Annual report and audited financial statements - BlackRock
642
Annual report and audited financial statements BlackRock Strategic Funds R.C.S. Luxembourg: B 127481 For the financial year ended 31 May 2021
-
Upload
khangminh22 -
Category
Documents
-
view
0 -
download
0
Transcript of Annual report and audited financial statements - BlackRock

Annual report and auditedfinancial statements
BlackRock Strategic Funds
R.C.S. Luxembourg: B 127481
For the financial year ended 31 May 2021

ContentsGeneral Information 2
Chairwoman’s Letter to Shareholders 5
Investment Advisers’ Report 7
Directors’ Report 11
Report on Remuneration (Unaudited) 15
Statement of Net Assets 19
Three Year Summary of Net Asset Values 28
Statement of Operations and Changes in Net Assets 40
Statement of Changes in Shares Outstanding 50
Portfolio of Investments 60BlackRock Americas Diversified Equity Absolute Return Fund 60BlackRock Asia Pacific Absolute Return Fund 171BlackRock Asia Pacific Diversified Equity Absolute Return Fund 174BlackRock Dynamic Diversified Growth Fund 217BlackRock Emerging Companies Absolute Return Fund 223BlackRock Emerging Markets Absolute Return Fund 228BlackRock Emerging Markets Equity Strategies Fund 231BlackRock Emerging Markets Flexi Dynamic Bond Fund 235BlackRock Emerging Markets Short Duration Bond Fund 245BlackRock ESG Euro Bond Fund 252BlackRock ESG Euro Corporate Bond Fund 267BlackRock ESG Euro Short Duration Bond Fund 277BlackRock European Absolute Return Fund 284BlackRock European Opportunities Extension Fund 289BlackRock European Select Strategies Fund 293BlackRock European Unconstrained Equity Fund 313BlackRock Fixed Income Credit Strategies Fund 314BlackRock Fixed Income Strategies Fund 325BlackRock Global Absolute Return Bond Fund 357BlackRock Global Equity Absolute Return Fund 403BlackRock Global Event Driven Fund 406BlackRock Global Real Asset Securities Fund 416BlackRock Managed Index Portfolios - Conservative 422BlackRock Managed Index Portfolios - Defensive 424BlackRock Managed Index Portfolios - Growth 426BlackRock Managed Index Portfolios - Moderate 428BlackRock Style Advantage Fund 430BlackRock Style Advantage Screened Fund 478BlackRock Systematic ESG World Equity Fund 505BlackRock Systematic Global Equity Fund 511BlackRock Systematic Global Long/Short Equity Fund 519BlackRock Total Advantage Fund 556BlackRock UK Equity Absolute Return Fund 586
Notes to the Financial Statements 590
Independent Auditor´s Report 611
Appendix I – Share Classes (Unaudited) 614
Appendix II – Global Market Risk Exposure (Unaudited) 617
Supplementary Information (Unaudited) 620
Subscriptions can only be made on the basis of the current Prospectus, the Key Investor Information Document (“KIID”) supplemented by the most recent Annual report and audited financial
statements and Interim report and unaudited financial statements, if published after such Annual report and audited financial statements. Copies are available at the registered office of BlackRock
Strategic Funds (the �Company�) from the Local Investor Servicing team, the Transfer Agent, the Management Company or any of the Distributors. See General Information section for further details.
Annual report and audited financial statements [1]

Board of DirectorsDenise Voss, Chairwoman (appointed as Chairwoman effective29 October 2020)Paul Freeman (resigned as Chairman effective 29 October2020)Ursula Marchioni (appointed effective 12 October 2020)Barry O’DwyerGeoffrey D. RadcliffeKeith Saldanha (appointed effective 3 May 2021)
All Directors are non-executive Directors.
Ursula Marchioni, Barry O’Dwyer, Geoffrey D. Radcliffe and Keith Saldanha are employees of
the BlackRock Group (the BlackRock Group of companies, the ultimate holding company of
which is BlackRock, Inc., of which the Management Company, Investment Advisers and
Principal Distributor are part of).
Paul Freeman is a former employee of the BlackRock Group.
Denise Voss is an independent Director.
Management CompanyBlackRock (Luxembourg) S.A.35A, avenue J.F. Kennedy,L-1855 Luxembourg,Grand Duchy of Luxembourg
Investment AdvisersBlackRock Financial Management, Inc.Park Avenue Plaza,55 East 52nd Street,New York, NY 10055,USA
BlackRock Institutional Trust Company N.A.400 Howard Street,San Francisco CA 94105,USA
BlackRock Investment Management LLC100 Bellevue Parkway,Wilmington, Delaware 19809,USA
BlackRock Investment Management (UK) Limited12 Throgmorton Avenue,London EC2N 2DL,United Kingdom
BlackRock (Singapore) Limited#18-01 Twenty Anson,20 Anson Road,Singapore, 079912
Sub-Investment AdvisersBlackRock Asset Management North Asia Limited16/F Cheung Kong Center,2 Queen’s Road Central,Hong Kong
BlackRock Investment Management (Australia) LimitedLevel 26, 101 Collins Street,Melbourne 3000,Australia
BlackRock Japan Co., Ltd.1-8-3 Marunouchi,Chiyoda-ku,Tokyo 100-8217,Japan
Principal DistributorBlackRock Investment Management (UK) Limited12 Throgmorton Avenue,London EC2N 2DL,United Kingdom
Depositary and Fund AccountantState Street Bank International GmbH, Luxembourg Branch49, avenue J.F. Kennedy,L-1855 Luxembourg,Grand Duchy of Luxembourg
Transfer Agent and RegistrarJ.P. Morgan Bank Luxembourg S.A.6C, route de Trèves,L-2633 Senningerberg,Grand Duchy of Luxembourg
Independent AuditorDeloitte Audit, S.à.r.l.20 Boulevard de KockelscheuerL-1821 Luxembourg,Grand Duchy of Luxembourg
Legal AdvisersLinklaters LLP35, avenue J.F. Kennedy,L-1855 Luxembourg,Grand Duchy of Luxembourg
Securities Lending AgentBlackRock Advisors (UK) Limited12 Throgmorton Avenue,London EC2N 2DL,United Kingdom
Paying AgentsAustriaRaiffeisen Bank International AGAm Stadtpark 9,1030 Vienna,Austria
BelgiumJ.P. Morgan Chase Bank N.A.Brussels Branch1 Boulevard du Roi Albert II,B-1210 Brussels,Belgium
Czech RepublicUniCredit Bank Czech Republic and Slovakia a.s.Prague 4 – Michle, Želetavská 1525/1,Postal Code 140 92,Czech Republic
General Information
BlackRock Strategic Funds[2]

FranceCACEIS Bank1-3 Place Valhubert,75013 Paris,France
GermanyJ.P. Morgan AGCIB / Investor Services – Trustee & FiduciaryTaunustor 1 (TaunusTurm)60310 Frankfurt am MainGermany
Ireland (Facilities Agent)J.P. Morgan200 Capital Dock,Sir John Rogerson’s Quay, 79D02 RK57 Dublin 2,Ireland
ItalyAllfunds Bank, S.A.Milan branchVia Santa Margherita, 720121 Milan,Italy
BNP Paribas Securities ServicesSuccursale di MilanoVia Ansperto. 520123 Milan,Italy
Société Générale Securities Services S.p.A.Via Benigno Crespi19/A, MAC II,20159 Milan,Italy
Banca Monte dei Paschi di Siena S.p.A.Piazza Salimbeni 3,53100 Siena,Italy
State Street Bank International GmbHSuccursale ItaliaVia Ferrante Aporti 10,20125 Milan,Italy
Banca Sella Holding S.p.A.Piazza Gaudenzio Sella 1,13900 Biella,Italy
CACEIS Bank S.A.Italy BranchPiazza Cavour, 2,20121 Milan,Italy
ICCREA Banca S.p.A.Via Lucrezia Romana 41/47,00178 Rome,Italy
Luxembourg(Central Paying Agent)J.P. Morgan Bank Luxembourg S.A.European Bank & Business Centre,6C, route de Trèves,L-2633 Senningerberg,Grand Duchy of Luxembourg
MaltaMeDirect Bank PlcThe Centre, Tigne Point, Sliema TPO, 0001Malta
PolandCiti HadlowyBank Handlowy w Warszawie S.A.ul. Senatorska 16PL-00-923 WarsawPoland
SwedenBlackRock Investment Management (UK)Limited Stockholm BranchNorrlandsgatan 16111 43 StockholmSweden
SwitzerlandState Street Bank International GmbHMunich, Zurich branchBeethovenstrasse 19,CH-8027 Zurich, Switzerland
United KingdomJ.P. Morgan Europe LimitedUK Paying Agency3 Lochside ViewEdinburghUnited KingdomEH12 9DH
Registered Office49, avenue J.F. Kennedy,L-1855 Luxembourg,Grand Duchy of Luxembourg
General Informationcontinued
Annual report and audited financial statements [3]

EnquiriesIn the absence of other arrangements, enquiries regardingthe Company should be addressed as follows:Written Enquiries:BlackRock Investment Management (UK) Limited,c/o BlackRock (Luxembourg) S.A.P.O. Box 1058,L-1010 Luxembourg,Grand Duchy of Luxembourg
All other enquiries:Telephone: + 44 207 743 3300,Fax: + 44 207 743 1143.Email: [email protected]
Current ProspectusThe Company’s Prospectus and the relevant KIID along with copies of the Application Form may be obtained from the InvestorService Centre, the Management Company or any of the Representatives or Distributors. Copies of the Company’s Articles ofIncorporation, the Annual report and audited financial statements and Interim report and unaudited financial statements may alsobe obtained free of charge from any of these offices and from the Paying Agents. All these documents are also available fromwww.blackrockinternational.com.
RepresentativesThe representative in Denmark is BlackRock Copenhagen Branch, subsidiary of BlackRock Investment Management (UK) Limited,United Kingdom, Harbour House, Sundkrogsgade 21, Copenhagen, DK 2100, Denmark.
The representative in Israel is Altshuler Shaham Group, 19A Habarzel St, Ramat Hahayal, Tel Aviv, Israel.
The representative in Poland is Dubinski Fabrycki Jelenski, ul. Zielna 37, 00-108 Warsaw, Poland.
The representative in Switzerland is BlackRock Asset Management Switzerland Limited, Bahnhofstrasse 39, 8001 Zurich,Switzerland.
Portfolio of InvestmentsEquities are primarily classified by the country of incorporation of the entity in which the Funds (each a “Fund”, together the“Funds”) hold shares.
Corporate and government fixed and variable income securities are primarily classified by the country of incorporation of the issuer.
Liquidity instruments are primarily classified by the country of incorporation of the issuer.
Collective Investment Schemes (“CIS”) and Exchange Traded Funds (“ETF”) are primarily classified by the country of domicile ofthe CIS or ETF.
Purchases and SalesA detailed list of investments purchased and sold for any Fund during the year is available upon request, free of charge, from theRegistered Office, or the offices of the Representatives as mentioned above.
Authorised StatusThe Company is an undertaking for collective investment in transferable securities (“UCITS”) under the Part I of the LuxembourgLaw of 17 December 2010 relating to undertakings for collective investment in transferable securities, as amended (�the2010 Law�). Regulatory consents have been obtained or appropriate notifications have been made for the distribution of shares ofthe Company’s Funds in the following countries: Austria, Belgium, Chile, China, Czech Republic, Denmark, Finland, France,Germany, Greece, Hungary, Iceland, Ireland, Italy, Luxembourg, Malta, the Netherlands, Norway, Poland, Portugal, Singapore,Slovak Republic, South Korea, Spain, Sweden, Switzerland, Taiwan, United Arab Emirates and the United Kingdom.
Shares of certain of the Company’s Funds may also be offered in Singapore by private placement.
The Company is duly registered with the Comisión Nacional de Mercado de Valores in Spain under number 626.
General Informationcontinued
BlackRock Strategic Funds[4]

Dear Shareholders,
I am writing to update you on the activities of BlackRock Strategic Funds (the “Company” or “BSF”) over the twelve months to31 May 2021. The Company offered shares in 33 Funds (each a “Fund” and together the “Funds”) at 31 May 2021.
In early 2020, an outbreak of an infectious respiratory illness caused by a novel coronavirus known as COVID-19 has developedinto a global pandemic, and its impact continued to be felt during the period under review. This coronavirus has resulted in travelrestrictions, closed international borders, enhanced health screenings at ports of entry and elsewhere, disruption of and delays inhealthcare service preparation and delivery, prolonged quarantines, cancellations, supply chain disruptions, and lower consumerdemand, as well as general concern and uncertainty.
The impact of COVID-19 has adversely affected the economies of many nations across the entire global economy, individualissuers and capital markets, and could continue to extents that cannot necessarily be foreseen. In addition, the impact of infectiousillnesses in emerging market countries may be greater due to generally less established healthcare systems. Public health crisescaused by the COVID-19 outbreak may exacerbate other pre-existing political, social and economic risks in certain countries orglobally.
In spite of impressive progress on vaccination across many of the world’s largest countries, the full duration of the COVID-19outbreak and its effects still cannot be determined with certainty, and the pandemic continues to be a major challenge forpolicymakers. Healthcare systems have not yet recovered from the impact and many businesses are still living with significantuncertainty. New virus mutations threaten to increase cases faster than vaccines can stop them. In particular, some emergingmarket countries, such as India and Brazil have seen significant new waves of the virus.
Furthermore, access to vaccines remains severely limited in some parts of the world, which may impede recovery in affected areas.Nevertheless, governments, policymakers and investors alike continue to anticipate some return to normality for economies in thesecond half of 2021.
Within the above context, however, economies have increasingly started to adapt to virus restrictions and there are clear signs ofrecovery. The International Monetary Fund (the “IMF”) is currently predicting the world economy will grow 6.0% in 2021, with Chinaand the United States of America (the “US”) predicted to expand by 8.4% and 6.4% respectively. In general, unemployment has notbeen nearly as bad as some of the dire early predictions, and business failures have been minimal.
Investors now have a new concern: inflation. The most recent Consumer Price Index figures from the US showed inflation rising5.0% year on year, the strongest increase since 2008. This comes on top of a 4.2% rise the previous month. The inflation shock hasbeen felt in bond markets, which have started to price in higher inflation figures. It also disrupted the long-term strength of thetechnology sector, which has benefited from ‘lower for longer’ interest rate expectations.
The Federal Reserve (the “Fed”) continues to believe that inflation will moderate in the second half of the year as the immediateeconomic bounce-back fades. However, businesses are increasingly reporting supply bottlenecks, rising prices for commodities andlabour shortages. If this is the case, central banks may be forced to reconsider their current policy, raising interest rates to sloweconomic growth and curb inflationary threats.
For the time being, economies continue to be well supported by the actions of governments and central banks. Interest rates remainlow across the world, and governments have directed significant capital towards support for individuals and new infrastructurebuilding, particularly for the clean energy transition. During the period under review, new US president Joe Biden signed a furtherUSD 1.9 trillion COVID-19 relief bill, while also promising trillions more in infrastructure spending.
Markets also continued to rally over this period, encouraged by the vaccine progress. However, from November onwards, as vaccineresults were announced, this progress was firmly rooted in the ‘recovery’ stocks, such as energy, financials or travel, rather than thehigh growth technology stocks that led for much of 2020.
Environmental, social and governance (�ESG�) factors are becoming increasingly important for regulators, policymakers andinvestors. BlackRock has a firm-wide commitment to integrate ESG information into our investment processes, including this rangeof funds. We believe that sustainability and climate-integrated portfolios can provide better risk-adjusted returns to investors overthe long-term, and that sustainability-related data provides an increasingly important set of tools to identify unpriced risks andopportunities within portfolios.
Chairwoman’s Letter to ShareholdersMay 2021
Annual report and audited financial statements [5]

The performances of the Funds are covered in more detail in the Investment Advisers’ Report, which also sets out some viewsregarding the investment outlook. Overall, the Company’s assets under management (“AUM”) rose 14.5% from USD 23,870 millionto USD 27,315 million. Three funds closed over the period – BlackRock European Diversified Equity Absolute Return Fund,BlackRock Asia Extension Fund and BlackRock Macro Opportunities Fund. One fund launched during the period - BlackRock ESGEuro Bond Fund.
The strongest percentage growth was seen with BlackRock Global Real Asset Securities Fund, which climbed 228.3% to USD315.2 million. BlackRock Global Equity Absolute Return Fund also saw strong growth, rising 214.4% to USD 70.6 million.BlackRock Fixed Income Credit Strategies Fund was also strong, in spite of a difficult climate for fixed income, rising 187.3% toEUR 385.4 million.
The weak spots included BlackRock Style Advantage Fund, which lost 91.7% of its AUM, falling to USD 178.5 million. TheBlackRock Managed Index Portfolios range were also not the strongest performers, with the Conservative portfolio falling 34.7% toEUR 101.7 m, and the Defensive fund falling 21.6% to EUR 159.2 million
Regulatory change continued throughout Europe, which could have implications for investors. Key developments during the periodincluded:
� The European Supervisory Authorities (ESAs) published a consultation paper in October 2019 on the content of Packaged RetailInvestment and Insurance-based Investment Products (“PRIIPs”) Key Information Documents (KIDs). The paper focuses onperformance scenarios and costs. The Company will benefit from the transitional period available for a UCITS fund until 1 July2022.
� The EU’s consultation on the new Sustainable Finance Disclosure Regulation (“SFDR”) came into effect in March 2021. Itimposes new transparency and reporting obligations on investment management firms, both at a firm-wide level and at a productlevel. Certain parts of the framework are still under consultation and are likely to be finalised later this year. At the same time, theEU is working on an EU-wide classification system or ’framework’. This taxonomy is designed to provide businesses and investorswith a common language to identify to what degree economic activities can be considered environmentally sustainable. There arealso moves to improve reporting, with the Corporate Sustainability Reporting Directive (“CSRD”) currently in discussions. TheLuxembourg government recently took further steps to encourage investment in environmentally sustainable funds, reducing the‘taxe d’abonnement’ (subscription tax) for funds that meet certain environmental criteria.
� In June 2020, the European Securities and Markets Authority (“ESMA”) issued a supervisory briefing aimed at local regulators,looking at the supervision of costs and charges applicable to UCITS funds and Alternative Investment Funds. Costs can have asignificant impact on final returns for investors and, with this issuance, ESMA looks to ensure that charges on retail investmentproducts is fair and transparent, with an emphasis on prevention of undue costs.
Should you have any questions on any of this material, please contact us via our website: www.blackrockinternational.com or viaemail: [email protected].
Yours sincerely,
Denise VossChairwoman
June 2021
Chairwoman’s Letter to ShareholdersMay 2021 continued
BlackRock Strategic Funds[6]

Market ReviewThe 12 months under review have largely been characterised bya recovery in markets, after the significant pandemic-relatedsell-offs. This market recovery has come in spite of mixedeconomic data and ongoing lockdowns, but accelerated andbroadened out once it was clear that the vaccines were likely tobe effective in halting the pandemic.
There were two clear periods in markets: much of 2020 wascharacterised by the strength of growth stocks and, in particular,those companies that benefited from lockdowns, which forced anew dependency on technology. This resulted in e-commerce,cloud computing and communication technology groups thriving.
In contrast, the leisure, high street retail and hospitality sectorswere hard hit initially. These sectors recovered significantly afterthe news of successful vaccines emerged. However it was toolate for a number of vulnerable companies - Hertz, Flybe, IntuProperties and department stores JC Penney and Lord & Taylorhave all filed for bankruptcy.
Inflation started to become an important factor in markets aseconomic recovery took hold. Bottlenecks in the supply of vitalgoods, such as commodities and semiconductors, conspiredwith pent-up demand from consumers and significantgovernment infrastructure spending to push up prices. The USsaw consumer price index (�CPI�) inflation figures of 4.2% and5% in April and May 2021 respectively. The US Federal Reserve(the “Fed”) continues to insist that the changes are ‘transitory’,but plenty of investors are not convinced.
These inflationary pressures have been felt across both bondand equity markets. They pushed up yields, which moveinversely to prices, on long-dated government bonds during thefirst quarter of 2021, though this has stabilised subsequently.Inflationary pressure was also another negative for the highlyrated technology sector, whose lofty valuations have to someextent been justified by low long-term interest rates.
ESG – sustainable factors ‘environmental’, ‘social’ and‘governance’ - became more important considerations for manyinvestors during the period under review, and this is likely tocontinue. Also, many ‘green’ companies were beneficiaries ofthe drive from governments to ‘build back better’, whichsupported share prices. At a time when flows into mutual fundswere generally lacklustre, ESG funds continued to attractinvestors.
It was a tough period for income seekers. Dividends were hithard, particularly in the US and United Kingdom, as companieseither could not make a distribution, or sought to conserve cashat an uncertain time. There were also regulatory pressures onsome companies to halt payments. By September 2020,companies had started to resume payouts as they had morevisibility on earnings, but it was a slow process.
Government bond yields, which move inversely to prices, initiallybenefited from a flight to quality and loosening monetary policyfrom global central banks. The US 10-year treasury dropped
from around 1.9% at the start of 2020 to 0.7% in early March,and remained near that level for the remainder of the year underreview. However, they rose rapidly as investors started to fearinflation, hitting 1.75% in March 2021. Corporate bonds saw asignificant widening of spreads (the difference in yield betweengovernment and corporate bonds with similar maturities) in theearly part of the crisis, but have recovered since.
Fund Performance
Equity Fund PerformanceA table setting out the performance returns for the primaryshare class for each Fund versus any applicable benchmarkmay be found on page 9 and 10. A brief summary of fundperformance follows.
BlackRock European Absolute Return Fund rose 1.3% –outperforming the 3 month LIBOR Index (EUR), which fell 0.5%.BlackRock UK Equity Absolute Return Fund dipped 0.4%against a largely flat benchmark (the 3 month LIBOR Index(GBP)). BlackRock Asia Pacific Diversified Equity AbsoluteReturn Fund rose 18.6% over the period, ahead of itsbenchmark, which was up 0.3%.
The BlackRock Emerging Markets Absolute Return Fund rose9.5% over the period, well ahead of its benchmark, 3 MonthLIBOR Index (USD), which was up 0.3%. BlackRock AmericasDiversified Equity Absolute Return Fund fell 3.8%, behind the3 Month LIBOR Index (USD), which was up by 0.3%.
The BlackRock Emerging Markets Equity Strategies Fund rose41.6%, behind its benchmark, the MSCI Emerging MarketsIndex, which was up 51.0%. The BlackRock Systematic GlobalLong/Short Equity Fund was up 3.2%, ahead of its benchmark,the BofA Merrill Lynch 3 Month US Treasury Bill, which was up0.1%.
BlackRock European Opportunities Extension Fund rose 41.1%outperforming its benchmark, the S&P Europe BMI Index(Developed Markets Only), which rose 32.5%. The BlackRockEuropean Select Strategies Fund rose 6.8%, ahead of itsbenchmark, which rose 6.5%. BlackRock Global Event DrivenFund rose 10.1%, compared to a rise of 0.1% in its benchmark,the BofA Merrill Lynch 3 Month US Treasury Bill.
BlackRock Systematic ESG World Equity Fund rose 42.3%,ahead of its benchmark, which rose 40.6%. BlackRock StyleAdvantage Fund fell 3.2%, compared to a rise of 0.3% in itsbenchmark, the 3 month LIBOR Index (USD). The ‘screened’version dropped 4.2%, against the same benchmark. BlackRockSystematic Global Equity Fund rose 22.4%, in line with itsbenchmark. The Global Real Assets Securities fund rose31.4%, against a rise in its benchmark of 26.3%
Bond Fund PerformanceBlackRock Emerging Markets Flexi Dynamic Bond Fund, whichdoes not measure its performance relative to a benchmark, roseby 5.0% over the period. BlackRock Fixed Income StrategiesFund rose 4.3% over the period, ahead of its benchmark, the
Investment Advisers’ ReportPerformance Overview1 June 2020 to 31 May 2021
The information stated in this report is historical and not necessarily indicative of future performance.
Annual report and audited financial statements [7]

Euro Overnight Index Average, which was down 0.4%.BlackRock Global Absolute Return Bond Fund dropped 5.6%,behind its benchmark, the 3 Month Euribor Index, which wasdown 0.5%.
BlackRock ESG Euro Bond Fund rose 0.4%, behind itsbenchmark, which rose 0.8%. The ESG Euro Corporate BondFund rose 4.2%, behind its benchmark, the Bloomberg BarclaysMSCI Euro Corporate Sustainable SRI Index, which rose 4.3%.
Mixed Fund PerformanceBlackRock Dynamic Diversified Growth Fund rose 11.4% overthe period, outperforming its benchmark, the Euro OvernightIndex Average, which fell by 0.4%. The BlackRock ManagedIndex Portfolios – Defensive, Growth and Moderate - were up5.7%, 25.6% and 15.3% respectively.
OutlookBy the end of May 2021, the COVID-19 vaccine rollout waswell-established, albeit with varying degrees of success indifferent countries. While many major economies had themajority of their vulnerable citizens vaccinated, with theresulting decline in the number of hospital admissions anddeaths, outbreaks in India and Brazil showed that the world wasstill vulnerable to new variants of the virus.
Nevertheless, the world economy continues to revive. AtBlackRock, we believe a powerful economic restart is underway.The IMF has forecast that world output will increase by 6.0% in2021, with the US expanding by 6.4% and China by 8.4%.
With this growth, however, comes the potential for inflation; thisis increasingly being reflected in financial markets. We expectinflation to build steadily over the medium-term as easymonetary policy allows the US economy to run hot. For the timebeing, although statements from the Fed have noted that higherinflation is “transitory”, there are still concerns pressures mayendure.
It is also clear that COVID-19 has accelerated profound shifts inhow economies and societies operate. There is a growing drivefor sustainability and to address issues, such as inequality. In
this new environment, it is plausible that a new model ofcapitalism may emerge. Many technological shifts, such asdigitisation and e-commerce, appear permanent, while parts ofthe healthcare market have seen a revolution. The extent ofthese changes and their impact may not be clear for some time.
Sectors on the right side of the ‘new normal’, such astechnology and healthcare, should have a notable tailwind.COVID-19 has also changed the geopolitical landscape. Supplychains are getting shorter, rolling back a decades’-longglobalisation trend that has gradually lowered inflation andexpanded corporate profit margins.
The shift toward sustainable investing is another important andenduring change. In his 2021 letter to the CEOs of companies inwhich BlackRock invests client assets, BlackRock CEO LarryFink said: “The past year saw major net zero commitments byChina, the European Union, Japan, and South Korea, and lastweek the US re-joined the Paris Agreement. More and morefinancial regulators are making climate risk disclosuremandatory, central banks are stress testing for climate risk, andpolicymakers around the world are collaborating to achievecommon climate goals. 127 governments – responsible for morethan 60% of the world’s emissions – and over 1,100 companiesare considering or already implementing net zero commitments.These changes will have dramatic impacts for investors.”Companies are increasingly judged on their environmentalfootprint, and overall sustainability agenda, and as such, theseconsiderations need to form part of the assessment of anyinvestment.
The world that emerges from the COVID-19 pandemic is unlikelyto be the same as the one that went in. Investors need toprepare for a new normal. This pandemic has delivered aprofound and enduring shock to the global economy, and therepercussions will be felt for many years to come.
June 2021
Investment Advisers’ ReportPerformance Overview1 June 2020 to 31 May 2021 continued
The information stated in this report is historical and not necessarily indicative of future performance.
BlackRock Strategic Funds[8]

Disclosed in the table below are the performance returns for the primary share class for each Fund, which has been selected as arepresentative share class. In accordance with the respective investment objective detailed in the Prospectus, the Funds do not aimto track the performance of a specific benchmark index. The benchmark index returns included in the below table are provided forreference only for the purpose of this Annual report and audited financial statements. The primary share class for the BlackRockAsia Pacific Absolute Return Fund, BlackRock Emerging Markets Absolute Return Fund and BlackRock Emerging CompaniesAbsolute Return Fund is the D class non-distributing share, for the BlackRock European Credit Strategies Fund is the H classnon-distributing share, for the BlackRock Managed Index Portfolios – Defensive, BlackRock Managed Index Portfolios – Growth andBlackRock Managed Index Portfolios – Moderate is the D class distributing share. For all other Funds the primary share class is theA class non-distributing share. Performance returns for any other share class can be made available on request.
Past performance is not a guide to future performance and should not be the sole factor of consideration when selecting a product.All financial investments involve an element of risk. Therefore, the value of your investment and the income from it will vary and yourinitial investment amount cannot be guaranteed. The Funds invest a large portion of assets which are denominated in multiplecurrencies; hence changes in the relevant exchange rate will affect the value of the investment. The performance figures do notconsider charges and fees that may be levied at the time of subscription or redemption of shares. Levels and bases of taxation maychange from time to time. Subscriptions can only be made on the basis of the current Prospectus, the KIID, supplemented by themost recent Annual report and audited financial statements and Interim report and unaudited financial statements, if published aftersuch Annual report and audited financial statements. Copies are available from the Local Investor Servicing team (local BlackRockGroup companies or branches of their administrators), the Transfer Agent, the Management Company or any of theRepresentatives or Distributors and at the registered office of the Company. BSF is only available for investment by non-US citizenswho are not residents of the US. The Funds are not offered for sale or sold in the US, its territories or possessions.
Fund Name
Financial yearperformance to
31 May 2021 Calendar year performance
1 year 2020 2019 2018 Launch date
BlackRock Americas Diversified Equity Absolute Return Fund ‘A’ Class NonDist (3.84)% (2.84)% 2.19% 0.56% 17 February 2012
3 Month LIBOR Index (USD) 0.28% 1.08% 2.60% 2.08%
BlackRock Asia Extension Fund ‘A’ Class Non Dist(1) 7.80% (8.69)% 12.52% (14.21)% 10 February 2012
MSCI All Country Asia ex Japan 7.40% (5.59)% 18.45% (14.12)%
BlackRock Asia Pacific Absolute Return Fund ‘D’ Class Non Dist 13.20% 8.43% 4.08% (4.19)% 31 August 2016
3 Month LIBOR Index (USD) 0.28% 1.08% 2.60% 2.08%
BlackRock Asia Pacific Diversified Equity Absolute Return Fund ‘A’Class Non Dist 18.59% 7.54% (1.98)% 5.16% 22 February 2017
3 Month LIBOR Index (USD) 0.28% 1.08% 2.60% 2.08%
BlackRock Dynamic Diversified Growth Fund ‘A’ Class Non Dist 11.38% 7.19% 8.55% (4.68)% 28 January 2011
Euro Overnight Index Average (0.45)% (0.44)% (0.38)% (0.35)%
BlackRock Emerging Companies Absolute Return Fund ‘D’ Class Non Dist(2) 11.54% 10.48% 14.24% (2.38)% 17 October 2018
3 month LIBOR Index (GBP) 0.07% 0.29% 0.81% 0.18%
BlackRock Emerging Markets Absolute Return Fund ‘D’ Class Non Dist 9.53% (19.70)% 1.61% 14.28% 15 November 2012
3 Month LIBOR Index (USD) 0.28% 1.08% 2.60% 2.08%
BlackRock Emerging Markets Equity Strategies Fund ‘A’ Class Non Dist 41.57% (9.86)% 23.24% (0.79)% 18 September 2015
MSCI Emerging Markets Index 51.00% 18.31% 18.42% (14.57)%
BlackRock Emerging Markets Flexi Dynamic Bond Fund ‘A’ Class Non Dist 5.00% 14.07% 5.66% (12.01)% 12 June 2013
BlackRock Emerging Markets Short Duration Bond Fund ‘A’ Class Non Dist 13.03% 8.41% 6.50% (0.45)% 6 December 2017
J.P. Morgan Emerging Markets Bond Index Global Diversified 1-3 year Index 7.99% 0.46% 4.02% 0.59%
BlackRock ESG Euro Bond Fund ‘A’ Class Non Dist 0.44% 4.16% 5.69% (0.47)% 23 August 2016
Bloomberg Barclays MSCI Euro Aggregate Sustainable SRI Index 0.78% 4.21% 5.91% 0.42%
BlackRock ESG Euro Corporate Bond Fund ‘A’ Class Non Dist 4.24% 2.79% 1.01% — 21 June 2019
Bloomberg Barclays MSCI Euro Corporate Sustainable SRI Index 4.33% 2.70% 0.91% —
BlackRock ESG Euro Short Duration Bond Fund (3) (0.38)% — — — 1 March 2021
Bloomberg Barclays MSCI Euro Aggregate 1-3 Years Sustainable SRI Index (0.10)% — — —
BlackRock European Absolute Return Fund ‘A’ Class Non Dist 1.33% 8.72% 0.54% 3.69% 27 February 2009
3 Month LIBOR Index (EUR) (0.52)% (0.43)% (0.39)% (0.37)%
BlackRock European Diversified Equity Absolute Return Fund ‘A’ Class NonDist(1) (0.07)% (5.61)% 5.93% (19.88)% 6 August 2010
3 Month LIBOR Index (EUR) — (0.15)% (0.39)% (0.37)%
Investment Advisers’ ReportPerformance Overview1 June 2020 to 31 May 2021 continued
The information stated in this report is historical and not necessarily indicative of future performance.
Annual report and audited financial statements [9]

Fund Name
Financial yearperformance to
31 May 2021 Calendar year performance
1 year 2020 2019 2018 Launch date
BlackRock European Opportunities Extension Fund ‘A’ Class Non Dist 41.13% 10.99% 31.64% (10.71)% 31 August 2007
S&P Europe BMI Index (Developed Markets only) 32.49% (1.45)% 27.77% (10.60)%
BlackRock European Select Strategies Fund ‘A’ Class Non Dist 6.84% 2.24% 9.94% (4.95)% 19 August 2015
75% Barclays Pan European Aggregate Index (Hedged EUR) / 25% MSCI EuropeIndex (Hedged EUR) 6.54% 3.24% 10.13% (2.60)%
BlackRock European Unconstrained Equity Fund ‘A’ Class Non Dist 25.41% 10.75% 39.23% (1.89)% 6 December 2018
MSCI Europe Index (Net Total Return) 29.67% (3.32)% 26.05% (1.62)%
BlackRock Fixed Income Credit Strategies Fund ‘A’ Class Non Dist 4.77% 1.15% 1.88% — 11 June 2019
Euro Overnight Index Average (0.45)% (0.44)% (0.22)% —
BlackRock Fixed Income Strategies Fund ‘A’ Class Non Dist 4.32% 3.44% 2.23% (2.92)% 30 September 2009
Euro Overnight Index Average (0.45)% (0.44)% (0.38)% (0.35)%
BlackRock Global Absolute Return Bond Fund ‘A’ Class Non Dist 5.62% 2.65% 1.29% (3.69)% 25 May 2012
3 month Euribor Index (0.45)% (0.39)% (0.34)% (0.33)%
BlackRock Global Equity Absolute Return Fund ‘D’ Class Non Dist 18.92% 14.89% 6.34% (1.14)% 12 December 2018
3 Month LIBOR Index (USD) 0.28% 1.08% 2.60% 0.14%
BlackRock Global Event Driven Fund ‘A’ Class Non Dist 10.07% 6.74% 6.93% 4.35% 5 August 2015
BofA Merrill Lynch 3 Month US Treasury Bill 0.11% 0.67% 2.28% 1.87%
BlackRock Global Real Asset Securities Fund ‘A’ Class Non Dist 31.84% 6.51% 25.18% (6.34)% 30 November 2017
FTSE Custom Developed Core Infrastructure 50/50 EPRA/Nareit DevelopedDividend+ Net Index 26.28% (6.80)% 21.79% (6.46)%
BlackRock Macro Opportunities Fund ‘A’ Class Non Dist(1) 0.29% (1.96)% 3.88% (2.84)% 29 November 2017
BlackRock Managed Index Portfolios − Conservative ‘A’ Class Non Dist 11.11% 0.35% 14.80% (7.01)% 26 January 2018
BlackRock Managed Index Portfolios − Defensive ‘D’ Class Dist 5.70% (0.22)% 11.41% (3.86)% 10 April 2015
BlackRock Managed Index Portfolios − Growth ‘D’ Class Dist 25.64% 7.36% 23.36% (8.40)% 10 April 2015
BlackRock Managed Index Portfolios − Moderate ‘D’ Class Dist 15.27% 0.37% 18.91% (6.75)% 10 April 2015
BlackRock Style Advantage Fund ‘A’ Class Non Dist (3.21)% (23.28)% (2.61)% (5.52)% 29 February 2016
3 month LIBOR Index (USD) 0.28% 1.08% 2.60% 2.08%
BlackRock Style Advantage Screened Fund ‘A’ Class Non Dist (4.22)% (19.51)% 0.82% 1.94% 29 October 2018
3 Month LIBOR Index (USD) 0.28% 1.08% 2.60% 0.40%
BlackRock Systematic ESG World Equity Fund ‘A’ Class Non Dist 42.27% 17.69% 27.48% (10.03)% 20 August 2015
MSCI World Index (Net Total Return) 40.63% 15.90% 27.67% (8.71)%
BlackRock Systematic Global Equity Fund ‘A’ Class Non Dist 41.30% 15.83% 24.72% (13.13)% 18 September 2015
MSCI All Country World Index (Net Total Return) 41.85% 16.25% 26.60% (9.41)%
BlackRock Systematic Global Long/Short Equity Fund ‘A’ Class Non Dist(2) 3.24% (0.61)% (1.20)% 0.45% 2 June 2014
BofA Merrill Lynch 3 Month US Treasury Bill 0.11% 0.67% 2.28% 1.87%
BlackRock Total Advantage Fund ‘A’ Class Non Dist 6.74% (12.70)% 10.28% (8.17)% 11 December 2017
3 month Euribor Index (0.45)% (0.39)% (0.34)% (0.33)%
BlackRock UK Equity Absolute Return Fund ‘A’ Class Non Dist (0.44)% (1.37)% 9.20% (5.39)% 18 August 2016
3 month LIBOR Index (GBP) 0.07% 0.29% 0.81% 0.72%(1) Fund terminated during the year, see Note 1 for further details. Performance disclosed denotes the Fund’s performance from 1 June 2020 to the date of termination.(2) Fund name changed, see Note 1 for further details.(3) New Fund launched, see Note 1 for further details. Performance disclosed denotes the Fund’s performance from the date of launch to 31 May 2021.
Fund performance returns are based on dealing prices with net dividends (after deduction of withholding tax) reinvested and are shown net of fees. Index Sources: Indices – Financial Times,MSCI, Citigroup, DataStream, MorningStar; Funds – BlackRock Investment Management (UK) Limited.
Investment Advisers’ ReportPerformance Overview1 June 2020 to 31 May 2021 continued
The information stated in this report is historical and not necessarily indicative of future performance.
BlackRock Strategic Funds[10]
Corporate Governance Statement
IntroductionBlackRock Strategic Funds (the “Company”) is a public limitedcompany (société anonyme) established under the laws of theGrand Duchy of Luxembourg as an open-ended variable capitalinvestment company (société d’investissement à capitalvariable). The Company has been authorised by theCommission de Surveillance du Secteur Financier (the “CSSF”)as an undertaking for collective investment in transferablesecurities (“UCITS”) pursuant to the provisions of Part I of thelaw of 17 December 2010, as amended from time to time and isregulated pursuant to such law. The Company complies with theprinciples set out in the Association of the Luxembourg FundIndustry (“ALFI”) Code of Conduct Revision 2013 (the “Code”)issued by ALFI in June 2013.
The Board of Directors of the Company (the “Board”) iscommitted to maintaining the highest standards of corporategovernance and is accountable to shareholders for thegovernance of the Company’s affairs. The Board hasconsidered the principles and recommendations of the Codeand has put in place a framework for corporate governancewhich it believes is appropriate for adherence to the principals ofthe Code given the nature of its structure as an InvestmentCompany. The Board considers that the Company has been incompliance with the principles of the Code for the year ended31 May 2021.
This statement summarises the corporate governance structureand processes in place for the Company for the period underreview from 1 June 2020 to 31 May 2021.
Board CompositionThe Board currently consists of six non-executive Directors,(including one independent Director). The Board is committed tomaintaining an appropriate balance of skills, experience,independence and knowledge amongst its members.
The Directors’ biographies, on pages 13 and 14, collectivelydemonstrate a breadth of investment knowledge andexperience, business and financial skills and legal andregulatory familiarity which enables them to provide effectivestrategic leadership, oversight and proper governance of theCompany. BlackRock considers the current composition to be asuitable and appropriate balance for the Board.
Article 13 of the Company’s Articles of Incorporation inaccordance with Luxembourg law, provides that Directors shallbe elected by the shareholders at their annual general meetingfor a period ending at the next annual general meeting and untiltheir successors are elected. Any Director who resigns his/herposition is obliged to confirm to the Board and the CSSF thatthe resignation is not connected with any issues with or claimsagainst the Company.
The Board supports a planned and progressive renewal of theBoard. BlackRock is committed to ensuring that Directors putforward for election by the shareholders possess the skillsneeded to maintain this balance. The Board is committed tocarrying out an annual review of its performance and activities.
The Directors have a continuing obligation to ensure they havesufficient time to discharge their duties. The details of eachDirector’s (including the Chairperson), other appointments andcommitments are made available to the Board and BlackRockgroup for inspection.
Before a new Director is proposed to the shareholders forappointment, he or she will receive a full induction incorporatingrelevant information regarding the Company and his or herduties and responsibilities as a Director. In addition, a newDirector is required to spend some time with representatives ofBlackRock so that the new Director will become familiar with thevarious processes which are considered necessary for theproper performance of his or her duties and responsibilities tothe Company.
The Company’s policy is to encourage Directors to keep up todate with developments relevant to the Company. The Directorshave attended and will continue to attend updates and briefingsrun by BlackRock entities. The Directors also receive regularbriefings from, amongst others, the auditors, investmentstrategists, risk specialists, depositary and legal advisersregarding any proposed product developments or changes inlaws or regulations that could affect the Company.
Board’s ResponsibilitiesThe Board meets at least quarterly and also on an ad hoc basisas required. The Board is supplied with information in a timelymanner and in a form and of a quality appropriate to enable it todischarge its duties. The Board is responsible for the long-termsuccess of the Company and recognises its responsibility toprovide leadership, direction and control to the Company withina framework of prudent and effective controls which enablesrisk to be assessed and managed. The Board reserves to itselfdecisions relating to the determination of investment policy andobjectives, any change in investment strategy and entering intoany material contracts, any change in board membership, anychange of external auditor, the prosecution defence orsettlement of litigation which is material or significant to theCompany and any significant change in accounting policies orpractices. The Board also approves the prospectus and anyaddenda to it, circulars to shareholders, financial statementsand other relevant legal documentation.
The Chairperson’s main responsibility is to lead and manage theBoard, encourage critical discussions and promote effectivecommunication within the Board. In addition, they is responsiblefor promoting best practice corporate governance and effectivecommunication with shareholders.
The Directors have access to the advice and services ofexternal counsel and the resources of BlackRock Group andBlackRock (Luxembourg) S.A. (the “Management Company”)should they be needed. Where necessary, in the furtherance of
Directors’ Report
Annual report and audited financial statements [11]

their duties, the Board and individual Directors may seekindependent professional advice. The Board has responsibilityfor ensuring that the Company keeps proper accounting recordswhich disclose with reasonable accuracy at any time thefinancial position of the Company and which enable it to ensurethat the financial statements comply with relevant accountingstandards. It is the Board’s responsibility to present a balancedand understandable assessment of the Company’s financialposition, which extends to interim financial statements and otherreports made available to shareholders and the public. TheBoard is responsible for taking reasonable steps forsafeguarding the assets of the Company and for takingreasonable steps in the prevention and detection of fraud andother irregularities.
InsuranceThe Company maintains appropriate Directors’ and Officers’liability insurance cover.
Delegation of ResponsibilitiesAs an open ended variable capital investment company most ofthe Company’s day-to-day management and administration isdelegated to BlackRock group companies such as theManagement Company which employs dedicated complianceand risk professionals. The Management Company appoints theInvestment Advisers and other third-party service providers. TheBoard has delegated the following areas of responsibility:
Management and Administration
The Board has delegated the investment management,administration, marketing & distribution of the Company and itsFunds to the Management Company. The Company hasappointed State Street Bank International GmbH, LuxembourgBranch as Depositary of its assets, which has responsibility forsafe-keeping of such assets, pursuant to the regulations. TheDepositary is a subsidiary of State Street Bank & Trust Co.
The Management Company has delegated the management ofthe investment portfolio to the Investment Advisers. TheInvestment Advisers operate under guidelines determined by theBoard and as detailed in the Company’s Prospectus relating tothe Company’s Funds. The relevant Investment Advisers havedirect responsibility for the decisions relating to the day-to-dayrunning of the Company’s Funds and are accountable to theManagement Company for the investment performance of theFunds. The Board has also delegated the exercise of votingrights attaching to the securities held in the portfolio to therespective Investment Advisers who may in turn delegate toBlackRock Investment Management (U.K.) Limited (“BIM UK”).Voting on behalf of shareholders is done in a manner which isbelieved to be in the best economic interest of shareholders aslong-term investors.
The Management Company has delegated its responsibilities foradministrative services of the Company and its Funds to StateStreet Bank International GmbH, Luxembourg Branch (�theAdministrator�). The Administrator has responsibility for theadministration of the Company’s affairs including the calculationof the net asset value and preparation of the financial
statements of the Company, subject to the overall supervision ofthe Management Company. The Administrator is a subsidiary ofState Street Bank & Trust Co. The Management Company hasdelegated transfer agent and share registration services to J.P.Morgan Bank Luxembourg S.A.
The Management Company has delegated distribution,promotion and marketing of the Shares and related ongoingadministration and marketing to BIM UK as Principal Distributor.As Principal Distributor BIM UK have responsibility for the offerfor sale of, promotion and marketing of shares in any fund. BIMUK is accountable to the Management Company for thedistribution and marketing of the Shares.
The Management company is accountable to the Board for allactivities delegated to it or by it, including, but not limited tothose detailed above.
The Management Company reports to the Board on a quarterlybasis and by exception where necessary. Reporting is in placeto ensure that the Board can effectively oversee the actions ofits delegates.
The Management Company is responsible for the riskmanagement and internal controls of the Company and forreviewing their effectiveness, for ensuring that financialinformation published or used within the business is reliable,and for regularly monitoring compliance with regulationsgoverning the operation of the Company. The ManagementCompany reviews the effectiveness of the internal control andrisk management systems on an ongoing basis to identify,evaluate and manage the Company’s significant risks. As part ofthat process, there are procedures designed to capture andevaluate any failings or weaknesses. Should a case becategorised by the Board as significant, procedures exist toensure that necessary action is taken to remedy the failings.
The control processes over the risks identified, coveringfinancial, operational, compliance and risk management, isembedded in the operations of the BlackRock Group, theManagement Company and other parties including theAdministrator and the Depositary. There is a monitoring andreporting process to review these controls, which has been inplace throughout the period under review and up to the date ofthis report, carried out by BlackRock’s corporate auditdepartment.
BlackRock’s internal audit and operational risk units report tothe Board through the Management Company on a quarterlybasis. The Management Company also receives a report fromthe Administrator and the Depositary on the internal controls ofthe administrative and custodial operations of the Company. TheBoard recognises that these control systems can only bedesigned to manage rather than eliminate the risk of failure toachieve fund objectives, and to provide reasonable, but notabsolute, assurance against material misstatement or loss, andrelies on the operating controls established by the serviceproviders.
Directors’ Report continued
BlackRock Strategic Funds[12]

Financial ReportingThe Board is also responsible for establishing and maintainingadequate internal control and risk management systems of theCompany in relation to the financial reporting process. Suchsystems are designed to manage rather than eliminate the riskof failure to achieve the Company’s financial reportingobjectives. The Company has procedures in place to ensure allrelevant accounting records are properly maintained and arereadily available, including production of annual and half yearlyfinancial statements. These procedures include appointing theAdministrator to maintain the accounting records of theCompany independently of the Investment Manager and theCustodian. The financial statements are prepared in accordancewith applicable law and Generally Accepted AccountingPrinciples (“GAAP”) and are approved by the Board of Directorsof the Company. The accounting information given in the annualreport is required to be audited and the Audit report, includingany qualifications, is reproduced in full in the annual report ofthe Company.
RemunerationThe Company is an investment company and has no employeesor executive Directors. No Director (past or present) has anyentitlement to a pension from the Company, and the Companyhas not awarded any share options or long-term performanceincentives. No element of Directors’ remuneration isperformance related. Those Directors who are also employeesof the BlackRock group are not entitled to receive a Director’sfee. All other Directors are paid fees which are submitted forapproval by the shareholders at the annual general meeting andare disclosed on page 592. The Board believes that the level ofremuneration for those Directors who take a fee properly reflectsthe responsibility of the Directors and their time commitment.The maximum amount of remuneration payable to the Directorsis approved by the Board.
Communication with ShareholdersThe Board is responsible for convening the annual generalmeeting and all other general meetings of the Company.Shareholders are encouraged to attend and vote at generalmeetings. Notice of general meetings is issued in accordancewith the Articles of Incorporation of the Company and notice ofthe annual general meeting is sent out at least 8 days inadvance of the meeting. All substantive matters put before ageneral meeting are dealt with by way of separate resolution.Proxy voting figures are noted by the chairman of the generalmeeting.
The next Annual General Meeting of Shareholders will be heldon 25 November 2021 and shareholders will be asked toconsider the usual matters presented at such meeting including:
� Approval of the financial statements and the payment ofdividends
� The approval of Directors fees
� The election or re-election of directors
� The election or re-election of the auditor
� The discharge of Directors duties – this resolution is requiredunder Luxembourg law and the discharge is only valid wherethe financial statements contain no omission or falseinformation concealing the real financial situation of theCompany. The discharge is granted based on the factsdisclosed and the information at the disposal of theshareholders at the time of the Annual General Meeting.
The proceedings of general meetings are governed by theArticles of Incorporation of the Company.
BIM UK as Principal Distributor is tasked with managing therelationship between the Company and its shareholders and theBoard has controls in place such that it is advised ofshareholder complaints.
Directors’ BiographiesDenise Voss (Chairwoman) (American): Ms Voss is aNon-Executive Director of financial services companies and isbased in Luxembourg. She serves as a Director on the Boardsof flagship funds of major fund promoters, including BlackRockGlobal Funds and BlackRock Strategic Funds. Ms. Vosspreviously worked for Franklin Templeton in Luxembourg forover 25 years as a Conducting Officer and Director of the firm’sUCITS and alternative investment fund management business.Prior to joining Franklin Templeton, she worked for 10 years atCoopers & Lybrand in Boston, USA and in Luxembourg. Sheholds a Massachusetts CPA license and earned anundergraduate degree from Tufts University, as well as amasters degree in accountancy from Bentley University. Ms.Voss is Chairwoman of LuxFLAG, an independent agencybased in Luxembourg that awards recognised sustainablefinance labels to eligible investment vehicles. She wasChairwoman of the Association of the Luxembourg FundIndustry (ALFI) from 2015-2019, and a member of the ALFIBoard of Directors from 2007-2019.
Geoffrey D. Radcliffe (British & Luxembourgish dualnationality, Luxembourg resident): Mr Radcliffe is aManaging Director of BlackRock and is based in Luxembourg.He is a member of the BlackRock Business Operations &Technology, Global Accounting and Product Services team andheads Product Oversight and Governance International andAlternatives International for BlackRock EMEA & Asia Pacific.Mr Radcliffe is a Fellow of The Institute of CharteredAccountants in England and Wales and an Associate of TheChartered Institute of Bankers. He has 30+ years of mutualfund, accounting and banking experience in Luxembourg,Bermuda, London and the Isle of Man. Mr Radcliffe joined theBlackRock Group in 1998. He serves as a Director on theBoards of BlackRock Luxembourg S.A. and BlackRock FundManagement Company S.A. and also on the Boards of anumber of BlackRock investment funds. He has been a Memberof the Board of Directors of ALFI (Luxembourg Fund IndustryAssociation) since 2013.
Barry O’Dwyer (Irish): Mr O’Dwyer is a Managing Director atBlackRock. He is the Head of Fund Governance forBlackRock’s European open-ended fund ranges and waspreviously the Chief Operating Officer for BlackRock’s Irish
Directors’ Report continued
Annual report and audited financial statements [13]

business. He serves as a director on the boards of a number ofBlackRock corporate, fund, and management companiesdomiciled in Ireland, Luxembourg, Switzerland and Germanyand on the board of BlackRock’s UK Life company. He was thechairman of the Irish Funds Industry Association 2014-2015, isa board director of Financial Services Ireland and is a memberof An Taoiseach’s Financial Services Industry AdvisoryCommittee. He joined BlackRock Advisors (UK) Limited in1999 as head of risk management and moved to his presentrole in 2006. Prior to joining BlackRock Advisors (UK) Limited,Mr O’Dwyer worked as risk manager at Gartmore InvestmentManagement and at HypoVereinsbank and NationalWestminster Bank. Mr O’Dwyer graduated from Trinity CollegeDublin with a degree in Business Studies and Economics in1991. He holds a Chartered Association of CertifiedAccountants qualification and an MBA from London CityUniversity Business School.
Paul Freeman (British): Mr Freeman currently serves as adirector on the boards of a number of BlackRock Groupcompanies and investment funds. He was until December2015 a Managing Director of BlackRock, which he had joined inAugust 2005 (which then was Merrill Lynch InvestmentManagers). Up until July 2011 Mr Freeman was the Head ofProduct Development and Range Management for the EMEAregion with responsibility for the development and ongoingproduct management of all funds domiciled in EMEA anddistributed on a cross-border basis by BlackRock. Between July2011 and December 2015 Mr Freeman worked closely withBlackRock’s Government affairs team and served on variousinternal governance committees and on the boards of a numberof group subsidiaries and managed funds. Mr Freeman hasworked in the financial services industry for over 35 years and,prior to BlackRock, has held senior management positions atSchroders, Rothschild Asset Management, Henderson Investorsand GT Management (now part of Invesco). Mr Freeman is aChartered Accountant.
Ursula Marchioni (British & Italian dual nationality, UKresident): Ms Marchioni is a Managing Director of BlackRockand is Head of BlackRock Portfolio Consulting business forEurope, Middle East and Africa. She is a member ofBlackRock’s European Investment Committee and of theEuropean ETF and Index Investment Executive Committee. MsMarchioni joined BlackRock in August 2012 in the iSharesInvestment and Product Strategy function; she became Head ofthe team and Chief Strategist for iShares in EMEA in March2016. Ms Marchioni began her current role in January 2017. MsMarchioni has 20 years of experience in the financial servicesindustry. Prior to joining BlackRock, Ms Marchioni worked CreditSuisse and Société Generale, in the Asset Management andInvestment Banking divisions. She began her career at KPMGFinancial Advisory services. Ms Marchioni holds a cum laudeDegree in Physics from University of Trento, Italy.
Keith Saldanha (British): Mr. Saldanha is a Managing Directorof BlackRock and is Head of the Wealth Product Group forEurope, Middle East and Africa. He is responsible for definingand executing the alpha and alternatives product agenda for theBlackRock EMEA Wealth business. In addition, Mr Saldanhaleads the Fund Selection and Manager Research segment forthe EMEA iShares & Wealth sales organisation. Mr Saldanha isa member of the EMEA Wealth Executive Committee, EMEAProduct Development Committee and EMEA CapacityManagement Committee. He joined BlackRock in 2015 fromMan Group where he was Global Head of InvestmentMarketing, responsible for a number of product specialist,business development and client service teams across Man’sinvestment management businesses. Prior to this, he spent anumber of years focused on the origination and execution ofMan’s hedge fund M&A activity and jointly leading corporatestrategy for the hedge fund business. Mr Saldanha started hiscareer in strategy consulting. He is a Chartered AlternativeInvestment analyst and holds a BSc (Hons) Economics degreefrom the University of Warwick.
Directors’ Report continued
BlackRock Strategic Funds[14]

The below disclosures are made in respect of the remunerationpolicies of the BlackRock group (�BlackRock�), as they apply toBlackRock (Luxembourg) S.A. (the �Manager�). The disclosuresare made in accordance with the Directive 2009/65/EC on thecoordination of laws, regulations and administrative provisionsrelating to undertakings for collective investment in transferablesecurities (“UCITS”), as amended, including in particular byDirective 2014/91/EU of the European Parliament and of thecouncil of 23 July 2014, (the “Directive”), and the �Guidelines onsound remuneration policies under the UCITS Directive andAIFMD� issued by the European Securities and MarketsAuthority.
BlackRock’s UCITS Remuneration Policy (the “UCITSRemuneration Policy”) will apply to the European EconomicArea (“EEA”) entities within the BlackRock Group authorised asa management company of UCITS funds in accordance with theDirective, and will ensure compliance with the requirements ofArticle 14b of the Directive.
The Manager has adopted the UCITS Remuneration Policy, asummary of which is set out below.
Remuneration GovernanceBlackRock’s remuneration governance in EMEA operates as atiered structure which includes: (a) the ManagementDevelopment and Compensation Committee (“MDCC”) (which isthe global, independent remuneration committee for BlackRock,Inc. and (b) the Manager’s board of directors (the “Manager’sBoard”). These bodies are responsible for the determination ofBlackRock’s remuneration policies.
(a) MDCCThe MDCC’s purposes include:
providing oversight of:� BlackRock’s executive compensation programmes;� BlackRock’s employee benefit plans; and� such other compensation plans as may be established by
BlackRock from time to time for which the MDCC is deemedas administrator;
� reviewing and discussing the compensation discussion andanalysis included in the BlackRock, Inc. annual proxystatement with management and approving the MDCC’sreport for inclusion in the proxy statement;
� reviewing, assessing and making reports andrecommendations to the BlackRock, Inc. Board of Directors(the “BlackRock, Inc. Board”) as appropriate on BlackRock’stalent development and succession planning, with theemphasis on performance and succession at the highestmanagement levels; and
� supporting the boards of the Company’s EMEA regulatedentities in meeting their remuneration-related obligations byoverseeing the design.
The MDCC directly retains its own independent compensationconsultant, Semler Brossy Consulting Group LLC, who has norelationship with BlackRock, Inc. or the BlackRock, Inc. Board
that would interfere with its ability to provide independent adviceto the MDCC on compensation matters.
The BlackRock, Inc. Board has determined that all of themembers of the MDCC are “independent” within the meaning ofthe listing standards of the New York Stock Exchange (NYSE),which requires each meet a “non-employee director” standard.
The MDCC held 9 meetings during 2020. The MDCC charter isavailable on BlackRock, Inc.’s website (www.blackrock.com).
Through its regular reviews, the MDCC continues to be satisfiedwith the principles of BlackRock’s compensation policy andapproach.
(b) The Manager’s BoardThe Manager’s Board has the task of supervising and providingoversight of the UCITS Remuneration Policy as it applies to theManager and its Identified Staff.
The Manager’s Board (through independent review by therelevant control functions) remains satisfied with theimplementation of the UCITS Remuneration Policy as it appliesto the Manager and its Identified Staff.
Decision-making processRemuneration decisions for employees are made once annuallyin January following the end of the performance year. Thistiming allows full-year financial results to be considered alongwith other non-financial goals and objectives. Although theframework for remuneration decision-making is tied to financialperformance, significant discretion is used to determineindividual variable remuneration based on achievement ofstrategic and operating results and other considerations such asmanagement and leadership capabilities.
No set formulas are established and no fixed benchmarks areused in determining annual incentive awards. In determiningspecific individual remuneration amounts, a number of factorsare considered including non-financial goals and objectives andoverall financial and investment performance. These results areviewed in the aggregate without any specific weighting, andthere is no direct correlation between any particularperformance measure and the resulting annual incentive award.The variable remuneration awarded to any individual(s) for aparticular performance year may also be zero.
Annual incentive awards are paid from a bonus pool.
The size of the projected bonus pool, including cash and equityawards, is reviewed throughout the year by the MDCC and thefinal total bonus pool is approved after year-end. As part of thisreview, the MDCC receives actual and projected financialinformation over the course of the year as well as final year-endinformation. The financial information that the MDCC receivesand considers includes the current year projected incomestatement and other financial measures compared with prioryear results and the current year budget. The MDCCadditionally reviews other metrics of BlackRock’s financial
Report on Remuneration (Unaudited)
Annual report and audited financial statements [15]

performance (e.g., net inflows of AUM and investmentperformance) as well as information regarding market conditionsand competitive compensation levels.
The MDCC regularly considers management’s recommendationas to the percentage of preincentive operating income that willbe accrued and reflected as a compensation expensethroughout the year for the cash portion of the total annualbonus pool (the “accrual rate”). The accrual rate of the cashportion of the total annual bonus pool may be modified by theMDCC during the year based on its review of the financialinformation described above. The MDCC does not apply anyparticular weighting or formula to the information it considerswhen determining the size of the total bonus pool or theaccruals made for the cash portion of the total bonus pool.
Following the end of the performance year, the MDCC approvesthe final bonus pool amount.
As part of the year-end review process the Enterprise Risk andRegulatory Compliance departments report to the MDCC onany activities, incidents or events that warrant consideration inmaking compensation decisions.
Individuals are not involved in setting their own remuneration.
Control functionsEach of the control functions (Enterprise Risk, Legal &Compliance, and Internal Audit) has its own organisationalstructure which is independent of the business units. The headof each control function is either a member of the GlobalExecutive Committee (“GEC”), the global managementcommittee, or has a reporting obligation to the Board ofDirectors of BlackRock Group Limited, the parent company ofall of BlackRock’s EMEA regulated entities, including theManager.
Functional bonus pools are determined with reference to theperformance of each individual function. The remuneration ofthe senior members of control functions is directly overseen bythe MDCC.
Link between pay and performanceThere is a clear and well-defined pay-for-performancephilosophy and compensation programmes which are designedto meet the following key objectives as detailed below:
� appropriately balance BlackRock’s financial results betweenshareholders and employees;
� attract, retain and motivate employees capable of makingsignificant contributions to the long-term success of thebusiness;
� align the interests of senior employees with those ofshareholders by awarding BlackRock Inc.’s stock as asignificant part of both annual and long-term incentiveawards;
� control fixed costs by ensuring that compensation expensevaries with profitability;
� link a significant portion of an employee’s total compensationto the financial and operational performance of the businessas well as its common stock performance;
� discourage excessive risk-taking; and
� ensure that client interests are not negatively impacted byremuneration awarded on a short-term, mid-term and/orlong-term basis.
Driving a high-performance culture is dependent on the ability tomeasure performance against objectives, values andbehaviours in a clear and consistent way. Managers use a5-point rating scale to provide an overall assessment of anemployee’s performance, and employees also provide aself-evaluation. The overall, final rating is reconciled during eachemployee’s performance appraisal. Employees are assessed onthe manner in which performance is attained as well as theabsolute performance itself.
In keeping with the pay-for-performance philosophy, ratings areused to differentiate and reward individual performance – butdon’t pre-determine compensation outcomes. Compensationdecisions remain discretionary and are made as part of theyear-end compensation process.
When setting remuneration levels other factors are considered,as well as individual performance, which may include:
� the performance of the Manager, the funds managed by theManager and/or the relevant functional department;
� factors relevant to an employee individually; relationships withclients and colleagues; teamwork; skills; any conduct issues;and, subject to any applicable policy, the impact that anyrelevant leave of absence may have on contribution to thebusiness);
� the management of risk within the risk profiles appropriate forBlackRocks clients;
� strategic business needs, including intentions regardingretention;
� market intelligence; and
� criticality to business.
A primary product tool is risk management and, whileemployees are compensated for strong performance in theirmanagement of client assets, they are required to manage riskwithin the risk profiles appropriate for their clients. Therefore,employees are not rewarded for engaging in high-risktransactions outside of established parameters. Remunerationpractices do not provide undue incentives for short-termplanning or short-term financial rewards, do not rewardunreasonable risk and provide a reasonable balance betweenthe many and substantial risks inherent within the business ofinvestment management, risk management and advisoryservices.
Report on Remuneration (Unaudited)continued
BlackRock Strategic Funds[16]

BlackRock operates a total compensation model forremuneration which includes a base salary, which is contractual,and a discretionary bonus scheme.
BlackRock operates an annual discretionary bonus scheme.Although all employees are eligible to be considered for adiscretionary bonus, there is no contractual obligation to makeany award to an employee under its discretionary bonusscheme. In exercising discretion to award a discretionary bonus,the factors listed above (under the heading “Link between payand performance”) may be taken into account in addition to anyother matters which become relevant to the exercise ofdiscretion in the course of the performance year.
Discretionary bonus awards for all employees, includingexecutive officers, are subject to a guideline that determines theportion paid in cash and the portion paid in BlackRock, Inc.stock and subject to additional vesting/clawback conditions.Stock awards are subject to further performance adjustmentthrough variation in BlackRock, Inc.’s share price over thevesting period. As total annual compensation increases, agreater portion is deferred into stock. The MDCC adopted thisapproach in 2006 to substantially increase the retention valueand shareholder alignment of the compensation package foreligible employees, including the executive officers. The portiondeferred into stock vests into three equal instalments over thethree years following grant.
Supplementary to the annual discretionary bonus as describedabove, equity awards may be made to select individuals toprovide greater linkage with future business results. Theselong-term incentive awards have been established individually toprovide meaningful incentive for continued performance over amulti-year period recognising the scope of the individual’s role,business expertise and leadership skills.
Selected senior leaders are eligible to receiveperformance-adjusted equity-based awards from the“BlackRock Performance Incentive Plan” (“BPIP”). Awards madefrom the BPIP have a three-year performance period based on ameasurement of As Adjusted Operating Margin(1) and OrganicRevenue Growth(2) Determination of pay-out will be madebased on the firm’s achievement relative to target financialresults at the conclusion of the performance period. Themaximum number of shares that can be earned is 165% of theaward in those situations where both metrics achievepre-determined financial targets. No shares will be earnedwhere the firm’s financial performance in both of the abovemetrics is below a pre-determined performance threshold.These metrics have been selected as key measures ofshareholder value which endure across market cycles.
A limited number of investment professionals have a portion oftheir annual discretionary bonus (as described above) awardedas deferred cash that notionally tracks investment in selectedproducts managed by the employee. The intention of these
awards is to align investment professionals with the investmentreturns of the products they manage through the deferral ofcompensation into those products. Clients and externalevaluators have increasingly viewed more favourably thoseproducts where key investors have “skin in the game” throughsignificant personal investments.
Identified StaffThe UCITS Remuneration Policy sets out the process that willbe applied to identify staff as Identified Staff, being categories ofstaff of the Manager, including senior management, risk takers,control functions and any employee receiving total remunerationthat takes them into the same remuneration bracket as seniormanagement and risk takers, whose professional activities havea material impact on the risk profiles of the ManagementCompany or of the funds it manages.
The list of Identified Staff will be subject to regular review, beingformally reviewed in the event of, but not limited to:
� organisational changes;
� new business initiatives;
� changes in significant influence function lists;
� changes in role responsibilities; and
� revised regulatory direction.
Quantitative Remuneration Disclosure (for Ireland, the UKand Luxembourg)The Manager is required under UCITS to make quantitativedisclosures of remuneration. These disclosures are made in linewith BlackRock’s interpretation of currently available regulatoryguidance on quantitative remuneration disclosures. As market orregulatory practice develops BlackRock may consider itappropriate to make changes to the way in which quantitativeremuneration disclosures are calculated. Where such changesare made, this may result in disclosures in relation to a fund notbeing comparable to the disclosures made in the prior year, or inrelation to other BlackRock fund disclosures in that same year.
Disclosures are provided in relation to (a) the staff of theManager; (b) staff who are senior management; and (c) staffwho have the ability to materially affect the risk profile of theCompany, including individuals who, although not directlyemployed by the Manager, are assigned by their employer tocarry out services directly for the Manager.
All individuals included in the aggregated figures disclosed arerewarded in line with BlackRock’s remuneration policy for theirresponsibilities across the relevant BlackRock business area. Asall individuals have a number of areas of responsibilities, onlythe portion of remuneration for those individuals’ servicesattributable to the Company is included in the aggregate figuresdisclosed.
(1) As Adjusted Operating Margin: As reported in BlackRock’s external filings, reflects adjusted Operating Income divided by Total Revenue net of distribution and servicing expenses and
amortisation of deferred sales commissions.
(2) Organic Revenue Growth: Equal to net new base fees plus net new Aladdin revenue generated in the year (in dollars).
Report on Remuneration (Unaudited)continued
Annual report and audited financial statements [17]

Members of staff and senior management of the Managertypically provide both UCITS and non-UCITS related services inrespect of multiple funds, clients and functions of the Managerand across the broader BlackRock group. Therefore, the figuresdisclosed are a sum of each individual’s portion of remunerationattributable to the Manager according to an objectiveapportionment methodology which acknowledges themultiple-service nature of the Manager. Accordingly, the figuresare not representative of any individual’s actual remuneration ortheir remuneration structure.
The amount of the total remuneration awarded by the Managerto its staff which has been attributed to the Manager’s
UCITS-related business in respect of the Manager’s financialyear ending 31 December 2020 is USD 166.3 million. This figureis comprised of fixed remuneration of USD 11.7 million andvariable remuneration of USD 154.6 million. There were a totalof 155 beneficiaries of the remuneration described above.
The amount of the aggregate remuneration awarded by theManager, which has been attributed to the Manager’sUCITS-related business in respect of the Manager’s financialyear ending 31 December 2020, to its senior management wasUSD 0.2 million, and to other members of its staff whoseactions have a material impact on the risk profile of theCompany was USD 166.1 million.
Report on Remuneration (Unaudited)continued
BlackRock Strategic Funds[18]

BlackRockStrategic Funds
Combined
BlackRockAmericas
Diversified EquityAbsolute Return
FundBlackRock Asia
Extension Fund(1)
BlackRock AsiaPacific Absolute
Return Fund
BlackRock AsiaPacific Diversified
Equity AbsoluteReturn Fund
Note USD USD USD USD USD
Assets
Securities portfolio at cost 24,615,467,924 649,950,412 — 29,965,082 34,811,365
Unrealised appreciation/(depreciation) 1,271,720,251 1,086,307 — 3,743,492 —
Securities portfolio at market value 2(a) 25,887,188,175 651,036,719 — 33,708,574 34,811,365
Cash at bank 2(a) 1,419,363,442 3,155,353 8,686 1,027,669 356,341
Due from broker 15 414,077,514 73,830 30,000 841,327 —
Interest and dividends receivable 2(a),2(d) 93,535,811 70,063 — 41,688 262,609
Receivable for investments sold 2(a),2(d) 479,879,023 166,809,291 — 747,167 7,230,221
Receivable for Fund shares subscribed 2(a) 130,016,737 33,214,619 — 75 3,291
Unrealised appreciation on:
Futures contracts 2(d) 19,198,878 — — — —
Open forward foreign exchange transactions 2(d) 193,506,968 3,611,072 — 21,671 226,810
Contracts for difference 2(d) 293,403,639 64,072,776 — 261,997 4,028,842
To Be Announced securities contracts 2(d) 20,545,946 — — — —
Swaps at market value 2(d) 77,663,838 — — — —
Purchased options/swaptions at market value 2(d) 8,529,157 — — — —
Other assets 2(a) 661,814 — — 406 10,742
Total assets 29,037,570,942 922,043,723 38,686 36,650,574 46,930,221
Liabilities
Cash owed to bank 2(a) 106,770,749 335 — 2,501 —
Due to broker 15 53,636,804 — — 33,007 727,535
Interest and dividends payable 2(a),2(d) 17,751,126 2,725,316 — 122,606 175,293
Payable for investments purchased 2(a),2(d) 678,825,474 160,995,883 — 174,367 5,979,924
Payable for Fund shares redeemed 2(a) 61,021,737 967,268 — — 2,067
Income distribution payable 2(a),11 6,564,260 — — — —
Unrealised depreciation on:
Futures contracts 2(d) 66,335,986 — — 115,724 —
Open forward foreign exchange transactions 2(d) 119,803,924 864,966 — 10 1,236
Contracts for difference 2(d) 260,321,114 66,489,912 — 1,368,721 4,062,008
To Be Announced securities contracts 2(d) 14,108,231 — — — —
Swaps at market value 2(d) 156,539,001 — — — 179,540
Written options/swaptions at market value 2(d) 18,490,992 — — — —
Accrued expenses and other liabilities 2(a),4,5,6,7,8 164,728,037 2,863,160 38,686 156,473 597,143
Total liabilities 1,724,897,435 234,906,840 38,686 1,973,409 11,724,746
Total net assets 27,312,673,507 687,136,883 — 34,677,165 35,205,475
(1) Fund terminated, see Note 1 for further details.
Approved on behalf of the Board
Director Director
Date 23 September 2021 Date 23 September 2021
Statement of Net Assetsas at 31 May 2021
The notes on pages 590 to 610 form an integral part of these financial statements.
Annual report and audited financial statements [19]
Denise Voss Geoffrey Radcliffe

BlackRock DynamicDiversified Growth Fund
BlackRock EmergingCompanies Absolute
Return Fund(2)
BlackRock EmergingMarkets Absolute Return
Fund
BlackRock EmergingMarkets Equity
Strategies Fund
Note EUR GBP USD USD
Assets
Securities portfolio at cost 1,037,905,814 792,403,872 11,873,676 870,304,565
Unrealised appreciation/(depreciation) 133,207,551 5,330,128 33,330 34,647,645
Securities portfolio at market value 2(a) 1,171,113,365 797,734,000 11,907,006 904,952,210
Cash at bank 2(a) 50,128,864 20,503,448 297,013 2,681,585
Due from broker 15 7,346,813 45,726,216 490,143 6,772,898
Interest and dividends receivable 2(a),2(d) 1,013,134 364,366 11,192 2,178,516
Receivable for investments sold 2(a),2(d) — 7,830,658 489,322 20,623,234
Receivable for Fund shares subscribed 2(a) 1,512,751 1,042,011 183 174,448
Unrealised appreciation on:
Futures contracts 2(d) 4,777,156 — — 677,670
Open forward foreign exchange transactions 2(d) 5,076,733 25,153 46,026 411,967
Contracts for difference 2(d) — 36,765,507 208,125 18,878,859
To Be Announced securities contracts 2(d) — — — —
Swaps at market value 2(d) 8,802,635 — — —
Purchased options/swaptions at market value 2(d) 937,407 — — —
Other assets 2(a) 17,404 4,427 191 12,135
Total assets 1,250,726,262 909,995,786 13,449,201 957,363,522
Liabilities
Cash owed to bank 2(a) — — 2 2,284
Due to broker 15 8,401,864 18,597,366 — 109
Interest and dividends payable 2(a),2(d) 134,651 240,059 8,828 300,788
Payable for investments purchased 2(a),2(d) — 16,533,502 289,591 11,763,820
Payable for Fund shares redeemed 2(a) 816,012 3,069,389 8,341 7,431,085
Income distribution payable 2(a),11 — — — 40
Unrealised depreciation on:
Futures contracts 2(d) 4,067,219 19,008,687 13,218 549,135
Open forward foreign exchange transactions 2(d) 3,141,574 5,143,988 1,126 8,339
Contracts for difference 2(d) — 10,465,422 463,336 28,016,332
To Be Announced securities contracts 2(d) — — — —
Swaps at market value 2(d) 3,478,123 — — —
Written options/swaptions at market value 2(d) — — — —
Accrued expenses and other liabilities 2(a),4,5,6,7,8 1,049,312 15,939,610 43,122 3,856,763
Total liabilities 21,088,755 88,998,023 827,564 51,928,695
Total net assets 1,229,637,507 820,997,763 12,621,637 905,434,827
(2) Fund name changed, see Note 1 for further details.
Statement of Net Assetsas at 31 May 2021 continued
The notes on pages 590 to 610 form an integral part of these financial statements.
BlackRock Strategic Funds[20]

BlackRock EmergingMarkets Flexi Dynamic
Bond Fund
BlackRock EmergingMarkets Short Duration
Bond FundBlackRock ESG Euro
Bond FundBlackRock ESG EuroCorporate Bond Fund
Note USD USD EUR EUR
Assets
Securities portfolio at cost 1,527,322,644 70,729,346 641,940,771 270,886,195
Unrealised appreciation/(depreciation) (121,134,782) (1,205,077) (367,964) 1,797,917
Securities portfolio at market value 2(a) 1,406,187,862 69,524,269 641,572,807 272,684,112
Cash at bank 2(a) 160,128,708 6,566,101 2,276,709 547,480
Due from broker 15 84,205,238 1,557,349 3,017,444 727,296
Interest and dividends receivable 2(a),2(d) 30,528,136 898,722 2,905,629 1,419,313
Receivable for investments sold 2(a),2(d) 25,761,092 — 1,478,723 205,994
Receivable for Fund shares subscribed 2(a) 46,083 396,246 761,581 79,763
Unrealised appreciation on:
Futures contracts 2(d) — 80,515 110,298 75,258
Open forward foreign exchange transactions 2(d) 58,847,377 1,236,718 151,567 195,911
Contracts for difference 2(d) — — — —
To Be Announced securities contracts 2(d) — — — —
Swaps at market value 2(d) 39,012,502 83,346 65,635 227,921
Purchased options/swaptions at market value 2(d) 3,063,339 42,908 2,842 1,171
Other assets 2(a) 10,958 1,585 3,109 3,053
Total assets 1,807,791,295 80,387,759 652,346,344 276,167,272
Liabilities
Cash owed to bank 2(a) 91,814,635 502,779 675,788 201,002
Due to broker 15 4 130,638 77,278 301,918
Interest and dividends payable 2(a),2(d) 4,060,882 80,975 — —
Payable for investments purchased 2(a),2(d) 26,313,153 — 6,459,234 3,094,194
Payable for Fund shares redeemed 2(a) 985,515 24,097 837,378 61,930
Income distribution payable 2(a),11 1,824,140 — — —
Unrealised depreciation on:
Futures contracts 2(d) 919,779 16,417 55,992 41,912
Open forward foreign exchange transactions 2(d) 56,555,472 1,204,895 119,789 60,586
Contracts for difference 2(d) — — — —
To Be Announced securities contracts 2(d) — — — —
Swaps at market value 2(d) 92,280,129 743,026 564,329 215,136
Written options/swaptions at market value 2(d) — — 681,264 185,745
Accrued expenses and other liabilities 2(a),4,5,6,7,8 750,457 69,198 375,693 187,709
Total liabilities 275,504,166 2,772,025 9,846,745 4,350,132
Total net assets 1,532,287,129 77,615,734 642,499,599 271,817,140
Statement of Net Assetsas at 31 May 2021 continued
The notes on pages 590 to 610 form an integral part of these financial statements.
Annual report and audited financial statements [21]

BlackRock ESG EuroShort Duration Bond
Fund(3)BlackRock European
Absolute Return Fund
BlackRock EuropeanDiversified Equity
Absolute Return Fund(1)
BlackRock EuropeanOpportunities
Extension Fund
Note EUR EUR EUR EUR
Assets
Securities portfolio at cost 237,446,472 1,459,305,422 — 377,077,431
Unrealised appreciation/(depreciation) (358,866) 169,159,777 — 292,821,030
Securities portfolio at market value 2(a) 237,087,606 1,628,465,199 — 669,898,461
Cash at bank 2(a) 675,343 50,361,581 24,993 1,990,117
Due from broker 15 728,688 9,922,672 — —
Interest and dividends receivable 2(a),2(d) 788,542 1,808,461 — 2,137,669
Receivable for investments sold 2(a),2(d) 284,775 20,206,456 — 2,552,145
Receivable for Fund shares subscribed 2(a) — 911,213 — —
Unrealised appreciation on:
Futures contracts 2(d) 132,375 — — —
Open forward foreign exchange transactions 2(d) 33,470 128,288 — —
Contracts for difference 2(d) — 16,414,300 — 5,887,885
To Be Announced securities contracts 2(d) — — — —
Swaps at market value 2(d) 6,439 — — —
Purchased options/swaptions at market value 2(d) 104 — — —
Other assets 2(a) 16,201 4,386 — 7,552
Total assets 239,753,543 1,728,222,556 24,993 682,473,829
Liabilities
Cash owed to bank 2(a) — 131,903 — 36,892
Due to broker 15 23,262 643 — 163,327
Interest and dividends payable 2(a),2(d) 1,485 2,949,168 — 135,442
Payable for investments purchased 2(a),2(d) 1,106,108 165,439,808 — 4,466,388
Payable for Fund shares redeemed 2(a) 104,586 9,640,804 — 218,671
Income distribution payable 2(a),11 — — — 79,808
Unrealised depreciation on:
Futures contracts 2(d) 28,032 — — —
Open forward foreign exchange transactions 2(d) 43,685 177,316 — 102,880
Contracts for difference 2(d) — 14,711,880 — 5,009,368
To Be Announced securities contracts 2(d) — — — —
Swaps at market value 2(d) 129,408 — — —
Written options/swaptions at market value 2(d) 192,070 — — —
Accrued expenses and other liabilities 2(a),4,5,6,7,8 84,347 6,799,091 24,993 12,218,957
Total liabilities 1,712,983 199,850,613 24,993 22,431,733
Total net assets 238,040,560 1,528,371,943 — 660,042,096
(1) Fund terminated, see Note 1 for further details.(3) New Fund launched, see Note 1 for further details.
Statement of Net Assetsas at 31 May 2021 continued
The notes on pages 590 to 610 form an integral part of these financial statements.
BlackRock Strategic Funds[22]

BlackRock EuropeanSelect Strategies Fund
BlackRock EuropeanUnconstrained Equity
FundBlackRock Fixed Income
Credit Strategies FundBlackRock Fixed Income
Strategies Fund
Note EUR EUR EUR EUR
Assets
Securities portfolio at cost 439,261,043 36,691,612 349,513,655 4,923,627,742
Unrealised appreciation/(depreciation) 28,107,309 10,007,939 2,272,271 29,832,103
Securities portfolio at market value 2(a) 467,368,352 46,699,551 351,785,926 4,953,459,845
Cash at bank 2(a) 15,937,998 152,363 32,051,922 624,642,731
Due from broker 15 3,801,459 — 4,784,112 101,468,972
Interest and dividends receivable 2(a),2(d) 1,878,962 9,976 1,844,340 25,163,259
Receivable for investments sold 2(a),2(d) 4,481,821 — 2,049,282 69,175,491
Receivable for Fund shares subscribed 2(a) 471,987 25,202 712,384 21,892,765
Unrealised appreciation on:
Futures contracts 2(d) 608,098 — 777,451 5,184,607
Open forward foreign exchange transactions 2(d) 736,968 16,896 358,755 23,818,741
Contracts for difference 2(d) 11,472 — 1,142 —
To Be Announced securities contracts 2(d) — — — —
Swaps at market value 2(d) 321,986 — 554,482 16,409,922
Purchased options/swaptions at market value 2(d) 2,596 — 1,592 1,462,268
Other assets 2(a) 3,356 253 2,649 29,437
Total assets 495,625,055 46,904,241 394,924,037 5,842,708,038
Liabilities
Cash owed to bank 2(a) — — 3,068 5,299,441
Due to broker 15 151,309 — 959,919 4,534,072
Interest and dividends payable 2(a),2(d) 18,460 — 21,441 1,738,160
Payable for investments purchased 2(a),2(d) 4,377,141 — 7,041,047 54,305,405
Payable for Fund shares redeemed 2(a) 852,013 25,469 156,248 20,729,181
Income distribution payable 2(a),11 23,800 — — 2,032,681
Unrealised depreciation on:
Futures contracts 2(d) 1,086,383 — 6,880 3,377,753
Open forward foreign exchange transactions 2(d) 1,459,919 28,121 174,334 20,302,935
Contracts for difference 2(d) — — 6,397 —
To Be Announced securities contracts 2(d) — — — —
Swaps at market value 2(d) 751,444 — 786,913 38,167,681
Written options/swaptions at market value 2(d) 417,966 — 204,098 10,148,053
Accrued expenses and other liabilities 2(a),4,5,6,7,8 783,451 56,896 163,283 5,785,918
Total liabilities 9,921,886 110,486 9,523,628 166,421,280
Total net assets 485,703,169 46,793,755 385,400,409 5,676,286,758
Statement of Net Assetsas at 31 May 2021 continued
The notes on pages 590 to 610 form an integral part of these financial statements.
Annual report and audited financial statements [23]

BlackRock GlobalAbsolute Return Bond
FundBlackRock Global Equity
Absolute Return FundBlackRock Global Event
Driven FundBlackRock Global RealAsset Securities Fund
Note EUR USD USD USD
Assets
Securities portfolio at cost 144,427,888 58,082,027 5,477,067,788 284,939,962
Unrealised appreciation/(depreciation) (1,385,330) 7,843,044 316,025,773 23,116,388
Securities portfolio at market value 2(a) 143,042,558 65,925,071 5,793,093,561 308,056,350
Cash at bank 2(a) 10,499,181 3,119,999 203,490,457 2,770,795
Due from broker 15 7,529,004 2,778,061 43,453,099 6,445,135
Interest and dividends receivable 2(a),2(d) 1,348,619 28,393 5,105,395 886,554
Receivable for investments sold 2(a),2(d) 33,528,389 115,685 61,762,443 3,164,506
Receivable for Fund shares subscribed 2(a) 99,700 — 45,707,456 6,205,177
Unrealised appreciation on:
Futures contracts 2(d) 381,375 893 18,963 —
Open forward foreign exchange transactions 2(d) 1,560,287 157,534 60,995,457 59,266
Contracts for difference 2(d) — 577,219 115,855,432 3,876
To Be Announced securities contracts 2(d) 16,835,410 — — —
Swaps at market value 2(d) 1,391,324 — — —
Purchased options/swaptions at market value 2(d) 2,033,842 — — —
Other assets 2(a) 1,339 — 47,411 2,231
Total assets 218,251,028 72,702,855 6,329,529,674 327,593,890
Liabilities
Cash owed to bank 2(a) 4,201,071 49,268 430,756 11,449
Due to broker 15 398,269 290,338 388,735 2
Interest and dividends payable 2(a),2(d) 4,051 91,908 3,431,045 12
Payable for investments purchased 2(a),2(d) 36,621,701 5 72,902,292 8,185,517
Payable for Fund shares redeemed 2(a) 14,967 — 3,686,394 363,697
Income distribution payable 2(a),11 11 — — 1,648,667
Unrealised depreciation on:
Futures contracts 2(d) 215,724 1,067,916 20,804,813 —
Open forward foreign exchange transactions 2(d) 407,003 77,588 1,858,272 547
Contracts for difference 2(d) — 495,823 106,680,690 —
To Be Announced securities contracts 2(d) 11,560,327 — — —
Swaps at market value 2(d) 3,040,097 — 4,842,234 —
Written options/swaptions at market value 2(d) 1,819,737 — — 1,833,825
Accrued expenses and other liabilities 2(a),4,5,6,7,8 513,826 78,398 94,064,133 328,709
Total liabilities 58,796,784 2,151,244 309,089,364 12,372,425
Total net assets 159,454,244 70,551,611 6,020,440,310 315,221,465
Statement of Net Assetsas at 31 May 2021 continued
The notes on pages 590 to 610 form an integral part of these financial statements.
BlackRock Strategic Funds[24]

BlackRock MacroOpportunities Fund(1)
BlackRock ManagedIndex Portfolios −
Conservative
BlackRock ManagedIndex Portfolios −
Defensive
BlackRock ManagedIndex Portfolios −
Growth
Note USD EUR EUR EUR
Assets
Securities portfolio at cost — 95,868,257 155,294,656 328,967,625
Unrealised appreciation/(depreciation) — 5,313,784 3,310,505 38,453,332
Securities portfolio at market value 2(a) — 101,182,041 158,605,161 367,420,957
Cash at bank 2(a) 60,802 11,919 33,171 498,487
Due from broker 15 — — — —
Interest and dividends receivable 2(a),2(d) — — — —
Receivable for investments sold 2(a),2(d) — 280,887 554,968 —
Receivable for Fund shares subscribed 2(a) — 11,098 115,365 1,035,932
Unrealised appreciation on:
Futures contracts 2(d) — — — —
Open forward foreign exchange transactions 2(d) — 1,023,438 1,481,837 2,503,066
Contracts for difference 2(d) — — — —
To Be Announced securities contracts 2(d) — — — —
Swaps at market value 2(d) — — — —
Purchased options/swaptions at market value 2(d) — — — —
Other assets 2(a) — 3,348 9,005 22,113
Total assets 60,802 102,512,731 160,799,507 371,480,555
Liabilities
Cash owed to bank 2(a) — 61,280 218,458 —
Due to broker 15 — — — —
Interest and dividends payable 2(a),2(d) — — — —
Payable for investments purchased 2(a),2(d) — — — —
Payable for Fund shares redeemed 2(a) — 172,327 333,413 403,111
Income distribution payable 2(a),11 — 131,745 4,244 2,919
Unrealised depreciation on:
Futures contracts 2(d) — — — —
Open forward foreign exchange transactions 2(d) — 306,708 927,976 926,917
Contracts for difference 2(d) — — — —
To Be Announced securities contracts 2(d) — — — —
Swaps at market value 2(d) — — — —
Written options/swaptions at market value 2(d) — — — —
Accrued expenses and other liabilities 2(a),4,5,6,7,8 60,802 112,446 146,383 300,128
Total liabilities 60,802 784,506 1,630,474 1,633,075
Total net assets — 101,728,225 159,169,033 369,847,480
(1) Fund terminated, see Note 1 for further details.
Statement of Net Assetsas at 31 May 2021 continued
The notes on pages 590 to 610 form an integral part of these financial statements.
Annual report and audited financial statements [25]

BlackRock ManagedIndex Portfolios −
ModerateBlackRock StyleAdvantage Fund
BlackRock StyleAdvantage Screened
FundBlackRock Systematic
ESG World Equity Fund
Note EUR USD USD USD
Assets
Securities portfolio at cost 642,057,049 130,934,980 21,095,879 304,309,842
Unrealised appreciation/(depreciation) 48,897,057 7,375 615,306 49,541,426
Securities portfolio at market value 2(a) 690,954,106 130,942,355 21,711,185 353,851,268
Cash at bank 2(a) 465,341 22,798,017 3,030,021 3,438,381
Due from broker 15 — 19,391,364 3,115,947 599,516
Interest and dividends receivable 2(a),2(d) 271,993 872,445 51,036 635,310
Receivable for investments sold 2(a),2(d) — 7,540,074 672,547 178,905
Receivable for Fund shares subscribed 2(a) 1,649,229 18,226 — 6,520,253
Unrealised appreciation on:
Futures contracts 2(d) — 2,532,175 482,185 880
Open forward foreign exchange transactions 2(d) 5,812,426 13,318,070 859,334 1,499
Contracts for difference 2(d) — 5,388,111 894,538 —
To Be Announced securities contracts 2(d) — — — —
Swaps at market value 2(d) — 4,054,732 352,837 —
Purchased options/swaptions at market value 2(d) — — — —
Other assets 2(a) 9,789 — 55,080 10,181
Total assets 699,162,884 206,855,569 31,224,710 365,236,193
Liabilities
Cash owed to bank 2(a) — — — 148,985
Due to broker 15 — 5,675,884 1,037,000 7
Interest and dividends payable 2(a),2(d) — 105,862 16,484 —
Payable for investments purchased 2(a),2(d) — 5,685,432 479,126 6,260,688
Payable for Fund shares redeemed 2(a) 830,242 9,581 — 222,800
Income distribution payable 2(a),11 257,905 — — —
Unrealised depreciation on:
Futures contracts 2(d) — 2,405,667 422,083 736
Open forward foreign exchange transactions 2(d) 2,328,770 8,968,163 1,042,865 44,242
Contracts for difference 2(d) — 5,984,881 918,340 —
To Be Announced securities contracts 2(d) — — — —
Swaps at market value 2(d) — 949,211 13,908 —
Written options/swaptions at market value 2(d) — — — —
Accrued expenses and other liabilities 2(a),4,5,6,7,8 492,026 920,277 241,972 220,064
Total liabilities 3,908,943 30,704,958 4,171,778 6,897,522
Total net assets 695,253,941 176,150,611 27,052,932 358,338,671
Statement of Net Assetsas at 31 May 2021 continued
The notes on pages 590 to 610 form an integral part of these financial statements.
BlackRock Strategic Funds[26]

BlackRock SystematicGlobal Equity Fund
BlackRock SystematicGlobal Long/Short
Equity Fund(2)BlackRock TotalAdvantage Fund
BlackRock UK EquityAbsolute Return Fund
Note USD USD EUR GBP
Assets
Securities portfolio at cost 162,493,365 43,375,175 14,099,272 141,312,152
Unrealised appreciation/(depreciation) 19,924,028 49,949 67,014 482,391
Securities portfolio at market value 2(a) 182,417,393 43,425,124 14,166,286 141,794,543
Cash at bank 2(a) 2,479,979 4,016,692 2,126,373 2,607,784
Due from broker 15 77,111 1,221,004 1,339,229 4,619,894
Interest and dividends receivable 2(a),2(d) 376,765 — 17,413 1,067,898
Receivable for investments sold 2(a),2(d) 1,733 5,541,272 214,509 2,381,782
Receivable for Fund shares subscribed 2(a) 465,669 51,797 — 852
Unrealised appreciation on:
Futures contracts 2(d) 21,934 315,921 291,134 —
Open forward foreign exchange transactions 2(d) 6,792 422,869 677,589 40,440
Contracts for difference 2(d) — 1,768,437 259,379 1,283,795
To Be Announced securities contracts 2(d) — — — —
Swaps at market value 2(d) — — 194,591 —
Purchased options/swaptions at market value 2(d) — — — —
Other assets 2(a) 2,352 339,924 — —
Total assets 185,849,728 57,103,040 19,286,503 153,796,988
Liabilities
Cash owed to bank 2(a) 581,923 10,231 — —
Due to broker 15 7 327,835 273,368 162
Interest and dividends payable 2(a),2(d) 8 88,183 4,765 64,335
Payable for investments purchased 2(a),2(d) — 5,179,006 164,676 4,038,743
Payable for Fund shares redeemed 2(a) — 16,078 — —
Income distribution payable 2(a),11 — — — —
Unrealised depreciation on:
Futures contracts 2(d) — 129,061 157,590 1,353,294
Open forward foreign exchange transactions 2(d) 126 54,796 416,768 2,882,108
Contracts for difference 2(d) — 1,886,998 325,119 3,283,101
To Be Announced securities contracts 2(d) — — — —
Swaps at market value 2(d) — — 1,497 —
Written options/swaptions at market value 2(d) — — — —
Accrued expenses and other liabilities 2(a),4,5,6,7,8 200,348 1,545,196 244,192 211,312
Total liabilities 782,412 9,237,384 1,587,975 11,833,055
Total net assets 185,067,316 47,865,656 17,698,528 141,963,933
(2) Fund name changed, see Note 1 for further details.
Statement of Net Assetsas at 31 May 2021 continued
The notes on pages 590 to 610 form an integral part of these financial statements.
Annual report and audited financial statements [27]

Currency 31 May 2021 31 May 2020 31 May 2019
BlackRock Americas Diversified Equity Absolute Return Fund
Total net assets USD 687,136,883 937,142,511 1,240,896,160
Net asset value per:
A Class non-distributing share AUD AUD 170.72 207.03 193.21
A Class non-distributing share EUR EUR 90.95 103.78 100.78
A Class non-distributing share SEK hedged SEK 120.10 125.53 125.05
A Class non-distributing UK reporting fund share USD 131.19 136.43 132.72
A Class non-distributing UK reporting fund share EUR hedged EUR 117.77 123.55 123.33
A Class non-distributing UK reporting fund share GBP GBP 146.85 175.23 167.39
D Class non-distributing share USD 113.03 116.95 113.21
D Class non-distributing share CHF hedged CHF 98.68 103.32 102.97
D Class non-distributing UK reporting fund share EUR hedged EUR 122.08 127.47 126.74
D Class non-distributing UK reporting fund share GBP hedged GBP 108.83 112.83 110.81
E Class non-distributing share EUR hedged EUR 94.29 99.43 99.76
I Class non-distributing share EUR hedged EUR 99.92 104.03 103.04
I Class non-distributing share JPY hedged JPY 9,650.34 10,001.49 9,901.72
I Class non-distributing share SEK hedged SEK 92.79 96.24 95.14
I Class non-distributing UK reporting fund share USD 107.53 110.94 107.08
X Class non-distributing share USD 160.83 164.27 156.99
BlackRock Asia Extension Fund(1)
Total net assets USD — 139,118,351 146,921,082
Net asset value per:
A Class non-distributing share USD — 130.59 140.35
A Class non-distributing UK reporting fund share GBP hedged GBP — 119.80 133.10
E Class non-distributing share USD — 125.64 135.70
X Class non-distributing share USD — 129.51 136.75
BlackRock Asia Pacific Absolute Return Fund
Total net assets USD 34,677,165 30,464,640 27,168,138
Net asset value per:
A Class distributing share EUR hedged EUR 104.61 92.79 93.12
A Class non-distributing share EUR EUR 104.88 101.49 99.22
A Class non-distributing UK reporting fund share GBP GBP 100.65 101.81 97.96
D Class non-distributing share USD 117.65 103.93 101.45
D Class non-distributing share EUR EUR 108.33 104.66 101.66
D Class non-distributing share EUR hedged EUR 107.49 95.06 94.93
D Class non-distributing share GBP hedged GBP 110.23 97.58 96.50
E Class non-distributing share EUR EUR 102.93 99.77 98.05
E Class non-distributing share EUR hedged EUR 103.96 92.26 93.09
X Class non-distributing share USD 127.23 108.88 104.93
Z Class non-distributing share USD 118.98 104.24 101.50
Z Class non-distributing share CHF hedged CHF 106.88 94.23 94.24
Z Class non-distributing share EUR hedged EUR 108.20 95.52 95.15
BlackRock Asia Pacific Diversified Equity Absolute Return Fund
Total net assets USD 35,205,475 26,406,843 23,413,208
Net asset value per:
A Class non-distributing share USD 123.43 104.08 102.16
A Class non-distributing share EUR hedged EUR 113.58 96.16 96.45
D Class non-distributing share USD 125.48 105.78 103.31
D Class non-distributing share EUR hedged EUR 114.79 96.90 96.71
E Class non-distributing share EUR hedged EUR 111.15 94.68 95.40
X Class non-distributing UK reporting fund share USD 136.78 110.29 106.37
Z Class non-distributing share EUR hedged EUR 118.53 99.38 98.68
Z Class non-distributing UK reporting fund share USD 128.61 107.15 104.24
Z Class non-distributing UK reporting fund share GBP hedged GBP 121.72 101.46 99.72
Three Year Summary of Net Asset Valuesas at 31 May 2021
The notes on pages 590 to 610 form an integral part of these financial statements.
BlackRock Strategic Funds[28]

Currency 31 May 2021 31 May 2020 31 May 2019
BlackRock Dynamic Diversified Growth Fund
Total net assets EUR 1,229,637,507 1,034,442,870 941,468,821
Net asset value per:
A Class non-distributing share EUR 132.13 118.63 115.96
A Class non-distributing share SEK hedged SEK 134.68 120.70 117.97
AI Class non-distributing share EUR 111.17 99.81 —
D Class non-distributing share EUR 140.87 125.59 121.93
E Class non-distributing share EUR 126.17 113.84 111.85
I Class non-distributing share EUR 144.61 128.63 124.61
I Class non-distributing share CAD hedged CAD 134.25 118.58 112.99
I Class non-distributing share JPY hedged JPY 11,674.51 10,348.04 10,000.51
I Class non-distributing share SEK hedged SEK 144.84 128.76 124.71
I Class non-distributing UK reporting share USD hedged USD 114.40 100.92 —
X Class non-distributing share EUR 153.24 135.55 130.59
BlackRock Emerging Companies Absolute Return Fund(2)
Total net assets GBP 820,997,763 633,318,122 190,609,615
Net asset value per:
A Class non-distributing share CHF hedged CHF 119.18 108.27 100.86
A Class non-distributing share CNH hedged(3) CNH 1,074.29 — —
A Class non-distributing share EUR hedged EUR 122.72 111.34 102.99
A Class non-distributing share USD hedged USD 123.18 110.86 101.05
A Class non-distributing UK reporting fund share GBP 121.46 109.28 100.96
D Class non-distributing share CHF hedged CHF 122.40 110.92 102.76
D Class non-distributing share EUR hedged EUR 123.91 111.94 103.10
D Class non-distributing UK reporting fund share GBP 126.42 113.34 103.69
D Class non-distributing UK reporting fund share USD hedged USD 129.54 116.00 104.86
I Class distributing UK reporting fund share GBP 119.14 106.51 —
I Class non-distributing share CHF hedged CHF 123.47 111.60 103.16
I Class non-distributing UK reporting fund share GBP 127.60 114.10 104.08
I Class non-distributing UK reporting fund share EUR hedged EUR 124.74 112.40 103.34
I Class non-distributing UK reporting fund share USD hedged USD 130.89 116.94 105.37
S Class non-distributing UK reporting fund share GBP 127.08 113.66 103.72
X Class non-distributing UK reporting fund share GBP 137.34 119.14 105.72
Z Class non-distributing share CHF hedged CHF 124.83 112.30 103.35
Z Class non-distributing UK reporting fund share GBP 129.23 115.11 104.58
Z Class non-distributing UK reporting fund share EUR hedged EUR 126.27 113.26 103.66
Z Class non-distributing UK reporting fund share USD hedged USD 132.40 117.81 105.59
BlackRock Emerging Markets Absolute Return Fund
Total net assets USD 12,621,637 14,513,860 34,564,157
Net asset value per:
A Class distributing UK reporting fund share GBP hedged GBP 92.27 85.25 110.63
A Class non-distributing share USD 100.11 91.79 117.37
A Class non-distributing share EUR hedged EUR 88.46 82.05 107.09
D Class distributing UK reporting fund share GBP hedged GBP 96.65 88.78 114.60
D Class non-distributing UK reporting fund share USD 107.80 98.42 125.31
D Class non-distributing UK reporting fund share EUR hedged EUR 96.40 89.07 115.69
E Class non-distributing share EUR hedged EUR 85.29 79.52 104.32
I Class distributing UK reporting fund share GBP GBP 107.04 111.75 138.99
I Class distributing UK reporting fund share GBP hedged GBP 82.87 75.99 —
I Class non-distributing share EUR EUR 125.32 124.77 157.75
I Class non-distributing share EUR hedged EUR 101.01 91.46 118.46
I Class non-distributing UK reporting fund share USD 94.97 86.39 109.61
X Class non-distributing share USD 108.38 97.57 122.61
Three Year Summary of Net Asset Valuesas at 31 May 2021 continued
The notes on pages 590 to 610 form an integral part of these financial statements.
Annual report and audited financial statements [29]

Currency 31 May 2021 31 May 2020 31 May 2019
BlackRock Emerging Markets Equity Strategies Fund
Total net assets USD 905,434,827 585,619,249 614,966,478
Net asset value per:
A Class non-distributing share USD 210.52 148.70 181.95
A Class non-distributing share CHF hedged CHF 101.30 72.45 91.08
D Class distributing share USD 110.47 78.17 95.52
D Class non-distributing share CHF hedged CHF 102.57 72.97 91.13
D Class non-distributing share EUR hedged EUR 182.71 129.96 161.91
D Class non-distributing UK reporting fund share USD 202.27 142.15 173.07
D Class non-distributing UK reporting fund share EUR EUR 176.48 136.16 165.26
D Class non-distributing UK reporting fund share GBP GBP 120.60 97.28 116.26
E Class non-distributing share EUR EUR 166.98 130.10 159.43
I Class non-distributing share USD 117.77 82.54 100.20
I Class non-distributing share EUR EUR 106.48 81.91 99.09
X Class non-distributing share USD 233.11 161.71 194.37
Z Class non-distributing share GBP GBP 127.95 102.56 121.78
Z Class non-distributing UK reporting fund share USD 224.34 156.72 189.66
BlackRock Emerging Markets Flexi Dynamic Bond Fund
Total net assets USD 1,532,287,129 1,581,561,191 2,816,904,920
Net asset value per:
A Class distributing UK reporting fund share GBP hedged GBP 85.81 85.60 89.19
A Class non-distributing share USD 120.50 114.76 112.08
A Class non-distributing share EUR hedged EUR 107.00 103.00 102.90
A Class non-distributing share SEK hedged SEK 93.20 89.50 90.21
A Class non-distributing UK reporting fund share CHF hedged CHF 92.83 89.38 89.55
AI Class non-distributing share EUR hedged EUR 101.48 97.66 —
D Class distributing UK reporting fund share USD 93.57 93.54 98.60
D Class distributing UK reporting fund share EUR EUR 87.64 96.17 100.15
D Class distributing UK reporting fund share EUR hedged EUR 86.04 86.93 90.85
D Class distributing UK reporting fund share GBP GBP 87.40 100.04 100.07
D Class distributing UK reporting fund share GBP hedged GBP 85.19 84.91 88.91
D Class non-distributing UK reporting fund share USD 128.37 121.33 117.61
D Class non-distributing UK reporting fund share CHF hedged CHF 95.40 91.36 90.89
D Class non-distributing UK reporting fund share EUR hedged EUR 114.75 109.62 109.07
E Class non-distributing share USD 115.89 110.93 108.89
E Class non-distributing share EUR hedged EUR 104.40 101.00 101.43
I Class distributing share EUR EUR 83.93 92.17 95.12
I Class distributing share EUR hedged EUR 85.06 85.63 89.49
I Class distributing share (G) EUR hedged EUR 79.97 80.83 86.24
I Class distributing UK reporting fund share USD 79.95 79.63 88.37
I Class non-distributing share EUR hedged EUR 100.28 95.61 94.66
I Class non-distributing UK reporting fund share USD 127.33 120.13 116.25
X Class distributing share EUR EUR 85.05 93.30 95.38
X Class non-distributing share USD 139.82 130.92 125.75
X Class non-distributing share AUD hedged AUD 118.31 111.17 109.27
X Class non-distributing share CAD hedged CAD 103.79 97.43 94.72
BlackRock Emerging Markets Short Duration Bond Fund
Total net assets USD 77,615,734 69,623,667 69,720,601
Net asset value per:
A Class non-distributing share USD 118.60 104.93 105.43
AI Class distributing share EUR hedged EUR 99.46 93.16 —
AI Class non-distributing share EUR hedged EUR 108.36 96.86 —
D Class non-distributing UK reporting fund share USD 120.04 105.84 106.00
D Class non-distributing UK reporting fund share EUR hedged EUR 110.95 98.89 101.43
E Class distributing share EUR EUR 104.67 106.49 112.01
E Class distributing share EUR hedged EUR 95.66 89.59 96.78
E Class non-distributing share EUR EUR 117.58 114.75 115.53
E Class non-distributing share EUR hedged EUR 107.77 96.89 100.16
I Class non-distributing share EUR hedged EUR 111.23 99.06 101.50
X Class non-distributing share USD 122.04 107.08 106.71
Three Year Summary of Net Asset Valuesas at 31 May 2021 continued
The notes on pages 590 to 610 form an integral part of these financial statements.
BlackRock Strategic Funds[30]

Currency 31 May 2021 31 May 2020 31 May 2019
BlackRock ESG Euro Bond Fund
Total net assets EUR 642,499,599 423,582,725 134,380,021
Net asset value per:
A Class distributing share EUR 104.01 103.56 100.95
A Class non-distributing share EUR 104.09 103.63 101.01
AI Class non-distributing share EUR 103.36 102.93 —
D Class non-distributing UK reporting fund share EUR 105.81 104.98 101.97
E Class non-distributing share EUR 101.62 101.70 99.62
I Class non-distributing share EUR 106.54 105.55 102.38
X Class distributing (G) share(3) EUR 98.94 — —
X Class non-distributing share EUR 108.50 107.07 103.44
Z Class non-distributing share EUR 107.98 106.81 103.45
BlackRock ESG Euro Corporate Bond Fund
Total net assets EUR 271,817,140 182,474,888 —
Net asset value per:
A Class non-distributing share EUR 102.60 98.43 —
AI Class non-distributing share EUR 101.65 97.51 —
D Class distributing share(3) EUR 99.69 — —
D Class non-distributing share EUR 103.40 98.80 —
E Class non-distributing share EUR 100.67 97.09 —
I Class non-distributing share EUR 103.69 98.93 —
X Class non-distributing share EUR 104.47 99.28 —
BlackRock ESG Euro Short Duration Bond Fund(4)
Total net assets EUR 238,040,560 — —
Net asset value per:
A Class non-distributing share EUR 99.62 — —
AI Class non-distributing share EUR 99.62 — —
D Class non-distributing share EUR 99.72 — —
E Class non-distributing share EUR 99.50 — —
I Class non-distributing share EUR 99.74 — —
X Class non-distributing share EUR 99.85 — —
Z Class non-distributing share EUR 99.81 — —
BlackRock European Absolute Return Fund
Total net assets EUR 1,528,371,943 1,263,445,114 1,712,365,331
Net asset value per:
A Class distributing share EUR 143.48 141.59 135.67
A Class non-distributing share EUR 143.52 141.64 135.73
D Class distributing share EUR 147.83 145.45 138.79
D Class non-distributing share CHF hedged CHF 145.16 143.54 137.57
D Class non-distributing UK reporting fund share EUR 150.41 147.85 141.09
D Class non-distributing UK reporting fund share GBP hedged GBP 159.38 156.14 147.50
D Class non-distributing UK reporting fund share USD hedged(3) USD 98.03 — —
E Class non-distributing share EUR 136.71 135.47 130.35
I Class non-distributing UK reporting fund share EUR 153.57 150.59 143.35
S Class non-distributing share EUR 106.81 105.03 —
X Class non-distributing share(3) EUR 97.32 — —
Three Year Summary of Net Asset Valuesas at 31 May 2021 continued
The notes on pages 590 to 610 form an integral part of these financial statements.
Annual report and audited financial statements [31]

Currency 31 May 2021 31 May 2020 31 May 2019
BlackRock European Diversified Equity Absolute Return Fund(1)
Total net assets EUR — 3,682,260 43,682,999
Net asset value per:
A Class non-distributing share EUR — 95.44 104.03
A Class non-distributing share CHF hedged CHF — 91.96 100.57
A Class non-distributing share SEK hedged SEK — 97.84 106.54
A Class non-distributing UK reporting fund share GBP hedged GBP — 99.94 108.97
D Class non-distributing share CHF hedged CHF — 72.78 78.74
D Class non-distributing share USD hedged USD — 106.97 113.88
D Class non-distributing UK reporting fund share EUR — 98.59 106.88
D Class non-distributing UK reporting fund share GBP hedged GBP — 107.54 114.78
E Class non-distributing share EUR — 91.63 100.33
I Class non-distributing share EUR — 103.15 111.45
X Class non-distributing share EUR — 124.54 132.57
BlackRock European Opportunities Extension Fund
Total net assets EUR 660,042,096 827,548,340 976,232,401
Net asset value per:
A Class distributing UK reporting fund share GBP GBP 452.57 335.26 315.20
A Class non-distributing share EUR 530.04 375.58 358.68
D Class distributing (G) share EUR 193.51 137.68 131.74
D Class distributing UK reporting fund share GBP GBP 465.61 343.60 321.74
D Class non-distributing share EUR 548.87 387.37 368.46
E Class non-distributing share EUR 505.90 359.94 344.92
I Class non-distributing share EUR 291.50 205.25 194.77
X Class non-distributing share EUR 346.17 237.37 218.69
BlackRock European Select Strategies Fund
Total net assets EUR 485,703,169 524,910,242 534,364,061
Net asset value per:
A Class distributing share EUR 112.38 105.42 104.54
A Class non-distributing share EUR 113.59 106.32 105.43
A Class non-distributing share CZK hedged CZK 1,116.18 1,041.02 1,022.14
AI Class non-distributing share EUR 104.40 97.72 —
D Class distributing share USD hedged USD 122.89 114.19 111.49
D Class non-distributing share EUR 117.60 109.42 107.86
E Class distributing share EUR 110.14 103.61 103.28
E Class non-distributing share EUR 110.36 103.82 103.46
I Class distributing share EUR 110.57 103.82 102.88
I Class non-distributing share EUR 114.61 106.43 104.71
X Class non-distributing share EUR 123.00 113.57 111.09
BlackRock European Unconstrained Equity Fund
Total net assets EUR 46,793,755 23,685,016 6,048,155
Net asset value per:
A Class non-distributing share EUR 167.90 133.88 117.75
D Class non-distributing UK reporting fund share EUR 169.88 134.70 117.98
D Class non-distributing UK reporting fund share GBP hedged GBP 169.82 134.11 118.16
E Class non-distributing share EUR 163.63 130.95 115.84
I Class non-distributing share USD hedged USD 129.64 102.01 —
I Class non-distributing UK reporting fund share EUR 170.39 135.17 118.01
I Class non-distributing UK reporting fund share GBP hedged GBP 171.44 134.63 118.19
X Class non-distributing UK reporting fund share EUR 184.49 144.91 120.87
Three Year Summary of Net Asset Valuesas at 31 May 2021 continued
The notes on pages 590 to 610 form an integral part of these financial statements.
BlackRock Strategic Funds[32]

Currency 31 May 2021 31 May 2020 31 May 2019
BlackRock Fixed Income Credit Strategies Fund
Total net assets EUR 385,400,409 134,136,086 —
Net asset value per:
A Class distributing share EUR 103.33 98.63 —
A Class non-distributing share EUR 103.33 98.63 —
AI Class non-distributing share EUR 102.49 97.84 —
D Class distributing share EUR 104.19 99.06 —
D Class non-distributing share EUR 104.13 99.01 —
E Class non-distributing share EUR 102.28 98.12 —
I Class non-distributing share EUR 104.55 99.21 —
X Class non-distributing share EUR 105.78 99.77 —
BlackRock Fixed Income Strategies Fund
Total net assets EUR 5,676,286,758 6,110,615,059 7,468,536,607
Net asset value per:
A Class distributing share EUR 108.25 103.80 103.67
A Class distributing share CHF hedged CHF 104.12 100.07 100.36
A Class distributing share USD hedged USD 119.73 113.77 111.17
A Class non-distributing share CHF hedged CHF 104.42 100.38 100.67
A Class non-distributing share JPY hedged JPY 10,484.10 10,012.68 10,011.78
A Class non-distributing share USD hedged USD 120.15 114.18 111.57
A Class non-distributing UK reporting fund share EUR 124.33 119.18 119.02
A Class non-distributing UK reporting fund share GBP hedged GBP 109.80 104.59 103.72
AI Class non-distributing share EUR 103.48 99.23 —
D Class distributing share EUR 107.43 102.86 102.59
D Class distributing UK reporting fund share GBP hedged GBP 112.72 107.27 106.33
D Class distributing UK reporting fund share USD hedged USD 118.37 112.21 109.44
D Class non-distributing share CHF hedged CHF 106.55 102.05 101.95
D Class non-distributing share USD hedged USD 122.38 115.83 112.73
D Class non-distributing UK reporting fund share EUR 130.08 124.27 123.61
D Class non-distributing UK reporting fund share GBP hedged GBP 115.29 109.40 107.93
E Class non-distributing share EUR 117.47 113.23 113.65
I Class distributing share EUR 126.97 121.52 121.21
I Class non-distributing share EUR 131.21 125.08 124.19
I Class non-distributing share SEK hedged SEK — — 1,046.06
I Class non-distributing share USD hedged USD 112.29 106.08 103.06
X Class distributing share EUR 105.35 100.85 100.57
X Class non-distributing share EUR 140.37 133.00 131.26
BlackRock Global Absolute Return Bond Fund
Total net assets EUR 159,454,244 135,075,502 403,117,483
Net asset value per:
A Class non-distributing share EUR 105.63 100.01 101.15
A Class non-distributing share SEK hedged SEK 1,033.93 976.61 986.30
A Class non-distributing share USD hedged USD 115.06 107.93 106.30
D class distributing share GBP hedged(3) GBP 99.85 — —
D Class non-distributing share EUR 110.33 103.91 104.56
D Class non-distributing share CHF hedged CHF 103.08 96.83 97.61
E Class non-distributing share EUR 101.15 96.21 97.78
I Class non-distributing share EUR 106.78 100.37 100.81
I Class non-distributing share GBP hedged GBP 107.15 100.12 99.98
I Class non-distributing share SEK hedged SEK 1,064.15 997.97 1,000.48
X Class non-distributing share EUR 118.12 110.47 110.41
Three Year Summary of Net Asset Valuesas at 31 May 2021 continued
The notes on pages 590 to 610 form an integral part of these financial statements.
Annual report and audited financial statements [33]

Currency 31 May 2021 31 May 2020 31 May 2019
BlackRock Global Equity Absolute Return Fund
Total net assets USD 70,551,611 22,443,888 20,798,321
Net asset value per:
A Class distributing share EUR hedged EUR 117.04 99.47 101.20
D Class non-distributing share USD 123.66 103.99 102.88
D Class non-distributing fund share EUR EUR 116.29 107.26 105.74
E Class non-distributing share EUR EUR 113.65 105.79 105.38
I Class non-distributing share EUR EUR 112.64 103.47 101.62
X Class non-distributing share USD 132.41 106.39 103.92
X Class non-distributing share AUD hedged(3) AUD 101.74 — —
Z Class non-distributing share USD 125.79 104.52 103.16
Z Class non-distributing share CHF hedged CHF 119.48 100.36 101.52
Z Class non-distributing share EUR hedged EUR 120.23 100.87 101.66
Z Class non-distributing UK reporting fund share GBP hedged GBP 122.21 102.19 102.12
BlackRock Global Event Driven Fund
Total net assets USD 6,020,440,310 3,349,256,567 2,222,743,667
Net asset value per:
A Class distributing share EUR hedged EUR 112.56 103.29 101.25
A Class non-distributing share USD 132.75 120.60 115.82
A Class non-distributing share CHF hedged CHF 117.34 107.77 106.38
A Class non-distributing share HKD hedged HKD 1,100.63 998.17 —
A Class non-distributing share SGD hedged SGD 109.91 99.84 —
A Class non-distributing UK reporting fund share EUR hedged EUR 117.25 107.49 105.36
AI Class non-distributing share EUR hedged EUR 108.86 99.58 —
D Class distributing UK reporting fund share GBP hedged(3) GBP 107.41 — —
D Class non-distributing share CHF hedged CHF 119.78 109.57 107.38
D Class non-distributing UK reporting fund share USD 135.72 122.77 117.45
D Class non-distributing UK reporting fund share EUR hedged EUR 120.69 110.19 107.55
D Class non-distributing UK reporting fund share GBP hedged GBP 124.81 113.39 109.84
E Class non-distributing share EUR EUR 122.12 122.27 117.50
E Class non-distributing share EUR hedged EUR 117.60 108.27 106.56
I Class distributing UK reporting fund share USD 126.67 114.31 109.01
I Class distributing UK reporting fund share EUR hedged EUR 117.61 107.09 104.79
I Class distributing UK reporting fund share GBP hedged GBP 120.37 109.09 105.43
I Class non-distributing share BRL BRL 87.34 74.95 —
I Class non-distributing share JPY hedged JPY 11,717.71 10,621.44 10,350.96
I Class non-distributing UK reporting fund share USD 125.40 113.16 107.93
I Class non-distributing UK reporting fund share CHF hedged CHF 115.46 105.35 103.13
I Class non-distributing UK reporting fund share EUR hedged EUR 122.71 111.76 108.83
IA Class non-distributing share USD 119.73 108.48 103.25
IA Class non-distributing share EUR hedged EUR 108.98 99.81 —
S Class non-distributing share USD 111.01 100.04 —
S Class non-distributing share EUR hedged EUR 109.63 99.79 —
X Class non-distributing share USD 155.50 136.10 127.82
Z Class non-distributing share CHF hedged CHF 126.22 114.32 111.30
Z Class non-distributing UK reporting fund share USD 141.69 127.06 120.81
Z Class non-distributing UK reporting fund share EUR hedged EUR 128.65 116.33 112.86
Z Class non-distributing UK reporting fund share GBP hedged GBP 133.95 120.64 116.22
Three Year Summary of Net Asset Valuesas at 31 May 2021 continued
The notes on pages 590 to 610 form an integral part of these financial statements.
BlackRock Strategic Funds[34]

Currency 31 May 2021 31 May 2020 31 May 2019
BlackRock Global Real Asset Securities Fund
Total net assets USD 315,221,465 96,029,475 5,560,181
Net asset value per:
A Class distributing UK reporting fund share USD 103.02 85.60 —
A Class distributing UK reporting fund share HKD hedged HKD 103.65 86.81 —
A Class distributing UK reporting fund share EUR hedged EUR 100.71 84.20 —
A Class distributing UK reporting fund share SGD hedged SGD 102.79 86.32 —
A Class non-distributing share USD 138.79 105.27 106.96
D Class distributing share USD 104.42 86.68 —
D Class non-distributing UK reporting fund share USD 141.69 106.82 107.91
E Class non-distributing share EUR EUR 133.11 111.39 113.34
X Class non-distributing UK reporting fund share USD 145.98 109.12 109.29
Z Class non-distributing UK reporting fund share USD 143.19 107.62 108.39
BlackRock Macro Opportunities Fund(1)
Total net assets USD — 38,089,075 159,152,959
Net asset value per:
A Class non-distributing share USD — 98.12 98.12
AI Class non-distributing share EUR hedged EUR — 96.77 —
D Class non-distributing share EUR EUR — 103.02 102.05
D Class non-distributing UK reporting fund share USD — 99.63 99.10
D Class non-distributing UK reporting fund share EUR hedged EUR — 96.53 98.06
D Class non-distributing UK reporting fund share GBP hedged GBP — 95.94 96.75
E Class non-distributing share EUR EUR — 107.41 107.53
E Class non-distributing share EUR hedged EUR — 90.79 93.55
I Class non-distributing share BRL hedged USD — 74.03 99.64
I Class non-distributing share EUR EUR — 104.61 103.47
X Class non-distributing share USD — 101.56 100.18
Z Class non-distributing share BRL hedged USD — 63.00 84.73
Z Class non-distributing share CHF hedged CHF — 92.50 94.23
Z Class non-distributing UK reporting fund share USD — 99.96 99.17
Z Class non-distributing UK reporting fund share EUR hedged EUR — 93.36 94.77
Z Class non-distributing UK reporting fund share GBP hedged GBP — 95.47 96.26
BlackRock Managed Index Portfolios − Conservative
Total net assets EUR 101,728,225 155,738,897 139,371,110
Net asset value per:
A Class distributing share EUR 109.60 98.80 98.24
A Class non-distributing share EUR 110.07 99.06 98.41
A Class non-distributing share USD hedged USD 117.47 104.89 102.32
D Class distributing share EUR 109.64 98.83 98.43
D Class non-distributing share EUR 112.43 100.54 99.25
D Class non-distributing share USD hedged USD 119.95 106.42 103.18
D Class non-distributing UK reporting fund share GBP hedged GBP 114.57 101.91 100.60
E Class non-distributing share EUR 104.37 94.40 —
I Class non-distributing share(3) EUR 108.52 — —
IndexInvest Balance Class distributing share EUR 109.59 98.80 98.25
Vermoegensstrategie Moderat - Ausgewogen Class dist. shares EUR 114.96 103.60 103.04
Three Year Summary of Net Asset Valuesas at 31 May 2021 continued
The notes on pages 590 to 610 form an integral part of these financial statements.
Annual report and audited financial statements [35]

Currency 31 May 2021 31 May 2020 31 May 2019
BlackRock Managed Index Portfolios − Defensive
Total net assets EUR 159,169,033 202,971,849 139,233,055
Net asset value per:
A Class distributing share EUR 108.56 103.36 103.16
A Class non-distributing share GBP hedged GBP 109.40 103.54 102.71
A Class non-distributing share USD hedged USD 124.34 117.42 114.60
A Class non-distributing UK reporting fund share EUR 111.29 105.97 105.28
D Class distributing UK reporting fund share EUR 104.48 99.47 99.41
D Class distributing UK reporting fund share GBP hedged GBP 109.10 103.23 103.01
D Class distributing UK reporting fund share USD hedged USD 121.27 114.53 112.39
D Class non-distributing share CHF hedged CHF 107.93 102.45 101.58
D Class non-distributing share USD hedged USD 129.22 121.25 117.46
D Class non-distributing UK reporting fund share EUR 115.80 109.56 108.17
D Class non-distributing UK reporting fund share GBP hedged GBP 116.14 109.22 107.57
E Class non-distributing share EUR 100.09 95.77 —
I Class non-distributing share(3) EUR 103.78 — —
I Class non-distributing share USD hedged USD 116.83 109.56 106.15
IndexInvest Substanz Class distributing share EUR 103.81 98.84 98.65
Vermoegensstrategie Defensiv Class distributing share EUR 108.51 103.30 103.12
X Class non-distributing share EUR 114.30 107.63 105.82
BlackRock Managed Index Portfolios − Growth
Total net assets EUR 369,847,480 278,497,988 211,502,093
Net asset value per:
A Class distributing share EUR 149.81 120.00 115.69
A Class non-distributing share GBP hedged GBP 129.34 103.16 100.01
A Class non-distributing share USD hedged USD 175.88 139.89 132.97
A Class non-distributing UK reporting fund share EUR 146.15 117.07 112.86
D Class distributing UK reporting fund share EUR 143.57 114.36 109.60
D Class distributing UK reporting fund share USD hedged USD 166.75 131.95 124.63
D Class distributing UK reporting fund share GBP hedged GBP 146.72 116.31 112.01
D Class non-distributing share CHF hedged CHF 140.39 112.05 107.63
D Class non-distributing share USD hedged USD 180.77 142.88 135.05
D Class non-distributing UK reporting fund share EUR 161.92 128.88 123.48
D Class non-distributing UK reporting fund share GBP hedged GBP 147.21 116.68 112.36
E Class non-distributing share EUR 117.26 94.40 —
I Class non-distributing share(3) EUR 119.98 — —
I Class non-distributing share USD hedged USD 142.33 112.30 106.05
IndexInvest Chance Class distributing share EUR 123.70 99.08 95.52
Vermoegensstrategie Wachstum Class distributing share EUR 134.75 107.33 102.83
X Class non-distributing share EUR 148.53 117.67 112.25
Three Year Summary of Net Asset Valuesas at 31 May 2021 continued
The notes on pages 590 to 610 form an integral part of these financial statements.
BlackRock Strategic Funds[36]

Currency 31 May 2021 31 May 2020 31 May 2019
BlackRock Managed Index Portfolios − Moderate
Total net assets EUR 695,253,941 695,725,488 550,633,567
Net asset value per:
A Class distributing share EUR 128.60 112.26 111.44
A Class non-distributing share GBP hedged GBP 117.12 101.71 101.27
A Class non-distributing share USD hedged USD 148.70 128.81 125.54
A Class non-distributing UK reporting fund share EUR 126.98 110.85 110.05
D Class distributing UK reporting fund share EUR 121.75 106.12 105.36
D Class distributing UK reporting fund share GBP hedged GBP 126.10 109.18 108.19
D Class distributing UK reporting fund share USD hedged USD 142.14 122.94 120.15
D Class non-distributing share CHF hedged CHF 122.47 106.55 105.42
D Class non-distributing share USD hedged USD 153.50 132.11 127.94
D Class non-distributing UK reporting fund share EUR 137.10 118.93 117.33
D Class non-distributing UK reporting fund share GBP hedged GBP 129.60 111.86 110.66
E Class non-distributing share EUR 106.41 93.35 —
I Class distributing share EUR 118.21 103.04 102.26
I Class non-distributing share(3) EUR 112.59 — —
I Class non-distributing share USD hedged USD 127.30 109.47 106.27
IndexInvest Wachstum Class distributing share EUR 111.92 97.70 96.99
IndexInvest Wachstum Class distributing share CHF hedged CHF 121.30 106.20 105.74
Vermoegensstrategie Ausgewogen Class distributing share EUR 119.18 103.90 103.11
X Class non-distributing share EUR 129.70 111.99 109.97
X Class non-distributing share GBP hedged GBP 124.83 107.26 105.59
X Class non-distributing share USD hedged USD 128.93 110.47 106.85
BlackRock Style Advantage Fund
Total net assets USD 176,150,611 2,150,166,004 3,245,426,903
Net asset value per:
A Class distributing share USD 83.40 86.16 106.29
A Class distributing share EUR hedged EUR 75.62 78.78 99.40
A Class non-distributing share USD 82.07 84.79 104.62
A Class non-distributing share EUR hedged EUR 66.82 69.57 87.87
A Class non-distributing share SEK hedged SEK 68.74 71.25 89.53
D Class non-distributing share CHF hedged CHF 68.93 71.55 89.83
D Class non-distributing share EUR EUR 77.56 87.23 106.55
D Class non-distributing UK reporting fund share USD 85.52 87.73 107.43
D Class non-distributing UK reporting fund share EUR hedged EUR 77.10 79.82 100.01
D Class non-distributing UK reporting fund share GBP hedged GBP 74.14 76.20 94.37
E Class non-distributing share EUR EUR 73.07 83.25 102.91
E Class non-distributing share EUR hedged EUR 72.91 76.34 96.82
I Class non-distributing PF share CHF hedged CHF 71.19 73.69 92.11
I Class non-distributing PF share EUR hedged EUR 78.66 81.13 101.38
I Class non-distributing share BRL hedged USD 52.21 50.61 83.34
I Class non-distributing share CHF hedged CHF 69.47 71.90 90.29
I Class non-distributing UK reporting fund share USD 76.09 77.97 95.35
I Class non-distributing UK reporting fund share EUR hedged EUR 77.84 80.42 100.61
I Class non-distributing UK reporting fund share GBP hedged GBP 74.20 76.24 94.73
I Class non-distributing UK reporting fund share JPY hedged JPY 7,918.17 8,162.20 10,175.36
X Class non-distributing share USD 89.48 91.12 110.60
X Class non-distributing share AUD hedged(5) AUD 89.80 91.81 111.75
X Class non-distributing share EUR hedged EUR 73.46 75.30 93.42
X Class non-distributing share NZD hedged NZD 90.03 91.00 110.98
X Class non-distributing UK reporting fund share GBP hedged GBP 87.26 86.47 106.63
Z Class non-distributing share USD 86.16 88.28 107.92
Z Class non-distributing share EUR hedged EUR 77.84 80.39 100.55
Three Year Summary of Net Asset Valuesas at 31 May 2021 continued
The notes on pages 590 to 610 form an integral part of these financial statements.
Annual report and audited financial statements [37]

Currency 31 May 2021 31 May 2020 31 May 2019
BlackRock Style Advantage Screened Fund
Total net assets USD 27,052,932 27,998,224 25,907,945
Net asset value per:
A Class non-distributing share USD 87.98 91.86 102.74
D Class non-distributing share USD 89.35 92.73 103.10
D Class non-distributing share EUR hedged EUR 84.77 88.73 101.23
D Class non-distributing share GBP hedged GBP 86.64 90.11 101.87
E Class non-distributing share EUR EUR 82.01 94.49 105.82
I Class non-distributing share USD 89.82 93.05 103.25
I Class non-distributing share EUR EUR 84.74 96.34 106.46
I Class non-distributing share EUR hedged EUR 85.26 89.05 101.38
I Class non-distributing share GBP hedged GBP 87.09 90.40 102.01
X Class non-distributing share USD 91.10 93.88 103.59
X Class non-distributing share AUD hedged AUD 85.43 88.17 —
BlackRock Systematic ESG World Equity Fund
Total net assets USD 358,338,671 220,697,286 186,266,828
Net asset value per:
A Class non-distributing share USD 196.28 137.96 128.84
D Class non-distributing share EUR EUR 183.58 141.09 130.80
E Class non-distributing share EUR EUR 184.88 143.36 134.07
I Class non-distributing share EUR hedged EUR 174.96 123.47 116.58
I Class non-distributing share JPY JPY 19,441.15 13,336.58 12,536.81
I Class non-distributing share JPY hedged JPY 19,668.58 13,794.26 13,076.90
X Class non-distributing UK reporting fund share GBP GBP 228.82 182.81 165.92
BlackRock Systematic Global Equity Fund
Total net assets USD 185,067,316 161,584,844 288,073,809
Net asset value per:
A Class non-distributing share USD 190.08 134.52 130.44
D Class non-distributing share EUR EUR 181.53 140.40 135.23
E Class non-distributing share EUR EUR 172.55 134.71 130.82
E Class non-distributing share EUR hedged EUR 167.05 119.92 118.56
I Class non-distributing share USD 164.06 115.34 111.14
I Class non-distributing share EUR EUR 180.05 138.98 133.45
X Class non-distributing share USD 148.44 103.94 99.76
X Class non-distributing share EUR EUR 145.19 111.64 106.77
X Class non-distributing share GBP GBP 222.06 178.42 167.99
X Class non-distributing share JPY JPY 14,023.59 9,634.73 9,353.57
BlackRock Systematic Global Long/Short Equity Fund(2)
Total net assets USD 47,865,656 72,200,396 103,685,956
Net asset value per:
A Class non-distributing share USD 112.00 108.48 112.23
A Class non-distributing share EUR hedged EUR 96.86 94.73 100.48
A Class non-distributing share SEK hedged SEK 977.04 952.17 1,008.03
AI Class non-distributing share EUR hedged EUR 97.77 95.56 —
C Class non-distributing share USD 100.72 98.53 102.95
D Class non-distributing share USD 111.63 107.46 110.52
D Class non-distributing UK reporting fund share EUR hedged EUR 104.72 101.81 107.35
D Class non-distributing UK reporting fund share GBP hedged GBP 108.11 104.55 109.26
E Class non-distributing share EUR hedged EUR 96.96 95.30 101.60
I Class non-distributing share EUR hedged EUR 99.27 96.22 —
J Class distributing share USD 116.76 112.41 115.62
X Class non-distributing share USD 129.52 122.84 124.47
Three Year Summary of Net Asset Valuesas at 31 May 2021 continued
The notes on pages 590 to 610 form an integral part of these financial statements.
BlackRock Strategic Funds[38]

Currency 31 May 2021 31 May 2020 31 May 2019
BlackRock Total Advantage Fund
Total net assets EUR 17,698,528 30,967,819 34,507,624
Net asset value per:
A Class non-distributing share EUR 90.75 85.02 96.69
D Class non-distributing share EUR 92.52 86.20 97.48
D Class non-distributing share USD hedged USD 99.11 91.61 101.48
D Class non-distributing UK reporting fund share GBP hedged GBP 94.66 87.65 99.00
E Class non-distributing share EUR 94.53 88.55 100.70
I Class non-distributing share EUR 93.16 86.61 97.75
X Class non-distributing share EUR 94.90 87.75 98.55
BlackRock UK Equity Absolute Return Fund
Total net assets GBP 141,963,933 153,650,726 71,743,502
Net asset value per:
A Class distributing share EUR hedged EUR 100.23 101.42 101.66
A Class non-distributing share EUR hedged EUR 101.00 102.14 102.32
A Class non-distributing UK reporting fund share GBP 105.23 105.70 105.05
D Class non-distributing share CHF hedged CHF 102.60 103.28 103.10
D Class non-distributing share EUR EUR 109.30 104.28 105.22
D Class non-distributing share EUR hedged EUR 103.76 104.21 104.29
D Class non-distributing share USD hedged USD 110.80 110.36 107.62
D Class non-distributing UK reporting fund share GBP 108.60 108.32 107.00
E Class non-distributing share EUR EUR 101.57 98.15 99.92
E Class non-distributing share EUR hedged EUR 98.06 99.69 100.41
I Class non-distributing share EUR hedged EUR 101.33 101.60 100.98
I Class non-distributing share JPY hedged JPY 10,637.96 10,616.54 10,557.09
I Class non-distributing share USD hedged USD 108.08 107.41 104.53
X Class non-distributing UK reporting fund share GBP 115.40 113.89 111.25
(1) Fund terminated, see Note 1 for further details.(2) Fund name changed, see Note 1 for further details.(3) New Share Class launched, see Appendix I for further details.(4) New Fund launched, see Note 1 for further details.(5) NAV per share at close valuation, see Note 2 for further details.
Three Year Summary of Net Asset Valuesas at 31 May 2021 continued
The notes on pages 590 to 610 form an integral part of these financial statements.
Annual report and audited financial statements [39]

Note
BlackRockStrategic Funds
Combined
BlackRockAmericas
Diversified EquityAbsolute Return
FundBlackRock Asia
Extension Fund(1)
BlackRock AsiaPacific Absolute
Return Fund
USD USD USD USD
Net assets at the beginning of the year 23,869,517,648 937,142,511 139,118,351 30,464,640IncomeBank interest 2(c) 2,980,635 583,855 24,169 130Bond interest 2(c) 234,823,795 2,147,022 44,622 4,437Contracts for difference interest 2(c),2(d) 401,478 1,486 — 423Swaps interest and dividends 2(c) 68,546,712 19,228 — —Dividends, net of withholding taxes 2(c) 78,674,029 — — 431,484Contracts for difference dividends, net of withholding taxes 2(c),2(d) 144,152,284 40,310,706 25,552 10,095Securities lending 2(c) 2,470,418 — — 3,832Management fee rebate 4 3,826,833 — — —Other income 721,746 — — 5,199
Total income 536,597,930 43,062,297 94,343 455,600
ExpensesBank interest 2(c) 6,772,100 9,311 10,922 720Contracts for difference interest 2(c),2(d) 51,001,847 13,412,933 — 206,588Swaps interest and dividends 2(c) 74,925,476 22,550 — —Negative yield on financial assets 2(c) 9,067,591 — — —Contracts for difference dividends, net of withholding taxes 2(c),2(d) 142,352,234 54,245,222 — 481,272Annual Service Charge 5 35,480,532 1,520,868 3,861 39,689Depositary fees 2(i),6 10,312,904 2,542,426 10,313 10,944Taxes 8 15,854,109 273,307 — 7,186Performance fees 7 126,266,113 128 — 109,871Distribution fees 4 7,237,994 43,914 13 10,942Loan commitment fees 14 30,026 766 — 61Management fees and sub-investment advisers fees 4 205,364,774 9,981,045 174 89,231Other charges 298,295 — — 110
Total expenses before reimbursement 684,963,995 82,052,470 25,283 956,614
Reimbursement of expenses 4 3,392,333 — — —
Total expenses after reimbursement 681,571,662 82,052,470 25,283 956,614
Net investment income/(deficit) (144,973,732) (38,990,173) 69,060 (501,014)Net realised gain/(loss) on:
Investments 2(a),2(b) 1,237,642,526 6,771,133 96,588 8,284,430To Be Announced securities contracts 2(d) 774,431 — — —Contracts for difference 2(d) (17,691,031) (8,515,291) (1,085) (5,007,131)Futures contracts 2(d) (115,384,887) — 11,863,494 (2,527,659)Foreign currencies and forward foreignexchange transactions 2(d),2(e),2(j) 584,475,870 43,363,572 155 815,742Swaps transactions 2(d) (44,627,803) (1,931,327) — —Options/swaptions contracts 2(d) (18,112,784) — — —
Net realised gain/(loss) for the year 1,627,076,322 39,688,087 11,959,152 1,565,382
Net change in unrealised appreciation/(depreciation) on:Investments 2(a) 1,130,578,393 1,026,305 — 4,793,983To Be Announced securities contracts 2(d) 81,337 — — —Contracts for difference 2(d) 18,500,698 (4,083,704) 61,743 (842,313)Futures contracts 2(d) 14,837,335 — (1,113,079) (42,541)Foreign currencies and forward foreignexchange transactions 2(d),2(e),2(j) (83,713,676) (8,053,157) 2,386 8,791Swaps transactions 2(d) 29,486,472 1,353,800 — —Options/swaptions contracts 2(d) (2,827,297) — — —
Net change in unrealised appreciation/(depreciation) for theyear 1,106,943,262 (9,756,756) (1,048,950) 3,917,920
Increase/(decrease) in net assets as a result of operations 2,589,045,852 (9,058,842) 10,979,262 4,982,288
Movements in share capitalNet receipts as a result of issue of shares 11,520,377,413 379,340,076 — 1,140,213Net payments as a result of repurchase of shares (12,131,245,022) (620,286,862) (150,097,613) (1,909,976)
Increase/(decrease) in net assets as a result of movements inshare capital (610,867,609) (240,946,786) (150,097,613) (769,763)
Dividends declared 11 (21,029,724) — — —Foreign exchange adjustment 2(f) 1,486,007,339 — — —
Net assets at the end of the year 27,312,673,506 687,136,883 — 34,677,165
(1) Fund terminated, see Note 1 for further details.
Statement of Operations and Changes in Net Assetsfor the year ended 31 May 2021
The notes on pages 590 to 610 form an integral part of these financial statements.
BlackRock Strategic Funds[40]

Note
BlackRock AsiaPacific Diversified
Equity AbsoluteReturn Fund
BlackRockDynamic
Diversified GrowthFund
BlackRockEmerging
CompaniesAbsolute Return
Fund(2)
BlackRockEmerging Markets
Absolute ReturnFund
USD EUR GBP USD
Net assets at the beginning of the year 26,406,843 1,034,442,870 633,318,122 14,513,860IncomeBank interest 2(c) 17,485 — 151,906 —Bond interest 2(c) 56,802 1,167,265 623,721 3,791Contracts for difference interest 2(c),2(d) — — 36,002 —Swaps interest and dividends 2(c) — 1,340,848 — —Dividends, net of withholding taxes 2(c) — 5,829,111 318,491 155,867Contracts for difference dividends, net of withholding taxes 2(c),2(d) 2,507,565 — 9,546,676 73,930Securities lending 2(c) — 77,864 17,237 1,632Management fee rebate 4 — 232,243 — —Other income 6,655 — 15,692 76,949
Total income 2,588,507 8,647,331 10,709,725 312,169
ExpensesBank interest 2(c) 3,815 203,871 69,860 1,458Contracts for difference interest 2(c),2(d) 946,214 — 2,854,094 74,563Swaps interest and dividends 2(c) 610,480 2,004,495 — —Negative yield on financial assets 2(c) — 115,063 — —Contracts for difference dividends, net of withholding taxes 2(c),2(d) 1,652,635 — 7,824,394 168,105Annual Service Charge 5 42,412 1,079,096 1,268,469 24,522Depositary fees 2(i),6 288,985 101,699 114,328 2,633Taxes 8 7,679 172,648 225,966 4,110Performance fees 7 318,418 — 14,949,521 —Distribution fees 4 3,515 698,981 — 9,098Loan commitment fees 14 49 1,301 1,238 —Management fees and sub-investment advisers fees 4 62,172 7,340,341 7,533,981 148,792Other charges — 192,048 — 13,745
Total expenses before reimbursement 3,936,374 11,909,543 34,841,851 447,026
Reimbursement of expenses 4 258,185 — 227 —
Total expenses after reimbursement 3,678,189 11,909,543 34,841,624 447,026
Net investment income/(deficit) (1,089,682) (3,262,212) (24,131,899) (134,857)Net realised gain/(loss) on:
Investments 2(a),2(b) 534 43,477,922 28,840,371 903,808To Be Announced securities contracts 2(d) — — — —Contracts for difference 2(d) 17,441,687 — 134,710,318 (3,510,155)Futures contracts 2(d) — (34,933,387) (63,618,868) (372,703)Foreign currencies and forward foreignexchange transactions 2(d),2(e),2(j) 1,150,421 2,349,737 (25,834,420) 449,187Swaps transactions 2(d) (10,035,362) 34,982,176 — —Options/swaptions contracts 2(d) — (40,584) — —
Net realised gain/(loss) for the year 8,557,280 45,835,864 74,097,401 (2,529,863)
Net change in unrealised appreciation/(depreciation) on:Investments 2(a) — 68,905,724 5,276,422 3,489,741To Be Announced securities contracts 2(d) — — — —Contracts for difference 2(d) (1,399,781) — 7,624,802 578,711Futures contracts 2(d) — 18,333,840 (5,410,299) 30,413Foreign currencies and forward foreignexchange transactions 2(d),2(e),2(j) 211,220 (1,823,407) (13,799,075) (63,009)Swaps transactions 2(d) 1,279,713 (5,920,988) — —Options/swaptions contracts 2(d) — 957,003 — —
Net change in unrealised appreciation/(depreciation) for theyear 91,152 80,452,172 (6,308,150) 4,035,856
Increase/(decrease) in net assets as a result of operations 7,558,750 123,025,824 43,657,352 1,371,136
Movements in share capitalNet receipts as a result of issue of shares 2,915,723 296,062,775 369,232,214 1,154,645Net payments as a result of repurchase of shares (1,675,841) (223,893,962) (225,209,925) (4,418,004)
Increase/(decrease) in net assets as a result of movements inshare capital 1,239,882 72,168,813 144,022,289 (3,263,359)
Dividends declared 11 — — — —Foreign exchange adjustment 2(f) — — — —
Net assets at the end of the year 35,205,475 1,229,637,507 820,997,763 12,621,637
(2) Fund name changed, see Note 1 for further details.
Statement of Operations and Changes in Net Assetsfor the year ended 31 May 2021 continued
The notes on pages 590 to 610 form an integral part of these financial statements.
Annual report and audited financial statements [41]

Note
BlackRockEmerging MarketsEquity Strategies
Fund
BlackRockEmerging Markets
Flexi DynamicBond Fund
BlackRockEmerging Markets
Short DurationBond Fund
BlackRock ESGEuro Bond Fund
USD USD USD EUR
Net assets at the beginning of the year 585,619,249 1,581,561,191 69,623,667 423,582,725IncomeBank interest 2(c) 11 38,157 11,784 3,762Bond interest 2(c) — 90,194,053 3,606,894 2,813,258Contracts for difference interest 2(c),2(d) — — — —Swaps interest and dividends 2(c) — 48,839,122 505,245 68,818Dividends, net of withholding taxes 2(c) 15,696,758 1,548,672 — —Contracts for difference dividends, net of withholding taxes 2(c),2(d) 6,171,743 — — —Securities lending 2(c) 210,229 222,348 19,408 30,516Management fee rebate 4 — 122,049 — —Other income 14,863 — 28,290 —
Total income 22,093,604 140,964,401 4,171,621 2,916,354
ExpensesBank interest 2(c) 18,516 386,179 169 15,810Contracts for difference interest 2(c),2(d) 1,810,953 — — —Swaps interest and dividends 2(c) — 37,773,668 301,715 59,654Negative yield on financial assets 2(c) — — — 681,573Contracts for difference dividends, net of withholding taxes 2(c),2(d) 4,806,178 — — —Annual Service Charge 5 1,621,757 957,075 37,533 485,929Depositary fees 2(i),6 162,489 377,440 6,183 125,215Taxes 8 5,775,683 938,364 14,388 201,825Performance fees 7 — — — —Distribution fees 4 239,022 191,081 14,739 152,038Loan commitment fees 14 300 1,142 348 1,002Management fees and sub-investment advisers fees 4 7,456,051 3,619,925 183,365 1,179,832Other charges — — — —
Total expenses before reimbursement 21,890,949 44,244,874 558,440 2,902,878
Reimbursement of expenses 4 — — — —
Total expenses after reimbursement 21,890,949 44,244,874 558,440 2,902,878
Net investment income/(deficit) 202,655 96,719,527 3,613,181 13,476Net realised gain/(loss) on:
Investments 2(a),2(b) 32,589,122 90,612,841 721,408 4,410,194To Be Announced securities contracts 2(d) — — — —Contracts for difference 2(d) (24,745,296) — — —Futures contracts 2(d) (2,938,417) (29,610,651) 510,006 1,958,286Foreign currencies and forward foreignexchange transactions 2(d),2(e),2(j) (4,218,008) 133,275,489 3,548,664 (59,377)Swaps transactions 2(d) — (132,024,851) (815,483) 240,498Options/swaptions contracts 2(d) — (15,759,385) — 34,323
Net realised gain/(loss) for the year 687,401 46,493,443 3,964,595 6,583,924
Net change in unrealised appreciation/(depreciation) on:Investments 2(a) 227,273,154 78,776,429 5,288,325 (5,100,176)To Be Announced securities contracts 2(d) — — — —Contracts for difference 2(d) 7,176,546 — — —Futures contracts 2(d) 128,535 (822,946) 31,637 176,327Foreign currencies and forward foreignexchange transactions 2(d),2(e),2(j) (576,470) (12,666,335) (854,544) (72,806)Swaps transactions 2(d) — 22,949,942 247,823 (473,753)Options/swaptions contracts 2(d) — (11,451) (11,460) (34,073)
Net change in unrealised appreciation/(depreciation) for theyear 234,001,765 88,225,639 4,701,781 (5,504,481)
Increase/(decrease) in net assets as a result of operations 234,891,821 231,438,609 12,279,557 1,092,919
Movements in share capitalNet receipts as a result of issue of shares 538,422,300 37,522,138 13,774,040 331,519,427Net payments as a result of repurchase of shares (453,498,503) (312,752,542) (18,040,937) (113,695,437)
Increase/(decrease) in net assets as a result of movements inshare capital 84,923,797 (275,230,404) (4,266,897) 217,823,990
Dividends declared 11 (40) (5,482,267) (20,593) (35)Foreign exchange adjustment 2(f) — — — —
Net assets at the end of the year 905,434,827 1,532,287,129 77,615,734 642,499,599
Statement of Operations and Changes in Net Assetsfor the year ended 31 May 2021 continued
The notes on pages 590 to 610 form an integral part of these financial statements.
BlackRock Strategic Funds[42]

Note
BlackRock ESGEuro Corporate
Bond Fund
BlackRock ESGEuro Short
Duration BondFund(3)
BlackRockEuropean Absolute
Return Fund
BlackRockEuropean
Diversified EquityAbsolute Return
Fund(1)
EUR EUR EUR EUR
Net assets at the beginning of the year 182,474,888 — 1,263,445,114 3,682,260IncomeBank interest 2(c) 22,700 — — —Bond interest 2(c) 2,347,044 97,265 2,079 —Contracts for difference interest 2(c),2(d) — — 519 —Swaps interest and dividends 2(c) 154,961 819 — —Dividends, net of withholding taxes 2(c) — — 5,926,367 —Contracts for difference dividends, net of withholding taxes 2(c),2(d) — — 6,432,430 —Securities lending 2(c) 8,681 — 86,593 —Management fee rebate 4 — — — —Other income — — 10,236 —
Total income 2,533,386 98,084 12,458,224 0
ExpensesBank interest 2(c) 28,718 1,248 179,232 165Contracts for difference interest 2(c),2(d) — — 8,931,541 209Swaps interest and dividends 2(c) 179,210 3,050 — —Negative yield on financial assets 2(c) — 223,399 6,221,722 —Contracts for difference dividends, net of withholding taxes 2(c),2(d) — — 17,887,020 —Annual Service Charge 5 129,588 49,716 3,828,011 121Depositary fees 2(i),6 68,174 15,791 223,566 66Taxes 8 176,075 22,036 683,927 —Performance fees 7 — — 4,580,919 —Distribution fees 4 18,382 6 171,135 91Loan commitment fees 14 330 — 1,557 —Management fees and sub-investment advisers fees 4 833,574 124,483 23,938,304 585Other charges — — 6,604 —
Total expenses before reimbursement 1,434,051 439,729 66,653,538 1,237
Reimbursement of expenses 4 166,151 49,739 — 26
Total expenses after reimbursement 1,267,900 389,990 66,653,538 1,211
Net investment income/(deficit) 1,265,486 (291,906) (54,195,314) (1,211)Net realised gain/(loss) on:
Investments 2(a),2(b) 1,793,330 (18,149) 112,871,291 (772)To Be Announced securities contracts 2(d) — — — —Contracts for difference 2(d) — — (166,654,247) 4,370Futures contracts 2(d) 1,520,826 146,773 — —Foreign currencies and forward foreignexchange transactions 2(d),2(e),2(j) (134,287) 40,127 5,780,222 753Swaps transactions 2(d) 226,261 (260) (5,454) —Options/swaptions contracts 2(d) 31,009 9,483 — —
Net realised gain/(loss) for the year 3,437,139 177,974 (48,008,188) 4,351
Net change in unrealised appreciation/(depreciation) on:Investments 2(a) 5,271,101 (358,866) 80,438,786 111To Be Announced securities contracts 2(d) — — — —Contracts for difference 2(d) — — 22,061,513 4,053Futures contracts 2(d) (63,273) 104,343 — —Foreign currencies and forward foreignexchange transactions 2(d),2(e),2(j) 6,124 (13,776) (1,750,758) 5,553Swaps transactions 2(d) (217,637) (123,842) — —Options/swaptions contracts 2(d) (23,720) (175) — —
Net change in unrealised appreciation/(depreciation) for theyear 4,972,595 (392,316) 100,749,541 9,717
Increase/(decrease) in net assets as a result of operations 9,675,220 (506,248) (1,453,961) 12,857
Movements in share capitalNet receipts as a result of issue of shares 108,899,430 240,287,706 1,903,091,006 —Net payments as a result of repurchase of shares (29,232,398) (1,740,898) (1,636,710,216) (3,695,117)
Increase/(decrease) in net assets as a result of movements inshare capital 79,667,032 238,546,808 266,380,790 (3,695,117)
Dividends declared 11 — — — —Foreign exchange adjustment 2(f) — — — —
Net assets at the end of the year 271,817,140 238,040,560 1,528,371,943 —
(1) Fund terminated, see Note 1 for further details.(3) New Fund launched, see Note 1 for further details.
Statement of Operations and Changes in Net Assetsfor the year ended 31 May 2021 continued
The notes on pages 590 to 610 form an integral part of these financial statements.
Annual report and audited financial statements [43]

Note
BlackRockEuropean
OpportunitiesExtension Fund
BlackRockEuropean SelectStrategies Fund
BlackRockEuropean
UnconstrainedEquity Fund
BlackRock FixedIncome Credit
Strategies Fund
EUR EUR EUR EUR
Net assets at the beginning of the year 827,548,340 524,910,242 23,685,016 134,136,086IncomeBank interest 2(c) — 88,714 — 971Bond interest 2(c) 1,135 3,460,362 — 3,229,718Contracts for difference interest 2(c),2(d) 81,711 — — —Swaps interest and dividends 2(c) — 153,744 — 273,056Dividends, net of withholding taxes 2(c) 7,219,670 6,271,239 447,991 65,741Contracts for difference dividends, net of withholding taxes 2(c),2(d) 5,340,943 — — —Securities lending 2(c) 106,434 53,727 2,192 15,911Management fee rebate 4 — 26,508 — 11,987Other income 34,604 — — —
Total income 12,784,497 10,054,294 450,183 3,597,384
ExpensesBank interest 2(c) 21,915 51,822 550 172,173Contracts for difference interest 2(c),2(d) 3,472,819 57,896 — 3,339Swaps interest and dividends 2(c) — 337,057 — 672,732Negative yield on financial assets 2(c) 218,114 — — —Contracts for difference dividends, net of withholding taxes 2(c),2(d) 3,718,203 251,201 — 48,750Annual Service Charge 5 2,240,020 649,605 45,662 162,711Depositary fees 2(i),6 52,574 132,037 9,194 64,423Taxes 8 374,418 171,955 8,955 37,053Performance fees 7 11,159,904 — 23,177 —Distribution fees 4 401,319 968,851 8,027 29,153Loan commitment fees 14 384 631 46 364Management fees and sub-investment advisers fees 4 10,139,664 4,915,799 90,897 108,695Other charges 16,718 901 — —
Total expenses before reimbursement 31,816,052 7,537,755 186,508 1,299,393
Reimbursement of expenses 4 — — — —
Total expenses after reimbursement 31,816,052 7,537,755 186,508 1,299,393
Net investment income/(deficit) (19,031,555) 2,516,539 263,675 2,297,991Net realised gain/(loss) on:
Investments 2(a),2(b) 225,375,448 21,905,084 838,342 3,940,690To Be Announced securities contracts 2(d) — — — —Contracts for difference 2(d) 13,891,394 (4,160,978) — (204,495)Futures contracts 2(d) — 3,559,444 — 6,345,284Foreign currencies and forward foreignexchange transactions 2(d),2(e),2(j) 2,945,999 (570,488) (203,098) (373,631)Swaps transactions 2(d) (1,277) (337,310) — (775,842)Options/swaptions contracts 2(d) — (2,889,905) — (1,656,458)
Net realised gain/(loss) for the year 242,211,564 17,505,847 635,244 7,275,548
Net change in unrealised appreciation/(depreciation) on:Investments 2(a) 57,488,713 19,504,613 7,285,414 3,815,373To Be Announced securities contracts 2(d) — — — —Contracts for difference 2(d) (13,535,743) 235,617 — 9,962Futures contracts 2(d) — 276,551 — 76,391Foreign currencies and forward foreignexchange transactions 2(d),2(e),2(j) 3,738,046 (3,587,197) 67,193 (178,926)Swaps transactions 2(d) — 523,073 — 13,393Options/swaptions contracts 2(d) — (78,997) — (22,610)
Net change in unrealised appreciation/(depreciation) for theyear 47,691,016 16,873,660 7,352,607 3,713,583
Increase/(decrease) in net assets as a result of operations 270,871,025 36,896,046 8,251,526 13,287,122
Movements in share capitalNet receipts as a result of issue of shares 6,159,353 138,418,809 20,505,476 288,309,208Net payments as a result of repurchase of shares (443,882,151) (214,494,842) (5,648,263) (50,332,007)
Increase/(decrease) in net assets as a result of movements inshare capital (437,722,798) (76,076,033) 14,857,213 237,977,201
Dividends declared 11 (654,471) (27,086) — —Foreign exchange adjustment 2(f) — — — —
Net assets at the end of the year 660,042,096 485,703,169 46,793,755 385,400,409
Statement of Operations and Changes in Net Assetsfor the year ended 31 May 2021 continued
The notes on pages 590 to 610 form an integral part of these financial statements.
BlackRock Strategic Funds[44]

Note
BlackRock FixedIncome Strategies
Fund
BlackRock GlobalAbsolute Return
Bond Fund
BlackRock GlobalEquity Absolute
Return FundBlackRock Global
Event Driven Fund
EUR EUR USD USD
Net assets at the beginning of the year 6,110,615,059 135,075,502 22,443,888 3,349,256,567IncomeBank interest 2(c) 51,307 133,446 — 1,668,445Bond interest 2(c) 74,484,310 4,769,788 — 24,279,645Contracts for difference interest 2(c),2(d) — 64 205 216,604Swaps interest and dividends 2(c) 7,925,866 1,718,391 — 4,915,201Dividends, net of withholding taxes 2(c) 925,596 20,892 339,408 3,936,148Contracts for difference dividends, net of withholding taxes 2(c),2(d) — 1,721 116,103 39,300,341Securities lending 2(c) 265,374 8,591 — 680,124Management fee rebate 4 225,554 10,477 — —Other income 419,230 — 1,596 —
Total income 84,297,237 6,663,370 457,312 74,996,508
ExpensesBank interest 2(c) 3,721,466 147,944 3,596 34,253Contracts for difference interest 2(c),2(d) — 41 83,725 8,057,476Swaps interest and dividends 2(c) 14,278,110 1,890,327 — 13,014,133Negative yield on financial assets 2(c) — — — —Contracts for difference dividends, net of withholding taxes 2(c),2(d) — — 360,581 18,689,668Annual Service Charge 5 8,109,604 96,214 20,772 7,190,980Depositary fees 2(i),6 1,025,147 565,970 4,112 418,256Taxes 8 3,307,886 41,799 4,354 1,345,267Performance fees 7 — — 46,909 87,035,955Distribution fees 4 2,278,066 2,732 1,034 954,850Loan commitment fees 14 5,001 61 46 6,314Management fees and sub-investment advisers fees 4 42,354,240 524,024 13,382 47,558,094Other charges 698 — — —
Total expenses before reimbursement 75,080,218 3,269,112 538,511 184,305,246
Reimbursement of expenses 4 — 427,621 24 —
Total expenses after reimbursement 75,080,218 2,841,491 538,487 184,305,246
Net investment income/(deficit) 9,217,019 3,821,879 (81,175) (109,308,738)Net realised gain/(loss) on:
Investments 2(a),2(b) 180,225,911 1,392,384 6,286,647 145,870,301To Be Announced securities contracts 2(d) — 652,772 — —Contracts for difference 2(d) — 20,462 (1,482,994) 97,878,824Futures contracts 2(d) 97,252,646 1,728,870 (5,067,785) (27,520,118)Foreign currencies and forward foreignexchange transactions 2(d),2(e),2(j) (55,560,116) 409,663 (351,953) 313,938,148Swaps transactions 2(d) (9,360,759) (412,678) — 29,206,477Options/swaptions contracts 2(d) 4,787,277 709,130 — —
Net realised gain/(loss) for the year 217,344,959 4,500,603 (616,085) 559,373,632
Net change in unrealised appreciation/(depreciation) on:Investments 2(a) 36,784,420 867,939 5,803,586 317,621,083To Be Announced securities contracts 2(d) — 68,559 — —Contracts for difference 2(d) — (1,428) 140,337 5,801,217Futures contracts 2(d) 295,983 145,101 401,504 (25,340,213)Foreign currencies and forward foreignexchange transactions 2(d),2(e),2(j) (22,569,790) (96,613) 128,138 11,836,756Swaps transactions 2(d) 9,312,830 105,380 — (7,344,173)Options/swaptions contracts 2(d) (3,004,496) (925,941) — —
Net change in unrealised appreciation/(depreciation) for theyear 20,818,947 162,997 6,473,565 302,574,670
Increase/(decrease) in net assets as a result of operations 247,380,925 8,485,479 5,776,305 752,639,564
Movements in share capitalNet receipts as a result of issue of shares 1,553,414,737 68,543,546 42,533,436 3,164,026,305Net payments as a result of repurchase of shares (2,232,056,092) (52,650,272) (202,018) (1,245,482,126)
Increase/(decrease) in net assets as a result of movements inshare capital (678,641,355) 15,893,274 42,331,418 1,918,544,179
Dividends declared 11 (3,067,871) (11) — —Foreign exchange adjustment 2(f) — — — —
Net assets at the end of the year 5,676,286,758 159,454,244 70,551,611 6,020,440,310
Statement of Operations and Changes in Net Assetsfor the year ended 31 May 2021 continued
The notes on pages 590 to 610 form an integral part of these financial statements.
Annual report and audited financial statements [45]

Note
BlackRock GlobalReal Asset
Securities Fund
BlackRock MacroOpportunities
Fund(1)
BlackRockManaged Index
Portfolios −Conservative
BlackRockManaged Index
Portfolios −Defensive
USD USD EUR EUR
Net assets at the beginning of the year 96,029,475 38,089,075 155,738,897 202,971,849IncomeBank interest 2(c) — 5,034 — —Bond interest 2(c) — 22,949 — —Contracts for difference interest 2(c),2(d) — — — —Swaps interest and dividends 2(c) — 50,359 — —Dividends, net of withholding taxes 2(c) 5,805,496 2,463 1,604,114 1,807,025Contracts for difference dividends, net of withholding taxes 2(c),2(d) 1,179 — — —Securities lending 2(c) 32,117 33 28,265 52,091Management fee rebate 4 — — 276,423 360,344Other income — 3,335 — 1,534
Total income 5,838,792 84,173 1,908,802 2,220,994
ExpensesBank interest 2(c) 21,205 1,434 7,135 5,644Contracts for difference interest 2(c),2(d) 138 — — —Swaps interest and dividends 2(c) — 19,939 — —Negative yield on financial assets 2(c) — — — —Contracts for difference dividends, net of withholding taxes 2(c),2(d) — — — —Annual Service Charge 5 340,996 10,175 83,535 113,433Depositary fees 2(i),6 43,014 7,972 22,542 22,670Taxes 8 80,626 935 65,649 86,832Performance fees 7 — — — —Distribution fees 4 3,710 391 26 36Loan commitment fees 14 384 560 760 413Management fees and sub-investment advisers fees 4 1,023,050 33,418 1,123,554 1,336,307Other charges — 3,848 — —
Total expenses before reimbursement 1,513,123 78,672 1,303,201 1,565,335
Reimbursement of expenses 4 — — — —
Total expenses after reimbursement 1,513,123 78,672 1,303,201 1,565,335
Net investment income/(deficit) 4,325,669 5,501 605,601 655,659Net realised gain/(loss) on:
Investments 2(a),2(b) 13,479,317 231,385 6,803,583 1,869,967To Be Announced securities contracts 2(d) — — — —Contracts for difference 2(d) (227) — — —Futures contracts 2(d) 17,262 162,176 — —Foreign currencies and forward foreignexchange transactions 2(d),2(e),2(j) 4,090,077 723,177 5,086,902 498,255Swaps transactions 2(d) — (24,747) — —Options/swaptions contracts 2(d) (3,139,720) (112,408) — —
Net realised gain/(loss) for the year 14,446,709 979,583 11,890,485 2,368,222
Net change in unrealised appreciation/(depreciation) on:Investments 2(a) 28,378,918 (356,977) 1,030,800 (443,576)To Be Announced securities contracts 2(d) — — — —Contracts for difference 2(d) 3,876 — — —Futures contracts 2(d) — (34,869) — —Foreign currencies and forward foreignexchange transactions 2(d),2(e),2(j) 49,615 247,839 (220,890) 1,293,278Swaps transactions 2(d) — 26,287 — —Options/swaptions contracts 2(d) 960,513 (77,896) — —
Net change in unrealised appreciation/(depreciation) for theyear 29,392,922 (195,616) 809,910 849,702
Increase/(decrease) in net assets as a result of operations 48,165,300 789,468 13,305,996 3,873,583
Movements in share capitalNet receipts as a result of issue of shares 202,423,281 118,596 15,969,436 42,804,202Net payments as a result of repurchase of shares (21,369,932) (38,997,139) (83,137,055) (90,266,447)
Increase/(decrease) in net assets as a result of movements inshare capital 181,053,349 (38,878,543) (67,167,619) (47,462,245)
Dividends declared 11 (10,026,659) — (149,049) (214,154)Foreign exchange adjustment 2(f) — — — —
Net assets at the end of the year 315,221,465 — 101,728,225 159,169,033
(1) Fund terminated, see Note 1 for further details.
Statement of Operations and Changes in Net Assetsfor the year ended 31 May 2021 continued
The notes on pages 590 to 610 form an integral part of these financial statements.
BlackRock Strategic Funds[46]

Note
BlackRockManaged Index
Portfolios −Growth
BlackRockManaged Index
Portfolios −Moderate
BlackRock StyleAdvantage Fund
EUR EUR USD
Net assets at the beginning of the year 278,497,988 695,725,488 2,150,166,004IncomeBank interest 2(c) — — 14,194Bond interest 2(c) — — 3,720,014Contracts for difference interest 2(c),2(d) — — 35,715Swaps interest and dividends 2(c) — — 375,886Dividends, net of withholding taxes 2(c) 1,073,704 5,522,122 —Contracts for difference dividends, net of withholding taxes 2(c),2(d) — — 21,156,332Securities lending 2(c) 158,154 119,085 —Management fee rebate 4 653,753 1,325,510 —Other income — — —
Total income 1,885,611 6,966,717 25,302,141
ExpensesBank interest 2(c) 8,296 11,662 641,001Contracts for difference interest 2(c),2(d) — — 6,472,457Swaps interest and dividends 2(c) — — 122,550Negative yield on financial assets 2(c) — — —Contracts for difference dividends, net of withholding taxes 2(c),2(d) — — 21,166,966Annual Service Charge 5 192,891 382,942 455,300Depositary fees 2(i),6 44,211 82,768 637,429Taxes 8 164,547 306,152 66,972Performance fees 7 — — —Distribution fees 4 345 305 3,125Loan commitment fees 14 366 1,043 1,730Management fees and sub-investment advisers fees 4 2,535,251 4,739,803 1,861,029Other charges — — —
Total expenses before reimbursement 2,945,907 5,524,675 31,428,559
Reimbursement of expenses 4 — — —
Total expenses after reimbursement 2,945,907 5,524,675 31,428,559
Net investment income/(deficit) (1,060,296) 1,442,042 (6,126,418)Net realised gain/(loss) on:
Investments 2(a),2(b) 31,732,675 29,659,157 1,840,542To Be Announced securities contracts 2(d) — — —Contracts for difference 2(d) — — (89,258,511)Futures contracts 2(d) — — (65,503,041)Foreign currencies and forward foreignexchange transactions 2(d),2(e),2(j) 2,823,718 17,190,799 153,213,696Swaps transactions 2(d) — — 39,702,418Options/swaptions contracts 2(d) — — —
Net realised gain/(loss) for the year 34,556,393 46,849,956 39,995,104
Net change in unrealised appreciation/(depreciation) on:Investments 2(a) 32,954,665 32,303,540 (1,094,930)To Be Announced securities contracts 2(d) — — —Contracts for difference 2(d) — — (5,165,707)Futures contracts 2(d) — — 25,494,397Foreign currencies and forward foreignexchange transactions 2(d),2(e),2(j) 1,189,619 3,877,690 (26,468,905)Swaps transactions 2(d) — — 6,827,999Options/swaptions contracts 2(d) — — —
Net change in unrealised appreciation/(depreciation) for the year 34,144,284 36,181,230 (407,146)
Increase/(decrease) in net assets as a result of operations 67,640,381 84,473,228 33,461,540
Movements in share capitalNet receipts as a result of issue of shares 136,383,739 193,853,563 14,633,315Net payments as a result of repurchase of shares (112,649,975) (278,299,551) (2,022,110,248)
Increase/(decrease) in net assets as a result of movements in share capital 23,733,764 (84,445,988) (2,007,476,933)
Dividends declared 11 (24,653) (498,787) —Foreign exchange adjustment 2(f) — — —
Net assets at the end of the year 369,847,480 695,253,941 176,150,611
Statement of Operations and Changes in Net Assetsfor the year ended 31 May 2021 continued
The notes on pages 590 to 610 form an integral part of these financial statements.
Annual report and audited financial statements [47]
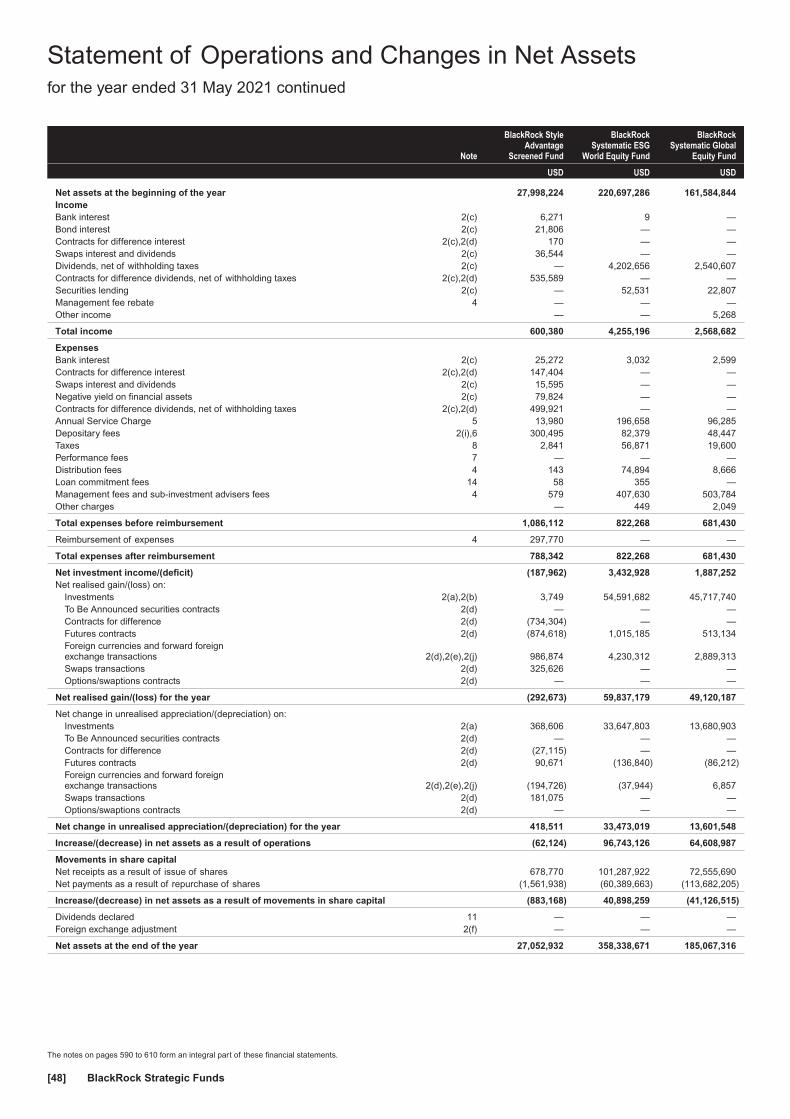
Note
BlackRock StyleAdvantage
Screened Fund
BlackRockSystematic ESG
World Equity Fund
BlackRockSystematic Global
Equity Fund
USD USD USD
Net assets at the beginning of the year 27,998,224 220,697,286 161,584,844IncomeBank interest 2(c) 6,271 9 —Bond interest 2(c) 21,806 — —Contracts for difference interest 2(c),2(d) 170 — —Swaps interest and dividends 2(c) 36,544 — —Dividends, net of withholding taxes 2(c) — 4,202,656 2,540,607Contracts for difference dividends, net of withholding taxes 2(c),2(d) 535,589 — —Securities lending 2(c) — 52,531 22,807Management fee rebate 4 — — —Other income — — 5,268
Total income 600,380 4,255,196 2,568,682
ExpensesBank interest 2(c) 25,272 3,032 2,599Contracts for difference interest 2(c),2(d) 147,404 — —Swaps interest and dividends 2(c) 15,595 — —Negative yield on financial assets 2(c) 79,824 — —Contracts for difference dividends, net of withholding taxes 2(c),2(d) 499,921 — —Annual Service Charge 5 13,980 196,658 96,285Depositary fees 2(i),6 300,495 82,379 48,447Taxes 8 2,841 56,871 19,600Performance fees 7 — — —Distribution fees 4 143 74,894 8,666Loan commitment fees 14 58 355 —Management fees and sub-investment advisers fees 4 579 407,630 503,784Other charges — 449 2,049
Total expenses before reimbursement 1,086,112 822,268 681,430
Reimbursement of expenses 4 297,770 — —
Total expenses after reimbursement 788,342 822,268 681,430
Net investment income/(deficit) (187,962) 3,432,928 1,887,252Net realised gain/(loss) on:
Investments 2(a),2(b) 3,749 54,591,682 45,717,740To Be Announced securities contracts 2(d) — — —Contracts for difference 2(d) (734,304) — —Futures contracts 2(d) (874,618) 1,015,185 513,134Foreign currencies and forward foreignexchange transactions 2(d),2(e),2(j) 986,874 4,230,312 2,889,313Swaps transactions 2(d) 325,626 — —Options/swaptions contracts 2(d) — — —
Net realised gain/(loss) for the year (292,673) 59,837,179 49,120,187
Net change in unrealised appreciation/(depreciation) on:Investments 2(a) 368,606 33,647,803 13,680,903To Be Announced securities contracts 2(d) — — —Contracts for difference 2(d) (27,115) — —Futures contracts 2(d) 90,671 (136,840) (86,212)Foreign currencies and forward foreignexchange transactions 2(d),2(e),2(j) (194,726) (37,944) 6,857Swaps transactions 2(d) 181,075 — —Options/swaptions contracts 2(d) — — —
Net change in unrealised appreciation/(depreciation) for the year 418,511 33,473,019 13,601,548
Increase/(decrease) in net assets as a result of operations (62,124) 96,743,126 64,608,987
Movements in share capitalNet receipts as a result of issue of shares 678,770 101,287,922 72,555,690Net payments as a result of repurchase of shares (1,561,938) (60,389,663) (113,682,205)
Increase/(decrease) in net assets as a result of movements in share capital (883,168) 40,898,259 (41,126,515)
Dividends declared 11 — — —Foreign exchange adjustment 2(f) — — —
Net assets at the end of the year 27,052,932 358,338,671 185,067,316
Statement of Operations and Changes in Net Assetsfor the year ended 31 May 2021 continued
The notes on pages 590 to 610 form an integral part of these financial statements.
BlackRock Strategic Funds[48]

Note
BlackRockSystematic GlobalLong/Short Equity
Fund(2)BlackRock TotalAdvantage Fund
BlackRock UKEquity Absolute
Return Fund
USD EUR GBP
Net assets at the beginning of the year 72,200,396 30,967,819 153,650,726IncomeBank interest 2(c) — — 38,524Bond interest 2(c) 57,681 66,061 124,085Contracts for difference interest 2(c),2(d) 902 209 39Swaps interest and dividends 2(c) — 10 —Dividends, net of withholding taxes 2(c) — — 25,478Contracts for difference dividends, net of withholding taxes 2(c),2(d) 1,231,944 270,640 4,257,560Securities lending 2(c) — — —Management fee rebate 4 — — —Other income — — 4,700
Total income 1,290,527 336,920 4,450,386
ExpensesBank interest 2(c) 51,182 22,955 4,644Contracts for difference interest 2(c),2(d) 455,781 74,138 485,603Swaps interest and dividends 2(c) — 134 —Negative yield on financial assets 2(c) — 115,972 —Contracts for difference dividends, net of withholding taxes 2(c),2(d) 1,585,054 265,176 1,463,869Annual Service Charge 5 160,796 12,692 75,588Depositary fees 2(i),6 1,857,387 256,824 16,737Taxes 8 25,739 2,293 14,370Performance fees 7 — — 78,012Distribution fees 4 65,682 1,090 750Loan commitment fees 14 20 184 219Management fees and sub-investment advisers fees 4 869,333 1,349 1,002,057Other charges 23 17,433 —
Total expenses before reimbursement 5,070,997 770,240 3,141,849
Reimbursement of expenses 4 1,782,246 244,378 305
Total expenses after reimbursement 3,288,751 525,862 3,141,544
Net investment income/(deficit) (1,998,224) (188,942) 1,308,842Net realised gain/(loss) on:
Investments 2(a),2(b) 2,144 357,081 210,865To Be Announced securities contracts 2(d) — — —Contracts for difference 2(d) 1,354,770 (797,955) 4,841,361Futures contracts 2(d) 1,310,935 485,370 (3,061,238)Foreign currencies and forward foreignexchange transactions 2(d),2(e),2(j) 5,540,427 (231,813) (15,707,536)Swaps transactions 2(d) — 1,551,598 —Options/swaptions contracts 2(d) (268,992) — —
Net realised gain/(loss) for the year 7,939,284 1,364,281 (13,716,548)
Net change in unrealised appreciation/(depreciation) on:Investments 2(a) 49,949 (2,307) 408,090To Be Announced securities contracts 2(d) — — —Contracts for difference 2(d) (114,671) (15,086) (3,143,224)Futures contracts 2(d) 463,274 (4,120) 36,704Foreign currencies and forward foreignexchange transactions 2(d),2(e),2(j) (1,006,360) 393,957 (3,333,463)Swaps transactions 2(d) — 122,376 —Options/swaptions contracts 2(d) 30,001 — —
Net change in unrealised appreciation/(depreciation) for the year (577,807) 494,820 (6,031,893)
Increase/(decrease) in net assets as a result of operations 5,363,253 1,670,159 (18,439,599)
Movements in share capitalNet receipts as a result of issue of shares 42,898,119 101,071 53,889,956Net payments as a result of repurchase of shares (72,596,112) (15,040,521) (47,137,150)
Increase/(decrease) in net assets as a result of movements in share capital (29,697,993) (14,939,450) 6,752,806
Dividends declared 11 — — —Foreign exchange adjustment 2(f) — — —
Net assets at the end of the year 47,865,656 17,698,528 141,963,933
(2) Fund name changed, see Note 1 for further details.
Statement of Operations and Changes in Net Assetsfor the year ended 31 May 2021 continued
The notes on pages 590 to 610 form an integral part of these financial statements.
Annual report and audited financial statements [49]

Shares outstandingat the beginning
of the yearSharesissued
Sharesredeemed
Shares outstandingat the end
of the year
BlackRock Americas Diversified Equity Absolute Return Fund
A Class non-distributing share AUD 149 — — 149
A Class non-distributing share EUR 45 — — 45
A Class non-distributing share SEK hedged 1,881,101 1,742,676 2,068,879 1,554,898
A Class non-distributing UK reporting fund share 353,261 60,755 196,445 217,571
A Class non-distributing UK reporting fund share EUR hedged 1,968,095 785,108 1,277,945 1,475,258
A Class non-distributing UK reporting fund share GBP 9,256 397 9,193 460
D Class non-distributing share 428,222 157,566 338,405 247,383
D Class non-distributing share CHF hedged 19,529 716 15,841 4,404
D Class non-distributing UK reporting fund share EUR hedged 473,060 240,170 326,200 387,030
D Class non-distributing UK reporting fund share GBP hedged 865 — 719 146
E Class non-distributing share EUR hedged 109,970 1,630 58,352 53,248
I Class non-distributing share EUR hedged 356,609 470,480 453,925 373,164
I Class non-distributing share JPY hedged 2,557,822 922,019 1,503,239 1,976,602
I Class non-distributing share SEK hedged 1,047,661 308,410 5,195 1,350,876
I Class non-distributing UK reporting fund share 1,395,570 346,382 976,896 765,056
X Class non-distributing share 94,160 22,194 24,372 91,982
BlackRock Asia Extension Fund(1)
A Class non-distributing share 1,223 — 1,223 —
A Class non-distributing UK reporting fund share GBP hedged 32 — 32 —
E Class non-distributing share 368 — 368 —
X Class non-distributing share 1,072,533 — 1,072,533 —
BlackRock Asia Pacific Absolute Return Fund
A Class distributing share EUR hedged 44 — — 44
A Class non-distributing share EUR 1,355 50 49 1,356
A Class non-distributing UK reporting fund share GBP 41 — — 41
D Class non-distributing share 3,057 — — 3,057
D Class non-distributing share EUR 45 — — 45
D Class non-distributing share EUR hedged 45 — — 45
D Class non-distributing share GBP hedged 1,614 3,327 1,093 3,848
E Class non-distributing share EUR 18,131 613 4,615 14,129
E Class non-distributing share EUR hedged 45 5,160 344 4,861
X Class non-distributing share 199,650 — — 199,650
Z Class non-distributing share 46,232 — 1,700 44,532
Z Class non-distributing share CHF hedged 11,958 — 8,720 3,238
Z Class non-distributing share EUR hedged 339 — — 339
BlackRock Asia Pacific Diversified Equity Absolute Return Fund
A Class non-distributing share 100 — — 100
A Class non-distributing share EUR hedged 94 — — 94
D Class non-distributing share 100 4,073 17 4,156
D Class non-distributing share EUR hedged 47 — — 47
E Class non-distributing share EUR hedged 5,323 3,353 1,337 7,339
X Class non-distributing UK reporting fund share 159,941 969 4,730 156,180
Z Class non-distributing share EUR hedged 94 — — 94
Z Class non-distributing UK reporting fund share 4,655 3,937 — 8,592
Z Class non-distributing UK reporting fund share GBP hedged 61,132 9,244 5,577 64,799
BlackRock Dynamic Diversified Growth Fund
A Class non-distributing share 440,243 24,907 18,241 446,909
A Class non-distributing share SEK hedged 1,651,747 48,919 224,366 1,476,300
AI Class non-distributing share 166,126 568,942 201,703 533,365
D Class non-distributing share 35,311 18,754 458 53,607
E Class non-distributing share 1,203,764 656,104 656,289 1,203,579
I Class non-distributing share 5,218,212 923,586 796,106 5,345,692
I Class non-distributing share CAD hedged 68 — — 68
I Class non-distributing share JPY hedged 381,375 125 — 381,500
I Class non-distributing share SEK hedged 164,076 — 160,253 3,823
I Class non-distributing UK reporting share USD hedged 50 — — 50
X Class non-distributing share 729,959 139,574 48,231 821,302
Statement of Changes in Shares Outstandingfor the year ended 31 May 2021
The notes on pages 590 to 610 form an integral part of these financial statements.
BlackRock Strategic Funds[50]

Shares outstandingat the beginning
of the yearSharesissued
Sharesredeemed
Shares outstandingat the end
of the year
BlackRock Emerging Companies Absolute Return Fund(2)
A Class non-distributing share CHF hedged 8,375 2,664 300 10,739
A Class non-distributing share CNH hedged(3) — 33 — 33
A Class non-distributing share EUR hedged 11,006 16,774 11,342 16,438
A Class non-distributing share USD hedged 9,568 178,299 11,996 175,871
A Class non-distributing UK reporting fund share 42,782 86,305 5,938 123,149
D Class non-distributing share CHF hedged 22,166 33,580 1,075 54,671
D Class non-distributing share EUR hedged 290,178 252,702 77,498 465,382
D Class non-distributing UK reporting fund share 691,315 564,862 212,404 1,043,773
D Class non-distributing UK reporting fund share USD hedged 182,388 101,065 47,829 235,624
I Class distributing UK reporting fund share 80,844 180,697 21,613 239,928
I Class non-distributing share CHF hedged 193,345 44,559 64,822 173,082
I Class non-distributing UK reporting fund share 54,851 26,576 14,708 66,719
I Class non-distributing UK reporting fund share EUR hedged 2,923,631 943,799 971,713 2,895,717
I Class non-distributing UK reporting fund share USD hedged 464,928 584,293 448,214 601,007
S Class non-distributing UK reporting fund share 642,444 378,671 98,474 922,641
X Class non-distributing UK reporting fund share 45 — — 45
Z Class non-distributing share CHF hedged 140,499 — 29,310 111,189
Z Class non-distributing UK reporting fund share 121,859 4,688 13,858 112,689
Z Class non-distributing UK reporting fund share EUR hedged 188,719 — 94,815 93,904
Z Class non-distributing UK reporting fund share USD hedged 70,005 — 3,250 66,755
BlackRock Emerging Markets Absolute Return Fund
A Class distributing UK reporting fund share GBP hedged 36 146 — 182
A Class non-distributing share 14,525 4,105 7,490 11,140
A Class non-distributing share EUR hedged 26,796 77 2,581 24,292
D Class distributing UK reporting fund share GBP hedged 121 13 91 43
D Class non-distributing UK reporting fund share 22,817 3,116 11,306 14,627
D Class non-distributing UK reporting fund share EUR hedged 10,906 100 10,899 107
E Class non-distributing share EUR hedged 26,675 2,643 12,937 16,381
I Class distributing UK reporting fund share GBP 33 — — 33
I Class distributing UK reporting fund share GBP hedged 39 — — 39
I Class non-distributing share EUR 53 8 26 35
I Class non-distributing share EUR hedged 1 — — 1
I Class non-distributing UK reporting fund share 56,057 — — 56,057
X Class non-distributing share 1,804 1,844 1,611 2,037
BlackRock Emerging Markets Equity Strategies Fund
A Class non-distributing share 987,189 726,783 796,078 917,894
A Class non-distributing share CHF hedged 5,597 584 712 5,469
D Class distributing share 170 — 120 50
D Class non-distributing share CHF hedged 70,464 10,927 52,236 29,155
D Class non-distributing share EUR hedged 280,403 129,522 243,625 166,300
D Class non-distributing UK reporting fund share 782,725 273,815 572,161 484,379
D Class non-distributing UK reporting fund share EUR 229,948 51,661 158,357 123,252
D Class non-distributing UK reporting fund share GBP 104,593 147,921 26,932 225,582
E Class non-distributing share EUR 339,924 84,165 174,788 249,301
I Class non-distributing share 616,502 2,677,359 472,207 2,821,654
I Class non-distributing share EUR 495,123 60,953 171,422 384,654
X Class non-distributing share 109,075 11,814 98,119 22,770
Z Class non-distributing share GBP 1,935 — 177 1,758
Z Class non-distributing UK reporting fund share 452,100 — 142,841 309,259
Statement of Changes in Shares Outstandingfor the year ended 31 May 2021 continued
The notes on pages 590 to 610 form an integral part of these financial statements.
Annual report and audited financial statements [51]

Shares outstandingat the beginning
of the yearSharesissued
Sharesredeemed
Shares outstandingat the end
of the year
BlackRock Emerging Markets Flexi Dynamic Bond Fund
A Class distributing UK reporting fund share GBP hedged 5,539 — 5,141 398
A Class non-distributing share 74,385 6,697 28,391 52,691
A Class non-distributing share EUR hedged 30,065 14,276 7,410 36,931
A Class non-distributing share SEK hedged 10,185 9,077 13,257 6,005
A Class non-distributing UK reporting fund share CHF hedged 51 — — 51
AI Class non-distributing share EUR hedged 45 — — 45
D Class distributing UK reporting fund share 108,531 18,231 51,648 75,114
D Class distributing UK reporting fund share EUR 41 — — 41
D Class distributing UK reporting fund share EUR hedged 14,352 7,500 3,500 18,352
D Class distributing UK reporting fund share GBP 47,187 552 24,276 23,463
D Class distributing UK reporting fund share GBP hedged 123,959 16,854 82,627 58,186
D Class non-distributing UK reporting fund share 65,843 1,826 20,242 47,427
D Class non-distributing UK reporting fund share CHF hedged 2,051 — 1,150 901
D Class non-distributing UK reporting fund share EUR hedged 171,480 58,595 140,621 89,454
E Class non-distributing share 56,258 5,478 20,963 40,773
E Class non-distributing share EUR hedged 300,441 11,880 90,933 221,388
I Class distributing share EUR 125,214 — 85,421 39,793
I Class distributing share EUR hedged 336,779 19,135 126,081 229,833
I Class distributing share (G) EUR hedged 754,111 36,334 594,402 196,043
I Class distributing UK reporting fund share 50 480 — 530
I Class non-distributing share EUR hedged 159,867 866 159,823 910
I Class non-distributing UK reporting fund share 2,083,378 104,199 69,192 2,118,385
X Class distributing share EUR 44 — — 44
X Class non-distributing share 2,992,260 1,321 1,048,111 1,945,470
X Class non-distributing share AUD hedged 7,184,515 — — 7,184,515
X Class non-distributing share CAD hedged 2,370,126 — — 2,370,126
BlackRock Emerging Markets Short Duration Bond Fund
A Class non-distributing share 50 3,453 — 3,503
AI Class distributing share EUR hedged 45 — — 45
AI Class non-distributing share EUR hedged 45 — — 45
D Class non-distributing UK reporting fund share 1,037 50,729 19 51,747
D Class non-distributing UK reporting fund share EUR hedged 3,317 24,392 2,900 24,809
E Class distributing share EUR 1,238 2,510 — 3,748
E Class distributing share EUR hedged 1,107 8,639 154 9,592
E Class non-distributing share EUR 17,562 8,134 5,547 20,149
E Class non-distributing share EUR hedged 128 3,006 566 2,568
I Class non-distributing share EUR hedged 362,043 10,000 134,000 238,043
X Class non-distributing share 249,750 — — 249,750
BlackRock ESG Euro Bond Fund
A Class distributing share 38,368 227,199 57,739 207,828
A Class non-distributing share 13,208 85,848 50,802 48,254
AI Class non-distributing share 47 — — 47
D Class non-distributing UK reporting fund share 125,130 172,691 43,617 254,204
E Class non-distributing share 98,079 394,953 89,945 403,087
I Class non-distributing share 785,646 1,224,944 309,962 1,700,628
X Class distributing (G) share(3) — 5,171 — 5,171
X Class non-distributing share 1,648,084 918,694 153,808 2,412,970
Z Class non-distributing share 1,270,851 40,945 343,922 967,874
BlackRock ESG Euro Corporate Bond Fund
A Class non-distributing share 44 2 — 46
AI Class non-distributing share 44 3,145 — 3,189
D Class distributing share(3) — 41 — 41
D Class non-distributing share 44 84,857 41,548 43,353
E Class non-distributing share 6,201 58,938 10,675 54,464
I Class non-distributing share 1,511,450 738,360 180,294 2,069,516
X Class non-distributing share 325,711 171,715 48,116 449,310
Statement of Changes in Shares Outstandingfor the year ended 31 May 2021 continued
The notes on pages 590 to 610 form an integral part of these financial statements.
BlackRock Strategic Funds[52]

Shares outstandingat the beginning
of the yearSharesissued
Sharesredeemed
Shares outstandingat the end
of the year
BlackRock ESG Euro Short Duration Bond Fund(4)
A Class non-distributing share — 34,333 — 34,333
AI Class non-distributing share — 42 — 42
D Class non-distributing share — 42 — 42
E Class non-distributing share — 42 — 42
I Class non-distributing share — 933,064 — 933,064
X Class non-distributing share — 717,720 17,373 700,347
Z Class non-distributing share — 717,552 50 717,502
BlackRock European Absolute Return Fund
A Class distributing share 99,976 76,958 37,020 139,914
A Class non-distributing share 4,215,762 3,679,070 4,471,302 3,423,530
D Class distributing share 13,666 104,553 40,420 77,799
D Class non-distributing share CHF hedged 53,861 174,636 31,192 197,305
D Class non-distributing UK reporting fund share 1,365,001 1,787,600 1,604,376 1,548,225
D Class non-distributing UK reporting fund share GBP hedged 1,482 38,634 3,908 36,208
D Class non-distributing UK reporting fund share USD hedged(3) — 169,686 34,148 135,538
E Class non-distributing share 190,308 112,608 60,030 242,886
I Class non-distributing UK reporting fund share 2,756,533 6,323,966 4,721,722 4,358,777
S Class non-distributing share 45 129,443 40,894 88,594
X Class non-distributing share(3) — 176,195 2,652 173,543
BlackRock European Diversified Equity Absolute Return Fund(1)
A Class non-distributing share 7,646 — 7,646 —
A Class non-distributing share CHF hedged 71 — 71 —
A Class non-distributing share SEK hedged 89,890 — 89,890 —
A Class non-distributing UK reporting fund share GBP hedged 882 — 882 —
D Class non-distributing share CHF hedged 1 — 1 —
D Class non-distributing share USD hedged 296 — 296 —
D Class non-distributing UK reporting fund share 3,293 — 3,293 —
D Class non-distributing UK reporting fund share GBP hedged 1 — 1 —
E Class non-distributing share 18,093 — 18,093 —
I Class non-distributing share 1 — 1 —
X Class non-distributing share 1 — 1 —
BlackRock European Opportunities Extension Fund
A Class distributing UK reporting fund share GBP 5,414 — 456 4,958
A Class non-distributing share 797,384 539 407,910 390,013
D Class distributing (G) share 473,339 3 324 473,018
D Class distributing UK reporting fund share GBP 21,905 — 9,033 12,872
D Class non-distributing share 712,190 11,793 356,667 367,316
E Class non-distributing share 207,042 19 34,946 172,115
I Class non-distributing share 497,485 — 279,558 217,927
X Class non-distributing share 37 — — 37
BlackRock European Select Strategies Fund
A Class distributing share 78,623 16,181 31,920 62,884
A Class non-distributing share 212,866 41,127 70,861 183,132
A Class non-distributing share CZK hedged 42,367 — 5,917 36,450
AI Class non-distributing share 87,075 69,973 54,595 102,453
D Class distributing share USD hedged 4,987 — — 4,987
D Class non-distributing share 126,331 75,368 51,685 150,014
E Class distributing share 786,905 35,906 369,938 452,873
E Class non-distributing share 1,341,231 127,047 585,430 882,848
I Class distributing share 291,244 147 284,930 6,461
I Class non-distributing share 2,052,792 886,462 501,752 2,437,502
X Class non-distributing share 43 — — 43
Statement of Changes in Shares Outstandingfor the year ended 31 May 2021 continued
The notes on pages 590 to 610 form an integral part of these financial statements.
Annual report and audited financial statements [53]

Shares outstandingat the beginning
of the yearSharesissued
Sharesredeemed
Shares outstandingat the end
of the year
BlackRock European Unconstrained Equity Fund
A Class non-distributing share 285 341 164 462
D Class non-distributing UK reporting fund share 31,906 77,197 22,178 86,925
D Class non-distributing UK reporting fund share GBP hedged 5,835 7,160 2,378 10,617
E Class non-distributing share 9,395 5,024 3,717 10,702
I Class non-distributing share USD hedged 24,869 14,545 14,178 25,236
I Class non-distributing UK reporting fund share 80 19,403 30 19,453
I Class non-distributing UK reporting fund share GBP hedged 105 9 69 45
X Class non-distributing UK reporting fund share 103,114 16,675 — 119,789
BlackRock Fixed Income Credit Strategies Fund
A Class distributing share 50 — — 50
A Class non-distributing share 50 — — 50
AI Class non-distributing share 5,955 104,348 17,103 93,200
D Class distributing share 50 — — 50
D Class non-distributing share 50 1,000 — 1,050
E Class non-distributing share 62,191 12,726 22,949 51,968
I Class non-distributing share 2,013 — — 2,013
X Class non-distributing share 1,275,272 2,665,811 441,291 3,499,792
BlackRock Fixed Income Strategies Fund
A Class distributing share 3,165,236 258,333 779,801 2,643,768
A Class distributing share CHF hedged 92,604 7,238 8,926 90,916
A Class distributing share USD hedged 20,752 2,035 4,625 18,162
A Class non-distributing share CHF hedged 889,659 28,606 146,732 771,533
A Class non-distributing share JPY hedged 4,874 — — 4,874
A Class non-distributing share USD hedged 419,119 192,146 148,681 462,584
A Class non-distributing UK reporting fund share 14,043,583 4,203,686 6,178,746 12,068,523
A Class non-distributing UK reporting fund share GBP hedged 37,664 8,413 3,171 42,906
AI Class non-distributing share 4,060 8,733 3,387 9,406
D Class distributing share 1,977,379 213,103 820,677 1,369,805
D Class distributing UK reporting fund share GBP hedged 46,244 35,083 68,964 12,363
D Class distributing UK reporting fund share USD hedged 2,962 9,200 140 12,022
D Class non-distributing share CHF hedged 469,937 68,338 87,112 451,163
D Class non-distributing share USD hedged 423,030 100,689 177,634 346,085
D Class non-distributing UK reporting fund share 6,131,504 1,882,857 2,317,381 5,696,980
D Class non-distributing UK reporting fund share GBP hedged 15,471 8,363 6,020 17,814
E Class non-distributing share 4,488,643 275,462 1,422,754 3,341,351
I Class distributing share 1,743,731 62,234 255,063 1,550,902
I Class non-distributing share 12,448,493 4,545,321 4,079,423 12,914,391
I Class non-distributing share USD hedged 1,602,771 326,905 1,182,653 747,023
X Class distributing share 1,487,937 — — 1,487,937
X Class non-distributing share 2,435,859 195,143 691,127 1,939,875
BlackRock Global Absolute Return Bond Fund
A Class non-distributing share 4,978 180,396 126,871 58,503
A Class non-distributing share SEK hedged 8,505 27 3,509 5,023
A Class non-distributing share USD hedged 1,619 3,756 742 4,633
D class distributing share GBP hedged(3) — 36 — 36
D Class non-distributing share 100,407 17,143 24,969 92,581
D Class non-distributing share CHF hedged 2 — — 2
E Class non-distributing share 5,222 2,751 1,079 6,894
I Class non-distributing share 708,017 75,807 27,875 755,949
I Class non-distributing share GBP hedged 30,300 — 6,768 23,532
I Class non-distributing share SEK hedged 24,677 8,583 14,403 18,857
X Class non-distributing share 415,678 331,068 274,553 472,193
Statement of Changes in Shares Outstandingfor the year ended 31 May 2021 continued
The notes on pages 590 to 610 form an integral part of these financial statements.
BlackRock Strategic Funds[54]

Shares outstandingat the beginning
of the yearSharesissued
Sharesredeemed
Shares outstandingat the end
of the year
BlackRock Global Equity Absolute Return Fund
A Class distributing share EUR hedged 44 — — 44
D Class non-distributing share 50 1,400 200 1,250
D Class non-distributing fund share EUR 44 — — 44
E Class non-distributing share EUR 622 1,835 — 2,457
I Class non-distributing share EUR 45 1,410 1,410 45
X Class non-distributing share 199,700 187,785 — 387,485
X Class non-distributing share AUD hedged(3) — 196,927 — 196,927
Z Class non-distributing share 2,874 — — 2,874
Z Class non-distributing share CHF hedged 49 4,674 — 4,723
Z Class non-distributing share EUR hedged 44 — — 44
Z Class non-distributing UK reporting fund share GBP hedged 6,293 6,586 — 12,879
BlackRock Global Event Driven Fund
A Class distributing share EUR hedged 2,869 19,784 2,150 20,503
A Class non-distributing share 437,114 979,405 111,696 1,304,823
A Class non-distributing share CHF hedged 54,308 32,638 19,573 67,373
A Class non-distributing share HKD hedged 39 — — 39
A Class non-distributing share SGD hedged 70 30,081 — 30,151
A Class non-distributing UK reporting fund share EUR hedged 5,358,688 3,509,786 2,344,856 6,523,618
AI Class non-distributing share EUR hedged 45 — — 45
D Class distributing UK reporting fund share GBP hedged(3) — 5,121 — 5,121
D Class non-distributing share CHF hedged 224,571 92,863 18,739 298,695
D Class non-distributing UK reporting fund share 1,477,636 1,466,690 510,356 2,433,970
D Class non-distributing UK reporting fund share EUR hedged 1,518,314 1,306,207 710,440 2,114,081
D Class non-distributing UK reporting fund share GBP hedged 1,651,426 1,684,263 539,904 2,795,785
E Class non-distributing share EUR 377,460 306,628 160,054 524,034
E Class non-distributing share EUR hedged 862,146 719,180 240,042 1,341,284
I Class distributing UK reporting fund share 183,628 92,151 102,604 173,175
I Class distributing UK reporting fund share EUR hedged 12,936 237,975 203 250,708
I Class distributing UK reporting fund share GBP hedged 3,377,112 1,753,159 748,578 4,381,693
I Class non-distributing share BRL 42,571 1,168,000 1,900 1,208,671
I Class non-distributing share JPY hedged 1,506,560 291,086 1,053,181 744,465
I Class non-distributing UK reporting fund share 1,735,190 2,459,420 463,042 3,731,568
I Class non-distributing UK reporting fund share CHF hedged 182,984 23,670 63,079 143,575
I Class non-distributing UK reporting fund share EUR hedged 6,901,497 6,447,234 1,991,866 11,356,865
IA Class non-distributing share 514,648 17,404 569 531,483
IA Class non-distributing share EUR hedged 65,835 314,878 18,516 362,197
S Class non-distributing share 50 10,472 — 10,522
S Class non-distributing share EUR hedged 45 433,497 11,860 421,682
X Class non-distributing share 31,560 72,334 10,210 93,684
Z Class non-distributing share CHF hedged 52,432 — — 52,432
Z Class non-distributing UK reporting fund share 125,146 — 2,787 122,359
Z Class non-distributing UK reporting fund share EUR hedged 375,282 — 222,011 153,271
Z Class non-distributing UK reporting fund share GBP hedged 225,439 — 3,563 221,876
BlackRock Global Real Asset Securities Fund
A Class distributing UK reporting fund share 48,880 850,866 44,192 855,554
A Class distributing UK reporting fund share HKD hedged 15,353 96,789 — 112,142
A Class distributing UK reporting fund share EUR hedged 45 34,667 1,201 33,511
A Class distributing UK reporting fund share SGD hedged 32,935 10,431 4,522 38,844
A Class non-distributing share 84,916 76,125 23,062 137,979
D Class distributing share 342,539 861,829 121,590 1,082,778
D Class non-distributing UK reporting fund share 38,300 116,071 12,386 141,985
E Class non-distributing share EUR 2,693 18,632 954 20,371
X Class non-distributing UK reporting fund share 382,257 1,428 11 383,674
Z Class non-distributing UK reporting fund share 46,591 4,621 — 51,212
Statement of Changes in Shares Outstandingfor the year ended 31 May 2021 continued
The notes on pages 590 to 610 form an integral part of these financial statements.
Annual report and audited financial statements [55]

Shares outstandingat the beginning
of the yearSharesissued
Sharesredeemed
Shares outstandingat the end
of the year
BlackRock Macro Opportunities Fund(1)
A Class non-distributing share 220 — 220 —
AI Class non-distributing share EUR hedged 45 — 45 —
D Class non-distributing share EUR 44 — 44 —
D Class non-distributing UK reporting fund share 369 — 369 —
D Class non-distributing UK reporting fund share EUR hedged 44 — 44 —
D Class non-distributing UK reporting fund share GBP hedged 12,355 — 12,355 —
E Class non-distributing share EUR 1,640 128 1,768 —
E Class non-distributing share EUR hedged 568 — 568 —
I Class non-distributing share BRL hedged 9,313 1,344 10,657 —
I Class non-distributing share EUR 76,831 — 76,831 —
X Class non-distributing share 51 — 51 —
Z Class non-distributing share BRL hedged 76,651 — 76,651 —
Z Class non-distributing share CHF hedged 50 — 50 —
Z Class non-distributing UK reporting fund share 50 — 50 —
Z Class non-distributing UK reporting fund share EUR hedged 206,043 — 206,043 —
Z Class non-distributing UK reporting fund share GBP hedged 3,716 — 3,716 —
BlackRock Managed Index Portfolios − Conservative
A Class distributing share 9,989 1,553 3,769 7,773
A Class non-distributing share 16,280 14,205 9,986 20,499
A Class non-distributing share USD hedged 3,228 2,052 1,102 4,178
D Class distributing share 23,225 3,622 11,403 15,444
D Class non-distributing share 216,003 86,878 264,563 38,318
D Class non-distributing share USD hedged 294,785 3,312 176,315 121,782
D Class non-distributing UK reporting fund share GBP hedged 7,381 3,903 6,794 4,490
E Class non-distributing share 45 39 — 84
I Class non-distributing share(3) — 3,808 16 3,792
IndexInvest Balance Class distributing share 1,009,808 30,702 317,625 722,885
Vermoegensstrategie Moderat - Ausgewogen Class dist. shares 45 — — 45
BlackRock Managed Index Portfolios − Defensive
A Class distributing share 416,346 73,726 194,458 295,614
A Class non-distributing share GBP hedged 12,198 4,113 4,646 11,665
A Class non-distributing share USD hedged 199,151 42,151 104,949 136,353
A Class non-distributing UK reporting fund share 106,123 25,533 28,144 103,512
D Class distributing UK reporting fund share 170,700 31,260 91,200 110,760
D Class distributing UK reporting fund share GBP hedged 5,805 484 2,867 3,422
D Class distributing UK reporting fund share USD hedged 131,326 61,751 20,961 172,116
D Class non-distributing share CHF hedged 12,664 8,050 4,348 16,366
D Class non-distributing share USD hedged 411,276 51,165 204,999 257,442
D Class non-distributing UK reporting fund share 88,496 46,946 99,610 35,832
D Class non-distributing UK reporting fund share GBP hedged 60,744 30,776 17,927 73,593
E Class non-distributing share 45 99 — 144
I Class non-distributing share(3) — 3,338 — 3,338
I Class non-distributing share USD hedged 50,902 10,752 4,826 56,828
IndexInvest Substanz Class distributing share 270,081 7,118 66,972 210,227
Vermoegensstrategie Defensiv Class distributing share 2,365 2,280 — 4,645
X Class non-distributing share 50 — — 50
Statement of Changes in Shares Outstandingfor the year ended 31 May 2021 continued
The notes on pages 590 to 610 form an integral part of these financial statements.
BlackRock Strategic Funds[56]

Shares outstandingat the beginning
of the yearSharesissued
Sharesredeemed
Shares outstandingat the end
of the year
BlackRock Managed Index Portfolios − Growth
A Class distributing share 579,933 212,608 140,366 652,175
A Class non-distributing share GBP hedged 8,175 4,483 2,995 9,663
A Class non-distributing share USD hedged 161,010 31,316 42,474 149,852
A Class non-distributing UK reporting fund share 181,439 142,252 34,124 289,567
D Class distributing UK reporting fund share 212,310 155,244 63,091 304,463
D Class distributing UK reporting fund share USD hedged 18,633 22,996 11,821 29,808
D Class distributing UK reporting fund share GBP hedged 2,523 318 42 2,799
D Class non-distributing share CHF hedged 13,053 5,112 4,022 14,143
D Class non-distributing share USD hedged 203,255 38,777 114,825 127,207
D Class non-distributing UK reporting fund share 144,194 163,166 128,950 178,410
D Class non-distributing UK reporting fund share GBP hedged 75,290 139,938 19,525 195,703
E Class non-distributing share 154 1,356 — 1,510
I Class non-distributing share(3) — 5,485 — 5,485
I Class non-distributing share USD hedged 153,028 22,478 150,255 25,251
IndexInvest Chance Class distributing share 667,496 46,402 165,989 547,909
Vermoegensstrategie Wachstum Class distributing share 20,645 8,770 — 29,415
X Class non-distributing share 43 — — 43
BlackRock Managed Index Portfolios − Moderate
A Class distributing share 1,046,893 81,967 275,913 852,947
A Class non-distributing share GBP hedged 19,243 8,532 10,677 17,098
A Class non-distributing share USD hedged 487,003 72,818 294,684 265,137
A Class non-distributing UK reporting fund share 524,180 470,146 86,871 907,455
D Class distributing UK reporting fund share 288,582 79,010 89,266 278,326
D Class distributing UK reporting fund share GBP hedged 573 1,010 — 1,583
D Class distributing UK reporting fund share USD hedged 159,179 45,601 39,490 165,290
D Class non-distributing share CHF hedged 16,531 10,878 1,272 26,137
D Class non-distributing share USD hedged 470,134 285,220 249,210 506,144
D Class non-distributing UK reporting fund share 362,206 205,152 281,948 285,410
D Class non-distributing UK reporting fund share GBP hedged 587,132 177,359 97,170 667,321
E Class non-distributing share 302 609 257 654
I Class distributing share 618,016 2,379 263,143 357,252
I Class non-distributing share(3) — 5,576 — 5,576
I Class non-distributing share USD hedged 315,737 68,096 198,150 185,683
IndexInvest Wachstum Class distributing share 1,407,367 52,373 510,630 949,110
IndexInvest Wachstum Class distributing share CHF hedged 17,978 3,002 5,122 15,858
Vermoegensstrategie Ausgewogen Class distributing share 49,617 — 12,222 37,395
X Class non-distributing share 50 — — 50
X Class non-distributing share GBP hedged 1,838 1,932 1,251 2,519
X Class non-distributing share USD hedged 2,231 8,592 219 10,604
Statement of Changes in Shares Outstandingfor the year ended 31 May 2021 continued
The notes on pages 590 to 610 form an integral part of these financial statements.
Annual report and audited financial statements [57]

Shares outstandingat the beginning
of the yearSharesissued
Sharesredeemed
Shares outstandingat the end
of the year
BlackRock Style Advantage Fund
A Class distributing share 152 360 49 463
A Class distributing share EUR hedged 1,857 216 304 1,769
A Class non-distributing share 8,637 2,220 5,998 4,859
A Class non-distributing share EUR hedged 129 — 84 45
A Class non-distributing share SEK hedged 440 — — 440
D Class non-distributing share CHF hedged 5,369 — — 5,369
D Class non-distributing share EUR 46 — — 46
D Class non-distributing UK reporting fund share 54,270 13,114 55,907 11,477
D Class non-distributing UK reporting fund share EUR hedged 1,029,434 9,225 1,008,859 29,800
D Class non-distributing UK reporting fund share GBP hedged 3,718 317 1,355 2,680
E Class non-distributing share EUR 6,901 3,607 6,944 3,564
E Class non-distributing share EUR hedged 3,165 207 1,497 1,875
I Class non-distributing PF share CHF hedged 276,538 — 276,488 50
I Class non-distributing PF share EUR hedged 15,129 137 12,665 2,601
I Class non-distributing share BRL hedged 50,186 — 50,136 50
I Class non-distributing share CHF hedged 48 — — 48
I Class non-distributing UK reporting fund share 853,113 4,300 390,376 467,037
I Class non-distributing UK reporting fund share EUR hedged 2,104,362 32,452 1,991,189 145,625
I Class non-distributing UK reporting fund share GBP hedged 1,677,619 26,950 1,543,371 161,198
I Class non-distributing UK reporting fund share JPY hedged 1,862,526 — 726,593 1,135,933
X Class non-distributing share 571,186 346 570,873 659
X Class non-distributing share AUD hedged 17,141,879 97,839 16,891,579 348,139
X Class non-distributing share EUR hedged 42 — — 42
X Class non-distributing share NZD hedged 841,786 — 841,784 2
X Class non-distributing UK reporting fund share GBP hedged 3,038,590 — 3,038,555 35
Z Class non-distributing share 50 — — 50
Z Class non-distributing share EUR hedged 79,409 — 79,363 46
BlackRock Style Advantage Screened Fund
A Class non-distributing share 50 — — 50
D Class non-distributing share 50 — — 50
D Class non-distributing share EUR hedged 44 — — 44
D Class non-distributing share GBP hedged 39 — — 39
E Class non-distributing share EUR 219 110 110 219
I Class non-distributing share 50 — — 50
I Class non-distributing share EUR 44 — — 44
I Class non-distributing share EUR hedged 44 — — 44
I Class non-distributing share GBP hedged 39 — — 39
X Class non-distributing share 249,650 — — 249,650
X Class non-distributing share AUD hedged 76,938 11,042 23,696 64,284
BlackRock Systematic ESG World Equity Fund
A Class non-distributing share 29,165 30,117 14,753 44,529
D Class non-distributing share EUR 152,534 253,404 73,755 332,183
E Class non-distributing share EUR 44,037 115,622 33,491 126,168
I Class non-distributing share EUR hedged 49 18,879 18,879 49
I Class non-distributing share JPY 70,532 74,460 1,311 143,681
I Class non-distributing share JPY hedged 15,267 41,918 2,406 54,779
X Class non-distributing UK reporting fund share GBP 775,171 — 123,200 651,971
Statement of Changes in Shares Outstandingfor the year ended 31 May 2021 continued
The notes on pages 590 to 610 form an integral part of these financial statements.
BlackRock Strategic Funds[58]

Shares outstandingat the beginning
of the yearSharesissued
Sharesredeemed
Shares outstandingat the end
of the year
BlackRock Systematic Global Equity Fund
A Class non-distributing share 53 1,565 — 1,618
D Class non-distributing share EUR 1,426 50 334 1,142
E Class non-distributing share EUR 5,948 5,394 2,501 8,841
E Class non-distributing share EUR hedged 2,680 4,323 3,595 3,408
I Class non-distributing share 1,020,975 210,276 621,360 609,891
I Class non-distributing share EUR 51,551 2,450 53,076 925
X Class non-distributing share 2,617 1,025 206 3,436
X Class non-distributing share EUR 41 247,500 19,609 227,932
X Class non-distributing share GBP 54,471 4,494 13,855 45,110
X Class non-distributing share JPY 246,736 — 38,770 207,966
BlackRock Systematic Global Long/Short Equity Fund(2)
A Class non-distributing share 48,096 3,713 13,262 38,547
A Class non-distributing share EUR hedged 134,935 — 92,120 42,815
A Class non-distributing share SEK hedged 584 377 372 589
AI Class non-distributing share EUR hedged 45 — — 45
C Class non-distributing share 1,148 — 110 1,038
D Class non-distributing share 42,701 8,199 43,578 7,322
D Class non-distributing UK reporting fund share EUR hedged 246,772 59,127 157,456 148,443
D Class non-distributing UK reporting fund share GBP hedged 4,506 1,670 2,517 3,659
E Class non-distributing share EUR hedged 113,255 299,017 310,099 102,173
I Class non-distributing share EUR hedged 11,085 1,485 3,676 8,894
J Class distributing share 44,414 — 11,918 32,496
X Class non-distributing share 10,633 2,482 5,425 7,690
BlackRock Total Advantage Fund
A Class non-distributing share 50 — — 50
D Class non-distributing share 50 — — 50
D Class non-distributing share USD hedged 60 — — 60
D Class non-distributing UK reporting fund share GBP hedged 45 — — 45
E Class non-distributing share 2,866 1,096 1,407 2,555
I Class non-distributing share 50 — — 50
X Class non-distributing share 349,750 — 166,051 183,699
BlackRock UK Equity Absolute Return Fund
A Class distributing share EUR hedged 49 — — 49
A Class non-distributing share EUR hedged 45 — — 45
A Class non-distributing UK reporting fund share 39 — — 39
D Class non-distributing share CHF hedged 49 — — 49
D Class non-distributing share EUR 49 — — 49
D Class non-distributing share EUR hedged 153,097 2,227 152,647 2,677
D Class non-distributing share USD hedged 50 — — 50
D Class non-distributing UK reporting fund share 999 — 432 567
E Class non-distributing share EUR 311 262 — 573
E Class non-distributing share EUR hedged 1,465 151 656 960
I Class non-distributing share EUR hedged 139,937 201,574 96,735 244,776
I Class non-distributing share JPY hedged 1,480,385 337,172 265,700 1,551,857
I Class non-distributing share USD hedged 52,206 127,318 10,653 168,871
X Class non-distributing UK reporting fund share 29,400 1,195 21,891 8,704
(1) Fund terminated, see Note 1 for further details.(2) Fund name changed, see Note 1 for further details.(3) New Share Class launched, see Appendix I for further details.(4) New Fund launched, see Note 1 for further details.
Statement of Changes in Shares Outstandingfor the year ended 31 May 2021 continued
The notes on pages 590 to 610 form an integral part of these financial statements.
Annual report and audited financial statements [59]

Holding Description
MarketValue
USD
% ofNet
Assets
Transferable Securities and Money Market Instruments Admittedto an Official Stock Exchange Listing or Dealt in on AnotherRegulated Market
COMMON STOCKSCayman Islands
152,274 Apollo Strategic Growth Capi-tal II (Unit) 1,522,740 0.22
1,522,740 0.22
United States3,242 Alkami Technology Inc 107,861 0.028,408 Bumble Inc ’A’ 401,230 0.06
17,358 DoubleVerify Holdings Inc 640,337 0.092,773 Figs Inc ’A’ 94,698 0.015,016 Flywire Corp 172,249 0.03
12,768 Ikena Oncology Inc 229,824 0.0317,663 Innovage Holding Corp 377,988 0.0545,776 Inspired Entertainment Inc 524,593 0.089,413 Olo Inc ’A’ 318,630 0.05
10,623 ON24 Inc 341,848 0.0522,048 Paymentus Holdings Inc ’A’ 672,464 0.1016,935 Privia Health Group Inc 554,282 0.084,876 Procore Technologies Inc 421,384 0.068,231 Qualtrics International Inc ’A’ 283,476 0.047,172 Recursion Pharmaceuticals
Inc ’A’ 189,054 0.037,795 UiPath Inc ’A’ 622,197 0.09
5,952,115 0.87
Total Common Stocks 7,474,855 1.09
BONDSUnited States
USD 24,450,000 United States Cash Manage-ment Bill 3/8/2021 (ZeroCoupon) 24,449,022 3.56
USD 15,000,000 United States Treasury Bill10/6/2021 (Zero Coupon) 14,999,644 2.18
USD 17,000,000 United States Treasury Bill1/7/2021 (Zero Coupon) 16,998,725 2.47
USD 15,500,000 United States Treasury Bill12/8/2021 (Zero Coupon) 15,499,709 2.26
USD 15,000,000 United States Treasury Bill26/8/2021 (Zero Coupon) 14,998,029 2.18
USD 15,000,000 United States Treasury Bill2/9/2021 (Zero Coupon) 14,998,954 2.18
USD 5,000,000 United States Treasury Bill27/1/2022 (Zero Coupon) 4,997,000 0.73
106,941,083 15.56
Total Bonds 106,941,083 15.56
CERTIFICATE OF DEPOSITSAustralia
USD 10,700,000 Westpac Banking Corp 0.39%9/6/2021 10,700,000 1.56
10,700,000 1.56
JapanUSD 2,000,000 The Norinchukin Bank FRN
13/8/2021 2,000,026 0.29
2,000,026 0.29
SwitzerlandUSD 5,000,000 Credit Suisse AG FRN
15/2/2022 5,000,000 0.73
5,000,000 0.73
Holding Description
MarketValue
USD
% ofNet
Assets
United StatesUSD 12,400,000 Bank of America NA 0.20%
1/12/2021 12,400,000 1.80USD 10,000,000 Bank of Montreal 0.27%
12/8/2021 10,000,000 1.45USD 10,000,000 Bank of Nova Scotia 0.28%
24/11/2021 10,000,000 1.46USD 6,000,000 Bank of Nova Scotia 0.23%
4/5/2022 6,000,000 0.87USD 7,000,000 BNP Paribas 0.22% 1/2/2022 7,000,000 1.02USD 4,500,000 Canadian Imperial Bank of
Commerce 0.24% 4/5/2022 4,500,000 0.65USD 7,000,000 DZ Bank AG Deutsche Zentral
Genoss 0.14% 9/7/2021 7,000,000 1.02USD 10,000,000 Mitsubishi Ufj Trust And Bank-
ing Corp 0.15% 16/8/2021 10,000,000 1.46USD 15,000,000 Mizuho Bank Ltd 0.22%
11/8/2021 15,000,000 2.18USD 10,000,000 Oversea-Chinese Banking
Corp 0.29% 18/6/2021 10,000,000 1.45USD 14,900,000 Skandinaviska Enskilda Ban-
ken AB 0.23% 4/8/2021 14,900,000 2.17USD 8,000,000 Sumitomo Mitsui Trust Bank
Ltd 0.19% 6/7/2021 8,000,078 1.16USD 3,000,000 Sumitomo Mitsui Trust Bank
Ltd 0.15% 11/8/2021 3,000,000 0.44USD 3,900,000 Swedbank AB 0.18% 8/9/2021 3,900,428 0.57USD 6,500,000 UBS AG 0.27% 11/3/2022 6,500,000 0.95USD 5,000,000 Westpac Banking Corp 0.24%
30/3/2022 5,000,000 0.73
133,200,506 19.38
Total Certificate of Deposits 150,900,532 21.96
COMMERCIAL PAPERAustralia
USD 5,000,000 ANZ New Zealand Interna-tional Ltd FRN 8/11/2021 4,996,222 0.73
USD 1,100,000 Westpac Banking Corp1/4/2022 (Zero Coupon) 1,097,864 0.16
6,094,086 0.89
CanadaUSD 4,200,000 Alberta 7/6/2021 (Zero Cou-
pon) 4,199,902 0.61USD 9,500,000 National Bank of Canada
1/7/2021 (Zero Coupon) 9,498,892 1.38USD 2,000,000 National Bank of Canada FRN
14/3/2022 1,996,346 0.29USD 9,000,000 Ontario Teachers’ Finance
Trust FRN 14/9/2021 8,996,587 1.31USD 9,000,000 Toronto-Dominion Bank
16/6/2021 (Zero Coupon) 8,999,437 1.31USD 6,000,000 Toronto-Dominion Bank FRN
6/8/2021 5,998,350 0.87
39,689,514 5.77
FranceUSD 15,000,000 BPCE SA 1/7/2021 (Zero Cou-
pon) 14,994,125 2.18
14,994,125 2.18
GermanyUSD 10,000,000 Erste Abwicklungsanstalt
10/8/2021 (Zero Coupon) 9,997,083 1.45
9,997,083 1.45
BlackRock Americas Diversified Equity Absolute Return Fund
Portfolio of Investments as at 31 May 2021
The notes on pages 590 to 610 form an integral part of these financial statements.
BlackRock Strategic Funds[60]

Holding Description
MarketValue
USD
% ofNet
Assets
IrelandUSD 7,000,000 Matchpoint Finance Plc FRN
12/10/2021 6,994,569 1.02
6,994,569 1.02
JapanUSD 6,050,000 Sumitomo Mitsui Banking Corp
9/8/2021 (Zero Coupon) 6,049,072 0.88
6,049,072 0.88
New ZealandUSD 4,500,000 ASB Finance Ltd FRN
12/11/2021 4,496,105 0.66USD 5,500,000 BNZ International Funding
9/6/2021 (Zero Coupon) 5,499,841 0.80USD 10,000,000 BNZ International Funding
FRN 1/11/2021 9,991,500 1.45
19,987,446 2.91
NorwayUSD 7,500,000 DNB Bank ASA
15/7/2021 (Zero Coupon) 7,498,213 1.09
7,498,213 1.09
SingaporeUSD 10,000,000 DBS Bank Ltd FRN 2/8/2021 9,997,244 1.46USD 13,500,000 Oversea-Chinese Banking
Corp 14/6/2021 (Zero Cou-pon) 13,499,220 1.96
23,496,464 3.42
SpainUSD 6,500,000 Banco Santander SA FRN
10/8/2021 6,497,978 0.94
6,497,978 0.94
SwedenUSD 7,400,000 Nordea Bank Abp FRN
8/11/2021 7,394,738 1.08USD 5,000,000 Skandinaviska Enskilda Ban-
ken AB 26/7/2021 (ZeroCoupon) 4,998,243 0.73
USD 1,500,000 Skandinaviska Enskilda Ban-ken AB 7/9/2021 (Zero Cou-pon) 1,499,306 0.22
USD 10,100,000 Svenska Handelsbanken AB5/10/2021 (Zero Coupon) 10,093,637 1.47
USD 5,250,000 Svenska Handelsbanken ABFRN 5/5/2022 5,238,663 0.76
USD 1,500,000 Swedbank AB 1/6/2021 (ZeroCoupon) 1,500,000 0.22
USD 6,500,000 Swedbank AB 5/10/2021 (ZeroCoupon) 6,496,360 0.94
37,220,947 5.42
United KingdomUSD 7,000,000 Standard Chartered Bank FRN
4/5/2022 6,983,618 1.02
6,983,618 1.02
United StatesUSD 4,000,000 ABN Amro Funding USA LLC
FRN 4/2/2022 3,994,213 0.58USD 5,000,000 Barton Capital SA FRN
27/9/2021 4,996,558 0.73USD 10,000,000 BNG Bank NV 1/6/2021 (Zero
Coupon) 10,000,000 1.46USD 3,000,000 CAFCO LLC FRN 1/9/2021 2,999,157 0.44USD 4,000,000 Charta LLC FRN 1/9/2021 3,998,876 0.58USD 8,465,000 Citigroup Global Markets Inc
FRN 1/4/2022 8,447,844 1.23USD 8,000,000 Crown Point Capital LLC
5/10/2021 (Zero Coupon) 7,991,600 1.16
Holding Description
MarketValue
USD
% ofNet
Assets
United States continuedUSD 945,000 Fairway Finance Co LLC
2/6/2021 (Zero Coupon) 944,997 0.14USD 6,000,000 Federation des Caisses
Desjardins FRN 2/7/2021 5,999,251 0.87USD 7,000,000 Federation Des Caisses
Desjardins 3/6/2021 (ZeroCoupon) 6,999,965 1.02
USD 11,500,000 FMS Wertmanagement2/6/2021 (Zero Coupon) 11,499,954 1.67
USD 2,800,000 ING US Funding LLC FRN18/2/2022 2,795,924 0.41
USD 4,500,000 Ionic Capital II Trust16/6/2021 (Zero Coupon) 4,499,662 0.65
USD 15,000,000 JP Morgan Securities LLCFRN 4/4/2022 14,969,300 2.18
USD 10,000,000 La Fayette Asset SecuritizationLLC 16/6/2021 (Zero Cou-pon) 9,999,333 1.46
USD 10,000,000 La Fayette Asset SecuritizationLLC 8/7/2021 (Zero Coupon) 9,998,458 1.45
USD 1,100,000 Lime Funding LLC17/6/2021 (Zero Coupon) 1,099,917 0.16
USD 15,000,000 Macquarie Bank Ltd FRN7/6/2021 14,999,587 2.18
USD 5,000,000 Macquarie Bank Ltd27/8/2021 (Zero Coupon) 4,997,946 0.73
USD 8,000,000 Manhattan Asset Funding CoLLC 2/7/2021 (Zero Coupon) 7,999,311 1.16
USD 8,000,000 Mont Blanc Capital Corp FRN10/8/2021 7,997,356 1.16
USD 15,000,000 Old Line Funding LLC FRN17/6/2021 14,999,033 2.18
USD 5,000,000 Ridgefield Funding Co LLC7/6/2021 (Zero Coupon) 4,999,758 0.73
USD 10,000,000 Societe Generale SA2/6/2021 (Zero Coupon) 9,999,917 1.46
USD 3,000,000 Societe Generale SA20/7/2021 (Zero Coupon) 2,999,143 0.44
USD 15,000,000 Suncorp Metway Ltd31/8/2021 (Zero Coupon) 14,992,796 2.18
USD 5,000,000 Suncorp Metway Ltd FRN7/9/2021 4,997,278 0.73
200,217,134 29.14
Total Commercial Papers 385,720,249 56.13
Total Transferable Securities and Money MarketInstruments Admitted to an Official Stock ExchangeListing or Dealt in on Another Regulated Market 651,036,719 94.74
Securities portfolio at market value 651,036,719 94.74
Other Net Assets 36,100,164 5.26
Total Net Assets (USD) 687,136,883 100.00
BlackRock Americas Diversified Equity Absolute Return FundcontinuedPortfolio of Investments as at 31 May 2021
The notes on pages 590 to 610 form an integral part of these financial statements.
Annual report and audited financial statements [61]

Holding Description Counterparty
Netunrealised
appreciation/(depreciation)
USD
Financial Derivative Instruments
CONTRACTS FOR DIFFERENCEBermuda
(12,964) Liberty Latin America Ltd ’C’ Goldman Sachs (25)(19,812) Liberty Latin America Ltd ’C’ Morgan Stanley 1,932
1,907
Brazil13,100 Agrenco Ltd* Morgan Stanley (395)
(3) Banco ABC Brasil SA (Pref) Morgan Stanley (1)13,700 Laep Investments Ltd* Goldman Sachs (730)24,300 Laep Investments Ltd* Morgan Stanley (1,280)
(2,406)
Canada744 Advanz Pharma Corp Ltd Morgan Stanley 304
1,858 Bellatrix Exploration Ltd* Morgan Stanley (565)(26,058) Poseidon Concepts Corp* Morgan Stanley 5,81112,100 Sears Canada Inc* Morgan Stanley (6,175)
(625)
Germany3,775 Perpetua Resources Corp Barclays Bank 343,9061,600 Perpetua Resources Corp Goldman Sachs 145,024
488,930
Heard And Mcdonald Islands(16,176) Eagle Bulk Shipping Inc Barclays Bank 20,313
20,313
Peru7,452 Tahoe Resources Inc Morgan Stanley —
—
Singapore(948) Maxeon Solar Technologies
Ltd Barclays Bank 19
19
United States(3,830) 10X Genomics Inc ’A’ Bank of America
Merrill Lynch (138,532)(757) 10X Genomics Inc ’A’ HSBC (34,186)
(4,151) 10X Genomics Inc ’A’ Morgan Stanley (57,408)12,111 180 Life Sciences Corp Goldman Sachs 11,14228,595 1-800-Flowers.com Inc ’A’ Morgan Stanley (44,608)8,175 1Life Healthcare Inc Bank of America
Merrill Lynch 32,863(741) 1Life Healthcare Inc Bank of America
Merrill Lynch (2,979)1,530 1Life Healthcare Inc Barclays Bank 5,997
(2,046) 1Life Healthcare Inc Barclays Bank (8,020)8,431 1Life Healthcare Inc Goldman Sachs 33,892
13,923 1Life Healthcare Inc Morgan Stanley 54,579(1,773) 1Life Healthcare Inc Morgan Stanley (6,950)5,723 1st Constitution Bancorp Bank of America
Merrill Lynch 6,8103,831 1st Constitution Bancorp Barclays Bank (843)6,479 1st Constitution Bancorp Goldman Sachs 7,710
24,122 1st Constitution Bancorp HSBC 62,95824,706 1st Constitution Bancorp Morgan Stanley (5,435)(6,807) 1st Source Corp Bank of America
Merrill Lynch (2,451)(14,087) 1st Source Corp Barclays Bank (12,819)(39,075) 1st Source Corp Goldman Sachs (14,067)(19,856) 1st Source Corp HSBC (29,784)(8,168) 1st Source Corp Morgan Stanley (7,433)6,692 2U Inc Bank of America
Merrill Lynch 9,8372,612 2U Inc Barclays Bank 52
(1,322) 2U Inc Goldman Sachs (1,943)(6,138) 3D Systems Corp Bank of America
Merrill Lynch (41,125)
Holding Description Counterparty
Netunrealised
appreciation/(depreciation)
USD
United States continued(6,177) 3D Systems Corp Barclays Bank (9,266)(7,136) 3D Systems Corp Goldman Sachs (47,811)(5,468) 3M Co Barclays Bank (2,351)(6,435) 3M Co HSBC 27,182
(13,155) 3M Co Morgan Stanley (5,657)3,129 4D Molecular Therapeutics
IncBank of AmericaMerrill Lynch (512)
11,850 4D Molecular TherapeuticsInc Barclays Bank 1,608
1,751 4D Molecular TherapeuticsInc Goldman Sachs (423)
1,304 4D Molecular TherapeuticsInc HSBC (452)
4,473 89bio Inc Bank of AmericaMerrill Lynch (12,748)
9,658 8x8 Inc Goldman Sachs (3,863)18,518 8x8 Inc HSBC (84,998)3,449 8x8 Inc Morgan Stanley 655
(3,485) 908 Devices Inc Bank of AmericaMerrill Lynch (18,924)
(3,605) 908 Devices Inc Barclays Bank (13,266)(1,147) 908 Devices Inc Goldman Sachs (6,228)6,749 A O Smith Corp Barclays Bank 12,7568,026 A O Smith Corp Goldman Sachs 1,6056,077 A O Smith Corp HSBC (7,171)
(4,282) A O Smith Corp Morgan Stanley (2,813)4,577 A10 Networks Inc Bank of America
Merrill Lynch 1,92234,266 A10 Networks Inc Goldman Sachs 14,392
(22,029) AAON Inc Bank of AmericaMerrill Lynch 26,745
(3,456) AAON Inc Barclays Bank 380(9,197) AAON Inc Goldman Sachs 14,899(1,436) AAON Inc HSBC (474)(9,442) AAON Inc Morgan Stanley 985(6,357) AAR Corp Barclays Bank (14,303)(8,343) AAR Corp Goldman Sachs (12,431)1,616 Aaron’s Co Inc Bank of America
Merrill Lynch 183,278 Aaron’s Co Inc Barclays Bank 4,5136,353 Aaron’s Co Inc HSBC 15,7222,621 Aaron’s Co Inc Morgan Stanley (77)
(1,226) Abbott Laboratories Bank of AmericaMerrill Lynch 110
(2,241) Abbott Laboratories Barclays Bank 1,434(29,683) Abbott Laboratories Goldman Sachs 2,67110,082 AbbVie Inc Barclays Bank (27,322)(1,789) AbbVie Inc Goldman Sachs 6,91711,509 Abeona Therapeutics Inc Goldman Sachs 3,33824,840 Abeona Therapeutics Inc Morgan Stanley 2,484
(20,241) Abercrombie & Fitch Co ’A’ Barclays Bank (102,419)916 ABIOMED Inc Bank of America
Merrill Lynch 15,2332,248 ABIOMED Inc Barclays Bank 10,817
458 ABIOMED Inc Goldman Sachs 2,981704 ABIOMED Inc HSBC 6,556
1,185 ABIOMED Inc Morgan Stanley 5,67022,246 ABM Industries Inc Bank of America
Merrill Lynch (66,516)39,117 ABM Industries Inc Barclays Bank 12,1268,131 ABM Industries Inc Goldman Sachs (24,312)1,979 ABM Industries Inc Morgan Stanley 613
(14,205) Acacia Research Corp HSBC 2,699(39,504) Acacia Research Corp Morgan Stanley 9,876
5,891 Academy Sports & Out-doors Inc Barclays Bank 16,907
8,625 Academy Sports & Out-doors Inc Goldman Sachs 10,091
(2,930) Acadia Healthcare Co Inc Bank of AmericaMerrill Lynch (2,520)
BlackRock Americas Diversified Equity Absolute Return FundcontinuedPortfolio of Investments as at 31 May 2021
The notes on pages 590 to 610 form an integral part of these financial statements.
BlackRock Strategic Funds[62]

Holding Description Counterparty
Netunrealised
appreciation/(depreciation)
USD
United States continued(6,640) Acadia Healthcare Co Inc Barclays Bank (10,690)(2,705) Acadia Healthcare Co Inc Goldman Sachs (2,326)1,489 Acadia Healthcare Co Inc HSBC 2,319
(7,686) Acadia Healthcare Co Inc Morgan Stanley (12,374)916 ACADIA Pharmaceuticals
IncBank of AmericaMerrill Lynch 1,017
(3,850) ACADIA PharmaceuticalsInc
Bank of AmericaMerrill Lynch (4,274)
5,322 ACADIA PharmaceuticalsInc Barclays Bank 5,428
(1,922) ACADIA PharmaceuticalsInc Barclays Bank (1,960)
2,873 ACADIA PharmaceuticalsInc Goldman Sachs 3,189
1,732 ACADIA PharmaceuticalsInc HSBC 2,286
17,414 ACADIA PharmaceuticalsInc Morgan Stanley 17,763
30,289 Acadia Realty Trust (REIT) Morgan Stanley 6,96626,272 Accel Entertainment Inc Bank of America
Merrill Lynch (9,195)24,405 Accel Entertainment Inc Barclays Bank 5,61313,122 Accel Entertainment Inc Goldman Sachs (4,593)11,265 Accel Entertainment Inc HSBC 9,1259,848 Accel Entertainment Inc Morgan Stanley 2,265
(14,125) Accelerate Diagnostics Inc Barclays Bank (10,170)(245) Accelerate Diagnostics Inc Goldman Sachs (157)
(1,191) Acceleron Pharma Inc Bank of AmericaMerrill Lynch (5,705)
(1,378) Acceleron Pharma Inc Barclays Bank (841)(999) Acceleron Pharma Inc Goldman Sachs (4,785)(875) Acceleron Pharma Inc HSBC (12,591)922 Acceleron Pharma Inc HSBC 13,268
(4,943) Acceleron Pharma Inc Morgan Stanley (3,015)5,167 Accenture Plc ’A’ Bank of America
Merrill Lynch (25,008)1,705 Accenture Plc ’A’ Barclays Bank (4,586)3,833 Accenture Plc ’A’ Goldman Sachs (18,552)7,440 Accenture Plc ’A’ Morgan Stanley (20,014)
14,539 ACCO Brands Corp Barclays Bank (6,688)87,069 ACCO Brands Corp Goldman Sachs (47,017)74,432 ACCO Brands Corp HSBC (248)50,495 ACCO Brands Corp Morgan Stanley (15,154)(8,794) Accolade Inc Bank of America
Merrill Lynch (73,518)(1,188) Accolade Inc Barclays Bank 717(2,407) Accolade Inc Goldman Sachs (20,123)53,767 Accuray Inc Goldman Sachs (6,452)72,508 Accuray Inc Morgan Stanley (15,952)
(80,572) AcelRx Pharmaceuticals Inc Barclays Bank (8,057)(18,887) AcelRx Pharmaceuticals Inc Goldman Sachs (3,966)(11,355) AcelRx Pharmaceuticals Inc HSBC (3,066)20,235 ACI Worldwide Inc Bank of America
Merrill Lynch (32,376)33,620 ACI Worldwide Inc Barclays Bank (56,145)50,133 ACI Worldwide Inc Goldman Sachs (80,212)7,042 ACI Worldwide Inc HSBC (3,732)
23,646 ACI Worldwide Inc Morgan Stanley (39,489)(900) ACM Research Inc ’A’ Barclays Bank (6,633)
(1,813) ACM Research Inc ’A’ HSBC (15,954)1,668 ACNB Corp Bank of America
Merrill Lynch 3505,858 ACNB Corp Barclays Bank 3,7494,971 ACNB Corp Goldman Sachs 1,044
13,805 ACNB Corp HSBC 96614,025 ACNB Corp Morgan Stanley 8,9761,855 ACRES Commercial Realty
Corp (REIT) Morgan Stanley (371)(2,581) Activision Blizzard Inc Bank of America
Merrill Lynch (12,776)
Holding Description Counterparty
Netunrealised
appreciation/(depreciation)
USD
United States continued13,117 Activision Blizzard Inc Barclays Bank 9,83816,065 Activision Blizzard Inc Goldman Sachs 79,5221,323 Actua Corp* Bank of America
Merrill Lynch (1,191)1,498 Acuity Brands Inc Bank of America
Merrill Lynch 6,831(1,242) Acushnet Holdings Corp Bank of America
Merrill Lynch 385(19,779) Acushnet Holdings Corp Barclays Bank (36,196)(1,092) Acushnet Holdings Corp Goldman Sachs 3391,613 Acutus Medical Inc Goldman Sachs 1515,167 Acutus Medical Inc Morgan Stanley 8,319
40,319 Adamas PharmaceuticalsInc
Bank of AmericaMerrill Lynch 18,984
3,772 Adamas PharmaceuticalsInc Barclays Bank 1,660
13,847 Adamas PharmaceuticalsInc Goldman Sachs 7,639
27,570 Adamas PharmaceuticalsInc Morgan Stanley 9,559
681 Adams Resources & EnergyInc
Bank of AmericaMerrill Lynch (735)
904 Adams Resources & EnergyInc Barclays Bank (145)
736 Adams Resources & EnergyInc Goldman Sachs (795)
6,457 Adams Resources & EnergyInc HSBC (2,583)
3,128 Adams Resources & EnergyInc Morgan Stanley (500)
7,980 AdaptHealth Corp Bank of AmericaMerrill Lynch 16,598
(8,071) AdaptHealth Corp Barclays Bank (8,555)8,398 AdaptHealth Corp Goldman Sachs 17,468
(1,535) AdaptHealth Corp Goldman Sachs (1,489)(769) AdaptHealth Corp HSBC (969)
(1,554) AdaptHealth Corp Morgan Stanley (1,647)3,843 AdaptHealth Corp Morgan Stanley 4,0748,865 Adaptive Biotechnologies
Corp Barclays Bank 10,6383,051 Adaptive Biotechnologies
Corp Goldman Sachs 10,373803 Adaptive Biotechnologies
Corp Morgan Stanley 964(808) Addus HomeCare Corp Barclays Bank (1,252)
(6,203) Addus HomeCare Corp Goldman Sachs (11,041)(4,974) Addus HomeCare Corp HSBC 647(3,536) Addus HomeCare Corp Morgan Stanley (5,481)
(11,138) Adicet Bio Inc Barclays Bank 9,467(11,240) Adient Plc Barclays Bank (27,431)14,796 Adient Plc Barclays Bank 35,658(4,757) Adient Plc Goldman Sachs (3,901)
313 Adient Plc Goldman Sachs 257(13,476) Adient Plc HSBC (21,562)(5,349) Adient Plc Morgan Stanley (12,891)72,719 ADMA Biologics Inc Bank of America
Merrill Lynch 1,454117,238 ADMA Biologics Inc Barclays Bank 4,69081,548 ADMA Biologics Inc Goldman Sachs 1,63133,193 ADMA Biologics Inc HSBC 2,65513,644 ADMA Biologics Inc Morgan Stanley 546
553 Adobe Inc Bank of AmericaMerrill Lynch 1,817
5,297 Adobe Inc Barclays Bank 30,814605 Adobe Inc Goldman Sachs 13,213608 Adobe Inc HSBC 13,312
13,344 Adobe Inc Morgan Stanley 89,545(2,015) ADT Inc Barclays Bank 302(2,450) ADT Inc Morgan Stanley 368
BlackRock Americas Diversified Equity Absolute Return FundcontinuedPortfolio of Investments as at 31 May 2021
The notes on pages 590 to 610 form an integral part of these financial statements.
Annual report and audited financial statements [63]

Holding Description Counterparty
Netunrealised
appreciation/(depreciation)
USD
United States continued(16,940) Adtalem Global Education
IncBank of AmericaMerrill Lynch 22,211
(4,036) Adtalem Global EducationInc Goldman Sachs 6,377
(11,392) Adtalem Global EducationInc HSBC 10,253
(17,337) Adtalem Global EducationInc Morgan Stanley (3,987)
18,837 ADTRAN Inc HSBC 4,1441,840 Aduro Biotech Inc* Barclays Bank 5,5202,984 Aduro Biotech Inc* Goldman Sachs 8,9524,665 Aduro Biotech Inc* Morgan Stanley 13,995
329 Advance Auto Parts Inc Goldman Sachs (233)646 Advance Auto Parts Inc Morgan Stanley 440
(1,174) Advance Auto Parts Inc Morgan Stanley 1,0803,258 Advanced Drainage Sys-
tems IncBank of AmericaMerrill Lynch 1,924
7,440 Advanced Drainage Sys-tems Inc Barclays Bank (12,875)
5,365 Advanced Drainage Sys-tems Inc Goldman Sachs 2,822
1,175 Advanced Drainage Sys-tems Inc HSBC (2,319)
16,599 Advanced Drainage Sys-tems Inc Morgan Stanley (37,696)
(3,743) Advanced Emissions Solu-tions Inc
Bank of AmericaMerrill Lynch (9,133)
(16,628) Advanced Emissions Solu-tions Inc Barclays Bank (13,136)
(16,175) Advanced Emissions Solu-tions Inc HSBC (53,539)
(15,235) Advanced Emissions Solu-tions Inc Morgan Stanley (12,036)
1,845 Advanced Energy IndustriesInc
Bank of AmericaMerrill Lynch 15,479
2,418 Advanced Energy IndustriesInc Barclays Bank 4,836
3,628 Advanced Energy IndustriesInc Goldman Sachs 30,439
5,340 Advanced Energy IndustriesInc Morgan Stanley 10,680
12,383 Advanced Micro Devices Inc Bank of AmericaMerrill Lynch 36,142
11,623 Advanced Micro Devices Inc Barclays Bank 6,41112,003 Advanced Micro Devices Inc Goldman Sachs 64,1883,190 Advanced Micro Devices Inc HSBC 6,4066,997 Advanced Micro Devices Inc Morgan Stanley 16,162
(3,827) AdvanSix Inc HSBC (2,602)11,095 Adverum Biotechnologies
IncBank of AmericaMerrill Lynch (1,331)
45,814 Adverum BiotechnologiesInc Barclays Bank 1,833
15,788 Adverum BiotechnologiesInc Goldman Sachs (1,895)
6,876 Adverum BiotechnologiesInc Morgan Stanley 275
(14,623) AECOM Goldman Sachs 22,37315,109 Aeglea BioTherapeutics Inc Goldman Sachs (12,994)19,844 Aeglea BioTherapeutics Inc Morgan Stanley (7,342)(5,907) Aemetis Inc Barclays Bank (13,350)(6,963) Aemetis Inc Goldman Sachs (23,674)(4,647) AerCap Holdings NV Morgan Stanley (12,268)(8,726) Aerie Pharmaceuticals Inc Bank of America
Merrill Lynch 9,075(7,552) Aerie Pharmaceuticals Inc Barclays Bank 6,948(9,506) Aerie Pharmaceuticals Inc Goldman Sachs 9,886(3,310) AeroVironment Inc Goldman Sachs (621)1,474 AerSale Corp Bank of America
Merrill Lynch (206)4,001 AES Corp Bank of America
Merrill Lynch 2,455
Holding Description Counterparty
Netunrealised
appreciation/(depreciation)
USD
United States continued24,516 AES Corp Barclays Bank (7,110)
(16,378) AES Corp Barclays Bank 4,75012,254 AES Corp Goldman Sachs 1,371
667 AES Corp HSBC (212)(11,633) AES Corp HSBC 3,723
5,605 AES Corp Morgan Stanley (863)(27,135) AES Corp Morgan Stanley 7,869
2,495 AFC Gamma Inc Barclays Bank 1,1981,580 AFC Gamma Inc Morgan Stanley 758
(1,372) Affiliated Managers GroupInc Barclays Bank (8,342)
4,346 Affiliated Managers GroupInc Morgan Stanley 28,032
(435) Affiliated Managers GroupInc Morgan Stanley 734
12,532 Affimed NV Barclays Bank (2,130)(14,671) Affirm Holdings Inc Bank of America
Merrill Lynch (48,104)(11,103) Affirm Holdings Inc Barclays Bank (85,049)(5,436) Aflac Inc Bank of America
Merrill Lynch (1,413)678 Aflac Inc Bank of America
Merrill Lynch 3(23,591) Aflac Inc Barclays Bank (7,313)(9,317) Aflac Inc Goldman Sachs (2,422)12,179 Aflac Inc Goldman Sachs 3,199
(21,986) Aflac Inc HSBC (3,298)599 AGCO Corp Bank of America
Merrill Lynch 2,5372,686 AGCO Corp Barclays Bank 13,2424,589 AGCO Corp Goldman Sachs 3,152
203 AGCO Corp HSBC (1,961)16,433 AGCO Corp Morgan Stanley 60,71816,641 Agenus Inc Bank of America
Merrill Lynch 16,64147,075 Agenus Inc Barclays Bank 10,82740,646 Agenus Inc Goldman Sachs 40,64616,438 Agenus Inc Morgan Stanley 3,781
(25,249) Agile Therapeutics Inc Bank of AmericaMerrill Lynch (1,262)
(82,645) Agile Therapeutics Inc Barclays Bank 4,132(8,293) Agile Therapeutics Inc HSBC (1,659)1,303 Agilent Technologies Inc Barclays Bank 8657,139 Agilent Technologies Inc Goldman Sachs 57,255
18,985 Agilent Technologies Inc Morgan Stanley 90,938(3,411) Agiliti Inc Bank of America
Merrill Lynch (24,355)(5,498) Agiliti Inc Barclays Bank (21,057)1,903 agilon health Inc Bank of America
Merrill Lynch 11,0944,793 agilon health Inc Barclays Bank 9,6342,034 agilon health Inc Goldman Sachs 8,905(425) Agilysys Inc Bank of America
Merrill Lynch (1,534)(1,334) Agilysys Inc Barclays Bank (774)(2,694) Agilysys Inc Goldman Sachs (8,999)
(12,916) Agilysys Inc Morgan Stanley (7,491)(1,874) Agios Pharmaceuticals Inc Bank of America
Merrill Lynch (112)(3,804) Agios Pharmaceuticals Inc Barclays Bank 3,081(4,157) Agios Pharmaceuticals Inc Goldman Sachs (249)(2,561) Agios Pharmaceuticals Inc Morgan Stanley 2,074
(17,012) AGNC Investment Corp(REIT)
Bank of AmericaMerrill Lynch (5,614)
(36,212) AGNC Investment Corp(REIT) Barclays Bank 1,448
2,309 AGNC Investment Corp(REIT) Barclays Bank (92)
(20,142) AGNC Investment Corp(REIT) HSBC (5,237)
BlackRock Americas Diversified Equity Absolute Return FundcontinuedPortfolio of Investments as at 31 May 2021
The notes on pages 590 to 610 form an integral part of these financial statements.
BlackRock Strategic Funds[64]

Holding Description Counterparty
Netunrealised
appreciation/(depreciation)
USD
United States continued(7,865) AGNC Investment Corp
(REIT) Morgan Stanley 315(9,211) Agree Realty Corp (REIT) Bank of America
Merrill Lynch (8,198)(3,685) Agree Realty Corp (REIT) Barclays Bank (995)
(23,323) Agree Realty Corp (REIT) Goldman Sachs (20,757)(4,066) Agree Realty Corp (REIT) HSBC 81
(15,011) Agree Realty Corp (REIT) Morgan Stanley (4,053)19,165 AgroFresh Solutions Inc Bank of America
Merrill Lynch (2,683)14,500 AgroFresh Solutions Inc Barclays Bank (1,015)17,009 AgroFresh Solutions Inc Goldman Sachs (2,381)29,560 AgroFresh Solutions Inc Morgan Stanley (2,069)
(586) Air Lease Corp Bank of AmericaMerrill Lynch (481)
5,083 Air Lease Corp Bank of AmericaMerrill Lynch 5,995
1,139 Air Lease Corp Barclays Bank 663593 Air Lease Corp Goldman Sachs 727
1,884 Air Lease Corp HSBC 2,958(13,450) Air Lease Corp Morgan Stanley (17,889)
(358) Air Products and ChemicalsInc
Bank of AmericaMerrill Lynch 712
2,245 Air Products and ChemicalsInc
Bank of AmericaMerrill Lynch (1,898)
(329) Air Products and ChemicalsInc Barclays Bank (30)
6,337 Air Products and ChemicalsInc Barclays Bank 1,130
701 Air Products and ChemicalsInc Morgan Stanley (86)
(14,866) Air Transport ServicesGroup Inc
Bank of AmericaMerrill Lynch 5,054
(18,054) Air Transport ServicesGroup Inc Barclays Bank (8,485)
(10,948) Air Transport ServicesGroup Inc Goldman Sachs 3,722
(23,430) Air Transport ServicesGroup Inc HSBC 20,384
(9,052) Air Transport ServicesGroup Inc Morgan Stanley (4,254)
1,923 Airbnb Inc Barclays Bank 8,6343,657 Airbnb Inc Morgan Stanley 16,420
(6,303) Airgain Inc Bank of AmericaMerrill Lynch (5,799)
(3,644) Airgain Inc Barclays Bank (292)(30,288) Airgain Inc Goldman Sachs (27,133)(1,484) Akamai Technologies Inc Bank of America
Merrill Lynch (1,068)(840) Akamai Technologies Inc Barclays Bank 134
(3,796) Akamai Technologies Inc HSBC (11,312)(4,823) Akamai Technologies Inc Morgan Stanley 7724,700 Akazoo SA* Bank of America
Merrill Lynch (5,452)5,417 Akazoo SA* Barclays Bank (6,284)
11,200 Akazoo SA* Goldman Sachs (12,992)7,099 Akazoo SA* Morgan Stanley (8,256)
(24,603) Akebia Therapeutics Inc Goldman Sachs (2,460)6,019 Akero Therapeutics Inc HSBC (3,250)1,323 Akero Therapeutics Inc Morgan Stanley (265)5,236 Akouos Inc Bank of America
Merrill Lynch 5210,424 Akouos Inc Barclays Bank 9,5903,397 Akouos Inc HSBC 1,868
(18,182) Akoustis Technologies Inc Bank of AmericaMerrill Lynch (20,000)
(50,786) Akoustis Technologies Inc Barclays Bank (25,911)(4,969) Akoustis Technologies Inc HSBC (5,118)
Holding Description Counterparty
Netunrealised
appreciation/(depreciation)
USD
United States continued(2,048) Akoustis Technologies Inc Morgan Stanley (1,126)1,812 Akoya Biosciences Inc Bank of America
Merrill Lynch (243)1,734 Akoya Biosciences Inc Barclays Bank (2,029)4,721 Akoya Biosciences Inc Goldman Sachs 3,0693,441 Akoya Biosciences Inc Morgan Stanley (4,026)
(1,350) Alamo Group Inc Barclays Bank (1,337)(3,609) Alamo Group Inc HSBC 24,794(1,293) Alamo Group Inc Morgan Stanley (1,280)(7,950) Alarm.com Holdings Inc Barclays Bank (1,736)(5,021) Alarm.com Holdings Inc Goldman Sachs (11,900)(6,007) Alarm.com Holdings Inc Morgan Stanley (4,396)(2,924) Alaska Air Group Inc Bank of America
Merrill Lynch 307410 Alaska Air Group Inc Bank of America
Merrill Lynch (1,013)(5,704) Alaska Air Group Inc Barclays Bank 2851,117 Alaska Air Group Inc Barclays Bank (56)
(8,364) Alaska Air Group Inc Goldman Sachs 8,7733,021 Alaska Air Group Inc Goldman Sachs 459,232 Alaska Air Group Inc HSBC 8,516(335) Alaska Air Group Inc Morgan Stanley 100
2,889 Alaska Air Group Inc Morgan Stanley (332)(361) Albany International Corp
’A’Bank of AmericaMerrill Lynch (1,227)
(576) Albany International Corp’A’ Goldman Sachs (1,958)
(8,321) Albany International Corp’A’ HSBC (12,149)
(13,718) Albany International Corp’A’ Morgan Stanley (74,763)
375 Albemarle Corp Bank of AmericaMerrill Lynch (565)
(1,371) Albemarle Corp Barclays Bank (10,347)(657) Albemarle Corp Goldman Sachs (5,323)326 Albemarle Corp HSBC 2,901
(4,672) Albemarle Corp Morgan Stanley (30,965)209 Albemarle Corp Morgan Stanley (33)
16,677 Albertsons Cos Inc Bank of AmericaMerrill Lynch (5,337)
(3,536) Albireo Pharma Inc Goldman Sachs (11,810)(5,271) Albireo Pharma Inc HSBC (23,983)(5,351) Albireo Pharma Inc Morgan Stanley (6,100)(9,862) Alcoa Corp Bank of America
Merrill Lynch 9,961(3,811) Alcoa Corp Barclays Bank (12,081)16,953 Alcoa Corp Barclays Bank 53,7419,817 Alcoa Corp Goldman Sachs 10,9853,080 Alcoa Corp HSBC 11,226
(16,872) Alcoa Corp Morgan Stanley (53,484)(4,159) Aldeyra Therapeutics Inc HSBC (1,996)(2,614) Alector Inc Bank of America
Merrill Lynch 667(2,096) Alector Inc Barclays Bank 184(8,436) Alector Inc Goldman Sachs (248)11,797 Alerus Financial Corp Barclays Bank 9,08413,568 Alerus Financial Corp Goldman Sachs 11,12624,447 Alerus Financial Corp HSBC 108,30014,999 Alerus Financial Corp Morgan Stanley 11,54929,715 Alexander & Baldwin Inc
(REIT)Bank of AmericaMerrill Lynch 16,570
40,703 Alexander & Baldwin Inc(REIT) Barclays Bank 15,467
18,779 Alexander & Baldwin Inc(REIT) Goldman Sachs 18,929
11,231 Alexander & Baldwin Inc(REIT) HSBC 11,006
BlackRock Americas Diversified Equity Absolute Return FundcontinuedPortfolio of Investments as at 31 May 2021
The notes on pages 590 to 610 form an integral part of these financial statements.
Annual report and audited financial statements [65]

Holding Description Counterparty
Netunrealised
appreciation/(depreciation)
USD
United States continued45,212 Alexander & Baldwin Inc
(REIT) Morgan Stanley 17,578(4,235) Alexander’s Inc (REIT) Bank of America
Merrill Lynch (19,009)(5,399) Alexander’s Inc (REIT) Barclays Bank (33,417)(5,334) Alexander’s Inc (REIT) Goldman Sachs (24,907)(1,409) Alexander’s Inc (REIT) HSBC 4,157(2,456) Alexander’s Inc (REIT) Morgan Stanley (15,129)
(348) Alexandria Real Estate Eq-uities Inc (REIT)
Bank of AmericaMerrill Lynch (1,883)
2,156 Alexandria Real Estate Eq-uities Inc (REIT) Barclays Bank 582
(1,178) Alexandria Real Estate Eq-uities Inc (REIT) Barclays Bank (318)
8,953 Alexandria Real Estate Eq-uities Inc (REIT) Goldman Sachs 48,436
(1,739) Alexandria Real Estate Eq-uities Inc (REIT) Goldman Sachs (9,408)
(1,157) Alexandria Real Estate Eq-uities Inc (REIT) HSBC 1,018
2,825 Alexandria Real Estate Eq-uities Inc (REIT) Morgan Stanley 763
(1,756) Alico Inc Bank of AmericaMerrill Lynch 931
(8,827) Alico Inc Barclays Bank 883(13,828) Alico Inc Goldman Sachs 7,329(1,837) Alico Inc HSBC (827)(5,761) Alico Inc Morgan Stanley 576
802 Align Technology Inc Bank of AmericaMerrill Lynch 24,565
2,001 Align Technology Inc Barclays Bank (28,615)583 Align Technology Inc Goldman Sachs 17,857890 Align Technology Inc HSBC 31,729
1,262 Align Technology Inc Morgan Stanley (18,047)3,904 Aligos Therapeutics Inc Bank of America
Merrill Lynch 21,0042,054 Aligos Therapeutics Inc Barclays Bank (349)
(2,416) Alkermes Plc Bank of AmericaMerrill Lynch (1,425)
(33,562) Alkermes Plc Barclays Bank (17,788)(11,262) Alkermes Plc Goldman Sachs (7,628)(1,327) Alkermes Plc Morgan Stanley (703)
(421) Allakos Inc Bank of AmericaMerrill Lynch 276
(1,412) Allakos Inc Barclays Bank (1,363)(1,603) Allakos Inc Goldman Sachs (1,096)(2,815) Allakos Inc HSBC (18,269)
(314) Allakos Inc Morgan Stanley (598)999 Alleghany Corp Bank of America
Merrill Lynch 2,387710 Alleghany Corp Barclays Bank 1,51943 Alleghany Corp Goldman Sachs 367
1,212 Alleghany Corp Morgan Stanley 4,842(8,871) Allegheny Technologies Inc Bank of America
Merrill Lynch (5,677)(20,548) Allegheny Technologies Inc Barclays Bank (24,863)(1,628) Allegheny Technologies Inc Goldman Sachs (1,042)(4,271) Allegheny Technologies Inc HSBC (2,947)
(34,210) Allegheny Technologies Inc Morgan Stanley (41,395)(6,690) Allegiance Bancshares Inc Goldman Sachs 2,944
(20,467) Allegiance Bancshares Inc HSBC (1,433)(15,761) Allegiance Bancshares Inc Morgan Stanley (1,734)
1,920 Allegiant Travel Co Bank of AmericaMerrill Lynch (15,110)
(2,267) Allegiant Travel Co Bank of AmericaMerrill Lynch 9,637
779 Allegiant Travel Co Barclays Bank (1,036)(1,502) Allegiant Travel Co Barclays Bank 345
347 Allegiant Travel Co Goldman Sachs (2,731)
Holding Description Counterparty
Netunrealised
appreciation/(depreciation)
USD
United States continued(1,612) Allegiant Travel Co Goldman Sachs 12,6861,527 Allegiant Travel Co HSBC (171)1,110 Allegiant Travel Co Morgan Stanley (255)2,871 Allegion Plc Bank of America
Merrill Lynch 4,4504,236 Allegion Plc Barclays Bank 7,413
16,100 Allegion Plc Goldman Sachs 24,0066,479 Allegion Plc HSBC (13,412)2,966 Allegion Plc Morgan Stanley 5,1908,923 Allegro MicroSystems Inc Barclays Bank 11,689
14,669 Allegro MicroSystems Inc Goldman Sachs 35,35211,664 Allegro MicroSystems Inc Morgan Stanley 15,280(4,621) ALLETE Inc Bank of America
Merrill Lynch 3,697(4,782) ALLETE Inc Barclays Bank 6,169
(16,557) ALLETE Inc HSBC 38,743(45,170) ALLETE Inc Morgan Stanley 58,269
(622) Alliance Data Systems Corp Bank of AmericaMerrill Lynch (707)
(285) Alliance Data Systems Corp Barclays Bank (1,161)(986) Alliance Data Systems Corp Goldman Sachs 1,035
(1,096) Alliance Data Systems Corp Morgan Stanley (1,033)16,635 Alliance Data Systems Corp Morgan Stanley 45,74631,890 Alliant Energy Corp Goldman Sachs 21,36645,309 Alliant Energy Corp Morgan Stanley (41,232)2,773 Allied Motion Technologies
IncBank of AmericaMerrill Lynch (438)
7,645 Allied Motion TechnologiesInc Barclays Bank (1,602)
3,257 Allied Motion TechnologiesInc Morgan Stanley (2,899)
9,683 Allison Transmission Hold-ings Inc Barclays Bank (13,363)
(9,487) Allison Transmission Hold-ings Inc Barclays Bank 8,280
(13,559) Allison Transmission Hold-ings Inc Goldman Sachs 22,269
2,599 Allison Transmission Hold-ings Inc Morgan Stanley (3,587)
(4,219) Allison Transmission Hold-ings Inc Morgan Stanley 5,822
(8,491) Allogene Therapeutics Inc Barclays Bank (4,415)(4,202) Allogene Therapeutics Inc Morgan Stanley (2,185)(3,273) Allovir Inc Goldman Sachs (839)(2,882) Allovir Inc Morgan Stanley 1,40047,120 Allscripts Healthcare Solu-
tions Inc Barclays Bank 25,44542,152 Allscripts Healthcare Solu-
tions Inc Morgan Stanley 22,7624,688 Allstate Corp Bank of America
Merrill Lynch (11,298)6,253 Allstate Corp Barclays Bank (3,939)5,569 Allstate Corp Goldman Sachs (13,421)
(5,971) Allstate Corp HSBC (12,659)2,141 Allstate Corp Morgan Stanley (1,349)
20,223 Ally Financial Inc Barclays Bank 24,26821,580 Ally Financial Inc Goldman Sachs 11,43724,766 Ally Financial Inc HSBC 25,75715,379 Ally Financial Inc Morgan Stanley 11,597(1,387) Ally Financial Inc Morgan Stanley (1,664)
211 Alnylam PharmaceuticalsInc Goldman Sachs 1,287
(1,245) Alnylam PharmaceuticalsInc Goldman Sachs (7,595)
(246) Alnylam PharmaceuticalsInc Morgan Stanley (913)
3,065 Alpha & Omega Semicon-ductor Ltd
Bank of AmericaMerrill Lynch 8,337
BlackRock Americas Diversified Equity Absolute Return FundcontinuedPortfolio of Investments as at 31 May 2021
The notes on pages 590 to 610 form an integral part of these financial statements.
BlackRock Strategic Funds[66]

Holding Description Counterparty
Netunrealised
appreciation/(depreciation)
USD
United States continued1,960 Alpha & Omega Semicon-
ductor Ltd Barclays Bank 1,6912,913 Alpha & Omega Semicon-
ductor Ltd Goldman Sachs 2,3803,654 Alpha & Omega Semicon-
ductor Ltd Morgan Stanley 3,907(12,196) Alpha Metallurgical Re-
sources Inc HSBC (57,199)(4,722) Alpha Metallurgical Re-
sources Inc Morgan Stanley (17,708)(5,004) Alpha Pro Tech Ltd Barclays Bank 400
602 Alphabet Inc ’A’ Bank of AmericaMerrill Lynch 40,894
(49) Alphabet Inc ’A’ Bank of AmericaMerrill Lynch 656
719 Alphabet Inc ’A’ Barclays Bank (3,013)(14) Alphabet Inc ’A’ Barclays Bank 59486 Alphabet Inc ’A’ Goldman Sachs 33,014(23) Alphabet Inc ’A’ Goldman Sachs (1,562)19 Alphabet Inc ’A’ HSBC 1,237
(1,057) Alphabet Inc ’A’ HSBC (68,811)(302) Alphabet Inc ’A’ Morgan Stanley 1,265
11,486 Alphatec Holdings Inc Bank of AmericaMerrill Lynch (4,135)
5,386 Alphatec Holdings Inc Barclays Bank (4,040)11,478 Alphatec Holdings Inc Goldman Sachs (4,132)4,521 Alphatec Holdings Inc HSBC 2,170
888 Alphatec Holdings Inc Morgan Stanley (666)(13,714) Alpine Immune Sciences Inc Bank of America
Merrill Lynch 26,879(11,987) Alpine Immune Sciences Inc Barclays Bank 2,877(40,789) Alta Equipment Group Inc Bank of America
Merrill Lynch 7,750(15,006) Altabancorp Bank of America
Merrill Lynch (38,415)(25,299) Altabancorp Barclays Bank 2,530(10,370) Altabancorp Goldman Sachs (26,547)(1,958) Altabancorp Morgan Stanley 19610,654 Altair Engineering Inc ’A’ Barclays Bank 16,62011,253 Altair Engineering Inc ’A’ Goldman Sachs 24,1941,588 Alteryx Inc ’A’ Bank of America
Merrill Lynch 1,09510,047 Alteryx Inc ’A’ Barclays Bank 16,47711,038 Alteryx Inc ’A’ Goldman Sachs 7,616
417 Alteryx Inc ’A’ HSBC 734,762 Alteryx Inc ’A’ Morgan Stanley 5,421
(4,245) Altice USA Inc ’A’ Barclays Bank 4,8822,688 Altice USA Inc ’A’ HSBC (4,702)
(8,200) Altimmune Inc Barclays Bank (5,000)(5,402) Altimmune Inc Goldman Sachs 8,26512,281 Altisource Portfolio Solu-
tions SABank of AmericaMerrill Lynch 3,085
7,472 Altisource Portfolio Solu-tions SA Barclays Bank 2,765
14,740 Altisource Portfolio Solu-tions SA Goldman Sachs 7,812
2,654 Altisource Portfolio Solu-tions SA HSBC 2,229
7,320 Altisource Portfolio Solu-tions SA Morgan Stanley 2,708
(5,502) Alto Ingredients Inc Bank of AmericaMerrill Lynch (7,208)
(25,289) Alto Ingredients Inc Barclays Bank (9,104)1,801 Altra Industrial Motion Corp Bank of America
Merrill Lynch (1,581)16,119 Altra Industrial Motion Corp Barclays Bank 14,1734,467 Altra Industrial Motion Corp Goldman Sachs (4,824)3,134 Altra Industrial Motion Corp HSBC (972)
16,430 Altra Industrial Motion Corp Morgan Stanley 15,7738,908 Altria Group Inc Barclays Bank (9,799)
Holding Description Counterparty
Netunrealised
appreciation/(depreciation)
USD
United States continued(34,418) Altria Group Inc Goldman Sachs 34,074(9,697) Altria Group Inc HSBC 14,158
(12,001) Altria Group Inc Morgan Stanley 13,201(3,972) ALX Oncology Holdings Inc Barclays Bank (10,566)(2,344) ALX Oncology Holdings Inc Goldman Sachs (4,149)3,807 Amalgamated Financial
Corp Barclays Bank (305)29,015 Amalgamated Financial
Corp Goldman Sachs 3,7722,147 A-Mark Precious Metals Inc Bank of America
Merrill Lynch (2,233)4,502 A-Mark Precious Metals Inc Barclays Bank (1,035)(199) Amazon.com Inc Bank of America
Merrill Lynch 9,417(621) Amazon.com Inc Barclays Bank 13,612
54 Amazon.com Inc HSBC 787116 Amazon.com Inc Morgan Stanley (3,826)
(1,960) Ambac Financial Group Inc Bank of AmericaMerrill Lynch (1,431)
(8,264) Ambac Financial Group Inc Barclays Bank (3,636)(7,638) Ambac Financial Group Inc HSBC 5,194
(38,792) Ambac Financial Group Inc Morgan Stanley (17,068)896 Ambarella Inc Bank of America
Merrill Lynch (386)2,228 Ambarella Inc Barclays Bank 1,8242,418 Ambarella Inc Goldman Sachs (808)
246 Ambarella Inc HSBC 7581,918 Ambarella Inc Morgan Stanley 1183,380 AMC Entertainment Hold-
ings Inc ’A’ Barclays Bank 42,047(2,558) AMC Entertainment Hold-
ings Inc ’A’ HSBC (26,017)(598) AMC Networks Inc ’A’ Bank of America
Merrill Lynch (1,746)(11,134) AMC Networks Inc ’A’ Barclays Bank (36,297)(1,309) AMC Networks Inc ’A’ Goldman Sachs (5,788)
(821) AMC Networks Inc ’A’ Morgan Stanley (2,676)85,384 Amcor Plc Bank of America
Merrill Lynch (41,838)26,505 Amcor Plc Barclays Bank (3,711)73,769 Amcor Plc Goldman Sachs (36,147)37,779 Amcor Plc Morgan Stanley (5,289)
(10,248) Amdocs Ltd Bank of AmericaMerrill Lynch (141)
4,806 Amdocs Ltd Bank of AmericaMerrill Lynch 48
(19,551) Amdocs Ltd Barclays Bank (6,528)(13,584) Amdocs Ltd Goldman Sachs (291)(2,159) Amdocs Ltd Morgan Stanley (691)
247 Amedisys Inc Goldman Sachs (634)(2,214) Amedisys Inc Morgan Stanley 1,174
242 Amedisys Inc Morgan Stanley (184)5,031 Amerant Bancorp Inc Bank of America
Merrill Lynch 4,47214,157 Amerant Bancorp Inc Barclays Bank 14,9851,525 Amerant Bancorp Inc Goldman Sachs 1,1135,715 Amerant Bancorp Inc HSBC 17,152
196 AMERCO Bank of AmericaMerrill Lynch (8,485)
124 AMERCO Goldman Sachs (5,368)1,361 AMERCO HSBC (77,523)1,098 AMERCO Morgan Stanley (3,393)
10,296 Ameren Corp Barclays Bank (4,736)5,465 Ameren Corp HSBC (8,963)
57,206 Ameren Corp Morgan Stanley (26,315)2,517 Ameresco Inc ’A’ Bank of America
Merrill Lynch 11,1501,047 Ameresco Inc ’A’ Barclays Bank 2,262
10,778 Ameresco Inc ’A’ Morgan Stanley 23,280
BlackRock Americas Diversified Equity Absolute Return FundcontinuedPortfolio of Investments as at 31 May 2021
The notes on pages 590 to 610 form an integral part of these financial statements.
Annual report and audited financial statements [67]

Holding Description Counterparty
Netunrealised
appreciation/(depreciation)
USD
United States continued7,166 American Airlines Group Inc Barclays Bank 8,958
11,957 American Airlines Group Inc Goldman Sachs 10,642(43,551) American Airlines Group Inc Goldman Sachs (73,277)
5,160 American Assets Trust Inc(REIT)
Bank of AmericaMerrill Lynch 5,882
3,855 American Assets Trust Inc(REIT) Barclays Bank 3,123
4,535 American Assets Trust Inc(REIT) Goldman Sachs 5,170
32,087 American Assets Trust Inc(REIT) HSBC 52,623
39,834 American Assets Trust Inc(REIT) Morgan Stanley 32,266
(4,348) American Axle & Manufac-turing Holdings Inc
Bank of AmericaMerrill Lynch (1,696)
(2,354) American Axle & Manufac-turing Holdings Inc Barclays Bank (659)
(34,760) American Axle & Manufac-turing Holdings Inc HSBC (29,546)
(26,975) American Axle & Manufac-turing Holdings Inc Morgan Stanley (7,553)
18,901 American Campus Commu-nities Inc (REIT) Barclays Bank 22,681
(5,561) American Campus Commu-nities Inc (REIT) Barclays Bank (6,673)
10,108 American Campus Commu-nities Inc (REIT) Goldman Sachs 5,054
(16,275) American Campus Commu-nities Inc (REIT) Goldman Sachs (8,138)
6,391 American Campus Commu-nities Inc (REIT) HSBC 4,665
(603) American Campus Commu-nities Inc (REIT) HSBC (440)
8,546 American Campus Commu-nities Inc (REIT) Morgan Stanley 10,255
(726) American Campus Commu-nities Inc (REIT) Morgan Stanley 59
12,360 American Eagle OutfittersInc
Bank of AmericaMerrill Lynch (22,124)
25,720 American Eagle OutfittersInc Barclays Bank 67,712
31,470 American Eagle OutfittersInc Goldman Sachs (56,331)
11,595 American Eagle OutfittersInc HSBC (10,053)
25,944 American Eagle OutfittersInc Morgan Stanley 68,688
(9,386) American Electric Power CoInc
Bank of AmericaMerrill Lynch (5,162)
(30,452) American Electric Power CoInc Barclays Bank 16,218
(20,802) American Electric Power CoInc Goldman Sachs (10,312)
(13,987) American Electric Power CoInc HSBC 21,820
(26,832) American Electric Power CoInc Morgan Stanley 15,294
(5,098) American Equity InvestmentLife Holding Co Morgan Stanley (2,549)
615 American Express Co Barclays Bank 916(983) American Express Co Barclays Bank 133
10,272 American Express Co Goldman Sachs 33,589(309) American Express Co Goldman Sachs (525)
8,481 American Express Co Morgan Stanley 12,637(10,018) American Express Co Morgan Stanley (17,810)63,430 American Finance Trust Inc
(REIT) Morgan Stanley 133(7,487) American Financial Group
Inc Barclays Bank (9,883)(7,620) American Financial Group
Inc HSBC (39,853)
Holding Description Counterparty
Netunrealised
appreciation/(depreciation)
USD
United States continued(5,123) American Financial Group
Inc Morgan Stanley (6,762)(167) American Homes 4 Rent ’A’
(REIT)Bank of AmericaMerrill Lynch (75)
(6,070) American Homes 4 Rent ’A’(REIT) Barclays Bank 304
(54,906) American Homes 4 Rent ’A’(REIT) HSBC (60,397)
(32,691) American Homes 4 Rent ’A’(REIT) Morgan Stanley 1,635
2,875 American InternationalGroup Inc Barclays Bank 2,760
14,942 American National Bank-shares Inc
Bank of AmericaMerrill Lynch (10,310)
7,750 American National Bank-shares Inc Goldman Sachs (5,348)
(1,824) American National GroupInc
Bank of AmericaMerrill Lynch 5,012
643 American National GroupInc Barclays Bank (2,186)
(3,511) American National GroupInc Goldman Sachs (691)
(299) American National GroupInc Morgan Stanley 23
(13,301) American Outdoor BrandsInc Barclays Bank (12,636)
(272) American Outdoor BrandsInc Morgan Stanley (258)
2,619 American Public EducationInc Goldman Sachs (52)
3,726 American Public EducationInc HSBC (9,166)
3,436 American Public EducationInc Morgan Stanley 344
(2,026) American Realty InvestorsInc Barclays Bank (61)
(73,007) American Software Inc ’A’ Barclays Bank (2,920)(40,218) American Software Inc ’A’ Goldman Sachs (19,305)(1,020) American Software Inc ’A’ Morgan Stanley 172,247 American States Water Co Barclays Bank 449
(1,863) American States Water Co Barclays Bank (373)3,548 American States Water Co Goldman Sachs 6,706
14,389 American States Water Co HSBC 6,331(3,311) American States Water Co Morgan Stanley (662)
(25,998) American SuperconductorCorp Morgan Stanley (9,879)
(1,234) American Tower Corp(REIT) Barclays Bank (3,307)
(4,208) American Tower Corp(REIT) Goldman Sachs (40,271)
(1,168) American Tower Corp(REIT) HSBC (7,989)
(8,201) American Vanguard Corp Goldman Sachs 4,839(27,291) American Vanguard Corp HSBC 32,476(16,139) American Vanguard Corp Morgan Stanley 3,551(1,767) American Water Works Co
IncBank of AmericaMerrill Lynch (7,368)
(5,172) American Water Works CoInc Barclays Bank (931)
(937) American Water Works CoInc Goldman Sachs (3,907)
(1,261) American Water Works CoInc Morgan Stanley (227)
(1,118) American Well Corp ’A’ Bank of AmericaMerrill Lynch (525)
(6,294) American Well Corp ’A’ Barclays Bank (5,790)(2,284) American Woodmark Corp Bank of America
Merrill Lynch 20,373(2,429) American Woodmark Corp Barclays Bank 16,833(9,336) American Woodmark Corp Goldman Sachs 78,126
BlackRock Americas Diversified Equity Absolute Return FundcontinuedPortfolio of Investments as at 31 May 2021
The notes on pages 590 to 610 form an integral part of these financial statements.
BlackRock Strategic Funds[68]

Holding Description Counterparty
Netunrealised
appreciation/(depreciation)
USD
United States continued921 America’s Car-Mart Inc Goldman Sachs 11,918
1,800 Americold Realty Trust(REIT)
Bank of AmericaMerrill Lynch 144
2,746 Americold Realty Trust(REIT) Barclays Bank 82
(8,353) Americold Realty Trust(REIT) Goldman Sachs (194)
2,691 Americold Realty Trust(REIT) Goldman Sachs 215
4,435 Americold Realty Trust(REIT) HSBC (2,528)
(29,647) Americold Realty Trust(REIT) Morgan Stanley (889)
1,527 Ameriprise Financial Inc Bank of AmericaMerrill Lynch 385
938 Ameriprise Financial Inc Goldman Sachs 3,623(532) Ameriprise Financial Inc HSBC 2,266(955) Ameris Bancorp Bank of America
Merrill Lynch (35)(22,177) Ameris Bancorp Goldman Sachs 34,818(12,299) Ameris Bancorp HSBC 10,208(18,100) Ameris Bancorp Morgan Stanley 21,177(12,820) AMERISAFE Inc Barclays Bank (6,795)(11,934) AMERISAFE Inc Goldman Sachs 13,247(4,214) AMERISAFE Inc HSBC (6,279)(9,605) AMERISAFE Inc Morgan Stanley (5,091)5,798 AmerisourceBergen Corp Bank of America
Merrill Lynch (19,539)2,589 AmerisourceBergen Corp Barclays Bank (6,727)9,661 AmerisourceBergen Corp Goldman Sachs (31,536)2,648 AmerisourceBergen Corp HSBC (18,685)6,244 AmerisourceBergen Corp Morgan Stanley (23,602)
(14,471) Ames National Corp Bank of AmericaMerrill Lynch 7,525
(7,994) Ames National Corp Barclays Bank 2,398(24,106) Ames National Corp Goldman Sachs 12,535(1,650) Ames National Corp HSBC (83)(4,150) Ames National Corp Morgan Stanley 1,24517,538 AMETEK Inc Morgan Stanley 24,729
(484) Amgen Inc Goldman Sachs 6,989(339) Amgen Inc HSBC 4,977
6,350 Amgen Inc Morgan Stanley (62,294)12,108 Amicus Therapeutics Inc Bank of America
Merrill Lynch 363(2,685) Amicus Therapeutics Inc Barclays Bank (752)18,974 Amicus Therapeutics Inc Barclays Bank 5,3136,137 Amicus Therapeutics Inc Goldman Sachs 184
(8,985) Amicus Therapeutics Inc HSBC 1,168(7,509) Amicus Therapeutics Inc Morgan Stanley (2,103)15,474 Amicus Therapeutics Inc Morgan Stanley 4,333
(18,732) Amkor Technology Inc Bank of AmericaMerrill Lynch (33,530)
(10,538) Amkor Technology Inc Barclays Bank (7,376)(14,506) Amkor Technology Inc Goldman Sachs (25,966)(43,450) Amkor Technology Inc Morgan Stanley (30,415)(4,487) AMMO Inc Barclays Bank (2,558)(3,881) AMMO Inc Morgan Stanley 105
849 AMN Healthcare ServicesInc Goldman Sachs (425)
8,751 AMN Healthcare ServicesInc Morgan Stanley (12,514)
(5,311) Amneal PharmaceuticalsInc Barclays Bank (53)
(58,401) Amneal PharmaceuticalsInc Goldman Sachs 7,008
9,232 Amphastar PharmaceuticalsInc
Bank of AmericaMerrill Lynch (9,601)
26,407 Amphastar PharmaceuticalsInc Barclays Bank (22,182)
Holding Description Counterparty
Netunrealised
appreciation/(depreciation)
USD
United States continued20,615 Amphastar Pharmaceuticals
Inc Goldman Sachs (21,440)22,933 Amphastar Pharmaceuticals
Inc HSBC (5,275)73,260 Amphastar Pharmaceuticals
Inc Morgan Stanley (61,538)(9,867) Amphenol Corp ’A’ Bank of America
Merrill Lynch (4,404)(28,877) Amphenol Corp ’A’ Barclays Bank (4,276)(7,075) Amphenol Corp ’A’ Goldman Sachs (1,397)(1,622) Amphenol Corp ’A’ HSBC (324)
(43,714) Amphenol Corp ’A’ Morgan Stanley (8,306)6,614 Amyris Inc Bank of America
Merrill Lynch 11,14510,696 Amyris Inc Barclays Bank 8,9852,887 Amyris Inc Goldman Sachs 4,8653,272 Amyris Inc HSBC 9,1291,810 Amyris Inc Morgan Stanley 1,520(607) Analog Devices Inc Bank of America
Merrill Lynch (679)(13,419) Analog Devices Inc Barclays Bank (28,046)(3,751) Analog Devices Inc Goldman Sachs (61,892)(1,154) Analog Devices Inc HSBC (15,937)8,728 Analog Devices Inc Morgan Stanley 18,242
(2,100) Analog Devices Inc Morgan Stanley (4,389)(7,972) Anaplan Inc Bank of America
Merrill Lynch 13,154(14,724) Anaplan Inc Barclays Bank 91,142(8,785) Anaplan Inc HSBC 26,355(1,395) Anaplan Inc Morgan Stanley 8,635(9,185) AnaptysBio Inc Barclays Bank 7,256(2,055) AnaptysBio Inc Goldman Sachs 4,213(1,480) Anavex Life Sciences Corp Bank of America
Merrill Lynch (1,732)(6,340) Anavex Life Sciences Corp Goldman Sachs (7,418)(6,055) Anavex Life Sciences Corp Morgan Stanley (6,237)1,635 Andersons Inc Bank of America
Merrill Lynch 9816,260 Andersons Inc Barclays Bank (325)9,159 Andersons Inc Goldman Sachs 5843,698 Andersons Inc HSBC 41
13,440 Andersons Inc Morgan Stanley 3(29,173) Angi Inc Bank of America
Merrill Lynch (46,917)(30,399) Angi Inc Barclays Bank 7,397(53,540) Angi Inc Goldman Sachs (85,084)(3,847) Angi Inc HSBC (6,155)
(22,451) Angi Inc Morgan Stanley 5,8373,938 AngioDynamics Inc Goldman Sachs (79)
16,555 AngioDynamics Inc Morgan Stanley (14,072)8,900 Angion Biomedica Corp Bank of America
Merrill Lynch 14,4183,617 Angion Biomedica Corp Barclays Bank 9042,845 Angion Biomedica Corp Morgan Stanley 711
(6,656) ANI Pharmaceuticals Inc Bank of AmericaMerrill Lynch 16,174
(8,869) ANI Pharmaceuticals Inc Barclays Bank 4,878(18,693) ANI Pharmaceuticals Inc Goldman Sachs 45,424(2,632) ANI Pharmaceuticals Inc HSBC (3,816)(3,745) ANI Pharmaceuticals Inc Morgan Stanley 2,060(4,762) Anika Therapeutics Inc Bank of America
Merrill Lynch (18,238)(7,909) Anika Therapeutics Inc Barclays Bank (21,908)
133,795 Annaly Capital ManagementInc (REIT)
Bank of AmericaMerrill Lynch 13,380
124,453 Annaly Capital ManagementInc (REIT) Barclays Bank 1,245
4,557 Annaly Capital ManagementInc (REIT) Goldman Sachs 456
BlackRock Americas Diversified Equity Absolute Return FundcontinuedPortfolio of Investments as at 31 May 2021
The notes on pages 590 to 610 form an integral part of these financial statements.
Annual report and audited financial statements [69]

Holding Description Counterparty
Netunrealised
appreciation/(depreciation)
USD
United States continued9,141 Annaly Capital Management
Inc (REIT) HSBC 27(4,701) Annexon Inc Bank of America
Merrill Lynch (1,692)(637) Annexon Inc Barclays Bank (363)
(6,079) Annexon Inc Goldman Sachs (2,188)(625) ANSYS Inc Barclays Bank 519773 ANSYS Inc Barclays Bank (642)
(343) ANSYS Inc Goldman Sachs (5,732)886 ANSYS Inc Goldman Sachs 1,277
(1,135) ANSYS Inc HSBC (16,764)(3,277) ANSYS Inc Morgan Stanley 2,720
429 ANSYS Inc Morgan Stanley (356)(44,735) Antares Pharma Inc Bank of America
Merrill Lynch 3,131(20,970) Antares Pharma Inc Barclays Bank 2,307(24,065) Antares Pharma Inc HSBC (4,091)(9,830) Antares Pharma Inc Morgan Stanley 1,081(7,697) Anterix Inc Bank of America
Merrill Lynch (18,319)(987) Anterix Inc Barclays Bank (1,086)
(3,032) Anterix Inc Goldman Sachs (3,811)(2,171) Anterix Inc HSBC (2,974)(6,466) Anterix Inc Morgan Stanley (7,113)26,318 Antero Midstream Corp Bank of America
Merrill Lynch (8,422)32,849 Antero Resources Corp Morgan Stanley 5,5841,689 Anthem Inc Morgan Stanley 6,553
(2,845) Aon Plc ’A’ Barclays Bank (541)(507) Aon Plc ’A’ Goldman Sachs 190
(3,738) APA Corp Bank of AmericaMerrill Lynch 5,084
(49,667) APA Corp Barclays Bank 3,973(9,850) APA Corp Goldman Sachs 13,396
(36,848) APA Corp Morgan Stanley 2,948(3,944) Apartment Income Corp
(REIT)Bank of AmericaMerrill Lynch (7,336)
(3,770) Apartment Income Corp(REIT) Barclays Bank (2,149)
1,086 Apartment Income Corp(REIT) Barclays Bank 619
(13,528) Apartment Income Corp(REIT) HSBC (28,544)
(7,577) Apartment Income Corp(REIT) Morgan Stanley (4,319)
92,995 Apartment Investment andManagement Co ’A’(REIT) Barclays Bank 2,790
139,569 Apartment Investment andManagement Co ’A’(REIT) Goldman Sachs 51,641
27,862 Apartment Investment andManagement Co ’A’(REIT) Morgan Stanley 836
(988) Apellis Pharmaceuticals Inc Bank of AmericaMerrill Lynch (3,181)
(6,705) Apellis Pharmaceuticals Inc Barclays Bank (60,881)(13,220) Apellis Pharmaceuticals Inc Goldman Sachs (42,569)(3,142) Apellis Pharmaceuticals Inc HSBC (34,970)(2,310) Apellis Pharmaceuticals Inc Morgan Stanley (20,975)
(17,708) API Group Corp Bank of AmericaMerrill Lynch (30,812)
(25,064) API Group Corp Barclays Bank (24,061)4,479 API Group Corp Barclays Bank 4,300
(15,461) API Group Corp Goldman Sachs (26,902)(6,639) API Group Corp Morgan Stanley (133)(9,167) Apogee Enterprises Inc Bank of America
Merrill Lynch (5,806)(5,111) Apogee Enterprises Inc Barclays Bank (1,650)
(11,031) Apogee Enterprises Inc Goldman Sachs (8,363)
Holding Description Counterparty
Netunrealised
appreciation/(depreciation)
USD
United States continued(7,840) Apogee Enterprises Inc Morgan Stanley (1,635)
(29,912) Apollo Commercial RealEstate Finance Inc (REIT) Morgan Stanley (7,179)
17,292 Apollo Global ManagementInc Barclays Bank (2,094)
(18,298) Apollo Medical Holdings Inc Barclays Bank 732(10,872) Apollo Medical Holdings Inc HSBC (2,935)(4,192) Apollo Medical Holdings Inc Morgan Stanley 168(3,551) Appfolio Inc ’A’ Bank of America
Merrill Lynch (30,680)(5,204) Appfolio Inc ’A’ Barclays Bank (4,735)(4,617) Appfolio Inc ’A’ Goldman Sachs (39,126)
(672) Appfolio Inc ’A’ HSBC (5,060)(1,972) Appfolio Inc ’A’ Morgan Stanley (1,795)1,341 Appian Corp Bank of America
Merrill Lynch 12,042(2,826) Appian Corp Barclays Bank (18,058)1,103 Appian Corp Barclays Bank 7,0481,008 Appian Corp Goldman Sachs 9,051
966 Appian Corp HSBC 3,168276 Appian Corp Morgan Stanley 1,764
(39,685) Apple Hospitality Inc (REIT) Bank of AmericaMerrill Lynch (16,109)
(48,384) Apple Hospitality Inc (REIT) Barclays Bank (20,395)(43,631) Apple Hospitality Inc (REIT) Goldman Sachs (16,200)(5,597) Apple Hospitality Inc (REIT) HSBC (2,947)
(73,152) Apple Hospitality Inc (REIT) Morgan Stanley (28,248)14,925 Apple Inc Bank of America
Merrill Lynch (24,097)21,765 Apple Inc Barclays Bank (54,195)1,326 Apple Inc Goldman Sachs (1,852)2,363 Apple Inc HSBC (1,731)
15,079 Applied Genetic Technolo-gies Corp
Bank of AmericaMerrill Lynch 2,563
4,641 Applied Genetic Technolo-gies Corp Goldman Sachs 789
5,742 Applied Genetic Technolo-gies Corp HSBC 1,148
21,202 Applied Industrial Technolo-gies Inc
Bank of AmericaMerrill Lynch (100,285)
11,156 Applied Industrial Technolo-gies Inc Barclays Bank 10,710
13,785 Applied Industrial Technolo-gies Inc Goldman Sachs (65,203)
13,766 Applied Industrial Technolo-gies Inc HSBC (95,737)
4,227 Applied Industrial Technolo-gies Inc Morgan Stanley 684
13,627 Applied Materials Inc Bank of AmericaMerrill Lynch 198,409
(12,029) Applied Materials Inc Barclays Bank (41,062)8,655 Applied Materials Inc Goldman Sachs 126,017
(2,345) Applied Materials Inc Goldman Sachs (33,422)(251) Applied Materials Inc HSBC (3,373)
9,885 Applied Materials Inc Morgan Stanley 35,092(10,426) Applied Materials Inc Morgan Stanley (37,012)(4,100) Applied Molecular Transport
IncBank of AmericaMerrill Lynch (3,608)
(1,082) Applied Molecular TransportInc Goldman Sachs (952)
6,308 Applied Optoelectronics Inc Bank of AmericaMerrill Lynch 2,839
11,181 Applied Optoelectronics Inc Barclays Bank 4,24919,386 Applied Optoelectronics Inc Goldman Sachs 8,72417,071 Applied Optoelectronics Inc HSBC 11,95020,252 Applied Optoelectronics Inc Morgan Stanley 7,6964,034 Applied Therapeutics Inc Bank of America
Merrill Lynch 18,4352,648 Applied Therapeutics Inc Goldman Sachs 12,1017,069 Applied Therapeutics Inc HSBC 21,207
BlackRock Americas Diversified Equity Absolute Return FundcontinuedPortfolio of Investments as at 31 May 2021
The notes on pages 590 to 610 form an integral part of these financial statements.
BlackRock Strategic Funds[70]

Holding Description Counterparty
Netunrealised
appreciation/(depreciation)
USD
United States continued1,365 AppLovin Corp ’A’ Barclays Bank 5,460
941 AppLovin Corp ’A’ Goldman Sachs 11,1701,134 AppLovin Corp ’A’ HSBC 21,331
530 AppLovin Corp ’A’ Morgan Stanley 2,120(23,756) Aprea Therapeutics Inc Goldman Sachs (475)
3,657 Apria Inc Bank of AmericaMerrill Lynch 4,169
1,247 Apria Inc Goldman Sachs 1,4222,292 AptarGroup Inc Bank of America
Merrill Lynch (13,294)4,729 AptarGroup Inc Barclays Bank (9,222)
(2,271) AptarGroup Inc Goldman Sachs 13,1724,764 AptarGroup Inc HSBC (38,922)7,687 AptarGroup Inc Morgan Stanley (14,990)
(1,528) AptarGroup Inc Morgan Stanley 2,9801,768 Aptevo Therapeutics Inc Bank of America
Merrill Lynch 5,30414,633 Aptinyx Inc Goldman Sachs (293)40,945 Aptinyx Inc HSBC 3,27661,021 Aptinyx Inc Morgan Stanley (3,661)
(664) Aptiv Plc Bank of AmericaMerrill Lynch (8,083)
(2,272) Aptiv Plc Barclays Bank (20,357)2,262 Aptiv Plc Goldman Sachs 25,7425,844 Aptiv Plc HSBC 38,804
(5,072) Aptiv Plc Morgan Stanley (45,445)(6,728) Apyx Medical Corp Bank of America
Merrill Lynch 1,547(9,287) Apyx Medical Corp Barclays Bank 4,644
(30,004) Apyx Medical Corp Goldman Sachs 6,901(6,926) Apyx Medical Corp Morgan Stanley 3,463(6,394) Aqua Metals Inc Bank of America
Merrill Lynch (2,238)(63,743) Aqua Metals Inc Morgan Stanley (22,310)(21,788) AquaBounty Technologies
Inc Barclays Bank (5,665)7,911 Aquestive Therapeutics Inc Bank of America
Merrill Lynch 1,82024,829 Aquestive Therapeutics Inc Barclays Bank 6,95211,329 Aquestive Therapeutics Inc Morgan Stanley 3,17227,934 Aramark Bank of America
Merrill Lynch (29,582)8,376 Aramark Barclays Bank (754)3,707 Aramark Goldman Sachs (4,745)
(4,025) Aramark HSBC 1,0871,613 Aramark Morgan Stanley (145)
(4,185) Aramark Morgan Stanley 377(5,036) Aravive Inc Bank of America
Merrill Lynch (1,460)(15,454) Aravive Inc Goldman Sachs (4,482)(1,683) Aravive Inc HSBC (488)(2,756) Aravive Inc Morgan Stanley (248)11,787 Arbor Realty Trust Inc
(REIT)Bank of AmericaMerrill Lynch 5,894
33,108 Arbor Realty Trust Inc(REIT) Barclays Bank 24,500
39,748 Arbor Realty Trust Inc(REIT) Goldman Sachs 19,874
13,659 Arbor Realty Trust Inc(REIT) HSBC 9,092
33,150 Arbor Realty Trust Inc(REIT) Morgan Stanley 24,531
62,980 ARC Document SolutionsInc
Bank of AmericaMerrill Lynch 4,409
8,327 ArcBest Corp Barclays Bank 4,2473,470 ArcBest Corp Goldman Sachs (16,483)5,053 ArcBest Corp Morgan Stanley 2,577
28,652 Arch Capital Group Ltd Barclays Bank (1,146)2,504 Arch Capital Group Ltd HSBC (75)
(6,187) Arch Capital Group Ltd Morgan Stanley 247
Holding Description Counterparty
Netunrealised
appreciation/(depreciation)
USD
United States continued(3,470) Archer-Daniels-Midland Co HSBC 3,817
(39,072) Archer-Daniels-Midland Co Morgan Stanley 3,51616,632 Archrock Inc Goldman Sachs (7,651)9,112 Archrock Inc HSBC (2,551)
73,230 Archrock Inc Morgan Stanley (9,760)(19,557) Arcimoto Inc Barclays Bank (30,118)(1,682) Arconic Corp Barclays Bank (913)(4,174) Arconic Corp Goldman Sachs (938)
(11,433) Arconic Corp Morgan Stanley (10,176)(4,799) Arcosa Inc Bank of America
Merrill Lynch (5,110)(24,161) Arcosa Inc Barclays Bank (19,447)(6,365) Arcosa Inc Goldman Sachs (8,149)(1,292) Arcosa Inc Morgan Stanley (1,202)(2,211) Arcturus Therapeutics Hold-
ings IncBank of AmericaMerrill Lynch (1,039)
(3,965) Arcturus Therapeutics Hold-ings Inc Barclays Bank (3,727)
(4,167) Arcturus Therapeutics Hold-ings Inc Goldman Sachs (1,958)
(840) Arcturus Therapeutics Hold-ings Inc HSBC (260)
(6,695) Arcus Biosciences Inc Bank of AmericaMerrill Lynch 21,089
(2,934) Arcus Biosciences Inc Barclays Bank (792)(3,998) Arcus Biosciences Inc Goldman Sachs 12,5941,033 Arcutis Biotherapeutics Inc Barclays Bank 1,1364,140 Arcutis Biotherapeutics Inc Goldman Sachs 5,2584,485 Arcutis Biotherapeutics Inc HSBC (27,807)
14,729 Ardagh Group SA Morgan Stanley (21,652)(40,292) Ardelyx Inc Bank of America
Merrill Lynch (12,893)(33,496) Ardelyx Inc Barclays Bank (7,034)(62,432) Ardelyx Inc Goldman Sachs (19,978)(2,921) Ardelyx Inc HSBC (1,753)
(17,672) Ardelyx Inc Morgan Stanley (3,711)18,887 Ardmore Shipping Corp Barclays Bank (7,177)67,226 Ardmore Shipping Corp Goldman Sachs (19,496)(4,375) Arena Pharmaceuticals Inc Bank of America
Merrill Lynch (963)(4,608) Arena Pharmaceuticals Inc Barclays Bank 7,834(4,134) Arena Pharmaceuticals Inc Goldman Sachs (909)(4,861) Arena Pharmaceuticals Inc Morgan Stanley 8,264
(22,780) Ares Commercial Real Es-tate Corp (REIT)
Bank of AmericaMerrill Lynch (6,606)
(29,881) Ares Commercial Real Es-tate Corp (REIT) Barclays Bank 2,988
(53,724) Ares Commercial Real Es-tate Corp (REIT) Goldman Sachs (15,580)
1,677 Ares Management Corp ’A’ Bank of AmericaMerrill Lynch 5,484
12,730 Ares Management Corp ’A’ Barclays Bank 11,7121,474 Ares Management Corp ’A’ Goldman Sachs 1201,496 Ares Management Corp ’A’ Morgan Stanley 1,376
(14,930) Argan Inc Bank of AmericaMerrill Lynch 3,882
(2,428) Argan Inc Barclays Bank 2,161(3,188) Argan Inc Goldman Sachs 829(6,962) Argan Inc HSBC (627)(7,728) Argan Inc Morgan Stanley 6,8787,442 Argo Group International
Holdings LtdBank of AmericaMerrill Lynch (30,289)
2,946 Argo Group InternationalHoldings Ltd Barclays Bank (1,385)
961 Argo Group InternationalHoldings Ltd Goldman Sachs (3,911)
5,016 Argo Group InternationalHoldings Ltd HSBC (19,312)
546 Arista Networks Inc Barclays Bank 1,594(322) Arista Networks Inc Goldman Sachs 356
BlackRock Americas Diversified Equity Absolute Return FundcontinuedPortfolio of Investments as at 31 May 2021
The notes on pages 590 to 610 form an integral part of these financial statements.
Annual report and audited financial statements [71]

Holding Description Counterparty
Netunrealised
appreciation/(depreciation)
USD
United States continued297 Arista Networks Inc Goldman Sachs 3,584
(890) Arista Networks Inc HSBC (11,730)(3,017) Arista Networks Inc Morgan Stanley (8,810)2,407 Arista Networks Inc Morgan Stanley 7,028
(15,434) Arko Corp Barclays Bank 3,550(47,845) Arlington Asset Investment
Corp ’A’ (REIT) Goldman Sachs (2,392)(74,648) Arlington Asset Investment
Corp ’A’ (REIT) HSBC (746)(8,561) Arlington Asset Investment
Corp ’A’ (REIT) Morgan Stanley 171(36,686) Arlo Technologies Inc Goldman Sachs (16,142)26,782 Armada Hoffler Properties
Inc (REIT) Goldman Sachs 6,1604,751 Armada Hoffler Properties
Inc (REIT) HSBC (570)94,087 Armada Hoffler Properties
Inc (REIT) Morgan Stanley 14,113(2,223) ARMOUR Residential Inc
(REIT)Bank of AmericaMerrill Lynch (57)
(51,360) ARMOUR Residential Inc(REIT) Barclays Bank (514)
(7,149) ARMOUR Residential Inc(REIT) Goldman Sachs (71)
(40,892) ARMOUR Residential Inc(REIT) Morgan Stanley (409)
(4,091) Armstrong World IndustriesInc
Bank of AmericaMerrill Lynch 655
(4,911) Armstrong World IndustriesInc HSBC (1,572)
(4,890) Armstrong World IndustriesInc Morgan Stanley (13,105)
(2,970) Array Technologies Inc Bank of AmericaMerrill Lynch (889)
(3,678) Array Technologies Inc Goldman Sachs (7,540)(428) Arrow Electronics Inc Goldman Sachs 73
(4,979) Arrow Electronics Inc HSBC (14,987)(10,752) Arrow Electronics Inc Morgan Stanley 35,697
8,990 Arrow Financial Corp Bank of AmericaMerrill Lynch 1,349
23,038 Arrow Financial Corp Barclays Bank 19,58211,349 Arrow Financial Corp Goldman Sachs 1,70217,360 Arrow Financial Corp HSBC (11,631)14,548 Arrow Financial Corp Morgan Stanley 12,366
(12,005) Arrowhead PharmaceuticalsInc
Bank of AmericaMerrill Lynch 5,290
(11,395) Arrowhead PharmaceuticalsInc Barclays Bank 25,525
(1,064) Arrowhead PharmaceuticalsInc Goldman Sachs 479
(1,289) Arrowhead PharmaceuticalsInc HSBC (8,379)
(6,351) Arrowhead PharmaceuticalsInc Morgan Stanley 13,535
4,086 Artesian Resources Corp ’A’ Goldman Sachs 3,96315,414 Artesian Resources Corp ’A’ Morgan Stanley 4,162(2,125) Arthur J Gallagher & Co Bank of America
Merrill Lynch (234)(10,819) Arthur J Gallagher & Co Barclays Bank (16,445)(1,455) Arthur J Gallagher & Co Morgan Stanley (2,211)2,071 Artisan Partners Asset Man-
agement Inc ’A’Bank of AmericaMerrill Lynch (104)
808 Artisan Partners Asset Man-agement Inc ’A’ Barclays Bank (129)
535 Artisan Partners Asset Man-agement Inc ’A’ Goldman Sachs (27)
9,857 Artisan Partners Asset Man-agement Inc ’A’ HSBC (52,143)
21,697 Artisan Partners Asset Man-agement Inc ’A’ Morgan Stanley (3,471)
Holding Description Counterparty
Netunrealised
appreciation/(depreciation)
USD
United States continued(3,577) Arvinas Inc Bank of America
Merrill Lynch (25,676)(1,202) Arvinas Inc Barclays Bank (8,149)
(886) Arvinas Inc Goldman Sachs (4,873)(315) Arvinas Inc Morgan Stanley (2,278)
(6,301) Asana Inc ’A’ Barclays Bank (5,574)(3,467) Asana Inc ’A’ Goldman Sachs (11,076)
(926) Asana Inc ’A’ HSBC (53)(3,772) Asana Inc ’A’ Morgan Stanley (2,806)1,232 Asbury Automotive Group
Inc Barclays Bank 1,454335 Asbury Automotive Group
Inc Goldman Sachs (2,747)253 Asbury Automotive Group
Inc HSBC (1,822)(11,680) Ascent Global Logistics Inc Bank of America
Merrill Lynch 117(16,747) Ascent Global Logistics Inc Goldman Sachs 17(3,298) Ascent Global Logistics Inc HSBC —(9,988) Ascent Global Logistics Incπ Morgan Stanley —
(38,624) Asensus Surgical Inc Barclays Bank (11,973)8,751 ASGN Inc Bank of America
Merrill Lynch (1,663)4,101 ASGN Inc Barclays Bank 861(104) ASGN Inc Goldman Sachs 20
4,244 ASGN Inc HSBC (8,700)(4,858) ASGN Inc Morgan Stanley (1,020)22,044 ASGN Inc Morgan Stanley 4,629(9,507) Ashland Global Holdings Inc Goldman Sachs (49,627)(7,212) Ashland Global Holdings Inc HSBC (50,412)
(20,635) Ashland Global Holdings Inc Morgan Stanley (99,667)(7,986) Aspen Aerogels Inc Morgan Stanley (1,922)
(17,096) Aspen Group Inc/CO Bank of AmericaMerrill Lynch (10,258)
(19,979) Aspen Group Inc/CO Barclays Bank (1,598)(6,305) Aspen Group Inc/CO Goldman Sachs (3,783)
(16,808) Aspen Group Inc/CO Morgan Stanley (1,345)(571) Aspen Technology Inc Barclays Bank 4,397
3,743 Aspen Technology Inc Barclays Bank (28,821)(668) Aspen Technology Inc Goldman Sachs 4,420
(3,380) Aspen Technology Inc Morgan Stanley 26,0263,860 Aspen Technology Inc Morgan Stanley (29,722)
(5,828) Aspira Women’s Health Inc Bank of AmericaMerrill Lynch (3,089)
(10,832) Aspira Women’s Health Inc Barclays Bank (357)(38,116) Aspira Women’s Health Inc HSBC (28,206)(14,850) Aspira Women’s Health Inc Morgan Stanley (1,188)(14,194) Assembly Biosciences Inc Barclays Bank (1,277)(8,122) Assembly Biosciences Inc Goldman Sachs 81(1,234) Assembly Biosciences Inc HSBC (86)(3,519) Assembly Biosciences Inc Morgan Stanley (317)22,675 AssetMark Financial Hold-
ings IncBank of AmericaMerrill Lynch 32,879
19,102 AssetMark Financial Hold-ings Inc Barclays Bank 16,237
19,752 AssetMark Financial Hold-ings Inc HSBC 62,811
32,466 AssetMark Financial Hold-ings Inc Morgan Stanley 27,596
(106,070) Associated Banc-Corp Bank of AmericaMerrill Lynch 36,064
(34,584) Associated Banc-Corp Barclays Bank (692)(23,930) Associated Banc-Corp Goldman Sachs 8,136(39,064) Associated Banc-Corp Morgan Stanley (781)(7,819) Associated Capital Group
Inc ’A’Bank of AmericaMerrill Lynch (6,568)
(2,131) Associated Capital GroupInc ’A’ Barclays Bank (1,428)
BlackRock Americas Diversified Equity Absolute Return FundcontinuedPortfolio of Investments as at 31 May 2021
The notes on pages 590 to 610 form an integral part of these financial statements.
BlackRock Strategic Funds[72]

Holding Description Counterparty
Netunrealised
appreciation/(depreciation)
USD
United States continued(1,139) Associated Capital Group
Inc ’A’ Goldman Sachs (957)(3,102) Associated Capital Group
Inc ’A’ HSBC (2,947)(2,262) Associated Capital Group
Inc ’A’ Morgan Stanley (1,516)6,447 Assurant Inc Bank of America
Merrill Lynch (1,127)3,601 Assurant Inc Barclays Bank 7,2382,647 Assurant Inc Goldman Sachs (1,350)
(2,462) Assurant Inc HSBC (2,930)(14,076) Assurant Inc Morgan Stanley (28,293)
600 Assurant Inc Morgan Stanley 1,206(1,741) Assured Guaranty Ltd Bank of America
Merrill Lynch (992)(10,705) Assured Guaranty Ltd Barclays Bank (10,812)(1,758) Assured Guaranty Ltd Goldman Sachs (1,002)(6,040) Assured Guaranty Ltd Morgan Stanley (6,100)(8,025) Astec Industries Inc Morgan Stanley (8,747)23,627 Astronics Corp Bank of America
Merrill Lynch 30,00612,932 Astronics Corp Barclays Bank 8,40615,040 Astronics Corp HSBC 19,2516,760 Astronics Corp Morgan Stanley 4,3942,017 AstroNova Inc Bank of America
Merrill Lynch 1,3922,350 AstroNova Inc HSBC 2,7973,017 Asure Software Inc Bank of America
Merrill Lynch 1,2973,230 Asure Software Inc Goldman Sachs 1,3891,820 Asure Software Inc HSBC 1,183
737 AT&T Inc Goldman Sachs (301)(19,936) AT&T Inc HSBC 63,79521,473 AT&T Inc Morgan Stanley (6,871)17,008 Atara Biotherapeutics Inc Bank of America
Merrill Lynch (13,776)14,853 Atara Biotherapeutics Inc Barclays Bank (446)6,745 Atara Biotherapeutics Inc Goldman Sachs (5,463)8,221 Atara Biotherapeutics Inc Morgan Stanley (247)
(5,866) Atea Pharmaceuticals Inc Barclays Bank 1,526(200) Aterian Inc Barclays Bank (143)
3,496 Athene Holding Ltd ’A’ Barclays Bank (245)(10,050) Athenex Inc Bank of America
Merrill Lynch (653)(7,243) Athenex Inc Goldman Sachs (471)
(13,054) Athenex Inc Morgan Stanley (392)1,900 Athersys Inc Bank of America
Merrill Lynch 5744,264 Athersys Inc Goldman Sachs 1,328
115,269 Athersys Inc HSBC 14,98544,484 Athersys Inc Morgan Stanley 4459,034 Athira Pharma Inc Barclays Bank 11,9251,876 Atkore Inc Bank of America
Merrill Lynch (9,530)2,403 Atkore Inc Barclays Bank 1,2982,609 Atkore Inc Goldman Sachs (8,900)3,334 Atkore Inc HSBC (30,056)
808 Atkore Inc Morgan Stanley 4365,504 Atlantic Capital Bancshares
IncBank of AmericaMerrill Lynch 716
24,019 Atlantic Capital BancsharesInc Barclays Bank 22,818
32,811 Atlantic Capital BancsharesInc Goldman Sachs 4,265
12,405 Atlantic Capital BancsharesInc Morgan Stanley 11,785
(2,786) Atlantic Union BanksharesCorp
Bank of AmericaMerrill Lynch (1,869)
(431) Atlantic Union BanksharesCorp Barclays Bank 198
Holding Description Counterparty
Netunrealised
appreciation/(depreciation)
USD
United States continued(1,430) Atlantic Union Bankshares
Corp Goldman Sachs (259)(55,245) Atlantic Union Bankshares
Corp HSBC (64,637)(113,372) Atlantic Union Bankshares
Corp Morgan Stanley 50,086(4,740) Atlanticus Holdings Corp Bank of America
Merrill Lynch (32,327)(7,607) Atlanticus Holdings Corp Barclays Bank (9,737)(4,031) Atlas Air Worldwide Hold-
ings IncBank of AmericaMerrill Lynch (645)
(7,611) Atlas Air Worldwide Hold-ings Inc Barclays Bank (6,545)
(4,782) Atlas Air Worldwide Hold-ings Inc Goldman Sachs (765)
(10,554) Atlas Air Worldwide Hold-ings Inc Morgan Stanley (9,076)
11 Atlas Financial Holdings Inc Bank of AmericaMerrill Lynch —
20,374 Atlas Technical ConsultantsInc
Bank of AmericaMerrill Lynch (2,037)
1,696 Atlassian Corp Plc ’A’ Bank of AmericaMerrill Lynch 35,582
(1,176) Atlassian Corp Plc ’A’ Barclays Bank (12,560)677 Atlassian Corp Plc ’A’ Barclays Bank 7,230
(6,028) Atlassian Corp Plc ’A’ Goldman Sachs (126,467)1,151 Atlassian Corp Plc ’A’ Goldman Sachs 12,2795,893 Atlassian Corp Plc ’A’ Morgan Stanley 62,937
12,656 Atmos Energy Corp Barclays Bank 9,365(13,654) Atmos Energy Corp Barclays Bank 1,09217,163 Atmos Energy Corp Goldman Sachs 11,328(4,053) Atmos Energy Corp Goldman Sachs 1333,519 Atmos Energy Corp HSBC (15,272)
17,323 Atmos Energy Corp Morgan Stanley 12,819(280) Atmos Energy Corp Morgan Stanley (158)
4,726 ATN International Inc Bank of AmericaMerrill Lynch (4,442)
13,874 ATN International Inc Barclays Bank 7,3535,014 ATN International Inc Goldman Sachs (3,679)1,487 ATN International Inc HSBC 454,606 ATN International Inc Morgan Stanley 2,441
(3,205) Atomera Inc Bank of AmericaMerrill Lynch (7,372)
(14,755) Atomera Inc Barclays Bank (18,296)(12,395) Atomera Inc HSBC (38,053)
3,876 Atreca Inc ’A’ Barclays Bank 1,0473,103 Atreca Inc ’A’ Goldman Sachs (1,489)4,260 Atreca Inc ’A’ HSBC (2,939)3,580 AtriCure Inc Bank of America
Merrill Lynch 8,3338,477 AtriCure Inc Barclays Bank 19,4971,802 AtriCure Inc Goldman Sachs (528)
726 AtriCure Inc HSBC 2,395992 Atrion Corp Morgan Stanley 33,629
(29,820) Audacy Inc Bank of AmericaMerrill Lynch (5,666)
(30,648) Audacy Inc Barclays Bank (919)(15,874) Audacy Inc Goldman Sachs (2,857)(7,892) AudioEye Inc Bank of America
Merrill Lynch (16,415)1,637 Autodesk Inc Barclays Bank (2,652)(219) Autodesk Inc Goldman Sachs (2,427)
18,014 Autoliv Inc Barclays Bank 40,5324,171 Automatic Data Processing
IncBank of AmericaMerrill Lynch 6,048
4,435 Automatic Data ProcessingInc Barclays Bank (4,524)
(628) Automatic Data ProcessingInc Barclays Bank 641
BlackRock Americas Diversified Equity Absolute Return FundcontinuedPortfolio of Investments as at 31 May 2021
The notes on pages 590 to 610 form an integral part of these financial statements.
Annual report and audited financial statements [73]

Holding Description Counterparty
Netunrealised
appreciation/(depreciation)
USD
United States continued3,447 Automatic Data Processing
Inc Goldman Sachs 4,998(9,378) Automatic Data Processing
Inc Goldman Sachs (13,598)156 Automatic Data Processing
Inc HSBC 220(2,398) Automatic Data Processing
Inc HSBC (3,030)306 Automatic Data Processing
Inc Morgan Stanley (312)(5,141) Automatic Data Processing
Inc Morgan Stanley 5,244(6,263) AutoNation Inc Barclays Bank (10,931)(4,574) AutoNation Inc Goldman Sachs (2,406)(1,908) AutoNation Inc Morgan Stanley 2,316
(443) AutoZone Inc Bank of AmericaMerrill Lynch 913
(1,128) AutoZone Inc Barclays Bank 12,441(221) AutoZone Inc Goldman Sachs 9,055
(2,178) AutoZone Inc Morgan Stanley 85,127(2,539) Avalara Inc Bank of America
Merrill Lynch (28,589)(370) Avalara Inc Goldman Sachs (4,166)
(3,212) Avalara Inc Morgan Stanley (10,375)(5,805) AvalonBay Communities Inc
(REIT)Bank of AmericaMerrill Lynch (50,329)
(2,830) AvalonBay Communities Inc(REIT) Barclays Bank (10,018)
(3,804) AvalonBay Communities Inc(REIT) Goldman Sachs (32,981)
(4,420) AvalonBay Communities Inc(REIT) HSBC (43,979)
(2,812) AvalonBay Communities Inc(REIT) Morgan Stanley (9,530)
3,962 Avangrid Inc Barclays Bank (991)21,024 Avangrid Inc Goldman Sachs 24,178
(10,363) Avanos Medical Inc Bank of AmericaMerrill Lynch (3,253)
(919) Avanos Medical Inc Barclays Bank 28(2,547) Avanos Medical Inc Goldman Sachs 518
(37,772) Avanos Medical Inc Morgan Stanley 1,133(9,267) Avantor Inc Bank of America
Merrill Lynch (11,584)(11,100) Avantor Inc Barclays Bank (4,995)(2,357) Avantor Inc Morgan Stanley (1,061)(1,416) Avaya Holdings Corp Bank of America
Merrill Lynch (3,682)(1,279) Avaya Holdings Corp Goldman Sachs (3,325)(5,579) Avaya Holdings Corp Morgan Stanley (4,739)11,529 Aveanna Healthcare Hold-
ings Inc Goldman Sachs 12,451(44,928) Avenue Therapeutics Inc Bank of America
Merrill Lynch (34,145)(4,634) Avenue Therapeutics Inc Goldman Sachs (3,522)6,021 AVEO Pharmaceuticals Inc Barclays Bank 2,5899,213 AVEO Pharmaceuticals Inc Morgan Stanley 2,558(649) Avery Dennison Corp HSBC 681
(3,158) Avery Dennison Corp Morgan Stanley (5,432)2,151 Aviat Networks Inc Goldman Sachs (91)1,150 Aviat Networks Inc HSBC 1,202
(6,584) Avid Bioservices Inc Bank of AmericaMerrill Lynch (6,782)
(4,209) Avid Bioservices Inc Barclays Bank (4,588)(27,730) Avid Bioservices Inc Goldman Sachs (28,562)(3,219) Avid Bioservices Inc HSBC (5,022)(5,182) Avid Bioservices Inc Morgan Stanley (5,648)
(10,074) Avid Technology Inc Morgan Stanley (8,160)1,618 Avidity Biosciences Inc Goldman Sachs 4,5633,054 Avidity Biosciences Inc Morgan Stanley 5,497
Holding Description Counterparty
Netunrealised
appreciation/(depreciation)
USD
United States continued5,775 Avient Corp Bank of America
Merrill Lynch (4,955)22,241 Avient Corp Barclays Bank (1,283)16,956 Avient Corp Goldman Sachs (24,247)(8,101) Avient Corp Goldman Sachs 11,5846,622 Avient Corp HSBC (4,967)
(5,319) Avient Corp HSBC 3,98952,009 Avient Corp Morgan Stanley (6,137)(3,275) Avient Corp Morgan Stanley 393(7,479) Avis Budget Group Inc Bank of America
Merrill Lynch 1,758(391) Avis Budget Group Inc Barclays Bank (1,290)
(11,499) Avis Budget Group Inc Goldman Sachs 1,971(2,347) Avis Budget Group Inc Morgan Stanley (7,745)21,050 Avista Corp Bank of America
Merrill Lynch (27,576)(33,185) Avista Corp Bank of America
Merrill Lynch 43,472(25,844) Avista Corp Goldman Sachs 33,856(1,054) Avita Medical Inc Bank of America
Merrill Lynch (464)(14,428) Avita Medical Inc Barclays Bank (577)
6,886 Avnet Inc Barclays Bank (5,509)(12,151) Avnet Inc Barclays Bank 9,721(4,906) Avnet Inc HSBC 29423,225 Avnet Inc Morgan Stanley (18,580)
(833) Avnet Inc Morgan Stanley 6661,292 Avrobio Inc HSBC 1,4869,280 Avrobio Inc Morgan Stanley 2,227
69,061 Axalta Coating Systems Ltd Bank of AmericaMerrill Lynch (30,387)
(7,290) Axalta Coating Systems Ltd Bank of AmericaMerrill Lynch 478
9,681 Axalta Coating Systems Ltd Barclays Bank 8,229(11,204) Axalta Coating Systems Ltd Barclays Bank (9,523)24,389 Axalta Coating Systems Ltd Goldman Sachs (10,731)
(15,789) Axalta Coating Systems Ltd Goldman Sachs (7,783)602 Axalta Coating Systems Ltd HSBC (746)280 Axalta Coating Systems Ltd Morgan Stanley 238
(4,779) Axcelis Technologies Inc Bank of AmericaMerrill Lynch (13,876)
(6,363) Axcelis Technologies Inc Barclays Bank (5,165)(5,788) Axcelis Technologies Inc Goldman Sachs (1,061)
(17,884) Axcelis Technologies Inc HSBC (49,002)(17,774) Axcelis Technologies Inc Morgan Stanley (14,041)
6,985 Axcella Health Inc Bank of AmericaMerrill Lynch (1,257)
3,521 Axcella Health Inc Morgan Stanley 1411,207 Axis Capital Holdings Ltd Bank of America
Merrill Lynch (3,042)1,818 Axis Capital Holdings Ltd Barclays Bank (1,036)
941 Axis Capital Holdings Ltd Goldman Sachs (2,371)2,651 Axis Capital Holdings Ltd HSBC (8,351)
(15,531) Axis Capital Holdings Ltd Morgan Stanley 8,8536,381 Axis Capital Holdings Ltd Morgan Stanley 222
10,260 Axogen Inc Barclays Bank (7,490)2,508 Axogen Inc HSBC (3,712)6,722 Axogen Inc Morgan Stanley (4,907)1,522 Axon Enterprise Inc Bank of America
Merrill Lynch 10,654213 Axon Enterprise Inc Barclays Bank 2,258970 Axon Enterprise Inc Goldman Sachs 6,790295 Axon Enterprise Inc HSBC 3,419
5,054 Axon Enterprise Inc Morgan Stanley 53,572(6,589) Axonics Inc Goldman Sachs (21,612)
(31,899) Axos Financial Inc Barclays Bank (52,633)(9,358) Axos Financial Inc Goldman Sachs (8,329)(3,595) Axos Financial Inc HSBC (6,363)
BlackRock Americas Diversified Equity Absolute Return FundcontinuedPortfolio of Investments as at 31 May 2021
The notes on pages 590 to 610 form an integral part of these financial statements.
BlackRock Strategic Funds[74]

Holding Description Counterparty
Netunrealised
appreciation/(depreciation)
USD
United States continued(32,448) Axos Financial Inc Morgan Stanley (53,539)
336 Axsome Therapeutics Inc Bank of AmericaMerrill Lynch 588
3,669 Axsome Therapeutics Inc Barclays Bank 20,840653 Axsome Therapeutics Inc Goldman Sachs 1,143
2,659 Axsome Therapeutics Inc Morgan Stanley 15,103(37,549) AXT Inc Morgan Stanley (3,755)
8,072 Aytu BioPharma Inc Bank of AmericaMerrill Lynch (4,278)
37,341 Aytu BioPharma Inc Goldman Sachs (19,791)4,878 AZEK Co Inc Goldman Sachs 1,073
747 Aziyo Biologics Inc ’A’ Bank of AmericaMerrill Lynch 1,158
3,029 Aziyo Biologics Inc ’A’ Barclays Bank 2,1201,765 Aziyo Biologics Inc ’A’ Goldman Sachs 2,736
471 Aziyo Biologics Inc ’A’ HSBC 5471,730 Aziyo Biologics Inc ’A’ Morgan Stanley 1,211
(34,789) AZZ Inc Barclays Bank 7,306(14,906) AZZ Inc Goldman Sachs 9,838
4,616 B Riley Financial Inc Bank of AmericaMerrill Lynch (6,093)
5,234 B Riley Financial Inc Barclays Bank (733)(25,963) B&G Foods Inc Bank of America
Merrill Lynch (39,237)(14,789) B&G Foods Inc Barclays Bank (18,634)(6,261) B&G Foods Inc Goldman Sachs (2,150)
(18,922) Babcock & Wilcox Enter-prises Inc Barclays Bank (11,732)
(3,755) Babcock & Wilcox Enter-prises Inc Goldman Sachs (2,854)
1,287 Badger Meter Inc Bank of AmericaMerrill Lynch (628)
7,196 Badger Meter Inc Morgan Stanley 21,3003,309 Baker Hughes Co Bank of America
Merrill Lynch (6,320)21,958 Baker Hughes Co HSBC 5,59512,006 Baker Hughes Co Morgan Stanley (9,005)2,510 Balchem Corp Bank of America
Merrill Lynch (25)13,050 Balchem Corp Morgan Stanley 21,533(4,382) Ball Corp Bank of America
Merrill Lynch 26,201(13,496) Ball Corp Barclays Bank 63,42512,357 Ball Corp Barclays Bank (18,239)
(20,103) Ball Corp Goldman Sachs 126,0181,686 Ball Corp Goldman Sachs (10,908)3,006 Ball Corp HSBC (21,341)
(20,392) Ball Corp Morgan Stanley 100,94010,863 Ball Corp Morgan Stanley (27,291)
(298) Bally’s Corp Bank of AmericaMerrill Lynch (1,383)
(627) Bally’s Corp Goldman Sachs (2,909)(6,276) Bally’s Corp HSBC (17,949)(1,129) Banc of California Inc Bank of America
Merrill Lynch 169(1,998) Banc of California Inc Barclays Bank 440(2,672) Banc of California Inc Goldman Sachs 401
(63,893) Banc of California Inc HSBC 13,418(44,729) Banc of California Inc Morgan Stanley 9,840(26,311) BancFirst Corp Bank of America
Merrill Lynch 89,984(466) BancFirst Corp Goldman Sachs 1,594
(3,667) BancFirst Corp Morgan Stanley (183)5,618 Bancorp Inc HSBC (4,270)
26,126 BancorpSouth Bank Bank of AmericaMerrill Lynch (20,962)
26,644 BancorpSouth Bank Barclays Bank (2,132)34,622 BancorpSouth Bank Goldman Sachs (37,045)3,247 BancorpSouth Bank HSBC (86)
Holding Description Counterparty
Netunrealised
appreciation/(depreciation)
USD
United States continued14,432 BancorpSouth Bank Morgan Stanley (1,155)1,628 Bandwidth Inc ’A’ Bank of America
Merrill Lynch 7,6122,754 Bandwidth Inc ’A’ Barclays Bank 735
138 Bandwidth Inc ’A’ Goldman Sachs 7882,797 Bandwidth Inc ’A’ HSBC 5,3061,332 Bandwidth Inc ’A’ Morgan Stanley 2,398
(10,897) Bank First Corp Barclays Bank 10,679(43,767) Bank of America Corp Barclays Bank 10,504(26,052) Bank of America Corp Goldman Sachs 9,118(5,785) Bank of America Corp HSBC (1,967)
(45,696) Bank of America Corp Morgan Stanley 10,96795,585 Bank of Commerce Hold-
ingsBank of AmericaMerrill Lynch 55,439
26,297 Bank of Commerce Hold-ings Goldman Sachs 15,252
16,442 Bank of Commerce Hold-ings Morgan Stanley 4,111
4,740 Bank of Hawaii Corp Bank of AmericaMerrill Lynch (15,500)
2,124 Bank of Hawaii Corp Barclays Bank (1,020)13,242 Bank of Hawaii Corp Goldman Sachs (43,301)8,480 Bank of Hawaii Corp HSBC (29,256)
12,321 Bank of Hawaii Corp Morgan Stanley (5,914)5,609 Bank of Marin Bancorp Barclays Bank (4,095)
19,838 Bank of Marin Bancorp Goldman Sachs (42,850)3,776 Bank of Marin Bancorp Morgan Stanley (2,756)
10,480 Bank of New York MellonCorp
Bank of AmericaMerrill Lynch (105)
7,562 Bank of New York MellonCorp Barclays Bank 2,571
(7,722) Bank of New York MellonCorp Barclays Bank (2,625)
8,643 Bank of New York MellonCorp Goldman Sachs (86)
(4,117) Bank of New York MellonCorp Goldman Sachs 1
12,585 Bank of New York MellonCorp HSBC (2,391)
(2,032) Bank of New York MellonCorp HSBC 386
25,462 Bank of New York MellonCorp Morgan Stanley 8,657
(5,347) Bank of New York MellonCorp Morgan Stanley (1,626)
(5,303) Bank of Princeton Bank of AmericaMerrill Lynch 5,038
(1,049) Bank of Princeton HSBC 136(3,062) Bank of Princeton Morgan Stanley 2,8483,205 Bank OZK Bank of America
Merrill Lynch (2,340)15,392 Bank OZK HSBC (3,540)7,890 Bank OZK Morgan Stanley 1,578
463 Bank7 Corp Bank of AmericaMerrill Lynch 458
2,080 Bank7 Corp Barclays Bank 1,4353,117 Bank7 Corp Goldman Sachs 3,086
11,846 Bank7 Corp HSBC 14,5712,378 Bank7 Corp Morgan Stanley 1,641
62,511 BankFinancial Corp Bank of AmericaMerrill Lynch 18,753
57,827 BankFinancial Corp Goldman Sachs 17,34848,456 BankFinancial Corp Morgan Stanley 9,207
(21,875) BankUnited Inc Bank of AmericaMerrill Lynch 2,844
(19,506) BankUnited Inc Barclays Bank (7,997)(19,002) BankUnited Inc Goldman Sachs 2,470(42,216) BankUnited Inc HSBC (13,087)(56,202) BankUnited Inc Morgan Stanley (23,043)
BlackRock Americas Diversified Equity Absolute Return FundcontinuedPortfolio of Investments as at 31 May 2021
The notes on pages 590 to 610 form an integral part of these financial statements.
Annual report and audited financial statements [75]
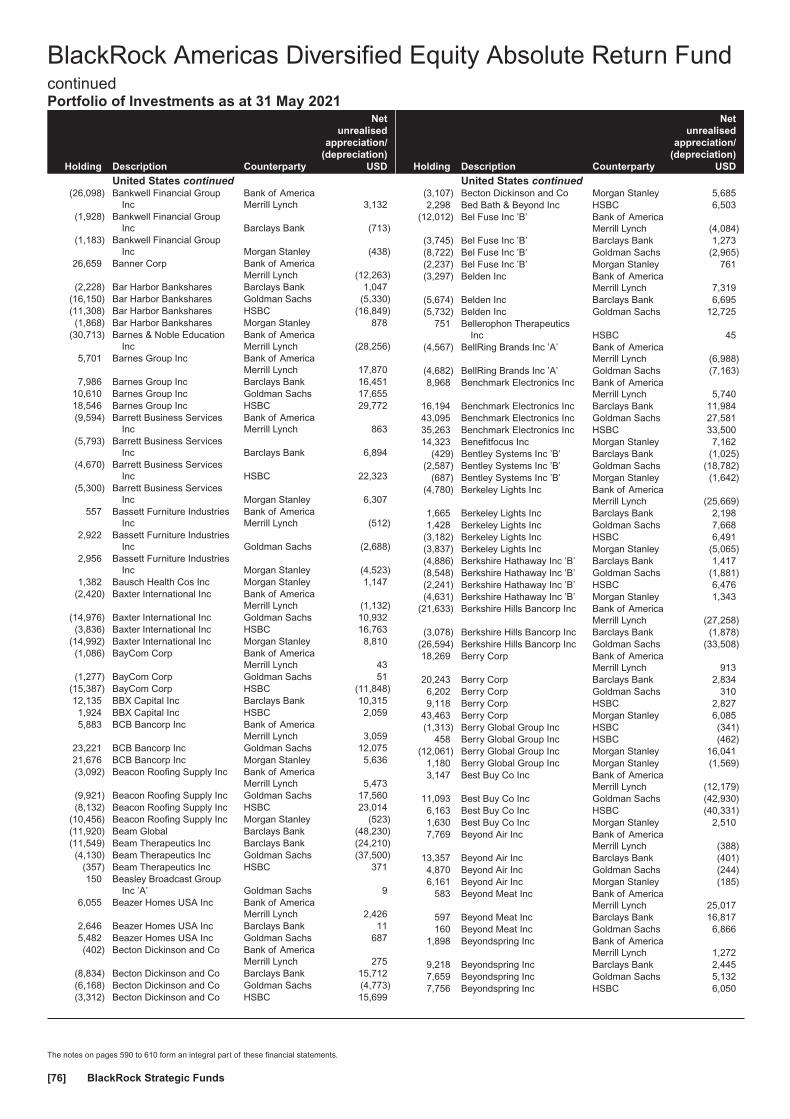
Holding Description Counterparty
Netunrealised
appreciation/(depreciation)
USD
United States continued(26,098) Bankwell Financial Group
IncBank of AmericaMerrill Lynch 3,132
(1,928) Bankwell Financial GroupInc Barclays Bank (713)
(1,183) Bankwell Financial GroupInc Morgan Stanley (438)
26,659 Banner Corp Bank of AmericaMerrill Lynch (12,263)
(2,228) Bar Harbor Bankshares Barclays Bank 1,047(16,150) Bar Harbor Bankshares Goldman Sachs (5,330)(11,308) Bar Harbor Bankshares HSBC (16,849)(1,868) Bar Harbor Bankshares Morgan Stanley 878
(30,713) Barnes & Noble EducationInc
Bank of AmericaMerrill Lynch (28,256)
5,701 Barnes Group Inc Bank of AmericaMerrill Lynch 17,870
7,986 Barnes Group Inc Barclays Bank 16,45110,610 Barnes Group Inc Goldman Sachs 17,65518,546 Barnes Group Inc HSBC 29,772(9,594) Barrett Business Services
IncBank of AmericaMerrill Lynch 863
(5,793) Barrett Business ServicesInc Barclays Bank 6,894
(4,670) Barrett Business ServicesInc HSBC 22,323
(5,300) Barrett Business ServicesInc Morgan Stanley 6,307
557 Bassett Furniture IndustriesInc
Bank of AmericaMerrill Lynch (512)
2,922 Bassett Furniture IndustriesInc Goldman Sachs (2,688)
2,956 Bassett Furniture IndustriesInc Morgan Stanley (4,523)
1,382 Bausch Health Cos Inc Morgan Stanley 1,147(2,420) Baxter International Inc Bank of America
Merrill Lynch (1,132)(14,976) Baxter International Inc Goldman Sachs 10,932(3,836) Baxter International Inc HSBC 16,763
(14,992) Baxter International Inc Morgan Stanley 8,810(1,086) BayCom Corp Bank of America
Merrill Lynch 43(1,277) BayCom Corp Goldman Sachs 51
(15,387) BayCom Corp HSBC (11,848)12,135 BBX Capital Inc Barclays Bank 10,3151,924 BBX Capital Inc HSBC 2,0595,883 BCB Bancorp Inc Bank of America
Merrill Lynch 3,05923,221 BCB Bancorp Inc Goldman Sachs 12,07521,676 BCB Bancorp Inc Morgan Stanley 5,636(3,092) Beacon Roofing Supply Inc Bank of America
Merrill Lynch 5,473(9,921) Beacon Roofing Supply Inc Goldman Sachs 17,560(8,132) Beacon Roofing Supply Inc HSBC 23,014
(10,456) Beacon Roofing Supply Inc Morgan Stanley (523)(11,920) Beam Global Barclays Bank (48,230)(11,549) Beam Therapeutics Inc Barclays Bank (24,210)(4,130) Beam Therapeutics Inc Goldman Sachs (37,500)
(357) Beam Therapeutics Inc HSBC 371150 Beasley Broadcast Group
Inc ’A’ Goldman Sachs 96,055 Beazer Homes USA Inc Bank of America
Merrill Lynch 2,4262,646 Beazer Homes USA Inc Barclays Bank 115,482 Beazer Homes USA Inc Goldman Sachs 687(402) Becton Dickinson and Co Bank of America
Merrill Lynch 275(8,834) Becton Dickinson and Co Barclays Bank 15,712(6,168) Becton Dickinson and Co Goldman Sachs (4,773)(3,312) Becton Dickinson and Co HSBC 15,699
Holding Description Counterparty
Netunrealised
appreciation/(depreciation)
USD
United States continued(3,107) Becton Dickinson and Co Morgan Stanley 5,6852,298 Bed Bath & Beyond Inc HSBC 6,503
(12,012) Bel Fuse Inc ’B’ Bank of AmericaMerrill Lynch (4,084)
(3,745) Bel Fuse Inc ’B’ Barclays Bank 1,273(8,722) Bel Fuse Inc ’B’ Goldman Sachs (2,965)(2,237) Bel Fuse Inc ’B’ Morgan Stanley 761(3,297) Belden Inc Bank of America
Merrill Lynch 7,319(5,674) Belden Inc Barclays Bank 6,695(5,732) Belden Inc Goldman Sachs 12,725
751 Bellerophon TherapeuticsInc HSBC 45
(4,567) BellRing Brands Inc ’A’ Bank of AmericaMerrill Lynch (6,988)
(4,682) BellRing Brands Inc ’A’ Goldman Sachs (7,163)8,968 Benchmark Electronics Inc Bank of America
Merrill Lynch 5,74016,194 Benchmark Electronics Inc Barclays Bank 11,98443,095 Benchmark Electronics Inc Goldman Sachs 27,58135,263 Benchmark Electronics Inc HSBC 33,50014,323 Benefitfocus Inc Morgan Stanley 7,162
(429) Bentley Systems Inc ’B’ Barclays Bank (1,025)(2,587) Bentley Systems Inc ’B’ Goldman Sachs (18,782)
(687) Bentley Systems Inc ’B’ Morgan Stanley (1,642)(4,780) Berkeley Lights Inc Bank of America
Merrill Lynch (25,669)1,665 Berkeley Lights Inc Barclays Bank 2,1981,428 Berkeley Lights Inc Goldman Sachs 7,668
(3,182) Berkeley Lights Inc HSBC 6,491(3,837) Berkeley Lights Inc Morgan Stanley (5,065)(4,886) Berkshire Hathaway Inc ’B’ Barclays Bank 1,417(8,548) Berkshire Hathaway Inc ’B’ Goldman Sachs (1,881)(2,241) Berkshire Hathaway Inc ’B’ HSBC 6,476(4,631) Berkshire Hathaway Inc ’B’ Morgan Stanley 1,343
(21,633) Berkshire Hills Bancorp Inc Bank of AmericaMerrill Lynch (27,258)
(3,078) Berkshire Hills Bancorp Inc Barclays Bank (1,878)(26,594) Berkshire Hills Bancorp Inc Goldman Sachs (33,508)18,269 Berry Corp Bank of America
Merrill Lynch 91320,243 Berry Corp Barclays Bank 2,8346,202 Berry Corp Goldman Sachs 3109,118 Berry Corp HSBC 2,827
43,463 Berry Corp Morgan Stanley 6,085(1,313) Berry Global Group Inc HSBC (341)
458 Berry Global Group Inc HSBC (462)(12,061) Berry Global Group Inc Morgan Stanley 16,041
1,180 Berry Global Group Inc Morgan Stanley (1,569)3,147 Best Buy Co Inc Bank of America
Merrill Lynch (12,179)11,093 Best Buy Co Inc Goldman Sachs (42,930)6,163 Best Buy Co Inc HSBC (40,331)1,630 Best Buy Co Inc Morgan Stanley 2,5107,769 Beyond Air Inc Bank of America
Merrill Lynch (388)13,357 Beyond Air Inc Barclays Bank (401)4,870 Beyond Air Inc Goldman Sachs (244)6,161 Beyond Air Inc Morgan Stanley (185)
583 Beyond Meat Inc Bank of AmericaMerrill Lynch 25,017
597 Beyond Meat Inc Barclays Bank 16,817160 Beyond Meat Inc Goldman Sachs 6,866
1,898 Beyondspring Inc Bank of AmericaMerrill Lynch 1,272
9,218 Beyondspring Inc Barclays Bank 2,4457,659 Beyondspring Inc Goldman Sachs 5,1327,756 Beyondspring Inc HSBC 6,050
BlackRock Americas Diversified Equity Absolute Return FundcontinuedPortfolio of Investments as at 31 May 2021
The notes on pages 590 to 610 form an integral part of these financial statements.
BlackRock Strategic Funds[76]

Holding Description Counterparty
Netunrealised
appreciation/(depreciation)
USD
United States continued15,938 Beyondspring Inc Morgan Stanley 7,331(8,005) BGC Partners Inc ’A’ Bank of America
Merrill Lynch (3,202)(81,353) BGC Partners Inc ’A’ Goldman Sachs (32,541)(69,659) BGC Partners Inc ’A’ HSBC (27,864)
(115,897) BGC Partners Inc ’A’ Morgan Stanley (60,266)(54,650) BGSF Inc Bank of America
Merrill Lynch 42,627(17,150) BGSF Inc Barclays Bank 6,346(8,375) BGSF Inc Goldman Sachs 6,533(4,584) BGSF Inc Morgan Stanley 1,696
(11,889) Big 5 Sporting Goods Corp Barclays Bank (17,631)4,227 Big Lots Inc Barclays Bank (11,413)
990 BigCommerce Holdings Inc Bank of AmericaMerrill Lynch 8,405
885 BigCommerce Holdings Inc Barclays Bank 47892 Biglari Holdings Inc ’A’ Bank of America
Merrill Lynch 4,3826 Biglari Holdings Inc ’A’ Barclays Bank (80)
137 Biglari Holdings Inc ’A’ Goldman Sachs 6,52556 Biglari Holdings Inc ’A’ Morgan Stanley (743)
3,505 Biglari Holdings Inc ’B’ Barclays Bank (25,481)255 Biglari Holdings Inc ’B’ HSBC 1,061
(563) Bill.com Holdings Inc Bank of AmericaMerrill Lynch (6,064)
(1,843) Bill.com Holdings Inc Barclays Bank (442)(799) Bill.com Holdings Inc Goldman Sachs (8,605)
(4,893) Bill.com Holdings Inc Morgan Stanley (1,174)(2,011) BioAtla Inc Bank of America
Merrill Lynch 5,530(2,409) BioAtla Inc Barclays Bank (3,694)(1,700) BioAtla Inc Goldman Sachs 2,624(6,785) BioCryst Pharmaceuticals
Inc Barclays Bank (14,588)46,731 BioDelivery Sciences Inter-
national IncBank of AmericaMerrill Lynch (5,608)
118,119 BioDelivery Sciences Inter-national Inc Barclays Bank (1,181)
30,531 BioDelivery Sciences Inter-national Inc Goldman Sachs (3,664)
22,460 BioDelivery Sciences Inter-national Inc HSBC 7,861
31,303 BioDelivery Sciences Inter-national Inc Morgan Stanley (313)
10,903 Biodesix Inc Goldman Sachs 25,186101 Biogen Inc Bank of America
Merrill Lynch 20(832) Biogen Inc Barclays Bank 9,468(223) Biogen Inc Goldman Sachs 2,881
(7,158) Biohaven PharmaceuticalHolding Co Ltd Barclays Bank (62,896)
(3,525) Biohaven PharmaceuticalHolding Co Ltd Goldman Sachs (55,688)
(1,283) Biohaven PharmaceuticalHolding Co Ltd HSBC (22,658)
(5,044) Biohaven PharmaceuticalHolding Co Ltd Morgan Stanley (37,373)
(4,714) BioLife Solutions Inc Bank of AmericaMerrill Lynch (12,964)
(5,381) BioLife Solutions Inc Goldman Sachs (9,786)(7,924) BioLife Solutions Inc HSBC (19,097)(4,327) BioLife Solutions Inc Morgan Stanley (7,480)4,123 BioMarin Pharmaceutical
IncBank of AmericaMerrill Lynch (126)
1,128 BioMarin PharmaceuticalInc Barclays Bank (282)
7,888 BioMarin PharmaceuticalInc Goldman Sachs (3,495)
1,135 BioMarin PharmaceuticalInc HSBC 1,033
Holding Description Counterparty
Netunrealised
appreciation/(depreciation)
USD
United States continued6,970 BioMarin Pharmaceutical
Inc Morgan Stanley (1,743)1,609 Biomea Fusion Inc Bank of America
Merrill Lynch 2,043963 Biomea Fusion Inc Barclays Bank (183)972 Biomea Fusion Inc Goldman Sachs (229)
7,969 Biomea Fusion Inc Morgan Stanley (1,636)1,240 BioNTech SE ADR Morgan Stanley 11,2962,041 Bio-Rad Laboratories Inc ’A’ Bank of America
Merrill Lynch 25,778460 Bio-Rad Laboratories Inc ’A’ Barclays Bank 4,283134 Bio-Rad Laboratories Inc ’A’ HSBC (172)
1,097 Bio-Rad Laboratories Inc ’A’ Morgan Stanley 10,213(16,107) BioSig Technologies Inc Barclays Bank (4,832)
(541) Bio-Techne Corp Bank of AmericaMerrill Lynch (14,326)
(1,205) Bio-Techne Corp Barclays Bank 8,640(41) Bio-Techne Corp Goldman Sachs (1,086)
(206) Bio-Techne Corp HSBC (1,154)(1,758) Bio-Techne Corp Morgan Stanley 12,605
(14,651) Bioventus Inc Barclays Bank (15,091)(415) Bioxcel Therapeutics Inc Bank of America
Merrill Lynch (822)(1,465) Bioxcel Therapeutics Inc Barclays Bank (1,553)(2,342) Bioxcel Therapeutics Inc Goldman Sachs (4,637)
(766) Bioxcel Therapeutics Inc Morgan Stanley (812)(7,282) BJ’s Restaurants Inc Barclays Bank 437
(11,908) BJ’s Restaurants Inc Goldman Sachs 20,958(406) BJ’s Restaurants Inc Morgan Stanley 24
(1,193) BJ’s Wholesale Club Hold-ings Inc
Bank of AmericaMerrill Lynch 3,178
(280) BJ’s Wholesale Club Hold-ings Inc Barclays Bank (70)
(1,908) BJ’s Wholesale Club Hold-ings Inc HSBC 3,453
(5,213) BJ’s Wholesale Club Hold-ings Inc Morgan Stanley (1,303)
(9,013) Black Diamond Therapeu-tics Inc Morgan Stanley 3,312
(15,221) Black Hills Corp Bank of AmericaMerrill Lynch 3,209
(16,860) Black Hills Corp Barclays Bank 2,306(9,538) Black Hills Corp Goldman Sachs 2,478
(18,552) Black Hills Corp HSBC 56,955(7,891) Black Hills Corp Morgan Stanley 1,796
(16,213) Black Knight Inc Morgan Stanley (3,567)(6,999) Blackbaud Inc Bank of America
Merrill Lynch (7,139)(12,745) Blackbaud Inc Barclays Bank (5,301)(8,542) Blackbaud Inc Goldman Sachs (8,713)(1,243) Blackbaud Inc Morgan Stanley (320)6,026 Blackline Inc Goldman Sachs (2,810)6,915 Blackline Inc Morgan Stanley 415
(8,670) Blackstone Group Inc HSBC (35,200)(10,036) Blackstone Group Inc Morgan Stanley (14,552)(40,544) Blackstone Mortgage Trust
Inc ’A’ (REIT)Bank of AmericaMerrill Lynch (15,812)
22,607 Blackstone Mortgage TrustInc ’A’ (REIT)
Bank of AmericaMerrill Lynch 7,206
(8,273) Blackstone Mortgage TrustInc ’A’ (REIT) Barclays Bank (1,737)
17,820 Blackstone Mortgage TrustInc ’A’ (REIT) Barclays Bank 3,343
(3,341) Blackstone Mortgage TrustInc ’A’ (REIT) Goldman Sachs (1,303)
27,622 Blackstone Mortgage TrustInc ’A’ (REIT) Goldman Sachs 10,699
(9,199) Blackstone Mortgage TrustInc ’A’ (REIT) Morgan Stanley (1,932)
BlackRock Americas Diversified Equity Absolute Return FundcontinuedPortfolio of Investments as at 31 May 2021
The notes on pages 590 to 610 form an integral part of these financial statements.
Annual report and audited financial statements [77]

Holding Description Counterparty
Netunrealised
appreciation/(depreciation)
USD
United States continued35,255 Blackstone Mortgage Trust
Inc ’A’ (REIT) Morgan Stanley 7,57425,103 Bloom Energy Corp ’A’ Bank of America
Merrill Lynch 112,73111,499 Bloom Energy Corp ’A’ Barclays Bank 26,6784,442 Bloom Energy Corp ’A’ Goldman Sachs 20,2557,038 Bloom Energy Corp ’A’ Morgan Stanley 16,328
(21,816) Bloomin’ Brands Inc Bank of AmericaMerrill Lynch (12,653)
(2,812) Bloomin’ Brands Inc Barclays Bank (2,165)(1,991) Bloomin’ Brands Inc Goldman Sachs 8(8,801) Blucora Inc Bank of America
Merrill Lynch (9,857)(27,255) Blucora Inc Barclays Bank (22,077)(17,914) Blucora Inc Goldman Sachs (20,064)(9,472) Blucora Inc HSBC (17,523)(6,703) Blucora Inc Morgan Stanley (5,429)(4,852) Blue Bird Corp Barclays Bank 388(6,847) Blue Bird Corp Goldman Sachs 7,345(5,947) Blue Bird Corp Morgan Stanley (1,378)1,565 Blue Ridge Bankshares Inc Goldman Sachs 13
(3,913) Bluebird Bio Inc Barclays Bank (2,035)(3,571) Bluebird Bio Inc Goldman Sachs (3,813)(4,054) Bluebird Bio Inc HSBC (11,027)(3,530) Bluebird Bio Inc Morgan Stanley (1,836)17,142 Bluegreen Vacations Hold-
ing Corp Barclays Bank (857)4,135 Bluegreen Vacations Hold-
ing Corp HSBC 9,386(1,452) BlueLinx Holdings Inc Barclays Bank 7,667(3,313) Blueprint Medicines Corp Bank of America
Merrill Lynch 9,303(1,454) Blueprint Medicines Corp Barclays Bank 5,001(6,962) Blueprint Medicines Corp Goldman Sachs 17,614
(10,250) Blueprint Medicines Corp Morgan Stanley 35,260(26,759) Bluerock Residential Growth
Inc (REIT) Goldman Sachs (5,352)523 BM Technologies Inc Barclays Bank 6,721
(568) Boeing Co Bank of AmericaMerrill Lynch (10,815)
(2,100) Boeing Co Goldman Sachs (29,089)(2,556) Boeing Co HSBC (36,014)(4,592) Boeing Co Morgan Stanley (43,991)3,738 Bogota Financial Corp Bank of America
Merrill Lynch (374)7,311 Bogota Financial Corp Morgan Stanley 219
(9,775) Boise Cascade Co Barclays Bank (5,572)(501) Boise Cascade Co Goldman Sachs 1,468
(1,934) BOK Financial Corp Bank of AmericaMerrill Lynch 97
(8,209) BOK Financial Corp Barclays Bank (7,799)(3,446) BOK Financial Corp Goldman Sachs 172
(578) BOK Financial Corp HSBC (92)2,424 BOK Financial Corp HSBC 388
(1,711) BOK Financial Corp Morgan Stanley (1,625)7,814 BOK Financial Corp Morgan Stanley 7,4233,184 Bolt Biotherapeutics Inc Bank of America
Merrill Lynch (3,375)5,779 Bolt Biotherapeutics Inc Barclays Bank (2,040)7,461 Bolt Biotherapeutics Inc HSBC (29,580)
588 Bolt Biotherapeutics Inc Morgan Stanley (288)(511) Bonanza Creek Energy Inc Bank of America
Merrill Lynch (332)(6,833) Bonanza Creek Energy Inc Barclays Bank 205(2,087) Bonanza Creek Energy Inc Goldman Sachs (1,357)
(275) Bonanza Creek Energy Inc HSBC (814)(10,958) Bonanza Creek Energy Inc Morgan Stanley 329
287 Booking Holdings Inc Bank of AmericaMerrill Lynch 28,604
419 Booking Holdings Inc Barclays Bank 4,896
Holding Description Counterparty
Netunrealised
appreciation/(depreciation)
USD
United States continued101 Booking Holdings Inc Goldman Sachs 11,311109 Booking Holdings Inc Morgan Stanley 1,832
(1,119) Boot Barn Holdings Inc Barclays Bank (2,754)(9,511) Boot Barn Holdings Inc HSBC (48,221)(2,862) Boot Barn Holdings Inc Morgan Stanley (1,620)2,499 Booz Allen Hamilton Hold-
ing CorpBank of AmericaMerrill Lynch 3,439
12,226 Booz Allen Hamilton Hold-ing Corp Barclays Bank (8,442)
4,837 Booz Allen Hamilton Hold-ing Corp Goldman Sachs 8,078
2,180 Booz Allen Hamilton Hold-ing Corp HSBC (1,782)
31,041 BorgWarner Inc Bank of AmericaMerrill Lynch (11,175)
(535) BorgWarner Inc Bank of AmericaMerrill Lynch 193
20,676 BorgWarner Inc Barclays Bank 18,276(14,256) BorgWarner Inc Barclays Bank (16,252)
6,249 BorgWarner Inc Goldman Sachs (2,250)8,808 BorgWarner Inc HSBC (14,445)
27,593 BorgWarner Inc Morgan Stanley 29,292(1,639) BorgWarner Inc Morgan Stanley (1,868)
169 Boston Beer Co Inc ’A’ Bank of AmericaMerrill Lynch (4,214)
58 Boston Beer Co Inc ’A’ Barclays Bank (174)400 Boston Beer Co Inc ’A’ Goldman Sachs (11,758)95 Boston Beer Co Inc ’A’ Morgan Stanley 551
(827) Boston Omaha Corp ’A’ Bank of AmericaMerrill Lynch (2,994)
(6,973) Boston Omaha Corp ’A’ Barclays Bank (12,342)(323) Boston Omaha Corp ’A’ HSBC (1,211)
(12,645) Boston Omaha Corp ’A’ Morgan Stanley (22,382)22,303 Boston Private Financial
Holdings Inc Morgan Stanley 4,907(1,791) Boston Properties Inc
(REIT) Goldman Sachs (13,289)5,495 Boston Properties Inc
(REIT) HSBC 51,37812,477 Boston Properties Inc
(REIT) Morgan Stanley 32,066(3,474) Boston Scientific Corp Bank of America
Merrill Lynch (2,884)(10,110) Boston Scientific Corp Barclays Bank 2,528
(733) Boston Scientific Corp Goldman Sachs (608)(26,500) Boston Scientific Corp HSBC 18,550(18,202) Boston Scientific Corp Morgan Stanley 4,009
3,103 Bottomline Technologies DEInc
Bank of AmericaMerrill Lynch (993)
1,404 Bottomline Technologies DEInc Barclays Bank (716)
14,298 Bottomline Technologies DEInc Goldman Sachs (4,575)
1,572 Bottomline Technologies DEInc HSBC (1,761)
26,339 Bottomline Technologies DEInc Morgan Stanley (13,433)
20,323 Box Inc ’A’ Barclays Bank (813)6,068 Box Inc ’A’ Goldman Sachs (1,517)
29,631 Box Inc ’A’ Morgan Stanley (1,185)(11,032) Boyd Gaming Corp Bank of America
Merrill Lynch (43,025)(24,132) Boyd Gaming Corp Barclays Bank (83,980)(3,393) Boyd Gaming Corp Goldman Sachs (13,233)
(38,612) Boyd Gaming Corp Morgan Stanley (134,370)4,311 Brady Corp ’A’ Bank of America
Merrill Lynch 4,5271,533 Brady Corp ’A’ Barclays Bank 1,180
13,799 Brady Corp ’A’ Goldman Sachs 8,72814,205 Brady Corp ’A’ Morgan Stanley 10,356
BlackRock Americas Diversified Equity Absolute Return FundcontinuedPortfolio of Investments as at 31 May 2021
The notes on pages 590 to 610 form an integral part of these financial statements.
BlackRock Strategic Funds[78]

Holding Description Counterparty
Netunrealised
appreciation/(depreciation)
USD
United States continued57,096 Braemar Hotels & Resorts
Inc (REIT)Bank of AmericaMerrill Lynch 19,413
39,486 Braemar Hotels & ResortsInc (REIT) Barclays Bank 11,846
7,760 Braemar Hotels & ResortsInc (REIT) Goldman Sachs 2,638
63,919 Braemar Hotels & ResortsInc (REIT) HSBC (50,650)
37,455 Braemar Hotels & ResortsInc (REIT) Morgan Stanley 11,237
(57,881) BrainStorm Cell Therapeu-tics Inc Barclays Bank (9,261)
(8,367) BrainStorm Cell Therapeu-tics Inc Goldman Sachs (1,841)
83,778 Brandywine Realty Trust(REIT)
Bank of AmericaMerrill Lynch 36,025
9,962 Brandywine Realty Trust(REIT) Barclays Bank (797)
21,169 Brandywine Realty Trust(REIT) Goldman Sachs 9,103
3,120 Bridgebio Pharma Inc Bank of AmericaMerrill Lynch 15,818
(2,131) Bridgebio Pharma Inc Bank of AmericaMerrill Lynch (4,145)
8,167 Bridgebio Pharma Inc Barclays Bank 18,2942,858 Bridgebio Pharma Inc Goldman Sachs 14,4903,673 Bridgebio Pharma Inc HSBC 46,757
353 Bridgebio Pharma Inc Morgan Stanley 7913,118 Bridgewater Bancshares Inc Bank of America
Merrill Lynch (967)(262) Bridgford Foods Corp Bank of America
Merrill Lynch 364(6,472) Bridgford Foods Corp Barclays Bank 10,840(3,165) Bridgford Foods Corp Goldman Sachs 4,236
(299) Bridgford Foods Corp HSBC (1,041)(826) Bridgford Foods Corp Morgan Stanley 1,470
3,518 Briggs & Stratton Corp* Barclays Bank (369)32,162 Briggs & Stratton Corp* Goldman Sachs (32)34,168 Brigham Minerals Inc ’A’ Barclays Bank 3,4173,567 Brigham Minerals Inc ’A’ Goldman Sachs (2,961)
19,369 Brigham Minerals Inc ’A’ HSBC 4,261361 Bright Horizons Family Solu-
tions IncBank of AmericaMerrill Lynch 151
2,733 Bright Horizons Family Solu-tions Inc Goldman Sachs 6,793
(1,063) Bright Horizons Family Solu-tions Inc Goldman Sachs (4,196)
1,485 Bright Horizons Family Solu-tions Inc HSBC (1,143)
2,823 Bright Horizons Family Solu-tions Inc Morgan Stanley 11,405
(1,772) Brightcove Inc Barclays Bank (354)(1,769) Brightcove Inc Goldman Sachs (1,698)(7,803) Brightcove Inc HSBC (7,803)
(19,118) Brightcove Inc Morgan Stanley (3,824)7,098 Brighthouse Financial Inc Bank of America
Merrill Lynch 1,8443,581 Brighthouse Financial Inc Barclays Bank 1173,385 Brighthouse Financial Inc Goldman Sachs (394)
13,280 Brighthouse Financial Inc HSBC 12,57717,072 Brighthouse Financial Inc Morgan Stanley 3,756
(28,502) Brightsphere InvestmentGroup Inc
Bank of AmericaMerrill Lynch 17,002
(14,040) Brightsphere InvestmentGroup Inc Barclays Bank 5,257
(7,160) Brightsphere InvestmentGroup Inc Goldman Sachs 4,141
(5,609) Brightsphere InvestmentGroup Inc Morgan Stanley 1,125
16,337 BrightView Holdings Inc Bank of AmericaMerrill Lynch (6,208)
Holding Description Counterparty
Netunrealised
appreciation/(depreciation)
USD
United States continued17,153 BrightView Holdings Inc Barclays Bank (515)22,917 BrightView Holdings Inc Goldman Sachs (8,708)1,446 BrightView Holdings Inc HSBC (1,547)
(1,249) Brinker International Inc Bank of AmericaMerrill Lynch 636
(2,696) Brinker International Inc Barclays Bank (405)(1,199) Brinker International Inc Morgan Stanley (791)1,231 Brink’s Co Bank of America
Merrill Lynch (5,244)12,843 Brink’s Co Goldman Sachs (54,711)
483 Brink’s Co Morgan Stanley (826)5,835 Bristol-Myers Squibb Co Bank of America
Merrill Lynch 71243,733 Bristol-Myers Squibb Co Barclays Bank (68,661)9,003 Bristol-Myers Squibb Co Goldman Sachs 2,3401,148 Bristol-Myers Squibb Co HSBC 1,662
24,317 Bristol-Myers Squibb Co Morgan Stanley (38,178)(8,331) Bristow Group Inc Bank of America
Merrill Lynch 7,831(3,275) Bristow Group Inc Barclays Bank 4,127(8,443) Bristow Group Inc Goldman Sachs 7,164(3,976) Bristow Group Inc Morgan Stanley 5,01024,464 Brixmor Property Group Inc
(REIT)Bank of AmericaMerrill Lynch 7,339
14,167 Brixmor Property Group Inc(REIT) Barclays Bank 8,784
(3,666) Brixmor Property Group Inc(REIT) Barclays Bank (2,273)
42,066 Brixmor Property Group Inc(REIT) Goldman Sachs 12,620
(12,120) Brixmor Property Group Inc(REIT) Morgan Stanley (7,514)
(1,052) Broadcom Inc Bank of AmericaMerrill Lynch (34,074)
2,597 Broadcom Inc Bank of AmericaMerrill Lynch 84,117
(861) Broadcom Inc Barclays Bank (11,314)147 Broadcom Inc Barclays Bank 1,932
(655) Broadcom Inc Goldman Sachs (21,215)1,830 Broadcom Inc Goldman Sachs 59,274
(1,856) Broadcom Inc HSBC (67,243)(5,263) Broadcom Inc Morgan Stanley (69,156)
(41,489) Broadmark Realty CapitalInc (REIT) Barclays Bank 4,979
(79,115) Broadmark Realty CapitalInc (REIT) Goldman Sachs (11,867)
(2,222) Broadridge Financial Solu-tions Inc
Bank of AmericaMerrill Lynch 5,297
(7,926) Broadridge Financial Solu-tions Inc Barclays Bank (392)
(3,861) Broadridge Financial Solu-tions Inc Goldman Sachs 10,167
(15,527) Broadridge Financial Solu-tions Inc Morgan Stanley 88
(11,586) Brookdale Senior Living Inc Barclays Bank 1,622(139,025) Brookdale Senior Living Inc Morgan Stanley 19,464
3,088 Brookfield InfrastructureCorp ’A’
Bank of AmericaMerrill Lynch 4,200
9,040 Brookfield InfrastructureCorp ’A’ Barclays Bank 19,436
3,164 Brookfield InfrastructureCorp ’A’ Goldman Sachs 4,699
696 Brookfield InfrastructureCorp ’A’ HSBC 1,478
1,806 Brookfield InfrastructureCorp ’A’ Morgan Stanley 2,060
(6,620) Brookfield Property Inc ’A’(REIT)
Bank of AmericaMerrill Lynch (2,449)
(39,382) Brookfield Property Inc ’A’(REIT) Barclays Bank (9,846)
BlackRock Americas Diversified Equity Absolute Return FundcontinuedPortfolio of Investments as at 31 May 2021
The notes on pages 590 to 610 form an integral part of these financial statements.
Annual report and audited financial statements [79]

Holding Description Counterparty
Netunrealised
appreciation/(depreciation)
USD
United States continued(9,740) Brookfield Property Inc ’A’
(REIT) Goldman Sachs (6,673)(6,044) Brookfield Property Inc ’A’
(REIT) HSBC 99(16,521) Brookfield Property Inc ’A’
(REIT) Morgan Stanley (3,430)2,491 Brookfield Property Part-
ners LP Goldman Sachs 3,9368,684 Brookfield Renewable Corp
’A’Bank of AmericaMerrill Lynch 24,749
17,913 Brookfield Renewable Corp’A’ Barclays Bank 5,374
3,768 Brookfield Renewable Corp’A’ Goldman Sachs 10,739
30,231 Brookfield Renewable Corp’A’ HSBC 106,413
1,197 Brookfield Renewable Corp’A’ Morgan Stanley 359
(24,887) Brookline Bancorp Inc Bank of AmericaMerrill Lynch —
(32,482) Brookline Bancorp Inc HSBC (6,821)(93,265) Brookline Bancorp Inc Morgan Stanley (7,461)
1,818 Brooklyn ImmunoTherapeu-tics Inc Goldman Sachs (7,908)
2,940 Brooklyn ImmunoTherapeu-tics Inc HSBC 773
(980) Brooks Automation Inc Barclays Bank (4,332)2,492 Brooks Automation Inc Barclays Bank 11,015
10,894 Brooks Automation Inc Goldman Sachs 123,102(1,568) Brooks Automation Inc HSBC (19,835)(1,727) Brooks Automation Inc Morgan Stanley (7,634)3,827 Brown & Brown Inc Barclays Bank 1,378
42,992 Brown & Brown Inc HSBC (36,543)7,270 Brown & Brown Inc Morgan Stanley 2,6174,426 Brown-Forman Corp ’A’ Morgan Stanley 5,267
(3,483) Brown-Forman Corp ’B’ Bank of AmericaMerrill Lynch (2,267)
(10,751) Brown-Forman Corp ’B’ Barclays Bank (42)9,630 Brown-Forman Corp ’B’ Goldman Sachs 23,112(689) Brown-Forman Corp ’B’ Goldman Sachs (460)
3,337 Brown-Forman Corp ’B’ HSBC 8,509(6,259) Brown-Forman Corp ’B’ HSBC (15,151)8,206 Brown-Forman Corp ’B’ Morgan Stanley 6,401
(5,385) Brown-Forman Corp ’B’ Morgan Stanley (2,693)(1,113) BRP Group Inc ’A’ Bank of America
Merrill Lynch 467(20,334) BRP Group Inc ’A’ Barclays Bank (2,440)(4,719) BRP Group Inc ’A’ Goldman Sachs 1,9827,604 BRT Apartments Corp
(REIT) Barclays Bank (2,205)22,177 BRT Apartments Corp
(REIT) Goldman Sachs (5,322)19,067 BRT Apartments Corp
(REIT) Morgan Stanley (5,529)13,138 Bruker Corp Bank of America
Merrill Lynch 29,155(686) Bruker Corp Bank of America
Merrill Lynch (1,585)4,171 Bruker Corp Barclays Bank (1,335)(677) Bruker Corp Barclays Bank 217
8,168 Bruker Corp Goldman Sachs 18,868(434) Bruker Corp Goldman Sachs (1,003)
10,683 Bruker Corp HSBC 9,8287,149 Bruker Corp Morgan Stanley (2,221)3,424 Brunswick Corp Barclays Bank 12,189
605 Brunswick Corp Goldman Sachs (2,305)3,729 Brunswick Corp HSBC (46,948)
(4,961) Brunswick Corp HSBC 62,4593,148 Brunswick Corp Morgan Stanley 11,207
(3,777) Brunswick Corp Morgan Stanley (13,446)
Holding Description Counterparty
Netunrealised
appreciation/(depreciation)
USD
United States continued13,890 Bryn Mawr Bank Corp Barclays Bank 8,6125,916 Bryn Mawr Bank Corp Goldman Sachs (2,189)
(1,999) Buckle Inc Bank of AmericaMerrill Lynch 6,757
(10,645) Buckle Inc Barclays Bank (16,074)(3,963) Buckle Inc Goldman Sachs 13,39517,384 Builders FirstSource Inc Bank of America
Merrill Lynch (38,755)8,278 Builders FirstSource Inc Barclays Bank 497
36,872 Builders FirstSource Inc Goldman Sachs (79,108)5,921 Builders FirstSource Inc HSBC (38,466)
42,356 Builders FirstSource Inc Morgan Stanley (173)580 Bumble Inc ’A’ Goldman Sachs (413)
7,286 Bunge Ltd Bank of AmericaMerrill Lynch (1,952)
(10,117) Bunge Ltd Bank of AmericaMerrill Lynch 8,741
10,500 Bunge Ltd Barclays Bank (1,245)(1,567) Bunge Ltd Barclays Bank (31)3,509 Bunge Ltd Goldman Sachs (9,544)
(3,906) Bunge Ltd Goldman Sachs 10,624536 Bunge Ltd HSBC (183)
9,579 Bunge Ltd Morgan Stanley (380)(4,820) Burford Capital Ltd Barclays Bank (735)(4,802) Burford Capital Ltd Morgan Stanley (1,298)3,471 BurgerFi International Inc Bank of America
Merrill Lynch 1,354(9,836) Burlington Stores Inc Barclays Bank (27,147)(1,358) Burlington Stores Inc Goldman Sachs 17,328(3,255) Burlington Stores Inc Morgan Stanley (8,984)
(11,873) Business First BancsharesInc
Bank of AmericaMerrill Lynch (4,868)
(905) Business First BancsharesInc Barclays Bank (235)
(5,058) Business First BancsharesInc Goldman Sachs (2,074)
(6,929) Business First BancsharesInc HSBC (8,246)
(3,364) Business First BancsharesInc Morgan Stanley (875)
(1,934) BWX Technologies Inc Barclays Bank (1,083)(2,984) BWX Technologies Inc Goldman Sachs 5,670(9,667) BWX Technologies Inc Morgan Stanley (5,414)
(21,313) Byline Bancorp Inc Morgan Stanley 2,131(718) Byrna Technologies Inc Barclays Bank (9)(979) C&F Financial Corp Barclays Bank 773
(1,023) C&F Financial Corp HSBC (4,174)(1,098) C&F Financial Corp Morgan Stanley 867
(473) C3.ai Inc ’A’ Barclays Bank (1,003)4,471 C4 Therapeutics Inc Bank of America
Merrill Lynch 10,8658,213 C4 Therapeutics Inc Barclays Bank (2,628)
539 C4 Therapeutics Inc HSBC 1,6821,318 C4 Therapeutics Inc Morgan Stanley (422)4,968 Cabaletta Bio Inc Bank of America
Merrill Lynch 9,93615,719 Cabaletta Bio Inc Barclays Bank 1,7293,347 Cabaletta Bio Inc Goldman Sachs 6,694
15,063 Cabaletta Bio Inc HSBC 33,13911,050 Cabaletta Bio Inc Morgan Stanley 1,216
293 Cable One Inc Bank of AmericaMerrill Lynch 25,838
83 Cable One Inc Goldman Sachs 6,19864 Cable One Inc HSBC 4,677
157 Cable One Inc Morgan Stanley 1,339(9,031) Cabot Corp Bank of America
Merrill Lynch (4,245)(18,225) Cabot Corp Barclays Bank (7,655)(6,562) Cabot Corp Goldman Sachs (2,993)
BlackRock Americas Diversified Equity Absolute Return FundcontinuedPortfolio of Investments as at 31 May 2021
The notes on pages 590 to 610 form an integral part of these financial statements.
BlackRock Strategic Funds[80]

Holding Description Counterparty
Netunrealised
appreciation/(depreciation)
USD
United States continued(8,997) Cabot Corp HSBC (18,151)
(13,508) Cabot Corp Morgan Stanley (5,673)(10,901) Cabot Oil & Gas Corp Goldman Sachs 20,821(9,761) Cabot Oil & Gas Corp HSBC 12,689(8,135) Cabot Oil & Gas Corp Morgan Stanley 1,6271,194 CACI International Inc ’A’ Goldman Sachs (5,612)
250 CACI International Inc ’A’ Morgan Stanley (800)(6,783) Cactus Inc ’A’ Bank of America
Merrill Lynch 5,019(1,748) Cactus Inc ’A’ Goldman Sachs 1,294
(17,980) Cactus Inc ’A’ HSBC (11,148)(15,469) Cactus Inc ’A’ Morgan Stanley (4,486)(7,254) Cadence BanCorp HSBC (725)
(16,316) Cadence BanCorp Morgan Stanley (4,405)1,256 Cadence Design Systems
IncBank of AmericaMerrill Lynch 6,475
11,728 Cadence Design SystemsInc Barclays Bank 7,088
4,011 Cadence Design SystemsInc Goldman Sachs 20,677
2,958 Cadence Design SystemsInc HSBC 2,434
11,009 Cadence Design SystemsInc Morgan Stanley 7,266
(17,968) Cadiz Inc Barclays Bank (17,429)(33,709) Cadiz Inc HSBC (58,991)
6,202 Caesars Entertainment Inc Bank of AmericaMerrill Lynch 2,652
1,507 Caesars Entertainment Inc Barclays Bank (44)(6,047) Caesars Entertainment Inc Goldman Sachs (14,685)10,362 Caesarstone Ltd Morgan Stanley 2,280(6,121) CAI International Inc Bank of America
Merrill Lynch (1,542)(3,561) CAI International Inc Barclays Bank (8,754)(2,525) CAI International Inc Goldman Sachs 581(2,534) CAI International Inc HSBC 1,596
(23,090) CAI International Inc Morgan Stanley (56,015)(6,075) CalAmp Corp HSBC (12,332)
(37,821) CalAmp Corp Morgan Stanley 378(59) Calavo Growers Inc Bank of America
Merrill Lynch 202(243) Calavo Growers Inc Barclays Bank 71
(9,916) Calavo Growers Inc Goldman Sachs 33,913(862) Calavo Growers Inc Morgan Stanley (87)
5,023 Caledonia Mining Corp Plc Barclays Bank (1,356)8,255 Caledonia Mining Corp Plc Goldman Sachs (6,026)
(1,165) Caleres Inc Bank of AmericaMerrill Lynch (570)
(3,228) Caleres Inc Barclays Bank 1,435(19,736) Caleres Inc Goldman Sachs 34,192(4,206) Caleres Inc HSBC 1,052
(18,332) Caleres Inc Morgan Stanley (4,787)4,179 California BanCorp Bank of America
Merrill Lynch 1,88110,321 California BanCorp Barclays Bank 1,5485,398 California BanCorp Goldman Sachs 2,4294,610 California BanCorp HSBC 6,1313,512 California BanCorp Morgan Stanley 527
(16,379) California Resources Corp Bank of AmericaMerrill Lynch (62,568)
3,829 California Water ServiceGroup
Bank of AmericaMerrill Lynch 2,106
18,141 California Water ServiceGroup Barclays Bank (1,814)
8,706 California Water ServiceGroup Goldman Sachs 4,788
23,686 California Water ServiceGroup Morgan Stanley (2,369)
18,452 Calithera Biosciences Inc Bank of AmericaMerrill Lynch 2,214
Holding Description Counterparty
Netunrealised
appreciation/(depreciation)
USD
United States continued36,803 Calithera Biosciences Inc Goldman Sachs 4,41614,780 Calithera Biosciences Inc HSBC 4,7306,711 Calithera Biosciences Inc Morgan Stanley 9401,434 Calix Inc Barclays Bank 1,1199,530 Calix Inc Goldman Sachs 29,352
(11,357) Callaway Golf Co Bank of AmericaMerrill Lynch (26,427)
(9,253) Callaway Golf Co Barclays Bank (19,061)(5,213) Callaway Golf Co Goldman Sachs (11,038)
(11,702) Callaway Golf Co Morgan Stanley (24,106)(12,015) Cal-Maine Foods Inc Barclays Bank 20,786(7,115) Cal-Maine Foods Inc Goldman Sachs 18,499
(852) Cal-Maine Foods Inc HSBC 2,164(1,999) Cal-Maine Foods Inc Morgan Stanley 3,458
(24,657) Calyxt Inc Barclays Bank (5,918)(1,478) Cambium Networks Corp Goldman Sachs (13,893)(7,422) Cambium Networks Corp Morgan Stanley (23,899)(7,626) Cambridge Bancorp Bank of America
Merrill Lynch 12,583(1,605) Cambridge Bancorp Barclays Bank 1,348(8,700) Cambridge Bancorp Goldman Sachs 14,355
(11,161) Cambridge Bancorp HSBC (1,451)(3,918) Cambridge Bancorp Morgan Stanley 3,29118,702 Camden National Corp Bank of America
Merrill Lynch (3,553)18,687 Camden National Corp Barclays Bank (4,298)17,970 Camden National Corp Goldman Sachs (3,414)8,011 Camden National Corp HSBC 6,329
17,597 Camden National Corp Morgan Stanley (4,047)(4,791) Camden Property Trust
(REIT) Barclays Bank (3,593)7,017 Camden Property Trust
(REIT) Goldman Sachs 15,9994,163 Camden Property Trust
(REIT) HSBC 8,78419,340 Camden Property Trust
(REIT) Morgan Stanley 14,505(3,576) Camden Property Trust
(REIT) Morgan Stanley (2,682)(6,740) Campbell Soup Co Morgan Stanley (202)3,862 Camping World Holdings Inc
’A’Bank of AmericaMerrill Lynch 9,759
15,846 Camping World Holdings Inc’A’ Barclays Bank 72,733
8,652 Camping World Holdings Inc’A’ HSBC (5,714)
3,080 Camping World Holdings Inc’A’ Morgan Stanley 14,137
4,292 Cannae Holdings Inc Bank of AmericaMerrill Lynch (4,206)
2,401 Cannae Holdings Inc Barclays Bank (1,849)2,329 Cannae Holdings Inc Goldman Sachs (2,282)
58,214 Cannae Holdings Inc Morgan Stanley (44,825)(14,746) Cantaloupe Inc Bank of America
Merrill Lynch (19,170)(20,048) Cantaloupe Inc Barclays Bank (2,606)(24,028) Cantaloupe Inc Goldman Sachs (31,236)(3,740) Cantaloupe Inc Morgan Stanley 200(6,213) Capital Bancorp Inc Bank of America
Merrill Lynch (311)(5,447) Capital Bancorp Inc Barclays Bank (1,416)(3,796) Capital Bancorp Inc Goldman Sachs (190)(5,576) Capital Bancorp Inc Morgan Stanley (1,450)40,144 Capital City Bank Group Inc Bank of America
Merrill Lynch 13,24820,651 Capital City Bank Group Inc Barclays Bank 7,22849,415 Capital City Bank Group Inc Goldman Sachs 16,25623,551 Capital City Bank Group Inc HSBC 30,85264,701 Capital City Bank Group Inc Morgan Stanley 22,6453,136 Capital One Financial Corp Barclays Bank (120)
BlackRock Americas Diversified Equity Absolute Return FundcontinuedPortfolio of Investments as at 31 May 2021
The notes on pages 590 to 610 form an integral part of these financial statements.
Annual report and audited financial statements [81]

Holding Description Counterparty
Netunrealised
appreciation/(depreciation)
USD
United States continued4,958 Capital One Financial Corp Morgan Stanley 198
(7,573) Capital Senior Living Corp Bank of AmericaMerrill Lynch 46,347
10,923 Capitol Federal Financial Inc Goldman Sachs (1,420)36,010 Capitol Federal Financial Inc HSBC 1,08035,235 Capitol Federal Financial Inc Morgan Stanley (4,581)8,545 Capri Holdings Ltd Bank of America
Merrill Lynch (9,998)(10,094) Capri Holdings Ltd Barclays Bank (35,935)18,089 Capstar Financial Holdings
Inc Barclays Bank 5,60825,388 Capstar Financial Holdings
Inc Goldman Sachs 12,9485,832 Capstar Financial Holdings
Inc HSBC 15,10535,287 Capstar Financial Holdings
Inc Morgan Stanley 10,939(11,178) Capstead Mortgage Corp
(REIT) Morgan Stanley 782(12,481) Cara Therapeutics Inc Bank of America
Merrill Lynch (2,621)(9,755) Cara Therapeutics Inc Barclays Bank (2,244)
(646) Cara Therapeutics Inc Goldman Sachs (136)(4,715) Cara Therapeutics Inc Morgan Stanley (1,084)(7,053) Cardiff Oncology Inc Bank of America
Merrill Lynch 353(3,356) Cardiff Oncology Inc Barclays Bank (1,946)(8,947) Cardiff Oncology Inc Goldman Sachs 4474,464 Cardinal Health Inc Bank of America
Merrill Lynch (1,696)18,821 Cardinal Health Inc Barclays Bank (10,540)
442 Cardinal Health Inc Goldman Sachs (168)8,916 Cardinal Health Inc HSBC (20,150)
38,428 Cardinal Health Inc Morgan Stanley (21,520)14,491 Cardiovascular Systems Inc Barclays Bank 6,23111,475 Cardiovascular Systems Inc Goldman Sachs 22,7211,499 Cardiovascular Systems Inc HSBC (252)8,799 Cardiovascular Systems Inc Morgan Stanley 3,7841,019 Cardlytics Inc Bank of America
Merrill Lynch 16,1211,968 Cardlytics Inc Barclays Bank 9,8924,906 Cardlytics Inc Goldman Sachs 70,0831,535 Cardlytics Inc HSBC 14,790
339 Cardlytics Inc Morgan Stanley 2,166(748) Cardtronics Plc ’A’ Barclays Bank (30)(344) Cardtronics Plc ’A’ Goldman Sachs (10)
(3,157) CareDx Inc Bank of AmericaMerrill Lynch (39,242)
(6,885) CareDx Inc Barclays Bank (11,980)(1,167) CareDx Inc Goldman Sachs (14,506)(1,224) CareDx Inc HSBC (18,431)
(11,218) CareDx Inc Morgan Stanley (19,520)(20,639) Cargurus Inc Bank of America
Merrill Lynch (9,781)(12,116) Cargurus Inc Goldman Sachs (4,495)(1,599) Cargurus Inc HSBC 99(1,531) Carlisle Cos Inc Bank of America
Merrill Lynch 643(5,492) Carlisle Cos Inc Barclays Bank 8,513(9,588) Carlisle Cos Inc Goldman Sachs 4,027(2,606) Carlisle Cos Inc Morgan Stanley 4,039(8,215) Carlyle Group Inc Barclays Bank (7,229)(1,002) Carlyle Group Inc Morgan Stanley (882)(8,537) CarMax Inc Bank of America
Merrill Lynch 78,967(2,189) CarMax Inc Goldman Sachs 20,248(1,431) CarMax Inc Morgan Stanley (1,874)
(48,263) Carnival Corp Barclays Bank (80,117)(39,616) Carnival Corp Goldman Sachs (81,976)
Holding Description Counterparty
Netunrealised
appreciation/(depreciation)
USD
United States continued(72,695) Carnival Corp Morgan Stanley (120,673)(8,829) CarParts.com Inc Bank of America
Merrill Lynch (7,063)(1,484) CarParts.com Inc Barclays Bank (608)(2,080) Carpenter Technology Corp Bank of America
Merrill Lynch (6,003)(1,883) Carpenter Technology Corp Barclays Bank (4,306)
(27,565) Carpenter Technology Corp Goldman Sachs (73,331)(1,501) Carpenter Technology Corp Morgan Stanley (20)14,615 Carriage Services Inc Goldman Sachs 6,2849,367 Carrier Global Corp Bank of America
Merrill Lynch 18,59723,880 Carrier Global Corp Barclays Bank 37,01436,227 Carrier Global Corp Goldman Sachs 56,1243,946 Carrier Global Corp HSBC 2,052
69,625 Carrier Global Corp Morgan Stanley 106,61410,781 Carrols Restaurant Group
IncBank of AmericaMerrill Lynch (216)
25,333 Carrols Restaurant GroupInc Barclays Bank 4,307
12,092 Carrols Restaurant GroupInc Morgan Stanley 2,056
4,973 Cars.com Inc Barclays Bank 84515,668 Cars.com Inc HSBC 21,862
(50,462) Carter Bankshares Inc Morgan Stanley 27,754(1,257) Carter’s Inc Bank of America
Merrill Lynch 153(281) Carter’s Inc Barclays Bank (397)524 Carter’s Inc Barclays Bank (562)
(3,839) Carter’s Inc Morgan Stanley (5,541)5,988 Carter’s Inc Morgan Stanley 9,577(114) Carvana Co Bank of America
Merrill Lynch (4,392)(2,228) Carvana Co Barclays Bank (17,066)
(932) Carvana Co Goldman Sachs (30,542)(298) Carvana Co Morgan Stanley (3,364)
24,707 Casa Systems Inc Goldman Sachs 6,918(8,378) Casella Waste Systems Inc
’A’ Barclays Bank 8,797(1,173) Casella Waste Systems Inc
’A’ Goldman Sachs 1,243(24,610) Casella Waste Systems Inc
’A’ HSBC 1,477(36,772) Casella Waste Systems Inc
’A’ Morgan Stanley 38,6111,687 Casey’s General Stores Inc Barclays Bank (34)
(4,107) Casey’s General Stores Inc Goldman Sachs 22,3013,637 Casey’s General Stores Inc Morgan Stanley (73)
(32,854) CASI Pharmaceuticals Inc Morgan Stanley 98633,899 Casper Sleep Inc Barclays Bank (10,170)30,441 Casper Sleep Inc Goldman Sachs (8,219)
929 Casper Sleep Inc HSBC 511(2,641) Cass Information Systems
IncBank of AmericaMerrill Lynch (2,268)
(13,859) Cass Information SystemsInc Barclays Bank (16,215)
(4,578) Cass Information SystemsInc Goldman Sachs (2,523)
(20,155) Cass Information SystemsInc HSBC (3,023)
(25,988) Cass Information SystemsInc Morgan Stanley (28,974)
(1,140) Cassava Sciences Inc Bank of AmericaMerrill Lynch (11,446)
(1,674) Cassava Sciences Inc Barclays Bank (9,441)(2,656) Cassava Sciences Inc HSBC (40,637)(4,372) Castle Biosciences Inc Morgan Stanley (4,897)69,352 Castlight Health Inc ’B’ Bank of America
Merrill Lynch 3,468
BlackRock Americas Diversified Equity Absolute Return FundcontinuedPortfolio of Investments as at 31 May 2021
The notes on pages 590 to 610 form an integral part of these financial statements.
BlackRock Strategic Funds[82]

Holding Description Counterparty
Netunrealised
appreciation/(depreciation)
USD
United States continued101,833 Castlight Health Inc ’B’ Morgan Stanley 15,275(23,219) Catabasis Pharmaceuticals
Inc Goldman Sachs (5,573)(2,138) Catalent Inc Bank of America
Merrill Lynch (6,008)(10,950) Catalent Inc Barclays Bank (24,857)(5,470) Catalent Inc Goldman Sachs (15,371)
582 Catalent Inc Morgan Stanley 1,32119,845 Catalyst Biosciences Inc Bank of America
Merrill Lynch 1,98530,102 Catalyst Biosciences Inc Barclays Bank 3,6123,322 Catalyst Biosciences Inc Goldman Sachs 332
27,443 Catalyst Biosciences Inc HSBC (6,586)19,329 Catalyst Biosciences Inc Morgan Stanley 2,319
(50,126) Catalyst PharmaceuticalsInc Barclays Bank 8,020
(21,075) Catalyst PharmaceuticalsInc Goldman Sachs (843)
(39,743) Catalyst PharmaceuticalsInc HSBC (28,218)
(29,461) Catalyst PharmaceuticalsInc Morgan Stanley 4,714
(8,832) CatchMark Timber Trust Inc’A’ (REIT) Barclays Bank 1,325
(154,934) CatchMark Timber Trust Inc’A’ (REIT) Goldman Sachs 20,141
(20,228) CatchMark Timber Trust Inc’A’ (REIT) HSBC 6,878
(49,571) CatchMark Timber Trust Inc’A’ (REIT) Morgan Stanley 7,436
1,826 Caterpillar Inc Bank of AmericaMerrill Lynch (6,774)
556 Caterpillar Inc Barclays Bank 1,129791 Caterpillar Inc Goldman Sachs (1,441)317 Caterpillar Inc HSBC (485)
1,842 Caterpillar Inc Morgan Stanley 3,73932,108 Cathay General Bancorp Morgan Stanley 11,451
(20,509) Cato Corp ’A’ Bank of AmericaMerrill Lynch (33,019)
(1,606) Cato Corp ’A’ Barclays Bank 80(23,944) Cato Corp ’A’ Goldman Sachs (38,550)
(195) Cavco Industries Inc Bank of AmericaMerrill Lynch (2,172)
(130) Cavco Industries Inc Barclays Bank (1,473)(1,437) Cavco Industries Inc Goldman Sachs (16,008)(2,772) Cavco Industries Inc HSBC (31,157)(3,734) Cavco Industries Inc Morgan Stanley (42,306)8,297 CB Financial Services Inc Barclays Bank (1,245)6,474 CB Financial Services Inc Goldman Sachs (5,762)9,178 CB Financial Services Inc Morgan Stanley (1,377)
22,313 cbdMD Inc Bank of AmericaMerrill Lynch 4,239
12,444 cbdMD Inc Goldman Sachs 2,364(39,138) CBIZ Inc Bank of America
Merrill Lynch 49,423(69,772) CBIZ Inc Barclays Bank 32,095(63,829) CBIZ Inc Goldman Sachs 84,254
(771) Cboe Global Markets Inc Morgan Stanley (948)14,386 CBRE Group Inc ’A’ Bank of America
Merrill Lynch 16,02922,374 CBRE Group Inc ’A’ Barclays Bank (21,927)2,431 CBRE Group Inc ’A’ Goldman Sachs 2,674
(20,950) CBTX Inc Bank of AmericaMerrill Lynch 17,598
(19,609) CBTX Inc Barclays Bank 784(42,672) CBTX Inc Goldman Sachs 35,844(4,004) CDK Global Inc Bank of America
Merrill Lynch 2,2422,332 CDK Global Inc Bank of America
Merrill Lynch (1,306)
Holding Description Counterparty
Netunrealised
appreciation/(depreciation)
USD
United States continued(2,811) CDK Global Inc Barclays Bank 1,99613,359 CDK Global Inc Barclays Bank (9,485)
(38,294) CDK Global Inc Goldman Sachs 21,44554,714 CDK Global Inc Goldman Sachs (30,640)2,434 CDK Global Inc HSBC (15)(444) CDK Global Inc Morgan Stanley 315
9,108 CDK Global Inc Morgan Stanley (6,467)(14,157) CDW Corp Bank of America
Merrill Lynch 52,664(9,826) CDW Corp Goldman Sachs 36,553(1,001) CDW Corp HSBC 6,006(6,521) CDW Corp Morgan Stanley 20,47676,090 CECO Environmental Corp Bank of America
Merrill Lynch (65,437)14,982 CECO Environmental Corp Barclays Bank (5,394)24,002 CECO Environmental Corp Goldman Sachs (20,642)5,298 CECO Environmental Corp Morgan Stanley (1,907)
12,757 Cedar Realty Trust Inc(REIT) Morgan Stanley 1,021
355 Celanese Corp Bank of AmericaMerrill Lynch 420
(16,256) Celanese Corp Morgan Stanley 8,128(4,302) Celcuity Inc Barclays Bank 3,054(6,863) Celldex Therapeutics Inc Barclays Bank (7,412)(2,472) Celldex Therapeutics Inc Goldman Sachs (1,409)(7,753) CEL-SCI Corp Barclays Bank (11,319)(1,430) Celsius Holdings Inc Bank of America
Merrill Lynch (15,530)(12,566) Celsius Holdings Inc Barclays Bank (20,734)(2,015) Celsius Holdings Inc Goldman Sachs (21,883)(1,049) Celsius Holdings Inc Morgan Stanley (1,731)9,868 Centene Corp Barclays Bank (3,158)8,400 Centene Corp Goldman Sachs 24,860
12,179 Centene Corp HSBC 43,7845,888 Centene Corp Morgan Stanley (1,884)
23,842 CenterPoint Energy Inc Barclays Bank 6,437(1,869) CenterPoint Energy Inc Goldman Sachs (505)39,340 CenterPoint Energy Inc HSBC 31,760(2,608) CenterPoint Energy Inc Morgan Stanley (704)
976 CenterPoint Energy Inc Morgan Stanley 264(2,941) Centerspace (REIT) Morgan Stanley 91216,048 Centogene NV Barclays Bank (9,950)3,344 Centogene NV Goldman Sachs (334)5,388 Centogene NV Morgan Stanley (3,341)
22,444 Central Garden & Pet Co ’A’ Bank of AmericaMerrill Lynch (45,337)
13,178 Central Garden & Pet Co ’A’ Barclays Bank (1,054)32,398 Central Garden & Pet Co ’A’ Goldman Sachs (65,444)5,480 Central Garden & Pet Co ’A’ HSBC (19,235)7,727 Central Garden & Pet Co ’A’ Morgan Stanley (618)
38,821 Central Pacific FinancialCorp
Bank of AmericaMerrill Lynch (29,892)
90,586 Central Pacific FinancialCorp Morgan Stanley (4,529)
(7,441) Central Valley CommunityBancorp
Bank of AmericaMerrill Lynch (8,706)
(1,634) Central Valley CommunityBancorp Barclays Bank (33)
(4,250) Central Valley CommunityBancorp Goldman Sachs (4,973)
(9,618) Central Valley CommunityBancorp HSBC (14,619)
(1,300) Central Valley CommunityBancorp Morgan Stanley (26)
(7,460) Centrus Energy Corp ’A’ Barclays Bank (298)(2,452) Centrus Energy Corp ’A’ Goldman Sachs 245
(920) Centrus Energy Corp ’A’ Morgan Stanley 253(13,084) Century Aluminum Co HSBC 32,972
9,552 Century Casinos Inc Morgan Stanley (669)
BlackRock Americas Diversified Equity Absolute Return FundcontinuedPortfolio of Investments as at 31 May 2021
The notes on pages 590 to 610 form an integral part of these financial statements.
Annual report and audited financial statements [83]

Holding Description Counterparty
Netunrealised
appreciation/(depreciation)
USD
United States continued(619) Century Communities Inc Bank of America
Merrill Lynch (2,649)(1,111) Century Communities Inc Barclays Bank (5,611)
(17,814) Century Communities Inc Goldman Sachs (76,244)(49,534) Cerecor Inc Bank of America
Merrill Lynch (20,309)(54,392) Cerecor Inc Barclays Bank (3,264)(10,916) Cerecor Inc Goldman Sachs (4,476)(11,196) Cerecor Inc HSBC (1,120)(2,075) Cerence Inc Bank of America
Merrill Lynch (24,485)1,708 Cerence Inc Bank of America
Merrill Lynch 13,702(573) Cerence Inc Goldman Sachs (6,761)350 Cerence Inc Goldman Sachs 4,130
1,796 Cerence Inc HSBC 10,3603,465 Cerence Inc Morgan Stanley 19,820
(1,503) Cerence Inc Morgan Stanley (8,597)4,719 Cerevel Therapeutics Hold-
ings Inc Barclays Bank (6,040)7,855 Cerevel Therapeutics Hold-
ings Inc Morgan Stanley (10,054)(2,602) Ceridian HCM Holding Inc Bank of America
Merrill Lynch (3,528)(19,568) Ceridian HCM Holding Inc Barclays Bank (3,131)(6,909) Ceridian HCM Holding Inc HSBC (38,207)(6,118) Ceridian HCM Holding Inc Morgan Stanley (979)5,662 Cerner Corp Bank of America
Merrill Lynch 9,9095,700 Cerner Corp Barclays Bank 7,1259,455 Cerner Corp Goldman Sachs 16,5464,151 Cerner Corp HSBC 3,736
20,906 Cerner Corp Morgan Stanley 26,1331,487 Certara Inc Goldman Sachs 2,2607,001 Certara Inc Morgan Stanley 3,2202,982 Cerus Corp Bank of America
Merrill Lynch 1538,468 Cerus Corp HSBC 38550,471 Cerus Corp Morgan Stanley (4,038)
(12,216) CEVA Inc Barclays Bank (3,481)(2,205) CEVA Inc Goldman Sachs (200)(2,255) CEVA Inc Morgan Stanley (834)
(36,357) CF Industries Holdings Inc Bank of AmericaMerrill Lynch 52,354
(14,295) CF Industries Holdings Inc Barclays Bank (2,001)(8,849) CF Industries Holdings Inc Goldman Sachs 12,742(1,866) CF Industries Holdings Inc Morgan Stanley (261)
863 CH Robinson Worldwide Inc Bank of AmericaMerrill Lynch (1,735)
9,100 CH Robinson Worldwide Inc Barclays Bank (6,370)15,874 CH Robinson Worldwide Inc Goldman Sachs (27,015)1,713 CH Robinson Worldwide Inc HSBC (8,068)9,879 CH Robinson Worldwide Inc Morgan Stanley (6,915)
(31,882) Champions Oncology Inc Bank of AmericaMerrill Lynch 13,709
(2,664) Champions Oncology Inc Barclays Bank 1,971(2,471) Champions Oncology Inc Goldman Sachs 1,06314,217 ChampionX Corp Bank of America
Merrill Lynch (4,834)68,362 ChampionX Corp Barclays Bank 80,66728,080 ChampionX Corp Goldman Sachs (9,547)10,026 ChampionX Corp HSBC 24,66416,479 ChampionX Corp Morgan Stanley 19,445(2,228) ChannelAdvisor Corp Barclays Bank 1,470
(25,246) ChannelAdvisor Corp Goldman Sachs 3,030(784) Charles River Laboratories
International IncBank of AmericaMerrill Lynch (11,980)
(1,362) Charles River LaboratoriesInternational Inc Barclays Bank (9,289)
Holding Description Counterparty
Netunrealised
appreciation/(depreciation)
USD
United States continued441 Charles River Laboratories
International Inc Barclays Bank 6,172(1,147) Charles River Laboratories
International Inc Goldman Sachs (17,526)675 Charles River Laboratories
International Inc HSBC 2,828(2,031) Charles River Laboratories
International Inc Morgan Stanley (13,851)556 Charles River Laboratories
International Inc Morgan Stanley 1291,097 Charles Schwab Corp Bank of America
Merrill Lynch 932330 Charles Schwab Corp Barclays Bank 409
2,526 Charles Schwab Corp Goldman Sachs 2,1471,361 Charles Schwab Corp HSBC 717
19,431 Charles Schwab Corp Morgan Stanley 23,359(1,493) Chart Industries Inc Bank of America
Merrill Lynch 12,825(2,498) Chart Industries Inc Barclays Bank 8,917
(567) Chart Industries Inc Goldman Sachs 4,871(392) Charter Communications
Inc ’A’Bank of AmericaMerrill Lynch (1,199)
(1,323) Charter CommunicationsInc ’A’ Barclays Bank 11,378
(375) Charter CommunicationsInc ’A’ Goldman Sachs (825)
(2,026) Charter CommunicationsInc ’A’ HSBC 385
(3,435) Charter CommunicationsInc ’A’ Morgan Stanley 29,541
(1,579) Chase Corp Barclays Bank 13(9,414) Chase Corp Goldman Sachs 43,878
(15,814) Chase Corp Morgan Stanley 5,66622,158 Chatham Lodging Trust
(REIT) Barclays Bank 4,8752,498 CHC Group Ltd* Morgan Stanley (1,124)(398) Check Point Software Tech-
nologies LtdBank of AmericaMerrill Lynch (16)
(11,260) Check Point Software Tech-nologies Ltd Morgan Stanley 23,083
905 Check Point Software Tech-nologies Ltd Morgan Stanley (1,855)
3,039 Checkmate Pharmaceuti-cals Inc
Bank of AmericaMerrill Lynch 1,398
4,500 Checkmate Pharmaceuti-cals Inc Barclays Bank 315
5,271 Checkmate Pharmaceuti-cals Inc Goldman Sachs 2,425
1,826 Checkmate Pharmaceuti-cals Inc HSBC 511
(33,647) Checkpoint TherapeuticsInc Goldman Sachs (8,075)
2,373 Cheesecake Factory Inc Barclays Bank 4,93613,338 Cheesecake Factory Inc HSBC (38,547)(1,551) Chefs’ Warehouse Inc Bank of America
Merrill Lynch 279(8,117) Chefs’ Warehouse Inc Barclays Bank 2,029(6,737) Chefs’ Warehouse Inc Goldman Sachs 1,213
455 Chegg Inc Bank of AmericaMerrill Lynch 209
3,862 Chegg Inc Barclays Bank 11,2774,989 Chegg Inc Morgan Stanley 14,568
(8,417) Chegg Inc Morgan Stanley (24,578)(45,974) Chembio Diagnostics Inc Bank of America
Merrill Lynch (460)(25,567) Chembio Diagnostics Inc Barclays Bank (3,068)
(73) Chemed Corp Bank of AmericaMerrill Lynch (880)
(4,610) Chemed Corp Barclays Bank 11,295
BlackRock Americas Diversified Equity Absolute Return FundcontinuedPortfolio of Investments as at 31 May 2021
The notes on pages 590 to 610 form an integral part of these financial statements.
BlackRock Strategic Funds[84]

Holding Description Counterparty
Netunrealised
appreciation/(depreciation)
USD
United States continued(1,026) Chemed Corp Goldman Sachs (12,374)
(14,873) ChemoCentryx Inc Barclays Bank (5,057)(11,014) ChemoCentryx Inc Morgan Stanley (3,744)(4,768) Chemours Co Bank of America
Merrill Lynch (5,817)(8,289) Chemours Co Barclays Bank (14,008)
(18,018) Chemours Co Goldman Sachs (21,982)(4,646) Chemours Co Morgan Stanley (7,852)(2,185) Chemung Financial Corp Bank of America
Merrill Lynch (5,943)(5,694) Chemung Financial Corp Morgan Stanley (11,616)(1,579) Cheniere Energy Inc Bank of America
Merrill Lynch (1,263)(1,952) Cheniere Energy Inc Barclays Bank (410)(5,472) Cheniere Energy Inc Goldman Sachs (4,378)1,571 Cheniere Energy Inc HSBC 5,059
(5,838) Cheniere Energy Inc Morgan Stanley (1,226)(30,414) Cherry Hill Mortgage Invest-
ment Corp (REIT)Bank of AmericaMerrill Lynch (4,866)
(5,924) Cherry Hill Mortgage Invest-ment Corp (REIT) Goldman Sachs (948)
(9,883) Cherry Hill Mortgage Invest-ment Corp (REIT) HSBC 692
(625) Cherry Hill Mortgage Invest-ment Corp (REIT) Morgan Stanley (50)
4,308 Chesapeake Energy Corp Bank of AmericaMerrill Lynch 12,105
7,059 Chesapeake Energy Corp Barclays Bank 15,0219,831 Chesapeake Energy Corp Morgan Stanley 22,120
(2,045) Chesapeake Utilities Corp Barclays Bank 4,867(1,084) Chesapeake Utilities Corp Goldman Sachs 2,027
(14,520) Chesapeake Utilities Corp HSBC 60,258(11,899) Chesapeake Utilities Corp Morgan Stanley 28,320(1,727) Chevron Corp Barclays Bank 3,126(1,632) Chevron Corp Goldman Sachs 11,4571,348 Chevron Corp Goldman Sachs (89)(330) Chevron Corp Morgan Stanley 597
(6,544) Chewy Inc ’A’ Barclays Bank (12,499)(9,105) Chewy Inc ’A’ Morgan Stanley (17,391)1,553 Chicken Soup For The Soul
Entertainment Inc Barclays Bank 2,966(24,316) Chico’s FAS Inc Bank of America
Merrill Lynch (5,350)(51,030) Chico’s FAS Inc Goldman Sachs (11,227)(10,900) Chico’s FAS Inc Morgan Stanley (4,142)(5,630) Children’s Place Inc Bank of America
Merrill Lynch (16,665)(2,898) Children’s Place Inc Barclays Bank 6,694(4,601) Children’s Place Inc Goldman Sachs (13,619)
(157,273) Chimera Investment Corp(REIT)
Bank of AmericaMerrill Lynch (83,354)
(9,154) Chimera Investment Corp(REIT) Barclays Bank (2,655)
(47,824) Chimera Investment Corp(REIT) Goldman Sachs (25,347)
(16,819) Chimera Investment Corp(REIT) HSBC (11,101)
(89,243) Chimera Investment Corp(REIT) Morgan Stanley (25,880)
(12,698) Chimerix Inc Bank of AmericaMerrill Lynch 4,571
(5,767) Chimerix Inc Barclays Bank 288(5,699) Chimerix Inc Goldman Sachs 2,0521,840 Chinook Therapeutics Inc Barclays Bank (2,742)2,984 Chinook Therapeutics Inc Goldman Sachs (656)4,665 Chinook Therapeutics Inc Morgan Stanley (6,951)
491 Chipotle Mexican Grill Inc Bank of AmericaMerrill Lynch 19,188
17 Chipotle Mexican Grill Inc Barclays Bank 5041,894 Chipotle Mexican Grill Inc Goldman Sachs 76,517
Holding Description Counterparty
Netunrealised
appreciation/(depreciation)
USD
United States continued103 Chipotle Mexican Grill Inc HSBC 4,239175 Chipotle Mexican Grill Inc Morgan Stanley 5,184
(4,699) Choice Hotels InternationalInc Barclays Bank (11,419)
(731) Choice Hotels InternationalInc Goldman Sachs (1,784)
8,866 Choice Hotels InternationalInc Morgan Stanley 20,873
1,390 ChoiceOne Financial Ser-vices Inc
Bank of AmericaMerrill Lynch (195)
2,670 ChoiceOne Financial Ser-vices Inc Barclays Bank (1,121)
4,491 ChoiceOne Financial Ser-vices Inc HSBC 943
476 ChoiceOne Financial Ser-vices Inc Morgan Stanley (200)
(27,493) ChromaDex Corp Barclays Bank (9,897)(2,658) ChromaDex Corp Goldman Sachs (2,685)
(792) Chubb Ltd Bank of AmericaMerrill Lynch (2,919)
(3,515) Chubb Ltd Barclays Bank (4,716)(3,053) Chubb Ltd Goldman Sachs (12,414)(1,092) Chubb Ltd HSBC 4,193
(886) Chubb Ltd Morgan Stanley (64)2,060 Church & Dwight Co Inc Bank of America
Merrill Lynch (3,269)(160) Church & Dwight Co Inc Barclays Bank 235
1,446 Church & Dwight Co Inc Barclays Bank (2,126)(4,411) Church & Dwight Co Inc Goldman Sachs 9,8701,364 Church & Dwight Co Inc HSBC (3,718)
(5,388) Church & Dwight Co Inc Morgan Stanley 7,92012,912 Church & Dwight Co Inc Morgan Stanley (18,981)(3,867) Churchill Downs Inc Bank of America
Merrill Lynch (11,012)(419) Churchill Downs Inc Barclays Bank (65)
(3,430) Churchill Downs Inc Goldman Sachs (6,643)(1,607) Churchill Downs Inc Morgan Stanley 1,6966,042 Churchill Downs Inc Morgan Stanley 3,323
(3,057) Chuy’s Holdings Inc Bank of AmericaMerrill Lynch 4,677
(11,415) Chuy’s Holdings Inc Barclays Bank 14,269(3,741) Chuy’s Holdings Inc Goldman Sachs 5,72434,197 Cidara Therapeutics Inc Bank of America
Merrill Lynch 68447,425 Cidara Therapeutics Inc Barclays Bank 94974,154 Cidara Therapeutics Inc Goldman Sachs 1,48340,100 Cidara Therapeutics Inc HSBC 3,9817,859 Ciena Corp Barclays Bank (4,637)
34,803 Ciena Corp Goldman Sachs 28,1903,009 Cigna Corp Barclays Bank (7,579)4,722 Cigna Corp Goldman Sachs (23,006)
76 Cigna Corp HSBC (613)3,152 Cigna Corp Morgan Stanley (8,447)
798 Cimpress Plc Bank of AmericaMerrill Lynch (3,503)
606 Cimpress Plc Barclays Bank 1,0057,188 Cimpress Plc Goldman Sachs (31,555)1,188 Cimpress Plc HSBC 1,0931,001 Cimpress Plc Morgan Stanley 2,1327,702 Cincinnati Financial Corp Morgan Stanley 6,007
15,063 Cinemark Holdings Inc Bank of AmericaMerrill Lynch 8,887
40,140 Cinemark Holdings Inc Barclays Bank 2926,280 Cinemark Holdings Inc Goldman Sachs 3,705
927 Cinemark Holdings Inc HSBC 47613,015 Cinemark Holdings Inc Morgan Stanley 2601,343 Cintas Corp Barclays Bank (1,343)
807 Cintas Corp Goldman Sachs 1,2111,570 Cintas Corp HSBC (11,304)
BlackRock Americas Diversified Equity Absolute Return FundcontinuedPortfolio of Investments as at 31 May 2021
The notes on pages 590 to 610 form an integral part of these financial statements.
Annual report and audited financial statements [85]

Holding Description Counterparty
Netunrealised
appreciation/(depreciation)
USD
United States continued2,194 Cintas Corp Morgan Stanley (2,194)
(7,579) CIRCOR International Inc Bank of AmericaMerrill Lynch 909
(9,405) CIRCOR International Inc Barclays Bank (2,822)(6,646) CIRCOR International Inc Goldman Sachs 798
(484) CIRCOR International Inc Morgan Stanley 4718,831 Cirrus Logic Inc Barclays Bank 31,2604,791 Cirrus Logic Inc Goldman Sachs 18,254
11,231 Cirrus Logic Inc HSBC 36,3012,263 Cirrus Logic Inc Morgan Stanley 3,757
(28,008) Cisco Systems Inc - CDI Goldman Sachs 1,120(1,142) Cisco Systems Inc - CDI HSBC 29715,637 Cisco Systems Inc - CDI Morgan Stanley (7,662)(6,512) Cisco Systems Inc - CDI Morgan Stanley 3,191
(280) Citi Trends Inc Bank of AmericaMerrill Lynch 4,539
(1,088) Citi Trends Inc Barclays Bank 7,148(4,755) Citi Trends Inc Goldman Sachs 77,079(1,270) Citigroup Inc Bank of America
Merrill Lynch (1,638)(3,678) Citigroup Inc Barclays Bank (2,501)(6,960) Citigroup Inc Morgan Stanley (4,733)
(28,085) Citizens & Northern Corp Bank of AmericaMerrill Lynch 17,132
(9,307) Citizens & Northern Corp Morgan Stanley 1,3039,022 Citizens Financial Group Inc Bank of America
Merrill Lynch (7,578)(5,009) Citizens Financial Group Inc Bank of America
Merrill Lynch 4,20818,996 Citizens Financial Group Inc Barclays Bank 11,018(4,446) Citizens Financial Group Inc Barclays Bank (2,579)46,836 Citizens Financial Group Inc Goldman Sachs (39,342)(8,180) Citizens Financial Group Inc Goldman Sachs (62)19,407 Citizens Financial Group Inc Morgan Stanley 11,256
(944) Citizens Holding Co Bank of AmericaMerrill Lynch 208
(4,421) Citizens Holding Co Barclays Bank 3,095(9,485) Citizens Holding Co Goldman Sachs 2,08712,191 Citizens Inc Bank of America
Merrill Lynch (4,479)63,873 Citizens Inc Barclays Bank (15,237)11,324 Citizens Inc Goldman Sachs (4,303)8,602 Citizens Inc HSBC (2,683)9,566 Citizens Inc Morgan Stanley (338)(907) Citrix Systems Inc Bank of America
Merrill Lynch 1,732(698) Citrix Systems Inc Barclays Bank 614
(1,974) Citrix Systems Inc Goldman Sachs 3,770(2,908) Citrix Systems Inc Morgan Stanley 2,559
(14,121) City Holding Co Morgan Stanley (13,274)(9,804) Civeo Corp Bank of America
Merrill Lynch 10,686(2,449) Civeo Corp Goldman Sachs 2,669(1,318) Civeo Corp Morgan Stanley 51420,737 Civista Bancshares Inc Bank of America
Merrill Lynch 41517,737 Civista Bancshares Inc Barclays Bank 1,06422,161 Civista Bancshares Inc Goldman Sachs 44318,260 Civista Bancshares Inc HSBC 16,25126,093 Civista Bancshares Inc Morgan Stanley 1,5661,327 Clarivate Plc Bank of America
Merrill Lynch 2,0302,838 Clarivate Plc Barclays Bank (449)
(9,134) Clarivate Plc Barclays Bank 9774,254 Clarivate Plc Goldman Sachs 5,7153,000 Clarivate Plc Morgan Stanley 1,050
(2,719) Clarus Corp Bank of AmericaMerrill Lynch (6,063)
(1,088) Clarus Corp Barclays Bank (914)(50,082) Clarus Corp Morgan Stanley (42,069)
Holding Description Counterparty
Netunrealised
appreciation/(depreciation)
USD
United States continued4,537 Clean Energy Fuels Corp Barclays Bank (181)
15,247 Clean Energy Fuels Corp HSBC 2,8132,867 Clean Energy Fuels Corp Morgan Stanley (220)
(8,800) Clean Harbors Inc Bank of AmericaMerrill Lynch 6,424
3,261 Clean Harbors Inc Bank of AmericaMerrill Lynch 369
(13,986) Clean Harbors Inc Barclays Bank 7,832(12,831) Clean Harbors Inc Goldman Sachs 9,367
3,516 Clean Harbors Inc Goldman Sachs (880)8,377 Clean Harbors Inc Morgan Stanley 2,070
(12,085) Cleanspark Inc Barclays Bank (8,327)(1,560) Clearfield Inc Bank of America
Merrill Lynch (3,323)(1,785) Clearfield Inc Barclays Bank (2,892)(1,099) Clearfield Inc Goldman Sachs (2,341)
(14,317) ClearPoint Neuro Inc Barclays Bank (859)5,510 Clearwater Paper Corp Goldman Sachs (10,249)
12,004 Clearway Energy Inc ’A’ Bank of AmericaMerrill Lynch 13,565
9,722 Clearway Energy Inc ’A’ Barclays Bank 3,1118,992 Clearway Energy Inc ’A’ HSBC 9,4771,104 Clearway Energy Inc ’A’ Morgan Stanley 3531,210 Clearway Energy Inc ’C’ Bank of America
Merrill Lynch 1,29523,441 Clearway Energy Inc ’C’ Barclays Bank 3,0472,386 Clearway Energy Inc ’C’ Goldman Sachs 2,553
24,273 Clearway Energy Inc ’C’ HSBC 23,7884,790 Clearway Energy Inc ’C’ Morgan Stanley 623
(11,554) Clene Inc Barclays Bank (28,769)(7,746) Clene Inc Goldman Sachs (21,766)7,451 Cleveland-Cliffs Inc Bank of America
Merrill Lynch 8,038(3,058) Cleveland-Cliffs Inc Barclays Bank (4,770)35,780 Cleveland-Cliffs Inc Barclays Bank 42,5462,908 Cleveland-Cliffs Inc Goldman Sachs (2,239)
60,325 Clipper Realty Inc (REIT) Barclays Bank 2,41330,431 Clipper Realty Inc (REIT) Goldman Sachs (4,565)6,055 Clipper Realty Inc (REIT) HSBC (2,301)
28,762 Clipper Realty Inc (REIT) Morgan Stanley 1,1504,035 Clorox Co Goldman Sachs (15,141)1,231 Clorox Co HSBC (13,861)
20,785 Cloudera Inc Bank of AmericaMerrill Lynch 19,330
34,415 Cloudera Inc Barclays Bank 8,60432,645 Cloudera Inc Goldman Sachs 30,3609,653 Cloudera Inc HSBC 11,004
12,961 Cloudera Inc Morgan Stanley 3,2401,349 Cloudflare Inc ’A’ Bank of America
Merrill Lynch 14,9743,884 Cloudflare Inc ’A’ Barclays Bank 8,068
328 Cloudflare Inc ’A’ Goldman Sachs 3,6413,203 Cloudflare Inc ’A’ Morgan Stanley 10,186
27,829 Clover Health InvestmentsCorp Barclays Bank 20,037
24,234 Clover Health InvestmentsCorp Goldman Sachs 19,872
14,880 Clovis Oncology Inc Goldman Sachs (11,011)1,806 Clovis Oncology Inc Morgan Stanley 1176,722 CMC Materials Inc Bank of America
Merrill Lynch 12,1334,915 CMC Materials Inc Barclays Bank 1,1171,921 CMC Materials Inc Goldman Sachs 5,681
(2,204) CMC Materials Inc HSBC (2,645)770 CMC Materials Inc HSBC 875
(768) CMC Materials Inc Morgan Stanley (369)2,478 CMC Materials Inc Morgan Stanley 1,6401,275 CME Group Inc Bank of America
Merrill Lynch 2,9714,753 CME Group Inc Barclays Bank 6,892
BlackRock Americas Diversified Equity Absolute Return FundcontinuedPortfolio of Investments as at 31 May 2021
The notes on pages 590 to 610 form an integral part of these financial statements.
BlackRock Strategic Funds[86]

Holding Description Counterparty
Netunrealised
appreciation/(depreciation)
USD
United States continued1,531 CME Group Inc Goldman Sachs 3,567(528) CME Group Inc Goldman Sachs (636)719 CME Group Inc HSBC 7,700
(1,136) CME Group Inc Morgan Stanley (194)10,682 CMS Energy Corp Bank of America
Merrill Lynch (2,293)6,216 CMS Energy Corp Barclays Bank (6,402)
30,847 CMS Energy Corp Goldman Sachs (7,256)42,676 CMS Energy Corp Morgan Stanley (43,957)
(12,070) CNA Financial Corp Bank of AmericaMerrill Lynch (6,365)
(18,219) CNA Financial Corp Barclays Bank (1,640)(612) CNA Financial Corp Goldman Sachs (233)
(35,376) CNA Financial Corp Morgan Stanley (9,197)(1,342) CNB Financial Corp Bank of America
Merrill Lynch 1,476(8,137) CNB Financial Corp Barclays Bank 1,383(8,304) CNB Financial Corp Goldman Sachs 9,134(8,772) CNB Financial Corp Morgan Stanley 1,491
(57,328) CNO Financial Group Inc Barclays Bank 5624,385 CNX Resources Corp Bank of America
Merrill Lynch (4,341)5,547 CNX Resources Corp Barclays Bank (1,609)8,047 CNX Resources Corp Goldman Sachs (7,967)3,504 CNX Resources Corp HSBC (491)8,957 Coastal Financial Corp Morgan Stanley 3,852
(23,059) Coca-Cola Co Barclays Bank (11,299)(2,048) Coca-Cola Consolidated Inc Morgan Stanley (76,841)(2,603) Coca-Cola Europacific Part-
ners Plc Barclays Bank 677(7,170) Coca-Cola Europacific Part-
ners Plc Goldman Sachs 6,525(6,534) Coca-Cola Europacific Part-
ners Plc Morgan Stanley 1,699(17,831) Coda Octopus Group Inc Barclays Bank (10,164)(9,400) Coda Octopus Group Inc Goldman Sachs (6,956)(3,489) Coda Octopus Group Inc HSBC (2,547)(2,093) Coda Octopus Group Inc Morgan Stanley (1,193)20,685 Codexis Inc Goldman Sachs 47,9897,932 Codexis Inc HSBC 23,9556,597 Codexis Inc Morgan Stanley 5,607
(14,359) Co-Diagnostics Inc Barclays Bank (574)(354) Co-Diagnostics Inc Goldman Sachs 120
(2,954) Codiak Biosciences Inc Barclays Bank (6,322)(1,865) Codiak Biosciences Inc Goldman Sachs (4,475)(1,975) Codiak Biosciences Inc Morgan Stanley (2,752)
(10,901) Codorus Valley Bancorp Inc Bank of AmericaMerrill Lynch (4,469)
(4,747) Codorus Valley Bancorp Inc Barclays Bank (133)(10,661) Codorus Valley Bancorp Inc Goldman Sachs (3,406)(6,145) Codorus Valley Bancorp Inc HSBC (2,642)(4,860) Codorus Valley Bancorp Inc Morgan Stanley (146)
(17,850) Coeur Mining Inc Bank of AmericaMerrill Lynch (179)
(9,980) Coeur Mining Inc Barclays Bank (1,497)(9,401) Coeur Mining Inc HSBC (12,221)
(36,001) Coeur Mining Inc Morgan Stanley (5,400)(23,534) Cogent Biosciences Inc Bank of America
Merrill Lynch (10,826)(7,196) Cogent Communications
Holdings IncBank of AmericaMerrill Lynch (2,255)
1,699 Cogent CommunicationsHoldings Inc Barclays Bank 1,274
(7,705) Cogent CommunicationsHoldings Inc Barclays Bank (5,779)
2,790 Cogent CommunicationsHoldings Inc Goldman Sachs 530
(1,785) Cogent CommunicationsHoldings Inc Goldman Sachs (339)
Holding Description Counterparty
Netunrealised
appreciation/(depreciation)
USD
United States continued6,721 Cognex Corp Bank of America
Merrill Lynch 35,4873,192 Cognex Corp Barclays Bank 6,5122,000 Cognex Corp Goldman Sachs 10,5608,028 Cognex Corp HSBC 24,325
11,837 Cognizant Technology Solu-tions Corp ’A’
Bank of AmericaMerrill Lynch 10,742
1,929 Cognizant Technology Solu-tions Corp ’A’ Barclays Bank 887
11,697 Cognizant Technology Solu-tions Corp ’A’ Goldman Sachs 10,820
(4,184) Cognizant Technology Solu-tions Corp ’A’ HSBC 10,251
1,705 Cognizant Technology Solu-tions Corp ’A’ HSBC (1,378)
(13,665) Cognizant Technology Solu-tions Corp ’A’ Morgan Stanley (6,286)
32,890 Cognizant Technology Solu-tions Corp ’A’ Morgan Stanley 15,129
1,509 Cognyte Software Ltd Goldman Sachs 2,9277,346 Cognyte Software Ltd Morgan Stanley 8,374
(107,211) Cohbar Inc Barclays Bank 6,4335,012 Cohen & Steers Inc Bank of America
Merrill Lynch 3,8095,174 Cohen & Steers Inc Barclays Bank (108)3,037 Cohen & Steers Inc Goldman Sachs 2,3088,948 Cohen & Steers Inc HSBC 25,754
10,343 Cohen & Steers Inc Morgan Stanley 1,551(553) Coherent Inc Bank of America
Merrill Lynch (1,604)(398) Coherent Inc Barclays Bank (494)403 Coherent Inc Barclays Bank 500320 Coherent Inc Goldman Sachs 254235 Coherent Inc HSBC 753
(1,515) Coherent Inc Morgan Stanley (1,879)24,466 Coherus Biosciences Inc Bank of America
Merrill Lynch (23,977)11,918 Coherus Biosciences Inc Barclays Bank (358)1,857 Coherus Biosciences Inc Goldman Sachs (1,820)1,778 Coherus Biosciences Inc HSBC (1,991)
17,550 Coherus Biosciences Inc Morgan Stanley (527)(2,329) Cohu Inc Bank of America
Merrill Lynch (1,689)(1,781) Cohu Inc Barclays Bank (614)(4,033) Cohu Inc Goldman Sachs (3,219)
(21,579) Cohu Inc Morgan Stanley (4,236)(6,427) Colfax Corp Bank of America
Merrill Lynch 368(8,289) Colfax Corp Barclays Bank (1,654)(6,479) Colfax Corp Goldman Sachs (788)
(15,079) Colfax Corp Morgan Stanley 3,1965,806 Colfax Corp Morgan Stanley —3,781 Colgate-Palmolive Co Bank of America
Merrill Lynch 87013,123 Colgate-Palmolive Co Barclays Bank (8,136)24,497 Colgate-Palmolive Co Goldman Sachs 5,6345,840 Colgate-Palmolive Co HSBC 2,570
14,514 Colgate-Palmolive Co Morgan Stanley (8,999)11,161 Collegium Pharmaceutical
IncBank of AmericaMerrill Lynch 7,925
16,233 Collegium PharmaceuticalInc Barclays Bank (9,131)
5,193 Collegium PharmaceuticalInc Goldman Sachs 5,712
7,445 Collegium PharmaceuticalInc HSBC 14,134
15,106 Collegium PharmaceuticalInc Morgan Stanley (5,628)
BlackRock Americas Diversified Equity Absolute Return FundcontinuedPortfolio of Investments as at 31 May 2021
The notes on pages 590 to 610 form an integral part of these financial statements.
Annual report and audited financial statements [87]

Holding Description Counterparty
Netunrealised
appreciation/(depreciation)
USD
United States continued4,354 Colony Bankcorp Inc Bank of America
Merrill Lynch 3,91913,125 Colony Bankcorp Inc Barclays Bank (4,331)14,091 Colony Bankcorp Inc Goldman Sachs 12,6829,497 Colony Bankcorp Inc HSBC 17,854
13,083 Colony Bankcorp Inc Morgan Stanley (4,317)40,618 Colony Capital Inc (REIT) Barclays Bank 2,03111,609 Colony Capital Inc (REIT) Morgan Stanley 580
(13,527) Colony Credit Real EstateInc (REIT) Goldman Sachs (406)
(10,905) Colony Credit Real EstateInc (REIT) HSBC (4,144)
(44,318) Colony Credit Real EstateInc (REIT) Morgan Stanley (443)
(26,596) Columbia Banking SystemInc Morgan Stanley (7,979)
(32,997) Columbia Financial Inc Barclays Bank (10,229)(55,664) Columbia Financial Inc Goldman Sachs 16,143(62,326) Columbia Financial Inc HSBC 1,247(76,433) Columbia Financial Inc Morgan Stanley (23,694)(27,223) Columbia Property Trust Inc
(REIT)Bank of AmericaMerrill Lynch 11,480
(36,370) Columbia Property Trust Inc(REIT) Barclays Bank 18,185
(42,151) Columbia Property Trust Inc(REIT) Goldman Sachs 19,826
(3,608) Columbia Property Trust Inc(REIT) HSBC 1,624
(2,884) Columbia Property Trust Inc(REIT) Morgan Stanley 1,442
(5,934) Columbia Sportswear Co Goldman Sachs 18,6923,400 Columbus McKinnon Corp Bank of America
Merrill Lynch (10,472)3,867 Columbus McKinnon Corp Barclays Bank (6,806)
25,979 Columbus McKinnon Corp HSBC (29,876)15,007 Columbus McKinnon Corp Morgan Stanley (26,412)20,097 Comcast Corp ’A’ Barclays Bank 33,76351,674 Comcast Corp ’A’ Goldman Sachs 109,44533,172 Comcast Corp ’A’ Morgan Stanley 53,775(2,830) Comerica Inc Goldman Sachs 3,28313,358 Comerica Inc Morgan Stanley 16,564
(960) Comerica Inc Morgan Stanley (1,190)2,142 Comfort Systems USA Inc Bank of America
Merrill Lynch (236)1,501 Comfort Systems USA Inc Barclays Bank 3,1821,019 Comfort Systems USA Inc Goldman Sachs (112)5,727 Comfort Systems USA Inc HSBC (19,357)9,752 Comfort Systems USA Inc Morgan Stanley 20,674
(3,428) Commerce Bancshares Inc Bank of AmericaMerrill Lynch 6,582
(9,871) Commerce Bancshares Inc Barclays Bank (3,660)(12,087) Commerce Bancshares Inc Goldman Sachs 4,713(3,705) Commerce Bancshares Inc HSBC 6,632(2,629) Commerce Bancshares Inc Morgan Stanley 684
(15,725) Commercial Metals Co Bank of AmericaMerrill Lynch 22,801
1,785 Commercial Metals Co Bank of AmericaMerrill Lynch (2,588)
47,221 Commercial Metals Co Barclays Bank 47228,056 Commercial Metals Co HSBC (26,653)17,784 Commercial Metals Co Morgan Stanley 178
(12,533) Commercial Vehicle GroupInc HSBC 20,679
(6,471) CommScope Holding Co Inc Bank of AmericaMerrill Lynch (12,295)
(9,271) CommScope Holding Co Inc Barclays Bank (13,536)(23,405) CommScope Holding Co Inc Goldman Sachs (44,470)(5,919) CommScope Holding Co Inc Morgan Stanley (8,642)(1,555) Community Bank System
Inc Morgan Stanley (482)
Holding Description Counterparty
Netunrealised
appreciation/(depreciation)
USD
United States continued31,911 Community Bankers Trust
CorpBank of AmericaMerrill Lynch (7,020)
32,061 Community Bankers TrustCorp Barclays Bank 321
33,776 Community Bankers TrustCorp Goldman Sachs (7,431)
51,249 Community Bankers TrustCorp Morgan Stanley 512
(1,554) Community Financial Corp Goldman Sachs 1,336(5,345) Community Financial Corp HSBC (6,147)(2,855) Community Financial Corp Morgan Stanley 514(7,672) Community Health Systems
Inc Morgan Stanley (3,989)(6,828) Community Healthcare
Trust Inc (REIT) Morgan Stanley 2,52615,086 Community Trust Bancorp
IncBank of AmericaMerrill Lynch (13,879)
25,468 Community Trust BancorpInc Barclays Bank (11,206)
15,468 Community Trust BancorpInc Goldman Sachs (14,231)
10,915 Community Trust BancorpInc HSBC (4,803)
35,972 Community Trust BancorpInc Morgan Stanley (15,828)
9,894 CommVault Systems Inc Bank of AmericaMerrill Lynch 76,184
15,844 CommVault Systems Inc Goldman Sachs 121,9994,773 CommVault Systems Inc HSBC 48,3031,526 CommVault Systems Inc Morgan Stanley 2,243
(1,419) Compass Minerals Interna-tional Inc
Bank of AmericaMerrill Lynch 1,788
(7,576) Compass Minerals Interna-tional Inc Barclays Bank (3,864)
(3,749) Compass Minerals Interna-tional Inc Goldman Sachs 4,724
(6,331) Compass Minerals Interna-tional Inc HSBC (4,685)
(9,524) Compass Minerals Interna-tional Inc Morgan Stanley (4,857)
(9,036) Computer Programs andSystems Inc
Bank of AmericaMerrill Lynch (2,078)
(4,845) Computer Programs andSystems Inc Barclays Bank (2,229)
(22,903) Computer Programs andSystems Inc Goldman Sachs (5,268)
(2,220) Computer Programs andSystems Inc HSBC (4,684)
(15,662) Computer Programs andSystems Inc Morgan Stanley (7,205)
862 CompX International Inc Bank of AmericaMerrill Lynch (2,052)
5,581 CompX International Inc Barclays Bank 5022,748 CompX International Inc Goldman Sachs (6,540)4,049 CompX International Inc Morgan Stanley 364
80,718 comScore Inc Barclays Bank (3,229)10,055 comScore Inc Goldman Sachs 3,519(5,870) Comstock Mining Inc Morgan Stanley (1,644)
(28,141) Comstock Resources Inc Bank of AmericaMerrill Lynch 14,071
(14,604) Comstock Resources Inc Barclays Bank 2,045(1,213) Comtech Telecommunica-
tions CorpBank of AmericaMerrill Lynch (1,722)
(14,462) Comtech Telecommunica-tions Corp Barclays Bank (24,441)
(13,840) Comtech Telecommunica-tions Corp Goldman Sachs (19,653)
33,730 Conagra Brands Inc Bank of AmericaMerrill Lynch 12,629
17,169 Conagra Brands Inc Barclays Bank (2,232)
BlackRock Americas Diversified Equity Absolute Return FundcontinuedPortfolio of Investments as at 31 May 2021
The notes on pages 590 to 610 form an integral part of these financial statements.
BlackRock Strategic Funds[88]

Holding Description Counterparty
Netunrealised
appreciation/(depreciation)
USD
United States continued32,560 Conagra Brands Inc Goldman Sachs 11,2656,408 Conagra Brands Inc HSBC (961)
77,371 Conagra Brands Inc Morgan Stanley (10,058)(291) Concentrix Corp Bank of America
Merrill Lynch (501)803 Concentrix Corp Barclays Bank 771
(479) Concentrix Corp Barclays Bank (460)440 Concentrix Corp Goldman Sachs 757
1,497 Concentrix Corp Morgan Stanley 1,437(1,859) Concentrix Corp Morgan Stanley (1,785)(3,892) Concert Pharmaceuticals
Inc Goldman Sachs 39(9,925) Concert Pharmaceuticals
Inc HSBC (2,481)(15,111) Concert Pharmaceuticals
Inc Morgan Stanley (604)(2,424) Concrete Pumping Holdings
IncBank of AmericaMerrill Lynch 24
(20,214) Concrete Pumping HoldingsInc Barclays Bank 3,639
(16,150) Concrete Pumping HoldingsInc HSBC (969)
14,163 Conduent Inc Bank of AmericaMerrill Lynch 5,240
87,348 Conduent Inc Goldman Sachs 32,3199,457 Conduent Inc HSBC 2,648
25,728 Conduent Inc Morgan Stanley 5,403(958) CONMED Corp Bank of America
Merrill Lynch (389)(2,938) CONMED Corp Barclays Bank 2,491(2,439) CONMED Corp Goldman Sachs 1,094(3,211) ConnectOne Bancorp Inc Bank of America
Merrill Lynch 1,349(7,720) ConnectOne Bancorp Inc Barclays Bank 386(9,201) ConnectOne Bancorp Inc Goldman Sachs 3,864
(26,648) ConnectOne Bancorp Inc HSBC (1,066)(7,859) ConnectOne Bancorp Inc Morgan Stanley 3934,528 Conn’s Inc Barclays Bank 2,852
926 Conn’s Inc Goldman Sachs 1,509(17,952) ConocoPhillips Bank of America
Merrill Lynch 45,957(16,804) ConocoPhillips Barclays Bank 6,049(6,540) ConocoPhillips Goldman Sachs 16,742
(60,641) Consolidated Communica-tions Holdings Inc
Bank of AmericaMerrill Lynch (6,671)
(30,019) Consolidated Communica-tions Holdings Inc Barclays Bank (8,405)
(41,091) Consolidated Communica-tions Holdings Inc Goldman Sachs (4,520)
14,882 Consolidated Edison Inc Bank of AmericaMerrill Lynch (22,174)
8,081 Consolidated Edison Inc Barclays Bank (9,212)3,778 Consolidated Edison Inc Goldman Sachs (5,629)5,915 Consolidated Edison Inc HSBC (15,438)
36,902 Consolidated Edison Inc Morgan Stanley (42,068)(27,051) Consolidated Water Co Ltd Bank of America
Merrill Lynch (20,829)(56,146) Consolidated Water Co Ltd Barclays Bank 8,422(56,967) Consolidated Water Co Ltd Goldman Sachs (43,560)(3,899) Consolidated Water Co Ltd Morgan Stanley 591,023 Constellation Brands Inc ’A’ Bank of America
Merrill Lynch 7,5751,077 Constellation Brands Inc ’A’ Barclays Bank 3,489
695 Constellation Brands Inc ’A’ Goldman Sachs 2,056(495) Constellation Brands Inc ’A’ Morgan Stanley (1,604)(962) Constellation Pharmaceuti-
cals Inc Barclays Bank 202(2,880) Constellation Pharmaceuti-
cals Inc HSBC (144)
Holding Description Counterparty
Netunrealised
appreciation/(depreciation)
USD
United States continued(14,417) Construction Partners Inc
’A’Bank of AmericaMerrill Lynch (8,085)
(21,140) Construction Partners Inc’A’ Barclays Bank (17,335)
(16,571) Construction Partners Inc’A’ Goldman Sachs (11,055)
(26,816) Construction Partners Inc’A’ Morgan Stanley (16,136)
37,629 Consumer Portfolio Ser-vices Inc Morgan Stanley 4,139
(6,023) Container Store Group Inc Bank of AmericaMerrill Lynch (1,807)
(18,158) Container Store Group Inc Barclays Bank (13,074)(14,743) Container Store Group Inc Goldman Sachs (3,732)(22,671) Contango Oil & Gas Co Goldman Sachs (3,401)
9,446 ContextLogic Inc ’A’ Barclays Bank (2,267)5,942 Continental Resources Inc Bank of America
Merrill Lynch 5,2827,546 Continental Resources Inc Barclays Bank 4,7548,096 Continental Resources Inc Goldman Sachs 4,939
21,113 Continental Resources Inc Morgan Stanley 13,301(55,459) ContraFect Corp Goldman Sachs (11,092)
(448) Cooper Cos Inc Barclays Bank 470(1,674) Cooper Cos Inc Morgan Stanley 1,758(4,702) Cooper Tire & Rubber Co Bank of America
Merrill Lynch 2,915(7,476) Cooper Tire & Rubber Co Barclays Bank (3,738)(4,823) Cooper Tire & Rubber Co Goldman Sachs 2,990
(30,160) Cooper Tire & Rubber Co Morgan Stanley (15,080)6,911 Cooper-Standard Holdings
Inc Morgan Stanley 2,41929,024 Copa Holdings SA ’A’ Goldman Sachs (21,768)7,404 Copa Holdings SA ’A’ Morgan Stanley 8,070
16,824 Copart Inc Barclays Bank 14,63711,694 Copart Inc Goldman Sachs 70,8654,439 Copart Inc HSBC 26,1909,923 Copart Inc Morgan Stanley 8,633
53,890 Corbus PharmaceuticalsHoldings Inc Barclays Bank 25,867
9,724 Corbus PharmaceuticalsHoldings Inc Goldman Sachs 5,640
24,917 Corbus PharmaceuticalsHoldings Inc HSBC 14,950
(16,026) Corcept Therapeutics Inc Morgan Stanley (6,410)(33,508) CoreCivic Inc (REIT) Barclays Bank 1,005(40,243) CoreCivic Inc (REIT) Goldman Sachs 12,073(31,037) CoreCivic Inc (REIT) Morgan Stanley 596(4,788) CoreLogic Inc Morgan Stanley 575
(242) Core-Mark Holding Co Inc HSBC (787)(14,660) Core-Mark Holding Co Inc Morgan Stanley 2,19993,067 CorePoint Lodging Inc
(REIT) Goldman Sachs 14,89180,806 CorePoint Lodging Inc
(REIT) Morgan Stanley 24,493(1,579) CoreSite Realty Corp
(REIT)Bank of AmericaMerrill Lynch (7,058)
1,066 CoreSite Realty Corp(REIT)
Bank of AmericaMerrill Lynch 4,765
(117) CoreSite Realty Corp(REIT) Barclays Bank (158)
304 CoreSite Realty Corp(REIT) Barclays Bank 410
(1,995) CoreSite Realty Corp(REIT) Goldman Sachs (8,918)
1,462 CoreSite Realty Corp(REIT) Goldman Sachs 6,535
(6,131) CoreSite Realty Corp(REIT) HSBC (17,903)
BlackRock Americas Diversified Equity Absolute Return FundcontinuedPortfolio of Investments as at 31 May 2021
The notes on pages 590 to 610 form an integral part of these financial statements.
Annual report and audited financial statements [89]

Holding Description Counterparty
Netunrealised
appreciation/(depreciation)
USD
United States continued3,663 CoreSite Realty Corp
(REIT) HSBC 10,696(4,694) CoreSite Realty Corp
(REIT) Morgan Stanley (6,337)2,223 CoreSite Realty Corp
(REIT) Morgan Stanley 3,001(16,361) CorMedix Inc Barclays Bank (4,908)
7,465 Cornerstone BuildingBrands Inc
Bank of AmericaMerrill Lynch 11,198
15,589 Cornerstone BuildingBrands Inc Barclays Bank (7,327)
28,366 Cornerstone BuildingBrands Inc Goldman Sachs 42,549
10,817 Cornerstone BuildingBrands Inc HSBC 19,579
12,293 Cornerstone BuildingBrands Inc Morgan Stanley (5,778)
(601) Cornerstone OnDemand Inc Barclays Bank 493(3,819) Cornerstone OnDemand Inc HSBC (7,676)
(18,140) Cornerstone OnDemand Inc Morgan Stanley 14,875(1,305) Corning Inc Bank of America
Merrill Lynch 731(565) Corning Inc Barclays Bank 215
(21,019) Corning Inc Goldman Sachs 11,771(9,783) Corning Inc HSBC 15,751(3,481) Corsair Gaming Inc Barclays Bank 701,920 Corsair Gaming Inc HSBC (442)4,600 Corteva Inc Barclays Bank 1,6106,155 Corteva Inc Goldman Sachs (4,432)
(9,164) Cortexyme Inc Barclays Bank (11,822)(266) CorVel Corp Barclays Bank (1,612)(550) CorVel Corp Morgan Stanley (3,531)
26,482 Corvus Pharmaceuticals Inc Goldman Sachs 6,621(64,227) Costamare Inc Barclays Bank 429(72,684) Costamare Inc Goldman Sachs (28,347)
(820) CoStar Group Inc Barclays Bank (7,201)(257) CoStar Group Inc Goldman Sachs (3,068)
(1,516) CoStar Group Inc Morgan Stanley (14,660)5,583 Costco Wholesale Corp Bank of America
Merrill Lynch (31,767)4,870 Costco Wholesale Corp Barclays Bank (25,227)
(5,631) Costco Wholesale Corp Barclays Bank 29,1693,952 Costco Wholesale Corp Goldman Sachs (22,487)
(2,265) Costco Wholesale Corp Goldman Sachs 12,8881,334 Costco Wholesale Corp HSBC (4,282)5,169 Costco Wholesale Corp Morgan Stanley (26,775)(986) Costco Wholesale Corp Morgan Stanley 5,584
5,097 Coty Inc ’A’ Goldman Sachs 1,0716,894 Coty Inc ’A’ HSBC (620)
20,174 Coty Inc ’A’ Morgan Stanley 5,245(7,451) County Bancorp Inc Barclays Bank (3,353)3,981 Coupa Software Inc Goldman Sachs 42,2858,167 Coupa Software Inc Morgan Stanley (7,300)1,049 Coursera Inc Bank of America
Merrill Lynch 94(1,231) Coursera Inc Barclays Bank (616)8,430 Coursera Inc Goldman Sachs 759
(3,103) Coursera Inc HSBC (238)10,500 Coursera Inc Morgan Stanley 5,250
(17,248) Cousins Properties Inc(REIT) HSBC (18,455)
(17,592) Cousins Properties Inc(REIT) Morgan Stanley (2,814)
(54,315) Covanta Holding Corp Bank of AmericaMerrill Lynch 16,295
(37,604) Covanta Holding Corp Barclays Bank 10,905(6,870) Covanta Holding Corp Goldman Sachs 2,061
(68,439) Covanta Holding Corp Morgan Stanley 19,8476,409 Covenant Logistics Group
IncBank of AmericaMerrill Lynch (6,858)
Holding Description Counterparty
Netunrealised
appreciation/(depreciation)
USD
United States continued20,696 Covenant Logistics Group
Inc Barclays Bank (5,795)3,448 Covenant Logistics Group
Inc Goldman Sachs (3,689)20,596 Covenant Logistics Group
Inc Morgan Stanley (5,767)5,018 Covetrus Inc Bank of America
Merrill Lynch 4,2364,629 Covetrus Inc Barclays Bank 6,666
12,282 Covetrus Inc Goldman Sachs 18,708(2,304) Covetrus Inc HSBC (1,290)
713 Covetrus Inc HSBC 932(5,237) Covetrus Inc Morgan Stanley (7,541)4,205 Covetrus Inc Morgan Stanley 6,0554,203 Cowen Inc ’A’ Bank of America
Merrill Lynch (9,121)9,134 Cowen Inc ’A’ Barclays Bank (822)3,608 Cowen Inc ’A’ Goldman Sachs (7,829)6,194 Cowen Inc ’A’ Morgan Stanley (557)
(10,772) CPS Technologies Corp Barclays Bank (5,601)(1,891) CPS Technologies Corp Goldman Sachs (1,210)(4,677) CRA International Inc Bank of America
Merrill Lynch (2,274)(4,939) CRA International Inc Barclays Bank 4,443(2,186) CRA International Inc Goldman Sachs (62)(2,284) Cracker Barrel Old Country
Store Inc Barclays Bank 4,876(1,588) Cracker Barrel Old Country
Store Inc Goldman Sachs (621)(3,266) Cracker Barrel Old Country
Store Inc HSBC 5,585(4,399) Crane Co Bank of America
Merrill Lynch 8,358(913) Crane Co Barclays Bank 630
(12,815) Crane Co Goldman Sachs 24,348(6,328) Crane Co HSBC 19,617(3,393) Crane Co Morgan Stanley 2,34134,659 Crawford & Co ’A’ Bank of America
Merrill Lynch (10,181)66,884 Crawford & Co ’A’ Barclays Bank 3,26032,638 Crawford & Co ’A’ Goldman Sachs (8,898)39,494 Crawford & Co ’A’ HSBC 2,29021,594 Crawford & Co ’A’ Morgan Stanley 1,512(2,216) Crawford & Co ’B’ Bank of America
Merrill Lynch 44(10,912) Crawford & Co ’B’ Goldman Sachs 218
(909) Credicorp Ltd Bank of AmericaMerrill Lynch 6,181
(556) Credicorp Ltd Barclays Bank (3,036)(907) Credicorp Ltd HSBC (3,601)(939) Credicorp Ltd Morgan Stanley (5,127)359 Credit Acceptance Corp Bank of America
Merrill Lynch 6,361(1,397) Credit Acceptance Corp Barclays Bank (14,738)
135 Credit Acceptance Corp Morgan Stanley 1,4243,243 Cree Inc Bank of America
Merrill Lynch 30,322295 Cree Inc Barclays Bank 873276 Cree Inc Goldman Sachs 1,233129 Cree Inc HSBC 1,024
4,155 Cree Inc Morgan Stanley 12,29910,637 Crinetics Pharmaceuticals
Inc Morgan Stanley 7,76510,596 Crocs Inc Barclays Bank (6,993)17,005 Crocs Inc HSBC (50,845)10,289 Crocs Inc Morgan Stanley (6,791)23,467 Cross Country Healthcare
IncBank of AmericaMerrill Lynch (10,616)
8,701 Cross Country HealthcareInc Morgan Stanley 174
BlackRock Americas Diversified Equity Absolute Return FundcontinuedPortfolio of Investments as at 31 May 2021
The notes on pages 590 to 610 form an integral part of these financial statements.
BlackRock Strategic Funds[90]

Holding Description Counterparty
Netunrealised
appreciation/(depreciation)
USD
United States continued(1,358) CrossFirst Bankshares Inc Barclays Bank 244
(60,265) CrossFirst Bankshares Inc Goldman Sachs 16,573(137) CrossFirst Bankshares Inc HSBC (38)
(33,476) CrossFirst Bankshares Inc Morgan Stanley 6,026(493) Crowdstrike Holdings Inc ’A’ Barclays Bank 513
(1,405) Crowdstrike Holdings Inc ’A’ Goldman Sachs (47,236)(2,792) Crowdstrike Holdings Inc ’A’ HSBC (96,519)(1,561) Crowdstrike Holdings Inc ’A’ Morgan Stanley (12,176)1,450 Crown Castle International
Corp (REIT)Bank of AmericaMerrill Lynch (51)
438 Crown Castle InternationalCorp (REIT) Barclays Bank 1,428
1,464 Crown Castle InternationalCorp (REIT) Goldman Sachs 786
(4,435) Crown Castle InternationalCorp (REIT) HSBC (27,985)
2,310 Crown Castle InternationalCorp (REIT) HSBC 14,576
(5,521) Crown Castle InternationalCorp (REIT) Morgan Stanley (17,998)
28,598 Crown Holdings Inc Barclays Bank (214,199)2,549 Crown Holdings Inc Goldman Sachs (20,749)
(3,398) CryoLife Inc Barclays Bank 3,670(3,052) CryoLife Inc Goldman Sachs 732(4,528) CryoLife Inc Morgan Stanley 4,890(1,966) CryoPort Inc Bank of America
Merrill Lynch (12,032)(5,776) CryoPort Inc Barclays Bank (20,967)10,928 CSG Systems International
IncBank of AmericaMerrill Lynch (9,507)
16,905 CSG Systems InternationalInc Barclays Bank (13,355)
1,620 CSG Systems InternationalInc Goldman Sachs (1,409)
41,815 CSG Systems InternationalInc Morgan Stanley (28,791)
(2,469) CSW Industrials Inc Bank of AmericaMerrill Lynch 15,061
(9,851) CSW Industrials Inc Barclays Bank 15,860(2,713) CSW Industrials Inc Goldman Sachs 16,549
(11,176) CSW Industrials Inc Morgan Stanley 17,993(660) CSX Corp Bank of America
Merrill Lynch (38)(27,528) CSX Corp Barclays Bank (4,439)(10,584) CSX Corp HSBC 32,175(6,542) CSX Corp Morgan Stanley (6,950)6,520 CTO Realty Growth Inc
(REIT)Bank of AmericaMerrill Lynch 3,782
3,212 CTO Realty Growth Inc(REIT) Barclays Bank (2,987)
9,396 CTO Realty Growth Inc(REIT) Goldman Sachs 5,450
6,832 CTO Realty Growth Inc(REIT) HSBC 10,521
9,414 CTO Realty Growth Inc(REIT) Morgan Stanley (8,755)
(28,241) CTS Corp Bank of AmericaMerrill Lynch (39,537)
(11,471) CTS Corp Goldman Sachs (16,059)(1,230) CTS Corp HSBC (7,343)
(15,292) CTS Corp Morgan Stanley 2,7535,314 CubeSmart (REIT) Bank of America
Merrill Lynch 7,333(1,860) CubeSmart (REIT) Bank of America
Merrill Lynch (2,567)10,434 CubeSmart (REIT) Barclays Bank 8,8696,310 CubeSmart (REIT) Goldman Sachs 8,708
33,060 CubeSmart (REIT) Morgan Stanley 28,101(2,011) CubeSmart (REIT) Morgan Stanley (1,709)6,359 Cue Biopharma Inc Goldman Sachs 2,162
Holding Description Counterparty
Netunrealised
appreciation/(depreciation)
USD
United States continued10,487 Cue Biopharma Inc Morgan Stanley 105(3,346) Cullen/Frost Bankers Inc Goldman Sachs 12,949(2,290) Cullen/Frost Bankers Inc Morgan Stanley 1,8324,617 Cullinan Oncology Inc Bank of America
Merrill Lynch 6,2792,526 Cullinan Oncology Inc Barclays Bank 3,0825,311 Cullinan Oncology Inc Goldman Sachs 7,2236,642 Culp Inc Bank of America
Merrill Lynch 10,76010,492 Culp Inc Barclays Bank 5,03610,042 Culp Inc Goldman Sachs 16,26816,166 Culp Inc HSBC 25,5847,146 Culp Inc Morgan Stanley 3,430(284) Cummins Inc Barclays Bank (497)
(3,639) Cummins Inc Goldman Sachs 3,629(2,314) Cummins Inc Morgan Stanley (4,050)2,447 Cumulus Media Inc ’A’ Bank of America
Merrill Lynch 2,49615,269 Cumulus Media Inc ’A’ Barclays Bank 45814,969 Cumulus Media Inc ’A’ HSBC 4,7907,071 Cumulus Media Inc ’A’ Morgan Stanley 2125,797 CuriosityStream Inc Barclays Bank 2,145
12,163 CuriosityStream Inc Goldman Sachs 25,29912,015 CuriosityStream Inc Morgan Stanley 4,446(8,625) Curis Inc Barclays Bank (2,760)2,712 Curo Group Holdings Corp Bank of America
Merrill Lynch 4,0414,339 Curo Group Holdings Corp Barclays Bank 2,9943,789 Curo Group Holdings Corp HSBC 3,1073,670 Curo Group Holdings Corp Morgan Stanley 2,532(675) Curtiss-Wright Corp Bank of America
Merrill Lynch 551(3,578) Curtiss-Wright Corp Barclays Bank 2,36112,661 Curtiss-Wright Corp Goldman Sachs (30,133)(3,087) Curtiss-Wright Corp Goldman Sachs 7,3471,858 Curtiss-Wright Corp HSBC (7,116)3,029 Curtiss-Wright Corp Morgan Stanley (1,999)(275) Curtiss-Wright Corp Morgan Stanley 182
42,738 Cushman & Wakefield Plc Goldman Sachs 34,61825,799 Cushman & Wakefield Plc Morgan Stanley (2,064)7,848 Custom Truck One Source
Inc Morgan Stanley 5,886(5,221) Customers Bancorp Inc Bank of America
Merrill Lynch (14,514)(4,714) Customers Bancorp Inc Goldman Sachs (13,105)(8,372) Cutera Inc Morgan Stanley (2,093)12,475 CVR Energy Inc Goldman Sachs (30,938)8,949 CVS Health Corp Barclays Bank (29,263)2,605 CVS Health Corp Goldman Sachs 4,8978,588 CVS Health Corp Morgan Stanley (28,083)
(5,648) CyberOptics Corp Barclays Bank 2,598(816) CyberOptics Corp HSBC (2,187)
(7,687) CyberOptics Corp Morgan Stanley 3,536(11,088) Cyclerion Therapeutics Inc HSBC (5,544)(54,123) Cyclerion Therapeutics Inc Morgan Stanley (15,696)45,799 Cymabay Therapeutics Inc Bank of America
Merrill Lynch (6,412)10,219 Cymabay Therapeutics Inc Barclays Bank (1,533)25,603 Cymabay Therapeutics Inc Goldman Sachs (2,656)8,518 Cymabay Therapeutics Inc HSBC 553
13,324 Cymabay Therapeutics Inc Morgan Stanley (1,999)(3,970) CyrusOne Inc (REIT) Barclays Bank 1,8262,495 CyrusOne Inc (REIT) Barclays Bank (1,148)
(1,261) Cytokinetics Inc Bank of AmericaMerrill Lynch 4,716
(2,117) Cytokinetics Inc Barclays Bank 1,948(9,915) Cytokinetics Inc Goldman Sachs 37,082
(16,947) Cytokinetics Inc Morgan Stanley 13,915(8,985) CytomX Therapeutics Inc Barclays Bank 9,614
BlackRock Americas Diversified Equity Absolute Return FundcontinuedPortfolio of Investments as at 31 May 2021
The notes on pages 590 to 610 form an integral part of these financial statements.
Annual report and audited financial statements [91]

Holding Description Counterparty
Netunrealised
appreciation/(depreciation)
USD
United States continued(47,416) CytomX Therapeutics Inc Goldman Sachs 58,322(5,451) CytoSorbents Corp Bank of America
Merrill Lynch 1,635(46,950) CytoSorbents Corp Barclays Bank 11,738(14,430) CytoSorbents Corp Goldman Sachs 4,329(3,901) CytoSorbents Corp Morgan Stanley 975
811 Daily Journal Corp HSBC 14,79369,788 Daktronics Inc Barclays Bank 2,09441,855 Daktronics Inc Goldman Sachs 7,11560,104 Daktronics Inc HSBC 21,03655,929 Daktronics Inc Morgan Stanley 1,67815,209 Dana Inc Barclays Bank 11,7114,730 Dana Inc Goldman Sachs 393
10,163 Dana Inc Morgan Stanley 7,219(6,954) Danaher Corp Barclays Bank (12,800)(3,274) Danaher Corp Goldman Sachs (8,852)(1,396) Danaher Corp HSBC 4,034(1,328) Danaher Corp Morgan Stanley (4,156)(3,746) Danimer Scientific Inc Barclays Bank (4,308)3,190 Darden Restaurants Inc Bank of America
Merrill Lynch 13,43014,659 Darden Restaurants Inc Barclays Bank 27,412
472 Darden Restaurants Inc Goldman Sachs 1,987142 Darden Restaurants Inc Morgan Stanley 266
(8,978) DarioHealth Corp Bank of AmericaMerrill Lynch (3,507)
(6,942) DarioHealth Corp Barclays Bank 13,120677 Darling Ingredients Inc Bank of America
Merrill Lynch 1,978(1,057) Darling Ingredients Inc Barclays Bank (15)1,015 Darling Ingredients Inc Barclays Bank 152
11,354 Darling Ingredients Inc Goldman Sachs 19,696923 Darling Ingredients Inc HSBC 115
(1,424) Darling Ingredients Inc Morgan Stanley (151)2,586 Darling Ingredients Inc Morgan Stanley (1,789)
(22,923) Daseke Inc Bank of AmericaMerrill Lynch (23,152)
(4,710) Daseke Inc Barclays Bank (1,413)(23,410) Daseke Inc Goldman Sachs (23,644)(1,759) Datadog Inc ’A’ Bank of America
Merrill Lynch (7,459)(3,057) Datadog Inc ’A’ Goldman Sachs (30,631)
(12,900) Datadog Inc ’A’ Morgan Stanley (16,641)(1,437) Datto Holding Corp Barclays Bank (144)(3,632) Datto Holding Corp Goldman Sachs (2,942)(1,133) Datto Holding Corp Morgan Stanley (113)7,338 Dave & Buster’s Entertain-
ment IncBank of AmericaMerrill Lynch (16,804)
1,570 Dave & Buster’s Entertain-ment Inc Barclays Bank 1,240
4,421 Dave & Buster’s Entertain-ment Inc Goldman Sachs (10,124)
3,215 Dave & Buster’s Entertain-ment Inc HSBC 59
(8,198) DaVita Inc Bank of AmericaMerrill Lynch 35,005
(12,495) DaVita Inc Barclays Bank 22,116661 DaVita Inc Barclays Bank (1,170)
(1,808) DaVita Inc Goldman Sachs 7,720(392) DaVita Inc HSBC 3,101
1,885 DaVita Inc HSBC 80(14,381) DaVita Inc Morgan Stanley 25,45437,646 Dawson Geophysical Co Morgan Stanley 2,2591,192 Decibel Therapeutics Inc Bank of America
Merrill Lynch 2,8851,132 Decibel Therapeutics Inc Barclays Bank 1,0307,211 Decibel Therapeutics Inc HSBC 13,4122,475 Deciphera Pharmaceuticals
IncBank of AmericaMerrill Lynch (2)
Holding Description Counterparty
Netunrealised
appreciation/(depreciation)
USD
United States continued2,502 Deciphera Pharmaceuticals
Inc Barclays Bank 2,3022,462 Deciphera Pharmaceuticals
Inc Goldman Sachs (1,920)2,309 Deciphera Pharmaceuticals
Inc HSBC 1,9167,747 Deciphera Pharmaceuticals
Inc Morgan Stanley 4,692445 Deckers Outdoor Corp Bank of America
Merrill Lynch (2,581)8,299 Deckers Outdoor Corp Barclays Bank (24,980)1,860 Deckers Outdoor Corp Goldman Sachs (10,789)
743 Deckers Outdoor Corp HSBC 4,0341,939 Deckers Outdoor Corp Morgan Stanley (6,243)
57 Deere & Co Bank of AmericaMerrill Lynch (1,280)
3,632 Deere & Co Barclays Bank 9,765513 Deere & Co Goldman Sachs (11,517)
4,153 Deere & Co HSBC (125,836)4,113 Deere & Co Morgan Stanley 2,179
(2,258) Del Taco Restaurants Inc Barclays Bank 361(52,721) Del Taco Restaurants Inc Goldman Sachs 1,054
9,641 Delek US Energy Inc Bank of AmericaMerrill Lynch (2,410)
3,497 Delek US Energy Inc Barclays Bank 4,7217,846 Delek US Energy Inc Goldman Sachs (1,962)
36,832 Delek US Energy Inc Morgan Stanley 49,7232,067 Dell Technologies Inc ’C’ Bank of America
Merrill Lynch 51712,647 Dell Technologies Inc ’C’ Barclays Bank (18,971)1,531 Dell Technologies Inc ’C’ HSBC 1,5526,021 Dell Technologies Inc ’C’ Morgan Stanley (9,032)
(86) Delta Air Lines Inc Bank of AmericaMerrill Lynch (133)
(16,603) Delta Air Lines Inc Barclays Bank (25,071)(4,452) Delta Air Lines Inc Goldman Sachs (4,140)
(771) Delta Air Lines Inc HSBC (1,735)(5,512) Delta Air Lines Inc Morgan Stanley (8,323)(3,936) Delta Apparel Inc Bank of America
Merrill Lynch 11,690(7,914) Delta Apparel Inc Barclays Bank 8,864(1,823) Delta Apparel Inc Goldman Sachs 5,414(5,897) Delta Apparel Inc HSBC 16,630(8,580) Delta Apparel Inc Morgan Stanley 9,6109,698 Deluxe Corp Bank of America
Merrill Lynch (6,387)4,434 Deluxe Corp Barclays Bank 1,1854,418 Deluxe Corp Goldman Sachs (3,711)3,733 Deluxe Corp HSBC (3,240)
17,901 Deluxe Corp Morgan Stanley 4,654(3,974) Denali Therapeutics Inc Bank of America
Merrill Lynch (39,541)(7,164) Denali Therapeutics Inc Barclays Bank (14,686)
(479) Denali Therapeutics Inc HSBC (5,758)(5,822) Denali Therapeutics Inc Morgan Stanley (11,935)20,784 Denny’s Corp Bank of America
Merrill Lynch 3,5339,543 Denny’s Corp Barclays Bank 5734,733 Denny’s Corp HSBC 2,272
(9,250) DENTSPLY SIRONA Inc Bank of AmericaMerrill Lynch 18,778
(5,216) DENTSPLY SIRONA Inc Barclays Bank 3,8081,153 DENTSPLY SIRONA Inc HSBC (977)(555) DermTech Inc Bank of America
Merrill Lynch (3,175)(4,698) DermTech Inc Barclays Bank (12,450)5,084 Design Therapeutics Inc Bank of America
Merrill Lynch 14,439
BlackRock Americas Diversified Equity Absolute Return FundcontinuedPortfolio of Investments as at 31 May 2021
The notes on pages 590 to 610 form an integral part of these financial statements.
BlackRock Strategic Funds[92]

Holding Description Counterparty
Netunrealised
appreciation/(depreciation)
USD
United States continued(864) Designer Brands Inc ’A’ Bank of America
Merrill Lynch 1,529(4,087) Designer Brands Inc ’A’ Barclays Bank 3,474(2,009) Designer Brands Inc ’A’ Goldman Sachs 5,22335,628 Devon Energy Corp Barclays Bank 21,73322,430 Devon Energy Corp Goldman Sachs (14,131)2,362 Dexcom Inc Bank of America
Merrill Lynch 97,722(2,807) Dexcom Inc Bank of America
Merrill Lynch (123,480)1,062 Dexcom Inc Barclays Bank 14,868
(1,214) Dexcom Inc Barclays Bank (16,996)305 Dexcom Inc Goldman Sachs 13,417
(1,563) Dexcom Inc Goldman Sachs (68,756)593 Dexcom Inc HSBC 19,750
(504) Dexcom Inc HSBC (13,457)37 Dexcom Inc Morgan Stanley 518
(300) Dexcom Inc Morgan Stanley (4,200)(11,060) DHI Group Inc Bank of America
Merrill Lynch (774)(31,054) DHI Group Inc Barclays Bank 3,416(22,836) DHI Group Inc Goldman Sachs (1,599)(7,065) DHI Group Inc HSBC 353
(21,654) DHI Group Inc Morgan Stanley 2,382(44,911) DHT Holdings Inc Barclays Bank (8,533)(13,096) DHT Holdings Inc Goldman Sachs (6,679)(4,500) DHT Holdings Inc Morgan Stanley (423)(2,516) Diamond Hill Investment
Group IncBank of AmericaMerrill Lynch 6,265
(2,354) Diamond Hill InvestmentGroup Inc Barclays Bank (330)
(2,066) Diamondback Energy Inc Bank of AmericaMerrill Lynch 599
7,342 Diamondback Energy Inc Barclays Bank 20,3372,289 Diamondback Energy Inc Goldman Sachs (664)
(1,784) Diamondback Energy Inc Goldman Sachs 517853 Diamondback Energy Inc HSBC (2,295)
6,567 Diamondback Energy Inc Morgan Stanley 18,19190,583 DiamondRock Hospitality
Co (REIT) HSBC (7,247)3,346 DiamondRock Hospitality
Co (REIT) Morgan Stanley 468(24,675) Dicerna Pharmaceuticals
Inc Morgan Stanley (61,441)10,334 Dick’s Sporting Goods Inc Goldman Sachs 95,756
(29,758) Diebold Nixdorf Inc Morgan Stanley (3,571)(10,426) Digi International Inc Barclays Bank (1,564)(34,674) Digi International Inc Goldman Sachs (24,965)(2,070) Digi International Inc HSBC (2,981)
(11,692) Digi International Inc Morgan Stanley (1,754)(9,442) Digimarc Corp Goldman Sachs (40,884)7,862 Digital Media Solutions Inc
’A’ Barclays Bank 3,3028,878 Digital Media Solutions Inc
’A’ Goldman Sachs 799(635) Digital Realty Trust Inc
(REIT)Bank of AmericaMerrill Lynch (2,121)
(3,185) Digital Realty Trust Inc(REIT) Barclays Bank (1,083)
(8,179) Digital Realty Trust Inc(REIT) Goldman Sachs (27,318)
(1,184) Digital Realty Trust Inc(REIT) Morgan Stanley (403)
(2,072) Digital Turbine Inc Bank of AmericaMerrill Lynch (16,099)
(5,314) Digital Turbine Inc Barclays Bank (14,348)(2,153) Digital Turbine Inc Goldman Sachs (16,729)(3,436) Digital Turbine Inc HSBC (20,994)
Holding Description Counterparty
Netunrealised
appreciation/(depreciation)
USD
United States continued(1,381) Digital Turbine Inc Morgan Stanley (3,729)1,116 DigitalOcean Holdings Inc Bank of America
Merrill Lynch 6,4392,830 DigitalOcean Holdings Inc Barclays Bank 5947,938 DigitalOcean Holdings Inc Goldman Sachs 45,8021,162 Dillard’s Inc ’A’ Goldman Sachs (11,004)1,634 Dillard’s Inc ’A’ Morgan Stanley 1,258
(3,925) Dime CommunityBancshares Inc
Bank of AmericaMerrill Lynch (903)
(3,427) Dime CommunityBancshares Inc Barclays Bank 891
(8,210) Dime CommunityBancshares Inc Goldman Sachs (1,888)
(22,304) Dime CommunityBancshares Inc Morgan Stanley 5,799
615 Dine Brands Global Inc Bank of AmericaMerrill Lynch 256
6,695 Dine Brands Global Inc Barclays Bank 5,54912,115 Dine Brands Global Inc Goldman Sachs (44,952)
945 Dine Brands Global Inc HSBC 1,242833 Dine Brands Global Inc Morgan Stanley 1,572
(2,650) Diodes Inc Bank of AmericaMerrill Lynch (12,853)
(254) Diodes Inc Barclays Bank (97)(4,658) Diodes Inc Goldman Sachs (22,591)
(19,031) Diodes Inc Morgan Stanley (7,232)(5,489) Discover Financial Services Morgan Stanley (13,613)6,175 Discovery Inc ’A’ Bank of America
Merrill Lynch (10,745)12,421 Discovery Inc ’A’ Barclays Bank 10,3098,684 Discovery Inc ’A’ Goldman Sachs 2,204
11,092 Discovery Inc ’A’ Morgan Stanley 9,206(35,421) DISH Network Corp ’A’ Bank of America
Merrill Lynch 10,410(26,069) DISH Network Corp ’A’ Barclays Bank 23,462(6,281) DISH Network Corp ’A’ HSBC 3,064
(24,987) DISH Network Corp ’A’ Morgan Stanley 22,4885,523 Diversified Healthcare Trust
(REIT) Barclays Bank (221)38,384 Diversified Healthcare Trust
(REIT) HSBC (13,051)(3,201) DMC Global Inc HSBC 10,915(4,109) DMC Global Inc Morgan Stanley (2,712)
20 DocuSign Inc Bank of AmericaMerrill Lynch 302
4,458 DocuSign Inc Barclays Bank 27,060(3,152) Dolby Laboratories Inc ’A’ Bank of America
Merrill Lynch (8,920)5,370 Dolby Laboratories Inc ’A’ Bank of America
Merrill Lynch 15,197(3,182) Dolby Laboratories Inc ’A’ Barclays Bank (1,941)9,324 Dolby Laboratories Inc ’A’ Barclays Bank 5,6881,727 Dolby Laboratories Inc ’A’ Goldman Sachs 4,887
691 Dolby Laboratories Inc ’A’ HSBC 2,839(8,627) Dolby Laboratories Inc ’A’ Morgan Stanley (5,262)18,501 Dolby Laboratories Inc ’A’ Morgan Stanley 11,286(3,903) Dollar General Corp Bank of America
Merrill Lynch 4,8401,348 Dollar General Corp Bank of America
Merrill Lynch (1,672)(5,588) Dollar General Corp Barclays Bank (32,466)9,449 Dollar General Corp Barclays Bank 40,691
(3,751) Dollar General Corp Goldman Sachs 4,651375 Dollar General Corp Goldman Sachs (89)
4,677 Dollar General Corp HSBC (11,261)(14,291) Dollar General Corp Morgan Stanley (83,031)
5,123 Dollar General Corp Morgan Stanley 27,096
BlackRock Americas Diversified Equity Absolute Return FundcontinuedPortfolio of Investments as at 31 May 2021
The notes on pages 590 to 610 form an integral part of these financial statements.
Annual report and audited financial statements [93]

Holding Description Counterparty
Netunrealised
appreciation/(depreciation)
USD
United States continued(7,421) Dollar Tree Inc Bank of America
Merrill Lynch 90,16511,880 Dollar Tree Inc Bank of America
Merrill Lynch (139,673)(1,409) Dollar Tree Inc Barclays Bank 13,6671,429 Dollar Tree Inc Barclays Bank (13,861)1,032 Dollar Tree Inc Goldman Sachs (11,370)
17,922 Dollar Tree Inc Morgan Stanley (104,669)(27,039) Dominion Energy Inc Bank of America
Merrill Lynch 41,123(17,562) Dominion Energy Inc Barclays Bank 10,827(18,224) Dominion Energy Inc Goldman Sachs 27,883
9,556 Dominion Energy Inc Goldman Sachs 2,038(46,104) Dominion Energy Inc Morgan Stanley 43,79924,589 Dominion Energy Inc Morgan Stanley 6,418
(627) Domino’s Pizza Inc Bank of AmericaMerrill Lynch 3,756
129 Domino’s Pizza Inc Barclays Bank 770(731) Domino’s Pizza Inc Barclays Bank (4,364)(345) Domino’s Pizza Inc Goldman Sachs 2,067(434) Domino’s Pizza Inc Morgan Stanley (2,591)
(1,003) Domo Inc ’B’ Bank of AmericaMerrill Lynch (6,449)
(576) Domo Inc ’B’ Barclays Bank (2,408)(703) Domo Inc ’B’ Goldman Sachs (5,918)
(3,670) Domo Inc ’B’ Morgan Stanley (13,185)(11,031) Domtar Corp Barclays Bank 1,875
1,259 Donaldson Co Inc Bank of AmericaMerrill Lynch (1,674)
6,842 Donaldson Co Inc Barclays Bank 4,584(7,300) Donaldson Co Inc Barclays Bank (4,891)11,534 Donaldson Co Inc Goldman Sachs (15,340)4,720 Donaldson Co Inc HSBC (15,104)
10,637 Donaldson Co Inc Morgan Stanley 7,127(831) Donaldson Co Inc Morgan Stanley (557)
36,445 Donegal Group Inc ’A’ Bank of AmericaMerrill Lynch 5,102
33,862 Donegal Group Inc ’A’ Barclays Bank (2,709)4,331 Donegal Group Inc ’A’ Goldman Sachs 606
19,217 Donegal Group Inc ’A’ HSBC 3,84317,902 Donegal Group Inc ’A’ Morgan Stanley (1,432)3,082 Donnelley Financial Solu-
tions IncBank of AmericaMerrill Lynch 2,984
4,297 Donnelley Financial Solu-tions Inc Barclays Bank (521)
1,948 Donnelley Financial Solu-tions Inc Goldman Sachs 4,987
1,472 Donnelley Financial Solu-tions Inc HSBC (194)
26,156 Donnelley Financial Solu-tions Inc Morgan Stanley 6,539
(5,541) DoorDash Inc ’A’ Barclays Bank (54,068)(794) DoorDash Inc ’A’ Morgan Stanley (7,797)
(51,256) Dorian LPG Ltd Barclays Bank 36,355(33,250) Dorian LPG Ltd Goldman Sachs 32,624(10,684) Dorian LPG Ltd Morgan Stanley (250)(1,247) Dorman Products Inc Bank of America
Merrill Lynch 873(384) Dorman Products Inc Barclays Bank (634)(479) Dorman Products Inc Goldman Sachs 335
1,393 Douglas Dynamics Inc Bank of AmericaMerrill Lynch 1,393
3,662 Douglas Dynamics Inc Barclays Bank 6,62814,663 Douglas Dynamics Inc HSBC (7,771)12,963 Douglas Dynamics Inc Morgan Stanley 23,46328,720 Douglas Emmett Inc (REIT) Bank of America
Merrill Lynch 56,578(5,657) Douglas Emmett Inc (REIT) Bank of America
Merrill Lynch (10,508)(8,720) Douglas Emmett Inc (REIT) Barclays Bank 3,837
Holding Description Counterparty
Netunrealised
appreciation/(depreciation)
USD
United States continued23,718 Douglas Emmett Inc (REIT) Morgan Stanley (10,436)(7,800) Douglas Emmett Inc (REIT) Morgan Stanley 3,432(4,689) Dova Pharmaceuticals Inc* HSBC (2,532)
(10,476) Dover Corp HSBC 30,904(16,215) Dover Corp Morgan Stanley (16,377)
6,750 Dow Inc Bank of AmericaMerrill Lynch (16,808)
1,398 Dow Inc Barclays Bank (1,580)(30,064) Dow Inc Morgan Stanley 33,972(1,378) DR Horton Inc Bank of America
Merrill Lynch (328)1,947 DR Horton Inc Barclays Bank 8,1581,809 DR Horton Inc Goldman Sachs (651)
(8,502) DR Horton Inc Goldman Sachs (17,531)4,703 DR Horton Inc HSBC (43,079)
17,508 DR Horton Inc Morgan Stanley 73,359(826) DR Horton Inc Morgan Stanley (3,461)
(9,981) DraftKings Inc ’A’ Barclays Bank (20,861)(2,551) Dril-Quip Inc Bank of America
Merrill Lynch 2,883(14,095) Dril-Quip Inc Barclays Bank (17,337)(2,338) Dril-Quip Inc Goldman Sachs 2,6426,311 Driven Brands Holdings Inc Bank of America
Merrill Lynch 2,5242,337 Driven Brands Holdings Inc Barclays Bank 2,0338,576 Driven Brands Holdings Inc HSBC 12,006
17,162 Driven Brands Holdings Inc Morgan Stanley 14,9312,262 Dropbox Inc ’A’ Bank of America
Merrill Lynch 996(12,758) Dropbox Inc ’A’ Bank of America
Merrill Lynch (7,746)(22,434) Dropbox Inc ’A’ Barclays Bank (4,487)(10,939) Dropbox Inc ’A’ HSBC (6,929)(56,253) Dropbox Inc ’A’ Morgan Stanley (10,066)
5,431 DSP Group Inc Barclays Bank 9233,000 DSP Group Inc HSBC 5,760
34,966 DSP Group Inc Morgan Stanley 5,9441,671 DTE Energy Co Bank of America
Merrill Lynch (3,730)204 DTE Energy Co Barclays Bank (853)
7,756 DTE Energy Co Goldman Sachs (9,603)13,258 DTE Energy Co Morgan Stanley (54,895)
(264) DTE Energy Co Morgan Stanley 1,104(2,096) Duck Creek Technologies
Inc Barclays Bank (1,425)1,925 Duck Creek Technologies
Inc Goldman Sachs 4,909(2,573) Duck Creek Technologies
Inc Goldman Sachs (6,561)(1,002) Duck Creek Technologies
Inc HSBC 73(1,140) Duck Creek Technologies
Inc Morgan Stanley (775)(5,201) Ducommun Inc Bank of America
Merrill Lynch 5,149(6,890) Ducommun Inc Barclays Bank (15,434)(2,049) Ducommun Inc Goldman Sachs 2,029(1,993) Ducommun Inc Morgan Stanley (4,464)(2,106) Duke Energy Corp Bank of America
Merrill Lynch 4,696(22,316) Duke Energy Corp Barclays Bank 46,640(16,702) Duke Energy Corp HSBC 58,791(28,702) Duke Energy Corp Morgan Stanley 59,98753,002 Duke Realty Corp (REIT) Bank of America
Merrill Lynch 83,21314,622 Duke Realty Corp (REIT) Barclays Bank 2,48614,026 Duke Realty Corp (REIT) Goldman Sachs 22,02111,208 Duke Realty Corp (REIT) Morgan Stanley 2,001
(10,156) Duluth Holdings Inc ’B’ Bank of AmericaMerrill Lynch (3,898)
BlackRock Americas Diversified Equity Absolute Return FundcontinuedPortfolio of Investments as at 31 May 2021
The notes on pages 590 to 610 form an integral part of these financial statements.
BlackRock Strategic Funds[94]

Holding Description Counterparty
Netunrealised
appreciation/(depreciation)
USD
United States continued(2,118) Duluth Holdings Inc ’B’ Barclays Bank (890)(1,877) Duluth Holdings Inc ’B’ Goldman Sachs (115)(2,394) Dun & Bradstreet Holdings
Inc Barclays Bank 4558,487 Dun & Bradstreet Holdings
Inc Morgan Stanley (1,613)(627) DuPont de Nemours Inc Bank of America
Merrill Lynch 659(12,001) DuPont de Nemours Inc Barclays Bank 7,181(3,240) DuPont de Nemours Inc Goldman Sachs (118)(2,496) DuPont de Nemours Inc HSBC (159)(1,142) DuPont de Nemours Inc Morgan Stanley 765
(52,906) Durect Corp Bank of AmericaMerrill Lynch 5,291
(33,312) Durect Corp Barclays Bank —(94,579) Durect Corp Goldman Sachs 9,458(6,125) DXC Technology Co Bank of America
Merrill Lynch (6,272)(665) DXC Technology Co Barclays Bank (392)
(5,396) DXC Technology Co Goldman Sachs (6,259)(1,672) DXC Technology Co Morgan Stanley (1,714)7,214 DXC Technology Co Morgan Stanley 4,256
16,957 DXP Enterprises Inc Morgan Stanley 5,0876,700 Dyadic International Inc Bank of America
Merrill Lynch 1,8097,549 Dyadic International Inc Barclays Bank 2267,962 Dyadic International Inc Morgan Stanley 239
(8,113) Dycom Industries Inc Bank of AmericaMerrill Lynch 148,143
(1,771) Dycom Industries Inc Barclays Bank 5,126(24,526) Dynatrace Inc Bank of America
Merrill Lynch (123,149)(2,419) Dynatrace Inc Barclays Bank (2,179)(5,402) Dynatrace Inc Goldman Sachs (19,904)(2,033) Dynatrace Inc HSBC (12,950)
(29,386) Dynatrace Inc Morgan Stanley (30,855)(10,553) Dynavax Technologies Corp Goldman Sachs (4,643)
1,421 Dyne Therapeutics Inc Bank of AmericaMerrill Lynch 1,606
4,703 Dyne Therapeutics Inc Goldman Sachs 5,3141,338 Dyne Therapeutics Inc HSBC 1,445
(22,748) Dynex Capital Inc (REIT) HSBC 7,279(29,239) Dynex Capital Inc (REIT) Morgan Stanley 292
1,313 DZS Inc Bank of AmericaMerrill Lynch 670
2,695 DZS Inc Barclays Bank 9432,889 DZS Inc Goldman Sachs 1,4736,805 DZS Inc Morgan Stanley 2,382
(7,385) E2open Parent Holdings Inc Barclays Bank 7,754(13,603) Eagle Bancorp Inc Morgan Stanley (11,154)
9,119 Eagle Bancorp Montana Inc Bank of AmericaMerrill Lynch 18,214
7,399 Eagle Bancorp Montana Inc Barclays Bank (1,110)10,370 Eagle Bancorp Montana Inc Goldman Sachs 20,8445,908 Eagle Bancorp Montana Inc HSBC 12,612
14,987 Eagle Bancorp Montana Inc Morgan Stanley (2,248)(1,903) Eagle Materials Inc Bank of America
Merrill Lynch (2,448)(5,820) Eagle Materials Inc Barclays Bank 3,085
(19,485) Eagle Materials Inc Morgan Stanley (32,137)(12,946) Eagle Pharmaceuticals Inc Bank of America
Merrill Lynch 27,834(1,159) Eagle Pharmaceuticals Inc Barclays Bank 2,341(1,215) Eagle Pharmaceuticals Inc Goldman Sachs 2,612(6,762) Eargo Inc Barclays Bank (5,545)(8,859) Earthstone Energy Inc ’A’ Barclays Bank (3,366)(9,283) Earthstone Energy Inc ’A’ Morgan Stanley (3,528)4,678 East West Bancorp Inc Bank of America
Merrill Lynch (15,344)
Holding Description Counterparty
Netunrealised
appreciation/(depreciation)
USD
United States continued54,479 Easterly Government Prop-
erties Inc (REIT)Bank of AmericaMerrill Lynch 32,687
6,368 Easterly Government Prop-erties Inc (REIT) Barclays Bank 318
71,110 Easterly Government Prop-erties Inc (REIT) Goldman Sachs 42,666
(22,199) Eastern Bankshares Inc Goldman Sachs (14,651)(14,594) Eastern Co Bank of America
Merrill Lynch (5,197)(11,685) Eastern Co Barclays Bank 1,402(14,491) Eastern Co Goldman Sachs (5,752)(2,590) Eastern Co HSBC (1,735)(1,315) Eastern Co Morgan Stanley 158(5,725) EastGroup Properties Inc
(REIT)Bank of AmericaMerrill Lynch (26,908)
(16,480) EastGroup Properties Inc(REIT) Goldman Sachs (77,456)
(9,066) EastGroup Properties Inc(REIT) Morgan Stanley 770
(8,500) Eastman Chemical Co Bank of AmericaMerrill Lynch 38,165
(14,748) Eastman Chemical Co Barclays Bank 12,683(5,579) Eastman Chemical Co Goldman Sachs 25,050
(18,703) Eastman Kodak Co Barclays Bank (11,374)(2,225) Eaton Corp Plc Barclays Bank (3,582)(2,834) Eaton Corp Plc Goldman Sachs 6,178
470 Eaton Corp Plc Goldman Sachs 191(1,812) Eaton Corp Plc Morgan Stanley (2,917)1,726 Eaton Corp Plc Morgan Stanley 2,7798,588 eBay Inc Bank of America
Merrill Lynch (6,956)3,887 eBay Inc Barclays Bank (350)
(12,254) eBay Inc Barclays Bank 1,10310,817 eBay Inc Morgan Stanley (974)(4,177) eBay Inc Morgan Stanley 376(1,001) Ebix Inc Bank of America
Merrill Lynch 691(10,395) Ebix Inc Barclays Bank 3,430(7,352) Ebix Inc Goldman Sachs 4,341(6,573) Ebix Inc HSBC 12,817
(10,398) Ebix Inc Morgan Stanley 3,43114,209 Echo Global Logistics Inc Goldman Sachs (20,319)28,959 Echo Global Logistics Inc HSBC (45,466)37,423 Echo Global Logistics Inc Morgan Stanley 1,559(9,738) EchoStar Corp ’A’ Bank of America
Merrill Lynch 1,071(1,181) EchoStar Corp ’A’ Barclays Bank (1,016)(7,097) EchoStar Corp ’A’ Goldman Sachs 7813,061 Ecolab Inc Bank of America
Merrill Lynch (20,080)259 Ecolab Inc Barclays Bank (57)
3,454 Ecolab Inc Goldman Sachs (22,658)2,642 Ecolab Inc HSBC (26,103)5,741 Ecolab Inc Morgan Stanley (1,263)
(5,976) Edgewell Personal Care Co Bank of AmericaMerrill Lynch (8,486)
(3,061) Edgewell Personal Care Co Goldman Sachs (4,347)(3,498) Edgewell Personal Care Co HSBC (3,008)
(11,304) Edgewell Personal Care Co Morgan Stanley 1,583(619) Edgewise Therapeutics Inc Barclays Bank (260)
(8,154) Edison International Bank of AmericaMerrill Lynch 15,332
(9,963) Edison International Barclays Bank 23,064(15,684) Edison International Goldman Sachs 29,800(2,501) Edison International Morgan Stanley 6,253
(752) Editas Medicine Inc Bank of AmericaMerrill Lynch (632)
1,174 Editas Medicine Inc Bank of AmericaMerrill Lynch 986
BlackRock Americas Diversified Equity Absolute Return FundcontinuedPortfolio of Investments as at 31 May 2021
The notes on pages 590 to 610 form an integral part of these financial statements.
Annual report and audited financial statements [95]

Holding Description Counterparty
Netunrealised
appreciation/(depreciation)
USD
United States continued(1,869) Editas Medicine Inc Barclays Bank (1,420)2,830 Editas Medicine Inc Goldman Sachs 2,377
65 Editas Medicine Inc HSBC 173717 Editas Medicine Inc Morgan Stanley 545
16,492 Edwards Lifesciences Corp Morgan Stanley 7,4213,118 eGain Corp Barclays Bank (1,621)5,016 eGain Corp Goldman Sachs 6524,113 eGain Corp Morgan Stanley (2,139)
983 eHealth Inc Bank of AmericaMerrill Lynch 2,418
3,662 eHealth Inc Barclays Bank (476)5,735 eHealth Inc Goldman Sachs 14,108(450) eHealth Inc Morgan Stanley 59726 eHealth Inc Morgan Stanley (94)
5,946 Eiger BioPharmaceuticalsInc Goldman Sachs (2,022)
12,336 El Pollo Loco Holdings Inc Bank of AmericaMerrill Lynch (1,759)
41,061 El Pollo Loco Holdings Inc Barclays Bank 5,4315,412 El Pollo Loco Holdings Inc Goldman Sachs (4,979)
11,790 El Pollo Loco Holdings Inc HSBC (11,433)23,328 El Pollo Loco Holdings Inc Morgan Stanley 3,033
98 Elah Holdings Inc Bank of AmericaMerrill Lynch 392
87 Elah Holdings Inc Morgan Stanley (87)1,705 Elanco Animal Health Inc Barclays Bank (44)8,436 Elanco Animal Health Inc Goldman Sachs 5,609(685) Elanco Animal Health Inc HSBC (1,364)
1,234 Elanco Animal Health Inc Morgan Stanley 247(3,043) Elanco Animal Health Inc Morgan Stanley (609)(1,622) Elastic NV Bank of America
Merrill Lynch (15,571)(2,204) Elastic NV Barclays Bank (2,160)(7,455) Elastic NV Goldman Sachs (71,568)(1,769) Elastic NV HSBC (25,880)(8,896) Elastic NV Morgan Stanley (8,718)(6,079) Electromed Inc Bank of America
Merrill Lynch (1,884)(13,741) Electromed Inc Barclays Bank (8,107)(25,392) Electromed Inc Goldman Sachs (7,872)(3,329) Electromed Inc HSBC 5661,310 Electronic Arts Inc Bank of America
Merrill Lynch 7,07410,031 Eledon Pharmaceuticals Inc Morgan Stanley 2,107(2,536) Element Solutions Inc Bank of America
Merrill Lynch 398(8,320) Element Solutions Inc Barclays Bank (3,994)
(34,752) Element Solutions Inc Goldman Sachs (25,021)(71,452) Element Solutions Inc Morgan Stanley (32,579)10,287 Elevate Credit Inc Goldman Sachs 5144,545 Elevate Credit Inc HSBC 1,091
13,541 Elevate Credit Inc Morgan Stanley (2,437)(6,049) elf Beauty Inc Bank of America
Merrill Lynch 7,682(8,464) elf Beauty Inc Barclays Bank 9,734(8,916) elf Beauty Inc Goldman Sachs 11,323(1,291) elf Beauty Inc Morgan Stanley 242(1,434) Eli Lilly & Co Barclays Bank 41
(614) Eli Lilly & Co Goldman Sachs (244)(1,814) Eli Lilly & Co HSBC (9,034)(7,889) Eli Lilly & Co Morgan Stanley 10,098
(14,803) Ellington Residential Mort-gage REIT (REIT)
Bank of AmericaMerrill Lynch (2,072)
(4,664) Ellington Residential Mort-gage REIT (REIT) Barclays Bank 466
(17,193) Ellington Residential Mort-gage REIT (REIT) Goldman Sachs (2,407)
(27,062) Ellington Residential Mort-gage REIT (REIT) Morgan Stanley 2,706
Holding Description Counterparty
Netunrealised
appreciation/(depreciation)
USD
United States continued(6,350) Eloxx Pharmaceuticals Inc Barclays Bank (635)
(19,449) Eloxx Pharmaceuticals Inc Goldman Sachs (3,695)(6,669) Eloxx Pharmaceuticals Inc Morgan Stanley (667)
(23,327) eMagin Corp Barclays Bank (38,956)(23,590) eMagin Corp Goldman Sachs (40,575)29,031 EMCOR Group Inc Bank of America
Merrill Lynch 26,41814,239 EMCOR Group Inc Barclays Bank 45,4229,453 EMCOR Group Inc Goldman Sachs 8,602
24,341 EMCOR Group Inc HSBC 42,5976,125 EMCOR Group Inc Morgan Stanley 19,539
(11,608) EMCORE Corp Bank of AmericaMerrill Lynch (18,689)
(4,996) EMCORE Corp Barclays Bank (3,098)(28,067) EMCORE Corp Goldman Sachs (45,188)35,290 Emerald Holding Inc Bank of America
Merrill Lynch 9,175(1,257) Emergent BioSolutions Inc Bank of America
Merrill Lynch (453)(4,758) Emergent BioSolutions Inc Barclays Bank (17,562)
(363) Emergent BioSolutions Inc Goldman Sachs (131)(1,389) Emergent BioSolutions Inc Morgan Stanley (5,251)1,271 Emerson Electric Co Bank of America
Merrill Lynch 2169,900 Emerson Electric Co Barclays Bank 16,6324,313 Emerson Electric Co Goldman Sachs 733
10,729 Emerson Electric Co Morgan Stanley 18,02531,909 Empire State Realty Trust
Inc ’A’ (REIT)Bank of AmericaMerrill Lynch 11,488
35,862 Empire State Realty TrustInc ’A’ (REIT) Barclays Bank 1,793
50,989 Empire State Realty TrustInc ’A’ (REIT) Goldman Sachs 18,356
2,129 Empire State Realty TrustInc ’A’ (REIT) HSBC 64
28,007 Empire State Realty TrustInc ’A’ (REIT) Morgan Stanley 1,401
3,054 Employers Holdings Inc Bank of AmericaMerrill Lynch (764)
9,333 Employers Holdings Inc Goldman Sachs (2,333)5,789 Employers Holdings Inc Morgan Stanley 8681,575 Enanta Pharmaceuticals Inc Bank of America
Merrill Lynch (1,339)451 Enanta Pharmaceuticals Inc Goldman Sachs (383)
13,095 Enanta Pharmaceuticals Inc HSBC 13,3576,164 Enanta Pharmaceuticals Inc Morgan Stanley (2,466)
(2,382) Enbridge Inc Bank of AmericaMerrill Lynch 715
2,321 Encompass Health Corp Bank of AmericaMerrill Lynch (1,576)
622 Encompass Health Corp Barclays Bank (193)(265) Encompass Health Corp Barclays Bank 225769 Encompass Health Corp HSBC (673)
(3,135) Encompass Health Corp Morgan Stanley 2,6654,104 Encore Capital Group Inc Bank of America
Merrill Lynch 14,2001,682 Encore Capital Group Inc Barclays Bank 3,8356,501 Encore Capital Group Inc Goldman Sachs 22,4931,762 Encore Capital Group Inc HSBC 7,665
503 Encore Capital Group Inc Morgan Stanley 1,147(3,325) Encore Wire Corp Bank of America
Merrill Lynch (181)(13,261) Encore Wire Corp Barclays Bank (14,414)(13,507) Encore Wire Corp Goldman Sachs 4,227(4,109) Encore Wire Corp Morgan Stanley (687)14,732 Endeavor Group Holdings
Inc ’A’Bank of AmericaMerrill Lynch (21,131)
6,462 Endeavor Group HoldingsInc ’A’ Morgan Stanley 5,299
BlackRock Americas Diversified Equity Absolute Return FundcontinuedPortfolio of Investments as at 31 May 2021
The notes on pages 590 to 610 form an integral part of these financial statements.
BlackRock Strategic Funds[96]

Holding Description Counterparty
Netunrealised
appreciation/(depreciation)
USD
United States continued(6,373) Endo International Plc HSBC (3,760)(1,618) Energizer Holdings Inc Bank of America
Merrill Lynch 2,443(2,172) Energizer Holdings Inc Goldman Sachs 2,096(6,255) Energizer Holdings Inc HSBC 28,085
(10,660) Energous Corp Bank of AmericaMerrill Lynch (1,706)
(40,544) Energous Corp Barclays Bank (7,298)19,253 Energy Fuels Inc Morgan Stanley 11,16718,345 Energy Recovery Inc Barclays Bank 16,180(6,754) Enerpac Tool Group Corp Barclays Bank (135)
(46,010) Enerpac Tool Group Corp Morgan Stanley (920)(18,052) EnerSys Bank of America
Merrill Lynch (55,858)(8,884) EnerSys Barclays Bank (7,551)
(18,456) EnerSys Goldman Sachs (56,893)(490) EnerSys HSBC (2,724)
(9,221) EnerSys Morgan Stanley (7,838)(3,023) Eneti Inc Barclays Bank 3,869(1,801) Eneti Inc Goldman Sachs 378(1,535) Eneti Inc HSBC (384)42,560 EnLink Midstream LLC Morgan Stanley (3,405)72,315 Ennis Inc Bank of America
Merrill Lynch (50,621)8,950 Enochian Biosciences Inc Barclays Bank 2,327
53,424 Enochian Biosciences Inc Goldman Sachs 21,90434,578 Enochian Biosciences Inc HSBC 12,79418,956 Enochian Biosciences Inc Morgan Stanley 4,929(7,701) Enova International Inc Goldman Sachs (15,864)3,261 Enphase Energy Inc Barclays Bank 7,109
344 Enphase Energy Inc Goldman Sachs 8,4721,124 Enphase Energy Inc Morgan Stanley 2,450
(2,612) EnPro Industries Inc Bank of AmericaMerrill Lynch 7,470
(10,493) EnPro Industries Inc Barclays Bank (6,296)(1,735) EnPro Industries Inc Goldman Sachs 4,962(9,114) Ensign Group Inc Bank of America
Merrill Lynch (9,934)(1,716) Ensign Group Inc Goldman Sachs (1,870)
(955) Ensign Group Inc HSBC 735(15,216) Ensign Group Inc Morgan Stanley (29,823)(1,402) Enstar Group Ltd Goldman Sachs (9,169)(4,379) Enstar Group Ltd Morgan Stanley (46,505)(7,111) Entegris Inc Bank of America
Merrill Lynch (50,488)(920) Entegris Inc Barclays Bank (1,168)
(3,748) Entegris Inc Goldman Sachs (26,611)(3,628) Entegris Inc Morgan Stanley (4,361)(1,639) Entergy Corp HSBC 6,310
(16,293) Entergy Corp Morgan Stanley 25,09112,732 Enterprise Bancorp Inc Bank of America
Merrill Lynch 3,0563,532 Enterprise Bancorp Inc Barclays Bank 1,589
13,164 Enterprise Bancorp Inc Goldman Sachs 3,1593,493 Enterprise Bancorp Inc HSBC (3,214)
19,575 Enterprise Bancorp Inc Morgan Stanley 8,809(33,317) Enterprise Financial Ser-
vices CorpBank of AmericaMerrill Lynch 1,570
(32,566) Enterprise Financial Ser-vices Corp Barclays Bank (8,142)
(9,977) Enterprise Financial Ser-vices Corp Goldman Sachs 3,292
(14,155) Enterprise Financial Ser-vices Corp HSBC 3,963
(30,671) Enterprise Financial Ser-vices Corp Morgan Stanley (5,593)
39,492 Entravision Communica-tions Corp ’A’
Bank of AmericaMerrill Lynch 10,773
17,267 Entravision Communica-tions Corp ’A’ Barclays Bank 1,036
Holding Description Counterparty
Netunrealised
appreciation/(depreciation)
USD
United States continued14,243 Entravision Communica-
tions Corp ’A’ Goldman Sachs 6,10358,818 Entravision Communica-
tions Corp ’A’ HSBC 42,34952,424 Entravision Communica-
tions Corp ’A’ Morgan Stanley 3,145(44,864) Envela Corp Bank of America
Merrill Lynch 11,216(15,392) Envela Corp Barclays Bank (2,309)(14,311) Envela Corp Goldman Sachs 3,578
6,401 Envista Holdings Corp Bank of AmericaMerrill Lynch (9,089)
11,566 Envista Holdings Corp Barclays Bank (6,014)8,795 Envista Holdings Corp Goldman Sachs (12,489)8,950 Envista Holdings Corp Morgan Stanley (4,654)
(57,198) Enzo Biochem Inc Barclays Bank (572)(7,486) Enzo Biochem Inc HSBC (1,198)
(21,006) Enzo Biochem Inc Morgan Stanley (210)1,437 EOG Resources Inc Bank of America
Merrill Lynch (2,677)6,793 EOG Resources Inc Barclays Bank 2,7734,479 EOG Resources Inc Goldman Sachs (21,320)7,526 EOG Resources Inc Morgan Stanley 1,505
(1,504) EPAM Systems Inc Bank of AmericaMerrill Lynch (44,909)
(2,719) EPAM Systems Inc Barclays Bank 18,544(2,951) EPAM Systems Inc Goldman Sachs (88,116)(4,544) EPAM Systems Inc Morgan Stanley 30,9903,014 Epizyme Inc Goldman Sachs (2,351)
21,378 Epizyme Inc Morgan Stanley (6,413)14,985 ePlus Inc Barclays Bank (6,144)2,269 ePlus Inc Goldman Sachs (12,956)
14,622 ePlus Inc Morgan Stanley (5,995)(5,072) EPR Properties (REIT) Bank of America
Merrill Lynch (6,188)(11,272) EPR Properties (REIT) Barclays Bank (13,639)14,514 EPR Properties (REIT) Barclays Bank 17,562(3,936) EPR Properties (REIT) Goldman Sachs (5,196)4,376 EPR Properties (REIT) Morgan Stanley 5,295
(24,921) EQT Corp Barclays Bank 12,9599,563 EQT Corp Goldman Sachs (21,517)
(6,244) EQT Corp Morgan Stanley 3,247(1,887) Equifax Inc Barclays Bank 4,642
(299) Equifax Inc Goldman Sachs (140)1,245 Equifax Inc Morgan Stanley (3,063)
(4,783) Equifax Inc Morgan Stanley 11,766(17,837) Equillium Inc Goldman Sachs (14,983)
849 Equinix Inc (REIT) Bank of AmericaMerrill Lynch 18,415
1,006 Equinix Inc (REIT) Barclays Bank 13,5011,020 Equinix Inc (REIT) Goldman Sachs 22,1242,162 Equinix Inc (REIT) HSBC 36,149
103 Equinix Inc (REIT) Morgan Stanley 1,382505 Equitable Holdings Inc Goldman Sachs (1,061)
10,797 Equitable Holdings Inc HSBC (27,856)23,896 Equitable Holdings Inc Morgan Stanley (23,896)
(12,420) Equitrans Midstream Corp HSBC 1,98720,993 Equitrans Midstream Corp Morgan Stanley (4,618)
(14,343) Equity Bancshares Inc ’A’ Morgan Stanley (18,933)(46,205) Equity Commonwealth
(REIT)Bank of AmericaMerrill Lynch (7,855)
(10,452) Equity Commonwealth(REIT) Barclays Bank 3,345
(40,188) Equity Commonwealth(REIT) Goldman Sachs (6,832)
(26,616) Equity Commonwealth(REIT) HSBC (5,057)
(37,012) Equity Commonwealth(REIT) Morgan Stanley 11,844
BlackRock Americas Diversified Equity Absolute Return FundcontinuedPortfolio of Investments as at 31 May 2021
The notes on pages 590 to 610 form an integral part of these financial statements.
Annual report and audited financial statements [97]

Holding Description Counterparty
Netunrealised
appreciation/(depreciation)
USD
United States continued(8,176) Equity LifeStyle Properties
Inc (REIT)Bank of AmericaMerrill Lynch (11,926)
3,320 Equity LifeStyle PropertiesInc (REIT) Barclays Bank (664)
(929) Equity LifeStyle PropertiesInc (REIT) Barclays Bank 186
8,984 Equity LifeStyle PropertiesInc (REIT) Morgan Stanley (1,797)
(6,050) Equity LifeStyle PropertiesInc (REIT) Morgan Stanley 949
10,880 Equity Residential (REIT) Bank of AmericaMerrill Lynch 37,862
409 Equity Residential (REIT) Barclays Bank 519(8,664) Equity Residential (REIT) Barclays Bank (11,003)3,269 Equity Residential (REIT) Goldman Sachs 11,376
11,385 Equity Residential (REIT) HSBC 32,44738,909 Equity Residential (REIT) Morgan Stanley 49,414(5,039) Equity Residential (REIT) Morgan Stanley (6,400)(1,222) Erie Indemnity Co ’A’ Bank of America
Merrill Lynch 2,823902 Erie Indemnity Co ’A’ Bank of America
Merrill Lynch (2,084)(4,080) Erie Indemnity Co ’A’ Barclays Bank (17,993)1,548 Erie Indemnity Co ’A’ Barclays Bank 5,100
651 Erie Indemnity Co ’A’ Goldman Sachs 1,5181,995 Erie Indemnity Co ’A’ HSBC 11,4032,322 Erie Indemnity Co ’A’ Morgan Stanley 4,887
43,006 Eros STX Global Corp Goldman Sachs 1,72071,796 Eros STX Global Corp HSBC 6,46221,108 Eros STX Global Corp Morgan Stanley (1,055)25,192 Esc Inc* Barclays Bank 6,74163,725 Esc Inc* Goldman Sachs (31,863)41,059 Esc Inc* Morgan Stanley 10,987
(13,745) Escalade Inc Bank of AmericaMerrill Lynch (10,034)
(5,486) Escalade Inc Barclays Bank (3,017)(8,717) Escalade Inc Goldman Sachs (6,363)
(15,527) Escalade Inc Morgan Stanley (8,540)2,621 ESCO Technologies Inc Barclays Bank 367
21,454 ESCO Technologies Inc Morgan Stanley 3,004(40,015) Escrow New York (REIT)* Bank of America
Merrill Lynch (776,291)(39,940) Escrow New York (REIT)* Goldman Sachs (774,796)(21,172) Escrow New York (REIT)* Morgan Stanley (410,737)
1,280 Esperion Therapeutics Inc Bank of AmericaMerrill Lynch (1,229)
5,523 Esperion Therapeutics Inc Barclays Bank (1,988)2,161 Esperion Therapeutics Inc HSBC (4,841)3,436 Esperion Therapeutics Inc Morgan Stanley (1,237)
782 Esports Technologies Inc Bank of AmericaMerrill Lynch 810
4,250 Esports Technologies Inc Goldman Sachs 9248,979 Esquire Financial Holdings
IncBank of AmericaMerrill Lynch 8,710
11,569 Esquire Financial HoldingsInc Barclays Bank 1,388
6,010 Esquire Financial HoldingsInc Goldman Sachs 5,830
4,342 Esquire Financial HoldingsInc HSBC 6,491
6,702 Esquire Financial HoldingsInc Morgan Stanley 804
6,408 ESSA Bancorp Inc Bank of AmericaMerrill Lynch 597
3,412 ESSA Bancorp Inc Barclays Bank 4446,045 ESSA Bancorp Inc Goldman Sachs 665
16,405 ESSA Bancorp Inc HSBC 6,23411,010 ESSA Bancorp Inc Morgan Stanley 1,4318,929 Essent Group Ltd Bank of America
Merrill Lynch (3,962)
Holding Description Counterparty
Netunrealised
appreciation/(depreciation)
USD
United States continued13,924 Essent Group Ltd Barclays Bank 4,05038,321 Essent Group Ltd Goldman Sachs 3,38018,974 Essent Group Ltd HSBC (2,687)4,275 Essent Group Ltd Morgan Stanley 1,497
(1,244) Essential Properties RealtyTrust Inc (REIT)
Bank of AmericaMerrill Lynch (684)
(9,961) Essential Properties RealtyTrust Inc (REIT) Barclays Bank (4,482)
(16,644) Essential Properties RealtyTrust Inc (REIT) Morgan Stanley (7,490)
(7,341) Essential Utilities Inc Goldman Sachs (8,426)(15,308) Essential Utilities Inc HSBC (15,920)(11,907) Essential Utilities Inc Morgan Stanley (3,572)
(379) Essex Property Trust Inc(REIT) Barclays Bank (96)
(58) Essex Property Trust Inc(REIT) HSBC (228)
525 Essex Property Trust Inc(REIT) Morgan Stanley 1,538
(1,097) Essex Property Trust Inc(REIT) Morgan Stanley (3,214)
(589) Estee Lauder Cos Inc ’A’ Goldman Sachs (5,819)962 Estee Lauder Cos Inc ’A’ Morgan Stanley 3,906
20,378 Ethan Allen Interiors Inc Goldman Sachs (21,397)368 Ethan Allen Interiors Inc Morgan Stanley 423
(23,644) Eton Pharmaceuticals Inc Barclays Bank 42,323972 Etsy Inc Barclays Bank (437)
(2,609) Etsy Inc Barclays Bank 1,1741,103 Etsy Inc Goldman Sachs (496)
(2,755) Etsy Inc Morgan Stanley 1,2402,612 Euronet Worldwide Inc Bank of America
Merrill Lynch 13,661352 Euronet Worldwide Inc Barclays Bank 496
9,225 Euronet Worldwide Inc Goldman Sachs 48,2472,947 Euronet Worldwide Inc HSBC 31,2682,659 Euronet Worldwide Inc Morgan Stanley 3,749
16,397 Evans Bancorp Inc Barclays Bank (492)6,693 Evans Bancorp Inc Goldman Sachs 6,7602,047 Evans Bancorp Inc Morgan Stanley (61)5,197 Evelo Biosciences Inc Morgan Stanley 6,029
(5,149) Eventbrite Inc ’A’ Bank of AmericaMerrill Lynch 2,266
(5,353) Eventbrite Inc ’A’ Barclays Bank 2,141(5,422) Eventbrite Inc ’A’ Goldman Sachs 2,3862,592 Everbridge Inc Bank of America
Merrill Lynch 8142,521 Everbridge Inc Barclays Bank 2,4713,992 Everbridge Inc Goldman Sachs 4,3033,762 Everbridge Inc Morgan Stanley 3,4804,986 Evercore Inc ’A’ Goldman Sachs (4,986)
898 Evercore Inc ’A’ HSBC 1,868(3,528) Everest Re Group Ltd Bank of America
Merrill Lynch 42,865(1,610) Everest Re Group Ltd Barclays Bank 5,812(2,030) Everest Re Group Ltd Goldman Sachs 24,665
(517) Everest Re Group Ltd HSBC 6,643(1,697) Everest Re Group Ltd Morgan Stanley 6,126
231 Everest Re Group Ltd Morgan Stanley 7(20,570) Evergy Inc HSBC 42,168(21,493) Evergy Inc Morgan Stanley 13,756(9,025) Everi Holdings Inc HSBC (24,187)(7,608) Everi Holdings Inc Morgan Stanley (9,662)4,993 EverQuote Inc ’A’ Bank of America
Merrill Lynch 10,7352,769 EverQuote Inc ’A’ Barclays Bank 5,704
569 EverQuote Inc ’A’ Goldman Sachs 1,1024,268 EverQuote Inc ’A’ HSBC 2,219
892 Eversource Energy Bank of AmericaMerrill Lynch (2,560)
BlackRock Americas Diversified Equity Absolute Return FundcontinuedPortfolio of Investments as at 31 May 2021
The notes on pages 590 to 610 form an integral part of these financial statements.
BlackRock Strategic Funds[98]

Holding Description Counterparty
Netunrealised
appreciation/(depreciation)
USD
United States continued(8,158) Eversource Energy Bank of America
Merrill Lynch 18,20518,170 Eversource Energy Barclays Bank (38,339)7,519 Eversource Energy Goldman Sachs (21,580)
12,131 Eversource Energy HSBC (51,678)36,772 Eversource Energy Morgan Stanley (77,589)
(13,732) EVERTEC Inc Bank of AmericaMerrill Lynch (137)
(6,091) EVERTEC Inc Barclays Bank (122)(4,192) EVERTEC Inc Goldman Sachs (42)
(22,598) EVERTEC Inc HSBC (13,785)(36,203) EVERTEC Inc Morgan Stanley (724)(6,851) EVI Industries Inc Barclays Bank 2,946
(11,566) Evo Payments Inc ’A’ Bank of AmericaMerrill Lynch (7,402)
(11,393) Evo Payments Inc ’A’ Barclays Bank (1,937)(27,225) Evo Payments Inc ’A’ Morgan Stanley (4,628)
(125,347) Evofem Biosciences Inc Barclays Bank (4,412)(22,333) Evofem Biosciences Inc Goldman Sachs 9,380(4,478) Evolent Health Inc ’A’ Barclays Bank (403)(1,982) Evolent Health Inc ’A’ Morgan Stanley (178)(7,167) Evolus Inc Barclays Bank (9,604)(1,546) Evolus Inc Goldman Sachs (2,891)24,419 Evolution Petroleum Corp Bank of America
Merrill Lynch (2,198)84,837 Evolution Petroleum Corp Goldman Sachs (7,635)74,590 Evolution Petroleum Corp Morgan Stanley (2,984)7,910 Evoqua Water Technologies
Corp Goldman Sachs 16,5321,665 Evoqua Water Technologies
Corp HSBC 2,53116,617 Evoqua Water Technologies
Corp Morgan Stanley 14,7892,010 EW Scripps Co ’A’ Goldman Sachs 1,286
26,408 EW Scripps Co ’A’ Morgan Stanley (15,053)(1,033) Exact Sciences Corp Bank of America
Merrill Lynch (16,383)(1,059) Exact Sciences Corp Barclays Bank (1,112)
(259) Exact Sciences Corp HSBC (3,028)(4,503) Exact Sciences Corp Morgan Stanley (4,728)11,257 Exagen Inc Bank of America
Merrill Lynch 19,1375,389 Exagen Inc Barclays Bank 8,6768,950 Exagen Inc Goldman Sachs 15,2158,117 Exagen Inc HSBC (2,650)1,900 Exagen Inc Morgan Stanley 3,059
(9,857) Exelixis Inc Bank of AmericaMerrill Lynch 26,515
(3,196) Exelixis Inc Barclays Bank 3,611(3,787) Exelixis Inc Goldman Sachs 10,187(4,983) Exelixis Inc HSBC 11,9597,422 Exelon Corp Bank of America
Merrill Lynch 223(2,987) Exelon Corp HSBC (1,792)
(21,166) Exelon Corp Morgan Stanley 19,26166,965 Exicure Inc Bank of America
Merrill Lynch 14,06319,006 Exicure Inc Barclays Bank 19026,919 Exicure Inc HSBC (1,884)(9,665) ExlService Holdings Inc Bank of America
Merrill Lynch (45,136)(3,391) ExlService Holdings Inc Barclays Bank (1,662)(1,712) ExlService Holdings Inc Goldman Sachs (7,995)(9,209) ExlService Holdings Inc HSBC (36,376)(6,914) ExlService Holdings Inc Morgan Stanley (3,221)(1,772) ExOne Co Bank of America
Merrill Lynch (3,473)(9,702) ExOne Co Barclays Bank (11,157)(1,902) eXp World Holdings Inc Bank of America
Merrill Lynch (10,347)
Holding Description Counterparty
Netunrealised
appreciation/(depreciation)
USD
United States continued(9,683) eXp World Holdings Inc Barclays Bank (39,410)5,674 eXp World Holdings Inc Barclays Bank 23,093
(1,647) eXp World Holdings Inc Goldman Sachs (8,960)1,814 eXp World Holdings Inc HSBC 11,628(975) eXp World Holdings Inc Morgan Stanley (597)285 Expedia Group Inc Bank of America
Merrill Lynch 2,1384,829 Expedia Group Inc Barclays Bank 26,1633,644 Expedia Group Inc Goldman Sachs 25,7101,375 Expedia Group Inc Morgan Stanley 4,3841,332 Expeditors International of
Washington IncBank of AmericaMerrill Lynch 6,700
6,753 Expeditors International ofWashington Inc Barclays Bank 9,985
4,523 Expeditors International ofWashington Inc Goldman Sachs 22,751
10,503 Expeditors International ofWashington Inc HSBC 59,237
22,658 Expeditors International ofWashington Inc Morgan Stanley 37,670
(1,107) Exponent Inc Bank of AmericaMerrill Lynch 2,546
(5,400) Exponent Inc Barclays Bank 4,806(25,059) Exponent Inc Goldman Sachs 57,636(3,085) Exponent Inc Morgan Stanley 2,74620,275 Express Inc Morgan Stanley 11,3547,137 Exterran Corp Bank of America
Merrill Lynch (2,926)22,300 Exterran Corp Barclays Bank (2,676)7,905 Exterran Corp Goldman Sachs (3,241)
18,718 Exterran Corp Morgan Stanley (2,246)1,351 Extra Space Storage Inc
(REIT)Bank of AmericaMerrill Lynch 5,674
3,910 Extra Space Storage Inc(REIT) Barclays Bank 4,461
930 Extra Space Storage Inc(REIT) Goldman Sachs 2,123
9,409 Extraction Oil & Gas Inc Barclays Bank (7,904)4,268 Extraction Oil & Gas Inc HSBC 11,737
(17,727) Extreme Networks Inc Bank of AmericaMerrill Lynch (2,937)
(22,900) Extreme Networks Inc Morgan Stanley (229)(3,989) Exxon Mobil Corp Bank of America
Merrill Lynch 4,453(19,153) Exxon Mobil Corp Barclays Bank 23,750(9,904) Exxon Mobil Corp Goldman Sachs 7,275
(17,458) Exxon Mobil Corp HSBC 73,498(39,968) Exxon Mobil Corp Morgan Stanley 49,560(6,882) EyePoint Pharmaceuticals
Inc Barclays Bank (4,817)(1,386) EyePoint Pharmaceuticals
Inc HSBC (1,331)(2,330) EyePoint Pharmaceuticals
Inc Morgan Stanley (1,631)32,795 EZCORP Inc ’A’ Bank of America
Merrill Lynch 3,60793,020 EZCORP Inc ’A’ Barclays Bank 5,58165,680 EZCORP Inc ’A’ Goldman Sachs 7,22564,016 EZCORP Inc ’A’ HSBC 51,85354,992 EZCORP Inc ’A’ Morgan Stanley 3,300
758 F5 Networks Inc Bank of AmericaMerrill Lynch 3,573
(549) F5 Networks Inc Barclays Bank 491,361 F5 Networks Inc Goldman Sachs 6,506
(14,291) Fabrinet Barclays Bank (50,055)(6,504) Fabrinet HSBC (44,032)
(21,098) Fabrinet Morgan Stanley (74,826)(228) Facebook Inc ’A’ Bank of America
Merrill Lynch (3,610)(12,547) Facebook Inc ’A’ Barclays Bank (31,567)
BlackRock Americas Diversified Equity Absolute Return FundcontinuedPortfolio of Investments as at 31 May 2021
The notes on pages 590 to 610 form an integral part of these financial statements.
Annual report and audited financial statements [99]

Holding Description Counterparty
Netunrealised
appreciation/(depreciation)
USD
United States continued(416) Facebook Inc ’A’ Goldman Sachs (6,461)(308) Facebook Inc ’A’ HSBC 722
(1,358) Facebook Inc ’A’ Morgan Stanley (5,568)2,207 FactSet Research Systems
Inc Goldman Sachs 10,185246 FactSet Research Systems
Inc HSBC 1,132325 FactSet Research Systems
Inc Morgan Stanley 744(544) Fair Isaac Corp Bank of America
Merrill Lynch (8,633)(1,236) Fair Isaac Corp Barclays Bank (7,120)(1,353) Fair Isaac Corp Goldman Sachs (21,472)
(80) Fair Isaac Corp HSBC (1,053)(1,440) Fair Isaac Corp Morgan Stanley (8,294)26,588 Falcon Minerals Corp Barclays Bank (3,722)42,993 Falcon Minerals Corp HSBC (8,169)65,599 Falcon Minerals Corp Morgan Stanley (9,184)(2,063) Farfetch Ltd ’A’ Barclays Bank (10,294)(3,786) Farfetch Ltd ’A’ Morgan Stanley (18,892)(2,282) Farmer Bros Co Goldman Sachs 90
(11,384) Farmer Bros Co Morgan Stanley 5,4644,511 Farmers & Merchants Ban-
corp IncBank of AmericaMerrill Lynch 722
2,943 Farmers & Merchants Ban-corp Inc Barclays Bank (59)
6,481 Farmers & Merchants Ban-corp Inc Goldman Sachs 1,037
3,602 Farmers & Merchants Ban-corp Inc HSBC —
9,253 Farmers & Merchants Ban-corp Inc Morgan Stanley (185)
68,337 Farmers National BancCorp
Bank of AmericaMerrill Lynch 17,084
24,465 Farmers National BancCorp Barclays Bank (3,670)
87,275 Farmers National BancCorp Goldman Sachs 21,819
39,923 Farmers National BancCorp Morgan Stanley (5,988)
(28,127) Farmland Partners Inc(REIT) Morgan Stanley 7,313
2,207 FARO Technologies Inc Barclays Bank 1,1703,489 FARO Technologies Inc Goldman Sachs 8,8624,146 FARO Technologies Inc HSBC 24,959
(18,067) Fastenal Co Bank of AmericaMerrill Lynch 11,382
(28,285) Fastenal Co Barclays Bank (5,630)(47,577) Fastenal Co Goldman Sachs 15,103
(921) Fastenal Co HSBC 654(28,416) Fastenal Co Morgan Stanley (5,399)(3,543) Fastly Inc ’A’ Bank of America
Merrill Lynch (7,128)(2,279) Fastly Inc ’A’ Barclays Bank 412
(581) Fastly Inc ’A’ Goldman Sachs (2,847)(5,234) Fate Therapeutics Inc Barclays Bank (13,451)(9,413) Fate Therapeutics Inc Goldman Sachs (2,448)
(714) Fate Therapeutics Inc HSBC (635)521 Fathom Holdings Inc Barclays Bank 880
1,126 Fathom Holdings Inc Goldman Sachs 4,572779 Fathom Holdings Inc Morgan Stanley 1,317
(8,121) FB Financial Corp HSBC (812)(36,282) FB Financial Corp Morgan Stanley 13,787
1,728 Federal Agricultural Mort-gage Corp ’C’
Bank of AmericaMerrill Lynch (4,355)
15,887 Federal Agricultural Mort-gage Corp ’C’ Barclays Bank (3,019)
4,661 Federal Agricultural Mort-gage Corp ’C’ Goldman Sachs (11,746)
Holding Description Counterparty
Netunrealised
appreciation/(depreciation)
USD
United States continued4,342 Federal Agricultural Mort-
gage Corp ’C’ Morgan Stanley (825)5,073 Federal Realty Investment
Trust (REIT)Bank of AmericaMerrill Lynch 6,899
(1,278) Federal Realty InvestmentTrust (REIT)
Bank of AmericaMerrill Lynch (1,738)
2,775 Federal Realty InvestmentTrust (REIT) Barclays Bank 3,302
227 Federal Realty InvestmentTrust (REIT) Goldman Sachs 309
(4,039) Federal Realty InvestmentTrust (REIT) Goldman Sachs (5,493)
(373) Federal Realty InvestmentTrust (REIT) HSBC 705
(1,080) Federal Realty InvestmentTrust (REIT) Morgan Stanley (1,285)
4,345 Federal Signal Corp Bank of AmericaMerrill Lynch 130
49,537 Federal Signal Corp Barclays Bank 42,6021,131 Federal Signal Corp Goldman Sachs 34
10,445 Federal Signal Corp HSBC (5,954)23,711 Federal Signal Corp Morgan Stanley 20,391(4,567) Federated Hermes Inc Bank of America
Merrill Lynch 381(18,017) Federated Hermes Inc Barclays Bank 3,485(9,869) Federated Hermes Inc Goldman Sachs 589
(15,573) Federated Hermes Inc HSBC 23,827(25,512) Federated Hermes Inc Morgan Stanley 5,868
(516) FedEx Corp Bank of AmericaMerrill Lynch (2,864)
(2,948) FedEx Corp Goldman Sachs (16,361)(3,108) FedEx Corp Morgan Stanley (9,231)5,719 FedNat Holding Co Barclays Bank 1,4879,122 FedNat Holding Co Goldman Sachs 3,6495,152 FedNat Holding Co HSBC 412
47,681 FedNat Holding Co Morgan Stanley 12,39718,344 Fennec Pharmaceuticals Inc Goldman Sachs 19,26140,865 Fennec Pharmaceuticals Inc Morgan Stanley 26,562(6,092) FibroGen Inc Bank of America
Merrill Lynch (5,970)(1,807) FibroGen Inc Barclays Bank (885)(1,351) FibroGen Inc Goldman Sachs (1,324)(6,914) FibroGen Inc Morgan Stanley (3,388)
(110) Fidelity D&D Bancorp Inc Bank of AmericaMerrill Lynch 36
(24) Fidelity D&D Bancorp Inc Barclays Bank (3)(1,224) Fidelity D&D Bancorp Inc Morgan Stanley (159)(2,484) Fidelity National Financial
Inc Morgan Stanley 1494,480 Fidelity National Information
Services IncBank of AmericaMerrill Lynch 134
423 Fidelity National InformationServices Inc Barclays Bank (871)
3,634 Fidelity National InformationServices Inc Goldman Sachs 109
19,128 Fidelity National InformationServices Inc Morgan Stanley (39,404)
(4,643) Fiesta Restaurant Group Inc Morgan Stanley 2,925(115,489) Fifth Third Bancorp Goldman Sachs 87,772(43,612) Fifth Third Bancorp Morgan Stanley (11,775)18,569 Finance Of America Cos Inc
’A’ Barclays Bank (11,698)4,918 Finance Of America Cos Inc
’A’ Goldman Sachs 36016,313 Finance Of America Cos Inc
’A’ HSBC (9,614)2,070 Finance Of America Cos Inc
’A’ Morgan Stanley (1,304)
BlackRock Americas Diversified Equity Absolute Return FundcontinuedPortfolio of Investments as at 31 May 2021
The notes on pages 590 to 610 form an integral part of these financial statements.
BlackRock Strategic Funds[100]

Holding Description Counterparty
Netunrealised
appreciation/(depreciation)
USD
United States continued(11,677) Financial Institutions Inc Bank of America
Merrill Lynch 7,707(3,267) Financial Institutions Inc Barclays Bank 33
(18,754) Financial Institutions Inc Goldman Sachs 12,378(9,697) Financial Institutions Inc Morgan Stanley 978,136 FireEye Inc Bank of America
Merrill Lynch 14,401(22,770) FireEye Inc Bank of America
Merrill Lynch (14,475)14,332 FireEye Inc Barclays Bank 57312,020 FireEye Inc Goldman Sachs 21,275
(10,625) FireEye Inc Goldman Sachs (17,282)(17,752) FireEye Inc HSBC (6,687)(39,633) FireEye Inc Morgan Stanley (1,721)
3,525 First American FinancialCorp
Bank of AmericaMerrill Lynch (8,284)
10,952 First American FinancialCorp Barclays Bank (14,347)
5,388 First American FinancialCorp Goldman Sachs (12,662)
3,182 First American FinancialCorp HSBC (6,046)
15,295 First American FinancialCorp Morgan Stanley (20,036)
7,275 First Bancorp Inc Bank of AmericaMerrill Lynch 12,950
10,177 First Bancorp Inc Barclays Bank 7,8368,226 First Bancorp Inc Goldman Sachs 14,6428,604 First Bancorp Inc HSBC 15,573
14,137 First Bancorp Inc Morgan Stanley 10,885(3,662) First Bancshares Inc Bank of America
Merrill Lynch 1,904(7,374) First Bancshares Inc Barclays Bank (1,401)(7,742) First Bancshares Inc Goldman Sachs 4,026(8,549) First Bancshares Inc HSBC (1,111)
(44,596) First Bancshares Inc Morgan Stanley (8,473)40,599 First Bank Bank of America
Merrill Lynch (2,030)17,854 First Bank Barclays Bank (179)11,783 First Bank Goldman Sachs (589)(4,598) First Busey Corp Goldman Sachs (6,253)
(40,880) First Busey Corp HSBC (60,911)(41,429) First Busey Corp Morgan Stanley (30,243)19,341 First Business Financial
Services IncBank of AmericaMerrill Lynch 1,934
18,719 First Business FinancialServices Inc Barclays Bank (11,044)
16,754 First Business FinancialServices Inc Goldman Sachs 1,675
14,209 First Business FinancialServices Inc HSBC 9,094
6,181 First Business FinancialServices Inc Morgan Stanley (3,647)
(1,621) First Capital Inc Bank of AmericaMerrill Lynch (567)
(14,032) First Choice Bancorp Bank of AmericaMerrill Lynch 1,684
(5,169) First Choice Bancorp Barclays Bank (310)(1,725) First Choice Bancorp Goldman Sachs 207(3,316) First Choice Bancorp Morgan Stanley (199)
269 First Citizens BancSharesInc ’A’
Bank of AmericaMerrill Lynch 3,661
300 First Citizens BancSharesInc ’A’ Barclays Bank (1,238)
633 First Citizens BancSharesInc ’A’ Goldman Sachs (731)
697 First Citizens BancSharesInc ’A’ Morgan Stanley 3,212
646 First Community Bank-shares Inc
Bank of AmericaMerrill Lynch (459)
Holding Description Counterparty
Netunrealised
appreciation/(depreciation)
USD
United States continued19,579 First Community Bank-
shares Inc Barclays Bank 2,74115,800 First Community Bank-
shares Inc Goldman Sachs (11,218)56,820 First Community Bank-
shares Inc HSBC 53,97936,624 First Community Bank-
shares Inc Morgan Stanley 5,1275,703 First Community Corp Barclays Bank 1,3127,187 First Community Corp Goldman Sachs 359
28,129 First Community Corp Morgan Stanley 6,470(4,539) First Financial Bancorp Barclays Bank (318)(3,194) First Financial Bancorp Goldman Sachs 958
(698) First Financial Bancorp Morgan Stanley (362)(21,812) First Financial Bankshares
Inc Goldman Sachs 21,594(37,705) First Financial Bankshares
Inc HSBC (22,623)(38,571) First Financial Bankshares
Inc Morgan Stanley (28,157)67,193 First Financial Corp Bank of America
Merrill Lynch 7,39110,085 First Financial Corp Barclays Bank 2,21942,396 First Financial Northwest
IncBank of AmericaMerrill Lynch 16,110
35,612 First Financial NorthwestInc Goldman Sachs 13,533
(37,569) First Foundation Inc Morgan Stanley (6,762)(2,148) First Guaranty Bancshares
IncBank of AmericaMerrill Lynch (1,998)
(2,205) First Guaranty BancsharesInc Morgan Stanley (728)
13,356 First Hawaiian Inc Bank of AmericaMerrill Lynch (7,078)
14,112 First Hawaiian Inc Barclays Bank 1,59813,250 First Hawaiian Inc Goldman Sachs (7,023)6,918 First Hawaiian Inc HSBC (346)
68,969 First Hawaiian Inc Morgan Stanley 6,937(27,326) First Horizon Corp Bank of America
Merrill Lynch 3,0064,817 First Horizon Corp Bank of America
Merrill Lynch (530)45,959 First Horizon Corp Goldman Sachs (5,055)(1,274) First Horizon Corp Goldman Sachs (420)14,579 First Horizon Corp HSBC 1,021(5,676) First Industrial Realty Trust
Inc (REIT) Barclays Bank 3,17983,412 First Industrial Realty Trust
Inc (REIT) Goldman Sachs 110,938(2,633) First Industrial Realty Trust
Inc (REIT) Goldman Sachs (3,502)4,009 First Industrial Realty Trust
Inc (REIT) Morgan Stanley (2,245)(2,948) First Internet Bancorp Bank of America
Merrill Lynch 4,245(2,303) First Internet Bancorp Barclays Bank 1,313
(972) First Internet Bancorp Goldman Sachs 1,400(8,763) First Internet Bancorp Morgan Stanley 4,9952,621 First Interstate BancSystem
Inc ’A’Bank of AmericaMerrill Lynch (1,048)
65,074 First Interstate BancSystemInc ’A’ Barclays Bank 48,805
21,516 First Interstate BancSystemInc ’A’ Goldman Sachs (8,606)
32,929 First Interstate BancSystemInc ’A’ HSBC 10,700
25,897 First Interstate BancSystemInc ’A’ Morgan Stanley 19,423
(53,908) First Merchants Corp Bank of AmericaMerrill Lynch 54,986
BlackRock Americas Diversified Equity Absolute Return FundcontinuedPortfolio of Investments as at 31 May 2021
The notes on pages 590 to 610 form an integral part of these financial statements.
Annual report and audited financial statements [101]

Holding Description Counterparty
Netunrealised
appreciation/(depreciation)
USD
United States continued(80,500) First Merchants Corp Barclays Bank 19,320(17,539) First Merchants Corp HSBC 9,120(19,500) First Merchants Corp Morgan Stanley 4,680(38,797) First Mid Bancshares Inc Bank of America
Merrill Lynch (14,355)(29,242) First Mid Bancshares Inc Goldman Sachs (10,820)(2,689) First Mid Bancshares Inc HSBC (2,366)
(13,824) First Mid Bancshares Inc Morgan Stanley (1,659)(16,991) First Midwest Bancorp Inc HSBC 3,398(30,927) First Midwest Bancorp Inc Morgan Stanley 3,71158,552 First Northwest Bancorp Bank of America
Merrill Lynch 28,6901,596 First Northwest Bancorp Barclays Bank 321,569 First Northwest Bancorp Goldman Sachs 7691,178 First Northwest Bancorp HSBC 1,1071,593 First Northwest Bancorp Morgan Stanley 32
(6,283) First of Long Island Corp Bank of AmericaMerrill Lynch 6,911
(13,419) First of Long Island Corp Barclays Bank 805(7,356) First of Long Island Corp Goldman Sachs 8,092
(27,209) First of Long Island Corp HSBC 4,353(15,207) First of Long Island Corp Morgan Stanley 912
9,415 First Republic Bank Barclays Bank 9,2271,689 First Republic Bank HSBC 4,729
(2,200) First Republic Bank Morgan Stanley (2,156)7,099 First Savings Financial
Group IncBank of AmericaMerrill Lynch 6,815
848 First Savings FinancialGroup Inc Barclays Bank (356)
2,139 First Savings FinancialGroup Inc Goldman Sachs 2,053
322 First Savings FinancialGroup Inc HSBC 493
741 First Savings FinancialGroup Inc Morgan Stanley (311)
(3,942) First Solar Inc Barclays Bank (2,878)3,488 First Solar Inc Barclays Bank 2,546(168) First Solar Inc Goldman Sachs (766)
5,911 First Solar Inc Goldman Sachs 16,785(775) First Solar Inc Morgan Stanley (566)
6,462 First United Corp Bank of AmericaMerrill Lynch (5,622)
4,382 First United Corp Barclays Bank (2,366)20,049 First United Corp Goldman Sachs (17,443)19,967 First United Corp Morgan Stanley (10,782)7,049 First Western Financial Inc Bank of America
Merrill Lynch 7,1903,066 First Western Financial Inc Barclays Bank 1846,322 First Western Financial Inc Goldman Sachs 6,448
13,280 First Western Financial Inc HSBC 16,202363 First Western Financial Inc Morgan Stanley 22
8,995 FirstCash Inc Morgan Stanley 2,069(23,365) FirstEnergy Corp HSBC (6,075)(30,670) FirstEnergy Corp Morgan Stanley 307
9,038 Fiserv Inc Bank of AmericaMerrill Lynch 21,510
9,124 Fiserv Inc Barclays Bank (6,022)(17,098) Fiserv Inc Barclays Bank 11,285
6,392 Fiserv Inc Goldman Sachs 15,213285 Fiserv Inc HSBC (271)
7,632 Fiserv Inc Morgan Stanley (5,037)(2,677) Fiserv Inc Morgan Stanley 1,767(5,973) Fisker Inc Bank of America
Merrill Lynch (7,898)(4,271) Fisker Inc Goldman Sachs (2,084)(4,237) Five Below Inc Bank of America
Merrill Lynch (1,737)10,687 Five Star Senior Living Inc Bank of America
Merrill Lynch (2,779)21,349 Five Star Senior Living Inc Barclays Bank (2,562)
Holding Description Counterparty
Netunrealised
appreciation/(depreciation)
USD
United States continued3,577 Five Star Senior Living Inc Goldman Sachs (930)3,471 Five Star Senior Living Inc Morgan Stanley (417)1,050 Five9 Inc Barclays Bank 4,914(162) Five9 Inc Barclays Bank (758)
(1,704) Five9 Inc Goldman Sachs (22,885)9,053 Five9 Inc Morgan Stanley 42,368
(2,146) FleetCor Technologies Inc Bank of AmericaMerrill Lynch (4,755)
(2,417) FleetCor Technologies Inc Barclays Bank (5,474)(346) FleetCor Technologies Inc Goldman Sachs (820)(357) FleetCor Technologies Inc HSBC 3,124
(10,852) FleetCor Technologies Inc Morgan Stanley (14,791)980 FleetCor Technologies Inc Morgan Stanley 1,392
12,869 Flex Ltd Bank of AmericaMerrill Lynch 9,910
128,935 Flex Ltd Barclays Bank 21,91961,224 Flex Ltd Goldman Sachs 47,14229,757 Flex Ltd Morgan Stanley 5,0592,055 Flexion Therapeutics Inc Bank of America
Merrill Lynch 28828,204 Flexion Therapeutics Inc Barclays Bank (475)1,094 Flexion Therapeutics Inc Goldman Sachs 1536,216 Flexion Therapeutics Inc HSBC 8,578
21,130 Flexion Therapeutics Inc Morgan Stanley (211)(5,158) Flexsteel Industries Inc Bank of America
Merrill Lynch (7,170)(11,802) Flexsteel Industries Inc Barclays Bank 1,652(3,768) Floor & Decor Holdings Inc
’A’Bank of AmericaMerrill Lynch 10,513
(4,463) Floor & Decor Holdings Inc’A’ Barclays Bank (2,098)
(1,695) Floor & Decor Holdings Inc’A’ Goldman Sachs 4,729
(4,084) Floor & Decor Holdings Inc’A’ HSBC 47,849
(15,461) Floor & Decor Holdings Inc’A’ Morgan Stanley (4,453)
(76,369) Flotek Industries Inc Bank of AmericaMerrill Lynch (21,383)
(11,910) Flotek Industries Inc Goldman Sachs (3,335)(55,703) Flotek Industries Inc HSBC (27,294)(72,024) Flotek Industries Inc Morgan Stanley (720)
4,585 Flowers Foods Inc HSBC (3,072)4,755 Flowserve Corp Bank of America
Merrill Lynch (5,231)7,520 Flowserve Corp Barclays Bank 226
15,136 Flowserve Corp Goldman Sachs (16,650)3,095 Flowserve Corp HSBC (650)2,998 Flowserve Corp Morgan Stanley 906,249 Fluent Inc Bank of America
Merrill Lynch (312)6,845 Fluent Inc Barclays Bank 137
28,405 Fluent Inc Goldman Sachs (1,420)12,948 Fluent Inc Morgan Stanley 259
(16,332) Fluidigm Corp Goldman Sachs (7,513)2,137 Fluor Corp Barclays Bank 2999,991 Fluor Corp Goldman Sachs (11,390)
40,150 Flushing Financial Corp Goldman Sachs (20,878)4,271 FMC Corp Barclays Bank (214)(562) FMC Corp Barclays Bank 28
3,581 FMC Corp Goldman Sachs (6,195)(12,165) FNB Corp Bank of America
Merrill Lynch 2,920(66,189) FNB Corp Barclays Bank (1,986)(48,473) FNB Corp Goldman Sachs 11,634(57,783) FNB Corp HSBC 1,734(27,171) FNB Corp Morgan Stanley (816)(5,482) FNCB Bancorp Inc Goldman Sachs 219
(410) FNCB Bancorp Inc HSBC (131)(11,032) FNCB Bancorp Inc Morgan Stanley 1,986
BlackRock Americas Diversified Equity Absolute Return FundcontinuedPortfolio of Investments as at 31 May 2021
The notes on pages 590 to 610 form an integral part of these financial statements.
BlackRock Strategic Funds[102]
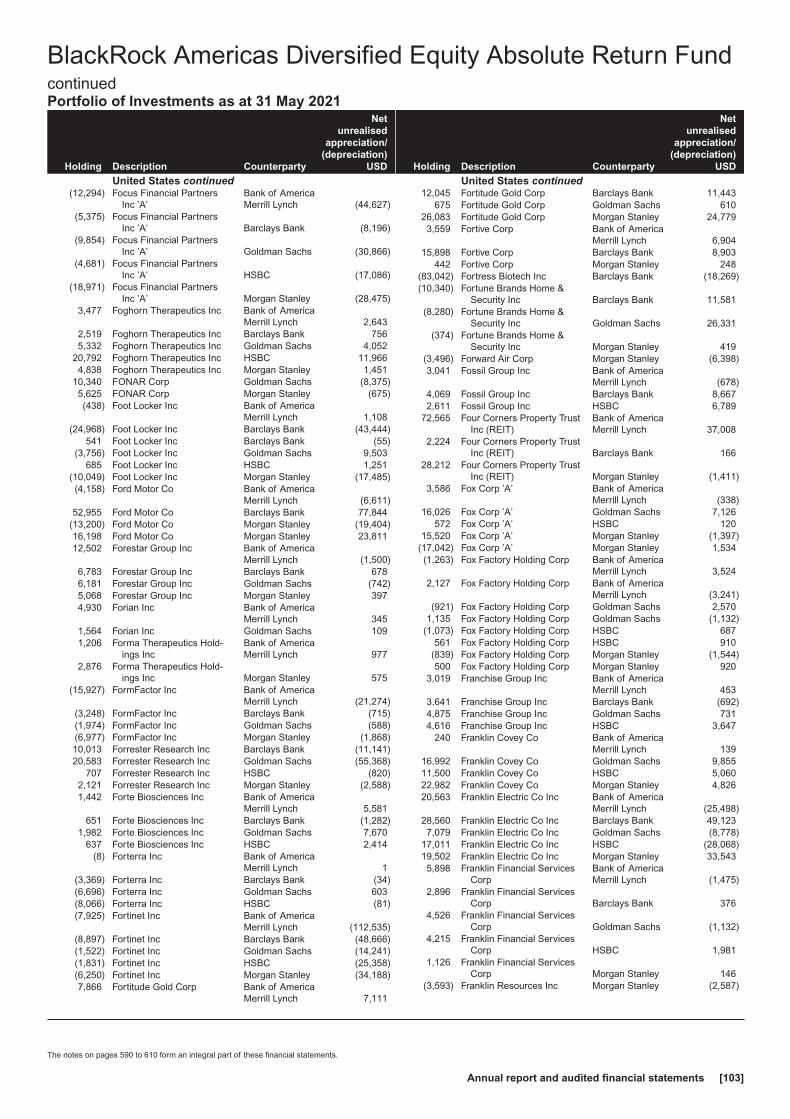
Holding Description Counterparty
Netunrealised
appreciation/(depreciation)
USD
United States continued(12,294) Focus Financial Partners
Inc ’A’Bank of AmericaMerrill Lynch (44,627)
(5,375) Focus Financial PartnersInc ’A’ Barclays Bank (8,196)
(9,854) Focus Financial PartnersInc ’A’ Goldman Sachs (30,866)
(4,681) Focus Financial PartnersInc ’A’ HSBC (17,086)
(18,971) Focus Financial PartnersInc ’A’ Morgan Stanley (28,475)
3,477 Foghorn Therapeutics Inc Bank of AmericaMerrill Lynch 2,643
2,519 Foghorn Therapeutics Inc Barclays Bank 7565,332 Foghorn Therapeutics Inc Goldman Sachs 4,052
20,792 Foghorn Therapeutics Inc HSBC 11,9664,838 Foghorn Therapeutics Inc Morgan Stanley 1,451
10,340 FONAR Corp Goldman Sachs (8,375)5,625 FONAR Corp Morgan Stanley (675)(438) Foot Locker Inc Bank of America
Merrill Lynch 1,108(24,968) Foot Locker Inc Barclays Bank (43,444)
541 Foot Locker Inc Barclays Bank (55)(3,756) Foot Locker Inc Goldman Sachs 9,503
685 Foot Locker Inc HSBC 1,251(10,049) Foot Locker Inc Morgan Stanley (17,485)(4,158) Ford Motor Co Bank of America
Merrill Lynch (6,611)52,955 Ford Motor Co Barclays Bank 77,844
(13,200) Ford Motor Co Morgan Stanley (19,404)16,198 Ford Motor Co Morgan Stanley 23,81112,502 Forestar Group Inc Bank of America
Merrill Lynch (1,500)6,783 Forestar Group Inc Barclays Bank 6786,181 Forestar Group Inc Goldman Sachs (742)5,068 Forestar Group Inc Morgan Stanley 3974,930 Forian Inc Bank of America
Merrill Lynch 3451,564 Forian Inc Goldman Sachs 1091,206 Forma Therapeutics Hold-
ings IncBank of AmericaMerrill Lynch 977
2,876 Forma Therapeutics Hold-ings Inc Morgan Stanley 575
(15,927) FormFactor Inc Bank of AmericaMerrill Lynch (21,274)
(3,248) FormFactor Inc Barclays Bank (715)(1,974) FormFactor Inc Goldman Sachs (588)(6,977) FormFactor Inc Morgan Stanley (1,868)10,013 Forrester Research Inc Barclays Bank (11,141)20,583 Forrester Research Inc Goldman Sachs (55,368)
707 Forrester Research Inc HSBC (820)2,121 Forrester Research Inc Morgan Stanley (2,588)1,442 Forte Biosciences Inc Bank of America
Merrill Lynch 5,581651 Forte Biosciences Inc Barclays Bank (1,282)
1,982 Forte Biosciences Inc Goldman Sachs 7,670637 Forte Biosciences Inc HSBC 2,414
(8) Forterra Inc Bank of AmericaMerrill Lynch 1
(3,369) Forterra Inc Barclays Bank (34)(6,696) Forterra Inc Goldman Sachs 603(8,066) Forterra Inc HSBC (81)(7,925) Fortinet Inc Bank of America
Merrill Lynch (112,535)(8,897) Fortinet Inc Barclays Bank (48,666)(1,522) Fortinet Inc Goldman Sachs (14,241)(1,831) Fortinet Inc HSBC (25,358)(6,250) Fortinet Inc Morgan Stanley (34,188)7,866 Fortitude Gold Corp Bank of America
Merrill Lynch 7,111
Holding Description Counterparty
Netunrealised
appreciation/(depreciation)
USD
United States continued12,045 Fortitude Gold Corp Barclays Bank 11,443
675 Fortitude Gold Corp Goldman Sachs 61026,083 Fortitude Gold Corp Morgan Stanley 24,7793,559 Fortive Corp Bank of America
Merrill Lynch 6,90415,898 Fortive Corp Barclays Bank 8,903
442 Fortive Corp Morgan Stanley 248(83,042) Fortress Biotech Inc Barclays Bank (18,269)(10,340) Fortune Brands Home &
Security Inc Barclays Bank 11,581(8,280) Fortune Brands Home &
Security Inc Goldman Sachs 26,331(374) Fortune Brands Home &
Security Inc Morgan Stanley 419(3,496) Forward Air Corp Morgan Stanley (6,398)3,041 Fossil Group Inc Bank of America
Merrill Lynch (678)4,069 Fossil Group Inc Barclays Bank 8,6672,611 Fossil Group Inc HSBC 6,789
72,565 Four Corners Property TrustInc (REIT)
Bank of AmericaMerrill Lynch 37,008
2,224 Four Corners Property TrustInc (REIT) Barclays Bank 166
28,212 Four Corners Property TrustInc (REIT) Morgan Stanley (1,411)
3,586 Fox Corp ’A’ Bank of AmericaMerrill Lynch (338)
16,026 Fox Corp ’A’ Goldman Sachs 7,126572 Fox Corp ’A’ HSBC 120
15,520 Fox Corp ’A’ Morgan Stanley (1,397)(17,042) Fox Corp ’A’ Morgan Stanley 1,534(1,263) Fox Factory Holding Corp Bank of America
Merrill Lynch 3,5242,127 Fox Factory Holding Corp Bank of America
Merrill Lynch (3,241)(921) Fox Factory Holding Corp Goldman Sachs 2,570
1,135 Fox Factory Holding Corp Goldman Sachs (1,132)(1,073) Fox Factory Holding Corp HSBC 687
561 Fox Factory Holding Corp HSBC 910(839) Fox Factory Holding Corp Morgan Stanley (1,544)500 Fox Factory Holding Corp Morgan Stanley 920
3,019 Franchise Group Inc Bank of AmericaMerrill Lynch 453
3,641 Franchise Group Inc Barclays Bank (692)4,875 Franchise Group Inc Goldman Sachs 7314,616 Franchise Group Inc HSBC 3,647
240 Franklin Covey Co Bank of AmericaMerrill Lynch 139
16,992 Franklin Covey Co Goldman Sachs 9,85511,500 Franklin Covey Co HSBC 5,06022,982 Franklin Covey Co Morgan Stanley 4,82620,563 Franklin Electric Co Inc Bank of America
Merrill Lynch (25,498)28,560 Franklin Electric Co Inc Barclays Bank 49,1237,079 Franklin Electric Co Inc Goldman Sachs (8,778)
17,011 Franklin Electric Co Inc HSBC (28,068)19,502 Franklin Electric Co Inc Morgan Stanley 33,5435,898 Franklin Financial Services
CorpBank of AmericaMerrill Lynch (1,475)
2,896 Franklin Financial ServicesCorp Barclays Bank 376
4,526 Franklin Financial ServicesCorp Goldman Sachs (1,132)
4,215 Franklin Financial ServicesCorp HSBC 1,981
1,126 Franklin Financial ServicesCorp Morgan Stanley 146
(3,593) Franklin Resources Inc Morgan Stanley (2,587)
BlackRock Americas Diversified Equity Absolute Return FundcontinuedPortfolio of Investments as at 31 May 2021
The notes on pages 590 to 610 form an integral part of these financial statements.
Annual report and audited financial statements [103]

Holding Description Counterparty
Netunrealised
appreciation/(depreciation)
USD
United States continued41,245 Franklin Street Properties
Corp (REIT) Barclays Bank (825)37,250 Franklin Street Properties
Corp (REIT) HSBC (3,353)24,541 Franklin Street Properties
Corp (REIT) Morgan Stanley (491)30,371 Frank’s International NV Morgan Stanley (3,645)
(17,791) Freeport-McMoRan Inc Bank of AmericaMerrill Lynch 25,975
(2,703) Freeport-McMoRan Inc Barclays Bank (3,696)(10,923) Freeport-McMoRan Inc Goldman Sachs 8,830
4,023 Freeport-McMoRan Inc HSBC 8,183(3,987) Freeport-McMoRan Inc Morgan Stanley (4,585)4,948 Freeport-McMoRan Inc Morgan Stanley 5,690
(11,542) FreightCar America Inc Bank of AmericaMerrill Lynch (9,580)
(13,437) Frequency Therapeutics Inc Barclays Bank (9,943)(4,416) Frequency Therapeutics Inc Goldman Sachs (309)
(620) Fresh Del Monte ProduceInc Barclays Bank 800
(19,395) Fresh Del Monte ProduceInc HSBC 9,698
(28,308) Fresh Del Monte ProduceInc Morgan Stanley 36,517
(283) Freshpet Inc Bank of AmericaMerrill Lynch (2,224)
5,708 Freshpet Inc Bank of AmericaMerrill Lynch 19,223
(1,437) Freshpet Inc Barclays Bank (2,500)1,616 Freshpet Inc Barclays Bank 2,8121,846 Freshpet Inc Goldman Sachs 2,392(425) Freshpet Inc Goldman Sachs (3,341)
(1,027) Freshpet Inc HSBC (5,227)1,321 Freshpet Inc HSBC 8,723(170) Freshpet Inc Morgan Stanley (296)
2,888 Freshpet Inc Morgan Stanley 5,025(10,382) frontdoor Inc Bank of America
Merrill Lynch (20,133)10,541 frontdoor Inc Barclays Bank 7,062
(10,286) frontdoor Inc Barclays Bank (6,871)4,464 frontdoor Inc Goldman Sachs 12,097
(6,705) frontdoor Inc Goldman Sachs (18,171)(3,884) frontdoor Inc HSBC (3,962)2,348 frontdoor Inc Morgan Stanley 1,573
(9,796) frontdoor Inc Morgan Stanley (6,064)(38,371) Frontline Ltd Barclays Bank 14,581(6,386) Frontline Ltd Morgan Stanley (171)
354 FRP Holdings Inc Barclays Bank 4712,991 FRP Holdings Inc Goldman Sachs 3,2281,134 FRP Holdings Inc Morgan Stanley 5416,887 FS Bancorp Inc Bank of America
Merrill Lynch 7,3007,349 FS Bancorp Inc Barclays Bank 4,9977,399 FS Bancorp Inc HSBC 11,6907,218 FS Bancorp Inc Morgan Stanley 4,908
532 F-star Therapeutics Inc* Goldman Sachs 213532 F-star Therapeutics Inc* Goldman Sachs 213
31,630 FTC Solar Inc Goldman Sachs 80,0245,919 FTC Solar Inc HSBC 1677,834 FTC Solar Inc Morgan Stanley 10,7331,860 FTI Consulting Inc Bank of America
Merrill Lynch 9681,134 FTI Consulting Inc Barclays Bank 265
(2,483) FTI Consulting Inc Morgan Stanley (1,341)987 FTI Consulting Inc Morgan Stanley (88)
4,964 FTS International Inc ’A’ Bank of AmericaMerrill Lynch (7,496)
673 FTS International Inc ’A’ Goldman Sachs (1,016)
Holding Description Counterparty
Netunrealised
appreciation/(depreciation)
USD
United States continued1,513 FTS International Inc ’A’ HSBC (2,950)
(28,952) FuelCell Energy Inc Bank of AmericaMerrill Lynch (54,140)
(8,820) FuelCell Energy Inc Barclays Bank (11,642)(21,474) FuelCell Energy Inc Goldman Sachs (40,156)(1,886) Fulgent Genetics Inc Barclays Bank (5,790)(4,119) Full House Resorts Inc Bank of America
Merrill Lynch (8,197)(3,251) Full House Resorts Inc Barclays Bank (1,495)
(32,910) Full House Resorts Inc Goldman Sachs (65,491)(2,783) Full House Resorts Inc Morgan Stanley (1,280)77,966 Fulton Financial Corp HSBC (10,915)72,903 Fulton Financial Corp Morgan Stanley 1,458(4,316) Funko Inc ’A’ Bank of America
Merrill Lynch (3,971)(8,718) Funko Inc ’A’ Barclays Bank (15,431)
(27,920) FutureFuel Corp Bank of AmericaMerrill Lynch 112,244
(29,832) FutureFuel Corp Barclays Bank 19,689(28,056) FutureFuel Corp Goldman Sachs 142,827(3,528) FutureFuel Corp Morgan Stanley 1,698
(11,711) FVCBankcorp Inc Barclays Bank 1,054(1,603) FVCBankcorp Inc Goldman Sachs 497
(27,591) FVCBankcorp Inc HSBC (276)5,546 G1 Therapeutics Inc Barclays Bank (333)5,382 Gaia Inc Bank of America
Merrill Lynch 8613,667 Gaia Inc Barclays Bank 2,017
18,746 Gaia Inc Goldman Sachs 2,9998,268 Gaia Inc HSBC 4,6307,973 Galera Therapeutics Inc Bank of America
Merrill Lynch 4,94311,512 Galera Therapeutics Inc Goldman Sachs 7,13713,030 Galera Therapeutics Inc HSBC 27,3634,627 Galera Therapeutics Inc Morgan Stanley 972
(10,204) GAMCO Investors Inc ’A’ Bank of AmericaMerrill Lynch 543
(5,727) GAMCO Investors Inc ’A’ Barclays Bank 15,577(2,552) GAMCO Investors Inc ’A’ Goldman Sachs 179(3,352) GAMCO Investors Inc ’A’ HSBC (9,821)(4,884) GameStop Corp ’A’ Barclays Bank (205,079)
(21,888) Gaming and Leisure Proper-ties Inc (REIT) Morgan Stanley (1,313)
3,221 Gaming and Leisure Proper-ties Inc (REIT) Morgan Stanley 193
(5,789) GAN Ltd Barclays Bank (7,526)(4,524) GAN Ltd Goldman Sachs (4,841)(5,731) Gannett Co Inc Bank of America
Merrill Lynch 344(10,284) Gap Inc Bank of America
Merrill Lynch 29,618(9,968) Gap Inc Barclays Bank (6,679)
(12,705) Gap Inc Goldman Sachs 36,590(5,388) Gap Inc Morgan Stanley (3,610)10,910 Gap Inc Morgan Stanley 7,310(4,937) Garmin Ltd Barclays Bank (11,109)
(657) Garmin Ltd Morgan Stanley (1,478)465 Gartner Inc Barclays Bank (405)135 Gartner Inc Goldman Sachs 732756 Gartner Inc HSBC 514
5,546 Gartner Inc Morgan Stanley (4,825)43,067 Gates Industrial Corp Plc Barclays Bank 32,3015,412 Gates Industrial Corp Plc Goldman Sachs 4,005
25,698 Gates Industrial Corp Plc HSBC 14,13425,310 Gates Industrial Corp Plc Morgan Stanley 18,983
(17,699) Gatos Silver Inc Barclays Bank (13,746)(7,344) Gatos Silver Inc Goldman Sachs (18,093)(3,230) Gatos Silver Inc Morgan Stanley (3,080)
BlackRock Americas Diversified Equity Absolute Return FundcontinuedPortfolio of Investments as at 31 May 2021
The notes on pages 590 to 610 form an integral part of these financial statements.
BlackRock Strategic Funds[104]

Holding Description Counterparty
Netunrealised
appreciation/(depreciation)
USD
United States continued(3,342) GATX Corp Bank of America
Merrill Lynch 3,3425,280 GATX Corp Morgan Stanley (2,165)
(28,166) GCP Applied TechnologiesInc Morgan Stanley 21,969
7,432 Gemini Therapeutics Inc Bank of AmericaMerrill Lynch 9,290
6,914 Gemini Therapeutics Inc Barclays Bank 9,4038,372 Gemini Therapeutics Inc Goldman Sachs 10,4653,048 Gemini Therapeutics Inc HSBC 4,6332,663 Gemini Therapeutics Inc Morgan Stanley 3,622
(60,317) Genasys Inc Bank of AmericaMerrill Lynch 19,905
(16,015) Genasys Inc Barclays Bank 9,449(11,002) Genasys Inc Goldman Sachs 3,631(18,950) Genasys Inc HSBC 3,032(5,637) Genasys Inc Morgan Stanley 3,326(8,808) Genco Shipping & Trading
Ltd Barclays Bank 9,160(23,626) Genco Shipping & Trading
Ltd Goldman Sachs (9,687)(13,601) Genco Shipping & Trading
Ltd Morgan Stanley 14,14523,474 Gencor Industries Inc Bank of America
Merrill Lynch (13,145)11,115 Gencor Industries Inc Barclays Bank 3,66817,670 Gencor Industries Inc Goldman Sachs (9,895)10,157 Gencor Industries Inc HSBC 11,47716,747 Gencor Industries Inc Morgan Stanley 5,5271,311 Generac Holdings Inc Bank of America
Merrill Lynch 45,166606 Generac Holdings Inc Barclays Bank 10,956
1,240 Generac Holdings Inc Goldman Sachs 43,115366 Generac Holdings Inc HSBC 8,605
5,574 Generac Holdings Inc Morgan Stanley 100,778(21,679) General Electric Co Bank of America
Merrill Lynch (19,728)(28,402) General Electric Co Barclays Bank (24,994)(80,273) General Electric Co Goldman Sachs (73,048)(10,263) General Electric Co HSBC (7,287)
(174,539) General Electric Co Morgan Stanley (153,594)(7,369) General Mills Inc Bank of America
Merrill Lynch (516)(11,091) General Mills Inc Goldman Sachs (776)
8,604 General Mills Inc Goldman Sachs 340450 General Mills Inc HSBC 225
1,329 General Mills Inc Morgan Stanley (253)(26,940) General Motors Co Bank of America
Merrill Lynch (88,094)(4,503) General Motors Co Barclays Bank (12,203)1,843 General Motors Co HSBC 8,470
(8,568) General Motors Co Morgan Stanley (23,219)(3,467) Generation Bio Co Bank of America
Merrill Lynch (11,857)(777) Generation Bio Co Barclays Bank (3,100)
(5,726) Generation Bio Co Goldman Sachs (19,583)892 Genesco Inc Bank of America
Merrill Lynch (2,337)1,365 Genesco Inc Morgan Stanley 683
(38,152) Genie Energy Ltd ’B’ Bank of AmericaMerrill Lynch 20,221
(5,009) Genie Energy Ltd ’B’ Barclays Bank 2,304(18,827) Genie Energy Ltd ’B’ Goldman Sachs 9,978(7,176) Genie Energy Ltd ’B’ HSBC (359)
(13,576) Genie Energy Ltd ’B’ Morgan Stanley 6,24544,754 Genpact Ltd Goldman Sachs 62,6565,628 Genprex Inc Bank of America
Merrill Lynch 1,7455,618 Genprex Inc Barclays Bank 674
Holding Description Counterparty
Netunrealised
appreciation/(depreciation)
USD
United States continued4,965 Genprex Inc Goldman Sachs 1,5399,969 Genprex Inc HSBC 3,5504,642 Genprex Inc Morgan Stanley 557
(15,236) Gentex Corp Goldman Sachs (11,884)(17,291) Gentex Corp HSBC (6,571)(17,986) Gentex Corp Morgan Stanley (19,964)
3,155 Gentherm Inc Bank of AmericaMerrill Lynch 4,733
7,412 Gentherm Inc Barclays Bank 12,2305,722 Gentherm Inc Goldman Sachs 1,3481,215 Gentherm Inc HSBC 1,042
669 Gentherm Inc Morgan Stanley 1,1041,736 Genuine Parts Co Bank of America
Merrill Lynch (2,135)13,103 Genuine Parts Co Barclays Bank (2,278)4,470 Genuine Parts Co Goldman Sachs (4,156)2,919 Genuine Parts Co HSBC (7,239)
22,243 Genuine Parts Co Morgan Stanley (5,477)(45,132) Genworth Financial Inc ’A’ Morgan Stanley (1,354)(20,985) GEO Group Inc (REIT) Barclays Bank 8,394(2,812) GEO Group Inc (REIT) Goldman Sachs 3,206
(10,122) Geospace TechnologiesCorp
Bank of AmericaMerrill Lynch (1,316)
(10,773) Geospace TechnologiesCorp Barclays Bank 970
(16,314) Geospace TechnologiesCorp Goldman Sachs (2,121)
(7,864) Geospace TechnologiesCorp Morgan Stanley 708
(10,271) German American BancorpInc Barclays Bank (13,660)
(14,357) German American BancorpInc Goldman Sachs (9,619)
(16,622) German American BancorpInc HSBC (499)
(50,731) German American BancorpInc Morgan Stanley (67,472)
(193,284) Geron Corp Barclays Bank —14,626 Getty Realty Corp (REIT) Goldman Sachs 17,4057,683 Getty Realty Corp (REIT) Morgan Stanley 4,917
198 Gibraltar Industries Inc Bank of AmericaMerrill Lynch 196
1,013 Gibraltar Industries Inc Barclays Bank 142388 Gibraltar Industries Inc Goldman Sachs 384391 Gibraltar Industries Inc HSBC (813)
10,185 Gibraltar Industries Inc Morgan Stanley 1,426(12,247) G-III Apparel Group Ltd Barclays Bank (11,022)(4,923) G-III Apparel Group Ltd Goldman Sachs 3,1843,271 Gilead Sciences Inc Bank of America
Merrill Lynch (9,682)35,195 Gilead Sciences Inc Barclays Bank (46,457)1,482 Gilead Sciences Inc Goldman Sachs (4,387)
241 Gilead Sciences Inc HSBC (648)38,348 Gilead Sciences Inc Morgan Stanley (48,422)5,613 Glacier Bancorp Inc Bank of America
Merrill Lynch (9,464)32,310 Glacier Bancorp Inc Barclays Bank (11,632)
312 Glacier Bancorp Inc Goldman Sachs (1,017)2,898 Glacier Bancorp Inc HSBC (7,622)3,692 Glacier Bancorp Inc Morgan Stanley (1,329)
(10,663) Gladstone Commercial Corp(REIT)
Bank of AmericaMerrill Lynch (8,881)
(68,052) Gladstone Commercial Corp(REIT) Barclays Bank (58,560)
(13,987) Gladstone Commercial Corp(REIT) Goldman Sachs (743)
(25,813) Gladstone Commercial Corp(REIT) Morgan Stanley (16,409)
BlackRock Americas Diversified Equity Absolute Return FundcontinuedPortfolio of Investments as at 31 May 2021
The notes on pages 590 to 610 form an integral part of these financial statements.
Annual report and audited financial statements [105]

Holding Description Counterparty
Netunrealised
appreciation/(depreciation)
USD
United States continued23,225 Gladstone Land Corp
(REIT)Bank of AmericaMerrill Lynch (32,283)
14,766 Gladstone Land Corp(REIT) Goldman Sachs (20,525)
5,961 Gladstone Land Corp(REIT) Morgan Stanley (8,107)
(26,140) Glatfelter Corp Barclays Bank (2,353)(48,054) Glatfelter Corp Goldman Sachs (24,988)(42,175) Glatfelter Corp HSBC 16,448(20,803) Glatfelter Corp Morgan Stanley (1,872)(1,212) Glaukos Corp Barclays Bank 2,872
626 Glaukos Corp Barclays Bank (1,484)387 Glaukos Corp Goldman Sachs (66)998 Glaukos Corp HSBC (2,824)
5,962 Global Blood TherapeuticsInc Barclays Bank 7,154
(639) Global Blood TherapeuticsInc Goldman Sachs (1,355)
(2,088) Global Blood TherapeuticsInc HSBC (2,004)
(572) Global Blood TherapeuticsInc Morgan Stanley (686)
3,321 Global Indemnity Group LLC’A’ Barclays Bank 2,258
10,817 Global Indemnity Group LLC’A’ Goldman Sachs 33,857
4,415 Global Indemnity Group LLC’A’ HSBC 12,804
6,738 Global Indemnity Group LLC’A’ Morgan Stanley 4,582
5,076 Global Medical Inc (REIT) Bank of AmericaMerrill Lynch 508
11,690 Global Medical Inc (REIT) Barclays Bank (1,754)12,824 Global Medical Inc (REIT) Goldman Sachs 1,28237,124 Global Medical Inc (REIT) HSBC 10,3952,726 Global Medical Inc (REIT) Morgan Stanley (409)
(4,021) Global Payments Inc Bank of AmericaMerrill Lynch 12,465
719 Global Payments Inc Bank of AmericaMerrill Lynch (2,229)
(532) Global Payments Inc Barclays Bank 8192,640 Global Payments Inc Barclays Bank (4,066)
(4,874) Global Payments Inc Goldman Sachs 15,1092,111 Global Payments Inc Goldman Sachs (6,544)
(7,319) Global Payments Inc Morgan Stanley 11,2711,683 Global Payments Inc Morgan Stanley (2,592)
13,858 Global Water Resources Inc Barclays Bank 27726,230 Global Water Resources Inc Goldman Sachs 6,82027,655 Global Water Resources Inc Morgan Stanley 553
812 Globant SA Goldman Sachs 4,2951,151 Globant SA HSBC 5,030
971 Globant SA Morgan Stanley 544(5,916) Globe Life Inc Bank of America
Merrill Lynch 2,176(30,442) Globe Life Inc Barclays Bank (5,501)(2,466) Globe Life Inc Goldman Sachs (231)(3,008) Globe Life Inc HSBC 246
(16,021) Globe Life Inc Morgan Stanley (1,787)1,546 Globus Medical Inc ’A’ Goldman Sachs 5262,776 Globus Medical Inc ’A’ HSBC 2,804
17,927 Globus Medical Inc ’A’ Morgan Stanley 17,031(8,222) GlycoMimetics Inc Bank of America
Merrill Lynch (987)(52,340) GlycoMimetics Inc HSBC (20,413)(4,050) GMS Inc Morgan Stanley (203)2,567 GoDaddy Inc ’A’ Bank of America
Merrill Lynch (539)13,309 GoDaddy Inc ’A’ Barclays Bank 12,777
Holding Description Counterparty
Netunrealised
appreciation/(depreciation)
USD
United States continued6,040 GoDaddy Inc ’A’ Morgan Stanley 5,798
(13,522) Gogo Inc Bank of AmericaMerrill Lynch (19,472)
(23,888) Gogo Inc Barclays Bank (36,310)(10,939) GoHealth Inc ’A’ Bank of America
Merrill Lynch (1,750)(1,464) GoHealth Inc ’A’ Goldman Sachs (234)9,387 GoHealth Inc ’A’ HSBC (20)
(35,612) Golar LNG Ltd Bank of AmericaMerrill Lynch (27,777)
(11,441) Golar LNG Ltd Goldman Sachs (8,924)36,930 Gold Resource Corp Bank of America
Merrill Lynch (2,216)29,666 Gold Resource Corp Barclays Bank (890)48,144 Gold Resource Corp Goldman Sachs (2,889)37,463 Gold Resource Corp HSBC 1,87391,293 Gold Resource Corp Morgan Stanley (2,739)
(11,534) Golden Entertainment Inc Bank of AmericaMerrill Lynch (19,904)
(5,569) Golden Entertainment Inc Barclays Bank (7,232)16,858 Golden Nugget Online
Gaming Inc Barclays Bank 7,418990 Golden Nugget Online
Gaming Inc HSBC 1,000(666) Goldman Sachs Group Inc Bank of America
Merrill Lynch (1,882)(1,926) Goldman Sachs Group Inc Barclays Bank (4,210)
(665) Goldman Sachs Group Inc HSBC (1,091)(3,863) Goldman Sachs Group Inc Morgan Stanley (14,409)8,387 Goodrich Petroleum Corp Bank of America
Merrill Lynch (3,606)3,294 Goodrich Petroleum Corp Goldman Sachs (1,416)
13,631 Goodrich Petroleum Corp Morgan Stanley (2,999)(4,419) GoodRx Holdings Inc ’A’ Bank of America
Merrill Lynch (13,018)(8,439) GoodRx Holdings Inc ’A’ Goldman Sachs (36,553)(1,447) GoodRx Holdings Inc ’A’ HSBC 566(3,668) GoodRx Holdings Inc ’A’ Morgan Stanley (17,093)12,454 Goodyear Tire & Rubber Co Bank of America
Merrill Lynch 9,77248,395 Goodyear Tire & Rubber Co Barclays Bank 33,8769,415 Goodyear Tire & Rubber Co Goldman Sachs (572)
10,262 Goodyear Tire & Rubber Co HSBC 7,26750,392 Goodyear Tire & Rubber Co Morgan Stanley 38,384
924 Goosehead Insurance Inc’A’
Bank of AmericaMerrill Lynch 6,893
(8,268) Goosehead Insurance Inc’A’ Barclays Bank (43,002)
896 Goosehead Insurance Inc’A’ Barclays Bank 5,197
(4,529) Goosehead Insurance Inc’A’ Goldman Sachs (33,786)
863 Goosehead Insurance Inc’A’ Goldman Sachs 6,438
1,492 Goosehead Insurance Inc’A’ HSBC (8,594)
(4,065) Goosehead Insurance Inc’A’ Morgan Stanley (23,577)
2,607 Goosehead Insurance Inc’A’ Morgan Stanley 15,121
(7,641) GoPro Inc ’A’ Barclays Bank (4,967)(7,975) GoPro Inc ’A’ Goldman Sachs (10,607)
(39,831) Gorman-Rupp Co Bank of AmericaMerrill Lynch (25,890)
(15,822) Gorman-Rupp Co Barclays Bank (16,455)(32,647) Gorman-Rupp Co Goldman Sachs (21,221)(7,703) Gorman-Rupp Co HSBC (3,929)
(12,186) Gorman-Rupp Co Morgan Stanley (12,673)
BlackRock Americas Diversified Equity Absolute Return FundcontinuedPortfolio of Investments as at 31 May 2021
The notes on pages 590 to 610 form an integral part of these financial statements.
BlackRock Strategic Funds[106]

Holding Description Counterparty
Netunrealised
appreciation/(depreciation)
USD
United States continued16,955 Gossamer Bio Inc Bank of America
Merrill Lynch (4,578)8,457 Gossamer Bio Inc Barclays Bank (4,651)
10,265 Gossamer Bio Inc Goldman Sachs (2,772)5,239 Gossamer Bio Inc HSBC 2,462
23,236 Gossamer Bio Inc Morgan Stanley (12,780)(35,394) GP Strategies Corp Bank of America
Merrill Lynch (43,889)2,604 Graco Inc Barclays Bank 2,083
367 Graco Inc Goldman Sachs (257)15,668 Graco Inc HSBC (39,953)16,935 Graco Inc Morgan Stanley 13,548
(38,367) GrafTech International Ltd Bank of AmericaMerrill Lynch 8,125
(31,826) GrafTech International Ltd Barclays Bank 10,856(47,334) GrafTech International Ltd Goldman Sachs 27,927(10,086) GrafTech International Ltd HSBC (7,968)(19,252) GrafTech International Ltd Morgan Stanley 6,207
4,053 Graham Corp Goldman Sachs (2,027)(632) Graham Holdings Co ’B’ Bank of America
Merrill Lynch (1,858)675 Graham Holdings Co ’B’ Barclays Bank (4,455)
(263) Graham Holdings Co ’B’ Goldman Sachs (773)(374) Graham Holdings Co ’B’ HSBC 2,061842 Graham Holdings Co ’B’ Morgan Stanley (5,557)
(322) Graham Holdings Co ’B’ Morgan Stanley 2,1251,685 Grand Canyon Education
Inc Barclays Bank (940)1,189 Grand Canyon Education
Inc HSBC 91(847) Grand Canyon Education
Inc Morgan Stanley 253,079 Grand Canyon Education
Inc Morgan Stanley (33)14,366 Granite Construction Inc Bank of America
Merrill Lynch 7,30521,764 Granite Construction Inc Barclays Bank 12,8513,901 Granite Construction Inc Goldman Sachs 1,756
19,123 Granite Construction Inc HSBC 15,9302,310 Granite Construction Inc Morgan Stanley (832)2,046 Graphic Packaging Holding
CoBank of AmericaMerrill Lynch (551)
4,261 Graphic Packaging HoldingCo Barclays Bank (1,236)
59,018 Graphic Packaging HoldingCo HSBC (100,921)
49,501 Graphic Packaging HoldingCo Morgan Stanley (14,356)
(9,475) Gray Television Inc Bank of AmericaMerrill Lynch (13,320)
(35,898) Gray Television Inc Barclays Bank (25,847)(43,127) Gray Television Inc Goldman Sachs (64,027)(26,251) Great Lakes Dredge & Dock
CorpBank of AmericaMerrill Lynch 2,100
(28,384) Great Lakes Dredge & DockCorp Barclays Bank (2,555)
(78,543) Great Lakes Dredge & DockCorp Goldman Sachs 6,080
(25,444) Great Lakes Dredge & DockCorp HSBC (18,829)
(24,263) Great Lakes Dredge & DockCorp Morgan Stanley (2,184)
(25,944) Great Southern Bancorp Inc Bank of AmericaMerrill Lynch 26,463
(11,697) Great Southern Bancorp Inc Barclays Bank (2,105)(23,362) Great Southern Bancorp Inc Goldman Sachs 23,829(9,374) Great Southern Bancorp Inc HSBC 2,906(4,367) Great Southern Bancorp Inc Morgan Stanley (786)(4,691) Great Western Bancorp Inc Bank of America
Merrill Lynch 2,486
Holding Description Counterparty
Netunrealised
appreciation/(depreciation)
USD
United States continued(7,985) Great Western Bancorp Inc Morgan Stanley 9582,222 Green Brick Partners Inc Bank of America
Merrill Lynch 7331,932 Green Brick Partners Inc Barclays Bank 1,7002,729 Green Brick Partners Inc Goldman Sachs 901
32,140 Green Brick Partners Inc Morgan Stanley 28,283(1,330) Green Dot Corp ’A’ Barclays Bank (612)(2,398) Green Dot Corp ’A’ Goldman Sachs (336)(4,208) Green Dot Corp ’A’ HSBC 8,963(3,898) Green Dot Corp ’A’ Morgan Stanley (1,793)12,261 Green Plains Inc Goldman Sachs 57,2595,709 Green Plains Inc Morgan Stanley 11,304
(11,895) Greenbrier Cos Inc Bank of AmericaMerrill Lynch 20,103
(21,410) Greenbrier Cos Inc Barclays Bank 66,157(2,184) Greenbrier Cos Inc Goldman Sachs 3,691(2,397) Greene County Bancorp Inc Bank of America
Merrill Lynch (5,681)(2,148) Greene County Bancorp Inc Barclays Bank (3,716)(2,856) Greene County Bancorp Inc Goldman Sachs (6,769)(2,486) Greene County Bancorp Inc HSBC (7,508)
(915) Greene County Bancorp Inc Morgan Stanley (1,583)(6,593) Greenhill & Co Inc Bank of America
Merrill Lynch 2,967(3,964) Greenhill & Co Inc Goldman Sachs 1,784(1,634) Greenhill & Co Inc HSBC (2,059)
(12,830) Greenhill & Co Inc Morgan Stanley (128)(3,547) Greenlane Holdings Inc ’A’ Barclays Bank (1,206)47,474 Greenlight Capital Re Ltd ’A’ Barclays Bank (4,747)36,326 Greenlight Capital Re Ltd ’A’ Goldman Sachs (8,718)5,303 GreenSky Inc ’A’ Bank of America
Merrill Lynch (530)(3,402) GreenSky Inc ’A’ Bank of America
Merrill Lynch 340(58,854) GreenSky Inc ’A’ Barclays Bank (1,177)
960 Greif Inc ’A’ Bank of AmericaMerrill Lynch (2,861)
4,941 Greif Inc ’A’ Barclays Bank (6,967)10,221 Greif Inc ’A’ Goldman Sachs (30,459)9,885 Greif Inc ’A’ Morgan Stanley (13,938)
(10,339) Greif Inc ’B’ Bank of AmericaMerrill Lynch 20,368
(6,195) Greif Inc ’B’ Barclays Bank 2,044(9,256) Greif Inc ’B’ Goldman Sachs 18,234(1,747) Greif Inc ’B’ HSBC 4,175
(174) Greif Inc ’B’ Morgan Stanley 5710,200 Grid Dynamics Holdings Inc Barclays Bank (6,120)34,278 Griffon Corp Bank of America
Merrill Lynch (18,853)12,409 Griffon Corp Barclays Bank (993)
651 Griffon Corp Morgan Stanley (52)(18,081) Gritstone bio Inc Bank of America
Merrill Lynch (7,413)(9,672) Grocery Outlet Holding
CorpBank of AmericaMerrill Lynch 8,995
(8,491) Grocery Outlet HoldingCorp Barclays Bank (1,490)
(3,233) Grocery Outlet HoldingCorp Goldman Sachs 3,007
(4,169) Grocery Outlet HoldingCorp HSBC 29,975
(6,553) Grocery Outlet HoldingCorp Morgan Stanley (643)
2,536 Group 1 Automotive Inc Barclays Bank (12,426)1,904 Group 1 Automotive Inc Goldman Sachs (21,153)1,806 Group 1 Automotive Inc Morgan Stanley (8,849)
(2,903) Groupon Inc Morgan Stanley (1,306)(9,597) GrowGeneration Corp Bank of America
Merrill Lynch (50,192)
BlackRock Americas Diversified Equity Absolute Return FundcontinuedPortfolio of Investments as at 31 May 2021
The notes on pages 590 to 610 form an integral part of these financial statements.
Annual report and audited financial statements [107]

Holding Description Counterparty
Netunrealised
appreciation/(depreciation)
USD
United States continued(5,734) GrowGeneration Corp Barclays Bank (43,234)(3,924) Grubhub Inc Bank of America
Merrill Lynch (10,241)(6,053) Grubhub Inc Barclays Bank (10,169)(2,082) Grubhub Inc Goldman Sachs (5,434)(4,802) Grubhub Inc HSBC 22,761
(14,674) Grubhub Inc Morgan Stanley (24,652)(34,014) GSI Technology Inc Bank of America
Merrill Lynch (12,726)(21,599) GSI Technology Inc Barclays Bank 4,752(36,279) GSI Technology Inc Goldman Sachs (12,043)(5,803) GSI Technology Inc Morgan Stanley 8813,720 GT Biopharma Inc Bank of America
Merrill Lynch 17,596(13,097) GTT Communications Inc Barclays Bank 13127,917 GTX Corp* Bank of America
Merrill Lynch 28,6157,571 GTX Corp* Goldman Sachs 7,760
59 GTX Corp* Morgan Stanley 60(23,654) GTY Technology Holdings
Inc Barclays Bank 5,914(4,708) GTY Technology Holdings
Inc Goldman Sachs 989(15,497) GTY Technology Holdings
Inc Morgan Stanley 3,874(13,811) Guaranty Bancshares Inc Bank of America
Merrill Lynch 19,197(4,194) Guaranty Bancshares Inc HSBC 5,662
(10,747) Guaranty Bancshares Inc Morgan Stanley 2,902(8,657) Guardant Health Inc Barclays Bank (5,194)
(552) Guardant Health Inc Goldman Sachs (6,331)(4,479) Guardant Health Inc Morgan Stanley (2,687)1,490 Guess? Inc Bank of America
Merrill Lynch (1,073)3,765 Guess? Inc Barclays Bank 6,0623,220 Guess? Inc HSBC 3,0595,022 Guess? Inc Morgan Stanley 8,085
725 Guidewire Software Inc Bank of AmericaMerrill Lynch 4,125
30,177 Guidewire Software Inc Barclays Bank 17,8044,681 Guidewire Software Inc Goldman Sachs 25,6824,687 Guidewire Software Inc HSBC 3,7265,803 Guidewire Software Inc Morgan Stanley 3,424
(39,677) Guild Holdings Co ’A’ Barclays Bank (19,045)(32,922) Gulf Island Fabrication Inc Goldman Sachs (16,132)(16,100) Gulf Island Fabrication Inc Morgan Stanley (483)(22,096) GWG Holdings Inc Morgan Stanley —
4,896 H&E Equipment ServicesInc Goldman Sachs (6,805)
3,817 H&R Block Inc Bank of AmericaMerrill Lynch (534)
21,875 H&R Block Inc Barclays Bank 9,18814,520 H&R Block Inc HSBC 10,96421,974 H&R Block Inc Morgan Stanley 9,229
(12,587) Hackett Group Inc Bank of AmericaMerrill Lynch (9,314)
(34,889) Hackett Group Inc Barclays Bank (13,607)(19,054) Hackett Group Inc Goldman Sachs (14,100)
1,120 Haemonetics Corp Bank of AmericaMerrill Lynch (166)
3,871 Haemonetics Corp Barclays Bank 2,9035,625 Haemonetics Corp Goldman Sachs (2,405)4,354 Haemonetics Corp Morgan Stanley 3,425
(16,355) Hain Celestial Group Inc Morgan Stanley (2,780)13,548 Hallador Energy Co Goldman Sachs 2,4395,621 Hallador Energy Co Morgan Stanley 1,349
(5,103) Halliburton Co Goldman Sachs 6,7876,074 Halliburton Co Goldman Sachs (8,078)
(29,030) Halliburton Co HSBC 8,419(14,213) Halliburton Co Morgan Stanley 853
Holding Description Counterparty
Netunrealised
appreciation/(depreciation)
USD
United States continued41,234 Halliburton Co Morgan Stanley (2,485)9,453 Hallmark Financial Services
IncBank of AmericaMerrill Lynch 1,985
2,733 Hallmark Financial ServicesInc Goldman Sachs 574
26,217 Hallmark Financial ServicesInc Morgan Stanley (3,670)
(4,150) Halozyme Therapeutics Inc Bank of AmericaMerrill Lynch 4,191
(20,236) Halozyme Therapeutics Inc Barclays Bank 10,725(6,264) Halozyme Therapeutics Inc Goldman Sachs 6,327(5,658) Halozyme Therapeutics Inc HSBC 26,536(7,142) Halozyme Therapeutics Inc Morgan Stanley 3,785
533 Hamilton Beach BrandsHolding Co ’A’
Bank of AmericaMerrill Lynch (7)
2,733 Hamilton Beach BrandsHolding Co ’A’ Goldman Sachs 4,420
1,360 Hamilton Beach BrandsHolding Co ’A’ HSBC 1,362
5,985 Hamilton Beach BrandsHolding Co ’A’ Morgan Stanley 5,247
3,972 Hamilton Lane Inc ’A’ Goldman Sachs (755)24,453 Hamilton Lane Inc ’A’ HSBC 14,916
(20,086) Hancock Whitney Corp Bank of AmericaMerrill Lynch 15,466
(24,203) Hancock Whitney Corp HSBC (11,133)(21,747) Hancock Whitney Corp Morgan Stanley 1,740(56,375) Hanesbrands Inc Barclays Bank (22,550)(31,285) Hanesbrands Inc Goldman Sachs 10,63710,949 Hanesbrands Inc Goldman Sachs (3,723)
(31,192) Hanesbrands Inc Morgan Stanley (12,477)12,053 Hanger Inc Bank of America
Merrill Lynch 81612,262 Hanger Inc Barclays Bank (4,285)14,742 Hanger Inc Goldman Sachs 1,78633,434 Hanger Inc Morgan Stanley (14,042)1,018 Hannon Armstrong Sustain-
able Infrastructure CapitalInc (REIT)
Bank of AmericaMerrill Lynch 2,382
(13,150) Hannon Armstrong Sustain-able Infrastructure CapitalInc (REIT) Barclays Bank 170
(4,270) Hannon Armstrong Sustain-able Infrastructure CapitalInc (REIT) Goldman Sachs (7,660)
3,173 Hannon Armstrong Sustain-able Infrastructure CapitalInc (REIT) Goldman Sachs 7,425
(8,894) Hannon Armstrong Sustain-able Infrastructure CapitalInc (REIT) Morgan Stanley (2,381)
3,729 Hanover Insurance GroupInc
Bank of AmericaMerrill Lynch (11,858)
6,114 Hanover Insurance GroupInc Barclays Bank (2,996)
3,955 Hanover Insurance GroupInc Goldman Sachs (12,577)
(4,783) Hanover Insurance GroupInc Goldman Sachs 15,210
4,181 Hanover Insurance GroupInc HSBC (2,885)
(3,601) Hanover Insurance GroupInc HSBC 2,485
10,571 Hanover Insurance GroupInc Morgan Stanley (5,180)
(1,881) Hanover Insurance GroupInc Morgan Stanley 922
(35,024) HarborOne Bancorp Inc Bank of AmericaMerrill Lynch 2,977
(29,870) HarborOne Bancorp Inc Barclays Bank (8,961)
BlackRock Americas Diversified Equity Absolute Return FundcontinuedPortfolio of Investments as at 31 May 2021
The notes on pages 590 to 610 form an integral part of these financial statements.
BlackRock Strategic Funds[108]

Holding Description Counterparty
Netunrealised
appreciation/(depreciation)
USD
United States continued(97,518) HarborOne Bancorp Inc Goldman Sachs 8,289(25,161) HarborOne Bancorp Inc HSBC (21,387)(60,488) HarborOne Bancorp Inc Morgan Stanley (18,146)(10,402) Harley-Davidson Inc Bank of America
Merrill Lynch 36,30311,927 Harley-Davidson Inc Barclays Bank 11,2111,676 Harley-Davidson Inc Goldman Sachs 1,350
12,039 Harley-Davidson Inc Morgan Stanley 11,3173,076 Harmonic Inc Bank of America
Merrill Lynch 9283,321 Harmonic Inc Barclays Bank 1,66628,082 Harmonic Inc Goldman Sachs 8424,623 Harmonic Inc Morgan Stanley 928,396 Harmony Biosciences Hold-
ings Inc Barclays Bank (5,793)6,905 Harmony Biosciences Hold-
ings Inc Goldman Sachs 14,4314,161 Harmony Biosciences Hold-
ings Inc HSBC 21,4713,478 Harmony Biosciences Hold-
ings Inc Morgan Stanley (2,400)5,058 Harpoon Therapeutics Inc Morgan Stanley 8,700
(7,587) Harrow Health Inc Bank of AmericaMerrill Lynch 1,062
(26,362) Harrow Health Inc Barclays Bank 21,880(21,358) Harrow Health Inc Goldman Sachs 2,990(12,067) Harsco Corp HSBC (10,740)(8,689) Harsco Corp Morgan Stanley 4341,626 Hartford Financial Services
Group IncBank of AmericaMerrill Lynch (1,301)
13,164 Hartford Financial ServicesGroup Inc Barclays Bank 1,448
1,771 Hartford Financial ServicesGroup Inc HSBC (956)
(12,137) Hartford Financial ServicesGroup Inc Morgan Stanley (1,335)
(14,106) Harvard Bioscience Inc Barclays Bank 3,809(66,304) Harvard Bioscience Inc Goldman Sachs 23,206
4,961 Hasbro Inc Barclays Bank 9,178871 Hasbro Inc HSBC (2,979)
1,391 Haverty Furniture Cos Inc Bank of AmericaMerrill Lynch (849)
13,926 Haverty Furniture Cos Inc Morgan Stanley 27,573(35,601) Hawaiian Electric Industries
IncBank of AmericaMerrill Lynch 46,993
(8,555) Hawaiian Electric IndustriesInc Barclays Bank 5,989
(7,066) Hawaiian Electric IndustriesInc Goldman Sachs 9,327
(6,333) Hawaiian Electric IndustriesInc HSBC 14,566
(16,496) Hawaiian Electric IndustriesInc Morgan Stanley 11,547
50,682 Hawaiian Holdings Inc Morgan Stanley 23,31411,772 Hawkins Inc Bank of America
Merrill Lynch 12,00742,004 Hawkins Inc Barclays Bank 36,9644,959 Hawkins Inc Goldman Sachs 5,058
(1,869) Hawthorn Bancshares Inc Bank of AmericaMerrill Lynch (1,626)
(2,646) Hawthorn Bancshares Inc Barclays Bank (1,985)(3,359) Hawthorn Bancshares Inc Goldman Sachs (2,922)(5,161) Hawthorn Bancshares Inc Morgan Stanley (3,871)
(13,118) Haynes International Inc Goldman Sachs (31,221)(15,567) Haynes International Inc HSBC (28,176)16,541 HB Fuller Co Barclays Bank 29,7748,510 HB Fuller Co Goldman Sachs 255
36,794 HBT Financial Inc Barclays Bank 2,57625,792 HBT Financial Inc Goldman Sachs (11,864)
Holding Description Counterparty
Netunrealised
appreciation/(depreciation)
USD
United States continued13,473 HBT Financial Inc HSBC —58,872 HBT Financial Inc Morgan Stanley 4,121
(80,083) HC2 Holdings Inc Barclays Bank 9,610(6,376) HCA Healthcare Inc Barclays Bank (55,280)(4,592) HCA Healthcare Inc Goldman Sachs (24,292)1,233 HCA Healthcare Inc Goldman Sachs 3,4861,403 HCA Healthcare Inc HSBC 9,567(962) HCA Healthcare Inc Morgan Stanley (8,341)
2,807 HCA Healthcare Inc Morgan Stanley 7,692(1,792) HCI Group Inc Bank of America
Merrill Lynch (169)(4,336) Health Catalyst Inc Bank of America
Merrill Lynch (28,271)(5,820) Health Catalyst Inc Barclays Bank (9,836)(3,698) Health Catalyst Inc Morgan Stanley (6,250)
(251) Healthcare Realty Trust Inc(REIT)
Bank of AmericaMerrill Lynch (88)
5,007 Healthcare Realty Trust Inc(REIT)
Bank of AmericaMerrill Lynch 1,752
688 Healthcare Realty Trust Inc(REIT) Barclays Bank (172)
(37,327) Healthcare Realty Trust Inc(REIT) Goldman Sachs (13,064)
7,799 Healthcare Realty Trust Inc(REIT) Goldman Sachs 2,730
(20,512) Healthcare Realty Trust Inc(REIT) HSBC 26,666
(69,485) Healthcare Realty Trust Inc(REIT) Morgan Stanley 17,372
(4,224) Healthcare Services GroupInc
Bank of AmericaMerrill Lynch (6)
(9,262) Healthcare Services GroupInc Goldman Sachs 2,502
(16,037) Healthcare Services GroupInc Morgan Stanley 6,037
6,460 Healthcare Trust of AmericaInc ’A’ (REIT) Barclays Bank (3,359)
17,612 Healthcare Trust of AmericaInc ’A’ (REIT) HSBC (17,260)
(765) Healthcare Trust of AmericaInc ’A’ (REIT) Morgan Stanley 398
14,410 Healthcare Trust of AmericaInc ’A’ (REIT) Morgan Stanley (6,780)
(2,787) HealthEquity Inc Bank of AmericaMerrill Lynch (18,366)
(6,124) HealthEquity Inc Barclays Bank (33,009)(19,418) HealthEquity Inc Goldman Sachs (126,644)(6,657) HealthEquity Inc Morgan Stanley (28,206)20,415 Healthpeak Properties Inc
(REIT) Barclays Bank (1,429)27,655 Healthpeak Properties Inc
(REIT) Goldman Sachs 1,65928,976 Healthpeak Properties Inc
(REIT) HSBC (3,767)14,873 Healthpeak Properties Inc
(REIT) Morgan Stanley (1,041)11,803 HealthStream Inc Bank of America
Merrill Lynch 4,24921,751 HealthStream Inc Barclays Bank (9,353)37,966 HealthStream Inc Goldman Sachs 13,668
(74,252) Heartland Express Inc Barclays Bank 6,683(33,735) Heartland Express Inc Goldman Sachs 18,89215,018 Heartland Financial USA Inc Bank of America
Merrill Lynch (8,410)23,432 Heartland Financial USA Inc Barclays Bank (3,983)27,384 Heartland Financial USA Inc Goldman Sachs (15,335)30,315 Heartland Financial USA Inc HSBC 7,57924,195 Heartland Financial USA Inc Morgan Stanley (4,113)
(14,343) Hecla Mining Co Goldman Sachs (2,725)
BlackRock Americas Diversified Equity Absolute Return FundcontinuedPortfolio of Investments as at 31 May 2021
The notes on pages 590 to 610 form an integral part of these financial statements.
Annual report and audited financial statements [109]

Holding Description Counterparty
Netunrealised
appreciation/(depreciation)
USD
United States continued(42,077) Hecla Mining Co Morgan Stanley (5,470)
1,201 HEICO Corp Bank of AmericaMerrill Lynch 8,011
(358) HEICO Corp Bank of AmericaMerrill Lynch (2,388)
2,796 HEICO Corp Barclays Bank 14,95910,882 HEICO Corp Morgan Stanley 58,2192,832 HEICO Corp ’A’ Bank of America
Merrill Lynch 29,6516,176 HEICO Corp ’A’ Morgan Stanley 42,3064,590 Heidrick & Struggles Inter-
national IncBank of AmericaMerrill Lynch 2,793
5,900 Heidrick & Struggles Inter-national Inc Barclays Bank 7,257
6,728 Heidrick & Struggles Inter-national Inc Goldman Sachs 2,826
4,486 Heidrick & Struggles Inter-national Inc HSBC 5,697
25,316 Heidrick & Struggles Inter-national Inc Morgan Stanley 26,997
(679) Helen of Troy Ltd Bank of AmericaMerrill Lynch 6,661
(2,620) Helen of Troy Ltd Barclays Bank 19,100(1,852) Helen of Troy Ltd Goldman Sachs 18,084(2,990) Helios Technologies Inc HSBC 11,541
(14,367) Helios Technologies Inc Morgan Stanley 8,38230,039 Helix Energy Solutions
Group Inc Goldman Sachs (1,802)18,307 Helix Energy Solutions
Group Inc HSBC 6,9578,562 Helix Energy Solutions
Group Inc Morgan Stanley 1,284(4,352) Helmerich & Payne Inc Bank of America
Merrill Lynch 10,7061,138 Helmerich & Payne Inc Bank of America
Merrill Lynch 84(2,990) Helmerich & Payne Inc Barclays Bank 1,13621,156 Helmerich & Payne Inc Barclays Bank (8,039)(3,232) Helmerich & Payne Inc Goldman Sachs 7,95114,849 Helmerich & Payne Inc Goldman Sachs (36,529)(2,373) Helmerich & Payne Inc Morgan Stanley 90215,314 Hemisphere Media Group
IncBank of AmericaMerrill Lynch (7,504)
12,056 Hemisphere Media GroupInc Barclays Bank (8,560)
38,170 Hemisphere Media GroupInc Goldman Sachs (18,703)
48,086 Hemisphere Media GroupInc Morgan Stanley (34,141)
15,672 Hennessy Advisors Inc Bank of AmericaMerrill Lynch 1,097
835 Hennessy Advisors Inc Morgan Stanley (42)12,929 Henry Schein Inc Goldman Sachs (57,663)15,400 Herbalife Nutrition Ltd Bank of America
Merrill Lynch 38,96212,839 Herbalife Nutrition Ltd Barclays Bank 6,9335,989 Herbalife Nutrition Ltd Goldman Sachs 15,152
12,860 Herbalife Nutrition Ltd Morgan Stanley 6,944(2,189) Herc Holdings Inc Bank of America
Merrill Lynch (18,782)(507) Herc Holdings Inc Barclays Bank (4,578)
144,906 Heritage Commerce Corp Morgan Stanley 12,317(12,333) Heritage Financial Corp Bank of America
Merrill Lynch (123)(17,816) Heritage Financial Corp Barclays Bank (3,741)(18,652) Heritage Financial Corp Goldman Sachs (187)(14,019) Heritage Financial Corp HSBC (8,692)(14,574) Heritage Financial Corp Morgan Stanley (3,061)48,387 Heritage Insurance Holdings
Inc Barclays Bank (8,710)
Holding Description Counterparty
Netunrealised
appreciation/(depreciation)
USD
United States continued47,208 Heritage Insurance Holdings
Inc Goldman Sachs (14,162)31,817 Heritage Insurance Holdings
Inc HSBC (21,680)39,001 Heritage Insurance Holdings
Inc Morgan Stanley (7,020)(7,270) Heritage-Crystal Clean Inc Bank of America
Merrill Lynch 7,052(11,087) Heritage-Crystal Clean Inc Barclays Bank 17,961(27,378) Heritage-Crystal Clean Inc Goldman Sachs 26,557(5,462) Heritage-Crystal Clean Inc HSBC 7,701
(12,661) Heritage-Crystal Clean Inc Morgan Stanley 20,51122,021 Herman Miller Inc Barclays Bank 36,3358,925 Heron Therapeutics Inc Bank of America
Merrill Lynch (2,499)30,392 Heron Therapeutics Inc Barclays Bank (6,990)13,547 Heron Therapeutics Inc Goldman Sachs (3,793)10,308 Heron Therapeutics Inc HSBC (44,221)
(39,125) Hersha Hospitality Trust(REIT) Goldman Sachs 9,390
(9,279) Hersha Hospitality Trust(REIT) HSBC 1,485
(22,043) Hersha Hospitality Trust(REIT) Morgan Stanley (7,715)
376 Hershey Co Bank of AmericaMerrill Lynch 211
5,891 Hershey Co Barclays Bank (6,186)7,538 Hershey Co Goldman Sachs 4,221
(1,764) Hershey Co Goldman Sachs 39713,710 Hershey Co Morgan Stanley (14,396)
142 Heska Corp Barclays Bank (995)8,155 Heska Corp Morgan Stanley (57,167)
686 Hess Corp Bank of AmericaMerrill Lynch (1,784)
16,753 Hess Corp Barclays Bank (6,198)14,584 Hess Corp Goldman Sachs (37,918)1,570 Hess Corp Morgan Stanley (581)
(8,495) Hess Midstream LP ’A’ Bank of AmericaMerrill Lynch (12,743)
(17,991) Hess Midstream LP ’A’ Goldman Sachs (26,987)130,853 Hewlett Packard Enterprise
CoBank of AmericaMerrill Lynch (75,528)
79,694 Hewlett Packard EnterpriseCo Barclays Bank (27,736)
14,210 Hewlett Packard EnterpriseCo Goldman Sachs (3,974)
78,193 Hewlett Packard EnterpriseCo Morgan Stanley (30,091)
(2,860) Hexcel Corp Bank of AmericaMerrill Lynch (21,193)
(3,825) Hexcel Corp Barclays Bank (19,546)(5,786) Hexcel Corp Goldman Sachs (40,579)(2,798) Hexcel Corp Morgan Stanley (14,298)5,001 HF Enterprises Inc Barclays Bank 250
(38,020) HF Foods Group Inc Barclays Bank 6,844(12,848) HF Foods Group Inc Morgan Stanley 2,313
9,535 Hibbett Sports Inc Morgan Stanley 58,1634,565 HighPeak Energy Inc Barclays Bank 2,0882,811 HighPeak Energy Inc HSBC 1,6042,569 HighPeak Energy Inc Morgan Stanley (194)(610) Highwoods Properties Inc
(REIT) Barclays Bank (8)(912) Highwoods Properties Inc
(REIT) Goldman Sachs (187)(1,778) Highwoods Properties Inc
(REIT) HSBC (199)(16,375) Highwoods Properties Inc
(REIT) Morgan Stanley (9,825)(145,151) Hill International Inc Bank of America
Merrill Lynch (24,676)
BlackRock Americas Diversified Equity Absolute Return FundcontinuedPortfolio of Investments as at 31 May 2021
The notes on pages 590 to 610 form an integral part of these financial statements.
BlackRock Strategic Funds[110]

Holding Description Counterparty
Netunrealised
appreciation/(depreciation)
USD
United States continued(41,500) Hill International Inc Morgan Stanley 2,905
4,355 Hillenbrand Inc Bank of AmericaMerrill Lynch (2,961)
14,531 Hillenbrand Inc Barclays Bank (8,864)26,122 Hillenbrand Inc Goldman Sachs (17,763)13,223 Hillenbrand Inc HSBC (13,752)7,950 Hillenbrand Inc Morgan Stanley (4,850)
444 Hill-Rom Holdings Inc Bank of AmericaMerrill Lynch 111
(358) Hill-Rom Holdings Inc Bank of AmericaMerrill Lynch (90)
5,171 Hill-Rom Holdings Inc Barclays Bank 2,5347,089 Hill-Rom Holdings Inc Goldman Sachs 1,7721,077 Hill-Rom Holdings Inc HSBC 2,1655,306 Hill-Rom Holdings Inc Morgan Stanley 2,600
(2,618) Hilltop Holdings Inc Bank of AmericaMerrill Lynch (1,981)
(20,401) Hilltop Holdings Inc Barclays Bank (19,345)(33,091) Hilltop Holdings Inc HSBC (49,967)(8,806) Hilltop Holdings Inc Morgan Stanley (1,549)28,672 Hilton Grand Vacations Inc Barclays Bank (18,063)(2,278) Hilton Grand Vacations Inc Morgan Stanley 1,435(2,322) Hilton Worldwide Holdings
IncBank of AmericaMerrill Lynch (8,266)
(1,191) Hilton Worldwide HoldingsInc Barclays Bank (2,001)
(20,864) Hilton Worldwide HoldingsInc Goldman Sachs (74,275)
(6,313) Hilton Worldwide HoldingsInc Morgan Stanley (10,606)
1,758 Hingham Institution For Sav-ings The Goldman Sachs (9,933)
1,380 Hingham Institution For Sav-ings The Morgan Stanley (483)
3 Histogen Inc Bank of AmericaMerrill Lynch —
27,326 HNI Corp Barclays Bank 17,2157,697 HNI Corp Goldman Sachs 3,0022,618 HNI Corp HSBC 2,024
929 HNI Corp Morgan Stanley 5857,594 HollyFrontier Corp Bank of America
Merrill Lynch (31,895)5,191 HollyFrontier Corp Barclays Bank (8,980)5,333 HollyFrontier Corp Goldman Sachs (22,399)
11,304 HollyFrontier Corp HSBC (30,069)(1,468) HollyFrontier Corp HSBC 3,1719,721 HollyFrontier Corp Morgan Stanley (16,817)3,013 Hologic Inc Goldman Sachs 1,2654,818 Hologic Inc Morgan Stanley 1,542
(7,336) Home Bancorp Inc Barclays Bank 4,695(11,776) Home Bancorp Inc Goldman Sachs (8,361)(3,588) Home Bancorp Inc HSBC (215)(7,651) Home Bancorp Inc Morgan Stanley 4,897
(60,871) Home BancShares Inc Barclays Bank 4,261(66,122) Home BancShares Inc Goldman Sachs 38,351(1,102) Home Depot Inc Barclays Bank 4773,534 Home Depot Inc Morgan Stanley 14,383
(23,715) Home Point Capital Inc Goldman Sachs (711)10,320 HomeTrust Bancshares Inc Bank of America
Merrill Lynch (7,430)19,708 HomeTrust Bancshares Inc Barclays Bank 2,1681,345 HomeTrust Bancshares Inc Goldman Sachs (968)4,970 Homology Medicines Inc Bank of America
Merrill Lynch 1,14333,885 Homology Medicines Inc Barclays Bank 21,0096,909 Homology Medicines Inc Goldman Sachs 1,5893,012 Homology Medicines Inc Morgan Stanley 1,8672,180 Honeywell International Inc Bank of America
Merrill Lynch 9,679
Holding Description Counterparty
Netunrealised
appreciation/(depreciation)
USD
United States continued4,804 Honeywell International Inc Barclays Bank 28,392
(4,959) Honeywell International Inc Barclays Bank (29,308)(2,240) Honeywell International Inc Goldman Sachs (10,419)
744 Honeywell International Inc HSBC (22)(5,880) Honeywell International Inc HSBC 17618,850 Honeywell International Inc Morgan Stanley 111,4032,376 Hooker Furniture Corp Barclays Bank (2,084)
18,446 Hooker Furniture Corp Morgan Stanley (26,009)3,317 Hookipa Pharma Inc Barclays Bank —1,720 Hookipa Pharma Inc Goldman Sachs (2,391)4,687 Hookipa Pharma Inc Morgan Stanley —
(60,950) Hope Bancorp Inc Goldman Sachs 28,037(32,760) Hope Bancorp Inc HSBC 328
(104,908) Hope Bancorp Inc Morgan Stanley 9,442(2,976) Horace Mann Educators
CorpBank of AmericaMerrill Lynch (518)
(535) Horace Mann EducatorsCorp Barclays Bank (402)
(1,073) Horace Mann EducatorsCorp Goldman Sachs (592)
(1,947) Horace Mann EducatorsCorp HSBC 273
(9,680) Horizon Bancorp Inc Barclays Bank (678)(93,883) Horizon Bancorp Inc Goldman Sachs (2,816)(38,317) Horizon Bancorp Inc HSBC (18,775)(91,119) Horizon Bancorp Inc Morgan Stanley (6,378)(25,409) Horizon Global Corp Bank of America
Merrill Lynch (48,023)(5,454) Horizon Therapeutics Plc Barclays Bank 19,416(2,661) Horizon Therapeutics Plc HSBC (14,423)
(10,343) Horizon Therapeutics Plc Morgan Stanley 36,821(5,348) Hormel Foods Corp Bank of America
Merrill Lynch (10,643)(24,371) Hormel Foods Corp Barclays Bank 17,547(30,502) Hormel Foods Corp Goldman Sachs (61,374)(14,289) Host Hotels & Resorts Inc
(REIT)Bank of AmericaMerrill Lynch 3,001
(18,088) Host Hotels & Resorts Inc(REIT) Barclays Bank (2,894)
(1,644) Host Hotels & Resorts Inc(REIT) Goldman Sachs (288)
17,040 Host Hotels & Resorts Inc(REIT) HSBC 1,022
(15,015) Host Hotels & Resorts Inc(REIT) HSBC (901)
(12,736) Host Hotels & Resorts Inc(REIT) Morgan Stanley (2,038)
12,695 Hostess Brands Inc Bank of AmericaMerrill Lynch 2,856
35,533 Hostess Brands Inc Barclays Bank 1,4212,002 Hostess Brands Inc Goldman Sachs 450
82,076 Hostess Brands Inc HSBC 11,491159,016 Hostess Brands Inc Morgan Stanley 6,217(13,291) Houghton Mifflin Harcourt
CoBank of AmericaMerrill Lynch (6,513)
(10,980) Houghton Mifflin HarcourtCo Barclays Bank (4,721)
(26,610) Houghton Mifflin HarcourtCo Goldman Sachs (13,039)
(5,400) Houlihan Lokey Inc Goldman Sachs (3,888)33,122 Houlihan Lokey Inc Goldman Sachs 23,848(4,376) Houlihan Lokey Inc HSBC (35,314)
832 Houlihan Lokey Inc HSBC 6,714(1,732) Houlihan Lokey Inc Morgan Stanley (831)21,872 Houlihan Lokey Inc Morgan Stanley 10,499
(25) Hovnanian Enterprises Inc’A’
Bank of AmericaMerrill Lynch (501)
(3,743) Hovnanian Enterprises Inc’A’ Barclays Bank (63,631)
BlackRock Americas Diversified Equity Absolute Return FundcontinuedPortfolio of Investments as at 31 May 2021
The notes on pages 590 to 610 form an integral part of these financial statements.
Annual report and audited financial statements [111]

Holding Description Counterparty
Netunrealised
appreciation/(depreciation)
USD
United States continued(49,244) Howard Bancorp Inc Bank of America
Merrill Lynch 3,447(7,473) Howard Hughes Corp Bank of America
Merrill Lynch (16,245)(4,125) Howard Hughes Corp Barclays Bank (1,650)(2,983) Howard Hughes Corp Goldman Sachs (6,473)(2,131) Howard Hughes Corp HSBC (5,865)
(12,153) Howard Hughes Corp Morgan Stanley (11,224)(9,718) Howmet Aerospace Inc Bank of America
Merrill Lynch (17,201)11,707 Howmet Aerospace Inc Bank of America
Merrill Lynch 20,597(10,715) Howmet Aerospace Inc Barclays Bank (15,430)
4,227 Howmet Aerospace Inc Barclays Bank 6,087(7,290) Howmet Aerospace Inc Goldman Sachs (12,903)14,182 Howmet Aerospace Inc Goldman Sachs 27,271
(14,393) Howmet Aerospace Inc HSBC (41,740)833 Howmet Aerospace Inc HSBC 1,424
(46,929) Howmet Aerospace Inc Morgan Stanley (67,578)31,356 Howmet Aerospace Inc Morgan Stanley 45,153
(23,870) HP Inc Bank of AmericaMerrill Lynch 87,655
18,472 HP Inc Barclays Bank (56,894)10,697 HP Inc Goldman Sachs (40,756)(6,234) HP Inc Goldman Sachs 19,58721,941 HP Inc HSBC (132,085)(9,896) HP Inc Morgan Stanley 30,4803,110 Hub Group Inc ’A’ Bank of America
Merrill Lynch (14,399)2,377 Hub Group Inc ’A’ Barclays Bank (713)2,015 Hub Group Inc ’A’ Goldman Sachs (9,329)
17,689 Hub Group Inc ’A’ HSBC (63,680)46,934 Hub Group Inc ’A’ Morgan Stanley (14,080)
(648) Hubbell Inc Bank of AmericaMerrill Lynch 1,452
(516) Hubbell Inc Barclays Bank (882)(3,576) Hubbell Inc Goldman Sachs 7,486
(347) Hubbell Inc HSBC 2,3771,713 Hubbell Inc Morgan Stanley 2,929(409) Hubbell Inc Morgan Stanley (161)
1,415 HubSpot Inc Bank of AmericaMerrill Lynch 12,267
606 HubSpot Inc Barclays Bank (1,557)922 HubSpot Inc Goldman Sachs 10,377862 HubSpot Inc HSBC 15,473
1,196 HubSpot Inc Morgan Stanley (2,914)20,183 Hudson Pacific Properties
Inc (REIT) Barclays Bank —(34,903) Hudson Pacific Properties
Inc (REIT) Barclays Bank —18,943 Hudson Pacific Properties
Inc (REIT) Goldman Sachs 41,864(1,022) Hudson Pacific Properties
Inc (REIT) Morgan Stanley —(657) Humana Inc Bank of America
Merrill Lynch 8,383604 Humana Inc Goldman Sachs (7,707)
(1,212) Humana Inc HSBC 22,5721,468 Huntington Bancshares Inc HSBC 159
99 Huntington Ingalls IndustriesInc
Bank of AmericaMerrill Lynch (62)
(1,396) Huntington Ingalls IndustriesInc
Bank of AmericaMerrill Lynch (553)
2,775 Huntington Ingalls IndustriesInc Barclays Bank 722
482 Huntington Ingalls IndustriesInc Goldman Sachs 451
(926) Huntington Ingalls IndustriesInc Goldman Sachs 583
Holding Description Counterparty
Netunrealised
appreciation/(depreciation)
USD
United States continued3,073 Huntington Ingalls Industries
Inc Morgan Stanley 799(1,213) Huntington Ingalls Industries
Inc Morgan Stanley (315)(24,468) Huntsman Corp HSBC 65,330(42,846) Huntsman Corp Morgan Stanley 1,714
5,498 Hurco Cos Inc Bank of AmericaMerrill Lynch (4,014)
5,577 Hurco Cos Inc Barclays Bank (1,840)6,095 Hurco Cos Inc Goldman Sachs (4,449)4,059 Hurco Cos Inc HSBC 5288,633 Hurco Cos Inc Morgan Stanley (2,849)
(10,075) Huron Consulting Group Inc Barclays Bank 6,851(4,938) Huron Consulting Group Inc Goldman Sachs 4,000(3,890) Huron Consulting Group Inc Morgan Stanley 2,645
(93,904) Huttig Building Products Inc Morgan Stanley 46,013(303) Hyatt Hotels Corp ’A’ Bank of America
Merrill Lynch 1254,592 Hyatt Hotels Corp ’A’ Barclays Bank 3,5112,328 Hyatt Hotels Corp ’A’ Goldman Sachs 6051,922 Hyatt Hotels Corp ’A’ HSBC 1,419
16,481 Hyatt Hotels Corp ’A’ Morgan Stanley 18,235(13,332) Hyatt Hotels Corp ’A’ Morgan Stanley (15,732)
1,629 Hydrofarm Holdings GroupInc
Bank of AmericaMerrill Lynch 8,015
1,114 Hydrofarm Holdings GroupInc Goldman Sachs 5,481
2,335 Hydrofarm Holdings GroupInc HSBC 654
778 Hydrofarm Holdings GroupInc Morgan Stanley 6,667
(5,270) HyreCar Inc Bank of AmericaMerrill Lynch 3,411
(4,915) HyreCar Inc Barclays Bank 2,478(175) Hyster-Yale Materials Han-
dling IncBank of AmericaMerrill Lynch (261)
(1,247) Hyster-Yale Materials Han-dling Inc Barclays Bank 823
(200) Hyster-Yale Materials Han-dling Inc Goldman Sachs 286
(97) Hyster-Yale Materials Han-dling Inc HSBC (213)
(7,109) Hyster-Yale Materials Han-dling Inc Morgan Stanley 4,022
(11,228) I3 Verticals Inc ’A’ Bank of AmericaMerrill Lynch (8,833)
(12,775) I3 Verticals Inc ’A’ Barclays Bank 4,195(7,433) I3 Verticals Inc ’A’ Goldman Sachs (4,504)(4,525) I3 Verticals Inc ’A’ Morgan Stanley (220)8,055 IAA Inc Bank of America
Merrill Lynch (5,075)12,630 IAA Inc Barclays Bank (19,324)45,039 IAA Inc Goldman Sachs (24,264)4,080 IAA Inc HSBC (2,176)4,081 IAA Inc Morgan Stanley (6,244)(675) IAC Via InterActive Corp Bank of America
Merrill Lynch 44,017(4,519) IAC Via InterActive Corp Barclays Bank 420,990
(345) IAC Via InterActive Corp Goldman Sachs 22,497(9,398) IAC Via InterActive Corp Morgan Stanley 875,5181,280 IBEX Holdings Ltd Bank of America
Merrill Lynch (1,715)3,706 IBEX Holdings Ltd Barclays Bank (1,668)6,222 IBEX Holdings Ltd Goldman Sachs (8,337)
488 IBEX Holdings Ltd Morgan Stanley (220)(82,022) iBio Inc Barclays Bank 3,281(14,103) iBio Inc Goldman Sachs (1,269)(6,042) iCAD Inc Goldman Sachs (6,405)(9,977) iCAD Inc HSBC (9,279)
BlackRock Americas Diversified Equity Absolute Return FundcontinuedPortfolio of Investments as at 31 May 2021
The notes on pages 590 to 610 form an integral part of these financial statements.
BlackRock Strategic Funds[112]

Holding Description Counterparty
Netunrealised
appreciation/(depreciation)
USD
United States continued(1,315) iCAD Inc Morgan Stanley 3021,372 ICF International Inc Goldman Sachs (7,176)8,734 ICF International Inc Morgan Stanley (22,883)
10,340 Ichor Holdings Ltd Bank of AmericaMerrill Lynch 66,486
550 Ichor Holdings Ltd Barclays Bank 1,60121,824 Ichor Holdings Ltd Goldman Sachs 140,328(1,553) ICU Medical Inc Goldman Sachs (12,207)(1,817) ICU Medical Inc HSBC (14,663)(1,612) ICU Medical Inc Morgan Stanley (5,755)12,383 IDACORP Inc Bank of America
Merrill Lynch (35,292)16,564 IDACORP Inc Goldman Sachs (47,207)12,743 IDACORP Inc Morgan Stanley (33,387)(5,235) Ideaya Biosciences Inc Bank of America
Merrill Lynch (1,124)(2,674) Ideaya Biosciences Inc Barclays Bank —(4,416) Ideaya Biosciences Inc Goldman Sachs (1,281)
(12,958) Identiv Inc Bank of AmericaMerrill Lynch (13,476)
(13,759) Identiv Inc Barclays Bank 16,373(17,725) Identiv Inc Goldman Sachs (18,434)(20,786) Idera Pharmaceuticals Inc Bank of America
Merrill Lynch (2,494)(35,875) Idera Pharmaceuticals Inc Barclays Bank (2,870)(2,615) IDEX Corp Bank of America
Merrill Lynch (255)(4,860) IDEX Corp Barclays Bank (9,234)2,970 IDEX Corp Barclays Bank 3,203
(10,369) IDEX Corp Goldman Sachs 5,639817 IDEX Corp Goldman Sachs 302
1,039 IDEX Corp HSBC 213(8,388) IDEX Corp Morgan Stanley (13,144)2,419 IDEXX Laboratories Inc Bank of America
Merrill Lynch 83,4314,189 IDEXX Laboratories Inc Barclays Bank 35,187
529 IDEXX Laboratories Inc Goldman Sachs 12,18539 IDEXX Laboratories Inc HSBC 1,207
2,032 IDEXX Laboratories Inc Morgan Stanley 9,83920,166 IDT Corp ’B’ Morgan Stanley (8,268)
(12,040) IES Holdings Inc Bank of AmericaMerrill Lynch (30,220)
(5,974) IES Holdings Inc Morgan Stanley (8,304)1,163 IGM Biosciences Inc Goldman Sachs 7,641
395 IGM Biosciences Inc HSBC 3,551626 IGM Biosciences Inc Morgan Stanley 4,088
5,468 iHeartMedia Inc ’A’ HSBC 1,69513,192 iHeartMedia Inc ’A’ Morgan Stanley 9,7624,237 IHS Markit Ltd HSBC (10,126)
13,509 IHS Markit Ltd Morgan Stanley 2,432(2,195) II-VI Inc Bank of America
Merrill Lynch (8,341)(2,818) II-VI Inc Barclays Bank (2,959)2,679 II-VI Inc Goldman Sachs 6,812
(1,445) II-VI Inc HSBC (7,745)(6,449) II-VI Inc Morgan Stanley (6,771)5,658 Illinois Tool Works Inc Barclays Bank (1,754)
(6,715) Illinois Tool Works Inc Goldman Sachs 1,557823 Illinois Tool Works Inc Goldman Sachs (158)
(715) Illumina Inc Bank of AmericaMerrill Lynch (18,704)
(951) Illumina Inc Morgan Stanley (5,373)2,770 IMARA Inc Goldman Sachs (2,161)1,673 IMARA Inc HSBC 5351,586 IMARA Inc Morgan Stanley (301)1,730 IMAX Corp Bank of America
Merrill Lynch 1,2806,552 IMAX Corp Barclays Bank (1,179)5,994 IMAX Corp Goldman Sachs 4,436
Holding Description Counterparty
Netunrealised
appreciation/(depreciation)
USD
United States continued5,810 IMAX Corp HSBC 5,322
15,476 IMAX Corp Morgan Stanley (2,745)(8,841) Immersion Corp Morgan Stanley (2,980)(8,803) Immunic Inc Bank of America
Merrill Lynch (2,905)(1,232) Immunic Inc Barclays Bank (517)(4,227) Immunic Inc Goldman Sachs (1,395)(2,209) ImmunityBio Inc Barclays Bank (4,087)
(28,094) ImmunoGen Inc HSBC 9,271(13,956) ImmunoGen Inc Morgan Stanley 3,070(7,404) Immunovant Inc Barclays Bank 3,258(2,660) Immunovant Inc Goldman Sachs 9041,584 Impel Neuropharma Inc HSBC (281)
(1,044) Impinj Inc Barclays Bank (793)(4,271) Impinj Inc HSBC (25,156)(2,280) Inari Medical Inc Bank of America
Merrill Lynch (12,129)(4,912) Inari Medical Inc Barclays Bank 786(5,741) Inari Medical Inc Goldman Sachs (30,542)
(223) Inari Medical Inc HSBC 535(1,199) Inari Medical Inc Morgan Stanley 192(1,680) Incyte Corp Bank of America
Merrill Lynch (2,537)(8,654) Incyte Corp Goldman Sachs (13,067)
(14,508) Independence Holding Co Bank of AmericaMerrill Lynch 6,238
(12,405) Independence Holding Co Morgan Stanley 24,562(53,656) Independence Realty Trust
Inc (REIT)Bank of AmericaMerrill Lynch (46,144)
(35,380) Independence Realty TrustInc (REIT) Goldman Sachs (30,427)
(56,687) Independence Realty TrustInc (REIT) HSBC (41,382)
(63,153) Independence Realty TrustInc (REIT) Morgan Stanley (20,209)
108,439 Independent Bank Corp Bank of AmericaMerrill Lynch (29,279)
43,625 Independent Bank Corp Barclays Bank (1,309)38,339 Independent Bank Corp Goldman Sachs (10,352)11,478 Independent Bank Corp HSBC (344)56,195 Independent Bank Corp Morgan Stanley (1,686)(5,516) Independent Bank Group
IncBank of AmericaMerrill Lynch (17,431)
(2,983) Independent Bank GroupInc Barclays Bank (7,666)
(16,155) Independent Bank GroupInc Goldman Sachs (51,050)
(5,830) Indus Realty Trust Inc(REIT)
Bank of AmericaMerrill Lynch (10,844)
(10,086) Indus Realty Trust Inc(REIT) Goldman Sachs (18,012)
(1,052) Indus Realty Trust Inc(REIT) HSBC (3,177)
(1,673) Indus Realty Trust Inc(REIT) Morgan Stanley (786)
(26,917) Industrial Logistics Proper-ties Trust (REIT) Morgan Stanley 3,499
(9,715) Infinera Corp Bank of AmericaMerrill Lynch (1,669)
(11,597) Infinera Corp Barclays Bank (2,953)(6,407) Infinera Corp Goldman Sachs (141)
(22,672) Infinera Corp Morgan Stanley (5,441)23,571 Infinity Pharmaceuticals Inc Bank of America
Merrill Lynch 10,37114,720 Infinity Pharmaceuticals Inc Barclays Bank 4,56311,972 Infinity Pharmaceuticals Inc Goldman Sachs 5,26826,123 Infinity Pharmaceuticals Inc HSBC 10,9723,761 Information Services Group
IncBank of AmericaMerrill Lynch 1,392
BlackRock Americas Diversified Equity Absolute Return FundcontinuedPortfolio of Investments as at 31 May 2021
The notes on pages 590 to 610 form an integral part of these financial statements.
Annual report and audited financial statements [113]
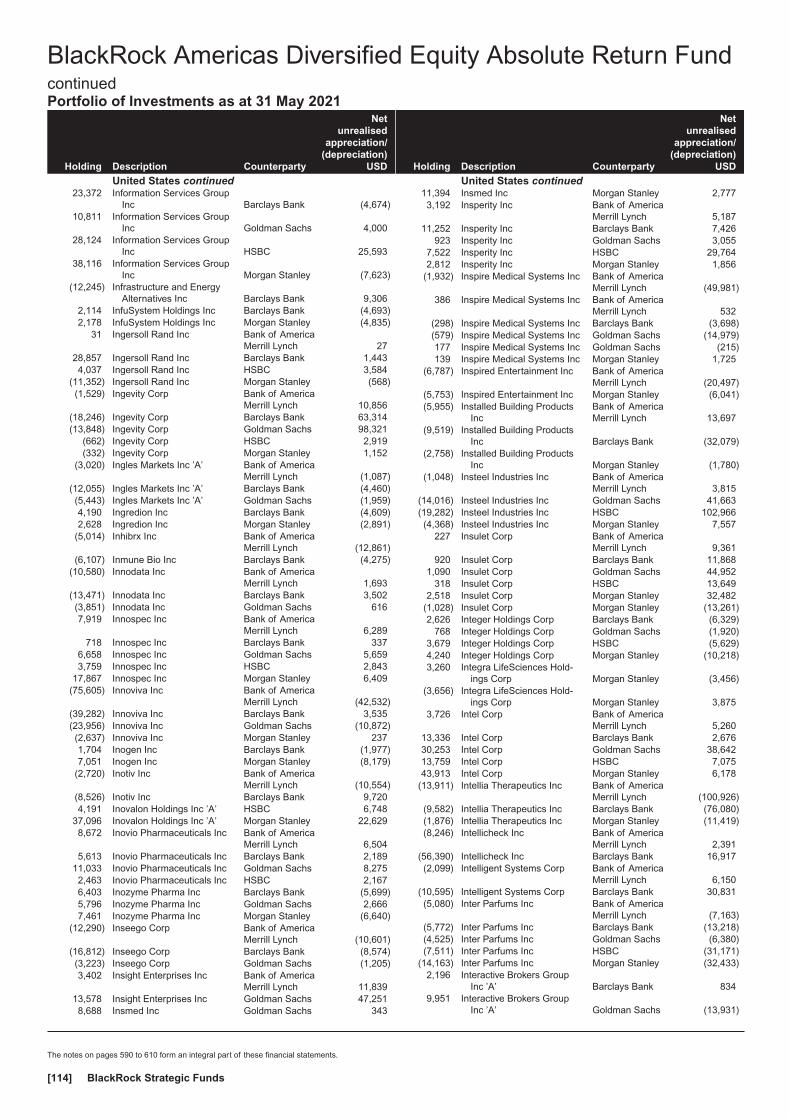
Holding Description Counterparty
Netunrealised
appreciation/(depreciation)
USD
United States continued23,372 Information Services Group
Inc Barclays Bank (4,674)10,811 Information Services Group
Inc Goldman Sachs 4,00028,124 Information Services Group
Inc HSBC 25,59338,116 Information Services Group
Inc Morgan Stanley (7,623)(12,245) Infrastructure and Energy
Alternatives Inc Barclays Bank 9,3062,114 InfuSystem Holdings Inc Barclays Bank (4,693)2,178 InfuSystem Holdings Inc Morgan Stanley (4,835)
31 Ingersoll Rand Inc Bank of AmericaMerrill Lynch 27
28,857 Ingersoll Rand Inc Barclays Bank 1,4434,037 Ingersoll Rand Inc HSBC 3,584
(11,352) Ingersoll Rand Inc Morgan Stanley (568)(1,529) Ingevity Corp Bank of America
Merrill Lynch 10,856(18,246) Ingevity Corp Barclays Bank 63,314(13,848) Ingevity Corp Goldman Sachs 98,321
(662) Ingevity Corp HSBC 2,919(332) Ingevity Corp Morgan Stanley 1,152
(3,020) Ingles Markets Inc ’A’ Bank of AmericaMerrill Lynch (1,087)
(12,055) Ingles Markets Inc ’A’ Barclays Bank (4,460)(5,443) Ingles Markets Inc ’A’ Goldman Sachs (1,959)4,190 Ingredion Inc Barclays Bank (4,609)2,628 Ingredion Inc Morgan Stanley (2,891)
(5,014) Inhibrx Inc Bank of AmericaMerrill Lynch (12,861)
(6,107) Inmune Bio Inc Barclays Bank (4,275)(10,580) Innodata Inc Bank of America
Merrill Lynch 1,693(13,471) Innodata Inc Barclays Bank 3,502(3,851) Innodata Inc Goldman Sachs 6167,919 Innospec Inc Bank of America
Merrill Lynch 6,289718 Innospec Inc Barclays Bank 337
6,658 Innospec Inc Goldman Sachs 5,6593,759 Innospec Inc HSBC 2,843
17,867 Innospec Inc Morgan Stanley 6,409(75,605) Innoviva Inc Bank of America
Merrill Lynch (42,532)(39,282) Innoviva Inc Barclays Bank 3,535(23,956) Innoviva Inc Goldman Sachs (10,872)(2,637) Innoviva Inc Morgan Stanley 2371,704 Inogen Inc Barclays Bank (1,977)7,051 Inogen Inc Morgan Stanley (8,179)
(2,720) Inotiv Inc Bank of AmericaMerrill Lynch (10,554)
(8,526) Inotiv Inc Barclays Bank 9,7204,191 Inovalon Holdings Inc ’A’ HSBC 6,748
37,096 Inovalon Holdings Inc ’A’ Morgan Stanley 22,6298,672 Inovio Pharmaceuticals Inc Bank of America
Merrill Lynch 6,5045,613 Inovio Pharmaceuticals Inc Barclays Bank 2,189
11,033 Inovio Pharmaceuticals Inc Goldman Sachs 8,2752,463 Inovio Pharmaceuticals Inc HSBC 2,1676,403 Inozyme Pharma Inc Barclays Bank (5,699)5,796 Inozyme Pharma Inc Goldman Sachs 2,6667,461 Inozyme Pharma Inc Morgan Stanley (6,640)
(12,290) Inseego Corp Bank of AmericaMerrill Lynch (10,601)
(16,812) Inseego Corp Barclays Bank (8,574)(3,223) Inseego Corp Goldman Sachs (1,205)3,402 Insight Enterprises Inc Bank of America
Merrill Lynch 11,83913,578 Insight Enterprises Inc Goldman Sachs 47,2518,688 Insmed Inc Goldman Sachs 343
Holding Description Counterparty
Netunrealised
appreciation/(depreciation)
USD
United States continued11,394 Insmed Inc Morgan Stanley 2,7773,192 Insperity Inc Bank of America
Merrill Lynch 5,18711,252 Insperity Inc Barclays Bank 7,426
923 Insperity Inc Goldman Sachs 3,0557,522 Insperity Inc HSBC 29,7642,812 Insperity Inc Morgan Stanley 1,856
(1,932) Inspire Medical Systems Inc Bank of AmericaMerrill Lynch (49,981)
386 Inspire Medical Systems Inc Bank of AmericaMerrill Lynch 532
(298) Inspire Medical Systems Inc Barclays Bank (3,698)(579) Inspire Medical Systems Inc Goldman Sachs (14,979)177 Inspire Medical Systems Inc Goldman Sachs (215)139 Inspire Medical Systems Inc Morgan Stanley 1,725
(6,787) Inspired Entertainment Inc Bank of AmericaMerrill Lynch (20,497)
(5,753) Inspired Entertainment Inc Morgan Stanley (6,041)(5,955) Installed Building Products
IncBank of AmericaMerrill Lynch 13,697
(9,519) Installed Building ProductsInc Barclays Bank (32,079)
(2,758) Installed Building ProductsInc Morgan Stanley (1,780)
(1,048) Insteel Industries Inc Bank of AmericaMerrill Lynch 3,815
(14,016) Insteel Industries Inc Goldman Sachs 41,663(19,282) Insteel Industries Inc HSBC 102,966(4,368) Insteel Industries Inc Morgan Stanley 7,557
227 Insulet Corp Bank of AmericaMerrill Lynch 9,361
920 Insulet Corp Barclays Bank 11,8681,090 Insulet Corp Goldman Sachs 44,952
318 Insulet Corp HSBC 13,6492,518 Insulet Corp Morgan Stanley 32,482
(1,028) Insulet Corp Morgan Stanley (13,261)2,626 Integer Holdings Corp Barclays Bank (6,329)
768 Integer Holdings Corp Goldman Sachs (1,920)3,679 Integer Holdings Corp HSBC (5,629)4,240 Integer Holdings Corp Morgan Stanley (10,218)3,260 Integra LifeSciences Hold-
ings Corp Morgan Stanley (3,456)(3,656) Integra LifeSciences Hold-
ings Corp Morgan Stanley 3,8753,726 Intel Corp Bank of America
Merrill Lynch 5,26013,336 Intel Corp Barclays Bank 2,67630,253 Intel Corp Goldman Sachs 38,64213,759 Intel Corp HSBC 7,07543,913 Intel Corp Morgan Stanley 6,178
(13,911) Intellia Therapeutics Inc Bank of AmericaMerrill Lynch (100,926)
(9,582) Intellia Therapeutics Inc Barclays Bank (76,080)(1,876) Intellia Therapeutics Inc Morgan Stanley (11,419)(8,246) Intellicheck Inc Bank of America
Merrill Lynch 2,391(56,390) Intellicheck Inc Barclays Bank 16,917(2,099) Intelligent Systems Corp Bank of America
Merrill Lynch 6,150(10,595) Intelligent Systems Corp Barclays Bank 30,831(5,080) Inter Parfums Inc Bank of America
Merrill Lynch (7,163)(5,772) Inter Parfums Inc Barclays Bank (13,218)(4,525) Inter Parfums Inc Goldman Sachs (6,380)(7,511) Inter Parfums Inc HSBC (31,171)
(14,163) Inter Parfums Inc Morgan Stanley (32,433)2,196 Interactive Brokers Group
Inc ’A’ Barclays Bank 8349,951 Interactive Brokers Group
Inc ’A’ Goldman Sachs (13,931)
BlackRock Americas Diversified Equity Absolute Return FundcontinuedPortfolio of Investments as at 31 May 2021
The notes on pages 590 to 610 form an integral part of these financial statements.
BlackRock Strategic Funds[114]

Holding Description Counterparty
Netunrealised
appreciation/(depreciation)
USD
United States continued3,770 Interactive Brokers Group
Inc ’A’ HSBC (1,939)4,101 Interactive Brokers Group
Inc ’A’ Morgan Stanley 1,558(5,723) Intercept Pharmaceuticals
Inc Barclays Bank (1,889)(3,221) Intercept Pharmaceuticals
Inc Goldman Sachs 2,029(2,926) Intercept Pharmaceuticals
Inc Morgan Stanley (966)2,492 Intercontinental Exchange
IncBank of AmericaMerrill Lynch 374
2,001 Intercontinental ExchangeInc Barclays Bank (180)
5,247 Intercontinental ExchangeInc Goldman Sachs 2,151
5,505 Intercontinental ExchangeInc Morgan Stanley (495)
(455) Intercontinental ExchangeInc Morgan Stanley 41
(1,254) InterDigital Inc Bank of AmericaMerrill Lynch (11,371)
(3,083) InterDigital Inc Barclays Bank (20,364)(6,308) InterDigital Inc Morgan Stanley (57,087)(5,233) International Bancshares
CorpBank of AmericaMerrill Lynch 18,525
(1,257) International BancsharesCorp Goldman Sachs 4,450
(25,873) International BancsharesCorp HSBC 68,563
(43,889) International BancsharesCorp Morgan Stanley 47,839
(11,821) International Business Ma-chines Corp Barclays Bank 11,585
(28,342) International Business Ma-chines Corp Goldman Sachs 38,829
(5,987) International Flavors & Fra-grances Inc Barclays Bank 1,138
(8,998) International Flavors & Fra-grances Inc Goldman Sachs 9,717
(701) International Flavors & Fra-grances Inc HSBC 473
(3,099) International Flavors & Fra-grances Inc Morgan Stanley 589
17,831 International Game Technol-ogy Plc
Bank of AmericaMerrill Lynch 26,527
53,360 International Game Technol-ogy Plc Goldman Sachs 91,795
(4,059) International Game Technol-ogy Plc Goldman Sachs (2,077)
12,456 International Game Technol-ogy Plc HSBC 69,873
41,482 International Game Technol-ogy Plc Morgan Stanley (3,087)
27,834 International Money Ex-press Inc Goldman Sachs 32,566
23,436 International Money Ex-press Inc Morgan Stanley 17,108
(14,653) International Paper Co Bank of AmericaMerrill Lynch 12,143
(4,564) International Paper Co Barclays Bank 5,933(4,056) International Paper Co Goldman Sachs 4,056(3,227) International Paper Co Morgan Stanley 3,627(8,529) International Seaways Inc Barclays Bank 7,676
(15,548) International Seaways Inc Goldman Sachs (2,488)(8,150) International Seaways Inc HSBC 1,875(1,641) Interpublic Group of Cos Inc Bank of America
Merrill Lynch (1,021)(17,875) Interpublic Group of Cos Inc Barclays Bank (2,463)(12,797) Interpublic Group of Cos Inc Goldman Sachs (12,292)(11,370) Interpublic Group of Cos Inc Morgan Stanley (3,648)
Holding Description Counterparty
Netunrealised
appreciation/(depreciation)
USD
United States continued21,134 Interpublic Group of Cos Inc Morgan Stanley 7,60821,788 Intersect ENT Inc Barclays Bank (9,805)13,264 Intersect ENT Inc Morgan Stanley (5,969)
(11,764) Intevac Inc Bank of AmericaMerrill Lynch (13,999)
(30,794) Intevac Inc Goldman Sachs (36,645)(900) Intevac Inc HSBC (1,089)(449) Intra-Cellular Therapies Inc Bank of America
Merrill Lynch 50(3,114) Intra-Cellular Therapies Inc HSBC (10,712)
(664) Intra-Cellular Therapies Inc Morgan Stanley 210(808) Intrepid Potash Inc Bank of America
Merrill Lynch (1,624)(10,158) Intrepid Potash Inc Barclays Bank (17,472)(1,431) Intrepid Potash Inc Goldman Sachs (2,876)(1,624) Intrepid Potash Inc HSBC (1,153)
(28,802) IntriCon Corp Goldman Sachs 51,556(4,660) IntriCon Corp HSBC (5,592)(9,706) IntriCon Corp Morgan Stanley 25,0412,715 Intuit Inc Bank of America
Merrill Lynch 53,4041,089 Intuit Inc Barclays Bank (1,437)1,151 Intuit Inc Goldman Sachs 22,640
338 Intuit Inc HSBC 15,7348,264 Intuit Inc Morgan Stanley (9,878)
(1,761) Intuitive Surgical Inc Bank of AmericaMerrill Lynch (44,669)
(1,660) Intuitive Surgical Inc Barclays Bank (12,052)(282) Intuitive Surgical Inc HSBC (2,084)
(2,161) Intuitive Surgical Inc Morgan Stanley (15,689)15,475 Invacare Corp Bank of America
Merrill Lynch (4,333)8,829 Invacare Corp Barclays Bank (88)
11,712 Invacare Corp Goldman Sachs (3,279)12,980 Invacare Corp HSBC 1304,531 Invacare Corp Morgan Stanley (45)
22,994 Invesco Ltd Barclays Bank 35,18179,825 Invesco Ltd Morgan Stanley 122,132
(15,000) Invesco Mortgage CapitalInc (REIT)
Bank of AmericaMerrill Lynch 1,923
(88,431) Invesco Mortgage CapitalInc (REIT) Barclays Bank 9,727
(62,815) Invesco Mortgage CapitalInc (REIT) Goldman Sachs 4,406
4,312 Investar Holding Corp Bank of AmericaMerrill Lynch 172
10,705 Investar Holding Corp Barclays Bank (1,499)10,254 Investar Holding Corp Goldman Sachs 41029,732 Investar Holding Corp HSBC 21,40712,707 Investar Holding Corp Morgan Stanley (1,779)
108,035 Investors Bancorp Inc Bank of AmericaMerrill Lynch (28,089)
17,659 Investors Bancorp Inc Barclays Bank 70627,330 Investors Bancorp Inc Goldman Sachs (7,106)74,329 Investors Bancorp Inc HSBC 18,5821,187 Investors Title Co Bank of America
Merrill Lynch (6,896)863 Investors Title Co Barclays Bank (1,001)
4,942 Investors Title Co Goldman Sachs (28,713)1,483 Investors Title Co HSBC (11,375)
933 Investors Title Co Morgan Stanley (1,082)1,178 Invitae Corp Bank of America
Merrill Lynch 1,7328,824 Invitae Corp Barclays Bank 4,765
(3,915) Invitae Corp Goldman Sachs (5,755)4,240 Invitae Corp Goldman Sachs 6,2332,594 Invitation Homes Inc (REIT) Bank of America
Merrill Lynch 2,85322,078 Invitation Homes Inc (REIT) Barclays Bank 4,85741,490 Invitation Homes Inc (REIT) Goldman Sachs 45,639
BlackRock Americas Diversified Equity Absolute Return FundcontinuedPortfolio of Investments as at 31 May 2021
The notes on pages 590 to 610 form an integral part of these financial statements.
Annual report and audited financial statements [115]

Holding Description Counterparty
Netunrealised
appreciation/(depreciation)
USD
United States continued40,863 Invitation Homes Inc (REIT) HSBC 44,95073,501 Invitation Homes Inc (REIT) Morgan Stanley 16,170(2,612) Ionis Pharmaceuticals Inc Bank of America
Merrill Lynch 423(2,937) Ionis Pharmaceuticals Inc Barclays Bank (5,795)(3,265) Ionis Pharmaceuticals Inc Goldman Sachs (5,559)(4,853) Ionis Pharmaceuticals Inc Morgan Stanley (3,324)(4,383) Iovance Biotherapeutics Inc Goldman Sachs 34,713
(12,545) Iovance Biotherapeutics Inc Morgan Stanley (10,036)(3,255) IPG Photonics Corp Bank of America
Merrill Lynch (41,892)(3,502) IPG Photonics Corp Barclays Bank (6,023)2,721 IPG Photonics Corp Barclays Bank 4,680(384) IPG Photonics Corp Goldman Sachs (4,942)
(1,753) IPG Photonics Corp HSBC (38,145)(2,055) IPG Photonics Corp Morgan Stanley (3,535)
204 IPG Photonics Corp Morgan Stanley 351(3,121) IQVIA Holdings Inc Barclays Bank 7,553(2,924) IQVIA Holdings Inc HSBC (25,351)(3,696) IQVIA Holdings Inc Morgan Stanley 8,9458,225 iRadimed Corp Bank of America
Merrill Lynch (9,212)6,382 iRadimed Corp Barclays Bank (2,042)4,019 iRadimed Corp Goldman Sachs (4,501)2,129 iRadimed Corp HSBC (405)6,682 iRadimed Corp Morgan Stanley (2,138)(309) iRhythm Technologies Inc Bank of America
Merrill Lynch (396)(2,802) iRhythm Technologies Inc Barclays Bank (2,746)(1,387) iRhythm Technologies Inc Goldman Sachs (1,775)(1,731) iRhythm Technologies Inc Morgan Stanley (1,696)
(434) Iridium Communications Inc Bank of AmericaMerrill Lynch (586)
(6,506) Iridium Communications Inc Barclays Bank (5,725)(802) Iridium Communications Inc Goldman Sachs (1,083)
(13,740) Iridium Communications Inc Morgan Stanley (12,091)1,381 iRobot Corp Bank of America
Merrill Lynch 1,2707,955 iRobot Corp Barclays Bank 33,7293,727 iRobot Corp Goldman Sachs 2,6015,035 iRobot Corp HSBC 7,4521,101 iRobot Corp Morgan Stanley 4,668
939 Iron Mountain Inc (REIT) Bank of AmericaMerrill Lynch (9)
7,054 Iron Mountain Inc (REIT) Barclays Bank (652)4,656 Iron Mountain Inc (REIT) Morgan Stanley (698)
(14,065) Ironwood PharmaceuticalsInc Goldman Sachs 373
(7,152) iTeos Therapeutics Inc Goldman Sachs 31,469(44,244) Iteris Inc Bank of America
Merrill Lynch 11,061(9,336) Iteris Inc Goldman Sachs 2,334
(17,355) Iteris Inc Morgan Stanley (5,554)8,904 Itron Inc Bank of America
Merrill Lynch 54,8495,195 Itron Inc Barclays Bank 18,0321,828 Itron Inc Goldman Sachs 6,8751,002 Itron Inc HSBC 10,2713,741 Itron Inc Morgan Stanley 13,5545,701 ITT Inc Bank of America
Merrill Lynch 815(2,386) ITT Inc Bank of America
Merrill Lynch 5,08213,520 ITT Inc Barclays Bank 6,010
(649) ITT Inc Barclays Bank (545)2,704 ITT Inc Goldman Sachs 3,5503,892 ITT Inc Morgan Stanley 1,757
(11,726) ITT Inc Morgan Stanley (9,850)(29,110) IVERIC bio Inc Bank of America
Merrill Lynch (2,329)
Holding Description Counterparty
Netunrealised
appreciation/(depreciation)
USD
United States continued(25,788) IVERIC bio Inc Goldman Sachs (2,063)(32,795) IZEA Worldwide Inc Barclays Bank (1,312)
4,531 J & J Snack Foods Corp Bank of AmericaMerrill Lynch 28,772
4,102 J & J Snack Foods Corp Barclays Bank 12,675506 J & J Snack Foods Corp HSBC 4,468
5,188 J & J Snack Foods Corp Morgan Stanley 16,0316,659 J M Smucker Co Bank of America
Merrill Lynch (1,465)8,481 J M Smucker Co Barclays Bank (19,676)2,702 J M Smucker Co HSBC (14,050)7,895 J M Smucker Co Morgan Stanley (18,316)
827 J2 Global Inc Bank of AmericaMerrill Lynch (546)
1,164 J2 Global Inc Barclays Bank (3,573)1,143 J2 Global Inc Goldman Sachs (754)(388) J2 Global Inc HSBC (1,870)
(6,463) J2 Global Inc Morgan Stanley 19,8419,137 J2 Global Inc Morgan Stanley (28,051)
12,999 Jabil Inc Barclays Bank 14,299954 Jabil Inc HSBC 3,215
14,200 Jabil Inc Morgan Stanley 15,620847 Jack Henry & Associates
Inc Barclays Bank (2,253)(461) Jack Henry & Associates
Inc Barclays Bank 1,2263,268 Jack Henry & Associates
Inc HSBC (15,392)(2,934) Jack Henry & Associates
Inc HSBC 13,8191,696 Jack in the Box Inc Barclays Bank (3,138)3,433 Jack in the Box Inc Goldman Sachs (8,651)
(3,401) Jacobs Engineering GroupInc Goldman Sachs (10,135)
(153) Jacobs Engineering GroupInc HSBC 43
(19,601) Jacobs Engineering GroupInc Morgan Stanley (47,630)
(10,766) James River Group Hold-ings Ltd HSBC 861
(24,662) James River Group Hold-ings Ltd Morgan Stanley (46,118)
(630) Jamf Holding Corp Bank of AmericaMerrill Lynch (3,629)
(16,444) Jamf Holding Corp Barclays Bank (53,772)(3,875) Jamf Holding Corp Goldman Sachs (22,320)(1,133) Jamf Holding Corp HSBC (4,305)(3,408) Jamf Holding Corp Morgan Stanley (8,254)(1,679) Jazz Pharmaceuticals Plc Bank of America
Merrill Lynch (915)(407) Jazz Pharmaceuticals Plc Barclays Bank 338(634) Jazz Pharmaceuticals Plc HSBC (1,287)
(8,274) Jazz Pharmaceuticals Plc Morgan Stanley 6,867(6,253) JB Hunt Transport Services
IncBank of AmericaMerrill Lynch 10,025
(6,958) JB Hunt Transport ServicesInc Barclays Bank (1,272)
(8,433) JB Hunt Transport ServicesInc Goldman Sachs 27,765
(3,463) JB Hunt Transport ServicesInc HSBC 30,924
(6,114) JB Hunt Transport ServicesInc Morgan Stanley (2,752)
6,248 JBG SMITH Properties(REIT) Barclays Bank 973
(11,974) JBG SMITH Properties(REIT) Barclays Bank 2,634
778 JBG SMITH Properties(REIT) Morgan Stanley 303
BlackRock Americas Diversified Equity Absolute Return FundcontinuedPortfolio of Investments as at 31 May 2021
The notes on pages 590 to 610 form an integral part of these financial statements.
BlackRock Strategic Funds[116]

Holding Description Counterparty
Netunrealised
appreciation/(depreciation)
USD
United States continued(3,798) JBG SMITH Properties
(REIT) Morgan Stanley 83622,857 Jefferies Financial Group
IncBank of AmericaMerrill Lynch (2,743)
97,928 Jefferies Financial GroupInc Barclays Bank (12,731)
9,070 Jefferies Financial GroupInc HSBC (10,612)
15,056 Jefferies Financial GroupInc Morgan Stanley (1,957)
6,836 JELD-WEN Holding Inc Bank of AmericaMerrill Lynch (2,460)
16,321 JELD-WEN Holding Inc Barclays Bank 8,81322,920 JELD-WEN Holding Inc Goldman Sachs (3,719)11,866 JELD-WEN Holding Inc HSBC (15,489)1,567 JELD-WEN Holding Inc Morgan Stanley 8466,918 JetBlue Airways Corp Bank of America
Merrill Lynch 4,6703,139 JetBlue Airways Corp Barclays Bank 75,114 JetBlue Airways Corp Goldman Sachs 1,7981,981 JetBlue Airways Corp HSBC (143)1,163 JetBlue Airways Corp Morgan Stanley (134)1,674 JFrog Ltd Goldman Sachs 8,537
(3,128) JOANN Inc Bank of AmericaMerrill Lynch (4,348)
(1,927) JOANN Inc Barclays Bank (501)(1,239) JOANN Inc Morgan Stanley (322)7,203 John B Sanfilippo & Son Inc Bank of America
Merrill Lynch 17,8631,381 John B Sanfilippo & Son Inc Barclays Bank 1,9896,773 John B Sanfilippo & Son Inc Goldman Sachs 16,797
211 John B Sanfilippo & Son Inc HSBC 4526,749 John B Sanfilippo & Son Inc Morgan Stanley 9,7196,400 John Bean Technologies
CorpBank of AmericaMerrill Lynch 21,888
4,714 John Bean TechnologiesCorp Barclays Bank 43,086
2,065 John Bean TechnologiesCorp Goldman Sachs 7,062
7,394 John Bean TechnologiesCorp HSBC 26,101
7,164 John Bean TechnologiesCorp Morgan Stanley 65,479
(2,013) John Wiley & Sons Inc ’A’ Bank of AmericaMerrill Lynch (880)
(5,282) John Wiley & Sons Inc ’A’ Barclays Bank 213407 John Wiley & Sons Inc ’A’ Goldman Sachs 537
(1,505) John Wiley & Sons Inc ’A’ Goldman Sachs (1,521)(8,925) John Wiley & Sons Inc ’A’ HSBC (13,685)3,917 John Wiley & Sons Inc ’A’ Morgan Stanley (705)
(6,092) John Wiley & Sons Inc ’A’ Morgan Stanley 1,0974,281 Johnson & Johnson Bank of America
Merrill Lynch (1,435)7,562 Johnson & Johnson Barclays Bank (9,831)1,106 Johnson & Johnson Goldman Sachs (1,261)2,089 Johnson & Johnson HSBC (2,131)
14,546 Johnson & Johnson Morgan Stanley (12,604)(3,999) Johnson Controls Interna-
tional Plc Barclays Bank (2,460)(1,184) Johnson Controls Interna-
tional Plc Goldman Sachs (520)(1,297) Johnson Controls Interna-
tional Plc HSBC (58)(78,728) Johnson Controls Interna-
tional Plc Morgan Stanley (141,710)1,252 Johnson Outdoors Inc ’A’ Bank of America
Merrill Lynch (23,062)2,495 Johnson Outdoors Inc ’A’ Barclays Bank (7,759)1,116 Johnson Outdoors Inc ’A’ Goldman Sachs (20,557)
Holding Description Counterparty
Netunrealised
appreciation/(depreciation)
USD
United States continued7,797 Johnson Outdoors Inc ’A’ HSBC (87,872)
962 Johnson Outdoors Inc ’A’ Morgan Stanley (2,992)(3,453) Joint Corp Barclays Bank (44,578)(4,496) Joint Corp Morgan Stanley (53,523)(1,417) Jones Lang LaSalle Inc Goldman Sachs 2,813
(212) Jones Lang LaSalle Inc HSBC 1,545(3,848) Jones Lang LaSalle Inc Morgan Stanley 26,166
(12,987) Jounce Therapeutics Inc Goldman Sachs (3,377)(7,468) JPMorgan Chase & Co Bank of America
Merrill Lynch 3,211(2,860) JPMorgan Chase & Co Barclays Bank (2,002)
(752) JPMorgan Chase & Co HSBC (2,271)(17,417) JPMorgan Chase & Co Morgan Stanley (12,192)(15,144) Juniper Networks Inc Bank of America
Merrill Lynch 4,187(74,804) Juniper Networks Inc Barclays Bank 38,150(42,739) Juniper Networks Inc Goldman Sachs 8,120(15,305) Juniper Networks Inc HSBC (836)(14,267) Juniper Networks Inc Morgan Stanley 6,230
(151) Kadant Inc Goldman Sachs 720(3,463) Kadant Inc HSBC 48,378
(12,929) Kadant Inc Morgan Stanley 3,103(8,266) Kadmon Holdings Inc Bank of America
Merrill Lynch (1,571)(10,406) Kadmon Holdings Inc Goldman Sachs (1,977)(4,360) Kadmon Holdings Inc HSBC (1,003)
(25,532) Kadmon Holdings Inc Morgan Stanley (2,298)1,510 Kaiser Aluminum Corp Bank of America
Merrill Lynch (5,844)371 Kaiser Aluminum Corp Barclays Bank 1,554
1,066 Kaiser Aluminum Corp Goldman Sachs (4,125)281 Kaiser Aluminum Corp HSBC (1,347)332 Kaiser Aluminum Corp Morgan Stanley 1,391
20,634 Kala Pharmaceuticals Inc Bank of AmericaMerrill Lynch 5,778
26,394 Kala Pharmaceuticals Inc Barclays Bank 14,51726,102 Kala Pharmaceuticals Inc Goldman Sachs 7,3093,958 Kala Pharmaceuticals Inc HSBC 1,544
(4,454) Kaleido Biosciences Inc Barclays Bank (34)(3,531) KalVista Pharmaceuticals
IncBank of AmericaMerrill Lynch (777)
(1,775) KalVista PharmaceuticalsInc Barclays Bank (4,242)
(9,900) KalVista PharmaceuticalsInc Goldman Sachs (2,178)
(5,033) Kaman Corp Bank of AmericaMerrill Lynch (151)
(2,086) Kaman Corp Barclays Bank (3,797)(3,890) Kaman Corp Goldman Sachs (117)(9,041) Kaman Corp HSBC 6,871
(38,053) Kaman Corp Morgan Stanley (69,256)(946) Kansas City Southern Barclays Bank (4,588)
(2,103) Kansas City Southern Goldman Sachs (1,346)(3,237) Kansas City Southern Morgan Stanley (15,699)11,206 KAR Auction Services Inc Barclays Bank (13,335)12,010 KAR Auction Services Inc Goldman Sachs (4,083)14,276 KAR Auction Services Inc Morgan Stanley (16,988)
722 Karat Packaging Inc Bank of AmericaMerrill Lynch 1,177
8,410 Karat Packaging Inc Barclays Bank 8,1413,500 Karat Packaging Inc Goldman Sachs 4,459
569 Karat Packaging Inc HSBC 3855,625 Karat Packaging Inc Morgan Stanley 1,527
(1,412) Karuna Therapeutics Inc Barclays Bank 10,527(1,664) Karuna Therapeutics Inc Goldman Sachs 459(1,477) Karuna Therapeutics Inc Morgan Stanley 13,08821,103 Karyopharm Therapeutics
IncBank of AmericaMerrill Lynch 3,799
BlackRock Americas Diversified Equity Absolute Return FundcontinuedPortfolio of Investments as at 31 May 2021
The notes on pages 590 to 610 form an integral part of these financial statements.
Annual report and audited financial statements [117]

Holding Description Counterparty
Netunrealised
appreciation/(depreciation)
USD
United States continued30,674 Karyopharm Therapeutics
Inc Barclays Bank 30744,863 Karyopharm Therapeutics
Inc Goldman Sachs 6,19416,848 Karyopharm Therapeutics
Inc HSBC 18,36415,581 Karyopharm Therapeutics
Inc Morgan Stanley 1563,775 KB Home Bank of America
Merrill Lynch 3,43513,953 KB Home Barclays Bank 45,06824,880 KB Home Goldman Sachs 22,2252,145 KB Home HSBC (8,987)
36,474 KB Home Morgan Stanley 117,811(432) KBR Inc Bank of America
Merrill Lynch 61(7,507) KBR Inc Barclays Bank 2,477(8,179) KBR Inc Goldman Sachs 5,5565,742 KBR Inc Goldman Sachs (9,130)
(3,193) KBR Inc HSBC 575(26,249) KBR Inc Morgan Stanley 8,662(20,026) Kearny Financial Corp Bank of America
Merrill Lynch 6,969(148,133) Kearny Financial Corp Barclays Bank (7,407)(128,208) Kearny Financial Corp Goldman Sachs 47,269
(7,614) Kearny Financial Corp Morgan Stanley (209)28,710 Kellogg Co Bank of America
Merrill Lynch (23,829)20,462 Kellogg Co Barclays Bank (12,482)22,946 Kellogg Co Goldman Sachs (19,045)9,792 Kellogg Co HSBC (26,634)
41,491 Kellogg Co Morgan Stanley (25,309)3,697 Kelly Services Inc ’A’ Bank of America
Merrill Lynch 77646,296 Kelly Services Inc ’A’ Barclays Bank 17,13024,298 Kelly Services Inc ’A’ Goldman Sachs 5,1031,579 Kemper Corp Bank of America
Merrill Lynch (765)5,567 Kemper Corp Barclays Bank 8191,578 Kemper Corp Goldman Sachs (4,024)
487 Kemper Corp HSBC (1,578)3,541 Kemper Corp Morgan Stanley (226)
(16,439) Kennametal Inc Morgan Stanley 20,38427,503 Kennedy-Wilson Holdings
Inc Barclays Bank (3,025)98,232 Kennedy-Wilson Holdings
Inc Goldman Sachs 13,82647,199 Kennedy-Wilson Holdings
Inc HSBC (7,552)49,020 Kennedy-Wilson Holdings
Inc Morgan Stanley (5,247)(2,736) Keros Therapeutics Inc Bank of America
Merrill Lynch (9,959)(1,072) Keros Therapeutics Inc Barclays Bank (4,384)(5,862) Keros Therapeutics Inc Goldman Sachs (19,690)
(16,659) Keurig Dr Pepper Inc Bank of AmericaMerrill Lynch (16,492)
(36,199) Keurig Dr Pepper Inc Barclays Bank (3,620)(6,231) Keurig Dr Pepper Inc Goldman Sachs (6,169)(1,842) Keurig Dr Pepper Inc HSBC (1,068)(4,994) Keurig Dr Pepper Inc Morgan Stanley (499)
518 Key Energy Services Inc Bank of AmericaMerrill Lynch 865
14,799 Key Tronic Corp Bank of AmericaMerrill Lynch (2,664)
(22,485) KeyCorp Bank of AmericaMerrill Lynch 10,793
(63,070) KeyCorp Barclays Bank —(42,728) KeyCorp Goldman Sachs 20,509
Holding Description Counterparty
Netunrealised
appreciation/(depreciation)
USD
United States continued(35,894) KeyCorp HSBC (2,872)(43,064) KeyCorp Morgan Stanley —
(993) Keysight Technologies Inc Barclays Bank (1,536)(6,967) Keysight Technologies Inc Goldman Sachs (12,106)(1,162) Keysight Technologies Inc Morgan Stanley (1,836)9,669 Kezar Life Sciences Inc Bank of America
Merrill Lynch 2,32118,006 Kezar Life Sciences Inc Barclays Bank 2,1614,209 Kezar Life Sciences Inc Goldman Sachs 1,0107,981 Kezar Life Sciences Inc HSBC 3,9911,814 Kezar Life Sciences Inc Morgan Stanley 218
10,640 Kforce Inc Barclays Bank 22,4508,074 Kforce Inc Goldman Sachs 18,005
23,612 Kforce Inc HSBC 83,35010,455 Kforce Inc Morgan Stanley 22,0601,622 Kilroy Realty Corp (REIT) Bank of America
Merrill Lynch 5,85516,393 Kilroy Realty Corp (REIT) HSBC 45,73626,041 Kilroy Realty Corp (REIT) Morgan Stanley (20,312)
(16,861) Kimball Electronics Inc Bank of AmericaMerrill Lynch (2,529)
(2,195) Kimball Electronics Inc Barclays Bank (329)(17,544) Kimball Electronics Inc Goldman Sachs (2,632)(6,722) Kimball Electronics Inc Morgan Stanley (929)21,560 Kimball International Inc ’B’ Bank of America
Merrill Lynch 4,95931,085 Kimball International Inc ’B’ Barclays Bank (10,880)81,333 Kimball International Inc ’B’ Goldman Sachs 18,707
(248) Kimberly-Clark Corp Bank of AmericaMerrill Lynch 744
(5,405) Kimberly-Clark Corp Barclays Bank 8,053(19,043) Kimberly-Clark Corp Goldman Sachs 57,129(10,386) Kimberly-Clark Corp HSBC 63,450(23,848) Kimberly-Clark Corp Morgan Stanley 35,758(6,678) Kimco Realty Corp (REIT) Barclays Bank (4,541)1,389 Kimco Realty Corp (REIT) Barclays Bank 9
51,537 Kinder Morgan Inc Bank of AmericaMerrill Lynch (23,707)
24,391 Kinder Morgan Inc Barclays Bank (11,952)64,240 Kinder Morgan Inc Goldman Sachs (29,550)(1,576) Kinder Morgan Inc Goldman Sachs (5)22,829 Kinder Morgan Inc HSBC 2,055
(46,762) Kinder Morgan Inc HSBC (4,209)28,137 Kinder Morgan Inc Morgan Stanley (13,787)
(10,349) Kinder Morgan Inc Morgan Stanley 4,472(18,075) Kindred Biosciences Inc Goldman Sachs (1,265)10,050 Kiniksa Pharmaceuticals Ltd
’A’ Barclays Bank (905)3,271 Kiniksa Pharmaceuticals Ltd
’A’ Goldman Sachs (622)(5,458) Kinsale Capital Group Inc Bank of America
Merrill Lynch (39,680)(1,091) Kinsale Capital Group Inc Barclays Bank (2,782)10,542 Kinsale Capital Group Inc Barclays Bank 26,882(2,309) Kinsale Capital Group Inc Goldman Sachs (15,068)
92 Kinsale Capital Group Inc Goldman Sachs 669(291) Kinsale Capital Group Inc HSBC (1,699)(774) Kinsale Capital Group Inc Morgan Stanley (1,895)
1,739 Kinsale Capital Group Inc Morgan Stanley 4,434(796) Kirby Corp Barclays Bank 1,146
(9,566) Kirby Corp Goldman Sachs 44,291(3,108) Kirby Corp HSBC 5,781
(10,498) Kirby Corp Morgan Stanley 15,117(6,639) Kirkland’s Inc Barclays Bank 11,95014,619 Kite Realty Group Trust
(REIT) Morgan Stanley —(3,512) KKR & Co Inc HSBC 4,917
(11,144) KKR & Co Inc Morgan Stanley (4,123)
BlackRock Americas Diversified Equity Absolute Return FundcontinuedPortfolio of Investments as at 31 May 2021
The notes on pages 590 to 610 form an integral part of these financial statements.
BlackRock Strategic Funds[118]

Holding Description Counterparty
Netunrealised
appreciation/(depreciation)
USD
United States continued26,826 KKR Real Estate Finance
Trust Inc (REIT)Bank of AmericaMerrill Lynch 21,729
24,782 KKR Real Estate FinanceTrust Inc (REIT) Barclays Bank 8,922
11,580 KKR Real Estate FinanceTrust Inc (REIT) Goldman Sachs 9,380
15,174 KKR Real Estate FinanceTrust Inc (REIT) HSBC 3,794
32,147 KKR Real Estate FinanceTrust Inc (REIT) Morgan Stanley 11,573
922 KLA Corp Bank of AmericaMerrill Lynch 17,675
(110) KLA Corp Bank of AmericaMerrill Lynch (10)
319 KLA Corp Barclays Bank (211)(82) KLA Corp Barclays Bank 20742 KLA Corp Morgan Stanley (490)
(9,098) KLX Energy Services Hold-ings Inc
Bank of AmericaMerrill Lynch 1,729
6,145 Knight-Swift TransportationHoldings Inc Barclays Bank (4,424)
12,988 Knight-Swift TransportationHoldings Inc Goldman Sachs (15,066)
8,296 Knight-Swift TransportationHoldings Inc Morgan Stanley (5,973)
(9,573) Knoll Inc HSBC (9,094)(19,391) Knoll Inc Morgan Stanley (11,635)
9,697 Knowles Corp Bank of AmericaMerrill Lynch 5,333
128,086 Knowles Corp Barclays Bank 32,02229,074 Knowles Corp Goldman Sachs 15,99127,409 Knowles Corp HSBC 22,74947,130 Knowles Corp Morgan Stanley 11,783(3,171) Kodiak Sciences Inc Bank of America
Merrill Lynch 3,108(2,896) Kodiak Sciences Inc Barclays Bank (6,428)(1,927) Kodiak Sciences Inc Goldman Sachs 1,888
(681) Kodiak Sciences Inc HSBC 3,262(3,678) Kodiak Sciences Inc Morgan Stanley (7,731)2,764 Kohl’s Corp Bank of America
Merrill Lynch (722)1,391 Kohl’s Corp Barclays Bank (264)
16,555 Kohl’s Corp HSBC (50,576)16,807 Kohl’s Corp Morgan Stanley (3,193)
(557) Kontoor Brands Inc Bank of AmericaMerrill Lynch 919
(259) Kontoor Brands Inc Barclays Bank (34)(270) Kontoor Brands Inc Goldman Sachs 446(554) Kontoor Brands Inc Morgan Stanley (72)
(28,747) Kopin Corp Bank of AmericaMerrill Lynch (32,620)
(2,768) Kopin Corp Goldman Sachs (3,764)(3,084) Koppers Holdings Inc Bank of America
Merrill Lynch 1,449(3,704) Koppers Holdings Inc Barclays Bank (3,445)(7,480) Koppers Holdings Inc Goldman Sachs 3,516
(13,730) Koppers Holdings Inc Morgan Stanley (12,769)(2,366) Korn Ferry Bank of America
Merrill Lynch 3,860(2,626) Korn Ferry Barclays Bank 236
(565) Korn Ferry Goldman Sachs 1,175(3,440) Korn Ferry Morgan Stanley 310
(32,307) Kosmos Energy Ltd Bank of AmericaMerrill Lynch 969
(38,910) Kosmos Energy Ltd Barclays Bank 3,502(92,581) Kosmos Energy Ltd Goldman Sachs 2,777(30,574) Kraft Heinz Co Barclays Bank 28,187(31,407) Kraft Heinz Co Goldman Sachs 6,595(32,708) Kraft Heinz Co HSBC 983
Holding Description Counterparty
Netunrealised
appreciation/(depreciation)
USD
United States continued(34,269) Kraft Heinz Co Morgan Stanley 29,597(6,962) Kraton Corp Bank of America
Merrill Lynch 11,418(486) Kraton Corp Barclays Bank 185
(1,713) Kraton Corp Goldman Sachs 2,809(1,687) Kratos Defense & Security
Solutions IncBank of AmericaMerrill Lynch (439)
(7,406) Kratos Defense & SecuritySolutions Inc Barclays Bank (3,999)
(4,957) Kratos Defense & SecuritySolutions Inc Goldman Sachs (1,289)
(20,612) Kratos Defense & SecuritySolutions Inc Morgan Stanley (11,130)
(28,619) Kroger Co Bank of AmericaMerrill Lynch 11,734
(27,512) Kroger Co Barclays Bank (10,455)(54,129) Kroger Co Goldman Sachs 22,193(20,992) Kroger Co Morgan Stanley (7,977)
5,000 Kronos Worldwide Inc Bank of AmericaMerrill Lynch (5,550)
31,860 Kronos Worldwide Inc Barclays Bank (23,895)25,755 Kronos Worldwide Inc Goldman Sachs (28,588)54,214 Kronos Worldwide Inc HSBC (56,925)69,454 Kronos Worldwide Inc Morgan Stanley (52,091)
(259) Krystal Biotech Inc Bank of AmericaMerrill Lynch 427
(2,632) Krystal Biotech Inc Barclays Bank 1,237(4,743) Krystal Biotech Inc Goldman Sachs 7,826(3,959) Krystal Biotech Inc Morgan Stanley 1,861
(927) Kura Oncology Inc Goldman Sachs 2,494(11,956) Kura Oncology Inc Morgan Stanley 2,272(3,058) Kura Sushi USA Inc ’A’ Bank of America
Merrill Lynch (22,874)(7,287) Kura Sushi USA Inc ’A’ Barclays Bank (10,931)5,357 KVH Industries Inc Bank of America
Merrill Lynch (214)30,118 KVH Industries Inc Barclays Bank (1,506)13,245 KVH Industries Inc Morgan Stanley (662)(2,412) Kymera Therapeutics Inc Bank of America
Merrill Lynch (21,342)(873) Kymera Therapeutics Inc Goldman Sachs (3,845)
(2,276) Kymera Therapeutics Inc Morgan Stanley (6,167)23,258 L B Foster Co ’A’ Bank of America
Merrill Lynch (1,628)8,413 L B Foster Co ’A’ Barclays Bank (252)
14,739 L B Foster Co ’A’ Goldman Sachs (1,032)6,384 L B Foster Co ’A’ HSBC 7,852
11,886 L B Foster Co ’A’ Morgan Stanley (357)704 L Brands Inc Bank of America
Merrill Lynch (429)11,324 L Brands Inc Barclays Bank 41,446
(354) L Brands Inc Goldman Sachs 216(1,405) L3Harris Technologies Inc Barclays Bank (2,487)
269 L3Harris Technologies Inc Barclays Bank 911(3,894) L3Harris Technologies Inc Goldman Sachs 156(5,485) L3Harris Technologies Inc HSBC (5,704)(2,235) L3Harris Technologies Inc Morgan Stanley (3,956)12,321 La Jolla Pharmaceutical Co Bank of America
Merrill Lynch 6,7775,352 La Jolla Pharmaceutical Co Barclays Bank 2,6763,764 La Jolla Pharmaceutical Co HSBC 2,0339,238 La Jolla Pharmaceutical Co Morgan Stanley 4,619(390) Laboratory Corp of America
Holdings Barclays Bank (1,252)(2,731) Laboratory Corp of America
Holdings Goldman Sachs (19,527)(18,426) Ladder Capital Corp (REIT) HSBC (2,395)(23,084) Ladder Capital Corp (REIT) Morgan Stanley (3,924)(4,307) Laird Superfood Inc Barclays Bank 3,101
BlackRock Americas Diversified Equity Absolute Return FundcontinuedPortfolio of Investments as at 31 May 2021
The notes on pages 590 to 610 form an integral part of these financial statements.
Annual report and audited financial statements [119]

Holding Description Counterparty
Netunrealised
appreciation/(depreciation)
USD
United States continued4,015 Lakeland Bancorp Inc Bank of America
Merrill Lynch —67,962 Lakeland Bancorp Inc Barclays Bank 13,59266,810 Lakeland Bancorp Inc Goldman Sachs —47,061 Lakeland Bancorp Inc HSBC 24,472
109,647 Lakeland Bancorp Inc Morgan Stanley 21,9294,861 Lakeland Financial Corp Bank of America
Merrill Lynch (5,347)15,113 Lakeland Financial Corp Barclays Bank (2,871)14,381 Lakeland Financial Corp Morgan Stanley (2,732)(5,542) Lakeland Industries Inc Barclays Bank 4933,033 Lam Research Corp Barclays Bank 46,1321,048 Lam Research Corp HSBC 66,4433,124 Lam Research Corp Morgan Stanley 47,5161,056 Lamar Advertising Co ’A’
(REIT) Goldman Sachs 2,2702,217 Lamar Advertising Co ’A’
(REIT) HSBC 2,0621,344 Lamar Advertising Co ’A’
(REIT) Morgan Stanley 1,129(1,436) Lamb Weston Holdings Inc Bank of America
Merrill Lynch (3,535)1,721 Lamb Weston Holdings Inc Barclays Bank 3,545
657 Lamb Weston Holdings Inc Goldman Sachs 3,1603,887 Lamb Weston Holdings Inc HSBC 13,954
(3,588) Lamb Weston Holdings Inc HSBC (12,881)(5,421) Lamb Weston Holdings Inc Morgan Stanley (11,137)(3,960) Lancaster Colony Corp Barclays Bank (1,861)35,603 Landec Corp Bank of America
Merrill Lynch (14,953)12,620 Landec Corp Barclays Bank 75760,758 Landec Corp Goldman Sachs (25,518)9,253 Landec Corp HSBC (463)
(8,748) Landmark Bancorp Inc Bank of AmericaMerrill Lynch 8,398
(2,728) Landmark Bancorp Inc Barclays Bank 1,610(2,210) Landmark Bancorp Inc Goldman Sachs 2,12210,965 Landos Biopharma Inc Bank of America
Merrill Lynch (7,566)1,888 Landos Biopharma Inc Barclays Bank 6806,753 Landos Biopharma Inc Goldman Sachs (4,660)1,152 Landos Biopharma Inc HSBC 4725,231 Landos Biopharma Inc Morgan Stanley 1,8832,928 Lands’ End Inc Bank of America
Merrill Lynch 5,6224,332 Lands’ End Inc Barclays Bank 6,1083,477 Lands’ End Inc Goldman Sachs 6,6762,508 Lands’ End Inc HSBC 8,427
14,923 Lands’ End Inc Morgan Stanley 21,0415,301 Landsea Homes Corp Bank of America
Merrill Lynch (689)16,490 Landsea Homes Corp Barclays Bank 1655,729 Landsea Homes Corp Goldman Sachs (745)
16,031 Landsea Homes Corp HSBC (6,252)5,018 Landsea Homes Corp Morgan Stanley 50
15,103 Landstar System Inc Bank of AmericaMerrill Lynch (60,684)
8,017 Landstar System Inc Goldman Sachs (25,958)1,198 Landstar System Inc Morgan Stanley 2,791
(19,676) Lannett Co Inc Barclays Bank 6,887(11,742) Lannett Co Inc Morgan Stanley 4,110
2,137 Lantern Pharma Inc Bank of AmericaMerrill Lynch 3,120
3,761 Lantern Pharma Inc Barclays Bank 1,6172,557 Lantern Pharma Inc HSBC 2,8033,869 Lantern Pharma Inc Morgan Stanley 1,664
(18,059) Lantheus Holdings Inc Bank of AmericaMerrill Lynch (58,511)
(4,090) Lantheus Holdings Inc Barclays Bank (12,270)(40,175) Lantheus Holdings Inc Morgan Stanley (120,525)
Holding Description Counterparty
Netunrealised
appreciation/(depreciation)
USD
United States continued(1,741) Laredo Petroleum Inc Bank of America
Merrill Lynch (2,899)(762) Laredo Petroleum Inc Barclays Bank (2,652)
(3,126) Laredo Petroleum Inc Goldman Sachs (7,766)(800) Laredo Petroleum Inc Morgan Stanley (795)
5,044 Larimar Therapeutics Inc Bank of AmericaMerrill Lynch (26,985)
1,764 Larimar Therapeutics Inc Barclays Bank (11,995)980 Larimar Therapeutics Inc Goldman Sachs (5,243)
3,791 Larimar Therapeutics Inc Morgan Stanley (25,779)(6,641) Las Vegas Sands Corp Bank of America
Merrill Lynch (6,575)(554) Las Vegas Sands Corp Barclays Bank (6)
(22,982) Las Vegas Sands Corp Goldman Sachs (22,752)26,160 Las Vegas Sands Corp Goldman Sachs 25,89816,079 Las Vegas Sands Corp HSBC 13,537(6,951) Las Vegas Sands Corp Morgan Stanley (70)7,747 Las Vegas Sands Corp Morgan Stanley 77
29,728 Lattice Semiconductor Corp Bank of AmericaMerrill Lynch 169,542
9,255 Lattice Semiconductor Corp Barclays Bank 11,6895,038 Lattice Semiconductor Corp Goldman Sachs 29,2207,120 Lattice Semiconductor Corp HSBC 26,2101,905 Lattice Semiconductor Corp Morgan Stanley 3,162
(12,400) Laureate Education Inc ’A’ Bank of AmericaMerrill Lynch (372)
(9,365) Laureate Education Inc ’A’ Barclays Bank (3,278)(33,616) Laureate Education Inc ’A’ Goldman Sachs (1,008)(17,775) Laureate Education Inc ’A’ HSBC (8,355)(21,104) Laureate Education Inc ’A’ Morgan Stanley (7,386)
563 Lawson Products Inc Morgan Stanley (839)(9,465) La-Z-Boy Inc Bank of America
Merrill Lynch 19,498(35,810) La-Z-Boy Inc Barclays Bank 20,770
1,457 Lazydays Holdings Inc Bank of AmericaMerrill Lynch (510)
5,011 Lazydays Holdings Inc Barclays Bank (3,007)2,343 Lazydays Holdings Inc Goldman Sachs (820)1,708 Lazydays Holdings Inc HSBC (1,196)
796 Lazydays Holdings Inc Morgan Stanley (478)1,114 LCI Industries Bank of America
Merrill Lynch 7,3414,053 LCI Industries Barclays Bank 27,0745,763 LCI Industries HSBC 110,246
13,425 LCI Industries Morgan Stanley 89,679(2,204) LCNB Corp Barclays Bank 1,168(5,399) LCNB Corp Goldman Sachs 1,890
(23,819) LCNB Corp HSBC (3,096)(2,101) Lear Corp Bank of America
Merrill Lynch (17,564)(1,192) Lear Corp Barclays Bank (7,545)(1,677) Lear Corp Goldman Sachs (14,019)
(243) Lear Corp HSBC (663)(6,716) Lear Corp Morgan Stanley (42,512)(5,957) Lee Enterprises Inc Goldman Sachs (11,557)(6,308) Legacy Housing Corp Bank of America
Merrill Lynch 189(7,441) Legacy Housing Corp Barclays Bank (1,265)(4,067) Legacy Housing Corp Goldman Sachs 122(6,737) Leggett & Platt Inc Bank of America
Merrill Lynch 6,670(13,038) Leggett & Platt Inc Barclays Bank (6,910)
8,371 Leggett & Platt Inc Barclays Bank 3,906(11,197) Leggett & Platt Inc Goldman Sachs 11,085
6,448 Leggett & Platt Inc Goldman Sachs (2,024)2,690 Leggett & Platt Inc HSBC 77
(2,363) Leidos Holdings Inc Bank of AmericaMerrill Lynch 460
(6,784) Leidos Holdings Inc Barclays Bank (592)
BlackRock Americas Diversified Equity Absolute Return FundcontinuedPortfolio of Investments as at 31 May 2021
The notes on pages 590 to 610 form an integral part of these financial statements.
BlackRock Strategic Funds[120]

Holding Description Counterparty
Netunrealised
appreciation/(depreciation)
USD
United States continued(2,773) Leidos Holdings Inc Goldman Sachs 1,747(6,711) Leidos Holdings Inc HSBC 11,610
(16,426) Leidos Holdings Inc Morgan Stanley 3,4076,257 LeMaitre Vascular Inc Goldman Sachs 14,078
(3,010) Lemonade Inc Bank of AmericaMerrill Lynch (50,655)
(372) Lemonade Inc Barclays Bank (3,582)(1,943) Lemonade Inc Goldman Sachs (34,955)6,817 LendingClub Corp Barclays Bank 9,407
(1,669) LendingTree Inc Bank of AmericaMerrill Lynch (15,436)
(2,572) LendingTree Inc Barclays Bank (16,915)(879) LendingTree Inc Goldman Sachs (17,703)(430) LendingTree Inc Morgan Stanley (1,707)
6,939 Lennar Corp ’A’ Barclays Bank 27,61713,412 Lennar Corp ’A’ HSBC (102,045)1,756 Lennar Corp ’A’ Morgan Stanley 6,989
(2,081) Lennar Corp ’B’ Bank of AmericaMerrill Lynch (2,601)
1,282 Lennox International Inc Barclays Bank 9,2051,763 Lennox International Inc Goldman Sachs 2,8215,179 Lennox International Inc Morgan Stanley 37,185
(22,250) LENSAR Inc Bank of AmericaMerrill Lynch (5,785)
(586) LENSAR Inc Barclays Bank (152)(1,462) LENSAR Inc Goldman Sachs (380)(7,457) LENSAR Inc HSBC (8,203)
(10,755) LENSAR Inc Morgan Stanley (2,796)14,205 Leslie’s Inc Barclays Bank 11,7902,922 Leslie’s Inc Goldman Sachs 6,691
11,255 Level One Bancorp Inc Bank of AmericaMerrill Lynch 3,939
11,581 Level One Bancorp Inc Barclays Bank 1,1582,835 Level One Bancorp Inc Goldman Sachs 992
18,805 Level One Bancorp Inc HSBC 3,00915,239 Level One Bancorp Inc Morgan Stanley 1,5241,709 Levi Strauss & Co ’A’ Bank of America
Merrill Lynch (936)6,237 Levi Strauss & Co ’A’ Barclays Bank (3,707)8,734 Levi Strauss & Co ’A’ Goldman Sachs 1,341
10,413 Levi Strauss & Co ’A’ Morgan Stanley (3,661)(3,374) Lexicon Pharmaceuticals
IncBank of AmericaMerrill Lynch (540)
(7,355) Lexicon PharmaceuticalsInc Barclays Bank (1,618)
(6,000) Lexicon PharmaceuticalsInc Morgan Stanley (1,320)
(163) Lexington Realty Trust(REIT)
Bank of AmericaMerrill Lynch (52)
(2,428) Lexington Realty Trust(REIT) Barclays Bank (583)
(57,169) Lexington Realty Trust(REIT) HSBC 11,434
(258,347) Lexington Realty Trust(REIT) Morgan Stanley (62,003)
668 LGI Homes Inc Bank of AmericaMerrill Lynch 5,582
1,073 LGI Homes Inc Goldman Sachs 5,054172 LGI Homes Inc HSBC 2,211
3,154 LGI Homes Inc Morgan Stanley 42,3272,006 LHC Group Inc Bank of America
Merrill Lynch 18,3153,952 LHC Group Inc Barclays Bank (2,198)3,549 LHC Group Inc Goldman Sachs 27,056
890 LHC Group Inc HSBC (3,527)3,645 LHC Group Inc Morgan Stanley (1,216)(174) Liberty Broadband Corp Barclays Bank 118
(8,934) Liberty Broadband Corp Morgan Stanley 6,075(6,874) Liberty Broadband Corp ’A’ Bank of America
Merrill Lynch (21,859)
Holding Description Counterparty
Netunrealised
appreciation/(depreciation)
USD
United States continued(4,344) Liberty Broadband Corp ’A’ HSBC (4,822)(2,786) Liberty Broadband Corp ’A’ Morgan Stanley 2,2568,811 Liberty Global Plc ’A’ Bank of America
Merrill Lynch (6,961)2,101 Liberty Global Plc ’A’ Barclays Bank 211,923 Liberty Global Plc ’A’ Goldman Sachs (1,519)
(19,655) Liberty Global Plc ’A’ Goldman Sachs 13,9226,246 Liberty Global Plc ’A’ HSBC (2,811)
25,647 Liberty Global Plc ’A’ Morgan Stanley 256(3,052) Liberty Global Plc ’A’ Morgan Stanley (31)(3,272) Liberty Latin America Ltd ’A’ Barclays Bank (1,178)(5,789) Liberty Latin America Ltd ’A’ Goldman Sachs (1,100)
(27,392) Liberty Latin America Ltd ’A’ Morgan Stanley (9,861)(739) Liberty Media Corp-Liberty
Braves ’A’Bank of AmericaMerrill Lynch (392)
(15,158) Liberty Media Corp-LibertyBraves ’A’ Goldman Sachs (8,034)
(8,369) Liberty Media Corp-LibertyBraves ’A’ HSBC (8,034)
(20,274) Liberty Media Corp-LibertyBraves ’A’ Morgan Stanley 2,433
(52,310) Liberty Media Corp-LibertyBraves ’C’ Morgan Stanley 5,231
13,909 Liberty Media Corp-LibertyFormula One ’A’
Bank of AmericaMerrill Lynch 8,485
5,752 Liberty Media Corp-LibertyFormula One ’A’ Barclays Bank (1,553)
5,518 Liberty Media Corp-LibertyFormula One ’A’ Goldman Sachs 3,366
3,398 Liberty Media Corp-LibertyFormula One ’A’ HSBC 4,689
8,059 Liberty Media Corp-LibertyFormula One ’A’ Morgan Stanley (2,176)
2,587 Liberty Media Corp-LibertyFormula One ’C’ Barclays Bank (880)
(6,934) Liberty Media Corp-LibertyFormula One ’C’ Morgan Stanley 2,358
5,556 Liberty Media Corp-LibertyFormula One ’C’ Morgan Stanley (1,889)
674 Liberty Media Corp-LibertySiriusXM ’C’ Barclays Bank 856
(5,310) Liberty Media Corp-LibertySiriusXM ’C’ Morgan Stanley (6,744)
3,467 Liberty Media Corp-LibertySiriusXM ’C’ Morgan Stanley 4,403
9,135 Liberty Oilfield Services Inc’A’ Barclays Bank 4,750
7,031 Liberty Oilfield Services Inc’A’ Goldman Sachs 2,039
(5,453) Liberty TripAdvisor HoldingsInc ’A’ HSBC (327)
(45,733) Liberty TripAdvisor HoldingsInc ’A’ Morgan Stanley (10,976)
2,554 Life Storage Inc (REIT) Bank of AmericaMerrill Lynch 7,202
8,563 Life Storage Inc (REIT) Goldman Sachs 24,14811,567 Life Storage Inc (REIT) Morgan Stanley 21,977(4,653) Life Storage Inc (REIT) Morgan Stanley (8,841)(3,446) LifeMD Inc Bank of America
Merrill Lynch (17,747)(2,930) LifeMD Inc Barclays Bank (4,747)
(23,705) Lifetime Brands Inc Goldman Sachs 54,047(4,210) Lifetime Brands Inc HSBC 2,105(2,300) Lifetime Brands Inc Morgan Stanley 1,95521,994 Lifevantage Corp Bank of America
Merrill Lynch (3,739)32,756 Lifevantage Corp Barclays Bank (5,569)19,275 Lifevantage Corp HSBC 9,25218,203 Lifevantage Corp Morgan Stanley (3,095)(3,194) Ligand Pharmaceuticals Inc Barclays Bank 12,489
BlackRock Americas Diversified Equity Absolute Return FundcontinuedPortfolio of Investments as at 31 May 2021
The notes on pages 590 to 610 form an integral part of these financial statements.
Annual report and audited financial statements [121]

Holding Description Counterparty
Netunrealised
appreciation/(depreciation)
USD
United States continued83,532 Limelight Networks Inc Goldman Sachs 6,6834,624 Limestone Bancorp Inc Bank of America
Merrill Lynch 139140 Limestone Bancorp Inc Barclays Bank (25)
5,667 Limestone Bancorp Inc Goldman Sachs 1702,141 Limestone Bancorp Inc HSBC 3431,823 Limestone Bancorp Inc Morgan Stanley (328)
(19,090) Limoneira Co Bank of AmericaMerrill Lynch 1,145
(22,503) Limoneira Co Barclays Bank (900)(32,348) Limoneira Co Goldman Sachs 1,941(10,711) Limoneira Co HSBC (214)(16,433) Limoneira Co Morgan Stanley (657)17,702 Lincoln Educational Ser-
vices CorpBank of AmericaMerrill Lynch 7,258
10,070 Lincoln Educational Ser-vices Corp Goldman Sachs 4,129
33,957 Lincoln Educational Ser-vices Corp HSBC 17,318
13,660 Lincoln Educational Ser-vices Corp Morgan Stanley 1,776
(13,468) Lincoln Electric Holdings Inc Bank of AmericaMerrill Lynch 34,478
278 Lincoln Electric Holdings Inc Bank of AmericaMerrill Lynch (119)
(1,629) Lincoln Electric Holdings Inc HSBC 10,295(1,114) Lincoln Electric Holdings Inc Morgan Stanley 452,026 Lincoln National Corp Bank of America
Merrill Lynch 11(7,225) Lincoln National Corp Barclays Bank (3,685)3,006 Lincoln National Corp Barclays Bank 4,335
(7,373) Lincoln National Corp Goldman Sachs 2,8021,803 Lincoln National Corp Goldman Sachs 25
(15,595) Lindblad Expeditions Hold-ings Inc
Bank of AmericaMerrill Lynch (9,045)
(63,015) Lindblad Expeditions Hold-ings Inc Barclays Bank (32,138)
(16,242) Lindblad Expeditions Hold-ings Inc Goldman Sachs (9,420)
2,945 Linde Plc Bank of AmericaMerrill Lynch (2,024)
1,016 Linde Plc Barclays Bank (199)12,899 Linde Plc Goldman Sachs (1,300)1,296 Linde Plc Morgan Stanley (868)(592) Lindsay Corp HSBC 989
(78,765) Lineage Cell TherapeuticsInc
Bank of AmericaMerrill Lynch (3,151)
(1,824) Lions Gate EntertainmentCorp ’A’
Bank of AmericaMerrill Lynch (201)
(14,353) Lions Gate EntertainmentCorp ’A’ Barclays Bank (12,565)
7,065 Lions Gate EntertainmentCorp ’A’ Goldman Sachs 20,065
(1,171) Lions Gate EntertainmentCorp ’A’ HSBC (1,052)
9,019 Lions Gate EntertainmentCorp ’B’ Barclays Bank 6,584
33,236 Lions Gate EntertainmentCorp ’B’ Goldman Sachs 88,740
3,250 Lions Gate EntertainmentCorp ’B’ HSBC 12,448
4,961 Lions Gate EntertainmentCorp ’B’ Morgan Stanley 3,622
(15,536) Liquidia Corp Bank of AmericaMerrill Lynch (4,195)
(11,499) Liquidia Corp Barclays Bank 1,150(52,159) Liquidia Corp Goldman Sachs (14,083)(7,523) Liquidia Corp Morgan Stanley 752(4,270) Liquidity Services Inc Bank of America
Merrill Lynch 18,062(13,613) Liquidity Services Inc HSBC 12,116
Holding Description Counterparty
Netunrealised
appreciation/(depreciation)
USD
United States continued1,450 Lithia Motors Inc ’A’ Bank of America
Merrill Lynch (20,445)2,297 Lithia Motors Inc ’A’ Barclays Bank 10,107(490) Lithia Motors Inc ’A’ Barclays Bank 250
1,208 Lithia Motors Inc ’A’ Goldman Sachs (17,033)(195) Lithia Motors Inc ’A’ Goldman Sachs 1,418
1,332 Lithia Motors Inc ’A’ HSBC (20,289)4,047 Lithia Motors Inc ’A’ Morgan Stanley 17,807(229) Lithia Motors Inc ’A’ Morgan Stanley (1,008)(970) Littelfuse Inc Barclays Bank (3,841)
(2,817) Littelfuse Inc HSBC (19,691)(8,102) Littelfuse Inc Morgan Stanley (32,084)3,427 LivaNova Plc Barclays Bank 3,290
10,756 Live Nation EntertainmentInc Barclays Bank (17,317)
(1,321) Live Nation EntertainmentInc Goldman Sachs (7,384)
(3,612) Live Oak Bancshares Inc Bank of AmericaMerrill Lynch 795
(1,746) Live Oak Bancshares Inc Barclays Bank (821)(3,694) Live Oak Bancshares Inc Morgan Stanley (1,736)
(15,257) Livent Corp Bank of AmericaMerrill Lynch (35,396)
(5,411) Livent Corp Barclays Bank (5,790)(1,325) Livent Corp Goldman Sachs (3,074)8,782 LivePerson Inc Bank of America
Merrill Lynch 29,771(10,553) LivePerson Inc Bank of America
Merrill Lynch (17,919)4,709 LivePerson Inc Barclays Bank 4,944
(4,969) LivePerson Inc Barclays Bank (5,217)3,288 LivePerson Inc Goldman Sachs 11,1461,201 LivePerson Inc HSBC 5,717
290 LivePerson Inc Morgan Stanley 3052,596 LiveRamp Holdings Inc Bank of America
Merrill Lynch 9,4238,011 LiveRamp Holdings Inc Barclays Bank 22,0312,001 LiveRamp Holdings Inc Goldman Sachs 7,264
689 LiveRamp Holdings Inc HSBC 2,4056,208 LiveRamp Holdings Inc Morgan Stanley 17,072
20,858 LiveXLive Media Inc Goldman Sachs 20,8584,899 LiveXLive Media Inc Morgan Stanley 2,156
16,498 LKQ Corp Barclays Bank 11,71414,231 LKQ Corp Morgan Stanley 10,104(4,907) Loews Corp Barclays Bank (573)(5,498) Loews Corp Goldman Sachs 385
(13,747) Loews Corp HSBC 687(7,522) Loews Corp Morgan Stanley 1,5046,705 LogicBio Therapeutics Inc Bank of America
Merrill Lynch (2,347)14,856 LogicBio Therapeutics Inc Barclays Bank 2,82315,004 LogicBio Therapeutics Inc HSBC (4,351)4,968 LogicBio Therapeutics Inc Morgan Stanley 944
(4,532) Loral Space & Communica-tions Inc
Bank of AmericaMerrill Lynch 4
(2,665) Loral Space & Communica-tions Inc Barclays Bank 2,177
(11,917) Loral Space & Communica-tions Inc Goldman Sachs (1,907)
(1,652) Loral Space & Communica-tions Inc HSBC 1,635
(8,187) Loral Space & Communica-tions Inc Morgan Stanley 8,924
1,020 Lordstown Motors Corp ’A’ Barclays Bank 2351,199 Lordstown Motors Corp ’A’ Goldman Sachs 1,7995,284 Lordstown Motors Corp ’A’ Morgan Stanley 1,215
27,079 Louisiana-Pacific Corp Bank of AmericaMerrill Lynch 70,405
7,848 Louisiana-Pacific Corp Barclays Bank 14,539(1,645) Louisiana-Pacific Corp Goldman Sachs 214
BlackRock Americas Diversified Equity Absolute Return FundcontinuedPortfolio of Investments as at 31 May 2021
The notes on pages 590 to 610 form an integral part of these financial statements.
BlackRock Strategic Funds[122]

Holding Description Counterparty
Netunrealised
appreciation/(depreciation)
USD
United States continued(1,434) Lovesac Co Bank of America
Merrill Lynch (9,034)(376) Lovesac Co Barclays Bank (2,399)
3,842 Lowe’s Cos Inc Bank of AmericaMerrill Lynch 3,446
9,307 Lowe’s Cos Inc Goldman Sachs 6,0953,302 Lowe’s Cos Inc HSBC (12,332)(464) LPL Financial Holdings Inc Bank of America
Merrill Lynch 413(3,371) LPL Financial Holdings Inc Barclays Bank 1,504(8,518) LPL Financial Holdings Inc Goldman Sachs 7,581
(751) LPL Financial Holdings Inc HSBC 3,289(9,198) LPL Financial Holdings Inc Morgan Stanley 2,859(9,887) LSB Industries Inc Morgan Stanley 2,373
(36,320) LSI Industries Inc Bank of AmericaMerrill Lynch (41,042)
(5,891) LSI Industries Inc Barclays Bank (6,303)(12,963) LSI Industries Inc Goldman Sachs (14,648)(1,036) LTC Properties Inc (REIT) Bank of America
Merrill Lynch 539(29,724) LTC Properties Inc (REIT) Barclays Bank 6,442(8,629) LTC Properties Inc (REIT) Goldman Sachs 4,487
(38,588) LTC Properties Inc (REIT) HSBC 65,214(91,117) LTC Properties Inc (REIT) Morgan Stanley 24,602
(667) Lululemon Athletica Inc Barclays Bank 3,178(143) Lululemon Athletica Inc Morgan Stanley 818
2,180 Lululemon Athletica Inc Morgan Stanley 10,769(5,762) Lumber Liquidators Hold-
ings IncBank of AmericaMerrill Lynch 3,745
(1,262) Lumber Liquidators Hold-ings Inc Barclays Bank (1,615)
(14,699) Lumber Liquidators Hold-ings Inc Goldman Sachs 9,554
(56,924) Lumen Technologies Inc Bank of AmericaMerrill Lynch 30,872
(14,643) Lumen Technologies Inc Barclays Bank 7,013(4,450) Lumen Technologies Inc Goldman Sachs 3,160
(12,579) Lumen Technologies Inc Morgan Stanley 6,415(601) Lumentum Holdings Inc Barclays Bank (316)307 Lumentum Holdings Inc Barclays Bank 335
(199) Lumentum Holdings Inc Goldman Sachs 211,568 Lumentum Holdings Inc Goldman Sachs 14,410(201) Lumentum Holdings Inc Morgan Stanley (212)
1,246 Lumentum Holdings Inc Morgan Stanley 1,358(8,357) Luminex Corp Barclays Bank (1,588)(1,800) Lumos Pharma Inc Bank of America
Merrill Lynch (522)(10,324) Lumos Pharma Inc Barclays Bank 4,439
(400) Lumos Pharma Inc Goldman Sachs (116)(36,842) Luna Innovations Inc Bank of America
Merrill Lynch 51,839(34,860) Luna Innovations Inc Barclays Bank 2,597(52,708) Luna Innovations Inc Goldman Sachs 85,387(47,066) Luna Innovations Inc HSBC 35,770(10,999) Luna Innovations Inc Morgan Stanley 99048,599 Luther Burbank Corp Bank of America
Merrill Lynch (6,804)10,292 Luther Burbank Corp Barclays Bank 10321,960 Luther Burbank Corp Goldman Sachs (3,074)6,309 Luther Burbank Corp HSBC 1,956
20,468 Luther Burbank Corp Morgan Stanley 205(2,154) Luxfer Holdings Plc Barclays Bank (431)
(25,638) Luxfer Holdings Plc Goldman Sachs (14,870)(14,599) Luxfer Holdings Plc HSBC (6,132)(15,921) Luxfer Holdings Plc Morgan Stanley (3,184)(2,471) Lydall Inc Morgan Stanley (692)1,165 Lyft Inc ’A’ Bank of America
Merrill Lynch 8,5982,874 Lyft Inc ’A’ Barclays Bank 10,8635,604 Lyft Inc ’A’ HSBC 44,440
Holding Description Counterparty
Netunrealised
appreciation/(depreciation)
USD
United States continued21,240 Lyft Inc ’A’ Morgan Stanley 82,24411,466 LyondellBasell Industries
NV ’A’ Barclays Bank 11,6952,108 Lyra Therapeutics Inc Barclays Bank 847,143 Lyra Therapeutics Inc Goldman Sachs (3,071)7,636 Lyra Therapeutics Inc Morgan Stanley 305
(1,799) M&T Bank Corp Barclays Bank 1,601(1,923) M&T Bank Corp Morgan Stanley 1,711
(12,581) M/I Homes Inc HSBC 30,194(6,852) M/I Homes Inc Morgan Stanley (26,654)
111,921 Macatawa Bank Corp Bank of AmericaMerrill Lynch (24,623)
44,390 Macatawa Bank Corp Barclays Bank (1,776)77,234 Macatawa Bank Corp Goldman Sachs (16,991)99,029 Macatawa Bank Corp HSBC 1,981
129,352 Macatawa Bank Corp Morgan Stanley (5,174)8,689 Macerich Co (REIT) Barclays Bank 8,168
27,846 Macerich Co (REIT) Goldman Sachs 44,5543,613 Macerich Co (REIT) HSBC 6,214
18,522 Macerich Co (REIT) Morgan Stanley 17,411(1,186) Mack-Cali Realty Corp
(REIT)Bank of AmericaMerrill Lynch (403)
(35,948) Mack-Cali Realty Corp(REIT) Morgan Stanley 6,111
(307) MACOM Technology Solu-tions Holdings Inc
Bank of AmericaMerrill Lynch (2,603)
(14,063) MACOM Technology Solu-tions Holdings Inc Barclays Bank (54,846)
(21,171) MACOM Technology Solu-tions Holdings Inc Goldman Sachs (179,530)
874 MACOM Technology Solu-tions Holdings Inc HSBC 3,261
(15,488) MACOM Technology Solu-tions Holdings Inc HSBC (94,477)
(22,549) MACOM Technology Solu-tions Holdings Inc Morgan Stanley (87,941)
(24,244) Macquarie InfrastructureCorp
Bank of AmericaMerrill Lynch 6,119
(11,235) Macquarie InfrastructureCorp Barclays Bank 1,573
(11,875) Macquarie InfrastructureCorp Goldman Sachs 3,325
(28,362) Macquarie InfrastructureCorp HSBC (9,620)
(26,590) Macquarie InfrastructureCorp Morgan Stanley 3,722
1,876 MacroGenics Inc Barclays Bank 4,0902,720 Madison Square Garden
Entertainment Corp Barclays Bank (8,841)3,754 Madison Square Garden
Entertainment Corp Goldman Sachs 12,914(1,265) Madison Square Garden
Sports CorpBank of AmericaMerrill Lynch (2,606)
(3,259) Madison Square GardenSports Corp Barclays Bank 21,998
(8,268) Madison Square GardenSports Corp Morgan Stanley 52,382
(2,915) Madrigal PharmaceuticalsInc
Bank of AmericaMerrill Lynch 63,255
(2,831) Madrigal PharmaceuticalsInc Barclays Bank 37,879
(1,644) Madrigal PharmaceuticalsInc Goldman Sachs 35,675
(372) Madrigal PharmaceuticalsInc Morgan Stanley 4,977
11,225 Magenta Therapeutics Inc Barclays Bank 8,7561,781 Magnite Inc Barclays Bank (1,140)
(2,178) Magnite Inc Barclays Bank 1,3941,812 Magnite Inc Goldman Sachs 7,4842,334 Magnite Inc HSBC 2,661
BlackRock Americas Diversified Equity Absolute Return FundcontinuedPortfolio of Investments as at 31 May 2021
The notes on pages 590 to 610 form an integral part of these financial statements.
Annual report and audited financial statements [123]

Holding Description Counterparty
Netunrealised
appreciation/(depreciation)
USD
United States continued1,180 Magnite Inc Morgan Stanley (755)
14,954 Magnolia Oil & Gas Corp ’A’ Barclays Bank 11,51548,829 Magnolia Oil & Gas Corp ’A’ Goldman Sachs 3,906
(14,964) Magnolia Oil & Gas Corp ’A’ Morgan Stanley (11,522)(2,575) MainStreet Bancshares Inc Bank of America
Merrill Lynch (541)(2,824) MainStreet Bancshares Inc Barclays Bank (565)(2,036) MainStreet Bancshares Inc Goldman Sachs (428)
(25,082) MainStreet Bancshares Inc Morgan Stanley (5,016)758 Malibu Boats Inc ’A’ Barclays Bank 1,327359 Malibu Boats Inc ’A’ Goldman Sachs (1,878)
2,089 Malibu Boats Inc ’A’ HSBC (9,526)8,756 Malibu Boats Inc ’A’ Morgan Stanley 15,323
(2,387) Malvern Bancorp Inc Barclays Bank 406(1,994) Malvern Bancorp Inc Goldman Sachs (1,356)
(10,216) Malvern Bancorp Inc HSBC (204)6,199 Mammoth Energy Services
IncBank of AmericaMerrill Lynch 4,091
2,872 Mammoth Energy ServicesInc Barclays Bank 115
14,243 Mammoth Energy ServicesInc HSBC 2,136
5,697 Mammoth Energy ServicesInc Morgan Stanley 228
587 Manhattan Associates Inc Bank of AmericaMerrill Lynch 2,231
889 Manhattan Associates Inc Barclays Bank 2,0801,124 Manhattan Associates Inc Goldman Sachs 4,2714,372 Manhattan Associates Inc Morgan Stanley 10,230
19,882 Manitowoc Co Inc Bank of AmericaMerrill Lynch 9,543
16,543 Manitowoc Co Inc Barclays Bank 29,1162,535 Manitowoc Co Inc Goldman Sachs 1,217
23,714 Manitowoc Co Inc HSBC (13,754)1,078 Manitowoc Co Inc Morgan Stanley 1,897
24,789 MannKind Corp Bank of AmericaMerrill Lynch 4,710
37,451 MannKind Corp Barclays Bank 6,8004,347 MannKind Corp Goldman Sachs 8269,059 ManpowerGroup Inc Barclays Bank (14,313)
864 ManpowerGroup Inc HSBC (2,030)2,366 ManTech International Corp
’A’ Goldman Sachs 3,525890 ManTech International Corp
’A’ HSBC 3,2046,299 ManTech International Corp
’A’ Morgan Stanley 4,913(620) Marathon Digital Holdings
IncBank of AmericaMerrill Lynch (1,494)
(2,305) Marathon Digital HoldingsInc Barclays Bank (3,734)
(34,291) Marathon Oil Corp Barclays Bank (4,801)(4,856) Marathon Oil Corp Goldman Sachs 6802,757 Marathon Oil Corp HSBC 353
(4,875) Marathon Oil Corp Morgan Stanley (683)(16,723) Marathon Petroleum Corp Bank of America
Merrill Lynch (4,682)(17,639) Marathon Petroleum Corp Barclays Bank (18,874)(18,012) Marathon Petroleum Corp Goldman Sachs (5,043)(11,793) Marathon Petroleum Corp Morgan Stanley (12,619)
4,904 Maravai LifeSciences Hold-ings Inc ’A’
Bank of AmericaMerrill Lynch (4,217)
(4,618) Maravai LifeSciences Hold-ings Inc ’A’ Goldman Sachs 3,971
6,163 Maravai LifeSciences Hold-ings Inc ’A’ HSBC 10,600
28,841 Marchex Inc ’B’ Bank of AmericaMerrill Lynch 865
60,103 Marchex Inc ’B’ Goldman Sachs 1,80347,945 Marchex Inc ’B’ Morgan Stanley 3,836
Holding Description Counterparty
Netunrealised
appreciation/(depreciation)
USD
United States continued1,918 Marcus & Millichap Inc Bank of America
Merrill Lynch 4,41178,873 Marcus & Millichap Inc Barclays Bank 69,408
506 Marcus & Millichap Inc Goldman Sachs 1,1649,916 Marcus & Millichap Inc HSBC 16,659
34,634 Marcus & Millichap Inc Morgan Stanley 30,47815,644 Marcus Corp Bank of America
Merrill Lynch 20,79710,556 Marcus Corp Barclays Bank 12,8785,739 Marcus Corp Goldman Sachs 4,220
28,515 Marcus Corp Morgan Stanley 34,788(7) Marine Products Corp Bank of America
Merrill Lynch 4(15,891) Marine Products Corp Barclays Bank (159)(10,660) Marine Products Corp Goldman Sachs 6,183(7,932) Marine Products Corp HSBC 2,618(8,372) Marine Products Corp Morgan Stanley (84)6,860 MarineMax Inc Barclays Bank 1,166
535 MarineMax Inc Goldman Sachs (129)17,370 MarineMax Inc Morgan Stanley 2,953(7,909) Marinus Pharmaceuticals
IncBank of AmericaMerrill Lynch (14,157)
(4,804) Marinus PharmaceuticalsInc Barclays Bank 2,354
(7,625) Marinus PharmaceuticalsInc Goldman Sachs (13,649)
1,495 Markel Corp Barclays Bank (6,742)580 Markel Corp HSBC 5,609793 Markel Corp Morgan Stanley (3,577)
18,550 Marker Therapeutics Inc HSBC 12,42916,257 Marker Therapeutics Inc Morgan Stanley 3,414
(44) MarketAxess Holdings Inc Bank of AmericaMerrill Lynch (504)
(359) MarketAxess Holdings Inc Barclays Bank (3,249)1,010 MarketAxess Holdings Inc Barclays Bank 10,241(386) MarketAxess Holdings Inc Goldman Sachs (752)
1,511 MarketAxess Holdings Inc Goldman Sachs 17,301(162) MarketAxess Holdings Inc Morgan Stanley (1,643)(670) Marlin Business Services
CorpBank of AmericaMerrill Lynch (34)
(21,881) Marlin Business ServicesCorp Morgan Stanley 4,814
(12,231) Marriott International Inc ’A’ Barclays Bank (20,160)(3,389) Marriott International Inc ’A’ Goldman Sachs (12,607)(1,779) Marriott International Inc ’A’ HSBC (4,995)(3,440) Marriott International Inc ’A’ Morgan Stanley (5,814)5,062 Marriott Vacations World-
wide CorpBank of AmericaMerrill Lynch (9,162)
10,644 Marriott Vacations World-wide Corp Barclays Bank (6,067)
(3,827) Marriott Vacations World-wide Corp Barclays Bank 2,181
1,220 Marriott Vacations World-wide Corp Goldman Sachs (2,208)
1,122 Marriott Vacations World-wide Corp HSBC 740
1,442 Marriott Vacations World-wide Corp Morgan Stanley (822)
(690) Marriott Vacations World-wide Corp Morgan Stanley 393
40,867 Marrone Bio Innovations Inc Bank of AmericaMerrill Lynch (4,087)
40,569 Marrone Bio Innovations Inc Barclays Bank (406)25,611 Marrone Bio Innovations Inc Goldman Sachs (2,561)24,228 Marrone Bio Innovations Inc HSBC (3,392)18,636 Marrone Bio Innovations Inc Morgan Stanley (186)3,488 Marsh & McLennan Cos Inc Bank of America
Merrill Lynch 13,4644,746 Marsh & McLennan Cos Inc Barclays Bank 9,112
(8,245) Marsh & McLennan Cos Inc Barclays Bank (15,830)
BlackRock Americas Diversified Equity Absolute Return FundcontinuedPortfolio of Investments as at 31 May 2021
The notes on pages 590 to 610 form an integral part of these financial statements.
BlackRock Strategic Funds[124]

Holding Description Counterparty
Netunrealised
appreciation/(depreciation)
USD
United States continued12,998 Marsh & McLennan Cos Inc Goldman Sachs 50,172
(87) Marsh & McLennan Cos Inc Goldman Sachs (336)5,839 Marsh & McLennan Cos Inc HSBC 3,270
(5,920) Marsh & McLennan Cos Inc HSBC (3,315)854 Marsh & McLennan Cos Inc Morgan Stanley 1,640
(776) Marsh & McLennan Cos Inc Morgan Stanley (1,490)13,429 Marten Transport Ltd Bank of America
Merrill Lynch (9,132)40,481 Marten Transport Ltd Barclays Bank 12,5497,645 Marten Transport Ltd Goldman Sachs (5,199)8,388 Marten Transport Ltd HSBC (6,165)
24,937 Marten Transport Ltd Morgan Stanley 7,7302,866 Martin Marietta Materials
IncBank of AmericaMerrill Lynch (35,538)
2,514 Martin Marietta MaterialsInc Barclays Bank (7,065)
3,058 Martin Marietta MaterialsInc Goldman Sachs (37,919)
1,780 Martin Marietta MaterialsInc Morgan Stanley (5,002)
(10,761) Marvell Technology Inc Barclays Bank (7,317)(7,212) Marvell Technology Inc Morgan Stanley (4,904)4,308 Masco Corp Bank of America
Merrill Lynch (15,078)(1,390) Masco Corp Bank of America
Merrill Lynch 7584,912 Masco Corp Barclays Bank (1,670)
25,425 Masco Corp Morgan Stanley (8,645)375 Masimo Corp Bank of America
Merrill Lynch 9602,558 Masimo Corp Barclays Bank (6,676)
359 Masimo Corp HSBC (460)231 Masimo Corp Morgan Stanley (603)
(7,072) Masonite International Corp Morgan Stanley (495)649 MasTec Inc Bank of America
Merrill Lynch (4)15,638 MasTec Inc Morgan Stanley 5,3176,213 Mastech Digital Inc Bank of America
Merrill Lynch (4,598)3,208 Mastech Digital Inc Barclays Bank (289)
934 Mastech Digital Inc Goldman Sachs (691)3,555 Mastech Digital Inc HSBC 5692,427 Mastech Digital Inc Morgan Stanley (218)
(1,700) Mastercard Inc ’A’ Barclays Bank 20,0602,628 Mastercard Inc ’A’ Barclays Bank (17,089)4,274 Mastercard Inc ’A’ Goldman Sachs (11,625)4,019 Mastercard Inc ’A’ Morgan Stanley (47,424)
(6,208) MasterCraft Boat HoldingsInc HSBC 6,208
(4,489) MasterCraft Boat HoldingsInc Morgan Stanley 5,117
(8,942) Matador Resources Co Barclays Bank (9,836)(2,604) Matador Resources Co Goldman Sachs (52)1,837 Match Group Inc Bank of America
Merrill Lynch 2,981(2,434) Match Group Inc Barclays Bank 9,541(1,465) Match Group Inc Goldman Sachs (4,966)
(590) Match Group Inc Morgan Stanley 2,3133,655 Materion Corp Bank of America
Merrill Lynch 9146,068 Materion Corp Barclays Bank 6,189
10,899 Materion Corp Goldman Sachs 2,7259,890 Materion Corp Morgan Stanley 10,0886,168 Matrix Service Co Barclays Bank (2,035)
23,220 Matrix Service Co Goldman Sachs (27,632)3,786 Matrix Service Co HSBC (9,238)
22,684 Matrix Service Co Morgan Stanley (7,486)(23,212) Matson Inc HSBC (6,267)(4,017) Matson Inc Morgan Stanley (402)
Holding Description Counterparty
Netunrealised
appreciation/(depreciation)
USD
United States continued(15,876) Mattel Inc Bank of America
Merrill Lynch (5,795)(9,092) Mattel Inc Barclays Bank (10,729)47,095 Mattel Inc Goldman Sachs 17,190
(18,258) Mattel Inc HSBC 9,1295,252 Matthews International Corp
’A’ HSBC (11,554)22,428 Matthews International Corp
’A’ Morgan Stanley (1,570)(55,499) Maui Land & Pineapple Co
IncBank of AmericaMerrill Lynch 7,770
(4,632) Maxar Technologies Inc Bank of AmericaMerrill Lynch (4,678)
(2,961) Maxar Technologies Inc Barclays Bank (1,866)(3,077) Maxar Technologies Inc Goldman Sachs (3,548)
(601) Maxar Technologies Inc Morgan Stanley (685)26,176 Maximus Inc Bank of America
Merrill Lynch 53,661(1,352) Maximus Inc Bank of America
Merrill Lynch (2,772)22,607 Maximus Inc Barclays Bank 42,501
(803) Maximus Inc Barclays Bank (1,510)539 Maximus Inc Goldman Sachs 1,105
(801) Maximus Inc Goldman Sachs (1,642)5,812 Maximus Inc HSBC 15,111
(3,133) Maximus Inc Morgan Stanley (5,890)45,730 Maximus Inc Morgan Stanley 85,972
(19,168) MaxLinear Inc Barclays Bank (37,186)(769) MaxLinear Inc Goldman Sachs (3,237)
4,931 Mayville Engineering Co Inc Bank of AmericaMerrill Lynch 9,911
1,445 Mayville Engineering Co Inc Goldman Sachs 2,90414,840 Mayville Engineering Co Inc HSBC 18,84712,815 Mayville Engineering Co Inc Morgan Stanley 8,842(2,938) MBIA Inc Bank of America
Merrill Lynch (2,615)(4,979) MBIA Inc Barclays Bank (1,095)
(14,483) MBIA Inc Goldman Sachs (12,890)(101,872) MBIA Inc Morgan Stanley (22,970)
(5,929) McAfee Corp ’A’ Barclays Bank 783(1,262) McAfee Corp ’A’ Goldman Sachs (1,855)(3,521) McAfee Corp ’A’ Morgan Stanley (6)2,521 McCormick & Co Inc Bank of America
Merrill Lynch (202)8,429 McCormick & Co Inc Barclays Bank (9,308)8,254 McCormick & Co Inc Goldman Sachs (660)8,221 McCormick & Co Inc HSBC (13,318)
40,764 McCormick & Co Inc Morgan Stanley (40,549)727 McDonald’s Corp Bank of America
Merrill Lynch 1,607(4,285) McDonald’s Corp Bank of America
Merrill Lynch (9,470)7,198 McDonald’s Corp Barclays Bank 14,2521,713 McDonald’s Corp Goldman Sachs 3,786
(6,029) McDonald’s Corp Goldman Sachs (13,324)(725) McDonald’s Corp HSBC 842
3,629 McDonald’s Corp Morgan Stanley 7,185(1,735) McDonald’s Corp Morgan Stanley (3,435)6,427 McGrath RentCorp Bank of America
Merrill Lynch 4,8202,257 McGrath RentCorp HSBC 7,3139,828 McGrath RentCorp Morgan Stanley (7,076)
580 McKesson Corp Bank of AmericaMerrill Lynch (251)
15,417 McKesson Corp Barclays Bank (110,941)4,369 McKesson Corp Goldman Sachs (30,452)7,134 McKesson Corp Morgan Stanley (47,766)4,537 MDC Holdings Inc Bank of America
Merrill Lynch (227)
BlackRock Americas Diversified Equity Absolute Return FundcontinuedPortfolio of Investments as at 31 May 2021
The notes on pages 590 to 610 form an integral part of these financial statements.
Annual report and audited financial statements [125]

Holding Description Counterparty
Netunrealised
appreciation/(depreciation)
USD
United States continued23,796 MDC Holdings Inc Barclays Bank 43,54721,034 MDC Holdings Inc HSBC (87,291)42,536 MDC Holdings Inc Morgan Stanley 77,8412,809 MDU Resources Group Inc Bank of America
Merrill Lynch (895)14,626 MDU Resources Group Inc Barclays Bank (6,143)6,906 MDU Resources Group Inc HSBC (304)
(17,565) MDU Resources Group Inc Morgan Stanley 7,37714,739 MDU Resources Group Inc Morgan Stanley (6,190)2,800 Medallia Inc Barclays Bank (616)1,586 Medallia Inc Goldman Sachs 2,522
(4,063) Medallia Inc Goldman Sachs (2,192)526 Medallia Inc HSBC 342
5,754 Medallia Inc Morgan Stanley (1,568)(6,843) Medallia Inc Morgan Stanley 1,5051,716 Media Gen Inc CVR*,π Bank of America
Merrill Lynch —1,127 Media Gen Inc CVR*,π Morgan Stanley —
(4,591) MediaAlpha Inc ’A’ Bank of AmericaMerrill Lynch (20,393)
(2,083) MediaAlpha Inc ’A’ Goldman Sachs (10,852)(35,122) Medical Properties Trust Inc
(REIT)Bank of AmericaMerrill Lynch (5,620)
13,223 Medical Properties Trust Inc(REIT)
Bank of AmericaMerrill Lynch 2,116
(7,777) Medical Properties Trust Inc(REIT) Barclays Bank 1,089
18,341 Medical Properties Trust Inc(REIT) Barclays Bank (2,568)
(7,367) Medical Properties Trust Inc(REIT) Goldman Sachs (1,179)
(17,711) Medical Properties Trust Inc(REIT) HSBC 5,845
17,624 Medical Properties Trust Inc(REIT) HSBC (5,816)
(21,586) Medical Properties Trust Inc(REIT) Morgan Stanley 3,022
1,234 Medical Properties Trust Inc(REIT) Morgan Stanley (7)
13,624 MediciNova Inc HSBC 3,270(2,146) Medifast Inc HSBC (80,282)
(750) MEDNAX Inc Bank of AmericaMerrill Lynch (188)
(20,994) MEDNAX Inc Barclays Bank (3,359)567 Medpace Holdings Inc Bank of America
Merrill Lynch (202)461 Medpace Holdings Inc Barclays Bank (433)
3,549 Medpace Holdings Inc Goldman Sachs 16,787(292) Medpace Holdings Inc HSBC (2,406)
(3,013) Medpace Holdings Inc Morgan Stanley 2,8333,959 Medpace Holdings Inc Morgan Stanley (3,721)
(9,143) Medtronic Plc Barclays Bank 13,806(1,356) Medtronic Plc Goldman Sachs (1,311)(3,611) Medtronic Plc Morgan Stanley 5,453(5,978) MEI Pharma Inc Bank of America
Merrill Lynch (1,136)(7,597) MEI Pharma Inc Barclays Bank (684)
(59,295) MEI Pharma Inc Goldman Sachs (11,266)2,806 MeiraGTx Holdings Plc Barclays Bank (393)
889 MercadoLibre Inc Bank of AmericaMerrill Lynch 704
860 MercadoLibre Inc Goldman Sachs (7,932)173 MercadoLibre Inc HSBC (3,399)837 MercadoLibre Inc Morgan Stanley (7,248)
72,156 Mercantile Bank Corp Bank of AmericaMerrill Lynch (10,102)
20,957 Merchants Bancorp HSBC 16,97527,769 Merchants Bancorp Morgan Stanley 16,106
(43,568) Merck & Co Inc Bank of AmericaMerrill Lynch 104,992
Holding Description Counterparty
Netunrealised
appreciation/(depreciation)
USD
United States continued(10,844) Merck & Co Inc Barclays Bank 30,514(30,717) Merck & Co Inc Goldman Sachs 117,27011,172 Merck & Co Inc Goldman Sachs (44,465)
(29,065) Merck & Co Inc Morgan Stanley 59,577(3,113) Mercury General Corp Barclays Bank 2,677
(604) Mercury General Corp Goldman Sachs 1,921(3,483) Mercury General Corp HSBC 9,509
(11,911) Mercury General Corp Morgan Stanley 5,1935,597 Mercury Systems Inc Bank of America
Merrill Lynch 17,7424,964 Mercury Systems Inc Barclays Bank 8,162
11,031 Mercury Systems Inc HSBC 19,5251,819 Mercury Systems Inc Morgan Stanley 3,807
(1,287) Meredith Corp Barclays Bank 2,947(9,903) Meredith Corp Morgan Stanley 22,678
(15,196) Meridian Bancorp Inc Bank of AmericaMerrill Lynch (5,440)
(54,468) Meridian Bancorp Inc Barclays Bank (37,583)(43,676) Meridian Bancorp Inc Goldman Sachs (13,672)(1,869) Meridian Bancorp Inc Morgan Stanley (1,290)(2,935) Meridian Bioscience Inc Bank of America
Merrill Lynch (4,432)(10,222) Meridian Bioscience Inc Barclays Bank (8,178)(4,141) Meridian Bioscience Inc Goldman Sachs (6,253)6,234 Meridian Corp Bank of America
Merrill Lynch 3,74015,620 Meridian Corp Barclays Bank (156)
800 Meridian Corp Goldman Sachs 48013,804 Meridian Corp HSBC 14,2188,803 Meridian Corp Morgan Stanley (88)
(3,990) Merit Medical Systems Inc Bank of AmericaMerrill Lynch (3,830)
(11,394) Merit Medical Systems Inc Barclays Bank 32,587(1,229) Merit Medical Systems Inc Goldman Sachs (1,180)(6,732) Merit Medical Systems Inc Morgan Stanley 19,2544,929 Meritage Homes Corp Bank of America
Merrill Lynch (20,653)8,030 Meritage Homes Corp Barclays Bank 13,8928,200 Meritage Homes Corp Goldman Sachs (34,358)5,649 Meritage Homes Corp HSBC (59,201)
(3,816) Meritage Homes Corp Morgan Stanley (6,602)7,291 Meritage Homes Corp Morgan Stanley 12,613
36,487 Meritor Inc Bank of AmericaMerrill Lynch (9,122)
8,890 Meritor Inc Barclays Bank 7,0233,893 Meritor Inc Goldman Sachs 946
(5,081) Mersana Therapeutics Inc Bank of AmericaMerrill Lynch (1,016)
(4,069) Mersana Therapeutics Inc Barclays Bank (122)(2,611) Mersana Therapeutics Inc Goldman Sachs (522)(6,018) Mersana Therapeutics Inc HSBC 3,611(7,359) Mersana Therapeutics Inc Morgan Stanley (55)(6,149) Mesa Air Group Inc Barclays Bank 4,981
(15,002) Mesa Air Group Inc Morgan Stanley 12,1523,918 Mesa Laboratories Inc Bank of America
Merrill Lynch 1,5671,240 Mesa Laboratories Inc Goldman Sachs 417
910 Mesa Laboratories Inc HSBC (2,054)(16,681) Meta Financial Group Inc Bank of America
Merrill Lynch (47,207)(12,597) Meta Financial Group Inc Barclays Bank (24,312)(50,484) Meta Financial Group Inc Morgan Stanley (97,434)32,456 Metacrine Inc Bank of America
Merrill Lynch 15,25411,710 Metacrine Inc Barclays Bank 58615,698 Metacrine Inc Goldman Sachs 7,3784,975 Metacrine Inc HSBC 2,587
10,351 Metacrine Inc Morgan Stanley 5189,131 Methode Electronics Inc Barclays Bank 9,040
BlackRock Americas Diversified Equity Absolute Return FundcontinuedPortfolio of Investments as at 31 May 2021
The notes on pages 590 to 610 form an integral part of these financial statements.
BlackRock Strategic Funds[126]

Holding Description Counterparty
Netunrealised
appreciation/(depreciation)
USD
United States continued29,765 Methode Electronics Inc Goldman Sachs 38,3978,143 Methode Electronics Inc HSBC 19,380
20,145 Methode Electronics Inc Morgan Stanley 19,94414,560 MetLife Inc Bank of America
Merrill Lynch (1,095)29,193 MetLife Inc Barclays Bank 2,41911,810 MetLife Inc Goldman Sachs (4,015)44,025 MetLife Inc HSBC (48,868)61,068 MetLife Inc Morgan Stanley (611)
(30,930) Metrocity Bankshares Inc Barclays Bank (1,856)(23,793) Metrocity Bankshares Inc Goldman Sachs (12,610)(10,537) Metrocity Bankshares Inc HSBC (7,481)(1,057) Metropolitan Bank Holding
Corp Barclays Bank (465)(3,742) Metropolitan Bank Holding
Corp Goldman Sachs 674(1,943) Metropolitan Bank Holding
Corp HSBC (2,740)(1,544) Metropolitan Bank Holding
Corp Morgan Stanley (679)100 Mettler-Toledo International
IncBank of AmericaMerrill Lynch 4,194
290 Mettler-Toledo InternationalInc Barclays Bank 1,925
1,411 Mettler-Toledo InternationalInc HSBC 66,200
(97,876) MFA Financial Inc (REIT) Bank of AmericaMerrill Lynch (979)
(77,825) MFA Financial Inc (REIT) Barclays Bank 3,891(465,790) MFA Financial Inc (REIT) Goldman Sachs (4,658)
(2,562) MGE Energy Inc Bank of AmericaMerrill Lynch (1,255)
(14,572) MGE Energy Inc Barclays Bank 9,763(25,694) MGE Energy Inc HSBC (13,618)(41,423) MGE Energy Inc Morgan Stanley 27,753(2,451) MGIC Investment Corp Bank of America
Merrill Lynch (907)9,713 MGM Growth Properties
LLC ’A’ (REIT)Bank of AmericaMerrill Lynch 8,256
11,393 MGM Growth PropertiesLLC ’A’ (REIT) Barclays Bank (1,253)
10,094 MGM Growth PropertiesLLC ’A’ (REIT) Goldman Sachs 8,580
17,125 MGM Growth PropertiesLLC ’A’ (REIT) HSBC 20,550
4,720 MGM Growth PropertiesLLC ’A’ (REIT) Morgan Stanley (519)
17,225 MGM Resorts International Bank of AmericaMerrill Lynch 70,475
23,966 MGM Resorts International Barclays Bank 27,0823,205 MGM Resorts International Goldman Sachs 13,205
491 MGM Resorts International HSBC 1,67451,551 MGM Resorts International Morgan Stanley 45,365(1,565) MGP Ingredients Inc Goldman Sachs (3,271)
(10,456) MGP Ingredients Inc HSBC (62,736)(589) MGP Ingredients Inc Morgan Stanley (1,213)
(5,093) Microchip Technology Inc Bank of AmericaMerrill Lynch (65,433)
(8,644) Microchip Technology Inc Barclays Bank (24,635)(1,747) Microchip Technology Inc Goldman Sachs (23,462)(6,666) Microchip Technology Inc HSBC (90,924)
(22,310) Microchip Technology Inc Morgan Stanley (63,583)(466) Micron Technology Inc Barclays Bank (578)
1,165 Micron Technology Inc Barclays Bank 1,445(6,750) Micron Technology Inc HSBC (22,208)
(13,193) Micron Technology Inc Morgan Stanley (16,359)(4,993) Microsoft Corp Bank of America
Merrill Lynch (22,469)2,032 Microsoft Corp Bank of America
Merrill Lynch (3,143)
Holding Description Counterparty
Netunrealised
appreciation/(depreciation)
USD
United States continued(1,783) Microsoft Corp Barclays Bank 1,9614,981 Microsoft Corp Barclays Bank (2,731)
(11,075) Microsoft Corp Goldman Sachs (49,838)842 Microsoft Corp Goldman Sachs 2,364
4,614 Microsoft Corp Morgan Stanley (5,075)(156) MicroStrategy Inc ’A’ Bank of America
Merrill Lynch 3,019(576) MicroStrategy Inc ’A’ Barclays Bank 1,412(37) MicroStrategy Inc ’A’ Goldman Sachs 716
8,539 Mid Penn Bancorp Inc Bank of AmericaMerrill Lynch —
14,154 Mid Penn Bancorp Inc Barclays Bank (1,982)3,743 Mid Penn Bancorp Inc Goldman Sachs —7,785 Mid Penn Bancorp Inc HSBC 2,111
17,763 Mid Penn Bancorp Inc Morgan Stanley (2,487)(8,772) Mid-America Apartment
Communities Inc (REIT) Goldman Sachs (30,489)(6,660) Mid-America Apartment
Communities Inc (REIT) HSBC (8,791)(18,480) Mid-America Apartment
Communities Inc (REIT) Morgan Stanley (24,394)16 Middleby Corp Bank of America
Merrill Lynch (118)3,972 Middleby Corp Morgan Stanley 5,521
(1,228) Middlefield Banc Corp Bank of AmericaMerrill Lynch (381)
(402) Middlefield Banc Corp Barclays Bank (125)(2,301) Middlesex Water Co Bank of America
Merrill Lynch (12,287)(24,288) Middlesex Water Co Morgan Stanley (123,869)22,494 Midland States Bancorp Inc Bank of America
Merrill Lynch (9,672)8,713 Midland States Bancorp Inc Barclays Bank 2,265
13,156 Midland States Bancorp Inc Goldman Sachs (5,657)15,056 Midland States Bancorp Inc HSBC (8,431)7,555 Midland States Bancorp Inc Morgan Stanley 1,964
400 Midwest Holding Inc Bank of AmericaMerrill Lynch (644)
1,084 Midwest Holding Inc Barclays Bank (1,062)974 Midwest Holding Inc Goldman Sachs (1,568)
1,012 Midwest Holding Inc Morgan Stanley (992)11,908 MidWestOne Financial
Group IncBank of AmericaMerrill Lynch (1,786)
28,737 MidWestOne FinancialGroup Inc Barclays Bank (10,058)
37,494 MidWestOne FinancialGroup Inc Goldman Sachs (5,624)
14,191 MidWestOne FinancialGroup Inc HSBC 5,534
33,239 MidWestOne FinancialGroup Inc Morgan Stanley (11,634)
(67,596) Milestone Scientific Inc Barclays Bank 3,380(20,990) Milestone Scientific Inc Goldman Sachs 2,309(10,406) Millendo Therapeutics Inc Bank of America
Merrill Lynch (1,249)(31,808) Millendo Therapeutics Inc Barclays Bank (1,590)(39,946) Millendo Therapeutics Inc Goldman Sachs (4,794)(32,935) Millendo Therapeutics Inc HSBC (3,623)(28,951) Millendo Therapeutics Inc Morgan Stanley (1,448)(3,442) Miller Industries Inc Bank of America
Merrill Lynch 1,318(25,103) Miller Industries Inc Barclays Bank (11,262)(21,501) Miller Industries Inc Goldman Sachs 9,040(3,096) Miller Industries Inc Morgan Stanley (334)15,254 Mimecast Ltd Goldman Sachs (2,630)15,739 Mimecast Ltd Morgan Stanley (5,521)1,993 MiMedx Group Inc Barclays Bank 1,6343,401 MiMedx Group Inc Goldman Sachs 5,1362,574 MiMedx Group Inc HSBC 3,166
BlackRock Americas Diversified Equity Absolute Return FundcontinuedPortfolio of Investments as at 31 May 2021
The notes on pages 590 to 610 form an integral part of these financial statements.
Annual report and audited financial statements [127]

Holding Description Counterparty
Netunrealised
appreciation/(depreciation)
USD
United States continued3,750 MiMedx Group Inc Morgan Stanley 3,075(413) Minerals Technologies Inc Barclays Bank (1,166)
(8,422) Minerals Technologies Inc HSBC (43,121)(34,192) Minerals Technologies Inc Morgan Stanley (76,590)(34,690) Minerva Neurosciences Inc HSBC (22,895)(9,178) Minerva Neurosciences Inc Morgan Stanley 73451,209 Miragen Therapeutics Inc* Goldman Sachs (51)1,884 Miragen Therapeutics Inc* Morgan Stanley —(331) Mirati Therapeutics Inc Bank of America
Merrill Lynch (1,337)1,361 Mirati Therapeutics Inc Barclays Bank 10,031
(1,676) Mirati Therapeutics Inc Barclays Bank (8,751)(274) Mirati Therapeutics Inc Goldman Sachs (726)
1,041 Mirati Therapeutics Inc Goldman Sachs 2,281(2,635) Mirati Therapeutics Inc Morgan Stanley (18,344)20,836 Mirum Pharmaceuticals Inc Barclays Bank (1,250)2,730 Mirum Pharmaceuticals Inc HSBC (3,221)3,399 Mirum Pharmaceuticals Inc Morgan Stanley (204)
(8,510) Misonix Inc Bank of AmericaMerrill Lynch 5,617
(7,551) Misonix Inc HSBC 755(41,075) Misonix Inc Morgan Stanley 32,449
3,818 Mission Produce Inc Bank of AmericaMerrill Lynch 2,902
28,782 Mission Produce Inc Barclays Bank (9,498)46,192 Mission Produce Inc Goldman Sachs 35,10614,489 Mission Produce Inc Morgan Stanley (4,781)35,814 Mistras Group Inc Bank of America
Merrill Lynch —7,157 Mistras Group Inc Barclays Bank 5733,615 Mistras Group Inc HSBC 1,157
37,123 Mistras Group Inc Morgan Stanley 2,97017,608 Mitek Systems Inc Bank of America
Merrill Lynch 10,0372,460 Mitek Systems Inc Barclays Bank (295)1,807 Mitek Systems Inc Goldman Sachs 1,0302,813 Mitek Systems Inc HSBC 4,6413,194 Mitek Systems Inc Morgan Stanley (383)
(4,514) MKS Instruments Inc Morgan Stanley (7,448)2,670 Model N Inc Bank of America
Merrill Lynch 2743,563 Model N Inc Barclays Bank 6,805
867 Model N Inc Goldman Sachs 8182,795 Model N Inc HSBC (1,202)8,693 Model N Inc Morgan Stanley 16,604
331 Moderna Inc Goldman Sachs 9,092(786) Moderna Inc Goldman Sachs 443302 Moderna Inc Morgan Stanley 6,294
4,613 Modine Manufacturing Co Barclays Bank 2,69840,060 Modine Manufacturing Co Goldman Sachs 25,238(6,010) ModivCare Inc Bank of America
Merrill Lynch (17,008)(775) ModivCare Inc Barclays Bank 612
(1,760) ModivCare Inc Goldman Sachs (4,981)(453) ModivCare Inc Morgan Stanley 358
3,987 Moelis & Co ’A’ Barclays Bank 2,1134,483 Moelis & Co ’A’ HSBC 4,304
(1,204) Mohawk Industries Inc HSBC 19,023(3,259) Mohawk Industries Inc Morgan Stanley (7,822)(5,994) Molecular Templates Inc Barclays Bank (60)(6,051) Molecular Templates Inc Goldman Sachs (3,933)(2,483) Molecular Templates Inc HSBC (1,068)(6,799) Molecular Templates Inc Morgan Stanley (68)(1,474) Molina Healthcare Inc Morgan Stanley 3,8912,667 Molson Coors Beverage Co
’B’ Goldman Sachs (398)9,586 Molson Coors Beverage Co
’B’ HSBC (11,887)25,080 Molson Coors Beverage Co
’B’ Morgan Stanley 11,854
Holding Description Counterparty
Netunrealised
appreciation/(depreciation)
USD
United States continued2,595 Monarch Casino & Resort
Inc Barclays Bank (727)1,849 Monarch Casino & Resort
Inc Goldman Sachs (92)333 Monarch Casino & Resort
Inc HSBC 103(9,634) Mondelez International Inc
’A’Bank of AmericaMerrill Lynch (10,810)
(36,704) Mondelez International Inc’A’ Barclays Bank 5,505
(34,327) Mondelez International Inc’A’ Goldman Sachs (36,387)
(18,801) Mondelez International Inc’A’ HSBC (25,288)
(14,746) Mondelez International Inc’A’ Morgan Stanley 2,212
(27,151) MoneyGram InternationalInc
Bank of AmericaMerrill Lynch (61,361)
(8,387) MoneyGram InternationalInc Barclays Bank (7,968)
90 MongoDB Inc Barclays Bank 465(463) MongoDB Inc Goldman Sachs (2,091)
(18,376) Monmouth Real Estate In-vestment Corp (REIT)
Bank of AmericaMerrill Lynch (177)
(31,765) Monmouth Real Estate In-vestment Corp (REIT) Barclays Bank 8,577
(79,746) Monmouth Real Estate In-vestment Corp (REIT) Goldman Sachs (6,278)
(6,051) Monmouth Real Estate In-vestment Corp (REIT) HSBC 1,694
(56,661) Monmouth Real Estate In-vestment Corp (REIT) Morgan Stanley 15,298
288 Monolithic Power SystemsInc
Bank of AmericaMerrill Lynch 8,876
1,033 Monolithic Power SystemsInc HSBC 21,962
865 Monolithic Power SystemsInc Morgan Stanley 11,435
(16,029) Monro Inc Barclays Bank 12,022(5,819) Monster Beverage Corp Bank of America
Merrill Lynch (18,467)2,898 Monster Beverage Corp Bank of America
Merrill Lynch 8,462(24,784) Monster Beverage Corp Barclays Bank (21,003)18,074 Monster Beverage Corp Barclays Bank 18,797
(13,677) Monster Beverage Corp Goldman Sachs (38,484)17,712 Monster Beverage Corp Goldman Sachs 51,719(7,348) Monster Beverage Corp HSBC (19,619)
(33,607) Monster Beverage Corp Morgan Stanley (33,696)5,966 Monster Beverage Corp Morgan Stanley 6,205
16,922 Montauk Renewables Inc Bank of AmericaMerrill Lynch 7,276
25,773 Montauk Renewables Inc Barclays Bank (2,577)19,513 Montauk Renewables Inc Goldman Sachs 8,39112,389 Montauk Renewables Inc HSBC 8,1776,303 Montauk Renewables Inc Morgan Stanley (630)(803) Montrose Environmental
Group IncBank of AmericaMerrill Lynch (1,780)
(2,240) Montrose EnvironmentalGroup Inc Barclays Bank (1,203)
3,521 Moody’s Corp Barclays Bank 12,218(1,003) Moody’s Corp Barclays Bank (3,480)
(741) Moody’s Corp Goldman Sachs (4,194)2,667 Moody’s Corp Morgan Stanley 9,254(908) Moody’s Corp Morgan Stanley (3,151)
7,958 Moog Inc ’A’ Bank of AmericaMerrill Lynch 10,425
10,835 Moog Inc ’A’ Barclays Bank 41,7153,279 Moog Inc ’A’ Goldman Sachs 4,2952,525 Moog Inc ’A’ HSBC 3,485
BlackRock Americas Diversified Equity Absolute Return FundcontinuedPortfolio of Investments as at 31 May 2021
The notes on pages 590 to 610 form an integral part of these financial statements.
BlackRock Strategic Funds[128]
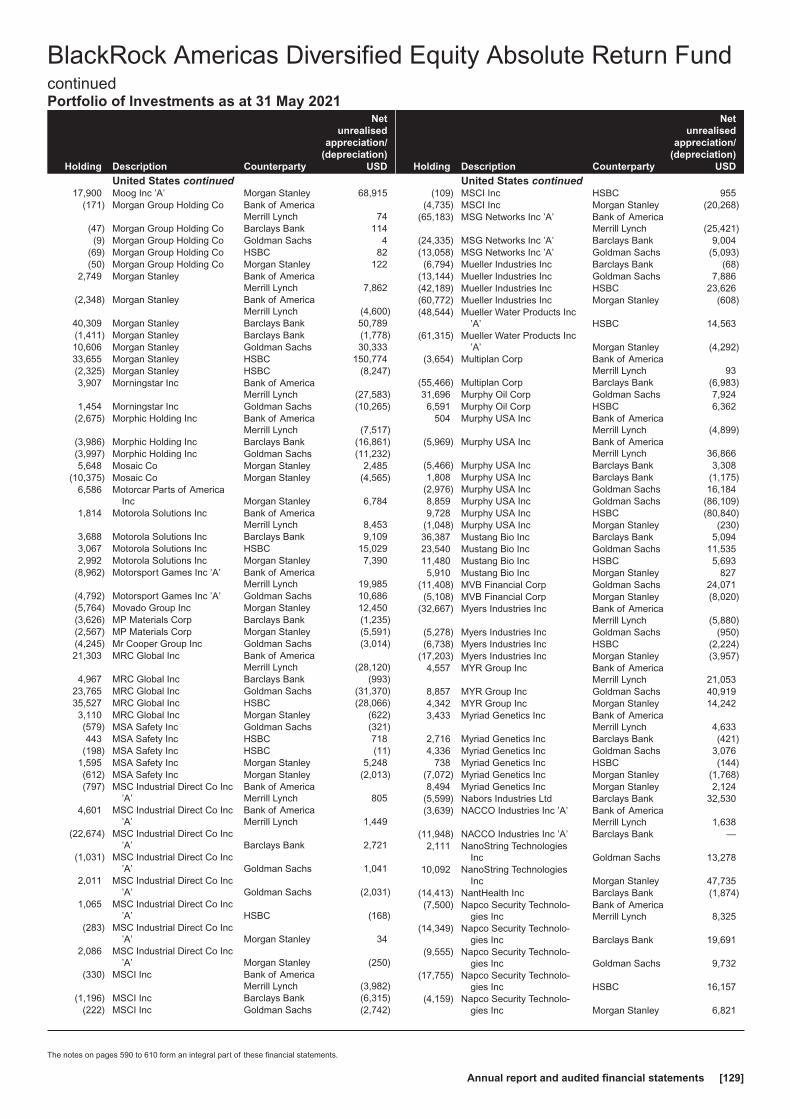
Holding Description Counterparty
Netunrealised
appreciation/(depreciation)
USD
United States continued17,900 Moog Inc ’A’ Morgan Stanley 68,915
(171) Morgan Group Holding Co Bank of AmericaMerrill Lynch 74
(47) Morgan Group Holding Co Barclays Bank 114(9) Morgan Group Holding Co Goldman Sachs 4
(69) Morgan Group Holding Co HSBC 82(50) Morgan Group Holding Co Morgan Stanley 122
2,749 Morgan Stanley Bank of AmericaMerrill Lynch 7,862
(2,348) Morgan Stanley Bank of AmericaMerrill Lynch (4,600)
40,309 Morgan Stanley Barclays Bank 50,789(1,411) Morgan Stanley Barclays Bank (1,778)10,606 Morgan Stanley Goldman Sachs 30,33333,655 Morgan Stanley HSBC 150,774(2,325) Morgan Stanley HSBC (8,247)3,907 Morningstar Inc Bank of America
Merrill Lynch (27,583)1,454 Morningstar Inc Goldman Sachs (10,265)
(2,675) Morphic Holding Inc Bank of AmericaMerrill Lynch (7,517)
(3,986) Morphic Holding Inc Barclays Bank (16,861)(3,997) Morphic Holding Inc Goldman Sachs (11,232)5,648 Mosaic Co Morgan Stanley 2,485
(10,375) Mosaic Co Morgan Stanley (4,565)6,586 Motorcar Parts of America
Inc Morgan Stanley 6,7841,814 Motorola Solutions Inc Bank of America
Merrill Lynch 8,4533,688 Motorola Solutions Inc Barclays Bank 9,1093,067 Motorola Solutions Inc HSBC 15,0292,992 Motorola Solutions Inc Morgan Stanley 7,390
(8,962) Motorsport Games Inc ’A’ Bank of AmericaMerrill Lynch 19,985
(4,792) Motorsport Games Inc ’A’ Goldman Sachs 10,686(5,764) Movado Group Inc Morgan Stanley 12,450(3,626) MP Materials Corp Barclays Bank (1,235)(2,567) MP Materials Corp Morgan Stanley (5,591)(4,245) Mr Cooper Group Inc Goldman Sachs (3,014)21,303 MRC Global Inc Bank of America
Merrill Lynch (28,120)4,967 MRC Global Inc Barclays Bank (993)
23,765 MRC Global Inc Goldman Sachs (31,370)35,527 MRC Global Inc HSBC (28,066)3,110 MRC Global Inc Morgan Stanley (622)(579) MSA Safety Inc Goldman Sachs (321)443 MSA Safety Inc HSBC 718
(198) MSA Safety Inc HSBC (11)1,595 MSA Safety Inc Morgan Stanley 5,248(612) MSA Safety Inc Morgan Stanley (2,013)(797) MSC Industrial Direct Co Inc
’A’Bank of AmericaMerrill Lynch 805
4,601 MSC Industrial Direct Co Inc’A’
Bank of AmericaMerrill Lynch 1,449
(22,674) MSC Industrial Direct Co Inc’A’ Barclays Bank 2,721
(1,031) MSC Industrial Direct Co Inc’A’ Goldman Sachs 1,041
2,011 MSC Industrial Direct Co Inc’A’ Goldman Sachs (2,031)
1,065 MSC Industrial Direct Co Inc’A’ HSBC (168)
(283) MSC Industrial Direct Co Inc’A’ Morgan Stanley 34
2,086 MSC Industrial Direct Co Inc’A’ Morgan Stanley (250)
(330) MSCI Inc Bank of AmericaMerrill Lynch (3,982)
(1,196) MSCI Inc Barclays Bank (6,315)(222) MSCI Inc Goldman Sachs (2,742)
Holding Description Counterparty
Netunrealised
appreciation/(depreciation)
USD
United States continued(109) MSCI Inc HSBC 955
(4,735) MSCI Inc Morgan Stanley (20,268)(65,183) MSG Networks Inc ’A’ Bank of America
Merrill Lynch (25,421)(24,335) MSG Networks Inc ’A’ Barclays Bank 9,004(13,058) MSG Networks Inc ’A’ Goldman Sachs (5,093)(6,794) Mueller Industries Inc Barclays Bank (68)
(13,144) Mueller Industries Inc Goldman Sachs 7,886(42,189) Mueller Industries Inc HSBC 23,626(60,772) Mueller Industries Inc Morgan Stanley (608)(48,544) Mueller Water Products Inc
’A’ HSBC 14,563(61,315) Mueller Water Products Inc
’A’ Morgan Stanley (4,292)(3,654) Multiplan Corp Bank of America
Merrill Lynch 93(55,466) Multiplan Corp Barclays Bank (6,983)31,696 Murphy Oil Corp Goldman Sachs 7,9246,591 Murphy Oil Corp HSBC 6,362
504 Murphy USA Inc Bank of AmericaMerrill Lynch (4,899)
(5,969) Murphy USA Inc Bank of AmericaMerrill Lynch 36,866
(5,466) Murphy USA Inc Barclays Bank 3,3081,808 Murphy USA Inc Barclays Bank (1,175)
(2,976) Murphy USA Inc Goldman Sachs 16,1848,859 Murphy USA Inc Goldman Sachs (86,109)9,728 Murphy USA Inc HSBC (80,840)
(1,048) Murphy USA Inc Morgan Stanley (230)36,387 Mustang Bio Inc Barclays Bank 5,09423,540 Mustang Bio Inc Goldman Sachs 11,53511,480 Mustang Bio Inc HSBC 5,6935,910 Mustang Bio Inc Morgan Stanley 827
(11,408) MVB Financial Corp Goldman Sachs 24,071(5,108) MVB Financial Corp Morgan Stanley (8,020)
(32,667) Myers Industries Inc Bank of AmericaMerrill Lynch (5,880)
(5,278) Myers Industries Inc Goldman Sachs (950)(6,738) Myers Industries Inc HSBC (2,224)
(17,203) Myers Industries Inc Morgan Stanley (3,957)4,557 MYR Group Inc Bank of America
Merrill Lynch 21,0538,857 MYR Group Inc Goldman Sachs 40,9194,342 MYR Group Inc Morgan Stanley 14,2423,433 Myriad Genetics Inc Bank of America
Merrill Lynch 4,6332,716 Myriad Genetics Inc Barclays Bank (421)4,336 Myriad Genetics Inc Goldman Sachs 3,076
738 Myriad Genetics Inc HSBC (144)(7,072) Myriad Genetics Inc Morgan Stanley (1,768)8,494 Myriad Genetics Inc Morgan Stanley 2,124
(5,599) Nabors Industries Ltd Barclays Bank 32,530(3,639) NACCO Industries Inc ’A’ Bank of America
Merrill Lynch 1,638(11,948) NACCO Industries Inc ’A’ Barclays Bank —
2,111 NanoString TechnologiesInc Goldman Sachs 13,278
10,092 NanoString TechnologiesInc Morgan Stanley 47,735
(14,413) NantHealth Inc Barclays Bank (1,874)(7,500) Napco Security Technolo-
gies IncBank of AmericaMerrill Lynch 8,325
(14,349) Napco Security Technolo-gies Inc Barclays Bank 19,691
(9,555) Napco Security Technolo-gies Inc Goldman Sachs 9,732
(17,755) Napco Security Technolo-gies Inc HSBC 16,157
(4,159) Napco Security Technolo-gies Inc Morgan Stanley 6,821
BlackRock Americas Diversified Equity Absolute Return FundcontinuedPortfolio of Investments as at 31 May 2021
The notes on pages 590 to 610 form an integral part of these financial statements.
Annual report and audited financial statements [129]

Holding Description Counterparty
Netunrealised
appreciation/(depreciation)
USD
United States continued(5,981) Nasdaq Inc Bank of America
Merrill Lynch (22,190)(6,742) Nasdaq Inc Barclays Bank (15,119)(9,201) Nasdaq Inc Goldman Sachs (34,136)(1,126) Nasdaq Inc Morgan Stanley (2,715)(3,014) Natera Inc Barclays Bank (23,268)7,088 Natera Inc Barclays Bank 54,719(674) Natera Inc Goldman Sachs (1,570)
8,227 Natera Inc Goldman Sachs 23,135525 Natera Inc HSBC 1,864
(294) Natera Inc Morgan Stanley (2,270)270 Natera Inc Morgan Stanley 668
2,168 Nathan’s Famous Inc Morgan Stanley 4775,079 National Bank Holdings
Corp ’A’ Goldman Sachs (9,142)10,583 National Bank Holdings
Corp ’A’ HSBC (14,816)22,005 National Bank Holdings
Corp ’A’ Morgan Stanley (18,484)(11,221) National Bankshares Inc Bank of America
Merrill Lynch 17,954(13,068) National Bankshares Inc Barclays Bank (3,790)(7,061) National Bankshares Inc Goldman Sachs 11,298
(12,807) National Bankshares Inc Morgan Stanley (3,714)(6,574) National Beverage Corp Bank of America
Merrill Lynch (29,057)(2,697) National Beverage Corp Barclays Bank (10,276)15,063 National CineMedia Inc Bank of America
Merrill Lynch 5,57326,676 National CineMedia Inc Barclays Bank 1,65430,368 National CineMedia Inc Goldman Sachs 11,23615,765 National CineMedia Inc Morgan Stanley 2059,089 National Energy Services
Reunited Corp Goldman Sachs (7,544)20,866 National Energy Services
Reunited Corp Morgan Stanley (10,224)(11,315) National Fuel Gas Co Bank of America
Merrill Lynch 2,037(9,511) National Fuel Gas Co Barclays Bank 5,421(6,144) National Fuel Gas Co Goldman Sachs 961(6,167) National Fuel Gas Co HSBC 6,105
(26,893) National Fuel Gas Co Morgan Stanley 15,329(22,432) National Health Investors
Inc (REIT)Bank of AmericaMerrill Lynch 20,638
(11,483) National Health InvestorsInc (REIT) Barclays Bank 9,769
(8,291) National Health InvestorsInc (REIT) Goldman Sachs 5,703
(12,129) National Health InvestorsInc (REIT) HSBC 54,944
(25,152) National Health InvestorsInc (REIT) Morgan Stanley 21,631
(2,430) National HealthCare Corp Barclays Bank 2,114(11,408) National HealthCare Corp Goldman Sachs 7,187(7,223) National HealthCare Corp HSBC (18,924)(6,119) National HealthCare Corp Morgan Stanley 5,32444,531 National Instruments Corp Morgan Stanley 33,398(2,168) National Presto Industries
IncBank of AmericaMerrill Lynch 12,336
(599) National Presto IndustriesInc Barclays Bank 1,072
(3,725) National Presto IndustriesInc Goldman Sachs 21,195
(3,291) National Presto IndustriesInc Morgan Stanley 5,891
8,881 National Research Corp Morgan Stanley (17,496)(8,340) National Retail Properties
Inc (REIT) Barclays Bank (5,588)(9,823) National Retail Properties
Inc (REIT) Goldman Sachs (12,770)
Holding Description Counterparty
Netunrealised
appreciation/(depreciation)
USD
United States continued19,398 National Storage Affiliates
Trust (REIT) Barclays Bank 16,10012,714 National Storage Affiliates
Trust (REIT) Morgan Stanley 10,55313,805 National Vision Holdings Inc Bank of America
Merrill Lynch (6,220)6,516 National Vision Holdings Inc Barclays Bank 8,536
24,207 National Vision Holdings Inc Goldman Sachs (7,129)10,140 National Vision Holdings Inc HSBC (8,142)3,471 National Vision Holdings Inc Morgan Stanley 4,547(572) National Western Life Group
Inc ’A’Bank of AmericaMerrill Lynch 5,485
(2,895) National Western Life GroupInc ’A’ Barclays Bank 5,153
(2,628) National Western Life GroupInc ’A’ Goldman Sachs 6,341
(692) National Western Life GroupInc ’A’ Morgan Stanley 238
687 Natural Gas Services GroupInc Goldman Sachs (199)
39,208 Natural Gas Services GroupInc Morgan Stanley (9,018)
(18,536) Natural Grocers by VitaminCottage Inc
Bank of AmericaMerrill Lynch (1,369)
(11,553) Natural Grocers by VitaminCottage Inc Barclays Bank (2,708)
(10,562) Natural Grocers by VitaminCottage Inc Goldman Sachs 2,723
(8,090) Natural Grocers by VitaminCottage Inc Morgan Stanley (2,346)
5,323 Natural Health Trends Corp Morgan Stanley (1,065)19,911 Nature’s Sunshine Products
IncBank of AmericaMerrill Lynch 24,094
20,720 Nature’s Sunshine ProductsInc Barclays Bank 9,738
10,524 Nature’s Sunshine ProductsInc Goldman Sachs 10,572
1,012 Nature’s Sunshine ProductsInc HSBC 101
19,046 Nature’s Sunshine ProductsInc Morgan Stanley 7,552
4,246 Natus Medical Inc Bank of AmericaMerrill Lynch (1,189)
38,838 Natus Medical Inc Goldman Sachs (10,875)12,226 Natus Medical Inc HSBC (7,336)3,339 Nautilus Inc Bank of America
Merrill Lynch 1,5363,967 Nautilus Inc Morgan Stanley 3,570
(20,609) Navient Corp Bank of AmericaMerrill Lynch (18,239)
(72,682) Navient Corp Barclays Bank (55,965)(7,505) Navient Corp Goldman Sachs (6,642)
(30,037) Navient Corp HSBC (30,638)(23,210) Navient Corp Morgan Stanley (17,872)21,284 Navigator Holdings Ltd Barclays Bank (10,429)7,527 Navigator Holdings Ltd Goldman Sachs (4,290)7,820 Navigator Holdings Ltd HSBC (6,256)
(5,907) Navistar International Corp Bank of AmericaMerrill Lynch 54
1,556 Navistar International Corp Bank of AmericaMerrill Lynch —
(19,312) Navistar International Corp Barclays Bank 58013,859 Navistar International Corp Barclays Bank (416)
(23,799) Navistar International Corp Goldman Sachs —12,857 Navistar International Corp Goldman Sachs (120)3,376 Navistar International Corp HSBC —
(6,523) Navistar International Corp Morgan Stanley 1962,940 Navistar International Corp Morgan Stanley (88)
(22,827) NBT Bancorp Inc HSBC (2,283)(17,747) NBT Bancorp Inc Morgan Stanley 19,522
BlackRock Americas Diversified Equity Absolute Return FundcontinuedPortfolio of Investments as at 31 May 2021
The notes on pages 590 to 610 form an integral part of these financial statements.
BlackRock Strategic Funds[130]

Holding Description Counterparty
Netunrealised
appreciation/(depreciation)
USD
United States continued1,979 nCino Inc Bank of America
Merrill Lynch 21,0571,207 nCino Inc Goldman Sachs 12,8423,212 NCR Corp Goldman Sachs (3,420)5,462 NCR Corp HSBC (3,769)5,215 Neenah Inc Goldman Sachs (17,679)9,204 Neenah Inc Morgan Stanley (21,629)
(3,186) Nektar Therapeutics Bank of AmericaMerrill Lynch 731
4,396 Nektar Therapeutics Barclays Bank 623(2,073) Nektar Therapeutics Barclays Bank 112
(18,015) Nektar Therapeutics Goldman Sachs 2,162(1,594) Nektar Therapeutics HSBC 2,646(7,404) Nelnet Inc ’A’ HSBC (2,073)(2,715) Nelnet Inc ’A’ Morgan Stanley 543,757 Nemaura Medical Inc Barclays Bank 2,292
810 NEOGAMES SA Bank of AmericaMerrill Lynch 13,349
1,617 NEOGAMES SA Goldman Sachs 26,6485,507 Neogen Corp Barclays Bank (2,038)2,196 Neogen Corp Goldman Sachs 2,2403,505 Neogen Corp Morgan Stanley (1,297)
(1,076) NeoGenomics Inc Bank of AmericaMerrill Lynch (3,658)
3,759 NeoGenomics Inc Bank of AmericaMerrill Lynch 5,998
14,508 NeoGenomics Inc Barclays Bank 27,914(1,162) NeoGenomics Inc Barclays Bank (2,370)8,908 NeoGenomics Inc Goldman Sachs 28,298(922) NeoGenomics Inc HSBC (4,095)
24,146 NeoGenomics Inc Morgan Stanley 34,385(6,324) Neoleukin Therapeutics Inc Bank of America
Merrill Lynch 5,375(7,958) Neoleukin Therapeutics Inc Barclays Bank 716
(11,281) Neoleukin Therapeutics Inc Goldman Sachs 6,159(3,007) Neoleukin Therapeutics Inc HSBC 2,135(2,605) Neoleukin Therapeutics Inc Morgan Stanley 234
(10,219) NeoPhotonics Corp Bank of AmericaMerrill Lynch (9,095)
(15,091) NeoPhotonics Corp Barclays Bank 604(13,340) NeoPhotonics Corp Goldman Sachs (6,272)(12,485) NeoPhotonics Corp HSBC (13,359)(32,318) NeoPhotonics Corp Morgan Stanley 1,293(10,008) NetApp Inc Bank of America
Merrill Lynch 10,709(10,789) NetApp Inc Barclays Bank 17,478(12,929) NetApp Inc Goldman Sachs 13,83419,212 NetApp Inc Morgan Stanley (31,123)(4,669) NetApp Inc Morgan Stanley 7,564
(149) Netflix Inc Bank of AmericaMerrill Lynch (2,067)
(2,210) Netflix Inc Barclays Bank 199(2,338) Netflix Inc Goldman Sachs (33,830)
(751) Netflix Inc HSBC (12,106)(1,340) Netflix Inc Morgan Stanley 1215,035 NETGEAR Inc Goldman Sachs 7,2507,181 NETGEAR Inc Morgan Stanley 6,822
(4,138) NetScout Systems Inc Bank of AmericaMerrill Lynch (6,704)
(715) NetScout Systems Inc Barclays Bank (1,051)(15,683) NetScout Systems Inc Goldman Sachs (25,406)(25,950) NetScout Systems Inc HSBC (71,103)(14,832) NetScout Systems Inc Morgan Stanley (21,803)(3,971) NETSTREIT Corp (REIT) Bank of America
Merrill Lynch (3,653)(25,165) NETSTREIT Corp (REIT) Goldman Sachs (23,152)(37,849) NeuBase Therapeutics Inc Bank of America
Merrill Lynch (8,327)(14,766) NeuBase Therapeutics Inc Barclays Bank (2,363)(1,280) Neurocrine Biosciences Inc Goldman Sachs (4,019)
Holding Description Counterparty
Netunrealised
appreciation/(depreciation)
USD
United States continued(8,953) Neurocrine Biosciences Inc Morgan Stanley (3,671)
(15,125) Neuronetics Inc Bank of AmericaMerrill Lynch (7,411)
(2,414) Neuronetics Inc Barclays Bank 2,245937 NeuroPace Inc Bank of America
Merrill Lynch 1,1342,621 NeuroPace Inc Barclays Bank 2,4382,807 NeuroPace Inc Goldman Sachs 3,3962,074 NeuroPace Inc Morgan Stanley 1,9295,799 Nevro Corp Bank of America
Merrill Lynch 37,75120,448 Nevro Corp Barclays Bank 23,8171,649 Nevro Corp HSBC (436)5,118 Nevro Corp Morgan Stanley 820
(2,260) New Fortress Energy Inc Morgan Stanley 5,96616,064 New Jersey Resources
CorpBank of AmericaMerrill Lynch 2,088
73,744 New Jersey ResourcesCorp Goldman Sachs 9,587
7,059 New Jersey ResourcesCorp HSBC (5,012)
2,050 New Jersey ResourcesCorp Morgan Stanley (1,169)
3,354 New Relic Inc Bank of AmericaMerrill Lynch 13,684
(4,595) New Relic Inc Bank of AmericaMerrill Lynch (14,335)
3,253 New Relic Inc Barclays Bank 3,546(2,278) New Relic Inc Barclays Bank (2,483)1,578 New Relic Inc Goldman Sachs 6,438
(5,068) New Relic Inc Goldman Sachs (19,681)(853) New Relic Inc HSBC (237)
(55,519) New Residential InvestmentCorp (REIT) Goldman Sachs (7,773)
3,797 New Residential InvestmentCorp (REIT) Goldman Sachs 532
(24,940) New Residential InvestmentCorp (REIT) HSBC (4,988)
16,592 New Residential InvestmentCorp (REIT) HSBC 4,335
(54,330) New Residential InvestmentCorp (REIT) Morgan Stanley (12,496)
(65,602) New Senior InvestmentGroup Inc (REIT) Goldman Sachs 10,496
(42,667) New Senior InvestmentGroup Inc (REIT) HSBC 3,413
(26,700) New Senior InvestmentGroup Inc (REIT) Morgan Stanley 4,539
60,837 New York Community Ban-corp Inc
Bank of AmericaMerrill Lynch 11,427
145,606 New York Community Ban-corp Inc Barclays Bank 19,989
67,000 New York Community Ban-corp Inc Goldman Sachs (8,710)
3,996 New York Community Ban-corp Inc HSBC 839
218,628 New York Community Ban-corp Inc Morgan Stanley 32,299
(122,463) New York Mortgage TrustInc (REIT)
Bank of AmericaMerrill Lynch (7,348)
(101,001) New York Mortgage TrustInc (REIT) Barclays Bank (1,010)
(131,605) New York Mortgage TrustInc (REIT) Morgan Stanley (1,316)
(1,249) New York Times Co ’A’ Bank of AmericaMerrill Lynch (287)
3,348 New York Times Co ’A’ Barclays Bank 1,540(3,324) New York Times Co ’A’ Barclays Bank 887(3,400) New York Times Co ’A’ Goldman Sachs (782)4,528 New York Times Co ’A’ HSBC (8,739)
BlackRock Americas Diversified Equity Absolute Return FundcontinuedPortfolio of Investments as at 31 May 2021
The notes on pages 590 to 610 form an integral part of these financial statements.
Annual report and audited financial statements [131]

Holding Description Counterparty
Netunrealised
appreciation/(depreciation)
USD
United States continued(1,653) New York Times Co ’A’ HSBC 3,19014,352 New York Times Co ’A’ Morgan Stanley 6,602(3,116) New York Times Co ’A’ Morgan Stanley (1,433)8,757 NewAge Inc Barclays Bank 1,138
13,236 NewAge Inc Goldman Sachs 3,9717,732 NewAge Inc HSBC 3,093
13,125 NewAge Inc Morgan Stanley 1,706(4,654) Newell Brands Inc HSBC 2,699
(14,944) Newell Brands Inc Morgan Stanley (6,575)54,532 Newmark Group Inc ’A’ Bank of America
Merrill Lynch (16,905)21,096 Newmark Group Inc ’A’ Barclays Bank (1,055)40,818 Newmark Group Inc ’A’ Goldman Sachs (12,654)17,302 Newmark Group Inc ’A’ HSBC 3,1145,307 Newmark Group Inc ’A’ Morgan Stanley (265)
270 NewMarket Corp Barclays Bank 50262 NewMarket Corp Goldman Sachs (707)
1,027 NewMarket Corp HSBC (7,939)458 NewMarket Corp Morgan Stanley 852
(1,070) NewMarket Corp Morgan Stanley (1,990)26,790 Newmont Corp Bank of America
Merrill Lynch (8,645)12,165 Newmont Corp Barclays Bank (4,445)7,917 Newmont Corp Goldman Sachs (2,336)
30,440 Newpark Resources Inc Bank of AmericaMerrill Lynch (7,306)
14,792 Newpark Resources Inc Barclays Bank —37,884 Newpark Resources Inc HSBC 758
(37,732) News Corp ’A’ Barclays Bank (2,743)(3,297) News Corp ’A’ Goldman Sachs (793)
(86,428) News Corp ’A’ Morgan Stanley (13,119)(36,718) News Corp ’B’ Morgan Stanley (3,672)
1,044 NexImmune Inc Bank of AmericaMerrill Lynch 626
968 NexImmune Inc Barclays Bank (407)3,020 NexImmune Inc HSBC 911,296 NexImmune Inc Morgan Stanley (544)
16,010 NexPoint Residential TrustInc (REIT) Morgan Stanley 7,205
(3,989) Nexstar Media Group Inc ’A’ Bank of AmericaMerrill Lynch 3,033
1,962 Nexstar Media Group Inc ’A’ Goldman Sachs 4,816(1,029) Nexstar Media Group Inc ’A’ Goldman Sachs (29)
494 Nexstar Media Group Inc ’A’ HSBC 1,907(1,116) Nexstar Media Group Inc ’A’ HSBC (903)6,314 Nexstar Media Group Inc ’A’ Morgan Stanley (5,556)8,713 NextCure Inc Bank of America
Merrill Lynch (1,394)16,172 NextCure Inc Barclays Bank (8,086)4,804 NextCure Inc Goldman Sachs (769)
15,562 NextCure Inc HSBC 1,71232,282 NextDecade Corp Morgan Stanley 646(4,559) NextEra Energy Inc Bank of America
Merrill Lynch (6,018)(256) NextEra Energy Inc Barclays Bank 207
(17,193) NextEra Energy Inc Goldman Sachs (8,872)(2,496) NextEra Energy Inc Morgan Stanley 2,0221,411 NextGen Healthcare Inc Barclays Bank (2,497)
19,532 NextGen Healthcare Inc Goldman Sachs (38,087)19,549 NextGen Healthcare Inc HSBC (32,451)
(68,020) NexTier Oilfield SolutionsInc
Bank of AmericaMerrill Lynch 36,731
(50,644) NexTier Oilfield SolutionsInc Goldman Sachs 27,348
(19,021) NGM BiopharmaceuticalsInc Barclays Bank 7,779
(1,393) NGM BiopharmaceuticalsInc Morgan Stanley 557
8,897 NI Holdings Inc Bank of AmericaMerrill Lynch (3,648)
Holding Description Counterparty
Netunrealised
appreciation/(depreciation)
USD
United States continued11,120 NI Holdings Inc Barclays Bank (3,336)17,241 NI Holdings Inc Goldman Sachs (7,069)16,681 NI Holdings Inc HSBC 6,5066,252 NI Holdings Inc Morgan Stanley (1,876)
19,538 Nicholas Financial Inc Bank of AmericaMerrill Lynch 2,931
(4,589) Nicolet Bankshares Inc HSBC 1,010(1,858) Nicolet Bankshares Inc Morgan Stanley (1,301)(6,618) Nielsen Holdings Plc Bank of America
Merrill Lynch 417(11,120) Nielsen Holdings Plc HSBC 9,674(16,219) Nielsen Holdings Plc Morgan Stanley 2,863
618 NIKE Inc ’B’ Bank of AmericaMerrill Lynch 2,237
6,543 NIKE Inc ’B’ Barclays Bank 15,652642 NIKE Inc ’B’ Goldman Sachs 32
2,167 NIKE Inc ’B’ HSBC 1305,320 NiSource Inc Barclays Bank (319)
(3,686) NiSource Inc Morgan Stanley 221657 Nkarta Inc Bank of America
Merrill Lynch (2,727)2,212 Nkarta Inc Barclays Bank (3,849)3,349 Nkarta Inc Goldman Sachs (8,737)
681 Nkarta Inc HSBC (650)(39,035) NL Industries Inc Bank of America
Merrill Lynch 15,614(2,310) NL Industries Inc Barclays Bank 832
(21,055) NL Industries Inc Goldman Sachs 8,422(3,077) nLight Inc Bank of America
Merrill Lynch (6,277)(4,514) nLight Inc Barclays Bank (7,584)
(432) nLight Inc Goldman Sachs (881)(9,503) NMI Holdings Inc ’A’ Barclays Bank (4,942)(6,817) NMI Holdings Inc ’A’ Goldman Sachs (3,886)
(10,194) NMI Holdings Inc ’A’ Morgan Stanley (5,301)(22,692) NN Inc Bank of America
Merrill Lynch 9,758(26,938) NN Inc Barclays Bank 14,277(12,015) NN Inc Goldman Sachs 5,166(8,618) NN Inc HSBC (259)
(14,139) NN Inc Morgan Stanley 7,494(30,695) Noodles & Co Barclays Bank (11,357)(7,050) Noodles & Co Goldman Sachs (7,614)
(18,533) Noodles & Co Morgan Stanley (6,857)16,980 Nordic American Tankers
Ltd HSBC 2,03852,796 Nordic American Tankers
Ltd Morgan Stanley (4,752)1,724 Nordson Corp Bank of America
Merrill Lynch 30,515(1,585) Nordson Corp HSBC (20,621)(4,724) Nordson Corp Morgan Stanley (90,795)11,381 Nordstrom Inc Bank of America
Merrill Lynch (28,102)7,390 Nordstrom Inc Barclays Bank (29,634)
10,641 Nordstrom Inc Goldman Sachs (101,834)3,725 Nordstrom Inc HSBC (16,568)3,290 Nordstrom Inc Morgan Stanley (13,193)
(1,078) Norfolk Southern Corp Morgan Stanley (453)(6,002) Northeast Bank Bank of America
Merrill Lynch (2,761)(4,984) Northeast Bank HSBC (9,220)(1,549) Northern Oil and Gas Inc Bank of America
Merrill Lynch (2,246)(3,344) Northern Oil and Gas Inc Barclays Bank (1,973)(7,008) Northern Oil and Gas Inc Goldman Sachs (10,162)
364 Northern Technologies In-ternational Corp
Bank of AmericaMerrill Lynch (80)
1,976 Northern Technologies In-ternational Corp Goldman Sachs (435)
BlackRock Americas Diversified Equity Absolute Return FundcontinuedPortfolio of Investments as at 31 May 2021
The notes on pages 590 to 610 form an integral part of these financial statements.
BlackRock Strategic Funds[132]

Holding Description Counterparty
Netunrealised
appreciation/(depreciation)
USD
United States continued7,337 Northern Technologies In-
ternational Corp Morgan Stanley (3,815)1,965 Northern Trust Corp Barclays Bank 1,041
568 Northern Trust Corp Goldman Sachs 324(700) Northern Trust Corp Morgan Stanley (371)
(143,894) Northfield Bancorp Inc Bank of AmericaMerrill Lynch 28,779
(12,257) Northfield Bancorp Inc Goldman Sachs 2,451(13,691) Northfield Bancorp Inc Morgan Stanley —25,641 Northrim BanCorp Inc Barclays Bank (18,974)16,932 Northrim BanCorp Inc Goldman Sachs (36,573)8,995 Northrim BanCorp Inc HSBC (180)
(18,836) Northwest Natural HoldingCo Barclays Bank 1,643
2,012 Northwest Natural HoldingCo Morgan Stanley (1,207)
(6,133) Northwest Pipe Co Bank of AmericaMerrill Lynch 1,901
(17,458) Northwest Pipe Co Barclays Bank 32,996(18,196) Northwest Pipe Co Goldman Sachs 5,641(3,380) Northwest Pipe Co HSBC 101(4,150) Northwest Pipe Co Morgan Stanley 7,84410,314 NorthWestern Corp Bank of America
Merrill Lynch (4,676)14,772 NorthWestern Corp Barclays Bank (6,073)7,915 NorthWestern Corp Goldman Sachs (5,145)
24,183 NorthWestern Corp HSBC (98,744)70,759 NorthWestern Corp Morgan Stanley (23,636)(4,236) NortonLifeLock Inc Bank of America
Merrill Lynch (4,282)(23,992) NortonLifeLock Inc Barclays Bank (3,839)(73,592) NortonLifeLock Inc Goldman Sachs (106,500)(33,937) NortonLifeLock Inc HSBC (30,990)(11,075) NortonLifeLock Inc Morgan Stanley (1,772)(23,190) Norwegian Cruise Line
Holdings Ltd Barclays Bank (42,902)(2,497) Norwood Financial Corp Bank of America
Merrill Lynch (474)(2,074) Norwood Financial Corp Barclays Bank —(2,575) Norwood Financial Corp Goldman Sachs (489)(1,696) Norwood Financial Corp HSBC 339(2,825) Norwood Financial Corp Morgan Stanley —(6,588) NOV Inc Barclays Bank 1,120(4,074) NOV Inc Goldman Sachs 7,455
(10,028) NOV Inc Morgan Stanley 1,70552,529 Novagold Resources Inc Barclays Bank 1,57615,190 Novagold Resources Inc Goldman Sachs (304)27,414 Novagold Resources Inc HSBC 25,76931,221 Novagold Resources Inc Morgan Stanley 937(1,033) Novanta Inc Bank of America
Merrill Lynch (3,399)(2,473) Novanta Inc Barclays Bank (4,748)
(748) Novanta Inc Goldman Sachs (2,461)(6,339) Novanta Inc Morgan Stanley (12,171)
599 Novavax Inc Barclays Bank 1,018226 Novavax Inc Goldman Sachs 1,686100 Novavax Inc HSBC (1,288)114 Novavax Inc Morgan Stanley 194
(3,416) Novocure Ltd Barclays Bank (64,084)(757) Novocure Ltd Goldman Sachs (21,953)
(2,817) Novocure Ltd HSBC (61,946)(1,775) Novocure Ltd Morgan Stanley (33,299)2,488 Novocure Ltd Morgan Stanley 46,675
29,490 NOW Inc Bank of AmericaMerrill Lynch (31,554)
22,454 NOW Inc Barclays Bank (1,572)4,874 NOW Inc Goldman Sachs (5,215)8,062 NOW Inc HSBC (7,014)9,079 NOW Inc Morgan Stanley (636)
(17,467) NRG Energy Inc Barclays Bank 28,122
Holding Description Counterparty
Netunrealised
appreciation/(depreciation)
USD
United States continued(11,608) NRG Energy Inc HSBC 38,423(44,364) NRG Energy Inc Morgan Stanley 71,426
4,253 Nu Skin Enterprises Inc ’A’ Bank of AmericaMerrill Lynch 1,395
5,737 Nu Skin Enterprises Inc ’A’ Barclays Bank (2,123)2,311 Nu Skin Enterprises Inc ’A’ Goldman Sachs 1,156
(3,791) Nu Skin Enterprises Inc ’A’ HSBC (3,981)1,093 Nu Skin Enterprises Inc ’A’ HSBC 1,148
(2,604) Nu Skin Enterprises Inc ’A’ Morgan Stanley 9638,795 Nu Skin Enterprises Inc ’A’ Morgan Stanley (3,254)
(4,536) Nucor Corp Bank of AmericaMerrill Lynch (484)
(4,839) Nucor Corp Barclays Bank (5,757)(7,539) Nucor Corp Goldman Sachs (12,006)
(43,331) Nucor Corp Morgan Stanley 35,532(3,169) Nurix Therapeutics Inc Barclays Bank (11,694)(5,889) Nurix Therapeutics Inc Goldman Sachs (12,190)(8,111) Nutanix Inc ’A’ Bank of America
Merrill Lynch 615(5,322) Nutanix Inc ’A’ Barclays Bank 2,3224,578 Nutanix Inc ’A’ Goldman Sachs 8,515
(20,103) Nutanix Inc ’A’ Goldman Sachs (16,294)9,317 Nutanix Inc ’A’ Morgan Stanley 4,938
(2,202) Nutanix Inc ’A’ Morgan Stanley (1,167)(61) NuVasive Inc Bank of America
Merrill Lynch 133(2,556) NuVasive Inc Barclays Bank 5,240(5,522) NuVasive Inc Morgan Stanley 11,320(1,064) NV5 Global Inc Barclays Bank (1,181)(4,057) NV5 Global Inc Goldman Sachs (14,321)(4,296) NV5 Global Inc HSBC (26,979)(6,664) NV5 Global Inc Morgan Stanley (7,397)(1,318) NVE Corp Bank of America
Merrill Lynch 3,229(13,725) NVE Corp Barclays Bank 5,078(8,143) NVE Corp Goldman Sachs 19,950(1,851) NVE Corp HSBC 11,291
(452) NVE Corp Morgan Stanley 167(22,899) nVent Electric Plc Barclays Bank (15,342)(12,492) nVent Electric Plc Goldman Sachs (7,245)(2,221) nVent Electric Plc HSBC (1,288)(9,688) nVent Electric Plc Morgan Stanley (6,491)(1,823) NVIDIA Corp Bank of America
Merrill Lynch (151,601)(742) NVIDIA Corp Barclays Bank (18,773)(738) NVIDIA Corp Goldman Sachs (61,372)974 NVIDIA Corp Goldman Sachs 303
(1,073) NVIDIA Corp Morgan Stanley (20,237)(19) NVR Inc Bank of America
Merrill Lynch (533)(55) NVR Inc Goldman Sachs (2,506)(17) NVR Inc HSBC (938)
(521) NVR Inc Morgan Stanley (118,756)(4,384) NXP Semiconductors NV Bank of America
Merrill Lynch (41,839)(14,710) NXP Semiconductors NV Barclays Bank (103,558)
(920) NXP Semiconductors NV Morgan Stanley (2,814)23,651 Nymox Pharmaceutical
CorpBank of AmericaMerrill Lynch (5,440)
21,901 Nymox PharmaceuticalCorp Goldman Sachs (5,037)
50,506 Nymox PharmaceuticalCorp Morgan Stanley —
1,509 Oak Street Health Inc Barclays Bank (3,259)950 Oak Street Health Inc Goldman Sachs 2,736
1,060 Oak Street Health Inc Morgan Stanley (2,290)3,294 Oak Valley Bancorp Bank of America
Merrill Lynch 3,8546,482 Oak Valley Bancorp Barclays Bank 5,510
10,299 Oak Valley Bancorp Goldman Sachs 12,050
BlackRock Americas Diversified Equity Absolute Return FundcontinuedPortfolio of Investments as at 31 May 2021
The notes on pages 590 to 610 form an integral part of these financial statements.
Annual report and audited financial statements [133]
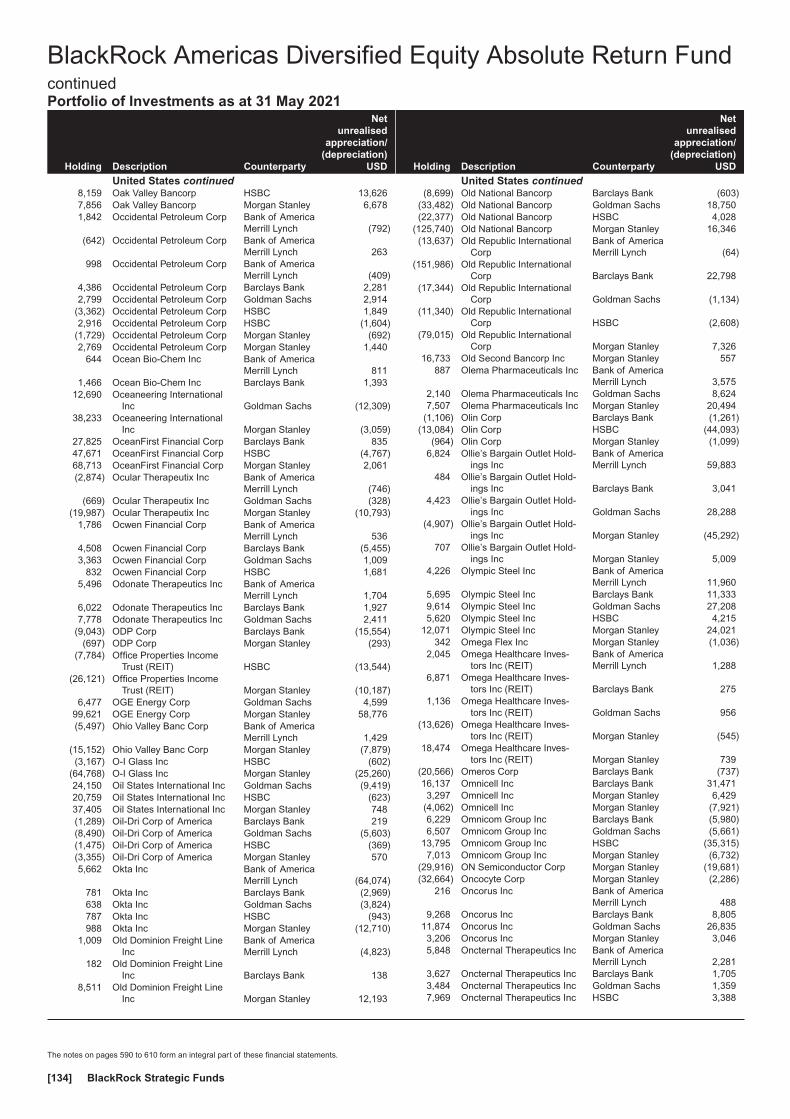
Holding Description Counterparty
Netunrealised
appreciation/(depreciation)
USD
United States continued8,159 Oak Valley Bancorp HSBC 13,6267,856 Oak Valley Bancorp Morgan Stanley 6,6781,842 Occidental Petroleum Corp Bank of America
Merrill Lynch (792)(642) Occidental Petroleum Corp Bank of America
Merrill Lynch 263998 Occidental Petroleum Corp Bank of America
Merrill Lynch (409)4,386 Occidental Petroleum Corp Barclays Bank 2,2812,799 Occidental Petroleum Corp Goldman Sachs 2,914
(3,362) Occidental Petroleum Corp HSBC 1,8492,916 Occidental Petroleum Corp HSBC (1,604)
(1,729) Occidental Petroleum Corp Morgan Stanley (692)2,769 Occidental Petroleum Corp Morgan Stanley 1,440
644 Ocean Bio-Chem Inc Bank of AmericaMerrill Lynch 811
1,466 Ocean Bio-Chem Inc Barclays Bank 1,39312,690 Oceaneering International
Inc Goldman Sachs (12,309)38,233 Oceaneering International
Inc Morgan Stanley (3,059)27,825 OceanFirst Financial Corp Barclays Bank 83547,671 OceanFirst Financial Corp HSBC (4,767)68,713 OceanFirst Financial Corp Morgan Stanley 2,061(2,874) Ocular Therapeutix Inc Bank of America
Merrill Lynch (746)(669) Ocular Therapeutix Inc Goldman Sachs (328)
(19,987) Ocular Therapeutix Inc Morgan Stanley (10,793)1,786 Ocwen Financial Corp Bank of America
Merrill Lynch 5364,508 Ocwen Financial Corp Barclays Bank (5,455)3,363 Ocwen Financial Corp Goldman Sachs 1,009
832 Ocwen Financial Corp HSBC 1,6815,496 Odonate Therapeutics Inc Bank of America
Merrill Lynch 1,7046,022 Odonate Therapeutics Inc Barclays Bank 1,9277,778 Odonate Therapeutics Inc Goldman Sachs 2,411
(9,043) ODP Corp Barclays Bank (15,554)(697) ODP Corp Morgan Stanley (293)
(7,784) Office Properties IncomeTrust (REIT) HSBC (13,544)
(26,121) Office Properties IncomeTrust (REIT) Morgan Stanley (10,187)
6,477 OGE Energy Corp Goldman Sachs 4,59999,621 OGE Energy Corp Morgan Stanley 58,776(5,497) Ohio Valley Banc Corp Bank of America
Merrill Lynch 1,429(15,152) Ohio Valley Banc Corp Morgan Stanley (7,879)(3,167) O-I Glass Inc HSBC (602)
(64,768) O-I Glass Inc Morgan Stanley (25,260)24,150 Oil States International Inc Goldman Sachs (9,419)20,759 Oil States International Inc HSBC (623)37,405 Oil States International Inc Morgan Stanley 748(1,289) Oil-Dri Corp of America Barclays Bank 219(8,490) Oil-Dri Corp of America Goldman Sachs (5,603)(1,475) Oil-Dri Corp of America HSBC (369)(3,355) Oil-Dri Corp of America Morgan Stanley 5705,662 Okta Inc Bank of America
Merrill Lynch (64,074)781 Okta Inc Barclays Bank (2,969)638 Okta Inc Goldman Sachs (3,824)787 Okta Inc HSBC (943)988 Okta Inc Morgan Stanley (12,710)
1,009 Old Dominion Freight LineInc
Bank of AmericaMerrill Lynch (4,823)
182 Old Dominion Freight LineInc Barclays Bank 138
8,511 Old Dominion Freight LineInc Morgan Stanley 12,193
Holding Description Counterparty
Netunrealised
appreciation/(depreciation)
USD
United States continued(8,699) Old National Bancorp Barclays Bank (603)
(33,482) Old National Bancorp Goldman Sachs 18,750(22,377) Old National Bancorp HSBC 4,028
(125,740) Old National Bancorp Morgan Stanley 16,346(13,637) Old Republic International
CorpBank of AmericaMerrill Lynch (64)
(151,986) Old Republic InternationalCorp Barclays Bank 22,798
(17,344) Old Republic InternationalCorp Goldman Sachs (1,134)
(11,340) Old Republic InternationalCorp HSBC (2,608)
(79,015) Old Republic InternationalCorp Morgan Stanley 7,326
16,733 Old Second Bancorp Inc Morgan Stanley 557887 Olema Pharmaceuticals Inc Bank of America
Merrill Lynch 3,5752,140 Olema Pharmaceuticals Inc Goldman Sachs 8,6247,507 Olema Pharmaceuticals Inc Morgan Stanley 20,494
(1,106) Olin Corp Barclays Bank (1,261)(13,084) Olin Corp HSBC (44,093)
(964) Olin Corp Morgan Stanley (1,099)6,824 Ollie’s Bargain Outlet Hold-
ings IncBank of AmericaMerrill Lynch 59,883
484 Ollie’s Bargain Outlet Hold-ings Inc Barclays Bank 3,041
4,423 Ollie’s Bargain Outlet Hold-ings Inc Goldman Sachs 28,288
(4,907) Ollie’s Bargain Outlet Hold-ings Inc Morgan Stanley (45,292)
707 Ollie’s Bargain Outlet Hold-ings Inc Morgan Stanley 5,009
4,226 Olympic Steel Inc Bank of AmericaMerrill Lynch 11,960
5,695 Olympic Steel Inc Barclays Bank 11,3339,614 Olympic Steel Inc Goldman Sachs 27,2085,620 Olympic Steel Inc HSBC 4,215
12,071 Olympic Steel Inc Morgan Stanley 24,021342 Omega Flex Inc Morgan Stanley (1,036)
2,045 Omega Healthcare Inves-tors Inc (REIT)
Bank of AmericaMerrill Lynch 1,288
6,871 Omega Healthcare Inves-tors Inc (REIT) Barclays Bank 275
1,136 Omega Healthcare Inves-tors Inc (REIT) Goldman Sachs 956
(13,626) Omega Healthcare Inves-tors Inc (REIT) Morgan Stanley (545)
18,474 Omega Healthcare Inves-tors Inc (REIT) Morgan Stanley 739
(20,566) Omeros Corp Barclays Bank (737)16,137 Omnicell Inc Barclays Bank 31,4713,297 Omnicell Inc Morgan Stanley 6,429
(4,062) Omnicell Inc Morgan Stanley (7,921)6,229 Omnicom Group Inc Barclays Bank (5,980)6,507 Omnicom Group Inc Goldman Sachs (5,661)
13,795 Omnicom Group Inc HSBC (35,315)7,013 Omnicom Group Inc Morgan Stanley (6,732)
(29,916) ON Semiconductor Corp Morgan Stanley (19,681)(32,664) Oncocyte Corp Morgan Stanley (2,286)
216 Oncorus Inc Bank of AmericaMerrill Lynch 488
9,268 Oncorus Inc Barclays Bank 8,80511,874 Oncorus Inc Goldman Sachs 26,8353,206 Oncorus Inc Morgan Stanley 3,0465,848 Oncternal Therapeutics Inc Bank of America
Merrill Lynch 2,2813,627 Oncternal Therapeutics Inc Barclays Bank 1,7053,484 Oncternal Therapeutics Inc Goldman Sachs 1,3597,969 Oncternal Therapeutics Inc HSBC 3,388
BlackRock Americas Diversified Equity Absolute Return FundcontinuedPortfolio of Investments as at 31 May 2021
The notes on pages 590 to 610 form an integral part of these financial statements.
BlackRock Strategic Funds[134]

Holding Description Counterparty
Netunrealised
appreciation/(depreciation)
USD
United States continued(2,174) Ondas Holdings Inc Bank of America
Merrill Lynch (3,739)(31,644) Ondas Holdings Inc Barclays Bank (49,681)
7,592 ONE Gas Inc Goldman Sachs 9116,182 ONE Group Hospitality Inc Bank of America
Merrill Lynch (2,658)2,843 ONE Group Hospitality Inc Goldman Sachs (1,222)
620 ONE Group Hospitality Inc HSBC 89311,602 ONE Group Hospitality Inc Morgan Stanley 3,94510,545 One Liberty Properties Inc
(REIT) Goldman Sachs 5,5895,541 OneMain Holdings Inc Bank of America
Merrill Lynch 18,106566 OneMain Holdings Inc Barclays Bank 1,517
4,948 OneMain Holdings Inc Goldman Sachs 15,83410,759 OneMain Holdings Inc HSBC 21,4105,232 OneMain Holdings Inc Morgan Stanley 3,486
(2,864) ONEOK Inc Bank of AmericaMerrill Lynch 6,501
(944) ONEOK Inc Barclays Bank 1,322(7,855) ONEOK Inc Goldman Sachs 17,831(2,354) ONEOK Inc HSBC 2,872(3,731) ONEOK Inc Morgan Stanley 5,2239,455 ONEOK Inc Morgan Stanley (13,237)
(19,882) OneSpan Inc Goldman Sachs (25,548)(4,406) OneSpan Inc HSBC (6,212)
(19,890) OneSpan Inc Morgan Stanley (8,354)(4,721) OneSpaWorld Holdings Ltd Barclays Bank (1,652)
(14,457) OneSpaWorld Holdings Ltd Goldman Sachs (3,759)(7,141) OneSpaWorld Holdings Ltd HSBC (5,713)(3,959) OneSpaWorld Holdings Ltd Morgan Stanley (787)(1,168) OneWater Marine Inc ’A’ Bank of America
Merrill Lynch 2,044(7,387) OneWater Marine Inc ’A’ Barclays Bank (7,134)
(606) OneWater Marine Inc ’A’ Morgan Stanley (600)(14,264) Onto Innovation Inc Morgan Stanley (76,883)(7,438) Ontrak Inc Barclays Bank (5,207)26,528 Ooma Inc Bank of America
Merrill Lynch 86,21617,763 Ooma Inc Goldman Sachs 57,7302,363 Ooma Inc HSBC 7,8921,148 Ooma Inc Morgan Stanley 3,880
10,568 OP Bancorp Bank of AmericaMerrill Lynch (4,610)
23,439 OP Bancorp Goldman Sachs (11,720)1,350 OP Bancorp HSBC (1,134)
26,830 OP Bancorp Morgan Stanley (6,439)(1,782) Open Lending Corp ’A’ Morgan Stanley (3,350)9,084 Open Lending Corp ’A’ Morgan Stanley 17,078
(45,387) Opendoor Technologies Inc Barclays Bank (24,386)11,606 OPKO Health Inc Bank of America
Merrill Lynch (492)6,120 OPKO Health Inc Goldman Sachs 1,2854,646 OPKO Health Inc HSBC 42
64,147 OPKO Health Inc Morgan Stanley 3,84914,702 Oportun Financial Corp Goldman Sachs (12,938)9,770 Oportun Financial Corp HSBC (18,758)
876 Oportun Financial Corp Morgan Stanley (1,498)(8,698) Oppenheimer Holdings Inc
’A’ Morgan Stanley (6,437)(3,004) OptimizeRx Corp Bank of America
Merrill Lynch (16,252)(2,089) OptimizeRx Corp Barclays Bank (480)(1,868) OptimizeRx Corp Goldman Sachs (10,106)
(17,093) OptimizeRx Corp Morgan Stanley (3,931)34,703 Optinose Inc Bank of America
Merrill Lynch 34727,036 Optinose Inc Goldman Sachs 27021,787 Optinose Inc HSBC 5,229
Holding Description Counterparty
Netunrealised
appreciation/(depreciation)
USD
United States continued12,313 Option Care Health Inc Morgan Stanley (6,403)(6,822) Oracle Corp Bank of America
Merrill Lynch 1,348(9,536) Oracle Corp Barclays Bank 6,1036,113 Oracle Corp Barclays Bank (3,912)
(4,159) Oracle Corp Goldman Sachs 1,4149,490 Oracle Corp Goldman Sachs (3,227)
(11,585) Oracle Corp HSBC 16,335(34,272) Oracle Corp Morgan Stanley 21,18928,015 OraSure Technologies Inc Bank of America
Merrill Lynch 4,7639,794 OraSure Technologies Inc Barclays Bank 196
33,563 OraSure Technologies Inc Goldman Sachs 5,7064,856 OraSure Technologies Inc HSBC (583)
11,072 OraSure Technologies Inc Morgan Stanley 7(19,579) Orbital Energy Group Inc Barclays Bank (8,223)(24,163) Orchid Island Capital Inc
(REIT) Barclays Bank 3,141(133,549) Orchid Island Capital Inc
(REIT) Goldman Sachs 5,342(7,716) Orchid Island Capital Inc
(REIT) HSBC (77)(41,453) Orchid Island Capital Inc
(REIT) Morgan Stanley 5,389211 O’Reilly Automotive Inc Barclays Bank (371)
(395) O’Reilly Automotive Inc Barclays Bank 574(965) O’Reilly Automotive Inc Goldman Sachs 9,146
(5,114) O’Reilly Automotive Inc Morgan Stanley 7,3941,484 Organogenesis Holdings Inc Bank of America
Merrill Lynch 2,0877,897 Organogenesis Holdings Inc Goldman Sachs 6,3183,603 Organogenesis Holdings Inc Morgan Stanley 2,1983,306 Orgenesis Inc Bank of America
Merrill Lynch (99)7,279 Orgenesis Inc Barclays Bank —7,034 Orgenesis Inc Goldman Sachs (211)6,913 Orgenesis Inc Morgan Stanley —1,138 ORIC Pharmaceuticals Inc Barclays Bank 2161,861 ORIC Pharmaceuticals Inc Goldman Sachs (4,001)
(21,634) Origin Bancorp Inc Morgan Stanley (2,812)(27,530) Orion Energy Systems Inc Bank of America
Merrill Lynch (15,692)(28,014) Orion Energy Systems Inc Barclays Bank (10,645)(4,857) Orion Energy Systems Inc HSBC (4,080)
(22,172) Orion Energy Systems Inc Morgan Stanley (8,425)(51,954) Orion Engineered Carbons
SA Barclays Bank 6,234(2,061) Ormat Technologies Inc Bank of America
Merrill Lynch (7,646)(537) Ormat Technologies Inc Barclays Bank 134
(1,018) Ormat Technologies Inc Goldman Sachs (1,603)3,236 Ormat Technologies Inc Goldman Sachs 12,0062,859 Ormat Technologies Inc HSBC 8,348
(2,157) Ormat Technologies Inc Morgan Stanley 5394,262 Orrstown Financial Services
IncBank of AmericaMerrill Lynch (1,151)
11,579 Orrstown Financial ServicesInc Barclays Bank (6,021)
23,587 Orrstown Financial ServicesInc Goldman Sachs (6,368)
1,767 Orrstown Financial ServicesInc HSBC 1,043
21,494 Orrstown Financial ServicesInc Morgan Stanley (11,177)
1,417 Ortho Clinical Diagnos-tics Holdings Plc
Bank of AmericaMerrill Lynch 113
(2,931) Ortho Clinical Diagnos-tics Holdings Plc
Bank of AmericaMerrill Lynch (882)
BlackRock Americas Diversified Equity Absolute Return FundcontinuedPortfolio of Investments as at 31 May 2021
The notes on pages 590 to 610 form an integral part of these financial statements.
Annual report and audited financial statements [135]

Holding Description Counterparty
Netunrealised
appreciation/(depreciation)
USD
United States continued4,722 Ortho Clinical Diagnos-
tics Holdings Plc Barclays Bank 2,314(5,434) Ortho Clinical Diagnos-
tics Holdings Plc Barclays Bank (2,663)(13,756) Ortho Clinical Diagnos-
tics Holdings Plc Goldman Sachs (2,291)(7,064) Ortho Clinical Diagnos-
tics Holdings Plc HSBC 50718,001 Ortho Clinical Diagnos-
tics Holdings Plc Morgan Stanley 8,820(3,386) Ortho Clinical Diagnos-
tics Holdings Plc Morgan Stanley (1,457)13,011 Orthofix Medical Inc Bank of America
Merrill Lynch (5,649)13,928 Orthofix Medical Inc Barclays Bank (15,460)2,837 Orthofix Medical Inc Morgan Stanley (353)
(5,041) OrthoPediatrics Corp Bank of AmericaMerrill Lynch (11,594)
(545) OrthoPediatrics Corp Barclays Bank (638)(4,169) OrthoPediatrics Corp Goldman Sachs (9,589)(6,155) OrthoPediatrics Corp Morgan Stanley (7,201)1,188 Oscar Health Inc ’A’ Bank of America
Merrill Lynch 1,33325,568 Oscar Health Inc ’A’ Barclays Bank 32,9823,561 Oscar Health Inc ’A’ Goldman Sachs 5,7692,031 Oscar Health Inc ’A’ HSBC 2,018
695 Oscar Health Inc ’A’ Morgan Stanley 897(7,532) Oshkosh Corp Bank of America
Merrill Lynch 23,491730 Oshkosh Corp Barclays Bank (185)
(1,194) Oshkosh Corp Barclays Bank 2394,158 Oshkosh Corp Goldman Sachs (22,786)
(3,953) Oshkosh Corp Goldman Sachs 20,901(1,967) Oshkosh Corp HSBC 7,76112,660 Oshkosh Corp Morgan Stanley (2,532)(6,043) Oshkosh Corp Morgan Stanley 1,2091,056 OSI Systems Inc Bank of America
Merrill Lynch 8346,794 OSI Systems Inc Barclays Bank 6,7946,255 OSI Systems Inc Goldman Sachs 4,941
473 OSI Systems Inc HSBC 27034,551 OSI Systems Inc Morgan Stanley 33,18616,828 Osmotica Pharmaceuticals
Plc Morgan Stanley (505)7,816 Otis Worldwide Corp Barclays Bank (630)
37,418 Otis Worldwide Corp Goldman Sachs 895,412 Otis Worldwide Corp HSBC 8979,399 Otis Worldwide Corp Morgan Stanley (2,332)
(72,684) Otonomy Inc Bank of AmericaMerrill Lynch 2,907
(14,831) Otonomy Inc Goldman Sachs 5937,486 Otter Tail Corp Barclays Bank 1,1984,735 Outfront Media Inc (REIT) Bank of America
Merrill Lynch 4,02510,604 Outfront Media Inc (REIT) Barclays Bank 4,45432,129 Outfront Media Inc (REIT) HSBC 9,96012,561 Outfront Media Inc (REIT) Morgan Stanley 5,276(4,393) Outset Medical Inc Bank of America
Merrill Lynch (21,701)(638) Outset Medical Inc Barclays Bank (1,480)
(138,038) Overseas ShipholdingGroup Inc ’A’
Bank of AmericaMerrill Lynch (13,804)
(25,219) Overseas ShipholdingGroup Inc ’A’ Barclays Bank 252
(11,707) Overseas ShipholdingGroup Inc ’A’ Goldman Sachs (1,171)
(9,870) Overseas ShipholdingGroup Inc ’A’ HSBC 395
(4,708) Overstock.com Inc Bank of AmericaMerrill Lynch (36,135)
Holding Description Counterparty
Netunrealised
appreciation/(depreciation)
USD
United States continued2,618 Overstock.com Inc Bank of America
Merrill Lynch 30,6573,797 Overstock.com Inc Goldman Sachs 44,463
526 Overstock.com Inc HSBC 5,4763,216 Overstock.com Inc Morgan Stanley 14,472
(11,490) Ovid therapeutics Inc Barclays Bank (3,217)(43,277) Ovid therapeutics Inc Goldman Sachs (20,773)(4,076) Ovid therapeutics Inc HSBC (3,179)1,209 Ovintiv Inc Bank of America
Merrill Lynch (19)20,581 Ovintiv Inc Barclays Bank 12,3219,790 Ovintiv Inc Goldman Sachs (455)
10,305 Ovintiv Inc HSBC 11,89818,625 Ovintiv Inc Morgan Stanley 12,706(1,176) Owens & Minor Inc Barclays Bank (15,206)(2,325) Owens & Minor Inc HSBC (26,273)
261 Owens Corning Bank of AmericaMerrill Lynch 241
10,687 Owens Corning Goldman Sachs 3,9864,279 Owens Corning Morgan Stanley 2,2891,978 Oxford Industries Inc Bank of America
Merrill Lynch 2184,250 Oxford Industries Inc Barclays Bank 12,0281,892 Oxford Industries Inc Morgan Stanley 5,3543,159 Oyster Point Pharma Inc Barclays Bank 5698,389 Oyster Point Pharma Inc Goldman Sachs 7,8865,751 Oyster Point Pharma Inc HSBC 6,269
11,793 Oyster Point Pharma Inc Morgan Stanley 2,1237,122 PACCAR Inc Morgan Stanley (1,994)
(6,852) Pacific Biosciences of Cali-fornia Inc
Bank of AmericaMerrill Lynch (25,079)
(4,746) Pacific Biosciences of Cali-fornia Inc Goldman Sachs (14,509)
(9,974) Pacific Mercantile Bancorp Barclays Bank 1,297(11,588) Pacific Mercantile Bancorp Goldman Sachs 695(13,526) Pacific Premier Bancorp Inc Bank of America
Merrill Lynch (2,000)(32,579) Pacific Premier Bancorp Inc Barclays Bank (23,131)(60,661) Pacific Premier Bancorp Inc Goldman Sachs —(6,848) Pacific Premier Bancorp Inc HSBC (3,629)(8,059) Pacific Premier Bancorp Inc Morgan Stanley (5,722)(4,829) Pacira BioSciences Inc Bank of America
Merrill Lynch 4,845(4,527) Pacira BioSciences Inc Barclays Bank 26,302(1,053) Pacira BioSciences Inc Goldman Sachs 979(8,863) Pacira BioSciences Inc HSBC 1,950(3,124) Packaging Corp of America Bank of America
Merrill Lynch 9,909(1,165) Packaging Corp of America Barclays Bank 3,320
(741) Packaging Corp of America Goldman Sachs 2,5123,320 Packaging Corp of America Goldman Sachs (21,514)
(5,046) Packaging Corp of America Morgan Stanley 14,381(2,455) Pactiv Evergreen Inc Bank of America
Merrill Lynch (134)(25,755) Pactiv Evergreen Inc Barclays Bank 28,048(6,435) Pactiv Evergreen Inc Goldman Sachs 3,7503,327 PacWest Bancorp Bank of America
Merrill Lynch (4,059)1,891 PacWest Bancorp Barclays Bank 7004,480 PacWest Bancorp HSBC 4,3015,249 PacWest Bancorp Morgan Stanley 1,943
36,233 PAE Inc Bank of AmericaMerrill Lynch (17,392)
78,524 PAE Inc Barclays Bank (31,410)27,187 PAE Inc Goldman Sachs (7,163)22,978 PAE Inc HSBC (12,035)13,513 PAE Inc Morgan Stanley (5,405)3,621 PagerDuty Inc Bank of America
Merrill Lynch 22,849
BlackRock Americas Diversified Equity Absolute Return FundcontinuedPortfolio of Investments as at 31 May 2021
The notes on pages 590 to 610 form an integral part of these financial statements.
BlackRock Strategic Funds[136]

Holding Description Counterparty
Netunrealised
appreciation/(depreciation)
USD
United States continued3,177 PagerDuty Inc Barclays Bank 11,469
10,047 PagerDuty Inc Goldman Sachs 48,4633,079 PagerDuty Inc Morgan Stanley 11,115
(1,321) Palantir Technologies Inc ’A’ Bank of AmericaMerrill Lynch (3,289)
(11,905) Palantir Technologies Inc ’A’ Goldman Sachs (29,643)(3,196) Palo Alto Networks Inc HSBC (70,024)(1,857) Palo Alto Networks Inc Morgan Stanley 2,358(4,280) Palomar Holdings Inc Bank of America
Merrill Lynch (32,614)(1,403) Palomar Holdings Inc Barclays Bank (5,037)
(791) Palomar Holdings Inc HSBC (5,418)(4,690) Palomar Holdings Inc Morgan Stanley (16,837)
(798) PAM Transportation Ser-vices Inc Barclays Bank 383
(2,802) PAM Transportation Ser-vices Inc Morgan Stanley 1,345
10,265 Pan American Silver Corp Bank of AmericaMerrill Lynch 51
46,959 Pan American Silver Corp Goldman Sachs 23521,553 Pan American Silver Corp Morgan Stanley —
(102,658) Pangaea Logistics SolutionsLtd Barclays Bank 11,341
(5,732) Pangaea Logistics SolutionsLtd Goldman Sachs (1,548)
(8,167) Papa John’s InternationalInc Barclays Bank 3,348
(169) Papa John’s InternationalInc Goldman Sachs 380
8,815 Par Pacific Holdings Inc Barclays Bank (2,204)14,196 Par Pacific Holdings Inc Goldman Sachs 8,66014,168 Par Pacific Holdings Inc Morgan Stanley (3,542)
669 PAR Technology Corp Bank of AmericaMerrill Lynch 5,780
1,962 PAR Technology Corp Goldman Sachs 16,9521,348 Paramount Group Inc
(REIT)Bank of AmericaMerrill Lynch 620
19,288 Paramount Group Inc(REIT) Barclays Bank 1,350
16,892 Paramount Group Inc(REIT) Goldman Sachs 7,770
(13,821) Paramount Group Inc(REIT) Goldman Sachs (6,358)
61,268 Paramount Group Inc(REIT) HSBC 23,282
112,955 Paramount Group Inc(REIT) Morgan Stanley 7,907
(29,496) Paratek PharmaceuticalsInc Goldman Sachs (23,007)
(15,672) Paratek PharmaceuticalsInc Morgan Stanley (3,761)
(12,531) Park Aerospace Corp Bank of AmericaMerrill Lynch (12,155)
(27,056) Park Aerospace Corp Barclays Bank (11,289)(36,926) Park Aerospace Corp Goldman Sachs (35,818)(14,459) Park Aerospace Corp HSBC (27,906)(19,328) Park Aerospace Corp Morgan Stanley (9,277)(21,646) Park City Group Inc Bank of America
Merrill Lynch (19,048)(117,868) Park City Group Inc Barclays Bank 70,721(10,895) Park City Group Inc Goldman Sachs (9,588)33,600 Park Hotels & Resorts Inc
(REIT)Bank of AmericaMerrill Lynch (25,872)
6,932 Park Hotels & Resorts Inc(REIT) Barclays Bank 694
1,334 Park Hotels & Resorts Inc(REIT) Goldman Sachs (1,027)
22,834 Park Hotels & Resorts Inc(REIT) HSBC (29,228)
10,528 Park Hotels & Resorts Inc(REIT) Morgan Stanley 1,053
Holding Description Counterparty
Netunrealised
appreciation/(depreciation)
USD
United States continued(27,763) Park National Corp Morgan Stanley (36,925)(11,201) Parke Bancorp Inc Bank of America
Merrill Lynch (1,363)(4,779) Parke Bancorp Inc Barclays Bank (621)(2,929) Parke Bancorp Inc Goldman Sachs (1,453)(9,235) Parke Bancorp Inc Morgan Stanley (1,201)4,891 Parker Drilling Co HSBC 3672,560 Parker Drilling Co Morgan Stanley 4485,559 Parker-Hannifin Corp Barclays Bank 12,6749,245 Parker-Hannifin Corp Morgan Stanley 21,0783,824 Park-Ohio Holdings Corp Goldman Sachs 4,551
(9,347) Parsons Corp HSBC 29,817(14,290) Parsons Corp Morgan Stanley 5,430
1,497 Partners Bancorp Bank of AmericaMerrill Lynch (180)
9,254 Partners Bancorp Barclays Bank 1,8516,937 Partners Bancorp Goldman Sachs (832)1,400 Partners Bancorp HSBC 350
16,432 Partners Bancorp Morgan Stanley 3,2864,386 PARTS iD Inc Bank of America
Merrill Lynch 9651,606 PARTS iD Inc Barclays Bank 6581,300 PARTS iD Inc Goldman Sachs 592
400 PARTS iD Inc HSBC 1245,471 PARTS iD Inc Morgan Stanley 2,243
(32,222) Party City Holdco Inc Barclays Bank (20,300)10,741 Passage Bio Inc Barclays Bank (6,876)4,174 Passage Bio Inc Goldman Sachs (4,606)1,172 Passage Bio Inc HSBC (3,046)2,292 Passage Bio Inc Morgan Stanley (1,742)
(1,620) Patrick Industries Inc Morgan Stanley (616)10,506 Patterson Cos Inc Bank of America
Merrill Lynch (32,043)6,528 Patterson Cos Inc Barclays Bank (9,466)7,362 Patterson Cos Inc Goldman Sachs (119)4,069 Patterson Cos Inc HSBC (12,471)
28,794 Patterson Cos Inc Morgan Stanley (41,751)42,221 Patterson-UTI Energy Inc Barclays Bank (1,689)52,268 Patterson-UTI Energy Inc Goldman Sachs (31,883)21,634 Patterson-UTI Energy Inc HSBC 1,08235,256 Patterson-UTI Energy Inc Morgan Stanley (1,410)
(86,878) PAVmed Inc Barclays Bank (46,045)33,770 Paya Holdings Inc ’A’ Bank of America
Merrill Lynch 16,88512,510 Paya Holdings Inc ’A’ Barclays Bank (3,503)26,358 Paychex Inc Bank of America
Merrill Lynch 34,00214,016 Paychex Inc Barclays Bank (9,612)24,601 Paychex Inc Goldman Sachs 31,735
(62) Paycom Software Inc Bank of AmericaMerrill Lynch (459)
(2,665) Paycom Software Inc Barclays Bank 18,2297,608 Paylocity Holding Corp Bank of America
Merrill Lynch 47,8121,230 Paylocity Holding Corp Barclays Bank (689)3,877 Paylocity Holding Corp Goldman Sachs 24,6143,736 Paylocity Holding Corp HSBC 12,8565,514 Paylocity Holding Corp Morgan Stanley (3,088)
(1,973) PayPal Holdings Inc Bank of AmericaMerrill Lynch (30,897)
(1,516) PayPal Holdings Inc Barclays Bank (4,321)1,198 PayPal Holdings Inc Goldman Sachs 18,761
(4,112) PayPal Holdings Inc Goldman Sachs (64,394)4,443 PayPal Holdings Inc HSBC 72,821(208) PayPal Holdings Inc HSBC (3,409)
1,211 PayPal Holdings Inc Morgan Stanley 3,451(4,826) PayPal Holdings Inc Morgan Stanley (13,754)
(41,190) Paysign Inc Bank of AmericaMerrill Lynch (5,767)
(17,193) Paysign Inc Barclays Bank 688
BlackRock Americas Diversified Equity Absolute Return FundcontinuedPortfolio of Investments as at 31 May 2021
The notes on pages 590 to 610 form an integral part of these financial statements.
Annual report and audited financial statements [137]

Holding Description Counterparty
Netunrealised
appreciation/(depreciation)
USD
United States continued(10,910) Paysign Inc Goldman Sachs (1,527)(11,281) Paysign Inc HSBC 1,354(15,724) Paysign Inc Morgan Stanley 629
4,601 PBF Energy Inc ’A’ Bank of AmericaMerrill Lynch 1,426
11,436 PBF Energy Inc ’A’ Barclays Bank 4,3468,782 PBF Energy Inc ’A’ Goldman Sachs 2,722
25,420 PBF Energy Inc ’A’ HSBC (2,542)1,690 PC Connection Inc Barclays Bank (135)1,493 PC Connection Inc HSBC 3,479
31,657 PC Connection Inc Morgan Stanley (2,533)25,001 PCB Bancorp Barclays Bank —8,960 PCB Bancorp Goldman Sachs (5,286)
27,064 PCB Bancorp Morgan Stanley —20,863 PCSB Financial Corp Bank of America
Merrill Lynch (626)16,879 PCSB Financial Corp Barclays Bank (506)42,748 PCSB Financial Corp Goldman Sachs (1,282)34,188 PCSB Financial Corp HSBC 20,85543,565 PCSB Financial Corp Morgan Stanley (1,307)(5,656) PCTEL Inc Bank of America
Merrill Lynch (47)(16,173) PCTEL Inc Goldman Sachs 147(7,745) PDC Energy Inc Goldman Sachs 2,478(7,162) PDC Energy Inc HSBC (9,955)(6,029) PDC Energy Inc Morgan Stanley (11,093)
(11,490) PDF Solutions Inc Morgan Stanley 7,239(337,585) PDL BioPharma Inc* Bank of America
Merrill Lynch 41,692(46,279) PDL BioPharma Inc* Barclays Bank 5,715(74,293) PDL BioPharma Inc* Goldman Sachs 9,175(98,282) PDL BioPharma Inc* HSBC 12,138
(141,740) PDL BioPharma Inc* Morgan Stanley 17,505(9,482) Peapack-Gladstone Finan-
cial Corp Morgan Stanley (2,560)(15,853) Pebblebrook Hotel Trust
(REIT)Bank of AmericaMerrill Lynch 5,379
(25,678) Pebblebrook Hotel Trust(REIT) Barclays Bank (12,582)
(14,206) Pebblebrook Hotel Trust(REIT) Goldman Sachs 2,324
(2,875) Pebblebrook Hotel Trust(REIT) Morgan Stanley (1,409)
418 Pegasystems Inc Bank of AmericaMerrill Lynch 573
11,300 Pegasystems Inc Barclays Bank (43,844)5,649 Pegasystems Inc Goldman Sachs 7,7391,015 Pegasystems Inc HSBC (264)2,072 Pegasystems Inc Morgan Stanley (8,039)(795) Peloton Interactive Inc ’A’ Barclays Bank (7,274)(983) Peloton Interactive Inc ’A’ HSBC (22,432)
(8,597) Peloton Interactive Inc ’A’ Morgan Stanley (78,663)(6,610) Penn National Gaming Inc Bank of America
Merrill Lynch (7,403)1,942 Penn National Gaming Inc Barclays Bank 3,476
(1,679) Penn National Gaming Inc Goldman Sachs (1,880)4,440 Penn National Gaming Inc Morgan Stanley 7,947(829) Penn National Gaming Inc Morgan Stanley (1,484)
(1,486) Penn Virginia Corp Bank of AmericaMerrill Lynch 89
(1,740) Penn Virginia Corp Barclays Bank (922)(2,722) Penn Virginia Corp Goldman Sachs 163(1,613) Pennant Group Inc Bank of America
Merrill Lynch (2,678)(1,357) Pennant Group Inc Barclays Bank (2,443)(1,440) Pennant Group Inc Goldman Sachs (2,390)(2,256) Pennant Group Inc HSBC 5,189(6,645) Pennant Group Inc Morgan Stanley (11,961)2,680 Penns Woods Bancorp Inc Bank of America
Merrill Lynch 1,179
Holding Description Counterparty
Netunrealised
appreciation/(depreciation)
USD
United States continued9,623 Penns Woods Bancorp Inc Barclays Bank 3,9454,640 Penns Woods Bancorp Inc Goldman Sachs 2,042
12,466 Penns Woods Bancorp Inc Morgan Stanley 5,111(3,754) PennyMac Financial Ser-
vices IncBank of AmericaMerrill Lynch (5,555)
(5,562) PennyMac Financial Ser-vices Inc Barclays Bank 2,002
(1,601) PennyMac Financial Ser-vices Inc Goldman Sachs (2,369)
6,803 PennyMac Financial Ser-vices Inc Goldman Sachs 10,068
(13,752) PennyMac Financial Ser-vices Inc Morgan Stanley 4,951
(20,072) PennyMac Mortgage Invest-ment Trust (REIT)
Bank of AmericaMerrill Lynch (9,233)
(8,497) PennyMac Mortgage Invest-ment Trust (REIT) Barclays Bank (2,379)
(25,683) PennyMac Mortgage Invest-ment Trust (REIT) Goldman Sachs (11,814)
15,387 Penske Automotive GroupInc Barclays Bank 2,616
1,329 Penske Automotive GroupInc Goldman Sachs (6,208)
1,586 Penske Automotive GroupInc HSBC (9,913)
(15,475) Pentair Plc Goldman Sachs (15,011)(8,184) Pentair Plc HSBC 655
(12,261) Pentair Plc Morgan Stanley (11,158)(468) Penumbra Inc Barclays Bank (1,067)289 Penumbra Inc HSBC (2)
(4,238) Peoples Bancorp Inc Bank of AmericaMerrill Lynch 3,857
(7,763) Peoples Bancorp Inc Barclays Bank 1,320(34,955) Peoples Bancorp Inc Goldman Sachs 31,809(27,409) Peoples Bancorp Inc HSBC 20,831(32,320) Peoples Bancorp Inc Morgan Stanley 5,494
912 Peoples Bancorp of NorthCarolina Inc
Bank of AmericaMerrill Lynch 36
177 Peoples Bancorp of NorthCarolina Inc Barclays Bank 39
8,166 Peoples Bancorp of NorthCarolina Inc Goldman Sachs 327
7,524 Peoples Bancorp of NorthCarolina Inc HSBC 11,211
13,115 Peoples Bancorp of NorthCarolina Inc Morgan Stanley 2,885
3,102 Peoples Financial ServicesCorp
Bank of AmericaMerrill Lynch 527
2,999 Peoples Financial ServicesCorp Goldman Sachs 510
8,283 PepsiCo Inc Bank of AmericaMerrill Lynch 14,661
16,299 PepsiCo Inc Barclays Bank 1,46712,134 PepsiCo Inc Goldman Sachs 22,6214,033 PepsiCo Inc HSBC 4,920
29,255 PepsiCo Inc Morgan Stanley 2,6333,939 Perdoceo Education Corp Bank of America
Merrill Lynch 11828,897 Perdoceo Education Corp Barclays Bank 6,06835,062 Perdoceo Education Corp Goldman Sachs 1,0524,648 Perdoceo Education Corp HSBC 930
22,259 Perdoceo Education Corp Morgan Stanley 4,674(4,968) Perficient Inc Morgan Stanley 10,97918,544 Performance Food Group
CoBank of AmericaMerrill Lynch (27,132)
5,562 Performance Food GroupCo Barclays Bank 2,836
19,963 Performance Food GroupCo Goldman Sachs (32,141)
BlackRock Americas Diversified Equity Absolute Return FundcontinuedPortfolio of Investments as at 31 May 2021
The notes on pages 590 to 610 form an integral part of these financial statements.
BlackRock Strategic Funds[138]

Holding Description Counterparty
Netunrealised
appreciation/(depreciation)
USD
United States continued1,435 Performance Food Group
Co HSBC (1,847)6,190 Performance Food Group
Co Morgan Stanley 3,157(212) PerkinElmer Inc Barclays Bank (98)(144) PerkinElmer Inc Goldman Sachs (265)
(5,119) PerkinElmer Inc Morgan Stanley (2,355)12,616 Perrigo Co Plc Bank of America
Merrill Lynch 8,61619,795 Perrigo Co Plc Barclays Bank 18,40910,645 Perrigo Co Plc Goldman Sachs 7,2395,053 Perrigo Co Plc HSBC 15,260
30,938 Perrigo Co Plc Morgan Stanley 25,1632,858 Personalis Inc Bank of America
Merrill Lynch 7,37411,173 Personalis Inc Barclays Bank 10,0562,012 Personalis Inc Goldman Sachs 5,1916,460 Personalis Inc HSBC 19,315
16,473 PET Acquisition LLC ’A’ Morgan Stanley (31,793)2,318 PetIQ Inc Bank of America
Merrill Lynch 511736 PetIQ Inc Barclays Bank 74
3,434 PetIQ Inc Goldman Sachs 3,9156,753 PetIQ Inc Morgan Stanley 675
(3,146) PetMed Express Inc Bank of AmericaMerrill Lynch 1,793
(5,805) PetMed Express Inc Barclays Bank (1,683)(22,167) PetMed Express Inc Goldman Sachs 12,635(31,569) Pfizer Inc Bank of America
Merrill Lynch 43,565(14,531) Pfizer Inc Barclays Bank 15,693(12,251) Pfizer Inc Goldman Sachs 16,906
3,321 Pfizer Inc Goldman Sachs (4,583)6,543 Pfizer Inc HSBC (7,394)7,510 Pfizer Inc Morgan Stanley (8,111)
(32,523) PFSweb Inc Bank of AmericaMerrill Lynch 19,839
(7,885) PFSweb Inc Goldman Sachs 4,810(78,611) PG&E Corp Bank of America
Merrill Lynch 54,440(39,271) PG&E Corp Goldman Sachs 18,457(25,588) PG&E Corp HSBC (2,019)(22,473) PG&E Corp Morgan Stanley 9,888(11,317) PGT Innovations Inc Barclays Bank (1,245)(16,933) PGT Innovations Inc Goldman Sachs 21,505(27,891) PGT Innovations Inc HSBC 88,693(66,474) PGT Innovations Inc Morgan Stanley (7,312)
6,985 PhaseBio PharmaceuticalsInc
Bank of AmericaMerrill Lynch 2,235
29,714 PhaseBio PharmaceuticalsInc Barclays Bank 3,269
27,918 PhaseBio PharmaceuticalsInc Morgan Stanley 3,071
3,047 Phathom PharmaceuticalsInc
Bank of AmericaMerrill Lynch 5,698
889 Phathom PharmaceuticalsInc Barclays Bank (498)
2,466 Phathom PharmaceuticalsInc Goldman Sachs 3,130
590 Phathom PharmaceuticalsInc HSBC 1,404
1,443 Phathom PharmaceuticalsInc Morgan Stanley (808)
(16,028) Phibro Animal Health Corp’A’ Morgan Stanley 801
(8,674) Philip Morris InternationalInc
Bank of AmericaMerrill Lynch 9,715
(22,977) Philip Morris InternationalInc Barclays Bank 39,751
Holding Description Counterparty
Netunrealised
appreciation/(depreciation)
USD
United States continued(1,444) Philip Morris International
Inc Goldman Sachs 1,174(6,249) Philip Morris International
Inc HSBC 1,502(28,416) Philip Morris International
Inc Morgan Stanley 47,3327,607 Phillips 66 Bank of America
Merrill Lynch (34,079)8,723 Phillips 66 Barclays Bank (11,253)
(6,819) Phillips 66 Barclays Bank 8,7971,594 Phillips 66 Goldman Sachs (7,141)3,666 Phillips 66 HSBC (5,022)
(5,128) Phillips 66 HSBC 7,02512,839 Phillips 66 Morgan Stanley (16,562)
(497) Phillips 66 Morgan Stanley 641(12,658) Photronics Inc Bank of America
Merrill Lynch (6,530)(6,289) Photronics Inc Barclays Bank 189
(40,092) Photronics Inc Goldman Sachs (22,140)8,522 Phreesia Inc Morgan Stanley 32,128
(31,171) PHX Minerals Inc Bank of AmericaMerrill Lynch 1,870
(17,887) PHX Minerals Inc Barclays Bank (715)(11,531) PHX Minerals Inc Goldman Sachs 692(2,276) PHX Minerals Inc HSBC (455)
(98,944) Physicians Realty Trust(REIT)
Bank of AmericaMerrill Lynch (9,894)
5,627 Physicians Realty Trust(REIT)
Bank of AmericaMerrill Lynch 563
(11,503) Physicians Realty Trust(REIT) Barclays Bank 3,106
(24,736) Physicians Realty Trust(REIT) Goldman Sachs (2,474)
(17,830) Physicians Realty Trust(REIT) HSBC 7,489
(23,953) Physicians Realty Trust(REIT) Morgan Stanley 6,467
65,576 Physicians Realty Trust(REIT) Morgan Stanley (17,706)
(53,423) Piedmont Office RealtyTrust Inc ’A’ (REIT) Morgan Stanley 9,616
(39,338) Pieris Pharmaceuticals Inc Bank of AmericaMerrill Lynch (59,794)
(1,921) Pieris Pharmaceuticals Inc Barclays Bank (3,054)(19,870) Pieris Pharmaceuticals Inc Goldman Sachs (30,202)(10,283) Pieris Pharmaceuticals Inc Morgan Stanley (16,350)(44,255) Pilgrim’s Pride Corp Bank of America
Merrill Lynch 62,842(15,498) Pilgrim’s Pride Corp Barclays Bank 10,897(61,373) Pilgrim’s Pride Corp Goldman Sachs 81,685(6,724) Pilgrim’s Pride Corp HSBC 1,927(7,239) Ping Identity Holding Corp Bank of America
Merrill Lynch (7,601)(3,620) Ping Identity Holding Corp Goldman Sachs (3,801)14,983 Pinnacle Financial Partners
IncBank of AmericaMerrill Lynch (30,266)
(1,553) Pinnacle Financial PartnersInc
Bank of AmericaMerrill Lynch 3,137
(3,032) Pinnacle Financial PartnersInc Barclays Bank (334)
9,320 Pinnacle Financial PartnersInc Goldman Sachs (18,826)
6,426 Pinnacle Financial PartnersInc Morgan Stanley 707
(1,069) Pinnacle Financial PartnersInc Morgan Stanley (118)
12,869 Pinnacle West Capital Corp Bank of AmericaMerrill Lynch (11,067)
11,999 Pinnacle West Capital Corp Barclays Bank (22,918)
BlackRock Americas Diversified Equity Absolute Return FundcontinuedPortfolio of Investments as at 31 May 2021
The notes on pages 590 to 610 form an integral part of these financial statements.
Annual report and audited financial statements [139]

Holding Description Counterparty
Netunrealised
appreciation/(depreciation)
USD
United States continued5,716 Pinnacle West Capital Corp Goldman Sachs (4,916)
16,300 Pinnacle West Capital Corp Morgan Stanley (31,133)(828) Pinterest Inc ’A’ Bank of America
Merrill Lynch (5,962)(8,294) Pinterest Inc ’A’ Barclays Bank (19,823)(2,583) Pinterest Inc ’A’ HSBC (18,016)(2,361) Pinterest Inc ’A’ Morgan Stanley (5,643)(3,310) Pioneer Bancorp Inc Bank of America
Merrill Lynch (66)(4,887) Pioneer Bancorp Inc Goldman Sachs (98)
(110,439) Pioneer Bancorp Inc Morgan Stanley (23,192)6,941 Pioneer Natural Resources
Co Morgan Stanley 25,946(4,069) Piper Sandler Cos Morgan Stanley (2,808)(7,775) Pitney Bowes Inc Bank of America
Merrill Lynch (3,343)(2,259) Pitney Bowes Inc Goldman Sachs (971)
(13,476) Pitney Bowes Inc Morgan Stanley (4,717)(12,372) Pixelworks Inc Bank of America
Merrill Lynch (1,684)(40,175) Pixelworks Inc Barclays Bank (9,642)(52,229) Pixelworks Inc Goldman Sachs (22,981)(13,855) Pixelworks Inc HSBC (6,650)(23,426) Pixelworks Inc Morgan Stanley (5,622)(4,694) PJT Partners Inc ’A’ Barclays Bank 2,347(5,480) PJT Partners Inc ’A’ Morgan Stanley 2,74021,530 Plains GP Holdings LP ’A’ HSBC 18,301
182 Planet Fitness Inc ’A’ Bank of AmericaMerrill Lynch (31)
18,609 Planet Fitness Inc ’A’ Goldman Sachs (3,164)1,741 Planet Fitness Inc ’A’ Morgan Stanley 540
(2,680) Plantronics Inc Bank of AmericaMerrill Lynch (9,249)
(7,513) Plantronics Inc Barclays Bank (11,582)(3,609) Plantronics Inc Goldman Sachs (4,130)
(905) Plantronics Inc Morgan Stanley (1,484)16,353 Playa Hotels & Resorts NV Barclays Bank 5,3966,707 PlayAGS Inc Goldman Sachs 9,256
32,355 PlayAGS Inc HSBC 31,38426,454 Playtika Holding Corp Bank of America
Merrill Lynch 56,347(957) Playtika Holding Corp Bank of America
Merrill Lynch (714)7,494 Playtika Holding Corp Barclays Bank 899
(1,864) Playtika Holding Corp Goldman Sachs (267)(520) Plexus Corp Bank of America
Merrill Lynch (208)(222) Plexus Corp Barclays Bank 102
(3,619) Plexus Corp Goldman Sachs (3,234)(13,534) Plexus Corp Morgan Stanley 6,120(13,632) Pliant Therapeutics Inc Barclays Bank (21,130)
697 Plug Power Inc Bank of AmericaMerrill Lynch 4,015
2,284 Plug Power Inc Barclays Bank 7,99410,291 Plug Power Inc Goldman Sachs 59,276(5,195) Plug Power Inc HSBC (55,223)
(937) Plug Power Inc Morgan Stanley (3,280)852 Plug Power Inc Morgan Stanley 2,982
(6,183) Plumas Bancorp Bank of AmericaMerrill Lynch (9,398)
(449) Plumas Bancorp Barclays Bank (314)(2,103) Plumas Bancorp Morgan Stanley (1,472)(6,389) PLx Pharma Inc Barclays Bank (11,820)1,492 Plymouth Industrial Inc
(REIT) Goldman Sachs (209)31,080 Plymouth Industrial Inc
(REIT) HSBC (11,189)40,699 Plymouth Industrial Inc
(REIT) Morgan Stanley (21,977)(2,305) PMV Pharmaceuticals Inc Barclays Bank 3,711
Holding Description Counterparty
Netunrealised
appreciation/(depreciation)
USD
United States continued(1,499) Polaris Inc Bank of America
Merrill Lynch 2,069(895) Polaris Inc Barclays Bank 302(743) Polaris Inc Goldman Sachs 83
(1,147) Polaris Inc Morgan Stanley 540(45,801) PolarityTE Inc Morgan Stanley (5,038)(25,197) Ponce de Leon Federal
Bank Morgan Stanley (64,252)(429) Pool Corp Barclays Bank (2,492)
4,489 Pool Corp Morgan Stanley 26,081(422) Pool Corp Morgan Stanley (2,452)
1,668 Popular Inc Bank of AmericaMerrill Lynch (367)
16,291 Popular Inc Barclays Bank 8,1463,393 Popular Inc Goldman Sachs (746)
33,334 Portland General ElectricCo
Bank of AmericaMerrill Lynch (44,726)
(6,228) Portland General ElectricCo
Bank of AmericaMerrill Lynch 6,747
46,356 Portland General ElectricCo Barclays Bank (51,394)
(5,080) Portland General ElectricCo Barclays Bank 6,350
30,934 Portland General ElectricCo Goldman Sachs (40,944)
(1,635) Portland General ElectricCo HSBC 2,122
461 Portland General ElectricCo HSBC (7)
77,105 Portland General ElectricCo Morgan Stanley (73,277)
15,574 Poseida Therapeutics Inc Barclays Bank 1,5578,035 Poseida Therapeutics Inc Goldman Sachs (3,134)(323) Poshmark Inc ’A’ Barclays Bank (1,686)
(11,580) Post Holdings Inc Bank of AmericaMerrill Lynch 3,691
(16,042) Post Holdings Inc Barclays Bank 885(22,115) Post Holdings Inc Goldman Sachs 30,500(13,184) Post Holdings Inc HSBC 7,383(36,913) Post Holdings Inc Morgan Stanley (346)(50,439) Potbelly Corp Bank of America
Merrill Lynch (2,522)(1,626) Potbelly Corp HSBC 520
(18,477) Potbelly Corp Morgan Stanley 3,880(11,185) PotlatchDeltic Corp (REIT) Morgan Stanley (11,409)(4,203) Powell Industries Inc Bank of America
Merrill Lynch 9,583(2,550) Powell Industries Inc Barclays Bank 1,556(5,443) Powell Industries Inc Goldman Sachs 12,410
(13,305) Powell Industries Inc Morgan Stanley 8,1163,549 Power Integrations Inc Bank of America
Merrill Lynch 6,54413,167 Power Integrations Inc Barclays Bank 27,2333,124 Power Integrations Inc Goldman Sachs 18,9005,785 Power Integrations Inc HSBC 26,505
50,309 Power Integrations Inc Morgan Stanley 110,68014,470 Powerfleet Inc Goldman Sachs (2,749)16,699 Powerfleet Inc HSBC 6,6805,228 PPD Inc Bank of America
Merrill Lynch 2099,434 PPD Inc Barclays Bank (48)
958 PPD Inc Goldman Sachs 382,821 PPD Inc HSBC —
(2,930) PPD Inc HSBC —5,879 PPD Inc Morgan Stanley —
386 PPG Industries Inc Bank of AmericaMerrill Lynch (350)
25,103 PPG Industries Inc Morgan Stanley 4,843(33,041) PPL Corp HSBC 12,225(61,083) PPL Corp Morgan Stanley 15,318
BlackRock Americas Diversified Equity Absolute Return FundcontinuedPortfolio of Investments as at 31 May 2021
The notes on pages 590 to 610 form an integral part of these financial statements.
BlackRock Strategic Funds[140]

Holding Description Counterparty
Netunrealised
appreciation/(depreciation)
USD
United States continued(18,262) PQ Group Holdings Inc Barclays Bank (7,853)
7,817 PRA Group Inc Bank of AmericaMerrill Lynch 5,403
13,861 PRA Group Inc Barclays Bank 4,22213,048 PRA Group Inc Goldman Sachs 7,69210,162 PRA Group Inc HSBC 2,03214,246 PRA Group Inc Morgan Stanley 7,693(2,262) PRA Health Sciences Inc Bank of America
Merrill Lynch 2,217(766) PRA Health Sciences Inc Barclays Bank 2,758(834) PRA Health Sciences Inc Morgan Stanley 3,002
(9,494) Praxis Precision MedicinesInc Barclays Bank (2,089)
(22,687) Precigen Inc Barclays Bank (822)10,888 Precision BioSciences Inc Morgan Stanley 1,415
(560) Preferred Bank Bank of AmericaMerrill Lynch 118
(241) Preferred Bank Barclays Bank (294)(2,175) Preferred Bank Goldman Sachs 457(2,123) Preferred Bank Morgan Stanley (2,590)
759 Preformed Line Products Co Goldman Sachs 1,016400 Preformed Line Products Co HSBC 955
4,415 Preformed Line Products Co Morgan Stanley 5,787(2,898) Prelude Therapeutics Inc Barclays Bank 3,680(2,215) Prelude Therapeutics Inc Goldman Sachs 15,549
(13,896) Premier Financial BancorpInc
Bank of AmericaMerrill Lynch 5,975
(8,104) Premier Financial BancorpInc Barclays Bank 810
(9,651) Premier Financial BancorpInc Goldman Sachs 4,150
27,224 Premier Financial Corp Bank of AmericaMerrill Lynch (31,852)
2,399 Premier Financial Corp Barclays Bank (312)618 Premier Financial Corp Morgan Stanley (80)
(3,667) Premier Inc ’A’ Bank of AmericaMerrill Lynch 3,667
(1,354) Premier Inc ’A’ Barclays Bank 2,275(8,038) Premier Inc ’A’ Goldman Sachs 7,292
(21,296) Premier Inc ’A’ Morgan Stanley 35,777(1,649) Prestige Consumer Health-
care Inc Goldman Sachs 241(273) PriceSmart Inc Bank of America
Merrill Lynch 1041,609 PriceSmart Inc Bank of America
Merrill Lynch (611)4,958 PriceSmart Inc Barclays Bank 9,2222,045 PriceSmart Inc Goldman Sachs (777)
18,200 PriceSmart Inc HSBC 34,034189 PriceSmart Inc Morgan Stanley 352
(252) PrimeEnergy ResourcesCorp
Bank of AmericaMerrill Lynch 318
(589) PrimeEnergy ResourcesCorp Barclays Bank 165
(176) PrimeEnergy ResourcesCorp Goldman Sachs 222
(238) PrimeEnergy ResourcesCorp HSBC 21
(543) PrimeEnergy ResourcesCorp Morgan Stanley 152
(2,957) Primerica Inc Bank of AmericaMerrill Lynch (5,470)
1,999 Primerica Inc Bank of AmericaMerrill Lynch 2,080
(2,863) Primerica Inc Barclays Bank (8,245)1,010 Primerica Inc Barclays Bank 2,453
(2,164) Primerica Inc Goldman Sachs (4,003)(355) Primerica Inc HSBC (131)
1,121 Primerica Inc HSBC 991(9,229) Primerica Inc Morgan Stanley (26,580)
Holding Description Counterparty
Netunrealised
appreciation/(depreciation)
USD
United States continued26,496 Primis Financial Corp Barclays Bank (5,034)4,511 Primis Financial Corp Goldman Sachs (1,263)
25,132 Primo Water Corp Bank of AmericaMerrill Lynch (4,272)
408 Primo Water Corp Barclays Bank (98)3,666 Primo Water Corp Goldman Sachs (623)
71,962 Primo Water Corp Morgan Stanley (17,271)23,776 Primoris Services Corp Goldman Sachs (26,154)4,775 Primoris Services Corp HSBC (2,053)
33,685 Primoris Services Corp Morgan Stanley 12,4634,684 Principal Financial Group
Inc Barclays Bank (560)1,050 Principal Financial Group
Inc Goldman Sachs 251(3,449) Principal Financial Group
Inc HSBC 4,898(2,469) Principal Financial Group
Inc Morgan Stanley 914(4,456) Priority Technology Holdings
Inc Barclays Bank (936)(17,643) ProAssurance Corp Bank of America
Merrill Lynch 15,879(671) ProAssurance Corp Barclays Bank 289
(7,958) ProAssurance Corp Goldman Sachs 5,829(17,386) ProAssurance Corp Morgan Stanley 7,476
(776) Procter & Gamble Co Bank of AmericaMerrill Lynch 2,235
(11,120) Procter & Gamble Co Barclays Bank 34,583(3,509) Procter & Gamble Co Goldman Sachs 10,106(9,897) Procter & Gamble Co Morgan Stanley 30,7803,148 Professional Holding Corp
’A’Bank of AmericaMerrill Lynch (157)
4,259 Professional Holding Corp’A’ Barclays Bank (852)
4,495 Professional Holding Corp’A’ Goldman Sachs (225)
7,294 Professional Holding Corp’A’ HSBC 4,012
4,612 Professional Holding Corp’A’ Morgan Stanley (922)
18,250 PROG Holdings Inc Bank of AmericaMerrill Lynch (39,820)
17,932 PROG Holdings Inc Barclays Bank (3,587)9,326 PROG Holdings Inc Goldman Sachs (20,430)
680 PROG Holdings Inc HSBC (24)331 PROG Holdings Inc Morgan Stanley (66)
6,872 Progress Software Corp Bank of AmericaMerrill Lynch (462)
4,797 Progress Software Corp Barclays Bank 4326,123 Progress Software Corp Goldman Sachs 1,531
32,952 Progress Software Corp HSBC 34,92915,309 Progress Software Corp Morgan Stanley 1,378
231 Progressive Corp Bank of AmericaMerrill Lynch (1,728)
3,161 Progressive Corp Barclays Bank 5,12125,732 Progressive Corp Goldman Sachs (192,475)(2,602) Progyny Inc Bank of America
Merrill Lynch (30,027)(12,142) Progyny Inc Barclays Bank (61,803)(3,834) Progyny Inc Goldman Sachs (44,245)
678 Progyny Inc Goldman Sachs 4,9313,178 Prologis Inc (REIT) Bank of America
Merrill Lynch 11,60032,574 Prologis Inc (REIT) Barclays Bank (9,974)
524 Prologis Inc (REIT) Goldman Sachs 1,913110 Prologis Inc (REIT) HSBC 180
32,223 Prologis Inc (REIT) Morgan Stanley (9,989)1,035 Prometheus Biosciences Inc Barclays Bank 4,6894,056 Prometheus Biosciences Inc Goldman Sachs 12,0821,550 Prometheus Biosciences Inc HSBC 7,098
BlackRock Americas Diversified Equity Absolute Return FundcontinuedPortfolio of Investments as at 31 May 2021
The notes on pages 590 to 610 form an integral part of these financial statements.
Annual report and audited financial statements [141]

Holding Description Counterparty
Netunrealised
appreciation/(depreciation)
USD
United States continued2,365 Prometheus Biosciences Inc Morgan Stanley 10,713
11,137 ProPetro Holding Corp Bank of AmericaMerrill Lynch (11,694)
9,438 ProPetro Holding Corp Barclays Bank 8495,427 ProPetro Holding Corp Goldman Sachs (5,698)
15,898 ProPetro Holding Corp HSBC (12,241)17,931 ProPetro Holding Corp Morgan Stanley 1,6141,546 PROS Holdings Inc Bank of America
Merrill Lynch 10,8223,377 PROS Holdings Inc Barclays Bank 19,5877,765 PROS Holdings Inc Goldman Sachs 54,355
13,041 PROS Holdings Inc Morgan Stanley 75,638(14,426) ProSight Global Inc Barclays Bank (144)(4,587) ProSight Global Inc Morgan Stanley (4)(4,464) Prosperity Bancshares Inc Bank of America
Merrill Lynch —(9,152) Prosperity Bancshares Inc Barclays Bank (3,569)(5,550) Prosperity Bancshares Inc Goldman Sachs —(1,095) Prosperity Bancshares Inc HSBC (580)
(11,883) Prosperity Bancshares Inc Morgan Stanley (4,634)(849) Protagonist Therapeutics
IncBank of AmericaMerrill Lynch (4,279)
(7,082) Protagonist TherapeuticsInc Barclays Bank 1,416
(3,075) Protagonist TherapeuticsInc Goldman Sachs (7,506)
(10,556) Protagonist TherapeuticsInc HSBC (71,992)
(3,066) Protagonist TherapeuticsInc Morgan Stanley 613
2,510 Protara Therapeutics Inc Barclays Bank 6533,884 Protara Therapeutics Inc HSBC 1,7871,446 Protective Insurance Corp
’B’Bank of AmericaMerrill Lynch 304
(51,193) Proteostasis TherapeuticsInc* Barclays Bank (5,529)
(62,121) Proteostasis TherapeuticsInc* Morgan Stanley (6,709)
(9,102) Prothena Corp Plc Morgan Stanley (37,500)1,000 Proto Labs Inc Bank of America
Merrill Lynch (5,378)1,156 Proto Labs Inc Barclays Bank 1,121
954 Proto Labs Inc Goldman Sachs (4,512)(732) Proto Labs Inc HSBC 3,331(462) Proto Labs Inc Morgan Stanley (448)
(4,319) Provention Bio Inc Barclays Bank 1,59856,615 Provident Bancorp Inc Barclays Bank 12,45535,672 Provident Bancorp Inc Goldman Sachs 6,7786,408 Provident Bancorp Inc Morgan Stanley 1,410
(6,771) Provident Financial Hold-ings Inc
Bank of AmericaMerrill Lynch (2,979)
(17,179) Provident Financial Hold-ings Inc Barclays Bank (12,171)
(18,189) Provident Financial Hold-ings Inc Goldman Sachs (8,113)
(40,156) Provident Financial ServicesInc
Bank of AmericaMerrill Lynch 14,055
(22,078) Provident Financial ServicesInc Barclays Bank (442)
(16,069) Provident Financial ServicesInc Goldman Sachs 5,624
(17,137) Provident Financial ServicesInc Morgan Stanley (343)
(3,016) Prudential Bancorp Inc Bank of AmericaMerrill Lynch 494
(10,167) Prudential Bancorp Inc Barclays Bank 1,220(14,662) Prudential Bancorp Inc Goldman Sachs 2,486(1,071) Prudential Bancorp Inc Morgan Stanley (135)
Holding Description Counterparty
Netunrealised
appreciation/(depreciation)
USD
United States continued17,527 Prudential Financial Inc Morgan Stanley 11,217(8,018) PS Business Parks Inc
(REIT)Bank of AmericaMerrill Lynch (8,980)
(8,064) PS Business Parks Inc(REIT) Barclays Bank 19,981
(6,241) PS Business Parks Inc(REIT) Goldman Sachs (6,990)
(21,387) PS Business Parks Inc(REIT) HSBC 23,740
(13,883) PS Business Parks Inc(REIT) Morgan Stanley 36,790
3,170 PTC Inc Bank of AmericaMerrill Lynch 19,167
9,831 PTC Inc Barclays Bank 12,9771,838 PTC Inc Goldman Sachs 11,9104,724 PTC Inc HSBC 23,6203,810 PTC Inc Morgan Stanley 5,029(138) PTC Therapeutics Inc Bank of America
Merrill Lynch (175)2,163 PTC Therapeutics Inc Bank of America
Merrill Lynch 2,747(479) PTC Therapeutics Inc Barclays Bank (53)
4,008 PTC Therapeutics Inc Barclays Bank 4412,261 PTC Therapeutics Inc Goldman Sachs 2,871
(6,115) PTC Therapeutics Inc HSBC (2,263)11,020 PTC Therapeutics Inc HSBC 4,077(5,782) PTC Therapeutics Inc Morgan Stanley (637)(8,039) Public Service Enterprise
Group IncBank of AmericaMerrill Lynch 1,367
(10,927) Public Service EnterpriseGroup Inc Barclays Bank 14,642
(11,558) Public Service EnterpriseGroup Inc Goldman Sachs 1,965
(8,973) Public Service EnterpriseGroup Inc HSBC 10,409
(31,351) Public Service EnterpriseGroup Inc Morgan Stanley 42,011
(2,441) Public Storage (REIT) Goldman Sachs (14,402)(5,459) Public Storage (REIT) HSBC (29,042)
244 Public Storage (REIT) HSBC 627(1,429) Public Storage (REIT) Morgan Stanley (5,759)(4,948) Pulmonx Corp Barclays Bank (8,758)(8,670) Pulmonx Corp Goldman Sachs (40,662)(1,275) Pulse Biosciences Inc Barclays Bank (26)(4,227) Pulse Biosciences Inc HSBC (7,313)(8,732) Pulse Biosciences Inc Morgan Stanley (175)3,421 Pulse Evolution Group Inc Bank of America
Merrill Lynch 11,4264,464 Pulse Evolution Group Inc HSBC 32,9891,564 PulteGroup Inc Barclays Bank 2,768
(3,841) PulteGroup Inc Morgan Stanley (4,816)8,946 Puma Biotechnology Inc Bank of America
Merrill Lynch 1,53924,491 Puma Biotechnology Inc Barclays Bank 6,12326,263 Puma Biotechnology Inc Goldman Sachs 7,616
(36,487) Pure Cycle Corp Goldman Sachs (16,784)(33,631) Pure Cycle Corp HSBC (3,699)14,566 Pure Storage Inc ’A’ Bank of America
Merrill Lynch 14,71213,366 Pure Storage Inc ’A’ Barclays Bank 1,3374,954 Pure Storage Inc ’A’ Goldman Sachs 5,0043,354 Pure Storage Inc ’A’ HSBC 3,958
18,960 Pure Storage Inc ’A’ Morgan Stanley 1,896(12,831) Pure Storage Inc ’A’ Morgan Stanley (1,283)(1,690) Purple Innovation Inc Bank of America
Merrill Lynch 5,915(8,218) Purple Innovation Inc Morgan Stanley 3,123
BlackRock Americas Diversified Equity Absolute Return FundcontinuedPortfolio of Investments as at 31 May 2021
The notes on pages 590 to 610 form an integral part of these financial statements.
BlackRock Strategic Funds[142]

Holding Description Counterparty
Netunrealised
appreciation/(depreciation)
USD
United States continued1,499 PVH Corp Bank of America
Merrill Lynch 6,6333,028 PVH Corp Goldman Sachs (729)1,172 PVH Corp HSBC (648)
(1,097) PVH Corp Morgan Stanley (191)2,055 PVH Corp Morgan Stanley 8,439
11,281 Pzena Investment Manage-ment Inc ’A’ Goldman Sachs 4,287
1,162 Pzena Investment Manage-ment Inc ’A’ HSBC 511
41,741 Pzena Investment Manage-ment Inc ’A’ Morgan Stanley 13,357
(9,874) Q2 Holdings Inc Bank of AmericaMerrill Lynch (17,378)
(18,566) Q2 Holdings Inc Barclays Bank 6,126(10,644) Q2 Holdings Inc Goldman Sachs (17,015)(5,296) Q2 Holdings Inc HSBC (5,790)
(23,830) Q2 Holdings Inc Morgan Stanley 7,864(4,095) QAD Inc ’A’ Bank of America
Merrill Lynch (28,785)(3,603) QAD Inc ’A’ Barclays Bank (12,574)(3,917) QAD Inc ’A’ Goldman Sachs (29,769)(2,070) QAD Inc ’A’ Morgan Stanley (5,695)(2,028) QCR Holdings Inc Bank of America
Merrill Lynch (1,501)(9,935) QCR Holdings Inc Barclays Bank 397
(15,531) QCR Holdings Inc Goldman Sachs (11,493)(4,856) QCR Holdings Inc HSBC (2,234)(3,735) QCR Holdings Inc Morgan Stanley 1492,602 QIAGEN NV Bank of America
Merrill Lynch 6,9213,029 QIAGEN NV Morgan Stanley 3,726
(2,566) Qorvo Inc Bank of AmericaMerrill Lynch (29,868)
(9,932) Qorvo Inc Barclays Bank (37,766)(4,729) Qorvo Inc Goldman Sachs (55,046)(4,066) Qorvo Inc HSBC (45,677)
(10,223) Qorvo Inc Morgan Stanley (41,812)1,443 QTS Realty Trust Inc ’A’
(REIT)Bank of AmericaMerrill Lynch 759
12,170 QTS Realty Trust Inc ’A’(REIT) Barclays Bank 2,482
2,346 QTS Realty Trust Inc ’A’(REIT) Goldman Sachs 2,722
7,540 QTS Realty Trust Inc ’A’(REIT) HSBC 2,365
31,933 QTS Realty Trust Inc ’A’(REIT) Morgan Stanley 5,062
19,725 Quad/Graphics Inc Bank of AmericaMerrill Lynch (4,436)
30,329 Quad/Graphics Inc Barclays Bank (3,639)25,934 Quad/Graphics Inc Goldman Sachs (11,152)8,654 Quad/Graphics Inc HSBC (235)5,446 Quad/Graphics Inc Morgan Stanley (654)
(3,619) Quaker Chemical Corp Goldman Sachs (34,634)(598) Quaker Chemical Corp HSBC (6,704)835 Quaker Chemical Corp Morgan Stanley 6,396
(4,226) Quaker Chemical Corp Morgan Stanley (32,371)912 QUALCOMM Inc Bank of America
Merrill Lynch 4,32318,021 QUALCOMM Inc Barclays Bank 26,35613,001 QUALCOMM Inc Goldman Sachs 48,3304,330 QUALCOMM Inc HSBC 7,859
16,250 QUALCOMM Inc Morgan Stanley 26,488(1,416) Qualtrics International Inc
’A’Bank of AmericaMerrill Lynch 180
(3,257) Qualtrics International Inc’A’ Barclays Bank (1,997)
(3,224) Qualtrics International Inc’A’ Morgan Stanley (2,410)
Holding Description Counterparty
Netunrealised
appreciation/(depreciation)
USD
United States continued(6,339) Qualys Inc Barclays Bank 18,8901,440 Qualys Inc Barclays Bank (4,291)
(7,488) Qualys Inc Goldman Sachs 8,836(1,841) Qualys Inc HSBC 7,511
(380) Qualys Inc Morgan Stanley 1,132412 Qualys Inc Morgan Stanley (1,228)836 Quanex Building Products
CorpBank of AmericaMerrill Lynch (192)
49,597 Quanex Building ProductsCorp Barclays Bank 22,319
10,245 Quanex Building ProductsCorp Goldman Sachs (2,356)
9,958 Quanex Building ProductsCorp HSBC (18,721)
25,251 Quanex Building ProductsCorp Morgan Stanley 11,363
4,471 Quanta Services Inc Bank of AmericaMerrill Lynch (6,394)
(9,550) Quanta Services Inc Bank of AmericaMerrill Lynch (6,537)
7,027 Quanta Services Inc Barclays Bank 20,167(2,002) Quanta Services Inc Barclays Bank (5,746)(6,473) Quanta Services Inc Goldman Sachs 669(3,008) Quanterix Corp Bank of America
Merrill Lynch (17,827)(3,456) Quanterix Corp Barclays Bank (8,222)(1,598) Quanterix Corp Goldman Sachs 635
(21,407) Quantum Corp Bank of AmericaMerrill Lynch 30,826
(13,119) Quantum Corp Barclays Bank 19,810(18,472) Quantum Corp Goldman Sachs 26,600
1,274 QuantumScape Corp Barclays Bank (697)2,248 QuantumScape Corp Goldman Sachs (756)1,152 QuantumScape Corp Morgan Stanley (241)(101) Quest Diagnostics Inc Goldman Sachs 34
(1,433) Quidel Corp Bank of AmericaMerrill Lynch 1,342
996 QuinStreet Inc Bank of AmericaMerrill Lynch 259
1,481 QuinStreet Inc Barclays Bank (252)19,388 QuinStreet Inc HSBC 5,6235,795 QuinStreet Inc Morgan Stanley (985)
(54,763) Quotient Ltd Barclays Bank 2,191(67,240) Quotient Ltd Goldman Sachs (33,620)(1,447) Quotient Technology Inc Bank of America
Merrill Lynch (521)(29,745) Quotient Technology Inc Barclays Bank (13,088)(2,461) Quotient Technology Inc Goldman Sachs (726)(5,901) Quotient Technology Inc Morgan Stanley (1,607)1,097 Qurate Retail Inc Goldman Sachs (735)
599 Qurate Retail Inc HSBC 54330 Qurate Retail Inc Morgan Stanley (507)
(24,292) Qurate Retail Inc ’A’ Bank of AmericaMerrill Lynch (19,919)
3,651 Qurate Retail Inc ’A’ Morgan Stanley 37(17,221) R1 RCM Inc Barclays Bank 36,853(10,179) R1 RCM Inc Morgan Stanley 21,783(12,601) Rackspace Technology Inc Bank of America
Merrill Lynch (4,221)(3,515) Rackspace Technology Inc Barclays Bank 2,2853,836 Rackspace Technology Inc Morgan Stanley (2,493)
(4,216) Rackspace Technology Inc Morgan Stanley 2,7402,134 Radian Group Inc Bank of America
Merrill Lynch 76843,347 Radian Group Inc Barclays Bank 23,4079,156 Radian Group Inc Goldman Sachs 3,297
13,369 Radian Group Inc Morgan Stanley 7,219109,412 Radiant Logistics Inc Bank of America
Merrill Lynch (52,518)
BlackRock Americas Diversified Equity Absolute Return FundcontinuedPortfolio of Investments as at 31 May 2021
The notes on pages 590 to 610 form an integral part of these financial statements.
Annual report and audited financial statements [143]

Holding Description Counterparty
Netunrealised
appreciation/(depreciation)
USD
United States continued26,454 Radiant Logistics Inc Barclays Bank (2,116)20,165 Radiant Logistics Inc Goldman Sachs (9,679)46,536 Radiant Logistics Inc HSBC 27,45647,942 Radiant Logistics Inc Morgan Stanley (3,835)78,650 Radius Global Infrastructure
Inc Morgan Stanley 7,865(6,987) Radius Health Inc Morgan Stanley 9073,890 RadNet Inc Barclays Bank 1,6342,392 RadNet Inc Goldman Sachs 7,367
14,033 RadNet Inc HSBC 51,501(5,068) Rafael Holdings Inc ’B’ Morgan Stanley (27,671)1,181 Ralph Lauren Corp Barclays Bank 5,2792,258 Ralph Lauren Corp Goldman Sachs (31,702)(133) Ralph Lauren Corp HSBC (535)
6,031 Ralph Lauren Corp Morgan Stanley 26,959(9,582) Ralph Lauren Corp Morgan Stanley (42,832)(3,671) Ramaco Resources Inc Bank of America
Merrill Lynch (1,836)(17,432) Ramaco Resources Inc Barclays Bank (10,285)(14,906) Ramaco Resources Inc Goldman Sachs (7,453)(10,266) Rambus Inc Barclays Bank (4,321)(10,996) Rambus Inc Goldman Sachs (8,261)(11,328) Rambus Inc Morgan Stanley (4,305)(8,304) Range Resources Corp Bank of America
Merrill Lynch 6,228(16,459) Range Resources Corp Barclays Bank 7,242(29,997) Range Resources Corp Goldman Sachs 22,498(8,796) Range Resources Corp Morgan Stanley 3,87014,906 Ranger Energy Services Inc Bank of America
Merrill Lynch 22,6574,130 Ranger Energy Services Inc Goldman Sachs 6,278
10,017 Ranger Energy Services Inc Morgan Stanley 8017,218 Ranpak Holdings Corp Barclays Bank (17,540)5,429 Ranpak Holdings Corp Morgan Stanley (13,192)6,602 Rapid7 Inc Bank of America
Merrill Lynch 22,245(1,164) Rapid7 Inc Bank of America
Merrill Lynch (5,653)2,390 Rapid7 Inc Barclays Bank 4,971
(8,231) Rapid7 Inc Barclays Bank (17,120)4,838 Rapid7 Inc Goldman Sachs 20,559
(2,653) Rapid7 Inc Goldman Sachs (12,841)1,162 Rapid7 Inc HSBC 8,413(421) Rapid7 Inc HSBC (3,048)
17,794 Rapid7 Inc Morgan Stanley 37,011(1,971) RAPT Therapeutics Inc Bank of America
Merrill Lynch 2,582(3,479) RAPT Therapeutics Inc Barclays Bank (4,244)(4,383) RAPT Therapeutics Inc Goldman Sachs 5,742
(30) RAPT Therapeutics Inc Morgan Stanley (37)(58,574) Rattler Midstream LP Barclays Bank (586)(3,765) Raven Industries Inc Bank of America
Merrill Lynch (7,078)(1,350) Raven Industries Inc Barclays Bank (1,283)
(805) Raven Industries Inc Goldman Sachs (1,513)(6,258) Raven Industries Inc HSBC (15,332)
(16,515) Raven Industries Inc Morgan Stanley (15,689)146 Raymond James Financial
IncBank of AmericaMerrill Lynch (194)
4,011 Raymond James FinancialInc Barclays Bank (7,781)
(1,196) Raymond James FinancialInc Barclays Bank 2,320
1,233 Raymond James FinancialInc Goldman Sachs (1,640)
(416) Raymond James FinancialInc Goldman Sachs (122)
(392) Raymond James FinancialInc Morgan Stanley 760
Holding Description Counterparty
Netunrealised
appreciation/(depreciation)
USD
United States continued(15,205) Rayonier Advanced Materi-
als Inc Morgan Stanley (2,889)(2,763) Rayonier Inc (REIT) Bank of America
Merrill Lynch (631)(8,709) Rayonier Inc (REIT) Barclays Bank (4,964)
(24,124) Rayonier Inc (REIT) HSBC 880(30,525) Rayonier Inc (REIT) Morgan Stanley (17,399)18,695 RBB Bancorp Bank of America
Merrill Lynch 23,7434,501 RBB Bancorp Barclays Bank 3,781
13,756 RBB Bancorp Goldman Sachs 17,4709,215 RBB Bancorp HSBC 27,737
25,455 RBB Bancorp Morgan Stanley 21,382(3,073) RBC Bearings Inc Bank of America
Merrill Lynch (791)(13,498) RBC Bearings Inc Barclays Bank (101,450)(13,705) RBC Bearings Inc Goldman Sachs (7,864)(1,746) RBC Bearings Inc Morgan Stanley (13,392)(1,640) RCI Hospitality Holdings Inc Morgan Stanley 1,050
843 RE/MAX Holdings Inc ’A’ Bank of AmericaMerrill Lynch 73
787 RE/MAX Holdings Inc ’A’ Barclays Bank (39)4,804 RE/MAX Holdings Inc ’A’ Goldman Sachs (4,131)
32,587 RE/MAX Holdings Inc ’A’ Morgan Stanley (1,629)(22,029) Reading International Inc ’A’ Bank of America
Merrill Lynch (12,116)(33,144) Reading International Inc ’A’ HSBC (25,852)(37,211) Ready Capital Corp (REIT) Bank of America
Merrill Lynch (25,303)(49,106) Ready Capital Corp (REIT) Barclays Bank (25,535)
3,250 RealNetworks Inc Bank of AmericaMerrill Lynch —
23,728 RealNetworks Inc Barclays Bank 1,42413,078 RealNetworks Inc HSBC (523)21,510 Realogy Holdings Corp Bank of America
Merrill Lynch (21,080)12,392 Realogy Holdings Corp Barclays Bank (13,755)5,659 Realogy Holdings Corp Goldman Sachs (5,546)
14,370 Realogy Holdings Corp HSBC 4,0244,386 Realogy Holdings Corp Morgan Stanley (4,868)5,853 RealReal Inc Barclays Bank 9,0144,892 RealReal Inc Goldman Sachs 14,285
(44,985) Realty Income Corp (REIT) Bank of AmericaMerrill Lynch (134,955)
(9,991) Realty Income Corp (REIT) Barclays Bank (2,598)(1,529) Reata Pharmaceuticals Inc
’A’ Barclays Bank (28,164)(780) Reata Pharmaceuticals Inc
’A’ Goldman Sachs (44,983)(1,164) Reata Pharmaceuticals Inc
’A’ HSBC (67,721)(1,529) Reata Pharmaceuticals Inc
’A’ Morgan Stanley (28,164)(31,919) Recro Pharma Inc Bank of America
Merrill Lynch 7,661(41,295) Recro Pharma Inc Barclays Bank 413(45,995) Recro Pharma Inc Goldman Sachs 11,039(3,123) Recro Pharma Inc HSBC 1,093(7,345) Recro Pharma Inc Morgan Stanley 73(9,321) Red River Bancshares Inc Barclays Bank 4,567(8,129) Red River Bancshares Inc Goldman Sachs 6,991(3,874) Red River Bancshares Inc HSBC (2,363)(6,299) Red River Bancshares Inc Morgan Stanley 3,0873,343 Red Robin Gourmet Burg-
ers Inc Barclays Bank (1,137)11,309 Red Rock Resorts Inc ’A’ Bank of America
Merrill Lynch 36,528(2,526) Red Rock Resorts Inc ’A’ Bank of America
Merrill Lynch (8,159)
BlackRock Americas Diversified Equity Absolute Return FundcontinuedPortfolio of Investments as at 31 May 2021
The notes on pages 590 to 610 form an integral part of these financial statements.
BlackRock Strategic Funds[144]

Holding Description Counterparty
Netunrealised
appreciation/(depreciation)
USD
United States continued(12,457) Red Rock Resorts Inc ’A’ Barclays Bank (27,405)
(795) Red Rock Resorts Inc ’A’ Goldman Sachs (2,568)(3,853) Red Rock Resorts Inc ’A’ HSBC (20,652)
(17,606) Red Rock Resorts Inc ’A’ Morgan Stanley (38,734)(18,712) Red Violet Inc Barclays Bank 12,911
(821) Red Violet Inc Goldman Sachs (1,617)(2,028) Red Violet Inc HSBC (7,037)(3,195) Redfin Corp Bank of America
Merrill Lynch (23,706)(9,133) Redfin Corp Barclays Bank (53,063)
(16,858) Redfin Corp Goldman Sachs (115,530)(2,297) Redfin Corp HSBC (13,153)
(30,202) Redwood Trust Inc (REIT) Morgan Stanley (6,342)(8,668) Regal Beloit Corp Morgan Stanley (27,564)(2,318) Regency Centers Corp
(REIT) Barclays Bank (2,040)14,917 Regency Centers Corp
(REIT) Morgan Stanley 13,127(1,913) Regeneron Pharmaceuticals
IncBank of AmericaMerrill Lynch 40,747
(409) Regeneron PharmaceuticalsInc HSBC 4,759
1,761 REGENXBIO Inc Bank of AmericaMerrill Lynch 933
2,936 REGENXBIO Inc Barclays Bank 2,78914,292 REGENXBIO Inc Goldman Sachs 7,5757,476 REGENXBIO Inc HSBC (5,457)
577 REGENXBIO Inc Morgan Stanley 5487,860 Regional Management Corp Goldman Sachs 17,606
12,814 Regional Management Corp Morgan Stanley (384)26,877 Regions Financial Corp Bank of America
Merrill Lynch 26926,430 Regions Financial Corp Barclays Bank 14,272
(16,210) Regions Financial Corp Barclays Bank (8,753)40,297 Regions Financial Corp Goldman Sachs 40375,252 Regions Financial Corp Morgan Stanley 40,636(6,308) Regions Financial Corp Morgan Stanley (3,406)
(14,031) Regis Corp Bank of AmericaMerrill Lynch (1,122)
(8,027) Regis Corp Barclays Bank (2,809)(5,604) Regis Corp Goldman Sachs (448)
(16,599) Regis Corp HSBC 1,660(7,687) Regis Corp Morgan Stanley (2,690)2,239 Reinsurance Group of
America IncBank of AmericaMerrill Lynch (2,597)
13,793 Reinsurance Group ofAmerica Inc Barclays Bank 31,172
10,069 Reinsurance Group ofAmerica Inc Goldman Sachs (11,680)
9,327 Reinsurance Group ofAmerica Inc Morgan Stanley 21,079
(26,292) Rekor Systems Inc Bank of AmericaMerrill Lynch (19,456)
(8,218) Rekor Systems Inc Barclays Bank 1,561(754) Rekor Systems Inc Goldman Sachs (558)
(5,949) Rekor Systems Inc Morgan Stanley 1,1306,832 Relay Therapeutics Inc Bank of America
Merrill Lynch 8,9426,516 Relay Therapeutics Inc Barclays Bank 2,988
13,113 Reliance Steel & AluminumCo
Bank of AmericaMerrill Lynch (32,613)
2,196 Reliance Steel & AluminumCo Barclays Bank 4,106
6,315 Reliance Steel & AluminumCo Goldman Sachs (15,682)
448 Reliance Steel & AluminumCo HSBC (3,409)
7,666 Reliance Steel & AluminumCo Morgan Stanley (631)
Holding Description Counterparty
Netunrealised
appreciation/(depreciation)
USD
United States continued(2,780) Reliant Bancorp Inc Bank of America
Merrill Lynch 973(32,623) Reliant Bancorp Inc Goldman Sachs 11,418(3,720) Relmada Therapeutics Inc Bank of America
Merrill Lynch 1,339(5,345) Relmada Therapeutics Inc Barclays Bank 18,9216,296 RenaissanceRe Holdings
Ltd Barclays Bank (315)(3,560) RenaissanceRe Holdings
Ltd Goldman Sachs 4,877(4,217) RenaissanceRe Holdings
Ltd HSBC 35,591306 RenaissanceRe Holdings
Ltd HSBC 109(6,674) RenaissanceRe Holdings
Ltd Morgan Stanley 3341,034 RenaissanceRe Holdings
Ltd Morgan Stanley (52)(2,390) Renasant Corp Barclays Bank 167(6,023) Renasant Corp HSBC (964)
(112,176) Renasant Corp Morgan Stanley 7,8521,801 Reneo Pharmaceuticals Inc Bank of America
Merrill Lynch (87)2,149 Reneo Pharmaceuticals Inc Barclays Bank 1,8051,471 Reneo Pharmaceuticals Inc Morgan Stanley 1,236
(4,323) Renewable Energy GroupInc
Bank of AmericaMerrill Lynch 8,646
(3,166) Renewable Energy GroupInc Barclays Bank (1,614)
(2,025) Renewable Energy GroupInc Goldman Sachs 4,050
1,301 Rent-A-Center Inc Bank of AmericaMerrill Lynch (845)
5,180 Rent-A-Center Inc Barclays Bank 17,1987,459 Rent-A-Center Inc Goldman Sachs 19,2382,260 Rent-A-Center Inc Morgan Stanley 6,057
(18,799) Rentech Inc* Morgan Stanley 56(11,258) Repay Holdings Corp Bank of America
Merrill Lynch (1,464)(2,440) Repay Holdings Corp Barclays Bank 2,708(4,543) Repay Holdings Corp Goldman Sachs (591)
(45,669) Repay Holdings Corp Morgan Stanley 50,693914 Repligen Corp Bank of America
Merrill Lynch 15,300353 Repligen Corp Barclays Bank 2,090
2,128 Repligen Corp Goldman Sachs 35,623659 Repligen Corp HSBC 4,929
(568) Repligen Corp HSBC (4,249)(2,000) Replimune Group Inc Barclays Bank (5,740)(4,601) Replimune Group Inc Goldman Sachs (16,242)(1,677) Replimune Group Inc Morgan Stanley (3,141)
(52,745) Repro-Med Systems Inc Bank of AmericaMerrill Lynch 1,055
(10,383) Repro-Med Systems Inc Barclays Bank (1,661)(4,741) Repro-Med Systems Inc Goldman Sachs 95
(14,462) Repro-Med Systems Inc HSBC (9,256)(3,548) Repro-Med Systems Inc Morgan Stanley (568)63,193 Republic Bancorp Inc ’A’ Bank of America
Merrill Lynch 56,8741,610 Republic Bancorp Inc ’A’ Barclays Bank 1,8033,276 Republic Bancorp Inc ’A’ Goldman Sachs 2,948
805 Republic Bancorp Inc ’A’ Morgan Stanley 90290,036 Republic First Bancorp Inc Bank of America
Merrill Lynch (8,103)77,434 Republic First Bancorp Inc Barclays Bank 7,743
148,695 Republic First Bancorp Inc Goldman Sachs (13,383)50,307 Republic First Bancorp Inc HSBC (9,558)
247,629 Republic First Bancorp Inc Morgan Stanley 23,826
BlackRock Americas Diversified Equity Absolute Return FundcontinuedPortfolio of Investments as at 31 May 2021
The notes on pages 590 to 610 form an integral part of these financial statements.
Annual report and audited financial statements [145]

Holding Description Counterparty
Netunrealised
appreciation/(depreciation)
USD
United States continued1,564 Republic Services Inc Bank of America
Merrill Lynch (1,329)(14,427) Republic Services Inc Barclays Bank 3,03012,016 Republic Services Inc Barclays Bank 1,0983,522 Republic Services Inc Goldman Sachs (2,994)1,905 Republic Services Inc HSBC (5,467)7,857 Republic Services Inc Morgan Stanley 2,836
(14,831) Research Frontiers Inc Barclays Bank (1,038)(14,789) Research Frontiers Inc HSBC 4,585(66,270) Research Frontiers Inc Morgan Stanley (4,639)
3,302 Resideo Technologies Inc Bank of AmericaMerrill Lynch 3,203
15,459 Resideo Technologies Inc Barclays Bank 10,3585,919 Resideo Technologies Inc Goldman Sachs 5,7414,351 Resideo Technologies Inc HSBC 5,787
(1,057) ResMed Inc Bank of AmericaMerrill Lynch (11,468)
(83) ResMed Inc Barclays Bank 402,567 ResMed Inc Morgan Stanley (1,232)
(6,381) Resonant Inc Barclays Bank (319)(14,699) Resources Connection Inc Morgan Stanley 1,323(1,855) resTORbio Inc* Bank of America
Merrill Lynch (182)(2,339) resTORbio Inc* Barclays Bank (2,569)
(10,959) Retail Opportunity Invest-ments Corp (REIT)
Bank of AmericaMerrill Lynch (4,164)
(11,317) Retail Opportunity Invest-ments Corp (REIT) Goldman Sachs (4,300)
(62,522) Retail Opportunity Invest-ments Corp (REIT) HSBC (8,128)
(41,196) Retail Opportunity Invest-ments Corp (REIT) Morgan Stanley (824)
28,905 Retail Properties of AmericaInc ’A’ (REIT)
Bank of AmericaMerrill Lynch 10,406
13,927 Retail Properties of AmericaInc ’A’ (REIT) Barclays Bank 4,317
10,411 Retail Properties of AmericaInc ’A’ (REIT) Goldman Sachs 3,748
(5,444) Retail Properties of AmericaInc ’A’ (REIT) Morgan Stanley (1,688)
2,088 Retail Properties of AmericaInc ’A’ (REIT) Morgan Stanley 383
(14,370) Retractable TechnologiesInc Barclays Bank (431)
1,326 REV Group Inc Bank of AmericaMerrill Lynch (27)
16,478 REV Group Inc Barclays Bank 15,48910,326 REV Group Inc HSBC 4,5432,852 Revance Therapeutics Inc Bank of America
Merrill Lynch 1,31219,098 Revance Therapeutics Inc Goldman Sachs 8,7854,738 Revance Therapeutics Inc HSBC 7,426
(2,122) REVOLUTION MedicinesInc
Bank of AmericaMerrill Lynch 3,332
(12,638) REVOLUTION MedicinesInc Barclays Bank 11,501
(360) REX American ResourcesCorp
Bank of AmericaMerrill Lynch (6,167)
(150) REX American ResourcesCorp Goldman Sachs (2,570)
(514) REX American ResourcesCorp Morgan Stanley (8,234)
2,320 Rexford Industrial Realty Inc(REIT) HSBC 1,740
42,126 Rexford Industrial Realty Inc(REIT) Morgan Stanley (62,347)
(5,940) Rexford Industrial Realty Inc(REIT) Morgan Stanley 8,791
(1,423) Rexnord Corp Barclays Bank 1854,311 Rexnord Corp Barclays Bank (560)
Holding Description Counterparty
Netunrealised
appreciation/(depreciation)
USD
United States continued(37,472) Rexnord Corp Goldman Sachs 23,982
6,616 Rexnord Corp Goldman Sachs (3,056)(13,023) Rexnord Corp Morgan Stanley 1,693
6,794 Reynolds Consumer Prod-ucts Inc
Bank of AmericaMerrill Lynch (10,123)
12,542 Reynolds Consumer Prod-ucts Inc Barclays Bank (6,020)
789 Reynolds Consumer Prod-ucts Inc HSBC (1,041)
26,406 Reynolds Consumer Prod-ucts Inc Morgan Stanley (12,674)
(5,830) RGC Resources Inc Bank of AmericaMerrill Lynch (6,122)
(6,892) RGC Resources Inc Barclays Bank (3,722)(7,553) RGC Resources Inc Goldman Sachs (7,152)(7,122) RGC Resources Inc HSBC (9,615)(3,307) RH Bank of America
Merrill Lynch (25,596)203 RH Bank of America
Merrill Lynch 5,536(2,182) RH Barclays Bank (56,601)
(109) RH Morgan Stanley (2,827)(2,764) Rhythm Pharmaceuticals
Inc Goldman Sachs 7,698(8,996) Rhythm Pharmaceuticals
Inc HSBC 8,096(4,190) Rhythm Pharmaceuticals
Inc Morgan Stanley 5,112(16,139) Ribbon Communications Inc Bank of America
Merrill Lynch (8,070)(20,092) Ribbon Communications Inc Goldman Sachs (10,046)
8,903 Richmond Mutual BanCorpInc
Bank of AmericaMerrill Lynch 6,143
15,914 Richmond Mutual BanCorpInc Barclays Bank (318)
27,625 Richmond Mutual BanCorpInc Goldman Sachs 19,061
11,338 Richmond Mutual BanCorpInc HSBC 11,451
17,366 Richmond Mutual BanCorpInc Morgan Stanley (347)
23,179 Rigel Pharmaceuticals Inc Goldman Sachs 92726,729 Rigel Pharmaceuticals Inc HSBC 14,70118,325 Rimini Street Inc Morgan Stanley 1,2833,597 RingCentral Inc ’A’ Bank of America
Merrill Lynch 96,903448 RingCentral Inc ’A’ Barclays Bank 7,087157 RingCentral Inc ’A’ HSBC 327
(1,209) RingCentral Inc ’A’ HSBC (2,515)222 RingCentral Inc ’A’ Morgan Stanley 2,590
(2,602) Riot Blockchain Inc Barclays Bank (3,070)(1,177) Riot Blockchain Inc Goldman Sachs (3,319)4,090 Rite Aid Corp Bank of America
Merrill Lynch (5,685)8,821 Rite Aid Corp Barclays Bank (8,292)2,399 Rite Aid Corp Goldman Sachs (3,335)
146,554 Riverview Bancorp Inc Bank of AmericaMerrill Lynch (35,173)
29,024 Riverview Bancorp Inc Goldman Sachs (6,966)79,247 Riverview Bancorp Inc Morgan Stanley (21,397)15,836 RLI Corp Morgan Stanley (10,135)
(19,534) RLJ Lodging Trust (REIT) HSBC 195(49,157) RLJ Lodging Trust (REIT) Morgan Stanley (17,697)
3,298 RMR Group Inc ’A’ Bank of AmericaMerrill Lynch (66)
1,925 RMR Group Inc ’A’ Barclays Bank 1734,302 RMR Group Inc ’A’ Goldman Sachs (86)6,829 RMR Group Inc ’A’ HSBC (683)
31,757 RMR Group Inc ’A’ Morgan Stanley 2,858
BlackRock Americas Diversified Equity Absolute Return FundcontinuedPortfolio of Investments as at 31 May 2021
The notes on pages 590 to 610 form an integral part of these financial statements.
BlackRock Strategic Funds[146]

Holding Description Counterparty
Netunrealised
appreciation/(depreciation)
USD
United States continued(11,680) Roadrunner Transportation
Systems IncBank of AmericaMerrill Lynch (1,168)
(16,747) Roadrunner TransportationSystems Inc Goldman Sachs (1,675)
(3,298) Roadrunner TransportationSystems Inc HSBC (726)
(9,988) Roadrunner TransportationSystems Inc Morgan Stanley (2,497)
1,182 Robert Half InternationalInc HSBC (2,376)
16,453 Robert Half InternationalInc Morgan Stanley 12,669
(3,501) Robert Half InternationalInc Morgan Stanley (2,696)
(4,936) ROBLOX Corp ’A’ Bank of AmericaMerrill Lynch (83,122)
(5,761) Rocket Cos Inc ’A’ Barclays Bank (4,666)(1,727) Rocket Pharmaceuticals Inc Bank of America
Merrill Lynch (3,627)(1,693) Rocket Pharmaceuticals Inc Goldman Sachs (3,555)(2,312) Rocket Pharmaceuticals Inc HSBC 1,965(3,986) Rocket Pharmaceuticals Inc Morgan Stanley (6,617)3,112 Rockwell Automation Inc Barclays Bank 4,1391,430 Rockwell Automation Inc Goldman Sachs (1,745)3,176 Rockwell Automation Inc HSBC (22,518)
(19,921) Rockwell Medical Inc Bank of AmericaMerrill Lynch 1,269
(7,977) Rockwell Medical Inc Barclays Bank (160)(87,368) Rockwell Medical Inc Morgan Stanley (1,756)
3,344 Rocky Brands Inc Bank of AmericaMerrill Lynch 4,815
10,019 Rocky Brands Inc Morgan Stanley 51,598(618) Rogers Corp Barclays Bank (2,589)
(4,820) Rogers Corp Goldman Sachs (22,859)(1,434) Rogers Corp HSBC (9,565)(5,316) Rogers Corp Morgan Stanley (22,274)
765 Roku Inc Bank of AmericaMerrill Lynch 26,224
1,426 Roku Inc Barclays Bank (727)181 Roku Inc Morgan Stanley (92)
6,869 Rollins Inc Bank of AmericaMerrill Lynch (13,807)
9,214 Rollins Inc Barclays Bank (2,856)29,530 Rollins Inc Goldman Sachs (59,355)6,584 Rollins Inc HSBC (20,608)2,733 Rollins Inc Morgan Stanley (847)
(3,461) Root Inc ’A’ Bank of AmericaMerrill Lynch —
(1,494) Root Inc ’A’ Barclays Bank (284)5,514 Root Inc ’A’ Goldman Sachs —
879 Roper Technologies Inc Bank of AmericaMerrill Lynch 13,447
1,961 Roper Technologies Inc Barclays Bank 10,378130 Roper Technologies Inc Goldman Sachs 2,206
1,088 Roper Technologies Inc HSBC 7,4325,140 Roper Technologies Inc Morgan Stanley 23,591(391) Ross Stores Inc Bank of America
Merrill Lynch 794(9,212) Ross Stores Inc Goldman Sachs 13,774
(536) Ross Stores Inc HSBC 2,450(23,029) Ross Stores Inc Morgan Stanley (66,324)(15,243) Royal Caribbean Cruises
LtdBank of AmericaMerrill Lynch (139,056)
(19,334) Royal Caribbean CruisesLtd Barclays Bank (143,072)
(2,997) Royal Caribbean CruisesLtd Goldman Sachs (27,759)
(6,121) Royal Caribbean CruisesLtd Morgan Stanley (45,296)
Holding Description Counterparty
Netunrealised
appreciation/(depreciation)
USD
United States continued3,500 Royal Gold Inc Bank of America
Merrill Lynch (15,085)(2,098) Royal Gold Inc Bank of America
Merrill Lynch 9,0426,085 Royal Gold Inc Barclays Bank (10,101)
(1,762) Royal Gold Inc Barclays Bank 2,9252,898 Royal Gold Inc Goldman Sachs (12,490)3,658 Royal Gold Inc HSBC 17,595
(2,401) Royal Gold Inc HSBC (11,549)2,005 Royal Gold Inc Morgan Stanley (3,328)(509) Royal Gold Inc Morgan Stanley 845
(2,468) Royalty Pharma Plc ’A’ Barclays Bank 1,481(11,072) Royalty Pharma Plc ’A’ Goldman Sachs 15,279
1,022 Royalty Pharma Plc ’A’ HSBC (1,400)(3,065) Royalty Pharma Plc ’A’ HSBC 4,199(4,639) Royalty Pharma Plc ’A’ Morgan Stanley 2,783
(50,215) RPC Inc Bank of AmericaMerrill Lynch 53,730
(81,224) RPC Inc Barclays Bank 10,246(4,187) RPC Inc Morgan Stanley 275(7,036) RPM International Inc HSBC 30,888
(14,226) RPM International Inc Morgan Stanley 9,8168,971 RPT Realty (REIT) Barclays Bank 2,691
14,418 RPT Realty (REIT) Goldman Sachs 5,91134,001 RPT Realty (REIT) HSBC (1,020)92,757 RPT Realty (REIT) Morgan Stanley 27,82768,267 RR Donnelley & Sons Co Bank of America
Merrill Lynch 111,95811,185 RR Donnelley & Sons Co Goldman Sachs 18,343
(15,110) Rubicon Technology Inc Morgan Stanley (4,231)(9,223) Rubius Therapeutics Inc Barclays Bank 2,4907,614 Rush Enterprises Inc ’A’ Bank of America
Merrill Lynch (30,456)23,453 Rush Enterprises Inc ’A’ Barclays Bank (8,443)7,954 Rush Enterprises Inc ’A’ Goldman Sachs (31,816)
616 Rush Enterprises Inc ’A’ Morgan Stanley (12)5,156 Rush Enterprises Inc ’B’ Bank of America
Merrill Lynch (17,118)12,287 Rush Enterprises Inc ’B’ Barclays Bank 6,6358,302 Rush Enterprises Inc ’B’ Goldman Sachs (27,563)4,585 Rush Enterprises Inc ’B’ HSBC (8,115)8,509 Rush Enterprises Inc ’B’ Morgan Stanley 4,5958,643 Rush Street Interactive Inc Barclays Bank (2,420)3,951 Rush Street Interactive Inc Goldman Sachs 1,541
24,000 Rush Street Interactive Inc HSBC 2403,466 Rush Street Interactive Inc Morgan Stanley (970)9,868 Ruth’s Hospitality Group Inc Morgan Stanley 808
11,314 Ryder System Inc Bank of AmericaMerrill Lynch (39,893)
2,906 Ryder System Inc Barclays Bank 52313,844 Ryder System Inc Goldman Sachs (58,709)3,990 Ryder System Inc HSBC (15,209)
14,256 Ryder System Inc Morgan Stanley 11,32147,156 Ryerson Holding Corp Goldman Sachs (18,862)10,077 Ryerson Holding Corp Morgan Stanley (1,915)(2,978) Ryman Hospitality Proper-
ties Inc (REIT)Bank of AmericaMerrill Lynch (5,822)
854 Ryman Hospitality Proper-ties Inc (REIT)
Bank of AmericaMerrill Lynch (228)
(1,359) Ryman Hospitality Proper-ties Inc (REIT) Barclays Bank (3,226)
4,116 Ryman Hospitality Proper-ties Inc (REIT) Barclays Bank 10,743
(2,571) Ryman Hospitality Proper-ties Inc (REIT) Goldman Sachs (427)
2,495 Ryman Hospitality Proper-ties Inc (REIT) Goldman Sachs 948
BlackRock Americas Diversified Equity Absolute Return FundcontinuedPortfolio of Investments as at 31 May 2021
The notes on pages 590 to 610 form an integral part of these financial statements.
Annual report and audited financial statements [147]

Holding Description Counterparty
Netunrealised
appreciation/(depreciation)
USD
United States continued(3,428) Ryman Hospitality Proper-
ties Inc (REIT) Morgan Stanley (3,906)362 Ryman Hospitality Proper-
ties Inc (REIT) Morgan Stanley 945(421) S&P Global Inc Bank of America
Merrill Lynch (1,903)(5,100) S&P Global Inc Barclays Bank (2,142)(6,209) S&P Global Inc Goldman Sachs (20,524)
(900) S&P Global Inc Morgan Stanley (315)(31,691) S&T Bancorp Inc Barclays Bank 6,972(32,783) S&T Bancorp Inc Goldman Sachs 6,557(21,581) S&T Bancorp Inc HSBC (15,754)(33,929) S&T Bancorp Inc Morgan Stanley 7,464(36,764) Sabra Health Care Inc
(REIT)Bank of AmericaMerrill Lynch (11,397)
6,193 Sabra Health Care Inc(REIT)
Bank of AmericaMerrill Lynch 1,920
(81,269) Sabra Health Care Inc(REIT) Barclays Bank 3,251
(20,357) Sabra Health Care Inc(REIT) Goldman Sachs (6,311)
15,738 Sabra Health Care Inc(REIT) HSBC (4,879)
(23,334) Sabra Health Care Inc(REIT) Morgan Stanley 933
37,747 Sabra Health Care Inc(REIT) Morgan Stanley (1,510)
(12,761) Sabre Corp Morgan Stanley (6,891)(96,079) Safe Bulkers Inc Barclays Bank 69,177(77,943) Safe Bulkers Inc Goldman Sachs 13,250
(219,081) Safeguard Scientifics Inc Bank of AmericaMerrill Lynch (8,763)
(9,877) Safeguard Scientifics Inc Barclays Bank (790)(6,938) Safeguard Scientifics Inc Goldman Sachs (278)(2,436) Safety Insurance Group Inc Goldman Sachs 1,598(4,838) Safety Insurance Group Inc Morgan Stanley 1,790
(16,612) Saga Communications Inc’A’ Morgan Stanley (16,114)
(771) Sage Therapeutics Inc Bank of AmericaMerrill Lynch (223)
(1,052) Sage Therapeutics Inc Barclays Bank 1,904(388) Sage Therapeutics Inc Goldman Sachs 1,222
(2,330) Sage Therapeutics Inc Morgan Stanley 4,217(848) Saia Inc Bank of America
Merrill Lynch 8,8451,887 Saia Inc Bank of America
Merrill Lynch (8,832)(2,435) Saia Inc Barclays Bank (6,697)1,210 Saia Inc Barclays Bank 619(798) Saia Inc Goldman Sachs 8,323
4,066 Saia Inc HSBC 24,214(3,981) Saia Inc HSBC 34,436(3,768) Saia Inc Morgan Stanley (10,362)5,930 Sailpoint Technologies Hold-
ings IncBank of AmericaMerrill Lynch 9,758
19,872 Sailpoint Technologies Hold-ings Inc Barclays Bank 24,244
30,521 Sailpoint Technologies Hold-ings Inc Goldman Sachs 67,988
17,277 Sailpoint Technologies Hold-ings Inc HSBC 31,781
5,863 Sailpoint Technologies Hold-ings Inc Morgan Stanley 7,153
(6,771) salesforce.com Inc Bank of AmericaMerrill Lynch (156,004)
3,032 Salisbury Bancorp Inc Bank of AmericaMerrill Lynch (667)
6,252 Salisbury Bancorp Inc Barclays Bank 1,8767,461 Salisbury Bancorp Inc Goldman Sachs (1,641)
Holding Description Counterparty
Netunrealised
appreciation/(depreciation)
USD
United States continued6,465 Salisbury Bancorp Inc HSBC 2,327
(7,084) Sally Beauty Holdings Inc Bank of AmericaMerrill Lynch 10,626
(13,997) Sally Beauty Holdings Inc Barclays Bank (5,879)(13,089) Sally Beauty Holdings Inc Goldman Sachs 19,634
1,827 Sanderson Farms Inc Bank of AmericaMerrill Lynch (22,417)
3,329 Sanderson Farms Inc Barclays Bank (21,772)8,091 Sanderson Farms Inc Goldman Sachs (99,277)
448 Sanderson Farms Inc HSBC (104)27,970 Sandy Spring Bancorp Inc Bank of America
Merrill Lynch (27,131)38,376 Sandy Spring Bancorp Inc Barclays Bank 2,68624,986 Sandy Spring Bancorp Inc Goldman Sachs (24,236)9,584 Sandy Spring Bancorp Inc Morgan Stanley 671
11,224 Sangamo Therapeutics Inc Barclays Bank 1,1221,524 Sangamo Therapeutics Inc HSBC 9303,965 Sangamo Therapeutics Inc Morgan Stanley 397
(30,134) Sanmina Corp Bank of AmericaMerrill Lynch 4,520
(2,968) Sanmina Corp Barclays Bank 1,395(971) Sanmina Corp Goldman Sachs 146
38,064 Santander Consumer USAHoldings Inc
Bank of AmericaMerrill Lynch 46,438
4,177 Santander Consumer USAHoldings Inc Goldman Sachs 5,096
18,074 Santander Consumer USAHoldings Inc Morgan Stanley 1,265
(52,923) Sapiens International CorpNV Barclays Bank (10,293)
(6,860) Sapiens International CorpNV Morgan Stanley (1,371)
(2,625) Sarepta Therapeutics Inc Barclays Bank 4,095(1,021) Sarepta Therapeutics Inc Morgan Stanley 1,5939,076 Satsuma Pharmaceuticals
Inc Morgan Stanley (1,906)6,906 Saul Centers Inc (REIT) Bank of America
Merrill Lynch 9,4617,822 Saul Centers Inc (REIT) Barclays Bank 16,113
10,277 Saul Centers Inc (REIT) Goldman Sachs 14,07918,567 Saul Centers Inc (REIT) Morgan Stanley 38,248
(58,571) Savara Inc Barclays Bank (7,029)(3,639) SB Financial Group Inc Bank of America
Merrill Lynch (4,258)(5,100) SB Financial Group Inc Barclays Bank (612)
174 SBA Communications Corp(REIT)
Bank of AmericaMerrill Lynch 1,674
1,900 SBA Communications Corp(REIT) Goldman Sachs 18,278
1,254 SBA Communications Corp(REIT) Morgan Stanley 1,981
21,538 ScanSource Inc Bank of AmericaMerrill Lynch (7,969)
16,685 ScanSource Inc Barclays Bank (3,003)4,296 ScanSource Inc HSBC (3,265)5,551 ScanSource Inc Morgan Stanley (910)
11,604 Schlumberger NV Bank of AmericaMerrill Lynch (31,563)
39,915 Schlumberger NV Barclays Bank (14,769)29,964 Schlumberger NV Goldman Sachs (81,502)40,466 Schneider National Inc ’B’ Bank of America
Merrill Lynch (35,279)22,526 Schneider National Inc ’B’ Barclays Bank (5,676)23,626 Schneider National Inc ’B’ Goldman Sachs (17,986)25,703 Schneider National Inc ’B’ HSBC (49,864)81,395 Schneider National Inc ’B’ Morgan Stanley (30,116)21,814 Schnitzer Steel Industries
Inc ’A’ Barclays Bank 4,145
BlackRock Americas Diversified Equity Absolute Return FundcontinuedPortfolio of Investments as at 31 May 2021
The notes on pages 590 to 610 form an integral part of these financial statements.
BlackRock Strategic Funds[148]

Holding Description Counterparty
Netunrealised
appreciation/(depreciation)
USD
United States continued8,952 Schnitzer Steel Industries
Inc ’A’ Goldman Sachs (15,487)13,536 Schnitzer Steel Industries
Inc ’A’ Morgan Stanley 2,572(2,369) Scholar Rock Holding Corp Bank of America
Merrill Lynch 3,648(4,441) Scholar Rock Holding Corp Barclays Bank (489)(8,322) Scholar Rock Holding Corp Morgan Stanley (243)(7,356) Scholastic Corp Morgan Stanley (5,738)(2,274) Schrodinger Inc Bank of America
Merrill Lynch (19,852)(4,135) Schrodinger Inc Barclays Bank (19,931)(7,800) Schrodinger Inc Goldman Sachs (61,901)(1,623) Schrodinger Inc HSBC (10,013)
(294) Schrodinger Inc Morgan Stanley (1,417)(13,923) Schweitzer-Mauduit Interna-
tional Inc Barclays Bank 41,560(13,040) Schweitzer-Mauduit Interna-
tional Inc Goldman Sachs 72,939(15,131) Schweitzer-Mauduit Interna-
tional Inc HSBC 102,437(15,235) Schweitzer-Mauduit Interna-
tional Inc Morgan Stanley 55,8171,587 Science Applications Inter-
national CorpBank of AmericaMerrill Lynch 1,895
(7,852) Science Applications Inter-national Corp Barclays Bank (629)
2,757 Science Applications Inter-national Corp Barclays Bank 221
(7,209) Science Applications Inter-national Corp Goldman Sachs (8,795)
1,365 Science Applications Inter-national Corp Goldman Sachs 250
(11,822) Science Applications Inter-national Corp HSBC 5,320
1,205 Science Applications Inter-national Corp HSBC 1,470
(14,118) Science Applications Inter-national Corp Morgan Stanley (1,130)
(2,541) Scientific Games Corp ’A’ Bank of AmericaMerrill Lynch (31,766)
(7,870) Scientific Games Corp ’A’ Barclays Bank (33,019)(4,783) Scientific Games Corp ’A’ HSBC (89,481)5,189 Scopus Biopharma Inc Goldman Sachs 6,901
19,789 Scorpio Tankers Inc Morgan Stanley (5,145)683 Scotts Miracle-Gro Co Barclays Bank (1,168)669 Scotts Miracle-Gro Co Morgan Stanley (1,144)
(592) Scotts Miracle-Gro Co Morgan Stanley 1,012(13,909) scPharmaceuticals Inc Bank of America
Merrill Lynch 3,060(15,143) scPharmaceuticals Inc Barclays Bank 909(8,135) scPharmaceuticals Inc Goldman Sachs 1,7904,414 Sculptor Capital Manage-
ment IncBank of AmericaMerrill Lynch 4,282
20,160 Sculptor Capital Manage-ment Inc Barclays Bank 15,498
4,619 Sculptor Capital Manage-ment Inc HSBC 1,909
(72) Seaboard Corp Bank of AmericaMerrill Lynch 3,506
(88) Seaboard Corp Barclays Bank 800(122) Seaboard Corp Goldman Sachs 11,346(149) Seaboard Corp HSBC 18,215(511) Seaboard Corp Morgan Stanley 1,930
(143,258) SeaChange InternationalInc
Bank of AmericaMerrill Lynch (7,163)
(37,439) Seacoast Banking Corp ofFlorida Goldman Sachs 37,439
(8,369) Seacoast Banking Corp ofFlorida HSBC 4,603
Holding Description Counterparty
Netunrealised
appreciation/(depreciation)
USD
United States continued(18,345) Seacoast Banking Corp of
Florida Morgan Stanley 9,173(1,157) Seagate Technology Hold-
ings Plc Barclays Bank 2,777(682) Seagate Technology Hold-
ings Plc Goldman Sachs 5,783(31,839) Seagate Technology Hold-
ings Plc Morgan Stanley 64,358(1,042) Seagen Inc Bank of America
Merrill Lynch (7,679)(3,332) Seagen Inc Barclays Bank (5,598)15,352 Sealed Air Corp Barclays Bank 3,7434,577 Sealed Air Corp Goldman Sachs 1,4657,298 Sealed Air Corp HSBC 12,506
17,491 Sealed Air Corp Morgan Stanley 6,0126,906 SeaSpine Holdings Corp Goldman Sachs 2,555
20,400 SeaSpine Holdings Corp Morgan Stanley (18,972)5,260 SeaWorld Entertainment Inc Bank of America
Merrill Lynch 7,96812,548 SeaWorld Entertainment Inc Barclays Bank 14,01521,716 SeaWorld Entertainment Inc Goldman Sachs 45,821(3,416) SecureWorks Corp ’A’ Bank of America
Merrill Lynch (1,571)(866) SecureWorks Corp ’A’ Barclays Bank 312
(5,216) SecureWorks Corp ’A’ HSBC (5,060)(37,301) SecureWorks Corp ’A’ Morgan Stanley 13,42816,341 Security National Financial
Corp ’A’Bank of AmericaMerrill Lynch (3,922)
26,337 Security National FinancialCorp ’A’ Barclays Bank (3,424)
25,243 Security National FinancialCorp ’A’ Goldman Sachs (6,058)
5,632 Security National FinancialCorp ’A’ HSBC 2,196
14,559 Security National FinancialCorp ’A’ Morgan Stanley (1,893)
(2,073) Seelos Therapeutics Inc Bank of AmericaMerrill Lynch 753
(3,343) Seer Inc Barclays Bank 1,337(1,364) SEI Investments Co Bank of America
Merrill Lynch (669)(5,583) SEI Investments Co Barclays Bank (3,049)(3,167) SEI Investments Co Goldman Sachs (778)(3,160) SEI Investments Co Morgan Stanley (1,212)13,779 Select Bancorp Inc Bank of America
Merrill Lynch 3,85848,236 Select Bancorp Inc Barclays Bank (6,753)13,403 Select Bancorp Inc Goldman Sachs 3,75328,109 Select Bancorp Inc Morgan Stanley (3,935)(2,103) Select Energy Services Inc
’A’ Barclays Bank (210)(20,648) Select Energy Services Inc
’A’ Goldman Sachs 15,692(28,160) Select Energy Services Inc
’A’ HSBC 18,867(54,852) Select Energy Services Inc
’A’ Morgan Stanley (5,485)6,894 Select Interior Concepts Inc
’A’ HSBC 3,7239,007 Select Interior Concepts Inc
’A’ Morgan Stanley (3,783)7,505 Select Medical Holdings
CorpBank of AmericaMerrill Lynch 15,685
14,072 Select Medical HoldingsCorp Barclays Bank 4,222
10,483 Select Medical HoldingsCorp Morgan Stanley 3,145
17,233 Selecta Biosciences Inc Bank of AmericaMerrill Lynch 24,126
10,124 Selecta Biosciences Inc Barclays Bank 9,112
BlackRock Americas Diversified Equity Absolute Return FundcontinuedPortfolio of Investments as at 31 May 2021
The notes on pages 590 to 610 form an integral part of these financial statements.
Annual report and audited financial statements [149]

Holding Description Counterparty
Netunrealised
appreciation/(depreciation)
USD
United States continued23,950 Selecta Biosciences Inc Goldman Sachs 33,5301,019 Selecta Biosciences Inc HSBC 1,5497,256 Selecta Biosciences Inc Morgan Stanley 6,530
(10,927) Selective Insurance GroupInc HSBC 16,172
(16,293) Selective Insurance GroupInc Morgan Stanley 32,423
(26,870) Selectquote Inc Bank of AmericaMerrill Lynch 23,298
(17,274) Selectquote Inc Barclays Bank 5,517(6,821) Selectquote Inc Goldman Sachs 2,270(8,007) Selectquote Inc HSBC 54,744(5,588) Selectquote Inc Morgan Stanley 2,179
(10,455) Sempra Energy Bank of AmericaMerrill Lynch 21,433
(8,995) Sempra Energy Barclays Bank 20,418(12,612) Sempra Energy Goldman Sachs 25,195(9,334) Sempra Energy HSBC 24,196(2,430) Sempra Energy Morgan Stanley 5,51610,877 Semtech Corp Barclays Bank 7,723
(943) Semtech Corp Goldman Sachs (1,848)370 Semtech Corp Goldman Sachs 725
(6,501) Semtech Corp HSBC (9,947)(12,453) Semtech Corp Morgan Stanley (8,842)
544 Seneca Foods Corp ’A’ Bank of AmericaMerrill Lynch (555)
3,911 Seneca Foods Corp ’A’ Barclays Bank (156)1,953 Seneca Foods Corp ’A’ Goldman Sachs (1,992)2,210 Seneca Foods Corp ’A’ HSBC (3,334)9,305 Seneca Foods Corp ’A’ Morgan Stanley (372)
(6,937) Sensata Technologies Hold-ing Plc
Bank of AmericaMerrill Lynch (19,289)
(9,900) Sensata Technologies Hold-ing Plc Barclays Bank (11,979)
(12,810) Sensata Technologies Hold-ing Plc Goldman Sachs (20,913)
(25,829) Sensata Technologies Hold-ing Plc Morgan Stanley (31,253)
2,418 Sensei Biotherapeutics Inc Bank of AmericaMerrill Lynch 8,052
1,776 Sensei Biotherapeutics Inc Barclays Bank (2,220)4,805 Sensei Biotherapeutics Inc Goldman Sachs 16,0015,206 Sensei Biotherapeutics Inc Morgan Stanley (6,508)
(16,531) Sensient Technologies Corp Bank of AmericaMerrill Lynch (20,168)
(6,621) Sensient Technologies Corp Barclays Bank 1,091(507) Sensient Technologies Corp Goldman Sachs (619)
(40,697) Sensient Technologies Corp Morgan Stanley 6,251(1,816) Seres Therapeutics Inc Bank of America
Merrill Lynch (100)(7,789) Seres Therapeutics Inc Barclays Bank (712)(1,120) Seres Therapeutics Inc Goldman Sachs 436(1,102) Seres Therapeutics Inc Morgan Stanley 24814,863 Seritage Growth Properties
(REIT)Bank of AmericaMerrill Lynch 12,634
(3,599) Service Corp International Bank of AmericaMerrill Lynch 2,519
2,244 Service Corp International Bank of AmericaMerrill Lynch 68
(11,222) Service Corp International Barclays Bank (2,581)8,637 Service Corp International Barclays Bank 1,987
(3,185) Service Corp International Goldman Sachs 2,230652 Service Corp International Goldman Sachs 218
(10,449) Service Corp International Morgan Stanley (2,403)6,488 Service Corp International Morgan Stanley 1,492
(12,608) Service Properties Trust(REIT)
Bank of AmericaMerrill Lynch (18,408)
(47,656) Service Properties Trust(REIT) Barclays Bank (77,718)
Holding Description Counterparty
Netunrealised
appreciation/(depreciation)
USD
United States continued(28,979) Service Properties Trust
(REIT) Goldman Sachs (32,762)(22,683) Service Properties Trust
(REIT) HSBC (29,261)(51,369) Service Properties Trust
(REIT) Morgan Stanley (84,759)2,051 ServiceNow Inc Bank of America
Merrill Lynch 18,47187 ServiceNow Inc Barclays Bank (216)
115 ServiceNow Inc HSBC 1,7252,615 ServiceNow Inc Morgan Stanley (9,823)
(140,523) ServiceSource InternationalInc
Bank of AmericaMerrill Lynch 8,431
(60,057) ServiceSource InternationalInc Barclays Bank 601
(24,738) ServiceSource InternationalInc Goldman Sachs 1,484
8,754 ServisFirst Bancshares Inc Morgan Stanley 9,192(43,860) SFL Corp Ltd Bank of America
Merrill Lynch 7,456(54,086) SFL Corp Ltd Barclays Bank 15,144(40,208) SFL Corp Ltd Goldman Sachs 6,835
8,397 Shake Shack Inc ’A’ Bank of AmericaMerrill Lynch 74,652
5,512 Shake Shack Inc ’A’ Barclays Bank 40,35013,329 Shake Shack Inc ’A’ Goldman Sachs 100,5212,036 Shake Shack Inc ’A’ HSBC 21,6797,877 Shake Shack Inc ’A’ Morgan Stanley 2,515
(6,506) Sharps Compliance Corp Barclays Bank 10,865(5,933) SharpSpring Inc Bank of America
Merrill Lynch 7,416(13,464) SharpSpring Inc Barclays Bank 18,715(4,790) Shattuck Labs Inc Bank of America
Merrill Lynch (1,581)(1,159) Shattuck Labs Inc Barclays Bank (1,901)
(74) Shenandoah Telecommuni-cations Co Barclays Bank 67
(5,734) Shenandoah Telecommuni-cations Co HSBC (3,842)
(24,650) Shenandoah Telecommuni-cations Co Morgan Stanley 22,432
6,505 Sherwin-Williams Co Barclays Bank (12,415)102 Sherwin-Williams Co Goldman Sachs (71)
4,665 Sherwin-Williams Co HSBC (23,885)6,907 Sherwin-Williams Co Morgan Stanley (13,884)
(1,254) Shift4 Payments Inc ’A’ Bank of AmericaMerrill Lynch (9,581)
(1,442) Shift4 Payments Inc ’A’ Barclays Bank (952)(626) Shift4 Payments Inc ’A’ Goldman Sachs (4,783)
(1,370) Shift4 Payments Inc ’A’ HSBC (13,289)(13,086) Shift4 Payments Inc ’A’ Morgan Stanley (8,637)(2,920) Shoals Technologies Group
Inc ’A’Bank of AmericaMerrill Lynch (17,286)
(5,468) Shoals Technologies GroupInc ’A’ Barclays Bank (10,061)
2,631 Shockwave Medical Inc Barclays Bank 14,7341,477 Shockwave Medical Inc Goldman Sachs 33,115
237 Shockwave Medical Inc HSBC 3,044(461) Shockwave Medical Inc Morgan Stanley (2,582)
1,710 Shoe Carnival Inc Barclays Bank 1,4883,795 Shore Bancshares Inc Bank of America
Merrill Lynch 91113,613 Shore Bancshares Inc Barclays Bank 3,26717,323 Shore Bancshares Inc Goldman Sachs 4,15822,250 Shore Bancshares Inc Morgan Stanley 5,340(9,082) ShotSpotter Inc Barclays Bank 11,353(8,775) ShotSpotter Inc HSBC (81,520)(1,948) ShotSpotter Inc Morgan Stanley 2,4351,866 Shutterstock Inc Barclays Bank 4,684
BlackRock Americas Diversified Equity Absolute Return FundcontinuedPortfolio of Investments as at 31 May 2021
The notes on pages 590 to 610 form an integral part of these financial statements.
BlackRock Strategic Funds[150]

Holding Description Counterparty
Netunrealised
appreciation/(depreciation)
USD
United States continued4,106 Shutterstock Inc Goldman Sachs 22,624
930 Shutterstock Inc HSBC 8,8263,072 Shutterstock Inc Morgan Stanley 7,711
(7,468) Shyft Group Inc Goldman Sachs (3,883)(11,868) Shyft Group Inc HSBC (29,670)(35,496) Shyft Group Inc Morgan Stanley (9,939)
8,544 SI-BONE Inc Goldman Sachs (11,705)5,115 SI-BONE Inc Morgan Stanley (12,071)
(67,758) Siebert Financial Corp Barclays Bank (22,360)(760) Siebert Financial Corp Goldman Sachs 61
(1,050) Siebert Financial Corp HSBC (452)(659) Siebert Financial Corp Morgan Stanley (217)777 Sienna Biopharmaceuticals
Inc Goldman Sachs (11)(9,983) Sientra Inc Barclays Bank 1,997
(18,951) Sientra Inc HSBC (6,064)28,046 Sierra Bancorp Bank of America
Merrill Lynch (3,646)20,395 Sierra Bancorp Goldman Sachs (2,651)67,340 Sierra Bancorp Morgan Stanley 42,424
(18,449) SIGA Technologies Inc Goldman Sachs (3,136)(26,087) SIGA Technologies Inc HSBC (2,609)(74,641) SIGA Technologies Inc Morgan Stanley (6,718)
998 Sigilon Therapeutics Inc Barclays Bank (40)10,549 Sigilon Therapeutics Inc Goldman Sachs (20,887)2,149 Sigilon Therapeutics Inc Morgan Stanley (86)
572 Signature Bank Bank of AmericaMerrill Lynch 1,888
4,706 Signature Bank Barclays Bank 48,096115 Signature Bank Goldman Sachs 380
1,647 Signature Bank HSBC (5,172)8,057 Signet Jewelers Ltd Bank of America
Merrill Lynch (39,882)2,187 Signet Jewelers Ltd Morgan Stanley 6,4749,344 Signify Health Inc ’A’ Morgan Stanley 5,326(796) Silgan Holdings Inc Barclays Bank 836
(9,326) Silgan Holdings Inc HSBC 8,487(25,369) Silgan Holdings Inc Morgan Stanley 26,637
6,305 Silicon Laboratories Inc Bank of AmericaMerrill Lynch 76,543
20,382 Silicon Laboratories Inc Barclays Bank 91,10710,024 Silicon Laboratories Inc Goldman Sachs 114,13210,401 Silicon Laboratories Inc HSBC 103,60030,013 Silicon Laboratories Inc Morgan Stanley 134,1599,700 Silk Road Medical Inc Bank of America
Merrill Lynch 19,7882,158 Silk Road Medical Inc Goldman Sachs 4,402
11,465 Silvercrest Asset Manage-ment Group Inc ’A’
Bank of AmericaMerrill Lynch 21,784
11,782 Silvercrest Asset Manage-ment Group Inc ’A’ Barclays Bank 8,130
11,133 Silvercrest Asset Manage-ment Group Inc ’A’ Goldman Sachs 21,153
11,604 Silvercrest Asset Manage-ment Group Inc ’A’ HSBC 22,164
21,829 Silvercrest Asset Manage-ment Group Inc ’A’ Morgan Stanley 15,062
(365) Silvergate Capital Corp ’A’ Bank of AmericaMerrill Lynch (7,358)
(1,926) Silvergate Capital Corp ’A’ Barclays Bank (10,285)(659) Silvergate Capital Corp ’A’ Goldman Sachs (13,285)
(10,133) Simmons First NationalCorp ’A’ HSBC (8,005)
(19,893) Simmons First NationalCorp ’A’ Morgan Stanley (2,586)
(8,295) Simon Property Group Inc(REIT) Barclays Bank (33,373)
1,892 Simon Property Group Inc(REIT) Morgan Stanley 7,284
(4,247) Simply Good Foods Co Barclays Bank 595
Holding Description Counterparty
Netunrealised
appreciation/(depreciation)
USD
United States continued(5,379) Simply Good Foods Co Goldman Sachs (15,276)(5,995) Simply Good Foods Co Morgan Stanley 839(1,988) Simpson Manufacturing Co
IncBank of AmericaMerrill Lynch 2,326
(6,711) Simpson Manufacturing CoInc Barclays Bank 3,758
(28,637) Simpson Manufacturing CoInc HSBC 120,848
1,792 Simpson Manufacturing CoInc HSBC (7,562)
(23,027) Simpson Manufacturing CoInc Morgan Stanley 12,895
(1,814) Simulations Plus Inc Bank of AmericaMerrill Lynch (2,884)
(2,374) Simulations Plus Inc Barclays Bank (2,944)(4,473) Simulations Plus Inc Goldman Sachs (7,112)(6,349) Simulations Plus Inc Morgan Stanley (7,873)10,252 Sinclair Broadcast Group
Inc ’A’Bank of AmericaMerrill Lynch 9,432
1,168 Sinclair Broadcast GroupInc ’A’ Barclays Bank 1,156
8,663 Sinclair Broadcast GroupInc ’A’ HSBC 3,292
36,609 Sinclair Broadcast GroupInc ’A’ Morgan Stanley 36,243
104,816 Sirius XM Holdings Inc Bank of AmericaMerrill Lynch 39,118
446,599 Sirius XM Holdings Inc Barclays Bank 49,126212,453 Sirius XM Holdings Inc Goldman Sachs 47,73964,678 Sirius XM Holdings Inc Morgan Stanley 6,840
(229,460) SiriusPoint Ltd Barclays Bank 16,062(49,585) SiriusPoint Ltd HSBC (10,909)
(105,346) SiriusPoint Ltd Morgan Stanley 7,37413,405 SITE Centers Corp (REIT) Bank of America
Merrill Lynch 3,48525,624 SITE Centers Corp (REIT) Barclays Bank 9,48174,764 SITE Centers Corp (REIT) Goldman Sachs 19,43920,389 SITE Centers Corp (REIT) Morgan Stanley 7,5444,626 SiteOne Landscape Supply
IncBank of AmericaMerrill Lynch 5,491
17,011 SiteOne Landscape SupplyInc Barclays Bank (43,037)
9,343 SiteOne Landscape SupplyInc Goldman Sachs 38,540
9,371 SiteOne Landscape SupplyInc HSBC (275,039)
8,547 SiteOne Landscape SupplyInc Morgan Stanley (30,442)
(1,377) SiTime Corp Bank of AmericaMerrill Lynch (20,999)
(2,035) SiTime Corp Barclays Bank (5,014)(7,112) SiTime Corp Goldman Sachs (71,877)
(285) SiTime Corp Morgan Stanley (878)(14,402) SITO Mobile Ltd Bank of America
Merrill Lynch 1(66,470) SITO Mobile Ltd Goldman Sachs 7
5,866 Six Flags EntertainmentCorp
Bank of AmericaMerrill Lynch 2,663
1,053 Six Flags EntertainmentCorp Barclays Bank 1,793
7,399 Six Flags EntertainmentCorp Goldman Sachs 21,309
470 Six Flags EntertainmentCorp HSBC 1,072
37,779 Six Flags EntertainmentCorp Morgan Stanley 54,919
1,153 SJW Group Bank of AmericaMerrill Lynch 1,487
2,393 SJW Group Barclays Bank 1689,698 SJW Group Goldman Sachs 12,510
BlackRock Americas Diversified Equity Absolute Return FundcontinuedPortfolio of Investments as at 31 May 2021
The notes on pages 590 to 610 form an integral part of these financial statements.
Annual report and audited financial statements [151]
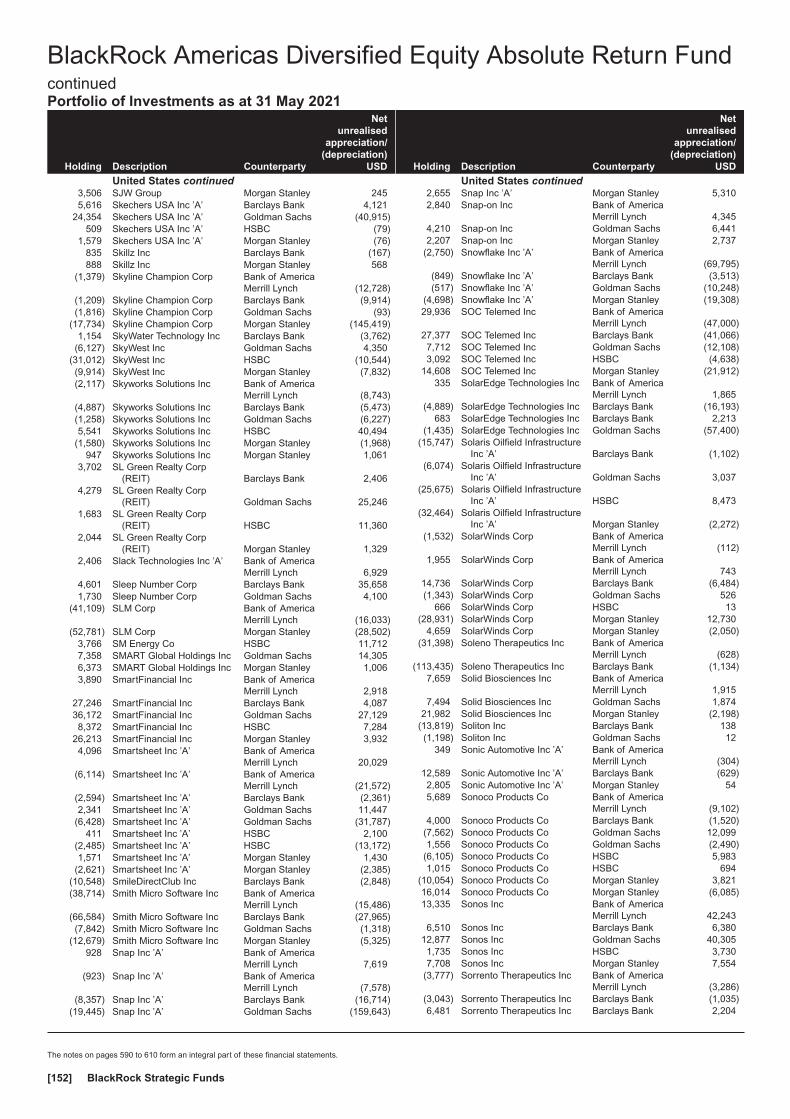
Holding Description Counterparty
Netunrealised
appreciation/(depreciation)
USD
United States continued3,506 SJW Group Morgan Stanley 2455,616 Skechers USA Inc ’A’ Barclays Bank 4,121
24,354 Skechers USA Inc ’A’ Goldman Sachs (40,915)509 Skechers USA Inc ’A’ HSBC (79)
1,579 Skechers USA Inc ’A’ Morgan Stanley (76)835 Skillz Inc Barclays Bank (167)888 Skillz Inc Morgan Stanley 568
(1,379) Skyline Champion Corp Bank of AmericaMerrill Lynch (12,728)
(1,209) Skyline Champion Corp Barclays Bank (9,914)(1,816) Skyline Champion Corp Goldman Sachs (93)
(17,734) Skyline Champion Corp Morgan Stanley (145,419)1,154 SkyWater Technology Inc Barclays Bank (3,762)
(6,127) SkyWest Inc Goldman Sachs 4,350(31,012) SkyWest Inc HSBC (10,544)(9,914) SkyWest Inc Morgan Stanley (7,832)(2,117) Skyworks Solutions Inc Bank of America
Merrill Lynch (8,743)(4,887) Skyworks Solutions Inc Barclays Bank (5,473)(1,258) Skyworks Solutions Inc Goldman Sachs (6,227)5,541 Skyworks Solutions Inc HSBC 40,494
(1,580) Skyworks Solutions Inc Morgan Stanley (1,968)947 Skyworks Solutions Inc Morgan Stanley 1,061
3,702 SL Green Realty Corp(REIT) Barclays Bank 2,406
4,279 SL Green Realty Corp(REIT) Goldman Sachs 25,246
1,683 SL Green Realty Corp(REIT) HSBC 11,360
2,044 SL Green Realty Corp(REIT) Morgan Stanley 1,329
2,406 Slack Technologies Inc ’A’ Bank of AmericaMerrill Lynch 6,929
4,601 Sleep Number Corp Barclays Bank 35,6581,730 Sleep Number Corp Goldman Sachs 4,100
(41,109) SLM Corp Bank of AmericaMerrill Lynch (16,033)
(52,781) SLM Corp Morgan Stanley (28,502)3,766 SM Energy Co HSBC 11,7127,358 SMART Global Holdings Inc Goldman Sachs 14,3056,373 SMART Global Holdings Inc Morgan Stanley 1,0063,890 SmartFinancial Inc Bank of America
Merrill Lynch 2,91827,246 SmartFinancial Inc Barclays Bank 4,08736,172 SmartFinancial Inc Goldman Sachs 27,1298,372 SmartFinancial Inc HSBC 7,284
26,213 SmartFinancial Inc Morgan Stanley 3,9324,096 Smartsheet Inc ’A’ Bank of America
Merrill Lynch 20,029(6,114) Smartsheet Inc ’A’ Bank of America
Merrill Lynch (21,572)(2,594) Smartsheet Inc ’A’ Barclays Bank (2,361)2,341 Smartsheet Inc ’A’ Goldman Sachs 11,447
(6,428) Smartsheet Inc ’A’ Goldman Sachs (31,787)411 Smartsheet Inc ’A’ HSBC 2,100
(2,485) Smartsheet Inc ’A’ HSBC (13,172)1,571 Smartsheet Inc ’A’ Morgan Stanley 1,430
(2,621) Smartsheet Inc ’A’ Morgan Stanley (2,385)(10,548) SmileDirectClub Inc Barclays Bank (2,848)(38,714) Smith Micro Software Inc Bank of America
Merrill Lynch (15,486)(66,584) Smith Micro Software Inc Barclays Bank (27,965)(7,842) Smith Micro Software Inc Goldman Sachs (1,318)
(12,679) Smith Micro Software Inc Morgan Stanley (5,325)928 Snap Inc ’A’ Bank of America
Merrill Lynch 7,619(923) Snap Inc ’A’ Bank of America
Merrill Lynch (7,578)(8,357) Snap Inc ’A’ Barclays Bank (16,714)
(19,445) Snap Inc ’A’ Goldman Sachs (159,643)
Holding Description Counterparty
Netunrealised
appreciation/(depreciation)
USD
United States continued2,655 Snap Inc ’A’ Morgan Stanley 5,3102,840 Snap-on Inc Bank of America
Merrill Lynch 4,3454,210 Snap-on Inc Goldman Sachs 6,4412,207 Snap-on Inc Morgan Stanley 2,737
(2,750) Snowflake Inc ’A’ Bank of AmericaMerrill Lynch (69,795)
(849) Snowflake Inc ’A’ Barclays Bank (3,513)(517) Snowflake Inc ’A’ Goldman Sachs (10,248)
(4,698) Snowflake Inc ’A’ Morgan Stanley (19,308)29,936 SOC Telemed Inc Bank of America
Merrill Lynch (47,000)27,377 SOC Telemed Inc Barclays Bank (41,066)7,712 SOC Telemed Inc Goldman Sachs (12,108)3,092 SOC Telemed Inc HSBC (4,638)
14,608 SOC Telemed Inc Morgan Stanley (21,912)335 SolarEdge Technologies Inc Bank of America
Merrill Lynch 1,865(4,889) SolarEdge Technologies Inc Barclays Bank (16,193)
683 SolarEdge Technologies Inc Barclays Bank 2,213(1,435) SolarEdge Technologies Inc Goldman Sachs (57,400)
(15,747) Solaris Oilfield InfrastructureInc ’A’ Barclays Bank (1,102)
(6,074) Solaris Oilfield InfrastructureInc ’A’ Goldman Sachs 3,037
(25,675) Solaris Oilfield InfrastructureInc ’A’ HSBC 8,473
(32,464) Solaris Oilfield InfrastructureInc ’A’ Morgan Stanley (2,272)
(1,532) SolarWinds Corp Bank of AmericaMerrill Lynch (112)
1,955 SolarWinds Corp Bank of AmericaMerrill Lynch 743
14,736 SolarWinds Corp Barclays Bank (6,484)(1,343) SolarWinds Corp Goldman Sachs 526
666 SolarWinds Corp HSBC 13(28,931) SolarWinds Corp Morgan Stanley 12,730
4,659 SolarWinds Corp Morgan Stanley (2,050)(31,398) Soleno Therapeutics Inc Bank of America
Merrill Lynch (628)(113,435) Soleno Therapeutics Inc Barclays Bank (1,134)
7,659 Solid Biosciences Inc Bank of AmericaMerrill Lynch 1,915
7,494 Solid Biosciences Inc Goldman Sachs 1,87421,982 Solid Biosciences Inc Morgan Stanley (2,198)
(13,819) Soliton Inc Barclays Bank 138(1,198) Soliton Inc Goldman Sachs 12
349 Sonic Automotive Inc ’A’ Bank of AmericaMerrill Lynch (304)
12,589 Sonic Automotive Inc ’A’ Barclays Bank (629)2,805 Sonic Automotive Inc ’A’ Morgan Stanley 545,689 Sonoco Products Co Bank of America
Merrill Lynch (9,102)4,000 Sonoco Products Co Barclays Bank (1,520)
(7,562) Sonoco Products Co Goldman Sachs 12,0991,556 Sonoco Products Co Goldman Sachs (2,490)
(6,105) Sonoco Products Co HSBC 5,9831,015 Sonoco Products Co HSBC 694
(10,054) Sonoco Products Co Morgan Stanley 3,82116,014 Sonoco Products Co Morgan Stanley (6,085)13,335 Sonos Inc Bank of America
Merrill Lynch 42,2436,510 Sonos Inc Barclays Bank 6,380
12,877 Sonos Inc Goldman Sachs 40,3051,735 Sonos Inc HSBC 3,7307,708 Sonos Inc Morgan Stanley 7,554
(3,777) Sorrento Therapeutics Inc Bank of AmericaMerrill Lynch (3,286)
(3,043) Sorrento Therapeutics Inc Barclays Bank (1,035)6,481 Sorrento Therapeutics Inc Barclays Bank 2,204
BlackRock Americas Diversified Equity Absolute Return FundcontinuedPortfolio of Investments as at 31 May 2021
The notes on pages 590 to 610 form an integral part of these financial statements.
BlackRock Strategic Funds[152]

Holding Description Counterparty
Netunrealised
appreciation/(depreciation)
USD
United States continued2,240 Sorrento Therapeutics Inc Goldman Sachs 1,949
(1,309) Sorrento Therapeutics Inc Morgan Stanley (445)7,740 Sotera Health Co Bank of America
Merrill Lynch 16,25417,504 Sotera Health Co Barclays Bank 4,02620,236 Sotera Health Co Goldman Sachs 42,4962,339 Sotera Health Co HSBC 164
22,390 Sotera Health Co Morgan Stanley 5,149(56,768) South Jersey Industries Inc Morgan Stanley (10,786)51,353 South Plains Financial Inc Barclays Bank 17,9743,099 South Plains Financial Inc Goldman Sachs 4034,138 South Plains Financial Inc HSBC 1,448
21,297 South Plains Financial Inc Morgan Stanley 7,45410,416 South State Corp Bank of America
Merrill Lynch (8,854)5,557 South State Corp Barclays Bank (6,280)1,549 South State Corp Goldman Sachs (1,317)2,452 South State Corp HSBC (932)8,000 South State Corp Morgan Stanley (9,040)
(7,575) Southern Co Morgan Stanley 3,788(4,800) Southern Copper Corp HSBC 51,408
(24,447) Southern Copper Corp Morgan Stanley (41,315)4,328 Southern First Bancshares
IncBank of AmericaMerrill Lynch (1,558)
11,302 Southern First BancsharesInc Barclays Bank 10,963
10,581 Southern First BancsharesInc Goldman Sachs (3,809)
4,028 Southern First BancsharesInc Morgan Stanley 3,907
(460) Southern Missouri BancorpInc Goldman Sachs 308
2,129 Southern Missouri BancorpInc Morgan Stanley (16)
(20,775) Southside Bancshares Inc Bank of AmericaMerrill Lynch 9,349
(9,643) Southside Bancshares Inc Barclays Bank (2,025)(35,282) Southside Bancshares Inc Goldman Sachs 15,877(8,154) Southside Bancshares Inc HSBC (4,322)
(50,223) Southside Bancshares Inc Morgan Stanley (10,547)1,878 Southwest Airlines Co Bank of America
Merrill Lynch (1,202)6,883 Southwest Airlines Co Barclays Bank 5,369
(40,721) Southwest Airlines Co Goldman Sachs 26,06125,989 Southwest Airlines Co Goldman Sachs (16,633)16,231 Southwest Airlines Co Morgan Stanley 12,66018,424 Southwest Gas Holdings Inc Bank of America
Merrill Lynch (45,006)26,460 Southwest Gas Holdings Inc Barclays Bank (12,001)35,100 Southwest Gas Holdings Inc Goldman Sachs (97,295)20,147 Southwest Gas Holdings Inc HSBC (114,183)32,348 Southwest Gas Holdings Inc Morgan Stanley (17,791)
(16,333) Southwestern Energy Co Goldman Sachs 3,920(21,339) Southwestern Energy Co HSBC (11,096)(71,785) Southwestern Energy Co Morgan Stanley 18,664
604 SP Plus Corp Barclays Bank (338)1,775 SP Plus Corp Goldman Sachs (1,438)9,458 SP Plus Corp Morgan Stanley (5,296)
(19,921) Spark Energy Inc ’A’ Bank of AmericaMerrill Lynch 6,375
(24,472) Spark Energy Inc ’A’ Barclays Bank 14,438(6,725) Spark Energy Inc ’A’ Goldman Sachs 2,152
(38,114) Spark Energy Inc ’A’ HSBC (8,766)(14,774) Spark Energy Inc ’A’ Morgan Stanley 8,717
1,407 SpartanNash Co Bank of AmericaMerrill Lynch 746
16,216 SpartanNash Co Barclays Bank 11,3517,369 SpartanNash Co Goldman Sachs 3,9068,197 SpartanNash Co HSBC 6,558
Holding Description Counterparty
Netunrealised
appreciation/(depreciation)
USD
United States continued3,217 SpartanNash Co Morgan Stanley 2,2523,790 Spectrum Brands Holdings
Inc Morgan Stanley (5,344)92,694 Spectrum Pharmaceuticals
IncBank of AmericaMerrill Lynch 927
82,779 Spectrum PharmaceuticalsInc Barclays Bank 19,039
86,318 Spectrum PharmaceuticalsInc Goldman Sachs 863
10,841 Spectrum PharmaceuticalsInc Morgan Stanley 2,493
10,447 Spero Therapeutics Inc Goldman Sachs 11,4926,500 Spero Therapeutics Inc Morgan Stanley 3,900
(20,013) Spire Inc Bank of AmericaMerrill Lynch 56,437
(6,452) Spire Inc Barclays Bank 4,409(5,303) Spire Inc Goldman Sachs 12,043
(27,915) Spire Inc HSBC 157,161(40,916) Spire Inc Morgan Stanley 60,147(4,414) Spirit AeroSystems Hold-
ings Inc ’A’ Morgan Stanley (11,388)13,112 Spirit Airlines Inc Bank of America
Merrill Lynch 5246,446 Spirit Airlines Inc Barclays Bank 2,1918,059 Spirit Airlines Inc Goldman Sachs 1,2965,586 Spirit Airlines Inc HSBC 7,150
49,770 Spirit Airlines Inc Morgan Stanley 14,576(5,312) Spirit of Texas Bancshares
Inc HSBC (425)(26,339) Spirit of Texas Bancshares
Inc Morgan Stanley (527)(4,962) Spirit Realty Capital Inc
(REIT) HSBC (2,580)(41,692) Spirit Realty Capital Inc
(REIT) Morgan Stanley (14,175)2,712 Splunk Inc Bank of America
Merrill Lynch 18,5239,384 Splunk Inc Barclays Bank 14,170
(1,576) Splunk Inc Barclays Bank 6191,498 Splunk Inc Goldman Sachs 10,2313,514 Splunk Inc Morgan Stanley 5,306
39,243 Spok Holdings Inc Bank of AmericaMerrill Lynch 45,914
32,009 Spok Holdings Inc Barclays Bank 10,88328,248 Spok Holdings Inc Goldman Sachs 33,05020,727 Spok Holdings Inc Morgan Stanley 7,047(5,016) Sportsman’s Warehouse
Holdings Inc Morgan Stanley (502)2,171 Spotify Technology SA Bank of America
Merrill Lynch 39,599956 Spotify Technology SA Barclays Bank 7,180699 Spotify Technology SA Goldman Sachs 12,750663 Spotify Technology SA HSBC 8,858
1,339 Spotify Technology SA Morgan Stanley 10,056(2,131) SpringWorks Therapeutics
Inc Goldman Sachs (18,540)(2,313) SpringWorks Therapeutics
Inc HSBC (29,838)(2,581) SpringWorks Therapeutics
Inc Morgan Stanley (10,247)6,620 Sprout Social Inc ’A’ Barclays Bank 29,7906,920 Sprout Social Inc ’A’ Morgan Stanley 31,140
(38,275) Sprouts Farmers Market Inc Barclays Bank (34,358)(2,751) Sprouts Farmers Market Inc Morgan Stanley (2,834)2,753 Spruce Biosciences Inc Bank of America
Merrill Lynch (3,772)2,411 Spruce Biosciences Inc Barclays Bank 2775,218 Spruce Biosciences Inc Goldman Sachs (4,199)2,344 Spruce Biosciences Inc Morgan Stanley (164)
BlackRock Americas Diversified Equity Absolute Return FundcontinuedPortfolio of Investments as at 31 May 2021
The notes on pages 590 to 610 form an integral part of these financial statements.
Annual report and audited financial statements [153]

Holding Description Counterparty
Netunrealised
appreciation/(depreciation)
USD
United States continued(4,834) SPS Commerce Inc Bank of America
Merrill Lynch 1,354(1,967) SPS Commerce Inc Barclays Bank 3,364(6,502) SPS Commerce Inc Goldman Sachs 1,821(1,621) SPX Corp Bank of America
Merrill Lynch (535)(1,845) SPX Corp Barclays Bank (1,790)
(446) SPX Corp Goldman Sachs (147)(1,952) SPX Corp HSBC 1,874
(25,208) SPX Corp Morgan Stanley (24,452)7,969 SPX FLOW Inc Barclays Bank 6618,253 SPX FLOW Inc Morgan Stanley (2,167)
(1,415) Square Inc ’A’ Bank of AmericaMerrill Lynch (27,734)
(935) Square Inc ’A’ Barclays Bank (10,818)(341) Square Inc ’A’ Morgan Stanley (3,945)
1,794 SQZ Biotechnologies Co Barclays Bank 30514,396 SQZ Biotechnologies Co Goldman Sachs 15,836
(18,257) SS&C Technologies Hold-ings Inc Barclays Bank 10,144
(3,743) SS&C Technologies Hold-ings Inc Goldman Sachs 898
(8,326) SS&C Technologies Hold-ings Inc HSBC (3,783)
(33,319) SS&C Technologies Hold-ings Inc Morgan Stanley 20,991
11,218 St Joe Co Barclays Bank 13,7825,636 St Joe Co Goldman Sachs 104(797) STAAR Surgical Co Bank of America
Merrill Lynch (25,592)3,581 STAAR Surgical Co Barclays Bank 57,081(301) STAAR Surgical Co Goldman Sachs (9,665)234 STAAR Surgical Co HSBC 8,264
(10,115) STAG Industrial Inc (REIT) Bank of AmericaMerrill Lynch (962)
(6,625) STAG Industrial Inc (REIT) Barclays Bank 79516,616 STAG Industrial Inc (REIT) Goldman Sachs 3,323(1,854) STAG Industrial Inc (REIT) Goldman Sachs (371)
(44,067) STAG Industrial Inc (REIT) HSBC 35,694(3,770) STAG Industrial Inc (REIT) Morgan Stanley 452
923 Stamps.com Inc Bank of AmericaMerrill Lynch 9,285
1,041 Stamps.com Inc Barclays Bank 1,7171,858 Stamps.com Inc Goldman Sachs 18,691
581 Stamps.com Inc HSBC 8,4184,507 Stamps.com Inc Morgan Stanley 7,4366,286 Standard Motor Products
IncBank of AmericaMerrill Lynch (10,686)
2,492 Standard Motor ProductsInc Barclays Bank 374
6,723 Standard Motor ProductsInc Goldman Sachs (11,429)
3,493 Standard Motor ProductsInc HSBC (6,776)
5,854 Standard Motor ProductsInc Morgan Stanley 878
(9,138) Standex International Corp Bank of AmericaMerrill Lynch 17,937
(11,753) Standex International Corp Barclays Bank (14,809)(3,529) Standex International Corp Goldman Sachs 9,846
(360) Standex International Corp Morgan Stanley (454)1,447 Stanley Black & Decker Inc Bank of America
Merrill Lynch 2,851152 Stanley Black & Decker Inc Barclays Bank 792
(3,145) Stanley Black & Decker Inc Goldman Sachs (6,196)553 Stanley Black & Decker Inc Goldman Sachs 1,089
(2,837) Stanley Black & Decker Inc HSBC 11,036(2,708) Stanley Black & Decker Inc Morgan Stanley (14,109)2,110 Stanley Black & Decker Inc Morgan Stanley 10,993
Holding Description Counterparty
Netunrealised
appreciation/(depreciation)
USD
United States continued(125) Starbucks Corp Bank of America
Merrill Lynch (363)(24,027) Starbucks Corp Barclays Bank (32,677)(22,039) Starbucks Corp Morgan Stanley (29,180)14,771 StarTek Inc Bank of America
Merrill Lynch 4,28413,568 StarTek Inc Barclays Bank 1,35710,982 StarTek Inc Goldman Sachs 3,1852,281 StarTek Inc HSBC (2,121)4,338 StarTek Inc Morgan Stanley 434
(21,763) Starwood Property Trust Inc(REIT)
Bank of AmericaMerrill Lynch (10,882)
(18,177) Starwood Property Trust Inc(REIT) Barclays Bank (5,635)
(16,761) Starwood Property Trust Inc(REIT) Goldman Sachs (8,381)
2,861 Starwood Property Trust Inc(REIT) Goldman Sachs 155
1,591 Starwood Property Trust Inc(REIT) HSBC 827
(49,828) Starwood Property Trust Inc(REIT) Morgan Stanley (15,447)
(18,274) State Auto Financial Corp Bank of AmericaMerrill Lynch 4,203
(5,615) State Auto Financial Corp Barclays Bank 562(6,462) State Auto Financial Corp HSBC (6,914)(6,240) State Auto Financial Corp Morgan Stanley 62420,712 State Street Corp Goldman Sachs 12,4278,000 Steel Dynamics Inc Bank of America
Merrill Lynch (16,880)3,829 Steel Dynamics Inc Goldman Sachs (8,079)5,542 Steel Dynamics Inc HSBC (8,590)
45,440 Steel Dynamics Inc Morgan Stanley 16,8135,676 Steelcase Inc ’A’ Bank of America
Merrill Lynch 34135,338 Steelcase Inc ’A’ Barclays Bank (4,947)36,118 Steelcase Inc ’A’ Goldman Sachs 2,1672,840 Steelcase Inc ’A’ HSBC (483)
33,617 Steelcase Inc ’A’ Morgan Stanley (4,706)1,555 Stepan Co Bank of America
Merrill Lynch (3,810)2,437 Stepan Co Barclays Bank 9751,318 Stepan Co Goldman Sachs (3,229)
11,712 Stepan Co HSBC (14,874)3,947 Stepan Co Morgan Stanley 1,579
(8,014) StepStone Group Inc ’A’ Bank of AmericaMerrill Lynch 3,968
(10,554) StepStone Group Inc ’A’ Barclays Bank 12,348(3,629) StepStone Group Inc ’A’ Goldman Sachs 930(1,231) StepStone Group Inc ’A’ Morgan Stanley 1,440
(16,820) Stereotaxis Inc Bank of AmericaMerrill Lynch (22,034)
(17,792) Stereotaxis Inc Goldman Sachs (23,308)(6,942) Stereotaxis Inc HSBC (6,109)(6,625) Stericycle Inc Bank of America
Merrill Lynch 2,948(21,566) Stericycle Inc Barclays Bank 5,392
189 Stericycle Inc Barclays Bank (47)(14,287) Stericycle Inc Goldman Sachs 6,358(21,263) Stericycle Inc HSBC (31,257)(4,359) Stericycle Inc Morgan Stanley 1,0901,294 Stericycle Inc Morgan Stanley (324)
(2,042) STERIS Plc Morgan Stanley (1,756)(61,423) Sterling Bancorp Bank of America
Merrill Lynch —(22,633) Sterling Bancorp Barclays Bank (15,362)(7,787) Sterling Bancorp Goldman Sachs —
(14,176) Sterling Bancorp HSBC (9,781)(6,852) Sterling Bancorp Morgan Stanley (2,609)
BlackRock Americas Diversified Equity Absolute Return FundcontinuedPortfolio of Investments as at 31 May 2021
The notes on pages 590 to 610 form an integral part of these financial statements.
BlackRock Strategic Funds[154]

Holding Description Counterparty
Netunrealised
appreciation/(depreciation)
USD
United States continued(18,459) Sterling Bancorp Inc Bank of America
Merrill Lynch (5,722)(23,473) Sterling Bancorp Inc Barclays Bank (1,643)(35,461) Sterling Bancorp Inc Goldman Sachs (10,993)(10,178) Sterling Bancorp Inc HSBC (1,628)(38,554) Sterling Bancorp Inc Morgan Stanley (2,699)(4,461) Sterling Construction Co Inc HSBC 892
570 Steven Madden Ltd Bank of AmericaMerrill Lynch 456
25,736 Steven Madden Ltd Barclays Bank 5,7912,445 Steven Madden Ltd Goldman Sachs 547
38,646 Steven Madden Ltd Morgan Stanley 17,77737,227 Stifel Financial Corp Bank of America
Merrill Lynch (24,779)43,946 Stifel Financial Corp Barclays Bank 11,42612,842 Stifel Financial Corp Goldman Sachs (8,875)55,789 Stifel Financial Corp HSBC 45,18927,693 Stifel Financial Corp Morgan Stanley 7,201(7,627) Stifel Financial Corp Morgan Stanley (1,983)2,724 Stitch Fix Inc ’A’ Barclays Bank 14,328(395) Stitch Fix Inc ’A’ Goldman Sachs (2,588)
(11,892) Stock Yards Bancorp Inc HSBC (22,833)(14,356) Stock Yards Bancorp Inc Morgan Stanley (34,885)
4,723 Stoke Therapeutics Inc Bank of AmericaMerrill Lynch 21,112
834 Stoke Therapeutics Inc Barclays Bank 2,5601,602 Stoke Therapeutics Inc Goldman Sachs 7,1611,179 Stoke Therapeutics Inc Morgan Stanley 3,620(274) StoneCo Ltd ’A’ Bank of America
Merrill Lynch (1,797)(3,442) StoneCo Ltd ’A’ Barclays Bank (10,257)1,744 StoneCo Ltd ’A’ Goldman Sachs (15)
(1,718) StoneCo Ltd ’A’ Goldman Sachs (9,715)(490) StoneCo Ltd ’A’ Morgan Stanley (1,460)
(1,728) Stoneridge Inc Bank of AmericaMerrill Lynch 297
(4,196) Stoneridge Inc Barclays Bank 1,430(965) Stoneridge Inc Goldman Sachs (605)
(4,441) Stoneridge Inc Morgan Stanley 4,752(11,764) StoneX Group Inc Morgan Stanley 14,352(14,851) STORE Capital Corp (REIT) Bank of America
Merrill Lynch (14,405)16,850 STORE Capital Corp (REIT) Bank of America
Merrill Lynch 16,345(11,965) STORE Capital Corp (REIT) Barclays Bank (3,623)(13,185) STORE Capital Corp (REIT) Goldman Sachs (12,789)
6,076 STORE Capital Corp (REIT) Goldman Sachs 5,894(5,098) STORE Capital Corp (REIT) HSBC 481,280 STORE Capital Corp (REIT) HSBC 294
(5,796) STORE Capital Corp (REIT) Morgan Stanley (106)6,277 STORE Capital Corp (REIT) Morgan Stanley 2,0095,687 Strategic Education Inc Barclays Bank (14,900)
474 Strategic Education Inc Goldman Sachs (2,896)201 Strategic Education Inc HSBC (1,678)
1,864 Strategic Education Inc Morgan Stanley (4,884)841 Strattec Security Corp Bank of America
Merrill Lynch 3,4991,531 Strattec Security Corp Barclays Bank 1,5772,386 Strattec Security Corp HSBC 14,793
(22,193) Stratus Properties Inc Bank of AmericaMerrill Lynch (19,974)
(6,172) Stratus Properties Inc Goldman Sachs (5,555)(7,225) Stratus Properties Inc Morgan Stanley 578(5,460) Stride Inc Morgan Stanley 4,1502,080 Stryker Corp Morgan Stanley (3,910)
(3,544) Stryker Corp Morgan Stanley 6,6631,260 Summit Financial Group Inc Bank of America
Merrill Lynch (1,512)10,729 Summit Financial Group Inc Barclays Bank (4,613)9,407 Summit Financial Group Inc Goldman Sachs (11,288)
Holding Description Counterparty
Netunrealised
appreciation/(depreciation)
USD
United States continued3,185 Summit Financial Group Inc HSBC (1,529)3,183 Summit Financial Group Inc Morgan Stanley (1,369)
(42,982) Summit Hotel Properties Inc(REIT)
Bank of AmericaMerrill Lynch 9,886
(17,356) Summit Hotel Properties Inc(REIT) Barclays Bank (2,430)
(144,495) Summit Hotel Properties Inc(REIT) Goldman Sachs 33,234
6,878 Summit Materials Inc ’A’ Bank of AmericaMerrill Lynch 1,466
7,689 Summit Materials Inc ’A’ Barclays Bank 11,9186,688 Summit Materials Inc ’A’ Goldman Sachs 4,615
22,878 Summit Materials Inc ’A’ HSBC 97,2319,239 Summit Materials Inc ’A’ Morgan Stanley 14,320
11,219 Summit Therapeutics Inc Barclays Bank 1,9073,225 Summit Therapeutics Inc Goldman Sachs 3,1281,681 Sumo Logic Inc Goldman Sachs 3,244
(1,780) Sun Communities Inc(REIT)
Bank of AmericaMerrill Lynch (5,474)
(2,056) Sun Communities Inc(REIT) Goldman Sachs (4,780)
(3,771) Sun Communities Inc(REIT) HSBC (5,430)
(3,067) Sun Communities Inc(REIT) Morgan Stanley (153)
6,107 Sun Country Airlines Hold-ings Inc HSBC (5,496)
(13,542) SunCoke Energy Inc Bank of AmericaMerrill Lynch 948
(10,449) SunCoke Energy Inc Barclays Bank (2,717)8,339 Sunnova Energy Interna-
tional IncBank of AmericaMerrill Lynch 21,681
38,163 Sunnova Energy Interna-tional Inc Barclays Bank 30,149
11,061 Sunnova Energy Interna-tional Inc Goldman Sachs 28,759
2,160 Sunnova Energy Interna-tional Inc HSBC 3,262
8,469 Sunnova Energy Interna-tional Inc Morgan Stanley 6,691
(2,652) SunPower Corp Bank of AmericaMerrill Lynch (3,819)
5,666 SunPower Corp Bank of AmericaMerrill Lynch 5,776
(4,280) SunPower Corp Barclays Bank 21411,055 SunPower Corp Barclays Bank 3,033
(720) SunPower Corp Goldman Sachs (1,037)2,044 SunPower Corp HSBC 2,0691,669 SunPower Corp Morgan Stanley (83)
11,377 Sunrun Inc Bank of AmericaMerrill Lynch 53,699
5,140 Sunrun Inc Barclays Bank (668)6,244 Sunrun Inc Goldman Sachs 27,0619,020 Sunrun Inc HSBC 35,358
375 Sunrun Inc Morgan Stanley (49)(4,322) Sunstone Hotel Investors
Inc (REIT)Bank of AmericaMerrill Lynch 475
(5,966) Sunstone Hotel InvestorsInc (REIT) Barclays Bank (418)
(79,588) Sunstone Hotel InvestorsInc (REIT) HSBC (25,468)
(57,321) Sunstone Hotel InvestorsInc (REIT) Morgan Stanley (4,012)
(26,025) Sunworks Inc Barclays Bank (5,465)4,707 Super League Gaming Inc Barclays Bank 8473,688 Super League Gaming Inc Goldman Sachs 1,512
13,008 Super League Gaming Inc HSBC 4,2935,855 Super Micro Computer Inc Bank of America
Merrill Lynch (8,138)10,738 Super Micro Computer Inc Barclays Bank (12,778)
BlackRock Americas Diversified Equity Absolute Return FundcontinuedPortfolio of Investments as at 31 May 2021
The notes on pages 590 to 610 form an integral part of these financial statements.
Annual report and audited financial statements [155]

Holding Description Counterparty
Netunrealised
appreciation/(depreciation)
USD
United States continued10,105 Super Micro Computer Inc Goldman Sachs (14,046)2,860 Super Micro Computer Inc HSBC (1,230)4,366 Super Micro Computer Inc Morgan Stanley (5,196)
(2,631) Superior Group of Cos Inc Bank of AmericaMerrill Lynch 2,078
(8,100) Superior Group of Cos Inc Barclays Bank 243(5,689) Superior Group of Cos Inc Goldman Sachs 4,494(4,058) Superior Group of Cos Inc HSBC (1,136)(7,745) Superior Group of Cos Inc Morgan Stanley 2323,445 Supernus Pharmaceuticals
IncBank of AmericaMerrill Lynch (3,755)
5,333 Supernus PharmaceuticalsInc Barclays Bank (2,400)
22,345 Supernus PharmaceuticalsInc Goldman Sachs (24,356)
(12,483) Surface Oncology Inc Bank of AmericaMerrill Lynch (7,240)
(10,870) Surface Oncology Inc Barclays Bank (3,152)(13,967) Surface Oncology Inc Goldman Sachs (8,101)33,911 Surgalign Holdings Inc Morgan Stanley 11,530(1,588) Surgery Partners Inc Barclays Bank (9,433)(5,629) Surgery Partners Inc HSBC (45,539)(8,046) Surgery Partners Inc Morgan Stanley (47,793)(8,869) Surmodics Inc Bank of America
Merrill Lynch 12,860(5,105) Surmodics Inc Barclays Bank 6,075(8,411) Surmodics Inc Goldman Sachs 12,196(1,357) Surmodics Inc Morgan Stanley 1,6159,745 Sutro Biopharma Inc Morgan Stanley 3,801(302) SVB Financial Group Goldman Sachs (2,667)(48) SVB Financial Group HSBC (223)523 SVB Financial Group Morgan Stanley 3,990
(609) SVB Financial Group Morgan Stanley (4,647)16,181 SVMK Inc Bank of America
Merrill Lynch 20,38826,615 SVMK Inc Barclays Bank 8,78310,320 SVMK Inc Morgan Stanley 3,406
(43,535) Switch Inc ’A’ Bank of AmericaMerrill Lynch (11,319)
(29,214) Switch Inc ’A’ Barclays Bank 3,506(39,789) Switch Inc ’A’ HSBC (30,240)(22,242) Switch Inc ’A’ Morgan Stanley 2,669(3,748) SWK Holdings Corp Bank of America
Merrill Lynch (600)(5,829) SWK Holdings Corp Goldman Sachs (933)(5,948) Sykes Enterprises Inc Morgan Stanley 1191,643 Synaptics Inc Bank of America
Merrill Lynch 7,6563,477 Synaptics Inc Barclays Bank 1,3566,511 Synaptics Inc Goldman Sachs 25,1725,931 Synaptics Inc HSBC 20,225
260 Synaptics Inc Morgan Stanley 10110,531 Synchronoss Technologies
IncBank of AmericaMerrill Lynch (527)
23,494 Synchronoss TechnologiesInc Barclays Bank 2,114
10,578 Synchronoss TechnologiesInc Goldman Sachs (529)
(16,574) Synchrony Financial Bank of AmericaMerrill Lynch (18,904)
(35,878) Synchrony Financial Goldman Sachs (17,939)(8,197) Syndax Pharmaceuticals
IncBank of AmericaMerrill Lynch —
(12,132) Syndax PharmaceuticalsInc Barclays Bank (8,250)
(941) Syndax PharmaceuticalsInc Goldman Sachs 75
(942) Syndax PharmaceuticalsInc Morgan Stanley (641)
Holding Description Counterparty
Netunrealised
appreciation/(depreciation)
USD
United States continued11,136 Syneos Health Inc Bank of America
Merrill Lynch 27,840728 Syneos Health Inc Barclays Bank (590)
1,146 Syneos Health Inc Goldman Sachs 2,865347 Syneos Health Inc Morgan Stanley (281)
(1,404) Syneos Health Inc Morgan Stanley 1,137(10,234) Synlogic Inc Goldman Sachs (1,535)(31,575) Synlogic Inc HSBC (23,366)(3,507) SYNNEX Corp Bank of America
Merrill Lynch (5,430)(2,632) SYNNEX Corp Barclays Bank (520)(1,092) SYNNEX Corp Morgan Stanley 1,3312,367 Synopsys Inc Bank of America
Merrill Lynch 43,411(267) Synopsys Inc Bank of America
Merrill Lynch 841,814 Synopsys Inc HSBC 39,8172,063 Synopsys Inc Morgan Stanley 11,883(328) Synopsys Inc Morgan Stanley (125)
(12,001) Synovus Financial Corp Bank of AmericaMerrill Lynch 1,440
15,464 Synovus Financial Corp Bank of AmericaMerrill Lynch (1,856)
(7,719) Synovus Financial Corp Barclays Bank (7,565)(9,939) Synovus Financial Corp Goldman Sachs 1,1932,958 Synovus Financial Corp Goldman Sachs (355)6,822 Synovus Financial Corp Morgan Stanley 6,686
(4,486) Syros Pharmaceuticals Inc Bank of AmericaMerrill Lynch (5,159)
(8,413) Syros Pharmaceuticals Inc Barclays Bank (10,769)(4,362) Syros Pharmaceuticals Inc HSBC (6,281)(6,104) Syros Pharmaceuticals Inc Morgan Stanley (7,813)(1,532) Sysco Corp Bank of America
Merrill Lynch 4,7951,539 Sysco Corp Bank of America
Merrill Lynch 7036,073 Sysco Corp Barclays Bank (866)(998) Sysco Corp HSBC 4,631564 Sysco Corp HSBC 94
(5,043) Sysco Corp Morgan Stanley (3,177)(26,066) Systemax Inc Bank of America
Merrill Lynch (4,607)(8,272) Systemax Inc Barclays Bank (8,851)(1,601) Systemax Inc Morgan Stanley (489)
235 T Rowe Price Group Inc Morgan Stanley 8156,181 Tabula Rasa HealthCare Inc Goldman Sachs 16,4412,170 Tactile Systems Technology
Inc Barclays Bank (152)1,765 Tactile Systems Technology
Inc HSBC (2,083)3,532 Tactile Systems Technology
Inc Morgan Stanley (247)1,037 Take-Two Interactive Soft-
ware IncBank of AmericaMerrill Lynch 17,982
5,911 Take-Two Interactive Soft-ware Inc Barclays Bank 3,192
665 Take-Two Interactive Soft-ware Inc Goldman Sachs 11,531
2,275 Take-Two Interactive Soft-ware Inc HSBC 37,629
6,251 Talis Biomedical Corp Barclays Bank (3,251)6,634 Talis Biomedical Corp Goldman Sachs (2,985)
14,967 Talos Energy Inc Goldman Sachs 15,56635,467 Talos Energy Inc Morgan Stanley 6,7394,311 Tandem Diabetes Care Inc Bank of America
Merrill Lynch 21,2511,072 Tandem Diabetes Care Inc Barclays Bank 386
12,423 Tandem Diabetes Care Inc Goldman Sachs 81,102724 Tandem Diabetes Care Inc HSBC 3,540
BlackRock Americas Diversified Equity Absolute Return FundcontinuedPortfolio of Investments as at 31 May 2021
The notes on pages 590 to 610 form an integral part of these financial statements.
BlackRock Strategic Funds[156]

Holding Description Counterparty
Netunrealised
appreciation/(depreciation)
USD
United States continued3,242 Tandem Diabetes Care Inc Morgan Stanley 1,167
(46,172) Tanger Factory Outlet Cen-ters Inc (REIT) Barclays Bank (40,631)
31,384 Tapestry Inc Goldman Sachs (65,361)573 Tapestry Inc HSBC (1,189)
16,481 Tapestry Inc Morgan Stanley 24,5571,971 Targa Resources Corp Bank of America
Merrill Lynch (374)21,724 Targa Resources Corp Barclays Bank 4,5622,236 Targa Resources Corp Goldman Sachs 1831,726 Targa Resources Corp HSBC 2628,834 Targa Resources Corp Morgan Stanley 1,855
723 Target Corp Bank of AmericaMerrill Lynch 12,219
3,870 Target Corp Barclays Bank 5,8441,942 Target Corp Goldman Sachs 32,8201,586 Target Corp HSBC 20,4444,068 Target Corp Morgan Stanley 6,143
27 Target Hospitality Corp HSBC 3181,538 Target Hospitality Corp Morgan Stanley 74,200(2,999) Tarsus Pharmaceuticals Inc Barclays Bank (6,658)
(11,031) Taylor Morrison Home Corp Bank of AmericaMerrill Lynch (4,170)
(43,562) Taylor Morrison Home Corp Barclays Bank (40,577)(14,666) Taylor Morrison Home Corp Goldman Sachs 1,25410,318 Taylor Morrison Home Corp Goldman Sachs (1,341)(9,071) Taylor Morrison Home Corp HSBC 21,680
(39,366) Taylor Morrison Home Corp Morgan Stanley (40,154)14,680 Taysha Gene Therapies Inc Barclays Bank —
(504) TCF Financial Corp Bank of AmericaMerrill Lynch —
(3,295) TCF Financial Corp Barclays Bank (2,900)(18,030) TCF Financial Corp Goldman Sachs —(9,561) TCF Financial Corp HSBC (4,494)(5,419) TCF Financial Corp Morgan Stanley (4,769)(2,813) TCR2 Therapeutics Inc Goldman Sachs 338(4,619) TCR2 Therapeutics Inc Morgan Stanley (1,755)(1,142) TE Connectivity Ltd HSBC 936
(12,700) TE Connectivity Ltd Morgan Stanley (14,478)(7,467) Team Inc Goldman Sachs 1,120
(14,611) Team Inc HSBC 146(14,264) Team Inc Morgan Stanley 143
1 Technip Energies NV ADRπ Morgan Stanley —32,879 TechnipFMC Plc Goldman Sachs 7,23342,634 TechnipFMC Plc Morgan Stanley 20,464(2,480) TechTarget Inc Bank of America
Merrill Lynch (4,042)(3,426) TechTarget Inc Barclays Bank 5,105
(11,235) TechTarget Inc Goldman Sachs (18,313)12,412 Teekay Corp Bank of America
Merrill Lynch 62133,529 Teekay Corp Morgan Stanley 6713,451 TEGNA Inc Bank of America
Merrill Lynch 35(6,251) TEGNA Inc Barclays Bank (1,004)66,088 TEGNA Inc Goldman Sachs 661
(22,569) TEGNA Inc HSBC 5,335(12,583) TEGNA Inc Morgan Stanley (450)(66,653) Tejon Ranch Co Goldman Sachs 26,661(13,005) Tejon Ranch Co HSBC 5,072(72,026) Tejon Ranch Co Morgan Stanley 7,923(13,890) Tela Bio Inc Bank of America
Merrill Lynch (8,612)(6,207) Tela Bio Inc Barclays Bank (2,607)2,867 Teladoc Health Inc Goldman Sachs 37,902
607 Teladoc Health Inc HSBC 6,8172,033 Teladoc Health Inc Morgan Stanley 16,772
(1,575) Teledyne Technologies Inc Bank of AmericaMerrill Lynch (5,009)
Holding Description Counterparty
Netunrealised
appreciation/(depreciation)
USD
United States continued537 Teledyne Technologies Inc Bank of America
Merrill Lynch 1,708(902) Teledyne Technologies Inc Barclays Bank (7,938)943 Teledyne Technologies Inc Barclays Bank 8,298
(942) Teledyne Technologies Inc Morgan Stanley (8,290)422 Teledyne Technologies Inc Morgan Stanley 3,714
(1,243) Teleflex Inc Bank of AmericaMerrill Lynch (10,950)
(3,646) Teleflex Inc Barclays Bank 4,667(3,036) Teleflex Inc Goldman Sachs (27,173)(2,026) Teleflex Inc HSBC 11,042(6,389) Teleflex Inc Morgan Stanley 7,122
(41,545) Telephone and Data Sys-tems Inc
Bank of AmericaMerrill Lynch (14,125)
(29,766) Telephone and Data Sys-tems Inc Barclays Bank (4,167)
2,836 Telephone and Data Sys-tems Inc HSBC 624
(1,639) Telephone and Data Sys-tems Inc HSBC (361)
30,457 Telephone and Data Sys-tems Inc Morgan Stanley 4,264
(20,135) Telephone and Data Sys-tems Inc Morgan Stanley (2,819)
12,137 Tellurian Inc Barclays Bank 19,41911,933 Tellurian Inc Goldman Sachs 22,673(8,799) Telos Corp Bank of America
Merrill Lynch 15,486(6,945) Telos Corp Barclays Bank (8,523)5,561 Tempur Sealy International
IncBank of AmericaMerrill Lynch 5,339
(25,072) Tempur Sealy InternationalInc
Bank of AmericaMerrill Lynch (24,069)
16,198 Tempur Sealy InternationalInc Barclays Bank 28,994
(4,412) Tempur Sealy InternationalInc Barclays Bank (7,897)
(3,957) Tempur Sealy InternationalInc Goldman Sachs (5,572)
1,669 Tempur Sealy InternationalInc Morgan Stanley 2,988
(8,325) Tempur Sealy InternationalInc Morgan Stanley (14,902)
12,312 Tenable Holdings Inc Bank of AmericaMerrill Lynch 31,395
(7,401) Tenable Holdings Inc Bank of AmericaMerrill Lynch (9,705)
(14,050) Tenable Holdings Inc Barclays Bank (4,496)7,615 Tenable Holdings Inc Barclays Bank 2,437
(7,863) Tenable Holdings Inc Goldman Sachs (19,689)(5,343) Tenable Holdings Inc HSBC (3,840)
(15,014) Tenable Holdings Inc Morgan Stanley (4,804)21,359 Tenable Holdings Inc Morgan Stanley 6,8351,699 Tenet Healthcare Corp Bank of America
Merrill Lynch 5,27510,146 Tenet Healthcare Corp Barclays Bank 24,9525,160 Tenet Healthcare Corp Morgan Stanley 15,726
(3,359) Tennant Co Bank of AmericaMerrill Lynch 5,878
(15,322) Tennant Co Barclays Bank 22,064(12,179) Tennant Co Goldman Sachs 21,313(7,644) Tennant Co HSBC 10,778
(13,638) Tennant Co Morgan Stanley 19,63910,681 Tenneco Inc ’A’ Barclays Bank 2,7775,713 Teradata Corp Goldman Sachs 33,135
(2,925) Teradata Corp Goldman Sachs (16,965)(8,127) Teradata Corp Morgan Stanley (11,703)(6,256) Teradyne Inc Bank of America
Merrill Lynch (78,137)
BlackRock Americas Diversified Equity Absolute Return FundcontinuedPortfolio of Investments as at 31 May 2021
The notes on pages 590 to 610 form an integral part of these financial statements.
Annual report and audited financial statements [157]

Holding Description Counterparty
Netunrealised
appreciation/(depreciation)
USD
United States continued(3,557) Teradyne Inc Goldman Sachs (44,427)(9,389) Teradyne Inc Morgan Stanley (43,753)(2,637) Terex Corp Bank of America
Merrill Lynch 8,148(3,091) Terex Corp Barclays Bank (3,895)
(17,383) Terex Corp Morgan Stanley (21,903)9,614 Terminix Global Holdings
IncBank of AmericaMerrill Lynch 4,889
12,403 Terminix Global HoldingsInc Barclays Bank 6,822
16,627 Terminix Global HoldingsInc Goldman Sachs 8,480
1,987 Terminix Global HoldingsInc HSBC 64
18,141 Terminix Global HoldingsInc Morgan Stanley 9,978
2,709 Terns Pharmaceuticals Inc Bank of AmericaMerrill Lynch 2,005
13,125 Terns Pharmaceuticals Inc Barclays Bank 17,0631,346 Terns Pharmaceuticals Inc Morgan Stanley 1,750
(8,638) Terreno Realty Corp (REIT) Bank of AmericaMerrill Lynch (6,738)
(15,339) Terreno Realty Corp (REIT) Goldman Sachs (11,964)(3,871) Terreno Realty Corp (REIT) HSBC 697(5,451) Terreno Realty Corp (REIT) Morgan Stanley 4,79751,300 Terreno Realty Corp (REIT) Morgan Stanley (45,144)12,587 Territorial Bancorp Inc Barclays Bank 5,9165,840 Territorial Bancorp Inc HSBC 2,453
13,546 Territorial Bancorp Inc Morgan Stanley 6,367(139) Tesla Inc Bank of America
Merrill Lynch (6,726)(71) Tesla Inc Barclays Bank (1,333)
(162) Tesla Inc Morgan Stanley (1,379)24,818 TESSCO Technologies Inc Morgan Stanley 3,4752,801 Tetra Tech Inc Goldman Sachs (5,658)8,034 Tetra Tech Inc HSBC (8,436)9,653 Tetra Tech Inc Morgan Stanley 1,545
10,635 Texas Capital BancsharesInc
Bank of AmericaMerrill Lynch (10,103)
11,778 Texas Capital BancsharesInc Barclays Bank (943)
3,578 Texas Capital BancsharesInc Goldman Sachs (3,399)
1,175 Texas Capital BancsharesInc HSBC (306)
(928) Texas Instruments Inc Bank of AmericaMerrill Lynch (938)
(4,589) Texas Instruments Inc Barclays Bank (5,186)(3,222) Texas Instruments Inc Goldman Sachs (3,244)8,940 Texas Instruments Inc Morgan Stanley 10,102(489) Texas Instruments Inc Morgan Stanley (553)(71) Texas Pacific Land Corp Bank of America
Merrill Lynch 13,978(45) Texas Pacific Land Corp Barclays Bank 2,399
(256) Texas Pacific Land Corp Goldman Sachs 50,401(206) Texas Pacific Land Corp Morgan Stanley 10,983
(8,152) Texas Roadhouse Inc Bank of AmericaMerrill Lynch (6,634)
(15,503) Texas Roadhouse Inc Barclays Bank (25,580)(8,032) Texas Roadhouse Inc Goldman Sachs (8,354)1,278 Texas Roadhouse Inc Goldman Sachs 1,923(223) Texas Roadhouse Inc Morgan Stanley (368)
(4,073) Textainer Group HoldingsLtd
Bank of AmericaMerrill Lynch (21,505)
(6,041) Textainer Group HoldingsLtd Barclays Bank (23,700)
(7,979) Textainer Group HoldingsLtd Goldman Sachs (42,129)
(10,736) Textainer Group HoldingsLtd Morgan Stanley (52,177)
Holding Description Counterparty
Netunrealised
appreciation/(depreciation)
USD
United States continued(1,488) TFF Pharmaceuticals Inc Bank of America
Merrill Lynch (1,830)(14,472) TFF Pharmaceuticals Inc Barclays Bank (4,776)40,131 TFS Financial Corp Bank of America
Merrill Lynch 1,2042,833 TFS Financial Corp Barclays Bank 255
22,326 TFS Financial Corp HSBC 50,45656,763 TFS Financial Corp Morgan Stanley 5,109(4,015) TG Therapeutics Inc Barclays Bank (4,617)(8,947) TG Therapeutics Inc Goldman Sachs (9,126)
(658) TG Therapeutics Inc HSBC (806)(6,806) TG Therapeutics Inc Morgan Stanley (7,827)
145,140 TherapeuticsMD Inc Morgan Stanley (1,451)2,555 Theravance Biopharma Inc Bank of America
Merrill Lynch (2,913)7,703 Theravance Biopharma Inc Barclays Bank 1,7723,614 Theravance Biopharma Inc Goldman Sachs (4,120)8,393 Theravance Biopharma Inc HSBC (16,031)
18,866 Theravance Biopharma Inc Morgan Stanley 4,339822 Thermo Fisher Scientific Inc Barclays Bank 5,787483 Thermo Fisher Scientific Inc Morgan Stanley 3,400
(1,135) Thermon Group HoldingsInc
Bank of AmericaMerrill Lynch 2,576
(2,209) Thermon Group HoldingsInc Goldman Sachs 5,014
(8,756) Thermon Group HoldingsInc HSBC 13,572
(16,289) Thermon Group HoldingsInc Morgan Stanley 36,162
(306) Thor Industries Inc Bank of AmericaMerrill Lynch 2,252
(3,202) Thor Industries Inc Barclays Bank (17,067)(1,651) Thor Industries Inc Goldman Sachs 12,1515,128 Thor Industries Inc Goldman Sachs (37,742)5,984 Thor Industries Inc Morgan Stanley 31,8958,412 Thryv Holdings Inc Barclays Bank 29,2741,478 Thryv Holdings Inc Goldman Sachs 2,956
(32,721) Tidewater Inc Morgan Stanley (1,963)(11,317) Tilly’s Inc Barclays Bank (8,727)(8,563) Tilly’s Inc Morgan Stanley (1,536)10,529 Timberland Bancorp Inc Bank of America
Merrill Lynch (5,896)563 Timberland Bancorp Inc Barclays Bank (23)
24,108 Timberland Bancorp Inc Goldman Sachs (13,500)6,743 Timberland Bancorp Inc Morgan Stanley (270)4,138 Timken Co Bank of America
Merrill Lynch (6,083)4,605 Timken Co Barclays Bank 10,6386,627 Timken Co Goldman Sachs (9,742)8,986 Timken Co HSBC (11,412)5,184 Timken Co Morgan Stanley 11,975
(6,697) TimkenSteel Corp Bank of AmericaMerrill Lynch 4,889
(3,366) TimkenSteel Corp Barclays Bank (1,851)11,681 Tiptree Inc Goldman Sachs (6,658)(2,432) Titan International Inc Goldman Sachs 1,386
(26,640) Titan International Inc HSBC 41,5581,018 Titan Machinery Inc Bank of America
Merrill Lynch 4,5912,287 Titan Machinery Inc Barclays Bank 13,470
13,274 Titan Machinery Inc Goldman Sachs 59,866(3,210) Tivity Health Inc Goldman Sachs (5,698)(1,738) Tivity Health Inc HSBC (3,702)(1,609) Tivity Health Inc Morgan Stanley (611)45,850 TJX Cos Inc Morgan Stanley 54,103(3,386) TJX Cos Inc Morgan Stanley (3,995)
(13,027) T-Mobile US Inc Barclays Bank (48,460)(158) T-Mobile US Inc Goldman Sachs (25)
(2,061) T-Mobile US Inc HSBC (11,624)
BlackRock Americas Diversified Equity Absolute Return FundcontinuedPortfolio of Investments as at 31 May 2021
The notes on pages 590 to 610 form an integral part of these financial statements.
BlackRock Strategic Funds[158]

Holding Description Counterparty
Netunrealised
appreciation/(depreciation)
USD
United States continued(18,687) T-Mobile US Inc Morgan Stanley (69,515)(6,423) Toll Brothers Inc Barclays Bank (19,334)(1,232) Toll Brothers Inc Goldman Sachs (80)(1,566) Toll Brothers Inc HSBC (7,196)
(18,252) Toll Brothers Inc Morgan Stanley (58,503)(9,303) Tompkins Financial Corp HSBC (21,676)
(10,702) Tompkins Financial Corp Morgan Stanley 3,960(5,926) Tootsie Roll Industries Inc Bank of America
Merrill Lynch 5,215(62,247) Tootsie Roll Industries Inc Barclays Bank 22,965(1,335) TopBuild Corp Bank of America
Merrill Lynch 10,587(5,056) TopBuild Corp Barclays Bank (6,219)3,671 TopBuild Corp Barclays Bank 1,715(736) TopBuild Corp Goldman Sachs 5,836
1,102 TopBuild Corp Goldman Sachs (3,909)(1,773) TopBuild Corp Morgan Stanley (2,181)
824 TopBuild Corp Morgan Stanley 1,014(3,144) Toro Co Bank of America
Merrill Lynch 3,616(21,046) Toro Co Barclays Bank (22,940)(10,219) Toro Co Goldman Sachs 11,752(1,553) Toro Co HSBC 7,610
(27,032) Toro Co Morgan Stanley (29,465)(16,027) Towne Bank Bank of America
Merrill Lynch (3,609)(28,063) Towne Bank Barclays Bank 4,771(19,235) Towne Bank Goldman Sachs (4,255)(54,442) Towne Bank Morgan Stanley 7,14621,283 Townsquare Media Inc ’A’ Bank of America
Merrill Lynch 20,64530,850 Townsquare Media Inc ’A’ Goldman Sachs 29,925(8,214) TPG RE Finance Trust Inc
(REIT)Bank of AmericaMerrill Lynch (1,725)
(17,136) TPG RE Finance Trust Inc(REIT) Barclays Bank (819)
(16,484) TPG RE Finance Trust Inc(REIT) Goldman Sachs (3,462)
(9,702) TPG RE Finance Trust Inc(REIT) Morgan Stanley (185)
7,656 TPI Composites Inc Bank of AmericaMerrill Lynch 36,289
1,338 TPI Composites Inc Barclays Bank 1,0843,813 TPI Composites Inc HSBC 10,6381,557 TPI Composites Inc Morgan Stanley 1,2611,621 Tractor Supply Co Bank of America
Merrill Lynch (7,602)(70) Trade Desk Inc ’A’ Bank of America
Merrill Lynch (5,635)1,857 Trade Desk Inc ’A’ Bank of America
Merrill Lynch 145,673(203) Trade Desk Inc ’A’ Barclays Bank (6,612)
1,937 Trade Desk Inc ’A’ Barclays Bank 63,088(75) Trade Desk Inc ’A’ Goldman Sachs (6,038)716 Trade Desk Inc ’A’ Goldman Sachs 32,242
(2,011) Trade Desk Inc ’A’ Morgan Stanley (65,499)(12,076) Tradeweb Markets Inc ’A’ Bank of America
Merrill Lynch (121)(822) Tradeweb Markets Inc ’A’ Goldman Sachs (3,475)
(6,541) Tradeweb Markets Inc ’A’ HSBC (4,775)(1,543) Tradeweb Markets Inc ’A’ Morgan Stanley (4,027)6,695 Trane Technologies Plc Bank of America
Merrill Lynch 19,1488,005 Trane Technologies Plc Barclays Bank 34,4226,941 Trane Technologies Plc HSBC (1,805)5,318 Trane Technologies Plc Morgan Stanley 22,867
(4,861) Transcat Inc Bank of AmericaMerrill Lynch (21,875)
(4,442) Transcat Inc Barclays Bank 13,681(2,460) Transcat Inc Goldman Sachs (9,415)
Holding Description Counterparty
Netunrealised
appreciation/(depreciation)
USD
United States continued(3,274) Translate Bio Inc Bank of America
Merrill Lynch (3,307)(13,118) Translate Bio Inc Barclays Bank (4,067)(3,326) Translate Bio Inc Goldman Sachs (3,359)
(10,005) Translate Bio Inc Morgan Stanley (3,102)(3,719) TransMedics Group Inc Bank of America
Merrill Lynch (10,785)(5,481) TransMedics Group Inc Barclays Bank (3,946)(1,123) TransMedics Group Inc Goldman Sachs (3,257)
(81,633) Transocean Ltd Barclays Bank 5,714(161,114) Transocean Ltd Goldman Sachs 58,096(14,121) Transocean Ltd HSBC 282(4,976) TransUnion Barclays Bank 11,395(1,261) TransUnion Goldman Sachs 1,311
(609) TransUnion Morgan Stanley 1,39534,374 Travel + Leisure Co Bank of America
Merrill Lynch (11,343)(1,417) Travel + Leisure Co Bank of America
Merrill Lynch 468(8,828) Travel + Leisure Co Barclays Bank 1,766
480 Travel + Leisure Co Goldman Sachs (158)(2,932) Travel + Leisure Co Goldman Sachs 968(3,937) Travel + Leisure Co HSBC (2,309)6,542 Travel + Leisure Co Morgan Stanley (1,308)
(34,972) Travel + Leisure Co Morgan Stanley 6,994(4,409) TravelCenters of America
IncBank of AmericaMerrill Lynch (8,553)
(4,854) TravelCenters of AmericaInc Barclays Bank (5,436)
(1,211) TravelCenters of AmericaInc Goldman Sachs (2,349)
(1,435) TravelCenters of AmericaInc HSBC (2,913)
(3,034) TravelCenters of AmericaInc Morgan Stanley (3,398)
5,812 Travelers Cos Inc Bank of AmericaMerrill Lynch (3,197)
5,418 Travelers Cos Inc Barclays Bank 5,25513,386 Travelers Cos Inc Goldman Sachs (7,362)1,832 Travelers Cos Inc HSBC (3,609)4,782 Travelers Cos Inc Morgan Stanley 4,639(512) Travelers Cos Inc Morgan Stanley (497)
5,241 Travere Therapeutics Inc Barclays Bank (14,622)1,873 Travere Therapeutics Inc Goldman Sachs (6,331)6,835 Travere Therapeutics Inc Morgan Stanley (19,070)
25,517 Trean Insurance Group Inc Goldman Sachs 13,52417,165 Trean Insurance Group Inc Morgan Stanley (8,583)
(39,476) Trecora Resources Bank of AmericaMerrill Lynch (5,477)
(23,597) Trecora Resources Barclays Bank (2,975)(13,357) Trecora Resources Goldman Sachs (1,826)(5,670) Trecora Resources HSBC (1,418)
(29,425) Trecora Resources Morgan Stanley (3,376)(29,832) Tredegar Corp Goldman Sachs 25,059(13,140) Tredegar Corp HSBC (5,782)(24,094) Tredegar Corp Morgan Stanley 6,264(10,268) TreeHouse Foods Inc Barclays Bank 21,768
(573) TreeHouse Foods Inc HSBC 768(10,194) TreeHouse Foods Inc Morgan Stanley 21,611(2,030) Trex Co Inc Bank of America
Merrill Lynch 8,87116,389 Trex Co Inc Goldman Sachs (71,619)(3,602) Trex Co Inc Goldman Sachs 15,7411,661 Trex Co Inc HSBC (17,324)
(1,645) Trex Co Inc Morgan Stanley (625)5,888 Trex Co Inc Morgan Stanley 2,237
(22,577) Tri Pointe Homes Inc Bank of AmericaMerrill Lynch 7,676
(7,041) Tri Pointe Homes Inc Barclays Bank (5,844)
BlackRock Americas Diversified Equity Absolute Return FundcontinuedPortfolio of Investments as at 31 May 2021
The notes on pages 590 to 610 form an integral part of these financial statements.
Annual report and audited financial statements [159]
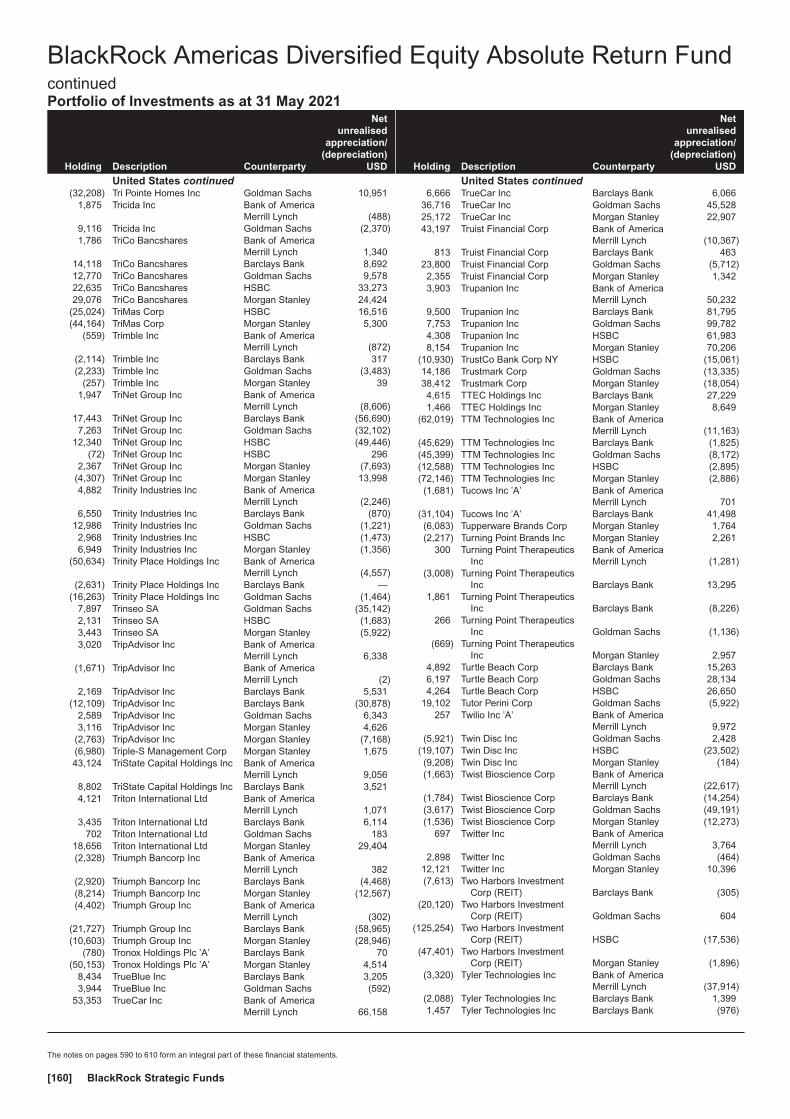
Holding Description Counterparty
Netunrealised
appreciation/(depreciation)
USD
United States continued(32,208) Tri Pointe Homes Inc Goldman Sachs 10,951
1,875 Tricida Inc Bank of AmericaMerrill Lynch (488)
9,116 Tricida Inc Goldman Sachs (2,370)1,786 TriCo Bancshares Bank of America
Merrill Lynch 1,34014,118 TriCo Bancshares Barclays Bank 8,69212,770 TriCo Bancshares Goldman Sachs 9,57822,635 TriCo Bancshares HSBC 33,27329,076 TriCo Bancshares Morgan Stanley 24,424
(25,024) TriMas Corp HSBC 16,516(44,164) TriMas Corp Morgan Stanley 5,300
(559) Trimble Inc Bank of AmericaMerrill Lynch (872)
(2,114) Trimble Inc Barclays Bank 317(2,233) Trimble Inc Goldman Sachs (3,483)
(257) Trimble Inc Morgan Stanley 391,947 TriNet Group Inc Bank of America
Merrill Lynch (8,606)17,443 TriNet Group Inc Barclays Bank (56,690)7,263 TriNet Group Inc Goldman Sachs (32,102)
12,340 TriNet Group Inc HSBC (49,446)(72) TriNet Group Inc HSBC 296
2,367 TriNet Group Inc Morgan Stanley (7,693)(4,307) TriNet Group Inc Morgan Stanley 13,9984,882 Trinity Industries Inc Bank of America
Merrill Lynch (2,246)6,550 Trinity Industries Inc Barclays Bank (870)
12,986 Trinity Industries Inc Goldman Sachs (1,221)2,968 Trinity Industries Inc HSBC (1,473)6,949 Trinity Industries Inc Morgan Stanley (1,356)
(50,634) Trinity Place Holdings Inc Bank of AmericaMerrill Lynch (4,557)
(2,631) Trinity Place Holdings Inc Barclays Bank —(16,263) Trinity Place Holdings Inc Goldman Sachs (1,464)
7,897 Trinseo SA Goldman Sachs (35,142)2,131 Trinseo SA HSBC (1,683)3,443 Trinseo SA Morgan Stanley (5,922)3,020 TripAdvisor Inc Bank of America
Merrill Lynch 6,338(1,671) TripAdvisor Inc Bank of America
Merrill Lynch (2)2,169 TripAdvisor Inc Barclays Bank 5,531
(12,109) TripAdvisor Inc Barclays Bank (30,878)2,589 TripAdvisor Inc Goldman Sachs 6,3433,116 TripAdvisor Inc Morgan Stanley 4,626
(2,763) TripAdvisor Inc Morgan Stanley (7,168)(6,980) Triple-S Management Corp Morgan Stanley 1,67543,124 TriState Capital Holdings Inc Bank of America
Merrill Lynch 9,0568,802 TriState Capital Holdings Inc Barclays Bank 3,5214,121 Triton International Ltd Bank of America
Merrill Lynch 1,0713,435 Triton International Ltd Barclays Bank 6,114
702 Triton International Ltd Goldman Sachs 18318,656 Triton International Ltd Morgan Stanley 29,404(2,328) Triumph Bancorp Inc Bank of America
Merrill Lynch 382(2,920) Triumph Bancorp Inc Barclays Bank (4,468)(8,214) Triumph Bancorp Inc Morgan Stanley (12,567)(4,402) Triumph Group Inc Bank of America
Merrill Lynch (302)(21,727) Triumph Group Inc Barclays Bank (58,965)(10,603) Triumph Group Inc Morgan Stanley (28,946)
(780) Tronox Holdings Plc ’A’ Barclays Bank 70(50,153) Tronox Holdings Plc ’A’ Morgan Stanley 4,514
8,434 TrueBlue Inc Barclays Bank 3,2053,944 TrueBlue Inc Goldman Sachs (592)
53,353 TrueCar Inc Bank of AmericaMerrill Lynch 66,158
Holding Description Counterparty
Netunrealised
appreciation/(depreciation)
USD
United States continued6,666 TrueCar Inc Barclays Bank 6,066
36,716 TrueCar Inc Goldman Sachs 45,52825,172 TrueCar Inc Morgan Stanley 22,90743,197 Truist Financial Corp Bank of America
Merrill Lynch (10,367)813 Truist Financial Corp Barclays Bank 463
23,800 Truist Financial Corp Goldman Sachs (5,712)2,355 Truist Financial Corp Morgan Stanley 1,3423,903 Trupanion Inc Bank of America
Merrill Lynch 50,2329,500 Trupanion Inc Barclays Bank 81,7957,753 Trupanion Inc Goldman Sachs 99,7824,308 Trupanion Inc HSBC 61,9838,154 Trupanion Inc Morgan Stanley 70,206
(10,930) TrustCo Bank Corp NY HSBC (15,061)14,186 Trustmark Corp Goldman Sachs (13,335)38,412 Trustmark Corp Morgan Stanley (18,054)4,615 TTEC Holdings Inc Barclays Bank 27,2291,466 TTEC Holdings Inc Morgan Stanley 8,649
(62,019) TTM Technologies Inc Bank of AmericaMerrill Lynch (11,163)
(45,629) TTM Technologies Inc Barclays Bank (1,825)(45,399) TTM Technologies Inc Goldman Sachs (8,172)(12,588) TTM Technologies Inc HSBC (2,895)(72,146) TTM Technologies Inc Morgan Stanley (2,886)(1,681) Tucows Inc ’A’ Bank of America
Merrill Lynch 701(31,104) Tucows Inc ’A’ Barclays Bank 41,498(6,083) Tupperware Brands Corp Morgan Stanley 1,764(2,217) Turning Point Brands Inc Morgan Stanley 2,261
300 Turning Point TherapeuticsInc
Bank of AmericaMerrill Lynch (1,281)
(3,008) Turning Point TherapeuticsInc Barclays Bank 13,295
1,861 Turning Point TherapeuticsInc Barclays Bank (8,226)
266 Turning Point TherapeuticsInc Goldman Sachs (1,136)
(669) Turning Point TherapeuticsInc Morgan Stanley 2,957
4,892 Turtle Beach Corp Barclays Bank 15,2636,197 Turtle Beach Corp Goldman Sachs 28,1344,264 Turtle Beach Corp HSBC 26,650
19,102 Tutor Perini Corp Goldman Sachs (5,922)257 Twilio Inc ’A’ Bank of America
Merrill Lynch 9,972(5,921) Twin Disc Inc Goldman Sachs 2,428
(19,107) Twin Disc Inc HSBC (23,502)(9,208) Twin Disc Inc Morgan Stanley (184)(1,663) Twist Bioscience Corp Bank of America
Merrill Lynch (22,617)(1,784) Twist Bioscience Corp Barclays Bank (14,254)(3,617) Twist Bioscience Corp Goldman Sachs (49,191)(1,536) Twist Bioscience Corp Morgan Stanley (12,273)
697 Twitter Inc Bank of AmericaMerrill Lynch 3,764
2,898 Twitter Inc Goldman Sachs (464)12,121 Twitter Inc Morgan Stanley 10,396(7,613) Two Harbors Investment
Corp (REIT) Barclays Bank (305)(20,120) Two Harbors Investment
Corp (REIT) Goldman Sachs 604(125,254) Two Harbors Investment
Corp (REIT) HSBC (17,536)(47,401) Two Harbors Investment
Corp (REIT) Morgan Stanley (1,896)(3,320) Tyler Technologies Inc Bank of America
Merrill Lynch (37,914)(2,088) Tyler Technologies Inc Barclays Bank 1,3991,457 Tyler Technologies Inc Barclays Bank (976)
BlackRock Americas Diversified Equity Absolute Return FundcontinuedPortfolio of Investments as at 31 May 2021
The notes on pages 590 to 610 form an integral part of these financial statements.
BlackRock Strategic Funds[160]

Holding Description Counterparty
Netunrealised
appreciation/(depreciation)
USD
United States continued(1,047) Tyler Technologies Inc Goldman Sachs (7,713)
568 Tyler Technologies Inc Goldman Sachs 6,4871,187 Tyler Technologies Inc HSBC 12,986
(2,723) Tyler Technologies Inc Morgan Stanley 4,762301 Tyler Technologies Inc Morgan Stanley (202)
57,461 Tyme Technologies Inc Barclays Bank 13,79112,020 Tyme Technologies Inc HSBC 4,26716,663 Tyme Technologies Inc Morgan Stanley 3,999(8,188) Tyson Foods Inc ’A’ Morgan Stanley 8,679(2,561) Uber Technologies Inc Barclays Bank (2,049)6,888 Uber Technologies Inc Morgan Stanley 5,510
253 Ubiquiti Inc Bank of AmericaMerrill Lynch 5,556
(140) Ubiquiti Inc Barclays Bank 20112 Ubiquiti Inc Goldman Sachs 2,460
(355) Ubiquiti Inc Goldman Sachs (3,732)91 Ubiquiti Inc HSBC 2,351
(151) Ubiquiti Inc HSBC (222)1,068 Ubiquiti Inc Morgan Stanley 10,157
(4,538) UDR Inc (REIT) Bank of AmericaMerrill Lynch (5,582)
(2,946) UDR Inc (REIT) HSBC (2,858)43,856 UDR Inc (REIT) Morgan Stanley 28,945(1,793) UDR Inc (REIT) Morgan Stanley (1,183)17,367 UFP Industries Inc Bank of America
Merrill Lynch (46,196)15,932 UFP Industries Inc Barclays Bank 15,773
(10,120) UFP Industries Inc Goldman Sachs 26,9194,166 UFP Industries Inc Goldman Sachs (11,082)5,579 UFP Industries Inc Morgan Stanley 5,5234,024 UFP Technologies Inc Bank of America
Merrill Lynch (15,412)1,412 UFP Technologies Inc Barclays Bank (1,779)1,208 UFP Technologies Inc HSBC (1,063)1,303 UFP Technologies Inc Morgan Stanley (1,642)
26,134 UGI Corp Bank of AmericaMerrill Lynch 22,618
11,255 UGI Corp Barclays Bank 13,32415,093 UGI Corp Goldman Sachs 3,21790,309 UGI Corp Morgan Stanley 93,1623,944 Ulta Salon Cosmetics & Fra-
grance Inc Barclays Bank 116,5065,492 Ulta Salon Cosmetics & Fra-
grance Inc Goldman Sachs 90,554(3,164) Ulta Salon Cosmetics & Fra-
grance Inc Morgan Stanley (93,465)1,922 Ulta Salon Cosmetics & Fra-
grance Inc Morgan Stanley 56,77613,317 Ultra Clean Holdings Inc Bank of America
Merrill Lynch 104,53818,105 Ultra Clean Holdings Inc Barclays Bank 57,2121,984 Ultra Clean Holdings Inc Morgan Stanley 3,8536,932 Ultragenyx Pharmaceutical
IncBank of AmericaMerrill Lynch (59,477)
1,419 Ultragenyx PharmaceuticalInc Goldman Sachs (12,175)
(1,088) Ultragenyx PharmaceuticalInc Goldman Sachs 9,335
171 Ultragenyx PharmaceuticalInc HSBC (1,289)
(702) Ultragenyx PharmaceuticalInc Morgan Stanley 2,724
(2,875) Ultralife Corp HSBC (3,680)(40,983) Ultralife Corp Morgan Stanley 6,147(4,088) UMB Financial Corp Goldman Sachs 9,689
(11,580) UMB Financial Corp HSBC 11,001(11,031) UMB Financial Corp Morgan Stanley 10,259(71,164) UMH Properties Inc (REIT) Goldman Sachs (712)(19,304) UMH Properties Inc (REIT) HSBC 17,181(93,623) UMH Properties Inc (REIT) Morgan Stanley 24,342
Holding Description Counterparty
Netunrealised
appreciation/(depreciation)
USD
United States continued30,454 Umpqua Holdings Corp Bank of America
Merrill Lynch (3,959)40,577 Umpqua Holdings Corp Barclays Bank 16,63758,392 Umpqua Holdings Corp Goldman Sachs (7,591)35,786 Umpqua Holdings Corp HSBC (537)50,295 Umpqua Holdings Corp Morgan Stanley 20,62124,208 Under Armour Inc ’A’ Bank of America
Merrill Lynch 2,8791,498 Under Armour Inc ’A’ Goldman Sachs (432)8,651 Under Armour Inc ’A’ HSBC 8,351
84,889 Under Armour Inc ’A’ Morgan Stanley 109,507(1,750) Unifi Inc Morgan Stanley (595)
(95) UniFirst Corp Barclays Bank (530)(921) UniFirst Corp Goldman Sachs 2,155605 UniFirst Corp HSBC (188)
(1,072) UniFirst Corp HSBC 3321,757 UniFirst Corp Morgan Stanley 9,804
(5,137) UniFirst Corp Morgan Stanley (27,890)(2,465) Union Bankshares
Inc/Morrisville VTBank of AmericaMerrill Lynch (1,750)
3,055 Union Pacific Corp Bank of AmericaMerrill Lynch 363
1,200 Union Pacific Corp Barclays Bank 1,404(11,472) Union Pacific Corp Morgan Stanley (13,422)(8,504) Unisys Corp Morgan Stanley (6,888)3,826 United Airlines Holdings Inc Bank of America
Merrill Lynch 6,810(14,473) United Airlines Holdings Inc Barclays Bank (31,985)
(377) United Airlines Holdings Inc Goldman Sachs 203(464) United Airlines Holdings Inc HSBC (2,004)
1,285 United Airlines Holdings Inc Morgan Stanley 2,840(2,808) United Airlines Holdings Inc Morgan Stanley (6,206)
(12,609) United Bankshares Inc Bank of AmericaMerrill Lynch 14,122
(19,347) United Bankshares Inc Barclays Bank (3,676)(64,791) United Bankshares Inc Goldman Sachs 72,566(26,449) United Bankshares Inc HSBC (15,605)(42,624) United Bankshares Inc Morgan Stanley (8,098)49,167 United Community Banks
IncBank of AmericaMerrill Lynch (32,450)
17,581 United Community BanksInc Goldman Sachs (11,603)
2,456 United Fire Group Inc HSBC (2,702)39,304 United Fire Group Inc Morgan Stanley (46,772)46,359 United Insurance Holdings
Corp Barclays Bank 92733,228 United Insurance Holdings
Corp HSBC (13,291)19,567 United Insurance Holdings
Corp Morgan Stanley 391(8,724) United Natural Foods Inc Bank of America
Merrill Lynch (14,607)(3,392) United Natural Foods Inc Barclays Bank (4,918)(3,794) United Natural Foods Inc Goldman Sachs (9,068)(1,017) United Natural Foods Inc Morgan Stanley (563)(3,930) United Parcel Service Inc ’B’ Goldman Sachs 962(3,103) United Parcel Service Inc ’B’ HSBC 4,748(7,874) United Parcel Service Inc ’B’ Morgan Stanley (9,213)
(433) United Rentals Inc Bank of AmericaMerrill Lynch (22)
(81) United Rentals Inc Barclays Bank (651)(1,157) United Rentals Inc Goldman Sachs 8,192(3,001) United Rentals Inc HSBC 42,554(1,063) United Rentals Inc Morgan Stanley (8,547)26,904 United Security
Bancshares/Fresno CA Barclays Bank 4,03615,447 United Security
Bancshares/Fresno CA Goldman Sachs 5,40621,793 United Security
Bancshares/Fresno CA HSBC 12,640
BlackRock Americas Diversified Equity Absolute Return FundcontinuedPortfolio of Investments as at 31 May 2021
The notes on pages 590 to 610 form an integral part of these financial statements.
Annual report and audited financial statements [161]

Holding Description Counterparty
Netunrealised
appreciation/(depreciation)
USD
United States continued34,348 United Security
Bancshares/Fresno CA Morgan Stanley 5,1525,713 United States Cellular Corp Bank of America
Merrill Lynch (440)1,776 United States Cellular Corp Barclays Bank (22)
25,679 United States Cellular Corp Goldman Sachs (519)7,024 United States Cellular Corp HSBC 101
26,520 United States Cellular Corp Morgan Stanley (2,122)(5,003) United States Lime & Miner-
als IncBank of AmericaMerrill Lynch 4,253
(305) United States Lime & Miner-als Inc Goldman Sachs 259
(791) United States Lime & Miner-als Inc Morgan Stanley (1,052)
9,288 United States Steel Corp Bank of AmericaMerrill Lynch (2,802)
26,960 United States Steel Corp Barclays Bank 35,082507 United States Steel Corp HSBC (771)
8,676 United States Steel Corp Morgan Stanley 13,968(594) United Therapeutics Corp Bank of America
Merrill Lynch 7,360(2,943) United Therapeutics Corp Barclays Bank 7,976(3,176) UnitedHealth Group Inc Bank of America
Merrill Lynch (5,181)(1,353) UnitedHealth Group Inc Goldman Sachs 1,399(2,631) UnitedHealth Group Inc HSBC 23,600(2,454) UnitedHealth Group Inc Morgan Stanley (2,380)16,121 Uniti Group Inc (REIT) Bank of America
Merrill Lynch 3,54756,723 Uniti Group Inc (REIT) Goldman Sachs 12,47919,367 Uniti Group Inc (REIT) Morgan Stanley (194)
(12,890) Unitil Corp Goldman Sachs 5,543(15,636) Unitil Corp HSBC 28,770(18,880) Unitil Corp Morgan Stanley 6,419
6,399 Unity Bancorp Inc Bank of AmericaMerrill Lynch 1,472
3,928 Unity Bancorp Inc Barclays Bank 1,53212,010 Unity Bancorp Inc Goldman Sachs 2,7629,580 Unity Bancorp Inc Morgan Stanley 3,736
38,391 UNITY Biotechnology Inc Bank of AmericaMerrill Lynch 3,455
(1,188) Unity Software Inc Bank of AmericaMerrill Lynch (9,373)
3,267 Univar Solutions Inc Bank of AmericaMerrill Lynch (22)
(5,323) Univar Solutions Inc Goldman Sachs (586)1,953 Univar Solutions Inc Goldman Sachs 17
(21,315) Univar Solutions Inc HSBC (49,664)(39,701) Univar Solutions Inc Morgan Stanley 7,543(4,711) Universal Corp HSBC 15,217
(53,036) Universal Corp Morgan Stanley 221,1601,912 Universal Display Corp Barclays Bank 5,8701,017 Universal Display Corp Goldman Sachs 20,4111,982 Universal Electronics Inc Bank of America
Merrill Lynch 3,76612,355 Universal Electronics Inc Barclays Bank (4,454)1,098 Universal Electronics Inc Goldman Sachs 2,0866,636 Universal Electronics Inc HSBC 15,4621,378 Universal Electronics Inc Morgan Stanley (510)
(3,680) Universal Health Realty In-come Trust (REIT)
Bank of AmericaMerrill Lynch (8,022)
(2,373) Universal Health Realty In-come Trust (REIT) Barclays Bank (4,153)
(2,177) Universal Health Realty In-come Trust (REIT) Goldman Sachs (4,746)
(9,800) Universal Health Realty In-come Trust (REIT) HSBC (36,358)
(4,714) Universal Health Realty In-come Trust (REIT) Morgan Stanley (8,250)
Holding Description Counterparty
Netunrealised
appreciation/(depreciation)
USD
United States continued(5,926) Universal Health Services
Inc ’B’Bank of AmericaMerrill Lynch 4,017
(10,016) Universal Health ServicesInc ’B’ Barclays Bank (4,814)
(12,568) Universal Health ServicesInc ’B’ Goldman Sachs 7,001
(16,097) Universal Health ServicesInc ’B’ Morgan Stanley (9,935)
7,214 Universal Insurance Hold-ings Inc
Bank of AmericaMerrill Lynch (2,453)
15,342 Universal Insurance Hold-ings Inc Barclays Bank 3,222
7,965 Universal Insurance Hold-ings Inc Goldman Sachs (2,708)
13,064 Universal Insurance Hold-ings Inc HSBC (6,401)
13,109 Universal Insurance Hold-ings Inc Morgan Stanley 2,753
29,339 Universal Logistics HoldingsInc
Bank of AmericaMerrill Lynch (42,835)
4,077 Universal Logistics HoldingsInc Barclays Bank (1,386)
20,914 Universal Technical InstituteInc
Bank of AmericaMerrill Lynch 1,255
12,201 Universal Technical InstituteInc Barclays Bank (1,464)
32,544 Universal Technical InstituteInc Goldman Sachs 1,953
7,929 Universal Technical InstituteInc HSBC (634)
28,218 Universal Technical InstituteInc Morgan Stanley (2,489)
67,134 Univest Financial Corp Bank of AmericaMerrill Lynch (4,699)
24,030 Univest Financial Corp Barclays Bank 14,17867,782 Univest Financial Corp Goldman Sachs (4,745)4,410 Univest Financial Corp HSBC 176
(4,849) Unum Group Bank of AmericaMerrill Lynch (436)
9,441 Unum Group Bank of AmericaMerrill Lynch 1,765
(37,234) Unum Group Barclays Bank (26,064)1,870 Unum Group Barclays Bank 1,309(595) Unum Group Goldman Sachs (54)
3,385 Unum Group Morgan Stanley 2,370(3,451) Upland Software Inc Bank of America
Merrill Lynch (5,004)(14,223) Upland Software Inc Goldman Sachs (20,623)(10,619) Upland Software Inc Morgan Stanley (1,274)(1,306) Upwork Inc Barclays Bank (4,898)1,439 Upwork Inc Barclays Bank 5,3963,291 Upwork Inc Goldman Sachs 22,774
(2,822) Upwork Inc HSBC (19,869)(19,370) Uranium Energy Corp Bank of America
Merrill Lynch 2,131(44,932) Uranium Energy Corp Barclays Bank (5,392)(32,585) Urban Edge Properties
(REIT)Bank of AmericaMerrill Lynch (11,055)
(48,314) Urban Edge Properties(REIT) Barclays Bank (15,072)
(21,710) Urban Edge Properties(REIT) Goldman Sachs (7,381)
(36,613) Urban Edge Properties(REIT) HSBC (11,716)
(66,556) Urban Edge Properties(REIT) Morgan Stanley (25,957)
11,160 Urban Outfitters Inc Bank of AmericaMerrill Lynch 1,562
2,565 Urban Outfitters Inc Barclays Bank 11,389
BlackRock Americas Diversified Equity Absolute Return FundcontinuedPortfolio of Investments as at 31 May 2021
The notes on pages 590 to 610 form an integral part of these financial statements.
BlackRock Strategic Funds[162]

Holding Description Counterparty
Netunrealised
appreciation/(depreciation)
USD
United States continued1,280 Urban Outfitters Inc Goldman Sachs 1791,738 Urban Outfitters Inc HSBC 2,4859,909 Urban Outfitters Inc Morgan Stanley 36,2893,782 UroGen Pharma Ltd Barclays Bank 1,513
11,300 UroGen Pharma Ltd Goldman Sachs 18,75812,971 UroGen Pharma Ltd Morgan Stanley 5,188(6,549) Urstadt Biddle Properties
Inc ’A’ (REIT) Barclays Bank (184)(60,250) Urstadt Biddle Properties
Inc ’A’ (REIT) Goldman Sachs 4,218(31,714) Urstadt Biddle Properties
Inc ’A’ (REIT) HSBC 11,734(60,195) Urstadt Biddle Properties
Inc ’A’ (REIT) Morgan Stanley (4,214)(8,579) US Bancorp Bank of America
Merrill Lynch 12,268(4,059) US Bancorp Barclays Bank (43)(9,718) US Bancorp Goldman Sachs 2,851(6,875) US Bancorp HSBC 2,681
(37,639) US Bancorp Morgan Stanley (15,959)2,027 US Concrete Inc Bank of America
Merrill Lynch (1,338)4,969 US Concrete Inc Barclays Bank 6,062
12,798 US Concrete Inc HSBC 4,479(967) US Ecology Inc Barclays Bank 590
(24,926) US Ecology Inc Goldman Sachs 63,811(22,311) US Ecology Inc HSBC 54,885(39,968) US Ecology Inc Morgan Stanley 24,380
(597) US Foods Holding Corp HSBC 3223,579 US Foods Holding Corp HSBC 2,506
(6,941) US Foods Holding Corp Morgan Stanley (5,180)59,520 US Oncology Inc Bank of America
Merrill Lynch (59)7,474 US Oncology Inc Barclays Bank —
41,718 US Oncology Inc Goldman Sachs (42)8,296 US Oncology Inc Morgan Stanley —(203) US Physical Therapy Inc Bank of America
Merrill Lynch 37(4,983) US Physical Therapy Inc Barclays Bank 5,132
(432) US Physical Therapy Inc Goldman Sachs 7811,486 US Silica Holdings Inc Goldman Sachs (17,918)3,406 US Silica Holdings Inc HSBC (2,657)
(26,344) US Xpress Enterprises Inc’A’
Bank of AmericaMerrill Lynch (5,796)
(13,457) US Xpress Enterprises Inc’A’ Barclays Bank (1,749)
4,317 USANA Health Sciences Inc Barclays Bank 3,9722,196 USANA Health Sciences Inc Goldman Sachs 12,803
(1,967) Utah Medical Products Inc Bank of AmericaMerrill Lynch 4,091
(3,491) Utah Medical Products Inc Barclays Bank 3,002(3,591) Utah Medical Products Inc Goldman Sachs 7,469(3,262) Utah Medical Products Inc HSBC 11,287(3,750) Utah Medical Products Inc Morgan Stanley 3,225
267 Vail Resorts Inc Bank of AmericaMerrill Lynch 2,291
444 Vail Resorts Inc Barclays Bank 2,7621,157 Vail Resorts Inc Goldman Sachs 9,927(417) Vail Resorts Inc Goldman Sachs (3,578)
1,474 Vail Resorts Inc Morgan Stanley 9,168(590) Vail Resorts Inc Morgan Stanley (3,670)520 Valero Energy Corp Barclays Bank 1,087
1,254 Valero Energy Corp Goldman Sachs (1,530)11,120 Valero Energy Corp Morgan Stanley 23,241(4,085) Valhi Inc Bank of America
Merrill Lynch 5,188(200) Valhi Inc Barclays Bank (24)
(2,339) Valhi Inc Goldman Sachs 2,971(579) Valhi Inc HSBC 1,639(786) Valhi Inc Morgan Stanley (94)
Holding Description Counterparty
Netunrealised
appreciation/(depreciation)
USD
United States continued(95,308) Valley National Bancorp Bank of America
Merrill Lynch 29,545(52,907) Valley National Bancorp HSBC 2,645
(370,002) Valley National Bancorp Morgan Stanley (14,799)(707) Valmont Industries Inc Bank of America
Merrill Lynch 8,046(345) Valmont Industries Inc Barclays Bank (642)
(1,702) Valmont Industries Inc Goldman Sachs 19,369(2,629) Valmont Industries Inc Morgan Stanley (4,890)
23 Value Line Inc Bank of AmericaMerrill Lynch (55)
512 Value Line Inc Barclays Bank (773)25 Value Line Inc Goldman Sachs (60)
11,375 Valvoline Inc Bank of AmericaMerrill Lynch 14,674
9,574 Valvoline Inc Barclays Bank 3,5423,684 Valvoline Inc Goldman Sachs 4,752
16,677 Valvoline Inc HSBC 12,71428,174 Valvoline Inc Morgan Stanley 10,424
(14,492) Vanda Pharmaceuticals Inc Bank of AmericaMerrill Lynch 12,898
(56,254) Vanda Pharmaceuticals Inc Goldman Sachs 50,06610,019 Vapotherm Inc Bank of America
Merrill Lynch 8,4456,924 Vapotherm Inc Barclays Bank 6,7862,911 Vapotherm Inc HSBC 1,6665,037 Varex Imaging Corp HSBC 7,253
24,625 Varex Imaging Corp Morgan Stanley (16,253)10,296 Varonis Systems Inc Bank of America
Merrill Lynch 38,09533,177 Varonis Systems Inc Barclays Bank 29,1969,067 Varonis Systems Inc Goldman Sachs 33,5482,490 Varonis Systems Inc HSBC 7,221
24,025 Varonis Systems Inc Morgan Stanley 21,142(25,337) Vaxart Inc Barclays Bank (6,841)(5,716) Vaxart Inc Goldman Sachs (1,086)
(18,643) Vaxcyte Inc Barclays Bank (6,525)(1,778) Vaxcyte Inc Morgan Stanley 465
(53,375) VBI Vaccines Inc Bank of AmericaMerrill Lynch (9,896)
(41,469) VBI Vaccines Inc Barclays Bank (6,220)(11,810) VBI Vaccines Inc Goldman Sachs (1,226)(3,867) VBI Vaccines Inc HSBC (2,282)21,722 Vector Group Ltd Bank of America
Merrill Lynch (16,074)16,501 Vector Group Ltd Barclays Bank (16,996)5,192 Vector Group Ltd Goldman Sachs (3,842)7,102 Vector Group Ltd HSBC (2,344)
358 Vector Group Ltd Morgan Stanley (369)5,700 Vectrus Inc Bank of America
Merrill Lynch (8,023)14,354 Vectrus Inc Goldman Sachs (26,698)16,018 Vectrus Inc Morgan Stanley (9,290)(8,327) Veeco Instruments Inc Bank of America
Merrill Lynch (12,824)(19,221) Veeco Instruments Inc Barclays Bank (15,569)(22,358) Veeco Instruments Inc HSBC (43,598)(19,241) Veeco Instruments Inc Morgan Stanley (15,585)(3,879) Veeva Systems Inc ’A’ Bank of America
Merrill Lynch (168,426)(2,962) Veeva Systems Inc ’A’ Barclays Bank (84,506)
(146) Veeva Systems Inc ’A’ Goldman Sachs 193573 Velocity Financial Inc Bank of America
Merrill Lynch (252)14,135 Velocity Financial Inc HSBC (2,968)15,185 Velocity Financial Inc Morgan Stanley 2,126(5,883) Ventas Inc (REIT) Barclays Bank (1,647)
(10,640) Ventas Inc (REIT) Goldman Sachs (12,715)(67,959) Venus Concept Inc Barclays Bank 4,757(19,015) Venus Concept Inc Goldman Sachs (3,042)
BlackRock Americas Diversified Equity Absolute Return FundcontinuedPortfolio of Investments as at 31 May 2021
The notes on pages 590 to 610 form an integral part of these financial statements.
Annual report and audited financial statements [163]

Holding Description Counterparty
Netunrealised
appreciation/(depreciation)
USD
United States continued(23,277) Vera Bradley Inc Barclays Bank (21,880)(1,163) Veracyte Inc Barclays Bank (2,047)6,774 Veracyte Inc Barclays Bank 11,922
(3,550) Veracyte Inc Goldman Sachs (12,176)6,026 Veracyte Inc Goldman Sachs 14,307
(1,214) Veracyte Inc HSBC 3,958(68,053) Verastem Inc Bank of America
Merrill Lynch (63,289)(25,545) Verastem Inc Morgan Stanley 2,810(2,187) Vericel Corp HSBC (14,806)(4,766) Vericel Corp Morgan Stanley (17,444)18,209 Verint Systems Inc Bank of America
Merrill Lynch 19,84822,496 Verint Systems Inc Barclays Bank (225)27,051 Verint Systems Inc Goldman Sachs 29,4855,547 Verint Systems Inc HSBC (1,831)
38,595 Verint Systems Inc Morgan Stanley (386)(7,081) VeriSign Inc Bank of America
Merrill Lynch (1,841)8,544 VeriSign Inc Bank of America
Merrill Lynch 2,221(2,868) VeriSign Inc Goldman Sachs (746)3,655 Verisk Analytics Inc Bank of America
Merrill Lynch (42)3,621 Verisk Analytics Inc Barclays Bank (4,852)4,725 Verisk Analytics Inc Goldman Sachs (520)7,075 Verisk Analytics Inc HSBC (38,612)
14,257 Verisk Analytics Inc Morgan Stanley (19,104)(5,136) Veritex Holdings Inc Bank of America
Merrill Lynch 1,541(7,000) Veritex Holdings Inc Barclays Bank 3,640
(24,239) Veritex Holdings Inc Goldman Sachs 7,272(20,845) Veritex Holdings Inc HSBC (4,586)(41,872) Veritex Holdings Inc Morgan Stanley 21,773
1,673 Veritiv Corp HSBC 24,008(4,400) Veritone Inc Bank of America
Merrill Lynch (9,152)(2,220) Veritone Inc Barclays Bank (1,487)
(841) Verizon CommunicationsInc Barclays Bank 412
(65,269) Verizon CommunicationsInc Goldman Sachs 94,640
13,774 Verra Mobility Corp Barclays Bank (14,738)13,327 Verra Mobility Corp Goldman Sachs (2,532)28,235 Verra Mobility Corp Morgan Stanley (30,211)(4,709) Verrica Pharmaceuticals Inc Bank of America
Merrill Lynch 2,072(3,298) Verrica Pharmaceuticals Inc Barclays Bank 726
(10,174) Verrica Pharmaceuticals Inc Goldman Sachs 4,477(2,085) Verrica Pharmaceuticals Inc HSBC 250(2,050) Verrica Pharmaceuticals Inc Morgan Stanley 451(7,739) Verso Corp ’A’ Goldman Sachs 3,947(5,390) Verso Corp ’A’ HSBC (10,672)
(14,584) Verso Corp ’A’ Morgan Stanley 1,167563 Vertex Pharmaceuticals Inc Bank of America
Merrill Lynch (2,989)4,014 Vertex Pharmaceuticals Inc Barclays Bank 3,466
666 Vertex Pharmaceuticals Inc HSBC (3,081)11,248 Vertex Pharmaceuticals Inc Morgan Stanley (16,002)(5,313) Vertiv Holdings Co Barclays Bank (2,603)(2,007) Veru Inc Barclays Bank (1,244)
(10,275) Veru Inc HSBC (14,796)(4,956) VF Corp Bank of America
Merrill Lynch 34,3455,376 VF Corp Bank of America
Merrill Lynch 14,379(16,519) VF Corp Barclays Bank (51,374)(9,349) VF Corp Goldman Sachs 64,7892,857 VF Corp Goldman Sachs (13,681)6,322 VF Corp Morgan Stanley (265)
Holding Description Counterparty
Netunrealised
appreciation/(depreciation)
USD
United States continued919 ViacomCBS Inc ’A’ Bank of America
Merrill Lynch 2,794550 ViacomCBS Inc ’A’ Barclays Bank 578606 ViacomCBS Inc ’A’ Goldman Sachs 1,842
3,394 ViacomCBS Inc ’A’ Morgan Stanley 3,5643,822 ViacomCBS Inc ’B’ Barclays Bank 3,6396,583 ViacomCBS Inc ’B’ HSBC 18,8596,342 ViacomCBS Inc ’B’ Morgan Stanley 5,581
811 Viad Corp HSBC 1,6796,496 Viad Corp Morgan Stanley 12,018
(7,232) Viant Technology Inc ’A’ Bank of AmericaMerrill Lynch (26,494)
(2,236) Viant Technology Inc ’A’ Barclays Bank 21(6,597) Viasat Inc Bank of America
Merrill Lynch (34,832)(3,924) Viasat Inc Goldman Sachs (20,719)(1,317) Viasat Inc Morgan Stanley (7,586)1,672 Viasat Inc Morgan Stanley 9,631
(8,386) Viatris Inc Bank of AmericaMerrill Lynch 7,631
(8,914) Viatris Inc Barclays Bank 1,070(65,352) Viatris Inc Goldman Sachs 59,470(7,715) Viatris Inc HSBC 3,79026,006 Viavi Solutions Inc Bank of America
Merrill Lynch 28,867100,203 Viavi Solutions Inc Barclays Bank 27,05510,591 Viavi Solutions Inc Goldman Sachs 11,756
(23,089) Viavi Solutions Inc HSBC (31,170)93,021 Viavi Solutions Inc Morgan Stanley 25,11510,541 VICI Properties Inc (REIT) Bank of America
Merrill Lynch (632)20,955 VICI Properties Inc (REIT) Barclays Bank (5,449)4,835 VICI Properties Inc (REIT) Goldman Sachs (290)
21,096 VICI Properties Inc (REIT) HSBC (3,165)(3,481) Vicor Corp Bank of America
Merrill Lynch (39,683)(6,292) Vicor Corp Barclays Bank (18,247)
(23,599) Vicor Corp Goldman Sachs (269,029)(1,481) Vicor Corp Morgan Stanley (4,295)
(20,762) Vidler Water Resouces Inc Bank of AmericaMerrill Lynch (9,551)
(60,213) Vidler Water Resouces Inc Goldman Sachs (27,698)(7,837) Vidler Water Resouces Inc HSBC (8,699)
(48,887) Viemed Healthcare Inc Barclays Bank 52,80414,834 ViewRay Inc Barclays Bank (1,928)5,848 ViewRay Inc Goldman Sachs 2,6027,510 ViewRay Inc HSBC 5,182
(39,118) Viking Therapeutics Inc Barclays Bank 24,644(31,394) Village Super Market Inc ’A’ Bank of America
Merrill Lynch 40,812(28,740) Village Super Market Inc ’A’ Barclays Bank 5,689(19,625) Village Super Market Inc ’A’ Goldman Sachs 25,513(5,390) Village Super Market Inc ’A’ HSBC 6,899(8,139) Village Super Market Inc ’A’ Morgan Stanley 1,709(1,095) Vimeo Inc Bank of America
Merrill Lynch (45,990)(7,336) Vimeo Inc Barclays Bank (308,112)
(560) Vimeo Inc Goldman Sachs (23,520)411 Vimeo Inc Goldman Sachs 17,262
(15,257) Vimeo Inc Morgan Stanley (640,794)(11,185) Vince Holding Corp Barclays Bank (6,264)(13,891) Vince Holding Corp Morgan Stanley (7,779)
3,678 Vincerx Pharma Inc Bank of AmericaMerrill Lynch (9,342)
7,347 Vincerx Pharma Inc Barclays Bank (2,236)1,398 Vincerx Pharma Inc HSBC (1,177)
12,191 Vincerx Pharma Inc Morgan Stanley (3,535)(32,051) Vine Energy Inc ’A’ Bank of America
Merrill Lynch (15,949)(4,434) Vine Energy Inc ’A’ Goldman Sachs (7)
BlackRock Americas Diversified Equity Absolute Return FundcontinuedPortfolio of Investments as at 31 May 2021
The notes on pages 590 to 610 form an integral part of these financial statements.
BlackRock Strategic Funds[164]

Holding Description Counterparty
Netunrealised
appreciation/(depreciation)
USD
United States continued(771) Vir Biotechnology Inc Goldman Sachs 2,143
(2,746) Vir Biotechnology Inc Morgan Stanley 4,0642,668 Viracta Therapeutics Inc Barclays Bank 694
300 Viracta Therapeutics Inc Goldman Sachs 651(2,552) Virgin Galactic Holdings Inc Bank of America
Merrill Lynch (37,234)(1,451) Virgin Galactic Holdings Inc Barclays Bank (6,297)
(381) Virgin Galactic Holdings Inc Goldman Sachs (5,559)(145,558) VirnetX Holding Corp Goldman Sachs (11,645)
13,083 Virtu Financial Inc ’A’ Barclays Bank 20,4097,207 Virtu Financial Inc ’A’ Goldman Sachs 10,306
(1,136) Virtu Financial Inc ’A’ HSBC (2,454)4,899 Virtu Financial Inc ’A’ HSBC 7,500
(8,964) Virtu Financial Inc ’A’ Morgan Stanley (13,984)9,712 Virtu Financial Inc ’A’ Morgan Stanley 15,151
275 Virtus Investment PartnersInc
Bank of AmericaMerrill Lynch 2,112
1,007 Virtus Investment PartnersInc Barclays Bank 2,383
296 Virtus Investment PartnersInc Goldman Sachs 2,273
2,435 Virtus Investment PartnersInc Morgan Stanley 6,550
7,332 Visa Inc ’A’ Morgan Stanley (9,066)(109,988) Vishay Intertechnology Inc Morgan Stanley 19,798
(7,389) Vishay Precision Group Inc Morgan Stanley 9,015(1,649) Visteon Corp Bank of America
Merrill Lynch (13,802)(2,882) Visteon Corp Barclays Bank (28,474)
(618) Visteon Corp Goldman Sachs (5,173)(8,738) Vistra Corp Bank of America
Merrill Lynch (2,185)(5,354) Vistra Corp Barclays Bank 2,623(2,453) Vistra Corp Goldman Sachs (613)
(34,970) Vistra Corp Morgan Stanley 17,13522,357 Vital Farms Inc Barclays Bank 24,8161,016 Vital Farms Inc Goldman Sachs 1,0301,389 Vital Farms Inc HSBC 1,583
(18,542) Vivint Smart Home Inc Barclays Bank (11,867)(7,198) Vivint Smart Home Inc Goldman Sachs (6,190)(3,857) Vivint Smart Home Inc Morgan Stanley (190)2,380 VMware Inc ’A’ Bank of America
Merrill Lynch (6,772)626 VMware Inc ’A’ Goldman Sachs (1,863)
2,192 VMware Inc ’A’ HSBC (12,648)7,496 VMware Inc ’A’ Morgan Stanley (32,233)
17,349 Vocera Communications Inc Morgan Stanley (1,561)9,696 VolitionRX Ltd Bank of America
Merrill Lynch —5,227 VolitionRX Ltd Barclays Bank (209)
12,853 VolitionRX Ltd Morgan Stanley (514)(5,435) Vonage Holdings Corp Bank of America
Merrill Lynch (1,794)(6,702) Vonage Holdings Corp Barclays Bank (469)(8,633) Vonage Holdings Corp Goldman Sachs (2,849)
(13,124) Vonage Holdings Corp HSBC (14,699)(45,659) Vonage Holdings Corp Morgan Stanley (3,196)14,894 Vontier Corp Bank of America
Merrill Lynch 14,149(3,180) Vontier Corp Barclays Bank (1,399)(3,018) Vontier Corp HSBC (1,811)
(32,957) Vontier Corp Morgan Stanley (14,501)2,427 Vor BioPharma Inc Bank of America
Merrill Lynch 4,7331,177 Vor BioPharma Inc Barclays Bank 1,1421,134 Vor BioPharma Inc Goldman Sachs 2,2112,328 Vor BioPharma Inc HSBC (2,538)
454 Vor BioPharma Inc Morgan Stanley 4401,399 Vornado Realty Trust (REIT) Barclays Bank 532
Holding Description Counterparty
Netunrealised
appreciation/(depreciation)
USD
United States continued(2,498) Vornado Realty Trust (REIT) Goldman Sachs (2,898)(2,939) Vornado Realty Trust (REIT) HSBC (2,263)(4,365) Vornado Realty Trust (REIT) Morgan Stanley (1,659)7,758 VOXX International Corp Bank of America
Merrill Lynch 4,5007,589 Voya Financial Inc Bank of America
Merrill Lynch (22,995)17,048 Voya Financial Inc Barclays Bank (13,809)8,600 Voya Financial Inc Goldman Sachs (26,058)
20,271 Voya Financial Inc HSBC (61,016)23,437 Voya Financial Inc Morgan Stanley (18,984)
(17,367) Voyager Therapeutics Inc Bank of AmericaMerrill Lynch 4,863
(16,684) Voyager Therapeutics Inc Barclays Bank (2,503)(15,333) Voyager Therapeutics Inc Goldman Sachs 4,293(12,864) Voyager Therapeutics Inc HSBC (1,930)(5,325) Voyager Therapeutics Inc Morgan Stanley (799)(6,477) Vroom Inc Bank of America
Merrill Lynch (26,297)(1,816) Vroom Inc Barclays Bank (200)(9,122) Vroom Inc HSBC (53,774)6,769 VSE Corp Bank of America
Merrill Lynch 27,8881,883 VSE Corp Goldman Sachs 7,7585,256 Vulcan Materials Co Bank of America
Merrill Lynch (34,788)4,816 Vulcan Materials Co HSBC (35,831)7,626 Vulcan Materials Co Morgan Stanley (10,295)
(6,630) Vuzix Corp Barclays Bank (6,962)(8,953) VYNE Therapeutics Inc Barclays Bank (3,581)
(14,105) VYNE Therapeutics Inc Goldman Sachs (4,514)3,066 W R Berkley Corp Barclays Bank (767)
415 W R Berkley Corp Goldman Sachs (589)10,359 W R Berkley Corp HSBC (27,899)21,120 W R Berkley Corp Morgan Stanley (3,249)20,327 W&T Offshore Inc Bank of America
Merrill Lynch (1,423)19,014 W&T Offshore Inc Barclays Bank 951
198,070 W&T Offshore Inc Goldman Sachs (13,865)5,623 W&T Offshore Inc HSBC 1,406
126,442 W&T Offshore Inc Morgan Stanley 6,32219,763 Wabash National Corp Bank of America
Merrill Lynch (23,320)42,242 Wabash National Corp Goldman Sachs (49,846)30,610 Wabash National Corp HSBC (56,935)
(21,780) Waitr Holdings Inc Bank of AmericaMerrill Lynch 653
(63,654) Waitr Holdings Inc Goldman Sachs 1,9104,369 Walgreens Boots Alliance
IncBank of AmericaMerrill Lynch (11,534)
9,562 Walgreens Boots AllianceInc Goldman Sachs (25,244)
8,767 Walgreens Boots AllianceInc HSBC (3,085)
9,498 Walgreens Boots AllianceInc Morgan Stanley (20,611)
569 Walker & Dunlop Inc Bank of AmericaMerrill Lynch 660
7,453 Walker & Dunlop Inc Goldman Sachs 8,645(2,623) Walmart Inc Barclays Bank (708)(1,729) Walmart Inc HSBC (2,092)(3,401) Warner Music Group Corp
’A’Bank of AmericaMerrill Lynch (510)
(14,099) Warner Music Group Corp’A’ Barclays Bank (13,958)
(17,552) Warner Music Group Corp’A’ Goldman Sachs (2,633)
(8,586) Warner Music Group Corp’A’ Morgan Stanley (8,500)
BlackRock Americas Diversified Equity Absolute Return FundcontinuedPortfolio of Investments as at 31 May 2021
The notes on pages 590 to 610 form an integral part of these financial statements.
Annual report and audited financial statements [165]

Holding Description Counterparty
Netunrealised
appreciation/(depreciation)
USD
United States continued(6,547) Warrior Met Coal Inc Bank of America
Merrill Lynch (5,830)(27,022) Warrior Met Coal Inc Barclays Bank (12,034)(8,627) Warrior Met Coal Inc Goldman Sachs (8,646)
(13,968) Warrior Met Coal Inc HSBC (35,060)(14,277) Warrior Met Coal Inc Morgan Stanley (5,996)13,216 Washington Federal Inc Bank of America
Merrill Lynch (5,947)24,926 Washington Federal Inc Barclays Bank (2,493)42,472 Washington Federal Inc Goldman Sachs (19,112)46,200 Washington Federal Inc Morgan Stanley (4,620)19,790 Washington Real Estate
Investment Trust (REIT)Bank of AmericaMerrill Lynch 17,217
74,238 Washington Real EstateInvestment Trust (REIT) Barclays Bank 25,241
19,934 Washington Real EstateInvestment Trust (REIT) Goldman Sachs 9,250
9,817 Washington Real EstateInvestment Trust (REIT) HSBC 8,136
14,111 Washington Trust BancorpInc Barclays Bank 25,823
9,575 Washington Trust BancorpInc Goldman Sachs 10,820
791 Washington Trust BancorpInc HSBC 2,041
45,117 Washington Trust BancorpInc Morgan Stanley 82,564
572 Waste Connections Inc Bank of AmericaMerrill Lynch (309)
2,276 Waste Connections Inc Barclays Bank 1,320375 Waste Connections Inc HSBC (818)
14,627 Waste Connections Inc Morgan Stanley 8,4832,514 Waste Management Inc Bank of America
Merrill Lynch 2,350(19,525) Waste Management Inc Goldman Sachs 16,206
2,767 Waste Management Inc Goldman Sachs 735(7,363) Waste Management Inc HSBC 18,997(8,882) Waste Management Inc Morgan Stanley 3,819
219 Waters Corp Bank of AmericaMerrill Lynch 1,720
1,147 Waters Corp Barclays Bank 5,792399 Waters Corp Goldman Sachs 5,311
(1,226) Waters Corp Goldman Sachs (16,318)(1,133) Waters Corp Morgan Stanley (5,722)
(32,703) Waterstone Financial Inc Morgan Stanley 3271,552 Watsco Inc Bank of America
Merrill Lynch (6,474)530 Watsco Inc Barclays Bank 2,947
3,334 Watsco Inc Goldman Sachs (18,970)314 Watsco Inc HSBC 972
5,524 Watts Water TechnologiesInc ’A’
Bank of AmericaMerrill Lynch 497
6,738 Watts Water TechnologiesInc ’A’ Barclays Bank 22,909
(788) Watts Water TechnologiesInc ’A’ Goldman Sachs (71)
406 Watts Water TechnologiesInc ’A’ HSBC (1,255)
17,221 Watts Water TechnologiesInc ’A’ Morgan Stanley 58,552
(423) Watts Water TechnologiesInc ’A’ Morgan Stanley (1,438)
(12,530) WaVe Life Sciences Ltd Barclays Bank (4,761)(1,513) Wayfair Inc ’A’ Barclays Bank 10,773(1,100) Wayfair Inc ’A’ Morgan Stanley 7,832(4,223) WD-40 Co Bank of America
Merrill Lynch (7,348)316 WD-40 Co Bank of America
Merrill Lynch 938(2,794) WD-40 Co Barclays Bank (10,170)(2,045) WD-40 Co Goldman Sachs (3,559)
Holding Description Counterparty
Netunrealised
appreciation/(depreciation)
USD
United States continued240 WD-40 Co Goldman Sachs 337
(2,903) WD-40 Co HSBC (11,873)(4,859) WD-40 Co Morgan Stanley (16,680)15,016 Webster Financial Corp Barclays Bank 1,95218,247 Webster Financial Corp Goldman Sachs (12,407)12,265 Webster Financial Corp Morgan Stanley 1,542(5,220) WEC Energy Group Inc Bank of America
Merrill Lynch 9,6571,731 WEC Energy Group Inc Barclays Bank (110)
(1,631) WEC Energy Group Inc Goldman Sachs 3,0171,575 WEC Energy Group Inc Goldman Sachs (113)
(8,952) WEC Energy Group Inc HSBC 47,8932,940 WEC Energy Group Inc HSBC 1,140
(36,028) WEC Energy Group Inc Morgan Stanley 52,241(16,068) Weingarten Realty Investors
(REIT)Bank of AmericaMerrill Lynch (9,858)
(90,720) Weingarten Realty Investors(REIT) Barclays Bank (87,091)
(12,485) Weingarten Realty Investors(REIT) Goldman Sachs (8,192)
(20,252) Weingarten Realty Investors(REIT) Morgan Stanley (18,070)
17,305 Weis Markets Inc Morgan Stanley (14,017)8,252 Welbilt Inc Bank of America
Merrill Lynch 32,01821,905 Welbilt Inc Barclays Bank 112,15411,434 Wells Fargo & Co Barclays Bank 5,488(7,787) Wells Fargo & Co Barclays Bank (3,738)
(788) Wells Fargo & Co Goldman Sachs 9307,805 Welltower Inc (REIT) Morgan Stanley 8591,734 Wendy’s Co Bank of America
Merrill Lynch (35)2,210 Wendy’s Co Barclays Bank (66)
54,718 Wendy’s Co Goldman Sachs (1,094)44,276 Wendy’s Co Morgan Stanley (1,328)5,526 Werner Enterprises Inc Bank of America
Merrill Lynch (3,260)33,007 Werner Enterprises Inc Barclays Bank (15,787)13,990 Werner Enterprises Inc Goldman Sachs (8,254)7,152 Werner Enterprises Inc HSBC (6,580)
83,034 Werner Enterprises Inc Morgan Stanley (44,008)4,571 WesBanco Inc Bank of America
Merrill Lynch (3,565)21,818 WesBanco Inc Barclays Bank (2,836)53,220 WesBanco Inc Goldman Sachs (41,512)28,319 WesBanco Inc HSBC 13,87618,747 WesBanco Inc Morgan Stanley (2,437)
(680) WESCO International Inc Barclays Bank (932)4,580 WESCO International Inc Goldman Sachs (10,351)
(4,451) WESCO International Inc Goldman Sachs 10,059(136) WESCO International Inc Morgan Stanley (65)
8,520 West BanCorp Inc Bank of AmericaMerrill Lynch 2,556
9,616 West BanCorp Inc Goldman Sachs 2,8851,920 West Pharmaceutical Ser-
vices Inc Barclays Bank 15,3412,497 West Pharmaceutical Ser-
vices Inc Goldman Sachs 51,962185 West Pharmaceutical Ser-
vices Inc HSBC 541,206 West Pharmaceutical Ser-
vices Inc Morgan Stanley 9,636(1,664) Westamerica BanCorp Barclays Bank 383(5,300) Westamerica BanCorp Goldman Sachs 5,724(8,640) Westamerica BanCorp HSBC 6,221(9,332) Westamerica BanCorp Morgan Stanley 2,1464,893 Western Alliance Bancorp Barclays Bank 7,193
(1,987) Western Alliance Bancorp HSBC 9,875(6,289) Western Alliance Bancorp Morgan Stanley (9,245)2,735 Western Alliance Bancorp Morgan Stanley 4,020
BlackRock Americas Diversified Equity Absolute Return FundcontinuedPortfolio of Investments as at 31 May 2021
The notes on pages 590 to 610 form an integral part of these financial statements.
BlackRock Strategic Funds[166]

Holding Description Counterparty
Netunrealised
appreciation/(depreciation)
USD
United States continued(65,967) Western Asset Mortgage
Capital Corp (REIT)Bank of AmericaMerrill Lynch (7,916)
(24,823) Western Asset MortgageCapital Corp (REIT) Goldman Sachs (2,979)
(12,814) Western Digital Corp Bank of AmericaMerrill Lynch 15,070
(9,900) Western Digital Corp Barclays Bank (13,068)(23,796) Western Digital Corp Goldman Sachs (19,668)(4,843) Western Digital Corp Morgan Stanley (6,393)
(36,338) Western New England Ban-corp Inc
Bank of AmericaMerrill Lynch 1,454
(5,658) Western New England Ban-corp Inc Barclays Bank (566)
(10,087) Western New England Ban-corp Inc Goldman Sachs 403
(7,453) Western Union Co Barclays Bank 1,714(10,929) Western Union Co HSBC 14,536(4,095) Westinghouse Air Brake
Technologies CorpBank of AmericaMerrill Lynch (9,584)
(2,406) Westinghouse Air BrakeTechnologies Corp Barclays Bank (4,086)
2,742 Westinghouse Air BrakeTechnologies Corp Barclays Bank 5,100
(4,545) Westinghouse Air BrakeTechnologies Corp Goldman Sachs (10,726)
(5,642) Westinghouse Air BrakeTechnologies Corp HSBC (10,720)
(20,102) Westinghouse Air BrakeTechnologies Corp Morgan Stanley (31,649)
6,564 Westlake Chemical Corp Bank of AmericaMerrill Lynch (27,109)
691 Westlake Chemical Corp Barclays Bank (87)3,228 Westlake Chemical Corp Goldman Sachs (13,332)2,866 Westlake Chemical Corp HSBC (4,418)2,475 Westlake Chemical Corp Morgan Stanley —
(20,356) Westrock Co Bank of AmericaMerrill Lynch 71,042
(11,612) Westrock Co Barclays Bank (697)(3,968) Westrock Co Goldman Sachs 13,8489,782 Westwater Resources Inc HSBC 4,304
18,357 Westwood Holdings GroupInc Goldman Sachs (11,198)
11,267 Westwood Holdings GroupInc Morgan Stanley (1,915)
3,277 WEX Inc Bank of AmericaMerrill Lynch 25,721
434 WEX Inc Barclays Bank 872330 WEX Inc Goldman Sachs 2,653
(2,102) WEX Inc HSBC 862350 WEX Inc HSBC (144)
(2,106) WEX Inc Morgan Stanley (5,328)1,191 WEX Inc Morgan Stanley 3,013
(3,097) Weyco Group Inc Bank of AmericaMerrill Lynch 3,716
(5,501) Weyco Group Inc Barclays Bank 6,436(9,164) Weyco Group Inc Goldman Sachs 10,997(2,718) Weyerhaeuser Co (REIT) Bank of America
Merrill Lynch 299(2,175) Weyerhaeuser Co (REIT) Barclays Bank (1,762)
928 Weyerhaeuser Co (REIT) HSBC (2,626)(39,487) Weyerhaeuser Co (REIT) Morgan Stanley (31,984)
467 Whirlpool Corp Bank of AmericaMerrill Lynch (3,937)
(1,149) Whirlpool Corp Bank of AmericaMerrill Lynch 5,269
4,714 Whirlpool Corp Barclays Bank 9,852(4,337) Whirlpool Corp Barclays Bank (9,064)(1,359) Whirlpool Corp Goldman Sachs 11,456
(33) White Mountains InsuranceGroup Ltd Barclays Bank 115
Holding Description Counterparty
Netunrealised
appreciation/(depreciation)
USD
United States continued(524) White Mountains Insurance
Group Ltd Goldman Sachs (1,747)(180) White Mountains Insurance
Group Ltd HSBC 3,761(134) White Mountains Insurance
Group Ltd Morgan Stanley 2,22731,473 Whitestone REIT (REIT) Bank of America
Merrill Lynch (16,681)72,683 Whitestone REIT (REIT) Barclays Bank (10,176)52,414 Whitestone REIT (REIT) Goldman Sachs (27,779)64,165 Whitestone REIT (REIT) HSBC (57,749)55,959 Whitestone REIT (REIT) Morgan Stanley (7,834)
(544) Whiting Petroleum Corp Bank of AmericaMerrill Lynch (3,862)
(11,278) Whiting Petroleum Corp Goldman Sachs (80,074)9,930 Whole Earth Brands Inc Bank of America
Merrill Lynch 3,97216,999 Whole Earth Brands Inc HSBC (9,179)38,299 Whole Earth Brands Inc Morgan Stanley 1,9157,098 WideOpenWest Inc Bank of America
Merrill Lynch 7,311(7,926) Willdan Group Inc Barclays Bank 6,579(2,890) Willdan Group Inc Goldman Sachs 7,283
(10,770) Willdan Group Inc HSBC 6,354(14,989) Willdan Group Inc Morgan Stanley 12,441(4,547) Williams Cos Inc Barclays Bank 773(1,210) Williams-Sonoma Inc Bank of America
Merrill Lynch 2,1183,005 Williams-Sonoma Inc Barclays Bank 13,8233,142 Williams-Sonoma Inc Morgan Stanley 14,453(806) Willis Lease Finance Corp Goldman Sachs (282)
(2,474) Willis Lease Finance Corp HSBC 3,934(1,303) Willis Lease Finance Corp Morgan Stanley 1,955
(25) Willis Towers Watson Plc Barclays Bank 39(109) Willis Towers Watson Plc Goldman Sachs 506(710) Willis Towers Watson Plc Morgan Stanley 1,108
14,182 WillScot Mobile Mini Hold-ings Corp
Bank of AmericaMerrill Lynch 17,018
8,064 WillScot Mobile Mini Hold-ings Corp Barclays Bank 403
18,287 WillScot Mobile Mini Hold-ings Corp Goldman Sachs 14,706
8,617 WillScot Mobile Mini Hold-ings Corp HSBC 8,919
79,223 WillScot Mobile Mini Hold-ings Corp Morgan Stanley 4,128
2,831 Wingstop Inc Bank of AmericaMerrill Lynch 26,810
1,661 Wingstop Inc Barclays Bank 7311,114 Wingstop Inc Goldman Sachs 10,550
222 Wingstop Inc HSBC 2,3021,549 Wingstop Inc Morgan Stanley 682
(2,401) Winmark Corp Bank of AmericaMerrill Lynch 2,113
(4,226) Winmark Corp Barclays Bank 19,693(1,863) Winmark Corp Goldman Sachs 1,639(1,285) Winmark Corp HSBC (386)
(195) Winmark Corp Morgan Stanley 909(4,215) Winnebago Industries Inc Barclays Bank (19,937)6,147 Wintrust Financial Corp Bank of America
Merrill Lynch (2,582)11,817 Wintrust Financial Corp Goldman Sachs (4,963)10,713 Wintrust Financial Corp HSBC 22,39091,885 WisdomTree Investments
Inc HSBC 4,59422,081 WisdomTree Investments
Inc Morgan Stanley (1,987)(2,245) Wix.com Ltd Barclays Bank (28,399)
711 Wix.com Ltd Goldman Sachs 24,942
BlackRock Americas Diversified Equity Absolute Return FundcontinuedPortfolio of Investments as at 31 May 2021
The notes on pages 590 to 610 form an integral part of these financial statements.
Annual report and audited financial statements [167]

Holding Description Counterparty
Netunrealised
appreciation/(depreciation)
USD
United States continued(568) Wix.com Ltd HSBC 12,343
(2,785) Wolverine World Wide Inc Bank of AmericaMerrill Lynch 612
(26,605) Wolverine World Wide Inc Barclays Bank 4,789(6,354) Wolverine World Wide Inc Goldman Sachs 10,276(8,200) Wolverine World Wide Inc Morgan Stanley 1,4762,770 Woodward Inc Goldman Sachs 14,875
13,950 Woodward Inc Morgan Stanley 65,00792 Workday Inc ’A’ Bank of America
Merrill Lynch (499)338 Workday Inc ’A’ Barclays Bank (1,785)
(1,600) Workday Inc ’A’ Barclays Bank 8,4481,864 Workday Inc ’A’ Goldman Sachs (1,469)
(3,260) Workday Inc ’A’ Goldman Sachs 2,380449 Workday Inc ’A’ HSBC 140
4,076 Workday Inc ’A’ Morgan Stanley (21,521)(557) Workday Inc ’A’ Morgan Stanley 2,941
(11,093) Workhorse Group Inc Bank of AmericaMerrill Lynch (12,424)
(17,328) Workhorse Group Inc Barclays Bank (18,368)(1,398) Workiva Inc Bank of America
Merrill Lynch (6,990)(4,830) Workiva Inc Barclays Bank 1,932
(10,045) Workiva Inc Goldman Sachs (50,225)(1,157) Workiva Inc HSBC (6,942)
(12,520) Workiva Inc Morgan Stanley 5,008(6,020) World Acceptance Corp Barclays Bank (20,950)
(425) World Acceptance Corp Goldman Sachs (2,852)(197) World Acceptance Corp Morgan Stanley (686)
11,735 World Fuel Services Corp Bank of AmericaMerrill Lynch (10,877)
19,135 World Fuel Services Corp Barclays Bank (37,313)9,284 World Fuel Services Corp Goldman Sachs (34,613)1,661 World Fuel Services Corp Morgan Stanley (1,247)
(2,949) World Wrestling Entertain-ment Inc ’A’
Bank of AmericaMerrill Lynch (5,721)
(4,194) World Wrestling Entertain-ment Inc ’A’ Barclays Bank 5,393
(11,011) World Wrestling Entertain-ment Inc ’A’ HSBC 964
(698) World Wrestling Entertain-ment Inc ’A’ Morgan Stanley 1,452
3,068 Worthington Industries Inc Bank of AmericaMerrill Lynch (10,493)
18,581 Worthington Industries Inc Goldman Sachs (63,547)35,914 Worthington Industries Inc Morgan Stanley 8,979
(13,813) WP Carey Inc (REIT) Bank of AmericaMerrill Lynch (22,239)
(3,125) WP Carey Inc (REIT) HSBC (1,313)(13,392) WP Carey Inc (REIT) Morgan Stanley 2,009
4,322 WP Carey Inc (REIT) Morgan Stanley (648)(17,998) WSFS Financial Corp Goldman Sachs 8,639
548 WW Grainger Inc Bank of AmericaMerrill Lynch (2,691)
423 WW Grainger Inc Barclays Bank 9094,347 WW Grainger Inc Goldman Sachs (21,344)3,335 WW Grainger Inc HSBC (40,220)
298 WW Grainger Inc Morgan Stanley 641(8,850) WW International Inc Bank of America
Merrill Lynch (19,072)(2,292) WW International Inc Barclays Bank (3,644)(8,175) WW International Inc Goldman Sachs (17,617)9,646 Wyndham Hotels & Resorts
IncBank of AmericaMerrill Lynch (675)
5,218 Wyndham Hotels & ResortsInc Barclays Bank 1,826
21,306 Wyndham Hotels & ResortsInc Goldman Sachs (1,491)
117 Wyndham Hotels & ResortsInc HSBC 216
Holding Description Counterparty
Netunrealised
appreciation/(depreciation)
USD
United States continued14,632 Wyndham Hotels & Resorts
Inc Morgan Stanley 5,1211,117 Wynn Resorts Ltd Bank of America
Merrill Lynch 7,97512,435 Wynn Resorts Ltd Barclays Bank 29,9683,563 Wynn Resorts Ltd Goldman Sachs 25,4401,820 Wynn Resorts Ltd HSBC 11,1751,800 Wynn Resorts Ltd Morgan Stanley 4,3389,744 X4 Pharmaceuticals Inc Bank of America
Merrill Lynch 19,5857,804 X4 Pharmaceuticals Inc Barclays Bank 8,5847,084 X4 Pharmaceuticals Inc Goldman Sachs 14,2393,686 X4 Pharmaceuticals Inc HSBC 5,5296,224 X4 Pharmaceuticals Inc Morgan Stanley 6,846
(21,459) XBiotech Inc Barclays Bank (2,146)(1,759) XBiotech Inc HSBC (457)21,628 Xcel Energy Inc Bank of America
Merrill Lynch 1,73010,050 Xcel Energy Inc Barclays Bank (7,940)10,568 Xcel Energy Inc HSBC (18,071)23,944 Xcel Energy Inc Morgan Stanley (18,916)(6,760) Xencor Inc Bank of America
Merrill Lynch 1,829(7,314) Xenia Hotels & Resorts Inc
(REIT) Morgan Stanley (6,656)4,938 Xeris Pharmaceuticals Inc Goldman Sachs (1,778)6,588 Xeris Pharmaceuticals Inc HSBC (922)7,373 Xeris Pharmaceuticals Inc Morgan Stanley (1,106)5,361 Xerox Holdings Corp Bank of America
Merrill Lynch (4,610)13,817 Xerox Holdings Corp Barclays Bank (6,080)4,933 Xerox Holdings Corp Goldman Sachs (3,149)
948 Xerox Holdings Corp HSBC 2039,929 Xerox Holdings Corp Morgan Stanley (17,743)
(20,536) XOMA Corp Barclays Bank 616(2,931) XOMA Corp Morgan Stanley 88(4,927) XPEL Inc Bank of America
Merrill Lynch (25,620)(1,441) XPEL Inc Barclays Bank (7,320)(2,579) XPEL Inc Goldman Sachs (13,411)(2,340) Xperi Holding Corp Bank of America
Merrill Lynch (1,287)(10,735) Xperi Holding Corp Barclays Bank (6,130)(2,391) Xperi Holding Corp Goldman Sachs (1,315)
(14,231) Xperi Holding Corp HSBC (15,369)(17,997) Xperi Holding Corp Morgan Stanley (14,578)
2,232 XPO Logistics Inc Bank of AmericaMerrill Lynch 4,053
3,223 XPO Logistics Inc Barclays Bank 5,3982,178 XPO Logistics Inc HSBC 4,291
(1,557) XPO Logistics Inc Morgan Stanley (4,951)1,907 Xylem Inc Bank of America
Merrill Lynch 1,1063,680 Xylem Inc Barclays Bank 8,170
14,975 Xylem Inc HSBC (25,158)22,612 Xylem Inc Morgan Stanley 50,199(2,885) Yandex NV ’A’ Morgan Stanley (2,539)
(39,936) Yellow Corp Barclays Bank (5,192)(5,294) Yellow Corp Morgan Stanley 123,676 Yelp Inc Bank of America
Merrill Lynch 2,2628,394 Yelp Inc Barclays Bank 9,9051,969 Yelp Inc Goldman Sachs 2,476
10,281 Yelp Inc Morgan Stanley 12,132(2,243) YETI Holdings Inc Bank of America
Merrill Lynch (3,566)(3,694) YETI Holdings Inc Barclays Bank (443)(3,844) YETI Holdings Inc Goldman Sachs (6,112)
872 YETI Holdings Inc Goldman Sachs 191
BlackRock Americas Diversified Equity Absolute Return FundcontinuedPortfolio of Investments as at 31 May 2021
The notes on pages 590 to 610 form an integral part of these financial statements.
BlackRock Strategic Funds[168]

Holding Description Counterparty
Netunrealised
appreciation/(depreciation)
USD
United States continued52,919 Yext Inc Barclays Bank 69,2132,981 Yext Inc Goldman Sachs 5,6049,983 Yext Inc HSBC 18,932
45,438 Yext Inc Morgan Stanley 84,9695,725 Y-mAbs Therapeutics Inc Bank of America
Merrill Lynch 13,9122,565 Y-mAbs Therapeutics Inc Barclays Bank 3591,759 Y-mAbs Therapeutics Inc Goldman Sachs 4,2745,748 Y-mAbs Therapeutics Inc Morgan Stanley 805
(9,274) York Water Co Bank of AmericaMerrill Lynch (20,959)
(25,763) York Water Co Barclays Bank (20,610)(13,109) York Water Co Goldman Sachs (29,626)(3,117) York Water Co Morgan Stanley (711)(7,228) Yum China Holdings Inc Goldman Sachs (30,213)
(851) Yum China Holdings Inc HSBC (5,863)(13,218) Yum China Holdings Inc Morgan Stanley (33,045)(33,002) Yum! Brands Inc Bank of America
Merrill Lynch (43,563)(21,115) Yum! Brands Inc Barclays Bank 11,014(26,003) Yum! Brands Inc Goldman Sachs (34,324)
(212) Yum! Brands Inc HSBC 413(1,517) Yum! Brands Inc Morgan Stanley 834(3,554) Yumanity Therapeutics Inc Barclays Bank (4,869)(3,106) Yumanity Therapeutics Inc Morgan Stanley (4,255)
(25,209) ZAGG Inc* Bank of AmericaMerrill Lynch (2,244)
(18,879) ZAGG Inc* Goldman Sachs —(10,414) ZAGG Inc* HSBC (937)
136 Zebra Technologies Corp ’A’ Bank of AmericaMerrill Lynch 2,045
1,248 Zebra Technologies Corp ’A’ Barclays Bank (5,704)1,013 Zebra Technologies Corp ’A’ Goldman Sachs 15,236
150 Zebra Technologies Corp ’A’ HSBC 1,6971,459 Zebra Technologies Corp ’A’ Morgan Stanley (6,668)
(9,640) Zedge Inc ’B’ Barclays Bank (11,375)2,877 Zendesk Inc Bank of America
Merrill Lynch 12,6881,348 Zendesk Inc Barclays Bank (350)
12,586 Zendesk Inc Morgan Stanley (3,272)1,258 Zentalis Pharmaceuticals
LLC Morgan Stanley (1,635)1,891 Zillow Group Inc ’C’ Morgan Stanley 8,301
(8,026) Zimmer Biomet Holdings Inc Bank of AmericaMerrill Lynch (20,226)
(289) Zimmer Biomet Holdings Inc Barclays Bank (136)(626) Zimmer Biomet Holdings Inc HSBC 2,266(891) Zimmer Biomet Holdings Inc Morgan Stanley (419)
8,421 Zions Bancorp NA Barclays Bank 2,947(3,546) Zions Bancorp NA Goldman Sachs 8,475(1,328) Zions Bancorp NA HSBC 1,38129,814 Zions Bancorp NA Morgan Stanley 10,435(3,895) Zions Bancorp NA Morgan Stanley (1,363)
(116,251) ZIOPHARM Oncology Inc Barclays Bank 1,163(23,706) Zix Corp Barclays Bank 2,371(12,963) Zix Corp Goldman Sachs (389)(17,091) Zix Corp HSBC (5,555)(40,433) Zix Corp Morgan Stanley 4,043
1,678 Zoetis Inc Bank of AmericaMerrill Lynch 10,756
1,102 Zoetis Inc Barclays Bank 30912,692 Zoetis Inc Morgan Stanley 3,5549,861 Zogenix Inc Bank of America
Merrill Lynch (14,397)16,590 Zogenix Inc Barclays Bank (2,323)38,248 Zogenix Inc Goldman Sachs (49,481)15,174 Zogenix Inc HSBC (17,905)(1,359) Zoom Video Communica-
tions Inc ’A’Bank of AmericaMerrill Lynch (29,128)
Holding Description Counterparty
Netunrealised
appreciation/(depreciation)
USD
United States continued(604) Zoom Video Communica-
tions Inc ’A’ Barclays Bank (6,022)(542) Zoom Video Communica-
tions Inc ’A’ Goldman Sachs (8,653)(2,182) Zoom Video Communica-
tions Inc ’A’ HSBC (89,587)(609) Zoom Video Communica-
tions Inc ’A’ Morgan Stanley (6,072)572 ZoomInfo Technologies Inc
’A’Bank of AmericaMerrill Lynch 1,449
(1,504) ZoomInfo Technologies Inc’A’ Barclays Bank (1,459)
567 ZoomInfo Technologies Inc’A’ Goldman Sachs 2,177
1,255 ZoomInfo Technologies Inc’A’ HSBC 1,856
2,765 ZoomInfo Technologies Inc’A’ Morgan Stanley 2,682
(17,339) Zovio Inc Barclays Bank (2,254)(26,573) Zovio Inc Morgan Stanley (3,454)
115 Zscaler Inc Bank of AmericaMerrill Lynch 3,556
5,530 Zscaler Inc Barclays Bank 109,494796 Zscaler Inc Goldman Sachs 21,414
9,510 Zscaler Inc Morgan Stanley 198,7413,607 Zumiez Inc Barclays Bank 6,312
66,147 Zuora Inc ’A’ Bank of AmericaMerrill Lynch 58,209
17,878 Zuora Inc ’A’ Barclays Bank 8,045(10,617) Zynerba Pharmaceuticals
Inc Barclays Bank (10,617)(2,515) Zynerba Pharmaceuticals
Inc Goldman Sachs (2,993)(11,987) Zynerba Pharmaceuticals
Inc HSBC (18,100)2,491 Zynex Inc Barclays Bank 1,3204,133 Zynex Inc Goldman Sachs 5,7867,124 Zynga Inc ’A’ Bank of America
Merrill Lynch 4,98716,899 Zynga Inc ’A’ Barclays Bank 7,605
(29,941) Zynga Inc ’A’ Barclays Bank (13,473)8,234 Zynga Inc ’A’ Goldman Sachs 5,764
(52,267) Zynga Inc ’A’ Goldman Sachs (36,587)80,398 Zynga Inc ’A’ HSBC 41,0032,450 Zynga Inc ’A’ Morgan Stanley 1,103
(19,156) Zynga Inc ’A’ Morgan Stanley (8,620)
(2,925,274)
Total (Gross underlying exposure - USD 4,863,663,088) (2,417,136)
* Security subject to a fair value adjustment as detailed in Note 2(a).π Amounts which are less than 0.5 USD have been rounded down to zero.
BlackRock Americas Diversified Equity Absolute Return FundcontinuedPortfolio of Investments as at 31 May 2021
The notes on pages 590 to 610 form an integral part of these financial statements.
Annual report and audited financial statements [169]

Currency Purchases Currency Sales CounterpartyMaturity
date
Netunrealised
appreciation/(depreciation)
USD
Financial Derivative Instruments
OPEN FORWARD FOREIGN EXCHANGE TRANSACTIONS
CHF Hedged Share Class
CHF 452,939 USD 498,794State Street Bank& Trust Company 15/6/2021 4,389
USD 20,005 CHF 17,986State Street Bank& Trust Company 15/6/2021 22
4,411
EUR Hedged Share Class
EUR 269,269,745 USD 325,601,191State Street Bank& Trust Company 15/6/2021 3,097,500
USD 6,987,591 EUR 5,723,029State Street Bank& Trust Company 15/6/2021 1,467
3,098,967
GBP Hedged Share Class
GBP 16,138 USD 22,456State Street Bank& Trust Company 15/6/2021 411
USD 332 GBP 235State Street Bank& Trust Company 15/6/2021 —
411
JPY Hedged Share Class
JPY 19,809,328,206 USD 181,558,355State Street Bank& Trust Company 15/6/2021 (864,966)
USD 6,570,423 JPY 715,458,412State Street Bank& Trust Company 15/6/2021 44,275
(820,691)
SEK Hedged Share Class
SEK 316,922,995 USD 37,761,564State Street Bank& Trust Company 15/6/2021 463,007
USD 543,915 SEK 4,509,642State Street Bank& Trust Company 15/6/2021 1
463,008
Total (Gross underlying exposure - USD 562,219,201) 2,746,106
Sector Breakdownas at 31 May 2021
% of NetAssets
Financial 73.57
Government 19.30
Technology 0.82
Basic Materials 0.65
Diversified 0.22
Consumer, Non-cyclical 0.11
Communications 0.06
Consumer, Cyclical 0.01
Securities portfolio at market value 94.74
Other Net Assets 5.26
100.00
BlackRock Americas Diversified Equity Absolute Return FundcontinuedPortfolio of Investments as at 31 May 2021
The notes on pages 590 to 610 form an integral part of these financial statements.
BlackRock Strategic Funds[170]

Holding Description
MarketValue
USD
% ofNet
Assets
Transferable Securities and Money Market Instruments Admittedto an Official Stock Exchange Listing or Dealt in on AnotherRegulated Market
COMMON STOCKSAustralia
26,150 ALS Ltd 250,556 0.72
250,556 0.72
Cayman Islands235,000 China Feihe Ltd 658,577 1.90179,000 China Mengniu Dairy Co Ltd 1,085,156 3.1341,700 ENN Energy Holdings Ltd 766,725 2.21
158,000 Jiumaojiu International Hold-ings Ltd 626,010 1.80
150,000 Xinyi Glass Holdings Ltd 599,146 1.73114,000 Zhongsheng Group Holdings
Ltd 980,473 2.83
4,716,087 13.60
China6,800 Asymchem Laboratories Tian-
jin Co Ltd ’A’ 398,223 1.15285,700 Baoshan Iron & Steel Co Ltd
’A’ 353,464 1.021,324,000 China Petroleum & Chemical
Corp ’H’ 704,559 2.03131,400 Haier Smart Home Co Ltd ’H’ 553,634 1.60152,700 Jinyu Bio-Technology Co Ltd
’A’ 484,043 1.4033,700 Joinn Laboratories China Co
Ltd ’H’ 660,014 1.901,500 Kweichow Moutai Co Ltd ’A’ 522,349 1.51
95,200 Shenzhen Megmeet ElectricalCo Ltd ’A’ 486,963 1.40
240,000 Shenzhen Topband Co Ltd ’A’ 570,486 1.6465,000 Sungrow Power Supply Co Ltd
’A’ 988,884 2.8591,500 Suzhou Basecare Medical
Corp Ltd ’H’ 332,468 0.96
6,055,087 17.46
Hong Kong262,000 Hang Lung Properties Ltd^ 660,988 1.90386,000 Melco International Develop-
ment Ltd^ 707,239 2.04
1,368,227 3.94
India54,621 ICICI Bank Ltd ADR^ 983,724 2.8427,113 Infosys Ltd ADR 524,366 1.51
1,508,090 4.35
Indonesia389,100 Bank Central Asia Tbk PT 868,527 2.50931,600 Indocement Tunggal Prakarsa
Tbk PT 789,381 2.283,321,100 XL Axiata Tbk PT 572,122 1.65
2,230,030 6.43
Philippines60,540 GT Capital Holdings Inc 748,896 2.16
748,896 2.16
Singapore75,600 BOC Aviation Ltd^ 672,126 1.94
672,126 1.94
South Korea9,563 Eoflow Co Ltd 486,305 1.40
81,542 Korean Reinsurance Co 719,240 2.07
Holding Description
MarketValue
USD
% ofNet
Assets
South Korea continued5,621 SK Hynix Inc 642,516 1.853,568 SK Innovation Co Ltd 851,015 2.46
2,699,076 7.78
Taiwan32,000 Chunghwa Precision Test Tech
Co Ltd 790,581 2.2851,000 Hiwin Technologies Corp 679,877 1.9636,000 Taiwan Semiconductor Manu-
facturing Co Ltd 778,555 2.2529,000 Wiwynn Corp 978,047 2.82
3,227,060 9.31
Thailand679,600 Precious Shipping PCL NVDR 391,638 1.13526,200 PTT PCL NVDR 665,436 1.92
1,057,074 3.05
United States5,904 Cree Inc^ 590,459 1.70
14,300 Yum China Holdings Inc^ 951,669 2.75
1,542,128 4.45
Total Common Stocks 26,074,437 75.19
COMMERCIAL PAPERUnited States
USD 1,536,000 Barton Capital SA9/6/2021 (Zero Coupon) 1,535,969 4.43
USD 1,509,000 Federation Des CaissesDesjardins FRN 14/7/2021 1,508,829 4.35
3,044,798 8.78
Total Commercial Papers 3,044,798 8.78
Total Transferable Securities and Money MarketInstruments Admitted to an Official Stock ExchangeListing or Dealt in on Another Regulated Market 29,119,235 83.97
Other Transferable Securities and Money Market Instruments
COMMON STOCKSHong Kong
54,600 Kuaishou Technology Lockup* 1,342,141 3.87
1,342,141 3.87
South Korea3,522 SK IE Technology* 471,014 1.36
471,014 1.36
Total Common Stocks 1,813,155 5.23
Total Other Transferable Securities and MoneyMarket Instruments 1,813,155 5.23
Collective Investment SchemesIreland
27,750 BlackRock ICS US Dollar Liq-uid Environmentally AwareFund (Dist)~ 2,776,184 8.00
2,776,184 8.00
Total Collective Investment Schemes 2,776,184 8.00
Securities portfolio at market value 33,708,574 97.20
Other Net Assets 968,591 2.80
Total Net Assets (USD) 34,677,165 100.00
* Security subject to a fair value adjustment as detailed in Note 2(a).^ All or a portion of this security represents a security on loan.~ Investment in related party fund.
BlackRock Asia Pacific Absolute Return Fund
Portfolio of Investments as at 31 May 2021
The notes on pages 590 to 610 form an integral part of these financial statements.
Annual report and audited financial statements [171]

Holding Description Counterparty
Netunrealised
appreciation/(depreciation)
USD
Financial Derivative Instruments
CONTRACTS FOR DIFFERENCEAustralia
(29,423) a2 Milk Co Ltd Bank of AmericaMerrill Lynch (3,556)
(69,796) a2 Milk Co Ltd Morgan Stanley (5,061)(22,859) Fortescue Metals Group Ltd Morgan Stanley (18,314)
(26,931)
Cayman Islands(14,148) NIO Inc ADR Morgan Stanley (38,624)
(38,624)
Hong Kong(15,600) Alibaba Group Holding Ltd Morgan Stanley (12,286)
(168,000) Alibaba Health InformationTechnology Ltd
Bank of AmericaMerrill Lynch 47,017
(890,000) Beijing Enterprises WaterGroup Ltd Morgan Stanley (9,364)
(50,400) China Literature Ltd JP Morgan (43,857)598,000 China Petroleum & Chemi-
cal Corp ’H’ Morgan Stanley 2,484(2,170,000) China Tower Corp Ltd ’H’ JP Morgan 10,964
(66,500) CK Asset Holdings Ltd Morgan Stanley (18,653)(34,000) Country Garden Services
Holdings Co Ltd JP Morgan (6,381)(235,500) Great Wall Motor Co Ltd ’H’ JP Morgan (81,770)(26,600) Hang Seng Bank Ltd Bank of America
Merrill Lynch (7,996)(70,500) Hengan International Group
Co Ltd Morgan Stanley (17,508)(390,000) Hong Kong & China Gas Co
Ltd Morgan Stanley (4,389)(7,500) Hong Kong Exchanges &
Clearing LtdBank of AmericaMerrill Lynch (39,787)
15,200 Joinn Laboratories ChinaCo Ltd ’H’ Morgan Stanley 6,231
(165,000) Kingdee International Soft-ware Group Co Ltd
Bank of AmericaMerrill Lynch (134,388)
(15,800) Meituan ’B’ JP Morgan (85,780)(59,500) MTR Corp Ltd JP Morgan 10,489(40,400) Nongfu Spring Co Ltd ’H’ Bank of America
Merrill Lynch (41,809)(68,800) Nongfu Spring Co Ltd ’H’ JP Morgan (61,414)
(831,000) Razer Inc Bank of AmericaMerrill Lynch (3,441)
(95,000) Sinotruk Hong Kong Ltd JP Morgan 6,691(332,000) Tingyi Cayman Islands
Holding Corp JP Morgan (31,228)(89,000) Wharf Real Estate Invest-
ment Co LtdBank of AmericaMerrill Lynch (22,207)
(70,400) Yeahka Ltd JP Morgan 57,230
(481,152)
Malaysia(175,000) Supermax Corp Bhd JP Morgan 21,812(159,800) Telekom Malaysia Bhd Morgan Stanley (12,799)
9,013
Singapore(152,800) Top Glove Corp Bhd Morgan Stanley 4,760
4,760
South Korea(1,508) Celltrion Inc Morgan Stanley (22,045)(2,614) Kumho Petrochemical Co
Ltd Morgan Stanley (19,968)(669) LG Chem Ltd JP Morgan 45,955
(14,168) LG Display Co Ltd JP Morgan (22,673)(386) LG Household & Health
Care Ltd JP Morgan (24,019)
Holding Description Counterparty
Netunrealised
appreciation/(depreciation)
USD
South Korea continued(5,622) Samsung Life Insurance Co
LtdBank of AmericaMerrill Lynch (966)
(2,235) Seegene Inc Bank of AmericaMerrill Lynch 20,186
(7,880) Shin Poong PharmaceuticalCo Ltd
Bank of AmericaMerrill Lynch 8,430
(15,100)
Taiwan(195,000) Acer Inc JP Morgan (17,497)(460,000) Acer Inc Morgan Stanley (20,464)(175,000) Nantex Industry Co Ltd Morgan Stanley (41,408)(20,000) Novatek Microelectronics
CorpBank of AmericaMerrill Lynch (21,233)
(330,000) Primax Electronics Ltd Bank of AmericaMerrill Lynch (40,256)
(5,000) Primax Electronics Ltd JP Morgan 475(1,681,701) Shin Kong Financial Holding
Co LtdBank of AmericaMerrill Lynch (83,698)
(224,081)
Thailand(483,500) Berli Jucker PCL Morgan Stanley (13,709)(90,100) Bumrungrad Hospital PCL
NVDR JP Morgan (9,383)(21,000) Delta Electronics Thailand
PCL NVDR JP Morgan (64,014)(120,100) Siam Commercial Bank
PCL NVDR Morgan Stanley (9,230)
(96,336)
United Kingdom55,329 Prudential Plc Morgan Stanley (2,961)
(2,961)
United States(15,634) Corsair Gaming Inc Bank of America
Merrill Lynch 16,728(10,617) Dada Nexus Ltd ADR Bank of America
Merrill Lynch (30,789)(4,808) Daqo New Energy Corp
ADR JP Morgan (12,424)(41,814) Himax Technologies Inc
ADR Morgan Stanley (67,739)(7,905) iQIYI Inc ADR Bank of America
Merrill Lynch (12,727)(5,120) Pinduoduo Inc ADR Bank of America
Merrill Lynch (35,123)(14,139) XPeng Inc ADR Bank of America
Merrill Lynch (84,975)(14,411) ZTO Express Cayman Inc
ADR JP Morgan (10,808)
(237,857)
Vietnam121,200 Mobile World Investment
Corp JP Morgan 2,545
2,545
Total (Gross underlying exposure - USD 26,046,247) (1,106,724)
BlackRock Asia Pacific Absolute Return Fund continued
Portfolio of Investments as at 31 May 2021
The notes on pages 590 to 610 form an integral part of these financial statements.
BlackRock Strategic Funds[172]

Numberof
contractsCurrencyof contracts
Contract/Description
Expirationdate
Grossunderlying
exposureUSD
Net unrealised(depreciation)
USD
Financial Derivative Instruments
FUTURES
(199) USD FTSE China A50 Futures June 2021 June 2021 3,613,442 (16,518)
(5) KRW KOSPI 200 Index Futures June 2021 June 2021 481,189 (21,320)
(115) USD SGX FTSE Indonesia Index Futures June 2021 June 2021 1,727,875 (51,090)
(42) USD SGX NIFTY 50 Futures June 2021 June 2021 1,308,720 (26,796)
Total 7,131,226 (115,724)
Currency Purchases Currency Sales CounterpartyMaturity
date
Netunrealised
appreciation/(depreciation)
USD
Financial Derivative Instruments
OPEN FORWARD FOREIGN EXCHANGE TRANSACTIONS
CHF Hedged Share Class
CHF 353,480 USD 389,293State Street Bank& Trust Company 15/6/2021 3,398
USD 7,489 CHF 6,706State Street Bank& Trust Company 15/6/2021 38
3,436
EUR Hedged Share Class
EUR 591,513 USD 714,688State Street Bank& Trust Company 15/6/2021 7,373
USD 47,227 EUR 38,594State Street Bank& Trust Company 15/6/2021 117
7,490
GBP Hedged Share Class
GBP 433,588 USD 603,657State Street Bank& Trust Company 15/6/2021 10,745
USD 11,684 GBP 8,252State Street Bank& Trust Company 15/6/2021 (10)
10,735
Total (Gross underlying exposure - USD 1,795,408) 21,661
Sector Breakdownas at 31 May 2021
% of NetAssets
Financial 20.03
Industrial 13.71
Consumer, Non-cyclical 13.35
Consumer, Cyclical 13.18
Technology 12.41
Collective Investment Schemes 8.00
Energy 6.41
Communications 5.52
Basic Materials 2.38
Utilities 2.21
Securities portfolio at market value 97.20
Other Net Assets 2.80
100.00
BlackRock Asia Pacific Absolute Return Fund continued
Portfolio of Investments as at 31 May 2021
The notes on pages 590 to 610 form an integral part of these financial statements.
Annual report and audited financial statements [173]

Holding Description
MarketValue
USD
% ofNet
Assets
Transferable Securities and Money Market Instruments Admittedto an Official Stock Exchange Listing or Dealt in on AnotherRegulated Market
BONDSUnited States
USD 1,000,000 United States Cash Manage-ment Bill 3/8/2021 (ZeroCoupon) 999,956 2.84
USD 1,000,000 United States Treasury Bill1/7/2021 (Zero Coupon) 999,925 2.84
USD 500,000 United States Treasury Bill27/1/2022 (Zero Coupon) 499,700 1.42
USD 2,400,000 United States Treasury Bill -WI Post Auction5/8/2021 (Zero Coupon) 2,399,944 6.82
4,899,525 13.92
Total Bonds 4,899,525 13.92
CERTIFICATE OF DEPOSITSJapan
USD 250,000 The Norinchukin Bank FRN13/8/2021 250,003 0.71
250,003 0.71
SingaporeUSD 500,000 Oversea-Chinese Banking
Corp 0.18% 9/11/2021 499,989 1.42
499,989 1.42
SwitzerlandUSD 500,000 Credit Suisse AG FRN
15/2/2022 500,000 1.42
500,000 1.42
United StatesUSD 750,000 DZ Bank AG Deutsche Zentral
Genoss 0.14% 8/7/2021 750,000 2.13USD 250,000 KBC Bank NV 0.07%
24/6/2021 250,000 0.71USD 295,000 Landesbank Baden Wuerttem-
berg 0.10% 23/6/2021 295,000 0.84USD 500,000 Landesbank Baden Wuerttem-
berg 0.25% 7/7/2021 500,000 1.42USD 1,000,000 Mizuho Bank Ltd 0.17%
1/6/2021 1,000,000 2.84USD 450,000 Norinchukin Bank 0.20%
14/10/2021 450,017 1.28USD 525,000 Skandinaviska Enskilda Ban-
ken AB 0.23% 4/8/2021 525,000 1.49USD 500,000 UBS AG 0.27% 11/3/2022 500,000 1.42
USD 1,000,000 Westpac Banking Corp 0.39%9/6/2021 1,000,053 2.84
5,270,070 14.97
Total Certificate of Deposits 6,520,062 18.52
COMMERCIAL PAPERAustralia
USD 500,000 Australia & New ZealandBanking Group17/6/2021 (Zero Coupon) 499,944 1.42
USD 400,000 Australia & New ZealandBanking Group23/6/2021 (Zero Coupon) 399,939 1.14
899,883 2.56
CanadaUSD 300,000 Alberta 7/6/2021 (Zero Cou-
pon) 299,993 0.85USD 750,000 CDP Financial Inc FRN
6/4/2022 748,712 2.13USD 375,000 National Bank of Canada FRN
7/7/2021 374,948 1.06
Holding Description
MarketValue
USD
% ofNet
Assets
Canada continuedUSD 1,000,000 Ontario Teachers’ Finance
Trust FRN 14/9/2021 999,621 2.84USD 1,000,000 Toronto-Dominion Bank FRN
6/8/2021 999,725 2.84
3,422,999 9.72
FranceUSD 990,000 Antalis SA FRN 6/7/2021 989,836 2.81USD 805,000 LVMH Moet Hennessy Vuit-
ton 12/10/2021 (Zero Cou-pon) 804,495 2.29
1,794,331 5.10
GermanyUSD 500,000 Erste Abwicklungsanstalt FRN
8/4/2022 499,136 1.42
499,136 1.42
IrelandUSD 1,000,000 Matchpoint Finance Plc FRN
12/10/2021 999,224 2.84
999,224 2.84
JapanUSD 300,000 MUFG Bank Ltd
22/6/2021 (Zero Coupon) 299,986 0.85
299,986 0.85
LuxembourgUSD 1,000,000 Banque et Caisse Epargne
7/7/2021 (Zero Coupon) 999,850 2.84
999,850 2.84
NorwayUSD 500,000 DNB Bank ASA
15/7/2021 (Zero Coupon) 499,881 1.42
499,881 1.42
SingaporeUSD 500,000 DBS Bank Ltd FRN 2/8/2021 499,862 1.42USD 500,000 Oversea-Chinese Banking
Corp 14/6/2021 (Zero Cou-pon) 499,971 1.42
USD 1,000,000 United Overseas Bank Ltd2/7/2021 (Zero Coupon) 999,837 2.84
1,999,670 5.68
SwedenUSD 1,000,000 Nordea Bank Abp FRN
8/11/2021 999,289 2.84USD 500,000 Skandinaviska Enskilda Ban-
ken AB 7/9/2021 (Zero Cou-pon) 499,769 1.42
USD 900,000 Svenska Handelsbanken AB5/10/2021 (Zero Coupon) 899,433 2.55
USD 700,000 Swedbank AB 1/6/2021 (ZeroCoupon) 700,000 1.99
USD 500,000 Swedish Export Credit Corp22/6/2021 (Zero Coupon) 499,924 1.42
3,598,415 10.22
United KingdomUSD 400,000 Santander UK Plc
3/8/2021 (Zero Coupon) 399,909 1.13
399,909 1.13
United StatesUSD 1,000,000 CAFCO LLC FRN 1/9/2021 999,719 2.84
USD 500,000 Charta LLC FRN 1/9/2021 499,859 1.42USD 500,000 Fairway Finance Co LLC
2/6/2021 (Zero Coupon) 499,998 1.42USD 500,000 Ionic Capital II Trust
16/6/2021 (Zero Coupon) 499,962 1.42
BlackRock Asia Pacific Diversified Equity Absolute ReturnFundPortfolio of Investments as at 31 May 2021
The notes on pages 590 to 610 form an integral part of these financial statements.
BlackRock Strategic Funds[174]
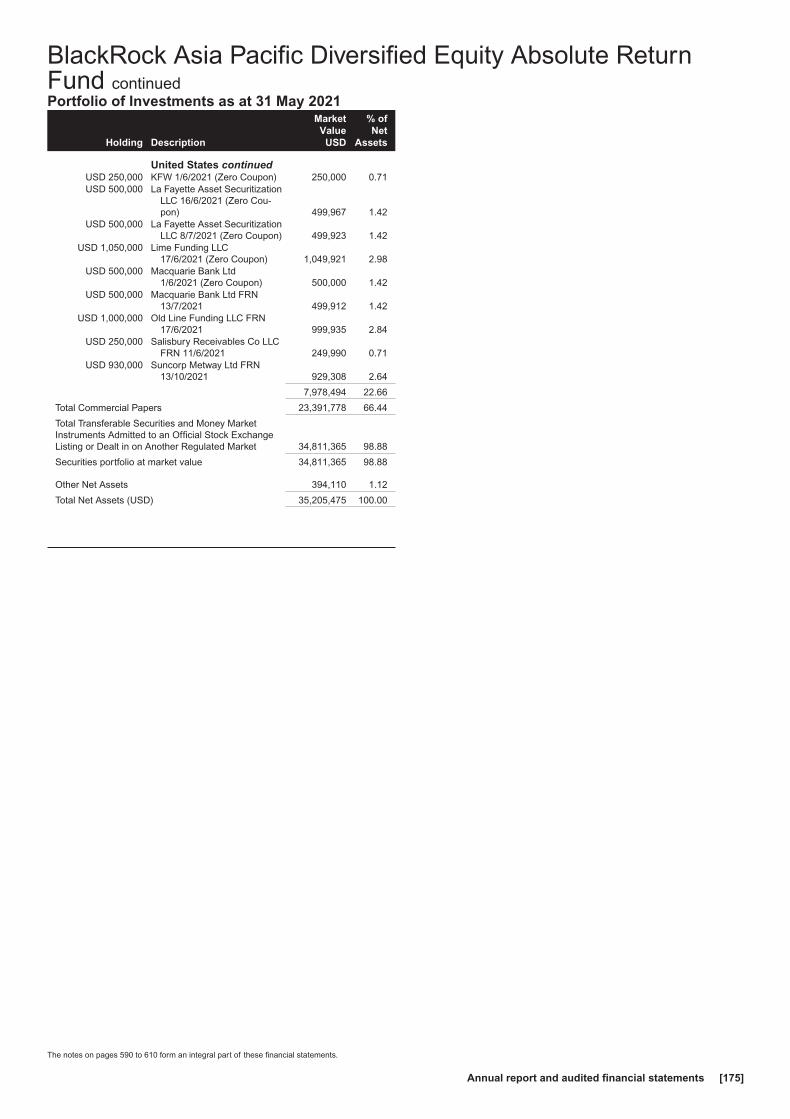
Holding Description
MarketValue
USD
% ofNet
Assets
United States continuedUSD 250,000 KFW 1/6/2021 (Zero Coupon) 250,000 0.71USD 500,000 La Fayette Asset Securitization
LLC 16/6/2021 (Zero Cou-pon) 499,967 1.42
USD 500,000 La Fayette Asset SecuritizationLLC 8/7/2021 (Zero Coupon) 499,923 1.42
USD 1,050,000 Lime Funding LLC17/6/2021 (Zero Coupon) 1,049,921 2.98
USD 500,000 Macquarie Bank Ltd1/6/2021 (Zero Coupon) 500,000 1.42
USD 500,000 Macquarie Bank Ltd FRN13/7/2021 499,912 1.42
USD 1,000,000 Old Line Funding LLC FRN17/6/2021 999,935 2.84
USD 250,000 Salisbury Receivables Co LLCFRN 11/6/2021 249,990 0.71
USD 930,000 Suncorp Metway Ltd FRN13/10/2021 929,308 2.64
7,978,494 22.66
Total Commercial Papers 23,391,778 66.44
Total Transferable Securities and Money MarketInstruments Admitted to an Official Stock ExchangeListing or Dealt in on Another Regulated Market 34,811,365 98.88
Securities portfolio at market value 34,811,365 98.88
Other Net Assets 394,110 1.12
Total Net Assets (USD) 35,205,475 100.00
BlackRock Asia Pacific Diversified Equity Absolute ReturnFund continuedPortfolio of Investments as at 31 May 2021
The notes on pages 590 to 610 form an integral part of these financial statements.
Annual report and audited financial statements [175]

Holding Description Counterparty
Netunrealised
appreciation/(depreciation)
USD
Financial Derivative Instruments
CONTRACTS FOR DIFFERENCEAustralia
29,969 Abacus Property Group(REIT) Citibank 1,017
6,160 Abacus Property Group(REIT) HSBC (478)
13,918 Abacus Property Group(REIT) JP Morgan (973)
4,174 Adbri Ltd Citibank (115)15,067 Adbri Ltd JP Morgan (1,219)
(79) Afterpay Ltd HSBC 386(132) Afterpay Ltd JP Morgan 613
26,738 Alkane Resources Ltd HSBC 210(327) Altium Ltd HSBC (755)
(1,442) Altium Ltd JP Morgan (3,417)4,147 Alumina Ltd Citibank 1194,346 Alumina Ltd HSBC (437)
40,225 Alumina Ltd JP Morgan (3,858)(1,333) Amcor Plc - CDI JP Morgan 80517,064 AMP Ltd Citibank 15828,485 AMP Ltd JP Morgan (327)(3,802) Ampol Ltd HSBC (3,062)
(766) Ampol Ltd JP Morgan (726)(198) Ansell Ltd HSBC 146(508) Ansell Ltd JP Morgan 322505 APA Group (Unit) Citibank (97)
6,550 APA Group (Unit) JP Morgan (3,647)770 Appen Ltd Citibank (67)
2,617 Appen Ltd JP Morgan 3,254(261) ARB Corp Ltd HSBC (873)(487) ARB Corp Ltd JP Morgan (945)246 ARB Corp Ltd JP Morgan 846
2,561 Aristocrat Leisure Ltd Citibank 798604 Aristocrat Leisure Ltd JP Morgan 1,192
(248) Atlas Arteria Ltd (Unit) Citibank (15)(2,731) Atlas Arteria Ltd (Unit) HSBC (7)
(15,381) Atlas Arteria Ltd (Unit) JP Morgan (331)3,150 AUB Group Ltd Citibank (499)1,052 AUB Group Ltd JP Morgan (1,066)
(11,158) Auckland International Air-port Ltd Citibank (766)
(11,314) Auckland International Air-port Ltd HSBC 2,586
(9,054) Auckland International Air-port Ltd JP Morgan 1,910
(136,557) Aurelia Metals Ltd Citibank (3,755)(39,651) Aurelia Metals Ltd JP Morgan (1,297)10,009 Aurizon Holdings Ltd Citibank 57819,066 Austal Ltd Citibank (546)3,143 Austal Ltd JP Morgan (516)1,981 Australia & New Zealand
Banking Group Ltd Citibank 899605 Australia & New Zealand
Banking Group Ltd HSBC 4124,108 Australia & New Zealand
Banking Group Ltd JP Morgan 3,08115,079 Australian Finance Group
Ltd Citibank 4310,571 Australian Finance Group
Ltd JP Morgan 525(180,779) Aventus Group (REIT) Citibank (17,303)
(9,835) Aventus Group (REIT) JP Morgan (621)(244) Baby Bunting Group Ltd JP Morgan 8
12,915 Bank of Queensland Ltd JP Morgan (1,685)(620) Bapcor Ltd HSBC (306)
(5,257) Bapcor Ltd JP Morgan (2,694)8,830 Bapcor Ltd JP Morgan 4,526
(8,717) Beach Energy Ltd JP Morgan 557(400) Bega Cheese Ltd Citibank (43)
Holding Description Counterparty
Netunrealised
appreciation/(depreciation)
USD
Australia continued(14,082) Bega Cheese Ltd HSBC 1,816(53,363) Bega Cheese Ltd JP Morgan 6,321(31,891) Bellevue Gold Ltd Citibank 834(11,290) Bellevue Gold Ltd HSBC 663(18,776) Bellevue Gold Ltd JP Morgan 1,058
952 Bendigo & Adelaide BankLtd Citibank 17
955 Bendigo & Adelaide BankLtd JP Morgan (161)
(26,259) Bingo Industries Ltd HSBC 937(8,713) Bingo Industries Ltd JP Morgan 236
(236) Blackmores Ltd HSBC (486)(71) Blackmores Ltd JP Morgan (158)808 BlueScope Steel Ltd JP Morgan 402
(454) Boral Ltd HSBC (71)(7,187) Boral Ltd JP Morgan (1,248)
244 Brambles Ltd HSBC 197,777 Brambles Ltd JP Morgan 446
(8,456) Bravura Solutions Ltd HSBC (1,948)(738) Breville Group Ltd JP Morgan (786)
15,605 BWP Trust (REIT) JP Morgan (190)(61,962) Capricorn Metals Ltd Citibank (4,910)(2,551) Capricorn Metals Ltd JP Morgan (94)
2 Cardno Ltd Citibank —(163,549) Carnarvon Petroleum Ltd Citibank 1,225(173,735) Carnarvon Petroleum Ltd JP Morgan 6,556
(32) carsales.com Ltd JP Morgan (45)1,809 Cedar Woods Properties Ltd JP Morgan (185)
29,699 Centuria Industrial REIT(REIT) Citibank 3,781
3,990 Centuria Industrial REIT(REIT) HSBC 223
31,590 Centuria Industrial REIT(REIT) JP Morgan 2,044
(29,944) Centuria Office REIT (REIT) HSBC (778)(2,795) Chalice Mining Ltd Citibank (1,407)(2,280) Chalice Mining Ltd JP Morgan (1,542)4,946 Challenger Ltd Citibank 1,1343,954 Challenger Ltd HSBC 9208,148 Challenger Ltd JP Morgan 1,876(653) Champion Iron Ltd Citibank 81
(2,821) Champion Iron Ltd HSBC 1,766(1,512) Champion Iron Ltd JP Morgan 665
378 Charter Hall Group (REIT) Citibank 1578,038 Charter Hall Group (REIT) JP Morgan (1,116)
25,800 Charter Hall Long WaleREIT (REIT) Citibank 522
13,517 Charter Hall Long WaleREIT (REIT) HSBC (1,246)
39,769 Charter Hall Long WaleREIT (REIT) JP Morgan (507)
6,104 Charter Hall Retail REIT(REIT) Citibank 684
12,590 Charter Hall Retail REIT(REIT) JP Morgan 701
13,383 Charter Hall Social Infra-structure REIT (REIT) Citibank 1,080
19,717 Charter Hall Social Infra-structure REIT (REIT) JP Morgan 1,937
1,832 Chorus Ltd Citibank (187)(22,667) Cleanaway Waste Manage-
ment Ltd HSBC 1,408(4,361) Cleanaway Waste Manage-
ment Ltd JP Morgan 431925 Clinuvel Pharmaceuticals
Ltd Citibank (1,131)345 Clinuvel Pharmaceuticals
Ltd JP Morgan 2731,837 Coles Group Ltd JP Morgan 2084,192 Collins Foods Ltd Citibank 3,196
BlackRock Asia Pacific Diversified Equity Absolute ReturnFund continuedPortfolio of Investments as at 31 May 2021
The notes on pages 590 to 610 form an integral part of these financial statements.
BlackRock Strategic Funds[176]

Holding Description Counterparty
Netunrealised
appreciation/(depreciation)
USD
Australia continued250 Collins Foods Ltd HSBC 264
5,381 Collins Foods Ltd JP Morgan 6,4391,535 Commonwealth Bank of
Australia Citibank 1,292658 Commonwealth Bank of
Australia JP Morgan 1,689434 Computershare Ltd HSBC 443
(4,607) Cooper Energy Ltd HSBC 30(50,298) Cooper Energy Ltd JP Morgan 535(2,247) Corporate Travel Manage-
ment Ltd JP Morgan (3,417)(1,206) Costa Group Holdings Ltd HSBC 890(6,181) Costa Group Holdings Ltd JP Morgan 4,794
(531) Credit Corp Group Ltd JP Morgan (235)89,331 Cromwell Property Group
(REIT) JP Morgan (1,525)(8,682) Crown Resorts Ltd JP Morgan 1,958
(275) CSL Ltd HSBC (2,517)(150) CSL Ltd JP Morgan (1,310)
32,125 CSR Ltd Citibank (3,789)9,816 CSR Ltd HSBC (1,803)
28,124 CSR Ltd JP Morgan (6,741)7,834 Data#3 Ltd Citibank 1,681
(10,813) De Grey Mining Ltd Citibank (17)(5,579) De Grey Mining Ltd HSBC (687)(6,654) De Grey Mining Ltd JP Morgan (260)(6,737) Deterra Royalties Ltd HSBC 440
(28,103) Deterra Royalties Ltd JP Morgan 4,9963,173 Dexus (REIT) Citibank 470
603 Dexus (REIT) HSBC 63,291 Dexus (REIT) JP Morgan 929(342) Domain Holdings Australia
Ltd HSBC (32)(5,292) Domain Holdings Australia
Ltd JP Morgan (564)34 Domino’s Pizza Enterprises
Ltd Citibank 40451 Domino’s Pizza Enterprises
Ltd JP Morgan 1,474(7,409) Downer EDI Ltd HSBC 1,282(5,669) Downer EDI Ltd JP Morgan 900
771 Eagers Automotive Ltd Citibank 358246 Eagers Automotive Ltd JP Morgan 106
3,290 Eclipx Group Ltd Citibank 833,479 Elders Ltd Citibank 5236,602 Elders Ltd HSBC (2,767)7,954 Elders Ltd JP Morgan (3,733)
(25,591) Electro Optic Systems Hold-ings Ltd Citibank (3,863)
(2,685) Electro Optic Systems Hold-ings Ltd JP Morgan 218
1,745 EML Payments Ltd Citibank 6(1,369) EML Payments Ltd JP Morgan 143(8,775) Estia Health Ltd Citibank 724
(14,759) Estia Health Ltd HSBC 817(2,220) EVENT Hospitality and En-
tertainment Ltd JP Morgan (408)2,050 Evolution Mining Ltd JP Morgan 401
(2,032) Fineos Corp Ltd - CDI Citibank (212)110 Fisher & Paykel Healthcare
Corp Ltd Citibank (322)1,335 Fisher & Paykel Healthcare
Corp Ltd HSBC (4,296)127 Fisher & Paykel Healthcare
Corp Ltd JP Morgan 3513,101 Fletcher Building Ltd Citibank 3,5359,636 Fletcher Building Ltd JP Morgan (267)
(1,171) Flight Centre Travel GroupLtd Citibank (99)
Holding Description Counterparty
Netunrealised
appreciation/(depreciation)
USD
Australia continued(1,856) Flight Centre Travel Group
Ltd JP Morgan 748(8,182) Fortescue Metals Group Ltd JP Morgan 17,01338,995 G8 Education Ltd Citibank 2,1505,055 G8 Education Ltd HSBC 53
44,583 G8 Education Ltd JP Morgan 691(4,093) Galaxy Resources Ltd Citibank (1,091)77,710 GDI Property Group (REIT) JP Morgan (567)2,128 Genworth Mortgage Insur-
ance Australia Ltd Citibank 392,521 Goodman Group (REIT) Citibank 4192,820 Goodman Group (REIT) JP Morgan (780)7,450 GPT Group (REIT) HSBC (349)1,537 GPT Group (REIT) JP Morgan 25
12,944 GrainCorp Ltd ’A’ Citibank 1,86615,844 Growthpoint Properties Aus-
tralia Ltd (REIT) Citibank 1,8711,968 Growthpoint Properties Aus-
tralia Ltd (REIT) HSBC 1218,356 Growthpoint Properties Aus-
tralia Ltd (REIT) JP Morgan 405(206) GUD Holdings Ltd HSBC 163(660) GUD Holdings Ltd JP Morgan 501
7,199 GWA Group Ltd Citibank (313)4,233 GWA Group Ltd HSBC (920)3,620 Harvey Norman Holdings
Ltd Citibank (2)497 Harvey Norman Holdings
Ltd HSBC 11(13,211) Harvey Norman Holdings
Ltd JP Morgan (319)5,057 Healius Ltd Citibank 8034,955 Healius Ltd HSBC 243
24,838 Hotel Property Investments(REIT) Citibank 638
16,432 Hotel Property Investments(REIT) HSBC 358
7,707 Hotel Property Investments(REIT) JP Morgan 229
(329) HUB24 Ltd JP Morgan (852)1,968 HUB24 Ltd JP Morgan 5,094
23,596 Humm Group Ltd Citibank 38910,943 Humm Group Ltd HSBC 63429,904 Humm Group Ltd JP Morgan 1,512
540 IDP Education Ltd JP Morgan 611(18,907) IGO Ltd JP Morgan 5,320(4,594) Iluka Resources Ltd JP Morgan (644)30,960 Incitec Pivot Ltd JP Morgan (4,483)10,802 Infomedia Ltd Citibank 4744,511 Infomedia Ltd HSBC 66
(6,993) Ingenia Communities Group(REIT) JP Morgan (150)
2,551 Inghams Group Ltd Citibank 7781,307 Inghams Group Ltd HSBC 229
15,967 Inghams Group Ltd JP Morgan 2,931(406) Insurance Australia Group
Ltd Citibank (46)(7,811) Insurance Australia Group
Ltd HSBC 990(9,748) Insurance Australia Group
Ltd JP Morgan 1,111(13,631) Integral Diagnostics Ltd HSBC (3,495)(1,152) Integral Diagnostics Ltd JP Morgan (303)(8,565) Integrated Research Ltd HSBC 386(2,387) Integrated Research Ltd JP Morgan 94(1,206) InvoCare Ltd Citibank (386)(6,516) InvoCare Ltd HSBC 2,662(1,567) InvoCare Ltd JP Morgan 598(8,034) ioneer Ltd Citibank (127)
BlackRock Asia Pacific Diversified Equity Absolute ReturnFund continuedPortfolio of Investments as at 31 May 2021
The notes on pages 590 to 610 form an integral part of these financial statements.
Annual report and audited financial statements [177]

Holding Description Counterparty
Netunrealised
appreciation/(depreciation)
USD
Australia continued(81,227) ioneer Ltd JP Morgan 1,820(2,372) IOOF Holdings Ltd HSBC (323)(2,732) IOOF Holdings Ltd JP Morgan (369)27,505 IOOF Holdings Ltd JP Morgan 6,477
(25,505) IPH Ltd HSBC 1,037(5,056) IPH Ltd JP Morgan 4594,269 IRESS Ltd Citibank 1,3004,014 IRESS Ltd JP Morgan 1,5451,031 James Hardie Industries Plc
- CDI Citibank 1,391564 James Hardie Industries Plc
- CDI HSBC (667)2,611 James Hardie Industries Plc
- CDI JP Morgan (2,803)(41) Janus Henderson Group Plc
- CDI HSBC (42)(581) Janus Henderson Group Plc
- CDI JP Morgan (659)44,538 Jupiter Mines Ltd Citibank 1366,915 Jupiter Mines Ltd JP Morgan (1,510)
(108,594) Karoon Energy Ltd Citibank (3,071)(47,845) Karoon Energy Ltd HSBC 1,688(54,911) Karoon Energy Ltd JP Morgan 1,765(5,582) Lendlease Corp Ltd (Unit) HSBC 213(1,184) Lendlease Corp Ltd (Unit) JP Morgan 9(1,740) Link Administration Holdings
Ltd JP Morgan (33)(242) Lovisa Holdings Ltd JP Morgan (23)
(8,037) Lynas Rare Earths Ltd JP Morgan 3,3527,870 MACA Ltd Citibank (115)
21,533 MACA Ltd JP Morgan (2,444)474 Macquarie Group Ltd JP Morgan (3,069)
1,064 Magellan Financial GroupLtd Citibank 155
1,327 Marley Spoon AG - CDI Citibank 3999 Marley Spoon AG - CDI JP Morgan (51)
3,097 McMillan Shakespeare Ltd Citibank 7592,183 McMillan Shakespeare Ltd HSBC 3146,264 McMillan Shakespeare Ltd JP Morgan 1,078
15,347 Medibank Pvt Ltd Citibank 4045,096 Medibank Pvt Ltd HSBC 78
19,702 Medibank Pvt Ltd JP Morgan 452(1,774) Megaport Ltd Citibank (1,041)(4,984) Megaport Ltd HSBC (5,285)(7,288) Megaport Ltd JP Morgan (7,972)7,669 Mesoblast Ltd Citibank 1636,583 Mesoblast Ltd JP Morgan 514(124) Mineral Resources Ltd HSBC (158)(155) Mineral Resources Ltd JP Morgan 547
(17,220) Mirvac Group (REIT) HSBC 881(1,198) Monadelphous Group Ltd JP Morgan 2,46011,662 Money3 Corp Ltd Citibank (143)1,716 Money3 Corp Ltd HSBC (70)
(96,500) Mount Gibson Iron Ltd HSBC 10,5431,818 MyState Ltd Citibank 79
275 MyState Ltd Citibank 12811,495 MyState Ltd JP Morgan 577
(14,425) Nanosonics Ltd HSBC 243(12,071) Nanosonics Ltd JP Morgan (514)
1,515 National Australia Bank Ltd JP Morgan (583)56,255 National Storage REIT
(REIT) Citibank 1,85734,204 National Storage REIT
(REIT) JP Morgan 612(5,701) Nearmap Ltd Citibank (32)(1,305) Nearmap Ltd HSBC 61
(115) Netwealth Group Ltd HSBC (91)(2,547) Netwealth Group Ltd JP Morgan (2,100)2,502 Newcrest Mining Ltd JP Morgan (291)
502 News Corp - CDI Citibank 44
Holding Description Counterparty
Netunrealised
appreciation/(depreciation)
USD
Australia continued246 News Corp - CDI HSBC 44768 News Corp - CDI JP Morgan 199
(1,138) NEXTDC Ltd HSBC (199)(296) NEXTDC Ltd JP Morgan 44
4,029 nib holdings Ltd Citibank 181(3,287) nib holdings Ltd HSBC 1333,695 nib holdings Ltd JP Morgan (92)
(25,238) Nickel Mines Ltd Citibank (1,001)8,878 Nickel Mines Ltd HSBC 163
(9,006) Nickel Mines Ltd JP Morgan 730616 Northern Star Resources
Ltd Citibank 169841 Northern Star Resources
Ltd JP Morgan 137(56,361) NRW Holdings Ltd HSBC 8,915
7,456 Nufarm Ltd Citibank 1514,700 Nufarm Ltd HSBC (1,328)9,680 Nufarm Ltd JP Morgan (2,406)
(5,114) Nuix Ltd HSBC 2,442(3,143) Nuix Ltd JP Morgan 1,568
(16,037) Oil Search Ltd JP Morgan 4,620(61,550) Omni Bridgeway Ltd HSBC (8,348)(15,966) Omni Bridgeway Ltd JP Morgan (2,356)(1,374) Orica Ltd HSBC 647(5,449) Orica Ltd JP Morgan 2,377(5,990) Origin Energy Ltd HSBC 1,197(1,682) Orocobre Ltd Citibank (648)
(984) Orocobre Ltd HSBC (334)(2,511) Orocobre Ltd JP Morgan 1,350(8,352) Orora Ltd HSBC 729(2,372) OZ Minerals Ltd HSBC 3,710(8,710) OZ Minerals Ltd JP Morgan 13,03813,452 Pendal Group Ltd Citibank 2,9134,794 Pendal Group Ltd HSBC 1,297
16,681 Pendal Group Ltd JP Morgan 4,81978,000 Pepper Money Ltd JP Morgan (29,180)
(134) Perpetual Ltd HSBC (165)(479) Perpetual Ltd JP Morgan (631)
2,535 Perpetual Ltd JP Morgan 3,338(99,394) Perseus Mining Ltd HSBC (10,287)(25,450) Perseus Mining Ltd JP Morgan (2,717)(20,362) Pilbara Minerals Ltd HSBC 690(15,441) Pilbara Minerals Ltd JP Morgan 1,042
3,833 Pinnacle Investment Man-agement Group Ltd JP Morgan 1,264
16,089 Platinum Asset Manage-ment Ltd Citibank 199
(7,619) Platinum Asset Manage-ment Ltd HSBC 1,046
1,057 Platinum Asset Manage-ment Ltd HSBC (11)
12,792 Platinum Asset Manage-ment Ltd JP Morgan (1,606)
(2,055) PointsBet Holdings Ltd Citibank (1,249)(7,055) PolyNovo Ltd Citibank (460)
(18,188) PolyNovo Ltd HSBC (141)(683) PolyNovo Ltd JP Morgan 35
1,412 Pro Medicus Ltd Citibank 2,4231,749 Pro Medicus Ltd JP Morgan 5,403
(7,700) Qantas Airways Ltd JP Morgan 120(725) QBE Insurance Group Ltd JP Morgan (73)
(12,719) Qube Holdings Ltd HSBC 1,287(894) Ramelius Resources Ltd Citibank (9)
(85,880) Ramelius Resources Ltd HSBC (5,621)(10,291) Ramelius Resources Ltd JP Morgan (721)
(187) Ramsay Health Care Ltd JP Morgan 36387 REA Group Ltd Citibank 2,597103 REA Group Ltd HSBC 47479 REA Group Ltd JP Morgan 410
BlackRock Asia Pacific Diversified Equity Absolute ReturnFund continuedPortfolio of Investments as at 31 May 2021
The notes on pages 590 to 610 form an integral part of these financial statements.
BlackRock Strategic Funds[178]

Holding Description Counterparty
Netunrealised
appreciation/(depreciation)
USD
Australia continued(11,378) Redbubble Ltd HSBC 754(2,061) Reece Ltd HSBC 1,914(5,824) Reece Ltd JP Morgan 5,0981,875 Regis Resources Ltd Citibank 48
32,531 Regis Resources Ltd HSBC (2,374)74,565 Regis Resources Ltd JP Morgan (3,872)(4,953) Reliance Worldwide Corp
Ltd HSBC 480(350) Reliance Worldwide Corp
Ltd JP Morgan 13(5,200) Resolute Mining Ltd HSBC (226)
(18,862) Resolute Mining Ltd JP Morgan (844)17,192 Resolute Mining Ltd JP Morgan 769
287 Rio Tinto Ltd JP Morgan (2,435)1,394 Rural Funds Group (REIT) JP Morgan 74
(11,417) Santos Ltd HSBC 3,554(19,477) Santos Ltd JP Morgan 6,51239,114 Scentre Group (REIT) Citibank 1,316
736 Scentre Group (REIT) HSBC (25)15,275 Scentre Group (REIT) JP Morgan (424)
(13,072) Select Harvests Ltd HSBC 4,650(4,004) Select Harvests Ltd JP Morgan 1,367
(17,966) Senex Energy Ltd JP Morgan (2,198)3,193 Service Stream Ltd Citibank 336
15,228 Service Stream Ltd HSBC 80314,558 Service Stream Ltd JP Morgan 559(6,764) Seven Group Holdings Ltd JP Morgan 7,27025,479 Shopping Centres Austral-
asia Property Group(REIT) Citibank 2,390
26,733 Shopping Centres Austral-asia Property Group(REIT) JP Morgan 160
(22,521) Silver Lake Resources Ltd HSBC (1,325)(38,094) Silver Lake Resources Ltd JP Morgan (862)
3,923 Sims Ltd Citibank 1,638(1,092) Sims Ltd HSBC 1,840(1,388) Sims Ltd JP Morgan 2,278
(75,742) SKY Network Television Ltd HSBC (144)9,378 SKYCITY Entertainment
Group Ltd Citibank 6843,022 SKYCITY Entertainment
Group Ltd HSBC 17914,039 SKYCITY Entertainment
Group Ltd JP Morgan 964(1,593) Sonic Healthcare Ltd HSBC 1,130
(957) Sonic Healthcare Ltd JP Morgan 3729,564 Southern Cross Media
Group Ltd Citibank (19)851 Southern Cross Media
Group Ltd JP Morgan 710,357 Spark Infrastructure Group
(Unit) Citibank 9620,854 Spark Infrastructure Group
(Unit) JP Morgan (840)21,652 Spark New Zealand Ltd Citibank 92934,338 Spark New Zealand Ltd JP Morgan 389
(25,182) SpeedCast InternationalLtd*,π Citibank —
(42,399) SpeedCast InternationalLtd* HSBC 26,349
2,143 SSR Mining Inc - CDI Citibank 1,195(4,668) Star Entertainment Grp Ltd HSBC 864(5,998) Star Entertainment Grp Ltd JP Morgan 72
(13,330) Starpharma Holdings Ltd Citibank (796)(3,572) Starpharma Holdings Ltd JP Morgan 937,673 Steadfast Group Ltd Citibank 2,35012,225 Steadfast Group Ltd HSBC (720)35,667 Steadfast Group Ltd JP Morgan (986)(2,727) Stockland (REIT) JP Morgan 108
Holding Description Counterparty
Netunrealised
appreciation/(depreciation)
USD
Australia continued4,919 Suncorp Group Ltd JP Morgan 2588,207 Super Retail Group Ltd Citibank 4,7376,917 Super Retail Group Ltd HSBC 3,0596,393 Super Retail Group Ltd JP Morgan 3,021
(13,113) Sydney Airport (Unit) JP Morgan 1,9162,088 Tabcorp Holdings Ltd Citibank 11
(41,229) Tassal Group Ltd HSBC 1,237(22,172) Tassal Group Ltd JP Morgan 487
9,893 Technology One Ltd Citibank 1,6972,382 Technology One Ltd HSBC 29
23,187 Technology One Ltd JP Morgan 1,479(2,007) Temple & Webster Group
Ltd JP Morgan 2921,513 TPG Telecom Ltd Citibank 3545,688 TPG Telecom Ltd HSBC (242)
25,977 TPG Telecom Ltd JP Morgan (648)796 Transurban Group (Unit) JP Morgan (400)476 Treasury Wine Estates Ltd Citibank 223
2,166 Treasury Wine Estates Ltd JP Morgan 660(516) Unibail-Rodamco-Westfield Citibank (147)(554) Unibail-Rodamco-Westfield HSBC (4)
(2,076) Unibail-Rodamco-Westfield JP Morgan (43)3,227 Unibail-Rodamco-Westfield JP Morgan 661,794 United Malt Grp Ltd Citibank (17)4,213 United Malt Grp Ltd HSBC (334)
683 United Malt Grp Ltd JP Morgan (6)(40,843) Uniti Group Ltd JP Morgan (5,230)39,618 Vicinity Centres (REIT) Citibank 1,28750,921 Vicinity Centres (REIT) JP Morgan (93)
(13,408) Virgin Money UK Plc - CDI HSBC (997)(13,906) Virgin Money UK Plc - CDI JP Morgan (444)
1,792 Virtus Health Ltd Citibank 9412,906 Viva Energy Group Ltd Citibank (473)(7,886) Vocus Group Ltd HSBC 331(3,184) Vocus Group Ltd JP Morgan 17729,104 Waypoint REIT (REIT) Citibank 97530,284 Waypoint REIT (REIT) HSBC (282)49,529 Waypoint REIT (REIT) JP Morgan (11)
(10,709) Webjet Ltd HSBC (1,071)(90,264) West African Resources Ltd HSBC (4,282)(20,670) West African Resources Ltd JP Morgan (983)(19,831) Western Areas Ltd HSBC 1,551(7,312) Western Areas Ltd JP Morgan 526
(24,874) Westgold Resources Ltd HSBC (2,138)(4,443) Westgold Resources Ltd JP Morgan (315)1,564 WiseTech Global Ltd JP Morgan 254
(3,677) Woodside Petroleum Ltd JP Morgan 5,460(1,612) Woolworths Group Ltd HSBC (337)(3,808) Woolworths Group Ltd JP Morgan (1,728)1,921 Zip Co Ltd Citibank (76)
207 Zip Co Ltd JP Morgan (24)
116,668
Bermuda(126,000) Sinopec Kantons Holdings
Ltd Citibank (1,002)
(1,002)
Cayman Islands488 Weibo Corp ADR JP Morgan 1,059
1,059
China857 Li Auto Inc ADR Citibank 2,134155 Li Auto Inc ADR HSBC 975
3,109
Hong Kong36,500 3SBio Inc Citibank 7,59315,500 3SBio Inc HSBC 4,98170,500 3SBio Inc JP Morgan 22,664
BlackRock Asia Pacific Diversified Equity Absolute ReturnFund continuedPortfolio of Investments as at 31 May 2021
The notes on pages 590 to 610 form an integral part of these financial statements.
Annual report and audited financial statements [179]

Holding Description Counterparty
Netunrealised
appreciation/(depreciation)
USD
Hong Kong continued1,500 AAC Technologies Holdings
Inc Citibank 2475,000 AAC Technologies Holdings
Inc HSBC 2,6453,000 AAC Technologies Holdings
Inc JP Morgan 2,0991,200 AIA Group Ltd Citibank (347)3,800 AIA Group Ltd HSBC (1,294)
13,600 AIA Group Ltd JP Morgan (4,604)(22,000) Air China Ltd ’H’ HSBC (350)(3,000) Akeso Inc JP Morgan (5,561)
(38,000) Alibaba Health InformationTechnology Ltd Citibank 10,663
(2,000) Alibaba Health InformationTechnology Ltd HSBC 1,038
(210,000) Alibaba Pictures Group Ltd Citibank (557)(80,000) Alibaba Pictures Group Ltd HSBC 97(50,000) Alibaba Pictures Group Ltd JP Morgan 60
6,000 A-Living Smart City Ser-vices Co Ltd Citibank (795)
500 A-Living Smart City Ser-vices Co Ltd HSBC 159
4,750 A-Living Smart City Ser-vices Co Ltd JP Morgan 1,515
1,000 Alphamab Oncology Citibank (242)3,000 Alphamab Oncology JP Morgan (1,118)
12,000 Aluminum Corp of ChinaLtd ’H’ HSBC (985)
(14,500) Anhui Conch Cement CoLtd ’H’ Citibank (3,319)
(5,000) Anhui Conch Cement CoLtd ’H’ HSBC (49)
(500) Anhui Conch Cement CoLtd ’H’ JP Morgan (5)
1,000 ANTA Sports Products Ltd Citibank 9771,000 ANTA Sports Products Ltd HSBC 2,4322,000 ANTA Sports Products Ltd JP Morgan 4,8703,000 Aoyuan Healthy Life Group
Co Ltd Citibank 17516,000 Aoyuan Healthy Life Group
Co Ltd HSBC 1,55260,000 Aoyuan Healthy Life Group
Co Ltd JP Morgan 5,826(14,000) Asia Cement China Hold-
ings Corp JP Morgan 4281,200 AsiaInfo Technologies Ltd Citibank 19,600 AsiaInfo Technologies Ltd HSBC (362)
24,800 AsiaInfo Technologies Ltd JP Morgan (929)2,300 ASM Pacific Technology Ltd Citibank 832
300 ASM Pacific Technology Ltd HSBC (376)6,400 ASM Pacific Technology Ltd JP Morgan (7,082)
(64,000) AviChina Industry & Tech-nology Co Ltd ’H’ Citibank (3,487)
(66,000) AviChina Industry & Tech-nology Co Ltd ’H’ JP Morgan (4,197)
43,500 BAIC Motor Corp Ltd ’H’ Citibank (383)59,000 BAIC Motor Corp Ltd ’H’ HSBC (140)50,000 BAIC Motor Corp Ltd ’H’ JP Morgan 4615,000 Bank of China Ltd ’H’ JP Morgan (147)
(28,000) Bank of East Asia Ltd Citibank 1,122(4,400) Bank of East Asia Ltd HSBC 222
(800) Bank of East Asia Ltd JP Morgan 40(100,000) Beijing Capital International
Airport Co Ltd ’H’ Citibank 2,666(10,000) Beijing Capital International
Airport Co Ltd ’H’ HSBC 756(12,000) Beijing Capital International
Airport Co Ltd ’H’ JP Morgan 9064,000 Beijing Enterprises Holdings
Ltd Citibank 162
Holding Description Counterparty
Netunrealised
appreciation/(depreciation)
USD
Hong Kong continued16,000 Beijing Enterprises Holdings
Ltd HSBC 1,26712,000 Beijing Enterprises Holdings
Ltd JP Morgan 957(108,000) Beijing Enterprises Urban
Resources Group Ltd Citibank 547108,000 Beijing Enterprises Water
Group Ltd JP Morgan 2,11714,000 Beijing Jingneng Clean En-
ergy Co Ltd ’H’ Citibank (16)2,000 Beijing Jingneng Clean En-
ergy Co Ltd ’H’ HSBC 598,000 Beijing Jingneng Clean En-
ergy Co Ltd ’H’ JP Morgan 268(32,000) Beijing North Star Co Ltd ’H’ Citibank 120(6,000) Beijing North Star Co Ltd ’H’ JP Morgan 157,000 Blue Moon Group Holdings
Ltd Citibank 7453,500 Blue Moon Group Holdings
Ltd JP Morgan 608(700) BOC Aviation Ltd JP Morgan 311
7,500 BOC Hong Kong HoldingsLtd Citibank 305
500 BOC Hong Kong HoldingsLtd HSBC (92)
12,000 BOC Hong Kong HoldingsLtd JP Morgan (2,209)
8,000 Bosideng InternationalHoldings Ltd Citibank 157
54,000 Bosideng InternationalHoldings Ltd HSBC 2,450
42,000 Bosideng InternationalHoldings Ltd JP Morgan 1,909
(82,000) Brilliance China AutomotiveHoldings Ltd Citibank (44)
(50,000) Brilliance China AutomotiveHoldings Ltd HSBC (26)
(8,000) Brilliance China AutomotiveHoldings Ltd JP Morgan (5)
1,900 Budweiser Brewing CoAPAC Ltd Citibank (21)
3,100 Budweiser Brewing CoAPAC Ltd HSBC 46
16,500 Budweiser Brewing CoAPAC Ltd JP Morgan 252
500 BYD Co Ltd ’H’ JP Morgan 2,184(6,000) BYD Electronic International
Co Ltd Citibank (5,392)(500) BYD Electronic International
Co Ltd HSBC (742)(13,000) C&D International Invest-
ment Group Ltd Citibank (147)(36,000) C&D International Invest-
ment Group Ltd HSBC 6,376(18,000) C&D International Invest-
ment Group Ltd JP Morgan 3,360(101,000) CA Cultural Technology
Group Ltd Citibank (1,065)(49,000) CA Cultural Technology
Group Ltd JP Morgan (2,622)1,000 Cathay Pacific Airways Ltd Citibank 73,000 Cathay Pacific Airways Ltd HSBC 21
155,000 Cathay Pacific Airways Ltd JP Morgan 1,093(18,000) Central China Management
Co Ltd Citibank (6,123)(21,000) Central China Management
Co Ltd JP Morgan (7,143)12,000 Central China New Life Ltd Citibank (241)48,000 Central China New Life Ltd HSBC 6,33069,000 Central China New Life Ltd JP Morgan 9,108
BlackRock Asia Pacific Diversified Equity Absolute ReturnFund continuedPortfolio of Investments as at 31 May 2021
The notes on pages 590 to 610 form an integral part of these financial statements.
BlackRock Strategic Funds[180]

Holding Description Counterparty
Netunrealised
appreciation/(depreciation)
USD
Hong Kong continued(200) Central China Real Estate
Ltd Citibank —(233) Central China Real Estate
Ltd JP Morgan —(78,000) CGN New Energy Holdings
Co Ltd Citibank (1,420)(274,000) CGN New Energy Holdings
Co Ltd JP Morgan (10,314)(5,000) Champion REIT (REIT) Citibank (15)
(214,000) Champion REIT (REIT) HSBC 1,701(48,000) Champion REIT (REIT) JP Morgan 413(7,200) Changsha Broad Homes
Industrial Group Co Ltd’H’ Citibank 2,773
(11,700) Changsha Broad HomesIndustrial Group Co Ltd’H’ JP Morgan 3,127
25,000 China Aoyuan Group Ltd Citibank 1,33737,000 China Aoyuan Group Ltd HSBC 4,45523,000 China Aoyuan Group Ltd JP Morgan 2,773
(39,000) China Bohai Bank Co Ltd’H’ Citibank (9)
(26,500) China Bohai Bank Co Ltd’H’ HSBC 642
(10,500) China Bohai Bank Co Ltd’H’ JP Morgan 254
(239,000) China Cinda Asset Manage-ment Co Ltd ’H’ Citibank (1,260)
(120,000) China Cinda Asset Manage-ment Co Ltd ’H’ JP Morgan (791)
14,000 China CITIC Bank Corp Ltd’H’ Citibank 94
72,000 China CITIC Bank Corp Ltd’H’ JP Morgan 770
(22,000) China Conch Venture Hold-ings Ltd Citibank 2,067
(20,000) China Conch Venture Hold-ings Ltd JP Morgan 6,372
7,000 China Construction BankCorp ’H’ Citibank 184
50,000 China Construction BankCorp ’H’ HSBC 538
29,000 China Construction BankCorp ’H’ JP Morgan 316
135,000 China Dongxiang Group CoLtd Citibank 531
16,000 China Dongxiang Group CoLtd HSBC (61)
87,000 China Dongxiang Group CoLtd JP Morgan (328)
2,000 China East Education Hold-ings Ltd Citibank (250)
1,000 China East Education Hold-ings Ltd HSBC (17)
3,000 China Education GroupHoldings Ltd Citibank 217
1,000 China Education GroupHoldings Ltd HSBC 247
3,000 China Education GroupHoldings Ltd JP Morgan 743
(53,000) China Everbright Environ-ment Group Ltd Citibank (496)
(18,000) China Everbright GreentechLtd Citibank (166)
(17,000) China Everbright GreentechLtd HSBC 171
(86,000) China Everbright GreentechLtd JP Morgan 862
6,000 China Everbright Ltd Citibank 3278,000 China Everbright Ltd HSBC 557
Holding Description Counterparty
Netunrealised
appreciation/(depreciation)
USD
Hong Kong continued14,000 China Everbright Ltd JP Morgan 892
(18,000) China Evergrande Group Citibank 1,932(73,000) China Galaxy Securities Co
Ltd ’H’ Citibank (684)(17,500) China Galaxy Securities Co
Ltd ’H’ HSBC (705)(4,500) China Galaxy Securities Co
Ltd ’H’ JP Morgan (182)(5,000) China Grand Pharmaceuti-
cal and Healthcare Hold-ings Ltd Citibank (705)
(8,500) China Grand Pharmaceuti-cal and Healthcare Hold-ings Ltd HSBC (1,625)
(142,000) China Harmony Auto Hold-ing Ltd Citibank 512
(42,000) China Harmony Auto Hold-ing Ltd JP Morgan 1,446
18,000 China High Speed Trans-mission Equipment GroupCo Ltd Citibank (54)
14,000 China High Speed Trans-mission Equipment GroupCo Ltd HSBC (136)
6,000 China High Speed Trans-mission Equipment GroupCo Ltd JP Morgan (7)
11,000 China Hongqiao Group Ltd JP Morgan (2,168)(320,000) China Huarong Asset Man-
agement Co Ltd ’H’* Citibank 10,490(2,000) China Huarong Asset Man-
agement Co Ltd ’H’* HSBC 66(98,000) China Huarong Asset Man-
agement Co Ltd ’H’* JP Morgan 3,2119,600 China International Capital
Corp Ltd ’H’ Citibank 2,7985,200 China International Capital
Corp Ltd ’H’ HSBC 2,72712,800 China International Capital
Corp Ltd ’H’ JP Morgan 6,718(19,000) China Isotope & Radiation
Corp Citibank (2,855)(9,000) China Isotope & Radiation
Corp JP Morgan (1,242)(58,000) China Lesso Group Hold-
ings Ltd Citibank (9,124)(8,000) China Lesso Group Hold-
ings Ltd JP Morgan (870)4,000 China Life Insurance Co Ltd
’H’ Citibank 1802,000 China Life Insurance Co Ltd
’H’ HSBC 1005,000 China Life Insurance Co Ltd
’H’ JP Morgan 252(9,000) China Lilang Ltd Citibank (84)
(46,000) China Lilang Ltd HSBC 339(120,000) China Lilang Ltd JP Morgan 606
(3,600) China Literature Ltd Citibank (1,088)(2,200) China Literature Ltd JP Morgan (495)
(43,000) China Longyuan PowerGroup Corp Ltd ’H’ Citibank 1,184
(1,000) China Longyuan PowerGroup Corp Ltd ’H’ HSBC 2
(17,000) China Longyuan PowerGroup Corp Ltd ’H’ JP Morgan 27
12,000 China Maple Leaf Educa-tional Systems Ltd Citibank 79
(8,000) China Medical System Hold-ings Ltd Citibank (321)
BlackRock Asia Pacific Diversified Equity Absolute ReturnFund continuedPortfolio of Investments as at 31 May 2021
The notes on pages 590 to 610 form an integral part of these financial statements.
Annual report and audited financial statements [181]

Holding Description Counterparty
Netunrealised
appreciation/(depreciation)
USD
Hong Kong continued(4,000) China Medical System Hold-
ings Ltd HSBC (1,314)(6,000) China Meidong Auto Hold-
ings Ltd Citibank (1,138)6,000 China Mengniu Dairy Co Ltd HSBC 4,6952,000 China Mengniu Dairy Co Ltd JP Morgan 1,567
(18,000) China Merchants Bank CoLtd ’H’ Citibank (12,727)
(1,000) China Merchants Bank CoLtd ’H’ HSBC (677)
(2,500) China Merchants Bank CoLtd ’H’ JP Morgan (1,202)
8,400 China Merchants SecuritiesCo Ltd ’H’ Citibank 830
(69,500) China Minsheng BankingCorp Ltd ’H’ HSBC 69
125,000 China Modern Dairy Hold-ings Ltd Citibank (2,710)
81,000 China Modern Dairy Hold-ings Ltd HSBC 950
153,000 China Modern Dairy Hold-ings Ltd JP Morgan 1,800
(42,000) China Molybdenum Co Ltd’H’ Citibank (1,531)
(8,000) China New Higher Educa-tion Group Ltd Citibank 275
(3,000) China New Higher Educa-tion Group Ltd JP Morgan (94)
(120,000) China Oriental Group CoLtd HSBC 10,278
(14,000) China Oriental Group CoLtd JP Morgan 1,277
(5,000) China Overseas PropertyHoldings Ltd Citibank (16)
12,200 China Pacific InsuranceGroup Co Ltd ’H’ HSBC 1,911
(87,000) China Power InternationalDevelopment Ltd Citibank (348)
(248,000) China Power InternationalDevelopment Ltd JP Morgan (4,834)
39,000 China Railway Group Ltd ’H’ Citibank (89)134,000 China Railway Group Ltd ’H’ HSBC (3,757)50,000 China Railway Group Ltd ’H’ JP Morgan (1,397)5,300 China Renaissance Hold-
ings Ltd JP Morgan 318(14,000) China Resources Beer
Holdings Co Ltd Citibank (5,209)(2,000) China Resources Beer
Holdings Co Ltd JP Morgan (1,450)(70,000) China Resources Cement
Holdings Ltd Citibank (2,115)(30,500) China Resources Medical
Holdings Co Ltd HSBC (5,517)400 China Resources Mixc Life-
style Services Ltd Citibank (37)1,600 China Resources Mixc Life-
style Services Ltd JP Morgan 87223,000 China Resources Pharma-
ceutical Group Ltd Citibank 63126,000 China Resources Pharma-
ceutical Group Ltd HSBC 1,18215,500 China Resources Pharma-
ceutical Group Ltd JP Morgan 706(18,000) China Sanjiang Fine Chemi-
cals Co Ltd Citibank (213)(109,000) China Sanjiang Fine Chemi-
cals Co Ltd JP Morgan 3,82313,000 China SCE Group Holdings
Ltd Citibank 1717,000 China SCE Group Holdings
Ltd JP Morgan (43)
Holding Description Counterparty
Netunrealised
appreciation/(depreciation)
USD
Hong Kong continued(26,000) China Southern Airlines Co
Ltd ’H’ Citibank 660(45,000) China Suntien Green En-
ergy Corp Ltd ’H’ Citibank (416)(45,000) China Suntien Green En-
ergy Corp Ltd ’H’ JP Morgan (767)13,200 China Taiping Insurance
Holdings Co Ltd Citibank 21810,400 China Taiping Insurance
Holdings Co Ltd HSBC 17111,200 China Taiping Insurance
Holdings Co Ltd JP Morgan 18842,000 China Tian Lun Gas Hold-
ings Ltd Citibank (483)9,500 China Tian Lun Gas Hold-
ings Ltd HSBC 55612,500 China Tian Lun Gas Hold-
ings Ltd JP Morgan 734156,000 China Tower Corp Ltd ’H’ Citibank 12
(240,000) China Traditional ChineseMedicine Holdings Co Ltd Citibank (5,033)
(36,000) China Traditional ChineseMedicine Holdings Co Ltd HSBC (2,702)
(734,000) China Travel InternationalInvestment Hong KongLtd Citibank (1,958)
(540,000) China Travel InternationalInvestment Hong KongLtd JP Morgan 1,288
(25,500) China Vanke Co Ltd ’H’ Citibank (2,020)(7,800) China Vanke Co Ltd ’H’ HSBC (216)(4,900) China Vanke Co Ltd ’H’ JP Morgan (138)32,000 China Water Affairs Group
Ltd Citibank (728)60,000 China Water Affairs Group
Ltd HSBC (3,761)66,000 China Water Affairs Group
Ltd JP Morgan (4,128)1,500 China Yongda Automobiles
Services Holdings Ltd Citibank (39)4,000 China Yongda Automobiles
Services Holdings Ltd JP Morgan 31(144,000) China Youzan Ltd Citibank (574)(12,000) China Youzan Ltd HSBC 632(20,000) China Youzan Ltd JP Morgan 1,05310,000 China Yuhua Education
Corp Ltd Citibank (329)12,000 China Yuhua Education
Corp Ltd HSBC 1,01158,000 China Yuhua Education
Corp Ltd JP Morgan 4,89527,600 China Zhongwang Holdings
Ltd Citibank 11112,800 China Zhongwang Holdings
Ltd HSBC (377)28,800 China Zhongwang Holdings
Ltd JP Morgan (848)(2,000) Chinasoft International Ltd Citibank (298)8,000 Chinasoft International Ltd Citibank 1,1914,000 Chinasoft International Ltd HSBC 801
44,000 Chinasoft International Ltd JP Morgan 8,8224,800 Chow Tai Fook Jewellery
Group Ltd Citibank 8834,400 Chow Tai Fook Jewellery
Group Ltd HSBC 1,3316,000 CIFI Holdings Group Co Ltd Citibank 96
16,000 CIFI Holdings Group Co Ltd HSBC 4926,000 CIFI Holdings Group Co Ltd JP Morgan 8317,000 CITIC Ltd Citibank 4711,000 CITIC Ltd HSBC (25)
BlackRock Asia Pacific Diversified Equity Absolute ReturnFund continuedPortfolio of Investments as at 31 May 2021
The notes on pages 590 to 610 form an integral part of these financial statements.
BlackRock Strategic Funds[182]

Holding Description Counterparty
Netunrealised
appreciation/(depreciation)
USD
Hong Kong continued163,000 CITIC Ltd JP Morgan (4,063)(51,000) CITIC Securities Co Ltd ’H’ Citibank (5,662)(15,000) CITIC Securities Co Ltd ’H’ HSBC (3,481)(15,000) CITIC Securities Co Ltd ’H’ JP Morgan (3,487)342,000 CITIC Telecom International
Holdings Ltd Citibank (3,900)82,000 CITIC Telecom International
Holdings Ltd HSBC (2,625)159,000 CITIC Telecom International
Holdings Ltd JP Morgan (5,080)10,000 CK Asset Holdings Ltd Citibank 2,8062,500 CK Asset Holdings Ltd HSBC 299
13,000 CK Asset Holdings Ltd JP Morgan 1,5687,000 CK Hutchison Holdings Ltd Citibank 317,000 CK Hutchison Holdings Ltd HSBC (4,477)2,500 CK Hutchison Holdings Ltd JP Morgan (1,595)
(1,000) CK Infrastructure HoldingsLtd JP Morgan 195
(5,000) COFCO Joycome Foods Ltd Citibank 198(16,000) COFCO Joycome Foods Ltd JP Morgan 283(60,000) Convoy Global Holdings Ltd* Citibank 968
(324,000) Convoy Global Holdings Ltd* HSBC 5,225(192,000) Convoy Global Holdings Ltd* JP Morgan 3,096(20,000) COSCO SHIPPING Devel-
opment Co Ltd ’H’ Citibank 24(57,000) COSCO SHIPPING Devel-
opment Co Ltd ’H’ HSBC 1,3898,000 COSCO SHIPPING Energy
Transportation Co Ltd ’H’ Citibank 124,000 COSCO SHIPPING Energy
Transportation Co Ltd ’H’ HSBC (200)30,000 COSCO SHIPPING Energy
Transportation Co Ltd ’H’ JP Morgan (1,496)19,500 COSCO SHIPPING Hold-
ings Co Ltd ’H’ Citibank (579)2,500 COSCO SHIPPING Hold-
ings Co Ltd ’H’ HSBC (467)5,500 COSCO SHIPPING Hold-
ings Co Ltd ’H’ JP Morgan (1,026)34,000 COSCO SHIPPING Ports
Ltd Citibank (1,342)16,000 COSCO SHIPPING Ports
Ltd HSBC (1,744)34,000 COSCO SHIPPING Ports
Ltd JP Morgan (3,701)(110,000) Country Garden Holdings
Co Ltd Citibank 635,000 Country Garden Services
Holdings Co Ltd Citibank 3512,000 Country Garden Services
Holdings Co Ltd HSBC 3727,000 Country Garden Services
Holdings Co Ltd JP Morgan 1,3142,000 CPMC Holdings Ltd Citibank 50
11,000 CPMC Holdings Ltd HSBC 485177,000 CPMC Holdings Ltd JP Morgan 7,824
(2,500) CSC Financial Co Ltd ’H’ Citibank (227)(42,000) CSC Financial Co Ltd ’H’ JP Morgan (6,311)
5,600 CSPC PharmaceuticalGroup Ltd Citibank 452
320 CSPC PharmaceuticalGroup Ltd JP Morgan 100
11,500 Dali Foods Group Co Ltd Citibank 25644,000 Dali Foods Group Co Ltd HSBC 92219,000 Dali Foods Group Co Ltd JP Morgan 400
278,000 Datang International PowerGeneration Co Ltd ’H’ Citibank 383
282,000 Datang International PowerGeneration Co Ltd ’H’ HSBC 944
34,000 Datang International PowerGeneration Co Ltd ’H’ JP Morgan 135
Holding Description Counterparty
Netunrealised
appreciation/(depreciation)
USD
Hong Kong continued(164,000) Differ Group Holding Co Ltd Citibank (7,204)(504,000) Differ Group Holding Co Ltd JP Morgan (66,929)
(5,600) Dongfang Electric Corp Ltd’H’ Citibank (17)
(800) Dongfang Electric Corp Ltd’H’ JP Morgan 2
14,000 Dongfeng Motor Group CoLtd ’H’ Citibank 116
(4,000) Dongyue Group Ltd Citibank (110)(16,000) Dongyue Group Ltd HSBC 1,037(11,000) Dongyue Group Ltd JP Morgan 984(97,000) Dynagreen Environmental
Protection Group Co Ltd’H’ Citibank (276)
(4,000) Dynagreen EnvironmentalProtection Group Co Ltd’H’ JP Morgan 105
9,000 EEKA Fashion Holdings Ltd Citibank (109)2,500 EEKA Fashion Holdings Ltd HSBC (352)7,000 EEKA Fashion Holdings Ltd JP Morgan (985)
(7,800) ENN Energy Holdings Ltd Citibank (2,994)(2,900) ENN Energy Holdings Ltd JP Morgan (1,586)
(23,800) ESR Cayman Ltd Citibank 264(400) ESR Cayman Ltd HSBC 12
8,000 Ever Sunshine Lifestyle Ser-vices Group Ltd Citibank 1,888
6,000 Ever Sunshine Lifestyle Ser-vices Group Ltd JP Morgan 2,839
11,000 Excellence CommercialProperty & Facilities Man-agement Group Ltd Citibank (148)
6,000 Excellence CommercialProperty & Facilities Man-agement Group Ltd HSBC (390)
6,000 Excellence CommercialProperty & Facilities Man-agement Group Ltd JP Morgan (389)
277,500 Fantasia Holdings Group CoLtd Citibank 1,450
45,000 Fantasia Holdings Group CoLtd HSBC 177
400,500 Fantasia Holdings Group CoLtd JP Morgan 1,562
45,000 Far East Horizon Ltd Citibank 8398,000 Far East Horizon Ltd HSBC (490)
30,000 Far East Horizon Ltd JP Morgan (763)46,000 FIH Mobile Ltd Citibank 241
112,000 FIH Mobile Ltd HSBC 1,46022,000 FIH Mobile Ltd JP Morgan 399
(28,000) First Tractor Co Ltd ’H’ Citibank (838)(14,000) First Tractor Co Ltd ’H’ JP Morgan 202(3,000) Flat Glass Group Co Ltd ’H’ Citibank (662)(7,000) Flat Glass Group Co Ltd ’H’ JP Morgan (5,126)(5,000) Fortune Real Estate Invest-
ment Trust (REIT) Citibank (48)(92,000) Fortune Real Estate Invest-
ment Trust (REIT) HSBC (2,779)(1,000) Fortune Real Estate Invest-
ment Trust (REIT) JP Morgan (30)(89,000) Fosun International Ltd Citibank (8,563)14,000 FriendTimes Inc JP Morgan (41)
(60,000) Fu Shou Yuan InternationalGroup Ltd Citibank (345)
(6,000) Fu Shou Yuan InternationalGroup Ltd HSBC (42)
(6,000) Fu Shou Yuan InternationalGroup Ltd JP Morgan (43)
400 Fuyao Glass Industry GroupCo Ltd ’H’ JP Morgan 455
(15,000) Galaxy EntertainmentGroup Ltd Citibank (1,035)
BlackRock Asia Pacific Diversified Equity Absolute ReturnFund continuedPortfolio of Investments as at 31 May 2021
The notes on pages 590 to 610 form an integral part of these financial statements.
Annual report and audited financial statements [183]

Holding Description Counterparty
Netunrealised
appreciation/(depreciation)
USD
Hong Kong continued(1,000) Galaxy Entertainment
Group Ltd HSBC 5691,600 Ganfeng Lithium Co Ltd ’H’ JP Morgan 3,437
(71,000) GCL-Poly Energy HoldingsLtd* Citibank 4,258
(16,000) GCL-Poly Energy HoldingsLtd* JP Morgan 959
(23,000) Geely Automobile HoldingsLtd Citibank (2,580)
(6,000) Geely Automobile HoldingsLtd HSBC (426)
(154,000) Gemdale Properties & In-vestment Corp Ltd HSBC (1,401)
(42,000) Gemdale Properties & In-vestment Corp Ltd JP Morgan (383)
(34,500) Genertec Universal MedicalGroup Co Ltd HSBC (3,126)
(130,000) Genertec Universal MedicalGroup Co Ltd JP Morgan (5,880)
(4,000) Genscript Biotech Corp Citibank (1,863)(45,600) GF Securities Co Ltd ’H’ Citibank (1,564)(57,400) GF Securities Co Ltd ’H’ HSBC (637)(2,200) GF Securities Co Ltd ’H’ JP Morgan (25)
(64,000) GOME Retail Holdings Ltd Citibank (500)120,000 Goodbaby International
Holdings Ltd Citibank 10,685120,000 Goodbaby International
Holdings Ltd JP Morgan 12,325(21,000) Great Wall Motor Co Ltd ’H’ Citibank (4,955)
4,000 Greentown China HoldingsLtd JP Morgan (25)
(4,000) Guangzhou BaiyunshanPharmaceutical HoldingsCo Ltd ’H’ Citibank (1,011)
(14,400) Guangzhou R&F PropertiesCo Ltd ’H’ Citibank (345)
(8,000) Guangzhou R&F PropertiesCo Ltd ’H’ HSBC (336)
(2,800) Guangzhou R&F PropertiesCo Ltd ’H’ JP Morgan (118)
488,000 Guotai Junan InternationalHoldings Ltd Citibank (580)
113,000 Guotai Junan InternationalHoldings Ltd HSBC (717)
456,000 Guotai Junan InternationalHoldings Ltd JP Morgan (2,878)
40,400 Guotai Junan Securities CoLtd ’H’ Citibank 1,491
6,400 Guotai Junan Securities CoLtd ’H’ HSBC 450
35,600 Guotai Junan Securities CoLtd ’H’ JP Morgan 2,513
10,000 Haidilao International Hold-ing Ltd Citibank (354)
2,000 Haidilao International Hold-ing Ltd HSBC 689
13,000 Haidilao International Hold-ing Ltd JP Morgan 4,489
(4,400) Haier Smart Home Co Ltd’H’ HSBC (549)
(18,000) Hainan Meilan InternationalAirport Co Ltd ’H’ Citibank (7,001)
(2,000) Hainan Meilan InternationalAirport Co Ltd ’H’ HSBC (559)
(7,000) Hainan Meilan InternationalAirport Co Ltd ’H’ JP Morgan (2,461)
(11,000) Haitian International Hold-ings Ltd Citibank 3,732
(3,000) Haitian International Hold-ings Ltd JP Morgan 1,827
Holding Description Counterparty
Netunrealised
appreciation/(depreciation)
USD
Hong Kong continued(12,400) Haitong Securities Co Ltd
’H’ Citibank (321)(94,000) Hang Lung Properties Ltd Citibank (2,313)(3,000) Hang Lung Properties Ltd HSBC 255(6,800) Hang Seng Bank Ltd Citibank (343)(1,700) Hang Seng Bank Ltd HSBC 2652,000 Hangzhou Tigermed Con-
sulting Co Ltd ’H’ Citibank (363)200 Hangzhou Tigermed Con-
sulting Co Ltd ’H’ HSBC 435300 Hangzhou Tigermed Con-
sulting Co Ltd ’H’ JP Morgan 653(4,000) Hansoh Pharmaceutical
Group Co Ltd Citibank (209)2,000 Hebei Construction Group
Corp Ltd ’H’ Citibank (10)7,000 Hebei Construction Group
Corp Ltd ’H’ HSBC 197,000 Hebei Construction Group
Corp Ltd ’H’ JP Morgan 20(6,000) Henderson Land Develop-
ment Co Ltd Citibank (1,059)(61,000) Henderson Land Develop-
ment Co Ltd HSBC (8,802)(30,000) Henderson Land Develop-
ment Co Ltd JP Morgan (4,351)(8,000) HengTen Networks Group
Ltd Citibank 1,232(4,000) HengTen Networks Group
Ltd JP Morgan (75)9,000 HKT Trust & HKT Ltd (Unit) Citibank 7
14,000 HKT Trust & HKT Ltd (Unit) HSBC (1,684)20,000 HKT Trust & HKT Ltd (Unit) JP Morgan (2,401)
(20,000) Homeland Interactive Tech-nology Ltd Citibank (239)
(12,000) Homeland Interactive Tech-nology Ltd JP Morgan (145)
(13,800) Hong Kong & China Gas CoLtd Citibank (156)
(49,450) Hong Kong & China Gas CoLtd HSBC 80
(17,800) Hong Kong & China Gas CoLtd JP Morgan 24
(71,000) Hong Kong Television Net-work Ltd Citibank (1,421)
(25,000) Hong Kong Television Net-work Ltd JP Morgan (1,645)
(374,000) Hope Education Group CoLtd Citibank 8,064
(108,000) Hope Education Group CoLtd HSBC 1,373
(78,000) Hope Education Group CoLtd JP Morgan 988
(30,000) Hopson Development Hold-ings Ltd Citibank (13,991)
(300) Hopson Development Hold-ings Ltd JP Morgan (122)
2,000 Hua Hong SemiconductorLtd HSBC (780)
(43,000) Huabao International Hold-ings Ltd Citibank 2,176
(13,400) Huatai Securities Co Ltd ’H’ Citibank (1,151)200 Hygeia Healthcare Holdings
Co Ltd JP Morgan 7234,000 Hysan Development Co Ltd Citibank (17)3,000 Hysan Development Co Ltd HSBC 373
54,000 Hysan Development Co Ltd JP Morgan 6,7556,000 IGG Inc Citibank 6071,000 IGG Inc HSBC (9)
BlackRock Asia Pacific Diversified Equity Absolute ReturnFund continuedPortfolio of Investments as at 31 May 2021
The notes on pages 590 to 610 form an integral part of these financial statements.
BlackRock Strategic Funds[184]

Holding Description Counterparty
Netunrealised
appreciation/(depreciation)
USD
Hong Kong continued31,000 IGG Inc JP Morgan (286)
(15,000) Immunotech Biopharm Ltd Citibank (1,719)(2,000) InnoCare Pharma Ltd HSBC (90)(2,000) InnoCare Pharma Ltd JP Morgan (514)
500 Innovent Biologics Inc JP Morgan 867300 Jacobio Pharmaceuticals
Group Co Ltd Citibank (25)300 Jacobio Pharmaceuticals
Group Co Ltd HSBC 99900 Jacobio Pharmaceuticals
Group Co Ltd JP Morgan 297(2,800) JD Health International Inc Citibank 2,755
(34,000) Jiangsu Expressway Co Ltd’H’ HSBC 21
(32,000) Jiangxi Copper Co Ltd ’H’ Citibank (5,318)(7,000) Jiangxi Copper Co Ltd ’H’ HSBC 3,912(1,000) Jiangxi Copper Co Ltd ’H’ JP Morgan 558
100 Jinke Smart Services GroupCo Ltd ’H’ HSBC 164
(34,000) Jinxin Fertility Group Ltd Citibank (13,410)(8,000) Jinxin Fertility Group Ltd HSBC (2,866)21,000 Jiumaojiu International
Holdings Ltd Citibank 5887,000 Jiumaojiu International
Holdings Ltd HSBC 2,0446,000 Jiumaojiu International
Holdings Ltd JP Morgan 1,75524,500 JNBY Design Ltd Citibank (2,120)11,500 JNBY Design Ltd HSBC (166)7,000 JNBY Design Ltd JP Morgan (99)7,500 Johnson Electric Holdings
Ltd Citibank 706500 Johnson Electric Holdings
Ltd HSBC 1016,500 Johnson Electric Holdings
Ltd JP Morgan 3493,000 Joinn Laboratories China
Co Ltd ’H’ JP Morgan 5,488(26,000) Joy Spreader Interactive
Technology Ltd Citibank 263(13,000) Joy Spreader Interactive
Technology Ltd JP Morgan (3)2,000 JS Global Lifestyle Co Ltd Citibank 364
500 JS Global Lifestyle Co Ltd JP Morgan 91(90,000) K Wah International Hold-
ings Ltd HSBC (742)(10,000) K Wah International Hold-
ings Ltd JP Morgan (55)1,000 Kaisa Prosperity Holdings
Ltd Citibank 356250 Kaisa Prosperity Holdings
Ltd HSBC 221500 Kaisa Prosperity Holdings
Ltd JP Morgan 44219,000 Kerry Logistics Network Ltd JP Morgan (669)7,000 Kerry Properties Ltd Citibank (1,114)
(6,500) Kingboard Holdings Ltd Citibank 2,533(4,500) Kingboard Holdings Ltd JP Morgan 1,895
(26,500) Kingboard Laminates Hold-ings Ltd Citibank 2,971
(500) Kingboard Laminates Hold-ings Ltd HSBC 90
(7,000) Kingboard Laminates Hold-ings Ltd JP Morgan 1,251
(2,000) Kingdee International Soft-ware Group Co Ltd Citibank (1,267)
(2,000) Kingdee International Soft-ware Group Co Ltd HSBC (448)
5,500 Koolearn Technology Hold-ing Ltd Citibank 5
Holding Description Counterparty
Netunrealised
appreciation/(depreciation)
USD
Hong Kong continued13,500 Koolearn Technology Hold-
ing Ltd HSBC (232)10,000 Koolearn Technology Hold-
ing Ltd JP Morgan (861)(112,000) Kunlun Energy Co Ltd Citibank 44,951(28,000) Kunlun Energy Co Ltd HSBC 10,157(11,500) KWG Group Holdings Ltd Citibank (839)14,000 KWG Living Group Holdings
Ltd Citibank 56752,000 KWG Living Group Holdings
Ltd HSBC 6,05723,000 KWG Living Group Holdings
Ltd JP Morgan 2,682(70,000) Lee & Man Paper Manufac-
turing Ltd Citibank 1,408(26,000) Lee & Man Paper Manufac-
turing Ltd HSBC 1,427(13,000) Lee & Man Paper Manufac-
turing Ltd JP Morgan 71214,000 Lenovo Group Ltd Citibank (45)6,000 Lenovo Group Ltd HSBC (691)
92,000 Lenovo Group Ltd JP Morgan (7,314)5,500 Li Ning Co Ltd Citibank 4,5274,000 Li Ning Co Ltd HSBC 4,3223,500 Li Ning Co Ltd JP Morgan 3,786
202,000 Liaoning Port Co Ltd ’H’ Citibank 27218,000 Liaoning Port Co Ltd ’H’ HSBC (45)
100,000 Liaoning Port Co Ltd ’H’ JP Morgan (250)(40,000) Lifetech Scientific Corp Citibank (1,355)(44,000) Lifetech Scientific Corp HSBC (4,719)
(212,000) Lifetech Scientific Corp JP Morgan (22,756)900 Link REIT (REIT) Citibank (13)
5,900 Link REIT (REIT) HSBC (919)14,700 Link REIT (REIT) JP Morgan (1,222)21,000 Logan Group Co Ltd Citibank 34416,000 Logan Group Co Ltd HSBC 59122,000 Logan Group Co Ltd JP Morgan 818
182,000 Lonking Holdings Ltd Citibank (10,511)86,000 Lonking Holdings Ltd HSBC (8,289)
128,000 Lonking Holdings Ltd JP Morgan (12,329)(3,000) Luk Fook Holdings Interna-
tional Ltd Citibank (82)(46,000) Luk Fook Holdings Interna-
tional Ltd HSBC (12,510)(4,000) Luoyang Glass Co Ltd ’H’ JP Morgan (92)22,000 LVGEM China Real Estate
Investment Co Ltd HSBC (110)26,000 LVGEM China Real Estate
Investment Co Ltd JP Morgan (129)2,800 Man Wah Holdings Ltd Citibank 559
(10,000) Man Wah Holdings Ltd Citibank (1,997)800 Man Wah Holdings Ltd HSBC 267
22,000 Man Wah Holdings Ltd JP Morgan 7,346(3,400) Maoyan Entertainment Citibank 14
(20,000) Maoyan Entertainment JP Morgan 3484,000 Meitu Inc HSBC (23)
30,500 Meitu Inc JP Morgan 13200 Meituan ’B’ Citibank 597100 Meituan ’B’ HSBC 404
1,200 Meituan ’B’ JP Morgan 4,853(125,000) Melco International Devel-
opment Ltd Citibank (3,993)(4,000) Melco International Devel-
opment Ltd HSBC (76)(1,000) Melco International Devel-
opment Ltd JP Morgan (19)(79,000) Metallurgical Corp of China
Ltd ’H’ Citibank (214)(156,000) MGM China Holdings Ltd Citibank (14,203)
BlackRock Asia Pacific Diversified Equity Absolute ReturnFund continuedPortfolio of Investments as at 31 May 2021
The notes on pages 590 to 610 form an integral part of these financial statements.
Annual report and audited financial statements [185]

Holding Description Counterparty
Netunrealised
appreciation/(depreciation)
USD
Hong Kong continued(2,800) MGM China Holdings Ltd JP Morgan (227)
(10,000) Microport Scientific Corp Citibank (10,221)(1,000) Microport Scientific Corp HSBC (777)(3,000) Microport Scientific Corp JP Morgan (2,336)(6,000) Ming Yuan Cloud Group
Holdings Ltd Citibank (2,413)2,000 Minth Group Ltd Citibank 4812,000 Minth Group Ltd JP Morgan 547
124,000 MMG Ltd Citibank (1,396)72,000 MMG Ltd HSBC (14,070)44,000 MMG Ltd JP Morgan (8,593)
(11,000) Mobvista Inc JP Morgan (2,249)11,000 MTR Corp Ltd Citibank (1,240)
500 MTR Corp Ltd HSBC (89)17,000 MTR Corp Ltd JP Morgan (2,997)24,000 NagaCorp Ltd Citibank 3544,000 NagaCorp Ltd HSBC (23)
20,000 NagaCorp Ltd JP Morgan (114)51,000 NetDragon Websoft Hold-
ings Ltd Citibank 6,3256,000 NetDragon Websoft Hold-
ings Ltd HSBC 1,59423,000 NetDragon Websoft Hold-
ings Ltd JP Morgan 6,131(7,000) Netjoy Holdings Ltd Citibank (31)5,000 New World Development Co
Ltd Citibank 6911,000 New World Development Co
Ltd HSBC (61)8,000 New World Development Co
Ltd JP Morgan (484)(2,000) Newborn Town Inc JP Morgan (324)1,000 Nissin Foods Co Ltd Citibank 265,000 Nissin Foods Co Ltd JP Morgan 235
(131,000) NWS Holdings Ltd HSBC 1,520(1,000) NWS Holdings Ltd JP Morgan 212,000 Ocumension Therapeutics Citibank 1,8971,000 Ocumension Therapeutics HSBC 1,1241,500 Ocumension Therapeutics JP Morgan 1,753
46,000 Orient Securities Co Ltd ’H’ Citibank 3,2776,000 Orient Securities Co Ltd ’H’ HSBC 4816,000 Orient Securities Co Ltd ’H’ JP Morgan 482
218,000 Pacific Basin Shipping Ltd Citibank 5,10057,000 Pacific Basin Shipping Ltd HSBC 48959,000 Pacific Basin Shipping Ltd JP Morgan (201)26,000 Pacific Textiles Holdings Ltd Citibank 1012,000 Pacific Textiles Holdings Ltd HSBC (88)21,000 Pacific Textiles Holdings Ltd JP Morgan (152)(8,000) PAX Global Technology Ltd Citibank (706)
(38,000) PCCW Ltd Citibank 331(17,000) PCCW Ltd HSBC 914
(202,000) People’s Insurance CoGroup of China Ltd ’H’ Citibank (3,424)
(58,000) People’s Insurance CoGroup of China Ltd ’H’ HSBC (1,058)
(17,000) People’s Insurance CoGroup of China Ltd ’H’ JP Morgan (311)
34,000 PetroChina Co Ltd ’H’ Citibank 13918,000 PetroChina Co Ltd ’H’ HSBC (112)
616,000 PetroChina Co Ltd ’H’ JP Morgan (3,786)200 Pharmaron Beijing Co Ltd
’H’ Citibank 1861,500 Pharmaron Beijing Co Ltd
’H’ HSBC 5,042200 Pharmaron Beijing Co Ltd
’H’ JP Morgan 673(38,000) PICC Property & Casualty
Co Ltd ’H’ Citibank 224(200) Ping An Healthcare and
Technology Co Ltd Citibank (31)
Holding Description Counterparty
Netunrealised
appreciation/(depreciation)
USD
Hong Kong continued(700) Ping An Healthcare and
Technology Co Ltd HSBC (487)(3,700) Ping An Healthcare and
Technology Co Ltd JP Morgan (2,580)5,000 Ping An Insurance Group
Co of China Ltd ’H’ Citibank 2,0593,000 Ping An Insurance Group
Co of China Ltd ’H’ HSBC 1,06110,500 Ping An Insurance Group
Co of China Ltd ’H’ JP Morgan 3,732(400) Pop Mart International
Group Ltd Citibank (275)(2,800) Pop Mart International
Group Ltd JP Morgan (3,587)13,000 Postal Savings Bank of
China Co Ltd ’H’ HSBC 650(36,000) Power Assets Holdings Ltd Citibank 107(12,500) Power Assets Holdings Ltd HSBC 4,867(3,500) Power Assets Holdings Ltd JP Morgan 1,3596,000 Powerlong Commercial
Management HoldingsLtd Citibank 979
14,000 Powerlong CommercialManagement HoldingsLtd HSBC (1,322)
8,500 Powerlong CommercialManagement HoldingsLtd JP Morgan (797)
8,000 Q Technology Group Co Ltd Citibank 1,141(16,000) Redsun Properties Group
Ltd Citibank (127)(92,000) Redsun Properties Group
Ltd HSBC (1,321)5,700 Samsonite International SA HSBC 1,092
(33,600) Sands China Ltd Citibank (5,061)(16,000) Sands China Ltd HSBC 785(2,000) Sands China Ltd JP Morgan 97
(30,000) Sany Heavy Equipment In-ternational Holdings CoLtd Citibank 1,642
(8,000) Sany Heavy Equipment In-ternational Holdings CoLtd HSBC 1,654
(27,000) Sany Heavy Equipment In-ternational Holdings CoLtd JP Morgan 5,576
31,000 Scholar Education Group Citibank (1,385)11,000 Scholar Education Group HSBC (1,894)37,000 Scholar Education Group JP Morgan (6,211)
(50,000) Seazen Group Ltd Citibank (2,479)(7,500) Shandong Gold Mining Co
Ltd ’H’ Citibank 29(24,000) Shandong Weigao Group
Medical Polymer Co Ltd’H’ Citibank 2,195
(86,000) Shanghai Electric Group CoLtd ’H’ Citibank 4,306
(22,000) Shanghai Electric Group CoLtd ’H’ HSBC 1,300
(30,000) Shanghai Fudan Microelec-tronics Group Co Ltd ’H’ Citibank (724)
(2,000) Shanghai Fudan Microelec-tronics Group Co Ltd ’H’ JP Morgan (744)
300 Shanghai Haohai BiologicalTechnology Co Ltd ’H’ Citibank 1,121
200 Shanghai Haohai BiologicalTechnology Co Ltd ’H’ HSBC 756
2,000 Shanghai Haohai BiologicalTechnology Co Ltd ’H’ JP Morgan 7,563
BlackRock Asia Pacific Diversified Equity Absolute ReturnFund continuedPortfolio of Investments as at 31 May 2021
The notes on pages 590 to 610 form an integral part of these financial statements.
BlackRock Strategic Funds[186]

Holding Description Counterparty
Netunrealised
appreciation/(depreciation)
USD
Hong Kong continued(1,800) Shanghai Kindly Medical
Instruments Co Ltd ’H’ Citibank (770)(11,600) Shanghai Pharmaceuticals
Holding Co Ltd ’H’ Citibank (1,807)(4,000) Shangri-La Asia Ltd HSBC (64)
(14,000) Shangri-La Asia Ltd JP Morgan (226)(6,000) Shenzhen Expressway Co
Ltd ’H’ HSBC 4141,000 Shenzhen Hepalink Phar-
maceutical Group Co Ltd’H’ Citibank 32
1,500 Shenzhen Hepalink Phar-maceutical Group Co Ltd’H’ HSBC 21
9,000 Shenzhen Hepalink Phar-maceutical Group Co Ltd’H’ JP Morgan 125
(12,500) Shenzhen InternationalHoldings Ltd Citibank 730
(4,000) Shenzhen InternationalHoldings Ltd HSBC 831
(2,000) Shenzhen InternationalHoldings Ltd JP Morgan 415
(36,000) Shenzhen Investment Ltd Citibank (285)(4,177) Shenzhen Investment Ltd HSBC 10
700 Shenzhou InternationalGroup Holdings Ltd Citibank 506
14,500 Shimao Group Holdings Ltd Citibank 1172,500 Shimao Group Holdings Ltd HSBC (109)7,500 Shimao Group Holdings Ltd JP Morgan (323)7,000 Shimao Services Holdings
Ltd Citibank 1,2735,000 Shimao Services Holdings
Ltd JP Morgan 1,10498,000 Shougang Fushan Re-
sources Group Ltd Citibank 5204,000 Shougang Fushan Re-
sources Group Ltd HSBC (138)56,000 Shougang Fushan Re-
sources Group Ltd JP Morgan (1,936)(60,000) Sihuan Pharmaceutical
Holdings Group Ltd Citibank (7,357)(8,000) Sihuan Pharmaceutical
Holdings Group Ltd JP Morgan (1,074)17,000 Sino Biopharmaceutical Ltd Citibank (660)17,000 Sino Biopharmaceutical Ltd HSBC 1,21511,000 Sino Biopharmaceutical Ltd JP Morgan 788
(87,346) Sino Land Co Ltd Citibank 1,272(32,000) Sino Land Co Ltd HSBC (770)(28,000) Sino Land Co Ltd JP Morgan (680)339,500 Sino-Ocean Group Holding
Ltd Citibank (3,894)114,000 Sino-Ocean Group Holding
Ltd HSBC (1,095)157,500 Sino-Ocean Group Holding
Ltd JP Morgan (2,613)2,500 Sino-Ocean Service Holding
Ltd Citibank 35818,500 Sino-Ocean Service Holding
Ltd HSBC 3,74841,500 Sino-Ocean Service Holding
Ltd JP Morgan 8,23183,000 Sinopec Engineering Group
Co Ltd ’H’ Citibank 350121,000 Sinopec Engineering Group
Co Ltd ’H’ HSBC (5,100)253,500 Sinopec Engineering Group
Co Ltd ’H’ JP Morgan (10,656)18,000 Sinopec Oilfield Service
Corp ’H’ Citibank (69)
Holding Description Counterparty
Netunrealised
appreciation/(depreciation)
USD
Hong Kong continued44,000 Sinopec Oilfield Service
Corp ’H’ JP Morgan (337)38,000 Sinopec Shanghai Petro-
chemical Co Ltd ’H’ JP Morgan (143)(4,000) Sinopharm Group Co Ltd ’H’ Citibank (394)3,000 Sinotrans Ltd ’H’ Citibank (3)
35,000 Sinotrans Ltd ’H’ JP Morgan (574)5,000 Sinotruk Hong Kong Ltd JP Morgan 76
46,000 SITC International HoldingsCo Ltd Citibank 7,202
30,000 SITC International HoldingsCo Ltd HSBC (14,235)
25,000 SITC International HoldingsCo Ltd JP Morgan (11,846)
(27,000) SJM Holdings Ltd Citibank 365(87,000) SJM Holdings Ltd HSBC 2,858(46,000) Skyworth Group Ltd HSBC 407(54,000) Skyworth Group Ltd JP Morgan 129(96,000) SMI Holdings Group Ltd* Citibank —
(216,000) SMI Holdings Group Ltd* JP Morgan 65,213(9,000) Smoore International Hold-
ings Ltd Citibank 4,078(157,000) SOHO China Ltd Citibank 175
(7,000) SOHO China Ltd JP Morgan (45)(30,000) SSY Group Ltd HSBC (1,363)(2,900) Standard Chartered Plc Citibank (348)
(21,600) Standard Chartered Plc HSBC 1,165(1,200) Standard Chartered Plc JP Morgan 6317,000 Sun Art Retail Group Ltd Citibank (36)19,000 Sun Art Retail Group Ltd HSBC (2,390)5,000 Sun Art Retail Group Ltd JP Morgan (628)
(8,500) Sun Hung Kai PropertiesLtd Citibank (2,044)
(12,000) Sun Hung Kai PropertiesLtd HSBC 825
2,000 Sunac China Holdings Ltd Citibank 176,000 Sunac China Holdings Ltd HSBC (335)
12,000 Sunac China Holdings Ltd JP Morgan (2,827)1,000 Sunac Services Holdings
Ltd Citibank 404,000 Sunac Services Holdings
Ltd HSBC 1,0118,000 Sunac Services Holdings
Ltd JP Morgan 2,027(26,000) SUNeVision Holdings Ltd Citibank 83(77,000) SUNeVision Holdings Ltd HSBC (1,013)(13,000) SUNeVision Holdings Ltd JP Morgan (43)
500 Swire Pacific Ltd ’A’ Citibank (33)500 Swire Pacific Ltd ’A’ HSBC (326)
4,500 Swire Pacific Ltd ’A’ JP Morgan (2,931)15,400 Swire Properties Ltd Citibank (272)19,600 Swire Properties Ltd HSBC (94)15,200 Swire Properties Ltd JP Morgan (66)3,000 TCL Electronics Holdings
Ltd Citibank 113,000 TCL Electronics Holdings
Ltd HSBC (430)1,000 TCL Electronics Holdings
Ltd JP Morgan (33)3,000 Techtronic Industries Co Ltd Citibank 1,1525,000 Techtronic Industries Co Ltd HSBC (4,327)5,000 Techtronic Industries Co Ltd JP Morgan (4,312)
900 Tencent Holdings Ltd Citibank 3,923500 Tencent Holdings Ltd HSBC 1,567
2,100 Tencent Holdings Ltd JP Morgan 6,6095,500 Texhong Textile Group Ltd Citibank 761,000 Texhong Textile Group Ltd HSBC 814,000 Texhong Textile Group Ltd JP Morgan 324
BlackRock Asia Pacific Diversified Equity Absolute ReturnFund continuedPortfolio of Investments as at 31 May 2021
The notes on pages 590 to 610 form an integral part of these financial statements.
Annual report and audited financial statements [187]

Holding Description Counterparty
Netunrealised
appreciation/(depreciation)
USD
Hong Kong continued17,000 Tianli Education Interna-
tional Holdings Ltd Citibank (257)16,000 Tianli Education Interna-
tional Holdings Ltd JP Morgan (1,484)8,000 Tianneng Power Interna-
tional Ltd Citibank 1,0802,000 Tianneng Power Interna-
tional Ltd HSBC 22912,000 Tianneng Power Interna-
tional Ltd JP Morgan 1,3751,000 Times China Holdings Ltd Citibank (97)6,000 Times China Holdings Ltd HSBC (165)
75,000 Times China Holdings Ltd JP Morgan (2,051)(34,000) Times Neighborhood Hold-
ings Ltd Citibank (1,898)(2,000) Times Neighborhood Hold-
ings Ltd HSBC (186)9,000 Times Neighborhood Hold-
ings Ltd HSBC 83922,000 Tingyi Cayman Islands
Holding Corp Citibank (373)16,000 Tingyi Cayman Islands
Holding Corp HSBC 1,5004,000 Tingyi Cayman Islands
Holding Corp JP Morgan 3763,000 Tong Ren Tang Technolo-
gies Co Ltd ’H’ Citibank 4652,000 Tong Ren Tang Technolo-
gies Co Ltd ’H’ HSBC 4497,000 Tong Ren Tang Technolo-
gies Co Ltd ’H’ JP Morgan 1,573(42,000) Tongcheng-Elong Holdings
Ltd Citibank (5,419)(5,200) Tongcheng-Elong Holdings
Ltd HSBC (1,568)410,000 Tongda Group Holdings Ltd Citibank (510)210,000 Tongda Group Holdings Ltd HSBC 1,632
1,030,000 Tongda Group Holdings Ltd JP Morgan 8,0154,000 Topsports International
Holdings Ltd Citibank (17)9,000 Topsports International
Holdings Ltd HSBC 56419,000 Topsports International
Holdings Ltd JP Morgan 1,19571,000 Towngas China Co Ltd Citibank 11816,000 Towngas China Co Ltd HSBC 1,592
166,000 Towngas China Co Ltd JP Morgan 16,536(67,000) TravelSky Technology Ltd
’H’ Citibank 4,749(2,000) TravelSky Technology Ltd
’H’ JP Morgan (158)2,000 Tsingtao Brewery Co Ltd ’H’ Citibank 1,326
62,000 Uni-President China Hold-ings Ltd Citibank (1,798)
10,000 Uni-President China Hold-ings Ltd HSBC (1,333)
32,000 Uni-President China Hold-ings Ltd JP Morgan (4,260)
(30,000) United Co RUSAL Interna-tional PJSC Citibank (477)
(34,000) United Laboratories Interna-tional Holdings Ltd HSBC (2,820)
4,000 Vesync Co Ltd Citibank 4677,000 Vinda International Holdings
Ltd Citibank 2381,000 Vinda International Holdings
Ltd HSBC (159)4,000 Vinda International Holdings
Ltd JP Morgan (635)
Holding Description Counterparty
Netunrealised
appreciation/(depreciation)
USD
Hong Kong continued2,000 Vitasoy International Hold-
ings Ltd Citibank 2492,000 Vitasoy International Hold-
ings Ltd HSBC 3784,000 Vitasoy International Hold-
ings Ltd JP Morgan 758(13,000) Vobile Group Ltd Citibank 50(5,000) Vobile Group Ltd JP Morgan (3,203)20,000 VSTECS Holdings Ltd Citibank (221)28,000 VSTECS Holdings Ltd HSBC 3038,000 VSTECS Holdings Ltd JP Morgan 887,500 VTech Holdings Ltd Citibank (536)3,700 VTech Holdings Ltd HSBC 963
13,300 VTech Holdings Ltd JP Morgan 4,046162,000 Want Want China Holdings
Ltd Citibank 48565,000 Want Want China Holdings
Ltd HSBC (224)130,000 Want Want China Holdings
Ltd JP Morgan (433)7,000 Weichai Power Co Ltd ’H’ Citibank 863,000 Weichai Power Co Ltd ’H’ HSBC 966,000 Weichai Power Co Ltd ’H’ JP Morgan 173
(24,000) Weimob Inc Citibank (5,347)25,500 WH Group Ltd Citibank (86)44,500 WH Group Ltd HSBC (928)33,000 WH Group Ltd JP Morgan (348)(7,000) Wharf Holdings Ltd Citibank (1,470)
(28,000) Wharf Holdings Ltd HSBC (8,527)(11,000) Wharf Holdings Ltd JP Morgan (3,708)(9,000) Wharf Real Estate Invest-
ment Co Ltd Citibank (783)1,536 WuXi AppTec Co Ltd ’H’ Citibank 1,838
360 WuXi AppTec Co Ltd ’H’ HSBC 1,1572,280 WuXi AppTec Co Ltd ’H’ JP Morgan 7,335
500 Wuxi Biologics Cayman Inc Citibank 7451,000 Wuxi Biologics Cayman Inc HSBC 2,3401,500 Wuxi Biologics Cayman Inc JP Morgan 3,5125,200 Wynn Macau Ltd Citibank 455,200 Wynn Macau Ltd HSBC (384)
14,000 Wynn Macau Ltd JP Morgan (1,029)(3,800) XD Inc Citibank (2,489)(3,400) XD Inc JP Morgan (2,778)16,500 Xiabuxiabu Catering Man-
agement China HoldingsCo Ltd Citibank 139
35,000 Xiabuxiabu Catering Man-agement China HoldingsCo Ltd HSBC (10,367)
27,000 Xiabuxiabu Catering Man-agement China HoldingsCo Ltd JP Morgan (8,094)
2,000 Xinyi Glass Holdings Ltd Citibank 7262,000 Xinyi Glass Holdings Ltd HSBC 7384,000 Xinyi Glass Holdings Ltd JP Morgan 1,479(658) Xinyi Solar Holdings Ltd Citibank (68)
(10,192) Xinyi Solar Holdings Ltd HSBC (4,263)(1,269) Xinyi Solar Holdings Ltd JP Morgan (531)
(10,500) Xtep International HoldingsLtd Citibank (1,277)
(19,500) Xtep International HoldingsLtd HSBC (5,159)
(17,500) Xtep International HoldingsLtd JP Morgan (4,465)
2,000 Yadea Group Holdings Ltd JP Morgan 36416,500 Yangtze Optical Fibre and
Cable Joint Stock Ltd Co’H’ Citibank (10)
BlackRock Asia Pacific Diversified Equity Absolute ReturnFund continuedPortfolio of Investments as at 31 May 2021
The notes on pages 590 to 610 form an integral part of these financial statements.
BlackRock Strategic Funds[188]

Holding Description Counterparty
Netunrealised
appreciation/(depreciation)
USD
Hong Kong continued2,000 Yangtze Optical Fibre and
Cable Joint Stock Ltd Co’H’ JP Morgan 4
(3,200) Yeahka Ltd Citibank (609)(1,600) Yeahka Ltd JP Morgan 1,30114,200 YiChang HEC ChangJiang
Pharmaceutical Co Ltd ’H’ Citibank 72112,400 YiChang HEC ChangJiang
Pharmaceutical Co Ltd ’H’ JP Morgan 9502,000 Yihai International Holding
Ltd Citibank (365)2,000 Yihai International Holding
Ltd HSBC (1,755)2,000 Yihai International Holding
Ltd JP Morgan (1,753)(87,000) Youyuan International Hold-
ings Ltd* Citibank 1,164(38,000) Youyuan International Hold-
ings Ltd* JP Morgan 50938,500 Yue Yuen Industrial Hold-
ings Ltd Citibank (1,183)25,000 Yue Yuen Industrial Hold-
ings Ltd HSBC (798)94,500 Yue Yuen Industrial Hold-
ings Ltd JP Morgan (1,607)8,000 Yuexiu Property Co Ltd Citibank 73
18,000 Yuexiu Property Co Ltd HSBC 16568,000 Yuexiu Property Co Ltd JP Morgan 625
(34,000) Yuexiu Transport Infrastruc-ture Ltd HSBC 470
(2,000) Yuexiu Transport Infrastruc-ture Ltd JP Morgan 27
15,000 Zhaojin Mining Industry CoLtd ’H’ Citibank 473
10,500 Zhaojin Mining Industry CoLtd ’H’ HSBC (237)
26,000 Zhaojin Mining Industry CoLtd ’H’ JP Morgan (583)
24,000 Zhejiang Expressway CoLtd ’H’ HSBC (174)
28,000 Zhejiang Expressway CoLtd ’H’ JP Morgan (199)
16,600 Zhengzhou Coal Mining Ma-chinery Group Co Ltd ’H’ Citibank 1,850
4,400 Zhengzhou Coal Mining Ma-chinery Group Co Ltd ’H’ HSBC 601
4,200 Zhengzhou Coal Mining Ma-chinery Group Co Ltd ’H’ JP Morgan 629
(14,000) Zhenro Properties GroupLtd HSBC 915
(1,000) ZhongAn Online P&C Insur-ance Co Ltd ’H’ Citibank 197
(8,500) Zhongsheng Group Hold-ings Ltd Citibank (4,307)
(8,000) Zhou Hei Ya InternationalHoldings Co Ltd Citibank (614)
(2,500) Zhou Hei Ya InternationalHoldings Co Ltd JP Morgan (112)
(8,500) Zhuzhou CRRC Times Elec-tric Co Ltd ’H’ Citibank (697)
(2,900) Zhuzhou CRRC Times Elec-tric Co Ltd ’H’ JP Morgan (906)
6,000 Zoomlion Heavy IndustryScience and TechnologyCo Ltd ’H’ Citibank 197
Holding Description Counterparty
Netunrealised
appreciation/(depreciation)
USD
Hong Kong continued200 Zoomlion Heavy Industry
Science and TechnologyCo Ltd ’H’ HSBC (18)
63,400 Zoomlion Heavy IndustryScience and TechnologyCo Ltd ’H’ JP Morgan (4,798)
(62,889)
Indonesia37,900 Bank Central Asia Tbk PT Citibank 1,102
200 Bank Central Asia Tbk PT HSBC (6)41,700 Bank Central Asia Tbk PT JP Morgan (624)49,900 Bank Mandiri Persero Tbk
PT Citibank 9797,300 Bank Mandiri Persero Tbk
PT HSBC (5)83,700 Bank Mandiri Persero Tbk
PT JP Morgan 159113,100 Bank Negara Indonesia Per-
sero Tbk PT Citibank 1,011(35,000) Bank Rakyat Indonesia Per-
sero Tbk PT JP Morgan (518)65,300 Bank Tabungan Negara Per-
sero Tbk PT Citibank 494(751,000) Barito Pacific Tbk PT JP Morgan 1,298(14,200) Charoen Pokphand Indone-
sia Tbk PT HSBC (401)(134,700) Charoen Pokphand Indone-
sia Tbk PT JP Morgan (1,663)678,300 Erajaya Swasembada Tbk
PT HSBC (222)67,800 Erajaya Swasembada Tbk
PT JP Morgan (23)(50,500) Hanjaya Mandala Sampo-
erna Tbk PT JP Morgan 87(2,000) Indah Kiat Pulp & Paper Tbk
PT HSBC 232(73,400) Indah Kiat Pulp & Paper Tbk
PT JP Morgan 8,2062,700 Indocement Tunggal Pra-
karsa Tbk PT HSBC (80)(32,500) Indofood Sukses Makmur
Tbk PT JP Morgan 5071,596,900 Industri Jamu Dan Farmasi
Sido Muncul Tbk PT Citibank 1,009335,800 Industri Jamu Dan Farmasi
Sido Muncul Tbk PT HSBC (106)407,900 Industri Jamu Dan Farmasi
Sido Muncul Tbk PT JP Morgan 824,800 Japfa Comfeed Indonesia
Tbk PT Citibank 16572,100 Japfa Comfeed Indonesia
Tbk PT HSBC (566)214,800 Japfa Comfeed Indonesia
Tbk PT JP Morgan (952)(179,500) Kalbe Farma Tbk PT JP Morgan 245(105,000) Merdeka Copper Gold Tbk
PT HSBC 633(50,500) Merdeka Copper Gold Tbk
PT JP Morgan 244(23,400) Mitra Adiperkasa Tbk PT JP Morgan 9810,500 Mitra Keluarga Karyasehat
Tbk PT Citibank (12)(1,700) Pabrik Kertas Tjiwi Kimia
Tbk PT JP Morgan 232
BlackRock Asia Pacific Diversified Equity Absolute ReturnFund continuedPortfolio of Investments as at 31 May 2021
The notes on pages 590 to 610 form an integral part of these financial statements.
Annual report and audited financial statements [189]

Holding Description Counterparty
Netunrealised
appreciation/(depreciation)
USD
Indonesia continued53,300 Perusahaan Gas Negara
Tbk PT Citibank 24498,900 Perusahaan Gas Negara
Tbk PT HSBC (502)471,300 Perusahaan Gas Negara
Tbk PT JP Morgan (3,037)(17,700) Sarana Menara Nusantara
Tbk PT HSBC 33(156,500) Sarana Menara Nusantara
Tbk PT JP Morgan 21541,600 Surya Citra Media Tbk PT Citibank 70792,600 Surya Citra Media Tbk PT HSBC 1,37183,900 Surya Citra Media Tbk PT JP Morgan 1,295
213,700 Telkom Indonesia PerseroTbk PT Citibank 2,949
33,000 Tower Bersama Infrastruc-ture Tbk PT Citibank 181
(12,000) Tower Bersama Infrastruc-ture Tbk PT HSBC 13
10,900 Tower Bersama Infrastruc-ture Tbk PT HSBC (12)
175,800 Tower Bersama Infrastruc-ture Tbk PT JP Morgan 236
(109,200) Unilever Indonesia Tbk PT JP Morgan (1,162)
14,062
Japan(200) 77 Bank Ltd HSBC 226
(4,200) 77 Bank Ltd JP Morgan 4,835600 ABC-Mart Inc Citibank 975
2,800 ABC-Mart Inc JP Morgan 4,341(1,400) Access Co Ltd HSBC 161(5,500) Access Co Ltd JP Morgan 1,120
(17,100) Acom Co Ltd JP Morgan (1,922)(7) Activia Properties Inc
(REIT) JP Morgan 283900 Adastria Co Ltd Citibank 79
1,500 Adastria Co Ltd HSBC (101)900 Adastria Co Ltd JP Morgan (137)
(3,000) ADEKA Corp JP Morgan 7,4322,800 Advan Co Ltd Citibank (706)1,400 Advan Co Ltd HSBC (563)4,300 Advan Co Ltd JP Morgan (1,791)
(13) Advance Residence Invest-ment Corp (REIT) JP Morgan 533
200 Advantest Corp JP Morgan 274(500) Aeon Co Ltd JP Morgan 557(300) Aeon Delight Co Ltd JP Morgan 249(400) Aeon Fantasy Co Ltd Citibank (514)(200) AEON Financial Service Co
Ltd Citibank 101(2,200) AEON Financial Service Co
Ltd JP Morgan 212(800) Aeon Hokkaido Corp HSBC 857
(6,400) Aeon Hokkaido Corp JP Morgan 6,957800 Aeon Mall Co Ltd Citibank 182700 Aeon Mall Co Ltd HSBC 196100 AGC Inc Citibank (47)300 AGC Inc HSBC 65800 AGC Inc JP Morgan 942100 Aica Kogyo Co Ltd HSBC (333)
1,100 Aica Kogyo Co Ltd JP Morgan (3,582)600 Aichi Corp Citibank 17900 Aichi Corp HSBC (357)300 Aichi Corp JP Morgan (123)800 Aichi Steel Corp JP Morgan (3,318)
(13,700) Aiful Corp JP Morgan (5,097)1,000 Ain Holdings Inc JP Morgan 2,790(700) Air Water Inc JP Morgan 2100 Ajinomoto Co Inc JP Morgan 40500 Alfresa Holdings Corp Citibank 84
Holding Description Counterparty
Netunrealised
appreciation/(depreciation)
USD
Japan continued1,500 Alfresa Holdings Corp HSBC 3182,300 Alfresa Holdings Corp JP Morgan (1,907)(100) Alpha Systems Inc HSBC 64(300) Alpha Systems Inc JP Morgan 138
1,200 Alps Alpine Co Ltd Citibank (200)500 Alps Alpine Co Ltd HSBC 57
4,200 Alps Alpine Co Ltd JP Morgan (3,745)1,000 Altech Corp HSBC (994)
300 Altech Corp JP Morgan (307)1,900 Amada Co Ltd Citibank 576
400 Amada Co Ltd HSBC (297)4,700 Amada Co Ltd JP Morgan (3,568)(100) Amano Corp HSBC 105(200) Amano Corp JP Morgan 219200 Amuse Inc JP Morgan (373)
(600) ANA Holdings Inc JP Morgan (432)1,000 AOKI Holdings Inc HSBC (67)3,200 AOKI Holdings Inc JP Morgan (243)
(1,100) Aomori Bank Ltd JP Morgan 1,892(3,100) Aozora Bank Ltd JP Morgan (336)1,700 Arcland Service Holdings
Co Ltd Citibank 1500 Arcland Service Holdings
Co Ltd HSBC (151)200 Arcland Service Holdings
Co Ltd JP Morgan (67)2,000 Arcs Co Ltd JP Morgan (1,223)
400 Ariake Japan Co Ltd Citibank 22300 Ariake Japan Co Ltd HSBC (973)200 Ariake Japan Co Ltd JP Morgan (668)
1,400 ARTERIA Networks Corp Citibank (963)200 Aruhi Corp Citibank (279)700 Aruhi Corp HSBC (1,738)
1,200 Aruhi Corp JP Morgan (3,011)400 As One Corp Citibank (1,528)500 Asahi Co Ltd Citibank (109)
2,100 Asahi Co Ltd HSBC (1,923)700 Asahi Co Ltd JP Morgan (656)
(900) Asahi Group Holdings Ltd JP Morgan (3,538)400 Asahi Holdings Inc Citibank 189300 Asahi Holdings Inc HSBC 405
2,400 Asahi Holdings Inc JP Morgan 202700 Asahi Intecc Co Ltd Citibank (1,168)600 Asahi Intecc Co Ltd JP Morgan (1,584)
2,400 Asahi Kasei Corp Citibank (1,197)5,000 Asahi Kasei Corp JP Morgan (659)(100) Asanuma Corp JP Morgan 41500 Asics Corp JP Morgan 3,571
1,400 ASKUL Corp Citibank 61(800) Astellas Pharma Inc JP Morgan (426)
3,500 Atom Corp HSBC (428)200 Atrae Inc Citibank 258400 Atrae Inc HSBC (109)900 Autobacs Seven Co Ltd Citibank (428)400 Autobacs Seven Co Ltd HSBC (212)
7,500 Autobacs Seven Co Ltd JP Morgan (3,608)500 Avant Corp Citibank (364)900 Avant Corp JP Morgan (1,332)
(300) Awa Bank Ltd HSBC 742(2,200) Awa Bank Ltd JP Morgan 5,145
(900) Axxzia Inc JP Morgan (2,117)200 Azbil Corp JP Morgan (466)
(100) Bank of Iwate Ltd JP Morgan 337(300) Bank of Nagoya Ltd Citibank 563
(1,200) Bank of Nagoya Ltd JP Morgan 2,049(2,500) Bank of Okinawa Ltd JP Morgan 4,152
200 Base Co Ltd Citibank 116200 Base Co Ltd HSBC (1,442)300 BASE Inc Citibank 239300 BASE Inc JP Morgan 132
BlackRock Asia Pacific Diversified Equity Absolute ReturnFund continuedPortfolio of Investments as at 31 May 2021
The notes on pages 590 to 610 form an integral part of these financial statements.
BlackRock Strategic Funds[190]

Holding Description Counterparty
Netunrealised
appreciation/(depreciation)
USD
Japan continued1,200 Bell System24 Holdings Inc Citibank (113)1,800 Bell System24 Holdings Inc JP Morgan (676)
(1,100) Belluna Co Ltd JP Morgan 1,208600 Benefit One Inc Citibank 516
1,100 Benefit One Inc JP Morgan 3,4201,200 Benesse Holdings Inc Citibank (852)3,230 BeNext-Yumeshin Group Co Citibank 124
900 BeNext-Yumeshin Group Co HSBC (1,288)400 BeNext-Yumeshin Group Co JP Morgan (581)300 Bengo4.com Inc JP Morgan (1,044)
2,800 Bic Camera Inc Citibank (325)2,100 Bic Camera Inc HSBC (401)
400 Bridgestone Corp Citibank 371,100 Bridgestone Corp JP Morgan 1,326
(1,200) Broadleaf Co Ltd JP Morgan 345(400) Bushiroad Inc JP Morgan (179)600 Calbee Inc Citibank (504)900 Calbee Inc HSBC (1,422)
2,500 Calbee Inc JP Morgan (4,047)1,900 Canon Inc JP Morgan (1,516)
600 Canon Marketing Japan Inc HSBC (370)1,800 Canon Marketing Japan Inc JP Morgan (1,178)1,100 Capcom Co Ltd JP Morgan 2,074
300 Carta Holdings Inc HSBC 201900 Carta Holdings Inc JP Morgan 582100 CellSource Co Ltd Citibank 230100 CellSource Co Ltd JP Morgan 52100 Central Security Patrols Co
Ltd JP Morgan (89)(1,800) Chiba Bank Ltd HSBC 426
(33,800) Chiba Bank Ltd JP Morgan 8,351900 Chiyoda Co Ltd Citibank 99
1,000 Chiyoda Co Ltd HSBC (250)800 Chiyoda Co Ltd JP Morgan (210)100 Chiyoda Integre Co Ltd JP Morgan (16)
(400) Chofu Seisakusho Co Ltd JP Morgan 173(6,300) Chubu Electric Power Co
Inc JP Morgan 3,734300 Chubu Shiryo Co Ltd Citibank (102)200 Chubu Shiryo Co Ltd HSBC (42)
(300) Chudenko Corp Citibank 143(600) Chudenko Corp JP Morgan 347100 Chugai Pharmaceutical Co
Ltd HSBC (7)700 Chugai Pharmaceutical Co
Ltd JP Morgan (91)(7,600) Chugoku Bank Ltd JP Morgan 4,229
200 Chukyo Bank Ltd Citibank (96)100 Ci Medical Co Ltd Citibank (820)300 CI Takiron Corp HSBC (251)200 CI Takiron Corp JP Morgan (169)
2,400 Citizen Watch Co Ltd Citibank 1700 Citizen Watch Co Ltd HSBC (47)200 CKD Corp Citibank 439300 CKD Corp HSBC 476
2,300 CMIC Holdings Co Ltd HSBC (1,807)1,800 CMIC Holdings Co Ltd JP Morgan (1,455)(400) cocokara fine Inc HSBC (1,194)
(1,000) cocokara fine Inc JP Morgan (4,377)(200) Colowide Co Ltd HSBC (61)
(1,300) Colowide Co Ltd JP Morgan (362)(11) Comforia Residential Inc
(REIT) JP Morgan 980800 Computer Engineering &
Consulting Ltd Citibank (232)1,400 Computer Engineering &
Consulting Ltd HSBC (260)1,400 Computer Engineering &
Consulting Ltd JP Morgan (147)(600) COMSYS Holdings Corp JP Morgan 2,524
Holding Description Counterparty
Netunrealised
appreciation/(depreciation)
USD
Japan continued(58,000) Concordia Financial Group
Ltd JP Morgan 20,7031,100 CONEXIO Corp Citibank (102)1,700 CONEXIO Corp JP Morgan (350)
(4,200) COOKPAD Inc HSBC 6582,600 Cosel Co Ltd Citibank 1,2071,000 Cosel Co Ltd JP Morgan (24)
(2,800) Cosmo Energy Holdings CoLtd JP Morgan 8,882
(4) CRE Logistics Inc (REIT) Citibank (164)(19) CRE Logistics Inc (REIT) JP Morgan (154)
1,500 Credit Saison Co Ltd JP Morgan 5221,200 CyberAgent Inc Citibank 2191,100 CyberAgent Inc HSBC (103)
(2,700) CYBERDYNE Inc JP Morgan 1,6732,500 Dai Nippon Printing Co Ltd JP Morgan 895
(1,900) Daibiru Corp JP Morgan 722(600) Daido Steel Co Ltd JP Morgan 4,162200 Daifuku Co Ltd HSBC (3,892)300 Daifuku Co Ltd JP Morgan (5,886)
(100) Daiho Corp Citibank 130(300) Daiho Corp HSBC (142)
(3,500) Daiho Corp JP Morgan 1,540(3,600) Dai-ichi Life Holdings Inc JP Morgan (5,127)1,000 Daiichi Sankyo Co Ltd HSBC (640)2,000 Daiichi Sankyo Co Ltd JP Morgan (4,533)(800) Daiichikosho Co Ltd JP Morgan 125
1,000 Daiken Corp Citibank (784)100 Daiken Corp HSBC (181)400 Daiken Corp JP Morgan (737)500 Daikin Industries Ltd JP Morgan (7,930)600 Dainichiseika Color &
Chemicals ManufacturingCo Ltd Citibank (388)
1,200 Dainichiseika Color &Chemicals ManufacturingCo Ltd HSBC (1,069)
800 Dainichiseika Color &Chemicals ManufacturingCo Ltd JP Morgan (739)
(100) Daio Paper Corp JP Morgan 183(700) Daiseki Co Ltd JP Morgan 86
(2,700) Daishi Hokuetsu FinancialGroup Inc JP Morgan 1,793
(400) Daito Trust Construction CoLtd JP Morgan 821
(700) Daiwa House Industry CoLtd JP Morgan 1,184
(28) Daiwa House InvestmentCorp (REIT) JP Morgan (1,161)
1,100 Daiwa Industries Ltd Citibank (296)400 Daiwa Industries Ltd HSBC (275)
(6) Daiwa Office InvestmentCorp (REIT) JP Morgan 422
(6,400) Daiwa Securities Group Inc JP Morgan 513(114) Daiwa Securities Living In-
vestments Corp (REIT) JP Morgan 1,062300 Demae-Can Co Ltd Citibank 222400 Demae-Can Co Ltd HSBC (162)400 Demae-Can Co Ltd JP Morgan (48)
(2,500) DeNA Co Ltd JP Morgan (1,669)(2,600) Denka Co Ltd JP Morgan 10,966
200 Densan System Co Ltd HSBC (804)200 Densan System Co Ltd JP Morgan (814)
(300) Denso Corp JP Morgan (430)1,600 Dentsu Group Inc Citibank 1,677(200) Descente Ltd HSBC 1
(2,200) Descente Ltd JP Morgan 521,100 DIC Corp Citibank (871)
300 DIC Corp HSBC (477)
BlackRock Asia Pacific Diversified Equity Absolute ReturnFund continuedPortfolio of Investments as at 31 May 2021
The notes on pages 590 to 610 form an integral part of these financial statements.
Annual report and audited financial statements [191]

Holding Description Counterparty
Netunrealised
appreciation/(depreciation)
USD
Japan continued2,900 DIC Corp JP Morgan (4,739)
200 Digital Arts Inc Citibank (634)100 Digital Arts Inc HSBC (705)400 Digital Arts Inc JP Morgan (2,220)
(300) Digital Garage Inc JP Morgan 124600 Digital Holdings Inc Citibank 828100 Digital Holdings Inc HSBC 318400 Digital Holdings Inc JP Morgan 1,110200 Direct Marketing MiX Inc Citibank 652200 Direct Marketing MiX Inc HSBC 212500 Disco Corp JP Morgan (4,970)
1,400 DMG Mori Co Ltd Citibank 1,0932,700 DMG Mori Co Ltd JP Morgan 2,272
400 Doshisha Co Ltd Citibank (244)300 Doshisha Co Ltd HSBC (648)400 Doshisha Co Ltd JP Morgan (874)
(500) Dowa Holdings Co Ltd JP Morgan 2,623900 Duskin Co Ltd Citibank (773)700 Duskin Co Ltd HSBC (659)
1,400 Duskin Co Ltd JP Morgan (1,517)(500) DyDo Group Holdings Inc JP Morgan 1,651
(2,100) East Japan Railway Co JP Morgan 2,089600 Ebara Corp Citibank 2,247
1,500 EDION Corp Citibank (571)3,700 EDION Corp JP Morgan (3,974)
100 Edulab Inc Citibank (118)100 Edulab Inc JP Morgan (106)100 Eisai Co Ltd JP Morgan 33
1,400 Elan Corp Citibank 181,800 Elan Corp HSBC 190
300 Elan Corp JP Morgan 261,100 Elecom Co Ltd Citibank (570)
400 Elecom Co Ltd HSBC (135)1,200 Elematec Corp Citibank (214)
100 Elematec Corp JP Morgan 1(600) EM Systems Co Ltd JP Morgan 243
(1,700) ENEOS Holdings Inc HSBC (44)(7,900) ENEOS Holdings Inc JP Morgan (128)
900 Enigmo Inc HSBC 25700 Enigmo Inc JP Morgan 7400 en-japan Inc Citibank 11100 en-japan Inc JP Morgan 329
4,900 EPS Holdings Inc Citibank 20,0996,800 EPS Holdings Inc HSBC 23,962
(4,100) ES-Con Japan Ltd HSBC (389)300 eSOL Co Ltd Citibank (176)600 eSOL Co Ltd JP Morgan (366)100 ESPEC Corp HSBC 63400 ESPEC Corp JP Morgan 240
1,500 Ezaki Glico Co Ltd Citibank (1,775)300 Ezaki Glico Co Ltd HSBC (275)700 Ezaki Glico Co Ltd JP Morgan (683)
8,500 FAN Communications Inc Citibank (363)9,100 FAN Communications Inc HSBC (1,437)5,100 FAN Communications Inc JP Morgan (835)(300) Fancl Corp JP Morgan 342400 FANUC Corp JP Morgan (1,982)100 Fast Retailing Co Ltd JP Morgan 586
2,200 FCC Co Ltd Citibank (1,228)700 FCC Co Ltd HSBC (702)
2,400 FCC Co Ltd JP Morgan (2,468)300 Feedforce Inc Citibank 6200 Feedforce Inc JP Morgan (58)
(700) Ferrotec Holdings Corp JP Morgan (1,609)800 Fibergate Inc Citibank 36600 Fibergate Inc JP Morgan (1,399)
1,100 Fixstars Corp Citibank (181)200 Fixstars Corp HSBC (282)
1,000 Fixstars Corp JP Morgan (527)400 Food & Life Cos Ltd Citibank 1,095
Holding Description Counterparty
Netunrealised
appreciation/(depreciation)
USD
Japan continued100 Food & Life Cos Ltd JP Morgan 135
1,100 FP Corp Citibank (2,768)500 FP Corp HSBC (1,149)
1,000 France Bed Holdings Co Ltd Citibank (187)600 France Bed Holdings Co Ltd HSBC (75)400 France Bed Holdings Co Ltd JP Morgan (56)400 Freee KK Citibank 2,436200 Freee KK JP Morgan 293
(7) Frontier Real Estate Invest-ment Corp (REIT) JP Morgan (1,099)
(200) Fudo Tetra Corp HSBC 107(1,900) Fudo Tetra Corp JP Morgan 421(1,800) Fuji Corp JP Morgan 4,554(1,500) Fuji Electric Co Ltd JP Morgan 971
(200) Fuji Kyuko Co Ltd HSBC 353(100) Fuji Kyuko Co Ltd JP Morgan 184200 Fuji Oil Holdings Inc HSBC (198)100 Fuji Pharma Co Ltd Citibank (6)800 Fuji Pharma Co Ltd HSBC (724)
1,900 Fuji Pharma Co Ltd JP Morgan (1,752)1,400 Fujicco Co Ltd Citibank (388)1,200 Fujicco Co Ltd HSBC (538)
400 Fujicco Co Ltd JP Morgan (191)100 FUJIFILM Holdings Corp JP Morgan 244
(600) Fujitec Co Ltd Citibank (184)(1,300) Fujitec Co Ltd JP Morgan 2,486
(700) Fujitsu General Ltd JP Morgan 1,621(500) Fujitsu Ltd JP Morgan 247(100) Fukuda Corp HSBC 15(300) Fukuda Corp JP Morgan 67(700) Fukuoka Financial Group
Inc JP Morgan (67)(200) Fukuyama Transporting Co
Ltd HSBC 222(600) Fukuyama Transporting Co
Ltd JP Morgan 1,740200 FULLCAST Holdings Co Ltd HSBC 116400 Funai Soken Holdings Inc HSBC 124500 Funai Soken Holdings Inc JP Morgan 139
(900) Furukawa Battery Co Ltd HSBC 752(200) Furukawa Battery Co Ltd JP Morgan 172
1,200 Furukawa Co Ltd Citibank (382)3,300 Furukawa Co Ltd HSBC (1,760)1,600 Furukawa Co Ltd JP Morgan (1,075)
100 Furukawa Electric Co Ltd JP Morgan 44400 Future Corp Citibank 99
1,200 Future Corp HSBC (1,056)800 Future Corp JP Morgan (728)100 Fuyo General Lease Co Ltd Citibank (468)200 Fuyo General Lease Co Ltd JP Morgan (647)300 GA Technologies Co Ltd Citibank 112
1,700 Gakken Holdings Co Ltd Citibank (237)100 Gakken Holdings Co Ltd HSBC (79)600 Gakken Holdings Co Ltd JP Morgan (487)200 Genki Sushi Co Ltd Citibank (99)
2,000 Geo Holdings Corp Citibank (489)100 Geo Holdings Corp HSBC (102)
1,500 Geo Holdings Corp JP Morgan (1,559)100 giftee Inc HSBC 218
1,600 Glory Ltd Citibank (977)600 Glory Ltd HSBC (891)
5,200 Glory Ltd JP Morgan (7,905)(22) GLP J-Reit (REIT) JP Morgan (422)
4,100 GMO Financial Holdings Inc Citibank (77)400 GMO Financial Holdings Inc JP Morgan 16100 GMO GlobalSign Holdings
KK Citibank 14200 GMO GlobalSign Holdings
KK JP Morgan (859)600 GMO internet Inc Citibank (156)
BlackRock Asia Pacific Diversified Equity Absolute ReturnFund continuedPortfolio of Investments as at 31 May 2021
The notes on pages 590 to 610 form an integral part of these financial statements.
BlackRock Strategic Funds[192]

Holding Description Counterparty
Netunrealised
appreciation/(depreciation)
USD
Japan continued900 GMO internet Inc JP Morgan (909)100 GMO Pepabo Inc Citibank (153)200 GMO Pepabo Inc JP Morgan (818)100 Godo Steel Ltd JP Morgan (26)800 Goldcrest Co Ltd Citibank (238)900 Goldcrest Co Ltd HSBC 658
2,500 Goldcrest Co Ltd JP Morgan 2,374300 Goldwin Inc Citibank (501)200 Goldwin Inc JP Morgan (1,399)
1,700 Grace Technology Inc Citibank (657)200 Grace Technology Inc JP Morgan (1,142)
(5,700) Gree Inc JP Morgan 2,285(200) GS Yuasa Corp HSBC (156)
(1,700) GS Yuasa Corp JP Morgan (1,047)(1,500) GungHo Online Entertain-
ment Inc JP Morgan 1,203(38,500) Gunma Bank Ltd JP Morgan 10,444
(400) H.U. Group Holdings Inc Citibank 387(1,000) H.U. Group Holdings Inc JP Morgan 6,8702,200 Hachijuni Bank Ltd Citibank (193)2,100 Hachijuni Bank Ltd JP Morgan (377)
(6,700) Hakuhodo DY Holdings Inc JP Morgan 2,672400 Halows Co Ltd HSBC (996)700 Halows Co Ltd JP Morgan (1,774)400 Hamakyorex Co Ltd HSBC (644)400 Hamamatsu Photonics KK JP Morgan 791
(1,500) Hankyu Hanshin HoldingsInc JP Morgan 1,914
(5) Hankyu Hanshin Inc (REIT) HSBC 29(8) Hankyu Hanshin Inc (REIT) JP Morgan 98
1,600 Hanwa Co Ltd Citibank (2,077)700 Hanwa Co Ltd HSBC (2,385)300 Harmonic Drive Systems Inc Citibank 187100 Harmonic Drive Systems Inc HSBC (173)800 Harmonic Drive Systems Inc JP Morgan (7,969)
(500) Haseko Corp HSBC 204(10,900) Haseko Corp JP Morgan 3,269
(400) Hazama Ando Corp HSBC 179(14,700) Hazama Ando Corp JP Morgan 5,876
100 Heiwa Corp Citibank (67)1,100 Heiwa Corp JP Morgan (398)
(1) Heiwa Real Estate Inc(REIT) HSBC 6
(37) Heiwa Real Estate Inc(REIT) JP Morgan 386
1,600 Hibiya Engineering Ltd Citibank (1,198)400 Hibiya Engineering Ltd HSBC (460)
1,200 Hibiya Engineering Ltd JP Morgan (1,413)800 Hino Motors Ltd JP Morgan 354300 Hioki EE Corp HSBC (889)
(20,900) Hirogin Holdings Inc JP Morgan 7,651(200) Hirose Electric Co Ltd JP Morgan 116
(1,000) Hisamitsu PharmaceuticalCo Inc JP Morgan 5,700
(800) Hitachi Construction Ma-chinery Co Ltd JP Morgan 410
(1,300) Hitachi Ltd JP Morgan (3,542)(200) Hitachi Metals Ltd HSBC 49
(2,000) Hitachi Metals Ltd JP Morgan 5491,400 Hitachi Transport System
Ltd Citibank (253)100 Hitachi Transport System
Ltd HSBC 551,000 Hitachi Transport System
Ltd JP Morgan 92300 Hochiki Corp Citibank 11800 Hochiki Corp HSBC (714)100 Hodogaya Chemical Co Ltd JP Morgan 80
(4,100) Hokkaido Electric Power CoInc JP Morgan 1,545
Holding Description Counterparty
Netunrealised
appreciation/(depreciation)
USD
Japan continued200 Hokuhoku Financial Group
Inc Citibank (38)2,200 Hokuto Corp Citibank (1,219)1,600 Hokuto Corp JP Morgan (1,709)
(4,100) Honda Motor Co Ltd JP Morgan 547100 Horiba Ltd HSBC (16)100 Horiba Ltd JP Morgan 87500 Hoshizaki Corp JP Morgan (2,788)
(100) House Foods Group Inc HSBC 42(1,000) House Foods Group Inc JP Morgan 315
600 Hoya Corp JP Morgan 5,8273,300 Hulic Co Ltd Citibank (69)4,800 Hulic Co Ltd HSBC (1,773)
100 Hulic Co Ltd JP Morgan (44)(10) Hulic Reit Inc (REIT) JP Morgan (63)
(300) Hyakugo Bank Ltd Citibank 33(1,300) Hyakugo Bank Ltd HSBC 189
(17,000) Hyakugo Bank Ltd JP Morgan 2,193(100) Ibiden Co Ltd JP Morgan (143)300 IBJ Inc HSBC 346200 IBJ Inc JP Morgan 228
(100) Ichibanya Co Ltd HSBC 206(500) Ichibanya Co Ltd JP Morgan 892
(2,900) Ichikoh Industries Ltd JP Morgan 55100 Icom Inc JP Morgan (81)800 Idemitsu Kosan Co Ltd JP Morgan (1,830)
1,700 IDOM Inc JP Morgan (312)(1,100) IHI Corp JP Morgan (3,201)(3,200) Iida Group Holdings Co Ltd JP Morgan (1,719)(1,300) Iino Kaiun Kaisha Ltd JP Morgan 438
600 I’ll Inc Citibank (147)200 I’ll Inc HSBC (406)300 I’ll Inc JP Morgan (617)
1,100 Inaba Denki Sangyo Co Ltd Citibank (481)600 Inaba Denki Sangyo Co Ltd JP Morgan (487)
(3) Industrial & InfrastructureFund Investment Corp(REIT) HSBC 89
(43) Industrial & InfrastructureFund Investment Corp(REIT) JP Morgan 1,395
100 Infocom Corp Citibank (207)400 Infocom Corp JP Morgan (924)
1,100 Infomart Corp Citibank (64)9,000 Inpex Corp Citibank (1,173)1,700 Inpex Corp HSBC (336)4,700 Inpex Corp JP Morgan (2,917)
600 Insource Co Ltd Citibank (1,242)600 Insource Co Ltd HSBC (1,819)
1,500 Internet Initiative Japan Inc JP Morgan 7,591(100) IR Japan Holdings Ltd JP Morgan (493)
(1,200) Isetan Mitsukoshi HoldingsLtd HSBC 84
(6,000) Isetan Mitsukoshi HoldingsLtd JP Morgan (3,272)
3,400 Isuzu Motors Ltd JP Morgan 8,545300 ITmedia Inc Citibank (149)800 ITmedia Inc HSBC (854)900 ITmedia Inc JP Morgan (1,858)
(800) Ito En Ltd JP Morgan 1,764(6) Itochu Advance Logistics
Investment Corp (REIT) Citibank (51)(2) Itochu Advance Logistics
Investment Corp (REIT) JP Morgan (50)900 ITOCHU Corp Citibank (48)700 Itochu Enex Co Ltd Citibank (167)
1,400 Itochu Techno-SolutionsCorp JP Morgan (5,272)
200 Itochu-Shokuhin Co Ltd Citibank (155)700 Itochu-Shokuhin Co Ltd JP Morgan (960)
BlackRock Asia Pacific Diversified Equity Absolute ReturnFund continuedPortfolio of Investments as at 31 May 2021
The notes on pages 590 to 610 form an integral part of these financial statements.
Annual report and audited financial statements [193]

Holding Description Counterparty
Netunrealised
appreciation/(depreciation)
USD
Japan continued9,700 Itoham Yonekyu Holdings
Inc Citibank (2,573)3,500 Itoham Yonekyu Holdings
Inc HSBC (961)11,000 Itoham Yonekyu Holdings
Inc JP Morgan (3,136)600 Itokuro Inc HSBC 123600 Itokuro Inc JP Morgan 114
(4,400) IwaiCosmo Holdings Inc JP Morgan 4,641(1,800) Iwatani Corp JP Morgan 13,116(1,800) Iyo Bank Ltd JP Morgan 1,055(1,500) J Front Retailing Co Ltd HSBC 255(4,000) J Front Retailing Co Ltd JP Morgan (192)1,800 J Trust Co Ltd HSBC 7941,000 J Trust Co Ltd JP Morgan 4361,000 JAC Recruitment Co Ltd JP Morgan (180)
(1,000) Jaccs Co Ltd Citibank 847(500) JAFCO Group Co ltd JP Morgan (102)(200) Japan Airport Terminal Co
Ltd HSBC 65(500) Japan Airport Terminal Co
Ltd JP Morgan 197(3,000) Japan Aviation Electronics
Industry Ltd JP Morgan 4413,100 Japan Best Rescue System
Co Ltd Citibank (176)1,800 Japan Best Rescue System
Co Ltd HSBC (658)1,400 Japan Best Rescue System
Co Ltd JP Morgan (305)(17) Japan Excellent Inc (REIT) JP Morgan (883)
(1,800) Japan Exchange Group Inc JP Morgan 2,359(21) Japan Hotel Investment
Corp (REIT) JP Morgan (375)(2,400) Japan Lifeline Co Ltd JP Morgan 2,599
(38) Japan Logistics Fund Inc(REIT) JP Morgan 2,636
2,700 Japan Material Co Ltd Citibank 529800 Japan Material Co Ltd HSBC (128)800 Japan Material Co Ltd JP Morgan (209)
(6) Japan Metropolitan FundInvest (REIT) HSBC (77)
(58) Japan Metropolitan FundInvest (REIT) JP Morgan 369
(600) Japan Post Bank Co Ltd HSBC 655(14,500) Japan Post Bank Co Ltd JP Morgan 14,575
7,100 Japan Post Holdings Co Ltd Citibank (1,257)1,400 Japan Post Holdings Co Ltd JP Morgan (613)
(2,300) Japan Post Insurance CoLtd JP Morgan 2,661
(19) Japan Prime Realty Invest-ment Corp (REIT) JP Morgan 826
400 Japan Pulp & Paper Co Ltd Citibank (604)1,200 Japan Pulp & Paper Co Ltd HSBC (1,702)
500 Japan Pulp & Paper Co Ltd JP Morgan (736)(11) Japan Real Estate Invest-
ment Corp (REIT) JP Morgan 2,186(14,400) Japan Securities Finance
Co Ltd JP Morgan (7,699)(1,700) Japan Steel Works Ltd JP Morgan (425)
200 JBCC Holdings Inc Citibank (120)1,300 JBCC Holdings Inc HSBC (813)
200 JBCC Holdings Inc JP Morgan (129)500 JCR Pharmaceuticals Co
Ltd Citibank 216200 JCR Pharmaceuticals Co
Ltd JP Morgan 428(500) JDC Corp HSBC 180
(13,300) JDC Corp JP Morgan 5,8706,700 JFE Holdings Inc JP Morgan (17,360)
Holding Description Counterparty
Netunrealised
appreciation/(depreciation)
USD
Japan continued600 JGC Holdings Corp Citibank (166)900 JGC Holdings Corp JP Morgan (373)
1,000 JM Holdings Co Ltd Citibank (847)1,100 JM Holdings Co Ltd HSBC (818)2,100 JM Holdings Co Ltd JP Morgan (1,682)
100 JMDC Inc Citibank 322100 JMDC Inc HSBC 7700 J-Oil Mills Inc Citibank (346)
1,300 J-Oil Mills Inc JP Morgan (530)700 JSP Corp JP Morgan (595)
(600) JSR Corp JP Morgan 948500 JTEKT Corp Citibank (178)700 JTEKT Corp HSBC 223
(100) Juroku Bank Ltd HSBC 6(1,200) Juroku Bank Ltd JP Morgan 510
(400) Kagome Co Ltd JP Morgan 1,247(16,900) Kajima Corp JP Morgan 11,963
(100) Kakaku.com Inc Citibank (137)(200) Kakaku.com Inc HSBC (283)
(2,300) Kakaku.com Inc JP Morgan (6,217)(700) Kaken Pharmaceutical Co
Ltd JP Morgan 673500 Kamei Corp Citibank (197)800 Kamei Corp JP Morgan (110)800 Kamigumi Co Ltd Citibank (499)
3,400 Kamigumi Co Ltd JP Morgan (2,451)2,300 Kanamic Network Co Ltd Citibank 5171,500 Kanamic Network Co Ltd HSBC 492,600 Kanamic Network Co Ltd JP Morgan 862
700 Kandenko Co Ltd HSBC (186)500 Kandenko Co Ltd JP Morgan (26)
(1,200) Kaneka Corp JP Morgan 484(9,200) Kansai Electric Power Co
Inc JP Morgan 5,947300 Kansai Paint Co Ltd Citibank 283
3,900 Kansai Paint Co Ltd JP Morgan 4,0241,500 Kansai Super Market Ltd Citibank (52)
200 Kansai Super Market Ltd JP Morgan (123)(5,900) Kanto Denka Kogyo Co Ltd JP Morgan (3,234)2,200 Kao Corp Citibank (5,073)
300 Kao Corp HSBC (942)600 Kao Corp JP Morgan (1,943)300 Kaonavi Inc JP Morgan 1,950
4,600 Kasai Kogyo Co Ltd HSBC (3,395)1,000 Kasai Kogyo Co Ltd JP Morgan (745)(100) Katakura Industries Co Ltd JP Morgan (48)
1,300 Katitas Co Ltd JP Morgan (3,771)800 Kato Sangyo Co Ltd Citibank (240)200 Kato Sangyo Co Ltd HSBC (78)800 Kato Sangyo Co Ltd JP Morgan (348)
(1,500) Kawasaki Heavy IndustriesLtd JP Morgan 2,774
(700) Kawasaki Kisen Kaisha Ltd JP Morgan (1,211)(3,100) KDDI Corp JP Morgan (6,869)2,900 Keihan Holdings Co Ltd Citibank 4,2521,400 Keihan Holdings Co Ltd JP Morgan (16)1,200 Keihanshin Building Co Ltd Citibank 283
100 Keihanshin Building Co Ltd JP Morgan (163)2,700 Keikyu Corp Citibank 1,1723,500 Keikyu Corp JP Morgan (513)(800) Keio Corp JP Morgan 3,513
(5,800) Keiyo Co Ltd JP Morgan 8(5) Kenedix Office Investment
Corp (REIT) JP Morgan (554)300 Kewpie Corp Citibank (137)
(100) Key Coffee Inc HSBC 4(3,600) Key Coffee Inc JP Morgan 451
600 Keyence Corp JP Morgan (819)300 Kikkoman Corp Citibank 912
BlackRock Asia Pacific Diversified Equity Absolute ReturnFund continuedPortfolio of Investments as at 31 May 2021
The notes on pages 590 to 610 form an integral part of these financial statements.
BlackRock Strategic Funds[194]
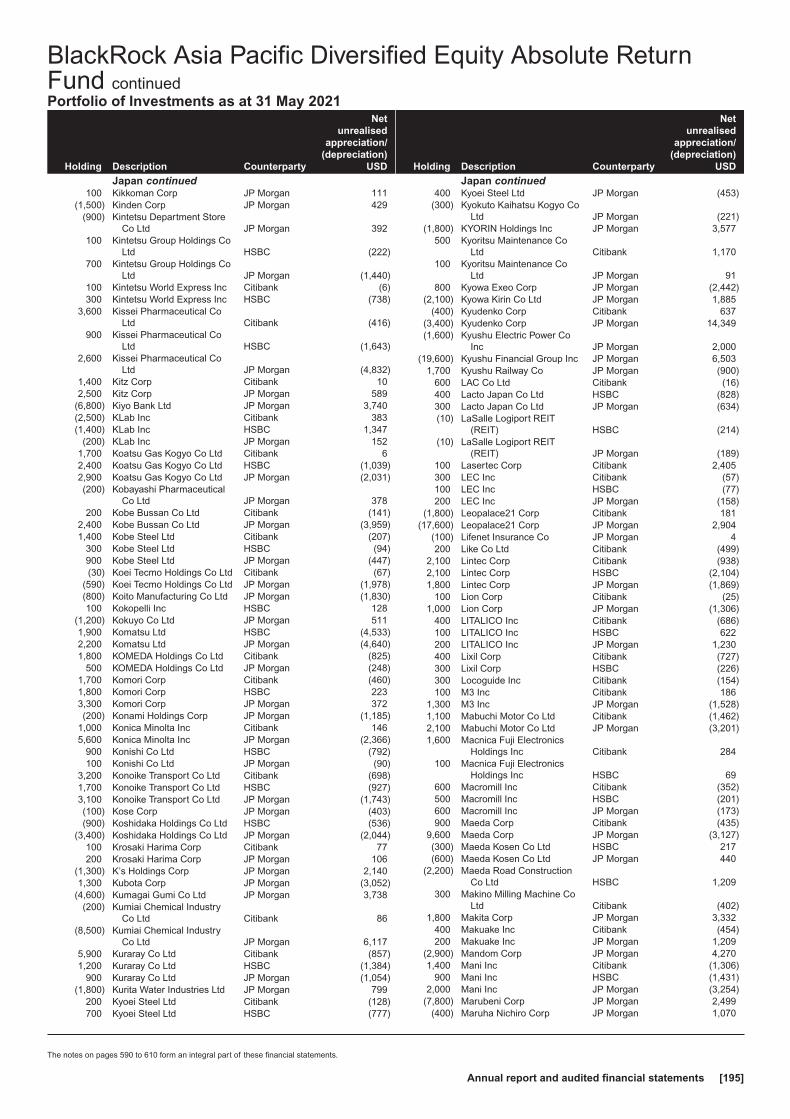
Holding Description Counterparty
Netunrealised
appreciation/(depreciation)
USD
Japan continued100 Kikkoman Corp JP Morgan 111
(1,500) Kinden Corp JP Morgan 429(900) Kintetsu Department Store
Co Ltd JP Morgan 392100 Kintetsu Group Holdings Co
Ltd HSBC (222)700 Kintetsu Group Holdings Co
Ltd JP Morgan (1,440)100 Kintetsu World Express Inc Citibank (6)300 Kintetsu World Express Inc HSBC (738)
3,600 Kissei Pharmaceutical CoLtd Citibank (416)
900 Kissei Pharmaceutical CoLtd HSBC (1,643)
2,600 Kissei Pharmaceutical CoLtd JP Morgan (4,832)
1,400 Kitz Corp Citibank 102,500 Kitz Corp JP Morgan 589
(6,800) Kiyo Bank Ltd JP Morgan 3,740(2,500) KLab Inc Citibank 383(1,400) KLab Inc HSBC 1,347
(200) KLab Inc JP Morgan 1521,700 Koatsu Gas Kogyo Co Ltd Citibank 62,400 Koatsu Gas Kogyo Co Ltd HSBC (1,039)2,900 Koatsu Gas Kogyo Co Ltd JP Morgan (2,031)(200) Kobayashi Pharmaceutical
Co Ltd JP Morgan 378200 Kobe Bussan Co Ltd Citibank (141)
2,400 Kobe Bussan Co Ltd JP Morgan (3,959)1,400 Kobe Steel Ltd Citibank (207)
300 Kobe Steel Ltd HSBC (94)900 Kobe Steel Ltd JP Morgan (447)(30) Koei Tecmo Holdings Co Ltd Citibank (67)
(590) Koei Tecmo Holdings Co Ltd JP Morgan (1,978)(800) Koito Manufacturing Co Ltd JP Morgan (1,830)100 Kokopelli Inc HSBC 128
(1,200) Kokuyo Co Ltd JP Morgan 5111,900 Komatsu Ltd HSBC (4,533)2,200 Komatsu Ltd JP Morgan (4,640)1,800 KOMEDA Holdings Co Ltd Citibank (825)
500 KOMEDA Holdings Co Ltd JP Morgan (248)1,700 Komori Corp Citibank (460)1,800 Komori Corp HSBC 2233,300 Komori Corp JP Morgan 372(200) Konami Holdings Corp JP Morgan (1,185)
1,000 Konica Minolta Inc Citibank 1465,600 Konica Minolta Inc JP Morgan (2,366)
900 Konishi Co Ltd HSBC (792)100 Konishi Co Ltd JP Morgan (90)
3,200 Konoike Transport Co Ltd Citibank (698)1,700 Konoike Transport Co Ltd HSBC (927)3,100 Konoike Transport Co Ltd JP Morgan (1,743)(100) Kose Corp JP Morgan (403)(900) Koshidaka Holdings Co Ltd HSBC (536)
(3,400) Koshidaka Holdings Co Ltd JP Morgan (2,044)100 Krosaki Harima Corp Citibank 77200 Krosaki Harima Corp JP Morgan 106
(1,300) K’s Holdings Corp JP Morgan 2,1401,300 Kubota Corp JP Morgan (3,052)
(4,600) Kumagai Gumi Co Ltd JP Morgan 3,738(200) Kumiai Chemical Industry
Co Ltd Citibank 86(8,500) Kumiai Chemical Industry
Co Ltd JP Morgan 6,1175,900 Kuraray Co Ltd Citibank (857)1,200 Kuraray Co Ltd HSBC (1,384)
900 Kuraray Co Ltd JP Morgan (1,054)(1,800) Kurita Water Industries Ltd JP Morgan 799
200 Kyoei Steel Ltd Citibank (128)700 Kyoei Steel Ltd HSBC (777)
Holding Description Counterparty
Netunrealised
appreciation/(depreciation)
USD
Japan continued400 Kyoei Steel Ltd JP Morgan (453)
(300) Kyokuto Kaihatsu Kogyo CoLtd JP Morgan (221)
(1,800) KYORIN Holdings Inc JP Morgan 3,577500 Kyoritsu Maintenance Co
Ltd Citibank 1,170100 Kyoritsu Maintenance Co
Ltd JP Morgan 91800 Kyowa Exeo Corp JP Morgan (2,442)
(2,100) Kyowa Kirin Co Ltd JP Morgan 1,885(400) Kyudenko Corp Citibank 637
(3,400) Kyudenko Corp JP Morgan 14,349(1,600) Kyushu Electric Power Co
Inc JP Morgan 2,000(19,600) Kyushu Financial Group Inc JP Morgan 6,503
1,700 Kyushu Railway Co JP Morgan (900)600 LAC Co Ltd Citibank (16)400 Lacto Japan Co Ltd HSBC (828)300 Lacto Japan Co Ltd JP Morgan (634)(10) LaSalle Logiport REIT
(REIT) HSBC (214)(10) LaSalle Logiport REIT
(REIT) JP Morgan (189)100 Lasertec Corp Citibank 2,405300 LEC Inc Citibank (57)100 LEC Inc HSBC (77)200 LEC Inc JP Morgan (158)
(1,800) Leopalace21 Corp Citibank 181(17,600) Leopalace21 Corp JP Morgan 2,904
(100) Lifenet Insurance Co JP Morgan 4200 Like Co Ltd Citibank (499)
2,100 Lintec Corp Citibank (938)2,100 Lintec Corp HSBC (2,104)1,800 Lintec Corp JP Morgan (1,869)
100 Lion Corp Citibank (25)1,000 Lion Corp JP Morgan (1,306)
400 LITALICO Inc Citibank (686)100 LITALICO Inc HSBC 622200 LITALICO Inc JP Morgan 1,230400 Lixil Corp Citibank (727)300 Lixil Corp HSBC (226)300 Locoguide Inc Citibank (154)100 M3 Inc Citibank 186
1,300 M3 Inc JP Morgan (1,528)1,100 Mabuchi Motor Co Ltd Citibank (1,462)2,100 Mabuchi Motor Co Ltd JP Morgan (3,201)1,600 Macnica Fuji Electronics
Holdings Inc Citibank 284100 Macnica Fuji Electronics
Holdings Inc HSBC 69600 Macromill Inc Citibank (352)500 Macromill Inc HSBC (201)600 Macromill Inc JP Morgan (173)900 Maeda Corp Citibank (435)
9,600 Maeda Corp JP Morgan (3,127)(300) Maeda Kosen Co Ltd HSBC 217(600) Maeda Kosen Co Ltd JP Morgan 440
(2,200) Maeda Road ConstructionCo Ltd HSBC 1,209
300 Makino Milling Machine CoLtd Citibank (402)
1,800 Makita Corp JP Morgan 3,332400 Makuake Inc Citibank (454)200 Makuake Inc JP Morgan 1,209
(2,900) Mandom Corp JP Morgan 4,2701,400 Mani Inc Citibank (1,306)
900 Mani Inc HSBC (1,431)2,000 Mani Inc JP Morgan (3,254)
(7,800) Marubeni Corp JP Morgan 2,499(400) Maruha Nichiro Corp JP Morgan 1,070
BlackRock Asia Pacific Diversified Equity Absolute ReturnFund continuedPortfolio of Investments as at 31 May 2021
The notes on pages 590 to 610 form an integral part of these financial statements.
Annual report and audited financial statements [195]

Holding Description Counterparty
Netunrealised
appreciation/(depreciation)
USD
Japan continued(800) Marui Group Co Ltd JP Morgan 239
2,300 Maruichi Steel Tube Ltd JP Morgan (3,476)(400) Marusan Securities Co Ltd Citibank 39
(1,300) Marusan Securities Co Ltd HSBC (194)2,600 Maruwa Unyu Kikan Co Ltd Citibank (2,640)
500 Maruwa Unyu Kikan Co Ltd HSBC (1,870)1,400 Maruwa Unyu Kikan Co Ltd JP Morgan (5,275)(100) Matsuda Sangyo Co Ltd HSBC 138
(2,300) Matsuda Sangyo Co Ltd JP Morgan 3,376(3,400) Matsui Securities Co Ltd JP Morgan 1,477
(400) Matsumotokiyoshi HoldingsCo Ltd HSBC 15
(100) Matsuyafoods Holdings CoLtd JP Morgan (5)
800 Max Co Ltd Citibank (41)800 Max Co Ltd HSBC (14)
1,100 Max Co Ltd JP Morgan 91200 Maxvalu Tokai Co Ltd Citibank (64)
(300) McDonald’s Holdings CoJapan Ltd JP Morgan 259
(10,300) Mebuki Financial Group Inc JP Morgan 1,829300 MEC Co Ltd Citibank 112500 Medipal Holdings Corp Citibank (34)100 Medley Inc Citibank 279100 Megachips Corp Citibank (122)900 Megmilk Snow Brand Co
Ltd Citibank (1,079)(200) MEIJI Holdings Co Ltd JP Morgan 263(100) Meiko Electronics Co Ltd Citibank (155)(700) Meiko Electronics Co Ltd HSBC (2,408)
2,400 Meiko Network Japan CoLtd Citibank (418)
4,100 Meiko Network Japan CoLtd HSBC (632)
400 Meiko Network Japan CoLtd JP Morgan (65)
600 Meisei Industrial Co Ltd Citibank (127)400 Meisei Industrial Co Ltd HSBC (214)
(100) Meitec Corp JP Morgan (111)400 Menicon Co Ltd Citibank (2,230)300 Menicon Co Ltd JP Morgan (213)
(600) Mercari Inc JP Morgan (309)300 METAWATER Co Ltd Citibank 207100 Milbon Co Ltd Citibank (68)600 Milbon Co Ltd JP Morgan 585
(4,600) MINEBEA MITSUMI Inc JP Morgan (3,635)(100) Ministop Co Ltd HSBC 47800 Miroku Jyoho Service Co
Ltd Citibank (794)800 MISUMI Group Inc JP Morgan 114500 Mitsuba Corp JP Morgan 1,078900 Mitsubishi Corp JP Morgan (466)
2,600 Mitsubishi Electric Corp JP Morgan (493)2,300 Mitsubishi Estate Co Ltd Citibank (679)1,700 Mitsubishi Estate Co Ltd HSBC (1,777)
200 Mitsubishi Estate Co Ltd JP Morgan (104)(1) Mitsubishi Estate Logistics
Investment Corp (REIT) HSBC (7)(30) Mitsubishi Estate Logistics
Investment Corp (REIT) JP Morgan (152)(2,100) Mitsubishi Gas Chemical Co
Inc JP Morgan 1,683(2,180) Mitsubishi HC Capital Inc Citibank 905(7,600) Mitsubishi HC Capital Inc JP Morgan 3,001
300 Mitsubishi Heavy IndustriesLtd Citibank (148)
1,800 Mitsubishi Heavy IndustriesLtd JP Morgan (2,015)
100 Mitsubishi Logistics Corp Citibank (145)100 Mitsubishi Logistics Corp HSBC (1)
Holding Description Counterparty
Netunrealised
appreciation/(depreciation)
USD
Japan continued500 Mitsubishi Logistics Corp JP Morgan (685)
1,200 Mitsubishi Materials Corp Citibank 3974,100 Mitsubishi Materials Corp JP Morgan (16,494)
(11,200) Mitsubishi Motors Corp JP Morgan 1,030500 Mitsubishi Pencil Co Ltd Citibank (358)100 Mitsubishi Pencil Co Ltd HSBC (57)500 Mitsubishi Pencil Co Ltd JP Morgan (295)200 Mitsubishi Research Insti-
tute Inc Citibank (683)(500) Mitsubishi Shokuhin Co Ltd JP Morgan 796
(28,700) Mitsubishi UFJ FinancialGroup Inc JP Morgan (1,592)
1,800 Mitsuboshi Belting Ltd Citibank (580)1,400 Mitsuboshi Belting Ltd HSBC 100
100 Mitsuboshi Belting Ltd JP Morgan 83,700 Mitsui & Co Ltd JP Morgan (5,084)2,100 Mitsui DM Sugar Holdings
Co Ltd Citibank (724)1,300 Mitsui DM Sugar Holdings
Co Ltd HSBC (670)3,000 Mitsui DM Sugar Holdings
Co Ltd JP Morgan (1,626)(5,000) Mitsui E&S Holdings Co Ltd JP Morgan 4,967
(12) Mitsui Fudosan LogisticsPark Inc (REIT) JP Morgan (165)
100 Mitsui High-Tec Inc Citibank (49)500 Mitsui Mining & Smelting Co
Ltd JP Morgan (4,038)(1,000) Mitsui OSK Lines Ltd JP Morgan 3,0222,200 Mitsui-Soko Holdings Co Ltd Citibank (1,429)1,100 Mitsui-Soko Holdings Co Ltd JP Morgan (1,108)
(1,700) Mitsuuroko Group HoldingsCo Ltd JP Morgan 2,410
(3,100) Mizuho Financial Group Inc JP Morgan 1,237(400) Mochida Pharmaceutical Co
Ltd JP Morgan 1,492200 Modalis Therapeutics Corp Citibank (104)200 Modalis Therapeutics Corp HSBC (45)
(500) Modec Inc HSBC 816(1,400) Modec Inc JP Morgan 2,332(1,100) Monex Group Inc JP Morgan 1,115
(400) Money Forward Inc JP Morgan (1,404)800 MonotaRO Co Ltd Citibank 217800 MonotaRO Co Ltd HSBC (213)
2,800 MonotaRO Co Ltd JP Morgan (849)(35) Mori Hills Investment Corp
(REIT) JP Morgan 305(1,000) Morinaga & Co Ltd JP Morgan 3,713
(100) Morinaga Milk Industry CoLtd HSBC 613
(1,800) Morinaga Milk Industry CoLtd JP Morgan 11,200
1,600 Morita Holdings Corp Citibank (1,728)300 Morita Holdings Corp HSBC (220)400 Morita Holdings Corp JP Morgan (309)
1,100 MS&AD Insurance GroupHoldings Inc JP Morgan 998
700 Murata Manufacturing CoLtd JP Morgan (3,231)
(100) Musashino Bank Ltd Citibank 60(500) Musashino Bank Ltd HSBC 195
(3,100) Musashino Bank Ltd JP Morgan 944(2,400) Nabtesco Corp JP Morgan 1,530
500 Nachi-Fujikoshi Corp Citibank (729)200 Nachi-Fujikoshi Corp HSBC (422)500 Nachi-Fujikoshi Corp JP Morgan (954)
(1,100) Nafco Co Ltd JP Morgan 2,380100 Nagaileben Co Ltd Citibank (71)100 Nagaileben Co Ltd HSBC (20)
1,300 Nagaileben Co Ltd JP Morgan (302)
BlackRock Asia Pacific Diversified Equity Absolute ReturnFund continuedPortfolio of Investments as at 31 May 2021
The notes on pages 590 to 610 form an integral part of these financial statements.
BlackRock Strategic Funds[196]

Holding Description Counterparty
Netunrealised
appreciation/(depreciation)
USD
Japan continued400 Nagase & Co Ltd Citibank (224)200 Nagase & Co Ltd HSBC (120)200 Nagase & Co Ltd JP Morgan (22)
1,100 Nagatanien Holdings Co Ltd JP Morgan (1,290)1,000 Nagoya Railroad Co Ltd JP Morgan 1,056
(2,400) Nankai Electric Railway CoLtd JP Morgan 1,436
(100) Nanto Bank Ltd HSBC 36(2,600) Nanto Bank Ltd JP Morgan 568
500 NEC Corp Citibank (402)600 NEC Corp JP Morgan (748)
(1,100) NEC Networks & SystemIntegration Corp JP Morgan 1,613
200 NEOJAPAN Inc Citibank (164)400 NEOJAPAN Inc JP Morgan (377)100 NET One Systems Co Ltd Citibank (159)400 NET One Systems Co Ltd HSBC (395)200 NET One Systems Co Ltd JP Morgan (138)
2,000 Neturen Co Ltd Citibank (107)2,300 Neturen Co Ltd JP Morgan (666)(600) Nexon Co Ltd JP Morgan 4,318
(1,700) NGK Insulators Ltd JP Morgan 2,2834,400 NGK Spark Plug Co Ltd Citibank 1,353
900 NGK Spark Plug Co Ltd HSBC 155,800 NGK Spark Plug Co Ltd JP Morgan 772(800) NH Foods Ltd JP Morgan 2,615
1,700 NHK Spring Co Ltd Citibank 6861,600 NHK Spring Co Ltd HSBC 7622,900 NHK Spring Co Ltd JP Morgan 1,347(100) Nichias Corp HSBC 273(300) Nichias Corp JP Morgan 831
1,100 Nichiha Corp JP Morgan (3,956)(1,100) Nichi-iko Pharmaceutical Co
Ltd JP Morgan 1,100400 Nichireki Co Ltd HSBC (328)700 Nidec Corp JP Morgan (534)400 Nifco Inc Citibank (425)200 Nifco Inc HSBC (287)
1,000 Nifco Inc JP Morgan (811)1,800 Nihon Chouzai Co Ltd Citibank (3,124)
300 Nihon Jyoho Create Co Ltd JP Morgan (899)100 Nihon Kohden Corp HSBC (235)900 Nihon Kohden Corp JP Morgan (2,105)
1,100 Nihon M&A Center Inc Citibank (1,116)500 Nihon M&A Center Inc HSBC (794)
3,000 Nihon M&A Center Inc JP Morgan (2,492)(2,300) Nihon Nohyaku Co Ltd JP Morgan 1,2521,600 Nihon Parkerizing Co Ltd Citibank (845)
600 Nihon Parkerizing Co Ltd HSBC (17)1,600 Nihon Parkerizing Co Ltd JP Morgan (69)
100 Nihon Unisys Ltd Citibank (71)2,300 Nikkon Holdings Co Ltd JP Morgan (590)(600) Nikon Corp HSBC 22(700) Nikon Corp JP Morgan 38100 Nintendo Co Ltd JP Morgan 6,560
4,100 Nippn Corp Citibank (725)1,900 Nippn Corp JP Morgan (1,229)(200) Nippo Corp Citibank 221(100) Nippo Corp HSBC 92
(5,300) Nippo Corp JP Morgan 4,8492 Nippon Accommodations
Fund Inc (REIT) HSBC (96)(1) Nippon Building Fund Inc
(REIT) HSBC 117(26) Nippon Building Fund Inc
(REIT) JP Morgan 3,194(100) Nippon Carbon Co Ltd HSBC 672(100) Nippon Carbon Co Ltd JP Morgan 679500 Nippon Chemi-Con Corp Citibank 1,907
(13,800) Nippon Denko Co Ltd JP Morgan 7,826
Holding Description Counterparty
Netunrealised
appreciation/(depreciation)
USD
Japan continued200 Nippon Electric Glass Co
Ltd JP Morgan (364)(100) Nippon Express Co Ltd HSBC 23
(1,100) Nippon Express Co Ltd JP Morgan 1,996800 Nippon Gas Co Ltd Citibank (997)
1,000 Nippon Gas Co Ltd HSBC (1,968)1,800 Nippon Gas Co Ltd JP Morgan (3,319)(800) Nippon Kayaku Co Ltd Citibank 191
(7,100) Nippon Kayaku Co Ltd JP Morgan 2,991(2,500) Nippon Koei Co Ltd JP Morgan (596)1,200 Nippon Light Metal Holdings
Co Ltd Citibank (322)100 Nippon Light Metal Holdings
Co Ltd HSBC (423)270 Nippon Light Metal Holdings
Co Ltd JP Morgan (1,150)500 Nippon Paint Holdings Co
Ltd HSBC 1792,500 Nippon Paint Holdings Co
Ltd JP Morgan (4,249)5,600 Nippon Paper Industries Co
Ltd Citibank (3,801)9,700 Nippon Paper Industries Co
Ltd JP Morgan (14,891)(10) Nippon Prologis Inc (REIT) JP Morgan 1,090
(100) Nippon Road Co Ltd JP Morgan 22100 Nippon Sanso Holdings
Corp Citibank (72)500 Nippon Seiki Co Ltd Citibank (237)200 Nippon Seiki Co Ltd HSBC (208)
1,400 Nippon Seiki Co Ltd JP Morgan (1,482)(100) Nippon Sharyo Ltd Citibank (22)(700) Nippon Sharyo Ltd HSBC 1,777
(6,200) Nippon Sheet Glass Co Ltd JP Morgan 9,709100 Nippon Shinyaku Co Ltd Citibank 6900 Nippon Shinyaku Co Ltd JP Morgan 3,147300 Nippon Shokubai Co Ltd Citibank (216)100 Nippon Shokubai Co Ltd HSBC (392)
(2,800) Nippon Signal Company Ltd JP Morgan 8051,300 Nippon Steel Corp Citibank (891)
100 Nippon Steel Corp HSBC (223)1,300 Nippon Steel Corp JP Morgan (2,455)
400 Nippon Steel Trading Corp Citibank (825)700 Nippon Steel Trading Corp HSBC (2,707)
1,800 Nippon Steel Trading Corp JP Morgan (5,770)(12,400) Nippon Suisan Kaisha Ltd JP Morgan 3,717
1,100 Nippon Telegraph & Tele-phone Corp Citibank (88)
700 Nippon Telegraph & Tele-phone Corp HSBC 343
1,100 Nippon Telegraph & Tele-phone Corp JP Morgan 494
(6,800) Nippon Thompson Co Ltd JP Morgan 5,685600 Nippon Yakin Kogyo Co Ltd HSBC (885)
2,000 Nippon Yakin Kogyo Co Ltd JP Morgan (4,288)600 Nippon Yusen KK JP Morgan 308
(6,600) Nipro Corp JP Morgan 3,349(100) Nishimatsu Construction Co
Ltd Citibank 44(6,100) Nishimatsu Construction Co
Ltd JP Morgan (20,642)900 Nishi-Nippon Financial
Holdings Inc HSBC (534)1,900 Nishi-Nippon Financial
Holdings Inc JP Morgan (1,148)(3,100) Nishi-Nippon Railroad Co
Ltd JP Morgan 4,332200 Nissan Chemical Corp Citibank (329)
1,200 Nissan Chemical Corp JP Morgan (4,041)1,100 Nissha Co Ltd Citibank (520)
BlackRock Asia Pacific Diversified Equity Absolute ReturnFund continuedPortfolio of Investments as at 31 May 2021
The notes on pages 590 to 610 form an integral part of these financial statements.
Annual report and audited financial statements [197]

Holding Description Counterparty
Netunrealised
appreciation/(depreciation)
USD
Japan continued1,200 Nissha Co Ltd HSBC 1,9362,900 Nissha Co Ltd JP Morgan 4,622
800 Nisshin Oillio Group Ltd JP Morgan (1,226)(700) Nisshin Seifun Group Inc JP Morgan 1,393
7,400 Nisshinbo Holdings Inc Citibank (2,666)200 Nissin Corp Citibank (70)400 Nissin Foods Holdings Co
Ltd Citibank (494)300 Nitori Holdings Co Ltd Citibank (1,078)200 Nitori Holdings Co Ltd HSBC (701)400 Nitori Holdings Co Ltd JP Morgan (3,430)
(100) Nittetsu Mining Co Ltd HSBC 636(400) Nittetsu Mining Co Ltd JP Morgan 2,584400 Nitto Denko Corp Citibank 116200 Nitto Denko Corp HSBC (1,122)200 Nitto Denko Corp JP Morgan (1,148)600 Nitto Kogyo Corp Citibank (431)400 Nitto Kogyo Corp HSBC (841)
1,800 Nitto Kogyo Corp JP Morgan (3,836)900 Nitto Kohki Co Ltd Citibank (710)100 Nitto Kohki Co Ltd HSBC (100)
(300) Noevir Holdings Co Ltd JP Morgan (361)(500) NOF Corp JP Morgan 2,467
2,400 NOK Corp Citibank (1,240)2,100 NOK Corp JP Morgan (2,325)
200 Nomura Co Ltd Citibank (19)200 Nomura Co Ltd JP Morgan 55
1,600 Nomura Holdings Inc HSBC 229(200) Nomura Micro Science Co
Ltd Citibank (501)(700) Nomura Micro Science Co
Ltd JP Morgan 929(600) Nomura Real Estate Hold-
ings Inc JP Morgan 422(1) Nomura Real Estate Master
Fund Inc (REIT) Citibank 25(2) Nomura Real Estate Master
Fund Inc (REIT) HSBC (7)(17) Nomura Real Estate Master
Fund Inc (REIT) JP Morgan (16)1,200 Nomura Research Institute
Ltd Citibank 5621,300 Nomura Research Institute
Ltd HSBC 971100 Noritake Co Ltd/Nagoya Ja-
pan Citibank (30)100 Noritake Co Ltd/Nagoya Ja-
pan HSBC (55)200 Noritake Co Ltd/Nagoya Ja-
pan JP Morgan 9(1,000) Noritsu Koki Co Ltd JP Morgan 2,4161,400 Noritz Corp Citibank (1,455)
700 Noritz Corp HSBC 1,134600 Noritz Corp JP Morgan 957
(62,900) North Pacific Bank Ltd JP Morgan 29,572(300) NS Solutions Corp JP Morgan 446300 NS United Kaiun Kaisha Ltd HSBC (801)
2,300 NS United Kaiun Kaisha Ltd JP Morgan (6,222)300 NSK Ltd Citibank (7)
4,500 NSK Ltd JP Morgan 7432,700 NTN Corp Citibank (300)4,800 NTN Corp JP Morgan (879)
100 NTT Data Corp Citibank 20100 NTT Data Corp JP Morgan (8)100 Obara Group Inc Citibank 3600 Obara Group Inc HSBC (229)500 Obara Group Inc JP Morgan (218)
(15,200) Obayashi Corp JP Morgan 14,332700 OBIC Business Consultants
Co Ltd Citibank (1,429)
Holding Description Counterparty
Netunrealised
appreciation/(depreciation)
USD
Japan continued100 OBIC Business Consultants
Co Ltd HSBC (367)200 OBIC Business Consultants
Co Ltd JP Morgan (127)300 Obic Co Ltd JP Morgan 991
(5,200) Odakyu Electric Railway CoLtd JP Morgan 9,518
300 Oiles Corp HSBC (256)1,200 Oiles Corp JP Morgan (922)
(11,400) Oji Holdings Corp JP Morgan 12,408300 Oki Electric Industry Co Ltd Citibank (123)500 Oki Electric Industry Co Ltd HSBC (1,044)
(700) Okinawa Cellular TelephoneCo HSBC (246)
300 OKUMA Corp Citibank (312)400 OKUMA Corp HSBC (404)100 OKUMA Corp JP Morgan (8)
1,200 Okuwa Co Ltd Citibank (459)100 Okuwa Co Ltd HSBC (68)600 Okuwa Co Ltd JP Morgan (419)
4,200 Olympus Corp JP Morgan 1,8942,000 Omron Corp JP Morgan 101
(3,700) Onward Holdings Co Ltd JP Morgan 63(1,100) Open Door Inc Citibank (3,585)
(600) Open House Co Ltd JP Morgan (2,764)100 Optex Group Co Ltd Citibank 3400 Optex Group Co Ltd JP Morgan 501
(2,500) Optorun Co Ltd JP Morgan 3,168100 Oracle Corp Japan Citibank (467)300 Oracle Corp Japan JP Morgan (2,702)
(100) Organo Corp JP Morgan 951(19,500) Orient Corp Citibank 1,442(91,100) Orient Corp JP Morgan (2,937)
(600) Oriental Land Co Ltd JP Morgan (4,892)(500) ORIX Corp HSBC (27)
(15,400) ORIX Corp JP Morgan (11,416)(73) Orix JREIT Inc (REIT) JP Morgan (6,593)
1,500 Osaka Gas Co Ltd HSBC (1,476)600 Osaka Gas Co Ltd JP Morgan (50)300 Osaka Organic Chemical
Industry Ltd JP Morgan (152)400 Osaka Soda Co Ltd Citibank (319)400 Osaka Soda Co Ltd JP Morgan (546)
1,800 Osaka Steel Co Ltd Citibank (1,385)300 Osaka Steel Co Ltd HSBC (793)
2,100 Osaka Steel Co Ltd JP Morgan (4,390)2,700 OSAKA Titanium Technolo-
gies Co Ltd Citibank 677900 OSAKA Titanium Technolo-
gies Co Ltd HSBC (2,051)1,100 OSAKA Titanium Technolo-
gies Co Ltd JP Morgan (2,524)800 OSG Corp Citibank (427)400 OSG Corp HSBC (462)
1,600 OSG Corp JP Morgan (1,775)1,000 Outsourcing Inc HSBC 9231,000 Pack Corp JP Morgan (1,049)
200 PALTAC Corp HSBC 464200 PALTAC Corp JP Morgan 448
1,300 Pan Pacific InternationalHoldings Corp HSBC (2,664)
1,000 Panasonic Corp Citibank 5144,200 Panasonic Corp JP Morgan (2,156)1,000 Paramount Bed Holdings Co
Ltd Citibank (614)200 Paramount Bed Holdings Co
Ltd HSBC (463)(700) Park24 Co Ltd JP Morgan (217)
1,700 Pasona Group Inc Citibank (110)1,100 Pasona Group Inc JP Morgan (467)
BlackRock Asia Pacific Diversified Equity Absolute ReturnFund continuedPortfolio of Investments as at 31 May 2021
The notes on pages 590 to 610 form an integral part of these financial statements.
BlackRock Strategic Funds[198]

Holding Description Counterparty
Netunrealised
appreciation/(depreciation)
USD
Japan continued600 PC Depot Corp Citibank (143)800 PC Depot Corp HSBC (211)200 PC Depot Corp JP Morgan (54)
(16,700) Penta-Ocean ConstructionCo Ltd JP Morgan 13,160
200 PeptiDream Inc Citibank 312100 PeptiDream Inc HSBC 200500 PeptiDream Inc JP Morgan 1,469900 Persol Holdings Co Ltd Citibank (93)
1,600 Persol Holdings Co Ltd JP Morgan (934)4,000 Pigeon Corp Citibank (11,250)
100 Pigeon Corp HSBC (589)3,400 Pigeon Corp JP Morgan (18,681)1,400 Pilot Corp JP Morgan (2,624)
800 Piolax Inc Citibank (257)800 Piolax Inc HSBC (530)
2,000 Piolax Inc JP Morgan (1,369)1,000 Poletowin Pitcrew Holdings
Inc JP Morgan (898)500 PR Times Inc Citibank (172)200 PR Times Inc HSBC (225)400 PR Times Inc JP Morgan 269
4,500 Press Kogyo Co Ltd Citibank (216)2,800 Press Kogyo Co Ltd HSBC (77)1,100 Press Kogyo Co Ltd JP Morgan 3
200 Pressance Corp Citibank (185)600 Pressance Corp JP Morgan (289)
(300) Prima Meat Packers Ltd JP Morgan 7121,800 Proto Corp Citibank (777)
800 Proto Corp HSBC (262)2,200 Proto Corp JP Morgan (758)(300) QD Laser Inc JP Morgan (265)(200) Raccoon Holdings Inc Citibank 523(400) Raccoon Holdings Inc JP Morgan 1,969(100) Raito Kogyo Co Ltd JP Morgan 71
(8,900) Raiznext Corp JP Morgan 4,284100 Raksul Inc Citibank 112300 Raksul Inc HSBC (659)200 Raksul Inc JP Morgan (453)300 Rakus Co Ltd Citibank 17
1,300 Rakus Co Ltd JP Morgan (741)1,000 Raysum Co Ltd Citibank 260
600 Raysum Co Ltd HSBC (71)600 Raysum Co Ltd JP Morgan (78)
1,800 Recruit Holdings Co Ltd JP Morgan 4,0381,400 Relo Group Inc Citibank (956)2,100 Relo Group Inc JP Morgan 1,7801,400 Renesas Electronics Corp HSBC (1,754)4,600 Renesas Electronics Corp JP Morgan (5,844)
(7,300) Rengo Co Ltd JP Morgan 3,766(1,600) ReproCELL Inc JP Morgan 186
(200) Resona Holdings Inc Citibank 27(4,000) Resona Holdings Inc HSBC 572
(34,606) Resona Holdings Inc JP Morgan 2,247100 Resorttrust Inc JP Morgan 45500 Ricoh Co Ltd HSBC 254
1,100 Ricoh Co Ltd JP Morgan 475(200) Ringer Hut Co Ltd Citibank 59(700) Ringer Hut Co Ltd JP Morgan 200(100) Rinnai Corp HSBC 624(500) Rinnai Corp JP Morgan 3,199700 Riso Kagaku Corp Citibank 303600 Riso Kagaku Corp JP Morgan 1,287
1,200 Rock Field Co Ltd JP Morgan (270)(2,200) Rohto Pharmaceutical Co
Ltd JP Morgan 3,779(100) Rokko Butter Co Ltd HSBC 91(300) Rorze Corp JP Morgan (1,373)
(3,100) Round One Corp JP Morgan (6,920)(1,000) RPA Holdings Inc Citibank (339)
Holding Description Counterparty
Netunrealised
appreciation/(depreciation)
USD
Japan continued(400) RPA Holdings Inc JP Morgan (122)(700) RS Technologies Co Ltd HSBC 6,399(700) RS Technologies Co Ltd JP Morgan 6,462
1,700 Ryohin Keikaku Co Ltd JP Morgan (1,589)300 Ryosan Co Ltd Citibank (204)
1,700 Ryosan Co Ltd HSBC (4,232)1,500 Ryosan Co Ltd JP Morgan (3,784)(400) Saibu Gas Holdings Co Ltd JP Morgan 468(100) Saizeriya Co Ltd HSBC 52(500) Saizeriya Co Ltd JP Morgan 26
2,300 Sakai Chemical Industry CoLtd JP Morgan (3,951)
(1,700) SAMTY Co Ltd JP Morgan 1,676(100) San-Ai Oil Co Ltd HSBC 94(400) San-Ai Oil Co Ltd JP Morgan 382100 SanBio Co Ltd HSBC (21)100 SanBio Co Ltd JP Morgan (41)900 Sangetsu Corp Citibank (632)
2,600 Sangetsu Corp JP Morgan (2,825)(500) Sankyo Co Ltd JP Morgan 1,355400 Sankyo Tateyama Inc Citibank (101)
2,000 Sankyo Tateyama Inc JP Morgan (1,469)200 Sankyu Inc JP Morgan (427)
(1,100) Sanoh Industrial Co Ltd HSBC 1,195(3,300) Sanoh Industrial Co Ltd JP Morgan 3,641
(100) Sanrio Co Ltd HSBC (40)(600) Sanrio Co Ltd JP Morgan (222)
5,600 Santen Pharmaceutical CoLtd Citibank 305
2,100 Santen Pharmaceutical CoLtd HSBC 404
1,500 Santen Pharmaceutical CoLtd JP Morgan 258
1,200 Sanwa Holdings Corp Citibank (960)1,100 Sanwa Holdings Corp HSBC (1,122)
600 Sanwa Holdings Corp JP Morgan (509)(300) Sanyo Denki Co Ltd JP Morgan 925(100) Sapporo Holdings Ltd Citibank 72(800) Sapporo Holdings Ltd HSBC 509
(7,800) Sapporo Holdings Ltd JP Morgan 7,258700 Sato Holdings Corp HSBC (1,514)
1,300 Sato Holdings Corp JP Morgan (2,863)(500) Sawai Group Holdings Co
Ltd JP Morgan 2,749100 SB Technology Corp Citibank (129)
(300) SBS Holdings Inc JP Morgan (505)(400) Scroll Corp Citibank 96(700) Scroll Corp JP Morgan 53200 SCSK Corp Citibank 140200 SCSK Corp HSBC (60)400 SCSK Corp JP Morgan (156)
(4,000) Sega Sammy Holdings Inc JP Morgan 8,2771,500 Seibu Holdings Inc JP Morgan 1,675(400) Seikagaku Corp HSBC (377)
(1,100) Seikagaku Corp JP Morgan (1,020)1,400 Seiko Epson Corp JP Morgan 323(300) Seino Holdings Co Ltd HSBC (17)
(4,500) Seino Holdings Co Ltd JP Morgan 296(100) Seiren Co Ltd HSBC (44)(800) Seiren Co Ltd JP Morgan (332)
4,400 Sekisui Chemical Co Ltd JP Morgan (2,562)(300) Sekisui House Ltd JP Morgan 172
(5) Sekisui House Reit Inc(REIT) Citibank (8)
(245) Sekisui House Reit Inc(REIT) JP Morgan (252)
1,500 Sekisui Jushi Corp Citibank (1,271)1,000 Sekisui Jushi Corp JP Morgan (1,118)4,000 Sekisui Kasei Co Ltd HSBC (839)2,900 Sekisui Kasei Co Ltd JP Morgan (633)
BlackRock Asia Pacific Diversified Equity Absolute ReturnFund continuedPortfolio of Investments as at 31 May 2021
The notes on pages 590 to 610 form an integral part of these financial statements.
Annual report and audited financial statements [199]
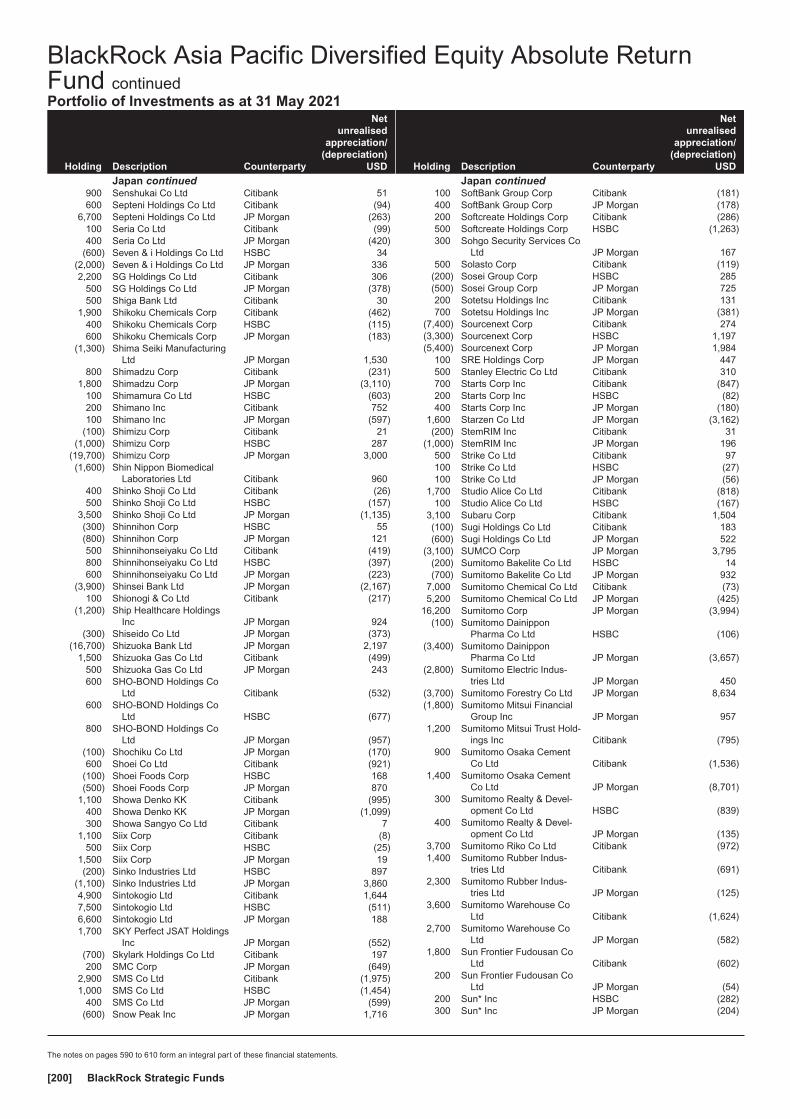
Holding Description Counterparty
Netunrealised
appreciation/(depreciation)
USD
Japan continued900 Senshukai Co Ltd Citibank 51600 Septeni Holdings Co Ltd Citibank (94)
6,700 Septeni Holdings Co Ltd JP Morgan (263)100 Seria Co Ltd Citibank (99)400 Seria Co Ltd JP Morgan (420)
(600) Seven & i Holdings Co Ltd HSBC 34(2,000) Seven & i Holdings Co Ltd JP Morgan 3362,200 SG Holdings Co Ltd Citibank 306
500 SG Holdings Co Ltd JP Morgan (378)500 Shiga Bank Ltd Citibank 30
1,900 Shikoku Chemicals Corp Citibank (462)400 Shikoku Chemicals Corp HSBC (115)600 Shikoku Chemicals Corp JP Morgan (183)
(1,300) Shima Seiki ManufacturingLtd JP Morgan 1,530
800 Shimadzu Corp Citibank (231)1,800 Shimadzu Corp JP Morgan (3,110)
100 Shimamura Co Ltd HSBC (603)200 Shimano Inc Citibank 752100 Shimano Inc JP Morgan (597)
(100) Shimizu Corp Citibank 21(1,000) Shimizu Corp HSBC 287
(19,700) Shimizu Corp JP Morgan 3,000(1,600) Shin Nippon Biomedical
Laboratories Ltd Citibank 960400 Shinko Shoji Co Ltd Citibank (26)500 Shinko Shoji Co Ltd HSBC (157)
3,500 Shinko Shoji Co Ltd JP Morgan (1,135)(300) Shinnihon Corp HSBC 55(800) Shinnihon Corp JP Morgan 121500 Shinnihonseiyaku Co Ltd Citibank (419)800 Shinnihonseiyaku Co Ltd HSBC (397)600 Shinnihonseiyaku Co Ltd JP Morgan (223)
(3,900) Shinsei Bank Ltd JP Morgan (2,167)100 Shionogi & Co Ltd Citibank (217)
(1,200) Ship Healthcare HoldingsInc JP Morgan 924
(300) Shiseido Co Ltd JP Morgan (373)(16,700) Shizuoka Bank Ltd JP Morgan 2,197
1,500 Shizuoka Gas Co Ltd Citibank (499)500 Shizuoka Gas Co Ltd JP Morgan 243600 SHO-BOND Holdings Co
Ltd Citibank (532)600 SHO-BOND Holdings Co
Ltd HSBC (677)800 SHO-BOND Holdings Co
Ltd JP Morgan (957)(100) Shochiku Co Ltd JP Morgan (170)600 Shoei Co Ltd Citibank (921)
(100) Shoei Foods Corp HSBC 168(500) Shoei Foods Corp JP Morgan 870
1,100 Showa Denko KK Citibank (995)400 Showa Denko KK JP Morgan (1,099)300 Showa Sangyo Co Ltd Citibank 7
1,100 Siix Corp Citibank (8)500 Siix Corp HSBC (25)
1,500 Siix Corp JP Morgan 19(200) Sinko Industries Ltd HSBC 897
(1,100) Sinko Industries Ltd JP Morgan 3,8604,900 Sintokogio Ltd Citibank 1,6447,500 Sintokogio Ltd HSBC (511)6,600 Sintokogio Ltd JP Morgan 1881,700 SKY Perfect JSAT Holdings
Inc JP Morgan (552)(700) Skylark Holdings Co Ltd Citibank 197200 SMC Corp JP Morgan (649)
2,900 SMS Co Ltd Citibank (1,975)1,000 SMS Co Ltd HSBC (1,454)
400 SMS Co Ltd JP Morgan (599)(600) Snow Peak Inc JP Morgan 1,716
Holding Description Counterparty
Netunrealised
appreciation/(depreciation)
USD
Japan continued100 SoftBank Group Corp Citibank (181)400 SoftBank Group Corp JP Morgan (178)200 Softcreate Holdings Corp Citibank (286)500 Softcreate Holdings Corp HSBC (1,263)300 Sohgo Security Services Co
Ltd JP Morgan 167500 Solasto Corp Citibank (119)
(200) Sosei Group Corp HSBC 285(500) Sosei Group Corp JP Morgan 725200 Sotetsu Holdings Inc Citibank 131700 Sotetsu Holdings Inc JP Morgan (381)
(7,400) Sourcenext Corp Citibank 274(3,300) Sourcenext Corp HSBC 1,197(5,400) Sourcenext Corp JP Morgan 1,984
100 SRE Holdings Corp JP Morgan 447500 Stanley Electric Co Ltd Citibank 310700 Starts Corp Inc Citibank (847)200 Starts Corp Inc HSBC (82)400 Starts Corp Inc JP Morgan (180)
1,600 Starzen Co Ltd JP Morgan (3,162)(200) StemRIM Inc Citibank 31
(1,000) StemRIM Inc JP Morgan 196500 Strike Co Ltd Citibank 97100 Strike Co Ltd HSBC (27)100 Strike Co Ltd JP Morgan (56)
1,700 Studio Alice Co Ltd Citibank (818)100 Studio Alice Co Ltd HSBC (167)
3,100 Subaru Corp Citibank 1,504(100) Sugi Holdings Co Ltd Citibank 183(600) Sugi Holdings Co Ltd JP Morgan 522
(3,100) SUMCO Corp JP Morgan 3,795(200) Sumitomo Bakelite Co Ltd HSBC 14(700) Sumitomo Bakelite Co Ltd JP Morgan 932
7,000 Sumitomo Chemical Co Ltd Citibank (73)5,200 Sumitomo Chemical Co Ltd JP Morgan (425)
16,200 Sumitomo Corp JP Morgan (3,994)(100) Sumitomo Dainippon
Pharma Co Ltd HSBC (106)(3,400) Sumitomo Dainippon
Pharma Co Ltd JP Morgan (3,657)(2,800) Sumitomo Electric Indus-
tries Ltd JP Morgan 450(3,700) Sumitomo Forestry Co Ltd JP Morgan 8,634(1,800) Sumitomo Mitsui Financial
Group Inc JP Morgan 9571,200 Sumitomo Mitsui Trust Hold-
ings Inc Citibank (795)900 Sumitomo Osaka Cement
Co Ltd Citibank (1,536)1,400 Sumitomo Osaka Cement
Co Ltd JP Morgan (8,701)300 Sumitomo Realty & Devel-
opment Co Ltd HSBC (839)400 Sumitomo Realty & Devel-
opment Co Ltd JP Morgan (135)3,700 Sumitomo Riko Co Ltd Citibank (972)1,400 Sumitomo Rubber Indus-
tries Ltd Citibank (691)2,300 Sumitomo Rubber Indus-
tries Ltd JP Morgan (125)3,600 Sumitomo Warehouse Co
Ltd Citibank (1,624)2,700 Sumitomo Warehouse Co
Ltd JP Morgan (582)1,800 Sun Frontier Fudousan Co
Ltd Citibank (602)200 Sun Frontier Fudousan Co
Ltd JP Morgan (54)200 Sun* Inc HSBC (282)300 Sun* Inc JP Morgan (204)
BlackRock Asia Pacific Diversified Equity Absolute ReturnFund continuedPortfolio of Investments as at 31 May 2021
The notes on pages 590 to 610 form an integral part of these financial statements.
BlackRock Strategic Funds[200]

Holding Description Counterparty
Netunrealised
appreciation/(depreciation)
USD
Japan continued(900) Sundrug Co Ltd JP Morgan 1,056
1,000 Suntory Beverage & FoodLtd Citibank 112
1,800 Suntory Beverage & FoodLtd JP Morgan 3,655
100 SuRaLa Net Co Ltd Citibank (38)200 SuRaLa Net Co Ltd HSBC (181)400 SuRaLa Net Co Ltd JP Morgan (596)
(18,300) Suruga Bank Ltd JP Morgan 10,867500 Suzuken Co Ltd JP Morgan (1,725)
(500) Suzuki Motor Corp JP Morgan (1,840)(500) SWCC Showa Holdings Co
Ltd JP Morgan (255)(1,300) SymBio Pharmaceuticals
Ltd JP Morgan (7,321)300 Sysmex Corp Citibank 1,097200 System Information Co Ltd Citibank (94)
(4,300) T Hasegawa Co Ltd JP Morgan 3,828(11,900) T&D Holdings Inc JP Morgan (8,593)
2,200 Tachibana Eletech Co Ltd Citibank (104)500 Tachibana Eletech Co Ltd HSBC (672)
4,200 Tachibana Eletech Co Ltd JP Morgan (4,011)(100) Tadano Ltd Citibank 21
(3,600) Tadano Ltd JP Morgan 4,0581,300 Taiheiyo Cement Corp Citibank (446)
700 Taiheiyo Cement Corp HSBC (2,651)1,400 Taiheiyo Cement Corp JP Morgan (5,361)
500 Taikisha Ltd Citibank (490)(1,900) Taisei Corp JP Morgan 7,0551,900 Takamatsu Construction
Group Co Ltd Citibank (1,380)400 Takamatsu Construction
Group Co Ltd HSBC (165)2,000 Takamatsu Construction
Group Co Ltd JP Morgan (886)(5,800) Takara Holdings Inc JP Morgan 1,7643,100 Takara Leben Co Ltd Citibank (499)
500 Takara Leben Co Ltd JP Morgan (135)1,800 Takara Standard Co Ltd Citibank (1,009)1,200 Takara Standard Co Ltd HSBC (256)1,500 Takara Standard Co Ltd JP Morgan (355)(100) Takasago International Corp HSBC 17(100) Takasago International Corp JP Morgan 21
(8,400) Takashimaya Co Ltd JP Morgan (457)100 Takeda Pharmaceutical Co
Ltd JP Morgan (44)(200) Taki Chemical Co Ltd Citibank 749(700) Taki Chemical Co Ltd JP Morgan 1,911(200) Takuma Co Ltd HSBC 801
(3,300) Takuma Co Ltd JP Morgan 11,387(100) Tamron Co Ltd HSBC (8)(800) Tamron Co Ltd JP Morgan (37)(300) Tanaka Chemical Corp Citibank (33)
(1,700) Tanaka Chemical Corp JP Morgan 6,612600 Tayca Corp Citibank (170)800 Tayca Corp JP Morgan (697)
(200) TDK Corp JP Morgan 1,873700 TeamSpirit Inc JP Morgan (1,399)200 TechnoPro Holdings Inc Citibank (375)200 TechnoPro Holdings Inc HSBC (468)300 TechnoPro Holdings Inc JP Morgan (1,367)
1,000 Teijin Ltd JP Morgan (199)800 Teikoku Sen-I Co Ltd HSBC (675)800 Teikoku Sen-I Co Ltd JP Morgan (699)
(2,400) Tenma Corp JP Morgan (1,835)2,300 T-Gaia Corp Citibank (2,215)1,000 T-Gaia Corp HSBC (721)
100 THK Co Ltd JP Morgan 106(900) TIS Inc JP Morgan (185)(400) Toa Corp JP Morgan (17)
Holding Description Counterparty
Netunrealised
appreciation/(depreciation)
USD
Japan continued200 Toagosei Co Ltd HSBC (138)
1,000 Toagosei Co Ltd JP Morgan (706)(600) Tobu Railway Co Ltd JP Morgan 1,041(500) Toda Corp Citibank 245
(2,000) Toda Corp HSBC 761(25,000) Toda Corp JP Morgan 9,234
(200) Toei Animation Co Ltd JP Morgan (257)(700) Toei Co Ltd JP Morgan 14,838
(12,400) Toho Bank Ltd JP Morgan 2,285(2,000) Toho Co Ltd JP Morgan (1,484)(2,000) Toho Gas Co Ltd JP Morgan 7,011(9,700) Tohoku Electric Power Co
Inc JP Morgan 8,464(2,400) Tokai Carbon Co Ltd JP Morgan 7,026
300 Tokai Corp JP Morgan (231)800 TOKAI Holdings Corp HSBC (318)
3,000 Tokai Rika Co Ltd Citibank (857)700 Tokai Rika Co Ltd JP Morgan (221)
(6,900) Tokai Tokyo Financial Hold-ings Inc JP Morgan 539
(100) Token Corp HSBC 431(600) Token Corp JP Morgan 2,672700 Tokio Marine Holdings Inc Citibank (4)700 Tokio Marine Holdings Inc JP Morgan (903)
(100) Tokuyama Corp Citibank 56(1,600) Tokuyama Corp JP Morgan 3,795
(500) Tokyo Century Corp JP Morgan 1,534(1,200) Tokyo Electric Power Co
Holdings Inc Citibank 92(1,200) Tokyo Electric Power Co
Holdings Inc HSBC 97(15,400) Tokyo Electric Power Co
Holdings Inc JP Morgan 1,323100 Tokyo Electron Ltd JP Morgan (1,729)
(700) Tokyo Gas Co Ltd HSBC 585(500) Tokyo Gas Co Ltd JP Morgan 427(600) Tokyo Kiraboshi Financial
Group Inc JP Morgan 259800 Tokyo Ohka Kogyo Co Ltd Citibank (1,004)400 Tokyo Ohka Kogyo Co Ltd JP Morgan (2,198)
(200) Tokyu Construction Co Ltd HSBC (205)(15,300) Tokyu Construction Co Ltd JP Morgan (15,519)
(600) Tokyu Corp HSBC 34(3,700) Tokyu Corp JP Morgan 285
900 Tokyu Fudosan HoldingsCorp HSBC 14
(600) TOMONY Holdings Inc HSBC 80(7,500) TOMONY Holdings Inc JP Morgan 809
100 Topcon Corp HSBC 1032,200 Topcon Corp JP Morgan 2,212(300) Toppan Printing Co Ltd HSBC 30
(7,200) Toppan Printing Co Ltd JP Morgan (5,883)1,100 Topy Industries Ltd Citibank (416)
200 Topy Industries Ltd HSBC (149)2,000 Topy Industries Ltd JP Morgan (1,529)
(1,000) Toridoll Holdings Corp HSBC (41)1,100 Tosei Corp Citibank (618)(600) Toshiba Corp JP Morgan (193)
(1,400) Toshiba TEC Corp JP Morgan 3,050(5,600) Tosoh Corp JP Morgan 6,669
200 TOTO Ltd Citibank 315400 TOTO Ltd HSBC 78200 TOTO Ltd JP Morgan 477
2,600 Toyo Ink SC Holdings CoLtd Citibank (644)
1,800 Toyo Ink SC Holdings CoLtd JP Morgan (1,341)
1,900 Toyo Seikan Group HoldingsLtd Citibank 2,228
200 Toyo Suisan Kaisha Ltd HSBC (185)
BlackRock Asia Pacific Diversified Equity Absolute ReturnFund continuedPortfolio of Investments as at 31 May 2021
The notes on pages 590 to 610 form an integral part of these financial statements.
Annual report and audited financial statements [201]

Holding Description Counterparty
Netunrealised
appreciation/(depreciation)
USD
Japan continued(600) Toyo Tire Corp Citibank 67
(1,900) Toyo Tire Corp JP Morgan (1,425)400 Toyobo Co Ltd Citibank (233)900 Toyobo Co Ltd HSBC (928)
3,400 Toyobo Co Ltd JP Morgan (3,578)400 Toyoda Gosei Co Ltd Citibank 73700 Toyoda Gosei Co Ltd JP Morgan 307
(200) Toyota Motor Corp HSBC (317)(500) Toyota Motor Corp JP Morgan (1,027)
(3,500) Toyota Tsusho Corp JP Morgan 6,879800 TPR Co Ltd HSBC (1,700)700 TPR Co Ltd JP Morgan (1,504)100 Trancom Co Ltd HSBC (625)
1,600 Transaction Co Ltd HSBC (122)1,200 Transcosmos Inc Citibank 381,300 Trend Micro Inc Citibank (456)
700 Trend Micro Inc JP Morgan 939(300) Tri Chemical Laboratories
Inc JP Morgan 701200 TS Tech Co Ltd Citibank 65
1,000 TS Tech Co Ltd HSBC 3202,400 TS Tech Co Ltd JP Morgan 4469,400 TSI Holdings Co Ltd HSBC (3,241)3,600 TSI Holdings Co Ltd JP Morgan (1,259)
300 Tsubakimoto Chain Co HSBC (224)1,100 Tsubakimoto Chain Co JP Morgan (69)
400 Tsugami Corp Citibank 329300 Tsugami Corp JP Morgan 153
(700) Tsukui Holdings Corp HSBC 17(200) Tsumura & Co Citibank 227(100) Tsumura & Co HSBC 67
(1,900) Tsumura & Co JP Morgan 5,045500 TV Asahi Holdings Corp Citibank (126)800 TV Asahi Holdings Corp HSBC (1,114)900 TV Asahi Holdings Corp JP Morgan (1,280)400 UACJ Corp Citibank (404)100 UACJ Corp HSBC (103)
1,800 UACJ Corp JP Morgan (7,055)2,700 Ube Industries Ltd Citibank (2,154)
200 Ube Industries Ltd HSBC (88)500 Ube Industries Ltd JP Morgan (238)100 Ubicom Holdings Inc HSBC (70)100 Ubicom Holdings Inc JP Morgan (74)
(400) Ulvac Inc JP Morgan (219)(200) Unipres Corp HSBC 320(300) Unipres Corp JP Morgan 484(25) United Urban Investment
Corp (REIT) JP Morgan 2,105(900) Universal Entertainment
Corp Citibank 1,019(700) Universal Entertainment
Corp HSBC 1,924(400) Universal Entertainment
Corp JP Morgan 1,139100 Usen-Next Holdings Co Ltd HSBC 79
1,000 Usen-Next Holdings Co Ltd JP Morgan (218)600 User Local inc Citibank (1,726)
(1,700) Ushio Inc JP Morgan 37500 UT Group Co Ltd Citibank (741)500 Valqua Ltd JP Morgan (411)400 ValueCommerce Co Ltd JP Morgan (1,398)300 Valuence Holdings Inc Citibank (479)100 Valuence Holdings Inc HSBC (307)200 VisasQ Inc HSBC (277)900 Visional Inc JP Morgan 14,052
3,600 Vital KSK Holdings Inc Citibank 7301,500 Vital KSK Holdings Inc HSBC 3281,700 Vital KSK Holdings Inc JP Morgan (485)1,800 VT Holdings Co Ltd Citibank 2612,200 VT Holdings Co Ltd HSBC 611
Holding Description Counterparty
Netunrealised
appreciation/(depreciation)
USD
Japan continued2,300 VT Holdings Co Ltd JP Morgan 624
200 Wacoal Holdings Corp JP Morgan (233)4,400 Wacom Co Ltd Citibank (2,044)4,200 Wacom Co Ltd HSBC (1,120)1,800 Wacom Co Ltd JP Morgan (473)1,000 Warabeya Nichiyo Holdings
Co Ltd HSBC (1,313)1,800 WDB Holdings Co Ltd Citibank 1231,100 WDB Holdings Co Ltd HSBC 1,7401,800 WDB Holdings Co Ltd JP Morgan 2,785(100) WealthNavi Inc Citibank (368)(300) WealthNavi Inc JP Morgan (1,235)
1,200 Welbe Inc Citibank (396)2,400 Welbe Inc JP Morgan (1,241)1,000 Welcia Holdings Co Ltd Citibank (325)
200 Welcia Holdings Co Ltd JP Morgan (59)(1,300) West Japan Railway Co JP Morgan 624(1,300) WingArc1st Inc JP Morgan 1,907
(600) Wowow Inc HSBC 762(100) Wowow Inc JP Morgan 140(600) W-Scope Corp Citibank 223(600) W-Scope Corp HSBC 471
(1,800) W-Scope Corp JP Morgan 9352,500 Xebio Holdings Co Ltd Citibank (539)7,200 Xebio Holdings Co Ltd HSBC 1,1416,200 Xebio Holdings Co Ltd JP Morgan 901
(1,200) Yahagi Construction Co Ltd JP Morgan 534(600) Yakult Honsha Co Ltd JP Morgan (1,771)
3,100 YAMABIKO Corp Citibank (1,919)100 YAMABIKO Corp HSBC —900 YAMABIKO Corp JP Morgan (16)
5,800 Yamada Holdings Co Ltd Citibank (621)5,900 Yamada Holdings Co Ltd JP Morgan (1,914)
400 Yamagata Bank Ltd HSBC 12900 Yamagata Bank Ltd JP Morgan (114)
(4,500) Yamaguchi Financial GroupInc JP Morgan 1,710
(3,700) Yamaha Motor Co Ltd JP Morgan (9,838)300 YA-MAN Ltd JP Morgan (219)
(300) Yamashin-Filter Corp Citibank (4)(1,400) Yamashin-Filter Corp HSBC 459
(200) Yamashin-Filter Corp JP Morgan 68900 Yamato Holdings Co Ltd JP Morgan (69)
(2,200) Yamato Kogyo Co Ltd JP Morgan 3,2981,700 Yamazen Corp Citibank (464)1,800 Yamazen Corp HSBC (946)
900 Yamazen Corp JP Morgan (509)800 Yaoko Co Ltd JP Morgan (5,685)
1,400 Yaskawa Electric Corp Citibank 5,059900 Yaskawa Electric Corp JP Morgan 1,042
(500) Yokogawa Bridge HoldingsCorp JP Morgan 338
100 Yokogawa Electric Corp Citibank (10)2,400 Yokohama Rubber Co Ltd JP Morgan 1,136
500 Yokowo Co Ltd Citibank 56200 Yokowo Co Ltd HSBC (655)400 Yokowo Co Ltd JP Morgan (1,325)300 Yondoshi Holdings Inc Citibank (131)600 Yondoshi Holdings Inc HSBC (349)
1,000 Yondoshi Holdings Inc JP Morgan (609)(1,600) Yonex Co Ltd JP Morgan (398)(2,500) Yoshinoya Holdings Co Ltd Citibank 1,442
(300) Yoshinoya Holdings Co Ltd JP Morgan 228300 Yuasa Trading Co Ltd Citibank 31100 Yuasa Trading Co Ltd HSBC (142)
1,400 Yuasa Trading Co Ltd JP Morgan 4718,400 Z Holdings Corp HSBC 2,7161,400 Z Holdings Corp JP Morgan 6151,300 Zenkoku Hosho Co Ltd Citibank (2,049)
BlackRock Asia Pacific Diversified Equity Absolute ReturnFund continuedPortfolio of Investments as at 31 May 2021
The notes on pages 590 to 610 form an integral part of these financial statements.
BlackRock Strategic Funds[202]

Holding Description Counterparty
Netunrealised
appreciation/(depreciation)
USD
Japan continued600 Zenkoku Hosho Co Ltd JP Morgan (503)
(200) Zensho Holdings Co Ltd HSBC 214(3,000) Zensho Holdings Co Ltd JP Morgan 3,337
200 Zeon Corp Citibank (134)1,200 Zeon Corp HSBC (1,736)
900 Zeon Corp JP Morgan (1,324)(100) ZERIA Pharmaceutical Co
Ltd HSBC 13(4,000) ZERIA Pharmaceutical Co
Ltd JP Morgan (2,419)(800) Zojirushi Corp JP Morgan 622700 ZOZO Inc JP Morgan 475100 Zuken Inc Citibank (57)
39,436
Malaysia800 Axis Real Estate Investment
Trust (REIT) Citibank 62,400 Axis Real Estate Investment
Trust (REIT) HSBC (16)18,000 Axis Real Estate Investment
Trust (REIT) JP Morgan (113)49,700 Bursa Malaysia Bhd Citibank 1,2301,600 Bursa Malaysia Bhd HSBC (122)
89,900 Bursa Malaysia Bhd JP Morgan (5,814)(54,300) Dayang Enterprise Holdings
Bhd JP Morgan 1,581(19,900) DiGi.Com Bhd Citibank (443)
(126,700) DiGi.Com Bhd JP Morgan (1,772)(40,100) Genting Malaysia Bhd JP Morgan 570(11,400) Genting Plantations Bhd Citibank 710(24,500) HAP Seng Consolidated
Bhd Citibank (1,432)(31,500) HAP Seng Consolidated
Bhd JP Morgan (731)2,900 Hartalega Holdings Bhd Citibank (303)
23,200 IJM Corp Bhd Citibank 2768,800 IJM Corp Bhd HSBC (166)
14,500 IJM Corp Bhd JP Morgan (266)167,700 Inari Amertron Bhd Citibank 1,88841,900 Inari Amertron Bhd HSBC 68267,700 Inari Amertron Bhd JP Morgan 1,157(7,000) Jaya Tiasa Holdings BHD Citibank 104
(36,300) Jaya Tiasa Holdings BHD JP Morgan 1,209(32,100) JHM Consolidation Bhd JP Morgan 27810,700 Kossan Rubber Industries HSBC (382)16,100 Lotte Chemical Titan Hold-
ing Bhd Citibank (600)11,800 Lotte Chemical Titan Hold-
ing Bhd HSBC (1,016)14,900 Lotte Chemical Titan Hold-
ing Bhd JP Morgan (1,638)8,900 Malayan Banking Bhd Citibank (252)
17,200 Malayan Banking Bhd HSBC (392)36,400 Malayan Banking Bhd JP Morgan (751)
(300) Malaysia Building SocietyBhd Citibank —
(700) Malaysian Pacific IndustriesBhd Citibank (375)
(500) Malaysian Pacific IndustriesBhd JP Morgan (385)
88,600 Media Prima Bhd Citibank (1,862)23,000 Media Prima Bhd HSBC (293)43,400 Media Prima Bhd JP Morgan (545)
(37,700) Mega First Corp BHD Citibank (4,260)(88,500) Mega First Corp BHD JP Morgan (10,067)(2,400) Nestle Malaysia Bhd Citibank (817)
(39,900) Pentamaster Corp Bhd Citibank 883(34,000) Pentamaster Corp Bhd JP Morgan (623)(22,600) Petronas Chemicals Group
Bhd Citibank (937)
Holding Description Counterparty
Netunrealised
appreciation/(depreciation)
USD
Malaysia continued12,400 Press Metal Aluminium
Holdings Bhd HSBC (608)3,400 Press Metal Aluminium
Holdings Bhd JP Morgan (162)78,000 Public Bank Bhd Citibank 1,3546,600 Public Bank Bhd HSBC 149
22,500 Public Bank Bhd JP Morgan 532(2,200) QL Resources Bhd Citibank (17)28,900 RHB Bank Bhd Citibank 75028,300 RHB Bank Bhd HSBC 81457,900 RHB Bank Bhd JP Morgan 1,745
376,800 Sapura Energy Bhd Citibank (398)687,600 Sapura Energy Bhd HSBC (3,072)593,200 Sapura Energy Bhd JP Morgan (2,938)(36,900) SCGM Bhd JP Morgan (3,157)
460 Scientex BHD Citibank (6)1,240 Scientex BHD JP Morgan (20)
10,100 Sime Darby Bhd JP Morgan 106(24,900) Sime Darby Plantation Bhd Citibank (646)(8,800) Sime Darby Plantation Bhd HSBC 512
(37,300) Sime Darby Plantation Bhd JP Morgan 2,121(29,400) Sunway Bhd Citibank 864(47,953) Sunway Bhd JP Morgan (1,763)
9,200 TASCO Bhd Citibank 19173,300 TASCO Bhd JP Morgan 501(9,000) Telekom Malaysia Bhd JP Morgan (915)(8,300) Tenaga Nasional Bhd Citibank (137)5,400 UWC BHD HSBC 893,500 UWC BHD JP Morgan 63
45,600 Uzma Bhd Citibank (128)6,200 Uzma Bhd HSBC (140)
338,400 Uzma Bhd JP Morgan (7,569)361,300 Velesto Energy Bhd Citibank 61
(38) Velesto Energy Bhd HSBC —527,000 Velesto Energy Bhd HSBC (1,354)425,400 Velesto Energy Bhd JP Morgan (1,077)
(6,000) VS Industry Bhd JP Morgan 1111,900 Westports Holdings Bhd Citibank (8)
100 Westports Holdings Bhd HSBC (1)24,000 Westports Holdings Bhd JP Morgan (135)
180,500 YTL Corp Bhd Citibank (936)416,400 YTL Corp Bhd HSBC (2,809)16,000 YTL Corp Bhd JP Morgan (105)
(43,937)
Philippines(94,600) Alliance Global Group Inc JP Morgan (487)
5 Altus Property Ventures Inc HSBC —(7,870) Ayala Corp JP Morgan (10,552)
(18,300) Ayala Land Inc JP Morgan (1,055)(1,350) Bank of the Philippine Is-
lands JP Morgan (41)1,890 BDO Unibank Inc Citibank 1345,900 BDO Unibank Inc HSBC (175)7,190 BDO Unibank Inc JP Morgan (207)
12,570 International Container Ter-minal Services Inc Citibank 1,131
6,330 International Container Ter-minal Services Inc HSBC 321
5,030 International Container Ter-minal Services Inc JP Morgan 260
(11,487) JG Summit Holdings Inc JP Morgan (1,494)3,000 Metro Pacific Investments
Corp Citibank 2511,000 Metro Pacific Investments
Corp HSBC 1595,000 Metro Pacific Investments
Corp JP Morgan 131(33,160) Metropolitan Bank & Trust
Co JP Morgan (2,904)
BlackRock Asia Pacific Diversified Equity Absolute ReturnFund continuedPortfolio of Investments as at 31 May 2021
The notes on pages 590 to 610 form an integral part of these financial statements.
Annual report and audited financial statements [203]

Holding Description Counterparty
Netunrealised
appreciation/(depreciation)
USD
Philippines continued100 PLDT Inc Citibank 138475 PLDT Inc HSBC 842385 PLDT Inc JP Morgan 686
(8,595) SM Investments Corp JP Morgan (6,362)(129,100) SM Prime Holdings Inc JP Morgan (6,799)
(1,010) Universal Robina Corp HSBC (225)(10,610) Universal Robina Corp JP Morgan (1,984)
(28,602)
Singapore(11,700) AEM Holdings Ltd Citibank (1,333)54,200 AIMS APAC REIT (REIT) Citibank 1,059
(72,000) ARA LOGOS Logistics Trust(REIT) Citibank (2,693)
(14,500) ARA LOGOS Logistics Trust(REIT) HSBC (442)
10,600 Ascendas Real Estate In-vestment Trust (REIT) HSBC (595)
18,100 Ascendas Real Estate In-vestment Trust (REIT) JP Morgan (949)
(208,400) Ascott Residence Trust(Unit) Citibank (4,833)
(162,500) Ascott Residence Trust(Unit) HSBC 7,740
2,300 Best World InternationalLtd* JP Morgan (103)
(67,400) CapitaLand China Trust(REIT) HSBC (767)
(96,200) CapitaLand China Trust(REIT) JP Morgan (1,076)
(127,800) CapitaLand IntegratedCommercial Trust (REIT) HSBC 1,541
(102,100) CapitaLand Ltd Citibank (5,314)(100,700) CapitaLand Ltd HSBC (3,449)(115,100) CDL Hospitality Trusts (Unit) Citibank (599)(77,700) CDL Hospitality Trusts (Unit) HSBC 3,70719,100 City Developments Ltd JP Morgan 825
100,100 ComfortDelGro Corp Ltd Citibank 4,515125,600 ComfortDelGro Corp Ltd HSBC 5,053535,700 ComfortDelGro Corp Ltd JP Morgan 22,743(13,800) Dairy Farm International
Holdings Ltd Citibank 690(10,100) Dairy Farm International
Holdings Ltd HSBC —(7,200) Dairy Farm International
Holdings Ltd JP Morgan —100 DBS Group Holdings Ltd HSBC 35
(1,900) Eagle Hospitality Trust(Unit)* Citibank 65
(15,200) Eagle Hospitality Trust(Unit)* JP Morgan 521
(20,340) Ezion Holdings Ltdπ Citibank —(5,400) Ezion Holdings Ltd HSBC —(6,480) Ezion Holdings Ltd JP Morgan —
(14,900) First Resources Ltd Citibank 472(36,600) First Resources Ltd HSBC 3,245(25,100) Frasers Centrepoint Trust
(REIT) JP Morgan 40992,500 Frasers Logistics & Com-
mercial Trust (REIT) HSBC (1,718)183,700 Frasers Logistics & Com-
mercial Trust (REIT) JP Morgan (3,639)33,500 Frencken Group Ltd JP Morgan 9,502
(14,200) Genting Singapore Ltd Citibank (427)(181,100) Genting Singapore Ltd HSBC (2,875)(56,900) Genting Singapore Ltd JP Morgan (343)(28,700) Hongkong Land Holdings
Ltd JP Morgan —87,900 Hutchison Port Holdings
Trust ’U’ Citibank —
Holding Description Counterparty
Netunrealised
appreciation/(depreciation)
USD
Singapore continued43,000 Hutchison Port Holdings
Trust ’U’ HSBC —71,700 Hutchison Port Holdings
Trust ’U’ JP Morgan 220(400) Jardine Matheson Holdings
Ltd Citibank (364)(400) Jardine Matheson Holdings
Ltd HSBC 832(1,800) Jardine Matheson Holdings
Ltd JP Morgan 3,74410,300 Keppel DC REIT (REIT) Citibank (193)(7,300) Keppel DC REIT (REIT) HSBC 835,500 Keppel DC REIT (REIT) HSBC (64)
(21,800) Keppel DC REIT (REIT) JP Morgan 17830,200 Keppel Infrastructure Trust
(Unit) Citibank 187229,200 Keppel REIT (REIT) Citibank 1,16218,200 Keppel REIT (REIT) HSBC (489)
323,600 Keppel REIT (REIT) JP Morgan (8,727)26,900 Lendlease Global Commer-
cial REIT (REIT) JP Morgan (148)(70,400) Mapletree Commercial Trust
(REIT) HSBC (747)(18,000) Mapletree Commercial Trust
(REIT) JP Morgan (237)420 Mapletree Industrial Trust Citibank 60
3,500 Mapletree Industrial Trust JP Morgan 5038,400 Mapletree Industrial Trust
(REIT) Citibank 2770,000 Mapletree Industrial Trust
(REIT) JP Morgan 4,2251,900 Mapletree North Asia Com-
mercial Trust (REIT) HSBC (40)170,100 Mapletree North Asia Com-
mercial Trust (REIT) JP Morgan (3,377)(6,800) Medtecs International Corp
Ltd JP Morgan (120)(65,600) NetLink NBN Trust (Unit) Citibank (279)
(420,800) NetLink NBN Trust (Unit) HSBC 4,679(5,200) NetLink NBN Trust (Unit) JP Morgan 45
200 Oversea-Chinese BankingCorp Ltd HSBC 41
(2,500) Parkway Life Real EstateInvestment Trust (REIT) HSBC (571)
(37,700) Parkway Life Real EstateInvestment Trust (REIT) JP Morgan (6,500)
101,700 Raffles Medical Group Ltd Citibank 5,86624,000 Raffles Medical Group Ltd JP Morgan 79756,400 Sasseur Real Estate Invest-
ment Trust (REIT) Citibank 63646,300 Sasseur Real Estate Invest-
ment Trust (REIT) HSBC (288)184,900 Sasseur Real Estate Invest-
ment Trust (REIT) JP Morgan (938)(4,200) SATS Ltd Citibank (768)
(15,200) SATS Ltd HSBC 25816,900 SATS Ltd JP Morgan (205)
(66,800) Sembcorp Industries Ltd Citibank (10,706)60,600 Sembcorp Marine Ltd HSBC 53370,600 Sheng Siong Group Ltd Citibank (1,098)22,100 Sheng Siong Group Ltd JP Morgan 1,260
(13,700) SIA Engineering Co Ltd Citibank (1,371)(39,200) SIA Engineering Co Ltd JP Morgan (825)(13,700) Singapore Airlines Ltd HSBC (1,237)(28,633) Singapore Airlines Ltdπ HSBC —(1,900) Singapore Airlines Ltd JP Morgan (224)(3,971) Singapore Airlines Ltd JP Morgan —23,100 Singapore Post Ltd JP Morgan 45
BlackRock Asia Pacific Diversified Equity Absolute ReturnFund continuedPortfolio of Investments as at 31 May 2021
The notes on pages 590 to 610 form an integral part of these financial statements.
BlackRock Strategic Funds[204]

Holding Description Counterparty
Netunrealised
appreciation/(depreciation)
USD
Singapore continued21,100 Singapore Press Holdings
Ltd Citibank 423,800 Singapore Technologies
Engineering Ltd JP Morgan 2,400(45,300) Singapore Telecommunica-
tions Ltd HSBC 867(68,600) Singapore Telecommunica-
tions Ltd JP Morgan 1,108(148,400) SPH (REIT) HSBC 373(51,200) SPH (REIT) JP Morgan 74(13,400) Starhill Global (REIT) HSBC (161)335,500 Suntec Real Estate Invest-
ment Trust (REIT) JP Morgan (13,881)(44,500) Thai Beverage PCL Citibank 200
(123,200) Thai Beverage PCL HSBC 2,668(19,400) Thai Beverage PCL JP Morgan 403
(113,700) UMS Holdings Ltd Citibank (8,414)(21,100) UOL Group Ltd HSBC 2,163(2,100) Venture Corp Ltd HSBC (217)
(12,100) Venture Corp Ltd JP Morgan (1,529)(85,700) Yangzijiang Shipbuilding
Holdings Ltd HSBC 1,107(24,000) Yanlord Land Group Ltd Citibank (315)
(100,300) Yanlord Land Group Ltd HSBC 7,414
11,096
South Korea(203) Advanced Process Systems
Corp HSBC 23(2,129) Aekyung Industrial Co Ltd Citibank (7,225)1,629 AfreecaTV Co Ltd HSBC 3,438
337 AfreecaTV Co Ltd JP Morgan 49456 AMOREPACIFIC Group Citibank 240
(50) BGF retail Co Ltd Citibank (472)(86) BGF retail Co Ltd JP Morgan (380)
(3,191) BH Co Ltd Citibank (7,480)(339) BH Co Ltd HSBC (562)(537) BH Co Ltd JP Morgan (1,061)
28,034 BNK Financial Group Inc Citibank 4,10913,991 BNK Financial Group Inc JP Morgan (645)(6,691) Boryung Pharmaceutical Co
Ltd Citibank (4,917)615 Bukwang Pharmaceutical
Co Ltd JP Morgan 482(619) Celltrion Healthcare Co Ltd Citibank (4,684)(291) Celltrion Healthcare Co Ltd JP Morgan (1,329)
8 Celltrion Inc HSBC 1(240) Celltrion Pharm Inc Citibank (1,977)
(6,697) Chabiotech Co Ltd Citibank (6,738)404 Chong Kun Dang Pharma-
ceutical Corp Citibank 1,932103 Chong Kun Dang Pharma-
ceutical Corp JP Morgan (573)(119) Chunbo Co Ltd Citibank (414)(272) CJ Corp JP Morgan (1,632)312 CJ Freshway Corp JP Morgan 1,165(31) CJ Logistics Corp JP Morgan (101)(58) CLIO Cosmetics Co Ltd Citibank (298)(63) CLIO Cosmetics Co Ltd JP Morgan (278)
(3,407) CMG Pharmaceutical CoLtd Citibank (747)
(477) CMG Pharmaceutical CoLtd JP Morgan (101)
(9) Cosmax Inc Citibank (190)(58) Coway Co Ltd Citibank (186)
(713) Coway Co Ltd JP Morgan (9,114)(2,713) CS Wind Corp Citibank (16,848)
(12) Cuckoo Holdings Co Ltd Citibank (37)(2,699) Daejoo Electronic Materials
Co Ltd Citibank (2,030)
Holding Description Counterparty
Netunrealised
appreciation/(depreciation)
USD
South Korea continued(168) Daewoo Engineering &
Construction Co Ltd JP Morgan (123)(2,201) Daewoo Shipbuilding & Ma-
rine Engineering Co Ltd Citibank (1,246)339 Daewoong Co Ltd JP Morgan 191(15) Daewoong Pharmaceutical
Co Ltd Citibank 4(26) Daewoong Pharmaceutical
Co Ltd JP Morgan 76(80) DB HiTek Co Ltd Citibank (81)
(253) DB HiTek Co Ltd JP Morgan 1,13214,828 DGB Financial Group Inc HSBC 3,7796,960 DGB Financial Group Inc JP Morgan 1,764
(1,261) DL E&C Co Ltd Citibank (1,062)(170) DL Holdings Co Ltd Citibank 5
(2,844) Dongjin Semichem Co Ltd Citibank (1,676)(2,415) DongKook Pharmaceutical
Co Ltd Citibank (3,358)(147) Dongkuk Steel Mill Co Ltd Citibank 55(167) Dongkuk Steel Mill Co Ltd JP Morgan 412894 Dongwon F&B Co Ltd HSBC 9,047
1,200 Doosan Bobcat Inc JP Morgan 1,53186 Doosan Co Ltd Citibank 799
1,985 Doosan Co Ltd JP Morgan 31,971719 Doosan Infracore Co Ltd JP Morgan 1,530190 DoubleUGames Co Ltd HSBC 219
1,243 Duk San Neolux Co Ltd Citibank 2,000(21) Ecopro BM Co Ltd Citibank (59)
(144) Ecopro BM Co Ltd JP Morgan 503(229) ENF Technology Co Ltd Citibank (196)
1,378 F&F Holdings Co Ltd Citibank (1,779)(176) Fila Holdings Corp JP Morgan 59(987) Foosung Co Ltd Citibank (329)
(2,336) Foosung Co Ltd JP Morgan 790(5,497) Grand Korea Leisure Co Ltd Citibank (10,849)(2,024) Grand Korea Leisure Co Ltd JP Morgan (3,394)
(42) Green Cross LabCell Corp Citibank (303)1,731 GS Holdings Corp JP Morgan (4,806)
564 GS Retail Co Ltd JP Morgan 1,0342,983 G-treeBNT Co Ltd HSBC (5,407)
572 Hana Financial Group Inc HSBC (68)(516) Hana Materials Inc Citibank (726)(389) Hana Tour Service Inc JP Morgan (7,479)345 Hanjin Transportation Co
Ltd JP Morgan 138(96) Hanmi Pharm Co Ltd Citibank (2,313)(75) Hanmi Pharm Co Ltd JP Morgan (359)946 Hansae Co Ltd HSBC 503
(183) Hansae Co Ltd JP Morgan 13(11) Hansol Chemical Co Ltd Citibank (61)116 Hansol Chemical Co Ltd Citibank 1,606
3,514 Hanwha Aerospace Co Ltd Citibank 11,076(6,049) Hanwha Life Insurance Co
Ltd Citibank (157)(19,798) Hanwha Life Insurance Co
Ltd JP Morgan (3,137)(1,547) Hanwha Solutions Corp JP Morgan 1,534
(473) HDC Holdings Co Ltd Citibank (270)(837) HDC Holdings Co Ltd JP Morgan 302(140) Hite Jinro Co Ltd Citibank (525)(185) Hite Jinro Co Ltd JP Morgan (696)
(2,518) HLB Life Science CO Ltd Citibank (1,083)(190) Hotel Shilla Co Ltd Citibank (1,984)
6,482 Huchems Fine ChemicalCorp HSBC 133
85 Hugel Inc Citibank 1,094580 Hugel Inc HSBC 4,462(29) Huons Co Ltd Citibank (85)32 Huons Co Ltd JP Morgan (142)
BlackRock Asia Pacific Diversified Equity Absolute ReturnFund continuedPortfolio of Investments as at 31 May 2021
The notes on pages 590 to 610 form an integral part of these financial statements.
Annual report and audited financial statements [205]

Holding Description Counterparty
Netunrealised
appreciation/(depreciation)
USD
South Korea continued(2,717) Hwaseung Enterprise Co
Ltd Citibank (2,961)61 Hyosung Advanced Materi-
als Corp Citibank 918(110) Hyosung Corp HSBC 1,022(36) Hyosung Corp JP Morgan 335
2,245 Hyosung Corp JP Morgan (16,119)69 Hyosung TNC Corp JP Morgan (2,556)
931 Hyundai ConstructionEquipment Co Ltd Citibank 2,426
3,261 HYUNDAI Corp Citibank 2,015(589) Hyundai Department Store
Co Ltd JP Morgan 888299 Hyundai Elevator Co Ltd HSBC 1,231
3,383 Hyundai Elevator Co Ltd JP Morgan 12,79484 Hyundai Glovis Co Ltd Citibank 390
887 Hyundai Home ShoppingNetwork Corp JP Morgan 3,465
3,820 Hyundai Marine & Fire In-surance Co Ltd Citibank 2,384
(2,630) Hyundai Mipo Dockyard CoLtd Citibank 11,083
(2,758) Hyundai Rotem Co Ltd Citibank (3,199)(458) Hyundai Rotem Co Ltd JP Morgan (539)
(1,586) Hyundai Wia Corp Citibank (9,523)(89) Hyundai Wia Corp JP Morgan (964)226 Il Dong Pharmaceutical Co
Ltd JP Morgan (22)(39) Iljin Materials Co Ltd Citibank (40)
(1,685) Iljin Materials Co Ltd JP Morgan 2,9954,802 InBody Co Ltd Citibank 12,671
24,861 Industrial Bank of Korea HSBC 11,767(605) iNtRON Biotechnology Inc Citibank (447)
(1,749) IS Dongseo Co Ltd Citibank 2,841(602) IS Dongseo Co Ltd JP Morgan 1,473
(1,881) ITM Semiconductor Co Ltd Citibank (1,815)11,988 JB Financial Group Co Ltd HSBC 2091,918 JR Reit XXVII (REIT) JP Morgan 281
84 JYP Entertainment Corp JP Morgan 92(587) Kakao Corp JP Morgan (4,835)
(2,399) Kangwon Land Inc JP Morgan (5,724)2,250 KB Financial Group Inc HSBC (1,115)
(3,174) KEPCO Engineering & Con-struction Co Inc Citibank (27,574)
(384) KEPCO Engineering & Con-struction Co Inc JP Morgan (7,399)
(1,695) KH Vatec Co Ltd Citibank (1,871)462 Koh Young Technology Inc HSBC 171
2,941 Koh Young Technology Inc JP Morgan 1,436(558) Kolmar BNH Co Ltd Citibank (281)(438) Kolmar BNH Co Ltd JP Morgan (304)
1,655 Kolon Industries Inc Citibank 7,0523,693 Kolon Plastic Inc JP Morgan (1,004)2,059 Komipharm International Co
Ltd Citibank 361990 Korea Gas Corp Citibank 1,648113 Korea Petrochemical Ind Co
Ltd JP Morgan (169)(254) Korea Shipbuilding & Off-
shore Engineering Co Ltd Citibank 774(184) Korea Shipbuilding & Off-
shore Engineering Co Ltd JP Morgan 2,4205,703 KT Corp JP Morgan 22,4312,283 KT Skylife Co Ltd Citibank 1,812
(13,729) Kuk-il Paper ManufacturingCo Ltd Citibank 1,603
(3,825) Kuk-il Paper ManufacturingCo Ltd JP Morgan 563
6,629 Kumho Tire Co Inc JP Morgan 3,881325 L&C Bio Co Ltd JP Morgan 270
Holding Description Counterparty
Netunrealised
appreciation/(depreciation)
USD
South Korea continued(478) L&F Co Ltd Citibank (756)294 LEENO Industrial Inc JP Morgan 704
(246) LegoChem Biosciences Inc Citibank (516)94 LG Chem Ltd Citibank (5,098)18 LG Display Co Ltd Citibank 23
726 LG Hausys Ltd JP Morgan (5,770)(2) LG Household & Health
Care Ltd JP Morgan (26)725 LG International Corp JP Morgan (3,012)288 Lotte Chilsung Beverage Co
Ltd Citibank 2,226554 LOTTE Fine Chemical Co
Ltd JP Morgan 1,4171,060 LS Electric Co Ltd Citibank 2,373
555 Mando Corp Citibank 3,034(3,413) Mcnex Co Ltd Citibank (7,126)
(383) Mcnex Co Ltd JP Morgan (22)(202) Medipost Co Ltd Citibank (110)(53) Medipost Co Ltd JP Morgan 13282 MegaStudyEdu Co Ltd Citibank 436
1,819 MegaStudyEdu Co Ltd JP Morgan (110)(366) Mezzion Pharma Co Ltd Citibank 3,421(216) Mezzion Pharma Co Ltd JP Morgan 3,862
4,833 Moorim P&P Co Ltd HSBC (1,938)5,339 Namhae Chemical Corp Citibank 2,6021,528 Nasmedia Co Ltd Citibank 3,035(821) Naturecell Co Ltd Citibank (442)152 NAVER Corp JP Morgan 184531 NeoPharm Co Ltd Citibank 1,460
(6,684) NEPES Corp Citibank (5,263)(31) NEPES Corp JP Morgan (16)
(676) Netmarble Corp Citibank (2,073)2,812 NH Investment & Securities
Co Ltd JP Morgan (679)1,978 NICE Information Service
Co Ltd HSBC 234(324) NongShim Co Ltd Citibank (101)(330) NOVAREX Co Ltd Citibank 37(90) NOVAREX Co Ltd JP Morgan (52)(48) OCI Co Ltd JP Morgan (187)
1,189 Optipharm Co Ltd JP Morgan 1,741(1,743) Oscotec Inc Citibank (5,278)
(113) Oscotec Inc JP Morgan (293)1,441 Osstem Implant Co Ltd Citibank 5,086
399 Osstem Implant Co Ltd HSBC 223(830) Pan Ocean Co Ltd Citibank (132)
(11,086) Pan Ocean Co Ltd HSBC 5,602(5,241) Paradise Co Ltd Citibank (7,382)(3,732) Paradise Co Ltd JP Morgan (4,832)
(11,896) Partron Co Ltd Citibank (4,764)(5,844) Partron Co Ltd JP Morgan (3,048)(1,058) Pearl Abyss Corp Citibank (2,858)
(65) Pearl Abyss Corp JP Morgan 33(135) People & Technology Inc Citibank (205)446 PharmaResearch Co Ltd Citibank 1,591
(187) PI Advanced Materials CoLtd Citibank (224)
661 PI Advanced Materials CoLtd Citibank 732
(79) PI Advanced Materials CoLtd JP Morgan 269
551 POSCO HSBC (25,281)16,145 Posco International Corp Citibank (2,865)
412 Posco International Corp JP Morgan (307)(2,983) RFHIC Corp Citibank (7,631)
(30) RFHIC Corp JP Morgan (48)(458) Sam Chun Dang Pharm Co
Ltd JP Morgan 1,9711 Samsung Biologics Co Ltd Citibank (1)
BlackRock Asia Pacific Diversified Equity Absolute ReturnFund continuedPortfolio of Investments as at 31 May 2021
The notes on pages 590 to 610 form an integral part of these financial statements.
BlackRock Strategic Funds[206]

Holding Description Counterparty
Netunrealised
appreciation/(depreciation)
USD
South Korea continued(63) Samsung C&T Corp JP Morgan (132)
4,722 Samsung Card Co Ltd HSBC (2,180)2,875 Samsung Electronics Co Ltd JP Morgan (6,482)
761 Samsung Fire & Marine In-surance Co Ltd JP Morgan 3,415
(1,833) Samsung Heavy IndustriesCo Ltd HSBC (58)
(130) Samsung SDI Co Ltd JP Morgan 2,351(843) Samyang Foods Co Ltd Citibank (5,224)(33) Samyang Holdings Corp JP Morgan 205
(944) Sang-A Frontec Co Ltd Citibank (3,508)(112) Sang-A Frontec Co Ltd JP Morgan (331)490 SaraminHR Co Ltd JP Morgan 1,218
2,994 Seah Besteel Corp Citibank (807)84 SeAH Steel Corp Citibank 375
(577) Seojin System Co Ltd Citibank (2,062)245 Seoul Broadcasting System JP Morgan 1,018
(7,972) Seoul Semiconductor CoLtd Citibank (2,565)
(521) SFA Engineering Corp HSBC 67(15,555) SFA Semicon Co Ltd Citibank (1,728)
(810) SFA Semicon Co Ltd JP Morgan (73)9,117 Shinhan Financial Group Co
Ltd Citibank 16,704742 Shinsegae Food Co Ltd JP Morgan 5,05397 Shinsegae International Inc JP Morgan 1,53387 Silicon Works Co Ltd JP Morgan 53561 SK Gas Ltd Citibank 275
3,069 SK IE Technology Co Ltd Citibank 23,577(175) SK Materials Co Ltd Citibank (783)389 SK Telecom Co Ltd Citibank 2,448
(185) SKC Co Ltd Citibank 1073,322 SL Corp JP Morgan 11,334(388) SM Entertainment Co Ltd Citibank (1,457)(73) SM Entertainment Co Ltd JP Morgan (734)
2,329 SM Entertainment Co Ltd JP Morgan 8,721(1,241) Soulbrain Co Ltd Citibank (5,644)
540 SPC Samlip Co Ltd JP Morgan 2,611(319) ST Pharm Co Ltd Citibank (3,507)(25) ST Pharm Co Ltd JP Morgan (132)14 Taekwang Industrial Co Ltd JP Morgan 1,216
(1,055) TES Co Ltd Citibank (138)(458) TES Co Ltd JP Morgan 1,245
(4,680) Toptec Co Ltd Citibank (1,543)2,458 Value Added Technology Co
Ltd JP Morgan 1,489(678) Wemade Co Ltd Citibank (4,665)
2,290 Whanin Pharmaceutical CoLtd HSBC 2,169
(36,968) Wonik Holdings Co Ltd Citibank (850)(312) WONIK IPS Co Ltd Citibank (327)(284) WONIK IPS Co Ltd JP Morgan 429
18,395 Woori Financial Group Inc HSBC (2,013)710 YG Entertainment Inc JP Morgan 5,080
5,272 Yonwoo Co Ltd JP Morgan 8,8631,851 Youngone Corp JP Morgan (76)(791) Yuhan Corp HSBC (757)(52) Zinus Inc Citibank (605)
(9,365)
Taiwan(43,000) AcBel Polytech Inc Citibank (1,500)(68,000) AcBel Polytech Inc JP Morgan 3,844(12,000) Accton Technology Corp Citibank (1,624)47,000 Acer Inc Citibank 2,08981,000 Acer Inc HSBC (8,922)2,000 Acer Inc JP Morgan (213)
(15,000) ACES Electronic Co Ltd JP Morgan (2,618)(8,000) ADATA Technology Co Ltd JP Morgan (3,986)2,000 Advanced Ceramic X Corp Citibank 3,860
Holding Description Counterparty
Netunrealised
appreciation/(depreciation)
USD
Taiwan continued1,000 Advanced Ceramic X Corp HSBC 7404,000 Advanced Ceramic X Corp JP Morgan 3,155
(42,000) Advanced Wireless Semi-conductor Co Citibank (22,907)
(22,000) Advanced Wireless Semi-conductor Co JP Morgan (16,303)
3,000 Advantech Co Ltd Citibank 591(90,000) Aerospace Industrial Devel-
opment Corp Citibank (2,552)(172,000) Aerospace Industrial Devel-
opment Corp JP Morgan 3,4621,000 Airtac International Group Citibank (1,243)1,000 Airtac International Group JP Morgan (3,286)1,000 Alchip Technologies Ltd Citibank 3,942
(2,000) Alltop Technology Co Ltd Citibank (372)(105,000) Alpha Networks Inc Citibank (5,420)(29,000) Alpha Networks Inc JP Morgan 1,884(6,000) Ample Electronic Technol-
ogy Co Ltd Citibank (3,104)(1,000) Ample Electronic Technol-
ogy Co Ltd JP Morgan (98)(4,000) AP Memory Technology
Corp JP Morgan (8,521)11,000 Apex International Co Ltd Citibank 1,376
(13,000) Apex International Co Ltd Citibank (1,626)61,000 Arcadyan Technology Corp Citibank 10,67814,000 Arcadyan Technology Corp HSBC (191)25,000 Arcadyan Technology Corp JP Morgan (86)3,000 Argosy Research Inc Citibank 1,0061,000 Argosy Research Inc JP Morgan (87)
(13,000) ASE Technology Holding CoLtd JP Morgan (3,607)
8,000 Asia Optical Co Inc Citibank 1,60610,000 Asia Optical Co Inc HSBC 3924,000 Asia Optical Co Inc JP Morgan 1,08615,000 Asia Polymer Corp Citibank 2,43933,000 Asia Polymer Corp HSBC 81614,000 Asia Polymer Corp JP Morgan 392(1,000) Asia Vital Components Co
Ltd Citibank (272)(27,000) Asia Vital Components Co
Ltd JP Morgan (4,802)(2,000) ASROCK Inc Citibank (680)(6,000) ASROCK Inc JP Morgan 3,0808,000 Asustek Computer Inc Citibank 2,8221,000 Asustek Computer Inc HSBC 3931,000 Asustek Computer Inc JP Morgan 434
10,000 AU Optronics Corp Citibank 1,3231,000 AU Optronics Corp HSBC 156
25,000 AU Optronics Corp JP Morgan (656)(17,000) AURAS Technology Co Ltd Citibank (11,362)(3,000) AURAS Technology Co Ltd JP Morgan (1,219)
(139,000) BES Engineering Corp JP Morgan 4,07413,000 Bizlink Holding Inc Citibank 5,3486,000 Bizlink Holding Inc HSBC (2,091)
17,000 Bizlink Holding Inc JP Morgan (5,471)(3,690) Brave C&H Supply Co Ltd HSBC 1,811
(244,000) Capital Securities Corp JP Morgan 2,802(107,000) Career Technology MFG.
Co Ltd Citibank (3,304)(165,000) Career Technology MFG.
Co Ltd JP Morgan 12,982(2,000) Caswell Inc JP Morgan (1,657)(1,000) Catcher Technology Co Ltd Citibank (153)
(28,000) Catcher Technology Co Ltd JP Morgan 5,1146,000 Cathay Financial Holding
Co Ltd HSBC (407)(8,000) Center Laboratories Inc Citibank 248
(35,000) Center Laboratories Inc JP Morgan (4,394)
BlackRock Asia Pacific Diversified Equity Absolute ReturnFund continuedPortfolio of Investments as at 31 May 2021
The notes on pages 590 to 610 form an integral part of these financial statements.
Annual report and audited financial statements [207]

Holding Description Counterparty
Netunrealised
appreciation/(depreciation)
USD
Taiwan continued(63,000) Century Iron & Steel Indus-
trial Co Ltd Citibank (18,846)(48,000) Century Iron & Steel Indus-
trial Co Ltd JP Morgan 18,682(292,000) Chang Hwa Commercial
Bank Ltd JP Morgan 10,212(61,000) Chenbro Micom Co Ltd Citibank 5,848(35,000) Chenbro Micom Co Ltd JP Morgan 9,897
7,000 Cheng Loong Corp Citibank (136)18,000 Cheng Loong Corp HSBC (3,038)21,000 Cheng Loong Corp JP Morgan (3,443)21,000 Cheng Shin Rubber Industry
Co Ltd Citibank 1,972(7,000) Cheng Uei Precision Indus-
try Co Ltd Citibank (399)(20,000) Cheng Uei Precision Indus-
try Co Ltd JP Morgan (1,715)(3,000) Chia Hsin Cement Corp Citibank (99)
(45,000) Chia Hsin Cement Corp JP Morgan (1,092)23,045 Chicony Electronics Co Ltd Citibank 1,1192,010 Chicony Electronics Co Ltd HSBC (276)4,175 Chicony Electronics Co Ltd JP Morgan (538)2,000 Chief Telecom Inc Citibank 5242,000 Chief Telecom Inc JP Morgan 1,163
(2,000) Chilisin Electronics Corp Citibank (574)(7,000) Chilisin Electronics Corp JP Morgan 343
104,000 China Development Finan-cial Holding Corp Citibank 2,059
19,000 China Development Finan-cial Holding Corp HSBC (552)
368,000 China Development Finan-cial Holding Corp JP Morgan (10,173)
46,000 China General Plastics Corp Citibank 6,1532,000 China General Plastics Corp HSBC (74)
28,000 China General Plastics Corp JP Morgan (935)(46,000) China Life Insurance Co Ltd JP Morgan 2,628(11,000) China Man-Made Fiber
Corp JP Morgan (438)(127,000) China Petrochemical Devel-
opment Corp JP Morgan 4,08020,000 China Steel Chemical Corp Citibank 1,6621,000 China Steel Chemical Corp HSBC (349)
44,000 China Steel Chemical Corp JP Morgan (14,807)114,000 China Steel Corp Citibank 7,76918,000 China Steel Corp HSBC (5,033)39,000 China Steel Corp JP Morgan (10,721)
(24,000) Chin-Poon Industrial Co Ltd JP Morgan 1,764152,000 Chipbond Technology Corp Citibank 21,97537,000 Chipbond Technology Corp HSBC (2,917)
168,000 Chipbond Technology Corp JP Morgan (12,001)84,000 ChipMOS Technologies Inc Citibank 9,95085,000 ChipMOS Technologies Inc HSBC 3,17382,000 ChipMOS Technologies Inc JP Morgan 6,10912,000 Chlitina Holding Ltd Citibank 1,3242,000 Chlitina Holding Ltd HSBC 768,000 Chlitina Holding Ltd JP Morgan 481
(66,000) Chong Hong ConstructionCo Ltd Citibank (3,706)
(9,000) Chong Hong ConstructionCo Ltd JP Morgan 182
(1,000) Chroma ATE Inc JP Morgan (339)(147,000) Chun Yuan Steel Industry
Co Ltd Citibank (9,795)(12,000) Chun Yuan Steel Industry
Co Ltd JP Morgan 1,8059,000 Chung Hung Steel Corp Citibank 2,5751,000 Chung Hung Steel Corp HSBC 446
31,000 Chung Hung Steel Corp JP Morgan 965(10,000) Chung Hwa Pulp Corp JP Morgan (507)
Holding Description Counterparty
Netunrealised
appreciation/(depreciation)
USD
Taiwan continued(41,000) Chung-Hsin Electric & Ma-
chinery ManufacturingCorp JP Morgan (240)
(32,000) CMC Magnetics Corp JP Morgan 3487,000 Compal Electronics Inc Citibank 1,36510,000 Compal Electronics Inc HSBC (243)3,000 Compal Electronics Inc JP Morgan (65)
(17,000) Compeq Manufacturing CoLtd JP Morgan 32
(13,000) Continental Holdings Corp Citibank (119)(109,000) Continental Holdings Corp JP Morgan 14,358(77,138) CSBC Corp Taiwan Citibank 218(30,591) CSBC Corp Taiwan JP Morgan 2,60136,000 CTBC Financial Holding Co
Ltd Citibank 1,07442,000 CTBC Financial Holding Co
Ltd HSBC (1,101)256,000 CTBC Financial Holding Co
Ltd JP Morgan (6,069)(1,091) Cub Elecparts Inc JP Morgan 1,190(3,000) Cyberlink Corp JP Morgan 197(3,000) DA CIN Construction Co Ltd Citibank (71)(1,000) DA CIN Construction Co Ltd JP Morgan 97
(46,000) Da-Li Development Co Ltd Citibank (1,666)(11,000) Da-Li Development Co Ltd JP Morgan 195
8,000 Darwin Precisions Corp Citibank 2205,000 Darwin Precisions Corp HSBC (305)3,000 Darwin Precisions Corp JP Morgan (178)2,000 Delta Electronics Inc Citibank 1,0483,000 Delta Electronics Inc HSBC 1,154
16,000 Delta Electronics Inc JP Morgan 6,635(6,000) Dyaco International Inc Citibank (735)23,000 E Ink Holdings Inc Citibank 4,0002,000 E Ink Holdings Inc HSBC 1707,000 E Ink Holdings Inc JP Morgan 638
(113,000) E.Sun Financial Holding CoLtd JP Morgan 3,992
5,000 Eclat Textile Co Ltd Citibank (728)1,000 Eclat Textile Co Ltd HSBC 1,3231,000 Eclat Textile Co Ltd JP Morgan 1,387
(24,000) Egis Technology Inc Citibank (6,043)24,000 Elan Microelectronics Corp Citibank 7,38215,000 Elan Microelectronics Corp HSBC 8,66614,000 Elan Microelectronics Corp JP Morgan 8,376(1,000) Elite Material Co Ltd Citibank (269)
(17,000) Elite Semiconductor Micro-electronics TechnologyInc Citibank (11,345)
(9,000) Elite Semiconductor Micro-electronics TechnologyInc JP Morgan 681
2,000 eMemory Technology Inc Citibank 4,0501,000 eMemory Technology Inc JP Morgan (726)2,000 Ennoconn Corp Citibank 1,0804,000 Ennoconn Corp JP Morgan 3,166
(43,500) ENNOSTAR Inc JP Morgan 289,000 Eurocharm Holdings Co Ltd Citibank 1,191
18,000 Eurocharm Holdings Co Ltd HSBC 4,9805,000 Eurocharm Holdings Co Ltd JP Morgan (1,560)
37,000 Eva Airways Corp Citibank 2,5947,000 Eva Airways Corp HSBC (94)
57,000 Eva Airways Corp JP Morgan (662)6,000 Evergreen Marine Corp Tai-
wan Ltd Citibank 2,8801,000 Evergreen Marine Corp Tai-
wan Ltd HSBC 21019,000 Evergreen Marine Corp Tai-
wan Ltd JP Morgan 4,17038,000 Everlight Electronics Co Ltd Citibank 1,922
BlackRock Asia Pacific Diversified Equity Absolute ReturnFund continuedPortfolio of Investments as at 31 May 2021
The notes on pages 590 to 610 form an integral part of these financial statements.
BlackRock Strategic Funds[208]

Holding Description Counterparty
Netunrealised
appreciation/(depreciation)
USD
Taiwan continued27,000 Everlight Electronics Co Ltd HSBC 1,68912,000 Everlight Electronics Co Ltd JP Morgan 806
101,000 Far Eastern New CenturyCorp Citibank 5,383
22,000 Far Eastern New CenturyCorp HSBC (1,594)
75,000 Far Eastern New CenturyCorp JP Morgan (3,384)
7,000 Far EasTone Telecommuni-cations Co Ltd Citibank 248
1,000 Far EasTone Telecommuni-cations Co Ltd HSBC (40)
53,000 Far EasTone Telecommuni-cations Co Ltd JP Morgan (1,773)
119,000 Faraday Technology Corp Citibank 33,39122,000 Faraday Technology Corp HSBC 2,09119,000 Faraday Technology Corp JP Morgan 5,468
(19,000) Farglory Land DevelopmentCo Ltd Citibank (527)
(69,000) Farglory Land DevelopmentCo Ltd JP Morgan 229
7,000 Feng Hsin Steel Co Ltd HSBC (1,923)(11,600) Feng TAY Enterprise Co Ltd Citibank (9,117)(1,000) Feng TAY Enterprise Co Ltd JP Morgan (1,183)
(381,970) First Financial Holding CoLtd JP Morgan 7,835
(35,000) FLEXium Interconnect Inc Citibank (6,217)(40,000) FLEXium Interconnect Inc JP Morgan (10,677)(3,501) FocalTech Systems Co Ltd JP Morgan (4,166)(5,473) Forcecon Tech Co Ltd Citibank (1,340)10,000 Formosa Chemicals & Fibre
Corp JP Morgan 1,2861,000 Formosa International Ho-
tels Corp JP Morgan (163)(52,000) Formosa Petrochemical
Corp JP Morgan 12,05124,000 Formosa Plastics Corp Citibank 2,2673,000 Formosa Plastics Corp HSBC 8624,000 Formosa Plastics Corp JP Morgan (205)
(5,000) Formosa Sumco Technol-ogy Corp Citibank (2,607)
(1,000) Formosa Sumco Technol-ogy Corp JP Morgan (529)
(39,000) Fortune Electric Co Ltd Citibank (3,786)(36,000) Fortune Electric Co Ltd JP Morgan 5,919(50,000) Foxconn Technology Co Ltd Citibank (4,658)(48,000) Foxconn Technology Co Ltd JP Morgan (992)(1,000) Foxsemicon Integrated
Technology Inc JP Morgan (679)(38,000) Fubon Financial Holding Co
Ltd Citibank (1,617)(39,000) Fubon Financial Holding Co
Ltd JP Morgan 4,9656,000 Fulgent Sun International
Holding Co Ltd Citibank 1,18112,000 Fulgent Sun International
Holding Co Ltd HSBC 11,60813,000 Fulgent Sun International
Holding Co Ltd JP Morgan 10,783(28,000) Gamania Digital Entertain-
ment Co Ltd Citibank 910(50,000) Gamania Digital Entertain-
ment Co Ltd JP Morgan (2,092)5,000 General Interface Solution
Holding Ltd Citibank 2705,000 General Interface Solution
Holding Ltd JP Morgan (2,435)(2,000) Genius Electronic Optical
Co Ltd JP Morgan 58525,000 Getac Technology Corp Citibank 2,17927,000 Getac Technology Corp HSBC (2,831)
Holding Description Counterparty
Netunrealised
appreciation/(depreciation)
USD
Taiwan continued3,000 Getac Technology Corp JP Morgan (297)3,000 Giant Manufacturing Co Ltd Citibank 1,1882,000 Giant Manufacturing Co Ltd HSBC 1,0662,000 Giant Manufacturing Co Ltd JP Morgan 295
26,000 Gigabyte Technology Co Ltd Citibank 11,40010,000 Gigabyte Technology Co Ltd HSBC (6,179)21,000 Gigabyte Technology Co Ltd JP Morgan (12,695)(1,000) Gigasolar Materials Corp JP Morgan 17510,000 Ginko International Co Ltd Citibank 2,5515,000 Ginko International Co Ltd HSBC 770
17,000 Ginko International Co Ltd JP Morgan 3,693(2,000) Global Lighting Technolo-
gies Inc Citibank (593)1,000 Global PMX Co Ltd Citibank 31,000 Global PMX Co Ltd HSBC (170)1,000 Global PMX Co Ltd JP Morgan (152)1,000 Global Unichip Corp Citibank 4454,000 Global Unichip Corp HSBC (982)
(4,000) Globalwafers Co Ltd Citibank (15,219)(2,000) Gold Circuit Electronics Ltd Citibank (249)
(25,000) Gold Circuit Electronics Ltd JP Morgan (4,277)(164,000) Goldsun Building Materials
Co Ltd Citibank (10,648)(53,107) Goldsun Building Materials
Co Ltd JP Morgan 2,733(2,000) Good Way Technology Co
Ltd Citibank (69)7,000 Gourmet Master Co Ltd Citibank 4,021
10,000 Gourmet Master Co Ltd HSBC (4,588)5,000 Gourmet Master Co Ltd JP Morgan (2,200)
43,000 Grand Pacific Petrochemical Citibank 3,0471,000 Grand Pacific Petrochemical HSBC (68)4,000 Grand Pacific Petrochemical JP Morgan (261)
13,000 Great Wall Enterprise CoLtd Citibank 888
1,000 Great Wall Enterprise CoLtd HSBC 47
10,000 Great Wall Enterprise CoLtd JP Morgan (790)
63,000 Greatek Electronics Inc Citibank 11,1441,000 Greatek Electronics Inc HSBC 70
34,000 Greatek Electronics Inc JP Morgan 3,270(2,000) Gudeng Precision Industrial
Co Ltd JP Morgan (4,218)(75,000) Hannstar Board Corp JP Morgan 655(25,000) HannStar Display Corp Citibank (3,568)
(132,000) HannStar Display Corp JP Morgan (9,624)(1,000) Highwealth Construction
Corp JP Morgan (9)2,000 Hiwin Technologies Corp Citibank 1,6483,000 Hiwin Technologies Corp HSBC (137)1,000 Hiwin Technologies Corp JP Morgan (7)
23,000 Holtek Semiconductor Inc Citibank 4,65927,000 Holtek Semiconductor Inc HSBC (1,844)28,000 Holtek Semiconductor Inc JP Morgan (419)(4,000) Holy Stone Enterprise Co
Ltd JP Morgan (2,225)5,000 Hota Industrial Manufactur-
ing Co Ltd HSBC (846)2,000 Hota Industrial Manufactur-
ing Co Ltd JP Morgan (317)8,000 Hotai Finance Co Ltd Citibank 1,1524,000 Hotai Finance Co Ltd HSBC (170)4,000 Hotai Finance Co Ltd JP Morgan (135)
(5,000) Hotai Motor Co Ltd JP Morgan 5,036(17,000) HTC Corp Citibank (1,372)(32,000) HTC Corp JP Morgan 631
3,000 Hu Lane Associate Inc Citibank 2455,000 Hu Lane Associate Inc HSBC (760)6,000 Hu Lane Associate Inc JP Morgan 2,140
BlackRock Asia Pacific Diversified Equity Absolute ReturnFund continuedPortfolio of Investments as at 31 May 2021
The notes on pages 590 to 610 form an integral part of these financial statements.
Annual report and audited financial statements [209]

Holding Description Counterparty
Netunrealised
appreciation/(depreciation)
USD
Taiwan continued(778,811) Hua Nan Financial Holdings
Co Ltd JP Morgan 18,455(15,000) Huaku Development Co Ltd JP Morgan (38)
7,000 Innolux Corp Citibank 7141,000 Innolux Corp HSBC (33)
14,000 Innolux Corp JP Morgan (426)(37,000) International CSRC Invest-
ment Holdings Co Citibank (4,283)(12,000) International CSRC Invest-
ment Holdings Co JP Morgan 9332,000 International Games Sys-
tem Co Ltd Citibank 7,7521,000 International Games Sys-
tem Co Ltd JP Morgan 6,748(128,000) Inventec Corp Citibank (2,372)
(9,000) Inventec Corp HSBC 164(66,000) Inventec Corp JP Morgan 1,023(3,000) ITEQ Corp JP Morgan 720(3,000) Jarllytec Co Ltd JP Morgan 68(3,000) Jentech Precision Industrial
Co Ltd JP Morgan (5,320)(115,000) Jih Sun Financial Holdings
Co Ltd Citibank (859)(2) Jih Sun Financial Holdings
Co Ltdπ JP Morgan —(5,750) Jinan Acetate Chemical Co
Ltd Citibank (268)(40,000) Johnson Health Tech Co Ltd Citibank (3,108)(12,000) Johnson Health Tech Co Ltd JP Morgan 293(24,000) Kindom Development Co
Ltd Citibank (525)(70,000) Kindom Development Co
Ltd JP Morgan 9,853(1,000) King Slide Works Co Ltd Citibank 6462,000 King Yuan Electronics Co
Ltd Citibank 6,83652,000 King Yuan Electronics Co
Ltd HSBC (7,440)84,000 King Yuan Electronics Co
Ltd JP Morgan (5,558)(14,000) Kinik Co JP Morgan 1,52210,000 Kinsus Interconnect Tech-
nology Corp Citibank 5,31311,000 Kinsus Interconnect Tech-
nology Corp HSBC 5,5827,000 Kinsus Interconnect Tech-
nology Corp JP Morgan 3,5262,000 KMC Kuei Meng Interna-
tional Inc Citibank 7082,000 KMC Kuei Meng Interna-
tional Inc HSBC 45013,000 KMC Kuei Meng Interna-
tional Inc JP Morgan 3,233(11,000) Kuoyang Construction Co
Ltd Citibank (325)(1,000) Kuoyang Construction Co
Ltd JP Morgan 96(5,000) LandMark Optoelectronics
Corp Citibank (3,244)(10,000) LandMark Optoelectronics
Corp JP Morgan (7,098)(100,000) Lealea Enterprise Co Ltd JP Morgan (774)(46,000) Leatec Fine Ceramics Co
Ltd JP Morgan 2,317(158,000) Lien Hwa Industrial Hold-
ings Corp Citibank (7,599)(43,000) Lien Hwa Industrial Hold-
ings Corp JP Morgan (155)58,000 Lite-On Technology Corp Citibank 7,9161,000 Lite-On Technology Corp HSBC 25
15,000 Lite-On Technology Corp JP Morgan 476
Holding Description Counterparty
Netunrealised
appreciation/(depreciation)
USD
Taiwan continued(22,000) Longchen Paper & Packag-
ing Co Ltd Citibank (975)(83,000) Longchen Paper & Packag-
ing Co Ltd JP Morgan 11,924(51,000) LuxNet Corp Citibank (1,714)(21,000) LuxNet Corp JP Morgan 714(2,000) M31 Technology Corp Citibank (982)28,000 Macauto Industrial Co Ltd Citibank 2,1991,000 Macauto Industrial Co Ltd HSBC (152)
27,000 Macauto Industrial Co Ltd JP Morgan (3,851)106,000 Macronix International Co
Ltd Citibank 13,9175,000 Macronix International Co
Ltd HSBC 1,3127,000 Macronix International Co
Ltd JP Morgan 1,2916,600 Makalot Industrial Co Ltd Citibank 8161,300 Makalot Industrial Co Ltd HSBC 775
13,251 Makalot Industrial Co Ltd JP Morgan 8,272(18,000) Marketech International
Corp JP Morgan 4,8001,000 MediaTek Inc Citibank 2,2991,000 MediaTek Inc HSBC 8415,000 MediaTek Inc JP Morgan 4,716
(94,000) Mega Financial Holding CoLtd JP Morgan (1,493)
12,000 Merida Industry Co Ltd Citibank 8,78910,000 Merida Industry Co Ltd HSBC 2,4793,000 Merida Industry Co Ltd JP Morgan 843
(14,000) Merry Electronics Co Ltd Citibank (2,415)(1,000) Merry Electronics Co Ltd JP Morgan (58)(9,000) Microbio Co Ltd Citibank (189)
(39,000) Microbio Co Ltd JP Morgan 10,2376,000 Micro-Star International Co
Ltd Citibank (108)6,000 Micro-Star International Co
Ltd JP Morgan 360(36,000) Mitac Holdings Corp Citibank (833)
(228,000) Mitac Holdings Corp JP Morgan 4,1521,000 momo.com Inc Citibank 1,261
80,000 Namchow Holdings Co Ltd Citibank 5,725(9,000) Nan Liu Enterprise Co Ltd Citibank (7)10,000 Nan Ya Plastics Corp Citibank 1,33818,000 Nan Ya Plastics Corp HSBC (2,572)13,000 Nan Ya Plastics Corp JP Morgan (1,737)
(51,126) Newmax Technology Co Ltd Citibank (6,838)(23,000) Newmax Technology Co Ltd JP Morgan 1,406(15,000) Nidec Chaun-Choung Tech-
nology Corp Citibank 5,645(1,000) Nidec Chaun-Choung Tech-
nology Corp JP Morgan 4273,000 Novatek Microelectronics
Corp Citibank 5,6971,000 Novatek Microelectronics
Corp HSBC (253)3,000 Novatek Microelectronics
Corp JP Morgan (588)(2,000) Oneness Biotech Co Ltd JP Morgan 1,6414,000 Oriental Union Chemical
Corp Citibank 1605,000 Oriental Union Chemical
Corp HSBC 31530,000 Oriental Union Chemical
Corp JP Morgan 2,651(9,000) Pan-International Industrial
Corp Citibank (527)2,000 Parade Technologies Ltd Citibank 9,2202,000 Parade Technologies Ltd HSBC 10,5264,000 Parade Technologies Ltd JP Morgan 26,993
(4,000) PChome Online Inc Citibank 1,762
BlackRock Asia Pacific Diversified Equity Absolute ReturnFund continuedPortfolio of Investments as at 31 May 2021
The notes on pages 590 to 610 form an integral part of these financial statements.
BlackRock Strategic Funds[210]

Holding Description Counterparty
Netunrealised
appreciation/(depreciation)
USD
Taiwan continued(24,000) Pegatron Corp Citibank (1,463)(6,000) Pegatron Corp JP Morgan (788)2,000 Pegavision Corp Citibank 3,0661,000 Pegavision Corp HSBC 1,2882,000 Pegavision Corp JP Morgan 5,6211,000 Phison Electronics Corp JP Morgan 1,6216,000 Pixart Imaging Inc Citibank 1,3325,000 Pixart Imaging Inc JP Morgan 4,335
(4,000) Powertech Technology Inc JP Morgan (446)(11,000) President Chain Store Corp HSBC 2,190(6,000) President Chain Store Corp JP Morgan 1,024
(56,000) President Securities Corp Citibank (3,711)(129,000) President Securities Corp JP Morgan 7,186108,000 Primax Electronics Ltd Citibank 9,094
6,000 Primax Electronics Ltd HSBC (606)114,000 Primax Electronics Ltd JP Morgan (10,831)
3,000 Qisda Corp Citibank 1968,000 Qisda Corp HSBC (956)
22,000 Qisda Corp JP Morgan (2,549)5,000 Quanta Computer Inc Citibank 5195,000 Quanta Computer Inc HSBC (743)
59,000 Quanta Computer Inc JP Morgan (8,188)(30,000) Radiant Opto-Electronics
Corp Citibank (3,705)(7,000) Radiant Opto-Electronics
Corp JP Morgan (659)2,000 Realtek Semiconductor
Corp Citibank 3,7674,000 Realtek Semiconductor
Corp HSBC (186)5,000 Realtek Semiconductor
Corp JP Morgan 1,708(2,000) RichWave Technology Corp Citibank (3,283)(1,000) RichWave Technology Corp JP Morgan (2,559)16,000 Ritek Corp Citibank 40823,000 Ritek Corp JP Morgan (904)
(25,840) Ruentex Development CoLtd JP Morgan 1,442
(17,000) Ruentex Industries Ltd JP Morgan 219(26,000) Savior Lifetec Corp Citibank (97)(21,000) Savior Lifetec Corp JP Morgan 302(12,000) ScinoPharm Taiwan Ltd JP Morgan (556)(19,000) Shanghai Commercial &
Savings Bank Ltd Citibank (1,060)(161,000) Shanghai Commercial &
Savings Bank Ltd JP Morgan (7,910)(15,000) Shin Kong Financial Holding
Co Ltd HSBC 95(785,000) Shin Kong Financial Holding
Co Ltd JP Morgan 4,106(1,000) ShunSin Technology Hold-
ing Ltd JP Morgan (274)(15,000) Silicon Optronics Inc Citibank (11,363)
5,000 Simplo Technology Co Ltd Citibank 2,8618,000 Simplo Technology Co Ltd HSBC 1,211
16,000 Simplo Technology Co Ltd JP Morgan 3,030(8,000) Sinbon Electronics Co Ltd JP Morgan (11,075)
(14,000) Sincere Navigation Corp Citibank 114(40,000) Sincere Navigation Corp JP Morgan 12,231(14,000) Sino-American Silicon Prod-
ucts Inc Citibank (7,301)(14,000) Sino-American Silicon Prod-
ucts Inc JP Morgan 45633,000 SinoPac Financial Holdings
Co Ltd Citibank 5515,000 SinoPac Financial Holdings
Co Ltd HSBC (63)315,000 SinoPac Financial Holdings
Co Ltd JP Morgan (3,497)1,000 Sitronix Technology Corp Citibank 1,111
Holding Description Counterparty
Netunrealised
appreciation/(depreciation)
USD
Taiwan continued1,000 Sitronix Technology Corp JP Morgan 1,057
(9,000) Soft-World InternationalCorp JP Morgan 1,261
(1,000) Solar Applied MaterialsTechnology Corp Citibank (146)
(16,000) Solar Applied MaterialsTechnology Corp JP Morgan 1,581
(1,000) Sonix Technology Co Ltd JP Morgan (148)(17,000) Speed Tech Corp Citibank (2,766)(17,000) Speed Tech Corp JP Morgan (2,202)
5,000 Sporton International Inc Citibank 6181,000 Sporton International Inc JP Morgan (522)2,000 St Shine Optical Co Ltd Citibank 1,2963,000 St Shine Optical Co Ltd HSBC (1,383)5,000 St Shine Optical Co Ltd JP Morgan (2,144)
(6,000) Sunny Friend EnvironmentalTechnology Co Ltd Citibank (1,423)
(30,000) Sunny Friend EnvironmentalTechnology Co Ltd JP Morgan 7,301
(4,000) Sunonwealth Electric Ma-chine Industry Co Ltd Citibank (191)
(13,000) Sunonwealth Electric Ma-chine Industry Co Ltd JP Morgan 1,422
(31,000) Sunrex Technology Corp Citibank (645)(17,000) Sunrex Technology Corp JP Morgan 3,063
1,000 Supreme Electronics Co Ltd Citibank 64(30,000) Swancor Holding Co Ltd Citibank (2,610)(3,000) Swancor Holding Co Ltd JP Morgan 2,558(3,000) Systex Corp Citibank (255)
(13,000) Systex Corp JP Morgan 1,2083,000 T3EX Global Holdings Corp Citibank 3,4643,000 T3EX Global Holdings Corp JP Morgan 2,640
18,000 TA Chen Stainless Pipe Citibank 3,12625,000 TA Chen Stainless Pipe HSBC 4,391
(207,000) Taishin Financial Holding CoLtd JP Morgan 1,831
(164,850) Taiwan Business Bank Citibank (2,113)(245,700) Taiwan Business Bank JP Morgan 3,880(23,000) Taiwan Cement Corp JP Morgan (1,692)(83,000) Taiwan Cogeneration Corp Citibank (2,167)(70,000) Taiwan Cogeneration Corp JP Morgan 1,99818,050 Taiwan Cooperative Finan-
cial Holding Co Ltd Citibank 3601,680 Taiwan Cooperative Finan-
cial Holding Co Ltd HSBC (39)209,090 Taiwan Cooperative Finan-
cial Holding Co Ltd JP Morgan (4,370)(34,000) Taiwan Fertilizer Co Ltd Citibank (1,315)(1,000) Taiwan Fertilizer Co Ltd HSBC 233
(119,000) Taiwan Fertilizer Co Ltd JP Morgan 18,822(25,000) Taiwan Glass Industry Corp Citibank (3,359)(80,000) Taiwan Glass Industry Corp JP Morgan 10,144(13,000) Taiwan High Speed Rail
Corp JP Morgan 69737,000 Taiwan Hon Chuan Enter-
prise Co Ltd Citibank 1,94625,000 Taiwan Hon Chuan Enter-
prise Co Ltd HSBC (4,382)19,000 Taiwan Hon Chuan Enter-
prise Co Ltd JP Morgan (3,180)(28,000) Taiwan Mobile Co Ltd Citibank (1,739)(1,000) Taiwan Mobile Co Ltd HSBC (27)(1,000) Taiwan Mobile Co Ltd JP Morgan (37)18,000 Taiwan Navigation Co Ltd Citibank 7211,000 Taiwan Navigation Co Ltd JP Morgan (434)
74,000 Taiwan Paiho Ltd Citibank 4,1697,000 Taiwan Paiho Ltd HSBC (677)
32,000 Taiwan Paiho Ltd JP Morgan (2,766)1,000 Taiwan Semiconductor
Manufacturing Co Ltd Citibank 1,301
BlackRock Asia Pacific Diversified Equity Absolute ReturnFund continuedPortfolio of Investments as at 31 May 2021
The notes on pages 590 to 610 form an integral part of these financial statements.
Annual report and audited financial statements [211]

Holding Description Counterparty
Netunrealised
appreciation/(depreciation)
USD
Taiwan continued1,000 Taiwan Semiconductor
Manufacturing Co Ltd HSBC 4472,000 Taiwan Semiconductor
Manufacturing Co Ltd JP Morgan 1,01710,000 Taiwan Surface Mounting
Technology Corp Citibank 3,20821,000 Taiwan Union Technology
Corp Citibank 7,6581,000 Taiwan Union Technology
Corp HSBC 4617,000 Taiwan Union Technology
Corp JP Morgan 3,6605,000 Teco Electric and Machinery
Co Ltd Citibank 35927,000 Teco Electric and Machinery
Co Ltd HSBC (158)3,000 Teco Electric and Machinery
Co Ltd JP Morgan 253(2,000) Thermaltake Technology Co
Ltd Citibank (163)175,000 Ton Yi Industrial Corp Citibank 2,265159,000 Ton Yi Industrial Corp JP Morgan (16,896)
(2,000) Topkey Corp JP Morgan (815)25,000 Topoint Technology Co Ltd Citibank 1,0602,000 Topoint Technology Co Ltd HSBC 68
55,000 Topoint Technology Co Ltd JP Morgan 2,08832,000 TPK Holding Co Ltd Citibank 1,50829,000 TPK Holding Co Ltd HSBC (5,900)16,000 TPK Holding Co Ltd JP Morgan (3,168)1,000 Transcend Information Inc Citibank 71
13,000 Transcend Information Inc JP Morgan (2,501)(5,000) TrueLight Corp Citibank (345)(1,000) TrueLight Corp JP Morgan (162)
(136,000) TSEC Corp Citibank (7,563)(11,000) TSEC Corp JP Morgan 2,11311,000 TSRC Corp Citibank 87930,000 TSRC Corp HSBC (6,763)7,000 TSRC Corp JP Morgan (1,551)
(4,000) TTY Biopharm Co Ltd JP Morgan 757,000 Tung Ho Steel Enterprise
Corp Citibank 4,27331,000 Tung Ho Steel Enterprise
Corp HSBC (11,917)179,000 Tung Ho Steel Enterprise
Corp JP Morgan (67,702)17,000 TURVO International Co Ltd Citibank 3,2387,000 TURVO International Co Ltd HSBC (4,582)
53,000 TURVO International Co Ltd JP Morgan (29,927)20,000 TXC Corp Citibank 12,7101,000 TXC Corp HSBC 2992,000 TXC Corp JP Morgan 620
(28,000) Unimicron Technology Corp JP Morgan (12,213)1,000 Uni-President Enterprises
Corp Citibank 321,000 Uni-President Enterprises
Corp JP Morgan (30)(45,000) Unitech Printed Circuit
Board Corp Citibank (2,267)(131,320) Unitech Printed Circuit
Board Corp JP Morgan 4,614(2,000) United Integrated Services
Co Ltd JP Morgan (1,785)1,000 United Microelectronics
Corp JP Morgan 38(4,000) Universal Vision Biotechnol-
ogy Co Ltd Citibank (1,967)(3,000) Universal Vision Biotechnol-
ogy Co Ltd JP Morgan 2,4047,000 USI Corp Citibank 1,3526,000 USI Corp JP Morgan 92
Holding Description Counterparty
Netunrealised
appreciation/(depreciation)
USD
Taiwan continued7,000 Vanguard International
Semiconductor Corp Citibank 2,86814,000 Vanguard International
Semiconductor Corp HSBC 2,20334,000 Vanguard International
Semiconductor Corp JP Morgan 5,757(4,000) Via Technologies Inc HSBC 65241,000 Visual Photonics Epitaxy Co
Ltd Citibank 22,44210,000 Visual Photonics Epitaxy Co
Ltd HSBC 1,38240,000 Visual Photonics Epitaxy Co
Ltd JP Morgan 5,9889,000 Wafer Works Corp Citibank 2,3622,000 Wafer Works Corp JP Morgan 5558,000 Wah Lee Industrial Corp Citibank 8182,000 Wah Lee Industrial Corp HSBC 131,000 Wah Lee Industrial Corp JP Morgan 15
(51,000) Walsin Lihwa Corp JP Morgan (7,283)(4,000) Walsin Technology Corp JP Morgan 1,409(8,000) Win Semiconductors Corp Citibank (5,013)
(60,000) Winbond Electronics Corp Citibank (10,027)(12,000) Winbond Electronics Corp JP Morgan (733)18,000 Wisdom Marine Lines Co
Ltd Citibank (1,141)14,000 Wisdom Marine Lines Co
Ltd HSBC (3,624)25,000 Wisdom Marine Lines Co
Ltd JP Morgan (6,276)(102,000) Wistron Corp Citibank (6,673)(51,000) Wistron Corp JP Morgan 240(21,000) Wistron NeWeb Corp Citibank (2,490)(25,000) Wistron NeWeb Corp JP Morgan 1,895(1,000) Wiwynn Corp JP Morgan (991)2,000 Wowprime Corp Citibank 1,0561,000 Wowprime Corp JP Morgan (413)
(89,000) WPG Holdings Ltd Citibank (10,314)(41,000) WPG Holdings Ltd JP Morgan (1,819)(37,000) XinTec Inc Citibank (14,399)(37,000) XinTec Inc JP Morgan (15,142)(1,000) Yageo Corp JP Morgan 284,000 Yang Ming Marine Transport
Corp Citibank 1,5261,000 Yang Ming Marine Transport
Corp HSBC 993,000 Yang Ming Marine Transport
Corp JP Morgan 329(6,000) Yen Sun Technology Corp Citibank (384)(9,000) Yen Sun Technology Corp JP Morgan (382)
(35,000) Yieh Phui Enterprise Co Ltd JP Morgan 4,888193,000 Yuanta Financial Holding Co
Ltd Citibank 6,3183,000 Yuanta Financial Holding Co
Ltd HSBC (98)13,000 Yuanta Financial Holding Co
Ltd JP Morgan (389)(5,000) Yulon Finance Corp JP Morgan 107(2,000) Zhen Ding Technology Hold-
ing Ltd JP Morgan (51)(5,000) Zhong Yang Technology Co
Ltd JP Morgan 608
111,955
Thailand(18,000) Advanced Info Service PCL Citibank 187
(183,600) Airports of Thailand PCL Citibank (14,649)(2,900) Airports of Thailand PCL HSBC (182)(4,200) Airports of Thailand PCL JP Morgan (287)
(26,600) Amata Corp PCL Citibank (914)416,200 AP Thailand PCL Citibank (1,536)
BlackRock Asia Pacific Diversified Equity Absolute ReturnFund continuedPortfolio of Investments as at 31 May 2021
The notes on pages 590 to 610 form an integral part of these financial statements.
BlackRock Strategic Funds[212]

Holding Description Counterparty
Netunrealised
appreciation/(depreciation)
USD
Thailand continued17,800 AP Thailand PCL HSBC (109)
1,291,400 AP Thailand PCL JP Morgan 11,722(1,400) B Grimm Power PCL Citibank (187)
200 Bangkok Bank PCL Reg Citibank 123,400 Bangkok Bank PCL Reg JP Morgan (351)
91,800 Bangkok Chain HospitalPCL Citibank 1,995
30,600 Bangkok Chain HospitalPCL HSBC 2,069
188,200 Bangkok Chain HospitalPCL JP Morgan 6,959
(96,700) Bangkok Dusit Medical Ser-vices PCL ’F’ Citibank (2,117)
(20,200) Bangkok Dusit Medical Ser-vices PCL ’F’ JP Morgan (218)
(277,100) Bangkok Expressway &Metro PCL Citibank (5,592)
16,300 Bangkok Ranch PCL Citibank 162,500 Berli Jucker PCL Citibank 714,900 Berli Jucker PCL HSBC (145)
800 Berli Jucker PCL JP Morgan (21)(375,300) BTS Group Holdings PCL Citibank (7,020)(52,900) Bumrungrad Hospital PCL Citibank (2,578)(1,200) Bumrungrad Hospital PCL HSBC (111)(4,100) Carabao Group PCL ’F’ Citibank (788)
(55,200) Central Pattana PCL JP Morgan 2,298(90,400) Central Plaza Hotel PCL Citibank (1,825)(69,900) Central Retail Corp PCL Citibank 30,909(21,800) Central Retail Corp PCL JP Morgan (130)
(719,200) CH Karnchang PCL Citibank (38,557)(2,400) CH Karnchang PCL JP Morgan (305)
(54,700) Charoen Pokphand FoodsPCL Citibank (626)
92,400 CK Power PCL Citibank 6554,700 CK Power PCL HSBC 12930,100 CK Power PCL JP Morgan 86
(196,200) CP ALL PCL Citibank (23,418)(5,300) CP ALL PCL JP Morgan 3(2,400) Delta Electronics Thailand
PCL Citibank (6,147)(100) Delta Electronics Thailand
PCL HSBC (390)766,500 Dynasty Ceramic PCL Citibank 47,23073,300 Dynasty Ceramic PCL JP Morgan 296(4,700) Electricity Generating PCL Citibank (1,004)(2,000) Energy Absolute PCL Citibank (127)
(500) Energy Absolute PCL JP Morgan 14(261,800) Esso Thailand PCL Citibank (1,117)(144,200) GFPT PCL Citibank (197)(31,200) Gulf Energy Development
PCL Citibank (1,129)(123,200) Gulf Energy Development
PCL HSBC 1,633(73,700) Hana Microelectronics PCL Citibank (11,685)(13,700) Hana Microelectronics PCL JP Morgan (3,953)10,300 Home Product Center PCL Citibank 51
900 Home Product Center PCL HSBC (8)120,900 Home Product Center PCL JP Morgan (3,594)30,000 Indorama Ventures PCL Citibank 1,0132,400 Indorama Ventures PCL HSBC 367,400 Indorama Ventures PCL JP Morgan 60
(119,300) Intouch Holdings PCL ’F’ HSBC 225897,400 IRPC PCL Citibank 463590,100 IRPC PCL HSBC (3,405)580,400 IRPC PCL JP Morgan (1,825)
(2,369,900) Jasmine International PCL Citibank (6,892)2,700 Kasikornbank PCL Citibank 127
12,300 Kasikornbank PCL JP Morgan (2,458)92,700 Kiatnakin Phatra Bank PCL Citibank 8,064
139,200 Kiatnakin Phatra Bank PCL JP Morgan 1,744
Holding Description Counterparty
Netunrealised
appreciation/(depreciation)
USD
Thailand continued112,500 Krung Thai Bank PCL JP Morgan (1,158)13,520 Laep Investments Ltd Citibank —
280 Laep Investments Ltd HSBC —2,040 Laep Investments Ltd JP Morgan —
343,900 Land & Houses PCL Reg Citibank 3,095451,600 Land & Houses PCL Reg HSBC 165402,200 Land & Houses PCL Reg JP Morgan 446
(247,700) LPN Development PCL Citibank (184)(14,900) Major Cineplex Group PCL Citibank (407)(3,900) Major Cineplex Group PCL JP Morgan (231)
(89,000) Minor International PCL Citibank (4,620)(2,781) Minor International PCL Citibank (374)(3,068) Minor International PCL Citibank (479)
(12,800) Minor International PCL HSBC (966)(581) Minor International PCL HSBC (12)(400) Minor International PCL HSBC (54)(441) Minor International PCL HSBC (69)
(1,400) Minor International PCL JP Morgan (110)(43) Minor International PCL JP Morgan (6)(48) Minor International PCL JP Morgan (8)
75,000 Ngern Tid Lor PCL JP Morgan 15,0984,100 Osotspa PCL Citibank 523,500 Osotspa PCL HSBC 1775,600 Osotspa PCL JP Morgan 167
17,100 Precious Shipping PCL JP Morgan (238)900 PTT Exploration & Produc-
tion PCL Citibank 57300 PTT Exploration & Produc-
tion PCL HSBC (34)30,300 PTT Exploration & Produc-
tion PCL JP Morgan 1,23712,000 PTT Global Chemical PCL Citibank (286)3,300 PTT Global Chemical PCL HSBC (643)
28,200 PTT Global Chemical PCL JP Morgan (5,311)(2,500) PTT Oil & Retail Business
PCL Citibank (30)(2,900) PTT Oil & Retail Business
PCL HSBC (57)73,200 PTT PCL Citibank 3,28781,300 PTT PCL HSBC (3,112)68,800 PTT PCL JP Morgan (2,374)(1,700) Ratch Group PCL Citibank (92)(1,000) Ratch Group PCL HSBC (24)
(14,000) Ratch Group PCL JP Morgan (405)(107,600) Sansiri PCL Citibank (466)
(1,700) SCG Packaging PCL Citibank 13715,000 Siam Cement PCL RegS Citibank 2,7521,800 Siam Cement PCL RegS HSBC (1,512)8,600 Siam Cement PCL RegS JP Morgan (6,155)1,000 Siam City Cement PCL Citibank 391,000 Siam City Cement PCL HSBC 149
24,800 Siam City Cement PCL JP Morgan (41,645)400 Siam Commercial Bank
PCL Citibank 319,900 Siam Commercial Bank
PCL JP Morgan 255(171,000) Sino-Thai Engineering &
Construction PCL Citibank (6,893)(72,350) Sri Trang Agro-Industry PCL Citibank 4,128(9,300) Sri Trang Agro-Industry PCL JP Morgan 1,143
(400) Srisawad Corp PCL Citibank (26)18,800 Supalai PCL Citibank 65117,500 Supalai PCL HSBC 618
116,700 Supalai PCL JP Morgan 4,339(71,800) Thai Oil PCL Citibank (7,409)
6,900 Thai Union Group PCL ’F’ Citibank 824,800 Thai Union Group PCL ’F’ HSBC 141
169,200 Thai Union Group PCL ’F’ JP Morgan 5,24242,100 Thanachart Capital PCL Citibank 855
BlackRock Asia Pacific Diversified Equity Absolute ReturnFund continuedPortfolio of Investments as at 31 May 2021
The notes on pages 590 to 610 form an integral part of these financial statements.
Annual report and audited financial statements [213]

Holding Description Counterparty
Netunrealised
appreciation/(depreciation)
USD
Thailand continued47,700 Thanachart Capital PCL HSBC (252)61,400 Thanachart Capital PCL JP Morgan (130)65,400 Tisco Financial Group PCL Citibank 3,349
133,200 Tisco Financial Group PCL JP Morgan 338532,400 TMBThanachart Bank PCL Citibank 416
2,717,100 TMBThanachart Bank PCL JP Morgan (3,674)(2,397,300) True Corp PCL Citibank (7,082)
(376,500) True Corp PCL JP Morgan 798(523,700) TTW PCL Citibank (2,459)
(77,863)
United States(1,337) 111 Inc ADR JP Morgan 1,912
605 21Vianet Group Inc ADR JP Morgan 27(356) 360 DigiTech Inc ADR Citibank (228)
(4,700) 360 DigiTech Inc ADR HSBC (25,239)211 51job Inc ADR JP Morgan (23)100 Agora Inc ADR Citibank 430252 Agora Inc ADR JP Morgan 1,02092 Alibaba Group Holding Ltd
ADR Citibank 32442 Alibaba Group Holding Ltd
ADR JP Morgan (234)4,346 Atlas Corp Citibank 1741,365 Atlas Corp HSBC (642)2,627 Atlas Corp JP Morgan (1,235)
650 Autohome Inc ADR Citibank (534)152 Autohome Inc ADR JP Morgan (2,306)64 Baidu Inc ADR Citibank 18161 Baidu Inc ADR JP Morgan 783
165 Baozun Inc ADR Citibank (120)(194) BeiGene Ltd ADR HSBC (10,707)
1,715 Beyondspring Inc JP Morgan 1,338(532) Bilibili Inc ADR HSBC (6,671)
2,991 BlueCity Holdings Ltd ADR Citibank 808406 BlueCity Holdings Ltd ADR HSBC 73
2,814 BlueCity Holdings Ltd ADR JP Morgan 4662,701 Boqii Holding Ltd ADR Citibank 5942,254 Boqii Holding Ltd ADR HSBC (203)1,066 Boqii Holding Ltd ADR JP Morgan (102)
(1,254) Chindata Group HoldingsLtd ADR Citibank (1,116)
(2,143) Coupang LLC ’A’ HSBC (7,972)425 Dada Nexus Ltd ADR Citibank 10652 Dada Nexus Ltd ADR HSBC 21745 Dada Nexus Ltd ADR JP Morgan 188
(367) Daqo New Energy CorpADR HSBC (818)
707 DouYu International Hold-ings Ltd ADR Citibank 153
(23) Dr Reddy’s Laboratories LtdADR HSBC 19
3,995 Fanhua Inc ADR Citibank (839)2,356 Fanhua Inc ADR JP Morgan (221)
(1,791) FinVolution Group ADR HSBC (2,149)(315) FinVolution Group ADR JP Morgan (378)226 Futu Holdings Ltd ADR Citibank 4,102256 Futu Holdings Ltd ADR JP Morgan 5,760
(486) GDS Holdings Ltd ADR HSBC (153)(2,098) Genetron Holdings Ltd ADR HSBC (4,941)
(727) Genetron Holdings Ltd ADR JP Morgan (1,665)443 Genpact Ltd Citibank 482
1,001 Genpact Ltd JP Morgan (1,141)390 Gracell Biotechnologies Inc
ADR JP Morgan 1,5521,026 GSX Techedu Inc ADR Citibank (523)
147 GSX Techedu Inc ADR HSBC (929)37 GSX Techedu Inc ADR JP Morgan (234)
3,010 HDFC Bank Ltd ADR Citibank 3,040
Holding Description Counterparty
Netunrealised
appreciation/(depreciation)
USD
United States continued1,155 HDFC Bank Ltd ADR JP Morgan 8,120
(1,169) Himax Technologies IncADR HSBC (947)
1,285 Hollysys Automation Tech-nologies Ltd JP Morgan (218)
(330) Huazhu Group Ltd ADR HSBC (482)413 Hutchmed China Ltd ADR Citibank 881125 Hutchmed China Ltd ADR HSBC 595
1,030 Hutchmed China Ltd ADR JP Morgan 4,0961,100 HUYA Inc ADR HSBC (99)
274 HUYA Inc ADR JP Morgan (25)449 ICICI Bank Ltd ADR Citibank 103
(282) iClick Interactive Asia GroupLtd ADR Citibank 161
(2,152) iClick Interactive Asia GroupLtd ADR HSBC (1,485)
(1,664) iClick Interactive Asia GroupLtd ADR JP Morgan (729)
760 iHuman Inc ADR Citibank (152)1,294 iHuman Inc ADR HSBC (2,223)
621 iHuman Inc ADR JP Morgan (1,621)47 I-Mab ADR Citibank 53186 I-Mab ADR JP Morgan 2,001
618 Infosys Ltd ADR Citibank 4141,061 Infosys Ltd ADR HSBC 1,0409,852 Infosys Ltd ADR JP Morgan 9,655
168 iQIYI Inc ADR HSBC 1852,848 iQIYI Inc ADR JP Morgan 3,133
350 JD.com Inc ADR JP Morgan 353(498) JinkoSolar Holding Co Ltd
ADR Citibank (1,664)(2,147) JinkoSolar Holding Co Ltd
ADR HSBC (13,634)(427) JinkoSolar Holding Co Ltd
ADR JP Morgan (2,711)(419) JOYY Inc ADR HSBC 3,591218 KE Holdings Inc ADR Citibank (26)622 KE Holdings Inc ADR HSBC 1,318
(742) Kingsoft Cloud Holdings LtdADR HSBC (215)
(39) Kingsoft Cloud Holdings LtdADR JP Morgan (11)
28 Legend Biotech Corp ADR JP Morgan 61360 LexinFintech Holdings Ltd
ADR JP Morgan 532(225) Lizhi Inc ADR HSBC (96)
(1,664) Lufax Holding Ltd ADR HSBC (3,128)(1,878) Melco Resorts & Entertain-
ment Ltd ADR HSBC 2,460188 MINISO Group Holding Ltd
ADR Citibank (735)1,241 MINISO Group Holding Ltd
ADR JP Morgan (2,271)56 NetEase Inc ADR JP Morgan 694
2,782 New Oriental Education &Technology Group IncADR Citibank 3,227
19,709 New Oriental Education &Technology Group IncADR JP Morgan (57,110)
318 NIO Inc ADR JP Morgan 1,364(1,987) Niu Technologies ADR HSBC (5,230)
(171) Niu Technologies ADR JP Morgan (679)257 Noah Holdings Ltd ADR Citibank 658420 Noah Holdings Ltd ADR HSBC 1,025745 Noah Holdings Ltd ADR JP Morgan 1,818
(1,381) O2Micro International LtdADR JP Morgan (346)
BlackRock Asia Pacific Diversified Equity Absolute ReturnFund continuedPortfolio of Investments as at 31 May 2021
The notes on pages 590 to 610 form an integral part of these financial statements.
BlackRock Strategic Funds[214]

Holding Description Counterparty
Netunrealised
appreciation/(depreciation)
USD
United States continued(38) OneConnect Financial Tech-
nology Co Ltd ADR Citibank 147(1,326) OneConnect Financial Tech-
nology Co Ltd ADR HSBC (1,326)(400) OneConnect Financial Tech-
nology Co Ltd ADR JP Morgan (400)234 PetroChina Co Ltd ADR Citibank 150323 PetroChina Co Ltd ADR JP Morgan 165(49) Pinduoduo Inc ADR Citibank 271(32) Pinduoduo Inc ADR JP Morgan (105)
(142) Recon Technology Ltd ’A’ JP Morgan 3(201) Sea Ltd ADR HSBC (6,148)593 Silicon Motion Technology
Corp ADR Citibank 878824 Silicon Motion Technology
Corp ADR JP Morgan (1,252)(1,511) Sohu.com Ltd ADR HSBC (488)
(90) Sohu.com Ltd ADR JP Morgan (28)362 So-Young International Inc
ADR Citibank 2393,062 So-Young International Inc
ADR HSBC 6,9513,356 So-Young International Inc
ADR JP Morgan 6,7862,748 TAL Education Group ADR Citibank 6,294
332 TAL Education Group ADR HSBC (4,728)2,151 TAL Education Group ADR JP Morgan (30,400)(116) Tata Motors Ltd ADR Citibank (24)
(3,706) Tata Motors Ltd ADR HSBC (2,117)(249) Tata Motors Ltd ADR JP Morgan (32)
1,652 Tencent Music Entertain-ment Group ADR Citibank 809
262 Tencent Music Entertain-ment Group ADR JP Morgan 134
(170) Trip.com Group Ltd ADR Citibank (427)(944) Trip.com Group Ltd ADR HSBC (4,758)(58) Trip.com Group Ltd ADR JP Morgan (292)
1,115 Viomi Technology Co LtdADR Citibank 948
945 Viomi Technology Co LtdADR JP Morgan 1,172
(232) Vipshop Holdings Ltd ADR HSBC 615645 WNS Holdings Ltd ADR JP Morgan 2,773
2,539 Yatsen Holding Ltd ADR Citibank 3,910722 Yatsen Holding Ltd ADR HSBC 1,682622 Yatsen Holding Ltd ADR JP Morgan 1,449247 Youdao Inc ADR Citibank 543
1,717 Youdao Inc ADR JP Morgan 4,372928 Yum China Holdings Inc JP Morgan 6,394
(198) Zai Lab Ltd ADR JP Morgan (5,492)826 Zepp Health Corp ADR JP Morgan 595
(895) ZTO Express Cayman IncADR HSBC (671)
(120) ZTO Express Cayman IncADR JP Morgan (90)
(106,893)
Total (Gross underlying exposure - USD 152,500,832) (33,166)
* Security subject to a fair value adjustment as detailed in Note 2(a).π Amounts which are less than 0.5 USD have been rounded down to zero.
BlackRock Asia Pacific Diversified Equity Absolute ReturnFund continuedPortfolio of Investments as at 31 May 2021
The notes on pages 590 to 610 form an integral part of these financial statements.
Annual report and audited financial statements [215]

TypeNominal
Value Description CounterpartyExpiration
date
Net unrealised(depreciation)
USD
MarketValue
USD
Financial Derivative Instruments
SWAPS
TRS USD 701Fund receives 3 Month LIBOR and pays MSCI AC Asia Pacific Small
Cap Index Goldman Sachs 9/7/2021 (13,566) (13,566)
TRS USD 2,700Fund receives 3 Month LIBOR and pays MSCI AC Asia Pacific Small
Cap Index Goldman Sachs 3/9/2021 (165,974) (165,974)
Total (Gross underlying exposure - USD 6,545,256) (179,540) (179,540)
TRS: Total Return Swaps
Currency Purchases Currency Sales CounterpartyMaturity
date
Netunrealised
appreciation/(depreciation)
USD
Financial Derivative Instruments
OPEN FORWARD FOREIGN EXCHANGE TRANSACTIONS
EUR Hedged Share Class
EUR 876,366 USD 1,059,307State Street Bank& Trust Company 15/6/2021 10,474
USD 40,676 EUR 33,438State Street Bank& Trust Company 15/6/2021 (140)
10,334
GBP Hedged Share Class
GBP 8,511,173 USD 11,844,134State Street Bank& Trust Company 15/6/2021 216,336
USD 903,572 GBP 638,432State Street Bank& Trust Company 15/6/2021 (1,096)
215,240
Total (Gross underlying exposure - USD 14,075,739) 225,574
Sector Breakdownas at 31 May 2021
% of NetAssets
Financial 76.00
Government 16.19
Technology 2.98
Consumer, Cyclical 2.29
Basic Materials 1.42
Securities portfolio at market value 98.88
Other Net Assets 1.12
100.00
BlackRock Asia Pacific Diversified Equity Absolute ReturnFund continuedPortfolio of Investments as at 31 May 2021
The notes on pages 590 to 610 form an integral part of these financial statements.
BlackRock Strategic Funds[216]

Holding Description
MarketValue
EUR
% ofNet
Assets
Transferable Securities and Money Market Instruments Admittedto an Official Stock Exchange Listing or Dealt in on AnotherRegulated Market
COMMON STOCKS & RIGHTSAustralia
64,495 Santos Ltd 276,428 0.0218,239 Woodside Petroleum Ltd 251,839 0.02
528,267 0.04
Austria3,592 ANDRITZ AG 169,399 0.022,047 Verbund AG 153,525 0.01
322,924 0.03
Belgium3,393 Umicore SA^ 166,495 0.01
166,495 0.01
Bermuda19,327 Axalta Coating Systems Ltd 512,795 0.04
512,795 0.04
Canada25,239 Cameco Corp 405,818 0.0369,610 Inter Pipeline Ltd 827,073 0.0767,655 Pembina Pipeline Corp 1,781,283 0.15
3,014,174 0.25
Curacao100,062 Schlumberger NV 2,564,057 0.21
2,564,057 0.21
Denmark34,154 Novo Nordisk A/S ’B’ 2,210,249 0.184,558 Orsted A/S 565,543 0.051,731 ROCKWOOL International A/S
’B’ 704,520 0.0621,155 Vestas Wind Systems A/S 673,564 0.05
4,153,876 0.34
Finland26,835 Kone Oyj ’B’ 1,774,867 0.1443,024 Neste Oyj 2,318,994 0.19
4,093,861 0.33
France13,629 Accor SA^ 447,849 0.043,343 EssilorLuxottica SA 474,305 0.041,435 Hermes International 1,653,838 0.13
801 Kering SA 599,388 0.055,093 L’Oreal SA 1,875,752 0.154,644 LVMH Moet Hennessy Louis
Vuitton SE 3,027,888 0.242,360 Sartorius Stedim Biotech 836,384 0.07
962 Schneider Electric SE 124,483 0.0124,654 Societe Generale SA 646,058 0.055,905 Sodexo SA 467,676 0.04
40,871 Suez SA 815,785 0.0739,052 Veolia Environnement SA 1,003,636 0.085,158 Vinci SA 479,281 0.04
12,452,323 1.01
Germany8,510 CTS Eventim AG & Co KGaA 478,092 0.044,995 Evonik Industries AG 146,104 0.01
15,496 HUGO BOSS AG 720,564 0.0650,225 Nordex SE 953,773 0.081,441 Rational AG 1,059,135 0.096,671 SAP SE 757,292 0.06
14,122 Siemens Energy AG 367,172 0.03
Holding Description
MarketValue
EUR
% ofNet
Assets
Germany continued12,344 SMA Solar Technology AG^ 564,861 0.0414,522 Symrise AG 1,575,637 0.13
192,594 TUI AG^ 967,547 0.08
7,590,177 0.62
Ireland180,787 C&C Group Plc 507,399 0.0447,161 C&C Group Plc (Right) 30,705 0.001,177 Eaton Corp Plc 139,827 0.01
20,532 Kingspan Group Plc (traded inIreland) 1,578,089 0.13
8,053 Kingspan Group Plc (traded inUnited Kingdom) 628,939 0.05
14,340 Pentair Plc 808,924 0.078,537 Seagate Technology Holdings
Plc 668,563 0.06
4,362,446 0.36
Italy14,132 Enel SpA 113,848 0.0153,618 Terna Rete Elettrica Nazionale
SpA 335,005 0.03
448,853 0.04
Japan367,400 ENEOS Holdings Inc 1,242,963 0.1031,800 Idemitsu Kosan Co Ltd^ 614,594 0.05
1,857,557 0.15
Jersey22,009 WPP Plc 249,232 0.02
249,232 0.02
Netherlands9,052 ASML Holding NV 4,953,254 0.40
13,849 CNH Industrial NV 195,617 0.0110,595 Ferrari NV 1,832,405 0.15
734 Koninklijke DSM NV 110,614 0.0121,089 Koninklijke Vopak NV 815,723 0.07
7,907,613 0.64
Norway58,411 Equinor ASA 1,031,715 0.0817,770 Tomra Systems ASA 748,080 0.06
1,779,795 0.14
Papua New Guinea439,123 Oil Search Ltd 1,011,940 0.08
1,011,940 0.08
Poland253 LPP SA 632,677 0.05
632,677 0.05
Portugal63,785 Galp Energia SGPS SA 649,331 0.05
649,331 0.05
Spain12,959 EDP Renovaveis SA^ 249,979 0.0210,067 Iberdrola SA 110,687 0.01
256,258 International Consolidated Air-lines Group SA 603,618 0.05
25,405 Siemens Gamesa RenewableEnergy SA 682,632 0.05
1,646,916 0.13
Sweden19,081 Alfa Laval AB 588,891 0.0590,676 Assa Abloy AB ’B’ 2,279,767 0.19
BlackRock Dynamic Diversified Growth Fund
Portfolio of Investments as at 31 May 2021
The notes on pages 590 to 610 form an integral part of these financial statements.
Annual report and audited financial statements [217]

Holding Description
MarketValue
EUR
% ofNet
Assets
Sweden continued163,709 Hexagon AB ’B’ 1,908,615 0.1512,503 Lundin Energy AB 351,593 0.03
110,712 Nibe Industrier AB ’B’ 985,203 0.08
6,114,069 0.50
Switzerland2,836 Lonza Group AG Reg 1,493,324 0.12
18,492 Nestle SA Reg 1,861,662 0.1548 SGS SA Reg 122,359 0.01
1,190 Swatch Group AG^ 352,588 0.03
3,829,933 0.31
United Kingdom221,728 Auto Trader Group Plc 1,447,747 0.12137,032 Barclays Plc 291,713 0.0232,842 Barratt Developments Plc 288,819 0.026,655 Bellway Plc 276,843 0.02
85,616 Biffa Plc 291,156 0.021,480,798 BP Plc 5,270,784 0.43
22,474 Burberry Group Plc 558,119 0.05406,194 Capita Plc 190,131 0.0230,170 Carnival Plc 619,246 0.05
980,280 Cineworld Group Plc^ 1,056,969 0.0962,101 Compass Group Plc 1,161,354 0.0967,947 Crest Nicholson Holdings Plc 361,968 0.035,699 Derwent London Plc (REIT) 228,991 0.02
13,509 Diageo Plc 534,636 0.0440,586 Go-Ahead Group Plc 584,646 0.0570,137 Grainger Plc 232,727 0.0228,108 Great Portland Estates Plc
(REIT) 235,619 0.0229,267 Greggs Plc 847,612 0.073,889 Halma Plc 117,740 0.01
864,972 Hammerson Plc (REIT) 401,757 0.0359,197 Hargreaves Lansdown Plc 1,140,427 0.0934,398 Informa Plc 217,559 0.027,904 InterContinental Hotels Group
Plc 452,215 0.04428,822 ITV Plc 640,158 0.0537,405 J D Wetherspoon Plc 572,744 0.0522,502 JD Sports Fashion Plc 247,281 0.0217,457 Johnson Matthey Plc 618,222 0.0527,668 Land Securities Group Plc
(REIT) 226,205 0.0232,382 London Stock Exchange
Group Plc 2,851,505 0.23130,493 Marks & Spencer Group Plc 250,939 0.02496,132 Marston’s Plc 526,928 0.0443,007 Meggitt Plc 254,508 0.02
150,400 Melrose Industries Plc 301,985 0.02154,960 Mitchells & Butlers Plc 549,496 0.04160,484 National Express Group Plc 564,233 0.05103,063 On the Beach Group Plc 488,886 0.04
9,686 Pennon Group Plc 119,032 0.017,148 Persimmon Plc 262,613 0.02
34,806 Redrow Plc 274,932 0.02439,079 Restaurant Group Plc 619,736 0.0531,504 Rightmove Plc 220,866 0.02
170,380 Rolls-Royce Holdings Plc 211,996 0.02127,274 Saga Plc 561,708 0.0530,304 Shaftesbury Plc (REIT)^ 218,971 0.0212,677 Smiths Group Plc 228,377 0.0216,926 Spirax-Sarco Engineering Plc 2,499,212 0.207,408 SSE Plc 132,810 0.01
258,189 SSP Group Plc 882,832 0.07340,306 Stagecoach Group Plc 344,218 0.03116,873 Taylor Wimpey Plc 232,900 0.0292,856 Trainline Plc^ 306,601 0.0311,733 Travis Perkins Plc 223,989 0.0219,178 UNITE Group Plc (REIT) 253,072 0.0211,317 United Utilities Group Plc 129,418 0.0116,368 WH Smith Plc^ 329,030 0.03
Holding Description
MarketValue
EUR
% ofNet
Assets
United Kingdom continued13,786 Whitbread Plc 510,016 0.0413,148 Wickes Group Plc 39,133 0.0024,367 Workspace Group Plc (REIT) 256,670 0.02
33,760,000 2.75
United States2,372 A O Smith Corp 137,879 0.011,853 Adobe Inc 764,722 0.062,813 AECOM 149,571 0.011,427 AGCO Corp 161,497 0.016,221 Alaska Air Group Inc 352,099 0.03
591 Alphabet Inc ’A’ 1,139,246 0.09230 Amazon.com Inc 606,311 0.05
3,010 Ameresco Inc ’A’ 132,350 0.0130,749 American Airlines Group Inc^ 609,623 0.0551,325 American Axle & Manufactur-
ing Holdings Inc^ 470,159 0.044,175 American Express Co 546,798 0.044,819 American Water Works Co Inc 611,002 0.054,661 Analog Devices Inc 627,490 0.055,762 ANSYS Inc 1,592,616 0.13
12,515 Apple Inc 1,275,504 0.101,524 Arista Networks Inc^ 423,028 0.033,349 Aspen Technology Inc 373,810 0.03
12,372 Avis Budget Group Inc 888,651 0.071,744 Badger Meter Inc 136,322 0.01
16,232 Bank of America Corp 562,773 0.057,562 Booz Allen Hamilton Holding
Corp 525,286 0.041,992 Broadcom Inc 769,543 0.068,887 Cadence Design Systems Inc 923,045 0.087,456 California Water Service
Group^ 346,624 0.034,551 Capital One Financial Corp 598,463 0.05
11,336 CECO Environmental Corp 70,743 0.0126,631 Cheniere Energy Inc 1,849,240 0.155,787 Chevron Corp 491,255 0.04
25,689 Cinemark Holdings Inc^ 476,108 0.0412,158 Cisco Systems Inc 526,037 0.048,416 Citigroup Inc 541,793 0.04
13,261 Citizens Financial Group Inc 541,221 0.0412,731 CommScope Holding Co Inc^ 211,481 0.0216,971 Conduent Inc 105,214 0.017,554 ConocoPhillips 344,383 0.03
23,042 Corteva Inc 857,491 0.071,532 Credit Acceptance Corp 560,675 0.053,136 Deere & Co 926,193 0.08
12,478 Delta Air Lines Inc 486,608 0.0411,877 Discovery Inc ’A’ 311,921 0.0315,295 Donaldson Co Inc 770,474 0.061,112 Dover Corp 136,880 0.013,894 Ecolab Inc 685,006 0.061,715 EnerSys 132,190 0.01
56,832 EOG Resources Inc 3,734,417 0.3018,033 Essential Utilities Inc 705,008 0.065,058 Euronet Worldwide Inc 619,048 0.05
32,180 Evoqua Water TechnologiesCorp 819,075 0.07
2,090 F5 Networks Inc 316,975 0.034,153 Facebook Inc ’A’ 1,116,604 0.091,652 Fair Isaac Corp 683,770 0.064,014 Fidelity National Information
Services Inc 489,106 0.0416,416 Fifth Third Bancorp 565,796 0.058,797 First Solar Inc 547,614 0.048,562 FirstCash Inc 558,265 0.054,620 Fiserv Inc 435,304 0.044,364 Fortinet Inc 780,034 0.06
15,997 General Electric Co 183,959 0.022,648 Global Payments Inc 419,535 0.031,087 Global Water Resources Inc 15,185 0.00
BlackRock Dynamic Diversified Growth Fund continued
Portfolio of Investments as at 31 May 2021
The notes on pages 590 to 610 form an integral part of these financial statements.
BlackRock Strategic Funds[218]

Holding Description
MarketValue
EUR
% ofNet
Assets
United States continued147,984 Halliburton Co 2,717,247 0.2225,564 Hewlett Packard Enterprise Co 333,703 0.0312,813 Intel Corp 598,601 0.053,341 International Business Ma-
chines Corp 392,783 0.031,933 Intuit Inc 694,198 0.06
32,171 JetBlue Airways Corp^ 528,882 0.043,833 JPMorgan Chase & Co 514,892 0.04
218,110 Kinder Morgan Inc 3,271,696 0.276,143 Lamar Advertising Co ’A’
(REIT) 526,651 0.046,724 Live Nation Entertainment Inc^ 495,563 0.042,777 Madison Square Garden
Sports Corp^ 420,281 0.0316,009 Marvell Technology Inc^ 632,426 0.052,444 MasTec Inc 232,536 0.02
10,341 Mastercard Inc ’A’ 3,049,736 0.259,663 Microsoft Corp 1,973,303 0.164,814 NetApp Inc 304,633 0.02
12,418 NortonLifeLock Inc 280,932 0.021,975 NVIDIA Corp 1,049,619 0.09
31,730 Occidental Petroleum Corp 673,710 0.069,321 ON Semiconductor Corp 305,249 0.039,964 OneMain Holdings Inc 471,368 0.04
10,556 Oracle Corp 679,818 0.0624,566 Outfront Media Inc (REIT) 481,013 0.041,661 Palo Alto Networks Inc 493,484 0.04
17,634 Pioneer Natural Resources Co 2,195,003 0.183,711 PTC Inc 407,143 0.031,987 Quanta Services Inc 154,959 0.017,999 Republic Services Inc 714,294 0.065,459 S&P Global Inc 1,694,293 0.14
56,047 Sabre Corp^ 634,893 0.053,086 salesforce.com Inc 600,971 0.05
21,208 Santander Consumer USAHoldings Inc 657,411 0.05
5,039 Simon Property Group Inc(REIT) 529,556 0.04
10,440 Southwest Airlines Co 524,797 0.041,299 Splunk Inc 128,769 0.012,787 SPX FLOW Inc 156,440 0.018,967 Sunrun Inc 327,980 0.03
14,132 Synchrony Financial 547,989 0.047,032 Sysco Corp 465,867 0.047,083 Tetra Tech Inc 692,109 0.062,311 Trimble Inc 147,035 0.01
14,630 TripAdvisor Inc 519,915 0.048,151 United Airlines Holdings Inc^ 389,000 0.03
14,862 US Foods Holding Corp^ 473,338 0.048,221 Valero Energy Corp 540,603 0.04
13,797 VeriSign Inc 2,481,690 0.2024,195 Verra Mobility Corp^ 281,993 0.026,573 Visa Inc ’A’ 1,221,972 0.102,538 VMware Inc ’A’ 327,751 0.031,085 Waste Management Inc 124,842 0.017,003 Watts Water Technologies Inc
’A’ 778,398 0.064,297 Westinghouse Air Brake Tech-
nologies Corp 290,860 0.0266,428 Williams Cos Inc 1,431,084 0.12
Holding Description
MarketValue
EUR
% ofNet
Assets
United States continued8,526 Xylem Inc 823,696 0.072,227 Zebra Technologies Corp ’A’ 905,354 0.07
79,031,349 6.43
Total Common Stocks & Rights 178,680,660 14.53
BONDSItaly
EUR 18,818,000 Italy Buoni Poliennali Del Te-soro RegS 1.35% 1/4/2030 19,782,422 1.61
EUR 16,070,000 Italy Buoni Poliennali Del Te-soro RegS 0.95% 1/8/2030 16,293,775 1.32
36,076,197 2.93
United KingdomUSD 10,900,000 Goldman Sachs International
RegS 21/12/2021 (ZeroCoupon) 13,253,138 1.08
13,253,138 1.08
Total Bonds 49,329,335 4.01
EXCHANGE TRADED FUNDSIreland
EUR 168,957 iShares EUR High Yield CorpBond UCITS ETF~^ 17,390,744 1.42
EUR 1,990,000 iShares EUR Ultrashort BondESG UCITS ETF ’D’~ 9,990,198 0.81
USD 1,306,095 iShares Physical Gold ETC~ 39,501,210 3.21USD 235,459 iShares Physical Silver ETC~ 5,152,504 0.42USD 206,646 iShares USD High Yield Corp
Bond UCITS ETF (Dist)~ 17,330,791 1.41
89,365,447 7.27
Total Exchange Traded Funds 89,365,447 7.27
Total Transferable Securities and Money MarketInstruments Admitted to an Official Stock ExchangeListing or Dealt in on Another Regulated Market 317,375,442 25.81
Collective Investment SchemesLuxembourg
2,438,000 BlackRock Global Fund -Emerging Markets EquityIncome Fund X2 (USD)~ 41,675,236 3.39
4,667,920 BlackRock Global Funds -Euro Corporate Bond FundX2 (EUR)~ 93,078,325 7.57
1,494,747 BlackRock Global Funds -Euro Short Duration BondFund X2 (EUR)~ 25,963,755 2.11
10,899,265 BlackRock Global Funds -Global Corporate BondFund X2 (EUR) Hedged~ 169,810,549 13.81
3,180,469 BlackRock Global Funds -Global High Yield BondFund (Acc)~ 36,543,589 2.97
BlackRock Dynamic Diversified Growth Fund continued
Portfolio of Investments as at 31 May 2021
The notes on pages 590 to 610 form an integral part of these financial statements.
Annual report and audited financial statements [219]

Holding Description
MarketValue
EUR
% ofNet
Assets
Luxembourg continued189,640 BlackRock Strategic Funds -
BlackRock Systematic ESGWorld Equity FundX2 (GBP)~ 50,450,912 4.10
56,373 Schroder International Selec-tion Fund - Frontier MarketsEquity I 10,000,912 0.82
427,523,278 34.77
United Kingdom1,055,354 BlackRock Frontiers Invest-
ment Trust Plc~ 1,460,126 0.124,582,376 Schroder UK Public Private 1,856,686 0.152,184,539 Scottish Mortgage Investment
Trust Plc 30,350,986 2.47
33,667,798 2.74
Ireland2,294,158 BlackRock ICS Euro Liquid
Environmentally AwareFund~ 226,755,927 18.44
149,987 BlackRock ICS Sterling LiquidEnvironmentally Aware Fund(Dist)~ 17,439,899 1.42
108,830 BlackRock ICS Ultra ShortBond Fund (Acc)~ 11,979,885 0.98
276,954 BlackRock ICS US Dollar Liq-uid Environmentally AwareFund (Dist)~ 22,661,994 1.84
967,568 iShares Developed World In-dex Fund~ 33,693,620 2.74
72,620 iShares MSCI EM Asia UCITSETF (Acc)~ 12,445,535 1.01
324,976,860 26.43
Jersey16,261,248 Blackstone Loan Financing Ltd 12,602,467 1.0318,065,000 Foresight Solar Fund Ltd 20,583,022 1.67
33,185,489 2.70
Guernsey14,244,393 Bluefield Solar Income Fund
Ltd 20,800,735 1.69
Holding Description
MarketValue
EUR
% ofNet
Assets
Guernsey continued6,741,359 Schiehallion Fund Ltd ’C’ 6,892,163 0.562,695,158 SME Credit Realisation Fund
Ltd 2,362,657 0.194,164,849 Starwood European Real Es-
tate Finance Ltd 4,328,943 0.35
34,384,498 2.79
Total Collective Investment Schemes 853,737,923 69.43
Securities portfolio at market value 1,171,113,365 95.24
Other Net Assets 58,524,142 4.76
Total Net Assets (EUR) 1,229,637,507 100.00
^ All or a portion of this security represents a security on loan.~ Investment in related party fund.
TypeNominal
Value Description CounterpartyExpiration
date
Net unrealisedappreciation/
(depreciation)EUR
MarketValue
EUR
Financial Derivative Instruments
SWAPS
TRS USD 17,516,267Fund receives Dow Jones US Selectet Home and pays 3 Month
LIBORBank of America
Merrill Lynch 22/4/2022 192,883 192,883
TRS USD 13,544,026Fund receives PHLX Semiconductor SectorSM and pays 3 Month
LIBORBank of America
Merrill Lynch 16/2/2022 869,555 869,555
TRS USD 60,955 Fund receives Volatility Carry Strategy and pays Fixed 0.600%Barclays Bank
Plc 4/3/2022 9,776 9,776
TRS USD 33,120Fund receives Volatility Carry Strategy Index and pays Fixed
0.600%Barclays Bank
Plc 8/9/2021 169,074 169,074
TRS USD 44,885Fund receives Volatility Carry Strategy Index and pays Fixed
0.600%Barclays Bank
Plc 13/9/2021 23,143 23,143
TRS USD 31,125,349 Fund receives Cyber Security Basket and pays 3 Month LIBOR BNP Paribas 22/4/2022 (103,191) (103,191)
TRS USD 4,170,907 Fund receives Global Brands Basket and pays 6 Month LIBOR Citibank 3/9/2021 575,401 575,401
TRS USD 31,731,715Fund receives Global Brands Basket Index and pays 6 Month
LIBOR Citibank 3/9/2021 6,946,748 6,946,748
TRS USD 79,830Fund receives 12 Month FEDL and pays GS US NonProfit Tech
GTR Goldman Sachs 20/5/2022 (1,702,146) (1,702,146)
BlackRock Dynamic Diversified Growth Fund continued
Portfolio of Investments as at 31 May 2021
The notes on pages 590 to 610 form an integral part of these financial statements.
BlackRock Strategic Funds[220]

TypeNominal
Value Description CounterpartyExpiration
date
Net unrealisedappreciation/
(depreciation)EUR
MarketValue
EUR
Financial Derivative Instruments
SWAPS
TRS USD 50,867Fund receives Goldman Sachs Vvol Carry Series 80 and pays
Fixed 0.000% Goldman Sachs 25/2/2022 9,985 9,985
TRS USD 30,922Fund receives Goldman Sachs VVol Carry Series 80 and pays
Fixed 0.000% Goldman Sachs 25/2/2022 6,070 6,070
TRS USD 92,437Fund receives Volatility PremiaStrategy Index and pays Fixed
0.000% Goldman Sachs 3/11/2021 (126,446) (126,446)
TRS EUR 355,659Fund receives 12 Month EONIA and pays MS EU China Exposure
Baske Morgan Stanley 21/3/2022 (1,451,089) (1,451,089)
TRS USD 34,000 Fund receives FX Volatility Strategy and pays Fixed 0.200% Morgan Stanley 13/4/2022 (278) (278)
TRS USD 223,306Fund receives MS Intraday Momentum Strategy and pays Fixed
0.000% Morgan Stanley 13/4/2022 (94,973) (94,973)
Total (Gross underlying exposure - EUR 219,418,314) 5,324,512 5,324,512
TRS: Total Return Swaps
Numberof
contractsCurrencyof contracts
Contract/Description
Expirationdate
Grossunderlying
exposureEUR
Net unrealisedappreciation/
(depreciation)EUR
Financial Derivative Instruments
FUTURES
(182) USD E-Mini S&P 500 Index Futures June 2021 June 2021 31,277,848 (2,347,104)
270 USD E-Mini S&P 500 Index Futures June 2021 June 2021 25,762,804 2,346,439
422 EUR EURO STOXX 50 Index Futures June 2021 June 2021 17,027,700 1,065,920
2,343 EUR EURO STOXX Bank Index Futures June 2021 June 2021 11,480,700 1,364,797
(110) USD NASDAQ 100 E-Mini Stock Index Futures June 2021 June 2021 24,627,094 (1,702,205)
(330) USD US Treasury 10 Year Note Futures September 2021 September 2021 35,576,942 (17,910)
Total 145,753,088 709,937
Numberof
contractsCall/Put Description Counterparty Strike Price
Expirationdate
Netunrealised
(depreciation)EUR
MarketValue
EUR
Financial Derivative Instruments
PURCHASED OPTIONS
486 Call MSCI Emerging Markets Exchange Traded USD 1,450.00 18/06/2021 (1,939,786) 23,850
2,560,000 Call Topix Index Goldman Sachs JPY 2,050.00 12/11/2021 (74,360) 555,651
2,560,000 Call Topix Index Goldman Sachs JPY 2,100.00 12/11/2021 (57,557) 357,906
Total (Gross underlying exposure - EUR 20,948,884) (2,071,703) 937,407
Currency Purchases Currency Sales CounterpartyMaturity
date
Netunrealised
appreciation/(depreciation)
EUR
Financial Derivative Instruments
OPEN FORWARD FOREIGN EXCHANGE TRANSACTIONS
EUR 116,500,000 GBP 101,096,720Toronto Dominion
Bank 27/7/2021 (922,162)
EUR 320,819,000 USD 386,882,690Toronto Dominion
Bank 27/7/2021 4,720,788INR 37,047,700 USD 500,000 BNP Paribas 27/7/2021 5,126
Currency Purchases Currency Sales CounterpartyMaturity
date
Netunrealised
appreciation/(depreciation)
EUR
Financial Derivative Instruments
OPEN FORWARD FOREIGN EXCHANGE TRANSACTIONS
INR 645,540,000 USD 8,700,000 Citibank 27/7/2021 99,343INR 70,284,920 USD 948,642 Deutsche Bank 27/7/2021 9,667INR 430,228,675 USD 5,801,358 JP Morgan 27/7/2021 63,653INR 646,801,500 USD 8,700,000 Morgan Stanley 27/7/2021 113,428
BlackRock Dynamic Diversified Growth Fund continued
Portfolio of Investments as at 31 May 2021
The notes on pages 590 to 610 form an integral part of these financial statements.
Annual report and audited financial statements [221]

Currency Purchases Currency Sales CounterpartyMaturity
date
Netunrealised
appreciation/(depreciation)
EUR
Financial Derivative Instruments
OPEN FORWARD FOREIGN EXCHANGE TRANSACTIONS
INR 322,291,500 USD 4,350,000 UBS 27/7/2021 44,329
USD 1,390,000 IDR 20,003,490,000Bank of America
Merrill Lynch 27/7/2021 (4,873)USD 8,555,000 IDR 123,534,200,000 HSBC 27/7/2021 (53,890)USD 5,860,000 IDR 84,501,200,000 Morgan Stanley 27/7/2021 (30,231)
USD 13,195,000 IDR 190,233,910,000Standard
Chartered Bank 27/7/2021 (65,906)USD 38,925,000 ZAR 564,455,317 Citibank 27/7/2021 (1,566,347)
2,412,925
CAD Hedged Share Class
CAD 9,129 EUR 6,207State Street Bank& Trust Company 15/6/2021 (28)
EUR 41 CAD 60State Street Bank& Trust Company 15/6/2021 —
(28)
JPY Hedged Share Class
EUR 607,157 JPY 80,255,177State Street Bank& Trust Company 15/6/2021 7,218
JPY 4,537,692,766 EUR 34,419,120State Street Bank& Trust Company 15/6/2021 (498,078)
(490,860)
SEK Hedged Share Class
EUR 325,436 SEK 3,298,257State Street Bank& Trust Company 15/6/2021 162
SEK 202,852,010 EUR 19,992,292State Street Bank& Trust Company 15/6/2021 13,018
13,180
USD Hedged Share Class
EUR 92 USD 113State Street Bank& Trust Company 15/6/2021 1
USD 5,839 EUR 4,832State Street Bank& Trust Company 15/6/2021 (59)
(58)
Total (Gross underlying exposure - EUR 648,822,813) 1,935,159
Sector Breakdownas at 31 May 2021
% of NetAssets
Collective Investment Schemes 68.42
Exchange Traded Funds 8.28
Energy 3.21
Government 2.93
Financial 2.62
Consumer, Cyclical 2.27
Industrial 2.11
Technology 2.03
Consumer, Non-cyclical 1.56
Communications 0.94
Utilities 0.53
Basic Materials 0.34
Securities portfolio at market value 95.24
Other Net Assets 4.76
100.00
BlackRock Dynamic Diversified Growth Fund continued
Portfolio of Investments as at 31 May 2021
The notes on pages 590 to 610 form an integral part of these financial statements.
BlackRock Strategic Funds[222]
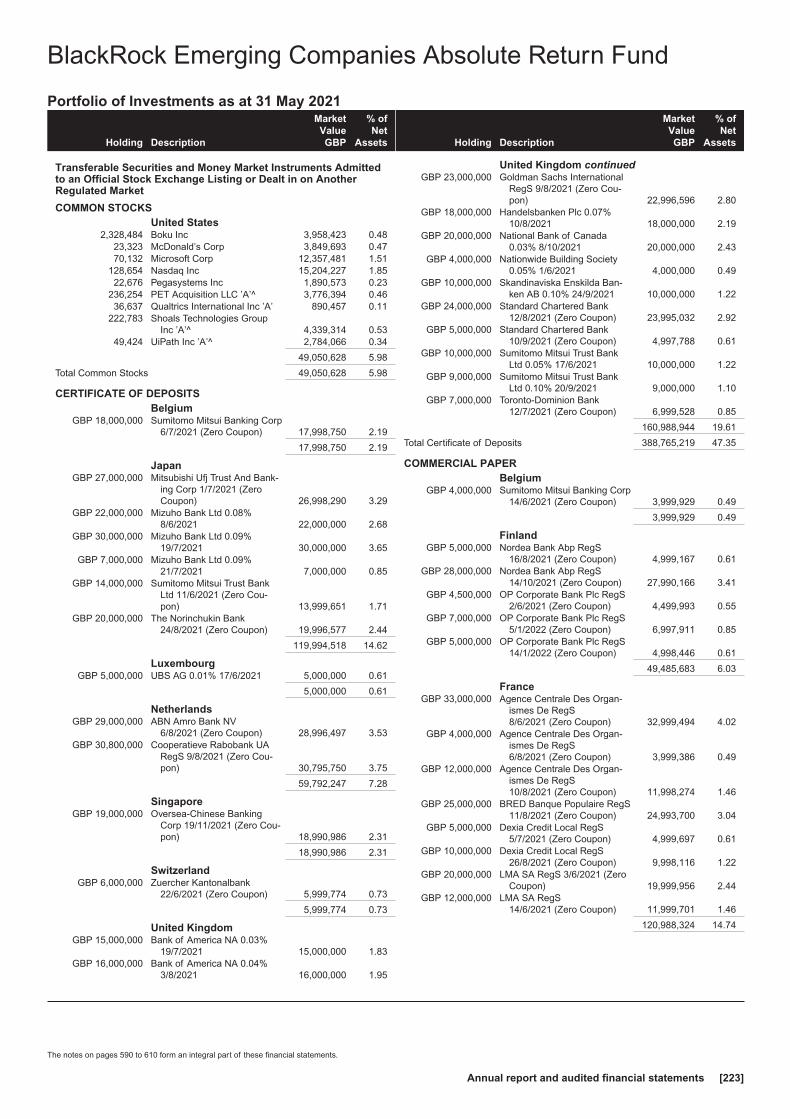
Holding Description
MarketValueGBP
% ofNet
Assets
Transferable Securities and Money Market Instruments Admittedto an Official Stock Exchange Listing or Dealt in on AnotherRegulated Market
COMMON STOCKSUnited States
2,328,484 Boku Inc 3,958,423 0.4823,323 McDonald’s Corp 3,849,693 0.4770,132 Microsoft Corp 12,357,481 1.51
128,654 Nasdaq Inc 15,204,227 1.8522,676 Pegasystems Inc 1,890,573 0.23
236,254 PET Acquisition LLC ’A’^ 3,776,394 0.4636,637 Qualtrics International Inc ’A’ 890,457 0.11
222,783 Shoals Technologies GroupInc ’A’^ 4,339,314 0.53
49,424 UiPath Inc ’A’^ 2,784,066 0.34
49,050,628 5.98
Total Common Stocks 49,050,628 5.98
CERTIFICATE OF DEPOSITSBelgium
GBP 18,000,000 Sumitomo Mitsui Banking Corp6/7/2021 (Zero Coupon) 17,998,750 2.19
17,998,750 2.19
JapanGBP 27,000,000 Mitsubishi Ufj Trust And Bank-
ing Corp 1/7/2021 (ZeroCoupon) 26,998,290 3.29
GBP 22,000,000 Mizuho Bank Ltd 0.08%8/6/2021 22,000,000 2.68
GBP 30,000,000 Mizuho Bank Ltd 0.09%19/7/2021 30,000,000 3.65
GBP 7,000,000 Mizuho Bank Ltd 0.09%21/7/2021 7,000,000 0.85
GBP 14,000,000 Sumitomo Mitsui Trust BankLtd 11/6/2021 (Zero Cou-pon) 13,999,651 1.71
GBP 20,000,000 The Norinchukin Bank24/8/2021 (Zero Coupon) 19,996,577 2.44
119,994,518 14.62
LuxembourgGBP 5,000,000 UBS AG 0.01% 17/6/2021 5,000,000 0.61
5,000,000 0.61
NetherlandsGBP 29,000,000 ABN Amro Bank NV
6/8/2021 (Zero Coupon) 28,996,497 3.53GBP 30,800,000 Cooperatieve Rabobank UA
RegS 9/8/2021 (Zero Cou-pon) 30,795,750 3.75
59,792,247 7.28
SingaporeGBP 19,000,000 Oversea-Chinese Banking
Corp 19/11/2021 (Zero Cou-pon) 18,990,986 2.31
18,990,986 2.31
SwitzerlandGBP 6,000,000 Zuercher Kantonalbank
22/6/2021 (Zero Coupon) 5,999,774 0.73
5,999,774 0.73
United KingdomGBP 15,000,000 Bank of America NA 0.03%
19/7/2021 15,000,000 1.83GBP 16,000,000 Bank of America NA 0.04%
3/8/2021 16,000,000 1.95
Holding Description
MarketValueGBP
% ofNet
Assets
United Kingdom continuedGBP 23,000,000 Goldman Sachs International
RegS 9/8/2021 (Zero Cou-pon) 22,996,596 2.80
GBP 18,000,000 Handelsbanken Plc 0.07%10/8/2021 18,000,000 2.19
GBP 20,000,000 National Bank of Canada0.03% 8/10/2021 20,000,000 2.43
GBP 4,000,000 Nationwide Building Society0.05% 1/6/2021 4,000,000 0.49
GBP 10,000,000 Skandinaviska Enskilda Ban-ken AB 0.10% 24/9/2021 10,000,000 1.22
GBP 24,000,000 Standard Chartered Bank12/8/2021 (Zero Coupon) 23,995,032 2.92
GBP 5,000,000 Standard Chartered Bank10/9/2021 (Zero Coupon) 4,997,788 0.61
GBP 10,000,000 Sumitomo Mitsui Trust BankLtd 0.05% 17/6/2021 10,000,000 1.22
GBP 9,000,000 Sumitomo Mitsui Trust BankLtd 0.10% 20/9/2021 9,000,000 1.10
GBP 7,000,000 Toronto-Dominion Bank12/7/2021 (Zero Coupon) 6,999,528 0.85
160,988,944 19.61
Total Certificate of Deposits 388,765,219 47.35
COMMERCIAL PAPERBelgium
GBP 4,000,000 Sumitomo Mitsui Banking Corp14/6/2021 (Zero Coupon) 3,999,929 0.49
3,999,929 0.49
FinlandGBP 5,000,000 Nordea Bank Abp RegS
16/8/2021 (Zero Coupon) 4,999,167 0.61GBP 28,000,000 Nordea Bank Abp RegS
14/10/2021 (Zero Coupon) 27,990,166 3.41GBP 4,500,000 OP Corporate Bank Plc RegS
2/6/2021 (Zero Coupon) 4,499,993 0.55GBP 7,000,000 OP Corporate Bank Plc RegS
5/1/2022 (Zero Coupon) 6,997,911 0.85GBP 5,000,000 OP Corporate Bank Plc RegS
14/1/2022 (Zero Coupon) 4,998,446 0.61
49,485,683 6.03
FranceGBP 33,000,000 Agence Centrale Des Organ-
ismes De RegS8/6/2021 (Zero Coupon) 32,999,494 4.02
GBP 4,000,000 Agence Centrale Des Organ-ismes De RegS6/8/2021 (Zero Coupon) 3,999,386 0.49
GBP 12,000,000 Agence Centrale Des Organ-ismes De RegS10/8/2021 (Zero Coupon) 11,998,274 1.46
GBP 25,000,000 BRED Banque Populaire RegS11/8/2021 (Zero Coupon) 24,993,700 3.04
GBP 5,000,000 Dexia Credit Local RegS5/7/2021 (Zero Coupon) 4,999,697 0.61
GBP 10,000,000 Dexia Credit Local RegS26/8/2021 (Zero Coupon) 9,998,116 1.22
GBP 20,000,000 LMA SA RegS 3/6/2021 (ZeroCoupon) 19,999,956 2.44
GBP 12,000,000 LMA SA RegS14/6/2021 (Zero Coupon) 11,999,701 1.46
120,988,324 14.74
BlackRock Emerging Companies Absolute Return Fund
Portfolio of Investments as at 31 May 2021
The notes on pages 590 to 610 form an integral part of these financial statements.
Annual report and audited financial statements [223]

Holding Description
MarketValueGBP
% ofNet
Assets
IrelandGBP 3,000,000 Matchpoint Finance Plc RegS
12/7/2021 (Zero Coupon) 2,999,663 0.37GBP 13,000,000 Matchpoint Finance Plc RegS
6/8/2021 (Zero Coupon) 12,997,415 1.58
15,997,078 1.95
NetherlandsGBP 25,000,000 Toyota Motor Finance Nether-
lands BV RegS29/6/2021 (Zero Coupon) 24,999,185 3.04
24,999,185 3.04
SingaporeGBP 11,000,000 DBS Bank Ltd 22/6/2021 (Zero
Coupon) 10,999,652 1.34
10,999,652 1.34
SwedenGBP 15,000,000 Svenska Handelsbanken AB
RegS 21/10/2021 (ZeroCoupon) 14,995,042 1.83
GBP 15,000,000 Svenska Handelsbanken ABRegS 29/10/2021 (ZeroCoupon) 14,994,454 1.82
GBP 12,000,000 Swedbank AB RegS10/11/2021 (Zero Coupon) 11,994,677 1.46
41,984,173 5.11
United StatesGBP 6,596,000 Mont Blanc Capital Corp RegS
16/8/2021 (Zero Coupon) 6,594,901 0.80GBP 4,000,000 Sheffield Receivables Co LLC
1/9/2021 (Zero Coupon) 3,999,194 0.49
10,594,095 1.29
Total Commercial Papers 279,048,119 33.99
Total Transferable Securities and Money MarketInstruments Admitted to an Official Stock ExchangeListing or Dealt in on Another Regulated Market 716,863,966 87.32
Collective Investment SchemesIreland
808,619 BlackRock ICS Sterling LiquidEnvironmentally Aware Fund(Dist)~ 80,870,034 9.85
80,870,034 9.85
Total Collective Investment Schemes 80,870,034 9.85
Securities portfolio at market value 797,734,000 97.17
Other Net Assets 23,263,763 2.83
Total Net Assets (GBP) 820,997,763 100.00
^ All or a portion of this security represents a security on loan.~ Investment in related party fund.
BlackRock Emerging Companies Absolute Return FundcontinuedPortfolio of Investments as at 31 May 2021
The notes on pages 590 to 610 form an integral part of these financial statements.
BlackRock Strategic Funds[224]

Holding Description Counterparty
Netunrealised
appreciation/(depreciation)
GBP
Financial Derivative Instruments
CONTRACTS FOR DIFFERENCEAustralia
45,687 Xero Ltd HSBC (83,595)10,382 Xero Ltd JP Morgan (18,996)
(102,591)
Denmark143,120 Vestas Wind Systems A/S JP Morgan 21,548
21,548
Germany(99,110) Deutsche EuroShop AG HSBC 34,144
34,144
Ireland(40,860) Kerry Group Plc ’A’ HSBC (66,863)(8,210) Kerry Group Plc ’A’ JP Morgan (13,435)
(80,298)
Italy28,119 Ferrari NV Goldman Sachs 202,217
202,217
Netherlands11,223 ASML Holding NV Goldman Sachs 312,20874,196 Euronext NV JP Morgan 720,765
(39,518) Unibail-Rodamco-Westfield(REIT) HSBC 70,112
1,103,085
Norway657,863 NEL ASA Goldman Sachs 54,519
54,519
Spain139,210 Siemens Gamesa Renew-
able Energy SA JP Morgan 64,743
64,743
Sweden516,019 Desenio Group AB HSBC (142,732)225,527 Hemnet Group AB HSBC 623,814
481,082
Switzerland(64,912) Nestle SA Reg HSBC (100,731)(32,098) Temenos AG Reg Goldman Sachs (164,774)
(265,505)
United Kingdom(198,689) 3i Group Plc HSBC (18,875)215,334 4imprint Group Plc JP Morgan 1,005,210101,772 888 Holdings Plc JP Morgan (6,513)799,985 AJ Bell Plc HSBC (82,376)345,412 Ashtead Group Plc HSBC 1,157,130
(169,416) Associated British Foods Plc JP Morgan 81,32072,716 AstraZeneca Plc Goldman Sachs 109,801
451,990 Auction Technology GroupPlc Goldman Sachs 994,378
(544,845) Auto Trader Group Plc Goldman Sachs 22,257184,779 AVEVA Group Plc HSBC 451,418
(585,874) Babcock InternationalGroup Plc Goldman Sachs (63,274)
(1,282,472) BAE Systems Plc Goldman Sachs (48,734)1,592,313 Balfour Beatty Plc Goldman Sachs 28,662
388,099 BHP Group Plc JP Morgan (974,792)478,641 Bovis Homes Group Plc HSBC 131,454
(1,354,069) BP Plc HSBC 60,83711,543,156 Breedon Group Plc JP Morgan 115,432
(172,919) British American TobaccoPlc Goldman Sachs 178,971
(883,106) British Land Co Plc (REIT) HSBC 307,321518,548 Bunzl Plc JP Morgan (160,750)
Holding Description Counterparty
Netunrealised
appreciation/(depreciation)
GBP
United Kingdom continued815,564 Bytes Technology Group Plc HSBC 172,900
(620,239) C&C Group Plc Goldman Sachs 137,732(161,801) C&C Group Plc Goldman Sachs (90,609)(80,601) Carnival Plc Goldman Sachs (139,279)
2,316,663 Chrysalis Investments Ltd HSBC 162,166(333,988) Clinigen Group Plc Goldman Sachs 18,413665,585 Clipper Logistics Plc Goldman Sachs 479,221
(227,724) Compass Group Plc HSBC (18,218)293,272 Computacenter Plc JP Morgan 199,425
(498,261) Countryside Properties Plc HSBC 87,196111,116 Cranswick Plc Goldman Sachs 56,307226,962 CRH Plc JP Morgan 133,908466,257 CVS Group Plc JP Morgan (116,564)197,679 Dechra Pharmaceuticals Plc JP Morgan 43,489(81,481) Deliveroo Plc Goldman Sachs (13,444)
(767,249) Deliveroo Plc JP Morgan (12,547)(215,814) Diageo Plc Goldman Sachs (92,800)(74,106) Dignity Plc HSBC 44,464230,048 Diploma Plc JP Morgan 82,644
(2,413,928) Dixons Carphone Plc JP Morgan 58,487(986,831) Domino’s Pizza Group Plc HSBC 270,392865,895 Dr. Martens Plc Goldman Sachs 58,881469,456 Draper Esprit Plc Goldman Sachs 328,619
(988,997) DS Smith Plc HSBC 59,958611,666 Dunelm Group Plc HSBC 87,878
(342,915) easyJet Plc JP Morgan (85,065)2,149,620 Electrocomponents Plc Goldman Sachs (365,435)
200,848 Experian Plc Goldman Sachs 111,821(330,486) FDM Group Holdings Plc Goldman Sachs (66,097)
92,473 Future Plc HSBC (62,670)81,272 Games Workshop Group
Plc HSBC 934,6281,211,739 Gamma Communications
Plc HSBC 2,496,182469,512 GB Group Plc JP Morgan 281,707
(310,246) Glanbia Plc HSBC (77,488)(599,588) GlaxoSmithKline Plc Goldman Sachs 212,254705,649 Grafton Group Plc (Unit) HSBC (465,728)
(1,305,639) Greencore Group Plc HSBC 239,001225,149 Greggs Plc HSBC (216,433)(33,198) Hammerson Plc (REIT) Goldman Sachs (13,263)265,075 Hargreaves Lansdown Plc HSBC (304,836)
(2,265,814) Hipgnosis Songs Fund Ltd JP Morgan (24,907)783,188 Howden Joinery Group Plc HSBC (97,115)
(1,343,300) HSBC Holdings Plc Goldman Sachs (159,853)859,003 Impax Asset Management
Group Plc Goldman Sachs 979,263(203,954) Imperial Tobacco Group Plc HSBC 27,534
1,715,035 IntegraFin Holdings Plc JP Morgan (85,389)(81,101) InterContinental Hotels
Group Plc Goldman Sachs (36,495)363,630 Intermediate Capital Group
Plc Goldman Sachs 316,358(83,224) Intertek Group Plc HSBC 439,716325,735 ITM Power Plc Goldman Sachs 237,787
(598,132) IWG Plc Goldman Sachs (2,991)(2,415,890) J Sainsbury Plc JP Morgan (229,510)1,957,923 JD Sports Fashion Plc JP Morgan 584,133
494,900 JET2 Plc HSBC (878,448)(564,960) John Wood Group Plc Goldman Sachs 146,890252,009 Kainos Group Plc Goldman Sachs 63,002
(379,633) Kier Group Plc Goldman Sachs 6,561(647,931) Land Securities Group Plc
(REIT) HSBC 307,1193,474,825 Learning Technologies
Group Plc HSBC 271,036(1,758,614) Legal & General Group Plc JP Morgan 72,103
320,187 Liontrust Asset Manage-ment Plc HSBC (256,150)
(7,341,408) Lloyds Banking Group Plc HSBC (149,765)
BlackRock Emerging Companies Absolute Return FundcontinuedPortfolio of Investments as at 31 May 2021
The notes on pages 590 to 610 form an integral part of these financial statements.
Annual report and audited financial statements [225]

Holding Description Counterparty
Netunrealised
appreciation/(depreciation)
GBP
United Kingdom continued55,975 London Stock Exchange
Group Plc HSBC 278,7561,624,668 LondonMetric Property Plc
(REIT) Goldman Sachs 133,223(2,455,829) Marks & Spencer Group Plc Goldman Sachs (228,392)
550,735 Marshalls Plc HSBC 22,0293,214,856 Melrose Industries Plc Goldman Sachs 361,671(441,314) Michael Page International
Plc HSBC 4,4132,029,666 Moonpig Group Plc Goldman Sachs 933,6462,121,923 Moonpig Group Plc HSBC 878,476
191,893 Morgan Sindall Group Plc HSBC (201,488)(618,497) National Grid Plc HSBC (56,902)
96,937 Next Plc JP Morgan (157,038)1,157,378 OSB Group Plc HSBC (222,217)
645,169 Oxford Instruments Plc JP Morgan (413,188)2,807,024 Pets at Home Group Plc Goldman Sachs 495,0523,174,973 QinetiQ Group Plc HSBC 595,653
171,725 Reckitt Benckiser Group Plc Goldman Sachs 10,304383,596 Reed Elsevier Plc Goldman Sachs (40,278)72,276 Renishaw Plc HSBC (357,766)
1,645,565 Rentokil Initial Plc HSBC (29,620)4,067,471 Restaurant Group Plc HSBC (326,356)
200,833 Rio Tinto Plc Goldman Sachs (415,882)(1,425,964) Rolls-Royce Holdings Plc HSBC 26,442
(319,310) Royal Dutch Shell Plc ’B’ HSBC 89,247(238,181) Sabre Insurance Group Plc HSBC (5,955)697,143 Safestore Holdings Plc
(REIT) Goldman Sachs 205,657(654,319) Sage Group Plc JP Morgan (163,580)(158,452) Severn Trent Plc Goldman Sachs 60,212758,800 Smith & Nephew Plc JP Morgan (29,565)233,029 Smurfit Kappa Group Plc Goldman Sachs (78,665)223,715 Spectris Plc JP Morgan (11,186)
2,419,935 Spirent Communications Plc Goldman Sachs 237,154(420,038) Sports Direct International
Plc Goldman Sachs 10,501(814,427) Standard Life Aberdeen Plc Goldman Sachs (57,824)(206,682) Tate & Lyle Plc Goldman Sachs 20,104
3,560,307 Taylor Wimpey Plc Goldman Sachs (151,313)(5,824,353) Tesco Plc Goldman Sachs 524,192(1,773,075) Tritax Big Box Plc (REIT) HSBC (47,873)
(645,339) TUI AG JP Morgan 18,760(194,729) Unilever Plc JP Morgan 101,259(388,731) UNITE Group Plc (REIT) HSBC 167,154(682,955) United Utilities Group Plc HSBC 30,050542,824 Vesuvius Plc Goldman Sachs (70,567)
(178,560) Victrex Plc HSBC 214,272(3,126,791) Vodafone Group Plc Goldman Sachs 418,9901,028,919 Watches of Switzerland
Group Plc HSBC 689,376243,550 Weir Group Plc HSBC (42,621)438,084 WH Smith Plc Goldman Sachs 348,277
(3,228,617) Wm Morrison SupermarketsPlc Goldman Sachs 222,775
951,896 Workspace Group Plc(REIT) Goldman Sachs 409,315
193,930 XP Power Ltd HSBC 30,560971,021 YouGov Plc HSBC 485,510
14,351,707
United States86,812 Activision Blizzard Inc HSBC 249,9607,288 Adobe Inc Goldman Sachs 100,294
11,910 Adobe Inc HSBC 211,80813,969 Alphabet Inc ’C’ Goldman Sachs 888,7123,507 Amazon.com Inc JP Morgan 69,527
19,592 American Tower Corp(REIT) Goldman Sachs 132,319
25,276 Apple Inc Goldman Sachs (34,650)
Holding Description Counterparty
Netunrealised
appreciation/(depreciation)
GBP
United States continued120,859 Apple Inc HSBC (191,054)
(141,459) AT&T Inc Goldman Sachs 193,67044,692 Axon Enterprise Inc Goldman Sachs 222,728
(113,193) Campbell Soup Co JP Morgan 118,22635,651 Chart Industries Inc JP Morgan (39,249)94,637 Chegg Inc HSBC (349,295)
(110,834) Cisco Systems Inc - CDI JP Morgan 20,3366,812 Coinbase Global Inc ’A’ Goldman Sachs (56,246)
16,161 Costco Wholesale Corp JP Morgan (36,610)13,622 Coupa Software Inc JP Morgan 35,28155,864 Datadog Inc ’A’ Goldman Sachs 372,19276,681 Domo Inc ’B’ JP Morgan 516,79879,772 Edwards Lifesciences Corp Goldman Sachs 340,59335,070 Equifax Inc JP Morgan (102,215)27,308 Etsy Inc Goldman Sachs (8,672)85,614 Facebook Inc ’A’ JP Morgan 1,362,6578,687 Fair Isaac Corp JP Morgan 80,678
89,990 Fidelity National InformationServices Inc Goldman Sachs 1,905
(107,134) General Mills Inc JP Morgan 73,33812,488 IDEXX Laboratories Inc JP Morgan 289,50646,631 IHS Markit Ltd Goldman Sachs 52,653
(39,948) International Business Ma-chines Corp JP Morgan 68,506
21,365 Intuit Inc JP Morgan 701,8636,530 Intuitive Surgical Inc JP Morgan 34,056
(70,692) Kraft Heinz Co JP Morgan 1,497(231,526) Kroger Co HSBC 307,176
8,043 MarketAxess Holdings Inc Goldman Sachs 64,99119,221 Masimo Corp JP Morgan (17,363)42,777 Mastercard Inc ’A’ Goldman Sachs (82,112)27,703 McDonald’s Corp Goldman Sachs 43,2064,025 MercadoLibre Inc JP Morgan (73,257)
94,863 Microsoft Corp Goldman Sachs 301,25824,675 MongoDB Inc JP Morgan 546,1077,660 MSCI Inc HSBC (47,355)
20,150 Nasdaq Inc Goldman Sachs 52,75758,467 NIKE Inc ’B’ Goldman Sachs 2,06314,465 Okta Inc Goldman Sachs (25,520)
(104,056) Oracle Corp Goldman Sachs 24,96892,983 PayPal Holdings Inc HSBC 1,075,5057,566 PayPal Holdings Inc JP Morgan 87,514
15,033 Pegasystems Inc Goldman Sachs 14,53496,686 Pinterest Inc ’A’ JP Morgan 425,13870,543 Qualtrics International Inc
’A’ Goldman Sachs 70,69210,250 RingCentral Inc ’A’ JP Morgan 15,04631,761 S&P Global Inc HSBC (244,091)50,122 salesforce.com Inc Goldman Sachs 566,4759,717 ServiceNow Inc HSBC 48,5514,970 Shopify Inc ’A’ Goldman Sachs 513,765
23,673 Square Inc ’A’ JP Morgan 101,74238,318 Thermo Fisher Scientific Inc HSBC 160,9908,145 Trade Desk Inc ’A’ Goldman Sachs 462,719
73,654 Tradeweb Markets Inc ’A’ HSBC 37,94557,113 TransUnion Goldman Sachs (41,918)88,477 Twitter Inc JP Morgan 386,5013,005 UiPath Inc ’A’ Goldman Sachs 25,066
68,160 Visa Inc ’A’ Goldman Sachs 41,367(6,977) WW Grainger Inc JP Morgan 59,38113,197 Zoom Video Communica-
tions Inc ’A’ Goldman Sachs 210,481
10,435,434
Total (Gross underlying exposure - GBP 1,180,771,999) 26,300,085
BlackRock Emerging Companies Absolute Return FundcontinuedPortfolio of Investments as at 31 May 2021
The notes on pages 590 to 610 form an integral part of these financial statements.
BlackRock Strategic Funds[226]

Numberof
contractsCurrencyof contracts
Contract/Description
Expirationdate
Grossunderlying
exposureGBP
Net unrealised(depreciation)
GBP
Financial Derivative Instruments
FUTURES
(517) USD E-Mini S&P 500 Index Futures June 2021 June 2021 76,721,746 (5,074,223)
(415) EUR EURO STOXX 50 Index Futures June 2021 June 2021 14,486,288 (1,002,567)
(2,159) GBP FTSE 100 Index Futures June 2021 June 2021 151,637,365 (7,742,713)
(1,872) GBP FTSE 250 Index Futures June 2021 June 2021 84,962,592 (5,189,184)
Total 327,807,991 (19,008,687)
Currency Purchases Currency Sales CounterpartyMaturity
date
Netunrealised
appreciation/(depreciation)
GBP
Financial Derivative Instruments
OPEN FORWARD FOREIGN EXCHANGE TRANSACTIONS
CHF Hedged Share Class
CHF 45,002,840 GBP 35,602,453State Street Bank& Trust Company 15/6/2021 (320,665)
GBP 1,389,511 CHF 1,772,091State Street Bank& Trust Company 15/6/2021 212
(320,453)
CNH Hedged Share Class
CNH 36,762 GBP 4,087State Street Bank& Trust Company 15/6/2021 (18)
GBP 162 CNH 1,474State Street Bank& Trust Company 15/6/2021 —
(18)
EUR Hedged Share Class
EUR 460,747,604 GBP 399,904,032State Street Bank& Trust Company 15/6/2021 (2,987,975)
GBP 24,036,340 EUR 27,910,028State Street Bank& Trust Company 15/6/2021 (7,058)
(2,995,033)
USD Hedged Share Class
GBP 5,906,777 USD 8,334,660State Street Bank& Trust Company 15/6/2021 24,941
USD 148,102,164 GBP 106,345,183State Street Bank& Trust Company 15/6/2021 (1,828,272)
(1,803,331)
Total (Gross underlying exposure - GBP 568,033,530) (5,118,835)
Sector Breakdownas at 31 May 2021
% of NetAssets
Financial 74.18
Collective Investment Schemes 9.85
Government 5.97
Consumer, Cyclical 3.97
Technology 2.67
Energy 0.53
Securities portfolio at market value 97.17
Other Net Assets 2.83
100.00
BlackRock Emerging Companies Absolute Return FundcontinuedPortfolio of Investments as at 31 May 2021
The notes on pages 590 to 610 form an integral part of these financial statements.
Annual report and audited financial statements [227]

Holding Description
MarketValue
USD
% ofNet
Assets
Transferable Securities and Money Market Instruments Admittedto an Official Stock Exchange Listing or Dealt in on AnotherRegulated Market
COMMON STOCKS & RIGHTSArgentina
17,368 YPF SA ADR 81,630 0.65
81,630 0.65
Brazil67,041 Banco Bradesco SA ADR 340,568 2.7042,651 Ultrapar Participacoes SA 155,878 1.23
496,446 3.93
Cayman Islands2,750 Baidu Inc ’A’ 68,209 0.541,748 Baidu Inc ADR^ 343,080 2.72
27,000 CK Hutchison Holdings Ltd 211,344 1.681,750 JD.com Inc ’A’ 65,661 0.52
36,000 Sunac China Holdings Ltd 132,895 1.05
821,189 6.51
China525,000 Industrial & Commercial Bank
of China Ltd ’H’ 344,992 2.7321,400 Inner Mongolia Yili Industrial
Group Co Ltd ’A’ 136,041 1.0850,925 Jinyu Bio-Technology Co Ltd
’A’ 161,427 1.2871,000 Suzhou Basecare Medical
Corp Ltd ’H’ 257,980 2.04
900,440 7.13
Cyprus5,182 Ozon Holdings Plc ADR 275,009 2.18
275,009 2.18
Greece101,942 National Bank of Greece SA 321,476 2.55129,251 Piraeus Financial Holdings
SA^ 239,762 1.90
561,238 4.45
Hong Kong34,000 Hua Hong Semiconductor Ltd 182,462 1.45
182,462 1.45
India38,313 Bandhan Bank Ltd 162,120 1.2822,754 ICICI Bank Ltd ADR^ 409,800 3.2555,162 Zee Entertainment Enterprises
Ltd 159,282 1.26
731,202 5.79
Indonesia721,200 Astra International Tbk PT 265,147 2.10
265,147 2.10
Italy33,300 PRADA SpA 231,910 1.84
231,910 1.84
Luxembourg4,679 Allegro.eu SA 73,801 0.58
73,801 0.58
Malaysia2,460,300 Sapura Energy Bhd 71,581 0.56
162,600 Top Glove Corp Bhd 204,211 1.62
275,792 2.18
Mexico22,080 Cemex SAB de CV ADR 182,822 1.45
182,822 1.45
Holding Description
MarketValue
USD
% ofNet
Assets
Poland14,067 Polski Koncern Naftowy OR-
LEN SA 315,739 2.50
315,739 2.50
Portugal1,002,932 Banco Comercial Portugues
SA ’R’ 195,102 1.55
195,102 1.55
Qatar24,638 Qatar National Bank QPSC 117,943 0.93
117,943 0.93
Russia7,107 LUKOIL PJSC ADR 578,936 4.592,657 Magnit PJSC 197,973 1.57
776,909 6.16
South Korea2,781 Eoflow Co Ltd 141,422 1.12
435 HYBE Co Ltd 103,753 0.8227 HYBE Co Ltd (Right) 1,579 0.01
255 NCSoft Corp 199,217 1.58647 SK Holdings Co Ltd 154,318 1.23
600,289 4.76
United Arab Emirates617,861 Air Arabia PJSC 230,463 1.82504,393 Emaar Properties PJSC 542,447 4.30
772,910 6.12
Total Common Stocks & Rights 7,857,980 62.26
BONDSUnited States
USD 486,100 United States Treasury Bill17/6/2021 (Zero Coupon) 486,075 3.85
USD 400,000 United States Treasury Bill8/7/2021 (Zero Coupon) 399,981 3.17
USD 400,000 United States Treasury Bill19/8/2021 (Zero Coupon) 399,983 3.17
USD 400,000 United States Treasury Bill23/9/2021 (Zero Coupon) 399,978 3.17
USD 400,000 United States Treasury Bill21/10/2021 (Zero Coupon) 399,966 3.17
USD 400,000 United States Treasury Bill26/11/2021 (Zero Coupon) 399,943 3.16
USD 400,000 United States Treasury Bill -WI Post Auction5/8/2021 (Zero Coupon) 399,965 3.17
2,885,891 22.86
Total Bonds 2,885,891 22.86
Total Transferable Securities and Money MarketInstruments Admitted to an Official Stock ExchangeListing or Dealt in on Another Regulated Market 10,743,871 85.12
Collective Investment SchemesIreland
11,626 BlackRock ICS US Dollar Liq-uid Environmentally AwareFund (Dist)~ 1,163,135 9.22
1,163,135 9.22
Total Collective Investment Schemes 1,163,135 9.22
Securities portfolio at market value 11,907,006 94.34
Other Net Assets 714,631 5.66
Total Net Assets (USD) 12,621,637 100.00
^ All or a portion of this security represents a security on loan.~ Investment in related party fund.
BlackRock Emerging Markets Absolute Return Fund
Portfolio of Investments as at 31 May 2021
The notes on pages 590 to 610 form an integral part of these financial statements.
BlackRock Strategic Funds[228]

Holding Description Counterparty
Netunrealised
appreciation/(depreciation)
USD
Financial Derivative Instruments
CONTRACTS FOR DIFFERENCEAustralia
(33,259) Fortescue Metals Group Ltd HSBC 71,219
71,219
Brazil(21,714) Banco Inter SA (Unit) Bank of America
Merrill Lynch (27,635)(82,503) Magazine Luiza SA HSBC (14,392)(70,119) Raia Drogasil SA HSBC (2,069)62,915 Via Varejo S/A Goldman Sachs 10,413
(42,396) WEG SA HSBC (13,222)
(46,905)
Cayman Islands(8,257) NIO Inc ADR HSBC (35,422)
(35,422)
Hong Kong(43,000) BYD Electronic International
Co Ltd Citibank (5,946)430,000 China Eastern Airlines Corp
Ltd ’H’ HSBC 4,537(21,200) China Literature Ltd HSBC (18,415)
(137,000) Great Wall Motor Co Ltd ’H’ Bank of AmericaMerrill Lynch (40,492)
(51,000) Kingdee International Soft-ware Group Co Ltd Citibank (5,501)
(9,400) Shenzhou InternationalGroup Holdings Ltd HSBC (21,803)
(87,620)
Malaysia(344,700) Top Glove Corp Bhd Citibank 8,524
8,524
Mexico(96,580) Becle SAB de CV Morgan Stanley (7,004)
(7,004)
Norway(781) Scatec ASA Goldman Sachs (1,152)
(1,152)
Philippines16,800 GT Capital Holdings Inc Credit Suisse 22,519
22,519
Poland(5,856) Dino Polska SA HSBC (50,125)
(50,125)
Saudi Arabia(10,673) Al Rajhi Bank HSBC (11,391)(77,433) Saudi Kayan Petrochemical
Co HSBC (9,507)
(20,898)
South Africa(1,002) Naspers Ltd ’N’ Goldman Sachs (4,195)
(4,195)
South Korea3,254 Fila Holdings Corp Citibank 4,878
4,878
Taiwan(212,000) Acer Inc Citibank (11,843)
(11,843)
Thailand(14,000) Delta Electronics Thailand
PCL NVDR Morgan Stanley (35,857)
(35,857)
Holding Description Counterparty
Netunrealised
appreciation/(depreciation)
USD
United Kingdom(9,628) MMC Norilsk Nickel PJSC
ADR Goldman Sachs 11,457(3,817) TCS Group Holding Plc Reg
GDR Goldman Sachs (51,453)
(39,996)
United States(17,288) Himax Technologies Inc
ADR Credit Suisse (37,798)(7,231) Jumia Technologies AG
ADR Citibank (13,667)(123) MercadoLibre Inc HSBC 3,172
(6,793) MINISO Group Holding LtdADR Citibank 26,561
29,640 Petroleo Brasileiro SA ADR HSBC 29,344(3,032) Pinduoduo Inc ADR HSBC (9,510)
(692) Sea Ltd ADR HSBC (21,238)(2,735) StoneCo Ltd ’A’ Citibank (8,150)(2,334) Tencent Holdings Ltd ADR Goldman Sachs (141)(4,799) XP Inc ’A’ Bank of America
Merrill Lynch 15,501(7,211) ZTO Express Cayman Inc
ADR Credit Suisse (5,408)
(21,334)
Total (Gross underlying exposure - USD 9,746,736) (255,211)
BlackRock Emerging Markets Absolute Return Fund continued
Portfolio of Investments as at 31 May 2021
The notes on pages 590 to 610 form an integral part of these financial statements.
Annual report and audited financial statements [229]

Numberof
contractsCurrencyof contracts
Contract/Description
Expirationdate
Grossunderlying
exposureUSD
Net unrealised(depreciation)
USD
Financial Derivative Instruments
FUTURES
(8) USD MSCI Emerging Markets Index Futures June 2021 June 2021 549,760 (10,607)
(9) INR UPL Ltd Futures June 2021 June 2021 132,019 (2,611)
Total 681,779 (13,218)
Currency Purchases Currency Sales CounterpartyMaturity
date
Netunrealised
appreciation/(depreciation)
USD
Financial Derivative Instruments
OPEN FORWARD FOREIGN EXCHANGE TRANSACTIONS
USD 150,122 INR 11,084,600Bank of America
Merrill Lynch 13/8/2021 (938)EUR Hedged Share Class
EUR 3,735,371 USD 4,514,375State Street Bank& Trust Company 15/6/2021 45,408
USD 218,704 EUR 179,315State Street Bank& Trust Company 15/6/2021 (187)
45,221
GBP Hedged Share Class
GBP 25,063 USD 34,893State Street Bank& Trust Company 15/6/2021 618
USD 1,250 GBP 885State Street Bank& Trust Company 15/6/2021 (1)
617
Total (Gross underlying exposure - USD 4,966,500) 44,900
Sector Breakdownas at 31 May 2021
% of NetAssets
Government 22.86
Financial 22.24
Energy 10.76
Communications 9.38
Collective Investment Schemes 9.22
Consumer, Non-cyclical 7.09
Consumer, Cyclical 6.59
Industrial 3.07
Diversified 1.68
Technology 1.45
Securities portfolio at market value 94.34
Other Net Assets 5.66
100.00
BlackRock Emerging Markets Absolute Return Fund continued
Portfolio of Investments as at 31 May 2021
The notes on pages 590 to 610 form an integral part of these financial statements.
BlackRock Strategic Funds[230]

Holding Description
MarketValue
USD
% ofNet
Assets
Transferable Securities and Money Market Instruments Admittedto an Official Stock Exchange Listing or Dealt in on AnotherRegulated Market
COMMON STOCKSArgentina
1,436,305 Grupo Financiero Galicia SAADR 12,754,389 1.41
2,083,669 YPF SA ADR 9,793,244 1.08
22,547,633 2.49
Brazil2,594,487 Banco do Brasil SA 16,730,602 1.853,124,608 BB Seguridade Participacoes
SA 13,977,950 1.541,308,686 Gol Linhas Aereas Inteligentes
SA ADR 13,400,945 1.48578,483 Petroleo Brasileiro SA ADR 5,906,311 0.65
1,220,765 Suzano SA 14,314,023 1.58
64,329,831 7.10
Cayman Islands697,000 Baidu Inc ’A’ 17,287,931 1.91865,000 CK Hutchison Holdings Ltd 6,770,830 0.75
4,664,000 Geely Automobile Holdings Ltd 11,862,745 1.31127,050 JD.com Inc ’A’ 4,767,004 0.5356,350 JD.com Inc ADR 4,166,519 0.46
677,173 Melco Resorts & Entertain-ment Ltd ADR 11,640,604 1.29
3,004,000 Sunac China Holdings Ltd 11,089,299 1.229,540,000 Topsports International Hold-
ings Ltd 14,529,323 1.606,510,000 Wynn Macau Ltd^ 10,988,333 1.21
93,102,588 10.28
Chile227,842 Sociedad Quimica y Minera de
Chile SA ADR 9,881,507 1.09
9,881,507 1.09
China35,356,000 China Eastern Airlines Corp
Ltd ’H’^ 15,944,492 1.769,523,000 China Molybdenum Co Ltd ’A’ 8,686,768 0.968,313,000 China Molybdenum Co Ltd ’H’^ 5,730,481 0.63
38,398,000 China Petroleum & ChemicalCorp ’H’ 20,433,284 2.26
2,833,300 Haier Smart Home Co Ltd ’A’ 13,420,731 1.482,604,300 Han’s Laser Technology Indus-
try Group Co Ltd ’A’ 15,333,121 1.698,671,118 Infore Environment Technology
Group Co Ltd ’A’ 10,850,299 1.202,612,884 Inner Mongolia Yili Industrial
Group Co Ltd ’A’ 16,610,251 1.843,864,546 Jinyu Bio-Technology Co Ltd
’A’ 12,250,198 1.352,099,000 Ping An Insurance Group Co
of China Ltd ’H’^ 22,839,764 2.528,628,853 Zhejiang Huace Film & TV Co
Ltd ’A’ 8,291,112 0.92
150,390,501 16.61
Cyprus437,401 Ozon Holdings Plc ADR 23,212,871 2.56
23,212,871 2.56
Holding Description
MarketValue
USD
% ofNet
Assets
Czech Republic608,302 CEZ AS 18,258,875 2.02
18,258,875 2.02
Greece5,763,111 National Bank of Greece SA 18,174,059 2.018,952,390 Piraeus Financial Holdings
SA^ 16,606,765 1.83
34,780,824 3.84
Hong Kong2,496,000 Hua Hong Semiconductor Ltd^ 13,394,889 1.48
13,394,889 1.48
India3,064,221 Bandhan Bank Ltd 12,966,162 1.432,289,773 ICICI Bank Ltd 20,883,764 2.31
197,554 ICICI Bank Ltd ADR^ 3,557,948 0.397,167,305 Indiabulls Housing Finance Ltd 22,013,389 2.43
498,150 InterGlobe Aviation Ltd 12,004,028 1.321,639,767 Tech Mahindra Ltd 23,143,808 2.56
94,569,099 10.44
Indonesia50,511,300 Astra International Tbk PT 18,570,331 2.0546,991,800 XL Axiata Tbk PT 8,095,226 0.90
26,665,557 2.95
Luxembourg321,487 Allegro.eu SA^ 5,070,723 0.56
5,070,723 0.56
Malaysia111,083,800 Sapura Energy Bhd 3,231,920 0.36
3,231,920 0.36
Mexico10,599,648 Fibra Uno Administracion SA
de CV (REIT) 12,451,378 1.38
12,451,378 1.38
Philippines712,100 Ayala Corp 11,854,647 1.31
5,923,620 BDO Unibank Inc 12,879,325 1.42
24,733,972 2.73
Poland419,832 Polski Koncern Naftowy OR-
LEN SA 9,423,284 1.04
9,423,284 1.04
Qatar1,957,460 Qatar National Bank QPSC 9,370,397 1.04
9,370,397 1.04
Russia456,656 LUKOIL PJSC ADR 37,199,198 4.11198,986 Magnit PJSC 14,826,434 1.64
52,025,632 5.75
South Africa2,628,300 Sibanye Stillwater Ltd 12,396,019 1.37
12,396,019 1.37
South Korea30,404 Korea Zinc Co Ltd 12,355,345 1.36
BlackRock Emerging Markets Equity Strategies Fund
Portfolio of Investments as at 31 May 2021
The notes on pages 590 to 610 form an integral part of these financial statements.
Annual report and audited financial statements [231]

Holding Description
MarketValue
USD
% ofNet
Assets
South Korea continued862,068 Samsung Electronics Co Ltd 62,460,262 6.9056,941 SK Holdings Co Ltd 13,581,175 1.50
88,396,782 9.76
Taiwan1,608,000 Catcher Technology Co Ltd 10,718,058 1.184,074,000 Hon Hai Precision Industry Co
Ltd 16,750,553 1.85287,000 Wiwynn Corp 9,679,297 1.07
37,147,908 4.10
United Arab Emirates31,148,493 Emaar Properties PJSC 33,498,475 3.70
33,498,475 3.70
United Kingdom2,665,234 Mediclinic International
Plc (traded in South Africa) 12,479,110 1.38540,997 Mediclinic International
Plc (traded in United King-dom) 2,502,160 0.27
14,981,270 1.65
United States119,216 Cree Inc 11,922,792 1.32
11,922,792 1.32
Total Common Stocks 865,784,727 95.62
Total Transferable Securities and Money MarketInstruments Admitted to an Official Stock ExchangeListing or Dealt in on Another Regulated Market 865,784,727 95.62
Collective Investment SchemesIreland
391,501 BlackRock ICS US Dollar Liq-uid Environmentally AwareFund (Dist)~ 39,167,483 4.33
39,167,483 4.33
Total Collective Investment Schemes 39,167,483 4.33
Securities portfolio at market value 904,952,210 99.95
Other Net Assets 482,617 0.05
Total Net Assets (USD) 905,434,827 100.00
^ All or a portion of this security represents a security on loan.~ Investment in related party fund.
BlackRock Emerging Markets Equity Strategies Fund continued
Portfolio of Investments as at 31 May 2021
The notes on pages 590 to 610 form an integral part of these financial statements.
BlackRock Strategic Funds[232]

Holding Description Counterparty
Netunrealised
appreciation/(depreciation)
USD
Financial Derivative Instruments
CONTRACTS FOR DIFFERENCEAustralia
(1,416,909) Fortescue Metals Group Ltd HSBC 3,034,110
3,034,110
Brazil(504,901) B2W Cia Digital Bank of America
Merrill Lynch (131,205)(1,569,708) Banco Inter SA (Unit) Bank of America
Merrill Lynch (1,776,536)22,662,126 Cielo SA Credit Suisse 3,092,971
(918,058) Magazine Luiza SA Bank of AmericaMerrill Lynch (244,121)
(3,763,277) Magazine Luiza SA Credit Suisse (656,480)(1,456,168) Magazine Luiza SA HSBC (254,019)
524,154 Suzano SA Credit Suisse (732,209)7,284,946 Via Varejo S/A Goldman Sachs 1,205,821
(1,817,082) WEG SA Bank of AmericaMerrill Lynch (696,963)
(1,246,370) WEG SA HSBC (388,696)
(581,437)
Cayman Islands(576,425) NIO Inc ADR UBS (2,772,604)
(2,772,604)
Greece885,236 National Bank of Greece SA HSBC (154,632)
(154,632)
Hong Kong35,619,000 China Construction Bank
Corp ’H’ HSBC 383,1672,625,000 CK Hutchison Holdings Ltd Credit Suisse (1,678,824)
(8,490,000) Great Wall Motor Co Ltd ’H’ Bank of AmericaMerrill Lynch (2,819,233)
(239,300) Hong Kong Exchanges &Clearing Ltd
Bank of AmericaMerrill Lynch (1,269,487)
42,642,000 Industrial & CommercialBank of China Ltd ’H’ Credit Suisse 344,999
109,600 JD.com Inc ’A’ HSBC 58,733267,000 Ping An Insurance Group
Co of China Ltd ’H’ Credit Suisse 94,4442,440,000 Sunac China Holdings Ltd Bank of America
Merrill Lynch (55,288)
(4,941,489)
Indonesia1,201,700 Astra International Tbk PT HSBC (13,148)
(13,148)
Malaysia55,823,800 Sapura Energy Bhd HSBC (278,536)
(278,536)
Poland4,871,736 PGE Polska Grupa Ener-
getyczna SA HSBC 693,760182,272 Polski Koncern Naftowy OR-
LEN SA HSBC 602,280
1,296,040
Saudi Arabia927,150 Saudi Arabian Mining Co HSBC 964,522
964,522
South Korea232,764 Fila Holdings Corp Credit Suisse (284,757)450,939 Korea Electric Power Corp Credit Suisse 572,867296,871 Samsung Electronics Co Ltd HSBC (665,552)26,731 Samsung SDI Co Ltd HSBC (850,758)
(1,228,200)
Holding Description Counterparty
Netunrealised
appreciation/(depreciation)
USD
Taiwan290,000 Wiwynn Corp Bank of America
Merrill Lynch 1,679,800
1,679,800
Thailand(68,000) Delta Electronics Thailand
PCL NVDR Goldman Sachs (161,385)(933,200) Delta Electronics Thailand
PCL NVDR UBS (2,188,318)
(2,349,703)
Turkey(20,000,000) Emlak Konut Gayrimenkul
Yatirim Ortakligi AS(REIT) Goldman Sachs 19,067
(28,190,800) Emlak Konut GayrimenkulYatirim Ortakligi AS(REIT) HSBC 45,505
(10,130,198) Haci Omer Sabanci HoldingAS HSBC 171,962
236,534
United Kingdom(553,445) MMC Norilsk Nickel PJSC
ADR Goldman Sachs 658,599
658,599
United States43,400 Baidu Inc ADR Goldman Sachs 306,838
1,083,288 Cemex SAB de CV ADR Credit Suisse (216,658)108,192 Credicorp Ltd Goldman Sachs (735,706)82,663 Cree Inc Credit Suisse 626,305
165,218 JD.com Inc ADR Credit Suisse 419,654(386,534) Jumia Technologies AG
ADRBank of AmericaMerrill Lynch (1,186,659)
(89,383) Jumia Technologies AGADR Credit Suisse (513,058)
(253,192) Lattice Semiconductor Corp Credit Suisse (1,615,365)(8,857) MercadoLibre Inc HSBC 228,42213,996 Petroleo Brasileiro SA ADR Credit Suisse 13,856
1,548,762 Petroleo Brasileiro SA ADR HSBC 1,533,274(202,463) Pinduoduo Inc ADR HSBC (633,361)(53,815) Sea Ltd ADR HSBC (1,651,582)222,232 Sociedad Quimica y Minera
de Chile SA ADR Credit Suisse (1,493,207)(289,327) StoneCo Ltd ’A’ Bank of America
Merrill Lynch (1,897,985)422,203 Trip.com Group Ltd ADR Credit Suisse 2,127,903
(4,687,329)
Total (Gross underlying exposure - USD 649,349,837) (9,137,473)
BlackRock Emerging Markets Equity Strategies Fund continued
Portfolio of Investments as at 31 May 2021
The notes on pages 590 to 610 form an integral part of these financial statements.
Annual report and audited financial statements [233]

Numberof
contractsCurrencyof contracts
Contract/Description
Expirationdate
Grossunderlying
exposureUSD
Net unrealisedappreciation/
(depreciation)USD
Financial Derivative Instruments
FUTURES
(8,400) TRY Bist 30 Index Futures June 2021 June 2021 15,085,795 (549,135)
461 USD FTSE Taiwan Index Future June 2021 June 2021 27,623,120 677,670
Total 42,708,915 128,535
Currency Purchases Currency Sales CounterpartyMaturity
date
Netunrealised
appreciation/(depreciation)
USD
Financial Derivative Instruments
OPEN FORWARD FOREIGN EXCHANGE TRANSACTIONS
CHF Hedged Share Class
CHF 3,757,445 USD 4,140,250State Street Bank& Trust Company 15/6/2021 33,996
USD 241,523 CHF 217,955State Street Bank& Trust Company 15/6/2021 (607)
33,389
EUR Hedged Share Class
EUR 31,571,823 USD 38,161,883State Street Bank& Trust Company 15/6/2021 377,971
USD 1,489,866 EUR 1,226,832State Street Bank& Trust Company 15/6/2021 (7,732)
370,239
Total (Gross underlying exposure - USD 44,453,832) 403,628
Sector Breakdownas at 31 May 2021
% of NetAssets
Financial 27.79
Consumer, Cyclical 13.50
Technology 13.33
Energy 11.00
Communications 7.84
Basic Materials 6.99
Consumer, Non-cyclical 6.48
Industrial 5.92
Collective Investment Schemes 4.33
Utilities 2.02
Diversified 0.75
Securities portfolio at market value 99.95
Other Net Assets 0.05
100.00
BlackRock Emerging Markets Equity Strategies Fund continued
Portfolio of Investments as at 31 May 2021
The notes on pages 590 to 610 form an integral part of these financial statements.
BlackRock Strategic Funds[234]

Holding Description
MarketValue
USD
% ofNet
Assets
Transferable Securities and Money Market Instruments Admittedto an Official Stock Exchange Listing or Dealt in on AnotherRegulated Market
BONDSAngola
USD 1,780,000 Angolan Government Interna-tional Bond RegS 9.50%12/11/2025 1,962,779 0.13
USD 8,545,000 Angolan Government Interna-tional Bond RegS 8.25%9/5/2028 8,891,372 0.58
USD 43,769,000 Angolan Government Interna-tional Bond RegS 9.375%8/5/2048 45,493,499 2.97
USD 15,349,000 Angolan Government Interna-tional Bond RegS 9.125%26/11/2049 15,694,007 1.02
72,041,657 4.70
ArgentinaUSD 10,907,072 Argentine Republic Govern-
ment International Bond1.00% 9/7/2029^ 4,267,556 0.28
USD 13,441,648 Argentine Republic Govern-ment International Bond0.125% 9/7/2030 4,978,114 0.32
USD 19,763,905 Argentine Republic Govern-ment International Bond0.125% 9/1/2038 7,845,677 0.51
USD 8,107,811 Province of Salta ArgentinaRegS 5.00% 1/12/2027 5,349,372 0.35
ARS 103,197,000 Provincia de Buenos AiresFRN 31/5/2022 608,722 0.04
USD 4,865,000 Provincia de Buenos AiresRegS 6.50% 15/2/2023 2,102,592 0.14
USD 17,227,000 Provincia de Buenos AiresRegS 9.125% 16/3/2024 7,337,625 0.48
ARS 389,865,000 Provincia de Buenos AiresRegS FRN 12/4/2025 2,067,809 0.14
USD 6,243,000 Provincia de Buenos AiresRegS 9.625% 18/4/2028^ 2,753,038 0.18
USD 2,009,466 Tarjeta Naranja SA RegS FRN11/4/2022^ 156,095 0.01
37,466,600 2.45
ChinaCNY 243,020,000 China Government Bond
3.03% 11/3/2026 38,372,000 2.50CNY 241,410,000 China Government Bond
3.27% 19/11/2030 38,516,139 2.51CNY 96,420,000 China Government Bond
3.81% 14/9/2050 15,728,784 1.03
92,616,923 6.04
ColombiaUSD 2,641,000 Colombia Government Interna-
tional Bond 4.50%15/3/2029 2,861,820 0.19
USD 3,671,000 Ecopetrol SA 6.875%29/4/2030 4,363,718 0.28
7,225,538 0.47
Costa RicaUSD 6,061,000 Costa Rica Government Inter-
national Bond RegS 6.125%19/2/2031^ 6,489,664 0.42
Holding Description
MarketValue
USD
% ofNet
Assets
Costa Rica continuedUSD 8,275,000 Costa Rica Government Inter-
national Bond RegS 7.00%4/4/2044 8,684,437 0.57
USD 22,886,000 Costa Rica Government Inter-national Bond RegS 7.158%12/3/2045 24,204,863 1.58
39,378,964 2.57
Dominican RepublicDOP 932,450,000 Dominican Republic Interna-
tional Bond RegS 9.75%5/6/2026 18,368,189 1.20
USD 10,381,000 Dominican Republic Interna-tional Bond RegS 4.875%23/9/2032 10,702,162 0.70
USD 11,654,000 Dominican Republic Interna-tional Bond RegS 5.30%21/1/2041^ 11,710,784 0.76
USD 5,070,000 Dominican Republic Interna-tional Bond RegS 7.45%30/4/2044 6,123,914 0.40
USD 4,917,000 Dominican Republic Interna-tional Bond RegS 6.85%27/1/2045 5,589,424 0.36
USD 6,257,000 Dominican Republic Interna-tional Bond RegS 6.50%15/2/2048 6,851,572 0.45
USD 5,578,000 Dominican Republic Interna-tional Bond RegS 5.875%30/1/2060 5,511,761 0.36
64,857,806 4.23
EcuadorUSD 13,887,069 Ecuador Government Interna-
tional Bond RegS31/7/2030 (Zero Coupon) 7,885,252 0.52
USD 13,200,921 Ecuador Government Interna-tional Bond RegS 0.50%31/7/2030^ 11,484,801 0.75
USD 15,754,328 Ecuador Government Interna-tional Bond RegS 0.50%31/7/2035 11,087,108 0.72
30,457,161 1.99
EgyptEGP 225,710,000 Egypt Government Bond
14.85% 10/4/2023 14,642,720 0.96EGP 124,588,000 Egypt Government Bond
14.425% 14/7/2030 7,801,335 0.51EGP 124,458,000 Egypt Government Bond
15.433% 28/7/2035 8,014,762 0.52USD 6,450,000 Egypt Government Interna-
tional Bond RegS 5.25%6/10/2025^ 6,855,447 0.45
USD 1,983,000 Egypt Government Interna-tional Bond RegS 5.875%16/2/2031 1,955,114 0.13
EUR 4,103,000 Egypt Government Interna-tional Bond RegS 6.375%11/4/2031 5,326,144 0.35
USD 22,627,000 Egypt Government Interna-tional Bond RegS 7.625%29/5/2032 24,550,974 1.60
BlackRock Emerging Markets Flexi Dynamic Bond Fund
Portfolio of Investments as at 31 May 2021
The notes on pages 590 to 610 form an integral part of these financial statements.
Annual report and audited financial statements [235]

Holding Description
MarketValue
USD
% ofNet
Assets
Egypt continuedUSD 3,512,000 Egypt Government Interna-
tional Bond RegS 8.50%31/1/2047 3,739,560 0.24
USD 8,651,000 Egypt Government Interna-tional Bond RegS 7.903%21/2/2048 8,787,967 0.57
USD 6,499,000 Egypt Government Interna-tional Bond RegS 8.70%1/3/2049 7,016,304 0.46
USD 2,254,000 Egypt Government Interna-tional Bond RegS 8.875%29/5/2050 2,481,496 0.16
USD 25,109,000 Egypt Government Interna-tional Bond RegS 7.50%16/2/2061 24,228,679 1.58
115,400,502 7.53
El SalvadorUSD 1,661,000 El Salvador Government Inter-
national Bond RegS 7.75%24/1/2023 1,705,640 0.11
USD 4,096,000 El Salvador Government Inter-national Bond RegS 8.25%10/4/2032 4,298,240 0.28
USD 99,000 El Salvador Government Inter-national Bond RegS 7.65%15/6/2035 99,866 0.01
USD 6,234,000 El Salvador Government Inter-national Bond RegS 7.625%1/2/2041^ 6,175,556 0.40
USD 3,243,000 El Salvador Government Inter-national Bond RegS 9.50%15/7/2052^ 3,502,440 0.23
15,781,742 1.03
GabonUSD 21,641,338 Gabon Government Interna-
tional Bond RegS 6.375%12/12/2024 22,938,358 1.50
USD 28,506,000 Gabon Government Interna-tional Bond RegS 6.95%16/6/2025 30,702,245 2.00
USD 9,347,000 Gabon Government Interna-tional Bond RegS 6.625%6/2/2031 9,347,654 0.61
62,988,257 4.11
GhanaUSD 3,418,000 Ghana Government Interna-
tional Bond RegS 6.375%11/2/2027 3,451,189 0.23
USD 9,546,000 Ghana Government Interna-tional Bond RegS 7.625%16/5/2029^ 9,791,332 0.64
USD 8,555,000 Ghana Government Interna-tional Bond RegS 8.125%26/3/2032^ 8,800,122 0.57
USD 10,785,000 Ghana Government Interna-tional Bond RegS 8.625%7/4/2034 11,265,256 0.73
USD 19,386,000 Ghana Government Interna-tional Bond RegS 8.875%7/5/2042 19,693,074 1.29
USD 7,753,000 Ghana Government Interna-tional Bond RegS 8.627%16/6/2049 7,591,040 0.50
USD 7,161,000 Ghana Government Interna-tional Bond RegS 8.95%26/3/2051 7,156,972 0.47
Holding Description
MarketValue
USD
% ofNet
Assets
Ghana continuedUSD 6,049,000 Ghana Government Interna-
tional Bond RegS 8.75%11/3/2061 5,885,314 0.38
GHS 47,907,000 Republic of Ghana Govern-ment Bonds 20.75%16/1/2023 8,674,179 0.57
GHS 50,649,000 Republic of Ghana Govern-ment Bonds 17.60%20/2/2023 8,784,657 0.57
91,093,135 5.95
IndonesiaIDR
120,548,000,000Indonesia Treasury Bond
7.00% 15/9/2030 8,787,848 0.58IDR
106,795,000,000Indonesia Treasury Bond
6.50% 15/2/2031 7,530,992 0.49
16,318,840 1.07
Ivory CoastEUR 11,171,000 Ivory Coast Government Inter-
national Bond RegS 4.875%30/1/2032 13,822,869 0.90
USD 800,000 Ivory Coast Government Inter-national Bond RegS 6.125%15/6/2033 854,466 0.06
EUR 1,946,000 Ivory Coast Government Inter-national Bond RegS 6.875%17/10/2040^ 2,596,715 0.17
17,274,050 1.13
KazakhstanKZT 7,045,000,000 Development Bank of Kazakh-
stan JSC RegS 8.95%4/5/2023 16,296,507 1.06
USD 6,680,000 KazMunayGas National CoJSC RegS 5.75% 19/4/2047 8,247,712 0.54
USD 7,489,000 KazMunayGas National CoJSC RegS 6.375%24/10/2048 9,854,026 0.64
34,398,245 2.24
KenyaUSD 4,488,000 Kenya Government Interna-
tional Bond RegS 8.00%22/5/2032^ 5,072,854 0.33
5,072,854 0.33
LebanonUSD 17,084,000 Lebanon Government Interna-
tional Bond (Defaulted)6.375% 9/3/2020 2,314,455 0.15
USD 11,282,000 Lebanon Government Interna-tional Bond RegS (De-faulted) 5.80% 14/4/2020 1,533,647 0.10
3,848,102 0.25
MexicoUSD 2,800,000 Cemex SAB de CV RegS
7.375% 5/6/2027^ 3,157,252 0.21MXN 161,942,100 Mexican Bonos 8.00%
7/12/2023 8,652,731 0.57USD 533,000 Mexico Government Interna-
tional Bond 2.659%24/5/2031 520,132 0.03
USD 6,283,000 Petroleos Mexicanos 6.75%21/9/2047 5,575,848 0.36
USD 26,645,000 Petroleos Mexicanos 7.69%23/1/2050 25,619,168 1.67
BlackRock Emerging Markets Flexi Dynamic Bond FundcontinuedPortfolio of Investments as at 31 May 2021
The notes on pages 590 to 610 form an integral part of these financial statements.
BlackRock Strategic Funds[236]

Holding Description
MarketValue
USD
% ofNet
Assets
Mexico continuedUSD 8,314,000 Petroleos Mexicanos 6.95%
28/1/2060 7,374,892 0.48EUR 6,872,000 Petroleos Mexicanos RegS
3.75% 21/2/2024 8,598,041 0.56USD 11,793,000 Petroleos Mexicanos RegS
6.875% 16/10/2025 13,133,628 0.86
72,631,692 4.74
MozambiqueUSD 7,340,000 Mozambique International
Bond RegS 5.00%15/9/2031^ 6,001,257 0.39
6,001,257 0.39
NetherlandsUSD 8,308,000 Kazakhstan Temir Zholy Fi-
nance BV RegS 6.95%10/7/2042 11,219,788 0.73
USD 66,312,000 Petrobras Global Finance BV6.85% 5/6/2115^ 74,545,961 4.87
85,765,749 5.60
NigeriaUSD 2,153,000 Nigeria Government Interna-
tional Bond RegS 7.143%23/2/2030 2,300,109 0.15
USD 15,994,000 Nigeria Government Interna-tional Bond RegS 8.747%21/1/2031 18,321,167 1.20
USD 14,981,000 Nigeria Government Interna-tional Bond RegS 7.875%16/2/2032 16,272,100 1.06
USD 5,000,000 Nigeria Government Interna-tional Bond RegS 7.625%28/11/2047 5,060,312 0.33
USD 10,486,000 Nigeria Government Interna-tional Bond RegS 9.248%21/1/2049 12,093,242 0.79
54,046,930 3.53
OmanUSD 8,040,000 Oman Government Interna-
tional Bond RegS 6.75%28/10/2027 9,010,750 0.59
USD 17,494,000 Oman Government Interna-tional Bond RegS 7.375%28/10/2032^ 19,814,229 1.29
USD 6,884,000 Oman Government Interna-tional Bond RegS 6.50%8/3/2047 6,612,529 0.43
USD 37,432,000 Oman Government Interna-tional Bond RegS 6.75%17/1/2048 36,636,196 2.39
USD 16,602,000 Oman Government Interna-tional Bond RegS 7.00%25/1/2051^ 16,620,262 1.09
88,693,966 5.79
PanamaUSD 459,000 Panama Government Interna-
tional Bond 3.16%23/1/2030 482,294 0.03
482,294 0.03
PeruUSD 459,000 Peruvian Government Interna-
tional Bond 2.783%23/1/2031 460,595 0.03
460,595 0.03
Holding Description
MarketValue
USD
% ofNet
Assets
RomaniaEUR 3,602,000 Romanian Government Inter-
national Bond RegS 3.624%26/5/2030 5,066,256 0.33
EUR 4,470,000 Romanian Government Inter-national Bond RegS 2.00%14/4/2033^ 5,400,039 0.35
10,466,295 0.68
RussiaRUB 540,591,000 Russian Federal Bond - OFZ
7.05% 19/1/2028 7,482,577 0.49RUB 521,601,000 Russian Federal Bond - OFZ
7.70% 23/3/2033 7,443,355 0.48
14,925,932 0.97
SenegalEUR 2,586,000 Senegal Government Interna-
tional Bond RegS 4.75%13/3/2028 3,305,864 0.22
USD 4,816,000 Senegal Government Interna-tional Bond RegS 6.25%23/5/2033^ 5,104,852 0.33
8,410,716 0.55
South AfricaUSD 7,139,000 Eskom Holdings SOC Ltd
RegS 7.125% 11/2/2025 7,594,111 0.49ZAR 361,940,332 Republic of South Africa Gov-
ernment Bond 8.875%28/2/2035 23,700,302 1.55
ZAR 390,091,858 Republic of South Africa Gov-ernment Bond 8.75%28/2/2048 23,750,677 1.55
USD 4,863,000 Republic of South Africa Gov-ernment International Bond5.875% 22/6/2030^ 5,536,331 0.36
60,581,421 3.95
SwedenEUR 5,000,000 East Renewable AB 13.50%
21/11/2021 6,126,351 0.40
6,126,351 0.40
TurkeyTRY 171,057,028 Turkey Government Bond
11.70% 13/11/2030 14,592,290 0.95USD 4,817,000 Turkey Government Interna-
tional Bond 7.625%26/4/2029 5,198,723 0.34
USD 5,573,000 Turkiye Vakiflar Bankasi TAORegS 6.50% 8/1/2026 5,671,252 0.37
25,462,265 1.66
UkraineUSD 3,678,000 Ukraine Government Interna-
tional Bond RegS 7.75%1/9/2024 4,058,728 0.27
EUR 8,700,000 Ukraine Government Interna-tional Bond RegS 6.75%20/6/2026 11,687,198 0.76
USD 3,805,000 Ukraine Government Interna-tional Bond RegS 9.75%1/11/2028^ 4,565,715 0.30
EUR 15,697,000 Ukraine Government Interna-tional Bond RegS 4.375%27/1/2030 17,970,068 1.17
USD 3,566,000 Ukraine Government Interna-tional Bond RegS 7.375%25/9/2032 3,796,560 0.25
BlackRock Emerging Markets Flexi Dynamic Bond FundcontinuedPortfolio of Investments as at 31 May 2021
The notes on pages 590 to 610 form an integral part of these financial statements.
Annual report and audited financial statements [237]

Holding Description
MarketValue
USD
% ofNet
Assets
Ukraine continuedUSD 10,319,000 Ukraine Government Interna-
tional Bond RegS 7.253%15/3/2033 10,870,963 0.71
USD 35,653,000 Ukraine Government Interna-tional Bond RegS FRN31/5/2040 39,606,561 2.58
92,555,793 6.04
United KingdomUSD 1,500,600 State Savings Bank of
Ukraine/SSB #1 Plc RegS9.375% 10/3/2023 1,576,320 0.10
USD 1,697,500 Ukreximbank/Biz Finance PlcRegS 9.625% 27/4/2022 1,759,922 0.12
3,336,242 0.22
United StatesUSD 7,841,000 CITGO Petroleum Corp 7.00%
15/6/2025 8,164,598 0.53USD 19,372,500 United States Treasury
Note/Bond 2.125%15/8/2021 19,508,621 1.28
27,673,219 1.81
UruguayUSD 1,249,552 Uruguay Government Interna-
tional Bond 4.375%23/1/2031 1,453,101 0.09
UYU 488,010,000 Uruguay Government Interna-tional Bond RegS 9.875%20/6/2022 11,500,624 0.75
UYU 194,721,000 Uruguay Government Interna-tional Bond RegS 8.50%15/3/2028 4,537,707 0.30
17,491,432 1.14
VenezuelaUSD 298,810,114 Petroleos de Venezuela SA
RegS 9.75% 17/5/2035 14,044,075 0.92USD 49,187,000 Petroleos de Venezuela SA
RegS (Defaulted) 8.50%27/10/2020 13,403,457 0.87
USD 9,827,000 Venezuela Government Inter-national Bond 9.25%15/9/2027 1,031,835 0.07
USD 9,983,500 Venezuela Government Inter-national Bond RegS 11.75%21/10/2026 1,060,747 0.07
USD 2,832,800 Venezuela Government Inter-national Bond RegS 9.25%7/5/2028 300,985 0.02
USD 44,697,400 Venezuela Government Inter-national Bond RegS 11.95%5/8/2031 4,749,099 0.31
34,590,198 2.26
Holding Description
MarketValue
USD
% ofNet
Assets
ZambiaUSD 10,031,000 Zambia Government Interna-
tional Bond RegS 5.375%20/9/2022 6,590,317 0.43
USD 2,632,000 Zambia Government Interna-tional Bond RegS 8.50%14/4/2024 1,746,167 0.12
USD 8,690,000 Zambia Government Interna-tional Bond RegS 8.97%30/7/2027 5,721,105 0.37
14,057,589 0.92
Total Bonds 1,329,980,312 86.80
Total Transferable Securities and Money MarketInstruments Admitted to an Official Stock ExchangeListing or Dealt in on Another Regulated Market 1,329,980,312 86.80
Other Transferable Securities and Money Market Instruments
BONDSUkraine
UAH 280,857,000 Ukraine Government Interna-tional Bond RegS 16.00%24/5/2023 10,961,850 0.71
10,961,850 0.71
Total Bonds 10,961,850 0.71
Total Other Transferable Securities and MoneyMarket Instruments 10,961,850 0.71
Collective Investment SchemesLuxembourg
4,030,000 BlackRock Global Funds -Emerging Markets Corpo-rate Bond Fund X2 (USD)~ 65,245,700 4.26
65,245,700 4.26
Total Collective Investment Schemes 65,245,700 4.26
Securities portfolio at market value 1,406,187,862 91.77
Other Net Assets 126,099,267 8.23
Total Net Assets (USD) 1,532,287,129 100.00
^ All or a portion of this security represents a security on loan.~ Investment in related party fund.
TypeNominal
Value Description CounterpartyExpiration
date
Net unrealisedappreciation/
(depreciation)USD
MarketValue
USD
Financial Derivative Instruments
SWAPS
CCCDS USD 61,299,822Fund receives default protection on Markit
CDX.NA.HY.25 Version 8 and pays Fixed 5.000%Bank of America
Merrill Lynch 20/6/2026 (165,854) (5,936,561)
CCCDS EUR 260,211,048Fund receives default protection on Markit iTraxx Europe
Crossover Series 30 Version 1 and pays Fixed 5.000%Bank of America
Merrill Lynch 20/12/2024 (1,585,973) (35,314,731)
BlackRock Emerging Markets Flexi Dynamic Bond FundcontinuedPortfolio of Investments as at 31 May 2021
The notes on pages 590 to 610 form an integral part of these financial statements.
BlackRock Strategic Funds[238]

TypeNominal
Value Description CounterpartyExpiration
date
Net unrealisedappreciation/
(depreciation)USD
MarketValue
USD
Financial Derivative Instruments
SWAPS
CCCDS EUR 197,177,214Fund receives Fixed 5.000% and provides default protection on
Markit iTraxx Europe Crossover Series 30 Version 1Bank of America
Merrill Lynch 20/6/2026 1,609,525 28,511,413
CCIRS HUF 9,303,727,505Fund receives Fixed 2.398% and pays Floating HUF 6 Month
BUBORBank of America
Merrill Lynch 15/9/2026 (16,682) (16,213)
CCIRS MXN 825,147,621Fund receives Fixed 6.120% and pays Floating MXN 1 Month
Mexican Interbank RateBank of America
Merrill Lynch 7/4/2028 (761,437) (760,841)
CCIRS MXN 661,836,614Fund receives Fixed 6.880% and pays Floating MXN 1 Month
Mexican Interbank RateBank of America
Merrill Lynch 14/5/2031 185,879 186,518
CCIRS EUR 29,580,723Fund receives Floating EUR 6 Month EURIBOR and pays Fixed
0.080%Bank of America
Merrill Lynch 19/4/2031 158,277 158,957
CCIRS EUR 37,506,089Fund receives Floating EUR 6 Month EURIBOR and pays Fixed
0.104%Bank of America
Merrill Lynch 21/4/2031 85,829 86,694
CCIRS EUR 14,043,028Fund receives Floating EUR 6 Month EURIBOR and pays Fixed
0.160%Bank of America
Merrill Lynch 26/5/2031 (53,236) (52,908)
CCIRS EUR 62,194,771Fund receives Floating EUR 6 Month EURIBOR and pays Fixed
0.197%Bank of America
Merrill Lynch 24/5/2031 (519,362) (517,903)
CCIRS EUR 10,367,552Fund receives Floating EUR 6 Month EURIBOR and pays Fixed
0.493%Bank of America
Merrill Lynch 19/4/2051 107,896 108,368
CCIRS EUR 10,875,576Fund receives Floating EUR 6 Month EURIBOR and pays Fixed
0.538%Bank of America
Merrill Lynch 14/5/2051 (57,308) (56,808)
CCIRS EUR 10,904,128Fund receives Floating EUR 6 Month EURIBOR and pays Fixed
0.576%Bank of America
Merrill Lynch 24/5/2051 (207,378) (206,872)
CCIRS USD 13,096,439Fund receives Floating USD 3 Month LIBOR and pays Fixed
1.581%Bank of America
Merrill Lynch 13/5/2031 (42,703) (42,452)
CCIRS USD 40,950,677Fund receives Floating USD 3 Month LIBOR and pays Fixed
1.583%Bank of America
Merrill Lynch 14/5/2031 (140,863) (140,077)
CCIRS USD 19,850,491Fund receives Floating USD 3 Month LIBOR and pays Fixed
1.602%Bank of America
Merrill Lynch 22/4/2031 (130,327) (110,946)
CCIRS USD 41,029,772Fund receives Floating USD 3 Month LIBOR and pays Fixed
1.625%Bank of America
Merrill Lynch 24/5/2031 (294,219) (293,431)
CCIRS USD 19,743,004Fund receives Floating USD 3 Month LIBOR and pays Fixed
1.630%Bank of America
Merrill Lynch 9/3/2031 (182,352) (181,973)
CCIRS USD 19,662,641Fund receives Floating USD 3 Month LIBOR and pays Fixed
1.690%Bank of America
Merrill Lynch 9/3/2031 (290,831) (290,453)
CCIRS USD 21,712,766Fund receives Floating USD 3 Month LIBOR and pays Fixed
1.730%Bank of America
Merrill Lynch 8/4/2031 (390,878) (390,461)
CCIRS USD 24,795,715Fund receives Floating USD 3 Month LIBOR and pays Fixed
2.048%Bank of America
Merrill Lynch 13/5/2051 (368,231) (391,479)
CDS USD 18,188,037Fund receives Fixed 1.000% and provides default protection on
Turkey Government International BondBarclays Bank
Plc 20/6/2026 500,041 (2,497,379)
CDS USD 21,760,000Fund receives Fixed 5.000% and provides default protection on
Argentine Republic Government International Bond Citibank 20/6/2026 (239,659) (8,519,339)
CDS USD 23,684,000Fund receives Fixed 5.000% and provides default protection on
Argentine Republic Government International Bond Citibank 20/6/2026 (260,849) (9,272,611)
CDS USD 4,190,000Fund receives Fixed 5.000% and provides default protection on
Argentine Republic Government International Bond Citibank 20/6/2026 (12,627) (1,640,442)
CDS USD 4,190,000Fund receives Fixed 5.000% and provides default protection on
Argentine Republic Government International Bond Deutsche Bank 20/6/2026 4,133 (1,640,442)
CDS USD 308,003,303Fund receives default protection on Markit CDX.EM.30 Version
1 and pays Fixed 1.000% Goldman Sachs 20/6/2026 (2,343,477) 8,898,644
CDS USD 39,182,000Fund receives Fixed 5.000% and provides default protection on
Argentine Republic Government International Bond Goldman Sachs 20/6/2026 (641,599) (15,340,291)
CDS USD 16,521,958Fund receives Fixed 1.000% and provides default protection on
Turkey Government International Bond JP Morgan 20/6/2026 402,442 (2,268,612)
CDS USD 4,060,000Fund receives Fixed 5.000% and provides default protection on
Argentine Republic Government International Bond JP Morgan 20/6/2026 18,214 (1,589,546)
CDS USD 4,870,000Fund receives Fixed 5.000% and provides default protection on
Argentine Republic Government International Bond JP Morgan 20/6/2026 4,803 (1,906,672)
CDS USD 4,250,000Fund receives Fixed 5.000% and provides default protection on
Argentine Republic Government International Bond Morgan Stanley 20/6/2026 (58) (1,663,933)
IRS USD 500,000Fund receives Fixed 0.781% and pays Floating USD 3 Month
JIBAR SOFR FEDLBank of America
Merrill Lynch 20/10/2035 (54,943) (54,943)
BlackRock Emerging Markets Flexi Dynamic Bond FundcontinuedPortfolio of Investments as at 31 May 2021
The notes on pages 590 to 610 form an integral part of these financial statements.
Annual report and audited financial statements [239]

TypeNominal
Value Description CounterpartyExpiration
date
Net unrealisedappreciation/
(depreciation)USD
MarketValue
USD
Financial Derivative Instruments
SWAPS
IRS USD 1,000,000Fund receives Fixed 0.902% and pays Floating USD 3 Month
JIBAR SOFR FEDLBank of America
Merrill Lynch 20/10/2040 (142,125) (142,125)
IRS GBP 28,671,629Fund receives Floating GBP 12 Month SONIA and pays Fixed
0.699%Bank of America
Merrill Lynch 25/3/2031 252,595 253,350
IRS GBP 28,455,965Fund receives Floating GBP 12 Month SONIA and pays Fixed
0.763%Bank of America
Merrill Lynch 14/3/2031 (721) 38
IRS GBP 10,535,715Fund receives Floating GBP 12 Month SONIA and pays Fixed
0.934%Bank of America
Merrill Lynch 15/3/2051 (22,702) (22,146)
IRS GBP 30,985,378Fund receives Floating GBP 12 Month SONIA and pays Fixed
1.016%Bank of America
Merrill Lynch 19/5/2051 (1,069,755) (1,017,539)
IRS USD 500,000Fund receives Floating USD 3 Month JIBAR SOFR and pays
Fixed 0.740%Bank of America
Merrill Lynch 20/10/2035 53,417 53,417
IRS USD 1,000,000Fund receives Floating USD 3 Month JIBAR SOFR FEDL and
pays Fixed 0.843%Bank of America
Merrill Lynch 20/10/2040 139,958 139,958
IRS BRL 365,388,566Fund receives Fixed 8.040% and pays Floating BRL 3 Month
BRCDI JP Morgan 2/1/2025 615,145 615,145
Total (Gross underlying exposure - USD 1,820,873,637) (5,857,995) (53,267,627)
CCCDS: Centrally Cleared Credit Default SwapsCCIRS: Centrally Cleared Interest Rate SwapsCDS: Credit Default SwapsIRS: Interest Rate Swaps
Numberof
contractsCurrencyof contracts
Contract/Description
Expirationdate
Grossunderlying
exposureUSD
Net unrealised(depreciation)
USD
Financial Derivative Instruments
FUTURES
(410) EUR Euro BTP Futures June 2021 June 2021 73,693,653 (353,244)
723 USD US Treasury 10 Year Note Futures September 2021 September 2021 95,300,437 (141,270)
3,775 USD US Treasury 5 Year Note Futures September 2021 September 2021 467,362,697 (342,608)
(225) USD US Ultra Bond Futures September 2021 September 2021 41,568,750 (82,657)
Total 677,925,537 (919,779)
Numberof
contractsCall/Put Description Counterparty Strike Price
Expirationdate
Netunrealised
appreciation/(depreciation)
USD
MarketValue
USD
Financial Derivative Instruments
PURCHASED OPTIONS
135,900,000 Call OTC EUR/USD BNP Paribas EUR 1.22 18/06/2021 59,164 935,408
98,150,000 Put OTC USD/HUF Deutsche Bank USD 286.50 18/06/2021 144,771 1,135,890
125,750,000 Put OTC AUD/USD Goldman Sachs AUD 0.75 19/08/2021 (122,954) 645,941
38,700,000 Put OTC AUD/JPY UBS AUD 82.00 18/08/2021 (49,284) 181,748
36,400,000 Put OTC CAD/JPY UBS CAD 88.00 18/08/2021 (43,148) 164,352
Total (Gross underlying exposure - USD 134,398,562) (11,451) 3,063,339
BlackRock Emerging Markets Flexi Dynamic Bond FundcontinuedPortfolio of Investments as at 31 May 2021
The notes on pages 590 to 610 form an integral part of these financial statements.
BlackRock Strategic Funds[240]

Currency Purchases Currency Sales CounterpartyMaturity
date
Netunrealised
appreciation/(depreciation)
USD
Financial Derivative Instruments
OPEN FORWARD FOREIGN EXCHANGE TRANSACTIONS
AUD 8,545,875 USD 6,674,713 Barclays Bank 4/6/2021 (60,583)AUD 69,134,578 USD 53,253,488 BNP Paribas 4/6/2021 253,620AUD 235,951,150 USD 183,096,576 JP Morgan 4/6/2021 (480,817)AUD 10,601,993 USD 8,236,237 Morgan Stanley 4/6/2021 (30,763)AUD 98,739,565 USD 77,236,149 Westpac 4/6/2021 (816,091)AUD 10,601,993 USD 8,167,644 BNP Paribas 2/7/2021 38,936AUD 49,231,960 USD 37,933,914 Deutsche Bank 2/7/2021 174,580
BRL 165,290,549 USD 31,406,146Bank of America
Merrill Lynch 4/6/2021 283,296BRL 56,599,282 USD 10,776,710 Barclays Bank 4/6/2021 74,483BRL 101,010,991 USD 19,089,870 Citibank 4/6/2021 275,920BRL 40,406,353 USD 7,367,775 JP Morgan 4/6/2021 378,916
BRL 148,519,863 USD 27,668,665Toronto Dominion
Bank 4/6/2021 805,508BRL 258,190,049 USD 49,226,187 Barclays Bank 2/7/2021 146,600
CAD 11,661,197 USD 9,613,910Bank of America
Merrill Lynch 4/6/2021 38,132CAD 56,246,890 USD 46,625,603 JP Morgan 4/6/2021 (69,720)CAD 146,435,799 USD 120,305,997 Morgan Stanley 4/6/2021 899,781
CAD 112,495,484 USD 92,873,665Bank of America
Merrill Lynch 2/7/2021 235,549CHF 110,627,726 USD 122,868,814 BNP Paribas 4/6/2021 (4,310)CHF 95,807,732 USD 106,169,946 JP Morgan 4/6/2021 235,292CHF 58,770,080 USD 64,737,891 Morgan Stanley 4/6/2021 532,878CHF 54,775,955 USD 60,855,005 BNP Paribas 2/7/2021 24,078
CLP 13,436,123,403 USD 19,026,847Bank of America
Merrill Lynch 4/6/2021 (397,833)CLP 31,696,638,567 USD 45,606,005 Citibank 4/6/2021 (1,659,019)CLP 21,739,629,349 USD 29,951,196 Deutsche Bank 4/6/2021 190,523CLP 11,394,499,395 USD 16,133,348 Goldman Sachs 4/6/2021 (335,019)CLP 27,801,208,951 USD 38,162,263 Natwest Markets 4/6/2021 383,759
CNH 133,660,409 USD 20,566,209Bank of America
Merrill Lynch 4/6/2021 416,399CNH 758,304,443 USD 116,968,283 Goldman Sachs 4/6/2021 2,073,733
CNH 610,789,200 USD 95,915,389Nomura
International 4/6/2021 (30,975)CNH 11,472,426 USD 1,765,195 Westpac 4/6/2021 35,798
CNH 903,437,278 USD 141,617,242Nomura
International 2/7/2021 (68,118)COP 145,204,347,831 USD 38,992,808 Citibank 4/6/2021 162,384COP 102,058,045,248 USD 27,441,181 Deutsche Bank 4/6/2021 79,361
COP 73,298,604,566 USD 19,666,918Toronto Dominion
Bank 4/6/2021 98,475
COP 16,621,589,932 USD 4,452,967Toronto Dominion
Bank 2/7/2021 21,059CZK 1,982,648,596 USD 92,760,009 Barclays Bank 4/6/2021 2,306,006CZK 1,822,245,565 USD 87,094,023 Citibank 4/6/2021 280,827
CZK 2,070,582,396 USD 98,927,034Toronto Dominion
Bank 2/7/2021 353,761EGP 321,455,217 USD 19,768,478 Goldman Sachs 12/7/2021 532,273EGP 246,434,034 USD 15,100,125 Barclays Bank 11/8/2021 348,596EGP 246,435,000 USD 15,118,712 JP Morgan 11/8/2021 330,070EGP 301,455,000 USD 18,423,529 Goldman Sachs 12/10/2021 155,477
EGP 301,457,782 USD 18,426,515Standard
Chartered Bank 12/10/2021 152,663EUR 150,963,890 USD 183,763,210 Barclays Bank 4/6/2021 480,128EUR 25,018,576 USD 30,300,248 BNP Paribas 4/6/2021 233,584EUR 24,918,901 USD 30,071,138 Citibank 4/6/2021 341,045EUR 11,924,160 USD 14,557,050 Credit Suisse 4/6/2021 (4,252)EUR 24,882,614 USD 30,296,573 Goldman Sachs 4/6/2021 71,324EUR 42,565,771 USD 52,094,868 HSBC 4/6/2021 (145,625)EUR 24,961,371 USD 30,422,844 JP Morgan 4/6/2021 41,172EUR 65,094,214 USD 78,873,819 Morgan Stanley 4/6/2021 570,181
Currency Purchases Currency Sales CounterpartyMaturity
date
Netunrealised
appreciation/(depreciation)
USD
Financial Derivative Instruments
OPEN FORWARD FOREIGN EXCHANGE TRANSACTIONS
EUR 6,174,228 USD 7,405,338 Westpac 4/6/2021 129,976
EUR 37,510,307 USD 45,647,981Bank of America
Merrill Lynch 2/7/2021 156,257EUR 119,176,413 USD 145,147,635 Barclays Bank 2/7/2021 379,959GBP 15,907,213 USD 22,600,857 Deutsche Bank 4/6/2021 (60,326)GBP 1,747,677 USD 2,432,480 HSBC 4/6/2021 43,979GBP 11,116,819 USD 15,751,754 Morgan Stanley 4/6/2021 785
GBP 26,895,887 USD 37,527,401State Street Bank& Trust Company 4/6/2021 584,087
GBP 53,836,437 USD 75,349,690 Westpac 4/6/2021 936,574GBP 41,424,588 USD 58,697,780 Morgan Stanley 2/7/2021 3,372
HUF 36,606,763,589 USD 125,244,501Bank of America
Merrill Lynch 4/6/2021 3,270,703HUF 23,628,183,079 USD 81,019,722 BNP Paribas 4/6/2021 1,931,636HUF 1,410,769,449 USD 4,750,237 JP Morgan 4/6/2021 202,546HUF 2,179,729,070 USD 7,593,063 UBS 4/6/2021 59,303HUF 30,336,318,606 USD 105,929,521 BNP Paribas 2/7/2021 526,309
IDR 326,603,685,710 USD 22,823,458Bank of America
Merrill Lynch 4/6/2021 59,853IDR 57,157,699,579 USD 3,986,143 BNP Paribas 4/6/2021 18,581IDR 418,085,393,614 USD 29,177,569 Citibank 4/6/2021 115,357IDR 1,094,834,030,688 USD 75,494,341 Deutsche Bank 4/6/2021 1,214,613
IDR 939,941,868,885 USD 65,854,541Standard
Chartered Bank 4/6/2021 1,977IDR 1,263,836,606,328 USD 87,968,024 Citibank 2/7/2021 474,006INR 4,217,998,782 USD 56,640,242 Credit Suisse 4/6/2021 1,439,201INR 2,781,901,682 USD 37,856,728 HSBC 4/6/2021 448,475
INR 3,202,370,813 USD 43,745,903Standard
Chartered Bank 4/6/2021 348,919INR 1,389,298,213 USD 18,743,905 UBS 4/6/2021 385,941
INR 5,984,272,495 USD 82,122,581Standard
Chartered Bank 2/7/2021 (40,551)
JPY 16,750,560,568 USD 152,305,792Bank of America
Merrill Lynch 4/6/2021 474,062
JPY 1,660,466,639 USD 15,251,297Standard
Chartered Bank 4/6/2021 (106,380)KRW 34,305,542,205 USD 30,458,619 Credit Suisse 4/6/2021 440,077
KRW 51,698,846,629 USD 46,366,679Toronto Dominion
Bank 4/6/2021 198,012KZT 10,194,336,838 USD 23,551,117 Citibank 4/6/2021 239,871KZT 10,194,345,000 USD 23,576,191 Goldman Sachs 4/6/2021 214,817KZT 8,454,380,000 USD 19,643,076 JP Morgan 30/6/2021 (556)KZT 8,454,377,368 USD 19,700,285 Natwest Markets 30/6/2021 (57,771)KZT 10,194,336,838 USD 23,637,398 Citibank 2/7/2021 39,527KZT 10,194,345,000 USD 23,630,841 Goldman Sachs 2/7/2021 46,103KZT 10,194,340,918 USD 23,565,282 Natwest Markets 12/7/2021 75,343MXN 1,976,223,282 USD 98,738,282 Citibank 4/6/2021 529,941MXN 4,169,957,450 USD 207,506,562 Goldman Sachs 4/6/2021 1,955,736MXN 379,300,287 USD 19,082,586 JP Morgan 4/6/2021 (29,847)MXN 1,425,307,247 USD 71,382,575 Morgan Stanley 4/6/2021 212,432MXN 302,948,800 USD 15,270,921 Natwest Markets 4/6/2021 (53,415)MXN 739,291,560 USD 36,712,846 Goldman Sachs 2/7/2021 302,999MYR 60,241,331 USD 14,682,264 Goldman Sachs 4/6/2021 (77,294)MYR 93,689,239 USD 22,649,399 Morgan Stanley 4/6/2021 64,717MYR 249,046 USD 60,178 Morgan Stanley 2/7/2021 186NZD 50,890,259 USD 36,644,549 Barclays Bank 4/6/2021 344,882NZD 65,623,660 USD 47,482,511 Goldman Sachs 4/6/2021 215,848NZD 119,153,496 USD 86,031,282 Morgan Stanley 4/6/2021 575,076
NZD 42,480,579 USD 30,981,299Standard
Chartered Bank 4/6/2021 (104,418)NZD 20,818,845 USD 15,020,047 Westpac 4/6/2021 112,067NZD 13,291,717 USD 9,614,005 Morgan Stanley 2/7/2021 46,412
BlackRock Emerging Markets Flexi Dynamic Bond FundcontinuedPortfolio of Investments as at 31 May 2021
The notes on pages 590 to 610 form an integral part of these financial statements.
Annual report and audited financial statements [241]

Currency Purchases Currency Sales CounterpartyMaturity
date
Netunrealised
appreciation/(depreciation)
USD
Financial Derivative Instruments
OPEN FORWARD FOREIGN EXCHANGE TRANSACTIONS
PEN 148,158,187 USD 39,143,510Bank of America
Merrill Lynch 4/6/2021 (93,590)PEN 1,969,447 USD 519,780 Deutsche Bank 4/6/2021 (695)PEN 57,635,549 USD 15,072,058 Goldman Sachs 4/6/2021 118,892
PEN 1,969,447 USD 521,432Bank of America
Merrill Lynch 2/7/2021 (689)
PHP 900,902,362 USD 18,729,779Bank of America
Merrill Lynch 4/6/2021 159,609PHP 955,247,073 USD 19,736,510 JP Morgan 4/6/2021 292,334
PHP 43,199,945 USD 902,481Standard
Chartered Bank 4/6/2021 3,301
PHP 1,856,149,435 USD 38,675,420Standard
Chartered Bank 2/7/2021 176,478
PLN 155,410,431 USD 41,397,520Bank of America
Merrill Lynch 4/6/2021 894,912PLN 29,840,485 USD 8,075,363 Barclays Bank 4/6/2021 45,242PLN 153,143,013 USD 41,379,491 Goldman Sachs 4/6/2021 295,901PLN 118,842,834 USD 31,557,199 Morgan Stanley 4/6/2021 783,954PLN 286,514,695 USD 77,044,896 Societe Generale 4/6/2021 925,440PLN 372,074,119 USD 100,706,461 Barclays Bank 2/7/2021 564,101RON 189,947,943 USD 46,577,844 Barclays Bank 4/6/2021 540,825RON 31,346,862 USD 7,734,659 BNP Paribas 4/6/2021 41,274RON 189,947,943 USD 46,824,663 BNP Paribas 2/7/2021 245,867
RUB 2,305,806,543 USD 31,331,022Bank of America
Merrill Lynch 4/6/2021 103,793RUB 1,336,541,479 USD 18,147,794 Barclays Bank 4/6/2021 73,134RUB 5,800,657,496 USD 77,340,553 Citibank 4/6/2021 1,739,192RUB 7,544,752,595 USD 102,057,277 Barclays Bank 2/7/2021 418,140THB 22,389,026 USD 715,551 BNP Paribas 4/6/2021 1,231THB 1,152,127,904 USD 36,903,520 Morgan Stanley 4/6/2021 (18,262)TRY 128,828,156 USD 15,302,619 Deutsche Bank 4/6/2021 (166,444)TRY 17,497,102 USD 2,030,651 Goldman Sachs 4/6/2021 25,105TRY 387,286,148 USD 46,309,476 JP Morgan 4/6/2021 (806,762)TRY 128,828,156 USD 14,725,742 Goldman Sachs 2/7/2021 181,986UAH 725,003,079 USD 25,955,538 BNP Paribas 4/6/2021 415,710UAH 725,005,000 USD 25,976,532 Goldman Sachs 4/6/2021 394,787UAH 725,003,079 USD 26,154,512 BNP Paribas 2/7/2021 7,078UAH 725,005,000 USD 26,154,582 Goldman Sachs 2/7/2021 7,078UAH 725,004,039 USD 26,126,272 Goldman Sachs 12/7/2021 (31,017)
USD 45,458,368 AUD 58,707,470Bank of America
Merrill Lynch 4/6/2021 21,382USD 8,166,581 AUD 10,601,993 BNP Paribas 4/6/2021 (38,893)USD 3,233,037 AUD 4,174,861 JP Morgan 4/6/2021 1,879USD 186,736,742 AUD 241,130,971 Morgan Stanley 4/6/2021 112,030USD 83,842,019 AUD 108,357,866 Westpac 4/6/2021 (22,179)USD 53,260,422 AUD 69,134,578 BNP Paribas 2/7/2021 (253,895)
USD 43,478,211 BRL 232,043,211Bank of America
Merrill Lynch 4/6/2021 (1,009,028)USD 42,148,993 BRL 223,184,545 Barclays Bank 4/6/2021 (639,865)
USD 10,544,223 BRL 56,599,282Toronto Dominion
Bank 4/6/2021 (306,970)USD 10,743,979 BRL 56,599,282 Barclays Bank 2/7/2021 (79,305)
USD 92,877,139 CAD 112,495,484Bank of America
Merrill Lynch 4/6/2021 (236,039)USD 75,206,686 CAD 91,381,583 Morgan Stanley 4/6/2021 (430,391)
USD 8,521,794 CAD 10,466,819Standard
Chartered Bank 4/6/2021 (141,654)
USD 8,641,163 CAD 10,466,819Bank of America
Merrill Lynch 2/7/2021 (21,916)USD 20,680,967 CHF 18,727,158 Barclays Bank 4/6/2021 (117,643)USD 30,490,674 CHF 27,356,736 Goldman Sachs 4/6/2021 107,949USD 242,189,708 CHF 219,121,644 JP Morgan 4/6/2021 (1,169,468)
Currency Purchases Currency Sales CounterpartyMaturity
date
Netunrealised
appreciation/(depreciation)
USD
Financial Derivative Instruments
OPEN FORWARD FOREIGN EXCHANGE TRANSACTIONS
USD 122,957,648 CHF 110,627,726 BNP Paribas 2/7/2021 3,799USD 55,790,359 CLP 40,649,956,539 Citibank 4/6/2021 (570,289)USD 29,043,133 CLP 20,943,662,821 Credit Suisse 4/6/2021 5,011USD 32,147,292 CLP 22,725,283,679 Goldman Sachs 4/6/2021 638,974USD 30,937,691 CLP 21,749,196,626 Natwest Markets 4/6/2021 782,706USD 38,154,407 CLP 27,801,208,951 Natwest Markets 2/7/2021 (379,175)USD 94,214,091 CNH 610,789,200 Goldman Sachs 4/6/2021 (1,670,324)
USD 141,871,432 CNH 903,437,278Nomura
International 4/6/2021 45,817
USD 95,743,538 CNH 610,789,200Nomura
International 2/7/2021 46,053USD 19,221,986 COP 72,101,670,562 Citibank 4/6/2021 (220,647)USD 62,234,143 COP 231,837,737,151 Credit Suisse 4/6/2021 (282,246)
USD 4,459,777 COP 16,621,589,932Toronto Dominion
Bank 4/6/2021 (22,331)
USD 19,636,886 COP 73,298,604,566Toronto Dominion
Bank 2/7/2021 (92,869)USD 36,453,332 CZK 784,087,103 BNP Paribas 4/6/2021 (1,142,860)USD 41,369,092 CZK 862,299,842 Citibank 4/6/2021 22,678USD 4,217,538 CZK 87,924,820 Deutsche Bank 4/6/2021 1,631
USD 98,928,925 CZK 2,070,582,396Toronto Dominion
Bank 4/6/2021 (353,428)
USD 68,114,659 EUR 56,193,422Bank of America
Merrill Lynch 4/6/2021 (466,402)USD 148,296,778 EUR 121,822,183 Barclays Bank 4/6/2021 (380,670)USD 240,516,428 EUR 198,488,120 Morgan Stanley 4/6/2021 (1,727,686)USD 183,862,318 EUR 150,963,890 Barclays Bank 2/7/2021 (481,304)
USD 7,652,383 GBP 5,436,546Bank of America
Merrill Lynch 4/6/2021 (51,206)USD 35,667,209 GBP 25,616,435 Deutsche Bank 4/6/2021 (631,295)USD 42,389,782 GBP 30,456,011 HSBC 4/6/2021 (766,404)USD 58,695,741 GBP 41,424,588 Morgan Stanley 4/6/2021 (2,924)
USD 9,100,406 GBP 6,570,453State Street Bank& Trust Company 4/6/2021 (209,930)
USD 15,752,301 GBP 11,116,819 Morgan Stanley 2/7/2021 (905)USD 143,678,635 HUF 41,133,927,957 BNP Paribas 4/6/2021 (730,065)USD 53,229,932 HUF 15,516,861,929 Citibank 4/6/2021 (1,245,047)USD 24,157,958 HUF 7,174,655,301 JP Morgan 4/6/2021 (1,030,073)USD 12,711,689 HUF 3,640,399,996 BNP Paribas 2/7/2021 (63,158)
USD 30,129,004 IDR 432,290,942,519Bank of America
Merrill Lynch 4/6/2021 (159,228)USD 88,201,313 IDR1,263,836,606,328 Citibank 4/6/2021 (348,716)USD 30,648,757 IDR 440,269,393,742 Credit Suisse 4/6/2021 (198,480)USD 28,829,102 IDR 418,085,393,614 Deutsche Bank 4/6/2021 (463,825)USD 19,654,500 IDR 282,140,342,273 UBS 4/6/2021 (113,511)USD 29,100,396 IDR 418,085,393,614 Citibank 2/7/2021 (156,804)USD 7,019,529 INR 521,117,402 Citibank 4/6/2021 (155,961)USD 7,942,857 INR 589,697,550 Deutsche Bank 4/6/2021 (176,943)
USD 82,496,174 INR 5,984,272,495Standard
Chartered Bank 4/6/2021 96,148
USD 60,874,325 INR 4,496,482,043State Street Bank& Trust Company 4/6/2021 (1,039,673)
USD 13,431,744 INR 978,771,159Standard
Chartered Bank 2/7/2021 6,632
USD 34,992,960 JPY 3,846,461,122Bank of America
Merrill Lynch 4/6/2021 (90,151)USD 133,829,924 JPY 14,564,566,085 Morgan Stanley 4/6/2021 988,264
USD 152,340,227 JPY 16,750,560,568Bank of America
Merrill Lynch 2/7/2021 (473,485)
USD 18,716,145 KRW 20,834,813,250Bank of America
Merrill Lynch 4/6/2021 (49,585)USD 57,468,762 KRW 65,169,575,584 HSBC 4/6/2021 (1,228,894)
BlackRock Emerging Markets Flexi Dynamic Bond FundcontinuedPortfolio of Investments as at 31 May 2021
The notes on pages 590 to 610 form an integral part of these financial statements.
BlackRock Strategic Funds[242]

Currency Purchases Currency Sales CounterpartyMaturity
date
Netunrealised
appreciation/(depreciation)
USD
Financial Derivative Instruments
OPEN FORWARD FOREIGN EXCHANGE TRANSACTIONS
USD 46,369,589 KRW 51,698,846,629Toronto Dominion
Bank 2/7/2021 (279,283)USD 23,763,023 KZT 10,194,336,838 Citibank 4/6/2021 (27,966)USD 23,757,504 KZT 10,194,345,000 Goldman Sachs 4/6/2021 (33,504)
USD 34,179,421 MXN 682,885,026Bank of America
Merrill Lynch 4/6/2021 (122,768)USD 1,820,554 MXN 36,470,357 Barclays Bank 4/6/2021 (11,399)USD 75,596,473 MXN 1,528,509,931 Citibank 4/6/2021 (1,182,537)USD 51,390,551 MXN 1,032,260,029 Goldman Sachs 4/6/2021 (461,188)USD 18,473,075 MXN 369,792,656 JP Morgan 4/6/2021 (102,083)USD 229,097,531 MXN 4,603,819,067 Morgan Stanley 4/6/2021 (2,158,189)USD 112,430,415 MXN 2,264,026,562 Goldman Sachs 2/7/2021 (927,914)USD 60,207 MYR 249,046 Morgan Stanley 4/6/2021 (172)USD 14,166,087 MYR 58,768,011 Natwest Markets 4/6/2021 (81,691)
USD 22,923,201 MYR 94,913,513State Street Bank& Trust Company 4/6/2021 (87,729)
USD 22,638,453 MYR 93,689,239 Morgan Stanley 2/7/2021 (69,961)USD 37,657,345 NZD 52,364,400 Barclays Bank 4/6/2021 (403,561)USD 1,642,035 NZD 2,286,464 Citibank 4/6/2021 (19,874)USD 9,509,292 NZD 13,142,408 Goldman Sachs 4/6/2021 (43,228)USD 90,275,925 NZD 125,951,887 Morgan Stanley 4/6/2021 (1,271,822)USD 75,506,463 NZD 105,221,680 Westpac 4/6/2021 (973,597)USD 9,506,009 NZD 13,142,408 Morgan Stanley 2/7/2021 (45,891)
USD 520,329 PEN 1,969,447Bank of America
Merrill Lynch 4/6/2021 1,244USD 24,472,326 PEN 93,408,714 Citibank 4/6/2021 (147,325)USD 1,319,615 PEN 5,000,022 Deutsche Bank 4/6/2021 1,764
USD 28,491,642 PEN 107,385,000State Street Bank& Trust Company 4/6/2021 188,274
USD 39,226,420 PEN 148,158,187Bank of America
Merrill Lynch 2/7/2021 51,859USD 892,561 PHP 43,199,945 JP Morgan 4/6/2021 (13,220)
USD 38,776,415 PHP 1,856,149,435Standard
Chartered Bank 4/6/2021 (141,816)
USD 900,130 PHP 43,199,945Standard
Chartered Bank 2/7/2021 (4,107)
USD 37,662,500 PLN 142,098,731Bank of America
Merrill Lynch 4/6/2021 (1,007,368)USD 100,689,837 PLN 372,074,119 Barclays Bank 4/6/2021 (564,111)USD 31,274,428 PLN 117,777,933 Morgan Stanley 4/6/2021 (776,930)USD 30,372,249 PLN 111,800,675 Societe Generale 4/6/2021 (52,494)USD 8,076,696 PLN 29,840,485 Barclays Bank 2/7/2021 (45,241)USD 7,686,681 RON 31,346,862 Barclays Bank 4/6/2021 (89,252)USD 46,868,567 RON 189,947,943 BNP Paribas 4/6/2021 (250,102)USD 7,727,413 RON 31,346,862 BNP Paribas 2/7/2021 (40,575)
USD 7,573,297 RUB 561,711,444Bank of America
Merrill Lynch 4/6/2021 (84,455)USD 102,443,971 RUB 7,544,752,595 Barclays Bank 4/6/2021 (412,837)USD 17,820,197 RUB 1,336,541,479 Citibank 4/6/2021 (400,731)USD 18,079,292 RUB 1,336,541,479 Barclays Bank 2/7/2021 (74,073)USD 37,632,711 THB 1,174,516,930 HSBC 4/6/2021 30,671USD 714,776 THB 22,389,026 BNP Paribas 2/7/2021 (1,949)USD 14,951,332 TRY 128,828,156 Goldman Sachs 4/6/2021 (184,842)
USD 14,828,316 TRY 125,810,702Standard
Chartered Bank 4/6/2021 46,666USD 33,272,961 TRY 278,972,548 UBS 4/6/2021 496,141USD 2,000,012 TRY 17,497,102 Goldman Sachs 2/7/2021 (24,717)USD 26,325,457 UAH 725,003,079 BNP Paribas 4/6/2021 (45,792)USD 26,325,527 UAH 725,005,000 Goldman Sachs 4/6/2021 (45,792)
USD 134,209,006 ZAR 1,888,302,682Bank of America
Merrill Lynch 4/6/2021 (3,085,296)USD 60,275,721 ZAR 872,317,145 BNP Paribas 4/6/2021 (3,148,526)
Currency Purchases Currency Sales CounterpartyMaturity
date
Netunrealised
appreciation/(depreciation)
USD
Financial Derivative Instruments
OPEN FORWARD FOREIGN EXCHANGE TRANSACTIONS
USD 172,857,998 ZAR 2,420,990,726 Citibank 4/6/2021 (3,166,872)USD 60,825,757 ZAR 855,197,976 Goldman Sachs 4/6/2021 (1,353,792)USD 13,667,052 ZAR 198,736,759 HSBC 4/6/2021 (782,657)USD 122,521,323 ZAR 1,690,403,501 JP Morgan 4/6/2021 (384,169)USD 37,983,643 ZAR 525,724,006 Morgan Stanley 4/6/2021 (240,584)
USD 21,157,789 ZAR 301,335,573Standard
Chartered Bank 4/6/2021 (751,653)
USD 64,772,123 ZAR 897,621,602Bank of America
Merrill Lynch 2/7/2021 (247,949)
ZAR 2,465,655,104 USD 174,151,384Bank of America
Merrill Lynch 4/6/2021 5,120,934ZAR 2,981,685,629 USD 215,656,088 Barclays Bank 4/6/2021 1,135,665ZAR 971,199,606 USD 69,152,403 Citibank 4/6/2021 1,461,368ZAR 405,624,238 USD 28,910,151 JP Morgan 4/6/2021 581,887ZAR 848,653,529 USD 60,747,089 Morgan Stanley 4/6/2021 956,628
ZAR 1,067,447,831 USD 76,064,540Standard
Chartered Bank 4/6/2021 1,547,225
ZAR 12,742,431 USD 891,321State Street Bank& Trust Company 4/6/2021 35,153
ZAR 1,089,243,333 USD 78,599,494Bank of America
Merrill Lynch 2/7/2021 300,881ZAR 568,606,785 USD 41,209,422 Citibank 2/7/2021 (21,851)ZAR 47,755,765 USD 3,459,743 Natwest Markets 2/7/2021 (509)
2,878,535
AUD Hedged Share Class
AUD 853,582,363 USD 663,921,103State Street Bank& Trust Company 15/6/2021 (3,253,856)
USD 4,837,014 AUD 6,213,465State Street Bank& Trust Company 15/6/2021 27,833
(3,226,023)
CAD Hedged Share Class
CAD 247,045,966 USD 202,923,439State Street Bank& Trust Company 15/6/2021 1,554,060
USD 1,477,692 CAD 1,790,107State Street Bank& Trust Company 15/6/2021 (3,962)
1,550,098
CHF Hedged Share Class
CHF 91,044 USD 100,271State Street Bank& Trust Company 15/6/2021 873
USD 749 CHF 675State Street Bank& Trust Company 15/6/2021 (1)
872
EUR Hedged Share Class
EUR 76,696,606 USD 92,666,161State Street Bank& Trust Company 15/6/2021 957,702
USD 1,954,267 EUR 1,605,948State Street Bank& Trust Company 15/6/2021 (6,119)
951,583
GBP Hedged Share Class
GBP 5,383,506 USD 7,491,904State Street Bank& Trust Company 15/6/2021 136,611
USD 218,027 GBP 154,363State Street Bank& Trust Company 15/6/2021 (708)
135,903
BlackRock Emerging Markets Flexi Dynamic Bond FundcontinuedPortfolio of Investments as at 31 May 2021
The notes on pages 590 to 610 form an integral part of these financial statements.
Annual report and audited financial statements [243]

Currency Purchases Currency Sales CounterpartyMaturity
date
Netunrealised
appreciation/(depreciation)
USD
Financial Derivative Instruments
OPEN FORWARD FOREIGN EXCHANGE TRANSACTIONS
SEK Hedged Share Class
SEK 616,062 USD 73,367State Street Bank& Trust Company 15/6/2021 937
USD 6,972 SEK 57,808State Street Bank& Trust Company 15/6/2021 (—)
937
Total (Gross underlying exposure - USD 13,802,809,979) 2,291,905
Sector Breakdownas at 31 May 2021
% of NetAssets
Government 71.56
Energy 12.98
Collective Investment Schemes 4.26
Financial 1.54
Industrial 0.94
Utilities 0.49
Securities portfolio at market value 91.77
Other Net Assets 8.23
100.00
BlackRock Emerging Markets Flexi Dynamic Bond FundcontinuedPortfolio of Investments as at 31 May 2021
The notes on pages 590 to 610 form an integral part of these financial statements.
BlackRock Strategic Funds[244]

Holding Description
MarketValue
USD
% ofNet
Assets
Transferable Securities and Money Market Instruments Admittedto an Official Stock Exchange Listing or Dealt in on AnotherRegulated Market
BONDSAngola
USD 1,311,000 Angolan Government Interna-tional Bond RegS 9.50%12/11/2025 1,445,620 1.86
1,445,620 1.86
ArgentinaEUR 48,278 Argentine Republic Govern-
ment International Bond0.50% 9/7/2029 21,520 0.03
EUR 802,870 Argentine Republic Govern-ment International Bond0.125% 9/7/2030 349,307 0.45
USD 975,000 Argentine Republic Govern-ment International BondFRN 9/7/2035 323,215 0.42
USD 1,710,294 Argentine Republic Govern-ment International Bond0.125% 9/1/2038 678,935 0.87
1,372,977 1.77
BahrainUSD 400,000 Bahrain Government Interna-
tional Bond RegS 6.125%1/8/2023 433,308 0.56
433,308 0.56
BrazilBRL 7,164,000 Brazil Notas do Tesouro Nacio-
nal Serie F 10.00% 1/1/2025 1,515,482 1.95USD 249,000 Caixa Economica Federal
RegS 3.50% 7/11/2022 257,236 0.33
1,772,718 2.28
British Virgin IslandsUSD 200,000 Chinalco Capital Holdings Ltd
RegS 4.00% 25/8/2021 200,910 0.26USD 200,000 SPIC 2016 US dollar Bond Co
Ltd RegS 3.00% 6/12/2021 202,216 0.26
403,126 0.52
CanadaUSD 1,015,000 MEGlobal Canada ULC RegS
5.00% 18/5/2025 1,142,648 1.47
1,142,648 1.47
Cayman IslandsUSD 735,000 QNB Finance Ltd RegS
2.625% 12/5/2025 767,524 0.99USD 200,000 Sharjah Sukuk Ltd RegS
3.764% 17/9/2024 214,845 0.28
982,369 1.27
Holding Description
MarketValue
USD
% ofNet
Assets
ChinaUSD 200,000 China Development Bank Corp
RegS FRN 6/3/2022 200,444 0.26USD 697,000 China Development Bank
RegS FRN 12/12/2023^ 701,334 0.90
901,778 1.16
ColombiaUSD 200,000 Bancolombia SA 5.125%
11/9/2022 208,500 0.27USD 200,000 Ecopetrol SA 4.125%
16/1/2025 210,000 0.27
418,500 0.54
Costa RicaUSD 600,000 Costa Rica Government Inter-
national Bond RegS 4.25%26/1/2023 613,262 0.79
613,262 0.79
Czech RepublicCZK 2,190,000 Czech Republic Government
Bond RegS 0.45%25/10/2023 103,433 0.13
103,433 0.13
Dominican RepublicUSD 340,000 Dominican Republic Interna-
tional Bond RegS 5.875%18/4/2024 364,500 0.47
USD 769,000 Dominican Republic Interna-tional Bond RegS 5.50%27/1/2025 849,637 1.09
1,214,137 1.56
EcuadorUSD 1,105,386 Ecuador Government Interna-
tional Bond RegS31/7/2030 (Zero Coupon) 627,652 0.81
627,652 0.81
EgyptEGP 5,331,000 Egypt Government Bond
14.425% 14/7/2030 333,811 0.43EGP 5,326,000 Egypt Government Bond
15.433% 28/7/2035 342,980 0.44USD 501,000 Egypt Government Interna-
tional Bond RegS 6.20%1/3/2024 540,250 0.70
USD 1,430,000 Egypt Government Interna-tional Bond RegS 5.75%29/5/2024 1,531,373 1.97
USD 755,000 Egypt Government Interna-tional Bond RegS 5.25%6/10/2025^ 802,459 1.04
3,550,873 4.58
BlackRock Emerging Markets Short Duration Bond Fund
Portfolio of Investments as at 31 May 2021
The notes on pages 590 to 610 form an integral part of these financial statements.
Annual report and audited financial statements [245]

Holding Description
MarketValue
USD
% ofNet
Assets
El SalvadorUSD 1,079,000 El Salvador Government Inter-
national Bond RegS 7.75%24/1/2023 1,107,998 1.43
USD 350,000 El Salvador Government Inter-national Bond RegS 5.875%30/1/2025 344,531 0.44
1,452,529 1.87
EthiopiaUSD 300,000 Ethiopia International Bond
RegS 6.625% 11/12/2024 278,615 0.36
278,615 0.36
GabonUSD 1,421,440 Gabon Government Interna-
tional Bond RegS 6.375%12/12/2024 1,506,630 1.94
USD 433,000 Gabon Government Interna-tional Bond RegS 6.95%16/6/2025 466,361 0.60
1,972,991 2.54
GeorgiaUSD 472,000 Georgian Railway JSC RegS
7.75% 11/7/2022 504,745 0.65
504,745 0.65
GhanaUSD 200,000 Ghana Government Interna-
tional Bond RegS 7.875%26/3/2027 212,006 0.27
GHS 3,454,000 Republic of Ghana Govern-ment Bonds 20.75%16/1/2023 625,391 0.81
837,397 1.08
GuatemalaUSD 200,000 Guatemala Government Bond
RegS 5.75% 6/6/2022 209,846 0.27
209,846 0.27
Hong KongUSD 859,000 CNAC HK Finbridge Co Ltd
RegS 4.625% 14/3/2023 895,069 1.15
895,069 1.15
HungaryHUF 632,360,000 Hungary Government Bond
1.75% 26/10/2022 2,248,605 2.90USD 204,000 Hungary Government Interna-
tional Bond 5.375%21/2/2023 221,586 0.28
2,470,191 3.18
IndiaUSD 284,000 Export-Import Bank of India
RegS 3.125% 20/7/2021^ 285,265 0.37USD 515,000 Export-Import Bank of India
RegS 4.00% 14/1/2023 539,682 0.69
824,947 1.06
IndonesiaUSD 273,000 Indonesia Government Inter-
national Bond 2.95%11/1/2023 283,831 0.37
USD 550,000 Indonesia Government Inter-national Bond RegS 3.75%25/4/2022 566,169 0.73
IDR 2,197,000,000 Indonesia Treasury Bond8.25% 15/5/2029 172,314 0.22
Holding Description
MarketValue
USD
% ofNet
Assets
Indonesia continuedIDR 2,240,000,000 Indonesia Treasury Bond
8.375% 15/4/2039 175,686 0.23USD 341,000 Pertamina Persero PT RegS
4.875% 3/5/2022 354,461 0.46USD 623,000 Pertamina Persero PT RegS
4.30% 20/5/2023^ 664,118 0.85
2,216,579 2.86
IraqUSD 1,069,000 Iraq International Bond RegS
6.752% 9/3/2023 1,100,081 1.42
1,100,081 1.42
KazakhstanKZT 145,000,000 Development Bank of Kazakh-
stan JSC RegS 8.95%4/5/2023 335,414 0.43
335,414 0.43
LebanonUSD 1,496,000 Lebanon Government Interna-
tional Bond RegS 6.10%4/10/2022 204,425 0.26
USD 1,100,000 Lebanon Government Interna-tional Bond RegS 6.00%27/1/2023^ 150,904 0.19
USD 1,000,000 Lebanon Government Interna-tional Bond RegS 6.65%22/4/2024 136,915 0.18
USD 1,055,000 Lebanon Government Interna-tional Bond RegS 6.60%27/11/2026 145,041 0.19
637,285 0.82
MalaysiaUSD 200,000 Petronas Capital Ltd RegS
7.875% 22/5/2022 214,088 0.28
214,088 0.28
MexicoUSD 270,000 Cemex SAB de CV RegS
7.375% 5/6/2027 304,449 0.39MXN 7,139,700 Mexican Bonos 6.50%
10/6/2021 358,936 0.46MXN 6,515,500 Mexican Bonos 8.00%
7/11/2047 342,708 0.44USD 205,000 Mexico Government Interna-
tional Bond 3.90%27/4/2025 229,934 0.30
USD 400,000 Petroleos Mexicanos 4.625%21/9/2023 418,904 0.54
EUR 419,000 Petroleos Mexicanos RegS1.875% 21/4/2022 512,798 0.66
EUR 497,000 Petroleos Mexicanos RegS5.125% 15/3/2023 636,886 0.82
EUR 812,000 Petroleos Mexicanos RegS3.75% 21/2/2024 1,015,950 1.31
USD 1,340,000 Petroleos Mexicanos RegS6.875% 16/10/2025 1,492,331 1.93
5,312,896 6.85
BlackRock Emerging Markets Short Duration Bond FundcontinuedPortfolio of Investments as at 31 May 2021
The notes on pages 590 to 610 form an integral part of these financial statements.
BlackRock Strategic Funds[246]

Holding Description
MarketValue
USD
% ofNet
Assets
MongoliaUSD 611,000 Mongolia Government Interna-
tional Bond RegS 5.125%5/12/2022 637,175 0.82
USD 342,000 Mongolia Government Interna-tional Bond RegS 5.625%1/5/2023 360,555 0.47
997,730 1.29
OmanUSD 679,000 Oman Government Interna-
tional Bond RegS 4.875%1/2/2025 711,775 0.92
USD 500,000 Oman Government Interna-tional Bond RegS 6.75%28/10/2027 560,370 0.72
1,272,145 1.64
PakistanUSD 500,000 Third Pakistan International
Sukuk Co Ltd RegS 5.50%13/10/2021 505,625 0.65
505,625 0.65
PanamaUSD 673,000 Panama Government Interna-
tional Bond 4.00%22/9/2024 733,099 0.95
733,099 0.95
ParaguayUSD 738,000 Paraguay Government Interna-
tional Bond RegS 4.625%25/1/2023 781,404 1.01
781,404 1.01
PeruUSD 472,000 Corp Financiera de Desarrollo
SA RegS 4.75% 8/2/2022 483,593 0.62USD 325,000 Fondo MIVIVIENDA SA RegS
3.50% 31/1/2023 336,233 0.44
819,826 1.06
PolandUSD 204,000 Republic of Poland Govern-
ment International Bond5.00% 23/3/2022 211,862 0.28
USD 200,000 Republic of Poland Govern-ment International Bond4.00% 22/1/2024 218,602 0.28
430,464 0.56
QatarUSD 491,000 Qatar Government Interna-
tional Bond RegS 3.875%23/4/2023 523,989 0.67
USD 625,000 Qatar Government Interna-tional Bond RegS 3.375%14/3/2024 674,027 0.87
1,198,016 1.54
RomaniaUSD 326,000 Romanian Government Inter-
national Bond RegS 6.75%7/2/2022 340,531 0.44
USD 310,000 Romanian Government Inter-national Bond RegS 4.375%22/8/2023 335,344 0.43
EUR 865,000 Romanian Government Inter-national Bond RegS 2.75%14/4/2041 1,046,779 1.35
1,722,654 2.22
Holding Description
MarketValue
USD
% ofNet
Assets
RussiaUSD 800,000 Russian Foreign Bond - Euro-
bond RegS 4.50% 4/4/2022 824,828 1.06USD 400,000 Russian Foreign Bond - Euro-
bond RegS 4.875%16/9/2023 435,275 0.56
1,260,103 1.62
Saudi ArabiaUSD 347,000 Saudi Government Interna-
tional Bond RegS 2.90%22/10/2025 370,645 0.48
370,645 0.48
SerbiaUSD 1,055,000 Serbia International Bond
RegS 7.25% 28/9/2021 1,077,089 1.39
1,077,089 1.39
South AfricaUSD 400,000 Eskom Holdings SOC Ltd
RegS 7.125% 11/2/2025 425,500 0.55ZAR 9,894,335 Republic of South Africa Gov-
ernment Bond 8.875%28/2/2035 647,893 0.83
ZAR 6,833,636 Republic of South Africa Gov-ernment Bond 8.75%28/2/2048 416,065 0.54
USD 417,000 Republic of South Africa Gov-ernment International Bond5.875% 30/5/2022^ 438,499 0.56
USD 351,000 Republic of South Africa Gov-ernment International Bond4.665% 17/1/2024 378,992 0.49
USD 560,000 Transnet SOC Ltd RegS4.00% 26/7/2022 573,888 0.74
2,880,837 3.71
Sri LankaUSD 921,000 Sri Lanka Government Interna-
tional Bond RegS 5.875%25/7/2022^ 811,620 1.04
USD 473,000 Sri Lanka Government Interna-tional Bond RegS 6.85%14/3/2024 353,794 0.46
USD 419,000 Sri Lanka Government Interna-tional Bond RegS 6.35%28/6/2024 312,434 0.40
1,477,848 1.90
SwedenEUR 125,000 East Renewable AB 13.50%
21/11/2021 153,159 0.20
153,159 0.20
TurkeyUSD 700,000 Hazine Mustesarligi Varlik Ki-
ralama A/S RegS 5.80%21/2/2022 716,137 0.92
USD 703,000 Turkey Government Interna-tional Bond 5.125%25/3/2022^ 720,320 0.93
USD 750,000 Turkey Government Interna-tional Bond 4.25%13/3/2025 729,998 0.94
USD 836,000 Turkey Government Interna-tional Bond 6.375%14/10/2025^ 871,187 1.12
3,037,642 3.91
BlackRock Emerging Markets Short Duration Bond FundcontinuedPortfolio of Investments as at 31 May 2021
The notes on pages 590 to 610 form an integral part of these financial statements.
Annual report and audited financial statements [247]
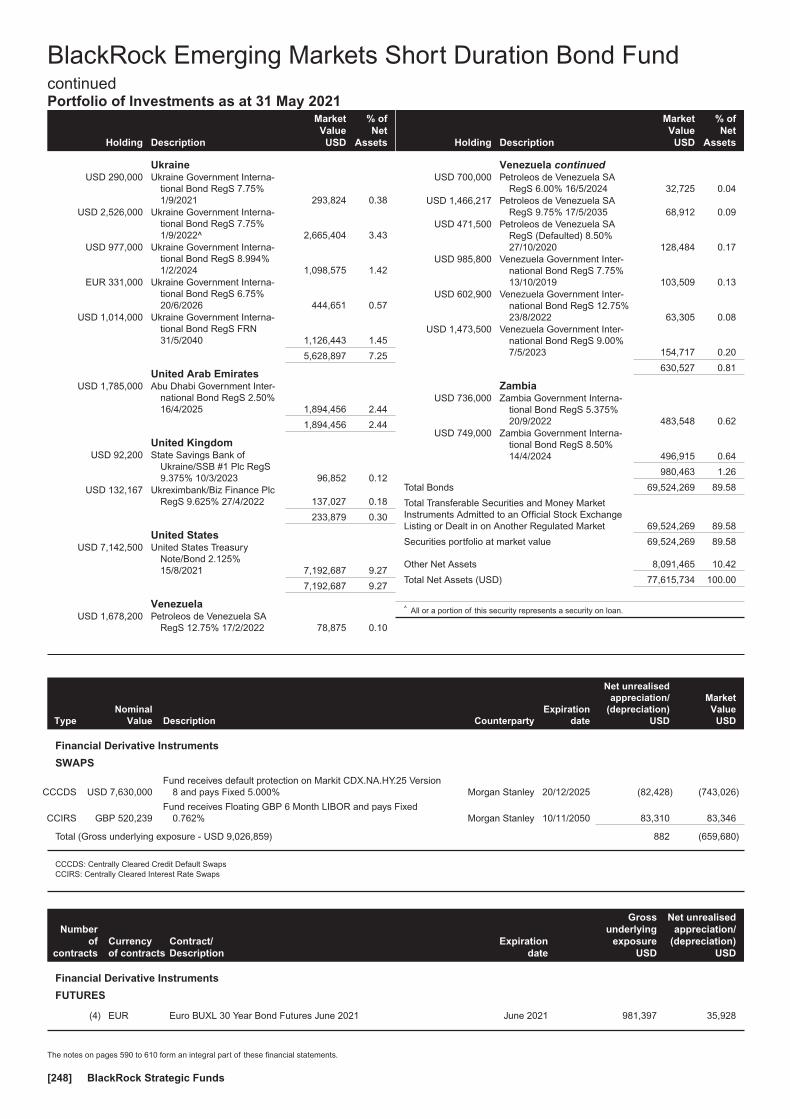
Holding Description
MarketValue
USD
% ofNet
Assets
UkraineUSD 290,000 Ukraine Government Interna-
tional Bond RegS 7.75%1/9/2021 293,824 0.38
USD 2,526,000 Ukraine Government Interna-tional Bond RegS 7.75%1/9/2022^ 2,665,404 3.43
USD 977,000 Ukraine Government Interna-tional Bond RegS 8.994%1/2/2024 1,098,575 1.42
EUR 331,000 Ukraine Government Interna-tional Bond RegS 6.75%20/6/2026 444,651 0.57
USD 1,014,000 Ukraine Government Interna-tional Bond RegS FRN31/5/2040 1,126,443 1.45
5,628,897 7.25
United Arab EmiratesUSD 1,785,000 Abu Dhabi Government Inter-
national Bond RegS 2.50%16/4/2025 1,894,456 2.44
1,894,456 2.44
United KingdomUSD 92,200 State Savings Bank of
Ukraine/SSB #1 Plc RegS9.375% 10/3/2023 96,852 0.12
USD 132,167 Ukreximbank/Biz Finance PlcRegS 9.625% 27/4/2022 137,027 0.18
233,879 0.30
United StatesUSD 7,142,500 United States Treasury
Note/Bond 2.125%15/8/2021 7,192,687 9.27
7,192,687 9.27
VenezuelaUSD 1,678,200 Petroleos de Venezuela SA
RegS 12.75% 17/2/2022 78,875 0.10
Holding Description
MarketValue
USD
% ofNet
Assets
Venezuela continuedUSD 700,000 Petroleos de Venezuela SA
RegS 6.00% 16/5/2024 32,725 0.04USD 1,466,217 Petroleos de Venezuela SA
RegS 9.75% 17/5/2035 68,912 0.09USD 471,500 Petroleos de Venezuela SA
RegS (Defaulted) 8.50%27/10/2020 128,484 0.17
USD 985,800 Venezuela Government Inter-national Bond RegS 7.75%13/10/2019 103,509 0.13
USD 602,900 Venezuela Government Inter-national Bond RegS 12.75%23/8/2022 63,305 0.08
USD 1,473,500 Venezuela Government Inter-national Bond RegS 9.00%7/5/2023 154,717 0.20
630,527 0.81
ZambiaUSD 736,000 Zambia Government Interna-
tional Bond RegS 5.375%20/9/2022 483,548 0.62
USD 749,000 Zambia Government Interna-tional Bond RegS 8.50%14/4/2024 496,915 0.64
980,463 1.26
Total Bonds 69,524,269 89.58
Total Transferable Securities and Money MarketInstruments Admitted to an Official Stock ExchangeListing or Dealt in on Another Regulated Market 69,524,269 89.58
Securities portfolio at market value 69,524,269 89.58
Other Net Assets 8,091,465 10.42
Total Net Assets (USD) 77,615,734 100.00
^ All or a portion of this security represents a security on loan.
TypeNominal
Value Description CounterpartyExpiration
date
Net unrealisedappreciation/
(depreciation)USD
MarketValue
USD
Financial Derivative Instruments
SWAPS
CCCDS USD 7,630,000Fund receives default protection on Markit CDX.NA.HY.25 Version
8 and pays Fixed 5.000% Morgan Stanley 20/12/2025 (82,428) (743,026)
CCIRS GBP 520,239Fund receives Floating GBP 6 Month LIBOR and pays Fixed
0.762% Morgan Stanley 10/11/2050 83,310 83,346
Total (Gross underlying exposure - USD 9,026,859) 882 (659,680)
CCCDS: Centrally Cleared Credit Default SwapsCCIRS: Centrally Cleared Interest Rate Swaps
Numberof
contractsCurrencyof contracts
Contract/Description
Expirationdate
Grossunderlying
exposureUSD
Net unrealisedappreciation/
(depreciation)USD
Financial Derivative Instruments
FUTURES
(4) EUR Euro BUXL 30 Year Bond Futures June 2021 June 2021 981,397 35,928
BlackRock Emerging Markets Short Duration Bond FundcontinuedPortfolio of Investments as at 31 May 2021
The notes on pages 590 to 610 form an integral part of these financial statements.
BlackRock Strategic Funds[248]

Numberof
contractsCurrencyof contracts
Contract/Description
Expirationdate
Grossunderlying
exposureUSD
Net unrealisedappreciation/
(depreciation)USD
Financial Derivative Instruments
FUTURES
(3) JPY Japan 10 Year Bond Futures June 2021 June 2021 4,144,290 (16,417)
(12) GBP UK Long Gilt Bond Futures September 2021 September 2021 2,163,760 5,101
(49) USD US Treasury 10 Year Note Futures September 2021 September 2021 6,458,813 9,947
(19) USD US Ultra Bond Futures September 2021 September 2021 3,510,250 29,539
Total 17,258,510 64,098
Numberof
contractsCall/Put Description Counterparty Strike Price
Expirationdate
Netunrealised
(depreciation)USD
MarketValue
USD
Financial Derivative Instruments
PURCHASED OPTIONS
4,810,000 Put OTC AUD/JPY UBS AUD 82.00 18/08/2021 (6,126) 22,590
4,500,000 Put OTC CAD/JPY UBS CAD 88.00 18/08/2021 (5,334) 20,318
Total (Gross underlying exposure - USD 1,771,655) (11,460) 42,908
Currency Purchases Currency Sales CounterpartyMaturity
date
Netunrealised
appreciation/(depreciation)
USD
Financial Derivative Instruments
OPEN FORWARD FOREIGN EXCHANGE TRANSACTIONS
AUD 640,000 USD 494,078 Citibank 4/6/2021 1,254AUD 647,317 USD 499,046 JP Morgan 4/6/2021 1,949AUD 607,317 USD 467,869 BNP Paribas 2/7/2021 2,230BRL 7,606,207 USD 1,448,250 Barclays Bank 4/6/2021 10,009BRL 1,988,695 USD 362,623 JP Morgan 4/6/2021 18,649
BRL 1,605,747 USD 299,144Toronto Dominion
Bank 4/6/2021 8,709BRL 1,605,747 USD 304,812 Barclays Bank 2/7/2021 2,250
CAD 475,145 USD 392,283Bank of America
Merrill Lynch 4/6/2021 997CAD 440,000 USD 358,212 BNP Paribas 4/6/2021 5,978CAD 39,432 USD 32,014 JP Morgan 4/6/2021 624CHF 796,448 USD 879,043 BNP Paribas 4/6/2021 5,502
CLP 136,024,378 USD 186,744Bank of America
Merrill Lynch 4/6/2021 1,852CLP 368,531,067 USD 505,877 Natwest Markets 4/6/2021 5,087
CNH 958,916 USD 150,520Bank of America
Merrill Lynch 4/6/2021 15CNH 450,000 USD 69,240 BNP Paribas 4/6/2021 1,403CNH 50,000 USD 7,713 Goldman Sachs 4/6/2021 137CNH 510,676 USD 78,552 JP Morgan 4/6/2021 1,616CNH 560,676 USD 87,851 Morgan Stanley 2/7/2021 (5)COP 706,952,043 USD 187,819 Deutsche Bank 4/6/2021 2,814
COP 2,512,871,218 USD 674,234Toronto Dominion
Bank 4/6/2021 3,376CZK 1,380,000 USD 64,055 BNP Paribas 4/6/2021 2,115
CZK 1,367,645 USD 65,344Toronto Dominion
Bank 4/6/2021 233EUR 5,574,403 USD 6,785,531 Barclays Bank 4/6/2021 17,729EUR 5,270,000 USD 6,325,063 BNP Paribas 4/6/2021 106,690EUR 747,746 USD 899,248 JP Morgan 4/6/2021 13,336EUR 1,499,031 USD 1,817,389 Morgan Stanley 4/6/2021 12,097
EUR 20,000 USD 24,243Standard
Chartered Bank 4/6/2021 166
Currency Purchases Currency Sales CounterpartyMaturity
date
Netunrealised
appreciation/(depreciation)
USD
Financial Derivative Instruments
OPEN FORWARD FOREIGN EXCHANGE TRANSACTIONS
EUR 304,606 USD 365,343 Westpac 4/6/2021 6,412EUR 2,126,777 USD 2,590,250 Barclays Bank 2/7/2021 6,781GBP 20,000 USD 28,254 Barclays Bank 4/6/2021 86GBP 18,133 USD 25,141 JP Morgan 4/6/2021 553GBP 494,899 USD 701,237 Morgan Stanley 4/6/2021 35
HUF 109,262,255 USD 382,183Bank of America
Merrill Lynch 4/6/2021 1,404HUF 1,868,221,152 USD 6,386,091 BNP Paribas 4/6/2021 172,665HUF 207,540,975 USD 698,816 JP Morgan 4/6/2021 29,797
HUF 109,262,255 USD 380,511Standard
Chartered Bank 4/6/2021 3,075HUF 207,540,975 USD 724,700 BNP Paribas 2/7/2021 3,601IDR 10,724,248,774 USD 748,429 Citibank 4/6/2021 2,959
INR 54,386,385 USD 749,743Standard
Chartered Bank 4/6/2021 (874)
JPY 77,708,709 USD 706,573Bank of America
Merrill Lynch 4/6/2021 2,199JPY 78,460,000 USD 717,492 BNP Paribas 4/6/2021 (1,868)
KRW 844,330,660 USD 758,472Bank of America
Merrill Lynch 4/6/2021 2,009
KRW 844,330,660 USD 757,247Toronto Dominion
Bank 4/6/2021 3,234
KRW 844,330,660 USD 757,295Toronto Dominion
Bank 2/7/2021 4,561MXN 21,380,000 USD 1,053,953 BNP Paribas 4/6/2021 19,992MXN 7,473,118 USD 368,103 Citibank 4/6/2021 7,281MXN 68,159,044 USD 3,395,747 Goldman Sachs 4/6/2021 27,970MXN 39,314,910 USD 1,936,492 JP Morgan 4/6/2021 38,346MXN 31,578,335 USD 1,568,164 Goldman Sachs 2/7/2021 12,942MYR 126,509 USD 30,584 Morgan Stanley 4/6/2021 87NZD 510,000 USD 365,717 BNP Paribas 4/6/2021 4,975NZD 909,864 USD 650,457 JP Morgan 4/6/2021 10,875NZD 1,416,386 USD 1,024,551 Morgan Stanley 4/6/2021 4,945NZD 909,864 USD 658,112 Morgan Stanley 2/7/2021 3,177
BlackRock Emerging Markets Short Duration Bond FundcontinuedPortfolio of Investments as at 31 May 2021
The notes on pages 590 to 610 form an integral part of these financial statements.
Annual report and audited financial statements [249]

Currency Purchases Currency Sales CounterpartyMaturity
date
Netunrealised
appreciation/(depreciation)
USD
Financial Derivative Instruments
OPEN FORWARD FOREIGN EXCHANGE TRANSACTIONS
PEN 1,114,003 USD 294,321Bank of America
Merrill Lynch 4/6/2021 (704)PEN 1,139,566 USD 300,757 Deutsche Bank 4/6/2021 (402)
PEN 1,139,566 USD 301,712Bank of America
Merrill Lynch 2/7/2021 (399)
PHP 8,510,217 USD 177,785Standard
Chartered Bank 4/6/2021 650PLN 6,043,834 USD 1,635,568 Barclays Bank 4/6/2021 9,163PLN 6,030,000 USD 1,581,708 BNP Paribas 4/6/2021 59,259PLN 5,793,185 USD 1,538,306 Morgan Stanley 4/6/2021 38,215PLN 5,793,185 USD 1,567,997 Barclays Bank 2/7/2021 8,783RUB 82,628,623 USD 1,101,693 Citibank 4/6/2021 24,774RUB 54,936,903 USD 743,127 Barclays Bank 2/7/2021 3,045UAH 1,041,592 USD 37,290 BNP Paribas 4/6/2021 597UAH 1,045,000 USD 37,442 Goldman Sachs 4/6/2021 569UAH 1,041,592 USD 37,575 BNP Paribas 2/7/2021 10UAH 1,045,000 USD 37,698 Goldman Sachs 2/7/2021 10UAH 1,043,295 USD 37,596 Goldman Sachs12/7/2021 (45)USD 962,095 AUD 1,247,317 BNP Paribas 4/6/2021 (3,272)USD 31,207 AUD 40,000 Citibank 4/6/2021 249USD 305,740 BRL 1,605,747 Barclays Bank 4/6/2021 (2,113)
USD 644,437 BRL 3,500,000State Street Bank& Trust Company 4/6/2021 (26,582)
USD 1,135,457 BRL 6,094,902Toronto Dominion
Bank 4/6/2021 (33,056)USD 1,443,851 BRL 7,606,207 Barclays Bank 2/7/2021 (10,657)USD 357,336 CAD 440,000 Citibank 4/6/2021 (6,854)USD 33,237 CAD 40,000 HSBC 4/6/2021 129USD 385,299 CAD 474,577 JP Morgan 4/6/2021 (7,511)
USD 392,269 CAD 475,145Bank of America
Merrill Lynch 2/7/2021 (995)USD 339,106 CHF 310,000 Citibank 4/6/2021 (5,184)USD 534,170 CHF 486,448 JP Morgan 4/6/2021 (6,085)USD 540,664 CHF 486,448 BNP Paribas 2/7/2021 16USD 714,395 CLP 504,555,445 Goldman Sachs 4/6/2021 14,835USD 505,772 CLP 368,531,067 Natwest Markets 2/7/2021 (5,026)USD 69,242 CNH 450,000 Citibank 4/6/2021 (1,401)USD 147,500 CNH 958,916 JP Morgan 4/6/2021 (3,035)USD 88,012 CNH 560,676 Morgan Stanley 4/6/2021 (5)
USD 150,253 CNH 958,916Bank of America
Merrill Lynch 2/7/2021 12USD 864,324 COP 3,219,823,261 Credit Suisse 4/6/2021 (3,920)
USD 673,205 COP 2,512,871,218Toronto Dominion
Bank 2/7/2021 (3,184)USD 63,688 CZK 1,370,000 Citibank 4/6/2021 (2,002)USD 64,085 CZK 1,377,645 JP Morgan 4/6/2021 (1,972)
USD 65,342 CZK 1,367,645Toronto Dominion
Bank 2/7/2021 (234)USD 2,588,854 EUR 2,126,777 Barclays Bank 4/6/2021 (6,764)USD 7,238,532 EUR 6,019,009 JP Morgan 4/6/2021 (107,345)
USD 6,334,672 EUR 5,270,000State Street Bank& Trust Company 4/6/2021 (97,081)
USD 6,789,191 EUR 5,574,403 Barclays Bank 2/7/2021 (17,772)
USD 753,570 GBP 533,032Standard
Chartered Bank 4/6/2021 (1,737)USD 701,262 GBP 494,899 Morgan Stanley 2/7/2021 (40)USD 725,010 HUF 207,540,975 BNP Paribas 4/6/2021 (3,604)USD 1,134,135 HUF 330,324,158 Citibank 4/6/2021 (25,532)USD 2,929,362 HUF 878,211,504 JP Morgan 4/6/2021 (153,772)
USD 2,927,886 HUF 878,210,000State Street Bank& Trust Company 4/6/2021 (155,242)
Currency Purchases Currency Sales CounterpartyMaturity
date
Netunrealised
appreciation/(depreciation)
USD
Financial Derivative Instruments
OPEN FORWARD FOREIGN EXCHANGE TRANSACTIONS
USD 3,456,959 HUF 990,011,152 BNP Paribas 2/7/2021 (17,176)USD 739,491 IDR 10,724,248,774 Deutsche Bank 4/6/2021 (11,897)USD 746,450 IDR 10,724,248,774 Citibank 2/7/2021 (4,022)USD 343,682 INR 25,514,323 Citibank 4/6/2021 (7,636)USD 388,889 INR 28,872,062 Deutsche Bank 4/6/2021 (8,663)
USD 746,348 INR 54,386,385Standard
Chartered Bank 2/7/2021 369USD 718,161 JPY 78,458,709 JP Morgan 4/6/2021 2,548
USD 710,172 JPY 77,710,000State Street Bank& Trust Company 4/6/2021 1,388
USD 706,732 JPY 77,708,709Bank of America
Merrill Lynch 2/7/2021 (2,197)
USD 758,472 KRW 844,330,660Bank of America
Merrill Lynch 4/6/2021 (2,009)
USD 757,247 KRW 844,330,660Toronto Dominion
Bank 4/6/2021 (3,234)
USD 757,295 KRW 844,330,660Toronto Dominion
Bank 2/7/2021 (4,561)
USD 374,322 MXN 7,473,118Bank of America
Merrill Lynch 4/6/2021 (1,062)USD 383,189 MXN 7,648,711 Citibank 4/6/2021 (1,016)USD 1,573,262 MXN 31,578,335 Goldman Sachs 4/6/2021 (12,958)USD 2,989,141 MXN 60,685,926 JP Morgan 4/6/2021 (59,190)
USD 1,433,570 MXN 28,940,982State Street Bank& Trust Company 4/6/2021 (20,171)
USD 3,384,743 MXN 68,159,044 Goldman Sachs 2/7/2021 (27,935)USD 30,833 MYR 126,509 Goldman Sachs 4/6/2021 162USD 30,569 MYR 126,509 Morgan Stanley 2/7/2021 (94)USD 363,977 NZD 510,000 Citibank 4/6/2021 (6,715)USD 1,012,567 NZD 1,416,386 JP Morgan 4/6/2021 (16,929)USD 658,156 NZD 909,864 Morgan Stanley 4/6/2021 (3,176)USD 1,024,483 NZD 1,416,386 Morgan Stanley 2/7/2021 (4,946)
USD 301,074 PEN 1,139,566Bank of America
Merrill Lynch 4/6/2021 720USD 294,010 PEN 1,114,003 Deutsche Bank 4/6/2021 393
USD 294,944 PEN 1,114,003Bank of America
Merrill Lynch 2/7/2021 390USD 175,831 PHP 8,510,217 JP Morgan 4/6/2021 (2,604)
USD 177,322 PHP 8,510,217Standard
Chartered Bank 2/7/2021 (809)USD 1,567,738 PLN 5,793,185 Barclays Bank 4/6/2021 (8,783)USD 1,592,063 PLN 6,040,000 Citibank 4/6/2021 (51,625)USD 1,591,370 PLN 6,033,834 JP Morgan 4/6/2021 (50,640)USD 1,635,839 PLN 6,043,834 Barclays Bank 2/7/2021 (9,163)
USD 373,355 RUB 27,691,720Bank of America
Merrill Lynch 4/6/2021 (4,164)USD 745,943 RUB 54,936,903 Barclays Bank 4/6/2021 (3,006)USD 37,821 UAH 1,041,592 BNP Paribas 4/6/2021 (66)USD 37,945 UAH 1,045,000 Goldman Sachs 4/6/2021 (66)
USD 307,855 ZAR 4,250,366Bank of America
Merrill Lynch 4/6/2021 (1,180)USD 1,680,418 ZAR 24,186,403 Citibank 4/6/2021 (78,122)USD 1,337,368 ZAR 19,440,487 JP Morgan 4/6/2021 (76,106)
USD 1,745,440 ZAR 24,188,565Bank of America
Merrill Lynch 2/7/2021 (6,682)
ZAR 28,438,931 USD 2,046,215Bank of America
Merrill Lynch 4/6/2021 21,516ZAR 18,050,000 USD 1,243,766 BNP Paribas 4/6/2021 68,610ZAR 1,388,325 USD 95,507 JP Morgan 4/6/2021 5,435
BlackRock Emerging Markets Short Duration Bond FundcontinuedPortfolio of Investments as at 31 May 2021
The notes on pages 590 to 610 form an integral part of these financial statements.
BlackRock Strategic Funds[250]

Currency Purchases Currency Sales CounterpartyMaturity
date
Netunrealised
appreciation/(depreciation)
USD
Financial Derivative Instruments
OPEN FORWARD FOREIGN EXCHANGE TRANSACTIONS
ZAR 4,250,366 USD 306,705Bank of America
Merrill Lynch 2/7/2021 1,174
(345,078)
EUR Hedged Share Class
EUR 30,330,431 USD 36,647,565State Street Bank& Trust Company15/6/2021 376,919
USD 19,598 EUR 16,069State Street Bank& Trust Company15/6/2021 (18)
376,901
Total (Gross underlying exposure - USD 184,795,195) 31,823
Sector Breakdownas at 31 May 2021
% of NetAssets
Government 72.03
Energy 7.72
Financial 4.36
Basic Materials 2.88
Industrial 1.78
Utilities 0.81
Securities portfolio at market value 89.58
Other Net Assets 10.42
100.00
BlackRock Emerging Markets Short Duration Bond FundcontinuedPortfolio of Investments as at 31 May 2021
The notes on pages 590 to 610 form an integral part of these financial statements.
Annual report and audited financial statements [251]

Holding Description
MarketValue
EUR
% ofNet
Assets
Transferable Securities and Money Market Instruments Admittedto an Official Stock Exchange Listing or Dealt in on AnotherRegulated Market
BONDSAustralia
EUR 800,000 APT Pipelines Ltd RegS0.75% 15/3/2029 791,944 0.12
EUR 325,000 APT Pipelines Ltd RegS2.00% 15/7/2030 349,811 0.06
EUR 675,000 Macquarie Group Ltd RegS0.35% 3/3/2028 663,525 0.10
EUR 425,000 Telstra Corp Ltd RegS 1.00%23/4/2030 443,351 0.07
2,248,631 0.35
AustriaEUR 500,000 BAWAG Group AG RegS FRN
26/3/2029 521,780 0.08EUR 600,000 Erste Group Bank AG RegS
0.05% 16/9/2025 601,980 0.09EUR 400,000 Raiffeisen Bank International
AG RegS 0.25% 5/7/2021 400,240 0.06EUR 930,000 Republic of Austria Govern-
ment Bond RegS 3.65%20/4/2022 965,182 0.15
EUR 1,370,000 Republic of Austria Govern-ment Bond RegS20/4/2023 (Zero Coupon) 1,386,714 0.22
EUR 2,585,000 Republic of Austria Govern-ment Bond RegS 1.65%21/10/2024 2,783,114 0.43
EUR 3,148,000 Republic of Austria Govern-ment Bond RegS20/4/2025 (Zero Coupon) 3,212,503 0.50
EUR 755,000 Republic of Austria Govern-ment Bond RegS 0.75%20/10/2026 802,331 0.13
EUR 1,410,000 Republic of Austria Govern-ment Bond RegS 0.50%20/4/2027 1,481,769 0.23
EUR 456,000 Republic of Austria Govern-ment Bond RegS 0.50%20/2/2029 478,800 0.07
EUR 965,000 Republic of Austria Govern-ment Bond RegS20/2/2030 (Zero Coupon) 968,628 0.15
EUR 750,000 Republic of Austria Govern-ment Bond RegS20/2/2031 (Zero Coupon) 746,167 0.12
EUR 110,000 Republic of Austria Govern-ment Bond RegS 2.40%23/5/2034 140,720 0.02
EUR 865,000 Republic of Austria Govern-ment Bond RegS 4.15%15/3/2037 1,375,765 0.21
EUR 180,000 Republic of Austria Govern-ment Bond RegS20/10/2040 (Zero Coupon) 163,114 0.03
EUR 430,000 Republic of Austria Govern-ment Bond RegS 3.15%20/6/2044^ 676,227 0.11
EUR 664,000 Republic of Austria Govern-ment Bond RegS 1.50%20/2/2047 803,467 0.13
EUR 1,140,000 Republic of Austria Govern-ment Bond RegS 0.75%20/3/2051 1,158,856 0.18
EUR 158,000 Republic of Austria Govern-ment Bond RegS 3.80%26/1/2062 323,612 0.05
EUR 1,250,000 Republic of Austria Govern-ment Bond RegS 0.70%20/4/2071 1,166,962 0.18
Holding Description
MarketValue
EUR
% ofNet
Assets
Austria continuedEUR 96,000 Republic of Austria Govern-
ment Bond RegS 2.10%20/9/2117 154,854 0.02
EUR 125,000 Republic of Austria Govern-ment Bond RegS 0.85%30/6/2120 110,804 0.02
20,423,589 3.18
BelgiumEUR 300,000 Ageas SA RegS FRN
24/11/2051 298,545 0.05EUR 200,000 Anheuser-Busch InBev SA
RegS 1.125% 1/7/2027 210,836 0.03EUR 124,000 Anheuser-Busch InBev SA
RegS 2.00% 17/3/2028 138,212 0.02EUR 100,000 Belfius Bank SA RegS 1.00%
12/6/2028 107,605 0.02EUR 300,000 BNP Paribas Fortis SA RegS
24/10/2023 (Zero Coupon) 303,162 0.05EUR 600,000 ING Belgium SA RegS 0.75%
28/9/2026 631,890 0.10EUR 1,000,000 KBC Bank NV RegS 0.75%
24/10/2027 1,057,550 0.16EUR 1,460,000 Kingdom of Belgium Govern-
ment Bond RegS 4.25%28/9/2021 1,483,272 0.23
EUR 1,090,000 Kingdom of Belgium Govern-ment Bond RegS 4.25%28/9/2022 1,161,689 0.18
EUR 3,114,029 Kingdom of Belgium Govern-ment Bond RegS 0.50%22/10/2024 3,229,902 0.50
EUR 2,165,000 Kingdom of Belgium Govern-ment Bond RegS 0.80%22/6/2025 2,282,906 0.36
EUR 585,000 Kingdom of Belgium Govern-ment Bond RegS 4.50%28/3/2026 726,903 0.11
EUR 575,000 Kingdom of Belgium Govern-ment Bond RegS22/10/2027 (Zero Coupon) 585,235 0.09
EUR 1,400,000 Kingdom of Belgium Govern-ment Bond RegS 0.80%22/6/2028 1,500,786 0.23
EUR 1,207,000 Kingdom of Belgium Govern-ment Bond RegS 0.90%22/6/2029 1,304,332 0.20
EUR 2,250,000 Kingdom of Belgium Govern-ment Bond RegS 0.10%22/6/2030 2,269,777 0.35
EUR 340,000 Kingdom of Belgium Govern-ment Bond RegS 1.00%22/6/2031 371,025 0.06
EUR 430,000 Kingdom of Belgium Govern-ment Bond RegS22/10/2031 (Zero Coupon) 423,374 0.07
EUR 1,645,000 Kingdom of Belgium Govern-ment Bond RegS 1.25%22/4/2033 1,843,502 0.29
EUR 263,000 Kingdom of Belgium Govern-ment Bond RegS 1.45%22/6/2037 300,604 0.05
EUR 1,072,397 Kingdom of Belgium Govern-ment Bond RegS 1.90%22/6/2038 1,306,126 0.20
EUR 1,585,000 Kingdom of Belgium Govern-ment Bond RegS 0.40%22/6/2040 1,509,808 0.24
EUR 75,000 Kingdom of Belgium Govern-ment Bond RegS 4.25%28/3/2041 124,958 0.02
BlackRock ESG Euro Bond Fund
Portfolio of Investments as at 31 May 2021
The notes on pages 590 to 610 form an integral part of these financial statements.
BlackRock Strategic Funds[252]

Holding Description
MarketValue
EUR
% ofNet
Assets
Belgium continuedEUR 115,000 Kingdom of Belgium Govern-
ment Bond RegS 3.75%22/6/2045 189,097 0.03
EUR 1,205,477 Kingdom of Belgium Govern-ment Bond RegS 1.60%22/6/2047 1,406,141 0.22
EUR 372,957 Kingdom of Belgium Govern-ment Bond RegS 1.70%22/6/2050 445,191 0.07
EUR 95,000 Kingdom of Belgium Govern-ment Bond RegS 2.15%22/6/2066 130,701 0.02
EUR 807,509 Kingdom of Belgium Govern-ment Bond RegS 0.65%22/6/2071 656,545 0.10
25,999,674 4.05
CanadaEUR 495,000 Canadian Imperial Bank of
Commerce RegS 0.25%24/1/2023 500,742 0.08
EUR 2,416,000 CPPIB Capital Inc RegS0.875% 6/2/2029 2,569,875 0.40
3,070,617 0.48
ColombiaUSD 2,045,000 Colombia Government Interna-
tional Bond 3.25%22/4/2032 1,621,052 0.25
1,621,052 0.25
CyprusEUR 41,000 Cyprus Government Interna-
tional Bond RegS 3.875%6/5/2022 42,644 0.01
EUR 84,000 Cyprus Government Interna-tional Bond RegS 3.75%26/7/2023 91,560 0.01
EUR 480,000 Cyprus Government Interna-tional Bond RegS 1.50%16/4/2027^ 520,613 0.08
654,817 0.10
Czech RepublicEUR 594,000 Komercni banka as RegS
0.01% 20/1/2026 599,197 0.09
599,197 0.09
DenmarkDKK 4,986,548 Nordea Kredit Realkreditaktie-
selskab 0.50% 1/10/2050 615,231 0.10DKK 9,083,046 Nykredit Realkredit A/S RegS
0.50% 1/10/2050 1,119,757 0.17DKK 11,189,624 Nykredit Realkredit A/S RegS
1.00% 1/10/2050 1,440,606 0.22DKK 12,460,000 Nykredit Realkredit A/S RegS
1.00% 1/10/2053 1,583,015 0.25EUR 350,000 Orsted A/S RegS FRN
24/11/3017 366,583 0.06EUR 250,000 Orsted A/S RegS FRN
9/12/3019 256,325 0.04
5,381,517 0.84
FinlandEUR 246,000 Finland Government Bond
RegS 15/4/2022 (Zero Cou-pon) 247,341 0.04
EUR 1,700,000 Finland Government BondRegS 15/9/2024 (Zero Cou-pon) 1,734,051 0.27
EUR 373,000 Finland Government BondRegS 0.50% 15/9/2027 392,724 0.06
Holding Description
MarketValue
EUR
% ofNet
Assets
Finland continuedEUR 475,000 Finland Government Bond
RegS 0.50% 15/9/2029 499,268 0.08EUR 605,000 Finland Government Bond
RegS 15/9/2030 (Zero Cou-pon) 605,950 0.09
EUR 310,000 Finland Government BondRegS 0.75% 15/4/2031 332,348 0.05
EUR 380,000 Finland Government BondRegS 1.125% 15/4/2034 423,620 0.07
EUR 105,000 Finland Government BondRegS 0.125% 15/4/2036 101,741 0.02
EUR 300,000 Finland Government BondRegS 0.25% 15/9/2040 287,790 0.04
EUR 65,000 Finland Government BondRegS 2.625% 4/7/2042 93,406 0.01
EUR 256,000 Finland Government BondRegS 1.375% 15/4/2047 307,333 0.05
EUR 250,000 Finland Government BondRegS 0.125% 15/4/2052 214,138 0.03
EUR 1,125,000 OP Corporate Bank Plc 0.60%18/1/2027 1,140,930 0.18
EUR 800,000 OP Corporate Bank Plc RegS0.125% 1/7/2024 807,464 0.13
EUR 850,000 OP Corporate Bank Plc RegS0.50% 12/8/2025 869,983 0.13
8,058,087 1.25
FranceEUR 100,000 Agence Francaise de Devel-
oppement EPIC RegS0.375% 30/4/2024 102,311 0.02
EUR 300,000 Agence Francaise de Devel-oppement EPIC RegS1.00% 31/1/2028 321,039 0.05
EUR 3,500,000 Agence France Locale RegS20/9/2027 (Zero Coupon) 3,501,505 0.54
EUR 1,000,000 Air Liquide Finance SA RegS0.375% 27/5/2031 1,002,210 0.16
EUR 600,000 AXA Bank Europe SCF RegS0.125% 14/3/2022 603,072 0.09
EUR 800,000 AXA SA RegS FRN 6/7/2047 914,480 0.14EUR 1,000,000 Banque Federative du Credit
Mutuel SA RegS 0.75%15/6/2023 1,021,690 0.16
EUR 300,000 Banque Federative du CreditMutuel SA RegS 0.125%5/2/2024 302,388 0.05
EUR 1,100,000 Banque Federative du CreditMutuel SA RegS 0.10%8/10/2027 1,091,222 0.17
EUR 100,000 BNP Paribas SA RegS 1.00%17/4/2024 103,084 0.02
EUR 200,000 BNP Paribas SA RegS FRN15/7/2025 202,466 0.03
EUR 750,000 BNP Paribas SA RegS 1.125%11/6/2026 780,315 0.12
EUR 300,000 BNP Paribas SA RegS FRN23/1/2027 323,433 0.05
EUR 900,000 BNP Paribas SA RegS FRN14/10/2027 898,767 0.14
EUR 700,000 BNP Paribas SA RegS FRN17/4/2029 721,238 0.11
EUR 1,100,000 BNP Paribas SA RegS FRN15/1/2032^ 1,103,762 0.17
EUR 700,000 BPCE SA RegS 0.625%26/9/2023 714,994 0.11
EUR 400,000 BPCE SA RegS 0.375%5/10/2023 406,204 0.06
EUR 500,000 BPCE SA RegS 1.00%15/7/2024 517,645 0.08
BlackRock ESG Euro Bond Fund continued
Portfolio of Investments as at 31 May 2021
The notes on pages 590 to 610 form an integral part of these financial statements.
Annual report and audited financial statements [253]

Holding Description
MarketValue
EUR
% ofNet
Assets
France continuedEUR 700,000 BPCE SA RegS 0.125%
4/12/2024 706,629 0.11EUR 200,000 BPCE SA RegS 1.00%
1/4/2025 206,514 0.03EUR 1,000,000 BPCE SFH SA RegS 0.01%
23/3/2028 1,007,150 0.16EUR 200,000 BPCE SFH SA RegS 0.01%
27/5/2030 198,708 0.03EUR 2,100,000 BPCE SFH SA RegS 0.125%
3/12/2030 2,098,635 0.33EUR 400,000 Bpifrance SACA RegS 0.125%
25/11/2023 405,956 0.06EUR 600,000 Caisse Centrale du Credit Im-
mobilier de France SA RegS0.125% 26/10/2022 604,896 0.09
EUR 300,000 Caisse de Refinancement del’Habitat SA RegS 0.25%7/2/2035 295,551 0.05
EUR 300,000 Caisse Francaise de Finance-ment Local RegS 0.625%26/1/2023 305,535 0.05
EUR 600,000 Caisse Francaise de Finance-ment Local RegS 0.375%11/5/2024 613,962 0.10
EUR 600,000 Cie de Financement FoncierSA RegS 0.25% 11/4/2023 608,220 0.09
EUR 100,000 Cie de Financement FoncierSA RegS 0.75% 29/5/2026 105,073 0.02
EUR 500,000 Cie de Saint-Gobain RegS0.875% 21/9/2023 512,460 0.08
EUR 600,000 Cie de Saint-Gobain RegS0.625% 15/3/2024 612,954 0.10
EUR 200,000 Cie de Saint-Gobain RegS2.375% 4/10/2027 226,432 0.04
EUR 2,800,000 Coentreprise de Transportd’Electricite SA RegS0.875% 29/9/2024 2,876,412 0.45
EUR 400,000 Coentreprise de Transportd’Electricite SA RegS2.125% 29/7/2032 456,516 0.07
EUR 500,000 Credit Agricole Assurances SARegS 2.00% 17/7/2030 520,220 0.08
EUR 200,000 Credit Agricole Assurances SARegS FRN 27/9/2048 243,686 0.04
EUR 800,000 Credit Agricole Home LoanSFH SA RegS 0.05%6/12/2029 802,024 0.12
EUR 200,000 Credit Agricole Public SectorSCF SA 0.01% 13/9/2028 200,720 0.03
EUR 400,000 Credit Agricole SA FRN5/6/2030 414,192 0.06
EUR 700,000 Credit Agricole SA RegS0.75% 5/12/2023 718,207 0.11
EUR 200,000 Credit Agricole SA RegS1.375% 13/3/2025 209,364 0.03
EUR 700,000 Credit Agricole SA RegS FRN22/4/2026 721,539 0.11
EUR 400,000 Credit Mutuel - CIC HomeLoan SFH SA RegS 0.25%30/4/2024 407,868 0.06
EUR 600,000 Credit Mutuel Arkea SA RegS0.875% 5/10/2023 615,612 0.10
EUR 100,000 Credit Mutuel Arkea SA RegS1.375% 17/1/2025 105,211 0.02
EUR 300,000 Credit Mutuel Arkea SA RegS0.875% 7/5/2027 310,941 0.05
EUR 200,000 Danone SA RegS 0.424%3/11/2022 201,910 0.03
EUR 700,000 Danone SA RegS1/12/2025 (Zero Coupon) 699,629 0.11
EUR 3,400,000 Engie SA RegS 0.375%21/6/2027 3,448,858 0.54
Holding Description
MarketValue
EUR
% ofNet
Assets
France continuedEUR 200,000 Engie SA RegS 1.375%
22/6/2028 214,738 0.03EUR 100,000 Engie SA RegS FRN (Per-
petual) 101,480 0.02EUR 1,534,286 France Government Bond OAT
RegS 3.00% 25/4/2022 1,584,841 0.25EUR 276,000 France Government Bond OAT
RegS 25/5/2022 (Zero Cou-pon) 277,744 0.04
EUR 41,877 France Government Bond OATRegS 2.25% 25/10/2022 43,597 0.01
EUR 9,515,000 France Government Bond OATRegS 25/2/2023 (Zero Cou-pon) 9,623,281 1.50
EUR 77,445 France Government Bond OATRegS 25/3/2023 (Zero Cou-pon) 78,367 0.01
EUR 3,000,000 France Government Bond OATRegS 4.25% 25/10/2023 3,355,230 0.52
EUR 6,230,000 France Government Bond OATRegS 1.75% 25/11/2024 6,733,260 1.05
EUR 6,255,000 France Government Bond OATRegS 25/3/2025 (Zero Cou-pon) 6,377,661 0.99
EUR 4,490,000 France Government Bond OATRegS 0.50% 25/5/2025 4,670,004 0.73
EUR 1,835,000 France Government Bond OATRegS 1.00% 25/11/2025 1,955,761 0.30
EUR 4,220,000 France Government Bond OATRegS 25/2/2026 (Zero Cou-pon) 4,301,066 0.67
EUR 2,760,000 France Government Bond OATRegS 0.50% 25/5/2026 2,885,276 0.45
EUR 3,370,000 France Government Bond OATRegS 25/11/2029 (ZeroCoupon) 3,373,539 0.52
EUR 2,405,554 France Government Bond OATRegS 2.50% 25/5/2030 2,943,219 0.46
EUR 3,620,000 France Government Bond OATRegS 25/11/2030 (ZeroCoupon) 3,589,954 0.56
EUR 940,000 France Government Bond OATRegS 1.50% 25/5/2031^ 1,069,288 0.17
EUR 610,000 France Government Bond OATRegS 25/11/2031 (ZeroCoupon) 598,508 0.09
EUR 691,196 France Government Bond OATRegS 5.75% 25/10/2032 1,125,689 0.18
EUR 1,093,013 France Government Bond OATRegS 1.25% 25/5/2034 1,217,442 0.19
EUR 5,047,573 France Government Bond OATRegS 1.75% 25/6/2039 6,074,603 0.95
EUR 1,525,127 France Government Bond OATRegS 0.50% 25/5/2040 1,480,090 0.23
EUR 420,000 France Government Bond OATRegS 4.50% 25/4/2041 723,731 0.11
EUR 3,118,064 France Government Bond OATRegS 0.50% 25/6/2044 2,946,165 0.46
EUR 405,000 France Government Bond OATRegS 3.25% 25/5/2045 625,138 0.10
EUR 320,000 France Government Bond OATRegS 1.50% 25/5/2050 366,774 0.06
EUR 8,760,000 France Government Bond OATRegS 0.75% 25/5/2052 8,235,451 1.28
EUR 368,727 France Government Bond OATRegS 4.00% 25/4/2060 719,755 0.11
EUR 545,000 France Government Bond OATRegS 1.75% 25/5/2066 675,484 0.10
EUR 1,501,940 France Government Bond OATRegS 0.50% 25/5/2072 1,137,524 0.18
EUR 1,200,000 HSBC Continental Europe SARegS 0.60% 20/3/2023 1,220,964 0.19
BlackRock ESG Euro Bond Fund continued
Portfolio of Investments as at 31 May 2021
The notes on pages 590 to 610 form an integral part of these financial statements.
BlackRock Strategic Funds[254]

Holding Description
MarketValue
EUR
% ofNet
Assets
France continuedEUR 700,000 La Poste SA RegS 1.375%
21/4/2032 752,325 0.12EUR 300,000 Orange SA RegS 1.00%
12/5/2025 312,213 0.05EUR 200,000 Orange SA RegS 1.00%
12/9/2025 208,886 0.03EUR 200,000 Orange SA RegS 1.25%
7/7/2027 213,310 0.03EUR 500,000 Orange SA RegS 1.375%
20/3/2028 538,600 0.08EUR 100,000 Orange SA RegS FRN (Per-
petual) 119,290 0.02EUR 1,300,000 RTE Reseau de Transport
d’Electricite SADIR RegS1.625% 8/10/2024 1,372,436 0.21
EUR 200,000 RTE Reseau de Transportd’Electricite SADIR RegS9/9/2027 (Zero Coupon) 197,330 0.03
EUR 400,000 Schneider Electric SE RegS12/6/2023 (Zero Coupon) 402,756 0.06
EUR 400,000 Societe Generale SA FRN24/11/2030 397,972 0.06
EUR 200,000 Societe Generale SA RegS0.125% 24/2/2026 200,526 0.03
EUR 800,000 Societe Generale SA RegSFRN 21/4/2026 824,232 0.13
EUR 200,000 Societe Generale SA RegS0.875% 1/7/2026 204,116 0.03
EUR 1,100,000 Societe Generale SA RegSFRN 22/9/2028 1,113,948 0.17
EUR 400,000 Societe Generale SA RegS1.75% 22/3/2029 426,620 0.07
EUR 300,000 Societe Generale SFH SARegS 0.50% 2/6/2025 310,275 0.05
EUR 300,000 Societe Generale SFH SARegS 0.50% 28/1/2026 311,010 0.05
EUR 800,000 Societe Generale SFH SARegS 0.125% 18/7/2029 808,168 0.13
EUR 900,000 Societe Generale SFH SARegS 0.01% 11/2/2030 897,597 0.14
EUR 900,000 Suez SA RegS 9/6/2026 (ZeroCoupon) 896,076 0.14
EUR 100,000 Suez SA RegS FRN (Per-petual) 99,984 0.02
EUR 800,000 Suez SA RegS FRN (Per-petual)^ 841,368 0.13
EUR 900,000 Total Capital International SARegS 0.696% 31/5/2028 930,582 0.14
EUR 2,300,000 UNEDIC ASSEO RegS0.875% 25/5/2028 2,450,972 0.38
EUR 900,000 Veolia Environnement SARegS 0.892% 14/1/2024 921,933 0.14
EUR 1,000,000 Veolia Environnement SARegS 0.664% 15/1/2031 1,005,160 0.16
EUR 300,000 Veolia Environnement SARegS 0.80% 15/1/2032 300,654 0.05
EUR 1,400,000 Veolia Environnement SARegS FRN (Perpetual) 1,436,302 0.22
EUR 600,000 Vinci SA RegS27/11/2028 (Zero Coupon)^ 588,720 0.09
135,502,394 21.09
GermanyEUR 700,000 Allianz SE RegS FRN
8/7/2050 745,969 0.12EUR 604,000 Berlin Hyp AG RegS 0.625%
22/10/2025 629,833 0.10EUR 2,000,000 Berlin Hyp AG RegS 0.01%
24/1/2028 2,020,960 0.31EUR 1,975,000 Berlin Hyp AG RegS 0.01%
7/7/2028^ 1,991,156 0.31
Holding Description
MarketValue
EUR
% ofNet
Assets
Germany continuedEUR 1,075,000 Berlin Hyp AG RegS 0.01%
2/9/2030 1,069,915 0.17EUR 1,370,000 Bundesobligation
11/4/2025 (Zero Coupon) 1,403,729 0.22EUR 8,300,000 Bundesobligation
10/10/2025 (Zero Coupon)^ 8,521,610 1.33EUR 2,695,759 Bundesobligation RegS
13/10/2023 (Zero Coupon)^ 2,740,886 0.43EUR 2,200,000 Bundesrepublik Deutschland
Bundesanleihe RegS 1.75%15/2/2024 2,346,762 0.36
EUR 1,457,000 Bundesrepublik DeutschlandBundesanleihe RegS 1.50%15/5/2024 1,551,982 0.24
EUR 200,000 Bundesrepublik DeutschlandBundesanleihe RegS 0.50%15/2/2026^ 210,398 0.03
EUR 784,000 Bundesrepublik DeutschlandBundesanleihe RegS 0.25%15/2/2027 818,567 0.13
EUR 57,000 Bundesrepublik DeutschlandBundesanleihe RegS 0.50%15/2/2028 60,640 0.01
EUR 1,082,000 Bundesrepublik DeutschlandBundesanleihe RegS 4.75%4/7/2028 1,488,075 0.23
EUR 1,100,000 Bundesrepublik DeutschlandBundesanleihe RegS 0.25%15/2/2029^ 1,151,843 0.18
EUR 1,775,000 Bundesrepublik DeutschlandBundesanleihe RegS15/2/2030 (Zero Coupon)^ 1,816,695 0.28
EUR 1,995,000 Bundesrepublik DeutschlandBundesanleihe RegS15/8/2030 (Zero Coupon)^ 2,035,997 0.32
EUR 5,705,000 Bundesrepublik DeutschlandBundesanleihe RegS15/8/2030 (Zero Coupon)^ 5,850,306 0.91
EUR 2,900,000 Bundesrepublik DeutschlandBundesanleihe RegS 4.25%4/7/2039^ 5,053,163 0.79
EUR 7,616,755 Bundesrepublik DeutschlandBundesanleihe RegS 4.75%4/7/2040^ 14,261,155 2.22
EUR 740,000 Bundesrepublik DeutschlandBundesanleihe RegS 3.25%4/7/2042^ 1,209,271 0.19
EUR 412,000 Bundesrepublik DeutschlandBundesanleihe RegS 2.50%4/7/2044^ 621,749 0.10
EUR 158,000 Bundesrepublik DeutschlandBundesanleihe RegS 2.50%15/8/2046^ 242,843 0.04
EUR 50,000 Bundesrepublik DeutschlandBundesanleihe RegS 1.25%15/8/2048 61,711 0.01
EUR 2,230,000 Bundesrepublik DeutschlandBundesanleihe RegS15/8/2050 (Zero Coupon)^ 1,993,352 0.31
EUR 4,557,147 Bundesrepublik DeutschlandBundesanleihe RegS15/8/2050 (Zero Coupon) 4,116,881 0.64
EUR 6,000,000 BundesschatzanweisungenRegS 16/9/2022 (Zero Cou-pon) 6,051,960 0.94
EUR 154,000 Commerzbank AG RegS0.125% 23/2/2023 155,683 0.02
EUR 100,000 Commerzbank AG RegS1.25% 23/10/2023 103,027 0.02
EUR 435,000 Commerzbank AG RegS0.50% 4/12/2026 440,655 0.07
BlackRock ESG Euro Bond Fund continued
Portfolio of Investments as at 31 May 2021
The notes on pages 590 to 610 form an integral part of these financial statements.
Annual report and audited financial statements [255]

Holding Description
MarketValue
EUR
% ofNet
Assets
Germany continuedEUR 800,000 Daimler AG RegS 0.75%
11/3/2033 792,712 0.12EUR 1,050,000 Deutsche Bahn Finance
GmbH RegS 0.625%15/4/2036 1,011,927 0.16
EUR 150,000 Deutsche Bank AG RegS FRN10/6/2026 157,466 0.02
EUR 300,000 Deutsche Pfandbriefbank AGRegS 0.75% 7/2/2023 304,857 0.05
EUR 1,100,000 Deutsche Pfandbriefbank AGRegS 0.125% 5/9/2024 1,104,994 0.17
EUR 543,000 DZ HYP AG RegS 0.50%30/9/2026 564,948 0.09
EUR 720,000 DZ HYP AG RegS 0.01%15/1/2027 729,986 0.11
EUR 1,100,000 DZ HYP AG RegS 0.01%27/10/2028 1,106,952 0.17
EUR 600,000 Eurogrid GmbH RegS 1.625%3/11/2023 624,318 0.10
EUR 1,100,000 Eurogrid GmbH RegS 1.113%15/5/2032 1,150,534 0.18
EUR 12,000 Kreditanstalt fuer Wiederauf-bau 0.05% 30/5/2024 12,214 0.00
EUR 60,000 Kreditanstalt fuer Wiederauf-bau 0.50% 15/9/2027 62,789 0.01
EUR 153,000 Kreditanstalt fuer Wiederauf-bau RegS 30/9/2026 (ZeroCoupon) 155,699 0.02
EUR 7,210,000 Kreditanstalt fuer Wiederauf-bau RegS 15/6/2029 (ZeroCoupon) 7,264,868 1.13
EUR 536,000 Land Berlin RegS 0.125%4/6/2035 518,130 0.08
EUR 218,000 Land Berlin RegS 0.625%15/7/2039 222,101 0.03
EUR 303,000 Landesbank Baden-Wuerttemberg RegS 0.05%11/11/2021 303,797 0.05
EUR 600,000 Landesbank Baden-Wuerttemberg RegS 0.125%27/6/2023^ 607,938 0.09
EUR 600,000 Landesbank Baden-Wuerttemberg RegS 2.20%9/5/2029 630,702 0.10
EUR 100,000 Landesbank Hessen-Thueringen Girozentrale0.01% 26/9/2029 100,177 0.02
EUR 300,000 Landesbank Hessen-Thueringen GirozentraleRegS 12/1/2022 (Zero Cou-pon) 301,002 0.05
EUR 304,000 Landwirtschaftliche Renten-bank RegS 0.05% 12/6/2023 307,815 0.05
EUR 300,000 Merck Financial ServicesGmbH RegS 0.125%16/7/2025 302,652 0.05
EUR 700,000 Merck Financial ServicesGmbH RegS 0.375%5/7/2027 710,346 0.11
EUR 300,000 Merck Financial ServicesGmbH RegS 0.875%5/7/2031 312,537 0.05
EUR 400,000 Muenchener HypothekenbankeG RegS 2.50% 4/7/2028 474,132 0.07
EUR 27,000 Muenchener HypothekenbankeG RegS 0.01% 2/11/2040 24,470 0.00
EUR 1,000,000 NRW Bank 15/10/2029 (ZeroCoupon) 999,470 0.15
EUR 26,000 NRW Bank 18/2/2030 (ZeroCoupon) 25,925 0.00
EUR 316,000 NRW Bank RegS 0.875%10/11/2025 333,061 0.05
Holding Description
MarketValue
EUR
% ofNet
Assets
Germany continuedEUR 405,000 NRW Bank RegS 0.625%
2/2/2029 425,825 0.07EUR 300,000 Santander Consumer Bank AG
RegS 0.25% 5/12/2024 306,534 0.05EUR 1,128,000 State of Hesse RegS
25/4/2025 (Zero Coupon) 1,144,751 0.18EUR 637,000 State of Lower Saxony
0.125% 8/4/2027 651,001 0.10EUR 776,000 State of Lower Saxony RegS
0.125% 7/3/2025 791,668 0.12EUR 3,967,000 State of Lower Saxony RegS
0.01% 16/6/2028 4,009,923 0.62EUR 840,000 State of North Rhine-
Westphalia Germany RegS0.50% 16/2/2027 876,691 0.14
EUR 600,000 State of North Rhine-Westphalia Germany RegS0.375% 2/9/2050 556,812 0.09
EUR 1,100,000 Vonovia SE RegS 0.625%24/3/2031 1,083,401 0.17
101,831,898 15.85
GreeceEUR 4,575,000 Hellenic Republic Government
Bond RegS 12/2/2026 (ZeroCoupon) 4,552,582 0.71
4,552,582 0.71
IcelandEUR 325,000 Iceland Government Interna-
tional Bond RegS 0.10%20/6/2024 326,554 0.05
326,554 0.05
IrelandEUR 575,000 CRH SMW Finance DAC
RegS 1.25% 5/11/2026 608,017 0.09EUR 1,700,000 Ireland Government Bond
5.40% 13/3/2025 2,080,222 0.32EUR 300,000 Ireland Government Bond
RegS 3.40% 18/3/2024 333,285 0.05EUR 674,000 Ireland Government Bond
RegS 1.35% 18/3/2031 754,759 0.12EUR 1,907,046 Ireland Government Bond
RegS 18/10/2031 (ZeroCoupon) 1,865,434 0.29
EUR 318,195 Ireland Government BondRegS 1.30% 15/5/2033 355,672 0.06
EUR 370,000 Ireland Government BondRegS 0.40% 15/5/2035 368,109 0.06
EUR 300,000 Ireland Government BondRegS 1.70% 15/5/2037 354,294 0.06
EUR 230,000 Ireland Government BondRegS 0.55% 22/4/2041 223,337 0.03
EUR 65,000 Ireland Government BondRegS 2.00% 18/2/2045 82,555 0.01
EUR 540,000 Ireland Government BondRegS 1.50% 15/5/2050 619,607 0.10
7,645,291 1.19
ItalyEUR 600,000 Cassa Depositi e Prestiti SpA
RegS 0.75% 21/11/2022 608,748 0.09EUR 100,000 Credit Agricole Italia SpA
RegS 1.00% 25/3/2027 106,616 0.02EUR 1,800,000 Credit Agricole Italia SpA
RegS 0.125% 15/3/2033^ 1,764,126 0.27EUR 450,000 Credito Emiliano SpA RegS
1.125% 17/1/2024 466,898 0.07EUR 300,000 Intesa Sanpaolo SpA RegS
0.50% 5/3/2024 307,812 0.05
BlackRock ESG Euro Bond Fund continued
Portfolio of Investments as at 31 May 2021
The notes on pages 590 to 610 form an integral part of these financial statements.
BlackRock Strategic Funds[256]

Holding Description
MarketValue
EUR
% ofNet
Assets
Italy continuedEUR 175,000 Intesa Sanpaolo SpA RegS
0.75% 4/12/2024 179,176 0.03EUR 1,150,000 Intesa Sanpaolo SpA RegS
1.35% 24/2/2031 1,125,930 0.18EUR 207,000 Italy Buoni Poliennali Del Te-
soro RegS 0.35% 1/11/2021 207,776 0.03EUR 4,410,000 Italy Buoni Poliennali Del Te-
soro RegS 2.15%15/12/2021 4,474,474 0.70
EUR 1,900,000 Italy Buoni Poliennali Del Te-soro RegS 1.35% 15/4/2022 1,930,210 0.30
EUR 1,179,000 Italy Buoni Poliennali Del Te-soro RegS 1.45% 15/9/2022 1,206,931 0.19
EUR 2,631,000 Italy Buoni Poliennali Del Te-soro RegS 0.95% 1/3/2023 2,690,066 0.42
EUR 1,741,462 Italy Buoni Poliennali Del Te-soro RegS 0.45% 22/5/2023 1,790,101 0.28
EUR 768,000 Italy Buoni Poliennali Del Te-soro RegS 0.65%15/10/2023^ 784,927 0.12
EUR 1,408,449 Italy Buoni Poliennali Del Te-soro RegS 0.25%20/11/2023 1,449,534 0.23
EUR 1,855,000 Italy Buoni Poliennali Del Te-soro RegS 1.75% 1/7/2024 1,963,499 0.31
EUR 4,072,000 Italy Buoni Poliennali Del Te-soro RegS 1.45%15/11/2024 4,288,264 0.67
EUR 1,865,000 Italy Buoni Poliennali Del Te-soro RegS 2.50% 1/12/2024 2,033,223 0.32
EUR 825,000 Italy Buoni Poliennali Del Te-soro RegS 0.35% 1/2/2025 837,284 0.13
EUR 2,852,000 Italy Buoni Poliennali Del Te-soro RegS 1.45% 15/5/2025 3,016,218 0.47
EUR 5,395,000 Italy Buoni Poliennali Del Te-soro RegS 1.85% 1/7/2025 5,795,147 0.90
EUR 410,000 Italy Buoni Poliennali Del Te-soro RegS 2.50%15/11/2025 454,149 0.07
EUR 4,370,000 Italy Buoni Poliennali Del Te-soro RegS 0.50% 1/2/2026^ 4,446,737 0.69
EUR 2,575,000 Italy Buoni Poliennali Del Te-soro RegS 4.50% 1/3/2026 3,108,205 0.48
EUR 210,000 Italy Buoni Poliennali Del Te-soro RegS 0.85% 15/1/2027 216,470 0.03
EUR 137,000 Italy Buoni Poliennali Del Te-soro RegS 2.05% 1/8/2027 150,925 0.02
EUR 600,000 Italy Buoni Poliennali Del Te-soro RegS 2.00% 1/2/2028 660,630 0.10
EUR 3,438,000 Italy Buoni Poliennali Del Te-soro RegS 4.75% 1/9/2028 4,463,349 0.69
EUR 1,505,000 Italy Buoni Poliennali Del Te-soro RegS 3.00% 1/8/2029 1,785,171 0.28
EUR 1,075,000 Italy Buoni Poliennali Del Te-soro RegS 3.50% 1/3/2030 1,326,464 0.21
EUR 750,000 Italy Buoni Poliennali Del Te-soro RegS 1.35% 1/4/2030 788,235 0.12
EUR 1,645,000 Italy Buoni Poliennali Del Te-soro RegS 0.95% 1/8/2030 1,667,191 0.26
EUR 1,140,000 Italy Buoni Poliennali Del Te-soro RegS 1.65% 1/12/2030 1,224,178 0.19
EUR 1,290,000 Italy Buoni Poliennali Del Te-soro RegS 0.90% 1/4/2031 1,293,586 0.20
EUR 1,580,000 Italy Buoni Poliennali Del Te-soro RegS 1.65% 1/3/2032 1,688,546 0.26
EUR 1,875,000 Italy Buoni Poliennali Del Te-soro RegS 2.45% 1/9/2033 2,160,637 0.34
EUR 845,000 Italy Buoni Poliennali Del Te-soro RegS 3.35% 1/3/2035 1,070,176 0.17
Holding Description
MarketValue
EUR
% ofNet
Assets
Italy continuedEUR 248,000 Italy Buoni Poliennali Del Te-
soro RegS 2.25% 1/9/2036 279,776 0.04EUR 1,559,000 Italy Buoni Poliennali Del Te-
soro RegS 2.95% 1/9/2038 1,913,532 0.30EUR 920,000 Italy Buoni Poliennali Del Te-
soro RegS 5.00% 1/8/2039 1,434,584 0.22EUR 3,460,000 Italy Buoni Poliennali Del Te-
soro RegS 3.10% 1/3/2040 4,333,858 0.67EUR 440,000 Italy Buoni Poliennali Del Te-
soro RegS 5.00% 1/9/2040 691,838 0.11EUR 2,005,000 Italy Buoni Poliennali Del Te-
soro RegS 1.80% 1/3/2041 2,070,102 0.32EUR 425,000 Italy Buoni Poliennali Del Te-
soro RegS 4.75% 1/9/2044 673,162 0.11EUR 2,932,000 Italy Buoni Poliennali Del Te-
soro RegS 1.50% 30/4/2045 2,813,078 0.44EUR 369,000 Italy Buoni Poliennali Del Te-
soro RegS 2.70% 1/3/2047 437,468 0.07EUR 1,012,000 Italy Buoni Poliennali Del Te-
soro RegS 3.85% 1/9/2049 1,459,324 0.23EUR 1,330,000 Italy Buoni Poliennali Del Te-
soro RegS 2.45% 1/9/2050 1,505,041 0.23EUR 1,040,000 Italy Buoni Poliennali Del Te-
soro RegS 1.70% 1/9/2051 997,433 0.16EUR 8,000 Italy Buoni Poliennali Del Te-
soro RegS 2.80% 1/3/2067 9,424 0.00EUR 350,000 Italy Buoni Poliennali Del Te-
soro RegS 2.15% 1/3/2072 340,018 0.05EUR 500,000 Mediobanca Banca di Credito
Finanziario SpA RegS1.00% 8/9/2027 513,805 0.08
EUR 200,000 UniCredit SpA RegS FRN25/6/2025 205,802 0.03
EUR 485,000 UniCredit SpA RegS FRN23/9/2029 485,897 0.08
EUR 1,275,000 UniCredit SpA RegS 0.85%19/1/2031^ 1,242,105 0.19
84,937,856 13.22
JapanEUR 755,000 Takeda Pharmaceutical Co Ltd
2.00% 9/7/2040 791,127 0.12
791,127 0.12
LuxembourgEUR 168,000 European Financial Stability
Facility RegS 0.20%28/4/2025 172,099 0.03
EUR 687,000 European Financial StabilityFacility RegS 0.40%31/5/2026 712,433 0.11
EUR 418,000 European Financial StabilityFacility RegS 0.75%3/5/2027 442,758 0.07
EUR 2,306,000 European Financial StabilityFacility RegS 0.05%17/10/2029 2,322,280 0.36
EUR 2,927,000 European Financial StabilityFacility RegS20/1/2031 (Zero Coupon) 2,912,336 0.45
EUR 15,000 European Financial StabilityFacility RegS 1.20%17/2/2045 16,814 0.00
EUR 1,010,000 European Financial StabilityFacility RegS 1.375%31/5/2047 1,173,802 0.18
EUR 878,000 European Financial StabilityFacility RegS 0.70%20/1/2050 884,058 0.14
BlackRock ESG Euro Bond Fund continued
Portfolio of Investments as at 31 May 2021
The notes on pages 590 to 610 form an integral part of these financial statements.
Annual report and audited financial statements [257]

Holding Description
MarketValue
EUR
% ofNet
Assets
Luxembourg continuedEUR 460,000 European Financial Stability
Facility RegS 0.05%18/1/2052 381,759 0.06
EUR 1,250,000 Holcim Finance LuxembourgSA RegS 0.50% 23/4/2031 1,206,437 0.19
EUR 125,000 Richemont International Hold-ing SA RegS 1.50%26/3/2030 137,031 0.02
EUR 1,355,000 State of the Grand-Duchy ofLuxembourg RegS14/9/2032 (Zero Coupon) 1,335,556 0.21
11,697,363 1.82
NetherlandsEUR 350,000 ABN AMRO Bank NV RegS
0.25% 3/12/2021 351,358 0.05EUR 320,000 ABN AMRO Bank NV RegS
0.50% 17/7/2023 325,485 0.05EUR 200,000 ABN AMRO Bank NV RegS
1.375% 10/1/2034 226,690 0.04EUR 200,000 Achmea Bank NV RegS 0.01%
16/6/2025 202,286 0.03EUR 600,000 Aegon Bank NV RegS 0.01%
16/11/2025 606,558 0.09EUR 325,000 ASML Holding NV RegS
1.375% 7/7/2026 347,555 0.05EUR 250,000 ASML Holding NV RegS
1.625% 28/5/2027 272,310 0.04EUR 870,000 BMW Finance NV RegS
24/3/2023 (Zero Coupon) 874,950 0.14EUR 300,000 Cooperatieve Rabobank UA
RegS 0.875% 8/2/2028 319,992 0.05EUR 1,700,000 Cooperatieve Rabobank UA
RegS 0.01% 2/7/2030^ 1,690,599 0.26EUR 220,000 Daimler International Finance
BV RegS 0.625% 27/2/2023 223,443 0.03EUR 500,000 de Volksbank NV RegS 0.75%
25/6/2023 509,925 0.08EUR 200,000 de Volksbank NV RegS 0.01%
16/9/2024 201,232 0.03EUR 415,000 Deutsche Telekom Interna-
tional Finance BV RegS0.625% 13/12/2024 425,719 0.07
EUR 631,000 Domi 2021-1 BV ’2021-1 A’RegS FRN 15/6/2053 633,297 0.10
EUR 200,000 EDP Finance BV RegS2.375% 23/3/2023 209,418 0.03
EUR 770,000 EDP Finance BV RegS1.875% 29/9/2023 806,398 0.13
EUR 2,000,000 EDP Finance BV RegS1.125% 12/2/2024 2,067,340 0.32
EUR 600,000 EDP Finance BV RegS 2.00%22/4/2025 646,404 0.10
USD 910,000 Enel Finance International NV2.65% 10/9/2024 785,336 0.12
EUR 1,000,000 Enel Finance International NVRegS 17/6/2024 (Zero Cou-pon) 1,006,600 0.16
EUR 2,325,000 Enel Finance International NVRegS 1.966% 27/1/2025 2,496,190 0.39
EUR 150,000 Enel Finance International NVRegS 1.50% 21/7/2025 159,227 0.03
EUR 325,000 Enexis Holding NV RegS1.50% 20/10/2023 337,409 0.05
EUR 125,000 Heineken NV RegS 2.25%30/3/2030 143,629 0.02
EUR 800,000 Iberdrola International BVRegS FRN (Perpetual) 804,120 0.13
EUR 1,800,000 Iberdrola International BVRegS FRN (Perpetual) 1,844,244 0.29
EUR 1,300,000 Iberdrola International BVRegS FRN (Perpetual) 1,415,687 0.22
Holding Description
MarketValue
EUR
% ofNet
Assets
Netherlands continuedEUR 300,000 ING Groep NV RegS 1.00%
20/9/2023 308,550 0.05EUR 700,000 ING Groep NV RegS FRN
3/9/2025 700,714 0.11EUR 1,100,000 ING Groep NV RegS FRN
18/2/2029 1,074,403 0.17EUR 700,000 ING Groep NV RegS FRN
13/11/2030 706,251 0.11EUR 500,000 Koninklijke DSM NV RegS
0.625% 23/6/2032 503,690 0.08EUR 100,000 Koninklijke Philips NV RegS
2.00% 30/3/2030 112,744 0.02EUR 200,000 Nationale-Nederlanden Bank
NV/The Netherlands RegS0.625% 11/9/2025 207,622 0.03
EUR 707,000 Nederlandse Financierings-Maatschappij voor Ontwik-kelingslanden NV RegS0.125% 20/4/2022 711,588 0.11
EUR 617,000 Nederlandse Waterschaps-bank NV RegS 1.50%15/6/2039 721,859 0.11
EUR 1,669,040 Netherlands Government BondRegS 15/1/2022 (Zero Cou-pon) 1,675,850 0.26
EUR 420,000 Netherlands Government BondRegS 2.00% 15/7/2024 455,188 0.07
EUR 1,356,422 Netherlands Government BondRegS 0.25% 15/7/2025 1,402,662 0.22
EUR 1,205,845 Netherlands Government BondRegS 0.50% 15/7/2026 1,267,415 0.20
EUR 1,470,000 Netherlands Government BondRegS 15/1/2027 (Zero Cou-pon) 1,504,516 0.23
EUR 184,050 Netherlands Government BondRegS 0.75% 15/7/2027 197,151 0.03
EUR 155,904 Netherlands Government BondRegS 5.50% 15/1/2028 217,241 0.03
EUR 625,000 Netherlands Government BondRegS 0.25% 15/7/2029 648,331 0.10
EUR 2,465,000 Netherlands Government BondRegS 15/7/2030 (Zero Cou-pon) 2,491,302 0.39
EUR 975,000 Netherlands Government BondRegS 2.50% 15/1/2033 1,256,434 0.20
EUR 360,000 Netherlands Government BondRegS 15/1/2038 (Zero Cou-pon) 343,782 0.05
EUR 2,231,000 Netherlands Government BondRegS 0.50% 15/1/2040 2,317,930 0.36
EUR 1,594,070 Netherlands Government BondRegS 15/1/2052 (Zero Cou-pon) 1,381,340 0.22
EUR 600,000 NN Group NV RegS FRN8/4/2044 670,434 0.10
EUR 600,000 Siemens Financierings-maatschappij NV RegS20/2/2023 (Zero Coupon) 603,606 0.09
EUR 400,000 Siemens Financierings-maatschappij NV RegS0.375% 5/6/2026 408,676 0.06
EUR 227,000 Siemens Financierings-maatschappij NV RegS0.90% 28/2/2028 238,815 0.04
EUR 900,000 Silver Arrow Athlon NL2021-1 BV ’2021-1 A’ RegSFRN 26/4/2031 908,311 0.14
EUR 100,000 Telefonica Europe BV RegSFRN (Perpetual) 101,984 0.02
EUR 200,000 Telefonica Europe BV RegSFRN (Perpetual) 205,890 0.03
BlackRock ESG Euro Bond Fund continued
Portfolio of Investments as at 31 May 2021
The notes on pages 590 to 610 form an integral part of these financial statements.
BlackRock Strategic Funds[258]

Holding Description
MarketValue
EUR
% ofNet
Assets
Netherlands continuedEUR 500,000 Telefonica Europe BV RegS
FRN (Perpetual) 535,685 0.08EUR 1,525,000 TenneT Holding BV RegS
0.50% 9/6/2031 1,516,948 0.24EUR 2,100,000 TenneT Holding BV RegS FRN
(Perpetual) 2,168,754 0.34EUR 600,000 Vonovia Finance BV RegS
1.80% 29/6/2025 641,112 0.10EUR 100,000 Vonovia Finance BV RegS
2.25% 7/4/2030 113,001 0.02
48,253,180 7.51
New ZealandEUR 495,000 ANZ New Zealand Interna-
tional Ltd RegS 0.125%22/9/2023 500,994 0.08
EUR 1,970,000 ASB Finance Ltd RegS 0.25%21/5/2031 1,968,956 0.31
NZD 726,000 Auckland Council RegS 2.95%28/9/2050 373,709 0.06
EUR 807,000 Chorus Ltd RegS 1.125%18/10/2023 828,741 0.13
EUR 600,000 Chorus Ltd RegS 0.875%5/12/2026^ 616,464 0.09
NZD 3,010,000 New Zealand GovernmentBond 1.75% 15/5/2041 1,543,949 0.24
5,832,813 0.91
NorwayEUR 1,400,000 DNB Bank ASA RegS 0.05%
14/11/2023 1,410,570 0.22EUR 1,452,000 DNB Boligkreditt AS RegS
0.625% 19/6/2025 1,508,497 0.23EUR 1,113,000 DNB Boligkreditt AS RegS
0.01% 21/1/2031 1,100,145 0.17EUR 873,000 SpareBank 1 Boligkreditt AS
RegS 0.50% 30/1/2025 900,718 0.14EUR 3,673,000 SpareBank 1 Boligkreditt AS
RegS 0.01% 22/9/2027^ 3,706,424 0.58EUR 150,000 Telenor ASA RegS
25/9/2023 (Zero Coupon) 150,861 0.02EUR 330,000 Telenor ASA RegS 2.50%
22/5/2025 364,211 0.06
9,141,426 1.42
PolandEUR 300,000 mBank Hipoteczny SA RegS
1.073% 5/3/2025 313,959 0.05EUR 633,000 Republic of Poland Govern-
ment International BondRegS 0.50% 20/12/2021 636,380 0.10
EUR 98,000 Republic of Poland Govern-ment International BondRegS 1.00% 25/10/2028 104,995 0.02
1,055,334 0.17
PortugalEUR 300,000 Banco Santander Totta SA
RegS 1.25% 26/9/2027 326,376 0.05EUR 200,000 EDP - Energias de Portugal
SA RegS 1.625% 15/4/2027 214,984 0.03EUR 300,000 EDP - Energias de Portugal
SA RegS FRN 30/4/2079 326,361 0.05EUR 300,000 EDP - Energias de Portugal
SA RegS FRN 20/7/2080^ 300,033 0.05EUR 435,000 Portugal Obrigacoes do Tes-
ouro OT RegS 4.95%25/10/2023 493,146 0.08
EUR 885,000 Portugal Obrigacoes do Tes-ouro OT RegS 5.65%15/2/2024 1,034,556 0.16
Holding Description
MarketValue
EUR
% ofNet
Assets
Portugal continuedEUR 1,085,000 Portugal Obrigacoes do Tes-
ouro OT RegS 2.875%15/10/2025 1,240,263 0.19
EUR 729,737 Portugal Obrigacoes do Tes-ouro OT RegS 4.125%14/4/2027 914,120 0.14
EUR 757,064 Portugal Obrigacoes do Tes-ouro OT RegS 0.70%15/10/2027 793,630 0.12
EUR 172,000 Portugal Obrigacoes do Tes-ouro OT RegS 2.125%17/10/2028 198,063 0.03
EUR 671,000 Portugal Obrigacoes do Tes-ouro OT RegS 1.95%15/6/2029 766,483 0.12
EUR 180,000 Portugal Obrigacoes do Tes-ouro OT RegS 3.875%15/2/2030 236,090 0.04
EUR 861,000 Portugal Obrigacoes do Tes-ouro OT RegS 0.475%18/10/2030 871,582 0.14
EUR 400,000 Portugal Obrigacoes do Tes-ouro OT RegS 0.30%17/10/2031 393,156 0.06
EUR 280,000 Portugal Obrigacoes do Tes-ouro OT RegS 0.90%12/10/2035 284,284 0.04
EUR 685,000 Portugal Obrigacoes do Tes-ouro OT RegS 4.10%15/4/2037 1,018,664 0.16
EUR 182,400 Portugal Obrigacoes do Tes-ouro OT RegS 4.10%15/2/2045 291,915 0.05
EUR 210,000 Portugal Obrigacoes do Tes-ouro OT RegS 1.00%12/4/2052 188,324 0.03
9,892,030 1.54
SingaporeEUR 516,000 Oversea-Chinese Banking
Corp Ltd RegS 0.625%18/4/2025 534,272 0.09
EUR 1,300,000 United Overseas Bank LtdRegS 0.01% 1/12/2027 1,305,148 0.20
1,839,420 0.29
SlovakiaEUR 100,000 Vseobecna Uverova Banka AS
RegS 0.25% 26/3/2024 101,633 0.02EUR 500,000 Vseobecna Uverova Banka AS
RegS 0.01% 23/6/2025 504,760 0.08EUR 700,000 Vseobecna Uverova Banka AS
RegS 0.01% 24/3/2026 706,062 0.11
1,312,455 0.21
SloveniaEUR 400,000 Slovenia Government Bond
RegS 0.275% 14/1/2030 406,672 0.06EUR 470,000 Slovenia Government Bond
RegS 0.875% 15/7/2030^ 501,476 0.08EUR 241,000 Slovenia Government Bond
RegS 0.488% 20/10/2050 209,745 0.03
1,117,893 0.17
SpainEUR 300,000 Adif Alta Velocidad RegS
1.25% 4/5/2026 319,488 0.05EUR 527,000 Autonomous Community of
Madrid Spain RegS 0.747%30/4/2022 532,544 0.08
BlackRock ESG Euro Bond Fund continued
Portfolio of Investments as at 31 May 2021
The notes on pages 590 to 610 form an integral part of these financial statements.
Annual report and audited financial statements [259]

Holding Description
MarketValue
EUR
% ofNet
Assets
Spain continuedEUR 808,000 Autonomous Community of
Madrid Spain RegS 1.773%30/4/2028 894,715 0.14
EUR 1,795,000 Autonomous Community ofMadrid Spain RegS 0.419%30/4/2030 1,794,803 0.28
EUR 600,000 Banco Bilbao Vizcaya Argen-taria SA RegS 1.00%21/6/2026 622,842 0.10
EUR 1,000,000 Banco Bilbao Vizcaya Argen-taria SA RegS 0.375%15/11/2026 1,009,400 0.16
EUR 2,500,000 Banco de Sabadell SA RegSFRN 11/3/2027 2,575,475 0.40
EUR 400,000 Banco de Sabadell SA RegS0.125% 10/2/2028 404,168 0.06
EUR 400,000 Banco Santander SA RegS1.375% 14/12/2022 410,232 0.06
EUR 500,000 Banco Santander SA RegS0.875% 9/5/2031 535,950 0.08
EUR 500,000 Bankia SA RegS 0.75%9/7/2026 511,540 0.08
EUR 600,000 CaixaBank SA RegS 0.375%3/2/2025 605,604 0.09
EUR 800,000 CaixaBank SA RegS 1.125%27/3/2026 833,976 0.13
EUR 1,500,000 CaixaBank SA RegS FRN10/7/2026 1,532,055 0.24
EUR 500,000 CaixaBank SA RegS FRN18/11/2026 498,660 0.08
EUR 600,000 Iberdrola Finanzas SA RegS0.875% 16/6/2025 622,320 0.10
EUR 200,000 Iberdrola Finanzas SA RegS1.25% 28/10/2026 212,906 0.03
EUR 400,000 Santander Consumer FinanceSA RegS 0.50% 4/10/2021 401,304 0.06
EUR 200,000 Santander Consumer FinanceSA RegS 0.375% 27/6/2024 202,414 0.03
EUR 2,730,000 Spain Government Bond0.40% 30/4/2022 2,754,215 0.43
EUR 1,060,000 Spain Government Bond30/4/2023 (Zero Coupon) 1,070,430 0.17
EUR 1,650,000 Spain Government Bond31/1/2025 (Zero Coupon) 1,670,938 0.26
EUR 2,265,000 Spain Government Bond31/1/2026 (Zero Coupon) 2,288,035 0.36
EUR 505,000 Spain Government Bond5.75% 30/7/2032 789,901 0.12
EUR 705,000 Spain Government Bond RegS4.40% 31/10/2023 788,761 0.12
EUR 1,065,000 Spain Government Bond RegS4.80% 31/1/2024 1,215,250 0.19
EUR 1,635,000 Spain Government Bond RegS0.25% 30/7/2024 1,669,646 0.26
EUR 2,316,000 Spain Government Bond RegS2.75% 31/10/2024 2,567,749 0.40
EUR 1,455,000 Spain Government Bond RegS1.60% 30/4/2025 1,566,642 0.24
EUR 1,330,000 Spain Government Bond RegS4.65% 30/7/2025 1,607,199 0.25
EUR 755,000 Spain Government Bond RegS2.15% 31/10/2025 836,766 0.13
EUR 2,054,000 Spain Government Bond RegS1.95% 30/4/2026 2,273,490 0.35
EUR 1,923,000 Spain Government Bond RegS1.30% 31/10/2026 2,074,552 0.32
EUR 240,000 Spain Government Bond RegS1.50% 30/4/2027 262,524 0.04
EUR 1,570,000 Spain Government Bond RegS0.80% 30/7/2027 1,649,725 0.26
Holding Description
MarketValue
EUR
% ofNet
Assets
Spain continuedEUR 500,000 Spain Government Bond RegS
1.40% 30/4/2028 545,625 0.08EUR 226,000 Spain Government Bond RegS
1.40% 30/7/2028 246,943 0.04EUR 200,000 Spain Government Bond RegS
1.45% 30/4/2029 219,520 0.03EUR 1,641,000 Spain Government Bond RegS
0.60% 31/10/2029 1,685,931 0.26EUR 2,631,000 Spain Government Bond RegS
0.50% 30/4/2030 2,668,729 0.42EUR 1,538,000 Spain Government Bond RegS
1.95% 30/7/2030 1,758,795 0.27EUR 2,415,000 Spain Government Bond RegS
1.25% 31/10/2030^ 2,603,925 0.41EUR 900,000 Spain Government Bond RegS
0.10% 30/4/2031 867,600 0.14EUR 2,409,000 Spain Government Bond RegS
2.35% 30/7/2033 2,882,031 0.45EUR 670,000 Spain Government Bond RegS
1.85% 30/7/2035 760,658 0.12EUR 325,000 Spain Government Bond RegS
4.20% 31/1/2037 481,702 0.08EUR 430,000 Spain Government Bond RegS
0.85% 30/7/2037 419,753 0.07EUR 1,490,000 Spain Government Bond RegS
4.90% 30/7/2040 2,478,600 0.39EUR 2,250,000 Spain Government Bond RegS
1.20% 31/10/2040 2,262,105 0.35EUR 567,000 Spain Government Bond RegS
4.70% 30/7/2041 930,073 0.14EUR 155,000 Spain Government Bond RegS
5.15% 31/10/2044 277,882 0.04EUR 225,000 Spain Government Bond RegS
2.90% 31/10/2046 301,073 0.05EUR 1,886,000 Spain Government Bond RegS
1.00% 31/10/2050 1,684,104 0.26EUR 1,237,000 Spain Government Bond RegS
3.45% 30/7/2066 1,895,938 0.30EUR 240,000 Spain Government Bond RegS
1.45% 31/10/2071 209,455 0.03
64,786,661 10.08
SupranationalEUR 400,000 African Development Bank
0.50% 21/3/2029 415,178 0.07EUR 433,000 European Investment Bank
0.10% 15/10/2026 443,544 0.07EUR 965,000 European Investment Bank
0.20% 17/3/2036 939,756 0.15EUR 764,000 European Investment Bank
1.50% 15/11/2047 928,298 0.14EUR 45,000 European Investment Bank
RegS 0.375% 15/5/2026 46,701 0.01EUR 56,000 European Investment Bank
RegS 0.875% 14/1/2028 60,132 0.01EUR 3,135,000 European Investment Bank
RegS 28/3/2028 (Zero Cou-pon) 3,176,758 0.49
EUR 2,729,000 European Investment BankRegS 0.25% 15/6/2040 2,608,078 0.41
EUR 343,000 European Stability MechanismRegS 17/1/2022 (Zero Cou-pon) 344,228 0.05
EUR 5,200,000 European Stability MechanismRegS 14/3/2025 (Zero Cou-pon) 5,284,500 0.82
EUR 114,000 European Stability MechanismRegS 0.75% 15/3/2027 120,791 0.02
EUR 559,000 European Union RegS4/7/2035 (Zero Coupon) 532,755 0.08
BlackRock ESG Euro Bond Fund continued
Portfolio of Investments as at 31 May 2021
The notes on pages 590 to 610 form an integral part of these financial statements.
BlackRock Strategic Funds[260]

Holding Description
MarketValue
EUR
% ofNet
Assets
Supranational continuedEUR 2,457,000 International Bank for Recon-
struction & Development0.625% 22/11/2027^ 2,587,403 0.40
EUR 419,000 International Bank for Recon-struction & Development0.125% 3/1/2051 358,689 0.06
17,846,811 2.78
SwedenEUR 100,000 Lansforsakringar Hypotek AB
RegS 0.625% 29/1/2026 103,988 0.02EUR 945,000 Skandinaviska Enskilda Ban-
ken AB RegS 0.05%1/7/2024 952,617 0.15
EUR 325,000 Svenska Handelsbanken ABRegS 0.375% 3/7/2023 330,012 0.05
EUR 845,000 Svenska Handelsbanken ABRegS 0.125% 18/6/2024 854,303 0.13
SEK 17,600,000 Sweden Government Interna-tional Bond RegS 0.125%9/9/2030 1,702,953 0.26
3,943,873 0.61
SwitzerlandEUR 160,000 Credit Suisse AG RegS
1.375% 31/1/2022 161,957 0.02EUR 630,000 Credit Suisse AG RegS 1.00%
7/6/2023 645,189 0.10EUR 1,100,000 Credit Suisse Group AG RegS
FRN 24/6/2027 1,119,855 0.17EUR 600,000 Credit Suisse Group AG RegS
FRN 14/1/2028 597,840 0.09EUR 325,000 Credit Suisse Group AG RegS
0.625% 18/1/2033 301,451 0.05EUR 227,000 UBS AG RegS 0.25%
10/1/2022 227,919 0.04EUR 300,000 UBS AG RegS 0.625%
23/1/2023 304,413 0.05EUR 200,000 UBS Group AG RegS FRN
29/1/2026 200,506 0.03EUR 575,000 UBS Group AG RegS 0.625%
24/2/2033 557,750 0.09
4,116,880 0.64
United KingdomEUR 1,250,000 AstraZeneca Plc RegS 0.375%
3/6/2029 1,243,125 0.19EUR 700,000 Barclays Plc RegS FRN
24/1/2026 727,902 0.11EUR 150,000 BP Capital Markets Plc RegS
1.231% 8/5/2031 155,853 0.03EUR 795,000 British Telecommunications Plc
RegS 1.00% 21/11/2024 821,267 0.13EUR 1,225,000 Cadent Finance Plc RegS
0.625% 19/3/2030 1,222,072 0.19EUR 410,000 Cadent Finance Plc RegS
0.75% 11/3/2032 404,699 0.06EUR 800,000 Diageo Finance Plc RegS
0.125% 12/10/2023 805,984 0.13EUR 158,000 DS Smith Plc RegS 0.875%
12/9/2026 161,261 0.03EUR 250,000 GlaxoSmithKline Capital Plc
RegS 23/9/2023 (Zero Cou-pon) 251,340 0.04
EUR 206,000 GlaxoSmithKline Capital PlcRegS 1.375% 2/12/2024 217,124 0.03
EUR 625,000 GlaxoSmithKline Capital PlcRegS 1.25% 21/5/2026 662,344 0.10
EUR 725,000 HSBC Holdings Plc RegS FRN13/11/2031 717,329 0.11
GBP 436,000 London Wall Mortgage CapitalPlc ’2021-FL1 A’ RegS FRN15/5/2051 508,507 0.08
Holding Description
MarketValue
EUR
% ofNet
Assets
United Kingdom continuedEUR 425,000 Motability Operations Group
Plc RegS 0.125% 20/7/2028 420,198 0.07EUR 527,000 National Grid Electricity Trans-
mission Plc RegS 0.823%7/7/2032 527,126 0.08
EUR 550,000 Nationwide Building SocietyRegS 0.50% 5/5/2041 536,134 0.08
EUR 125,000 Santander UK Plc 0.10%12/5/2024 126,658 0.02
EUR 325,000 Sky Ltd RegS 1.50%15/9/2021 326,843 0.05
EUR 452,000 Sky Ltd RegS 1.875%24/11/2023 475,549 0.07
EUR 327,000 Sky Ltd RegS 2.25%17/11/2025 359,582 0.06
EUR 100,000 Sky Ltd RegS 2.50%15/9/2026 112,678 0.02
EUR 1,000,000 SSE Plc RegS 1.25%16/4/2025 1,046,150 0.16
USD 660,000 Standard Chartered Plc RegSFRN 23/3/2025 545,441 0.09
EUR 400,000 Swiss Re Finance UK PlcRegS FRN 4/6/2052 437,644 0.07
EUR 200,000 Yorkshire Building SocietyRegS 0.01% 13/10/2027 200,656 0.03
13,013,466 2.03
United StatesEUR 2,475,000 Air Products and Chemicals
Inc 0.80% 5/5/2032 2,508,759 0.39USD 1,500,000 Apple Inc 2.80% 8/2/2061 1,124,583 0.17
EUR 500,000 AT&T Inc 2.45% 15/3/2035 553,425 0.09EUR 1,025,000 Bank of America Corp RegS
FRN 26/10/2031 1,005,295 0.16EUR 1,225,000 Bank of America Corp RegS
FRN 24/5/2032 1,240,092 0.19EUR 625,000 Booking Holdings Inc 0.10%
8/3/2025 626,337 0.10EUR 600,000 Citigroup Inc RegS FRN
6/7/2026 625,596 0.10EUR 1,025,000 Coca-Cola Co 0.40% 6/5/2030 1,018,317 0.16EUR 1,103,000 Coca-Cola Co 0.375%
15/3/2033 1,053,357 0.16EUR 225,000 Comcast Corp 0.75%
20/2/2032 224,735 0.03EUR 100,000 Danaher Corp 2.50%
30/3/2030 115,635 0.02EUR 1,420,000 Fiserv Inc 0.375% 1/7/2023 1,433,504 0.22
EUR 600,000 Fiserv Inc 1.125% 1/7/2027 625,412 0.10EUR 135,000 Goldman Sachs Group Inc
RegS 0.125% 19/8/2024 135,186 0.02EUR 150,000 Goldman Sachs Group Inc
RegS 3.375% 27/3/2025 168,258 0.03EUR 1,050,000 Goldman Sachs Group Inc
RegS 0.25% 26/1/2028 1,026,301 0.16EUR 400,000 Goldman Sachs Group Inc
RegS 2.00% 22/3/2028 438,062 0.07EUR 900,000 Goldman Sachs Group Inc
RegS 1.00% 18/3/2033 890,901 0.14EUR 776,000 International Business Ma-
chines Corp 0.375%31/1/2023 784,901 0.12
EUR 150,000 International Business Ma-chines Corp 1.25%29/1/2027 158,997 0.02
EUR 411,000 International Business Ma-chines Corp 1.75% 7/3/2028 452,019 0.07
EUR 400,000 International Flavors & Fra-grances Inc 1.80%25/9/2026 428,668 0.07
EUR 135,000 JPMorgan Chase & Co RegSFRN 11/3/2027 140,237 0.02
BlackRock ESG Euro Bond Fund continued
Portfolio of Investments as at 31 May 2021
The notes on pages 590 to 610 form an integral part of these financial statements.
Annual report and audited financial statements [261]

Holding Description
MarketValue
EUR
% ofNet
Assets
United States continuedEUR 800,000 JPMorgan Chase & Co RegS
FRN 18/5/2028 857,266 0.13EUR 225,000 Levi Strauss & Co 3.375%
15/3/2027 232,934 0.04EUR 620,000 Morgan Stanley 1.875%
30/3/2023 644,062 0.10EUR 200,000 Morgan Stanley FRN
26/7/2024 203,138 0.03EUR 325,000 National Grid North America
Inc RegS 0.75% 8/8/2023 331,087 0.05EUR 150,000 PepsiCo Inc 1.05% 9/10/2050 139,854 0.02EUR 600,000 Verizon Communications Inc
0.875% 8/4/2027 620,484 0.10EUR 741,000 Verizon Communications Inc
1.25% 8/4/2030 778,532 0.12
20,585,934 3.20
Total Bonds 618,080,422 96.20
Total Transferable Securities and Money MarketInstruments Admitted to an Official Stock ExchangeListing or Dealt in on Another Regulated Market 618,080,422 96.20
Other Transferable Securities and Money Market Instruments
BONDSNew Zealand
NZD 974,000 New Zealand Government In-flation Linked Bond RegS2.50% 20/9/2040 793,997 0.12
793,997 0.12
Total Bonds 793,997 0.12
Total Other Transferable Securities and MoneyMarket Instruments 793,997 0.12
Holding Description
MarketValue
EUR
% ofNet
Assets
Collective Investment SchemesIreland
229,640 BlackRock ICS Euro LiquidEnvironmentally AwareFund~ 22,698,388 3.53
22,698,388 3.53
Total Collective Investment Schemes 22,698,388 3.53
Securities portfolio at market value 641,572,807 99.85
Other Net Assets 926,792 0.15
Total Net Assets (EUR) 642,499,599 100.00
^ All or a portion of this security represents a security on loan.~ Investment in related party fund.
TypeNominal
Value Description CounterpartyExpiration
date
Net unrealisedappreciation/
(depreciation)EUR
MarketValue
EUR
Financial Derivative Instruments
SWAPS
CCILS EUR 2,830,000Fund receives Fixed 1.382% and pays Floating EUR 12 Month
CPTFE Credit Suisse 15/4/2031 (48,080) (48,021)
CCILS USD 860,000Fund receives Fixed 2.338% and pays Floating USD 12 Month
USCPI Credit Suisse 11/3/2031 (21,851) (21,836)
CCILS USD 857,500Fund receives Fixed 2.350% and pays Floating USD 12 Month
USCPI Credit Suisse 5/3/2031 (20,908) (20,893)
CCILS USD 857,500Fund receives Fixed 2.354% and pays Floating USD 12 Month
USCPI Credit Suisse 5/3/2031 (20,603) (20,589)
CCILS USD 1,715,000Fund receives Fixed 2.358% and pays Floating USD 12 Month
USCPI Credit Suisse 5/3/2031 (40,674) (40,644)
CCILS USD 1,780,000Fund receives Fixed 2.388% and pays Floating USD 12 Month
USCPI Credit Suisse 17/2/2031 (38,583) (38,553)
CCILS USD 542,500Fund receives Fixed 2.432% and pays Floating USD 12 Month
USCPI Credit Suisse 6/5/2051 (6,555) (6,539)
CCILS USD 542,500Fund receives Fixed 2.438% and pays Floating USD 12 Month
USCPI Credit Suisse 7/5/2051 (5,712) (5,695)
CCILS USD 542,500Fund receives Fixed 2.484% and pays Floating USD 12 Month
USCPI Credit Suisse 4/5/2051 1,670 1,687
CCILS USD 542,500Fund receives Fixed 2.488% and pays Floating USD 12 Month
USCPI Credit Suisse 4/5/2051 2,312 2,329
CCILS USD 410,000Fund receives Fixed 2.505% and pays Floating USD 12 Month
USCPI Credit Suisse 30/3/2031 (4,179) (4,172)
BlackRock ESG Euro Bond Fund continued
Portfolio of Investments as at 31 May 2021
The notes on pages 590 to 610 form an integral part of these financial statements.
BlackRock Strategic Funds[262]

TypeNominal
Value Description CounterpartyExpiration
date
Net unrealisedappreciation/
(depreciation)EUR
MarketValue
EUR
Financial Derivative Instruments
SWAPS
CCILS USD 2,330,000Fund receives Fixed 2.669% and pays Floating USD 12 Month
USCPI Credit Suisse 14/5/2031 16,609 16,649
CCILS GBP 400,000Fund receives Fixed 3.202% and pays Floating GBP 12 Month
UKRPI Credit Suisse 15/3/2030 (18,895) (18,886)
CCILS GBP 505,000Fund receives Fixed 3.270% and pays Floating GBP 12 Month
UKRPI Credit Suisse 15/3/2030 (18,870) (18,858)
CCILS GBP 430,000Fund receives Fixed 3.285% and pays Floating GBP 12 Month
UKRPI Credit Suisse 15/3/2030 (15,128) (15,117)
CCILS GBP 505,000Fund receives Fixed 3.290% and pays Floating GBP 12 Month
UKRPI Credit Suisse 15/3/2030 (17,398) (17,386)
CCILS GBP 430,000Fund receives Fixed 3.293% and pays Floating GBP 12 Month
UKRPI Credit Suisse 15/3/2030 (14,626) (14,615)
CCILS GBP 2,510,000Fund receives Fixed 3.315% and pays Floating GBP 12 Month
UKRPI Credit Suisse 15/5/2030 (91,200) (91,141)
CCILS GBP 355,000Fund receives Fixed 3.340% and pays Floating GBP 12 Month
UKRPI Credit Suisse 15/3/2030 (9,635) (9,627)
CCILS GBP 390,000Fund receives Fixed 3.391% and pays Floating GBP 12 Month
UKRPI Credit Suisse 15/12/2029 (6,066) (6,056)
CCILS GBP 1,170,000Fund receives Fixed 3.410% and pays Floating GBP 12 Month
UKRPI Credit Suisse 15/12/2029 (14,913) (14,884)
CCILS GBP 950,000Fund receives Fixed 3.455% and pays Floating GBP 12 Month
UKRPI Credit Suisse 15/2/2030 (10,132) (10,108)
CCILS GBP 700,000Fund receives Fixed 3.495% and pays Floating GBP 12 Month
UKRPI Credit Suisse 15/12/2029 (93) (76)
CCILS GBP 700,000Fund receives Fixed 3.510% and pays Floating GBP 12 Month
UKRPI Credit Suisse 15/12/2029 1,471 1,489
CCILS GBP 1,000,000Fund receives Fixed 3.625% and pays Floating GBP 12 Month
UKRPI Credit Suisse 15/2/2031 (20,071) (20,047)
CCILS GBP 2,210,000Fund receives Fixed 3.650% and pays Floating GBP 12 Month
UKRPI Credit Suisse 15/4/2031 (37,146) (37,093)
CCILS GBP 2,250,000Fund receives Fixed 3.658% and pays Floating GBP 12 Month
UKRPI Credit Suisse 15/4/2031 (35,311) (35,257)
CCILS GBP 1,108,269Fund receives Fixed 3.756% and pays Floating GBP 12 Month
UKRPI Credit Suisse 15/4/2031 (1,096) (1,070)
CCILS GBP 120,000Fund receives Fixed 3.773% and pays Floating GBP 12 Month
UKRPI Credit Suisse 15/9/2029 6,274 6,277
CCIRS EUR 550,000Fund receives Floating EUR 6 Month EURIBOR and pays Fixed
0.473% Credit Suisse 29/4/2041 3,914 3,927
CCIRS EUR 1,010,000Fund receives Floating EUR 6 Month EURIBOR and pays Fixed
0.568% Credit Suisse 31/5/2047 (8,368) (8,340)
CCIRS EUR 217,600Fund receives Floating EUR 6 Month EURIBOR and pays Fixed
0.663% Credit Suisse 15/7/2039 (7,173) (7,167)
CCIRS SEK 20,000,000Fund receives Floating SEK 3 Month STIBOR and pays Fixed
0.824% Credit Suisse 6/4/2031 1,718 1,752
CCIRS USD 1,010,000Fund receives Floating USD 3 Month LIBOR and pays Fixed
1.570% Credit Suisse 11/3/2031 (2,914) (2,900)
CCIRS USD 2,930,000Fund receives Floating USD 3 Month LIBOR and pays Fixed
1.650% Credit Suisse 14/5/2031 (25,835) (23,479)
CCIRS USD 480,000Fund receives Floating USD 3 Month LIBOR and pays Fixed
1.680% Credit Suisse 30/3/2031 (5,287) (5,280)
IRS EUR 1,040,000Fund receives Floating EUR 6 Month LIBOR and pays Fixed
-0.204% Credit Suisse 20/1/2031 31,507 31,525
Total (Gross underlying exposure - EUR 38,031,831) (501,827) (498,694)
CCILS: Centrally Cleared Inflation Linked SwapsCCIRS: Centrally Cleared Interest Rate SwapsIRS: Interest Rate Swaps
BlackRock ESG Euro Bond Fund continued
Portfolio of Investments as at 31 May 2021
The notes on pages 590 to 610 form an integral part of these financial statements.
Annual report and audited financial statements [263]

Numberof
contractsCurrencyof contracts
Contract/Description
Expirationdate
Grossunderlying
exposureEUR
Net unrealisedappreciation/
(depreciation)EUR
Financial Derivative Instruments
FUTURES
5 EUR Euro BOBL Futures June 2021 June 2021 673,400 1,200
66 EUR Euro BTP Futures June 2021 June 2021 9,720,480 11,283
(95) EUR Euro Bund Futures June 2021 June 2021 16,131,950 (37,250)
(2) EUR Euro BUXL 30 Year Bond Futures June 2021 June 2021 402,080 (2,743)
254 EUR Euro Schatz Futures June 2021 June 2021 28,458,160 (15,850)
29 EUR Euro-OAT Futures June 2021 June 2021 4,649,280 29,034
(11) EUR Euro-OAT Futures September 2021 September 2021 1,739,760 1,210
(8) JPY Japan 10 Year Bond Futures June 2021 June 2021 9,055,584 (149)
33 EUR Short Euro BTP Futures June 2021 June 2021 3,732,960 3,500
(102) USD US Treasury 10 Year Note Futures September 2021 September 2021 12,096,770 28,531
(33) USD US Treasury 10 Year Note Futures September 2021 September 2021 3,564,249 8,211
(6) USD US Treasury 5 Year Note Futures September 2021 September 2021 608,676 496
(44) USD US Ultra Bond Futures September 2021 September 2021 6,660,927 26,833
Total 97,494,276 54,306
Numberof
contractsCall/Put Description Counterparty Strike Price
Expirationdate
Netunrealised
(depreciation)EUR
MarketValue
EUR
Financial Derivative Instruments
PURCHASED OPTIONS
5,620,000 Call OTC USD/CAD Bank of America Merrill Lynch USD 1.28 23/06/2021 (37,086) 313
1,620,000 Call OTC EUR/GBP BNP Paribas EUR 0.89 06/08/2021 (21,431) 2,529
Total (Gross underlying exposure - EUR 7,322) (58,517) 2,842
NominalValue
Call/Put Description Counterparty Strike Price
Expirationdate
Netunrealised
appreciation/(depreciation)
EUR
MarketValue
EUR
Financial Derivative Instruments
WRITTEN SWAPTIONS
(1,932,421) Put
Fund writes an option to enter into an InterestRate Swap. If exercised Fund receives-0.11% Fixed annually from 14/1/2022; andpays Floating EUR Interbank Offer Rate6 Month semi-annually from 18/7/2022 Barclays Bank EUR 0.11 14/01/2022 (41,328) (70,265)
(1,932,421) Call
Fund writes an option to enter into an InterestRate Swap. If exercised Fund receivesFloating EUR Interbank Offer Rate6 Month semi-annually from 18/7/2022;and pays -0.11% Fixed annually from14/1/2022 Barclays Bank EUR 0.11 14/01/2022 22,448 (6,490)
(3,860,000) Call
Fund writes an option to enter into an InterestRate Swap. If exercised Fund receivesFloating USD LIBOR 3 Month BBAquarterly from 28/10/2021; and pays0.92% Fixed semi-annually from 26/7/2021 BNP Paribas USD 0.92 26/07/2021 20,940 (477)
(3,750,000) Call
Fund writes an option to enter into an InterestRate Swap. If exercised Fund receivesFloating USD LIBOR 3 Month BBAquarterly from 10/12/2021; and pays1.125% Fixed semi-annually from 8/9/2021 JP Morgan USD 1.12 08/09/2021 (468) (32,908)
BlackRock ESG Euro Bond Fund continued
Portfolio of Investments as at 31 May 2021
The notes on pages 590 to 610 form an integral part of these financial statements.
BlackRock Strategic Funds[264]

NominalValue
Call/Put Description Counterparty Strike Price
Expirationdate
Netunrealised
appreciation/(depreciation)
EUR
MarketValue
EUR
Financial Derivative Instruments
WRITTEN SWAPTIONS
(3,750,000) Put
Fund writes an option to enter into an InterestRate Swap. If exercised Fund receives1.125% Fixed semi-annually from8/9/2021; and pays Floating USD LIBOR3 Month BBA quarterly from 10/12/2021 JP Morgan USD 1.13 08/09/2021 20,982 (11,459)
(7,785,000) Call
Fund writes an option to enter into an InterestRate Swap. If exercised Fund receivesFloating USD LIBOR 3 Month BBAquarterly from 28/7/2023; and pays 2%Fixed semi-annually from 26/4/2023 Barclays Bank USD 0.02 26/04/2023 14,378 (243,047)
(7,785,000) Put
Fund writes an option to enter into an InterestRate Swap. If exercised Fund receives 2%Fixed semi-annually from 26/4/2023; andpays Floating USD LIBOR 3 Month BBAquarterly from 28/7/2023 Barclays Bank USD 0.02 26/04/2023 7,811 (247,125)
(31,955,000) Put
Fund writes an option to enter into an InterestRate Swap. If exercised Fund receives0.45% Fixed annually from 19/5/2022; andpays Floating EUR Interbank Offer Rate6 Month semi-annually from 23/11/2022 Citibank EUR 0.00 19/05/2022 20,940 (69,493)
Total (Gross underlying exposure - EUR 15,840,248) 65,703 (681,264)
Currency Purchases Currency Sales CounterpartyMaturity
date
Netunrealised
appreciation/(depreciation)
EUR
Financial Derivative Instruments
OPEN FORWARD FOREIGN EXCHANGE TRANSACTIONS
AUD 1,700,000 EUR 1,092,715 Natwest Markets 15/7/2021 (15,289)EUR 1,490,588 AUD 2,330,000 HSBC 15/7/2021 13,881EUR 1,610,547 DKK 11,980,000 JP Morgan 15/7/2021 (163)
EUR 3,058,205 DKK 22,750,000Toronto Dominion
Bank 15/7/2021 (532)EUR 57,715 GBP 50,000 Natwest Markets 15/7/2021 (295)
EUR 34,556 GBP 30,000Royal Bank of
Canada 15/7/2021 (250)EUR 1,003,591 GBP 870,000 UBS 15/7/2021 (5,773)EUR 948,490 NOK 9,700,000 JP Morgan 16/6/2021 (3,690)
EUR 3,315,957 NZD 5,620,000Bank of America
Merrill Lynch 15/7/2021 (28,081)
EUR 3,450,623 SEK 35,220,000Bank of America
Merrill Lynch 15/7/2021 (28,106)EUR 1,930,000 USD 2,333,273 UBS 16/6/2021 18,621EUR 5,416,410 USD 6,490,000 Morgan Stanley 15/7/2021 102,891
EUR 66,480 USD 80,000Standard
Chartered Bank 15/7/2021 982
Currency Purchases Currency Sales CounterpartyMaturity
date
Netunrealised
appreciation/(depreciation)
EUR
Financial Derivative Instruments
OPEN FORWARD FOREIGN EXCHANGE TRANSACTIONS
KRW 530,000,000 USD 472,348 BNP Paribas 16/6/2021 4,812KRW 795,000,000 USD 712,110 HSBC 16/6/2021 4,278NOK 12,250,000 EUR 1,204,493 HSBC 16/6/2021 (1,998)NOK 9,700,000 EUR 958,714 Societe Generale 16/6/2021 (6,534)NOK 2,450,000 USD 292,702 Citibank 16/6/2021 723NOK 13,350,000 USD 1,603,396 JP Morgan 16/6/2021 (2,999)NOK 3,170,000 USD 383,101 Morgan Stanley 16/6/2021 (2,654)
NOK 1,580,000 USD 190,138Toronto Dominion
Bank 16/6/2021 (661)SEK 16,500,000 EUR 1,632,909 Morgan Stanley 15/7/2021 (3,181)SEK 1,225,000 USD 146,641 Barclays Bank 16/6/2021 909
SEK 610,000 USD 73,121Standard
Chartered Bank 16/6/2021 370USD 2,358,286 EUR 1,930,000 BNP Paribas 16/6/2021 1,869USD 145,414 NOK 1,200,000 Barclays Bank 16/6/2021 1,325USD 72,815 NOK 600,000 Citibank 16/6/2021 751USD 289,862 SEK 2,450,000 Citibank 16/6/2021 (4,619)
BlackRock ESG Euro Bond Fund continued
Portfolio of Investments as at 31 May 2021
The notes on pages 590 to 610 form an integral part of these financial statements.
Annual report and audited financial statements [265]
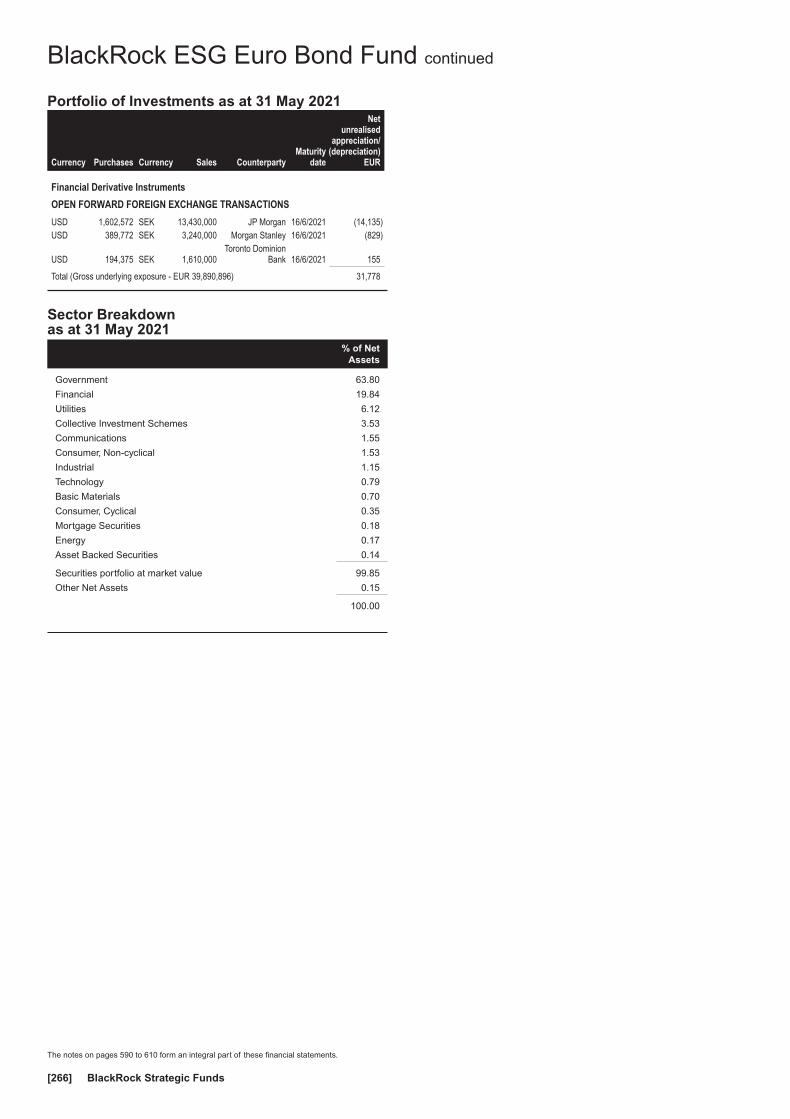
Currency Purchases Currency Sales CounterpartyMaturity
date
Netunrealised
appreciation/(depreciation)
EUR
Financial Derivative Instruments
OPEN FORWARD FOREIGN EXCHANGE TRANSACTIONS
USD 1,602,572 SEK 13,430,000 JP Morgan 16/6/2021 (14,135)USD 389,772 SEK 3,240,000 Morgan Stanley 16/6/2021 (829)
USD 194,375 SEK 1,610,000Toronto Dominion
Bank 16/6/2021 155
Total (Gross underlying exposure - EUR 39,890,896) 31,778
Sector Breakdownas at 31 May 2021
% of NetAssets
Government 63.80
Financial 19.84
Utilities 6.12
Collective Investment Schemes 3.53
Communications 1.55
Consumer, Non-cyclical 1.53
Industrial 1.15
Technology 0.79
Basic Materials 0.70
Consumer, Cyclical 0.35
Mortgage Securities 0.18
Energy 0.17
Asset Backed Securities 0.14
Securities portfolio at market value 99.85
Other Net Assets 0.15
100.00
BlackRock ESG Euro Bond Fund continued
Portfolio of Investments as at 31 May 2021
The notes on pages 590 to 610 form an integral part of these financial statements.
BlackRock Strategic Funds[266]

Holding Description
MarketValue
EUR
% ofNet
Assets
Transferable Securities and Money Market Instruments Admittedto an Official Stock Exchange Listing or Dealt in on AnotherRegulated Market
BONDSAustralia
EUR 675,000 APT Pipelines Ltd RegS0.75% 15/3/2029 668,203 0.25
EUR 850,000 APT Pipelines Ltd RegS2.00% 15/7/2030 914,889 0.34
EUR 875,000 Macquarie Group Ltd RegS0.35% 3/3/2028 860,125 0.32
EUR 136,000 Telstra Corp Ltd RegS 1.375%26/3/2029 146,316 0.05
EUR 425,000 Telstra Corp Ltd RegS 1.00%23/4/2030 443,351 0.16
3,032,884 1.12
AustriaEUR 1,100,000 BAWAG Group AG RegS FRN
26/3/2029 1,147,916 0.42EUR 300,000 Erste Group Bank AG RegS
0.05% 16/9/2025 300,990 0.11EUR 200,000 Kommunalkredit Austria AG
RegS 0.25% 14/5/2024 199,850 0.07EUR 100,000 Raiffeisen Bank International
AG RegS 1.00% 4/12/2023 102,898 0.04EUR 800,000 Raiffeisen Bank International
AG RegS 0.25% 22/1/2025 808,296 0.30EUR 400,000 Raiffeisen Bank International
AG RegS 0.375% 25/9/2026 406,160 0.15
2,966,110 1.09
BelgiumEUR 900,000 Ageas SA RegS FRN
24/11/2051 895,635 0.33EUR 600,000 Ageas SA RegS FRN (Per-
petual) 636,162 0.23EUR 120,000 Anheuser-Busch InBev SA
RegS 1.125% 1/7/2027 126,501 0.05EUR 70,000 Anheuser-Busch InBev SA
RegS 2.00% 17/3/2028 78,023 0.03EUR 600,000 Belfius Bank SA RegS
28/8/2026 (Zero Coupon) 596,058 0.22EUR 100,000 Elia Transmission Belgium SA
RegS 1.375% 14/1/2026 105,983 0.04EUR 200,000 Elia Transmission Belgium SA
RegS 1.375% 7/4/2027 210,786 0.08EUR 300,000 KBC Group NV RegS 0.75%
18/10/2023 307,065 0.11EUR 1,700,000 KBC Group NV RegS FRN
10/9/2026 1,695,444 0.62EUR 700,000 KBC Group NV RegS FRN
11/3/2027 709,758 0.26EUR 400,000 KBC Group NV RegS FRN
(Perpetual) 423,536 0.16
5,784,951 2.13
CanadaEUR 400,000 Royal Bank of Canada RegS
0.125% 23/7/2024 402,628 0.15
402,628 0.15
DenmarkDKK 571,108 Nordea Kredit Realkreditaktie-
selskab 0.50% 1/10/2050 70,462 0.03EUR 1,700,000 Orsted A/S RegS FRN
24/11/3017 1,780,546 0.65
1,851,008 0.68
FinlandEUR 857,000 OP Corporate Bank Plc RegS
0.375% 29/8/2023 870,121 0.32
Holding Description
MarketValue
EUR
% ofNet
Assets
Finland continuedEUR 750,000 OP Corporate Bank Plc RegS
0.50% 12/8/2025 767,632 0.28EUR 375,000 OP Corporate Bank Plc RegS
FRN 9/6/2030 387,165 0.14
2,024,918 0.74
FranceEUR 100,000 Air Liquide Finance SA RegS
1.375% 2/4/2030 109,232 0.04EUR 600,000 Air Liquide Finance SA RegS
0.375% 27/5/2031 601,326 0.22EUR 300,000 AXA SA RegS FRN 4/7/2043 331,149 0.12EUR 400,000 AXA SA RegS FRN 6/7/2047 457,240 0.17EUR 850,000 AXA SA RegS FRN 28/5/2049 969,612 0.36
EUR 1,000,000 Banque Federative du CreditMutuel SA RegS 0.125%5/2/2024 1,007,960 0.37
EUR 200,000 Banque Federative du CreditMutuel SA RegS 2.625%18/3/2024 215,590 0.08
EUR 200,000 Banque Federative du CreditMutuel SA RegS 0.75%17/7/2025 206,212 0.08
EUR 200,000 Banque Federative du CreditMutuel SA RegS 1.625%19/1/2026 214,702 0.08
EUR 1,400,000 Banque Federative du CreditMutuel SA RegS 0.10%8/10/2027 1,388,828 0.51
EUR 300,000 Banque Federative du CreditMutuel SA RegS 0.625%21/2/2031 294,138 0.11
EUR 300,000 BNP Paribas Cardif SA RegSFRN (Perpetual) 339,030 0.12
EUR 900,000 BNP Paribas SA RegS FRN15/7/2025 911,097 0.34
EUR 1,100,000 BNP Paribas SA RegS FRN14/10/2027 1,098,493 0.40
EUR 400,000 BNP Paribas SA RegS FRN19/2/2028 399,112 0.15
EUR 700,000 BNP Paribas SA RegS FRN15/1/2032 702,394 0.26
EUR 600,000 BNP Paribas SA RegS 0.625%3/12/2032 575,106 0.21
EUR 900,000 BPCE SA RegS 0.625%26/9/2023 919,278 0.34
EUR 200,000 BPCE SA RegS 0.375%5/10/2023 203,102 0.07
EUR 800,000 BPCE SA RegS 1.00%15/7/2024 828,232 0.30
EUR 1,000,000 BPCE SA RegS 0.125%4/12/2024 1,009,470 0.37
EUR 600,000 BPCE SA RegS FRN15/9/2027 600,498 0.22
EUR 900,000 Capgemini SE RegS 2.50%1/7/2023 945,099 0.35
EUR 800,000 Capgemini SE RegS 1.00%18/10/2024 827,792 0.30
EUR 100,000 Capgemini SE RegS 2.00%15/4/2029 111,937 0.04
EUR 200,000 Capgemini SE RegS 1.125%23/6/2030 209,346 0.08
EUR 136,000 Carrefour SA RegS 1.75%15/7/2022 138,447 0.05
EUR 1,100,000 Cie de Saint-Gobain RegS0.625% 15/3/2024 1,123,749 0.41
EUR 400,000 Cie de Saint-Gobain RegS2.375% 4/10/2027 452,864 0.17
EUR 2,700,000 Coentreprise de Transportd’Electricite SA RegS0.875% 29/9/2024 2,773,683 1.02
BlackRock ESG Euro Corporate Bond Fund
Portfolio of Investments as at 31 May 2021
The notes on pages 590 to 610 form an integral part of these financial statements.
Annual report and audited financial statements [267]

Holding Description
MarketValue
EUR
% ofNet
Assets
France continuedEUR 900,000 Credit Agricole Assurances SA
RegS FRN 27/9/2048 1,096,587 0.40EUR 600,000 Credit Agricole SA FRN
5/6/2030 621,288 0.23EUR 1,100,000 Credit Agricole SA RegS
0.75% 5/12/2023 1,128,611 0.42EUR 400,000 Credit Agricole SA RegS FRN
22/4/2026 412,308 0.15EUR 1,100,000 Credit Mutuel Arkea SA RegS
0.875% 5/10/2023 1,128,622 0.42EUR 300,000 Credit Mutuel Arkea SA RegS
1.375% 17/1/2025 315,633 0.12EUR 300,000 Credit Mutuel Arkea SA RegS
0.875% 7/5/2027 310,941 0.11EUR 1,100,000 Danone SA RegS
1/12/2025 (Zero Coupon) 1,099,417 0.40EUR 200,000 Electricite de France SA RegS
FRN (Perpetual) 223,976 0.08EUR 600,000 Electricite de France SA RegS
FRN (Perpetual) 671,520 0.25EUR 600,000 Electricite de France SA RegS
FRN (Perpetual) 624,828 0.23EUR 700,000 Elis SA RegS 1.75%
11/4/2024 715,274 0.26EUR 200,000 Engie SA RegS 0.875%
27/3/2024 205,758 0.08EUR 2,100,000 Engie SA RegS 0.375%
21/6/2027 2,130,177 0.78EUR 300,000 Engie SA RegS 1.75%
27/3/2028 329,379 0.12EUR 300,000 Engie SA RegS 0.50%
24/10/2030 300,561 0.11EUR 500,000 Icade Sante SAS RegS
1.375% 17/9/2030 522,325 0.19EUR 152,000 LVMH Moet Hennessy Louis
Vuitton SE RegS 0.375%26/5/2022 152,879 0.06
EUR 700,000 Orange SA RegS 1.00%12/5/2025 728,497 0.27
EUR 800,000 Orange SA RegS 1.00%12/9/2025 835,544 0.31
EUR 200,000 Orange SA RegS 1.25%7/7/2027 213,310 0.08
EUR 300,000 Orange SA RegS 1.875%12/9/2030 338,688 0.12
EUR 200,000 Orange SA RegS 0.50%4/9/2032 197,356 0.07
EUR 500,000 Orange SA RegS FRN (Per-petual) 561,490 0.21
EUR 50,000 RTE Reseau de Transportd’Electricite SADIR RegS3.875% 28/6/2022 52,290 0.02
EUR 700,000 RTE Reseau de Transportd’Electricite SADIR RegS1.625% 8/10/2024 739,004 0.27
EUR 200,000 RTE Reseau de Transportd’Electricite SADIR RegS1.00% 19/10/2026 209,386 0.08
EUR 300,000 Schneider Electric SE RegS12/6/2023 (Zero Coupon) 302,067 0.11
EUR 400,000 Societe Generale SA FRN24/11/2030 397,972 0.15
EUR 1,000,000 Societe Generale SA RegS0.875% 1/7/2026 1,020,580 0.38
EUR 600,000 Societe Generale SA RegS0.75% 25/1/2027 604,152 0.22
EUR 1,100,000 Societe Generale SA RegS0.125% 18/2/2028 1,083,731 0.40
EUR 600,000 Societe Generale SA RegSFRN 23/2/2028 609,408 0.22
EUR 900,000 Societe Generale SA RegSFRN 22/9/2028 911,412 0.34
Holding Description
MarketValue
EUR
% ofNet
Assets
France continuedEUR 400,000 Societe Generale SA RegS
FRN 12/6/2029 389,172 0.14EUR 100,000 Societe Generale SA RegS
0.875% 24/9/2029 99,606 0.04EUR 700,000 Suez SA RegS 9/6/2026 (Zero
Coupon) 696,948 0.26EUR 400,000 Suez SA RegS 1.25%
14/5/2035^ 413,708 0.15EUR 800,000 Suez SA RegS FRN (Per-
petual) 811,616 0.30EUR 500,000 Suez SA RegS FRN (Per-
petual)^ 525,855 0.19EUR 500,000 Terega SA RegS 0.875%
17/9/2030 501,345 0.18EUR 518,000 TOTAL SE RegS FRN (Per-
petual) 543,993 0.20EUR 197,000 TOTAL SE RegS FRN (Per-
petual) 216,605 0.08EUR 800,000 TOTAL SE RegS FRN (Per-
petual) 795,720 0.29EUR 600,000 Valeo SA RegS 1.625%
18/3/2026^ 621,384 0.23EUR 100,000 Veolia Environnement SA
RegS 0.892% 14/1/2024 102,437 0.04EUR 500,000 Veolia Environnement SA
RegS 0.664% 15/1/2031 502,580 0.18EUR 500,000 Veolia Environnement SA
RegS 0.80% 15/1/2032 501,090 0.18EUR 1,500,000 Veolia Environnement SA
RegS FRN (Perpetual) 1,538,895 0.57EUR 400,000 Veolia Environnement SA
RegS FRN (Perpetual) 397,360 0.15EUR 500,000 Vinci SA RegS
27/11/2028 (Zero Coupon) 490,600 0.18EUR 900,000 Vinci SA RegS 1.625%
18/1/2029 986,274 0.36
50,894,877 18.72
GermanyEUR 1,000,000 Allianz SE RegS FRN
25/9/2049 1,005,450 0.37EUR 200,000 Allianz SE RegS FRN
8/7/2050 213,134 0.08EUR 200,000 Allianz SE RegS FRN (Per-
petual) 201,426 0.07EUR 1,000,000 BASF SE RegS 0.101%
5/6/2023 1,006,980 0.37EUR 900,000 Bertelsmann SE & Co KGaA
RegS FRN 23/4/2075 932,868 0.34EUR 500,000 Commerzbank AG RegS
1.25% 23/10/2023 515,135 0.19EUR 1,325,000 Commerzbank AG RegS
0.375% 1/9/2027 1,324,019 0.49EUR 416,000 Daimler AG RegS 0.75%
8/2/2030 421,870 0.16EUR 675,000 Daimler AG RegS 0.75%
11/3/2033 668,851 0.25EUR 156,000 Deutsche Bahn Finance
GmbH RegS 1.375%28/3/2031 170,931 0.06
EUR 475,000 Deutsche Bahn FinanceGmbH RegS 0.625%15/4/2036 457,776 0.17
EUR 100,000 Deutsche Bahn FinanceGmbH RegS 0.625%8/12/2050 86,929 0.03
EUR 150,000 Deutsche Bank AG RegS FRN10/6/2026 157,466 0.06
EUR 500,000 Deutsche Bank AG RegS FRN19/11/2030 520,280 0.19
EUR 600,000 Deutsche Bank AG RegS FRN17/2/2032 598,092 0.22
BlackRock ESG Euro Corporate Bond Fund continued
Portfolio of Investments as at 31 May 2021
The notes on pages 590 to 610 form an integral part of these financial statements.
BlackRock Strategic Funds[268]

Holding Description
MarketValue
EUR
% ofNet
Assets
Germany continuedEUR 700,000 Deutsche Pfandbriefbank AG
RegS 0.75% 7/2/2023 711,333 0.26EUR 900,000 Deutsche Pfandbriefbank AG
RegS 0.125% 5/9/2024 904,086 0.33EUR 800,000 Deutsche Pfandbriefbank AG
RegS 0.10% 2/2/2026 798,216 0.29EUR 900,000 Deutsche Telekom AG RegS
0.50% 5/7/2027 918,576 0.34EUR 473,000 Deutsche Telekom AG RegS
1.75% 25/3/2031 527,078 0.19EUR 326,000 E.ON SE RegS 0.375%
23/8/2021 326,052 0.12EUR 150,000 E.ON SE RegS 1.00%
7/10/2025 156,122 0.06EUR 800,000 Eurogrid GmbH RegS 1.625%
3/11/2023 832,424 0.31EUR 300,000 Eurogrid GmbH RegS 1.875%
10/6/2025 321,681 0.12EUR 800,000 Eurogrid GmbH RegS 1.113%
15/5/2032 836,752 0.31EUR 300,000 Eurogrid GmbH RegS 0.741%
21/4/2033 298,752 0.11EUR 500,000 Evonik Industries AG RegS
0.625% 18/9/2025 511,770 0.19EUR 1,975,000 Fraport AG Frankfurt Airport
Services Worldwide RegS1.875% 31/3/2028 2,043,552 0.75
EUR 267,000 HeidelbergCement AG RegS2.25% 3/6/2024 284,181 0.10
EUR 357,000 HeidelbergCement AG RegS1.50% 7/2/2025 375,082 0.14
EUR 1,100,000 KION Group AG RegS 1.625%24/9/2025 1,145,485 0.42
EUR 400,000 Landesbank Baden-Wuerttemberg RegS 2.875%28/9/2026 439,000 0.16
EUR 1,100,000 Landesbank Baden-Wuerttemberg RegS 2.20%9/5/2029 1,156,287 0.43
EUR 500,000 Merck Financial ServicesGmbH RegS 0.005%15/12/2023 502,440 0.18
EUR 400,000 Merck Financial ServicesGmbH RegS 0.125%16/7/2025 403,536 0.15
EUR 500,000 Merck Financial ServicesGmbH RegS 0.875%5/7/2031 520,895 0.19
EUR 800,000 Merck KGaA RegS FRN25/6/2079 867,008 0.32
EUR 200,000 MuenchenerRueckversicherungs-Gesellschaft AG inMuenchen RegS FRN26/5/2042 212,152 0.08
EUR 600,000 MuenchenerRueckversicherungs-Gesellschaft AG inMuenchen RegS FRN26/5/2049 696,900 0.26
EUR 300,000 SAP SE RegS 0.375%18/5/2029 303,234 0.11
EUR 800,000 Vonovia SE RegS 0.625%24/3/2031 787,928 0.29
25,161,729 9.26
GreeceEUR 100,000 Alpha Bank SA RegS 2.50%
5/2/2023 103,956 0.04
103,956 0.04
Holding Description
MarketValue
EUR
% ofNet
Assets
IrelandEUR 300,000 AIB Group Plc RegS 1.25%
28/5/2024 310,674 0.12EUR 400,000 Bank of Ireland Group Plc
RegS FRN 25/11/2025 410,788 0.15EUR 575,000 Bank of Ireland Group Plc
RegS FRN 10/5/2027 570,296 0.21EUR 525,000 CRH SMW Finance DAC
RegS 1.25% 5/11/2026 555,145 0.20EUR 975,000 Eaton Capital Unlimited Co
RegS 0.128% 8/3/2026 974,971 0.36EUR 669,000 Smurfit Kappa Acquisi-
tions ULC RegS 2.375%1/2/2024 708,692 0.26
EUR 570,000 Smurfit Kappa Treasury ULCRegS 1.50% 15/9/2027 599,127 0.22
EUR 700,000 Zurich Finance Ireland Desig-nated Activity Co RegS FRN17/9/2050 730,709 0.27
4,860,402 1.79
ItalyEUR 300,000 Assicurazioni Generali SpA
RegS 3.875% 29/1/2029 351,336 0.13EUR 200,000 Assicurazioni Generali SpA
RegS 2.124% 1/10/2030 208,802 0.08EUR 921,000 ASTM SpA RegS 1.625%
8/2/2028 949,477 0.35EUR 300,000 Enel SpA RegS FRN (Per-
petual) 330,750 0.12EUR 325,000 Enel SpA RegS FRN (Per-
petual) 338,185 0.13EUR 1,023,000 Hera SpA RegS 0.25%
3/12/2030 986,295 0.36EUR 200,000 Intesa Sanpaolo SpA RegS
0.75% 4/12/2024 204,772 0.08EUR 805,000 Intesa Sanpaolo SpA RegS
1.00% 19/11/2026 824,875 0.30EUR 1,066,000 Intesa Sanpaolo SpA RegS
2.925% 14/10/2030 1,121,699 0.41EUR 950,000 Intesa Sanpaolo SpA RegS
1.35% 24/2/2031 930,117 0.34EUR 300,000 Iren SpA RegS 1.00%
1/7/2030 306,771 0.11EUR 400,000 Mediobanca Banca di Credito
Finanziario SpA RegS1.00% 8/9/2027 411,044 0.15
EUR 450,000 Snam SpA RegS15/8/2025 (Zero Coupon) 449,375 0.17
EUR 2,264,000 Snam SpA RegS 0.75%17/6/2030 2,289,628 0.84
EUR 1,115,000 Terna Rete Elettrica NazionaleSpA RegS 0.75% 24/7/2032 1,106,136 0.41
EUR 717,000 UniCredit SpA RegS FRN25/6/2025 737,800 0.27
EUR 800,000 UniCredit SpA RegS 1.80%20/1/2030^ 822,024 0.30
12,369,086 4.55
JapanEUR 1,802,000 Takeda Pharmaceutical Co Ltd
2.00% 9/7/2040 1,888,226 0.69
1,888,226 0.69
LuxembourgEUR 325,000 Becton Dickinson Euro Fi-
nance Sarl 1.213%12/2/2036 316,875 0.12
EUR 974,000 GELF Bond Issuer I SA RegS1.125% 18/7/2029 999,470 0.37
BlackRock ESG Euro Corporate Bond Fund continued
Portfolio of Investments as at 31 May 2021
The notes on pages 590 to 610 form an integral part of these financial statements.
Annual report and audited financial statements [269]

Holding Description
MarketValue
EUR
% ofNet
Assets
Luxembourg continuedEUR 495,000 HeidelbergCement Finance
Luxembourg SA RegS1.625% 7/4/2026 527,611 0.19
EUR 83,000 HeidelbergCement FinanceLuxembourg SA RegS1.50% 14/6/2027 88,659 0.03
EUR 281,000 HeidelbergCement FinanceLuxembourg SA RegS1.125% 1/12/2027 294,244 0.11
EUR 459,000 HeidelbergCement FinanceLuxembourg SA RegS1.75% 24/4/2028 497,285 0.18
EUR 380,000 Holcim Finance LuxembourgSA RegS 0.50% 23/4/2031 366,757 0.14
EUR 450,000 SES SA RegS FRN (Per-petual) 452,250 0.17
EUR 365,000 SIG Combibloc PurchaseCoSarl RegS 2.125%18/6/2025 385,852 0.14
3,929,003 1.45
NetherlandsEUR 200,000 Achmea Bank NV RegS 0.01%
16/6/2025 202,286 0.07EUR 200,000 Allianz Finance II BV FRN
8/7/2041 201,190 0.07EUR 947,000 ASML Holding NV RegS
3.375% 19/9/2023 1,027,656 0.38EUR 141,000 ASML Holding NV RegS
1.375% 7/7/2026 150,785 0.06EUR 274,000 ASML Holding NV RegS
1.625% 28/5/2027 298,452 0.11EUR 475,000 ASML Holding NV RegS
0.625% 7/5/2029 488,096 0.18EUR 169,000 BMW Finance NV RegS
0.50% 22/11/2022 171,253 0.06EUR 554,000 BMW Finance NV RegS
24/3/2023 (Zero Coupon) 557,152 0.20EUR 715,000 BMW Finance NV RegS
1.00% 14/11/2024 742,914 0.27EUR 278,000 BMW Finance NV RegS
1.00% 29/8/2025 290,849 0.11EUR 1,000,000 BMW Finance NV RegS
0.75% 13/7/2026 1,037,960 0.38EUR 991,000 BMW Finance NV RegS
0.375% 14/1/2027^ 1,006,876 0.37EUR 543,000 Daimler International Finance
BV RegS 0.25% 9/8/2021 543,733 0.20EUR 257,000 Daimler International Finance
BV RegS 0.25% 11/5/2022 258,575 0.10EUR 508,000 Daimler International Finance
BV RegS 0.85% 28/2/2025 525,648 0.19EUR 260,000 Daimler International Finance
BV RegS 1.00% 11/11/2025 271,445 0.10EUR 623,000 Daimler International Finance
BV RegS 1.375% 26/6/2026 664,087 0.24EUR 300,000 de Volksbank NV RegS 0.01%
16/9/2024 301,848 0.11EUR 294,000 Deutsche Telekom Interna-
tional Finance BV RegS0.625% 1/12/2022 298,251 0.11
EUR 97,000 Deutsche Telekom Interna-tional Finance BV RegS0.625% 3/4/2023 98,605 0.04
EUR 500,000 Deutsche Telekom Interna-tional Finance BV RegS0.625% 13/12/2024 512,915 0.19
EUR 400,000 Diageo Capital BV RegS0.125% 28/9/2028^ 395,224 0.15
EUR 880,000 EDP Finance BV RegS2.625% 18/1/2022 896,861 0.33
EUR 1,000,000 EDP Finance BV RegS1.125% 12/2/2024 1,033,670 0.38
Holding Description
MarketValue
EUR
% ofNet
Assets
Netherlands continuedEUR 242,000 EDP Finance BV RegS
1.625% 26/1/2026 258,974 0.10EUR 823,000 EDP Finance BV RegS
0.375% 16/9/2026 830,695 0.31EUR 305,000 EDP Finance BV RegS 1.50%
22/11/2027 327,665 0.12USD 1,248,000 Enel Finance International NV
2.65% 10/9/2024 1,077,032 0.40EUR 300,000 Enel Finance International NV
RegS 1.966% 27/1/2025 322,089 0.12EUR 1,016,000 Enel Finance International NV
RegS 0.375% 17/6/2027 1,029,645 0.38EUR 100,000 Heineken NV RegS 2.25%
30/3/2030 114,903 0.04EUR 600,000 Iberdrola International BV
RegS FRN (Perpetual) 603,090 0.22EUR 1,100,000 Iberdrola International BV
RegS FRN (Perpetual) 1,127,038 0.41EUR 600,000 Iberdrola International BV
RegS FRN (Perpetual) 635,328 0.23EUR 700,000 Iberdrola International BV
RegS FRN (Perpetual) 762,293 0.28EUR 1,000,000 ING Groep NV RegS FRN
3/9/2025 1,001,020 0.37EUR 1,300,000 ING Groep NV RegS FRN
18/2/2029 1,269,749 0.47EUR 300,000 ING Groep NV RegS FRN
13/11/2030 302,679 0.11EUR 1,200,000 ING Groep NV RegS FRN
26/5/2031 1,272,336 0.47EUR 224,000 Koninklijke Ahold Delhaize NV
RegS 1.125% 19/3/2026 234,922 0.09EUR 300,000 Koninklijke DSM NV RegS
0.625% 23/6/2032 302,214 0.11GBP 685,000 LafargeHolcim Sterling Fi-
nance Netherlands BV RegS3.00% 12/5/2032^ 859,161 0.32
EUR 310,000 Nederlandse Gasunie NVRegS 1.00% 11/5/2026 325,162 0.12
EUR 107,000 NN Group NV RegS 1.00%18/3/2022 108,158 0.04
EUR 2,078,000 NN Group NV RegS FRN8/4/2044 2,321,936 0.85
EUR 225,000 RELX Finance BV RegS0.50% 10/3/2028 227,007 0.08
EUR 325,000 Sagax Euro Mtn NL BV RegS0.75% 26/1/2028 321,835 0.12
EUR 600,000 Siemens Financierings-maatschappij NV RegS20/2/2023 (Zero Coupon) 603,606 0.22
EUR 200,000 Siemens Financierings-maatschappij NV RegS0.375% 5/6/2026 204,338 0.08
EUR 1,402,000 Siemens Financierings-maatschappij NV RegS0.90% 28/2/2028 1,474,974 0.54
EUR 200,000 Siemens Financierings-maatschappij NV RegS0.25% 20/2/2029 200,480 0.07
EUR 100,000 Telefonica Europe BV RegSFRN (Perpetual) 101,984 0.04
EUR 1,100,000 Telefonica Europe BV RegSFRN (Perpetual) 1,132,395 0.42
EUR 1,000,000 Telefonica Europe BV RegSFRN (Perpetual) 1,071,370 0.39
EUR 950,000 TenneT Holding BV RegS0.50% 9/6/2031 944,984 0.35
EUR 2,225,000 TenneT Holding BV RegS FRN(Perpetual) 2,297,846 0.85
EUR 114,000 Toyota Motor Finance Nether-lands BV RegS 0.25%10/1/2022 114,522 0.04
BlackRock ESG Euro Corporate Bond Fund continued
Portfolio of Investments as at 31 May 2021
The notes on pages 590 to 610 form an integral part of these financial statements.
BlackRock Strategic Funds[270]

Holding Description
MarketValue
EUR
% ofNet
Assets
Netherlands continuedEUR 100,000 Vonovia Finance BV RegS
2.25% 7/4/2030 113,001 0.04EUR 300,000 Vonovia Finance BV RegS
1.00% 9/7/2030 306,777 0.11EUR 400,000 Vonovia Finance BV RegS
1.125% 14/9/2034 399,300 0.15
36,576,839 13.46
New ZealandEUR 2,114,000 Chorus Ltd RegS 1.125%
18/10/2023 2,170,951 0.80EUR 535,000 Chorus Ltd RegS 0.875%
5/12/2026 549,681 0.20NZD 1,345,000 New Zealand Government
Bond 1.75% 15/5/2041 689,904 0.25
3,410,536 1.25
NorwayEUR 873,000 DNB Bank ASA RegS 0.25%
9/4/2024 884,960 0.33EUR 250,000 Telenor ASA RegS
25/9/2023 (Zero Coupon) 251,435 0.09
1,136,395 0.42
PolandEUR 150,000 Santander Bank Polska SA
RegS 0.75% 20/9/2021 150,511 0.06
150,511 0.06
PortugalEUR 100,000 EDP - Energias de Portugal
SA RegS 1.625% 15/4/2027 107,492 0.04EUR 500,000 EDP - Energias de Portugal
SA RegS FRN 20/7/2080 500,055 0.18
607,547 0.22
SingaporeEUR 2,400,000 DBS Group Holdings Ltd RegS
FRN 11/4/2028^ 2,455,464 0.90
2,455,464 0.90
SpainEUR 100,000 Banco Bilbao Vizcaya Argen-
taria SA RegS 0.625%17/1/2022 100,680 0.04
EUR 800,000 Banco Bilbao Vizcaya Argen-taria SA RegS 0.375%15/11/2026 807,520 0.30
EUR 1,500,000 Banco de Sabadell SA RegSFRN 11/3/2027 1,545,285 0.57
EUR 200,000 Banco de Sabadell SA RegS2.50% 15/4/2031 200,694 0.07
EUR 300,000 Banco Santander SA RegS1.375% 14/12/2022 307,674 0.11
EUR 1,400,000 Bankia SA RegS 0.75%9/7/2026 1,432,312 0.53
EUR 300,000 Bankia SA RegS 1.125%12/11/2026 308,058 0.11
EUR 300,000 CaixaBank SA RegS 0.375%3/2/2025 302,802 0.11
EUR 600,000 CaixaBank SA RegS 1.125%27/3/2026 625,482 0.23
EUR 1,700,000 CaixaBank SA RegS FRN10/7/2026 1,736,329 0.64
EUR 800,000 CaixaBank SA RegS FRN18/11/2026 797,856 0.29
GBP 200,000 CaixaBank SA RegS FRN3/12/2026 232,398 0.09
EUR 300,000 Cellnex Finance Co SA RegS2.00% 15/2/2033 291,474 0.11
EUR 500,000 Iberdrola Finanzas SA RegS0.875% 16/6/2025 518,600 0.19
Holding Description
MarketValue
EUR
% ofNet
Assets
Spain continuedEUR 600,000 Santander Consumer Finance
SA RegS 1.00% 27/2/2024 617,718 0.23EUR 400,000 Santander Consumer Finance
SA RegS 0.375% 27/6/2024 404,828 0.15EUR 600,000 Telefonica Emisiones SA RegS
1.477% 14/9/2021 603,180 0.22
10,832,890 3.99
SupranationalEUR 936,000 European Union RegS
4/11/2025 (Zero Coupon) 953,316 0.35
953,316 0.35
SwedenEUR 620,000 Lansforsakringar Bank AB
RegS 0.125% 19/2/2025 623,410 0.23EUR 1,300,000 Nordea Bank AB RegS FRN
18/8/2031 1,296,087 0.48EUR 994,000 Skandinaviska Enskilda Ban-
ken AB RegS 0.05%1/7/2024 1,002,012 0.37
EUR 1,600,000 Skandinaviska Enskilda Ban-ken AB RegS FRN31/10/2028 1,643,520 0.60
4,565,029 1.68
SwitzerlandEUR 200,000 Credit Suisse AG RegS 1.00%
7/6/2023 204,822 0.08EUR 100,000 Credit Suisse Group AG RegS
FRN 2/4/2026 110,352 0.04EUR 953,000 Credit Suisse Group AG RegS
FRN 24/6/2027 970,202 0.36EUR 925,000 Credit Suisse Group AG RegS
FRN 14/1/2028 921,670 0.34EUR 350,000 Credit Suisse Group AG RegS
0.625% 18/1/2033 324,639 0.12EUR 200,000 UBS Group AG RegS FRN
20/9/2022 200,354 0.07EUR 400,000 UBS Group AG RegS 1.50%
30/11/2024 415,368 0.15EUR 502,000 UBS Group AG RegS FRN
17/4/2025 519,068 0.19EUR 500,000 UBS Group AG RegS FRN
29/1/2026 501,265 0.18EUR 675,000 UBS Group AG RegS FRN
5/11/2028 665,591 0.24EUR 450,000 UBS Group AG RegS 0.625%
24/2/2033 436,500 0.16USD 300,000 UBS Group AG RegS FRN
(Perpetual) 265,319 0.10USD 261,000 UBS Group AG RegS FRN
(Perpetual) 235,801 0.09
5,770,951 2.12
United KingdomEUR 825,000 AstraZeneca Plc RegS 0.375%
3/6/2029 820,462 0.30EUR 800,000 Barclays Plc RegS FRN
9/6/2025 813,008 0.30EUR 500,000 Barclays Plc RegS FRN
24/1/2026 519,930 0.19GBP 149,000 Barclays Plc RegS 3.00%
8/5/2026 185,788 0.07EUR 586,000 BP Capital Markets Plc RegS
1.231% 8/5/2031 608,866 0.22EUR 1,000,000 BP Capital Markets Plc RegS
FRN (Perpetual) 1,065,600 0.39EUR 300,000 BP Capital Markets Plc RegS
FRN (Perpetual) 321,801 0.12
BlackRock ESG Euro Corporate Bond Fund continued
Portfolio of Investments as at 31 May 2021
The notes on pages 590 to 610 form an integral part of these financial statements.
Annual report and audited financial statements [271]

Holding Description
MarketValue
EUR
% ofNet
Assets
United Kingdom continuedEUR 228,000 British Telecommunications Plc
RegS 0.50% 23/6/2022 229,573 0.08EUR 100,000 British Telecommunications Plc
RegS 1.00% 23/6/2024 103,044 0.04EUR 783,000 British Telecommunications Plc
RegS 1.00% 21/11/2024 808,870 0.30EUR 1,475,000 Cadent Finance Plc RegS
0.625% 19/3/2030 1,471,475 0.54EUR 800,000 Cadent Finance Plc RegS
0.75% 11/3/2032 789,656 0.29GBP 570,000 Crh Finance UK Plc RegS
4.125% 2/12/2029 785,870 0.29EUR 100,000 Diageo Finance Plc RegS
0.125% 12/10/2023 100,748 0.04EUR 164,000 Diageo Finance Plc RegS
1.00% 22/4/2025 170,567 0.06EUR 911,000 DS Smith Plc RegS 0.875%
12/9/2026 929,803 0.34EUR 874,000 GlaxoSmithKline Capital Plc
RegS 0.125% 12/5/2023 881,184 0.32EUR 787,000 GlaxoSmithKline Capital Plc
RegS 23/9/2023 (Zero Cou-pon) 791,218 0.29
EUR 444,000 GlaxoSmithKline Capital PlcRegS 1.375% 12/9/2029 482,908 0.18
EUR 925,000 HSBC Holdings Plc RegS FRN13/11/2031 915,213 0.34
EUR 225,000 Lloyds Bank Corporate Mar-kets Plc RegS 0.25%4/10/2022 226,760 0.08
EUR 525,000 Motability Operations GroupPlc RegS 0.125% 20/7/2028 519,068 0.19
EUR 734,000 National Grid Electricity Trans-mission Plc RegS 0.823%7/7/2032 734,176 0.27
EUR 1,400,000 Natwest Group Plc RegS FRN8/3/2023 1,423,016 0.52
EUR 400,000 NGG Finance Plc RegS FRN5/12/2079 403,136 0.15
EUR 390,000 NGG Finance Plc RegS FRN5/9/2082 392,964 0.15
EUR 575,000 OTE Plc RegS 0.875%24/9/2026^ 588,691 0.22
EUR 228,000 Sky Ltd RegS 2.50%15/9/2026 256,906 0.09
EUR 400,000 SSE Plc RegS 1.375%4/9/2027 426,352 0.16
EUR 600,000 SSE Plc RegS 1.75%16/4/2030 653,544 0.24
USD 610,000 Standard Chartered Plc RegSFRN 23/3/2025 504,119 0.19
EUR 700,000 Swiss Re Finance UK PlcRegS FRN 4/6/2052 765,877 0.28
GBP 1,552,000 Tesco Corporate Treasury Ser-vices Plc RegS 2.75%27/4/2030 1,917,510 0.71
21,607,703 7.95
United StatesEUR 472,000 AbbVie Inc 1.50% 15/11/2023 490,323 0.18EUR 705,000 AbbVie Inc 1.375% 17/5/2024 732,065 0.27
EUR 1,000,000 AbbVie Inc 1.25% 1/6/2024 1,035,020 0.38EUR 1,850,000 Air Products and Chemicals
Inc 0.80% 5/5/2032 1,875,234 0.69USD 1,306,000 Amazon.com Inc 2.70%
3/6/2060 955,621 0.35USD 1,206,000 Apple Inc 2.55% 20/8/2060 867,069 0.32USD 1,100,000 Apple Inc 2.80% 8/2/2061 824,694 0.30
EUR 300,000 AT&T Inc 2.45% 15/3/2035 332,055 0.12
Holding Description
MarketValue
EUR
% ofNet
Assets
United States continuedEUR 200,000 Bank of America Corp RegS
FRN 4/5/2027 214,648 0.08EUR 200,000 Bank of America Corp RegS
FRN 31/3/2029 241,032 0.09EUR 600,000 Bank of America Corp RegS
FRN 22/3/2031 592,008 0.22EUR 775,000 Bank of America Corp RegS
FRN 26/10/2031 760,101 0.28EUR 1,125,000 Bank of America Corp RegS
FRN 24/5/2032 1,138,860 0.42EUR 2,202,000 Becton Dickinson and Co
1.401% 24/5/2023 2,264,449 0.83EUR 525,000 Booking Holdings Inc 0.10%
8/3/2025 526,123 0.19EUR 400,000 Citigroup Inc RegS 0.75%
26/10/2023 407,924 0.15EUR 1,225,000 Citigroup Inc RegS FRN
6/7/2026 1,277,258 0.47EUR 732,000 Citigroup Inc RegS FRN
24/7/2026 769,837 0.28EUR 350,000 Citigroup Inc RegS FRN
8/10/2027 351,406 0.13EUR 300,000 Coca-Cola Co 0.125%
9/3/2029 294,984 0.11EUR 375,000 Coca-Cola Co 0.40% 6/5/2030 372,555 0.14
EUR 1,625,000 Coca-Cola Co 0.375%15/3/2033 1,551,864 0.57
EUR 575,000 Comcast Corp 0.75%20/2/2032 574,321 0.21
EUR 100,000 Danaher Corp 2.50%30/3/2030 115,635 0.04
EUR 314,000 Eli Lilly & Co 0.625%1/11/2031 316,638 0.12
EUR 600,000 Equinix Inc 0.25% 15/3/2027 594,834 0.22EUR 191,000 Fidelity National Information
Services Inc 0.75%21/5/2023 194,111 0.07
EUR 400,000 Fidelity National InformationServices Inc 0.625%3/12/2025 408,352 0.15
EUR 550,000 Fidelity National InformationServices Inc 1.00%3/12/2028 564,049 0.21
EUR 1,257,000 Fidelity National InformationServices Inc 2.00%21/5/2030^ 1,382,059 0.51
EUR 193,000 Fiserv Inc 1.125% 1/7/2027 201,174 0.07EUR 343,000 Fiserv Inc 1.625% 1/7/2030 366,758 0.13EUR 432,000 Goldman Sachs Group Inc
RegS FRN 9/9/2022 432,531 0.16EUR 400,000 Goldman Sachs Group Inc
RegS 3.25% 1/2/2023 423,000 0.16EUR 254,000 Goldman Sachs Group Inc
RegS 2.00% 27/7/2023 265,519 0.10EUR 950,000 Goldman Sachs Group Inc
RegS FRN 30/4/2024 950,731 0.35EUR 690,000 Goldman Sachs Group Inc
RegS 1.375% 15/5/2024 708,913 0.26EUR 125,000 Goldman Sachs Group Inc
RegS 0.125% 19/8/2024 125,173 0.05EUR 19,000 Goldman Sachs Group Inc
RegS 2.125% 30/9/2024 20,264 0.01EUR 200,000 Goldman Sachs Group Inc
RegS 3.375% 27/3/2025 224,344 0.08EUR 116,000 Goldman Sachs Group Inc
RegS 1.625% 27/7/2026 123,552 0.05EUR 1,125,000 Goldman Sachs Group Inc
RegS 0.25% 26/1/2028 1,099,609 0.40
BlackRock ESG Euro Corporate Bond Fund continued
Portfolio of Investments as at 31 May 2021
The notes on pages 590 to 610 form an integral part of these financial statements.
BlackRock Strategic Funds[272]

Holding Description
MarketValue
EUR
% ofNet
Assets
United States continuedEUR 675,000 Goldman Sachs Group Inc
RegS 1.00% 18/3/2033 668,176 0.25EUR 100,000 International Business Ma-
chines Corp 0.375%31/1/2023 101,139 0.04
EUR 852,000 International Business Ma-chines Corp 0.95%23/5/2025 885,866 0.33
EUR 816,000 International Business Ma-chines Corp 1.25%29/1/2027 864,944 0.32
EUR 766,000 International Business Ma-chines Corp 0.65%11/2/2032 759,596 0.28
EUR 207,000 International Flavors & Fra-grances Inc 0.50%25/9/2021 207,381 0.08
EUR 1,163,000 International Flavors & Fra-grances Inc 1.80%25/9/2026 1,246,352 0.46
EUR 183,000 JPMorgan Chase & Co RegS1.50% 26/10/2022 187,848 0.07
EUR 300,000 JPMorgan Chase & Co RegSFRN 25/7/2031 306,837 0.11
EUR 4,087,000 JPMorgan Chase & Co RegSFRN 4/11/2032 4,167,800 1.53
EUR 863,000 Levi Strauss & Co 3.375%15/3/2027 893,429 0.33
USD 621,000 Microsoft Corp 2.675%1/6/2060 474,603 0.17
EUR 174,000 Morgan Stanley 1.00%2/12/2022 177,341 0.06
EUR 800,000 Morgan Stanley 1.875%30/3/2023 831,048 0.31
EUR 625,000 Morgan Stanley 1.75%11/3/2024 656,625 0.24
EUR 1,388,000 Morgan Stanley FRN26/7/2024 1,409,778 0.52
EUR 530,000 Morgan Stanley FRN23/10/2026 555,583 0.20
EUR 1,200,000 Morgan Stanley FRN29/10/2027 1,198,344 0.44
EUR 346,000 Morgan Stanley FRN26/10/2029 342,076 0.13
EUR 329,000 National Grid North AmericaInc RegS 0.75% 8/8/2023 335,162 0.12
USD 1,185,000 Oracle Corp 2.875%25/3/2031 994,462 0.37
Holding Description
MarketValue
EUR
% ofNet
Assets
United States continuedEUR 275,000 PepsiCo Inc 1.05% 9/10/2050 256,399 0.09
EUR 1,100,000 Prologis Euro Finance LLC0.50% 16/2/2032 1,061,500 0.39
EUR 751,000 RELX Capital Inc 1.30%12/5/2025 788,415 0.29
EUR 125,000 Thermo Fisher Scientific Inc0.125% 1/3/2025 125,456 0.05
EUR 400,000 Thermo Fisher Scientific Inc2.375% 15/4/2032 459,830 0.17
EUR 875,000 Toyota Motor Credit CorpRegS 0.125% 5/11/2027 870,231 0.32
EUR 192,000 Verizon Communications Inc0.875% 2/4/2025 198,411 0.07
EUR 200,000 Verizon Communications Inc1.25% 8/4/2030 210,130 0.08
EUR 186,000 Verizon Communications Inc2.625% 1/12/2031 219,800 0.08
EUR 200,000 Verizon Communications Inc0.875% 19/3/2032 199,410 0.07
EUR 1,075,000 Verizon Communications Inc1.30% 18/5/2033 1,098,263 0.40
EUR 452,000 Verizon Communications Inc2.875% 15/1/2038 543,598 0.20
50,262,530 18.49
Total Bonds 253,599,489 93.30
Total Transferable Securities and Money MarketInstruments Admitted to an Official Stock ExchangeListing or Dealt in on Another Regulated Market 253,599,489 93.30
Collective Investment SchemesIreland
193,079 BlackRock ICS Euro LiquidEnvironmentally AwareFund~ 19,084,623 7.02
19,084,623 7.02
Total Collective Investment Schemes 19,084,623 7.02
Securities portfolio at market value 272,684,112 100.32
Other Net Liabilities (866,972) (0.32)
Total Net Assets (EUR) 271,817,140 100.00
^ All or a portion of this security represents a security on loan.~ Investment in related party fund.
TypeNominal
Value Description CounterpartyExpiration
date
Net unrealisedappreciation/
(depreciation)EUR
MarketValue
EUR
Financial Derivative Instruments
SWAPS
CCCDS EUR 3,550,000Fund receives Fixed 1.000% and provides default protection on
Markit iTraxx Europe Series 23 Version 1Bank of America
Merrill Lynch 20/6/2026 7,338 89,897
CCCDS EUR 1,078,377Fund receives Fixed 5.000% and provides default protection on
Markit iTraxx Europe Crossover Series 30 Version 1Bank of America
Merrill Lynch 20/12/2025 16,085 132,689
CCILS EUR 590,000Fund receives Fixed 1.382% and pays Floating EUR 12 Month
CPTFEBank of America
Merrill Lynch 15/4/2031 (10,025) (10,011)
CCILS USD 185,000Fund receives Fixed 2.350% and pays Floating USD 12 Month
USCPIBank of America
Merrill Lynch 5/3/2031 (4,511) (4,508)
CCILS USD 185,000Fund receives Fixed 2.354% and pays Floating USD 12 Month
USCPIBank of America
Merrill Lynch 5/3/2031 (4,445) (4,442)
BlackRock ESG Euro Corporate Bond Fund continued
Portfolio of Investments as at 31 May 2021
The notes on pages 590 to 610 form an integral part of these financial statements.
Annual report and audited financial statements [273]

TypeNominal
Value Description CounterpartyExpiration
date
Net unrealisedappreciation/
(depreciation)EUR
MarketValue
EUR
Financial Derivative Instruments
SWAPS
CCILS USD 370,000Fund receives Fixed 2.358% and pays Floating USD 12 Month
USCPIBank of America
Merrill Lynch 5/3/2031 (8,776) (8,769)
CCILS USD 370,000Fund receives Fixed 2.388% and pays Floating USD 12 Month
USCPIBank of America
Merrill Lynch 17/2/2031 (8,021) (8,014)
CCILS USD 115,000Fund receives Fixed 2.432% and pays Floating USD 12 Month
USCPIBank of America
Merrill Lynch 6/5/2051 (1,398) (1,394)
CCILS USD 115,000Fund receives Fixed 2.438% and pays Floating USD 12 Month
USCPIBank of America
Merrill Lynch 7/5/2051 (1,212) (1,207)
CCILS USD 115,000Fund receives Fixed 2.484% and pays Floating USD 12 Month
USCPIBank of America
Merrill Lynch 4/5/2051 353 358
CCILS USD 115,000Fund receives Fixed 2.488% and pays Floating USD 12 Month
USCPIBank of America
Merrill Lynch 4/5/2051 489 494
CCILS GBP 215,000Fund receives Fixed 3.202% and pays Floating GBP 12 Month
UKRPIBank of America
Merrill Lynch 15/3/2030 (10,157) (10,151)
CCILS GBP 270,000Fund receives Fixed 3.270% and pays Floating GBP 12 Month
UKRPIBank of America
Merrill Lynch 15/3/2030 (10,089) (10,082)
CCILS GBP 690,000Fund receives Fixed 3.315% and pays Floating GBP 12 Month
UKRPIBank of America
Merrill Lynch 15/5/2030 (25,072) (25,055)
CCILS GBP 790,000Fund receives Fixed 3.440% and pays Floating GBP 12 Month
UKRPIBank of America
Merrill Lynch 15/10/2029 3,255 3,276
CCILS GBP 210,000Fund receives Fixed 3.625% and pays Floating GBP 12 Month
UKRPIBank of America
Merrill Lynch 15/2/2031 (4,215) (4,210)
CCILS GBP 470,000Fund receives Fixed 3.650% and pays Floating GBP 12 Month
UKRPIBank of America
Merrill Lynch 15/4/2031 (7,901) (7,889)
CCILS GBP 440,000Fund receives Fixed 3.658% and pays Floating GBP 12 Month
UKRPIBank of America
Merrill Lynch 15/4/2031 (6,906) (6,895)
CCILS GBP 251,246Fund receives Fixed 3.756% and pays Floating GBP 12 Month
UKRPIBank of America
Merrill Lynch 15/4/2031 (249) (242)
CDS EUR 150,000Fund receives default protection on Peugeot SA and pays Fixed
5.000% BNP Paribas 20/6/2025 (12,554) (24,337)
CDS EUR 161,000Fund receives default protection on CNH Industrial NV and pays
Fixed 5.000% Goldman Sachs 20/6/2025 (8,551) (28,314)
CDS EUR 170,000Fund receives default protection on CNH Industrial Finance Europe
SA and pays Fixed 5.000% JP Morgan 20/6/2025 (9,029) (29,896)
CDS EUR 169,000Fund receives default protection on CNH Industrial NV and pays
Fixed 5.000% JP Morgan 20/6/2025 (9,474) (29,720)
IRS CNY 18,500,000Fund receives Fixed 2.716% and pays Floating CNY 12 Month
UKRPI CNRR BNP Paribas 26/8/2025 1,207 1,207
Total (Gross underlying exposure - EUR 13,645,860) (113,858) 12,785
CCCDS: Centrally Cleared Credit Default SwapsCCILS: Centrally Cleared Inflation Linked SwapsCDS: Credit Default SwapsIRS: Interest Rate Swaps
Numberof
contractsCurrencyof contracts
Contract/Description
Expirationdate
Grossunderlying
exposureEUR
Net unrealisedappreciation/
(depreciation)EUR
Financial Derivative Instruments
FUTURES
97 EUR Euro BOBL Futures June 2021 June 2021 13,063,960 (13,521)
(15) EUR Euro BTP Futures June 2021 June 2021 2,209,200 3,559
42 EUR Euro Bund Futures June 2021 June 2021 7,132,020 (6,792)
9 EUR Euro BUXL 30 Year Bond Futures June 2021 June 2021 1,809,360 11,153
7 EUR Euro-OAT Futures June 2021 June 2021 1,122,240 (12,996)
(25) GBP UK Long Gilt Bond Futures September 2021 September 2021 3,693,732 (8,149)
(1) USD US Long Bond Futures September 2021 September 2021 128,032 557
(59) USD US Treasury 10 Year Note Futures September 2021 September 2021 6,997,151 16,767
BlackRock ESG Euro Corporate Bond Fund continued
Portfolio of Investments as at 31 May 2021
The notes on pages 590 to 610 form an integral part of these financial statements.
BlackRock Strategic Funds[274]

Numberof
contractsCurrencyof contracts
Contract/Description
Expirationdate
Grossunderlying
exposureEUR
Net unrealisedappreciation/
(depreciation)EUR
Financial Derivative Instruments
FUTURES
(90) USD US Treasury 10 Year Note Futures September 2021 September 2021 9,720,680 23,752
7 USD US Treasury 5 Year Note Futures September 2021 September 2021 710,121 (454)
(32) USD US Ultra Bond Futures September 2021 September 2021 4,844,311 19,470
Total 51,430,807 33,346
Numberof
contractsCall/Put Description Counterparty Strike Price
Expirationdate
Netunrealised
(depreciation)EUR
MarketValue
EUR
Financial Derivative Instruments
PURCHASED OPTIONS
2,390,000 Call OTC USD/CAD Bank of America Merrill Lynch USD 1.28 23/06/2021 (15,772) 133
665,000 Call OTC EUR/GBP BNP Paribas EUR 0.89 06/08/2021 (8,797) 1,038
Total (Gross underlying exposure - EUR 3,113) (24,569) 1,171
NominalValue
Call/Put Description Counterparty Strike Price
Expirationdate
Netunrealised
appreciation/(depreciation)
EUR
MarketValue
EUR
Financial Derivative Instruments
WRITTEN SWAPTIONS
(848,867) Put
Fund writes an option to enter into an InterestRate Swap. If exercised Fund receives-0.11% Fixed annually from 14/1/2022; andpays Floating EUR Interbank Offer Rate6 Month semi-annually from 18/7/2022 Barclays Bank EUR 0.11 14/01/2022 (18,154) (30,866)
(848,867) Call
Fund writes an option to enter into an InterestRate Swap. If exercised Fund receivesFloating EUR Interbank Offer Rate6 Month semi-annually from 18/7/2022;and pays -0.11% Fixed annually from14/1/2022 Barclays Bank EUR 0.11 14/01/2022 9,861 (2,851)
(1,675,000) Call
Fund writes an option to enter into an InterestRate Swap. If exercised Fund receivesFloating USD LIBOR 3 Month BBAquarterly from 28/10/2021; and pays0.92% Fixed semi-annually from 26/7/2021 BNP Paribas USD 0.92 26/07/2021 9,086 (207)
(1,590,000) Call
Fund writes an option to enter into an InterestRate Swap. If exercised Fund receivesFloating USD LIBOR 3 Month BBAquarterly from 10/12/2021; and pays1.125% Fixed semi-annually from 8/9/2021 JP Morgan USD 1.12 08/09/2021 (198) (13,953)
(1,590,000) Put
Fund writes an option to enter into an InterestRate Swap. If exercised Fund receives1.125% Fixed semi-annually from8/9/2021; and pays Floating USD LIBOR3 Month BBA quarterly from 10/12/2021 JP Morgan USD 1.13 08/09/2021 8,896 (4,858)
(1,645,000) Call
Fund writes an option to enter into an InterestRate Swap. If exercised Fund receivesFloating USD LIBOR 3 Month BBAquarterly from 28/7/2023; and pays 2%Fixed semi-annually from 26/4/2023 Barclays Bank USD 0.02 26/04/2023 3,038 (51,357)
BlackRock ESG Euro Corporate Bond Fund continued
Portfolio of Investments as at 31 May 2021
The notes on pages 590 to 610 form an integral part of these financial statements.
Annual report and audited financial statements [275]

NominalValue
Call/Put Description Counterparty Strike Price
Expirationdate
Netunrealised
appreciation/(depreciation)
EUR
MarketValue
EUR
Financial Derivative Instruments
WRITTEN SWAPTIONS
(1,645,000) Put
Fund writes an option to enter into an InterestRate Swap. If exercised Fund receives 2%Fixed semi-annually from 26/4/2023; andpays Floating USD LIBOR 3 Month BBAquarterly from 28/7/2023 Barclays Bank USD 0.02 26/04/2023 1,650 (52,218)
(13,535,000) Put
Fund writes an option to enter into an InterestRate Swap. If exercised Fund receives0.45% Fixed annually from 19/5/2022; andpays Floating EUR Interbank Offer Rate6 Month semi-annually from 23/11/2022 Citibank EUR 0.00 19/05/2022 8,870 (29,435)
Total (Gross underlying exposure - EUR 5,391,853) 23,049 (185,745)
Currency Purchases Currency Sales CounterpartyMaturity
date
Netunrealised
appreciation/(depreciation)
EUR
Financial Derivative Instruments
OPEN FORWARD FOREIGN EXCHANGE TRANSACTIONS
AUD 750,000 EUR 481,999State Street Bank& Trust Company 15/7/2021 (6,664)
EUR 620,545 AUD 970,000 HSBC 15/7/2021 5,779
EUR 77,967 DKK 580,000Toronto Dominion
Bank 15/7/2021 (14)EUR 3,747,681 GBP 3,250,000 Goldman Sachs 15/7/2021 (22,932)EUR 400,908 NOK 4,100,000 JP Morgan 16/6/2021 (1,560)
EUR 861,441 NZD 1,460,000Bank of America
Merrill Lynch 15/7/2021 (7,295)EUR 820,000 USD 991,409 Goldman Sachs 16/6/2021 7,854EUR 7,959,364 USD 9,500,000 Morgan Stanley 15/7/2021 181,484NOK 9,300,000 EUR 916,706 HSBC 16/6/2021 (3,791)USD 1,001,966 EUR 820,000 BNP Paribas 16/6/2021 794
USD 1,700,000 EUR 1,410,161State Street Bank& Trust Company 15/7/2021 (18,330)
Total (Gross underlying exposure - EUR 17,925,463) 135,325
Sector Breakdownas at 31 May 2021
% of NetAssets
Financial 41.56
Utilities 16.70
Consumer, Non-cyclical 8.40
Communications 7.39
Collective Investment Schemes 7.02
Industrial 6.44
Technology 4.88
Consumer, Cyclical 3.61
Basic Materials 2.42
Energy 1.30
Government 0.60
Securities portfolio at market value 100.32
Other Net Liabilities (0.32)
100.00
BlackRock ESG Euro Corporate Bond Fund continued
Portfolio of Investments as at 31 May 2021
The notes on pages 590 to 610 form an integral part of these financial statements.
BlackRock Strategic Funds[276]

Holding Description
MarketValue
EUR
% ofNet
Assets
Transferable Securities and Money Market Instruments Admittedto an Official Stock Exchange Listing or Dealt in on AnotherRegulated Market
BONDSAustralia
EUR 450,000 Macquarie Group Ltd RegS0.35% 3/3/2028 442,350 0.19
442,350 0.19
AustriaEUR 400,000 Raiffeisen Bank International
AG RegS 0.25% 5/7/2021 400,240 0.17EUR 400,000 Raiffeisen Bank International
AG RegS 0.25% 22/1/2025 404,148 0.17EUR 1,700,000 Republic of Austria Govern-
ment Bond RegS20/9/2022 (Zero Coupon) 1,714,518 0.72
EUR 1,480,000 Republic of Austria Govern-ment Bond RegS20/4/2023 (Zero Coupon) 1,498,056 0.63
EUR 1,100,000 Republic of Austria Govern-ment Bond RegS 1.75%20/10/2023 1,162,931 0.49
EUR 1,157,000 Republic of Austria Govern-ment Bond RegS20/4/2025 (Zero Coupon) 1,180,707 0.49
EUR 400,000 Republic of Austria Govern-ment Bond RegS 0.70%20/4/2071 373,428 0.16
6,734,028 2.83
BelgiumEUR 600,000 Belfius Bank SA RegS
28/8/2026 (Zero Coupon) 596,058 0.25EUR 600,000 Elia Transmission Belgium SA
RegS 1.375% 14/1/2026 635,898 0.27EUR 1,000,000 KBC Group NV RegS FRN
10/9/2026 997,320 0.42EUR 400,000 KBC Group NV RegS FRN
11/3/2027 405,576 0.17EUR 2,500,000 Kingdom of Belgium Govern-
ment Bond RegS 4.25%28/9/2022 2,664,425 1.12
EUR 1,380,000 Kingdom of Belgium Govern-ment Bond RegS 0.20%22/10/2023 1,408,345 0.59
6,707,622 2.82
CanadaEUR 646,000 National Bank of Canada
RegS 0.25% 24/7/2023 655,748 0.27EUR 450,000 Royal Bank of Canada RegS
0.125% 23/7/2024 452,957 0.19EUR 540,000 Toronto-Dominion Bank RegS
9/2/2024 (Zero Coupon) 545,659 0.23
1,654,364 0.69
ColombiaUSD 765,000 Colombia Government Interna-
tional Bond 3.25%22/4/2032 606,408 0.25
606,408 0.25
CyprusEUR 60,000 Cyprus Government Interna-
tional Bond RegS 3.875%6/5/2022 62,395 0.03
EUR 160,000 Cyprus Government Interna-tional Bond RegS 3.75%26/7/2023 174,400 0.07
Holding Description
MarketValue
EUR
% ofNet
Assets
Cyprus continuedEUR 1,376,000 Cyprus Government Interna-
tional Bond RegS 0.625%3/12/2024 1,412,491 0.59
EUR 180,000 Cyprus Government Interna-tional Bond RegS9/2/2026 (Zero Coupon) 180,346 0.08
1,829,632 0.77
DenmarkDKK 4,099,866 Nykredit Realkredit A/S RegS
1.00% 1/10/2040 545,374 0.23DKK 3,823,095 Nykredit Realkredit A/S RegS
1.00% 1/10/2050 492,204 0.21DKK 4,525,000 Nykredit Realkredit A/S RegS
1.00% 1/10/2053 574,891 0.24DKK 1,992,766 Realkredit Danmark A/S RegS
0.50% 1/10/2050 245,660 0.10DKK 3,487,144 Realkredit Danmark A/S RegS
1.00% 1/10/2050 447,582 0.19
2,305,711 0.97
FinlandEUR 230,000 CRH Finland Services Oyj
RegS 0.875% 5/11/2023 235,635 0.10EUR 440,000 Finland Government Bond
RegS 1.625% 15/9/2022 453,015 0.19EUR 870,000 Finland Government Bond
RegS 15/9/2023 (Zero Cou-pon) 883,128 0.37
EUR 660,000 OP Corporate Bank Plc RegS0.50% 12/8/2025 675,517 0.28
2,247,295 0.94
FranceGBP 400,000 Banque Federative du Credit
Mutuel SA RegS 1.375%20/12/2021 467,512 0.20
EUR 500,000 Banque Federative du CreditMutuel SA RegS 0.375%13/1/2022 502,765 0.21
EUR 500,000 Banque Federative du CreditMutuel SA RegS 0.75%15/6/2023 510,845 0.21
EUR 600,000 Banque Federative du CreditMutuel SA RegS 0.75%17/7/2025 618,636 0.26
EUR 500,000 BPCE SA RegS 0.125%4/12/2024 504,735 0.21
EUR 600,000 BPCE SA RegS 0.25%15/1/2026 604,392 0.25
EUR 600,000 Capgemini SE RegS 0.625%23/6/2025 614,856 0.26
EUR 300,000 Capgemini SE RegS 1.625%15/4/2026 321,615 0.13
EUR 700,000 Cie de Financement FoncierSA RegS 0.25% 11/4/2023 709,590 0.30
EUR 600,000 Cie de Saint-Gobain RegS0.625% 15/3/2024 612,954 0.26
EUR 700,000 Credit Mutuel - CIC HomeLoan SFH SA RegS 0.25%30/4/2024 713,769 0.30
EUR 600,000 Credit Mutuel Arkea SA RegS0.875% 7/5/2027 621,882 0.26
EUR 500,000 Danone SA RegS1/12/2025 (Zero Coupon) 499,735 0.21
EUR 400,000 Dassault Systemes SE RegS16/9/2024 (Zero Coupon) 401,952 0.17
EUR 600,000 Engie SA RegS 1.375%27/3/2025 631,626 0.27
BlackRock ESG Euro Short Duration Bond Fund
Portfolio of Investments as at 31 May 2021
The notes on pages 590 to 610 form an integral part of these financial statements.
Annual report and audited financial statements [277]

Holding Description
MarketValue
EUR
% ofNet
Assets
France continuedEUR 400,000 Engie SA RegS FRN (Per-
petual) 405,920 0.17EUR 7,000,000 France Government Bond OAT
RegS 25/5/2022 (Zero Cou-pon) 7,044,240 2.96
EUR 7,700,000 France Government Bond OATRegS 25/2/2023 (Zero Cou-pon) 7,787,626 3.27
EUR 3,700,000 France Government Bond OATRegS 25/3/2023 (Zero Cou-pon) 3,744,067 1.57
EUR 1,900,000 France Government Bond OATRegS 1.75% 25/5/2023 1,990,858 0.84
EUR 2,400,000 France Government Bond OATRegS 4.25% 25/10/2023 2,684,184 1.13
EUR 2,030,000 France Government Bond OATRegS 25/2/2024 (Zero Cou-pon) 2,062,034 0.87
EUR 4,350,000 France Government Bond OATRegS 25/3/2024 (Zero Cou-pon) 4,423,254 1.86
EUR 400,000 France Government Bond OATRegS 0.75% 25/5/2052 376,048 0.16
EUR 270,000 France Government Bond OATRegS 0.50% 25/5/2072 204,490 0.09
EUR 600,000 Gecina SA RegS FRN30/6/2022 602,154 0.25
EUR 500,000 La Poste SA RegS 0.625%21/10/2026 513,605 0.22
EUR 400,000 LVMH Moet Hennessy LouisVuitton SE RegS 0.125%28/2/2023 402,884 0.17
EUR 400,000 Orange SA RegS 1.125%15/7/2024 415,160 0.17
EUR 400,000 Pernod Ricard SA RegS24/10/2023 (Zero Coupon) 401,880 0.17
EUR 600,000 Schneider Electric SE RegS12/6/2023 (Zero Coupon) 604,134 0.25
EUR 600,000 Societe Generale SA RegS0.25% 18/1/2022 602,814 0.25
EUR 500,000 Societe Generale SA RegSFRN 1/4/2022 503,150 0.21
EUR 600,000 Societe Generale SA RegS27/5/2022 (Zero Coupon) 602,802 0.25
EUR 500,000 Societe Generale SA RegS0.125% 18/2/2028 492,605 0.21
EUR 500,000 Societe Generale SFH SARegS 0.125% 18/7/2029 505,105 0.21
EUR 400,000 Suez SA RegS FRN (Per-petual) 405,808 0.17
EUR 230,000 TOTAL SE RegS FRN (Per-petual) 241,541 0.10
EUR 230,000 TOTAL SE RegS FRN (Per-petual) 234,572 0.10
EUR 600,000 Veolia Environnement SARegS 0.672% 30/3/2022 603,594 0.25
EUR 300,000 Veolia Environnement SARegS FRN (Perpetual) 307,779 0.13
46,499,172 19.53
GermanyEUR 681,000 Berlin Hyp AG 0.125%
23/10/2023 691,399 0.29EUR 400,000 Bertelsmann SE & Co KGaA
RegS FRN 23/4/2075 414,608 0.17EUR 6,500,000 Bundesobligation RegS
14/4/2023 (Zero Coupon) 6,584,435 2.77EUR 4,000,000 Bundesobligation RegS
13/10/2023 (Zero Coupon) 4,066,960 1.71
Holding Description
MarketValue
EUR
% ofNet
Assets
Germany continuedEUR 900,000 Bundesrepublik Deutschland
Bundesanleihe RegS 1.75%15/2/2024 960,039 0.40
EUR 3,100,000 BundesschatzanweisungenRegS 10/6/2022 (Zero Cou-pon) 3,121,049 1.31
EUR 7,000,000 BundesschatzanweisungenRegS 16/9/2022 (Zero Cou-pon) 7,060,620 2.97
EUR 7,000,000 BundesschatzanweisungenRegS 15/12/2022 (ZeroCoupon) 7,072,660 2.97
EUR 7,500,000 BundesschatzanweisungenRegS 10/3/2023 (Zero Cou-pon) 7,589,700 3.19
EUR 600,000 Deutsche Pfandbriefbank AGRegS 0.125% 5/9/2024 602,724 0.25
EUR 500,000 Deutsche Pfandbriefbank AGRegS 0.10% 2/2/2026 498,885 0.21
EUR 225,000 E.ON SE RegS 1.00%7/10/2025 234,182 0.10
EUR 300,000 Eurogrid GmbH RegS 1.625%3/11/2023 312,159 0.13
EUR 875,000 Fraport AG Frankfurt AirportServices Worldwide RegS1.625% 9/7/2024 905,415 0.38
EUR 2,523,000 Kreditanstalt fuer Wiederauf-bau 0.625% 4/7/2022 2,557,944 1.08
EUR 959,000 Kreditanstalt fuer Wiederauf-bau 0.125% 7/11/2023 975,639 0.41
EUR 2,947,000 Kreditanstalt fuer Wiederauf-bau RegS 30/6/2022 (ZeroCoupon) 2,967,098 1.25
EUR 1,424,000 Kreditanstalt fuer Wiederauf-bau RegS 15/6/2029 (ZeroCoupon) 1,434,837 0.60
EUR 900,000 Landesbank Baden-Wuerttemberg RegS 0.125%27/6/2023 911,907 0.38
EUR 700,000 Landesbank Baden-Wuerttemberg RegS 2.875%28/9/2026 768,250 0.32
EUR 600,000 Merck Financial ServicesGmbH RegS 0.125%16/7/2025 605,304 0.25
EUR 1,276,000 Muenchener HypothekenbankeG RegS 0.25% 13/12/2023 1,299,402 0.55
EUR 667,000 State of Lower Saxony RegS0.01% 17/3/2026 678,045 0.29
52,313,261 21.98
GreeceEUR 2,675,000 Hellenic Republic Government
Bond RegS 12/2/2026 (ZeroCoupon) 2,661,893 1.12
2,661,893 1.12
IcelandEUR 400,000 Iceland Government Interna-
tional Bond RegS 0.10%20/6/2024 401,912 0.17
EUR 210,000 Iceland Government Interna-tional Bond RegS 0.625%3/6/2026 216,353 0.09
618,265 0.26
BlackRock ESG Euro Short Duration Bond Fund continued
Portfolio of Investments as at 31 May 2021
The notes on pages 590 to 610 form an integral part of these financial statements.
BlackRock Strategic Funds[278]

Holding Description
MarketValue
EUR
% ofNet
Assets
IrelandEUR 970,000 Ireland Government Bond
RegS 3.90% 20/3/2023 1,049,045 0.44EUR 750,000 Ireland Government Bond
RegS 3.40% 18/3/2024 833,213 0.35
1,882,258 0.79
ItalyEUR 450,000 Intesa Sanpaolo SpA RegS
0.875% 27/6/2022 455,274 0.19EUR 500,000 Intesa Sanpaolo SpA RegS
0.50% 5/3/2024 513,020 0.21EUR 540,000 Intesa Sanpaolo SpA RegS
1.00% 4/7/2024 555,628 0.23EUR 500,000 Intesa Sanpaolo SpA RegS
0.625% 24/2/2026 496,860 0.21EUR 3,900,000 Italy Buoni Poliennali Del Te-
soro 0.30% 15/8/2023 3,949,569 1.66EUR 5,100,000 Italy Buoni Poliennali Del Te-
soro RegS 1.00% 15/7/2022 5,181,855 2.18EUR 4,900,000 Italy Buoni Poliennali Del Te-
soro RegS 1.45% 15/9/2022 5,016,081 2.11EUR 2,300,000 Italy Buoni Poliennali Del Te-
soro RegS 5.50% 1/11/2022 2,490,923 1.05EUR 2,900,000 Italy Buoni Poliennali Del Te-
soro RegS 0.05% 15/1/2023 2,919,546 1.23EUR 2,650,000 Italy Buoni Poliennali Del Te-
soro RegS 0.95% 1/3/2023 2,709,492 1.14EUR 900,000 Italy Buoni Poliennali Del Te-
soro RegS 0.60% 15/6/2023 917,001 0.38EUR 875,000 Italy Buoni Poliennali Del Te-
soro RegS 0.65%15/10/2023 894,285 0.37
EUR 4,400,000 Italy Buoni Poliennali Del Te-soro RegS 15/1/2024 (ZeroCoupon) 4,424,024 1.86
EUR 1,700,000 Italy Buoni Poliennali Del Te-soro RegS 4.50% 1/3/2024 1,919,368 0.81
EUR 495,000 Italy Buoni Poliennali Del Te-soro RegS 1.50% 30/4/2045 474,923 0.20
EUR 230,000 Mediobanca Banca di CreditoFinanziario SpA RegS1.00% 8/9/2027 236,350 0.10
EUR 450,000 Snam SpA RegS12/5/2024 (Zero Coupon) 451,787 0.19
EUR 450,000 UniCredit SpA RegS 6.95%31/10/2022 492,552 0.21
EUR 450,000 UniCredit SpA RegS FRN25/6/2025 463,054 0.19
EUR 990,000 UniCredit SpA RegS 0.325%19/1/2026 985,258 0.41
35,546,850 14.93
LuxembourgEUR 450,000 Becton Dickinson Euro Fi-
nance Sarl 0.632% 4/6/2023 456,372 0.19EUR 450,000 HeidelbergCement Finance
Luxembourg SA RegS0.50% 9/8/2022 453,402 0.19
909,774 0.38
MontenegroEUR 751,000 Montenegro Government Inter-
national Bond RegS 2.875%16/12/2027 697,446 0.29
697,446 0.29
NetherlandsEUR 890,000 ABN AMRO Bank NV RegS
0.625% 31/5/2022 899,808 0.38EUR 890,000 BMW Finance NV RegS
0.625% 6/10/2023 908,254 0.38
Holding Description
MarketValue
EUR
% ofNet
Assets
Netherlands continuedEUR 500,000 de Volksbank NV RegS 0.75%
25/6/2023 509,925 0.21EUR 500,000 de Volksbank NV RegS 0.01%
16/9/2024 503,080 0.21EUR 225,000 Deutsche Telekom Interna-
tional Finance BV RegS0.625% 13/12/2024 230,812 0.10
EUR 376,000 Domi 2021-1 BV ’2021-1 A’RegS FRN 15/6/2053 377,369 0.16
EUR 150,000 Heineken NV RegS 1.625%30/3/2025 159,558 0.07
EUR 400,000 Iberdrola International BVRegS FRN (Perpetual) 402,060 0.17
EUR 300,000 Iberdrola International BVRegS FRN (Perpetual) 307,374 0.13
EUR 500,000 Iberdrola International BVRegS FRN (Perpetual) 529,440 0.22
EUR 600,000 ING Groep NV RegS FRN3/9/2025 600,612 0.25
EUR 300,000 ING Groep NV RegS FRN15/2/2029 316,785 0.13
EUR 300,000 ING Groep NV RegS FRN18/2/2029 293,019 0.12
EUR 3,705,000 Netherlands Government BondRegS 2.25% 15/7/2022 3,826,857 1.61
EUR 2,250,000 Netherlands Government BondRegS 15/1/2024 (Zero Cou-pon) 2,290,747 0.96
EUR 355,000 NN Group NV RegS FRN8/4/2044 396,673 0.17
EUR 230,000 RELX Finance BV RegS18/3/2024 (Zero Coupon) 230,948 0.10
EUR 500,000 Siemens Financierings-maatschappij NV RegS20/2/2023 (Zero Coupon) 503,005 0.21
EUR 600,000 Siemens Financierings-maatschappij NV RegS0.25% 5/6/2024 608,460 0.26
EUR 500,000 Silver Arrow Athlon NL2021-1 BV ’2021-1 A’ RegSFRN 26/4/2031 504,618 0.21
EUR 400,000 Telefonica Europe BV RegSFRN (Perpetual) 407,936 0.17
EUR 300,000 Telefonica Europe BV RegSFRN (Perpetual) 308,835 0.13
EUR 300,000 Vonovia Finance BV RegS0.125% 6/4/2023 301,569 0.13
15,417,744 6.48
New ZealandEUR 230,000 Chorus Ltd RegS 0.875%
5/12/2026 236,311 0.10NZD 1,603,000 New Zealand Government
Bond 0.50% 15/5/2026 929,228 0.39NZD 1,050,000 New Zealand Government
Bond 1.75% 15/5/2041 538,587 0.23
1,704,126 0.72
NorwayEUR 660,000 DNB Bank ASA RegS 0.05%
14/11/2023 664,983 0.28EUR 750,000 DNB Boligkreditt AS RegS
0.625% 19/6/2025 779,183 0.33EUR 731,000 SpareBank 1 Boligkreditt AS
RegS 0.50% 30/1/2025 754,209 0.31
2,198,375 0.92
BlackRock ESG Euro Short Duration Bond Fund continued
Portfolio of Investments as at 31 May 2021
The notes on pages 590 to 610 form an integral part of these financial statements.
Annual report and audited financial statements [279]

Holding Description
MarketValue
EUR
% ofNet
Assets
PolandEUR 230,000 Santander Bank Polska SA
RegS 0.75% 20/9/2021 230,715 0.10
230,715 0.10
PortugalEUR 1,000,000 Portugal Obrigacoes do Tes-
ouro OT RegS 2.20%17/10/2022 1,039,510 0.44
EUR 950,000 Portugal Obrigacoes do Tes-ouro OT RegS 4.95%25/10/2023 1,076,986 0.45
EUR 1,100,000 Portugal Obrigacoes do Tes-ouro OT RegS 5.65%15/2/2024 1,285,889 0.54
3,402,385 1.43
SingaporeEUR 540,000 DBS Group Holdings Ltd RegS
FRN 11/4/2028 552,479 0.23
552,479 0.23
SlovakiaEUR 400,000 Vseobecna Uverova Banka AS
RegS 0.25% 26/3/2024 406,532 0.17EUR 200,000 Vseobecna Uverova Banka AS
RegS 0.01% 24/3/2026 201,732 0.09
608,264 0.26
SloveniaEUR 123,000 Slovenia Government Bond
RegS 0.488% 20/10/2050 107,048 0.04
107,048 0.04
SpainEUR 600,000 Banco Bilbao Vizcaya Argen-
taria SA RegS 0.625%17/1/2022 604,080 0.25
EUR 300,000 Banco de Sabadell SA RegS1.625% 7/3/2024 312,639 0.13
EUR 700,000 Banco de Sabadell SA RegS0.875% 22/7/2025 715,204 0.30
EUR 300,000 Banco de Sabadell SA RegSFRN 11/3/2027 309,057 0.13
EUR 600,000 Banco Santander SA 0.01%27/2/2025 607,368 0.26
EUR 600,000 CaixaBank SA RegS 0.375%3/2/2025 605,604 0.25
EUR 500,000 CaixaBank SA RegS FRN10/7/2026 510,685 0.22
EUR 400,000 CaixaBank SA RegS FRN15/3/2027 410,044 0.17
EUR 2,015,000 Instituto de Credito OficialRegS 0.75% 31/10/2023 2,072,891 0.87
EUR 600,000 Santander Consumer FinanceSA RegS 0.375% 27/6/2024 607,242 0.26
EUR 3,800,000 Spain Government Bond0.45% 31/10/2022 3,854,682 1.62
EUR 3,000,000 Spain Government Bond30/4/2023 (Zero Coupon) 3,029,520 1.27
EUR 3,704,000 Spain Government Bond RegS4.40% 31/10/2023 4,144,072 1.74
EUR 1,750,000 Spain Government Bond RegS3.80% 30/4/2024 1,966,983 0.83
19,750,071 8.30
SupranationalEUR 3,841,000 European Investment Bank
RegS 0.50% 15/11/2023 3,946,512 1.66
Holding Description
MarketValue
EUR
% ofNet
Assets
Supranational continuedEUR 720,000 European Stability Mechanism
RegS 18/10/2022 (ZeroCoupon) 725,739 0.30
EUR 580,000 European Stability MechanismRegS 0.10% 31/7/2023 588,085 0.25
5,260,336 2.21
SwedenEUR 575,000 Nordea Bank AB RegS FRN
18/8/2031 573,269 0.24EUR 540,000 Skandinaviska Enskilda Ban-
ken AB RegS 0.05%1/7/2024 544,352 0.23
EUR 450,000 Svenska Handelsbanken ABRegS 0.25% 28/2/2022 452,538 0.19
EUR 230,000 Svenska Handelsbanken ABRegS 0.375% 3/7/2023 233,547 0.10
EUR 450,000 Svenska Handelsbanken ABRegS 0.125% 18/6/2024 454,955 0.19
SEK 4,050,000 Sweden Government Interna-tional Bond RegS 0.125%9/9/2030 391,873 0.16
2,650,534 1.11
SwitzerlandEUR 990,000 Credit Suisse Group AG RegS
FRN 16/1/2026 995,811 0.42EUR 710,000 UBS AG RegS 0.25%
10/1/2022 712,875 0.30EUR 475,000 UBS AG RegS 0.625%
23/1/2023 481,987 0.20EUR 325,000 UBS AG RegS 0.01%
31/3/2026 324,087 0.14EUR 710,000 UBS Group AG RegS 0.25%
24/2/2028 700,025 0.29
3,214,785 1.35
United KingdomEUR 450,000 Barclays Plc RegS FRN
9/6/2025 457,317 0.19EUR 990,000 British Telecommunications Plc
RegS 1.125% 10/3/2023 1,014,314 0.43EUR 540,000 Diageo Finance Plc RegS
0.125% 12/10/2023 544,039 0.23EUR 230,000 GlaxoSmithKline Capital Plc
RegS 1.375% 2/12/2024 242,420 0.10EUR 450,000 HSBC Holdings Plc RegS FRN
13/11/2031 445,239 0.19EUR 230,000 Lloyds Bank Corporate Mar-
kets Plc RegS 0.25%4/10/2022 231,799 0.10
GBP 259,000 London Wall Mortgage CapitalPlc ’2021-FL1 A’ RegS FRN15/5/2051 302,072 0.13
EUR 100,000 NGG Finance Plc RegS FRN5/12/2079 100,784 0.04
USD 210,000 Standard Chartered Plc RegSFRN 23/3/2025 173,549 0.07
3,511,533 1.48
United StatesEUR 230,000 AbbVie Inc 1.25% 1/6/2024 238,055 0.10EUR 450,000 Bank of America Corp RegS
FRN 4/5/2023 452,596 0.19EUR 450,000 Bank of America Corp RegS
FRN 26/10/2031 441,349 0.18EUR 150,000 Citigroup Inc 1.75% 28/1/2025 159,285 0.07
BlackRock ESG Euro Short Duration Bond Fund continued
Portfolio of Investments as at 31 May 2021
The notes on pages 590 to 610 form an integral part of these financial statements.
BlackRock Strategic Funds[280]

Holding Description
MarketValue
EUR
% ofNet
Assets
United States continuedEUR 230,000 Citigroup Inc RegS 0.75%
26/10/2023 234,556 0.10EUR 450,000 Fidelity National Information
Services Inc 0.75%21/5/2023 457,330 0.19
EUR 450,000 Fidelity National InformationServices Inc 0.625%3/12/2025 459,396 0.19
EUR 660,000 Fiserv Inc 0.375% 1/7/2023 666,277 0.28EUR 450,000 Goldman Sachs Group Inc
RegS 2.00% 27/7/2023 470,407 0.20EUR 400,000 Goldman Sachs Group Inc
RegS FRN 30/4/2024 400,308 0.17EUR 450,000 Goldman Sachs Group Inc
RegS 0.125% 19/8/2024 450,621 0.19EUR 230,000 International Business Ma-
chines Corp 1.25%26/5/2023 236,934 0.10
EUR 450,000 International Business Ma-chines Corp 0.875%31/1/2025 465,912 0.20
EUR 450,000 JPMorgan Chase & Co RegS1.50% 26/10/2022 461,920 0.19
EUR 230,000 JPMorgan Chase & Co RegSFRN 11/3/2027 238,922 0.10
EUR 990,000 Morgan Stanley FRN8/11/2022 992,693 0.42
EUR 540,000 Morgan Stanley FRN26/7/2024 548,473 0.23
EUR 230,000 National Grid North AmericaInc RegS 0.75% 8/8/2023 234,308 0.10
EUR 230,000 Thermo Fisher Scientific Inc0.125% 1/3/2025 230,840 0.10
USD 465,000 Verizon Communications Inc1.45% 20/3/2026 384,508 0.16
8,224,690 3.46
Total Bonds 230,489,414 96.83
Total Transferable Securities and Money MarketInstruments Admitted to an Official Stock ExchangeListing or Dealt in on Another Regulated Market 230,489,414 96.83
Holding Description
MarketValue
EUR
% ofNet
Assets
Other Transferable Securities and Money Market Instruments
BONDSNew Zealand
NZD 280,000 New Zealand Government In-flation Linked Bond RegS2.50% 20/9/2040 228,254 0.09
228,254 0.09
Total Bonds 228,254 0.09
Total Other Transferable Securities and MoneyMarket Instruments 228,254 0.09
Collective Investment SchemesIreland
64,445 BlackRock ICS Euro LiquidEnvironmentally AwareFund~ 6,369,938 2.68
6,369,938 2.68
Total Collective Investment Schemes 6,369,938 2.68
Securities portfolio at market value 237,087,606 99.60
Other Net Assets 952,954 0.40
Total Net Assets (EUR) 238,040,560 100.00
~ Investment in related party fund.
TypeNominal
Value Description CounterpartyExpiration
date
Net unrealisedappreciation/
(depreciation)EUR
MarketValue
EUR
Financial Derivative Instruments
SWAPS
CCILS EUR 1,020,000Fund receives Fixed 1.3825% and pays Floating EUR 12 Month
CPTFE BNP Paribas 15/4/2031 (17,329) (17,308)
CCILS USD 170,000Fund receives Fixed 2.4010% and pays Floating USD 12 Month
USCPI BNP Paribas 17/3/2031 (3,346) (3,343)
CCILS USD 1,595,000Fund receives Fixed 2.4200% and pays Floating USD 12 Month
USCPI BNP Paribas 17/3/2031 (28,691) (28,663)
CCILS USD 202,500Fund receives Fixed 2.4325% and pays Floating USD 12 Month
USCPI BNP Paribas 6/5/2051 (2,462) (2,454)
CCILS USD 202,500Fund receives Fixed 2.4375% and pays Floating USD 12 Month
USCPI BNP Paribas 7/5/2051 (2,134) (2,126)
CCILS USD 202,500Fund receives Fixed 2.4845% and pays Floating USD 12 Month
USCPI BNP Paribas 4/5/2051 862 869
CCILS USD 202,500Fund receives Fixed 2.4845% and pays Floating USD 3 Month
USCPI BNP Paribas 4/5/2051 622 630
CCILS USD 100,000Fund receives Fixed 2.5050% and pays Floating USD 12 Month
USCPI BNP Paribas 30/3/2031 (1,019) (1,018)
BlackRock ESG Euro Short Duration Bond Fund continued
Portfolio of Investments as at 31 May 2021
The notes on pages 590 to 610 form an integral part of these financial statements.
Annual report and audited financial statements [281]

TypeNominal
Value Description CounterpartyExpiration
date
Net unrealisedappreciation/
(depreciation)EUR
MarketValue
EUR
Financial Derivative Instruments
SWAPS
CCILS USD 630,000Fund receives Fixed 2.6694% and pays Floating USD 12 Month
USCPI BNP Paribas 14/5/2031 4,491 4,502
CCILS GBP 2,800,000Fund receives Fixed 3.6410% and pays Floating GBP 12 Month
USCPI BNP Paribas 15/3/2031 (39,010) (38,942)
CCILS GBP 830,000Fund receives Fixed 3.6500% and pays Floating GBP 12 Month
UKRPI BNP Paribas 15/4/2031 (13,951) (13,931)
CCILS GBP 750,000Fund receives Fixed 3.6575% and pays Floating GBP 12 Month
UKRPI BNP Paribas 15/4/2031 (11,770) (11,752)
CCILS GBP 981,167Fund receives Fixed 3.7560% and pays Floating GBP 12 Month
UKRPI BNP Paribas 15/4/2031 (971) (947)
CCIRS SEK 5,000,000Fund receives Floating SEK 3 Month STIBOR and pays Fixed
0.824% BNP Paribas 6/4/2031 430 438
CCIRS USD 200,000Fund receives Floating USD 3 Month LIBOR and pays Fixed
1.6165% BNP Paribas 17/3/2031 (1,276) (1,273)
CCIRS USD 790,000Fund receives Floating USD 3 Month LIBOR and pays Fixed
1.650% BNP Paribas 14/5/2031 (6,966) (6,331)
CCIRS USD 120,000Fund receives Floating USD 3 Month LIBOR and pays Fixed
1.680% BNP Paribas 30/3/2031 (1,322) (1,320)
Total (Gross underlying exposure - EUR 11,250,584) (123,842) (122,969)
CCILS: Centrally Cleared Inflation Linked SwapsCCIRS: Centrally Cleared Interest Rate Swaps
Numberof
contractsCurrencyof contracts
Contract/Description
Expirationdate
Grossunderlying
exposureEUR
Net unrealisedappreciation/
(depreciation)EUR
Financial Derivative Instruments
FUTURES
(109) EUR Euro BOBL Futures June 2021 June 2021 14,680,120 33,831
(8) EUR Euro BTP Futures June 2021 June 2021 1,178,240 (7,140)
(16) EUR Euro Bund Futures June 2021 June 2021 2,716,960 (2,927)
(12) EUR Euro BUXL 30 Year Bond Futures June 2021 June 2021 2,412,480 56,520
329 EUR Euro Schatz Futures June 2021 June 2021 36,861,160 (17,965)
(15) EUR Euro-OAT Futures June 2021 June 2021 2,404,800 8,427
(4) EUR Euro-OAT Futures September 2021 September 2021 632,640 430
(3) JPY Japan 10 Year Bond Futures June 2021 June 2021 3,395,844 523
91 EUR Short Euro BTP Futures June 2021 June 2021 10,293,920 13,380
(34) USD US Treasury 10 Year Note Futures September 2021 September 2021 4,032,257 9,493
(8) USD US Treasury 10 Year Note Futures September 2021 September 2021 864,060 2,122
(4) USD US Treasury 5 Year Note Futures September 2021 September 2021 405,784 331
(12) USD US Ultra Bond Futures September 2021 September 2021 1,816,616 7,318
Total 81,694,881 104,343
Numberof
contractsCall/Put Description Counterparty Strike Price
Expirationdate
Netunrealised
(depreciation)EUR
MarketValue
EUR
Financial Derivative Instruments
PURCHASED OPTIONS
1,870,000 Call OTC USD/CAD Bank of America Merrill Lynch USD 1.28 23/06/2021 (12,340) 104
Total (Gross underlying exposure - EUR 2,437) (12,340) 104
BlackRock ESG Euro Short Duration Bond Fund continued
Portfolio of Investments as at 31 May 2021
The notes on pages 590 to 610 form an integral part of these financial statements.
BlackRock Strategic Funds[282]

NominalValue
Call/Put Description Counterparty Strike Price
Expirationdate
Netunrealised
appreciation/(depreciation)
EUR
MarketValue
EUR
Financial Derivative Instruments
WRITTEN SWAPTIONS
(1,200,000) Call
Fund writes an option to enter into an InterestRate Swap. If exercised Fund receivesFloating USD LIBOR 3 Month BBAquarterly from 10/12/2021; and pays1.125% Fixed semi-annually from 8/9/2021 BNP Paribas USD 1.12 08/09/2021 (1,398) (10,531)
(1,200,000) Put
Fund writes an option to enter into an InterestRate Swap. If exercised Fund receives1.125% Fixed semi-annually from8/9/2021; and pays Floating USD LIBOR3 Month BBA quarterly from 10/12/2021 BNP Paribas USD 1.13 08/09/2021 5,512 (3,667)
(2,825,000) Call
Fund writes an option to enter into an InterestRate Swap. If exercised Fund receivesFloating USD LIBOR 3 Month BBAquarterly from 28/7/2023; and pays 2%Fixed semi-annually from 26/4/2023 Barclays Bank USD 0.02 26/04/2023 5,217 (88,196)
(2,825,000) Put
Fund writes an option to enter into an InterestRate Swap. If exercised Fund receives 2%Fixed semi-annually from 26/4/2023; andpays Floating USD LIBOR 3 Month BBAquarterly from 28/7/2023 Barclays Bank USD 0.02 26/04/2023 2,834 (89,676)
Total (Gross underlying exposure - EUR 3,285,974) 12,165 (192,070)
Currency Purchases Currency Sales CounterpartyMaturity
date
Netunrealised
appreciation/(depreciation)
EUR
Financial Derivative Instruments
OPEN FORWARD FOREIGN EXCHANGE TRANSACTIONS
AUD 500,000 EUR 321,350 Westpac 15/7/2021 (4,461)
EUR 518,206 AUD 810,000Royal Bank of
Canada 15/7/2021 4,844EUR 584,800 DKK 4,350,000 BNP Paribas 15/7/2021 (58)EUR 1,789,092 DKK 13,310,000 Westpac 15/7/2021 (437)
EUR 336,378 GBP 290,000Royal Bank of
Canada 15/7/2021 (76)EUR 449,958 GBP 390,000 UBS 15/7/2021 (2,515)EUR 322,682 NOK 3,300,000 JP Morgan 16/6/2021 (1,255)EUR 2,183,943 NZD 3,700,000 Morgan Stanley 15/7/2021 (17,647)
EUR 785,816 SEK 8,020,000Bank of America
Merrill Lynch 15/7/2021 (6,331)EUR 700,000 USD 846,265 UBS 16/6/2021 6,754EUR 662,234 USD 800,000 Morgan Stanley 15/7/2021 7,253
EUR 460,897 USD 550,000Royal Bank of
Canada 15/7/2021 10,599EUR 16,620 USD 20,000 Westpac 15/7/2021 246KRW 325,000,000 USD 290,493 BNP Paribas 16/6/2021 2,258NOK 4,550,000 EUR 447,298 JP Morgan 16/6/2021 (657)NOK 3,300,000 EUR 326,159 UBS 16/6/2021 (2,222)NOK 3,700,000 USD 444,503 JP Morgan 16/6/2021 (926)NOK 1,400,000 USD 168,374 Morgan Stanley 16/6/2021 (501)NZD 800,000 EUR 477,152 Morgan Stanley 15/7/2021 (1,133)SEK 3,700,000 EUR 366,167 Morgan Stanley 15/7/2021 (713)SEK 300,000 USD 35,912 Barclays Bank 16/6/2021 223
SEK 150,000 USD 17,978Royal Bank of
Canada 16/6/2021 93USD 855,337 EUR 700,000 BNP Paribas 16/6/2021 678USD 36,353 NOK 300,000 Barclays Bank 16/6/2021 331USD 18,208 NOK 150,000 BNP Paribas 16/6/2021 191
Currency Purchases Currency Sales CounterpartyMaturity
date
Netunrealised
appreciation/(depreciation)
EUR
Financial Derivative Instruments
OPEN FORWARD FOREIGN EXCHANGE TRANSACTIONS
USD 119,289 SEK 1,000,000Bank of America
Merrill Lynch 16/6/2021 (1,085)USD 393,793 SEK 3,300,000 JP Morgan 16/6/2021 (3,463)USD 96,240 SEK 800,000 Morgan Stanley 16/6/2021 (205)
Total (Gross underlying exposure - EUR 14,100,271) (10,215)
Sector Breakdownas at 31 May 2021
% of NetAssets
Government 63.04
Financial 23.95
Collective Investment Schemes 2.68
Utilities 2.34
Industrial 1.87
Communications 1.53
Technology 1.52
Consumer, Non-cyclical 1.42
Consumer, Cyclical 0.55
Mortgage Securities 0.29
Asset Backed Securities 0.21
Energy 0.20
Securities portfolio at market value 99.60
Other Net Assets 0.40
100.00
BlackRock ESG Euro Short Duration Bond Fund continued
Portfolio of Investments as at 31 May 2021
The notes on pages 590 to 610 form an integral part of these financial statements.
Annual report and audited financial statements [283]

Holding Description
MarketValue
EUR
% ofNet
Assets
Transferable Securities and Money Market Instruments Admittedto an Official Stock Exchange Listing or Dealt in on AnotherRegulated Market
COMMON STOCKSDenmark
304,771 DSV PANALPINA A/S 60,449,516 3.96615,150 Novo Nordisk A/S ’B’ 39,870,826 2.61527,893 Royal Unibrew A/S 55,965,410 3.66
1,679,206 Tryg A/S 32,256,066 2.11
188,541,818 12.34
Finland303,951 Neste Oyj 16,346,485 1.07
16,346,485 1.07
Netherlands24,252 ASML Holding NV 13,365,277 0.88
225,364 IMCD NV 29,962,144 1.96688,871 QIAGEN NV 27,844,166 1.82
71,171,587 4.66
Switzerland287,569 Logitech International SA Reg 29,348,053 1.92111,459 Lonza Group AG Reg 58,868,164 3.85
4,681 Partners Group Holding AG 5,822,977 0.38118,112 Sika AG Reg^ 31,169,510 2.0423,639 Straumann Holding AG Reg 30,449,273 1.99
155,657,977 10.18
United Kingdom3,860,762 Dr. Martens Plc 21,983,208 1.441,549,833 RELX Plc 33,197,423 2.17
55,180,631 3.61
Total Common Stocks 486,898,498 31.86
BONDSFrance
EUR 8,100,000 HSBC Continental Europe SARegS 0.20% 4/9/2021 8,114,904 0.53
EUR 8,000,000 Societe Generale SA RegS0.25% 18/1/2022 8,037,520 0.53
16,152,424 1.06
Total Bonds 16,152,424 1.06
CERTIFICATE OF DEPOSITSBelgium
EUR 16,000,000 Sumitomo Mitsui Banking Corp2/7/2021 (Zero Coupon) 16,008,870 1.05
16,008,870 1.05
JapanEUR 22,000,000 Mizuho Bank Ltd
1/6/2021 (Zero Coupon) 22,001,375 1.44EUR 20,000,000 Sumitomo Mitsui Banking Corp
RegS 3/8/2021 (Zero Cou-pon) 20,020,344 1.31
EUR 50,000,000 TheNorinchukin Bank1/9/2021 (Zero Coupon) 50,068,455 3.28
92,090,174 6.03
LuxembourgEUR 10,000,000 BPCE SA RegS
7/6/2021 (Zero Coupon) 10,000,919 0.65
10,000,919 0.65
SwitzerlandEUR 19,000,000 Zuercher Kantonalbank
16/8/2021 (Zero Coupon) 19,026,085 1.24
19,026,085 1.24
Holding Description
MarketValue
EUR
% ofNet
Assets
United KingdomEUR 34,000,000 Credit Agricole SA
1/9/2021 (Zero Coupon) 34,055,848 2.23EUR 7,000,000 Mizuho International Plc
29/10/2021 (Zero Coupon) 7,016,147 0.46
41,071,995 2.69
Total Certificate of Deposits 178,198,043 11.66
COMMERCIAL PAPERFrance
EUR 70,000,000 Axa Banque S.A.15/6/2021 (Zero Coupon) 70,014,993 4.58
EUR 66,000,000 Jyske Bank A/S RegS1/6/2021 (Zero Coupon) 66,000,000 4.32
EUR 25,000,000 LMA SA RegS 7/6/2021 (ZeroCoupon) 25,002,254 1.63
EUR 15,000,000 LMA SA RegS 8/6/2021 (ZeroCoupon) 15,001,518 0.98
EUR 30,000,000 Oesterreichische KontrollbankAG 28/9/2021 (Zero Cou-pon) 30,053,898 1.97
EUR 20,000,000 Svenska Handelsbanken ABRegS 22/6/2021 (Zero Cou-pon) 20,006,728 1.31
EUR 18,000,000 Svenska Handelsbanken ABRegS 13/12/2021 (ZeroCoupon) 18,049,422 1.18
244,128,813 15.97
GermanyEUR 20,000,000 Toyota Kreditbank GmbH
RegS 30/7/2021 (Zero Cou-pon) 20,017,906 1.31
20,017,906 1.31
IrelandEUR 15,500,000 Matchpoint Finance Plc RegS
19/7/2021 (Zero Coupon) 15,510,152 1.01
15,510,152 1.01
LuxembourgEUR 25,000,000 Albion Capital Corp SA RegS
16/6/2021 (Zero Coupon) 25,005,531 1.64EUR 46,000,000 Antalis SA 7/6/2021 (Zero
Coupon) 46,003,682 3.01EUR 40,000,000 Archer Daniels-Midland Co
4/6/2021 (Zero Coupon) 40,001,868 2.62EUR 5,000,000 Archer-Daniels-Midland Co
29/6/2021 (Zero Coupon) 5,002,179 0.33EUR 50,000,000 Barclays Bank Plc
7/7/2021 (Zero Coupon) 50,026,034 3.27EUR 24,500,000 Collateralized Commercial Pa-
per III Co LLC RegS22/6/2021 (Zero Coupon) 24,507,164 1.60
EUR 20,000,000 Collateralized Commercial Pa-per III Co LLC RegS8/7/2021 (Zero Coupon) 20,011,106 1.31
EUR 55,000,000 Collateralized Commercial Pa-per III Co LLC RegS24/11/2021 (Zero Coupon) 55,132,086 3.61
EUR 19,500,000 Deutsche Boerse AG RegS25/8/2021 (Zero Coupon) 19,523,050 1.28
EUR 38,000,000 Linde Finance BV2/8/2021 (Zero Coupon) 38,035,373 2.49
EUR 25,000,000 LMA SA RegS13/7/2021 (Zero Coupon) 25,015,468 1.64
EUR 15,000,000 Matchpoint Finance Plc RegS4/6/2021 (Zero Coupon) 15,000,601 0.98
EUR 10,000,000 Matchpoint Finance Plc RegS5/7/2021 (Zero Coupon) 10,004,825 0.65
BlackRock European Absolute Return Fund
Portfolio of Investments as at 31 May 2021
The notes on pages 590 to 610 form an integral part of these financial statements.
BlackRock Strategic Funds[284]
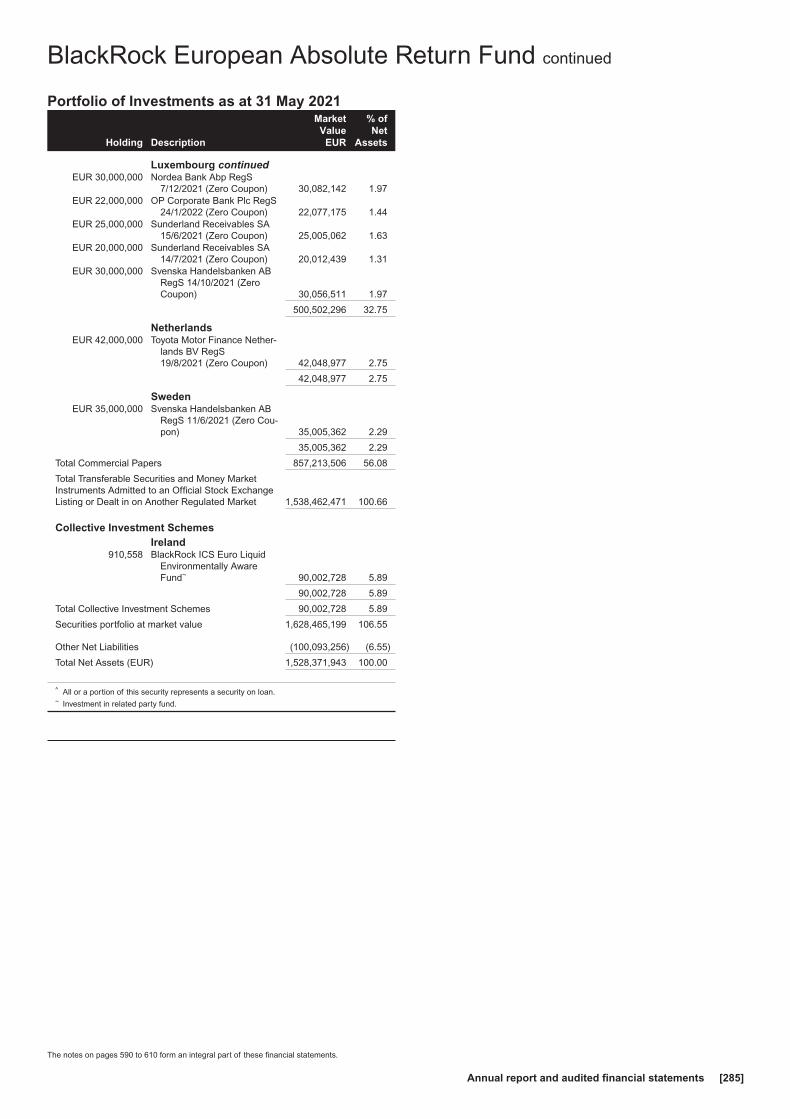
Holding Description
MarketValue
EUR
% ofNet
Assets
Luxembourg continuedEUR 30,000,000 Nordea Bank Abp RegS
7/12/2021 (Zero Coupon) 30,082,142 1.97EUR 22,000,000 OP Corporate Bank Plc RegS
24/1/2022 (Zero Coupon) 22,077,175 1.44EUR 25,000,000 Sunderland Receivables SA
15/6/2021 (Zero Coupon) 25,005,062 1.63EUR 20,000,000 Sunderland Receivables SA
14/7/2021 (Zero Coupon) 20,012,439 1.31EUR 30,000,000 Svenska Handelsbanken AB
RegS 14/10/2021 (ZeroCoupon) 30,056,511 1.97
500,502,296 32.75
NetherlandsEUR 42,000,000 Toyota Motor Finance Nether-
lands BV RegS19/8/2021 (Zero Coupon) 42,048,977 2.75
42,048,977 2.75
SwedenEUR 35,000,000 Svenska Handelsbanken AB
RegS 11/6/2021 (Zero Cou-pon) 35,005,362 2.29
35,005,362 2.29
Total Commercial Papers 857,213,506 56.08
Total Transferable Securities and Money MarketInstruments Admitted to an Official Stock ExchangeListing or Dealt in on Another Regulated Market 1,538,462,471 100.66
Collective Investment SchemesIreland
910,558 BlackRock ICS Euro LiquidEnvironmentally AwareFund~ 90,002,728 5.89
90,002,728 5.89
Total Collective Investment Schemes 90,002,728 5.89
Securities portfolio at market value 1,628,465,199 106.55
Other Net Liabilities (100,093,256) (6.55)
Total Net Assets (EUR) 1,528,371,943 100.00
^ All or a portion of this security represents a security on loan.~ Investment in related party fund.
BlackRock European Absolute Return Fund continued
Portfolio of Investments as at 31 May 2021
The notes on pages 590 to 610 form an integral part of these financial statements.
Annual report and audited financial statements [285]

Holding Description Counterparty
Netunrealised
appreciation/(depreciation)
EUR
Financial Derivative Instruments
CONTRACTS FOR DIFFERENCEBelgium
(731,681) Proximus SADP Citibank 339,510(188,294) Umicore SA Bank of America
Merrill Lynch 154,401
493,911
Denmark(202,459) Novozymes A/S ’B’ Bank of America
Merrill Lynch 97,339
97,339
Finland(247,427) Nokian Renkaat Oyj Bank of America
Merrill Lynch (84,125)(1,087,209) Wartsila Oyj Abp Bank of America
Merrill Lynch (587,093)
(671,218)
France154,613 Alten SA Bank of America
Merrill Lynch 256,659(70,224) Atos SE Bank of America
Merrill Lynch (32,303)(261,904) Casino Guichard Perrachon
SABank of AmericaMerrill Lynch 369,285
(34,112) Casino Guichard PerrachonSA Citibank 10,575
(130,065) Danone SA Barclays Bank 103,07422,158 Kering SA Bank of America
Merrill Lynch 946,147(473,039) Klepierre SA (REIT) Citibank (402,083)
37,699 LVMH Moet Hennessy LouisVuitton SE JP Morgan 1,149,819
(1,281,238) Orange SA Bank of AmericaMerrill Lynch 322,872
115,960 Pernod Ricard SA JP Morgan 782,730228,368 Safran SA JP Morgan (621,161)
(102,320) Societe BIC SA Bank of AmericaMerrill Lynch 368,352
(1,369,637) TechnipFMC Plc Citibank (512,244)119,640 Teleperformance Citibank 11,964
(350,068) Valeo SA Bank of AmericaMerrill Lynch (366,891)
306,451 Worldline SA Citibank 392,257
2,779,052
Germany(168,763) BASF SE JP Morgan 651,425(147,010) Bayerische Motoren Werke
AG JP Morgan (274,909)(88,195) Continental AG JP Morgan (652,643)
(1,097,421) Deutsche Bank AG Bank of AmericaMerrill Lynch (539,931)
(200,869) Deutsche EuroShop AG JP Morgan 80,348(262,028) Evonik Industries AG JP Morgan 196,521(245,932) GEA Group AG Bank of America
Merrill Lynch (167,234)(22,758) GRENKE AG Bank of America
Merrill Lynch (118,569)(199,705) GRENKE AG JP Morgan (1,332,032)(126,017) Henkel AG & Co KGaA
(Pref) JP Morgan 303,384(21) SLM Solutions Group AG Bank of America
Merrill Lynch (5,457)(18) SLM Solutions Group AG Bank of America
Merrill Lynch 16,200(300,174) TeamViewer AG Citibank (203,190)(480,763) thyssenkrupp AG Citibank (60,978)
(2,107,065)
Holding Description Counterparty
Netunrealised
appreciation/(depreciation)
EUR
Italy(1,596,476) Leonardo SpA Citibank (169,226)
(719,821) Saipem SpA Bank of AmericaMerrill Lynch 23,754
(3,586,091) Saipem SpA Citibank (50,205)(914,360) Saipem SpA JP Morgan (6,401)
(202,078)
Netherlands(308,430) JDE Peet’s NV Citibank 15,422
(1,161,591) SNS REAAL NV* Deutsche Bank 10(172,919) Unibail-Rodamco-Westfield
(REIT)Bank of AmericaMerrill Lynch (498,007)
(482,575)
Portugal(1,657,328) CTT-Correios de Portugal
SA Citibank (406,046)
(406,046)
Spain(1,364,212) Inmobiliaria Colonial Socimi
SA (REIT)Bank of AmericaMerrill Lynch (402,443)
(7,183,453) Mapfre SA JP Morgan 380,723(1,375,092) Merlin Properties Socimi SA
(REIT) JP Morgan (253,017)(3,102,038) Telefonica SA Citibank 378,449
103,712
Sweden1,297,906 AddTech AB ’B’ Bank of America
Merrill Lynch (608,666)358,322 Atlas Copco AB ’B’ JP Morgan (686,936)
(559,856) Electrolux AB ’B’ Citibank (199,168)(993,673) Elekta AB ’B’ JP Morgan (761,002)(349,554) Essity AB ’B’ JP Morgan 66,639(300,980) H & M Hennes & Mauritz AB
’B’Bank of AmericaMerrill Lynch (31,230)
1,319,017 Hexagon AB ’B’ Deutsche Bank 613,548(294,875) ICA Gruppen AB Bank of America
Merrill Lynch —(411,395) SKF AB ’B’ Bank of America
Merrill Lynch 16,261206,268 Thule Group AB Deutsche Bank 370,975
(415,137) Veoneer Inc SDR JP Morgan (140,692)(470,328) Volvo AB ’B’ Bank of America
Merrill Lynch 20,915
(1,339,356)
Switzerland(478,441) ABB Ltd Reg JP Morgan (169,797)(182,103) Adecco Group AG Reg Bank of America
Merrill Lynch (281,278)(620,779) Clariant AG Reg Citibank (84,736)(967,531) Credit Suisse Group AG
RegBank of AmericaMerrill Lynch (412,049)
(134) Credit Suisse Group Guern-sey VII Ltd RegS
Bank of AmericaMerrill Lynch 107,949
(18,278) dormakaba Holding AG Bank of AmericaMerrill Lynch (8,316)
(63,194) Landis+Gyr Group AG Barclays Bank (93,015)(156,712) Swiss Prime Site AG Reg JP Morgan (213,910)(27,312) Swisscom AG Reg Citibank 69,590
(1,004,451) UBS Group AG Reg Bank of AmericaMerrill Lynch (607,839)
114,983 VAT Group AG JP Morgan 2,260,088(26,135) Zur Rose Group AG Bank of America
Merrill Lynch (321,066)
245,621
BlackRock European Absolute Return Fund continued
Portfolio of Investments as at 31 May 2021
The notes on pages 590 to 610 form an integral part of these financial statements.
BlackRock Strategic Funds[286]

Holding Description Counterparty
Netunrealised
appreciation/(depreciation)
EUR
United Kingdom2,746,808 AJ Bell Plc Bank of America
Merrill Lynch (376,338)(271,083) Aston Martin Lagonda
Global Holdings Plc Barclays Bank (579,145)4,182,896 Auto Trader Group Plc Bank of America
Merrill Lynch 679,943(1,705,723) British Land Co Plc (REIT) Citibank 202,012(1,356,357) Centrica Plc Citibank (21,103)(2,779,271) Deliveroo Plc Citibank 212,982
611,503 Experian Plc Citibank (196,285)(2,267,681) HSBC Holdings Plc Bank of America
Merrill Lynch (313,326)(5,081,556) J Sainsbury Plc Bank of America
Merrill Lynch (64,902)2,971,565 JD Sports Fashion Plc Citibank 1,097,185
(1,091,741) John Wood Group Plc Barclays Bank 87,441(291,014) Johnson Matthey Plc Bank of America
Merrill Lynch 537,253(3,310,590) Jupiter Fund Management
PlcBank of AmericaMerrill Lynch (256,957)
1,994,153 Rightmove Plc Bank of AmericaMerrill Lynch 782,605
(7,472,882) Rolls-Royce Holdings Plc JP Morgan 230,801(224,957) Schroders Plc Citibank 20,896108,296 Spirax-Sarco Engineering
Plc Citibank 345,790(162,137) St James’s Place Plc JP Morgan (26,356)
(4,216,003) Standard Life Aberdeen Plc Citibank (293,711)(1,443,393) TUI AG Bank of America
Merrill Lynch (217,869)(383,987) TUI AG JP Morgan 20,955320,884 Wizz Air Holdings Plc Citibank 801,008
(7,199,052) Wm Morrison SupermarketsPlc JP Morgan 518,244
3,191,123
Total (Gross underlying exposure - EUR 1,044,492,228) 1,702,420
* Security subject to a fair value adjustment as detailed in Note 2(a).
BlackRock European Absolute Return Fund continued
Portfolio of Investments as at 31 May 2021
The notes on pages 590 to 610 form an integral part of these financial statements.
Annual report and audited financial statements [287]

Currency Purchases Currency Sales CounterpartyMaturity
date
Netunrealised
appreciation/(depreciation)
EUR
Financial Derivative Instruments
OPEN FORWARD FOREIGN EXCHANGE TRANSACTIONS
EUR 25,004,440 CHF 27,451,250 Barclays Bank 18/6/2021 21,376EUR 7,408,914 CHF 8,135,893 Citibank 18/6/2021 4,532EUR 47,484,467 CHF 52,128,913 JP Morgan 18/6/2021 42,546
68,454
CHF Hedged Share Class
CHF 29,300,328 EUR 26,707,039State Street Bank& Trust Company 15/6/2021 (41,670)
EUR 659,454 CHF 722,597State Street Bank& Trust Company 15/6/2021 1,839
(39,831)
GBP Hedged Share Class
EUR 142,869 GBP 122,862State Street Bank& Trust Company 15/6/2021 250
GBP 5,882,994 EUR 6,779,125State Street Bank& Trust Company 15/6/2021 49,964
50,214
USD Hedged Share Class
EUR 2,283,678 USD 2,778,198State Street Bank& Trust Company 15/6/2021 7,781
USD 16,038,434 EUR 13,274,319State Street Bank& Trust Company 15/6/2021 (135,646)
(127,865)
Total (Gross underlying exposure - EUR 129,538,633) (49,028)
Sector Breakdownas at 31 May 2021
% of NetAssets
Financial 61.46
Consumer, Non-cyclical 16.10
Consumer, Cyclical 7.14
Industrial 6.00
Collective Investment Schemes 5.89
Basic Materials 4.45
Technology 2.80
Mortgage Securities 1.64
Energy 1.07
Securities portfolio at market value 106.55
Other Net Liabilities (6.55)
100.00
BlackRock European Absolute Return Fund continued
Portfolio of Investments as at 31 May 2021
The notes on pages 590 to 610 form an integral part of these financial statements.
BlackRock Strategic Funds[288]

Holding Description
MarketValue
EUR
% ofNet
Assets
Transferable Securities and Money Market Instruments Admittedto an Official Stock Exchange Listing or Dealt in on AnotherRegulated Market
COMMON STOCKSBelgium
70,251 KBC Group NV 4,722,272 0.72258,472 Kinepolis Group NV 12,804,703 1.94
17,526,975 2.66
Denmark89,941 Chemometec A/S 9,107,095 1.38
241,736 DSV PANALPINA A/S 47,946,899 7.2627,599 Genmab A/S 9,174,216 1.39
583,384 Novo Nordisk A/S ’B’ 37,811,919 5.73430,147 Royal Unibrew A/S 45,602,713 6.91925,855 Tryg A/S 17,784,858 2.70
167,427,700 25.37
Finland1,166,117 Metso Outotec Oyj 11,392,963 1.73
220,290 Neste Oyj^ 11,847,196 1.79
23,240,159 3.52
France129,365 Alten SA 13,195,230 2.0020,234 Sartorius Stedim Biotech 7,221,515 1.1028,484 Teleperformance 8,998,096 1.3628,091 Virbac SA 7,542,433 1.14
36,957,274 5.60
Germany65,364 Amadeus Fire AG 10,052,983 1.52
146,912 Puma SE 13,871,431 2.1048,511 Wacker Chemie AG 6,643,582 1.01
30,567,996 4.63
Ireland52,145 DCC Plc 3,625,451 0.55
898,208 Irish Continental Group Plc(Unit) 3,985,798 0.60
7,611,249 1.15
Italy565,129 GVS SpA 8,188,719 1.24
8,000 Tinexta SpA 219,040 0.03
8,407,759 1.27
Jersey228,474 Wizz Air Holdings Plc 12,794,450 1.94
12,794,450 1.94
Luxembourg117,269 Stabilus SA 8,115,015 1.23
8,115,015 1.23
Netherlands9,544 ASML Holding NV 5,259,698 0.80
128,864 IMCD NV^ 17,132,469 2.59
22,392,167 3.39
Sweden697,085 AddLife AB ’B’ 16,780,461 2.54
1,136,966 AddTech AB ’B’ 15,392,492 2.33473,272 Alfa Laval AB 14,638,481 2.22912,968 Assa Abloy AB ’B’ 23,141,089 3.51237,090 Hemnet Group AB 5,107,526 0.77
1,168,314 Hexagon AB ’B’ 13,744,529 2.08178,804 Thule Group AB 6,912,211 1.05493,551 Troax Group AB 15,314,491 2.32
111,031,280 16.82
Switzerland146,049 LafargeHolcim Ltd Reg 7,150,210 1.08
Holding Description
MarketValue
EUR
% ofNet
Assets
Switzerland continued175,855 Logitech International SA
Reg^ 17,947,004 2.7259,126 Lonza Group AG Reg 31,227,977 4.738,852 Partners Group Holding AG 11,011,535 1.67
96,354 Sika AG Reg^ 25,427,619 3.8513,293 Straumann Holding AG Reg 17,122,644 2.6022,245 Tecan Group AG Reg^ 9,093,061 1.3842,033 VAT Group AG^ 10,618,124 1.61
129,598,174 19.64
United Kingdom693,588 Alphawave IP Group Plc 2,468,309 0.37354,364 Computacenter Plc 11,051,550 1.68
2,283,034 Dr. Martens Plc 12,999,613 1.97324,353 FDM Group Holdings Plc 3,743,449 0.57
1,343,048 JD Sports Fashion Plc 14,739,503 2.23447,584 Prudential Plc 7,800,507 1.18884,940 RELX Plc 18,955,415 2.87
71,758,346 10.87
Total Common Stocks 647,428,544 98.09
Total Transferable Securities and Money MarketInstruments Admitted to an Official Stock ExchangeListing or Dealt in on Another Regulated Market 647,428,544 98.09
Collective Investment SchemesIreland
227,328 BlackRock ICS Euro LiquidEnvironmentally AwareFund~ 22,469,917 3.40
22,469,917 3.40
Total Collective Investment Schemes 22,469,917 3.40
Securities portfolio at market value 669,898,461 101.49
Other Net Liabilities (9,856,365) (1.49)
Total Net Assets (EUR) 660,042,096 100.00
^ All or a portion of this security represents a security on loan.~ Investment in related party fund.
BlackRock European Opportunities Extension Fund
Portfolio of Investments as at 31 May 2021
The notes on pages 590 to 610 form an integral part of these financial statements.
Annual report and audited financial statements [289]
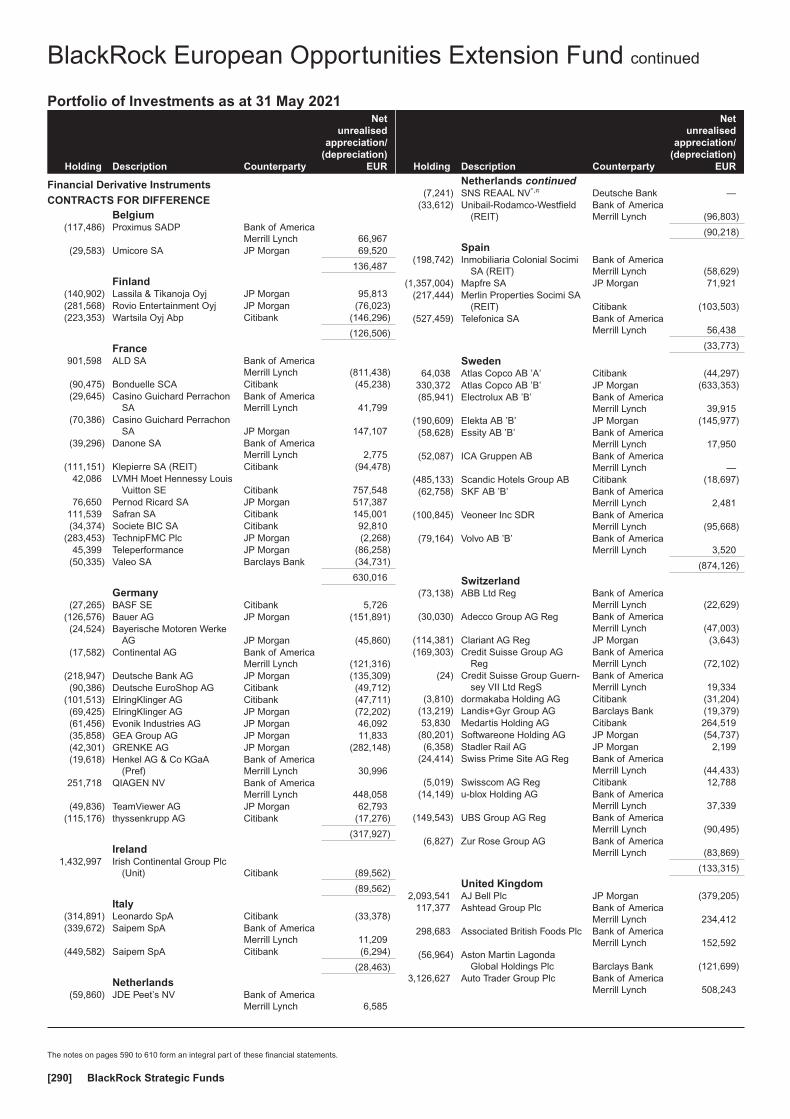
Holding Description Counterparty
Netunrealised
appreciation/(depreciation)
EUR
Financial Derivative Instruments
CONTRACTS FOR DIFFERENCEBelgium
(117,486) Proximus SADP Bank of AmericaMerrill Lynch 66,967
(29,583) Umicore SA JP Morgan 69,520
136,487
Finland(140,902) Lassila & Tikanoja Oyj JP Morgan 95,813(281,568) Rovio Entertainment Oyj JP Morgan (76,023)(223,353) Wartsila Oyj Abp Citibank (146,296)
(126,506)
France901,598 ALD SA Bank of America
Merrill Lynch (811,438)(90,475) Bonduelle SCA Citibank (45,238)(29,645) Casino Guichard Perrachon
SABank of AmericaMerrill Lynch 41,799
(70,386) Casino Guichard PerrachonSA JP Morgan 147,107
(39,296) Danone SA Bank of AmericaMerrill Lynch 2,775
(111,151) Klepierre SA (REIT) Citibank (94,478)42,086 LVMH Moet Hennessy Louis
Vuitton SE Citibank 757,54876,650 Pernod Ricard SA JP Morgan 517,387
111,539 Safran SA Citibank 145,001(34,374) Societe BIC SA Citibank 92,810
(283,453) TechnipFMC Plc JP Morgan (2,268)45,399 Teleperformance JP Morgan (86,258)
(50,335) Valeo SA Barclays Bank (34,731)
630,016
Germany(27,265) BASF SE Citibank 5,726
(126,576) Bauer AG JP Morgan (151,891)(24,524) Bayerische Motoren Werke
AG JP Morgan (45,860)(17,582) Continental AG Bank of America
Merrill Lynch (121,316)(218,947) Deutsche Bank AG JP Morgan (135,309)(90,386) Deutsche EuroShop AG Citibank (49,712)
(101,513) ElringKlinger AG Citibank (47,711)(69,425) ElringKlinger AG JP Morgan (72,202)(61,456) Evonik Industries AG JP Morgan 46,092(35,858) GEA Group AG JP Morgan 11,833(42,301) GRENKE AG JP Morgan (282,148)(19,618) Henkel AG & Co KGaA
(Pref)Bank of AmericaMerrill Lynch 30,996
251,718 QIAGEN NV Bank of AmericaMerrill Lynch 448,058
(49,836) TeamViewer AG JP Morgan 62,793(115,176) thyssenkrupp AG Citibank (17,276)
(317,927)
Ireland1,432,997 Irish Continental Group Plc
(Unit) Citibank (89,562)
(89,562)
Italy(314,891) Leonardo SpA Citibank (33,378)(339,672) Saipem SpA Bank of America
Merrill Lynch 11,209(449,582) Saipem SpA Citibank (6,294)
(28,463)
Netherlands(59,860) JDE Peet’s NV Bank of America
Merrill Lynch 6,585
Holding Description Counterparty
Netunrealised
appreciation/(depreciation)
EUR
Netherlands continued(7,241) SNS REAAL NV*,π Deutsche Bank —
(33,612) Unibail-Rodamco-Westfield(REIT)
Bank of AmericaMerrill Lynch (96,803)
(90,218)
Spain(198,742) Inmobiliaria Colonial Socimi
SA (REIT)Bank of AmericaMerrill Lynch (58,629)
(1,357,004) Mapfre SA JP Morgan 71,921(217,444) Merlin Properties Socimi SA
(REIT) Citibank (103,503)(527,459) Telefonica SA Bank of America
Merrill Lynch 56,438
(33,773)
Sweden64,038 Atlas Copco AB ’A’ Citibank (44,297)
330,372 Atlas Copco AB ’B’ JP Morgan (633,353)(85,941) Electrolux AB ’B’ Bank of America
Merrill Lynch 39,915(190,609) Elekta AB ’B’ JP Morgan (145,977)(58,628) Essity AB ’B’ Bank of America
Merrill Lynch 17,950(52,087) ICA Gruppen AB Bank of America
Merrill Lynch —(485,133) Scandic Hotels Group AB Citibank (18,697)(62,758) SKF AB ’B’ Bank of America
Merrill Lynch 2,481(100,845) Veoneer Inc SDR Bank of America
Merrill Lynch (95,668)(79,164) Volvo AB ’B’ Bank of America
Merrill Lynch 3,520
(874,126)
Switzerland(73,138) ABB Ltd Reg Bank of America
Merrill Lynch (22,629)(30,030) Adecco Group AG Reg Bank of America
Merrill Lynch (47,003)(114,381) Clariant AG Reg JP Morgan (3,643)(169,303) Credit Suisse Group AG
RegBank of AmericaMerrill Lynch (72,102)
(24) Credit Suisse Group Guern-sey VII Ltd RegS
Bank of AmericaMerrill Lynch 19,334
(3,810) dormakaba Holding AG Citibank (31,204)(13,219) Landis+Gyr Group AG Barclays Bank (19,379)53,830 Medartis Holding AG Citibank 264,519
(80,201) Softwareone Holding AG JP Morgan (54,737)(6,358) Stadler Rail AG JP Morgan 2,199
(24,414) Swiss Prime Site AG Reg Bank of AmericaMerrill Lynch (44,433)
(5,019) Swisscom AG Reg Citibank 12,788(14,149) u-blox Holding AG Bank of America
Merrill Lynch 37,339(149,543) UBS Group AG Reg Bank of America
Merrill Lynch (90,495)(6,827) Zur Rose Group AG Bank of America
Merrill Lynch (83,869)
(133,315)
United Kingdom2,093,541 AJ Bell Plc JP Morgan (379,205)
117,377 Ashtead Group Plc Bank of AmericaMerrill Lynch 234,412
298,683 Associated British Foods Plc Bank of AmericaMerrill Lynch 152,592
(56,964) Aston Martin LagondaGlobal Holdings Plc Barclays Bank (121,699)
3,126,627 Auto Trader Group Plc Bank of AmericaMerrill Lynch 508,243
BlackRock European Opportunities Extension Fund continued
Portfolio of Investments as at 31 May 2021
The notes on pages 590 to 610 form an integral part of these financial statements.
BlackRock Strategic Funds[290]

Holding Description Counterparty
Netunrealised
appreciation/(depreciation)
EUR
United Kingdom continued(290,097) British Land Co Plc (REIT) Bank of America
Merrill Lynch 28,294(77,476) Carnival Plc JP Morgan (141,232)
(1,494,738) Centrica Plc Citibank (23,256)57,823 DCC Plc JP Morgan (93,993)
(632,957) Deliveroo Plc Citibank 48,505546,970 Experian Plc Bank of America
Merrill Lynch 425,506(88,371) HomeServe Plc Barclays Bank 15,391
(856,233) J Sainsbury Plc JP Morgan (94,446)(261,529) John Wood Group Plc Barclays Bank 20,550(53,039) Johnson Matthey Plc Citibank 94,838
(534,510) Jupiter Fund ManagementPlc Citibank 14,895
71,592 London Stock ExchangeGroup Plc JP Morgan 413,963
(3,528,710) N Brown Group Plc Bank of AmericaMerrill Lynch 251,976
(1,564,850) Rolls-Royce Holdings Plc Citibank (23,620)70,595 Spirax-Sarco Engineering
PlcBank of AmericaMerrill Lynch 475,411
(489,992) Standard Life Aberdeen Plc Citibank (34,136)(235,328) TUI AG Citibank 17,214(252,865) TUI AG JP Morgan 13,799(54,978) Victrex Plc Citibank (7,660)
(1,046,903) Wm Morrison SupermarketsPlc
Bank of AmericaMerrill Lynch 83,873
1,880,215
United States(54,632) Carnival Corp Citibank (74,311)
(74,311)
Total (Gross underlying exposure - EUR 333,554,092) 878,517
* Security subject to a fair value adjustment as detailed in Note 2(a).π Amounts which are less than 0.5 USD have been rounded down to zero.
BlackRock European Opportunities Extension Fund continued
Portfolio of Investments as at 31 May 2021
The notes on pages 590 to 610 form an integral part of these financial statements.
Annual report and audited financial statements [291]

Currency Purchases Currency Sales CounterpartyMaturity
date
Netunrealised
(depreciation)EUR
Financial Derivative Instruments
OPEN FORWARD FOREIGN EXCHANGE TRANSACTIONS
GBP 76,811,928 EUR 89,190,810State Street Bank& Trust Company 18/6/2021 (30,833)
NOK 56,112,980 EUR 5,580,068State Street Bank& Trust Company 18/6/2021 (72,047)
Total (Gross underlying exposure - EUR 94,667,998) (102,880)
Sector Breakdownas at 31 May 2021
% of NetAssets
Consumer, Non-cyclical 31.91
Industrial 30.11
Consumer, Cyclical 14.11
Technology 9.53
Financial 6.27
Basic Materials 3.60
Collective Investment Schemes 3.40
Energy 1.79
Communications 0.77
Securities portfolio at market value 101.49
Other Net Liabilities (1.49)
100.00
BlackRock European Opportunities Extension Fund continued
Portfolio of Investments as at 31 May 2021
The notes on pages 590 to 610 form an integral part of these financial statements.
BlackRock Strategic Funds[292]

Holding Description
MarketValue
EUR
% ofNet
Assets
Transferable Securities and Money Market Instruments Admittedto an Official Stock Exchange Listing or Dealt in on AnotherRegulated Market
COMMON STOCKSBelgium
13,000 Solvay SA 1,442,350 0.30
1,442,350 0.30
Denmark16,667 DSV PANALPINA A/S 3,305,800 0.6875,390 Novo Nordisk A/S ’B’ 4,886,388 1.00
121,145 Tryg A/S 2,327,089 0.48
10,519,277 2.16
Finland53,071 Kone Oyj ’B’ 3,518,607 0.72
339,361 Nordea Bank Abp 2,998,396 0.62
6,517,003 1.34
France26,590 BNP Paribas SA 1,491,965 0.3188,787 Engie SA 1,083,557 0.224,144 Kering SA 3,106,342 0.648,014 L’Oreal SA 2,957,166 0.614,725 LVMH Moet Hennessy Louis
Vuitton SE 3,097,238 0.6472,091 Sanofi 6,307,242 1.3021,361 Schneider Electric SE 2,773,939 0.5795,499 SCOR SE^ 2,533,588 0.529,404 Teleperformance 2,970,724 0.61
48,835 Vinci SA 4,551,910 0.94
30,873,671 6.36
Germany20,487 Allianz SE Reg 4,420,070 0.9125,287 LEG Immobilien AG 3,034,440 0.6315,504 MTU Aero Engines AG 3,299,251 0.689,238 Muenchener
Rueckversicherungs-Gesellschaft AG inMuenchen Reg 2,187,559 0.45
1,136 Rational AG 840,186 0.17
13,781,506 2.84
Italy83,584 ACEA SpA 1,666,665 0.34
677,157 Enel SpA 5,474,814 1.13652,020 Iren SpA 1,676,996 0.3546,661 UniCredit SpA 490,407 0.10
9,308,882 1.92
Netherlands8,124 ASML Holding NV 4,477,136 0.92
19,928 Koninklijke DSM NV 3,013,114 0.62
7,490,250 1.54
Norway155,424 Gjensidige Forsikring ASA 2,849,133 0.59
2,849,133 0.59
Portugal1,289,702 EDP - Energias de Portugal
SA 6,080,945 1.25
6,080,945 1.25
Spain176,063 Endesa SA 3,952,614 0.82357,560 Iberdrola SA 3,951,038 0.81
7,903,652 1.63
Holding Description
MarketValue
EUR
% ofNet
Assets
Sweden52,025 Alfa Laval AB 1,609,153 0.33
123,032 Assa Abloy AB ’B’ 3,118,504 0.64496,962 Tele2 AB ’B’^ 5,522,345 1.14
10,250,002 2.11
Switzerland13,510 Cembra Money Bank AG 1,255,218 0.269,513 Lonza Group AG Reg 5,024,384 1.03
48,665 Nestle SA Reg^ 4,914,727 1.014,570 Roche Holding AG^ 1,303,326 0.27
11,937 Sika AG Reg^ 3,150,149 0.6515,371 Zurich Insurance Group AG^ 5,264,895 1.08
20,912,699 4.30
United Kingdom62,623 AstraZeneca Plc 5,850,345 1.20
416,772 Auto Trader Group Plc 2,717,648 0.561,138,895 Direct Line Insurance Group
Plc 3,931,391 0.8169,153 National Grid Plc 754,113 0.16
120,718 Persimmon Plc 4,429,214 0.91501,295 Phoenix Group Holdings Plc^ 4,281,566 0.88199,503 RELX Plc 4,259,894 0.88
26,224,171 5.40
Total Common Stocks 154,153,541 31.74
BONDSAlbania
EUR 310,000 Albania Government Interna-tional Bond RegS 3.50%9/10/2025 329,425 0.07
EUR 100,000 Albania Government Interna-tional Bond RegS 3.50%16/6/2027 106,885 0.02
436,310 0.09
AustraliaEUR 550,000 APT Pipelines Ltd RegS
2.00% 15/7/2030 591,987 0.12EUR 550,000 Macquarie Group Ltd RegS
0.35% 3/3/2028 540,650 0.11
1,132,637 0.23
AustriaEUR 400,000 Erste Group Bank AG RegS
0.05% 16/9/2025 401,320 0.08EUR 400,000 Erste Group Bank AG RegS
FRN (Perpetual) 425,900 0.09EUR 100,000 Kommunalkredit Austria AG
RegS 0.25% 14/5/2024 99,925 0.02EUR 500,000 Raiffeisen Bank International
AG RegS 0.25% 5/7/2021 500,300 0.10EUR 1,348,000 Republic of Austria Govern-
ment Bond RegS20/4/2025 (Zero Coupon) 1,375,621 0.28
EUR 1,300,000 Republic of Austria Govern-ment Bond RegS 1.20%20/10/2025 1,397,812 0.29
EUR 1,240,000 Republic of Austria Govern-ment Bond RegS 0.50%20/4/2027 1,303,116 0.27
EUR 302,000 Republic of Austria Govern-ment Bond RegS 4.15%15/3/2037 480,325 0.10
EUR 249,000 Republic of Austria Govern-ment Bond RegS 1.50%20/2/2047 301,300 0.06
BlackRock European Select Strategies Fund
Portfolio of Investments as at 31 May 2021
The notes on pages 590 to 610 form an integral part of these financial statements.
Annual report and audited financial statements [293]

Holding Description
MarketValue
EUR
% ofNet
Assets
Austria continuedEUR 86,000 Republic of Austria Govern-
ment Bond RegS 3.80%26/1/2062 176,143 0.04
EUR 715,000 Republic of Austria Govern-ment Bond RegS 0.70%20/4/2071 667,503 0.14
EUR 136,000 Republic of Austria Govern-ment Bond RegS 2.10%20/9/2117 219,376 0.04
EUR 45,000 Republic of Austria Govern-ment Bond RegS 0.85%30/6/2120 39,889 0.01
EUR 200,000 Volksbank Wien AG RegS0.875% 23/3/2026 200,972 0.04
7,589,502 1.56
BelgiumEUR 300,000 Ageas SA RegS FRN
24/11/2051 298,545 0.06EUR 800,000 Ageas SA RegS FRN (Per-
petual) 848,216 0.18EUR 125,000 Anheuser-Busch InBev SA
RegS 3.70% 2/4/2040 166,178 0.03EUR 800,000 Argenta Spaarbank NV RegS
1.00% 6/2/2024 822,672 0.17EUR 200,000 Belfius Bank SA RegS 1.00%
12/6/2028 215,210 0.05EUR 300,000 BNP Paribas Fortis SA RegS
24/10/2023 (Zero Coupon) 303,162 0.06EUR 200,000 Fluxys Belgium SA RegS
1.75% 5/10/2027 209,794 0.04EUR 400,000 KBC Group NV RegS FRN
11/3/2027 405,576 0.08EUR 585,000 Kingdom of Belgium Govern-
ment Bond RegS 0.50%22/10/2024 606,768 0.13
EUR 180,000 Kingdom of Belgium Govern-ment Bond RegS22/10/2027 (Zero Coupon) 183,204 0.04
EUR 2,400,000 Kingdom of Belgium Govern-ment Bond RegS 0.80%22/6/2028 2,572,776 0.53
EUR 601,778 Kingdom of Belgium Govern-ment Bond RegS 0.90%22/6/2029 650,305 0.13
EUR 160,000 Kingdom of Belgium Govern-ment Bond RegS 3.00%22/6/2034 214,856 0.05
EUR 341,000 Kingdom of Belgium Govern-ment Bond RegS 1.45%22/6/2037 389,756 0.08
EUR 174,000 Kingdom of Belgium Govern-ment Bond RegS 1.90%22/6/2038 211,923 0.04
EUR 140,000 Kingdom of Belgium Govern-ment Bond RegS 0.40%22/6/2040 133,358 0.03
EUR 511,264 Kingdom of Belgium Govern-ment Bond RegS 1.60%22/6/2047 596,369 0.12
EUR 210,000 Kingdom of Belgium Govern-ment Bond RegS 1.70%22/6/2050 250,673 0.05
EUR 255,004 Kingdom of Belgium Govern-ment Bond RegS 0.65%22/6/2071 207,331 0.04
9,286,672 1.91
CanadaEUR 1,000,000 Canadian Imperial Bank of
Commerce RegS 0.25%24/1/2023 1,011,600 0.21
Holding Description
MarketValue
EUR
% ofNet
Assets
Canada continuedEUR 514,000 CPPIB Capital Inc RegS
0.375% 20/6/2024 526,609 0.11EUR 680,000 CPPIB Capital Inc RegS
0.875% 6/2/2029^ 723,309 0.15
2,261,518 0.47
ChinaEUR 150,000 China Development Bank
RegS 27/10/2023 (ZeroCoupon) 150,135 0.03
EUR 100,000 China Government Interna-tional Bond RegS 0.125%12/11/2026 100,300 0.02
EUR 386,000 China Government Interna-tional Bond RegS 0.50%12/11/2031 383,877 0.08
EUR 150,000 China Government Interna-tional Bond RegS 0.625%25/11/2035 146,800 0.03
781,112 0.16
ColombiaUSD 1,245,000 Colombia Government Interna-
tional Bond 3.25%22/4/2032 986,900 0.20
986,900 0.20
CyprusEUR 118,000 Cyprus Government Interna-
tional Bond RegS 3.875%6/5/2022 122,733 0.03
EUR 277,000 Cyprus Government Interna-tional Bond RegS 3.75%26/7/2023 301,930 0.06
EUR 725,000 Cyprus Government Interna-tional Bond RegS 0.625%3/12/2024 744,227 0.15
1,168,890 0.24
Czech RepublicEUR 297,000 Komercni banka as RegS
0.01% 20/1/2026 299,599 0.06
299,599 0.06
DenmarkEUR 600,000 Danske Bank A/S FRN
24/5/2023 608,400 0.12EUR 350,000 Danske Bank A/S RegS 0.25%
28/11/2022 352,828 0.07USD 397,000 Danske Bank A/S RegS FRN
12/9/2023 329,283 0.07DKK 3,594,000 Denmark Government Bond
1.75% 15/11/2025 530,297 0.11DKK 3,292,000 Denmark Government Bond
4.50% 15/11/2039 770,630 0.16EUR 100,000 Kommunekredit RegS 0.875%
3/11/2036 105,476 0.02DKK 7,901,729 Nordea Kredit Realkreditaktie-
selskab 0.50% 1/10/2050 974,900 0.20DKK 396,935 Nordea Kredit Realkreditaktie-
selskab RegS 1.00%1/10/2050 51,023 0.01
DKK 3,080,583 Nykredit Realkredit A/S RegS0.50% 1/10/2050 379,774 0.08
DKK 5,548,188 Nykredit Realkredit A/S RegS1.00% 1/10/2050 714,300 0.15
DKK 5,240,000 Nykredit Realkredit A/S RegS1.00% 1/10/2053 665,730 0.14
BlackRock European Select Strategies Fund continued
Portfolio of Investments as at 31 May 2021
The notes on pages 590 to 610 form an integral part of these financial statements.
BlackRock Strategic Funds[294]

Holding Description
MarketValue
EUR
% ofNet
Assets
Denmark continuedDKK 2,967,480 Realkredit Danmark A/S RegS
0.50% 1/10/2050 365,819 0.07DKK 5,135,022 Realkredit Danmark A/S RegS
1.00% 1/10/2050 659,091 0.14
6,507,551 1.34
FinlandEUR 400,000 Aktia Bank Oyj RegS 0.375%
5/3/2026 413,164 0.09EUR 805,000 Finland Government Bond
RegS 0.50% 15/9/2027 847,568 0.17EUR 691,000 Finland Government Bond
RegS 0.50% 15/9/2029 726,303 0.15EUR 75,000 Finland Government Bond
RegS 0.25% 15/9/2040 71,948 0.01EUR 57,000 Finland Government Bond
RegS 1.375% 15/4/2047 68,430 0.01EUR 400,000 Nordea Bank Abp RegS 3.25%
5/7/2022 416,276 0.09EUR 525,000 OP Corporate Bank Plc 0.60%
18/1/2027 532,434 0.11EUR 550,000 OP Corporate Bank Plc RegS
0.375% 29/8/2023 558,420 0.12
3,634,543 0.75
FranceEUR 1,100,000 Agence Francaise de Devel-
oppement EPIC RegS1.00% 31/1/2028 1,177,143 0.24
EUR 700,000 AXA Home Loan SFH SARegS 0.01% 16/10/2029 698,271 0.14
EUR 700,000 Banque Federative du CreditMutuel SA RegS 0.75%15/6/2023 715,183 0.15
EUR 600,000 Banque Federative du CreditMutuel SA RegS 0.125%5/2/2024 604,776 0.12
EUR 700,000 Banque Federative du CreditMutuel SA RegS 0.75%17/7/2025 721,742 0.15
EUR 200,000 BNP Paribas Cardif SA RegSFRN (Perpetual) 226,020 0.05
EUR 1,400,000 BNP Paribas SA RegS FRN15/7/2025 1,417,262 0.29
EUR 1,000,000 BNP Paribas SA RegS FRN15/1/2032^ 1,003,420 0.21
EUR 300,000 BNP Paribas SA RegS 0.625%3/12/2032 287,553 0.06
GBP 200,000 Bouygues SA RegS 5.50%6/10/2026 285,056 0.06
EUR 100,000 BPCE SA RegS 0.625%26/9/2023 102,142 0.02
EUR 500,000 BPCE SA RegS 0.375%5/10/2023 507,755 0.11
EUR 700,000 BPCE SA RegS 1.00%15/7/2024 724,703 0.15
EUR 200,000 BPCE SA RegS 0.125%4/12/2024 201,894 0.04
EUR 200,000 BPCE SA RegS 1.00%1/4/2025 206,514 0.04
EUR 200,000 BPCE SFH SA RegS 0.01%27/5/2030 198,708 0.04
EUR 1,000,000 BPCE SFH SA RegS 0.125%3/12/2030 999,350 0.21
EUR 500,000 Caisse des Depots et Consig-nations RegS 0.01%1/6/2026 507,100 0.10
EUR 200,000 Caisse Francaise de Finance-ment Local RegS 1.125%9/9/2025 212,424 0.04
EUR 100,000 Cars Alliance Auto LoansFrance V ’2018-1 B’ RegSFRN 21/10/2029 99,940 0.02
Holding Description
MarketValue
EUR
% ofNet
Assets
France continuedEUR 300,000 Cie de Financement Foncier
SA RegS 0.75% 29/5/2026 315,219 0.07EUR 100,000 Cie de Saint-Gobain RegS
0.875% 21/9/2023 102,492 0.02EUR 200,000 Cie de Saint-Gobain RegS
0.625% 15/3/2024 204,318 0.04EUR 600,000 Coentreprise de Transport
d’Electricite SA RegS0.875% 29/9/2024 616,374 0.13
EUR 300,000 Credit Agricole Assurances SARegS FRN 27/9/2048 365,529 0.08
EUR 130,000 Credit Agricole Home LoanSFH SA RegS 0.625%11/9/2023 133,254 0.03
EUR 100,000 Credit Agricole Home LoanSFH SA RegS 0.25%23/2/2024 101,894 0.02
EUR 400,000 Credit Agricole Public SectorSCF SA 0.01% 13/9/2028 401,440 0.08
EUR 200,000 Credit Agricole SA RegS1.375% 13/3/2025 209,364 0.04
EUR 700,000 Credit Mutuel - CIC HomeLoan SFH SA RegS 0.25%30/4/2024 713,769 0.15
EUR 200,000 Credit Mutuel Arkea SA RegS1.375% 17/1/2025 210,422 0.04
EUR 300,000 Danone SA RegS1/12/2025 (Zero Coupon) 299,841 0.06
GBP 1,900,000 Dexia Credit Local SA RegS1.125% 15/6/2022 2,227,721 0.46
GBP 2,800,000 Dexia Credit Local SA RegS1.625% 8/12/2023 3,354,579 0.69
GBP 300,000 Dexia Credit Local SA RegS0.25% 10/12/2026 339,125 0.07
EUR 100,000 Dexia Credit Local SA RegS21/1/2028 (Zero Coupon) 100,143 0.02
GBP 200,000 Electricite de France SA RegSFRN (Perpetual) 260,550 0.05
EUR 100,000 Engie SA RegS 0.875%27/3/2024 102,879 0.02
EUR 500,000 Engie SA RegS 4/3/2027 (ZeroCoupon) 496,025 0.10
EUR 800,000 Engie SA RegS 0.375%11/6/2027 810,440 0.17
EUR 200,000 Engie SA RegS 2.00%28/9/2037 228,582 0.05
EUR 100,000 Engie SA RegS FRN (Per-petual) 101,480 0.02
EUR 210,504 FCT Autonoria ’2019-1 B’RegS FRN 25/9/2035 211,025 0.04
EUR 200,000 Firmenich Productions Partici-pations SAS RegS 1.75%30/4/2030 218,550 0.05
EUR 1,620,000 France Government Bond OATRegS 25/2/2023 (Zero Cou-pon) 1,638,435 0.34
EUR 1,070,000 France Government Bond OATRegS 25/3/2025 (Zero Cou-pon) 1,090,983 0.23
EUR 490,000 France Government Bond OATRegS 0.50% 25/5/2025 509,644 0.11
EUR 1,080,000 France Government Bond OATRegS 25/2/2026 (Zero Cou-pon) 1,100,747 0.23
EUR 1,750,192 France Government Bond OATRegS 25/11/2031 (ZeroCoupon) 1,717,218 0.35
EUR 46,178 France Government Bond OATRegS 1.25% 25/5/2034 51,435 0.01
EUR 2,865,400 France Government Bond OATRegS 1.75% 25/6/2039 3,448,423 0.71
BlackRock European Select Strategies Fund continued
Portfolio of Investments as at 31 May 2021
The notes on pages 590 to 610 form an integral part of these financial statements.
Annual report and audited financial statements [295]

Holding Description
MarketValue
EUR
% ofNet
Assets
France continuedEUR 200,000 France Government Bond OAT
RegS 0.50% 25/5/2040 194,094 0.04EUR 195,000 France Government Bond OAT
RegS 0.50% 25/6/2044 184,250 0.04EUR 338,967 France Government Bond OAT
RegS 3.25% 25/5/2045 523,212 0.11EUR 2,025,000 France Government Bond OAT
RegS 0.75% 25/5/2052 1,903,743 0.39EUR 217,000 France Government Bond OAT
RegS 4.00% 25/4/2060 423,584 0.09EUR 630,000 France Government Bond OAT
RegS 1.75% 25/5/2066 780,835 0.16EUR 541,005 France Government Bond OAT
RegS 0.50% 25/5/2072 409,741 0.08EUR 500,000 Harmony French Home Loans
FCT ’2020-2 B’ RegS FRN27/8/2061 508,167 0.11
EUR 400,000 HSBC Continental Europe SARegS 0.20% 4/9/2021 400,736 0.08
EUR 600,000 La Poste SA RegS 1.375%21/4/2032 644,850 0.13
EUR 200,000 Orange SA RegS 1.25%7/7/2027 213,310 0.04
EUR 200,000 Orange SA RegS 1.375%20/3/2028 215,440 0.04
EUR 400,000 RTE Reseau de Transportd’Electricite SADIR RegS9/9/2027 (Zero Coupon) 394,660 0.08
EUR 300,000 Schneider Electric SE RegS12/6/2023 (Zero Coupon) 302,067 0.06
EUR 500,000 Societe Generale SA FRN24/11/2030 497,465 0.10
EUR 200,000 Societe Generale SA RegS0.125% 24/2/2026 200,526 0.04
EUR 200,000 Societe Generale SA RegS0.875% 1/7/2026 204,116 0.04
EUR 700,000 Societe Generale SA RegSFRN 22/9/2028 708,876 0.15
EUR 800,000 Societe Generale SFH SARegS 0.50% 2/6/2025 827,400 0.17
EUR 400,000 Suez SA RegS 9/6/2026 (ZeroCoupon) 398,256 0.08
EUR 100,000 Suez SA RegS FRN (Per-petual) 99,984 0.02
EUR 400,000 Thales SA RegS26/3/2026 (Zero Coupon) 398,384 0.08
EUR 800,000 Total Capital International SARegS 0.696% 31/5/2028 827,184 0.17
EUR 400,000 UNEDIC ASSEO RegS 0.10%25/5/2034 383,252 0.08
EUR 300,000 Veolia Environnement SARegS 0.80% 15/1/2032 300,654 0.06
EUR 1,400,000 Veolia Environnement SARegS FRN (Perpetual) 1,436,302 0.30
EUR 300,000 Veolia Environnement SARegS FRN (Perpetual) 298,020 0.06
46,257,964 9.52
GermanyEUR 300,000 Allianz SE RegS FRN
8/7/2050 319,701 0.07EUR 525,000 Berlin Hyp AG RegS 0.01%
24/1/2028 530,502 0.11EUR 100,000 Bertelsmann SE & Co KGaA
RegS FRN 23/4/2075 103,652 0.02EUR 2,163,546 Bundesrepublik Deutschland
Bundesanleihe RegS15/2/2031 (Zero Coupon) 2,200,002 0.45
EUR 1,170,000 Bundesrepublik DeutschlandBundesanleihe RegS15/5/2036 (Zero Coupon) 1,147,559 0.24
Holding Description
MarketValue
EUR
% ofNet
Assets
Germany continuedEUR 1,040,000 Bundesrepublik Deutschland
Bundesanleihe RegS 4.25%4/7/2039^ 1,812,169 0.37
EUR 156,000 Bundesrepublik DeutschlandBundesanleihe RegS 4.75%4/7/2040 292,085 0.06
EUR 216,651 Bundesrepublik DeutschlandBundesanleihe RegS15/8/2050 (Zero Coupon) 195,720 0.04
EUR 250,000 Deutsche Bahn FinanceGmbH RegS 0.625%15/4/2036 240,935 0.05
EUR 200,000 Deutsche Bank AG RegS FRN17/2/2032 199,364 0.04
EUR 700,000 Deutsche Pfandbriefbank AGRegS 0.125% 5/9/2024 703,178 0.15
EUR 300,000 Eurogrid GmbH RegS 1.625%3/11/2023 312,159 0.07
EUR 200,000 Eurogrid GmbH RegS 1.113%15/5/2032 209,188 0.04
EUR 600,000 FMS Wertmanagement RegS0.375% 29/4/2030 617,778 0.13
EUR 225,000 Fraport AG Frankfurt AirportServices Worldwide RegS1.875% 31/3/2028 232,810 0.05
EUR 765,000 Gemeinsame DeutscheBundeslaender RegS0.625% 13/2/2029 807,917 0.17
EUR 200,000 ING-DiBa AG RegS 0.25%16/11/2026 205,406 0.04
EUR 200,000 KION Group AG RegS 1.625%24/9/2025 208,270 0.04
EUR 113,000 Kreditanstalt fuer Wiederauf-bau 0.125% 4/10/2024 115,396 0.02
EUR 114,000 Kreditanstalt fuer Wiederauf-bau 0.50% 15/9/2027 119,300 0.03
EUR 74,000 Kreditanstalt fuer Wiederauf-bau RegS 30/9/2026 (ZeroCoupon) 75,305 0.02
EUR 1,571,000 Kreditanstalt fuer Wiederauf-bau RegS 15/6/2029 (ZeroCoupon) 1,582,955 0.33
EUR 430,000 Land Berlin RegS 0.625%15/7/2039^ 438,088 0.09
EUR 100,000 Landesbank Baden-Wuerttemberg RegS 2.875%28/9/2026 109,750 0.02
EUR 600,000 Landesbank Baden-Wuerttemberg RegS 2.20%9/5/2029 630,702 0.13
EUR 300,000 Merck Financial ServicesGmbH RegS 0.125%16/7/2025 302,652 0.06
EUR 100,000 Merck Financial ServicesGmbH RegS 0.875%5/7/2031 104,179 0.02
EUR 8,000 Muenchener HypothekenbankeG RegS 0.01% 2/11/2040 7,250 0.00
EUR 640,000 NRW Bank RegS 0.625%2/2/2029 672,909 0.14
EUR 371,000 NRW Bank RegS 0.375%16/5/2029^ 382,201 0.08
EUR 14,350 Red & Black Auto Germany5 UG haftungsbeschrankt ’A’RegS FRN 15/1/2027 14,387 0.00
EUR 400,000 Santander Consumer Bank AGRegS 0.25% 5/12/2024 408,712 0.08
EUR 1,495,000 State of Hesse RegS25/4/2025 (Zero Coupon) 1,517,201 0.31
EUR 1,553,000 State of Lower Saxony0.125% 8/4/2027 1,587,135 0.33
BlackRock European Select Strategies Fund continued
Portfolio of Investments as at 31 May 2021
The notes on pages 590 to 610 form an integral part of these financial statements.
BlackRock Strategic Funds[296]

Holding Description
MarketValue
EUR
% ofNet
Assets
Germany continuedEUR 557,000 State of Lower Saxony RegS
0.01% 16/6/2028 563,027 0.12EUR 10,000 State of North Rhine-
Westphalia Germany RegS1.625% 24/10/2030 11,465 0.00
EUR 425,000 Volkswagen Financial ServicesAG RegS 1.50% 1/10/2024 445,166 0.09
EUR 400,000 Volkswagen Leasing GmbHRegS 12/7/2023 (Zero Cou-pon) 400,656 0.08
EUR 200,000 Volkswagen Leasing GmbHRegS 1.375% 20/1/2025 209,172 0.04
EUR 325,000 Volkswagen Leasing GmbHRegS 1.625% 15/8/2025^ 344,650 0.07
EUR 725,000 Volkswagen Leasing GmbHRegS 0.375% 20/7/2026 725,297 0.15
EUR 200,000 ZF Finance GmbH RegS2.75% 25/5/2027 207,038 0.04
21,312,988 4.39
GreeceEUR 175,000 Alpha Bank SA RegS 2.50%
5/2/2023 181,923 0.04EUR 2,575,000 Hellenic Republic Government
Bond RegS 12/2/2026 (ZeroCoupon) 2,562,382 0.53
2,744,305 0.57
HungaryHUF 359,150,000 Hungary Government Bond
3.25% 22/10/2031 1,085,875 0.22EUR 114,000 Hungary Government Interna-
tional Bond RegS 1.75%5/6/2035 120,322 0.03
1,206,197 0.25
IndonesiaIDR 3,396,000,000 Indonesia Treasury Bond
7.00% 15/9/2030 202,856 0.04USD 375,000 Pertamina Persero PT RegS
1.40% 9/2/2026 301,195 0.06USD 205,000 Pertamina Persero PT RegS
2.30% 9/2/2031 159,579 0.04
663,630 0.14
IrelandEUR 425,000 Abbott Ireland Financing DAC
RegS 0.10% 19/11/2024 427,951 0.09GBP 100,000 BAMS CMBS 2018-1 DAC ’C’
RegS FRN 17/5/2028 116,532 0.02EUR 700,000 Bank of Ireland Mortgage
Bank RegS 0.625%14/3/2025 725,053 0.15
SEK 1,990,000 Bluestep Mortgage SecuritiesNo 4 DAC ’B’ RegS FRN10/8/2066 196,745 0.04
EUR 650,000 CRH SMW Finance DACRegS 1.25% 5/11/2026 687,323 0.14
EUR 159,878 Ireland Government Bond5.40% 13/3/2025 195,636 0.04
EUR 270,000 Ireland Government BondRegS 3.40% 18/3/2024 299,956 0.06
EUR 129,293 Ireland Government BondRegS 1.35% 18/3/2031 144,785 0.03
EUR 876,959 Ireland Government BondRegS 18/10/2031 (ZeroCoupon) 857,824 0.18
EUR 50,000 Ireland Government BondRegS 0.55% 22/4/2041 48,552 0.01
EUR 295,000 Ireland Government BondRegS 1.50% 15/5/2050 338,489 0.07
Holding Description
MarketValue
EUR
% ofNet
Assets
Ireland continuedEUR 269,000 Last Mile Securities PE
’2021-X1 A1’ DAC RegSFRN 17/8/2031 269,448 0.06
EUR 98,750 River Green Finance’2020-1 A’ DAC RegS FRN22/1/2032 98,947 0.02
GBP 99,692 Taurus ’2019-2 B’ UK DACRegS FRN 17/11/2029 116,122 0.02
GBP 99,691 Taurus ’2019-2 C’ UK DACRegS FRN 17/11/2029 115,952 0.02
GBP 179,444 Taurus 2019-2 UK DAC ’A’RegS FRN 17/11/2029 210,160 0.04
GBP 364,705 Taurus ’2020-2 A’ UK DACRegS FRN 17/8/2030 426,182 0.09
EUR 500,000 Zurich Finance Ireland Desig-nated Activity Co RegS FRN17/9/2050 521,935 0.11
5,797,592 1.19
ItalyEUR 300,000 ACEA SpA RegS 1.50%
8/6/2027 320,313 0.07EUR 335,000 ASTM SpA RegS 1.625%
8/2/2028 345,358 0.07EUR 93,668 AutoFlorence 1 Srl ’A’ RegS
FRN 25/12/2042 94,231 0.02EUR 69,902 AutoFlorence 1 Srl ’B’ RegS
FRN 25/12/2042 70,226 0.01EUR 200,000 Banca Monte dei Paschi di
Siena SpA RegS 1.25%20/1/2022 202,008 0.04
EUR 1,010,000 Banca Monte dei Paschi diSiena SpA RegS 0.875%8/10/2026 1,051,753 0.22
EUR 200,000 Credit Agricole Italia SpARegS 1.00% 25/3/2027 213,232 0.04
EUR 675,000 Credito Emiliano SpA RegS1.125% 17/1/2024 700,346 0.14
EUR 200,000 Intesa Sanpaolo SpA RegS2.00% 18/6/2021 200,220 0.04
EUR 600,000 Intesa Sanpaolo SpA RegS1.125% 4/3/2022 606,342 0.12
EUR 500,000 Intesa Sanpaolo SpA RegS0.50% 5/3/2024 513,020 0.11
EUR 225,000 Intesa Sanpaolo SpA RegS0.75% 4/12/2024 230,369 0.05
EUR 300,000 Intesa Sanpaolo SpA RegS2.925% 14/10/2030 315,675 0.06
EUR 875,000 Intesa Sanpaolo SpA RegS1.35% 24/2/2031 856,686 0.18
EUR 1,473,237 Italy Buoni Poliennali Del Te-soro RegS 0.45% 22/5/2023 1,514,384 0.31
EUR 674,694 Italy Buoni Poliennali Del Te-soro RegS 0.25%20/11/2023 694,375 0.14
EUR 2,911,000 Italy Buoni Poliennali Del Te-soro RegS 1.45%15/11/2024 3,065,603 0.63
EUR 750,000 Italy Buoni Poliennali Del Te-soro RegS 0.35% 1/2/2025 761,168 0.16
EUR 945,000 Italy Buoni Poliennali Del Te-soro RegS 1.45% 15/5/2025 999,413 0.21
EUR 1,535,000 Italy Buoni Poliennali Del Te-soro RegS 1.85% 1/7/2025 1,648,851 0.34
EUR 1,989,000 Italy Buoni Poliennali Del Te-soro RegS 0.50% 1/2/2026 2,023,927 0.42
EUR 400,000 Italy Buoni Poliennali Del Te-soro RegS 4.50% 1/3/2026 482,828 0.10
EUR 602,564 Italy Buoni Poliennali Del Te-soro RegS 1.30% 15/5/2028 689,400 0.14
BlackRock European Select Strategies Fund continued
Portfolio of Investments as at 31 May 2021
The notes on pages 590 to 610 form an integral part of these financial statements.
Annual report and audited financial statements [297]

Holding Description
MarketValue
EUR
% ofNet
Assets
Italy continuedEUR 1,573,000 Italy Buoni Poliennali Del Te-
soro RegS 1.65% 1/3/2032 1,681,065 0.35EUR 65,000 Italy Buoni Poliennali Del Te-
soro RegS 2.45% 1/9/2033 74,902 0.02EUR 1,500,000 Italy Buoni Poliennali Del Te-
soro RegS 3.35% 1/3/2035 1,899,720 0.39EUR 660,000 Italy Buoni Poliennali Del Te-
soro RegS 2.25% 1/9/2036 744,566 0.15EUR 139,000 Italy Buoni Poliennali Del Te-
soro RegS 2.95% 1/9/2038 170,610 0.04EUR 195,000 Italy Buoni Poliennali Del Te-
soro RegS 5.00% 1/8/2039 304,069 0.06EUR 240,000 Italy Buoni Poliennali Del Te-
soro RegS 3.10% 1/3/2040 300,614 0.06EUR 400,000 Italy Buoni Poliennali Del Te-
soro RegS 1.80% 1/3/2041 412,988 0.09EUR 1,817,000 Italy Buoni Poliennali Del Te-
soro RegS 1.50% 30/4/2045 1,743,302 0.36EUR 709,000 Italy Buoni Poliennali Del Te-
soro RegS 3.25% 1/9/2046 921,154 0.19EUR 70,000 Italy Buoni Poliennali Del Te-
soro RegS 2.70% 1/3/2047 82,989 0.02EUR 65,000 Italy Buoni Poliennali Del Te-
soro RegS 2.80% 1/3/2067 76,572 0.02EUR 75,000 Italy Buoni Poliennali Del Te-
soro RegS 2.15% 1/3/2072 72,861 0.01EUR 500,000 Mediobanca Banca di Credito
Finanziario SpA RegS1.125% 15/7/2025 517,740 0.11
EUR 350,000 Mediobanca Banca di CreditoFinanziario SpA RegS0.50% 1/10/2026^ 363,808 0.07
EUR 144,009 Progetto Quinto SRL ’A’ RegSFRN 27/10/2036 144,556 0.03
EUR 100,000 Snam SpA RegS 0.75%17/6/2030 101,132 0.02
EUR 32,291 Sunrise SPV 40 Srl ’2018-1 A’RegS FRN 27/7/2042 32,317 0.01
EUR 47,744 Sunrise SPV Z70 Srl’2019-1 A’ RegS FRN27/5/2044 47,887 0.01
EUR 300,000 Terna Rete Elettrica NazionaleSpA RegS 0.75% 24/7/2032 297,615 0.06
EUR 1,050,000 UniCredit SpA RegS FRN25/6/2025 1,080,461 0.22
EUR 725,000 UniCredit SpA RegS FRN23/9/2029^ 726,341 0.15
EUR 300,000 UniCredit SpA RegS 1.80%20/1/2030 308,259 0.06
EUR 600,000 UniCredit SpA RegS 0.85%19/1/2031^ 584,520 0.12
30,289,776 6.24
JapanEUR 375,000 Takeda Pharmaceutical Co Ltd
2.00% 9/7/2040 392,944 0.08
392,944 0.08
JerseyGBP 200,000 Heathrow Funding Ltd RegS
2.75% 9/8/2049 227,956 0.04GBP 200,000 HSBC Bank Capital Funding
Sterling 1 LP RegS FRN(Perpetual) 327,180 0.07
555,136 0.11
LuxembourgEUR 240,000 European Financial Stability
Facility RegS 0.20%28/4/2025 245,856 0.05
EUR 110,000 European Financial StabilityFacility RegS 0.75%3/5/2027 116,515 0.03
Holding Description
MarketValue
EUR
% ofNet
Assets
Luxembourg continuedEUR 513,000 European Financial Stability
Facility RegS20/1/2031 (Zero Coupon) 510,430 0.11
EUR 420,000 European Financial StabilityFacility RegS 1.375%31/5/2047 488,116 0.10
EUR 250,000 European Financial StabilityFacility RegS 0.70%20/1/2050 251,725 0.05
EUR 500,000 European Financial StabilityFacility RegS 1.75%17/7/2053 647,680 0.13
EUR 450,000 Medtronic Global HoldingsSCA 0.25% 2/7/2025 455,040 0.09
EUR 400,000 Medtronic Global HoldingsSCA 1.00% 2/7/2031 412,028 0.09
EUR 150,000 Medtronic Global HoldingsSCA 1.50% 2/7/2039 152,225 0.03
EUR 100,000 Medtronic Global HoldingsSCA 1.75% 2/7/2049 101,372 0.02
EUR 500,000 Novartis Finance SA RegS23/9/2028 (Zero Coupon) 491,800 0.10
EUR 200,000 SC Germany SA Compart-ment Consumer ’2020-1 D’RegS FRN 14/11/2034 202,003 0.04
EUR 350,000 SES SA RegS FRN (Per-petual) 351,750 0.07
EUR 100,000 Silver Arrow S.A. Compart-ment 10 ’D’ RegS FRN15/3/2027 100,905 0.02
EUR 200,000 Swiss Re Finance Luxem-bourg SA RegS FRN30/4/2050 220,150 0.05
EUR 500,000 Traton Finance LuxembourgSA RegS 1.25% 24/3/2033 498,630 0.10
5,246,225 1.08
MacedoniaEUR 195,000 North Macedonia Government
International Bond RegS1.625% 10/3/2028 189,394 0.04
189,394 0.04
MexicoMXN 5,000,000 Mexican Bonos 8.50%
31/5/2029 231,580 0.05USD 358,000 Mexico Government Interna-
tional Bond 3.75%19/4/2071 264,315 0.05
495,895 0.10
MontenegroEUR 500,000 Montenegro Government Inter-
national Bond RegS 2.875%16/12/2027 464,345 0.09
EUR 100,000 Montenegro Government Inter-national Bond RegS 2.55%3/10/2029 89,752 0.02
554,097 0.11
MoroccoEUR 154,000 Morocco Government Interna-
tional Bond RegS 1.375%30/3/2026 156,008 0.03
156,008 0.03
NetherlandsEUR 850,000 ABN AMRO Bank NV RegS
0.25% 3/12/2021 853,298 0.18EUR 300,000 ABN AMRO Bank NV RegS
1.375% 10/1/2034 340,035 0.07EUR 200,000 Achmea Bank NV RegS 0.01%
16/6/2025 202,286 0.04
BlackRock European Select Strategies Fund continued
Portfolio of Investments as at 31 May 2021
The notes on pages 590 to 610 form an integral part of these financial statements.
BlackRock Strategic Funds[298]

Holding Description
MarketValue
EUR
% ofNet
Assets
Netherlands continuedEUR 300,000 Aegon Bank NV RegS 0.01%
16/11/2025 303,279 0.06EUR 100,000 ASML Holding NV RegS
3.375% 19/9/2023 108,517 0.02EUR 750,000 ASML Holding NV RegS
1.375% 7/7/2026 802,050 0.17EUR 250,000 Athora Netherlands NV RegS
FRN 15/7/2031 254,458 0.05EUR 425,000 BMW Finance NV RegS
24/3/2023 (Zero Coupon) 427,418 0.09EUR 450,000 BMW Finance NV RegS
0.375% 10/7/2023 456,057 0.09EUR 447,000 BNG Bank NV RegS 0.75%
11/1/2028 474,303 0.10EUR 500,000 Daimler International Finance
BV RegS 0.25% 11/5/2022 503,065 0.10EUR 400,000 de Volksbank NV RegS 0.75%
25/6/2023 407,940 0.09EUR 300,000 de Volksbank NV RegS 0.01%
16/9/2024 301,848 0.06EUR 40,000 Deutsche Telekom Interna-
tional Finance BV RegS0.625% 3/4/2023 40,662 0.01
EUR 261,870 Dutch Property Finance BV’2020-2 A’ RegS FRN28/1/2058 263,547 0.06
EUR 702,000 ELM BV for Firmenich Interna-tional SA RegS FRN (Per-petual) 754,131 0.16
EUR 100,000 Heineken NV RegS 2.25%30/3/2030 114,903 0.02
EUR 600,000 Iberdrola International BVRegS FRN (Perpetual) 603,090 0.13
EUR 1,200,000 Iberdrola International BVRegS FRN (Perpetual) 1,229,496 0.25
EUR 200,000 ING Groep NV RegS 1.00%20/9/2023 205,700 0.04
EUR 600,000 ING Groep NV RegS FRN3/9/2025 600,612 0.12
EUR 700,000 ING Groep NV RegS FRN18/2/2029 683,711 0.14
EUR 162,283 Jubilee Place 2020-1 BV ’A’RegS FRN 17/10/2057 164,152 0.03
EUR 100,000 Koninklijke Philips NV RegS2.00% 30/3/2030 112,744 0.02
EUR 300,000 Nationale-Nederlanden BankNV RegS 0.50% 10/10/2024 308,526 0.06
EUR 150,000 Netherlands Government BondRegS 0.25% 15/7/2025 155,114 0.03
EUR 310,000 Netherlands Government BondRegS 0.25% 15/7/2029 321,572 0.07
EUR 1,000,000 Netherlands Government BondRegS 15/7/2030 (Zero Cou-pon)^ 1,010,670 0.21
EUR 80,000 Netherlands Government BondRegS 15/1/2038 (Zero Cou-pon) 76,396 0.02
EUR 75,000 Netherlands Government BondRegS 0.50% 15/1/2040 77,922 0.02
EUR 2,975 Netherlands Government BondRegS 2.75% 15/1/2047 4,708 0.00
EUR 960,451 Netherlands Government BondRegS 15/1/2052 (Zero Cou-pon) 832,278 0.17
EUR 200,000 NN Group NV RegS 1.00%18/3/2022 202,164 0.04
EUR 700,000 NN Group NV RegS FRN8/4/2044 782,173 0.16
EUR 225,000 Shell International Finance BVRegS 1.875% 7/4/2032^ 253,422 0.05
Holding Description
MarketValue
EUR
% ofNet
Assets
Netherlands continuedEUR 500,000 Siemens Financierings-
maatschappij NV RegS20/2/2023 (Zero Coupon) 503,005 0.10
EUR 300,000 Siemens Financierings-maatschappij NV RegS0.375% 5/6/2026 306,507 0.06
EUR 1,100,000 Telefonica Europe BV RegSFRN (Perpetual) 1,132,395 0.23
EUR 500,000 Telefonica Europe BV RegSFRN (Perpetual) 535,685 0.11
EUR 325,000 TenneT Holding BV RegS0.50% 9/6/2031 323,284 0.07
EUR 875,000 TenneT Holding BV RegS FRN(Perpetual) 903,647 0.19
EUR 300,000 Volkswagen International Fi-nance NV RegS FRN (Per-petual) 323,490 0.07
EUR 100,000 Vonovia Finance BV RegS2.25% 7/4/2030 113,001 0.02
18,373,261 3.78
New ZealandEUR 400,000 ANZ New Zealand Interna-
tional Ltd RegS 0.125%22/9/2023 404,844 0.08
EUR 425,000 ANZ New Zealand Int’l LtdRegS 0.50% 17/1/2024 434,499 0.09
EUR 300,000 ASB Finance Ltd RegS0.625% 18/10/2024 309,384 0.07
EUR 940,000 ASB Finance Ltd RegS 0.25%21/5/2031 939,502 0.19
NZD 115,000 Auckland Council RegS 2.95%28/9/2050 59,196 0.01
EUR 320,000 Chorus Ltd RegS 1.125%18/10/2023^ 328,621 0.07
NZD 320,000 Housing New Zealand LtdRegS 1.534% 10/9/2035 162,793 0.03
NZD 1,750,000 New Zealand GovernmentBond 1.75% 15/5/2041 897,645 0.19
NZD 596,000 New Zealand Government In-flation Linked Bond RegS2.00% 20/9/2025 446,148 0.09
3,982,632 0.82
NorwayEUR 750,000 DNB Bank ASA RegS 0.60%
25/9/2023 764,910 0.16EUR 575,000 DNB Bank ASA RegS 0.05%
14/11/2023 579,342 0.12EUR 225,000 Eika Boligkreditt AS RegS
0.50% 28/8/2025 232,542 0.05NOK 2,833,000 Norway Government Bond
RegS 1.75% 13/3/2025 286,445 0.06NOK 3,300,000 Norway Government Bond
RegS 1.75% 6/9/2029 332,539 0.07EUR 325,000 Sbanken Boligkreditt AS RegS
0.375% 26/4/2023 330,385 0.07EUR 500,000 SpareBank 1 Boligkreditt AS
RegS 0.50% 30/1/2025 515,875 0.10EUR 300,000 Telenor ASA RegS
25/9/2023 (Zero Coupon) 301,722 0.06
3,343,760 0.69
PolandPLN 1,000,000 Republic of Poland Govern-
ment Bond 1.25%25/10/2030 211,479 0.04
EUR 275,000 Republic of Poland Govern-ment International BondRegS 0.50% 20/12/2021 276,468 0.06
BlackRock European Select Strategies Fund continued
Portfolio of Investments as at 31 May 2021
The notes on pages 590 to 610 form an integral part of these financial statements.
Annual report and audited financial statements [299]

Holding Description
MarketValue
EUR
% ofNet
Assets
Poland continuedEUR 300,000 Republic of Poland Govern-
ment International BondRegS 10/2/2025 (Zero Cou-pon)^ 302,592 0.06
EUR 171,000 Republic of Poland Govern-ment International BondRegS 1.00% 25/10/2028^ 183,206 0.04
973,745 0.20
PortugalEUR 400,000 Banco Comercial Portugues
SA RegS 0.75% 31/5/2022 404,900 0.08EUR 200,000 Banco Santander Totta SA
RegS 1.25% 26/9/2027 217,584 0.05EUR 200,000 Caixa Economica Montepio
Geral Caixa EconomicaBancaria SA RegS 0.875%17/10/2022 203,214 0.04
EUR 100,000 EDP - Energias de PortugalSA RegS 1.625% 15/4/2027 107,492 0.02
EUR 533,000 Portugal Obrigacoes do Tes-ouro OT RegS 4.125%14/4/2027 667,673 0.14
EUR 62,000 Portugal Obrigacoes do Tes-ouro OT RegS 2.125%17/10/2028 71,395 0.01
EUR 844,000 Portugal Obrigacoes do Tes-ouro OT RegS 1.95%15/6/2029 964,101 0.20
EUR 430,791 Portugal Obrigacoes do Tes-ouro OT RegS 0.30%17/10/2031 423,420 0.09
EUR 137,000 Portugal Obrigacoes do Tes-ouro OT RegS 2.25%18/4/2034 163,766 0.03
EUR 120,000 Portugal Obrigacoes do Tes-ouro OT RegS 4.10%15/4/2037 178,452 0.04
EUR 163,800 Portugal Obrigacoes do Tes-ouro OT RegS 4.10%15/2/2045 262,147 0.05
EUR 40,161 Portugal Obrigacoes do Tes-ouro OT RegS 1.00%12/4/2052 36,016 0.01
EUR 44,222 TAGUS - Sociedade de Titular-izacao de Creditos SA/VoltaVI RegS 1.10% 13/2/2023 44,573 0.01
EUR 181,189 TAGUS - Sociedade de Titular-izacao de Creditos SA/VoltaVII RegS 0.70% 12/2/2024 180,810 0.04
EUR 37,636 TAGUS-Sociedade de Titular-izacao de Creditos SA/VoltaV RegS 0.85% 12/2/2022 37,757 0.01
3,963,300 0.82
RomaniaEUR 123,000 Romanian Government Inter-
national Bond RegS 3.624%26/5/2030 141,757 0.03
141,757 0.03
RussiaRUB 49,900,000 Russian Federal Bond - OFZ
7.05% 19/1/2028 565,953 0.12
565,953 0.12
SerbiaEUR 110,000 Serbia International Bond
RegS 1.50% 26/6/2029 109,863 0.02
Holding Description
MarketValue
EUR
% ofNet
Assets
Serbia continuedUSD 250,000 Serbia International Bond
RegS 2.125% 1/12/2030 191,314 0.04EUR 170,000 Serbia International Bond
RegS 1.65% 3/3/2033 164,385 0.04
465,562 0.10
SingaporeEUR 1,375,000 Oversea-Chinese Banking
Corp Ltd RegS 0.625%18/4/2025 1,423,689 0.29
EUR 675,000 United Overseas Bank LtdRegS 0.01% 1/12/2027 677,673 0.14
2,101,362 0.43
SlovakiaEUR 300,000 Vseobecna Uverova Banka AS
RegS 0.25% 26/3/2024 304,899 0.06EUR 400,000 Vseobecna Uverova Banka AS
RegS 0.01% 23/6/2025 403,808 0.09EUR 400,000 Vseobecna Uverova Banka AS
RegS 0.01% 24/3/2026 403,464 0.08
1,112,171 0.23
SloveniaEUR 300,000 Slovenia Government Bond
RegS 0.275% 14/1/2030 305,004 0.06EUR 199,000 Slovenia Government Bond
RegS 0.488% 20/10/2050 173,192 0.04
478,196 0.10
SpainEUR 400,000 Abanca Corp Bancaria SA
RegS 0.75% 28/5/2029 421,732 0.09EUR 500,000 Adif Alta Velocidad RegS
1.25% 4/5/2026 532,480 0.11EUR 456 Auto ABS Spanish Loans FT
’2016-1 A’ RegS FRN31/12/2032 456 0.00
EUR 700,000 Banco Bilbao Vizcaya Argen-taria SA RegS 0.375%15/11/2026^ 706,580 0.15
EUR 1,100,000 Banco de Sabadell SA RegS0.875% 22/7/2025 1,123,892 0.23
EUR 300,000 Banco de Sabadell SA RegSFRN 11/3/2027 309,057 0.06
EUR 400,000 Banco de Sabadell SA RegS0.125% 10/2/2028 404,168 0.08
EUR 100,000 Banco de Sabadell SA RegS2.50% 15/4/2031 100,347 0.02
EUR 100,000 Banco Santander SA RegS1.00% 7/4/2025 104,988 0.02
EUR 400,000 Banco Santander SA RegS0.875% 9/5/2031 428,760 0.09
EUR 300,000 Bankia SA RegS 1.00%14/3/2023 307,641 0.06
EUR 200,000 Bankia SA RegS 0.75%9/7/2026 204,616 0.04
EUR 200,000 Bankia SA RegS 1.125%12/11/2026 205,372 0.04
EUR 300,000 BBVA Consumer Auto’2020-1 A’ FTA RegS FRN20/1/2036 303,352 0.06
EUR 500,000 CaixaBank SA RegS 0.375%3/2/2025 504,670 0.10
EUR 600,000 CaixaBank SA RegS FRN10/7/2026 612,822 0.13
GBP 100,000 CaixaBank SA RegS FRN3/12/2026 116,199 0.03
BlackRock European Select Strategies Fund continued
Portfolio of Investments as at 31 May 2021
The notes on pages 590 to 610 form an integral part of these financial statements.
BlackRock Strategic Funds[300]

Holding Description
MarketValue
EUR
% ofNet
Assets
Spain continuedEUR 400,000 Caja Rural de Navarra SCC
RegS 0.625% 1/12/2023 408,668 0.09EUR 200,000 Caja Rural de Navarra SCC
RegS 0.875% 8/5/2025 207,994 0.04EUR 13,645 Driver Espana Five FDT ’5A’
RegS FRN 21/12/2028 13,666 0.00EUR 177,299 FT Santander Consumer
Spain Auto ’2020-1 A’ RegSFRN 20/3/2033 179,306 0.04
EUR 200,000 Ibercaja Banco SA RegS0.25% 18/10/2023 202,644 0.04
EUR 100,000 Santander Consumer FinanceSA RegS 0.50% 4/10/2021 100,326 0.02
EUR 400,000 Santander Consumer FinanceSA RegS 0.375% 27/6/2024 404,828 0.08
EUR 280,000 Spain Government Bond0.40% 30/4/2022 282,484 0.06
EUR 210,000 Spain Government Bond31/1/2028 (Zero Coupon) 209,139 0.04
EUR 487,000 Spain Government Bond RegS5.40% 31/1/2023 535,525 0.11
EUR 390,000 Spain Government Bond RegS4.40% 31/10/2023 436,336 0.09
EUR 139,000 Spain Government Bond RegS4.80% 31/1/2024 158,610 0.03
EUR 1,726,000 Spain Government Bond RegS0.25% 30/7/2024 1,762,574 0.36
EUR 1,722,000 Spain Government Bond RegS2.75% 31/10/2024 1,909,181 0.39
EUR 865,000 Spain Government Bond RegS1.60% 30/4/2025 931,371 0.19
EUR 421,000 Spain Government Bond RegS1.95% 30/4/2026 465,988 0.10
EUR 737,000 Spain Government Bond RegS1.30% 31/10/2026 795,083 0.16
EUR 204,000 Spain Government Bond RegS1.50% 30/4/2027 223,145 0.05
EUR 1,155,000 Spain Government Bond RegS1.40% 30/7/2028 1,262,034 0.26
EUR 1,207,000 Spain Government Bond RegS1.45% 30/4/2029 1,324,803 0.27
EUR 600,000 Spain Government Bond RegS0.60% 31/10/2029 616,428 0.13
EUR 1,451,000 Spain Government Bond RegS0.50% 30/4/2030 1,471,807 0.30
EUR 1,048,000 Spain Government Bond RegS2.35% 30/7/2033 1,253,785 0.26
EUR 170,000 Spain Government Bond RegS0.85% 30/7/2037 165,949 0.04
EUR 50,000 Spain Government Bond RegS4.90% 30/7/2040 83,175 0.02
EUR 620,000 Spain Government Bond RegS1.20% 31/10/2040 623,336 0.13
EUR 127,000 Spain Government Bond RegS5.15% 31/10/2044 227,684 0.05
EUR 822,000 Spain Government Bond RegS2.70% 31/10/2048 1,068,296 0.22
EUR 88,000 Spain Government Bond RegS1.00% 31/10/2050 78,580 0.02
EUR 528,000 Spain Government Bond RegS3.45% 30/7/2066 809,260 0.17
EUR 100,000 Wizink Master Credit Cards FT’2019-2 A’ RegS FRN26/3/2033 99,836 0.02
24,698,973 5.09
SupranationalEUR 500,000 African Development Bank
0.50% 21/3/2029 518,973 0.11EUR 122,000 Ardagh Metal Packaging Fi-
nance USA LLC/ArdaghMetal Packaging FinancePlc RegS 2.00% 1/9/2028 122,116 0.02
Holding Description
MarketValue
EUR
% ofNet
Assets
Supranational continuedEUR 59,000 European Investment Bank
0.10% 15/10/2026 60,437 0.01EUR 44,000 European Investment Bank
2.625% 15/3/2035 57,629 0.01EUR 430,000 European Investment Bank
0.20% 17/3/2036 418,751 0.09EUR 128,000 European Investment Bank
RegS 0.375% 15/5/2026 132,840 0.03EUR 99,000 European Investment Bank
RegS 0.875% 14/1/2028 106,305 0.02EUR 1,690,000 European Investment Bank
RegS 28/3/2028 (Zero Cou-pon) 1,712,511 0.35
EUR 226,000 European Investment BankRegS 14/1/2031 (Zero Cou-pon) 225,100 0.05
GBP 21,000 European Investment BankRegS 3.875% 8/6/2037 33,235 0.01
EUR 1,223,000 European Investment BankRegS 0.25% 15/6/2040 1,168,809 0.24
EUR 390,336 European Stability MechanismRegS 0.75% 15/3/2027 413,588 0.08
EUR 282,000 European Union RegS4/7/2035 (Zero Coupon) 268,760 0.06
GBP 700,000 International Bank for Recon-struction & Development0.75% 7/12/2021 815,481 0.17
EUR 74,000 International Bank for Recon-struction & Development0.125% 3/1/2051 63,348 0.01
EUR 216,000 International Bank for Recon-struction & Development0.20% 21/1/2061 178,230 0.04
6,296,113 1.30
SwedenSEK 4,700,000 Kommuninvest I Sverige AB
RegS 1.00% 12/5/2025 478,509 0.10SEK 6,000,000 Landshypotek Bank AB RegS
0.75% 25/5/2023 601,132 0.12EUR 225,000 Lansforsakringar Hypotek AB
RegS 0.625% 29/1/2026 233,973 0.05EUR 375,000 Nordea Bank AB RegS FRN
18/8/2031 373,871 0.08SEK 5,000,000 Skandinaviska Enskilda Ban-
ken AB RegS 1.50%21/12/2022 506,171 0.10
EUR 145,000 Skandinaviska Enskilda Ban-ken AB RegS 0.625%30/1/2023 147,733 0.03
EUR 950,000 Skandinaviska Enskilda Ban-ken AB RegS 0.05%1/7/2024 957,657 0.20
SEK 15,000,000 Stadshypotek AB RegS 1.50%1/6/2023 1,527,778 0.31
GBP 287,000 Svensk Exportkredit AB RegS0.125% 15/12/2025 327,046 0.07
EUR 100,000 Svenska Handelsbanken ABRegS 1.125% 14/12/2022 102,414 0.02
EUR 150,000 Svenska Handelsbanken ABRegS 0.125% 18/6/2024 151,652 0.03
SEK 2,000,000 Sveriges Sakerstallda Obliga-tioner AB RegS 1.00%21/6/2023 201,822 0.04
EUR 800,000 Swedbank AB RegS 0.30%6/9/2022 807,232 0.17
SEK 2,375,000 Sweden Government Bond3.50% 30/3/2039 338,694 0.07
SEK 6,350,000 Sweden Government Interna-tional Bond RegS 0.125%9/9/2030 614,418 0.13
7,370,102 1.52
BlackRock European Select Strategies Fund continued
Portfolio of Investments as at 31 May 2021
The notes on pages 590 to 610 form an integral part of these financial statements.
Annual report and audited financial statements [301]

Holding Description
MarketValue
EUR
% ofNet
Assets
SwitzerlandEUR 225,000 Credit Suisse AG RegS 0.25%
5/1/2026 225,180 0.05EUR 975,000 Credit Suisse Group AG RegS
FRN 24/6/2027 992,599 0.20EUR 850,000 Credit Suisse Group AG RegS
FRN 14/1/2028 846,940 0.17EUR 250,000 Credit Suisse Group AG RegS
0.625% 18/1/2033 231,885 0.05CHF 999,000 Swiss Confederation Govern-
ment Bond RegS 4.00%8/4/2028 1,187,262 0.24
CHF 1,050,000 Swiss Confederation Govern-ment Bond RegS 0.50%27/6/2032 1,019,061 0.21
CHF 721,000 Swiss Confederation Govern-ment Bond RegS 1.50%30/4/2042 844,912 0.17
EUR 625,000 UBS AG RegS 0.625%23/1/2023 634,194 0.13
EUR 200,000 UBS Group AG RegS FRN29/1/2026 200,506 0.04
EUR 225,000 UBS Group AG RegS 0.625%24/2/2033^ 218,250 0.05
USD 200,000 UBS Group AG RegS FRN(Perpetual) 176,880 0.04
6,577,669 1.35
United KingdomEUR 375,000 AstraZeneca Plc RegS 0.375%
3/6/2029 372,938 0.08GBP 285,416 Azure Finance No 2 Plc ’A’
RegS FRN 20/7/2030 333,053 0.07GBP 100,000 Azure Finance Plc ’C’ RegS
FRN 30/6/2027 116,547 0.02GBP 675,000 Barclays Plc RegS FRN
6/10/2023 801,655 0.17EUR 700,000 BAT International Finance Plc
RegS 3.625% 9/11/2021 711,977 0.15GBP 164,000 BAT International Finance Plc
RegS 4.00% 4/9/2026 209,429 0.04EUR 219,000 BAT International Finance Plc
RegS 2.25% 16/1/2030 232,773 0.05GBP 475,000 Bellis Acquisition Co Plc RegS
3.25% 16/2/2026 552,209 0.11EUR 100,000 BP Capital Markets Plc RegS
1.573% 16/2/2027 107,709 0.02EUR 375,000 BP Capital Markets Plc RegS
1.231% 8/5/2031 389,633 0.08EUR 175,000 BP Capital Markets Plc RegS
1.104% 15/11/2034 174,704 0.04EUR 925,000 BP Capital Markets Plc RegS
FRN (Perpetual) 992,220 0.20GBP 81,855 Brass No 7 Plc ’A’ RegS FRN
16/10/2059 95,516 0.02EUR 350,000 British Telecommunications Plc
RegS 1.00% 21/11/2024 361,564 0.08GBP 250,000 British Telecommunications Plc
RegS 3.125% 21/11/2031 316,047 0.07GBP 200,000 Cadent Finance Plc RegS
1.125% 22/9/2021 232,635 0.05EUR 750,000 Cadent Finance Plc RegS
0.625% 19/3/2030 748,207 0.15GBP 400,000 Cadent Finance Plc RegS
2.75% 22/9/2046 478,831 0.10EUR 150,000 Chanel Ceres Plc RegS 1.00%
31/7/2031 149,334 0.03EUR 125,000 Channel Link Enterprises Fi-
nance Plc RegS FRN30/6/2050 124,694 0.03
EUR 200,000 Channel Link Enterprises Fi-nance Plc RegS FRN30/6/2050 203,846 0.04
Holding Description
MarketValue
EUR
% ofNet
Assets
United Kingdom continuedGBP 100,000 Channel Link Enterprises Fi-
nance Plc RegS FRN30/6/2050 117,043 0.02
GBP 152,578 CMF ’2020-1 A’ Plc RegS FRN16/1/2057 177,584 0.04
GBP 220,000 CMF ’2020-1 B’ Plc RegS FRN16/1/2057 255,025 0.05
GBP 100,000 CMF ’2020-1 C’ Plc RegS FRN16/1/2057 115,926 0.02
EUR 100,000 Diageo Finance Plc RegS0.125% 12/10/2023 100,748 0.02
EUR 300,000 DS Smith Plc RegS 0.875%12/9/2026 306,192 0.06
GBP 58,028 Feldspar Plc ’2016-1 A’ RegSFRN 15/9/2045 67,456 0.01
GBP 120,000 Finsbury Square ’2018-2B’ PlcRegS FRN 12/9/2068 139,907 0.03
GBP 136,280 Finsbury Square ’2020-1X A’Plc RegS FRN 16/3/2070 158,670 0.03
GBP 99,982 Finsbury Square ’2020-1X C’Plc RegS FRN 16/3/2070 115,606 0.02
GBP 109,000 Finsbury Square Plc’2018-2 C’ RegS FRN12/9/2068 127,319 0.03
GBP 91,977 Finsbury Square Plc’2020-2 A’ RegS FRN16/6/2070 107,901 0.02
GBP 234,000 Gemgarto ’2021-1 A’ Plc RegSFRN 16/12/2067 273,027 0.06
GBP 127,535 Gemgarto Plc ’2018-1 A’ RegSFRN 16/9/2065 148,967 0.03
GBP 99,977 Gemgarto Plc ’2018-1 B’ RegSFRN 16/9/2065 115,722 0.02
EUR 475,000 GlaxoSmithKline Capital PlcRegS 23/9/2023 (Zero Cou-pon)^ 477,546 0.10
EUR 178,000 GlaxoSmithKline Capital PlcRegS 1.375% 2/12/2024 187,612 0.04
EUR 200,000 GlaxoSmithKline Capital PlcRegS 1.25% 21/5/2026 211,950 0.04
GBP 32,407 Globaldrive Auto ReceivablesUK ’2019-A A’ Plc RegSFRN 20/9/2026 37,657 0.01
GBP 131,000 Globaldrive Auto Receivables’UK 2019-A B’ Plc RegSFRN 20/9/2026 152,873 0.03
GBP 200,000 Gosforth Funding Plc ’2017-1XA2’ RegS FRN 19/12/2059 232,987 0.05
GBP 99,994 Hops Hill No 1 Plc ’B’ RegSFRN 27/5/2054 117,159 0.02
EUR 625,000 HSBC Holdings Plc RegS FRN13/11/2031 618,387 0.13
EUR 200,000 INEOS Quattro Finance 2 PlcRegS 2.50% 15/1/2026 201,014 0.04
GBP 285,000 Lanark Master Issuer Plc’2017-1X 2A’ RegS FRN22/12/2069 332,560 0.07
GBP 75,000 Lanark Master Issuer Plc’2019-1X 1A2’ RegS FRN22/12/2069 87,202 0.02
GBP 170,000 Lanebrook Mortgage Transac-tion Plc ’2020-1 B’ RegSFRN 12/6/2057 200,537 0.04
GBP 142,000 LCR Finance Plc RegS 4.50%7/12/2028 207,677 0.04
GBP 230,000 Lloyds Bank Plc RegS 7.50%15/4/2024^ 318,443 0.07
GBP 157,000 London Wall Mortgage CapitalPlc ’2021-FL1 A’ RegS FRN15/5/2051 183,109 0.04
GBP 100,000 Marks & Spencer Plc RegS4.50% 10/7/2027 123,039 0.03
BlackRock European Select Strategies Fund continued
Portfolio of Investments as at 31 May 2021
The notes on pages 590 to 610 form an integral part of these financial statements.
BlackRock Strategic Funds[302]

Holding Description
MarketValue
EUR
% ofNet
Assets
United Kingdom continuedGBP 100,000 Motor Plc ’2016-1 C’ RegS
3.75% 25/11/2025 116,144 0.02EUR 350,000 Nationwide Building Society
RegS 0.50% 5/5/2041 341,177 0.07GBP 156,000 Newday Funding Master Is-
suer Plc ’2021-1X A1’ RegSFRN 15/3/2029 181,888 0.04
EUR 100,000 NGG Finance Plc RegS FRN5/12/2079 100,784 0.02
GBP 378,208 Oat Hill No 2 Plc ’A’ RegSFRN 27/5/2046 440,235 0.09
EUR 450,000 OTE Plc RegS 0.875%24/9/2026 460,715 0.10
EUR 38,302 Paragon Mortgages No 12 Plc’12X B1B’ RegS FRN15/11/2038 37,417 0.01
EUR 150,000 Paragon Mortgages No 14 Plc’14X BB’ RegS FRN15/9/2039 146,760 0.03
GBP 76,827 Paragon Mortgages No 25 Plc’A’ RegS FRN 15/5/2050 89,239 0.02
GBP 212,000 PCL Funding III Plc ’2017-2 A’RegS FRN 15/6/2023 246,309 0.05
GBP 185,000 PCL Funding V Plc ’2021-1 A’RegS FRN 15/10/2025 215,109 0.04
GBP 394,454 Prs Finance Plc RegS 1.75%24/11/2026 483,752 0.10
GBP 100,000 Residential Mortgage Securi-ties 29 Plc ’B’ RegS FRN20/12/2046 116,447 0.02
GBP 100,000 Residential Mortgage Securi-ties 30 Plc ’B’ RegS FRN20/3/2050 116,272 0.02
GBP 205,000 Residential Mortgage Securi-ties ’32X C’ Plc RegS FRN20/6/2070 242,449 0.05
GBP 179,937 Ripon Mortgages Plc ’1X A1’RegS FRN 20/8/2056 209,479 0.04
GBP 600,000 Ripon Mortgages Plc ’1X B1’RegS FRN 20/8/2056 698,266 0.14
GBP 450,000 Ripon Mortgages Plc ’1X C1’RegS FRN 20/8/2056 523,754 0.11
GBP 109,196 RMAC Securities No 2 Plc’2018-2 A’ RegS FRN12/6/2046 127,378 0.03
EUR 250,000 Santander UK Plc 0.10%12/5/2024 253,315 0.05
GBP 92,093 Silk Road Finance Number SixPlc ’A’ RegS FRN 21/9/2067 107,838 0.02
GBP 320,000 Silverstone Master Issuer PlcRegS FRN 21/1/2070 373,035 0.08
EUR 300,000 Sky Ltd RegS 1.50%15/9/2021 301,701 0.06
GBP 200,000 SSE Plc RegS FRN 16/9/2077 238,480 0.05EUR 100,000 Swiss Re Finance UK Plc
RegS FRN 4/6/2052 109,411 0.02GBP 47,461 Tesco Property Finance 3 Plc
RegS 5.744% 13/4/2040 73,167 0.02GBP 150,000 Tower Bridge Funding Plc
’2020-1 B’ RegS FRN20/9/2063 176,923 0.04
GBP 100,000 Tower Bridge Funding Plc’2020-1 C’ RegS FRN20/9/2063 118,002 0.02
GBP 3,808 Turbo Finance 8 Plc ’A’ RegSFRN 20/2/2026 4,423 0.00
GBP 100,000 Twin Bridges 2018-1 Plc ’B’RegS FRN 12/9/2050 116,452 0.02
GBP 250,000 Twin Bridges ’2021-1 D’ PlcRegS FRN 12/3/2055 291,751 0.06
GBP 100,000 Twin Bridges Plc ’2018-1 D’RegS FRN 12/9/2050 116,888 0.02
Holding Description
MarketValue
EUR
% ofNet
Assets
United Kingdom continuedGBP 90,732 Twin Bridges Plc ’2019-1 A’
RegS FRN 12/12/2052 105,808 0.02GBP 225,000 Twin Bridges Plc ’2020-1 C’
RegS FRN 12/12/2054 265,865 0.06GBP 5,020,000 United Kingdom Gilt RegS
0.125% 30/1/2026 5,768,951 1.19GBP 165,000 United Kingdom Gilt RegS
1.25% 22/7/2027 200,516 0.04GBP 110,000 United Kingdom Gilt RegS
1.75% 7/9/2037 138,121 0.03GBP 2,177,000 United Kingdom Gilt RegS
4.25% 7/9/2039 3,786,120 0.78GBP 620,000 United Kingdom Gilt RegS
4.25% 7/12/2040 1,095,605 0.23GBP 270,701 United Kingdom Gilt RegS
3.25% 22/1/2044 435,601 0.09GBP 3,601,662 United Kingdom Gilt RegS
3.50% 22/1/2045 6,064,569 1.25GBP 1,515,000 United Kingdom Gilt RegS
4.25% 7/12/2046 2,884,398 0.59GBP 745,000 United Kingdom Gilt RegS
0.625% 22/10/2050 722,262 0.15GBP 277,000 United Kingdom Gilt RegS
4.25% 7/12/2055 589,947 0.12GBP 240,000 United Kingdom Gilt RegS
1.75% 22/7/2057 318,358 0.07GBP 821,620 United Kingdom Gilt RegS
4.00% 22/1/2060 1,767,026 0.36GBP 55,000 United Kingdom Gilt RegS
0.50% 22/10/2061 49,445 0.01GBP 300,000 United Kingdom Gilt RegS
2.50% 22/7/2065 502,223 0.10GBP 240,000 United Kingdom Gilt RegS
3.50% 22/7/2068 511,667 0.11GBP 50,000 United Kingdom Gilt RegS
1.625% 22/10/2071^ 69,268 0.01GBP 200,000 WPP Finance 2013 RegS
2.875% 14/9/2046 227,672 0.05EUR 100,000 Yorkshire Building Society
RegS 0.75% 10/11/2022 101,756 0.02EUR 150,000 Yorkshire Building Society
RegS 0.375% 11/4/2023 152,153 0.03EUR 125,000 Yorkshire Building Society
RegS 0.01% 13/10/2027 125,410 0.03
46,780,067 9.63
United StatesEUR 675,000 Air Products and Chemicals
Inc 0.80% 5/5/2032 684,207 0.14USD 205,000 Amazon.com Inc 2.70%
3/6/2060 150,002 0.03USD 425,000 Apple Inc 2.55% 20/8/2060 305,559 0.06USD 800,000 Apple Inc 2.80% 8/2/2061 599,778 0.12EUR 313,000 AT&T Inc 3.15% 4/9/2036 373,731 0.08EUR 150,000 AT&T Inc 2.60% 19/5/2038 168,281 0.04EUR 875,000 Bank of America Corp RegS
FRN 26/10/2031 858,179 0.18EUR 650,000 Bank of America Corp RegS
FRN 24/5/2032 658,008 0.14GBP 450,000 BAT Capital Corp RegS
2.125% 15/8/2025 536,631 0.11EUR 400,000 Becton Dickinson and Co
1.401% 24/5/2023 411,344 0.09EUR 300,000 Booking Holdings Inc 0.10%
8/3/2025 300,642 0.06EUR 400,000 Citigroup Inc RegS FRN
24/7/2026 420,676 0.09EUR 400,000 Citigroup Inc RegS FRN
8/10/2027 401,607 0.08EUR 175,000 Coca-Cola Co 0.125%
9/3/2029 172,074 0.04
BlackRock European Select Strategies Fund continued
Portfolio of Investments as at 31 May 2021
The notes on pages 590 to 610 form an integral part of these financial statements.
Annual report and audited financial statements [303]

Holding Description
MarketValue
EUR
% ofNet
Assets
United States continuedEUR 375,000 Coca-Cola Co 0.40% 6/5/2030 372,555 0.08EUR 200,000 Comcast Corp 0.75%
20/2/2032 199,764 0.04EUR 100,000 Danaher Corp 2.50%
30/3/2030 115,635 0.02EUR 295,000 Fidelity National Information
Services Inc 0.75%21/5/2023 299,806 0.06
EUR 425,000 Fidelity National InformationServices Inc 0.625%3/12/2025 433,874 0.09
EUR 675,000 Fidelity National InformationServices Inc 2.00%21/5/2030 742,156 0.15
EUR 125,000 Fiserv Inc 1.125% 1/7/2027 130,294 0.03EUR 190,000 Goldman Sachs Group Inc
RegS FRN 27/7/2021 190,281 0.04EUR 200,000 Goldman Sachs Group Inc
RegS 0.125% 19/8/2024 200,276 0.04EUR 125,000 Goldman Sachs Group Inc
RegS 3.375% 27/3/2025 140,215 0.03EUR 356,000 Goldman Sachs Group Inc
RegS 1.25% 1/5/2025 367,994 0.08EUR 200,000 Goldman Sachs Group Inc
RegS 1.625% 27/7/2026 213,020 0.04EUR 500,000 Goldman Sachs Group Inc
RegS 0.25% 26/1/2028 488,715 0.10EUR 400,000 Goldman Sachs Group Inc
RegS 1.00% 18/3/2033 395,956 0.08EUR 475,000 International Business Ma-
chines Corp 1.25%29/1/2027 503,490 0.10
EUR 450,000 International Business Ma-chines Corp 0.65%11/2/2032 446,235 0.09
EUR 425,000 International Flavors & Fra-grances Inc 1.80%25/9/2026 455,460 0.09
EUR 200,000 JPMorgan Chase & Co RegS0.625% 25/1/2024 203,856 0.04
EUR 200,000 JPMorgan Chase & Co RegSFRN 25/7/2031 204,558 0.04
EUR 450,000 Levi Strauss & Co 3.375%15/3/2027 465,867 0.10
EUR 300,000 Morgan Stanley 1.875%30/3/2023 311,643 0.06
EUR 450,000 Morgan Stanley FRN26/7/2024 457,060 0.09
EUR 350,000 Morgan Stanley FRN29/10/2027 349,517 0.07
EUR 100,000 Morgan Stanley FRN26/10/2029 98,866 0.02
EUR 625,000 National Grid North AmericaInc RegS 0.75% 8/8/2023 636,706 0.13
USD 300,000 Oracle Corp 2.875%25/3/2031 251,762 0.05
EUR 250,000 Thermo Fisher Scientific Inc0.125% 1/3/2025 250,912 0.05
USD 159,150 United States Treasury Infla-tion Indexed Bond 1.00%15/2/2048 168,121 0.04
EUR 115,000 US Bancorp 0.85% 7/6/2024 118,197 0.03EUR 300,000 Verizon Communications Inc
0.875% 19/3/2032 299,115 0.06
15,552,625 3.20
Total Bonds 292,724,633 60.27
Holding Description
MarketValue
EUR
% ofNet
Assets
EXCHANGE TRADED FUNDSIreland
EUR 327,378 iShares Euro Dividend UCITSETF~ 6,881,485 1.41
USD 5,000 iShares JP Morgan EM LocalGovernment Bond UCITSETF~ 234,882 0.05
7,116,367 1.46
Total Exchange Traded Funds 7,116,367 1.46
Total Transferable Securities and Money MarketInstruments Admitted to an Official Stock ExchangeListing or Dealt in on Another Regulated Market 453,994,541 93.47
Other Transferable Securities and Money Market Instruments
BONDSNew Zealand
NZD 573,000 New Zealand Government In-flation Linked Bond RegS2.50% 20/9/2040 467,105 0.10
467,105 0.10
Total Bonds 467,105 0.10
Total Other Transferable Securities and MoneyMarket Instruments 467,105 0.10
Collective Investment SchemesIreland
130,577 BlackRock ICS Euro LiquidEnvironmentally AwareFund~ 12,906,706 2.66
12,906,706 2.66
Total Collective Investment Schemes 12,906,706 2.66
Securities portfolio at market value 467,368,352 96.23
Other Net Assets 18,334,817 3.77
Total Net Assets (EUR) 485,703,169 100.00
^ All or a portion of this security represents a security on loan.~ Investment in related party fund.
BlackRock European Select Strategies Fund continued
Portfolio of Investments as at 31 May 2021
The notes on pages 590 to 610 form an integral part of these financial statements.
BlackRock Strategic Funds[304]

Holding Description Counterparty
Netunrealised
appreciationEUR
Financial Derivative Instruments
CONTRACTS FOR DIFFERENCEUnited Kingdom
(26,000) Severn Trent Plc Bank of AmericaMerrill Lynch 11,472
11,472
Total (Gross underlying exposure - EUR 740,523) 11,472
BlackRock European Select Strategies Fund continued
Portfolio of Investments as at 31 May 2021
The notes on pages 590 to 610 form an integral part of these financial statements.
Annual report and audited financial statements [305]

TypeNominal
Value Description CounterpartyExpiration
date
Net unrealisedappreciation/
(depreciation)EUR
MarketValue
EUR
Financial Derivative Instruments
SWAPS
CCCDS EUR 493,330Fund receives Fixed 5.000% and provides default protection on
Markit iTraxx Europe Crossover Series 30 Version 1Bank of America
Merrill Lynch 20/12/2025 7,359 60,702
CCILS EUR 550,000Fund receives Fixed 0.682% and pays Floating EUR 12 Month
CPTFEBank of America
Merrill Lynch 15/5/2028 (35,918) (35,906)
CCILS EUR 1,500,689Fund receives Fixed 1.382% and pays Floating EUR 12 Month
CPTFEBank of America
Merrill Lynch 15/4/2031 (25,499) (25,465)
CCILS USD 50,000Fund receives Fixed 2.248% and pays Floating USD 12 Month
USCPIBank of America
Merrill Lynch 8/1/2031 (1,749) (1,748)
CCILS USD 297,000Fund receives Fixed 2.321% and pays Floating USD 12 Month
USCPIBank of America
Merrill Lynch 25/2/2031 (8,162) (8,156)
CCILS USD 500,000Fund receives Fixed 2.338% and pays Floating USD 12 Month
USCPIBank of America
Merrill Lynch 11/3/2031 (12,705) (12,695)
CCILS USD 253,000Fund receives Fixed 2.348% and pays Floating USD 12 Month
USCPIBank of America
Merrill Lynch 8/3/2031 (6,232) (6,227)
CCILS USD 269,125Fund receives Fixed 2.350% and pays Floating USD 12 Month
USCPIBank of America
Merrill Lynch 5/3/2031 (6,562) (6,557)
CCILS USD 387,500Fund receives Fixed 2.350% and pays Floating USD 12 Month
USCPIBank of America
Merrill Lynch 5/3/2031 (9,449) (9,441)
CCILS USD 269,125Fund receives Fixed 2.354% and pays Floating USD 12 Month
USCPIBank of America
Merrill Lynch 5/3/2031 (6,467) (6,462)
CCILS USD 387,500Fund receives Fixed 2.354% and pays Floating USD 12 Month
USCPIBank of America
Merrill Lynch 5/3/2031 (9,311) (9,304)
CCILS USD 1,313,250Fund receives Fixed 2.358% and pays Floating USD 12 Month
USCPIBank of America
Merrill Lynch 5/3/2031 (31,148) (31,123)
CCILS USD 1,270,000Fund receives Fixed 2.388% and pays Floating USD 12 Month
USCPIBank of America
Merrill Lynch 17/2/2031 (27,531) (27,507)
CCILS USD 350,000Fund receives Fixed 2.432% and pays Floating USD 12 Month
USCPIBank of America
Merrill Lynch 6/5/2051 (4,256) (4,242)
CCILS USD 350,000Fund receives Fixed 2.438% and pays Floating USD 12 Month
USCPIBank of America
Merrill Lynch 7/5/2051 (3,688) (3,674)
CCILS USD 240,000Fund receives Fixed 2.448% and pays Floating USD 12 Month
USCPIBank of America
Merrill Lynch 29/3/2031 (3,700) (3,696)
CCILS USD 120,000Fund receives Fixed 2.474% and pays Floating USD 12 Month
USCPIBank of America
Merrill Lynch 6/4/2031 (1,531) (1,529)
CCILS USD 350,000Fund receives Fixed 2.484% and pays Floating USD 12 Month
USCPIBank of America
Merrill Lynch 4/5/2051 1,075 1,088
CCILS USD 350,000Fund receives Fixed 2.488% and pays Floating USD 12 Month
USCPIBank of America
Merrill Lynch 4/5/2051 1,489 1,502
CCILS USD 230,000Fund receives Fixed 2.505% and pays Floating USD 12 Month
USCPIBank of America
Merrill Lynch 30/3/2031 (2,345) (2,340)
CCILS USD 1,250,000Fund receives Fixed 2.669% and pays Floating USD 12 Month
USCPIBank of America
Merrill Lynch 14/5/2031 8,908 8,932
CCILS GBP 460,000Fund receives Fixed 3.202% and pays Floating GBP 12 Month
UKRPIBank of America
Merrill Lynch 15/3/2030 (21,731) (21,719)
CCILS GBP 575,000Fund receives Fixed 3.270% and pays Floating GBP 12 Month
UKRPIBank of America
Merrill Lynch 15/3/2030 (21,487) (21,472)
CCILS GBP 340,000Fund receives Fixed 3.285% and pays Floating GBP 12 Month
UKRPIBank of America
Merrill Lynch 15/3/2030 (11,962) (11,953)
CCILS GBP 575,000Fund receives Fixed 3.290% and pays Floating GBP 12 Month
UKRPIBank of America
Merrill Lynch 15/3/2030 (19,811) (19,796)
CCILS GBP 340,000Fund receives Fixed 3.293% and pays Floating GBP 12 Month
UKRPIBank of America
Merrill Lynch 15/3/2030 (11,565) (11,556)
CCILS GBP 1,680,000Fund receives Fixed 3.315% and pays Floating GBP 12 Month
UKRPIBank of America
Merrill Lynch 15/5/2030 (61,046) (61,003)
CCILS GBP 217,000Fund receives Fixed 3.334% and pays Floating GBP 12 Month
UKRPIBank of America
Merrill Lynch 15/3/2030 (6,089) (6,083)
CCILS GBP 400,000Fund receives Fixed 3.340% and pays Floating GBP 12 Month
UKRPIBank of America
Merrill Lynch 15/3/2030 (10,857) (10,847)
CCILS GBP 383,000Fund receives Fixed 3.456% and pays Floating GBP 12 Month
UKRPIBank of America
Merrill Lynch 15/7/2030 (12,364) (12,354)
CCILS GBP 540,000Fund receives Fixed 3.475% and pays Floating GBP 12 Month
UKRPIBank of America
Merrill Lynch 15/10/2029 5,037 5,051
BlackRock European Select Strategies Fund continued
Portfolio of Investments as at 31 May 2021
The notes on pages 590 to 610 form an integral part of these financial statements.
BlackRock Strategic Funds[306]

TypeNominal
Value Description CounterpartyExpiration
date
Net unrealisedappreciation/
(depreciation)EUR
MarketValue
EUR
Financial Derivative Instruments
SWAPS
CCILS GBP 500,000Fund receives Fixed 3.495% and pays Floating GBP 12 Month
UKRPIBank of America
Merrill Lynch 15/12/2029 (68) (54)
CCILS GBP 699,000Fund receives Fixed 3.500% and pays Floating GBP 12 Month
UKRPIBank of America
Merrill Lynch 15/9/2030 (13,850) (13,833)
CCILS GBP 500,000Fund receives Fixed 3.510% and pays Floating GBP 12 Month
UKRPIBank of America
Merrill Lynch 15/12/2029 1,050 1,063
CCILS GBP 290,000Fund receives Fixed 3.625% and pays Floating GBP 12 Month
UKRPIBank of America
Merrill Lynch 15/2/2031 (5,821) (5,814)
CCILS GBP 273,000Fund receives Fixed 3.640% and pays Floating GBP 12 Month
UKRPIBank of America
Merrill Lynch 15/12/2030 (3,328) (3,321)
CCILS GBP 1,515,000Fund receives Fixed 3.650% and pays Floating GBP 12 Month
UKRPIBank of America
Merrill Lynch 15/4/2031 (25,468) (25,428)
CCILS GBP 1,180,000Fund receives Fixed 3.658% and pays Floating GBP 12 Month
UKRPIBank of America
Merrill Lynch 15/4/2031 (18,521) (18,490)
CCILS GBP 208,000Fund receives Fixed 3.700% and pays Floating GBP 12 Month
UKRPIBank of America
Merrill Lynch 15/5/2031 (1,312) (1,968)
CCILS GBP 365,000Fund receives Fixed 3.730% and pays Floating GBP 12 Month
UKRPIBank of America
Merrill Lynch 15/5/2031 (1,632) (1,820)
CCILS GBP 417,916Fund receives Fixed 3.756% and pays Floating GBP 12 Month
UKRPIBank of America
Merrill Lynch 15/4/2031 (415) (403)
CCILS GBP 182,500Fund receives Fixed 3.758% and pays Floating GBP 12 Month
UKRPIBank of America
Merrill Lynch 15/5/2031 (151) (146)
CCILS GBP 360,000Fund receives Fixed 3.773% and pays Floating GBP 12 Month
UKRPIBank of America
Merrill Lynch 15/9/2029 18,821 18,830
CCILS GBP 583,000Fund receives Fixed 3.776% and pays Floating GBP 12 Month
UKRPIBank of America
Merrill Lynch 15/9/2028 30,130 30,340
CCILS GBP 60,500Fund receives Fixed 3.790% and pays Floating GBP 12 Month
UKRPIBank of America
Merrill Lynch 15/5/2031 240 242
CCILS GBP 96,000Fund receives Fixed 3.796% and pays Floating GBP 12 Month
UKRPIBank of America
Merrill Lynch 15/5/2031 468 470
CCILS EUR 1,000,000Fund receives Floating EUR 12 Month CPTFEMU and pays Fixed
1.122%Bank of America
Merrill Lynch 15/12/2021 (5,529) (5,520)
CCILS GBP 699,000Fund receives Floating GBP 12 Month UKRPI and pays Fixed
3.410%Bank of America
Merrill Lynch 15/9/2025 4,423 4,435
CCIRS NZD 100,000Fund receives Fixed 1.890% and pays Floating NZD 3 Month
New Zealand Bank Bill RateBank of America
Merrill Lynch 11/5/2031 (581) (580)
CCIRS HUF 283,220,000Fund receives Fixed 2.162% and pays Floating HUF 6 Month
BUBORBank of America
Merrill Lynch 16/6/2026 (5,537) (5,525)
CCIRS EUR 320,000Fund receives Floating EUR 6 Month EURIBOR and pays Fixed
0.032%Bank of America
Merrill Lynch 9/4/2031 2,840 2,846
CCIRS EUR 37,000Fund receives Floating EUR 6 Month EURIBOR and pays Fixed
0.172%Bank of America
Merrill Lynch 12/4/2052 3,797 3,798
CCIRS EUR 350,000Fund receives Floating EUR 6 Month EURIBOR and pays Fixed
0.473%Bank of America
Merrill Lynch 29/4/2041 2,488 2,499
CCIRS EUR 182,247Fund receives Floating EUR 6 Month EURIBOR and pays Fixed
0.533%Bank of America
Merrill Lynch 4/12/2049 (256) (249)
CCIRS EUR 420,000Fund receives Floating EUR 6 Month EURIBOR and pays Fixed
0.568%Bank of America
Merrill Lynch 31/5/2047 (3,484) (3,468)
CCIRS EUR 429,440Fund receives Floating EUR 6 Month EURIBOR and pays Fixed
0.663%Bank of America
Merrill Lynch 15/7/2039 (14,157) (14,145)
CCIRS SEK 8,000,000Fund receives Floating SEK 3 Month STIBOR and pays Fixed
0.824%Bank of America
Merrill Lynch 6/4/2031 685 701
CCIRS USD 590,000Fund receives Floating USD 3 Month LIBOR and pays Fixed
1.570%Bank of America
Merrill Lynch 11/3/2031 (1,703) (1,694)
CCIRS USD 1,570,000Fund receives Floating USD 3 Month LIBOR and pays Fixed
1.650%Bank of America
Merrill Lynch 14/5/2031 (13,846) (12,581)
CCIRS USD 280,000Fund receives Floating USD 3 Month LIBOR and pays Fixed
1.680%Bank of America
Merrill Lynch 30/3/2031 (3,085) (3,080)
CCIRS USD 132,000Fund receives Floating USD 3 Month LIBOR and pays Fixed
2.860%Bank of America
Merrill Lynch 3/4/2028 (11,993) (11,991)
CCIRS USD 1,000,000Fund receives Floating USD 3 Month LIBOR and pays Fixed
2.972%Bank of America
Merrill Lynch 10/5/2027 (91,966) (91,950)
BlackRock European Select Strategies Fund continued
Portfolio of Investments as at 31 May 2021
The notes on pages 590 to 610 form an integral part of these financial statements.
Annual report and audited financial statements [307]

TypeNominal
Value Description CounterpartyExpiration
date
Net unrealisedappreciation/
(depreciation)EUR
MarketValue
EUR
Financial Derivative Instruments
SWAPS
CCIRS USD 200,000Fund receives Floating USD 3 Month LIBOR and pays Fixed
2.974%Bank of America
Merrill Lynch 3/5/2028 (19,507) (19,504)
CDS EUR 185,000Fund receives default protection on BASF SE and pays Fixed
1.000%Barclays Bank
Plc 20/6/2021 4,978 (96)
CDS EUR 185,000Fund receives Fixed 1.000% and provides default protection on
Air Liquide SABarclays Bank
Plc 20/6/2021 (4,512) 94
CDS EUR 24,500Fund receives Fixed 1.000% and provides default protection on
BNP ParibasBarclays Bank
Plc 20/6/2022 156 230
CDS EUR 50,000Fund receives default protection on Barclays Bank Plc and pays
Fixed 1.000% BNP Paribas 20/6/2021 (3,371) (20)
CDS EUR 295,000Fund receives default protection on Peugeot SA and pays Fixed
5.000% BNP Paribas 20/6/2025 (24,690) (47,863)
CDS EUR 100,000Fund receives Fixed 1.000% and provides default protection on
ING Bank NV BNP Paribas 20/6/2021 (1,389) 52
CDS EUR 92,000Fund receives Fixed 1.000% and provides default protection on
BNP Paribas Citibank 20/6/2022 539 864
CDS EUR 73,220Fund receives Fixed 1.000% and provides default protection on
BNP Paribas Citibank 20/6/2022 466 688
CDS EUR 85,887Fund receives Fixed 1.000% and provides default protection on
BNP Paribas Citibank 20/6/2022 503 807
CDS EUR 150,000Fund receives Fixed 1.000% and provides default protection on
Markit iTraxx Europe Series 23 Version 1
Deutsche AssetManagement
Life 20/12/2021 (1,333) 787
CDS EUR 81,000Fund receives default protection on CNH Industrial NV and pays
Fixed 5.000% Goldman Sachs 20/6/2025 (4,302) (14,245)
CDS EUR 200,000Fund receives default protection on Barclays Plc and pays Fixed
1.000% JP Morgan 20/12/2025 (3,070) (4,319)
CDS EUR 200,000Fund receives default protection on Barclays Plc and pays Fixed
1.000% JP Morgan 20/12/2025 (2,967) (4,319)
CDS EUR 85,000Fund receives default protection on CNH Industrial Finance
Europe SA and pays Fixed 5.000% JP Morgan 20/6/2025 (4,515) (14,948)
CDS EUR 84,000Fund receives default protection on CNH Industrial NV and pays
Fixed 5.000% JP Morgan 20/6/2025 (4,709) (14,772)
CDS EUR 400,000Fund receives default protection on Lloyds Banking Group Plc
and pays Fixed 1.000% JP Morgan 20/12/2025 (6,290) (10,785)
CDS EUR 400,000Fund receives default protection on Lloyds Banking Group Plc
and pays Fixed 1.000% JP Morgan 20/12/2025 (6,085) (10,784)
CDS EUR 200,000Fund receives default protection on Royal Bank of Scotland Plc
and pays Fixed 1.000% JP Morgan 20/12/2025 (2,928) (4,597)
CDS EUR 200,000Fund receives default protection on Royal Bank of Scotland Plc
and pays Fixed 1.000% JP Morgan 20/12/2025 (2,826) (4,597)
IRS EUR 430,143Fund receives Fixed -0.012% and pays Floating EUR 6 Month
LIBORBank of America
Merrill Lynch 4/3/2031 (5,388) (5,380)
IRS GBP 420,000Fund receives Fixed 0.766% and pays Floating GBP 12 Month
SONIABank of America
Merrill Lynch 7/4/2031 185 6
IRS GBP 10,000Fund receives Fixed 0.786% and pays Floating GBP 12 Month
SONIABank of America
Merrill Lynch 31/3/2031 23 24
IRS GBP 840,000Fund receives Fixed 0.800% and pays Floating GBP 12 Month
SONIABank of America
Merrill Lynch 7/12/2030 2,006 2,025
IRS EUR 4,100,000Fund receives Floating EUR 6 Month LIBOR and pays Fixed
0.000%Bank of America
Merrill Lynch 23/6/2030 78,480 78,559
IRS EUR 70,000Fund receives Floating EUR 6 Month LIBOR and pays Fixed
0.000%Bank of America
Merrill Lynch 25/9/2050 10,405 10,408
IRS EUR 110,000Fund receives Floating EUR 6 Month LIBOR and pays Fixed
-0.018%Bank of America
Merrill Lynch 21/1/2061 20,275 20,279
IRS EUR 104,000Fund receives Floating EUR 6 Month LIBOR and pays Fixed
-0.025%Bank of America
Merrill Lynch 21/1/2061 19,428 19,432
IRS EUR 510,000Fund receives Floating EUR 6 Month LIBOR and pays Fixed
-0.204%Bank of America
Merrill Lynch 20/1/2031 15,450 15,459
IRS EUR 222,000Fund receives Floating EUR 6 Month LIBOR and pays Fixed
-0.234%Bank of America
Merrill Lynch 14/1/2031 7,340 7,344
BlackRock European Select Strategies Fund continued
Portfolio of Investments as at 31 May 2021
The notes on pages 590 to 610 form an integral part of these financial statements.
BlackRock Strategic Funds[308]

TypeNominal
Value Description CounterpartyExpiration
date
Net unrealisedappreciation/
(depreciation)EUR
MarketValue
EUR
Financial Derivative Instruments
SWAPS
IRS EUR 860,286Fund receives Floating EUR 6 Month LIBOR and pays Fixed
-0.336%Bank of America
Merrill Lynch 4/3/2026 2,688 2,699
IRS EUR 134,000Fund receives Floating EUR 6 Month LIBOR and pays Fixed
-0.357%Bank of America
Merrill Lynch 21/1/2028 2,134 2,137
IRS GBP 295,000Fund receives Floating GBP 12 Month SONIA and pays Fixed
-0.043%Bank of America
Merrill Lynch 15/12/2025 7,046 7,050
IRS GBP 253,000Fund receives Floating GBP 12 Month SONIA and pays Fixed
0.092%Bank of America
Merrill Lynch 10/12/2026 6,948 6,555
IRS GBP 150,000Fund receives Floating GBP 12 Month SONIA and pays Fixed
0.933%Bank of America
Merrill Lynch 7/4/2051 127 (242)
IRS GBP 10,000Fund receives Floating GBP 12 Month SONIA and pays Fixed
0.947%Bank of America
Merrill Lynch 31/3/2051 (58) (58)
IRS GBP 193,000Fund receives Floating GBP 6 Month LIBOR SONIO and pays
Fixed 0.168%Bank of America
Merrill Lynch 24/11/2026 4,018 3,988
Total (Gross underlying exposure - EUR 44,328,812) (421,803) (429,458)
CCCDS: Centrally Cleared Credit Default SwapsCCILS: Centrally Cleared Inflation Linked SwapsCCIRS: Centrally Cleared Interest Rate SwapsCDS: Credit Default SwapsIRS: Interest Rate Swaps
Numberof
contractsCurrencyof contracts
Contract/Description
Expirationdate
Grossunderlying
exposureEUR
Net unrealisedappreciation/
(depreciation)EUR
Financial Derivative Instruments
FUTURES
29 EUR 3 Month Euribor Futures December 2022 December 2022 7,282,987 725
2,070 EUR Enel SpA Futures December 2021 December 2021 745,200 62,100
20 EUR Euro BOBL Futures June 2021 June 2021 2,693,600 4,130
35 EUR Euro BTP Futures June 2021 June 2021 5,154,800 (3,120)
(78) EUR Euro BTP Futures June 2021 June 2021 11,487,840 56,147
6 EUR Euro Bund Futures June 2021 June 2021 1,018,860 (770)
(79) EUR Euro Bund Futures June 2021 June 2021 13,414,990 19,961
21 EUR Euro BUXL 30 Year Bond Futures June 2021 June 2021 4,221,840 (80,823)
(23) EUR Euro BUXL 30 Year Bond Futures June 2021 June 2021 4,623,920 133,730
40 EUR Euro Schatz Futures June 2021 June 2021 4,481,600 (2,480)
(11) EUR Euro Schatz Futures June 2021 June 2021 1,232,440 385
(17) EUR EURO STOXX 50 Index Futures June 2021 June 2021 689,010 (50,065)
162 EUR EURO STOXX Bank Index Futures June 2021 June 2021 797,040 45,468
45 EUR Euro-OAT Futures June 2021 June 2021 7,214,400 (41,140)
(35) EUR Euro-OAT Futures June 2021 June 2021 5,611,200 1,560
(6) EUR Euro-OAT Futures September 2021 September 2021 948,960 730
8 GBP FTSE 100 Index Futures June 2021 June 2021 652,396 34,090
3,764 EUR Iberdrola SA Futures December 2021 December 2021 1,562,060 178,790
(6) JPY Japan 10 Year Bond Futures June 2021 June 2021 6,791,688 (1,196)
1,703 EUR Repsol SA Futures December 2021 December 2021 519,415 (902,590)
35 EUR Short Euro BTP Futures June 2021 June 2021 3,959,200 3,720
56 GBP UK Long Gilt Bond Futures September 2021 September 2021 8,273,960 16,906
(23) GBP UK Long Gilt Bond Futures September 2021 September 2021 3,398,233 (2,044)
(2) USD US Long Bond Futures September 2021 September 2021 256,063 1,116
(102) USD US Treasury 10 Year Note Futures September 2021 September 2021 12,096,770 28,645
(33) USD US Treasury 10 Year Note Futures September 2021 September 2021 3,564,249 8,753
7 USD US Treasury 5 Year Note Futures September 2021 September 2021 710,122 (445)
(2) USD US Treasury 5 Year Note Futures September 2021 September 2021 202,892 165
BlackRock European Select Strategies Fund continued
Portfolio of Investments as at 31 May 2021
The notes on pages 590 to 610 form an integral part of these financial statements.
Annual report and audited financial statements [309]

Numberof
contractsCurrencyof contracts
Contract/Description
Expirationdate
Grossunderlying
exposureEUR
Net unrealisedappreciation/
(depreciation)EUR
Financial Derivative Instruments
FUTURES
3 USD US Ultra Bond Futures September 2021 September 2021 454,154 (1,710)
(18) USD US Ultra Bond Futures September 2021 September 2021 2,724,925 10,977
Total 116,784,814 (478,285)
Numberof
contractsCall/Put Description Counterparty Strike Price
Expirationdate
Netunrealised
(depreciation)EUR
MarketValue
EUR
Financial Derivative Instruments
PURCHASED OPTIONS
4,850,000 Call OTC USD/CAD Bank of America Merrill Lynch USD 1.28 23/06/2021 (32,005) 270
1,490,000 Call OTC EUR/GBP BNP Paribas EUR 0.89 06/08/2021 (19,711) 2,326
Total (Gross underlying exposure - EUR 6,318) (51,716) 2,596
NominalValue
Call/Put Description Counterparty Strike Price
Expirationdate
Netunrealised
appreciation/(depreciation)
EUR
MarketValue
EUR
Financial Derivative Instruments
WRITTEN SWAPTIONS
(1,492,696) Put
Fund writes an option to enter into an InterestRate Swap. If exercised Fund receives-0.11% Fixed annually from 14/1/2022; andpays Floating EUR Interbank Offer Rate6 Month semi-annually from 18/7/2022 Barclays Bank EUR 0.11 14/01/2022 (31,923) (54,277)
(1,492,696) Call
Fund writes an option to enter into an InterestRate Swap. If exercised Fund receivesFloating EUR Interbank Offer Rate6 Month semi-annually from 18/7/2022;and pays -0.11% Fixed annually from14/1/2022 Barclays Bank EUR 0.11 14/01/2022 17,340 (5,013)
(2,925,000) Call
Fund writes an option to enter into an InterestRate Swap. If exercised Fund receivesFloating USD LIBOR 3 Month BBAquarterly from 28/10/2021; and pays0.92% Fixed semi-annually from 26/7/2021 BNP Paribas USD 0.92 26/07/2021 15,867 (361)
(2,570,000) Call
Fund writes an option to enter into an InterestRate Swap. If exercised Fund receivesFloating USD LIBOR 3 Month BBAquarterly from 10/12/2021; and pays1.125% Fixed semi-annually from 8/9/2021 JP Morgan USD 1.12 08/09/2021 (321) (22,553)
(2,570,000) Put
Fund writes an option to enter into an InterestRate Swap. If exercised Fund receives1.125% Fixed semi-annually from8/9/2021; and pays Floating USD LIBOR3 Month BBA quarterly from 10/12/2021 JP Morgan USD 1.13 08/09/2021 14,380 (7,853)
(4,580,000) Call
Fund writes an option to enter into an InterestRate Swap. If exercised Fund receivesFloating USD LIBOR 3 Month BBAquarterly from 28/7/2023; and pays 2%Fixed semi-annually from 26/4/2023 Barclays Bank USD 0.02 26/04/2023 8,459 (142,987)
BlackRock European Select Strategies Fund continued
Portfolio of Investments as at 31 May 2021
The notes on pages 590 to 610 form an integral part of these financial statements.
BlackRock Strategic Funds[310]

NominalValue
Call/Put Description Counterparty Strike Price
Expirationdate
Netunrealised
appreciation/(depreciation)
EUR
MarketValue
EUR
Financial Derivative Instruments
WRITTEN SWAPTIONS
(4,580,000) Put
Fund writes an option to enter into an InterestRate Swap. If exercised Fund receives 2%Fixed semi-annually from 26/4/2023; andpays Floating USD LIBOR 3 Month BBAquarterly from 28/7/2023 Barclays Bank USD 0.02 26/04/2023 4,595 (145,386)
(18,180,000) Put
Fund writes an option to enter into an InterestRate Swap. If exercised Fund receives0.45% Fixed annually from 19/5/2022; andpays Floating EUR Interbank Offer Rate6 Month semi-annually from 23/11/2022 Citibank EUR 0.00 19/05/2022 11,913 (39,536)
Total (Gross underlying exposure - EUR 9,884,397) 40,310 (417,966)
Currency Purchases Currency Sales CounterpartyMaturity
date
Netunrealised
appreciation/(depreciation)
EUR
Financial Derivative Instruments
OPEN FORWARD FOREIGN EXCHANGE TRANSACTIONS
AUD 930,000 EUR 597,671State Street Bank& Trust Company 15/7/2021 (8,255)
BRL 280,000 USD 49,701 Barclays Bank 16/6/2021 3,215CHF 28,915,000 EUR 26,379,449 Goldman Sachs 2/6/2021 (67,009)CHF 70,000 EUR 63,515 HSBC 15/7/2021 202
CHF 1,440,000 EUR 1,313,579Royal Bank of
Canada 15/7/2021 (2,828)
CHF 1,750,000 EUR 1,586,939Standard
Chartered Bank 15/7/2021 5,987CNH 6,540,000 USD 1,000,459 Goldman Sachs 16/6/2021 20,804CNH 500,000 USD 76,252 Natwest Markets 16/6/2021 1,784CZK 23,716,000 EUR 932,034 Morgan Stanley 2/6/2021 (241)
CZK 28,920,000 EUR 1,107,751Standard
Chartered Bank 15/7/2021 27,486DKK 54,980,000 EUR 7,392,976 Goldman Sachs 2/6/2021 214EUR 742,095 AUD 1,160,000 HSBC 15/7/2021 6,911EUR 26,237,557 CHF 28,915,000 Goldman Sachs 2/6/2021 (74,884)EUR 25,709,296 CHF 28,175,000 Goldman Sachs 2/7/2021 65,221
EUR 90,576 CHF 100,000Bank of America
Merrill Lynch 15/7/2021 (449)EUR 1,391,879 CHF 1,530,000 HSBC 15/7/2021 (794)EUR 917,888 CZK 23,716,000 Morgan Stanley 2/6/2021 (13,905)EUR 931,478 CZK 23,716,000 Morgan Stanley 2/7/2021 243EUR 7,393,074 DKK 54,980,000 Morgan Stanley 2/6/2021 (117)EUR 7,392,051 DKK 54,980,000 Goldman Sachs 2/7/2021 (201)EUR 744,784 DKK 5,540,000 JP Morgan 15/7/2021 (69)
EUR 2,589,055 DKK 19,260,000Toronto Dominion
Bank 15/7/2021 (451)EUR 76,169,930 GBP 66,236,000 Goldman Sachs 2/6/2021 (736,329)
EUR 1,859,256 GBP 1,620,000Standard
Chartered Bank 2/6/2021 (21,717)EUR 77,319,402 GBP 66,436,000 JP Morgan 2/7/2021 222,511
EUR 178,605 GBP 155,000Bank of America
Merrill Lynch 15/7/2021 (1,224)EUR 634,497 GBP 550,000 Barclays Bank 15/7/2021 (3,607)EUR 126,830 GBP 110,000 BNP Paribas 15/7/2021 (791)EUR 6,192,399 GBP 5,370,000 Goldman Sachs 15/7/2021 (37,811)EUR 23,139 GBP 20,000 HSBC 15/7/2021 (65)EUR 229,937 GBP 200,000 JP Morgan 15/7/2021 (2,101)EUR 23,092 GBP 20,000 Morgan Stanley 15/7/2021 (111)
EUR 69,464 GBP 60,000Royal Bank of
Canada 15/7/2021 (147)
Currency Purchases Currency Sales CounterpartyMaturity
date
Netunrealised
appreciation/(depreciation)
EUR
Financial Derivative Instruments
OPEN FORWARD FOREIGN EXCHANGE TRANSACTIONS
EUR 347,668 GBP 300,000 Societe Generale 15/7/2021 (389)
EUR 843,992 GBP 730,000Standard
Chartered Bank 15/7/2021 (2,946)
EUR 682,174 HUF 246,305,000The Bank of New
York Mellon 2/6/2021 (26,382)EUR 1,103,972 HUF 405,640,000 Goldman Sachs 16/6/2021 (62,408)EUR 707,411 HUF 246,305,000 Morgan Stanley 2/7/2021 (413)EUR 214,223 IDR 3,725,980,000 HSBC 16/6/2021 254
EUR 579,167 JPY 75,510,000Bank of America
Merrill Lynch 15/7/2021 15,119EUR 235,399 MXN 5,930,000 Natwest Markets 16/6/2021 (8,268)EUR 2,635,566 NOK 26,149,000 Morgan Stanley 2/6/2021 68,095EUR 811,594 NOK 8,300,000 JP Morgan 16/6/2021 (3,158)
EUR 2,566,052 NOK 26,149,000Bank of America
Merrill Lynch 2/7/2021 (101)EUR 599,264 NOK 6,070,000 Barclays Bank 15/7/2021 3,720
EUR 44,782 NOK 450,000State Street Bank& Trust Company 15/7/2021 631
EUR 2,070,998 NZD 3,510,000Bank of America
Merrill Lynch 15/7/2021 (17,538)
EUR 35,827 NZD 60,000State Street Bank& Trust Company 15/7/2021 125
EUR 2,114,130 PLN 9,661,000 Morgan Stanley 2/6/2021 (40,129)EUR 2,152,219 PLN 9,661,000 Societe Generale 2/7/2021 (1,161)EUR 111,170 PLN 500,000 JP Morgan 15/7/2021 (255)
EUR 12,192,354 SEK 123,338,000Bank of America
Merrill Lynch 2/6/2021 4,204
EUR 12,178,366 SEK 123,338,000Bank of America
Merrill Lynch 2/7/2021 (5,680)
EUR 1,121,795 SEK 11,450,000Bank of America
Merrill Lynch 15/7/2021 (9,137)EUR 73,870 SEK 750,000 Morgan Stanley 15/7/2021 (208)
EUR 73,806 SEK 750,000Standard
Chartered Bank 15/7/2021 (273)EUR 238,972 USD 290,000 Morgan Stanley 2/6/2021 1,345EUR 1,630,000 USD 1,970,727 Goldman Sachs 16/6/2021 15,613EUR 296,130 USD 355,000 Natwest Markets 16/6/2021 5,320
EUR 238,220 USD 290,000Bank of America
Merrill Lynch 2/7/2021 732EUR 49,691 USD 60,000 BNP Paribas 15/7/2021 568EUR 5,567,690 USD 6,660,000 Morgan Stanley 15/7/2021 114,987
BlackRock European Select Strategies Fund continued
Portfolio of Investments as at 31 May 2021
The notes on pages 590 to 610 form an integral part of these financial statements.
Annual report and audited financial statements [311]

Currency Purchases Currency Sales CounterpartyMaturity
date
Netunrealised
appreciation/(depreciation)
EUR
Financial Derivative Instruments
OPEN FORWARD FOREIGN EXCHANGE TRANSACTIONS
EUR 24,876 USD 30,000Royal Bank of
Canada 15/7/2021 314
EUR 8,272 USD 10,000Standard
Chartered Bank 15/7/2021 85
EUR 16,317 USD 20,000State Street Bank& Trust Company 15/7/2021 (57)
GBP 600,000 EUR 696,917 Deutsche Bank 2/6/2021 (260)GBP 66,436,000 EUR 77,360,907 JP Morgan 2/6/2021 (222,430)GBP 820,000 EUR 943,467 Morgan Stanley 2/6/2021 8,631GBP 440,000 EUR 505,382 Barclays Bank 15/7/2021 5,100GBP 1,910,000 EUR 2,206,258 Citibank 15/7/2021 9,703GBP 80,000 EUR 92,581 Goldman Sachs 15/7/2021 234GBP 35,000 EUR 40,508 Morgan Stanley 15/7/2021 98
GBP 40,000 EUR 46,305Standard
Chartered Bank 15/7/2021 103HUF 246,305,000 EUR 708,140 Morgan Stanley 2/6/2021 416HUF 278,720,000 EUR 779,228 Barclays Bank 15/7/2021 21,321IDR 441,767,542 USD 30,217 Barclays Bank 16/6/2021 616IDR 628,800,000 USD 43,691 Citibank 16/6/2021 318IDR 786,000,000 USD 54,376 HSBC 16/6/2021 593IDR 8,693,650,000 USD 599,355 JP Morgan 16/6/2021 8,262IDR 1,006,232,458 USD 68,817 UBS 16/6/2021 1,410JPY 47,000,000 EUR 357,070 Morgan Stanley 15/7/2021 (5,987)KRW 146,000,000 USD 130,048 BNP Paribas 16/6/2021 1,383KRW 146,000,000 USD 130,160 Goldman Sachs 16/6/2021 1,292KRW 438,000,000 USD 392,332 HSBC 16/6/2021 2,357
MXN 7,100,000 USD 337,625Bank of America
Merrill Lynch 16/6/2021 15,166
NOK 26,149,000 EUR 2,567,356Bank of America
Merrill Lynch 2/6/2021 115NOK 18,450,000 EUR 1,818,719 HSBC 16/6/2021 (7,613)
NOK 2,550,000 EUR 252,261Bank of America
Merrill Lynch 15/7/2021 (2,073)NOK 7,040,000 EUR 697,136 Morgan Stanley 15/7/2021 (6,422)NOK 1,380,000 USD 164,869 Citibank 16/6/2021 407NOK 7,450,000 USD 894,783 JP Morgan 16/6/2021 (1,678)NOK 1,770,000 USD 213,908 Morgan Stanley 16/6/2021 (1,482)
NOK 880,000 USD 105,900Toronto Dominion
Bank 16/6/2021 (368)NZD 120,000 EUR 71,709 Morgan Stanley 15/7/2021 (307)PLN 9,661,000 EUR 2,153,080 Societe Generale 2/6/2021 1,178PLN 5,700,000 EUR 1,249,993 Citibank 15/7/2021 20,249PLN 2,600,000 EUR 574,247 Goldman Sachs 15/7/2021 5,161
RUB 1,159,480 USD 15,365Bank of America
Merrill Lynch 16/6/2021 342RUB 3,130,474 USD 40,550 Citibank 16/6/2021 1,688RUB 79,670,851 USD 1,069,970 Goldman Sachs 16/6/2021 11,829RUB 7,329,195 USD 95,135 UBS 16/6/2021 3,788
SEK 123,338,000 EUR 12,182,320Bank of America
Merrill Lynch 2/6/2021 5,829SEK 7,400,000 EUR 730,986 Morgan Stanley 15/7/2021 (78)SEK 700,000 USD 83,795 Barclays Bank 16/6/2021 520SEK 350,000 USD 41,952 Morgan Stanley 16/6/2021 215TRY 2,140,000 USD 274,500 HSBC 16/6/2021 (20,137)
USD 290,000 EUR 238,357Bank of America
Merrill Lynch 2/6/2021 (730)USD 1,991,713 EUR 1,630,000 BNP Paribas 16/6/2021 1,578USD 230,000 EUR 189,925 Citibank 15/7/2021 (1,619)USD 160,000 EUR 132,966 HSBC 15/7/2021 (1,970)
Currency Purchases Currency Sales CounterpartyMaturity
date
Netunrealised
appreciation/(depreciation)
EUR
Financial Derivative Instruments
OPEN FORWARD FOREIGN EXCHANGE TRANSACTIONS
USD 70,000 EUR 57,944Standard
Chartered Bank 15/7/2021 (634)
USD 610,000 EUR 505,999State Street Bank& Trust Company 15/7/2021 (6,577)
USD 81,795 NOK 675,000 Barclays Bank 16/6/2021 745USD 41,269 NOK 340,000 JP Morgan 16/6/2021 432USD 275,842 RUB 20,400,000 Barclays Bank 16/6/2021 (1,494)USD 922,827 RUB 68,691,898 Goldman Sachs 16/6/2021 (9,951)USD 163,269 SEK 1,380,000 Citibank 16/6/2021 (2,602)USD 894,933 SEK 7,500,000 JP Morgan 16/6/2021 (7,915)USD 216,540 SEK 1,800,000 Morgan Stanley 16/6/2021 (461)
USD 108,657 SEK 900,000Toronto Dominion
Bank 16/6/2021 87USD 82,751 TRY 710,000 Barclays Bank 16/6/2021 (136)USD 85,167 TRY 720,000 Credit Suisse 16/6/2021 887
(736,790)
CZK Hedged Share Class
CZK 44,682,723 EUR 1,735,946State Street Bank& Trust Company 15/6/2021 19,169
EUR 160,071 CZK 4,075,445State Street Bank& Trust Company 15/6/2021 (10)
19,159
USD Hedged Share Class
EUR 10,340 USD 12,554State Street Bank& Trust Company 15/6/2021 56
USD 624,184 EUR 516,707State Street Bank& Trust Company 15/6/2021 (5,376)
(5,320)
Total (Gross underlying exposure - EUR 453,927,336) (722,951)
Sector Breakdownas at 31 May 2021
% of NetAssets
Government 28.47
Financial 26.70
Consumer, Non-cyclical 9.30
Utilities 7.80
Industrial 6.16
Consumer, Cyclical 3.44
Communications 3.02
Collective Investment Schemes 2.66
Technology 2.47
Mortgage Securities 2.03
Exchange Traded Funds 1.46
Basic Materials 1.40
Energy 0.66
Asset Backed Securities 0.66
Securities portfolio at market value 96.23
Other Net Assets 3.77
100.00
BlackRock European Select Strategies Fund continued
Portfolio of Investments as at 31 May 2021
The notes on pages 590 to 610 form an integral part of these financial statements.
BlackRock Strategic Funds[312]
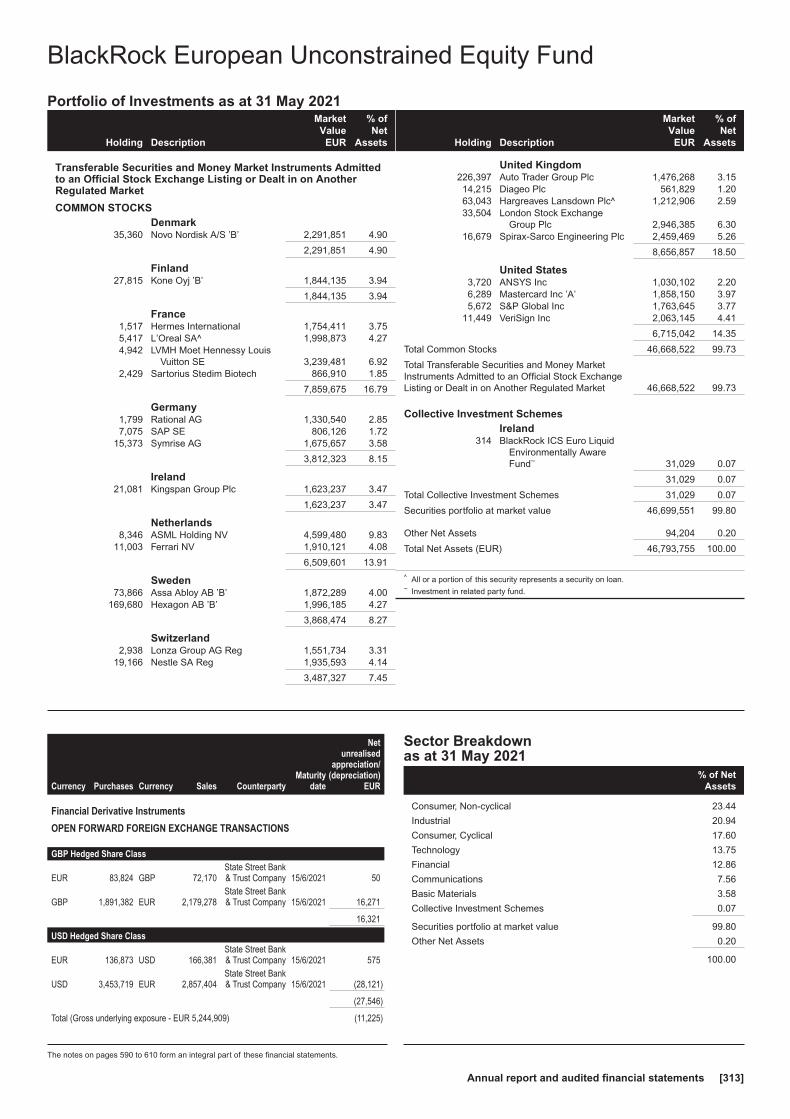
Holding Description
MarketValue
EUR
% ofNet
Assets
Transferable Securities and Money Market Instruments Admittedto an Official Stock Exchange Listing or Dealt in on AnotherRegulated Market
COMMON STOCKSDenmark
35,360 Novo Nordisk A/S ’B’ 2,291,851 4.90
2,291,851 4.90
Finland27,815 Kone Oyj ’B’ 1,844,135 3.94
1,844,135 3.94
France1,517 Hermes International 1,754,411 3.755,417 L’Oreal SA^ 1,998,873 4.274,942 LVMH Moet Hennessy Louis
Vuitton SE 3,239,481 6.922,429 Sartorius Stedim Biotech 866,910 1.85
7,859,675 16.79
Germany1,799 Rational AG 1,330,540 2.857,075 SAP SE 806,126 1.72
15,373 Symrise AG 1,675,657 3.58
3,812,323 8.15
Ireland21,081 Kingspan Group Plc 1,623,237 3.47
1,623,237 3.47
Netherlands8,346 ASML Holding NV 4,599,480 9.83
11,003 Ferrari NV 1,910,121 4.08
6,509,601 13.91
Sweden73,866 Assa Abloy AB ’B’ 1,872,289 4.00
169,680 Hexagon AB ’B’ 1,996,185 4.27
3,868,474 8.27
Switzerland2,938 Lonza Group AG Reg 1,551,734 3.31
19,166 Nestle SA Reg 1,935,593 4.14
3,487,327 7.45
Holding Description
MarketValue
EUR
% ofNet
Assets
United Kingdom226,397 Auto Trader Group Plc 1,476,268 3.1514,215 Diageo Plc 561,829 1.2063,043 Hargreaves Lansdown Plc^ 1,212,906 2.5933,504 London Stock Exchange
Group Plc 2,946,385 6.3016,679 Spirax-Sarco Engineering Plc 2,459,469 5.26
8,656,857 18.50
United States3,720 ANSYS Inc 1,030,102 2.206,289 Mastercard Inc ’A’ 1,858,150 3.975,672 S&P Global Inc 1,763,645 3.77
11,449 VeriSign Inc 2,063,145 4.41
6,715,042 14.35
Total Common Stocks 46,668,522 99.73
Total Transferable Securities and Money MarketInstruments Admitted to an Official Stock ExchangeListing or Dealt in on Another Regulated Market 46,668,522 99.73
Collective Investment SchemesIreland
314 BlackRock ICS Euro LiquidEnvironmentally AwareFund~ 31,029 0.07
31,029 0.07
Total Collective Investment Schemes 31,029 0.07
Securities portfolio at market value 46,699,551 99.80
Other Net Assets 94,204 0.20
Total Net Assets (EUR) 46,793,755 100.00
^ All or a portion of this security represents a security on loan.~ Investment in related party fund.
Currency Purchases Currency Sales CounterpartyMaturity
date
Netunrealised
appreciation/(depreciation)
EUR
Financial Derivative Instruments
OPEN FORWARD FOREIGN EXCHANGE TRANSACTIONS
GBP Hedged Share Class
EUR 83,824 GBP 72,170State Street Bank& Trust Company 15/6/2021 50
GBP 1,891,382 EUR 2,179,278State Street Bank& Trust Company 15/6/2021 16,271
16,321
USD Hedged Share Class
EUR 136,873 USD 166,381State Street Bank& Trust Company 15/6/2021 575
USD 3,453,719 EUR 2,857,404State Street Bank& Trust Company 15/6/2021 (28,121)
(27,546)
Total (Gross underlying exposure - EUR 5,244,909) (11,225)
Sector Breakdownas at 31 May 2021
% of NetAssets
Consumer, Non-cyclical 23.44
Industrial 20.94
Consumer, Cyclical 17.60
Technology 13.75
Financial 12.86
Communications 7.56
Basic Materials 3.58
Collective Investment Schemes 0.07
Securities portfolio at market value 99.80
Other Net Assets 0.20
100.00
BlackRock European Unconstrained Equity Fund
Portfolio of Investments as at 31 May 2021
The notes on pages 590 to 610 form an integral part of these financial statements.
Annual report and audited financial statements [313]

Holding Description
MarketValue
EUR
% ofNet
Assets
Transferable Securities and Money Market Instruments Admittedto an Official Stock Exchange Listing or Dealt in on AnotherRegulated Market
COMMON STOCKSBelgium
1,500 Solvay SA 166,425 0.04
166,425 0.04
France8,995 Engie SA 109,775 0.03
109,775 0.03
Italy23,999 ACEA SpA 478,540 0.12
187,211 Iren SpA 481,507 0.13
960,047 0.25
Total Common Stocks 1,236,247 0.32
BONDSAustralia
EUR 925,000 APT Pipelines Ltd RegS0.75% 15/3/2029 915,685 0.24
EUR 1,907,000 APT Pipelines Ltd RegS2.00% 15/7/2030 2,052,580 0.53
EUR 1,350,000 Macquarie Group Ltd RegS0.35% 3/3/2028 1,327,050 0.34
EUR 575,000 Telstra Corp Ltd RegS 1.00%23/4/2030 599,829 0.16
4,895,144 1.27
AustriaEUR 2,300,000 BAWAG Group AG RegS FRN
26/3/2029 2,400,188 0.62EUR 800,000 Erste Group Bank AG RegS
0.05% 16/9/2025 802,640 0.21EUR 200,000 Erste Group Bank AG RegS
0.875% 15/5/2034 214,288 0.05EUR 1,800,000 Erste Group Bank AG RegS
FRN (Perpetual) 1,916,550 0.50EUR 500,000 Kommunalkredit Austria AG
RegS 0.25% 14/5/2024 499,625 0.13EUR 100,000 Raiffeisen Bank International
AG RegS 1.00% 4/12/2023 102,898 0.03EUR 296,000 Republic of Austria Govern-
ment Bond RegS 0.70%20/4/2071 276,337 0.07
EUR 800,000 Volksbank Wien AG RegS0.875% 23/3/2026 803,888 0.21
7,016,414 1.82
BelgiumEUR 300,000 Ageas SA RegS FRN
24/11/2051 298,545 0.08EUR 1,800,000 Ageas SA RegS FRN (Per-
petual) 1,908,486 0.49EUR 600,000 FLUVIUS System Operator
CVBA RegS 0.25%2/12/2030 588,102 0.15
EUR 2,000,000 KBC Group NV RegS FRN10/9/2026 1,994,640 0.52
EUR 1,400,000 KBC Group NV RegS FRN11/3/2027 1,419,516 0.37
6,209,289 1.61
ChinaEUR 625,000 China Development Bank
RegS 27/10/2023 (ZeroCoupon) 625,562 0.16
625,562 0.16
Holding Description
MarketValue
EUR
% ofNet
Assets
ColombiaUSD 560,000 Colombia Government Interna-
tional Bond 3.25%22/4/2032 443,907 0.11
443,907 0.11
DenmarkEUR 600,000 Danske Bank A/S FRN
24/5/2023 608,400 0.16DKK 5,590,668 Nordea Kredit Realkreditaktie-
selskab 0.50% 1/10/2050 689,766 0.18DKK 13,518,302 Nykredit Realkredit A/S RegS
0.50% 1/10/2035 1,799,708 0.47GBP 500,000 Orsted A/S RegS 2.50%
16/5/2033 624,855 0.16DKK 7,917,088 Realkredit Danmark A/S
0.50% 1/10/2035 1,053,777 0.27DKK 1,986,235 Realkredit Danmark A/S RegS
0.50% 1/10/2050 244,855 0.06
5,021,361 1.30
EstoniaEUR 800,000 Elering AS RegS 0.875%
3/5/2023^ 811,910 0.21
811,910 0.21
FinlandEUR 525,000 OP Corporate Bank Plc RegS
0.50% 12/8/2025 537,343 0.14
537,343 0.14
FranceEUR 300,000 AXA SA RegS FRN 4/7/2043 331,149 0.09
EUR 1,600,000 Banque Federative du CreditMutuel SA RegS 0.75%15/6/2023 1,634,704 0.42
GBP 815,000 BNP Paribas SA RegS 3.375%23/1/2026 1,033,266 0.27
GBP 200,000 BNP Paribas SA RegS 1.875%14/12/2027 236,424 0.06
EUR 1,000,000 BNP Paribas SA RegS FRN19/2/2028 997,780 0.26
GBP 400,000 BNP Paribas SA RegS FRN24/5/2031 468,269 0.12
EUR 600,000 BNP Paribas SA RegS FRN15/1/2032 602,052 0.16
EUR 1,100,000 BNP Paribas SA RegS 0.625%3/12/2032 1,054,361 0.27
EUR 600,000 BPCE SA RegS 0.125%4/12/2024 605,682 0.16
EUR 300,000 BPCE SFH SA RegS 0.125%3/12/2030 299,805 0.08
EUR 2,500,000 Coentreprise de Transportd’Electricite SA RegS 1.50%29/7/2028 2,691,725 0.70
EUR 1,100,000 Credit Agricole Assurances SARegS FRN 27/9/2048 1,340,273 0.35
EUR 700,000 Credit Agricole SA RegS0.50% 24/6/2024 710,822 0.18
EUR 1,500,000 Danone SA RegS1/12/2025 (Zero Coupon) 1,499,205 0.39
EUR 2,400,000 Electricite de France SA RegSFRN (Perpetual) 2,687,712 0.70
GBP 100,000 Electricite de France SA RegS6.00% 23/1/2114 203,124 0.05
EUR 1,600,000 Elis SA RegS 1.75%11/4/2024 1,634,912 0.42
EUR 800,000 Engie SA RegS 1.375%27/3/2025 842,168 0.22
EUR 3,500,000 Engie SA RegS 0.375%11/6/2027^ 3,545,675 0.92
BlackRock Fixed Income Credit Strategies Fund
Portfolio of Investments as at 31 May 2021
The notes on pages 590 to 610 form an integral part of these financial statements.
BlackRock Strategic Funds[314]

Holding Description
MarketValue
EUR
% ofNet
Assets
France continuedEUR 540,000 France Government Bond OAT
RegS 0.75% 25/5/2052 507,665 0.13EUR 500,000 La Poste SA RegS 1.375%
21/4/2032 537,375 0.14EUR 600,000 Orange SA RegS 1.25%
7/7/2027 639,930 0.17EUR 800,000 Orange SA RegS FRN (Per-
petual) 898,384 0.23EUR 500,000 PSA Banque France SA RegS
22/1/2025 (Zero Coupon) 498,475 0.13EUR 600,000 RTE Reseau de Transport
d’Electricite SADIR RegS9/9/2027 (Zero Coupon) 591,990 0.15
EUR 500,000 Schneider Electric SE RegS12/6/2023 (Zero Coupon) 503,445 0.13
EUR 700,000 Societe Generale SA FRN24/11/2030 696,451 0.18
EUR 600,000 Societe Generale SA RegSFRN 1/4/2022 603,780 0.16
EUR 200,000 Societe Generale SA RegS0.125% 24/2/2026 200,526 0.05
EUR 600,000 Societe Generale SA RegS0.75% 25/1/2027 604,152 0.16
EUR 2,900,000 Societe Generale SA RegS0.125% 18/2/2028 2,857,109 0.74
EUR 1,800,000 Societe Generale SA RegSFRN 23/2/2028 1,828,224 0.47
EUR 900,000 Societe Generale SA RegSFRN 22/9/2028 911,412 0.24
EUR 400,000 Societe Generale SA RegSFRN 12/6/2029 389,172 0.10
EUR 500,000 Societe Generale SA RegS0.875% 24/9/2029 498,030 0.13
EUR 2,000,000 Suez SA RegS 9/6/2026 (ZeroCoupon)^ 1,991,280 0.52
EUR 900,000 Suez SA RegS FRN (Per-petual) 899,856 0.23
EUR 1,200,000 Terega SA RegS 0.875%17/9/2030 1,203,228 0.31
EUR 3,200,000 Thales SA RegS26/3/2026 (Zero Coupon)^ 3,187,072 0.83
EUR 1,500,000 TOTAL SE RegS FRN (Per-petual) 1,649,280 0.43
EUR 1,150,000 TOTAL SE RegS FRN (Per-petual) 1,143,848 0.30
EUR 600,000 UNEDIC ASSEO RegS 0.10%25/5/2034 574,878 0.15
EUR 200,000 Veolia Environnement SARegS 0.672% 30/3/2022 201,198 0.05
EUR 300,000 Veolia Environnement SARegS 0.80% 15/1/2032 300,654 0.08
EUR 4,300,000 Veolia Environnement SARegS FRN (Perpetual) 4,411,499 1.14
EUR 1,600,000 Veolia Environnement SARegS FRN (Perpetual) 1,589,440 0.41
52,337,461 13.58
GermanyEUR 2,100,000 BASF SE RegS 0.101%
5/6/2023 2,114,658 0.55EUR 1,500,000 Bayer AG RegS 0.05%
12/1/2025 1,494,630 0.39EUR 1,700,000 Bertelsmann SE & Co KGaA
RegS FRN 23/4/2075 1,762,084 0.46EUR 1,085,560 Bundesrepublik Deutschland
Bundesanleihe RegS 0.50%15/2/2025^ 1,132,576 0.29
EUR 5,904,495 Bundesrepublik DeutschlandBundesanleihe RegS15/8/2029 (Zero Coupon)^ 6,054,528 1.57
Holding Description
MarketValue
EUR
% ofNet
Assets
Germany continuedEUR 1,083,256 Bundesrepublik Deutschland
Bundesanleihe RegS15/8/2050 (Zero Coupon) 978,603 0.25
EUR 300,000 Commerzbank AG RegS1.25% 23/10/2023 309,081 0.08
EUR 400,000 Deutsche Bahn FinanceGmbH RegS FRN (Per-petual) 398,752 0.10
GBP 100,000 Deutsche Bank AG RegS2.625% 16/12/2024 121,311 0.03
EUR 900,000 Deutsche Bank AG RegS FRN17/2/2032 897,138 0.23
EUR 300,000 Deutsche Pfandbriefbank AGRegS 0.125% 5/9/2024 301,362 0.08
EUR 1,800,000 Deutsche Pfandbriefbank AGRegS 0.10% 2/2/2026 1,795,986 0.47
EUR 1,376,000 E.ON SE RegS24/10/2022 (Zero Coupon) 1,381,738 0.36
EUR 500,000 Eurogrid GmbH RegS 1.113%15/5/2032 522,970 0.14
EUR 700,000 Eurogrid GmbH RegS 0.741%21/4/2033 697,088 0.18
EUR 800,000 Evonik Industries AG RegS0.625% 18/9/2025 818,832 0.21
EUR 5,600,000 Fraport AG Frankfurt AirportServices Worldwide RegS1.875% 31/3/2028 5,794,376 1.50
EUR 1,500,000 KION Group AG RegS 1.625%24/9/2025^ 1,562,025 0.41
EUR 400,000 Landesbank Baden-Wuerttemberg RegS 2.875%28/9/2026 439,000 0.11
EUR 2,100,000 Landesbank Baden-Wuerttemberg RegS 2.20%9/5/2029 2,207,457 0.57
EUR 200,000 Merck Financial ServicesGmbH RegS 0.005%15/12/2023 200,976 0.05
EUR 200,000 Merck Financial ServicesGmbH RegS 0.125%16/7/2025 201,768 0.05
EUR 1,847,000 Merck KGaA RegS FRN12/12/2074 2,023,333 0.53
EUR 1,450,000 Volkswagen Leasing GmbHRegS 0.375% 20/7/2026^ 1,450,594 0.38
EUR 2,400,000 ZF Finance GmbH RegS2.75% 25/5/2027 2,484,456 0.65
37,145,322 9.64
GreeceEUR 1,700,000 Hellenic Republic Government
Bond RegS 12/2/2026 (ZeroCoupon) 1,691,670 0.44
1,691,670 0.44
IrelandEUR 800,000 Abbott Ireland Financing DAC
RegS 0.10% 19/11/2024 805,555 0.21EUR 600,000 AIB Group Plc RegS 1.50%
29/3/2023 617,496 0.16EUR 200,000 AIB Group Plc RegS FRN
(Perpetual) 226,564 0.06EUR 1,500,000 Bank of Ireland Group Plc
RegS FRN 25/11/2025 1,540,455 0.40EUR 2,900,000 Eaton Capital Unlimited Co
RegS 0.128% 8/3/2026 2,899,913 0.75EUR 251,000 GAS Networks Ireland RegS
0.125% 4/12/2024 252,908 0.07
BlackRock Fixed Income Credit Strategies Fund continued
Portfolio of Investments as at 31 May 2021
The notes on pages 590 to 610 form an integral part of these financial statements.
Annual report and audited financial statements [315]

Holding Description
MarketValue
EUR
% ofNet
Assets
Ireland continuedEUR 1,480,000 Smurfit Kappa Treasury ULC
RegS 1.50% 15/9/2027 1,555,628 0.40EUR 400,000 Zurich Finance Ireland Desig-
nated Activity Co RegS FRN17/9/2050 417,548 0.11
8,316,067 2.16
ItalyEUR 1,660,000 ASTM SpA RegS 1.625%
8/2/2028 1,711,327 0.44EUR 800,000 Eni SpA RegS FRN (Per-
petual) 796,184 0.21EUR 650,000 Hera SpA RegS 0.25%
3/12/2030 626,678 0.16EUR 100,000 Intesa Sanpaolo SpA RegS
0.75% 4/12/2024 102,386 0.03EUR 871,000 Intesa Sanpaolo SpA RegS
2.925% 14/10/2030 916,510 0.24EUR 2,575,000 Intesa Sanpaolo SpA RegS
1.35% 24/2/2031 2,521,106 0.65EUR 1,225,000 Snam SpA RegS
15/8/2025 (Zero Coupon) 1,223,297 0.32EUR 513,000 Snam SpA RegS 0.75%
17/6/2030 518,807 0.14EUR 2,619,000 Terna Rete Elettrica Nazionale
SpA RegS 0.75% 24/7/2032 2,598,179 0.67EUR 200,000 UniCredit SpA RegS FRN
25/6/2025 205,802 0.05EUR 1,725,000 UniCredit SpA RegS 1.80%
20/1/2030^ 1,772,489 0.46
12,992,765 3.37
JapanEUR 1,900,000 Takeda Pharmaceutical Co Ltd
2.00% 9/7/2040 1,990,915 0.52
1,990,915 0.52
LuxembourgEUR 1,100,000 Becton Dickinson Euro Fi-
nance Sarl 0.632% 4/6/2023 1,115,576 0.29EUR 600,000 GELF Bond Issuer I SA RegS
1.625% 20/10/2026 639,540 0.17EUR 600,000 HeidelbergCement Finance
Luxembourg SA RegS2.50% 9/10/2024^ 648,498 0.17
EUR 400,000 HeidelbergCement FinanceLuxembourg SA RegS1.625% 7/4/2026 426,352 0.11
EUR 800,000 Medtronic Global HoldingsSCA 0.25% 2/7/2025 808,960 0.21
EUR 650,000 Medtronic Global HoldingsSCA 15/10/2025 (Zero Cou-pon) 649,461 0.17
EUR 1,300,000 Medtronic Global HoldingsSCA 1.00% 2/7/2031 1,339,091 0.35
EUR 650,000 Novartis Finance SA RegS23/9/2028 (Zero Coupon) 639,340 0.17
EUR 1,550,000 SES SA RegS FRN (Per-petual) 1,557,750 0.40
EUR 747,000 SIG Combibloc PurchaseCoSarl RegS 2.125%18/6/2025 789,676 0.20
EUR 2,400,000 Traton Finance LuxembourgSA RegS 1.25% 24/3/2033 2,393,424 0.62
11,007,668 2.86
MexicoUSD 240,000 Mexico Government Interna-
tional Bond 3.75%19/4/2071 177,195 0.05
177,195 0.05
Holding Description
MarketValue
EUR
% ofNet
Assets
MontenegroEUR 601,000 Montenegro Government Inter-
national Bond RegS 2.875%16/12/2027 558,143 0.14
558,143 0.14
NetherlandsEUR 200,000 ABN AMRO Bank NV RegS
FRN (Perpetual) 214,846 0.06EUR 300,000 Achmea Bank NV RegS 0.01%
16/6/2025 303,429 0.08EUR 600,000 Allianz Finance II BV FRN
8/7/2041 603,570 0.16EUR 1,000,000 Athora Netherlands NV RegS
FRN 15/7/2031 1,017,830 0.26EUR 600,000 BMW Finance NV RegS
0.625% 6/10/2023 612,306 0.16EUR 350,000 Deutsche Telekom Interna-
tional Finance BV RegS0.625% 1/12/2022 355,061 0.09
EUR 2,000,000 Deutsche Telekom Interna-tional Finance BV RegS1.125% 22/5/2026 2,105,920 0.55
EUR 300,000 EDP Finance BV RegS2.625% 18/1/2022 305,748 0.08
EUR 2,700,000 EDP Finance BV RegS1.125% 12/2/2024 2,790,909 0.72
EUR 900,000 EDP Finance BV RegS 2.00%22/4/2025 969,606 0.25
EUR 684,000 EDP Finance BV RegS1.875% 13/10/2025 738,638 0.19
EUR 2,625,000 ELM BV for Firmenich Interna-tional SA RegS FRN (Per-petual) 2,819,932 0.73
EUR 1,450,000 Enel Finance International NVRegS 1.966% 27/1/2025 1,556,764 0.40
EUR 1,200,000 Iberdrola International BVRegS FRN (Perpetual) 1,206,180 0.31
EUR 3,300,000 Iberdrola International BVRegS FRN (Perpetual) 3,381,114 0.88
EUR 800,000 Iberdrola International BVRegS FRN (Perpetual) 871,192 0.23
EUR 1,000,000 ING Groep NV RegS FRN3/9/2025 1,001,020 0.26
EUR 300,000 ING Groep NV RegS FRN15/2/2029 316,785 0.08
EUR 1,700,000 ING Groep NV RegS FRN18/2/2029 1,660,441 0.43
EUR 1,500,000 ING Groep NV RegS FRN26/5/2031 1,590,420 0.41
GBP 210,000 innogy Finance BV RegS6.25% 3/6/2030 327,985 0.09
EUR 2,000,000 Koninklijke DSM NV RegS0.625% 23/6/2032 2,014,760 0.52
EUR 2,320,000 NN Group NV RegS FRN8/4/2044 2,592,345 0.67
EUR 400,000 Redexis Gas Finance BVRegS 1.875% 28/5/2025 424,248 0.11
EUR 247,000 Repsol International FinanceBV RegS FRN (Perpetual) 269,872 0.07
EUR 300,000 Siemens Financierings-maatschappij NV RegS20/2/2023 (Zero Coupon) 301,803 0.08
EUR 1,000,000 Siemens Financierings-maatschappij NV RegS0.375% 5/6/2026 1,021,690 0.27
EUR 1,900,000 Siemens Financierings-maatschappij NV RegS0.90% 28/2/2028 1,998,895 0.52
EUR 400,000 Telefonica Europe BV RegSFRN (Perpetual) 407,936 0.11
BlackRock Fixed Income Credit Strategies Fund continued
Portfolio of Investments as at 31 May 2021
The notes on pages 590 to 610 form an integral part of these financial statements.
BlackRock Strategic Funds[316]

Holding Description
MarketValue
EUR
% ofNet
Assets
Netherlands continuedEUR 1,100,000 Telefonica Europe BV RegS
FRN (Perpetual) 1,132,395 0.29EUR 800,000 Telefonica Europe BV RegS
FRN (Perpetual) 857,096 0.22EUR 1,375,000 TenneT Holding BV RegS
0.50% 9/6/2031 1,367,740 0.36EUR 5,240,000 TenneT Holding BV RegS FRN
(Perpetual) 5,411,558 1.40
42,550,034 11.04
New ZealandEUR 610,000 ASB Finance Ltd RegS 0.25%
21/5/2031 609,677 0.16NZD 146,000 Auckland Council RegS 2.95%
28/9/2050 75,154 0.02EUR 2,350,000 Chorus Ltd RegS 1.125%
18/10/2023 2,413,309 0.63EUR 225,000 Chorus Ltd RegS 0.875%
5/12/2026 231,174 0.06NZD 390,000 Housing New Zealand Ltd
RegS 1.534% 10/9/2035 198,404 0.05NZD 475,000 New Zealand Government
Bond 1.75% 15/5/2041 243,646 0.06
3,771,364 0.98
NorwayEUR 350,000 DNB Bank ASA RegS 0.05%
14/11/2023 352,642 0.09EUR 200,000 Telenor ASA RegS
25/9/2023 (Zero Coupon) 201,148 0.05
553,790 0.14
PortugalEUR 500,000 EDP - Energias de Portugal
SA RegS FRN 20/7/2080 500,055 0.13EUR 136,790 Portugal Obrigacoes do Tes-
ouro OT RegS 1.00%12/4/2052 122,671 0.03
EUR 543,566 TAGUS - Sociedade de Titular-izacao de Creditos SA/VoltaVII RegS 0.70% 12/2/2024 542,430 0.14
1,165,156 0.30
SingaporeEUR 2,962,000 DBS Group Holdings Ltd RegS
FRN 11/4/2028 3,030,452 0.79EUR 3,500,000 Temasek Financial I Ltd RegS
0.50% 20/11/2031^ 3,487,750 0.90
6,518,202 1.69
SloveniaEUR 269,000 Slovenia Government Bond
RegS 0.488% 20/10/2050 234,113 0.06
234,113 0.06
SpainEUR 200,000 Banco Bilbao Vizcaya Argen-
taria SA RegS 0.625%17/1/2022 201,360 0.05
EUR 800,000 Banco Bilbao Vizcaya Argen-taria SA RegS 0.375%15/11/2026 807,520 0.21
EUR 1,000,000 Banco de Sabadell SA RegSFRN 11/3/2027 1,030,190 0.27
EUR 500,000 Banco de Sabadell SA RegS2.50% 15/4/2031 501,735 0.13
EUR 800,000 Bankia SA RegS 0.75%9/7/2026 818,464 0.21
EUR 500,000 CaixaBank SA RegS 0.875%25/3/2024 513,040 0.13
EUR 1,000,000 CaixaBank SA RegS 0.375%3/2/2025 1,009,340 0.26
Holding Description
MarketValue
EUR
% ofNet
Assets
Spain continuedEUR 1,500,000 CaixaBank SA RegS FRN
10/7/2026 1,532,055 0.40GBP 500,000 CaixaBank SA RegS FRN
3/12/2026 580,994 0.15EUR 300,000 Cellnex Finance Co SA RegS
2.00% 15/2/2033 291,474 0.08EUR 1,100,000 Iberdrola Finanzas SA RegS
0.875% 16/6/2025 1,140,920 0.30EUR 500,000 Telefonica Emisiones SA RegS
1.477% 14/9/2021 502,650 0.13
8,929,742 2.32
SupranationalEUR 900,000 Ardagh Metal Packaging Fi-
nance USA LLC/ArdaghMetal Packaging FinancePlc RegS 2.00% 1/9/2028 900,855 0.24
EUR 200,000 International Bank for Recon-struction & Development0.20% 21/1/2061 165,028 0.04
1,065,883 0.28
SwedenEUR 700,000 Skandinaviska Enskilda Ban-
ken AB RegS 0.05%1/7/2024 705,642 0.18
EUR 2,700,000 Skandinaviska Enskilda Ban-ken AB RegS FRN31/10/2028 2,773,440 0.72
EUR 600,000 Swedbank AB RegS 0.30%6/9/2022 605,424 0.16
4,084,506 1.06
SwitzerlandEUR 1,850,000 Credit Suisse AG RegS 0.25%
5/1/2026 1,851,480 0.48EUR 600,000 Credit Suisse Group AG RegS
FRN 17/7/2025 615,432 0.16EUR 500,000 Credit Suisse Group AG RegS
FRN 24/6/2027 509,025 0.13EUR 1,200,000 Credit Suisse Group AG RegS
FRN 14/1/2028 1,195,680 0.31EUR 875,000 Credit Suisse Group AG RegS
0.625% 18/1/2033 811,598 0.21EUR 600,000 UBS AG RegS 0.75%
21/4/2023 611,502 0.16EUR 600,000 UBS Group AG RegS FRN
20/9/2022 601,062 0.16USD 300,000 UBS Group AG RegS FRN
(Perpetual) 265,319 0.07
6,461,098 1.68
United KingdomEUR 1,075,000 AstraZeneca Plc RegS 0.375%
3/6/2029 1,069,087 0.28EUR 1,500,000 Barclays Plc RegS FRN
9/6/2025 1,524,390 0.39GBP 150,000 Barclays Plc RegS 3.00%
8/5/2026 187,035 0.05EUR 4,806,000 BAT International Finance Plc
RegS 0.875% 13/10/2023 4,887,558 1.27GBP 100,000 BAT International Finance Plc
RegS 4.00% 4/9/2026 127,701 0.03GBP 2,425,000 Bellis Acquisition Co Plc RegS
3.25% 16/2/2026 2,819,174 0.73EUR 500,000 BP Capital Markets Plc RegS
1.594% 3/7/2028 540,425 0.14EUR 1,800,000 BP Capital Markets Plc RegS
FRN (Perpetual) 1,930,806 0.50GBP 420,000 BP Capital Markets Plc RegS
FRN (Perpetual) 515,256 0.13
BlackRock Fixed Income Credit Strategies Fund continued
Portfolio of Investments as at 31 May 2021
The notes on pages 590 to 610 form an integral part of these financial statements.
Annual report and audited financial statements [317]

Holding Description
MarketValue
EUR
% ofNet
Assets
United Kingdom continuedEUR 600,000 British Telecommunications Plc
RegS 0.875% 26/9/2023 613,302 0.16GBP 400,000 BUPA Finance Plc RegS
5.00% 8/12/2026 541,887 0.14EUR 2,325,000 Cadent Finance Plc RegS
0.625% 19/3/2030 2,319,443 0.60EUR 1,225,000 Chanel Ceres Plc RegS 0.50%
31/7/2026 1,233,465 0.32EUR 1,825,000 Chanel Ceres Plc RegS 1.00%
31/7/2031 1,816,897 0.47EUR 250,000 Channel Link Enterprises Fi-
nance Plc RegS FRN30/6/2050 254,807 0.07
GBP 100,000 Dignity Finance Plc RegS4.696% 31/12/2049 108,251 0.03
EUR 1,050,000 DS Smith Plc RegS 0.875%12/9/2026 1,071,672 0.28
EUR 225,000 GlaxoSmithKline Capital PlcRegS 23/9/2023 (Zero Cou-pon) 226,206 0.06
EUR 104,000 HSBC Holdings Plc RegS FRN27/9/2022 104,210 0.03
EUR 800,000 HSBC Holdings Plc RegS FRN13/11/2026 800,672 0.21
EUR 1,500,000 HSBC Holdings Plc RegS FRN13/11/2031 1,484,130 0.38
EUR 775,000 INEOS Quattro Finance 2 PlcRegS 2.50% 15/1/2026 778,929 0.20
EUR 475,000 Motability Operations GroupPlc RegS 0.125% 20/7/2028 469,632 0.12
GBP 393,000 National Grid Electricity Trans-mission Plc RegS 2.00%16/9/2038 446,020 0.12
GBP 200,000 National Grid Electricity Trans-mission Plc RegS 2.00%17/4/2040 223,678 0.06
EUR 725,000 Nationwide Building SocietyRegS 0.25% 22/7/2025 731,590 0.19
EUR 150,000 Nationwide Building SocietyRegS 0.50% 5/5/2041 146,219 0.04
EUR 500,000 Natwest Group Plc RegS FRN8/3/2023 508,220 0.13
EUR 800,000 Natwest Group Plc RegS2.50% 22/3/2023 837,448 0.22
EUR 500,000 Natwest Group Plc RegS FRN2/3/2026 526,835 0.14
GBP 4,925,000 Natwest Group Plc RegS FRN28/11/2031 5,718,677 1.48
GBP 563,000 NGG Finance Plc RegS FRN18/6/2073 731,323 0.19
EUR 1,400,000 NGG Finance Plc RegS FRN5/12/2079 1,410,976 0.37
EUR 810,000 NGG Finance Plc RegS FRN5/9/2082 816,156 0.21
EUR 1,500,000 OTE Plc RegS 2.375%18/7/2022^ 1,544,235 0.40
EUR 2,100,000 OTE Plc RegS 0.875%24/9/2026^ 2,150,001 0.56
GBP 400,000 Rolls-Royce Plc 3.375%18/6/2026 463,277 0.12
EUR 500,000 Sky Ltd RegS 2.50%15/9/2026 563,390 0.15
GBP 200,000 SP Transmission Plc RegS2.00% 13/11/2031 237,376 0.06
USD 865,000 Standard Chartered Plc RegSFRN 23/3/2025 714,858 0.18
EUR 1,200,000 Swiss Re Finance UK PlcRegS FRN 4/6/2052 1,312,932 0.34
Holding Description
MarketValue
EUR
% ofNet
Assets
United Kingdom continuedGBP 1,300,000 Tesco Corporate Treasury Ser-
vices Plc RegS 2.75%27/4/2030^ 1,606,162 0.42
GBP 94,921 Tesco Property Finance 3 PlcRegS 5.744% 13/4/2040 146,335 0.04
GBP 574,000 Tritax Big Box REIT Plc RegS1.50% 27/11/2033 635,311 0.16
GBP 250,000 United Kingdom Gilt RegS0.625% 22/10/2050 242,370 0.06
GBP 200,000 Yorkshire Water Finance PlcRegS FRN 22/3/2046 240,203 0.06
47,378,527 12.29
United StatesEUR 1,640,000 AbbVie Inc 1.375% 17/5/2024 1,702,960 0.44EUR 1,000,000 AbbVie Inc 1.25% 1/6/2024 1,035,020 0.27EUR 1,650,000 Air Products and Chemicals
Inc 0.80% 5/5/2032 1,672,506 0.43USD 1,024,000 Amazon.com Inc 2.70%
3/6/2060 749,277 0.19USD 2,126,000 Apple Inc 2.55% 20/8/2060 1,528,514 0.40USD 1,200,000 Apple Inc 2.80% 8/2/2061 899,666 0.23
GBP 200,000 AT&T Inc 4.375% 14/9/2029 276,407 0.07EUR 200,000 AT&T Inc 2.45% 15/3/2035 221,370 0.06GBP 585,000 Bank of America Corp RegS
FRN 2/6/2029 681,135 0.18EUR 800,000 Bank of America Corp RegS
FRN 9/5/2030 842,650 0.22EUR 1,025,000 Bank of America Corp RegS
FRN 26/10/2031 1,005,295 0.26EUR 3,975,000 Bank of America Corp RegS
FRN 24/5/2032 4,023,972 1.04EUR 2,847,000 Becton Dickinson and Co
1.401% 24/5/2023 2,927,741 0.76USD 2,092,000 Becton Dickinson and Co
2.823% 20/5/2030 1,775,909 0.46EUR 1,475,000 Booking Holdings Inc 0.10%
8/3/2025 1,478,156 0.38EUR 650,000 Chubb INA Holdings Inc 0.30%
15/12/2024 655,935 0.17EUR 810,000 Citigroup Inc RegS 0.50%
29/1/2022 814,795 0.21EUR 1,050,000 Citigroup Inc RegS 0.75%
26/10/2023 1,070,800 0.28EUR 500,000 Citigroup Inc RegS FRN
8/10/2027 502,009 0.13EUR 1,475,000 Coca-Cola Co 0.125%
9/3/2029 1,450,338 0.38EUR 2,800,000 Coca-Cola Co 0.375%
15/3/2033 2,673,980 0.69EUR 1,100,000 Comcast Corp 0.75%
20/2/2032 1,098,702 0.29EUR 1,100,000 Equinix Inc 0.25% 15/3/2027 1,090,529 0.28
EUR 700,000 Fidelity National InformationServices Inc 0.125%3/12/2022 703,241 0.18
EUR 150,000 Fidelity National InformationServices Inc 0.75%21/5/2023 152,444 0.04
EUR 562,000 Fidelity National InformationServices Inc 1.10%15/7/2024 580,091 0.15
EUR 900,000 Fidelity National InformationServices Inc 0.625%3/12/2025 918,792 0.24
EUR 1,734,000 Fidelity National InformationServices Inc 1.50%21/5/2027 1,836,913 0.48
BlackRock Fixed Income Credit Strategies Fund continued
Portfolio of Investments as at 31 May 2021
The notes on pages 590 to 610 form an integral part of these financial statements.
BlackRock Strategic Funds[318]

Holding Description
MarketValue
EUR
% ofNet
Assets
United States continuedEUR 150,000 Fidelity National Information
Services Inc 1.00%3/12/2028 153,832 0.04
EUR 1,000,000 Fiserv Inc 0.375% 1/7/2023 1,009,510 0.26EUR 285,000 Fiserv Inc 1.125% 1/7/2027 297,071 0.08GBP 200,000 Ford Motor Credit Co LLC
4.535% 6/3/2025 247,313 0.06EUR 500,000 Goldman Sachs Group Inc
RegS 3.25% 1/2/2023 528,750 0.14EUR 690,000 Goldman Sachs Group Inc
RegS FRN 21/4/2023 691,577 0.18EUR 1,200,000 Goldman Sachs Group Inc
RegS FRN 30/4/2024 1,200,924 0.31EUR 500,000 Goldman Sachs Group Inc
RegS 1.375% 15/5/2024 513,705 0.13EUR 300,000 Goldman Sachs Group Inc
RegS 2.875% 3/6/2026 338,739 0.09EUR 1,150,000 Goldman Sachs Group Inc
RegS 0.25% 26/1/2028 1,124,044 0.29EUR 700,000 Goldman Sachs Group Inc
RegS 2.00% 1/11/2028 769,608 0.20EUR 275,000 Honeywell International Inc
0.75% 10/3/2032 278,501 0.07EUR 500,000 International Business Ma-
chines Corp 0.875%31/1/2025 517,680 0.13
EUR 830,000 International Flavors & Fra-grances Inc 1.80%25/9/2026 889,486 0.23
EUR 400,000 JPMorgan Chase & Co RegS2.75% 24/8/2022 415,524 0.11
GBP 350,000 JPMorgan Chase & Co RegSFRN 28/4/2026 407,139 0.11
EUR 800,000 JPMorgan Chase & Co RegSFRN 24/2/2028 799,842 0.21
EUR 350,000 JPMorgan Chase & Co RegSFRN 25/7/2031 357,977 0.09
EUR 4,000,000 JPMorgan Chase & Co RegSFRN 4/11/2032 4,079,080 1.06
GBP 215,000 JPMorgan Chase & Co RegSFRN 28/4/2033 250,424 0.07
EUR 1,400,000 Levi Strauss & Co 3.375%15/3/2027 1,449,364 0.38
EUR 1,200,000 McDonald’s Corp RegS 1.00%15/11/2023 1,234,848 0.32
EUR 1,000,000 Morgan Stanley 1.875%30/3/2023 1,038,810 0.27
EUR 800,000 Morgan Stanley FRN23/10/2026 838,616 0.22
EUR 4,346,000 Morgan Stanley FRN26/10/2029 4,296,716 1.11
USD 3,195,000 Oracle Corp 2.875%25/3/2031 2,681,270 0.70
USD 1,200,000 United States TreasuryNote/Bond 1.125%15/8/2040 819,601 0.21
EUR 700,000 Verizon Communications Inc1.25% 8/4/2030 735,455 0.19
62,334,553 16.17
Total Bonds 336,825,104 87.39
EXCHANGE TRADED FUNDSIreland
EUR 28,331 iShares EUR Corp Bond 1-5yrUCITS ETF~^ 3,163,014 0.82
Holding Description
MarketValue
EUR
% ofNet
Assets
Ireland continuedEUR 17,869 iShares EUR Corp Bond Large
Cap UCITS ETF~ 2,498,466 0.65EUR 12,498 iShares Euro Dividend UCITS
ETF~ 262,708 0.07
5,924,188 1.54
Total Exchange Traded Funds 5,924,188 1.54
Total Transferable Securities and Money MarketInstruments Admitted to an Official Stock ExchangeListing or Dealt in on Another Regulated Market 343,985,539 89.25
Other Transferable Securities and Money Market Instruments
BONDSNew Zealand
NZD 125,000 New Zealand Government In-flation Linked Bond RegS2.50% 20/9/2040 101,899 0.03
101,899 0.03
Total Bonds 101,899 0.03
Total Other Transferable Securities and MoneyMarket Instruments 101,899 0.03
Collective Investment SchemesIreland
77,886 BlackRock ICS Euro LiquidEnvironmentally AwareFund~ 7,698,488 2.00
7,698,488 2.00
Total Collective Investment Schemes 7,698,488 2.00
Securities portfolio at market value 351,785,926 91.28
Other Net Assets 33,614,483 8.72
Total Net Assets (EUR) 385,400,409 100.00
^ All or a portion of this security represents a security on loan.~ Investment in related party fund.
BlackRock Fixed Income Credit Strategies Fund continued
Portfolio of Investments as at 31 May 2021
The notes on pages 590 to 610 form an integral part of these financial statements.
Annual report and audited financial statements [319]

Holding Description Counterparty
Netunrealised
appreciation/(depreciation)
EUR
Financial Derivative Instruments
CONTRACTS FOR DIFFERENCEPortugal
(39,005) EDP - Energias de PortugalSA
Bank of AmericaMerrill Lynch (6,397)
(6,397)
Sweden(25,671) Volvo AB ’B’ Bank of America
Merrill Lynch 1,142
1,142
Total (Gross underlying exposure - EUR 739,211) (5,255)
BlackRock Fixed Income Credit Strategies Fund continued
Portfolio of Investments as at 31 May 2021
The notes on pages 590 to 610 form an integral part of these financial statements.
BlackRock Strategic Funds[320]

TypeNominal
Value Description CounterpartyExpiration
date
Net unrealisedappreciation/
(depreciation)EUR
MarketValue
EUR
Financial Derivative Instruments
SWAPS
CCCDS USD 9,000,000Fund receives Fixed 1.000% and provides default protection on
Markit iTraxx Asia HJ IG Series 24 Version 1 Credit Suisse 20/6/2026 20,841 51,985
CCCDS EUR 2,466,650Fund receives Fixed 5.000% and provides default protection on
Markit iTraxx Europe Crossover Series 30 Version 1 Credit Suisse 20/12/2025 36,793 303,510
CCILS EUR 585,734Fund receives Fixed 1.382% and pays Floating EUR 12 Month
CPTFE Credit Suisse 15/4/2031 (9,951) (9,939)
CCILS USD 478,500Fund receives Fixed 2.321% and pays Floating USD 12 Month
USCPI Credit Suisse 25/2/2031 (13,149) (13,141)
CCILS USD 414,000Fund receives Fixed 2.348% and pays Floating USD 12 Month
USCPI Credit Suisse 8/3/2031 (10,197) (10,190)
CCILS USD 442,062Fund receives Fixed 2.350% and pays Floating USD 12 Month
USCPI Credit Suisse 5/3/2031 (10,779) (10,771)
CCILS USD 442,063Fund receives Fixed 2.354% and pays Floating USD 12 Month
USCPI Credit Suisse 5/3/2031 (10,622) (10,614)
CCILS USD 884,125Fund receives Fixed 2.358% and pays Floating USD 12 Month
USCPI Credit Suisse 5/3/2031 (20,968) (20,953)
CCILS USD 830,000Fund receives Fixed 2.388% and pays Floating USD 12 Month
USCPI Credit Suisse 17/2/2031 (17,991) (17,977)
CCILS USD 205,000Fund receives Fixed 2.432% and pays Floating USD 12 Month
USCPI Credit Suisse 6/5/2051 (2,477) (2,471)
CCILS USD 205,000Fund receives Fixed 2.438% and pays Floating USD 12 Month
USCPI Credit Suisse 7/5/2051 (2,158) (2,152)
CCILS USD 390,000Fund receives Fixed 2.448% and pays Floating USD 12 Month
USCPI Credit Suisse 29/3/2031 (6,012) (6,006)
CCILS USD 190,000Fund receives Fixed 2.474% and pays Floating USD 12 Month
USCPI Credit Suisse 6/4/2031 (2,424) (2,420)
CCILS USD 205,000Fund receives Fixed 2.484% and pays Floating USD 12 Month
USCPI Credit Suisse 4/5/2051 631 637
CCILS USD 205,000Fund receives Fixed 2.488% and pays Floating USD 12 Month
USCPI Credit Suisse 4/5/2051 874 880
CCILS GBP 70,000Fund receives Fixed 3.202% and pays Floating GBP 12 Month
UKRPI Credit Suisse 15/3/2030 (3,307) (3,305)
CCILS GBP 87,500Fund receives Fixed 3.270% and pays Floating GBP 12 Month
UKRPI Credit Suisse 15/3/2030 (3,270) (3,267)
CCILS GBP 40,000Fund receives Fixed 3.285% and pays Floating GBP 12 Month
UKRPI Credit Suisse 15/3/2030 (1,407) (1,406)
CCILS GBP 87,500Fund receives Fixed 3.290% and pays Floating GBP 12 Month
UKRPI Credit Suisse 15/3/2030 (3,015) (3,012)
CCILS GBP 40,000Fund receives Fixed 3.293% and pays Floating GBP 12 Month
UKRPI Credit Suisse 15/3/2030 (1,361) (1,360)
CCILS GBP 450,000Fund receives Fixed 3.315% and pays Floating GBP 12 Month
UKRPI Credit Suisse 15/5/2030 (16,351) (16,340)
CCILS GBP 60,000Fund receives Fixed 3.340% and pays Floating GBP 12 Month
UKRPI Credit Suisse 15/3/2030 (1,628) (1,627)
CCILS GBP 470,000Fund receives Fixed 3.372% and pays Floating GBP 12 Month
UKRPI Credit Suisse 15/3/2030 (10,515) (10,504)
CCILS GBP 666,000Fund receives Fixed 3.500% and pays Floating GBP 12 Month
UKRPI Credit Suisse 15/9/2030 (13,195) (13,180)
CCILS GBP 860,000Fund receives Fixed 3.625% and pays Floating GBP 12 Month
UKRPI Credit Suisse 15/2/2031 (17,261) (17,241)
CCILS GBP 916,000Fund receives Fixed 3.650% and pays Floating GBP 12 Month
UKRPI Credit Suisse 15/4/2031 (15,396) (15,374)
CCILS GBP 620,000Fund receives Fixed 3.658% and pays Floating GBP 12 Month
UKRPI Credit Suisse 15/4/2031 (9,730) (9,715)
CCILS GBP 659,000Fund receives Fixed 3.730% and pays Floating GBP 12 Month
UKRPI Credit Suisse 15/5/2031 (2,923) (3,286)
CCILS GBP 164,084Fund receives Fixed 3.756% and pays Floating GBP 12 Month
UKRPI Credit Suisse 15/4/2031 (162) (158)
CCILS GBP 295,000Fund receives Fixed 3.7580% and pays Floating GBP 12 Month
UKRPI Credit Suisse 15/5/2031 (243) (236)
CCILS GBP 99,000Fund receives Fixed 3.7900% and pays Floating GBP 12 Month
UKRPI Credit Suisse 15/5/2031 393 396
BlackRock Fixed Income Credit Strategies Fund continued
Portfolio of Investments as at 31 May 2021
The notes on pages 590 to 610 form an integral part of these financial statements.
Annual report and audited financial statements [321]

TypeNominal
Value Description CounterpartyExpiration
date
Net unrealisedappreciation/
(depreciation)EUR
MarketValue
EUR
Financial Derivative Instruments
SWAPS
CCILS GBP 158,000Fund receives Fixed 3.7960% and pays Floating GBP 12 Month
UKRPI Credit Suisse 15/5/2031 770 774
CCILS GBP 666,000Fund receives Floating GBP 12 Month UKRPI and pays Fixed
3.410% Credit Suisse 15/9/2025 4,213 4,225
CCIRS EUR 200,000Fund receives Floating EUR 6 Month EURIBOR and pays Fixed
0.014% Credit Suisse 13/5/2034 7,606 7,610
CCIRS EUR 2,630,000Fund receives Floating EUR 6 Month EURIBOR and pays Fixed
0.214% Credit Suisse 15/8/2028 (55,697) (55,652)
CCIRS EUR 2,500,000Fund receives Floating EUR 6 Month EURIBOR and pays Fixed
0.246% Credit Suisse 18/6/2029 (52,539) (52,496)
CCIRS EUR 150,000Fund receives Floating EUR 6 Month EURIBOR and pays Fixed
0.473% Credit Suisse 29/4/2041 1,068 1,071
CCIRS EUR 421,194Fund receives Floating EUR 6 Month EURIBOR and pays Fixed
0.533% Credit Suisse 4/12/2049 (588) (576)
CCIRS EUR 8,800,000Fund receives Floating EUR 6 Month EURIBOR and pays Fixed
0.5750% Credit Suisse 24/5/2051 (133,253) (133,006)
CDS EUR 485,000Fund receives default protection on Peugeot SA and pays Fixed
5.000% BNP Paribas 20/6/2025 (40,592) (78,690)
CDS EUR 193,000Fund receives default protection on CNH Industrial NV and pays
Fixed 5.000% Goldman Sachs 20/6/2025 (10,251) (33,941)
CDS EUR 1,000,000Fund receives default protection on Barclays Plc and pays Fixed
1.000% JP Morgan 20/12/2025 (15,351) (21,597)
CDS EUR 1,000,000Fund receives default protection on Barclays Plc and pays Fixed
1.000% JP Morgan 20/12/2025 (14,836) (21,597)
CDS EUR 205,000Fund receives default protection on CNH Industrial Finance Europe
SA and pays Fixed 5.000% JP Morgan 20/6/2025 (10,888) (36,051)
CDS EUR 202,000Fund receives default protection on CNH Industrial NV and pays
Fixed 5.000% JP Morgan 20/6/2025 (11,323) (35,524)
CDS EUR 1,000,000Fund receives default protection on Lloyds Banking Group Plc and
pays Fixed 1.000% JP Morgan 20/12/2025 (15,724) (26,961)
CDS EUR 1,000,000Fund receives default protection on Lloyds Banking Group Plc and
pays Fixed 1.000% JP Morgan 20/12/2025 (15,211) (26,961)
CDS EUR 1,000,000Fund receives default protection on Royal Bank of Scotland Plc
and pays Fixed 1.000% JP Morgan 20/12/2025 (14,643) (22,985)
CDS EUR 1,000,000Fund receives default protection on Royal Bank of Scotland Plc
and pays Fixed 1.000% JP Morgan 20/12/2025 (14,129) (22,985)
IRS CNY 40,000,000Fund receives Fixed 2.716% and pays Floating CNY 12 Month
UKRPI CNRR BNP Paribas 26/8/2025 2,610 2,610
IRS EUR 899,168Fund receives Fixed -0.012% and pays Floating EUR 6 Month
LIBOR Credit Suisse 4/3/2031 (11,261) (11,246)
IRS EUR 7,200,000Fund receives Floating EUR 6 Month LIBOR and pays Fixed
0.000% Credit Suisse 23/6/2030 137,833 137,957
IRS EUR 200,000Fund receives Floating EUR 6 Month LIBOR and pays Fixed
-0.018% Credit Suisse 21/1/2061 36,865 36,871
IRS EUR 1,898,336Fund receives Floating EUR 6 Month LIBOR and pays Fixed
-0.336% Credit Suisse 4/3/2026 5,929 5,956
Total (Gross underlying exposure - EUR 59,522,783) (366,352) (232,431)
CCCDS: Centrally Cleared Credit Default SwapsCCILS: Centrally Cleared Inflation Linked SwapsCCIRS: Centrally Cleared Interest Rate SwapsCDS: Credit Default SwapsIRS: Interest Rate Swaps
BlackRock Fixed Income Credit Strategies Fund continued
Portfolio of Investments as at 31 May 2021
The notes on pages 590 to 610 form an integral part of these financial statements.
BlackRock Strategic Funds[322]

Numberof
contractsCurrencyof contracts
Contract/Description
Expirationdate
Grossunderlying
exposureEUR
Net unrealisedappreciation/
(depreciation)EUR
Financial Derivative Instruments
FUTURES
50 EUR 3 Month Euribor Futures December 2022 December 2022 12,556,875 1,206
781 EUR Enel SpA Futures December 2021 December 2021 281,160 22,118
(555) EUR Euro BOBL Futures June 2021 June 2021 74,747,400 150,158
(55) EUR Euro BTP Futures June 2021 June 2021 8,100,400 32,044
(391) EUR Euro Bund Futures June 2021 June 2021 66,395,710 332,658
24 EUR Euro BUXL 30 Year Bond Futures June 2021 June 2021 4,824,960 64,179
(64) EUR Euro-OAT Futures June 2021 June 2021 10,260,480 46,882
710 EUR Iberdrola SA Futures December 2021 December 2021 294,650 34,307
(4) JPY Japan 10 Year Bond Futures June 2021 June 2021 4,527,792 (981)
(82) GBP UK Long Gilt Bond Futures September 2021 September 2021 12,115,441 (5,899)
(5) USD US Long Bond Futures September 2021 September 2021 640,159 2,784
(97) USD US Treasury 10 Year Note Futures September 2021 September 2021 11,503,791 27,277
(92) USD US Treasury 10 Year Note Futures September 2021 September 2021 9,936,695 24,279
(2) USD US Treasury 2 Year Note Futures September 2021 September 2021 361,728 10
(65) USD US Ultra Bond Futures September 2021 September 2021 9,840,006 39,549
Total 226,387,247 770,571
Numberof
contractsCall/Put Description Counterparty Strike Price
Expirationdate
Netunrealised
(depreciation)EUR
MarketValue
EUR
Financial Derivative Instruments
PURCHASED OPTIONS
3,210,000 Call OTC USD/CAD Bank of America Merrill Lynch USD 1.28 23/06/2021 (21,183) 179
905,000 Call OTC EUR/GBP BNP Paribas EUR 0.89 06/08/2021 (11,972) 1,413
Total (Gross underlying exposure - EUR 4,182) (33,155) 1,592
NominalValue
Call/Put Description Counterparty Strike Price
Expirationdate
Netunrealised
appreciation/(depreciation)
EUR
MarketValue
EUR
Financial Derivative Instruments
WRITTEN SWAPTIONS
(749,313) Put
Fund writes an option to enter into an InterestRate Swap. If exercised Fund receives-0.11% Fixed annually from 14/1/2022; andpays Floating EUR Interbank Offer Rate6 Month semi-annually from 18/7/2022 Barclays Bank EUR 0.11 14/01/2022 (16,025) (27,246)
(749,313) Call
Fund writes an option to enter into an InterestRate Swap. If exercised Fund receivesFloating EUR Interbank Offer Rate6 Month semi-annually from 18/7/2022;and pays -0.11% Fixed annually from14/1/2022 Barclays Bank EUR 0.11 14/01/2022 8,705 (2,516)
(1,400,000) Call
Fund writes an option to enter into an InterestRate Swap. If exercised Fund receivesFloating USD LIBOR 3 Month BBAquarterly from 28/10/2021; and pays0.92% Fixed semi-annually from 26/7/2021 BNP Paribas USD 0.92 26/07/2021 7,595 (173)
(1,440,000) Call
Fund writes an option to enter into an InterestRate Swap. If exercised Fund receivesFloating USD LIBOR 3 Month BBAquarterly from 10/12/2021; and pays1.125% Fixed semi-annually from 8/9/2021 JP Morgan USD 1.12 08/09/2021 (180) (12,637)
BlackRock Fixed Income Credit Strategies Fund continued
Portfolio of Investments as at 31 May 2021
The notes on pages 590 to 610 form an integral part of these financial statements.
Annual report and audited financial statements [323]

NominalValue
Call/Put Description Counterparty Strike Price
Expirationdate
Netunrealised
appreciation/(depreciation)
EUR
MarketValue
EUR
Financial Derivative Instruments
WRITTEN SWAPTIONS
(1,440,000) Put
Fund writes an option to enter into an InterestRate Swap. If exercised Fund receives1.125% Fixed semi-annually from8/9/2021; and pays Floating USD LIBOR3 Month BBA quarterly from 10/12/2021 JP Morgan USD 1.13 08/09/2021 8,057 (4,400)
(2,195,000) Call
Fund writes an option to enter into an InterestRate Swap. If exercised Fund receivesFloating USD LIBOR 3 Month BBAquarterly from 28/7/2023; and pays 2%Fixed semi-annually from 26/4/2023 Barclays Bank USD 0.02 26/04/2023 4,054 (68,528)
(2,195,000) Put
Fund writes an option to enter into an InterestRate Swap. If exercised Fund receives 2%Fixed semi-annually from 26/4/2023; andpays Floating USD LIBOR 3 Month BBAquarterly from 28/7/2023 Barclays Bank USD 0.02 26/04/2023 2,202 (69,678)
(8,700,000) Put
Fund writes an option to enter into an InterestRate Swap. If exercised Fund receives0.45% Fixed annually from 19/5/2022; andpays Floating EUR Interbank Offer Rate6 Month semi-annually from 23/11/2022 Citibank EUR 0.00 19/05/2022 5,701 (18,920)
Total (Gross underlying exposure - EUR 4,938,780) 20,109 (204,098)
Currency Purchases Currency Sales CounterpartyMaturity
date
Netunrealised
appreciation/(depreciation)
EUR
Financial Derivative Instruments
OPEN FORWARD FOREIGN EXCHANGE TRANSACTIONS
EUR 236,703 AUD 370,000 HSBC 15/7/2021 2,204
EUR 3,919,879 DKK 29,160,000Toronto Dominion
Bank 15/7/2021 (682)EUR 13,037,722 GBP 11,310,000 Goldman Sachs 15/7/2021 (84,010)EUR 127,266 GBP 110,000 HSBC 15/7/2021 (355)EUR 276,756 GBP 240,000 Morgan Stanley 15/7/2021 (1,689)
EUR 312,930 GBP 270,000Royal Bank of
Canada 15/7/2021 (321)EUR 3,751,659 GBP 3,240,000 Societe Generale 15/7/2021 (7,352)
EUR 470,999 GBP 410,000Standard
Chartered Bank 15/7/2021 (4,679)EUR 1,232,858 GBP 1,060,000 Westpac 15/7/2021 3,058EUR 537,803 NOK 5,500,000 JP Morgan 16/6/2021 (2,092)EUR 1,735,595 NOK 17,580,000 Barclays Bank 15/7/2021 10,774
EUR 743,435 NZD 1,260,000Bank of America
Merrill Lynch 15/7/2021 (6,296)
EUR 205,744 SEK 2,100,000Bank of America
Merrill Lynch 15/7/2021 (1,676)EUR 1,090,000 USD 1,317,848 Goldman Sachs 16/6/2021 10,441EUR 14,492,781 USD 17,300,000 Morgan Stanley 15/7/2021 328,853
EUR 24,835 USD 30,000Standard
Chartered Bank 15/7/2021 273EUR 149,466 USD 180,000 Westpac 15/7/2021 2,097NOK 12,850,000 EUR 1,266,540 HSBC 16/6/2021 (5,147)
NOK 4,300,000 EUR 425,381Bank of America
Merrill Lynch 15/7/2021 (3,496)NOK 4,100,000 EUR 408,124 Morgan Stanley 15/7/2021 (5,862)USD 1,331,882 EUR 1,090,000 BNP Paribas 16/6/2021 1,055
USD 4,700,000 EUR 3,898,680State Street Bank& Trust Company 15/7/2021 (50,677)
Total (Gross underlying exposure - EUR 49,122,483) 184,421
Sector Breakdownas at 31 May 2021
% of NetAssets
Financial 33.91
Utilities 16.21
Consumer, Non-cyclical 10.34
Industrial 6.40
Communications 6.00
Government 3.76
Consumer, Cyclical 3.36
Technology 2.93
Basic Materials 2.91
Collective Investment Schemes 2.00
Energy 1.78
Exchange Traded Funds 1.54
Asset Backed Securities 0.14
Securities portfolio at market value 91.28
Other Net Assets 8.72
100.00
BlackRock Fixed Income Credit Strategies Fund continued
Portfolio of Investments as at 31 May 2021
The notes on pages 590 to 610 form an integral part of these financial statements.
BlackRock Strategic Funds[324]
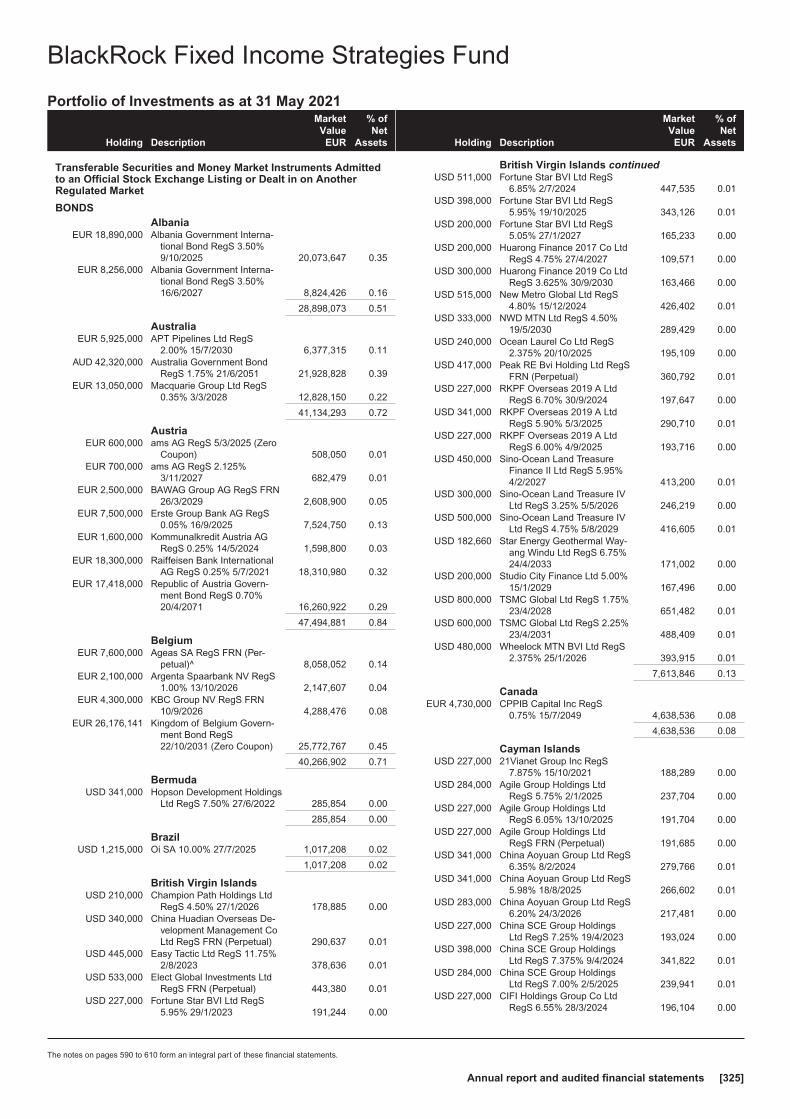
Holding Description
MarketValue
EUR
% ofNet
Assets
Transferable Securities and Money Market Instruments Admittedto an Official Stock Exchange Listing or Dealt in on AnotherRegulated Market
BONDSAlbania
EUR 18,890,000 Albania Government Interna-tional Bond RegS 3.50%9/10/2025 20,073,647 0.35
EUR 8,256,000 Albania Government Interna-tional Bond RegS 3.50%16/6/2027 8,824,426 0.16
28,898,073 0.51
AustraliaEUR 5,925,000 APT Pipelines Ltd RegS
2.00% 15/7/2030 6,377,315 0.11AUD 42,320,000 Australia Government Bond
RegS 1.75% 21/6/2051 21,928,828 0.39EUR 13,050,000 Macquarie Group Ltd RegS
0.35% 3/3/2028 12,828,150 0.22
41,134,293 0.72
AustriaEUR 600,000 ams AG RegS 5/3/2025 (Zero
Coupon) 508,050 0.01EUR 700,000 ams AG RegS 2.125%
3/11/2027 682,479 0.01EUR 2,500,000 BAWAG Group AG RegS FRN
26/3/2029 2,608,900 0.05EUR 7,500,000 Erste Group Bank AG RegS
0.05% 16/9/2025 7,524,750 0.13EUR 1,600,000 Kommunalkredit Austria AG
RegS 0.25% 14/5/2024 1,598,800 0.03EUR 18,300,000 Raiffeisen Bank International
AG RegS 0.25% 5/7/2021 18,310,980 0.32EUR 17,418,000 Republic of Austria Govern-
ment Bond RegS 0.70%20/4/2071 16,260,922 0.29
47,494,881 0.84
BelgiumEUR 7,600,000 Ageas SA RegS FRN (Per-
petual)^ 8,058,052 0.14EUR 2,100,000 Argenta Spaarbank NV RegS
1.00% 13/10/2026 2,147,607 0.04EUR 4,300,000 KBC Group NV RegS FRN
10/9/2026 4,288,476 0.08EUR 26,176,141 Kingdom of Belgium Govern-
ment Bond RegS22/10/2031 (Zero Coupon) 25,772,767 0.45
40,266,902 0.71
BermudaUSD 341,000 Hopson Development Holdings
Ltd RegS 7.50% 27/6/2022 285,854 0.00
285,854 0.00
BrazilUSD 1,215,000 Oi SA 10.00% 27/7/2025 1,017,208 0.02
1,017,208 0.02
British Virgin IslandsUSD 210,000 Champion Path Holdings Ltd
RegS 4.50% 27/1/2026 178,885 0.00USD 340,000 China Huadian Overseas De-
velopment Management CoLtd RegS FRN (Perpetual) 290,637 0.01
USD 445,000 Easy Tactic Ltd RegS 11.75%2/8/2023 378,636 0.01
USD 533,000 Elect Global Investments LtdRegS FRN (Perpetual) 443,380 0.01
USD 227,000 Fortune Star BVI Ltd RegS5.95% 29/1/2023 191,244 0.00
Holding Description
MarketValue
EUR
% ofNet
Assets
British Virgin Islands continuedUSD 511,000 Fortune Star BVI Ltd RegS
6.85% 2/7/2024 447,535 0.01USD 398,000 Fortune Star BVI Ltd RegS
5.95% 19/10/2025 343,126 0.01USD 200,000 Fortune Star BVI Ltd RegS
5.05% 27/1/2027 165,233 0.00USD 200,000 Huarong Finance 2017 Co Ltd
RegS 4.75% 27/4/2027 109,571 0.00USD 300,000 Huarong Finance 2019 Co Ltd
RegS 3.625% 30/9/2030 163,466 0.00USD 515,000 New Metro Global Ltd RegS
4.80% 15/12/2024 426,402 0.01USD 333,000 NWD MTN Ltd RegS 4.50%
19/5/2030 289,429 0.00USD 240,000 Ocean Laurel Co Ltd RegS
2.375% 20/10/2025 195,109 0.00USD 417,000 Peak RE Bvi Holding Ltd RegS
FRN (Perpetual) 360,792 0.01USD 227,000 RKPF Overseas 2019 A Ltd
RegS 6.70% 30/9/2024 197,647 0.00USD 341,000 RKPF Overseas 2019 A Ltd
RegS 5.90% 5/3/2025 290,710 0.01USD 227,000 RKPF Overseas 2019 A Ltd
RegS 6.00% 4/9/2025 193,716 0.00USD 450,000 Sino-Ocean Land Treasure
Finance II Ltd RegS 5.95%4/2/2027 413,200 0.01
USD 300,000 Sino-Ocean Land Treasure IVLtd RegS 3.25% 5/5/2026 246,219 0.00
USD 500,000 Sino-Ocean Land Treasure IVLtd RegS 4.75% 5/8/2029 416,605 0.01
USD 182,660 Star Energy Geothermal Way-ang Windu Ltd RegS 6.75%24/4/2033 171,002 0.00
USD 200,000 Studio City Finance Ltd 5.00%15/1/2029 167,496 0.00
USD 800,000 TSMC Global Ltd RegS 1.75%23/4/2028 651,482 0.01
USD 600,000 TSMC Global Ltd RegS 2.25%23/4/2031 488,409 0.01
USD 480,000 Wheelock MTN BVI Ltd RegS2.375% 25/1/2026 393,915 0.01
7,613,846 0.13
CanadaEUR 4,730,000 CPPIB Capital Inc RegS
0.75% 15/7/2049 4,638,536 0.08
4,638,536 0.08
Cayman IslandsUSD 227,000 21Vianet Group Inc RegS
7.875% 15/10/2021 188,289 0.00USD 284,000 Agile Group Holdings Ltd
RegS 5.75% 2/1/2025 237,704 0.00USD 227,000 Agile Group Holdings Ltd
RegS 6.05% 13/10/2025 191,704 0.00USD 227,000 Agile Group Holdings Ltd
RegS FRN (Perpetual) 191,685 0.00USD 341,000 China Aoyuan Group Ltd RegS
6.35% 8/2/2024 279,766 0.01USD 341,000 China Aoyuan Group Ltd RegS
5.98% 18/8/2025 266,602 0.01USD 283,000 China Aoyuan Group Ltd RegS
6.20% 24/3/2026 217,481 0.00USD 227,000 China SCE Group Holdings
Ltd RegS 7.25% 19/4/2023 193,024 0.00USD 398,000 China SCE Group Holdings
Ltd RegS 7.375% 9/4/2024 341,822 0.01USD 284,000 China SCE Group Holdings
Ltd RegS 7.00% 2/5/2025 239,941 0.01USD 227,000 CIFI Holdings Group Co Ltd
RegS 6.55% 28/3/2024 196,104 0.00
BlackRock Fixed Income Strategies Fund
Portfolio of Investments as at 31 May 2021
The notes on pages 590 to 610 form an integral part of these financial statements.
Annual report and audited financial statements [325]

Holding Description
MarketValue
EUR
% ofNet
Assets
Cayman Islands continuedUSD 227,000 CIFI Holdings Group Co Ltd
RegS 6.45% 7/11/2024 197,611 0.00USD 284,000 CIFI Holdings Group Co Ltd
RegS 6.00% 16/7/2025 246,066 0.01USD 341,000 CIFI Holdings Group Co Ltd
RegS 5.95% 20/10/2025 296,830 0.01USD 227,000 Country Garden Holdings Co
Ltd RegS 4.20% 6/2/2026 194,254 0.00USD 255,000 Country Garden Holdings Co
Ltd RegS 2.70% 12/7/2026 205,063 0.00USD 365,000 Country Garden Holdings Co
Ltd RegS 3.30% 12/1/2031 284,792 0.01USD 200,000 Fantasia Holdings Group Co
Ltd RegS 6.95% 17/12/2021 160,824 0.00USD 398,000 Fantasia Holdings Group Co
Ltd RegS 10.875% 9/1/2023 317,232 0.01USD 227,000 Fantasia Holdings Group Co
Ltd RegS 11.875% 1/6/2023 180,625 0.00USD 227,000 Fantasia Holdings Group Co
Ltd RegS 9.25% 28/7/2023 169,921 0.00USD 575,000 Haidilao International Holding
Ltd RegS 2.15% 14/1/2026 466,699 0.01USD 341,000 Kaisa Group Holdings Ltd
RegS 11.50% 30/1/2023 287,908 0.01USD 341,000 Kaisa Group Holdings Ltd
RegS 10.875% 23/7/2023 289,894 0.01USD 227,000 Kaisa Group Holdings Ltd
RegS 9.75% 28/9/2023 191,067 0.00USD 454,000 Kaisa Group Holdings Ltd
RegS 11.95% 12/11/2023 391,655 0.01USD 227,000 Kaisa Group Holdings Ltd
RegS 11.70% 11/11/2025 185,932 0.00USD 515,000 Logan Group Co Ltd RegS
4.85% 14/12/2026 425,461 0.01USD 227,000 Redsun Properties Group Ltd
RegS 10.50% 3/10/2022 194,957 0.00USD 341,000 Redsun Properties Group Ltd
RegS 9.70% 16/4/2023 291,286 0.01USD 227,000 Ronshine China Holdings Ltd
RegS 8.10% 9/6/2023 185,634 0.00USD 454,000 Ronshine China Holdings Ltd
RegS 7.35% 15/12/2023 361,801 0.01USD 4,670,000 Seagate HDD Cayman
4.091% 1/6/2029 3,860,229 0.07USD 977,000 Shimao Group Holdings Ltd
RegS 5.60% 15/7/2026 863,072 0.02USD 227,000 Shimao Group Holdings Ltd
RegS 3.45% 11/1/2031 175,828 0.00USD 284,000 Sunac China Holdings Ltd
RegS 7.95% 11/10/2023 245,409 0.01USD 284,000 Sunac China Holdings Ltd
RegS 7.50% 1/2/2024 244,963 0.01USD 335,000 Sunac China Holdings Ltd
RegS 6.65% 3/8/2024 285,365 0.01USD 200,000 Times China Holdings Ltd
RegS 6.75% 16/7/2023 169,423 0.00USD 400,000 Times China Holdings Ltd
RegS 6.75% 8/7/2025 339,515 0.01USD 390,000 Times China Holdings Ltd
RegS 6.20% 22/3/2026 320,283 0.01GBP 350,000 Trafford Centre Finance Ltd
RegS FRN 28/7/2035 345,239 0.01USD 200,000 Wynn Macau Ltd RegS
5.625% 26/8/2028 172,116 0.00USD 227,000 Yuzhou Group Holdings Co Ltd
RegS 8.50% 26/2/2024 180,832 0.00USD 227,000 Yuzhou Group Holdings Co Ltd
RegS 8.375% 30/10/2024 176,719 0.00
Holding Description
MarketValue
EUR
% ofNet
Assets
Cayman Islands continuedUSD 284,000 Yuzhou Group Holdings Co Ltd
RegS 7.70% 20/2/2025 213,642 0.00USD 284,000 Yuzhou Group Holdings Co Ltd
RegS 8.30% 27/5/2025 214,566 0.00USD 284,000 Yuzhou Group Holdings Co Ltd
RegS 7.375% 13/1/2026 201,781 0.00USD 227,000 Zhenro Properties Group Ltd
RegS 9.15% 6/5/2023 195,173 0.00USD 227,000 Zhenro Properties Group Ltd
RegS 8.30% 15/9/2023 192,621 0.00USD 227,000 Zhenro Properties Group Ltd
RegS 8.35% 10/3/2024 193,110 0.00USD 227,000 Zhenro Properties Group Ltd
RegS 7.875% 14/4/2024^ 190,043 0.00
16,849,563 0.30
ChinaEUR 15,425,000 China Development Bank
RegS 27/10/2023 (ZeroCoupon) 15,438,882 0.27
CNY 112,450,000 China Government Bond1.99% 9/4/2025 13,977,750 0.25
CNY 91,430,000 China Government Bond3.29% 23/5/2029 11,955,212 0.21
CNY 206,690,000 China Government Bond2.68% 21/5/2030 25,664,788 0.45
EUR 4,080,000 China Government Interna-tional Bond RegS 0.125%12/11/2026 4,092,240 0.07
EUR 3,214,000 China Government Interna-tional Bond RegS 0.50%12/11/2031 3,193,913 0.06
EUR 7,725,000 China Government Interna-tional Bond RegS 0.625%25/11/2035^ 7,560,226 0.13
USD 200,000 Guoren Property & CasualtyInsurance Co Ltd RegS3.35% 1/6/2026 164,572 0.00
USD 450,000 Wens Foodstuffs Group Co LtdRegS 2.349% 29/10/2025 336,840 0.01
USD 300,000 Wens Foodstuffs Group Co LtdRegS 3.258% 29/10/2030 194,961 0.00
USD 267,000 ZhongAn Online P&C Insur-ance Co Ltd RegS 3.125%16/7/2025 219,645 0.01
USD 517,000 ZhongAn Online P&C Insur-ance Co Ltd RegS 3.50%8/3/2026 428,812 0.01
83,227,841 1.47
ColombiaUSD 27,720,000 Colombia Government Interna-
tional Bond 3.25%22/4/2032 21,973,380 0.39
21,973,380 0.39
CyprusEUR 27,194,000 Cyprus Government Interna-
tional Bond RegS 3.75%26/7/2023 29,641,460 0.52
EUR 38,475,000 Cyprus Government Interna-tional Bond RegS 2.75%27/6/2024 42,031,629 0.74
EUR 82,750,000 Cyprus Government Interna-tional Bond RegS 0.625%3/12/2024 84,944,530 1.50
156,617,619 2.76
BlackRock Fixed Income Strategies Fund continued
Portfolio of Investments as at 31 May 2021
The notes on pages 590 to 610 form an integral part of these financial statements.
BlackRock Strategic Funds[326]

Holding Description
MarketValue
EUR
% ofNet
Assets
DenmarkDKK 440,377,393 Nordea Kredit Realkreditaktie-
selskab 0.50% 1/10/2050 54,332,914 0.96GBP 2,507,000 Orsted A/S RegS 2.50%
16/5/2033 3,133,021 0.05DKK 113,147,144 Realkredit Danmark A/S RegS
0.50% 1/10/2050 13,948,313 0.25
71,414,248 1.26
EgyptUSD 6,800,000 Egypt Government Interna-
tional Bond RegS 5.875%16/2/2031 5,493,585 0.10
USD 4,265,000 Egypt Government Interna-tional Bond RegS 7.50%16/2/2061 3,372,228 0.06
8,865,813 0.16
EstoniaEUR 5,700,000 Elering AS RegS 0.875%
3/5/2023 5,784,859 0.10
5,784,859 0.10
FinlandEUR 1,225,000 Finnair Oyj RegS 4.25%
19/5/2025 1,248,030 0.02
1,248,030 0.02
FranceEUR 1,465,000 Altice France SA RegS
5.875% 1/2/2027 1,560,870 0.03EUR 15,300,000 Banque Federative du Credit
Mutuel SA RegS 0.75%15/6/2023 15,631,857 0.28
USD 300,000 BNP Paribas SA FRN (Per-petual) 231,094 0.00
EUR 8,900,000 BNP Paribas SA RegS FRN15/7/2025 9,009,737 0.16
GBP 12,041,000 BNP Paribas SA RegS 3.375%23/1/2026 15,265,709 0.27
GBP 4,900,000 BNP Paribas SA RegS FRN24/5/2031 5,736,301 0.10
EUR 12,300,000 BNP Paribas SA RegS 0.625%3/12/2032^ 11,789,673 0.21
EUR 1,200,000 BPCE SA RegS 0.625%26/9/2023 1,225,704 0.02
EUR 4,200,000 BPCE SA RegS 0.125%4/12/2024 4,239,774 0.07
EUR 7,200,000 BPCE SFH SA RegS 0.125%3/12/2030 7,195,320 0.13
USD 400,000 Carrefour SA RegS14/6/2023 (Zero Coupon) 322,504 0.01
USD 800,000 Carrefour SA RegS27/3/2024 (Zero Coupon) 682,392 0.01
EUR 5,800,000 Cars Alliance Auto LoansFrance V ’2018-1 B’ RegSFRN 21/10/2029 5,796,520 0.10
EUR 1,731,000 Casino Guichard PerrachonSA FRN (Perpetual) 801,453 0.01
EUR 700,000 Casino Guichard PerrachonSA RegS FRN (Perpetual) 519,029 0.01
EUR 1,100,000 Cie de Saint-Gobain RegS0.875% 21/9/2023 1,127,412 0.02
EUR 3,600,000 Cie de Saint-Gobain RegS0.625% 15/3/2024 3,677,724 0.07
EUR 2,400,000 CMA CGM SA RegS 5.25%15/1/2025^ 2,463,576 0.04
EUR 1,700,000 Credit Mutuel Arkea SA RegS1.375% 17/1/2025 1,788,587 0.03
EUR 10,100,000 Credit Mutuel Arkea SA RegS0.875% 7/5/2027^ 10,468,347 0.18
GBP 20,100,000 Dexia Credit Local SA RegS0.25% 10/12/2026 22,721,410 0.40
Holding Description
MarketValue
EUR
% ofNet
Assets
France continuedEUR 9,100,000 Dexia Credit Local SA RegS
21/1/2028 (Zero Coupon) 9,113,013 0.16EUR 546,182 E-Carat SA ’B’ RegS FRN
20/12/2028 546,237 0.01EUR 136,546 E-Carat SA ’C’ RegS FRN
20/12/2028 136,463 0.00EUR 136,546 E-Carat SA ’D’ RegS FRN
20/12/2028 136,744 0.00EUR 204,818 E-Carat SA ’E’ RegS FRN
20/12/2028 205,127 0.00EUR 1,768,900 Electricite de France SA RegS
14/9/2024 (Zero Coupon) 268,944 0.00GBP 1,400,000 Electricite de France SA RegS
FRN (Perpetual) 1,823,847 0.03EUR 600,000 Electricite de France SA RegS
2.00% 9/12/2049 633,012 0.01GBP 300,000 Electricite de France SA RegS
FRN (Perpetual) 387,080 0.01GBP 150,000 Electricite de France SA RegS
5.125% 22/9/2050 262,359 0.00EUR 600,000 Electricite de France SA RegS
FRN (Perpetual) 618,108 0.01EUR 600,000 Electricite de France SA RegS
FRN (Perpetual) 624,828 0.01EUR 4,700,000 Engie SA RegS 4/3/2027 (Zero
Coupon) 4,662,635 0.08EUR 3,789,070 FCT Autonoria ’2019-1 B’
RegS FRN 25/9/2035 3,798,448 0.07EUR 280,672 FCT Autonoria ’2019-1 C’
RegS FRN 25/9/2035 281,804 0.01EUR 210,821 FCT Autonoria ’2019-1 D’
RegS FRN 25/9/2035 211,343 0.00EUR 280,250 FCT Autonoria ’2019-1 E’
RegS FRN 25/9/2035 282,830 0.01EUR 280,672 FCT Autonoria ’2019-1 F’
RegS FRN 25/9/2035 280,728 0.01EUR 986,264 FCT Noria ’2018-1 C’ RegS
FRN 25/6/2038 989,207 0.02EUR 460,325 FCT Noria ’2018-1 D’ RegS
FRN 25/6/2038 460,505 0.01EUR 493,132 FCT Noria ’2018-1 E’ RegS
FRN 25/6/2038 494,765 0.01EUR 1,117,765 FCT Noria ’2018-1B’ RegS
FRN 25/6/2038 1,120,003 0.02EUR 21,370,000 France Government Bond OAT
RegS 0.75% 25/5/2052 20,090,364 0.35EUR 400,000 Goldstory SASU RegS 5.375%
1/3/2026 408,352 0.01EUR 9,045,391 Harmony French Home Loans
FCT ’2020-2 A’ RegS FRN27/8/2061 9,177,661 0.16
EUR 4,500,000 Harmony French Home LoansFCT ’2020-2 B’ RegS FRN27/8/2061 4,573,507 0.08
EUR 826,500 Korian SA RegS 0.875%6/3/2027 470,692 0.01
EUR 943,000 La Financiere Atalian SASURegS 4.00% 15/5/2024^ 928,855 0.02
EUR 12,700,000 La Poste SA RegS 1.375%21/4/2032 13,649,325 0.24
EUR 2,825,000 PSA Banque France SA RegS0.50% 12/4/2022 2,843,956 0.05
EUR 4,500,000 Schneider Electric SE RegS12/6/2023 (Zero Coupon) 4,531,005 0.08
EUR 13,800,000 Societe Generale SA FRN24/11/2030 13,730,034 0.24
EUR 9,900,000 Societe Generale SA RegS0.75% 25/1/2027 9,968,508 0.18
EUR 11,500,000 Societe Generale SA RegS0.125% 18/2/2028 11,329,915 0.20
BlackRock Fixed Income Strategies Fund continued
Portfolio of Investments as at 31 May 2021
The notes on pages 590 to 610 form an integral part of these financial statements.
Annual report and audited financial statements [327]

Holding Description
MarketValue
EUR
% ofNet
Assets
France continuedEUR 3,500,000 Societe Generale SA RegS
FRN 22/9/2028 3,544,380 0.06USD 400,000 Societe Generale SA RegS
FRN (Perpetual) 333,597 0.01EUR 11,300,000 Suez SA RegS 9/6/2026 (Zero
Coupon) 11,250,732 0.20EUR 1,300,000 Suez SA RegS FRN (Per-
petual) 1,299,792 0.02EUR 8,100,000 Thales SA RegS
26/3/2026 (Zero Coupon)^ 8,067,276 0.14USD 1,400,000 TOTAL SE RegS 0.50%
2/12/2022 1,178,711 0.02EUR 295,000 TOTAL SE RegS FRN (Per-
petual) 306,428 0.01EUR 23,200,000 UNEDIC ASSEO RegS 0.10%
25/5/2034 22,228,616 0.39USD 200,000 Valeo SA RegS
16/6/2021 (Zero Coupon) 163,731 0.00EUR 4,100,000 Veolia Environnement SA
RegS 0.80% 15/1/2032^ 4,108,938 0.07EUR 20,900,000 Veolia Environnement SA
RegS FRN (Perpetual)^ 21,441,937 0.38EUR 7,400,000 Veolia Environnement SA
RegS FRN (Perpetual)^ 7,351,160 0.13
322,570,495 5.68
GermanyEUR 600,000 Bayer AG RegS FRN
12/11/2079 609,426 0.01EUR 500,000 Bayer AG RegS FRN
12/11/2079 518,535 0.01EUR 114,270,000 Bundesobligation RegS
8/4/2022 (Zero Coupon) 114,909,912 2.02EUR 137,422,737 Bundesobligation RegS
10/4/2026 (Zero Coupon)^ 141,200,488 2.49EUR 16,629,849 Bundesrepublik Deutschland
Bundesanleihe RegS15/8/2050 (Zero Coupon) 15,023,239 0.27
EUR 880,000 CeramTec BondCo GmbHRegS 5.25% 15/12/2025 895,339 0.02
GBP 9,000,000 Deutsche Bank AG RegS2.625% 16/12/2024 10,918,004 0.19
EUR 7,000,000 Deutsche Bank AG RegS FRN17/2/2032^ 6,977,740 0.12
EUR 29,800,000 FMS Wertmanagement RegS0.375% 29/4/2030 30,682,974 0.54
EUR 17,100,000 Fraport AG Frankfurt AirportServices Worldwide RegS1.875% 31/3/2028 17,693,541 0.31
EUR 6,400,000 KION Group AG RegS 1.625%24/9/2025 6,664,640 0.12
EUR 1,236,000 KME SE RegS 6.75%1/2/2023 928,545 0.02
EUR 11,200,000 Landesbank Baden-Wuerttemberg RegS 2.20%9/5/2029 11,773,104 0.21
EUR 8,700,000 Merck Financial ServicesGmbH RegS 0.005%15/12/2023 8,742,456 0.15
EUR 2,000,000 Nidda Healthcare HoldingGmbH RegS 3.50%30/9/2024 2,002,540 0.04
EUR 177,947 Red & Black Auto Germany6 UG ’C’ RegS FRN15/10/2028 178,751 0.00
EUR 177,947 Red & Black Auto Germany6 UG ’D’ RegS FRN15/10/2028 181,211 0.00
Holding Description
MarketValue
EUR
% ofNet
Assets
Germany continuedEUR 568,000 TK Elevator Midco GmbH
RegS 4.375% 15/7/2027 595,764 0.01EUR 200,000 TUI AG RegS 5.00%
16/4/2028 227,548 0.00EUR 12,000,000 Volkswagen Financial Services
AG RegS 1.375%16/10/2023 12,423,960 0.22
EUR 19,075,000 Volkswagen Leasing GmbHRegS 0.375% 20/7/2026 19,082,821 0.34
EUR 6,700,000 ZF Finance GmbH RegS2.75% 25/5/2027 6,935,773 0.12
409,166,311 7.21
GreeceEUR 10,225,000 Alpha Bank SA RegS 2.50%
5/2/2023 10,629,501 0.19EUR 48,950,000 Hellenic Republic Government
Bond RegS 12/2/2026 (ZeroCoupon) 48,710,145 0.86
EUR 6,212,000 Hellenic Republic GovernmentBond RegS 2.00%22/4/2027 6,853,700 0.12
EUR 10,212,000 Hellenic Republic GovernmentBond RegS 3.875%12/3/2029 12,749,273 0.22
EUR 13,959,000 Hellenic Republic GovernmentBond RegS 1.50%18/6/2030 14,901,791 0.26
EUR 14,845,000 Hellenic Republic GovernmentBond RegS 0.75%18/6/2031 14,741,085 0.26
EUR 14,345,000 Hellenic Republic GovernmentBond RegS 1.875%24/1/2052 14,670,631 0.26
123,256,126 2.17
Hong KongUSD 850,000 Bank of East Asia Ltd RegS
FRN 29/5/2030 730,258 0.01USD 284,000 Bank of East Asia Ltd RegS
FRN (Perpetual) 250,746 0.01USD 284,000 Bank of East Asia Ltd RegS
FRN (Perpetual) 248,346 0.01USD 583,000 CMB International Leasing
Management Ltd RegS2.75% 12/8/2030 463,662 0.01
USD 240,000 Far East Horizon Ltd RegS2.625% 3/3/2024 196,049 0.00
USD 420,000 GLP China Holdings Ltd RegS2.95% 29/3/2026 348,885 0.01
USD 700,000 Huaxin Cement InternationalFinance Co Ltd RegS 2.25%19/11/2025 570,135 0.01
USD 300,000 Lenovo Group Ltd RegS3.421% 2/11/2030 252,362 0.01
USD 333,000 Nanyang Commercial BankLtd RegS FRN 20/11/2029 283,566 0.01
USD 227,000 Nanyang Commercial BankLtd RegS FRN (Perpetual) 188,272 0.00
USD 227,000 Yango Justice International LtdRegS 10.00% 12/2/2023 193,956 0.00
USD 227,000 Yango Justice International LtdRegS 8.25% 25/11/2023 188,774 0.00
BlackRock Fixed Income Strategies Fund continued
Portfolio of Investments as at 31 May 2021
The notes on pages 590 to 610 form an integral part of these financial statements.
BlackRock Strategic Funds[328]

Holding Description
MarketValue
EUR
% ofNet
Assets
Hong Kong continuedUSD 284,000 Yango Justice International Ltd
RegS 7.50% 15/4/2024 234,209 0.00USD 200,000 Yanlord Land HK Co Ltd RegS
5.125% 20/5/2026 167,006 0.00
4,316,226 0.08
HungaryHUF 6,795,830,000 Hungary Government Bond
3.25% 22/10/2031^ 20,546,907 0.36EUR 4,442,000 Hungary Government Interna-
tional Bond RegS 1.75%5/6/2035 4,688,353 0.08
25,235,260 0.44
IcelandEUR 3,375,000 Iceland Government Interna-
tional Bond RegS 0.625%3/6/2026 3,477,094 0.06
EUR 3,275,000 Iceland Government Interna-tional Bond RegS15/4/2028 (Zero Coupon) 3,241,791 0.06
6,718,885 0.12
IndiaUSD 467,000 Adani Electricity Mumbai Ltd
RegS 3.949% 12/2/2030 389,607 0.01USD 227,000 Adani Green Energy UP Ltd /
Prayatna Developers Pvt Ltd/ Parampujya Solar EnergRegS 6.25% 10/12/2024 206,897 0.00
USD 333,000 Adani Transmission Ltd RegS4.00% 3/8/2026 292,707 0.01
USD 249,645 Adani Transmission Ltd RegS4.25% 21/5/2036 211,938 0.00
USD 365,000 Bharti Airtel Ltd RegS 3.25%3/6/2031 294,469 0.01
USD 284,000 GMR Hyderabad InternationalAirport Ltd RegS 5.375%10/4/2024 239,478 0.00
USD 227,000 HPCL-Mittal Energy Ltd RegS5.45% 22/10/2026 192,717 0.00
USD 284,000 Manappuram Finance LtdRegS 5.90% 13/1/2023 239,468 0.00
USD 500,000 Oil India Ltd RegS 5.125%4/2/2029 458,345 0.01
USD 600,000 Power Finance Corp Ltd RegS4.50% 18/6/2029 525,201 0.01
USD 600,000 Power Finance Corp Ltd RegS3.90% 16/9/2029 505,295 0.01
USD 275,000 REC Ltd RegS 2.25%1/9/2026 220,403 0.00
USD 250,000 REC Ltd RegS 3.875%7/7/2027 214,962 0.00
USD 284,000 ReNew Power Synthetic RegS6.67% 12/3/2024 245,204 0.01
USD 227,000 Shriram Transport Finance CoLtd RegS 5.95% 24/10/2022 190,376 0.00
USD 341,000 Shriram Transport Finance CoLtd RegS 5.10% 16/7/2023 282,001 0.01
4,709,068 0.08
IndonesiaUSD 200,000 Bank Mandiri Persero Tbk PT
RegS 2.00% 19/4/2026 163,430 0.00USD 227,000 Bank Tabungan Negara Per-
sero Tbk PT RegS 4.20%23/1/2025 190,208 0.01
Holding Description
MarketValue
EUR
% ofNet
Assets
Indonesia continuedIDR 64,458,000,000 Indonesia Treasury Bond
7.00% 15/9/2030 3,850,320 0.07USD 7,015,000 Pertamina Persero PT RegS
1.40% 9/2/2026 5,634,357 0.10USD 3,855,000 Pertamina Persero PT RegS
2.30% 9/2/2031^ 3,000,859 0.05
12,839,174 0.23
IrelandEUR 12,225,000 Abbott Ireland Financing DAC
RegS 0.10% 19/11/2024 12,309,890 0.22EUR 500,000 AIB Group Plc RegS FRN
(Perpetual) 566,410 0.01EUR 150,000 Anchorage Capital Europe
CLO 2021-4 DAC ’E’ RegSFRN 25/4/2034 148,399 0.00
EUR 100,000 Avoca CLO XIV DAC ’14X ER’RegS FRN 12/1/2031 99,403 0.00
EUR 100,000 Avoca CLO XIV DAC ’14X FR’RegS FRN 12/1/2031 96,676 0.00
EUR 275,000 Avoca CLO XIV DAC ’14XSUB’ RegS FRN 12/1/2031 203,980 0.00
EUR 500,000 Avoca CLO XV DAC ’15X FR’RegS FRN 15/4/2031 474,100 0.01
GBP 8,540,000 BAMS CMBS 2018-1 DAC ’A’RegS FRN 17/5/2028 9,945,255 0.18
GBP 2,985,000 BAMS CMBS 2018-1 DAC ’B’RegS FRN 17/5/2028 3,466,481 0.06
GBP 1,775,000 BAMS CMBS 2018-1 DAC ’C’RegS FRN 17/5/2028 2,068,434 0.04
USD 1,600,000 Bank of Ireland Group PlcRegS FRN 19/9/2027 1,343,939 0.02
EUR 150,000 BBAM European CLO I DAC’1X ER’ RegS FRN22/7/2034 148,500 0.00
EUR 150,000 BlueMountain EUR CLO DAC’2021-1X E’ RegS FRN15/4/2034 149,829 0.00
SEK 65,580,000 Bluestep Mortgage SecuritiesNo 4 DAC ’B’ RegS FRN10/8/2066 6,483,673 0.11
EUR 150,000 Capital Four CLO II DAC ’E’RegS FRN 15/1/2034 148,331 0.00
EUR 150,000 CIFC European Funding CLOIII DAC ’E’ RegS FRN15/1/2034 145,599 0.00
EUR 4,400,000 CRH SMW Finance DACRegS 1.25% 5/11/2026^ 4,652,648 0.08
EUR 150,000 CVC Cordatus Loan Fund XXDAC ’20X E’ RegS FRN22/6/2034 148,500 0.00
EUR 10,550,000 Eaton Capital Unlimited CoRegS 0.128% 8/3/2026 10,549,684 0.19
EUR 150,000 Henley CLO IV DAC ’E’ RegSFRN 25/4/2034 145,310 0.00
EUR 265,498 Invesco Euro Clo III DAC ’F’RegS FRN 15/7/2032 266,153 0.01
EUR 150,000 Invesco Euro CLO V DAC ’E’RegS FRN 15/1/2034 150,426 0.00
EUR 7,389,000 Last Mile Securities PE’2021-X1 A1’ DAC RegSFRN 17/8/2031 7,401,315 0.13
EUR 1,988,000 Last Mile Securities PE’2021-X1 A2’ DAC RegSFRN 17/8/2031 1,990,485 0.04
BlackRock Fixed Income Strategies Fund continued
Portfolio of Investments as at 31 May 2021
The notes on pages 590 to 610 form an integral part of these financial statements.
Annual report and audited financial statements [329]

Holding Description
MarketValue
EUR
% ofNet
Assets
Ireland continuedEUR 939,000 Last Mile Securities PE
’2021-X1 B’ DAC RegS FRN17/8/2031 941,629 0.02
EUR 1,061,000 Last Mile Securities PE’2021-X1 C’ DAC RegS FRN17/8/2031 1,063,440 0.02
EUR 6,600,000 LT Autorahoitus DAC ’A’ RegSFRN 18/4/2030 6,647,663 0.12
EUR 150,000 Marino Park CLO DAC ’D’RegS FRN 16/1/2034 148,065 0.00
EUR 150,000 Neuberger Berman Loan Ad-visers Euro CLO ’2021-1X E’RegS FRN 17/4/2034 147,608 0.00
EUR 150,000 Northwoods Capital 23 EuroDAC ’2021-23X E’ RegSFRN 15/3/2034 148,579 0.00
EUR 150,000 OCP Euro CLO DAC ’2019-3XER’ RegS FRN 20/4/2033 149,428 0.00
EUR 10,845,000 Pearl Finance 2020 DAC ’A1’RegS FRN 17/11/2032 10,896,405 0.19
EUR 1,195,000 Pearl Finance 2020 DAC ’A2’RegS FRN 17/11/2032 1,197,988 0.02
EUR 1,435,000 Pearl Finance 2020 DAC ’B’RegS FRN 17/11/2032 1,438,588 0.03
EUR 150,000 Providus CLO V DAC ’E’ RegSFRN 15/2/2035 147,316 0.00
EUR 4,335,125 River Green Finance’2020-1 A’ DAC RegS FRN22/1/2032 4,343,795 0.08
EUR 548,063 River Green Finance’2020-1 B’ DAC RegS FRN22/1/2032 545,825 0.01
EUR 325,875 River Green Finance’2020-1 C’ DAC RegS FRN22/1/2032 324,568 0.01
EUR 150,000 Rockford Tower Europe CLODAC ’2021-1X E’ RegS FRN20/4/2034 149,513 0.00
EUR 1,600,000 SCF Rahoituspalvelut IX DAC’B’ RegS FRN 25/10/2030 1,596,885 0.03
EUR 166,667 Sound Point Euro CLO II Fund-ing DAC ’X’ RegS FRN26/10/2032 166,687 0.00
EUR 150,000 Sound Point Euro CLO VFunding DAC ’E’ RegS FRN25/7/2035 148,659 0.00
EUR 343,082 Taurus ’2019-1 FR B’ DACRegS FRN 2/2/2031 344,052 0.01
EUR 319,990 Taurus ’2019-1 FR C’ DACRegS FRN 2/2/2031 321,161 0.01
EUR 1,197,059 Taurus ’2019-1 FR’ DAC RegSFRN 2/2/2031 1,200,889 0.02
GBP 3,484,208 Taurus ’2019-2 B’ UK DACRegS FRN 17/11/2029 4,058,449 0.07
GBP 2,178,253 Taurus ’2019-2 C’ UK DACRegS FRN 17/11/2029 2,533,561 0.04
GBP 9,829,554 Taurus 2019-2 UK DAC ’A’RegS FRN 17/11/2029 11,512,107 0.20
GBP 4,642,596 Taurus ’2020-2 A’ UK DACRegS FRN 17/8/2030 5,425,182 0.10
GBP 2,690,000 Taurus ’2021-1 UK1X A’ DACRegS FRN 17/5/2031 3,132,823 0.06
GBP 886,000 Taurus ’2021-1 UK1X B’ DACRegS FRN 17/5/2031 1,029,728 0.02
GBP 540,000 Taurus ’2021-1 UK1X C’ DACRegS FRN 17/5/2031 627,932 0.01
GBP 551,000 Taurus ’2021-1 UK1X D’ DACRegS FRN 17/5/2031 642,502 0.01
Holding Description
MarketValue
EUR
% ofNet
Assets
Ireland continuedGBP 700,000 Virgin Media Vendor Financing
Notes III DAC RegS 4.875%15/7/2028 831,053 0.02
EUR 5,500,000 Zurich Finance Ireland Desig-nated Activity Co RegS FRN17/9/2050 5,741,285 0.10
130,706,785 2.30
ItalyEUR 650,000 Asset-Backed European Secu-
ritisation Transaction Seven-teen Srl ’B’ RegS FRN15/4/2032 652,128 0.01
EUR 320,000 Asset-Backed European Secu-ritisation Transaction Seven-teen Srl ’C’ RegS FRN15/4/2032 319,645 0.01
EUR 300,000 Asset-Backed European Secu-ritisation Transaction Seven-teen Srl ’D’ RegS FRN15/4/2032 301,616 0.01
EUR 100,000 Asset-Backed European Secu-ritisation Transaction Seven-teen Srl ’E’ RegS FRN15/4/2032 100,964 0.00
EUR 2,500,000 ASTM SpA RegS 1.625%8/2/2028 2,577,300 0.05
EUR 6,252,681 AutoFlorence 1 Srl ’A’ RegSFRN 25/12/2042 6,290,283 0.11
EUR 947,165 AutoFlorence 1 Srl ’B’ RegSFRN 25/12/2042 951,560 0.02
EUR 903,000 Autostrade per l’Italia SpARegS 2.00% 4/12/2028 934,813 0.02
EUR 900,000 Autostrade per l’Italia SpARegS 1.875% 26/9/2029 925,929 0.02
EUR 500,000 Autostrade per l’Italia SpARegS 2.00% 15/1/2030 512,250 0.01
EUR 100,000 Banca Monte dei Paschi diSiena SpA RegS 3.625%24/9/2024 105,976 0.00
EUR 200,000 Banca Monte dei Paschi diSiena SpA RegS 2.625%28/4/2025 206,248 0.00
EUR 2,967,068 Brignole Co ’2019 1 A’ RegSFRN 24/7/2034 2,968,939 0.05
EUR 330,000 Brignole Co ’2019 1 B’ RegSFRN 24/7/2034 330,500 0.01
EUR 225,000 Brignole Co ’2019 1 C’ RegSFRN 24/7/2034 225,536 0.00
EUR 17,955,000 Buzzi Unicem SpA RegS2.125% 28/4/2023 18,647,345 0.33
USD 3,185,000 Intesa Sanpaolo SpA 4.198%1/6/2032 2,648,145 0.05
USD 3,200,000 Intesa Sanpaolo SpA 4.95%1/6/2042 2,653,738 0.05
EUR 3,290,000 Intesa Sanpaolo SpA RegS0.875% 27/6/2022 3,328,559 0.06
EUR 5,050,000 Intesa Sanpaolo SpA RegS0.75% 4/12/2024 5,170,493 0.09
EUR 10,125,000 Intesa Sanpaolo SpA RegS1.35% 24/2/2031 9,913,084 0.17
EUR 250,000 Intesa Sanpaolo SpA RegSFRN (Perpetual) 271,160 0.01
EUR 450,000 Intesa Sanpaolo SpA RegSFRN (Perpetual) 502,735 0.01
EUR 228,970,000 Italy Buoni Poliennali Del Te-soro RegS 0.95% 1/3/2023 234,110,376 4.12
BlackRock Fixed Income Strategies Fund continued
Portfolio of Investments as at 31 May 2021
The notes on pages 590 to 610 form an integral part of these financial statements.
BlackRock Strategic Funds[330]

Holding Description
MarketValue
EUR
% ofNet
Assets
Italy continuedEUR 86,804,000 Italy Buoni Poliennali Del Te-
soro RegS 15/4/2024 (ZeroCoupon) 87,204,166 1.54
EUR 147,478,000 Italy Buoni Poliennali Del Te-soro RegS 0.50% 1/2/2026^ 150,067,714 2.64
EUR 41,326,383 Italy Buoni Poliennali Del Te-soro RegS 1.30% 15/5/2028 47,281,928 0.83
EUR 6,160,000 Italy Buoni Poliennali Del Te-soro RegS 1.50% 30/4/2045 5,910,150 0.10
EUR 14,690,000 Italy Buoni Poliennali Del Te-soro RegS 2.45% 1/9/2050 16,623,351 0.29
EUR 800,000 Nexi SpA RegS24/2/2028 (Zero Coupon) 775,520 0.01
EUR 3,937,880 Progetto Quinto SRL ’A’ RegSFRN 27/10/2036 3,952,836 0.07
EUR 550,000 Sisal Group SpA RegS 7.00%31/7/2023 558,833 0.01
EUR 19,381,000 Snam SpA RegS 0.75%17/6/2030^ 19,600,393 0.35
EUR 2,599,415 Sunrise SPV 40 Srl ’2018-1 A’RegS FRN 27/7/2042 2,601,505 0.05
EUR 1,768,929 Sunrise SPV Z70 Srl’2019-1 A’ RegS FRN27/5/2044 1,774,221 0.03
EUR 197,319 Taurus ’2018-IT1 A’ SRL FRN18/5/2030 196,582 0.00
EUR 9,788,000 Terna Rete Elettrica NazionaleSpA RegS 0.75%24/7/2032^ 9,710,185 0.17
EUR 10,100,000 UniCredit SpA RegS 6.95%31/10/2022 11,055,056 0.19
EUR 14,150,000 UniCredit SpA RegS FRN25/6/2025 14,560,491 0.26
EUR 5,775,000 UniCredit SpA RegS FRN3/1/2027 5,922,262 0.10
EUR 5,570,000 UniCredit SpA RegS 1.80%20/1/2030^ 5,723,342 0.10
EUR 1,144,000 UniCredit SpA RegS FRN(Perpetual) 1,074,079 0.02
679,241,936 11.97
JapanUSD 700,000 Asahi Mutual Life Insurance
Co RegS FRN (Perpetual) 617,060 0.01JPY 1,392,000,000 Japan Government Thirty Year
Bond 0.60% 20/9/2050 10,237,392 0.18USD 250,000 Nippon Life Insurance Co
RegS FRN 21/1/2051 198,763 0.00USD 5,600,000 Nissan Motor Co Ltd 4.81%
17/9/2030^ 5,080,153 0.09EUR 1,583,000 Rakuten Group Inc RegS FRN
(Perpetual) 1,623,303 0.03USD 200,000 SoftBank Group Corp RegS
4.75% 19/9/2024 175,372 0.00EUR 529,000 SoftBank Group Corp RegS
5.00% 15/4/2028 603,203 0.01EUR 2,039,000 SoftBank Group Corp RegS
4.00% 19/9/2029^ 2,198,557 0.04USD 1,700,000 SoftBank Group Corp RegS
FRN (Perpetual) 1,423,282 0.03EUR 10,950,000 Takeda Pharmaceutical Co Ltd
2.00% 9/7/2040 11,473,957 0.20
33,631,042 0.59
JerseyGBP 600,000 Derwent London Capital No
3 Jersey Ltd RegS 1.50%12/6/2025 716,804 0.01
GBP 1,000,000 Galaxy Finco Ltd RegS 9.25%31/7/2027 1,232,943 0.02
USD 600,000 Galaxy Pipeline Assets BidcoLtd RegS 2.16% 31/3/2034 486,603 0.01
Holding Description
MarketValue
EUR
% ofNet
Assets
Jersey continuedUSD 742,000 Galaxy Pipeline Assets Bidco
Ltd RegS 2.625% 31/3/2036 597,777 0.01USD 675,000 Galaxy Pipeline Assets Bidco
Ltd RegS 2.94% 30/9/2040 548,672 0.01GBP 600,000 Heathrow Funding Ltd RegS
2.75% 13/10/2029 721,151 0.01GBP 900,000 Intu Jersey 2 Ltd RegS FRN
1/11/2022 205,266 0.01
4,509,216 0.08
KuwaitUSD 425,000 Burgan Bank SAK RegS FRN
15/12/2031 332,293 0.01
332,293 0.01
LuxembourgEUR 1,000,000 ADLER Group SA RegS
2.75% 13/11/2026 1,018,230 0.02EUR 1,700,000 Altice Financing SA RegS
3.00% 15/1/2028 1,637,219 0.03EUR 9,000,000 Bank of China Luxembourg
SA RegS 0.125% 16/1/2023 9,028,170 0.16EUR 5,668,000 Becton Dickinson Euro Fi-
nance Sarl 0.632% 4/6/2023 5,748,259 0.10EUR 8,121,000 BL Consumer Credit’
2021-1 A’ RegS FRN25/9/2038 8,251,394 0.15
EUR 528,000 BL Consumer Credit’2021-1 C’ RegS FRN25/9/2038 528,328 0.01
EUR 681,000 BL Consumer Credit’2021-1 D’ RegS FRN25/9/2038 684,201 0.01
EUR 355,000 BL Consumer Credit’2021-1 E’ RegS FRN25/9/2038 355,517 0.01
USD 200,000 Cirsa Finance InternationalSarl 7.875% 20/12/2023 167,361 0.00
EUR 691,000 Cirsa Finance InternationalSarl RegS 6.25%20/12/2023 703,086 0.01
EUR 341,000 Codere Finance 2 LuxembourgSA RegS 10.75% 30/9/2023 362,198 0.01
EUR 1,200,000 European TopSoho Sarl RegS4.00% 21/9/2021 1,042,356 0.02
EUR 2,716,473 FACT SA Compartment’2018-1 A’ RegS FRN20/11/2025 2,726,778 0.05
EUR 2,520,000 Garfunkelux Holdco 3 SARegS 6.75% 1/11/2025 2,626,067 0.05
GBP 379,000 Garfunkelux Holdco 3 SARegS 7.75% 1/11/2025 459,307 0.01
EUR 671,000 Herens Midco Sarl RegS5.25% 15/5/2029 661,975 0.01
EUR 1,100,000 Kleopatra Holdings 2 SCARegS 6.50% 1/9/2026^ 1,062,292 0.02
EUR 245,000 Matterhorn Telecom SA RegS4.00% 15/11/2027 252,306 0.00
EUR 10,675,000 Medtronic Global HoldingsSCA 2/12/2022 (Zero Cou-pon) 10,735,954 0.19
EUR 5,100,000 Medtronic Global HoldingsSCA 0.25% 2/7/2025 5,157,120 0.09
EUR 730,000 Medtronic Global HoldingsSCA 1.125% 7/3/2027 767,434 0.01
EUR 300,000 Monitchem HoldCo 3 SA RegS5.25% 15/3/2025 309,255 0.01
EUR 1,600,000 Motion Finco Sarl RegS 7.00%15/5/2025 1,690,256 0.03
EUR 9,600,000 Novartis Finance SA RegS23/9/2028 (Zero Coupon) 9,442,560 0.17
BlackRock Fixed Income Strategies Fund continued
Portfolio of Investments as at 31 May 2021
The notes on pages 590 to 610 form an integral part of these financial statements.
Annual report and audited financial statements [331]

Holding Description
MarketValue
EUR
% ofNet
Assets
Luxembourg continuedEUR 6,500,000 SC Germany SA Compart-
ment Consumer ’2020-1 A’RegS FRN 14/11/2034 6,580,857 0.12
EUR 5,500,000 SC Germany SA Compart-ment Consumer ’2020-1 B’RegS FRN 14/11/2034 5,542,799 0.10
EUR 2,500,000 SC Germany SA Compart-ment Consumer ’2020-1 C’RegS FRN 14/11/2034 2,524,150 0.04
EUR 1,400,000 SC Germany SA Compart-ment Consumer ’2020-1 D’RegS FRN 14/11/2034 1,414,021 0.02
EUR 7,767,000 SES SA RegS FRN (Per-petual) 7,805,835 0.14
EUR 3,100,000 Silver Arrow S.A. Compart-ment 10 ’B’ RegS FRN15/3/2027 3,101,389 0.05
EUR 300,000 Silver Arrow S.A. Compart-ment 10 ’D’ RegS FRN15/3/2027 302,716 0.01
EUR 300,000 Silver Arrow S.A. Compart-ment 10 RegS FRN15/3/2027 299,782 0.00
EUR 450,526 Summer BC Holdco A SarlRegS 9.25% 31/10/2027 480,378 0.01
EUR 1,600,000 Summer BC Holdco B SarlRegS 5.75% 31/10/2026 1,671,840 0.03
USD 300,000 Telecom Italia Capital SA6.375% 15/11/2033 284,865 0.00
EUR 520,000 Telecom Italia Finance SA7.75% 24/1/2033 761,914 0.01
EUR 6,400,000 Traton Finance LuxembourgSA RegS 1.25% 24/3/2033 6,382,464 0.11
102,570,633 1.81
MacedoniaEUR 8,000,000 North Macedonia Government
International Bond RegS3.675% 3/6/2026^ 8,750,000 0.16
EUR 14,805,000 North Macedonia GovernmentInternational Bond RegS1.625% 10/3/2028 14,379,356 0.25
23,129,356 0.41
MalaysiaUSD 1,135,000 Dua Capital Ltd RegS 2.78%
11/5/2031 922,313 0.02
922,313 0.02
Marshall IslandsUSD 1,300,000 Danaos Corp 8.50% 1/3/2028 1,151,432 0.02
1,151,432 0.02
MauritiusUSD 250,000 India Green Energy Holdings
RegS 5.375% 29/4/2024 213,058 0.00USD 511,000 Network i2i Ltd RegS FRN
(Perpetual) 445,894 0.01
658,952 0.01
MexicoMXN 101,000,000 Mexican Bonos 8.50%
31/5/2029 4,677,921 0.08USD 11,716,000 Mexico Government Interna-
tional Bond 3.75%19/4/2071 8,650,049 0.15
13,327,970 0.23
MontenegroEUR 2,000,000 Montenegro Government Inter-
national Bond RegS 3.375%21/4/2025^ 1,986,280 0.03
Holding Description
MarketValue
EUR
% ofNet
Assets
Montenegro continuedEUR 39,793,000 Montenegro Government Inter-
national Bond RegS 2.875%16/12/2027 36,955,361 0.65
EUR 4,900,000 Montenegro Government Inter-national Bond RegS 2.55%3/10/2029 4,397,848 0.08
43,339,489 0.76
MoroccoEUR 15,839,000 Morocco Government Interna-
tional Bond RegS 1.375%30/3/2026 16,045,541 0.28
16,045,541 0.28
NetherlandsEUR 2,340,000 Ashland Services BV RegS
2.00% 30/1/2028 2,334,150 0.04EUR 5,300,000 Athora Netherlands NV RegS
FRN 15/7/2031 5,394,499 0.10EUR 8,600,000 Bayer Capital Corp BV RegS
FRN 26/6/2022 8,631,476 0.15EUR 6,980,000 BMW Finance NV RegS
0.50% 22/11/2022 7,073,043 0.12EUR 10,225,000 BMW Finance NV RegS
24/3/2023 (Zero Coupon) 10,283,180 0.18EUR 44,169,000 Daimler International Finance
BV RegS 0.25% 9/8/2021 44,228,628 0.78EUR 12,700,000 de Volksbank NV RegS 0.75%
25/6/2023^ 12,952,095 0.23EUR 5,349,000 Domi 2021-1 BV ’2021-1 A’
RegS FRN 15/6/2053 5,368,470 0.09CHF 1,400,000 Dufry One BV RegS 0.75%
30/3/2026 1,278,232 0.02EUR 1,000,000 Dufry One BV RegS 2.00%
15/2/2027 933,140 0.02EUR 500,000 Dufry One BV RegS 3.375%
15/4/2028 493,330 0.01EUR 290,000 Dutch Property Finance
’2020-2 B’ BV RegS FRN28/1/2058 294,517 0.01
EUR 8,654,000 Dutch Property Finance’2021-1 A’ BV RegS FRN28/7/2058 8,680,533 0.15
EUR 739,000 Dutch Property Finance’2021-1 B’ BV RegS FRN28/7/2058 740,811 0.01
EUR 7,371,157 Dutch Property Finance BV’2020-2 A’ RegS FRN28/1/2058 7,418,357 0.13
EUR 3,725,000 ELM BV for Firmenich Interna-tional SA RegS FRN (Per-petual) 4,001,619 0.07
EUR 6,400,000 Iberdrola International BVRegS FRN (Perpetual) 6,432,960 0.11
EUR 9,200,000 Iberdrola International BVRegS FRN (Perpetual) 9,426,136 0.17
EUR 3,500,000 Iberdrola International BVRegS FRN (Perpetual) 3,811,465 0.07
EUR 6,000,000 ING Groep NV RegS 1.00%20/9/2023 6,171,000 0.11
EUR 25,700,000 ING Groep NV RegS FRN18/2/2029^ 25,101,961 0.44
EUR 3,590,408 Jubilee Place 2020-1 BV ’A’RegS FRN 17/10/2057 3,631,747 0.06
EUR 6,475,000 Jubilee Place ’2021-1 A’ BVRegS FRN 17/7/2058 6,527,933 0.12
EUR 200,000 Just Eat Takeaway.com NVRegS 1.25% 30/4/2026 203,136 0.00
EUR 200,000 Koninklijke KPN NV RegS0.875% 14/12/2032 197,852 0.00
BlackRock Fixed Income Strategies Fund continued
Portfolio of Investments as at 31 May 2021
The notes on pages 590 to 610 form an integral part of these financial statements.
BlackRock Strategic Funds[332]

Holding Description
MarketValue
EUR
% ofNet
Assets
Netherlands continuedEUR 420,276 Magoi BV ’2019-1 B’ RegS
FRN 27/7/2039 421,093 0.01EUR 139,984 Magoi BV ’2019-1 C’ RegS
FRN 27/7/2039 140,431 0.00EUR 70,163 Magoi BV ’2019-1 D’ RegS
FRN 27/7/2039 70,585 0.00EUR 70,164 Magoi BV ’2019-1 E’ RegS
FRN 27/7/2039 70,964 0.00USD 454,000 Mong Duong Finance Holdings
BV RegS 5.125% 7/5/2029 370,675 0.01EUR 22,896,000 NN Group NV RegS FRN
8/4/2044 25,583,762 0.45EUR 537,000 Repsol International Finance
BV RegS FRN (Perpetual) 586,726 0.01EUR 10,000,000 Siemens Financierings-
maatschappij NV RegS20/2/2023 (Zero Coupon) 10,060,100 0.18
EUR 8,500,000 Silver Arrow Athlon NL2021-1 BV ’2021-1 A’ RegSFRN 26/4/2031 8,578,498 0.15
EUR 2,385,200 Stichting AK Rabobank Certifi-caten RegS FRN (Per-petual)^ 3,123,825 0.06
EUR 144,000 Sudzucker International Fi-nance BV RegS FRN (Per-petual) 120,960 0.00
EUR 1,048,750 Summer BidCo BV RegS9.00% 15/11/2025 1,073,522 0.02
EUR 10,900,000 Telefonica Europe BV RegSFRN (Perpetual) 11,221,005 0.20
EUR 7,500,000 Telefonica Europe BV RegSFRN (Perpetual) 8,035,275 0.14
EUR 3,100,000 Telefonica Europe BV RegSFRN (Perpetual) 3,356,277 0.06
EUR 12,216,000 TenneT Holding BV RegS FRN(Perpetual) 12,615,952 0.22
EUR 1,000,000 Volkswagen International Fi-nance NV RegS FRN (Per-petual) 1,156,320 0.02
EUR 290,000 Ziggo Bond Co BV RegS3.375% 28/2/2030 286,050 0.01
USD 758,000 Ziggo BV 5.50% 15/1/2027 644,399 0.01
269,126,689 4.74
New ZealandEUR 9,270,000 ASB Finance Ltd RegS 0.25%
21/5/2031 9,265,087 0.16NZD 7,513,000 Auckland Council RegS 2.95%
28/9/2050 3,867,320 0.07EUR 10,000,000 Chorus Ltd RegS 1.125%
18/10/2023 10,269,400 0.18NZD 21,960,000 Housing New Zealand Ltd
RegS 1.534% 10/9/2035 11,171,691 0.20NZD 22,369,000 New Zealand Government
Bond 1.75% 15/5/2041 11,473,951 0.20NZD 65,107,000 New Zealand Government In-
flation Linked Bond RegS2.00% 20/9/2025 48,737,168 0.86
94,784,617 1.67
NorwayEUR 15,100,000 DNB Bank ASA RegS 0.05%
14/11/2023 15,214,005 0.27USD 3,205,000 Norske Skogindustrier ASA
7.125% 15/10/2033 53 0.00EUR 7,200,000 Telenor ASA RegS
25/9/2023 (Zero Coupon)^ 7,241,328 0.12
22,455,386 0.39
Holding Description
MarketValue
EUR
% ofNet
Assets
OmanUSD 11,690,000 Oman Government Interna-
tional Bond RegS 3.625%15/6/2021^ 9,578,342 0.17
9,578,342 0.17
PakistanUSD 260,000 Pakistan Government Interna-
tional Bond RegS 7.375%8/4/2031 223,275 0.01
USD 200,000 Pakistan Water & Power De-velopment Authority RegS7.50% 4/6/2031 165,130 0.00
388,405 0.01
PanamaEUR 1,515,000 Carnival Corp RegS 10.125%
1/2/2026 1,772,444 0.03
1,772,444 0.03
PhilippinesUSD 320,000 Globe Telecom Inc RegS
2.50% 23/7/2030 248,983 0.01USD 227,000 Rizal Commercial Banking
Corp RegS FRN (Perpetual) 191,728 0.00
440,711 0.01
PolandEUR 6,550,000 Santander Bank Polska SA
RegS 0.75% 20/9/2021 6,572,303 0.12
6,572,303 0.12
PortugalEUR 6,500,000 Caixa Economica Montepio
Geral Caixa EconomicaBancaria SA RegS 0.875%17/10/2022 6,604,455 0.12
EUR 32,519,556 Portugal Obrigacoes do Tes-ouro OT RegS 0.30%17/10/2031 31,963,146 0.56
EUR 7,853,874 Portugal Obrigacoes do Tes-ouro OT RegS 1.00%12/4/2052 7,043,197 0.12
EUR 500,000 SAGRES Socidade de Titular-izacao de Creditos SA/Ulisses Finance No. 1 ’B’RegS FRN 20/3/2033 502,450 0.01
EUR 283,745 SAGRES Socidade de Titular-izacao de CreditosSA/Ulisses Finance No. 1 ’A’RegS FRN 20/3/2033 284,809 0.01
EUR 800,000 SAGRES Socidade de Titular-izacao de CreditosSA/Ulisses Finance No. 1 ’C’RegS FRN 20/3/2033 832,741 0.01
EUR 4,731,753 TAGUS - Sociedade de Titular-izacao de Creditos SA/VoltaVI RegS 1.10% 13/2/2023 4,769,324 0.08
EUR 18,662,427 TAGUS - Sociedade de Titular-izacao de Creditos SA/VoltaVII RegS 0.70% 12/2/2024 18,623,447 0.33
EUR 9,333,847 TAGUS-Sociedade de Titular-izacao de Creditos SA/VoltaV RegS 0.85% 12/2/2022 9,363,855 0.17
79,987,424 1.41
BlackRock Fixed Income Strategies Fund continued
Portfolio of Investments as at 31 May 2021
The notes on pages 590 to 610 form an integral part of these financial statements.
Annual report and audited financial statements [333]

Holding Description
MarketValue
EUR
% ofNet
Assets
RomaniaEUR 9,877,000 Romanian Government Inter-
national Bond RegS 3.624%26/5/2030 11,383,243 0.20
11,383,243 0.20
RussiaRUB 958,160,000 Russian Federal Bond - OFZ
7.05% 19/1/2028 10,867,208 0.19
10,867,208 0.19
SerbiaEUR 9,890,000 Serbia International Bond
RegS 1.50% 26/6/2029 9,877,638 0.18USD 17,100,000 Serbia International Bond
RegS 2.125% 1/12/2030 13,085,892 0.23EUR 7,830,000 Serbia International Bond
RegS 1.65% 3/3/2033 7,571,375 0.13
30,534,905 0.54
SingaporeUSD 200,000 ABJA Investment Co Pte Ltd
RegS 5.95% 31/7/2024 178,365 0.00USD 631,104 LLPL Capital Pte Ltd RegS
6.875% 4/2/2039 605,322 0.01
783,687 0.01
SloveniaEUR 4,569,000 Slovenia Government Bond
RegS 0.488% 20/10/2050^ 3,976,446 0.07
3,976,446 0.07
South KoreaUSD 450,000 Shinhan Financial Group Co
Ltd RegS FRN (Perpetual) 367,072 0.01USD 400,000 Tongyang Life Insurance Co
Ltd RegS FRN (Perpetual) 341,537 0.00
708,609 0.01
SpainEUR 12,302 Auto ABS Spanish Loans FT
’2016-1 A’ RegS FRN31/12/2032 12,311 0.00
EUR 502,277 Autonoria Spain ’2019 B’ RegSFRN 25/12/2035 503,061 0.01
EUR 418,564 Autonoria Spain ’2019 C’RegS FRN 25/12/2035 422,731 0.01
EUR 251,138 Autonoria Spain ’2019 D’RegS FRN 25/12/2035 251,962 0.00
EUR 251,139 Autonoria Spain ’2019 E’ RegSFRN 25/12/2035 254,404 0.00
EUR 167,426 Autonoria Spain ’2019 F’ RegSFRN 25/12/2035 168,143 0.00
EUR 3,400,000 Banco Bilbao Vizcaya Argen-taria SA RegS 0.375%15/11/2026^ 3,431,960 0.06
EUR 200,000 Banco Bilbao Vizcaya Argen-taria SA RegS FRN (Per-petual) 228,482 0.00
EUR 2,800,000 Banco de Sabadell SA RegS0.875% 22/7/2025 2,860,816 0.05
EUR 2,800,000 Banco de Sabadell SA RegSFRN 11/3/2027 2,884,532 0.05
EUR 400,000 Banco de Sabadell SA RegSFRN (Perpetual) 419,152 0.01
EUR 200,000 Banco Santander SA RegSFRN (Perpetual) 205,918 0.00
EUR 8,100,000 Bankia SA RegS 1.125%12/11/2026^ 8,317,566 0.15
EUR 4,800,000 BBVA Consumer Auto’2020-1 A’ FTA RegS FRN20/1/2036 4,853,635 0.09
Holding Description
MarketValue
EUR
% ofNet
Assets
Spain continuedGBP 2,500,000 CaixaBank SA RegS FRN
3/12/2026 2,904,971 0.05EUR 400,000 CaixaBank SA RegS FRN
(Perpetual) 457,740 0.01EUR 4,600,000 Cellnex Finance Co SA RegS
2.00% 15/2/2033 4,469,268 0.08EUR 700,000 Cellnex Telecom SA RegS
1.50% 16/1/2026 1,203,916 0.02EUR 800,000 Cellnex Telecom SA RegS
0.50% 5/7/2028 1,058,456 0.02EUR 3,400,000 Cellnex Telecom SA RegS
0.75% 20/11/2031 3,281,340 0.06EUR 1,132,533 Driver Espana Five FDT ’5A’
RegS FRN 21/12/2028 1,134,298 0.02EUR 690,193 Driver Espana Five FDT ’5B’
RegS FRN 21/12/2028 689,803 0.01EUR 3,545,982 FT Santander Consumer
Spain Auto ’2020-1 A’ RegSFRN 20/3/2033 3,586,129 0.06
EUR 886,495 FT Santander ConsumerSpain Auto ’2020-1 B’ RegSFRN 20/3/2033 887,097 0.02
EUR 265,949 FT Santander ConsumerSpain Auto ’2020-1 C’ RegSFRN 20/3/2033 266,985 0.00
EUR 443,248 FT Santander ConsumerSpain Auto ’2020-1 D’ RegS3.50% 20/3/2033 447,509 0.01
EUR 1,800,000 International Consolidated Air-lines Group SA RegS0.625% 17/11/2022 1,742,454 0.03
EUR 900,000 International Consolidated Air-lines Group SA RegS 1.50%4/7/2027 815,184 0.01
EUR 1,100,000 International Consolidated Air-lines Group SA RegS1.125% 18/5/2028 1,105,324 0.02
EUR 600,000 International Consolidated Air-lines Group SA RegS 3.75%25/3/2029 597,348 0.01
EUR 4,900,000 Santander Consumer FinanceSA RegS 0.50% 4/10/2021 4,915,974 0.09
EUR 5,300,000 Santander Consumer FinanceSA RegS 1.00% 27/2/2024 5,456,509 0.10
EUR 34,100,000 Spain Government Bond RegS0.50% 30/4/2030 34,588,994 0.61
EUR 13,453,000 Spain Government Bond RegS0.85% 30/7/2037 13,132,415 0.23
EUR 4,500,000 Telefonica Emisiones SA RegS1.477% 14/9/2021 4,523,850 0.08
EUR 1,500,000 Tendam Brands SAU RegS5.00% 15/9/2024^ 1,449,450 0.03
EUR 4,100,000 Wizink Master Credit Cards FT’2019-2 A’ RegS FRN26/3/2033 4,093,254 0.07
117,622,941 2.07
SupranationalEUR 3,451,000 Ardagh Metal Packaging Fi-
nance USA LLC/ArdaghMetal Packaging FinancePlc RegS 2.00% 1/9/2028 3,454,278 0.06
GBP 30,499,000 Council Of Europe Develop-ment Bank RegS 0.625%15/6/2022^ 35,580,077 0.63
EUR 15,167,000 European Investment BankRegS 14/1/2031 (Zero Cou-pon) 15,106,635 0.27
BlackRock Fixed Income Strategies Fund continued
Portfolio of Investments as at 31 May 2021
The notes on pages 590 to 610 form an integral part of these financial statements.
BlackRock Strategic Funds[334]

Holding Description
MarketValue
EUR
% ofNet
Assets
Supranational continuedEUR 4,722,000 International Bank for Recon-
struction & Development0.125% 3/1/2051 4,042,315 0.07
EUR 14,489,000 International Bank for Recon-struction & Development0.20% 21/1/2061 11,955,454 0.21
70,138,759 1.24
SwedenEUR 185,000 Heimstaden Bostad AB RegS
FRN (Perpetual) 183,731 0.00EUR 3,600,000 Skandinaviska Enskilda Ban-
ken AB RegS FRN31/10/2028 3,697,920 0.07
GBP 19,823,000 Svensk Exportkredit AB RegS0.125% 15/12/2025 22,588,963 0.40
EUR 648,000 Verisure Holding AB RegSFRN 15/4/2025 663,714 0.01
EUR 1,580,000 Verisure Midholding AB RegS5.25% 15/2/2029 1,631,366 0.03
28,765,694 0.51
SwitzerlandCHF 1,000,000 Cembra Money Bank AG
RegS 9/7/2026 (Zero Cou-pon) 938,603 0.02
EUR 9,450,000 Credit Suisse AG RegS 0.25%5/1/2026 9,457,560 0.17
USD 200,000 Credit Suisse Group AG FRN(Perpetual) 182,890 0.00
EUR 3,325,000 Credit Suisse Group AG RegSFRN 2/4/2026 3,669,204 0.06
EUR 21,675,000 Credit Suisse Group AG RegSFRN 14/1/2028 21,596,970 0.38
EUR 7,100,000 Credit Suisse Group AG RegS0.625% 18/1/2033 6,585,534 0.12
USD 200,000 Credit Suisse Group AG RegSFRN (Perpetual) 182,890 0.00
USD 200,000 Credit Suisse Group AG RegSFRN (Perpetual) 177,237 0.00
EUR 8,354,000 UBS AG RegS 0.25%10/1/2022 8,387,834 0.15
EUR 9,275,000 UBS AG RegS 0.01%31/3/2026 9,248,937 0.16
EUR 12,250,000 UBS Group AG RegS FRN20/9/2022 12,271,682 0.22
USD 4,125,000 UBS Group AG RegS FRN(Perpetual)^ 3,648,142 0.06
76,347,483 1.34
ThailandUSD 227,000 Bangkok Bank PCL RegS FRN
25/9/2034 190,377 0.00USD 398,000 Bangkok Bank PCL RegS FRN
(Perpetual) 343,547 0.01USD 200,000 GC Treasury Center Co Ltd
RegS 2.98% 18/3/2031 164,900 0.00USD 265,000 GC Treasury Center Co Ltd
RegS 4.30% 18/3/2051 229,385 0.01USD 227,000 Kasikornbank PCL RegS FRN
2/10/2031 191,087 0.00USD 398,000 Kasikornbank PCL RegS FRN
(Perpetual) 345,302 0.01USD 227,000 TMB Bank PCL RegS FRN
(Perpetual) 187,573 0.00
1,652,171 0.03
Holding Description
MarketValue
EUR
% ofNet
Assets
TurkeyUSD 7,510,000 Turkey Government Interna-
tional Bond 5.125%25/3/2022^ 6,305,329 0.11
USD 7,310,000 Turkey Government Interna-tional Bond 6.25%26/9/2022^ 6,248,147 0.11
12,553,476 0.22
United Arab EmiratesUSD 250,000 Abu Dhabi National Energy Co
PJSC RegS 3.40%29/4/2051 210,287 0.00
USD 300,000 Abu Dhabi Ports Co PJSCRegS 2.50% 6/5/2031 245,538 0.00
USD 375,000 MDGH GMTN RSC Ltd RegS3.40% 7/6/2051 309,197 0.01
765,022 0.01
United KingdomGBP 957,434 Albion No 4 Plc ’A’ RegS FRN
17/8/2062 1,119,865 0.02GBP 3,291,000 Atlas Funding ’2021-1 A’ Plc
RegS FRN 25/7/2058 3,847,980 0.07GBP 306,000 Atlas Funding ’2021-1 B’ Plc
RegS FRN 25/7/2058 357,521 0.01GBP 100,000 Atlas Funding ’2021-1 C’ Plc
RegS FRN 25/7/2058 116,167 0.00GBP 100,000 Atlas Funding ’2021-1 D’ Plc
RegS FRN 25/7/2058 117,205 0.00GBP 2,986,971 Auto ABS UK Loans ’2019-1 A’
Plc RegS FRN 27/11/2027 3,476,726 0.06GBP 685,574 Azure Finance No 1 Plc ’B’
RegS FRN 30/6/2027 797,218 0.01GBP 6,461,241 Azure Finance No 2 Plc ’A’
RegS FRN 20/7/2030 7,539,647 0.13GBP 555,000 Azure Finance No 2 Plc ’C’
RegS FRN 20/7/2030 659,174 0.01GBP 4,355,000 Azure Finance Plc ’C’ RegS
FRN 30/6/2027 5,075,619 0.09USD 500,000 Barclays Plc FRN (Perpetual) 453,613 0.01
GBP 1,622,993 Barley Hill No 1 Plc ’A’ RegSFRN 28/8/2059 1,891,411 0.03
GBP 1,300,000 BAT International Finance PlcRegS 4.00% 4/9/2026 1,660,109 0.03
EUR 11,457,000 BAT International Finance PlcRegS 2.25% 16/1/2030 12,177,531 0.21
GBP 12,900,000 Bellis Acquisition Co Plc RegS3.25% 16/2/2026 14,996,842 0.26
GBP 1,800,000 BP Capital Markets Plc RegS1.00% 28/4/2023 2,181,887 0.04
EUR 6,421,000 BP Capital Markets Plc RegS1.104% 15/11/2034 6,410,149 0.11
EUR 9,075,000 BP Capital Markets Plc RegSFRN (Perpetual) 9,734,480 0.17
GBP 9,297,000 BP Capital Markets Plc RegSFRN (Perpetual) 11,405,568 0.20
GBP 4,048,830 Brass No 10 Plc ’A2’ RegSFRN 16/4/2069 4,711,693 0.08
GBP 1,917,000 Brass No 6 Plc ’A’ RegS FRN16/12/2060 2,228,189 0.04
GBP 2,921,100 Brass No 7 Plc ’A’ RegS FRN16/10/2059 3,408,599 0.06
GBP 1,177,940 Brass No 8 Plc ’A2’ RegS FRN16/11/2066 1,380,891 0.02
GBP 7,067,000 BUPA Finance Plc RegS5.00% 8/12/2026 9,573,797 0.17
BlackRock Fixed Income Strategies Fund continued
Portfolio of Investments as at 31 May 2021
The notes on pages 590 to 610 form an integral part of these financial statements.
Annual report and audited financial statements [335]

Holding Description
MarketValue
EUR
% ofNet
Assets
United Kingdom continuedEUR 9,325,000 Cadent Finance Plc RegS
0.625% 19/3/2030 9,302,713 0.16GBP 300,000 Canary Wharf Finance II Plc
’C2’ RegS FRN 22/10/2037 296,527 0.01GBP 2,051,000 Canary Wharf Finance II Plc
’D2’ RegS FRN 22/10/2037 2,071,697 0.04EUR 10,250,000 Chanel Ceres Plc RegS 1.00%
31/7/2031 10,204,490 0.18EUR 3,450,000 Channel Link Enterprises Fi-
nance Plc RegS FRN30/6/2050 3,441,548 0.06
EUR 5,125,000 Channel Link Enterprises Fi-nance Plc RegS FRN30/6/2050 5,223,554 0.09
GBP 1,625,000 Channel Link Enterprises Fi-nance Plc RegS FRN30/6/2050 1,901,948 0.03
GBP 975,962 Charter Mortgage Funding Plc’2017-1 A’ RegS FRN12/6/2054 1,134,013 0.02
GBP 4,489,624 CMF ’2020-1 A’ Plc RegS FRN16/1/2057 5,225,415 0.09
GBP 220,000 CMF ’2020-1 B’ Plc RegS FRN16/1/2057 255,025 0.00
GBP 100,000 CMF ’2020-1 C’ Plc RegS FRN16/1/2057 115,926 0.00
GBP 7,064,241 Dignity Finance Plc RegS3.546% 31/12/2034 8,906,005 0.16
GBP 3,404,000 Dignity Finance Plc RegS4.696% 31/12/2049 3,684,870 0.07
GBP 296,769 DLL UK Equipment FinancePlc ’2019-1UK A’ RegS FRN25/3/2028 345,283 0.01
EUR 2,000,000 EC Finance Plc RegS 2.375%15/11/2022 1,964,120 0.03
GBP 4,696,000 E-Carat 12 Plc ’12 A’ RegSFRN 18/8/2029 5,453,182 0.10
GBP 1,400,000 Economic Master Issuer Plc’2020-1 A1’ RegS FRN25/6/2072 1,632,226 0.03
EUR 100,000 eG Global Finance Plc RegS3.625% 7/2/2024 96,978 0.00
GBP 1,967,000 eG Global Finance Plc RegS6.25% 30/3/2026 2,268,183 0.04
GBP 4,009,268 Elvet Mortgages Plc ’2018-1 A’RegS FRN 22/10/2058 4,674,750 0.08
USD 1,265,466 EnQuest Plc RegS 7.00%15/10/2023 912,153 0.02
GBP 110,872 EnQuest Plc RegS 7.00%15/10/2023 113,658 0.00
GBP 48,966 Eurosail Plc ’2006-1X A2C’RegS FRN 10/6/2044 56,842 0.00
GBP 1,828,826 Feldspar Plc ’2016-1 A’ RegSFRN 15/9/2045 2,125,968 0.04
GBP 2,705,000 Finsbury Square ’2018-2B’ PlcRegS FRN 12/9/2068 3,153,744 0.06
GBP 155,000 Finsbury Square ’2019-2 C’Plc RegS FRN 16/9/2069 181,175 0.00
GBP 145,000 Finsbury Square ’2019-2 D’Plc RegS FRN 16/9/2069 169,825 0.00
GBP 2,053,388 Finsbury Square ’2019-3 A’Plc RegS FRN 16/12/2069 2,398,804 0.04
GBP 348,998 Finsbury Square ’2019-3 C’Plc RegS FRN 16/12/2069 408,908 0.01
GBP 3,143,530 Finsbury Square ’2020-1X A’Plc RegS FRN 16/3/2070 3,659,984 0.06
GBP 214,960 Finsbury Square ’2020-1X C’Plc RegS FRN 16/3/2070 248,554 0.00
GBP 5,481,731 Finsbury Square Plc’2018-2 A’ RegS FRN12/9/2068 6,384,693 0.11
Holding Description
MarketValue
EUR
% ofNet
Assets
United Kingdom continuedGBP 5,985,000 Finsbury Square Plc
’2018-2 C’ RegS FRN12/9/2068 6,990,846 0.12
GBP 950,000 Finsbury Square Plc’2018-2 D’ RegS FRN12/9/2068 1,112,963 0.02
GBP 1,403,152 Finsbury Square Plc’2019-1 A’ RegS FRN16/6/2069 1,634,372 0.03
GBP 485,000 Finsbury Square Plc’2019-1 B’ RegS FRN16/6/2069 566,147 0.01
GBP 1,637,184 Finsbury Square Plc’2020-2 A’ RegS FRN16/6/2070 1,920,645 0.03
GBP 1,404,871 Friary No 4 Plc ’A’ RegS FRN21/1/2050 1,634,350 0.03
GBP 654,847 Gemgarto 2018-1 Plc ’C’ RegSFRN 16/9/2065 752,641 0.01
GBP 6,334,000 Gemgarto ’2021-1 A’ Plc RegSFRN 16/12/2067 7,390,409 0.13
GBP 669,000 Gemgarto ’2021-1 B’ Plc RegSFRN 16/12/2067 779,322 0.01
GBP 218,000 Gemgarto ’2021-1 C’ Plc RegSFRN 16/12/2067 253,946 0.00
GBP 11,118,402 Gemgarto Plc ’2018-1 A’ RegSFRN 16/9/2065 12,986,806 0.23
GBP 1,585,629 Gemgarto Plc ’2018-1 B’ RegSFRN 16/9/2065 1,835,358 0.03
GBP 234,945 Gemgarto Plc ’2018-1 D’ RegSFRN 16/9/2065 269,483 0.00
EUR 11,050,000 GlaxoSmithKline Capital PlcRegS 23/9/2023 (Zero Cou-pon)^ 11,109,228 0.20
GBP 2,175,744 Globaldrive Auto ReceivablesUK ’2019-A A’ Plc RegSFRN 20/9/2026 2,528,206 0.04
GBP 2,820,000 Globaldrive Auto Receivables’UK 2019-A B’ Plc RegSFRN 20/9/2026 3,290,859 0.06
GBP 5,000,000 Gosforth Funding Plc ’2017-1XA2’ RegS FRN 19/12/2059 5,824,682 0.10
GBP 4,576,001 Gosforth Funding Plc ’2018-1XA2’ RegS FRN 25/8/2060 5,336,545 0.09
GBP 1,000,000 Greene King Finance Plc1.88% 15/12/2034 979,174 0.02
GBP 2,758,614 Greene King Finance PlcRegS FRN 15/12/2033 3,186,260 0.06
GBP 1,666,850 Greene King Finance PlcRegS 3.593% 15/3/2035 2,047,854 0.04
GBP 905,821 Greene King Finance PlcRegS 4.064% 15/3/2035 1,145,380 0.02
GBP 3,687,293 Hops Hill No 1 Plc ’A’ RegSFRN 27/5/2054 4,309,659 0.08
GBP 345,980 Hops Hill No 1 Plc ’B’ RegSFRN 27/5/2054 405,371 0.01
GBP 199,992 Hops Hill No 1 Plc ’C’ RegSFRN 27/5/2054 233,951 0.00
GBP 99,998 Hops Hill No 1 Plc ’D’ RegSFRN 27/5/2054 117,558 0.00
USD 400,000 HSBC Bank Plc FRN (Per-petual) 306,457 0.01
EUR 15,375,000 HSBC Holdings Plc RegS FRN13/11/2026^ 15,387,915 0.27
EUR 7,475,000 HSBC Holdings Plc RegS FRN13/11/2031 7,395,915 0.13
EUR 400,000 HSBC Holdings Plc RegS FRN(Perpetual) 451,120 0.01
EUR 5,450,000 INEOS Quattro Finance 2 PlcRegS 2.50% 15/1/2026 5,477,632 0.10
BlackRock Fixed Income Strategies Fund continued
Portfolio of Investments as at 31 May 2021
The notes on pages 590 to 610 form an integral part of these financial statements.
BlackRock Strategic Funds[336]

Holding Description
MarketValue
EUR
% ofNet
Assets
United Kingdom continuedUSD 1,050,000 Ithaca Energy North Sea Plc
9.375% 15/7/2024 870,853 0.02USD 1,500,000 Jaguar Land Rover Automotive
Plc 4.50% 1/10/2027^ 1,178,760 0.02USD 800,000 Jaguar Land Rover Automotive
Plc 5.875% 15/1/2028 669,872 0.01GBP 5,720,818 Jupiter Mortgage NO 1 Plc ’A’
RegS FRN 20/7/2060 6,648,721 0.12GBP 4,046,088 Kenrick No 3 Plc ’A’ RegS
FRN 11/10/2054 4,708,832 0.08GBP 7,790,000 Lanark Master Issuer Plc
’2017-1X 2A’ RegS FRN22/12/2069 9,089,961 0.16
GBP 7,500,000 Lanark Master Issuer Plc’2018-1X 2A’ RegS FRN22/12/2069 8,747,631 0.15
GBP 2,115,500 Lanark Master Issuer Plc’2019-1X 1A2’ RegS FRN22/12/2069 2,459,690 0.04
GBP 1,334,500 Lanark Master Issuer PlcRegS FRN 22/12/2069 1,558,416 0.03
GBP 370,000 Lanebrook Mortgage Transac-tion ’2020-1 C’ Plc RegSFRN 12/6/2057 437,150 0.01
GBP 10,058,740 Lanebrook Mortgage Transac-tion Plc ’2020-1 A1’ RegSFRN 12/6/2057 11,779,007 0.21
GBP 630,000 Lanebrook Mortgage Transac-tion Plc ’2020-1 B’ RegSFRN 12/6/2057 743,168 0.01
GBP 20,517,000 LCR Finance Plc RegS 4.50%7/12/2028 30,006,414 0.53
GBP 375,000 Legal & General Group PlcRegS FRN (Perpetual) 481,294 0.01
EUR 400,000 Lloyds Banking Group PlcRegS FRN (Perpetual)^ 439,208 0.01
GBP 3,719,000 London Wall Mortgage CapitalPlc ’2021-FL1 A’ RegS FRN15/5/2051 4,337,471 0.08
GBP 933,000 Matalan Finance Plc RegS6.75% 31/1/2023^ 988,512 0.02
GBP 100,000 Metrocentre Finance Plc8.75% 6/12/2023 58,358 0.00
GBP 394,850 Mitchells & Butlers Finance PlcRegS 6.013% 15/12/2028 506,596 0.01
GBP 2,080,000 Mitchells & Butlers Finance PlcRegS 6.469% 15/9/2030 2,716,357 0.05
GBP 955,000 Mitchells & Butlers Finance PlcRegS FRN 15/9/2034 902,622 0.02
GBP 1,165,000 Mitchells & Butlers Finance PlcRegS FRN 15/6/2036 1,091,933 0.02
GBP 336,718 Motor Plc ’2016-1 A’ RegS1.30% 25/11/2025 391,185 0.01
GBP 1,710,000 Motor Plc ’2016-1 C’ RegS3.75% 25/11/2025 1,986,067 0.04
GBP 343,000 Motor Plc ’2016-1 D’ RegS4.25% 25/11/2025 398,375 0.01
GBP 285,000 Motor Plc ’2016-1 E’ RegS5.25% 25/11/2025 331,011 0.01
GBP 6,133,000 National Grid Electricity Trans-mission Plc RegS 2.00%16/9/2038 6,960,414 0.12
GBP 3,090,000 National Grid Electricity Trans-mission Plc RegS 2.00%17/4/2040 3,455,824 0.06
EUR 6,525,000 Nationwide Building SocietyRegS 0.50% 5/5/2041 6,360,505 0.11
GBP 12,075,000 Natwest Group Plc RegS FRN28/11/2031 14,020,918 0.25
USD 3,489,000 Neptune Energy Bondco Plc6.625% 15/5/2025 2,898,922 0.05
Holding Description
MarketValue
EUR
% ofNet
Assets
United Kingdom continuedGBP 3,121,000 Newday Funding Master Is-
suer Plc ’2021-1X A1’ RegSFRN 15/3/2029 3,638,935 0.06
GBP 775,000 Newday Funding Master Is-suer Plc ’2021-1X B’ RegSFRN 15/3/2029 901,855 0.02
GBP 6,800,000 Newday Partnership FundingPlc ’2017-1 A’ RegS FRN15/12/2027 7,892,048 0.14
EUR 334,800 Newgate Funding Plc’2006-1 BB’ RegS FRN1/12/2050 327,882 0.01
GBP 8,223,000 NGG Finance Plc RegS FRN18/6/2073 10,681,468 0.19
EUR 5,000,000 NGG Finance Plc RegS FRN5/12/2079 5,039,200 0.09
GBP 9,743,581 Oat Hill No 2 Plc ’A’ RegSFRN 27/5/2046 11,341,546 0.20
GBP 1,729,021 Orbita Funding ’2020-1 A’ PlcRegS FRN 17/3/2027 2,011,014 0.04
EUR 20,836,000 OTE Plc RegS 0.875%24/9/2026^ 21,332,105 0.38
EUR 800,714 Paragon Mortgages No 12 Plc’12X A2B’ RegS FRN15/11/2038 788,303 0.01
GBP 6,445,785 Paragon Mortgages No 25 Plc’A’ RegS FRN 15/5/2050 7,487,154 0.13
GBP 975,000 Paragon Mortgages No 25 Plc’B’ RegS FRN 15/5/2050 1,126,022 0.02
GBP 770,000 Paragon Mortgages No 25 Plc’C’ RegS FRN 15/5/2050 893,154 0.02
GBP 7,462,000 PCL Funding III Plc ’2017-2 A’RegS FRN 15/6/2023 8,669,624 0.15
GBP 332,000 PCL Funding III Plc ’2017-2 C’RegS FRN 15/6/2023 385,520 0.01
GBP 745,000 PCL Funding III Plc ’B’ RegSFRN 15/6/2023 865,208 0.02
GBP 5,730,000 PCL Funding IV Plc ’2020-1 A’RegS FRN 15/9/2024 6,692,550 0.12
GBP 605,000 PCL Funding IV Plc ’2020-1 B’RegS FRN 15/9/2024 707,543 0.01
GBP 230,000 PCL Funding IV Plc ’2020-1 C’RegS FRN 15/9/2024 269,192 0.00
GBP 4,402,000 PCL Funding V Plc ’2021-1 A’RegS FRN 15/10/2025 5,118,422 0.09
GBP 486,000 PCL Funding V Plc ’2021-1 B’RegS FRN 15/10/2025 564,699 0.01
GBP 115,000 PCL Funding V Plc ’2021-1 C’RegS FRN 15/10/2025 133,593 0.00
GBP 5,305,000 Penarth Master Issuer Plc’2018-1X A2’ RegS FRN18/3/2025 6,182,128 0.11
GBP 3,965,000 Permanent Master Issuer PlcRegS FRN 15/7/2058 4,624,139 0.08
GBP 4,453,000 Precise Mortgage Funding’2019-1B A2’ Plc RegS FRN12/12/2055 5,236,053 0.09
GBP 115,000 Precise Mortgage Funding’2020-1B B’ Plc RegS FRN16/10/2056 134,417 0.00
GBP 100,000 Precise Mortgage Funding’2020-1B C’ Plc RegS FRN16/10/2056 116,667 0.00
GBP 100,000 Precise Mortgage Funding’2020-1B D’ Plc RegS FRN16/10/2056 116,258 0.00
GBP 133,793 Premiertel Plc 6.175%8/5/2032 186,920 0.00
GBP 8,668,376 Prs Finance Plc RegS 1.75%24/11/2026 10,630,749 0.19
BlackRock Fixed Income Strategies Fund continued
Portfolio of Investments as at 31 May 2021
The notes on pages 590 to 610 form an integral part of these financial statements.
Annual report and audited financial statements [337]

Holding Description
MarketValue
EUR
% ofNet
Assets
United Kingdom continuedGBP 5,200,000 Prs Finance Plc RegS 2.00%
23/1/2029 6,422,534 0.11GBP 2,155,644 Residential Mortgage Securi-
ties 29 Plc ’A’ RegS FRN20/12/2046 2,506,795 0.04
GBP 3,070,000 Residential Mortgage Securi-ties 29 Plc ’B’ RegS FRN20/12/2046 3,574,915 0.06
GBP 695,000 Residential Mortgage Securi-ties 29 Plc ’C’ RegS FRN20/12/2046 807,647 0.01
GBP 2,734,816 Residential Mortgage Securi-ties 30 Plc ’A’ RegS FRN20/3/2050 3,179,456 0.06
GBP 2,350,000 Residential Mortgage Securi-ties 30 Plc ’B’ RegS FRN20/3/2050 2,732,392 0.05
GBP 460,000 Residential Mortgage Securi-ties 30 Plc ’C’ RegS FRN20/3/2050 534,157 0.01
GBP 5,152,177 Residential Mortgage Securi-ties ’32X A’ Plc RegS FRN20/6/2070 6,058,903 0.11
GBP 525,000 Residential Mortgage Securi-ties ’32X C’ Plc RegS FRN20/6/2070 620,907 0.01
GBP 6,883,338 Ripon Mortgages Plc ’1X A1’RegS FRN 20/8/2056 8,013,441 0.14
GBP 22,810,000 Ripon Mortgages Plc ’1X B1’RegS FRN 20/8/2056 26,545,759 0.47
GBP 485,000 Ripon Mortgages Plc ’1X B2’RegS FRN 20/8/2056 563,699 0.01
GBP 11,250,000 Ripon Mortgages Plc ’1X C1’RegS FRN 20/8/2056 13,093,860 0.23
EUR 2,314,310 RMAC Securities No 1 Plc’2006-NS1X M1C’ RegSFRN 12/6/2044 2,238,026 0.04
GBP 4,651,766 RMAC Securities No 2 Plc’2018-2 A’ RegS FRN12/6/2046 5,426,311 0.10
GBP 410,000 RMAC Securities No 2 Plc’2018-2 B’ RegS FRN12/6/2046 477,775 0.01
GBP 420,000 RMAC Securities No 2 Plc’2018-2 C’ RegS FRN12/6/2046 488,554 0.01
GBP 3,345,000 Sage AR Funding No 1 Plc ’A’RegS FRN 17/11/2030 3,895,768 0.07
GBP 1,085,000 Sage AR Funding No 1 Plc ’B’RegS FRN 17/11/2030 1,264,213 0.02
GBP 535,000 Sage AR Funding No 1 Plc ’C’RegS FRN 17/11/2030 623,661 0.01
GBP 5,893,952 Silk Road Finance Number SixPlc ’A’ RegS FRN 21/9/2067 6,901,658 0.12
GBP 9,435,000 Silverstone Master Issuer Plc’2018-1X 2A’ RegS FRN21/1/2070 11,007,368 0.19
GBP 1,768,800 Silverstone Master Issuer Plc’2019-1X 2A’ RegS FRN21/1/2070 2,073,676 0.04
GBP 9,640,000 Silverstone Master Issuer PlcRegS FRN 21/1/2070 11,237,672 0.20
EUR 951,000 Sky Ltd RegS 2.25%17/11/2025 1,045,758 0.02
USD 5,195,000 Standard Chartered Plc RegSFRN 23/3/2025^ 4,293,279 0.08
GBP 525,221 Stanlington No 1 Plc’2017-1 A’ RegS FRN12/6/2046 610,655 0.01
GBP 180,000 Stanlington No 1 Plc ’2017-1E’RegS FRN 12/6/2046 211,105 0.00
Holding Description
MarketValue
EUR
% ofNet
Assets
United Kingdom continuedEUR 500,000 Stonegate Pub Co Financing
2019 Plc RegS FRN31/7/2025 499,450 0.01
GBP 1,300,000 Stonegate Pub Co Financing2019 Plc RegS 8.25%31/7/2025 1,592,577 0.03
EUR 2,800,000 Swiss Re Finance UK PlcRegS FRN 4/6/2052 3,063,508 0.05
GBP 250,000 Telereal Securitisation Plc FRN10/12/2031 247,554 0.00
GBP 510,206 Tesco Property Finance 1 PlcRegS 7.623% 13/7/2039 875,539 0.02
GBP 12,605,557 Tesco Property Finance 3 PlcRegS 5.744% 13/4/2040 19,433,273 0.34
GBP 1,347,096 Tesco Property Finance 4 PlcRegS 5.801% 13/10/2040 2,080,699 0.04
GBP 8,190,000 Tower Bridge Funding’2021-1 A’ RegS FRN21/7/2064 9,536,704 0.17
GBP 383,000 Tower Bridge Funding’2021-1 B’ RegS FRN21/7/2064 445,433 0.01
GBP 365,000 Tower Bridge Funding’2021-1 C’ RegS FRN21/7/2064 424,509 0.01
GBP 253,000 Tower Bridge Funding’2021-1 D’ RegS FRN21/7/2064 293,904 0.01
GBP 4,629,018 Tower Bridge Funding Plc’2020-1 A’ RegS FRN20/9/2063 5,435,059 0.10
GBP 695,000 Tower Bridge Funding Plc’2020-1 B’ RegS FRN20/9/2063 819,743 0.01
GBP 145,000 Tower Bridge Funding Plc’2020-1 C’ RegS FRN20/9/2063 171,102 0.00
GBP 115,000 Tower Bridge Funding Plc’2020-1 D’ RegS FRN20/9/2063 137,590 0.00
GBP 8,250,000 Tritax Big Box REIT Plc RegS1.50% 27/11/2033 9,131,210 0.16
USD 1,400,000 Tullow Oil Plc 10.25%15/5/2026 1,180,145 0.02
GBP 252,941 Turbo Finance 8 Plc ’A’ RegSFRN 20/2/2026 293,788 0.01
GBP 1,190,000 Turbo Finance 8 Plc ’C’ RegSFRN 20/2/2026 1,387,085 0.02
GBP 1,594,000 Turbo Finance 9 Plc ’B’ RegSFRN 20/8/2028 1,866,799 0.03
GBP 8,620,000 Turbo Finance Plc ’9 A’ RegSFRN 20/8/2028 10,070,662 0.18
GBP 1,685,000 Twin Bridges 2018-1 Plc ’B’RegS FRN 12/9/2050 1,962,216 0.03
GBP 1,854,039 Twin Bridges ’2019-2 A’ PlcRegS FRN 12/6/2053 2,168,516 0.04
GBP 1,196,000 Twin Bridges ’2019-2 B’ PlcRegS FRN 12/6/2053 1,399,339 0.02
GBP 565,000 Twin Bridges ’2019-2 C’ PlcRegS FRN 12/6/2053 660,863 0.01
GBP 250,000 Twin Bridges ’2019-2 D’ PlcRegS FRN 12/6/2053 293,598 0.01
GBP 5,884,000 Twin Bridges ’2021-1 D’ PlcRegS FRN 12/3/2055 6,866,651 0.12
GBP 436,000 Twin Bridges ’2021-1 D’ PlcRegS FRN 12/3/2055 507,326 0.01
GBP 220,000 Twin Bridges ’2021-1 D’ PlcRegS FRN 12/3/2055 256,999 0.00
GBP 1,310,000 Twin Bridges ’2021-1 D’ PlcRegS FRN 12/3/2055 1,525,293 0.03
BlackRock Fixed Income Strategies Fund continued
Portfolio of Investments as at 31 May 2021
The notes on pages 590 to 610 form an integral part of these financial statements.
BlackRock Strategic Funds[338]

Holding Description
MarketValue
EUR
% ofNet
Assets
United Kingdom continuedGBP 10,860,827 Twin Bridges Plc ’2018-1 A’
RegS FRN 12/9/2050 12,682,194 0.22GBP 3,483,000 Twin Bridges Plc ’2018-1 C’
RegS FRN 12/9/2050 4,081,660 0.07GBP 2,040,000 Twin Bridges Plc ’2018-1 D’
RegS FRN 12/9/2050 2,384,512 0.04GBP 2,186,632 Twin Bridges Plc ’2019-1 A’
RegS FRN 12/12/2052 2,549,968 0.05GBP 385,000 Twin Bridges Plc ’2019-1B’
RegS FRN 12/12/2052 448,701 0.01GBP 550,000 Twin Bridges Plc ’2019-1C’
RegS FRN 12/12/2052 641,659 0.01GBP 6,540,780 Twin Bridges Plc ’2020-1 A’
RegS FRN 12/12/2054 7,706,402 0.14GBP 1,145,000 Twin Bridges Plc ’2020-1 B’
RegS FRN 12/12/2054 1,353,223 0.02GBP 390,000 Twin Bridges Plc ’2020-1 C’
RegS FRN 12/12/2054 460,832 0.01GBP 225,000 Twin Bridges Plc ’2020-1 D’
RegS FRN 12/12/2054 265,472 0.00GBP 272,000 Unique Pub Finance Co Plc
RegS 7.395% 28/3/2024 341,361 0.01GBP 1,022,433 Unique Pub Finance Co Plc
RegS 5.659% 30/6/2027 1,341,885 0.02GBP 371,000 Unique Pub Finance Co Plc
RegS 6.464% 30/3/2032 504,201 0.01GBP 11,100,000 United Kingdom Gilt RegS
0.625% 22/10/2050 10,761,218 0.19GBP 100,000 Virgin Media Secured Finance
Plc RegS 5.25% 15/5/2029 123,140 0.00GBP 600,000 Virgin Media Secured Finance
Plc RegS 4.25% 15/1/2030 698,155 0.01GBP 245,000 Vmed O2 UK Financing I Plc
RegS 4.00% 31/1/2029 282,585 0.01EUR 300,000 Vmed O2 UK Financing I Plc
RegS 3.25% 31/1/2031 302,736 0.01EUR 500,000 Vodafone Group Plc RegS
FRN 3/1/2079 518,620 0.01EUR 900,000 Vodafone Group Plc RegS
FRN 27/8/2080 917,631 0.02
811,757,344 14.30
United StatesUSD 3,250,000 ADT Security Corp 3.50%
15/7/2022 2,714,470 0.05EUR 11,050,000 Air Products and Chemicals
Inc 0.80% 5/5/2032 11,200,722 0.20USD 2,776,000 Albertsons Cos Inc / Safeway
Inc / New Albertsons LP /Albertsons LLC 3.50%15/2/2023 2,334,327 0.04
USD 5,846,000 Amazon.com Inc 2.70%3/6/2060 4,277,611 0.07
USD 15,737,972 American Airlines ’2013-2 A’Pass Through Trust 4.95%15/1/2023 13,014,769 0.23
USD 2,776,465 American Airlines ’2015-2B’Pass Through Trust 4.40%22/9/2023 2,190,981 0.04
USD 3,983,151 American Airlines2016-3 Class AA PassThrough Trust 3.00%15/10/2028 3,288,709 0.06
USD 6,099,446 American Airlines2017-2 Class B PassThrough Trust 3.70%15/10/2025 4,708,026 0.08
USD 2,000,000 Amkor Technology Inc 6.625%15/9/2027 1,770,705 0.03
USD 14,878,000 Apple Inc 2.55% 20/8/2060 10,696,724 0.19USD 12,600,000 Apple Inc 2.80% 8/2/2061 9,446,496 0.17GBP 8,780,000 Bank of America Corp RegS
FRN 2/6/2029 10,222,853 0.18
Holding Description
MarketValue
EUR
% ofNet
Assets
United States continuedEUR 21,300,000 Bank of America Corp RegS
FRN 26/10/2031 20,890,529 0.37EUR 7,300,000 Bank of America Corp RegS
FRN 24/5/2032 7,389,936 0.13EUR 11,825,000 BAT Capital Corp RegS FRN
16/8/2021 11,832,331 0.21EUR 2,556,000 Becton Dickinson and Co
1.401% 24/5/2023 2,628,488 0.05EUR 5,700,000 Booking Holdings Inc 0.10%
8/3/2025 5,712,198 0.10USD 5,000,000 Cargo Aircraft Management
Inc 4.75% 1/2/2028 4,199,830 0.07EUR 600,000 Clarios Global LP / Clarios US
Finance Co RegS 4.375%15/5/2026 622,887 0.01
EUR 6,150,000 Coca-Cola Co 0.125%9/3/2029 6,047,172 0.11
USD 6,500,000 Commercial Metals Co 4.875%15/5/2023 5,626,646 0.10
USD 5,310,000 Delta Air Lines ’2019-1 AA’Pass Through Trust 3.204%25/4/2024 4,556,529 0.08
GBP 528,000 Encore Capital Group IncRegS 4.25% 1/6/2028 613,499 0.01
USD 3,577,000 Energy Transfer LP 4.25%15/3/2023 3,086,657 0.05
USD 8,540,000 Energy Transfer LP 5.875%15/1/2024 7,785,722 0.14
USD 2,080,000 Energy Transfer LP 7.60%1/2/2024 1,943,458 0.03
USD 5,231,000 Energy Transfer LP 4.20%15/4/2027 4,714,361 0.08
USD 2,821,000 Energy Transfer LP / RegencyEnergy Finance Corp 4.50%1/11/2023 2,486,534 0.04
EUR 8,450,000 Fidelity National InformationServices Inc 0.125%3/12/2022 8,489,123 0.15
EUR 3,235,000 Fidelity National InformationServices Inc 0.75%21/5/2023 3,287,698 0.06
USD 5,500,000 FirstEnergy Transmission LLC4.35% 15/1/2025 4,902,267 0.09
USD 3,210,000 Flex Intermediate Holdco LLC4.317% 30/12/2039 2,639,463 0.05
USD 17,100,000 Ford Motor Credit Co LLC5.875% 2/8/2021 14,099,365 0.25
USD 19,897,000 Ford Motor Credit Co LLC3.813% 12/10/2021 16,499,402 0.29
USD 19,896,000 Ford Motor Credit Co LLC3.339% 28/3/2022 16,547,385 0.29
USD 6,500,000 Ford Motor Credit Co LLC3.35% 1/11/2022 5,454,665 0.10
USD 6,500,000 Ford Motor Credit Co LLC3.087% 9/1/2023 5,432,669 0.10
GBP 10,269,000 Ford Motor Credit Co LLC4.535% 6/3/2025 12,698,293 0.22
USD 4,000,000 GLP Capital LP / GLP Financ-ing II Inc 5.25% 1/6/2025 3,705,258 0.06
USD 9,000,000 GLP Capital LP / GLP Financ-ing II Inc 5.375% 15/4/2026 8,429,715 0.15
USD 1,000,000 GLP Capital LP / GLP Financ-ing II Inc 5.30% 15/1/2029 947,742 0.02
EUR 9,500,000 Goldman Sachs Group IncRegS FRN 27/7/2021 9,514,060 0.17
EUR 16,150,000 Goldman Sachs Group IncRegS FRN 9/9/2022 16,169,864 0.28
EUR 18,350,000 Goldman Sachs Group IncRegS FRN 21/4/2023 18,391,948 0.32
EUR 9,425,000 Goldman Sachs Group IncRegS FRN 30/4/2024 9,432,257 0.17
BlackRock Fixed Income Strategies Fund continued
Portfolio of Investments as at 31 May 2021
The notes on pages 590 to 610 form an integral part of these financial statements.
Annual report and audited financial statements [339]

Holding Description
MarketValue
EUR
% ofNet
Assets
United States continuedEUR 5,950,000 Goldman Sachs Group Inc
RegS 3.375% 27/3/2025 6,674,234 0.12USD 1,015,000 Gray Oak Pipeline LLC 2.00%
15/9/2023 849,460 0.01USD 7,010,000 Gray Oak Pipeline LLC 2.60%
15/10/2025 5,917,666 0.10USD 2,730,000 Huntsman International LLC
2.95% 15/6/2031 2,251,621 0.04USD 600,000 Hyundai Capital America RegS
6.375% 8/4/2030 631,320 0.01EUR 15,025,000 International Flavors & Fra-
grances Inc 1.80%25/9/2026^ 16,101,842 0.28
GBP 5,330,000 JPMorgan Chase & Co RegSFRN 28/4/2026 6,200,145 0.11
GBP 3,220,000 JPMorgan Chase & Co RegSFRN 28/4/2033 3,750,539 0.07
EUR 500,000 Kronos International Inc RegS3.75% 15/9/2025^ 510,715 0.01
USD 1,345,000 Level 3 Financing Inc 3.75%15/7/2029 1,064,020 0.02
EUR 5,609,000 Levi Strauss & Co 3.375%15/3/2027 5,806,773 0.10
USD 2,895,000 Mid-Atlantic Interstate Trans-mission LLC 4.10%15/5/2028 2,637,126 0.05
EUR 14,700,000 Morgan Stanley FRN26/7/2024 14,930,643 0.26
EUR 24,600,000 Morgan Stanley FRN29/10/2027 24,566,052 0.43
EUR 8,800,000 National Grid North AmericaInc RegS 0.75% 8/8/2023 8,964,824 0.16
USD 2,782,000 Navient Corp 7.25% 25/1/2022 2,365,063 0.04USD 3,718,000 Navient Corp 6.50% 15/6/2022 3,191,251 0.06
USD 21,500,000 NextEra Energy OperatingPartners LP 4.25%15/7/2024 18,687,495 0.33
USD 13,962,000 NGPL PipeCo LLC 4.375%15/8/2022 11,852,001 0.21
USD 7,135,000 Nissan Motor AcceptanceCorp 2.00% 9/3/2026 5,860,851 0.10
USD 3,415,000 Nissan Motor AcceptanceCorp 2.75% 9/3/2028 2,807,385 0.05
USD 14,900,000 Occidental Petroleum Corp10/10/2036 (Zero Coupon) 6,086,117 0.11
USD 12,800,000 Oracle Corp 2.875%25/3/2031 10,741,863 0.19
USD 427,000 Periama Holdings LLC RegS5.95% 19/4/2026 378,179 0.01
EUR 2,000,000 Scientific Games InternationalInc RegS 5.50% 15/2/2026 2,023,980 0.04
USD 365,000 SK Battery America Inc RegS2.125% 26/1/2026 297,143 0.00
USD 750,000 Sprint Spectrum Co LLC /Sprint Spectrum Co II LLC /Sprint Spectrum Co III LLC3.36% 20/9/2021 616,546 0.01
USD 5,000,000 Trans-Allegheny Interstate LineCo 3.85% 1/6/2025 4,431,656 0.08
USD 2,008,633 United Airlines ’2014-1 A’ PassThrough Trust 4.00%11/4/2026 1,711,649 0.03
USD 2,108,498 United Airlines ’2014-2 B’ PassThrough Trust 4.625%3/9/2022 1,765,961 0.03
USD 8,640,030 United Airlines ’2020-1 A’ PassThrough Trust 5.875%15/10/2027 7,824,023 0.14
USD 2,144,805 United Airlines ’2020-1 B’ PassThrough Trust ’B’ 4.875%15/1/2026 1,848,426 0.03
Holding Description
MarketValue
EUR
% ofNet
Assets
United States continuedUSD 13,394,952 United States Treasury Infla-
tion Indexed Bond 1.00%15/2/2048^ 14,149,923 0.25
USD 2,253,006 United States Treasury Infla-tion Indexed Bond 0.25%15/2/2050 2,006,739 0.03
522,147,575 9.20
Total Bonds 4,680,820,333 82.46
EXCHANGE TRADED FUNDSIreland
EUR 133,413 iShares EUR Corp Bond 1-5yrUCITS ETF~^ 14,894,894 0.26
USD 528,076 iShares JP Morgan EM LocalGovernment Bond UCITSETF~^ 24,807,096 0.44
39,701,990 0.70
Total Exchange Traded Funds 39,701,990 0.70
Total Transferable Securities and Money MarketInstruments Admitted to an Official Stock ExchangeListing or Dealt in on Another Regulated Market 4,720,522,323 83.16
Other Transferable Securities and Money Market Instruments
BONDSJapan
JPY 7,891,395 Japanese Government CPILinked Bond 0.10%10/3/2028 60,363 0.00
60,363 0.00
New ZealandNZD 10,240,000 New Zealand Government In-
flation Linked Bond RegS2.50% 20/9/2040 8,347,569 0.15
8,347,569 0.15
United KingdomGBP 950,000 Stonegate Pub Co Financing
Plc RegS 8.00% 13/7/2025 1,149,456 0.02GBP 649,000 Virgin Media Secured Finance
Plc RegS 4.125% 15/8/2030 749,782 0.01
1,899,238 0.03
Total Bonds 10,307,170 0.18
Total Other Transferable Securities and MoneyMarket Instruments 10,307,170 0.18
Collective Investment SchemesIreland
3,596 BlackRock ICS Euro LiquidEnvironmentally AwareFund~ 355,405 0.01
2,248,224 BlackRock ICS Euro LiquidityFund (Dist)~ 222,274,947 3.91
222,630,352 3.92
Total Collective Investment Schemes 222,630,352 3.92
Securities portfolio at market value 4,953,459,845 87.26
Other Net Assets 722,826,913 12.74
Total Net Assets (EUR) 5,676,286,758 100.00
^ All or a portion of this security represents a security on loan.~ Investment in related party fund.
BlackRock Fixed Income Strategies Fund continued
Portfolio of Investments as at 31 May 2021
The notes on pages 590 to 610 form an integral part of these financial statements.
BlackRock Strategic Funds[340]

TypeNominal
Value Description CounterpartyExpiration
date
Net unrealisedappreciation/
(depreciation)EUR
MarketValue
EUR
Financial Derivative Instruments
SWAPS
CCCDS USD 6,750,000Fund receives default protection on Markit
CDX.NA.HY.25 Version 8 and pays Fixed 5.000%Bank of America
Merrill Lynch 20/6/2026 (28,501) (535,645)
CCCDS EUR 26,338,200Fund receives default protection on Markit iTraxx Europe
Crossover Series 30 Version 1 and pays Fixed 5.000%Bank of America
Merrill Lynch 20/6/2026 (73,820) (3,120,654)
CCCDS EUR 282,500,000Fund receives default protection on Markit iTraxx Europe
Series 23 Version 1 and pays Fixed 1.000%Bank of America
Merrill Lynch 20/6/2026 (577,183) (7,153,787)
CCCDS EUR 9,220,000Fund receives default protection on Markit iTraxx Europe Sub
Financials Series 29 Version 1 and pays Fixed 1.000%Bank of America
Merrill Lynch 20/6/2026 (63,970) 37,516
CCCDS USD 30,000,000Fund receives Fixed 1.000% and provides default protection on
Markit iTraxx Asia HJ IG Series 24 Version 1Bank of America
Merrill Lynch 20/6/2026 72,394 173,283
CCILS EUR 25,093,577Fund receives Fixed 1.382% and pays Floating EUR 12 Month
CPTFEBank of America
Merrill Lynch 15/4/2031 (426,376) (425,804)
CCILS USD 21,536,100Fund receives Fixed 2.321% and pays Floating USD 12 Month
USCPIBank of America
Merrill Lynch 25/2/2031 (591,846) (591,442)
CCILS USD 10,280,000Fund receives Fixed 2.338% and pays Floating USD 12 Month
USCPIBank of America
Merrill Lynch 11/3/2031 (261,211) (261,014)
CCILS USD 18,795,000Fund receives Fixed 2.348% and pays Floating USD 12 Month
USCPIBank of America
Merrill Lynch 8/3/2031 (462,961) (462,605)
CCILS USD 19,928,863Fund receives Fixed 2.350% and pays Floating USD 12 Month
USCPIBank of America
Merrill Lynch 5/3/2031 (485,948) (485,572)
CCILS USD 19,928,862Fund receives Fixed 2.354% and pays Floating USD 12 Month
USCPIBank of America
Merrill Lynch 5/3/2031 (478,871) (478,494)
CCILS USD 39,857,725Fund receives Fixed 2.358% and pays Floating USD 12 Month
USCPIBank of America
Merrill Lynch 5/3/2031 (945,354) (944,600)
CCILS USD 39,110,000Fund receives Fixed 2.388% and pays Floating USD 12 Month
USCPIBank of America
Merrill Lynch 17/2/2031 (847,811) (847,074)
CCILS USD 9,505,000Fund receives Fixed 2.432% and pays Floating USD 12 Month
USCPIBank of America
Merrill Lynch 6/5/2051 (115,571) (115,200)
CCILS USD 9,505,000Fund receives Fixed 2.438% and pays Floating USD 12 Month
USCPIBank of America
Merrill Lynch 7/5/2051 (100,156) (99,783)
CCILS USD 18,330,000Fund receives Fixed 2.448% and pays Floating USD 12 Month
USCPIBank of America
Merrill Lynch 29/3/2031 (282,617) (282,263)
CCILS USD 9,180,000Fund receives Fixed 2.474% and pays Floating USD 12 Month
USCPIBank of America
Merrill Lynch 6/4/2031 (117,119) (116,941)
CCILS USD 9,505,000Fund receives Fixed 2.484% and pays Floating USD 12 Month
USCPIBank of America
Merrill Lynch 4/5/2051 29,183 29,552
CCILS USD 9,505,000Fund receives Fixed 2.488% and pays Floating USD 12 Month
USCPIBank of America
Merrill Lynch 4/5/2051 40,431 40,800
CCILS USD 4,860,000Fund receives Fixed 2.505% and pays Floating USD 12 Month
USCPIBank of America
Merrill Lynch 30/3/2031 (49,549) (49,455)
CCILS USD 26,610,000Fund receives Fixed 2.669% and pays Floating USD 12 Month
USCPIBank of America
Merrill Lynch 14/5/2031 189,643 190,145
CCILS GBP 10,695,000Fund receives Fixed 3.202% and pays Floating GBP 12 Month
UKRPIBank of America
Merrill Lynch 15/3/2030 (505,241) (504,973)
CCILS GBP 13,367,500Fund receives Fixed 3.270% and pays Floating GBP 12 Month
UKRPIBank of America
Merrill Lynch 15/3/2030 (499,522) (499,173)
CCILS GBP 5,445,000Fund receives Fixed 3.285% and pays Floating GBP 12 Month
UKRPIBank of America
Merrill Lynch 15/3/2030 (191,569) (191,427)
CCILS GBP 13,367,500Fund receives Fixed 3.290% and pays Floating GBP 12 Month
UKRPIBank of America
Merrill Lynch 15/3/2030 (460,554) (460,205)
CCILS GBP 5,445,000Fund receives Fixed 3.293% and pays Floating GBP 12 Month
UKRPIBank of America
Merrill Lynch 15/3/2030 (185,215) (185,073)
CCILS GBP 25,780,000Fund receives Fixed 3.315% and pays Floating GBP 12 Month
UKRPIBank of America
Merrill Lynch 15/5/2030 (936,763) (936,103)
CCILS GBP 9,360,000Fund receives Fixed 3.340% and pays Floating GBP 12 Month
UKRPIBank of America
Merrill Lynch 15/3/2030 (254,060) (253,816)
CCILS GBP 33,942,000Fund receives Fixed 3.456% and pays Floating GBP 12 Month
UKRPIBank of America
Merrill Lynch 15/7/2030 (1,095,711) (1,094,861)
CCILS GBP 43,112,933Fund receives Fixed 3.475% and pays Floating GBP 12 Month
UKRPIBank of America
Merrill Lynch 15/10/2029 402,125 403,259
CCILS GBP 48,635,000Fund receives Fixed 3.500% and pays Floating GBP 12 Month
UKRPIBank of America
Merrill Lynch 15/9/2030 (963,686) (962,467)
BlackRock Fixed Income Strategies Fund continued
Portfolio of Investments as at 31 May 2021
The notes on pages 590 to 610 form an integral part of these financial statements.
Annual report and audited financial statements [341]

TypeNominal
Value Description CounterpartyExpiration
date
Net unrealisedappreciation/
(depreciation)EUR
MarketValue
EUR
Financial Derivative Instruments
SWAPS
CCILS GBP 22,100,000Fund receives Fixed 3.625% and pays Floating GBP 12 Month
UKRPIBank of America
Merrill Lynch 15/2/2031 (443,623) (443,040)
CCILS GBP 18,765,000Fund receives Fixed 3.640% and pays Floating GBP 12 Month
UKRPIBank of America
Merrill Lynch 15/12/2030 (228,764) (228,296)
CCILS GBP 49,279,000Fund receives Fixed 3.650% and pays Floating GBP 12 Month
UKRPIBank of America
Merrill Lynch 15/4/2031 (828,396) (827,103)
CCILS GBP 27,410,000Fund receives Fixed 3.658% and pays Floating GBP 12 Month
UKRPIBank of America
Merrill Lynch 15/4/2031 (430,229) (429,503)
CCILS GBP 14,340,000Fund receives Fixed 3.700% and pays Floating GBP 12 Month
UKRPIBank of America
Merrill Lynch 15/5/2031 (90,467) (135,654)
CCILS GBP 28,300,000Fund receives Fixed 3.730% and pays Floating GBP 12 Month
UKRPIBank of America
Merrill Lynch 15/5/2031 (126,317) (141,101)
CCILS GBP 7,055,666Fund receives Fixed 3.756% and pays Floating GBP 12 Month
UKRPIBank of America
Merrill Lynch 15/4/2031 (6,997) (6,809)
CCILS GBP 13,851,000Fund receives Fixed 3.758% and pays Floating GBP 12 Month
UKRPIBank of America
Merrill Lynch 15/5/2031 (11,443) (11,077)
CCILS GBP 55,113,000Fund receives Fixed 3.776% and pays Floating GBP 12 Month
UKRPIBank of America
Merrill Lynch 15/9/2028 2,848,482 2,868,169
CCILS GBP 4,617,000Fund receives Fixed 3.790% and pays Floating GBP 12 Month
UKRPIBank of America
Merrill Lynch 15/5/2031 18,332 18,454
CCILS GBP 7,353,000Fund receives Fixed 3.796% and pays Floating GBP 12 Month
UKRPIBank of America
Merrill Lynch 15/5/2031 35,819 36,014
CCILS EUR 100,000,000Fund receives Floating EUR 12 Month CPTFEMU and pays
Fixed 1.122%Bank of America
Merrill Lynch 15/12/2021 (552,941) (552,004)
CCILS GBP 48,635,000Fund receives Floating GBP 12 Month UKRPI and pays Fixed
3.410%Bank of America
Merrill Lynch 15/9/2025 307,737 308,543
CCIRS NOK 424,942,500Fund receives Fixed 0.470% and pays Floating NOK 3 Month
NIBORBank of America
Merrill Lynch 23/11/2022 (174,350) (174,022)
CCIRS NOK 481,601,500Fund receives Fixed 0.470% and pays Floating NOK 3 Month
NIBORBank of America
Merrill Lynch 24/11/2022 (198,661) (198,288)
CCIRS NOK 385,281,200Fund receives Fixed 0.470% and pays Floating NOK 3 Month
NIBORBank of America
Merrill Lynch 25/11/2022 (159,779) (159,482)
CCIRS NOK 732,034,280Fund receives Fixed 0.470% and pays Floating NOK 3 Month
NIBORBank of America
Merrill Lynch 26/11/2022 (308,541) (307,973)
CCIRS NOK 404,545,260Fund receives Fixed 0.475% and pays Floating NOK 3 Month
NIBORBank of America
Merrill Lynch 26/11/2022 (168,535) (168,221)
CCIRS NOK 252,580,000Fund receives Fixed 0.490% and pays Floating NOK 6 Month
NIBORBank of America
Merrill Lynch 2/9/2022 (64,584) (64,393)
CCIRS NOK 404,545,260Fund receives Fixed 0.495% and pays Floating NOK 3 Month
NIBORBank of America
Merrill Lynch 7/12/2022 (167,473) (167,160)
CCIRS CAD 34,529,000Fund receives Fixed 0.780% and pays Floating CAD 3 Month
CDORBank of America
Merrill Lynch 17/11/2023 (98,803) (98,620)
CCIRS CAD 135,166,000Fund receives Fixed 0.780% and pays Floating CAD 3 Month
CDORBank of America
Merrill Lynch 18/11/2023 (393,261) (392,543)
CCIRS CAD 278,995,000Fund receives Fixed 0.809% and pays Floating CAD 3 Month
CDORBank of America
Merrill Lynch 16/11/2023 (741,351) (739,864)
CCIRS CZK 1,476,930,000Fund receives Fixed 1.120% and pays Floating CZK 6 Month
PRIBOBank of America
Merrill Lynch 16/6/2023 (234,860) (234,389)
CCIRS CZK 2,213,370,000Fund receives Fixed 1.170% and pays Floating CZK 6 Month
PRIBOBank of America
Merrill Lynch 16/6/2023 (264,823) (264,117)
CCIRS NZD 10,900,000Fund receives Fixed 1.890% and pays Floating NZD 3 Month
New Zealand Bank Bill RateBank of America
Merrill Lynch 11/5/2031 (63,351) (63,225)
CCIRS HUF 5,359,290,000Fund receives Fixed 2.162% and pays Floating HUF 6 Month
BUBORBank of America
Merrill Lynch 16/6/2026 (104,766) (104,556)
CCIRS AUD 3,617,354Fund receives Floating AUD 6 Month BBSW and pays Fixed
1.676%Bank of America
Merrill Lynch 21/6/2051 306,420 306,507
CCIRS AUD 3,568,919Fund receives Floating AUD 6 Month BBSW and pays Fixed
1.677%Bank of America
Merrill Lynch 21/6/2051 301,795 301,881
CCIRS AUD 3,621,530Fund receives Floating AUD 6 Month BBSW and pays Fixed
1.682%Bank of America
Merrill Lynch 21/6/2051 303,335 303,422
CCIRS AUD 3,809,191Fund receives Floating AUD 6 Month BBSW and pays Fixed
1.685%Bank of America
Merrill Lynch 21/6/2051 317,662 317,754
BlackRock Fixed Income Strategies Fund continued
Portfolio of Investments as at 31 May 2021
The notes on pages 590 to 610 form an integral part of these financial statements.
BlackRock Strategic Funds[342]

TypeNominal
Value Description CounterpartyExpiration
date
Net unrealisedappreciation/
(depreciation)EUR
MarketValue
EUR
Financial Derivative Instruments
SWAPS
CCIRS AUD 3,836,588Fund receives Floating AUD 6 Month BBSW and pays Fixed
1.686%Bank of America
Merrill Lynch 21/6/2051 319,387 319,479
CCIRS AUD 3,577,000Fund receives Floating AUD 6 Month BBSW and pays Fixed
1.708%Bank of America
Merrill Lynch 21/6/2051 286,283 286,369
CCIRS AUD 3,429,252Fund receives Floating AUD 6 Month BBSW and pays Fixed
1.727%Bank of America
Merrill Lynch 21/6/2051 264,942 265,024
CCIRS AUD 4,388,466Fund receives Floating AUD 6 Month BBSW and pays Fixed
2.152%Bank of America
Merrill Lynch 21/6/2051 66,318 66,427
CCIRS AUD 6,651,700Fund receives Floating AUD 6 Month BBSW and pays Fixed
2.172%Bank of America
Merrill Lynch 21/6/2051 81,575 81,739
CCIRS CZK 318,280,000Fund receives Floating CZK 6 Month PRIBO and pays Fixed
1.766%Bank of America
Merrill Lynch 16/6/2031 11,186 11,434
CCIRS CZK 239,180,000Fund receives Floating CZK 6 Month PRIBO and pays Fixed
1.798%Bank of America
Merrill Lynch 16/6/2031 (20,134) (19,948)
CCIRS CZK 239,180,000Fund receives Floating CZK 6 Month PRIBO and pays Fixed
1.809%Bank of America
Merrill Lynch 16/6/2031 (29,944) (29,758)
CCIRS EUR 23,970,000Fund receives Floating EUR 6 Month EURIBOR and pays Fixed
0.032%Bank of America
Merrill Lynch 9/4/2031 212,750 213,211
CCIRS EUR 2,382,000Fund receives Floating EUR 6 Month EURIBOR and pays Fixed
0.172%Bank of America
Merrill Lynch 12/4/2052 244,443 244,533
CCIRS EUR 6,525,000Fund receives Floating EUR 6 Month EURIBOR and pays Fixed
0.473%Bank of America
Merrill Lynch 29/4/2041 46,376 46,594
CCIRS EUR 13,769,797Fund receives Floating EUR 6 Month EURIBOR and pays Fixed
0.533%Bank of America
Merrill Lynch 4/12/2049 (19,363) (18,840)
CCIRS USD 11,990,000Fund receives Floating USD 3 Month LIBOR and pays Fixed
1.570%Bank of America
Merrill Lynch 11/3/2031 (34,614) (34,421)
CCIRS USD 33,400,000Fund receives Floating USD 3 Month LIBOR and pays Fixed
1.650%Bank of America
Merrill Lynch 14/5/2031 (294,558) (267,645)
CCIRS USD 5,740,000Fund receives Floating USD 3 Month LIBOR and pays Fixed
1.680%Bank of America
Merrill Lynch 30/3/2031 (63,234) (63,140)
CCIRS USD 12,000,000Fund receives Floating USD 3 Month LIBOR and pays Fixed
2.860%Bank of America
Merrill Lynch 3/4/2028 (1,090,277) (1,090,082)
CCIRS USD 28,000,000Fund receives Floating USD 3 Month LIBOR and pays Fixed
2.972%Bank of America
Merrill Lynch 10/5/2027 (2,575,059) (2,574,609)
CCIRS USD 5,340,000Fund receives Floating USD 3 Month LIBOR and pays Fixed
2.974%Bank of America
Merrill Lynch 3/5/2028 (520,837) (520,752)
CCIRS USD 1,903,567Fund receives Floating USD 3 Month LIBOR and pays Fixed
3.018%Bank of America
Merrill Lynch 10/5/2028 (190,561) (190,530)
CDS USD 2,000,000Fund receives Fixed 1.000% and provides default protection on
Republic of Italy Bank of America 20/6/2025 109,424 40,621
CDS EUR 1,250,000Fund receives default protection on Glencore Finance Europe
Ltd and pays Fixed 5.000%Bank of America
Merrill Lynch 20/12/2025 (21,930) (220,259)
CDS EUR 250,000Fund receives default protection on Koninklijke KPN NV and
pays Fixed 1.000%Bank of America
Merrill Lynch 20/12/2025 2,388 850
CDS EUR 730,000Fund receives default protection on Renault SA and pays Fixed
1.000%Bank of America
Merrill Lynch 20/6/2026 6,534 38,562
CDS USD 2,000,000Fund receives default protection on Republic of Italy and pays
Fixed 1.000%Bank of America
Merrill Lynch 20/6/2025 (142,322) (22,020)
CDS EUR 144,000Fund receives Fixed 5.000% and provides default protection on
CMA CGM SABank of America
Merrill Lynch 20/6/2026 129 7,450
CDS EUR 260,000Fund receives Fixed 5.000% and provides default protection on
Intrum ABBank of America
Merrill Lynch 20/12/2025 6,986 23,225
CDS USD 180,000Fund receives default protection on Avis Budget Car Rental LLC
/ Avis Budget Finance Inc and pays Fixed 5.000%Barclays Bank
Plc 20/6/2023 (8,524) (11,805)
CDS EUR 9,240,000Fund receives default protection on BASF SE and pays Fixed
1.000%Barclays Bank
Plc 20/6/2021 248,625 (4,784)
CDS EUR 300,000Fund receives default protection on Casino Guichard Perrachon
SA and pays Fixed 5.000%Barclays Bank
Plc 20/6/2021 (8,016) (516)
CDS EUR 180,000Fund receives default protection on Casino Guichard Perrachon
SA and pays Fixed 5.000%Barclays Bank
Plc 20/12/2022 (7,003) (4,303)
CDS EUR 1,000,000Fund receives default protection on Cellnex Telecom SA and
pays Fixed 5.000%Barclays Bank
Plc 20/6/2026 (9,248) (185,035)
BlackRock Fixed Income Strategies Fund continued
Portfolio of Investments as at 31 May 2021
The notes on pages 590 to 610 form an integral part of these financial statements.
Annual report and audited financial statements [343]

TypeNominal
Value Description CounterpartyExpiration
date
Net unrealisedappreciation/
(depreciation)EUR
MarketValue
EUR
Financial Derivative Instruments
SWAPS
CDS EUR 370,000Fund receives default protection on Glencore Finance Europe
Ltd and pays Fixed 5.000%Barclays Bank
Plc 20/12/2025 (957) (65,197)
CDS EUR 1,210,000Fund receives default protection on Jaguar Land Rover
Automotive Plc and pays Fixed 5.000%Barclays Bank
Plc 20/12/2022 (75,975) (54,376)
CDS EUR 300,000Fund receives default protection on Jaguar Land Rover
Automotive PLC and pays Fixed 5.000%Barclays Bank
Plc 20/12/2022 (1,773) (13,482)
CDS EUR 100,000Fund receives default protection on Marks & Spencer Plc and
pays Fixed 1.000%Barclays Bank
Plc 20/6/2022 (3,801) (298)
CDS EUR 250,000Fund receives default protection on Marks & Spencer Plc and
pays Fixed 1.000%Barclays Bank
Plc 20/12/2025 (13,993) 7,500
CDS EUR 750,000Fund receives default protection on Marks & Spencer Plc and
pays Fixed 1.000%Barclays Bank
Plc 20/12/2025 (38,640) 22,500
CDS EUR 1,500,000Fund receives default protection on Nokia Oyj and pays Fixed
5.000%Barclays Bank
Plc 20/6/2026 (18,265) (301,771)
CDS EUR 1,000,000Fund receives default protection on SES SA and pays Fixed
1.000%Barclays Bank
Plc 20/6/2026 (5,511) (8,089)
CDS EUR 250,000Fund receives default protection on Stonegate Pub Co
Financing Plc and pays Fixed 5.000%Barclays Bank
Plc 20/6/2022 (3,350) (4,249)
CDS EUR 750,000Fund receives default protection on Sunrise Communications
Holdings SA and pays Fixed 5.000%Barclays Bank
Plc 20/12/2024 28,124 (129,876)
CDS EUR 9,240,000Fund receives Fixed 1.000% and provides default protection on
Air Liquide SABarclays Bank
Plc 20/6/2021 (248,696) 4,713
CDS EUR 106,555Fund receives Fixed 5.000% and provides default protection on
Altice France SA/FranceBarclays Bank
Plc 20/12/2025 (481) 7,947
CDS EUR 153,445Fund receives Fixed 5.000% and provides default protection on
Altice France SA/FranceBarclays Bank
Plc 20/12/2025 (1,055) 11,445
CDS EUR 360,000Fund receives Fixed 5.000% and provides default protection on
CMA CGM SABarclays Bank
Plc 20/6/2026 92 18,625
CDS EUR 360,000Fund receives Fixed 5.000% and provides default protection on
CMA CGM SABarclays Bank
Plc 20/6/2026 92 18,625
CDS EUR 144,000Fund receives Fixed 5.000% and provides default protection on
Jaguar Land Rover Automotive PlcBarclays Bank
Plc 20/6/2026 1,690 8,713
CDS EUR 216,000Fund receives Fixed 5.000% and provides default protection on
Jaguar Land Rover Automotive PlcBarclays Bank
Plc 20/6/2026 2,548 13,070
CDS EUR 165,000Fund receives Fixed 5.000% and provides default protection on
UPC Holding BVBarclays Bank
Plc 20/6/2026 (1,228) 19,543
CDS EUR 165,000Fund receives Fixed 5.000% and provides default protection on
UPC Holding BVBarclays Bank
Plc 20/6/2026 (1,228) 19,543
CDS EUR 330,000Fund receives Fixed 5.000% and provides default protection on
UPC Holding BVBarclays Bank
Plc 20/6/2026 (2,447) 39,087
CDS EUR 250,000Fund receives Fixed 5.000% and provides default protection on
Ziggo Bond Company BVBarclays Bank
Plc 20/12/2025 (2,836) 29,380
CDS EUR 2,750,000Fund receives default protection on Barclays Bank Plc and pays
Fixed 1.000% BNP Paribas 20/6/2021 (185,403) (1,115)
CDS EUR 66,084Fund receives default protection on Cable Wireless Ltd and
pays Fixed 5.000% BNP Paribas 20/12/2023 4,444 (7,559)
CDS EUR 250,000Fund receives default protection on Koninklijke KPN NV and
pays Fixed 1.000% BNP Paribas 20/12/2025 2,389 850
CDS EUR 160,000Fund receives Fixed 5.000% and provides default protection on
Altice France SA/France BNP Paribas 20/12/2025 (497) 11,934
CDS EUR 220,000Fund receives Fixed 5.000% and provides default protection on
CMA CGM SA BNP Paribas 20/6/2026 1,180 11,382
CDS EUR 250,000Fund receives Fixed 5.000% and provides default protection on
Virgin Media Finance PLC BNP Paribas 20/12/2025 (226) 27,662
CDS USD 240,000Fund receives default protection on Avis Budget Car Rental LLC
/ Avis Budget Finance Inc and pays Fixed 5.000% Citibank 20/6/2022 (20,658) (8,964)
CDS USD 102,857Fund receives default protection on Avis Budget Car Rental LLC
/ Avis Budget Finance Inc and pays Fixed 5.000% Citibank 20/12/2025 (13,527) (10,020)
CDS USD 220,000Fund receives default protection on Avis Budget Car Rental LLC
/ Avis Budget Finance Inc and pays Fixed 5.000% Citibank 20/6/2026 (2,359) (21,453)
CDS USD 470,000Fund receives default protection on Bausch Health Cos Inc and
pays Fixed 5.000% Citibank 20/6/2022 13,628 (16,624)
BlackRock Fixed Income Strategies Fund continued
Portfolio of Investments as at 31 May 2021
The notes on pages 590 to 610 form an integral part of these financial statements.
BlackRock Strategic Funds[344]

TypeNominal
Value Description CounterpartyExpiration
date
Net unrealisedappreciation/
(depreciation)EUR
MarketValue
EUR
Financial Derivative Instruments
SWAPS
CDS USD 720,000Fund receives default protection on Brazilian Government
International Bond and pays Fixed 1.000% Citibank 20/6/2026 (3,095) 20,274
CDS EUR 1,020,000Fund receives default protection on British Telecommunications
Plc and pays Fixed 1.000% Citibank 20/12/2025 (15,807) (19,531)
CDS EUR 500,000Fund receives default protection on Deuchsche Bank AG
London and pays Fixed 1.000% Citibank 20/6/2026 (10,351) 11,582
CDS EUR 510,000Fund receives default protection on Deutsche Lufthansa AG and
pays Fixed 1.000% Citibank 20/6/2023 (24,494) 8,345
CDS EUR 500,000Fund receives default protection on HeidelbergCement AG and
pays Fixed 5.000% Citibank 20/12/2025 9,278 (97,626)
CDS EUR 1,900,000Fund receives default protection on HSBC Holdings Plc and
pays Fixed 1.000% Citibank 20/12/2025 (59,593) (20,709)
CDS EUR 2,370,000Fund receives default protection on Next Group PLC and pays
Fixed 1.000% Citibank 20/6/2026 (16,085) (17,308)
CDS USD 2,764,865Fund receives default protection on Occidental Petroleum Corp
and pays Fixed 1.000% Citibank 20/12/2025 (86,352) 153,228
CDS EUR 500,000Fund receives default protection on Saipem Finance
International BV and pays Fixed 5.000% Citibank 20/6/2026 4,055 (27,577)
CDS JPY 135,676,243Fund receives default protection on SoftBank Group Corp and
pays Fixed 1.000% Citibank 20/6/2026 3,200 33,058
CDS EUR 390,000Fund receives default protection on Stonegate Pub Co
Financing Plc and pays Fixed 5.000% Citibank 20/6/2022 3,799 (6,628)
CDS EUR 250,000Fund receives Fixed 5.000% and provides default protection on
Intrum AB Citibank 20/12/2025 15,956 22,332
CDS EUR 106,560Fund receives Fixed 5.000% and provides default protection on
Vougeot Bidco Plc Citibank 20/12/2025 378 (5,483)
CDS EUR 80,000Fund receives default protection on Jaguar Land Rover
Automotive Plc and pays Fixed 5.000% Credit Suisse 20/12/2024 (3,372) (4,974)
CDS EUR 250,000Fund receives default protection on Stonegate Pub Co
Financing Plc and pays Fixed 5.000% Credit Suisse 20/12/2021 (5,338) (2,838)
CDS EUR 200,000Fund receives default protection on Stonegate Pub Co
Financing Plc and pays Fixed 5.000% Credit Suisse 20/3/2022 1,137 (2,833)
CDS EUR 250,000Fund receives default protection on Stonegate Pub Co
Financing Plc and pays Fixed 5.000% Credit Suisse 20/6/2022 (6,124) (4,249)
CDS EUR 150,000Fund receives default protection on Stonegate Pub Co
Financing Plc and pays Fixed 5.000% Credit Suisse 20/12/2022 (8,599) (2,599)
CDS EUR 270,000Fund receives default protection on Stonegate Pub Co
Financing PLC and pays Fixed 5.000% Credit Suisse 20/12/2022 (10,079) (4,679)
CDS EUR 100,000Fund receives default protection on Sunrise Communications
Holdings SA and pays Fixed 5.000% Credit Suisse 20/12/2024 4,755 (17,317)
CDS EUR 325,000Fund receives Fixed 5.000% and provides default protection on
Altice Finco SA Credit Suisse 20/6/2026 1,349 20,269
CDS EUR 400,000Fund receives Fixed 5.000% and provides default protection on
Altice Finco SA Credit Suisse 20/6/2026 3,173 24,946
CDS EUR 150,000Fund receives Fixed 5.000% and provides default protection on
Altice France SA/France Credit Suisse 20/12/2025 2,994 11,188
CDS EUR 520,000Fund receives Fixed 5.000% and provides default protection on
Altice France SA/France Credit Suisse 20/12/2025 3,190 38,784
CDS EUR 310,000Fund receives Fixed 5.000% and provides default protection on
CMA CGM SA Credit Suisse 20/12/2025 8,773 18,448
CDS EUR 360,000Fund receives Fixed 5.000% and provides default protection on
CMA CGM SA Credit Suisse 20/6/2026 1,401 18,625
CDS EUR 110,000Fund receives Fixed 5.000% and provides default protection on
Jaguar Land Rover Automotive Plc Credit Suisse 20/12/2024 8,672 6,840
CDS EUR 40,000Fund receives Fixed 5.000% and provides default protection on
Jaguar Land Rover Automotive Plc Credit Suisse 20/12/2027 126 2,297
CDS EUR 131,680Fund receives Fixed 5.000% and provides default protection on
Jaguar Land Rover Automotive PLC Credit Suisse 20/12/2027 13,486 7,561
CDS EUR 590,000Fund receives Fixed 5.000% and provides default protection on
Monitchem HoldCo 3 SA Credit Suisse 20/12/2025 7,655 63,163
CDS EUR 160,000Fund receives Fixed 5.000% and provides default protection on
Novafives SAS Credit Suisse 20/12/2025 6,764 (17,636)
BlackRock Fixed Income Strategies Fund continued
Portfolio of Investments as at 31 May 2021
The notes on pages 590 to 610 form an integral part of these financial statements.
Annual report and audited financial statements [345]

TypeNominal
Value Description CounterpartyExpiration
date
Net unrealisedappreciation/
(depreciation)EUR
MarketValue
EUR
Financial Derivative Instruments
SWAPS
CDS EUR 204,000Fund receives Fixed 5.000% and provides default protection on
Unilabs Subholding AB Credit Suisse 20/6/2026 106 30,990
CDS EUR 136,000Fund receives Fixed 5.000% and provides default protection on
Unilabs Subholding AB Credit Suisse 20/6/2026 466 20,660
CDS EUR 570,000Fund receives Fixed 5.000% and provides default protection on
Ziggo Bond Co BV Credit Suisse 20/12/2025 (4,030) 66,987
CDS EUR 500,000Fund receives Fixed 5.000% and provides default protection on
Ziggo Bond Company BV Credit Suisse 20/12/2025 (4,383) 58,761
CDS EUR 4,925,000Fund receives Fixed 1.000% and provides default protection on
Markit iTraxx Europe Series 23 Version 1
Deutsche AssetManagement
Life 20/12/2021 (43,772) 25,825
CDS EUR 317,822Fund receives default protection on Koninklijke KPN NV and
pays Fixed 1.000% Deutsche Bank 20/6/2026 5,694 2,905
CDS EUR 150,000Fund receives default protection on Marks & Spencer Plc and
pays Fixed 1.000% Deutsche Bank 20/6/2022 (4,713) (447)
CDS EUR 640,000Fund receives Fixed 1.000% and provides default protection on
Credit Suisse Group Finance Deutsche Bank 20/6/2026 2,888 12,859
CDS EUR 640,000Fund receives Fixed 1.000% and provides default protection on
Credit Suisse Group Finance Deutsche Bank 20/6/2026 3,224 12,859
CDS USD 220,000Fund receives default protection on Ally Finl Inc and pays Fixed
5.000% Goldman Sachs 20/6/2023 1,104 (16,881)
CDS USD 266,766Fund receives default protection on Ashland LLC and pays
Fixed 5.000% Goldman Sachs 20/12/2025 5,621 (39,589)
CDS USD 300,000Fund receives default protection on Avis Budget Car Rental LLC
/ Avis Budget Finance Inc and pays Fixed 5.000% Goldman Sachs 20/6/2023 (26,707) (19,674)
CDS EUR 470,000Fund receives default protection on BP Capital Markets Plc and
pays Fixed 1.000% Goldman Sachs 20/12/2025 (9,492) (10,462)
CDS EUR 92,518Fund receives default protection on Cable Wireless Ltd and
pays Fixed 5.000% Goldman Sachs 20/12/2023 6,793 (10,583)
CDS EUR 76,250Fund receives default protection on Cable Wireless Ltd and
pays Fixed 5.000% Goldman Sachs 20/12/2023 4,914 (8,722)
CDS USD 280,000Fund receives default protection on Carnival Corp and pays
Fixed 1.000% Goldman Sachs 20/12/2021 (15,016) 506
CDS EUR 100,000Fund receives default protection on Casino Guichard Perrachon
SA and pays Fixed 5.000% Goldman Sachs 20/6/2021 (2,422) (172)
CDS EUR 160,000Fund receives default protection on Casino Guichard Perrachon
SA and pays Fixed 5.000% Goldman Sachs 20/12/2023 (221) (2,292)
CDS EUR 1,629,000Fund receives default protection on CNH Industrial NV and pays
Fixed 5.000% Goldman Sachs 20/6/2025 (86,522) (286,476)
CDS EUR 100,000Fund receives default protection on Crown European Holdings
SA and pays Fixed 5.000% Goldman Sachs 20/6/2025 1,518 (15,165)
CDS EUR 855,000Fund receives default protection on Electricite de France SA
and pays Fixed 1.000% Goldman Sachs 20/6/2026 1,746 (21,859)
CDS USD 3,900,000Fund receives default protection on ERP Operating LP and
pays Fixed 1.000% Goldman Sachs 20/12/2025 (8,940) (90,945)
CDS EUR 800,000Fund receives default protection on ITV Plc and pays Fixed
5.000% Goldman Sachs 20/12/2025 (17,407) (147,140)
CDS EUR 2,300,000Fund receives default protection on LANXESS AG and pays
Fixed 1.000% Goldman Sachs 20/6/2026 1,587 (52,577)
CDS EUR 106,550Fund receives default protection on Marks & Spencer PLC and
pays Fixed 1.000% Goldman Sachs 20/12/2025 (5,786) 3,197
CDS USD 1,885,135Fund receives default protection on Occidental Petroleum Corp
and pays Fixed 1.000% Goldman Sachs 20/12/2025 (65,994) 104,474
CDS EUR 230,000Fund receives default protection on Ses SA and pays Fixed
1.000% Goldman Sachs 20/6/2025 (9,592) (3,086)
CDS EUR 200,000Fund receives default protection on Ses SA and pays Fixed
1.000% Goldman Sachs 20/6/2025 (7,154) (2,684)
CDS EUR 200,000Fund receives default protection on Standard Chartered Plc and
pays Fixed 1.000% Goldman Sachs 20/6/2024 (7,316) (2,371)
CDS EUR 200,000Fund receives Fixed 5.000% and provides default protection on
Monitchem HoldCo 3 SA Goldman Sachs 20/6/2026 1,015 21,978
BlackRock Fixed Income Strategies Fund continued
Portfolio of Investments as at 31 May 2021
The notes on pages 590 to 610 form an integral part of these financial statements.
BlackRock Strategic Funds[346]

TypeNominal
Value Description CounterpartyExpiration
date
Net unrealisedappreciation/
(depreciation)EUR
MarketValue
EUR
Financial Derivative Instruments
SWAPS
CDS EUR 153,440Fund receives Fixed 5.000% and provides default protection on
Vertical Holdco GmbH Goldman Sachs 20/12/2026 8,046 10,234
CDS EUR 2,280,000Fund receives default protection on Altice France Holding SA
and pays Fixed 5.000% JP Morgan 20/6/2021 52,862 (5,601)
CDS EUR 1,000,000Fund receives default protection on Altice France Holding SA
and pays Fixed 5.000% JP Morgan 20/6/2021 22,975 (2,457)
CDS EUR 190,000Fund receives default protection on Altice Luxembourg SA and
pays Fixed 5.000% JP Morgan 20/6/2021 10,440 (467)
CDS EUR 180,000Fund receives default protection on Altice Luxembourg SA and
pays Fixed 5.000% JP Morgan 20/6/2022 (2,562) (7,603)
CDS USD 2,500,000Fund receives default protection on American Electric Power Co
Inc and pays Fixed 1.000% JP Morgan 20/6/2025 17,882 (60,616)
CDS EUR 1,010,000Fund receives default protection on Auchan Holding SA and
pays Fixed 1.000% JP Morgan 20/6/2026 (10,090) (13,015)
CDS USD 102,857Fund receives default protection on Avis Budget Car Rental LLC
/ Avis Budget Finance Inc and pays Fixed 5.000% JP Morgan 20/12/2025 (13,965) (10,020)
CDS EUR 5,000,000Fund receives default protection on Barclays Plc and pays Fixed
1.000% JP Morgan 20/12/2025 (76,756) (107,984)
CDS EUR 5,000,000Fund receives default protection on Barclays Plc and pays Fixed
1.000% JP Morgan 20/12/2025 (74,183) (107,984)
CDS EUR 1,140,000Fund receives default protection on Cellnex Telecom SA and
pays Fixed 5.000% JP Morgan 20/6/2026 (11,501) (210,940)
CDS EUR 1,000,000Fund receives default protection on Clariant AG and pays Fixed
1.000% JP Morgan 20/6/2026 (7,486) (12,201)
CDS EUR 1,685,000Fund receives default protection on CNH Industrial Finance
Europe SA and pays Fixed 5.000% JP Morgan 20/6/2025 (89,496) (296,324)
CDS EUR 1,686,000Fund receives default protection on CNH Industrial NV and pays
Fixed 5.000% JP Morgan 20/6/2025 (94,508) (296,500)
CDS USD 2,500,000Fund receives default protection on Dominion Energy Inc and
pays Fixed 1.000% JP Morgan 20/6/2025 4,902 (58,959)
CDS USD 2,500,000Fund receives default protection on Exelon Corp and pays Fixed
1.000% JP Morgan 20/6/2025 20,882 (60,773)
CDS EUR 260,000Fund receives default protection on INEOS Group Holdings SA
and pays Fixed 5.000% JP Morgan 20/12/2025 (4,687) (30,992)
CDS EUR 255,000Fund receives default protection on Koninklijke KPN NV and
pays Fixed 1.000% JP Morgan 20/12/2025 (1,290) 867
CDS EUR 255,000Fund receives default protection on Koninklijke KPN NV and
pays Fixed 1.000% JP Morgan 20/12/2025 (1,037) 867
CDS EUR 5,000,000Fund receives default protection on Lloyds Banking Group Plc
and pays Fixed 1.000% JP Morgan 20/12/2025 (78,620) (134,806)
CDS EUR 5,000,000Fund receives default protection on Lloyds Banking Group Plc
and pays Fixed 1.000% JP Morgan 20/12/2025 (76,057) (134,806)
CDS EUR 163,000Fund receives default protection on Novafives SAS and pays
Fixed 5.000% JP Morgan 20/12/2022 (2,282) 4,238
CDS EUR 535,000Fund receives default protection on Publicis Groupe SA and
pays Fixed 1.000% JP Morgan 20/12/2025 (3,776) (11,421)
CDS EUR 535,000Fund receives default protection on Publicis Groupe SA and
pays Fixed 1.000% JP Morgan 20/12/2025 (5,373) (11,421)
CDS USD 4,020,000Fund receives default protection on Republic of Italy and pays
Fixed 1.000% JP Morgan 20/12/2024 (120,118) (46,238)
CDS USD 660,000Fund receives default protection on Republic of South Africa
Government International Bond and pays Fixed 1.000% JP Morgan 20/6/2026 (10,684) 23,439
CDS EUR 5,000,000Fund receives default protection on Royal Bank of Scotland Plc
and pays Fixed 1.000% JP Morgan 20/12/2025 (73,213) (114,924)
CDS EUR 5,000,000Fund receives default protection on Royal Bank of Scotland Plc
and pays Fixed 1.000% JP Morgan 20/12/2025 (70,644) (114,924)
CDS EUR 500,000Fund receives default protection on Santander Issuances and
pays Fixed 1.000% JP Morgan 20/12/2025 (18,360) 687
CDS JPY 95,893,757Fund receives default protection on SoftBank Group Corp and
pays Fixed 1.000% JP Morgan 20/6/2026 2,621 23,365
CDS USD 2,500,000Fund receives default protection on Southern Co/The and pays
Fixed 1.000% JP Morgan 20/6/2025 25,121 (56,534)
BlackRock Fixed Income Strategies Fund continued
Portfolio of Investments as at 31 May 2021
The notes on pages 590 to 610 form an integral part of these financial statements.
Annual report and audited financial statements [347]

TypeNominal
Value Description CounterpartyExpiration
date
Net unrealisedappreciation/
(depreciation)EUR
MarketValue
EUR
Financial Derivative Instruments
SWAPS
CDS EUR 200,000Fund receives default protection on Standard Chartered Plc and
pays Fixed 1.000% JP Morgan 20/6/2024 (7,035) (2,371)
CDS EUR 1,720,000Fund receives default protection on Sudzucker International
Finance BV and pays Fixed 1.000% JP Morgan 20/6/2026 (13,833) (2,800)
CDS USD 2,500,000Fund receives default protection on United Parcel Service of
America Inc and pays Fixed 1.000% JP Morgan 20/6/2025 12,972 (66,577)
CDS USD 4,020,000Fund receives Fixed 1.000% and provides default protection on
Republic of Italy JP Morgan 20/12/2024 72,326 75,748
CDS EUR 520,000Fund receives Fixed 1.000% and provides default protection on
thyssenkrupp AG JP Morgan 20/12/2025 (6,597) (36,183)
CDS EUR 220,000Fund receives Fixed 5.000% and provides default protection on
Adler Real Estate AG JP Morgan 20/6/2025 30,186 27,834
CDS EUR 60,000Fund receives Fixed 5.000% and provides default protection on
Adler Real Estate AG JP Morgan 20/6/2025 6,135 7,591
CDS EUR 520,000Fund receives Fixed 5.000% and provides default protection on
ADLER Real Estate AG JP Morgan 20/12/2025 (4,036) 69,649
CDS EUR 325,000Fund receives Fixed 5.000% and provides default protection on
Altice Finco SA JP Morgan 20/6/2026 (529) 20,269
CDS EUR 180,000Fund receives Fixed 5.000% and provides default protection on
Altice Finco SA JP Morgan 20/6/2026 1,638 11,226
CDS EUR 240,000Fund receives Fixed 5.000% and provides default protection on
Altice France SA/France JP Morgan 20/12/2025 770 17,900
CDS EUR 300,000Fund receives Fixed 5.000% and provides default protection on
Altice France SA/France JP Morgan 20/12/2025 963 22,375
CDS EUR 261,000Fund receives Fixed 5.000% and provides default protection on
Altice France SA/France JP Morgan 20/12/2025 459 19,467
CDS EUR 330,000Fund receives Fixed 5.000% and provides default protection on
Cirsa Finance International Sarl JP Morgan 20/6/2026 11,788 7,539
CDS EUR 277,122Fund receives Fixed 5.000% and provides default protection on
Cirsa Finance International Sarl JP Morgan 20/6/2026 8,115 6,331
CDS EUR 132,000Fund receives Fixed 5.000% and provides default protection on
Cirsa Finance International Sarl JP Morgan 20/6/2026 3,016 3,016
CDS EUR 330,000Fund receives Fixed 5.000% and provides default protection on
CMA CGM SA JP Morgan 20/12/2025 5,860 19,638
CDS EUR 400,000Fund receives Fixed 5.000% and provides default protection on
Novafives SAS JP Morgan 20/12/2025 8,910 (44,090)
CDS EUR 170,000Fund receives Fixed 5.000% and provides default protection on
Virgin Media Finance Plc JP Morgan 20/12/2025 854 18,810
CDS EUR 210,000Fund receives Fixed 5.000% and provides default protection on
Virgin Media Finance PLC JP Morgan 20/12/2025 700 23,236
CDS EUR 270,000Fund receives Fixed 5.000% and provides default protection on
Virgin Media Finance PLC JP Morgan 20/6/2026 521 29,511
CDS EUR 350,000Fund receives Fixed 5.000% and provides default protection on
Ziggo Bond Co BV JP Morgan 20/6/2025 (4,228) 41,103
CDS EUR 250,000Fund receives Fixed 5.000% and provides default protection on
Ziggo Bond Co BV JP Morgan 20/12/2025 (2,011) 29,380
CDS EUR 200,000Fund receives Fixed 5.000% and provides default protection on
Ziggo Bond Co BV JP Morgan 20/6/2026 (609) 23,520
CDS EUR 250,000Fund receives Fixed 5.000% and provides default protection on
Ziggo Bond Co BV JP Morgan 20/12/2027 (1,499) 26,139
CDS USD 3,900,000Fund receives default protection on Altria Group Inc and pays
Fixed 1.000% Morgan Stanley 20/12/2025 35,951 (69,640)
CDS USD 154,286Fund receives default protection on Avis Budget Car Rental LLC
/ Avis Budget Finance Inc and pays Fixed 5.000% Morgan Stanley 20/12/2025 (19,961) (15,030)
CDS USD 2,500,000Fund receives default protection on Cardinal Health Inc and
pays Fixed 1.000% Morgan Stanley 20/6/2025 14,917 (43,757)
CDS EUR 400,000Fund receives default protection on Casino Guichard Perrachon
SA and pays Fixed 5.000% Morgan Stanley 20/12/2021 (5,170) (7,076)
CDS EUR 220,000Fund receives default protection on Deutsche Bank AG and
pays Fixed 1.000% Morgan Stanley 20/12/2021 (16,095) (870)
CDS USD 2,500,000Fund receives default protection on DR Horton Inc and pays
Fixed 1.000% Morgan Stanley 20/6/2025 18,294 (53,910)
BlackRock Fixed Income Strategies Fund continued
Portfolio of Investments as at 31 May 2021
The notes on pages 590 to 610 form an integral part of these financial statements.
BlackRock Strategic Funds[348]
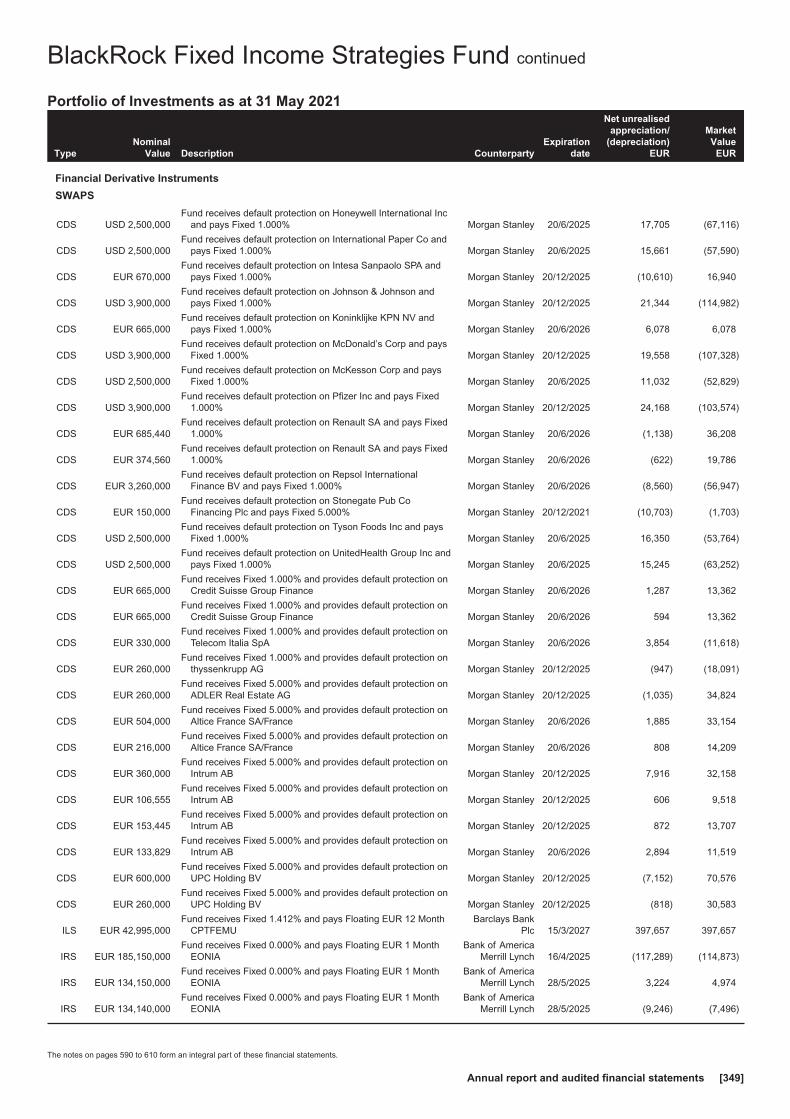
TypeNominal
Value Description CounterpartyExpiration
date
Net unrealisedappreciation/
(depreciation)EUR
MarketValue
EUR
Financial Derivative Instruments
SWAPS
CDS USD 2,500,000Fund receives default protection on Honeywell International Inc
and pays Fixed 1.000% Morgan Stanley 20/6/2025 17,705 (67,116)
CDS USD 2,500,000Fund receives default protection on International Paper Co and
pays Fixed 1.000% Morgan Stanley 20/6/2025 15,661 (57,590)
CDS EUR 670,000Fund receives default protection on Intesa Sanpaolo SPA and
pays Fixed 1.000% Morgan Stanley 20/12/2025 (10,610) 16,940
CDS USD 3,900,000Fund receives default protection on Johnson & Johnson and
pays Fixed 1.000% Morgan Stanley 20/12/2025 21,344 (114,982)
CDS EUR 665,000Fund receives default protection on Koninklijke KPN NV and
pays Fixed 1.000% Morgan Stanley 20/6/2026 6,078 6,078
CDS USD 3,900,000Fund receives default protection on McDonald’s Corp and pays
Fixed 1.000% Morgan Stanley 20/12/2025 19,558 (107,328)
CDS USD 2,500,000Fund receives default protection on McKesson Corp and pays
Fixed 1.000% Morgan Stanley 20/6/2025 11,032 (52,829)
CDS USD 3,900,000Fund receives default protection on Pfizer Inc and pays Fixed
1.000% Morgan Stanley 20/12/2025 24,168 (103,574)
CDS EUR 685,440Fund receives default protection on Renault SA and pays Fixed
1.000% Morgan Stanley 20/6/2026 (1,138) 36,208
CDS EUR 374,560Fund receives default protection on Renault SA and pays Fixed
1.000% Morgan Stanley 20/6/2026 (622) 19,786
CDS EUR 3,260,000Fund receives default protection on Repsol International
Finance BV and pays Fixed 1.000% Morgan Stanley 20/6/2026 (8,560) (56,947)
CDS EUR 150,000Fund receives default protection on Stonegate Pub Co
Financing Plc and pays Fixed 5.000% Morgan Stanley 20/12/2021 (10,703) (1,703)
CDS USD 2,500,000Fund receives default protection on Tyson Foods Inc and pays
Fixed 1.000% Morgan Stanley 20/6/2025 16,350 (53,764)
CDS USD 2,500,000Fund receives default protection on UnitedHealth Group Inc and
pays Fixed 1.000% Morgan Stanley 20/6/2025 15,245 (63,252)
CDS EUR 665,000Fund receives Fixed 1.000% and provides default protection on
Credit Suisse Group Finance Morgan Stanley 20/6/2026 1,287 13,362
CDS EUR 665,000Fund receives Fixed 1.000% and provides default protection on
Credit Suisse Group Finance Morgan Stanley 20/6/2026 594 13,362
CDS EUR 330,000Fund receives Fixed 1.000% and provides default protection on
Telecom Italia SpA Morgan Stanley 20/6/2026 3,854 (11,618)
CDS EUR 260,000Fund receives Fixed 1.000% and provides default protection on
thyssenkrupp AG Morgan Stanley 20/12/2025 (947) (18,091)
CDS EUR 260,000Fund receives Fixed 5.000% and provides default protection on
ADLER Real Estate AG Morgan Stanley 20/12/2025 (1,035) 34,824
CDS EUR 504,000Fund receives Fixed 5.000% and provides default protection on
Altice France SA/France Morgan Stanley 20/6/2026 1,885 33,154
CDS EUR 216,000Fund receives Fixed 5.000% and provides default protection on
Altice France SA/France Morgan Stanley 20/6/2026 808 14,209
CDS EUR 360,000Fund receives Fixed 5.000% and provides default protection on
Intrum AB Morgan Stanley 20/12/2025 7,916 32,158
CDS EUR 106,555Fund receives Fixed 5.000% and provides default protection on
Intrum AB Morgan Stanley 20/12/2025 606 9,518
CDS EUR 153,445Fund receives Fixed 5.000% and provides default protection on
Intrum AB Morgan Stanley 20/12/2025 872 13,707
CDS EUR 133,829Fund receives Fixed 5.000% and provides default protection on
Intrum AB Morgan Stanley 20/6/2026 2,894 11,519
CDS EUR 600,000Fund receives Fixed 5.000% and provides default protection on
UPC Holding BV Morgan Stanley 20/12/2025 (7,152) 70,576
CDS EUR 260,000Fund receives Fixed 5.000% and provides default protection on
UPC Holding BV Morgan Stanley 20/12/2025 (818) 30,583
ILS EUR 42,995,000Fund receives Fixed 1.412% and pays Floating EUR 12 Month
CPTFEMUBarclays Bank
Plc 15/3/2027 397,657 397,657
IRS EUR 185,150,000Fund receives Fixed 0.000% and pays Floating EUR 1 Month
EONIABank of America
Merrill Lynch 16/4/2025 (117,289) (114,873)
IRS EUR 134,150,000Fund receives Fixed 0.000% and pays Floating EUR 1 Month
EONIABank of America
Merrill Lynch 28/5/2025 3,224 4,974
IRS EUR 134,140,000Fund receives Fixed 0.000% and pays Floating EUR 1 Month
EONIABank of America
Merrill Lynch 28/5/2025 (9,246) (7,496)
BlackRock Fixed Income Strategies Fund continued
Portfolio of Investments as at 31 May 2021
The notes on pages 590 to 610 form an integral part of these financial statements.
Annual report and audited financial statements [349]

TypeNominal
Value Description CounterpartyExpiration
date
Net unrealisedappreciation/
(depreciation)EUR
MarketValue
EUR
Financial Derivative Instruments
SWAPS
IRS EUR 32,470,689Fund receives Fixed -0.012% and pays Floating EUR 6 Month
LIBORBank of America
Merrill Lynch 4/3/2031 (406,724) (406,100)
IRS USD 5,000,000Fund receives Fixed 0.056% and pays Floating USD 6 Month
LIBOR SONIA FEDL SOFRBank of America
Merrill Lynch 20/10/2022 670 670
IRS USD 2,500,000Fund receives Fixed 0.176% and pays Floating USD 6 Month
LIBOR SONIA FEDL SOFRBank of America
Merrill Lynch 20/10/2025 (32,998) (32,998)
IRS EUR 92,575,000Fund receives Fixed -0.236% and pays Floating EUR 1 Month
EONIABank of America
Merrill Lynch 22/4/2025 (16,813) (15,604)
IRS EUR 92,575,000Fund receives Fixed -0.266% and pays Floating EUR 1 Month
EONIABank of America
Merrill Lynch 29/4/2025 (47,517) (46,309)
IRS EUR 185,130,000Fund receives Fixed -0.303% and pays Floating EUR 1 Month
EONIABank of America
Merrill Lynch 9/4/2025 (148,925) (149,069)
IRS GBP 32,060,000Fund receives Fixed 0.766% and pays Floating GBP 12 Month
SONIABank of America
Merrill Lynch 7/4/2031 14,144 451
IRS GBP 640,000Fund receives Fixed 0.786% and pays Floating GBP 12 Month
SONIABank of America
Merrill Lynch 31/3/2031 1,494 1,509
IRS GBP 63,960,000Fund receives Fixed 0.800% and pays Floating GBP 12 Month
SONIABank of America
Merrill Lynch 7/12/2030 152,738 154,166
IRS EUR 4,570,000Fund receives Floating EUR 6 Month LIBOR and pays Fixed
0.000%Bank of America
Merrill Lynch 25/9/2050 679,324 679,498
IRS EUR 4,730,000Fund receives Floating EUR 6 Month LIBOR and pays Fixed
0.000%Bank of America
Merrill Lynch 25/9/2050 703,774 703,954
IRS EUR 7,450,000Fund receives Floating EUR 6 Month LIBOR and pays Fixed
-0.018%Bank of America
Merrill Lynch 21/1/2061 1,373,145 1,373,428
IRS EUR 6,944,000Fund receives Floating EUR 6 Month LIBOR and pays Fixed
-0.025%Bank of America
Merrill Lynch 21/1/2061 1,297,186 1,297,449
IRS EUR 26,519,000Fund receives Floating EUR 6 Month LIBOR and pays Fixed
-0.144%Bank of America
Merrill Lynch 22/10/2031 840,337 840,870
IRS EUR 14,886,000Fund receives Floating EUR 6 Month LIBOR and pays Fixed
-0.234%Bank of America
Merrill Lynch 14/1/2031 492,183 492,469
IRS EUR 64,941,378Fund receives Floating EUR 6 Month LIBOR and pays Fixed
-0.336%Bank of America
Merrill Lynch 4/3/2026 202,896 203,744
IRS EUR 8,900,000Fund receives Floating EUR 6 Month LIBOR and pays Fixed
-0.357%Bank of America
Merrill Lynch 21/1/2028 141,756 141,901
IRS GBP 31,628,000Fund receives Floating GBP 12 Month CPTFEMU and pays
Fixed 0.440%Bank of America
Merrill Lynch 15/6/2022 (142,676) (142,366)
IRS GBP 19,677,000Fund receives Floating GBP 12 Month SONIA and pays Fixed
-0.043%Bank of America
Merrill Lynch 15/12/2025 469,989 470,274
IRS GBP 17,266,000Fund receives Floating GBP 12 Month SONIA and pays Fixed
0.092%Bank of America
Merrill Lynch 10/12/2026 474,142 447,314
IRS GBP 11,740,000Fund receives Floating GBP 12 Month SONIA and pays Fixed
0.933%Bank of America
Merrill Lynch 7/4/2051 9,961 (18,908)
IRS GBP 250,000Fund receives Floating GBP 12 Month SONIA and pays Fixed
0.947%Bank of America
Merrill Lynch 31/3/2051 (1,459) (1,448)
IRS GBP 7,525,000Fund receives Floating GBP 6 Month LIBOR SONIO and pays
Fixed 0.168%Bank of America
Merrill Lynch 24/11/2026 156,665 155,506
IRS USD 5,000,000Fund receives Floating USD 6 Month LIBOR SONIA FEDL and
pays Fixed 0.051%Bank of America
Merrill Lynch 20/10/2022 2,475 2,475
IRS USD 2,500,000Fund receives Floating USD 6 Month LIBOR SONIA FEDL and
pays Fixed 0.182%Bank of America
Merrill Lynch 20/10/2025 35,894 35,894
TRS EUR 12,021Fund receives 3 Month EURIBOR and pays iBoxx EUR Liquid
High Yield IndexBarclays Bank
Plc 20/9/2021 (20,272) (22,502)
TRS EUR 13,750Fund receives 3 Month EURIBOR and pays iBoxx EUR Liquid
High Yield IndexBarclays Bank
Plc 20/9/2021 (25,666) (28,214)
TRS EUR 700,000 Fund receives 1 Month LIBOR and pays Altice Finco SA Credit Suisse 13/1/2023 (4,898) (4,898)
TRS EUR 250,000 Fund receives 1 Month LIBOR and pays Altice Finco SA Credit Suisse 16/1/2023 (1,716) (1,716)
TRS EUR 333,000 Fund receives 1 Month LIBOR and pays ams AG Credit Suisse 12/12/2022 (1,153) (1,153)
TRS EUR 167,000 Fund receives 1 Month LIBOR and pays ams AG Credit Suisse 12/12/2022 (578) (578)
TRS EUR 300,000 Fund receives 1 Month LIBOR and pays ams AG Credit Suisse 9/3/2023 (4,524) (4,524)
TRS EUR 300,000 Fund receives 1 Month LIBOR and pays ams AG Credit Suisse 9/3/2023 (5,004) (5,004)
TRS EUR 200,000 Fund receives 1 Month LIBOR and pays ams AG Credit Suisse 9/3/2023 (3,776) (3,776)
BlackRock Fixed Income Strategies Fund continued
Portfolio of Investments as at 31 May 2021
The notes on pages 590 to 610 form an integral part of these financial statements.
BlackRock Strategic Funds[350]

TypeNominal
Value Description CounterpartyExpiration
date
Net unrealisedappreciation/
(depreciation)EUR
MarketValue
EUR
Financial Derivative Instruments
SWAPS
TRS EUR 200,000 Fund receives 1 Month LIBOR and pays ams AG Credit Suisse 9/3/2023 (3,276) (3,276)
TRS EUR 900,000 Fund receives 1 Month LIBOR and pays ARD Finance SA Credit Suisse 22/11/2021 (50,616) (50,616)
TRS EUR 1,000,000 Fund receives 1 Month LIBOR and pays Banijay Group SAS Credit Suisse 9/3/2023 (57,045) (57,045)
TRS USD 500,000 Fund receives 1 Month LIBOR and pays BNP Paribas SA Credit Suisse 10/3/2023 (13,776) (13,776)
TRS EUR 391,000 Fund receives 1 Month LIBOR and pays Eircom Finance Dac Credit Suisse 18/10/2021 1,765 1,765
TRS EUR 200,000 Fund receives 1 Month LIBOR and pays Eircom Finance Dac Credit Suisse 18/10/2021 753 753
TRS EUR 500,000Fund receives 1 Month LIBOR and pays INEOS Quattro
Finance 1 Plc Credit Suisse 1/2/2023 (11,103) (11,103)
TRS EUR 1,000,000Fund receives 1 Month LIBOR and pays INEOS Quattro
Finance 2 Plc Credit Suisse 1/2/2023 (14,799) (14,799)
TRS GBP 190,000Fund receives 1 Month LIBOR and pays TALKTALK Telecom
Group Plc Credit Suisse 7/3/2022 504 504
TRS GBP 20,000Fund receives 1 Month LIBOR and pays TALKTALK Telecom
Group Plc Credit Suisse 7/3/2022 (5) (5)
TRS EUR 200,000 Fund receives 1 Month LIBOR and pays Vivendi SE Credit Suisse 17/3/2023 (86) (86)
TRS EUR 400,000Fund receives Fixed 0.000% and pays BanCo Bilbao Vizcaya
Argentaria JP Morgan 16/8/2021 (62,929) (62,929)
TRS EUR 400,000Fund receives Fixed 0.000% and pays Cooperatieve Rabobank
UA JP Morgan 16/8/2021 (47,846) (47,846)
TRS EUR 300,000 Fund receives Fixed 0.000% and pays Ericom Finance Dac JP Morgan 10/1/2022 1,725 1,725
TRS EUR 132,000 Fund receives Fixed 0.000% and pays Ericom Finance Dac JP Morgan 19/4/2022 181 180
TRS EUR 198,000 Fund receives Fixed 0.000% and pays Ericom Finance Dac JP Morgan 25/4/2022 (643) (643)
TRS EUR 1,000,000 Fund receives Fixed 0.000% and pays Orange SA JP Morgan 14/6/2022 3,845 3,845
TRS EUR 350,000 Fund receives Fixed 0.000% and pays SES SA JP Morgan 21/6/2022 (1,664) (1,664)
TRS EUR 350,000 Fund receives Fixed 0.000% and pays SES SA JP Morgan 24/6/2022 (1,995) (1,995)
TRS EUR 300,000 Fund receives Fixed 0.000% and pays Vivendi SA JP Morgan 21/6/2022 (2,229) (2,229)
TRS EUR 300,000 Fund receives Fixed 0.000% and pays Vivendi SA JP Morgan 24/6/2022 (2,501) (2,501)
TRS EUR 800,000 Fund receives Fixed 0.000% and pays Vivendi SE JP Morgan 19/4/2022 (321) (321)
TRS EUR 300,000 Fund receives Fixed 0.000% and pays ARD Finance SA
JP MorganChase Bank
(Depository Cle) 4/2/2022 (6,172) (6,172)
TRS EUR 228,000 Fund receives Fixed 0.000% and pays Ericom Finance Dac
JP MorganChase Bank
(Depository Cle) 30/12/2021 (2,908) (2,908)
TRS EUR 100,000 Fund receives Fixed 0.000% and pays Ineos Finance Plc
JP MorganChase Bank
(Depository Cle) 16/7/2021 (4,004) (4,004)
TRS EUR 250,000 Fund receives Fixed 0.000% and pays Ineos Finance Plc
JP MorganChase Bank
(Depository Cle) 13/9/2021 (7,889) (7,889)
TRS EUR 500,000 Fund receives Fixed 0.000% and pays Ryanair DAC
JP MorganChase Bank
(Depository Cle) 30/8/2021 (43,355) (43,355)
TRS GBP 100,000Fund receives Fixed 0.000% and pays TalkTalk Telecom Group
Plc
JP MorganChase Bank
(Depository Cle) 19/7/2021 707 707
TRS GBP 100,000Fund receives Fixed 0.000% and pays TalkTalk Telecom Group
Plc
JP MorganChase Bank
(Depository Cle) 22/7/2021 (127) (127)
TRS GBP 500,000Fund receives Fixed 0.000% and pays TalkTalk Telecom Group
Plc
JP MorganChase Bank
(Depository Cle) 30/7/2021 (11,745) (11,745)
Total (Gross underlying exposure - EUR 3,703,657,942) (10,120,125) (21,757,759)
CCCDS: Centrally Cleared Credit Default SwapsCCILS: Centrally Cleared Inflation Linked SwapsCCIRS: Centrally Cleared Interest Rate SwapsCDS: Credit Default SwapsILS: Inflation Linked SwapsIRS: Interest Rate SwapsTRS: Total Return Swaps
BlackRock Fixed Income Strategies Fund continued
Portfolio of Investments as at 31 May 2021
The notes on pages 590 to 610 form an integral part of these financial statements.
Annual report and audited financial statements [351]

Numberof
contractsCurrencyof contracts
Contract/Description
Expirationdate
Grossunderlying
exposureEUR
Net unrealisedappreciation/
(depreciation)EUR
Financial Derivative Instruments
FUTURES
2,233 EUR 3 Month Euribor Futures December 2022 December 2022 560,790,038 55,825
(4,812) EUR Euro BOBL Futures June 2021 June 2021 648,080,160 1,530,877
(705) EUR Euro BTP Futures June 2021 June 2021 103,832,400 (757,836)
(3,242) EUR Euro Bund Futures June 2021 June 2021 550,524,020 (1,428,095)
(490) EUR Euro BUXL 30 Year Bond Futures June 2021 June 2021 98,509,600 1,431,179
625 EUR Euro Schatz Futures June 2021 June 2021 70,025,000 12,500
(1,215) EUR Euro-OAT Futures June 2021 June 2021 194,788,800 (710,212)
(242) EUR Euro-OAT Futures September 2021 September 2021 38,274,720 27,560
(255) JPY Japan 10 Year Bond Futures June 2021 June 2021 288,646,739 (60,760)
2,062 EUR Short Euro BTP Futures June 2021 June 2021 233,253,440 185,680
(2,802) GBP UK Long Gilt Bond Futures September 2021 September 2021 413,993,486 (420,850)
(50) USD US Long Bond Futures September 2021 September 2021 6,401,586 9,425
(3,942) USD US Treasury 10 Year Note Futures September 2021 September 2021 467,504,569 1,098,368
(1,201) USD US Treasury 10 Year Note Futures September 2021 September 2021 129,717,077 301,303
(170) USD US Treasury 2 Year Note Futures September 2021 September 2021 30,746,881 1,076
(682) USD US Treasury 5 Year Note Futures September 2021 September 2021 69,186,126 53,796
(781) USD US Ultra Bond Futures September 2021 September 2021 118,231,454 477,018
Total 4,022,506,096 1,806,854
Numberof
contractsCall/Put Description Counterparty Strike Price
Expirationdate
Netunrealised
(depreciation)EUR
MarketValue
EUR
Financial Derivative Instruments
PURCHASED OPTIONS
67,100,000 Call OTC USD/CAD Bank of America Merrill Lynch USD 1.28 23/06/2021 (442,785) 3,739
18,800,000 Call OTC EUR/GBP BNP Paribas EUR 0.89 06/08/2021 (248,705) 29,347
11,540,000 Call OTC EUR/USD BNP Paribas EUR 1.25 28/06/2021 (187,087) 878,055
113,390,000 Call OTC EUR/USD BNP Paribas EUR 1.22 18/06/2021 (46,263) 427,820
112,500,000 Put OTC EUR/GBP Citibank EUR 0.85 11/06/2021 (983,843) 35,550
260 PutiShares USD High Yield Corp
Bond Exchange Traded USD 102.50 18/06/2021 (1,768) 21,518
113,420,000 Put OTC EUR/GBP Goldman Sachs EUR 0.85 03/06/2021 (731,332) 1,361
Total (Gross underlying exposure - EUR 1,146,208) (2,641,783) 1,397,390
Numberof
contractsCall/Put Description Counterparty Strike Price
Expirationdate
Netunrealised
appreciation/(depreciation)
EUR
MarketValue
EUR
Financial Derivative Instruments
WRITTEN OPTIONS
(113,390,000) Call OTC EUR/USD Bank of America Merrill Lynch EUR 1.23 18/06/2021 (56,241) (427,820)
(112,500,000) Put OTC EUR/GBP Citibank EUR 0.83 11/06/2021 293,655 (113)
Total (Gross underlying exposure - EUR 0) 237,414 (427,933)
BlackRock Fixed Income Strategies Fund continued
Portfolio of Investments as at 31 May 2021
The notes on pages 590 to 610 form an integral part of these financial statements.
BlackRock Strategic Funds[352]

NominalValue
Call/Put Description Counterparty Strike Price
Expirationdate
Netunrealised
(depreciation)EUR
MarketValue
EUR
Financial Derivative Instruments
PURCHASED SWAPTIONS
5,400,000 Put
Fund purchases an option to enter into aCredit Default Swap. If exercised Fundreceives default protection on Markit iTraxxEurope Series 35 Version 1 from16/6/2021; and provides 5% Fixedquarterly from 20/6/2021 Barclays Bank EUR 2.75 16/06/2021 (17,008) 5,537
11,100,000 Put
Fund purchases an option to enter into aCredit Default Swap. If exercised Fundreceives default protection on Markit iTraxxEurope Series 35 Version 1 from18/8/2021; and provides 1% Fixedquarterly from 20/6/2021 Barclays Bank EUR 0.65 18/08/2021 (8,562) 9,864
11,100,000 Put
Fund purchases an option to enter into aCredit Default Swap. If exercised Fundreceives default protection on Markit iTraxxEurope Series 35 Version 1 from21/7/2021; and provides 5% Fixedquarterly from 20/6/2021 Barclays Bank EUR 2.75 21/07/2021 (43,208) 49,477
Total (Gross underlying exposure - EUR 7,664,358) (68,778) 64,878
NominalValue
Call/Put Description Counterparty Strike Price
Expirationdate
Netunrealised
appreciation/(depreciation)
EUR
MarketValue
EUR
Financial Derivative Instruments
WRITTEN SWAPTIONS
(36,660,768) Put
Fund writes an option to enter into an InterestRate Swap. If exercised Fund receives-0.11% Fixed annually from 14/1/2022; andpays Floating EUR Interbank Offer Rate6 Month semi-annually from 18/7/2022 Barclays Bank EUR 0.11 14/01/2022 (784,042) (1,333,037)
(36,660,768) Call
Fund writes an option to enter into an InterestRate Swap. If exercised Fund receivesFloating EUR Interbank Offer Rate6 Month semi-annually from 18/7/2022;and pays -0.11% Fixed annually from14/1/2022 Barclays Bank EUR 0.11 14/01/2022 425,877 (123,118)
(70,750,000) Call
Fund writes an option to enter into an InterestRate Swap. If exercised Fund receivesFloating USD LIBOR 3 Month BBAquarterly from 28/10/2021; and pays0.92% Fixed semi-annually from 26/7/2021 BNP Paribas USD 0.92 26/07/2021 383,800 (8,737)
(68,620,000) Call
Fund writes an option to enter into an InterestRate Swap. If exercised Fund receivesFloating USD LIBOR 3 Month BBAquarterly from 10/12/2021; and pays1.125% Fixed semi-annually from 8/9/2021 JP Morgan USD 1.13 08/09/2021 (8,560) (602,179)
(68,620,000) Put
Fund writes an option to enter into an InterestRate Swap. If exercised Fund receives1.125% Fixed semi-annually from8/9/2021; and pays Floating USD LIBOR3 Month BBA quarterly from 10/12/2021 JP Morgan USD 1.13 08/09/2021 383,941 (209,678)
(104,125,000) Call
Fund writes an option to enter into an InterestRate Swap. If exercised Fund receivesFloating USD LIBOR 3 Month BBAquarterly from 28/7/2023; and pays 2%Fixed semi-annually from 26/4/2023 Barclays Bank USD 0.02 26/04/2023 192,304 (3,250,773)
(104,125,000) Put
Fund writes an option to enter into an InterestRate Swap. If exercised Fund receives 2%Fixed semi-annually from 26/4/2023; andpays Floating USD LIBOR 3 Month BBAquarterly from 28/7/2023 Barclays Bank USD 0.02 26/04/2023 104,467 (3,305,318)
BlackRock Fixed Income Strategies Fund continued
Portfolio of Investments as at 31 May 2021
The notes on pages 590 to 610 form an integral part of these financial statements.
Annual report and audited financial statements [353]

NominalValue
Call/Put Description Counterparty Strike Price
Expirationdate
Netunrealised
appreciation/(depreciation)
EUR
MarketValue
EUR
Financial Derivative Instruments
WRITTEN SWAPTIONS
(3,600,000) Put
Fund writes an option to enter into a CreditDefault Swap. If exercised Fund receives5% Fixed quarterly from 20/6/2021; andprovides default protection on Markit iTraxxEurope Series 35 Version 1 from16/6/2021 BNP Paribas EUR 3.00 16/06/2021 9,493 (1,577)
(11,100,000) Call
Fund writes an option to enter into a CreditDefault Swap. If exercised Fund receivesdefault protection on Markit iTraxx EuropeSeries 35 Version 1 from 21/7/2021; andprovides 5% Fixed quarterly from20/6/2021 Barclays Bank EUR 2.37 21/07/2021 2,321 (29,175)
(11,100,000) Put
Fund writes an option to enter into a CreditDefault Swap. If exercised Fund receives5% Fixed quarterly from 20/6/2021; andprovides default protection on Markit iTraxxEurope Series 35 Version 1 from21/7/2021 Barclays Bank EUR 3.25 21/07/2021 26,076 (23,596)
(380,000,000) Put
Fund writes an option to enter into an InterestRate Swap. If exercised Fund receives0.45% Fixed annually from 19/5/2022; andpays Floating EUR Interbank Offer Rate6 Month semi-annually from 23/11/2022 Citibank EUR 0.00 19/05/2022 249,014 (826,386)
(11,100,000) Put
Fund writes an option to enter into a CreditDefault Swap. If exercised Fund receivesdefault protection on Markit iTraxx EuropeSeries 35 Version 1 from 18/8/2021; andprovides 1% Fixed quarterly from20/6/2021 Barclays Bank EUR 0.75 18/08/2021 6,496 (6,546)
Total (Gross underlying exposure - EUR 181,764,673) 991,187 (9,720,120)
Currency Purchases Currency Sales CounterpartyMaturity
date
Netunrealised
appreciation/(depreciation)
EUR
Financial Derivative Instruments
OPEN FORWARD FOREIGN EXCHANGE TRANSACTIONS
AUD 29,000,000 EUR 18,638,323 Westpac 15/7/2021 (258,708)BRL 5,590,000 USD 992,243 Barclays Bank 16/6/2021 64,178CNH 124,200,000 USD 18,996,211 Goldman Sachs 16/6/2021 397,834CNH 13,110,000 USD 1,999,329 Natwest Markets 16/6/2021 46,767EUR 44,231,432 AUD 69,140,000 HSBC 15/7/2021 411,895
EUR 2,044,205 CHF 2,240,000Bank of America
Merrill Lynch 17/6/2021 5,621EUR 30,935,062 CNH 242,059,000 Citibank 16/6/2021 (168,568)EUR 17,085,326 CNH 134,510,000 Goldman Sachs 15/7/2021 (156,554)
EUR 71,951,824 DKK 535,250,000Toronto Dominion
Bank 15/7/2021 (12,521)EUR 3,181,179 GBP 2,762,520 Barclays Bank 16/6/2021 (25,549)EUR 58,030,000 GBP 50,180,849 BNP Paribas 16/6/2021 (219,835)EUR 22,490,000 GBP 19,283,938 Citibank 16/6/2021 105,241EUR 33,900,000 GBP 29,358,814 Deutsche Bank 16/6/2021 (179,657)EUR 6,478,821 GBP 5,617,436 JP Morgan 16/6/2021 (41,887)
EUR 22,620,000 GBP 19,590,147Standard
Chartered Bank 16/6/2021 (120,206)EUR 11,581 GBP 10,000 BNP Paribas 17/6/2021 (27)EUR 500,308 GBP 430,000 Citibank 17/6/2021 1,174EUR 17,983,564 GBP 15,480,000 JP Morgan 17/6/2021 14,728EUR 9,581,446 GBP 8,310,000 BNP Paribas 15/7/2021 (59,721)
Currency Purchases Currency Sales CounterpartyMaturity
date
Netunrealised
appreciation/(depreciation)
EUR
Financial Derivative Instruments
OPEN FORWARD FOREIGN EXCHANGE TRANSACTIONS
EUR 794,253,551 GBP 688,820,000 Goldman Sachs 15/7/2021 (4,907,544)EUR 2,082,531 GBP 1,800,000 HSBC 15/7/2021 (5,809)EUR 1,482,085 GBP 1,290,000 Morgan Stanley 15/7/2021 (14,559)EUR 496,353 GBP 430,000 Natwest Markets 15/7/2021 (2,528)
EUR 6,237,610 GBP 5,390,000Royal Bank of
Canada 15/7/2021 (15,805)EUR 10,971,079 GBP 9,470,000 Societe Generale 15/7/2021 (15,906)
EUR 5,974,643 GBP 5,200,000Standard
Chartered Bank 15/7/2021 (58,337)EUR 20,889,540 HUF 7,675,590,000 Goldman Sachs 16/6/2021 (1,180,897)EUR 4,068,781 IDR 70,768,300,000 HSBC 16/6/2021 4,822EUR 119,665 JPY 15,930,000 Deutsche Bank 17/6/2021 632
EUR 53,500,093 JPY 6,975,180,000Bank of America
Merrill Lynch 15/7/2021 1,396,565EUR 4,755,996 MXN 119,810,000 Natwest Markets 16/6/2021 (167,060)EUR 11,235,202 NOK 114,900,000 JP Morgan 16/6/2021 (43,712)EUR 46,011,042 NOK 466,050,000 Barclays Bank 15/7/2021 285,607
EUR 93,773,140 NZD 158,930,000Bank of America
Merrill Lynch 15/7/2021 (794,106)
EUR 6,810,131 SEK 69,510,000Bank of America
Merrill Lynch 15/7/2021 (55,469)EUR 274,641 TRY 2,810,000 Goldman Sachs 14/7/2021 10,036
BlackRock Fixed Income Strategies Fund continued
Portfolio of Investments as at 31 May 2021
The notes on pages 590 to 610 form an integral part of these financial statements.
BlackRock Strategic Funds[354]

Currency Purchases Currency Sales CounterpartyMaturity
date
Netunrealised
appreciation/(depreciation)
EUR
Financial Derivative Instruments
OPEN FORWARD FOREIGN EXCHANGE TRANSACTIONS
EUR 812,608 USD 990,000 Deutsche Bank 1/6/2021 1,399
EUR 77,760,563 USD 94,374,053Bank of America
Merrill Lynch 16/6/2021 450,920EUR 44,990,000 USD 53,935,632 Barclays Bank 16/6/2021 806,833EUR 39,377,035 USD 47,820,849 BNP Paribas 16/6/2021 202,997EUR 148,415,097 USD 178,656,652 Citibank 16/6/2021 2,062,561EUR 100,254,903 USD 120,505,717 Goldman Sachs 16/6/2021 1,538,639EUR 41,237,746 USD 49,625,695 JP Morgan 16/6/2021 585,209EUR 32,046,073 USD 38,374,692 Morgan Stanley 16/6/2021 610,167EUR 41,394,857 USD 49,666,358 Natwest Markets 16/6/2021 709,008EUR 7,148,583 USD 8,585,829 UBS 16/6/2021 115,217EUR 17,273,260 USD 21,110,000 BNP Paribas 17/6/2021 (19,359)EUR 269,781 USD 330,000 Goldman Sachs 17/6/2021 (544)EUR 575,430 USD 700,000 HSBC 15/7/2021 2,324EUR 459,353,311 USD 548,570,000 Morgan Stanley 15/7/2021 10,225,815
EUR 1,951,164 USD 2,390,000Royal Bank of
Canada 15/7/2021 (5,587)
EUR 4,670,171 USD 5,670,000Standard
Chartered Bank 15/7/2021 28,006
EUR 7,310,157 USD 8,960,000State Street Bank& Trust Company 15/7/2021 (25,611)
EUR 11,485,420 USD 13,870,000 UBS 15/7/2021 129,716EUR 3,216,009 USD 3,870,000 Westpac 15/7/2021 47,546GBP 420,000 EUR 488,870 Citibank 1/6/2021 (1,211)GBP 1,875,628 EUR 2,154,260 Barclays Bank 16/6/2021 22,965GBP 102,201,180 EUR 118,440,000 BNP Paribas 16/6/2021 194,937GBP 12,882,104 EUR 14,795,740 Deutsche Bank 16/6/2021 157,781
GBP 9,800,036 EUR 11,310,000Standard
Chartered Bank 16/6/2021 65,863GBP 5,330,000 EUR 6,160,404 JP Morgan 15/7/2021 23,401GBP 58,190,000 USD 81,260,275 HSBC 16/6/2021 979,787GBP 9,800,000 USD 13,470,204 Morgan Stanley 16/6/2021 341,256IDR 7,955,476,789 USD 544,155 Barclays Bank 16/6/2021 11,090IDR 16,374,400,000 USD 1,137,759 Citibank 16/6/2021 8,287IDR 20,468,000,000 USD 1,415,981 HSBC 16/6/2021 15,453IDR 166,097,460,000 USD 11,451,049 JP Morgan 16/6/2021 157,848IDR 18,120,523,211 USD 1,239,275 UBS 16/6/2021 25,400INR 1,920,390,000 USD 26,064,809 ANZ 16/6/2021 282,916INR 131,770,000 USD 1,747,592 BNP Paribas 16/6/2021 52,899JPY 3,500,000,000 EUR 26,590,352 Morgan Stanley 15/7/2021 (445,887)KRW 3,057,000,000 USD 2,722,997 BNP Paribas 16/6/2021 28,958KRW 3,057,000,000 USD 2,725,328 Goldman Sachs 16/6/2021 27,049KRW 9,171,000,000 USD 8,214,798 HSBC 16/6/2021 49,351
MXN 129,300,000 USD 6,148,602Bank of America
Merrill Lynch 16/6/2021 276,174NOK 256,300,000 EUR 25,264,687 HSBC 16/6/2021 (105,542)
NOK 195,000,000 EUR 19,290,518Bank of America
Merrill Lynch 15/7/2021 (158,537)
NOK 128,000,000 EUR 12,738,907Toronto Dominion
Bank 15/7/2021 (180,479)NOK 28,250,000 USD 3,375,032 Citibank 16/6/2021 8,332NOK 289,300,000 USD 34,612,080 Goldman Sachs 16/6/2021 44,884NOK 154,630,000 USD 18,572,885 JP Morgan 16/6/2021 (35,670)NOK 37,170,000 USD 4,492,076 Morgan Stanley 16/6/2021 (31,119)
NOK 18,580,000 USD 2,235,928Toronto Dominion
Bank 16/6/2021 (7,768)NOK 55,800,000 USD 6,716,494 UBS 16/6/2021 (24,551)NZD 9,500,000 EUR 5,677,034 Morgan Stanley 15/7/2021 (24,301)
Currency Purchases Currency Sales CounterpartyMaturity
date
Netunrealised
appreciation/(depreciation)
EUR
Financial Derivative Instruments
OPEN FORWARD FOREIGN EXCHANGE TRANSACTIONS
RUB 32,776,772 USD 434,343Bank of America
Merrill Lynch 16/6/2021 9,655RUB 88,817,114 USD 1,150,479 Citibank 16/6/2021 47,858RUB 1,551,561,428 USD 20,829,064 Goldman Sachs 16/6/2021 237,106RUB 207,724,686 USD 2,696,278 UBS 16/6/2021 107,387SEK 14,150,000 USD 1,693,848 Barclays Bank 16/6/2021 10,501SEK 58,700,000 USD 7,042,548 JP Morgan 16/6/2021 30,644SEK 7,080,000 USD 848,621 Morgan Stanley 16/6/2021 4,354TRY 40,430,000 USD 5,185,994 HSBC 16/6/2021 (380,438)
USD 59,183,261 EUR 49,326,869Bank of America
Merrill Lynch 16/6/2021 (844,933)USD 59,667,859 EUR 49,449,963 Barclays Bank 16/6/2021 (571,054)USD 147,424,423 EUR 122,121,168 BNP Paribas 16/6/2021 (1,353,551)USD 70,251,708 EUR 58,230,000 Citibank 16/6/2021 (680,977)USD 112,433,614 EUR 93,000,000 Goldman Sachs 16/6/2021 (896,267)USD 9,685,772 EUR 8,052,000 JP Morgan 16/6/2021 (117,578)USD 114,316,180 EUR 94,610,000 Morgan Stanley 16/6/2021 (964,101)
USD 7,479,720 EUR 6,170,000Royal Bank of
Canada 16/6/2021 (42,739)
USD 2,720,287 EUR 2,220,000Toronto Dominion
Bank 16/6/2021 8,414USD 2,218,428 EUR 1,860,000 UBS 16/6/2021 (42,701)USD 990,000 EUR 812,371 Deutsche Bank 17/6/2021 (1,396)USD 10,000,000 EUR 8,257,629 Citibank 15/7/2021 (70,388)
USD 54,000,000 EUR 44,793,346State Street Bank& Trust Company 15/7/2021 (582,243)
USD 49,575,997 GBP 35,780,000 Barclays Bank 16/6/2021 (921,530)USD 45,028,093 GBP 32,210,000 Morgan Stanley 16/6/2021 (503,048)USD 1,534,837 INR 111,695,588 Citibank 16/6/2021 (1,030)USD 4,210,717 INR 306,424,412 Deutsche Bank 16/6/2021 (2,774)USD 644,471 INR 47,082,068 Goldman Sachs 16/6/2021 (2,478)USD 842,150 INR 61,535,464 HSBC 16/6/2021 (3,373)USD 421,075 INR 30,762,468 Morgan Stanley 16/6/2021 (1,627)USD 1,675,291 NOK 13,825,000 Barclays Bank 16/6/2021 15,269USD 8,557,596 NOK 70,010,000 JP Morgan 16/6/2021 137,856USD 5,688,551 RUB 420,620,000 Barclays Bank 16/6/2021 (29,951)USD 17,691,796 RUB 1,316,888,491 Goldman Sachs 16/6/2021 (190,496)USD 23,823,349 SEK 201,250,000 Citibank 16/6/2021 (368,571)USD 13,726,305 SEK 115,300,000 Goldman Sachs 16/6/2021 (147,716)USD 18,591,155 SEK 155,800,000 JP Morgan 16/6/2021 (164,065)USD 4,531,705 SEK 37,670,000 Morgan Stanley 16/6/2021 (9,641)
USD 2,273,347 SEK 18,830,000Toronto Dominion
Bank 16/6/2021 1,813USD 6,410,167 SEK 53,100,000 UBS 16/6/2021 4,621USD 1,571,096 TRY 13,480,000 Barclays Bank 16/6/2021 (2,584)USD 1,594,515 TRY 13,480,000 Credit Suisse 16/6/2021 16,601
5,199,786
CHF Hedged Share Class
CHF 139,599,692 EUR 127,242,065State Street Bank& Trust Company 15/6/2021 (196,478)
EUR 1,167,394 CHF 1,280,578State Street Bank& Trust Company 15/6/2021 1,977
(194,501)
BlackRock Fixed Income Strategies Fund continued
Portfolio of Investments as at 31 May 2021
The notes on pages 590 to 610 form an integral part of these financial statements.
Annual report and audited financial statements [355]

Currency Purchases Currency Sales CounterpartyMaturity
date
Netunrealised
appreciation/(depreciation)
EUR
Financial Derivative Instruments
OPEN FORWARD FOREIGN EXCHANGE TRANSACTIONS
GBP Hedged Share Class
EUR 6,849,988 GBP 5,896,441State Street Bank& Trust Company 15/6/2021 5,289
GBP 14,078,450 EUR 16,215,209State Street Bank& Trust Company 15/6/2021 127,319
132,608
JPY Hedged Share Class
EUR 4,378 JPY 577,173State Street Bank& Trust Company 15/6/2021 65
JPY 51,846,806 EUR 393,314State Street Bank& Trust Company 15/6/2021 (5,892)
(5,827)
USD Hedged Share Class
EUR 2,953,610 USD 3,586,045State Street Bank& Trust Company 15/6/2021 15,924
USD 189,260,195 EUR 156,674,001State Street Bank& Trust Company 15/6/2021 (1,632,184)
(1,616,260)
Total (Gross underlying exposure - EUR 4,356,935,273) 3,515,806
Sector Breakdownas at 31 May 2021
% of NetAssets
Government 33.15
Financial 16.89
Mortgage Securities 8.77
Consumer, Cyclical 4.99
Asset Backed Securities 4.05
Collective Investment Schemes 3.92
Utilities 3.68
Consumer, Non-cyclical 3.48
Industrial 2.19
Communications 1.92
Energy 1.69
Basic Materials 0.92
Technology 0.91
Exchange Traded Funds 0.70
Diversified 0.00
Securities portfolio at market value 87.26
Other Net Assets 12.74
100.00
BlackRock Fixed Income Strategies Fund continued
Portfolio of Investments as at 31 May 2021
The notes on pages 590 to 610 form an integral part of these financial statements.
BlackRock Strategic Funds[356]

Holding Description
MarketValue
EUR
% ofNet
Assets
Transferable Securities and Money Market Instruments Admittedto an Official Stock Exchange Listing or Dealt in on AnotherRegulated Market
COMMON STOCKSItaly
33,005 Telecom Italia SpA - RSP 15,559 0.01
15,559 0.01
Total Common Stocks 15,559 0.01
BONDSArgentina
USD 152,000 Argentine Republic Govern-ment International BondFRN 9/7/2035 41,288 0.02
USD 13,000 Capex SA 6.875% 15/5/2024 9,740 0.01USD 26,000 Genneia SA RegS 8.75%
20/1/2022 19,470 0.01USD 24,000 YPF SA 7.00% 15/12/2047 11,875 0.01
82,373 0.05
AustraliaGBP 100,000 APT Pipelines Ltd RegS
4.25% 26/11/2024 129,034 0.08AUD 1,130,000 Australia Government Bond
RegS 1.75% 21/6/2051 585,529 0.37GBP 280,000 BHP Billiton Finance Ltd RegS
FRN 22/10/2077 349,164 0.22USD 75,000 Macquarie Bank Ltd 2.10%
17/10/2022 63,046 0.04GBP 100,000 QBE Insurance Group Ltd
RegS FRN 24/5/2042 121,622 0.07
1,248,395 0.78
AustriaEUR 100,000 ams AG RegS 2.125%
3/11/2027 97,497 0.06EUR 400,000 BAWAG Group AG RegS FRN
26/3/2029 417,424 0.26USD 200,000 Klabin Austria GmbH 3.20%
12/1/2031 158,397 0.10EUR 200,000 Lenzing AG RegS FRN (Per-
petual) 210,546 0.13EUR 100,000 Volksbank Wien AG RegS
FRN 6/10/2027 102,461 0.07
986,325 0.62
BelgiumGBP 300,000 Anheuser-Busch InBev SA
RegS 9.75% 30/7/2024 444,850 0.28EUR 200,000 Belfius Bank SA RegS 1.00%
26/10/2024 206,368 0.13EUR 200,000 KBC Group NV RegS FRN
3/12/2029 199,626 0.13EUR 685,268 Kingdom of Belgium Govern-
ment Bond RegS22/10/2031 (Zero Coupon) 674,708 0.42
EUR 100,000 Solvay SA FRN (Perpetual) 102,641 0.06
1,628,193 1.02
BermudaUSD 200,000 Hopson Development Holdings
Ltd RegS 7.50% 27/6/2022 167,656 0.11
167,656 0.11
BrazilUSD 200,000 Brazilian Government Interna-
tional Bond 3.875%12/6/2030 165,914 0.10
Holding Description
MarketValue
EUR
% ofNet
Assets
Brazil continuedUSD 200,000 Itau Unibanco Holding SA
3.25% 24/1/2025 168,920 0.11USD 60,000 Oi SA 10.00% 27/7/2025 50,232 0.03
385,066 0.24
British Virgin IslandsUSD 200,000 Fortune Star BVI Ltd RegS
5.95% 29/1/2023 168,497 0.11USD 200,000 Ocean Laurel Co Ltd RegS
2.375% 20/10/2025 162,591 0.10USD 200,000 RKPF Overseas 2019 A Ltd
RegS 6.70% 30/9/2024 174,138 0.11USD 200,000 Sino-Ocean Land Treasure
Finance II Ltd RegS 5.95%4/2/2027 183,645 0.12
USD 177,340 Star Energy Geothermal Way-ang Windu Ltd RegS 6.75%24/4/2033 166,021 0.10
USD 200,000 TSMC Global Ltd RegS 1.75%23/4/2028 162,870 0.10
1,017,762 0.64
CanadaUSD 100,000 Bank of Montreal FRN
10/3/2023 82,741 0.05USD 30,000 Bausch Health Cos Inc 5.50%
1/11/2025 25,265 0.02USD 35,000 Bausch Health Cos Inc 5.75%
15/8/2027 29,935 0.02USD 100,000 Cenovus Energy Inc 3.80%
15/9/2023 86,568 0.05USD 40,000 Enbridge Inc 2.50% 15/1/2025 34,420 0.02
USD 246,192 Stoneway Capital Corp10.00% 1/3/2027 55,539 0.04
USD 132,838 Stoneway Capital Corp RegS10.00% 1/3/2027 29,967 0.02
USD 45,000 Toronto-Dominion Bank FRN27/1/2023 37,066 0.02
381,501 0.24
Cayman IslandsUSD 200,000 21Vianet Group Inc RegS
7.875% 15/10/2021 165,893 0.10USD 200,000 Agile Group Holdings Ltd
RegS 5.125% 14/8/2022 166,567 0.10USD 112,500 Battalion CLO VII Ltd ’2014-7A
XRP’ FRN 17/7/2028 92,151 0.06USD 200,000 China Aoyuan Group Ltd RegS
7.95% 19/2/2023 168,797 0.11USD 200,000 China SCE Group Holdings
Ltd RegS 7.25% 19/4/2023 170,065 0.11USD 200,000 CIFI Holdings Group Co Ltd
RegS 6.45% 7/11/2024 174,107 0.11USD 13,000 Embraer Overseas Ltd RegS
5.696% 16/9/2023 11,390 0.01USD 200,000 Fantasia Holdings Group Co
Ltd RegS 15.00%18/12/2021 167,568 0.10
USD 200,000 Grupo Aval Ltd 4.375%4/2/2030 161,660 0.10
USD 200,000 Kaisa Group Holdings LtdRegS 11.95% 22/10/2022 172,833 0.11
USD 200,000 Logan Group Co Ltd RegS6.50% 16/7/2023 168,135 0.10
USD 250,000 Madison Park Funding XIII Ltd’2014-13A BR2’ FRN19/4/2030 203,995 0.13
BlackRock Global Absolute Return Bond Fund
Portfolio of Investments as at 31 May 2021
The notes on pages 590 to 610 form an integral part of these financial statements.
Annual report and audited financial statements [357]

Holding Description
MarketValue
EUR
% ofNet
Assets
Cayman Islands continuedUSD 250,000 Marble Point CLO XVII Ltd
’2020-1A D’ FRN 20/4/2033 206,398 0.13USD 200,000 Modern Land China Co Ltd
RegS 12.85% 25/10/2021 168,558 0.10USD 250,000 Neuberger Berman Loan Ad-
visers CLO Ltd ’2017-26A B’FRN 18/10/2030 205,146 0.13
USD 249,883 OZLM XIII Ltd ’2015-13A A1R’FRN 30/7/2027 204,672 0.13
USD 155,000 Park Aerospace Holdings Ltd5.25% 15/8/2022 133,547 0.08
USD 200,000 Powerlong Real Estate Hold-ings Ltd RegS 7.125%8/11/2022 170,880 0.11
USD 250,000 Redco Properties Group LtdRegS 8.50% 19/8/2021 205,590 0.13
USD 200,000 Redsun Properties Group LtdRegS 9.95% 11/4/2022 169,933 0.11
USD 355,000 Ronshine China Holdings LtdRegS 8.75% 25/10/2022 295,966 0.18
USD 105,000 Seagate HDD Cayman4.875% 1/3/2024 93,028 0.06
USD 130,000 Seagate HDD Cayman4.091% 1/6/2029 107,458 0.07
USD 200,000 Seazen Group Ltd RegS6.45% 11/6/2022 167,699 0.10
USD 200,000 Shui On Development HoldingLtd RegS 5.75% 12/11/2023 169,398 0.11
USD 200,000 Times China Holdings LtdRegS 6.75% 16/7/2023 169,423 0.11
USD 186,956 Treman Park CLO Ltd’2015-1A ARR’ FRN20/10/2028 153,333 0.10
EUR 100,000 UPCB Finance VII Ltd RegS3.625% 15/6/2029 102,335 0.06
USD 200,000 Yuzhou Group Holdings Co LtdRegS 8.50% 4/2/2023 163,817 0.10
USD 200,000 Zhenro Properties Group LtdRegS 8.70% 3/8/2022 169,246 0.11
4,879,588 3.06
ChileUSD 200,000 Empresa Nacional de Teleco-
municaciones SA 4.75%1/8/2026 181,556 0.11
181,556 0.11
ChinaCNY 11,240,000 China Development Bank
2.89% 22/6/2025 1,429,507 0.90CNY 3,290,000 China Development Bank
3.45% 20/9/2029 421,810 0.27CNY 6,600,000 China Government Bond
1.99% 9/4/2025 820,393 0.51CNY 3,000,000 China Government Bond
2.41% 19/6/2025 378,579 0.24CNY 7,300,000 China Government Bond
2.85% 4/6/2027 929,152 0.58CNY 600,000 China Government Bond
3.29% 23/5/2029 78,455 0.05CNY 7,260,000 China Government Bond
3.13% 21/11/2029 934,936 0.59CNY 1,800,000 China Government Bond
2.68% 21/5/2030 223,507 0.14CNY 1,500,000 China Government Bond
3.27% 19/11/2030 196,099 0.12CNY 2,060,000 China Government Bond
3.86% 22/7/2049 275,973 0.17
5,688,411 3.57
Holding Description
MarketValue
EUR
% ofNet
Assets
ColombiaUSD 17,000 Ecopetrol SA 5.375%
26/6/2026 15,327 0.01USD 13,000 Ecopetrol SA 6.875%
29/4/2030 12,662 0.01
27,989 0.02
DenmarkEUR 300,000 Danske Bank A/S RegS FRN
27/8/2025 302,895 0.19EUR 150,000 Danske Bank A/S RegS FRN
21/6/2029 158,032 0.10GBP 200,000 Orsted A/S RegS 2.50%
16/5/2033 249,942 0.16
710,869 0.45
EcuadorUSD 105,000 Ecuador Government Interna-
tional Bond RegS 0.50%31/7/2035 60,549 0.04
60,549 0.04
EgyptUSD 200,000 Egypt Government Interna-
tional Bond RegS 5.875%16/2/2031 161,576 0.10
161,576 0.10
FinlandEUR 100,000 Finnair Oyj RegS 4.25%
19/5/2025 101,880 0.06EUR 100,000 OP Corporate Bank Plc RegS
FRN 9/6/2030 103,244 0.07
205,124 0.13
FranceEUR 27,000 Accor SA RegS 0.70%
7/12/2027 14,209 0.01EUR 100,000 Altice France SA RegS
5.875% 1/2/2027 106,544 0.07EUR 100,000 Altice France SA RegS
4.125% 15/1/2029 101,500 0.06EUR 200,000 AXA SA RegS FRN 4/7/2043 220,766 0.14EUR 300,000 Banque Federative du Credit
Mutuel SA RegS 3.00%21/5/2024 325,989 0.20
GBP 200,000 BNP Paribas SA 5.75%24/1/2022 239,961 0.15
USD 250,000 BNP Paribas SA FRN10/1/2025 225,004 0.14
GBP 300,000 BNP Paribas SA RegS 3.375%23/1/2026 380,343 0.24
GBP 200,000 BNP Paribas SA RegS FRN24/5/2031 234,135 0.15
EUR 100,000 BNP Paribas SA RegS FRN15/1/2032 100,342 0.06
EUR 100,000 BPCE SA RegS 4.625%18/7/2023 109,886 0.07
EUR 100,000 Casino Guichard PerrachonSA RegS 4.048% 5/8/2026 97,456 0.06
EUR 100,000 Credit Agricole Assurances SARegS FRN (Perpetual) 111,000 0.07
GBP 100,000 Credit Agricole SA 7.375%18/12/2023 134,861 0.08
USD 200,000 Credit Agricole SA 4.375%17/3/2025 180,885 0.11
EUR 200,000 Credit Agricole SA RegS0.50% 24/6/2024 203,092 0.13
EUR 200,000 Credit Agricole SA RegS FRN22/4/2026 206,154 0.13
BlackRock Global Absolute Return Bond Fund continued
Portfolio of Investments as at 31 May 2021
The notes on pages 590 to 610 form an integral part of these financial statements.
BlackRock Strategic Funds[358]

Holding Description
MarketValue
EUR
% ofNet
Assets
France continuedEUR 300,000 Credit Mutuel Arkea SA RegS
1.25% 31/5/2024 310,620 0.19EUR 100,000 Credit Mutuel Arkea SA RegS
FRN 25/10/2029 104,251 0.07GBP 600,000 Dexia Credit Local SA RegS
0.25% 10/12/2026 678,251 0.43EUR 100,000 Dexia Credit Local SA RegS
21/1/2028 (Zero Coupon) 100,143 0.06GBP 100,000 Electricite de France SA RegS
FRN (Perpetual) 129,027 0.08EUR 200,000 Electricite de France SA RegS
FRN (Perpetual) 204,954 0.13EUR 100,000 Engie SA RegS FRN (Per-
petual) 108,247 0.07EUR 350,840 FCT Autonoria ’2019-1 B’
RegS FRN 25/9/2035 351,708 0.22EUR 65,751 FCT Noria ’2018-1 C’ RegS
FRN 25/6/2038 65,947 0.04EUR 1,000,000 Harmony French Home Loans
FCT ’2020-2 B’ RegS FRN27/8/2061 1,016,335 0.64
EUR 100,000 Loxam SAS RegS 5.75%15/7/2027 104,671 0.07
EUR 100,000 Orange SA RegS FRN (Per-petual) 112,298 0.07
EUR 100,000 Picard Groupe SAS RegSFRN 30/11/2023 100,005 0.06
EUR 260,000 RCI Banque SA RegS 0.75%10/4/2023 263,468 0.17
USD 250,000 Societe Generale SA 4.75%24/11/2025 229,341 0.14
EUR 200,000 Societe Generale SA RegSFRN 16/9/2026 201,506 0.13
EUR 200,000 Societe Generale SA RegSFRN 30/6/2031 198,858 0.12
EUR 300,000 Teleperformance RegS 1.50%3/4/2024 311,388 0.20
EUR 100,000 TOTAL SE RegS FRN (Per-petual) 99,465 0.06
EUR 100,000 TOTAL SE RegS FRN (Per-petual) 99,458 0.06
EUR 200,000 Veolia Environnement SARegS FRN (Perpetual) 205,186 0.13
EUR 300,000 Veolia Environnement SARegS FRN (Perpetual) 298,020 0.19
EUR 100,000 Verallia SA RegS 1.625%14/5/2028 100,402 0.06
8,385,676 5.26
GermanyEUR 100,000 Bayer AG RegS 0.375%
6/7/2024 101,058 0.06EUR 100,000 Bayer AG RegS 0.05%
12/1/2025 99,642 0.06EUR 100,000 Bayer AG RegS 1.375%
6/7/2032 100,995 0.06EUR 200,000 Bayer AG RegS FRN
12/11/2079 203,142 0.13EUR 100,000 Bertelsmann SE & Co KGaA
RegS FRN 23/4/2075 103,652 0.06EUR 100,000 Cheplapharm Arzneimittel
GmbH RegS 4.375%15/1/2028 103,709 0.06
EUR 400,000 Commerzbank AG RegS1.25% 23/10/2023 412,108 0.26
EUR 200,000 Commerzbank AG RegS FRN(Perpetual) 217,962 0.14
GBP 100,000 Deutsche Bank AG RegS1.75% 16/12/2021 116,843 0.07
Holding Description
MarketValue
EUR
% ofNet
Assets
Germany continuedGBP 300,000 Deutsche Bank AG RegS
2.625% 16/12/2024 363,934 0.23GBP 200,000 Deutsche Pfandbriefbank AG
RegS 1.75% 21/11/2022 235,270 0.15EUR 200,000 Evonik Industries AG RegS
FRN 7/7/2077 203,486 0.13EUR 116,000 Fraport AG Frankfurt Airport
Services Worldwide RegS2.125% 9/7/2027 123,155 0.08
EUR 200,000 Fraport AG Frankfurt AirportServices Worldwide RegS1.875% 31/3/2028 206,942 0.13
EUR 250,000 Fresenius Medical Care AG &Co KGaA RegS 0.25%29/11/2023 251,953 0.16
EUR 100,000 HeidelbergCement AG RegS2.25% 3/6/2024 106,435 0.07
EUR 100,000 KION Group AG RegS 1.625%24/9/2025 104,135 0.06
GBP 200,000 MuenchenerRueckversicherungs-Gesellschaft AG inMuenchen RegS FRN26/5/2042 245,490 0.15
EUR 100,000 Nidda Healthcare HoldingGmbH RegS 3.50%30/9/2024 100,127 0.06
GBP 500,000 NRW Bank RegS 1.00%15/6/2022 585,540 0.37
EUR 240,000 thyssenkrupp AG RegS1.375% 3/3/2022 240,562 0.15
EUR 100,000 Vertical Holdco GmbH RegS6.625% 15/7/2028 107,178 0.07
EUR 161,000 Volkswagen Leasing GmbHRegS 0.625% 19/7/2029 159,591 0.10
EUR 200,000 ZF Finance GmbH RegS2.00% 6/5/2027 200,560 0.13
EUR 100,000 ZF Finance GmbH RegS3.75% 21/9/2028 108,812 0.07
4,802,281 3.01
GreeceEUR 96,000 Hellenic Republic Government
Bond RegS 2.00%22/4/2027 105,917 0.07
EUR 40,000 Hellenic Republic GovernmentBond RegS 3.75%30/1/2028 48,858 0.03
EUR 146,000 Hellenic Republic GovernmentBond RegS 3.875%12/3/2029 182,275 0.11
EUR 337,000 Hellenic Republic GovernmentBond RegS 1.50%18/6/2030 359,761 0.23
EUR 268,000 Hellenic Republic GovernmentBond RegS 0.75%18/6/2031 266,124 0.17
EUR 200,000 Hellenic Republic GovernmentBond RegS 1.875%24/1/2052 204,540 0.13
EUR 100,000 Mytilineos SA RegS 2.25%30/10/2026 101,449 0.06
1,268,924 0.80
BlackRock Global Absolute Return Bond Fund continued
Portfolio of Investments as at 31 May 2021
The notes on pages 590 to 610 form an integral part of these financial statements.
Annual report and audited financial statements [359]

Holding Description
MarketValue
EUR
% ofNet
Assets
GuernseyUSD 250,000 Credit Suisse Group Funding
Guernsey Ltd 3.80%15/9/2022 213,678 0.13
GBP 250,000 Credit Suisse Group FundingGuernsey Ltd RegS 3.00%27/5/2022 297,144 0.19
510,822 0.32
Hong KongUSD 250,000 Bank of East Asia Ltd RegS
FRN (Perpetual) 220,727 0.14USD 200,000 Yango Justice International Ltd
RegS 9.25% 15/4/2023 169,125 0.10
389,852 0.24
HungaryEUR 52,000 Hungary Government Interna-
tional Bond RegS 1.75%5/6/2035 54,884 0.03
54,884 0.03
IndiaUSD 200,000 Adani Transmission Ltd RegS
4.00% 3/8/2026 175,800 0.11USD 200,000 Power Finance Corp Ltd RegS
4.50% 18/6/2029 175,067 0.11USD 200,000 ReNew Power Pvt Ltd RegS
6.45% 27/9/2022 170,026 0.11USD 200,000 ReNew Power Synthetic RegS
6.67% 12/3/2024 172,679 0.11USD 200,000 Shriram Transport Finance Co
Ltd RegS 5.70% 27/2/2022 165,419 0.10
858,991 0.54
IndonesiaIDR 1,416,000,000 Indonesia Treasury Bond
6.50% 15/6/2025 84,624 0.05IDR 8,508,000,000 Indonesia Treasury Bond
7.00% 15/9/2030 508,215 0.32IDR 752,000,000 Indonesia Treasury Bond
6.50% 15/2/2031 43,453 0.03USD 200,000 Pertamina Persero PT RegS
1.40% 9/2/2026 160,637 0.10USD 200,000 Pertamina Persero PT RegS
2.30% 9/2/2031 155,686 0.10
952,615 0.60
IrelandUSD 150,000 AerCap Ireland Capital DAC /
AerCap Global AviationTrust 3.50% 26/5/2022 126,138 0.08
EUR 300,000 AIB Group Plc RegS FRN19/11/2029^ 306,687 0.19
EUR 100,000 AIB Group Plc RegS FRN30/5/2031 106,775 0.07
EUR 200,000 Bank of Ireland Group PlcRegS FRN 25/11/2025 205,394 0.13
EUR 100,000 Bank of Ireland Group PlcRegS FRN 11/8/2031 99,340 0.06
EUR 100,000 BBAM European CLO I DAC’1X ER’ RegS FRN22/7/2034 99,000 0.06
SEK 1,230,000 Bluestep Mortgage SecuritiesNo 4 DAC ’B’ RegS FRN10/8/2066 121,606 0.08
EUR 100,000 CVC Cordatus Loan Fund XXDAC ’20X E’ RegS FRN22/6/2034 99,000 0.06
EUR 40,000 Fresenius Finance Ireland PlcRegS 0.875% 1/10/2031 39,484 0.03
EUR 150,000 Glencore Capital Finance DACRegS 1.25% 1/3/2033 144,426 0.09
Holding Description
MarketValue
EUR
% ofNet
Assets
Ireland continuedEUR 100,000 Kerry Group Financial Ser-
vices Unltd Co RegS2.375% 10/9/2025 109,462 0.07
EUR 538,000 Last Mile Securities PE’2021-X1 A1’ DAC RegSFRN 17/8/2031 538,897 0.34
EUR 100,000 Northwoods Capital 23 EuroDAC ’2021-23X E’ RegSFRN 15/3/2034 99,053 0.06
EUR 100,000 OCP Euro CLO DAC ’2019-3XER’ RegS FRN 20/4/2033 99,619 0.06
EUR 780,000 Pearl Finance 2020 DAC ’A1’RegS FRN 17/11/2032 783,697 0.49
EUR 250,000 Penta CLO DAC ’2019-6X B1’RegS FRN 25/7/2032 250,391 0.16
EUR 241,938 River Green Finance’2020-1 A’ DAC RegS FRN22/1/2032 242,421 0.15
EUR 600,000 Rockford Tower Europe CLODAC ’2019-1 B1’ RegS FRN20/1/2033 599,549 0.38
EUR 700,000 SCF Rahoituspalvelut IX DAC’B’ RegS FRN 25/10/2030 698,637 0.44
USD 95,000 Shire Acquisitions InvestmentsIreland DAC 2.875%23/9/2023 81,793 0.05
EUR 157,648 Taurus ’2019-1 FR’ DAC RegSFRN 2/2/2031 158,153 0.10
GBP 199,382 Taurus ’2019-2 C’ UK DACRegS FRN 17/11/2029 231,905 0.15
GBP 225,000 Taurus ’2021-1 UK1X A’ DACRegS FRN 17/5/2031 262,039 0.16
GBP 100,000 Virgin Media Vendor FinancingNotes III DAC RegS 4.875%15/7/2028 118,722 0.07
5,622,188 3.53
IsraelUSD 35,000 Energean Israel Finance Ltd
RegS 5.875% 30/3/2031 29,814 0.02USD 16,031 Leviathan Bond Ltd RegS
5.75% 30/6/2023 13,861 0.01
43,675 0.03
ItalyEUR 100,000 Atlantia SpA RegS 1.875%
12/2/2028 102,355 0.06EUR 100,000 Autostrade per l’Italia SpA
RegS 2.00% 4/12/2028 103,523 0.07EUR 100,000 Banca Monte dei Paschi di
Siena SpA RegS 2.625%28/4/2025 103,124 0.06
EUR 100,000 Cedacri Mergeco SpA RegSFRN 15/5/2028 102,403 0.06
EUR 100,000 Centurion Bidco SpA RegS5.875% 30/9/2026 104,658 0.07
EUR 250,000 Eni SpA RegS 0.625%19/9/2024 256,047 0.16
EUR 100,000 Eni SpA RegS FRN (Per-petual) 104,286 0.07
EUR 100,000 Eni SpA RegS FRN (Per-petual) 99,523 0.06
EUR 100,000 FCA Bank SpA RegS 0.125%16/11/2023 100,320 0.06
USD 200,000 Intesa Sanpaolo SpA 4.95%1/6/2042 165,859 0.10
EUR 100,000 Intesa Sanpaolo SpA RegS6.625% 13/9/2023 113,411 0.07
EUR 150,000 Intesa Sanpaolo SpA RegS0.75% 4/12/2024 153,579 0.10
BlackRock Global Absolute Return Bond Fund continued
Portfolio of Investments as at 31 May 2021
The notes on pages 590 to 610 form an integral part of these financial statements.
BlackRock Strategic Funds[360]

Holding Description
MarketValue
EUR
% ofNet
Assets
Italy continuedEUR 100,000 Intesa Sanpaolo SpA RegS
1.00% 19/11/2026 102,469 0.06EUR 100,000 Intesa Sanpaolo SpA RegS
2.925% 14/10/2030 105,225 0.07EUR 500,000 Intesa Sanpaolo SpA RegS
1.35% 24/2/2031 489,535 0.31EUR 200,000 Intesa Sanpaolo SpA RegS
FRN (Perpetual) 218,466 0.14EUR 0 Italy Buoni Poliennali Del Te-
soro RegS 1.30% 15/5/2028 — 0.00EUR 538,000 Italy Buoni Poliennali Del Te-
soro RegS 1.50% 30/4/2045 516,179 0.32EUR 230,000 Italy Buoni Poliennali Del Te-
soro RegS 2.45% 1/9/2050 260,270 0.16EUR 30,000 Italy Buoni Poliennali Del Te-
soro RegS 2.80% 1/3/2067 35,341 0.02EUR 287,046 Progetto Quinto SRL ’A’ RegS
FRN 27/10/2036 288,136 0.18EUR 100,000 Rekeep SpA RegS 7.25%
1/2/2026 107,659 0.07EUR 80,727 Sunrise SPV 40 Srl ’2018-1 A’
RegS FRN 27/7/2042 80,792 0.05GBP 300,000 Telecom Italia SpA 5.875%
19/5/2023 378,400 0.24EUR 350,000 UniCredit SpA RegS FRN
3/7/2025 361,137 0.23EUR 200,000 UniCredit SpA RegS FRN
(Perpetual) 187,776 0.12
4,640,473 2.91
JapanJPY 39,000,000 Japan Government Thirty Year
Bond 0.60% 20/9/2050 286,824 0.18USD 125,000 Mitsubishi UFJ Financial
Group Inc 3.455% 2/3/2023 107,852 0.07USD 200,000 Mizuho Financial Group Inc
FRN 8/9/2024 164,866 0.10USD 200,000 Nissan Motor Co Ltd 4.81%
17/9/2030 181,434 0.11EUR 220,000 Nissan Motor Co Ltd RegS
2.652% 17/3/2026^ 238,872 0.15EUR 200,000 Rakuten Group Inc RegS FRN
(Perpetual) 205,092 0.13USD 200,000 SoftBank Group Corp RegS
FRN (Perpetual) 167,445 0.10USD 100,000 Sumitomo Mitsui Financial
Group Inc 3.748% 19/7/2023 87,750 0.06EUR 200,000 Takeda Pharmaceutical Co Ltd
RegS 1.125% 21/11/2022 203,958 0.13
1,644,093 1.03
JerseyGBP 100,000 CPUK Finance Ltd RegS
4.875% 28/8/2025 117,531 0.08USD 200,000 Galaxy Pipeline Assets Bidco
Ltd 2.16% 31/3/2034 162,116 0.10GBP 200,000 Glencore Finance Europe Ltd
RegS 6.00% 3/4/2022 242,313 0.15
521,960 0.33
KuwaitUSD 200,000 Burgan Bank SAK RegS FRN
15/12/2031 156,373 0.10
156,373 0.10
LuxembourgEUR 150,000 ArcelorMittal SA RegS 3.125%
14/1/2022 153,018 0.10EUR 200,000 Becton Dickinson Euro Fi-
nance Sarl 0.632% 4/6/2023 202,832 0.13EUR 100,000 Cidron Aida Finco Sarl RegS
5.00% 1/4/2028 101,431 0.06
Holding Description
MarketValue
EUR
% ofNet
Assets
Luxembourg continuedEUR 100,000 CNH Industrial Finance Eu-
rope SA RegS 2.875%17/5/2023 105,756 0.07
EUR 100,000 Garfunkelux Holdco 3 SARegS 6.75% 1/11/2025 104,209 0.06
USD 40,000 Gol Finance SA 7.00%31/1/2025 30,187 0.02
EUR 100,000 Herens Midco Sarl RegS5.25% 15/5/2029 98,655 0.06
EUR 100,000 Matterhorn Telecom SA RegS4.00% 15/11/2027 102,982 0.06
EUR 100,000 Rossini Sarl RegS 6.75%30/10/2025 105,208 0.07
USD 200,000 Rumo Luxembourg Sarl5.875% 18/1/2025 172,648 0.11
EUR 600,000 SC Germany SA Compart-ment Consumer ’2020-1 B’RegS FRN 14/11/2034 604,669 0.38
USD 70,000 Schlumberger Investment SA2.40% 1/8/2022 58,410 0.04
EUR 100,000 SES SA RegS 2.00% 2/7/2028 108,035 0.07EUR 200,000 SES SA RegS FRN (Per-
petual) 201,000 0.13EUR 100,000 Silver Arrow S.A. Compart-
ment 10 ’B’ RegS FRN15/3/2027 100,045 0.06
EUR 100,000 Simon International FinanceSCA RegS 1.125%19/3/2033 99,384 0.06
EUR 90,105 Summer BC Holdco A SarlRegS 9.25% 31/10/2027 96,076 0.06
EUR 100,000 Summer BC Holdco B SarlRegS 5.75% 31/10/2026 104,490 0.06
EUR 100,000 Traton Finance LuxembourgSA RegS 0.125% 24/3/2025 100,081 0.06
EUR 100,000 Traton Finance LuxembourgSA RegS 0.75% 24/3/2029 100,293 0.06
2,749,409 1.72
Marshall IslandsUSD 107,000 Danaos Corp 8.50% 1/3/2028 94,772 0.06
94,772 0.06
MauritiusUSD 200,000 Network i2i Ltd RegS FRN
(Perpetual) 174,518 0.11
174,518 0.11
MexicoUSD 200,000 Mexico City Airport Trust RegS
5.50% 31/7/2047 162,946 0.10MXN 500,000 Petroleos Mexicanos 7.19%
12/9/2024 19,543 0.01USD 76,000 Petroleos Mexicanos 6.50%
23/1/2029 63,894 0.04USD 42,000 Petroleos Mexicanos 6.75%
21/9/2047 30,542 0.02USD 40,000 Petroleos Mexicanos 7.69%
23/1/2050 31,514 0.02USD 12,000 Petroleos Mexicanos RegS
6.875% 16/10/2025 10,951 0.01
319,390 0.20
NetherlandsEUR 400,000 ABN AMRO Bank NV RegS
FRN 18/1/2028 417,512 0.26EUR 100,000 Achmea BV RegS FRN
4/4/2043 110,611 0.07EUR 300,000 Aegon NV RegS FRN
25/4/2044 330,975 0.21EUR 300,000 Allianz Finance II BV FRN
8/7/2041 301,785 0.19
BlackRock Global Absolute Return Bond Fund continued
Portfolio of Investments as at 31 May 2021
The notes on pages 590 to 610 form an integral part of these financial statements.
Annual report and audited financial statements [361]

Holding Description
MarketValue
EUR
% ofNet
Assets
Netherlands continuedEUR 100,000 ASML Holding NV RegS
0.25% 25/2/2030 99,147 0.06EUR 100,000 BMW Finance NV RegS
1.00% 15/2/2022 101,027 0.06EUR 100,000 Conti-Gummi Finance BV
2.125% 27/11/2023 105,159 0.07EUR 110,000 Conti-Gummi Finance BV
RegS 1.125% 25/9/2024 113,705 0.07GBP 300,000 Daimler International Finance
BV RegS 1.50% 18/8/2021 349,147 0.22EUR 398,000 Domi 2021-1 BV ’2021-1 A’
RegS FRN 15/6/2053 399,449 0.25EUR 100,000 Dufry One BV RegS 3.375%
15/4/2028 98,666 0.06EUR 632,000 Dutch Property Finance
’2021-1 A’ BV RegS FRN28/7/2058 633,938 0.40
EUR 528,589 Dutch Property Finance BV’2020-2 A’ RegS FRN28/1/2058 531,974 0.33
EUR 100,000 easyJet FinCo BV RegS1.875% 3/3/2028 100,453 0.06
EUR 100,000 ELM BV for Firmenich Interna-tional SA RegS FRN (Per-petual) 107,426 0.07
USD 8,000 Embraer Netherlands FinanceBV 5.40% 1/2/2027 6,981 0.00
EUR 100,000 Givaudan Finance Europe BVRegS 1.625% 22/4/2032 110,596 0.07
USD 200,000 Greenko Dutch BV RegS3.85% 29/3/2026 167,782 0.11
EUR 100,000 Iberdrola International BVRegS FRN (Perpetual) 100,515 0.06
EUR 100,000 Iberdrola International BVRegS FRN (Perpetual) 102,750 0.06
EUR 100,000 Iberdrola International BVRegS FRN (Perpetual) 108,899 0.07
EUR 100,000 ING Groep NV RegS 1.00%20/9/2023 102,850 0.06
EUR 400,000 ING Groep NV RegS FRN15/2/2029 422,380 0.27
EUR 325,484 Jubilee Place 2020-1 BV ’A’RegS FRN 17/10/2057 329,231 0.21
USD 75,000 LYB International Finance BV4.00% 15/7/2023 65,868 0.04
EUR 70,046 Magoi BV ’2019-1 B’ RegSFRN 27/7/2039 70,182 0.04
EUR 200,000 NN Group NV RegS FRN8/4/2044 223,478 0.14
USD 40,000 NXP BV / NXP Funding LLC4.875% 1/3/2024 36,327 0.02
USD 9,000 Petrobras Global Finance BV6.25% 17/3/2024 8,286 0.01
USD 34,000 Petrobras Global Finance BV5.299% 27/1/2025 31,151 0.02
EUR 200,000 Repsol International FinanceBV RegS FRN (Perpetual) 199,320 0.13
EUR 180,000 Stellantis NV RegS 3.375%7/7/2023 191,187 0.12
EUR 94,950 Stichting AK Rabobank Certifi-caten RegS FRN (Perpetual) 124,353 0.08
EUR 125,000 Technip Energies NV RegS1.125% 28/5/2028 124,568 0.08
EUR 100,000 Telefonica Europe BV RegSFRN (Perpetual) 107,137 0.07
EUR 100,000 TenneT Holding BV RegS FRN(Perpetual) 103,274 0.06
EUR 100,000 Teva Pharmaceutical FinanceNetherlands II BV 4.50%1/3/2025 104,767 0.07
EUR 100,000 United Group BV RegS 4.00%15/11/2027 99,544 0.06
Holding Description
MarketValue
EUR
% ofNet
Assets
Netherlands continuedEUR 100,000 Upjohn Finance BV RegS
0.816% 23/6/2022 101,025 0.06GBP 200,000 Volkswagen Financial Services
NV RegS 1.625%30/11/2022 235,321 0.15
GBP 200,000 Volkswagen Financial ServicesNV RegS 1.125% 18/9/2023 233,807 0.15
EUR 100,000 Volkswagen International Fi-nance NV RegS FRN (Per-petual) 102,931 0.06
EUR 100,000 Volkswagen International Fi-nance NV RegS FRN (Per-petual) 107,830 0.07
EUR 100,000 Wintershall Dea Finance BVRegS FRN (Perpetual) 98,852 0.06
EUR 100,000 Wolters Kluwer NV RegS0.75% 3/7/2030 101,599 0.06
7,723,765 4.84
NorwayEUR 825,000 Storebrand Livsforsikring AS
RegS FRN 30/9/2051 804,680 0.50
804,680 0.50
OmanUSD 360,000 Oman Government Interna-
tional Bond RegS 3.625%15/6/2021 294,971 0.18
USD 200,000 Oman Government Interna-tional Bond RegS 4.125%17/1/2023 169,082 0.11
USD 450,000 Oman Sovereign Sukuk CoRegS 4.397% 1/6/2024 384,333 0.24
848,386 0.53
PakistanUSD 200,000 Pakistan Government Interna-
tional Bond RegS 6.00%8/4/2026 168,135 0.11
168,135 0.11
PanamaEUR 100,000 Carnival Corp RegS 10.125%
1/2/2026 116,993 0.07
116,993 0.07
PortugalEUR 916,715 Portugal Obrigacoes do Tes-
ouro OT RegS 0.30%17/10/2031 901,030 0.57
EUR 75,813 Portugal Obrigacoes do Tes-ouro OT RegS 1.00%12/4/2052 67,988 0.04
969,018 0.61
South AfricaZAR 2,401,490 Republic of South Africa Gov-
ernment Bond 7.00%28/2/2031 122,481 0.08
ZAR 1,445,828 Republic of South Africa Gov-ernment Bond 8.25%31/3/2032 78,152 0.05
200,633 0.13
SpainEUR 300,000 Amadeus IT Group SA RegS
FRN 18/3/2022 300,228 0.19EUR 200,000 Amadeus IT Group SA RegS
FRN 9/2/2023 200,278 0.13EUR 100,000 Amadeus IT Group SA RegS
1.875% 24/9/2028 106,507 0.07
BlackRock Global Absolute Return Bond Fund continued
Portfolio of Investments as at 31 May 2021
The notes on pages 590 to 610 form an integral part of these financial statements.
BlackRock Strategic Funds[362]

Holding Description
MarketValue
EUR
% ofNet
Assets
Spain continuedEUR 100,000 Banco Bilbao Vizcaya Argen-
taria SA RegS 0.75%11/9/2022 101,391 0.06
EUR 200,000 Banco Bilbao Vizcaya Argen-taria SA RegS 1.125%28/2/2024 206,410 0.13
EUR 100,000 Banco Bilbao Vizcaya Argen-taria SA RegS FRN16/1/2030 100,160 0.06
EUR 200,000 Banco de Sabadell SA RegS0.875% 5/3/2023 203,280 0.13
EUR 100,000 Banco de Sabadell SA RegSFRN 29/6/2023 102,043 0.06
EUR 100,000 Banco de Sabadell SA RegS2.50% 15/4/2031 100,347 0.06
GBP 400,000 Banco Santander SA RegS2.75% 12/9/2023 485,059 0.30
EUR 300,000 BBVA Consumer Auto’2020-1 A’ FTA RegS FRN20/1/2036 303,352 0.19
EUR 400,000 CaixaBank SA RegS 1.00%25/6/2024 410,332 0.26
EUR 100,000 CaixaBank SA RegS FRN16/11/2026 104,198 0.07
EUR 100,000 Cellnex Finance Co SA RegS0.75% 15/11/2026 98,893 0.06
EUR 200,000 Cellnex Finance Co SA RegS1.50% 8/6/2028 198,984 0.12
EUR 100,000 Cellnex Finance Co SA RegS2.00% 15/2/2033 97,158 0.06
EUR 200,000 Cellnex Telecom SA RegS0.75% 20/11/2031 193,020 0.12
EUR 354,598 FT Santander ConsumerSpain Auto ’2020-1 A’ RegSFRN 20/3/2033 358,613 0.23
GBP 100,000 Iberdrola Finanzas SA 7.375%29/1/2024 136,402 0.09
EUR 100,000 International Consolidated Air-lines Group SA RegS 2.75%25/3/2025 99,832 0.06
EUR 100,000 International Consolidated Air-lines Group SA RegS1.125% 18/5/2028 100,484 0.06
EUR 100,000 Lorca Telecom Bondco SARegS 4.00% 18/9/2027 101,488 0.06
EUR 845,000 Spain Government Bond RegS0.50% 30/4/2030 857,117 0.54
EUR 200,000 Wizink Master Credit Cards FT’2019-2 A’ RegS FRN26/3/2033 199,671 0.13
5,165,247 3.24
Sri LankaUSD 200,000 Sri Lanka Government Interna-
tional Bond RegS 7.85%14/3/2029 110,853 0.07
110,853 0.07
SupranationalUSD 200,000 Ardagh Packaging Finance Plc
/ Ardagh Holdings USA Inc5.25% 30/4/2025 172,374 0.11
EUR 243,000 European Investment BankRegS 14/1/2031 (Zero Cou-pon) 242,033 0.15
EUR 76,000 International Bank for Recon-struction & Development0.20% 21/1/2061 62,711 0.04
477,118 0.30
SwedenEUR 100,000 Molnlycke Holding AB RegS
0.625% 15/1/2031 96,314 0.06
Holding Description
MarketValue
EUR
% ofNet
Assets
Sweden continuedEUR 100,000 Skandinaviska Enskilda Ban-
ken AB RegS 0.05%1/7/2024 100,806 0.06
EUR 350,000 Skandinaviska Enskilda Ban-ken AB RegS FRN31/10/2028 359,520 0.23
GBP 488,000 Svensk Exportkredit AB RegS0.125% 15/12/2025 556,092 0.35
EUR 300,000 Svenska Handelsbanken ABRegS FRN 5/3/2029 311,832 0.20
EUR 100,000 Svenska Handelsbanken ABRegS 0.50% 18/2/2030 99,422 0.06
GBP 150,000 Swedbank AB RegS 1.625%28/12/2022 177,562 0.11
EUR 100,000 Telefonaktiebolaget LM Erics-son RegS 1.00% 26/5/2029 100,236 0.06
EUR 100,000 Verisure Holding AB RegS3.875% 15/7/2026 102,735 0.07
EUR 100,000 Verisure Holding AB RegS3.25% 15/2/2027 100,914 0.06
2,005,433 1.26
SwitzerlandUSD 200,000 UBS Group AG 3.491%
23/5/2023 168,896 0.11EUR 200,000 UBS Group AG RegS FRN
20/9/2022 200,354 0.12EUR 200,000 UBS Group AG RegS FRN
17/4/2025 206,800 0.13
576,050 0.36
ThailandUSD 200,000 Bangkok Bank PCL RegS FRN
25/9/2034 167,734 0.10USD 200,000 Kasikornbank PCL RegS FRN
(Perpetual) 173,518 0.11
341,252 0.21
TurkeyUSD 230,000 Turkey Government Interna-
tional Bond 6.25%26/9/2022^ 196,590 0.12
196,590 0.12
United KingdomGBP 270,000 Atlas Funding ’2021-1 A’ Plc
RegS FRN 25/7/2058 315,696 0.20GBP 200,000 Aviva Plc FRN (Perpetual) 247,771 0.16GBP 31,604 Azure Finance No 1 Plc ’B’
RegS FRN 30/6/2027 36,750 0.02GBP 570,831 Azure Finance No 2 Plc ’A’
RegS FRN 20/7/2030 666,105 0.42EUR 450,000 Barclays Plc RegS FRN
7/2/2028 462,163 0.29GBP 250,000 BAT International Finance Plc
7.25% 12/3/2024 337,434 0.21GBP 220,000 BP Capital Markets Plc RegS
FRN (Perpetual) 269,896 0.17GBP 271,245 Brass No 7 Plc ’A’ RegS FRN
16/10/2059 316,513 0.20GBP 68,334 Brass No 8 Plc ’A2’ RegS FRN
16/11/2066 80,107 0.05EUR 200,000 British Telecommunications Plc
RegS 1.00% 21/11/2024 206,608 0.13EUR 100,000 British Telecommunications Plc
RegS FRN 18/8/2080 99,126 0.06GBP 200,000 BUPA Finance Plc RegS
5.00% 25/4/2023 249,991 0.16GBP 200,000 BUPA Finance Plc RegS
5.00% 8/12/2026 270,944 0.17EUR 225,000 Channel Link Enterprises Fi-
nance Plc RegS FRN30/6/2050 224,449 0.14
BlackRock Global Absolute Return Bond Fund continued
Portfolio of Investments as at 31 May 2021
The notes on pages 590 to 610 form an integral part of these financial statements.
Annual report and audited financial statements [363]

Holding Description
MarketValue
EUR
% ofNet
Assets
United Kingdom continuedGBP 146,307 Charter Mortgage Funding Plc
’2017-1 A’ RegS FRN12/6/2054 170,000 0.11
GBP 215,899 CMF ’2020-1 A’ Plc RegS FRN16/1/2057 251,282 0.16
GBP 241,454 Dignity Finance Plc RegS3.546% 31/12/2034 304,405 0.19
GBP 37,683 DLL UK Equipment FinancePlc ’2019-1UK A’ RegS FRN25/3/2028 43,843 0.03
EUR 100,000 eG Global Finance Plc RegS6.25% 30/10/2025 101,874 0.06
EUR 400,000 FCE Bank Plc RegS 0.869%13/9/2021 400,772 0.25
GBP 245,042 Feldspar Plc ’2016-1 A’ RegSFRN 15/9/2045 284,855 0.18
GBP 554,000 Finsbury Square ’2018-2B’ PlcRegS FRN 12/9/2068 645,905 0.41
GBP 323,301 Finsbury Square Plc’2018-2 A’ RegS FRN12/9/2068 376,555 0.24
GBP 124,168 Finsbury Square Plc’2020-2 A’ RegS FRN16/6/2070 145,667 0.09
GBP 295,023 Friary No 4 Plc ’A’ RegS FRN21/1/2050 343,214 0.22
GBP 468,000 Gemgarto ’2021-1 A’ Plc RegSFRN 16/12/2067 546,055 0.34
GBP 619,204 Gemgarto Plc ’2018-1 A’ RegSFRN 16/9/2065 723,259 0.45
GBP 419,467 Gosforth Funding Plc ’2018-1XA2’ RegS FRN 25/8/2060 489,183 0.31
GBP 303,777 Hops Hill No 1 Plc ’A’ RegSFRN 27/5/2054 355,051 0.22
GBP 99,994 Hops Hill No 1 Plc ’B’ RegSFRN 27/5/2054 117,159 0.07
GBP 200,000 HSBC Bank Plc RegS 6.50%7/7/2023 259,368 0.16
USD 250,000 HSBC Holdings Plc 4.25%18/8/2025 227,312 0.14
EUR 100,000 Informa Plc RegS 1.50%5/7/2023 103,092 0.06
EUR 100,000 Informa Plc RegS 2.125%6/10/2025 106,221 0.07
USD 200,000 Jaguar Land Rover AutomotivePlc 5.875% 15/1/2028 167,468 0.10
GBP 100,000 Jerrold Finco Plc RegS 5.25%15/1/2027 120,246 0.08
GBP 114,750 Lanark Master Issuer PlcRegS FRN 22/12/2069 134,004 0.08
GBP 345,000 Lanebrook Mortgage Transac-tion Plc ’2020-1 B’ RegSFRN 12/6/2057 406,973 0.26
GBP 300,000 Legal & General Group PlcRegS FRN 23/7/2041 352,944 0.22
GBP 250,000 Lloyds Bank Plc RegS 7.625%22/4/2025 361,289 0.23
USD 200,000 Lloyds Banking Group Plc3.00% 11/1/2022 166,690 0.10
EUR 250,000 Lloyds Banking Group PlcRegS FRN 12/11/2025 253,335 0.16
GBP 313,000 London Wall Mortgage CapitalPlc ’2021-FL1 A’ RegS FRN15/5/2051 365,052 0.23
GBP 283,000 Mitchells & Butlers Finance PlcRegS FRN 15/9/2034 267,479 0.17
GBP 288,000 Motor Plc ’2016-1 C’ RegS3.75% 25/11/2025 334,496 0.21
GBP 280,000 National Grid Electricity Trans-mission Plc RegS 2.00%16/9/2038 317,775 0.20
Holding Description
MarketValue
EUR
% ofNet
Assets
United Kingdom continuedGBP 100,000 National Grid Electricity Trans-
mission Plc RegS 2.00%17/4/2040 111,839 0.07
EUR 450,000 Natwest Group Plc RegS FRN4/3/2025 473,575 0.30
GBP 345,000 Natwest Group Plc RegS FRN28/11/2031 400,598 0.25
GBP 312,000 Newday Funding Master Is-suer Plc ’2021-1X A1’ RegSFRN 15/3/2029 363,777 0.23
GBP 350,000 NGG Finance Plc RegS FRN18/6/2073 454,641 0.29
GBP 846,240 Oat Hill No 2 Plc ’A’ RegSFRN 27/5/2046 985,025 0.62
GBP 226,960 Orbita Funding ’2020-1 A’ PlcRegS FRN 17/3/2027 263,976 0.17
GBP 260,000 PCL Funding IV Plc ’2020-1 B’RegS FRN 15/9/2024 304,068 0.19
GBP 370,000 PCL Funding V Plc ’2021-1 A’RegS FRN 15/10/2025 430,217 0.27
GBP 100,000 Phoenix Group Holdings PlcRegS 4.125% 20/7/2022 120,285 0.08
GBP 370,000 Precise Mortgage Funding’2019-1B A2’ Plc RegS FRN12/12/2055 435,064 0.27
GBP 408,886 Prs Finance Plc RegS 1.75%24/11/2026 501,450 0.31
GBP 300,000 Prs Finance Plc RegS 2.00%23/1/2029 370,531 0.23
GBP 923,000 Residential Mortgage Securi-ties 29 Plc ’B’ RegS FRN20/12/2046 1,074,804 0.67
GBP 320,559 Residential Mortgage Securi-ties 31 Plc ’A’ RegS FRN20/9/2065 373,107 0.23
GBP 411,808 Residential Mortgage Securi-ties ’32X A’ Plc RegS FRN20/6/2070 484,282 0.30
GBP 114,671 Ripon Mortgages Plc ’1X A1’RegS FRN 20/8/2056 133,498 0.08
GBP 340,000 Ripon Mortgages Plc ’1X B1’RegS FRN 20/8/2056 395,684 0.25
GBP 135,000 RMAC Securities No 2 Plc’2018-2 B’ RegS FRN12/6/2046 157,316 0.10
GBP 385,000 Sage AR Funding No 1 Plc ’B’RegS FRN 17/11/2030 448,592 0.28
EUR 200,000 Santander UK Group HoldingsPlc RegS FRN 28/2/2025 201,574 0.13
GBP 50,000 Segro Plc 5.75% 20/6/2035 84,479 0.05GBP 257,860 Silk Road Finance Number Six
Plc ’A’ RegS FRN 21/9/2067 301,948 0.19GBP 131,340 Silverstone Master Issuer Plc
’2019-1X 2A’ RegS FRN21/1/2070 153,978 0.10
GBP 479,000 Silverstone Master Issuer PlcRegS FRN 21/1/2070 558,386 0.35
USD 400,000 SSE Plc RegS FRN 16/9/2077 339,561 0.21EUR 200,000 Standard Chartered Plc RegS
3.625% 23/11/2022 210,824 0.13EUR 200,000 Standard Chartered Plc RegS
3.125% 19/11/2024 220,510 0.14EUR 200,000 Standard Chartered Plc RegS
FRN 23/9/2031 200,120 0.13GBP 203,495 Stanlington No 1 Plc
’2017-1 A’ RegS FRN12/6/2046 236,596 0.15
GBP 100,000 Stonegate Pub Co Financing2019 Plc RegS 8.25%31/7/2025 122,506 0.08
BlackRock Global Absolute Return Bond Fund continued
Portfolio of Investments as at 31 May 2021
The notes on pages 590 to 610 form an integral part of these financial statements.
BlackRock Strategic Funds[364]

Holding Description
MarketValue
EUR
% ofNet
Assets
United Kingdom continuedGBP 265,780 Tesco Property Finance 3 Plc
RegS 5.744% 13/4/2040 409,738 0.26GBP 168,000 Thames Water Kemble Fi-
nance Plc RegS 4.625%19/5/2026 198,577 0.12
GBP 150,000 Thames Water Utilities Fi-nance Plc FRN 13/9/2030 183,308 0.11
GBP 355,000 Tritax Big Box REIT Plc RegS1.50% 27/11/2033 392,919 0.25
GBP 13,467 Turbo Finance 8 Plc ’A’ RegSFRN 20/2/2026 15,641 0.01
GBP 685,000 Turbo Finance Plc ’9 A’ RegSFRN 20/8/2028 800,279 0.50
GBP 475,832 Twin Bridges Plc ’2018-1 A’RegS FRN 12/9/2050 555,630 0.35
GBP 167,853 Twin Bridges Plc ’2019-1 A’RegS FRN 12/12/2052 195,744 0.12
GBP 65,000 United Kingdom Gilt RegS0.625% 22/10/2050 63,016 0.04
GBP 100,000 Very Group Funding Plc RegS7.75% 15/11/2022 117,513 0.07
GBP 100,000 Virgin Media Secured FinancePlc RegS 4.25% 15/1/2030 116,359 0.07
EUR 100,000 Virgin Money UK Plc RegSFRN 27/5/2024 100,516 0.06
EUR 150,000 Virgin Money UK Plc RegSFRN 24/6/2025 160,804 0.10
EUR 100,000 Vmed O2 UK Financing I PlcRegS 3.25% 31/1/2031 100,912 0.06
EUR 200,000 Vodafone Group Plc RegS4.65% 20/1/2022 206,532 0.13
EUR 100,000 Vodafone Group Plc RegSFRN 3/1/2079 103,724 0.06
EUR 100,000 WPP Finance 2013 RegS3.00% 20/11/2023 107,880 0.07
27,768,279 17.41
United StatesUSD 55,000 7-Eleven Inc 0.80% 10/2/2024 45,043 0.03
USD 142,000 AbbVie Inc 3.45% 15/3/2022 118,666 0.07USD 125,000 AbbVie Inc 3.25% 1/10/2022 105,650 0.07EUR 200,000 AbbVie Inc 1.375% 17/5/2024 207,678 0.13USD 100,000 ADT Security Corp 3.50%
15/7/2022 83,522 0.05USD 55,000 Air Lease Corp 2.625%
1/7/2022 46,024 0.03USD 85,000 Albertsons Cos Inc / Safeway
Inc / New Albertsons LP /Albertsons LLC 3.50%15/2/2023 71,476 0.04
EUR 100,000 Altria Group Inc 2.20%15/6/2027 107,286 0.07
USD 180,000 Altria Group Inc 2.45%4/2/2032 139,806 0.09
USD 35,046 American Airlines ’2013-2 A’Pass Through Trust 4.95%15/1/2023 28,981 0.02
USD 157,124 American Airlines2016-1 Class AA PassThrough Trust 3.575%15/1/2028 131,876 0.08
USD 335,394 American Airlines2017-1 Class B PassThrough Trust 4.95%15/2/2025 264,937 0.17
USD 150,000 American Express Co 2.50%1/8/2022 125,897 0.08
USD 45,000 American Express Co 3.40%27/2/2023 38,758 0.02
USD 35,000 American Honda Finance Corp2.05% 10/1/2023 29,501 0.02
USD 75,000 American Tower Corp 3.00%15/6/2023 64,519 0.04
Holding Description
MarketValue
EUR
% ofNet
Assets
United States continuedUSD 160,000 Amkor Technology Inc 6.625%
15/9/2027 141,656 0.09USD 20,000 Anthem Inc 3.125% 15/5/2022 16,843 0.01
USD 100,000 Anthem Inc 3.30% 15/1/2023 85,817 0.05EUR 100,000 Apple Inc 0.50% 15/11/2031 101,019 0.06USD 250,000 Ares Capital Corp 4.25%
1/3/2025 222,259 0.14EUR 250,000 AT&T Inc 1.30% 5/9/2023 257,307 0.16USD 70,000 AT&T Inc 0.90% 25/3/2024 57,520 0.04USD 65,000 Atmos Energy Corp 0.625%
9/3/2023 53,312 0.03USD 50,000 Baker Hughes a GE Co LLC /
Baker Hughes Co-ObligorInc 2.773% 15/12/2022 42,482 0.03
USD 200,000 BAMLL Commercial MortgageSecurities Trust 2015-200P’B’ 3.49% 14/4/2033 175,689 0.11
USD 74,000 Bank 2017-BNK5 ’C’ FRN15/6/2060 66,131 0.04
USD 65,000 Bank ’2017-BNK8 B’ FRN15/11/2050 58,046 0.04
USD 265,000 Bank of America Corp FRN23/7/2024 232,482 0.15
USD 55,000 Bank of America Corp FRN22/4/2025 45,491 0.03
USD 120,000 Bank of America Corp FRN22/10/2030 102,332 0.06
EUR 350,000 Bank of America Corp RegSFRN 7/2/2025 362,957 0.23
GBP 295,000 Bank of America Corp RegSFRN 2/6/2029 343,479 0.22
USD 40,000 Bank of New York Mellon Corp3.50% 28/4/2023 34,880 0.02
USD 60,000 BAT Capital Corp 2.259%25/3/2028 48,348 0.03
USD 70,000 BAT Capital Corp 4.906%2/4/2030 65,015 0.04
USD 152,000 Baylor Scott & White Holdings2.839% 15/11/2050 119,980 0.08
USD 50,000 Becton Dickinson and Co3.734% 15/12/2024 44,868 0.03
USD 220,000 Best Buy Co Inc 4.45%1/10/2028 207,408 0.13
USD 160,000 BHMS 2018-ATLS ’A’ FRN15/7/2035 131,264 0.08
USD 224,000 BHMS 2018-ATLS ’B’ FRN15/7/2035 183,659 0.12
USD 166,000 BHMS 2018-ATLS ’C’ FRN15/7/2035 135,940 0.09
EUR 100,000 Boxer Parent Co Inc RegS6.50% 2/10/2025 106,705 0.07
USD 15,000 BP Capital Markets AmericaInc 3.79% 6/2/2024 13,352 0.01
USD 290,000 Broadcom Inc 4.11%15/9/2028 262,773 0.16
USD 350,000 California Pollution ControlFinancing Authority 5.00%21/11/2045 303,006 0.19
USD 145,000 Capital One Financial Corp3.05% 9/3/2022 121,109 0.08
USD 60,000 Capital One Financial Corp3.20% 30/1/2023 51,382 0.03
EUR 220,000 Capital One Financial Corp0.80% 12/6/2024 224,754 0.14
EUR 100,000 Capital One Financial Corp1.65% 12/6/2029 105,366 0.07
USD 357,000 Cargo Aircraft ManagementInc 4.75% 1/2/2028 299,868 0.19
USD 150,000 Carrier Global Corp 2.722%15/2/2030 126,317 0.08
USD 105,000 CDW LLC / CDW FinanceCorp 4.125% 1/5/2025 90,060 0.06
BlackRock Global Absolute Return Bond Fund continued
Portfolio of Investments as at 31 May 2021
The notes on pages 590 to 610 form an integral part of these financial statements.
Annual report and audited financial statements [365]

Holding Description
MarketValue
EUR
% ofNet
Assets
United States continuedUSD 100,000 Central Puget Sound Regional
Transit Authority ’S1’ 5.00%1/11/2041 98,575 0.06
USD 5,570,010 CFCRE Commercial MortgageTrust ’2016-C4 XA’ FRN10/5/2058 303,789 0.19
USD 40,000 Charles Schwab Corp FRN13/5/2026 32,913 0.02
USD 165,000 Charter Communications Op-erating LLC / Charter Com-munications Operating Capi-tal 4.464% 23/7/2022 140,514 0.09
USD 300,000 Charter Communications Op-erating LLC / Charter Com-munications Operating Capi-tal 4.908% 23/7/2025 279,468 0.18
USD 120,000 Charter Communications Op-erating LLC / Charter Com-munications Operating Capi-tal 3.75% 15/2/2028 107,049 0.07
USD 90,000 Cheniere Corpus Christi Hold-ings LLC 5.875% 31/3/2025 84,704 0.05
USD 27,000 Cigna Corp 3.75% 15/7/2023 23,635 0.01USD 40,000 Cigna Corp 4.125%
15/11/2025 36,923 0.02USD 43,000 Citgo Holding Inc 9.25%
1/8/2024 36,159 0.02USD 100,000 Citigroup Commercial Mort-
gage Trust ’2016-P6 B’ FRN10/12/2049 90,839 0.06
USD 100,000 Citigroup Commercial Mort-gage Trust 2018-B2 ’A4’4.009% 10/3/2051 93,072 0.06
USD 90,000 Citigroup Inc FRN 24/7/2023 75,903 0.05USD 140,000 Citigroup Inc FRN 30/10/2024 115,300 0.07USD 70,000 Citigroup Inc FRN 29/1/2031 58,476 0.04
USD 160,000 Citrix Systems Inc 1.25%1/3/2026 129,437 0.08
USD 30,000 Citrix Systems Inc 4.50%1/12/2027 27,931 0.02
USD 10,000 City of Riverside CA ElectricRevenue 7.605% 1/10/2040 12,808 0.01
USD 1,000,000 CityLine Commercial MortgageTrust ’2016-CLNE A’ FRN10/11/2031 852,757 0.53
USD 65,000 Clarios Global LP / Clarios USFinance Co 6.25%15/5/2026^ 56,934 0.04
EUR 100,000 Coca-Cola Co 0.50% 9/3/2033 97,044 0.06USD 260,000 Colorado Health Facilities Au-
thority 5.00% 1/8/2044 263,404 0.17USD 30,000 Comcast Corp 3.00% 1/2/2024 26,185 0.02
EUR 100,000 Comcast Corp 0.75%20/2/2032 99,882 0.06
USD 160,000 COMM 2014-UBS5 MortgageTrust ’B’ FRN 10/9/2047 132,133 0.08
USD 92,000 COMM 2015-CCRE25 Mort-gage Trust ’C’ FRN10/8/2048 81,052 0.05
USD 200,000 Commercial Metals Co 4.875%15/5/2023 173,128 0.11
USD 100,000 Commercial Mortgage Trust’2015-CCRE23 B’ FRN10/5/2048 87,783 0.06
USD 168,122 Commercial Mortgage Trust’2015-CCRE27 B’ FRN10/10/2048 150,941 0.09
USD 5,000 Commonwealth Financing Au-thority 4.144% 1/6/2038 4,742 0.00
USD 75,000 Commonwealth of Massachu-setts 2.90% 1/9/2049 62,625 0.04
Holding Description
MarketValue
EUR
% ofNet
Assets
United States continuedUSD 170,000 Connecticut State Health &
Educational Facilities Au-thority ’L’ 5.00% 1/7/2045 157,732 0.10
EUR 100,000 Coty Inc RegS 4.00%15/4/2023 99,259 0.06
USD 53 Countrywide Asset-BackedCertificates ’2007-4 A2’ FRN25/4/2047 2 0.00
USD 10,000 County of Miami-Dade FLAviation Revenue 3.454%1/10/2030 8,907 0.01
USD 120,000 County of Miami-Dade FLAviation Revenue 4.062%1/10/2031 110,925 0.07
USD 80,000 Cox Communications Inc3.25% 15/12/2022 68,429 0.04
USD 40,000 Cox Communications Inc2.95% 30/6/2023 34,362 0.02
USD 539,111 Credit Suisse Mortgage Secu-rities Corp ’2005-12 2A1’6.50% 25/1/2036 356,130 0.22
USD 50,000 Crown Castle InternationalCorp 3.30% 1/7/2030 43,478 0.03
USD 29,000 CSAIL 2015-C4 CommercialMortgage Trust ’D’ FRN15/11/2048 24,170 0.02
USD 160,000 CSAIL 2018-CX12 Commer-cial Mortgage Trust ’C’ FRN15/8/2051 144,648 0.09
USD 100,000 CVS Health Corp 3.50%20/7/2022 84,534 0.05
USD 7,000 CVS Health Corp 3.70%9/3/2023 6,064 0.00
USD 150,000 Daimler Finance NorthAmerica LLC 0.75%1/3/2024 123,227 0.08
EUR 100,000 Danaher Corp 2.50%30/3/2030 115,635 0.07
USD 70,000 Dell International LLC / EMCCorp 5.85% 15/7/2025 67,189 0.04
USD 280,000 Dell International LLC / EMCCorp 6.02% 15/6/2026 273,380 0.17
USD 100,000 Dell International LLC / EMCCorp 6.20% 15/7/2030 102,720 0.06
USD 170,000 Delta Air Lines ’2019-1 AA’Pass Through Trust 3.204%25/4/2024 145,878 0.09
USD 98,046 Delta Air Lines Pass ThroughTrust ’2015 B’ 4.25%30/7/2023 82,353 0.05
USD 25,000 Diamondback Energy Inc0.90% 24/3/2023 20,497 0.01
GBP 100,000 Discovery CommunicationsLLC 2.50% 20/9/2024 120,876 0.08
USD 190,000 District of Columbia 5.591%1/12/2034 200,630 0.13
USD 25,000 Dominion Energy Inc FRN15/9/2023 20,501 0.01
USD 10,000 DuPont de Nemours Inc4.205% 15/11/2023 8,910 0.01
USD 145,000 East Bay Municipal Utility Dis-trict Water System Revenue5.874% 1/6/2040 170,615 0.11
USD 142,000 Elanco Animal Health Inc4.662% 27/8/2021 117,517 0.07
EUR 100,000 Encore Capital Group IncRegS 4.875% 15/10/2025 106,245 0.07
GBP 100,000 Encore Capital Group IncRegS 4.25% 1/6/2028 116,193 0.07
USD 50,000 Energy Transfer LP 5.20%1/2/2022 41,771 0.03
BlackRock Global Absolute Return Bond Fund continued
Portfolio of Investments as at 31 May 2021
The notes on pages 590 to 610 form an integral part of these financial statements.
BlackRock Strategic Funds[366]

Holding Description
MarketValue
EUR
% ofNet
Assets
United States continuedUSD 120,000 Energy Transfer LP 3.60%
1/2/2023 102,286 0.06USD 100,000 Energy Transfer LP 4.25%
15/3/2023 86,292 0.05USD 230,000 Energy Transfer LP 5.875%
15/1/2024 209,686 0.13USD 80,000 Energy Transfer LP 7.60%
1/2/2024 74,748 0.05USD 105,000 Energy Transfer LP / Regency
Energy Finance Corp 4.50%1/11/2023 92,551 0.06
EUR 100,000 Exxon Mobil Corp 1.408%26/6/2039 96,084 0.06
USD 39,892 Fannie Mae ’2014-14 LA’2.50% 25/4/2031 33,062 0.02
USD 1,579 Fannie Mae Pool 4.00%1/5/2026 1,383 0.00
USD 4,160 Fannie Mae Pool 4.00%1/9/2026 3,639 0.00
USD 464 Fannie Mae Pool 4.00%1/1/2027 409 0.00
USD 25,820 Fannie Mae Pool 4.00%1/3/2027 22,583 0.01
USD 38,150 Fannie Mae Pool 4.00%1/5/2027 33,416 0.02
USD 87,693 Fannie Mae Pool 4.00%1/8/2027 76,811 0.05
USD 8,459 Fannie Mae Pool 4.00%1/3/2031 7,410 0.00
USD 26,203 Fannie Mae Pool 4.00%1/4/2033 22,918 0.01
USD 20,551 Fannie Mae Pool 4.00%1/6/2033 18,191 0.01
USD 7,135 Fannie Mae Pool 4.00%1/9/2033 6,322 0.00
USD 10,707 Fannie Mae Pool 4.00%1/2/2034 9,604 0.01
USD 5,711 Fannie Mae Pool 4.00%1/3/2034 4,995 0.00
USD 5,002 Fannie Mae Pool 4.00%1/3/2034 4,451 0.00
EUR 100,000 FedEx Corp 0.45% 4/5/2029 99,198 0.06EUR 200,000 Fidelity National Information
Services Inc 0.125%3/12/2022 200,926 0.13
USD 25,000 Fidelity National InformationServices Inc 0.60% 1/3/2024 20,491 0.01
EUR 150,000 Fidelity National InformationServices Inc 1.10%15/7/2024 154,828 0.10
EUR 250,000 Fiserv Inc 0.375% 1/7/2023 252,377 0.16USD 40,000 Fiserv Inc 3.80% 1/10/2023 35,236 0.02USD 85,000 Flex Intermediate Holdco LLC
4.317% 30/12/2039 69,892 0.04USD 200,000 Ford Motor Credit Co LLC
5.875% 2/8/2021 164,905 0.10USD 258,000 Ford Motor Credit Co LLC
3.813% 12/10/2021 213,944 0.13USD 259,000 Ford Motor Credit Co LLC
3.339% 28/3/2022 215,409 0.14USD 200,000 Ford Motor Credit Co LLC
3.35% 1/11/2022 167,836 0.11USD 200,000 Ford Motor Credit Co LLC
3.087% 9/1/2023 167,159 0.10GBP 130,000 Ford Motor Credit Co LLC
4.535% 6/3/2025 160,754 0.10USD 179,402 Freddie Mac Gold Pool 3.00%
1/8/2030 158,039 0.10USD 25,076 Freddie Mac Gold Pool 4.00%
1/2/2034 22,483 0.01
Holding Description
MarketValue
EUR
% ofNet
Assets
United States continuedUSD 30,049 Freddie Mac Gold Pool 4.00%
1/2/2034 26,955 0.02USD 27,629 Freddie Mac Gold Pool 4.00%
1/3/2034 24,808 0.02USD 74,324 Freddie Mac REMICS
’4390 CA’ 3.50% 15/6/2050 62,726 0.04USD 42,226 Freddie Mac REMICS
’4459 BN’ 3.00% 15/8/2043 37,145 0.02USD 17,588 Freddie Mac REMICS
’4482 DH’ 3.00% 15/6/2042 14,863 0.01USD 170,000 Freeport-McMoRan Inc 5.00%
1/9/2027 147,139 0.09USD 55,526,431 FREMF Mortgage Trust
’2015-K151 X2A’ 0.10%25/4/2030 275,525 0.17
USD 80,370,487 FREMF Mortgage Trust’2015-K718 X2A’ 0.10%25/2/2048 21,041 0.01
USD 10,000 General Motors Co 5.40%2/10/2023 9,065 0.01
USD 140,000 General Motors Financial CoInc 3.25% 5/1/2023 119,367 0.07
USD 50,000 General Motors Financial CoInc 3.70% 9/5/2023 43,164 0.03
USD 100,000 General Motors Financial CoInc 4.15% 19/6/2023 87,518 0.05
USD 135,000 General Motors Financial CoInc 1.05% 8/3/2024 111,324 0.07
USD 180,000 General Motors Financial CoInc 1.25% 8/1/2026 146,327 0.09
USD 50,000 General Motors Financial CoInc 3.60% 21/6/2030 43,924 0.03
EUR 350,000 General Motors Financial CoInc RegS 0.20% 2/9/2022 351,564 0.22
USD 40,000 Georgia-Pacific LLC 3.734%15/7/2023 34,778 0.02
USD 200,000 Gilead Sciences Inc 0.75%29/9/2023 163,965 0.10
USD 25,000 Glencore Funding LLC 4.625%29/4/2024 22,624 0.01
USD 5,000 Global Payments Inc 3.75%1/6/2023 4,329 0.00
USD 20,000 Global Payments Inc 4.00%1/6/2023 17,476 0.01
USD 75,000 GLP Capital LP / GLP Financ-ing II Inc 5.375% 1/11/2023 67,216 0.04
USD 355,000 GLP Capital LP / GLP Financ-ing II Inc 5.25% 1/6/2025 328,842 0.21
USD 150,000 GLP Capital LP / GLP Financ-ing II Inc 5.375% 15/4/2026 140,495 0.09
USD 50,000 GLP Capital LP / GLP Financ-ing II Inc 4.00% 15/1/2030 43,539 0.03
USD 45,000 Goldman Sachs Group Inc3.20% 23/2/2023 38,604 0.02
USD 75,000 Goldman Sachs Group IncFRN 17/11/2023 61,584 0.04
USD 30,000 Goldman Sachs Group Inc3.625% 20/2/2024 26,556 0.02
USD 335,000 Goldman Sachs Group IncFRN 5/6/2028 303,370 0.19
USD 145,000 Goldman Sachs Group Inc3.80% 15/3/2030 132,473 0.08
EUR 500,000 Goldman Sachs Group IncRegS 3.375% 27/3/2025 560,860 0.35
USD 2,463,566 Government National Mort-gage Association’2017-64 IO’ FRN16/11/2057 111,410 0.07
USD 300,000 Grant County Public Utility Dis-trict No 2 4.584% 1/1/2040 322,354 0.20
BlackRock Global Absolute Return Bond Fund continued
Portfolio of Investments as at 31 May 2021
The notes on pages 590 to 610 form an integral part of these financial statements.
Annual report and audited financial statements [367]

Holding Description
MarketValue
EUR
% ofNet
Assets
United States continuedUSD 135,000 Graphic Packaging Interna-
tional LLC 4.125%15/8/2024 117,660 0.07
USD 70,000 Gray Oak Pipeline LLC 2.00%15/9/2023 58,583 0.04
USD 155,000 Gray Oak Pipeline LLC 2.60%15/10/2025 130,847 0.08
USD 125,000 GS Mortgage Securities Trust’2015-GS1 A3’ 3.734%10/11/2048 113,393 0.07
USD 360,000 HCA Inc 4.125% 15/6/2029 330,482 0.21USD 142,599 HSI Asset Securitization Corp
Trust ’2007-NC1 A2’ FRN25/4/2037 89,116 0.06
USD 25,000 Humana Inc 4.875% 1/4/2030 24,436 0.02USD 85,000 Huntsman International LLC
4.50% 1/5/2029 78,717 0.05USD 95,000 Huntsman International LLC
2.95% 15/6/2031 78,353 0.05EUR 100,000 Illinois Tool Works Inc 0.25%
5/12/2024 101,259 0.06USD 25,000 International Flavors & Fra-
grances Inc 0.697%15/9/2022 20,533 0.01
USD 10,000 Interpublic Group of Cos Inc3.75% 1/10/2021 8,287 0.01
USD 205,000 IQVIA Inc 5.00% 15/5/2027 176,099 0.11EUR 100,000 IQVIA Inc RegS 2.875%
15/9/2025 101,562 0.06EUR 100,000 IQVIA Inc RegS 1.75%
15/3/2026 100,954 0.06EUR 100,000 IQVIA Inc RegS 2.25%
15/3/2029 99,814 0.06USD 40,000 Jefferies Group LLC / Jefferies
Group Capital Finance Inc4.15% 23/1/2030 36,355 0.02
USD 227,029 JP Morgan Mortgage Trust2017-2 ’B3’ FRN 25/5/2047 192,804 0.12
USD 35,000 JPMorgan Chase & Co3.625% 13/5/2024 31,322 0.02
USD 100,000 JPMorgan Chase & Co FRN1/6/2024 83,669 0.05
USD 70,000 JPMorgan Chase & Co 4.25%1/10/2027 66,021 0.04
GBP 175,000 JPMorgan Chase & Co RegSFRN 28/4/2026 203,569 0.13
GBP 110,000 JPMorgan Chase & Co RegSFRN 28/4/2033 128,124 0.08
EUR 100,000 Kellogg Co 0.80% 17/11/2022 101,581 0.06USD 43,000 Keurig Dr Pepper Inc 4.057%
25/5/2023 37,691 0.02USD 35,000 Keurig Dr Pepper Inc 0.75%
15/3/2024 28,735 0.02USD 25,000 Keysight Technologies Inc
4.60% 6/4/2027 23,694 0.01USD 60,000 Kinder Morgan Energy Part-
ners LP 3.95% 1/9/2022 50,941 0.03USD 30,000 Kinder Morgan Energy Part-
ners LP 4.15% 1/2/2024 26,641 0.02USD 30,000 Kinder Morgan Inc 3.15%
15/1/2023 25,610 0.02USD 30,000 Lear Corp 4.25% 15/5/2029 27,498 0.02
USD 150,000 Lear Corp 3.50% 30/5/2030 131,147 0.08USD 45,000 Level 3 Financing Inc 3.75%
15/7/2029 35,599 0.02USD 70,000 Los Angeles Department of
Water & Power Power Sys-tem Revenue 5.716%1/7/2039 81,187 0.05
USD 250,000 Marsh & McLennan Cos Inc2.25% 15/11/2030 205,499 0.13
Holding Description
MarketValue
EUR
% ofNet
Assets
United States continuedEUR 100,000 Metropolitan Life Global Fund-
ing I RegS 2.375%11/1/2023 104,392 0.07
USD 20,000 Michigan Finance Authority5.00% 15/11/2028 20,192 0.01
USD 90,000 Michigan Finance Authority5.00% 15/11/2041 89,149 0.06
USD 70,000 Micron Technology Inc 5.327%6/2/2029 68,475 0.04
USD 120,000 Micron Technology Inc 4.663%15/2/2030 113,422 0.07
USD 150,000 Mid-Atlantic Interstate Trans-mission LLC 4.10%15/5/2028 136,639 0.09
USD 45,000 Moody’s Corp 2.625%15/1/2023 38,166 0.02
USD 95,000 Morgan Stanley 3.125%23/1/2023 81,449 0.05
USD 100,000 Morgan Stanley FRN10/11/2023 82,124 0.05
EUR 450,000 Morgan Stanley FRN26/7/2024 457,060 0.29
USD 120,000 Morgan Stanley 3.95%23/4/2027 110,714 0.07
EUR 100,000 Morgan Stanley 1.875%27/4/2027 108,586 0.07
USD 140,000 Morgan Stanley FRN23/1/2030 133,202 0.08
USD 500,000 Morgan Stanley Capital I Trust’2014-150E A’ 3.912%9/9/2032 446,794 0.28
USD 170,000 Morgan Stanley Capital I Trust2017-CLS ’E’ FRN15/11/2034 139,513 0.09
USD 32,782 Morgan Stanley Capital I Trust’2017-H1 C’ FRN 15/6/2050 27,757 0.02
USD 365,000 Morgan Stanley Capital I Trust’2018-H3 A5’ 4.177%15/7/2051 342,066 0.21
USD 144,931 Morgan Stanley Capital I Trust’2018-H3 B’ FRN 15/7/2051 134,740 0.08
USD 160,000 Morgan Stanley Capital I Trust2018-H3 ’C’ FRN 15/7/2051 148,933 0.09
USD 250,000 Morgan Stanley Capital I Trust’2018-H4 A4’ 4.31%15/12/2051 235,111 0.15
USD 100,000 Morgan Stanley Capital I Trust’2018-L1 A4’ FRN15/10/2051 94,803 0.06
USD 86,275 Mosaic Solar Loan Trust’2020-2A A’ 1.44%20/8/2046 68,839 0.04
USD 30,000 MPLX LP 3.50% 1/12/2022 25,598 0.02USD 20,000 MPLX LP 3.375% 15/3/2023 17,185 0.01USD 35,000 MPLX LP 4.875% 1/12/2024 32,384 0.02
GBP 100,000 MPT Operating Partnership LP/ MPT Finance Corp 3.375%24/4/2030 118,594 0.07
USD 86,000 Navient Corp 7.25% 25/1/2022 73,111 0.05USD 114,000 Navient Corp 6.50% 15/6/2022 97,849 0.06USD 50,000 Navient Corp 6.125%
25/3/2024 43,966 0.03USD 310,000 Navient Private Education Refi
Loan Trust ’2020-CA A2A’2.15% 15/11/2068 259,479 0.16
USD 120,000 New Jersey Economic Devel-opment Authority 3.72%15/6/2030 104,954 0.07
USD 15,000 New Jersey Turnpike Authority1.047% 1/1/2026 12,272 0.01
BlackRock Global Absolute Return Bond Fund continued
Portfolio of Investments as at 31 May 2021
The notes on pages 590 to 610 form an integral part of these financial statements.
BlackRock Strategic Funds[368]

Holding Description
MarketValue
EUR
% ofNet
Assets
United States continuedUSD 51,198 New Residential Mortgage
Trust ’2018-1A A1A’ FRN25/12/2057 44,856 0.03
USD 95,000 New York City Transitional Fi-nance Authority Future TaxSecured Revenue 2.90%1/11/2032 82,657 0.05
USD 55,000 New York City Water & SewerSystem 5.724% 15/6/2042 66,274 0.04
USD 45,000 New York City Water & SewerSystem 5.44% 15/6/2043 52,779 0.03
USD 15,000 New York Life Global Funding1.10% 5/5/2023 12,484 0.01
USD 15,000 New York State Dormitory Au-thority 3.19% 15/2/2043 12,986 0.01
USD 20,000 New York State Urban Devel-opment Corp ’B’ 3.12%15/3/2025 17,807 0.01
USD 170,000 New York Transportation De-velopment Corp ’A’ 5.00%1/7/2046 157,613 0.10
USD 10,000 New York Transportation De-velopment Corp ’A’ 5.25%1/1/2050 9,312 0.01
USD 70,000 NextEra Energy Capital Hold-ings Inc 2.403% 1/9/2021 57,669 0.04
USD 70,000 NextEra Energy Capital Hold-ings Inc 0.65% 1/3/2023 57,689 0.04
USD 595,000 NextEra Energy OperatingPartners LP 4.25%15/7/2024 517,166 0.32
USD 370,000 NGPL PipeCo LLC 4.375%15/8/2022 314,084 0.20
USD 78,000 Nissan Motor AcceptanceCorp 3.875% 21/9/2023 68,112 0.04
USD 20,000 Nissan Motor AcceptanceCorp 1.05% 8/3/2024 16,422 0.01
USD 205,000 Nissan Motor AcceptanceCorp 2.00% 9/3/2026 168,392 0.11
USD 450,000 Occidental Petroleum Corp10/10/2036 (Zero Coupon) 183,809 0.12
USD 25,000 Omega Healthcare InvestorsInc 4.75% 15/1/2028 22,894 0.01
USD 100,000 ONE Gas Inc 1.10% 11/3/2024 82,027 0.05USD 155,000 OneMain Financial Issuance
Trust ’2020-1A A’ 3.84%14/5/2032 132,902 0.08
USD 20,000 ONEOK Inc 4.35% 15/3/2029 18,295 0.01USD 150,000 ONEOK Partners LP 4.90%
15/3/2025 137,572 0.09USD 130,000 Oracle Corp 2.625%
15/2/2023 110,616 0.07USD 25,000 Oracle Corp 2.95%
15/11/2024 21,910 0.01USD 20,000 Oregon School Boards Asso-
ciation 5.68% 30/6/2028 20,121 0.01USD 10,000 Oregon School Boards Asso-
ciation ’B’ 5.55% 30/6/2028 9,861 0.01USD 80,000 Pacific Gas and Electric Co
1.367% 10/3/2023 65,608 0.04USD 50,000 Par Pharmaceutical Inc 7.50%
1/4/2027 41,841 0.03USD 80,000 PayPal Holdings Inc 1.35%
1/6/2023 66,884 0.04USD 75,000 Penske Truck Leasing Co Lp /
PTL Finance Corp 2.70%14/3/2023 63,695 0.04
USD 35,000 Pioneer Natural Resources Co0.55% 15/5/2023 28,776 0.02
USD 110,000 Pioneer Natural Resources Co0.75% 15/1/2024 90,248 0.06
Holding Description
MarketValue
EUR
% ofNet
Assets
United States continuedUSD 55,000 Port Authority of New York &
New Jersey 5.647%1/11/2040 61,755 0.04
EUR 100,000 Procter & Gamble Co 1.20%30/10/2028 107,555 0.07
USD 95,000 Public Storage 1.85% 1/5/2028 77,906 0.05USD 50,000 Public Storage 2.30% 1/5/2031 41,079 0.03USD 45,000 QUALCOMM Inc FRN
30/1/2023 37,270 0.02USD 105,000 Qwest Corp 6.75% 1/12/2021 88,511 0.06USD 120,000 Reliance Steel & Aluminum Co
2.15% 15/8/2030 95,926 0.06USD 30,000 Reynolds American Inc 4.45%
12/6/2025 27,321 0.02USD 10,000 Roper Technologies Inc 0.45%
15/8/2022 8,209 0.01USD 60,000 Rutgers The State University
of New Jersey 3.27%1/5/2043 51,942 0.03
USD 90,000 Sabine Pass Liquefaction LLC5.625% 1/3/2025 84,660 0.05
USD 40,000 Salt River Project AgriculturalImprovement & Power Dis-trict 4.839% 1/1/2041 42,559 0.03
USD 16,000 Santander Holdings USA Inc4.45% 3/12/2021 13,337 0.01
USD 155,000 Sealed Air Corp 5.25%1/4/2023 134,204 0.08
USD 59 Sequoia Mortgage Trust’2017-CH2 A10’ FRN25/12/2047 48 0.00
USD 105,000 Service Corp International4.625% 15/12/2027 90,877 0.06
USD 3,000 Sherwin-Williams Co 2.75%1/6/2022 2,513 0.00
USD 96,000 Sherwin-Williams Co 2.30%15/5/2030 78,969 0.05
USD 50,000 Simon Property Group LP3.375% 1/10/2024 44,202 0.03
USD 105,000 Sirius XM Radio Inc 5.00%1/8/2027 90,017 0.06
USD 200,000 SK Battery America Inc RegS2.125% 26/1/2026 162,818 0.10
USD 110,000 SMB Private Education LoanTrust ’2020-PTB B’ 2.50%15/9/2054 91,565 0.06
USD 7,000 South Carolina Public ServiceAuthority ’D’ 2.388%1/12/2023 5,992 0.00
USD 138,571 Southern California Edison Co1.845% 1/2/2022 113,662 0.07
USD 35,000 Southern California Edison Co1.10% 1/4/2024 28,893 0.02
USD 107,500 Sprint Spectrum Co LLC /Sprint Spectrum Co II LLC /Sprint Spectrum Co III LLC3.36% 20/9/2021 88,372 0.06
USD 15,000 State of Maryland Departmentof Transportation 0.361%1/8/2023 12,288 0.01
USD 115,000 Teleflex Inc 4.625%15/11/2027 100,398 0.06
USD 120,000 Texas Municipal Gas Acquisi-tion & Supply Corp I ’D’6.25% 15/12/2026 115,307 0.07
EUR 100,000 Thermo Fisher Scientific Inc1.75% 15/4/2027 108,365 0.07
USD 205,000 T-Mobile USA Inc 2.625%15/4/2026 171,177 0.11
USD 170,000 T-Mobile USA Inc 2.05%15/2/2028 138,915 0.09
BlackRock Global Absolute Return Bond Fund continued
Portfolio of Investments as at 31 May 2021
The notes on pages 590 to 610 form an integral part of these financial statements.
Annual report and audited financial statements [369]

Holding Description
MarketValue
EUR
% ofNet
Assets
United States continuedUSD 34,375 Towd Point Mortgage Trust
’2016-3 A1’ FRN 25/4/2056 28,368 0.02USD 160,000 UBS Commercial Mortgage
Trust 2018-C12 ’B’ FRN15/8/2051 150,531 0.09
USD 50,000 Union Pacific Corp 3.15%1/3/2024 43,964 0.03
USD 157,688 United Airlines 2019-2 Class APass Through Trust ’A’2.90% 1/5/2028 126,353 0.08
USD 196,177 United Airlines 2019-2 Class BPass Through Trust ’B’3.50% 1/5/2028 158,808 0.10
USD 266,462 United Airlines ’2020-1 A’ PassThrough Trust 5.875%15/10/2027 241,296 0.15
USD 24,262 United Airlines ’2020-1 B’ PassThrough Trust ’B’ 4.875%15/1/2026 20,910 0.01
USD 5,000 University of California 5.77%15/5/2043 5,661 0.00
USD 40,000 Verisk Analytics Inc 4.125%15/3/2029 36,792 0.02
USD 30,000 Verizon Communications IncFRN 22/3/2024 24,744 0.02
USD 100,000 Verizon Communications Inc0.75% 22/3/2024 82,645 0.05
USD 155,000 VICI Properties LP / VICI NoteCo Inc 3.50% 15/2/2025 129,532 0.08
USD 105,000 VICI Properties LP / VICI NoteCo Inc 4.25% 1/12/2026 88,660 0.06
USD 25,000 Virginia Electric & Power Co3.45% 1/9/2022 21,112 0.01
USD 18,000 VMware Inc 3.90% 21/8/2027 16,375 0.01GBP 45,000 Walmart Inc 5.25% 28/9/2035 76,192 0.05USD 75,000 Wells Fargo & Co 3.75%
24/1/2024 66,459 0.04GBP 200,000 Wells Fargo Bank NA RegS
5.25% 1/8/2023 253,908 0.16USD 9,208,165 Wells Fargo Commercial Mort-
gage Trust ’2017-C41 XA’FRN 15/11/2050 476,381 0.30
USD 200,000 Wells Fargo Commercial Mort-gage Trust 2018-C48 ’C’FRN 15/1/2052 188,750 0.12
GBP 100,000 Welltower Inc 4.80%20/11/2028 137,665 0.09
USD 25,000 Williams Cos Inc 4.00%15/11/2021 20,634 0.01
USD 25,000 WRKCo Inc 3.75% 15/3/2025 22,515 0.01
34,976,154 21.93
Total Bonds 133,452,415 83.69
Holding Description
MarketValue
EUR
% ofNet
Assets
COMMERCIAL PAPERUnited States
USD 35,000 UBS AG 0.305% 18/11/2021 28,679 0.02
28,679 0.02
Total Commercial Papers 28,679 0.02
EXCHANGE TRADED FUNDSIreland
EUR 30,800 iShares EUR Corp Bond 1-5yrUCITS ETF~^ 3,438,666 2.16
EUR 57,000 iShares EUR Ultrashort BondUCITS ETF~ 5,707,125 3.58
9,145,791 5.74
Total Exchange Traded Funds 9,145,791 5.74
Total Transferable Securities and Money MarketInstruments Admitted to an Official Stock ExchangeListing or Dealt in on Another Regulated Market 142,642,444 89.46
Other Transferable Securities and Money Market Instruments
BONDSMexico
USD 116,000 Petroleos Mexicanos 6.84%23/1/2030 98,615 0.06
98,615 0.06
United KingdomGBP 100,000 Stonegate Pub Co Financing
Plc RegS 8.00% 13/7/2025 120,995 0.08
120,995 0.08
United StatesUSD 100,000 Air Lease Corp FRN
15/12/2022 81,959 0.05USD 95,000 JPMorgan Chase & Co FRN
1/6/2025 77,982 0.05USD 25,000 Morgan Stanley FRN 5/4/2024 20,563 0.01
180,504 0.11
Total Bonds 400,114 0.25
Total Other Transferable Securities and MoneyMarket Instruments 400,114 0.25
Securities portfolio at market value 143,042,558 89.71
Other Net Assets 16,411,686 10.29
Total Net Assets (EUR) 159,454,244 100.00
^ All or a portion of this security represents a security on loan.~ Investment in related party fund.
TypeNominal
Value Description CounterpartyExpiration
date
Net unrealisedappreciation/
(depreciation)EUR
MarketValue
EUR
Financial Derivative Instruments
SWAPS
CCCDS USD 7,330,000Fund receives default protection on Markit CDX.NA.IG.30 and
pays Fixed 1.000%Bank of America
Merrill Lynch 20/6/2026 (8,573) (146,337)
CCCDS EUR 6,685,000Fund receives default protection on Markit iTraxx Europe
Crossover Series 30 Version 1 and pays Fixed 5.000%Bank of America
Merrill Lynch 20/6/2026 (51,614) (792,065)
CCCDS EUR 4,190,000
Fund receives default protection on Markit iTraxx EuropeSenior Financials Series 27 Version 1 and pays Fixed1.000%
Bank of AmericaMerrill Lynch 20/6/2026 (4,962) (87,922)
BlackRock Global Absolute Return Bond Fund continued
Portfolio of Investments as at 31 May 2021
The notes on pages 590 to 610 form an integral part of these financial statements.
BlackRock Strategic Funds[370]

TypeNominal
Value Description CounterpartyExpiration
date
Net unrealisedappreciation/
(depreciation)EUR
MarketValue
EUR
Financial Derivative Instruments
SWAPS
CCCDS EUR 19,460,000Fund receives default protection on Markit iTraxx Europe
Series 23 Version 1 and pays Fixed 1.000%Bank of America
Merrill Lynch 20/6/2026 (31,072) (492,789)
CCILS EUR 700,000Fund receives Fixed 1.382% and pays Floating EUR 12 Month
CPTFEBank of America
Merrill Lynch 15/4/2031 (11,894) (11,878)
CCILS USD 4,110,000Fund receives Fixed 2.278% and pays Floating USD 12 Month
USCPIBank of America
Merrill Lynch 29/1/2031 (131,840) (131,762)
CCILS USD 105,000Fund receives Fixed 2.321% and pays Floating USD 12 Month
USCPIBank of America
Merrill Lynch 25/2/2031 (2,886) (2,884)
CCILS USD 230,000Fund receives Fixed 2.342% and pays Floating USD 12 Month
USCPIBank of America
Merrill Lynch 23/2/2031 (5,894) (5,889)
CCILS USD 30,625Fund receives Fixed 2.350% and pays Floating USD 12 Month
USCPIBank of America
Merrill Lynch 5/3/2031 (747) (746)
CCILS USD 215,000Fund receives Fixed 2.350% and pays Floating USD 12 Month
USCPIBank of America
Merrill Lynch 5/3/2031 (5,243) (5,239)
CCILS USD 30,625Fund receives Fixed 2.354% and pays Floating USD 12 Month
USCPIBank of America
Merrill Lynch 5/3/2031 (736) (735)
CCILS USD 215,000Fund receives Fixed 2.354% and pays Floating USD 12 Month
USCPIBank of America
Merrill Lynch 5/3/2031 (5,166) (5,162)
CCILS USD 61,250Fund receives Fixed 2.358% and pays Floating USD 12 Month
USCPIBank of America
Merrill Lynch 5/3/2031 (1,453) (1,452)
CCILS USD 430,000Fund receives Fixed 2.358% and pays Floating USD 12 Month
USCPIBank of America
Merrill Lynch 5/3/2031 (10,199) (10,191)
CCILS USD 450,000Fund receives Fixed 2.388% and pays Floating USD 12 Month
USCPIBank of America
Merrill Lynch 17/2/2031 (9,755) (9,746)
CCILS USD 135,000Fund receives Fixed 2.432% and pays Floating USD 12 Month
USCPIBank of America
Merrill Lynch 6/5/2051 (1,641) (1,636)
CCILS USD 135,000Fund receives Fixed 2.438% and pays Floating USD 12 Month
USCPIBank of America
Merrill Lynch 7/5/2051 (1,422) (1,417)
CCILS USD 40,000Fund receives Fixed 2.443% and pays Floating USD 12 Month
USCPIBank of America
Merrill Lynch 25/3/2031 (633) (632)
CCILS USD 90,000Fund receives Fixed 2.445% and pays Floating USD 12 Month
USCPIBank of America
Merrill Lynch 18/3/2031 (1,417) (1,415)
CCILS USD 170,000Fund receives Fixed 2.454% and pays Floating USD 12 Month
USCPIBank of America
Merrill Lynch 18/3/2031 (2,532) (2,529)
CCILS USD 135,000Fund receives Fixed 2.484% and pays Floating USD 12 Month
USCPIBank of America
Merrill Lynch 4/5/2051 415 420
CCILS USD 135,000Fund receives Fixed 2.488% and pays Floating USD 12 Month
USCPIBank of America
Merrill Lynch 4/5/2051 574 579
CCILS USD 100,000Fund receives Fixed 2.505% and pays Floating USD 12 Month
USCPIBank of America
Merrill Lynch 30/3/2031 (1,019) (1,018)
CCILS USD 7,180,000Fund receives Fixed 2.656% and pays Floating USD 12 Month
USCPIBank of America
Merrill Lynch 14/5/2031 42,591 42,726
CCILS USD 310,000Fund receives Fixed 2.669% and pays Floating USD 12 Month
USCPIBank of America
Merrill Lynch 14/5/2031 2,209 2,215
CCILS GBP 245,000Fund receives Fixed 3.202% and pays Floating GBP 12 Month
UKRPIBank of America
Merrill Lynch 15/3/2030 (11,574) (11,568)
CCILS GBP 310,000Fund receives Fixed 3.270% and pays Floating GBP 12 Month
UKRPIBank of America
Merrill Lynch 15/3/2030 (11,584) (11,576)
CCILS GBP 265,000Fund receives Fixed 3.285% and pays Floating GBP 12 Month
UKRPIBank of America
Merrill Lynch 15/3/2030 (9,323) (9,316)
CCILS GBP 310,000Fund receives Fixed 3.290% and pays Floating GBP 12 Month
UKRPIBank of America
Merrill Lynch 15/3/2030 (10,680) (10,672)
CCILS GBP 265,000Fund receives Fixed 3.293% and pays Floating GBP 12 Month
UKRPIBank of America
Merrill Lynch 15/3/2030 (9,014) (9,007)
CCILS GBP 290,000Fund receives Fixed 3.315% and pays Floating GBP 12 Month
UKRPIBank of America
Merrill Lynch 15/5/2030 (10,538) (10,530)
CCILS GBP 6,300,000Fund receives Fixed 3.380% and pays Floating GBP 12 Month
UKRPIBank of America
Merrill Lynch 15/1/2022 (72,342) (72,290)
CCILS GBP 300,000Fund receives Fixed 3.461% and pays Floating GBP 12 Month
UKRPIBank of America
Merrill Lynch 15/1/2031 (13,661) (13,653)
CCILS GBP 320,000Fund receives Fixed 3.480% and pays Floating GBP 12 Month
UKRPIBank of America
Merrill Lynch 15/1/2030 (691) (683)
BlackRock Global Absolute Return Bond Fund continued
Portfolio of Investments as at 31 May 2021
The notes on pages 590 to 610 form an integral part of these financial statements.
Annual report and audited financial statements [371]

TypeNominal
Value Description CounterpartyExpiration
date
Net unrealisedappreciation/
(depreciation)EUR
MarketValue
EUR
Financial Derivative Instruments
SWAPS
CCILS GBP 180,000Fund receives Fixed 3.510% and pays Floating GBP 12 Month
UKRPIBank of America
Merrill Lynch 15/12/2029 378 383
CCILS GBP 830,000Fund receives Fixed 3.510% and pays Floating GBP 12 Month
UKRPIBank of America
Merrill Lynch 15/11/2030 (24,743) (24,722)
CCILS GBP 150,000Fund receives Fixed 3.535% and pays Floating GBP 12 Month
UKRPIBank of America
Merrill Lynch 15/12/2030 (4,166) (4,162)
CCILS GBP 390,000Fund receives Fixed 3.580% and pays Floating GBP 12 Month
UKRPIBank of America
Merrill Lynch 15/12/2029 4,903 4,913
CCILS GBP 526,000Fund receives Fixed 3.618% and pays Floating GBP 12 Month
UKRPIBank of America
Merrill Lynch 15/2/2031 (11,145) (11,131)
CCILS GBP 330,000Fund receives Fixed 3.625% and pays Floating GBP 12 Month
UKRPIBank of America
Merrill Lynch 15/2/2031 (6,624) (6,616)
CCILS GBP 10,000Fund receives Fixed 3.637% and pays Floating GBP 12 Month
UKRPIBank of America
Merrill Lynch 15/3/2031 (145) (145)
CCILS GBP 1,074,000Fund receives Fixed 3.640% and pays Floating GBP 12 Month
UKRPIBank of America
Merrill Lynch 15/12/2030 (27,891) (13,066)
CCILS GBP 550,000Fund receives Fixed 3.650% and pays Floating GBP 12 Month
UKRPIBank of America
Merrill Lynch 15/4/2031 (9,246) (9,231)
CCILS GBP 550,000Fund receives Fixed 3.658% and pays Floating GBP 12 Month
UKRPIBank of America
Merrill Lynch 15/4/2031 (8,633) (8,618)
CCILS GBP 266,000Fund receives Fixed 3.700% and pays Floating GBP 12 Month
UKRPIBank of America
Merrill Lynch 15/5/2031 (1,678) (2,516)
CCILS GBP 48,000Fund receives Fixed 3.735% and pays Floating GBP 12 Month
UKRPIBank of America
Merrill Lynch 15/5/2031 (205) (204)
CCILS GBP 228,117Fund receives Fixed 3.756% and pays Floating GBP 12 Month
UKRPIBank of America
Merrill Lynch 15/4/2031 (226) (220)
CCILS GBP 54,000Fund receives Fixed 3.758% and pays Floating GBP 12 Month
UKRPIBank of America
Merrill Lynch 15/5/2031 (45) (43)
CCILS GBP 1,646,000Fund receives Fixed 3.776% and pays Floating GBP 12 Month
UKRPIBank of America
Merrill Lynch 15/9/2028 85,064 85,660
CCILS GBP 18,000Fund receives Fixed 3.790% and pays Floating GBP 12 Month
UKRPIBank of America
Merrill Lynch 15/5/2031 71 72
CCILS GBP 320,000Fund receives Floating GBP 12 Month UKRPI and pays Fixed
3.345%Bank of America
Merrill Lynch 15/1/2025 (2,662) (2,657)
CCILS GBP 830,000Fund receives Floating GBP 12 Month UKRPI and pays Fixed
3.428%Bank of America
Merrill Lynch 15/11/2025 12,849 12,863
CCILS GBP 1,000,000Fund receives Floating GBP 12 Month UKRPI and pays Fixed
3.467%Bank of America
Merrill Lynch 15/1/2031 44,642 44,667
CCILS GBP 390,000Fund receives Floating GBP 12 Month UKRPI and pays Fixed
3.505%Bank of America
Merrill Lynch 15/12/2024 (7,260) (7,254)
CCILS USD 543,333Fund receives Floating USD 12 Month USCPI and pays Fixed
2.285%Bank of America
Merrill Lynch 11/1/2031 17,083 17,093
CCILS USD 543,334Fund receives Floating USD 12 Month USCPI and pays Fixed
2.298%Bank of America
Merrill Lynch 11/1/2031 16,481 16,491
CCILS USD 156,667Fund receives Floating USD 12 Month USCPI and pays Fixed
2.312%Bank of America
Merrill Lynch 11/1/2051 7,935 7,941
CCILS USD 156,667Fund receives Floating USD 12 Month USCPI and pays Fixed
2.319%Bank of America
Merrill Lynch 11/1/2051 7,658 7,664
CCILS USD 9,580,000Fund receives Floating USD 12 Month USCPI and pays Fixed
3.565%Bank of America
Merrill Lynch 25/5/2022 12,332 12,390
CCIRS EUR 710,000Fund receives Fixed 0.016% and pays Floating EUR 6 Month
EURIBORBank of America
Merrill Lynch 31/3/2031 (6,296) (7,320)
CCIRS EUR 130,000Fund receives Fixed 0.017% and pays Floating EUR 6 Month
EURIBORBank of America
Merrill Lynch 29/3/2031 (1,779) (1,326)
CCIRS EUR 520,000Fund receives Fixed 0.023% and pays Floating EUR 6 Month
EURIBORBank of America
Merrill Lynch 14/4/2031 (3,660) (5,155)
CCIRS EUR 1,170,000Fund receives Fixed 0.034% and pays Floating EUR 6 Month
EURIBORBank of America
Merrill Lynch 8/4/2031 (9,733) (10,143)
CCIRS EUR 2,300,000Fund receives Fixed 0.035% and pays Floating EUR 6 Month
EURIBORBank of America
Merrill Lynch 8/6/2031 3,720 (23,010)
CCIRS EUR 390,000Fund receives Fixed 0.078% and pays Floating EUR 6 Month
EURIBORBank of America
Merrill Lynch 23/4/2031 (1,816) (1,809)
BlackRock Global Absolute Return Bond Fund continued
Portfolio of Investments as at 31 May 2021
The notes on pages 590 to 610 form an integral part of these financial statements.
BlackRock Strategic Funds[372]

TypeNominal
Value Description CounterpartyExpiration
date
Net unrealisedappreciation/
(depreciation)EUR
MarketValue
EUR
Financial Derivative Instruments
SWAPS
CCIRS JPY 19,250,000Fund receives Fixed 0.130% and pays Floating JPY 6 Month
LIBORBank of America
Merrill Lynch 16/9/2035 (2,400) (2,397)
CCIRS JPY 3,200,000Fund receives Fixed 0.130% and pays Floating JPY 6 Month
LIBORBank of America
Merrill Lynch 16/9/2035 (400) (399)
CCIRS JPY 12,000,000Fund receives Fixed 0.136% and pays Floating JPY 6 Month
LIBORBank of America
Merrill Lynch 12/6/2035 (1,292) (1,289)
CCIRS EUR 140,000Fund receives Fixed 0.162% and pays Floating EUR 6 Month
EURIBORBank of America
Merrill Lynch 8/6/2031 186 403
CCIRS USD 620,000Fund receives Fixed 0.250% and pays Floating USD 3 Month
LIBORBank of America
Merrill Lynch 8/7/2023 (474) (469)
CCIRS USD 40,000Fund receives Fixed 0.325% and pays Floating USD 3 Month
LIBORBank of America
Merrill Lynch 23/9/2025 (558) (557)
CCIRS JPY 52,650,000Fund receives Fixed 0.363% and pays Floating JPY 6 Month
LIBORBank of America
Merrill Lynch 31/7/2028 8,814 8,822
CCIRS JPY 79,810,000Fund receives Fixed 0.366% and pays Floating JPY 6 Month
LIBORBank of America
Merrill Lynch 29/1/2028 13,006 13,018
CCIRS JPY 14,690,000Fund receives Fixed 0.399% and pays Floating JPY 6 Month
LIBORBank of America
Merrill Lynch 20/4/2041 269 274
CCIRS USD 210,000Fund receives Fixed 0.441% and pays Floating USD 3 Month
LIBORBank of America
Merrill Lynch 1/3/2024 (2) (1)
CCIRS NOK 10,705,500Fund receives Fixed 0.470% and pays Floating NOK 3 Month
NIBORBank of America
Merrill Lynch 23/11/2022 (4,392) (4,384)
CCIRS NOK 12,132,900Fund receives Fixed 0.470% and pays Floating NOK 3 Month
NIBORBank of America
Merrill Lynch 24/11/2022 (5,005) (4,995)
CCIRS NOK 9,706,320Fund receives Fixed 0.470% and pays Floating NOK 3 Month
NIBORBank of America
Merrill Lynch 25/11/2022 (4,025) (4,018)
CCIRS NOK 18,442,008Fund receives Fixed 0.470% and pays Floating NOK 3 Month
NIBORBank of America
Merrill Lynch 26/11/2022 (7,773) (7,759)
CCIRS USD 710,000Fund receives Fixed 0.471% and pays Floating USD 3 Month
LIBORBank of America
Merrill Lynch 21/1/2026 (8,672) (8,665)
CCIRS NOK 10,191,636Fund receives Fixed 0.475% and pays Floating NOK 3 Month
NIBORBank of America
Merrill Lynch 26/11/2022 (4,246) (4,238)
CCIRS NOK 4,920,000Fund receives Fixed 0.490% and pays Floating NOK 6 Month
NIBORBank of America
Merrill Lynch 2/9/2022 (1,258) (1,254)
CCIRS NOK 10,191,636Fund receives Fixed 0.495% and pays Floating NOK 3 Month
NIBORBank of America
Merrill Lynch 7/12/2022 (4,219) (4,211)
CCIRS USD 620,000Fund receives Fixed 0.532% and pays Floating USD 3 Month
LIBORBank of America
Merrill Lynch 12/5/2024 74 79
CCIRS USD 10,000Fund receives Fixed 0.586% and pays Floating USD 3 Month
LIBORBank of America
Merrill Lynch 20/4/2024 14 14
CCIRS CAD 170,000Fund receives Fixed 0.640% and pays Floating CAD 3 Month
CDORBank of America
Merrill Lynch 21/4/2023 (10) (10)
CCIRS CAD 821,000Fund receives Fixed 0.780% and pays Floating CAD 3 Month
CDORBank of America
Merrill Lynch 17/11/2023 (2,349) (2,345)
CCIRS CAD 3,214,000Fund receives Fixed 0.780% and pays Floating CAD 3 Month
CDORBank of America
Merrill Lynch 18/11/2023 (9,351) (9,334)
CCIRS CAD 6,635,000Fund receives Fixed 0.809% and pays Floating CAD 3 Month
CDORBank of America
Merrill Lynch 16/11/2023 (17,631) (17,595)
CCIRS USD 645,000Fund receives Fixed 0.872% and pays Floating USD 3 Month
LIBORBank of America
Merrill Lynch 2/3/2023 6,258 6,263
CCIRS USD 2,570,000Fund receives Fixed 0.876% and pays Floating USD 3 Month
LIBORBank of America
Merrill Lynch 2/3/2023 25,065 25,084
CCIRS USD 645,000Fund receives Fixed 0.903% and pays Floating USD 3 Month
LIBORBank of America
Merrill Lynch 2/3/2023 6,541 6,545
CCIRS HKD 1,520,000Fund receives Fixed 0.910% and pays Floating HKD 3 Month
HIBORBank of America
Merrill Lynch 15/9/2026 123 125
CCIRS CAD 13,660,000Fund receives Fixed 0.960% and pays Floating CAD 3 Month
CDORBank of America
Merrill Lynch 16/6/2024 (4,549) (4,429)
CCIRS USD 95,000Fund receives Fixed 0.978% and pays Floating USD 3 Month
LIBORBank of America
Merrill Lynch 2/3/2023 1,065 1,066
CCIRS USD 2,950,000Fund receives Fixed 0.979% and pays Floating USD 3 Month
LIBORBank of America
Merrill Lynch 8/6/2026 4,242 12,450
BlackRock Global Absolute Return Bond Fund continued
Portfolio of Investments as at 31 May 2021
The notes on pages 590 to 610 form an integral part of these financial statements.
Annual report and audited financial statements [373]

TypeNominal
Value Description CounterpartyExpiration
date
Net unrealisedappreciation/
(depreciation)EUR
MarketValue
EUR
Financial Derivative Instruments
SWAPS
CCIRS USD 635,000Fund receives Fixed 0.986% and pays Floating USD 3 Month
LIBORBank of America
Merrill Lynch 2/3/2023 7,191 7,196
CCIRS HKD 1,570,000Fund receives Fixed 1.024% and pays Floating HKD 3 Month
HIBORBank of America
Merrill Lynch 15/9/2026 1,062 1,064
CCIRS SGD 150,000Fund receives Fixed 1.055% and pays Floating SGD 6 Month
SORF6Bank of America
Merrill Lynch 15/9/2026 (48) (47)
CCIRS SGD 155,000Fund receives Fixed 1.060% and pays Floating SGD 6 Month
STIBORBank of America
Merrill Lynch 15/9/2026 (26) (25)
CCIRS SGD 430,000Fund receives Fixed 1.070% and pays Floating SGD 6 Month
STIBORBank of America
Merrill Lynch 15/9/2026 59 63
CCIRS SGD 400,000Fund receives Fixed 1.080% and pays Floating SGD 6 Month
STIBORBank of America
Merrill Lynch 15/9/2026 178 181
CCIRS USD 1,950,000Fund receives Fixed 1.088% and pays Floating USD 3 Month
LIBORBank of America
Merrill Lynch 1/3/2023 24,915 24,930
CCIRS SGD 300,000Fund receives Fixed 1.100% and pays Floating SGD 6 Month
SORF6Bank of America
Merrill Lynch 15/9/2026 317 319
CCIRS SGD 150,000Fund receives Fixed 1.102% and pays Floating SGD 6 Month
SORF6Bank of America
Merrill Lynch 15/9/2026 168 169
CCIRS SGD 430,000Fund receives Fixed 1.102% and pays Floating SGD 6 Month
STIBORBank of America
Merrill Lynch 15/9/2026 487 491
CCIRS SGD 155,000Fund receives Fixed 1.105% and pays Floating SGD 6 Month
STIBORBank of America
Merrill Lynch 15/9/2026 187 189
CCIRS SGD 84,960Fund receives Fixed 1.115% and pays Floating SGD 6 Month
SORF6Bank of America
Merrill Lynch 15/9/2026 129 129
CCIRS CZK 41,750,000Fund receives Fixed 1.120% and pays Floating CZK 6 Month
PRIBOBank of America
Merrill Lynch 16/6/2023 (6,639) (6,626)
CCIRS SGD 151,040Fund receives Fixed 1.120% and pays Floating SGD 6 Month
SORF6Bank of America
Merrill Lynch 15/9/2026 252 253
CCIRS SGD 164,000Fund receives Fixed 1.136% and pays Floating SGD 6 Month
SORF6Bank of America
Merrill Lynch 15/9/2026 354 355
CCIRS SGD 230,000Fund receives Fixed 1.148% and pays Floating SGD 6 Month
STIBORBank of America
Merrill Lynch 15/9/2026 577 579
CCIRS CZK 62,530,000Fund receives Fixed 1.170% and pays Floating CZK 6 Month
PRIBOBank of America
Merrill Lynch 16/6/2023 (7,482) (7,462)
CCIRS SGD 350,000Fund receives Fixed 1.180% and pays Floating SGD 6 Month
SORF6Bank of America
Merrill Lynch 15/9/2026 1,226 1,229
CCIRS SGD 210,000Fund receives Fixed 1.195% and pays Floating SGD 6 Month
STIBORBank of America
Merrill Lynch 15/9/2026 832 834
CCIRS USD 1,665,000Fund receives Fixed 1.247% and pays Floating USD 3 Month
LIBORBank of America
Merrill Lynch 6/10/2022 19,895 19,908
CCIRS USD 110,000Fund receives Fixed 1.270% and pays Floating USD 3 Month
LIBORBank of America
Merrill Lynch 21/1/2032 (3,669) (3,667)
CCIRS USD 103,000Fund receives Fixed 1.342% and pays Floating USD 3 Month
LIBORBank of America
Merrill Lynch 22/3/2027 698 699
CCIRS USD 403,000Fund receives Fixed 1.375% and pays Floating USD 3 Month
LIBORBank of America
Merrill Lynch 30/3/2027 3,225 3,125
CCIRS PLN 590,000Fund receives Fixed 1.463% and pays Floating PLN 6 Month
WIBORBank of America
Merrill Lynch 15/9/2026 (1,050) (1,048)
CCIRS PLN 660,000Fund receives Fixed 1.465% and pays Floating PLN 6 Month
WIBORBank of America
Merrill Lynch 15/9/2026 (1,160) (1,158)
CCIRS USD 140,000Fund receives Fixed 1.505% and pays Floating USD 3 Month
LIBORBank of America
Merrill Lynch 3/3/2031 (450) (264)
CCIRS PLN 640,000Fund receives Fixed 1.513% and pays Floating PLN 6 Month
WIBORBank of America
Merrill Lynch 15/9/2026 (794) (792)
CCIRS PLN 720,000Fund receives Fixed 1.524% and pays Floating PLN 6 Month
WIBORBank of America
Merrill Lynch 15/9/2026 (807) (805)
CCIRS USD 280,000Fund receives Fixed 1.534% and pays Floating USD 3 Month
LIBORBank of America
Merrill Lynch 11/5/2031 (268) (264)
CCIRS USD 130,000Fund receives Fixed 1.544% and pays Floating USD 3 Month
LIBORBank of America
Merrill Lynch 27/5/2031 (53) (51)
CCIRS PLN 660,000Fund receives Fixed 1.562% and pays Floating PLN 6 Month
WIBORBank of America
Merrill Lynch 15/9/2026 (466) (464)
BlackRock Global Absolute Return Bond Fund continued
Portfolio of Investments as at 31 May 2021
The notes on pages 590 to 610 form an integral part of these financial statements.
BlackRock Strategic Funds[374]

TypeNominal
Value Description CounterpartyExpiration
date
Net unrealisedappreciation/
(depreciation)EUR
MarketValue
EUR
Financial Derivative Instruments
SWAPS
CCIRS PLN 730,000Fund receives Fixed 1.580% and pays Floating PLN 6 Month
WIBORBank of America
Merrill Lynch 15/9/2026 (378) (376)
CCIRS PLN 840,000Fund receives Fixed 1.598% and pays Floating PLN 6 Month
WIBORBank of America
Merrill Lynch 15/9/2026 (276) (274)
CCIRS PLN 780,000Fund receives Fixed 1.600% and pays Floating PLN 6 Month
WIBORBank of America
Merrill Lynch 15/9/2026 (236) (233)
CCIRS PLN 570,000Fund receives Fixed 1.616% and pays Floating PLN 6 Month
WIBORBank of America
Merrill Lynch 15/9/2026 (74) (72)
CCIRS PLN 460,000Fund receives Fixed 1.630% and pays Floating PLN 6 Month
WIBORBank of America
Merrill Lynch 15/9/2026 10 11
CCIRS PLN 660,000Fund receives Fixed 1.643% and pays Floating PLN 6 Month
WIBORBank of America
Merrill Lynch 15/9/2026 107 109
CCIRS USD 10,000Fund receives Fixed 1.912% and pays Floating USD 3 Month
LIBORBank of America
Merrill Lynch 1/12/2056 (506) (505)
CCIRS USD 800,000Fund receives Fixed 1.946% and pays Floating USD 3 Month
LIBORBank of America
Merrill Lynch 8/6/2051 6,532 (5,774)
CCIRS USD 7,270,000Fund receives Fixed 1.977% and pays Floating USD 3 Month
LIBORBank of America
Merrill Lynch 25/3/2026 16,387 16,448
CCIRS USD 1,790,000Fund receives Fixed 2.030% and pays Floating USD 3 Month
LIBORBank of America
Merrill Lynch 8/6/2051 24,198 16,285
CCIRS USD 90,000Fund receives Fixed 2.044% and pays Floating USD 3 Month
LIBORBank of America
Merrill Lynch 5/5/2033 347 348
CCIRS USD 60,000Fund receives Fixed 2.061% and pays Floating USD 3 Month
LIBORBank of America
Merrill Lynch 8/6/2051 838 913
CCIRS USD 1,640,000Fund receives Fixed 2.068% and pays Floating USD 3 Month
LIBORBank of America
Merrill Lynch 8/6/2051 51,961 27,020
CCIRS USD 280,000Fund receives Fixed 2.120% and pays Floating USD 3 Month
LIBORBank of America
Merrill Lynch 16/5/2033 2,557 2,562
CCIRS USD 150,000Fund receives Fixed 2.420% and pays Floating USD 3 Month
LIBORBank of America
Merrill Lynch 18/5/2031 10,187 10,190
CCIRS MXN 4,838,000Fund receives Fixed 4.180% and pays Floating MXN 1 Month
Mexican Interbank RateBank of America
Merrill Lynch 16/2/2023 (3,066) (3,064)
CCIRS MXN 9,256,000Fund receives Fixed 4.288% and pays Floating MXN 1 Month
Mexican Interbank RateBank of America
Merrill Lynch 13/1/2023 (4,580) (4,576)
CCIRS MXN 5,101,000Fund receives Fixed 4.915% and pays Floating MXN 1 Month
Mexican Interbank RateBank of America
Merrill Lynch 25/4/2023 (1,106) (1,104)
CCIRS MXN 5,262,000Fund receives Fixed 5.220% and pays Floating MXN 1 Month
Mexican Interbank RateBank of America
Merrill Lynch 29/3/2023 219 220
CCIRS MXN 3,367,000Fund receives Fixed 5.310% and pays Floating MXN 1 Month
Mexican Interbank RateBank of America
Merrill Lynch 22/4/2024 (1,152) (1,151)
CCIRS MXN 1,735,941Fund receives Fixed 5.470% and pays Floating MXN 1 Month
Mexican Interbank RateBank of America
Merrill Lynch 21/3/2024 (217) (216)
CCIRS MXN 2,110,000Fund receives Fixed 5.778% and pays Floating MXN 1 Month
Mexican Interbank RateBank of America
Merrill Lynch 9/9/2026 (1,999) (1,998)
CCIRS MXN 4,360,000Fund receives Fixed 6.110% and pays Floating MXN 1 Month
Mexican Interbank RateBank of America
Merrill Lynch 9/9/2026 (1,541) (1,539)
CCIRS MXN 3,330,000Fund receives Fixed 6.262% and pays Floating MXN 1 Month
Mexican Interbank RateBank of America
Merrill Lynch 9/9/2026 (273) (271)
CCIRS MXN 1,930,000Fund receives Fixed 6.380% and pays Floating MXN 1 Month
Mexican Interbank RateBank of America
Merrill Lynch 9/9/2026 249 250
CCIRS MXN 3,220,000Fund receives Fixed 6.402% and pays Floating MXN 1 Month
TIIEBank of America
Merrill Lynch 9/9/2026 544 546
CCIRS AUD 60,000Fund receives Floating AUD 6 Month BBSW and pays Fixed
0.906%Bank of America
Merrill Lynch 15/9/2026 191 191
CCIRS AUD 100,000Fund receives Floating AUD 6 Month BBSW and pays Fixed
0.910%Bank of America
Merrill Lynch 15/9/2026 307 308
CCIRS AUD 200,000Fund receives Floating AUD 6 Month BBSW and pays Fixed
0.923%Bank of America
Merrill Lynch 15/9/2026 529 531
CCIRS AUD 160,000Fund receives Floating AUD 6 Month BBSW and pays Fixed
0.935%Bank of America
Merrill Lynch 15/9/2026 363 365
CCIRS AUD 100,000Fund receives Floating AUD 6 Month BBSW and pays Fixed
0.936%Bank of America
Merrill Lynch 15/9/2026 222 223
BlackRock Global Absolute Return Bond Fund continued
Portfolio of Investments as at 31 May 2021
The notes on pages 590 to 610 form an integral part of these financial statements.
Annual report and audited financial statements [375]
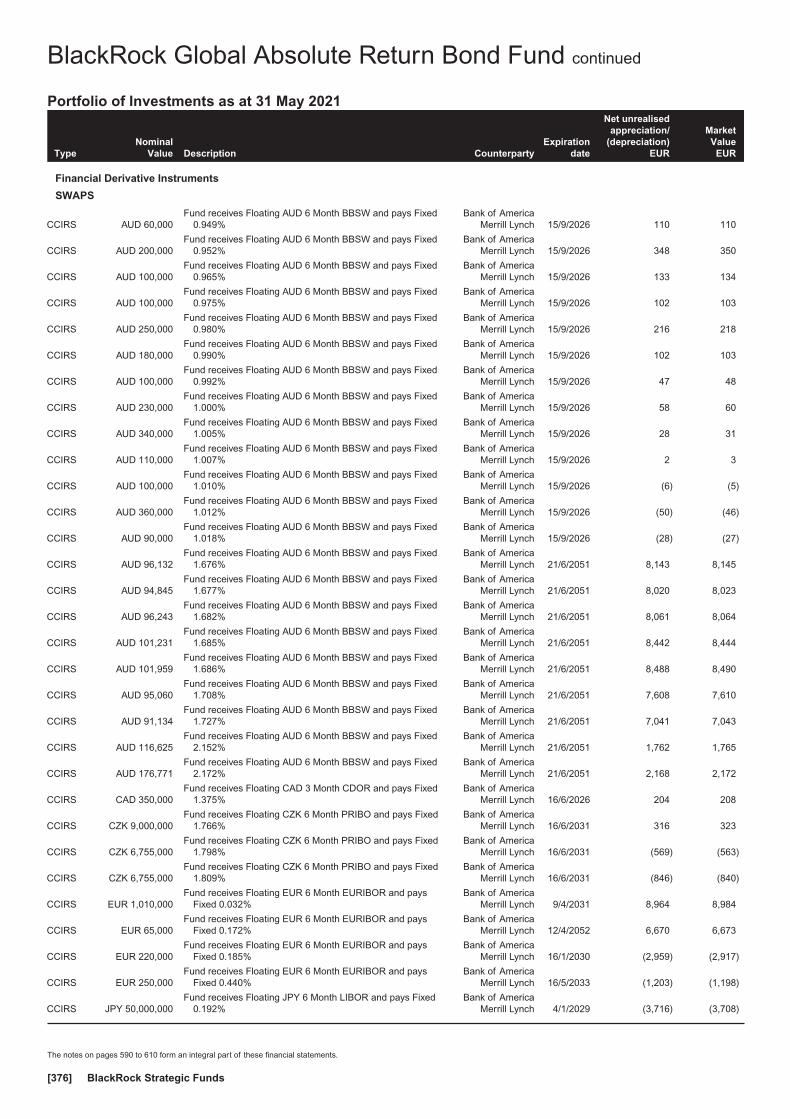
TypeNominal
Value Description CounterpartyExpiration
date
Net unrealisedappreciation/
(depreciation)EUR
MarketValue
EUR
Financial Derivative Instruments
SWAPS
CCIRS AUD 60,000Fund receives Floating AUD 6 Month BBSW and pays Fixed
0.949%Bank of America
Merrill Lynch 15/9/2026 110 110
CCIRS AUD 200,000Fund receives Floating AUD 6 Month BBSW and pays Fixed
0.952%Bank of America
Merrill Lynch 15/9/2026 348 350
CCIRS AUD 100,000Fund receives Floating AUD 6 Month BBSW and pays Fixed
0.965%Bank of America
Merrill Lynch 15/9/2026 133 134
CCIRS AUD 100,000Fund receives Floating AUD 6 Month BBSW and pays Fixed
0.975%Bank of America
Merrill Lynch 15/9/2026 102 103
CCIRS AUD 250,000Fund receives Floating AUD 6 Month BBSW and pays Fixed
0.980%Bank of America
Merrill Lynch 15/9/2026 216 218
CCIRS AUD 180,000Fund receives Floating AUD 6 Month BBSW and pays Fixed
0.990%Bank of America
Merrill Lynch 15/9/2026 102 103
CCIRS AUD 100,000Fund receives Floating AUD 6 Month BBSW and pays Fixed
0.992%Bank of America
Merrill Lynch 15/9/2026 47 48
CCIRS AUD 230,000Fund receives Floating AUD 6 Month BBSW and pays Fixed
1.000%Bank of America
Merrill Lynch 15/9/2026 58 60
CCIRS AUD 340,000Fund receives Floating AUD 6 Month BBSW and pays Fixed
1.005%Bank of America
Merrill Lynch 15/9/2026 28 31
CCIRS AUD 110,000Fund receives Floating AUD 6 Month BBSW and pays Fixed
1.007%Bank of America
Merrill Lynch 15/9/2026 2 3
CCIRS AUD 100,000Fund receives Floating AUD 6 Month BBSW and pays Fixed
1.010%Bank of America
Merrill Lynch 15/9/2026 (6) (5)
CCIRS AUD 360,000Fund receives Floating AUD 6 Month BBSW and pays Fixed
1.012%Bank of America
Merrill Lynch 15/9/2026 (50) (46)
CCIRS AUD 90,000Fund receives Floating AUD 6 Month BBSW and pays Fixed
1.018%Bank of America
Merrill Lynch 15/9/2026 (28) (27)
CCIRS AUD 96,132Fund receives Floating AUD 6 Month BBSW and pays Fixed
1.676%Bank of America
Merrill Lynch 21/6/2051 8,143 8,145
CCIRS AUD 94,845Fund receives Floating AUD 6 Month BBSW and pays Fixed
1.677%Bank of America
Merrill Lynch 21/6/2051 8,020 8,023
CCIRS AUD 96,243Fund receives Floating AUD 6 Month BBSW and pays Fixed
1.682%Bank of America
Merrill Lynch 21/6/2051 8,061 8,064
CCIRS AUD 101,231Fund receives Floating AUD 6 Month BBSW and pays Fixed
1.685%Bank of America
Merrill Lynch 21/6/2051 8,442 8,444
CCIRS AUD 101,959Fund receives Floating AUD 6 Month BBSW and pays Fixed
1.686%Bank of America
Merrill Lynch 21/6/2051 8,488 8,490
CCIRS AUD 95,060Fund receives Floating AUD 6 Month BBSW and pays Fixed
1.708%Bank of America
Merrill Lynch 21/6/2051 7,608 7,610
CCIRS AUD 91,134Fund receives Floating AUD 6 Month BBSW and pays Fixed
1.727%Bank of America
Merrill Lynch 21/6/2051 7,041 7,043
CCIRS AUD 116,625Fund receives Floating AUD 6 Month BBSW and pays Fixed
2.152%Bank of America
Merrill Lynch 21/6/2051 1,762 1,765
CCIRS AUD 176,771Fund receives Floating AUD 6 Month BBSW and pays Fixed
2.172%Bank of America
Merrill Lynch 21/6/2051 2,168 2,172
CCIRS CAD 350,000Fund receives Floating CAD 3 Month CDOR and pays Fixed
1.375%Bank of America
Merrill Lynch 16/6/2026 204 208
CCIRS CZK 9,000,000Fund receives Floating CZK 6 Month PRIBO and pays Fixed
1.766%Bank of America
Merrill Lynch 16/6/2031 316 323
CCIRS CZK 6,755,000Fund receives Floating CZK 6 Month PRIBO and pays Fixed
1.798%Bank of America
Merrill Lynch 16/6/2031 (569) (563)
CCIRS CZK 6,755,000Fund receives Floating CZK 6 Month PRIBO and pays Fixed
1.809%Bank of America
Merrill Lynch 16/6/2031 (846) (840)
CCIRS EUR 1,010,000Fund receives Floating EUR 6 Month EURIBOR and pays
Fixed 0.032%Bank of America
Merrill Lynch 9/4/2031 8,964 8,984
CCIRS EUR 65,000Fund receives Floating EUR 6 Month EURIBOR and pays
Fixed 0.172%Bank of America
Merrill Lynch 12/4/2052 6,670 6,673
CCIRS EUR 220,000Fund receives Floating EUR 6 Month EURIBOR and pays
Fixed 0.185%Bank of America
Merrill Lynch 16/1/2030 (2,959) (2,917)
CCIRS EUR 250,000Fund receives Floating EUR 6 Month EURIBOR and pays
Fixed 0.440%Bank of America
Merrill Lynch 16/5/2033 (1,203) (1,198)
CCIRS JPY 50,000,000Fund receives Floating JPY 6 Month LIBOR and pays Fixed
0.192%Bank of America
Merrill Lynch 4/1/2029 (3,716) (3,708)
BlackRock Global Absolute Return Bond Fund continued
Portfolio of Investments as at 31 May 2021
The notes on pages 590 to 610 form an integral part of these financial statements.
BlackRock Strategic Funds[376]

TypeNominal
Value Description CounterpartyExpiration
date
Net unrealisedappreciation/
(depreciation)EUR
MarketValue
EUR
Financial Derivative Instruments
SWAPS
CCIRS JPY 1,500,000Fund receives Floating JPY 6 Month LIBOR and pays Fixed
0.225%Bank of America
Merrill Lynch 22/12/2040 333 333
CCIRS JPY 6,110,000Fund receives Floating JPY 6 Month LIBOR and pays Fixed
0.295%Bank of America
Merrill Lynch 17/6/2039 407 408
CCIRS JPY 7,720,000Fund receives Floating JPY 6 Month LIBOR and pays Fixed
0.329%Bank of America
Merrill Lynch 10/6/2039 158 160
CCIRS JPY 10,970,000Fund receives Floating JPY 6 Month LIBOR and pays Fixed
0.355%Bank of America
Merrill Lynch 4/2/2034 (1,621) (1,619)
CCIRS JPY 12,850,000Fund receives Floating JPY 6 Month LIBOR and pays Fixed
0.409%Bank of America
Merrill Lynch 3/4/2039 (1,162) (1,159)
CCIRS JPY 30,000,000Fund receives Floating JPY 6 Month LIBOR and pays Fixed
0.522%Bank of America
Merrill Lynch 30/11/2031 (8,384) (8,379)
CCIRS JPY 2,000,000Fund receives Floating JPY 6 Month LIBOR and pays Fixed
0.616%Bank of America
Merrill Lynch 14/12/2038 (736) (736)
CCIRS JPY 10,522,000Fund receives Floating JPY 6 Month LIBOR and pays Fixed
0.657%Bank of America
Merrill Lynch 6/12/2038 (4,427) (4,424)
CCIRS JPY 8,200,000Fund receives Floating JPY 6 Month LIBOR and pays Fixed
0.715%Bank of America
Merrill Lynch 21/3/2044 (2,468) (2,466)
CCIRS SEK 2,710,000Fund receives Floating SEK 3 Month STIBOR and pays Fixed
0.378%Bank of America
Merrill Lynch 15/9/2026 912 915
CCIRS SEK 2,690,000Fund receives Floating SEK 3 Month STIBOR and pays Fixed
0.387%Bank of America
Merrill Lynch 15/9/2026 792 796
CCIRS SEK 2,550,000Fund receives Floating SEK 3 Month STIBOR and pays Fixed
0.389%Bank of America
Merrill Lynch 15/9/2026 726 729
CCIRS SEK 2,810,000Fund receives Floating SEK 3 Month STIBOR and pays Fixed
0.392%Bank of America
Merrill Lynch 15/9/2026 758 762
CCIRS SEK 1,430,000Fund receives Floating SEK 3 Month STIBOR and pays Fixed
0.395%Bank of America
Merrill Lynch 15/9/2026 350 368
CCIRS SEK 2,970,000Fund receives Floating SEK 3 Month STIBOR and pays Fixed
0.398%Bank of America
Merrill Lynch 15/9/2026 713 718
CCIRS SEK 1,330,000Fund receives Floating SEK 3 Month STIBOR and pays Fixed
0.402%Bank of America
Merrill Lynch 15/9/2026 297 298
CCIRS SEK 2,290,000Fund receives Floating SEK 3 Month STIBOR and pays Fixed
0.406%Bank of America
Merrill Lynch 15/9/2026 427 463
CCIRS SEK 2,390,000Fund receives Floating SEK 3 Month STIBOR and pays Fixed
0.421%Bank of America
Merrill Lynch 15/9/2026 298 302
CCIRS USD 600,000Fund receives Floating USD 3 Month LIBOR and pays Fixed
0.202%Bank of America
Merrill Lynch 8/2/2023 (76) (72)
CCIRS USD 440,000Fund receives Floating USD 3 Month LIBOR and pays Fixed
0.203%Bank of America
Merrill Lynch 10/2/2023 (59) (56)
CCIRS USD 1,170,000Fund receives Floating USD 3 Month LIBOR and pays Fixed
0.242%Bank of America
Merrill Lynch 11/5/2023 (415) (407)
CCIRS USD 140,000Fund receives Floating USD 3 Month LIBOR and pays Fixed
0.273%Bank of America
Merrill Lynch 23/4/2023 (119) (124)
CCIRS USD 12,320,000Fund receives Floating USD 3 Month LIBOR and pays Fixed
0.281%Bank of America
Merrill Lynch 8/6/2023 (14,804) (10,664)
CCIRS USD 80,000Fund receives Floating USD 3 Month LIBOR and pays Fixed
0.394%Bank of America
Merrill Lynch 22/11/2023 72 73
CCIRS USD 11,930,000Fund receives Floating USD 3 Month LIBOR and pays Fixed
0.450%Bank of America
Merrill Lynch 16/6/2024 (6,734) (6,817)
CCIRS USD 467,000Fund receives Floating USD 3 Month LIBOR and pays Fixed
0.505%Bank of America
Merrill Lynch 7/4/2024 (1,328) (1,324)
CCIRS USD 50,000Fund receives Floating USD 3 Month LIBOR and pays Fixed
0.634%Bank of America
Merrill Lynch 15/7/2030 3,016 3,017
CCIRS USD 140,000Fund receives Floating USD 3 Month LIBOR and pays Fixed
0.666%Bank of America
Merrill Lynch 16/9/2030 8,431 8,434
CCIRS USD 250,000Fund receives Floating USD 3 Month LIBOR and pays Fixed
0.670%Bank of America
Merrill Lynch 9/10/2030 15,180 15,185
CCIRS USD 300,000Fund receives Floating USD 3 Month LIBOR and pays Fixed
0.678%Bank of America
Merrill Lynch 16/9/2030 17,793 17,798
CCIRS USD 150,000Fund receives Floating USD 3 Month LIBOR and pays Fixed
0.684%Bank of America
Merrill Lynch 17/9/2030 8,836 8,838
BlackRock Global Absolute Return Bond Fund continued
Portfolio of Investments as at 31 May 2021
The notes on pages 590 to 610 form an integral part of these financial statements.
Annual report and audited financial statements [377]

TypeNominal
Value Description CounterpartyExpiration
date
Net unrealisedappreciation/
(depreciation)EUR
MarketValue
EUR
Financial Derivative Instruments
SWAPS
CCIRS USD 140,000Fund receives Floating USD 3 Month LIBOR and pays Fixed
0.706%Bank of America
Merrill Lynch 14/9/2030 8,017 8,019
CCIRS USD 317,000Fund receives Floating USD 3 Month LIBOR and pays Fixed
0.760%Bank of America
Merrill Lynch 3/6/2031 19,601 19,607
CCIRS USD 700,000Fund receives Floating USD 3 Month LIBOR and pays Fixed
0.765%Bank of America
Merrill Lynch 4/5/2032 54,067 54,080
CCIRS USD 590,000Fund receives Floating USD 3 Month LIBOR and pays Fixed
0.834%Bank of America
Merrill Lynch 15/11/2027 9,412 9,419
CCIRS USD 194,000Fund receives Floating USD 3 Month LIBOR and pays Fixed
0.886%Bank of America
Merrill Lynch 5/11/2030 8,858 8,861
CCIRS USD 250,000Fund receives Floating USD 3 Month LIBOR and pays Fixed
0.944%Bank of America
Merrill Lynch 30/12/2030 10,723 10,727
CCIRS USD 170,000Fund receives Floating USD 3 Month LIBOR and pays Fixed
1.034%Bank of America
Merrill Lynch 15/9/2026 (409) (407)
CCIRS USD 220,000Fund receives Floating USD 3 Month LIBOR and pays Fixed
1.040%Bank of America
Merrill Lynch 15/9/2026 (582) (580)
CCIRS USD 550,000Fund receives Floating USD 3 Month LIBOR and pays Fixed
1.046%Bank of America
Merrill Lynch 15/9/2026 (1,612) (1,605)
CCIRS USD 100,000Fund receives Floating USD 3 Month LIBOR and pays Fixed
1.051%Bank of America
Merrill Lynch 15/9/2026 (311) (310)
CCIRS USD 340,000Fund receives Floating USD 3 Month LIBOR and pays Fixed
1.069%Bank of America
Merrill Lynch 15/9/2026 (1,306) (1,302)
CCIRS USD 100,000Fund receives Floating USD 3 Month LIBOR and pays Fixed
1.151%Bank of America
Merrill Lynch 4/2/2031 2,838 2,840
CCIRS USD 190,000Fund receives Floating USD 3 Month LIBOR and pays Fixed
1.154%Bank of America
Merrill Lynch 4/2/2031 5,357 5,360
CCIRS USD 190,000Fund receives Floating USD 3 Month LIBOR and pays Fixed
1.164%Bank of America
Merrill Lynch 4/2/2031 5,206 5,209
CCIRS USD 190,000Fund receives Floating USD 3 Month LIBOR and pays Fixed
1.176%Bank of America
Merrill Lynch 14/1/2031 4,934 4,937
CCIRS USD 780,000Fund receives Floating USD 3 Month LIBOR and pays Fixed
1.194%Bank of America
Merrill Lynch 19/8/2030 16,320 16,333
CCIRS USD 190,000Fund receives Floating USD 3 Month LIBOR and pays Fixed
1.216%Bank of America
Merrill Lynch 8/2/2031 4,480 4,483
CCIRS USD 50,000Fund receives Floating USD 3 Month LIBOR and pays Fixed
1.237%Bank of America
Merrill Lynch 6/3/2050 7,040 7,042
CCIRS USD 860,000Fund receives Floating USD 3 Month LIBOR and pays Fixed
1.251%Bank of America
Merrill Lynch 15/2/2028 (2,618) (2,607)
CCIRS USD 390,000Fund receives Floating USD 3 Month LIBOR and pays Fixed
1.270%Bank of America
Merrill Lynch 20/4/2027 (1,027) (1,023)
CCIRS USD 10,000Fund receives Floating USD 3 Month LIBOR and pays Fixed
1.292%Bank of America
Merrill Lynch 29/4/2027 (32) (32)
CCIRS USD 780,000Fund receives Floating USD 3 Month LIBOR and pays Fixed
1.300%Bank of America
Merrill Lynch 27/2/2030 7,292 7,442
CCIRS USD 870,000Fund receives Floating USD 3 Month LIBOR and pays Fixed
1.305%Bank of America
Merrill Lynch 27/8/2030 11,374 11,391
CCIRS USD 980,000Fund receives Floating USD 3 Month LIBOR and pays Fixed
1.370%Bank of America
Merrill Lynch 15/2/2028 (9,137) (9,125)
CCIRS USD 200,000Fund receives Floating USD 3 Month LIBOR and pays Fixed
1.482%Bank of America
Merrill Lynch 26/2/2031 723 727
CCIRS USD 1,390,000Fund receives Floating USD 3 Month LIBOR and pays Fixed
1.505%Bank of America
Merrill Lynch 25/2/2026 1,783 1,794
CCIRS USD 79,000Fund receives Floating USD 3 Month LIBOR and pays Fixed
1.516%Bank of America
Merrill Lynch 28/5/2031 200 201
CCIRS USD 200,000Fund receives Floating USD 3 Month LIBOR and pays Fixed
1.545%Bank of America
Merrill Lynch 8/3/2031 (206) (203)
CCIRS USD 2,070,000Fund receives Floating USD 3 Month LIBOR and pays Fixed
1.545%Bank of America
Merrill Lynch 8/6/2031 (9,629) 1,641
CCIRS USD 70,000Fund receives Floating USD 3 Month LIBOR and pays Fixed
1.553%Bank of America
Merrill Lynch 12/3/2031 (112) (111)
CCIRS USD 200,000Fund receives Floating USD 3 Month LIBOR and pays Fixed
1.568%Bank of America
Merrill Lynch 1/3/2031 (589) (586)
BlackRock Global Absolute Return Bond Fund continued
Portfolio of Investments as at 31 May 2021
The notes on pages 590 to 610 form an integral part of these financial statements.
BlackRock Strategic Funds[378]
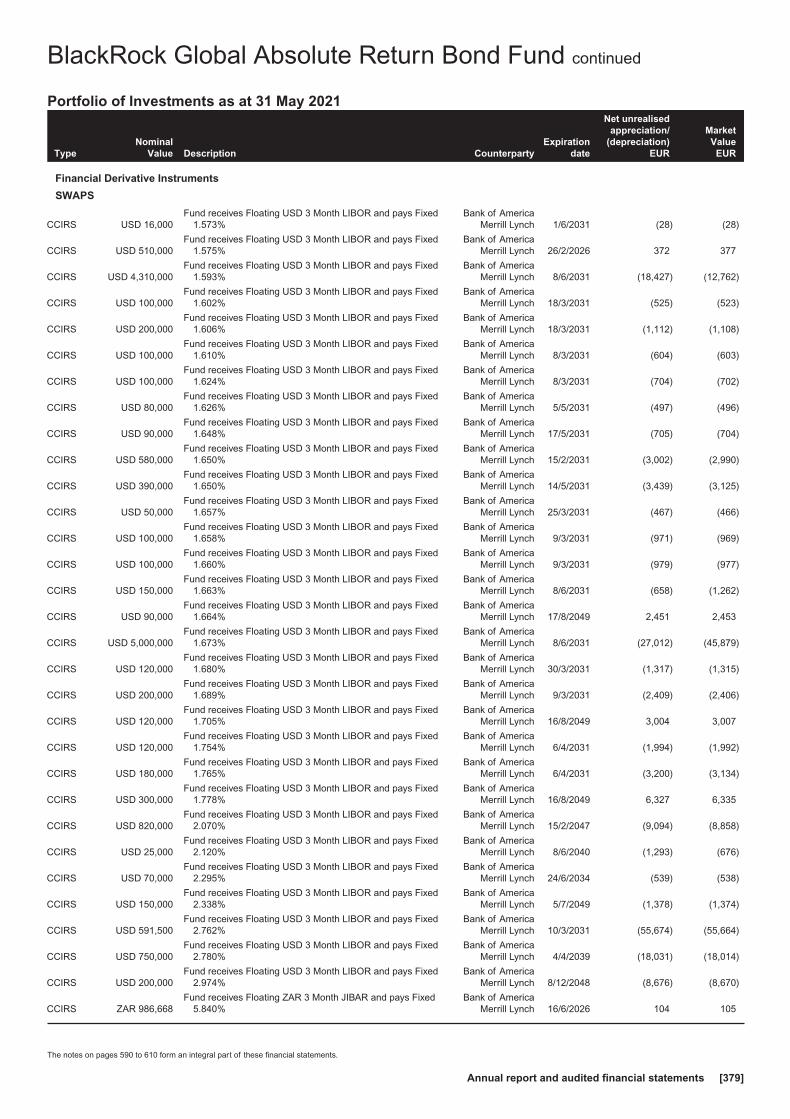
TypeNominal
Value Description CounterpartyExpiration
date
Net unrealisedappreciation/
(depreciation)EUR
MarketValue
EUR
Financial Derivative Instruments
SWAPS
CCIRS USD 16,000Fund receives Floating USD 3 Month LIBOR and pays Fixed
1.573%Bank of America
Merrill Lynch 1/6/2031 (28) (28)
CCIRS USD 510,000Fund receives Floating USD 3 Month LIBOR and pays Fixed
1.575%Bank of America
Merrill Lynch 26/2/2026 372 377
CCIRS USD 4,310,000Fund receives Floating USD 3 Month LIBOR and pays Fixed
1.593%Bank of America
Merrill Lynch 8/6/2031 (18,427) (12,762)
CCIRS USD 100,000Fund receives Floating USD 3 Month LIBOR and pays Fixed
1.602%Bank of America
Merrill Lynch 18/3/2031 (525) (523)
CCIRS USD 200,000Fund receives Floating USD 3 Month LIBOR and pays Fixed
1.606%Bank of America
Merrill Lynch 18/3/2031 (1,112) (1,108)
CCIRS USD 100,000Fund receives Floating USD 3 Month LIBOR and pays Fixed
1.610%Bank of America
Merrill Lynch 8/3/2031 (604) (603)
CCIRS USD 100,000Fund receives Floating USD 3 Month LIBOR and pays Fixed
1.624%Bank of America
Merrill Lynch 8/3/2031 (704) (702)
CCIRS USD 80,000Fund receives Floating USD 3 Month LIBOR and pays Fixed
1.626%Bank of America
Merrill Lynch 5/5/2031 (497) (496)
CCIRS USD 90,000Fund receives Floating USD 3 Month LIBOR and pays Fixed
1.648%Bank of America
Merrill Lynch 17/5/2031 (705) (704)
CCIRS USD 580,000Fund receives Floating USD 3 Month LIBOR and pays Fixed
1.650%Bank of America
Merrill Lynch 15/2/2031 (3,002) (2,990)
CCIRS USD 390,000Fund receives Floating USD 3 Month LIBOR and pays Fixed
1.650%Bank of America
Merrill Lynch 14/5/2031 (3,439) (3,125)
CCIRS USD 50,000Fund receives Floating USD 3 Month LIBOR and pays Fixed
1.657%Bank of America
Merrill Lynch 25/3/2031 (467) (466)
CCIRS USD 100,000Fund receives Floating USD 3 Month LIBOR and pays Fixed
1.658%Bank of America
Merrill Lynch 9/3/2031 (971) (969)
CCIRS USD 100,000Fund receives Floating USD 3 Month LIBOR and pays Fixed
1.660%Bank of America
Merrill Lynch 9/3/2031 (979) (977)
CCIRS USD 150,000Fund receives Floating USD 3 Month LIBOR and pays Fixed
1.663%Bank of America
Merrill Lynch 8/6/2031 (658) (1,262)
CCIRS USD 90,000Fund receives Floating USD 3 Month LIBOR and pays Fixed
1.664%Bank of America
Merrill Lynch 17/8/2049 2,451 2,453
CCIRS USD 5,000,000Fund receives Floating USD 3 Month LIBOR and pays Fixed
1.673%Bank of America
Merrill Lynch 8/6/2031 (27,012) (45,879)
CCIRS USD 120,000Fund receives Floating USD 3 Month LIBOR and pays Fixed
1.680%Bank of America
Merrill Lynch 30/3/2031 (1,317) (1,315)
CCIRS USD 200,000Fund receives Floating USD 3 Month LIBOR and pays Fixed
1.689%Bank of America
Merrill Lynch 9/3/2031 (2,409) (2,406)
CCIRS USD 120,000Fund receives Floating USD 3 Month LIBOR and pays Fixed
1.705%Bank of America
Merrill Lynch 16/8/2049 3,004 3,007
CCIRS USD 120,000Fund receives Floating USD 3 Month LIBOR and pays Fixed
1.754%Bank of America
Merrill Lynch 6/4/2031 (1,994) (1,992)
CCIRS USD 180,000Fund receives Floating USD 3 Month LIBOR and pays Fixed
1.765%Bank of America
Merrill Lynch 6/4/2031 (3,200) (3,134)
CCIRS USD 300,000Fund receives Floating USD 3 Month LIBOR and pays Fixed
1.778%Bank of America
Merrill Lynch 16/8/2049 6,327 6,335
CCIRS USD 820,000Fund receives Floating USD 3 Month LIBOR and pays Fixed
2.070%Bank of America
Merrill Lynch 15/2/2047 (9,094) (8,858)
CCIRS USD 25,000Fund receives Floating USD 3 Month LIBOR and pays Fixed
2.120%Bank of America
Merrill Lynch 8/6/2040 (1,293) (676)
CCIRS USD 70,000Fund receives Floating USD 3 Month LIBOR and pays Fixed
2.295%Bank of America
Merrill Lynch 24/6/2034 (539) (538)
CCIRS USD 150,000Fund receives Floating USD 3 Month LIBOR and pays Fixed
2.338%Bank of America
Merrill Lynch 5/7/2049 (1,378) (1,374)
CCIRS USD 591,500Fund receives Floating USD 3 Month LIBOR and pays Fixed
2.762%Bank of America
Merrill Lynch 10/3/2031 (55,674) (55,664)
CCIRS USD 750,000Fund receives Floating USD 3 Month LIBOR and pays Fixed
2.780%Bank of America
Merrill Lynch 4/4/2039 (18,031) (18,014)
CCIRS USD 200,000Fund receives Floating USD 3 Month LIBOR and pays Fixed
2.974%Bank of America
Merrill Lynch 8/12/2048 (8,676) (8,670)
CCIRS ZAR 986,668Fund receives Floating ZAR 3 Month JIBAR and pays Fixed
5.840%Bank of America
Merrill Lynch 16/6/2026 104 105
BlackRock Global Absolute Return Bond Fund continued
Portfolio of Investments as at 31 May 2021
The notes on pages 590 to 610 form an integral part of these financial statements.
Annual report and audited financial statements [379]

TypeNominal
Value Description CounterpartyExpiration
date
Net unrealisedappreciation/
(depreciation)EUR
MarketValue
EUR
Financial Derivative Instruments
SWAPS
CCIRS ZAR 1,276,332Fund receives Floating ZAR 3 Month JIBAR and pays Fixed
5.880%Bank of America
Merrill Lynch 16/6/2026 2 3
CCIRS ZAR 2,830,000Fund receives Floating ZAR 3 Month JIBAR and pays Fixed
6.020%Bank of America
Merrill Lynch 15/9/2026 640 642
CCIRS ZAR 2,850,000Fund receives Floating ZAR 3 Month JIBAR and pays Fixed
6.061%Bank of America
Merrill Lynch 15/9/2026 344 347
CCIRS ZAR 2,930,000Fund receives Floating ZAR 3 Month JIBAR and pays Fixed
6.110%Bank of America
Merrill Lynch 15/9/2026 (15) (12)
CCIRS ZAR 2,310,000Fund receives Floating ZAR 3 Month JIBAR and pays Fixed
6.159%Bank of America
Merrill Lynch 15/9/2026 (302) (301)
CCIRS ZAR 2,920,000Fund receives Floating ZAR 3 Month JIBAR and pays Fixed
6.225%Bank of America
Merrill Lynch 15/9/2026 (877) (875)
CCIRS ZAR 5,100,000Fund receives Floating ZAR 3 Month JIBAR and pays Fixed
6.240%Bank of America
Merrill Lynch 15/9/2026 (1,729) (1,725)
CCIRS ZAR 2,930,000Fund receives Floating ZAR 3 Month JIBAR and pays Fixed
6.260%Bank of America
Merrill Lynch 15/9/2026 (1,144) (1,141)
CDS EUR 150,000Fund receives default protection on Lloyds Banking Group PLC
and pays Fixed 1.000%Bank of America
Merrill Lynch 20/6/2026 (15) (4,178)
CDS USD 396,003Fund receives default protection on Brazilian Government
International Bond and pays Fixed 1.000%Barclays Bank
Plc 20/6/2026 (8,128) 11,151
CDS EUR 570,000Fund receives default protection on LANXESS AG and pays
Fixed 1.000%Barclays Bank
Plc 20/6/2026 403 (13,030)
CDS USD 30,000Fund receives default protection on Mexico Government
International Bond and pays Fixed 1.000%Barclays Bank
Plc 20/6/2026 (55) (74)
CDS USD 30,000Fund receives default protection on Mexico Government
International Bond and pays Fixed 1.000%Barclays Bank
Plc 20/6/2026 (61) (74)
CDS USD 30,000Fund receives default protection on Mexico Government
International Bond and pays Fixed 1.000%Barclays Bank
Plc 20/6/2026 — (74)
CDS USD 30,000Fund receives default protection on Mexico Government
International Bond and pays Fixed 1.000%Barclays Bank
Plc 20/6/2026 (49) (74)
CDS USD 30,000Fund receives default protection on Mexico Government
International Bond and pays Fixed 1.000%Barclays Bank
Plc 20/6/2026 (74) (74)
CDS USD 48,000Fund receives default protection on Mexico Government
International Bond and pays Fixed 1.000%Barclays Bank
Plc 20/6/2026 (128) (118)
CDS USD 30,000Fund receives default protection on Mexico Government
International Bond and pays Fixed 1.000%Barclays Bank
Plc 20/6/2026 (19) (74)
CDS USD 30,000Fund receives default protection on Mexico Government
International Bond and pays Fixed 1.000%Barclays Bank
Plc 20/6/2026 (19) (74)
CDS USD 20,000Fund receives default protection on Mexico Government
International Bond and pays Fixed 1.000%Barclays Bank
Plc 20/6/2026 (25) (49)
CDS USD 20,000Fund receives default protection on Mexico Government
International Bond and pays Fixed 1.000%Barclays Bank
Plc 20/6/2026 (13) (49)
CDS USD 30,000Fund receives default protection on Mexico Government
International Bond and pays Fixed 1.000%Barclays Bank
Plc 20/6/2026 (37) (74)
CDS USD 20,000Fund receives default protection on Mexico Government
International Bond and pays Fixed 1.000%Barclays Bank
Plc 20/6/2026 (25) (49)
CDS USD 21,000Fund receives default protection on Mexico Government
International Bond and pays Fixed 1.000%Barclays Bank
Plc 20/6/2026 (35) (52)
CDS USD 200,000Fund receives default protection on Hess Corp and pays Fixed
1.000% BNP Paribas 20/6/2025 (41,003) (598)
CDS EUR 150,000Fund receives default protection on Lloyds Banking Group Plc
and pays Fixed 1.000% BNP Paribas 20/6/2026 (201) (4,178)
CDS USD 290,000Fund receives default protection on Tyson Foods Inc and pays
Fixed 1.000% BNP Paribas 20/12/2023 (2,082) (4,667)
CDS EUR 300,000Fund receives Fixed 1.000% and provides default protection on
Unibail-Rodamco-Westfield SE BNP Paribas 20/6/2026 348 (2,045)
CDS EUR 500,000Fund receives Fixed 1.000% and provides default protection on
Valeo SA BNP Paribas 20/6/2026 908 (10,358)
CDS USD 27,000Fund receives default protection on Colombia Government
International Bond and pays Fixed 1.000% Citibank 20/6/2026 79 444
CDS USD 27,000Fund receives default protection on Colombia Government
International Bond and pays Fixed 1.000% Citibank 20/6/2026 58 444
BlackRock Global Absolute Return Bond Fund continued
Portfolio of Investments as at 31 May 2021
The notes on pages 590 to 610 form an integral part of these financial statements.
BlackRock Strategic Funds[380]

TypeNominal
Value Description CounterpartyExpiration
date
Net unrealisedappreciation/
(depreciation)EUR
MarketValue
EUR
Financial Derivative Instruments
SWAPS
CDS USD 44,000Fund receives default protection on Colombia Government
International Bond and pays Fixed 1.000% Citibank 20/6/2026 69 724
CDS EUR 300,000Fund receives default protection on Lloyds Banking Group PLC
and pays Fixed 1.000% Citibank 20/6/2026 (30) (8,355)
CDS USD 20,000Fund receives default protection on Mexico Government
International Bond and pays Fixed 1.000% Citibank 20/6/2026 (1) (49)
CDS USD 20,000Fund receives default protection on Mexico Government
International Bond and pays Fixed 1.000% Citibank 20/6/2026 3 (49)
CDS USD 20,000Fund receives default protection on Mexico Government
International Bond and pays Fixed 1.000% Citibank 20/6/2026 (1) (49)
CDS USD 20,000Fund receives default protection on Mexico Government
International Bond and pays Fixed 1.000% Citibank 20/6/2026 (5) (49)
CDS USD 31,000Fund receives default protection on Mexico Government
International Bond and pays Fixed 1.000% Citibank 20/6/2026 (32) (76)
CDS USD 83,243Fund receives default protection on Occidental Petroleum Corp
and pays Fixed 1.000% Citibank 20/12/2025 (2,600) 4,613
CDS USD 280,000Fund receives default protection on Arrow Electronics Inc and
pays Fixed 1.000% Credit Suisse 20/12/2023 (3,150) (4,385)
CDS USD 150,000Fund receives default protection on Allstate Corp/The and pays
Fixed 1.000% Goldman Sachs 20/6/2025 1,488 (4,043)
CDS USD 300,000Fund receives default protection on Autozone Inc and pays
Fixed 1.000% Goldman Sachs 20/12/2024 1,638 (6,301)
CDS EUR 450,000Fund receives default protection on Barclays PLC and pays
Fixed 1.000% Goldman Sachs 20/6/2026 (283) (9,721)
CDS USD 150,000Fund receives default protection on Barrick Gold Corp and
pays Fixed 1.000% Goldman Sachs 20/6/2025 1,627 (2,933)
CDS USD 300,000Fund receives default protection on Bristol Myers Squibb Co
and pays Fixed 1.000% Goldman Sachs 20/12/2024 2,723 (7,127)
CDS USD 150,000Fund receives default protection on Campbell Soup Co and
pays Fixed 1.000% Goldman Sachs 20/6/2025 2,299 (3,131)
CDS USD 150,000Fund receives default protection on Cardinal Health Inc and
pays Fixed 1.000% Goldman Sachs 20/6/2025 1,790 (2,625)
CDS USD 150,000Fund receives default protection on Caterpillar Inc and pays
Fixed 1.000% Goldman Sachs 20/6/2025 426 (3,846)
CDS USD 79,000Fund receives default protection on Chile Government
International Bond and pays Fixed 1.000% Goldman Sachs 20/6/2026 363 (1,027)
CDS USD 150,000Fund receives default protection on CSX Corp and pays Fixed
1.000% Goldman Sachs 20/6/2025 1,977 (3,965)
CDS USD 300,000Fund receives default protection on Dominion Energy Inc and
pays Fixed 1.000% Goldman Sachs 20/12/2024 3,243 (6,470)
CDS USD 300,000Fund receives default protection on ERP Operating LP and
pays Fixed 1.000% Goldman Sachs 20/12/2025 (688) (6,996)
CDS USD 150,000Fund receives default protection on Exelon Corp and pays
Fixed 1.000% Goldman Sachs 20/6/2025 1,020 (3,646)
CDS USD 300,000Fund receives default protection on Home Depot Inc and pays
Fixed 1.000% Goldman Sachs 20/12/2024 3,187 (7,351)
CDS USD 150,000Fund receives default protection on International Paper Co and
pays Fixed 1.000% Goldman Sachs 20/6/2025 1,829 (3,455)
CDS USD 300,000Fund receives default protection on Lowes Cos Inc and pays
Fixed 1.000% Goldman Sachs 20/12/2024 2,820 (6,755)
CDS USD 150,000Fund receives default protection on McKesson Corp and pays
Fixed 1.000% Goldman Sachs 20/6/2025 1,607 (3,170)
CDS USD 20,000Fund receives default protection on Mexico Government
International Bond and pays Fixed 1.000% Goldman Sachs 20/6/2026 (9) (49)
CDS USD 20,000Fund receives default protection on Mexico Government
International Bond and pays Fixed 1.000% Goldman Sachs 20/6/2026 (9) (49)
CDS USD 20,000Fund receives default protection on Mexico Government
International Bond and pays Fixed 1.000% Goldman Sachs 20/6/2026 (9) (49)
CDS USD 150,000Fund receives default protection on Mondelez International Inc
and pays Fixed 1.000% Goldman Sachs 20/6/2025 1,731 (3,480)
CDS USD 150,000Fund receives default protection on Motorola Solutions Inc and
pays Fixed 1.000% Goldman Sachs 20/6/2025 1,037 (3,163)
BlackRock Global Absolute Return Bond Fund continued
Portfolio of Investments as at 31 May 2021
The notes on pages 590 to 610 form an integral part of these financial statements.
Annual report and audited financial statements [381]

TypeNominal
Value Description CounterpartyExpiration
date
Net unrealisedappreciation/
(depreciation)EUR
MarketValue
EUR
Financial Derivative Instruments
SWAPS
CDS USD 150,000Fund receives default protection on Newmont Corp and pays
Fixed 1.000% Goldman Sachs 20/6/2025 776 (3,568)
CDS USD 150,000Fund receives default protection on Norfolk Southern Corp and
pays Fixed 1.000% Goldman Sachs 20/6/2025 1,726 (3,996)
CDS USD 56,757Fund receives default protection on Occidental Petroleum Corp
and pays Fixed 1.000% Goldman Sachs 20/12/2025 (1,987) 3,145
CDS USD 156,981Fund receives default protection on Philippine Government
International Bond and pays Fixed 1.000% Goldman Sachs 20/6/2026 116 (3,464)
CDS USD 300,000Fund receives default protection on Quest Diagnostics Inc and
pays Fixed 1.000% Goldman Sachs 20/12/2024 2,641 (6,388)
CDS USD 57,600Fund receives default protection on Republic of South Africa
Government International Bond and pays Fixed 1.000% Goldman Sachs 20/6/2026 (1,413) 2,046
CDS USD 542,236Fund receives default protection on Republic of South Africa
Government International Bond and pays Fixed 1.000% Goldman Sachs 20/6/2026 (13,306) 19,257
CDS USD 85,164Fund receives default protection on Republic of South Africa
Government International Bond and pays Fixed 1.000% Goldman Sachs 20/6/2026 (2,090) 3,024
CDS USD 150,000Fund receives default protection on Southern Co/The and pays
Fixed 1.000% Goldman Sachs 20/6/2025 1,561 (3,392)
CDS USD 150,000Fund receives default protection on United Parcel Service of
America Inc and pays Fixed 1.000% Goldman Sachs 20/6/2025 277 (3,995)
CDS USD 300,000Fund receives default protection on UnitedHealth Gp Inc and
pays Fixed 1.000% Goldman Sachs 20/12/2024 1,991 (6,901)
CDS EUR 30,000Fund receives default protection on Volkswagen International
Finance NV and pays Fixed 1.000% Goldman Sachs 20/6/2026 (38) (569)
CDS USD 300,000Fund receives default protection on WestRock MWV LLC and
pays Fixed 1.000% Goldman Sachs 20/12/2024 3,646 (7,168)
CDS USD 150,000Fund receives default protection on XLIT Ltd and pays Fixed
1.000% Goldman Sachs 20/6/2025 1,925 (4,333)
CDS USD 125,000Fund receives Fixed 3.000% and provides default protection on
Markit CMBX.NA.BBB Goldman Sachs 17/9/2058 1,581 (10,118)
CDS EUR 30,000Fund receives Fixed 5.000% and provides default protection on
Altice France SA/France Goldman Sachs 20/6/2025 (642) 2,520
CDS EUR 260,000Fund receives Fixed 5.000% and provides default protection on
ArcelorMittal SA Goldman Sachs 20/6/2026 (961) 46,591
CDS EUR 10,000Fund receives Fixed 5.000% and provides default protection on
International Game Technology PLC Goldman Sachs 20/12/2025 170 1,174
CDS USD 200,000Fund receives default protection on CDN Natural Resorces Ltd
and pays Fixed 1.000% JP Morgan 20/6/2025 (27,985) (2,698)
CDS USD 300,000Fund receives default protection on D R Horton Inc and pays
Fixed 1.000% JP Morgan 20/6/2025 (16,454) (6,469)
CDS USD 225,000Fund receives default protection on Indonesia Government
International Bond and pays Fixed 1.000% JP Morgan 20/6/2026 (1,059) (2,156)
CDS EUR 450,000Fund receives default protection on Standard Chartered PLC
and pays Fixed 1.000% JP Morgan 20/6/2026 864 (10,720)
CDS EUR 250,000Fund receives Fixed 1.000% and provides default protection on
Repsol International Finance BV JP Morgan 20/6/2026 264 4,367
CDS EUR 250,000Fund receives Fixed 1.000% and provides default protection on
Repsol International Finance BV JP Morgan 20/6/2026 (387) 4,367
CDS EUR 20,000Fund receives Fixed 5.000% and provides default protection on
Altice France SA/France JP Morgan 20/6/2025 (317) 1,680
CDS EUR 30,000Fund receives Fixed 5.000% and provides default protection on
Altice France SA/France JP Morgan 20/6/2025 (358) 2,520
CDS EUR 10,000Fund receives Fixed 5.000% and provides default protection on
International Game Technology PLC JP Morgan 20/6/2026 232 1,175
CDS EUR 10,000Fund receives Fixed 5.000% and provides default protection on
Virgin Media Finance PLC JP Morgan 20/12/2025 33 1,106
CDS USD 300,000Fund receives default protection on Altria Group Inc and pays
Fixed 1.000% Morgan Stanley 20/12/2025 2,765 (5,357)
CDS EUR 150,000Fund receives default protection on Barclays PLC and pays
Fixed 1.000% Morgan Stanley 20/6/2026 24 (3,240)
CDS USD 300,000Fund receives default protection on Johnson & Johnson and
pays Fixed 1.000% Morgan Stanley 20/12/2025 1,642 (8,845)
BlackRock Global Absolute Return Bond Fund continued
Portfolio of Investments as at 31 May 2021
The notes on pages 590 to 610 form an integral part of these financial statements.
BlackRock Strategic Funds[382]

TypeNominal
Value Description CounterpartyExpiration
date
Net unrealisedappreciation/
(depreciation)EUR
MarketValue
EUR
Financial Derivative Instruments
SWAPS
CDS USD 300,000Fund receives default protection on McDonald’s Corp and pays
Fixed 1.000% Morgan Stanley 20/12/2025 1,504 (8,256)
CDS USD 372,495Fund receives default protection on Mexico Government
International Bond and pays Fixed 1.000% Morgan Stanley 20/6/2026 (2,990) (915)
CDS USD 300,000Fund receives default protection on Pfizer Inc and pays Fixed
1.000% Morgan Stanley 20/12/2025 1,859 (7,967)
CDS USD 125,000Fund receives Fixed 3.000% and provides default protection on
Markit CMBX.NA.BBB Morgan Stanley 17/9/2058 11,234 (10,118)
CDS USD 77,000Fund receives Fixed 3.000% and provides default protection on
Markit CMBX.NA.BBB Morgan Stanley 17/9/2058 11,173 (6,233)
CDS EUR 10,000Fund receives Fixed 5.000% and provides default protection on
ADLER Real Estate AG Morgan Stanley 20/12/2025 (40) 1,339
IRS EUR 2,610,000Fund receives Fixed 0.000% and pays Floating EUR 1 Month
EONIABank of America
Merrill Lynch 16/4/2025 (1,653) (1,619)
IRS EUR 1,980,000Fund receives Fixed 0.000% and pays Floating EUR 1 Month
EONIABank of America
Merrill Lynch 28/5/2025 48 73
IRS EUR 1,980,000Fund receives Fixed 0.000% and pays Floating EUR 1 Month
EONIABank of America
Merrill Lynch 28/5/2025 (136) (111)
IRS EUR 700,000Fund receives Fixed 0.000% and pays Floating EUR 6 Month
LIBORBank of America
Merrill Lynch 16/11/2026 1,299 1,309
IRS GBP 1,540,000Fund receives Fixed 0.019% and pays Floating GBP 12 Month
SONIABank of America
Merrill Lynch 12/2/2023 (2,904) (2,890)
IRS GBP 34,700,000Fund receives Fixed 0.025% and pays Floating GBP 12 Month
SONIABank of America
Merrill Lynch 10/2/2023 (54,322) (60,131)
IRS GBP 120,000Fund receives Fixed 0.047% and pays Floating GBP 12 Month
SONIABank of America
Merrill Lynch 22/2/2023 (143) (165)
IRS GBP 630,000Fund receives Fixed 0.110% and pays Floating GBP 12 Month
SONIABank of America
Merrill Lynch 6/4/2023 (198) (216)
IRS GBP 1,890,000Fund receives Fixed 0.116% and pays Floating GBP 12 Month
SONIABank of America
Merrill Lynch 9/4/2023 (492) (474)
IRS GBP 1,460,000Fund receives Fixed 0.118% and pays Floating GBP 12 Month
SONIABank of America
Merrill Lynch 7/5/2023 (539) (525)
IRS GBP 530,000Fund receives Fixed 0.120% and pays Floating GBP 12 Month
SONIABank of America
Merrill Lynch 22/3/2023 (24) (31)
IRS EUR 1,310,000Fund receives Fixed -0.236% and pays Floating EUR 1 Month
EONIABank of America
Merrill Lynch 22/4/2025 (238) (221)
IRS EUR 1,310,000Fund receives Fixed -0.266% and pays Floating EUR 1 Month
EONIABank of America
Merrill Lynch 29/4/2025 (672) (655)
IRS EUR 2,610,000Fund receives Fixed -0.303% and pays Floating EUR 1 Month
EONIABank of America
Merrill Lynch 9/4/2025 (2,100) (2,102)
IRS GBP 33,300,000Fund receives Fixed 0.324% and pays Floating GBP 12 Month
SONIABank of America
Merrill Lynch 8/6/2026 (181,734) (259,153)
IRS GBP 6,900,000Fund receives Fixed 0.404% and pays Floating GBP 12 Month
SONIABank of America
Merrill Lynch 8/3/2024 (415) (349)
IRS GBP 470,000Fund receives Fixed 0.424% and pays Floating GBP 12 Month
SONIABank of America
Merrill Lynch 8/6/2026 (495) (944)
IRS GBP 330,000Fund receives Fixed 0.470% and pays Floating GBP 12 Month
SONIABank of America
Merrill Lynch 8/6/2026 409 199
IRS GBP 1,040,000Fund receives Fixed 0.512% and pays Floating GBP 12 Month
SONIABank of America
Merrill Lynch 8/6/2026 3,255 3,168
IRS GBP 900,000Fund receives Fixed 0.766% and pays Floating GBP 12 Month
SONIABank of America
Merrill Lynch 7/4/2031 397 13
IRS GBP 20,000Fund receives Fixed 0.786% and pays Floating GBP 12 Month
SONIABank of America
Merrill Lynch 31/3/2031 47 47
IRS GBP 1,870,000Fund receives Fixed 0.800% and pays Floating GBP 12 Month
SONIABank of America
Merrill Lynch 7/12/2030 4,466 4,507
IRS GBP 1,460,000Fund receives Fixed 0.811% and pays Floating GBP 12 Month
SONIABank of America
Merrill Lynch 7/12/2030 5,099 5,131
IRS GBP 520,000Fund receives Fixed 0.858% and pays Floating GBP 12 Month
SONIABank of America
Merrill Lynch 8/6/2051 12,807 (11,065)
IRS GBP 520,000Fund receives Fixed 0.925% and pays Floating GBP 12 Month
SONIABank of America
Merrill Lynch 8/6/2051 4,408 (344)
BlackRock Global Absolute Return Bond Fund continued
Portfolio of Investments as at 31 May 2021
The notes on pages 590 to 610 form an integral part of these financial statements.
Annual report and audited financial statements [383]

TypeNominal
Value Description CounterpartyExpiration
date
Net unrealisedappreciation/
(depreciation)EUR
MarketValue
EUR
Financial Derivative Instruments
SWAPS
IRS GBP 525,000Fund receives Fixed 0.934% and pays Floating GBP 12 Month
SONIABank of America
Merrill Lynch 8/6/2051 1,630 964
IRS GBP 50,000Fund receives Fixed 0.959% and pays Floating GBP 12 Month
SONIABank of America
Merrill Lynch 8/6/2051 467 482
IRS GBP 540,000Fund receives Fixed 0.981% and pays Floating GBP 12 Month
SONIABank of America
Merrill Lynch 8/6/2051 20,361 8,841
IRS KRW 185,675,000Fund receives Fixed 1.535% and pays Floating KRW 3 Month
KSDABank of America
Merrill Lynch 15/9/2026 (906) (906)
IRS KRW 158,635,000Fund receives Fixed 1.547% and pays Floating KRW 3 Month
KSDABank of America
Merrill Lynch 15/9/2026 (705) (705)
IRS KRW 209,766,000Fund receives Fixed 1.557% and pays Floating KRW 3 Month
KSDABank of America
Merrill Lynch 15/9/2026 (855) (855)
IRS KRW 158,635,000Fund receives Fixed 1.560% and pays Floating KRW 3 Month
KSDABank of America
Merrill Lynch 15/9/2026 (630) (630)
IRS KRW 211,885,000Fund receives Fixed 1.560% and pays Floating KRW 3 Month
KSDABank of America
Merrill Lynch 15/9/2026 (841) (841)
IRS KRW 326,200,000Fund receives Fixed 1.560% and pays Floating KRW 3 Month
KSDABank of America
Merrill Lynch 15/9/2026 (1,295) (1,295)
IRS KRW 291,470,000Fund receives Fixed 1.561% and pays Floating KRW 3 Month
KSDABank of America
Merrill Lynch 15/9/2026 (1,146) (1,146)
IRS KRW 332,160,000Fund receives Fixed 1.566% and pays Floating KRW 3 Month
KSDABank of America
Merrill Lynch 15/9/2026 (1,246) (1,246)
IRS KRW 391,760,000Fund receives Fixed 1.590% and pays Floating KRW 3 Month
KSDABank of America
Merrill Lynch 15/9/2026 (1,120) (1,120)
IRS KRW 292,160,000Fund receives Fixed 1.591% and pays Floating KRW 3 Month
KSDABank of America
Merrill Lynch 15/9/2026 (830) (830)
IRS KRW 303,526,400Fund receives Fixed 1.599% and pays Floating KRW 3 Month
KSDABank of America
Merrill Lynch 15/9/2026 (774) (774)
IRS EUR 900,000Fund receives Floating EUR 6 Month LIBOR and pays Fixed
0.000%Bank of America
Merrill Lynch 11/5/2023 137 144
IRS EUR 5,360,000Fund receives Floating EUR 6 Month LIBOR and pays Fixed
0.000%Bank of America
Merrill Lynch 16/6/2024 (346) 134
IRS EUR 270,000Fund receives Floating EUR 6 Month LIBOR and pays Fixed
0.000%Bank of America
Merrill Lynch 8/6/2026 49 (184)
IRS EUR 230,000Fund receives Floating EUR 6 Month LIBOR and pays Fixed
0.000%Bank of America
Merrill Lynch 15/9/2026 301 304
IRS EUR 440,000Fund receives Floating EUR 6 Month LIBOR and pays Fixed
0.000%Bank of America
Merrill Lynch 15/9/2026 (810) (804)
IRS EUR 280,000Fund receives Floating EUR 6 Month LIBOR and pays Fixed
0.000%Bank of America
Merrill Lynch 15/9/2026 (800) (796)
IRS EUR 170,000Fund receives Floating EUR 6 Month LIBOR and pays Fixed
0.000%Bank of America
Merrill Lynch 15/9/2026 (11) (8)
IRS EUR 75,000Fund receives Floating EUR 6 Month LIBOR and pays Fixed
-0.025%Bank of America
Merrill Lynch 21/1/2061 14,011 14,013
IRS EUR 702,000Fund receives Floating EUR 6 Month LIBOR and pays Fixed
-0.145%Bank of America
Merrill Lynch 22/10/2031 23,585 22,259
IRS EUR 250,000Fund receives Floating EUR 6 Month LIBOR and pays Fixed
-0.195%Bank of America
Merrill Lynch 15/9/2026 (213) (209)
IRS EUR 239,000Fund receives Floating EUR 6 Month LIBOR and pays Fixed
-0.234%Bank of America
Merrill Lynch 14/1/2031 7,902 7,907
IRS EUR 190,000Fund receives Floating EUR 6 Month LIBOR and pays Fixed
-0.259%Bank of America
Merrill Lynch 15/9/2026 456 458
IRS EUR 990,000Fund receives Floating EUR 6 Month LIBOR and pays Fixed
-0.261%Bank of America
Merrill Lynch 15/9/2026 1,920 2,504
IRS EUR 250,000Fund receives Floating EUR 6 Month LIBOR and pays Fixed
-0.275%Bank of America
Merrill Lynch 15/9/2026 803 806
IRS EUR 3,040,000Fund receives Floating EUR 6 Month LIBOR and pays Fixed
-0.306%Bank of America
Merrill Lynch 8/6/2026 7,496 8,946
IRS EUR 146,000Fund receives Floating EUR 6 Month LIBOR and pays Fixed
-0.357%Bank of America
Merrill Lynch 21/1/2028 2,325 2,328
IRS EUR 8,170,000Fund receives Floating EUR 6 Month LIBOR and pays Fixed
-0.475%Bank of America
Merrill Lynch 8/6/2023 945 1,634
BlackRock Global Absolute Return Bond Fund continued
Portfolio of Investments as at 31 May 2021
The notes on pages 590 to 610 form an integral part of these financial statements.
BlackRock Strategic Funds[384]

TypeNominal
Value Description CounterpartyExpiration
date
Net unrealisedappreciation/
(depreciation)EUR
MarketValue
EUR
Financial Derivative Instruments
SWAPS
IRS EUR 1,090,000Fund receives Floating EUR 6 Month LIBOR and pays Fixed
-0.489%Bank of America
Merrill Lynch 23/4/2023 321 330
IRS EUR 830,000Fund receives Floating EUR 6 Month LIBOR and pays Fixed
-0.499%Bank of America
Merrill Lynch 20/4/2023 325 419
IRS EUR 8,380,000Fund receives Floating EUR 6 Month LIBOR and pays Fixed
-0.504%Bank of America
Merrill Lynch 8/4/2023 4,623 4,547
IRS EUR 5,530,000Fund receives Floating EUR 6 Month LIBOR and pays Fixed
-0.510%Bank of America
Merrill Lynch 31/3/2023 3,177 3,561
IRS EUR 3,660,000Fund receives Floating EUR 6 Month LIBOR and pays Fixed
-0.512%Bank of America
Merrill Lynch 14/4/2023 2,191 2,576
IRS GBP 486,000Fund receives Floating GBP 12 Month SONIA and pays Fixed
-0.043%Bank of America
Merrill Lynch 15/12/2025 11,608 11,615
IRS GBP 23,210,000Fund receives Floating GBP 12 Month SONIA and pays Fixed
0.059%Bank of America
Merrill Lynch 8/6/2023 42,851 45,507
IRS GBP 582,000Fund receives Floating GBP 12 Month SONIA and pays Fixed
0.092%Bank of America
Merrill Lynch 10/12/2026 15,982 15,078
IRS GBP 160,000Fund receives Floating GBP 12 Month SONIA and pays Fixed
0.094%Bank of America
Merrill Lynch 16/3/2023 84 91
IRS GBP 1,040,000Fund receives Floating GBP 12 Month SONIA and pays Fixed
0.162%Bank of America
Merrill Lynch 8/6/2023 (422) (435)
IRS GBP 2,340,000Fund receives Floating GBP 12 Month SONIA and pays Fixed
0.250%Bank of America
Merrill Lynch 16/6/2024 1,089 579
IRS GBP 2,970,000Fund receives Floating GBP 12 Month SONIA and pays Fixed
0.422%Bank of America
Merrill Lynch 10/2/2031 103,575 109,420
IRS GBP 20,000Fund receives Floating GBP 12 Month SONIA and pays Fixed
0.478%Bank of America
Merrill Lynch 15/2/2031 497 618
IRS GBP 230,000Fund receives Floating GBP 12 Month SONIA and pays Fixed
0.509%Bank of America
Merrill Lynch 15/9/2026 (48) (45)
IRS GBP 130,000Fund receives Floating GBP 12 Month SONIA and pays Fixed
0.538%Bank of America
Merrill Lynch 15/9/2026 (236) (234)
IRS GBP 230,000Fund receives Floating GBP 12 Month SONIA and pays Fixed
0.561%Bank of America
Merrill Lynch 15/9/2026 (734) (730)
IRS GBP 310,000Fund receives Floating GBP 12 Month SONIA and pays Fixed
0.640%Bank of America
Merrill Lynch 22/2/2031 3,764 4,104
IRS GBP 14,410,000Fund receives Floating GBP 12 Month SONIA and pays Fixed
0.664%Bank of America
Merrill Lynch 8/6/2031 50,250 180,027
IRS GBP 710,000Fund receives Floating GBP 12 Month SONIA and pays Fixed
0.712%Bank of America
Merrill Lynch 8/3/2031 2,435 3,997
IRS GBP 240,000Fund receives Floating GBP 12 Month SONIA and pays Fixed
0.727%Bank of America
Merrill Lynch 8/6/2031 400 1,315
IRS GBP 130,000Fund receives Floating GBP 12 Month SONIA and pays Fixed
0.740%Bank of America
Merrill Lynch 10/5/2031 107 439
IRS GBP 260,000Fund receives Floating GBP 12 Month SONIA and pays Fixed
0.744%Bank of America
Merrill Lynch 7/5/2031 742 748
IRS GBP 520,000Fund receives Floating GBP 12 Month SONIA and pays Fixed
0.745%Bank of America
Merrill Lynch 1/3/2031 3,228 944
IRS GBP 410,000Fund receives Floating GBP 12 Month SONIA and pays Fixed
0.763%Bank of America
Merrill Lynch 9/4/2031 142 151
IRS GBP 360,000Fund receives Floating GBP 12 Month SONIA and pays Fixed
0.764%Bank of America
Merrill Lynch 6/4/2031 (108) 75
IRS GBP 1,420,000Fund receives Floating GBP 12 Month SONIA and pays Fixed
0.774%Bank of America
Merrill Lynch 8/6/2031 (5,935) 192
IRS GBP 1,425,000Fund receives Floating GBP 12 Month SONIA and pays Fixed
0.801%Bank of America
Merrill Lynch 8/6/2031 (539) (4,117)
IRS GBP 880,000Fund receives Floating GBP 12 Month SONIA and pays Fixed
0.805%Bank of America
Merrill Lynch 22/3/2031 (3,295) (3,987)
IRS GBP 1,430,000Fund receives Floating GBP 12 Month SONIA and pays Fixed
0.819%Bank of America
Merrill Lynch 8/6/2031 (19,050) (6,966)
IRS GBP 170,000Fund receives Floating GBP 12 Month SONIA and pays Fixed
0.819%Bank of America
Merrill Lynch 8/6/2031 (1,145) (838)
IRS GBP 430,000Fund receives Floating GBP 12 Month SONIA and pays Fixed
0.828%Bank of America
Merrill Lynch 8/6/2031 (2,555) (2,573)
BlackRock Global Absolute Return Bond Fund continued
Portfolio of Investments as at 31 May 2021
The notes on pages 590 to 610 form an integral part of these financial statements.
Annual report and audited financial statements [385]

TypeNominal
Value Description CounterpartyExpiration
date
Net unrealisedappreciation/
(depreciation)EUR
MarketValue
EUR
Financial Derivative Instruments
SWAPS
IRS GBP 340,000Fund receives Floating GBP 12 Month SONIA and pays Fixed
0.933%Bank of America
Merrill Lynch 7/4/2051 288 (548)
IRS GBP 558,000Fund receives Floating GBP 12 Month SONIO and pays Fixed
0.347%Bank of America
Merrill Lynch 15/6/2022 (1,008) (1,882)
IRS GBP 416,000Fund receives Floating GBP 6 Month LIBOR SONIO and pays
Fixed 0.168%Bank of America
Merrill Lynch 24/11/2026 8,661 8,597
IRS USD 9,520,000Fund receives Floating USD 12 Month FEDL and pays Fixed
0.628%Bank of America
Merrill Lynch 10/3/2024 (11,079) (11,013)
IRS KRW 1,733,851,280Fund receives Fixed 1.418% and pays Floating KRW 3 Month
KSDABarclays Bank
Plc 21/9/2023 (1,492) (1,492)
IRS KRW 119,682,500Fund receives Fixed 1.558% and pays Floating KRW 3 Month
KSDA Citibank 15/9/2026 (482) (481)
IRS KRW 323,145,000Fund receives Fixed 1.575% and pays Floating KRW 3 Month
KSDA Citibank 15/9/2026 (1,106) (1,106)
IRS KRW 170,733,600Fund receives Fixed 1.580% and pays Floating KRW 3 Month
KSDA Citibank 15/9/2026 (553) (553)
IRS KRW 1,769,236,000Fund receives Fixed 1.415% and pays Floating KRW 3 Month
KSDA HSBC 21/9/2023 (1,555) (1,555)
IRS KRW 107,715,000Fund receives Fixed 1.566% and pays Floating KRW 3 Month
KSDA JP Morgan 15/9/2026 (406) (406)
IRS KRW 222,267,500Fund receives Fixed 1.568% and pays Floating KRW 3 Month
KSDA JP Morgan 15/9/2026 (813) (813)
IRS KRW 211,885,000Fund receives Fixed 1.572% and pays Floating KRW 3 Month
KSDA JP Morgan 15/9/2026 (745) (744)
IRS KRW 351,670,000Fund receives Fixed 1.576% and pays Floating KRW 3 Month
KSDA JP Morgan 15/9/2026 (1,197) (1,197)
IRS KRW 1,496,065,961Fund receives Fixed 1.400% and pays Floating KRW 3 Month
KSDA Morgan Stanley 21/9/2023 (1,479) (1,479)
IRS KRW 185,675,000Fund receives Fixed 1.540% and pays Floating KRW 3 Month
KSDA Morgan Stanley 15/9/2026 (872) (872)
IRS KRW 69,922,000Fund receives Fixed 1.545% and pays Floating KRW 3 Month
KSDA Morgan Stanley 15/9/2026 (316) (316)
IRS KRW 69,922,000Fund receives Fixed 1.555% and pays Floating KRW 3 Month
KSDA Morgan Stanley 15/9/2026 (290) (290)
IRS KRW 321,580,000Fund receives Fixed 1.556% and pays Floating KRW 3 Month
KSDA Morgan Stanley 15/9/2026 (1,323) (1,323)
IRS KRW 370,060,000Fund receives Fixed 1.562% and pays Floating KRW 3 Month
KSDA Morgan Stanley 15/9/2026 (1,442) (1,442)
IRS KRW 378,360,000Fund receives Fixed 1.587% and pays Floating KRW 3 Month
KSDA Morgan Stanley 15/9/2026 (1,130) (1,130)
Total (Gross underlying exposure - EUR 448,710,816) (98,120) (1,648,773)
CCCDS: Centrally Cleared Credit Default SwapsCCILS: Centrally Cleared Inflation Linked SwapsCCIRS: Centrally Cleared Interest Rate SwapsCDS: Credit Default SwapsIRS: Interest Rate Swaps
Numberof
contractsCurrencyof contracts
Contract/Description
Expirationdate
Grossunderlying
exposureEUR
Net unrealisedappreciation/
(depreciation)EUR
Financial Derivative Instruments
FUTURES
(7) USD 90 Day Euro Futures June 2022 June 2022 1,431,087 (645)
162 AUD Australian 10 Year Bond Futures June 2021 June 2021 14,377,933 87,841
(77) CAD Canadian 10 Year Bond Futures September 2021 September 2021 7,528,043 (17,234)
39 EUR Euro BOBL Futures June 2021 June 2021 5,252,520 (17,160)
(29) EUR Euro BOBL Futures June 2021 June 2021 3,905,720 9,930
BlackRock Global Absolute Return Bond Fund continued
Portfolio of Investments as at 31 May 2021
The notes on pages 590 to 610 form an integral part of these financial statements.
BlackRock Strategic Funds[386]

Numberof
contractsCurrencyof contracts
Contract/Description
Expirationdate
Grossunderlying
exposureEUR
Net unrealisedappreciation/
(depreciation)EUR
Financial Derivative Instruments
FUTURES
40 EUR Euro BTP Futures June 2021 June 2021 5,891,200 (35,520)
(11) EUR Euro BTP Futures June 2021 June 2021 1,620,080 (8,683)
(210) EUR Euro Bund Futures June 2021 June 2021 35,660,100 80,106
(9) EUR Euro BUXL 30 Year Bond Futures June 2021 June 2021 1,809,360 45,510
(27) EUR EURO STOXX Bank Index Futures June 2021 June 2021 132,840 (225)
47 EUR Euro-OAT Futures June 2021 June 2021 7,535,040 (68,341)
(3) EUR Euro-OAT Futures June 2021 June 2021 480,960 (110)
(3) EUR Euro-OAT Futures September 2021 September 2021 474,480 350
(3) JPY Japan 10 Year Bond Futures June 2021 June 2021 3,395,844 (673)
206 EUR Short Euro BTP Futures June 2021 June 2021 23,302,720 19,960
84 GBP UK Long Gilt Bond Futures September 2021 September 2021 12,410,940 (32,522)
(94) GBP UK Long Gilt Bond Futures September 2021 September 2021 13,888,432 (28,273)
(15) USD US Long Bond Futures September 2021 September 2021 1,920,476 8,717
4 USD US Treasury 10 Year Note Futures September 2021 September 2021 474,383 (867)
(165) USD US Treasury 10 Year Note Futures September 2021 September 2021 19,568,304 71,607
8 USD US Treasury 10 Year Note Futures September 2021 September 2021 864,060 (822)
(232) USD US Treasury 10 Year Note Futures September 2021 September 2021 25,057,753 40,014
9 USD US Treasury 2 Year Note Futures September 2021 September 2021 1,627,776 288
(25) USD US Treasury 2 Year Note Futures September 2021 September 2021 4,521,600 (574)
(65) USD US Treasury 5 Year Note Futures September 2021 September 2021 6,593,986 (1,957)
5 USD US Ultra Bond Futures September 2021 September 2021 756,924 (2,118)
(14) USD US Ultra Bond Futures September 2021 September 2021 2,119,386 17,052
Total 202,601,947 165,651
Numberof
contractsCall/Put Description Counterparty Strike Price
Expirationdate
Netunrealised
appreciation/(depreciation)
EUR
MarketValue
EUR
Financial Derivative Instruments
PURCHASED OPTIONS
64,000 Put OTC EUR/PLN Bank of America Merrill Lynch EUR 4.52 02/06/2021 378 578
130,000 Call OTC EUR/USD Bank of America Merrill Lynch EUR 1.22 15/06/2021 207 530
6,000 Call OTC EUR/USD Bank of America Merrill Lynch EUR 1.24 16/07/2021 92 871
96,000 Put OTC USD/IDR Bank of America Merrill Lynch USD 14,450.00 24/06/2021 536 1,206
86,000 Put OTC USD/KRW Bank of America Merrill Lynch USD 1,110.00 21/07/2021 115 817
86,000 Call OTC USD/KRW Bank of America Merrill Lynch USD 1,132.00 21/07/2021 (391) 287
118,000 Put OTC USD/KRW Bank of America Merrill Lynch USD 1,130.00 17/06/2021 1,416 2,010
79,000 Call OTC USD/MXN Bank of America Merrill Lynch USD 20.30 10/06/2021 (375) 187
78,000 Put OTC USD/RUB Bank of America Merrill Lynch USD 73.75 16/07/2021 17 993
95,000 Put OTC USD/BRL Barclays Bank USD 5.48 18/06/2021 2,261 4,033
76,000 Put OTC USD/BRL Barclays Bank USD 5.48 21/06/2021 1,635 3,251
70,000 Call OTC EUR/USD BNP Paribas EUR 1.25 28/06/2021 (1,135) 5,326
1,590,000 Call OTC EUR/USD BNP Paribas EUR 1.23 18/06/2021 (649) 5,999
96,000 Call OTC EUR/USD BNP Paribas EUR 1.23 16/07/2021 (194) 661
154,000 Put OTC USD/BRL BNP Paribas USD 5.30 01/06/2021 1,673 2,067
153,600 Call OTC USD/CAD BNP Paribas USD 1.22 24/06/2021 (68) 605
98,000 Put OTC USD/ZAR BNP Paribas USD 14.00 08/07/2021 634 2,038
1,600,000 Put OTC EUR/GBP Citibank EUR 0.85 11/06/2021 (13,992) 506
29,000 Call OTC USD/TRY Citibank USD 9.00 29/06/2021 (216) 224
98,000 Put OTC USD/BRL Deutsche Bank USD 5.18 08/07/2021 (396) 1,260
57,000 Call OTC USD/CAD Deutsche Bank USD 1.26 18/06/2021 (298) 5
97,000 Put OTC USD/IDR Deutsche Bank USD 14,450.00 02/07/2021 478 1,265
57,000 Put OTC USD/MXN Deutsche Bank USD 20.00 17/06/2021 (24) 581
BlackRock Global Absolute Return Bond Fund continued
Portfolio of Investments as at 31 May 2021
The notes on pages 590 to 610 form an integral part of these financial statements.
Annual report and audited financial statements [387]

Numberof
contractsCall/Put Description Counterparty Strike Price
Expirationdate
Netunrealised
appreciation/(depreciation)
EUR
MarketValue
EUR
Financial Derivative Instruments
PURCHASED OPTIONS
77,000 Call OTC USD/MXN Deutsche Bank USD 20.20 25/06/2021 (587) 535
78,000 Put OTC USD/MXN Deutsche Bank USD 19.85 17/06/2021 10 152
24 Put 90 Day Euro Futures Exchange Traded USD 99.62 10/09/2021 116 1,229
24 Put 90 Day Euro Futures Exchange Traded USD 99.50 10/09/2021 10,284 16,470
14 Put 90 Day Euro Futures Exchange Traded USD 99.50 10/09/2021 73 502
8 Put Cellnex Telecom SA Exchange Traded EUR 32.82 18/06/2021 (679) 74
19 Call Cellnex Telecom SA Exchange Traded EUR 59.28 17/12/2021 1,969 2,719
7 Put Cellnex Telecom SA Exchange Traded EUR 42.32 18/06/2021 (626) 61
1 Call E-Mini S&P 500 Index Exchange Traded USD 4,300.00 18/06/2021 (545) 738
1 Put E-Mini S&P 500 Index Exchange Traded USD 3,850.00 16/07/2021 (3,681) 1,745
1 Call E-Mini S&P 500 Index Exchange Traded USD 4,400.00 16/07/2021 (1,341) 758
2 Put E-Mini S&P 500 Index Exchange Traded USD 4,100.00 16/07/2021 (7,433) 8,574
1 Call E-Mini S&P 500 Index Exchange Traded USD 4,200.00 16/07/2021 (543) 6,660
1 Put E-Mini S&P 500 Index Exchange Traded USD 4,000.00 20/08/2021 (2,535) 5,449
6 Put EURO STOXX 50 Index Exchange Traded EUR 3,700.00 18/06/2021 (1,731) 318
9 Call EURO STOXX 50 Index Exchange Traded EUR 4,300.00 17/09/2021 1,071 2,880
20 Call EURO STOXX 50 Index Exchange Traded EUR 4,200.00 20/08/2021 1,363 8,600
27 Call EURO STOXX 600 Telecom Exchange Traded EUR 230.00 18/06/2021 2,177 5,603
54 Call EURO STOXX Banks Index Exchange Traded EUR 100.00 18/06/2021 1,657 4,118
36 Call EURO STOXX Banks Index Exchange Traded EUR 100.00 17/09/2021 4,822 8,820
7 Call EURO STOXX Banks Index Exchange Traded EUR 90.00 18/06/2021 2,079 3,089
734 Call EURO STOXX Banks Index Exchange Traded EUR 95.00 17/12/2021 31,530 317,455
25 Call FTSE MIB Exchange Traded EUR 26,000.00 17/06/2022 12,656 67,656
5 Put US Treasury 10 Year Note Exchange Traded USD 130.50 25/06/2021 (1,033) 640
4 Put US Treasury 10 Year Note Exchange Traded USD 131.00 23/07/2021 (972) 1,690
11 Put US Treasury 5 Year Note Exchange Traded USD 122.50 25/06/2021 (2,317) 246
1,580,000 Put OTC EUR/GBP Goldman Sachs EUR 0.85 03/06/2021 (10,188) 19
8,000 Put OTC USD/BRL Morgan Stanley USD 5.05 16/11/2021 2 854
5,000 Put OTC USD/MXN Morgan Stanley USD 19.50 18/06/2021 60 702
78,000 Put OTC USD/MXN Morgan Stanley USD 19.85 09/07/2021 (250) 746
69,000 Put OTC USD/ZAR UBS USD 13.90 10/06/2021 178 805
Total (Gross underlying exposure - EUR 9,005,753) 27,290 505,207
Numberof
contractsCall/Put Description Counterparty Strike Price
Expirationdate
Netunrealised
appreciation/(depreciation)
EUR
MarketValue
EUR
Financial Derivative Instruments
WRITTEN OPTIONS
(1,590,000) Call OTC EUR/USD Bank of America Merrill Lynch EUR 1.23 18/06/2021 (789) (5,999)
(144,000) Put OTC USD/IDR Bank of America Merrill Lynch USD 14,150.00 24/06/2021 (99) (375)
(78,000) Call OTC USD/KRW Bank of America Merrill Lynch USD 1,155.00 17/06/2021 195 (18)
(39,000) Call OTC USD/RUB Bank of America Merrill Lynch USD 75.50 18/06/2021 163 (91)
(118,000) Put OTC USD/RUB Bank of America Merrill Lynch USD 72.20 16/07/2021 52 (606)
(95,000) Put OTC USD/BRL Barclays Bank USD 5.24 18/06/2021 (620) (1,259)
(38,000) Call OTC USD/BRL Barclays Bank USD 5.75 21/06/2021 515 (17)
(76,000) Put OTC USD/BRL Barclays Bank USD 5.24 21/06/2021 (455) (1,056)
(70,000) Put OTC USD/MXN Barclays Bank USD 19.50 11/06/2021 247 (85)
(146,000) Call OTC EUR/USD BNP Paribas EUR 1.25 16/07/2021 192 (323)
(153,600) Call OTC USD/CAD BNP Paribas USD 1.24 24/06/2021 40 (168)
(59,000) Call OTC USD/ZAR BNP Paribas USD 14.40 10/06/2021 389 (27)
(98,000) Put OTC USD/ZAR BNP Paribas USD 13.50 08/07/2021 (168) (571)
BlackRock Global Absolute Return Bond Fund continued
Portfolio of Investments as at 31 May 2021
The notes on pages 590 to 610 form an integral part of these financial statements.
BlackRock Strategic Funds[388]

Numberof
contractsCall/Put Description Counterparty Strike Price
Expirationdate
Netunrealised
appreciation/(depreciation)
EUR
MarketValue
EUR
Financial Derivative Instruments
WRITTEN OPTIONS
(1,600,000) Put OTC EUR/GBP Citibank EUR 0.83 11/06/2021 4,176 (2)
(35,000) Call OTC USD/TRY Citibank USD 9.50 29/06/2021 180 (116)
(59,000) Call OTC USD/BRL Deutsche Bank USD 5.45 10/06/2021 261 (54)
(98,000) Put OTC USD/BRL Deutsche Bank USD 4.99 08/07/2021 273 (328)
(86,000) Call OTC USD/CAD Deutsche Bank USD 1.29 18/06/2021 128 (1)
(78,000) Call OTC USD/IDR Deutsche Bank USD 14,800.00 02/07/2021 293 (74)
(115,000) Call OTC USD/MXN Deutsche Bank USD 20.85 25/06/2021 569 (260)
(24) Put 90 Day Euro Futures Exchange Traded USD 99.37 10/09/2021 (7,841) (11,799)
(24) Put 90 Day Euro Futures Exchange Traded USD 99.75 10/09/2021 (600) (2,827)
(1) Put E-Mini S&P 500 Index Exchange Traded USD 3,950.00 16/07/2021 4,456 (2,475)
(1) Put E-Mini S&P 500 Index Exchange Traded USD 4,000.00 16/07/2021 4,930 (2,954)
(2) Call E-Mini S&P 500 Index Exchange Traded USD 4,300.00 16/07/2021 2,822 (5,120)
(1) Put E-Mini S&P 500 Index Exchange Traded USD 3,750.00 20/08/2021 1,825 (2,847)
(1) Put E-Mini S&P 500 Index Exchange Traded USD 3,900.00 16/07/2021 997 (2,073)
(9) Call EURO STOXX 50 Index Exchange Traded EUR 4,400.00 17/09/2021 (315) (1,296)
(11) Call EURO STOXX 50 Index Exchange Traded EUR 4,350.00 20/08/2021 (2) (1,100)
(9) Call EURO STOXX 50 Index Exchange Traded EUR 4,400.00 20/08/2021 87 (612)
(734) Call EURO STOXX Banks Index Exchange Traded EUR 105.00 17/12/2021 (74,464) (155,058)
(25) Call FTSE MIB Exchange Traded EUR 30,000.00 17/06/2022 (2,025) (12,438)
(4) Put US Treasury 10 Year Note Exchange Traded USD 129.00 23/07/2021 486 (435)
(5) Put US Treasury 10 Year Note Exchange Traded USD 130.00 25/06/2021 806 (352)
(2) Call US Treasury 10 Year Note Exchange Traded USD 133.50 23/07/2021 — (307)
(4) Put US Treasury 5 Year Note Exchange Traded USD 123.00 25/06/2021 1,013 (256)
(39,000) Call OTC USD/BRL Morgan Stanley USD 5.50 02/06/2021 418 —
(98,000) Put OTC USD/MXN Morgan Stanley USD 19.45 09/07/2021 224 (350)
(49,000) Call OTC USD/ZAR UBS USD 14.35 10/06/2021 275 (28)
Total (Gross underlying exposure - EUR 8,775,253) (61,366) (213,757)
NominalValue
Call/Put Description Counterparty Strike Price
Expirationdate
Netnrealised
appreciation/(depreciation)
EUR
MarketValue
EUR
Financial Derivative Instruments
PURCHASED SWAPTIONS
2,170,000 Call
Fund purchases an option to enter into anInterest Rate Swap. If exercised Fundreceives 1.2% Fixed semi-annually from28/4/2022; and pays Floating USD LIBOR3 Month BBA quarterly from 3/8/2022
Bank of AmericaMerrill Lynch USD 0.01 28/04/2022 3,375 20,975
4,950,000 Call
Fund purchases an option to enter into anInterest Rate Swap. If exercised Fundreceives 1.595% Fixed semi-annually from24/2/2025; and pays Floating USD LIBOR3 Month BBA quarterly from 26/5/2025
Bank of AmericaMerrill Lynch USD 1.59 24/02/2025 (690) 21,719
4,950,000 Put
Fund purchases an option to enter into anInterest Rate Swap. If exercised Fundreceives Floating USD LIBOR 3 MonthBBA quarterly from 26/5/2025; and pays1.595% Fixed semi-annually from24/2/2025
Bank of AmericaMerrill Lynch USD 1.59 24/02/2025 5,200 25,368
2,800,000 Put
Fund purchases an option to enter into aCredit Default Swap. If exercised Fundreceives default protection on Markit iTraxxEurope Series 35 Version 1 from16/6/2021; and provides 1% Fixedquarterly from 20/6/2021 Barclays Bank EUR 55.00 16/06/2021 (2,356) 780
BlackRock Global Absolute Return Bond Fund continued
Portfolio of Investments as at 31 May 2021
The notes on pages 590 to 610 form an integral part of these financial statements.
Annual report and audited financial statements [389]

NominalValue
Call/Put Description Counterparty Strike Price
Expirationdate
Netnrealised
appreciation/(depreciation)
EUR
MarketValue
EUR
Financial Derivative Instruments
PURCHASED SWAPTIONS
32,508,000 Put
Fund purchases an option to enter into aCredit Default Swap. If exercised Fundreceives default protection on Markit iTraxxEurope Series 35 Version 1 from16/6/2021; and provides 1% Fixedquarterly from 20/6/2021 Barclays Bank EUR 0.55 16/06/2021 (38,892) 9,057
50,000 Call
Fund purchases an option to enter into anInterest Rate Swap. If exercised Fundreceives 2.95% Fixed annually from12/3/2024; and pays Floating Max USD 0 -5 Year Constant Maturity Swap quarterlyfrom 7/1/2020 Barclays Bank USD 2.95 12/03/2024 1,817 3,816
50,000 Put
Fund purchases an option to enter into anInterest Rate Swap. If exercised Fundreceives 2.95% Fixed semi-annually from12/3/2024; and pays Floating USD LIBOR3 Month BBA quarterly from 21/11/2020 Barclays Bank USD 2.95 12/03/2024 (1,105) 894
1,400,000 Put
Fund purchases an option to enter into anInterest Rate Swap. If exercised Fundreceives Floating EUR Interbank OfferRate 6 Month semi-annually from17/5/2022; and pays -0.15% Fixedannually from 15/11/2021 Barclays Bank EUR 0.00 15/11/2021 (2,426) 5,844
130,000 Put
Fund purchases an option to enter into anInterest Rate Swap. If exercised Fundreceives Floating Markit iTraxx quarterlyfrom 20/6/2019; and pays 2.25% Fixedquarterly from 8/8/2022 Barclays Bank USD 2.25 08/08/2022 (961) 1,793
737,500 Put
Fund purchases an option to enter into anInterest Rate Swap. If exercised Fundreceives Floating Markit iTraxx quarterlyfrom 20/6/2019; and pays 2.9775% Fixedquarterly from 7/3/2024 Barclays Bank USD 2.98 07/03/2024 (17,413) 12,775
1,060,000 Put
Fund purchases an option to enter into anInterest Rate Swap. If exercised Fundreceives Floating Markit iTraxx quarterlyfrom 20/6/2019; and pays 3.8% Fixedquarterly from 7/6/2021 Barclays Bank USD 3.80 07/06/2021 (35,000) —
322,000 Put
Fund purchases an option to enter into anInterest Rate Swap. If exercised Fundreceives Floating Markit iTraxx quarterlyfrom 20/6/2019; and pays 4% Fixedquarterly from 9/8/2033 Barclays Bank EUR 4.00 09/08/2033 (6,698) 4,411
737,500 Call
Fund purchases an option to enter into anInterest Rate Swap. If exercised Fundreceives Floating USD LIBOR 3 MonthBBA quarterly from 4/2/2021; and pays2.9775% Fixed semi-annually from7/3/2024 Barclays Bank USD 2.98 07/03/2024 27,277 57,466
270,000 Call
Fund purchases an option to enter into anInterest Rate Swap. If exercised Fundreceives Floating Markit iTraxx quarterlyfrom 20/6/2019; and pays 1.492% Fixedquarterly from 25/2/2025 Citibank USD 1.49 25/02/2025 (8,016) 5,071
270,000 Put
Fund purchases an option to enter into anInterest Rate Swap. If exercised Fundreceives Floating USD LIBOR 3 MonthBBA quarterly from 27/5/2027; and pays1.492% Fixed semi-annually from25/2/2025 Citibank USD 1.49 25/02/2025 7,744 20,831
83,580,000 Put
Fund purchases an option to enter into anInterest Rate Swap. If exercised Fundreceives 1.25% Fixed semi-annually from11/1/2022; and pays Floating USD LIBOR3 Month BBA quarterly from 10/11/2022 Credit Suisse JPY 1.25 11/01/2022 (9,694) 19
BlackRock Global Absolute Return Bond Fund continued
Portfolio of Investments as at 31 May 2021
The notes on pages 590 to 610 form an integral part of these financial statements.
BlackRock Strategic Funds[390]

NominalValue
Call/Put Description Counterparty Strike Price
Expirationdate
Netnrealised
appreciation/(depreciation)
EUR
MarketValue
EUR
Financial Derivative Instruments
PURCHASED SWAPTIONS
150,000 Put
Fund purchases an option to enter into anInterest Rate Swap. If exercised Fundreceives 0.89% Fixed annually from30/4/2025; and pays Floating EUREURIBOR 6 Month semi-annually from29/1/2021 Deutsche Bank USD 0.89 30/04/2025 9,525 16,977
150,000 Call
Fund purchases an option to enter into anInterest Rate Swap. If exercised Fundreceives 0.89% Fixed quarterly from30/4/2025; and pays Floating Markit iTraxxquarterly from 20/12/2019 Deutsche Bank USD 0.89 30/04/2025 (5,977) 1,475
4,460,000 Call
Fund purchases an option to enter into anInterest Rate Swap. If exercised Fundreceives 1.71% Fixed semi-annually from4/3/2025; and pays Floating USD LIBOR3 Month BBA quarterly from 6/6/2025 Deutsche Bank USD 1.71 04/03/2025 1,957 21,965
390,000 Call
Fund purchases an option to enter into anInterest Rate Swap. If exercised Fundreceives 2.602% Fixed semi-annually from7/4/2026; and pays Floating USD LIBOR3 Month BBA quarterly from 9/7/2022 Deutsche Bank USD 0.03 07/04/2026 3,160 21,653
1,170,000 Call
Fund purchases an option to enter into anInterest Rate Swap. If exercised Fundreceives Floating USD LIBOR 3 MonthBBA quarterly from 29/9/2028; and pays3.05% Fixed semi-annually from 27/6/2028 Deutsche Bank USD 0.00 27/06/2028 (24,648) 983,322
4,460,000 Put
Fund purchases an option to enter into anInterest Rate Swap. If exercised Fundreceives Floating USD LIBOR 3 MonthBBA quarterly from 6/6/2025; and pays1.71% Fixed semi-annually from 4/3/2025 Deutsche Bank USD 1.71 04/03/2025 1,452 21,460
390,000 Put
Fund purchases an option to enter into anInterest Rate Swap. If exercised Fundreceives Floating USD LIBOR 3 MonthBBA quarterly from 9/7/2022; and pays2.602% Fixed semi-annually from 7/4/2026 Deutsche Bank USD 0.03 07/04/2026 (3,056) 15,437
140,000 Call
Fund purchases an option to enter into anInterest Rate Swap. If exercised Fundreceives 1.2825% Fixed semi-annuallyfrom 4/6/2025; and pays Floating USDLIBOR 3 Month BBA quarterly from6/9/2025 Goldman Sachs USD 1.28 04/06/2025 (4,560) 2,158
1,280,000 Put
Fund purchases an option to enter into anInterest Rate Swap. If exercised Fundreceives 3.25% Fixed annually from3/5/2022; and pays Floating EUREURIBOR 6 Month semi-annually from29/12/2021 Goldman Sachs USD 3.25 03/05/2022 (57,594) 4,546
140,000 Put
Fund purchases an option to enter into anInterest Rate Swap. If exercised Fundreceives Floating USD LIBOR 3 MonthBBA quarterly from 6/9/2025; and pays1.2825% Fixed semi-annually from4/6/2025 Goldman Sachs USD 1.28 04/06/2025 5,975 12,693
765,000 Call
Fund purchases an option to enter into anInterest Rate Swap. If exercised Fundreceives 1.525% Fixed semi-annually from5/4/2022; and pays Floating USD LIBOR3 Month BBA quarterly from 7/7/2022 JP Morgan USD 0.02 05/04/2022 4,795 14,244
35,000 Call
Fund purchases an option to enter into anInterest Rate Swap. If exercised Fundreceives 2.86% Fixed semi-annually from22/2/2039; and pays Floating USD LIBOR3 Month BBA quarterly from 15/9/2020 JP Morgan USD 2.86 22/02/2039 1,035 2,562
BlackRock Global Absolute Return Bond Fund continued
Portfolio of Investments as at 31 May 2021
The notes on pages 590 to 610 form an integral part of these financial statements.
Annual report and audited financial statements [391]

NominalValue
Call/Put Description Counterparty Strike Price
Expirationdate
Netnrealised
appreciation/(depreciation)
EUR
MarketValue
EUR
Financial Derivative Instruments
PURCHASED SWAPTIONS
26,750,000 Put
Fund purchases an option to enter into anInterest Rate Swap. If exercised Fundreceives Floating Markit iTraxx quarterlyfrom 20/6/2019; and pays 1.6% Fixedquarterly from 16/3/2022 JP Morgan JPY 1.60 16/03/2022 (2,757) 1
680,000 Put
Fund purchases an option to enter into anInterest Rate Swap. If exercised Fundreceives Floating Markit iTraxx quarterlyfrom 20/6/2019; and pays 2.25% Fixedquarterly from 2/8/2022 JP Morgan USD 2.25 02/08/2022 (7,319) 9,217
200,000 Put
Fund purchases an option to enter into anInterest Rate Swap. If exercised Fundreceives Floating Markit iTraxx quarterlyfrom 20/6/2019; and pays 2.985% Fixedquarterly from 27/4/2038 JP Morgan USD 2.98 27/04/2038 (772) 6,919
200,000 Call
Fund purchases an option to enter into anInterest Rate Swap. If exercised Fundreceives Floating Markit iTraxx quarterlyfrom 20/6/2019; and pays 2.985% Fixedquarterly from 27/4/2038 JP Morgan USD 2.98 27/04/2038 7,820 15,510
35,000 Put
Fund purchases an option to enter into anInterest Rate Swap. If exercised Fundreceives Floating USD LIBOR 3 MonthBBA quarterly from 12/9/2020; and pays2.86% Fixed semi-annually from 22/2/2039 JP Morgan USD 2.86 22/02/2039 (249) 1,278
765,000 Put
Fund purchases an option to enter into anInterest Rate Swap. If exercised Fundreceives Floating USD LIBOR 3 MonthBBA quarterly from 7/7/2022; and pays1.525% Fixed semi-annually from 5/4/2022 JP Morgan USD 0.02 05/04/2022 (5,047) 4,402
40,000 Call
Fund purchases an option to enter into anInterest Rate Swap. If exercised Fundreceives 1.1806% Fixed semi-annuallyfrom 15/9/2025; and pays Floating USDLIBOR 3 Month BBA quarterly from17/12/2025 Morgan Stanley USD 1.18 15/09/2025 (1,253) 573
1,520,000 Call
Fund purchases an option to enter into anInterest Rate Swap. If exercised Fundreceives 1.385% Fixed semi-annually from8/4/2022; and pays Floating USD LIBOR3 Month BBA quarterly from 12/7/2022 Morgan Stanley USD 0.01 08/04/2022 2,872 21,930
4,960,000 Call
Fund purchases an option to enter into anInterest Rate Swap. If exercised Fundreceives 1.62% Fixed semi-annually from24/2/2025; and pays Floating USD LIBOR3 Month BBA quarterly from 26/5/2025 Morgan Stanley USD 1.62 24/02/2025 (370) 22,355
720,000 Put
Fund purchases an option to enter into anInterest Rate Swap. If exercised Fundreceives Floating Markit iTraxx quarterlyfrom 20/6/2019; and pays 2.5% Fixedquarterly from 13/6/2024 Morgan Stanley USD 2.50 13/06/2024 (7,136) 21,575
130,000 Put
Fund purchases an option to enter into anInterest Rate Swap. If exercised Fundreceives Floating Markit iTraxx quarterlyfrom 20/6/2019; and pays 2.5% Fixedquarterly from 20/6/2024 Morgan Stanley USD 2.50 20/06/2024 (735) 3,918
30,000 Put
Fund purchases an option to enter into anInterest Rate Swap. If exercised Fundreceives Floating Markit iTraxx quarterlyfrom 20/6/2019; and pays 3.0366% Fixedquarterly from 11/1/2029 Morgan Stanley USD 3.04 11/01/2029 (424) 1,065
1,520,000 Put
Fund purchases an option to enter into anInterest Rate Swap. If exercised Fundreceives Floating USD LIBOR 3 MonthBBA quarterly from 12/7/2022; and pays1.385% Fixed semi-annually from 8/4/2022 Morgan Stanley USD 0.01 08/04/2022 (7,259) 11,271
BlackRock Global Absolute Return Bond Fund continued
Portfolio of Investments as at 31 May 2021
The notes on pages 590 to 610 form an integral part of these financial statements.
BlackRock Strategic Funds[392]

NominalValue
Call/Put Description Counterparty Strike Price
Expirationdate
Netnrealised
appreciation/(depreciation)
EUR
MarketValue
EUR
Financial Derivative Instruments
PURCHASED SWAPTIONS
130,000 Call
Fund purchases an option to enter into anInterest Rate Swap. If exercised Fundreceives Floating USD LIBOR 3 MonthBBA quarterly from 17/12/2025; and pays1.1784% Fixed semi-annually from15/9/2025 Morgan Stanley USD 1.18 15/09/2025 (4,066) 1,857
130,000 Put
Fund purchases an option to enter into anInterest Rate Swap. If exercised Fundreceives Floating USD LIBOR 3 MonthBBA quarterly from 17/12/2025; and pays1.1784% Fixed semi-annually from15/9/2025 Morgan Stanley USD 1.18 15/09/2025 6,685 12,790
40,000 Put
Fund purchases an option to enter into anInterest Rate Swap. If exercised Fundreceives Floating USD LIBOR 3 MonthBBA quarterly from 17/12/2025; and pays1.1806% Fixed semi-annually from15/9/2025 Morgan Stanley USD 1.18 15/09/2025 2,055 3,930
4,960,000 Put
Fund purchases an option to enter into anInterest Rate Swap. If exercised Fundreceives Floating USD LIBOR 3 MonthBBA quarterly from 26/5/2025; and pays1.62% Fixed semi-annually from 24/2/2025 Morgan Stanley USD 1.62 24/02/2025 2,369 25,021
30,000 Call
Fund purchases an option to enter into anInterest Rate Swap. If exercised Fundreceives Floating USD LIBOR 3 MonthBBA quarterly from 8/10/2020; and pays3.0366% Fixed semi-annually from11/1/2029 Morgan Stanley USD 3.04 11/01/2029 785 2,274
330,000 Put
Fund purchases an option to enter into anInterest Rate Swap. If exercised Fundreceives 3.04% Fixed semi-annually from10/1/2029; and pays Floating USD LIBOR3 Month BBA quarterly from 4/11/2022
NomuraInternational USD 3.04 10/01/2029 (4,597) 11,688
330,000 Call
Fund purchases an option to enter into anInterest Rate Swap. If exercised Fundreceives 3.04% Fixed semi-annually from10/1/2029; and pays Floating USD LIBOR3 Month BBA quarterly from 7/2/2025
NomuraInternational USD 3.04 10/01/2029 8,784 25,068
1,150,000 Put
Fund purchases an option to enter into anInterest Rate Swap. If exercised Fundreceives Floating USD LIBOR 3 MonthBBA quarterly from 24/9/2024; and pays2.85% Fixed semi-annually from 9/5/2022
NomuraInternational USD 2.85 09/05/2022 (45,959) 13,660
30,000 Put
Fund purchases an option to enter into anInterest Rate Swap. If exercised Fundreceives 1.429% Fixed semi-annually from5/6/2025; and pays Floating USD LIBOR3 Month BBA quarterly from 9/12/2025 UBS USD 1.43 05/06/2025 1,057 2,481
30,000 Call
Fund purchases an option to enter into anInterest Rate Swap. If exercised Fundreceives 1.429% Fixed semi-annually from5/6/2025; and pays Floating USD LIBOR3 Month BBA quarterly from 9/9/2025 UBS USD 1.43 05/06/2025 (882) 541
Total (Gross underlying exposure - EUR 32,852,745) (202,172) 1,528,635
BlackRock Global Absolute Return Bond Fund continued
Portfolio of Investments as at 31 May 2021
The notes on pages 590 to 610 form an integral part of these financial statements.
Annual report and audited financial statements [393]

NominalValue
Call/Put Description Counterparty Strike Price
Expirationdate
Netunrealised
appreciation/(depreciation)
EUR
MarketValue
EUR
Financial Derivative Instruments
WRITTEN SWAPTIONS
(3,200,000) Put
Fund writes an option to enter into an InterestRate Swap. If exercised Fund receives3.25% Fixed semi-annually from 3/5/2022;and pays Floating USD LIBOR 3 MonthBBA quarterly from 12/11/2020 Goldman Sachs USD 3.25 03/05/2022 59,224 (2,134)
(2,240,000) Put
Fund writes an option to enter into an InterestRate Swap. If exercised Fund receivesFloating Markit iTraxx quarterly from20/6/2019; and pays 3.87% Fixed quarterlyfrom 7/6/2021 Barclays Bank USD 3.87 07/06/2021 37,142 —
(320,000) Put
Fund writes an option to enter into an InterestRate Swap. If exercised Fund receivesFloating USD LIBOR 3 Month BBAquarterly from 21/11/2020; and pays3.05% Fixed semi-annually from 12/3/2029 Barclays Bank USD 3.05 12/03/2029 3,739 (11,321)
(320,000) Call
Fund writes an option to enter into an InterestRate Swap. If exercised Fund receivesFloating Markit iTraxx quarterly from20/6/2019; and pays 3.05% Fixed quarterlyfrom 12/3/2029 Barclays Bank USD 3.05 12/03/2029 (9,403) (24,463)
(2,510,000) Put
Fund writes an option to enter into an InterestRate Swap. If exercised Fund receives2.75% Fixed semi-annually from 9/5/2022;and pays Floating USD LIBOR 3 MonthBBA quarterly from 8/10/2020
NomuraInternational USD 2.75 09/05/2022 53,658 (11,255)
(9,790,000) Put
Fund writes an option to enter into an InterestRate Swap. If exercised Fund receivesFloating USD LIBOR 3 Month BBAquarterly from 7/11/2020; and pays 2.4%Fixed semi-annually from 1/6/2021 Morgan Stanley USD 2.40 01/06/2021 15,902 —
(720,000) Put
Fund writes an option to enter into an InterestRate Swap. If exercised Fund receivesFloating Markit iTraxx quarterly from20/6/2019; and pays 3.5% Fixed quarterlyfrom 13/6/2024 Morgan Stanley USD 3.50 13/06/2024 1,904 (8,784)
(720,000) Put
Fund writes an option to enter into an InterestRate Swap. If exercised Fund receives 3%Fixed semi-annually from 13/6/2024; andpays Floating USD LIBOR 3 Month BBAquarterly from 10/11/2022 Morgan Stanley USD 3.00 13/06/2024 3,839 (13,697)
(130,000) Put
Fund writes an option to enter into an InterestRate Swap. If exercised Fund receives 3%Fixed annually from 20/6/2024; and paysFloating EUR EURIBOR 6 Monthsemi-annually from 11/9/2020 Morgan Stanley USD 3.00 20/06/2024 320 (2,491)
(130,000) Put
Fund writes an option to enter into an InterestRate Swap. If exercised Fund receivesFloating Markit iTraxx quarterly from20/6/2019; and pays 3.5% Fixed quarterlyfrom 20/6/2024 Morgan Stanley USD 3.50 20/06/2024 87 (1,600)
(630,000) Put
Fund writes an option to enter into an InterestRate Swap. If exercised Fund receivesFloating Markit iTraxx quarterly from20/6/2019; and pays 0% Fixed quarterlyfrom 1/7/2021 Barclays Bank EUR 0.00 01/07/2021 1,153 —
(680,000) Put
Fund writes an option to enter into an InterestRate Swap. If exercised Fund receives3.25% Fixed semi-annually from 2/8/2022;and pays Floating USD LIBOR 3 MonthBBA quarterly from 15/9/2020 JP Morgan USD 3.25 02/08/2022 1,804 (2,208)
(680,000) Put
Fund writes an option to enter into an InterestRate Swap. If exercised Fund receives2.75% Fixed semi-annually from 2/8/2022;and pays Floating USD LIBOR 3 MonthBBA quarterly from 7/11/2020 JP Morgan USD 2.75 02/08/2022 3,986 (4,405)
BlackRock Global Absolute Return Bond Fund continued
Portfolio of Investments as at 31 May 2021
The notes on pages 590 to 610 form an integral part of these financial statements.
BlackRock Strategic Funds[394]

NominalValue
Call/Put Description Counterparty Strike Price
Expirationdate
Netunrealised
appreciation/(depreciation)
EUR
MarketValue
EUR
Financial Derivative Instruments
WRITTEN SWAPTIONS
(130,000) Put
Fund writes an option to enter into an InterestRate Swap. If exercised Fund receivesFloating Markit iTraxx quarterly from20/6/2019; and pays 2.75% Fixed quarterlyfrom 8/8/2022 Barclays Bank USD 2.75 08/08/2022 540 (861)
(130,000) Put
Fund writes an option to enter into an InterestRate Swap. If exercised Fund receivesFloating Markit iTraxx quarterly from20/6/2019; and pays 3.25% Fixed quarterlyfrom 8/8/2022 Barclays Bank USD 3.25 08/08/2022 258 (434)
(400,000) Put
Fund writes an option to enter into an InterestRate Swap. If exercised Fund receives2.25% Fixed semi-annually from20/8/2024; and pays Floating USD LIBOR3 Month BBA quarterly from 11/11/2020 Morgan Stanley USD 2.25 20/08/2024 (5,025) (15,725)
(810,000) Put
Fund writes an option to enter into an InterestRate Swap. If exercised Fund receives2.1% Fixed semi-annually from 6/1/2022;and pays Floating USD LIBOR 3 MonthBBA quarterly from 14/10/2020 Barclays Bank USD 2.10 06/01/2022 10,565 (6,047)
(530,000) Put
Fund writes an option to enter into an InterestRate Swap. If exercised Fund receives2.15% Fixed annually from 10/1/2022; andpays Floating EUR EURIBOR 6 Monthsemi-annually from 15/3/2023
Bank of AmericaMerrill Lynch USD 2.15 10/01/2022 7,479 (3,634)
(540,000) Put
Fund writes an option to enter into an InterestRate Swap. If exercised Fund receivesFloating Markit iTraxx quarterly from20/6/2019; and pays 1.6% Fixed quarterlyfrom 28/2/2022 Deutsche Bank USD 1.60 28/02/2022 (4,750) (13,605)
(100,000) Put
Fund writes an option to enter into an InterestRate Swap. If exercised Fund receives1.6% Fixed annually from 4/3/2022; andpays Floating EUR EURIBOR 6 Monthsemi-annually from 21/1/2022 Deutsche Bank USD 1.60 04/03/2022 (1,039) (2,551)
(230,000) Call
Fund writes an option to enter into an InterestRate Swap. If exercised Fund receivesFloating Markit iTraxx quarterly from20/6/2019; and pays 0.74% Fixed quarterlyfrom 2/5/2022 Deutsche Bank USD 0.74 02/05/2022 6,915 (413)
(230,000) Put
Fund writes an option to enter into an InterestRate Swap. If exercised Fund receivesFloating Markit iTraxx quarterly from20/6/2019; and pays 0.74% Fixed quarterlyfrom 2/5/2022 Deutsche Bank USD 0.74 02/05/2022 (11,585) (18,913)
(1,170,000) Call
Fund purchases an option to enter into anInterest Rate Swap. If exercised Fundreceives Floating USD LIBOR 3 MonthBBA quarterly from 29/9/2028; and pays3.05% Fixed semi-annually from 27/6/2028 Deutsche Bank USD 0.00 27/06/2028 49,441 (958,702)
(1,250,000) Put
Fund writes an option to enter into an InterestRate Swap. If exercised Fund receives 1%Fixed semi-annually from 1/6/2021; andpays Floating USD LIBOR 3 Month BBAquarterly from 3/9/2021
Bank of AmericaMerrill Lynch USD 1.00 01/06/2021 (38,467) (55,405)
(600,000) Put
Fund writes an option to enter into an InterestRate Swap. If exercised Fund receives0.746% Fixed semi-annually from2/6/2021; and pays Floating USD LIBOR3 Month BBA quarterly from 4/9/2021 Deutsche Bank USD 0.75 02/06/2021 (25,080) (38,523)
(600,000) Call
Fund writes an option to enter into an InterestRate Swap. If exercised Fund receivesFloating USD LIBOR 3 Month BBAquarterly from 4/9/2021; and pays 0.746%Fixed semi-annually from 2/6/2021 Deutsche Bank USD 0.75 02/06/2021 13,443 —
BlackRock Global Absolute Return Bond Fund continued
Portfolio of Investments as at 31 May 2021
The notes on pages 590 to 610 form an integral part of these financial statements.
Annual report and audited financial statements [395]

NominalValue
Call/Put Description Counterparty Strike Price
Expirationdate
Netunrealised
appreciation/(depreciation)
EUR
MarketValue
EUR
Financial Derivative Instruments
WRITTEN SWAPTIONS
(305,000) Put
Fund writes an option to enter into an InterestRate Swap. If exercised Fund receives0.742% Fixed semi-annually from25/6/2021; and pays Floating USD LIBOR3 Month BBA quarterly from 29/9/2021
Bank of AmericaMerrill Lynch USD 0.74 25/06/2021 (12,886) (20,037)
(305,000) Call
Fund writes an option to enter into an InterestRate Swap. If exercised Fund receivesFloating USD LIBOR 3 Month BBAquarterly from 29/9/2021; and pays0.742% Fixed semi-annually from25/6/2021
Bank of AmericaMerrill Lynch USD 0.74 25/06/2021 7,151 —
(15,000) Call
Fund writes an option to enter into an InterestRate Swap. If exercised Fund receivesFloating USD LIBOR 3 Month BBAquarterly from 1/10/2021; and pays0.715% Fixed semi-annually from29/6/2021 BNP Paribas USD 0.71 29/06/2021 348 —
(15,000) Put
Fund writes an option to enter into an InterestRate Swap. If exercised Fund receives0.715% Fixed semi-annually from29/6/2021; and pays Floating USD LIBOR3 Month BBA quarterly from 1/10/2021 BNP Paribas USD 0.71 29/06/2021 (670) (1,019)
(140,000) Put
Fund writes an option to enter into an InterestRate Swap. If exercised Fund receives1.15% Fixed semi-annually from10/1/2022; and pays Floating USD LIBOR3 Month BBA semi-annually from12/4/2022
Bank of AmericaMerrill Lynch USD 1.15 10/01/2022 (4,723) (6,589)
(240,000) Put
Fund writes an option to enter into an InterestRate Swap. If exercised Fund receives0.95% Fixed semi-annually from 5/8/2021;and pays Floating USD LIBOR 3 MonthBBA quarterly from 9/11/2021 Deutsche Bank USD 0.95 05/08/2021 (10,052) (12,393)
(120,000) Call
Fund writes an option to enter into an InterestRate Swap. If exercised Fund receivesFloating USD LIBOR 3 Month BBAquarterly from 9/11/2021; and pays 0.75%Fixed semi-annually from 5/8/2021
Bank of AmericaMerrill Lynch USD 0.75 05/08/2021 1,998 (10)
(780,000) Put
Fund writes an option to enter into an InterestRate Swap. If exercised Fund receives0.6% Fixed semi-annually from 3/9/2021;and pays Floating USD LIBOR 3 MonthBBA quarterly from 7/12/2021 Deutsche Bank USD 0.60 03/09/2021 (9,086) (12,444)
(2,470,000) Put
Fund writes an option to enter into an InterestRate Swap. If exercised Fund receives-0.4664% Fixed annually from 14/9/2021;and pays Floating EUR Interbank OfferRate 6 Month semi-annually from16/3/2022 Barclays Bank EUR 0.47 14/09/2021 2,037 (2,343)
(380,000) Put
Fund writes an option to enter into an InterestRate Swap. If exercised Fund receives0.7761% Fixed semi-annually from14/9/2021; and pays Floating USD LIBOR3 Month BBA quarterly from 16/12/2021 Barclays Bank USD 0.78 14/09/2021 (17,129) (25,503)
(35,000) Put
Fund writes an option to enter into an InterestRate Swap. If exercised Fund receives0.8938% Fixed semi-annually from14/9/2022; and pays Floating USD LIBOR3 Month BBA quarterly from 16/12/2022 Morgan Stanley USD 0.89 14/09/2022 (1,680) (2,755)
(35,000) Call
Fund writes an option to enter into an InterestRate Swap. If exercised Fund receivesFloating USD LIBOR 3 Month BBAquarterly from 16/12/2022; and pays0.8938% Fixed semi-annually from14/9/2022 Morgan Stanley USD 0.89 14/09/2022 877 (136)
BlackRock Global Absolute Return Bond Fund continued
Portfolio of Investments as at 31 May 2021
The notes on pages 590 to 610 form an integral part of these financial statements.
BlackRock Strategic Funds[396]

NominalValue
Call/Put Description Counterparty Strike Price
Expirationdate
Netunrealised
appreciation/(depreciation)
EUR
MarketValue
EUR
Financial Derivative Instruments
WRITTEN SWAPTIONS
(255,000) Put
Fund writes an option to enter into an InterestRate Swap. If exercised Fund receives1.064% Fixed semi-annually from11/10/2022; and pays Floating USD LIBOR3 Month BBA quarterly from 13/1/2023 Deutsche Bank USD 1.06 11/10/2022 (10,258) (17,561)
(255,000) Call
Fund writes an option to enter into an InterestRate Swap. If exercised Fund receivesFloating USD LIBOR 3 Month BBAquarterly from 13/1/2023; and pays1.064% Fixed semi-annually from11/10/2022 Deutsche Bank USD 1.06 11/10/2022 5,806 (1,486)
(255,000) Put
Fund writes an option to enter into an InterestRate Swap. If exercised Fund receives1.2325% Fixed semi-annually from16/12/2022; and pays Floating USD LIBOR3 Month BBA quarterly from 20/3/2023 Goldman Sachs USD 1.23 16/12/2022 (8,973) (15,812)
(255,000) Put
Fund writes an option to enter into an InterestRate Swap. If exercised Fund receives1.245% Fixed semi-annually from16/12/2022; and pays Floating USD LIBOR3 Month BBA quarterly from 20/3/2023 Goldman Sachs USD 1.24 16/12/2022 (8,783) (15,622)
(255,000) Call
Fund writes an option to enter into an InterestRate Swap. If exercised Fund receivesFloating USD LIBOR 3 Month BBAquarterly from 20/3/2023; and pays1.2325% Fixed semi-annually from16/12/2022 Goldman Sachs USD 1.23 16/12/2022 4,599 (2,240)
(255,000) Call
Fund writes an option to enter into an InterestRate Swap. If exercised Fund receivesFloating USD LIBOR 3 Month BBAquarterly from 20/3/2023; and pays1.245% Fixed semi-annually from16/12/2022 Goldman Sachs USD 1.24 16/12/2022 4,546 (2,293)
(280,000) Call
Fund writes an option to enter into an InterestRate Swap. If exercised Fund receivesFloating USD LIBOR 3 Month BBAquarterly from 4/4/2023; and pays 1.254%Fixed semi-annually from 30/12/2022 Citibank USD 1.25 30/12/2022 4,932 (2,594)
(280,000) Put
Fund writes an option to enter into an InterestRate Swap. If exercised Fund receives1.254% Fixed semi-annually from30/12/2022; and pays Floating USD LIBOR3 Month BBA quarterly from 4/4/2023 Citibank USD 1.25 30/12/2022 (9,683) (17,210)
(540,000) Put
Fund writes an option to enter into an InterestRate Swap. If exercised Fund receives1.438% Fixed semi-annually from9/1/2023; and pays Floating USD LIBOR3 Month BBA quarterly from 11/4/2023 Barclays Bank USD 1.44 09/01/2023 (13,468) (27,829)
(540,000) Call
Fund writes an option to enter into an InterestRate Swap. If exercised Fund receivesFloating USD LIBOR 3 Month BBAquarterly from 11/4/2023; and pays1.438% Fixed semi-annually from 9/1/2023 Barclays Bank USD 1.44 09/01/2023 7,338 (7,023)
(380,000) Put
Fund writes an option to enter into an InterestRate Swap. If exercised Fund receives1.2475% Fixed semi-annually from27/1/2022; and pays Floating USD LIBOR3 Month BBA quarterly from 30/4/2022
Bank of AmericaMerrill Lynch USD 1.25 27/01/2022 (8,538) (15,943)
(380,000) Call
Fund writes an option to enter into an InterestRate Swap. If exercised Fund receivesFloating USD LIBOR 3 Month BBAquarterly from 30/4/2022; and pays1.2475% Fixed semi-annually from27/1/2022
Bank of AmericaMerrill Lynch USD 1.25 27/01/2022 5,435 (1,970)
BlackRock Global Absolute Return Bond Fund continued
Portfolio of Investments as at 31 May 2021
The notes on pages 590 to 610 form an integral part of these financial statements.
Annual report and audited financial statements [397]

NominalValue
Call/Put Description Counterparty Strike Price
Expirationdate
Netunrealised
appreciation/(depreciation)
EUR
MarketValue
EUR
Financial Derivative Instruments
WRITTEN SWAPTIONS
(410,000) Put
Fund writes an option to enter into an InterestRate Swap. If exercised Fund receives1.5% Fixed semi-annually from 27/1/2022;and pays Floating USD LIBOR 3 MonthBBA quarterly from 30/4/2022 Deutsche Bank USD 1.50 27/01/2022 (6,726) (11,379)
(410,000) Call
Fund writes an option to enter into an InterestRate Swap. If exercised Fund receivesFloating USD LIBOR 3 Month BBAquarterly from 30/4/2022; and pays 1%Fixed semi-annually from 27/1/2022 Deutsche Bank USD 1.00 27/01/2022 3,637 (1,015)
(370,000) Put
Fund writes an option to enter into an InterestRate Swap. If exercised Fund receives1.62% Fixed semi-annually from18/2/2022; and pays Floating USD LIBOR3 Month BBA quarterly from 22/5/2022
Bank of AmericaMerrill Lynch USD 1.62 18/02/2022 (647) (8,768)
(370,000) Call
Fund writes an option to enter into an InterestRate Swap. If exercised Fund receivesFloating USD LIBOR 3 Month BBAquarterly from 22/5/2022; and pays 1.62%Fixed semi-annually from 18/2/2022
Bank of AmericaMerrill Lynch USD 1.62 18/02/2022 2,710 (5,412)
(3,260,000) Call
Fund writes an option to enter into an InterestRate Swap. If exercised Fund receivesFloating USD LIBOR 3 Month BBAquarterly from 25/5/2022; and pays0.405% Fixed semi-annually from23/2/2022 Goldman Sachs USD 0.41 23/02/2022 1,652 (4,912)
(3,780,000) Call
Fund writes an option to enter into an InterestRate Swap. If exercised Fund receivesFloating USD LIBOR 3 Month BBAquarterly from 3/6/2022; and pays 0.508%Fixed semi-annually from 1/3/2022 Deutsche Bank USD 0.51 01/03/2022 434 (9,415)
(3,780,000) Put
Fund writes an option to enter into an InterestRate Swap. If exercised Fund receives0.508% Fixed semi-annually from1/3/2022; and pays Floating USD LIBOR3 Month BBA quarterly from 3/6/2022 Deutsche Bank USD 0.51 01/03/2022 3,113 (6,735)
(580,000) Call
Fund writes an option to enter into an InterestRate Swap. If exercised Fund receivesFloating USD LIBOR 3 Month BBAquarterly from 3/6/2023; and pays 2.01%Fixed semi-annually from 1/3/2023
Bank of AmericaMerrill Lynch USD 2.01 01/03/2023 (27) (18,377)
(580,000) Put
Fund writes an option to enter into an InterestRate Swap. If exercised Fund receives2.01% Fixed semi-annually from 1/3/2023;and pays Floating USD LIBOR 3 MonthBBA quarterly from 3/6/2023
Bank of AmericaMerrill Lynch USD 2.01 01/03/2023 1,549 (16,801)
(5,610,000) Call
Fund writes an option to enter into an InterestRate Swap. If exercised Fund receivesFloating USD LIBOR 3 Month BBAquarterly from 4/6/2022; and pays 0.485%Fixed semi-annually from 2/3/2022 JP Morgan USD 0.48 02/03/2022 810 (12,583)
(5,610,000) Put
Fund writes an option to enter into an InterestRate Swap. If exercised Fund receives0.485% Fixed semi-annually from2/3/2022; and pays Floating USD LIBOR3 Month BBA quarterly from 4/6/2022 JP Morgan USD 0.49 02/03/2022 2,576 (10,817)
(1,930,000) Call
Fund writes an option to enter into an InterestRate Swap. If exercised Fund receivesFloating USD LIBOR 3 Month BBAquarterly from 7/6/2022; and pays 0.518%Fixed semi-annually from 3/3/2022 Citibank USD 0.52 03/03/2022 (293) (4,956)
(1,930,000) Put
Fund writes an option to enter into an InterestRate Swap. If exercised Fund receives0.518% Fixed semi-annually from3/3/2022; and pays Floating USD LIBOR3 Month BBA quarterly from 7/6/2022 Citibank USD 0.52 03/03/2022 1,249 (3,413)
BlackRock Global Absolute Return Bond Fund continued
Portfolio of Investments as at 31 May 2021
The notes on pages 590 to 610 form an integral part of these financial statements.
BlackRock Strategic Funds[398]

NominalValue
Call/Put Description Counterparty Strike Price
Expirationdate
Netunrealised
appreciation/(depreciation)
EUR
MarketValue
EUR
Financial Derivative Instruments
WRITTEN SWAPTIONS
(1,930,000) Call
Fund writes an option to enter into an InterestRate Swap. If exercised Fund receivesFloating USD LIBOR 3 Month BBAquarterly from 23/6/2022; and pays0.562% Fixed semi-annually from21/3/2022 Deutsche Bank USD 0.56 21/03/2022 (345) (5,804)
(1,930,000) Put
Fund writes an option to enter into an InterestRate Swap. If exercised Fund receives0.562% Fixed semi-annually from21/3/2022; and pays Floating USD LIBOR3 Month BBA quarterly from 23/6/2022 Deutsche Bank USD 0.56 21/03/2022 2,010 (3,450)
(3,750,000) Call
Fund writes an option to enter into an InterestRate Swap. If exercised Fund receivesFloating USD LIBOR 3 Month BBAquarterly from 25/6/2022; and pays0.568% Fixed semi-annually from23/3/2022 Deutsche Bank USD 0.57 23/03/2022 (1,232) (11,498)
(3,750,000) Put
Fund writes an option to enter into an InterestRate Swap. If exercised Fund receives0.568% Fixed semi-annually from23/3/2022; and pays Floating USD LIBOR3 Month BBA quarterly from 25/6/2022 Deutsche Bank USD 0.57 23/03/2022 3,568 (6,698)
(3,260,000) Put
Fund writes an option to enter into an InterestRate Swap. If exercised Fund receives0.75% Fixed semi-annually from25/2/2022; and pays Floating USD LIBOR3 Month BBA quarterly from 1/6/2022 Deutsche Bank USD 0.01 25/02/2022 3,716 (2,820)
(4,280,000) Call
Fund writes an option to enter into an InterestRate Swap. If exercised Fund receivesFloating USD LIBOR 3 Month BBAquarterly from 12/4/2022; and pays0.508% Fixed semi-annually from10/1/2022 Morgan Stanley USD 0.01 10/01/2022 (924) (11,595)
(4,280,000) Put
Fund writes an option to enter into an InterestRate Swap. If exercised Fund receives0.508% Fixed semi-annually from10/1/2022; and pays Floating USD LIBOR3 Month BBA quarterly from 12/4/2022 Morgan Stanley USD 0.01 10/01/2022 5,329 (4,783)
(340,000) Put
Fund writes an option to enter into an InterestRate Swap. If exercised Fund receives1.775% Fixed semi-annually from14/10/2021; and pays Floating USD LIBOR3 Month BBA quarterly from 18/1/2022 Goldman Sachs USD 0.02 14/10/2021 2,832 (3,260)
(340,000) Call
Fund writes an option to enter into an InterestRate Swap. If exercised Fund receivesFloating USD LIBOR 3 Month BBAquarterly from 18/1/2022; and pays1.775% Fixed semi-annually from14/10/2021 Goldman Sachs USD 0.02 14/10/2021 (308) (6,400)
(3,250,000) Call
Fund writes an option to enter into an InterestRate Swap. If exercised Fund receivesFloating USD LIBOR 3 Month BBAquarterly from 3/8/2022; and pays 0.9%Fixed semi-annually from 28/4/2022
Bank of AmericaMerrill Lynch USD 0.01 28/04/2022 (2,129) (14,155)
(700,000) Put
Fund writes an option to enter into an InterestRate Swap. If exercised Fund receives0.7% Fixed annually from 15/5/2023; andpays Floating EUR Interbank Offer Rate6 Month semi-annually from 17/11/2023 Barclays Bank EUR 0.01 15/05/2023 2,560 (12,951)
Total (Gross underlying exposure - EUR 30,279,929) 130,302 (1,605,980)
BlackRock Global Absolute Return Bond Fund continued
Portfolio of Investments as at 31 May 2021
The notes on pages 590 to 610 form an integral part of these financial statements.
Annual report and audited financial statements [399]

Currency Purchases Currency Sales CounterpartyMaturity
date
Netunrealised
appreciation/(depreciation)
EUR
Financial Derivative Instruments
OPEN FORWARD FOREIGN EXCHANGE TRANSACTIONS
AUD 30,000 CAD 28,525 JP Morgan 16/6/2021 (320)
AUD 460,000 EUR 297,121Royal Bank of
Canada 16/6/2021 (5,460)AUD 60,000 NZD 65,198 JP Morgan 16/6/2021 (777)BRL 257,568 USD 49,000 Barclays Bank 2/6/2021 318BRL 213,300 USD 40,798 Citibank 2/6/2021 84BRL 349,835 USD 66,914 Deutsche Bank 2/6/2021 136BRL 203,412 USD 37,600 Goldman Sachs 2/6/2021 1,151BRL 715,553 USD 135,528 Morgan Stanley 2/6/2021 1,377BRL 158,489 USD 30,000 Citibank 4/6/2021 316BRL 80,000 USD 14,200 Barclays Bank 16/6/2021 918CAD 28,002 AUD 30,000 Citibank 16/6/2021 (35)CLP 21,320,800 USD 29,000 Citibank 16/6/2021 456
CNH 3,060,000 USD 466,876Bank of America
Merrill Lynch 16/6/2021 10,740CNH 600,000 USD 92,067 Barclays Bank 16/6/2021 1,678CNH 2,425,000 USD 369,221 BNP Paribas 16/6/2021 9,144CNH 1,855,000 USD 285,043 Citibank 16/6/2021 4,858CNH 1,265,000 USD 194,046 Goldman Sachs 16/6/2021 3,589CNH 3,135,000 USD 481,515 HSBC 16/6/2021 8,386CNH 250,000 USD 38,617 Natwest Markets 16/6/2021 490EUR 1,556,958 AUD 2,400,000 Natwest Markets 16/6/2021 35,249
EUR 83,969 AUD 130,000Royal Bank of
Canada 16/6/2021 1,543EUR 129,413 AUD 200,000 Westpac 16/6/2021 2,604
EUR 33,170 CAD 50,000Royal Bank of
Canada 16/6/2021 (732)
EUR 267,915 CAD 400,000State Street Bank& Trust Company 16/6/2021 (3,297)
EUR 46,897 GBP 40,725 Barclays Bank 16/6/2021 (377)EUR 820,000 GBP 709,078 BNP Paribas 16/6/2021 (3,096)EUR 322,069 GBP 276,147 Citibank 16/6/2021 1,517EUR 480,000 GBP 415,701 Deutsche Bank 16/6/2021 (2,544)EUR 708,706 GBP 610,725 JP Morgan 16/6/2021 (222)EUR 253,160 GBP 220,000 Morgan Stanley 16/6/2021 (2,215)
EUR 926,083 GBP 800,000Royal Bank of
Canada 16/6/2021 (2,555)
EUR 320,000 GBP 277,139Standard
Chartered Bank 16/6/2021 (1,702)
EUR 36,152,868 GBP 31,000,000State Street Bank& Trust Company 16/6/2021 168,127
EUR 1,152,605 GBP 1,000,000The Bank of New
York Mellon 16/6/2021 (8,193)EUR 99,473 HKD 920,000 Barclays Bank 16/6/2021 2,363
EUR 53,863 HKD 500,000Royal Bank of
Canada 16/6/2021 1,086EUR 323,035 JPY 42,061,000 Natwest Markets 16/6/2021 8,740
EUR 77,236 JPY 10,000,000Royal Bank of
Canada 16/6/2021 2,512EUR 8,740 JPY 1,131,000 UBS 16/6/2021 289EUR 20,000 MXN 498,044 Citibank 16/6/2021 (465)EUR 40,130 MXN 1,000,000 Goldman Sachs 16/6/2021 (960)
EUR 24,000 PLN 109,419Bank of America
Merrill Lynch 16/6/2021 (394)EUR 22,056 PLN 100,000 Goldman Sachs 16/6/2021 (239)
EUR 196,899 SEK 2,000,000Bank of America
Merrill Lynch 16/6/2021 (709)EUR 34,253 SGD 55,000 Barclays Bank 16/6/2021 167
EUR 913,586 USD 1,103,283Bank of America
Merrill Lynch 16/6/2021 9,796EUR 31,772 USD 38,000 Bank of New York 16/6/2021 643EUR 16,450,088 USD 19,605,213 Barclays Bank 16/6/2021 389,828EUR 1,027,677 USD 1,236,669 BNP Paribas 16/6/2021 14,619
Currency Purchases Currency Sales CounterpartyMaturity
date
Netunrealised
appreciation/(depreciation)
EUR
Financial Derivative Instruments
OPEN FORWARD FOREIGN EXCHANGE TRANSACTIONS
EUR 19,174,815 USD 23,201,263 Citibank 16/6/2021 168,731EUR 1,098,129 USD 1,317,695 Goldman Sachs 16/6/2021 18,695EUR 1,668,574 USD 2,040,000 HSBC 16/6/2021 (2,560)EUR 3,556,629 USD 4,243,499 JP Morgan 16/6/2021 80,427EUR 537,731 USD 644,316 Morgan Stanley 16/6/2021 9,918EUR 3,436,899 USD 4,107,814 Natwest Markets 16/6/2021 71,847
EUR 32,573 USD 38,919Royal Bank of
Canada 16/6/2021 692
EUR 79,514 USD 95,559Standard
Chartered Bank 16/6/2021 1,233
EUR 621,037 USD 752,087State Street Bank& Trust Company 16/6/2021 4,940
EUR 56,937 USD 68,287Toronto Dominion
Bank 16/6/2021 998EUR 995,940 USD 1,216,963 UBS 16/6/2021 (976)EUR 18,291,253 USD 21,838,000 Westpac 16/6/2021 401,929EUR 14,665 ZAR 270,000 Societe Generale 17/6/2021 (1,388)GBP 26,558 EUR 30,503 Barclays Bank 16/6/2021 325GBP 1,449,652 EUR 1,680,000 BNP Paribas 16/6/2021 2,752GBP 182,401 EUR 209,497 Deutsche Bank 16/6/2021 2,234GBP 1,000 EUR 1,158 Natwest Markets 16/6/2021 2
GBP 698,639 EUR 808,979Standard
Chartered Bank 16/6/2021 2,000
GBP 4,100,000 EUR 4,775,334State Street Bank& Trust Company 16/6/2021 (16,062)
GBP 830,000 USD 1,159,233 HSBC 16/6/2021 13,839GBP 140,000 USD 192,431 Morgan Stanley 16/6/2021 4,875
IDR 4,771,210,000 USD 327,019Bank of America
Merrill Lynch 16/6/2021 6,104IDR 761,200,000 USD 52,002 Barclays Bank 16/6/2021 1,114IDR 4,776,285,000 USD 328,263 BNP Paribas 16/6/2021 5,377IDR 841,305,000 USD 57,545 Deutsche Bank 16/6/2021 1,173IDR 840,420,000 USD 58,000 JP Morgan 16/6/2021 750IDR 561,070,000 USD 38,000 Morgan Stanley 1/7/2021 1,038INR 3,546,720 USD 48,000 JP Morgan 9/6/2021 682
INR 38,456,700 USD 511,076Bank of America
Merrill Lynch 16/6/2021 14,582INR 19,943,300 USD 265,457 Goldman Sachs 16/6/2021 7,219JPY 4,152,271 USD 38,000 Natwest Markets 16/6/2021 (102)JPY 4,257,415 USD 39,000 Barclays Bank 21/6/2021 (134)
KRW 266,265,000 USD 235,637Bank of America
Merrill Lynch 16/6/2021 3,780KRW 116,295,000 USD 103,116 Barclays Bank 16/6/2021 1,489KRW 45,000,000 USD 40,083 BNP Paribas 16/6/2021 426KRW 32,316,440 USD 29,000 Citibank 16/6/2021 130KRW 45,000,000 USD 40,118 Goldman Sachs 16/6/2021 398KRW 197,440,000 USD 176,078 HSBC 16/6/2021 1,697KRW 21,392,480 USD 19,000 JP Morgan 16/6/2021 248KZT 8,442,512 USD 19,240 Deutsche Bank 15/7/2021 269MXN 512,682 EUR 20,000 Barclays Bank 16/6/2021 1,066MXN 1,178,391 USD 59,000 Citibank 16/6/2021 89MXN 616,132 USD 30,289 Goldman Sachs 16/6/2021 505MXN 599,450 USD 30,145 HSBC 16/6/2021 (63)MYR 480,000 USD 117,173 Barclays Bank 16/6/2021 (672)MYR 320,000 USD 78,106 Morgan Stanley 16/6/2021 (441)NOK 400,000 USD 47,788 Citibank 16/6/2021 118NOK 8,200,000 USD 981,147 Goldman Sachs 16/6/2021 1,197NOK 2,200,000 USD 264,254 JP Morgan 16/6/2021 (512)NOK 540,000 USD 65,260 Morgan Stanley 16/6/2021 (452)
NOK 260,000 USD 31,289Toronto Dominion
Bank 16/6/2021 (109)NOK 1,700,000 USD 204,624 UBS 16/6/2021 (748)
BlackRock Global Absolute Return Bond Fund continued
Portfolio of Investments as at 31 May 2021
The notes on pages 590 to 610 form an integral part of these financial statements.
BlackRock Strategic Funds[400]

Currency Purchases Currency Sales CounterpartyMaturity
date
Netunrealised
appreciation/(depreciation)
EUR
Financial Derivative Instruments
OPEN FORWARD FOREIGN EXCHANGE TRANSACTIONS
NZD 32,703 AUD 30,000Bank of America
Merrill Lynch 16/6/2021 450NZD 32,713 AUD 30,000 JP Morgan 16/6/2021 456PLN 109,434 EUR 24,000 Citibank 16/6/2021 397RUB 2,730,000 USD 36,717 Goldman Sachs 16/6/2021 361
SEK 90,000 EUR 8,866Bank of America
Merrill Lynch 16/6/2021 27SEK 200,000 USD 23,941 Barclays Bank 16/6/2021 148SEK 1,600,000 USD 191,960 JP Morgan 16/6/2021 835SEK 100,000 USD 11,986 Morgan Stanley 16/6/2021 61TWD 1,586,200 USD 56,000 Citibank 7/6/2021 1,276
TWD 3,570,000 USD 128,371Bank of America
Merrill Lynch 16/6/2021 1,137TWD 3,465,000 USD 124,604 Barclays Bank 16/6/2021 1,097TWD 3,465,000 USD 124,595 BNP Paribas 16/6/2021 1,104USD 49,266 BRL 257,569 Barclays Bank 2/6/2021 (100)USD 40,000 BRL 213,300 Citibank 2/6/2021 (738)USD 65,500 BRL 349,835 Deutsche Bank 2/6/2021 (1,295)USD 38,907 BRL 203,412 Goldman Sachs 2/6/2021 (79)USD 136,238 BRL 715,553 Morgan Stanley 2/6/2021 (793)USD 30,000 BRL 159,182 Citibank 4/6/2021 (425)USD 59,000 BRL 312,676 Citibank 2/7/2021 (648)USD 29,000 CLP 20,447,030 Morgan Stanley 16/6/2021 536
USD 1,128,074 CNH 7,404,000Bank of America
Merrill Lynch 16/6/2021 (27,286)USD 1,126,695 CNH 7,400,000 BNP Paribas 16/6/2021 (27,901)USD 55,263 CNH 360,000 Citibank 16/6/2021 (988)USD 3,668,844 CNH 23,626,256 Goldman Sachs 16/6/2021 (30,425)USD 926,010 CNH 6,005,820 HSBC 24/8/2021 (9,856)USD 37,683 CNH 244,000 Morgan Stanley 24/8/2021 (350)USD 29,000 COP 106,972,300 Deutsche Bank 16/6/2021 144
USD 1,205,770 EUR 1,009,782Bank of America
Merrill Lynch 16/6/2021 (22,036)USD 850,090 EUR 704,594 Barclays Bank 16/6/2021 (8,214)USD 1,710,209 EUR 1,420,415 BNP Paribas 16/6/2021 (19,443)USD 1,339,291 EUR 1,107,503 Citibank 16/6/2021 (10,379)USD 1,595,842 EUR 1,320,000 Goldman Sachs 16/6/2021 (12,715)USD 140,744 EUR 119,308 HSBC 16/6/2021 (4,012)USD 174,306 EUR 144,000 JP Morgan 16/6/2021 (1,212)USD 2,397,301 EUR 1,990,894 Morgan Stanley 16/6/2021 (27,065)
USD 138,869 EUR 115,000Royal Bank of
Canada 16/6/2021 (1,240)
USD 4,022,000 EUR 3,376,545State Street Bank& Trust Company 16/6/2021 (81,790)
USD 36,761 EUR 30,000Toronto Dominion
Bank 16/6/2021 114USD 2,000,000 EUR 1,641,230 UBS 16/6/2021 (2,864)USD 706,642 GBP 510,000 Barclays Bank 16/6/2021 (13,137)USD 643,140 GBP 460,000 Morgan Stanley 16/6/2021 (7,118)
USD 694,119 IDR 9,887,000,597Bank of America
Merrill Lynch 16/6/2021 837USD 46,082 IDR 673,125,000 BNP Paribas 16/6/2021 (905)USD 34,538 IDR 504,842,758 Goldman Sachs 16/6/2021 (698)USD 38,000 IDR 560,500,000 Morgan Stanley 1/7/2021 (1,005)
USD 51,011 IDR 739,713,296Standard
Chartered Bank 24/8/2021 (356)USD 48,000 INR 3,557,760 JP Morgan 9/6/2021 (807)
USD 132,153 INR 9,700,000Bank of America
Merrill Lynch 16/6/2021 (1,021)
Currency Purchases Currency Sales CounterpartyMaturity
date
Netunrealised
appreciation/(depreciation)
EUR
Financial Derivative Instruments
OPEN FORWARD FOREIGN EXCHANGE TRANSACTIONS
USD 268,504 INR 19,700,000 Barclays Bank 16/6/2021 (1,983)USD 38,000 JPY 4,149,265 HSBC 16/6/2021 124USD 29,000 JPY 3,175,562 JP Morgan 16/6/2021 27USD 39,000 JPY 4,258,738 HSBC 21/6/2021 124USD 67,000 KRW 75,101,300 Citibank 16/6/2021 (626)USD 30,000 MXN 600,976 Citibank 16/6/2021 (119)USD 30,000 MXN 604,050 HSBC 16/6/2021 (245)USD 12,178 MXN 242,472 JP Morgan 16/6/2021 12USD 20,000 MXN 398,857 Morgan Stanley 16/6/2021 (6)USD 2,336 MXN 47,000 UBS 16/6/2021 (18)USD 21,206 NOK 175,000 Barclays Bank 16/6/2021 193USD 218,881 NOK 1,790,000 JP Morgan 16/6/2021 3,592USD 615,585 SEK 5,200,000 Citibank 16/6/2021 (9,502)USD 404,765 SEK 3,400,000 Goldman Sachs 16/6/2021 (4,356)USD 268,546 SEK 2,250,000 JP Morgan 16/6/2021 (2,319)USD 68,571 SEK 570,000 Morgan Stanley 16/6/2021 (146)
USD 33,804 SEK 280,000Toronto Dominion
Bank 16/6/2021 27USD 193,150 SEK 1,600,000 UBS 16/6/2021 139USD 19,000 TRY 164,255 JP Morgan 30/7/2021 224USD 56,000 TWD 1,567,440 BNP Paribas 7/6/2021 (718)
USD 305,890 TWD 8,535,000Bank of America
Merrill Lynch 16/6/2021 (3,550)USD 134,468 TWD 3,730,000 BNP Paribas 16/6/2021 (907)USD 135,008 TWD 3,735,000 Goldman Sachs 16/6/2021 (613)USD 56,000 ZAR 800,601 BNP Paribas 17/6/2021 (1,727)USD 20,000 ZAR 276,159 Deutsche Bank 17/6/2021 (36)USD 47,002 ZAR 660,531 Citibank 24/8/2021 (419)USD 199,814 ZAR 2,782,715 JP Morgan 24/8/2021 (293)
1,128,059
CHF Hedged Share Class
CHF 156 EUR 142State Street Bank& Trust Company 15/6/2021 —
EUR 1 CHF 1State Street Bank& Trust Company 15/6/2021 —
—
GBP Hedged Share Class
EUR 6,297 GBP 5,477State Street Bank& Trust Company 15/6/2021 (61)
GBP 2,530,546 EUR 2,914,620State Street Bank& Trust Company 15/6/2021 22,885
22,824
SEK Hedged Share Class
EUR 2,812 SEK 28,464State Street Bank& Trust Company 15/6/2021 (1)
SEK 25,235,296 EUR 2,487,055State Street Bank& Trust Company 15/6/2021 6,316
6,315
USD Hedged Share Class
EUR 6,203 USD 7,533State Street Bank& Trust Company 15/6/2021 32
USD 538,924 EUR 445,432State Street Bank& Trust Company 15/6/2021 (3,946)
(3,914)
Total (Gross underlying exposure - EUR 173,599,338) 1,153,284
BlackRock Global Absolute Return Bond Fund continued
Portfolio of Investments as at 31 May 2021
The notes on pages 590 to 610 form an integral part of these financial statements.
Annual report and audited financial statements [401]

Holding Description
MarketvalueEUR
% ofNetAssets
To be Announced Securities Contracts
United States
USD (7,602,000)Fannie Mae or Freddie Mac3.000 TBA (6,505,032) (4.08)
USD 11,734,008Fannie Mae or Freddie Mac2.500 TBA 9,954,414 6.24
USD (6,120,000)Fannie Mae or Freddie Mac2.000 TBA (5,055,295) (3.17)
USD 3,702,000 Ginnie Mae 3.000 TBA 3,165,195 1.99
USD 3,300,000 Ginnie Mae 3.000 TBA 2,820,641 1.77
USD 600,000 Ginnie Mae 3.000 TBA 512,383 0.32
USD 450,800 Ginnie Mae 2.500 TBA 382,777 0.24
5,275,083 3.31
Total (Gross underlying exposure - EUR 28,395,736) 5,275,083 3.31
Sector Breakdownas at 31 May 2021
% of NetAssets
Financial 25.06
Mortgage Securities 15.42
Government 9.73
Consumer, Cyclical 5.93
Asset Backed Securities 5.89
Exchange Traded Funds 5.74
Consumer, Non-cyclical 5.58
Communications 3.86
Energy 3.26
Utilities 3.13
Industrial 2.22
Technology 2.16
Basic Materials 1.73
Securities portfolio at market value 89.71
Other Net Assets 10.29
100.00
BlackRock Global Absolute Return Bond Fund continued
Portfolio of Investments as at 31 May 2021
The notes on pages 590 to 610 form an integral part of these financial statements.
BlackRock Strategic Funds[402]

Holding Description
MarketValue
USD
% ofNet
Assets
Transferable Securities and Money Market Instruments Admittedto an Official Stock Exchange Listing or Dealt in on AnotherRegulated Market
COMMON STOCKS & PREFERRED STOCKSCayman Islands
5,400 Kuaishou Technology 135,191 0.1969,052 RMG Acquisition Corp II ’A’ 685,686 0.972,806 Sea Ltd ADR 710,591 1.01
344,000 Weimob Inc 788,079 1.1273,000 Wuxi Biologics Cayman Inc 1,140,941 1.62
142,400 XD Inc 1,154,091 1.63
4,614,579 6.54
Denmark4,090 Ascendis Pharma A/S ADR 549,614 0.78
549,614 0.78
France6,428 L’Oreal SA 2,894,707 4.10
20,023 Sanofi 2,137,913 3.03
5,032,620 7.13
Germany18,621 Covestro AG 1,310,783 1.8613,959 Volkswagen AG (Pref) 3,899,443 5.53
5,210,226 7.39
Iceland179,171 Marel HF 1,311,963 1.86
1,311,963 1.86
India32,038 Reliance Industries Ltd GDR 1,846,991 2.62
1,846,991 2.62
Ireland15,850 Ryanair Holdings Plc ADR 1,850,488 2.62
1,850,488 2.62
Italy844,117 Intesa Sanpaolo SpA 2,497,110 3.54
2,497,110 3.54
Japan47,700 BASE Inc 751,349 1.0712,300 FANUC Corp 2,950,474 4.1850,000 Recruit Holdings Co Ltd 2,533,291 3.5928,400 Sony Corp 2,793,634 3.9627,200 Toyota Motor Corp 2,261,291 3.219,100 Visional Inc 560,243 0.79
11,850,282 16.80
Luxembourg38,665 Arrival Group 741,981 1.05
741,981 1.05
Netherlands13,477 Koninklijke DSM NV 2,486,838 3.52
2,486,838 3.52
South Korea2,481 LG Chem Ltd 1,828,846 2.59
1,828,846 2.59
Spain50,289 Cellnex Telecom SA 3,037,336 4.31
3,037,336 4.31
United States8,037 Axon Enterprise Inc 1,129,922 1.60
53,302 BTRS Holdings Inc 762,219 1.086,942 Cadence Design Systems Inc 881,564 1.255,838 Chart Industries Inc 851,998 1.21
Holding Description
MarketValue
USD
% ofNet
Assets
United States continued63,180 Comcast Corp ’A’ 3,622,741 5.1444,993 Desktop Metal Inc ’A’ 594,357 0.8416,536 Fidelity National Information
Services Inc 2,463,533 3.494,030 Freshpet Inc 712,585 1.011,001 Intuitive Surgical Inc 843,022 1.20
16,303 Live Nation Entertainment Inc 1,469,063 2.087,500 Mastercard Inc ’A’ 2,704,350 3.83
14,891 Mondelez International Inc ’A’ 946,025 1.349,673 Natera Inc 910,616 1.29
21,414 Otis Worldwide Corp 1,677,359 2.385,435 PayPal Holdings Inc 1,413,209 2.00
32,426 Ruth’s Hospitality Group Inc 782,764 1.11
21,765,327 30.85
Total Common Stocks & Preferred Stocks 64,624,201 91.60
Total Transferable Securities and Money MarketInstruments Admitted to an Official Stock ExchangeListing or Dealt in on Another Regulated Market 64,624,201 91.60
Other Transferable Securities and Money Market Instruments
COMMON STOCKSHong Kong
36,400 Kuaishou Technology Lockup* 894,761 1.27
894,761 1.27
South Korea3,036 SK IE Technology* 406,019 0.57
406,019 0.57
Total Common Stocks 1,300,780 1.84
Total Other Transferable Securities and MoneyMarket Instruments 1,300,780 1.84
Collective Investment SchemesIreland
1 BlackRock ICS US Dollar Liq-uid Environmentally AwareFund (Dist)~ 90 0.00
90 0.00
Total Collective Investment Schemes 90 0.00
Securities portfolio at market value 65,925,071 93.44
Other Net Assets 4,626,540 6.56
Total Net Assets (USD) 70,551,611 100.00
* Security subject to a fair value adjustment as detailed in Note 2(a).~ Investment in related party fund.
BlackRock Global Equity Absolute Return Fund
Portfolio of Investments as at 31 May 2021
The notes on pages 590 to 610 form an integral part of these financial statements.
Annual report and audited financial statements [403]

Holding Description Counterparty
Netunrealised
appreciation/(depreciation)
USD
Financial Derivative Instruments
CONTRACTS FOR DIFFERENCEAustralia
(19,825) Commonwealth Bank ofAustralia JP Morgan (62,495)
(62,495)
Brazil232,797 Locaweb Servicos de Inter-
net SA JP Morgan 104,529
104,529
Canada16,980 Canadian National Railway
Co UBS 79,590
79,590
France6,276 EssilorLuxottica SA Goldman Sachs 14,153
14,153
Germany(7,333) BASF SE JP Morgan 30,527
(40,473) Freenet AG UBS (27,739)(8,768) Stroeer SE & Co KGaA UBS (2,463)
325
Italy(15,582) De’ Longhi SpA JP Morgan 915
915
Japan(27,900) Dentsu Group Inc JP Morgan (53,148)(11,600) Secom Co Ltd Goldman Sachs (75)
(414,000) Seven Bank Ltd UBS 39,785(67,100) SoftBank Corp JP Morgan 23,618(12,100) Unicharm Corp UBS (3,175)
7,005
Netherlands(17,379) JDE Peet’s NV Goldman Sachs 1,924
1,924
Spain(304,019) Mapfre SA JP Morgan 10,144(205,518) Telefonica SA UBS 26,353
36,497
Sweden(25,662) Electrolux AB ’B’ JP Morgan 2,859(91,717) Telefonaktiebolaget LM Er-
icsson ’B’ Goldman Sachs (585)
2,274
Switzerland(36,242) ABB Ltd Reg Goldman Sachs (14,976)
(14,976)
United Kingdom(32,506) Bunzl Plc Goldman Sachs 14,17566,066 Prudential Plc Goldman Sachs 5,322
(82,365) Sage Group Plc JP Morgan (23,749)
(4,252)
United States(26,230) 2U Inc JP Morgan (7,024)(3,807) Alibaba Group Holding Ltd
ADR Goldman Sachs (10,481)(8,944) AppLovin Corp ’A’ Goldman Sachs (99,899)
(33,903) AT&T Inc Goldman Sachs 58,85647,749 Baker Hughes Co JP Morgan (8,675)
(406) Booking Holdings Inc JP Morgan (35,492)(9,638) Brink’s Co UBS 36,99922,948 Bristol-Myers Squibb Co UBS 3,678
(18,279) Conagra Brands Inc UBS (6,695)
Holding Description Counterparty
Netunrealised
appreciation/(depreciation)
USD
United States continued(7,418) Electronic Arts Inc UBS (33,569)2,228 Equinix Inc (REIT) Goldman Sachs 41,798
(4,248) Expedia Group Inc JP Morgan (16,043)(13,683) Fastenal Co Goldman Sachs 6,882(22,457) GFL Environmental Inc UBS (17,208)(43,290) Interpublic Group of Cos Inc Goldman Sachs (46,189)(13,175) Molson Coors Beverage Co
’B’ Goldman Sachs (5,656)1,902 Netflix Inc UBS 23,3397,940 NIKE Inc ’B’ UBS 163
(14,959) Omnicom Group Inc UBS 11,600(32,286) Pfizer Inc Goldman Sachs 40,010(3,682) Wayfair Inc ’A’ UBS (9,697)(2,793) WD-40 Co JP Morgan (10,790)
(84,093)
Total (Gross underlying exposure - USD 43,649,430) 81,396
BlackRock Global Equity Absolute Return Fund continued
Portfolio of Investments as at 31 May 2021
The notes on pages 590 to 610 form an integral part of these financial statements.
BlackRock Strategic Funds[404]

Numberof
contractsCurrencyof contracts
Contract/Description
Expirationdate
Grossunderlying
exposureUSD
Net unrealisedappreciation/
(depreciation)USD
Financial Derivative Instruments
FUTURES
(62) EUR CAC 40 Index Futures June 2021 June 2021 4,887,949 (89,632)
(54) USD E-Mini S&P 500 Index Futures June 2021 June 2021 11,355,120 (533,995)
(94) JPY Mini-Topix Index Futures June 2021 June 2021 1,653,402 893
(10) USD NASDAQ 100 E-Mini Stock Index Futures June 2021 June 2021 2,734,450 (90,380)
(305) EUR STOXX Europe 600 Index Futures June 2021 June 2021 8,324,750 (353,909)
Total 28,955,671 (1,067,023)
Currency Purchases Currency Sales CounterpartyMaturity
date
Netunrealised
appreciation/(depreciation)
USD
Financial Derivative Instruments
OPEN FORWARD FOREIGN EXCHANGE TRANSACTIONS
USD 623,586 CHF 558,555Royal Bank of
Canada 25/6/2021 2,910
USD 2,316,980 EUR 1,897,662Bank of America
Merrill Lynch 25/6/2021 43USD 17,210,476 EUR 14,075,290 UBS 25/6/2021 25,346USD 9,493,492 JPY 1,031,425,740 Barclays Bank 25/6/2021 84,436USD 2,349,152 JPY 257,145,746 BNP Paribas 25/6/2021 3,371USD 2,009,850 KRW 2,262,569,179 Citibank 25/6/2021 (31,696)
84,410
AUD Hedged Share Class
AUD 20,249,648 USD 15,718,798State Street Bank& Trust Company 15/6/2021 (45,700)
USD 173,072 AUD 221,198State Street Bank& Trust Company 15/6/2021 1,866
(43,834)
CHF Hedged Share Class
CHF 576,669 USD 635,156State Street Bank& Trust Company 15/6/2021 5,481
USD 14,173 CHF 12,773State Street Bank& Trust Company 15/6/2021 (17)
5,464
EUR Hedged Share Class
EUR 10,618 USD 12,831State Street Bank& Trust Company 15/6/2021 130
USD 254 EUR 208State Street Bank& Trust Company 15/6/2021 —
130
GBP Hedged Share Class
GBP 1,598,808 USD 2,231,584State Street Bank& Trust Company 15/6/2021 33,951
USD 35,787 GBP 25,380State Street Bank& Trust Company 15/6/2021 (175)
33,776
Total (Gross underlying exposure - USD 52,732,971) 79,946
Sector Breakdownas at 31 May 2021
% of NetAssets
Consumer, Non-cyclical 20.00
Consumer, Cyclical 19.52
Industrial 15.54
Communications 9.80
Technology 9.08
Basic Materials 8.54
Financial 7.37
Energy 2.62
Diversified 0.97
Collective Investment Schemes 0.00
Securities portfolio at market value 93.44
Other Net Assets 6.56
100.00
BlackRock Global Equity Absolute Return Fund continued
Portfolio of Investments as at 31 May 2021
The notes on pages 590 to 610 form an integral part of these financial statements.
Annual report and audited financial statements [405]

Holding Description
MarketValue
USD
% ofNet
Assets
Transferable Securities and Money Market Instruments Admittedto an Official Stock Exchange Listing or Dealt in on AnotherRegulated Market
COMMON STOCKS & PREFERRED STOCKSBermuda
264,630 Axalta Coating Systems Ltd 8,584,597 0.14
8,584,597 0.14
Canada52,469 AbCellera Biologics Inc^ 1,407,743 0.02
1,079,603 GFL Environmental Inc 35,130,282 0.59
36,538,025 0.61
Cayman Islands68,106 Gracell Biotechnologies Inc
ADR 1,025,676 0.02786,278 Lufax Holding Ltd ADR 9,584,729 0.16220,156 Patria Investments Ltd ’A’ 3,722,838 0.06418,438 RLX Technology Inc ADR^ 4,732,534 0.08141,963 Tuya Inc ADR 3,387,237 0.05
22,453,014 0.37
Germany97,420 Auto1 Group SE^ 5,226,468 0.08
158,145 OSRAM Licht AG 10,093,914 0.17
15,320,382 0.25
Netherlands25,598 Akzo Nobel NV 3,292,677 0.0548,902 MYT Netherlands Parent BV
ADR 1,540,413 0.0321,124 Pharvaris NV^ 433,042 0.01
811,336 QIAGEN NV 40,022,066 0.66
45,288,198 0.75
Sweden78,269 Olink Holding AB ADR^ 2,765,244 0.05
2,765,244 0.05
United Kingdom155,759 Immunocore Holdings Plc ADR 6,386,119 0.10140,325 Ortho Clinical Diagnos-
tics Holdings Plc 2,883,679 0.05
9,269,798 0.15
United States8,398 2020 Cash Mandatory Ex-
changeable Trust (Pref) 10,374,650 0.17106,216 ACV Auctions Inc ’A’ 2,753,119 0.0529,974 Affirm Holdings Inc^ 1,822,719 0.0320,759 Airbnb Inc 2,914,564 0.0550,966 Alkami Technology Inc 1,695,639 0.03
195,421 Allegheny Technologies Inc^ 4,785,860 0.08412,274 Arconic Rolled Products Corp^ 14,911,951 0.25327,872 AT&T Inc 9,649,273 0.1629,658 Atea Pharmaceuticals Inc 605,616 0.0116,178 Bioventus Inc 287,645 0.0018,942 Boeing Co 4,679,053 0.08
3,707,387 Brookdale Senior Living Inc 24,987,788 0.4297,189 Bumble Inc ’A’^ 4,637,859 0.0875,724 C3.ai Inc ’A’^ 4,672,928 0.08
223,163 Caesars Entertainment Inc 23,978,864 0.4025,117 Charter Communications Inc
’A’ 17,444,510 0.2988,520 Cigna Corp 22,913,402 0.38
532,624 Conagra Brands Inc 20,292,974 0.3467,048 ContextLogic Inc ’A’ 532,361 0.01
4,101,964 Coty Inc ’A’ 36,548,499 0.61
Holding Description
MarketValue
USD
% ofNet
Assets
United States continued40,966 Coursera Inc 1,556,708 0.03
311 Cullinan Oncology Inc 9,246 0.00105,765 Danaher Corp 27,090,647 0.4510,607 Danaher Corp (Pref) 15,221,363 0.25
115,906 Datto Holding Corp 3,122,508 0.0514,407 DigitalOcean Holdings Inc 605,670 0.014,036 DoorDash Inc ’A’ 606,530 0.01
888,135 DoubleVerify Holdings Inc^ 32,763,300 0.5437,311 Dream Finders Homes Inc ’A’ 1,185,370 0.02
188,468 DuPont de Nemours Inc 15,942,508 0.26991,392 Elanco Animal Health Inc 35,670,284 0.59114,000 Elanco Animal Health
Inc (Pref) 6,173,100 0.10201,999 Energy Harbor Corp 6,531,638 0.11
1,002,570 Envista Holdings Corp^ 43,752,155 0.7325,613 Fortive Corp 1,857,455 0.0345,450 Hexcel Corp^ 2,702,457 0.04
2,137,519 Howmet Aerospace Inc 75,839,174 1.26103,341 Innovage Holding Corp 2,211,497 0.0473,778 International Flavors & Fra-
grances Inc 10,452,129 0.17129,714 Keysight Technologies Inc 18,468,679 0.31466,000 KKR Acquisition Holdings I
Corp (Unit) 4,678,640 0.08621,493 Olin Corp 30,384,793 0.50103,779 Olo Inc ’A’^ 3,512,919 0.0649,556 ON24 Inc 1,594,712 0.03
1,835,000 Orion Acquisition Corp (Unit) 18,258,250 0.30243,899 Playtika Holding Corp 6,690,150 0.11423,362 PPD Inc 19,525,455 0.3273,775 Privia Health Group Inc 2,414,656 0.0446,812 QUALCOMM Inc 6,298,087 0.1067,509 Qualtrics International Inc ’A’^ 2,325,010 0.0423,821 ROBLOX Corp ’A’ 2,233,695 0.0424,285 Root Inc ’A’ 221,479 0.00
125,256 Sana Biotechnology Inc^ 2,626,618 0.0437,396 Seer Inc^ 1,106,174 0.0234,599 Sherwin-Williams Co 9,809,855 0.16
143,476 Shoals Technologies GroupInc ’A’^ 3,959,938 0.07
86,520 Signify Health Inc ’A’^ 2,188,956 0.04498,618 Sotera Health Co 12,016,694 0.2010,650 Talis Biomedical Corp 103,731 0.00
210,585 T-Mobile US Inc 29,787,248 0.499,468 UiPath Inc ’A’^ 755,736 0.01
17,112 Upstart Holdings Inc^ 2,536,341 0.0445,500 Ventas Inc (REIT) 2,522,975 0.042,388 VMware Inc ’A’ 377,041 0.01
318,513 Welltower Inc (REIT) 23,815,217 0.40623,370 WESCO International
Inc (Pref) 19,598,753 0.33
721,594,815 11.99
Total Common Stocks & Preferred Stocks 861,814,073 14.31
BONDSCanada
USD 3,777,000 Canadian Solar Inc 2.50%1/10/2025 4,830,028 0.08
4,830,028 0.08
GuernseyCHF 35,600,000 Credit Suisse Group Guernsey
VII Ltd RegS 3.00%12/11/2021 45,244,755 0.75
45,244,755 0.75
BlackRock Global Event Driven Fund
Portfolio of Investments as at 31 May 2021
The notes on pages 590 to 610 form an integral part of these financial statements.
BlackRock Strategic Funds[406]

Holding Description
MarketValue
USD
% ofNet
Assets
IsraelUSD 1,625,000 Fiverr International Ltd
1/11/2025 (Zero Coupon) 1,953,104 0.03USD 1,612,000 Wix.com Ltd 15/8/2025 (Zero
Coupon) 1,628,233 0.03
3,581,337 0.06
JerseyUSD 3,118,000 Novocure Ltd 1/11/2025 (Zero
Coupon) 4,366,572 0.07
4,366,572 0.07
LuxembourgUSD 3,219,000 Endo Luxembourg Finance Co
I Sarl / Endo US Inc 6.125%1/4/2029 3,178,762 0.05
3,178,762 0.05
United StatesUSD 2,903,000 Allegheny Technologies Inc
3.50% 15/6/2025 5,093,023 0.08USD 11,000,000 AMC Entertainment Holdings
Inc 12.00% 15/6/2026 10,848,750 0.18USD 9,000,000 American Airlines Group Inc
5.00% 1/6/2022 9,000,450 0.15USD 2,536,000 Bentley Systems Inc 0.125%
15/1/2026 2,875,824 0.05USD 12,564,000 Bill.com Holdings Inc
1/12/2025 (Zero Coupon) 14,990,422 0.25USD 7,587,000 Box Inc 15/1/2026 (Zero Cou-
pon) 8,602,141 0.14USD 2,439,000 Boyd Gaming Corp 4.75%
15/6/2031 2,470,219 0.04USD 9,369,000 Caesars Entertainment Inc
6.25% 1/7/2025 9,885,888 0.16USD 10,660,000 Caesars Entertainment Inc
8.125% 1/7/2027^ 11,845,232 0.20USD 13,000,000 Cengage Learning Inc 9.50%
15/6/2024^ 13,254,735 0.22USD 7,879,000 CHS/Community Health Sys-
tems Inc 5.625% 15/3/2027 8,271,689 0.14USD 25,263,000 Coty Inc 5.00% 15/4/2026 25,665,440 0.43USD 1,820,000 Dropbox Inc 1/3/2026 (Zero
Coupon) 1,861,860 0.03USD 6,808,000 Entercom Media Corp 6.75%
31/3/2029 6,940,041 0.12USD 12,333,000 Envista Holdings Corp 2.375%
1/6/2025 26,655,313 0.44USD 30,000,000 FirstEnergy Transmission LLC
2.866% 15/9/2028 30,654,562 0.51USD 13,000,000 Golden Nugget Inc 6.75%
15/10/2024 13,136,890 0.22USD 5,500,000 GrubHub Holdings Inc 5.50%
1/7/2027 5,795,735 0.10USD 6,269,000 Guardant Health Inc
15/11/2027 (Zero Coupon) 7,017,362 0.12USD 6,781,000 LivePerson Inc
15/12/2026 (Zero Coupon) 6,818,974 0.11USD 25,000,000 Magic Mergeco Inc 7.875%
1/5/2029 25,574,750 0.42USD 2,707,000 Middleby Corp 1.00% 1/9/2025 3,774,912 0.06USD 7,019,000 Olin Corp 9.50% 1/6/2025 8,728,828 0.15USD 7,194,000 Omnicell Inc 0.25% 15/9/2025 10,859,343 0.18USD 9,600,000 Palo Alto Networks Inc 0.75%
1/7/2023 13,824,000 0.23USD 1,462,000 Peloton Interactive Inc
15/2/2026 (Zero Coupon) 1,403,520 0.02USD 5,411,000 Redfin Corp 15/10/2025 (Zero
Coupon) 5,879,052 0.10USD 2,235,000 Repay Holdings Corp
1/2/2026 (Zero Coupon) 2,169,347 0.04
Holding Description
MarketValue
USD
% ofNet
Assets
United States continuedUSD 13,487,000 RingCentral Inc
15/3/2026 (Zero Coupon) 13,276,266 0.22USD 5,020,000 Shift4 Payments Inc
15/12/2025 (Zero Coupon) 6,802,351 0.11USD 4,013,000 SolarEdge Technologies Inc
15/9/2025 (Zero Coupon) 4,859,181 0.08USD 12,080,000 Sotheby’s 7.375% 15/10/2027 12,940,942 0.22USD 5,446,000 Spotify USA Inc
15/3/2026 (Zero Coupon) 4,985,813 0.08USD 5,000,000 Sprint Corp 7.25% 15/9/2021 5,083,400 0.08USD 8,079,000 Square Inc 0.25% 1/11/2027 9,124,221 0.15
USD 10,894,000 Staples Inc 7.50% 15/4/2026 11,312,874 0.19USD 17,829,000 Staples Inc 10.75% 15/4/2027 18,289,701 0.30USD 13,767,000 Tenet Healthcare Corp 4.25%
1/6/2029 13,779,115 0.23USD 20,320,000 T-Mobile USA Inc 2.625%
15/4/2026 20,706,994 0.34USD 3,698,000 Twitter Inc 15/3/2026 (Zero
Coupon) 3,416,028 0.06USD 166,000,000 United States Treasury Bill
15/7/2021 (Zero Coupon) 165,997,565 2.76USD 62,000,000 United States Treasury Bill
30/9/2021 (Zero Coupon) 61,992,706 1.03USD 199,925,000 United States Treasury Bill-
When Issued 6/7/2021 (ZeroCoupon) 199,923,445 3.32
USD 5,746,000 Wayfair Inc 0.625% 1/10/2025 6,079,986 0.10
852,468,890 14.16
Total Bonds 913,670,344 15.17
CERTIFICATE OF DEPOSITSCanada
USD 28,000,000 Canadian Imperial Bank ofCommerce FRN 16/6/2021 28,000,000 0.47
28,000,000 0.47
SwedenUSD 18,250,000 Svenska Handelsbanken AB
FRN 16/6/2021 18,250,000 0.30
18,250,000 0.30
SwitzerlandUSD 11,900,000 Credit Suisse AG FRN
15/2/2022 11,900,000 0.20
11,900,000 0.20
United StatesUSD 14,550,000 Bank of Montreal 0.234%
6/10/2021 14,550,000 0.24USD 80,850,000 Bank of Nova Scotia 0.19%
18/5/2022 80,850,000 1.34USD 25,200,000 Canadian Imperial Bank of
Commerce 0.24% 4/5/2022 25,200,000 0.42USD 20,600,000 Citibank NA 0.27% 16/8/2021 20,600,000 0.34USD 25,000,000 Citibank NA 0.25% 8/9/2021 25,000,000 0.42USD 30,000,000 Commonwealth Bank of Aus-
tralia 0.24% 18/6/2021 30,000,000 0.50USD 16,500,000 Mizuho Bank Ltd 0.22%
16/8/2021 16,500,000 0.27USD 6,000,000 Mizuho Bank Ltd 0.21%
26/8/2021 6,000,000 0.10USD 14,000,000 Royal Bank of Canada 0.31%
16/11/2021 14,000,000 0.23USD 36,500,000 Standard Chartered Bank
0.214% 3/9/2021 36,500,000 0.61USD 21,750,000 Swedbank AB 0.222%
20/8/2021 21,750,000 0.36USD 12,850,000 Toronto-Dominion Bank 0.37%
16/7/2021 12,850,000 0.21
BlackRock Global Event Driven Fund continued
Portfolio of Investments as at 31 May 2021
The notes on pages 590 to 610 form an integral part of these financial statements.
Annual report and audited financial statements [407]

Holding Description
MarketValue
USD
% ofNet
Assets
United States continuedUSD 15,300,000 Toronto-Dominion Bank 0.43%
28/7/2021 15,300,000 0.26USD 56,100,000 Toronto-Dominion Bank 0.19%
23/5/2022 56,100,000 0.93
375,200,000 6.23
Total Certificate of Deposits 433,350,000 7.20
COMMERCIAL PAPERAustralia
USD 25,000,000 ANZ New Zealand Interna-tional Ltd 2/8/2021 (ZeroCoupon) 24,992,681 0.42
USD 24,000,000 Westpac Banking Corp FRN31/8/2021 24,000,000 0.40
USD 32,100,000 Westpac Banking Corp FRN4/2/2022 32,097,776 0.53
81,090,457 1.35
CanadaUSD 1,250,000 British Columbia
8/6/2021 (Zero Coupon) 1,249,961 0.02USD 7,500,000 Canadian Imperial Bank of
Commerce 13/9/2021 (ZeroCoupon) 7,495,667 0.13
USD 1,900,000 Canadian Imperial Bank ofCommerce FRN 12/10/2021 1,898,596 0.03
USD 34,750,000 National Bank of Canada1/6/2021 (Zero Coupon) 34,750,000 0.58
USD 69,900,000 National Bank of Canada23/6/2021 (Zero Coupon) 69,894,020 1.16
USD 40,000,000 National Bank of Canada22/7/2021 (Zero Coupon) 39,992,633 0.67
USD 17,600,000 National Bank of Canada1/9/2021 (Zero Coupon) 17,591,904 0.29
USD 12,250,000 Royal Bank of Canada3/9/2021 (Zero Coupon) 12,242,003 0.20
USD 22,250,000 Toronto-Dominion Bank FRN22/9/2021 22,237,429 0.37
USD 26,120,000 Total Capital Canada Ltd2/8/2021 (Zero Coupon) 26,115,052 0.43
233,467,265 3.88
FranceUSD 7,500,000 BPCE SA FRN 10/12/2021 7,491,000 0.13USD 5,200,000 Credit Industriel et Commercial
1/7/2021 (Zero Coupon) 5,199,437 0.09USD 33,750,000 Electricite De France
4/6/2021 (Zero Coupon) 33,749,227 0.56USD 46,400,000 Electricite De France
23/6/2021 (Zero Coupon) 46,394,612 0.77USD 15,777,000 Electricite De France
28/6/2021 (Zero Coupon) 15,773,746 0.26
108,608,022 1.81
GermanyUSD 50,000,000 BASF SE FRN 10/6/2021 49,997,750 0.83USD 51,800,000 BASF SE FRN 21/6/2021 51,795,396 0.86USD 45,000,000 BASF SE FRN 14/7/2021 44,992,206 0.75USD 37,500,000 Landesbank Baden Wuerttem-
berg FRN 10/9/2021 37,480,010 0.62
184,265,362 3.06
JapanUSD 65,225,000 Mitsubishi Ufj Trust And Bank-
ing Corp FRN 3/9/2021 65,197,751 1.08USD 28,600,000 Mitsubishi UFJ Trust And
Banking Corp FRN12/7/2021 28,593,974 0.48
USD 41,250,000 Mitsubishi UFJ Trust AndBanking Corp24/8/2021 (Zero Coupon) 41,230,750 0.68
Holding Description
MarketValue
USD
% ofNet
Assets
Japan continuedUSD 13,125,000 Mizuho Bank Ltd FRN
26/8/2021 13,120,610 0.22USD 12,500,000 Mizuho Corporate Bank
14/6/2021 (Zero Coupon) 12,498,759 0.21USD 12,000,000 Mizuho Corporate Bank
2/8/2021 (Zero Coupon) 11,996,073 0.20USD 23,150,000 Mizuho Corporate Bank FRN
20/10/2021 23,132,319 0.38USD 8,950,000 Sumitomo Mitsui Banking Corp
FRN 13/8/2021 8,947,096 0.15
204,717,332 3.40
New ZealandUSD 15,550,000 ASB Finance Ltd
28/6/2021 (Zero Coupon) 15,546,968 0.26USD 13,600,000 ASB Finance Ltd FRN
1/10/2021 13,590,782 0.22USD 17,950,000 Westpac Securities NZ Ltd
11/8/2021 (Zero Coupon) 17,942,920 0.30
47,080,670 0.78
SingaporeUSD 28,950,000 DBS Bank Ltd FRN 15/9/2021 28,934,656 0.48USD 13,600,000 DBS Group Holdings Ltd
7/9/2021 (Zero Coupon) 13,588,523 0.22USD 9,100,000 Oversea-Chinese Banking
Corp 16/7/2021 (Zero Cou-pon) 9,096,815 0.15
USD 49,300,000 Sumitomo Mitsui Trust BankLtd 9/6/2021 (Zero Coupon) 49,298,138 0.82
USD 18,525,000 Sumitomo Mitsui Trust BankLtd 17/6/2021 (Zero Cou-pon) 18,523,683 0.31
USD 16,000,000 Sumitomo Mitsui Trust BankLtd FRN 1/7/2021 15,998,317 0.27
135,440,132 2.25
SwedenUSD 41,100,000 Nordea Bank Abp
1/6/2021 (Zero Coupon) 41,100,000 0.68USD 37,000,000 Skandinaviska Enskilda Ban-
ken AB 8/6/2021 (Zero Cou-pon) 36,998,273 0.62
USD 20,125,000 Skandinaviska Enskilda Ban-ken AB 12/7/2021 (ZeroCoupon) 20,119,499 0.33
USD 26,100,000 Svenska Handelsbanken AB28/1/2022 (Zero Coupon) 26,063,308 0.43
USD 10,000,000 Svenska Handelsbanken ABFRN 5/5/2022 9,978,405 0.17
USD 70,000,000 Swedbank AB 1/6/2021 (ZeroCoupon) 70,000,000 1.16
USD 4,225,000 Swedbank AB29/11/2021 (Zero Coupon) 4,221,369 0.07
208,480,854 3.46
SwitzerlandUSD 14,000,000 Credit Suisse AG
2/7/2021 (Zero Coupon) 13,996,986 0.23
13,996,986 0.23
United KingdomUSD 73,600,000 Lloyds Bank Plc FRN 2/8/2021 73,591,127 1.22
73,591,127 1.22
United StatesUSD 50,000,000 Alinghi Funding Co LLC
8/7/2021 (Zero Coupon) 49,989,208 0.83USD 61,435,000 Alinghi Funding Co LLC FRN
15/10/2021 61,383,941 1.02USD 19,850,000 Amcor Flexibles North America
Inc FRN 11/6/2021 19,849,228 0.33
BlackRock Global Event Driven Fund continued
Portfolio of Investments as at 31 May 2021
The notes on pages 590 to 610 form an integral part of these financial statements.
BlackRock Strategic Funds[408]

Holding Description
MarketValue
USD
% ofNet
Assets
United States continuedUSD 15,000,000 American Electric Power Co
Inc FRN 14/6/2021 14,998,538 0.25USD 9,760,000 American Electric Power Co
Inc FRN 19/7/2021 9,756,747 0.16USD 47,050,000 American Honda Finance Corp
3/6/2021 (Zero Coupon) 47,049,399 0.78USD 51,000,000 American Honda Finance Corp
FRN 7/6/2021 50,998,130 0.85USD 25,645,000 American Honda Finance Corp
FRN 19/7/2021 25,637,619 0.43USD 6,000,000 AT&T Inc 17/8/2021 (Zero
Coupon) 5,996,792 0.10USD 33,750,000 AT&T Inc 19/10/2021 (Zero
Coupon) 33,701,437 0.56USD 27,000,000 AT&T Inc 14/12/2021 (Zero
Coupon) 26,941,200 0.45USD 18,750,000 Barton Capital SA
6/7/2021 (Zero Coupon) 18,747,083 0.31USD 24,750,000 Barton Capital SA
21/7/2021 (Zero Coupon) 24,743,813 0.41USD 16,300,000 Barton Capital SA FRN
27/7/2021 16,295,690 0.27USD 21,200,000 Barton Capital SA
2/8/2021 (Zero Coupon) 21,194,888 0.35USD 43,300,000 Bayerische Landesbank
5/8/2021 (Zero Coupon) 43,288,273 0.72USD 59,050,000 Bayerische Landesbank FRN
12/8/2021 59,035,205 0.98USD 15,000,000 Bedford Row Funding Corp
16/8/2021 (Zero Coupon) 14,993,033 0.25USD 35,000,000 Bedford Row Funding Corp
0.301% 7/4/2022 35,000,000 0.58USD 60,000,000 Bell Canada FRN 16/6/2021 59,996,250 1.00USD 25,500,000 Bng Bank NV FRN 24/6/2021 25,498,697 0.42USD 4,250,000 BNG Bank NV 16/6/2021 (Zero
Coupon) 4,249,619 0.07USD 29,500,000 BofA Securities Inc FRN
9/12/2021 29,471,827 0.49USD 20,000,000 Caisse Des Depots et Consig-
nations 3/6/2021 (Zero Cou-pon) 19,999,844 0.33
USD 29,750,000 Cancara Asset Secur LLC3/6/2021 (Zero Coupon) 29,749,537 0.49
USD 34,650,000 Chariot Funding LLC9/7/2021 (Zero Coupon) 34,645,977 0.58
USD 25,000,000 Citigroup Global Markets IncFRN 1/4/2022 24,949,333 0.41
USD 38,500,000 Collateralized Commercial Pa-per V Co 9/8/2021 (ZeroCoupon) 38,478,600 0.64
USD 50,000,000 Collateralized Commercial Pa-per V Co 22/11/2021 (ZeroCoupon) 49,961,333 0.83
USD 75,425,000 DBS Bank Ltd 2/8/2021 (ZeroCoupon) 75,404,866 1.25
USD 29,900,000 Duke Energy Corp9/6/2021 (Zero Coupon) 29,899,203 0.50
USD 20,000,000 Duke Energy Corp FRN8/7/2021 19,996,506 0.33
USD 14,375,000 Eaton Corp FRN 6/7/2021 14,372,624 0.24USD 4,800,000 Enbridge US Inc FRN 9/8/2021 4,797,424 0.08
USD 32,400,000 Eversource Energy23/6/2021 (Zero Coupon) 32,397,426 0.54
USD 250,000 Exxon Mobil Corp23/6/2021 (Zero Coupon) 249,969 0.00
USD 20,000,000 Federation des CaissesDesjardins FRN 2/7/2021 19,997,503 0.33
USD 11,650,000 Federation des CaissesDesjardins 6/7/2021 (ZeroCoupon) 11,648,414 0.19
Holding Description
MarketValue
USD
% ofNet
Assets
United States continuedUSD 7,750,000 Federation des Caisses
Desjardins 15/12/2021 (ZeroCoupon) 7,742,154 0.13
USD 6,000,000 Fidelity National InformationServices FRN 7/6/2021 5,999,730 0.10
USD 46,800,000 Goldman Sachs International7/7/2021 (Zero Coupon) 46,791,644 0.78
USD 7,250,000 ING US Funding LLC7/9/2021 (Zero Coupon) 7,245,066 0.12
USD 37,325,000 ING US Funding LLC FRN15/9/2021 37,305,218 0.62
USD 62,500,000 Ionic Capital II Trust23/7/2021 (Zero Coupon) 62,481,944 1.04
USD 5,750,000 Korea Development Bank FRN21/7/2021 5,748,642 0.10
USD 14,150,000 Korea Development Bank FRN9/9/2021 14,143,318 0.23
USD 10,300,000 La Fayette Asset SecuritizationLLC 9/7/2021 (Zero Coupon) 10,299,130 0.17
USD 38,929,000 Lime Funding LLC10/6/2021 (Zero Coupon) 38,927,443 0.65
USD 4,500,000 Lime Funding LLC17/6/2021 (Zero Coupon) 4,499,660 0.07
USD 25,007,000 Lime Funding LLC8/7/2021 (Zero Coupon) 25,003,916 0.41
USD 12,858,000 Lime Funding LLC5/8/2021 (Zero Coupon) 12,853,821 0.21
USD 17,800,000 LMA Americas LLC FRN25/6/2021 17,797,983 0.30
USD 50,000,000 Macquarie Bank Ltd1/6/2021 (Zero Coupon) 50,000,000 0.83
USD 3,350,000 Macquarie Bank Ltd3/6/2021 (Zero Coupon) 3,349,972 0.06
USD 34,670,000 Macquarie Bank Ltd FRN7/6/2021 34,669,075 0.58
USD 82,618,000 Manhattan Asset Funding CoLLC FRN 4/6/2021 82,617,105 1.37
USD 19,200,000 Mont Blanc Capital Corp FRN14/6/2021 19,198,891 0.32
USD 33,382,000 Mont Blanc Capital Corp FRN1/9/2021 33,370,057 0.55
USD 8,000,000 National Grid Holdings IncFRN 14/6/2021 7,999,480 0.13
USD 15,250,000 Nederlandse Waterschaps-bank NV 2/7/2021 (ZeroCoupon) 15,247,374 0.25
USD 49,240,000 Nederlandse Waterschaps-bank NV 26/7/2021 (ZeroCoupon) 49,231,349 0.82
USD 20,300,000 Nextera Energy Capital Hold-ings Inc FRN 2/6/2021 20,299,899 0.34
USD 49,500,000 NextEra Energy Capital Hold-ings Inc FRN 24/6/2021 49,494,624 0.82
USD 13,585,000 NextEra Energy Capital Hold-ings Inc FRN 28/6/2021 13,583,268 0.23
USD 28,350,000 NextEra Energy Capital Hold-ings Inc FRN 30/6/2021 28,346,346 0.47
USD 20,400,000 Nieuw Amsterdam Receiv-ables Corp 27/7/2021 (ZeroCoupon) 20,396,192 0.34
USD 10,000,000 Nieuw Amsterdam Receiv-ables Corp 20/8/2021 (ZeroCoupon) 9,998,222 0.17
USD 40,650,000 Nrw.Bank 23/7/2021 (ZeroCoupon) 40,645,890 0.67
USD 15,850,000 NRW.BANK 3/8/2021 (ZeroCoupon) 15,846,533 0.26
USD 15,500,000 Ridgefield Funding Co LLC16/6/2021 (Zero Coupon) 15,498,967 0.26
BlackRock Global Event Driven Fund continued
Portfolio of Investments as at 31 May 2021
The notes on pages 590 to 610 form an integral part of these financial statements.
Annual report and audited financial statements [409]

Holding Description
MarketValue
USD
% ofNet
Assets
United States continuedUSD 37,350,000 Ridgefield Funding Co LLC
3/9/2021 (Zero Coupon) 37,330,495 0.62USD 42,500,000 Salisbury Receivables Co LLC
FRN 10/6/2021 42,498,300 0.71USD 16,000,000 Sheffield Receivables Corp
9/7/2021 (Zero Coupon) 15,997,467 0.27USD 19,500,000 Societe Generale SA
2/6/2021 (Zero Coupon) 19,499,892 0.32USD 47,700,000 Unitedhealth Group Inc FRN
10/6/2021 47,698,330 0.79USD 10,000,000 Unitedhealth Group Inc FRN
15/6/2021 9,999,417 0.17USD 48,800,000 Versailles Com Paper LLC
7/6/2021 (Zero Coupon) 48,798,780 0.81USD 33,244,000 Versailles Com Paper LLC
28/7/2021 (Zero Coupon) 33,236,631 0.55USD 5,752,000 Victory Receivables Corp FRN
16/6/2021 5,751,641 0.10USD 39,000,000 VW Credit Inc FRN 2/6/2021 38,999,772 0.65USD 29,300,000 VW Credit Inc 14/6/2021 (Zero
Coupon) 29,298,201 0.49USD 34,500,000 VW Credit Inc FRN 18/6/2021 34,497,230 0.57
2,275,604,245 37.80
Total Commercial Papers 3,566,342,452 59.24
Total Transferable Securities and Money MarketInstruments Admitted to an Official Stock ExchangeListing or Dealt in on Another Regulated Market 5,775,176,869 95.92
Other Transferable Securities and Money Market Instruments
COMMON STOCKSUnited States
476,486 Escrow Altegrity Inc 6,909,047 0.1189,469 Project Butternut ’A’* 3,164,419 0.05
112,616 Project Dvorak ’F’* 1,564,236 0.03
11,637,702 0.19
Total Common Stocks 11,637,702 0.19
BONDSUnited States
USD 6,968,580 Bombardier Inc31/5/2023 (Zero Coupon) 6,184,615 0.11
USD 18,875,000 Bruce Mansfield Unit 1 6.85%1/6/2034 94,375 0.00
6,278,990 0.11
Total Bonds 6,278,990 0.11
Total Other Transferable Securities and MoneyMarket Instruments 17,916,692 0.30
Securities portfolio at market value 5,793,093,561 96.22
Other Net Assets 227,346,749 3.78
Total Net Assets (USD) 6,020,440,310 100.00
* Security subject to a fair value adjustment as detailed in Note 2(a).^ All or a portion of this security represents a security on loan.
BlackRock Global Event Driven Fund continued
Portfolio of Investments as at 31 May 2021
The notes on pages 590 to 610 form an integral part of these financial statements.
BlackRock Strategic Funds[410]

Holding Description Counterparty
Netunrealised
appreciation/(depreciation)
USD
Financial Derivative Instruments
CONTRACTS FOR DIFFERENCECanada
(78,487) Canadian Solar Inc Credit Suisse (167,913)1,468,238 Shaw Communications Inc
’B’ Morgan Stanley 72,917
(94,996)
France1,980,846 Suez SA Barclays Bank 12,087
264,244 Suez SA Citibank 1,613314,318 Suez SA Credit Suisse 40,277
1,810,743 Suez SA Goldman Sachs (29,844)
24,133
Germany1,691,454 Deutsche Wohnen SE Goldman Sachs (52,469)
571,070 Dialog Semiconductor Plc Barclays Bank 153,326
100,857
Japan83,459 Toshiba Corp UBS 91,345
91,345
Netherlands(25,161) Just Eat Takeaway.com NV Citibank (71,909)
(668,063) Just Eat Takeaway.com NV Credit Suisse 4,477,265(512,205) Just Eat Takeaway.com NV Goldman Sachs (1,916,359)
2,488,997
Switzerland(1,912,425) Credit Suisse Group AG
Reg Goldman Sachs (993,964)(2,178,789) Credit Suisse Group AG
Reg JP Morgan (1,627,523)(211) Credit Suisse Group Guern-
sey VII Ltd RegS Goldman Sachs 207,443
(2,414,044)
United Kingdom9,298,854 RSA Insurance Group LTD Citibank 26,3536,563,696 RSA Insurance Group LTD Credit Suisse 18,601
904,342 RSA Insurance Group LTD Goldman Sachs 10,252443,968 Signature Aviation Plc Barclays Bank 137537,640 Signature Aviation Plc Goldman Sachs 4,680
60,023
United States(20,024) 3M Co Citibank (8,610)
(407) 3M Co Morgan Stanley (175)(50,552) Advanced Micro Devices Inc Citibank (133,457)
(2,204,510) Advanced Micro Devices Inc Goldman Sachs (11,970,489)(2,214,382) Advanced Micro Devices Inc JP Morgan (9,048,300)
(2,032) Advanced Micro Devices Inc Morgan Stanley (5,364)(11,671) Agilent Technologies Inc Citibank (55,904)(17,106) Air Products and Chemicals
Inc Morgan Stanley (1,540)(43,869) Albemarle Corp Morgan Stanley (328,579)
1,288,406 Alexion Pharmaceuticals Inc Citibank (1,919,725)453,299 Alexion Pharmaceuticals Inc Goldman Sachs 815,938(10,889) Analog Devices Inc Citibank (22,758)
(364,902) Analog Devices Inc Credit Suisse (5,039,297)(686,857) Analog Devices Inc Goldman Sachs (11,333,141)
(1,249,117) Analog Devices Inc JP Morgan (17,250,306)(2,301) Analog Devices Inc Morgan Stanley (4,809)
(74,828) Antero Midstream Corp Citibank 11,97249,053 Anthem Inc Citibank 190,32610,460 Anthem Inc Morgan Stanley 40,585
(466,965) Aon Plc ’A’ Barclays Bank (88,723)(389,011) Aon Plc ’A’ JP Morgan 1,976,176(28,599) Applied Materials Inc Citibank (101,526)(3,214) Applied Materials Inc Morgan Stanley (11,410)(4,445) ASML Holding NV Reg Citibank (73,431)
Holding Description Counterparty
Netunrealised
appreciation/(depreciation)
USD
United States continued(477) ASML Holding NV Reg Morgan Stanley (7,880)
(2,736,754) AstraZeneca Plc ADR Citibank 1,915,728(962,941) AstraZeneca Plc ADR Goldman Sachs (857,018)(20,067) Avery Dennison Corp Morgan Stanley (34,515)(37,547) Ball Corp Morgan Stanley 185,858(4,355) Becton Dickinson and Co Citibank 7,970
(26,019) Bentley Systems Inc ’B’ Credit Suisse (276,329)(25,027) Berry Global Group Inc Morgan Stanley 33,286
(490,147) BHP Group Ltd ADR Goldman Sachs 2,249,775490,147 BHP Group Plc ADR Goldman Sachs (1,882,164)(55,296) Bill.com Holdings Inc Credit Suisse (346,291)(2,262) Bio-Rad Laboratories Inc ’A’ Citibank (21,059)
(16,634) Boeing Co Citibank (159,354)(385) Boeing Co Morgan Stanley (3,688)
(189,120) Box Inc ’A’ Credit Suisse (157,779)(598,103) Brookfield Asset Manage-
ment Inc ’A’ Credit Suisse (2,593,044)3,579,311 Brookfield Property Part-
ners LP Credit Suisse 3,031,174(25,584) Bruker Corp Citibank 8,187(91,439) Canadian National Railway
Co Credit Suisse (188,523)(297,196) Canadian National Railway
Co JP Morgan (1,012,048)(293,548) Canadian National Railway
Co Morgan Stanley (2,917,867)91,124 Cantel Medical Corp UBS (156,733)
(12,586) Carrier Global Corp Citibank (19,508)95,636 Carrier Global Corp Morgan Stanley 148,236
(25,029) Caterpillar Inc Citibank (50,809)(464) Caterpillar Inc Morgan Stanley (942)
(12,271) Celanese Corp Morgan Stanley 6,1353,245,047 Change Healthcare Inc Goldman Sachs 1,914,5782,835,508 Change Healthcare Inc JP Morgan 2,013,211
2,659 Cigna Corp Citibank (7,126)11,789 Cigna Corp Morgan Stanley (31,595)
166,547 CoreLogic Inc Barclays Bank (19,986)33,031 CoreLogic Inc Goldman Sachs —
307,713 CoreLogic Inc JP Morgan (36,926)568,840 Corteva Inc Morgan Stanley 199,094(19,316) Cummins Inc Citibank (33,803)
(318) Cummins Inc Morgan Stanley (557)(20,320) Deere & Co Citibank (35,357)
(314) Deere & Co Morgan Stanley (546)127,893 Dow Inc Morgan Stanley (144,519)(28,361) Dropbox Inc ’A’ Credit Suisse (50,303)273,708 DuPont de Nemours Inc Morgan Stanley (183,384)(48,124) Eastman Chemical Co Morgan Stanley 41,387(15,247) Ecolab Inc Morgan Stanley 3,354(76,563) Emerson Electric Co Citibank (128,626)(1,361) Emerson Electric Co Morgan Stanley (2,286)
(82,746) Enbridge Inc Citibank 34,753(155,500) Envista Holdings Corp Morgan Stanley 80,860(67,456) Equitrans Midstream Corp Citibank 14,840(19,611) FedEx Corp Citibank (58,245)
(301) FedEx Corp Morgan Stanley (894)(5,333) Fiverr International Ltd Credit Suisse (194,880)
(24,896) FMC Corp Morgan Stanley 1,245(191,223) Freeport-McMoRan Inc Morgan Stanley (219,906)
(439) Garrett Motion Inc Citibank (531)(377,473) General Electric Co Citibank (332,176)(10,314) General Electric Co Morgan Stanley (9,076)(51,086) Genesis Energy LP Citibank 16,85837,497 Grubhub Inc Citibank 62,995
995,622 Grubhub Inc Credit Suisse (4,719,248)763,347 Grubhub Inc Goldman Sachs 1,992,336(32,551) Guardant Health Inc Credit Suisse (75,897)(16,651) Hologic Inc Citibank (5,328)(21,558) Honeywell International Inc Citibank (127,408)
(401) Honeywell International Inc Morgan Stanley (2,370)
BlackRock Global Event Driven Fund continued
Portfolio of Investments as at 31 May 2021
The notes on pages 590 to 610 form an integral part of these financial statements.
Annual report and audited financial statements [411]

Holding Description Counterparty
Netunrealised
appreciation/(depreciation)
USD
United States continued13,591 Humana Inc Morgan Stanley (69,178)
(199,156) Huntington Bancshares Inc JP Morgan (19,916)(60,311) Huntsman Corp Morgan Stanley 2,412(96,247) ICON Plc Barclays Bank 812,325
(109,941) ICON Plc Citibank 927,902923,002 IHS Markit Ltd Goldman Sachs 1,476,803
2,427,507 IHS Markit Ltd JP Morgan (4,136,965)(20,017) Illinois Tool Works Inc Citibank 6,205
(334) Illinois Tool Works Inc Morgan Stanley 104(3,247) Illumina Inc Citibank (18,346)
100,959 International Flavors & Fra-grances Inc Morgan Stanley (19,182)
(57,213) International Paper Co Morgan Stanley 74,37780,991 Kansas City Southern Credit Suisse (821,249)
263,237 Kansas City Southern JP Morgan (381,183)260,007 Kansas City Southern Morgan Stanley 1,261,034
(141,927) Kinder Morgan Inc Citibank 69,544(11,413) KLA Corp Citibank 7,533(1,045) KLA Corp Morgan Stanley 690(9,139) Lam Research Corp Citibank (139,004)
(721) Lam Research Corp Morgan Stanley (10,966)(5,253) Livent Corp Morgan Stanley (5,621)
(57,871) LivePerson Inc Credit Suisse (258,549)(55,999) LyondellBasell Industries
NV ’A’ Morgan Stanley (57,119)(19,283) Magellan Midstream Part-
ners LP Citibank 7,713(10,925) Martin Marietta Materials
Inc Morgan Stanley 30,699(16,360) Maxim Integrated Products
Inc Citibank (21,432)579,210 Maxim Integrated Products
Inc Credit Suisse 5,421,4061,090,249 Maxim Integrated Products
Inc Goldman Sachs 11,534,8341,982,724 Maxim Integrated Products
Inc JP Morgan 18,558,297(4,225) Maxim Integrated Products
Inc Morgan Stanley (5,535)(3,850) Mettler-Toledo International
Inc Citibank (80,234)(11,019) Microchip Technology Inc Citibank (31,404)(2,626) Microchip Technology Inc Morgan Stanley (7,484)
(20,351) Micron Technology Inc Citibank (25,235)(4,429) Micron Technology Inc Morgan Stanley (5,492)
(17,298) Middleby Corp Morgan Stanley (24,044)(3,731) MKS Instruments Inc Citibank (6,156)
(883) MKS Instruments Inc Morgan Stanley (1,457)(1,656) Monolithic Power Systems
Inc Citibank (21,892)(393) Monolithic Power Systems
Inc Morgan Stanley (5,195)(141,491) Mosaic Co Morgan Stanley (62,256)(37,180) MPLX LP Citibank 8,551(46,444) Newmont Corp Morgan Stanley 27,866(14,587) Novocure Ltd Credit Suisse (308,396)
2,357,297 Nuance CommunicationsInc Barclays Bank 23,573
1,614,572 Nuance CommunicationsInc Goldman Sachs 613,537
1,761,827 Nuance CommunicationsInc Morgan Stanley 82,603
(58,599) Nucor Corp Morgan Stanley 48,051191,875 NXP Semiconductors NV JP Morgan 4,296,081(63,200) Omnicell Inc Morgan Stanley (120,094)(15,508) ON Semiconductor Corp Citibank (10,856)(4,961) ON Semiconductor Corp Morgan Stanley (3,473)(6,293) Otis Worldwide Corp Citibank (1,259)65,111 Otis Worldwide Corp Morgan Stanley 13,022
(30,205) Palo Alto Networks Inc JP Morgan (624,396)
Holding Description Counterparty
Netunrealised
appreciation/(depreciation)
USD
United States continued(2,970) Peloton Interactive Inc ’A’ Credit Suisse (59,319)(9,514) PerkinElmer Inc Citibank (4,376)
(19,377) Phillips 66 Partners LP Citibank 5,6191,801,906 PPD Inc Barclays Bank —1,074,229 PPD Inc Goldman Sachs 42,969
(36,458) PPG Industries Inc Morgan Stanley (5,469)233,320 PRA Health Sciences Inc Barclays Bank (839,952)266,523 PRA Health Sciences Inc Citibank (959,483)313,461 Proofpoint Inc Barclays Bank 550,022405,124 Proofpoint Inc Morgan Stanley 704,916
(7,589) Qorvo Inc Citibank (31,039)(829) Qorvo Inc Morgan Stanley (3,391)
(49,105) Redfin Corp Credit Suisse (164,732)(35,921) Repay Holdings Corp Credit Suisse (58,139)(79,761) Republic Services Inc Morgan Stanley 16,750
(757) Resideo Technologies Inc Citibank (507)(15,203) RingCentral Inc ’A’ Credit Suisse (25,656)(15,528) Rockwell Automation Inc Citibank (20,652)
(288) Rockwell Automation Inc Morgan Stanley (383)(261,947) S&P Global Inc Goldman Sachs (1,184,000)(688,927) S&P Global Inc JP Morgan 5,834,570(265,982) salesforce.com Inc Goldman Sachs (6,128,225)(270,931) salesforce.com Inc UBS (6,242,250)(64,529) Sealed Air Corp Morgan Stanley (24,521)(49,030) Shift4 Payments Inc ’A’ Morgan Stanley (32,360)(8,586) Skyworks Solutions Inc Citibank (9,616)(1,671) Skyworks Solutions Inc Morgan Stanley (1,872)
3,427,604 Slack Technologies Inc ’A’ Goldman Sachs 9,871,4993,491,375 Slack Technologies Inc ’A’ UBS 10,055,160
(10,099) SolarEdge Technologies Inc Morgan Stanley (30,907)(3,803) Spotify Technology SA Credit Suisse (49,592)
(16,258) Square Inc ’A’ Credit Suisse (100,912)(19,578) Stanley Black & Decker Inc Citibank (102,001)
(352) Stanley Black & Decker Inc Morgan Stanley (1,834)(30,788) STERIS Plc UBS 175,799(30,342) Taiwan Semiconductor
Manufacturing Co LtdADR Citibank (113,176)
(3,000) Taiwan SemiconductorManufacturing Co LtdADR Morgan Stanley (11,190)
117,635 Talend SA ADR Barclays Bank 19,99866,315 TCF Financial Corp JP Morgan 31,168
(14,385) Teradyne Inc Citibank (67,034)(1,273) Teradyne Inc Morgan Stanley (5,932)(9,453) Texas Instruments Inc Citibank (10,682)(2,125) Texas Instruments Inc Morgan Stanley (2,401)(2,741) Thermo Fisher Scientific Inc Citibank (19,297)18,333 T-Mobile US Inc Morgan Stanley 68,199(9,609) Twitter Inc Credit Suisse (55,809)
(20,951) Union Pacific Corp Citibank (24,513)(344) Union Pacific Corp Morgan Stanley (402)
(28,119) United Parcel Service Inc ’B’ Citibank (32,899)(405) United Parcel Service Inc ’B’ Morgan Stanley (474)
(7,213) UnitedHealth Group Inc Morgan Stanley (6,997)(19,371) Vulcan Materials Co Morgan Stanley 26,151(63,528) Waste Management Inc Morgan Stanley 27,317(8,666) Wayfair Inc ’A’ Credit Suisse 126,523
(30,523) Western Midstream Part-ners LP Citibank 22,892
(193) Westinghouse Air BrakeTechnologies Corp Citibank (359)
(64,474) Westrock Co Morgan Stanley (3,868)863,459 Williams Cos Inc Citibank (146,788)432,375 Willis Towers Watson Plc Barclays Bank (674,505)360,230 Willis Towers Watson Plc JP Morgan (2,708,930)
(1,908) Wix.com Ltd Credit Suisse 25,407(12,468) Xilinx Inc Citibank (40,272)
1,279,163 Xilinx Inc Goldman Sachs 11,333,384
BlackRock Global Event Driven Fund continued
Portfolio of Investments as at 31 May 2021
The notes on pages 590 to 610 form an integral part of these financial statements.
BlackRock Strategic Funds[412]

Holding Description Counterparty
Netunrealised
appreciation/(depreciation)
USD
United States continued1,284,891 Xilinx Inc JP Morgan 9,498,774
(1,968) Xilinx Inc Morgan Stanley (6,357)
8,918,427
Total (Gross underlying exposure - USD 6,102,826,512) 9,174,742
BlackRock Global Event Driven Fund continued
Portfolio of Investments as at 31 May 2021
The notes on pages 590 to 610 form an integral part of these financial statements.
Annual report and audited financial statements [413]

TypeNominal
Value Description CounterpartyExpiration
date
Net unrealised(depreciation)
USD
MarketValue
USD
Financial Derivative Instruments
SWAPS
CCCDS USD 50,000,000Fund receives default protection on Markit CDX.NA.HY.25 Version
8 and pays Fixed 5.000% Morgan Stanley 20/6/2026 (38,284) (4,842,234)
Total (Gross underlying exposure - USD 54,842,234) (38,284) (4,842,234)
CCCDS: Centrally Cleared Credit Default Swaps
Numberof
contractsCurrencyof contracts
Contract/Description
Expirationdate
Grossunderlying
exposureUSD
Net unrealisedappreciation/
(depreciation)USD
Financial Derivative Instruments
FUTURES
(1,358) USD E-Mini S&P 500 Index Futures June 2021 June 2021 285,560,240 (19,691,520)
(68) USD NASDAQ 100 E-Mini Stock Index Futures June 2021 June 2021 18,594,260 (1,113,293)
(135) USD US Treasury 10 Year Note Futures September 2021 September 2021 17,794,687 18,963
Total 321,949,187 (20,785,850)
Currency Purchases Currency Sales CounterpartyMaturity
date
Netunrealised
appreciation/(depreciation)
USD
Financial Derivative Instruments
OPEN FORWARD FOREIGN EXCHANGE TRANSACTIONS
BRL Hedged Share Class
BRL 530,270,801 USD 98,938,349State Street Bank& Trust Company 2/6/2021 2,740,567
BRL 543,234,435 USD 102,381,660State Street Bank& Trust Company 2/7/2021 1,499,174
USD 100,192,155 BRL 530,270,801State Street Bank& Trust Company 2/6/2021 (1,486,761)
2,752,980
CHF Hedged Share Class
CHF 66,714,826 USD 73,484,916State Street Bank& Trust Company 15/6/2021 630,390
USD 54,615 CHF 49,192State Street Bank& Trust Company 15/6/2021 (36)
630,354
EUR Hedged Share Class
EUR 2,703,228,520 USD 3,266,660,291State Street Bank& Trust Company 15/6/2021 33,181,943
USD 2,357,380 EUR 1,934,162State Street Bank& Trust Company 15/6/2021 (3,657)
33,178,286
Currency Purchases Currency Sales CounterpartyMaturity
date
Netunrealised
appreciation/(depreciation)
USD
Financial Derivative Instruments
OPEN FORWARD FOREIGN EXCHANGE TRANSACTIONS
GBP Hedged Share Class
GBP 906,112,342 USD 1,261,049,652State Street Bank& Trust Company 15/6/2021 22,926,270
USD 1,261,507 GBP 893,179State Street Bank& Trust Company 15/6/2021 (4,143)
22,922,127
HKD Hedged Share Class
HKD 42,742 USD 5,503State Street Bank& Trust Company 15/6/2021 4
4
JPY Hedged Share Class
JPY 8,678,417,071 USD 79,524,971State Street Bank& Trust Company 15/6/2021 (363,651)
(363,651)
BlackRock Global Event Driven Fund continued
Portfolio of Investments as at 31 May 2021
The notes on pages 590 to 610 form an integral part of these financial statements.
BlackRock Strategic Funds[414]

Currency Purchases Currency Sales CounterpartyMaturity
date
Netunrealised
appreciation/(depreciation)
USD
Financial Derivative Instruments
OPEN FORWARD FOREIGN EXCHANGE TRANSACTIONS
SGD Hedged Share Class
SGD 3,307,907 USD 2,485,462State Street Bank& Trust Company 15/6/2021 17,109
USD 5,264 SGD 6,990State Street Bank& Trust Company 15/6/2021 (24)
17,085
Total (Gross underlying exposure - USD 5,050,528,154) 59,137,185
Sector Breakdownas at 31 May 2021
% of NetAssets
Financial 48.98
Government 8.88
Consumer, Non-cyclical 7.73
Consumer, Cyclical 6.40
Utilities 5.98
Basic Materials 5.40
Communications 4.87
Technology 3.72
Industrial 3.14
Energy 0.74
Diversified 0.38
Securities portfolio at market value 96.22
Other Net Assets 3.78
100.00
BlackRock Global Event Driven Fund continued
Portfolio of Investments as at 31 May 2021
The notes on pages 590 to 610 form an integral part of these financial statements.
Annual report and audited financial statements [415]

Holding Description
MarketValue
USD
% ofNet
Assets
Transferable Securities and Money Market Instruments Admittedto an Official Stock Exchange Listing or Dealt in on AnotherRegulated Market
COMMON STOCKSAustralia
1,295,596 Atlas Arteria Ltd (Unit) 6,166,769 1.964,621,975 AusNet Services 6,277,947 1.991,375,925 Centuria Industrial REIT
(REIT) 3,886,875 1.233,556,256 Centuria Office REIT (REIT) 6,302,915 2.00
414,355 Goodman Group (REIT) 6,231,009 1.981,375,690 Sydney Airport (Unit) 6,249,879 1.981,188,856 Transurban Group (Unit) 12,771,199 4.05
47,886,593 15.19
Belgium81,107 Warehouses De Pauw CVA
(REIT) 3,086,291 0.98
3,086,291 0.98
Canada20,140 Summit Industrial Income
(REIT) 266,722 0.08
266,722 0.08
Cayman Islands491,500 CK Asset Holdings Ltd 3,255,114 1.03
2,437,200 ESR Cayman Ltd^ 7,709,428 2.45382,700 GDS Holdings Ltd ’A’ 3,634,172 1.15
1,095,500 Shimao Group Holdings Ltd 3,105,379 0.99
17,704,093 5.62
China46,170,000 China Tower Corp Ltd ’H’ 6,305,874 2.00
6,305,874 2.00
Denmark10,198 Orsted A/S 1,537,009 0.49
1,537,009 0.49
France64,674 Covivio (REIT)^ 6,080,628 1.93
297,295 Getlink SE 4,752,929 1.51
10,833,557 3.44
Germany45,613 Fraport AG Frankfurt Airport
Services Worldwide^ 3,236,429 1.03117,283 Hamburger Hafen und Logistik
AG 3,088,794 0.98152,415 Vonovia SE 9,523,578 3.02
15,848,801 5.03
Guernsey1,439,049 Stenprop Ltd 3,140,265 1.00
3,140,265 1.00
Hong Kong1,322,000 SF Real Estate Investment
Trust (REIT) 746,080 0.24
746,080 0.24
Italy1,169,945 Enel SpA 11,543,777 3.66
218,101 ERG SpA 6,632,971 2.11748,738 Infrastrutture Wireless Italiane
SpA^ 8,397,458 2.66537,521 Snam SpA^ 3,157,941 1.00
29,732,147 9.43
Holding Description
MarketValue
USD
% ofNet
Assets
Japan454 Kenedix Office Investment
Corp (REIT)^ 3,362,349 1.07134,100 Seibu Holdings Inc 1,548,437 0.49
4,910,786 1.56
Mexico1,491,990 Corp Inmobiliaria Vesta SAB
de CV 3,021,761 0.96
3,021,761 0.96
Portugal241,764 REN - Redes Energeticas Na-
cionais SGPS SA 674,187 0.21
674,187 0.21
Singapore3,293,580 Cromwell European Real Es-
tate Investment Trust (REIT) 9,084,041 2.8810,035,300 ESR-REIT (REIT) 3,036,974 0.96
12,121,015 3.84
South Korea1,041,891 ESR Kendall Square Co Ltd
(REIT) 6,198,551 1.97
6,198,551 1.97
Spain150,869 Cellnex Telecom SA^ 9,112,130 2.89
9,112,130 2.89
United Kingdom6,087,663 Assura Plc (REIT)^ 6,417,909 2.03
60,954 Derwent London Plc (REIT)^ 2,985,011 0.95860,016 National Grid Plc 11,445,497 3.63725,016 Secure Income REIT Plc
(REIT) 3,903,923 1.24272,672 Severn Trent Plc 9,477,813 3.01
1,942,457 Target Healthcare Plc (REIT) 3,165,332 1.00
37,395,485 11.86
United States31,173 Alexandria Real Estate Equi-
ties Inc (REIT) 5,556,899 1.7639,151 Boston Properties Inc (REIT) 4,602,591 1.4689,318 CareTrust Inc (REIT) 2,079,323 0.6632,666 Crown Castle International
Corp (REIT) 6,190,207 1.9667,975 EPR Properties (REIT) 3,340,971 1.0612,883 Equinix Inc (REIT) 9,491,164 3.0177,978 Eversource Energy^ 6,331,034 2.01
375,906 Medical Properties Trust Inc(REIT) 7,957,930 2.52
126,930 NextEra Energy Inc^ 9,293,815 2.95301,105 Outfront Media Inc (REIT) 7,208,454 2.2952,581 Prologis Inc (REIT) 6,196,145 1.9765,703 Public Service Enterprise
Group Inc 4,081,470 1.29115,102 Rexford Industrial Realty Inc
(REIT) 6,357,083 2.0299,264 Spirit Realty Capital Inc
(REIT)^ 4,691,217 1.49
BlackRock Global Real Asset Securities Fund
Portfolio of Investments as at 31 May 2021
The notes on pages 590 to 610 form an integral part of these financial statements.
BlackRock Strategic Funds[416]

Holding Description
MarketValue
USD
% ofNet
Assets
United States continued197,439 UDR Inc (REIT) 9,404,020 2.9863,564 Welltower Inc (REIT) 4,752,680 1.51
97,535,003 30.94
Total Common Stocks 308,056,350 97.73
Total Transferable Securities and Money MarketInstruments Admitted to an Official Stock ExchangeListing or Dealt in on Another Regulated Market 308,056,350 97.73
Securities portfolio at market value 308,056,350 97.73
Other Net Assets 7,165,115 2.27
Total Net Assets (USD) 315,221,465 100.00
^ All or a portion of this security represents a security on loan.
BlackRock Global Real Asset Securities Fund continued
Portfolio of Investments as at 31 May 2021
The notes on pages 590 to 610 form an integral part of these financial statements.
Annual report and audited financial statements [417]

Holding Description Counterparty
Netunrealised
appreciationUSD
Financial Derivative Instruments
CONTRACTS FOR DIFFERENCEUnited States
6,354 CareTrust REIT Inc (REIT) Deutsche Bank 3,876
3,876
Total (Gross underlying exposure - USD 147,921) 3,876
BlackRock Global Real Asset Securities Fund continued
Portfolio of Investments as at 31 May 2021
The notes on pages 590 to 610 form an integral part of these financial statements.
BlackRock Strategic Funds[418]

Numberof
contractsCall/Put Description Counterparty Strike Price
Expirationdate
Netunrealised
appreciation/(depreciation)
USD
MarketValue
USD
Financial Derivative Instruments
WRITTEN OPTIONS
(12,000) Call Rexford Industrial Realty Inc Bank of America Merrill Lynch USD 54.11 24/06/2021 (9,735) (25,523)
(12,000) Call Rexford Industrial Realty Inc Bank of America Merrill Lynch USD 54.11 18/06/2021 (8,896) (23,283)
(12,000) Call Rexford Industrial Realty Inc Bank of America Merrill Lynch USD 54.11 07/07/2021 (10,784) (28,163)
(12,000) Call Rexford Industrial Realty Inc Bank of America Merrill Lynch USD 53.75 16/07/2021 (16,150) (33,288)
(488,000) Call Assura Plc Barclays Bank GBP 0.72 22/06/2021 (7,869) (14,851)
(604,500) Call Assura Plc Barclays Bank GBP 0.74 29/06/2021 (4,409) (11,249)
(42,537) Call Cellnex Telecom SA Barclays Bank EUR 49.11 08/06/2021 21,689 (36,074)
(108,400) CallInfrastrutture Wireless Italiane
SpA Barclays Bank EUR 9.74 29/06/2021 (626) (10,780)
(87,000) Call Severn Trent Plc Barclays Bank GBP 25.01 22/06/2021 (1,420) (22,619)
(100,000) Call Stenprop Ltd Barclays Bank GBP 1.51 29/06/2021 (3,566) (5,766)
(100,000) Call Stenprop Ltd Barclays Bank GBP 1.51 22/06/2021 (3,367) (5,315)
(37,700) Call Caretrust REIT Inc Citibank USD 24.39 09/06/2021 24,310 (1,103)
(487,300) Call Assura Plc Credit Suisse GBP 0.78 01/06/2021 6,786 (1)
(23,500) Call Cellnex Telecom Sa Credit Suisse EUR 47.11 22/06/2021 (39,563) (72,269)
(27,300) Call Derwent London Plc Credit Suisse GBP 35.34 01/06/2021 10,475 (125)
(300,100) Call Enel SpA Credit Suisse EUR 8.37 15/06/2021 44,643 (8,654)
(175,800) Call Enel SpA Credit Suisse EUR 8.27 29/06/2021 13,432 (18,606)
(46,300) Call ERG SpA Credit Suisse EUR 24.75 22/06/2021 (31,316) (47,940)
(50,400) CallHamburger Hafen und Logistik
AG Credit Suisse EUR 20.60 08/06/2021 (36,577) (63,764)
(101,000) Call National Grid Plc Credit Suisse GBP 9.62 24/06/2021 5,672 (1,406)
(3,400) Call Orsted A/S Credit Suisse DKK 1,026.55 03/06/2021 15,492 (4)
(79,300) Call Secure Income REIT Plc Credit Suisse GBP 3.86 01/06/2021 3,777 (35)
(113,800) Call Secure Income REIT Plc Credit Suisse GBP 3.91 29/06/2021 1,185 (4,267)
(80,500) Call Target Healthcare REIT Plc Credit Suisse GBP 1.19 08/06/2021 905 (26)
(102,800) Call Target Healthcare REIT Plc Credit Suisse GBP 1.20 10/06/2021 844 (23)
(122,000) Call Target Healthcare REIT Plc Credit Suisse GBP 1.19 15/06/2021 1,020 (195)
(85,000) Call Target Healthcare REIT Plc Credit Suisse GBP 1.21 24/06/2021 626 (84)
(75,600) Call Target Healthcare REIT Plc Credit Suisse GBP 1.17 22/06/2021 1,109 (915)
(100,000) Call Target Healthcare REIT Plc Credit Suisse GBP 1.15 29/06/2021 (864) (2,324)
(100,000) Call Target Healthcare REIT Plc Credit Suisse GBP 1.18 07/07/2021 457 (1,376)
(17) Call Alexandria Real Estate Equities Exchange Traded USD 180.00 18/06/2021 1,870 (3,400)
(114) Call Alexandria Real Estate Equities Exchange Traded USD 175.00 16/07/2021 (15,267) (67,260)
(39) Call Boston Properties Inc Exchange Traded USD 115.00 18/06/2021 (8,895) (14,430)
(128) Call Boston Properties Inc Exchange Traded USD 115.00 16/07/2021 (30,336) (62,336)
(16) CallCrown Castle International
Corp Exchange Traded USD 185.00 16/07/2021 (5,440) (12,000)
(130) CallCrown Castle International
Corp Exchange Traded USD 185.00 18/06/2021 (34,859) (78,000)
(305) Call EPR Properties Exchange Traded USD 50.00 18/06/2021 30,042 (33,550)
(49) Call Equinix Inc Exchange Traded USD 740.00 18/06/2021 (17,158) (66,395)
(6) Call Equinix Inc Exchange Traded USD 740.00 16/07/2021 (1,260) (14,190)
(309) Call Eversource Energy Exchange Traded USD 85.00 18/06/2021 30,112 (9,270)
(592) Call Medical Properties Trust Inc Exchange Traded USD 23.00 18/06/2021 18,944 (1,776)
(155) Call Medical Properties Trust Inc Exchange Traded USD 21.00 18/06/2021 — (6,200)
(884) Call Medical Properties Trust Inc Exchange Traded USD 21.00 16/07/2021 3,066 (44,200)
(233) Call NextEra Energy Inc Exchange Traded USD 75.00 18/06/2021 3,029 (13,281)
(78) Call NextEra Energy Inc Exchange Traded USD 77.50 18/06/2021 4,758 (1,872)
(246) Call NextEra Energy Inc Exchange Traded USD 75.00 16/07/2021 (477) (33,210)
(1,282) Call Outfront Media Inc Exchange Traded USD 25.00 18/06/2021 1,247 (42,306)
(25) Call Prologis Inc Exchange Traded USD 120.00 18/06/2021 750 (2,875)
(203) Call Prologis Inc Exchange Traded USD 115.00 18/06/2021 (25,984) (84,854)
(11) CallPublic Service Enterprise
Group Inc Exchange Traded USD 65.00 18/06/2021 220 (110)
(461) Call Spirit Realty Capital Inc Exchange Traded USD 47.00 18/06/2021 (10,372) (44,947)
BlackRock Global Real Asset Securities Fund continued
Portfolio of Investments as at 31 May 2021
The notes on pages 590 to 610 form an integral part of these financial statements.
Annual report and audited financial statements [419]

Numberof
contractsCall/Put Description Counterparty Strike Price
Expirationdate
Netunrealised
appreciation/(depreciation)
USD
MarketValue
USD
Financial Derivative Instruments
WRITTEN OPTIONS
(381) Call UDR Inc Exchange Traded USD 45.00 18/06/2021 (50,122) (109,537)
(230) Call Welltower Inc Exchange Traded USD 77.50 18/06/2021 39,100 (14,950)
(30) Call Welltower Inc Exchange Traded USD 75.00 18/06/2021 (1,020) (4,470)
(26) Call Welltower Inc Exchange Traded USD 77.50 16/07/2021 — (3,900)
(900,000) Call Assura Plc Goldman Sachs GBP 0.76 24/06/2021 761 (7,992)
(1,784,700) Call Ausnet Services Goldman Sachs AUD 1.92 22/06/2021 5,595 (3,235)
(492,500) Call Centuria Industrial REIT Goldman Sachs AUD 3.66 01/06/2021 11,418 (3,834)
(119,000) Call Centuria Industrial REIT Goldman Sachs AUD 3.57 24/06/2021 (5,950) (10,463)
(239,000) Call Centuria Office REIT Goldman Sachs AUD 2.31 24/06/2021 (2,011) (6,201)
(37,300) Call ERG SpA Goldman Sachs EUR 25.05 02/06/2021 6,508 (7,505)
(11,900) Call ERG SpA Goldman Sachs EUR 25.24 22/06/2021 (3,817) (8,757)
(115,100) Call Getlink SE Goldman Sachs EUR 13.16 10/06/2021 (3,464) (22,415)
(200,000) CallInfrastrutture Wireless Italiane
SpA Goldman Sachs EUR 9.85 24/06/2021 15,620 (13,402)
(300) Call Kenedix Office Investment Corp Goldman SachsJPY817,820.00 24/06/2021 (13,672) (35,488)
(277,000) Call National Grid Plc Goldman Sachs GBP 9.34 15/06/2021 10,752 (8,548)
(112,900) Call Secure Income REIT Plc Goldman Sachs GBP 3.87 22/06/2021 724 (5,028)
(458,800) Call Snam SpA Goldman Sachs EUR 4.88 22/06/2021 7,566 (8,459)
(79,400) Call Target Healthcare REIT Plc Goldman Sachs GBP 1.19 02/06/2021 1,038 —
(371,000) Call Transurban Group Goldman Sachs AUD 14.43 15/06/2021 31,301 (13,571)
(33,235) Call Warehouses De Pauw SCA Goldman Sachs EUR 30.54 10/06/2021 (17,589) (32,577)
(913,600) Call ESR Cayman Ltd JP Morgan HKD 27.09 02/06/2021 86,672 —
(58,500) Call Seibu Holdings Inc JP Morgan JPY 1,186.33 15/06/2021 (30,546) (47,107)
(1,271,400) Call Centuria Office REIT Morgan Stanley AUD 2.15 01/06/2021 (114,416) (135,092)
(18,500,000) Call China Tower Corp Ltd Morgan Stanley HKD 1.15 15/06/2021 23,036 (3,640)
(28,800) Call Covivio Morgan Stanley EUR 77.96 22/06/2021 5,942 (37,907)
(19,300) CallFraport AG Frankfurt Airport
Services Worldwide Morgan Stanley EUR 61.11 22/06/2021 10,944 (18,004)
(162,000) Call Goodman Group Morgan Stanley AUD 19.77 01/06/2021 35,665 (626)
(30,700) Call Vonovia SE Morgan Stanley EUR 53.10 24/06/2021 16,734 (10,107)
(32,900) Call Vonovia SE Morgan Stanley EUR 52.10 08/07/2021 18,674 (30,510)
(173) CallPublic Service Enterprise
Group Inc Nomura International USD 61.50 18/06/2021 8,102 (17,848)
(113) CallPublic Service Enterprise
Group Inc Nomura International USD 62.25 16/07/2021 7,892 (12,448)
(474) Call UDR Inc Nomura International USD 46.10 16/07/2021 (40,280) (100,478)
(41,200) Call Severn Trent Plc UBS GBP 24.81 08/07/2021 (4,444) (23,236)
Total (Gross underlying exposure - USD 41,989,006) (22,017) (1,833,825)
Currency Purchases Currency Sales CounterpartyMaturity
date
Netunrealised
appreciation/(depreciation)
USD
Financial Derivative Instruments
OPEN FORWARD FOREIGN EXCHANGE TRANSACTIONS
EUR Hedged Share Class
EUR 3,447,823 USD 4,171,743State Street Bank& Trust Company 15/6/2021 37,029
USD 70,727 EUR 58,186State Street Bank& Trust Company 15/6/2021 (300)
36,729
Currency Purchases Currency Sales CounterpartyMaturity
date
Netunrealised
appreciation/(depreciation)
USD
Financial Derivative Instruments
OPEN FORWARD FOREIGN EXCHANGE TRANSACTIONS
HKD Hedged Share Class
HKD 11,681,147 USD 1,504,000State Street Bank& Trust Company 15/6/2021 1,140
USD 3,731 HKD 28,976State Street Bank& Trust Company 15/6/2021 (3)
1,137
BlackRock Global Real Asset Securities Fund continued
Portfolio of Investments as at 31 May 2021
The notes on pages 590 to 610 form an integral part of these financial statements.
BlackRock Strategic Funds[420]

Currency Purchases Currency Sales CounterpartyMaturity
date
Netunrealised
appreciation/(depreciation)
USD
Financial Derivative Instruments
OPEN FORWARD FOREIGN EXCHANGE TRANSACTIONS
SGD Hedged Share Class
SGD 4,075,734 USD 3,062,367State Street Bank& Trust Company 15/6/2021 21,097
USD 49,409 SGD 65,632State Street Bank& Trust Company 15/6/2021 (244)
20,853
Total (Gross underlying exposure - USD 8,921,791) 58,719
Sector Breakdownas at 31 May 2021
% of NetAssets
Financial 54.68
Utilities 20.24
Industrial 12.56
Consumer, Non-cyclical 6.99
Energy 2.11
Communications 1.15
Securities portfolio at market value 97.73
Other Net Assets 2.27
100.00
BlackRock Global Real Asset Securities Fund continued
Portfolio of Investments as at 31 May 2021
The notes on pages 590 to 610 form an integral part of these financial statements.
Annual report and audited financial statements [421]

Holding Description
MarketValue
EUR
% ofNet
Assets
Transferable Securities and Money Market Instruments Admittedto an Official Stock Exchange Listing or Dealt in on AnotherRegulated Market
EXCHANGE TRADED FUNDSIreland
USD 63,448 iShares Agribusiness UCITSETF~ 2,490,556 2.45
GBP 8,142 iShares Core FTSE100 UCITS ETF GBP Acc~ 1,138,974 1.12
GBP 3,528 iShares Core GBP CorporateBond UCITS ETF~ 627,764 0.62
EUR 6,531 iShares Core S&P 500 UCITSETF~ 2,278,339 2.24
USD 211,196 iShares Digitalisation UCITSETF~ 1,838,706 1.81
EUR 5,816 iShares EUR Covered BondUCITS ETF~ 914,421 0.90
EUR 32,698 iShares EUR Goverment Bond0-1yr UCITS ETF~ 3,185,766 3.13
EUR 206,956 iShares EUR Goverment Bond20yr Target Duration UCITSETF~ 1,217,936 1.20
EUR 7,470 iShares EUR GovernmentBond 10-15yr UCITS ETF~ 1,440,814 1.42
EUR 3,768 iShares EUR GovernmentBond 15-30yr UCITS ETF~ 1,002,288 0.98
EUR 31,759 iShares EUR High Yield Cor-porate Bond UCITS ETF~^ 3,267,048 3.21
EUR 27,033 iShares Euro Corporate BondInterest Rate Hedged UCITSETF~^ 2,618,416 2.57
USD 26,043 iShares Global Water UCITSETF~^ 1,353,044 1.33
EUR 45,301 iShares JP Morgan EM LocalGovernment Bond UCITSETF~ 2,133,677 2.10
EUR 681,037 iShares JP Morgan ESG USDEM Bond UCITS ETF ’A’~ 3,328,160 3.27
EUR 788,465 iShares MSCI EMU ESG En-hanced UCITS ETF (Acc)~ 4,504,501 4.43
EUR 765,579 iShares MSCI EMU ESG En-hanced UCITS ETF ’A’~ 4,849,943 4.77
EUR 325,945 iShares MSCI Japan ESG En-hanced UCITS ETF ’A’~ 1,751,628 1.72
Holding Description
MarketValue
EUR
% ofNet
Assets
Ireland continuedEUR 2,868,971 iShares MSCI USA ESG En-
hanced UCITS ETF ’A’~ 18,197,883 17.89USD 48,458 iShares Physical Gold ETC~ 1,468,252 1.44
GBP 1,250,041 iShares US Mortgage BackedSecurities UCITS ETF~ 4,997,225 4.91
EUR 57,306 iShares USD Corporate BondInterest Rate Hedged UCITSETF~ 4,649,809 4.57
EUR 69,940 iShares USD Corporate BondUCITS ETF (Dist)~^ 7,235,992 7.11
EUR 29,203 iShares USD TIPS UCITSETF~ 5,889,661 5.79
EUR 72,889 iShares USD Treasury Bond1-3yr UCITS ETF (Dist)~ 8,017,790 7.88
EUR 344,437 iShares USD Treasury Bond20+yr UCITS ETF~ 1,463,857 1.44
91,862,450 90.30
Total Exchange Traded Funds 91,862,450 90.30
Total Transferable Securities and Money MarketInstruments Admitted to an Official Stock ExchangeListing or Dealt in on Another Regulated Market 91,862,450 90.30
Collective Investment SchemesIreland
1,353,499 iShares China CNY BondUCITS ETF (Dist)~ 6,193,747 6.09
64,563 iShares Developed MarketsProperty Yield UCITS ETF~ 1,487,467 1.46
264,297 iShares MSCI Europe Finan-cials Sector UCITS ETF ’A’~ 1,638,377 1.61
9,319,591 9.16
Total Collective Investment Schemes 9,319,591 9.16
Securities portfolio at market value 101,182,041 99.46
Other Net Assets 546,184 0.54
Total Net Assets (EUR) 101,728,225 100.00
~ Investment in related party fund.^ All or a portion of this security represents a security on loan.
Currency Purchases Currency Sales CounterpartyMaturity
date
Netunrealised
appreciation/(depreciation)
EUR
Financial Derivative Instruments
OPEN FORWARD FOREIGN EXCHANGE TRANSACTIONS
EUR 1,828,627 GBP 1,590,675 Goldman Sachs 3/6/2021 (18,263)EUR 1,850,360 GBP 1,590,675 Goldman Sachs 6/7/2021 4,569EUR 1,139,569 USD 1,370,549 Goldman Sachs 3/6/2021 16,559
EUR 67,487,561 USD 81,288,835State Street Bank& Trust Company 3/6/2021 880,493
EUR 537,360 USD 654,136The Bank of New
York Mellon 3/6/2021 1,369EUR 62,460,296 USD 76,137,539 Morgan Stanley 6/7/2021 113,986GBP 1,590,675 EUR 1,851,452 Goldman Sachs 3/6/2021 (4,562)USD 1,338,543 EUR 1,105,598 Deutsche Bank 3/6/2021 (8,812)USD 3,552,601 EUR 2,917,804 Goldman Sachs 3/6/2021 (6,846)
Currency Purchases Currency Sales CounterpartyMaturity
date
Netunrealised
appreciation/(depreciation)
EUR
Financial Derivative Instruments
OPEN FORWARD FOREIGN EXCHANGE TRANSACTIONS
USD 76,768,409 EUR 63,022,173 Morgan Stanley 3/6/2021 (119,087)
USD 767,497 EUR 635,863State Street Bank& Trust Company 3/6/2021 (6,986)
USD 886,470 EUR 738,170The Bank of New
York Mellon 3/6/2021 (11,808)
840,612
BlackRock Managed Index Portfolios - Conservative
Portfolio of Investments as at 31 May 2021
The notes on pages 590 to 610 form an integral part of these financial statements.
BlackRock Strategic Funds[422]

Currency Purchases Currency Sales CounterpartyMaturity
date
Netunrealised
appreciation/(depreciation)
EUR
Financial Derivative Instruments
OPEN FORWARD FOREIGN EXCHANGE TRANSACTIONS
GBP Hedged Share Class
EUR 15,671 GBP 13,488State Street Bank& Trust Company15/6/2021 13
GBP 526,145 EUR 606,031State Street Bank& Trust Company15/6/2021 4,729
4,742
USD Hedged Share Class
EUR 369,469 USD 448,913State Street Bank& Trust Company15/6/2021 1,720
USD 15,494,857 EUR 12,823,720State Street Bank& Trust Company15/6/2021 (130,344)
(128,624)
Total (Gross underlying exposure - EUR 218,105,560) 716,730
Sector Breakdownas at 31 May 2021
% of NetAssets
Exchange Traded Funds 99.46
Securities portfolio at market value 99.46
Other Net Assets 0.54
100.00
BlackRock Managed Index Portfolios - Conservative continued
Portfolio of Investments as at 31 May 2021
The notes on pages 590 to 610 form an integral part of these financial statements.
Annual report and audited financial statements [423]

Holding Description
MarketValue
EUR
% ofNet
Assets
Transferable Securities and Money Market Instruments Admittedto an Official Stock Exchange Listing or Dealt in on AnotherRegulated Market
EXCHANGE TRADED FUNDSIreland
USD 47,053 iShares Agribusiness UCITSETF~ 1,846,995 1.16
GBP 5,646 iShares Core FTSE100 UCITS ETF GBP Acc~ 789,811 0.50
GBP 14,375 iShares Core GBP CorporateBond UCITS ETF~ 2,557,855 1.61
USD 195,745 iShares Digitalisation UCITSETF~ 1,704,187 1.07
EUR 97,407 iShares EUR Goverment Bond0-1yr UCITS ETF~ 9,490,364 5.96
EUR 589,140 iShares EUR Goverment Bond20yr Target Duration UCITSETF~ 3,467,089 2.18
EUR 16,018 iShares EUR GovernmentBond 10-15yr UCITS ETF~ 3,089,552 1.94
EUR 3,803 iShares EUR GovernmentBond 15-30yr UCITS ETF~^ 1,011,598 0.64
EUR 17,459 iShares EUR Govt Bond 5-7yrUCITS ETF~ 2,855,245 1.79
EUR 70,042 iShares EUR High Yield Cor-porate Bond UCITS ETF~^ 7,205,220 4.53
EUR 86,567 iShares Euro Corporate BondInterest Rate Hedged UCITSETF~^ 8,384,880 5.27
USD 18,777 iShares Global Water UCITSETF~ 975,545 0.61
EUR 11,642 iShares II Plc - iShares EURGovernment Bond 7-10yrUCITS ETF~ 2,632,722 1.65
EUR 65,466 iShares JP Morgan EM LocalGovernment Bond UCITSETF~ 3,083,449 1.94
EUR 433,916 iShares JP Morgan ESG USDEM Bond UCITS ETF ’A’~ 2,120,504 1.33
EUR 654,844 iShares MSCI EMU ESG En-hanced UCITS ETF (Acc)~ 3,741,124 2.35
EUR 595,621 iShares MSCI EMU ESG En-hanced UCITS ETF ’A’~ 3,773,259 2.37
EUR 291,375 iShares MSCI Japan ESG En-hanced UCITS ETF ’A’~ 1,565,849 0.98
EUR 2,533,261 iShares MSCI USA ESG En-hanced UCITS ETF ’A’~ 16,068,474 10.10
USD 69,462 iShares Physical Gold ETC~ 2,104,662 1.32
Holding Description
MarketValue
EUR
% ofNet
Assets
Ireland continuedGBP 3,192,576 iShares US Mortgage Backed
Securities UCITS ETF~ 12,762,797 8.02EUR 2,477,723 iShares USD Corporate Bond
ESG UCITS ETF (Acc)~ 10,459,708 6.57EUR 74,467 iShares USD TIPS UCITS
ETF~ 15,018,504 9.44EUR 109,555 iShares USD Treasury Bond
1-3yr UCITS ETF (Dist)~ 12,051,050 7.57EUR 203,957 iShares USD Treasury Bond
20+yr UCITS ETF~ 866,817 0.54
129,627,260 81.44
Total Exchange Traded Funds 129,627,260 81.44
Total Transferable Securities and Money MarketInstruments Admitted to an Official Stock ExchangeListing or Dealt in on Another Regulated Market 129,627,260 81.44
Collective Investment SchemesLuxembourg
15,509 BlackRock Global Index Funds- iShares Emerging MarketsGovernment Bond IndexFund (LU) X2 (USD)~ 1,866,527 1.17
1,866,527 1.17
Ireland3,091,909 iShares China CNY Bond
UCITS ETF (Dist)~ 14,148,885 8.8991,720 iShares Developed Markets
Property Yield UCITS ETF~ 2,113,137 1.331,287,765 iShares Euro Govt Bond Cli-
mate UCITS ETF (Acc)~ 6,281,846 3.9519,248 iShares Italy Govt Bond UCITS
ETF~ 3,312,581 2.08202,440 iShares MSCI Europe Finan-
cials Sector UCITS ETF ’A’~ 1,254,925 0.79
27,111,374 17.04
Total Collective Investment Schemes 28,977,901 18.21
Securities portfolio at market value 158,605,161 99.65
Other Net Assets 563,872 0.35
Total Net Assets (EUR) 159,169,033 100.00
~ Investment in related party fund.^ All or a portion of this security represents a security on loan.
Currency Purchases Currency Sales CounterpartyMaturity
date
Netunrealised
appreciation/(depreciation)
EUR
Financial Derivative Instruments
OPEN FORWARD FOREIGN EXCHANGE TRANSACTIONS
EUR 1,335,524 GBP 1,161,733Bank of America
Merrill Lynch 3/6/2021 (13,333)EUR 2,480,250 GBP 2,157,505 Goldman Sachs 3/6/2021 (24,770)EUR 3,861,119 GBP 3,319,239 Goldman Sachs 6/7/2021 9,534
EUR 93,549,751 USD 112,680,768State Street Bank& Trust Company 3/6/2021 1,220,520
EUR 85,316,767 USD 103,999,006 Morgan Stanley 6/7/2021 155,697
Currency Purchases Currency Sales CounterpartyMaturity
date
Netunrealised
appreciation/(depreciation)
EUR
Financial Derivative Instruments
OPEN FORWARD FOREIGN EXCHANGE TRANSACTIONS
GBP 3,319,238 EUR 3,863,398 Goldman Sachs 3/6/2021 (9,521)USD 4,314,295 EUR 3,543,394 Goldman Sachs 3/6/2021 (8,314)USD 3,077,457 EUR 2,533,122 JP Morgan 3/6/2021 (11,492)USD 105,289,016 EUR 86,438,551 Morgan Stanley 3/6/2021 (166,031)
1,152,290
BlackRock Managed Index Portfolios - Defensive
Portfolio of Investments as at 31 May 2021
The notes on pages 590 to 610 form an integral part of these financial statements.
BlackRock Strategic Funds[424]

Currency Purchases Currency Sales CounterpartyMaturity
date
Netunrealised
appreciation/(depreciation)
EUR
Financial Derivative Instruments
OPEN FORWARD FOREIGN EXCHANGE TRANSACTIONS
CHF Hedged Share Class
CHF 1,772,538 EUR 1,615,634State Street Bank& Trust Company15/6/2021 (2,499)
EUR 9,773 CHF 10,722State Street Bank& Trust Company15/6/2021 15
(2,484)
GBP Hedged Share Class
EUR 130,997 GBP 112,932State Street Bank& Trust Company15/6/2021 (96)
GBP 10,286,831 EUR 11,857,559State Street Bank& Trust Company15/6/2021 83,586
83,490
USD Hedged Share Class
EUR 2,893,363 USD 3,516,698State Street Bank& Trust Company15/6/2021 12,485
USD 81,073,153 EUR 67,106,991State Street Bank& Trust Company15/6/2021 (691,920)
(679,435)
Total (Gross underlying exposure - EUR 364,369,950) 553,861
Sector Breakdownas at 31 May 2021
% of NetAssets
Exchange Traded Funds 98.48
Collective Investment Schemes 1.17
Securities portfolio at market value 99.65
Other Net Assets 0.35
100.00
BlackRock Managed Index Portfolios - Defensive continued
Portfolio of Investments as at 31 May 2021
The notes on pages 590 to 610 form an integral part of these financial statements.
Annual report and audited financial statements [425]

Holding Description
MarketValue
EUR
% ofNet
Assets
Transferable Securities and Money Market Instruments Admittedto an Official Stock Exchange Listing or Dealt in on AnotherRegulated Market
EXCHANGE TRADED FUNDSIreland
USD 511,707 iShares Agribusiness UCITSETF~^ 20,086,291 5.43
USD 483,473 iShares Automation & Robot-ics UCITS ETF ’A’~ 4,944,067 1.34
GBP 38,495 iShares Core FTSE100 UCITS ETF GBP Acc~ 5,385,014 1.46
EUR 101,279 iShares Core S&P 500 UCITSETF~^ 35,331,179 9.55
USD 524,008 iShares Digital Security UCITSETF ’A’~ 3,199,693 0.87
USD 443,491 iShares Digitalisation UCITSETF~ 3,861,102 1.04
USD 69,827 iShares Edge MSCI WorldMinimum Volatility UCITSETF (Acc)~ 3,283,652 0.89
USD 183,037 iShares Edge MSCI World Mo-mentum Factor UCITS ETF~ 9,364,068 2.53
USD 340,010 iShares Edge MSCI WorldQuality Factor UCITS ETF~ 14,754,932 3.99
USD 264,190 iShares Edge MSCI WorldSize Factor UCITS ETF~ 9,685,229 2.62
EUR 311,911 iShares Edge MSCI WorldValue Factor UCITS ETF~ 9,546,036 2.58
EUR 422,006 iShares Edge S&P 500 Mini-mum Volatility UCITS ETF~ 25,531,363 6.90
USD 194,680 iShares Global Water UCITSETF~ 10,114,453 2.73
EUR 2,520,192 iShares MSCI China A UCITSETF~^ 13,782,930 3.73
EUR 4,422,235 iShares MSCI EMU ESG En-hanced UCITS ETF ’A’~ 28,014,859 7.57
EUR 476,358 iShares MSCI India UCITSETF~ 2,764,306 0.75
EUR 943,079 iShares MSCI Japan ESG En-hanced UCITS ETF ’A’~ 5,068,107 1.37
Holding Description
MarketValue
EUR
% ofNet
Assets
Ireland continuedEUR 90,704 iShares MSCI Korea UCITS
ETF USD (Dist)~ 4,811,847 1.30EUR 138,927 iShares MSCI Taiwan UCITS
ETF~ 9,488,714 2.57EUR 11,178,670 iShares MSCI USA ESG En-
hanced UCITS ETF ’A’~ 70,906,304 19.17USD 214,187 iShares Physical Gold ETC~ 6,489,754 1.75
EUR 7,305,377 iShares USD Treasury Bond20+yr UCITS ETF~ 31,047,852 8.40
EUR 100,415 iShares USD Treasury Bond7-10yr UCITS ETF~ 17,168,957 4.64
344,630,709 93.18
Total Exchange Traded Funds 344,630,709 93.18
Total Transferable Securities and Money MarketInstruments Admitted to an Official Stock ExchangeListing or Dealt in on Another Regulated Market 344,630,709 93.18
Collective Investment SchemesIreland
273,858 iShares Developed MarketsProperty Yield UCITS ETF~ 6,309,414 1.71
183,684 iShares MSCI China UCITSETF (Acc)~ 1,124,319 0.30
1,964,588 iShares MSCI Europe Finan-cials Sector UCITS ETF ’A’~ 12,178,481 3.29
31,924 iShares MSCI Mexico CappedUCITS ETF~ 3,178,034 0.86
22,790,248 6.16
Total Collective Investment Schemes 22,790,248 6.16
Securities portfolio at market value 367,420,957 99.34
Other Net Assets 2,426,523 0.66
Total Net Assets (EUR) 369,847,480 100.00
~ Investment in related party fund.^ All or a portion of this security represents a security on loan.
Currency Purchases Currency Sales CounterpartyMaturity
date
Netunrealised
appreciation/(depreciation)
EUR
Financial Derivative Instruments
OPEN FORWARD FOREIGN EXCHANGE TRANSACTIONS
EUR 2,905,629 GBP 2,527,522Bank of America
Merrill Lynch 3/6/2021 (29,008)EUR 5,396,149 GBP 4,693,970 Goldman Sachs 3/6/2021 (53,892)EUR 5,426,636 GBP 4,665,046 Goldman Sachs 6/7/2021 13,399EUR 6,954,447 USD 8,434,825 Goldman Sachs 3/6/2021 43,056EUR 2,519,325 USD 3,087,619 JP Morgan 3/6/2021 (10,632)
EUR 2,382,397 USD 2,894,154Standard
Chartered Bank 3/6/2021 10,963
EUR 144,947,867 USD 174,589,851State Street Bank& Trust Company 3/6/2021 1,891,099
EUR 2,567,672 USD 3,125,665The Bank of New
York Mellon 3/6/2021 6,540EUR 153,930,885 USD 187,637,900 Morgan Stanley 6/7/2021 280,913
Currency Purchases Currency Sales CounterpartyMaturity
date
Netunrealised
appreciation/(depreciation)
EUR
Financial Derivative Instruments
OPEN FORWARD FOREIGN EXCHANGE TRANSACTIONS
GBP 4,665,046 EUR 5,429,839 Goldman Sachs 3/6/2021 (13,381)GBP 2,556,446 EUR 2,972,872 JP Morgan 3/6/2021 (4,652)USD 192,132,114 EUR 157,747,268 Morgan Stanley 3/6/2021 (316,586)
1,817,819
CHF Hedged Share Class
CHF 2,060,067 EUR 1,877,819State Street Bank& Trust Company15/6/2021 (3,013)
EUR 71,347 CHF 78,469State Street Bank& Trust Company15/6/2021 (65)
(3,078)
BlackRock Managed Index Portfolios - Growth
Portfolio of Investments as at 31 May 2021
The notes on pages 590 to 610 form an integral part of these financial statements.
BlackRock Strategic Funds[426]

Currency Purchases Currency Sales CounterpartyMaturity
date
Netunrealised
appreciation/(depreciation)
EUR
Financial Derivative Instruments
OPEN FORWARD FOREIGN EXCHANGE TRANSACTIONS
GBP Hedged Share Class
EUR 941,504 GBP 810,801State Street Bank& Trust Company15/6/2021 312
GBP 31,230,570 EUR 36,003,824State Street Bank& Trust Company15/6/2021 249,205
249,517
USD Hedged Share Class
EUR 2,098,581 USD 2,552,495State Street Bank& Trust Company15/6/2021 7,579
USD 60,373,285 EUR 49,953,441State Street Bank& Trust Company15/6/2021 (495,688)
(488,109)
Total (Gross underlying exposure - EUR 581,383,125) 1,576,149
Sector Breakdownas at 31 May 2021
% of NetAssets
Exchange Traded Funds 99.34
Securities portfolio at market value 99.34
Other Net Assets 0.66
100.00
BlackRock Managed Index Portfolios - Growth continued
Portfolio of Investments as at 31 May 2021
The notes on pages 590 to 610 form an integral part of these financial statements.
Annual report and audited financial statements [427]

Holding Description
MarketValue
EUR
% ofNet
Assets
Transferable Securities and Money Market Instruments Admittedto an Official Stock Exchange Listing or Dealt in on AnotherRegulated Market
EXCHANGE TRADED FUNDSIreland
USD 659,686 iShares Agribusiness UCITSETF~ 25,894,985 3.72
USD 822,996 iShares Automation & Robot-ics UCITS ETF ’A’~ 8,416,080 1.21
GBP 52,832 iShares Core FTSE100 UCITS ETF GBP Acc~ 7,390,598 1.06
EUR 30,400 iShares Core S&P 500 UCITSETF~ 10,605,040 1.53
USD 911,888 iShares Digital Security UCITSETF ’A’~ 5,568,163 0.80
USD 505,223 iShares Digitalisation UCITSETF~ 4,398,551 0.63
USD 90,448 iShares Edge MSCI WorldMinimum Volatility UCITSETF (Acc)~ 4,253,366 0.61
USD 233,241 iShares Edge MSCI World Mo-mentum Factor UCITS ETF~ 11,932,476 1.72
USD 433,459 iShares Edge MSCI WorldQuality Factor UCITS ETF~ 18,810,206 2.71
USD 336,935 iShares Edge MSCI WorldSize Factor UCITS ETF~ 12,352,068 1.78
EUR 396,425 iShares Edge MSCI WorldValue Factor UCITS ETF~ 12,132,587 1.75
EUR 571,364 iShares Edge S&P 500 Mini-mum Volatility UCITS ETF~ 34,567,522 4.97
EUR 40,595 iShares EUR Covered BondUCITS ETF~ 6,382,549 0.92
EUR 130,819 iShares EUR Goverment Bond0-1yr UCITS ETF~ 12,745,695 1.83
EUR 972,641 iShares EUR Goverment Bond20yr Target Duration UCITSETF~ 5,723,992 0.82
EUR 75,240 iShares EUR GovernmentBond 10-15yr UCITS ETF~^ 14,512,291 2.09
EUR 160,496 iShares EUR High Yield Cor-porate Bond UCITS ETF~^ 16,510,224 2.37
EUR 47,486 iShares Euro Inflation LinkedGovernment Bond UCITSETF~ 10,836,305 1.56
USD 260,050 iShares Global Water UCITSETF~ 13,510,702 1.94
EUR 173,353 iShares JP Morgan EM LocalGovernment Bond UCITSETF~ 8,164,926 1.17
EUR 2,611,813 iShares JP Morgan ESG USDEM Bond UCITS ETF ’A’~ 12,763,669 1.84
Holding Description
MarketValue
EUR
% ofNet
Assets
Ireland continuedEUR 7,625,641 iShares MSCI EMU ESG En-
hanced UCITS ETF (Acc)~ 43,565,287 6.27EUR 5,928,639 iShares MSCI EMU ESG En-
hanced UCITS ETF ’A’~ 37,557,928 5.40EUR 1,387,065 iShares MSCI Japan ESG En-
hanced UCITS ETF ’A’~^ 7,454,087 1.07EUR 19,284,415 iShares MSCI USA ESG En-
hanced UCITS ETF ’A’~ 122,321,044 17.59USD 371,165 iShares Physical Gold ETC~ 11,246,104 1.62EUR 261,744 iShares USD Corporate Bond
UCITS ETF (Dist)~^ 27,080,034 3.90EUR 152,063 iShares USD High Yield Cor-
porate Bond UCITS ETF(Dist)~ 12,770,251 1.84
EUR 149,983 iShares USD TIPS UCITSETF~^ 30,248,572 4.35
EUR 433,503 iShares USD Treasury Bond1-3yr UCITS ETF (Dist)~ 47,685,330 6.86
EUR 3,262,783 iShares USD Treasury Bond20+yr UCITS ETF~ 13,866,828 1.99
EUR 141,213 iShares USD Treasury Bond3-7yr UCITS ETF~ 16,199,955 2.33
627,467,415 90.25
Total Exchange Traded Funds 627,467,415 90.25
Total Transferable Securities and Money MarketInstruments Admitted to an Official Stock ExchangeListing or Dealt in on Another Regulated Market 627,467,415 90.25
Collective Investment SchemesIreland
8,422,106 iShares China CNY BondUCITS ETF (Dist)~ 38,540,399 5.54
489,825 iShares Developed MarketsProperty Yield UCITS ETF~ 11,285,078 1.62
2,203,777 iShares MSCI Europe Finan-cials Sector UCITS ETF ’A’~ 13,661,214 1.97
63,486,691 9.13
Total Collective Investment Schemes 63,486,691 9.13
Securities portfolio at market value 690,954,106 99.38
Other Net Assets 4,299,835 0.62
Total Net Assets (EUR) 695,253,941 100.00
~ Investment in related party fund.^ All or a portion of this security represents a security on loan.
Currency Purchases Currency Sales CounterpartyMaturity
date
Netunrealised
appreciation/(depreciation)
EUR
Financial Derivative Instruments
OPEN FORWARD FOREIGN EXCHANGE TRANSACTIONS
EUR 2,577,725 GBP 2,242,288Bank of America
Merrill Lynch 3/6/2021 (25,735)EUR 4,787,185 GBP 4,164,248 Goldman Sachs 3/6/2021 (47,810)EUR 7,452,433 GBP 6,406,536 Goldman Sachs 6/7/2021 18,401EUR 6,085,137 USD 7,318,534 Goldman Sachs 3/6/2021 88,421
Currency Purchases Currency Sales CounterpartyMaturity
date
Netunrealised
appreciation/(depreciation)
EUR
Financial Derivative Instruments
OPEN FORWARD FOREIGN EXCHANGE TRANSACTIONS
EUR 26,485,002 USD 32,442,620 JP Morgan 3/6/2021 (98,081)
EUR 328,397,762 USD 395,555,433State Street Bank& Trust Company 3/6/2021 4,284,524
EUR 331,399,918 USD 403,968,215 Morgan Stanley 6/7/2021 604,781GBP 6,406,536 EUR 7,456,831 Goldman Sachs 3/6/2021 (18,376)
BlackRock Managed Index Portfolios - Moderate
Portfolio of Investments as at 31 May 2021
The notes on pages 590 to 610 form an integral part of these financial statements.
BlackRock Strategic Funds[428]

Currency Purchases Currency Sales CounterpartyMaturity
date
Netunrealised
appreciation/(depreciation)
EUR
Financial Derivative Instruments
OPEN FORWARD FOREIGN EXCHANGE TRANSACTIONS
USD 19,289,588 EUR 15,842,823 Goldman Sachs 3/6/2021 (37,173)USD 416,026,999 EUR 341,548,392 Morgan Stanley 3/6/2021 (661,004)
4,107,948
CHF Hedged Share Class
CHF 5,200,754 EUR 4,740,487State Street Bank& Trust Company15/6/2021 (7,433)
EUR 80,632 CHF 88,638State Street Bank& Trust Company15/6/2021 (35)
(7,468)
GBP Hedged Share Class
EUR 2,309,286 GBP 1,990,152State Street Bank& Trust Company15/6/2021 (923)
GBP 90,778,436 EUR 104,584,498State Street Bank& Trust Company15/6/2021 792,812
791,889
USD Hedged Share Class
EUR 5,648,598 USD 6,866,597State Street Bank& Trust Company15/6/2021 23,487
USD 172,112,521 EUR 142,426,654State Street Bank& Trust Company15/6/2021 (1,432,200)
(1,408,713)
Total (Gross underlying exposure - EUR 1,325,612,954) 3,483,656
Sector Breakdownas at 31 May 2021
% of NetAssets
Exchange Traded Funds 99.38
Securities portfolio at market value 99.38
Other Net Assets 0.62
100.00
BlackRock Managed Index Portfolios - Moderate continued
Portfolio of Investments as at 31 May 2021
The notes on pages 590 to 610 form an integral part of these financial statements.
Annual report and audited financial statements [429]

Holding Description
MarketValue
USD
% ofNet
Assets
Transferable Securities and Money Market Instruments Admittedto an Official Stock Exchange Listing or Dealt in on AnotherRegulated Market
BONDSGermany
USD 9,000,000 Kreditanstalt fuer Wiederauf-bau 2.50% 15/2/2022 9,150,595 5.20
9,150,595 5.20
SupranationalUSD 16,000,000 African Development Bank
1.25% 26/7/2021 16,028,226 9.10USD 15,000,000 Asian Development Bank
1.75% 8/6/2021 15,003,787 8.52USD 16,000,000 European Investment Bank
2.25% 15/3/2022 16,274,263 9.24USD 8,000,000 Inter-American Development
Bank 1.75% 14/4/2022 8,113,627 4.60USD 16,500,000 International Bank for Recon-
struction & Development2.125% 1/7/2022 16,855,322 9.57
72,275,225 41.03
United StatesUSD 5,000,000 United States Treasury Bill
17/6/2021 (Zero Coupon) 4,999,766 2.84USD 34,000 United States Treasury Bill
15/7/2021 (Zero Coupon) 33,997 0.02USD 9,000,000 United States Treasury Bill
7/10/2021 (Zero Coupon) 8,996,672 5.11USD 10,000,000 United States Treasury Bill
2/12/2021 (Zero Coupon) 9,996,243 5.67USD 14,500,000 United States Treasury Bill
24/2/2022 (Zero Coupon) 14,494,132 8.23USD 5,000,000 United States Treasury Bill
24/3/2022 (Zero Coupon) 4,998,047 2.84USD 6,000,000 United States Treasury Bill
21/4/2022 (Zero Coupon) 5,997,678 3.40
49,516,535 28.11
Total Bonds 130,942,355 74.34
Total Transferable Securities and Money MarketInstruments Admitted to an Official Stock ExchangeListing or Dealt in on Another Regulated Market 130,942,355 74.34
Securities portfolio at market value 130,942,355 74.34
Other Net Assets 45,208,256 25.66
Total Net Assets (USD) 176,150,611 100.00
BlackRock Style Advantage Fund
Portfolio of Investments as at 31 May 2021
The notes on pages 590 to 610 form an integral part of these financial statements.
BlackRock Strategic Funds[430]

Holding Description Counterparty
Netunrealised
appreciation/(depreciation)
USD
Financial Derivative Instruments
CONTRACTS FOR DIFFERENCEAustralia
(160) Afterpay Ltd Barclays Bank (110)(843) Afterpay Ltd Deutsche Bank (4,123)
(2,380) Afterpay Ltd Goldman Sachs (11,641)(136) Afterpay Ltd HSBC 497
(160,490) AMP Ltd HSBC —1,445 Ampol Ltd Deutsche Bank 1,163
(5,603) APA Group (Unit) Deutsche Bank 338837 Aristocrat Leisure Ltd Bank of America
Merrill Lynch 1,3802,303 Aristocrat Leisure Ltd Citibank 6241,227 Aristocrat Leisure Ltd Credit Suisse 2,8963,641 Aristocrat Leisure Ltd Deutsche Bank 6,0027,949 Aristocrat Leisure Ltd Goldman Sachs 13,104
844 Aristocrat Leisure Ltd HSBC 1,992581 ASX Ltd Bank of America
Merrill Lynch 1,079150 ASX Ltd Barclays Bank 224384 ASX Ltd Credit Suisse 1,290650 ASX Ltd Goldman Sachs 1,207
34,293 Aurizon Holdings Ltd Bank of AmericaMerrill Lynch —
23,419 Aurizon Holdings Ltd Barclays Bank 1,26927,555 Aurizon Holdings Ltd Credit Suisse (1,706)24,796 Aurizon Holdings Ltd Deutsche Bank —38,593 Aurizon Holdings Ltd Goldman Sachs —13,941 Aurizon Holdings Ltd HSBC (863)22,402 Aurizon Holdings Ltd JP Morgan (1,387)
(32,257) AusNet Services Ltd Deutsche Bank 405(13,502) AusNet Services Ltd Goldman Sachs 366
(527) Australia & New ZealandBanking Group Ltd Barclays Bank (224)
(2,713) Australia & New ZealandBanking Group Ltd Deutsche Bank (2,940)
(2,373) BlueScope Steel Ltd Barclays Bank (2,498)(1,675) BlueScope Steel Ltd Goldman Sachs 3895,781 Brambles Ltd Bank of America
Merrill Lynch 8056,423 Brambles Ltd Barclays Bank 6934,733 Brambles Ltd Citibank 6089,367 Brambles Ltd Credit Suisse 1,667
43,710 Brambles Ltd Deutsche Bank 6,26829,135 Brambles Ltd Goldman Sachs 4,0595,284 Brambles Ltd HSBC 941
(13,476) CIMIC Group Ltd Barclays Bank 1,356(3,914) CIMIC Group Ltd Goldman Sachs (1,333)(2,709) CIMIC Group Ltd HSBC (3,711)
607 Cochlear Ltd Barclays Bank 2,978(2,624) Coles Group Ltd Deutsche Bank (487)(1,598) Commonwealth Bank of
Australia Deutsche Bank (2,387)(1,192) Computershare Ltd Deutsche Bank (747)
(11,195) Crown Resorts Ltd Barclays Bank 227(20,903) Crown Resorts Ltd Deutsche Bank 4,165(1,314) Crown Resorts Ltd JP Morgan 122
(48) CSL Ltd Barclays Bank (35)(449) CSL Ltd Deutsche Bank (4,740)(209) CSL Ltd Goldman Sachs (2,206)
(1) Deterra Royalties Ltdπ Bank of AmericaMerrill Lynch —
(31,315) Evolution Mining Ltd Deutsche Bank (5,439)(2,520) Evolution Mining Ltd Goldman Sachs (129)
(885) Fortescue Metals Group Ltd Barclays Bank (712)(3,149) Fortescue Metals Group Ltd Deutsche Bank (1,736)(7,474) Fortescue Metals Group Ltd Goldman Sachs 3,876
(972) Fortescue Metals Group Ltd HSBC (415)(2) Iluka Resources Ltd Bank of America
Merrill Lynch 1
Holding Description Counterparty
Netunrealised
appreciation/(depreciation)
USD
Australia continued(99,359) Insurance Australia Group
Ltd Barclays Bank (10,766)6,565 James Hardie Industries Plc
- CDI Barclays Bank 2,620299 James Hardie Industries Plc
- CDI Citibank 3915,491 James Hardie Industries Plc
- CDI Deutsche Bank 6,9614,965 James Hardie Industries Plc
- CDI Goldman Sachs 3,420(13,997) Lendlease Corp Ltd (Unit) Goldman Sachs (3,683)
(173) Macquarie Group Ltd Deutsche Bank (179)(878) Magellan Financial Group
Ltd Deutsche Bank (1,223)(319) Magellan Financial Group
Ltd HSBC (220)(70,739) Medibank Pvt Ltd Goldman Sachs (8,212)(1,012) National Australia Bank Ltd Barclays Bank (235)(7,627) National Australia Bank Ltd Deutsche Bank (5,313)(1,355) Newcrest Mining Ltd Deutsche Bank (237)(9,291) Newcrest Mining Ltd Goldman Sachs 216
(16,722) Northern Star ResourcesLtd Deutsche Bank (5,302)
(7,716) Northern Star ResourcesLtd Goldman Sachs (2,866)
(3,204) Northern Star ResourcesLtd JP Morgan (893)
(28,642) Oil Search Ltd Goldman Sachs 4,655(6,662) Orica Ltd Credit Suisse 1,959
(27,071) Orica Ltd Deutsche Bank 12,361(6,055) Orica Ltd Goldman Sachs 2,765(6,853) Qantas Airways Ltd Deutsche Bank (849)(5,100) QBE Insurance Group Ltd HSBC (1,066)(5,172) Ramsay Health Care Ltd Barclays Bank 2,682
199 REA Group Ltd Barclays Bank 1,3053,257 REA Group Ltd Goldman Sachs 35,215
992 Rio Tinto Ltd Barclays Bank 3,248(3,018) Santos Ltd Barclays Bank (70)(9,578) Santos Ltd Deutsche Bank 2,298(2,646) Santos Ltd Goldman Sachs 635(6,177) SEEK Ltd Barclays Bank (8,127)3,841 Sonic Healthcare Ltd Barclays Bank 1,486
354 Sonic Healthcare Ltd Deutsche Bank (85)594 Sonic Healthcare Ltd Goldman Sachs (143)
22,960 Suncorp Group Ltd Barclays Bank 7,996(21,723) Sydney Airport (Unit) Bank of America
Merrill Lynch (1,681)(40,765) Sydney Airport (Unit) Barclays Bank (3,430)(6,489) Sydney Airport (Unit) Deutsche Bank (453)(3,090) Sydney Airport (Unit) Goldman Sachs (226)11,548 Tabcorp Holdings Ltd Bank of America
Merrill Lynch 26811,536 Tabcorp Holdings Ltd Barclays Bank 98261,214 Tabcorp Holdings Ltd Citibank 5,21121,476 Tabcorp Holdings Ltd Credit Suisse (665)16,046 Tabcorp Holdings Ltd Deutsche Bank 37327,840 Tabcorp Holdings Ltd HSBC (862)24,299 Tabcorp Holdings Ltd JP Morgan (752)23,066 Telstra Corp Ltd Bank of America
Merrill Lynch 1,6074,817 Telstra Corp Ltd Credit Suisse 112
43,339 Telstra Corp Ltd Deutsche Bank 3,01913,146 Telstra Corp Ltd Goldman Sachs 91619,678 Telstra Corp Ltd HSBC 457
(16,585) TPG Telecom Ltd Barclays Bank (3,851)(38,853) TPG Telecom Ltd Deutsche Bank (4,596)(14,684) TPG Telecom Ltd Goldman Sachs (320)(45,731) Transurban Group (Unit) Bank of America
Merrill Lynch 7,787(1,358) Transurban Group (Unit) Barclays Bank (192)
BlackRock Style Advantage Fund continued
Portfolio of Investments as at 31 May 2021
The notes on pages 590 to 610 form an integral part of these financial statements.
Annual report and audited financial statements [431]
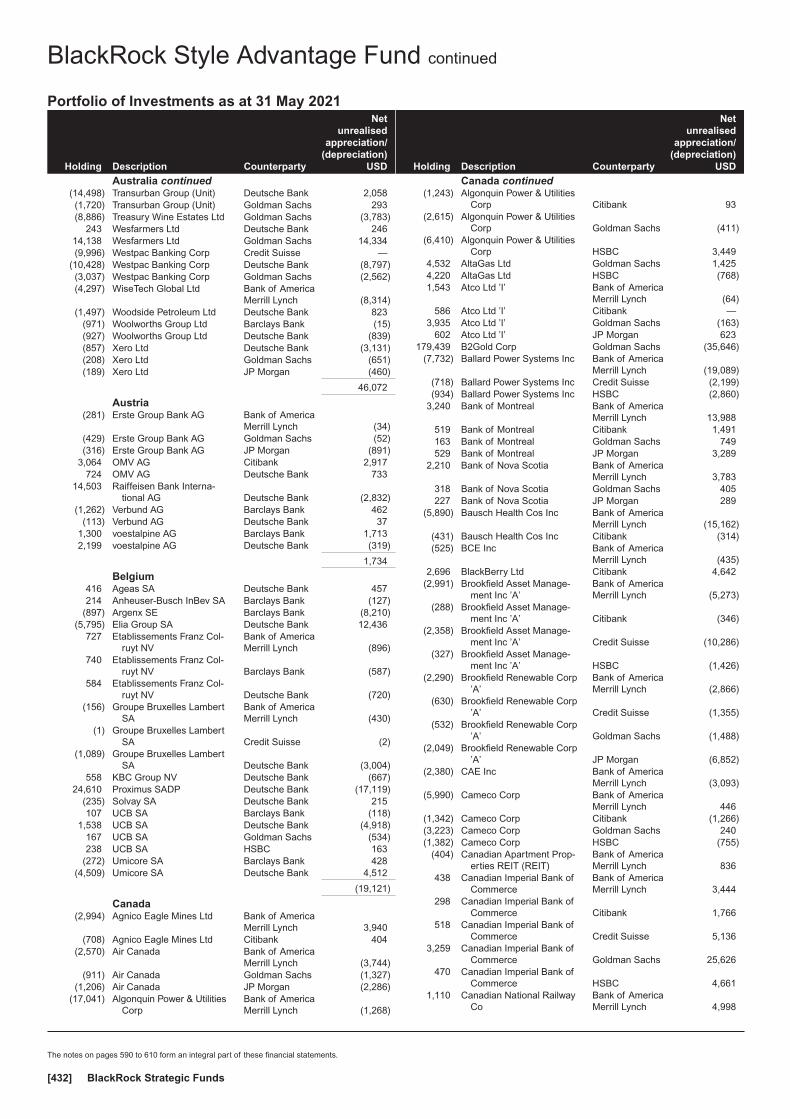
Holding Description Counterparty
Netunrealised
appreciation/(depreciation)
USD
Australia continued(14,498) Transurban Group (Unit) Deutsche Bank 2,058(1,720) Transurban Group (Unit) Goldman Sachs 293(8,886) Treasury Wine Estates Ltd Goldman Sachs (3,783)
243 Wesfarmers Ltd Deutsche Bank 24614,138 Wesfarmers Ltd Goldman Sachs 14,334(9,996) Westpac Banking Corp Credit Suisse —
(10,428) Westpac Banking Corp Deutsche Bank (8,797)(3,037) Westpac Banking Corp Goldman Sachs (2,562)(4,297) WiseTech Global Ltd Bank of America
Merrill Lynch (8,314)(1,497) Woodside Petroleum Ltd Deutsche Bank 823
(971) Woolworths Group Ltd Barclays Bank (15)(927) Woolworths Group Ltd Deutsche Bank (839)(857) Xero Ltd Deutsche Bank (3,131)(208) Xero Ltd Goldman Sachs (651)(189) Xero Ltd JP Morgan (460)
46,072
Austria(281) Erste Group Bank AG Bank of America
Merrill Lynch (34)(429) Erste Group Bank AG Goldman Sachs (52)(316) Erste Group Bank AG JP Morgan (891)
3,064 OMV AG Citibank 2,917724 OMV AG Deutsche Bank 733
14,503 Raiffeisen Bank Interna-tional AG Deutsche Bank (2,832)
(1,262) Verbund AG Barclays Bank 462(113) Verbund AG Deutsche Bank 37
1,300 voestalpine AG Barclays Bank 1,7132,199 voestalpine AG Deutsche Bank (319)
1,734
Belgium416 Ageas SA Deutsche Bank 457214 Anheuser-Busch InBev SA Barclays Bank (127)
(897) Argenx SE Barclays Bank (8,210)(5,795) Elia Group SA Deutsche Bank 12,436
727 Etablissements Franz Col-ruyt NV
Bank of AmericaMerrill Lynch (896)
740 Etablissements Franz Col-ruyt NV Barclays Bank (587)
584 Etablissements Franz Col-ruyt NV Deutsche Bank (720)
(156) Groupe Bruxelles LambertSA
Bank of AmericaMerrill Lynch (430)
(1) Groupe Bruxelles LambertSA Credit Suisse (2)
(1,089) Groupe Bruxelles LambertSA Deutsche Bank (3,004)
558 KBC Group NV Deutsche Bank (667)24,610 Proximus SADP Deutsche Bank (17,119)
(235) Solvay SA Deutsche Bank 215107 UCB SA Barclays Bank (118)
1,538 UCB SA Deutsche Bank (4,918)167 UCB SA Goldman Sachs (534)238 UCB SA HSBC 163
(272) Umicore SA Barclays Bank 428(4,509) Umicore SA Deutsche Bank 4,512
(19,121)
Canada(2,994) Agnico Eagle Mines Ltd Bank of America
Merrill Lynch 3,940(708) Agnico Eagle Mines Ltd Citibank 404
(2,570) Air Canada Bank of AmericaMerrill Lynch (3,744)
(911) Air Canada Goldman Sachs (1,327)(1,206) Air Canada JP Morgan (2,286)
(17,041) Algonquin Power & UtilitiesCorp
Bank of AmericaMerrill Lynch (1,268)
Holding Description Counterparty
Netunrealised
appreciation/(depreciation)
USD
Canada continued(1,243) Algonquin Power & Utilities
Corp Citibank 93(2,615) Algonquin Power & Utilities
Corp Goldman Sachs (411)(6,410) Algonquin Power & Utilities
Corp HSBC 3,4494,532 AltaGas Ltd Goldman Sachs 1,4254,220 AltaGas Ltd HSBC (768)1,543 Atco Ltd ’I’ Bank of America
Merrill Lynch (64)586 Atco Ltd ’I’ Citibank —
3,935 Atco Ltd ’I’ Goldman Sachs (163)602 Atco Ltd ’I’ JP Morgan 623
179,439 B2Gold Corp Goldman Sachs (35,646)(7,732) Ballard Power Systems Inc Bank of America
Merrill Lynch (19,089)(718) Ballard Power Systems Inc Credit Suisse (2,199)(934) Ballard Power Systems Inc HSBC (2,860)
3,240 Bank of Montreal Bank of AmericaMerrill Lynch 13,988
519 Bank of Montreal Citibank 1,491163 Bank of Montreal Goldman Sachs 749529 Bank of Montreal JP Morgan 3,289
2,210 Bank of Nova Scotia Bank of AmericaMerrill Lynch 3,783
318 Bank of Nova Scotia Goldman Sachs 405227 Bank of Nova Scotia JP Morgan 289
(5,890) Bausch Health Cos Inc Bank of AmericaMerrill Lynch (15,162)
(431) Bausch Health Cos Inc Citibank (314)(525) BCE Inc Bank of America
Merrill Lynch (435)2,696 BlackBerry Ltd Citibank 4,642
(2,991) Brookfield Asset Manage-ment Inc ’A’
Bank of AmericaMerrill Lynch (5,273)
(288) Brookfield Asset Manage-ment Inc ’A’ Citibank (346)
(2,358) Brookfield Asset Manage-ment Inc ’A’ Credit Suisse (10,286)
(327) Brookfield Asset Manage-ment Inc ’A’ HSBC (1,426)
(2,290) Brookfield Renewable Corp’A’
Bank of AmericaMerrill Lynch (2,866)
(630) Brookfield Renewable Corp’A’ Credit Suisse (1,355)
(532) Brookfield Renewable Corp’A’ Goldman Sachs (1,488)
(2,049) Brookfield Renewable Corp’A’ JP Morgan (6,852)
(2,380) CAE Inc Bank of AmericaMerrill Lynch (3,093)
(5,990) Cameco Corp Bank of AmericaMerrill Lynch 446
(1,342) Cameco Corp Citibank (1,266)(3,223) Cameco Corp Goldman Sachs 240(1,382) Cameco Corp HSBC (755)
(404) Canadian Apartment Prop-erties REIT (REIT)
Bank of AmericaMerrill Lynch 836
438 Canadian Imperial Bank ofCommerce
Bank of AmericaMerrill Lynch 3,444
298 Canadian Imperial Bank ofCommerce Citibank 1,766
518 Canadian Imperial Bank ofCommerce Credit Suisse 5,136
3,259 Canadian Imperial Bank ofCommerce Goldman Sachs 25,626
470 Canadian Imperial Bank ofCommerce HSBC 4,661
1,110 Canadian National RailwayCo
Bank of AmericaMerrill Lynch 4,998
BlackRock Style Advantage Fund continued
Portfolio of Investments as at 31 May 2021
The notes on pages 590 to 610 form an integral part of these financial statements.
BlackRock Strategic Funds[432]

Holding Description Counterparty
Netunrealised
appreciation/(depreciation)
USD
Canada continued904 Canadian National Railway
Co Citibank 6,86938 Canadian National Railway
Co Goldman Sachs 171137 Canadian National Railway
Co JP Morgan (45)(466) Canadian Pacific Railway
LtdBank of AmericaMerrill Lynch (197)
(172) Canadian Pacific RailwayLtd Citibank 38
433 Canadian Tire Corp Ltd ’A’ Bank of AmericaMerrill Lynch (1,989)
1,009 Canadian Tire Corp Ltd ’A’ Citibank 67497 Canadian Tire Corp Ltd ’A’ Credit Suisse 3,332293 Canadian Tire Corp Ltd ’A’ Goldman Sachs (1,346)382 Canadian Tire Corp Ltd ’A’ HSBC 2,561200 Canadian Tire Corp Ltd ’A’ JP Morgan 1,341
(15,296) Canadian Utilities Ltd ’A’ Bank of AmericaMerrill Lynch 3,798
(906) Canadian Utilities Ltd ’A’ Goldman Sachs 225353 CCL Industries Inc ’B’ Credit Suisse (622)578 CGI Inc Bank of America
Merrill Lynch (256)274 CGI Inc Goldman Sachs (90)263 CGI Inc HSBC (62)125 CGI Inc JP Morgan (85)33 Constellation Software Inc Bank of America
Merrill Lynch (327)34 Constellation Software Inc Credit Suisse (852)
373 Constellation Software Inc Goldman Sachs 4,67116 Constellation Software Inc JP Morgan (140)
(7,121) Dollarama Inc Bank of AmericaMerrill Lynch 2,799
(277) Dollarama Inc Citibank 177(1,431) Dollarama Inc Credit Suisse 1,139(1,052) Dollarama Inc Goldman Sachs 409
400 Empire Co Ltd ’A’ Bank of AmericaMerrill Lynch 377
10,811 Empire Co Ltd ’A’ Goldman Sachs 10,201(2,291) Enbridge Inc Bank of America
Merrill Lynch 910(1,617) Enbridge Inc Credit Suisse 2,797(2,420) Enbridge Inc Goldman Sachs 961
(148) Fairfax Financial HoldingsLtd
Bank of AmericaMerrill Lynch 728
(1,520) First Quantum Minerals Ltd Bank of AmericaMerrill Lynch 881
(1,216) First Quantum Minerals Ltd Citibank (2,416)(4,097) First Quantum Minerals Ltd Credit Suisse 7,393
(788) FirstService Corp Bank of AmericaMerrill Lynch (4,050)
(157) FirstService Corp Citibank (220)(319) FirstService Corp HSBC (40)
(9,887) Fortis Inc Bank of AmericaMerrill Lynch (492)
(1,209) Fortis Inc Citibank 115(362) Fortis Inc Credit Suisse 55
(9,826) Fortis Inc Goldman Sachs (2,074)(7,386) Fortis Inc JP Morgan (80)
(144) Franco-Nevada Corp Bank of AmericaMerrill Lynch 39
5,004 George Weston Ltd Bank of AmericaMerrill Lynch 13,668
739 George Weston Ltd HSBC 2,275(3,999) GFL Environmental Inc Bank of America
Merrill Lynch (3,803)(1,413) GFL Environmental Inc Citibank (199)(1,599) GFL Environmental Inc Goldman Sachs (1,407)(8,258) GFL Environmental Inc HSBC (5,058)
(206) GFL Environmental Inc JP Morgan (126)
Holding Description Counterparty
Netunrealised
appreciation/(depreciation)
USD
Canada continued1,365 Gildan Activewear Inc Bank of America
Merrill Lynch 816596 Gildan Activewear Inc Citibank 577
2,362 Gildan Activewear Inc Goldman Sachs (137)651 Gildan Activewear Inc HSBC (38)842 Gildan Activewear Inc JP Morgan 56
(328) Great-West Lifeco Inc Bank of AmericaMerrill Lynch (170)
20,302 Hydro One Ltd Goldman Sachs 14,28419,743 Hydro One Ltd HSBC 7,8442,792 iA Financial Corp Inc Bank of America
Merrill Lynch (4,668)693 iA Financial Corp Inc Citibank (459)
(5,748) IGM Financial Inc Bank of AmericaMerrill Lynch 1,522
1,601 Intact Financial Corp Bank of AmericaMerrill Lynch 6,467
(16,464) Inter Pipeline Ltd Goldman Sachs 4,770(1,037) Keyera Corp Bank of America
Merrill Lynch 38637,556 Kinross Gold Corp Bank of America
Merrill Lynch (6,839)(4,385) Kirkland Lake Gold Ltd Bank of America
Merrill Lynch 2,003(2,195) Kirkland Lake Gold Ltd Goldman Sachs 601
(709) Kirkland Lake Gold Ltd HSBC (1,678)4,743 Loblaw Cos Ltd Bank of America
Merrill Lynch 7,420(1,948) Lundin Mining Corp Bank of America
Merrill Lynch 1,032798 Magna International Inc Bank of America
Merrill Lynch 2,730678 Magna International Inc Goldman Sachs (308)
8,855 Manulife Financial Corp Bank of AmericaMerrill Lynch (2,932)
5,863 Manulife Financial Corp Citibank 2,329(11,669) Metro Inc Goldman Sachs (4,733)
1,138 National Bank of Canada Bank of AmericaMerrill Lynch 1,403
254 National Bank of Canada Citibank (10)2,345 National Bank of Canada Goldman Sachs 2,892
682 National Bank of Canada HSBC 2,004(3,313) Northland Power Inc Bank of America
Merrill Lynch (4,410)(530) Northland Power Inc Citibank (254)
(1,729) Northland Power Inc Credit Suisse (2,247)(3,502) Northland Power Inc Goldman Sachs (6,870)
(379) Northland Power Inc HSBC (492)(1,053) Northland Power Inc JP Morgan (1,368)
193 Nutrien Ltd Bank of AmericaMerrill Lynch 192
477 Nutrien Ltd Credit Suisse 1181,951 Nutrien Ltd Goldman Sachs 1,938
718 Nutrien Ltd HSBC 178168 Onex Corp Bank of America
Merrill Lynch 217157 Onex Corp Citibank 234
1,822 Onex Corp Goldman Sachs 2,353786 Onex Corp HSBC 3,032
5,902 Open Text Corp Bank of AmericaMerrill Lynch 6,790
1,496 Open Text Corp HSBC (74)3,358 Open Text Corp JP Morgan (167)
(6,244) Pan American Silver Corp Bank of AmericaMerrill Lynch 932
(862) Pan American Silver Corp Citibank 342(628) Pan American Silver Corp Goldman Sachs 94(743) Pan American Silver Corp HSBC 726(573) Pan American Silver Corp JP Morgan 560
6,535 Parkland Corp Goldman Sachs (5,680)
BlackRock Style Advantage Fund continued
Portfolio of Investments as at 31 May 2021
The notes on pages 590 to 610 form an integral part of these financial statements.
Annual report and audited financial statements [433]

Holding Description Counterparty
Netunrealised
appreciation/(depreciation)
USD
Canada continued(2,424) Pembina Pipeline Corp Bank of America
Merrill Lynch 40(1,839) Pembina Pipeline Corp Citibank (1,324)
(367) Pembina Pipeline Corp Credit Suisse (349)3,828 Power Corp of Canada Bank of America
Merrill Lynch 4,975814 Power Corp of Canada Credit Suisse 1,759
1,408 Power Corp of Canada Goldman Sachs 1,830556 Power Corp of Canada HSBC 1,201744 Power Corp of Canada JP Morgan 1,607
1,045 Quebecor Inc ’B’ Credit Suisse (1,622)6,274 Quebecor Inc ’B’ HSBC (9,737)
11,619 Quebecor Inc ’B’ JP Morgan (18,032)(284) Restaurant Brands Interna-
tional IncBank of AmericaMerrill Lynch (156)
(147) Restaurant Brands Interna-tional Inc Citibank (251)
(163) Restaurant Brands Interna-tional Inc Goldman Sachs (366)
(174) Restaurant Brands Interna-tional Inc HSBC (203)
(783) Restaurant Brands Interna-tional Inc JP Morgan (408)
471 Ritchie Bros Auctioneers Inc Bank of AmericaMerrill Lynch (1,442)
377 Ritchie Bros Auctioneers Inc Goldman Sachs (1,155)(36) Rogers Communications Inc
’B’Bank of AmericaMerrill Lynch (32)
(1,401) Rogers Communications Inc’B’ Goldman Sachs (1,241)
1,661 Royal Bank of Canada Bank of AmericaMerrill Lynch 3,328
271 Royal Bank of Canada Citibank 460760 Royal Bank of Canada Credit Suisse 2,784
(7,600) Saputo Inc Bank of AmericaMerrill Lynch (16,167)
(733) Saputo Inc Citibank (959)(983) Saputo Inc HSBC (1,766)
2,249 Shaw Communications Inc’B’
Bank of AmericaMerrill Lynch 261
742 Shaw Communications Inc’B’ Goldman Sachs 86
(161) Shopify Inc ’A’ Bank of AmericaMerrill Lynch (22,324)
(36) Shopify Inc ’A’ Citibank 3(16) Shopify Inc ’A’ HSBC (2,577)
(15,173) SSR Mining Inc Bank of AmericaMerrill Lynch (1,885)
(1,975) SSR Mining Inc Citibank 82(1,548) SSR Mining Inc Goldman Sachs (192)(3,385) SSR Mining Inc HSBC (5,884)(7,278) SSR Mining Inc JP Morgan (12,651)
483 Sun Life Financial Inc Bank of AmericaMerrill Lynch (236)
358 Sun Life Financial Inc Citibank 3081,068 Sun Life Financial Inc Credit Suisse (583)3,062 Sun Life Financial Inc Goldman Sachs (1,495)
663 Sun Life Financial Inc HSBC (362)249 Sun Life Financial Inc JP Morgan (136)
(5,099) TC Energy Corp Bank of AmericaMerrill Lynch 872
(2,048) TC Energy Corp Citibank (763)(473) TC Energy Corp Credit Suisse 294(227) TC Energy Corp Goldman Sachs 34
(1,841) TC Energy Corp HSBC 1,143(1,227) TC Energy Corp JP Morgan 762(1,297) TELUS Corp Bank of America
Merrill Lynch (78)
Holding Description Counterparty
Netunrealised
appreciation/(depreciation)
USD
Canada continued(2,019) TELUS Corp HSBC (1,571)
(182) Thomson Reuters Corp Bank of AmericaMerrill Lynch (575)
(171) Thomson Reuters Corp Goldman Sachs (541)(770) Thomson Reuters Corp HSBC (1,115)418 TMX Group Ltd Bank of America
Merrill Lynch 301282 TMX Group Ltd HSBC (324)197 Toromont Industries Ltd Citibank 215118 Toromont Industries Ltd Goldman Sachs 260
(2,794) Toronto-Dominion Bank Citibank 2,3821,565 West Fraser Timber Co Ltd Bank of America
Merrill Lynch 2,1501,492 West Fraser Timber Co Ltd Goldman Sachs 2,0502,857 Wheaton Precious Metals
CorpBank of AmericaMerrill Lynch 1,111
2,931 Wheaton Precious MetalsCorp Goldman Sachs 1,140
37 Wheaton Precious MetalsCorp JP Morgan 159
(810) WSP Global Inc Bank of AmericaMerrill Lynch (1,629)
(232) WSP Global Inc Goldman Sachs (467)
(38,691)
Denmark(3,714) Ambu A/S ’B’ Deutsche Bank 2,194
(499) Ambu A/S ’B’ Goldman Sachs 2959 AP Moller - Maersk A/S ’B’ Barclays Bank (332)
10 AP Moller - Maersk A/S ’B’ Citibank (369)82 AP Moller - Maersk A/S ’B’ Deutsche Bank 16,61921 AP Moller - Maersk A/S ’B’ Goldman Sachs 4,2566 AP Moller - Maersk A/S ’B’ HSBC 350
24 AP Moller - Maersk A/S ’B’ JP Morgan 1,398194 Carlsberg A/S ’B’ Barclays Bank 96
1,313 Carlsberg A/S ’B’ Deutsche Bank (147)(276) Chr Hansen Holding A/S Bank of America
Merrill Lynch 199(218) Chr Hansen Holding A/S Barclays Bank 429(319) Chr Hansen Holding A/S Credit Suisse 366
(5,473) Chr Hansen Holding A/S Deutsche Bank 3,332(543) Chr Hansen Holding A/S Goldman Sachs 392
2,521 Coloplast A/S ’B’ Deutsche Bank (5,889)294 Coloplast A/S ’B’ Goldman Sachs (685)
1,671 Danske Bank A/S Bank of AmericaMerrill Lynch (644)
(237) Demant A/S Credit Suisse (685)(1,290) Demant A/S Deutsche Bank (7,473)(1,015) DSV PANALPINA A/S Deutsche Bank (17,740)1,092 Genmab A/S Deutsche Bank 20,788
583 GN Store Nord AS Bank of AmericaMerrill Lynch 2,535
190 GN Store Nord AS Barclays Bank 56118 GN Store Nord AS Citibank 35494 GN Store Nord AS Deutsche Bank 1,563
(1,651) H Lundbeck A/S Barclays Bank 1,707(510) H Lundbeck A/S Credit Suisse 404
(6,988) H Lundbeck A/S Deutsche Bank 9,498(522) H Lundbeck A/S Goldman Sachs 42
1,952 Novo Nordisk A/S ’B’ Barclays Bank (2,338)13,307 Novo Nordisk A/S ’B’ Deutsche Bank (25,004)
274 Novozymes A/S ’B’ Credit Suisse (279)7,415 Novozymes A/S ’B’ Deutsche Bank (4,502)
182 Novozymes A/S ’B’ Goldman Sachs (110)475 Novozymes A/S ’B’ HSBC (483)
(306) Orsted A/S Barclays Bank 783(92) Orsted A/S Credit Suisse (812)
(210) Orsted A/S Deutsche Bank (794)
BlackRock Style Advantage Fund continued
Portfolio of Investments as at 31 May 2021
The notes on pages 590 to 610 form an integral part of these financial statements.
BlackRock Strategic Funds[434]

Holding Description Counterparty
Netunrealised
appreciation/(depreciation)
USD
Denmark continued(452) Orsted A/S HSBC (3,991)100 Pandora A/S Bank of America
Merrill Lynch 1,106181 Pandora A/S Barclays Bank 867
1,541 Pandora A/S Deutsche Bank 17,045(374) ROCKWOOL International
A/S ’B’ Barclays Bank (3,744)(298) ROCKWOOL International
A/S ’B’ Deutsche Bank (8,558)(2,975) Tryg A/S Barclays Bank 2,295(2,791) Tryg A/S Citibank 2,153(1,021) Tryg A/S Credit Suisse 251
(16,184) Tryg A/S Deutsche Bank 10,225(780) Vestas Wind Systems A/S Bank of America
Merrill Lynch (1,293)(2,764) Vestas Wind Systems A/S Barclays Bank (953)
(45) Vestas Wind Systems A/S Citibank (15)(3,730) Vestas Wind Systems A/S Credit Suisse (796)(5,857) Vestas Wind Systems A/S Deutsche Bank (7,129)
(975) Vestas Wind Systems A/S Goldman Sachs (1,616)(2,199) Vestas Wind Systems A/S HSBC (1,586)
3,312
Finland679 Elisa Oyj Deutsche Bank (174)
(1,306) Fortum Oyj Deutsche Bank 307(1,311) Fortum Oyj Goldman Sachs (921)1,281 Kesko Oyj ’B’ Barclays Bank 7956,909 Kesko Oyj ’B’ Deutsche Bank 10,437
969 Kesko Oyj ’B’ Goldman Sachs 552(400) Kone Oyj ’B’ Barclays Bank 644(871) Kone Oyj ’B’ Deutsche Bank 468195 Neste Oyj Citibank 395
4,740 Neste Oyj Deutsche Bank 16,081751 Neste Oyj HSBC 3,171
1,191 Neste Oyj JP Morgan 5,029(6,004) Nokia Oyj Barclays Bank (571)(1,536) Nokia Oyj Goldman Sachs (277)1,513 Orion Oyj ’B’ Deutsche Bank (2,825)(563) Sampo Oyj ’A’ Deutsche Bank 1,635575 Stora Enso Oyj ’R’ Barclays Bank (432)
2,618 Stora Enso Oyj ’R’ Deutsche Bank (3,722)2,152 UPM-Kymmene Oyj Barclays Bank (2,075)
(13,926) Wartsila Oyj Abp Deutsche Bank (9,177)
19,340
France(578) Accor SA Bank of America
Merrill Lynch (839)(355) Accor SA Barclays Bank (425)
(1,018) Accor SA Deutsche Bank (1,478)(334) Aeroports de Paris Bank of America
Merrill Lynch (1,060)(1,846) Aeroports de Paris Barclays Bank (10,025)
(425) Aeroports de Paris Deutsche Bank (1,349)(106) Aeroports de Paris Goldman Sachs (336)(144) Aeroports de Paris HSBC 18(115) Aeroports de Paris JP Morgan 14
(1,434) Air Liquide SA Barclays Bank 2,765(872) Air Liquide SA Deutsche Bank 163
(1,205) Air Liquide SA Goldman Sachs 29(2,874) Alstom SA Bank of America
Merrill Lynch (7,190)(2,034) Alstom SA Barclays Bank (2,433)
(763) Alstom SA Citibank (913)(3,606) Alstom SA Deutsche Bank (9,022)
(177) Alstom SA Goldman Sachs (443)(419) Alstom SA HSBC 276(700) Alstom SA JP Morgan 461286 Amundi SA Bank of America
Merrill Lynch 87
Holding Description Counterparty
Netunrealised
appreciation/(depreciation)
USD
France continued274 Amundi SA Barclays Bank 251725 Amundi SA Deutsche Bank 347145 Amundi SA Goldman Sachs 44471 Arkema SA Bank of America
Merrill Lynch 402118 Arkema SA Citibank 44203 Arkema SA Credit Suisse (446)923 Arkema SA Deutsche Bank 515161 Atos SE Deutsche Bank 90
(6,520) AXA SA Goldman Sachs 1,233979 BioMerieux Deutsche Bank (573)
6,220 BNP Paribas SA Deutsche Bank (6,604)33,951 Bollore SA Deutsche Bank 4,972(3,562) Bouygues SA Deutsche Bank 3,217
730 Bureau Veritas SA Deutsche Bank 29487 Capgemini SE Citibank (154)
468 Capgemini SE Deutsche Bank (257)438 Capgemini SE Goldman Sachs (241)25 Carrefour SA Bank of America
Merrill Lynch (17)8,508 Carrefour SA Goldman Sachs (5,711)
524 Cie de Saint-Gobain Barclays Bank (51)5,392 Cie de Saint-Gobain Deutsche Bank 2,369
775 Cie de Saint-Gobain Goldman Sachs 340249 Cie Generale des Etablisse-
ments Michelin SCA Barclays Bank 229174 Cie Generale des Etablisse-
ments Michelin SCA Deutsche Bank 149,981 CNP Assurances Deutsche Bank (3,411)
11,006 Credit Agricole SA Deutsche Bank (14,238)(6,247) Danone SA Deutsche Bank (1,144)
(508) Dassault Systemes SE Deutsche Bank (3,286)(99) Dassault Systemes SE HSBC (399)468 Edenred Deutsche Bank (354)
(2,176) Eiffage SA Deutsche Bank (1,062)(4,799) Electricite de France SA Deutsche Bank 1,9415,787 Engie SA Barclays Bank (3,093)5,000 Engie SA Deutsche Bank (3,124)
12,916 Engie SA Goldman Sachs (8,070)1,557 Engie SA JP Morgan (847)(749) EssilorLuxottica SA Bank of America
Merrill Lynch (1,974)(268) EssilorLuxottica SA Barclays Bank 111
(1,963) EssilorLuxottica SA Deutsche Bank (5,175)28 Eurazeo SE Barclays Bank 65
4,478 Eurazeo SE Deutsche Bank 7,924(1,589) Eurofins Scientific SE HSBC (13,128)
(640) Faurecia SE Bank of AmericaMerrill Lynch (8)
(1,193) Faurecia SE Barclays Bank (510)(500) Faurecia SE Citibank (214)
(4,546) Faurecia SE Deutsche Bank (55)(18,917) Getlink SE Deutsche Bank 3,463
91 Hermes International Bank of AmericaMerrill Lynch 10,106
20 Hermes International Barclays Bank 1,464105 Hermes International Deutsche Bank 11,66114 Hermes International JP Morgan 1,657
(123) Iliad SA Bank of AmericaMerrill Lynch 2,342
(294) Iliad SA Barclays Bank (843)(55) Iliad SA Credit Suisse 735
(629) Iliad SA Deutsche Bank 10,8922,316 Ipsen SA Deutsche Bank (2,770)
124 Ipsen SA HSBC 448(46) Kering SA Bank of America
Merrill Lynch (2,397)(124) Kering SA Barclays Bank (4,222)(236) Kering SA Deutsche Bank (12,298)(43) Kering SA Goldman Sachs (2,241)
BlackRock Style Advantage Fund continued
Portfolio of Investments as at 31 May 2021
The notes on pages 590 to 610 form an integral part of these financial statements.
Annual report and audited financial statements [435]

Holding Description Counterparty
Netunrealised
appreciation/(depreciation)
USD
France continued1,017 La Francaise des Jeux
SAEMBank of AmericaMerrill Lynch 3,637
483 La Francaise des JeuxSAEM Barclays Bank 914
43 La Francaise des JeuxSAEM Credit Suisse 143
6,745 La Francaise des JeuxSAEM Deutsche Bank 24,119
1,863 La Francaise des JeuxSAEM JP Morgan 6,207
(644) Legrand SA Barclays Bank 1,399(526) Legrand SA Deutsche Bank 231101 L’Oreal SA Barclays Bank 530
(843) LVMH Moet Hennessy LouisVuitton SE Deutsche Bank (32,407)
6,784 Natixis SA Deutsche Bank (166)18,973 Orange SA Bank of America
Merrill Lynch (5,835)30,997 Orange SA Barclays Bank (3,934)1,695 Orange SA Citibank (215)
865 Orange SA Credit Suisse (177)20,560 Orange SA Deutsche Bank (6,323)12,465 Orange SA Goldman Sachs (3,833)1,173 Orange SA JP Morgan (240)(334) Orpea SA Bank of America
Merrill Lynch 1,916(3,388) Orpea SA Deutsche Bank 19,433
(166) Pernod Ricard SA Barclays Bank (122)(182) Pernod Ricard SA Deutsche Bank (911)
(8) Pernod Ricard SA Goldman Sachs (40)596 Publicis Groupe SA Bank of America
Merrill Lynch 4071,059 Publicis Groupe SA Barclays Bank 5951,008 Publicis Groupe SA Citibank 5664,468 Publicis Groupe SA Deutsche Bank 3,054
296 Publicis Groupe SA HSBC (246)863 Publicis Groupe SA JP Morgan (716)
(1,606) Remy Cointreau SA Deutsche Bank (7,644)(2,164) Renault SA Bank of America
Merrill Lynch (977)(971) Renault SA Barclays Bank (1,238)(585) Renault SA Credit Suisse 921
(5,570) Renault SA Deutsche Bank (2,515)(995) Renault SA Goldman Sachs (449)(567) Sanofi Barclays Bank 477(131) Sanofi Deutsche Bank (54)(86) Sartorius Stedim Biotech Goldman Sachs (52)
2,030 Schneider Electric SE Citibank 1,486(804) SCOR SE Barclays Bank 608(301) SCOR SE Deutsche Bank 334207 SEB SA Bank of America
Merrill Lynch (606)108 SEB SA Barclays Bank (79)99 SEB SA Credit Suisse (290)
302 SEB SA Deutsche Bank (885)45 SEB SA HSBC (132)
4,461 SES SA Barclays Bank 5,49914,941 SES SA Deutsche Bank 10,5391,199 SES SA HSBC 1,1681,218 SES SA JP Morgan 1,1863,553 Societe Generale SA Deutsche Bank 564(324) Sodexo SA Barclays Bank (593)(252) Sodexo SA Deutsche Bank 554946 STMicroelectronics NV Deutsche Bank 2,015857 Suez SA Barclays Bank 5
2,265 Suez SA Deutsche Bank (41)463 Teleperformance Deutsche Bank 1,69545 Teleperformance HSBC (104)
(1,237) TOTAL SE Bank of AmericaMerrill Lynch 2,861
Holding Description Counterparty
Netunrealised
appreciation/(depreciation)
USD
France continued(3,056) TOTAL SE Deutsche Bank 7,067
(134) TOTAL SE Goldman Sachs 310(1,156) Ubisoft Entertainment SA Deutsche Bank (7,703)
(823) Valeo SA Deutsche Bank (1,105)(1,000) Valeo SA Goldman Sachs (1,342)
(69) Valeo SA HSBC (3)(2,761) Veolia Environnement SA Bank of America
Merrill Lynch (231)(780) Veolia Environnement SA Deutsche Bank 126(855) Veolia Environnement SA JP Morgan 123159 Vinci SA Bank of America
Merrill Lynch (91)630 Vinci SA Barclays Bank (477)120 Vinci SA Citibank (91)114 Vinci SA Deutsche Bank (85)
3,981 Vivendi SE Barclays Bank 1,8461,094 Vivendi SE Deutsche Bank 9083,400 Wendel SE Barclays Bank 2,075
(2,259) Worldline SA Bank of AmericaMerrill Lynch (8,629)
(445) Worldline SA Barclays Bank (695)(3,833) Worldline SA Deutsche Bank (14,641)
(373) Worldline SA Goldman Sachs (1,425)(185) Worldline SA JP Morgan (352)
(65,623)
Germany(17) adidas AG Bank of America
Merrill Lynch (73)(41) adidas AG Credit Suisse (693)
(562) adidas AG Deutsche Bank (2,401)(53) adidas AG JP Morgan (896)221 Allianz SE Reg Barclays Bank 217729 Allianz SE Reg Deutsche Bank (1,690)302 Allianz SE Reg Goldman Sachs (700)71 Allianz SE Reg JP Morgan 48
686 BASF SE Bank of AmericaMerrill Lynch (1,892)
1,375 BASF SE Barclays Bank (1,577)130 BASF SE Credit Suisse (60)
3,855 BASF SE Deutsche Bank (10,632)1,665 BASF SE Goldman Sachs (4,592)(513) Bayerische Motoren Werke
AG (Pref)Bank of AmericaMerrill Lynch (2,254)
(1,371) Bayerische Motoren WerkeAG (Pref) Deutsche Bank (6,023)
848 Bechtle AG Barclays Bank 3,984299 Bechtle AG Deutsche Bank 2,317
(218) Beiersdorf AG Bank of AmericaMerrill Lynch 16
(99) Beiersdorf AG Barclays Bank 106(186) Beiersdorf AG Credit Suisse 32
(1,425) Beiersdorf AG Deutsche Bank 1043,824 Brenntag SE Deutsche Bank 6,440(352) Carl Zeiss Meditec AG Deutsche Bank (5,155)
(2,823) Commerzbank AG Bank of AmericaMerrill Lynch (493)
(2,906) Commerzbank AG Barclays Bank (418)(21,999) Commerzbank AG Deutsche Bank (3,839)
(730) Continental AG Bank of AmericaMerrill Lynch (6,147)
(809) Continental AG Deutsche Bank (6,812)(503) Continental AG Goldman Sachs (4,236)(344) Covestro AG Citibank (714)753 Daimler AG Barclays Bank 358
(101) Delivery Hero SE Bank of AmericaMerrill Lynch (1,116)
(510) Delivery Hero SE Barclays Bank (5,104)(384) Delivery Hero SE Citibank (1,382)
(3,166) Delivery Hero SE Deutsche Bank (34,333)
BlackRock Style Advantage Fund continued
Portfolio of Investments as at 31 May 2021
The notes on pages 590 to 610 form an integral part of these financial statements.
BlackRock Strategic Funds[436]

Holding Description Counterparty
Netunrealised
appreciation/(depreciation)
USD
Germany continued(317) Delivery Hero SE Goldman Sachs (3,501)
(1,306) Deutsche Bank AG Barclays Bank (252)(9,835) Deutsche Bank AG Goldman Sachs (5,905)
148 Deutsche Boerse AG Barclays Bank (424)905 Deutsche Boerse AG Deutsche Bank (5,357)93 Deutsche Boerse AG HSBC (760)
121 Deutsche Boerse AG JP Morgan (989)(7,486) Deutsche Lufthansa AG
Reg Barclays Bank (4,605)(2,043) Deutsche Lufthansa AG
Reg HSBC 1,7801,679 Deutsche Post AG Reg Bank of America
Merrill Lynch 9,8357,879 Deutsche Post AG Reg Barclays Bank 35,097
199 Deutsche Post AG Reg Credit Suisse 1,04717,230 Deutsche Post AG Reg Deutsche Bank 99,475
823 Deutsche Post AG Reg Goldman Sachs 4,8213,113 Deutsche Post AG Reg HSBC 16,374
(9,192) Deutsche Telekom AG Reg Barclays Bank 1,638(2,152) Deutsche Telekom AG Reg Citibank 383
(735) Deutsche Telekom AG Reg Credit Suisse (337)(5,942) Deutsche Telekom AG Reg Deutsche Bank 1,798(1,665) Deutsche Wohnen SE Deutsche Bank (14,881)
(215) Deutsche Wohnen SE Goldman Sachs (2,241)3,345 E.ON SE Barclays Bank (1,200)
17,784 E.ON SE Deutsche Bank (12,552)8,465 E.ON SE Goldman Sachs (6,154)
539 E.ON SE HSBC (507)(873) Evonik Industries AG Barclays Bank (330)
(1,489) Evonik Industries AG Deutsche Bank (145)(797) Fresenius Medical Care AG
& Co KGaA Deutsche Bank 1,595(966) Fresenius SE & Co KGaA Barclays Bank 2,487
(1,618) Fresenius SE & Co KGaA Deutsche Bank 2,024185 FUCHS PETROLUB SE
(Pref) Goldman Sachs (181)307 FUCHS PETROLUB SE
(Pref) JP Morgan (824)9,570 GEA Group AG Deutsche Bank 7,942
256 Hannover Rueck SE Deutsche Bank (750)1,183 HeidelbergCement AG Barclays Bank 2,0212,234 HeidelbergCement AG Deutsche Bank (818)
362 HeidelbergCement AG Goldman Sachs (133)178 HeidelbergCement AG JP Morgan (152)
(435) HelloFresh SE Bank of AmericaMerrill Lynch (2,920)
(129) HelloFresh SE Goldman Sachs (866)51 Henkel AG & Co KGaA
(Pref)Bank of AmericaMerrill Lynch (98)
2,152 Henkel AG & Co KGaA(Pref) Barclays Bank (1,366)
522 Henkel AG & Co KGaA(Pref) Deutsche Bank (1,007)
(527) HOCHTIEF AG Deutsche Bank 1,659(3,332) Infineon Technologies AG Bank of America
Merrill Lynch (8,397)(5,616) Infineon Technologies AG Barclays Bank (10,658)
(11,152) Infineon Technologies AG Deutsche Bank (28,104)(4,633) Infineon Technologies AG Goldman Sachs (11,676)
(898) Infineon Technologies AG JP Morgan (2,038)(494) KION Group AG Barclays Bank (1,242)(315) KION Group AG Credit Suisse (1,192)(236) KION Group AG Deutsche Bank (651)
(1,788) KION Group AG HSBC (6,764)(150) KION Group AG JP Morgan (567)(226) Knorr-Bremse AG Barclays Bank 290
(1,966) Knorr-Bremse AG Deutsche Bank 3,239(185) Knorr-Bremse AG Goldman Sachs 305(179) Knorr-Bremse AG JP Morgan 546174 LANXESS AG Citibank 153
Holding Description Counterparty
Netunrealised
appreciation/(depreciation)
USD
Germany continued245 LANXESS AG Deutsche Bank (413)
1,255 LEG Immobilien SE Barclays Bank 3,216240 Merck KGaA Barclays Bank 491162 Merck KGaA Deutsche Bank 887(55) MTU Aero Engines AG Bank of America
Merrill Lynch (242)(59) MTU Aero Engines AG Barclays Bank (439)(77) MTU Aero Engines AG Credit Suisse (94)
(339) MTU Aero Engines AG Deutsche Bank (1,651)(96) Muenchener
Rueckversicherungs-Gesellschaft AG inMuenchen Reg JP Morgan 1,259
(34) MuenchenerRueckversicherungs-Gesellschaft AG inMuenchen Reg
Bank of AmericaMerrill Lynch 212
(34) MuenchenerRueckversicherungs-Gesellschaft AG inMuenchen Reg Barclays Bank 131
(212) MuenchenerRueckversicherungs-Gesellschaft AG inMuenchen Reg Credit Suisse 2,781
(133) MuenchenerRueckversicherungs-Gesellschaft AG inMuenchen Reg Deutsche Bank 828
1,323 Nemetschek SE Bank of AmericaMerrill Lynch 6,749
2,043 Nemetschek SE Deutsche Bank 10,422(565) Porsche Automobil Holding
SE (Pref) Barclays Bank (4,634)(930) Porsche Automobil Holding
SE (Pref) Credit Suisse (5,652)(1,934) Porsche Automobil Holding
SE (Pref) Deutsche Bank (16,427)(176) Porsche Automobil Holding
SE (Pref) Goldman Sachs (1,495)(264) Porsche Automobil Holding
SE (Pref) HSBC (1,604)(93) Puma SE Barclays Bank (238)
(194) Puma SE Citibank (275)(548) Puma SE Deutsche Bank (2,488)
(3,147) QIAGEN NV Goldman Sachs (6,836)(24) Rational AG Citibank 392(66) Rational AG Deutsche Bank 2,33098 SAP SE Bank of America
Merrill Lynch 115580 SAP SE Deutsche Bank 680(74) Sartorius AG (Pref) Bank of America
Merrill Lynch (9)(594) Sartorius AG (Pref) Deutsche Bank (72)(20) Sartorius AG (Pref) Goldman Sachs (2)(20) Sartorius AG (Pref) HSBC 447
1,540 Scout24 AG Deutsche Bank 5,901632 Scout24 AG Goldman Sachs 2,422775 Siemens AG Reg Bank of America
Merrill Lynch (8,153)169 Siemens AG Reg Citibank (532)272 Siemens AG Reg Credit Suisse (3,651)
1,839 Siemens AG Reg Deutsche Bank (18,247)421 Siemens AG Reg Goldman Sachs (4,429)
(691) Siemens Energy AG Citibank (177)(676) Siemens Energy AG Deutsche Bank (411)(744) Siemens Energy AG Goldman Sachs (1,289)(549) Siemens Healthineers AG Barclays Bank 74(445) Siemens Healthineers AG Citibank 22
(11,950) Siemens Healthineers AG Deutsche Bank 10,114
BlackRock Style Advantage Fund continued
Portfolio of Investments as at 31 May 2021
The notes on pages 590 to 610 form an integral part of these financial statements.
Annual report and audited financial statements [437]

Holding Description Counterparty
Netunrealised
appreciation/(depreciation)
USD
Germany continued(735) Siemens Healthineers AG Goldman Sachs 655(179) Siemens Healthineers AG HSBC 221442 Symrise AG Barclays Bank 539451 Symrise AG Deutsche Bank 1,509
(1,024) TeamViewer AG Barclays Bank (1,950)(5,332) TeamViewer AG Deutsche Bank (9,221)
(562) TeamViewer AG Goldman Sachs (448)9,317 Telefonica Deutschland
Holding AG Goldman Sachs (4,264)526 Uniper SE Barclays Bank 353611 Uniper SE Citibank 507
2,129 Uniper SE Deutsche Bank (3,352)428 Uniper SE Goldman Sachs (674)270 Uniper SE HSBC (260)256 United Internet AG Reg Barclays Bank (172)244 United Internet AG Reg Deutsche Bank 1293 Volkswagen AG Deutsche Bank 2,792
(1,505) Vonovia SE Bank of AmericaMerrill Lynch (8,377)
(10) Vonovia SE Barclays Bank (625)(928) Zalando SE Bank of America
Merrill Lynch (2,152)(201) Zalando SE Barclays Bank (235)
(1,105) Zalando SE Deutsche Bank (2,562)
(93,336)
Hong Kong11,800 AIA Group Ltd Barclays Bank (3,497)(5,500) ASM Pacific Technology Ltd HSBC 6,945
(257,000) Bank of East Asia Ltd Citibank 10,596192,000 BOC Hong Kong Holdings
LtdBank of AmericaMerrill Lynch (25,976)
31,500 BOC Hong Kong HoldingsLtd Barclays Bank 1,218
(16,100) Budweiser Brewing CoAPAC Ltd
Bank of AmericaMerrill Lynch 726
(65,600) Budweiser Brewing CoAPAC Ltd Citibank 845
(29,400) Budweiser Brewing CoAPAC Ltd Goldman Sachs 1,326
109,500 CK Asset Holdings Ltd HSBC 12,698(4,000) CK Hutchison Holdings Ltd Goldman Sachs 465(9,600) ESR Cayman Ltd Goldman Sachs (1,237)(5,000) Galaxy Entertainment
Group Ltd Goldman Sachs 960(13,000) Hang Lung Properties Ltd Goldman Sachs (201)
4,000 Henderson Land Develop-ment Co Ltd Barclays Bank 696
200,000 Henderson Land Develop-ment Co Ltd Goldman Sachs 57,982
(357,500) HK Electric Investments &HK Electric InvestmentsLtd (Unit) Barclays Bank (3,225)
(141,000) HKT Trust & HKT Ltd (Unit) Bank of AmericaMerrill Lynch (727)
(258,000) Hong Kong & China Gas CoLtd Barclays Bank (2,660)
(900) Hong Kong Exchanges &Clearing Ltd Goldman Sachs (4,731)
(177,952) MTR Corp Ltd Barclays Bank 20,63613,000 New World Development Co
Ltd Barclays Bank 1,75928,000 New World Development Co
Ltd Goldman Sachs 5,05115,000 New World Development Co
Ltd HSBC (966)2,000 New World Development Co
Ltd JP Morgan (129)(13,600) Sands China Ltd Goldman Sachs (2,453)
(1) Sisram Medical Ltd JP Morgan (1)(128,000) SJM Holdings Ltd Goldman Sachs (961)
Holding Description Counterparty
Netunrealised
appreciation/(depreciation)
USD
Hong Kong continued38,500 Sun Hung Kai Properties
LtdBank of AmericaMerrill Lynch 22,819
6,000 Sun Hung Kai PropertiesLtd Goldman Sachs 3,556
7,000 Sun Hung Kai PropertiesLtd HSBC (541)
87,000 Swire Pacific Ltd ’A’ HSBC (57,170)(108,400) Swire Properties Ltd Bank of America
Merrill Lynch (698)(51,400) Swire Properties Ltd Barclays Bank 993
7,500 Techtronic Industries Co Ltd Credit Suisse (6,571)1,500 Techtronic Industries Co Ltd HSBC (1,314)2,000 Techtronic Industries Co Ltd JP Morgan (1,752)
(81,000) Wharf Real Estate Invest-ment Co Ltd Citibank (6,784)
(7,200) Wynn Macau Ltd Goldman Sachs (241)(8,000) Xinyi Glass Holdings Ltd HSBC (2,938)
24,498
Ireland2,032 CRH Plc Bank of America
Merrill Lynch 2,5794,264 CRH Plc Barclays Bank 4,892
844 CRH Plc Citibank 9681,535 CRH Plc Goldman Sachs 1,948
328 CRH Plc JP Morgan 280(151) Flutter Entertainment Plc Barclays Bank (175)(103) Flutter Entertainment Plc Credit Suisse 1,232(105) Kerry Group Plc ’A’ Bank of America
Merrill Lynch (167)(366) Kerry Group Plc ’A’ Barclays Bank (447)
(1,515) Kerry Group Plc ’A’ Citibank (1,849)(484) Kingspan Group Plc Barclays Bank 461(26) Kingspan Group Plc JP Morgan (19)
1,654 Smurfit Kappa Group Plc Barclays Bank 162366 Smurfit Kappa Group Plc Citibank 36336 Smurfit Kappa Group Plc Goldman Sachs (66)512 Smurfit Kappa Group Plc JP Morgan (450)
9,385
Israel2,406 Bank Hapoalim BM Bank of America
Merrill Lynch 674,066 Bank Hapoalim BM Barclays Bank (263)
52,664 Israel Discount Bank Ltd ’A’ Goldman Sachs 2,595476 Mizrahi Tefahot Bank Ltd Goldman Sachs 155146 Nice Ltd Barclays Bank (728)
1,826
Italy(1,319) Amplifon SpA Deutsche Bank (8,725)(9,406) Atlantia SpA Barclays Bank (7,289)2,987 CNH Industrial NV Bank of America
Merrill Lynch (91)804 CNH Industrial NV Deutsche Bank (25)
(2,959) Davide Campari-Milano NV Barclays Bank (253)(28,691) Davide Campari-Milano NV Citibank (2,451)
(96) DiaSorin SpA Deutsche Bank (492)27,408 Enel SpA Deutsche Bank (2,408)20,611 Enel SpA Goldman Sachs (1,811)36,947 Eni SpA Deutsche Bank (17,405)1,924 EXOR NV Barclays Bank 3,1461,355 EXOR NV Deutsche Bank 3,473(188) Ferrari NV Bank of America
Merrill Lynch (1,916)(168) Ferrari NV Barclays Bank 92(100) Ferrari NV Citibank 55(77) Ferrari NV Credit Suisse (785)
(865) Ferrari NV Deutsche Bank (8,815)(89) Ferrari NV Goldman Sachs (907)
(133) Ferrari NV HSBC (554)
BlackRock Style Advantage Fund continued
Portfolio of Investments as at 31 May 2021
The notes on pages 590 to 610 form an integral part of these financial statements.
BlackRock Strategic Funds[438]

Holding Description Counterparty
Netunrealised
appreciation/(depreciation)
USD
Italy continued1,138 FinecoBank Banca Fineco
SpA Deutsche Bank 277(886) Infrastrutture Wireless Ital-
iane SpABank of AmericaMerrill Lynch 318
(48,586) Infrastrutture Wireless Ital-iane SpA Deutsche Bank 17,433
(2,263) Infrastrutture Wireless Ital-iane SpA JP Morgan 895
266,098 Intesa Sanpaolo SpA Goldman Sachs 4,546(9,136) Mediobanca Banca di
Credito Finanziario SpA Deutsche Bank (290)(1,809) Moncler SpA Bank of America
Merrill Lynch (14,527)(3,217) Moncler SpA Deutsche Bank (24,651)
(265) Moncler SpA HSBC (2,199)(10,340) Nexi SpA Barclays Bank (2,965)12,181 Poste Italiane SpA Deutsche Bank 4,190
(627) Recordati Industria Chimicae Farmaceutica SpA
Bank of AmericaMerrill Lynch (497)
(355) Recordati Industria Chimicae Farmaceutica SpA Barclays Bank 182
(299) Recordati Industria Chimicae Farmaceutica SpA Deutsche Bank (237)
(222) Recordati Industria Chimicae Farmaceutica SpA Goldman Sachs (176)
10,367 Snam SpA Deutsche Bank (25)(3,239) Stellantis NV Deutsche Bank (4,957)
(14,036) Tenaris SA Bank of AmericaMerrill Lynch 7,057
(21,795) Tenaris SA Barclays Bank (187)(22,318) Tenaris SA Deutsche Bank 9,91422,601 Terna SpA Deutsche Bank 16624,332 Terna SpA Goldman Sachs 178(2,312) UniCredit SpA Deutsche Bank (762)
(53,478)
Japan200 ABC-Mart Inc Bank of America
Merrill Lynch 5841,700 ABC-Mart Inc Barclays Bank 3,411
(91,600) Acom Co Ltd Barclays Bank (2,506)(900) Advantest Corp Citibank (4,269)
(6,500) Aeon Co Ltd Barclays Bank 1,364(600) Aeon Co Ltd HSBC 854
(9,400) Aeon Mall Co Ltd Goldman Sachs (7,287)(2,900) Aeon Mall Co Ltd JP Morgan (582)5,500 AGC Inc Bank of America
Merrill Lynch (8,026)(12,400) Air Water Inc Goldman Sachs 2,601
100 Aisin Corp Bank of AmericaMerrill Lynch 474
1,200 Aisin Corp Barclays Bank 2,572500 Ajinomoto Co Inc Bank of America
Merrill Lynch 1423,000 Ajinomoto Co Inc Barclays Bank 339
800 Ajinomoto Co Inc Goldman Sachs 3411,600 Ajinomoto Co Inc HSBC 2,226
100 Ajinomoto Co Inc JP Morgan 17631,900 Amada Co Ltd JP Morgan (20,658)(4,900) ANA Holdings Inc Goldman Sachs (7,553)(3,800) Asahi Group Holdings Ltd Barclays Bank (381)
(200) Asahi Group Holdings Ltd Citibank (20)(2,500) Asahi Group Holdings Ltd Credit Suisse (10,899)(2,000) Asahi Intecc Co Ltd Bank of America
Merrill Lynch 2,809(2,400) Asahi Intecc Co Ltd Barclays Bank 3,5684,200 Asahi Kasei Corp Barclays Bank (1,762)1,400 Asahi Kasei Corp Goldman Sachs (268)3,200 Asahi Kasei Corp HSBC (73)
21,300 Astellas Pharma Inc Credit Suisse 14,668400 Azbil Corp Barclays Bank 328
Holding Description Counterparty
Netunrealised
appreciation/(depreciation)
USD
Japan continued(900) Bandai Namco Holdings Inc Bank of America
Merrill Lynch (1,453)(800) Bandai Namco Holdings Inc Barclays Bank (44)
(1,300) Bandai Namco Holdings Inc Credit Suisse 2,964(300) Bandai Namco Holdings Inc Goldman Sachs (484)
(1,300) Bank of Kyoto Ltd Barclays Bank (3,557)(3,100) Bank of Kyoto Ltd Citibank (8,482)(1,100) Bank of Kyoto Ltd Credit Suisse 6,120(1,800) Bank of Kyoto Ltd JP Morgan 10,0152,200 Bridgestone Corp Barclays Bank 7426,200 Brother Industries Ltd Credit Suisse 6,729
27,300 Brother Industries Ltd JP Morgan 29,63116,800 Calbee Inc Goldman Sachs (13,024)(2,400) Canon Inc Barclays Bank 1,029(1,100) Canon Inc Citibank 472
800 Capcom Co Ltd Bank of AmericaMerrill Lynch 1,934
1,200 Capcom Co Ltd Barclays Bank 3,885400 Capcom Co Ltd Citibank 1,295600 Capcom Co Ltd HSBC 1,313
1,300 Casio Computer Co Ltd Citibank 1,020(300) Central Japan Railway Co Bank of America
Merrill Lynch (1,122)(900) Central Japan Railway Co Barclays Bank (3,160)
(1,200) Central Japan Railway Co Goldman Sachs (4,487)(100) Chiba Bank Ltd Barclays Bank 34
(19,600) Chiba Bank Ltd Goldman Sachs 4,6482,500 Chugai Pharmaceutical Co
Ltd Barclays Bank 1,072400 Chugai Pharmaceutical Co
Ltd Goldman Sachs 4382,400 Coca-Cola Bottlers Japan
Holdings IncBank of AmericaMerrill Lynch (1,138)
9,900 Coca-Cola Bottlers JapanHoldings Inc HSBC (2,438)
(100) Cosmos PharmaceuticalCorp Barclays Bank 182
(1,600) CyberAgent Inc Bank of AmericaMerrill Lynch (2,101)
1,300 Dai Nippon Printing Co Ltd Barclays Bank 3911,200 Dai Nippon Printing Co Ltd HSBC 679(200) Daifuku Co Ltd Barclays Bank 1,131(100) Daifuku Co Ltd Citibank 565
(3,100) Daifuku Co Ltd Credit Suisse 57,680(6,000) Dai-ichi Life Holdings Inc Goldman Sachs (10,398)
(400) Daiichi Sankyo Co Ltd Barclays Bank 166(1,100) Daiichi Sankyo Co Ltd Goldman Sachs 1,033
(400) Daiichi Sankyo Co Ltd HSBC 1,432(600) Daikin Industries Ltd Barclays Bank (2,271)
(1,200) Daikin Industries Ltd Credit Suisse 16,527(5,000) Daiwa House Industry Co
Ltd Barclays Bank (1,368)(11,000) Daiwa Securities Group Inc Bank of America
Merrill Lynch (1,525)(24,100) Daiwa Securities Group Inc Barclays Bank 1,231
(300) Denso Corp Barclays Bank (317)(2,800) Denso Corp Goldman Sachs (8,708)2,400 Dentsu Group Inc Barclays Bank 3,065
100 Disco Corp HSBC (1,368)(1,900) East Japan Railway Co Barclays Bank (2,045)(3,200) East Japan Railway Co Goldman Sachs (3,123)
(300) East Japan Railway Co HSBC 90(700) East Japan Railway Co JP Morgan 211(500) Eisai Co Ltd Bank of America
Merrill Lynch (2,166)(300) Eisai Co Ltd Goldman Sachs (1,300)
17,900 ENEOS Holdings Inc Bank of AmericaMerrill Lynch (1,551)
141,000 ENEOS Holdings Inc Barclays Bank (4,887)2,300 ENEOS Holdings Inc Goldman Sachs (199)
BlackRock Style Advantage Fund continued
Portfolio of Investments as at 31 May 2021
The notes on pages 590 to 610 form an integral part of these financial statements.
Annual report and audited financial statements [439]
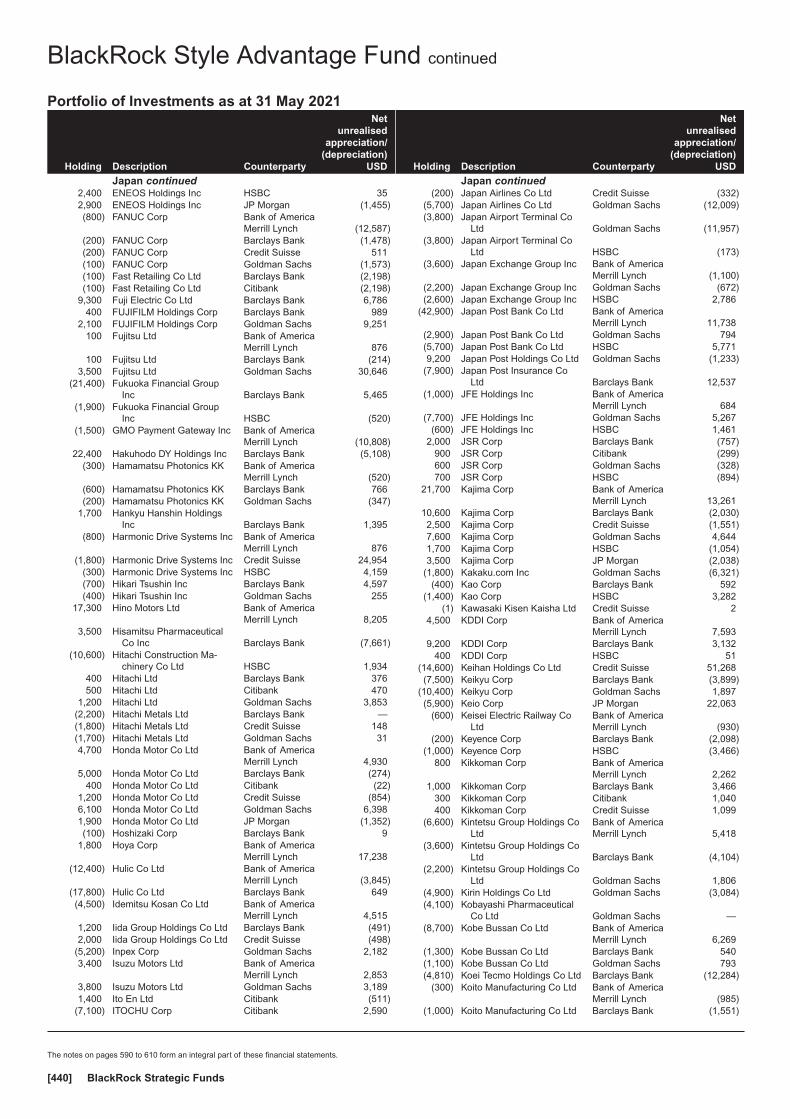
Holding Description Counterparty
Netunrealised
appreciation/(depreciation)
USD
Japan continued2,400 ENEOS Holdings Inc HSBC 352,900 ENEOS Holdings Inc JP Morgan (1,455)(800) FANUC Corp Bank of America
Merrill Lynch (12,587)(200) FANUC Corp Barclays Bank (1,478)(200) FANUC Corp Credit Suisse 511(100) FANUC Corp Goldman Sachs (1,573)(100) Fast Retailing Co Ltd Barclays Bank (2,198)(100) Fast Retailing Co Ltd Citibank (2,198)
9,300 Fuji Electric Co Ltd Barclays Bank 6,786400 FUJIFILM Holdings Corp Barclays Bank 989
2,100 FUJIFILM Holdings Corp Goldman Sachs 9,251100 Fujitsu Ltd Bank of America
Merrill Lynch 876100 Fujitsu Ltd Barclays Bank (214)
3,500 Fujitsu Ltd Goldman Sachs 30,646(21,400) Fukuoka Financial Group
Inc Barclays Bank 5,465(1,900) Fukuoka Financial Group
Inc HSBC (520)(1,500) GMO Payment Gateway Inc Bank of America
Merrill Lynch (10,808)22,400 Hakuhodo DY Holdings Inc Barclays Bank (5,108)
(300) Hamamatsu Photonics KK Bank of AmericaMerrill Lynch (520)
(600) Hamamatsu Photonics KK Barclays Bank 766(200) Hamamatsu Photonics KK Goldman Sachs (347)
1,700 Hankyu Hanshin HoldingsInc Barclays Bank 1,395
(800) Harmonic Drive Systems Inc Bank of AmericaMerrill Lynch 876
(1,800) Harmonic Drive Systems Inc Credit Suisse 24,954(300) Harmonic Drive Systems Inc HSBC 4,159(700) Hikari Tsushin Inc Barclays Bank 4,597(400) Hikari Tsushin Inc Goldman Sachs 255
17,300 Hino Motors Ltd Bank of AmericaMerrill Lynch 8,205
3,500 Hisamitsu PharmaceuticalCo Inc Barclays Bank (7,661)
(10,600) Hitachi Construction Ma-chinery Co Ltd HSBC 1,934
400 Hitachi Ltd Barclays Bank 376500 Hitachi Ltd Citibank 470
1,200 Hitachi Ltd Goldman Sachs 3,853(2,200) Hitachi Metals Ltd Barclays Bank —(1,800) Hitachi Metals Ltd Credit Suisse 148(1,700) Hitachi Metals Ltd Goldman Sachs 314,700 Honda Motor Co Ltd Bank of America
Merrill Lynch 4,9305,000 Honda Motor Co Ltd Barclays Bank (274)
400 Honda Motor Co Ltd Citibank (22)1,200 Honda Motor Co Ltd Credit Suisse (854)6,100 Honda Motor Co Ltd Goldman Sachs 6,3981,900 Honda Motor Co Ltd JP Morgan (1,352)(100) Hoshizaki Corp Barclays Bank 9
1,800 Hoya Corp Bank of AmericaMerrill Lynch 17,238
(12,400) Hulic Co Ltd Bank of AmericaMerrill Lynch (3,845)
(17,800) Hulic Co Ltd Barclays Bank 649(4,500) Idemitsu Kosan Co Ltd Bank of America
Merrill Lynch 4,5151,200 Iida Group Holdings Co Ltd Barclays Bank (491)2,000 Iida Group Holdings Co Ltd Credit Suisse (498)
(5,200) Inpex Corp Goldman Sachs 2,1823,400 Isuzu Motors Ltd Bank of America
Merrill Lynch 2,8533,800 Isuzu Motors Ltd Goldman Sachs 3,1891,400 Ito En Ltd Citibank (511)
(7,100) ITOCHU Corp Citibank 2,590
Holding Description Counterparty
Netunrealised
appreciation/(depreciation)
USD
Japan continued(200) Japan Airlines Co Ltd Credit Suisse (332)
(5,700) Japan Airlines Co Ltd Goldman Sachs (12,009)(3,800) Japan Airport Terminal Co
Ltd Goldman Sachs (11,957)(3,800) Japan Airport Terminal Co
Ltd HSBC (173)(3,600) Japan Exchange Group Inc Bank of America
Merrill Lynch (1,100)(2,200) Japan Exchange Group Inc Goldman Sachs (672)(2,600) Japan Exchange Group Inc HSBC 2,786
(42,900) Japan Post Bank Co Ltd Bank of AmericaMerrill Lynch 11,738
(2,900) Japan Post Bank Co Ltd Goldman Sachs 794(5,700) Japan Post Bank Co Ltd HSBC 5,7719,200 Japan Post Holdings Co Ltd Goldman Sachs (1,233)
(7,900) Japan Post Insurance CoLtd Barclays Bank 12,537
(1,000) JFE Holdings Inc Bank of AmericaMerrill Lynch 684
(7,700) JFE Holdings Inc Goldman Sachs 5,267(600) JFE Holdings Inc HSBC 1,461
2,000 JSR Corp Barclays Bank (757)900 JSR Corp Citibank (299)600 JSR Corp Goldman Sachs (328)700 JSR Corp HSBC (894)
21,700 Kajima Corp Bank of AmericaMerrill Lynch 13,261
10,600 Kajima Corp Barclays Bank (2,030)2,500 Kajima Corp Credit Suisse (1,551)7,600 Kajima Corp Goldman Sachs 4,6441,700 Kajima Corp HSBC (1,054)3,500 Kajima Corp JP Morgan (2,038)
(1,800) Kakaku.com Inc Goldman Sachs (6,321)(400) Kao Corp Barclays Bank 592
(1,400) Kao Corp HSBC 3,282(1) Kawasaki Kisen Kaisha Ltd Credit Suisse 2
4,500 KDDI Corp Bank of AmericaMerrill Lynch 7,593
9,200 KDDI Corp Barclays Bank 3,132400 KDDI Corp HSBC 51
(14,600) Keihan Holdings Co Ltd Credit Suisse 51,268(7,500) Keikyu Corp Barclays Bank (3,899)
(10,400) Keikyu Corp Goldman Sachs 1,897(5,900) Keio Corp JP Morgan 22,063
(600) Keisei Electric Railway CoLtd
Bank of AmericaMerrill Lynch (930)
(200) Keyence Corp Barclays Bank (2,098)(1,000) Keyence Corp HSBC (3,466)
800 Kikkoman Corp Bank of AmericaMerrill Lynch 2,262
1,000 Kikkoman Corp Barclays Bank 3,466300 Kikkoman Corp Citibank 1,040400 Kikkoman Corp Credit Suisse 1,099
(6,600) Kintetsu Group Holdings CoLtd
Bank of AmericaMerrill Lynch 5,418
(3,600) Kintetsu Group Holdings CoLtd Barclays Bank (4,104)
(2,200) Kintetsu Group Holdings CoLtd Goldman Sachs 1,806
(4,900) Kirin Holdings Co Ltd Goldman Sachs (3,084)(4,100) Kobayashi Pharmaceutical
Co Ltd Goldman Sachs —(8,700) Kobe Bussan Co Ltd Bank of America
Merrill Lynch 6,269(1,300) Kobe Bussan Co Ltd Barclays Bank 540(1,100) Kobe Bussan Co Ltd Goldman Sachs 793(4,810) Koei Tecmo Holdings Co Ltd Barclays Bank (12,284)
(300) Koito Manufacturing Co Ltd Bank of AmericaMerrill Lynch (985)
(1,000) Koito Manufacturing Co Ltd Barclays Bank (1,551)
BlackRock Style Advantage Fund continued
Portfolio of Investments as at 31 May 2021
The notes on pages 590 to 610 form an integral part of these financial statements.
BlackRock Strategic Funds[440]

Holding Description Counterparty
Netunrealised
appreciation/(depreciation)
USD
Japan continued(300) Koito Manufacturing Co Ltd Credit Suisse (328)(900) Koito Manufacturing Co Ltd Goldman Sachs (2,812)(800) Komatsu Ltd Bank of America
Merrill Lynch 350(700) Komatsu Ltd Goldman Sachs 306
(3,100) Komatsu Ltd HSBC 6,588(1,400) Konami Holdings Corp Goldman Sachs (9,960)
(700) Kose Corp Barclays Bank (3,320)(300) Kose Corp Citibank (1,423)(600) Kose Corp Credit Suisse (4,792)(200) Kose Corp Goldman Sachs (2,390)
(7,900) Kubota Corp Bank of AmericaMerrill Lynch 5,080
(500) Kubota Corp Barclays Bank 34410,800 Kuraray Co Ltd Barclays Bank (788)9,400 Kuraray Co Ltd HSBC (9,945)3,800 Kurita Water Industries Ltd Bank of America
Merrill Lynch 11,7846,600 Kurita Water Industries Ltd Goldman Sachs 20,4672,200 Kyocera Corp Barclays Bank 1,505(800) Kyowa Kirin Co Ltd Barclays Bank 292(400) Kyowa Kirin Co Ltd Citibank 146(800) Kyowa Kirin Co Ltd Goldman Sachs 182(400) Kyowa Kirin Co Ltd JP Morgan 237(600) Kyushu Railway Co Bank of America
Merrill Lynch (71)(1,500) Kyushu Railway Co Barclays Bank (1,560)
(600) Kyushu Railway Co HSBC 181(300) Lasertec Corp Bank of America
Merrill Lynch (7,437)(1,400) Lasertec Corp Barclays Bank (34,434)
(100) Lasertec Corp Goldman Sachs (3,055)(100) Lasertec Corp HSBC (2,311)
(1,200) Lion Corp Bank of AmericaMerrill Lynch 539
(600) Lion Corp Barclays Bank 443(800) Lion Corp Credit Suisse 218
(3,000) Lion Corp Goldman Sachs 3,658(600) Lion Corp JP Morgan 446
9,700 Lixil Corp Bank of AmericaMerrill Lynch (7,432)
(1,100) M3 Inc Barclays Bank (2,548)(1,400) Makita Corp Goldman Sachs (4,725)3,000 Marubeni Corp Bank of America
Merrill Lynch 1,240(15,700) Marui Group Co Ltd Barclays Bank (14,320)15,500 Mazda Motor Corp Barclays Bank 6,6443,300 McDonald’s Holdings Co
Japan LtdBank of AmericaMerrill Lynch (2,257)
100 McDonald’s Holdings CoJapan Ltd Barclays Bank (23)
500 McDonald’s Holdings CoJapan Ltd Citibank (114)
1,500 McDonald’s Holdings CoJapan Ltd Goldman Sachs (1,026)
800 McDonald’s Holdings CoJapan Ltd HSBC (328)
5,500 MEIJI Holdings Co Ltd Goldman Sachs 2,508(500) Mercari Inc Bank of America
Merrill Lynch (1,779)(300) Mercari Inc Barclays Bank (438)
(2,100) Mercari Inc Credit Suisse (2,107)(300) Mercari Inc Goldman Sachs (1,067)
4,100 MINEBEA MITSUMI Inc Barclays Bank 4,263(1,200) MISUMI Group Inc Bank of America
Merrill Lynch (711)(1,400) MISUMI Group Inc Barclays Bank 64
(700) MISUMI Group Inc Goldman Sachs (415)4,600 Mitsubishi Chemical Hold-
ings Corp Barclays Bank (800)
Holding Description Counterparty
Netunrealised
appreciation/(depreciation)
USD
Japan continued(16,300) Mitsubishi Corp Barclays Bank (5,724)39,400 Mitsubishi Electric Corp Bank of America
Merrill Lynch 19,0464,700 Mitsubishi Electric Corp Barclays Bank 86
30,800 Mitsubishi Electric Corp Citibank 56211,900 Mitsubishi Electric Corp Credit Suisse (434)
700 Mitsubishi Electric Corp Goldman Sachs 3383,200 Mitsubishi Electric Corp HSBC (117)2,100 Mitsubishi Estate Co Ltd Barclays Bank (383)2,300 Mitsubishi Estate Co Ltd Citibank (420)1,200 Mitsubishi Gas Chemical Co
IncBank of AmericaMerrill Lynch 843
4,800 Mitsubishi Gas Chemical CoInc Barclays Bank 2,977
800 Mitsubishi Gas Chemical CoInc Credit Suisse (452)
2,800 Mitsubishi Gas Chemical CoInc HSBC (1,583)
900 Mitsubishi Gas Chemical CoInc JP Morgan (509)
(20,000) Mitsubishi HC Capital Inc HSBC 5,655(2,500) Mitsubishi Heavy Industries
LtdBank of AmericaMerrill Lynch (1,095)
(6,500) Mitsubishi Heavy IndustriesLtd Barclays Bank 1,773
(600) Mitsubishi Heavy IndustriesLtd Citibank 170
(900) Mitsubishi Heavy IndustriesLtd Credit Suisse 45
(2,000) Mitsubishi Heavy IndustriesLtd HSBC (1,046)
40,700 Mitsubishi UFJ FinancialGroup Inc Barclays Bank (3,786)
2,100 Mitsui & Co Ltd Barclays Bank (402)500 Mitsui & Co Ltd Citibank (96)800 Mitsui & Co Ltd Goldman Sachs 128
3,500 Mitsui Chemicals Inc Bank of AmericaMerrill Lynch 1,596
2,000 Mitsui Chemicals Inc Barclays Bank 2,3713,900 Mitsui Chemicals Inc Goldman Sachs 1,7793,300 Mitsui Chemicals Inc HSBC 3012,500 Mitsui Chemicals Inc JP Morgan 228
(6,100) Mitsui Fudosan Co Ltd HSBC (1,919)(3,400) Miura Co Ltd HSBC 27,28919,590 Mizuho Financial Group Inc Bank of America
Merrill Lynch 2,323(500) MonotaRO Co Ltd Bank of America
Merrill Lynch 133(8,200) MonotaRO Co Ltd Barclays Bank (3,515)(2,000) MonotaRO Co Ltd Goldman Sachs (2,791)
(600) MS&AD Insurance GroupHoldings Inc
Bank of AmericaMerrill Lynch (115)
(1,200) MS&AD Insurance GroupHoldings Inc Barclays Bank (219)
(400) MS&AD Insurance GroupHoldings Inc Goldman Sachs (77)
(800) Murata Manufacturing CoLtd
Bank of AmericaMerrill Lynch (839)
(1,800) Murata Manufacturing CoLtd Barclays Bank (887)
(400) Murata Manufacturing CoLtd Citibank (197)
(1,300) Murata Manufacturing CoLtd Credit Suisse 4,980
(600) Murata Manufacturing CoLtd Goldman Sachs (629)
(900) Murata Manufacturing CoLtd HSBC 3,448
(1,100) Murata Manufacturing CoLtd JP Morgan 4,214
BlackRock Style Advantage Fund continued
Portfolio of Investments as at 31 May 2021
The notes on pages 590 to 610 form an integral part of these financial statements.
Annual report and audited financial statements [441]

Holding Description Counterparty
Netunrealised
appreciation/(depreciation)
USD
Japan continued(600) Nagoya Railroad Co Ltd Barclays Bank (1,029)
(1,600) Nagoya Railroad Co Ltd Goldman Sachs (102)300 NEC Corp Credit Suisse (3,393)
2,400 NEC Corp Goldman Sachs (876)1,300 NEC Corp HSBC (14,703)
900 NEC Corp JP Morgan (10,179)(1,100) Nexon Co Ltd Bank of America
Merrill Lynch 328(2,300) Nexon Co Ltd Barclays Bank 462
(500) Nexon Co Ltd HSBC 550(700) Nexon Co Ltd JP Morgan (231)
5,100 NGK Insulators Ltd Barclays Bank (837)23,600 NGK Insulators Ltd Goldman Sachs (13,130)2,300 NGK Spark Plug Co Ltd Bank of America
Merrill Lynch 1,9723,900 NGK Spark Plug Co Ltd Barclays Bank 1,636
900 NGK Spark Plug Co Ltd Credit Suisse 1313,600 NGK Spark Plug Co Ltd Goldman Sachs 3,0861,500 NGK Spark Plug Co Ltd HSBC 219
300 NH Foods Ltd Barclays Bank (107)800 NH Foods Ltd Goldman Sachs (1,042)
(700) Nidec Corp Bank of AmericaMerrill Lynch (3,324)
(600) Nidec Corp Barclays Bank (23)(100) Nidec Corp Citibank (187)(100) Nidec Corp Credit Suisse (221)(400) Nidec Corp HSBC (146)(300) Nidec Corp JP Morgan (372)
(1,500) Nihon M&A Center Inc Bank of AmericaMerrill Lynch 82
(1,300) Nihon M&A Center Inc Barclays Bank 949(5,500) Nihon M&A Center Inc HSBC 7,575
(400) Nihon M&A Center Inc JP Morgan 551(100) Nintendo Co Ltd Citibank (2,463)
1,200 Nippon Express Co Ltd Bank of AmericaMerrill Lynch 1,423
2,500 Nippon Express Co Ltd Barclays Bank (5,480)200 Nippon Express Co Ltd Citibank (529)
1,300 Nippon Express Co Ltd Goldman Sachs 1,254400 Nippon Express Co Ltd HSBC (447)300 Nippon Express Co Ltd JP Morgan (465)
(13,000) Nippon Paint Holdings CoLtd
Bank of AmericaMerrill Lynch 12,568
(6,500) Nippon Paint Holdings CoLtd Barclays Bank (3,735)
(6,300) Nippon Paint Holdings CoLtd Goldman Sachs 6,091
(6,600) Nippon Sanso HoldingsCorp
Bank of AmericaMerrill Lynch 3,853
(3,100) Nippon Sanso HoldingsCorp Citibank 1,810
(2,600) Nippon Sanso HoldingsCorp Credit Suisse (617)
(2,300) Nippon Sanso HoldingsCorp Goldman Sachs 1,343
(2,400) Nippon Sanso HoldingsCorp HSBC (569)
(1,100) Nippon Shinyaku Co Ltd Bank of AmericaMerrill Lynch (6,822)
(600) Nippon Shinyaku Co Ltd Barclays Bank (328)(900) Nippon Shinyaku Co Ltd Credit Suisse (3,530)
(3,100) Nippon Steel Corp Barclays Bank 1,711(3,900) Nippon Steel Corp Goldman Sachs 3,6991,400 Nippon Telegraph & Tele-
phone CorpBank of AmericaMerrill Lynch 1,028
16,100 Nippon Telegraph & Tele-phone Corp Barclays Bank 1,434
900 Nippon Telegraph & Tele-phone Corp Citibank 94
Holding Description Counterparty
Netunrealised
appreciation/(depreciation)
USD
Japan continued3,200 Nippon Telegraph & Tele-
phone Corp Credit Suisse 1,78711,100 Nippon Telegraph & Tele-
phone Corp Goldman Sachs 8,1503,800 Nippon Telegraph & Tele-
phone Corp HSBC 2,6861,900 Nippon Telegraph & Tele-
phone Corp JP Morgan 1,3435,800 Nippon Yusen KK Bank of America
Merrill Lynch 12,696800 Nippon Yusen KK Citibank (620)900 Nippon Yusen KK HSBC 821
1,900 Nippon Yusen KK JP Morgan 1,733500 Nissan Chemical Corp Goldman Sachs 547
(37,600) Nissan Motor Co Ltd Bank of AmericaMerrill Lynch (446)
(1,900) Nissan Motor Co Ltd Barclays Bank (109)(28,300) Nissan Motor Co Ltd Credit Suisse 11,176(18,200) Nissan Motor Co Ltd Goldman Sachs (216)
700 Nisshin Seifun Group Inc Bank of AmericaMerrill Lynch (1,124)
700 Nisshin Seifun Group Inc HSBC (1,277)1,100 Nisshin Seifun Group Inc JP Morgan (2,007)4,800 Nissin Foods Holdings Co
Ltd Credit Suisse 1,3131,200 Nitori Holdings Co Ltd Goldman Sachs (3,831)1,500 Nitto Denko Corp Bank of America
Merrill Lynch (547)1,200 Nitto Denko Corp Barclays Bank 150
300 Nitto Denko Corp Citibank 246500 Nitto Denko Corp Credit Suisse (2,463)
2,300 Nitto Denko Corp Goldman Sachs (67)300 Nitto Denko Corp HSBC (1,478)
8,400 Nitto Denko Corp JP Morgan (41,372)2,900 Nomura Holdings Inc Bank of America
Merrill Lynch 2315,700 Nomura Holdings Inc Barclays Bank 3583,700 Nomura Holdings Inc Goldman Sachs 655
(2,300) Nomura Real Estate Hold-ings Inc Barclays Bank 2,601
(100) Nomura Real Estate Hold-ings Inc Goldman Sachs 25
1,000 Nomura Research InstituteLtd Credit Suisse 2,119
35,500 NSK Ltd Barclays Bank 3243,200 NTT Data Corp Bank of America
Merrill Lynch 3,619(3,100) Obayashi Corp HSBC 3,365(4,000) Obayashi Corp JP Morgan 4,341
(800) Obic Co Ltd Bank of AmericaMerrill Lynch (1,824)
(17,100) Odakyu Electric Railway CoLtd Barclays Bank (6,862)
(2,000) Oji Holdings Corp Barclays Bank 657(29,700) Oji Holdings Corp Goldman Sachs 14,899
6,500 Olympus Corp Goldman Sachs 15,859(200) Omron Corp Credit Suisse (164)
10,900 Ono Pharmaceutical Co Ltd Barclays Bank (4,474)(1,200) Oracle Corp Japan Goldman Sachs 3,065(1,700) Oriental Land Co Ltd Bank of America
Merrill Lynch (15,970)(300) Oriental Land Co Ltd Barclays Bank (2,890)(700) Oriental Land Co Ltd Goldman Sachs (7,037)(300) Oriental Land Co Ltd HSBC (2,058)
2,000 ORIX Corp Barclays Bank 19228,400 Osaka Gas Co Ltd Bank of America
Merrill Lynch (40,409)9,800 Osaka Gas Co Ltd Barclays Bank (7,687)
600 Osaka Gas Co Ltd Goldman Sachs (10)
BlackRock Style Advantage Fund continued
Portfolio of Investments as at 31 May 2021
The notes on pages 590 to 610 form an integral part of these financial statements.
BlackRock Strategic Funds[442]

Holding Description Counterparty
Netunrealised
appreciation/(depreciation)
USD
Japan continued7,200 Osaka Gas Co Ltd HSBC (5,617)
600 Osaka Gas Co Ltd JP Morgan (493)(3,600) Otsuka Corp Bank of America
Merrill Lynch (3,283)(4,100) Otsuka Corp Goldman Sachs (3,740)2,800 Otsuka Holdings Co Ltd Bank of America
Merrill Lynch 2,579400 Otsuka Holdings Co Ltd Barclays Bank 168
1,400 Otsuka Holdings Co Ltd HSBC 1,686(8,900) Pan Pacific International
Holdings Corp Barclays Bank 7,306(2,800) Pan Pacific International
Holdings Corp Goldman Sachs 2619,000 Panasonic Corp Bank of America
Merrill Lynch 6,5855,500 Panasonic Corp Barclays Bank 3,2361,000 Panasonic Corp Citibank 588
900 Panasonic Corp Credit Suisse (357)6,600 Panasonic Corp Goldman Sachs 2,2876,800 Panasonic Corp HSBC (2,698)3,100 Panasonic Corp JP Morgan (1,230)
(5,700) PeptiDream Inc Barclays Bank (10,658)(800) PeptiDream Inc Goldman Sachs (2,007)(300) PeptiDream Inc HSBC (711)800 Persol Holdings Co Ltd Bank of America
Merrill Lynch 6281,400 Persol Holdings Co Ltd Citibank 38
200 Persol Holdings Co Ltd JP Morgan (78)(400) Pigeon Corp Barclays Bank 353
(10,300) Pigeon Corp Goldman Sachs 34,2893,000 Pola Orbis Holdings Inc Barclays Bank (383)
(2,200) Rakuten Group Inc Barclays Bank 482(1,200) Rakuten Group Inc Credit Suisse 865
(23,800) Rakuten Group Inc Goldman Sachs 15,846600 Recruit Holdings Co Ltd Goldman Sachs 4,203
(2,700) Renesas Electronics Corp Goldman Sachs 1,330(7,600) Resona Holdings Inc Goldman Sachs 35411,600 Ricoh Co Ltd Barclays Bank 1,693
100 Rinnai Corp Credit Suisse (20)400 Rohm Co Ltd Citibank 1,678
(600) Ryohin Keikaku Co Ltd Bank of AmericaMerrill Lynch 684
(1,900) Ryohin Keikaku Co Ltd Barclays Bank 1,646(7,000) Ryohin Keikaku Co Ltd Goldman Sachs 7,98116,000 Santen Pharmaceutical Co
Ltd Barclays Bank 2,335(1,900) SBI Holdings Inc Goldman Sachs (399)(5,700) SBI Holdings Inc HSBC 13,881(2,100) SCSK Corp Barclays Bank (2,298)1,300 Secom Co Ltd Bank of America
Merrill Lynch (344)300 Secom Co Ltd Citibank 47300 Secom Co Ltd Credit Suisse (2,044)700 Secom Co Ltd Goldman Sachs (185)200 Secom Co Ltd HSBC (1,363)300 Secom Co Ltd JP Morgan (2,044)
9,200 Sega Sammy Holdings Inc Bank of AmericaMerrill Lynch 503
4,000 Sega Sammy Holdings Inc Barclays Bank (876)7,700 Sega Sammy Holdings Inc Goldman Sachs 421
(1,000) Seibu Holdings Inc Bank of AmericaMerrill Lynch (921)
(10,400) Seibu Holdings Inc Barclays Bank (9,391)(2,500) Seibu Holdings Inc Citibank (2,257)(3,800) Seibu Holdings Inc Credit Suisse (3,431)(3,100) Seibu Holdings Inc Goldman Sachs (2,856)13,800 Seiko Epson Corp Barclays Bank 62935,800 Sekisui Chemical Co Ltd Credit Suisse (45,387)28,500 Sekisui House Ltd HSBC (10,398)(2,300) SG Holdings Co Ltd HSBC 1,217
Holding Description Counterparty
Netunrealised
appreciation/(depreciation)
USD
Japan continued(8,900) Sharp Corp Goldman Sachs (13,800)
900 Shimadzu Corp Barclays Bank 47600 Shimadzu Corp Goldman Sachs —100 Shimadzu Corp JP Morgan (137)300 Shimamura Co Ltd Credit Suisse (1,560)
(500) Shimano Inc Barclays Bank (2,645)10,500 Shimizu Corp Bank of America
Merrill Lynch 7665,900 Shimizu Corp Credit Suisse (2,045)
12,600 Shimizu Corp Goldman Sachs 919(500) Shin-Etsu Chemical Co Ltd Bank of America
Merrill Lynch (3,420)(700) Shin-Etsu Chemical Co Ltd Barclays Bank (2,681)(200) Shin-Etsu Chemical Co Ltd Citibank (766)(500) Shin-Etsu Chemical Co Ltd Credit Suisse (1,277)
(1,000) Shin-Etsu Chemical Co Ltd Goldman Sachs (6,841)(7,500) Shinsei Bank Ltd Bank of America
Merrill Lynch (2,736)(700) Shionogi & Co Ltd Barclays Bank 467
(2,000) Shiseido Co Ltd Bank of AmericaMerrill Lynch (4,232)
(3,600) Shiseido Co Ltd Barclays Bank (9,982)(1,700) Shiseido Co Ltd Credit Suisse (140)
(300) Shiseido Co Ltd Goldman Sachs (635)(1,200) Shiseido Co Ltd HSBC (99)2,500 Shizuoka Bank Ltd Bank of America
Merrill Lynch (958)2,500 Shizuoka Bank Ltd Barclays Bank (980)1,400 Shizuoka Bank Ltd Citibank (549)5,900 Shizuoka Bank Ltd HSBC —(400) SMC Corp Bank of America
Merrill Lynch (15,432)(100) SMC Corp JP Morgan (264)
(4,800) SoftBank Corp Barclays Bank 285(4,700) SoftBank Corp Goldman Sachs 943(1,100) SoftBank Group Corp Barclays Bank 592(1,800) SoftBank Group Corp HSBC 31,423
400 Sohgo Security Services CoLtd
Bank of AmericaMerrill Lynch (146)
300 Sohgo Security Services CoLtd Goldman Sachs (25)
(3,600) Sompo Holdings Inc Goldman Sachs (1,740)(800) Sompo Holdings Inc HSBC (1,087)600 Sony Group Corp Bank of America
Merrill Lynch 2,4904,200 Sony Group Corp Barclays Bank 10,534
200 Sony Group Corp Citibank 502300 Sony Group Corp Credit Suisse 14200 Sony Group Corp Goldman Sachs 830
1,200 Sony Group Corp HSBC 55(1,400) Square Enix Holdings Co
Ltd Barclays Bank 1,149(200) Square Enix Holdings Co
Ltd Credit Suisse 235(400) Square Enix Holdings Co
Ltd HSBC 1,0225,600 Stanley Electric Co Ltd Bank of America
Merrill Lynch 12,769100 Stanley Electric Co Ltd JP Morgan 59600 Subaru Corp Bank of America
Merrill Lynch 3514,500 Subaru Corp Barclays Bank 2,7708,900 Subaru Corp Goldman Sachs 6,413
(1,900) SUMCO Corp Bank of AmericaMerrill Lynch (1,594)
(700) SUMCO Corp Barclays Bank (830)(5,800) SUMCO Corp Citibank (6,877)(4,900) SUMCO Corp Credit Suisse 4,827(1,800) SUMCO Corp Goldman Sachs (1,510)
(17,500) Sumitomo Chemical Co Ltd Barclays Bank (479)
BlackRock Style Advantage Fund continued
Portfolio of Investments as at 31 May 2021
The notes on pages 590 to 610 form an integral part of these financial statements.
Annual report and audited financial statements [443]

Holding Description Counterparty
Netunrealised
appreciation/(depreciation)
USD
Japan continued(24,600) Sumitomo Chemical Co Ltd Goldman Sachs (4,487)(18,300) Sumitomo Corp Goldman Sachs (3,505)(1,300) Sumitomo Dainippon
Pharma Co LtdBank of AmericaMerrill Lynch (688)
(1,400) Sumitomo DainipponPharma Co Ltd Citibank 702
(1,400) Sumitomo DainipponPharma Co Ltd Credit Suisse (1,686)
(4,200) Sumitomo Electric Indus-tries Ltd
Bank of AmericaMerrill Lynch (2,950)
(4,900) Sumitomo Electric Indus-tries Ltd Barclays Bank (2,302)
(2,000) Sumitomo Electric Indus-tries Ltd Credit Suisse (784)
(500) Sumitomo Metal Mining CoLtd Barclays Bank (141)
(300) Sumitomo Metal Mining CoLtd Credit Suisse (692)
(800) Sumitomo Metal Mining CoLtd Goldman Sachs (1,561)
10,600 Sumitomo Mitsui FinancialGroup Inc Credit Suisse (1,837)
700 Sumitomo Mitsui Trust Hold-ings Inc
Bank of AmericaMerrill Lynch (645)
500 Sumitomo Mitsui Trust Hold-ings Inc Barclays Bank (305)
300 Sumitomo Mitsui Trust Hold-ings Inc Credit Suisse 23
600 Sumitomo Mitsui Trust Hold-ings Inc Goldman Sachs (236)
(1,000) Sumitomo Realty & Devel-opment Co Ltd Barclays Bank (55)
12,700 Suntory Beverage & FoodLtd
Bank of AmericaMerrill Lynch (6,371)
(3,400) Suzuken Co Ltd Goldman Sachs 3,411700 Suzuki Motor Corp Barclays Bank 990700 Sysmex Corp Bank of America
Merrill Lynch 3,895600 Sysmex Corp Citibank 2,599100 Sysmex Corp Credit Suisse —200 Sysmex Corp HSBC —
1,900 T&D Holdings Inc Goldman Sachs 1,45615,300 Taiheiyo Cement Corp Goldman Sachs (9,768)5,600 Taisei Corp Barclays Bank (6,895)
800 Taisei Corp Credit Suisse (2,992)1,500 Taisei Corp Goldman Sachs (752)5,800 Taisho Pharmaceutical
Holdings Co Ltd Barclays Bank (4,761)(600) Takeda Pharmaceutical Co
LtdBank of AmericaMerrill Lynch 268
(5,200) Takeda Pharmaceutical CoLtd Barclays Bank 2,039
(4,700) Takeda Pharmaceutical CoLtd Citibank 1,843
(27,800) Takeda Pharmaceutical CoLtd Goldman Sachs 12,424
(1,200) Takeda Pharmaceutical CoLtd HSBC 120
400 TDK Corp Citibank 219700 TDK Corp Goldman Sachs 3,192
1,000 TDK Corp HSBC (8,026)18,100 Teijin Ltd Credit Suisse (17,994)8,200 Teijin Ltd HSBC (8,152)
29,100 Teijin Ltd JP Morgan (28,930)4,300 Terumo Corp Barclays Bank 3,216
(1,400) THK Co Ltd Credit Suisse 4,022(1,700) TIS Inc Bank of America
Merrill Lynch (4,031)(8,000) TIS Inc HSBC (9,777)(3,500) Tobu Railway Co Ltd Bank of America
Merrill Lynch 3,192
Holding Description Counterparty
Netunrealised
appreciation/(depreciation)
USD
Japan continued(14,700) Tobu Railway Co Ltd Barclays Bank (2,950)
(200) Tobu Railway Co Ltd Goldman Sachs 182(12,100) Toho Co Ltd HSBC (13,795)(1,000) Tokio Marine Holdings Inc Bank of America
Merrill Lynch 2,426(500) Tokio Marine Holdings Inc Citibank 451
(2,500) Tokio Marine Holdings Inc Goldman Sachs 6,065(300) Tokio Marine Holdings Inc HSBC 802
(2,100) Tokio Marine Holdings Inc JP Morgan 5,612(3,200) Tokyo Century Corp Goldman Sachs 876
200 Tokyo Electron Ltd Barclays Bank 4,7433,400 Tokyo Gas Co Ltd Bank of America
Merrill Lynch (4,869)14,700 Tokyo Gas Co Ltd Barclays Bank (7,843)
900 Tokyo Gas Co Ltd Citibank (480)900 Tokyo Gas Co Ltd Credit Suisse (1,379)
3,600 Tokyo Gas Co Ltd HSBC (5,516)1,100 Tokyo Gas Co Ltd JP Morgan (1,686)
(7,900) Tokyu Corp Bank of AmericaMerrill Lynch (648)
(7,500) Tokyu Corp Barclays Bank (2,736)(3,900) Tokyu Corp Credit Suisse (213)(2,300) Tokyu Corp Goldman Sachs (189)(1,400) Tokyu Corp JP Morgan (77)
(28,400) Tokyu Fudosan HoldingsCorp HSBC (1,813)
11,900 Toppan Printing Co Ltd Bank of AmericaMerrill Lynch 9,551
2,800 Toppan Printing Co Ltd Barclays Bank 4091,300 Toppan Printing Co Ltd Goldman Sachs 1,0431,400 Toppan Printing Co Ltd JP Morgan (447)2,100 Toray Industries Inc Bank of America
Merrill Lynch 5002,100 Toray Industries Inc Barclays Bank 86
69,800 Toray Industries Inc Goldman Sachs 16,616(1,400) Toshiba Corp HSBC (1,022)2,500 Tosoh Corp Bank of America
Merrill Lynch (3,147)2,400 Tosoh Corp Goldman Sachs (3,021)2,100 Tosoh Corp HSBC (2,394)4,500 TOTO Ltd Barclays Bank 9,4408,900 Toyo Suisan Kaisha Ltd Bank of America
Merrill Lynch —19,600 Toyoda Gosei Co Ltd Goldman Sachs 19,843
(600) Toyota Industries Corp Goldman Sachs (284)(1,100) Toyota Motor Corp Bank of America
Merrill Lynch (3,250)(400) Toyota Motor Corp Credit Suisse (2,222)(600) Toyota Motor Corp Goldman Sachs (2,556)400 Toyota Tsusho Corp Bank of America
Merrill Lynch 91600 Toyota Tsusho Corp Citibank (575)300 Toyota Tsusho Corp Credit Suisse (561)800 Trend Micro Inc Bank of America
Merrill Lynch 1,532200 Trend Micro Inc Barclays Bank —500 Tsuruha Holdings Inc Barclays Bank 775
(3,300) Unicharm Corp Barclays Bank 8,698(1,100) Unicharm Corp HSBC (692)(3,000) USS Co Ltd Barclays Bank (1,067)(3,300) USS Co Ltd Credit Suisse 2,619
(300) Welcia Holdings Co Ltd Bank of AmericaMerrill Lynch 123
(1,200) Welcia Holdings Co Ltd Barclays Bank 219(1,900) West Japan Railway Co Bank of America
Merrill Lynch (2,409)(900) West Japan Railway Co Barclays Bank (804)(300) West Japan Railway Co Credit Suisse (25)
(1,900) West Japan Railway Co Goldman Sachs (2,409)1,700 Yakult Honsha Co Ltd Barclays Bank 1,240
BlackRock Style Advantage Fund continued
Portfolio of Investments as at 31 May 2021
The notes on pages 590 to 610 form an integral part of these financial statements.
BlackRock Strategic Funds[444]

Holding Description Counterparty
Netunrealised
appreciation/(depreciation)
USD
Japan continued5,900 Yamada Holdings Co Ltd Goldman Sachs (1,130)
200 Yamaha Corp Bank of AmericaMerrill Lynch 711
600 Yamaha Corp Barclays Bank 1,204500 Yamaha Corp Goldman Sachs 1,779
16,300 Yamaha Motor Co Ltd Barclays Bank 11,893800 Yamato Holdings Co Ltd Barclays Bank (219)
2,400 Yamato Holdings Co Ltd Citibank (657)100 Yamato Holdings Co Ltd Credit Suisse (87)600 Yamato Holdings Co Ltd Goldman Sachs 120
(1,500) Yamazaki Baking Co Ltd Bank of AmericaMerrill Lynch 903
(1,500) Yamazaki Baking Co Ltd Citibank 192(1,100) Yamazaki Baking Co Ltd Credit Suisse 1,174(1,600) Yamazaki Baking Co Ltd Goldman Sachs 963
(400) Yaskawa Electric Corp Bank of AmericaMerrill Lynch (2,134)
(900) Yaskawa Electric Corp Barclays Bank (3,530)(300) Yaskawa Electric Corp Citibank (1,177)(500) Yaskawa Electric Corp Credit Suisse (638)(300) Yaskawa Electric Corp Goldman Sachs (1,601)
8,600 Yokogawa Electric Corp Bank of AmericaMerrill Lynch (3,687)
(5,600) Z Holdings Corp Bank of AmericaMerrill Lynch (2,232)
(6,900) Z Holdings Corp Barclays Bank (2,782)(4,800) Z Holdings Corp Goldman Sachs (1,913)
(36,100) Z Holdings Corp HSBC (12,973)(4,000) Z Holdings Corp JP Morgan (1,437)2,000 ZOZO Inc Barclays Bank (730)
77,007
Netherlands(4,604) ABN AMRO Bank NV - CVA Barclays Bank (1,113)
(18,262) ABN AMRO Bank NV - CVA Deutsche Bank (7,488)7 Adyen NV Bank of America
Merrill Lynch 1,72019 Adyen NV Barclays Bank 605
107 Adyen NV Deutsche Bank 23,9897 Adyen NV JP Morgan 516
(33,821) Aegon NV Deutsche Bank 5,9442,337 Akzo Nobel NV Deutsche Bank 7,199
95 Akzo Nobel NV Goldman Sachs 330(11,863) ArcelorMittal SA Barclays Bank (19,834)
(904) ArcelorMittal SA Credit Suisse (1,612)(5,145) ArcelorMittal SA Deutsche Bank (3,973)
(137) ASM International NV Credit Suisse (635)73 ASML Holding NV Barclays Bank 1,31039 ASML Holding NV Deutsche Bank 1,53740 ASML Holding NV Goldman Sachs 1,577
(1,552) Galapagos NV Deutsche Bank 4,186(4,119) Heineken NV Deutsche Bank 3,619(1,393) ING Groep NV Barclays Bank (469)(3,033) ING Groep NV Deutsche Bank (1,732)
(474) JDE Peet’s NV Barclays Bank 29(5,330) JDE Peet’s NV Deutsche Bank 715
(438) Just Eat Takeaway.com NV Bank of AmericaMerrill Lynch (413)
(348) Just Eat Takeaway.com NV Barclays Bank (451)(389) Just Eat Takeaway.com NV Citibank (1,154)
(6,486) Just Eat Takeaway.com NV Deutsche Bank (20,933)(240) Just Eat Takeaway.com NV JP Morgan 1,693
2,859 Koninklijke Ahold DelhaizeNV
Bank of AmericaMerrill Lynch (925)
2,139 Koninklijke Ahold DelhaizeNV Barclays Bank (796)
21,739 Koninklijke Ahold DelhaizeNV Deutsche Bank (6,902)
(198) Koninklijke DSM NV Bank of AmericaMerrill Lynch (495)
Holding Description Counterparty
Netunrealised
appreciation/(depreciation)
USD
Netherlands continued50,785 Koninklijke KPN NV Bank of America
Merrill Lynch (6,082)8,149 Koninklijke KPN NV Barclays Bank (885)
17,674 Koninklijke KPN NV Deutsche Bank (1,964)83 Koninklijke Philips NV Barclays Bank (73)
12,793 Koninklijke Philips NV Deutsche Bank (7,260)252 Koninklijke Vopak NV Deutsche Bank 22290 Koninklijke Vopak NV Goldman Sachs 25334 NN Group NV Barclays Bank (241)601 NN Group NV Citibank (433)247 NN Group NV Credit Suisse (531)
4,321 NN Group NV Deutsche Bank (10,230)7,438 NN Group NV Goldman Sachs (17,610)
(5,974) Prosus NV Deutsche Bank (5,778)(850) Prosus NV Goldman Sachs (695)(372) Prosus NV HSBC 626(135) Prosus NV JP Morgan (55)
2,123 Randstad NV Bank of AmericaMerrill Lynch 6,218
4,881 Randstad NV Barclays Bank 12,86710,264 Randstad NV Deutsche Bank 30,063
747 Randstad NV Goldman Sachs 2,188143 Randstad NV JP Morgan 22746 Wolters Kluwer NV Credit Suisse 22
1,923 Wolters Kluwer NV Deutsche Bank 1,549857 Wolters Kluwer NV HSBC 418
(11,568)
New Zealand(7,015) a2 Milk Co Ltd Deutsche Bank (510)
(85,037) Auckland International Air-port Ltd HSBC 14,216
19,708 Fisher & Paykel HealthcareCorp Ltd Goldman Sachs (52,858)
(54,097) Mercury NZ Ltd HSBC 10,42022,661 Meridian Energy Ltd Bank of America
Merrill Lynch (165)14,116 Meridian Energy Ltd Deutsche Bank (103)
(52,599) Ryman Healthcare Ltd HSBC 43,58410,732 Spark New Zealand Ltd Barclays Bank (117)4,884 Spark New Zealand Ltd Credit Suisse (35)
24,739 Spark New Zealand Ltd Deutsche Bank 8218,034 Spark New Zealand Ltd Goldman Sachs 350
15,603
Norway(1,316) Adevinta ASA Bank of America
Merrill Lynch (2,689)(11,988) Adevinta ASA Deutsche Bank (24,492)(1,067) DNB ASA Barclays Bank 383,685 Equinor ASA Barclays Bank 1,669
523 Equinor ASA Citibank 2374,083 Equinor ASA Deutsche Bank (127)
(2,513) Gjensidige Forsikring ASA Deutsche Bank 934(9,968) Mowi ASA Bank of America
Merrill Lynch (9,078)(1,437) Mowi ASA Citibank (430)(1,016) Mowi ASA Credit Suisse 377(6,200) Mowi ASA Deutsche Bank (5,646)
(986) Mowi ASA Goldman Sachs (898)21,385 Norsk Hydro ASA Barclays Bank 11,53123,398 Norsk Hydro ASA Deutsche Bank 2,3551,472 Orkla ASA Barclays Bank 282
22,571 Orkla ASA Deutsche Bank 9,250(811) Schibsted ASA ’A’ Bank of America
Merrill Lynch (2,099)(2,115) Schibsted ASA ’A’ Deutsche Bank (5,474)
(380) Schibsted ASA ’B’ Citibank (391)2,751 Telenor ASA Barclays Bank (1,961)
BlackRock Style Advantage Fund continued
Portfolio of Investments as at 31 May 2021
The notes on pages 590 to 610 form an integral part of these financial statements.
Annual report and audited financial statements [445]

Holding Description Counterparty
Netunrealised
appreciation/(depreciation)
USD
Norway continued1,897 Telenor ASA Deutsche Bank (1,080)
298 Yara International ASA Deutsche Bank (268)
(27,960)
Portugal816 Galp Energia SGPS SA Credit Suisse (45)
10,248 Galp Energia SGPS SA Deutsche Bank (2,439)(8,878) Jeronimo Martins SGPS SA Deutsche Bank 650
(1,834)
Singapore(28,000) CapitaLand Ltd Bank of America
Merrill Lynch (1,907)(10,600) CapitaLand Ltd Citibank (401)(48,900) CapitaLand Ltd Deutsche Bank (3,330)(31,200) CapitaLand Ltd Goldman Sachs (2,124)(3,700) CapitaLand Ltd JP Morgan (112)10,200 City Developments Ltd Bank of America
Merrill Lynch 2,701(60,200) Keppel Corp Ltd Goldman Sachs (8,198)(16,200) Singapore Airlines Ltd Barclays Bank (1,965)(23,199) Singapore Airlines Ltdπ Barclays Bank —(42,900) Singapore Airlines Ltd Goldman Sachs (10,198)(82,137) Singapore Airlines Ltdπ Goldman Sachs —(3,000) Singapore Airlines Ltd HSBC (250)(6,270) Singapore Airlines Ltdπ HSBC —35,400 Singapore Technologies
Engineering Ltd Barclays Bank 1,8756,500 Singapore Technologies
Engineering Ltd Citibank 34414,400 Singapore Technologies
Engineering Ltd Credit Suisse 1,30710,600 Singapore Technologies
Engineering Ltd Deutsche Bank 9623,900 Singapore Technologies
Engineering Ltd Goldman Sachs 3547,200 Singapore Technologies
Engineering Ltd HSBC 65426,400 Singapore Technologies
Engineering Ltd JP Morgan 2,39749,200 Singapore Telecommunica-
tions LtdBank of AmericaMerrill Lynch 1,489
54,100 Singapore Telecommunica-tions Ltd Barclays Bank (1,228)
87,800 Singapore Telecommunica-tions Ltd Deutsche Bank 1,773
29,300 United Overseas Bank Ltd Barclays Bank 8,424(36,100) UOL Group Ltd Bank of America
Merrill Lynch (3,824)(13,900) Venture Corp Ltd Goldman Sachs (7,256)
4,700 Wilmar International Ltd Deutsche Bank (134)
(18,647)
South Korea1 Doosan Co Ltd Citibank 91 HDC Holdings Co Ltd Goldman Sachs 21 HDC Holdings Co Ltdπ JP Morgan —
(1) Lotte Shopping Co Ltd Bank of AmericaMerrill Lynch (6)
5
Spain(290) Aena SME SA Bank of America
Merrill Lynch (248)(310) Aena SME SA Barclays Bank (208)
(2,259) Aena SME SA Deutsche Bank (2,020)(174) Aena SME SA Goldman Sachs (149)(119) Aena SME SA JP Morgan 36(221) Amadeus IT Group SA Barclays Bank (291)
(3,847) Amadeus IT Group SA Deutsche Bank (8,826)14,809 Banco Bilbao Vizcaya Ar-
gentaria SA Deutsche Bank 2,333
Holding Description Counterparty
Netunrealised
appreciation/(depreciation)
USD
Spain continued(10,864) Banco Santander SA Deutsche Bank (1,538)(5,567) CaixaBank SA Barclays Bank (245)
(16,927) CaixaBank SA Credit Suisse (785)(14,212) CaixaBank SA Deutsche Bank 468(9,890) CaixaBank SA Goldman Sachs 326(1,651) Cellnex Telecom SA Bank of America
Merrill Lynch (7,112)(8,760) Cellnex Telecom SA Barclays Bank (3,421)
(234) Cellnex Telecom SA Citibank (91)(7,815) Cellnex Telecom SA Deutsche Bank (33,667)(1,043) Cellnex Telecom SA Goldman Sachs (4,493)
44 Endesa SA Credit Suisse 325,830 Endesa SA Deutsche Bank (21,751)
882 Endesa SA HSBC 65(471) Ferrovial SA Barclays Bank 150(471) Ferrovial SA Barclays Bank 3
(16,238) Ferrovial SA Citibank 5,152(16,238) Ferrovial SA Citibank 84(3,118) Ferrovial SA Deutsche Bank 1,674(3,118) Ferrovial SA Deutsche Bank 14
(884) Ferrovial SA HSBC 561(884) Ferrovial SA HSBC (215)(462) Grifols SA Bank of America
Merrill Lynch 609(2,543) Grifols SA Barclays Bank 1,185(1,153) Grifols SA Citibank 580
(705) Grifols SA Credit Suisse 533(5,059) Grifols SA Deutsche Bank 6,029(5,475) Grifols SA JP Morgan 4,143
983 Iberdrola SA Barclays Bank (498)10,142 Iberdrola SA Credit Suisse (5,198)14,113 Iberdrola SA Deutsche Bank (4,650)1,940 Industria de Diseno Textil
SABank of AmericaMerrill Lynch (1,373)
1,472 Industria de Diseno TextilSA Deutsche Bank (1,042)
(2,672) Naturgy Energy Group SA Deutsche Bank 631,922 Repsol SA Barclays Bank (108)3,386 Repsol SA Citibank (190)
24,258 Repsol SA Deutsche Bank (5,684)3,662 Repsol SA Goldman Sachs (858)
629 Repsol SA JP Morgan 61(602) Siemens Gamesa Renew-
able Energy SABank of AmericaMerrill Lynch (221)
(4,450) Siemens Gamesa Renew-able Energy SA Barclays Bank (5,105)
(2,805) Siemens Gamesa Renew-able Energy SA Deutsche Bank (3,471)
(1,099) Siemens Gamesa Renew-able Energy SA Goldman Sachs (966)
2,619 Telefonica SA Deutsche Bank (342)2,143 Telefonica SA HSBC (64)
(90,758)
Sweden1,073 Alfa Laval AB Deutsche Bank 1,799
(3,021) Assa Abloy AB ’B’ Barclays Bank 182(1,197) Atlas Copco AB ’A’ Credit Suisse 2,483(1,184) Atlas Copco AB ’A’ Deutsche Bank 1,3144,798 Boliden AB Bank of America
Merrill Lynch (9,432)4,798 Boliden AB Bank of America
Merrill Lynch 121,049 Boliden AB Credit Suisse (3,473)1,049 Boliden AB Credit Suisse 7595,222 Boliden AB Deutsche Bank (10,265)5,222 Boliden AB Deutsche Bank 13
968 Electrolux AB ’B’ Bank of AmericaMerrill Lynch (549)
338 Electrolux AB ’B’ Citibank 147
BlackRock Style Advantage Fund continued
Portfolio of Investments as at 31 May 2021
The notes on pages 590 to 610 form an integral part of these financial statements.
BlackRock Strategic Funds[446]

Holding Description Counterparty
Netunrealised
appreciation/(depreciation)
USD
Sweden continued13,499 Electrolux AB ’B’ Deutsche Bank (7,651)3,257 Electrolux AB ’B’ Goldman Sachs (1,846)1,447 Electrolux AB ’B’ HSBC (297)1,438 Electrolux AB ’B’ JP Morgan (295)
(2,814) EQT AB Deutsche Bank (12,217)(3,292) Essity AB ’B’ Bank of America
Merrill Lynch 2,025(1,216) Essity AB ’B’ Barclays Bank 1,874(1,961) Essity AB ’B’ Credit Suisse 1,508(8,727) Essity AB ’B’ Deutsche Bank 4,797
(333) Essity AB ’B’ Goldman Sachs 205(304) Essity AB ’B’ HSBC 70(123) Evolution AB Barclays Bank (1,602)(91) Evolution AB Credit Suisse (11)
(157) Evolution AB Deutsche Bank (3,683)(736) Fastighets AB Balder Bank of America
Merrill Lynch (2,024)(1,618) Fastighets AB Balder Deutsche Bank (4,449)
(745) Fastighets AB Balder Goldman Sachs (2,049)(172) Fastighets AB Balder JP Morgan (452)
(9,070) H & M Hennes & Mauritz AB’B’ Deutsche Bank (1,149)
(20,055) Hexagon AB ’B’ Credit Suisse (10,348)(1,697) Hexagon AB ’B’ Deutsche Bank (1,024)(4,788) Hexagon AB ’B’ Goldman Sachs 1,274
(10,486) Hexagon AB ’B’ HSBC (5,411)27,533 Husqvarna AB ’B’ Barclays Bank 12,1205,765 Husqvarna AB ’B’ Deutsche Bank 1,182
(8,681) ICA Gruppen AB Barclays Bank 2,199(768) Investment AB Latour ’B’ Deutsche Bank (2,084)
(23,944) Investment AB Latour ’B’ Goldman Sachs (64,971)1,550 Investor AB ’B’ Deutsche Bank 1,149
26,160 Investor AB ’B’ JP Morgan 25,239496 Kinnevik AB Bank of America
Merrill Lynch 9,451686 Kinnevik AB Citibank (331)
1,331 Kinnevik AB Deutsche Bank 25,362496 Kinnevik AB ’B’ Bank of America
Merrill Lynch 3,670686 Kinnevik AB ’B’ Citibank 3,342
1,331 Kinnevik AB ’B’ Deutsche Bank 9,848(1,724) L E Lundbergforetagen AB
’B’ Barclays Bank (6,487)(2,653) L E Lundbergforetagen AB
’B’ Deutsche Bank (12,318)299 Lundin Energy AB Bank of America
Merrill Lynch 7911,555 Lundin Energy AB Barclays Bank 9,894
444 Lundin Energy AB Credit Suisse 3592,955 Lundin Energy AB Deutsche Bank 784
(2) NCC AB ’B’ Credit Suisse 140,989 Nordea Bank Abp Deutsche Bank 12,259(2,040) Sandvik AB Barclays Bank (369)
(761) Sandvik AB Citibank (138)(4,459) Sandvik AB Deutsche Bank 4,463
(564) Sandvik AB Goldman Sachs 565(4,653) Securitas AB ’B’ Deutsche Bank 4,6011,813 Skandinaviska Enskilda
Banken AB ’A’ Deutsche Bank (590)912 Skanska AB ’B’ Bank of America
Merrill Lynch (473)6,876 Skanska AB ’B’ Barclays Bank (3,317)1,251 Skanska AB ’B’ Credit Suisse (830)5,577 Skanska AB ’B’ Deutsche Bank (2,892)
613 Skanska AB ’B’ HSBC (407)(663) SKF AB ’B’ Barclays Bank (480)(983) SKF AB ’B’ Deutsche Bank 76
(1,179) Svenska Cellulosa AB SCA’B’
Bank of AmericaMerrill Lynch 322
Holding Description Counterparty
Netunrealised
appreciation/(depreciation)
USD
Sweden continued(2,576) Svenska Cellulosa AB SCA
’B’ Credit Suisse 1,663(24,539) Svenska Cellulosa AB SCA
’B’ Deutsche Bank 23,572(13,641) Svenska Cellulosa AB SCA
’B’ Goldman Sachs 14,724(3,659) Svenska Handelsbanken AB
’A’ Barclays Bank 1,9951,554 Swedbank AB ’A’ Goldman Sachs (457)6,499 Tele2 AB ’B’ Deutsche Bank 1,058
10,853 Telefonaktiebolaget LM Er-icsson ’B’ Barclays Bank (2,120)
15,312 Telefonaktiebolaget LM Er-icsson ’B’ Deutsche Bank (28)
14,867 Telia Co AB Barclays Bank (1,981)5,806 Telia Co AB Credit Suisse (484)
67,948 Telia Co AB Deutsche Bank (3,655)14,980 Telia Co AB Goldman Sachs (587)4,934 Telia Co AB HSBC 627,887 Telia Co AB JP Morgan 100
(1,143) Volvo AB ’B’ Bank of AmericaMerrill Lynch 62
(471) Volvo AB ’B’ Deutsche Bank 26
5,463
Switzerland(12,418) ABB Ltd Reg Barclays Bank (8,137)(1,130) ABB Ltd Reg Citibank (740)
(994) ABB Ltd Reg HSBC (431)3,082 Adecco Group AG Reg Bank of America
Merrill Lynch 5,390820 Adecco Group AG Reg Barclays Bank 903405 Adecco Group AG Reg Citibank 504
1,082 Adecco Group AG Reg Goldman Sachs 1,7892,670 Adecco Group AG Reg JP Morgan 2,847
(1,711) Alcon Inc Goldman Sachs (1,558)374 Baloise Holding AG Reg Bank of America
Merrill Lynch (665)527 Baloise Holding AG Reg Barclays Bank 1,756418 Baloise Holding AG Reg Citibank 1,393403 Baloise Holding AG Reg HSBC (1,164)
(1,187) Banque Cantonale Vaudo-ise Reg
Bank of AmericaMerrill Lynch 4,482
(4,777) Banque Cantonale Vaudo-ise Reg Barclays Bank 3,714
230 Banque Cantonale Vaudo-ise Reg Deutsche Bank (868)
(146) Barry Callebaut AG Reg Barclays Bank (6,161)(24) Chocoladefabriken Lindt &
Spruengli AG Citibank (2,665)(16,806) Clariant AG Reg Bank of America
Merrill Lynch (2,520)2,040 Credit Suisse Group AG Barclays Bank —(913) Credit Suisse Group AG
RegBank of AmericaMerrill Lynch (9)
(7,489) Credit Suisse Group AGReg Barclays Bank (1,697)
(3,764) Credit Suisse Group AGReg Citibank (853)
(3,759) Credit Suisse Group AGReg Goldman Sachs (1,456)
(6,542) Credit Suisse Group AGReg HSBC (4,882)
(1,154) Credit Suisse Group AGReg JP Morgan (494)
(265) EMS-Chemie Holding AGReg Barclays Bank (5,445)
(87) EMS-Chemie Holding AGReg Citibank (1,787)
BlackRock Style Advantage Fund continued
Portfolio of Investments as at 31 May 2021
The notes on pages 590 to 610 form an integral part of these financial statements.
Annual report and audited financial statements [447]

Holding Description Counterparty
Netunrealised
appreciation/(depreciation)
USD
Switzerland continued(170) EMS-Chemie Holding AG
Reg Credit Suisse 1,510(4) EMS-Chemie Holding AG
Reg Goldman Sachs (169)242 Geberit AG Reg Bank of America
Merrill Lynch 7,09045 Geberit AG Reg Barclays Bank 47016 Geberit AG Reg Citibank 1477 Givaudan SA Reg JP Morgan (118)
760 Holcim Ltd Bank of AmericaMerrill Lynch (304)
5,454 Holcim Ltd Barclays Bank 1,2114,003 Holcim Ltd Credit Suisse (6,846)
392 Holcim Ltd Goldman Sachs (157)462 Holcim Ltd HSBC (790)170 Holcim Ltd JP Morgan (291)201 Julius Baer Group Ltd Bank of America
Merrill Lynch 464205 Julius Baer Group Ltd Barclays Bank 310157 Julius Baer Group Ltd Credit Suisse 729580 Julius Baer Group Ltd Goldman Sachs 1,225
1,740 Kuehne + Nagel Interna-tional AG Reg Barclays Bank 13,527
1,918 Logitech International SAReg Barclays Bank 17,999
164 Logitech International SAReg Citibank 1,539
297 Logitech International SAReg Credit Suisse 4,542
308 Logitech International SAReg Goldman Sachs 5,764
1,159 Logitech International SAReg HSBC 17,724
(329) Lonza Group AG Reg Bank of AmericaMerrill Lynch (5,408)
(17) Lonza Group AG Reg Barclays Bank (102)(33) Lonza Group AG Reg Citibank (198)
(390) Lonza Group AG Reg Goldman Sachs (6,410)(22) Lonza Group AG Reg HSBC (411)
1,526 Nestle SA Reg Bank of AmericaMerrill Lynch 1,546
146 Nestle SA Reg HSBC 321161 Nestle SA Reg JP Morgan 354
3,716 Novartis AG Reg Credit Suisse (1,527)3,511 Novartis AG Reg JP Morgan (1,443)(103) Partners Group Holding AG Bank of America
Merrill Lynch (10,123)97 Roche Holding AG Bank of America
Merrill Lynch 937102 Roche Holding AG Barclays Bank 125
1,270 Roche Holding AG Credit Suisse 16,431(616) Schindler Holding AG Barclays Bank (2,668)
51 SGS SA Reg Goldman Sachs 4,644(1,053) Sika AG Reg Bank of America
Merrill Lynch (17,424)(63) Sika AG Reg Barclays Bank (231)662 Sonova Holding AG Reg Bank of America
Merrill Lynch 45,65525 Straumann Holding AG Reg Bank of America
Merrill Lynch 2,22452 Straumann Holding AG Reg Barclays Bank 1,86310 Straumann Holding AG Reg Citibank 3839 Straumann Holding AG Reg Goldman Sachs 855
45 Straumann Holding AG Reg HSBC 2,524262 Swiss Life Holding AG Reg Bank of America
Merrill Lynch 1,804508 Swiss Life Holding AG Reg Goldman Sachs 3,49869 Swiss Life Holding AG Reg JP Morgan 452
521 Swiss Re AG Bank of AmericaMerrill Lynch (694)
Holding Description Counterparty
Netunrealised
appreciation/(depreciation)
USD
Switzerland continued546 Swiss Re AG Goldman Sachs (728)878 Swisscom AG Reg Bank of America
Merrill Lynch 1,365(1,104) Temenos AG Reg Bank of America
Merrill Lynch (8,031)(85) Temenos AG Reg Barclays Bank (217)(69) Temenos AG Reg Goldman Sachs (502)
5,736 UBS Group AG Reg Bank of AmericaMerrill Lynch 4,236
14,739 UBS Group AG Reg Barclays Bank 3,9281,244 UBS Group AG Reg Credit Suisse 7745,286 UBS Group AG Reg Goldman Sachs 3,9042,314 UBS Group AG Reg HSBC 1,439
(2,782) Vifor Pharma AG Bank of AmericaMerrill Lynch (16,335)
(2,419) Vifor Pharma AG Barclays Bank (12,098)(150) Vifor Pharma AG Citibank (808)(168) Vifor Pharma AG Credit Suisse (699)(902) Vifor Pharma AG Goldman Sachs (5,434)622 Zurich Insurance Group AG Barclays Bank 1,658
56,251
Taiwan(415) Shin Kong Financial Holding
Co Ltd (Pref)Bank of AmericaMerrill Lynch (22)
(22)
United Kingdom2,349 3i Group Plc Bank of America
Merrill Lynch 6998,501 3i Group Plc Barclays Bank (1,205)4,995 3i Group Plc Citibank (708)
12,367 3i Group Plc Deutsche Bank 3,6801,210 3i Group Plc Goldman Sachs 3606,043 3i Group Plc HSBC 814
(1,250) Admiral Group Plc Bank of AmericaMerrill Lynch 159
(6,572) Admiral Group Plc Barclays Bank (2,887)(3,326) Admiral Group Plc Deutsche Bank 424(4,619) Antofagasta Plc Bank of America
Merrill Lynch 10,309(238) Antofagasta Plc Barclays Bank (66)
(10,811) Antofagasta Plc Deutsche Bank 18,538(638) Antofagasta Plc Goldman Sachs 1,424236 Ashtead Group Plc Bank of America
Merrill Lynch 575184 Ashtead Group Plc Citibank 130910 Ashtead Group Plc Deutsche Bank 2,218337 Ashtead Group Plc Goldman Sachs 821
(1,452) Associated British Foods Plc Barclays Bank 185(972) Associated British Foods Plc Deutsche Bank (606)
(1,043) Associated British Foods Plc Goldman Sachs (650)(289) AstraZeneca Plc Barclays Bank 426
(2,303) AstraZeneca Plc Deutsche Bank (4,928)(147) AstraZeneca Plc JP Morgan (685)
27,801 Auto Trader Group Plc Barclays Bank (2,442)2,023 Auto Trader Group Plc Citibank (178)8,633 Auto Trader Group Plc Goldman Sachs 1,713(834) AVEVA Group Plc Barclays Bank (2,647)
(9,038) AVEVA Group Plc Deutsche Bank (32,092)(643) AVEVA Group Plc Goldman Sachs (2,824)(354) AVEVA Group Plc JP Morgan (1,244)
43,143 Aviva Plc Barclays Bank 3,3622,737 Aviva Plc Credit Suisse (78)
30,378 Aviva Plc Deutsche Bank 1,9378,551 Aviva Plc Goldman Sachs 545
(53,727) Barclays Plc Deutsche Bank (2,954)937 Barratt Developments Plc Bank of America
Merrill Lynch 9815,614 Barratt Developments Plc Barclays Bank 1,253
BlackRock Style Advantage Fund continued
Portfolio of Investments as at 31 May 2021
The notes on pages 590 to 610 form an integral part of these financial statements.
BlackRock Strategic Funds[448]

Holding Description Counterparty
Netunrealised
appreciation/(depreciation)
USD
United Kingdom continued2,480 Barratt Developments Plc Citibank 155
11,693 Barratt Developments Plc Deutsche Bank (497)1,289 Barratt Developments Plc HSBC (453)
925 Barratt Developments Plc JP Morgan (325)(85,926) Barrick Gold Corp HSBC 71,715
310 Berkeley Group HoldingsPlc Barclays Bank 206
1,016 Berkeley Group HoldingsPlc Deutsche Bank 144
233 Berkeley Group HoldingsPlc Goldman Sachs 33
5,184 BP Plc Barclays Bank (753)2,396 BP Plc Credit Suisse (324)
15,946 BP Plc Deutsche Bank (2,090)(24,684) BT Group Plc Deutsche Bank (3,026)
561 Bunzl Plc Barclays Bank (24)3,469 Bunzl Plc Goldman Sachs (1,720)1,747 Burberry Group Plc Barclays Bank 593
476 Burberry Group Plc Deutsche Bank (46)1,066 Coca-Cola HBC AG Barclays Bank 2778,672 Coca-Cola HBC AG Deutsche Bank 7,990(781) Compass Group Plc Barclays Bank (288)(568) Compass Group Plc Deutsche Bank (749)
(3,097) Compass Group Plc Goldman Sachs (4,081)(1,041) Croda International Plc Barclays Bank (1,918)(1,118) Croda International Plc Deutsche Bank (5,565)
505 DCC Plc Deutsche Bank (773)(207) Diageo Plc Barclays Bank (41)(242) Diageo Plc Deutsche Bank (147)
(4,063) Direct Line Insurance GroupPlc Barclays Bank (288)
(5,746) Direct Line Insurance GroupPlc Credit Suisse (277)
(4,005) Direct Line Insurance GroupPlc Deutsche Bank (250)
2,642 Entain Plc Barclays Bank 1,3101,073 Entain Plc Deutsche Bank 1,5139,336 Evraz Plc Bank of America
Merrill Lynch (5,053)3,899 Evraz Plc Barclays Bank (1,558)3,757 Evraz Plc Deutsche Bank (2,034)(128) Experian Plc Barclays Bank 51
(1,935) Experian Plc Deutsche Bank (1,837)644 Ferguson Plc Bank of America
Merrill Lynch 3,541365 Ferguson Plc Barclays Bank (724)579 Ferguson Plc Deutsche Bank 1,331
3,591 Ferguson Plc HSBC 7,429135 Ferguson Plc JP Morgan (109)
(1,053) Fresnillo Plc Credit Suisse 337(6,392) Fresnillo Plc Deutsche Bank 1,648(6,299) Fresnillo Plc Goldman Sachs 1,624(4,859) GlaxoSmithKline Plc Credit Suisse 523(2,917) GlaxoSmithKline Plc Deutsche Bank 1,463
(37,435) Glencore Plc Barclays Bank (3,230)(5,430) Glencore Plc Credit Suisse (836)
(15,029) Glencore Plc Deutsche Bank (1,720)(2,457) Glencore Plc Goldman Sachs (530)(5,090) Halma Plc Bank of America
Merrill Lynch (8,944)(2,586) Halma Plc Barclays Bank (1,283)
(399) Halma Plc Credit Suisse (243)(3,880) Halma Plc Deutsche Bank (6,817)
(736) Halma Plc Goldman Sachs (1,293)(1,438) Hargreaves Lansdown Plc Deutsche Bank 289(8,044) Hargreaves Lansdown Plc HSBC 13,108
(439) Hikma Pharmaceuticals Plc Bank of AmericaMerrill Lynch (373)
(3,194) Hikma Pharmaceuticals Plc Barclays Bank 2,082
Holding Description Counterparty
Netunrealised
appreciation/(depreciation)
USD
United Kingdom continued(42,418) HSBC Holdings Plc Deutsche Bank (7,153)(1,789) Informa Plc Bank of America
Merrill Lynch 117(4,506) Informa Plc Citibank (359)
(15,677) Informa Plc Deutsche Bank 1,022(1,263) Informa Plc Goldman Sachs 82(5,463) InterContinental Hotels
Group Plc Deutsche Bank (3,483)(1,197) InterContinental Hotels
Group Plc Goldman Sachs (763)3,719 Intertek Group Plc Deutsche Bank (19,831)
484 Intertek Group Plc Goldman Sachs (2,316)293 Intertek Group Plc HSBC (2,308)493 Intertek Group Plc JP Morgan (3,884)
9,065 J Sainsbury Plc Deutsche Bank 1056,366 J Sainsbury Plc Goldman Sachs 998,630 JD Sports Fashion Plc Barclays Bank 3,889
533 Johnson Matthey Plc Bank of AmericaMerrill Lynch (1,201)
1,092 Johnson Matthey Plc Barclays Bank (2,383)55,501 Kingfisher Plc Deutsche Bank (6,097)3,449 Legal & General Group Plc Barclays Bank 483,710 Legal & General Group Plc Citibank 311
52,390 Legal & General Group Plc Deutsche Bank 3,188(1,529) London Stock Exchange
Group PlcBank of AmericaMerrill Lynch (8,580)
(478) London Stock ExchangeGroup Plc Barclays Bank (230)
(932) London Stock ExchangeGroup Plc Citibank (449)
(1,164) London Stock ExchangeGroup Plc Deutsche Bank (6,532)
(206) London Stock ExchangeGroup Plc HSBC (1,454)
3,339 M&G Plc Citibank 2843,413 M&G Plc Credit Suisse 1,108
24,511 M&G Plc Deutsche Bank 2,7798,880 M&G Plc Goldman Sachs 1,0073,754 M&G Plc JP Morgan 1,218
(32,246) Melrose Industries Plc Barclays Bank (4,272)(10,279) Melrose Industries Plc Deutsche Bank (1,612)(4,322) Melrose Industries Plc Goldman Sachs (594)
365 Mondi Plc Bank of AmericaMerrill Lynch (153)
876 Mondi Plc Barclays Bank (168)5,876 Mondi Plc Deutsche Bank (2,456)1,345 Mondi Plc Goldman Sachs (562)
(5,793) National Grid Plc Bank of AmericaMerrill Lynch 455
(1,934) National Grid Plc Deutsche Bank (222)(25,680) Natwest Group Plc Barclays Bank (1,492)
318 Next Plc Barclays Bank 32480 Next Plc Deutsche Bank 86
1,219 Next Plc HSBC (2,798)(2,783) Ocado Group Plc Bank of America
Merrill Lynch 3,037(3,043) Ocado Group Plc Barclays Bank 3,169
(771) Ocado Group Plc Credit Suisse 901(8,462) Ocado Group Plc Deutsche Bank 9,233
(725) Ocado Group Plc HSBC 848(1,657) Pearson Plc Barclays Bank 6572,496 Persimmon Plc Bank of America
Merrill Lynch 1,839641 Persimmon Plc Barclays Bank 817553 Persimmon Plc Citibank 705512 Persimmon Plc Credit Suisse (152)
3,290 Persimmon Plc Deutsche Bank 2,424347 Persimmon Plc HSBC (103)227 Persimmon Plc JP Morgan (68)
BlackRock Style Advantage Fund continued
Portfolio of Investments as at 31 May 2021
The notes on pages 590 to 610 form an integral part of these financial statements.
Annual report and audited financial statements [449]
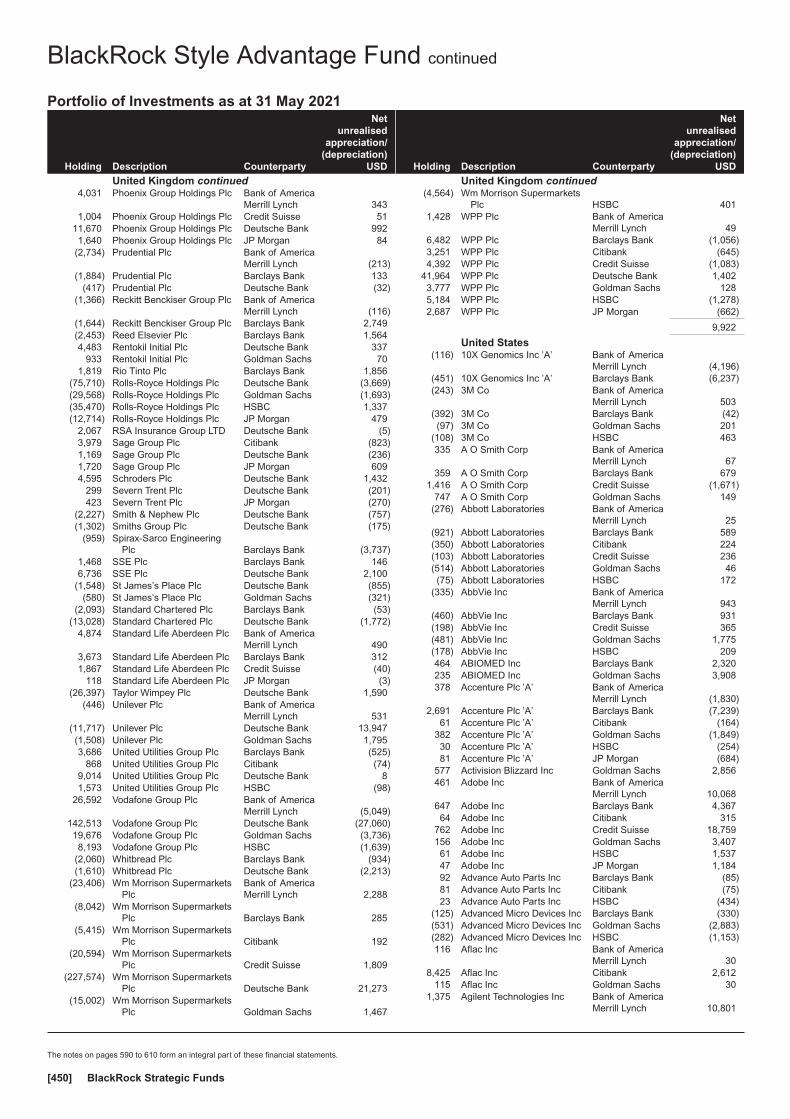
Holding Description Counterparty
Netunrealised
appreciation/(depreciation)
USD
United Kingdom continued4,031 Phoenix Group Holdings Plc Bank of America
Merrill Lynch 3431,004 Phoenix Group Holdings Plc Credit Suisse 51
11,670 Phoenix Group Holdings Plc Deutsche Bank 9921,640 Phoenix Group Holdings Plc JP Morgan 84
(2,734) Prudential Plc Bank of AmericaMerrill Lynch (213)
(1,884) Prudential Plc Barclays Bank 133(417) Prudential Plc Deutsche Bank (32)
(1,366) Reckitt Benckiser Group Plc Bank of AmericaMerrill Lynch (116)
(1,644) Reckitt Benckiser Group Plc Barclays Bank 2,749(2,453) Reed Elsevier Plc Barclays Bank 1,5644,483 Rentokil Initial Plc Deutsche Bank 337
933 Rentokil Initial Plc Goldman Sachs 701,819 Rio Tinto Plc Barclays Bank 1,856
(75,710) Rolls-Royce Holdings Plc Deutsche Bank (3,669)(29,568) Rolls-Royce Holdings Plc Goldman Sachs (1,693)(35,470) Rolls-Royce Holdings Plc HSBC 1,337(12,714) Rolls-Royce Holdings Plc JP Morgan 479
2,067 RSA Insurance Group LTD Deutsche Bank (5)3,979 Sage Group Plc Citibank (823)1,169 Sage Group Plc Deutsche Bank (236)1,720 Sage Group Plc JP Morgan 6094,595 Schroders Plc Deutsche Bank 1,432
299 Severn Trent Plc Deutsche Bank (201)423 Severn Trent Plc JP Morgan (270)
(2,227) Smith & Nephew Plc Deutsche Bank (757)(1,302) Smiths Group Plc Deutsche Bank (175)
(959) Spirax-Sarco EngineeringPlc Barclays Bank (3,737)
1,468 SSE Plc Barclays Bank 1466,736 SSE Plc Deutsche Bank 2,100
(1,548) St James’s Place Plc Deutsche Bank (855)(580) St James’s Place Plc Goldman Sachs (321)
(2,093) Standard Chartered Plc Barclays Bank (53)(13,028) Standard Chartered Plc Deutsche Bank (1,772)
4,874 Standard Life Aberdeen Plc Bank of AmericaMerrill Lynch 490
3,673 Standard Life Aberdeen Plc Barclays Bank 3121,867 Standard Life Aberdeen Plc Credit Suisse (40)
118 Standard Life Aberdeen Plc JP Morgan (3)(26,397) Taylor Wimpey Plc Deutsche Bank 1,590
(446) Unilever Plc Bank of AmericaMerrill Lynch 531
(11,717) Unilever Plc Deutsche Bank 13,947(1,508) Unilever Plc Goldman Sachs 1,7953,686 United Utilities Group Plc Barclays Bank (525)
868 United Utilities Group Plc Citibank (74)9,014 United Utilities Group Plc Deutsche Bank 81,573 United Utilities Group Plc HSBC (98)
26,592 Vodafone Group Plc Bank of AmericaMerrill Lynch (5,049)
142,513 Vodafone Group Plc Deutsche Bank (27,060)19,676 Vodafone Group Plc Goldman Sachs (3,736)8,193 Vodafone Group Plc HSBC (1,639)
(2,060) Whitbread Plc Barclays Bank (934)(1,610) Whitbread Plc Deutsche Bank (2,213)
(23,406) Wm Morrison SupermarketsPlc
Bank of AmericaMerrill Lynch 2,288
(8,042) Wm Morrison SupermarketsPlc Barclays Bank 285
(5,415) Wm Morrison SupermarketsPlc Citibank 192
(20,594) Wm Morrison SupermarketsPlc Credit Suisse 1,809
(227,574) Wm Morrison SupermarketsPlc Deutsche Bank 21,273
(15,002) Wm Morrison SupermarketsPlc Goldman Sachs 1,467
Holding Description Counterparty
Netunrealised
appreciation/(depreciation)
USD
United Kingdom continued(4,564) Wm Morrison Supermarkets
Plc HSBC 4011,428 WPP Plc Bank of America
Merrill Lynch 496,482 WPP Plc Barclays Bank (1,056)3,251 WPP Plc Citibank (645)4,392 WPP Plc Credit Suisse (1,083)
41,964 WPP Plc Deutsche Bank 1,4023,777 WPP Plc Goldman Sachs 1285,184 WPP Plc HSBC (1,278)2,687 WPP Plc JP Morgan (662)
9,922
United States(116) 10X Genomics Inc ’A’ Bank of America
Merrill Lynch (4,196)(451) 10X Genomics Inc ’A’ Barclays Bank (6,237)(243) 3M Co Bank of America
Merrill Lynch 503(392) 3M Co Barclays Bank (42)(97) 3M Co Goldman Sachs 201
(108) 3M Co HSBC 463335 A O Smith Corp Bank of America
Merrill Lynch 67359 A O Smith Corp Barclays Bank 679
1,416 A O Smith Corp Credit Suisse (1,671)747 A O Smith Corp Goldman Sachs 149
(276) Abbott Laboratories Bank of AmericaMerrill Lynch 25
(921) Abbott Laboratories Barclays Bank 589(350) Abbott Laboratories Citibank 224(103) Abbott Laboratories Credit Suisse 236(514) Abbott Laboratories Goldman Sachs 46(75) Abbott Laboratories HSBC 172
(335) AbbVie Inc Bank of AmericaMerrill Lynch 943
(460) AbbVie Inc Barclays Bank 931(198) AbbVie Inc Credit Suisse 365(481) AbbVie Inc Goldman Sachs 1,775(178) AbbVie Inc HSBC 209464 ABIOMED Inc Barclays Bank 2,320235 ABIOMED Inc Goldman Sachs 3,908378 Accenture Plc ’A’ Bank of America
Merrill Lynch (1,830)2,691 Accenture Plc ’A’ Barclays Bank (7,239)
61 Accenture Plc ’A’ Citibank (164)382 Accenture Plc ’A’ Goldman Sachs (1,849)30 Accenture Plc ’A’ HSBC (254)81 Accenture Plc ’A’ JP Morgan (684)
577 Activision Blizzard Inc Goldman Sachs 2,856461 Adobe Inc Bank of America
Merrill Lynch 10,068647 Adobe Inc Barclays Bank 4,36764 Adobe Inc Citibank 315
762 Adobe Inc Credit Suisse 18,759156 Adobe Inc Goldman Sachs 3,40761 Adobe Inc HSBC 1,53747 Adobe Inc JP Morgan 1,18492 Advance Auto Parts Inc Barclays Bank (85)81 Advance Auto Parts Inc Citibank (75)23 Advance Auto Parts Inc HSBC (434)
(125) Advanced Micro Devices Inc Barclays Bank (330)(531) Advanced Micro Devices Inc Goldman Sachs (2,883)(282) Advanced Micro Devices Inc HSBC (1,153)116 Aflac Inc Bank of America
Merrill Lynch 308,425 Aflac Inc Citibank 2,612
115 Aflac Inc Goldman Sachs 301,375 Agilent Technologies Inc Bank of America
Merrill Lynch 10,801
BlackRock Style Advantage Fund continued
Portfolio of Investments as at 31 May 2021
The notes on pages 590 to 610 form an integral part of these financial statements.
BlackRock Strategic Funds[450]

Holding Description Counterparty
Netunrealised
appreciation/(depreciation)
USD
United States continued824 Agilent Technologies Inc Barclays Bank 3,032148 Agilent Technologies Inc Citibank 592323 Agilent Technologies Inc Credit Suisse 2,378
1,014 Agilent Technologies Inc Goldman Sachs 8,132924 Agilent Technologies Inc HSBC 5,602628 Agilent Technologies Inc JP Morgan 3,572
(1,383) Air Products and ChemicalsInc
Bank of AmericaMerrill Lynch 2,752
(348) Air Products and ChemicalsInc Barclays Bank (95)
(78) Air Products and ChemicalsInc Citibank (7)
(142) Air Products and ChemicalsInc Credit Suisse (870)
(304) Air Products and ChemicalsInc Goldman Sachs 605
(144) Air Products and ChemicalsInc HSBC (883)
(35) Air Products and ChemicalsInc JP Morgan (215)
61 Airbnb Inc Bank of AmericaMerrill Lynch 482
171 Airbnb Inc Barclays Bank 768127 Airbnb Inc HSBC (804)
4 Airbnb Inc JP Morgan (25)(449) Akamai Technologies Inc Bank of America
Merrill Lynch (323)(776) Akamai Technologies Inc Barclays Bank 124(158) Akamai Technologies Inc Credit Suisse (471)(152) Akamai Technologies Inc Goldman Sachs (109)(536) Akamai Technologies Inc HSBC (1,597)(727) Albemarle Corp Barclays Bank (5,445)(73) Albemarle Corp Goldman Sachs (678)
(378) Alexion Pharmaceuticals Inc Bank of AmericaMerrill Lynch (680)
(96) Alexion Pharmaceuticals Inc Goldman Sachs (173)17 Align Technology Inc Barclays Bank (243)19 Align Technology Inc Credit Suisse 677
262 Align Technology Inc Goldman Sachs 7,417(15) Alleghany Corp Barclays Bank (32)(24) Alleghany Corp Goldman Sachs (37)(23) Alleghany Corp HSBC 156144 Allegion Plc Bank of America
Merrill Lynch 2231,110 Allegion Plc Barclays Bank 1,911
196 Allegion Plc Citibank 264125 Allegion Plc Credit Suisse (259)73 Allegion Plc Goldman Sachs 203
216 Allegion Plc HSBC (447)1,865 Allstate Corp Bank of America
Merrill Lynch (4,495)27 Allstate Corp Barclays Bank (17)
354 Ally Financial Inc Bank of AmericaMerrill Lynch 188
4,409 Ally Financial Inc Barclays Bank 5,291202 Ally Financial Inc Citibank 242294 Ally Financial Inc Credit Suisse 306188 Ally Financial Inc Goldman Sachs 251
1,170 Ally Financial Inc HSBC 1,229230 Ally Financial Inc JP Morgan 286
(289) Alnylam PharmaceuticalsInc Goldman Sachs (1,763)
74 Alphabet Inc ’A’ Bank of AmericaMerrill Lynch 5,027
188 Alphabet Inc ’A’ Barclays Bank (788)6 Alphabet Inc ’A’ Citibank (25)
14 Alphabet Inc ’A’ Credit Suisse 91141 Alphabet Inc ’A’ Goldman Sachs 1,60919 Alphabet Inc ’A’ HSBC 1,237
Holding Description Counterparty
Netunrealised
appreciation/(depreciation)
USD
United States continued6 Alphabet Inc ’C’ Barclays Bank 297 Alphabet Inc ’C’ Credit Suisse 489
19 Alphabet Inc ’C’ Goldman Sachs 1,713610 Altice USA Inc ’A’ Barclays Bank (702)13 Amazon.com Inc Bank of America
Merrill Lynch (173)11 Amazon.com Inc Barclays Bank (185)7 Amazon.com Inc Goldman Sachs (172)6 Amazon.com Inc HSBC 195
32 Amazon.com Inc JP Morgan 1,043122 AMERCO Bank of America
Merrill Lynch (5,281)212 AMERCO Barclays Bank (655)74 AMERCO Citibank (229)
128 AMERCO Credit Suisse (7,291)191 AMERCO Goldman Sachs (8,268)
5 AMERCO HSBC (285)79 AMERCO JP Morgan (4,500)
(538) American Express Co Bank of AmericaMerrill Lynch (1,759)
(589) American Financial GroupInc Barclays Bank (777)
(585) American Financial GroupInc JP Morgan (3,060)
(511) American InternationalGroup Inc Barclays Bank (491)
(1,405) American Water Works CoInc
Bank of AmericaMerrill Lynch (3,582)
(708) American Water Works CoInc Barclays Bank (101)
(126) American Water Works CoInc Citibank (23)
(358) American Water Works CoInc HSBC 351
307 Ameriprise Financial Inc Bank of AmericaMerrill Lynch 826
78 Ameriprise Financial Inc Barclays Bank 33454 Ameriprise Financial Inc Citibank 22741 Ameriprise Financial Inc Credit Suisse (175)
202 Ameriprise Financial Inc Goldman Sachs 54393 Ameriprise Financial Inc HSBC (396)
562 Ameriprise Financial Inc JP Morgan (1,666)1,624 AmerisourceBergen Corp Barclays Bank (6,139)
144 AmerisourceBergen Corp Citibank (544)608 AmerisourceBergen Corp Goldman Sachs (2,049)186 AmerisourceBergen Corp HSBC (1,583)72 AmerisourceBergen Corp JP Morgan (613)
(423) AMETEK Inc Bank of AmericaMerrill Lynch (247)
(453) AMETEK Inc Barclays Bank (432)(319) AMETEK Inc Goldman Sachs (995)
1,120 Amgen Inc Bank of AmericaMerrill Lynch (16,173)
191 Amgen Inc Goldman Sachs (2,758)31 Amgen Inc HSBC (455)59 Amgen Inc JP Morgan (866)
(764) Amphenol Corp ’A’ Bank of AmericaMerrill Lynch (95)
(3,176) Amphenol Corp ’A’ Barclays Bank (585)(681) Amphenol Corp ’A’ Citibank (129)(456) Amphenol Corp ’A’ Credit Suisse (378)(420) Amphenol Corp ’A’ Goldman Sachs (319)(174) Amphenol Corp ’A’ JP Morgan (31)
(2,068) Analog Devices Inc Bank of AmericaMerrill Lynch (34,122)
(2,158) Analog Devices Inc Barclays Bank (4,510)(143) Analog Devices Inc Citibank (299)(258) Analog Devices Inc Credit Suisse (3,563)(581) Analog Devices Inc Goldman Sachs (9,586)
BlackRock Style Advantage Fund continued
Portfolio of Investments as at 31 May 2021
The notes on pages 590 to 610 form an integral part of these financial statements.
Annual report and audited financial statements [451]

Holding Description Counterparty
Netunrealised
appreciation/(depreciation)
USD
United States continued(100) Analog Devices Inc HSBC (1,381)(245) ANSYS Inc Bank of America
Merrill Lynch (4,094)(294) ANSYS Inc Barclays Bank 244(175) ANSYS Inc Credit Suisse (2,585)(234) ANSYS Inc Goldman Sachs (3,910)(210) ANSYS Inc HSBC (3,102)(81) ANSYS Inc JP Morgan (1,196)(30) Anthem Inc Credit Suisse (86)
(250) Anthem Inc Goldman Sachs (1,140)(1,024) Aon Plc ’A’ Barclays Bank (195)
(431) Aon Plc ’A’ Goldman Sachs 7891 Apartment Income Corp
(REIT)Bank of AmericaMerrill Lynch 2
1 Apartment Investment andManagement Co ’A’(REIT)π
Bank of AmericaMerrill Lynch —
(1,913) Apollo Global ManagementInc
Bank of AmericaMerrill Lynch 77
(3,322) Apollo Global ManagementInc Barclays Bank 332
(991) Apollo Global ManagementInc Citibank 99
2,025 Apple Inc Bank of AmericaMerrill Lynch (3,361)
409 Apple Inc Barclays Bank (1,018)567 Apple Inc Citibank (1,390)97 Apple Inc Credit Suisse (217)
2,397 Apple Inc Goldman Sachs (3,979)185 Apple Inc HSBC (414)87 Applied Materials Inc Bank of America
Merrill Lynch 1,267727 Applied Materials Inc Barclays Bank 2,58197 Applied Materials Inc Credit Suisse 1,304
3,539 Applied Materials Inc Goldman Sachs 51,528138 Applied Materials Inc HSBC 2,036146 Applied Materials Inc JP Morgan 1,962
(281) Aptiv Plc Bank of AmericaMerrill Lynch (3,198)
(1,465) Aptiv Plc Barclays Bank (13,126)(349) Aptiv Plc Credit Suisse (2,317)(949) Aptiv Plc Goldman Sachs (10,800)(317) Aptiv Plc HSBC (2,105)(72) Aptiv Plc JP Morgan (478)
(3,645) Aramark Barclays Bank 328566 Arch Capital Group Ltd Bank of America
Merrill Lynch (300)2,558 Archer-Daniels-Midland Co Bank of America
Merrill Lynch (2,839)7,286 Archer-Daniels-Midland Co Barclays Bank (656)
340 Archer-Daniels-Midland Co Credit Suisse (374)4,097 Archer-Daniels-Midland Co Goldman Sachs (4,548)
160 Archer-Daniels-Midland Co HSBC (176)496 Arista Networks Inc Barclays Bank 1,448407 Arrow Electronics Inc Bank of America
Merrill Lynch (370)2,921 Arrow Electronics Inc Barclays Bank (9,698)
223 Arrow Electronics Inc Citibank (740)150 Arrow Electronics Inc Credit Suisse 452243 Arrow Electronics Inc Goldman Sachs (221)697 Arrow Electronics Inc HSBC 2,098
(799) Arthur J Gallagher & Co Bank of AmericaMerrill Lynch (88)
(433) Arthur J Gallagher & Co Barclays Bank (525)(73) Arthur J Gallagher & Co Goldman Sachs (8)
(365) Arthur J Gallagher & Co HSBC 1,526150 Assurant Inc Barclays Bank 302373 Assurant Inc Citibank 750
7,821 AT&T Inc Barclays Bank (2,503)
Holding Description Counterparty
Netunrealised
appreciation/(depreciation)
USD
United States continued1,039 Athene Holding Ltd ’A’ Bank of America
Merrill Lynch 447969 Athene Holding Ltd ’A’ Barclays Bank (68)651 Athene Holding Ltd ’A’ Citibank (46)452 Athene Holding Ltd ’A’ Goldman Sachs 194
(767) Atmos Energy Corp Bank of AmericaMerrill Lynch (502)
(3,083) Atmos Energy Corp Barclays Bank (906)(987) Atmos Energy Corp Credit Suisse 2,613(240) Atmos Energy Corp Goldman Sachs (158)181 Autodesk Inc Bank of America
Merrill Lynch 1,5841,662 Autodesk Inc Barclays Bank (2,721)
69 Autodesk Inc Citibank (112)280 Autodesk Inc Credit Suisse 1,853313 Autodesk Inc Goldman Sachs 3,15942 Autodesk Inc HSBC (165)37 Autodesk Inc JP Morgan 36388 Automatic Data Processing
IncBank of AmericaMerrill Lynch 128
620 Automatic Data ProcessingInc Barclays Bank (632)
113 Automatic Data ProcessingInc Citibank (115)
95 Automatic Data ProcessingInc Goldman Sachs 138
72 AutoZone Inc Barclays Bank (3,010)8 AutoZone Inc Credit Suisse (124)7 AutoZone Inc Goldman Sachs (83)
(243) Avalara Inc Bank of AmericaMerrill Lynch (1,909)
(1,954) Avalara Inc Barclays Bank (6,311)(216) Avalara Inc Citibank (698)(142) Avalara Inc Credit Suisse (1,336)(946) Avalara Inc Goldman Sachs (5,724)(256) Avalara Inc HSBC (2,409)
(3,849) Avantor Inc Barclays Bank (1,732)819 Avery Dennison Corp Bank of America
Merrill Lynch (352)1,709 Avery Dennison Corp Barclays Bank 3,127
801 Avery Dennison Corp Goldman Sachs (344)113 Avery Dennison Corp HSBC (119)124 Avery Dennison Corp JP Morgan (130)
9,128 Axalta Coating Systems Ltd Barclays Bank 7,759(1,927) Baker Hughes Co Bank of America
Merrill Lynch (98)(9,209) Baker Hughes Co Barclays Bank 1,953
(509) Baker Hughes Co Goldman Sachs (8)(2,660) Baker Hughes Co JP Morgan 1,187
(240) Ball Corp Bank of AmericaMerrill Lynch 1,553
(639) Ball Corp Barclays Bank 3,163(943) Ball Corp Goldman Sachs 6,101506 Bank of America Corp Goldman Sachs (177)
1,751 Bank of New York MellonCorp Barclays Bank 595
663 Bank of New York MellonCorp Citibank 225
1,151 Bank of New York MellonCorp Goldman Sachs (12)
(17,184) Bank OZK JP Morgan 3,952(1,163) Baxter International Inc Bank of America
Merrill Lynch 849(1,304) Baxter International Inc Barclays Bank 430(2,337) Baxter International Inc Citibank 1,519
(577) Baxter International Inc Goldman Sachs 421(280) Becton Dickinson and Co Bank of America
Merrill Lynch (137)(415) Becton Dickinson and Co Barclays Bank 706
BlackRock Style Advantage Fund continued
Portfolio of Investments as at 31 May 2021
The notes on pages 590 to 610 form an integral part of these financial statements.
BlackRock Strategic Funds[452]

Holding Description Counterparty
Netunrealised
appreciation/(depreciation)
USD
United States continued(607) Becton Dickinson and Co Citibank 984(63) Becton Dickinson and Co Credit Suisse 12(48) Becton Dickinson and Co Goldman Sachs 93
(208) Becton Dickinson and Co HSBC 418858 Berkshire Hathaway Inc ’B’ Bank of America
Merrill Lynch 189476 Berkshire Hathaway Inc ’B’ Barclays Bank (138)350 Berkshire Hathaway Inc ’B’ Goldman Sachs 7717 Berkshire Hathaway Inc ’B’ HSBC (49)
2,698 Best Buy Co Inc Bank of AmericaMerrill Lynch (10,441)
426 Best Buy Co Inc Barclays Bank 670117 Best Buy Co Inc Citibank 180321 Best Buy Co Inc Credit Suisse (2,209)69 Best Buy Co Inc HSBC (659)
113 Biogen Inc Bank of AmericaMerrill Lynch (1,460)
450 Biogen Inc Barclays Bank (5,121)38 Biogen Inc Goldman Sachs (491)20 Biogen Inc HSBC (163)
(562) BioMarin PharmaceuticalInc
Bank of AmericaMerrill Lynch 22
(1,051) BioMarin PharmaceuticalInc Barclays Bank 263
(219) BioMarin PharmaceuticalInc Citibank 55
(2,765) BioMarin PharmaceuticalInc Goldman Sachs 111
(333) BioMarin PharmaceuticalInc JP Morgan (303)
(547) Bio-Rad Laboratories Inc ’A’ Barclays Bank (5,093)(596) Black Knight Inc Bank of America
Merrill Lynch (1,120)(1,053) Black Knight Inc Barclays Bank (232)
(369) Black Knight Inc Citibank (81)(566) Black Knight Inc Credit Suisse 923
(5,849) Black Knight Inc Goldman Sachs (10,996)(216) Black Knight Inc JP Morgan 352
(1,437) Blackstone Group Inc Credit Suisse (5,834)(32) Booking Holdings Inc Bank of America
Merrill Lynch (4,429)(20) Booking Holdings Inc Barclays Bank (326)(6) Booking Holdings Inc Goldman Sachs (315)(4) Booking Holdings Inc JP Morgan (286)
1,711 Booz Allen Hamilton Hold-ing Corp
Bank of AmericaMerrill Lynch 2,857
704 Booz Allen Hamilton Hold-ing Corp Barclays Bank (487)
130 Booz Allen Hamilton Hold-ing Corp HSBC 204
(1,547) BorgWarner Inc Bank of AmericaMerrill Lynch 557
(988) BorgWarner Inc Barclays Bank (1,126)(2,073) BorgWarner Inc Citibank (2,363)(1,464) BorgWarner Inc Goldman Sachs 527(1,168) BorgWarner Inc HSBC 1,916(1,339) BorgWarner Inc JP Morgan 2,196(8,744) Boston Scientific Corp Barclays Bank 2,186(1,445) Bristol-Myers Squibb Co Bank of America
Merrill Lynch (303)(461) Bristol-Myers Squibb Co Barclays Bank 653(402) Bristol-Myers Squibb Co Credit Suisse (68)
(1,097) Bristol-Myers Squibb Co Goldman Sachs (65)(102) Broadcom Inc Bank of America
Merrill Lynch (3,304)(1,425) Broadcom Inc Barclays Bank (18,513)
(25) Broadcom Inc Citibank (329)(37) Broadcom Inc Credit Suisse (1,341)
(140) Broadcom Inc Goldman Sachs (4,535)(96) Broadcom Inc HSBC (3,478)
Holding Description Counterparty
Netunrealised
appreciation/(depreciation)
USD
United States continued1 Brookfield Property Part-
ners LP JP Morgan 1(865) Brown & Brown Inc Bank of America
Merrill Lynch (251)(1,090) Brown & Brown Inc Barclays Bank (376)
(122) Brown & Brown Inc Citibank (44)(691) Brown & Brown Inc Credit Suisse 587(600) Brown & Brown Inc HSBC 510
(2,660) Brown-Forman Corp ’B’ Bank of AmericaMerrill Lynch (6,384)
1,336 Bunge Ltd Bank of AmericaMerrill Lynch (3,634)
1,273 Bunge Ltd Barclays Bank 251,712 Bunge Ltd Goldman Sachs (4,657)
810 Bunge Ltd HSBC (3,013)31 Bunge Ltd JP Morgan (115)
(48) Burlington Stores Inc Bank of AmericaMerrill Lynch 612
(639) Burlington Stores Inc Barclays Bank (1,764)(36) Burlington Stores Inc Credit Suisse 190(88) Burlington Stores Inc Goldman Sachs 1,123(45) Cable One Inc Bank of America
Merrill Lynch (4,548)(77) Cable One Inc Barclays Bank (657)(8) Cable One Inc Citibank (68)
(25) Cable One Inc Credit Suisse (1,827)(34) Cable One Inc Goldman Sachs (3,436)(15) Cable One Inc HSBC (1,096)(2) Cable One Inc JP Morgan (146)
(2,018) Cabot Oil & Gas Corp Goldman Sachs 3,854178 Cadence Design Systems
IncBank of AmericaMerrill Lynch 918
190 Cadence Design SystemsInc Barclays Bank (83)
6,718 Cadence Design SystemsInc Citibank 4,434
47 Cadence Design SystemsInc Credit Suisse 134
79 Cadence Design SystemsInc Goldman Sachs 407
177 Cadence Design SystemsInc HSBC 504
166 Cadence Design SystemsInc JP Morgan 473
(3,032) Campbell Soup Co Goldman Sachs 2,0921,160 Capital One Financial Corp Barclays Bank 46
552 Cardinal Health Inc Bank of AmericaMerrill Lynch (210)
7,875 Cardinal Health Inc Barclays Bank (4,410)915 Cardinal Health Inc HSBC (2,068)
(369) CarMax Inc Bank of AmericaMerrill Lynch 3,413
(843) CarMax Inc Barclays Bank (1,104)(112) CarMax Inc Citibank (147)(762) CarMax Inc Goldman Sachs 7,049
(4,825) Carnival Corp Barclays Bank (8,009)(2,326) Carnival Corp Citibank (3,861)(6,599) Carnival Corp Goldman Sachs (13,462)
(517) Carnival Corp HSBC (1,976)(259) Carrier Global Corp Bank of America
Merrill Lynch (456)(715) Carrier Global Corp Barclays Bank (1,108)(828) Carvana Co Bank of America
Merrill Lynch (31,903)(232) Carvana Co Barclays Bank (2,619)(13) Carvana Co Citibank (147)(87) Carvana Co Credit Suisse (1,993)(76) Carvana Co Goldman Sachs (2,928)
(3,601) Catalent Inc Bank of AmericaMerrill Lynch (10,119)
BlackRock Style Advantage Fund continued
Portfolio of Investments as at 31 May 2021
The notes on pages 590 to 610 form an integral part of these financial statements.
Annual report and audited financial statements [453]

Holding Description Counterparty
Netunrealised
appreciation/(depreciation)
USD
United States continued(1,326) Catalent Inc Barclays Bank (2,829)
(301) Catalent Inc Credit Suisse (9)(109) Catalent Inc Goldman Sachs (143)(217) Catalent Inc HSBC (7)(548) Catalent Inc JP Morgan (16)(353) Caterpillar Inc Barclays Bank (717)(90) Caterpillar Inc Credit Suisse 50(12) Caterpillar Inc Goldman Sachs 45
(339) Cboe Global Markets Inc Bank of AmericaMerrill Lynch 454
443 CBRE Group Inc ’A’ Bank of AmericaMerrill Lynch 487
602 CBRE Group Inc ’A’ Barclays Bank (590)435 CBRE Group Inc ’A’ Citibank (426)240 CBRE Group Inc ’A’ Credit Suisse 286
1,204 CBRE Group Inc ’A’ Goldman Sachs 1,324543 CBRE Group Inc ’A’ HSBC 665257 CBRE Group Inc ’A’ JP Morgan 30674 CDW Corp Bank of America
Merrill Lynch (253)182 CDW Corp Goldman Sachs (677)
(2,220) Centene Corp Credit Suisse (8,969)(1,623) CenterPoint Energy Inc Bank of America
Merrill Lynch (531)(10,008) CenterPoint Energy Inc Barclays Bank (2,067)
(713) CenterPoint Energy Inc Citibank (193)(408) CenterPoint Energy Inc Credit Suisse (258)
(6,416) CenterPoint Energy Inc Goldman Sachs (1,732)(310) Ceridian HCM Holding Inc Bank of America
Merrill Lynch (502)(1,079) Ceridian HCM Holding Inc Barclays Bank (239)
(390) Ceridian HCM Holding Inc Citibank (43)(830) Ceridian HCM Holding Inc Credit Suisse (4,590)(183) Ceridian HCM Holding Inc Goldman Sachs (296)
(5,189) Ceridian HCM Holding Inc HSBC (28,695)(324) Ceridian HCM Holding Inc JP Morgan (1,191)
8,356 Cerner Corp Bank of AmericaMerrill Lynch 13,717
321 Cerner Corp Barclays Bank 401508 Cerner Corp Citibank 635468 Cerner Corp Credit Suisse 176
1,092 Cerner Corp Goldman Sachs 1,589217 Cerner Corp HSBC 195498 CF Industries Holdings Inc Barclays Bank 753372 CH Robinson Worldwide Inc Bank of America
Merrill Lynch (748)641 CH Robinson Worldwide Inc Barclays Bank (449)120 CH Robinson Worldwide Inc Credit Suisse (565)529 CH Robinson Worldwide Inc HSBC (2,492)
(2,029) Charles Schwab Corp Goldman Sachs (1,725)(318) Charter Communications
Inc ’A’Bank of AmericaMerrill Lynch (2,442)
(132) Charter CommunicationsInc ’A’ Barclays Bank 1,135
(57) Charter CommunicationsInc ’A’ Citibank 490
(60) Charter CommunicationsInc ’A’ Goldman Sachs (461)
(20) Charter CommunicationsInc ’A’ HSBC 4
(19) Charter CommunicationsInc ’A’ JP Morgan 4
703 Check Point Software Tech-nologies Ltd
Bank of AmericaMerrill Lynch 28
1,256 Check Point Software Tech-nologies Ltd Barclays Bank (2,575)
119 Check Point Software Tech-nologies Ltd Citibank (244)
585 Check Point Software Tech-nologies Ltd Goldman Sachs 23
Holding Description Counterparty
Netunrealised
appreciation/(depreciation)
USD
United States continued197 Check Point Software Tech-
nologies Ltd HSBC (565)(171) Cheniere Energy Inc Bank of America
Merrill Lynch (137)(233) Cheniere Energy Inc Barclays Bank (184)
(3,205) Cheniere Energy Inc Goldman Sachs (2,564)(285) Cheniere Energy Inc JP Morgan (918)(231) Chevron Corp Bank of America
Merrill Lynch 838(4,996) Chevron Corp Barclays Bank 6,869(1,426) Chevron Corp Goldman Sachs 10,011
(593) Chevron Corp JP Morgan 841(394) Chewy Inc ’A’ Bank of America
Merrill Lynch (1,344)(377) Chewy Inc ’A’ Barclays Bank (720)
(1,768) Chewy Inc ’A’ Citibank (3,377)(1,405) Chewy Inc ’A’ Goldman Sachs (4,791)
85 Chipotle Mexican Grill Inc Barclays Bank 2,518(642) Church & Dwight Co Inc Bank of America
Merrill Lynch 1,644(2,911) Church & Dwight Co Inc Barclays Bank 3,430
(549) Church & Dwight Co Inc Citibank 807(665) Church & Dwight Co Inc Credit Suisse 2,194
(2,755) Church & Dwight Co Inc Goldman Sachs 6,397(176) Church & Dwight Co Inc JP Morgan 644307 Cigna Corp Bank of America
Merrill Lynch (1,802)94 Cigna Corp Barclays Bank (252)
122 Cigna Corp Citibank (327)56 Cigna Corp Credit Suisse (451)
422 Cigna Corp Goldman Sachs (2,477)(1,461) Cincinnati Financial Corp HSBC (1,476)
409 Cintas Corp Barclays Bank (409)98 Cintas Corp Citibank (98)
164 Cintas Corp HSBC (1,181)86 Cintas Corp JP Morgan (619)
(2,279) Cisco Systems Inc - CDI Barclays Bank 1,117(101) Cisco Systems Inc - CDI Citibank 49(919) Cisco Systems Inc - CDI Credit Suisse 239
(2,455) Cisco Systems Inc - CDI Goldman Sachs 98353 Citigroup Inc Bank of America
Merrill Lynch 4552,776 Citigroup Inc Barclays Bank 1,888
157 Citigroup Inc Credit Suisse 562506 Citigroup Inc HSBC 1,811
5,173 Citizens Financial Group Inc Barclays Bank 3,000217 Citrix Systems Inc Bank of America
Merrill Lynch (414)458 Citrix Systems Inc Barclays Bank (403)372 Citrix Systems Inc Goldman Sachs (711)
(463) Clorox Co Bank of AmericaMerrill Lynch 1,829
(410) Clorox Co Barclays Bank 543(152) Clorox Co Citibank 318(364) Clorox Co Goldman Sachs 1,438(96) Clorox Co HSBC 467
(150) Clorox Co JP Morgan 1,689(1,120) Cloudflare Inc ’A’ Bank of America
Merrill Lynch (12,432)(134) Cloudflare Inc ’A’ Barclays Bank (426)(128) Cloudflare Inc ’A’ Credit Suisse (1,688)(690) Cloudflare Inc ’A’ Goldman Sachs (7,659)(509) CME Group Inc Bank of America
Merrill Lynch (1,186)(157) CME Group Inc Barclays Bank (245)(980) CME Group Inc Citibank (1,421)(59) CME Group Inc Goldman Sachs (137)320 Coca-Cola Co Bank of America
Merrill Lynch 208
BlackRock Style Advantage Fund continued
Portfolio of Investments as at 31 May 2021
The notes on pages 590 to 610 form an integral part of these financial statements.
BlackRock Strategic Funds[454]

Holding Description Counterparty
Netunrealised
appreciation/(depreciation)
USD
United States continued819 Coca-Cola Co Barclays Bank 82809 Coca-Cola Co Citibank 396
1,126 Coca-Cola Co Goldman Sachs 7321,023 Coca-Cola Co HSBC 389
166 Coca-Cola Europacific Part-ners Plc Barclays Bank 30
617 Coca-Cola Europacific Part-ners Plc Citibank (160)
479 Cognex Corp Bank of AmericaMerrill Lynch 2,529
257 Cognex Corp Barclays Bank 524480 Cognex Corp Goldman Sachs 2,53473 Cognex Corp HSBC 221
1,089 Cognizant Technology Solu-tions Corp ’A’
Bank of AmericaMerrill Lynch 1,007
514 Cognizant Technology Solu-tions Corp ’A’ Barclays Bank 236
3,761 Cognizant Technology Solu-tions Corp ’A’ Goldman Sachs 3,479
128 Cognizant Technology Solu-tions Corp ’A’ HSBC (314)
745 Colgate-Palmolive Co Bank of AmericaMerrill Lynch 171
(812) Comcast Corp ’A’ Goldman Sachs (1,531)(590) Conagra Brands Inc Goldman Sachs (224)
(1,856) ConocoPhillips Bank of AmericaMerrill Lynch 3,829
(2,287) ConocoPhillips Barclays Bank (208)(1,063) ConocoPhillips Citibank 383
(259) ConocoPhillips Credit Suisse 463(1,322) ConocoPhillips Goldman Sachs 3,384
(14,613) ConocoPhillips JP Morgan 18,412(2,357) Consolidated Edison Inc Bank of America
Merrill Lynch 839(905) Consolidated Edison Inc Barclays Bank 670(401) Consolidated Edison Inc Credit Suisse 1,047
51 Constellation Brands Inc ’A’ Bank of AmericaMerrill Lynch 3
557 Constellation Brands Inc ’A’ Barclays Bank 1,80549 Constellation Brands Inc ’A’ Goldman Sachs 189
(560) Cooper Cos Inc Bank of AmericaMerrill Lynch (2,929)
(189) Cooper Cos Inc Goldman Sachs (988)255 Copart Inc Bank of America
Merrill Lynch 1,5451,233 Copart Inc Barclays Bank 536
204 Copart Inc Citibank 177669 Copart Inc Goldman Sachs 3,630109 Copart Inc HSBC 643309 Copart Inc JP Morgan 440
2,596 Corning Inc Barclays Bank (986)348 Corning Inc Citibank (132)518 Corning Inc Goldman Sachs (290)231 Corning Inc HSBC (372)
1,520 Corteva Inc Bank of AmericaMerrill Lynch (1,094)
3,154 Corteva Inc Barclays Bank 1,104494 Corteva Inc Citibank 173
1,026 Corteva Inc Credit Suisse (1,529)1,158 Corteva Inc Goldman Sachs (834)
829 Corteva Inc HSBC (1,235)416 Corteva Inc JP Morgan (620)
(141) CoStar Group Inc Bank of AmericaMerrill Lynch (5,082)
(163) CoStar Group Inc Barclays Bank (1,318)(51) CoStar Group Inc Citibank (493)
(248) CoStar Group Inc Credit Suisse (3,541)(131) CoStar Group Inc Goldman Sachs (4,721)(18) CoStar Group Inc HSBC (586)(12) CoStar Group Inc JP Morgan (134)
Holding Description Counterparty
Netunrealised
appreciation/(depreciation)
USD
United States continued75 Costco Wholesale Corp Goldman Sachs (486)
108 Costco Wholesale Corp JP Morgan (670)(343) Coupa Software Inc Bank of America
Merrill Lynch (3,697)(1,342) Coupa Software Inc Barclays Bank 1,160
(142) Coupa Software Inc Credit Suisse (464)(325) Coupa Software Inc Goldman Sachs (3,588)(61) Coupa Software Inc HSBC 143(47) Crowdstrike Holdings Inc ’A’ Bank of America
Merrill Lynch (385)(216) Crowdstrike Holdings Inc ’A’ Barclays Bank (1,685)(282) Crowdstrike Holdings Inc ’A’ Goldman Sachs (9,481)(221) Crowdstrike Holdings Inc ’A’ JP Morgan (7,640)(71) Crown Holdings Inc Bank of America
Merrill Lynch 578(2,166) Crown Holdings Inc Barclays Bank 16,2232,316 CSX Corp Barclays Bank 1,783
125 CSX Corp Citibank 96113 CSX Corp Goldman Sachs (32)112 CSX Corp HSBC (37)127 CSX Corp JP Morgan (386)
1,405 Cummins Inc Bank of AmericaMerrill Lynch (12,701)
1,337 CVS Health Corp Barclays Bank (4,372)1,613 CVS Health Corp Goldman Sachs 3,032
339 CVS Health Corp HSBC 200(1,517) CyberArk Software Ltd Bank of America
Merrill Lynch (15,519)(315) CyberArk Software Ltd Barclays Bank (79)(246) CyberArk Software Ltd Citibank 55(552) CyberArk Software Ltd Goldman Sachs (5,647)(187) CyberArk Software Ltd HSBC (1,270)(86) CyberArk Software Ltd JP Morgan (584)
(1,280) Danaher Corp Bank of AmericaMerrill Lynch (5,741)
(184) Danaher Corp Barclays Bank (410)(384) Danaher Corp Credit Suisse 1,110
(3,054) Danaher Corp Goldman Sachs (15,671)(213) Danaher Corp HSBC 616(96) Danaher Corp JP Morgan (436)
1,530 Darden Restaurants Inc Barclays Bank 2,861(449) Datadog Inc ’A’ Bank of America
Merrill Lynch (4,499)(1,222) Datadog Inc ’A’ Barclays Bank (1,576)
(301) Datadog Inc ’A’ Credit Suisse (4,271)(1,481) Datadog Inc ’A’ Goldman Sachs (14,840)
(20) Datadog Inc ’A’ JP Morgan (284)1,219 DaVita Inc Bank of America
Merrill Lynch (4,825)404 DaVita Inc Barclays Bank (624)110 DaVita Inc Credit Suisse (870)83 DaVita Inc Goldman Sachs 3
157 DaVita Inc HSBC (1,242)528 Deere & Co Barclays Bank 91929 Deere & Co Credit Suisse (879)
364 Dell Technologies Inc ’C’ Bank of AmericaMerrill Lynch 91
533 Dell Technologies Inc ’C’ Barclays Bank (799)52 Dell Technologies Inc ’C’ Credit Suisse (54)
140 Dell Technologies Inc ’C’ Goldman Sachs 35127 Dell Technologies Inc ’C’ JP Morgan (132)347 Delta Air Lines Inc Barclays Bank 524
1,409 Delta Air Lines Inc Goldman Sachs 1,3101,398 DENTSPLY SIRONA Inc Goldman Sachs (2,838)
970 Devon Energy Corp Bank of AmericaMerrill Lynch (611)
8,012 Devon Energy Corp Barclays Bank 4,887520 Devon Energy Corp Goldman Sachs (328)(69) Dexcom Inc Citibank (966)
BlackRock Style Advantage Fund continued
Portfolio of Investments as at 31 May 2021
The notes on pages 590 to 610 form an integral part of these financial statements.
Annual report and audited financial statements [455]

Holding Description Counterparty
Netunrealised
appreciation/(depreciation)
USD
United States continued(30) Dexcom Inc Goldman Sachs (768)105 Discover Financial Services Barclays Bank 260
(328) Discovery Inc ’A’ Bank of AmericaMerrill Lynch (97)
(1,328) Discovery Inc ’A’ Barclays Bank (1,102)(279) Discovery Inc ’A’ Credit Suisse 1,437(799) DISH Network Corp ’A’ Bank of America
Merrill Lynch 965(1,079) DISH Network Corp ’A’ Barclays Bank 971
(342) DISH Network Corp ’A’ Credit Suisse 1,005(696) DISH Network Corp ’A’ HSBC 2,046(398) DocuSign Inc Barclays Bank (2,416)(474) DocuSign Inc Citibank (2,877)(190) Dollar General Corp Goldman Sachs 236389 Dollar Tree Inc Bank of America
Merrill Lynch (4,581)316 Dollar Tree Inc Barclays Bank (3,068)346 Dollar Tree Inc Citibank (3,356)173 Dollar Tree Inc Credit Suisse (3,207)295 Dollar Tree Inc Goldman Sachs (2,166)32 Dollar Tree Inc HSBC (593)
491 Domino’s Pizza Inc Barclays Bank 2,9314,298 Dover Corp Bank of America
Merrill Lynch 731772 Dow Inc Bank of America
Merrill Lynch (1,922)185 Dow Inc Barclays Bank (209)198 Dow Inc Goldman Sachs (493)222 DR Horton Inc Barclays Bank 930291 DR Horton Inc Goldman Sachs (105)384 DR Horton Inc HSBC (3,517)
(1,068) DraftKings Inc ’A’ Bank of AmericaMerrill Lynch (6,878)
(566) DraftKings Inc ’A’ Barclays Bank (1,183)(356) DraftKings Inc ’A’ Citibank (744)(272) DraftKings Inc ’A’ Credit Suisse (452)(653) DraftKings Inc ’A’ Goldman Sachs (4,205)(672) DraftKings Inc ’A’ JP Morgan (3,098)
5,797 Dropbox Inc ’A’ Bank of AmericaMerrill Lynch 6,854
3,401 Dropbox Inc ’A’ Barclays Bank 76717 Dropbox Inc ’A’ Citibank 3
761 Dropbox Inc ’A’ Goldman Sachs 951327 DuPont de Nemours Inc Bank of America
Merrill Lynch (232)767 DuPont de Nemours Inc Barclays Bank (514)404 DuPont de Nemours Inc Citibank (271)147 DuPont de Nemours Inc Credit Suisse 428863 DuPont de Nemours Inc Goldman Sachs (286)559 DuPont de Nemours Inc HSBC 1,627578 DuPont de Nemours Inc JP Morgan 1,373
(1,058) Dynatrace Inc Bank of AmericaMerrill Lynch (5,396)
(56) Dynatrace Inc Citibank (59)(668) Dynatrace Inc Goldman Sachs (3,407)
1,765 eBay Inc Barclays Bank (181)302 eBay Inc Citibank (27)
4,441 eBay Inc Credit Suisse (2,487)590 eBay Inc HSBC (330)345 eBay Inc JP Morgan (193)54 Ecolab Inc Bank of America
Merrill Lynch (354)337 Ecolab Inc Barclays Bank (74)55 Ecolab Inc Citibank (12)
334 Ecolab Inc Goldman Sachs (2,191)106 Ecolab Inc HSBC (329)
(476) Edison International Bank of AmericaMerrill Lynch 904
(5,215) Edison International Barclays Bank 7,503
Holding Description Counterparty
Netunrealised
appreciation/(depreciation)
USD
United States continued1,735 Edwards Lifesciences Corp Bank of America
Merrill Lynch 10,4973,877 Edwards Lifesciences Corp Barclays Bank 1,745
335 Edwards Lifesciences Corp Citibank 151920 Edwards Lifesciences Corp Goldman Sachs 5,566354 Edwards Lifesciences Corp HSBC 1,947
(2,328) Elanco Animal Health Inc Bank of AmericaMerrill Lynch (2,258)
(9,618) Elanco Animal Health Inc Barclays Bank (1,924)(507) Elanco Animal Health Inc Credit Suisse (1,896)(572) Elanco Animal Health Inc Goldman Sachs (555)(591) Elanco Animal Health Inc HSBC (2,210)(754) Elanco Animal Health Inc JP Morgan (2,820)
1,977 Electronic Arts Inc Bank of AmericaMerrill Lynch 9,938
1,884 Electronic Arts Inc Barclays Bank 1,32464 Electronic Arts Inc Credit Suisse 146
3,598 Electronic Arts Inc Goldman Sachs 19,429814 Electronic Arts Inc HSBC 2,408186 Electronic Arts Inc JP Morgan 424
(234) Eli Lilly & Co Bank of AmericaMerrill Lynch (985)
(299) Eli Lilly & Co Barclays Bank 213(60) Eli Lilly & Co Citibank 11
(122) Eli Lilly & Co Credit Suisse (608)(160) Eli Lilly & Co HSBC (453)434 Emerson Electric Co Bank of America
Merrill Lynch 744,015 Emerson Electric Co Barclays Bank 6,745
136 Emerson Electric Co Credit Suisse 42195 Emerson Electric Co Goldman Sachs 33346 Emerson Electric Co HSBC 107
(405) Enphase Energy Inc Bank of AmericaMerrill Lynch (9,975)
(657) Enphase Energy Inc Barclays Bank (1,432)(460) Enphase Energy Inc Goldman Sachs (11,330)(68) Enphase Energy Inc JP Morgan (1,695)204 EPAM Systems Inc Bank of America
Merrill Lynch 6,087219 EPAM Systems Inc Barclays Bank (1,494)
(377) Equifax Inc Barclays Bank 927653 Equitable Holdings Inc Goldman Sachs (1,371)
2,469 Equitable Holdings Inc HSBC (6,370)(740) Erie Indemnity Co ’A’ Bank of America
Merrill Lynch 1,033(1,055) Erie Indemnity Co ’A’ Barclays Bank (4,508)
(142) Erie Indemnity Co ’A’ Credit Suisse 1,065(198) Erie Indemnity Co ’A’ Goldman Sachs 227
(8,855) Essential Utilities Inc Bank of AmericaMerrill Lynch (14,168)
(3,609) Essential Utilities Inc Barclays Bank (947)(368) Essential Utilities Inc Citibank (110)
(2,984) Essential Utilities Inc Credit Suisse (3,103)(1,448) Essential Utilities Inc Goldman Sachs (2,317)(1,939) Essential Utilities Inc JP Morgan (2,017)
(158) Estee Lauder Cos Inc ’A’ Bank of AmericaMerrill Lynch (227)
(268) Estee Lauder Cos Inc ’A’ Barclays Bank (930)(67) Estee Lauder Cos Inc ’A’ Credit Suisse (599)(42) Estee Lauder Cos Inc ’A’ Goldman Sachs (415)
(153) Etsy Inc HSBC 367(287) Everest Re Group Ltd Citibank 1,036(369) Eversource Energy Bank of America
Merrill Lynch 421(1,254) Eversource Energy Barclays Bank 151
(425) Eversource Energy Credit Suisse 1,811(603) Exact Sciences Corp Bank of America
Merrill Lynch (9,564)(1,725) Exact Sciences Corp Barclays Bank (1,811)
BlackRock Style Advantage Fund continued
Portfolio of Investments as at 31 May 2021
The notes on pages 590 to 610 form an integral part of these financial statements.
BlackRock Strategic Funds[456]

Holding Description Counterparty
Netunrealised
appreciation/(depreciation)
USD
United States continued(136) Exact Sciences Corp Citibank (143)(114) Exact Sciences Corp Credit Suisse (1,333)(144) Exact Sciences Corp Goldman Sachs (2,284)(78) Exact Sciences Corp HSBC (912)
3,234 Exelon Corp Bank of AmericaMerrill Lynch 97
(58) Expedia Group Inc Bank of AmericaMerrill Lynch (435)
(104) Expedia Group Inc Barclays Bank (608)(1,170) Expedia Group Inc Credit Suisse (4,516)
229 Expeditors International ofWashington Inc Barclays Bank 380
173 Expeditors International ofWashington Inc Credit Suisse 976
315 Expeditors International ofWashington Inc Goldman Sachs 766
8,869 Expeditors International ofWashington Inc JP Morgan 49,642
(284) Exxon Mobil Corp Bank of AmericaMerrill Lynch 1,085
(3,028) Exxon Mobil Corp Barclays Bank 3,755(183) F5 Networks Inc Bank of America
Merrill Lynch (875)(90) F5 Networks Inc Barclays Bank 8
(114) F5 Networks Inc Credit Suisse (282)760 Facebook Inc ’A’ Bank of America
Merrill Lynch 10,085602 Facebook Inc ’A’ Barclays Bank 2,468179 Facebook Inc ’A’ Citibank 73466 Facebook Inc ’A’ Goldman Sachs 876
117 Facebook Inc ’A’ JP Morgan 2,663103 FactSet Research Systems
Inc Barclays Bank 55825 Fair Isaac Corp Bank of America
Merrill Lynch 151973 Fair Isaac Corp Barclays Bank 5,18341 Fair Isaac Corp Credit Suisse 552
159 Fair Isaac Corp Goldman Sachs 2,20621 Fair Isaac Corp HSBC 34938 Fair Isaac Corp JP Morgan 135
2,622 Fastenal Co Barclays Bank 49819 FedEx Corp Bank of America
Merrill Lynch 105909 FedEx Corp Barclays Bank 2,700104 FedEx Corp Credit Suisse 57660 FedEx Corp Goldman Sachs 33360 FedEx Corp JP Morgan 332
(152) Fidelity National InformationServices Inc
Bank of AmericaMerrill Lynch (5)
(3,042) Fidelity National InformationServices Inc Barclays Bank 6,267
(303) Fidelity National InformationServices Inc Citibank 624
1,579 Fifth Third Bancorp Goldman Sachs (1,200)337 First Republic Bank Barclays Bank 330
(862) Fiserv Inc Bank of AmericaMerrill Lynch (1,082)
(4,459) Fiserv Inc Barclays Bank 2,934(767) Fiserv Inc Goldman Sachs (1,825)(804) Fiserv Inc HSBC 541(156) FleetCor Technologies Inc Barclays Bank (222)212 FMC Corp Bank of America
Merrill Lynch (367)2,657 FMC Corp Barclays Bank (133)
(5,999) Ford Motor Co Barclays Bank (8,819)(1,259) Ford Motor Co Goldman Sachs (2,996)1,761 Fortinet Inc Bank of America
Merrill Lynch 25,006(654) Fortive Corp Bank of America
Merrill Lynch (1,269)
Holding Description Counterparty
Netunrealised
appreciation/(depreciation)
USD
United States continued(286) Fortive Corp Barclays Bank (160)120 Fortune Brands Home &
Security IncBank of AmericaMerrill Lynch (382)
1,544 Fortune Brands Home &Security Inc Barclays Bank (1,729)
108 Fortune Brands Home &Security Inc Citibank (121)
(677) Fox Corp ’A’ Credit Suisse 1,002(1,910) Franklin Resources Inc Barclays Bank (1,375)
(193) Garmin Ltd Barclays Bank (434)392 Gartner Inc Bank of America
Merrill Lynch 1,231497 Gartner Inc Barclays Bank (432)128 Gartner Inc Credit Suisse 87158 Gartner Inc Goldman Sachs 496106 Gartner Inc HSBC 72127 Gartner Inc JP Morgan 86(56) Generac Holdings Inc Bank of America
Merrill Lynch (213)(1,710) General Electric Co Bank of America
Merrill Lynch (1,556)(18,455) General Electric Co Barclays Bank (13,373)(2,506) General Electric Co Citibank (2,217)(1,289) General Electric Co Goldman Sachs (1,173)
(763) General Electric Co HSBC (626)(869) General Mills Inc Bank of America
Merrill Lynch (61)(3,876) General Mills Inc Barclays Bank 736(2,064) General Mills Inc Citibank 392
(631) General Mills Inc Goldman Sachs (44)(449) General Motors Co Barclays Bank (1,217)815 Genuine Parts Co Bank of America
Merrill Lynch (1,002)772 Genuine Parts Co Barclays Bank (191)614 Genuine Parts Co Citibank (106)
1,723 Genuine Parts Co Goldman Sachs (2,119)539 Genuine Parts Co HSBC (816)286 Genuine Parts Co JP Morgan (709)959 Gilead Sciences Inc Bank of America
Merrill Lynch (1,906)1,752 Gilead Sciences Inc Barclays Bank (2,101)
101 Gilead Sciences Inc Citibank (133)452 Gilead Sciences Inc Credit Suisse (619)478 Gilead Sciences Inc Goldman Sachs (1,415)
2,971 Gilead Sciences Inc HSBC (4,070)(1,445) Global Payments Inc Barclays Bank 2,225
155 Globe Life Inc Bank of AmericaMerrill Lynch (57)
221 Globe Life Inc Barclays Bank 18122 Globe Life Inc Goldman Sachs (45)
7 Globe Life Inc HSBC (3)2,953 GoDaddy Inc ’A’ Barclays Bank 2,835
41 GoDaddy Inc ’A’ Citibank 3942 GoDaddy Inc ’A’ HSBC 3
(167) Guidewire Software Inc Bank of AmericaMerrill Lynch (103)
(1,094) Guidewire Software Inc Barclays Bank (504)(288) Guidewire Software Inc Goldman Sachs (232)(103) Guidewire Software Inc JP Morgan (158)
(12,670) Halliburton Co Barclays Bank 38(1,145) Halliburton Co Credit Suisse (151)
(465) Hartford Financial ServicesGroup Inc Barclays Bank (51)
(2,186) Hasbro Inc Bank of AmericaMerrill Lynch (37)
(127) Hasbro Inc Barclays Bank (158)151 HCA Healthcare Inc Barclays Bank 1,309
1,337 HCA Healthcare Inc Citibank 11,592141 HCA Healthcare Inc Goldman Sachs 746
BlackRock Style Advantage Fund continued
Portfolio of Investments as at 31 May 2021
The notes on pages 590 to 610 form an integral part of these financial statements.
Annual report and audited financial statements [457]

Holding Description Counterparty
Netunrealised
appreciation/(depreciation)
USD
United States continued(112) HEICO Corp Bank of America
Merrill Lynch (595)(130) HEICO Corp Barclays Bank (251)(183) HEICO Corp Credit Suisse (1,381)
(1,498) HEICO Corp Goldman Sachs (9,992)488 Henry Schein Inc Barclays Bank (756)
1,750 Hershey Co Barclays Bank (1,776)63 Hershey Co Citibank (66)
107 Hershey Co Goldman Sachs 60108 Hershey Co HSBC (109)
(126) Hess Corp Bank of AmericaMerrill Lynch (36)
(3,490) Hess Corp Barclays Bank 1,506(192) Hess Corp Credit Suisse (242)(465) Hess Corp Goldman Sachs 1,209
6,313 Hewlett Packard EnterpriseCo Barclays Bank (2,525)
2,396 Hewlett Packard EnterpriseCo HSBC (1,078)
816 Hewlett Packard EnterpriseCo JP Morgan (367)
(714) Hilton Worldwide HoldingsInc
Bank of AmericaMerrill Lynch (2,542)
(94) Hilton Worldwide HoldingsInc Citibank (158)
(563) Hilton Worldwide HoldingsInc Goldman Sachs (2,004)
(225) Hilton Worldwide HoldingsInc HSBC (830)
2,161 Hologic Inc Bank of AmericaMerrill Lynch 908
820 Hologic Inc Barclays Bank 262242 Hologic Inc Citibank 99319 Hologic Inc Credit Suisse (648)237 Hologic Inc Goldman Sachs 100
1,793 Home Depot Inc Bank of AmericaMerrill Lynch (1,625)
750 Home Depot Inc Barclays Bank 2,24265 Home Depot Inc Goldman Sachs (72)
248 Home Depot Inc HSBC (1,932)80 Home Depot Inc JP Morgan (1,777)
(1,029) Horizon Therapeutics Plc Barclays Bank 3,663(228) Horizon Therapeutics Plc Citibank 812(159) Horizon Therapeutics Plc Goldman Sachs 339
(10,317) Hormel Foods Corp Barclays Bank 7,428(3,181) Howmet Aerospace Inc Bank of America
Merrill Lynch (5,630)(352) Howmet Aerospace Inc Barclays Bank (507)
(3,034) Howmet Aerospace Inc Goldman Sachs (5,370)(306) Howmet Aerospace Inc HSBC (887)
7,508 HP Inc Bank of AmericaMerrill Lynch (28,605)
6,484 HP Inc Barclays Bank (19,971)1,315 HP Inc Credit Suisse (7,916)1,753 HP Inc Goldman Sachs (6,679)
901 HP Inc JP Morgan (5,424)(19) HubSpot Inc Bank of America
Merrill Lynch (408)(23) HubSpot Inc Barclays Bank 59(1) HubSpot Inc Credit Suisse (18)
(116) HubSpot Inc Goldman Sachs (2,491)(139) Humana Inc Barclays Bank 708
(5,058) Huntington Bancshares Inc Barclays Bank (1,113)(79) IAC Via InterActive Corp Bank of America
Merrill Lynch 5,152(924) IAC Via InterActive Corp Barclays Bank 86,080(382) IAC Via InterActive Corp Citibank 35,587(611) IAC Via InterActive Corp Goldman Sachs 39,843(198) IAC Via InterActive Corp HSBC 14,786
Holding Description Counterparty
Netunrealised
appreciation/(depreciation)
USD
United States continued(200) IDEX Corp Bank of America
Merrill Lynch (55)(384) IDEX Corp Barclays Bank (559)(50) IDEX Corp Credit Suisse (53)287 IDEXX Laboratories Inc Bank of America
Merrill Lynch 9,12572 IDEXX Laboratories Inc Barclays Bank 60544 IDEXX Laboratories Inc Credit Suisse 1,445
601 IDEXX Laboratories Inc Goldman Sachs 19,76235 IDEXX Laboratories Inc HSBC 1,08485 IDEXX Laboratories Inc JP Morgan 2,792
(228) IHS Markit Ltd Barclays Bank (41)300 Illinois Tool Works Inc Barclays Bank (93)113 Illinois Tool Works Inc Citibank (70)
3,148 Illinois Tool Works Inc Credit Suisse (22,980)(26) Illumina Inc Bank of America
Merrill Lynch (680)(214) Illumina Inc Barclays Bank (1,209)(25) Illumina Inc Citibank (141)(8) Illumina Inc HSBC (201)
1,069 Incyte Corp Bank of AmericaMerrill Lynch 1,541
732 Incyte Corp Barclays Bank 573122 Incyte Corp Credit Suisse 191161 Incyte Corp Goldman Sachs 98914 Incyte Corp HSBC 2,184
(6,290) Ingersoll Rand Inc Bank of AmericaMerrill Lynch (5,535)
(1,849) Ingersoll Rand Inc Barclays Bank (92)(388) Ingersoll Rand Inc Citibank (19)(554) Ingersoll Rand Inc Credit Suisse 147(619) Ingersoll Rand Inc Goldman Sachs (545)(410) Insulet Corp Bank of America
Merrill Lynch (16,908)(116) Insulet Corp Barclays Bank (1,496)(34) Insulet Corp Citibank (439)(45) Insulet Corp Goldman Sachs (844)
1,165 Intel Corp Bank of AmericaMerrill Lynch 2,085
2,133 Intel Corp Barclays Bank 34171 Intel Corp Citibank 11
(405) Intercontinental ExchangeInc Barclays Bank (26)
(128) International Business Ma-chines Corp
Bank of AmericaMerrill Lynch 175
(947) International Business Ma-chines Corp Barclays Bank 928
(472) International Flavors & Fra-grances Inc Barclays Bank 90
(108) International Flavors & Fra-grances Inc Citibank 21
(3,092) International Flavors & Fra-grances Inc Credit Suisse 3,216
(56) International Flavors & Fra-grances Inc Goldman Sachs 60
(237) International Flavors & Fra-grances Inc JP Morgan 246
5,077 International Paper Co Barclays Bank (6,600)313 International Paper Co Credit Suisse 319
1,936 International Paper Co Goldman Sachs (1,936)356 International Paper Co JP Morgan 363
1,187 Interpublic Group of Cos Inc Bank of AmericaMerrill Lynch 1,329
7,832 Interpublic Group of Cos Inc Barclays Bank 2,9101,117 Interpublic Group of Cos Inc Goldman Sachs 1,251
404 Interpublic Group of Cos Inc HSBC 3641,333 Interpublic Group of Cos Inc JP Morgan 1,114
600 Intuit Inc Bank of AmericaMerrill Lynch 11,802
BlackRock Style Advantage Fund continued
Portfolio of Investments as at 31 May 2021
The notes on pages 590 to 610 form an integral part of these financial statements.
BlackRock Strategic Funds[458]

Holding Description Counterparty
Netunrealised
appreciation/(depreciation)
USD
United States continued358 Intuit Inc Citibank (473)
(218) Intuitive Surgical Inc Barclays Bank (1,544)(33) Intuitive Surgical Inc Goldman Sachs (831)377 Invesco Ltd Barclays Bank 577
1,558 Invesco Ltd Credit Suisse 483417 Invesco Ltd Goldman Sachs 321382 Invesco Ltd HSBC 118
(268) Ionis Pharmaceuticals Inc Bank of AmericaMerrill Lynch 19
(1,300) Ionis Pharmaceuticals Inc Barclays Bank (2,366)(770) Ionis Pharmaceuticals Inc Citibank (1,401)(234) Ionis Pharmaceuticals Inc HSBC (236)(256) IPG Photonics Corp Bank of America
Merrill Lynch (3,295)(618) IPG Photonics Corp Barclays Bank (1,148)(113) IPG Photonics Corp Citibank (194)(63) IPG Photonics Corp Credit Suisse (408)
(188) IPG Photonics Corp Goldman Sachs (1,492)(144) IQVIA Holdings Inc Goldman Sachs (1,250)272 J M Smucker Co Barclays Bank (631)83 J M Smucker Co HSBC (140)
(65) Jack Henry & AssociatesInc Barclays Bank 173
(84) Jack Henry & AssociatesInc Goldman Sachs 197
(119) Jack Henry & AssociatesInc HSBC 560
273 Jazz Pharmaceuticals Plc Bank of AmericaMerrill Lynch 363
331 Jazz Pharmaceuticals Plc Barclays Bank (275)23 Jazz Pharmaceuticals Plc Citibank (19)
607 Jazz Pharmaceuticals Plc Goldman Sachs 80714 Jazz Pharmaceuticals Plc HSBC 28
501 Jazz Pharmaceuticals Plc JP Morgan 1,0172,274 JB Hunt Transport Services
Inc Barclays Bank 1,02359 JB Hunt Transport Services
Inc JP Morgan (527)(519) Johnson & Johnson Bank of America
Merrill Lynch 125(974) Johnson & Johnson Barclays Bank 1,266(102) Johnson & Johnson Credit Suisse 138(750) Johnson & Johnson Goldman Sachs 855(539) Johnson & Johnson HSBC 550(115) Johnson & Johnson JP Morgan (13)
4,933 Johnson Controls Interna-tional Plc
Bank of AmericaMerrill Lynch 3,108
862 Johnson Controls Interna-tional Plc Barclays Bank 1,332
458 Johnson Controls Interna-tional Plc Credit Suisse 304
724 Johnson Controls Interna-tional Plc Goldman Sachs 456
160 Johnson Controls Interna-tional Plc HSBC 114
796 Johnson Controls Interna-tional Plc JP Morgan 565
(75) JPMorgan Chase & Co Barclays Bank (53)(181) JPMorgan Chase & Co Goldman Sachs 78
(3,145) Juniper Networks Inc Barclays Bank 1,604(83) Kansas City Southern Barclays Bank (189)(68) Kansas City Southern Citibank (330)
(120) Kansas City Southern Goldman Sachs (429)695 Kellogg Co Citibank (424)
(13,738) Keurig Dr Pepper Inc Bank of AmericaMerrill Lynch (13,601)
(3,821) Keurig Dr Pepper Inc Barclays Bank (382)372 KeyCorp Bank of America
Merrill Lynch (179)18,504 KeyCorp Barclays Bank —
Holding Description Counterparty
Netunrealised
appreciation/(depreciation)
USD
United States continued1,553 Keysight Technologies Inc Goldman Sachs 4,411
(1,766) Kimberly-Clark Corp Barclays Bank 2,316(1,068) Kimberly-Clark Corp Credit Suisse 6,102(1,061) Kimberly-Clark Corp Goldman Sachs 3,037
(111) Kimberly-Clark Corp HSBC 6961,108 Kinder Morgan Inc Bank of America
Merrill Lynch (510)7,070 Kinder Morgan Inc Barclays Bank (3,464)1,266 KKR & Co Inc Barclays Bank 468
184 KKR & Co Inc Credit Suisse (48)218 KLA Corp Bank of America
Merrill Lynch 3,46652 KLA Corp Credit Suisse 88390 KLA Corp Goldman Sachs 1,72547 KLA Corp JP Morgan 799
595 Knight-Swift TransportationHoldings Inc
Bank of AmericaMerrill Lynch (690)
8,053 Knight-Swift TransportationHoldings Inc Barclays Bank (5,798)
861 Kraft Heinz Co Goldman Sachs (493)648 Kroger Co Bank of America
Merrill Lynch (266)2,726 Kroger Co Barclays Bank 1,036(992) L3Harris Technologies Inc Bank of America
Merrill Lynch 40(632) L3Harris Technologies Inc Barclays Bank (768)(243) L3Harris Technologies Inc Credit Suisse (361)(315) L3Harris Technologies Inc Goldman Sachs 13(305) L3Harris Technologies Inc HSBC (317)(102) L3Harris Technologies Inc JP Morgan (106)247 Laboratory Corp of America
HoldingsBank of AmericaMerrill Lynch 1,292
48 Laboratory Corp of AmericaHoldings Barclays Bank 154
371 Laboratory Corp of AmericaHoldings Goldman Sachs 2,653
49 Laboratory Corp of AmericaHoldings HSBC (127)
289 Lam Research Corp Bank of AmericaMerrill Lynch 16,698
48 Lam Research Corp Barclays Bank 73022 Lam Research Corp Credit Suisse 600
277 Lam Research Corp Goldman Sachs 16,005(1,970) Lamb Weston Holdings Inc Bank of America
Merrill Lynch (9,476)(2,114) Las Vegas Sands Corp Bank of America
Merrill Lynch (2,093)(6,718) Las Vegas Sands Corp Barclays Bank (67)(1,059) Las Vegas Sands Corp Goldman Sachs (1,048)
(594) Las Vegas Sands Corp HSBC (362)(287) Las Vegas Sands Corp JP Morgan (175)(315) Lear Corp Barclays Bank (1,994)(191) Lear Corp Citibank (1,209)(394) Lear Corp Goldman Sachs (3,294)(321) Lear Corp HSBC (876)796 Lennar Corp ’A’ Bank of America
Merrill Lynch 732177 Lennar Corp ’A’ Credit Suisse (1,584)128 Lennar Corp ’A’ Goldman Sachs 118271 Lennar Corp ’A’ HSBC (2,425)299 Lennox International Inc Bank of America
Merrill Lynch 478372 Lennox International Inc Barclays Bank 2,67134 Lennox International Inc Credit Suisse (122)
170 Lennox International Inc Goldman Sachs 272(1,082) Liberty Broadband Corp Bank of America
Merrill Lynch (3,376)(2,091) Liberty Broadband Corp Barclays Bank 1,422
(461) Liberty Broadband Corp Citibank 313(901) Liberty Broadband Corp Credit Suisse (451)
BlackRock Style Advantage Fund continued
Portfolio of Investments as at 31 May 2021
The notes on pages 590 to 610 form an integral part of these financial statements.
Annual report and audited financial statements [459]

Holding Description Counterparty
Netunrealised
appreciation/(depreciation)
USD
United States continued(1,499) Liberty Broadband Corp Goldman Sachs (4,677)
(84) Liberty Broadband Corp HSBC (42)(282) Liberty Broadband Corp JP Morgan (141)
(3,980) Liberty Global Plc ’A’ Barclays Bank (40)(3,887) Liberty Media Corp-Liberty
Formula One ’C’Bank of AmericaMerrill Lynch (2,954)
(2,763) Liberty Media Corp-LibertyFormula One ’C’ Barclays Bank 939
(1,025) Liberty Media Corp-LibertySiriusXM ’C’ Barclays Bank (1,302)
(945) Liberty Media Corp-LibertySiriusXM ’C’ HSBC (1,276)
(313) Lincoln National Corp Barclays Bank (160)(93) Linde Plc Bank of America
Merrill Lynch 26(74) Linde Plc Barclays Bank 50
(1,689) Linde Plc Goldman Sachs 473(40) Linde Plc HSBC 16
(1,655) Live Nation EntertainmentInc
Bank of AmericaMerrill Lynch (9,251)
(896) Live Nation EntertainmentInc Barclays Bank 1,443
(125) Live Nation EntertainmentInc Goldman Sachs (699)
695 LKQ Corp Bank of AmericaMerrill Lynch 265
2,685 LKQ Corp Barclays Bank 1,578537 LKQ Corp Citibank 381
2,314 LKQ Corp Goldman Sachs (231)277 LKQ Corp HSBC 277553 LKQ Corp JP Morgan 553
3,320 Loews Corp Barclays Bank (664)2,183 Lowe’s Cos Inc Bank of America
Merrill Lynch 1,528596 Lowe’s Cos Inc Barclays Bank 2,17664 Lowe’s Cos Inc Credit Suisse (1,055)
227 Lowe’s Cos Inc Goldman Sachs 159578 Lowe’s Cos Inc HSBC (6,775)(48) Lululemon Athletica Inc Bank of America
Merrill Lynch (412)(12,129) Lumen Technologies Inc Bank of America
Merrill Lynch 8,612(1,075) LyondellBasell Industries
NV ’A’ Barclays Bank (1,096)343 M&T Bank Corp Barclays Bank (305)
(906) Marathon Petroleum Corp Bank of AmericaMerrill Lynch (712)
(427) Marathon Petroleum Corp Barclays Bank (457)(963) Marathon Petroleum Corp Goldman Sachs (270)
36 Markel Corp Citibank (162)(294) MarketAxess Holdings Inc Bank of America
Merrill Lynch (3,366)(93) MarketAxess Holdings Inc Barclays Bank (786)(21) MarketAxess Holdings Inc Credit Suisse (562)(40) MarketAxess Holdings Inc Goldman Sachs (458)(23) MarketAxess Holdings Inc HSBC (74)
(519) Marriott International Inc ’A’ Bank of AmericaMerrill Lynch (1,931)
(1,537) Marriott International Inc ’A’ Barclays Bank (2,598)(145) Marsh & McLennan Cos Inc Bank of America
Merrill Lynch (560)(889) Marsh & McLennan Cos Inc Barclays Bank (1,707)(843) Marsh & McLennan Cos Inc Citibank (1,619)(501) Marsh & McLennan Cos Inc Credit Suisse (281)(453) Marsh & McLennan Cos Inc Goldman Sachs (1,749)(103) Martin Marietta Materials
Inc Barclays Bank 289(2,145) Marvell Technology Inc Bank of America
Merrill Lynch (11,776)(437) Marvell Technology Inc Barclays Bank (297)
Holding Description Counterparty
Netunrealised
appreciation/(depreciation)
USD
United States continued(1,382) Marvell Technology Inc Goldman Sachs (7,587)(1,122) Marvell Technology Inc JP Morgan (4,466)5,731 Masco Corp Bank of America
Merrill Lynch (20,058)2,488 Masco Corp Barclays Bank (984)
725 Masco Corp Citibank (247)178 Masco Corp Credit Suisse (1,210)
1,271 Masco Corp Goldman Sachs (3,448)741 Masco Corp HSBC (1,818)182 Masimo Corp Bank of America
Merrill Lynch 466159 Masimo Corp Barclays Bank (415)61 Masimo Corp Citibank (159)88 Masimo Corp Goldman Sachs 225
255 Masimo Corp HSBC (326)(534) Match Group Inc Barclays Bank 2,093(23) Match Group Inc Citibank 90(40) Match Group Inc Goldman Sachs (136)
1,588 Maxim Integrated ProductsInc
Bank of AmericaMerrill Lynch 16,801
892 Maxim Integrated ProductsInc Barclays Bank 1,169
673 Maxim Integrated ProductsInc Goldman Sachs 7,120
4,306 Maxim Integrated ProductsInc HSBC 40,304
106 Maxim Integrated ProductsInc JP Morgan 992
(434) McCormick & Co Inc Bank of AmericaMerrill Lynch 35
(555) McCormick & Co Inc Barclays Bank 855(202) McCormick & Co Inc Citibank 311(198) McCormick & Co Inc Goldman Sachs 16339 McDonald’s Corp Bank of America
Merrill Lynch 677336 McDonald’s Corp Barclays Bank 291224 McDonald’s Corp Goldman Sachs 49542 McDonald’s Corp JP Morgan (135)
259 McKesson Corp Bank of AmericaMerrill Lynch (1,805)
1,521 McKesson Corp Barclays Bank (11,027)91 McKesson Corp Citibank (660)
204 McKesson Corp Goldman Sachs (1,422)295 McKesson Corp HSBC (2,873)215 McKesson Corp JP Morgan (2,094)
(1,342) Medtronic Plc Bank of AmericaMerrill Lynch (1,076)
(4,014) Medtronic Plc Barclays Bank 6,034(843) Medtronic Plc Citibank 1,273(595) Medtronic Plc Credit Suisse 127
(1,673) Medtronic Plc Goldman Sachs (1,773)(209) Medtronic Plc HSBC (111)
(5,831) Melco Resorts & Entertain-ment Ltd ADR
Bank of AmericaMerrill Lynch 573
(6,136) Melco Resorts & Entertain-ment Ltd ADR Barclays Bank (127)
(848) Melco Resorts & Entertain-ment Ltd ADR Citibank (51)
(1,340) Melco Resorts & Entertain-ment Ltd ADR HSBC 1,755
(7) MercadoLibre Inc Bank of AmericaMerrill Lynch (153)
(127) MercadoLibre Inc Barclays Bank 1,100(969) Merck & Co Inc Barclays Bank 491287 MetLife Inc Bank of America
Merrill Lynch (98)7,955 MetLife Inc Barclays Bank (80)
45 MetLife Inc Credit Suisse (50)1,809 MetLife Inc Goldman Sachs (615)
BlackRock Style Advantage Fund continued
Portfolio of Investments as at 31 May 2021
The notes on pages 590 to 610 form an integral part of these financial statements.
BlackRock Strategic Funds[460]

Holding Description Counterparty
Netunrealised
appreciation/(depreciation)
USD
United States continued160 MetLife Inc JP Morgan (178)262 Mettler-Toledo International
IncBank of AmericaMerrill Lynch 10,782
215 Mettler-Toledo InternationalInc Barclays Bank 4,036
45 Mettler-Toledo InternationalInc Credit Suisse 1,661
75 Mettler-Toledo InternationalInc Goldman Sachs 2,530
16 Mettler-Toledo InternationalInc JP Morgan 902
697 MGM Resorts International Bank of AmericaMerrill Lynch 2,872
276 MGM Resorts International Credit Suisse 941(2,045) Microchip Technology Inc Bank of America
Merrill Lynch (27,464)(998) Microchip Technology Inc Barclays Bank (2,844)(392) Microchip Technology Inc Credit Suisse (4,364)(406) Microchip Technology Inc Goldman Sachs (5,453)(118) Micron Technology Inc Bank of America
Merrill Lynch (443)(682) Micron Technology Inc Barclays Bank (846)(287) Micron Technology Inc Goldman Sachs (1,076)406 Microsoft Corp Bank of America
Merrill Lynch 1,827716 Microsoft Corp Barclays Bank (788)147 Microsoft Corp Goldman Sachs 662114 Microsoft Corp HSBC 285
2,287 Microsoft Corp JP Morgan 5,71862 Moderna Inc Barclays Bank 1,29298 Moderna Inc JP Morgan 2,61791 Mohawk Industries Inc Bank of America
Merrill Lynch (689)757 Mohawk Industries Inc Barclays Bank 1,81780 Mohawk Industries Inc Goldman Sachs (606)
122 Mohawk Industries Inc HSBC (1,928)120 Mohawk Industries Inc JP Morgan (1,896)290 Molina Healthcare Inc Bank of America
Merrill Lynch (3,100)590 Molina Healthcare Inc Citibank (1,558)115 Molina Healthcare Inc Credit Suisse (1,999)48 Molina Healthcare Inc Goldman Sachs (513)59 Molina Healthcare Inc JP Morgan (1,025)
269 Molson Coors Beverage Co’B’
Bank of AmericaMerrill Lynch 105
735 Molson Coors Beverage Co’B’ Barclays Bank 419
1,761 Molson Coors Beverage Co’B’ Goldman Sachs 687
349 Mondelez International Inc’A’ Goldman Sachs 370
630 Mondelez International Inc’A’ HSBC 920
(371) MongoDB Inc Bank of AmericaMerrill Lynch (10,299)
(414) MongoDB Inc Barclays Bank (2,140)(72) MongoDB Inc Citibank (372)681 Monolithic Power Systems
Inc Barclays Bank 9,00329 Monolithic Power Systems
Inc Citibank 383157 Monster Beverage Corp Bank of America
Merrill Lynch 4581,861 Monster Beverage Corp Barclays Bank 1,707
135 Monster Beverage Corp Citibank 176563 Monster Beverage Corp Goldman Sachs 1,644
1,988 Monster Beverage Corp HSBC 5,308(200) Moody’s Corp Bank of America
Merrill Lynch (1,132)520 Morgan Stanley Bank of America
Merrill Lynch 1,487
Holding Description Counterparty
Netunrealised
appreciation/(depreciation)
USD
United States continued482 Morgan Stanley Barclays Bank 607141 Morgan Stanley Citibank 178
2,354 Morgan Stanley Goldman Sachs 6,732599 Morgan Stanley HSBC 2,684
2,142 Mosaic Co Bank of AmericaMerrill Lynch (1,971)
795 Mosaic Co Barclays Bank 350588 Mosaic Co Citibank 259364 Mosaic Co Credit Suisse 229
1,167 Mosaic Co Goldman Sachs (1,074)353 Mosaic Co JP Morgan 222194 Motorola Solutions Inc Bank of America
Merrill Lynch 904973 Motorola Solutions Inc Barclays Bank 2,403
4 Motorola Solutions Inc JP Morgan 20(220) MSCI Inc Bank of America
Merrill Lynch (2,717)(32) MSCI Inc Barclays Bank (169)(67) MSCI Inc Citibank (354)(33) MSCI Inc Goldman Sachs (408)(54) MSCI Inc HSBC 473(77) Nasdaq Inc Bank of America
Merrill Lynch (286)(636) Nasdaq Inc Barclays Bank (1,296)(66) Nasdaq Inc Credit Suisse (259)
(230) Nasdaq Inc Goldman Sachs (853)(62) Nasdaq Inc HSBC (227)(80) Nasdaq Inc JP Morgan (142)
1,967 NetApp Inc Barclays Bank (3,187)160 NetApp Inc Citibank (259)310 NetApp Inc Credit Suisse (462)
1,911 NetApp Inc Goldman Sachs (2,045)41 NetApp Inc HSBC (61)
134 NetApp Inc JP Morgan (200)(292) Netflix Inc Bank of America
Merrill Lynch (4,050)(73) Netflix Inc Barclays Bank (29)
(294) Netflix Inc Goldman Sachs (4,078)(35) Netflix Inc HSBC (4)
(318) Neurocrine Biosciences Inc Bank of AmericaMerrill Lynch (999)
(711) Neurocrine Biosciences Inc Barclays Bank (292)(380) Neurocrine Biosciences Inc Goldman Sachs (1,193)(288) Neurocrine Biosciences Inc HSBC (1,434)(301) Neurocrine Biosciences Inc JP Morgan (1,499)
1,003 Newell Brands Inc Bank of AmericaMerrill Lynch 600
(159) Newmont Corp Bank of AmericaMerrill Lynch 83
(5,551) Newmont Corp Barclays Bank 1,369(417) Newmont Corp Credit Suisse (2,139)
(1,256) Newmont Corp Goldman Sachs 653(246) Newmont Corp JP Morgan (1,262)375 News Corp ’A’ Barclays Bank 56
3,393 News Corp ’A’ Goldman Sachs 271624 News Corp ’A’ HSBC (281)
(2,538) NextEra Energy Inc Bank of AmericaMerrill Lynch (3,023)
(4,358) NextEra Energy Inc Barclays Bank 1,782(2,211) NextEra Energy Inc Goldman Sachs (2,919)
(293) NextEra Energy Inc HSBC 463886 NIKE Inc ’B’ Barclays Bank 2,126209 Nordson Corp Bank of America
Merrill Lynch 3,699256 Nordson Corp Barclays Bank 4,920190 Nordson Corp Citibank 3,652997 Nordson Corp Goldman Sachs 17,647112 Nordson Corp HSBC 1,457146 Nordson Corp JP Morgan 1,899
BlackRock Style Advantage Fund continued
Portfolio of Investments as at 31 May 2021
The notes on pages 590 to 610 form an integral part of these financial statements.
Annual report and audited financial statements [461]

Holding Description Counterparty
Netunrealised
appreciation/(depreciation)
USD
United States continued59 Norfolk Southern Corp Bank of America
Merrill Lynch (286)189 Norfolk Southern Corp Barclays Bank 79424 Norfolk Southern Corp Goldman Sachs (2,052)341 Northern Trust Corp Bank of America
Merrill Lynch 194739 Northern Trust Corp Barclays Bank 392167 Northern Trust Corp Citibank 89181 Northern Trust Corp Credit Suisse 183660 Northern Trust Corp Goldman Sachs 376910 NortonLifeLock Inc HSBC 2,01734 Novocure Ltd Barclays Bank 638
154 Novocure Ltd Goldman Sachs 4,466(131) Nucor Corp Bank of America
Merrill Lynch (132)(3,198) Nucor Corp Barclays Bank 2,622
(518) Nucor Corp JP Morgan 358(52) NVIDIA Corp Bank of America
Merrill Lynch (3,292)(98) NVIDIA Corp Barclays Bank (2,479)
(157) NVIDIA Corp Goldman Sachs (13,056)2 NVR Inc Bank of America
Merrill Lynch 3149 NVR Inc Barclays Bank 11,4918 NVR Inc Credit Suisse (2,629)
707 NXP Semiconductors NV Barclays Bank 4,97760 NXP Semiconductors NV Citibank 422
(179) Occidental Petroleum Corp Bank of AmericaMerrill Lynch 77
(1,280) Occidental Petroleum Corp Barclays Bank (887)(2,962) Occidental Petroleum Corp Goldman Sachs 1,274
(418) Occidental Petroleum Corp HSBC 280(114) Okta Inc Bank of America
Merrill Lynch 285(416) Okta Inc Barclays Bank 8,370
(1,254) Okta Inc Goldman Sachs 3,135399 Old Dominion Freight Line
IncBank of AmericaMerrill Lynch (676)
268 Old Dominion Freight LineInc Barclays Bank 129
37 Old Dominion Freight LineInc Citibank 28
1,173 Old Dominion Freight LineInc Goldman Sachs (4,852)
1,237 Old Dominion Freight LineInc HSBC (5,789)
38 Old Dominion Freight LineInc JP Morgan 63
580 Omnicom Group Inc Bank of AmericaMerrill Lynch (505)
4,746 Omnicom Group Inc Barclays Bank (4,556)483 Omnicom Group Inc Citibank (464)723 Omnicom Group Inc Goldman Sachs (629)204 Omnicom Group Inc HSBC (522)491 Omnicom Group Inc JP Morgan (1,257)
(3,693) ON Semiconductor Corp Bank of AmericaMerrill Lynch (12,187)
(789) ON Semiconductor Corp Barclays Bank (552)(385) ON Semiconductor Corp Credit Suisse (359)(377) ONEOK Inc Barclays Bank 528
(2,949) Oracle Corp Bank of AmericaMerrill Lynch 1,061
(520) Oracle Corp Barclays Bank 333(312) Oracle Corp Credit Suisse 440
(2,072) Oracle Corp Goldman Sachs 70484 O’Reilly Automotive Inc Bank of America
Merrill Lynch (1,054)469 O’Reilly Automotive Inc Barclays Bank (583)52 O’Reilly Automotive Inc Citibank (92)61 O’Reilly Automotive Inc Credit Suisse (49)
Holding Description Counterparty
Netunrealised
appreciation/(depreciation)
USD
United States continued32 O’Reilly Automotive Inc Goldman Sachs (63)
259 Otis Worldwide Corp Citibank 52366 Otis Worldwide Corp Goldman Sachs (249)979 Owens Corning Bank of America
Merrill Lynch 3521,021 Owens Corning Barclays Bank 1,521
341 Owens Corning Citibank 504278 Owens Corning Credit Suisse (22)353 Owens Corning Goldman Sachs 127
2,102 Owens Corning HSBC (3,300)111 Owens Corning JP Morgan (174)311 PACCAR Inc Bank of America
Merrill Lynch (697)705 PACCAR Inc Barclays Bank (197)544 PACCAR Inc Goldman Sachs (1,219)(37) Packaging Corp of America Bank of America
Merrill Lynch 240(361) Packaging Corp of America Barclays Bank 1,029(136) Palo Alto Networks Inc Bank of America
Merrill Lynch (3,733)(67) Palo Alto Networks Inc Barclays Bank 85
(465) Palo Alto Networks Inc Goldman Sachs (12,764)561 Parker-Hannifin Corp Barclays Bank 1,279
(117) Paychex Inc Barclays Bank 88(122) Paycom Software Inc Barclays Bank 834(155) Paycom Software Inc Goldman Sachs (1,147)(521) PayPal Holdings Inc Bank of America
Merrill Lynch (8,159)(561) PayPal Holdings Inc Barclays Bank (1,599)(88) PayPal Holdings Inc Citibank (251)(10) PayPal Holdings Inc HSBC (164)
1 Pebblebrook Hotel Trust(REIT)π Credit Suisse —
(650) Peloton Interactive Inc ’A’ Bank of AmericaMerrill Lynch (10,011)
(473) Peloton Interactive Inc ’A’ Barclays Bank (4,328)(99) Peloton Interactive Inc ’A’ Credit Suisse (2,259)
(737) Peloton Interactive Inc ’A’ Goldman Sachs (13,281)4,802 Pentair Plc Barclays Bank 4,3703,873 PepsiCo Inc Bank of America
Merrill Lynch 6,855883 PepsiCo Inc Barclays Bank 13131 PepsiCo Inc Citibank 1269 PepsiCo Inc Credit Suisse 84
484 PepsiCo Inc Goldman Sachs 857(2,167) PerkinElmer Inc Barclays Bank (997)(1,749) Pfizer Inc Bank of America
Merrill Lynch 1,266(2,917) Pfizer Inc Barclays Bank 3,150
(173) Phillips 66 Bank of AmericaMerrill Lynch (13)
(410) Phillips 66 Barclays Bank 529(263) Phillips 66 HSBC 360868 Pinterest Inc ’A’ Barclays Bank 2,075300 Pinterest Inc ’A’ Citibank 717
1,094 Pinterest Inc ’A’ Goldman Sachs 7,877172 Pinterest Inc ’A’ HSBC 1,085
(908) Pioneer Natural ResourcesCo
Bank of AmericaMerrill Lynch 3,816
(67) Pioneer Natural ResourcesCo Barclays Bank (155)
(161) Pioneer Natural ResourcesCo Citibank (89)
(863) Pioneer Natural ResourcesCo Goldman Sachs 1,603
(1,074) Plug Power Inc Bank of AmericaMerrill Lynch (6,186)
(2,528) Plug Power Inc Barclays Bank (8,426)(2,617) Plug Power Inc Citibank (9,159)
BlackRock Style Advantage Fund continued
Portfolio of Investments as at 31 May 2021
The notes on pages 590 to 610 form an integral part of these financial statements.
BlackRock Strategic Funds[462]

Holding Description Counterparty
Netunrealised
appreciation/(depreciation)
USD
United States continued(1,512) Plug Power Inc Credit Suisse (11,403)(1,020) Plug Power Inc Goldman Sachs (5,875)(1,708) Plug Power Inc HSBC (18,156)
104 PNC Financial ServicesGroup Inc Citibank 72
61 PNC Financial ServicesGroup Inc Goldman Sachs (265)
807 Pool Corp Barclays Bank 4,68945 Pool Corp Citibank 26145 Pool Corp Goldman Sachs 40
(354) PPD Inc Barclays Bank —(374) PPG Industries Inc Bank of America
Merrill Lynch 90(597) PPG Industries Inc Barclays Bank (90)(389) PPG Industries Inc Goldman Sachs 93416 Principal Financial Group
Inc Citibank (154)(585) Procter & Gamble Co Goldman Sachs 1,685
(2,703) Progressive Corp Bank of AmericaMerrill Lynch 20,218
(611) Progressive Corp Barclays Bank (582)(132) Progressive Corp Credit Suisse 879(234) Progressive Corp Goldman Sachs 1,750(416) Progressive Corp JP Morgan 2,771
2,422 Prudential Financial Inc Barclays Bank 1,550800 PTC Inc Barclays Bank 1,056182 PTC Inc Goldman Sachs 1,179
(2,341) Public Service EnterpriseGroup Inc Barclays Bank 60
(351) Public Service EnterpriseGroup Inc Goldman Sachs 60
529 PulteGroup Inc Bank of AmericaMerrill Lynch (106)
2,667 PulteGroup Inc Barclays Bank 4,721246 PulteGroup Inc Citibank 435427 PulteGroup Inc Goldman Sachs (85)22 PulteGroup Inc HSBC (100)72 Qorvo Inc Bank of America
Merrill Lynch 838532 Qorvo Inc Barclays Bank 2,176226 Qorvo Inc Goldman Sachs 1,849171 Qorvo Inc HSBC 1,92468 Qorvo Inc JP Morgan 744
1,564 QUALCOMM Inc Bank of AmericaMerrill Lynch 7,413
1,238 QUALCOMM Inc Barclays Bank 2,018302 QUALCOMM Inc Citibank 492179 QUALCOMM Inc Credit Suisse 272
1,709 QUALCOMM Inc Goldman Sachs 6,8971,193 QUALCOMM Inc HSBC 6,681
338 QUALCOMM Inc JP Morgan 1,893124 Quest Diagnostics Inc Bank of America
Merrill Lynch (42)602 Quest Diagnostics Inc Barclays Bank 722376 Raymond James Financial
IncBank of AmericaMerrill Lynch (500)
286 Raymond James FinancialInc Barclays Bank (555)
361 Raymond James FinancialInc Citibank (700)
186 Raymond James FinancialInc Credit Suisse (458)
489 Raymond James FinancialInc Goldman Sachs (650)
79 Raymond James FinancialInc HSBC (194)
233 Raymond James FinancialInc JP Morgan (573)
32 Regeneron PharmaceuticalsInc Barclays Bank 63
Holding Description Counterparty
Netunrealised
appreciation/(depreciation)
USD
United States continued30 Regeneron Pharmaceuticals
Inc HSBC 31,435 Regions Financial Corp Bank of America
Merrill Lynch 143,631 Regions Financial Corp Barclays Bank 1,9612,403 Regions Financial Corp Goldman Sachs 245,984 Regions Financial Corp HSBC 4,5481,126 Regions Financial Corp JP Morgan 856(196) Reinsurance Group of
America Inc Barclays Bank (443)(680) Reinsurance Group of
America Inc Citibank (1,537)(394) RenaissanceRe Holdings
Ltd Barclays Bank (13)(130) RenaissanceRe Holdings
Ltd Citibank (31)(252) RenaissanceRe Holdings
Ltd Credit Suisse 1,479(1,747) RenaissanceRe Holdings
Ltd Goldman Sachs 2,274(2,945) Republic Services Inc Bank of America
Merrill Lynch 2,503(107) Republic Services Inc Credit Suisse (79)
(3,740) Republic Services Inc Goldman Sachs 3,179(366) Republic Services Inc HSBC 1,050(322) Republic Services Inc JP Morgan 924(243) ResMed Inc Bank of America
Merrill Lynch (2,536)(55) ResMed Inc Barclays Bank 26
(212) ResMed Inc Citibank 102(158) ResMed Inc Goldman Sachs (1,714)(92) ResMed Inc HSBC (1,163)
(200) RingCentral Inc ’A’ Bank of AmericaMerrill Lynch (5,388)
(457) RingCentral Inc ’A’ Barclays Bank (7,230)(43) RingCentral Inc ’A’ Citibank (436)(57) RingCentral Inc ’A’ Credit Suisse (119)
(312) RingCentral Inc ’A’ Goldman Sachs (8,405)(117) RingCentral Inc ’A’ HSBC (243)(157) RingCentral Inc ’A’ JP Morgan (934)249 Robert Half International
IncBank of AmericaMerrill Lynch (234)
3,583 Robert Half InternationalInc Barclays Bank 2,759
88 Robert Half InternationalInc Citibank 68
638 Robert Half InternationalInc Goldman Sachs (600)
178 Robert Half InternationalInc HSBC (358)
1,187 Rockwell Automation Inc Bank of AmericaMerrill Lynch (1,448)
(38) Roku Inc Credit Suisse 113(3,209) Rollins Inc Bank of America
Merrill Lynch 6,450(63) Rollins Inc Barclays Bank 20
(492) Rollins Inc Credit Suisse 1,540(1,787) Rollins Inc Goldman Sachs 3,592(3,108) Rollins Inc HSBC 9,728
(259) Roper Technologies Inc Bank of AmericaMerrill Lynch (4,395)
(676) Roper Technologies Inc Barclays Bank (3,099)(54) Roper Technologies Inc Citibank (301)(76) Roper Technologies Inc Goldman Sachs (912)
(1,267) Roper Technologies Inc JP Morgan (7,108)122 Ross Stores Inc Bank of America
Merrill Lynch 331,208 Ross Stores Inc Barclays Bank 3,257
100 Ross Stores Inc Citibank 28821 Ross Stores Inc Credit Suisse (96)
BlackRock Style Advantage Fund continued
Portfolio of Investments as at 31 May 2021
The notes on pages 590 to 610 form an integral part of these financial statements.
Annual report and audited financial statements [463]

Holding Description Counterparty
Netunrealised
appreciation/(depreciation)
USD
United States continued499 Ross Stores Inc Goldman Sachs (689)
(300) Royal Caribbean CruisesLtd
Bank of AmericaMerrill Lynch (2,619)
(1,086) Royal Caribbean CruisesLtd Barclays Bank (8,036)
(234) Royal Caribbean CruisesLtd Citibank (990)
(801) Royal Caribbean CruisesLtd Goldman Sachs (6,993)
(183) Royal Caribbean CruisesLtd HSBC (1,709)
(2,074) Royalty Pharma Plc ’A’ Barclays Bank 1,244(236) RPM International Inc Bank of America
Merrill Lynch 701(218) RPM International Inc Barclays Bank 150(42) S&P Global Inc Bank of America
Merrill Lynch (190)(585) S&P Global Inc Barclays Bank (246)
(1,029) salesforce.com Inc Bank of AmericaMerrill Lynch (20,840)
(1,855) salesforce.com Inc Barclays Bank (20,604)(316) salesforce.com Inc Citibank (3,511)(298) salesforce.com Inc Credit Suisse (5,843)(587) salesforce.com Inc Goldman Sachs (11,995)(50) salesforce.com Inc HSBC (1,122)
(253) Sarepta Therapeutics Inc Bank of AmericaMerrill Lynch 906
(1,824) Sarepta Therapeutics Inc Barclays Bank 2,610(228) Sarepta Therapeutics Inc Citibank 356(358) Sarepta Therapeutics Inc Credit Suisse (1,998)
(1,923) Sarepta Therapeutics Inc Goldman Sachs (257)(150) Sarepta Therapeutics Inc HSBC (843)
(3,265) Schlumberger NV Bank of AmericaMerrill Lynch 139
(7,562) Schlumberger NV Barclays Bank 1,133(1,600) Schlumberger NV JP Morgan 508
(330) Seagate Technology Hold-ings Plc Goldman Sachs 2,798
(341) Seagen Inc Bank of AmericaMerrill Lynch (2,513)
(480) Seagen Inc Barclays Bank (806)(1,308) Seagen Inc Goldman Sachs (9,640)1,644 Sealed Air Corp Bank of America
Merrill Lynch 5261,791 Sealed Air Corp Barclays Bank 681
555 Sealed Air Corp Citibank 211564 Sealed Air Corp Credit Suisse 23
3,114 Sealed Air Corp Goldman Sachs 9961,250 Sealed Air Corp JP Morgan 50(609) SEI Investments Co Bank of America
Merrill Lynch (311)(413) SEI Investments Co Barclays Bank (85)(513) SEI Investments Co Goldman Sachs (156)(481) Sempra Energy Bank of America
Merrill Lynch 110(199) Sempra Energy Barclays Bank (24)(296) Sensata Technologies Hold-
ing PlcBank of AmericaMerrill Lynch (210)
36 ServiceNow Inc Bank of AmericaMerrill Lynch (119)
645 ServiceNow Inc Barclays Bank (1,611)25 ServiceNow Inc Goldman Sachs 487
649 Sherwin-Williams Co Bank of AmericaMerrill Lynch (426)
1,205 Sherwin-Williams Co Barclays Bank (1,922)238 Sherwin-Williams Co Credit Suisse (1,219)625 Sherwin-Williams Co Goldman Sachs (441)62 Sherwin-Williams Co HSBC (317)
174 Sherwin-Williams Co JP Morgan (316)
Holding Description Counterparty
Netunrealised
appreciation/(depreciation)
USD
United States continued33,867 Sirius XM Holdings Inc Barclays Bank 3,725
729 Skyworks Solutions Inc Bank of AmericaMerrill Lynch 4,257
53 Skyworks Solutions Inc Barclays Bank 591 Skyworks Solutions Inc JP Morgan 4
(321) Slack Technologies Inc ’A’ Bank of AmericaMerrill Lynch (368)
(1,244) Slack Technologies Inc ’A’ Citibank (1,344)(1,985) Slack Technologies Inc ’A’ Goldman Sachs (5,128)
(896) Snap Inc ’A’ Barclays Bank (1,792)(604) Snap Inc ’A’ Goldman Sachs (4,959)(65) Snap-on Inc Bank of America
Merrill Lynch (30)(54) Snowflake Inc ’A’ Bank of America
Merrill Lynch (1,371)(531) Snowflake Inc ’A’ Barclays Bank (2,182)(74) Snowflake Inc ’A’ Goldman Sachs (1,878)(59) Snowflake Inc ’A’ HSBC (2,608)(79) SolarEdge Technologies Inc Bank of America
Merrill Lynch (3,160)(328) SolarEdge Technologies Inc Barclays Bank (1,063)(395) SolarEdge Technologies Inc Credit Suisse (17,505)(211) SolarEdge Technologies Inc Goldman Sachs (8,440)(83) SolarEdge Technologies Inc HSBC (3,708)(57) SolarEdge Technologies Inc JP Morgan (2,546)
(258) Southwest Airlines Co Bank of AmericaMerrill Lynch 165
(1,989) Southwest Airlines Co Barclays Bank (1,551)(566) Southwest Airlines Co Credit Suisse (62)
(1,315) Southwest Airlines Co Goldman Sachs 842(395) Southwest Airlines Co HSBC (43)
(38,622) Spectrum Brands HoldingsInc JP Morgan 233,663
(1,512) Splunk Inc Bank of AmericaMerrill Lynch (10,327)
(457) Splunk Inc Barclays Bank (466)(152) Splunk Inc Citibank (326)(107) Splunk Inc HSBC (798)(786) Square Inc ’A’ Barclays Bank (9,094)(58) Square Inc ’A’ Goldman Sachs (1,137)
(104) Square Inc ’A’ HSBC (633)(403) SS&C Technologies Hold-
ings IncBank of AmericaMerrill Lynch 97
(611) SS&C Technologies Hold-ings Inc Barclays Bank 385
(255) SS&C Technologies Hold-ings Inc Goldman Sachs 61
(448) SS&C Technologies Hold-ings Inc HSBC (246)
157 Stanley Black & Decker Inc Barclays Bank 81848 Stanley Black & Decker Inc Goldman Sachs 95
162 Starbucks Corp Bank of AmericaMerrill Lynch 11
2,678 Starbucks Corp Barclays Bank 3,3994,671 Starbucks Corp Citibank 6,353
137 Starbucks Corp Credit Suisse (58)593 Starbucks Corp Goldman Sachs 1,720180 Starbucks Corp HSBC (76)106 Starbucks Corp JP Morgan 6647 State Street Corp Bank of America
Merrill Lynch 281,599 State Street Corp Barclays Bank 911
317 State Street Corp Goldman Sachs 190120 State Street Corp HSBC (102)
(576) Steel Dynamics Inc Bank of AmericaMerrill Lynch 684
(1,064) Steel Dynamics Inc Barclays Bank (391)(914) Steel Dynamics Inc HSBC 1,417
BlackRock Style Advantage Fund continued
Portfolio of Investments as at 31 May 2021
The notes on pages 590 to 610 form an integral part of these financial statements.
BlackRock Strategic Funds[464]

Holding Description Counterparty
Netunrealised
appreciation/(depreciation)
USD
United States continued(91) STERIS Plc Bank of America
Merrill Lynch 520(368) STERIS Plc Barclays Bank (57)(75) STERIS Plc Credit Suisse 1,259(93) STERIS Plc JP Morgan 1,561
(1,738) Sunrun Inc Bank of AmericaMerrill Lynch (4,089)
(1,921) Sunrun Inc Barclays Bank 250(367) Sunrun Inc Citibank 199(636) Sunrun Inc Credit Suisse (2,493)(485) Sunrun Inc Goldman Sachs (2,289)(538) Sunrun Inc HSBC (2,209)
(2,392) Sunrun Inc JP Morgan (9,377)39 SVB Financial Group Citibank 298
1,098 Synchrony Financial Bank of AmericaMerrill Lynch 549
385 Synchrony Financial Barclays Bank 389336 Synchrony Financial Goldman Sachs 168255 Synopsys Inc Bank of America
Merrill Lynch 4,677433 Synopsys Inc Barclays Bank 1,479
3,102 Synopsys Inc Citibank 17,86864 Synopsys Inc Credit Suisse 1,405
288 Synopsys Inc Goldman Sachs 3,326166 Synopsys Inc HSBC 3,644250 Synopsys Inc JP Morgan 2,718247 Sysco Corp Bank of America
Merrill Lynch 138116 T Rowe Price Group Inc Bank of America
Merrill Lynch (14)231 T Rowe Price Group Inc Barclays Bank 802
5 T Rowe Price Group Inc Citibank 1790 T Rowe Price Group Inc Goldman Sachs (11)
515 Take-Two Interactive Soft-ware Inc Barclays Bank 278
210 Target Corp Bank of AmericaMerrill Lynch 3,549
851 Target Corp Barclays Bank 1,164335 Target Corp HSBC 4,318
(2,391) TE Connectivity Ltd Barclays Bank (2,726)(575) Teladoc Health Inc Bank of America
Merrill Lynch (7,237)(911) Teladoc Health Inc Barclays Bank (6,917)(91) Teladoc Health Inc Citibank (751)
(1,002) Teladoc Health Inc Goldman Sachs (13,246)(93) Teledyne Technologies Inc Bank of America
Merrill Lynch (462)(470) Teledyne Technologies Inc Barclays Bank (3,882)(71) Teledyne Technologies Inc Citibank (625)(33) Teledyne Technologies Inc Goldman Sachs (105)(30) Teledyne Technologies Inc JP Morgan (402)
(454) Teleflex Inc Bank of AmericaMerrill Lynch (4,063)
(299) Teleflex Inc Barclays Bank 383(48) Teleflex Inc Goldman Sachs (430)376 Teradyne Inc Bank of America
Merrill Lynch 4,6961,444 Teradyne Inc Barclays Bank 6,729
94 Teradyne Inc Citibank 438155 Teradyne Inc Credit Suisse 1,62992 Teradyne Inc Goldman Sachs 1,149
(37) Tesla Inc Bank of AmericaMerrill Lynch (1,790)
(256) Tesla Inc Barclays Bank (4,808)(21) Tesla Inc Citibank (394)(39) Tesla Inc Credit Suisse (2,009)(19) Tesla Inc Goldman Sachs (919)(52) Tesla Inc JP Morgan 199
(10,748) Teva Pharmaceutical Indus-tries Ltd ADR
Bank of AmericaMerrill Lynch 3,869
Holding Description Counterparty
Netunrealised
appreciation/(depreciation)
USD
United States continued96 Texas Instruments Inc Bank of America
Merrill Lynch 863340 Texas Instruments Inc Barclays Bank 384679 Texas Instruments Inc Credit Suisse 5,276781 Texas Instruments Inc Goldman Sachs 5,562
(504) Thermo Fisher Scientific Inc Barclays Bank (3,548)(110) Thermo Fisher Scientific Inc Citibank (774)(143) Thermo Fisher Scientific Inc Goldman Sachs (2,371)684 TJX Cos Inc Bank of America
Merrill Lynch (3,057)3,591 TJX Cos Inc Barclays Bank 3,586
230 TJX Cos Inc Credit Suisse 208528 TJX Cos Inc Goldman Sachs (576)142 TJX Cos Inc HSBC (774)159 TJX Cos Inc JP Morgan (867)
(688) T-Mobile US Inc Bank of AmericaMerrill Lynch (1,292)
(3,872) T-Mobile US Inc Barclays Bank (14,616)(557) T-Mobile US Inc Credit Suisse (3,034)
(3,218) T-Mobile US Inc Goldman Sachs (4,395)(98) T-Mobile US Inc HSBC (214)43 Tractor Supply Co Bank of America
Merrill Lynch (202)816 Tractor Supply Co Barclays Bank (65)55 Tractor Supply Co Citibank (4)72 Tractor Supply Co Credit Suisse (1,008)65 Tractor Supply Co HSBC (910)57 Tractor Supply Co JP Morgan (798)
(34) Trade Desk Inc ’A’ Bank of AmericaMerrill Lynch (2,737)
(107) Trade Desk Inc ’A’ Barclays Bank (3,235)(22) Trade Desk Inc ’A’ Citibank (211)
(191) Trade Desk Inc ’A’ Goldman Sachs (14,546)(14) Trade Desk Inc ’A’ JP Morgan (1,380)
(557) Tradeweb Markets Inc ’A’ Bank of AmericaMerrill Lynch (6)
(302) Tradeweb Markets Inc ’A’ Citibank (788)(1,936) Tradeweb Markets Inc ’A’ Goldman Sachs (19)
166 Trane Technologies Plc Bank of AmericaMerrill Lynch 475
952 Trane Technologies Plc Barclays Bank 4,09483 Trane Technologies Plc Credit Suisse (22)
125 Trane Technologies Plc Goldman Sachs 440148 Trane Technologies Plc HSBC 693
(394) TransUnion Bank of AmericaMerrill Lynch 410
(1,445) TransUnion Barclays Bank 3,309(576) TransUnion Citibank 1,319
(1,195) TransUnion Goldman Sachs 1,243(683) Travelers Cos Inc Goldman Sachs 376(371) Travelers Cos Inc HSBC 731427 Trimble Inc Bank of America
Merrill Lynch 176408 Trimble Inc Barclays Bank (61)669 Trimble Inc Citibank (100)280 Trimble Inc Credit Suisse 483143 Trimble Inc Goldman Sachs (68)438 Trimble Inc HSBC 477293 Trimble Inc JP Morgan 15877 Truist Financial Corp Bank of America
Merrill Lynch (210)1,253 Truist Financial Corp Barclays Bank 714
242 Truist Financial Corp Goldman Sachs (58)(797) Twilio Inc ’A’ Bank of America
Merrill Lynch (30,924)(289) Twilio Inc ’A’ Barclays Bank (3,062)(80) Twilio Inc ’A’ Citibank (953)
(355) Twilio Inc ’A’ Goldman Sachs (12,516)(29) Twilio Inc ’A’ HSBC (1,198)
BlackRock Style Advantage Fund continued
Portfolio of Investments as at 31 May 2021
The notes on pages 590 to 610 form an integral part of these financial statements.
Annual report and audited financial statements [465]

Holding Description Counterparty
Netunrealised
appreciation/(depreciation)
USD
United States continued(552) Twitter Inc Bank of America
Merrill Lynch (2,981)(387) Twitter Inc Barclays Bank (364)
(1,389) Twitter Inc Citibank (1,306)(1,254) Twitter Inc Goldman Sachs (4,504)
(597) Twitter Inc JP Morgan (925)(66) Tyler Technologies Inc Bank of America
Merrill Lynch (754)(611) Tyler Technologies Inc Barclays Bank 409(134) Tyler Technologies Inc Goldman Sachs (1,530)(26) Tyler Technologies Inc JP Morgan (284)987 Tyson Foods Inc ’A’ Barclays Bank (1,046)391 Tyson Foods Inc ’A’ Citibank (414)962 Tyson Foods Inc ’A’ Credit Suisse 654
1,312 Tyson Foods Inc ’A’ Goldman Sachs (1,456)214 Tyson Foods Inc ’A’ HSBC 146
(1,389) Uber Technologies Inc Bank of AmericaMerrill Lynch (3,396)
(603) Uber Technologies Inc Barclays Bank (482)(661) Uber Technologies Inc HSBC (3,253)(229) Uber Technologies Inc JP Morgan (1,154)
1,798 UGI Corp Bank of AmericaMerrill Lynch 4,028
4,709 UGI Corp Barclays Bank 5,839484 UGI Corp Citibank 600334 UGI Corp Credit Suisse (53)
2,052 UGI Corp Goldman Sachs 4,596772 UGI Corp HSBC (124)43 Ulta Salon Cosmetics & Fra-
grance IncBank of AmericaMerrill Lynch 669
97 Ulta Salon Cosmetics & Fra-grance Inc Barclays Bank 2,865
19 Ulta Salon Cosmetics & Fra-grance Inc Citibank 561
191 Ulta Salon Cosmetics & Fra-grance Inc Goldman Sachs 2,970
123 Union Pacific Corp Bank of AmericaMerrill Lynch (4)
336 Union Pacific Corp Barclays Bank 39351 Union Pacific Corp Citibank 6054 Union Pacific Corp Credit Suisse (200)
184 Union Pacific Corp Goldman Sachs (6)119 Union Pacific Corp HSBC (441)157 United Parcel Service Inc ’B’ Bank of America
Merrill Lynch (265)437 United Parcel Service Inc ’B’ Barclays Bank 51140 United Rentals Inc Bank of America
Merrill Lynch (80)69 United Rentals Inc Barclays Bank 55579 United Rentals Inc Citibank 635
127 United Rentals Inc Goldman Sachs (899)142 United Rentals Inc HSBC (2,014)(56) UnitedHealth Group Inc Barclays Bank (54)
(585) UnitedHealth Group Inc Citibank (567)(31) UnitedHealth Group Inc Goldman Sachs (102)253 Universal Health Services
Inc ’B’Bank of AmericaMerrill Lynch (245)
1,375 Universal Health ServicesInc ’B’ Barclays Bank 866
72 Universal Health ServicesInc ’B’ Citibank 45
121 Universal Health ServicesInc ’B’ Credit Suisse 312
568 Universal Health ServicesInc ’B’ Goldman Sachs (551)
152 Universal Health ServicesInc ’B’ HSBC 392
130 Vail Resorts Inc Bank of AmericaMerrill Lynch 1,115
Holding Description Counterparty
Netunrealised
appreciation/(depreciation)
USD
United States continued339 Vail Resorts Inc Barclays Bank 2,10985 Vail Resorts Inc Credit Suisse 75434 Vail Resorts Inc Goldman Sachs 29280 Vail Resorts Inc HSBC 7109 Vail Resorts Inc JP Morgan 80
(273) Valero Energy Corp Bank of AmericaMerrill Lynch (812)
(1,090) Valero Energy Corp Barclays Bank (1,564)(202) Valero Energy Corp Citibank (422)(138) Valero Energy Corp Credit Suisse (105)
(1,705) Valero Energy Corp Goldman Sachs 2,080(295) Valero Energy Corp HSBC (103)(638) Valero Energy Corp JP Morgan (1,363)889 Veeva Systems Inc ’A’ Barclays Bank 25,36386 Veeva Systems Inc ’A’ Citibank 2,45490 Veeva Systems Inc ’A’ Credit Suisse 3,79856 Veeva Systems Inc ’A’ Goldman Sachs 2,43242 Veeva Systems Inc ’A’ JP Morgan 1,772
1,077 VeriSign Inc Barclays Bank (4,933)(632) Verisk Analytics Inc Bank of America
Merrill Lynch 84(625) Verisk Analytics Inc Barclays Bank 838(81) Verisk Analytics Inc Citibank 109
(939) Verisk Analytics Inc Goldman Sachs 103(213) Verisk Analytics Inc HSBC 1,433(239) Verisk Analytics Inc JP Morgan 1,608
3,074 Verizon CommunicationsInc
Bank of AmericaMerrill Lynch (4,457)
2,423 Verizon CommunicationsInc Barclays Bank (1,187)
2,067 Verizon CommunicationsInc Credit Suisse (6,263)
761 Verizon CommunicationsInc Goldman Sachs (1,103)
1,638 Vertex Pharmaceuticals Inc Bank of AmericaMerrill Lynch (12,645)
845 Vertex Pharmaceuticals Inc Barclays Bank (2,189)247 Vertex Pharmaceuticals Inc Goldman Sachs (1,907)147 Vertex Pharmaceuticals Inc HSBC (628)
(129) VF Corp Barclays Bank 13(738) VF Corp Goldman Sachs 5,114(299) ViacomCBS Inc ’B’ Barclays Bank (263)(643) ViacomCBS Inc ’B’ Credit Suisse (2,025)
(1,938) Viatris Inc Bank of AmericaMerrill Lynch 1,764
(8,978) Viatris Inc Barclays Bank 941(1,786) Viatris Inc Citibank 214(4,339) Viatris Inc Credit Suisse (868)(7,421) Viatris Inc Goldman Sachs 6,753(5,653) Viatris Inc HSBC (1,131)(2,121) Viatris Inc JP Morgan (424)
(128) Vimeo Inc Bank of AmericaMerrill Lynch (5,376)
(1,500) Vimeo Inc Barclays Bank (63,000)(620) Vimeo Inc Citibank (26,040)(991) Vimeo Inc Goldman Sachs (41,622)(321) Vimeo Inc HSBC (13,482)
(4,037) Visa Inc ’A’ Barclays Bank 7,479(203) Visa Inc ’A’ Credit Suisse 40
(1,007) Visa Inc ’A’ Goldman Sachs (866)524 VMware Inc ’A’ Barclays Bank (2,253)630 Voya Financial Inc Credit Suisse (1,896)88 Vulcan Materials Co Bank of America
Merrill Lynch (862)(336) W R Berkley Corp Barclays Bank 84(139) W R Berkley Corp HSBC 402(311) Walgreens Boots Alliance
IncBank of AmericaMerrill Lynch 821
BlackRock Style Advantage Fund continued
Portfolio of Investments as at 31 May 2021
The notes on pages 590 to 610 form an integral part of these financial statements.
BlackRock Strategic Funds[466]

Holding Description Counterparty
Netunrealised
appreciation/(depreciation)
USD
United States continued(181) Walgreens Boots Alliance
Inc Barclays Bank 393(1,661) Walt Disney Co Barclays Bank (7,209)
(139) Walt Disney Co Credit Suisse 785(225) Walt Disney Co Goldman Sachs (1,928)(203) Walt Disney Co HSBC 1,147(114) Walt Disney Co JP Morgan 644(387) Waste Connections Inc Bank of America
Merrill Lynch 209(2,400) Waste Connections Inc Barclays Bank (1,403)
(542) Waste Connections Inc JP Morgan 1,182(3,361) Waste Management Inc Bank of America
Merrill Lynch 2,679(1,436) Waste Management Inc Barclays Bank 617(1,271) Waste Management Inc Citibank 547
(38) Waste Management Inc Goldman Sachs 32(206) Waste Management Inc JP Morgan 531
36 Waters Corp Bank of AmericaMerrill Lynch 479
760 Waters Corp Barclays Bank 3,68962 Waters Corp Citibank 31332 Waters Corp Credit Suisse 148
229 Waters Corp HSBC 1,14233 Waters Corp JP Morgan 149
(83) Wayfair Inc ’A’ Goldman Sachs (408)(27) Wayfair Inc ’A’ HSBC 393
(1,458) Wells Fargo & Co Barclays Bank (700)(765) Wells Fargo & Co Citibank (367)
(4,276) Wells Fargo & Co Goldman Sachs 5,0461,746 West Pharmaceutical Ser-
vices IncBank of AmericaMerrill Lynch 34,722
132 West Pharmaceutical Ser-vices Inc Barclays Bank 1,055
30 West Pharmaceutical Ser-vices Inc Citibank 240
134 West Pharmaceutical Ser-vices Inc Goldman Sachs 1,056
31 West Pharmaceutical Ser-vices Inc JP Morgan 70
(3,018) Western Digital Corp JP Morgan (19,949)3,066 Western Union Co Bank of America
Merrill Lynch (1,288)2,734 Western Union Co Barclays Bank (629)
427 Western Union Co Credit Suisse (568)1,150 Western Union Co Goldman Sachs (483)
(1,559) Westinghouse Air BrakeTechnologies Corp
Bank of AmericaMerrill Lynch (3,679)
(588) Westinghouse Air BrakeTechnologies Corp Barclays Bank (1,094)
(877) Westinghouse Air BrakeTechnologies Corp Goldman Sachs (2,070)
(156) Westinghouse Air BrakeTechnologies Corp JP Morgan (296)
176 Westrock Co Bank of AmericaMerrill Lynch (614)
1,034 Westrock Co Barclays Bank 62337 Westrock Co Goldman Sachs (1,176)198 Whirlpool Corp Bank of America
Merrill Lynch (1,669)787 Whirlpool Corp Barclays Bank 1,64564 Whirlpool Corp Citibank 134
469 Whirlpool Corp Goldman Sachs (3,954)(1,726) Williams Cos Inc Credit Suisse (1,381)
(875) Willis Towers Watson Plc Barclays Bank 1,365(83) Willis Towers Watson Plc JP Morgan 624
(179) Wix.com Ltd Bank of AmericaMerrill Lynch (6,279)
(294) Wix.com Ltd Barclays Bank (3,719)(147) Wix.com Ltd Credit Suisse 3,194
Holding Description Counterparty
Netunrealised
appreciation/(depreciation)
USD
United States continued(120) Wix.com Ltd Goldman Sachs (2,379)(59) Wix.com Ltd JP Morgan (145)189 Workday Inc ’A’ Bank of America
Merrill Lynch (300)443 Workday Inc ’A’ Barclays Bank (2,339)134 Workday Inc ’A’ Goldman Sachs (332)55 Workday Inc ’A’ HSBC 8182 Workday Inc ’A’ JP Morgan (293)
829 WW Grainger Inc HSBC (9,998)(575) Wynn Resorts Ltd Bank of America
Merrill Lynch (4,105)(926) Wynn Resorts Ltd Barclays Bank (2,012)(168) Wynn Resorts Ltd Credit Suisse (741)(143) Wynn Resorts Ltd Goldman Sachs (346)261 Xilinx Inc Bank of America
Merrill Lynch 2,26784 Xilinx Inc Barclays Bank 271
283 Xilinx Inc Credit Suisse 1,3921,541 Xilinx Inc Goldman Sachs 13,653
113 Xilinx Inc HSBC 837183 Xilinx Inc JP Morgan 951160 XPO Logistics Inc Bank of America
Merrill Lynch 429126 XPO Logistics Inc Barclays Bank 401
(511) Xylem Inc Citibank (1,134)209 Yum! Brands Inc Bank of America
Merrill Lynch 2763,805 Yum! Brands Inc Barclays Bank (2,093)
174 Yum! Brands Inc Credit Suisse (339)684 Yum! Brands Inc Goldman Sachs 903159 Zebra Technologies Corp ’A’ Barclays Bank (727)263 Zebra Technologies Corp ’A’ Goldman Sachs 3,95623 Zebra Technologies Corp ’A’ HSBC 299
(583) Zendesk Inc Bank of AmericaMerrill Lynch (2,571)
(537) Zendesk Inc Barclays Bank 200(301) Zendesk Inc Citibank 78(148) Zendesk Inc Goldman Sachs (653)(926) Zendesk Inc HSBC (4,380)(630) Zillow Group Inc ’C’ Bank of America
Merrill Lynch (4,504)(291) Zillow Group Inc ’C’ Barclays Bank (1,277)(119) Zillow Group Inc ’C’ Citibank (522)(364) Zillow Group Inc ’C’ Goldman Sachs (2,603)315 Zimmer Biomet Holdings Inc Bank of America
Merrill Lynch 794122 Zimmer Biomet Holdings Inc HSBC (442)
(545) Zoetis Inc Bank of AmericaMerrill Lynch (3,493)
(789) Zoetis Inc Barclays Bank (221)(120) Zoetis Inc Credit Suisse (661)(500) Zoetis Inc Goldman Sachs (3,205)(117) Zoetis Inc HSBC (645)(49) Zoom Video Communica-
tions Inc ’A’Bank of AmericaMerrill Lynch (1,107)
(498) Zoom Video Communica-tions Inc ’A’ Barclays Bank (4,626)
(47) Zoom Video Communica-tions Inc ’A’ Citibank (469)
(238) Zoom Video Communica-tions Inc ’A’ Goldman Sachs (4,878)
(51) Zoom Video Communica-tions Inc ’A’ HSBC (2,195)
(31) Zoom Video Communica-tions Inc ’A’ JP Morgan (151)
(239) Zscaler Inc Bank of AmericaMerrill Lynch (7,390)
(279) Zscaler Inc Barclays Bank (5,524)(117) Zscaler Inc Citibank (2,317)
BlackRock Style Advantage Fund continued
Portfolio of Investments as at 31 May 2021
The notes on pages 590 to 610 form an integral part of these financial statements.
Annual report and audited financial statements [467]

Holding Description Counterparty
Netunrealised
appreciation/(depreciation)
USD
United States continued(114) Zscaler Inc Credit Suisse (3,241)(618) Zscaler Inc Goldman Sachs (19,109)(151) Zscaler Inc HSBC (4,293)
(446,150)
Total (Gross underlying exposure - USD 374,412,412) (596,770)
π Amounts which are less than 0.5 USD have been rounded down to zero.
BlackRock Style Advantage Fund continued
Portfolio of Investments as at 31 May 2021
The notes on pages 590 to 610 form an integral part of these financial statements.
BlackRock Strategic Funds[468]

TypeNominal
Value Description CounterpartyExpiration
date
Net unrealisedappreciation/
(depreciation)USD
MarketValue
USD
Financial Derivative Instruments
SWAPS
CCCDS USD 13,914,000Fund receives Fixed 1.000% and provides default protection on
Markit CDX.NA.IG.30Bank of America
Merrill Lynch 20/6/2026 29,593 339,004
CCCDS EUR 12,050,000Fund receives Fixed 1.000% and provides default protection on
Markit iTraxx Europe Series 23 Version 1Bank of America
Merrill Lynch 20/6/2026 26,677 372,398
CCCDS USD 2,925,000Fund receives Fixed 5.000% and provides default protection on
Markit CDX.NA.HY.25 Version 8Bank of America
Merrill Lynch 20/6/2026 9,921 283,270
CCCDS EUR 2,435,000Fund receives Fixed 5.000% and provides default protection on
Markit iTraxx Europe Crossover Series 30 Version 1Bank of America
Merrill Lynch 20/6/2026 21,050 352,096
CCIRS EUR 1,069,000Fund receives Fixed 0.074% and pays Floating EUR 6 Month
EURIBORBank of America
Merrill Lynch 15/9/2031 (12,651) (12,626)
CCIRS EUR 1,395,000Fund receives Fixed 0.083% and pays Floating EUR 6 Month
EURIBORBank of America
Merrill Lynch 15/9/2031 (15,346) (14,891)
CCIRS EUR 7,478,000Fund receives Fixed 0.087% and pays Floating EUR 6 Month
EURIBORBank of America
Merrill Lynch 15/9/2031 (75,166) (76,382)
CCIRS EUR 4,144,000Fund receives Fixed 0.099% and pays Floating EUR 6 Month
EURIBORBank of America
Merrill Lynch 15/9/2031 (35,412) (36,044)
CCIRS EUR 798,000Fund receives Fixed 0.117% and pays Floating EUR 6 Month
EURIBORBank of America
Merrill Lynch 15/9/2031 (5,295) (5,162)
CCIRS EUR 1,935,000Fund receives Fixed 0.139% and pays Floating EUR 6 Month
EURIBORBank of America
Merrill Lynch 15/9/2031 (7,343) (7,298)
CCIRS EUR 2,920,000Fund receives Fixed 0.151% and pays Floating EUR 6 Month
EURIBORBank of America
Merrill Lynch 15/9/2031 (5,585) (6,690)
CCIRS EUR 602,000Fund receives Fixed 0.229% and pays Floating EUR 6 Month
EURIBORBank of America
Merrill Lynch 15/9/2031 4,416 4,431
CCIRS GBP 20,829,000Fund receives Fixed 0.731% and pays Floating GBP 6 Month
LIBORBank of America
Merrill Lynch 15/9/2026 (39,123) (32,590)
CCIRS SEK 56,751,000Fund receives Fixed 0.875% and pays Floating SEK 3 Month
STIBORBank of America
Merrill Lynch 15/9/2031 (9,028) (11,027)
CCIRS HKD 10,105,000Fund receives Fixed 0.931% and pays Floating HKD 3 Month
HIBORBank of America
Merrill Lynch 15/9/2026 2,348 2,367
CCIRS USD 1,271,000Fund receives Fixed 0.978% and pays Floating USD 3 Month
LIBORBank of America
Merrill Lynch 15/9/2026 384 198
CCIRS USD 1,303,000Fund receives Fixed 1.002% and pays Floating USD 3 Month
LIBORBank of America
Merrill Lynch 15/9/2026 1,940 1,811
CCIRS USD 2,745,000Fund receives Fixed 1.014% and pays Floating USD 3 Month
LIBORBank of America
Merrill Lynch 15/9/2026 5,781 5,306
CCIRS USD 1,849,000Fund receives Fixed 1.034% and pays Floating USD 3 Month
LIBORBank of America
Merrill Lynch 15/9/2026 5,373 5,400
CCIRS USD 1,354,000Fund receives Fixed 1.045% and pays Floating USD 3 Month
LIBORBank of America
Merrill Lynch 15/9/2026 4,703 4,723
CCIRS USD 1,323,000Fund receives Fixed 1.076% and pays Floating USD 3 Month
LIBORBank of America
Merrill Lynch 15/9/2026 6,620 6,639
CCIRS HKD 21,315,000Fund receives Fixed 1.113% and pays Floating HKD 3 Month
HIBORBank of America
Merrill Lynch 15/9/2026 29,687 29,727
CCIRS USD 2,807,000Fund receives Fixed 1.140% and pays Floating USD 3 Month
LIBORBank of America
Merrill Lynch 15/9/2026 22,307 22,955
CCIRS USD 2,314,000Fund receives Fixed 1.182% and pays Floating USD 3 Month
LIBORBank of America
Merrill Lynch 15/9/2026 23,194 23,778
CCIRS USD 2,457,000Fund receives Fixed 1.220% and pays Floating USD 3 Month
LIBORBank of America
Merrill Lynch 15/9/2026 29,372 29,796
CCIRS USD 495,000Fund receives Fixed 1.222% and pays Floating USD 3 Month
LIBORBank of America
Merrill Lynch 15/9/2026 5,991 6,064
CCIRS CAD 1,411,000Fund receives Fixed 1.488% and pays Floating CAD 3 Month
CDORBank of America
Merrill Lynch 15/9/2026 319 420
CCIRS CAD 18,079,000Fund receives Fixed 1.600% and pays Floating CAD 3 Month
CDORBank of America
Merrill Lynch 15/9/2026 86,733 87,144
CCIRS CAD 5,636,000Fund receives Fixed 1.615% and pays Floating CAD 3 Month
CDORBank of America
Merrill Lynch 15/9/2026 30,966 30,581
CCIRS AUD 878,000Fund receives Fixed 1.872% and pays Floating AUD 6 Month
BBSWBank of America
Merrill Lynch 15/9/2031 3,479 3,492
CCIRS AUD 4,956,400Fund receives Fixed 1.979% and pays Floating AUD 6 Month
BBSWBank of America
Merrill Lynch 15/9/2031 53,447 58,341
BlackRock Style Advantage Fund continued
Portfolio of Investments as at 31 May 2021
The notes on pages 590 to 610 form an integral part of these financial statements.
Annual report and audited financial statements [469]

TypeNominal
Value Description CounterpartyExpiration
date
Net unrealisedappreciation/
(depreciation)USD
MarketValue
USD
Financial Derivative Instruments
SWAPS
CCIRS ZAR 5,804,000Fund receives Fixed 6.295% and pays Floating ZAR 3 Month
JIBARBank of America
Merrill Lynch 15/9/2026 3,390 3,396
CCIRS ZAR 47,313,000Fund receives Fixed 6.461% and pays Floating ZAR 3 Month
JIBARBank of America
Merrill Lynch 15/9/2026 52,255 52,302
CCIRS ZAR 151,154,000Fund receives Fixed 6.478% and pays Floating ZAR 3 Month
JIBARBank of America
Merrill Lynch 15/9/2026 174,766 174,910
CCIRS AUD 1,717,000Fund receives Floating AUD 6 Month BBSW and pays Fixed
0.981%Bank of America
Merrill Lynch 15/9/2026 1,646 1,743
CCIRS AUD 8,923,943Fund receives Floating AUD 6 Month BBSW and pays Fixed
1.167%Bank of America
Merrill Lynch 15/9/2026 (50,440) (54,198)
CCIRS CAD 749,000Fund receives Floating CAD 3 Month CDOR and pays Fixed
2.040%Bank of America
Merrill Lynch 15/9/2031 (2,187) (2,125)
CCIRS CAD 9,587,000Fund receives Floating CAD 3 Month CDOR and pays Fixed
2.110%Bank of America
Merrill Lynch 15/9/2031 (76,347) (78,930)
CCIRS CAD 2,978,000Fund receives Floating CAD 3 Month CDOR and pays Fixed
2.164%Bank of America
Merrill Lynch 15/9/2031 (36,469) (36,915)
CCIRS GBP 10,818,500Fund receives Floating GBP 6 Month LIBOR and pays Fixed
1.025%Bank of America
Merrill Lynch 15/9/2031 65,260 65,538
CCIRS MXN 165,341,000Fund receives Floating MXN 1 Month Mexican Interbank Rate
and pays Fixed 5.735%Bank of America
Merrill Lynch 9/9/2026 206,274 206,386
CCIRS PLN 100,269,196Fund receives Floating PLN 6 Month WIBOR and pays Fixed
1.315%Bank of America
Merrill Lynch 15/9/2026 412,158 412,533
CCIRS SEK 109,613,000Fund receives Floating SEK 3 Month STIBOR and pays Fixed
0.464%Bank of America
Merrill Lynch 15/9/2026 (12,972) (11,258)
CCIRS SGD 1,119,000Fund receives Floating SGD 6 Month SORF6 and pays Fixed
1.037%Bank of America
Merrill Lynch 15/9/2026 1,166 1,178
CCIRS SGD 3,005,000Fund receives Floating SGD 6 Month STIBOR and pays Fixed
1.191%Bank of America
Merrill Lynch 15/9/2026 (14,148) (14,115)
CCIRS SGD 837,000Fund receives Floating SGD 6 Month STIBOR and pays Fixed
1.198%Bank of America
Merrill Lynch 15/9/2026 (4,159) (4,150)
CCIRS SGD 3,037,000Fund receives Floating SGD 6 Month STIBOR and pays Fixed
1.286%Bank of America
Merrill Lynch 15/9/2026 (25,071) (25,038)
CCIRS SGD 2,546,000Fund receives Floating SGD 6 Month STIBOR and pays Fixed
1.326%Bank of America
Merrill Lynch 15/9/2026 (24,820) (24,793)
CCIRS USD 1,444,000Fund receives Floating USD 3 Month LIBOR and pays Fixed
1.628%Bank of America
Merrill Lynch 15/9/2031 (1,737) (1,332)
CCIRS USD 966,000Fund receives Floating USD 3 Month LIBOR and pays Fixed
1.650%Bank of America
Merrill Lynch 15/9/2031 (2,882) (2,863)
CCIRS USD 1,386,000Fund receives Floating USD 3 Month LIBOR and pays Fixed
1.666%Bank of America
Merrill Lynch 15/9/2031 (3,015) (6,345)
CCIRS USD 1,386,000Fund receives Floating USD 3 Month LIBOR and pays Fixed
1.668%Bank of America
Merrill Lynch 15/9/2031 (6,793) (6,476)
CCIRS USD 1,479,000Fund receives Floating USD 3 Month LIBOR and pays Fixed
1.770%Bank of America
Merrill Lynch 15/9/2031 (21,318) (21,303)
CCIRS USD 1,226,000Fund receives Floating USD 3 Month LIBOR and pays Fixed
1.807%Bank of America
Merrill Lynch 15/9/2031 (21,424) (21,965)
CCIRS USD 1,300,000Fund receives Floating USD 3 Month LIBOR and pays Fixed
1.836%Bank of America
Merrill Lynch 15/9/2031 (26,517) (26,932)
CCIRS USD 279,000Fund receives Floating USD 3 Month LIBOR and pays Fixed
1.881%Bank of America
Merrill Lynch 15/9/2031 (6,842) (6,959)
IRS GBP 3,537,000Fund receives Fixed 0.509% and pays Floating GBP 12 Month
SONIABank of America
Merrill Lynch 15/9/2026 (422) 603
IRS USD 1,250,000Fund receives Fixed 0.537% and pays Floating USD 6 Month
LIBOR FEDL SOFRBank of America
Merrill Lynch 20/10/2030 (81,655) (81,655)
IRS KRW 2,837,421,000Fund receives Fixed 1.566% and pays Floating KRW 3 Month
KSDABank of America
Merrill Lynch 15/9/2026 (12,987) (12,987)
IRS EUR 5,717,000Fund receives Floating EUR 6 Month LIBOR and pays Fixed
0.000%Bank of America
Merrill Lynch 15/9/2026 7,730 9,055
IRS EUR 1,139,000Fund receives Floating EUR 6 Month LIBOR and pays Fixed
0.000%Bank of America
Merrill Lynch 15/9/2026 (3,264) (3,244)
IRS EUR 14,858,000Fund receives Floating EUR 6 Month LIBOR and pays Fixed
-0.251%Bank of America
Merrill Lynch 15/9/2026 36,258 36,621
BlackRock Style Advantage Fund continued
Portfolio of Investments as at 31 May 2021
The notes on pages 590 to 610 form an integral part of these financial statements.
BlackRock Strategic Funds[470]

TypeNominal
Value Description CounterpartyExpiration
date
Net unrealisedappreciation/
(depreciation)USD
MarketValue
USD
Financial Derivative Instruments
SWAPS
IRS EUR 3,801,000Fund receives Floating EUR 6 Month LIBOR and pays Fixed
-0.253%Bank of America
Merrill Lynch 15/9/2026 9,832 9,896
IRS EUR 1,552,000Fund receives Floating EUR 6 Month LIBOR and pays Fixed
-0.268%Bank of America
Merrill Lynch 15/9/2026 5,530 5,498
IRS EUR 8,212,000Fund receives Floating EUR 6 Month LIBOR and pays Fixed
-0.28%Bank of America
Merrill Lynch 15/9/2026 34,116 34,862
IRS EUR 2,059,000Fund receives Floating EUR 6 Month LIBOR and pays Fixed
-0.291%Bank of America
Merrill Lynch 15/9/2026 10,004 10,257
IRS EUR 2,767,000Fund receives Floating EUR 6 Month LIBOR and pays Fixed
-0.301%Bank of America
Merrill Lynch 15/9/2026 15,385 15,432
IRS GBP 1,828,000Fund receives Floating GBP 12 Month SONIA and pays Fixed
0.808%Bank of America
Merrill Lynch 15/9/2031 1,402 (138)
IRS INR 6,669,000Fund receives Floating INR 6 Month India National Stock
Exchange NSE Interbank Offer Rate and pays Fixed 5.350%Bank of America
Merrill Lynch 15/9/2026 (382) (382)
IRS THB 21,250,000Fund receives Floating THB 6 Month Thailand Fixing Rate and
pays Fixed 1.053%Bank of America
Merrill Lynch 15/9/2026 1,150 1,150
IRS USD 1,250,000Fund receives Floating USD 6 Month LIBOR FEDL and pays
Fixed 0.554%Bank of America
Merrill Lynch 20/10/2030 85,972 85,972
IRS KRW 911,021,000Fund receives Fixed 1.575% and pays Floating KRW 3 Month
KSDA Citibank 15/9/2026 (3,806) (3,806)
IRS INR 40,707,520Fund receives Floating INR 6 Month MIBOR and pays Fixed
5.250% Goldman Sachs 15/9/2026 61 61
IRS THB 123,654,000Fund receives Floating THB 6 Month Thailand Fixing Rate and
pays Fixed 1.270% Goldman Sachs 15/9/2026 (35,211) (35,211)
IRS KRW 1,606,941,000Fund receives Fixed 1.504% and pays Floating KRW 3 Month
KSDA HSBC 15/9/2026 (11,781) (11,781)
IRS KRW 9,525,697,000Fund receives Fixed 1.508% and pays Floating KRW 3 Month
KSDA HSBC 15/9/2026 (68,354) (68,354)
IRS INR 93,487,000Fund receives Floating INR 6 Month MIBOR and pays Fixed
5.180% HSBC 15/9/2026 3,984 3,984
IRS INR 126,354,000Fund receives Floating INR 6 Month MIBOR and pays Fixed
5.352% HSBC 15/9/2026 (7,421) (7,421)
IRS KRW 1,413,114,000Fund receives Fixed 1.472% and pays Floating KRW 3 Month
KSDA JP Morgan 15/9/2026 (12,368) (12,368)
IRS KRW 3,573,387,000Fund receives Fixed 1.585% and pays Floating KRW 3 Month
KSDA JP Morgan 15/9/2026 (13,340) (13,340)
IRS KRW 2,946,870,000Fund receives Fixed 1.608% and pays Floating KRW 3 Month
KSDA JP Morgan 15/9/2026 (8,056) (8,056)
IRS INR 79,020,480Fund receives Floating INR 6 Month MIBOR and pays Fixed
5.240% JP Morgan 15/9/2026 582 582
IRS KRW 1,699,380,000Fund receives Fixed 1.556% and pays Floating KRW 3 Month
KSDA Morgan Stanley 15/9/2026 (8,533) (8,533)
IRS CNY 40,804,000Fund receives Fixed 2.959% and pays Floating CNY 3 Month
China Fixing Repo RatesStandard
Chartered Bank 15/9/2026 56,618 56,618
TRS BRL 41 Fund receives Fixed 0.000% and pays Ibovespa IndexBank of America
Merrill Lynch 16/6/2021 (59,101) (59,101)
TRS BRL 9 Fund receives Fixed 0.000% and pays Ibovespa IndexBank of America
Merrill Lynch 16/6/2021 (9,230) (9,230)
TRS BRL 20 Fund receives Fixed 0.000% and pays Ibovespa IndexBank of America
Merrill Lynch 16/6/2021 (11,862) (11,862)
TRS KRW 500,000 Fund receives KOSPI 200 Index and pays Fixed 0.000%Bank of America
Merrill Lynch 10/6/2021 1,646 1,646
TRS KRW 750,000 Fund receives KOSPI 200 Index and pays Fixed 0.000%Bank of America
Merrill Lynch 10/6/2021 5,310 5,310
TRS KRW 3,500,000 Fund receives KOSPI 200 Index and pays Fixed 0.000%Bank of America
Merrill Lynch 10/6/2021 8,812 8,812
TRS TWD 18,800 Fund receives TAIEX Futures Index and pays Fixed 0.000%Bank of America
Merrill Lynch 16/6/2021 872,191 872,191
TRS TWD 3,800 Fund receives TAIEX Futures Index and pays Fixed 0.000%Bank of America
Merrill Lynch 16/6/2021 131,172 131,172
TRS TWD 11,600 Fund receives TAIEX Futures Index and pays Fixed 0.000%Bank of America
Merrill Lynch 16/6/2021 107,323 107,323
BlackRock Style Advantage Fund continued
Portfolio of Investments as at 31 May 2021
The notes on pages 590 to 610 form an integral part of these financial statements.
Annual report and audited financial statements [471]

TypeNominal
Value Description CounterpartyExpiration
date
Net unrealisedappreciation/
(depreciation)USD
MarketValue
USD
Financial Derivative Instruments
SWAPS
TRS THB 23,000 Fund receives Fixed 0.000% and pays SET50 Futures Index Credit Suisse 29/6/2021 (22,208) (22,208)
TRS THB 24,000 Fund receives Fixed 0.000% and pays SET50 Futures Index Credit Suisse 29/6/2021 (14,459) (14,459)
TRS THB 27,400 Fund receives Fixed 0.000% and pays SET50 Futures Index Credit Suisse 29/6/2021 (13,859) (13,859)
TRS THB 31,400 Fund receives Fixed 0.000% and pays SET50 Futures Index Credit Suisse 29/6/2021 (2,809) (2,809)
TRS PLN 720 Fund receives WIG20 Index and pays Fixed 0.000% HSBC 18/6/2021 37,936 37,936
TRS PLN 840 Fund receives WIG20 Index and pays Fixed 0.000% HSBC 18/6/2021 31,824 31,824
Total (Gross underlying exposure - USD 385,483,502) 1,842,856 3,105,521
CCCDS: Centrally Cleared Credit Default SwapsCCIRS: Centrally Cleared Interest Rate SwapsIRS: Interest Rate SwapsTRS: Total Return Swaps
Numberof
contractsCurrencyof contracts
Contract/Description
Expirationdate
Grossunderlying
exposureUSD
Net unrealisedappreciation/
(depreciation)USD
Financial Derivative Instruments
FUTURES
(50) EUR Amsterdam Index Futures June 2021 June 2021 8,680,100 (107,896)
722 AUD Australian 10 Year Bond Futures June 2021 June 2021 78,202,582 388,482
141 EUR CAC 40 Index Futures June 2021 June 2021 11,116,142 289,473
(359) CAD Canadian 10 Year Bond Futures September 2021 September 2021 42,833,961 (82,490)
5 USD E-Mini S&P 500 Index Futures June 2021 June 2021 1,051,400 17,775
(194) EUR Euro Bund Futures June 2021 June 2021 40,203,831 362,935
(143) GBP FTSE 100 Index Futures June 2021 June 2021 14,231,794 (342,886)
213 USD FTSE China A50 Futures June 2021 June 2021 3,867,654 55,278
104 EUR FTSE MIB Index Futures June 2021 June 2021 16,020,688 425,601
(227) ZAR FTSE/JSE Top 40 Index Futures June 2021 June 2021 10,219,458 (28,612)
(70) EUR IBEX 35 Index Futures June 2021 June 2021 7,827,772 (14,286)
1 JPY Japan 10 Year Bond Futures June 2021 June 2021 1,381,430 91
148 USD MSCI Hong Kong Index Futures June 2021 June 2021 11,967,280 (19,240)
13 SGD MSCI Singapore Index Futures June 2021 June 2021 353,633 2,239
(494) SEK OMX Stockholm 30 Index Futures June 2021 June 2021 13,406,057 (133,340)
(54) CAD S&P/TSX 60 Index Futures June 2021 June 2021 10,626,131 (437,937)
(345) USD SGX NIFTY 50 Futures June 2021 June 2021 10,750,200 (210,702)
(128) AUD SPI 200 Index Futures June 2021 June 2021 17,747,604 (825,805)
155 CHF Swiss Market Index Futures June 2021 June 2021 19,594,258 970,600
55 JPY Topix Index Futures June 2021 June 2021 9,674,161 (41,728)
(463) GBP UK Long Gilt Bond Futures September 2021 September 2021 83,485,071 (160,745)
417 USD US Treasury 10 Year Note Futures September 2021 September 2021 54,965,813 19,701
Total 468,207,020 126,508
Currency Purchases Currency Sales CounterpartyMaturity
date
Netunrealised
appreciation/(depreciation)
USD
Financial Derivative Instruments
OPEN FORWARD FOREIGN EXCHANGE TRANSACTIONS
AUD 2,277,275 USD 1,770,373Bank of America
Merrill Lynch 16/6/2021 (7,768)AUD 2,115,000 USD 1,638,784 Barclays Bank 16/6/2021 (1,780)AUD 1,488,000 USD 1,153,530 Deutsche Bank 16/6/2021 (1,822)
Currency Purchases Currency Sales CounterpartyMaturity
date
Netunrealised
appreciation/(depreciation)
USD
Financial Derivative Instruments
OPEN FORWARD FOREIGN EXCHANGE TRANSACTIONS
AUD 182,000 USD 140,348 Goldman Sachs 16/6/2021 520AUD 543,000 USD 415,665 JP Morgan 16/6/2021 4,615AUD 950,000 USD 732,026 Morgan Stanley 16/6/2021 3,272
BlackRock Style Advantage Fund continued
Portfolio of Investments as at 31 May 2021
The notes on pages 590 to 610 form an integral part of these financial statements.
BlackRock Strategic Funds[472]

Currency Purchases Currency Sales CounterpartyMaturity
date
Netunrealised
appreciation/(depreciation)
USD
Financial Derivative Instruments
OPEN FORWARD FOREIGN EXCHANGE TRANSACTIONS
AUD 1,227,000 USD 936,441Standard
Chartered Bank 16/6/2021 13,254AUD 726,000 USD 566,006 UBS 16/6/2021 (4,084)AUD 1,487,000 USD 1,152,944 Deutsche Bank 21/7/2021 (1,828)AUD 82,000 USD 63,161 JP Morgan 21/7/2021 317AUD 5,352,850 USD 4,194,022 Deutsche Bank 18/8/2021 (49,872)BRL 14,693,148 USD 2,603,252 BNP Paribas 16/6/2021 210,752BRL 10,351,000 USD 1,850,093 Citibank 16/6/2021 132,312BRL 11,091,769 USD 1,972,590 Deutsche Bank 16/6/2021 151,687BRL 1,591,851 USD 274,646 Goldman Sachs 16/6/2021 30,222BRL 379,231 USD 67,446 JP Morgan 16/6/2021 5,183BRL 16,063,000 USD 2,829,565 UBS 16/6/2021 246,792BRL 20,509,000 USD 3,743,065 Barclays Bank 21/7/2021 171,757BRL 10,323,000 USD 1,849,314 Citibank 21/7/2021 121,173BRL 3,557,000 USD 640,982 Goldman Sachs 21/7/2021 37,989BRL 7,738,000 USD 1,416,412 HSBC 21/7/2021 60,642BRL 15,287,000 USD 2,697,928 JP Morgan 21/7/2021 220,102BRL 914,000 USD 172,774 UBS 21/7/2021 1,693BRL 8,983,550 USD 1,689,109 Citibank 18/8/2021 20,552BRL 459,000 USD 86,512 Goldman Sachs 18/8/2021 840BRL 1,893,000 USD 357,885 HSBC 18/8/2021 2,372
CAD 49,889,000 USD 39,537,143Bank of America
Merrill Lynch 16/6/2021 1,755,431CAD 1,587,000 USD 1,315,009 BNP Paribas 16/6/2021 (1,466)CAD 3,023,000 USD 2,422,792 Goldman Sachs 16/6/2021 79,312CAD 457,000 USD 363,923 JP Morgan 16/6/2021 14,331CAD 2,613,000 USD 2,082,675 Morgan Stanley 16/6/2021 80,077
CAD 302,000 USD 242,064Standard
Chartered Bank 16/6/2021 7,898CAD 465,000 USD 370,456 UBS 16/6/2021 14,419CAD 1,586,000 USD 1,314,155 BNP Paribas 21/7/2021 (1,502)CAD 294,000 USD 234,635 Morgan Stanley 21/7/2021 8,695CAD 1,586,000 USD 1,314,135 BNP Paribas 18/8/2021 (1,526)CAD 1,213,000 USD 1,007,151 JP Morgan 18/8/2021 (3,245)
CHF 21,000 EUR 18,990Standard
Chartered Bank 16/6/2021 149CHF 1,181,083 USD 1,278,707 Deutsche Bank 16/6/2021 33,424CLP 171,038,000 USD 233,633 BNP Paribas 16/6/2021 3,476CLP 369,250,000 USD 513,732 Citibank 16/6/2021 (1,844)CLP 325,295,000 USD 455,755 Credit Suisse 16/6/2021 (4,800)CLP 3,036,932,000 USD 4,307,717 Deutsche Bank 16/6/2021 (97,636)CLP 83,001,000 USD 113,624 Goldman Sachs 16/6/2021 1,440
CLP 171,049,000 USD 233,536Bank of America
Merrill Lynch 21/7/2021 3,524CLP 325,345,000 USD 455,646 Credit Suisse 21/7/2021 (4,743)CLP 1,258,849,000 USD 1,789,790 Deutsche Bank 21/7/2021 (45,124)CLP 43,720,000 USD 62,607 HSBC 21/7/2021 (2,015)
CLP 171,075,000 USD 233,575Bank of America
Merrill Lynch 18/8/2021 3,461CLP 325,427,000 USD 455,755 Credit Suisse 18/8/2021 (4,853)CLP 43,728,000 USD 62,617 HSBC 18/8/2021 (2,029)CNH 10,170,000 USD 1,584,692 Deutsche Bank 16/6/2021 10,562CNH 10,171,000 USD 1,581,207 Deutsche Bank 21/7/2021 10,673CNH 10,170,000 USD 1,578,108 UBS 18/8/2021 10,954
EUR 482,761 CHF 533,000Bank of America
Merrill Lynch 16/6/2021 (2,820)EUR 416,419 CHF 459,000 BNP Paribas 16/6/2021 (1,594)EUR 366,944 CHF 405,000 JP Morgan 16/6/2021 (1,998)
EUR 487,225 CHF 534,000Standard
Chartered Bank 16/6/2021 1,519
EUR 161,268 HUF 58,131,000Standard
Chartered Bank 21/7/2021 (6,910)
Currency Purchases Currency Sales CounterpartyMaturity
date
Netunrealised
appreciation/(depreciation)
USD
Financial Derivative Instruments
OPEN FORWARD FOREIGN EXCHANGE TRANSACTIONS
EUR 531,000 USD 632,793 JP Morgan 16/6/2021 15,414
EUR 169,000 USD 202,481Standard
Chartered Bank 16/6/2021 3,822EUR 5,292,149 USD 6,309,268 UBS 16/6/2021 151,006
EUR 12,396,000 USD 14,765,152Standard
Chartered Bank 21/7/2021 377,205EUR 1,113,000 USD 1,362,601 Deutsche Bank 18/8/2021 (2,290)EUR 1,903,000 USD 2,328,526 UBS 18/8/2021 (2,675)
GBP 466,000 USD 642,623Bank of America
Merrill Lynch 16/6/2021 17,707GBP 48,000 USD 67,951 Citibank 16/6/2021 66GBP 1,899,000 USD 2,631,579 Deutsche Bank 16/6/2021 59,339GBP 2,963,000 USD 4,145,381 JP Morgan 16/6/2021 53,246GBP 444,000 USD 621,383 Morgan Stanley 16/6/2021 7,773
GBP 1,811,000 USD 2,498,673Bank of America
Merrill Lynch 21/7/2021 67,646GBP 48,000 USD 67,955 Citibank 21/7/2021 64GBP 876,000 USD 1,242,589 JP Morgan 21/7/2021 (1,234)GBP 3,374,000 USD 4,696,702 Morgan Stanley 21/7/2021 84,502GBP 1,450,000 USD 1,991,749 UBS 21/7/2021 63,007
GBP 2,823,270 USD 3,991,115Bank of America
Merrill Lynch 18/8/2021 9,701GBP 48,000 USD 67,957 Citibank 18/8/2021 63GBP 876,000 USD 1,242,610 JP Morgan 18/8/2021 (1,243)HKD 989,000 USD 127,353 HSBC 16/6/2021 82HKD 7,777,000 USD 1,001,430 UBS 16/6/2021 655HUF 196,878,000 EUR 546,054 Morgan Stanley 21/7/2021 23,560HUF 71,582,000 USD 231,592 Citibank 16/6/2021 19,668HUF 231,674,000 USD 758,731 HSBC 16/6/2021 54,465HUF 236,256,000 USD 808,884 Morgan Stanley 16/6/2021 20,396
HUF 698,774,000 USD 2,376,112Standard
Chartered Bank 16/6/2021 76,647
HUF 259,063,000 USD 911,154Bank of America
Merrill Lynch 21/7/2021 (2,434)HUF 196,819,000 USD 654,135 Citibank 21/7/2021 36,251HUF 462,993,000 USD 1,537,299 HSBC 21/7/2021 86,751HUF 163,663,000 USD 573,701 Morgan Stanley 21/7/2021 383
HUF 148,091,000 USD 516,427Standard
Chartered Bank 21/7/2021 3,034HUF 259,225,000 USD 911,182 HSBC 18/8/2021 (2,477)HUF 163,761,000 USD 573,680 Morgan Stanley 18/8/2021 379
HUF 148,179,000 USD 516,347Standard
Chartered Bank 18/8/2021 3,089
INR 13,989,776 USD 186,183Bank of America
Merrill Lynch 16/6/2021 6,212INR 1,341,221,000 USD 18,085,260 Barclays Bank 16/6/2021 359,895INR 297,660,305 USD 3,973,376 BNP Paribas 16/6/2021 120,201INR 14,614,000 USD 198,593 Deutsche Bank 16/6/2021 2,386INR 29,641,729 USD 399,167 Goldman Sachs 16/6/2021 8,482INR 29,338,919 USD 386,272 JP Morgan 16/6/2021 17,212INR 16,015,271 USD 215,635 Morgan Stanley 16/6/2021 4,615INR 553,082,000 USD 7,477,870 UBS 16/6/2021 128,396INR 1,390,917,570 USD 18,363,701 BNP Paribas 22/7/2021 655,624INR 5,664,000 USD 77,388 UBS 22/7/2021 61INR 5,688,000 USD 77,401 Deutsche Bank 18/8/2021 56INR 1,225,753,740 USD 16,434,871 JP Morgan 18/8/2021 256,908
JPY 62,388,000 USD 569,838Bank of America
Merrill Lynch 16/6/2021 (753)JPY 69,685,000 USD 640,185 Barclays Bank 16/6/2021 (4,539)JPY 20,028,000 USD 184,455 Goldman Sachs 16/6/2021 (1,765)JPY 762,531,000 USD 6,962,986 JP Morgan 16/6/2021 (7,403)
BlackRock Style Advantage Fund continued
Portfolio of Investments as at 31 May 2021
The notes on pages 590 to 610 form an integral part of these financial statements.
Annual report and audited financial statements [473]

Currency Purchases Currency Sales CounterpartyMaturity
date
Netunrealised
appreciation/(depreciation)
USD
Financial Derivative Instruments
OPEN FORWARD FOREIGN EXCHANGE TRANSACTIONS
JPY 148,579,000 USD 1,354,695Standard
Chartered Bank 16/6/2021 598JPY 291,992,000 USD 2,687,937 UBS 16/6/2021 (24,472)
JPY 48,850,000 USD 446,004Bank of America
Merrill Lynch 21/7/2021 (288)JPY 2,877,635,000 USD 26,274,109 Goldman Sachs 21/7/2021 (18,095)
JPY 1,887,415,650 USD 17,364,504Bank of America
Merrill Lynch 18/8/2021 (139,877)KRW 3,908,095,762 USD 3,451,856 BNP Paribas 16/6/2021 74,441KRW 675,816,330 USD 605,261 Citibank 16/6/2021 4,532KRW 272,945,074 USD 244,315 Deutsche Bank 16/6/2021 1,964KRW 632,814,000 USD 568,137 Goldman Sachs 16/6/2021 2,854KRW 63,480,331 USD 56,818 Morgan Stanley 16/6/2021 460KRW 1,768,653,503 USD 1,583,866 UBS 16/6/2021 11,999KRW 93,440,000 USD 83,417 UBS 21/7/2021 900KRW 93,437,000 USD 83,415 UBS 18/8/2021 904MXN 712,086,000 USD 33,071,147 Goldman Sachs 16/6/2021 2,647,351
MXN 5,370,000 USD 263,288Standard
Chartered Bank 16/6/2021 6,073MXN 18,231,000 USD 882,940 UBS 16/6/2021 31,534MXN 3,423,000 USD 170,474 JP Morgan 21/7/2021 558MXN 3,434,000 USD 170,495 JP Morgan 18/8/2021 556NOK 4,800,000 USD 566,283 Barclays Bank 16/6/2021 8,902NOK 7,477,000 USD 896,433 Citibank 16/6/2021 (463)NOK 1,215,000 USD 141,724 Deutsche Bank 16/6/2021 3,869NOK 7,749,000 USD 909,376 Goldman Sachs 16/6/2021 19,187NOK 8,696,000 USD 1,041,063 JP Morgan 16/6/2021 980NOK 951,000 USD 112,855 Morgan Stanley 16/6/2021 1,104NOK 1,320,000 USD 159,856 UBS 16/6/2021 (1,680)NOK 7,475,000 USD 896,244 Citibank 21/7/2021 (464)NOK 6,927,000 USD 831,603 JP Morgan 21/7/2021 (1,493)NOK 1,320,000 USD 159,865 UBS 21/7/2021 (1,681)NOK 5,422,000 USD 650,950 JP Morgan 18/8/2021 (1,178)NOK 1,320,000 USD 159,873 UBS 18/8/2021 (1,684)NZD 1,818,000 USD 1,306,852 Barclays Bank 16/6/2021 14,521NZD 1,030,000 USD 732,635 JP Morgan 16/6/2021 15,998NZD 5,305,000 USD 3,766,544 Morgan Stanley 16/6/2021 89,277NZD 2,571,000 USD 1,862,499 Barclays Bank 18/8/2021 5,804
NZD 756,000 USD 547,771Standard
Chartered Bank 18/8/2021 1,602PLN 46,248,000 USD 12,006,759 JP Morgan 16/6/2021 579,735PLN 4,834,000 USD 1,254,400 Morgan Stanley 16/6/2021 61,184PLN 2,497,000 USD 656,545 UBS 16/6/2021 23,019PLN 3,438,000 USD 909,298 JP Morgan 21/7/2021 26,516PLN 4,847,000 USD 1,277,831 Societe Generale 21/7/2021 41,508PLN 2,496,000 USD 656,454 UBS 21/7/2021 22,950
RUB 100,060,993 USD 1,349,150Bank of America
Merrill Lynch 16/6/2021 12,799RUB 361,760,000 USD 4,830,545 BNP Paribas 16/6/2021 93,437RUB 13,854,007 USD 184,320 Goldman Sachs 16/6/2021 4,248RUB 269,063,000 USD 3,529,423 JP Morgan 16/6/2021 132,843RUB 95,602,000 USD 1,283,002 Citibank 21/7/2021 11,940RUB 562,804,490 USD 7,236,998 JP Morgan 21/7/2021 386,263
RUB 389,889,600 USD 5,185,185Bank of America
Merrill Lynch 18/8/2021 74,686SEK 4,894,000 USD 574,816 Barclays Bank 16/6/2021 15,462SEK 3,854,000 USD 464,860 Citibank 16/6/2021 (19)SEK 65,695,000 USD 7,700,852 Deutsche Bank 16/6/2021 222,788SEK 14,374,000 USD 1,644,329 Goldman Sachs 16/6/2021 89,356SEK 4,639,000 USD 545,292 JP Morgan 16/6/2021 14,230
SEK 7,882,000 USD 905,749Standard
Chartered Bank 16/6/2021 44,919
Currency Purchases Currency Sales CounterpartyMaturity
date
Netunrealised
appreciation/(depreciation)
USD
Financial Derivative Instruments
OPEN FORWARD FOREIGN EXCHANGE TRANSACTIONS
SEK 3,851,000 USD 464,638 Citibank 21/7/2021 (29)SEK 3,851,000 USD 464,740 Citibank 18/8/2021 (32)SGD 18,634,429 USD 13,849,257 BNP Paribas 16/6/2021 248,432SGD 1,445,571 USD 1,087,190 Morgan Stanley 16/6/2021 6,442
SGD 1,448,000 USD 1,079,151Standard
Chartered Bank 16/6/2021 16,318
SGD 1,886,000 USD 1,423,862Bank of America
Merrill Lynch 21/7/2021 2,832SGD 1,881,000 USD 1,409,453 Barclays Bank 21/7/2021 13,458SGD 122,429 USD 92,055 BNP Paribas 21/7/2021 558SGD 583,000 USD 438,874 Citibank 21/7/2021 2,146SGD 1,049,000 USD 782,124 HSBC 21/7/2021 11,408SGD 2,548,000 USD 1,922,051 JP Morgan 21/7/2021 5,423SGD 4,024,571 USD 3,031,541 Morgan Stanley 21/7/2021 12,908SGD 122,429 USD 92,047 BNP Paribas 18/8/2021 560SGD 8,139,560 USD 6,142,021 HSBC 18/8/2021 14,836SGD 1,445,571 USD 1,087,000 Morgan Stanley 18/8/2021 6,447
SGD 1,274,000 USD 960,946Standard
Chartered Bank 18/8/2021 2,722
THB 7,492,000 USD 239,109Bank of America
Merrill Lynch 16/6/2021 735THB 38,378,795 USD 1,235,923 Barclays Bank 16/6/2021 (7,291)THB 47,584,000 USD 1,543,447 Citibank 16/6/2021 (20,126)THB 90,077,000 USD 2,880,319 Goldman Sachs 16/6/2021 3,344THB 11,994,000 USD 381,888 JP Morgan 16/6/2021 2,079
THB 46,284,205 USD 1,471,506Standard
Chartered Bank 16/6/2021 10,203THB 7,739,529 USD 247,435 Barclays Bank 21/7/2021 308THB 37,549,000 USD 1,193,767 Goldman Sachs 21/7/2021 8,180THB 11,347,000 USD 361,807 HSBC 21/7/2021 1,412
THB 29,004,471 USD 928,982Standard
Chartered Bank 21/7/2021 (546)THB 27,563,000 USD 875,592 Goldman Sachs 18/8/2021 6,613THB 7,501,000 USD 238,972 HSBC 18/8/2021 1,111TWD 10,663,378 USD 382,919 BNP Paribas 16/6/2021 4,665TWD 8,698,000 USD 312,408 Citibank 16/6/2021 3,740TWD 69,227,622 USD 2,470,298 Deutsche Bank 16/6/2021 45,930
TWD 25,917,000 USD 920,606Standard
Chartered Bank 16/6/2021 21,403TWD 5,934,000 USD 214,666 Deutsche Bank 21/7/2021 2,116TWD 5,912,000 USD 214,693 BNP Paribas 18/8/2021 2,137USD 1,309,544 AUD 1,707,443 Barclays Bank 16/6/2021 (12,012)USD 312,559 AUD 402,000 JP Morgan 16/6/2021 1,412USD 22,515,507 AUD 29,235,000 Morgan Stanley 16/6/2021 (112,310)
USD 48,369 AUD 62,557Standard
Chartered Bank 16/6/2021 (50)USD 6,321,754 AUD 8,286,000 HSBC 21/7/2021 (92,600)USD 779,577 AUD 1,005,000 JP Morgan 18/8/2021 1,511
USD 2,676,860 BRL 15,722,000Bank of America
Merrill Lynch 16/6/2021 (334,190)USD 1,053,058 BRL 5,928,000 BNP Paribas 16/6/2021 (82,262)USD 329,276 BRL 1,842,000 JP Morgan 16/6/2021 (23,502)USD 690,300 BRL 3,616,000 Morgan Stanley 16/6/2021 (2,230)USD 8,229,189 BRL 46,836,430 Citibank 21/7/2021 (711,094)USD 115,852 BRL 613,000 UBS 21/7/2021 (1,159)USD 115,873 BRL 615,000 UBS 18/8/2021 (1,168)
USD 614,538 CAD 750,000Bank of America
Merrill Lynch 16/6/2021 (6,228)USD 1,771,772 CAD 2,223,000 Citibank 16/6/2021 (68,180)USD 1,848,292 CAD 2,245,000 Goldman Sachs 16/6/2021 (9,870)USD 8,659,364 CAD 10,723,000 JP Morgan 16/6/2021 (215,946)USD 4,201,808 CAD 5,213,000 Morgan Stanley 16/6/2021 (112,934)
BlackRock Style Advantage Fund continued
Portfolio of Investments as at 31 May 2021
The notes on pages 590 to 610 form an integral part of these financial statements.
BlackRock Strategic Funds[474]

Currency Purchases Currency Sales CounterpartyMaturity
date
Netunrealised
appreciation/(depreciation)
USD
Financial Derivative Instruments
OPEN FORWARD FOREIGN EXCHANGE TRANSACTIONS
USD 105,957 CAD 133,000Bank of America
Merrill Lynch 21/7/2021 (4,121)USD 9,998,382 CAD 12,090,970 Morgan Stanley 18/8/2021 (8,374)USD 873,593 CHF 814,000 Goldman Sachs 16/6/2021 (30,726)USD 4,774,382 CLP 3,469,715,535 Deutsche Bank 16/6/2021 (35,663)USD 172,636 CLP 126,403,000 Goldman Sachs 16/6/2021 (2,596)USD 63,365 CLP 44,435,465 Morgan Stanley 16/6/2021 1,765USD 1,232,652 CLP 875,971,500 BNP Paribas 21/7/2021 18,623USD 172,618 CLP 126,425,000 Goldman Sachs 21/7/2021 (2,597)USD 643,097 CLP 450,871,000 HSBC 21/7/2021 18,225USD 92,336 CLP 64,153,500 Citibank 18/8/2021 3,447USD 172,608 CLP 126,439,000 Goldman Sachs 18/8/2021 (2,582)USD 488,262 CNH 3,117,000 Citibank 16/6/2021 (667)USD 487,038 CNH 3,116,000 Citibank 21/7/2021 (652)USD 486,165 CNH 3,116,000 HSBC 18/8/2021 (710)
USD 783,369 EUR 655,000Bank of America
Merrill Lynch 16/6/2021 (16,208)USD 828,565 EUR 692,000 HSBC 16/6/2021 (16,180)USD 2,394,315 EUR 2,012,000 JP Morgan 16/6/2021 (61,790)USD 2,084,912 EUR 1,749,000 Morgan Stanley 16/6/2021 (50,141)
USD 345,431 EUR 287,000Standard
Chartered Bank 16/6/2021 (4,919)USD 2,536,572 EUR 2,099,000 UBS 16/6/2021 (25,736)
USD 413,909 EUR 345,000Bank of America
Merrill Lynch 21/7/2021 (7,527)USD 2,591,146 EUR 2,153,000 BNP Paribas 21/7/2021 (38,855)USD 1,995,625 EUR 1,650,000 Goldman Sachs 21/7/2021 (19,935)USD 464,169 EUR 380,000 HSBC 21/7/2021 (20)USD 2,537,389 EUR 2,083,000 JP Morgan 21/7/2021 (7,103)
USD 212,814 EUR 174,000Standard
Chartered Bank 21/7/2021 264USD 35,655,202 EUR 29,268,937 JP Morgan 18/8/2021 (117,358)
USD 212,929 EUR 174,000Standard
Chartered Bank 18/8/2021 266
USD 361,811 GBP 260,000Bank of America
Merrill Lynch 16/6/2021 (6,614)USD 113,251 GBP 81,000 Barclays Bank 16/6/2021 (1,528)USD 231,963 GBP 167,000 JP Morgan 16/6/2021 (4,679)USD 4,142,764 GBP 2,961,000 Morgan Stanley 16/6/2021 (53,030)
USD 960,121 GBP 683,000Standard
Chartered Bank 16/6/2021 (7,702)USD 5,778,686 GBP 4,208,000 HSBC 21/7/2021 (184,356)USD 1,463,586 GBP 1,036,000 JP Morgan 21/7/2021 (4,502)USD 541,619 GBP 381,000 UBS 21/7/2021 1,714
USD 541,641 GBP 381,000Standard
Chartered Bank 18/8/2021 1,732USD 1,335,853 GBP 944,000 UBS 18/8/2021 (1,876)USD 1,642,733 HKD 12,757,000 Barclays Bank 16/6/2021 (1,039)
USD 1,004,120 HUF 309,817,000Bank of America
Merrill Lynch 16/6/2021 (83,366)USD 739,255 HUF 221,827,000 Citibank 16/6/2021 (39,377)USD 811,238 HUF 239,155,000 Goldman Sachs 16/6/2021 (28,217)USD 525,151 HUF 157,012,000 HSBC 16/6/2021 (25,975)USD 249,272 HUF 75,206,000 JP Morgan 16/6/2021 (14,708)USD 1,981,428 HUF 595,388,000 Citibank 21/7/2021 (107,026)USD 810,948 HUF 239,223,000 Goldman Sachs 21/7/2021 (28,179)USD 301,549 HUF 89,729,000 HSBC 21/7/2021 (13,195)
USD 692,381 HUF 208,614,000Standard
Chartered Bank 21/7/2021 (39,378)USD 1,136,562 HUF 334,825,790 Goldman Sachs 18/8/2021 (37,159)USD 15,637,288 INR 1,157,851,299 BNP Paribas 16/6/2021 (286,072)USD 416,788 INR 30,704,000 Deutsche Bank 16/6/2021 (5,470)USD 521,963 INR 39,205,701 JP Morgan 16/6/2021 (17,213)
Currency Purchases Currency Sales CounterpartyMaturity
date
Netunrealised
appreciation/(depreciation)
USD
Financial Derivative Instruments
OPEN FORWARD FOREIGN EXCHANGE TRANSACTIONS
USD 231,752 INR 17,450,000 Morgan Stanley 16/6/2021 (8,229)USD 4,233,752 INR 317,459,000 BNP Paribas 22/7/2021 (107,164)USD 389,629 INR 29,731,000 HSBC 22/7/2021 (16,911)
USD 21,986,965 JPY 2,387,461,000Bank of America
Merrill Lynch 16/6/2021 209,247USD 3,563,884 JPY 389,393,000 JP Morgan 16/6/2021 11,956
USD 595,665 JPY 64,758,000Standard
Chartered Bank 16/6/2021 4,961
USD 1,977,082 JPY 213,826,000Bank of America
Merrill Lynch 21/7/2021 26,098
USD 13,588,552 KRW 15,465,811,000Bank of America
Merrill Lynch 16/6/2021 (366,330)USD 870,177 KRW 983,171,000 BNP Paribas 16/6/2021 (16,943)USD 90,113 KRW 101,585,000 Deutsche Bank 16/6/2021 (1,548)USD 737,734 KRW 836,981,000 Goldman Sachs 16/6/2021 (17,477)USD 2,201,555 KRW 2,465,742,000 JP Morgan 16/6/2021 (23,297)USD 602,308 KRW 681,360,000 Morgan Stanley 16/6/2021 (12,487)USD 6,755,969 KRW 7,566,212,540 HSBC 21/7/2021 (71,473)USD 4,335,369 KRW 4,886,715,000 Morgan Stanley 21/7/2021 (74,204)USD 460,251 KRW 519,278,000 Societe Generale 21/7/2021 (8,325)USD 793,723 KRW 890,384,000 UBS 21/7/2021 (9,723)USD 11,084,634 KRW 12,340,080,230 Citibank 18/8/2021 (51,252)USD 460,363 KRW 519,239,000 Societe Generale 18/8/2021 (8,206)USD 210,201 KRW 234,868,000 UBS 18/8/2021 (1,748)
USD 4,295,663 MXN 88,105,000Bank of America
Merrill Lynch 16/6/2021 (123,717)USD 1,472,543 MXN 29,867,000 Barclays Bank 16/6/2021 (25,597)USD 1,124,076 MXN 22,956,000 Goldman Sachs 16/6/2021 (27,406)USD 1,830,498 MXN 36,576,000 JP Morgan 16/6/2021 (4,168)USD 1,031,676 MXN 20,765,000 Morgan Stanley 16/6/2021 (9,905)
USD 174,519 MXN 3,496,000Standard
Chartered Bank 16/6/2021 (842)USD 10,394,361 MXN 211,767,000 Goldman Sachs 21/7/2021 (186,708)
USD 174,486 MXN 3,509,000Standard
Chartered Bank 21/7/2021 (844)USD 15,502,540 MXN 311,665,360 Citibank 18/8/2021 (21,874)USD 522,419 NOK 4,434,000 Deutsche Bank 16/6/2021 (8,908)USD 1,111,662 NOK 9,440,000 Goldman Sachs 16/6/2021 (19,535)USD 441,760 NOK 3,626,000 JP Morgan 16/6/2021 7,255USD 559,164 NOK 4,667,000 Morgan Stanley 16/6/2021 (83)
USD 1,489,259 NOK 12,696,000Standard
Chartered Bank 16/6/2021 (32,104)USD 441,650 NOK 3,625,000 JP Morgan 21/7/2021 7,242USD 558,958 NOK 4,665,000 Morgan Stanley 21/7/2021 (81)
USD 1,195,114 NOK 9,996,000Standard
Chartered Bank 21/7/2021 (2,774)
USD 306,579 NOK 2,526,890Bank of America
Merrill Lynch 18/8/2021 3,756USD 321,254 NOK 2,636,000 JP Morgan 18/8/2021 5,356USD 558,975 NOK 4,665,000 Morgan Stanley 18/8/2021 (78)
USD 1,039,349 NZD 1,442,000Bank of America
Merrill Lynch 16/6/2021 (8,737)USD 659,625 NZD 938,000 BNP Paribas 16/6/2021 (22,139)USD 240,978 NZD 334,000 Goldman Sachs 16/6/2021 (1,783)USD 557,590 NZD 775,000 JP Morgan 16/6/2021 (5,701)USD 4,386,914 NZD 6,062,000 Morgan Stanley 16/6/2021 (19,116)USD 510,318 NZD 725,000 Goldman Sachs 21/7/2021 (16,581)USD 2,278,055 NZD 3,121,000 Morgan Stanley 21/7/2021 9,847USD 4,292,956 NZD 5,890,400 JP Morgan 18/8/2021 12,500USD 2,277,828 NZD 3,121,000 Morgan Stanley 18/8/2021 9,849
USD 351,885 PLN 1,346,000Bank of America
Merrill Lynch 16/6/2021 (14,432)USD 4,605,715 PLN 17,613,000 Citibank 16/6/2021 (187,702)
BlackRock Style Advantage Fund continued
Portfolio of Investments as at 31 May 2021
The notes on pages 590 to 610 form an integral part of these financial statements.
Annual report and audited financial statements [475]

Currency Purchases Currency Sales CounterpartyMaturity
date
Netunrealised
appreciation/(depreciation)
USD
Financial Derivative Instruments
OPEN FORWARD FOREIGN EXCHANGE TRANSACTIONS
USD 450,946 PLN 1,658,000 Goldman Sachs 16/6/2021 (282)USD 847,370 PLN 3,285,000 HSBC 16/6/2021 (46,650)USD 3,810,310 PLN 14,113,000 JP Morgan 16/6/2021 (30,574)USD 397,353 PLN 1,528,000 Morgan Stanley 16/6/2021 (18,495)
USD 668,976 PLN 2,637,000Standard
Chartered Bank 16/6/2021 (48,690)USD 3,231,275 PLN 12,027,000 UBS 16/6/2021 (41,898)
USD 7,541,785 PLN 28,760,000Bank of America
Merrill Lynch 21/7/2021 (286,603)USD 450,744 PLN 1,657,000 Goldman Sachs 21/7/2021 (286)USD 5,419,134 PLN 20,318,226 Barclays Bank 18/8/2021 (111,814)USD 450,781 PLN 1,657,000 Goldman Sachs 18/8/2021 (281)USD 567,322 RUB 41,992,000 Barclays Bank 16/6/2021 (4,239)USD 2,222,422 RUB 167,782,000 Citibank 16/6/2021 (61,289)USD 1,021,881 RUB 77,665,000 Goldman Sachs 16/6/2021 (35,232)USD 228,309 RUB 17,525,000 JP Morgan 16/6/2021 (10,227)USD 1,298,714 RUB 99,962,000 Morgan Stanley 16/6/2021 (61,887)USD 343,120 RUB 25,446,000 UBS 16/6/2021 (3,230)USD 191,289 RUB 14,163,000 BNP Paribas 21/7/2021 (551)USD 119,367 RUB 8,968,000 Goldman Sachs 21/7/2021 (2,106)USD 523,162 RUB 40,838,000 HSBC 21/7/2021 (29,994)USD 228,238 RUB 17,604,000 JP Morgan 21/7/2021 (10,210)USD 1,297,996 RUB 100,413,000 Morgan Stanley 21/7/2021 (62,111)USD 2,099,006 RUB 157,823,000 UBS 21/7/2021 (38,729)USD 211,277 RUB 15,688,000 Barclays Bank 18/8/2021 (365)USD 191,283 RUB 14,220,000 BNP Paribas 18/8/2021 (554)USD 567,341 RUB 42,359,000 Goldman Sachs 18/8/2021 (4,110)
USD 205,504 SEK 1,758,000Bank of America
Merrill Lynch 16/6/2021 (6,533)USD 528,694 SEK 4,471,000 Barclays Bank 16/6/2021 (10,564)USD 3,472,626 SEK 29,462,000 Citibank 16/6/2021 (80,861)USD 112,163 SEK 964,000 Deutsche Bank 16/6/2021 (4,107)USD 2,249,724 SEK 18,683,000 JP Morgan 16/6/2021 (3,680)USD 2,838,268 SEK 23,583,000 Morgan Stanley 16/6/2021 (6,137)
USD 500,026 SEK 4,180,736Standard
Chartered Bank 16/6/2021 (4,223)USD 3,771,307 SEK 32,218,000 Societe Generale 21/7/2021 (115,675)USD 4,583,851 SEK 38,126,140 Morgan Stanley 18/8/2021 (16,906)USD 4,814,394 SGD 6,471,000 Barclays Bank 16/6/2021 (81,176)USD 627,266 SGD 833,000 Citibank 16/6/2021 (2,932)USD 802,666 SGD 1,082,000 HSBC 16/6/2021 (15,911)USD 2,693,974 SGD 3,615,000 JP Morgan 16/6/2021 (40,918)
USD 896,398 SGD 1,187,000Standard
Chartered Bank 16/6/2021 (1,614)USD 627,196 SGD 833,000 Citibank 21/7/2021 (2,940)USD 444,299 SGD 594,000 JP Morgan 21/7/2021 (5,041)
USD 895,553 SGD 1,186,000Standard
Chartered Bank 21/7/2021 (1,615)
USD 1,523,384 SGD 2,020,000Standard
Chartered Bank 18/8/2021 (4,568)USD 179,201 THB 5,595,000 Barclays Bank 16/6/2021 87USD 6,371,588 THB 196,597,000 BNP Paribas 16/6/2021 77,871USD 437,534 THB 13,732,000 Goldman Sachs 16/6/2021 (2,073)USD 179,182 THB 5,599,000 HSBC 21/7/2021 (42)USD 1,721,120 THB 54,264,000 Societe Generale 21/7/2021 (15,876)USD 278,858 THB 8,671,930 Goldman Sachs 18/8/2021 1,297USD 989,169 TWD 27,697,000 BNP Paribas 16/6/2021 (17,538)USD 9,347,828 TWD 262,880,000 Credit Suisse 16/6/2021 (207,116)USD 1,660,031 TWD 46,964,000 Deutsche Bank 16/6/2021 (46,979)USD 204,573 TWD 5,745,636 JP Morgan 16/6/2021 (4,265)USD 1,797,423 TWD 50,114,000 Morgan Stanley 16/6/2021 (24,078)
Currency Purchases Currency Sales CounterpartyMaturity
date
Netunrealised
appreciation/(depreciation)
USD
Financial Derivative Instruments
OPEN FORWARD FOREIGN EXCHANGE TRANSACTIONS
USD 164,802 TWD 4,629,364 UBS 16/6/2021 (3,462)
USD 288,363 TWD 7,979,000Bank of America
Merrill Lynch 21/7/2021 (3,127)USD 6,703,469 TWD 189,037,830 HSBC 21/7/2021 (202,478)USD 1,714,337 TWD 47,590,000 Morgan Stanley 21/7/2021 (24,225)USD 81,381 TWD 2,262,000 UBS 21/7/2021 (1,254)USD 7,478,630 TWD 204,667,660 BNP Paribas 18/8/2021 (27,800)USD 1,713,826 TWD 47,413,000 Morgan Stanley 18/8/2021 (25,102)
USD 8,361,493 ZAR 130,181,000Bank of America
Merrill Lynch 17/6/2021 (1,087,217)USD 614,441 ZAR 9,227,000 Deutsche Bank 17/6/2021 (55,267)USD 180,169 ZAR 2,711,000 Goldman Sachs 17/6/2021 (16,599)USD 111,391 ZAR 1,631,000 JP Morgan 17/6/2021 (6,989)USD 559,199 ZAR 8,187,000 Morgan Stanley 17/6/2021 (35,024)
USD 617,752 ZAR 9,317,000Standard
Chartered Bank 17/6/2021 (58,488)USD 145,926 ZAR 2,092,000 Morgan Stanley 21/7/2021 (5,232)
USD 630,777 ZAR 8,945,000Standard
Chartered Bank 18/8/2021 (13,180)ZAR 78,100,000 USD 5,441,137 Morgan Stanley 17/6/2021 227,466
ZAR 20,613,000 USD 1,404,451Standard
Chartered Bank 17/6/2021 91,668ZAR 11,479,114 USD 780,216 UBS 17/6/2021 52,953ZAR 69,016,000 USD 4,665,492 UBS 21/7/2021 321,260ZAR 95,891,750 USD 6,743,676 JP Morgan 18/8/2021 159,639
4,359,247
AUD Hedged Share Class
AUD 31,444,803 USD 24,456,606State Street Bank& Trust Company 15/6/2021 (118,531)
USD 63,693 AUD 81,951State Street Bank& Trust Company 15/6/2021 264
(118,267)
BRL Hedged Share Class
BRL 13,597 USD 2,535State Street Bank& Trust Company 2/6/2021 72
BRL 13,633 USD 2,569State Street Bank& Trust Company 2/7/2021 39
USD 2,570 BRL 13,597State Street Bank& Trust Company 2/6/2021 (38)
73
CHF Hedged Share Class
CHF 378,850 USD 417,203State Street Bank& Trust Company 15/6/2021 3,672
3,672
EUR Hedged Share Class
EUR 14,279,990 USD 17,252,919State Street Bank& Trust Company 15/6/2021 178,723
USD 110,661 EUR 90,812State Street Bank& Trust Company 15/6/2021 (193)
178,530
GBP Hedged Share Class
GBP 12,323,466 USD 17,150,241State Street Bank& Trust Company 15/6/2021 312,309
USD 136,729 GBP 97,489State Street Bank& Trust Company 15/6/2021 (1,413)
310,896
BlackRock Style Advantage Fund continued
Portfolio of Investments as at 31 May 2021
The notes on pages 590 to 610 form an integral part of these financial statements.
BlackRock Strategic Funds[476]

Currency Purchases Currency Sales CounterpartyMaturity
date
Netunrealised
appreciation/(depreciation)
USD
Financial Derivative Instruments
OPEN FORWARD FOREIGN EXCHANGE TRANSACTIONS
JPY Hedged Share Class
JPY 9,041,541,201 USD 82,857,896State Street Bank& Trust Company 15/6/2021 (384,291)
(384,291)
NZD Hedged Share Class
NZD 185 USD 134State Street Bank& Trust Company 15/6/2021 1
1
SEK Hedged Share Class
SEK 30,405 USD 3,621State Street Bank& Trust Company 15/6/2021 46
46
Total (Gross underlying exposure - USD 1,063,857,930) 4,349,907
Sector Breakdownas at 31 May 2021
% of NetAssets
Government 69.14
Financial 5.20
Securities portfolio at market value 74.34
Other Net Assets 25.66
100.00
BlackRock Style Advantage Fund continued
Portfolio of Investments as at 31 May 2021
The notes on pages 590 to 610 form an integral part of these financial statements.
Annual report and audited financial statements [477]

Holding Description
MarketValue
USD
% ofNet
Assets
Transferable Securities and Money Market Instruments Admittedto an Official Stock Exchange Listing or Dealt in on AnotherRegulated Market
BONDSFrance
EUR 2,300,000 France Treasury Bill BTF RegS4/11/2021 (Zero Coupon) 2,814,837 10.40
EUR 2,900,000 France Treasury Bill BTF RegS23/2/2022 (Zero Coupon) 3,556,327 13.15
6,371,164 23.55
GermanyEUR 3,000,000 German Treasury Bill RegS
9/6/2021 (Zero Coupon) 3,661,678 13.54EUR 2,800,000 German Treasury Bill RegS
25/8/2021 (Zero Coupon) 3,422,316 12.65
7,083,994 26.19
United StatesUSD 1,200,000 United States Treasury Bill
24/2/2022 (Zero Coupon) 1,199,478 4.43USD 1,100,000 United States Treasury Bill
24/3/2022 (Zero Coupon) 1,099,552 4.07USD 1,400,000 United States Treasury Bill
21/4/2022 (Zero Coupon) 1,399,458 5.17
3,698,488 13.67
Total Bonds 17,153,646 63.41
Total Transferable Securities and Money MarketInstruments Admitted to an Official Stock ExchangeListing or Dealt in on Another Regulated Market 17,153,646 63.41
Other Transferable Securities and Money Market Instruments
BONDSCanada
CAD 2,400,000 Canadian Treasury Bill31/3/2022 (Zero Coupon) 1,983,687 7.33
1,983,687 7.33
Total Bonds 1,983,687 7.33
Total Other Transferable Securities and MoneyMarket Instruments 1,983,687 7.33
Collective Investment SchemesIreland
25,300 BlackRock ICS US Dollar Liq-uid Environmentally AwareFund ’T0’~ 2,573,852 9.51
2,573,852 9.51
Total Collective Investment Schemes 2,573,852 9.51
Securities portfolio at market value 21,711,185 80.25
Other Net Assets 5,341,747 19.75
Total Net Assets (USD) 27,052,932 100.00
~ Investment in related party fund.
BlackRock Style Advantage Screened Fund
Portfolio of Investments as at 31 May 2021
The notes on pages 590 to 610 form an integral part of these financial statements.
BlackRock Strategic Funds[478]

Holding Description Counterparty
Netunrealised
appreciation/(depreciation)
USD
Financial Derivative Instruments
CONTRACTS FOR DIFFERENCEAustralia
(262) Afterpay Ltd Citibank (180)(113) Afterpay Ltd HSBC 413(125) Afterpay Ltd JP Morgan 457
(17,644) AMP Ltd Citibank (546)(11,431) AMP Ltdπ HSBC —
(336) Ampol Ltd Citibank 122(1,534) APA Group (Unit) JP Morgan 7001,428 Aristocrat Leisure Ltd Citibank 387
667 Aristocrat Leisure Ltd HSBC 1,5751,032 Aristocrat Leisure Ltd JP Morgan 2,436
456 ASX Ltd Citibank 681316 ASX Ltd JP Morgan 1,061
(6,482) AusNet Services Ltd Citibank (125)(16,713) AusNet Services Ltd HSBC 1,682
(223) Australia & New ZealandBanking Group Ltd Citibank (95)
(325) Australia & New ZealandBanking Group Ltd HSBC (335)
(402) BlueScope Steel Ltd Citibank (423)(1,057) BlueScope Steel Ltd HSBC 1,759
(543) BlueScope Steel Ltd JP Morgan 9044,211 Brambles Ltd Citibank 7174,995 Brambles Ltd HSBC 8819,969 Brambles Ltd JP Morgan 1,686
341 Cochlear Ltd HSBC 2,264(455) Coles Group Ltd HSBC (127)(451) Commonwealth Bank of
Australia Citibank (335)(3,284) Crown Resorts Ltd Citibank 51
(537) Crown Resorts Ltd HSBC 50(555) Crown Resorts Ltd JP Morgan 52(53) CSL Ltd HSBC (609)(25) CSL Ltd JP Morgan (287)
(1,224) Evolution Mining Ltd Citibank (127)(1,707) Evolution Mining Ltd HSBC (161)(2,004) Evolution Mining Ltd JP Morgan (496)(1,053) Fortescue Metals Group Ltd HSBC (257)(1,648) Fortescue Metals Group Ltd JP Morgan 3,010
(12,428) Insurance Australia GroupLtd JP Morgan 770
744 James Hardie Industries Plc- CDI Citibank 722
704 James Hardie Industries Plc- CDI HSBC 254
632 James Hardie Industries Plc- CDI JP Morgan 603
(495) Lendlease Corp Ltd (Unit) HSBC (57)(132) Magellan Financial Group
Ltd HSBC (91)(18,643) Medibank Pvt Ltd Citibank (433)(4,471) Medibank Pvt Ltd HSBC (242)
(951) National Australia Bank Ltd Citibank (221)(750) National Australia Bank Ltd JP Morgan 81(507) Newcrest Mining Ltd Citibank 78(311) Newcrest Mining Ltd HSBC (53)
(1,200) Newcrest Mining Ltd JP Morgan (204)(557) Northern Star Resources
Ltd HSBC (83)(3,198) Northern Star Resources
Ltd JP Morgan (891)(517) Orica Ltd Citibank 56
(2,150) Orica Ltd HSBC 632(2,238) Orica Ltd JP Morgan 658(1,919) Qantas Airways Ltd JP Morgan —
149 QBE Insurance Group Ltd HSBC 31
Holding Description Counterparty
Netunrealised
appreciation/(depreciation)
USD
Australia continued3,811 QBE Insurance Group Ltd JP Morgan 796(481) Ramsay Health Care Ltd Citibank 249(48) Ramsay Health Care Ltd HSBC (22)
(225) Ramsay Health Care Ltd JP Morgan (101)320 REA Group Ltd Citibank 2,098242 REA Group Ltd HSBC 603135 REA Group Ltd JP Morgan 336
(220) Rio Tinto Ltd HSBC (337)(835) SEEK Ltd HSBC (200)693 Sonic Healthcare Ltd HSBC (182)
1,625 Suncorp Group Ltd HSBC 75(6,706) Sydney Airport (Unit) JP Morgan 40620,727 Tabcorp Holdings Ltd Citibank 1,7652,238 Tabcorp Holdings Ltd HSBC (69)8,599 Tabcorp Holdings Ltd JP Morgan (266)3,963 Telstra Corp Ltd Citibank 2766,048 Telstra Corp Ltd JP Morgan 140
(6,159) Transurban Group (Unit) Citibank (143)(779) Transurban Group (Unit) HSBC 277
(1,144) Transurban Group (Unit) JP Morgan 407(1,714) Treasury Wine Estates Ltd HSBC (2,056)(1,040) Treasury Wine Estates Ltd JP Morgan (1,248)
116 Wesfarmers Ltd Citibank 59792 Wesfarmers Ltd HSBC 331
1,089 Wesfarmers Ltd JP Morgan 455(890) Westpac Banking Corp Citibank (303)
(2,068) Westpac Banking Corp HSBC —(995) Westpac Banking Corp JP Morgan —(487) WiseTech Global Ltd Citibank (464)(305) WiseTech Global Ltd HSBC (71)(194) Woolworths Group Ltd Citibank (3)(597) Woolworths Group Ltd HSBC (517)(161) Woolworths Group Ltd JP Morgan (140)
20,546
Austria207 Erste Group Bank AG HSBC 583
1,352 Raiffeisen Bank Interna-tional AG Citibank 33
1,046 Raiffeisen Bank Interna-tional AG JP Morgan 294
(67) Verbund AG Citibank 82298 voestalpine AG Citibank 378
1,370
Belgium(384) Ageas SA Citibank (253)100 Anheuser-Busch InBev SA HSBC 25
(162) Argenx SE Citibank (1,483)(67) Argenx SE HSBC (1,333)
(376) Elia Group SA Citibank 2,019(371) Elia Group SA HSBC 543(87) Elia Group SA JP Morgan 127150 Etablissements Franz Col-
ruyt NV JP Morgan (17)194 Groupe Bruxelles Lambert
SA Citibank 355246 KBC Group NV Citibank (120)254 KBC Group NV HSBC 29856 KBC Group NV JP Morgan 66
1,420 Proximus SADP Citibank (823)1,689 Proximus SADP HSBC (1,731)1,268 Proximus SADP JP Morgan (1,300)
(22) Sofina SA Citibank (274)(84) Sofina SA HSBC (2,173)(48) Sofina SA JP Morgan (1,242)219 Solvay SA HSBC (1,029)92 UCB SA Citibank (101)
BlackRock Style Advantage Screened Fund continued
Portfolio of Investments as at 31 May 2021
The notes on pages 590 to 610 form an integral part of these financial statements.
Annual report and audited financial statements [479]

Holding Description Counterparty
Netunrealised
appreciation/(depreciation)
USD
Belgium continued112 UCB SA HSBC 7768 UCB SA JP Morgan 46
(468) Umicore SA HSBC 1,342
(6,981)
Canada(86) Agnico Eagle Mines Ltd HSBC (264)
(290) Air Canada Citibank (329)(617) Air Canada HSBC (1,169)(574) Algonquin Power & Utilities
Corp Citibank 43(706) Algonquin Power & Utilities
Corp HSBC 380(708) Algonquin Power & Utilities
Corp JP Morgan 381(657) Atco Ltd ’I’ JP Morgan (680)
9,029 B2Gold Corp Citibank 756,469 B2Gold Corp HSBC 428
881 B2Gold Corp JP Morgan 58(1,257) Ballard Power Systems Inc HSBC (2,832)
323 Bank of Montreal Citibank 928484 Bank of Montreal HSBC 3,71032 Bank of Montreal JP Morgan 245
939 Bank of Nova Scotia Citibank 1,50076 Bank of Nova Scotia HSBC 107
267 Bank of Nova Scotia JP Morgan 508(1,198) Bausch Health Cos Inc Citibank (873)
(177) Bausch Health Cos Inc JP Morgan (778)(202) BCE Inc Citibank (60)(567) BCE Inc HSBC (314)(998) BCE Inc JP Morgan (553)(163) CAE Inc HSBC (196)(515) Cameco Corp Citibank (486)(736) Cameco Corp HSBC (402)(143) Canadian Apartment Prop-
erties REIT (REIT) Citibank 7327 Canadian Imperial Bank of
Commerce Citibank 1,938337 Canadian Imperial Bank of
Commerce HSBC 3,342265 Canadian Imperial Bank of
Commerce JP Morgan 2,62854 Canadian National Railway
Co JP Morgan (18)(175) Canadian Pacific Railway
Ltd Citibank 39(155) Canadian Pacific Railway
Ltd JP Morgan (268)74 Canadian Tire Corp Ltd ’A’ Citibank 5
259 Canadian Tire Corp Ltd ’A’ HSBC 1,736155 Canadian Tire Corp Ltd ’A’ JP Morgan 1,039
(1,485) Canadian Utilities Ltd ’A’ Citibank 356(1,134) Canadian Utilities Ltd ’A’ HSBC 329(1,991) Canadian Utilities Ltd ’A’ JP Morgan 577
111 CGI Inc HSBC (75)14 Constellation Software Inc Citibank (293)9 Constellation Software Inc HSBC (217)7 Constellation Software Inc JP Morgan (169)
(1,030) Dollarama Inc Citibank 656(638) Dollarama Inc HSBC 563(241) Dollarama Inc JP Morgan 168(182) Empire Co Ltd ’A’ JP Morgan (101)(373) Enbridge Inc Citibank 9(711) Enbridge Inc JP Morgan 1,230(133) Fairfax Financial Holdings
Ltd HSBC 1,073(956) First Quantum Minerals Ltd HSBC 1,725(395) First Quantum Minerals Ltd JP Morgan 713(580) Fortis Inc Citibank 55
(1,106) Fortis Inc HSBC (16)(1,802) Fortis Inc JP Morgan (5)
Holding Description Counterparty
Netunrealised
appreciation/(depreciation)
USD
Canada continued66 George Weston Ltd Citibank 15
751 George Weston Ltd HSBC 2,312262 George Weston Ltd JP Morgan 807188 Gildan Activewear Inc Citibank 182296 Gildan Activewear Inc HSBC 92374 Gildan Activewear Inc JP Morgan (22)
1,718 Hydro One Ltd Citibank 4276,537 Hydro One Ltd HSBC 2,597
984 Hydro One Ltd JP Morgan 391153 iA Financial Corp Inc Citibank (101)
(382) IGM Financial Inc Citibank (63)180 Intact Financial Corp Citibank 790291 Intact Financial Corp JP Morgan (542)
(367) Inter Pipeline Ltd HSBC 46879 Kinross Gold Corp Citibank 22586 Kinross Gold Corp HSBC 199
(446) Kirkland Lake Gold Ltd Citibank 183(813) Kirkland Lake Gold Ltd HSBC (1,264)(375) Kirkland Lake Gold Ltd JP Morgan (888)774 Loblaw Cos Ltd Citibank (346)
(394) Lundin Mining Corp Citibank (59)(424) Lundin Mining Corp HSBC 670
69 Magna International Inc Citibank 1232 Magna International Inc HSBC 408
(300) Metro Inc JP Morgan 30248 National Bank of Canada Citibank (10)603 National Bank of Canada HSBC 1,77272 National Bank of Canada JP Morgan 212
240 Nutrien Ltd Citibank 42385 Nutrien Ltd JP Morgan 21
152 Onex Corp HSBC 586309 Open Text Corp Citibank 256349 Open Text Corp HSBC (17)135 Open Text Corp JP Morgan (7)
(705) Pan American Silver Corp Citibank 280(280) Pan American Silver Corp HSBC 273(850) Pan American Silver Corp JP Morgan 830195 Parkland Corp Citibank 40
1,081 Parkland Corp HSBC (814)(180) Pembina Pipeline Corp Citibank (130)(715) Pembina Pipeline Corp HSBC (681)(184) Pembina Pipeline Corp JP Morgan (175)337 Power Corp of Canada Citibank 181733 Power Corp of Canada HSBC 1,584222 Quebecor Inc ’B’ Citibank (41)257 Quebecor Inc ’B’ HSBC (399)
1,069 Quebecor Inc ’B’ JP Morgan (1,659)(294) Restaurant Brands Interna-
tional Inc HSBC (153)87 Ritchie Bros Auctioneers Inc Citibank (134)
218 Ritchie Bros Auctioneers Inc HSBC (1,689)103 Ritchie Bros Auctioneers Inc JP Morgan (798)175 Rogers Communications Inc
’B’ HSBC 75186 Royal Bank of Canada Citibank 316
(685) Saputo Inc Citibank (896)(1,221) Saputo Inc HSBC (2,193)
(645) Saputo Inc JP Morgan (1,159)(43) Shaw Communications Inc
’B’ Citibank (2)(140) Shaw Communications Inc
’B’ HSBC 8(25) Shopify Inc ’A’ Citibank (24)
(930) SSR Mining Inc Citibank 38(2,274) SSR Mining Inc HSBC (3,953)(1,220) SSR Mining Inc JP Morgan (2,121)
33 Sun Life Financial Inc Citibank 281,634 Sun Life Financial Inc HSBC (893)
248 Sun Life Financial Inc JP Morgan (135)(1,482) TC Energy Corp Citibank (552)
BlackRock Style Advantage Screened Fund continued
Portfolio of Investments as at 31 May 2021
The notes on pages 590 to 610 form an integral part of these financial statements.
BlackRock Strategic Funds[480]

Holding Description Counterparty
Netunrealised
appreciation/(depreciation)
USD
Canada continued(558) TC Energy Corp JP Morgan 346(11) Thomson Reuters Corp Citibank (14)
(557) Thomson Reuters Corp HSBC (807)(122) Thomson Reuters Corp JP Morgan (177)104 TMX Group Ltd HSBC (120)
(124) Toronto-Dominion Bank Citibank 106(412) Toronto-Dominion Bank HSBC (440)399 West Fraser Timber Co Ltd HSBC (3,646)137 West Fraser Timber Co Ltd JP Morgan (1,252)762 Wheaton Precious Metals
Corp Citibank 76140 Wheaton Precious Metals
Corp HSBC 523227 Wheaton Precious Metals
Corp JP Morgan 977(96) WSP Global Inc HSBC (755)
5,445
Denmark(697) Ambu A/S ’B’ JP Morgan 11,244
5 AP Moller - Maersk A/S ’B’ Citibank (185)11 AP Moller - Maersk A/S ’B’ HSBC 6413 AP Moller - Maersk A/S ’B’ JP Morgan 175
479 Carlsberg A/S ’B’ HSBC (197)(425) Chr Hansen Holding A/S Citibank 837(390) Chr Hansen Holding A/S HSBC 448(175) Chr Hansen Holding A/S JP Morgan 201448 Coloplast A/S ’B’ JP Morgan (160)
(1,065) Danske Bank A/S Citibank 883(1,443) Danske Bank A/S JP Morgan 1,433
(22) Demant A/S Citibank (68)(442) Demant A/S HSBC (1,277)(320) DSV PANALPINA A/S HSBC (2,258)107 Genmab A/S Citibank 68533 Genmab A/S HSBC 99132 Genmab A/S JP Morgan 961
263 GN Store Nord A/S Citibank 7885 GN Store Nord A/S HSBC 176
(913) H Lundbeck A/S Citibank 949(491) H Lundbeck A/S JP Morgan 187
1,886 Novo Nordisk A/S ’B’ HSBC 4,4101,085 Novo Nordisk A/S ’B’ JP Morgan 2,537
404 Novozymes A/S ’B’ Citibank (955)186 Novozymes A/S ’B’ HSBC (189)793 Novozymes A/S ’B’ JP Morgan (807)(90) Orsted A/S JP Morgan (795)68 Pandora A/S Citibank 326
169 Pandora A/S HSBC 1,353109 Pandora A/S JP Morgan 873
(2,171) Tryg A/S Citibank 1,675(1,059) Tryg A/S JP Morgan 261
(995) Vestas Wind Systems A/S Citibank (343)(913) Vestas Wind Systems A/S HSBC (125)(270) Vestas Wind Systems A/S JP Morgan (58)
23,907
Finland400 Elisa Oyj HSBC 205
(195) Fortum Oyj Citibank 12(913) Fortum Oyj HSBC (371)(326) Fortum Oyj JP Morgan (229)(740) Kone Oyj ’B’ HSBC 1,283(287) Kone Oyj ’B’ JP Morgan 497490 Neste Oyj Citibank 993225 Neste Oyj HSBC 950838 Neste Oyj JP Morgan 3,539
(1,285) Nokia Oyj HSBC (89)127 Orion Oyj ’B’ HSBC (183)233 Orion Oyj ’B’ JP Morgan (335)
(333) Sampo Oyj ’A’ Citibank 394(343) Sampo Oyj ’A’ HSBC 841
Holding Description Counterparty
Netunrealised
appreciation/(depreciation)
USD
Finland continued985 Stora Enso Oyj ’R’ JP Morgan (2,206)504 UPM-Kymmene Oyj Citibank (486)584 UPM-Kymmene Oyj HSBC (1,397)479 UPM-Kymmene Oyj JP Morgan (1,146)
2,272
France166 Accor SA Citibank 199
(190) Aeroports de Paris Citibank (1,032)(72) Aeroports de Paris HSBC 9
(168) Aeroports de Paris JP Morgan 21(150) Air Liquide SA Citibank 289(303) Air Liquide SA HSBC 1,390(279) Air Liquide SA JP Morgan 1,280(243) Alstom SA Citibank (291)(297) Alstom SA HSBC 196(996) Alstom SA JP Morgan 656251 Amundi SA Citibank 23056 Amundi SA JP Morgan 58
122 Arkema SA HSBC (137)43 Arkema SA JP Morgan 2576 Atos SE Citibank 4
222 Atos SE HSBC (282)188 Atos SE JP Morgan (239)948 AXA SA Citibank 162212 AXA SA HSBC (5)248 AXA SA JP Morgan (117)82 BioMerieux Citibank 807 BioMerieux JP Morgan (2)
906 BNP Paribas SA Citibank 564(1,194) Bollore SA Citibank (154)
(563) Bouygues SA JP Morgan 1,278(491) Bureau Veritas SA JP Morgan (168)117 Capgemini SE JP Morgan (207)
1,169 Carrefour SA Citibank (671)343 Carrefour SA HSBC (31)302 Carrefour SA JP Morgan (28)298 Cie de Saint-Gobain Citibank (29)515 Cie de Saint-Gobain JP Morgan (603)232 Cie Generale des Etablisse-
ments Michelin SCA Citibank 28346 Cie Generale des Etablisse-
ments Michelin SCA JP Morgan 4748 CNP Assurances HSBC (607)
2,190 CNP Assurances JP Morgan (1,777)2,040 Credit Agricole SA HSBC (2,724)(673) Danone SA Citibank 1,708(44) Danone SA HSBC (46)(35) Danone SA JP Morgan (37)(29) Dassault Systemes SE Citibank (12)(22) Dassault Systemes SE HSBC (89)321 Edenred Citibank (403)
(160) Eiffage SA HSBC 844(424) EssilorLuxottica SA Citibank 176(96) EssilorLuxottica SA HSBC (291)561 Eurazeo SE Citibank 1,30154 Eurazeo SE HSBC 161
581 Eurazeo SE JP Morgan 1,737(436) Eurofins Scientific SE Citibank (1,341)(444) Faurecia SE Citibank (190)(149) Faurecia SE HSBC 95(823) Faurecia SE JP Morgan 410
(2,573) Getlink SE HSBC 1,7274 Hermes International Citibank 2939 Hermes International HSBC 1,065
(95) Iliad SA Citibank (272)(105) Iliad SA HSBC 1,403(141) Iliad SA JP Morgan 1,884206 Ipsen SA Citibank (885)88 Ipsen SA HSBC 318
BlackRock Style Advantage Screened Fund continued
Portfolio of Investments as at 31 May 2021
The notes on pages 590 to 610 form an integral part of these financial statements.
Annual report and audited financial statements [481]

Holding Description Counterparty
Netunrealised
appreciation/(depreciation)
USD
France continued(45) Kering SA HSBC (2,482)(14) Kering SA JP Morgan (772)
(139) Legrand SA HSBC (159)13 L’Oreal SA Citibank 68
112 L’Oreal SA HSBC 2,2698 L’Oreal SA JP Morgan 192
(116) LVMH Moet Hennessy LouisVuitton SE HSBC (4,318)
(52) LVMH Moet Hennessy LouisVuitton SE JP Morgan (1,936)
1,489 Natixis SA Citibank (40)1,107 Natixis SA JP Morgan (58)4,001 Orange SA Citibank (508)3,706 Orange SA HSBC (760)5,132 Orange SA JP Morgan (1,052)(111) Orpea SA Citibank 264(527) Orpea SA HSBC 1,351(37) Pernod Ricard SA Citibank (27)(25) Pernod Ricard SA HSBC (206)(32) Pernod Ricard SA JP Morgan (264)838 Publicis Groupe SA Citibank 470461 Publicis Groupe SA HSBC (383)80 Publicis Groupe SA JP Morgan (66)
(53) Remy Cointreau SA Citibank (84)(69) Remy Cointreau SA HSBC (303)(88) Remy Cointreau SA JP Morgan (387)
(718) Renault SA Citibank (916)(341) Renault SA HSBC 537(566) Renault SA JP Morgan 891(48) Sanofi Citibank 40
(247) Sanofi HSBC (338)(319) Sanofi JP Morgan (436)(24) Sartorius Stedim Biotech JP Morgan 164479 Schneider Electric SE Citibank 351
(247) SCOR SE Citibank 18775 SEB SA Citibank (55)
2,557 SES SA JP Morgan 2,490999 Societe Generale SA Citibank 152(90) Sodexo SA JP Morgan 71097 STMicroelectronics NV Citibank 101
220 STMicroelectronics NV JP Morgan 168215 Suez SA HSBC 28
(388) Ubisoft Entertainment SA JP Morgan 1,260266 Valeo SA Citibank 224
(182) Veolia Environnement SA Citibank 18(327) Veolia Environnement SA JP Morgan (135)(225) Vinci SA HSBC 437
1,466 Vivendi SE HSBC (358)290 Vivendi SE JP Morgan (71)160 Wendel SE Citibank 98112 Wendel SE HSBC (41)133 Wendel SE JP Morgan (49)
(249) Worldline SA Citibank (389)(121) Worldline SA HSBC (230)(848) Worldline SA JP Morgan (1,614)
1,213
Germany(17) adidas AG Citibank (24)(18) adidas AG HSBC (304)(16) adidas AG JP Morgan (270)154 Allianz SE Reg Citibank 7545 Allianz SE Reg HSBC 30
278 Allianz SE Reg JP Morgan 187(866) Aroundtown SA Citibank (139)(24) Aroundtown SA HSBC (6)
(206) Bayerische Motoren WerkeAG (Pref) HSBC (830)
(90) Bayerische Motoren WerkeAG (Pref) JP Morgan (362)
Holding Description Counterparty
Netunrealised
appreciation/(depreciation)
USD
Germany continued(63) Beiersdorf AG HSBC 11(45) Beiersdorf AG JP Morgan 51332 Brenntag SE Citibank 65226 Brenntag SE HSBC 171
(149) Carl Zeiss Meditec AG HSBC (2,264)(2,174) Commerzbank AG HSBC (2,231)
(775) Commerzbank AG JP Morgan (795)(227) Continental AG Citibank (809)(81) Continental AG HSBC (778)
(102) Continental AG JP Morgan (921)(197) Covestro AG JP Morgan 236(101) Daimler AG HSBC (354)(105) Daimler AG JP Morgan (368)(320) Delivery Hero SE Citibank (1,152)(110) Delivery Hero SE HSBC 691(285) Delivery Hero SE JP Morgan 1,618(11) Deutsche Bank AG Citibank 1
(1,883) Deutsche Bank AG HSBC (1,420)84 Deutsche Boerse AG Citibank (256)
122 Deutsche Boerse AG HSBC (998)304 Deutsche Boerse AG JP Morgan (2,486)
(1,199) Deutsche Lufthansa AGReg Citibank (515)
(381) Deutsche Lufthansa AGReg JP Morgan 332
218 Deutsche Post AG Reg Citibank 5752,986 Deutsche Post AG Reg HSBC 15,7061,755 Deutsche Post AG Reg JP Morgan 9,231
(1,258) Deutsche Telekom AG Reg Citibank 224(3,661) Deutsche Telekom AG Reg HSBC (1,680)
(857) Deutsche Telekom AG Reg JP Morgan (393)(91) Deutsche Wohnen SE HSBC (944)
2,051 E.ON SE Citibank (425)1,597 E.ON SE HSBC (1,501)
667 E.ON SE JP Morgan (627)(88) Evonik Industries AG Citibank (38)
(306) Evonik Industries AG HSBC 280(614) Evonik Industries AG JP Morgan 562(347) Fresenius Medical Care AG
& Co KGaA HSBC (322)(248) Fresenius SE & Co KGaA Citibank 115(265) Fresenius SE & Co KGaA HSBC (302)(106) FUCHS PETROLUB SE
(Pref) HSBC 2851,595 GEA Group AG HSBC (642)
(39) Hannover Rueck SE JP Morgan 381456 HeidelbergCement AG Citibank 71267 HeidelbergCement AG HSBC (57)
192 HeidelbergCement AG JP Morgan (164)(125) Henkel AG & Co KGaA Citibank 221(53) Henkel AG & Co KGaA JP Morgan 129
(162) HOCHTIEF AG HSBC 649(106) HOCHTIEF AG JP Morgan 424
(1,104) Infineon Technologies AG Citibank (1,381)(792) Infineon Technologies AG HSBC (1,798)
(1,929) Infineon Technologies AG JP Morgan (4,379)(505) KION Group AG Citibank (838)(109) Knorr-Bremse AG Citibank (173)(65) Knorr-Bremse AG HSBC 198
(291) Knorr-Bremse AG JP Morgan 88887 LANXESS AG Citibank 7644 LEG Immobilien SE Citibank (32)
104 LEG Immobilien SE HSBC 476130 LEG Immobilien SE JP Morgan 59536 Merck KGaA Citibank 484 Merck KGaA HSBC 651
175 Merck KGaA JP Morgan 1,502(22) MTU Aero Engines AG JP Morgan (27)93 Nemetschek SE Citibank 245
BlackRock Style Advantage Screened Fund continued
Portfolio of Investments as at 31 May 2021
The notes on pages 590 to 610 form an integral part of these financial statements.
BlackRock Strategic Funds[482]

Holding Description Counterparty
Netunrealised
appreciation/(depreciation)
USD
Germany continued189 Puma SE Citibank 268
(671) QIAGEN NV JP Morgan (1,212)57 SAP SE Citibank (79)
134 SAP SE HSBC (271)303 SAP SE JP Morgan (453)(22) Sartorius AG (Pref) Citibank (35)(33) Sartorius AG (Pref) HSBC 737(48) Sartorius AG (Pref) JP Morgan 1,072351 Scout24 AG Citibank (180)42 Siemens AG Reg Citibank (132)
214 Siemens AG Reg HSBC (2,714)224 Siemens AG Reg JP Morgan (3,007)(33) Siemens Energy AG HSBC (12)
(963) Siemens Energy AG JP Morgan (341)(884) Siemens Healthineers AG Citibank 43
(1,496) Siemens Healthineers AG HSBC 1,844(94) Siemens Healthineers AG JP Morgan 116133 Symrise AG Citibank 24
(306) TeamViewer AG Citibank (288)(133) TeamViewer AG HSBC (164)(283) TeamViewer AG JP Morgan 435
1,271 Telefonica DeutschlandHolding AG Citibank (36)
12,852 Telefonica DeutschlandHolding AG JP Morgan (3,937)
(25) Uniper SE HSBC 24(511) Uniper SE JP Morgan 493(139) United Internet AG Reg Citibank 61(926) United Internet AG Reg HSBC 633(115) Vonovia SE Citibank (321)(213) Zalando SE Citibank 478(54) Zalando SE JP Morgan (232)
(2,594)
Hong Kong(500) ASM Pacific Technology Ltd Citibank (190)(900) ASM Pacific Technology Ltd HSBC 1,136
(15,400) Bank of East Asia Ltd Citibank 6354,500 BOC Hong Kong Holdings
Ltd Citibank 17419,500 BOC Hong Kong Holdings
Ltd HSBC (3,643)4,000 BOC Hong Kong Holdings
Ltd JP Morgan (747)6,500 CK Asset Holdings Ltd Citibank 1,801
(1,000) Galaxy EntertainmentGroup Ltd Citibank (64)
(3,000) Hang Lung Properties Ltd HSBC 259(7,000) HKT Trust & HKT Ltd (Unit) HSBC 848
(3) MTR Corp Ltd Citibank —(22,802) MTR Corp Ltd HSBC 4,113(1,000) New World Development Co
Ltd HSBC 64(6,264) Sino Land Co Ltd Citibank 97
(25,000) SJM Holdings Ltd Citibank 354(34,000) SJM Holdings Ltd HSBC 1,139
2,000 Sun Hung Kai PropertiesLtd Citibank 464
2,500 Swire Pacific Ltd ’A’ Citibank (177)3,500 Swire Pacific Ltd ’A’ HSBC (2,300)1,500 Techtronic Industries Co Ltd Citibank 561
(12,000) Wharf Real Estate Invest-ment Co Ltd JP Morgan 2,551
(3,200) Wynn Macau Ltd Citibank (25)
7,050
Ireland1,322 CRH Plc Citibank 1,517
144 CRH Plc HSBC 123489 CRH Plc JP Morgan 418(23) Flutter Entertainment Plc Citibank (27)
Holding Description Counterparty
Netunrealised
appreciation/(depreciation)
USD
Ireland continued(346) Kerry Group Plc ’A’ JP Morgan (844)(80) Kingspan Group Plc JP Morgan (59)97 Smurfit Kappa Group Plc Citibank 9
115 Smurfit Kappa Group Plc JP Morgan (101)
1,036
Israel(74) Azrieli Group Ltd HSBC (198)822 Bank Hapoalim BM Citibank (48)621 Bank Hapoalim BM JP Morgan 176926 Bank Leumi Le-Israel BM Citibank 148
3,267 Bank Leumi Le-Israel BM HSBC 1,077(4,407) ICL Group Ltd HSBC (1,411)1,145 Israel Discount Bank Ltd ’A’ Citibank 563,176 Israel Discount Bank Ltd ’A’ HSBC 7041,201 Israel Discount Bank Ltd ’A’ JP Morgan 266
770
Italy460 Assicurazioni Generali SpA Citibank (14)
(482) Atlantia SpA Citibank (374)(2,108) Atlantia SpA HSBC (64)
(256) Atlantia SpA JP Morgan (8)906 CNH Industrial NV Citibank 464
(1,961) Davide Campari-Milano NV Citibank (168)75 DiaSorin SpA HSBC 2201 DiaSorin SpA JP Morgan 3
76 EXOR NV HSBC 111(187) Ferrari NV Citibank 103(107) Ferrari NV HSBC (1,090)(467) FinecoBank Banca Fineco
SpA JP Morgan 194(720) Infrastrutture Wireless Ital-
iane SpA HSBC 285(8,219) Infrastrutture Wireless Ital-
iane SpA JP Morgan 3,25034,630 Intesa Sanpaolo SpA Citibank 2,57849,266 Intesa Sanpaolo SpA HSBC 2,0741,710 Intesa Sanpaolo SpA JP Morgan 72
(4,220) Mediobanca Banca diCredito Finanziario SpA Citibank (608)
(255) Moncler SpA Citibank (1,326)(193) Moncler SpA HSBC (1,602)(265) Moncler SpA JP Morgan (2,199)
(1,135) Nexi SpA Citibank (326)(436) Nexi SpA HSBC (649)
1,041 Poste Italiane SpA HSBC 4321,751 Poste Italiane SpA JP Morgan 727(104) Recordati Industria Chimica
e Farmaceutica SpA JP Morgan (104)2,120 Snam SpA HSBC (8)1,979 Snam SpA JP Morgan (7)
(1,048) Stellantis NV Citibank (1,233)(358) Stellantis NV HSBC (547)
(8,160) Tenaris SA Citibank (4,579)(3,466) Tenaris SA HSBC 611
(812) Tenaris SA JP Morgan 694,469 Terna SpA Citibank (229)2,006 Terna SpA HSBC 2115,391 Terna SpA JP Morgan 566
587 UniCredit SpA Citibank 181
(2,984)
Japan(100) ABC-Mart Inc JP Morgan (237)
(4,100) Acom Co Ltd Citibank (112)(7,300) Acom Co Ltd HSBC (1,132)(3,200) Acom Co Ltd JP Morgan (496)
(100) Advantest Corp JP Morgan 283(200) Aeon Co Ltd JP Morgan 285(700) Aeon Mall Co Ltd HSBC (140)
BlackRock Style Advantage Screened Fund continued
Portfolio of Investments as at 31 May 2021
The notes on pages 590 to 610 form an integral part of these financial statements.
Annual report and audited financial statements [483]
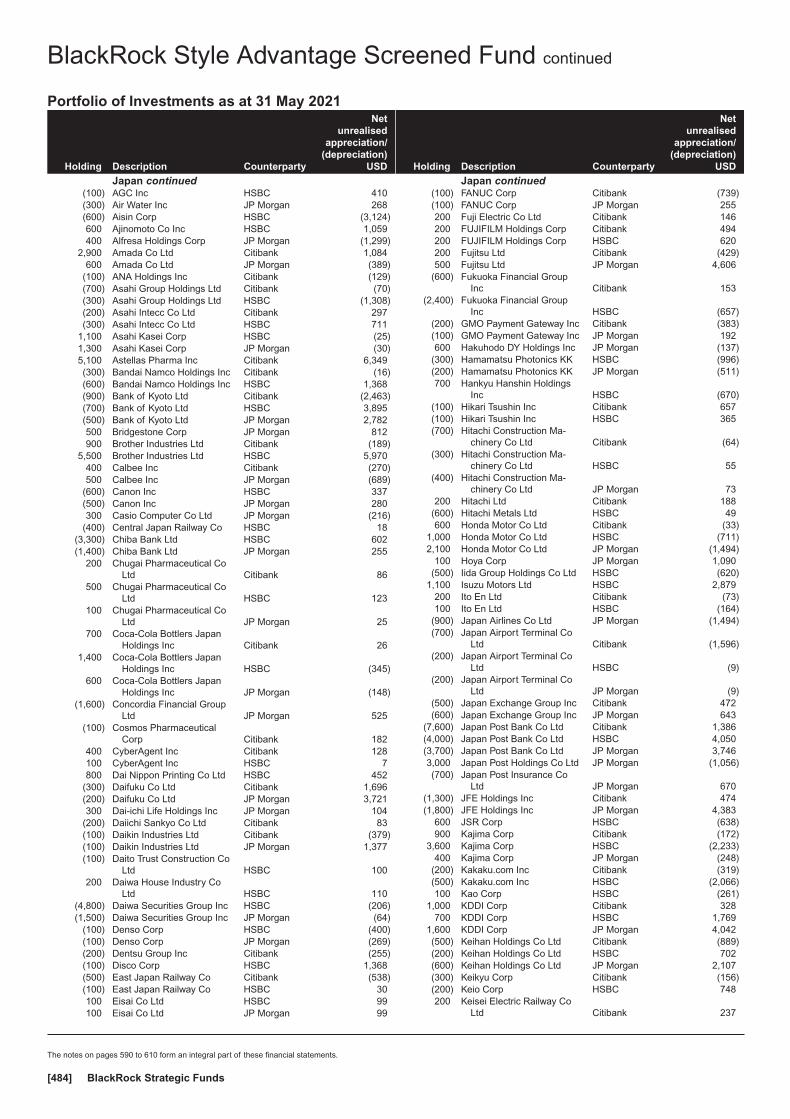
Holding Description Counterparty
Netunrealised
appreciation/(depreciation)
USD
Japan continued(100) AGC Inc HSBC 410(300) Air Water Inc JP Morgan 268(600) Aisin Corp HSBC (3,124)600 Ajinomoto Co Inc HSBC 1,059400 Alfresa Holdings Corp JP Morgan (1,299)
2,900 Amada Co Ltd Citibank 1,084600 Amada Co Ltd JP Morgan (389)
(100) ANA Holdings Inc Citibank (129)(700) Asahi Group Holdings Ltd Citibank (70)(300) Asahi Group Holdings Ltd HSBC (1,308)(200) Asahi Intecc Co Ltd Citibank 297(300) Asahi Intecc Co Ltd HSBC 711
1,100 Asahi Kasei Corp HSBC (25)1,300 Asahi Kasei Corp JP Morgan (30)5,100 Astellas Pharma Inc Citibank 6,349(300) Bandai Namco Holdings Inc Citibank (16)(600) Bandai Namco Holdings Inc HSBC 1,368(900) Bank of Kyoto Ltd Citibank (2,463)(700) Bank of Kyoto Ltd HSBC 3,895(500) Bank of Kyoto Ltd JP Morgan 2,782500 Bridgestone Corp JP Morgan 812900 Brother Industries Ltd Citibank (189)
5,500 Brother Industries Ltd HSBC 5,970400 Calbee Inc Citibank (270)500 Calbee Inc JP Morgan (689)
(600) Canon Inc HSBC 337(500) Canon Inc JP Morgan 280300 Casio Computer Co Ltd JP Morgan (216)
(400) Central Japan Railway Co HSBC 18(3,300) Chiba Bank Ltd HSBC 602(1,400) Chiba Bank Ltd JP Morgan 255
200 Chugai Pharmaceutical CoLtd Citibank 86
500 Chugai Pharmaceutical CoLtd HSBC 123
100 Chugai Pharmaceutical CoLtd JP Morgan 25
700 Coca-Cola Bottlers JapanHoldings Inc Citibank 26
1,400 Coca-Cola Bottlers JapanHoldings Inc HSBC (345)
600 Coca-Cola Bottlers JapanHoldings Inc JP Morgan (148)
(1,600) Concordia Financial GroupLtd JP Morgan 525
(100) Cosmos PharmaceuticalCorp Citibank 182
400 CyberAgent Inc Citibank 128100 CyberAgent Inc HSBC 7800 Dai Nippon Printing Co Ltd HSBC 452
(300) Daifuku Co Ltd Citibank 1,696(200) Daifuku Co Ltd JP Morgan 3,721300 Dai-ichi Life Holdings Inc JP Morgan 104
(200) Daiichi Sankyo Co Ltd Citibank 83(100) Daikin Industries Ltd Citibank (379)(100) Daikin Industries Ltd JP Morgan 1,377(100) Daito Trust Construction Co
Ltd HSBC 100200 Daiwa House Industry Co
Ltd HSBC 110(4,800) Daiwa Securities Group Inc HSBC (206)(1,500) Daiwa Securities Group Inc JP Morgan (64)
(100) Denso Corp HSBC (400)(100) Denso Corp JP Morgan (269)(200) Dentsu Group Inc Citibank (255)(100) Disco Corp HSBC 1,368(500) East Japan Railway Co Citibank (538)(100) East Japan Railway Co HSBC 30100 Eisai Co Ltd HSBC 99100 Eisai Co Ltd JP Morgan 99
Holding Description Counterparty
Netunrealised
appreciation/(depreciation)
USD
Japan continued(100) FANUC Corp Citibank (739)(100) FANUC Corp JP Morgan 255200 Fuji Electric Co Ltd Citibank 146200 FUJIFILM Holdings Corp Citibank 494200 FUJIFILM Holdings Corp HSBC 620200 Fujitsu Ltd Citibank (429)500 Fujitsu Ltd JP Morgan 4,606
(600) Fukuoka Financial GroupInc Citibank 153
(2,400) Fukuoka Financial GroupInc HSBC (657)
(200) GMO Payment Gateway Inc Citibank (383)(100) GMO Payment Gateway Inc JP Morgan 192600 Hakuhodo DY Holdings Inc JP Morgan (137)
(300) Hamamatsu Photonics KK HSBC (996)(200) Hamamatsu Photonics KK JP Morgan (511)700 Hankyu Hanshin Holdings
Inc HSBC (670)(100) Hikari Tsushin Inc Citibank 657(100) Hikari Tsushin Inc HSBC 365(700) Hitachi Construction Ma-
chinery Co Ltd Citibank (64)(300) Hitachi Construction Ma-
chinery Co Ltd HSBC 55(400) Hitachi Construction Ma-
chinery Co Ltd JP Morgan 73200 Hitachi Ltd Citibank 188
(600) Hitachi Metals Ltd HSBC 49600 Honda Motor Co Ltd Citibank (33)
1,000 Honda Motor Co Ltd HSBC (711)2,100 Honda Motor Co Ltd JP Morgan (1,494)
100 Hoya Corp JP Morgan 1,090(500) Iida Group Holdings Co Ltd HSBC (620)
1,100 Isuzu Motors Ltd HSBC 2,879200 Ito En Ltd Citibank (73)100 Ito En Ltd HSBC (164)
(900) Japan Airlines Co Ltd JP Morgan (1,494)(700) Japan Airport Terminal Co
Ltd Citibank (1,596)(200) Japan Airport Terminal Co
Ltd HSBC (9)(200) Japan Airport Terminal Co
Ltd JP Morgan (9)(500) Japan Exchange Group Inc Citibank 472(600) Japan Exchange Group Inc JP Morgan 643
(7,600) Japan Post Bank Co Ltd Citibank 1,386(4,000) Japan Post Bank Co Ltd HSBC 4,050(3,700) Japan Post Bank Co Ltd JP Morgan 3,7463,000 Japan Post Holdings Co Ltd JP Morgan (1,056)(700) Japan Post Insurance Co
Ltd JP Morgan 670(1,300) JFE Holdings Inc Citibank 474(1,800) JFE Holdings Inc JP Morgan 4,383
600 JSR Corp HSBC (638)900 Kajima Corp Citibank (172)
3,600 Kajima Corp HSBC (2,233)400 Kajima Corp JP Morgan (248)
(200) Kakaku.com Inc Citibank (319)(500) Kakaku.com Inc HSBC (2,066)100 Kao Corp HSBC (261)
1,000 KDDI Corp Citibank 328700 KDDI Corp HSBC 1,769
1,600 KDDI Corp JP Morgan 4,042(500) Keihan Holdings Co Ltd Citibank (889)(200) Keihan Holdings Co Ltd HSBC 702(600) Keihan Holdings Co Ltd JP Morgan 2,107(300) Keikyu Corp Citibank (156)(200) Keio Corp HSBC 748200 Keisei Electric Railway Co
Ltd Citibank 237
BlackRock Style Advantage Screened Fund continued
Portfolio of Investments as at 31 May 2021
The notes on pages 590 to 610 form an integral part of these financial statements.
BlackRock Strategic Funds[484]

Holding Description Counterparty
Netunrealised
appreciation/(depreciation)
USD
Japan continued(100) Keyence Corp HSBC (347)(100) Keyence Corp JP Morgan (347)300 Kikkoman Corp Citibank 1,040
(600) Kintetsu Group Holdings CoLtd Citibank (684)
(100) Kintetsu Group Holdings CoLtd HSBC 192
(400) Kintetsu Group Holdings CoLtd JP Morgan 766
(200) Kobayashi PharmaceuticalCo Ltd JP Morgan 201
(500) Kobe Bussan Co Ltd Citibank 265(1,300) Kobe Bussan Co Ltd JP Morgan 1,802
(600) Koito Manufacturing Co Ltd JP Morgan (657)(300) Komatsu Ltd Citibank 99(100) Konami Holdings Corp JP Morgan (255)(100) Kose Corp Citibank (474)(200) Kose Corp HSBC (1,915)
(1,600) Kubota Corp Citibank 1,036700 Kuraray Co Ltd HSBC (741)300 Kurita Water Industries Ltd HSBC 27200 Kurita Water Industries Ltd JP Morgan 18500 Kyocera Corp Citibank 342200 Kyowa Kirin Co Ltd HSBC (119)600 Kyushu Railway Co Citibank 624800 Kyushu Railway Co JP Morgan (241)
(100) Lasertec Corp Citibank (2,517)(300) Lasertec Corp JP Morgan (4,953)(600) Lion Corp JP Morgan 673300 Lixil Corp Citibank (487)
(200) M3 Inc HSBC 100(100) M3 Inc JP Morgan 50
(1,100) Makita Corp Citibank (2,809)(300) Makita Corp HSBC (438)(200) Makita Corp JP Morgan (292)(500) Marui Group Co Ltd HSBC 55
(2,200) Marui Group Co Ltd JP Morgan 2415,200 Mazda Motor Corp Citibank 2,229
600 Mazda Motor Corp JP Morgan 192600 McDonald’s Holdings Co
Japan Ltd Citibank (137)200 McDonald’s Holdings Co
Japan Ltd HSBC (82)300 Medipal Holdings Corp Citibank 19600 Medipal Holdings Corp HSBC (115)
(100) MEIJI Holdings Co Ltd Citibank 55(300) Mercari Inc Citibank (438)800 MINEBEA MITSUMI Inc JP Morgan 839
(300) MISUMI Group Inc JP Morgan (137)2,400 Mitsubishi Chemical Hold-
ings Corp HSBC 1385,300 Mitsubishi Electric Corp HSBC (193)7,800 Mitsubishi Electric Corp JP Morgan (285)
300 Mitsubishi Estate Co Ltd Citibank (55)400 Mitsubishi Estate Co Ltd HSBC (361)800 Mitsubishi Gas Chemical Co
Inc HSBC (452)1,300 Mitsubishi HC Capital Inc HSBC (368)
(1,200) Mitsubishi Heavy IndustriesLtd HSBC 1,300
(200) Mitsubishi Heavy IndustriesLtd JP Morgan 52
400 Mitsui Chemicals Inc Citibank 474300 Mitsui Chemicals Inc HSBC 27
1,200 Mitsui Chemicals Inc JP Morgan 109(300) Mitsui Fudosan Co Ltd JP Morgan (94)(300) Miura Co Ltd HSBC 2,408
80 Mizuho Financial Group Inc Citibank (25)1,430 Mizuho Financial Group Inc HSBC 659
(1,400) MonotaRO Co Ltd Citibank (600)
Holding Description Counterparty
Netunrealised
appreciation/(depreciation)
USD
Japan continued(200) MonotaRO Co Ltd HSBC 15400 MS&AD Insurance Group
Holdings Inc HSBC 171(200) Murata Manufacturing Co
Ltd Citibank (99)(700) Murata Manufacturing Co
Ltd HSBC 2,682(100) Murata Manufacturing Co
Ltd JP Morgan 383100 Nabtesco Corp HSBC (18)
(200) Nagoya Railroad Co Ltd HSBC 839300 NEC Corp Citibank (547)600 NEC Corp HSBC (6,786)200 NEC Corp JP Morgan (2,262)
(400) Nexon Co Ltd HSBC 3,232(400) Nexon Co Ltd JP Morgan 3,232
1,000 NGK Insulators Ltd JP Morgan (1,158)1,100 NGK Spark Plug Co Ltd Citibank 462
700 NGK Spark Plug Co Ltd HSBC 102800 NGK Spark Plug Co Ltd JP Morgan 117
(200) NH Foods Ltd JP Morgan 830(300) Nidec Corp HSBC (109)(100) Nidec Corp JP Morgan (112)(600) Nihon M&A Center Inc Citibank 438(200) Nihon M&A Center Inc HSBC 275(600) Nihon M&A Center Inc JP Morgan 826200 Nippon Express Co Ltd Citibank (339)200 Nippon Express Co Ltd HSBC (310)500 Nippon Express Co Ltd JP Morgan (505)
(3,000) Nippon Paint Holdings CoLtd Citibank (1,724)
(500) Nippon Paint Holdings CoLtd HSBC 771
(1,000) Nippon Paint Holdings CoLtd JP Morgan 1,541
(1,000) Nippon Sanso HoldingsCorp Citibank 584
(1,300) Nippon Sanso HoldingsCorp HSBC (308)
(700) Nippon Sanso HoldingsCorp JP Morgan (166)
(100) Nippon Shinyaku Co Ltd HSBC (392)2,300 Nippon Telegraph & Tele-
phone Corp Citibank 1852,000 Nippon Telegraph & Tele-
phone Corp HSBC 1,2681,500 Nippon Telegraph & Tele-
phone Corp JP Morgan 1,0601,200 Nippon Yusen KK Citibank (930)(300) Nissan Chemical Corp HSBC 848
(6,100) Nissan Motor Co Ltd Citibank (351)(900) Nissan Motor Co Ltd HSBC 355
(12,200) Nissan Motor Co Ltd JP Morgan 4,818400 Nisshin Seifun Group Inc JP Morgan (730)300 Nissin Foods Holdings Co
Ltd JP Morgan 82100 Nitori Holdings Co Ltd Citibank (333)900 Nitto Denko Corp Citibank 739200 Nitto Denko Corp HSBC (985)
1,100 Nitto Denko Corp JP Morgan (4,863)2,100 Nomura Holdings Inc HSBC 3934,300 Nomura Holdings Inc JP Morgan 804
300 Nomura Real Estate Hold-ings Inc HSBC (30)
300 Nomura Research InstituteLtd HSBC 301
100 NSK Ltd Citibank 13,200 NSK Ltd HSBC (934)3,900 NSK Ltd JP Morgan (1,138)
600 NTT Data Corp HSBC 159
BlackRock Style Advantage Screened Fund continued
Portfolio of Investments as at 31 May 2021
The notes on pages 590 to 610 form an integral part of these financial statements.
Annual report and audited financial statements [485]

Holding Description Counterparty
Netunrealised
appreciation/(depreciation)
USD
Japan continued1,200 Obayashi Corp JP Morgan (1,302)(200) Obic Co Ltd Citibank 839(200) Obic Co Ltd JP Morgan (1,022)
(1,000) Odakyu Electric Railway CoLtd Citibank (401)
(900) Odakyu Electric Railway CoLtd JP Morgan 1,404
(2,200) Oji Holdings Corp Citibank 722(900) Oji Holdings Corp HSBC 928(900) Oji Holdings Corp JP Morgan 928300 Olympus Corp JP Morgan 197600 Omron Corp Citibank 1,751100 Omron Corp JP Morgan 82100 Ono Pharmaceutical Co Ltd Citibank (41)
1,300 Ono Pharmaceutical Co Ltd HSBC (4,784)(200) Oracle Corp Japan HSBC 1,605(200) Oriental Land Co Ltd Citibank (1,970)(100) Oriental Land Co Ltd JP Morgan (919)400 ORIX Corp JP Morgan 403
(900) Otsuka Corp HSBC (1,642)100 Otsuka Holdings Co Ltd Citibank 42100 Otsuka Holdings Co Ltd HSBC 120
(1,300) Pan Pacific InternationalHoldings Corp Citibank 1,067
(1,500) Pan Pacific InternationalHoldings Corp JP Morgan 2,805
3,100 Panasonic Corp Citibank 1,824900 Panasonic Corp HSBC (357)
3,900 Panasonic Corp JP Morgan (1,547)(900) PeptiDream Inc Citibank (1,683)(600) PeptiDream Inc JP Morgan (1,423)300 Persol Holdings Co Ltd HSBC (118)
(900) Pigeon Corp Citibank 2,339(1,200) Pigeon Corp HSBC 6,731
(600) Pola Orbis Holdings Inc HSBC 126(1,700) Rakuten Group Inc Citibank 372(2,800) Rakuten Group Inc HSBC 2,018
400 Recruit Holdings Co Ltd HSBC 1,087300 Recruit Holdings Co Ltd JP Morgan 815
(1,700) Renesas Electronics Corp Citibank 7133,600 Resona Holdings Inc JP Morgan (33)2,000 Ricoh Co Ltd Citibank 292
100 Ricoh Co Ltd HSBC 60(100) Rinnai Corp JP Morgan 538100 Rohm Co Ltd Citibank 420
(800) Ryohin Keikaku Co Ltd HSBC 1,875(700) Ryohin Keikaku Co Ltd JP Morgan 1,641400 Santen Pharmaceutical Co
Ltd JP Morgan 120(400) SBI Holdings Inc Citibank (219)
(1,100) SBI Holdings Inc HSBC 2,679(300) SBI Holdings Inc JP Morgan 731300 Secom Co Ltd Citibank 47400 Secom Co Ltd HSBC (2,725)100 Sega Sammy Holdings Inc Citibank (22)900 Sega Sammy Holdings Inc HSBC (1,732)800 Sega Sammy Holdings Inc JP Morgan (1,540)
(2,200) Seibu Holdings Inc HSBC (1,986)1,600 Seiko Epson Corp Citibank 73
700 Seiko Epson Corp HSBC 2811,000 Seiko Epson Corp JP Morgan 4011,600 Sekisui Chemical Co Ltd Citibank (817)2,300 Sekisui Chemical Co Ltd HSBC (2,916)6,000 Sekisui Chemical Co Ltd JP Morgan (7,607)
700 Sekisui House Ltd Citibank (166)5,100 Sekisui House Ltd HSBC (1,861)(300) SG Holdings Co Ltd HSBC 159
(1,500) Sharp Corp JP Morgan (2,408)200 Shimadzu Corp Citibank (9)900 Shimadzu Corp HSBC (1,231)
Holding Description Counterparty
Netunrealised
appreciation/(depreciation)
USD
Japan continued(200) Shimamura Co Ltd HSBC 1,040(200) Shimano Inc JP Morgan 739
2,000 Shimizu Corp HSBC (693)2,600 Shimizu Corp JP Morgan (901)(300) Shin-Etsu Chemical Co Ltd HSBC (766)(200) Shin-Etsu Chemical Co Ltd JP Morgan (511)
(1,300) Shinsei Bank Ltd Citibank 12(700) Shinsei Bank Ltd HSBC (492)300 Shionogi & Co Ltd Citibank (542)300 Shionogi & Co Ltd HSBC (657)100 Shionogi & Co Ltd JP Morgan (219)
(300) Shiseido Co Ltd Citibank (832)(800) Shiseido Co Ltd HSBC (66)(400) Shiseido Co Ltd JP Morgan (33)700 Shizuoka Bank Ltd Citibank (275)
(200) SMC Corp HSBC (529)(500) SoftBank Corp Citibank 30(400) SoftBank Corp JP Morgan 155(500) SoftBank Group Corp HSBC 8,729100 Sohgo Security Services Co
Ltd HSBC 123300 Sompo Holdings Inc Citibank 41200 Sony Group Corp Citibank 502
1,000 Sony Group Corp HSBC 46200 Sony Group Corp JP Morgan 9
(200) Square Enix Holdings CoLtd HSBC 511
400 Stanley Electric Co Ltd Citibank 328400 Stanley Electric Co Ltd JP Morgan 237400 Subaru Corp JP Morgan 9
(1,300) SUMCO Corp HSBC 1,281(1,700) SUMCO Corp JP Morgan 1,6751,700 Sumitomo Chemical Co Ltd Citibank 47
700 Sumitomo DainipponPharma Co Ltd HSBC 843
(700) Sumitomo Electric Indus-tries Ltd Citibank (329)
(500) Sumitomo Electric Indus-tries Ltd HSBC (199)
(600) Sumitomo Electric Indus-tries Ltd JP Morgan (357)
(100) Sumitomo Metal Mining CoLtd HSBC 275
(200) Sumitomo Metal Mining CoLtd JP Morgan (500)
400 Sumitomo Mitsui FinancialGroup Inc Citibank (288)
1,200 Sumitomo Mitsui FinancialGroup Inc HSBC (208)
600 Sumitomo Mitsui FinancialGroup Inc JP Morgan (104)
300 Sumitomo Mitsui Trust Hold-ings Inc Citibank (347)
800 Sumitomo Mitsui Trust Hold-ings Inc JP Morgan (628)
(400) Sumitomo Realty & Devel-opment Co Ltd HSBC 1,000
(400) Sundrug Co Ltd Citibank (328)1,400 Suntory Beverage & Food
Ltd Citibank 511100 Suntory Beverage & Food
Ltd HSBC 2371,300 Suntory Beverage & Food
Ltd JP Morgan 3,083(300) Suzuken Co Ltd Citibank (205)(200) Suzuken Co Ltd HSBC 1,140200 Sysmex Corp Citibank 866100 Sysmex Corp HSBC —100 Sysmex Corp JP Morgan —
1,000 T&D Holdings Inc JP Morgan 848
BlackRock Style Advantage Screened Fund continued
Portfolio of Investments as at 31 May 2021
The notes on pages 590 to 610 form an integral part of these financial statements.
BlackRock Strategic Funds[486]

Holding Description Counterparty
Netunrealised
appreciation/(depreciation)
USD
Japan continued600 Taiheiyo Cement Corp Citibank (109)300 Taiheiyo Cement Corp JP Morgan (1,070)600 Taisei Corp Citibank (739)200 Taisei Corp HSBC (748)
(100) Taisho PharmaceuticalHoldings Co Ltd HSBC 91
(4,000) Takeda Pharmaceutical CoLtd Citibank 1,569
(700) Takeda Pharmaceutical CoLtd HSBC 70
(1,700) Takeda Pharmaceutical CoLtd JP Morgan 171
300 TDK Corp Citibank 1642,200 Teijin Ltd Citibank (742)8,500 Teijin Ltd HSBC (8,450)1,900 Teijin Ltd JP Morgan (1,889)
400 Terumo Corp Citibank 299(200) THK Co Ltd Citibank (301)(900) TIS Inc Citibank 107(300) TIS Inc HSBC (367)(600) TIS Inc JP Morgan (733)(900) Tobu Railway Co Ltd Citibank (181)(300) Toho Co Ltd Citibank (616)(300) Toho Co Ltd HSBC (342)(600) Toho Co Ltd JP Morgan (684)(500) Tokio Marine Holdings Inc JP Morgan 1,336(100) Tokyo Century Corp HSBC 246(600) Tokyo Century Corp JP Morgan 1,478100 Tokyo Electron Ltd HSBC (1,277)
(900) Tokyu Corp JP Morgan (49)(1,200) Tokyu Fudosan Holdings
Corp Citibank (252)400 Toppan Printing Co Ltd Citibank 58300 Toppan Printing Co Ltd HSBC (96)900 Toppan Printing Co Ltd JP Morgan (287)
5,400 Toray Industries Inc Citibank 22214,200 Toray Industries Inc HSBC 324
500 Toray Industries Inc JP Morgan 11(300) Toshiba Corp HSBC (219)500 Tosoh Corp HSBC (570)200 TOTO Ltd Citibank 420600 TOTO Ltd HSBC 383600 TOTO Ltd JP Morgan 383400 Toyo Suisan Kaisha Ltd Citibank (219)400 Toyo Suisan Kaisha Ltd JP Morgan (602)400 Toyoda Gosei Co Ltd HSBC 274700 Toyoda Gosei Co Ltd JP Morgan 479
(500) Toyota Industries Corp HSBC (1,435)(400) Toyota Industries Corp JP Morgan (1,167)(200) Trend Micro Inc Citibank —(100) Tsuruha Holdings Inc HSBC (265)(500) Unicharm Corp HSBC (315)(300) Unicharm Corp JP Morgan (189)(600) USS Co Ltd Citibank (213)(300) USS Co Ltd HSBC 238(300) USS Co Ltd JP Morgan 238(200) Welcia Holdings Co Ltd HSBC 237(100) West Japan Railway Co HSBC (8)(300) West Japan Railway Co JP Morgan (25)100 Yakult Honsha Co Ltd JP Morgan 328
1,800 Yamada Holdings Co Ltd Citibank (131)100 Yamaha Corp Citibank 201600 Yamaha Corp HSBC 1,532
1,000 Yamaha Motor Co Ltd Citibank 730300 Yamaha Motor Co Ltd HSBC 876
1,600 Yamaha Motor Co Ltd JP Morgan 4,670300 Yamato Holdings Co Ltd Citibank (82)
(400) Yamazaki Baking Co Ltd Citibank 51(1,200) Yamazaki Baking Co Ltd HSBC 1,281
Holding Description Counterparty
Netunrealised
appreciation/(depreciation)
USD
Japan continued(200) Yaskawa Electric Corp HSBC (255)800 Yokogawa Electric Corp HSBC (2,430)400 Yokogawa Electric Corp JP Morgan (1,215)
(1,100) Z Holdings Corp Citibank (443)(4,100) Z Holdings Corp HSBC (1,473)
200 ZOZO Inc JP Morgan 201
37,560
Netherlands(1,807) ABN AMRO Bank NV - CVA Citibank (437)(1,137) ABN AMRO Bank NV - CVA HSBC 266(1,739) ABN AMRO Bank NV - CVA JP Morgan 407
4 Adyen NV Citibank 506 Adyen NV HSBC 442
(4,036) Aegon NV HSBC 537332 Akzo Nobel NV Citibank 284344 Akzo Nobel NV JP Morgan 630(24) ASM International NV Citibank (410)
2 ASML Holding NV HSBC 6254 ASML Holding NV JP Morgan 1,674
(199) Galapagos NV Citibank (287)(175) Galapagos NV HSBC (410)(608) Heineken NV JP Morgan 1,113(517) ING Groep NV Citibank (174)(795) JDE Peet’s NV Citibank 49(127) JDE Peet’s NV HSBC (40)(120) JDE Peet’s NV JP Morgan (38)(179) Just Eat Takeaway.com NV Citibank (321)(812) Just Eat Takeaway.com NV HSBC 5,728(266) Just Eat Takeaway.com NV JP Morgan 1,876186 Koninklijke Ahold Delhaize
NV Citibank (44)2,623 Koninklijke Ahold Delhaize
NV HSBC 1,457602 Koninklijke Ahold Delhaize
NV JP Morgan 33429 Koninklijke DSM NV Citibank 5527 Koninklijke DSM NV JP Morgan 51
7,817 Koninklijke KPN NV Citibank (849)4,384 Koninklijke KPN NV HSBC (427)4,819 Koninklijke KPN NV JP Morgan (553)
153 Koninklijke Philips NV Citibank (135)245 Koninklijke Philips NV HSBC (147)230 Koninklijke Vopak NV Citibank (34)335 Koninklijke Vopak NV JP Morgan 188
1,011 NN Group NV HSBC (2,172)1,221 NN Group NV JP Morgan (2,623)(313) Prosus NV Citibank (504)(270) Prosus NV HSBC 74(536) Prosus NV JP Morgan 903225 Randstad NV Citibank 593
1,884 Randstad NV HSBC 2,989865 Randstad NV JP Morgan 1,372764 Wolters Kluwer NV Citibank (690)141 Wolters Kluwer NV HSBC 69
10,908
New Zealand(2,436) a2 Milk Co Ltd JP Morgan 1,346(6,987) Auckland International Air-
port Ltd JP Morgan 9841,389 Fisher & Paykel Healthcare
Corp Ltd Citibank (4,251)1,559 Fisher & Paykel Healthcare
Corp Ltd HSBC (4,657)149 Fisher & Paykel Healthcare
Corp Ltd JP Morgan (445)(2,323) Ryman Healthcare Ltd HSBC 1,925
BlackRock Style Advantage Screened Fund continued
Portfolio of Investments as at 31 May 2021
The notes on pages 590 to 610 form an integral part of these financial statements.
Annual report and audited financial statements [487]

Holding Description Counterparty
Netunrealised
appreciation/(depreciation)
USD
New Zealand continued(1,358) Ryman Healthcare Ltd JP Morgan 1,1251,601 Spark New Zealand Ltd HSBC (12)
(3,985)
Norway(627) Adevinta ASA Citibank (605)
(1,118) Adevinta ASA HSBC (2,686)(538) DNB ASA JP Morgan (158)(248) Gjensidige Forsikring ASA HSBC 71(318) Gjensidige Forsikring ASA JP Morgan 92
(1,239) Mowi ASA Citibank (371)(1,548) Mowi ASA HSBC 575
(286) Mowi ASA JP Morgan 1063,453 Norsk Hydro ASA Citibank 1,8622,983 Norsk Hydro ASA JP Morgan (615)3,009 Orkla ASA Citibank 5775,998 Orkla ASA HSBC 1,653
7 Orkla ASA JP Morgan 2(136) Schibsted ASA ’B’ JP Morgan 108
22 Telenor ASA Citibank (16)2,909 Telenor ASA JP Morgan (871)(448) Yara International ASA Citibank (403)(261) Yara International ASA JP Morgan (188)
(867)
Portugal(87) Jeronimo Martins SGPS SA Citibank 3
(680) Jeronimo Martins SGPS SA JP Morgan (170)
(167)
Singapore(11,900) CapitaLand Ltd Citibank (450)(2,700) CapitaLand Ltd HSBC (82)7,900 City Developments Ltd Citibank 1,0162,400 City Developments Ltd HSBC 54
200 DBS Group Holdings Ltd HSBC 615,100 Oversea-Chinese Banking
Corp Ltd HSBC (810)12,100 Oversea-Chinese Banking
Corp Ltd JP Morgan (1,922)(5,100) Singapore Airlines Ltd Citibank (926)
(10,659) Singapore Airlines Ltdπ Citibank —(3,900) Singapore Airlines Ltd HSBC (325)(8,151) Singapore Airlines Ltdπ HSBC —3,300 Singapore Technologies
Engineering Ltd Citibank 1758,300 Singapore Telecommunica-
tions Ltd JP Morgan (188)(3,300) UOL Group Ltd Citibank (175)(6,700) UOL Group Ltd HSBC 760(4,000) Venture Corp Ltd HSBC (303)(2,200) Venture Corp Ltd JP Morgan (166)(1,600) Wilmar International Ltd Citibank 36(1,900) Wilmar International Ltd HSBC 201(5,600) Wilmar International Ltd JP Morgan 593
(2,451)
Spain(343) Aena SME SA Citibank (230)(72) Aena SME SA HSBC 22
(129) Aena SME SA JP Morgan 39(501) Amadeus IT Group SA Citibank (660)(78) Amadeus IT Group SA HSBC (263)
4,072 Banco Bilbao Vizcaya Ar-gentaria SA HSBC 1,108
4,502 Banco Bilbao Vizcaya Ar-gentaria SA JP Morgan 1,225
(4,363) Banco Santander SA Citibank (471)(4,479) CaixaBank SA HSBC (208)(1,480) Cellnex Telecom SA Citibank (578)
(790) Cellnex Telecom SA HSBC (2,381)(916) Cellnex Telecom SA JP Morgan (2,761)
Holding Description Counterparty
Netunrealised
appreciation/(depreciation)
USD
Spain continued(1,316) Ferrovial SA Citibank 418(1,316) Ferrovial SA Citibank 7
(394) Ferrovial SA HSBC 250(394) Ferrovial SA HSBC (96)
(2,387) Ferrovial SA JP Morgan 1,515(2,387) Ferrovial SA JP Morgan (581)(1,758) Grifols SA Citibank 778
(179) Grifols SA HSBC 135(220) Grifols SA JP Morgan 166330 Iberdrola SA Citibank (167)
1,860 Iberdrola SA HSBC (953)6,614 Iberdrola SA JP Morgan (3,390)1,241 Industria de Diseno Textil
SA Citibank 3,483543 Industria de Diseno Textil
SA HSBC 205(738) Siemens Gamesa Renew-
able Energy SA HSBC (439)(488) Siemens Gamesa Renew-
able Energy SA JP Morgan (196)(1,302) Telefonica SA Citibank 194
(3,829)
Sweden182 Alfa Laval AB JP Morgan 222
(659) Assa Abloy AB ’B’ JP Morgan (167)(377) Atlas Copco AB ’A’ Citibank 318(89) Atlas Copco AB ’A’ HSBC 185
1,361 Boliden AB Citibank 491,361 Boliden AB Citibank —
712 Boliden AB HSBC (2,357)712 Boliden AB HSBC —237 Boliden AB JP Morgan (785)237 Boliden AB JP Morgan —
1,470 Electrolux AB ’B’ Citibank 6381,067 Electrolux AB ’B’ HSBC (219)1,039 Electrolux AB ’B’ JP Morgan (213)(230) EQT AB Citibank (325)(224) EQT AB JP Morgan (646)(920) Essity AB ’B’ HSBC 383(173) Essity AB ’B’ JP Morgan 40(48) Evolution AB HSBC (967)
(1,205) H & M Hennes & Mauritz AB’B’ Citibank 269
(4,067) Hexagon AB ’B’ Citibank (2,085)(115) Hexagon AB ’B’ HSBC (102)(434) Hexagon AB ’B’ HSBC (224)
(1,757) Hexagon AB ’B’ JP Morgan (907)1,636 Husqvarna AB ’B’ Citibank 7202,637 Husqvarna AB ’B’ HSBC 2392,199 Husqvarna AB ’B’ JP Morgan 199(547) ICA Gruppen AB HSBC (488)(256) Industrivarden AB ’C’ Citibank (293)(163) Industrivarden AB ’C’ HSBC (271)
(1,893) Investment AB Latour ’B’ Citibank (1,507)(2,467) Investment AB Latour ’B’ JP Morgan (6,248)1,756 Investor AB ’B’ Citibank 3601,196 Investor AB ’B’ HSBC 1,154
373 Kinnevik AB Citibank (180)104 Kinnevik AB JP Morgan 1,982373 Kinnevik AB ’B’ Citibank 1,817104 Kinnevik AB ’B’ JP Morgan (1,252)
(482) L E Lundbergforetagen AB’B’ Citibank (1,814)
(659) L E Lundbergforetagen AB’B’ JP Morgan (2,575)
896 Nibe Industrier AB ’B’ Citibank 1,1451,288 Nordea Bank Abp Citibank 722,225 Nordea Bank Abp HSBC 845(177) Sandvik AB Citibank (32)
BlackRock Style Advantage Screened Fund continued
Portfolio of Investments as at 31 May 2021
The notes on pages 590 to 610 form an integral part of these financial statements.
BlackRock Strategic Funds[488]
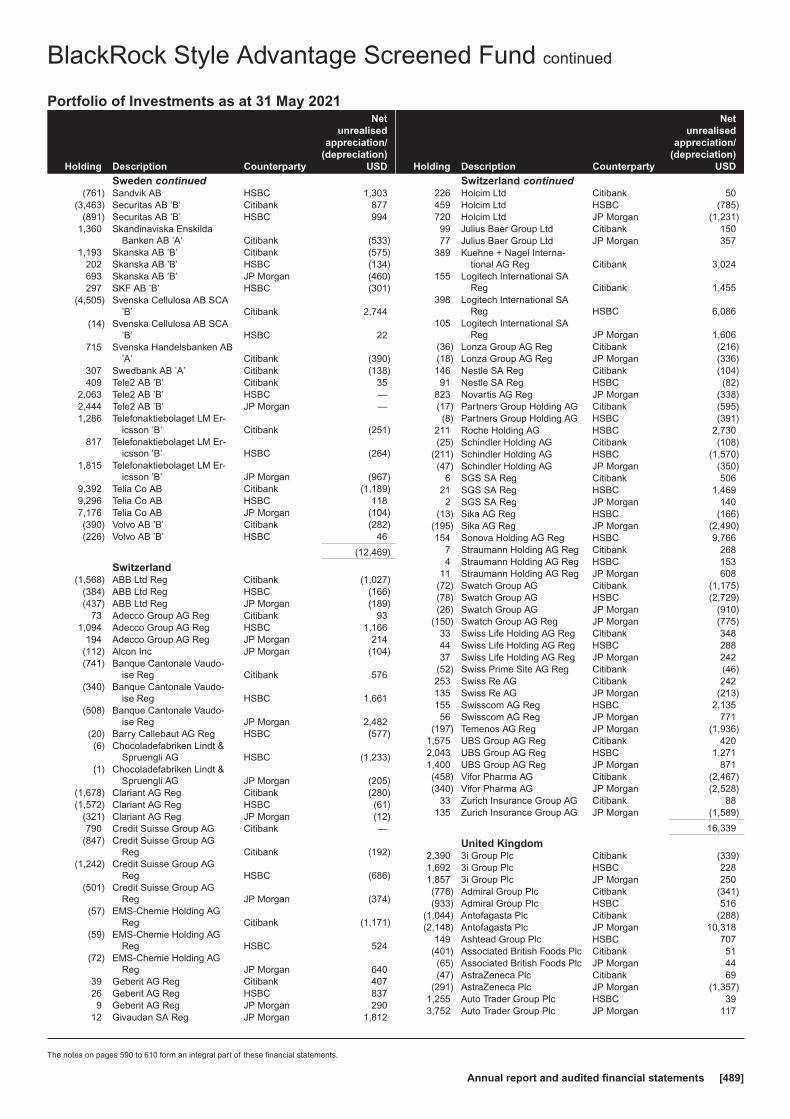
Holding Description Counterparty
Netunrealised
appreciation/(depreciation)
USD
Sweden continued(761) Sandvik AB HSBC 1,303
(3,463) Securitas AB ’B’ Citibank 877(891) Securitas AB ’B’ HSBC 994
1,360 Skandinaviska EnskildaBanken AB ’A’ Citibank (533)
1,193 Skanska AB ’B’ Citibank (575)202 Skanska AB ’B’ HSBC (134)693 Skanska AB ’B’ JP Morgan (460)297 SKF AB ’B’ HSBC (301)
(4,505) Svenska Cellulosa AB SCA’B’ Citibank 2,744
(14) Svenska Cellulosa AB SCA’B’ HSBC 22
715 Svenska Handelsbanken AB’A’ Citibank (390)
307 Swedbank AB ’A’ Citibank (138)409 Tele2 AB ’B’ Citibank 35
2,063 Tele2 AB ’B’ HSBC —2,444 Tele2 AB ’B’ JP Morgan —1,286 Telefonaktiebolaget LM Er-
icsson ’B’ Citibank (251)817 Telefonaktiebolaget LM Er-
icsson ’B’ HSBC (264)1,815 Telefonaktiebolaget LM Er-
icsson ’B’ JP Morgan (967)9,392 Telia Co AB Citibank (1,189)9,296 Telia Co AB HSBC 1187,176 Telia Co AB JP Morgan (104)(390) Volvo AB ’B’ Citibank (282)(226) Volvo AB ’B’ HSBC 46
(12,469)
Switzerland(1,568) ABB Ltd Reg Citibank (1,027)
(384) ABB Ltd Reg HSBC (166)(437) ABB Ltd Reg JP Morgan (189)
73 Adecco Group AG Reg Citibank 931,094 Adecco Group AG Reg HSBC 1,166
194 Adecco Group AG Reg JP Morgan 214(112) Alcon Inc JP Morgan (104)(741) Banque Cantonale Vaudo-
ise Reg Citibank 576(340) Banque Cantonale Vaudo-
ise Reg HSBC 1,661(508) Banque Cantonale Vaudo-
ise Reg JP Morgan 2,482(20) Barry Callebaut AG Reg HSBC (577)(6) Chocoladefabriken Lindt &
Spruengli AG HSBC (1,233)(1) Chocoladefabriken Lindt &
Spruengli AG JP Morgan (205)(1,678) Clariant AG Reg Citibank (280)(1,572) Clariant AG Reg HSBC (61)
(321) Clariant AG Reg JP Morgan (12)790 Credit Suisse Group AG Citibank —
(847) Credit Suisse Group AGReg Citibank (192)
(1,242) Credit Suisse Group AGReg HSBC (686)
(501) Credit Suisse Group AGReg JP Morgan (374)
(57) EMS-Chemie Holding AGReg Citibank (1,171)
(59) EMS-Chemie Holding AGReg HSBC 524
(72) EMS-Chemie Holding AGReg JP Morgan 640
39 Geberit AG Reg Citibank 40726 Geberit AG Reg HSBC 8379 Geberit AG Reg JP Morgan 290
12 Givaudan SA Reg JP Morgan 1,812
Holding Description Counterparty
Netunrealised
appreciation/(depreciation)
USD
Switzerland continued226 Holcim Ltd Citibank 50459 Holcim Ltd HSBC (785)720 Holcim Ltd JP Morgan (1,231)99 Julius Baer Group Ltd Citibank 15077 Julius Baer Group Ltd JP Morgan 357
389 Kuehne + Nagel Interna-tional AG Reg Citibank 3,024
155 Logitech International SAReg Citibank 1,455
398 Logitech International SAReg HSBC 6,086
105 Logitech International SAReg JP Morgan 1,606
(36) Lonza Group AG Reg Citibank (216)(18) Lonza Group AG Reg JP Morgan (336)146 Nestle SA Reg Citibank (104)91 Nestle SA Reg HSBC (82)
823 Novartis AG Reg JP Morgan (338)(17) Partners Group Holding AG Citibank (595)(8) Partners Group Holding AG HSBC (391)
211 Roche Holding AG HSBC 2,730(25) Schindler Holding AG Citibank (108)
(211) Schindler Holding AG HSBC (1,570)(47) Schindler Holding AG JP Morgan (350)
6 SGS SA Reg Citibank 50621 SGS SA Reg HSBC 1,4692 SGS SA Reg JP Morgan 140
(13) Sika AG Reg HSBC (166)(195) Sika AG Reg JP Morgan (2,490)154 Sonova Holding AG Reg HSBC 9,766
7 Straumann Holding AG Reg Citibank 2684 Straumann Holding AG Reg HSBC 153
11 Straumann Holding AG Reg JP Morgan 608(72) Swatch Group AG Citibank (1,175)(78) Swatch Group AG HSBC (2,729)(26) Swatch Group AG JP Morgan (910)
(150) Swatch Group AG Reg JP Morgan (775)33 Swiss Life Holding AG Reg Citibank 34844 Swiss Life Holding AG Reg HSBC 28837 Swiss Life Holding AG Reg JP Morgan 242
(52) Swiss Prime Site AG Reg Citibank (46)253 Swiss Re AG Citibank 242135 Swiss Re AG JP Morgan (213)155 Swisscom AG Reg HSBC 2,13556 Swisscom AG Reg JP Morgan 771
(197) Temenos AG Reg JP Morgan (1,936)1,575 UBS Group AG Reg Citibank 4202,043 UBS Group AG Reg HSBC 1,2711,400 UBS Group AG Reg JP Morgan 871(458) Vifor Pharma AG Citibank (2,467)(340) Vifor Pharma AG JP Morgan (2,528)
33 Zurich Insurance Group AG Citibank 88135 Zurich Insurance Group AG JP Morgan (1,589)
16,339
United Kingdom2,390 3i Group Plc Citibank (339)1,692 3i Group Plc HSBC 2281,857 3i Group Plc JP Morgan 250(776) Admiral Group Plc Citibank (341)(933) Admiral Group Plc HSBC 516
(1,044) Antofagasta Plc Citibank (288)(2,148) Antofagasta Plc JP Morgan 10,318
149 Ashtead Group Plc HSBC 707(401) Associated British Foods Plc Citibank 51(65) Associated British Foods Plc JP Morgan 44(47) AstraZeneca Plc Citibank 69
(291) AstraZeneca Plc JP Morgan (1,357)1,255 Auto Trader Group Plc HSBC 393,752 Auto Trader Group Plc JP Morgan 117
BlackRock Style Advantage Screened Fund continued
Portfolio of Investments as at 31 May 2021
The notes on pages 590 to 610 form an integral part of these financial statements.
Annual report and audited financial statements [489]

Holding Description Counterparty
Netunrealised
appreciation/(depreciation)
USD
United Kingdom continued(610) AVEVA Group Plc Citibank (1,368)
(1,323) AVEVA Group Plc JP Morgan (4,192)1,107 Aviva Plc Citibank 862,902 Aviva Plc HSBC (82)9,733 Aviva Plc JP Morgan (276)
(4,412) Barclays Plc Citibank (214)(12,951) Barclays Plc HSBC 433(2,143) Barclays Plc JP Morgan 721,741 Barratt Developments Plc Citibank 109
974 Barratt Developments Plc HSBC (72)3,454 Barratt Developments Plc JP Morgan (1,214)
414 Berkeley Group HoldingsPlc Citibank 276
230 Berkeley Group HoldingsPlc HSBC (710)
6 Berkeley Group HoldingsPlc JP Morgan (19)
(3,411) BT Group Plc Citibank 152(885) BT Group Plc HSBC (50)(155) Bunzl Plc HSBC 68776 Burberry Group Plc JP Morgan (594)
1,600 Coca-Cola HBC AG JP Morgan 23(589) Compass Group Plc HSBC (67)
26 Croda International Plc Citibank 4838 Croda International Plc JP Morgan 155
156 DCC Plc Citibank (641)279 Diageo Plc JP Morgan 494
(1,706) Direct Line Insurance GroupPlc HSBC (82)
721 Entain Plc Citibank 358(260) Experian Plc Citibank 103(601) Experian Plc HSBC 162(154) Experian Plc JP Morgan 41816 Ferguson Plc Citibank (1,619)143 Ferguson Plc HSBC 296
(757) GlaxoSmithKline Plc HSBC 146(342) GlaxoSmithKline Plc JP Morgan 37(684) Halma Plc Citibank (339)
(1,904) Halma Plc HSBC (1,160)(358) Halma Plc JP Morgan (218)
(2,324) Hargreaves Lansdown Plc HSBC 3,787(520) Hikma Pharmaceuticals Plc Citibank 339(179) Hikma Pharmaceuticals Plc JP Morgan (238)
(6,236) HSBC Holdings Plc Citibank (773)(1,009) Informa Plc JP Morgan 349
(84) InterContinental HotelsGroup Plc Citibank 1
(75) InterContinental HotelsGroup Plc HSBC 63
(660) InterContinental HotelsGroup Plc JP Morgan 552
462 Intertek Group Plc Citibank (3,064)391 Intertek Group Plc HSBC (2,798)
7,675 J Sainsbury Plc JP Morgan 1,0331,168 JD Sports Fashion Plc Citibank 526
494 Johnson Matthey Plc HSBC (1,358)7,409 Kingfisher Plc HSBC (1,050)4,002 Kingfisher Plc JP Morgan (567)2,925 Legal & General Group Plc HSBC (170)6,070 Legal & General Group Plc JP Morgan (157)(139) London Stock Exchange
Group Plc Citibank (67)(87) London Stock Exchange
Group Plc HSBC (614)(496) London Stock Exchange
Group Plc JP Morgan (3,500)3,634 M&G Plc JP Morgan 1,179
628 Mondi Plc Citibank (120)184 Mondi Plc HSBC (139)
1,729 Mondi Plc JP Morgan (1,311)
Holding Description Counterparty
Netunrealised
appreciation/(depreciation)
USD
United Kingdom continued444 National Grid Plc Citibank (70)26 National Grid Plc JP Morgan 3
(3,657) Natwest Group Plc Citibank (212)59 Next Plc Citibank 6063 Next Plc HSBC (145)
113 Next Plc JP Morgan (259)(515) NMC Health Plc*,π HSBC —
(2,420) NMC Health Plc* JP Morgan —(1,455) Ocado Group Plc Citibank 1,515(1,044) Ocado Group Plc HSBC 1,220
(308) Ocado Group Plc JP Morgan 360(413) Pearson Plc Citibank 164386 Persimmon Plc Citibank 492194 Persimmon Plc HSBC (58)312 Persimmon Plc JP Morgan (93)
(822) Prudential Plc Citibank 58(261) Prudential Plc JP Morgan 312(138) Reckitt Benckiser Group Plc Citibank 231(138) Reckitt Benckiser Group Plc HSBC (35)(337) Reckitt Benckiser Group Plc JP Morgan (86)827 Reed Elsevier Plc Citibank (527)98 Rentokil Initial Plc Citibank (16)
2,032 Rentokil Initial Plc HSBC (52)(81) Rio Tinto Plc Citibank (83)(84) Rio Tinto Plc HSBC (201)
(111) Rio Tinto Plc JP Morgan (145)536 RSA Insurance Group LTD Citibank 2858 Sage Group Plc Citibank (177)736 Sage Group Plc JP Morgan 261643 Schroders Plc Citibank (73)23 Schroders Plc HSBC (13)
610 Schroders Plc JP Morgan (354)(101) Severn Trent Plc Citibank 66(252) Severn Trent Plc HSBC 161(703) Severn Trent Plc JP Morgan 448(550) Smith & Nephew Plc Citibank 175(282) Smith & Nephew Plc HSBC 18(437) Smith & Nephew Plc JP Morgan 28(579) Smiths Group Plc JP Morgan 336(192) Spirax-Sarco Engineering
Plc HSBC (2,449)298 St James’s Place Plc HSBC 59
(823) Standard Chartered Plc Citibank (21)1,979 Standard Life Aberdeen Plc HSBC (42)
(2,344) Taylor Wimpey Plc Citibank (48)(2,585) Taylor Wimpey Plc HSBC 353
(874) Unilever Plc HSBC 644(1,738) Unilever Plc JP Morgan 1,281
397 United Utilities Group Plc HSBC 725,127 Vodafone Group Plc Citibank (78)6,503 Vodafone Group Plc HSBC (1,301)
14,865 Vodafone Group Plc JP Morgan (2,974)(190) Whitbread Plc HSBC 16
(17,410) Wm Morrison SupermarketsPlc Citibank 617
(4,919) Wm Morrison SupermarketsPlc HSBC 432
(22,642) Wm Morrison SupermarketsPlc JP Morgan 1,989
5,394 WPP Plc Citibank (1,070)4,098 WPP Plc HSBC (1,010)2,220 WPP Plc JP Morgan (547)
(8,707)
United States101 3M Co Citibank 4358 3M Co HSBC 49 3M Co JP Morgan (39)
100 A O Smith Corp Citibank 18989 A O Smith Corp HSBC (105)
BlackRock Style Advantage Screened Fund continued
Portfolio of Investments as at 31 May 2021
The notes on pages 590 to 610 form an integral part of these financial statements.
BlackRock Strategic Funds[490]

Holding Description Counterparty
Netunrealised
appreciation/(depreciation)
USD
United States continued(132) Abbott Laboratories Citibank 84(185) Abbott Laboratories HSBC 424(236) Abbott Laboratories JP Morgan 540(49) AbbVie Inc Citibank 133
(116) AbbVie Inc HSBC 219(162) AbbVie Inc JP Morgan 489
18 ABIOMED Inc Citibank 9053 ABIOMED Inc HSBC 9969 ABIOMED Inc JP Morgan 128
205 Accenture Plc ’A’ Citibank (551)26 Accenture Plc ’A’ HSBC (220)
354 Accenture Plc ’A’ JP Morgan (2,991)(55) Activision Blizzard Inc Citibank (41)(68) Activision Blizzard Inc JP Morgan (277)326 Adobe Inc Citibank 2,20055 Adobe Inc HSBC 1,32612 Adobe Inc JP Morgan 30230 Advance Auto Parts Inc Citibank (28)
(170) Advanced Micro Devices Inc HSBC (695)(47) Advanced Micro Devices Inc JP Morgan (192)94 Aflac Inc Citibank 29
403 Aflac Inc HSBC 60666 Aflac Inc JP Morgan 100671 Agilent Technologies Inc Citibank 3,214134 Agilent Technologies Inc HSBC 839292 Agilent Technologies Inc JP Morgan 1,828(97) Air Products and Chemicals
Inc Citibank (9)(265) Air Products and Chemicals
Inc HSBC (1,624)(33) Air Products and Chemicals
Inc JP Morgan (202)(34) Airbnb Inc Citibank (153)
(106) Akamai Technologies Inc Citibank 17(100) Akamai Technologies Inc HSBC (298)(64) Akamai Technologies Inc JP Morgan (191)
(197) Albemarle Corp HSBC (1,497)(42) Alexion Pharmaceuticals Inc HSBC (199)51 Align Technology Inc HSBC 1,818
(61) Alleghany Corp HSBC 414(9) Alleghany Corp JP Morgan 6180 Allegion Plc Citibank 140
256 Allegion Plc HSBC (530)174 Allstate Corp Citibank (110)77 Allstate Corp JP Morgan 163
649 Ally Financial Inc Citibank 779202 Ally Financial Inc HSBC 210228 Ally Financial Inc JP Morgan 233
(152) Alnylam PharmaceuticalsInc Citibank (564)
23 Alphabet Inc ’A’ Citibank (96)19 Alphabet Inc ’A’ HSBC 1,1335 Alphabet Inc ’A’ JP Morgan 3261 Alphabet Inc ’C’ HSBC 703 Alphabet Inc ’C’ JP Morgan 210
(179) Altice USA Inc ’A’ Citibank 2063 Amazon.com Inc Citibank (66)3 Amazon.com Inc HSBC (42)
35 AMERCO Citibank (108)88 AMERCO JP Morgan (5,012)
144 American Express Co Citibank 21563 American Express Co HSBC 91
(237) American Financial GroupInc Citibank (313)
(187) American Financial GroupInc HSBC (978)
(287) American InternationalGroup Inc Citibank (276)
(210) American Water Works CoInc Citibank (38)
Holding Description Counterparty
Netunrealised
appreciation/(depreciation)
USD
United States continued(81) American Water Works Co
Inc HSBC 79(90) American Water Works Co
Inc JP Morgan 8862 Ameriprise Financial Inc Citibank 31846 Ameriprise Financial Inc HSBC 2386 Ameriprise Financial Inc JP Morgan (202)
180 AmerisourceBergen Corp Citibank (680)307 AmerisourceBergen Corp HSBC (2,613)
(217) AMETEK Inc Citibank (306)(179) AMETEK Inc HSBC 356(505) AMETEK Inc JP Morgan 670101 Amgen Inc Citibank (991)142 Amgen Inc HSBC (2,085)49 Amgen Inc JP Morgan (719)
(152) Amphenol Corp ’A’ Citibank (29)(672) Amphenol Corp ’A’ HSBC (268)(268) Amphenol Corp ’A’ JP Morgan (172)(527) Analog Devices Inc Citibank (1,101)(351) Analog Devices Inc HSBC (5,002)(84) Analog Devices Inc JP Morgan (1,215)(47) ANSYS Inc Citibank 39(72) ANSYS Inc HSBC (1,063)(18) ANSYS Inc JP Morgan (266)(52) Anthem Inc HSBC 191
(131) Aon Plc ’A’ HSBC 665(143) Aon Plc ’A’ JP Morgan 726(221) Apollo Global Management
Inc Citibank 22(31) Apollo Global Management
Inc HSBC 9(1,069) Apollo Global Management
Inc JP Morgan 310472 Apple Inc Citibank (1,175)139 Apple Inc HSBC (311)131 Apple Inc JP Morgan (293)564 Applied Materials Inc Citibank 2,002250 Applied Materials Inc HSBC 3,45340 Applied Materials Inc JP Morgan 588
(58) Aptiv Plc Citibank (520)(47) Aptiv Plc HSBC (489)
(281) Aptiv Plc JP Morgan (1,866)(402) Aramark Citibank 36(219) Aramark JP Morgan 59(253) Arch Capital Group Ltd HSBC 8651 Archer-Daniels-Midland Co Citibank (59)
1,393 Archer-Daniels-Midland Co HSBC (1,532)816 Archer-Daniels-Midland Co JP Morgan (898)52 Arista Networks Inc HSBC 68569 Arrow Electronics Inc Citibank (229)88 Arrow Electronics Inc HSBC 265
134 Arrow Electronics Inc JP Morgan 403(173) Arthur J Gallagher & Co HSBC 552
80 Assurant Inc HSBC 95(153) AT&T Inc HSBC 436(211) AT&T Inc JP Morgan 554118 Athene Holding Ltd ’A’ HSBC 40
(204) Atmos Energy Corp Citibank (136)(247) Atmos Energy Corp HSBC 744(189) Atmos Energy Corp JP Morgan 324
72 Autodesk Inc Citibank (117)286 Autodesk Inc HSBC 2,80686 Autodesk Inc JP Morgan 84418 Autoliv Inc Citibank 4166 Autoliv Inc HSBC 26558 Automatic Data Processing
Inc Citibank (59)211 Automatic Data Processing
Inc HSBC 342(5) AutoZone Inc JP Morgan 565
BlackRock Style Advantage Screened Fund continued
Portfolio of Investments as at 31 May 2021
The notes on pages 590 to 610 form an integral part of these financial statements.
Annual report and audited financial statements [491]

Holding Description Counterparty
Netunrealised
appreciation/(depreciation)
USD
United States continued(196) Avalara Inc Citibank (533)(341) Avalara Inc HSBC (2,999)(87) Avalara Inc JP Morgan (819)
(338) Avantor Inc Citibank (152)(278) Avantor Inc HSBC (464)385 Avery Dennison Corp HSBC (309)126 Avery Dennison Corp JP Morgan (132)637 Axalta Coating Systems Ltd Citibank 541466 Axalta Coating Systems Ltd HSBC (578)
1,653 Axalta Coating Systems Ltd JP Morgan (2,050)(1,809) Baker Hughes Co HSBC 214
(618) Baker Hughes Co JP Morgan (28)(107) Ball Corp Citibank 530(150) Ball Corp HSBC 1,157(61) Ball Corp JP Morgan 470
(374) Bank of America Corp Citibank 90647 Bank of New York Mellon
Corp Citibank 220(420) Baxter International Inc Citibank 273(312) Baxter International Inc HSBC 1,363(83) Baxter International Inc JP Morgan 363(91) Becton Dickinson and Co Citibank 167(80) Becton Dickinson and Co HSBC 278(94) Becton Dickinson and Co JP Morgan 342268 Best Buy Co Inc HSBC (2,559)454 Best Buy Co Inc JP Morgan (4,336)133 Biogen Inc Citibank (1,514)
5 Biogen Inc HSBC (41)20 Biogen Inc JP Morgan (163)
(312) BioMarin PharmaceuticalInc Citibank 78
(390) BioMarin PharmaceuticalInc HSBC (355)
(87) BioMarin PharmaceuticalInc JP Morgan (79)
(59) Bio-Rad Laboratories Inc ’A’ Citibank (549)(36) Bio-Rad Laboratories Inc ’A’ HSBC 46(31) Bio-Rad Laboratories Inc ’A’ JP Morgan 40
(165) Black Knight Inc Citibank (36)(151) Black Knight Inc HSBC 246
(1,226) Black Knight Inc JP Morgan 1,998(191) Blackstone Group Inc Citibank (277)(382) Blackstone Group Inc HSBC (1,551)
(5) Booking Holdings Inc Citibank (65)(2) Booking Holdings Inc HSBC (30)(2) Booking Holdings Inc JP Morgan (265)
(663) BorgWarner Inc Citibank (756)(373) BorgWarner Inc JP Morgan 612
(1,968) Boston Scientific Corp Citibank 492(385) Bristol-Myers Squibb Co HSBC (373)(77) Bristol-Myers Squibb Co JP Morgan (17)
(315) Broadcom Inc Citibank (4,139)(39) Broadcom Inc HSBC (1,351)(15) Broadcom Inc JP Morgan (534)
(153) Broadridge Financial Solu-tions Inc HSBC 941
(20) Broadridge Financial Solu-tions Inc JP Morgan 123
(155) Brown & Brown Inc Citibank (56)(281) Brown & Brown Inc HSBC 239(441) Brown & Brown Inc JP Morgan 375(355) Brown-Forman Corp ’B’ HSBC (905)365 Bunge Ltd Citibank 7306 Bunge Ltd HSBC (1,138)328 Bunge Ltd JP Morgan (1,220)(89) Burlington Stores Inc Citibank (246)(54) Burlington Stores Inc HSBC 285(16) Cable One Inc HSBC (1,169)(3) Cable One Inc JP Morgan (219)
Holding Description Counterparty
Netunrealised
appreciation/(depreciation)
USD
United States continued66 Cadence Design Systems
Inc Citibank 441,280 Cadence Design Systems
Inc JP Morgan 3,648(110) Campbell Soup Co HSBC 163875 Cardinal Health Inc Citibank (490)730 Cardinal Health Inc JP Morgan (1,650)
(548) Carlyle Group Inc HSBC 477(122) Carlyle Group Inc JP Morgan 106(59) CarMax Inc Citibank (77)
(258) CarMax Inc HSBC 3,282(582) Carnival Corp Citibank (966)
(1,403) Carnival Corp HSBC (4,616)(781) Carnival Corp JP Morgan (2,664)144 Carrier Global Corp HSBC 178
(578) Catalent Inc Citibank (1,312)(178) Catalent Inc HSBC (5)(137) Catalent Inc JP Morgan (4)(72) Caterpillar Inc JP Morgan 110(60) Cboe Global Markets Inc HSBC (40)(64) Cboe Global Markets Inc JP Morgan (43)320 CBRE Group Inc ’A’ Citibank (314)409 CBRE Group Inc ’A’ HSBC 487237 CBRE Group Inc ’A’ JP Morgan 282
(2) CDW Corp Citibank 6(45) CDW Corp HSBC 270
(470) Centene Corp JP Morgan (1,899)(999) CenterPoint Energy Inc Citibank (263)
(1,432) CenterPoint Energy Inc HSBC (1,038)(515) CenterPoint Energy Inc JP Morgan (412)
1,442 Cerner Corp Citibank 1,753623 Cerner Corp HSBC 601
(398) CF Industries Holdings Inc Citibank (56)255 CH Robinson Worldwide Inc Citibank (179)113 CH Robinson Worldwide Inc JP Morgan (532)
(306) Charles Schwab Corp HSBC (842)(107) Charles Schwab Corp JP Morgan (294)(146) Charter Communications
Inc ’A’ Citibank 1,25653 Check Point Software Tech-
nologies Ltd Citibank (109)22 Check Point Software Tech-
nologies Ltd HSBC (63)43 Check Point Software Tech-
nologies Ltd JP Morgan (123)(89) Cheniere Energy Inc Citibank (19)
(449) Cheniere Energy Inc HSBC (1,446)(8) Cheniere Energy Inc JP Morgan (26)18 Chipotle Mexican Grill Inc Citibank 533
(569) Church & Dwight Co Inc Citibank 763(594) Church & Dwight Co Inc HSBC 2,174(177) Church & Dwight Co Inc JP Morgan 323
59 Cigna Corp Citibank (158)96 Cigna Corp HSBC (774)31 Cigna Corp JP Morgan (250)
(79) Cincinnati Financial Corp Citibank (62)(272) Cincinnati Financial Corp HSBC (275)
58 Cintas Corp Citibank (58)11 Cintas Corp HSBC (79)
377 Citigroup Inc HSBC 1,350299 Citigroup Inc JP Morgan 1,070930 Citizens Financial Group Inc HSBC 512
3 Citrix Systems Inc HSBC (13)207 Citrix Systems Inc JP Morgan (896)(97) Clorox Co JP Morgan 1,092(26) CME Group Inc Citibank (38)
(214) CME Group Inc HSBC (2,292)(53) CME Group Inc JP Morgan (568)589 Coca-Cola Co Citibank 289
BlackRock Style Advantage Screened Fund continued
Portfolio of Investments as at 31 May 2021
The notes on pages 590 to 610 form an integral part of these financial statements.
BlackRock Strategic Funds[492]

Holding Description Counterparty
Netunrealised
appreciation/(depreciation)
USD
United States continued188 Coca-Cola Co HSBC 71355 Coca-Cola Co JP Morgan 169435 Coca-Cola Europacific Part-
ners Plc JP Morgan 1,779207 Cognex Corp Citibank 42265 Cognex Corp JP Morgan 197
201 Cognizant Technology Solu-tions Corp ’A’ HSBC (492)
669 Cognizant Technology Solu-tions Corp ’A’ JP Morgan (1,639)
639 Colgate-Palmolive Co Citibank (396)(172) Comcast Corp ’A’ Citibank (289)(67) Comcast Corp ’A’ HSBC 11(91) Comcast Corp ’A’ JP Morgan 15141 Conagra Brands Inc JP Morgan (21)
(125) Consolidated Edison Inc JP Morgan 32621 Constellation Brands Inc ’A’ Citibank 23
(133) Cooper Cos Inc Citibank 140243 Copart Inc Citibank 18252 Copart Inc HSBC 307
189 Copart Inc JP Morgan 544436 Corning Inc HSBC (702)160 Corning Inc JP Morgan (258)392 Corteva Inc Citibank 137245 Corteva Inc HSBC (365)392 Corteva Inc JP Morgan (584)(34) CoStar Group Inc Citibank (329)(87) CoStar Group Inc HSBC (1,240)(23) CoStar Group Inc JP Morgan (486)(4) Costco Wholesale Corp Citibank 21
(25) Costco Wholesale Corp HSBC 80(39) Costco Wholesale Corp JP Morgan 125(40) Coupa Software Inc Citibank 36
(146) Coupa Software Inc HSBC (442)(161) Coupa Software Inc JP Morgan (492)(30) Crowdstrike Holdings Inc ’A’ Citibank (234)(96) Crowdstrike Holdings Inc ’A’ HSBC (3,319)(62) Crowdstrike Holdings Inc ’A’ JP Morgan (2,143)
(403) Crown Holdings Inc Citibank 3,018(272) Crown Holdings Inc HSBC 2,549229 CSX Corp Citibank 17649 CSX Corp HSBC (149)
105 CSX Corp JP Morgan (319)267 Cummins Inc Citibank 467263 CVS Health Corp Citibank (860)179 CVS Health Corp HSBC 10667 CVS Health Corp JP Morgan 40
(49) CyberArk Software Ltd Citibank (12)(139) CyberArk Software Ltd HSBC (944)(187) CyberArk Software Ltd JP Morgan (1,270)(561) Danaher Corp Citibank (1,251)(248) Danaher Corp HSBC 717(94) Danaher Corp JP Morgan 27293 Darden Restaurants Inc Citibank 174
198 Darden Restaurants Inc HSBC 503(444) Datadog Inc ’A’ Citibank (573)(158) Datadog Inc ’A’ JP Morgan (2,242)103 DaVita Inc Citibank (182)88 DaVita Inc HSBC (696)
126 DaVita Inc JP Morgan (997)90 Deere & Co Citibank 157
106 Dell Technologies Inc ’C’ JP Morgan (110)141 Delta Air Lines Inc Citibank 213105 Delta Air Lines Inc HSBC 236250 Delta Air Lines Inc JP Morgan 563405 DENTSPLY SIRONA Inc Citibank (296)20 Dexcom Inc Citibank 280
(76) Discover Financial Services HSBC 112(160) Discovery Inc ’A’ Citibank (189)
Holding Description Counterparty
Netunrealised
appreciation/(depreciation)
USD
United States continued(219) Discovery Inc ’C’ HSBC 485(150) DISH Network Corp ’A’ Citibank 135(166) DISH Network Corp ’A’ HSBC 488(490) DISH Network Corp ’A’ JP Morgan 1,441(195) DocuSign Inc JP Morgan (2,266)(47) Dollar General Corp HSBC 373(86) Dollar General Corp JP Morgan 1,36785 Dollar Tree Inc JP Morgan (1,576)18 Domino’s Pizza Inc Citibank 10729 Domino’s Pizza Inc HSBC (122)51 Domino’s Pizza Inc JP Morgan (214)
160 Dover Corp Citibank 16248 Dover Corp HSBC (142)
149 Dover Corp JP Morgan (440)198 Dow Inc JP Morgan 61160 DR Horton Inc Citibank 670243 Dropbox Inc ’A’ Citibank 49847 Dropbox Inc ’A’ HSBC 1,626255 Dropbox Inc ’A’ JP Morgan 112234 DuPont de Nemours Inc Citibank (157)137 DuPont de Nemours Inc HSBC 399142 DuPont de Nemours Inc JP Morgan 413
(447) Dynatrace Inc Citibank (469)(118) Dynatrace Inc HSBC (752)(40) Dynatrace Inc JP Morgan (255)
(111) Eaton Corp Plc HSBC (281)524 eBay Inc Citibank (47)226 eBay Inc HSBC (127)579 eBay Inc JP Morgan (324)167 Ecolab Inc Citibank (37)134 Ecolab Inc HSBC (1,324)48 Ecolab Inc JP Morgan (474)
(1,007) Edison International Citibank 2,5171,328 Edwards Lifesciences Corp Citibank 598
29 Edwards Lifesciences Corp HSBC 16078 Edwards Lifesciences Corp JP Morgan 429
(1,843) Elanco Animal Health Inc Citibank (369)(190) Elanco Animal Health Inc HSBC (711)(232) Elanco Animal Health Inc JP Morgan (868)676 Electronic Arts Inc Citibank 568453 Electronic Arts Inc HSBC 1,033132 Electronic Arts Inc JP Morgan 234(80) Eli Lilly & Co Citibank 102(25) Eli Lilly & Co JP Morgan 6333 Emerson Electric Co Citibank 55999 Emerson Electric Co HSBC 31
116 Emerson Electric Co JP Morgan 3627 EPAM Systems Inc HSBC 475
(98) Equifax Inc HSBC 405(21) Equifax Inc JP Morgan 87640 Equitable Holdings Inc JP Morgan (1,651)
(141) Erie Indemnity Co ’A’ Citibank (622)(158) Erie Indemnity Co ’A’ JP Morgan 1,185(992) Essential Utilities Inc Citibank (298)(915) Essential Utilities Inc HSBC (952)
(1,458) Essential Utilities Inc JP Morgan (1,516)(55) Estee Lauder Cos Inc ’A’ Citibank (169)(44) Estee Lauder Cos Inc ’A’ HSBC (358)(58) Estee Lauder Cos Inc ’A’ JP Morgan (316)
(137) Everest Re Group Ltd HSBC 1,760(29) Everest Re Group Ltd JP Morgan 37386 Eversource Energy HSBC (366)
(213) Exact Sciences Corp Citibank (224)(145) Exact Sciences Corp HSBC (1,695)(81) Exact Sciences Corp JP Morgan (947)
1,125 Exelon Corp JP Morgan 675(44) Expedia Group Inc Citibank (257)
(226) Expedia Group Inc JP Morgan (872)
BlackRock Style Advantage Screened Fund continued
Portfolio of Investments as at 31 May 2021
The notes on pages 590 to 610 form an integral part of these financial statements.
Annual report and audited financial statements [493]

Holding Description Counterparty
Netunrealised
appreciation/(depreciation)
USD
United States continued527 Expeditors International of
Washington Inc Citibank 875744 Expeditors International of
Washington Inc HSBC 4,196569 Expeditors International of
Washington Inc JP Morgan 3,209(36) F5 Networks Inc Citibank 3
5 Facebook Inc ’A’ Citibank 21113 Facebook Inc ’A’ HSBC 2,57247 Facebook Inc ’A’ JP Morgan 71134 FactSet Research Systems
Inc Citibank 18495 FactSet Research Systems
Inc JP Morgan (71)56 Fair Isaac Corp Citibank 323
128 Fair Isaac Corp HSBC 1,68410 Fair Isaac Corpπ JP Morgan —
293 Fastenal Co Citibank 56385 Fastenal Co HSBC (273)13 Fastenal Co JP Morgan (9)
113 FedEx Corp Citibank 33624 FedEx Corp JP Morgan 133
(117) Fidelity National InformationServices Inc Citibank 241
(572) Fidelity National InformationServices Inc HSBC 275
(1) Fidelity National InformationServices Inc JP Morgan —
(137) Fifth Third Bancorp Citibank (37)(363) Fifth Third Bancorp HSBC 36(369) Fifth Third Bancorp JP Morgan 37(64) First Republic Bank HSBC (179)
(1,014) Fiserv Inc Citibank 632(52) Fiserv Inc HSBC 49(46) Fiserv Inc JP Morgan 44(80) FleetCor Technologies Inc HSBC 700(40) FleetCor Technologies Inc JP Morgan 350232 FMC Corp HSBC (387)
(2,517) Ford Motor Co HSBC (7,098)286 Fortinet Inc Citibank 1,564310 Fortune Brands Home &
Security Inc HSBC (2,728)174 Fortune Brands Home &
Security Inc JP Morgan (1,531)(323) Fox Corp ’A’ JP Morgan 478(140) Franklin Resources Inc Citibank (101)(350) Franklin Resources Inc JP Morgan 165(238) Garmin Ltd HSBC 33
77 Gartner Inc Citibank (67)27 Gartner Inc HSBC 1880 Gartner Inc JP Morgan 54
(201) General Mills Inc HSBC 195(626) General Mills Inc JP Morgan 607(348) General Motors Co Citibank (943)(106) General Motors Co HSBC (201)173 Genuine Parts Co Citibank (48)386 Genuine Parts Co HSBC (957)165 Genuine Parts Co JP Morgan (409)
1,075 Gilead Sciences Inc Citibank (1,340)268 Gilead Sciences Inc HSBC (367)
(311) Global Payments Inc HSBC 498(50) Globe Life Inc JP Morgan 22350 GoDaddy Inc ’A’ Citibank 336261 GoDaddy Inc ’A’ HSBC 18
(126) Guidewire Software Inc Citibank (74)(1,791) Halliburton Co Citibank (99)
(316) Halliburton Co HSBC (45)(667) Halliburton Co JP Morgan 34(105) Hartford Financial Services
Group Inc Citibank (12)
Holding Description Counterparty
Netunrealised
appreciation/(depreciation)
USD
United States continued(93) Hasbro Inc Citibank (172)
(108) Hasbro Inc HSBC 369318 HCA Healthcare Inc Citibank 2,757
(417) HEICO Corp Citibank (2,231)(2) HEICO Corp JP Morgan (3)93 Henry Schein Inc HSBC (644)38 Henry Schein Inc JP Morgan (263)68 Hershey Co Citibank (73)41 Hershey Co HSBC 11237 Hershey Co JP Morgan 101
1,448 Hewlett Packard EnterpriseCo Citibank (579)
335 Hewlett Packard EnterpriseCo HSBC (151)
843 Hewlett Packard EnterpriseCo JP Morgan (379)
(85) Hilton Worldwide HoldingsInc HSBC (314)
228 Hologic Inc Citibank 73364 Hologic Inc HSBC (739)125 Hologic Inc JP Morgan (254)431 Home Depot Inc Citibank 1,72993 Home Depot Inc HSBC (471)3 Home Depot Inc JP Morgan (67)
(1,230) Hormel Foods Corp Citibank 886(203) Howmet Aerospace Inc Citibank (292)(156) Howmet Aerospace Inc HSBC (452)(751) Howmet Aerospace Inc JP Morgan (2,178)
1,707 HP Inc Citibank (5,258)410 HP Inc HSBC (2,468)831 HP Inc JP Morgan (5,003)(11) Humana Inc JP Morgan 200844 Huntington Bancshares Inc Citibank 186
(245) IAC Via InterActive Corp Citibank 22,824(64) IAC Via InterActive Corp HSBC 4,819
(103) IAC Via InterActive Corp JP Morgan 7,755(68) IDEX Corp Citibank (70)91 IDEXX Laboratories Inc Citibank 76478 IDEXX Laboratories Inc HSBC 2,56237 IDEXX Laboratories Inc JP Morgan 1,16677 IHS Markit Ltd Citibank 14
122 Illinois Tool Works Inc Citibank (38)358 Illinois Tool Works Inc HSBC (2,613)(31) Illumina Inc Citibank (175)196 Incyte Corp Citibank 171
(115) Ingersoll Rand Inc Citibank (6)(1,537) Ingersoll Rand Inc JP Morgan 738
(23) Insulet Corp Citibank (297)552 Intel Corp Citibank 88104 Intel Corp HSBC 12081 Intel Corp JP Morgan 93
(149) Intercontinental ExchangeInc Citibank 13
(179) Intercontinental ExchangeInc HSBC 251
57 International Business Ma-chines Corp HSBC 67
(228) International Flavors & Fra-grances Inc HSBC 237
(291) International Flavors & Fra-grances Inc JP Morgan 303
438 International Paper Co Citibank (569)304 International Paper Co HSBC 310604 International Paper Co JP Morgan 616668 Interpublic Group of Cos Inc Citibank 240
1,282 Interpublic Group of Cos Inc HSBC 1,154646 Interpublic Group of Cos Inc JP Morgan 58169 Intuit Inc Citibank (91)
166 Intuit Inc HSBC 7,727(11) Intuitive Surgical Inc HSBC (81)
BlackRock Style Advantage Screened Fund continued
Portfolio of Investments as at 31 May 2021
The notes on pages 590 to 610 form an integral part of these financial statements.
BlackRock Strategic Funds[494]

Holding Description Counterparty
Netunrealised
appreciation/(depreciation)
USD
United States continued(39) Intuitive Surgical Inc JP Morgan (288)628 Invesco Ltd JP Morgan 195
(217) Ionis Pharmaceuticals Inc HSBC (219)(135) Ionis Pharmaceuticals Inc JP Morgan (136)(168) IPG Photonics Corp HSBC (3,656)(52) IPG Photonics Corp JP Morgan (412)
(136) IQVIA Holdings Inc HSBC (1,179)105 J M Smucker Co JP Morgan (373)(43) Jack Henry & Associates
Inc JP Morgan 203106 Jazz Pharmaceuticals Plc Citibank (88)33 Jazz Pharmaceuticals Plc HSBC 67
164 Jazz Pharmaceuticals Plc JP Morgan 333(161) Johnson & Johnson Citibank 152(164) Johnson & Johnson HSBC 185(268) Johnson & Johnson JP Morgan 273666 Johnson Controls Interna-
tional Plc Citibank 1,199620 Johnson Controls Interna-
tional Plc HSBC 440752 Johnson Controls Interna-
tional Plc JP Morgan 691(188) JPMorgan Chase & Co HSBC (568)
(1,057) Juniper Networks Inc JP Morgan 708333 Kellogg Co Citibank (203)173 Kellogg Co HSBC (471)331 Kellogg Co JP Morgan (900)
(1,998) Keurig Dr Pepper Inc Citibank (200)(521) Keurig Dr Pepper Inc HSBC (302)
3,575 KeyCorp Citibank —172 Keysight Technologies Inc Citibank 272280 Keysight Technologies Inc HSBC 694(96) Kimberly-Clark Corp Citibank 143
(176) Kimberly-Clark Corp HSBC 1,104(84) Kimberly-Clark Corp JP Morgan 209(4) KLA Corp Citibank 3
(14) KLA Corp JP Morgan (238)592 Knight-Swift Transportation
Holdings Inc Citibank (426)202 Knight-Swift Transportation
Holdings Inc JP Morgan (477)(376) Kraft Heinz Co JP Morgan 11153 Kroger Co Citibank 58540 Kroger Co HSBC (1,015)81 Laboratory Corp of America
Holdings HSBC (143)63 Laboratory Corp of America
Holdings JP Morgan (164)22 Lam Research Corp Citibank 33523 Lam Research Corp HSBC 1,45876 Lam Research Corp JP Morgan 4,818
(64) Lamb Weston Holdings Inc Citibank (132)(69) Lamb Weston Holdings Inc HSBC (248)(60) Lamb Weston Holdings Inc JP Morgan (215)
(1,618) Las Vegas Sands Corp Citibank (16)(203) Las Vegas Sands Corp HSBC (124)(197) Lear Corp HSBC (538)(26) Lear Corp JP Morgan (71)121 Lennar Corp ’A’ HSBC (1,083)45 Lennox International Inc Citibank 32365 Lennox International Inc HSBC (233)21 Lennox International Inc JP Morgan (75)
(410) Liberty Broadband Corp Citibank 279(507) Liberty Broadband Corp HSBC (254)(193) Liberty Broadband Corp JP Morgan (97)
(1,290) Liberty Global Plc ’A’ HSBC 581(139) Liberty Global Plc ’A’ JP Morgan 63(919) Liberty Global Plc ’C’ Citibank (28)
(1,284) Liberty Media Corp-LibertyFormula One ’C’ Citibank 437
Holding Description Counterparty
Netunrealised
appreciation/(depreciation)
USD
United States continued(198) Liberty Media Corp-Liberty
SiriusXM ’A’ JP Morgan (333)(112) Liberty Media Corp-Liberty
SiriusXM ’C’ Citibank (142)(131) Liberty Media Corp-Liberty
SiriusXM ’C’ HSBC (177)97 Lincoln National Corp HSBC 42
(186) Linde Plc Citibank 125(41) Linde Plc HSBC 17
(422) Live Nation EntertainmentInc Citibank 679
(9) Live Nation EntertainmentInc JP Morgan (63)
378 LKQ Corp Citibank 268348 LKQ Corp HSBC 348249 LKQ Corp JP Morgan 249263 Loews Corp HSBC (13)116 Lowe’s Cos Inc Citibank 48431 Lowe’s Cos Inc HSBC (511)
479 Lowe’s Cos Inc JP Morgan (7,440)19 Lululemon Athletica Inc Citibank 9412 Lululemon Athletica Inc JP Morgan (14)
(2,428) Lumen Technologies Inc JP Morgan 1,093(196) LyondellBasell Industries
NV ’A’ Citibank (200)(135) M&T Bank Corp HSBC 294(70) Marathon Petroleum Corp Citibank (75)(98) Marathon Petroleum Corp HSBC (48)
(200) Marathon Petroleum Corp JP Morgan (398)(5) Markel Corp HSBC (48)
(10) MarketAxess Holdings Inc Citibank (101)(47) MarketAxess Holdings Inc HSBC (1,257)(99) Marriott International Inc ’A’ Citibank (167)
(260) Marriott International Inc ’A’ HSBC (759)(111) Marsh & McLennan Cos Inc JP Morgan (62)(42) Martin Marietta Materials
Inc Citibank 118(689) Marvell Technology Inc Citibank (469)(126) Marvell Technology Inc JP Morgan (501)488 Masco Corp Citibank (166)318 Masco Corp HSBC (1,605)877 Masco Corp JP Morgan (5,430)52 Masimo Corp JP Morgan (67)
(139) Match Group Inc HSBC (218)(55) Match Group Inc JP Morgan (86)506 Maxim Integrated Products
Inc Citibank 663267 Maxim Integrated Products
Inc HSBC 2,499657 Maxim Integrated Products
Inc JP Morgan 6,150(54) McCormick & Co Inc Citibank 8379 McDonald’s Corp Citibank 15653 McKesson Corp Citibank (384)
134 McKesson Corp HSBC (1,305)171 McKesson Corp JP Morgan (1,666)
(691) Medtronic Plc Citibank 1,043(650) Medtronic Plc HSBC 167(299) Medtronic Plc JP Morgan 93(852) Melco Resorts & Entertain-
ment Ltd ADR HSBC 1,116(8) MercadoLibre Inc Citibank 69(6) MercadoLibre Inc HSBC 155(4) MercadoLibre Inc JP Morgan 103
(135) Merck & Co Inc HSBC 520620 MetLife Inc Citibank (6)
1,433 MetLife Inc HSBC (1,591)59 Mettler-Toledo International
Inc Citibank 1,198
BlackRock Style Advantage Screened Fund continued
Portfolio of Investments as at 31 May 2021
The notes on pages 590 to 610 form an integral part of these financial statements.
Annual report and audited financial statements [495]

Holding Description Counterparty
Netunrealised
appreciation/(depreciation)
USD
United States continued38 Mettler-Toledo International
Inc HSBC 2,0034 Mettler-Toledo International
Inc JP Morgan 132137 MGM Resorts International HSBC 467
(683) Microchip Technology Inc Citibank (1,947)(34) Microchip Technology Inc HSBC (214)
(123) Microchip Technology Inc JP Morgan (1,606)(133) Micron Technology Inc Citibank (165)(65) Micron Technology Inc JP Morgan (214)245 Microsoft Corp Citibank (270)495 Microsoft Corp HSBC 1,23824 Mohawk Industries Inc Citibank 5873 Mohawk Industries Inc HSBC (1,153)72 Mohawk Industries Inc JP Morgan (1,138)72 Molina Healthcare Inc Citibank (190)22 Molina Healthcare Inc HSBC (382)20 Molina Healthcare Inc JP Morgan (348)39 Molson Coors Beverage Co
’B’ Citibank 22661 Molson Coors Beverage Co
’B’ JP Morgan (820)(17) MongoDB Inc Citibank (88)
(102) MongoDB Inc HSBC (3,830)(44) MongoDB Inc JP Morgan (1,652)
(415) Monster Beverage Corp JP Morgan (1,660)53 Moody’s Corp Citibank 184
211 Morgan Stanley Citibank 266610 Morgan Stanley HSBC 2,73365 Morgan Stanley JP Morgan 291
192 Mosaic Co Citibank 84177 Mosaic Co HSBC 112379 Mosaic Co JP Morgan 23927 Motorola Solutions Inc Citibank 67
190 Motorola Solutions Inc JP Morgan 931(69) MSCI Inc Citibank (364)(64) MSCI Inc HSBC 561(15) MSCI Inc JP Morgan (56)
(125) Nasdaq Inc HSBC (429)231 NetApp Inc Citibank (374)179 NetApp Inc HSBC (267)174 NetApp Inc JP Morgan (259)(70) Netflix Inc Citibank 6(25) Netflix Inc HSBC (157)(35) Netflix Inc JP Morgan (564)(62) Neurocrine Biosciences Inc Citibank (25)
(165) Neurocrine Biosciences Inc HSBC (822)(53) Neurocrine Biosciences Inc JP Morgan (264)206 Newell Brands Inc Citibank 91
(166) Newmont Corp HSBC (852)(366) News Corp ’A’ HSBC 165(132) NextEra Energy Inc Citibank 107(68) NextEra Energy Inc HSBC 4
(384) NextEra Energy Inc JP Morgan 479208 NIKE Inc ’B’ Citibank 49948 Nordson Corp Citibank 923
110 Nordson Corp HSBC 1,43142 Nordson Corp JP Morgan 546
253 Northern Trust Corp Citibank 134203 Northern Trust Corp HSBC 205233 NortonLifeLock Inc JP Morgan 1,533(19) NVIDIA Corp Citibank (481)
1 NVR Inc Citibank 2351 NVR Inc HSBC (329)5 NVR Inc JP Morgan (1,643)
25 NXP Semiconductors NV Citibank 17682 NXP Semiconductors NV HSBC 1,83624 NXP Semiconductors NV JP Morgan 537
(20) Okta Inc Citibank 402(25) Okta Inc HSBC 208
Holding Description Counterparty
Netunrealised
appreciation/(depreciation)
USD
United States continued(166) Okta Inc JP Morgan 1,379177 Old Dominion Freight Line
Inc HSBC (504)223 Old Dominion Freight Line
Inc JP Morgan (1,044)409 Omnicom Group Inc Citibank (393)676 Omnicom Group Inc HSBC (1,731)112 Omnicom Group Inc JP Morgan (287)
(433) ON Semiconductor Corp HSBC (1,308)78 ONEOK Inc Citibank (109)
(646) Oracle Corp Citibank 413(157) Oracle Corp HSBC 221(288) Oracle Corp JP Morgan 406
50 O’Reilly Automotive Inc Citibank 63(115) Otis Worldwide Corp Citibank (23)755 Owens Corning Citibank 1,12556 Owens Corning HSBC (88)49 Owens Corning JP Morgan (77)58 PACCAR Inc Citibank (16)
(151) Packaging Corp of America JP Morgan 892(112) Palo Alto Networks Inc Citibank 142(27) Palo Alto Networks Inc HSBC (592)(56) Palo Alto Networks Inc JP Morgan (1,227)44 Parker-Hannifin Corp HSBC (359)
(54) Paychex Inc Citibank 41(40) Paycom Software Inc HSBC (496)(77) PayPal Holdings Inc Citibank (219)(83) PayPal Holdings Inc JP Morgan (1,360)
(137) Peloton Interactive Inc ’A’ Citibank (1,254)(72) Peloton Interactive Inc ’A’ HSBC (1,643)
(186) Peloton Interactive Inc ’A’ JP Morgan (4,245)315 Pentair Plc Citibank 287247 Pentair Plc HSBC (20)612 PepsiCo Inc Citibank 55195 PepsiCo Inc HSBC 238203 PepsiCo Inc JP Morgan 248
(117) PerkinElmer Inc Citibank (54)(205) PerkinElmer Inc HSBC (1,039)(110) PerkinElmer Inc JP Morgan (558)(619) Pfizer Inc Citibank 669(185) Pfizer Inc HSBC 180
(1,120) Pfizer Inc JP Morgan 1,266(225) Phillips 66 JP Morgan 308257 Pinterest Inc ’A’ HSBC 1,784
(1,424) Plug Power Inc Citibank (4,882)(212) Plug Power Inc HSBC (2,254)
82 PNC Financial ServicesGroup Inc Citibank 57
(108) PPD Inc Citibank —(111) PPG Industries Inc Citibank (17)(234) Principal Financial Group
Inc Citibank 87(35) Principal Financial Group
Inc HSBC 50(202) Procter & Gamble Co JP Morgan 570(187) Progressive Corp Citibank (303)(451) Progressive Corp JP Morgan 3,004
79 Prudential Financial Inc Citibank 51597 Prudential Financial Inc JP Morgan 14943 PTC Inc Citibank 57
133 PTC Inc HSBC 665169 Public Service Enterprise
Group Inc HSBC (196)254 PulteGroup Inc Citibank 45093 PulteGroup Inc HSBC (424)
272 PulteGroup Inc JP Morgan (1,240)54 Qorvo Inc JP Morgan 608
122 QUALCOMM Inc Citibank 199371 QUALCOMM Inc HSBC 1,904349 QUALCOMM Inc JP Morgan 1,684
BlackRock Style Advantage Screened Fund continued
Portfolio of Investments as at 31 May 2021
The notes on pages 590 to 610 form an integral part of these financial statements.
BlackRock Strategic Funds[496]

Holding Description Counterparty
Netunrealised
appreciation/(depreciation)
USD
United States continued44 Quest Diagnostics Inc Citibank 53
251 Quest Diagnostics Inc HSBC (2,462)43 Raymond James Financial
Inc Citibank (83)79 Raymond James Financial
Inc HSBC (194)112 Raymond James Financial
Inc JP Morgan (276)2,734 Regions Financial Corp HSBC 2,0781,597 Regions Financial Corp JP Morgan 1,214(213) Reinsurance Group of
America Inc HSBC 420(481) RenaissanceRe Holdings
Ltd Citibank 24(458) Republic Services Inc Citibank 96(626) Republic Services Inc HSBC 1,797(510) Republic Services Inc JP Morgan 1,464(42) ResMed Inc Citibank 20
(100) RingCentral Inc ’A’ Citibank (1,582)(41) RingCentral Inc ’A’ HSBC (85)(63) RingCentral Inc ’A’ JP Morgan (131)783 Robert Half International
Inc HSBC (1,574)345 Robert Half International
Inc JP Morgan (693)86 Rockwell Automation Inc Citibank 114
146 Rockwell Automation Inc HSBC (1,035)41 Rockwell Automation Inc JP Morgan (291)
(12) Roku Inc Citibank 6(7) Roku Inc JP Morgan (317)
(1,470) Rollins Inc HSBC 4,601(134) Rollins Inc JP Morgan 419(258) Roper Technologies Inc Citibank (1,437)(48) Roper Technologies Inc HSBC (269)(11) Roper Technologies Inc JP Morgan (65)68 Ross Stores Inc Citibank 19642 Ross Stores Inc JP Morgan 123
(100) Royal Caribbean CruisesLtd Citibank (740)
(129) Royal Caribbean CruisesLtd HSBC (875)
(208) Royal Caribbean CruisesLtd JP Morgan (1,943)
(135) Royalty Pharma Plc ’A’ Citibank 81(103) Royalty Pharma Plc ’A’ JP Morgan 141(272) RPM International Inc Citibank 188(62) RPM International Inc JP Morgan 272(20) S&P Global Inc HSBC 218(40) S&P Global Inc JP Morgan 436
(261) salesforce.com Inc Citibank (2,850)(22) salesforce.com Inc HSBC (238)
(317) salesforce.com Inc JP Morgan (7,658)(316) Sarepta Therapeutics Inc Citibank 493(362) Sarepta Therapeutics Inc HSBC (2,034)(77) Seagate Technology Hold-
ings Plc Citibank 185(64) Seagen Inc Citibank (108)
(137) Seagen Inc HSBC (2,661)(211) Seagen Inc JP Morgan (4,098)638 Sealed Air Corp Citibank 242279 Sealed Air Corp HSBC 11239 Sealed Air Corp JP Morgan 10
(101) SEI Investments Co Citibank (56)(246) SEI Investments Co HSBC (175)(472) SEI Investments Co JP Morgan (229)
60 Sempra Energy HSBC (212)(95) Sensata Technologies Hold-
ing Plc HSBC (128)31 ServiceNow Inc Citibank (77)
104 ServiceNow Inc HSBC 736
Holding Description Counterparty
Netunrealised
appreciation/(depreciation)
USD
United States continued108 Sherwin-Williams Co Citibank (156)161 Sherwin-Williams Co HSBC (654)134 Sherwin-Williams Co JP Morgan (522)
7,383 Sirius XM Holdings Inc HSBC 2,141212 Skyworks Solutions Inc JP Morgan 859
(236) Slack Technologies Inc ’A’ HSBC (708)(138) Slack Technologies Inc ’A’ JP Morgan (414)(420) Snap Inc ’A’ Citibank (840)(34) Snap-on Inc HSBC 26(48) Snowflake Inc ’A’ Citibank (197)(22) Snowflake Inc ’A’ HSBC (973)(43) Snowflake Inc ’A’ JP Morgan (1,901)
(105) Southwest Airlines Co Citibank (82)(106) Southwest Airlines Co HSBC (12)(800) Southwest Airlines Co JP Morgan (88)(118) Splunk Inc Citibank (178)(114) Splunk Inc HSBC (850)(44) Splunk Inc JP Morgan (91)
(115) Square Inc ’A’ Citibank (1,331)(43) Square Inc ’A’ HSBC (262)
(661) SS&C Technologies Hold-ings Inc Citibank 416
(117) SS&C Technologies Hold-ings Inc JP Morgan (64)
(48) Stanley Black & Decker Inc JP Morgan 187702 Starbucks Corp Citibank 955307 Starbucks Corp HSBC (129)142 Starbucks Corp JP Morgan 12383 State Street Corp Citibank 21859 State Street Corp HSBC (50)63 State Street Corp JP Morgan (54)
(641) Steel Dynamics Inc HSBC 994(55) STERIS Plc HSBC 50(40) Stryker Corp Citibank 75(49) Stryker Corp HSBC 35(48) Stryker Corp JP Morgan 3421 SVB Financial Group JP Morgan 147
192 Synopsys Inc Citibank 979324 Synopsys Inc HSBC 6,676204 Synopsys Inc JP Morgan 4,478
(106) Sysco Corp JP Morgan 492165 T Rowe Price Group Inc HSBC 18841 Take-Two Interactive Soft-
ware Inc Citibank 22150 Target Corp Citibank 227125 Target Corp HSBC 1,61132 Target Corp JP Morgan 321
(240) TE Connectivity Ltd Citibank (274)(196) TE Connectivity Ltd HSBC 161(65) Teladoc Health Inc Citibank (536)
(204) Teladoc Health Inc HSBC (1,944)(65) Teladoc Health Inc JP Morgan (361)(62) Teledyne Technologies Inc Citibank (531)(13) Teledyne Technologies Inc HSBC 163(13) Teledyne Technologies Inc JP Morgan 163
(104) Teleflex Inc Citibank 133(37) Teleflex Inc HSBC 202(5) Teleflex Inc JP Morgan 27
124 Teradyne Inc Citibank 57826 Teradyne Inc JP Morgan 273(9) Tesla Inc Citibank (169)
(30) Tesla Inc HSBC (365)(24) Tesla Inc JP Morgan 92
(1,175) Teva Pharmaceutical Indus-tries Ltd ADR Citibank 447
(2,061) Teva Pharmaceutical Indus-tries Ltd ADR HSBC (309)
547 Texas Instruments Inc Citibank 61878 Texas Instruments Inc JP Morgan 606
BlackRock Style Advantage Screened Fund continued
Portfolio of Investments as at 31 May 2021
The notes on pages 590 to 610 form an integral part of these financial statements.
Annual report and audited financial statements [497]

Holding Description Counterparty
Netunrealised
appreciation/(depreciation)
USD
United States continued(31) Thermo Fisher Scientific Inc HSBC (187)(94) Thermo Fisher Scientific Inc JP Morgan (567)582 TJX Cos Inc HSBC (2,347)101 TJX Cos Inc JP Morgan (550)
(722) T-Mobile US Inc HSBC (4,055)(767) T-Mobile US Inc JP Morgan (4,081)
75 Tractor Supply Co HSBC (1,050)181 Tractor Supply Co JP Morgan (2,534)(11) Trade Desk Inc ’A’ Citibank (106)(66) Trade Desk Inc ’A’ HSBC (6,310)(98) Tradeweb Markets Inc ’A’ Citibank (256)
(590) Tradeweb Markets Inc ’A’ HSBC (431)33 Trane Technologies Plc Citibank 142
169 Trane Technologies Plc HSBC (44)221 Trane Technologies Plc JP Morgan 154
(117) TransUnion Citibank 268(255) TransUnion HSBC (122)(219) TransUnion JP Morgan (105)(34) Travelers Cos Inc Citibank (33)
(113) Travelers Cos Inc HSBC 22392 Trimble Inc Citibank (14)
202 Trimble Inc HSBC 451205 Trimble Inc JP Morgan 8792 Truist Financial Corp Citibank 52
322 Truist Financial Corp HSBC 287(18) Twilio Inc ’A’ Citibank (214)
(158) Twilio Inc ’A’ HSBC (5,956)(65) Twilio Inc ’A’ JP Morgan (2,685)
(509) Twitter Inc Citibank (478)(271) Twitter Inc HSBC (860)(117) Tyler Technologies Inc HSBC (1,280)(27) Tyler Technologies Inc JP Morgan (295)89 Tyson Foods Inc ’A’ Citibank (94)
334 Tyson Foods Inc ’A’ JP Morgan 227(182) Uber Technologies Inc Citibank (146)(333) Uber Technologies Inc HSBC (1,678)(172) Uber Technologies Inc JP Morgan (817)580 UGI Corp Citibank 719680 UGI Corp HSBC (109)360 UGI Corp JP Morgan (58)18 Ulta Salon Cosmetics & Fra-
grance Inc JP Morgan 49440 United Parcel Service Inc ’B’ HSBC (61)30 United Rentals Inc HSBC (425)
(136) UnitedHealth Group Inc HSBC 1,220136 Universal Health Services
Inc ’B’ Citibank 86(721) US Bancorp Citibank (260)(117) US Bancorp JP Morgan 46
50 Vail Resorts Inc Citibank 311110 Vail Resorts Inc HSBC 97619 Vail Resorts Inc JP Morgan 169
(83) Valero Energy Corp Citibank (173)(508) Valero Energy Corp HSBC (343)(172) Valero Energy Corp JP Morgan (326)
19 Veeva Systems Inc ’A’ Citibank 54223 Veeva Systems Inc ’A’ HSBC 97139 Veeva Systems Inc ’A’ JP Morgan 1,64679 VeriSign Inc Citibank (362)
154 VeriSign Inc HSBC (303)(80) Verisk Analytics Inc Citibank 107
(171) Verisk Analytics Inc HSBC 1,151(199) Verisk Analytics Inc JP Morgan 1,339551 Verizon Communications
Inc Citibank (270)230 Verizon Communications
Inc HSBC (697)292 Vertex Pharmaceuticals Inc Citibank (756)163 Vertex Pharmaceuticals Inc HSBC (696)125 Vertex Pharmaceuticals Inc JP Morgan (534)
Holding Description Counterparty
Netunrealised
appreciation/(depreciation)
USD
United States continued144 VF Corp Citibank 448
(158) ViacomCBS Inc ’B’ Citibank (139)(1,485) Viatris Inc Citibank 178(2,955) Viatris Inc HSBC (591)
(845) Viatris Inc JP Morgan (169)(397) Vimeo Inc Citibank (16,674)(103) Vimeo Inc HSBC (4,326)(167) Vimeo Inc JP Morgan (7,014)(791) Visa Inc ’A’ Citibank 1,429
84 VMware Inc ’A’ HSBC (485)76 VMware Inc ’A’ JP Morgan (439)
320 Voya Financial Inc Citibank (259)(82) Vulcan Materials Co HSBC 610(33) W R Berkley Corp HSBC 95
(288) W R Berkley Corp JP Morgan 832(175) Walgreens Boots Alliance
Inc JP Morgan 429(248) Walt Disney Co Citibank (1,076)(35) Walt Disney Co HSBC 198
(365) Waste Connections Inc Citibank (212)(140) Waste Connections Inc HSBC 305(31) Waste Connections Inc JP Morgan 68
(552) Waste Management Inc Citibank 237(473) Waste Management Inc HSBC 1,220(57) Waste Management Inc JP Morgan 147135 Waters Corp Citibank 68267 Waters Corp HSBC 374
104 Waters Corp JP Morgan 480(23) Wayfair Inc ’A’ Citibank 164(12) Wayfair Inc ’A’ HSBC 175
(1,522) Wells Fargo & Co HSBC (183)308 West Pharmaceutical Ser-
vices Inc Citibank 2,461183 West Pharmaceutical Ser-
vices Inc HSBC 2,522(608) Western Digital Corp JP Morgan (4,019)261 Western Union Co Citibank (60)421 Western Union Co HSBC (560)653 Western Union Co JP Morgan (868)
(377) Westinghouse Air BrakeTechnologies Corp Citibank (701)
(320) Westinghouse Air BrakeTechnologies Corp HSBC (608)
(154) Westinghouse Air BrakeTechnologies Corp JP Morgan (293)
104 Westrock Co HSBC (141)119 Whirlpool Corp Citibank 24921 Whirlpool Corp HSBC (309)15 Whirlpool Corp JP Morgan (221)
(849) Williams Cos Inc HSBC (679)(26) Willis Towers Watson Plc Citibank 41
(101) Willis Towers Watson Plc HSBC 760(41) Willis Towers Watson Plc JP Morgan 308(42) Wix.com Ltd Citibank (452)(28) Wix.com Ltd HSBC (1,141)(18) Wix.com Ltd JP Morgan 39154 Workday Inc ’A’ Citibank (285)89 Workday Inc ’A’ HSBC (318)22 Workday Inc ’A’ JP Morgan 11924 WW Grainger Inc Citibank 52
121 WW Grainger Inc HSBC (1,459)85 WW Grainger Inc JP Morgan (1,025)
(109) Wynn Resorts Ltd Citibank (263)(198) Wynn Resorts Ltd HSBC (1,013)255 Xilinx Inc Citibank 824
(155) XPO Logistics Inc HSBC 19459 Xylem Inc Citibank 13195 Xylem Inc HSBC (160)
328 Xylem Inc JP Morgan (551)342 Yum! Brands Inc Citibank (188)
BlackRock Style Advantage Screened Fund continued
Portfolio of Investments as at 31 May 2021
The notes on pages 590 to 610 form an integral part of these financial statements.
BlackRock Strategic Funds[498]

Holding Description Counterparty
Netunrealised
appreciation/(depreciation)
USD
United States continued167 Yum! Brands Inc HSBC (326)69 Yum! Brands Inc JP Morgan (135)54 Zebra Technologies Corp ’A’ Citibank (247)28 Zebra Technologies Corp ’A’ HSBC 40712 Zebra Technologies Corp ’A’ JP Morgan 156
(82) Zillow Group Inc ’C’ Citibank (360)(72) Zillow Group Inc ’C’ HSBC (349)
(126) Zillow Group Inc ’C’ JP Morgan (611)(40) Zimmer Biomet Holdings Inc HSBC 145(91) Zimmer Biomet Holdings Inc JP Morgan 329(33) Zoetis Inc Citibank (9)(68) Zoetis Inc HSBC (375)(63) Zoom Video Communica-
tions Inc ’A’ HSBC (2,712)(89) Zoom Video Communica-
tions Inc ’A’ JP Morgan (3,831)(116) Zscaler Inc Citibank (2,297)(70) Zscaler Inc HSBC (1,990)(54) Zscaler Inc JP Morgan (1,535)
(107,184)
Total (Gross underlying exposure - USD 57,487,250) (23,802)
* Security subject to a fair value adjustment as detailed in Note 2(a).π Amounts which are less than 0.5 USD have been rounded down to zero.
BlackRock Style Advantage Screened Fund continued
Portfolio of Investments as at 31 May 2021
The notes on pages 590 to 610 form an integral part of these financial statements.
Annual report and audited financial statements [499]

TypeNominal
Value Description CounterpartyExpiration
date
Net unrealisedappreciation/
(depreciation)USD
MarketValue
USD
Financial Derivative Instruments
SWAPS
CCCDS USD 2,287,000Fund receives Fixed 1.000% and provides default protection on
Markit CDX.NA.IG.30 Morgan Stanley 20/6/2026 5,079 55,721
CCCDS EUR 1,808,000Fund receives Fixed 1.000% and provides default protection on
Markit iTraxx Europe Series 23 Version 1 Morgan Stanley 20/6/2026 4,565 55,875
CCCDS USD 576,000Fund receives Fixed 5.000% and provides default protection on
Markit CDX.NA.HY.25 Version 8 Morgan Stanley 20/6/2026 2,073 55,783
CCCDS EUR 470,000Fund receives Fixed 5.000% and provides default protection on
Markit iTraxx Europe Crossover Series 30 Version 1 Morgan Stanley 20/6/2026 3,641 67,961
TRS BRL 1 Fund receives Fixed 0.000% and pays Ibovespa IndexBank of America
Merrill Lynch 16/6/2021 (1,244) (1,244)
TRS BRL 14 Fund receives Fixed 0.000% and pays Ibovespa IndexBank of America
Merrill Lynch 16/6/2021 (8,303) (8,303)
TRS KRW 250,000 Fund receives KOSPI 200 Index and pays Fixed 0.000%Bank of America
Merrill Lynch 10/6/2021 630 629
TRS TWD 2,200 Fund receives TAIEX Futures Index and pays Fixed 0.000%Bank of America
Merrill Lynch 16/6/2021 102,065 102,065
TRS TWD 1,600 Fund receives TAIEX Futures Index and pays Fixed 0.000%Bank of America
Merrill Lynch 16/6/2021 14,803 14,803
TRS USD 1Fund receives 3 Month LIBOR and pays MSCI Hong Kong Net Total
Return US Goldman Sachs 8/6/2021 (4,361) (4,361)
Total (Gross underlying exposure - USD 8,755,943) 118,948 338,929
CCCDS: Centrally Cleared Credit Default SwapsTRS: Total Return Swaps
Numberof
contractsCurrencyof contracts
Contract/Description
Expirationdate
Grossunderlying
exposureUSD
Net unrealisedappreciation/
(depreciation)USD
Financial Derivative Instruments
FUTURES
(8) EUR Amsterdam Index Futures June 2021 June 2021 1,388,816 (16,625)
145 AUD Australian 10 Year Bond Futures June 2021 June 2021 15,705,505 100,536
21 EUR CAC 40 Index Futures June 2021 June 2021 1,655,596 44,484
(31) CAD Canadian 10 Year Bond Futures September 2021 September 2021 3,698,754 (6,398)
3 USD E-Mini S&P 500 Index Futures June 2021 June 2021 630,840 5,877
(53) EUR Euro Bund Futures June 2021 June 2021 10,983,521 107,078
(32) GBP FTSE 100 Index Futures June 2021 June 2021 3,184,737 (87,627)
39 USD FTSE China A50 Futures June 2021 June 2021 708,162 10,121
16 EUR FTSE MIB Index Futures June 2021 June 2021 2,464,721 65,139
(13) EUR IBEX 35 Index Futures June 2021 June 2021 1,453,729 (2,657)
17 USD MSCI Hong Kong Index Futures June 2021 June 2021 1,374,620 (10,580)
(58) SEK OMX Stockholm 30 Index Futures June 2021 June 2021 1,573,990 (13,070)
(11) CAD S&P/TSX 60 Index Futures June 2021 June 2021 2,164,582 (91,118)
(50) USD SGX NIFTY 50 Futures June 2021 June 2021 1,558,000 (29,283)
(19) AUD SPI 200 Index Futures June 2021 June 2021 2,634,410 (123,174)
24 CHF Swiss Market Index Futures June 2021 June 2021 3,033,950 145,649
10 JPY Topix Index Futures June 2021 June 2021 1,758,938 (11,355)
(87) GBP UK Long Gilt Bond Futures September 2021 September 2021 15,687,260 (30,196)
68 USD US Treasury 10 Year Note Futures September 2021 September 2021 8,963,250 3,301
Total 80,623,381 60,102
BlackRock Style Advantage Screened Fund continued
Portfolio of Investments as at 31 May 2021
The notes on pages 590 to 610 form an integral part of these financial statements.
BlackRock Strategic Funds[500]
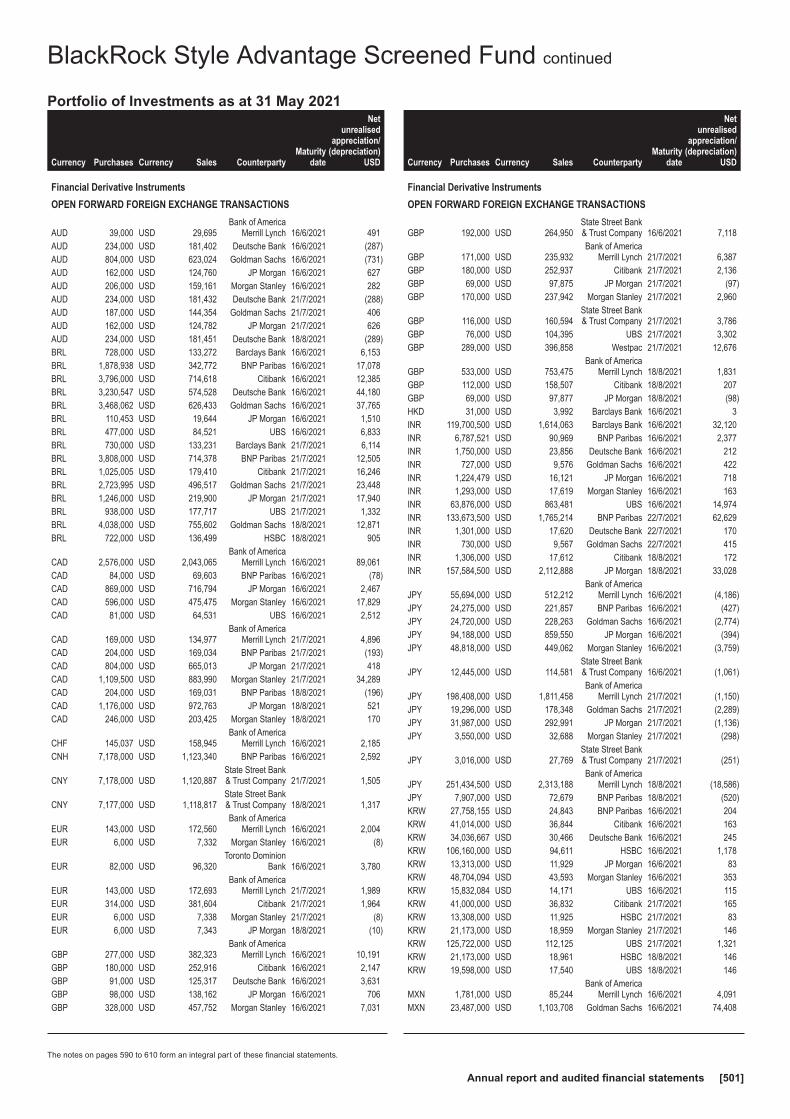
Currency Purchases Currency Sales CounterpartyMaturity
date
Netunrealised
appreciation/(depreciation)
USD
Financial Derivative Instruments
OPEN FORWARD FOREIGN EXCHANGE TRANSACTIONS
AUD 39,000 USD 29,695Bank of America
Merrill Lynch 16/6/2021 491AUD 234,000 USD 181,402 Deutsche Bank 16/6/2021 (287)AUD 804,000 USD 623,024 Goldman Sachs 16/6/2021 (731)AUD 162,000 USD 124,760 JP Morgan 16/6/2021 627AUD 206,000 USD 159,161 Morgan Stanley 16/6/2021 282AUD 234,000 USD 181,432 Deutsche Bank 21/7/2021 (288)AUD 187,000 USD 144,354 Goldman Sachs 21/7/2021 406AUD 162,000 USD 124,782 JP Morgan 21/7/2021 626AUD 234,000 USD 181,451 Deutsche Bank 18/8/2021 (289)BRL 728,000 USD 133,272 Barclays Bank 16/6/2021 6,153BRL 1,878,938 USD 342,772 BNP Paribas 16/6/2021 17,078BRL 3,796,000 USD 714,618 Citibank 16/6/2021 12,385BRL 3,230,547 USD 574,528 Deutsche Bank 16/6/2021 44,180BRL 3,468,062 USD 626,433 Goldman Sachs 16/6/2021 37,765BRL 110,453 USD 19,644 JP Morgan 16/6/2021 1,510BRL 477,000 USD 84,521 UBS 16/6/2021 6,833BRL 730,000 USD 133,231 Barclays Bank 21/7/2021 6,114BRL 3,808,000 USD 714,378 BNP Paribas 21/7/2021 12,505BRL 1,025,005 USD 179,410 Citibank 21/7/2021 16,246BRL 2,723,995 USD 496,517 Goldman Sachs 21/7/2021 23,448BRL 1,246,000 USD 219,900 JP Morgan 21/7/2021 17,940BRL 938,000 USD 177,717 UBS 21/7/2021 1,332BRL 4,038,000 USD 755,602 Goldman Sachs 18/8/2021 12,871BRL 722,000 USD 136,499 HSBC 18/8/2021 905
CAD 2,576,000 USD 2,043,065Bank of America
Merrill Lynch 16/6/2021 89,061CAD 84,000 USD 69,603 BNP Paribas 16/6/2021 (78)CAD 869,000 USD 716,794 JP Morgan 16/6/2021 2,467CAD 596,000 USD 475,475 Morgan Stanley 16/6/2021 17,829CAD 81,000 USD 64,531 UBS 16/6/2021 2,512
CAD 169,000 USD 134,977Bank of America
Merrill Lynch 21/7/2021 4,896CAD 204,000 USD 169,034 BNP Paribas 21/7/2021 (193)CAD 804,000 USD 665,013 JP Morgan 21/7/2021 418CAD 1,109,500 USD 883,990 Morgan Stanley 21/7/2021 34,289CAD 204,000 USD 169,031 BNP Paribas 18/8/2021 (196)CAD 1,176,000 USD 972,763 JP Morgan 18/8/2021 521CAD 246,000 USD 203,425 Morgan Stanley 18/8/2021 170
CHF 145,037 USD 158,945Bank of America
Merrill Lynch 16/6/2021 2,185CNH 7,178,000 USD 1,123,340 BNP Paribas 16/6/2021 2,592
CNY 7,178,000 USD 1,120,887State Street Bank& Trust Company 21/7/2021 1,505
CNY 7,177,000 USD 1,118,817State Street Bank& Trust Company 18/8/2021 1,317
EUR 143,000 USD 172,560Bank of America
Merrill Lynch 16/6/2021 2,004EUR 6,000 USD 7,332 Morgan Stanley 16/6/2021 (8)
EUR 82,000 USD 96,320Toronto Dominion
Bank 16/6/2021 3,780
EUR 143,000 USD 172,693Bank of America
Merrill Lynch 21/7/2021 1,989EUR 314,000 USD 381,604 Citibank 21/7/2021 1,964EUR 6,000 USD 7,338 Morgan Stanley 21/7/2021 (8)EUR 6,000 USD 7,343 JP Morgan 18/8/2021 (10)
GBP 277,000 USD 382,323Bank of America
Merrill Lynch 16/6/2021 10,191GBP 180,000 USD 252,916 Citibank 16/6/2021 2,147GBP 91,000 USD 125,317 Deutsche Bank 16/6/2021 3,631GBP 98,000 USD 138,162 JP Morgan 16/6/2021 706GBP 328,000 USD 457,752 Morgan Stanley 16/6/2021 7,031
Currency Purchases Currency Sales CounterpartyMaturity
date
Netunrealised
appreciation/(depreciation)
USD
Financial Derivative Instruments
OPEN FORWARD FOREIGN EXCHANGE TRANSACTIONS
GBP 192,000 USD 264,950State Street Bank& Trust Company 16/6/2021 7,118
GBP 171,000 USD 235,932Bank of America
Merrill Lynch 21/7/2021 6,387GBP 180,000 USD 252,937 Citibank 21/7/2021 2,136GBP 69,000 USD 97,875 JP Morgan 21/7/2021 (97)GBP 170,000 USD 237,942 Morgan Stanley 21/7/2021 2,960
GBP 116,000 USD 160,594State Street Bank& Trust Company 21/7/2021 3,786
GBP 76,000 USD 104,395 UBS 21/7/2021 3,302GBP 289,000 USD 396,858 Westpac 21/7/2021 12,676
GBP 533,000 USD 753,475Bank of America
Merrill Lynch 18/8/2021 1,831GBP 112,000 USD 158,507 Citibank 18/8/2021 207GBP 69,000 USD 97,877 JP Morgan 18/8/2021 (98)HKD 31,000 USD 3,992 Barclays Bank 16/6/2021 3INR 119,700,500 USD 1,614,063 Barclays Bank 16/6/2021 32,120INR 6,787,521 USD 90,969 BNP Paribas 16/6/2021 2,377INR 1,750,000 USD 23,856 Deutsche Bank 16/6/2021 212INR 727,000 USD 9,576 Goldman Sachs 16/6/2021 422INR 1,224,479 USD 16,121 JP Morgan 16/6/2021 718INR 1,293,000 USD 17,619 Morgan Stanley 16/6/2021 163INR 63,876,000 USD 863,481 UBS 16/6/2021 14,974INR 133,673,500 USD 1,765,214 BNP Paribas 22/7/2021 62,629INR 1,301,000 USD 17,620 Deutsche Bank 22/7/2021 170INR 730,000 USD 9,567 Goldman Sachs 22/7/2021 415INR 1,306,000 USD 17,612 Citibank 18/8/2021 172INR 157,584,500 USD 2,112,888 JP Morgan 18/8/2021 33,028
JPY 55,694,000 USD 512,212Bank of America
Merrill Lynch 16/6/2021 (4,186)JPY 24,275,000 USD 221,857 BNP Paribas 16/6/2021 (427)JPY 24,720,000 USD 228,263 Goldman Sachs 16/6/2021 (2,774)JPY 94,188,000 USD 859,550 JP Morgan 16/6/2021 (394)JPY 48,818,000 USD 449,062 Morgan Stanley 16/6/2021 (3,759)
JPY 12,445,000 USD 114,581State Street Bank& Trust Company 16/6/2021 (1,061)
JPY 198,408,000 USD 1,811,458Bank of America
Merrill Lynch 21/7/2021 (1,150)JPY 19,296,000 USD 178,348 Goldman Sachs 21/7/2021 (2,289)JPY 31,987,000 USD 292,991 JP Morgan 21/7/2021 (1,136)JPY 3,550,000 USD 32,688 Morgan Stanley 21/7/2021 (298)
JPY 3,016,000 USD 27,769State Street Bank& Trust Company 21/7/2021 (251)
JPY 251,434,500 USD 2,313,188Bank of America
Merrill Lynch 18/8/2021 (18,586)JPY 7,907,000 USD 72,679 BNP Paribas 18/8/2021 (520)KRW 27,758,155 USD 24,843 BNP Paribas 16/6/2021 204KRW 41,014,000 USD 36,844 Citibank 16/6/2021 163KRW 34,036,667 USD 30,466 Deutsche Bank 16/6/2021 245KRW 106,160,000 USD 94,611 HSBC 16/6/2021 1,178KRW 13,313,000 USD 11,929 JP Morgan 16/6/2021 83KRW 48,704,094 USD 43,593 Morgan Stanley 16/6/2021 353KRW 15,832,084 USD 14,171 UBS 16/6/2021 115KRW 41,000,000 USD 36,832 Citibank 21/7/2021 165KRW 13,308,000 USD 11,925 HSBC 21/7/2021 83KRW 21,173,000 USD 18,959 Morgan Stanley 21/7/2021 146KRW 125,722,000 USD 112,125 UBS 21/7/2021 1,321KRW 21,173,000 USD 18,961 HSBC 18/8/2021 146KRW 19,598,000 USD 17,540 UBS 18/8/2021 146
MXN 1,781,000 USD 85,244Bank of America
Merrill Lynch 16/6/2021 4,091MXN 23,487,000 USD 1,103,708 Goldman Sachs 16/6/2021 74,408
BlackRock Style Advantage Screened Fund continued
Portfolio of Investments as at 31 May 2021
The notes on pages 590 to 610 form an integral part of these financial statements.
Annual report and audited financial statements [501]

Currency Purchases Currency Sales CounterpartyMaturity
date
Netunrealised
appreciation/(depreciation)
USD
Financial Derivative Instruments
OPEN FORWARD FOREIGN EXCHANGE TRANSACTIONS
MXN 5,544,000 USD 273,282State Street Bank& Trust Company 16/6/2021 4,808
MXN 442,000 USD 22,077 Goldman Sachs 21/7/2021 8MXN 18,135,500 USD 890,129 HSBC 21/7/2021 16,022MXN 3,186,000 USD 158,441 JP Morgan 21/7/2021 750MXN 1,050,000 USD 52,426 Morgan Stanley 21/7/2021 38
MXN 2,902,000 USD 143,734State Street Bank& Trust Company 21/7/2021 1,267
MXN 19,643,000 USD 977,062 Citibank 18/8/2021 1,379MXN 1,622,000 USD 80,531 JP Morgan 18/8/2021 263NOK 786,000 USD 92,597 Goldman Sachs 16/6/2021 1,589
NZD 15,000 USD 10,742Bank of America
Merrill Lynch 16/6/2021 160NZD 148,000 USD 107,238 Barclays Bank 16/6/2021 332NZD 129,000 USD 92,010 Citibank 16/6/2021 1,751NZD 48,000 USD 34,353 JP Morgan 16/6/2021 534NZD 422,000 USD 298,027 Morgan Stanley 16/6/2021 8,695
NZD 27,000 USD 18,982State Street Bank& Trust Company 16/6/2021 643
NZD 27,000 USD 19,473 UBS 16/6/2021 151NZD 148,000 USD 107,227 Barclays Bank 21/7/2021 333NZD 129,000 USD 91,999 Citibank 21/7/2021 1,753NZD 119,000 USD 86,589 JP Morgan 21/7/2021 (105)NZD 242,000 USD 175,164 Morgan Stanley 21/7/2021 711NZD 27,000 USD 19,472 UBS 21/7/2021 151NZD 27,000 USD 18,979 Westpac 21/7/2021 644NZD 148,000 USD 107,215 Barclays Bank 18/8/2021 334
RUB 26,661,566 USD 359,182Bank of America
Merrill Lynch 16/6/2021 3,713RUB 49,979,000 USD 667,403 BNP Paribas 16/6/2021 12,870RUB 3,760,434 USD 50,047 Goldman Sachs 16/6/2021 1,137RUB 14,444,000 USD 187,427 JP Morgan 16/6/2021 9,173RUB 34,444,000 USD 467,321 UBS 16/6/2021 1,502RUB 23,200,000 USD 311,349 Citibank 21/7/2021 2,898RUB 34,598,000 USD 467,182 Goldman Sachs 21/7/2021 1,453RUB 51,449,500 USD 656,206 JP Morgan 21/7/2021 40,684
RUB 29,403,000 USD 391,034Bank of America
Merrill Lynch 18/8/2021 5,632RUB 34,738,000 USD 467,211 UBS 18/8/2021 1,428SEK 667,000 USD 79,281 Goldman Sachs 16/6/2021 1,168SEK 267,000 USD 32,226 HSBC 16/6/2021 (21)SEK 237,000 USD 28,554 JP Morgan 16/6/2021 30
TWD 981,000 USD 35,287Bank of America
Merrill Lynch 16/6/2021 369TWD 3,133,635 USD 112,644 BNP Paribas 16/6/2021 1,255TWD 2,245,000 USD 80,634 Citibank 16/6/2021 965TWD 6,947,365 USD 249,424 Deutsche Bank 16/6/2021 3,093TWD 1,044,000 USD 37,404 Morgan Stanley 16/6/2021 543TWD 2,757,000 USD 99,298 UBS 16/6/2021 911
TWD 977,000 USD 35,309Bank of America
Merrill Lynch 21/7/2021 383TWD 2,236,000 USD 80,696 BNP Paribas 21/7/2021 990TWD 6,119,000 USD 221,358 Deutsche Bank 21/7/2021 2,182TWD 3,189,000 USD 115,203 Morgan Stanley 21/7/2021 1,297TWD 2,980,000 USD 107,418 UBS 21/7/2021 1,447TWD 6,097,000 USD 221,411 BNP Paribas 18/8/2021 2,204TWD 2,228,000 USD 80,707 HSBC 18/8/2021 1,007TWD 586,000 USD 21,262 Morgan Stanley 18/8/2021 230
USD 102,722 AUD 132,000Bank of America
Merrill Lynch 16/6/2021 554USD 87,993 AUD 115,000 Barclays Bank 16/6/2021 (1,017)USD 44,435 AUD 57,000 Citibank 16/6/2021 317
Currency Purchases Currency Sales CounterpartyMaturity
date
Netunrealised
appreciation/(depreciation)
USD
Financial Derivative Instruments
OPEN FORWARD FOREIGN EXCHANGE TRANSACTIONS
USD 40,521 AUD 52,000 JP Morgan 16/6/2021 273USD 1,643,623 AUD 2,136,000 Morgan Stanley 16/6/2021 (9,635)
USD 334,543 AUD 432,000State Street Bank& Trust Company 16/6/2021 176
USD 15,509 AUD 20,000 UBS 16/6/2021 29
USD 102,739 AUD 132,000Bank of America
Merrill Lynch 21/7/2021 556USD 44,442 AUD 57,000 Citibank 21/7/2021 318USD 302,473 AUD 390,000 Deutsche Bank 21/7/2021 566USD 10,199 AUD 13,000 JP Morgan 21/7/2021 136
USD 64,530 AUD 83,000State Street Bank& Trust Company 21/7/2021 279
USD 15,512 AUD 20,000 UBS 21/7/2021 29USD 959,794 AUD 1,258,000 Westpac 21/7/2021 (14,049)USD 44,447 AUD 57,000 Citibank 18/8/2021 318USD 919,559 AUD 1,169,000 Deutsche Bank 18/8/2021 14,525USD 302,533 AUD 390,000 JP Morgan 18/8/2021 597
USD 913,030 BRL 5,362,500Bank of America
Merrill Lynch 16/6/2021 (113,986)USD 410,680 BRL 2,330,000 BNP Paribas 16/6/2021 (35,558)USD 298,742 BRL 1,614,000 Morgan Stanley 16/6/2021 (10,369)USD 122,868 BRL 681,000 UBS 16/6/2021 (7,557)USD 981,464 BRL 5,586,000 Citibank 21/7/2021 (84,809)USD 218,873 BRL 1,150,000 Goldman Sachs 21/7/2021 (643)USD 203,743 BRL 1,075,500 Citibank 18/8/2021 (935)
USD 159,780 CAD 195,000Bank of America
Merrill Lynch 16/6/2021 (1,619)USD 81,287 CAD 101,574 Citibank 16/6/2021 (2,785)USD 252,751 CAD 307,000 Goldman Sachs 16/6/2021 (1,350)USD 993,743 CAD 1,229,000 JP Morgan 16/6/2021 (23,487)USD 177,880 CAD 223,000 Morgan Stanley 16/6/2021 (6,695)
USD 118,768 CAD 149,000Bank of America
Merrill Lynch 21/7/2021 (4,552)USD 251,955 CAD 306,000 Goldman Sachs 21/7/2021 (1,306)USD 357,432 CAD 439,000 JP Morgan 21/7/2021 (5,906)USD 59,128 CAD 74,000 Morgan Stanley 21/7/2021 (2,118)USD 36,530 CAD 44,000 JP Morgan 18/8/2021 115USD 177,080 CHF 165,000 Goldman Sachs 16/6/2021 (6,228)USD 98,514 CHF 92,000 Morgan Stanley 16/6/2021 (3,694)
USD 129,644 CHF 116,000State Street Bank& Trust Company 16/6/2021 773
USD 329,951 CNH 2,111,000 UBS 21/7/2021 (445)
USD 330,542 CNY 2,110,000State Street Bank& Trust Company 16/6/2021 (197)
USD 329,212 CNY 2,110,000State Street Bank& Trust Company 18/8/2021 (101)
USD 334,634 EUR 280,000Bank of America
Merrill Lynch 16/6/2021 (7,170)USD 37,280 EUR 31,000 BNP Paribas 16/6/2021 (562)USD 81,949 EUR 67,000 Citibank 16/6/2021 160USD 254,091 EUR 210,000 HSBC 16/6/2021 (2,262)USD 481,861 EUR 404,000 JP Morgan 16/6/2021 (11,313)USD 593,639 EUR 497,000 Morgan Stanley 16/6/2021 (13,063)
USD 13,427 EUR 11,000Toronto Dominion
Bank 16/6/2021 (1)USD 4,564,911 EUR 3,829,000 UBS 16/6/2021 (109,257)
USD 6,248,598 EUR 5,245,615Bank of America
Merrill Lynch 21/7/2021 (159,194)USD 37,309 EUR 31,000 BNP Paribas 21/7/2021 (559)USD 82,005 EUR 67,000 Citibank 21/7/2021 161USD 140,052 EUR 115,000 JP Morgan 21/7/2021 (427)USD 161,124 EUR 134,000 Morgan Stanley 21/7/2021 (2,565)
BlackRock Style Advantage Screened Fund continued
Portfolio of Investments as at 31 May 2021
The notes on pages 590 to 610 form an integral part of these financial statements.
BlackRock Strategic Funds[502]

Currency Purchases Currency Sales CounterpartyMaturity
date
Netunrealised
appreciation/(depreciation)
USD
Financial Derivative Instruments
OPEN FORWARD FOREIGN EXCHANGE TRANSACTIONS
USD 13,437 EUR 11,000State Street Bank& Trust Company 21/7/2021 (1)
USD 82,048 EUR 67,000 Citibank 18/8/2021 161USD 13,444 EUR 11,000 Deutsche Bank 18/8/2021 —USD 6,520,717 EUR 5,353,000 JP Morgan 18/8/2021 (21,732)
USD 243,029 GBP 175,000Bank of America
Merrill Lynch 16/6/2021 (4,948)USD 22,371 GBP 16,000 Barclays Bank 16/6/2021 (302)USD 451,421 GBP 323,000 JP Morgan 16/6/2021 (6,275)USD 132,734 GBP 95,000 Morgan Stanley 16/6/2021 (1,883)
USD 144,987 GBP 102,000State Street Bank& Trust Company 16/6/2021 452
USD 99,979 GBP 72,000 Barclays Bank 21/7/2021 (2,050)USD 270,266 GBP 191,000 JP Morgan 21/7/2021 (395)USD 308,845 GBP 222,411 Morgan Stanley 21/7/2021 (6,327)
USD 144,999 GBP 102,000State Street Bank& Trust Company 21/7/2021 458
USD 415,288 GBP 293,000 JP Morgan 18/8/2021 81USD 36,200 HKD 281,000 BNP Paribas 16/6/2021 (7)USD 138,430 INR 10,384,000 BNP Paribas 16/6/2021 (4,376)USD 15,816 INR 1,154,000 Citibank 16/6/2021 (54)USD 10,795 INR 815,000 Deutsche Bank 16/6/2021 (413)USD 300,152 INR 22,250,000 JP Morgan 16/6/2021 (5,841)USD 9,166 INR 667,000 UBS 16/6/2021 (7)USD 10,794 INR 819,000 Deutsche Bank 22/7/2021 (405)USD 24,970 INR 1,831,000 UBS 22/7/2021 (66)USD 9,158 INR 673,000 Deutsche Bank 18/8/2021 (7)USD 15,819 INR 1,166,000 UBS 18/8/2021 (59)
USD 60,657 JPY 6,561,000Bank of America
Merrill Lynch 16/6/2021 809USD 66,651 JPY 7,246,000 BNP Paribas 16/6/2021 555USD 130,984 JPY 14,265,000 HSBC 16/6/2021 863
USD 76,647 JPY 8,281,000State Street Bank& Trust Company 16/6/2021 1,110
USD 60,642 JPY 6,557,000Bank of America
Merrill Lynch 21/7/2021 815USD 130,940 JPY 14,256,000 Deutsche Bank 21/7/2021 866USD 130,940 JPY 14,253,000 Morgan Stanley 18/8/2021 867
USD 1,364,978 KRW 1,553,097,000Bank of America
Merrill Lynch 16/6/2021 (36,390)USD 240,328 KRW 271,336,000 BNP Paribas 16/6/2021 (4,501)USD 11,772 KRW 13,170,000 Citibank 16/6/2021 (111)USD 72,859 KRW 82,135,000 Deutsche Bank 16/6/2021 (1,252)USD 92,270 KRW 104,393,000 Goldman Sachs 16/6/2021 (1,926)USD 414,076 KRW 463,765,000 JP Morgan 16/6/2021 (4,382)USD 99,435 KRW 113,209,000 Morgan Stanley 16/6/2021 (2,714)USD 13,682 KRW 15,243,000 BNP Paribas 21/7/2021 (73)USD 11,769 KRW 13,166,000 Citibank 21/7/2021 (112)USD 2,036,013 KRW 2,280,191,500 HSBC 21/7/2021 (21,540)USD 41,696 KRW 46,999,000 Morgan Stanley 21/7/2021 (714)USD 68,503 KRW 77,288,000 Societe Generale 21/7/2021 (1,239)USD 44,884 KRW 50,420,000 UBS 21/7/2021 (613)USD 2,001,076 KRW 2,227,718,000 Citibank 18/8/2021 (9,252)USD 68,519 KRW 77,282,000 Societe Generale 18/8/2021 (1,221)
USD 40,665 MXN 826,000Bank of America
Merrill Lynch 16/6/2021 (767)USD 141,796 MXN 2,876,000 Barclays Bank 16/6/2021 (2,465)USD 187,753 MXN 3,809,000 Goldman Sachs 16/6/2021 (3,307)USD 119,639 MXN 2,395,000 Morgan Stanley 16/6/2021 (495)
Currency Purchases Currency Sales CounterpartyMaturity
date
Netunrealised
appreciation/(depreciation)
USD
Financial Derivative Instruments
OPEN FORWARD FOREIGN EXCHANGE TRANSACTIONS
USD 742,299 MXN 14,786,000State Street Bank& Trust Company 16/6/2021 628
USD 28,298 MXN 578,000Bank of America
Merrill Lynch 21/7/2021 (582)USD 141,728 MXN 2,886,000 Barclays Bank 21/7/2021 (2,472)USD 117,941 MXN 2,360,000 Goldman Sachs 21/7/2021 22
USD 861,767 MXN 17,245,000State Street Bank& Trust Company 21/7/2021 111
USD 712,954 MXN 14,289,000State Street Bank& Trust Company 18/8/2021 1,202
USD 94,877 NOK 782,000Bank of America
Merrill Lynch 18/8/2021 1,162
USD 49,303 NZD 70,000Bank of America
Merrill Lynch 16/6/2021 (1,575)USD 263,318 NZD 361,000 Barclays Bank 16/6/2021 933USD 76,934 NZD 109,000 BNP Paribas 16/6/2021 (2,290)USD 38,960 NZD 54,000 Goldman Sachs 16/6/2021 (288)USD 762,013 NZD 1,056,000 Morgan Stanley 16/6/2021 (5,516)USD 74,612 NZD 106,000 Goldman Sachs 21/7/2021 (2,424)USD 263,292 NZD 361,000 JP Morgan 21/7/2021 932USD 699,410 NZD 967,000 Morgan Stanley 21/7/2021 (3,363)USD 344,161 NZD 472,000 JP Morgan 18/8/2021 1,167USD 351,053 NZD 481,000 Morgan Stanley 18/8/2021 1,518USD 47,164 RUB 3,491,000 Barclays Bank 16/6/2021 (352)USD 719,209 RUB 54,724,000 Goldman Sachs 16/6/2021 (25,652)USD 58,181 RUB 4,466,000 JP Morgan 16/6/2021 (2,606)USD 205,531 RUB 15,755,000 Morgan Stanley 16/6/2021 (8,914)USD 344,784 RUB 25,985,000 Goldman Sachs 21/7/2021 (7,187)USD 64,489 RUB 5,034,000 HSBC 21/7/2021 (3,697)USD 58,162 RUB 4,486,000 JP Morgan 21/7/2021 (2,602)USD 165,447 RUB 12,799,000 Morgan Stanley 21/7/2021 (7,917)USD 134,987 RUB 10,195,000 UBS 21/7/2021 (3,107)USD 15,191 RUB 1,128,000 Barclays Bank 18/8/2021 (26)USD 204,861 RUB 15,361,000 Goldman Sachs 18/8/2021 (2,369)USD 105,843 SEK 889,080 Citibank 16/6/2021 (1,390)USD 92,136 SEK 786,000 Deutsche Bank 16/6/2021 (2,666)USD 11,472 SEK 95,000 JP Morgan 16/6/2021 13
USD 22,944 SEK 190,000State Street Bank& Trust Company 16/6/2021 28
USD 41,502 SGD 55,000 HSBC 18/8/2021 (100)USD 252,359 TWD 7,141,000 Barclays Bank 16/6/2021 (7,196)USD 35,871 TWD 1,003,000 BNP Paribas 16/6/2021 (585)USD 18,824 TWD 530,000 Citibank 16/6/2021 (440)USD 331,217 TWD 9,377,000 Deutsche Bank 16/6/2021 (9,612)USD 37,385 TWD 1,049,997 JP Morgan 16/6/2021 (779)USD 592,428 TWD 16,627,000 Morgan Stanley 16/6/2021 (11,916)USD 1,210,947 TWD 33,603,003 UBS 16/6/2021 (10,427)USD 1,180,304 TWD 32,600,000 Deutsche Bank 21/7/2021 (10,642)USD 1,127,179 TWD 31,791,500 HSBC 21/7/2021 (34,231)USD 55,050 TWD 1,532,000 Morgan Stanley 21/7/2021 (917)USD 18,831 TWD 528,000 UBS 21/7/2021 (458)USD 1,008,642 TWD 27,603,500 BNP Paribas 18/8/2021 (3,749)USD 1,180,526 TWD 32,481,000 Deutsche Bank 18/8/2021 (10,753)
(162,606)
BlackRock Style Advantage Screened Fund continued
Portfolio of Investments as at 31 May 2021
The notes on pages 590 to 610 form an integral part of these financial statements.
Annual report and audited financial statements [503]

Currency Purchases Currency Sales CounterpartyMaturity
date
Netunrealised
appreciation/(depreciation)
USD
Financial Derivative Instruments
OPEN FORWARD FOREIGN EXCHANGE TRANSACTIONS
AUD Hedged Share Class
AUD 5,574,196 USD 4,335,496State Street Bank& Trust Company 15/6/2021 (21,104)
USD 48,075 AUD 62,223State Street Bank& Trust Company 15/6/2021 (85)
(21,189)
EUR Hedged Share Class
EUR 7,556 USD 9,130State Street Bank& Trust Company 15/6/2021 93
USD 102 EUR 84State Street Bank& Trust Company 15/6/2021 —
93
GBP Hedged Share Class
GBP 6,840 USD 9,522State Street Bank& Trust Company 15/6/2021 171
USD 106 GBP 74State Street Bank& Trust Company 15/6/2021 —
171
Total (Gross underlying exposure - USD 110,334,145) (183,531)
Sector Breakdownas at 31 May 2021
% of NetAssets
Government 70.74
Collective Investment Schemes 9.51
Securities portfolio at market value 80.25
Other Net Assets 19.75
100.00
BlackRock Style Advantage Screened Fund continued
Portfolio of Investments as at 31 May 2021
The notes on pages 590 to 610 form an integral part of these financial statements.
BlackRock Strategic Funds[504]

Holding Description
MarketValue
USD
% ofNet
Assets
Transferable Securities and Money Market Instruments Admittedto an Official Stock Exchange Listing or Dealt in on AnotherRegulated Market
COMMON STOCKSAustralia
20,647 Alumina Ltd^ 27,405 0.019,516 APA Group (Unit) 67,978 0.02
14,070 Aristocrat Leisure Ltd 447,013 0.128,641 ASX Ltd 510,004 0.144,941 BlueScope Steel Ltd 81,185 0.022,821 Cochlear Ltd^ 495,699 0.147,934 Commonwealth Bank of Aus-
tralia 612,333 0.171,938 CSL Ltd 435,290 0.123,544 Fortescue Metals Group Ltd 61,523 0.026,696 Goodman Group (REIT) 100,693 0.031,983 IDP Education Ltd 34,532 0.013,205 Medibank Pvt Ltd 7,764 0.003,029 Mineral Resources Ltd 106,384 0.03
197,495 Mirvac Group (REIT) 426,455 0.1210,371 Northern Star Resources Ltd 93,912 0.036,246 REA Group Ltd 791,148 0.228,590 Rio Tinto Ltd 822,586 0.231,396 SEEK Ltd 33,018 0.01
273,689 Stockland (REIT) 989,207 0.2840,662 Tabcorp Holdings Ltd 160,814 0.0439,132 Westpac Banking Corp 800,162 0.223,574 Worley Ltd 29,210 0.01
7,134,315 1.99
Austria1,778 ANDRITZ AG 103,199 0.03
103,199 0.03
Belgium32,660 Anheuser-Busch InBev SA 2,463,640 0.694,047 Umicore SA 242,849 0.07
2,706,489 0.76
Bermuda692 Athene Holding Ltd ’A’ 43,340 0.01
20,476 Invesco Ltd 584,180 0.1628,000 Shangri-La Asia Ltd 26,120 0.01
653,640 0.18
Canada34,896 ARC Resources Ltd 271,219 0.089,239 Bank of Montreal 971,733 0.271,931 Bank of Nova Scotia 130,390 0.042,021 Canadian Western Bank 62,530 0.021,000 CGI Inc 89,492 0.02
450 Colliers International GroupInc 50,030 0.01
3,043 First Quantum Minerals Ltd 75,058 0.02365 FirstService Corp 59,205 0.02
44,001 Hydro One Ltd 1,121,012 0.31364 Intact Financial Corp 49,628 0.01
1,258 National Bank of Canada 98,170 0.0316,455 Rogers Communications Inc
’B’ 852,612 0.247,566 Royal Bank of Canada 786,002 0.221,423 Shopify Inc ’A’^ 1,764,219 0.49
13,298 Sun Life Financial Inc^ 718,201 0.20324 TMX Group Ltd 35,880 0.01
28,060 Toronto-Dominion Bank 2,022,717 0.56351 West Fraser Timber Co Ltd 27,310 0.01
34,335 Wheaton Precious MetalsCorp 1,644,067 0.46
10,829,475 3.02
Holding Description
MarketValue
USD
% ofNet
Assets
Cayman Islands3,852 Herbalife Nutrition Ltd 202,500 0.06
10,000 Wharf Real Estate InvestmentCo Ltd 58,626 0.01
261,126 0.07
Denmark219 AP Moller - Maersk A/S ’A’ 577,550 0.16357 AP Moller - Maersk A/S ’B’ 984,547 0.28
1,616 Coloplast A/S ’B’ 255,227 0.0738,422 Novo Nordisk A/S ’B’ 3,039,181 0.851,516 Orsted A/S 228,486 0.06
57 ROCKWOOL International A/S’B’ 28,437 0.01
5,113,428 1.43
Finland2,493 Neste Oyj^ 163,623 0.05
82,185 Nordea Bank Abp 886,180 0.259,004 UPM-Kymmene Oyj 343,171 0.103,743 Valmet Oyj^ 161,797 0.04
994 Wartsila Oyj Abp 13,623 0.00
1,568,394 0.44
France2,971 Air Liquide SA 505,946 0.141,549 Alstom SA 86,977 0.027,585 Amundi SA 675,742 0.19
89,256 AXA SA 2,468,310 0.6910,756 BNP Paribas SA 736,535 0.212,081 Casino Guichard Perrachon
SA 67,072 0.022,949 Cie de Saint-Gobain 198,159 0.053,799 CNP Assurances 68,872 0.02
21,304 Constellium SE 380,490 0.113,614 Electricite de France SA 50,302 0.01
10,659 Engie SA 158,753 0.04687 Faurecia SE 37,318 0.01991 Imerys SA 51,957 0.01773 Kering SA 707,150 0.20
2,445 Legrand SA 257,091 0.076,449 L’Oreal SA 2,904,164 0.816,660 Pernod Ricard SA 1,469,925 0.411,133 Renault SA 47,088 0.019,362 Rexel SA 191,033 0.059,340 Rubis SCA 451,382 0.138,541 Schneider Electric SE 1,353,588 0.389,432 Valeo SA 308,720 0.093,028 Vinci SA 344,446 0.10
13,521,020 3.77
Germany3,332 adidas AG 1,221,132 0.341,505 Allianz SE Reg 396,269 0.115,317 BASF SE 434,105 0.123,118 Bayerische Motoren Werke AG 331,243 0.092,448 Beiersdorf AG 289,433 0.081,067 Covestro AG 75,109 0.029,751 Daimler AG 911,907 0.259,771 Deutsche Post AG Reg 664,912 0.19
13,012 E.ON SE 157,052 0.04819 HelloFresh SE 74,603 0.02
7,561 Infineon Technologies AG 308,289 0.09431 Knorr-Bremse AG 53,625 0.02
1,892 Rheinmetall AG 196,588 0.06126 SAP SE 17,521 0.01
11,537 Siemens AG Reg 1,869,793 0.52
BlackRock Systematic ESG World Equity Fund
Portfolio of Investments as at 31 May 2021
The notes on pages 590 to 610 form an integral part of these financial statements.
Annual report and audited financial statements [505]

Holding Description
MarketValue
USD
% ofNet
Assets
Germany continued2,323 Siemens Energy AG 73,625 0.025,414 Zalando SE 576,813 0.16
7,652,019 2.14
Hong Kong67,600 AIA Group Ltd 864,048 0.24
295,000 BOC Hong Kong Holdings Ltd^ 1,066,189 0.30220,500 MTR Corp Ltd 1,227,360 0.34222,800 Swire Properties Ltd 655,965 0.1910,000 Vitasoy International Holdings
Ltd 39,106 0.01
3,852,668 1.08
Ireland10,870 Accenture Plc ’A’ 3,067,079 0.855,692 Allegion Plc 799,612 0.221,294 Flutter Entertainment Plc 243,196 0.072,265 Kingspan Group Plc 212,844 0.06
500 Linde Plc 150,300 0.04244 Medtronic Plc 30,888 0.01
14,583 Perrigo Co Plc 672,860 0.194,767 Trane Technologies Plc 888,569 0.25
6,065,348 1.69
Israel139,057 Bank Hapoalim BM 1,182,343 0.3324,925 Israel Discount Bank Ltd ’A’ 124,040 0.04
390 Nice Ltd 85,488 0.021,003 Teva Pharmaceutical Indus-
tries Ltd 10,629 0.00
1,402,500 0.39
Italy52,111 Enel SpA 514,176 0.14
181,143 Intesa Sanpaolo SpA 535,867 0.1518 Italgas SpA 119 0.00
42,861 Pirelli & C SpA 254,476 0.071,409 Prysmian SpA 48,818 0.02
1,353,456 0.38
Japan3,600 Aeon Co Ltd^ 96,271 0.03
29,300 Alps Alpine Co Ltd 314,539 0.0982,300 Asahi Kasei Corp 904,519 0.2525,900 Astellas Pharma Inc 424,619 0.127,500 Azbil Corp^ 299,959 0.084,200 Benesse Holdings Inc^ 96,304 0.033,600 Bridgestone Corp 157,804 0.04
14,800 Dai Nippon Printing Co Ltd 318,435 0.095,100 Daikin Industries Ltd 1,004,975 0.283,600 Denso Corp 246,359 0.071,200 Dowa Holdings Co Ltd 49,635 0.011,300 Ebara Corp 64,028 0.02
50,000 ENEOS Holdings Inc 206,357 0.061,400 FANUC Corp 335,826 0.091,100 Fast Retailing Co Ltd 894,628 0.254,400 Hitachi Transport System Ltd 140,058 0.047,800 Honda Motor Co Ltd 238,539 0.07
123,100 Inpex Corp^ 845,442 0.246,000 Japan Post Holdings Co Ltd 49,843 0.019,700 Kansai Paint Co Ltd 261,433 0.07
57,000 KDDI Corp 1,932,406 0.541,500 Keyence Corp 737,003 0.21
13,800 Komatsu Ltd 403,150 0.11800 Kyowa Exeo Corp 19,628 0.01
1,400 Lintec Corp 30,876 0.0111,500 Mitsubishi Chemical Holdings
Corp 91,841 0.035,800 Mitsubishi Corp 157,855 0.04
38,300 Mitsubishi Materials Corp 810,434 0.231,900 Mitsui Mining & Smelting Co
Ltd 56,061 0.02
Holding Description
MarketValue
USD
% ofNet
Assets
Japan continued10,600 MS&AD Insurance Group
Holdings Inc 323,201 0.092,000 Nidec Corp 228,566 0.065,000 Nikon Corp 51,168 0.011,000 Nintendo Co Ltd 617,475 0.178,100 Nippon Paint Holdings Co Ltd^ 117,023 0.033,300 Nippon Telegraph & Telephone
Corp 88,234 0.02800 Nippon Yusen KK 32,944 0.01
5,300 Nitto Denko Corp 410,407 0.113,600 NOK Corp 44,163 0.01
45,900 Nomura Holdings Inc 251,604 0.077,000 Nomura Research Institute Ltd 222,820 0.06
12,000 Omron Corp 943,451 0.2629,900 Panasonic Corp 340,070 0.091,200 Persol Holdings Co Ltd 22,711 0.01
23,800 Recruit Holdings Co Ltd 1,205,846 0.34900 Secom Co Ltd 70,348 0.02
12,100 Sekisui House Ltd 251,403 0.0715,700 SoftBank Corp 201,405 0.068,700 SoftBank Group Corp^ 655,119 0.181,300 Sohgo Security Services Co
Ltd 59,404 0.026,900 Sompo Holdings Inc^ 277,158 0.081,900 Sony Corp 186,898 0.053,500 Stanley Electric Co Ltd 104,068 0.03
335,000 Sumitomo Chemical Co Ltd 1,833,273 0.515,200 Sumitomo Metal Mining Co Ltd 232,776 0.07
44,600 Sumitomo Mitsui FinancialGroup Inc 1,607,211 0.45
11,300 Sumitomo Rubber IndustriesLtd 145,940 0.04
2,300 Sysmex Corp 234,112 0.07700 Taisei Corp 24,389 0.01
37,800 Takeda Pharmaceutical CoLtd^ 1,282,180 0.36
9,100 Teijin Ltd 146,659 0.043,200 Tokio Marine Holdings Inc 151,157 0.042,300 Tokyo Electron Ltd 1,020,777 0.285,300 Tokyo Gas Co Ltd 104,729 0.03
67,000 Toray Industries Inc^ 434,241 0.124,400 Toyota Motor Corp^ 365,797 0.10
700 Yaskawa Electric Corp^ 33,902 0.017,000 Z Holdings Corp 32,855 0.01
25,544,311 7.13
Jersey1,415 Aptiv Plc 212,844 0.065,656 Ferguson Plc 768,115 0.21
128,455 Glencore Plc 585,106 0.1619,094 Janus Henderson Group Plc^ 735,310 0.21
2,301,375 0.64
Netherlands7,754 Akzo Nobel NV 997,399 0.282,744 ASML Holding NV 1,845,512 0.525,949 Heineken NV 711,496 0.202,970 JDE Peet’s NV 118,488 0.03
18,420 Koninklijke Ahold Delhaize NV 532,883 0.1517,493 NN Group NV 886,389 0.257,464 PostNL NV 43,842 0.015,966 Randstad NV 466,998 0.135,886 Stellantis NV 117,461 0.033,697 STMicroelectronics NV^ 138,851 0.04
5,859,319 1.64
New Zealand51,462 Air New Zealand Ltd 62,467 0.0211,035 Contact Energy Ltd 63,204 0.0223,671 Fisher & Paykel Healthcare
Corp Ltd 512,545 0.14
BlackRock Systematic ESG World Equity Fund continued
Portfolio of Investments as at 31 May 2021
The notes on pages 590 to 610 form an integral part of these financial statements.
BlackRock Strategic Funds[506]
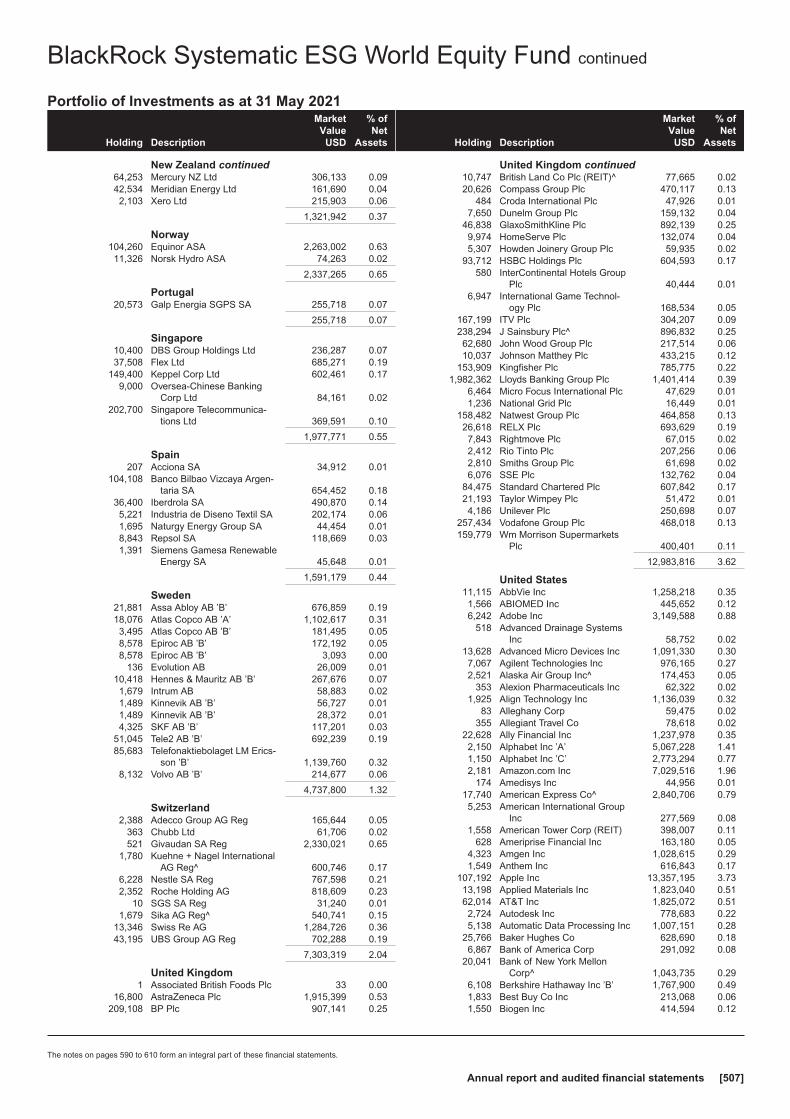
Holding Description
MarketValue
USD
% ofNet
Assets
New Zealand continued64,253 Mercury NZ Ltd 306,133 0.0942,534 Meridian Energy Ltd 161,690 0.042,103 Xero Ltd 215,903 0.06
1,321,942 0.37
Norway104,260 Equinor ASA 2,263,002 0.6311,326 Norsk Hydro ASA 74,263 0.02
2,337,265 0.65
Portugal20,573 Galp Energia SGPS SA 255,718 0.07
255,718 0.07
Singapore10,400 DBS Group Holdings Ltd 236,287 0.0737,508 Flex Ltd 685,271 0.19
149,400 Keppel Corp Ltd 602,461 0.179,000 Oversea-Chinese Banking
Corp Ltd 84,161 0.02202,700 Singapore Telecommunica-
tions Ltd 369,591 0.10
1,977,771 0.55
Spain207 Acciona SA 34,912 0.01
104,108 Banco Bilbao Vizcaya Argen-taria SA 654,452 0.18
36,400 Iberdrola SA 490,870 0.145,221 Industria de Diseno Textil SA 202,174 0.061,695 Naturgy Energy Group SA 44,454 0.018,843 Repsol SA 118,669 0.031,391 Siemens Gamesa Renewable
Energy SA 45,648 0.01
1,591,179 0.44
Sweden21,881 Assa Abloy AB ’B’ 676,859 0.1918,076 Atlas Copco AB ’A’ 1,102,617 0.313,495 Atlas Copco AB ’B’ 181,495 0.058,578 Epiroc AB ’B’ 172,192 0.058,578 Epiroc AB ’B’ 3,093 0.00
136 Evolution AB 26,009 0.0110,418 Hennes & Mauritz AB ’B’ 267,676 0.071,679 Intrum AB 58,883 0.021,489 Kinnevik AB ’B’ 56,727 0.011,489 Kinnevik AB ’B’ 28,372 0.014,325 SKF AB ’B’ 117,201 0.03
51,045 Tele2 AB ’B’ 692,239 0.1985,683 Telefonaktiebolaget LM Erics-
son ’B’ 1,139,760 0.328,132 Volvo AB ’B’ 214,677 0.06
4,737,800 1.32
Switzerland2,388 Adecco Group AG Reg 165,644 0.05
363 Chubb Ltd 61,706 0.02521 Givaudan SA Reg 2,330,021 0.65
1,780 Kuehne + Nagel InternationalAG Reg^ 600,746 0.17
6,228 Nestle SA Reg 767,598 0.212,352 Roche Holding AG 818,609 0.23
10 SGS SA Reg 31,240 0.011,679 Sika AG Reg^ 540,741 0.15
13,346 Swiss Re AG 1,284,726 0.3643,195 UBS Group AG Reg 702,288 0.19
7,303,319 2.04
United Kingdom1 Associated British Foods Plc 33 0.00
16,800 AstraZeneca Plc 1,915,399 0.53209,108 BP Plc 907,141 0.25
Holding Description
MarketValue
USD
% ofNet
Assets
United Kingdom continued10,747 British Land Co Plc (REIT)^ 77,665 0.0220,626 Compass Group Plc 470,117 0.13
484 Croda International Plc 47,926 0.017,650 Dunelm Group Plc 159,132 0.04
46,838 GlaxoSmithKline Plc 892,139 0.259,974 HomeServe Plc 132,074 0.045,307 Howden Joinery Group Plc 59,935 0.02
93,712 HSBC Holdings Plc 604,593 0.17580 InterContinental Hotels Group
Plc 40,444 0.016,947 International Game Technol-
ogy Plc 168,534 0.05167,199 ITV Plc 304,207 0.09238,294 J Sainsbury Plc^ 896,832 0.2562,680 John Wood Group Plc 217,514 0.0610,037 Johnson Matthey Plc 433,215 0.12
153,909 Kingfisher Plc 785,775 0.221,982,362 Lloyds Banking Group Plc 1,401,414 0.39
6,464 Micro Focus International Plc 47,629 0.011,236 National Grid Plc 16,449 0.01
158,482 Natwest Group Plc 464,858 0.1326,618 RELX Plc 693,629 0.197,843 Rightmove Plc 67,015 0.022,412 Rio Tinto Plc 207,256 0.062,810 Smiths Group Plc 61,698 0.026,076 SSE Plc 132,762 0.04
84,475 Standard Chartered Plc 607,842 0.1721,193 Taylor Wimpey Plc 51,472 0.014,186 Unilever Plc 250,698 0.07
257,434 Vodafone Group Plc 468,018 0.13159,779 Wm Morrison Supermarkets
Plc 400,401 0.11
12,983,816 3.62
United States11,115 AbbVie Inc 1,258,218 0.351,566 ABIOMED Inc 445,652 0.126,242 Adobe Inc 3,149,588 0.88
518 Advanced Drainage SystemsInc 58,752 0.02
13,628 Advanced Micro Devices Inc 1,091,330 0.307,067 Agilent Technologies Inc 976,165 0.272,521 Alaska Air Group Inc^ 174,453 0.05
353 Alexion Pharmaceuticals Inc 62,322 0.021,925 Align Technology Inc 1,136,039 0.32
83 Alleghany Corp 59,475 0.02355 Allegiant Travel Co 78,618 0.02
22,628 Ally Financial Inc 1,237,978 0.352,150 Alphabet Inc ’A’ 5,067,228 1.411,150 Alphabet Inc ’C’ 2,773,294 0.772,181 Amazon.com Inc 7,029,516 1.96
174 Amedisys Inc 44,956 0.0117,740 American Express Co^ 2,840,706 0.795,253 American International Group
Inc 277,569 0.081,558 American Tower Corp (REIT) 398,007 0.11
628 Ameriprise Financial Inc 163,180 0.054,323 Amgen Inc 1,028,615 0.291,549 Anthem Inc 616,843 0.17
107,192 Apple Inc 13,357,195 3.7313,198 Applied Materials Inc 1,823,040 0.5162,014 AT&T Inc 1,825,072 0.512,724 Autodesk Inc 778,683 0.225,138 Automatic Data Processing Inc 1,007,151 0.28
25,766 Baker Hughes Co 628,690 0.186,867 Bank of America Corp 291,092 0.08
20,041 Bank of New York MellonCorp^ 1,043,735 0.29
6,108 Berkshire Hathaway Inc ’B’ 1,767,900 0.491,833 Best Buy Co Inc 213,068 0.061,550 Biogen Inc 414,594 0.12
BlackRock Systematic ESG World Equity Fund continued
Portfolio of Investments as at 31 May 2021
The notes on pages 590 to 610 form an integral part of these financial statements.
Annual report and audited financial statements [507]

Holding Description
MarketValue
USD
% ofNet
Assets
United States continued1,823 BioMarin Pharmaceutical Inc 140,918 0.04
468 Booking Holdings Inc 1,105,205 0.3111,287 BorgWarner Inc 578,910 0.1637,720 Bristol-Myers Squibb Co 2,478,958 0.69
762 Builders FirstSource Inc 33,939 0.014,278 Cadence Design Systems Inc 543,263 0.15
13,748 Carrier Global Corp 631,446 0.185,057 Caterpillar Inc 1,219,142 0.34
22,969 CBRE Group Inc ’A’ 2,016,219 0.564,523 Centene Corp 332,893 0.094,324 Cerner Corp 338,353 0.097,741 CH Robinson Worldwide Inc 751,032 0.218,101 Charles Schwab Corp 598,259 0.17
22,003 Chevron Corp 2,283,691 0.6439 Chipotle Mexican Grill Inc 53,507 0.01
6,743 Cigna Corp 1,745,426 0.494,459 Cisco Systems Inc 235,881 0.074,656 Citigroup Inc 366,474 0.104,917 Clorox Co 868,981 0.241,436 CME Group Inc 314,139 0.09
38,914 Coca-Cola Co 2,151,555 0.605,239 Cognizant Technology Solu-
tions Corp ’A’ 374,903 0.1030,107 Colgate-Palmolive Co 2,522,364 0.701,022 Columbia Sportswear Co 104,990 0.03
27,359 Comcast Corp ’A’ 1,568,765 0.4426,987 Conagra Brands Inc 1,028,205 0.29
987 ConocoPhillips 55,015 0.0215,843 Consolidated Edison Inc 1,223,713 0.343,134 Corning Inc 136,736 0.044,556 Costco Wholesale Corp 1,723,398 0.483,323 CSX Corp 332,699 0.092,896 Cummins Inc 745,083 0.21
33,678 CVS Health Corp 2,911,126 0.81183 Danaher Corp 46,874 0.01613 Deckers Outdoor Corp 205,625 0.06
3,146 Deere & Co 1,136,021 0.3212,517 Delta Air Lines Inc 596,811 0.17
910 DexCom Inc 336,145 0.091,347 Donaldson Co Inc 82,962 0.02
970 DR Horton Inc 92,431 0.035,693 eBay Inc 346,590 0.103,551 Ecolab Inc 763,749 0.213,192 Edison International 178,337 0.053,750 Edwards Lifesciences Corp 359,625 0.103,113 Eli Lilly and Co 621,791 0.17
438 EMCOR Group Inc 55,236 0.025,942 EOG Resources Inc 477,380 0.132,020 Equinix Inc (REIT)^ 1,488,174 0.426,406 Equity Residential (REIT) 496,145 0.14
296 Estee Lauder Cos Inc ’A’ 90,730 0.031,405 Etsy Inc 231,446 0.06
11,191 Exelon Corp 504,938 0.1419,751 Expeditors International of
Washington Inc^ 2,482,503 0.6911,014 Facebook Inc ’A’ 3,620,632 1.01
76 FactSet Research Systems Inc 25,411 0.013,756 FedEx Corp 1,182,426 0.33
15,184 Fidelity National InformationServices Inc 2,262,112 0.63
6,296 Flowserve Corp^ 266,887 0.079,439 Genuine Parts Co 1,237,642 0.35
10,464 Gilead Sciences Inc 691,775 0.191,356 Hartford Financial Services
Group Inc 88,615 0.022,486 Hasbro Inc 238,581 0.072,312 HCA Healthcare Inc 496,594 0.14
69,099 Hewlett Packard Enterprise Co 1,102,820 0.31528 Hexcel Corp 31,395 0.01
3,497 Hilton Worldwide Holdings Inc 438,069 0.1213,208 Hologic Inc 832,897 0.23
Holding Description
MarketValue
USD
% ofNet
Assets
United States continued8,645 Home Depot Inc 2,756,977 0.779,330 HP Inc 272,716 0.081,122 HubSpot Inc 565,914 0.162,300 Humana Inc 1,006,710 0.28
14,737 Huntington Bancshares Inc 233,729 0.061,761 IDEXX Laboratories Inc 982,832 0.27
941 Illinois Tool Works Inc 218,086 0.061,346 Illumina Inc 545,991 0.15
147 Ingersoll Rand Inc 7,297 0.002,373 Insulet Corp 639,927 0.18
52,473 Intel Corp 2,997,258 0.847,203 International Business Ma-
chines Corp 1,035,359 0.296,658 Intuit Inc^ 2,923,461 0.821,712 Itron Inc 163,239 0.051,134 ITT Inc 106,483 0.034,539 J M Smucker Co 605,003 0.17
23,449 Johnson & Johnson 3,968,743 1.1116,525 JPMorgan Chase & Co 2,714,066 0.76
265 Kansas City Southern 78,885 0.0228,664 Kellogg Co 1,877,205 0.5210,512 KeyCorp 242,196 0.07
470 Keysight Technologies Inc 66,919 0.0285,720 Kinder Morgan Inc 1,572,105 0.44
225 Laboratory Corp of AmericaHoldings 61,758 0.02
1,421 Lam Research Corp 923,437 0.263,084 Lennar Corp ’A’ 305,347 0.08
566 Lennox International Inc 198,060 0.06825 LHC Group Inc 162,401 0.05
1,781 Lincoln National Corp 124,296 0.034,559 LKQ Corp 232,327 0.067,879 Lowe’s Cos Inc 1,535,066 0.438,772 Marsh & McLennan Cos Inc 1,213,606 0.34
13,983 Masco Corp 843,315 0.247,023 Mastercard Inc ’A’ 2,532,353 0.716,954 McDonald’s Corp 1,626,471 0.452,618 McKesson Corp 503,677 0.142,201 MDU Resources Group Inc 74,086 0.02
385 MercadoLibre Inc 523,088 0.151,818 Mercury Systems Inc 118,988 0.03
32,411 MetLife Inc^ 2,118,383 0.59409 Mettler-Toledo International Inc 532,089 0.15751 MGM Resorts International 32,195 0.01
38,190 Microsoft Corp 9,535,279 2.66931 Moderna Inc 172,244 0.05
7,684 Molson Coors Beverage Co ’B’ 448,131 0.1229,957 Morgan Stanley 2,724,589 0.761,250 Netflix Inc 628,513 0.18
13,414 New York Community BancorpInc 160,566 0.04
13,338 NextEra Energy Inc 976,608 0.276,671 NIKE Inc ’B’ 910,325 0.254,920 NVIDIA Corp 3,196,918 0.89
527 Okta Inc 117,226 0.031,618 Oshkosh Corp 212,670 0.065,590 Otis Worldwide Corp 437,865 0.12
471 Owens Corning 50,232 0.015,950 Paychex Inc 601,783 0.17
11,408 PayPal Holdings Inc 2,966,308 0.8317,657 PepsiCo Inc 2,612,177 0.739,372 Pfizer Inc 362,978 0.101,357 Phillips 66 114,287 0.031,942 PPG Industries Inc 349,016 0.105,137 Procter & Gamble Co 692,724 0.192,390 Progressive Corp 236,801 0.077,395 Prologis Inc (REIT) 871,427 0.242,882 PTC Inc 386,591 0.114,936 PulteGroup Inc 285,251 0.08
10,564 QUALCOMM Inc 1,421,281 0.40872 Quidel Corp 102,992 0.03
BlackRock Systematic ESG World Equity Fund continued
Portfolio of Investments as at 31 May 2021
The notes on pages 590 to 610 form an integral part of these financial statements.
BlackRock Strategic Funds[508]

Holding Description
MarketValue
USD
% ofNet
Assets
United States continued696 Regeneron Pharmaceuticals
Inc 349,691 0.1049,844 Regions Financial Corp^ 1,166,848 0.336,433 Reliance Steel & Aluminum
Co^ 1,081,194 0.30875 ResMed Inc 180,119 0.05928 Robert Half International Inc 82,397 0.02
1,805 Rockwell Automation Inc^ 476,015 0.13119 Roku Inc 41,259 0.01
1,294 Roper Technologies Inc 582,313 0.165,951 salesforce.com Inc 1,416,933 0.403,623 SBA Communications Corp
(REIT) 1,080,089 0.302,518 ServiceNow Inc 1,193,230 0.33
73,434 Sirius XM Holdings Inc 458,963 0.133,854 Snap Inc ’A’ 239,410 0.079,558 Southwest Airlines Co 587,435 0.163,554 Square Inc ’A’ 790,836 0.22
11,045 Starbucks Corp 1,257,805 0.354,527 State Street Corp 393,758 0.11
423 Synopsys Inc 107,586 0.031,776 Sysco Corp 143,856 0.045,275 T Rowe Price Group Inc^ 1,009,371 0.281,956 Tandem Diabetes Care Inc 167,023 0.055,431 Tapestry Inc 243,798 0.075,237 Target Corp 1,188,380 0.331,892 Teladoc Health Inc 284,897 0.088,124 Terminix Global Holdings Inc 400,838 0.114,547 Tesla Inc^ 2,842,875 0.797,014 Texas Instruments Inc 1,331,398 0.372,749 Thermo Fisher Scientific Inc 1,290,656 0.362,098 Timken Co^ 185,568 0.05
19,424 TJX Cos Inc 1,311,897 0.37616 Travel + Leisure Co 40,132 0.01
14,302 Travelers Cos Inc 2,284,029 0.6411,674 Truist Financial Corp 721,220 0.2013,573 UGI Corp 625,037 0.175,265 United Parcel Service Inc ’B’ 1,129,869 0.32
Holding Description
MarketValue
USD
% ofNet
Assets
United States continued9,005 UnitedHealth Group Inc 3,709,340 1.03
10,154 Verizon Communications Inc 573,599 0.162,362 Vertex Pharmaceuticals Inc 492,784 0.148,540 VF Corp 680,809 0.19
15,908 Visa Inc ’A’^ 3,615,888 1.019,766 Voya Financial Inc 639,868 0.183,118 Walgreens Boots Alliance Inc 164,194 0.05
17,991 Walt Disney Co 3,214,092 0.903,938 Waters Corp 1,269,021 0.35
15,744 Wells Fargo & Co 735,560 0.204,846 Western Union Co 118,582 0.031,532 Weyerhaeuser Co (REIT) 58,155 0.02
682 Wintrust Financial Corp 54,846 0.023,195 Workday Inc ’A’ 730,760 0.204,650 WW Grainger Inc 2,149,044 0.60
458 Wyndham Hotels & ResortsInc^ 34,377 0.01
10,845 Xylem Inc^ 1,281,011 0.36847 Zebra Technologies Corp ’A’ 421,001 0.12
1,891 Zendesk Inc 258,424 0.072,024 Zions Bancorp NA 117,149 0.032,479 Zoetis Inc 437,990 0.12
507 Zoom Video CommunicationsInc ’A’ 168,086 0.05
1,282 Zscaler Inc 248,964 0.07
225,420,376 62.91
Total Common Stocks 353,851,268 98.75
Total Transferable Securities and Money MarketInstruments Admitted to an Official Stock ExchangeListing or Dealt in on Another Regulated Market 353,851,268 98.75
Securities portfolio at market value 353,851,268 98.75
Other Net Assets 4,487,403 1.25
Total Net Assets (USD) 358,338,671 100.00
^ All or a portion of this security represents a security on loan.
Numberof
contractsCurrencyof contracts
Contract/Description
Expirationdate
Grossunderlying
exposureUSD
Net unrealisedappreciation/
(depreciation)USD
Financial Derivative Instruments
FUTURES
11 USD E-Mini S&P 500 Index Futures June 2021 June 2021 2,313,080 880
10 USD MSCI EAFE Index Futures June 2021 June 2021 1,166,500 (736)
Total 3,479,580 144
BlackRock Systematic ESG World Equity Fund continued
Portfolio of Investments as at 31 May 2021
The notes on pages 590 to 610 form an integral part of these financial statements.
Annual report and audited financial statements [509]

Currency Purchases Currency Sales CounterpartyMaturity
date
Netunrealised
appreciation/(depreciation)
USD
Financial Derivative Instruments
OPEN FORWARD FOREIGN EXCHANGE TRANSACTIONS
EUR Hedged Share Class
EUR 8,793 USD 10,627State Street Bank& Trust Company 15/6/2021 106
USD 345 EUR 284State Street Bank& Trust Company 15/6/2021 (1)
105
JPY Hedged Share Class
JPY 1,112,004,496 USD 10,187,536State Street Bank& Trust Company 15/6/2021 (44,241)
USD 287,170 JPY 31,329,593State Street Bank& Trust Company 15/6/2021 1,393
(42,848)
Total (Gross underlying exposure - USD 10,440,152) (42,743)
Sector Breakdownas at 31 May 2021
% of NetAssets
Consumer, Non-cyclical 20.97
Financial 19.20
Technology 17.27
Communications 10.81
Consumer, Cyclical 10.49
Industrial 10.19
Basic Materials 4.80
Energy 3.07
Utilities 1.95
Securities portfolio at market value 98.75
Other Net Assets 1.25
100.00
BlackRock Systematic ESG World Equity Fund continued
Portfolio of Investments as at 31 May 2021
The notes on pages 590 to 610 form an integral part of these financial statements.
BlackRock Strategic Funds[510]

Holding Description
MarketValue
USD
% ofNet
Assets
Transferable Securities and Money Market Instruments Admittedto an Official Stock Exchange Listing or Dealt in on AnotherRegulated Market
COMMON STOCKS & PREFERRED STOCKSAustralia
7,187 Aristocrat Leisure Ltd 228,336 0.128,231 BHP Group Ltd^ 304,823 0.17
838 CSL Ltd 188,221 0.104,911 Goodman Group (REIT) 73,851 0.04
56,937 Iluka Resources Ltd 340,192 0.1843,311 Medibank Pvt Ltd 104,919 0.06
334 Mineral Resources Ltd 11,731 0.012,523 REA Group Ltd 319,575 0.17
666 Rio Tinto Ltd 63,777 0.042,016 Scentre Group (REIT) 4,244 0.00
13,515 South32 Ltd 31,171 0.0221,849 Stockland (REIT) 78,970 0.04
1,749,810 0.95
Belgium3,493 Anheuser-Busch InBev SA 263,487 0.14
263,487 0.14
Bermuda3,949 Arch Capital Group Ltd 157,526 0.08
334 Athene Holding Ltd ’A’ 20,918 0.01937 Credicorp Ltd 128,809 0.07
6,970 Essent Group Ltd 333,445 0.1811,283 Genpact Ltd^ 516,085 0.284,329 Invesco Ltd 123,506 0.076,000 Kerry Properties Ltd 19,327 0.01
1,299,616 0.70
Brazil26,859 Ambev SA 91,467 0.051,953 Azul SA (Pref) 16,144 0.01
34,989 Banco Bradesco SA (Pref) 177,321 0.092,095 Banco do Brasil SA 13,510 0.013,738 Cia de Saneamento de Minas
Gerais-COPASA 12,393 0.0127,742 Itau Unibanco Holding
SA (Pref) 157,776 0.0812,822 Petroleo Brasileiro SA (Pref) 66,358 0.041,321 Telefonica Brasil SA 11,239 0.01
17,353 Ultrapar Participacoes SA 63,420 0.0310,206 Vale SA 223,312 0.12
832,940 0.45
Canada10,969 ARC Resources Ltd 85,253 0.054,406 Bank of Montreal 463,411 0.254,167 Bank of Nova Scotia 281,376 0.15
893 Bausch Health Cos Inc 28,524 0.02406 BRP Inc 34,247 0.02
3,872 Canada Goose Holdings Inc 156,158 0.08505 Canadian Apartment Proper-
ties REIT (REIT) 23,098 0.014,165 Canadian Imperial Bank of
Commerce 492,119 0.27789 Canadian Utilities Ltd ’A’ 22,825 0.01
3,410 Canadian Western Bank 105,505 0.06777 Canfor Corp 19,197 0.01
4,720 CGI Inc 422,403 0.231,313 CI Financial Corp 24,464 0.01
413 Colliers International GroupInc 45,917 0.02
Holding Description
MarketValue
USD
% ofNet
Assets
Canada continued535 Emera Inc 25,046 0.01
1,354 Enbridge Inc 51,934 0.031,157 First Quantum Minerals Ltd 28,538 0.02
337 FirstService Corp 54,664 0.03616 Great-West Lifeco Inc 19,044 0.01
3,345 H&R Real Estate InvestmentTrust (REIT) 44,271 0.02
380 IGM Financial Inc 14,053 0.01491 Intact Financial Corp 66,943 0.04158 Kinaxis Inc 17,934 0.01
5,826 Manulife Financial Corp 121,906 0.078,766 Open Text Corp 411,472 0.221,436 Parex Resources Inc 24,806 0.011,079 Parkland Corp 35,367 0.02
280 Pembina Pipeline Corp 9,099 0.01148 Rogers Communications Inc
’B’ 7,669 0.0013,721 Royal Bank of Canada 1,425,421 0.77
873 Shopify Inc ’A’ 1,082,335 0.585,943 Sun Life Financial Inc^ 320,971 0.171,590 Teck Resources Ltd ’B’ 39,258 0.02
22,761 Toronto-Dominion Bank 1,640,736 0.891,045 Waste Connections Inc 126,905 0.07
420 West Fraser Timber Co Ltd 32,678 0.024,126 Wheaton Precious Metals
Corp 197,566 0.11
8,003,113 4.33
Cayman Islands3,797 Alibaba Group Holding Ltd
ADR 812,406 0.44871 Baidu Inc ADR 170,951 0.09
3,500 CK Asset Holdings Ltd 23,180 0.012,122 Herbalife Nutrition Ltd 111,554 0.064,650 JD.com Inc ’A’ 174,471 0.096,961 JD.com Inc ADR 514,696 0.28
359 KE Holdings Inc ADR 18,629 0.0111,000 Logan Group Co Ltd 17,688 0.0114,400 Meituan ’B’ 545,493 0.292,900 NetEase Inc 70,174 0.042,214 NetEase Inc ADR 261,097 0.14
10,019 New Oriental Education &Technology Group Inc ADR 102,494 0.06
2,000 Parade Technologies Ltd 110,849 0.0618,000 Sunac China Holdings Ltd 66,447 0.041,462 TAL Education Group ADR 58,436 0.03
24,100 Tencent Holdings Ltd 1,922,150 1.047,000 Times China Holdings Ltd 9,633 0.015,000 Wuxi Biologics Cayman Inc 78,147 0.04
753 XP Inc ’A’ 29,864 0.02
5,098,359 2.76
China121,500 Agricultural Bank of China Ltd
’A’ 62,187 0.03361,600 Bank of China Ltd ’A’ 189,052 0.10141,100 Bank of Communications Co
Ltd ’A’ 108,550 0.066,200 Baoshan Iron & Steel Co Ltd
’A’ 7,671 0.0020,800 BOE Technology Group Co Ltd
’A’ 20,639 0.013,500 BYD Co Ltd ’A’ 98,198 0.05
134,600 China Construction Bank Corp’A’ 146,449 0.08
BlackRock Systematic Global Equity Fund
Portfolio of Investments as at 31 May 2021
The notes on pages 590 to 610 form an integral part of these financial statements.
Annual report and audited financial statements [511]

Holding Description
MarketValue
USD
% ofNet
Assets
China continued26,000 China Construction Bank Corp
’H’ 21,373 0.0198,400 China Everbright Bank Co Ltd
’A’ 59,170 0.035,000 China Life Insurance Co Ltd
’H’ 10,540 0.0116,000 China Merchants Bank Co Ltd
’A’ 146,176 0.089,939 China Minsheng Banking Corp
Ltd ’A’ 7,365 0.0058,100 China Petroleum & Chemical
Corp ’A’ 40,319 0.0216,200 China Railway Group Ltd ’A’ 13,709 0.0155,704 China Vanke Co Ltd ’A’ 233,510 0.133,500 China Yangtze Power Co Ltd
’A’ 10,913 0.011,700 Contemporary Amperex Tech-
nology Co Ltd ’A’ 115,864 0.0619,320 East Money Information Co
Ltd ’A’ 96,459 0.051,400 Ganfeng Lithium Co Ltd ’H’ 21,015 0.01
15,700 Greenland Holdings Corp Ltd’A’ 14,346 0.01
2,000 Hithink RoyalFlush InformationNetwork Co Ltd ’A’ 37,492 0.02
143,000 Industrial & Commercial Bankof China Ltd ’H’ 93,969 0.05
31,500 Industrial Bank Co Ltd ’A’ 114,293 0.0611,100 Jinke Properties Group Co Ltd
’A’ 10,509 0.01113,700 PetroChina Co Ltd ’A’ 82,473 0.0540,000 PetroChina Co Ltd ’H’ 16,338 0.012,000 Ping An Insurance Group Co
of China Ltd ’H’ 21,763 0.0143,000 Postal Savings Bank of China
Co Ltd ’H’ 30,971 0.023,200 Shenzhen Inovance Technol-
ogy Co Ltd ’A’ 49,482 0.035,967 Shenzhen Mindray Bio-
Medical Electronics Co Ltd’A’ 452,493 0.24
2,100 Spring Airlines Co Ltd ’A’ 21,510 0.014,400 Wanhua Chemical Group Co
Ltd ’A’ 75,147 0.042,000 Will Semiconductor Co Ltd
Shanghai ’A’ 94,513 0.051,440 WuXi AppTec Co Ltd ’H’ 30,837 0.02
2,555,295 1.38
Denmark186 AP Moller - Maersk A/S ’A’ 490,522 0.27291 AP Moller - Maersk A/S ’B’ 802,530 0.43668 Coloplast A/S ’B’ 105,502 0.06
2,631 Novo Nordisk A/S ’B’ 208,112 0.11
1,606,666 0.87
Finland835 Kone Oyj ’B’ 67,562 0.03
2 Neles Oyj 30 0.0052,798 Nordea Bank Abp 569,307 0.31
636,899 0.34
France909 Amundi SA^ 80,982 0.04
11,819 AXA SA 326,846 0.182,856 BNP Paribas SA 195,569 0.113,180 Casino Guichard Perrachon
SA 102,494 0.062,047 CNP Assurances 37,110 0.021,457 Constellium SE 26,022 0.01
10,994 Engie SA 163,742 0.093,774 Eutelsat Communications SA 48,084 0.03
Holding Description
MarketValue
USD
% ofNet
Assets
France continued31 Faurecia SE 1,684 0.00
248 Hermes International 350,026 0.19341 Imerys SA 17,878 0.01401 Kering SA 366,840 0.20
2,372 Legrand SA 249,415 0.132,525 L’Oreal SA 1,137,078 0.61
125 LVMH Moet Hennessy LouisVuitton SE^ 99,997 0.05
690 Pernod Ricard SA 152,290 0.0814,947 Rexel SA^ 304,995 0.171,318 Rubis SCA 63,696 0.03
286 Sodexo SA 27,762 0.023,973 Valeo SA 130,041 0.07
3,882,551 2.10
Germany514 adidas AG 188,374 0.10269 Bayerische Motoren Werke AG 28,577 0.02
7,243 Beiersdorf AG 856,357 0.4618,318 Daimler AG 1,713,087 0.934,626 Deutsche Post AG Reg 314,797 0.17
223 DWS Group GmbH & CoKGaA 10,701 0.01
1,056 Evonik Industries AG 37,915 0.02315 Fielmann AG 25,334 0.01
3,650 HelloFresh SE 332,481 0.18971 Rheinmetall AG 100,892 0.05
7,461 Schaeffler AG (Pref) 70,521 0.045,721 Siemens AG Reg 927,198 0.50
453 Talanx AG 19,117 0.01439 Volkswagen AG 157,191 0.09191 Volkswagen AG (Pref) 53,356 0.03413 Zalando SE 44,001 0.02
4,879,899 2.64
Hong Kong30,400 AIA Group Ltd 388,566 0.21
117,500 BOC Hong Kong Holdings Ltd^ 424,669 0.236,000 Hang Lung Properties Ltd 15,137 0.018,000 Henderson Land Development
Co Ltd 38,242 0.024,000 Hysan Development Co Ltd 15,488 0.01
831 I-CABLE Communications Ltd 10 0.0020,000 Lenovo Group Ltd 23,966 0.0139,000 Link REIT (REIT) 371,354 0.2094,000 MTR Corp Ltd 523,228 0.285,000 New World Development Co
Ltd 26,962 0.026,500 Sun Hung Kai Properties Ltd 99,832 0.052,000 Swire Pacific Ltd ’A’ 15,024 0.01
68,600 Swire Properties Ltd 201,971 0.112,000 Techtronic Industries Co Ltd 36,928 0.026,000 Vitasoy International Holdings
Ltd 23,463 0.01
2,204,840 1.19
Hungary14,227 MOL Hungarian Oil & Gas Plc^ 114,081 0.062,241 OTP Bank Nyrt^ 122,775 0.07
236,856 0.13
Ireland6,878 Accenture Plc ’A’ 1,940,696 1.052,852 Allegion Plc 400,649 0.22
882 Flutter EntertainmentPlc (traded in Ireland) 165,765 0.09
954 Flutter EntertainmentPlc (traded in United King-dom) 178,575 0.10
1,652 Kingspan Group Plc 155,240 0.082,917 Linde Plc 876,850 0.47
BlackRock Systematic Global Equity Fund continued
Portfolio of Investments as at 31 May 2021
The notes on pages 590 to 610 form an integral part of these financial statements.
BlackRock Strategic Funds[512]

Holding Description
MarketValue
USD
% ofNet
Assets
Ireland continued3,120 Medtronic Plc 394,961 0.21
807 Perrigo Co Plc 37,235 0.02
4,149,971 2.24
Israel39,468 Bank Hapoalim BM 335,580 0.188,344 Check Point Software Tech-
nologies Ltd 976,081 0.5332,473 Israel Discount Bank Ltd ’A’ 161,602 0.09
396 Nice Ltd 86,804 0.0519,119 Teva Pharmaceutical Indus-
tries Ltd 202,598 0.1138,381 Teva Pharmaceutical Indus-
tries Ltd ADR 399,162 0.21
2,161,827 1.17
Italy13,029 Pirelli & C SpA 77,356 0.0420,029 Unipol Gruppo SpA 112,220 0.06
189,576 0.10
Japan1,100 AEON Financial Service Co
Ltd 12,772 0.016,600 Aisin Corp^ 288,946 0.16
19,400 Alps Alpine Co Ltd 208,262 0.115,500 Amada Co Ltd 58,391 0.03
14,400 Asahi Kasei Corp 158,263 0.091,100 Bandai Namco Holdings Inc 78,667 0.043,200 Benesse Holdings Inc^ 73,375 0.04
10,800 Bridgestone Corp 473,411 0.26500 Canon Marketing Japan Inc 11,656 0.01
1,200 Casio Computer Co Ltd 20,850 0.012,600 Credit Saison Co Ltd 31,990 0.026,000 Dai Nippon Printing Co Ltd 129,095 0.07
100 Daikin Industries Ltd 19,705 0.011,500 Daiwa House Industry Co Ltd 43,862 0.021,600 DIC Corp 40,788 0.02
300 Disco Corp 91,937 0.05200 Ebara Corp 9,850 0.01
1,600 FANUC Corp 383,802 0.21600 Fast Retailing Co Ltd 487,979 0.26
1,200 Haseko Corp 16,800 0.0111,800 Honda Motor Co Ltd^ 360,866 0.1924,800 Inpex Corp 170,325 0.098,100 Japan Post Bank Co Ltd 68,781 0.04
48,300 Japan Post Holdings Co Ltd^ 401,237 0.222,200 Japan Tobacco Inc 43,392 0.023,300 JTEKT Corp 34,342 0.029,900 KDDI Corp 335,628 0.182,000 Keyence Corp 982,671 0.531,400 Koito Manufacturing Co Ltd^ 90,788 0.051,000 Lintec Corp 22,054 0.01
200 MEIJI Holdings Co Ltd 12,404 0.018,800 Mitsubishi Chemical Holdings
Corp 70,278 0.045,800 Mitsubishi Corp 157,855 0.09
10,000 Mitsubishi Materials Corp 211,602 0.112,200 Mitsui Mining & Smelting Co
Ltd 64,912 0.031,000 MS&AD Insurance Group
Holdings Inc 30,491 0.02400 NGK Spark Plug Co Ltd 6,290 0.00
1,500 NHK Spring Co Ltd 11,985 0.01600 Nidec Corp 68,570 0.04
26,300 Nikon Corp 269,141 0.153,000 Nippon Paint Holdings Co Ltd 43,342 0.022,400 Nippon Telegraph & Telephone
Corp 64,170 0.032,200 Nippon Television Holdings Inc 26,226 0.01
400 Nippon Yusen KK 16,472 0.01
Holding Description
MarketValue
USD
% ofNet
Assets
Japan continued5,000 NOK Corp 61,337 0.03
900 Nomura Research Institute Ltd 28,648 0.022,100 Obayashi Corp 17,660 0.01
100 Obic Co Ltd 18,716 0.01200 Omron Corp 15,724 0.01
14,300 Panasonic Corp^ 162,642 0.09500 Pigeon Corp 14,069 0.01
18,100 Recruit Holdings Co Ltd 917,051 0.50300 Relo Group Inc 6,088 0.00
33,000 Ricoh Co Ltd 390,679 0.21600 Sekisui House Ltd 12,466 0.01400 Shimano Inc 90,478 0.05300 SMC Corp 179,278 0.10
7,800 SoftBank Corp^ 100,061 0.054,300 SoftBank Group Corp^ 323,794 0.177,000 Subaru Corp^ 136,022 0.07
114,400 Sumitomo Chemical Co Ltd 626,049 0.341,500 Sumitomo Corp 20,905 0.01
700 Sumitomo Electric IndustriesLtd 10,704 0.01
800 Sumitomo Heavy IndustriesLtd 24,699 0.01
14,200 Sumitomo Mitsui FinancialGroup Inc 511,713 0.28
40,600 Sumitomo Rubber IndustriesLtd 524,349 0.28
3,300 Suntory Beverage & Food Ltd 121,447 0.071,700 T&D Holdings Inc 23,103 0.01
400 Taisei Corp 13,937 0.01900 Takeda Pharmaceutical Co Ltd 30,528 0.02
7,500 Tokio Marine Holdings Inc 354,273 0.19600 Tokyo Electron Ltd 266,290 0.14
1,200 Tokyo Gas Co Ltd 23,712 0.019,400 Toray Industries Inc 60,923 0.031,100 Toshiba Corp 46,101 0.02
200 Toyo Seikan Group HoldingsLtd 2,736 0.00
900 Toyota Motor Corp 74,822 0.0443,000 Yamada Holdings Co Ltd 208,647 0.112,500 Yokohama Rubber Co Ltd 50,301 0.03
11,674,175 6.31
Jersey1,236 Amcor Plc 14,585 0.015,416 Experian Plc 207,441 0.11
11,181 Glencore Plc 50,929 0.033,417 Janus Henderson Group Plc 131,588 0.07
747 WPP Plc 10,310 0.00
414,853 0.22
Luxembourg4,761 Aroundtown SA 39,929 0.02
673 Globant SA 146,626 0.082,819 RTL Group SA 168,782 0.09
355,337 0.19
Malaysia108,900 AirAsia Group Bhd 22,047 0.01
6,400 Bursa Malaysia Bhd 12,677 0.0165,300 CIMB Group Holdings Bhd 67,762 0.0456,900 Dialog Group Bhd 39,869 0.028,200 Hartalega Holdings Bhd 17,893 0.01
14,900 Hong Leong Bank Bhd 66,471 0.04116,100 IHH Healthcare Bhd 149,189 0.0826,800 Inari Amertron Bhd 20,793 0.0120,500 Kossan Rubber Industries 20,130 0.011,700 Kuala Lumpur Kepong Bhd 9,150 0.00
218,500 Malayan Banking Bhd 433,345 0.2383,600 Maxis Bhd 94,251 0.0540,400 MISC Bhd 67,292 0.0417,300 MR DIY Group M Bhd 16,778 0.01
BlackRock Systematic Global Equity Fund continued
Portfolio of Investments as at 31 May 2021
The notes on pages 590 to 610 form an integral part of these financial statements.
Annual report and audited financial statements [513]

Holding Description
MarketValue
USD
% ofNet
Assets
Malaysia continued2,500 Petronas Chemicals Group
Bhd 4,879 0.003,700 PPB Group Bhd 16,614 0.01
157,200 Press Metal Aluminium Hold-ings Bhd 198,191 0.11
480,500 Public Bank Bhd 490,461 0.26109,300 RHB Bank Bhd 140,451 0.0828,200 Sime Darby Bhd 15,657 0.0116,904 Supermax Corp Bhd 16,927 0.0135,600 Telekom Malaysia Bhd 53,083 0.034,800 Tenaga Nasional Bhd 11,580 0.01
10,100 Westports Holdings Bhd 10,554 0.00
1,996,044 1.08
Marshall Islands294 Danaos Corp 18,737 0.01
18,737 0.01
Mexico413,955 America Movil SAB de CV ’L’ 320,507 0.17
9,568 Arca Continental SAB de CV 53,765 0.032,762 Coca-Cola Femsa SAB de CV
(Unit) 13,422 0.0122,317 Grupo Bimbo SAB de CV ’A’ 49,045 0.0330,425 Grupo Financiero Banorte
SAB de CV ’O’ 209,427 0.1110,609 Grupo Financiero Inbursa SAB
de CV ’O’ 10,650 0.007,006 Grupo Mexico SAB de CV ’B’ 33,990 0.02
690,806 0.37
Netherlands4,440 ABN AMRO Bank NV - CVA 59,474 0.03
728 Akzo Nobel NV 93,643 0.05218 Flow Traders 9,503 0.01
2,380 Heineken NV 284,646 0.154,003 JDE Peet’s NV 159,699 0.09
22,582 Koninklijke Ahold Delhaize NV 653,288 0.351,730 NN Group NV 87,661 0.05
293 NXP Semiconductors NV 61,946 0.0312,634 PostNL NV 74,210 0.0418,831 Randstad NV^ 1,474,025 0.80
561 Signify NV 34,849 0.024,116 Stellantis NV 82,139 0.042,032 Technip Energies NV 30,874 0.02
3,105,957 1.68
New Zealand550 Fisher & Paykel Healthcare
Corp Ltd 11,909 0.01
11,909 0.01
Norway2,296 Equinor ASA 49,836 0.03
49,836 0.03
Russia1,122 LUKOIL PJSC 91,801 0.05
170 MMC Norilsk Nickel PJSC 61,196 0.03
152,997 0.08
Singapore1,400 DBS Group Holdings Ltd 31,808 0.023,656 Flex Ltd 66,795 0.04
30,900 Singapore Telecommunica-tions Ltd 56,341 0.03
2,400 United Overseas Bank Ltd 47,337 0.0237,400 Yangzijiang Shipbuilding Hold-
ings Ltd 42,444 0.02
244,725 0.13
South Africa3,337 AngloGold Ashanti Ltd 82,151 0.04
Holding Description
MarketValue
USD
% ofNet
Assets
South Africa continued15,281 FirstRand Ltd 62,269 0.03
909 Gold Fields Ltd 11,348 0.011,863 Naspers Ltd ’N’ 412,646 0.226,663 Sanlam Ltd 28,842 0.02
16,589 Standard Bank Group Ltd 164,225 0.09
761,481 0.41
South Korea1 Celltrion Inc 247 0.00
247 Hyundai Mobis Co Ltd 62,247 0.03914 Kakao Corp 101,185 0.06695 Korea Electric Power Corp 16,139 0.01151 Korea Zinc Co Ltd 61,362 0.03
1,288 KT Corp 39,647 0.02401 LG Chem Ltd 295,593 0.16
5 LG Household & Health CareLtd 7,016 0.00
1,074 NAVER Corp 350,412 0.1980 NCSoft Corp 62,500 0.03
506 POSCO 161,676 0.098,378 Samsung Electronics Co Ltd 607,020 0.33
1,765,044 0.95
Sweden3,737 Assa Abloy AB ’B’ 115,599 0.06
13,392 Atlas Copco AB ’A’ 816,898 0.442,545 Electrolux AB ’B’ 72,096 0.041,140 Epiroc AB ’A’ 25,922 0.011,140 Epiroc AB ’A’ 412 0.001,420 Epiroc AB ’B’ 28,505 0.021,420 Epiroc AB ’B’ 512 0.00
24,147 Hennes & Mauritz AB ’B’ 620,423 0.34856 Intrum AB 30,020 0.02
2,991 Kinnevik AB ’B’ 113,949 0.062,991 Kinnevik AB ’B’ 56,992 0.034,932 Loomis AB 155,836 0.089,892 Saab AB ’B’ 285,715 0.155,160 SKF AB ’B’ 139,829 0.083,360 Swedish Match AB 31,193 0.02
55,787 Telefonaktiebolaget LM Erics-son ’B’ 742,082 0.40
6,708 Trelleborg AB ’B’ 172,636 0.099,728 Volvo AB ’B’^ 256,810 0.14
3,665,429 1.98
Switzerland4,537 Adecco Group AG Reg 314,711 0.17
587 Chubb Ltd 99,784 0.051,441 Cie Financiere Richemont SA
’A’ Reg 175,074 0.107,630 Credit Suisse Group AG Reg^ 83,481 0.05
73 Givaudan SA Reg 326,471 0.18435 Kuehne + Nagel International
AG Reg^ 146,812 0.0816 Schindler Holding AG Reg 4,631 0.00
2,029 Sika AG Reg^ 653,462 0.35725 Swatch Group AG 263,124 0.14
1,910 Swatch Group AG Reg 132,148 0.07
2,199,698 1.19
Taiwan2,000 ASE Technology Holding Co
Ltd 8,078 0.0034,000 Cathay Financial Holding Co
Ltd 68,850 0.0460,000 China Airlines Ltd 38,145 0.0273,000 CTBC Financial Holding Co
Ltd 60,954 0.0342,000 Delta Electronics Inc 450,353 0.24
350,000 Eva Airways Corp 215,541 0.1259,000 Fubon Financial Holding Co
Ltd 154,526 0.08
BlackRock Systematic Global Equity Fund continued
Portfolio of Investments as at 31 May 2021
The notes on pages 590 to 610 form an integral part of these financial statements.
BlackRock Strategic Funds[514]

Holding Description
MarketValue
USD
% ofNet
Assets
Taiwan continued12,000 Hon Hai Precision Industry Co
Ltd 49,339 0.031,000 Largan Precision Co Ltd 109,763 0.06
25,000 MediaTek Inc 901,105 0.491,000 momo.com Inc 44,919 0.023,000 Novatek Microelectronics Corp 58,033 0.03
22,000 Realtek Semiconductor Corp 397,682 0.2294,000 Taiwan Semiconductor Manu-
facturing Co Ltd 2,032,893 1.1031,000 Tung Ho Steel Enterprise Corp 54,296 0.03
114,000 Uni-President EnterprisesCorp 303,945 0.16
4,948,422 2.67
Thailand7,500 Gulf Energy Development PCL 8,104 0.00
8,104 0.00
Turkey124,035 Turkcell Iletisim Hizmetleri AS 230,640 0.1234,930 Turkiye Garanti Bankasi AS 32,846 0.0241,854 Yapi ve Kredi Bankasi AS 10,640 0.01
274,126 0.15
United Kingdom1,397 Anglo American Plc 62,059 0.032,537 AstraZeneca Plc 289,248 0.165,100 Aviva Plc 29,716 0.022,555 BHP Group Plc 76,862 0.04
110,477 BP Plc 479,266 0.266,338 British American Tobacco Plc^ 243,653 0.131,910 British Land Co Plc (REIT) 13,803 0.01
46,479 Centrica Plc 35,999 0.021,533 Compass Group Plc 34,941 0.02
18,065 Diageo Plc 871,360 0.473,456 Dunelm Group Plc 71,890 0.04
11,003 GlaxoSmithKline Plc 209,578 0.1126,781 HSBC Holdings Plc 172,780 0.092,299 Imperial Brands Plc 52,123 0.031,983 Intertek Group Plc 152,522 0.08
19,994 ITV Plc 36,378 0.023,871 J Sainsbury Plc 14,569 0.013,714 JD Sports Fashion Plc 49,743 0.032,175 JET2 Plc 41,607 0.02
16,837 John Wood Group Plc 58,428 0.038,728 Johnson Matthey Plc 376,717 0.20
73,918 Kingfisher Plc^ 377,385 0.20243,555 Lloyds Banking Group Plc^ 172,179 0.0945,257 Marks & Spencer Group Plc 106,070 0.068,410 Meggitt Plc 60,657 0.03
34,652 Micro Focus International Plc 255,330 0.144,131 RELX Plc 107,648 0.06
35,155 Rentokil Initial Plc 236,022 0.1337,434 Rightmove Plc^ 319,855 0.17
139 Rio Tinto Plc 11,944 0.0111,357 Royal Dutch Shell Plc ’A’ 216,546 0.1210,263 Royal Dutch Shell Plc ’B’ 186,670 0.1019,044 Royal Mail Plc 156,137 0.0913,417 Standard Chartered Plc 96,542 0.0539,772 Wm Morrison Supermarkets
Plc^ 99,667 0.05
5,775,894 3.12
United States1,571 3M Co 318,976 0.17
176 A O Smith Corp 12,508 0.014,891 Abbott Laboratories - CDI 570,535 0.314,939 AbbVie Inc 559,095 0.30
331 ABIOMED Inc 94,196 0.051,340 Adobe Inc 676,137 0.37
703 Advanced Drainage SystemsInc 79,734 0.04
Holding Description
MarketValue
USD
% ofNet
Assets
United States continued2,745 Advanced Micro Devices Inc 219,820 0.121,475 AES Corp 37,480 0.021,112 Affiliated Managers Group Inc 182,368 0.102,162 Aflac Inc 122,542 0.07
786 AGCO Corp 108,759 0.061,070 Agilent Technologies Inc 147,799 0.08
791 Alaska Air Group Inc 54,737 0.033,513 Albertsons Cos Inc 67,414 0.041,453 Alcoa Corp 57,641 0.03
451 Alexion Pharmaceuticals Inc 79,624 0.041,970 Align Technology Inc 1,162,595 0.63
951 Alleghany Corp 681,458 0.37329 Allegiant Travel Co 72,860 0.04411 Alliance Data Systems Corp 49,752 0.03
1,166 Allison Transmission HoldingsInc 49,333 0.03
442 Allstate Corp 60,382 0.031,006 Ally Financial Inc 55,038 0.03
841 Alphabet Inc ’A’ 1,982,111 1.07830 Alphabet Inc ’C’ 2,001,595 1.08
4,753 Altria Group Inc 233,943 0.131,193 Amazon.com Inc 3,845,122 2.084,716 American Eagle Outfitters Inc 167,088 0.091,854 American Express Co 296,881 0.162,368 American International Group
Inc 125,125 0.07320 Ameriprise Financial Inc 83,149 0.04
1,967 Amgen Inc 468,028 0.254,582 Antero Midstream Corp 43,987 0.02
696 Anthem Inc 277,161 0.1547,561 Apple Inc 5,926,576 3.20
599 Aramark 22,373 0.0119,748 AT&T Inc 581,184 0.31
405 Autodesk Inc 115,773 0.061,889 Autoliv Inc 200,291 0.11
510 Baker Hughes Co 12,444 0.0185 Bank OZK 3,630 0.002 Berkshire Hathaway Inc ’A’ 872,000 0.47
1,623 Berkshire Hathaway Inc ’B’ 469,761 0.256,302 Berry Global Group Inc 429,859 0.23
748 Biogen Inc 200,075 0.111,670 BioMarin Pharmaceutical Inc 129,091 0.07
322 Bio-Rad Laboratories Inc ’A’ 193,963 0.10775 Blackstone Mortgage Trust Inc
’A’ (REIT) 24,823 0.011,486 Boeing Co 367,072 0.20
102 Booking Holdings Inc 240,878 0.13375 Booz Allen Hamilton Holding
Corp 31,849 0.025,515 BorgWarner Inc 282,864 0.153,638 Brighthouse Financial Inc 177,025 0.10
20,173 Bristol-Myers Squibb Co 1,325,770 0.72842 Broadcom Inc 397,702 0.21
3,712 Brown & Brown Inc 194,954 0.10341 Bruker Corp 23,679 0.01
1,033 Brunswick Corp 105,604 0.06222 Builders FirstSource Inc 9,888 0.00179 Burlington Stores Inc 57,883 0.03383 Capital One Financial Corp 61,579 0.03
8,463 Carrier Global Corp 388,706 0.21175 Carvana Co 46,391 0.02
1,494 Caterpillar Inc 360,174 0.193,697 CBRE Group Inc ’A’ 324,523 0.184,163 Centene Corp 306,397 0.172,399 CenterPoint Energy Inc 60,695 0.03
879 CH Robinson Worldwide Inc 85,281 0.057,781 Charles Schwab Corp 574,627 0.31
388 Charter Communications Inc’A’ 269,478 0.15
2,197 Chegg Inc 168,971 0.095,331 Chevron Corp 553,304 0.30
BlackRock Systematic Global Equity Fund continued
Portfolio of Investments as at 31 May 2021
The notes on pages 590 to 610 form an integral part of these financial statements.
Annual report and audited financial statements [515]

Holding Description
MarketValue
USD
% ofNet
Assets
United States continued35 Chipotle Mexican Grill Inc 48,019 0.03
1,449 Choice Hotels International Inc 175,199 0.093,338 Cigna Corp 864,041 0.47
191 Clean Harbors Inc 17,782 0.01551 Cloudflare Inc ’A’ 45,215 0.02774 CMS Energy Corp 48,561 0.03
11,317 Coca-Cola Co 625,717 0.346,432 Cognizant Technology Solu-
tions Corp ’A’ 460,274 0.255,907 Colgate-Palmolive Co 494,888 0.27
12,597 Comcast Corp ’A’ 722,312 0.392,934 Conagra Brands Inc 111,785 0.065,220 Consolidated Edison Inc 403,193 0.22
167 Cooper Cos Inc 65,706 0.046,162 Corning Inc 268,848 0.14
110 CoStar Group Inc 93,940 0.051,233 Costco Wholesale Corp 466,407 0.25
374 Coupa Software Inc 89,087 0.05197 Credit Acceptance Corp 88,150 0.05400 Cummins Inc 102,912 0.06272 Curtiss-Wright Corp 34,087 0.02
3,662 CVS Health Corp 316,543 0.17323 Danaher Corp 82,733 0.04246 Darden Restaurants Inc 35,235 0.02
2,127 Darling Ingredients Inc 145,614 0.082,615 Deere & Co 944,276 0.51
432 Delta Air Lines Inc 20,598 0.01265 DexCom Inc 97,888 0.05
1,268 Dick’s Sporting Goods Inc 123,668 0.07378 Discovery Inc ’C’ 11,359 0.01473 DocuSign Inc 95,366 0.05
2,799 Donaldson Co Inc 172,390 0.096,900 DR Horton Inc 657,501 0.35
541 DTE Energy Co 74,653 0.042,037 Duke Energy Corp 204,148 0.111,476 East West Bancorp Inc 110,375 0.06
591 Emergent BioSolutions Inc 35,844 0.02561 EOG Resources Inc 45,071 0.02733 Equinix Inc (REIT) 540,016 0.29
9,017 Equitrans Midstream Corp 74,300 0.044,329 Equity Residential (REIT) 335,281 0.18
495 Estee Lauder Cos Inc ’A’ 151,727 0.08338 Etsy Inc 55,679 0.03
2,146 Euronet Worldwide Inc 321,127 0.17302 Eversource Energy 24,519 0.01
2,692 Exelon Corp 121,463 0.07371 Expedia Group Inc 65,648 0.04
4,192 Expeditors International ofWashington Inc 526,892 0.28
11,047 Exxon Mobil Corp 644,813 0.356,358 Facebook Inc ’A’ 2,090,065 1.131,016 FedEx Corp 319,847 0.17
11,435 Fidelity National InformationServices Inc 1,703,586 0.92
1,917 Fifth Third Bancorp 80,782 0.042,720 First American Financial Corp 174,923 0.09
346 Flowserve Corp 14,667 0.015,388 Franklin Resources Inc 184,323 0.102,459 Gartner Inc 570,095 0.311,667 General Mills Inc 104,788 0.063,340 Genuine Parts Co 437,941 0.244,794 Gilead Sciences Inc 316,931 0.17
811 Global Payments Inc 157,099 0.08457 GoDaddy Inc ’A’ 36,999 0.02508 Goldman Sachs Group Inc 188,986 0.10214 Graco Inc 16,204 0.01773 Guidewire Software Inc 75,553 0.04215 Hanover Insurance Group Inc 29,990 0.02
2,730 Hartford Financial ServicesGroup Inc 178,405 0.10
549 Hasbro Inc^ 52,688 0.03
Holding Description
MarketValue
USD
% ofNet
Assets
United States continued1,023 Henry Schein Inc 77,789 0.04
14,187 Hewlett Packard Enterprise Co 226,425 0.12481 Hexcel Corp 28,600 0.02142 Hill-Rom Holdings Inc 15,802 0.01756 Hilton Worldwide Holdings Inc 94,704 0.05
2,054 Hologic Inc 129,525 0.073,012 Home Depot Inc 960,557 0.523,324 HP Inc 97,161 0.05
120 HubSpot Inc 60,526 0.03365 Humana Inc 159,760 0.09
2,846 Huntington Bancshares Inc 45,138 0.0223 IDEXX Laboratories Inc 12,837 0.01
866 Illinois Tool Works Inc 200,704 0.117,278 Ingersoll Rand Inc 361,280 0.19
37,174 Intel Corp 2,123,379 1.154,000 Intuit Inc 1,756,360 0.95
196 ITT Inc 18,404 0.013,690 J M Smucker Co 491,840 0.27
537 Jabil Inc 30,314 0.027,372 Jefferies Financial Group Inc 236,862 0.13
186 John Bean Technologies Corp 26,790 0.0110,673 Johnson & Johnson 1,806,405 0.98
269 Jones Lang LaSalle Inc 54,405 0.037,929 JPMorgan Chase & Co 1,302,259 0.702,080 KB Home 97,365 0.055,077 Kellogg Co 332,493 0.182,097 KeyCorp 48,315 0.031,611 Keysight Technologies Inc 229,374 0.12
50,640 Kinder Morgan Inc 928,738 0.502,286 Kohl’s Corp 126,850 0.07
793 L3Harris Technologies Inc 172,922 0.0999 Laboratory Corp of America
Holdings 27,174 0.01923 Las Vegas Sands Corp 53,303 0.03243 Leggett & Platt Inc 13,372 0.01
5,676 Lennar Corp ’A’ 561,981 0.30490 Lennox International Inc 171,466 0.09212 LHC Group Inc 41,732 0.02
2,562 Lincoln National Corp 178,802 0.10256 Lithia Motors Inc ’A’^ 90,109 0.05798 LKQ Corp 40,666 0.02253 Louisiana-Pacific Corp 17,004 0.01
3,154 Lowe’s Cos Inc 614,494 0.33240 Lumentum Holdings Inc 19,529 0.01
1,554 Manhattan Associates Inc 211,313 0.1149 Markel Corp 60,049 0.03
750 Marriott International Inc ’A’ 107,685 0.06306 Marriott Vacations Worldwide
Corp 52,721 0.03643 Marsh & McLennan Cos Inc 88,959 0.05
10,681 Masco Corp 644,171 0.35171 MasTec Inc 19,892 0.01
2,460 Mastercard Inc ’A’ 887,027 0.48332 MAXIMUS Inc 30,766 0.02
2,064 McDonald’s Corp 482,749 0.263,232 McKesson Corp 621,804 0.346,836 MDU Resources Group Inc 230,100 0.122,417 Medical Properties Trust Inc
(REIT) 51,168 0.03123 MercadoLibre Inc 167,116 0.09
7,040 Merck & Co Inc 534,266 0.29589 Meritage Homes Corp 63,418 0.03
7,500 MetLife Inc 490,200 0.263,041 MGIC Investment Corp 44,764 0.021,615 MGM Resorts International 69,235 0.04
15,684 Microsoft Corp 3,915,981 2.12927 Moderna Inc 171,504 0.09212 Molina Healthcare Inc 53,288 0.03
3,936 Morgan Stanley 357,979 0.191,350 National Fuel Gas Co 70,051 0.041,799 National Vision Holdings Inc 89,356 0.05
BlackRock Systematic Global Equity Fund continued
Portfolio of Investments as at 31 May 2021
The notes on pages 590 to 610 form an integral part of these financial statements.
BlackRock Strategic Funds[516]

Holding Description
MarketValue
USD
% ofNet
Assets
United States continued1,217 Netflix Inc 611,920 0.338,489 New Residential Investment
Corp (REIT) 89,814 0.0513,221 New York Community Bancorp
Inc 158,255 0.095,474 NextEra Energy Inc 400,806 0.221,032 NiSource Inc 26,316 0.01
406 Nordson Corp 90,006 0.052,008 NVIDIA Corp 1,304,758 0.70
457 OGE Energy Corp 15,766 0.01893 Old Dominion Freight Line Inc 237,047 0.13
1,569 OneMain Holdings Inc 90,751 0.053,916 Otis Worldwide Corp 306,740 0.17
839 PacWest Bancorp 37,898 0.02933 Parker-Hannifin Corp 287,504 0.16
6,590 Paychex Inc 666,513 0.3670 Paycom Software Inc 23,072 0.01
3,110 PayPal Holdings Inc 808,662 0.44136 Pegasystems Inc 16,067 0.01
3,862 PepsiCo Inc 571,344 0.3123,630 Pfizer Inc 915,190 0.49
388 Philip Morris International Inc 37,415 0.028,368 Phillips 66 704,753 0.381,096 Planet Fitness Inc ’A’ 86,332 0.05
67 Pool Corp 29,249 0.021 PotlatchDeltic Corp (REIT) 60 0.00
726 PPL Corp 21,134 0.01789 Principal Financial Group Inc 51,593 0.03
6,936 Procter & Gamble Co 935,320 0.511,475 Progressive Corp 146,143 0.08
867 Prologis Inc (REIT) 102,167 0.051,093 Prudential Financial Inc 116,918 0.06
274 PTC Inc 36,754 0.0211,858 PulteGroup Inc 685,274 0.373,197 QTS Realty Trust Inc ’A’
(REIT) 202,626 0.116,595 QUALCOMM Inc 887,291 0.48
360 Quest Diagnostics Inc 47,401 0.032,257 Qurate Retail Inc ’A’ 30,763 0.026,800 Radian Group Inc 158,780 0.091,176 Raymond James Financial Inc 155,926 0.08
127 Regeneron PharmaceuticalsInc 63,809 0.03
1,623 Regions Financial Corp 37,994 0.02667 Reinsurance Group of
America Inc 84,062 0.052,004 Reliance Steel & Aluminum Co 336,812 0.185,859 Republic Services Inc 639,686 0.351,754 Rockwell Automation Inc 462,565 0.25
293 Roku Inc 101,586 0.05969 Ross Stores Inc 122,472 0.07
1,284 Sailpoint Technologies Hold-ings Inc 59,745 0.03
1,272 Santander Consumer USAHoldings Inc 48,209 0.03
1,147 SBA Communications Corp(REIT) 341,944 0.18
104 Seagen Inc 16,156 0.01545 ServiceNow Inc 258,265 0.14686 Sherwin-Williams Co 194,502 0.10625 Signature Bank 156,094 0.08
82,814 Sirius XM Holdings Inc 517,587 0.285,358 Skechers USA Inc ’A’ 254,505 0.142,921 Southern Co 186,710 0.10
238 Southern Copper Corp 16,598 0.014,745 Southwest Airlines Co 291,628 0.161,046 Square Inc ’A’ 232,756 0.13
903 Starwood Property Trust Inc(REIT) 22,927 0.01
1,432 Stifel Financial Corp 99,209 0.051,104 Synchrony Financial 52,341 0.03
Holding Description
MarketValue
USD
% ofNet
Assets
United States continued1,480 T Rowe Price Group Inc 283,198 0.15
193 Tandem Diabetes Care Inc 16,480 0.017,793 Tempur Sealy International Inc 300,030 0.16
587 Terminix Global Holdings Inc 28,963 0.022,121 Tesla Inc 1,326,092 0.72
216 Texas Instruments Inc 41,001 0.021,030 Thermo Fisher Scientific Inc 483,585 0.26
155 Timken Co 13,710 0.0119,722 TJX Cos Inc 1,332,024 0.723,274 Toll Brothers Inc 213,596 0.12
321 Tractor Supply Co 58,326 0.039,838 Travelers Cos Inc 1,571,129 0.85
670 Trimble Inc 52,119 0.033,020 TripAdvisor Inc 131,219 0.072,313 Truist Financial Corp 142,897 0.08
137 Trupanion Inc 12,353 0.012,128 Twitter Inc 123,424 0.074,692 UGI Corp 216,067 0.12
146 Ulta Beauty Inc 50,423 0.033,712 United Parcel Service Inc ’B’ 796,595 0.43
199 United Rentals Inc 66,458 0.046,053 UnitedHealth Group Inc 2,493,352 1.35
81 Universal Display Corp 17,485 0.01114 Vail Resorts Inc 37,264 0.02
1,950 Valvoline Inc 64,350 0.031,116 Vertex Pharmaceuticals Inc 232,831 0.13
898 VF Corp 71,589 0.049,276 VICI Properties Inc (REIT) 288,762 0.164,734 Visa Inc ’A’ 1,076,038 0.582,828 Vontier Corp 99,206 0.05
342 Voya Financial Inc 22,408 0.01304 W R Berkley Corp 23,709 0.01
2,059 Walgreens Boots Alliance Inc 108,427 0.063,909 Walmart Inc 555,195 0.305,687 Walt Disney Co 1,015,983 0.55
114 Waters Corp 36,736 0.029,243 Wells Fargo & Co 431,833 0.23
498 Western Alliance Bancorp 49,805 0.03347 Westlake Chemical Corp 35,002 0.02
3,757 Williams Cos Inc 98,959 0.05273 Wintrust Financial Corp 21,955 0.01276 Workday Inc ’A’ 63,127 0.03126 WW Grainger Inc 58,232 0.03
1,090 Wyndham Hotels & ResortsInc 81,815 0.04
433 Xilinx Inc 54,991 0.031,501 XPO Logistics Inc 220,542 0.12
239 Zebra Technologies Corp ’A’ 118,795 0.0674 Zendesk Inc 10,113 0.01
163 Zillow Group Inc ’A’ 19,281 0.01418 Zillow Group Inc ’C’ 49,040 0.03
2,303 Zscaler Inc 447,243 0.24
103,092,156 55.71
Total Common Stocks & Preferred Stocks 180,957,435 97.78
BlackRock Systematic Global Equity Fund continued
Portfolio of Investments as at 31 May 2021
The notes on pages 590 to 610 form an integral part of these financial statements.
Annual report and audited financial statements [517]

Holding Description
MarketValue
USD
% ofNet
Assets
EXCHANGE TRADED FUNDSFrance
USD 59,712 Lyxor MSCI India UCITS ETF^ 1,459,958 0.79
1,459,958 0.79
Total Exchange Traded Funds 1,459,958 0.79
Total Transferable Securities and Money MarketInstruments Admitted to an Official Stock ExchangeListing or Dealt in on Another Regulated Market 182,417,393 98.57
Securities portfolio at market value 182,417,393 98.57
Other Net Assets 2,649,923 1.43
Total Net Assets (USD) 185,067,316 100.00
^ All or a portion of this security represents a security on loan.
Numberof
contractsCurrencyof contracts
Contract/Description
Expirationdate
Grossunderlying
exposureUSD
Net unrealisedappreciation
USD
Financial Derivative Instruments
FUTURES
6 USD E-Mini S&P 500 Index Futures June 2021 June 2021 1,261,680 10,811
5 USD MSCI EAFE Index Futures June 2021 June 2021 583,250 3,593
4 USD MSCI Emerging Markets Index Futures June 2021 June 2021 274,880 7,530
Total 2,119,810 21,934
Currency Purchases Currency Sales CounterpartyMaturity
date
Netunrealised
appreciation/(depreciation)
USD
Financial Derivative Instruments
OPEN FORWARD FOREIGN EXCHANGE TRANSACTIONS
EUR Hedged Share Class
EUR 592,439 USD 716,401State Street Bank& Trust Company 15/6/2021 6,792
USD 27,379 EUR 22,532State Street Bank& Trust Company 15/6/2021 (126)
6,666
Total (Gross underlying exposure - USD 750,699) 6,666
Sector Breakdownas at 31 May 2021
% of NetAssets
Consumer, Non-cyclical 18.89
Financial 17.75
Technology 17.43
Communications 13.05
Consumer, Cyclical 12.40
Industrial 10.91
Basic Materials 3.39
Energy 2.73
Utilities 1.22
Exchange Traded Funds 0.79
Diversified 0.01
Securities portfolio at market value 98.57
Other Net Assets 1.43
100.00
BlackRock Systematic Global Equity Fund continued
Portfolio of Investments as at 31 May 2021
The notes on pages 590 to 610 form an integral part of these financial statements.
BlackRock Strategic Funds[518]

Holding Description
MarketValue
USD
% ofNet
Assets
Transferable Securities and Money Market Instruments Admittedto an Official Stock Exchange Listing or Dealt in on AnotherRegulated Market
COMMON STOCKS & WARRANTSCayman Islands
18,000 Hedosophia European Growth(Unit) 220,551 0.46
220,551 0.46
Germany3,260 Vantage Towers AG 108,574 0.23
108,574 0.23
Luxembourg2,999 468 Spac I SE (Wts 30/4/2026) 3,294 0.018,996 468 Spac I SE ’A’ 106,164 0.221,576 SUSE SA 57,720 0.12
167,178 0.35
Netherlands3,340 European FinTech IPO Co
1 BV (Wts 26/3/2026) 2,853 0.0110,022 European FinTech IPO Co
1 BV (Unit) 119,251 0.259,928 Pegasus Acquisition Co Eu-
rope BV (Unit) 120,919 0.25
243,023 0.51
Sweden913 Hemnet Group AB 24,003 0.05
24,003 0.05
Switzerland755 PolyPeptide Group AG 63,858 0.13
63,858 0.13
United Kingdom9,462 Allfunds UK Ltd 159,354 0.33
27,827 Alphawave IP Group Plc 120,856 0.2527,712 Trustpilot Group Plc 117,804 0.25
398,014 0.83
Total Common Stocks & Warrants 1,225,201 2.56
BONDSUnited States
USD 7,700,000 United States Treasury Bill1/6/2021 (Zero Coupon) 7,700,000 16.09
USD 1,500,000 United States Treasury Bill3/6/2021 (Zero Coupon) 1,499,997 3.13
USD 5,000,000 United States Treasury Bill8/6/2021 (Zero Coupon) 4,999,998 10.44
USD 2,000,000 United States Treasury Bill10/6/2021 (Zero Coupon) 1,999,984 4.18
USD 1,000,000 United States Treasury Bill15/6/2021 (Zero Coupon) 999,999 2.09
USD 12,000,000 United States Treasury Bill17/6/2021 (Zero Coupon) 11,999,985 25.07
USD 6,000,000 United States Treasury Bill22/6/2021 (Zero Coupon) 5,999,968 12.53
USD 1,000,000 United States Treasury Bill24/6/2021 (Zero Coupon) 999,998 2.09
Holding Description
MarketValue
USD
% ofNet
Assets
United States continuedUSD 1,000,000 United States Treasury Bill
13/7/2021 (Zero Coupon) 999,994 2.09USD 5,000,000 United States Treasury Bill
15/7/2021 (Zero Coupon) 5,000,000 10.45
42,199,923 88.16
Total Bonds 42,199,923 88.16
Total Transferable Securities and Money MarketInstruments Admitted to an Official Stock ExchangeListing or Dealt in on Another Regulated Market 43,425,124 90.72
Securities portfolio at market value 43,425,124 90.72
Other Net Assets 4,440,532 9.28
Total Net Assets (USD) 47,865,656 100.00
BlackRock Systematic Global Long/Short Equity Fund
Portfolio of Investments as at 31 May 2021
The notes on pages 590 to 610 form an integral part of these financial statements.
Annual report and audited financial statements [519]

Holding Description Counterparty
Netunrealised
appreciation/(depreciation)
USD
Financial Derivative Instruments
CONTRACTS FOR DIFFERENCEAustralia
27,730 Alumina Ltd Bank of AmericaMerrill Lynch (13)
34,304 Alumina Ltd Goldman Sachs 57150,620 Alumina Ltd Morgan Stanley 1,3791,171 Appen Ltd Bank of America
Merrill Lynch 403701 Appen Ltd Goldman Sachs 1,232860 Appen Ltd Morgan Stanley (87)
(2,945) ARB Corp Ltd Goldman Sachs (10,913)440 AUB Group Ltd Bank of America
Merrill Lynch (201)280 AUB Group Ltd Goldman Sachs (128)
21,151 Aurizon Holdings Ltd Bank of AmericaMerrill Lynch 159
69,083 Aurizon Holdings Ltd Goldman Sachs 4,80763,449 Aurizon Holdings Ltd Morgan Stanley 2,8726,991 Austal Ltd Bank of America
Merrill Lynch (54)3,163 Austal Ltd Goldman Sachs (24)
(38) Bega Cheese Ltd Bank of AmericaMerrill Lynch (1)
(30,359) Bega Cheese Ltd Goldman Sachs (1,236)(9,125) Boral Ltd Goldman Sachs (296)(6,143) Bravura Solutions Ltd Goldman Sachs (1,277)(3,409) Breville Group Ltd Goldman Sachs (3,261)(5,341) Brickworks Ltd Goldman Sachs (1,728)(1,038) BWP Trust (REIT) Goldman Sachs (38)(3,775) BWX Ltd Goldman Sachs (789)(4,041) Chalice Mining Ltd Goldman Sachs (3,439)32,243 Challenger Ltd Goldman Sachs 8,03828,780 Challenger Ltd Morgan Stanley 6,4601,810 Charter Hall Long Wale
REIT (REIT)Bank of AmericaMerrill Lynch (42)
948 Charter Hall Long WaleREIT (REIT) Goldman Sachs (22)
1,908 Charter Hall Social Infra-structure REIT (REIT) Goldman Sachs 236
(9,043) Cleanaway Waste Manage-ment Ltd Goldman Sachs 95
538 Clinuvel PharmaceuticalsLtd
Bank of AmericaMerrill Lynch (32)
624 Clinuvel PharmaceuticalsLtd Goldman Sachs 97
(429) Corporate Travel Manage-ment Ltd Goldman Sachs (164)
305 Credit Corp Group Ltd Bank of AmericaMerrill Lynch 462
(10,335) Crown Resorts Ltd Goldman Sachs 2,16013,896 CSR Ltd Bank of America
Merrill Lynch 6868,960 CSR Ltd Goldman Sachs (1,210)3,937 CSR Ltd Morgan Stanley (488)
(5,701) Data#3 Ltd Goldman Sachs (1,324)(4,479) Deterra Royalties Ltd Morgan Stanley —4,078 Domain Holdings Australia
LtdBank of AmericaMerrill Lynch 1,478
3,710 Domain Holdings AustraliaLtd Goldman Sachs 259
859 Eagers Automotive Ltd Bank of AmericaMerrill Lynch 558
531 Eagers Automotive Ltd Goldman Sachs 3458,289 Elders Ltd Goldman Sachs (3,913)
(21,647) Electro Optic Systems Hold-ings Ltd Goldman Sachs (6,493)
6,487 Flight Centre Travel GroupLtd Goldman Sachs 384
821 Flight Centre Travel GroupLtd Morgan Stanley 57
Holding Description Counterparty
Netunrealised
appreciation/(depreciation)
USD
Australia continued(1) G8 Education Ltd Bank of America
Merrill Lynch —28,953 Genworth Mortgage Insur-
ance Australia LtdBank of AmericaMerrill Lynch 1,793
8,813 Genworth Mortgage Insur-ance Australia Ltd Goldman Sachs 546
3,926 GrainCorp Ltd ’A’ Goldman Sachs (577)(5,374) Home Consortium (REIT) Goldman Sachs (374)(6,382) Ingenia Communities Group
(REIT) Goldman Sachs (593)1,081 Inghams Group Ltd Bank of America
Merrill Lynch 3366,740 Inghams Group Ltd Goldman Sachs 1,930
(10,987) Integrated Research Ltd Goldman Sachs (680)(4,520) InvoCare Ltd Goldman Sachs (770)(2,879) IPH Ltd Goldman Sachs (1,003)4,102 Lifestyle Communities Ltd Goldman Sachs 3,1436,840 Link Administration Holdings
Ltd Goldman Sachs (548)(12,826) Lynas Rare Earths Ltd Goldman Sachs (1,718)(16,711) Lynas Rare Earths Ltd Morgan Stanley (374)
31 Magellan Financial GroupLtd
Bank of AmericaMerrill Lynch (9)
1,086 Magellan Financial GroupLtd Goldman Sachs 1,331
306 Magellan Financial GroupLtd Morgan Stanley 42
22,203 Medibank Pvt Ltd Bank of AmericaMerrill Lynch 1,711
60,375 Medibank Pvt Ltd Goldman Sachs 3,02249,297 Medibank Pvt Ltd Morgan Stanley 1,442
(95,701) Mirvac Group (REIT) Goldman Sachs (1,186)(512) Netwealth Group Ltd Goldman Sachs (622)
1,683 Nick Scali Ltd Bank of AmericaMerrill Lynch 880
(7,047) Omni Bridgeway Ltd Goldman Sachs (1,145)2,241 Pendal Group Ltd Bank of America
Merrill Lynch 3305,010 Pendal Group Ltd Goldman Sachs 737
10,359 Platinum Asset Manage-ment Ltd
Bank of AmericaMerrill Lynch (401)
12,109 Platinum Asset Manage-ment Ltd Goldman Sachs (391)
9,425 Platinum Asset Manage-ment Ltd Morgan Stanley 73
(3,340) Premier Investments Ltd Goldman Sachs (2,921)(10,958) Ramelius Resources Ltd Goldman Sachs (714)
727 Ramsay Health Care Ltd Goldman Sachs 289960 REA Group Ltd Bank of America
Merrill Lynch 6,244823 REA Group Ltd Goldman Sachs 6,683188 REA Group Ltd Morgan Stanley 999
(4,490) Redbubble Ltd Goldman Sachs 510(11,898) Reece Ltd Goldman Sachs 4,86239,038 Regis Resources Ltd Bank of America
Merrill Lynch 74942,316 Regis Resources Ltd Goldman Sachs 6582,777 Rural Funds Group (REIT) Bank of America
Merrill Lynch 1721,727 Sandfire Resources Ltd Bank of America
Merrill Lynch (212)2,862 Sandfire Resources Ltd Goldman Sachs (673)
(22,842) Santos Ltd Goldman Sachs 2,9904,909 Scentre Group (REIT) Morgan Stanley 152
(2,738) SeaLink Travel Group Ltd Goldman Sachs 5381,787 SEEK Ltd Bank of America
Merrill Lynch 2,305629 SEEK Ltd Goldman Sachs 528
1,188 SEEK Ltd Morgan Stanley 1,563
BlackRock Systematic Global Long/Short Equity Fund continued
Portfolio of Investments as at 31 May 2021
The notes on pages 590 to 610 form an integral part of these financial statements.
BlackRock Strategic Funds[520]

Holding Description Counterparty
Netunrealised
appreciation/(depreciation)
USD
Australia continued3,155 Southern Cross Media
Group LtdBank of AmericaMerrill Lynch (183)
10,345 Southern Cross MediaGroup Ltd Goldman Sachs (600)
20,371 St Barbara Ltd Goldman Sachs (2,286)3,572 Steadfast Group Ltd Bank of America
Merrill Lynch 3872,366 Steadfast Group Ltd Goldman Sachs 273
19,487 Super Retail Group Ltd Goldman Sachs 10,407(146) Sydney Airport (Unit) Goldman Sachs (9)
(40,514) Sydney Airport (Unit) Morgan Stanley (3,449)6,048 Tabcorp Holdings Ltd Bank of America
Merrill Lynch 651,315 Tabcorp Holdings Ltd Goldman Sachs (75)
(3,588) Tassal Group Ltd Goldman Sachs (167)1,693 Technology One Ltd Bank of America
Merrill Lynch 5936,479 Technology One Ltd Goldman Sachs 971
(3,121) Temple & Webster GroupLtd Goldman Sachs (507)
9,658 Treasury Wine Estates Ltd Morgan Stanley 4,410(3,137) Tyro Payments Ltd Goldman Sachs (364)
738 United Malt Grp Ltd Bank of AmericaMerrill Lynch (21)
5,697 United Malt Grp Ltd Goldman Sachs (243)(46,523) Western Areas Ltd Goldman Sachs (3,241)(6,118) Westgold Resources Ltd Goldman Sachs (758)2,808 WiseTech Global Ltd Bank of America
Merrill Lynch 5,4092,408 WiseTech Global Ltd Morgan Stanley 2,292
(2,577) Woolworths Group Ltd Goldman Sachs (2,342)2,701 Worley Ltd Bank of America
Merrill Lynch (499)1,978 Worley Ltd Goldman Sachs 119
617 Worley Ltd Morgan Stanley (115)
37,279
Austria(98) AT&S Austria Technologie &
Systemtechnik AGBank of AmericaMerrill Lynch 54
(312) CA Immobilien Anlagen AG Bank of AmericaMerrill Lynch 30
(430) Erste Group Bank AG Bank of AmericaMerrill Lynch (53)
(1,098) Erste Group Bank AG Morgan Stanley 1,206(206) FACC AG Goldman Sachs (88)(377) IMMOFINANZ AG Goldman Sachs (144)
55 Oesterreichische Post AG Bank of AmericaMerrill Lynch 138
1,105 Oesterreichische Post AG Goldman Sachs 2,289(429) S IMMO AG Bank of America
Merrill Lynch —219 Semperit AG Holding Bank of America
Merrill Lynch (254)690 Semperit AG Holding Goldman Sachs (800)
(406) UNIQA Insurance Group AG Goldman Sachs (74)(376) Vienna Insurance Group AG
Wiener VersicherungGruppe Goldman Sachs 229
405 voestalpine AG Bank of AmericaMerrill Lynch (69)
1,270 voestalpine AG Goldman Sachs (198)5,134 voestalpine AG Morgan Stanley 6,767
9,033
Belgium(1,380) AGFA-Gevaert NV Bank of America
Merrill Lynch (170)(94) Befimmo SA (REIT) Bank of America
Merrill Lynch (63)
Holding Description Counterparty
Netunrealised
appreciation/(depreciation)
USD
Belgium continued(243) Biocartis Group NV Goldman Sachs 47
1,929 bpost SA Bank of AmericaMerrill Lynch 195
1,613 bpost SA Goldman Sachs 580(19) D’ieteren SA Bank of America
Merrill Lynch 26(172) Elia Group SA Bank of America
Merrill Lynch 470(17) Elia Group SA Morgan Stanley 91
(200) Fagron Bank of AmericaMerrill Lynch 85
47 Ion Beam Applications Goldman Sachs 2(9) KBC Ancora Bank of America
Merrill Lynch 7(585) Ontex Group NV Goldman Sachs 150(117) Sofina SA Morgan Stanley (1,456)
2,179 Umicore SA Morgan Stanley (3,430)
(3,466)
Bermuda(591) Liberty Latin America Ltd ’C’ Bank of America
Merrill Lynch 2
2
Canada198 Absolute Software Corp Bank of America
Merrill Lynch (36)(4,661) Advantage Energy Ltd Bank of America
Merrill Lynch (232)(456) Air Canada Goldman Sachs (546)(770) Altius Minerals Corp Bank of America
Merrill Lynch (389)379 Boardwalk Real Estate In-
vestment Trust (REIT)Bank of AmericaMerrill Lynch 248
958 Boardwalk Real Estate In-vestment Trust (REIT) Goldman Sachs 626
(385) Brookfield Asset Manage-ment Inc ’A’
Bank of AmericaMerrill Lynch (483)
(331) Brookfield Asset Manage-ment Inc ’A’ Goldman Sachs (207)
(1,864) Brookfield Asset Manage-ment Inc ’A’ Morgan Stanley (237)
75 BRP Inc Bank of AmericaMerrill Lynch 224
121 BRP Inc Goldman Sachs 361169 BRP Inc Morgan Stanley 270
(3,845) Cameco Corp Bank of AmericaMerrill Lynch 286
(2,634) Cameco Corp Goldman Sachs (68)(546) Cameco Corp Morgan Stanley (515)262 Canada Goose Holdings Inc Goldman Sachs 366
(155) Canadian Pacific RailwayLtd
Bank of AmericaMerrill Lynch (65)
(1,715) Canadian Pacific RailwayLtd Goldman Sachs (6,785)
(6,332) Canadian Pacific RailwayLtd Morgan Stanley 1,415
313 Cargojet Inc Morgan Stanley 1,241(330) Celestica Inc Goldman Sachs (55)
5,057 Chorus Aviation Inc Bank of AmericaMerrill Lynch 1,046
2,304 Chorus Aviation Inc Goldman Sachs 477234 Cineplex Inc Goldman Sachs 304383 Cogeco Inc Bank of America
Merrill Lynch (499)125 Cogeco Inc Goldman Sachs (163)199 Colliers International Group
IncBank of AmericaMerrill Lynch 450
546 Colliers International GroupInc Morgan Stanley 1,401
BlackRock Systematic Global Long/Short Equity Fund continued
Portfolio of Investments as at 31 May 2021
The notes on pages 590 to 610 form an integral part of these financial statements.
Annual report and audited financial statements [521]
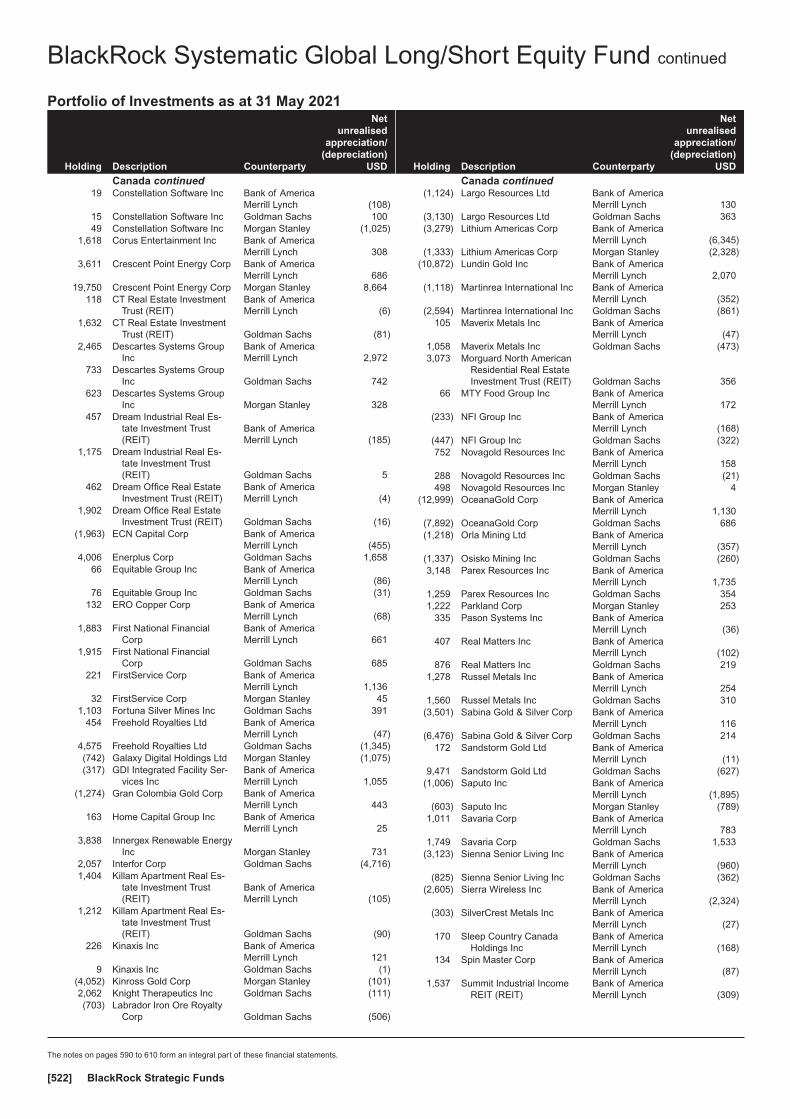
Holding Description Counterparty
Netunrealised
appreciation/(depreciation)
USD
Canada continued19 Constellation Software Inc Bank of America
Merrill Lynch (108)15 Constellation Software Inc Goldman Sachs 10049 Constellation Software Inc Morgan Stanley (1,025)
1,618 Corus Entertainment Inc Bank of AmericaMerrill Lynch 308
3,611 Crescent Point Energy Corp Bank of AmericaMerrill Lynch 686
19,750 Crescent Point Energy Corp Morgan Stanley 8,664118 CT Real Estate Investment
Trust (REIT)Bank of AmericaMerrill Lynch (6)
1,632 CT Real Estate InvestmentTrust (REIT) Goldman Sachs (81)
2,465 Descartes Systems GroupInc
Bank of AmericaMerrill Lynch 2,972
733 Descartes Systems GroupInc Goldman Sachs 742
623 Descartes Systems GroupInc Morgan Stanley 328
457 Dream Industrial Real Es-tate Investment Trust(REIT)
Bank of AmericaMerrill Lynch (185)
1,175 Dream Industrial Real Es-tate Investment Trust(REIT) Goldman Sachs 5
462 Dream Office Real EstateInvestment Trust (REIT)
Bank of AmericaMerrill Lynch (4)
1,902 Dream Office Real EstateInvestment Trust (REIT) Goldman Sachs (16)
(1,963) ECN Capital Corp Bank of AmericaMerrill Lynch (455)
4,006 Enerplus Corp Goldman Sachs 1,65866 Equitable Group Inc Bank of America
Merrill Lynch (86)76 Equitable Group Inc Goldman Sachs (31)
132 ERO Copper Corp Bank of AmericaMerrill Lynch (68)
1,883 First National FinancialCorp
Bank of AmericaMerrill Lynch 661
1,915 First National FinancialCorp Goldman Sachs 685
221 FirstService Corp Bank of AmericaMerrill Lynch 1,136
32 FirstService Corp Morgan Stanley 451,103 Fortuna Silver Mines Inc Goldman Sachs 391
454 Freehold Royalties Ltd Bank of AmericaMerrill Lynch (47)
4,575 Freehold Royalties Ltd Goldman Sachs (1,345)(742) Galaxy Digital Holdings Ltd Morgan Stanley (1,075)(317) GDI Integrated Facility Ser-
vices IncBank of AmericaMerrill Lynch 1,055
(1,274) Gran Colombia Gold Corp Bank of AmericaMerrill Lynch 443
163 Home Capital Group Inc Bank of AmericaMerrill Lynch 25
3,838 Innergex Renewable EnergyInc Morgan Stanley 731
2,057 Interfor Corp Goldman Sachs (4,716)1,404 Killam Apartment Real Es-
tate Investment Trust(REIT)
Bank of AmericaMerrill Lynch (105)
1,212 Killam Apartment Real Es-tate Investment Trust(REIT) Goldman Sachs (90)
226 Kinaxis Inc Bank of AmericaMerrill Lynch 121
9 Kinaxis Inc Goldman Sachs (1)(4,052) Kinross Gold Corp Morgan Stanley (101)2,062 Knight Therapeutics Inc Goldman Sachs (111)(703) Labrador Iron Ore Royalty
Corp Goldman Sachs (506)
Holding Description Counterparty
Netunrealised
appreciation/(depreciation)
USD
Canada continued(1,124) Largo Resources Ltd Bank of America
Merrill Lynch 130(3,130) Largo Resources Ltd Goldman Sachs 363(3,279) Lithium Americas Corp Bank of America
Merrill Lynch (6,345)(1,333) Lithium Americas Corp Morgan Stanley (2,328)
(10,872) Lundin Gold Inc Bank of AmericaMerrill Lynch 2,070
(1,118) Martinrea International Inc Bank of AmericaMerrill Lynch (352)
(2,594) Martinrea International Inc Goldman Sachs (861)105 Maverix Metals Inc Bank of America
Merrill Lynch (47)1,058 Maverix Metals Inc Goldman Sachs (473)3,073 Morguard North American
Residential Real EstateInvestment Trust (REIT) Goldman Sachs 356
66 MTY Food Group Inc Bank of AmericaMerrill Lynch 172
(233) NFI Group Inc Bank of AmericaMerrill Lynch (168)
(447) NFI Group Inc Goldman Sachs (322)752 Novagold Resources Inc Bank of America
Merrill Lynch 158288 Novagold Resources Inc Goldman Sachs (21)498 Novagold Resources Inc Morgan Stanley 4
(12,999) OceanaGold Corp Bank of AmericaMerrill Lynch 1,130
(7,892) OceanaGold Corp Goldman Sachs 686(1,218) Orla Mining Ltd Bank of America
Merrill Lynch (357)(1,337) Osisko Mining Inc Goldman Sachs (260)3,148 Parex Resources Inc Bank of America
Merrill Lynch 1,7351,259 Parex Resources Inc Goldman Sachs 3541,222 Parkland Corp Morgan Stanley 253
335 Pason Systems Inc Bank of AmericaMerrill Lynch (36)
407 Real Matters Inc Bank of AmericaMerrill Lynch (102)
876 Real Matters Inc Goldman Sachs 2191,278 Russel Metals Inc Bank of America
Merrill Lynch 2541,560 Russel Metals Inc Goldman Sachs 310
(3,501) Sabina Gold & Silver Corp Bank of AmericaMerrill Lynch 116
(6,476) Sabina Gold & Silver Corp Goldman Sachs 214172 Sandstorm Gold Ltd Bank of America
Merrill Lynch (11)9,471 Sandstorm Gold Ltd Goldman Sachs (627)
(1,006) Saputo Inc Bank of AmericaMerrill Lynch (1,895)
(603) Saputo Inc Morgan Stanley (789)1,011 Savaria Corp Bank of America
Merrill Lynch 7831,749 Savaria Corp Goldman Sachs 1,533
(3,123) Sienna Senior Living Inc Bank of AmericaMerrill Lynch (960)
(825) Sienna Senior Living Inc Goldman Sachs (362)(2,605) Sierra Wireless Inc Bank of America
Merrill Lynch (2,324)(303) SilverCrest Metals Inc Bank of America
Merrill Lynch (27)170 Sleep Country Canada
Holdings IncBank of AmericaMerrill Lynch (168)
134 Spin Master Corp Bank of AmericaMerrill Lynch (87)
1,537 Summit Industrial IncomeREIT (REIT)
Bank of AmericaMerrill Lynch (309)
BlackRock Systematic Global Long/Short Equity Fund continued
Portfolio of Investments as at 31 May 2021
The notes on pages 590 to 610 form an integral part of these financial statements.
BlackRock Strategic Funds[522]

Holding Description Counterparty
Netunrealised
appreciation/(depreciation)
USD
Canada continued1,520 Summit Industrial Income
REIT (REIT) Goldman Sachs (145)228 Torex Gold Resources Inc Goldman Sachs (137)821 Tricon Residential Inc Goldman Sachs 35
(2,253) Turquoise Hill ResourcesLtd
Bank of AmericaMerrill Lynch (2,518)
(1,619) Turquoise Hill ResourcesLtd Goldman Sachs (1,809)
(8,645) Uranium Participation Corp Goldman Sachs 6441,440 Vermilion Energy Inc Bank of America
Merrill Lynch (393)5,855 Vermilion Energy Inc Goldman Sachs (1,599)(937) Victoria Gold Corp Bank of America
Merrill Lynch 729(1,144) Viemed Healthcare Inc Goldman Sachs 871(2,682) Wesdome Gold Mines Ltd Goldman Sachs (2,708)6,567 Wheaton Precious Metals
CorpBank of AmericaMerrill Lynch 1,660
1,612 Wheaton Precious MetalsCorp Goldman Sachs 1,276
3,779 Wheaton Precious MetalsCorp Morgan Stanley 375
3,635 Whitecap Resources Inc Bank of AmericaMerrill Lynch 271
8,155 Whitecap Resources Inc Goldman Sachs 6075,317 Whitecap Resources Inc Morgan Stanley 2,597(448) Winpak Ltd Bank of America
Merrill Lynch 712(132) Winpak Ltd Goldman Sachs 210
1,316
Denmark(19) ALK-Abello A/S Bank of America
Merrill Lynch 2743 AP Moller - Maersk A/S ’B’ Bank of America
Merrill Lynch (10)142 AP Moller - Maersk A/S ’B’ Morgan Stanley (5,243)566 Dfds A/S Goldman Sachs (353)89 ISS A/S Bank of America
Merrill Lynch 307,550 ISS A/S Morgan Stanley 3,159
75 Nilfisk Holding A/S Bank of AmericaMerrill Lynch 254
(90) Ringkjoebing LandbobankA/S
Bank of AmericaMerrill Lynch (30)
(1,637) Scandinavian TobaccoGroup A/S
Bank of AmericaMerrill Lynch 940
1,036 Spar Nord Bank A/S Bank of AmericaMerrill Lynch (17)
10,050 Spar Nord Bank A/S Goldman Sachs (360)(482) TORM Plc Goldman Sachs 12
(2,834) Vestas Wind Systems A/S Morgan Stanley (946)
(2,290)
Finland(135) Aktia Bank Oyj Goldman Sachs 36
(1,302) BasWare Oyj Goldman Sachs (2,754)(548) Caverion Oyj Bank of America
Merrill Lynch (28)(435) Caverion Oyj Goldman Sachs 48
(14,521) Fortum Oyj Morgan Stanley 886(867) Metsa Board Oyj Goldman Sachs 474
20,811 Outokumpu Oyj Morgan Stanley (584)230 Revenio Group Oyj Bank of America
Merrill Lynch 1,811583 Revenio Group Oyj Goldman Sachs 4,514466 Rovio Entertainment Oyj Bank of America
Merrill Lynch (74)(2,752) Sanoma Oyj Goldman Sachs (1,478)
2,851
Holding Description Counterparty
Netunrealised
appreciation/(depreciation)
USD
France(21) Aeroports de Paris Bank of America
Merrill Lynch (67)(20) Aeroports de Paris Morgan Stanley (109)
1 Akka Technologies Bank of AmericaMerrill Lynch 1
184 Akka Technologies Goldman Sachs 112107 AKWEL Bank of America
Merrill Lynch 157215 AKWEL Goldman Sachs 315
(168) Albioma SA Goldman Sachs 16705 ALD SA Bank of America
Merrill Lynch (774)1,954 ALD SA Goldman Sachs (2,146)
401 ALD SA Morgan Stanley (392)133 Alten SA Bank of America
Merrill Lynch 276568 Alten SA Goldman Sachs 1,17843 Aubay Bank of America
Merrill Lynch 4541 Aubay Goldman Sachs 43
105 Beneteau SA Bank of AmericaMerrill Lynch 53
252 Beneteau SA Goldman Sachs 279(148) BioMerieux Morgan Stanley 212(393) Bollore SA Goldman Sachs (58)682 Coface SA Goldman Sachs (608)
(1,121) Danone SA Goldman Sachs 932(11) Dassault Aviation SA Bank of America
Merrill Lynch (732)(21) Dassault Aviation SA Morgan Stanley (1,320)342 Eramet SA Goldman Sachs (1,488)(50) Eurazeo SE Goldman Sachs (88)
(102,447) Europcar Mobility Group Morgan Stanley 1,350831 Faurecia SE Bank of America
Merrill Lynch 226497 Faurecia SE Goldman Sachs (265)984 Faurecia SE Morgan Stanley 420(58) Fnac Darty SA Goldman Sachs 25
(312) ICADE (REIT) Bank of AmericaMerrill Lynch (457)
(230) ICADE (REIT) Goldman Sachs (337)1,054 Imerys SA Bank of America
Merrill Lynch 1,3651,368 Imerys SA Goldman Sachs 135
528 Imerys SA Morgan Stanley 46424 Interparfums SA Bank of America
Merrill Lynch 123202 Interparfums SA Goldman Sachs 1,035(59) Korian SA Bank of America
Merrill Lynch 153(300) Korian SA Goldman Sachs 776225 Lagardere SCA Goldman Sachs 242(93) LISI Bank of America
Merrill Lynch (386)(172) LISI Goldman Sachs (714)
53 Manitou BF SA Bank of AmericaMerrill Lynch (55)
199 Manitou BF SA Goldman Sachs (185)(90) McPhy Energy SA Bank of America
Merrill Lynch (235)(459) Mercialys SA (REIT) Goldman Sachs (482)118 Nexans SA Goldman Sachs 294(34) Nexity SA Goldman Sachs 134
(761) Novacyt SA Goldman Sachs 730174 Remy Cointreau SA Bank of America
Merrill Lynch 82846 Remy Cointreau SA Goldman Sachs 283
1,011 Remy Cointreau SA Morgan Stanley 1,604
BlackRock Systematic Global Long/Short Equity Fund continued
Portfolio of Investments as at 31 May 2021
The notes on pages 590 to 610 form an integral part of these financial statements.
Annual report and audited financial statements [523]

Holding Description Counterparty
Netunrealised
appreciation/(depreciation)
USD
France continued3,048 Rubis SCA Bank of America
Merrill Lynch 2,103811 Rubis SCA Goldman Sachs 637
1,118 Rubis SCA Morgan Stanley 953(4,440) Sanofi Morgan Stanley 3,7392,684 SCOR SE Bank of America
Merrill Lynch (2,981)3,843 SCOR SE Morgan Stanley (2,908)(410) SEB SA Goldman Sachs 1,201(199) SEB SA Morgan Stanley 146
2,089 SES SA Bank of AmericaMerrill Lynch 2,405
3,416 SES SA Goldman Sachs 3,1879,592 SES SA Morgan Stanley 10,651
5 Societe BIC SA Goldman Sachs (22)(121) SOITEC Morgan Stanley (247)178 Sopra Steria Group SACA Goldman Sachs 673
7 Synergie SE Bank of AmericaMerrill Lynch 11
773 Television Francaise 1 Goldman Sachs 6719 Trigano SA Bank of America
Merrill Lynch 21812 Trigano SA Goldman Sachs 21
1,120 Valeo SA Goldman Sachs (614)8,086 Valeo SA Morgan Stanley 6,6941,198 Valneva SE Bank of America
Merrill Lynch 95243 Valneva SE Goldman Sachs (316)(61) Vicat SA Goldman Sachs (89)
(307) Vivendi SE Goldman Sachs (255)(2,101) Vivendi SE Morgan Stanley (974)
(327) Worldline SA Morgan Stanley (511)
26,792
Germany(46) Adesso SE Bank of America
Merrill Lynch (640)(9) Adesso SE Goldman Sachs (125)
(16) Amadeus Fire AG Bank of AmericaMerrill Lynch (82)
(34) Amadeus Fire AG Goldman Sachs (126)(1,496) Auto1 Group SE Bank of America
Merrill Lynch (522)(374) Auto1 Group SE Goldman Sachs (1,539)
3 Basler AG Bank of AmericaMerrill Lynch (1)
44 Befesa SA Goldman Sachs 40(185) Bertrandt AG Goldman Sachs (90)497 Bilfinger SE Bank of America
Merrill Lynch (261)531 Bilfinger SE Goldman Sachs (722)
(692) Borussia Dortmund GmbH& Co KGaA
Bank of AmericaMerrill Lynch 258
(1,036) Borussia Dortmund GmbH& Co KGaA Goldman Sachs 386
(216) CANCOM SE Bank of AmericaMerrill Lynch (180)
(107) CANCOM SE Goldman Sachs 52(980) CECONOMY AG Bank of America
Merrill Lynch (230)(11,979) Commerzbank AG Bank of America
Merrill Lynch (2,024)(2,182) Commerzbank AG Morgan Stanley (27)
(18) Corestate Capital HoldingSA Goldman Sachs 18
4,163 Covestro AG Morgan Stanley 9,247366 CropEnergies AG Bank of America
Merrill Lynch 143293 CropEnergies AG Goldman Sachs 11414 Datagroup SE Bank of America
Merrill Lynch 79
Holding Description Counterparty
Netunrealised
appreciation/(depreciation)
USD
Germany continued36 Datagroup SE Goldman Sachs 20248 Dermapharm Holding SE Bank of America
Merrill Lynch 39235 Dermapharm Holding SE Goldman Sachs (20)127 Deutsche Beteiligungs AG Bank of America
Merrill Lynch 132(409) Deutsche EuroShop AG Bank of America
Merrill Lynch (399)(245) Deutsche EuroShop AG Goldman Sachs (239)
3,179 Deutsche PfandbriefbankAG Goldman Sachs 303
(3,289) Deutsche Telekom AG Reg Bank of AmericaMerrill Lynch (1,660)
(1,098) Deutsche Telekom AG Reg Goldman Sachs 119(23,223) Deutsche Telekom AG Reg Morgan Stanley 4,138
(652) DIC Asset AG Goldman Sachs (788)557 Duerr AG Bank of America
Merrill Lynch 258767 Duerr AG Goldman Sachs 455242 Duerr AG Morgan Stanley 55
(145) flatexDEGIRO AG Morgan Stanley (813)(1,763) Fraport AG Frankfurt Airport
Services WorldwideBank of AmericaMerrill Lynch 1,334
(645) Fraport AG Frankfurt AirportServices Worldwide Goldman Sachs (11)
(1,843) Fraport AG Frankfurt AirportServices Worldwide Morgan Stanley (3,187)
945 Freenet AG Bank of AmericaMerrill Lynch 473
1,125 Freenet AG Morgan Stanley 590(1,846) Fresenius SE & Co KGaA Bank of America
Merrill Lynch 1,852(3,513) Fresenius SE & Co KGaA Goldman Sachs 2,479(1,832) Fresenius SE & Co KGaA Morgan Stanley 4,717(1,231) Hamborner AG (REIT) Goldman Sachs (1,672)
58 Hamburger Hafen und Lo-gistik AG
Bank of AmericaMerrill Lynch 14
819 Hamburger Hafen und Lo-gistik AG Goldman Sachs 137
(297) Home24 SE Bank of AmericaMerrill Lynch (874)
(425) Home24 SE Goldman Sachs (1,250)(1) Hypoport SE Bank of America
Merrill Lynch (14)(42) Hypoport SE Goldman Sachs (605)
1,259 Kloeckner & Co SE Bank of AmericaMerrill Lynch 175
5,699 Kloeckner & Co SE Goldman Sachs 1,160191 Krones AG Bank of America
Merrill Lynch 1,002693 Krones AG Goldman Sachs 2,622(61) KWS Saat SE & Co KGaA Bank of America
Merrill Lynch 208(26) KWS Saat SE & Co KGaA Goldman Sachs 89(80) MBB SE Bank of America
Merrill Lynch (371)(94) MBB SE Goldman Sachs (436)(76) Medios AG Goldman Sachs 97
3,229 MLP SE Bank of AmericaMerrill Lynch 1,287
10,407 MLP SE Goldman Sachs 4,17291 MTU Aero Engines AG Bank of America
Merrill Lynch 400210 MTU Aero Engines AG Goldman Sachs 759694 MTU Aero Engines AG Morgan Stanley 4,327
(452) Nagarro SE Bank of AmericaMerrill Lynch (2,317)
74 New Work SE Goldman Sachs (452)(71) Norma Group SE Bank of America
Merrill Lynch (231)
BlackRock Systematic Global Long/Short Equity Fund continued
Portfolio of Investments as at 31 May 2021
The notes on pages 590 to 610 form an integral part of these financial statements.
BlackRock Strategic Funds[524]

Holding Description Counterparty
Netunrealised
appreciation/(depreciation)
USD
Germany continued(96) PATRIZIA AG Goldman Sachs (121)
(765) Porsche Automobil HoldingSE (Pref)
Bank of AmericaMerrill Lynch (6,897)
(439) Porsche Automobil HoldingSE (Pref) Goldman Sachs (1,572)
(2,023) Porsche Automobil HoldingSE (Pref) Morgan Stanley (16,591)
822 ProSiebenSat.1 Media SE Bank of AmericaMerrill Lynch 529
94 ProSiebenSat.1 Media SE Goldman Sachs 26216 Rheinmetall AG Bank of America
Merrill Lynch 2753,212 Rheinmetall AG Morgan Stanley 2,119
3 RTL Group SA Bank of AmericaMerrill Lynch 3
144 RTL Group SA Goldman Sachs 1153,884 RTL Group SA Morgan Stanley 5,653
418 Salzgitter AG Bank of AmericaMerrill Lynch (159)
69 Salzgitter AG Goldman Sachs (60)(126) SAP SE Morgan Stanley 204103 Sartorius AG (Pref) Goldman Sachs 29461 Sartorius AG (Pref) Morgan Stanley 272
17,998 Schaeffler AG (Pref) Bank of AmericaMerrill Lynch 7,482
11,601 Schaeffler AG (Pref) Goldman Sachs 4,60119,115 Schaeffler AG (Pref) Morgan Stanley 10,148
536 Scout24 AG Bank of AmericaMerrill Lynch 1,118
176 Scout24 AG Morgan Stanley (17)(491) Shop Apotheke Europe NV Bank of America
Merrill Lynch 1,738(719) Shop Apotheke Europe NV Goldman Sachs 2,227(447) Sixt SE Bank of America
Merrill Lynch (3,328)179 Stabilus SA Bank of America
Merrill Lynch 590786 Stabilus SA Goldman Sachs 2,59026 STO SE & Co KGaA (Pref) Bank of America
Merrill Lynch 22277 STO SE & Co KGaA (Pref) Goldman Sachs 642
6,298 thyssenkrupp AG Morgan Stanley 569(203) VERBIO Vereinigte BioEner-
gie AGBank of AmericaMerrill Lynch (2,537)
(217) Volkswagen AG (Pref) Bank of AmericaMerrill Lynch (3,424)
(530) Volkswagen AG (Pref) Morgan Stanley (7,547)(65) Vossloh AG Bank of America
Merrill Lynch 79(519) Vossloh AG Goldman Sachs 633(10) Washtec AG Bank of America
Merrill Lynch 39(350) Washtec AG Goldman Sachs 1,367(375) Westwing Group AG Bank of America
Merrill Lynch (3,158)1,205 Zalando SE Goldman Sachs (1,867)1,793 Zalando SE Morgan Stanley 1,163
51 Zeal Network SE Bank of AmericaMerrill Lynch 69
34 Zeal Network SE Goldman Sachs (18)
19,495
Hong Kong1,100 ASM Pacific Technology Ltd Goldman Sachs (19)2,800 ASM Pacific Technology Ltd Morgan Stanley 1,0643,000 Cathay Pacific Airways Ltd Bank of America
Merrill Lynch 6215,000 Cathay Pacific Airways Ltd Morgan Stanley 9711,000 Chow Sang Sang Holdings
International LtdBank of AmericaMerrill Lynch 1,834
Holding Description Counterparty
Netunrealised
appreciation/(depreciation)
USD
Hong Kong continued13,000 Chow Sang Sang Holdings
International Ltd Goldman Sachs 2,6319,200 Dah Sing Financial Holdings
LtdBank of AmericaMerrill Lynch 2,904
14,000 Dah Sing Financial HoldingsLtd Goldman Sachs 4,389
(41,000) Galaxy EntertainmentGroup Ltd Goldman Sachs (2,497)
37,000 Haitong International Secu-rities Group Ltd Morgan Stanley 572
(33,000) Hang Lung Group Ltd Goldman Sachs (1,084)(5,500) Health & Happiness H&H
International Holdings Ltd Goldman Sachs (1,660)(41,000) Hong Kong Television Net-
work Ltd Goldman Sachs (1,109)4,200 Link REIT (REIT) Goldman Sachs (467)4,300 Link REIT (REIT) Morgan Stanley (83)
30,000 NWS Holdings Ltd Bank of AmericaMerrill Lynch 551
37,000 NWS Holdings Ltd Goldman Sachs 85417,000 NWS Holdings Ltd Morgan Stanley 2353,300 PRADA SpA Bank of America
Merrill Lynch 1,4592,400 PRADA SpA Goldman Sachs 1,0871,900 PRADA SpA Morgan Stanley 4412,000 Shangri-La Asia Ltd Goldman Sachs 1068,000 SITC International Holdings
Co LtdBank of AmericaMerrill Lynch 363
(179,000) SJM Holdings Ltd Goldman Sachs 3,46552,200 Swire Properties Ltd Bank of America
Merrill Lynch (713)10,800 Swire Properties Ltd Goldman Sachs 2110,800 Swire Properties Ltd Morgan Stanley (209)2,000 Vitasoy International Hold-
ings LtdBank of AmericaMerrill Lynch 155
2,000 Vitasoy International Hold-ings Ltd Goldman Sachs 155
20,000 Vitasoy International Hold-ings Ltd Morgan Stanley 2,448
(8,000) Xinyi Glass Holdings Ltd Bank of AmericaMerrill Lynch (3,596)
14,000 Yue Yuen Industrial Hold-ings Ltd
Bank of AmericaMerrill Lynch 630
20,500 Yue Yuen Industrial Hold-ings Ltd Goldman Sachs 951
5,500 Yue Yuen Industrial Hold-ings Ltd Morgan Stanley (177)
14,860
Ireland1,514 Origin Enterprises Plc Bank of America
Merrill Lynch (351)2,639 Origin Enterprises Plc Goldman Sachs (612)
(4,622) Ryanair Holdings Plc Bank of AmericaMerrill Lynch (2,146)
(3,109)
Israel(352) AFI Properties Ltd Bank of America
Merrill Lynch (1,366)1,334 Altshuler Shaham Provident
Funds & Pension LtdBank of AmericaMerrill Lynch 744
2,648 Altshuler Shaham ProvidentFunds & Pension Ltd Goldman Sachs 1,476
(4,113) Ashtrom Group Ltd Bank of AmericaMerrill Lynch (4,838)
8,267 Bank Hapoalim BM Morgan Stanley (743)(54) Brack Capital Properties NV Bank of America
Merrill Lynch 173(85) Brack Capital Properties NV Goldman Sachs 233
BlackRock Systematic Global Long/Short Equity Fund continued
Portfolio of Investments as at 31 May 2021
The notes on pages 590 to 610 form an integral part of these financial statements.
Annual report and audited financial statements [525]

Holding Description Counterparty
Netunrealised
appreciation/(depreciation)
USD
Israel continued197 Camtek Ltd Bank of America
Merrill Lynch 1,509408 Camtek Ltd Goldman Sachs 3,125
(2,681) Cellcom Israel Ltd Bank of AmericaMerrill Lynch (908)
(75) Delek Group Ltd Bank of AmericaMerrill Lynch 10
79 Delta Galil Industries Ltd Bank of AmericaMerrill Lynch (156)
325 Delta Galil Industries Ltd Goldman Sachs (640)(592) Electra Consumer Products
1970 Ltd Goldman Sachs (1,148)(218) Electreon Wireless Ltd Bank of America
Merrill Lynch (1,344)(43) Electreon Wireless Ltd Goldman Sachs (261)195 FIBI Holdings Ltd Goldman Sachs 204
(601) Formula Systems 1985 Ltd Bank of AmericaMerrill Lynch (740)
(244) Formula Systems 1985 Ltd Goldman Sachs (301)(1,143) Gilat Satellite Networks Ltd Bank of America
Merrill Lynch (834)(997) Gilat Satellite Networks Ltd Goldman Sachs (728)726 IDI Insurance Co Ltd Goldman Sachs 29114 Israel Corp Ltd Bank of America
Merrill Lynch 8941 Israel Corp Ltd Goldman Sachs 727
(69) Matrix IT Ltd Bank of AmericaMerrill Lynch 49
(628) Matrix IT Ltd Goldman Sachs 443(359) Maytronics Ltd Goldman Sachs (78)(179) Mega Or Holdings Ltd Goldman Sachs (182)
1,075 Menora Mivtachim HoldingsLtd Goldman Sachs 20
(31,244) Mivne Real Estate KD Ltd Goldman Sachs (5,937)(2,060) Naphtha Israel Petroleum
Corp LtdBank of AmericaMerrill Lynch 317
(2,221) Naphtha Israel PetroleumCorp Ltd Goldman Sachs 342
147 Nova Measuring Instru-ments Ltd Goldman Sachs 1,870
(638) Partner Communications CoLtd
Bank of AmericaMerrill Lynch (49)
(500) Phoenix Holdings Ltd Bank of AmericaMerrill Lynch 266
(18) Property & Building CorpLtd
Bank of AmericaMerrill Lynch 103
(92) Property & Building CorpLtd Goldman Sachs 527
890 Summit Real Estate Hold-ings Ltd
Bank of AmericaMerrill Lynch 38
1,912 Summit Real Estate Hold-ings Ltd Goldman Sachs 82
631 Tower Semiconductor Ltd Goldman Sachs 923(72) YH Dimri Construction &
Development LtdBank of AmericaMerrill Lynch 115
(6,577)
Italy(298) Banca IFIS SpA Bank of America
Merrill Lynch 554,690 Banca Mediolanum SpA Bank of America
Merrill Lynch 1,2368,251 Banca Mediolanum SpA Goldman Sachs 2,756
16,933 Banca Mediolanum SpA Morgan Stanley 4,050(1,098) Banca Popolare di Sondrio
SCPABank of AmericaMerrill Lynch (300)
(648) Banca Popolare di SondrioSCPA Goldman Sachs (177)
(1,455) BFF Bank SpA Goldman Sachs (107)(175) Carel Industries SpA Bank of America
Merrill Lynch (320)
Holding Description Counterparty
Netunrealised
appreciation/(depreciation)
USD
Italy continued(45) Cementir Holding NV Goldman Sachs (3)
(390) Credito Emiliano SpA Bank of AmericaMerrill Lynch 29
771 Danieli & C Officine Mec-caniche SpA
Bank of AmericaMerrill Lynch 894
1,191 Danieli & C Officine Mec-caniche SpA Goldman Sachs 1,381
(773) Danieli & C Officine Mec-caniche SpA - RSP
Bank of AmericaMerrill Lynch (1,000)
243 Datalogic SpA Goldman Sachs 379123 El.En. SpA Bank of America
Merrill Lynch 1,17166 El.En. SpA Goldman Sachs 628
(2,334) Enav SpA Bank of AmericaMerrill Lynch (330)
(531) Enav SpA Goldman Sachs (75)(2,068) Falck Renewables SpA Goldman Sachs (292)
(55) Ferrari NV Goldman Sachs (560)(2,021) Fila SpA Goldman Sachs (987)
122 Gruppo MutuiOnline SpA Bank of AmericaMerrill Lynch 73
34 Gruppo MutuiOnline SpA Goldman Sachs 33(1,492) Immobiliare Grande Dis-
tribuzione SIIQ SpA(REIT) Goldman Sachs (146)
(104) MARR SpA Bank of AmericaMerrill Lynch (135)
710 Piaggio & C SpA Goldman Sachs 40759 Pirelli & C SpA Bank of America
Merrill Lynch 1121,875 Pirelli & C SpA Morgan Stanley 318
(1,450) RAI Way SpA Goldman Sachs (93)(4,628) Societa Cattolica Di Assi-
curazione SpA Goldman Sachs (10,546)(260) Tamburi Investment Part-
ners SpABank of AmericaMerrill Lynch (69)
5,134 Tenaris SA Bank of AmericaMerrill Lynch 1,166
1,726 Tenaris SA Morgan Stanley 302(140) Tinexta SpA Bank of America
Merrill Lynch (523)(108) Tinexta SpA Goldman Sachs (403)
(15,491) UniCredit SpA Morgan Stanley (4,764)(6,289) Webuild SpA Bank of America
Merrill Lynch (1,167)(1,552) Webuild SpA Goldman Sachs (288)
(7,662)
Japan400 ABC-Mart Inc Bank of America
Merrill Lynch 698100 ABC-Mart Inc Goldman Sachs 292
1,800 ABC-Mart Inc Morgan Stanley 3,583400 Adastria Co Ltd Bank of America
Merrill Lynch 76400 Adastria Co Ltd Goldman Sachs 108
(800) Aeon Hokkaido Corp Bank of AmericaMerrill Lynch 292
(3) AEON Investment Corp(REIT) Goldman Sachs (143)
(200) Ai Holdings Corp Bank of AmericaMerrill Lynch 46
(2,100) Ai Holdings Corp Goldman Sachs 479(200) Aichi Bank Ltd Goldman Sachs 171
1,000 Aichi Steel Corp Goldman Sachs (1,186)(1,800) Aiful Corp Bank of America
Merrill Lynch 39(4,000) Aiful Corp Goldman Sachs 274
(100) Akatsuki Inc Bank of AmericaMerrill Lynch 22
BlackRock Systematic Global Long/Short Equity Fund continued
Portfolio of Investments as at 31 May 2021
The notes on pages 590 to 610 form an integral part of these financial statements.
BlackRock Strategic Funds[526]

Holding Description Counterparty
Netunrealised
appreciation/(depreciation)
USD
Japan continued3,100 Alfresa Holdings Corp Bank of America
Merrill Lynch 7308,100 Alfresa Holdings Corp Goldman Sachs 239,100 Alfresa Holdings Corp Morgan Stanley 2,896
600 Alpen Co Ltd Bank of AmericaMerrill Lynch 974
800 Alpen Co Ltd Goldman Sachs 1,299(500) Alpha Systems Inc Goldman Sachs —
10,600 Alps Alpine Co Ltd Bank of AmericaMerrill Lynch 3,627
3,600 Alps Alpine Co Ltd Goldman Sachs 1,6966,800 Alps Alpine Co Ltd Morgan Stanley (778)3,900 Amada Co Ltd Bank of America
Merrill Lynch 2,0364,500 Amada Co Ltd Goldman Sachs 2,0156,300 Amada Co Ltd Morgan Stanley 2,356
(5,600) ANA Holdings Inc Morgan Stanley (7,208)(300) Anest Iwata Corp Goldman Sachs (49)(100) Aomori Bank Ltd Bank of America
Merrill Lynch 127(300) Aomori Bank Ltd Goldman Sachs 380(400) Arata Corp Goldman Sachs (36)(700) Arcland Sakamoto Co Ltd Bank of America
Merrill Lynch 38(1,500) Arcland Sakamoto Co Ltd Goldman Sachs 82
300 Arcs Co Ltd Goldman Sachs (85)(100) Argo Graphics Inc Goldman Sachs (1)500 Aruhi Corp Goldman Sachs (559)300 Asahi Holdings Inc Bank of America
Merrill Lynch 3562,500 Asahi Holdings Inc Goldman Sachs 2,9642,200 Asahi Kasei Corp Bank of America
Merrill Lynch (826)1,600 Asahi Kasei Corp Goldman Sachs (332)(700) ASKA Pharmaceutical Hold-
ings Co Ltd Goldman Sachs 287600 ASKUL Corp Bank of America
Merrill Lynch 9,768(600) Avex Inc Bank of America
Merrill Lynch (72)(1,800) Avex Inc Goldman Sachs (788)(1,700) Awa Bank Ltd Bank of America
Merrill Lynch 2,341(5,400) Awa Bank Ltd Goldman Sachs 7,437
(300) Axial Retailing Inc Goldman Sachs 575(1,100) Bank of Nagoya Ltd Bank of America
Merrill Lynch 1,495(300) Bank of Nagoya Ltd Goldman Sachs 408(900) Bank of Okinawa Ltd Goldman Sachs 550(100) BayCurrent Consulting Inc Bank of America
Merrill Lynch (1,140)(400) BayCurrent Consulting Inc Morgan Stanley (3,466)300 Bell System24 Holdings Inc Bank of America
Merrill Lynch 522,700 Bell System24 Holdings Inc Goldman Sachs 294
(1,000) Belluna Co Ltd Bank of AmericaMerrill Lynch 702
(500) Belluna Co Ltd Goldman Sachs 3511,400 BeNext-Yumeshin Group Co Bank of America
Merrill Lynch 63810,700 Bic Camera Inc Bank of America
Merrill Lynch (4,094)3,100 Bic Camera Inc Goldman Sachs (1,216)1,700 Bic Camera Inc Morgan Stanley (264)
(2,600) Bunka Shutter Co Ltd Goldman Sachs (403)600 Canon Electronics Inc Goldman Sachs (109)600 Canon Inc Bank of America
Merrill Lynch (202)600 Canon Inc Goldman Sachs 81
Holding Description Counterparty
Netunrealised
appreciation/(depreciation)
USD
Japan continued2,200 Canon Inc Morgan Stanley (811)
100 Canon Marketing Japan Inc Bank of AmericaMerrill Lynch (38)
1,200 Canon Marketing Japan Inc Goldman Sachs (460)800 Canon Marketing Japan Inc Morgan Stanley (832)600 Cawachi Ltd Bank of America
Merrill Lynch (393)1,500 Cawachi Ltd Goldman Sachs (1,256)(700) Central Glass Co Ltd Goldman Sachs 632100 Central Security Patrols Co
Ltd Goldman Sachs 104(3,800) Change Inc Morgan Stanley 5201,100 Chiyoda Co Ltd Goldman Sachs 502,400 Chiyoda Corp Bank of America
Merrill Lynch (385)3,600 Chiyoda Corp Goldman Sachs (558)
800 Chori Co Ltd Bank of AmericaMerrill Lynch 394
600 Chori Co Ltd Goldman Sachs 296(100) Chudenko Corp Goldman Sachs (12)
1,300 Chugoku Marine Paints Ltd Bank of AmericaMerrill Lynch (213)
1,800 Chugoku Marine Paints Ltd Goldman Sachs (296)(1,600) Chukyo Bank Ltd Goldman Sachs 2,0582,500 CI Takiron Corp Bank of America
Merrill Lynch (707)2,800 CI Takiron Corp Goldman Sachs (792)1,200 Citizen Watch Co Ltd Bank of America
Merrill Lynch (44)11,800 Citizen Watch Co Ltd Goldman Sachs 2,260(1,400) Coca-Cola Bottlers Japan
Holdings IncBank of AmericaMerrill Lynch (112)
(200) Coca-Cola Bottlers JapanHoldings Inc Morgan Stanley (20)
(100) cocokara fine Inc Bank of AmericaMerrill Lynch (675)
(700) cocokara fine Inc Goldman Sachs (699)(500) Colowide Co Ltd Goldman Sachs (210)
(7) Comforia Residential Inc(REIT)
Bank of AmericaMerrill Lynch 160
(6) Comforia Residential Inc(REIT) Goldman Sachs 137
200 Computer Engineering &Consulting Ltd
Bank of AmericaMerrill Lynch (40)
300 CONEXIO Corp Bank of AmericaMerrill Lynch 44
3,200 CONEXIO Corp Goldman Sachs 4672,200 COOKPAD Inc Goldman Sachs 120
300 Cosel Co Ltd Bank of AmericaMerrill Lynch 224
1,100 Cosel Co Ltd Goldman Sachs 8234,000 CyberAgent Inc Bank of America
Merrill Lynch 1,0291,800 Dai Nippon Printing Co Ltd Goldman Sachs 1,2311,900 Dai Nippon Printing Co Ltd Morgan Stanley 549
(1,200) Daibiru Corp Bank of AmericaMerrill Lynch 252
(5,800) Daibiru Corp Goldman Sachs 1,217300 Dai-Dan Co Ltd Bank of America
Merrill Lynch (156)(400) Daihen Corp Goldman Sachs (707)(500) Daiho Corp Bank of America
Merrill Lynch 402(500) Daiho Corp Goldman Sachs 410300 Daiichi Jitsugyo Co Ltd Bank of America
Merrill Lynch (328)900 Daiichi Jitsugyo Co Ltd Goldman Sachs (985)
1,900 Daiken Corp Bank of AmericaMerrill Lynch (1,386)
BlackRock Systematic Global Long/Short Equity Fund continued
Portfolio of Investments as at 31 May 2021
The notes on pages 590 to 610 form an integral part of these financial statements.
Annual report and audited financial statements [527]

Holding Description Counterparty
Netunrealised
appreciation/(depreciation)
USD
Japan continued1,200 Daiken Corp Goldman Sachs (876)(200) Daikokutenbussan Co Ltd Bank of America
Merrill Lynch 1,812900 Dainichiseika Color &
Chemicals ManufacturingCo Ltd
Bank of AmericaMerrill Lynch (509)
2,800 Dainichiseika Color &Chemicals ManufacturingCo Ltd Goldman Sachs (1,583)
(600) Daio Paper Corp Bank of AmericaMerrill Lynch 281
(1,300) Daio Paper Corp Morgan Stanley 582(700) Daiseki Co Ltd Goldman Sachs (1,341)
(1,700) Daishi Hokuetsu FinancialGroup Inc Goldman Sachs 465
100 Daito Trust Construction CoLtd Morgan Stanley (365)
(1) Daiwa House InvestmentCorp (REIT)
Bank of AmericaMerrill Lynch (68)
(16) Daiwa House InvestmentCorp (REIT) Goldman Sachs (1,166)
(22) Daiwa House InvestmentCorp (REIT) Morgan Stanley (1,305)
1,000 Daiwa Industries Ltd Bank of AmericaMerrill Lynch (246)
5,000 Daiwa Industries Ltd Goldman Sachs (1,231)(39) Daiwa Securities Living In-
vestments Corp (REIT) Goldman Sachs (36)(2,500) DeNA Co Ltd Bank of America
Merrill Lynch (4,239)(4,400) DeNA Co Ltd Morgan Stanley (3,291)4,400 DIC Corp Bank of America
Merrill Lynch (4,053)2,000 DIC Corp Goldman Sachs (1,842)5,900 DIC Corp Morgan Stanley (3,605)
100 Digital Arts Inc Bank of AmericaMerrill Lynch (138)
100 Digital Arts Inc Goldman Sachs (458)(400) Digital Garage Inc Bank of America
Merrill Lynch (699)(1,100) Digital Garage Inc Goldman Sachs (1,706)
200 Disco Corp Goldman Sachs 3,1861,000 Disco Corp Morgan Stanley 10,818
500 DKK Co Ltd Bank of AmericaMerrill Lynch (36)
1,400 DKK Co Ltd Goldman Sachs (102)100 DKS Co Ltd Goldman Sachs 46200 Doshisha Co Ltd Goldman Sachs (139)
(200) DTS Corp Goldman Sachs 4(100) DyDo Group Holdings Inc Bank of America
Merrill Lynch 201(200) Eagle Industry Co Ltd Bank of America
Merrill Lynch (11)(1,300) Eagle Industry Co Ltd Goldman Sachs (71)
(100) Earth Corp Bank of AmericaMerrill Lynch 228
(100) Earth Corp Goldman Sachs 22810,600 EDION Corp Goldman Sachs (4,737)
(300) Eizo Corp Bank of AmericaMerrill Lynch (371)
200 en-japan Inc Goldman Sachs 5751,100 EPS Holdings Inc Bank of America
Merrill Lynch 4,7851,400 EPS Holdings Inc Goldman Sachs 6,049
900 ESPEC Corp Bank of AmericaMerrill Lynch 804
800 Exedy Corp Bank of AmericaMerrill Lynch 448
700 Exedy Corp Goldman Sachs 2622,400 FAN Communications Inc Bank of America
Merrill Lynch 110
Holding Description Counterparty
Netunrealised
appreciation/(depreciation)
USD
Japan continued4,700 FAN Communications Inc Goldman Sachs 201
500 FANUC Corp Morgan Stanley 3,6941,400 FCC Co Ltd Bank of America
Merrill Lynch (270)1,400 FCC Co Ltd Goldman Sachs (345)2,800 Feed One Co Ltd Bank of America
Merrill Lynch (1,456)3,700 Feed One Co Ltd Goldman Sachs (1,924)(700) Ferrotec Holdings Corp Bank of America
Merrill Lynch (2,582)1,400 Financial Products Group
Co Ltd Goldman Sachs 255300 Fixstars Corp Bank of America
Merrill Lynch 14900 Fixstars Corp Goldman Sachs 41
1,400 Foster Electric Co Ltd Bank of AmericaMerrill Lynch (1,609)
200 Foster Electric Co Ltd Goldman Sachs (230)1,600 France Bed Holdings Co Ltd Bank of America
Merrill Lynch (131)2,300 France Bed Holdings Co Ltd Goldman Sachs (189)
(7) Frontier Real Estate Invest-ment Corp (REIT)
Bank of AmericaMerrill Lynch (1,205)
(300) Fuji Corp Goldman Sachs (252)(400) Fuji Kyuko Co Ltd Bank of America
Merrill Lynch (186)(1,700) Fuji Kyuko Co Ltd Morgan Stanley (620)7,100 Fuji Media Holdings Inc Bank of America
Merrill Lynch (769)1,400 Fuji Media Holdings Inc Goldman Sachs (119)
600 Fuji Pharma Co Ltd Goldman Sachs (105)200 Fuji Seal International Inc Bank of America
Merrill Lynch (13)100 Fuji Seal International Inc Goldman Sachs —
(300) Fujibo Holdings Inc Goldman Sachs (438)2,600 Fujikura Ltd Bank of America
Merrill Lynch (142)4,100 Fujikura Ltd Goldman Sachs (224)(200) Fujio Food Group Inc Bank of America
Merrill Lynch 146(2,500) Fujio Food Group Inc Goldman Sachs (31)
(700) Fujitec Co Ltd Bank of AmericaMerrill Lynch (524)
(5,500) Fujitec Co Ltd Goldman Sachs (4,469)(700) Fujitsu General Ltd Bank of America
Merrill Lynch 246(1,100) Fujiya Co Ltd Goldman Sachs 472
100 Fukui Computer HoldingsInc
Bank of AmericaMerrill Lynch 228
400 Fukui Computer HoldingsInc Goldman Sachs 912
100 Funai Soken Holdings Inc Bank of AmericaMerrill Lynch 4
200 Gecoss Corp Bank of AmericaMerrill Lynch (20)
1,500 Gecoss Corp Goldman Sachs (112)300 Geo Holdings Corp Goldman Sachs (149)
(1) Global One Real Estate In-vestment Corp (REIT) Goldman Sachs 5
1,600 Glory Ltd Bank of AmericaMerrill Lynch 283
5,300 Glory Ltd Goldman Sachs 400300 GMO Financial Holdings Inc Bank of America
Merrill Lynch 44(200) GMO GlobalSign Holdings
KKBank of AmericaMerrill Lynch (310)
(400) GMO GlobalSign HoldingsKK Goldman Sachs (620)
600 Goldcrest Co Ltd Bank of AmericaMerrill Lynch (13)
2,400 Goldcrest Co Ltd Goldman Sachs 212
BlackRock Systematic Global Long/Short Equity Fund continued
Portfolio of Investments as at 31 May 2021
The notes on pages 590 to 610 form an integral part of these financial statements.
BlackRock Strategic Funds[528]

Holding Description Counterparty
Netunrealised
appreciation/(depreciation)
USD
Japan continued100 Goldwin Inc Bank of America
Merrill Lynch —(9,900) Gree Inc Goldman Sachs 181(3,800) GS Yuasa Corp Bank of America
Merrill Lynch (7,556)(4,900) GS Yuasa Corp Goldman Sachs (9,743)(2,100) GS Yuasa Corp Morgan Stanley (1,532)
400 G-Tekt Corp Bank of AmericaMerrill Lynch (51)
1,500 G-Tekt Corp Goldman Sachs (192)(1,600) H2O Retailing Corp Bank of America
Merrill Lynch (336)(3,900) H2O Retailing Corp Goldman Sachs (818)
(400) Hakuhodo DY Holdings Inc Bank of AmericaMerrill Lynch 206
100 Halows Co Ltd Bank of AmericaMerrill Lynch (126)
400 Halows Co Ltd Goldman Sachs (503)(3) Hankyu Hanshin Inc (REIT) Goldman Sachs 15
400 Hanwa Co Ltd Goldman Sachs (584)400 Hazama Ando Corp Goldman Sachs (194)(26) Heiwa Real Estate Inc
(REIT) Goldman Sachs 1191,600 Heiwado Co Ltd Bank of America
Merrill Lynch (15)700 Heiwado Co Ltd Goldman Sachs 187
(300) Hiday Hidaka Corp Bank of AmericaMerrill Lynch 16
(200) Hiday Hidaka Corp Goldman Sachs 11(100) Hioki EE Corp Bank of America
Merrill Lynch 73(900) Hirogin Holdings Inc Bank of America
Merrill Lynch 174(200) Hirogin Holdings Inc Morgan Stanley 15(200) HIS Co Ltd Goldman Sachs (140)200 Hochiki Corp Bank of America
Merrill Lynch 85400 Hochiki Corp Goldman Sachs 114
(300) Hokkoku Bank Ltd Bank of AmericaMerrill Lynch 219
(400) Hokkoku Bank Ltd Goldman Sachs 292(2,100) Hokuetsu Corp Goldman Sachs 521
(700) Hokuhoku Financial GroupInc
Bank of AmericaMerrill Lynch 306
(2,400) Hokuhoku Financial GroupInc Goldman Sachs 1,051
700 Hoshizaki Corp Bank of AmericaMerrill Lynch 416
300 Hoshizaki Corp Goldman Sachs (296)200 Hoshizaki Corp Morgan Stanley (18)
3,100 Hosiden Corp Goldman Sachs 311(600) Hosokawa Micron Corp Goldman Sachs (1,532)
(3) Hulic Reit Inc (REIT) Bank of AmericaMerrill Lynch (49)
(7) Hulic Reit Inc (REIT) Goldman Sachs (115)(800) Hyakugo Bank Ltd Bank of America
Merrill Lynch 109(800) Hyakugo Bank Ltd Goldman Sachs 109
(1,100) Hyakujushi Bank Ltd Bank of AmericaMerrill Lynch 943
(1,900) Hyakujushi Bank Ltd Goldman Sachs 1,629(500) Ibiden Co Ltd Morgan Stanley (1,300)
(1,300) Ichibanya Co Ltd Goldman Sachs 889(10,700) Ichigo Inc Bank of America
Merrill Lynch (47)(37,300) Ichigo Inc Goldman Sachs (714)(34,500) Ichigo Inc Morgan Stanley 947
(600) Ichikoh Industries Ltd Goldman Sachs 82(300) Idec Corp Bank of America
Merrill Lynch (265)
Holding Description Counterparty
Netunrealised
appreciation/(depreciation)
USD
Japan continued(3,000) Idec Corp Goldman Sachs (2,654)
700 Inaba Denki Sangyo Co Ltd Goldman Sachs 217(300) Inageya Co Ltd Goldman Sachs 230(47) Industrial & Infrastructure
Fund Investment Corp(REIT) Goldman Sachs (772)
(21) Industrial & InfrastructureFund Investment Corp(REIT) Morgan Stanley 19
(100) Information ServicesInternational-Dentsu Ltd Goldman Sachs (119)
3,700 Inpex Corp Bank of AmericaMerrill Lynch (1,552)
17,400 Inpex Corp Goldman Sachs (7,821)400 Insource Co Ltd Goldman Sachs (930)300 Internet Initiative Japan Inc Goldman Sachs 818
(200) IR Japan Holdings Ltd Bank of AmericaMerrill Lynch (2,262)
(600) IR Japan Holdings Ltd Morgan Stanley (1,149)500 ITOCHU Corp Goldman Sachs 34
2,100 Itokuro Inc Bank of AmericaMerrill Lynch 1,283
2,700 Itokuro Inc Goldman Sachs 1,650(800) Iwatani Corp Bank of America
Merrill Lynch 2,108(600) Iwatani Corp Goldman Sachs 1,915
(1,000) Iwatani Corp Morgan Stanley (1,277)(2,100) JAFCO Group Co ltd Goldman Sachs (8,428)(3,500) Japan Airlines Co Ltd Goldman Sachs (7,374)(5,700) Japan Airlines Co Ltd Morgan Stanley (6,914)(3,900) Japan Airport Terminal Co
Ltd Morgan Stanley (8,893)(3,200) Japan Aviation Electronics
Industry LtdBank of AmericaMerrill Lynch (1,664)
(700) Japan Aviation ElectronicsIndustry Ltd Goldman Sachs (364)
(2,800) Japan Aviation ElectronicsIndustry Ltd Morgan Stanley (306)
(7) Japan Excellent Inc (REIT) Bank of AmericaMerrill Lynch (543)
(22) Japan Excellent Inc (REIT) Goldman Sachs (1,623)(300) Japan Investment Adviser
Co LtdBank of AmericaMerrill Lynch 120
(200) Japan Lifeline Co Ltd Bank of AmericaMerrill Lynch 139
(500) Japan Lifeline Co Ltd Goldman Sachs 347200 Japan Material Co Ltd Bank of America
Merrill Lynch 193(100) Japan Metropolitan Fund
Invest (REIT) Morgan Stanley (1,642)400 Japan Pulp & Paper Co Ltd Bank of America
Merrill Lynch (146)200 Japan Pulp & Paper Co Ltd Goldman Sachs (73)
(1,400) Japan Securities FinanceCo Ltd Goldman Sachs (638)
1,100 Japan Wool Textile Co Ltd Bank of AmericaMerrill Lynch (361)
500 Japan Wool Textile Co Ltd Goldman Sachs (164)(100) JCU Corp Goldman Sachs 160
(2,000) JDC Corp Bank of AmericaMerrill Lynch 417
(300) Jeol Ltd Goldman Sachs (985)(100) JINS Holdings Inc Goldman Sachs 9100 JM Holdings Co Ltd Goldman Sachs (16)
1,400 J-Oil Mills Inc Bank of AmericaMerrill Lynch (575)
2,600 J-Oil Mills Inc Goldman Sachs (1,067)1,400 JSP Corp Bank of America
Merrill Lynch 773,600 JSP Corp Goldman Sachs 197
BlackRock Systematic Global Long/Short Equity Fund continued
Portfolio of Investments as at 31 May 2021
The notes on pages 590 to 610 form an integral part of these financial statements.
Annual report and audited financial statements [529]

Holding Description Counterparty
Netunrealised
appreciation/(depreciation)
USD
Japan continued(300) JTOWER Inc Bank of America
Merrill Lynch (230)(300) Juroku Bank Ltd Bank of America
Merrill Lynch 170(500) Juroku Bank Ltd Goldman Sachs 283900 K&O Energy Group Inc Bank of America
Merrill Lynch (328)700 K&O Energy Group Inc Goldman Sachs (255)
(400) Kadokawa Corp Bank of AmericaMerrill Lynch (1,351)
(100) Kadokawa Corp Goldman Sachs (384)200 Kaga Electronics Co Ltd Goldman Sachs 278
2,100 Kamei Corp Bank of AmericaMerrill Lynch —
2,100 Kamei Corp Goldman Sachs —500 Kamigumi Co Ltd Goldman Sachs (263)900 Kamigumi Co Ltd Morgan Stanley (435)
1,200 Kanamoto Co Ltd Bank of AmericaMerrill Lynch 131
700 Kanamoto Co Ltd Goldman Sachs 181(200) Kanematsu Corp Bank of America
Merrill Lynch 4(600) Kansai Super Market Ltd Bank of America
Merrill Lynch 126(300) Katakura Industries Co Ltd Bank of America
Merrill Lynch (227)(2,700) Katakura Industries Co Ltd Goldman Sachs (2,044)
(100) Katitas Co Ltd Goldman Sachs 24(2,300) Kawasaki Heavy Industries
Ltd Morgan Stanley (2,916)(100) Kawasaki Kisen Kaisha Ltd Bank of America
Merrill Lynch (80)(100) Kawasaki Kisen Kaisha Ltd Morgan Stanley (32)
(2,200) Keisei Electric Railway CoLtd Goldman Sachs (2,807)
(3,300) Keisei Electric Railway CoLtd Morgan Stanley (3,913)
(1,100) Keiyo Co Ltd Bank of AmericaMerrill Lynch (241)
(900) Keiyo Co Ltd Goldman Sachs (197)(6) Kenedix Residential Next
Investment Corp (REIT)Bank of AmericaMerrill Lynch (241)
(14) Kenedix Residential NextInvestment Corp (REIT) Goldman Sachs (562)
(1) Kenedix Retail Corp (REIT) Goldman Sachs (43)(600) Key Coffee Inc Bank of America
Merrill Lynch (43)(1,600) Key Coffee Inc Goldman Sachs (18)
(800) KFC Holdings Japan Ltd Bank of AmericaMerrill Lynch 190
(100) Kintetsu Department StoreCo Ltd
Bank of AmericaMerrill Lynch 23
(1,900) Kintetsu Department StoreCo Ltd Goldman Sachs 433
700 Kintetsu Group Holdings CoLtd
Bank of AmericaMerrill Lynch 670
100 Kintetsu Group Holdings CoLtd Goldman Sachs 95
700 Kintetsu World Express Inc Goldman Sachs (1,136)(300) Kisoji Co Ltd Bank of America
Merrill Lynch (53)(1,000) Kissei Pharmaceutical Co
Ltd Goldman Sachs 137(700) Kiyo Bank Ltd Bank of America
Merrill Lynch 404(3,300) Kiyo Bank Ltd Goldman Sachs 1,955
400 Koatsu Gas Kogyo Co Ltd Bank of AmericaMerrill Lynch 9
3,000 Koatsu Gas Kogyo Co Ltd Goldman Sachs 62(1,100) Koei Tecmo Holdings Co Ltd Bank of America
Merrill Lynch (2,435)
Holding Description Counterparty
Netunrealised
appreciation/(depreciation)
USD
Japan continued(2,400) Koei Tecmo Holdings Co Ltd Morgan Stanley (5,904)
(600) Kojima Co Ltd Bank of AmericaMerrill Lynch 383
(3,900) Kojima Co Ltd Goldman Sachs 2,4901,200 KOMEDA Holdings Co Ltd Goldman Sachs (263)
200 Komeri Co Ltd Goldman Sachs (332)15,000 Konica Minolta Inc Bank of America
Merrill Lynch 2,66625,600 Konica Minolta Inc Goldman Sachs 5,7949,600 Konica Minolta Inc Morgan Stanley 672
900 Konoike Transport Co Ltd Bank of AmericaMerrill Lynch (99)
3,800 Konoike Transport Co Ltd Goldman Sachs (416)(400) Koshidaka Holdings Co Ltd Goldman Sachs (118)
2,200 K’s Holdings Corp Bank of AmericaMerrill Lynch (1,826)
800 K’s Holdings Corp Goldman Sachs (664)5,600 K’s Holdings Corp Morgan Stanley (3,422)
(2,400) Kumiai Chemical IndustryCo Ltd Goldman Sachs 153
1,000 Kura Sushi Inc Goldman Sachs (410)(100) Kureha Corp Goldman Sachs 255(300) Kusuri no Aoki Holdings Co
LtdBank of AmericaMerrill Lynch 234
100 KYB Corp Bank of AmericaMerrill Lynch 164
200 Kyoei Steel Ltd Bank of AmericaMerrill Lynch (162)
1,700 Kyoei Steel Ltd Goldman Sachs (1,636)(300) Kyokuto Kaihatsu Kogyo Co
LtdBank of AmericaMerrill Lynch (222)
(500) Kyokuto Kaihatsu Kogyo CoLtd Goldman Sachs (139)
(1,500) KYORIN Holdings Inc Bank of AmericaMerrill Lynch 274
(4,500) KYORIN Holdings Inc Goldman Sachs 8591,500 LAC Co Ltd Bank of America
Merrill Lynch 2971,500 LAC Co Ltd Goldman Sachs (139)
(11,500) Leopalace21 Corp Bank of AmericaMerrill Lynch 524
(300) Lifenet Insurance Co Bank of AmericaMerrill Lynch (142)
3,300 Link And Motivation Inc Goldman Sachs 120500 Lixil Corp Bank of America
Merrill Lynch (383)100 Lixil Corp Morgan Stanley (162)100 Mars Group Holdings Corp Bank of America
Merrill Lynch 19600 Mars Group Holdings Corp Goldman Sachs 115300 Marudai Food Co Ltd Goldman Sachs (90)100 Marui Group Co Ltd Goldman Sachs 79
1,600 Marui Group Co Ltd Morgan Stanley 1,459800 Maruichi Steel Tube Ltd Bank of America
Merrill Lynch (200)(700) Marusan Securities Co Ltd Bank of America
Merrill Lynch 170(1,400) Marusan Securities Co Ltd Goldman Sachs 73
(100) Maruwa Co Ltd Goldman Sachs (128)(2,400) Marvelous Inc Bank of America
Merrill Lynch (547)(1,700) Marvelous Inc Goldman Sachs (388)
(500) Matsuda Sangyo Co Ltd Bank of AmericaMerrill Lynch 113
(600) Matsuda Sangyo Co Ltd Goldman Sachs 527(1,900) Matsuya Co Ltd Bank of America
Merrill Lynch 154(1,600) Matsuya Co Ltd Goldman Sachs 2332,600 Max Co Ltd Goldman Sachs 1,304
BlackRock Systematic Global Long/Short Equity Fund continued
Portfolio of Investments as at 31 May 2021
The notes on pages 590 to 610 form an integral part of these financial statements.
BlackRock Strategic Funds[530]
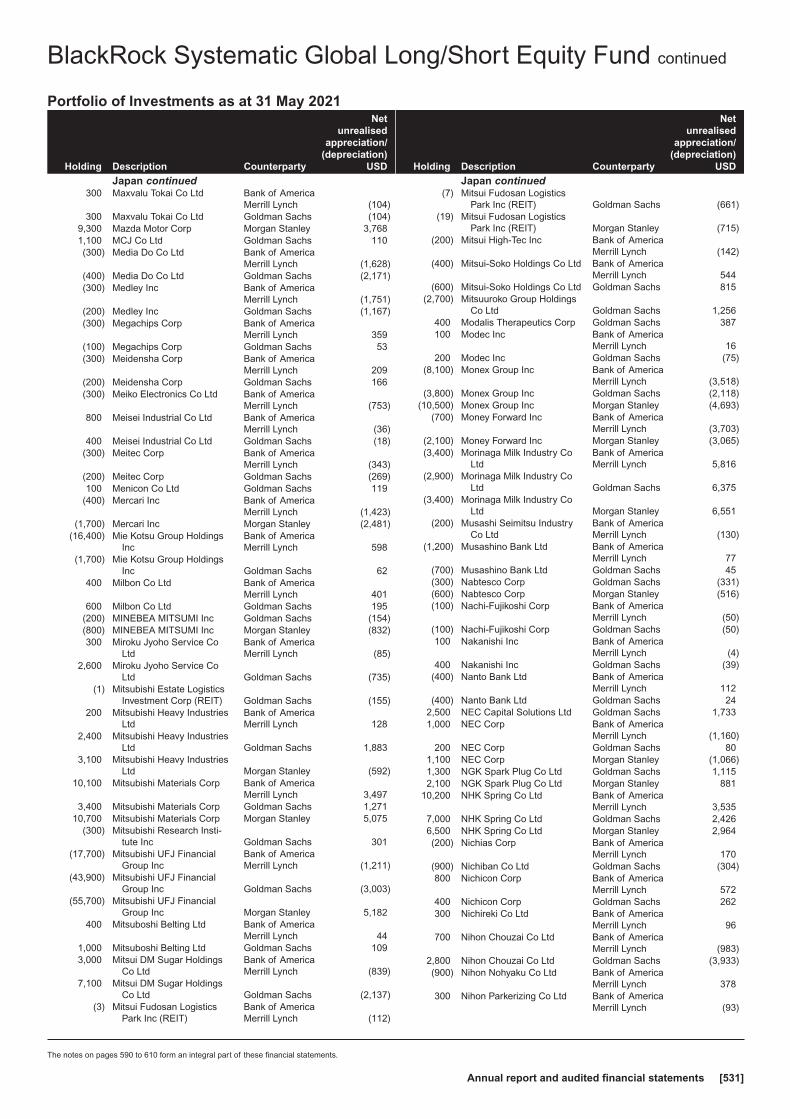
Holding Description Counterparty
Netunrealised
appreciation/(depreciation)
USD
Japan continued300 Maxvalu Tokai Co Ltd Bank of America
Merrill Lynch (104)300 Maxvalu Tokai Co Ltd Goldman Sachs (104)
9,300 Mazda Motor Corp Morgan Stanley 3,7681,100 MCJ Co Ltd Goldman Sachs 110(300) Media Do Co Ltd Bank of America
Merrill Lynch (1,628)(400) Media Do Co Ltd Goldman Sachs (2,171)(300) Medley Inc Bank of America
Merrill Lynch (1,751)(200) Medley Inc Goldman Sachs (1,167)(300) Megachips Corp Bank of America
Merrill Lynch 359(100) Megachips Corp Goldman Sachs 53(300) Meidensha Corp Bank of America
Merrill Lynch 209(200) Meidensha Corp Goldman Sachs 166(300) Meiko Electronics Co Ltd Bank of America
Merrill Lynch (753)800 Meisei Industrial Co Ltd Bank of America
Merrill Lynch (36)400 Meisei Industrial Co Ltd Goldman Sachs (18)
(300) Meitec Corp Bank of AmericaMerrill Lynch (343)
(200) Meitec Corp Goldman Sachs (269)100 Menicon Co Ltd Goldman Sachs 119
(400) Mercari Inc Bank of AmericaMerrill Lynch (1,423)
(1,700) Mercari Inc Morgan Stanley (2,481)(16,400) Mie Kotsu Group Holdings
IncBank of AmericaMerrill Lynch 598
(1,700) Mie Kotsu Group HoldingsInc Goldman Sachs 62
400 Milbon Co Ltd Bank of AmericaMerrill Lynch 401
600 Milbon Co Ltd Goldman Sachs 195(200) MINEBEA MITSUMI Inc Goldman Sachs (154)(800) MINEBEA MITSUMI Inc Morgan Stanley (832)300 Miroku Jyoho Service Co
LtdBank of AmericaMerrill Lynch (85)
2,600 Miroku Jyoho Service CoLtd Goldman Sachs (735)
(1) Mitsubishi Estate LogisticsInvestment Corp (REIT) Goldman Sachs (155)
200 Mitsubishi Heavy IndustriesLtd
Bank of AmericaMerrill Lynch 128
2,400 Mitsubishi Heavy IndustriesLtd Goldman Sachs 1,883
3,100 Mitsubishi Heavy IndustriesLtd Morgan Stanley (592)
10,100 Mitsubishi Materials Corp Bank of AmericaMerrill Lynch 3,497
3,400 Mitsubishi Materials Corp Goldman Sachs 1,27110,700 Mitsubishi Materials Corp Morgan Stanley 5,075
(300) Mitsubishi Research Insti-tute Inc Goldman Sachs 301
(17,700) Mitsubishi UFJ FinancialGroup Inc
Bank of AmericaMerrill Lynch (1,211)
(43,900) Mitsubishi UFJ FinancialGroup Inc Goldman Sachs (3,003)
(55,700) Mitsubishi UFJ FinancialGroup Inc Morgan Stanley 5,182
400 Mitsuboshi Belting Ltd Bank of AmericaMerrill Lynch 44
1,000 Mitsuboshi Belting Ltd Goldman Sachs 1093,000 Mitsui DM Sugar Holdings
Co LtdBank of AmericaMerrill Lynch (839)
7,100 Mitsui DM Sugar HoldingsCo Ltd Goldman Sachs (2,137)
(3) Mitsui Fudosan LogisticsPark Inc (REIT)
Bank of AmericaMerrill Lynch (112)
Holding Description Counterparty
Netunrealised
appreciation/(depreciation)
USD
Japan continued(7) Mitsui Fudosan Logistics
Park Inc (REIT) Goldman Sachs (661)(19) Mitsui Fudosan Logistics
Park Inc (REIT) Morgan Stanley (715)(200) Mitsui High-Tec Inc Bank of America
Merrill Lynch (142)(400) Mitsui-Soko Holdings Co Ltd Bank of America
Merrill Lynch 544(600) Mitsui-Soko Holdings Co Ltd Goldman Sachs 815
(2,700) Mitsuuroko Group HoldingsCo Ltd Goldman Sachs 1,256
400 Modalis Therapeutics Corp Goldman Sachs 387100 Modec Inc Bank of America
Merrill Lynch 16200 Modec Inc Goldman Sachs (75)
(8,100) Monex Group Inc Bank of AmericaMerrill Lynch (3,518)
(3,800) Monex Group Inc Goldman Sachs (2,118)(10,500) Monex Group Inc Morgan Stanley (4,693)
(700) Money Forward Inc Bank of AmericaMerrill Lynch (3,703)
(2,100) Money Forward Inc Morgan Stanley (3,065)(3,400) Morinaga Milk Industry Co
LtdBank of AmericaMerrill Lynch 5,816
(2,900) Morinaga Milk Industry CoLtd Goldman Sachs 6,375
(3,400) Morinaga Milk Industry CoLtd Morgan Stanley 6,551
(200) Musashi Seimitsu IndustryCo Ltd
Bank of AmericaMerrill Lynch (130)
(1,200) Musashino Bank Ltd Bank of AmericaMerrill Lynch 77
(700) Musashino Bank Ltd Goldman Sachs 45(300) Nabtesco Corp Goldman Sachs (331)(600) Nabtesco Corp Morgan Stanley (516)(100) Nachi-Fujikoshi Corp Bank of America
Merrill Lynch (50)(100) Nachi-Fujikoshi Corp Goldman Sachs (50)100 Nakanishi Inc Bank of America
Merrill Lynch (4)400 Nakanishi Inc Goldman Sachs (39)
(400) Nanto Bank Ltd Bank of AmericaMerrill Lynch 112
(400) Nanto Bank Ltd Goldman Sachs 242,500 NEC Capital Solutions Ltd Goldman Sachs 1,7331,000 NEC Corp Bank of America
Merrill Lynch (1,160)200 NEC Corp Goldman Sachs 80
1,100 NEC Corp Morgan Stanley (1,066)1,300 NGK Spark Plug Co Ltd Goldman Sachs 1,1152,100 NGK Spark Plug Co Ltd Morgan Stanley 881
10,200 NHK Spring Co Ltd Bank of AmericaMerrill Lynch 3,535
7,000 NHK Spring Co Ltd Goldman Sachs 2,4266,500 NHK Spring Co Ltd Morgan Stanley 2,964(200) Nichias Corp Bank of America
Merrill Lynch 170(900) Nichiban Co Ltd Goldman Sachs (304)800 Nichicon Corp Bank of America
Merrill Lynch 572400 Nichicon Corp Goldman Sachs 262300 Nichireki Co Ltd Bank of America
Merrill Lynch 96700 Nihon Chouzai Co Ltd Bank of America
Merrill Lynch (983)2,800 Nihon Chouzai Co Ltd Goldman Sachs (3,933)(900) Nihon Nohyaku Co Ltd Bank of America
Merrill Lynch 378300 Nihon Parkerizing Co Ltd Bank of America
Merrill Lynch (93)
BlackRock Systematic Global Long/Short Equity Fund continued
Portfolio of Investments as at 31 May 2021
The notes on pages 590 to 610 form an integral part of these financial statements.
Annual report and audited financial statements [531]

Holding Description Counterparty
Netunrealised
appreciation/(depreciation)
USD
Japan continued100 Nihon Unisys Ltd Bank of America
Merrill Lynch (101)1,700 Nihon Unisys Ltd Goldman Sachs (1,915)
900 Nihon Unisys Ltd Morgan Stanley (1,143)(200) Nikkon Holdings Co Ltd Bank of America
Merrill Lynch 48300 Nippon Densetsu Kogyo Co
Ltd Goldman Sachs 55(200) Nippon Fine Chemical Co
LtdBank of AmericaMerrill Lynch (133)
(100) Nippon Fine Chemical CoLtd Goldman Sachs (67)
500 Nippon Gas Co Ltd Bank of AmericaMerrill Lynch (156)
(300) Nippon Koei Co Ltd Goldman Sachs 1562,280 Nippon Light Metal Holdings
Co Ltd Goldman Sachs (6,031)400 Nippon Paper Industries Co
LtdBank of AmericaMerrill Lynch (197)
1,300 Nippon Paper Industries CoLtd Morgan Stanley (154)
2,800 Nippon Seiki Co Ltd Bank of AmericaMerrill Lynch 234
2,000 Nippon Seiki Co Ltd Goldman Sachs 1071,300 Nippon Telegraph & Tele-
phone CorpBank of AmericaMerrill Lynch 205
5,100 Nippon Television HoldingsInc Goldman Sachs 1,161
3,900 Nippon Television HoldingsInc Morgan Stanley 489
1,700 Nippon Yusen KK Morgan Stanley (1,318)(4,800) Nishimatsu Construction Co
Ltd Goldman Sachs 3,940(100) Nishi-Nippon Financial
Holdings IncBank of AmericaMerrill Lynch 48
(3,900) Nishi-Nippon FinancialHoldings Inc Goldman Sachs 1,885
(500) Nishi-Nippon Railroad CoLtd
Bank of AmericaMerrill Lynch (150)
400 Nissan Shatai Co Ltd Goldman Sachs (46)(100) Nissei ASB Machine Co Ltd Bank of America
Merrill Lynch (119)200 Nissha Co Ltd Goldman Sachs (48)700 Nisshinbo Holdings Inc Bank of America
Merrill Lynch (164)(200) Nitta Corp Goldman Sachs 173100 Nitto Kogyo Corp Bank of America
Merrill Lynch (71)1,300 Nitto Kohki Co Ltd Bank of America
Merrill Lynch (415)600 Nitto Kohki Co Ltd Goldman Sachs (192)
(400) Nittoku Co Ltd Bank of AmericaMerrill Lynch 201
6,100 NOK Corp Bank of AmericaMerrill Lynch 278
6,800 NOK Corp Goldman Sachs 3104,800 NOK Corp Morgan Stanley (2,058)
500 Nomura Co Ltd Bank of AmericaMerrill Lynch 228
5,600 Nomura Co Ltd Goldman Sachs 2,554(200) Noritsu Koki Co Ltd Goldman Sachs 91
(31,600) North Pacific Bank Ltd Bank of AmericaMerrill Lynch 6,585
(68,600) North Pacific Bank Ltd Goldman Sachs 14,1441,000 NS United Kaiun Kaisha Ltd Bank of America
Merrill Lynch (657)2,500 NS United Kaiun Kaisha Ltd Goldman Sachs (1,642)
200 NSD Co Ltd Bank of AmericaMerrill Lynch (142)
21,800 NTN Corp Goldman Sachs (795)
Holding Description Counterparty
Netunrealised
appreciation/(depreciation)
USD
Japan continued100 OBIC Business Consultants
Co Ltd Morgan Stanley (137)(200) Ogaki Kyoritsu Bank Ltd Bank of America
Merrill Lynch 244(2,400) Ogaki Kyoritsu Bank Ltd Goldman Sachs 2,9331,500 Oiles Corp Bank of America
Merrill Lynch (666)1,300 Oiles Corp Goldman Sachs (485)(700) Oisix ra daichi Inc Bank of America
Merrill Lynch 969(9,500) Oji Holdings Corp Bank of America
Merrill Lynch 4,047(7,900) Oji Holdings Corp Goldman Sachs 3,849(8,100) Oji Holdings Corp Morgan Stanley 2,660
400 Okabe Co Ltd Bank of AmericaMerrill Lynch (120)
1,900 Okabe Co Ltd Goldman Sachs (572)(200) Okumura Corp Goldman Sachs 95200 Omron Corp Goldman Sachs 836
(200) Optorun Co Ltd Bank of AmericaMerrill Lynch (81)
(400) Optorun Co Ltd Goldman Sachs (99)(200) Organo Corp Goldman Sachs (215)
(4,800) ORIX Corp Bank of AmericaMerrill Lynch (3,966)
(12,200) ORIX Corp Goldman Sachs (5,183)(7,200) ORIX Corp Morgan Stanley (1,567)
(11) Orix JREIT Inc (REIT) Bank of AmericaMerrill Lynch (224)
300 Osaka Steel Co Ltd Bank of AmericaMerrill Lynch (369)
400 Osaka Steel Co Ltd Goldman Sachs (493)600 OSAKA Titanium Technolo-
gies Co Ltd Goldman Sachs 66800 Pacific Metals Co Ltd Bank of America
Merrill Lynch 2832,000 Pacific Metals Co Ltd Goldman Sachs 5241,900 Pack Corp Goldman Sachs (503)(300) PAL GROUP Holdings Co
LtdBank of AmericaMerrill Lynch (77)
400 PALTAC Corp Bank of AmericaMerrill Lynch 346
300 PALTAC Corp Goldman Sachs 98800 PALTAC Corp Morgan Stanley (1,088)
(100) Penta-Ocean ConstructionCo Ltd
Bank of AmericaMerrill Lynch 34
(5,200) Penta-Ocean ConstructionCo Ltd Morgan Stanley 2,580
300 Persol Holdings Co Ltd Bank of AmericaMerrill Lynch 235
2,700 Persol Holdings Co Ltd Morgan Stanley 74(700) Pharma Foods International
Co Ltd Goldman Sachs 145400 Pilot Corp Bank of America
Merrill Lynch (547)600 Pilot Corp Goldman Sachs (821)
3,300 Piolax Inc Bank of AmericaMerrill Lynch (654)
2,300 Piolax Inc Goldman Sachs (577)500 Press Kogyo Co Ltd Bank of America
Merrill Lynch —3,500 Press Kogyo Co Ltd Goldman Sachs —
700 Pressance Corp Bank of AmericaMerrill Lynch (217)
2,100 Pressance Corp Goldman Sachs (651)(500) Prima Meat Packers Ltd Bank of America
Merrill Lynch 630(1,700) Prima Meat Packers Ltd Goldman Sachs 2,4191,900 Proto Corp Goldman Sachs (312)
BlackRock Systematic Global Long/Short Equity Fund continued
Portfolio of Investments as at 31 May 2021
The notes on pages 590 to 610 form an integral part of these financial statements.
BlackRock Strategic Funds[532]

Holding Description Counterparty
Netunrealised
appreciation/(depreciation)
USD
Japan continued(100) Raiznext Corp Bank of America
Merrill Lynch 48(5,500) Raiznext Corp Goldman Sachs 2,659
100 Rakus Co Ltd Goldman Sachs (31)2,900 Raysum Co Ltd Goldman Sachs 7672,600 Resorttrust Inc Bank of America
Merrill Lynch (849)700 Resorttrust Inc Goldman Sachs (193)900 Ricoh Leasing Co Ltd Bank of America
Merrill Lynch (739)1,300 Ricoh Leasing Co Ltd Goldman Sachs (1,067)(300) Riken Vitamin Co Ltd Bank of America
Merrill Lynch 61(800) Riken Vitamin Co Ltd Goldman Sachs 166(700) Ringer Hut Co Ltd Bank of America
Merrill Lynch (19)300 Riso Kagaku Corp Goldman Sachs 651
3,400 Rock Field Co Ltd Goldman Sachs 434(300) Rokko Butter Co Ltd Bank of America
Merrill Lynch (41)(700) Round One Corp Goldman Sachs (782)
(2,000) Royal Holdings Co Ltd Bank of AmericaMerrill Lynch (237)
(500) Royal Holdings Co Ltd Goldman Sachs (58)(200) RS Technologies Co Ltd Bank of America
Merrill Lynch (274)500 Ryobi Ltd Goldman Sachs (109)
(2,100) Ryoyo Electro Corp Bank of AmericaMerrill Lynch (1,034)
(200) Saibu Gas Holdings Co Ltd Bank of AmericaMerrill Lynch 144
(100) Saibu Gas Holdings Co Ltd Goldman Sachs 721,800 Sakai Chemical Industry Co
LtdBank of AmericaMerrill Lynch (1,248)
1,500 Sakai Chemical Industry CoLtd Goldman Sachs (1,040)
200 SAMTY Co Ltd Goldman Sachs (173)30 Samty Residential Invest-
ment Corp (REIT) Goldman Sachs 1,259(800) San ju San Financial Group
Inc Goldman Sachs (36)(100) Sanken Electric Co Ltd Goldman Sachs (512)(200) Sanrio Co Ltd Bank of America
Merrill Lynch 29(500) Sansan Inc Bank of America
Merrill Lynch 186(200) Sansan Inc Morgan Stanley (91)
1,400 Sanwa Holdings Corp Bank of AmericaMerrill Lynch (580)
200 Sanwa Holdings Corp Goldman Sachs (68)400 Sanwa Holdings Corp Morgan Stanley (318)
(400) Sanyo Denki Co Ltd Bank of AmericaMerrill Lynch (2,262)
(900) Sanyo Denki Co Ltd Goldman Sachs (5,089)300 Sanyo Special Steel Co Ltd Bank of America
Merrill Lynch 31,500 Sanyo Special Steel Co Ltd Goldman Sachs 14
200 SB Technology Corp Bank of AmericaMerrill Lynch 89
300 Seiko Epson Corp Bank of AmericaMerrill Lynch 216
1,100 Seiko Epson Corp Morgan Stanley 50(300) Seiren Co Ltd Bank of America
Merrill Lynch (159)(3,100) Seiren Co Ltd Goldman Sachs (1,640)
(167) Sekisui House Reit Inc(REIT)
Bank of AmericaMerrill Lynch (2,742)
(22) Sekisui House Reit Inc(REIT) Goldman Sachs (361)
(63) Sekisui House Reit Inc(REIT) Morgan Stanley (460)
Holding Description Counterparty
Netunrealised
appreciation/(depreciation)
USD
Japan continued(1,500) Senshu Ikeda Holdings Inc Bank of America
Merrill Lynch 137(1,700) Senshu Ikeda Holdings Inc Goldman Sachs 155
(100) Seria Co Ltd Goldman Sachs 43(300) Serverworks Co Ltd Goldman Sachs 274(300) SFP Holdings Co Ltd Bank of America
Merrill Lynch (85)(1,600) Shibaura Machine Co Ltd Bank of America
Merrill Lynch (482)(1,500) Shibaura Machine Co Ltd Goldman Sachs (451)
(400) Shibuya Corp Goldman Sachs 949(200) SHIFT Inc Morgan Stanley (638)(100) Shiga Bank Ltd Goldman Sachs 119800 Shikoku Chemicals Corp Goldman Sachs 263
(300) Shima Seiki ManufacturingLtd Goldman Sachs 93
4,800 Shimadzu Corp Bank of AmericaMerrill Lynch —
4,400 Shimadzu Corp Goldman Sachs —1,700 Shimadzu Corp Morgan Stanley (78)(100) Shin Nippon Air Technolo-
gies Co LtdBank of AmericaMerrill Lynch 109
(1,000) Shin Nippon Air Technolo-gies Co Ltd Goldman Sachs 1,085
1,000 Shin-Etsu Polymer Co Ltd Goldman Sachs 465,200 Shinmaywa Industries Ltd Goldman Sachs (95)1,500 Shinnihon Corp Bank of America
Merrill Lynch (123)2,000 Shinnihon Corp Goldman Sachs (164)
(4,600) Shizuoka Bank Ltd Bank of AmericaMerrill Lynch 1,897
(700) Shizuoka Bank Ltd Goldman Sachs 263(4,300) Shizuoka Bank Ltd Morgan Stanley 1,686(3,500) Shizuoka Gas Co Ltd Goldman Sachs (287)
(300) Shochiku Co Ltd Bank of AmericaMerrill Lynch (1,218)
500 Shoei Co Ltd Bank of AmericaMerrill Lynch 2
700 Shoei Co Ltd Goldman Sachs (323)200 Showa Denko KK Bank of America
Merrill Lynch (220)300 Showa Denko KK Goldman Sachs (276)400 Showa Denko KK Morgan Stanley (274)200 Siix Corp Bank of America
Merrill Lynch 212(800) Sinanen Holdings Co Ltd Goldman Sachs 781
(2,400) Sinfonia Technology Co Ltd Goldman Sachs (525)5,400 Sintokogio Ltd Bank of America
Merrill Lynch 1,5736,600 Sintokogio Ltd Goldman Sachs 1,694(700) Sodick Co Ltd Bank of America
Merrill Lynch (389)(2,400) Sodick Co Ltd Goldman Sachs (824)
400 Solasto Corp Goldman Sachs 1682,200 Sourcenext Corp Bank of America
Merrill Lynch —2,700 Sourcenext Corp Goldman Sachs —(100) SRE Holdings Corp Goldman Sachs (579)(200) St Marc Holdings Co Ltd Bank of America
Merrill Lynch 115(400) St Marc Holdings Co Ltd Goldman Sachs 230300 Starzen Co Ltd Bank of America
Merrill Lynch (197)200 Starzen Co Ltd Goldman Sachs (131)
1,800 Strike Co Ltd Goldman Sachs 2,227(200) Sugi Holdings Co Ltd Bank of America
Merrill Lynch 115(200) Sugi Holdings Co Ltd Morgan Stanley 255
10,700 Sumitomo Chemical Co Ltd Bank of AmericaMerrill Lynch 1,952
BlackRock Systematic Global Long/Short Equity Fund continued
Portfolio of Investments as at 31 May 2021
The notes on pages 590 to 610 form an integral part of these financial statements.
Annual report and audited financial statements [533]

Holding Description Counterparty
Netunrealised
appreciation/(depreciation)
USD
Japan continued8,200 Sumitomo Chemical Co Ltd Goldman Sachs 1,496
65,300 Sumitomo Chemical Co Ltd Morgan Stanley 1,7877,500 Sumitomo Corp Bank of America
Merrill Lynch 97145,700 Sumitomo Corp Morgan Stanley (1,129)
100 Sumitomo Osaka CementCo Ltd
Bank of AmericaMerrill Lynch (124)
100 Sumitomo Osaka CementCo Ltd Goldman Sachs (160)
1,800 Sumitomo Riko Co Ltd Bank of AmericaMerrill Lynch 82
6,000 Sumitomo Riko Co Ltd Goldman Sachs 274100 Sumitomo Seika Chemicals
Co Ltd Goldman Sachs (36)(900) Sumitomo Warehouse Co
LtdBank of AmericaMerrill Lynch 334
(3,200) Sumitomo Warehouse CoLtd Goldman Sachs 1,173
5,400 Sun Frontier Fudousan CoLtd
Bank of AmericaMerrill Lynch (788)
3,300 Sun Frontier Fudousan CoLtd Goldman Sachs (482)
(3,500) Suruga Bank Ltd Bank of AmericaMerrill Lynch 1,468
(16,700) Suruga Bank Ltd Goldman Sachs 7,007(3,500) T Hasegawa Co Ltd Bank of America
Merrill Lynch 413(2,800) T Hasegawa Co Ltd Goldman Sachs 306
500 Tachibana Eletech Co Ltd Bank of AmericaMerrill Lynch (46)
(700) Tachi-S Co Ltd Goldman Sachs (1,188)200 Taihei Dengyo Kaisha Ltd Bank of America
Merrill Lynch 711,600 Taihei Dengyo Kaisha Ltd Goldman Sachs 5693,300 Takamatsu Construction
Group Co LtdBank of AmericaMerrill Lynch (1,023)
4,500 Takamatsu ConstructionGroup Co Ltd Goldman Sachs (1,395)
(900) Takara Holdings Inc Bank of AmericaMerrill Lynch (234)
(1,500) Takara Holdings Inc Goldman Sachs (235)(600) Takara Holdings Inc Morgan Stanley (27)
2,400 Takara Leben Co Ltd Goldman Sachs (175)(100) Takasago International Corp Goldman Sachs 3
1,600 Takasago Thermal Engi-neering Co Ltd Goldman Sachs 681
600 Takeuchi Manufacturing CoLtd
Bank of AmericaMerrill Lynch 144
100 Takeuchi Manufacturing CoLtd Goldman Sachs (13)
(300) Taki Chemical Co Ltd Bank of AmericaMerrill Lynch 1,117
(100) Taki Chemical Co Ltd Goldman Sachs 401(1,800) Takuma Co Ltd Bank of America
Merrill Lynch 2,021(2,000) Takuma Co Ltd Goldman Sachs 2,645
400 Tama Home Co Ltd Bank of AmericaMerrill Lynch (839)
1,100 Tama Home Co Ltd Goldman Sachs (2,308)(500) Tamura Corp Bank of America
Merrill Lynch (137)(700) Tamura Corp Goldman Sachs (192)
1,700 Tanseisha Co Ltd Goldman Sachs 481100 Teikoku Sen-I Co Ltd Bank of America
Merrill Lynch (12)(500) Tenma Corp Bank of America
Merrill Lynch 42(1,200) Tenma Corp Goldman Sachs (394)(2,500) TerraSky Co Ltd Goldman Sachs 440
Holding Description Counterparty
Netunrealised
appreciation/(depreciation)
USD
Japan continued2,000 T-Gaia Corp Bank of America
Merrill Lynch (1,022)2,400 T-Gaia Corp Goldman Sachs (1,226)(900) TKC Corp Goldman Sachs 451300 TKP Corp Goldman Sachs 1,021600 Toagosei Co Ltd Bank of America
Merrill Lynch (60)1,200 Toagosei Co Ltd Goldman Sachs (181)
(6,700) Toho Bank Ltd Bank of AmericaMerrill Lynch 550
(25,800) Toho Bank Ltd Goldman Sachs 2,118300 Toho Titanium Co Ltd Goldman Sachs 50800 Tokai Corp Bank of America
Merrill Lynch (511)1,900 Tokai Corp Goldman Sachs (1,213)
800 TOKAI Holdings Corp Bank of AmericaMerrill Lynch (161)
2,000 Tokai Tokyo Financial Hold-ings Inc
Bank of AmericaMerrill Lynch 55
900 Tokai Tokyo Financial Hold-ings Inc Goldman Sachs 25
(1,900) Tokushu Tokai Paper Co Ltd Goldman Sachs 6,065(32,700) Tokyo Electric Power Co
Holdings IncBank of AmericaMerrill Lynch 2,414
(13,400) Tokyo Electric Power CoHoldings Inc Goldman Sachs 527
(60,000) Tokyo Electric Power CoHoldings Inc Morgan Stanley 3,068
(200) Tokyo Kiraboshi FinancialGroup Inc
Bank of AmericaMerrill Lynch 55
(1,400) Tokyu Construction Co Ltd Bank of AmericaMerrill Lynch (268)
(5) Tokyu Inc (REIT) Goldman Sachs (319)(800) TOMONY Holdings Inc Bank of America
Merrill Lynch 58(7,700) TOMONY Holdings Inc Goldman Sachs 562
(200) Tonami Holdings Co Ltd Bank of AmericaMerrill Lynch 237
800 Topcon Corp Goldman Sachs 810(600) Torii Pharmaceutical Co Ltd Goldman Sachs 657300 Tosei Corp Bank of America
Merrill Lynch (109)200 Towa Pharmaceutical Co
LtdBank of AmericaMerrill Lynch 49
(1,400) Toyo Construction Co Ltd Bank of AmericaMerrill Lynch 148
(2,900) Toyo Construction Co Ltd Goldman Sachs 312(100) Toyo Gosei Co Ltd Bank of America
Merrill Lynch (1,040)700 Toyo Seikan Group Holdings
LtdBank of AmericaMerrill Lynch 888
400 Toyo Seikan Group HoldingsLtd Goldman Sachs 606
(900) Toyota Motor Corp Bank of AmericaMerrill Lynch (3,088)
(3,900) Toyota Motor Corp Goldman Sachs (10,354)(2,600) Toyota Motor Corp Morgan Stanley (3,739)1,300 TPR Co Ltd Bank of America
Merrill Lynch (711)2,600 TPR Co Ltd Goldman Sachs (1,423)(100) Trancom Co Ltd Goldman Sachs 246200 Trusco Nakayama Corp Bank of America
Merrill Lynch (191)300 Trusco Nakayama Corp Goldman Sachs (199)500 Tsugami Corp Bank of America
Merrill Lynch 410500 UACJ Corp Bank of America
Merrill Lynch (488)1,500 UACJ Corp Goldman Sachs (1,464)
BlackRock Systematic Global Long/Short Equity Fund continued
Portfolio of Investments as at 31 May 2021
The notes on pages 590 to 610 form an integral part of these financial statements.
BlackRock Strategic Funds[534]

Holding Description Counterparty
Netunrealised
appreciation/(depreciation)
USD
Japan continued(300) Uchida Yoko Co Ltd Bank of America
Merrill Lynch 123(400) Uchida Yoko Co Ltd Goldman Sachs 164(100) Universal Entertainment
CorpBank of AmericaMerrill Lynch 98
(100) Valor Holdings Co Ltd Bank of AmericaMerrill Lynch 109
(500) Valor Holdings Co Ltd Goldman Sachs 511(100) Valuence Holdings Inc Bank of America
Merrill Lynch 174(800) Vital KSK Holdings Inc Bank of America
Merrill Lynch (88)1,400 VT Holdings Co Ltd Bank of America
Merrill Lynch 5362,200 VT Holdings Co Ltd Goldman Sachs 8431,800 Wakita & Co Ltd Goldman Sachs (279)1,700 WDB Holdings Co Ltd Bank of America
Merrill Lynch 1,4571,000 WDB Holdings Co Ltd Goldman Sachs 857
100 Weathernews Inc Bank of AmericaMerrill Lynch 91
(130) West Holdings Corp Bank of AmericaMerrill Lynch (622)
100 Workman Co Ltd Goldman Sachs (83)400 Workman Co Ltd Morgan Stanley 219
2,500 World Co Ltd Goldman Sachs (1,209)(900) Wowow Inc Bank of America
Merrill Lynch 985900 Xebio Holdings Co Ltd Bank of America
Merrill Lynch (33)3,000 Xebio Holdings Co Ltd Goldman Sachs (109)
16,700 Yamada Holdings Co Ltd Bank of AmericaMerrill Lynch (3,199)
62,200 Yamada Holdings Co Ltd Goldman Sachs (11,914)57,900 Yamada Holdings Co Ltd Morgan Stanley (4,225)
(400) Yamagata Bank Ltd Bank of AmericaMerrill Lynch 80
(500) Yamagata Bank Ltd Goldman Sachs 1002,400 Yamaguchi Financial Group
IncBank of AmericaMerrill Lynch (497)
500 Yamaguchi Financial GroupInc Goldman Sachs (154)
500 Yamaguchi Financial GroupInc Morgan Stanley (53)
(6,100) Yoshinoya Holdings Co Ltd Bank of AmericaMerrill Lynch 4,451
(3,000) Yoshinoya Holdings Co Ltd Goldman Sachs 2,1892,700 Yurtec Corp Bank of America
Merrill Lynch (222)9,900 Yurtec Corp Goldman Sachs (813)
600 ZIGExN Co Ltd Bank of AmericaMerrill Lynch 38
600 ZIGExN Co Ltd Goldman Sachs 38
(46,664)
Netherlands(451) Alfen Beheer BV Bank of America
Merrill Lynch (3,961)(112) Alfen Beheer BV Morgan Stanley (512)361 AMG Advanced Metallurgi-
cal Group NVBank of AmericaMerrill Lynch 811
854 AMG Advanced Metallurgi-cal Group NV Goldman Sachs 1,480
(207) ArcelorMittal SA Bank of AmericaMerrill Lynch (371)
(193) Boskalis Westminster Bank of AmericaMerrill Lynch (113)
(1,769) Boskalis Westminster Goldman Sachs (1,034)(70) CM.com NV Bank of America
Merrill Lynch (218)
Holding Description Counterparty
Netunrealised
appreciation/(depreciation)
USD
Netherlands continued(324) Corbion NV Bank of America
Merrill Lynch 455(1,625) Corbion NV Goldman Sachs 1,156
(12,959) InPost SA Bank of AmericaMerrill Lynch (36,278)
(400) InPost SA Goldman Sachs (513)(2,711) InPost SA Morgan Stanley (4,471)(1,537) Intertrust NV Bank of America
Merrill Lynch 486(2,982) Intertrust NV Goldman Sachs 1,019
(21,033) Koninklijke BAM Groep NV Goldman Sachs 3,748(454) NSI NV (REIT) Bank of America
Merrill Lynch 111(546) NSI NV (REIT) Goldman Sachs 133
1,100 OCI NV Bank of AmericaMerrill Lynch (237)
544 OCI NV Goldman Sachs (2)16,144 PostNL NV Bank of America
Merrill Lynch (1,071)4,631 PostNL NV Goldman Sachs 1,7508,420 PostNL NV Morgan Stanley 341(460) SIF Holding NV Goldman Sachs (449)
(1,082) TomTom NV Goldman Sachs 1201,035 Unibail-Rodamco-Westfield
(REIT)Bank of AmericaMerrill Lynch 3,638
845 Unibail-Rodamco-Westfield(REIT) Goldman Sachs 2,970
517 Unibail-Rodamco-Westfield(REIT) Morgan Stanley 1,262
(451) Van Lanschot Kempen NV Goldman Sachs (193)(2,552) Wolters Kluwer NV Bank of America
Merrill Lynch 1,858(1,916) Wolters Kluwer NV Goldman Sachs 1,740
(26,345)
New Zealand33,539 Air New Zealand Ltd Bank of America
Merrill Lynch 51126,508 Air New Zealand Ltd Goldman Sachs 38558,541 Air New Zealand Ltd Morgan Stanley (638)
(79,277) Auckland International Air-port Ltd
Bank of AmericaMerrill Lynch 6,674
(940) Chorus Ltd Goldman Sachs 14144 Fisher & Paykel Healthcare
Corp LtdBank of AmericaMerrill Lynch 55
44 Fisher & Paykel HealthcareCorp Ltd Goldman Sachs (103)
791 Fisher & Paykel HealthcareCorp Ltd Morgan Stanley (1,636)
4,238 Fletcher Building Ltd Bank of AmericaMerrill Lynch 493
10,304 Fletcher Building Ltd Goldman Sachs 1,198(13,961) Genesis Energy Ltd Bank of America
Merrill Lynch (102)1,435 Infratil Ltd Bank of America
Merrill Lynch 907,087 Infratil Ltd Morgan Stanley 111(532) Summerset Group Holdings
LtdBank of AmericaMerrill Lynch 35
(31,137) Synlait Milk Ltd Bank of AmericaMerrill Lynch (74)
(2,981) Z Energy Ltd Goldman Sachs 433
7,446
Norway(4,343) Adevinta ASA Bank of America
Merrill Lynch (8,873)(424) Adevinta ASA Goldman Sachs (866)(241) Adevinta ASA Morgan Stanley (232)
BlackRock Systematic Global Long/Short Equity Fund continued
Portfolio of Investments as at 31 May 2021
The notes on pages 590 to 610 form an integral part of these financial statements.
Annual report and audited financial statements [535]

Holding Description Counterparty
Netunrealised
appreciation/(depreciation)
USD
Norway continued(456) Aker ASA ’A’ Bank of America
Merrill Lynch (1,202)(445) Aker ASA ’A’ Goldman Sachs (1,173)
(1,681) Aker ASA ’A’ Morgan Stanley (1,007)365 Atea ASA Bank of America
Merrill Lynch 179322 Atea ASA Goldman Sachs 89
1,672 Austevoll Seafood ASA Goldman Sachs (616)(373) Bakkafrost P Bank of America
Merrill Lynch (149)(1,132) Bakkafrost P Goldman Sachs (4,339)(1,974) Bakkafrost P Morgan Stanley (2,365)1,769 Borregaard ASA Bank of America
Merrill Lynch 2,3745,003 Borregaard ASA Goldman Sachs 6,463
659 BW LPG Ltd Bank of AmericaMerrill Lynch (886)
248 BW LPG Ltd Goldman Sachs (358)3,506 BW Offshore Ltd Bank of America
Merrill Lynch 2444,930 BW Offshore Ltd Goldman Sachs 606
617 Crayon Group Holding ASA Bank of AmericaMerrill Lynch 128
889 Crayon Group Holding ASA Goldman Sachs 4285,740 Elkem ASA Bank of America
Merrill Lynch 2752,096 Europris ASA Bank of America
Merrill Lynch 278696 Europris ASA Goldman Sachs 96197 FLEX LNG Ltd Bank of America
Merrill Lynch 891,855 Golden Ocean Group Ltd Bank of America
Merrill Lynch 7246,667 Golden Ocean Group Ltd Goldman Sachs 4,230(734) Grieg Seafood ASA Bank of America
Merrill Lynch (633)(392) Grieg Seafood ASA Goldman Sachs (338)
(6,755) Hafnia Ltd Goldman Sachs 146(6,577) Leroy Seafood Group ASA Bank of America
Merrill Lynch (583)(2,080) Leroy Seafood Group ASA Goldman Sachs (184)(7,273) Leroy Seafood Group ASA Morgan Stanley 1,168
105 Norway Royal Salmon ASA Goldman Sachs (98)(1,730) Norwegian Finans Holding
ASABank of AmericaMerrill Lynch 3
574 Ocean Yield ASA Bank of AmericaMerrill Lynch 30
882 Ocean Yield ASA Goldman Sachs (34)16 Pexip Holding ASA Bank of America
Merrill Lynch 112,855 Pexip Holding ASA Goldman Sachs 1,561
(1,309) Sbanken ASA Bank of AmericaMerrill Lynch (91)
(5,530) Sbanken ASA Goldman Sachs (33)1,589 Selvaag Bolig ASA Bank of America
Merrill Lynch 249502 Selvaag Bolig ASA Goldman Sachs 66483 Sparebank 1 Oestlandet Bank of America
Merrill Lynch 831,484 Sparebank 1 Oestlandet Goldman Sachs 218
343 SpareBank 1 SMN Goldman Sachs 3420 SpareBank 1 SR-Bank ASA Goldman Sachs (115)
(2,158) Stolt-Nielsen Ltd Goldman Sachs 3108,661 TGS NOPEC Geophysical
Co ASA Goldman Sachs (5,466)(841) Wallenius Wilhelmsen ASA Bank of America
Merrill Lynch (129)(2,213) Wallenius Wilhelmsen ASA Goldman Sachs (251)(5,370) XXL ASA Goldman Sachs 746
(9,224)
Holding Description Counterparty
Netunrealised
appreciation/(depreciation)
USD
Portugal(251,770) Banco Comercial Portugues
SA ’R’ Goldman Sachs (1,313)(73,448) Banco Comercial Portugues
SA ’R’ Morgan Stanley (350)(27,320) Mota-Engil SGPS SA Goldman Sachs (1,800)(24,844) Mota-Engil SGPS SA Goldman Sachs 12
4,820 NOS SGPS SA Goldman Sachs (1,600)(657) REN - Redes Energeticas
Nacionais SGPS SABank of AmericaMerrill Lynch 76
(12,541) REN - Redes EnergeticasNacionais SGPS SA Goldman Sachs 1,454
(3,521)
Singapore(2,100) AEM Holdings Ltd Goldman Sachs (178)
(26,900) CapitaLand Ltd Goldman Sachs (1,650)(210,900) CapitaLand Ltd Morgan Stanley (6,288)109,600 ComfortDelGro Corp Ltd Morgan Stanley 4,146(23,100) Frasers Centrepoint Trust
(REIT) Goldman Sachs (664)63,900 Hutchison Port Holdings
Trust ’U’Bank of AmericaMerrill Lynch 38
299,200 Hutchison Port HoldingsTrust ’U’ Goldman Sachs 1,166
229,900 Hutchison Port HoldingsTrust ’U’ Morgan Stanley —
28,600 Keppel REIT (REIT) Morgan Stanley —(12,800) Parkway Life Real Estate
Investment Trust (REIT)Bank of AmericaMerrill Lynch (2,324)
(27,500) Singapore Airlines Ltd Morgan Stanley (3,704)(45,980) Singapore Airlines Ltd Morgan Stanley —11,500 Singapore Post Ltd Morgan Stanley 935,700 Singapore Press Holdings
LtdBank of AmericaMerrill Lynch 396
80,200 Singapore Press HoldingsLtd Morgan Stanley (607)
1,000 Wilmar International Ltd Goldman Sachs (37)10,100 Wilmar International Ltd Morgan Stanley (481)
(10,094)
Spain(759) Aedas Homes SA Goldman Sachs 463(79) Aena SME SA Morgan Stanley (53)
(177) Almirall SA Bank of AmericaMerrill Lynch (50)
89 Amadeus IT Group SA Goldman Sachs 5444 Applus Services SA Bank of America
Merrill Lynch 18982 Applus Services SA Goldman Sachs 90
27,708 Banco de Sabadell SA Goldman Sachs (1,115)19,926 Banco de Sabadell SA Morgan Stanley (371)
(148) CIE Automotive SA Goldman Sachs (15)(55) Corp Financiera Alba SA Goldman Sachs —
(2,021) eDreams ODIGEO SA Bank of AmericaMerrill Lynch (1,159)
(1,067) Faes Farma SA Goldman Sachs 1121,855 Gestamp Automocion SA Goldman Sachs (294)
(1,734) Grupo Empresarial SanJose SA Goldman Sachs 63
339 Indra Sistemas SA Bank of AmericaMerrill Lynch (50)
1,237 Indra Sistemas SA Goldman Sachs 16773 Mediaset Espana Comuni-
cacion SABank of AmericaMerrill Lynch 151
5,788 Mediaset Espana Comuni-cacion SA Goldman Sachs 2,614
(328) Melia Hotels InternationalSA
Bank of AmericaMerrill Lynch 3
(602) Melia Hotels InternationalSA Goldman Sachs 63
BlackRock Systematic Global Long/Short Equity Fund continued
Portfolio of Investments as at 31 May 2021
The notes on pages 590 to 610 form an integral part of these financial statements.
BlackRock Strategic Funds[536]

Holding Description Counterparty
Netunrealised
appreciation/(depreciation)
USD
Spain continued(870) Metrovacesa SA Bank of America
Merrill Lynch 541(3,025) Metrovacesa SA Goldman Sachs 1,883(1,118) Prosegur Cia de Seguridad
SA Goldman Sachs 281(1,000) Sacyr SA Goldman Sachs 83
(117) Solarpack Corp TecnologicaSA Goldman Sachs (137)
(402) Talgo SA Bank of AmericaMerrill Lynch (41)
(402) Talgo SA Goldman Sachs (141)
2,960
Sweden(914) Adapteo Oyj Goldman Sachs (44)296 AddTech AB ’B’ Goldman Sachs 48
(759) AF Poyry AB Bank of AmericaMerrill Lynch (679)
(2,092) AF Poyry AB Goldman Sachs (2,809)(1,393) Alimak Group AB Goldman Sachs 504(1,780) Ambea AB Bank of America
Merrill Lynch (912)(746) Ambea AB Goldman Sachs (382)
4,959 Arjo AB ’B’ Goldman Sachs 2,930(4,907) Attendo AB Goldman Sachs (166)
(199) Boozt AB Goldman Sachs (81)(2,084) Bravida Holding AB Bank of America
Merrill Lynch (518)(4,620) Bravida Holding AB Goldman Sachs (1,451)
(267) Bure Equity AB Bank of AmericaMerrill Lynch (250)
(202) Bure Equity AB Goldman Sachs (199)514 Catena AB Bank of America
Merrill Lynch 6351,618 Catena AB Goldman Sachs 3,259
197 Cibus Nordic Real EstateAB
Bank of AmericaMerrill Lynch 109
165 Clas Ohlson AB ’B’ Goldman Sachs (6)(13,933) Cloetta AB ’B’ Goldman Sachs (1,042)
(870) Collector AB Bank of AmericaMerrill Lynch (141)
(1,390) Creades AB ’A’ Goldman Sachs (2,885)(200) Duni AB Bank of America
Merrill Lynch (140)(710) Duni AB Goldman Sachs (269)280 GARO AB Goldman Sachs 209
(135) Instalco AB Goldman Sachs (736)928 Intrum AB Bank of America
Merrill Lynch (341)385 Intrum AB Goldman Sachs (56)502 Intrum AB Morgan Stanley (267)150 Inwido AB Goldman Sachs (7)21 John Mattson Fastighets-
foretagen ABBank of AmericaMerrill Lynch 26
232 John Mattson Fastighets-foretagen AB Goldman Sachs 285
204 Kambi Group Plc Goldman Sachs 238(4,640) Karo Pharma AB Bank of America
Merrill Lynch (659)(3,406) Karo Pharma AB Goldman Sachs (447)3,661 Kindred Group Plc SDR Bank of America
Merrill Lynch 3,785395 Kindred Group Plc SDR Goldman Sachs 443
(13,333) Klovern AB ’B’ Goldman Sachs (482)(130) KNOW IT AB Bank of America
Merrill Lynch (172)(220) KNOW IT AB Goldman Sachs (292)408 Kungsleden AB Goldman Sachs 5265 Lime Technologies AB Bank of America
Merrill Lynch 99
Holding Description Counterparty
Netunrealised
appreciation/(depreciation)
USD
Sweden continued373 Loomis AB Goldman Sachs (216)
(204) Mekonomen AB Bank of AmericaMerrill Lynch (69)
(1,084) Mekonomen AB Goldman Sachs (366)66 Millicom International Cellu-
lar SA SDRBank of AmericaMerrill Lynch (26)
(306) Munters Group AB Goldman Sachs (11)(141) NCC AB ’B’ Bank of America
Merrill Lynch 80(2,064) NCC AB ’B’ Goldman Sachs 884(2,845) Peab AB ’B’ Goldman Sachs 274
(837) Recipharm AB ’B’ Bank of AmericaMerrill Lynch —
(208) Recipharm AB ’B’ Morgan Stanley —946 Saab AB ’B’ Bank of America
Merrill Lynch (625)206 Saab AB ’B’ Goldman Sachs (131)990 Saab AB ’B’ Morgan Stanley (735)
2,111 Scandi Standard AB Bank of AmericaMerrill Lynch (1,095)
2,289 Scandi Standard AB Goldman Sachs (1,187)2,760 Scandic Hotels Group AB Goldman Sachs (33)3,640 SKF AB ’B’ Bank of America
Merrill Lynch 1,4201,199 SKF AB ’B’ Morgan Stanley 676
(18) SkiStar AB Bank of AmericaMerrill Lynch (14)
(676) SkiStar AB Goldman Sachs (538)3,094 SSAB AB ’A’ Bank of America
Merrill Lynch (306)251 SSAB AB ’A’ Goldman Sachs (23)
40,534 SSAB AB ’A’ Morgan Stanley (4,141)38,765 SSAB AB ’B’ Goldman Sachs 82(4,170) Stillfront Group AB Morgan Stanley (471)(1,450) Thule Group AB Bank of America
Merrill Lynch (2,567)(1,926) Thule Group AB Goldman Sachs (1,620)
(891) Thule Group AB Morgan Stanley (796)1,623 Tobii AB Bank of America
Merrill Lynch (754)184 Tobii AB Goldman Sachs (85)256 Troax Group AB Bank of America
Merrill Lynch 163132 Troax Group AB Goldman Sachs 132394 Vitrolife AB Goldman Sachs 1,302
1,943 Wihlborgs Fastigheter AB Goldman Sachs 485
(13,122)
Switzerland65 ALSO Holding AG Reg Goldman Sachs 974
(25) APG SGA SA Bank of AmericaMerrill Lynch (458)
(1) APG SGA SA Goldman Sachs (18)(268) Arbonia AG Bank of America
Merrill Lynch (119)18 Autoneum Holding AG Bank of America
Merrill Lynch 120(636) Basilea Pharmaceutica AG
Reg Goldman Sachs (198)21 Bell Food Group AG Reg Goldman Sachs 8219 Bossard Holding AG Reg Goldman Sachs (84)(9) Daetwyler Holding AG Bank of America
Merrill Lynch (100)(45) Daetwyler Holding AG Goldman Sachs (500)
(1,188) EFG International AG Bank of AmericaMerrill Lynch 383
(6,885) EFG International AG Goldman Sachs 2,217(17) Forbo Holding AG Reg Goldman Sachs (1,020)
(1,796) Galenica AG Bank of AmericaMerrill Lynch (709)
BlackRock Systematic Global Long/Short Equity Fund continued
Portfolio of Investments as at 31 May 2021
The notes on pages 590 to 610 form an integral part of these financial statements.
Annual report and audited financial statements [537]
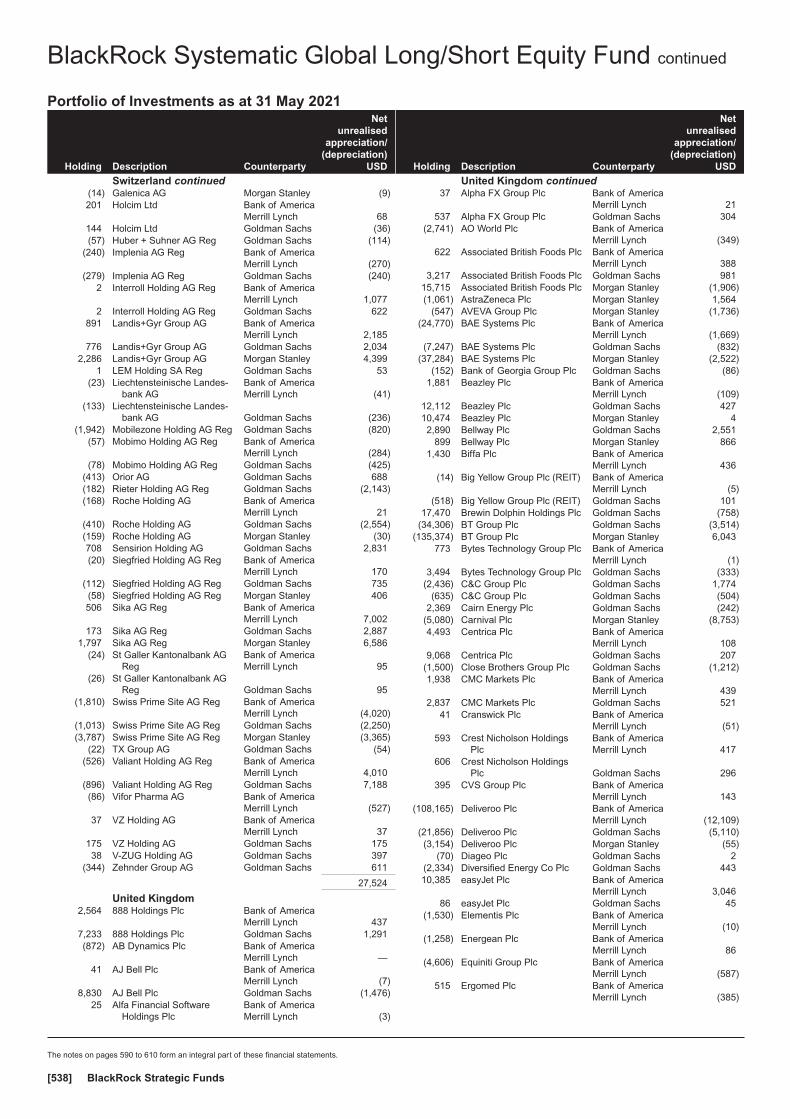
Holding Description Counterparty
Netunrealised
appreciation/(depreciation)
USD
Switzerland continued(14) Galenica AG Morgan Stanley (9)201 Holcim Ltd Bank of America
Merrill Lynch 68144 Holcim Ltd Goldman Sachs (36)(57) Huber + Suhner AG Reg Goldman Sachs (114)
(240) Implenia AG Reg Bank of AmericaMerrill Lynch (270)
(279) Implenia AG Reg Goldman Sachs (240)2 Interroll Holding AG Reg Bank of America
Merrill Lynch 1,0772 Interroll Holding AG Reg Goldman Sachs 622
891 Landis+Gyr Group AG Bank of AmericaMerrill Lynch 2,185
776 Landis+Gyr Group AG Goldman Sachs 2,0342,286 Landis+Gyr Group AG Morgan Stanley 4,399
1 LEM Holding SA Reg Goldman Sachs 53(23) Liechtensteinische Landes-
bank AGBank of AmericaMerrill Lynch (41)
(133) Liechtensteinische Landes-bank AG Goldman Sachs (236)
(1,942) Mobilezone Holding AG Reg Goldman Sachs (820)(57) Mobimo Holding AG Reg Bank of America
Merrill Lynch (284)(78) Mobimo Holding AG Reg Goldman Sachs (425)
(413) Orior AG Goldman Sachs 688(182) Rieter Holding AG Reg Goldman Sachs (2,143)(168) Roche Holding AG Bank of America
Merrill Lynch 21(410) Roche Holding AG Goldman Sachs (2,554)(159) Roche Holding AG Morgan Stanley (30)708 Sensirion Holding AG Goldman Sachs 2,831(20) Siegfried Holding AG Reg Bank of America
Merrill Lynch 170(112) Siegfried Holding AG Reg Goldman Sachs 735(58) Siegfried Holding AG Reg Morgan Stanley 406506 Sika AG Reg Bank of America
Merrill Lynch 7,002173 Sika AG Reg Goldman Sachs 2,887
1,797 Sika AG Reg Morgan Stanley 6,586(24) St Galler Kantonalbank AG
RegBank of AmericaMerrill Lynch 95
(26) St Galler Kantonalbank AGReg Goldman Sachs 95
(1,810) Swiss Prime Site AG Reg Bank of AmericaMerrill Lynch (4,020)
(1,013) Swiss Prime Site AG Reg Goldman Sachs (2,250)(3,787) Swiss Prime Site AG Reg Morgan Stanley (3,365)
(22) TX Group AG Goldman Sachs (54)(526) Valiant Holding AG Reg Bank of America
Merrill Lynch 4,010(896) Valiant Holding AG Reg Goldman Sachs 7,188(86) Vifor Pharma AG Bank of America
Merrill Lynch (527)37 VZ Holding AG Bank of America
Merrill Lynch 37175 VZ Holding AG Goldman Sachs 17538 V-ZUG Holding AG Goldman Sachs 397
(344) Zehnder Group AG Goldman Sachs 611
27,524
United Kingdom2,564 888 Holdings Plc Bank of America
Merrill Lynch 4377,233 888 Holdings Plc Goldman Sachs 1,291(872) AB Dynamics Plc Bank of America
Merrill Lynch —41 AJ Bell Plc Bank of America
Merrill Lynch (7)8,830 AJ Bell Plc Goldman Sachs (1,476)
25 Alfa Financial SoftwareHoldings Plc
Bank of AmericaMerrill Lynch (3)
Holding Description Counterparty
Netunrealised
appreciation/(depreciation)
USD
United Kingdom continued37 Alpha FX Group Plc Bank of America
Merrill Lynch 21537 Alpha FX Group Plc Goldman Sachs 304
(2,741) AO World Plc Bank of AmericaMerrill Lynch (349)
622 Associated British Foods Plc Bank of AmericaMerrill Lynch 388
3,217 Associated British Foods Plc Goldman Sachs 98115,715 Associated British Foods Plc Morgan Stanley (1,906)(1,061) AstraZeneca Plc Morgan Stanley 1,564
(547) AVEVA Group Plc Morgan Stanley (1,736)(24,770) BAE Systems Plc Bank of America
Merrill Lynch (1,669)(7,247) BAE Systems Plc Goldman Sachs (832)
(37,284) BAE Systems Plc Morgan Stanley (2,522)(152) Bank of Georgia Group Plc Goldman Sachs (86)
1,881 Beazley Plc Bank of AmericaMerrill Lynch (109)
12,112 Beazley Plc Goldman Sachs 42710,474 Beazley Plc Morgan Stanley 42,890 Bellway Plc Goldman Sachs 2,551
899 Bellway Plc Morgan Stanley 8661,430 Biffa Plc Bank of America
Merrill Lynch 436(14) Big Yellow Group Plc (REIT) Bank of America
Merrill Lynch (5)(518) Big Yellow Group Plc (REIT) Goldman Sachs 101
17,470 Brewin Dolphin Holdings Plc Goldman Sachs (758)(34,306) BT Group Plc Goldman Sachs (3,514)
(135,374) BT Group Plc Morgan Stanley 6,043773 Bytes Technology Group Plc Bank of America
Merrill Lynch (1)3,494 Bytes Technology Group Plc Goldman Sachs (333)
(2,436) C&C Group Plc Goldman Sachs 1,774(635) C&C Group Plc Goldman Sachs (504)
2,369 Cairn Energy Plc Goldman Sachs (242)(5,080) Carnival Plc Morgan Stanley (8,753)4,493 Centrica Plc Bank of America
Merrill Lynch 1089,068 Centrica Plc Goldman Sachs 207
(1,500) Close Brothers Group Plc Goldman Sachs (1,212)1,938 CMC Markets Plc Bank of America
Merrill Lynch 4392,837 CMC Markets Plc Goldman Sachs 521
41 Cranswick Plc Bank of AmericaMerrill Lynch (51)
593 Crest Nicholson HoldingsPlc
Bank of AmericaMerrill Lynch 417
606 Crest Nicholson HoldingsPlc Goldman Sachs 296
395 CVS Group Plc Bank of AmericaMerrill Lynch 143
(108,165) Deliveroo Plc Bank of AmericaMerrill Lynch (12,109)
(21,856) Deliveroo Plc Goldman Sachs (5,110)(3,154) Deliveroo Plc Morgan Stanley (55)
(70) Diageo Plc Goldman Sachs 2(2,334) Diversified Energy Co Plc Goldman Sachs 44310,385 easyJet Plc Bank of America
Merrill Lynch 3,04686 easyJet Plc Goldman Sachs 45
(1,530) Elementis Plc Bank of AmericaMerrill Lynch (10)
(1,258) Energean Plc Bank of AmericaMerrill Lynch 86
(4,606) Equiniti Group Plc Bank of AmericaMerrill Lynch (587)
515 Ergomed Plc Bank of AmericaMerrill Lynch (385)
BlackRock Systematic Global Long/Short Equity Fund continued
Portfolio of Investments as at 31 May 2021
The notes on pages 590 to 610 form an integral part of these financial statements.
BlackRock Strategic Funds[538]

Holding Description Counterparty
Netunrealised
appreciation/(depreciation)
USD
United Kingdom continued(227) Euromoney Institutional In-
vestor Plc Goldman Sachs (153)(2,938) Filtrona Plc Bank of America
Merrill Lynch (163)(6,592) Filtrona Plc Goldman Sachs (200)
(1) First Derivatives Plc Bank of AmericaMerrill Lynch 6
(78) First Derivatives Plc Goldman Sachs 4971,157 Forterra Plc Bank of America
Merrill Lynch 148(340) Future Plc Goldman Sachs (840)
(1,480) Future Plc Morgan Stanley (2,475)203 Gamesys Group Plc Bank of America
Merrill Lynch (43)(2,039) GlaxoSmithKline Plc Bank of America
Merrill Lynch 1,023(4,772) GlaxoSmithKline Plc Goldman Sachs 2,394
(28,114) GlaxoSmithKline Plc Morgan Stanley 4,143406 Go-Ahead Group Plc Goldman Sachs (242)902 Greggs Plc Morgan Stanley 40
(323,151) Harbour Energy Plc Goldman Sachs (545)(210,452) Harbour Energy Plc Morgan Stanley 541
57 HomeServe Plc Bank of AmericaMerrill Lynch (83)
736 HomeServe Plc Goldman Sachs (403)28,753 HomeServe Plc Morgan Stanley (2,970)1,112 Hunting Plc Bank of America
Merrill Lynch 651,798 Indivior Plc Bank of America
Merrill Lynch 156(2,235) Informa Plc Bank of America
Merrill Lynch (29)(6,381) Informa Plc Goldman Sachs (25)
(314) InterContinental HotelsGroup Plc Goldman Sachs 217
(8,263) Investec Plc Goldman Sachs (2,845)(4,888) IP Group Plc Bank of America
Merrill Lynch (288)(25,656) IP Group Plc Goldman Sachs (2,006)(16,543) ITM Power Plc Bank of America
Merrill Lynch (16,948)3,241 John Wood Group Plc Bank of America
Merrill Lynch (756)5,479 John Wood Group Plc Goldman Sachs (1,606)
32,071 John Wood Group Plc Morgan Stanley (3,681)67 Judges Scientific Plc Bank of America
Merrill Lynch 17180 Judges Scientific Plc Goldman Sachs 204
128 Kainos Group Plc Bank of AmericaMerrill Lynch 44
2,360 Kainos Group Plc Goldman Sachs 804(2,738) Lancashire Holdings Ltd Bank of America
Merrill Lynch 1,561(9,388) Lancashire Holdings Ltd Goldman Sachs 6,7181,107 Marshalls Plc Bank of America
Merrill Lynch (16)3,214 Marshalls Plc Goldman Sachs (144)
26 Mediclinic International Plc Bank of AmericaMerrill Lynch 10
5,938 Mediclinic International Plc Goldman Sachs 2,3225,851 Micro Focus International
PlcBank of AmericaMerrill Lynch 4,046
9,854 Micro Focus InternationalPlc Goldman Sachs 6,357
10,160 Micro Focus InternationalPlc Morgan Stanley 1,811
2 Moneysupermarket.comGroup Plcπ
Bank of AmericaMerrill Lynch —
Holding Description Counterparty
Netunrealised
appreciation/(depreciation)
USD
United Kingdom continued362 Moneysupermarket.com
Group Plc Goldman Sachs 112 Moneysupermarket.com
Group Plcπ Morgan Stanley —385 Morgan Sindall Group Plc Goldman Sachs 191
7,651 National Express Group Plc Bank of AmericaMerrill Lynch 1,149
5,548 National Express Group Plc Goldman Sachs 1,0344,390 National Express Group Plc Morgan Stanley 460(821) NCC Group Plc Bank of America
Merrill Lynch 17(532) NCC Group Plc Goldman Sachs (31)
3,928 Network International Hold-ings Plc
Bank of AmericaMerrill Lynch 433
5,173 Network International Hold-ings Plc Goldman Sachs 736
3,374 Network International Hold-ings Plc Morgan Stanley 585
184 Next Plc Morgan Stanley 18815,474 Ninety One Plc Bank of America
Merrill Lynch (1,359)25,176 Ninety One Plc Goldman Sachs (2,212)
(298) Ocado Group Plc Bank of AmericaMerrill Lynch 385
(86) Pearson Plc Goldman Sachs 30(1,880) Pearson Plc Morgan Stanley 74618,519 Phoenix Group Holdings Plc Morgan Stanley —(2,103) Premier Foods Plc Bank of America
Merrill Lynch 116(8,658) Premier Foods Plc Goldman Sachs 526
(841) Reckitt Benckiser Group Plc Bank of AmericaMerrill Lynch 604
(936) Reckitt Benckiser Group Plc Goldman Sachs 1,408(383) Redde Northgate Plc Bank of America
Merrill Lynch 27(16,451) Redde Northgate Plc Goldman Sachs 1,166
366 Redrow Plc Bank of AmericaMerrill Lynch 36
1,259 Redrow Plc Morgan Stanley 1505,349 Restaurant Group Plc Goldman Sachs 106(108) RWS Holdings Plc Bank of America
Merrill Lynch 12(9,303) RWS Holdings Plc Goldman Sachs 3951,692 Safestore Holdings Plc
(REIT)Bank of AmericaMerrill Lynch 707
1,387 Safestore Holdings Plc(REIT) Goldman Sachs 580
(2,017) Sage Group Plc Bank of AmericaMerrill Lynch 455
(4,452) Sage Group Plc Goldman Sachs 1,089(2,917) Serica Energy Plc Bank of America
Merrill Lynch 83(16,040) Serica Energy Plc Goldman Sachs 455
(485) Shaftesbury Plc (REIT) Goldman Sachs (86)(3,201) Spire Healthcare Group Plc Goldman Sachs (2,336)
(798) Sports Direct InternationalPlc Goldman Sachs 28
1,374 St Modwen Properties Plc Bank of AmericaMerrill Lynch 76
2,358 Strix Group Plc Bank of AmericaMerrill Lynch 529
6,238 Strix Group Plc Goldman Sachs 1,64524,420 Taylor Wimpey Plc Bank of America
Merrill Lynch (960)8,504 Taylor Wimpey Plc Morgan Stanley 175(412) TBC Bank Group Plc Bank of America
Merrill Lynch (416)(160) TBC Bank Group Plc Goldman Sachs (74)
BlackRock Systematic Global Long/Short Equity Fund continued
Portfolio of Investments as at 31 May 2021
The notes on pages 590 to 610 form an integral part of these financial statements.
Annual report and audited financial statements [539]

Holding Description Counterparty
Netunrealised
appreciation/(depreciation)
USD
United Kingdom continued464 Team17 Group Plc Bank of America
Merrill Lynch (208)6,850 Team17 Group Plc Goldman Sachs (343)
256 Ultra Electronics HoldingsPlc Goldman Sachs 102
(6,963) United Utilities Group Plc Morgan Stanley 5927,243 Virgin Money UK Plc Bank of America
Merrill Lynch 7578,156 Virgin Money UK Plc Goldman Sachs 869
370 Workspace Group Plc(REIT) Goldman Sachs (16)
(13,954)
United States(1,235) 10X Genomics Inc ’A’ Morgan Stanley (17,047)
137 1-800-Flowers.com Inc ’A’ Goldman Sachs (101)180 1st Source Corp Goldman Sachs 63
(306) 2U Inc Bank of AmericaMerrill Lynch 19
(889) 2U Inc Goldman Sachs (1,012)(333) 8x8 Inc Goldman Sachs 133
(1,328) A10 Networks Inc Bank of AmericaMerrill Lynch (558)
(528) A10 Networks Inc Goldman Sachs (222)(181) AAON Inc Bank of America
Merrill Lynch (32)(1,132) AAON Inc Goldman Sachs 474
142 AAR Corp Bank of AmericaMerrill Lynch 260
834 AAR Corp Goldman Sachs 1,2431,764 Aaron’s Co Inc Goldman Sachs 5,715
68 ACM Research Inc ’A’ Bank of AmericaMerrill Lynch 791
89 ACM Research Inc ’A’ Goldman Sachs 1,009(74) Adtalem Global Education
IncBank of AmericaMerrill Lynch 117
(2,934) Adtalem Global EducationInc Goldman Sachs 4,636
(1,264) ADTRAN Inc Bank of AmericaMerrill Lynch 63
(3,335) ADTRAN Inc Goldman Sachs 1,334119 Advanced Drainage Sys-
tems IncBank of AmericaMerrill Lynch (210)
3,008 Advanced Micro Devices Inc Morgan Stanley (893)(723) Adverum Biotechnologies
IncBank of AmericaMerrill Lynch (31)
(32) AeroVironment Inc Bank of AmericaMerrill Lynch (58)
(239) AeroVironment Inc Goldman Sachs (527)(263) Affirm Holdings Inc Bank of America
Merrill Lynch (2,685)(125) Affirm Holdings Inc Goldman Sachs (468)
68 Agilysys Inc Bank of AmericaMerrill Lynch (125)
1,993 AGNC Investment Corp(REIT) Goldman Sachs 658
286 AGNC Investment Corp(REIT) Morgan Stanley (11)
(4,164) Akebia Therapeutics Inc Goldman Sachs (497)260 Albany International Corp
’A’Bank of AmericaMerrill Lynch 1,194
448 Albany International Corp’A’ Goldman Sachs 1,967
895 Alcoa Corp Morgan Stanley 2,837242 Alexander & Baldwin Inc
(REIT)Bank of AmericaMerrill Lynch 179
1,071 Alexander & Baldwin Inc(REIT) Goldman Sachs 810
(1,255) Allegheny Technologies Inc Goldman Sachs (803)
Holding Description Counterparty
Netunrealised
appreciation/(depreciation)
USD
United States continued(557) ALLETE Inc Goldman Sachs 151(158) Altabancorp Bank of America
Merrill Lynch (404)(384) Altabancorp Goldman Sachs (1,075)377 Alteryx Inc ’A’ Bank of America
Merrill Lynch 282389 Alteryx Inc ’A’ Goldman Sachs 459984 Alteryx Inc ’A’ Morgan Stanley 1,411
(3,865) Alto Ingredients Inc Bank of AmericaMerrill Lynch (5,063)
(67) Altra Industrial Motion Corp Goldman Sachs (8)156 Amalgamated Financial
CorpBank of AmericaMerrill Lynch 20
1,475 Amalgamated FinancialCorp Goldman Sachs 192
711 Ambarella Inc Bank of AmericaMerrill Lynch 8,752
812 Ambarella Inc Goldman Sachs 7,162449 Ambarella Inc Morgan Stanley 1,165(94) AMC Entertainment Hold-
ings Inc ’A’ Morgan Stanley 85(122) Ameresco Inc ’A’ Bank of America
Merrill Lynch (340)(653) Ameresco Inc ’A’ Goldman Sachs (1,431)
1,577 American Eagle OutfittersInc
Bank of AmericaMerrill Lynch 3,403
673 American Eagle OutfittersInc Morgan Stanley 1,837
(363) American National GroupInc
Bank of AmericaMerrill Lynch (1,047)
(591) American National GroupInc Goldman Sachs (1,294)
(85) American Public EducationInc Goldman Sachs (1)
95 American Software Inc ’A’ Bank of AmericaMerrill Lynch 46
1,260 American Software Inc ’A’ Goldman Sachs 605(30) American States Water Co Bank of America
Merrill Lynch 11(76) American States Water Co Goldman Sachs 3559 American Woodmark Corp Bank of America
Merrill Lynch (4,357)608 American Woodmark Corp Goldman Sachs (4,196)
(1,847) Ameris Bancorp Goldman Sachs 2,9002,896 Amphastar Pharmaceuticals
Inc Goldman Sachs (3,012)(8,307) Amphenol Corp ’A’ Morgan Stanley (1,578)
(162) Analog Devices Inc Bank of AmericaMerrill Lynch (122)
(724) Analog Devices Inc Goldman Sachs 291(441) Analog Devices Inc Morgan Stanley (707)(434) AnaptysBio Inc Bank of America
Merrill Lynch 890(408) AnaptysBio Inc Goldman Sachs 836648 Andersons Inc Goldman Sachs 39
(408) Antero Resources Corp Goldman Sachs (134)(425) Apogee Enterprises Inc Bank of America
Merrill Lynch (68)(562) Apogee Enterprises Inc Goldman Sachs 101
(1,047) Apollo Medical Holdings Inc Bank of AmericaMerrill Lynch (3,580)
(1,743) Apollo Medical Holdings Inc Goldman Sachs (5,976)(2,565) Apple Hospitality Inc (REIT) Goldman Sachs (975)
434 Apple Inc Goldman Sachs (974)1,675 Apple Inc Morgan Stanley (3,378)
(1,290) Applied Materials Inc Bank of AmericaMerrill Lynch (666)
(721) Applied Materials Inc Goldman Sachs (274)
BlackRock Systematic Global Long/Short Equity Fund continued
Portfolio of Investments as at 31 May 2021
The notes on pages 590 to 610 form an integral part of these financial statements.
BlackRock Strategic Funds[540]

Holding Description Counterparty
Netunrealised
appreciation/(depreciation)
USD
United States continued(2,791) Applied Materials Inc Morgan Stanley (6,540)(1,340) AppLovin Corp ’A’ Bank of America
Merrill Lynch (6,735)2,460 Aramark Bank of America
Merrill Lynch (2,646)795 Aramark Goldman Sachs 43248 Aramark Morgan Stanley (22)
3,291 Arch Capital Group Ltd Bank of AmericaMerrill Lynch (1,630)
1,300 Arch Capital Group Ltd Goldman Sachs 305694 Arch Capital Group Ltd Morgan Stanley (28)(31) Arcosa Inc Bank of America
Merrill Lynch (38)(783) Arcosa Inc Goldman Sachs (938)
99 Arcus Biosciences Inc Bank of AmericaMerrill Lynch 33
(517) Ares Management Corp ’A’ Goldman Sachs (703)(65) Argo Group International
Holdings Ltd Goldman Sachs 74(287) Arrow Electronics Inc Bank of America
Merrill Lynch 201(177) Arrow Electronics Inc Goldman Sachs 414(149) Arrow Electronics Inc Morgan Stanley 495(177) Arrow Financial Corp Bank of America
Merrill Lynch (27)(189) Arrow Financial Corp Goldman Sachs (28)
(2,046) Asana Inc ’A’ Bank of AmericaMerrill Lynch (5,050)
(297) Asana Inc ’A’ Goldman Sachs (1,877)(341) Asana Inc ’A’ Morgan Stanley (204)(62) Asbury Automotive Group
IncBank of AmericaMerrill Lynch 508
(706) Assembly Biosciences Inc Bank of AmericaMerrill Lynch 7
(4,459) Assembly Biosciences Inc Goldman Sachs 45129 AssetMark Financial Hold-
ings IncBank of AmericaMerrill Lynch 187
864 AssetMark Financial Hold-ings Inc Goldman Sachs 1,253
(101) Atkore Inc Bank of AmericaMerrill Lynch (205)
674 Atlantica Sustainable Infra-structure Plc
Bank of AmericaMerrill Lynch 931
1,887 Atlantica Sustainable Infra-structure Plc Goldman Sachs (1,151)
594 Atlantica Sustainable Infra-structure Plc Morgan Stanley (368)
(685) Atlas Air Worldwide Hold-ings Inc Goldman Sachs (246)
10 Atlassian Corp Plc ’A’ Bank of AmericaMerrill Lynch 182
104 Atlassian Corp Plc ’A’ Goldman Sachs 263676 Atlassian Corp Plc ’A’ Morgan Stanley 7,22057 ATN International Inc Bank of America
Merrill Lynch (54)46 ATN International Inc Goldman Sachs (43)
356 Atreca Inc ’A’ Goldman Sachs (55)(82) AutoZone Inc Morgan Stanley 2,054
(256) Avalara Inc Goldman Sachs 300(204) Avalara Inc Morgan Stanley (450)192 Avantor Inc Bank of America
Merrill Lynch 2401,533 Avantor Inc Morgan Stanley 690
101 Avaya Holdings Corp Goldman Sachs 142(126) Avista Corp Bank of America
Merrill Lynch (11)(549) Avista Corp Goldman Sachs 197583 Avrobio Inc Bank of America
Merrill Lynch (169)291 Avrobio Inc Goldman Sachs (84)
Holding Description Counterparty
Netunrealised
appreciation/(depreciation)
USD
United States continued820 Axis Capital Holdings Ltd Bank of America
Merrill Lynch (43)1,320 Axis Capital Holdings Ltd Goldman Sachs 1,120
826 Axis Capital Holdings Ltd Morgan Stanley 468(396) Axogen Inc Bank of America
Merrill Lynch 309(76) AZEK Co Inc Bank of America
Merrill Lynch (17)(345) AZEK Co Inc Goldman Sachs (77)(328) AZEK Co Inc Morgan Stanley (157)(282) AZZ Inc Goldman Sachs 227(166) B Riley Financial Inc Bank of America
Merrill Lynch 219(233) B Riley Financial Inc Goldman Sachs 308
10 Bandwidth Inc ’A’ Bank of AmericaMerrill Lynch 25
334 Bandwidth Inc ’A’ Goldman Sachs 571227 Bandwidth Inc ’A’ Morgan Stanley 409
(155) Bank First Corp Bank of AmericaMerrill Lynch 148
(15,636) Bank of America Corp Morgan Stanley (582)1,220 Bank of Marin Bancorp Bank of America
Merrill Lynch (2,171)739 Bank of Marin Bancorp Goldman Sachs (1,245)(44) Barrett Business Services
Inc Goldman Sachs (17)(325) Baxter International Inc Morgan Stanley 211(139) Beacon Roofing Supply Inc Goldman Sachs (101)(431) Becton Dickinson and Co Bank of America
Merrill Lynch (104)(1,056) Becton Dickinson and Co Morgan Stanley 1,932
348 BellRing Brands Inc ’A’ Bank of AmericaMerrill Lynch 339
471 BellRing Brands Inc ’A’ Goldman Sachs 7211,493 Benchmark Electronics Inc Bank of America
Merrill Lynch 9221,011 Benchmark Electronics Inc Goldman Sachs 647
(3,003) BGC Partners Inc ’A’ Bank of AmericaMerrill Lynch (1,201)
(6,217) BGC Partners Inc ’A’ Goldman Sachs (2,487)50 Big Lots Inc Bank of America
Merrill Lynch (228)(240) BigCommerce Holdings Inc Morgan Stanley 328(257) Bill.com Holdings Inc Morgan Stanley (62)
(1,645) Black Knight Inc Bank of AmericaMerrill Lynch (567)
(1,494) Black Knight Inc Goldman Sachs (2,249)(1,719) Black Knight Inc Morgan Stanley (236)
(95) Blackbaud Inc Bank of AmericaMerrill Lynch (134)
(180) Blackbaud Inc Goldman Sachs (113)220 Blackstone Mortgage Trust
Inc ’A’ (REIT)Bank of AmericaMerrill Lynch 104
107 Blackstone Mortgage TrustInc ’A’ (REIT) Goldman Sachs 42
6,238 Blackstone Mortgage TrustInc ’A’ (REIT) Morgan Stanley 1,310
777 Bloom Energy Corp ’A’ Goldman Sachs 1,36868 Bloom Energy Corp ’A’ Morgan Stanley 45
800 Bloomin’ Brands Inc Goldman Sachs 1,033(38) Bluebird Bio Inc Bank of America
Merrill Lynch (46)(1,999) Bluebird Bio Inc Goldman Sachs (2,084)
(50) BOK Financial Corp Bank of AmericaMerrill Lynch (89)
(358) BOK Financial Corp Goldman Sachs (202)62 Boot Barn Holdings Inc Bank of America
Merrill Lynch (9)(540) Brandywine Realty Trust
(REIT)Bank of AmericaMerrill Lynch —
BlackRock Systematic Global Long/Short Equity Fund continued
Portfolio of Investments as at 31 May 2021
The notes on pages 590 to 610 form an integral part of these financial statements.
Annual report and audited financial statements [541]

Holding Description Counterparty
Netunrealised
appreciation/(depreciation)
USD
United States continued(2,418) Brandywine Realty Trust
(REIT) Goldman Sachs (342)488 Bright Horizons Family Solu-
tions IncBank of AmericaMerrill Lynch 850
1,486 Bright Horizons Family Solu-tions Inc Morgan Stanley 5,362
689 Brighthouse Financial Inc Bank of AmericaMerrill Lynch (448)
2,440 Brighthouse Financial Inc Goldman Sachs (1,247)4,058 Brighthouse Financial Inc Morgan Stanley 9331,121 BrightView Holdings Inc Bank of America
Merrill Lynch (41)716 BrightView Holdings Inc Goldman Sachs (44)
(1,007) Broadridge Financial Solu-tions Inc
Bank of AmericaMerrill Lynch 2,779
(889) Broadridge Financial Solu-tions Inc Morgan Stanley (27)
(251) Brookline Bancorp Inc Bank of AmericaMerrill Lynch (22)
(27) Brown-Forman Corp ’B’ Bank of AmericaMerrill Lynch (11)
(444) Brown-Forman Corp ’B’ Goldman Sachs (522)(3,256) Brown-Forman Corp ’B’ Morgan Stanley (2,540)
112 Bruker Corp Bank of AmericaMerrill Lynch 28
433 Bruker Corp Goldman Sachs (283)466 Bruker Corp Morgan Stanley (149)87 Buckle Inc Bank of America
Merrill Lynch (8)273 Buckle Inc Goldman Sachs 322
(243) Bumble Inc ’A’ Bank of AmericaMerrill Lynch (1,473)
(279) Bumble Inc ’A’ Goldman Sachs 170(148) Bumble Inc ’A’ Morgan Stanley (359)(967) C3.ai Inc ’A’ Goldman Sachs (8,181)(358) C3.ai Inc ’A’ Morgan Stanley (759)(528) Cabot Corp Bank of America
Merrill Lynch (313)(2,079) Cabot Corp Goldman Sachs (1,112)1,001 Cabot Oil & Gas Corp Goldman Sachs (76)(237) Cadence BanCorp Goldman Sachs 166
(1,734) Cadiz Inc Bank of AmericaMerrill Lynch (2,853)
(2,155) Cadiz Inc Goldman Sachs (4,051)1,064 Caesarstone Ltd Bank of America
Merrill Lynch 7552,745 Caesarstone Ltd Goldman Sachs 1,949
1 CAI International Inc Bank of AmericaMerrill Lynch —
287 CAI International Inc Goldman Sachs (66)135 Calavo Growers Inc Bank of America
Merrill Lynch (323)321 Calavo Growers Inc Goldman Sachs (1,050)
(100) California Water ServiceGroup
Bank of AmericaMerrill Lynch 44
(932) California Water ServiceGroup Goldman Sachs (613)
(410) Calix Inc Bank of AmericaMerrill Lynch (1,263)
(473) Calix Inc Goldman Sachs (1,457)(177) Callaway Golf Co Morgan Stanley —(282) Cal-Maine Foods Inc Bank of America
Merrill Lynch 719(299) Cal-Maine Foods Inc Goldman Sachs 431316 Camden National Corp Bank of America
Merrill Lynch 1191,055 Camden National Corp Goldman Sachs (7)1,138 Campbell Soup Co Bank of America
Merrill Lynch 286720 Campbell Soup Co Goldman Sachs (210)523 Campbell Soup Co Morgan Stanley 16
Holding Description Counterparty
Netunrealised
appreciation/(depreciation)
USD
United States continued483 Camping World Holdings Inc
’A’ Goldman Sachs 1,963788 Camping World Holdings Inc
’A’ Morgan Stanley 3,198632 Capital City Bank Group Inc Bank of America
Merrill Lynch 256553 Capital City Bank Group Inc Goldman Sachs 182
(691) Cara Therapeutics Inc Bank of AmericaMerrill Lynch (145)
108 Cardlytics Inc Morgan Stanley 690(30) CarMax Inc Bank of America
Merrill Lynch 22(70) CarMax Inc Morgan Stanley (66)
(942) Carnival Corp Goldman Sachs (1,688)(3,166) Carnival Corp Morgan Stanley 503
(329) Carpenter Technology Corp Bank of AmericaMerrill Lynch (842)
(455) Carpenter Technology Corp Goldman Sachs (1,171)3,121 Carrier Global Corp Bank of America
Merrill Lynch 5,866440 Carrier Global Corp Goldman Sachs 806825 Carrier Global Corp Morgan Stanley 1,279696 Cars.com Inc Goldman Sachs 821
1,140 Carter’s Inc Bank of AmericaMerrill Lynch 1,546
2,396 Carter’s Inc Goldman Sachs (206)683 Carter’s Inc Morgan Stanley (418)
(1,317) Casa Systems Inc Bank of AmericaMerrill Lynch (316)
(632) Casa Systems Inc Goldman Sachs (105)171 Castle Biosciences Inc Bank of America
Merrill Lynch 47653 Castle Biosciences Inc Goldman Sachs 217
(592) Catalyst PharmaceuticalsInc
Bank of AmericaMerrill Lynch (24)
(192) CatchMark Timber Trust Inc’A’ (REIT)
Bank of AmericaMerrill Lynch (4)
(1,053) CatchMark Timber Trust Inc’A’ (REIT) Goldman Sachs 45
1,200 CBRE Group Inc ’A’ Morgan Stanley (1,176)5,826 CDK Global Inc Bank of America
Merrill Lynch (2,948)1,245 CDK Global Inc Goldman Sachs (697)7,487 CDK Global Inc Morgan Stanley (5,316)(113) Central Garden & Pet Co ’A’ Goldman Sachs 29
(1,482) Cerner Corp Bank of AmericaMerrill Lynch (1,002)
(921) Cerner Corp Morgan Stanley (1,151)(7,328) ChargePoint Holdings Inc Bank of America
Merrill Lynch (9,307)(389) ChargePoint Holdings Inc Morgan Stanley (370)(79) Chase Corp Goldman Sachs 446125 Check Point Software Tech-
nologies LtdBank of AmericaMerrill Lynch (183)
237 Check Point Software Tech-nologies Ltd Morgan Stanley (486)
1,305 Cheesecake Factory Inc Goldman Sachs 1,29295 Chesapeake Utilities Corp Bank of America
Merrill Lynch (243)272 Cimpress Plc Bank of America
Merrill Lynch (651)547 Cimpress Plc Goldman Sachs (2,401)634 Cinemark Holdings Inc Goldman Sachs 374
(1,525) Cisco Systems Inc - CDI Bank of AmericaMerrill Lynch 194
(5,569) Cisco Systems Inc - CDI Morgan Stanley 2,7291,334 Citizens Inc Bank of America
Merrill Lynch (245)2,435 Citizens Inc Goldman Sachs (186)
(1,029) Clarivate Plc Goldman Sachs (217)(506) Clarivate Plc Morgan Stanley (177)
BlackRock Systematic Global Long/Short Equity Fund continued
Portfolio of Investments as at 31 May 2021
The notes on pages 590 to 610 form an integral part of these financial statements.
BlackRock Strategic Funds[542]

Holding Description Counterparty
Netunrealised
appreciation/(depreciation)
USD
United States continued(452) Clean Energy Fuels Corp Bank of America
Merrill Lynch 95(3,462) Clean Energy Fuels Corp Goldman Sachs 1862,332 Clean Harbors Inc Bank of America
Merrill Lynch (1,191)1,627 Clean Harbors Inc Goldman Sachs (392)1,965 Clean Harbors Inc Morgan Stanley (965)
(7,455) Clear Channel OutdoorHoldings Inc
Bank of AmericaMerrill Lynch (373)
(6,517) Clear Channel OutdoorHoldings Inc Goldman Sachs (326)
132 CMC Materials Inc Bank of AmericaMerrill Lynch 308
373 CMC Materials Inc Goldman Sachs 664952 CMC Materials Inc Morgan Stanley 503
(2,537) Co-Diagnostics Inc Goldman Sachs 934770 Cogent Communications
Holdings IncBank of AmericaMerrill Lynch 701
848 Cogent CommunicationsHoldings Inc Goldman Sachs 1,189
113 Cogent CommunicationsHoldings Inc Morgan Stanley 96
610 Cognizant Technology Solu-tions Corp ’A’ Morgan Stanley 281
358 Cohen & Steers Inc Bank of AmericaMerrill Lynch 295
551 Cohen & Steers Inc Goldman Sachs 419312 Coherus Biosciences Inc Bank of America
Merrill Lynch (169)(476) Cohu Inc Bank of America
Merrill Lynch (387)(302) Cohu Inc Goldman Sachs (248)(197) Coinbase Global Inc ’A’ Bank of America
Merrill Lynch 764(1,243) Coinbase Global Inc ’A’ Goldman Sachs (1,313)
(106) Coinbase Global Inc ’A’ Morgan Stanley (1,191)263 Collegium Pharmaceutical
IncBank of AmericaMerrill Lynch 167
97 Collegium PharmaceuticalInc Goldman Sachs 107
(49) Colony Capital Inc (REIT) Bank of AmericaMerrill Lynch (16)
(3,627) Colony Capital Inc (REIT) Goldman Sachs (1,161)(169) Columbia Financial Inc Bank of America
Merrill Lynch 49(228) Columbia Financial Inc Goldman Sachs 66(166) Columbia Property Trust Inc
(REIT)Bank of AmericaMerrill Lynch 78
(1,303) Columbia Property Trust Inc(REIT) Goldman Sachs 612
410 Columbia Sportswear Co Bank of AmericaMerrill Lynch (383)
66 Columbia Sportswear Co Morgan Stanley (105)914 Comcast Corp ’A’ Morgan Stanley 1,536
(354) Commercial Metals Co Bank of AmericaMerrill Lynch 64
(671) Commercial Metals Co Goldman Sachs 256(268) CommScope Holding Co Inc Bank of America
Merrill Lynch (509)(3,454) CommScope Holding Co Inc Goldman Sachs (6,645)
176 Community Health SystemsInc Goldman Sachs (48)
179 Community Trust BancorpInc
Bank of AmericaMerrill Lynch 60
286 Community Trust BancorpInc Goldman Sachs (120)
157 CommVault Systems Inc Goldman Sachs (87)(30) CONMED Corp Goldman Sachs 143314 ConnectOne Bancorp Inc Bank of America
Merrill Lynch (132)501 ConnectOne Bancorp Inc Goldman Sachs (210)
Holding Description Counterparty
Netunrealised
appreciation/(depreciation)
USD
United States continued(992) Consolidated Communica-
tions Holdings Inc Goldman Sachs (109)(660) Construction Partners Inc
’A’ Goldman Sachs (388)(3,330) ContextLogic Inc ’A’ Goldman Sachs 1,783
(155) Cornerstone BuildingBrands Inc
Bank of AmericaMerrill Lynch (4)
(1,397) Cornerstone BuildingBrands Inc Goldman Sachs 27
(1,812) Coursera Inc Bank of AmericaMerrill Lynch (1,074)
(1,912) Coursera Inc Morgan Stanley (211)(723) Covanta Holding Corp Goldman Sachs 217
1,370 Cracker Barrel Old CountryStore Inc Goldman Sachs (2,467)
1,854 Crawford & Co ’A’ Bank of AmericaMerrill Lynch (630)
2,469 Crawford & Co ’A’ Goldman Sachs (839)66 Credit Acceptance Corp Bank of America
Merrill Lynch 969126 Credit Acceptance Corp Goldman Sachs 1,359401 Credit Acceptance Corp Morgan Stanley 3,935832 Crocs Inc Bank of America
Merrill Lynch (2,187)299 Crocs Inc Goldman Sachs 955143 Crocs Inc Morgan Stanley (94)345 CrossFirst Bankshares Inc Bank of America
Merrill Lynch (95)1,203 CrossFirst Bankshares Inc Goldman Sachs (168)(158) Crowdstrike Holdings Inc ’A’ Bank of America
Merrill Lynch 264(44) Crowdstrike Holdings Inc ’A’ Morgan Stanley (42)
(153) CryoLife Inc Bank of AmericaMerrill Lynch 37
(455) CryoPort Inc Goldman Sachs (2,785)383 CSG Systems International
IncBank of AmericaMerrill Lynch (325)
559 CSG Systems InternationalInc Goldman Sachs (486)
739 CTS Corp Bank of AmericaMerrill Lynch 645
275 CTS Corp Goldman Sachs 3381,026 Cushman & Wakefield Plc Goldman Sachs 8311,415 CVR Energy Inc Bank of America
Merrill Lynch (2,822)1,370 CVR Energy Inc Goldman Sachs (2,720)(823) Dana Inc Goldman Sachs 551(183) Danaher Corp Goldman Sachs 217(688) Danaher Corp Morgan Stanley (3,043)
1,109 Darling Ingredients Inc Bank of AmericaMerrill Lynch 60
294 Darling Ingredients Inc Goldman Sachs 20179 Darling Ingredients Inc Morgan Stanley 27
(1,097) Datadog Inc ’A’ Bank of AmericaMerrill Lynch (321)
(754) Datadog Inc ’A’ Goldman Sachs (6,274)(3,668) Datadog Inc ’A’ Morgan Stanley (3,682)
395 Dave & Buster’s Entertain-ment Inc Goldman Sachs (905)
475 Deckers Outdoor Corp Morgan Stanley (1,530)341 Deere & Co Bank of America
Merrill Lynch 71685 Deere & Co Morgan Stanley 23
686 Delek US Energy Inc Bank of AmericaMerrill Lynch 109
2,141 Delek US Energy Inc Goldman Sachs 2,698(451) Deluxe Corp Bank of America
Merrill Lynch (217)(187) Deluxe Corp Goldman Sachs (11)
2,346 Denny’s Corp Goldman Sachs 399
BlackRock Systematic Global Long/Short Equity Fund continued
Portfolio of Investments as at 31 May 2021
The notes on pages 590 to 610 form an integral part of these financial statements.
Annual report and audited financial statements [543]

Holding Description Counterparty
Netunrealised
appreciation/(depreciation)
USD
United States continued359 Designer Brands Inc ’A’ Goldman Sachs (62)(74) Diamond Hill Investment
Group IncBank of AmericaMerrill Lynch 47
(188) Diamond Hill InvestmentGroup Inc Goldman Sachs 397
431 Digi International Inc Bank of AmericaMerrill Lynch 5
211 Digi International Inc Goldman Sachs 1521 Digital Realty Trust Inc
(REIT) Goldman Sachs 3702 Dine Brands Global Inc Goldman Sachs (2,920)57 Diodes Inc Goldman Sachs 32
985 Diversified Healthcare Trust(REIT) Goldman Sachs 99
91 Dollar General Corp Morgan Stanley (87)2,371 Donegal Group Inc ’A’ Goldman Sachs 332(688) Dorian LPG Ltd Bank of America
Merrill Lynch (62)(1,302) Dorian LPG Ltd Goldman Sachs 746
(65) Dorman Products Inc Bank of AmericaMerrill Lynch (26)
(117) Dorman Products Inc Goldman Sachs (187)76 Dril-Quip Inc Bank of America
Merrill Lynch 113108 Ducommun Inc Goldman Sachs 221(39) DuPont de Nemours Inc Goldman Sachs (1)
(2,719) DuPont de Nemours Inc Morgan Stanley 1,584171 DXP Enterprises Inc Goldman Sachs 51
(2,131) Dynatrace Inc Morgan Stanley (2,238)(45) Eagle Bancorp Inc Bank of America
Merrill Lynch (31)99 Eagle Pharmaceuticals Inc Bank of America
Merrill Lynch (188)888 Easterly Government Prop-
erties Inc (REIT) Goldman Sachs 533(130) Eastman Chemical Co Goldman Sachs 6(730) Eastman Chemical Co Morgan Stanley 628
(1,991) Eastman Kodak Co Bank of AmericaMerrill Lynch (498)
(5,108) Eastman Kodak Co Goldman Sachs (2,359)(726) Edgewell Personal Care Co Goldman Sachs (639)(84) eHealth Inc Goldman Sachs (81)871 El Pollo Loco Holdings Inc Bank of America
Merrill Lynch (801)6,333 El Pollo Loco Holdings Inc Goldman Sachs (5,826)(681) Element Solutions Inc Goldman Sachs (490)
(7,522) Element Solutions Inc Morgan Stanley (3,611)399 Empire State Realty Trust
Inc ’A’ (REIT)Bank of AmericaMerrill Lynch 144
2,487 Empire State Realty TrustInc ’A’ (REIT) Goldman Sachs 895
(471) Employers Holdings Inc Goldman Sachs (373)(55) Encore Capital Group Inc Bank of America
Merrill Lynch 8(288) Encore Capital Group Inc Goldman Sachs (676)(310) Encore Wire Corp Goldman Sachs 99(260) Endo International Plc Bank of America
Merrill Lynch (39)(2,158) Endo International Plc Goldman Sachs (324)
120 Enerpac Tool Group Corp Bank of AmericaMerrill Lynch 50
3,599 EnLink Midstream LLC Bank of AmericaMerrill Lynch (165)
344 Ennis Inc Bank of AmericaMerrill Lynch (241)
675 Ennis Inc Goldman Sachs (473)281 Enstar Group Ltd Goldman Sachs 2,211537 Envista Holdings Corp Bank of America
Merrill Lynch (282)306 Envista Holdings Corp Goldman Sachs (181)
Holding Description Counterparty
Netunrealised
appreciation/(depreciation)
USD
United States continued1,059 Envista Holdings Corp Morgan Stanley (409)(199) ePlus Inc Bank of America
Merrill Lynch 1,109(146) ePlus Inc Goldman Sachs 834
74 EPR Properties (REIT) Goldman Sachs 136(1,182) EQT Corp Bank of America
Merrill Lynch 2,581(3,476) EQT Corp Morgan Stanley 1,808
(960) Equity Commonwealth(REIT) Goldman Sachs (163)
(3,090) Equity Commonwealth(REIT) Morgan Stanley 989
294 Erie Indemnity Co ’A’ Bank of AmericaMerrill Lynch 1,581
247 Erie Indemnity Co ’A’ Goldman Sachs 470375 Erie Indemnity Co ’A’ Morgan Stanley 1,571
(2,804) Esperion Therapeutics Inc Bank of AmericaMerrill Lynch 2,692
1,559 Essent Group Ltd Bank of AmericaMerrill Lynch 649
1,489 Essent Group Ltd Goldman Sachs (625)5,202 Essent Group Ltd Morgan Stanley 1,768
198 Essential Properties RealtyTrust Inc (REIT) Goldman Sachs 109
217 Ethan Allen Interiors Inc Bank of AmericaMerrill Lynch (28)
299 Ethan Allen Interiors Inc Goldman Sachs 151334 Euronet Worldwide Inc Bank of America
Merrill Lynch 1,454115 Euronet Worldwide Inc Goldman Sachs 3
1,057 Euronet Worldwide Inc Morgan Stanley 1,071787 Everbridge Inc Bank of America
Merrill Lynch 3,3171,182 Everbridge Inc Morgan Stanley 1,1581,620 Everi Holdings Inc Goldman Sachs 4,423
463 EverQuote Inc ’A’ Bank of AmericaMerrill Lynch 917
950 EverQuote Inc ’A’ Goldman Sachs 1,6131,055 EVERTEC Inc Goldman Sachs 11(322) Evoqua Water Technologies
CorpBank of AmericaMerrill Lynch (682)
(128) Evoqua Water TechnologiesCorp Goldman Sachs (146)
(24) EW Scripps Co ’A’ Bank of AmericaMerrill Lynch (15)
(154) EW Scripps Co ’A’ Goldman Sachs (99)(3,527) Exelon Corp Bank of America
Merrill Lynch 2,460(298) Exelon Corp Goldman Sachs 24
26 ExlService Holdings Inc Bank of AmericaMerrill Lynch 23
431 ExlService Holdings Inc Goldman Sachs 1,383133 Expeditors International of
Washington Inc Goldman Sachs 293734 Expeditors International of
Washington Inc Morgan Stanley 1,26052 Exponent Inc Bank of America
Merrill Lynch 4(53) Fabrinet Bank of America
Merrill Lynch (198)(325) Fabrinet Goldman Sachs (1,515)(165) Facebook Inc ’A’ Bank of America
Merrill Lynch (2,415)(192) Facebook Inc ’A’ Goldman Sachs (1,286)(421) Facebook Inc ’A’ Morgan Stanley (1,726)(825) Fastly Inc ’A’ Bank of America
Merrill Lynch (3,850)(3,619) Fastly Inc ’A’ Goldman Sachs (6,309)
307 FB Financial Corp Bank of AmericaMerrill Lynch (193)
BlackRock Systematic Global Long/Short Equity Fund continued
Portfolio of Investments as at 31 May 2021
The notes on pages 590 to 610 form an integral part of these financial statements.
BlackRock Strategic Funds[544]

Holding Description Counterparty
Netunrealised
appreciation/(depreciation)
USD
United States continued1,311 FB Financial Corp Goldman Sachs (830)(381) Federal Signal Corp Bank of America
Merrill Lynch (330)(1,024) Federal Signal Corp Goldman Sachs (786)(2,335) Federated Hermes Inc Goldman Sachs 1401,112 FibroGen Inc Bank of America
Merrill Lynch 6712,674 FibroGen Inc Goldman Sachs 2,058
(4,424) Fifth Third Bancorp Bank of AmericaMerrill Lynch 961
(2,887) Fifth Third Bancorp Morgan Stanley (779)(3,040) FireEye Inc Bank of America
Merrill Lynch (932)(4,068) FireEye Inc Morgan Stanley (718)
(282) First Bancshares Inc Bank of AmericaMerrill Lynch 147
(619) First Bancshares Inc Goldman Sachs 3222,515 First Busey Corp Goldman Sachs 3,299
120 First Citizens BancSharesInc ’A’
Bank of AmericaMerrill Lynch 1,034
15 First Citizens BancSharesInc ’A’ Goldman Sachs (128)
10 First Citizens BancSharesInc ’A’ Morgan Stanley 39
(487) First Community Bank-shares Inc
Bank of AmericaMerrill Lynch 65
(447) First Community Bank-shares Inc Goldman Sachs (14)
(420) First Financial BanksharesInc Goldman Sachs (614)
(2,016) First Foundation Inc Goldman Sachs (666)1,078 First Merchants Corp Bank of America
Merrill Lynch 708(61) First Mid Bancshares Inc Bank of America
Merrill Lynch (23)(85) First Mid Bancshares Inc Goldman Sachs (11)691 First of Long Island Corp Goldman Sachs (760)
(4,319) Fisker Inc Goldman Sachs (3,222)(2,091) Fisker Inc Morgan Stanley (1,582)
(385) FleetCor Technologies Inc Bank of AmericaMerrill Lynch (922)
(326) FleetCor Technologies Inc Morgan Stanley (463)(398) Floor & Decor Holdings Inc
’A’ Morgan Stanley (187)6,546 Flowers Foods Inc Morgan Stanley (327)
(2,750) Fluidigm Corp Bank of AmericaMerrill Lynch (1,186)
(2,442) Fluidigm Corp Goldman Sachs (1,123)2,492 Flushing Financial Corp Goldman Sachs (1,296)
(99) Focus Financial PartnersInc ’A’
Bank of AmericaMerrill Lynch (80)
(147) Focus Financial PartnersInc ’A’ Goldman Sachs (100)
140 Forestar Group Inc Bank of AmericaMerrill Lynch (17)
815 FormFactor Inc Bank of AmericaMerrill Lynch 683
550 FormFactor Inc Goldman Sachs 305739 Forrester Research Inc Bank of America
Merrill Lynch (1,988)1,416 Forrester Research Inc Goldman Sachs (3,763)(448) Fortinet Inc Morgan Stanley (2,451)
90 Franklin Electric Co Inc Bank of AmericaMerrill Lynch 161
488 Franklin Electric Co Inc Goldman Sachs 6321,433 Franklin Street Properties
Corp (REIT)Bank of AmericaMerrill Lynch 100
474 Franklin Street PropertiesCorp (REIT) Goldman Sachs 33
3,161 Frank’s International NV Bank of AmericaMerrill Lynch (1,227)
Holding Description Counterparty
Netunrealised
appreciation/(depreciation)
USD
United States continued3,012 Frank’s International NV Goldman Sachs (307)
(1,651) Frequency Therapeutics Inc Goldman Sachs (116)(368) frontdoor Inc Goldman Sachs (271)306 FRP Holdings Inc Bank of America
Merrill Lynch (251)17 FRP Holdings Inc Goldman Sachs (14)16 FTI Consulting Inc Bank of America
Merrill Lynch (5)1,276 FTI Consulting Inc Morgan Stanley 715
63 Futu Holdings Ltd ADR Bank of AmericaMerrill Lynch 821
145 Futu Holdings Ltd ADR Goldman Sachs 2,500(1,232) FutureFuel Corp Bank of America
Merrill Lynch 4,272(827) FutureFuel Corp Goldman Sachs 1,001(514) Garmin Ltd Bank of America
Merrill Lynch (1,022)(601) Garmin Ltd Goldman Sachs (2,631)
(2,348) Garmin Ltd Morgan Stanley (5,283)(7,420) General Motors Co Bank of America
Merrill Lynch 211(1,604) General Motors Co Morgan Stanley (4,347)
847 Genesco Inc Goldman Sachs (2,219)(316) Gentherm Inc Bank of America
Merrill Lynch (757)(1,018) Gentherm Inc Goldman Sachs (1,712)(2,904) Genworth Financial Inc ’A’ Goldman Sachs (261)
96 German American BancorpInc
Bank of AmericaMerrill Lynch 101
51 German American BancorpInc Goldman Sachs 65
333 G-III Apparel Group Ltd Bank of AmericaMerrill Lynch 268
271 G-III Apparel Group Ltd Goldman Sachs 15(338) Gladstone Commercial Corp
(REIT)Bank of AmericaMerrill Lynch (59)
(237) Gladstone Commercial Corp(REIT) Goldman Sachs (137)
1,072 Glatfelter Corp Bank of AmericaMerrill Lynch 557
11 Global Indemnity Group LLC’A’ Goldman Sachs 34
539 Global Medical Inc (REIT) Goldman Sachs 54(1,111) GoHealth Inc ’A’ Bank of America
Merrill Lynch (178)(391) GoodRx Holdings Inc ’A’ Bank of America
Merrill Lynch 211(533) GoodRx Holdings Inc ’A’ Goldman Sachs (3,311)171 Goosehead Insurance Inc
’A’Bank of AmericaMerrill Lynch 900
266 Goosehead Insurance Inc’A’ Goldman Sachs 1,950
1,132 GoPro Inc ’A’ Goldman Sachs 1,506(670) Gorman-Rupp Co Bank of America
Merrill Lynch (415)(432) Gorman-Rupp Co Goldman Sachs (368)(778) GrafTech International Ltd Bank of America
Merrill Lynch 459(1,115) GrafTech International Ltd Goldman Sachs 219(1,080) Great Lakes Dredge & Dock
CorpBank of AmericaMerrill Lynch 73
(4,813) Great Lakes Dredge & DockCorp Goldman Sachs (1,086)
21 Great Southern Bancorp Inc Bank of AmericaMerrill Lynch (21)
376 Great Southern Bancorp Inc Goldman Sachs (355)(379) Green Brick Partners Inc Bank of America
Merrill Lynch (404)(435) Green Brick Partners Inc Goldman Sachs (285)170 Group 1 Automotive Inc Goldman Sachs (1,052)496 Groupon Inc Goldman Sachs 1,455
BlackRock Systematic Global Long/Short Equity Fund continued
Portfolio of Investments as at 31 May 2021
The notes on pages 590 to 610 form an integral part of these financial statements.
Annual report and audited financial statements [545]

Holding Description Counterparty
Netunrealised
appreciation/(depreciation)
USD
United States continued9,389 GTT Communications Inc Goldman Sachs (94)1,642 Guess? Inc Bank of America
Merrill Lynch 1126 Guidewire Software Inc Bank of America
Merrill Lynch 341,438 Guidewire Software Inc Morgan Stanley 848
69 H&E Equipment ServicesInc
Bank of AmericaMerrill Lynch 24
1,036 H&R Block Inc Goldman Sachs 32(1,981) Hancock Whitney Corp Goldman Sachs 1,5251,019 Harley-Davidson Inc Goldman Sachs 174
114 Harley-Davidson Inc Morgan Stanley 78235 Haverty Furniture Cos Inc Goldman Sachs (143)
(344) Hawaiian Electric IndustriesInc Goldman Sachs 454
(182) Hawaiian Holdings Inc Bank of AmericaMerrill Lynch (15)
(3,582) Hawaiian Holdings Inc Goldman Sachs (2,308)(1,243) Hawkins Inc Goldman Sachs (1,268)
(220) HCI Group Inc Goldman Sachs (1,003)(234) Healthcare Services Group
IncBank of AmericaMerrill Lynch 220
(3,706) Healthcare Services GroupInc Goldman Sachs 3,484
2,253 Healthcare Trust of AmericaInc ’A’ (REIT)
Bank of AmericaMerrill Lynch (541)
2,314 Healthcare Trust of AmericaInc ’A’ (REIT) Goldman Sachs (555)
2,951 Healthcare Trust of AmericaInc ’A’ (REIT) Morgan Stanley (1,490)
2,170 Heartland Express Inc Bank of AmericaMerrill Lynch (630)
6,605 Heartland Express Inc Goldman Sachs (1,216)295 Heartland Financial USA Inc Bank of America
Merrill Lynch 1431,013 Heartland Financial USA Inc Goldman Sachs (90)
71 Heidrick & Struggles Inter-national Inc Goldman Sachs 73
(293) Helios Technologies Inc Bank of AmericaMerrill Lynch 263
(464) Helios Technologies Inc Goldman Sachs 1,154764 Helix Energy Solutions
Group IncBank of AmericaMerrill Lynch (46)
1,721 Helix Energy SolutionsGroup Inc Goldman Sachs (103)
486 Hemisphere Media GroupInc
Bank of AmericaMerrill Lynch (238)
723 Hemisphere Media GroupInc Goldman Sachs (354)
464 Herbalife Nutrition Ltd Bank of AmericaMerrill Lynch 835
608 Herbalife Nutrition Ltd Goldman Sachs 1,1773,004 Herbalife Nutrition Ltd Morgan Stanley 1,622
658 Herc Holdings Inc Goldman Sachs 6,300(228) Herman Miller Inc Goldman Sachs (609)(462) Hershey Co Bank of America
Merrill Lynch 643(151) Hershey Co Goldman Sachs 46111 Hess Corp Bank of America
Merrill Lynch (118)175 Hess Corp Morgan Stanley (37)
1,313 Hexcel Corp Bank of AmericaMerrill Lynch 9,729
1,425 Hexcel Corp Goldman Sachs 10,4971,407 Hexcel Corp Morgan Stanley 7,190
292 Hibbett Sports Inc Goldman Sachs 1,702(1,809) Hilltop Holdings Inc Bank of America
Merrill Lynch (1,035)(513) Hilton Worldwide Holdings
IncBank of AmericaMerrill Lynch (1,826)
Holding Description Counterparty
Netunrealised
appreciation/(depreciation)
USD
United States continued(337) Hilton Worldwide Holdings
Inc Goldman Sachs (1,200)(788) Hilton Worldwide Holdings
Inc Morgan Stanley (1,324)1,111 HollyFrontier Corp Bank of America
Merrill Lynch (3,025)1,344 HollyFrontier Corp Goldman Sachs (4,810)1,601 HollyFrontier Corp Morgan Stanley (2,770)
933 Homology Medicines Inc Goldman Sachs 2152,588 Horizon Bancorp Inc Bank of America
Merrill Lynch 4501,841 Horizon Bancorp Inc Goldman Sachs 79
(1,666) Host Hotels & Resorts Inc(REIT) Morgan Stanley (65)
610 Hostess Brands Inc Goldman Sachs 37(718) Howard Hughes Corp Bank of America
Merrill Lynch (1,120)(486) Howard Hughes Corp Goldman Sachs (880)(62) Howard Hughes Corp Morgan Stanley (81)40 Hub Group Inc ’A’ Bank of America
Merrill Lynch 37707 Hub Group Inc ’A’ Goldman Sachs (2,943)122 HubSpot Inc Bank of America
Merrill Lynch 40151 HubSpot Inc Morgan Stanley (180)
5,948 Huntington Bancshares Inc Bank of AmericaMerrill Lynch 1,421
5,444 Huntington Bancshares Inc Goldman Sachs (63)10,896 Huntington Bancshares Inc Morgan Stanley 2,397
(481) Huron Consulting Group Inc Bank of AmericaMerrill Lynch 92
(800) Huron Consulting Group Inc Goldman Sachs (10)(1,513) IAC Via InterActive Corp Morgan Stanley 140,951
63 Ichor Holdings Ltd Bank of AmericaMerrill Lynch 405
620 Ichor Holdings Ltd Goldman Sachs 3,987(289) Independence Realty Trust
Inc (REIT) Goldman Sachs (249)400 Independent Bank Corp Bank of America
Merrill Lynch (108)1,067 Independent Bank Corp Goldman Sachs (236)(215) Industrial Logistics Proper-
ties Trust (REIT)Bank of AmericaMerrill Lynch (19)
(3,089) Infinera Corp Bank of AmericaMerrill Lynch (2,297)
(923) Infinera Corp Goldman Sachs (26)(473) Inmode Ltd Morgan Stanley (1,216)292 Innospec Inc Bank of America
Merrill Lynch 498594 Innospec Inc Goldman Sachs 579
(1,307) Innoviva Inc Bank of AmericaMerrill Lynch (749)
(5,358) Innoviva Inc Goldman Sachs (1,793)(354) Insight Enterprises Inc Goldman Sachs (1,292)288 Inspire Medical Systems Inc Bank of America
Merrill Lynch 3,22497 Inspire Medical Systems Inc Goldman Sachs 1,777
219 Inspire Medical Systems Inc Morgan Stanley 2,7181,512 Intel Corp Goldman Sachs 4766,006 Intel Corp Morgan Stanley (22)
240 Inter Parfums Inc Bank of AmericaMerrill Lynch 338
802 Inter Parfums Inc Goldman Sachs 1,151268 Interactive Brokers Group
Inc ’A’Bank of AmericaMerrill Lynch 102
1,105 Interactive Brokers GroupInc ’A’ Goldman Sachs (186)
2,042 Interactive Brokers GroupInc ’A’ Morgan Stanley 503
BlackRock Systematic Global Long/Short Equity Fund continued
Portfolio of Investments as at 31 May 2021
The notes on pages 590 to 610 form an integral part of these financial statements.
BlackRock Strategic Funds[546]

Holding Description Counterparty
Netunrealised
appreciation/(depreciation)
USD
United States continued410 Intercept Pharmaceuticals
IncBank of AmericaMerrill Lynch (317)
(1,335) InterDigital Inc Bank of AmericaMerrill Lynch (13,305)
472 Interface Inc Goldman Sachs 618(421) International Bancshares
CorpBank of AmericaMerrill Lynch 1,110
(3,299) International BancsharesCorp Goldman Sachs 10,792
230 International Game Technol-ogy Plc Goldman Sachs (11)
512 International Game Technol-ogy Plc Morgan Stanley (51)
(1,350) International Money Ex-press Inc
Bank of AmericaMerrill Lynch (1,580)
(162) International Money Ex-press Inc Goldman Sachs (220)
1,213 Invitation Homes Inc (REIT) Morgan Stanley 267110 iRhythm Technologies Inc Bank of America
Merrill Lynch 136132 iRhythm Technologies Inc Goldman Sachs 170291 iRobot Corp Goldman Sachs 170116 iTeos Therapeutics Inc Bank of America
Merrill Lynch (219)194 Itron Inc Goldman Sachs 413608 Itron Inc Morgan Stanley 2,132
(306) Ituran Location and ControlLtd
Bank of AmericaMerrill Lynch (405)
61 J & J Snack Foods Corp Bank of AmericaMerrill Lynch 339
218 J & J Snack Foods Corp Goldman Sachs 77010 J2 Global Inc Bank of America
Merrill Lynch (7)622 J2 Global Inc Goldman Sachs (411)627 J2 Global Inc Morgan Stanley (1,925)
(553) JBG SMITH Properties(REIT) Goldman Sachs (224)
2,761 JELD-WEN Holding Inc Goldman Sachs (972)(543) John Wiley & Sons Inc ’A’ Bank of America
Merrill Lynch (717)(1,549) John Wiley & Sons Inc ’A’ Goldman Sachs (2,045)(8,561) Juniper Networks Inc Morgan Stanley 4,366
180 Kadant Inc Goldman Sachs (265)(109) Kaiser Aluminum Corp Bank of America
Merrill Lynch (46)(81) Kaman Corp Bank of America
Merrill Lynch (2)(160) Kaman Corp Goldman Sachs (88)
1,329 KAR Auction Services Inc Goldman Sachs (452)(798) Karyopharm Therapeutics
IncBank of AmericaMerrill Lynch (111)
(4,835) Karyopharm TherapeuticsInc Goldman Sachs (870)
(183) Kearny Financial Corp Goldman Sachs (9)185 Kemper Corp Goldman Sachs (55)364 Kennedy-Wilson Holdings
Inc Goldman Sachs 83(2,035) Keurig Dr Pepper Inc Morgan Stanley (204)
(169) Kimball Electronics Inc Bank of AmericaMerrill Lynch (25)
(108) Kimball Electronics Inc Goldman Sachs (16)3,798 Kimco Realty Corp (REIT) Goldman Sachs 2,3351,384 Kimco Realty Corp (REIT) Morgan Stanley 846
794 Kite Realty Group Trust(REIT)
Bank of AmericaMerrill Lynch 517
348 Kite Realty Group Trust(REIT) Goldman Sachs 340
1,251 Kohl’s Corp Bank of AmericaMerrill Lynch (5,784)
1,313 Kohl’s Corp Goldman Sachs (3,229)
Holding Description Counterparty
Netunrealised
appreciation/(depreciation)
USD
United States continued835 Kohl’s Corp Morgan Stanley (203)51 Kontoor Brands Inc Goldman Sachs (23)
930 Koppers Holdings Inc Bank of AmericaMerrill Lynch 306
212 Koppers Holdings Inc Goldman Sachs 6(6,049) Kosmos Energy Ltd Bank of America
Merrill Lynch 181(5,464) Kosmos Energy Ltd Goldman Sachs 164(3,249) Kraft Heinz Co Bank of America
Merrill Lynch 662(11,885) Kraft Heinz Co Morgan Stanley 10,051
109 Kraton Corp Bank of AmericaMerrill Lynch (179)
210 Kraton Corp Goldman Sachs 12110 Kulicke & Soffa Industries
Inc Goldman Sachs 114(144) Lakeland Bancorp Inc Bank of America
Merrill Lynch (31)424 Lakeland Financial Corp Bank of America
Merrill Lynch (108)1,723 Lakeland Financial Corp Goldman Sachs 9
(1,074) Landec Corp Bank of AmericaMerrill Lynch 149
(1,395) Landec Corp Goldman Sachs 535396 Lands’ End Inc Bank of America
Merrill Lynch 7601,014 Lands’ End Inc Goldman Sachs 2,018
(2,643) Laureate Education Inc ’A’ Bank of AmericaMerrill Lynch (79)
(3,708) Laureate Education Inc ’A’ Goldman Sachs (111)(1,394) La-Z-Boy Inc Goldman Sachs 2,872
5 LCI Industries Bank of AmericaMerrill Lynch 36
181 LCI Industries Goldman Sachs 1,193(643) Leidos Holdings Inc Bank of America
Merrill Lynch (470)(859) Leidos Holdings Inc Goldman Sachs 189(424) Leidos Holdings Inc Morgan Stanley (170)234 LeMaitre Vascular Inc Bank of America
Merrill Lynch 527119 LeMaitre Vascular Inc Goldman Sachs 268
(1,863) Lemonade Inc Bank of AmericaMerrill Lynch (33,515)
(269) Lemonade Inc Morgan Stanley (3,522)1,731 LendingClub Corp Bank of America
Merrill Lynch 3,160422 LendingClub Corp Goldman Sachs 1,013
2,331 Levi Strauss & Co ’A’ Goldman Sachs (1,308)3,049 Levi Strauss & Co ’A’ Morgan Stanley (661)
16 LHC Group Inc Bank of AmericaMerrill Lynch 93
389 LHC Group Inc Goldman Sachs 2,879932 LHC Group Inc Morgan Stanley 760
(655) Liberty Broadband Corp ’A’ Bank of AmericaMerrill Lynch (592)
(150) Liberty Broadband Corp ’A’ Morgan Stanley 767,135 Liberty Global Plc ’A’ Bank of America
Merrill Lynch (2,321)3,719 Liberty Global Plc ’A’ Goldman Sachs (2,275)3,330 Liberty Global Plc ’A’ Morgan Stanley 5874,413 Liberty Global Plc ’C’ Bank of America
Merrill Lynch 321,864 Liberty Global Plc ’C’ Goldman Sachs 2345,030 Liberty Global Plc ’C’ Morgan Stanley 151
158 Liberty Latin America Ltd ’A’ Goldman Sachs 30840 Liberty Media Corp-Liberty
Braves ’C’Bank of AmericaMerrill Lynch 318
1,511 Liberty Media Corp-LibertyBraves ’C’ Goldman Sachs 604
BlackRock Systematic Global Long/Short Equity Fund continued
Portfolio of Investments as at 31 May 2021
The notes on pages 590 to 610 form an integral part of these financial statements.
Annual report and audited financial statements [547]

Holding Description Counterparty
Netunrealised
appreciation/(depreciation)
USD
United States continued265 Liberty Oilfield Services Inc
’A’Bank of AmericaMerrill Lynch 77
336 Liberty Oilfield Services Inc’A’ Goldman Sachs 97
1 Liberty TripAdvisor HoldingsInc ’A’π Goldman Sachs —
(3,195) Limelight Networks Inc Bank of AmericaMerrill Lynch 6
(4,988) Limelight Networks Inc Goldman Sachs (11)55 Lincoln Electric Holdings
IncπBank of AmericaMerrill Lynch —
470 Lincoln Electric Holdings Inc Morgan Stanley 58(603) Lindblad Expeditions Hold-
ings Inc Goldman Sachs (350)(1,034) Lions Gate Entertainment
Corp ’B’Bank of AmericaMerrill Lynch (1,730)
(971) Lions Gate EntertainmentCorp ’B’ Goldman Sachs (2,593)
(90) Littelfuse Inc Bank of AmericaMerrill Lynch (188)
(175) Live Oak Bancshares Inc Goldman Sachs (243)(86) LTC Properties Inc (REIT) Bank of America
Merrill Lynch 21(858) LTC Properties Inc (REIT) Goldman Sachs 27
3,026 Luther Burbank Corp Goldman Sachs (424)110 Lyft Inc ’A’ Bank of America
Merrill Lynch 2592,784 Lyft Inc ’A’ Morgan Stanley 10,474
355 Mack-Cali Realty Corp(REIT)
Bank of AmericaMerrill Lynch 121
963 Mack-Cali Realty Corp(REIT) Goldman Sachs 294
(66) Macquarie InfrastructureCorp
Bank of AmericaMerrill Lynch 18
(5,160) Macquarie InfrastructureCorp Goldman Sachs 1,408
(304) Madison Square GardenEntertainment Corp Goldman Sachs (1,046)
(145) Madison Square GardenSports Corp
Bank of AmericaMerrill Lynch 583
(117) Madison Square GardenSports Corp Goldman Sachs 835
(1,005) Madison Square GardenSports Corp Morgan Stanley 6,784
1,073 Magnolia Oil & Gas Corp ’A’ Goldman Sachs 8658 Malibu Boats Inc ’A’ Bank of America
Merrill Lynch 69291 Malibu Boats Inc ’A’ Goldman Sachs (882)97 Manhattan Associates Inc Bank of America
Merrill Lynch 3133 Manhattan Associates Inc Goldman Sachs 220
600 Manhattan Associates Inc Morgan Stanley 597267 Manitowoc Co Inc Goldman Sachs 476(61) ManTech International Corp
’A’ Goldman Sachs (54)910 Marathon Oil Corp Goldman Sachs 240
1,997 Marathon Oil Corp Morgan Stanley 280335 Marcus & Millichap Inc Bank of America
Merrill Lynch 7711,967 Marcus & Millichap Inc Goldman Sachs 4,067
(58) Marriott International Inc ’A’ Goldman Sachs (216)(1,372) Marriott International Inc ’A’ Morgan Stanley (2,319)
94 Masonite International Corp Bank of AmericaMerrill Lynch (425)
276 Masonite International Corp Goldman Sachs (1,248)458 Matador Resources Co Goldman Sachs 9
(191) Matthews International Corp’A’
Bank of AmericaMerrill Lynch 9
(192) Matthews International Corp’A’ Goldman Sachs 342
Holding Description Counterparty
Netunrealised
appreciation/(depreciation)
USD
United States continued(673) Maxar Technologies Inc Goldman Sachs (680)(262) MaxLinear Inc Bank of America
Merrill Lynch (893)(102) MaxLinear Inc Goldman Sachs (429)
(1,372) MBIA Inc Goldman Sachs (1,221)(407) McGrath RentCorp Goldman Sachs (550)(301) MDC Holdings Inc Bank of America
Merrill Lynch (124)(159) MDC Holdings Inc Goldman Sachs (236)686 Media Gen Inc CVR* Bank of America
Merrill Lynch —(177) MEDNAX Inc Goldman Sachs (44)
8 MercadoLibre Inc Morgan Stanley (69)151 Mercantile Bank Corp Bank of America
Merrill Lynch (21)1,204 Mercantile Bank Corp Goldman Sachs (144)
191 Merchants Bancorp Bank of AmericaMerrill Lynch 156
435 Merchants Bancorp Goldman Sachs 197(1,093) Mercury General Corp Goldman Sachs 3,2682,164 Mercury Systems Inc Morgan Stanley 4,598
(95) Meredith Corp Bank of AmericaMerrill Lynch 29
(456) Meredith Corp Goldman Sachs 158(565) Meridian Bancorp Inc Bank of America
Merrill Lynch (157)(7,122) Meridian Bancorp Inc Goldman Sachs (2,186)(1,195) Meridian Bioscience Inc Bank of America
Merrill Lynch (1,732)(1,272) Meridian Bioscience Inc Goldman Sachs (1,921)
263 Meritor Inc Goldman Sachs (66)(48) Methode Electronics Inc Goldman Sachs (53)
6 Mettler-Toledo InternationalInc
Bank of AmericaMerrill Lynch 112
1 Mettler-Toledo InternationalInc Goldman Sachs 7
(1,749) MGE Energy Inc Goldman Sachs (857)(127) MGP Ingredients Inc Bank of America
Merrill Lynch (292)(467) MGP Ingredients Inc Goldman Sachs (1,232)
(1,171) Microchip Technology Inc Morgan Stanley (3,337)(301) Middlesex Water Co Bank of America
Merrill Lynch (1,615)(904) Middlesex Water Co Goldman Sachs (2,686)188 Midland States Bancorp Inc Bank of America
Merrill Lynch 13420 Midland States Bancorp Inc Goldman Sachs 134507 MidWestOne Financial
Group IncBank of AmericaMerrill Lynch (39)
1,883 MidWestOne FinancialGroup Inc Goldman Sachs (241)
(1,140) Mitek Systems Inc Bank of AmericaMerrill Lynch (181)
(323) Mitek Systems Inc Goldman Sachs (184)140 Model N Inc Bank of America
Merrill Lynch 193531 Model N Inc Goldman Sachs 690
(216) Moelis & Co ’A’ Goldman Sachs (145)110 Molina Healthcare Inc Bank of America
Merrill Lynch (1,176)458 Molson Coors Beverage Co
’B’ Morgan Stanley 261(857) Mondelez International Inc
’A’Bank of AmericaMerrill Lynch (1,051)
(4,197) Mondelez International Inc’A’ Goldman Sachs (4,046)
(5,328) Mondelez International Inc’A’ Morgan Stanley 799
(932) Monmouth Real Estate In-vestment Corp (REIT)
Bank of AmericaMerrill Lynch (84)
BlackRock Systematic Global Long/Short Equity Fund continued
Portfolio of Investments as at 31 May 2021
The notes on pages 590 to 610 form an integral part of these financial statements.
BlackRock Strategic Funds[548]

Holding Description Counterparty
Netunrealised
appreciation/(depreciation)
USD
United States continued(1,182) Monmouth Real Estate In-
vestment Corp (REIT) Goldman Sachs (106)91 Moog Inc ’A’ Bank of America
Merrill Lynch 126128 Moog Inc ’A’ Goldman Sachs 137
(614) Morgan Stanley Bank of AmericaMerrill Lynch (3,445)
(5,022) Mosaic Co Bank of AmericaMerrill Lynch 890
(104) Mosaic Co Goldman Sachs (43)(5,015) Mosaic Co Morgan Stanley (2,207)(7,139) MP Materials Corp Morgan Stanley (11,212)
(715) Mr Cooper Group Inc Bank of AmericaMerrill Lynch (508)
(806) Mr Cooper Group Inc Goldman Sachs (572)1,499 MRC Global Inc Goldman Sachs (1,979)
(86) Mueller Industries Inc Bank of AmericaMerrill Lynch (32)
(2,995) Myers Industries Inc Goldman Sachs (539)(82) MYR Group Inc Bank of America
Merrill Lynch (360)(235) MYR Group Inc Goldman Sachs (1,086)
(1,337) Nasdaq Inc Bank of AmericaMerrill Lynch (4,851)
(564) Nasdaq Inc Goldman Sachs (1,974)(2,102) Nasdaq Inc Morgan Stanley (5,339)
(331) National Research Corp Bank of AmericaMerrill Lynch 436
(895) National Research Corp Goldman Sachs 1,6301,864 National Vision Holdings Inc Bank of America
Merrill Lynch 311,236 National Vision Holdings Inc Goldman Sachs 3002,384 National Vision Holdings Inc Morgan Stanley 3,123(259) Nautilus Inc Bank of America
Merrill Lynch (238)(1,535) Nautilus Inc Goldman Sachs (558)
637 Neenah Inc Bank of AmericaMerrill Lynch (1,072)
185 Neenah Inc Goldman Sachs (554)233 Nelnet Inc ’A’ Bank of America
Merrill Lynch 19164 Nelnet Inc ’A’ Goldman Sachs 28
(847) NeoPhotonics Corp Goldman Sachs (754)(79) Netflix Inc Bank of America
Merrill Lynch —(200) Netflix Inc Goldman Sachs 19(681) Netflix Inc Morgan Stanley (349)(51) NETGEAR Inc Bank of America
Merrill Lynch (73)(275) NETGEAR Inc Goldman Sachs (264)(962) NetScout Systems Inc Bank of America
Merrill Lynch (1,477)(1,137) NetScout Systems Inc Goldman Sachs (1,508)
333 Nevro Corp Bank of AmericaMerrill Lynch 1,075
1,947 Nevro Corp Morgan Stanley 1,537995 New York Community Ban-
corp Inc Goldman Sachs (38)33,541 New York Community Ban-
corp Inc Morgan Stanley 5,031(918) Newell Brands Inc Bank of America
Merrill Lynch (583)(1,187) Newell Brands Inc Goldman Sachs (329)
(703) Newell Brands Inc Morgan Stanley (314)274 NextCure Inc Bank of America
Merrill Lynch (154)223 NextCure Inc Goldman Sachs (36)797 NextGen Healthcare Inc Goldman Sachs (810)63 NexTier Oilfield Solutions
IncBank of AmericaMerrill Lynch (34)
Holding Description Counterparty
Netunrealised
appreciation/(depreciation)
USD
United States continued1,290 NexTier Oilfield Solutions
Inc Goldman Sachs (697)127 Nicolet Bankshares Inc Bank of America
Merrill Lynch 236152 Nicolet Bankshares Inc Goldman Sachs 16
(117) NMI Holdings Inc ’A’ Bank of AmericaMerrill Lynch 4
1,554 Nordstrom Inc Bank of AmericaMerrill Lynch (3,503)
762 Nordstrom Inc Goldman Sachs (4,448)3,415 Nordstrom Inc Morgan Stanley (10,292)(673) Norwegian Cruise Line
Holdings LtdBank of AmericaMerrill Lynch (1,443)
(818) Norwegian Cruise LineHoldings Ltd Goldman Sachs (692)
(2,310) Norwegian Cruise LineHoldings Ltd Morgan Stanley (1,609)
(202) Novanta Inc Goldman Sachs (519)809 NOW Inc Bank of America
Merrill Lynch (401)1,091 NOW Inc Goldman Sachs (798)(488) Nu Skin Enterprises Inc ’A’ Goldman Sachs (244)
(3,286) Nucor Corp Bank of AmericaMerrill Lynch (4,679)
(642) Nucor Corp Goldman Sachs (361)(529) Nucor Corp Morgan Stanley 434(338) NXP Semiconductors NV Bank of America
Merrill Lynch (3,473)(476) NXP Semiconductors NV Goldman Sachs (1,436)470 Oceaneering International
IncBank of AmericaMerrill Lynch 133
479 OceanFirst Financial Corp Bank of AmericaMerrill Lynch (240)
(2,828) Odonate Therapeutics Inc Bank of AmericaMerrill Lynch (877)
(6,596) Odonate Therapeutics Inc Goldman Sachs (2,045)(8,228) Old Republic International
CorpBank of AmericaMerrill Lynch (209)
(1,554) Old Republic InternationalCorp Goldman Sachs (94)
993 Ollie’s Bargain Outlet Hold-ings Inc Goldman Sachs 6,532
489 Ollie’s Bargain Outlet Hold-ings Inc Morgan Stanley 4,513
(1,674) One Liberty Properties Inc(REIT) Goldman Sachs (887)
(691) OneSpan Inc Goldman Sachs (888)47 Onto Innovation Inc Goldman Sachs 633
(319) Ontrak Inc Bank of AmericaMerrill Lynch 427
(5,284) Opendoor Technologies Inc Morgan Stanley (2,611)(337) Option Care Health Inc Goldman Sachs 69603 Origin Bancorp Inc Bank of America
Merrill Lynch (211)697 Origin Bancorp Inc Goldman Sachs (244)272 Orthofix Medical Inc Goldman Sachs (98)
(4,272) Oscar Health Inc ’A’ Morgan Stanley (4,782)478 OSI Systems Inc Goldman Sachs 37884 Otis Worldwide Corpπ Bank of America
Merrill Lynch —594 Otis Worldwide Corp Goldman Sachs 355
2,874 Otis Worldwide Corp Morgan Stanley 575304 Ovintiv Inc Bank of America
Merrill Lynch 137314 Ovintiv Inc Goldman Sachs 426
(332) Owens & Minor Inc Bank of AmericaMerrill Lynch (4,382)
(318) Pacira BioSciences Inc Goldman Sachs 2961,322 PAE Inc Bank of America
Merrill Lynch (635)
BlackRock Systematic Global Long/Short Equity Fund continued
Portfolio of Investments as at 31 May 2021
The notes on pages 590 to 610 form an integral part of these financial statements.
Annual report and audited financial statements [549]
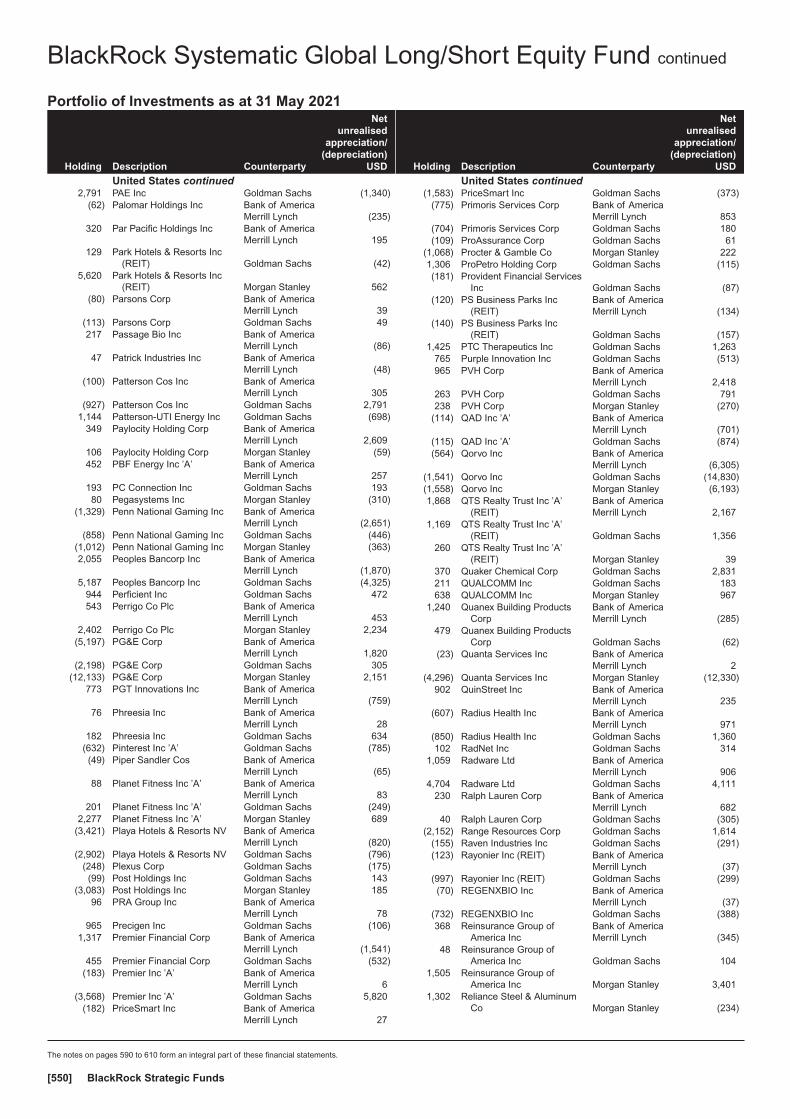
Holding Description Counterparty
Netunrealised
appreciation/(depreciation)
USD
United States continued2,791 PAE Inc Goldman Sachs (1,340)
(62) Palomar Holdings Inc Bank of AmericaMerrill Lynch (235)
320 Par Pacific Holdings Inc Bank of AmericaMerrill Lynch 195
129 Park Hotels & Resorts Inc(REIT) Goldman Sachs (42)
5,620 Park Hotels & Resorts Inc(REIT) Morgan Stanley 562
(80) Parsons Corp Bank of AmericaMerrill Lynch 39
(113) Parsons Corp Goldman Sachs 49217 Passage Bio Inc Bank of America
Merrill Lynch (86)47 Patrick Industries Inc Bank of America
Merrill Lynch (48)(100) Patterson Cos Inc Bank of America
Merrill Lynch 305(927) Patterson Cos Inc Goldman Sachs 2,791
1,144 Patterson-UTI Energy Inc Goldman Sachs (698)349 Paylocity Holding Corp Bank of America
Merrill Lynch 2,609106 Paylocity Holding Corp Morgan Stanley (59)452 PBF Energy Inc ’A’ Bank of America
Merrill Lynch 257193 PC Connection Inc Goldman Sachs 19380 Pegasystems Inc Morgan Stanley (310)
(1,329) Penn National Gaming Inc Bank of AmericaMerrill Lynch (2,651)
(858) Penn National Gaming Inc Goldman Sachs (446)(1,012) Penn National Gaming Inc Morgan Stanley (363)2,055 Peoples Bancorp Inc Bank of America
Merrill Lynch (1,870)5,187 Peoples Bancorp Inc Goldman Sachs (4,325)
944 Perficient Inc Goldman Sachs 472543 Perrigo Co Plc Bank of America
Merrill Lynch 4532,402 Perrigo Co Plc Morgan Stanley 2,234
(5,197) PG&E Corp Bank of AmericaMerrill Lynch 1,820
(2,198) PG&E Corp Goldman Sachs 305(12,133) PG&E Corp Morgan Stanley 2,151
773 PGT Innovations Inc Bank of AmericaMerrill Lynch (759)
76 Phreesia Inc Bank of AmericaMerrill Lynch 28
182 Phreesia Inc Goldman Sachs 634(632) Pinterest Inc ’A’ Goldman Sachs (785)(49) Piper Sandler Cos Bank of America
Merrill Lynch (65)88 Planet Fitness Inc ’A’ Bank of America
Merrill Lynch 83201 Planet Fitness Inc ’A’ Goldman Sachs (249)
2,277 Planet Fitness Inc ’A’ Morgan Stanley 689(3,421) Playa Hotels & Resorts NV Bank of America
Merrill Lynch (820)(2,902) Playa Hotels & Resorts NV Goldman Sachs (796)
(248) Plexus Corp Goldman Sachs (175)(99) Post Holdings Inc Goldman Sachs 143
(3,083) Post Holdings Inc Morgan Stanley 18596 PRA Group Inc Bank of America
Merrill Lynch 78965 Precigen Inc Goldman Sachs (106)
1,317 Premier Financial Corp Bank of AmericaMerrill Lynch (1,541)
455 Premier Financial Corp Goldman Sachs (532)(183) Premier Inc ’A’ Bank of America
Merrill Lynch 6(3,568) Premier Inc ’A’ Goldman Sachs 5,820
(182) PriceSmart Inc Bank of AmericaMerrill Lynch 27
Holding Description Counterparty
Netunrealised
appreciation/(depreciation)
USD
United States continued(1,583) PriceSmart Inc Goldman Sachs (373)
(775) Primoris Services Corp Bank of AmericaMerrill Lynch 853
(704) Primoris Services Corp Goldman Sachs 180(109) ProAssurance Corp Goldman Sachs 61
(1,068) Procter & Gamble Co Morgan Stanley 2221,306 ProPetro Holding Corp Goldman Sachs (115)(181) Provident Financial Services
Inc Goldman Sachs (87)(120) PS Business Parks Inc
(REIT)Bank of AmericaMerrill Lynch (134)
(140) PS Business Parks Inc(REIT) Goldman Sachs (157)
1,425 PTC Therapeutics Inc Goldman Sachs 1,263765 Purple Innovation Inc Goldman Sachs (513)965 PVH Corp Bank of America
Merrill Lynch 2,418263 PVH Corp Goldman Sachs 791238 PVH Corp Morgan Stanley (270)
(114) QAD Inc ’A’ Bank of AmericaMerrill Lynch (701)
(115) QAD Inc ’A’ Goldman Sachs (874)(564) Qorvo Inc Bank of America
Merrill Lynch (6,305)(1,541) Qorvo Inc Goldman Sachs (14,830)(1,558) Qorvo Inc Morgan Stanley (6,193)1,868 QTS Realty Trust Inc ’A’
(REIT)Bank of AmericaMerrill Lynch 2,167
1,169 QTS Realty Trust Inc ’A’(REIT) Goldman Sachs 1,356
260 QTS Realty Trust Inc ’A’(REIT) Morgan Stanley 39
370 Quaker Chemical Corp Goldman Sachs 2,831211 QUALCOMM Inc Goldman Sachs 183638 QUALCOMM Inc Morgan Stanley 967
1,240 Quanex Building ProductsCorp
Bank of AmericaMerrill Lynch (285)
479 Quanex Building ProductsCorp Goldman Sachs (62)
(23) Quanta Services Inc Bank of AmericaMerrill Lynch 2
(4,296) Quanta Services Inc Morgan Stanley (12,330)902 QuinStreet Inc Bank of America
Merrill Lynch 235(607) Radius Health Inc Bank of America
Merrill Lynch 971(850) Radius Health Inc Goldman Sachs 1,360102 RadNet Inc Goldman Sachs 314
1,059 Radware Ltd Bank of AmericaMerrill Lynch 906
4,704 Radware Ltd Goldman Sachs 4,111230 Ralph Lauren Corp Bank of America
Merrill Lynch 68240 Ralph Lauren Corp Goldman Sachs (305)
(2,152) Range Resources Corp Goldman Sachs 1,614(155) Raven Industries Inc Goldman Sachs (291)(123) Rayonier Inc (REIT) Bank of America
Merrill Lynch (37)(997) Rayonier Inc (REIT) Goldman Sachs (299)(70) REGENXBIO Inc Bank of America
Merrill Lynch (37)(732) REGENXBIO Inc Goldman Sachs (388)368 Reinsurance Group of
America IncBank of AmericaMerrill Lynch (345)
48 Reinsurance Group ofAmerica Inc Goldman Sachs 104
1,505 Reinsurance Group ofAmerica Inc Morgan Stanley 3,401
1,302 Reliance Steel & AluminumCo Morgan Stanley (234)
BlackRock Systematic Global Long/Short Equity Fund continued
Portfolio of Investments as at 31 May 2021
The notes on pages 590 to 610 form an integral part of these financial statements.
BlackRock Strategic Funds[550]

Holding Description Counterparty
Netunrealised
appreciation/(depreciation)
USD
United States continued(126) Renewable Energy Group
IncBank of AmericaMerrill Lynch 57
(68) Rent-A-Center Inc Bank of AmericaMerrill Lynch (88)
(1,112) Rent-A-Center Inc Goldman Sachs (5,587)(314) Repay Holdings Corp Bank of America
Merrill Lynch 33(4,353) Repay Holdings Corp Goldman Sachs 1,1612,850 Resources Connection Inc Bank of America
Merrill Lynch 439,032 Resources Connection Inc Goldman Sachs 86
798 Retail Properties of AmericaInc ’A’ (REIT) Goldman Sachs 309
(162) REV Group Inc Bank of AmericaMerrill Lynch 3
(146) REV Group Inc Goldman Sachs 3199 REX American Resources
CorpBank of AmericaMerrill Lynch 3,409
(3,941) Rigel Pharmaceuticals Inc Bank of AmericaMerrill Lynch (158)
(6,722) Rigel Pharmaceuticals Inc Goldman Sachs (264)1,910 RLI Corp Goldman Sachs (5,508)
601 RLJ Lodging Trust (REIT) Bank of AmericaMerrill Lynch 215
(766) RMR Group Inc ’A’ Goldman Sachs 15(970) Rocket Cos Inc ’A’ Bank of America
Merrill Lynch (213)(446) Rocket Cos Inc ’A’ Goldman Sachs 13
(5,362) Rocket Cos Inc ’A’ Morgan Stanley (4,343)(225) Rogers Corp Goldman Sachs (1,145)
(1,310) Royal Caribbean CruisesLtd Morgan Stanley (9,694)
(283) Royal Gold Inc Bank of AmericaMerrill Lynch 401
(190) Royal Gold Inc Goldman Sachs 145(783) Royal Gold Inc Morgan Stanley 712
5,615 RPC Inc Goldman Sachs (6,008)107 Rush Enterprises Inc ’B’ Goldman Sachs (355)293 Ruth’s Hospitality Group Inc Bank of America
Merrill Lynch (117)1,355 Ruth’s Hospitality Group Inc Goldman Sachs (542)6,285 Sabra Health Care Inc
(REIT)Bank of AmericaMerrill Lynch 1,948
719 Sabra Health Care Inc(REIT) Goldman Sachs 223
4,840 Sabra Health Care Inc(REIT) Morgan Stanley (194)
3,554 Sabre Corp Bank of AmericaMerrill Lynch 2,224
790 Sabre Corp Goldman Sachs 1311,147 Sailpoint Technologies Hold-
ings IncBank of AmericaMerrill Lynch 2,043
4,248 Sailpoint Technologies Hold-ings Inc Goldman Sachs 7,072
3,257 Sailpoint Technologies Hold-ings Inc Morgan Stanley 3,844
(214) salesforce.com Inc Bank of AmericaMerrill Lynch 158
(250) salesforce.com Inc Goldman Sachs (2,689)(332) salesforce.com Inc Morgan Stanley (2,931)329 Sanderson Farms Inc Bank of America
Merrill Lynch (924)375 Sanderson Farms Inc Morgan Stanley (819)(69) Sandy Spring Bancorp Inc Bank of America
Merrill Lynch 67(1,167) Sandy Spring Bancorp Inc Goldman Sachs 1,036
(353) Saul Centers Inc (REIT) Bank of AmericaMerrill Lynch (484)
(590) Saul Centers Inc (REIT) Goldman Sachs (808)(1,160) Schnitzer Steel Industries
Inc ’A’ Goldman Sachs 2,007
Holding Description Counterparty
Netunrealised
appreciation/(depreciation)
USD
United States continued(165) Scholastic Corp Bank of America
Merrill Lynch (93)(147) Scholastic Corp Goldman Sachs (172)(63) Schrodinger Inc Morgan Stanley 36(4) Seaboard Corp Bank of America
Merrill Lynch 54(4) Seaboard Corp Goldman Sachs 226
266 SeaWorld Entertainment Inc Goldman Sachs 561456 Select Energy Services Inc
’A’ Goldman Sachs 51(63) Selective Insurance Group
IncBank of AmericaMerrill Lynch 9
(299) Selective Insurance GroupInc Goldman Sachs 208
(1,985) Sensient Technologies Corp Goldman Sachs (2,422)664 Service Properties Trust
(REIT) Goldman Sachs 969(767) ServisFirst Bancshares Inc Goldman Sachs (949)
1,059 Shake Shack Inc ’A’ Bank of AmericaMerrill Lynch 10,756
335 Shake Shack Inc ’A’ Goldman Sachs 2,379(790) Shift4 Payments Inc ’A’ Morgan Stanley (485)
(2,365) Shoals Technologies GroupInc ’A’
Bank of AmericaMerrill Lynch (14,001)
(542) Shoals Technologies GroupInc ’A’ Goldman Sachs (1,756)
(2,896) Shoals Technologies GroupInc ’A’ Morgan Stanley (4,463)
891 Shoe Carnival Inc Goldman Sachs 1,410(58) ShotSpotter Inc Goldman Sachs 37
(802) Shyft Group Inc Bank of AmericaMerrill Lynch (784)
(2,417) Shyft Group Inc Goldman Sachs (1,815)1,503 SIGA Technologies Inc Bank of America
Merrill Lynch 256780 SIGA Technologies Inc Goldman Sachs 133116 Signature Bank Bank of America
Merrill Lynch 179157 Signature Bank Goldman Sachs 1,349462 Signet Jewelers Ltd Goldman Sachs (2,287)
(677) Simmons First NationalCorp ’A’ Goldman Sachs 223
(963) Simply Good Foods Co Goldman Sachs (2,735)116 Sinclair Broadcast Group
Inc ’A’Bank of AmericaMerrill Lynch 107
1,745 Sirius XM Holdings Inc Bank of AmericaMerrill Lynch 663
123,882 Sirius XM Holdings Inc Morgan Stanley 13,550512 SITE Centers Corp (REIT) Bank of America
Merrill Lynch 1332,361 SITE Centers Corp (REIT) Goldman Sachs 614
206 SiteOne Landscape SupplyInc Goldman Sachs (760)
49 SiteOne Landscape SupplyInc Morgan Stanley (197)
101 Six Flags EntertainmentCorp
Bank of AmericaMerrill Lynch 78
100 Six Flags EntertainmentCorp Goldman Sachs (1)
(126) SJW Group Goldman Sachs 21,318 Skechers USA Inc ’A’ Bank of America
Merrill Lynch 94299 Skechers USA Inc ’A’ Goldman Sachs (30)
3,113 Skechers USA Inc ’A’ Morgan Stanley 2,312(162) Skyworks Solutions Inc Bank of America
Merrill Lynch (127)(675) Skyworks Solutions Inc Goldman Sachs (1,927)(192) Skyworks Solutions Inc Morgan Stanley (215)150 SMART Global Holdings Inc Goldman Sachs 488
(1,208) Snap Inc ’A’ Bank of AmericaMerrill Lynch (3,229)
BlackRock Systematic Global Long/Short Equity Fund continued
Portfolio of Investments as at 31 May 2021
The notes on pages 590 to 610 form an integral part of these financial statements.
Annual report and audited financial statements [551]
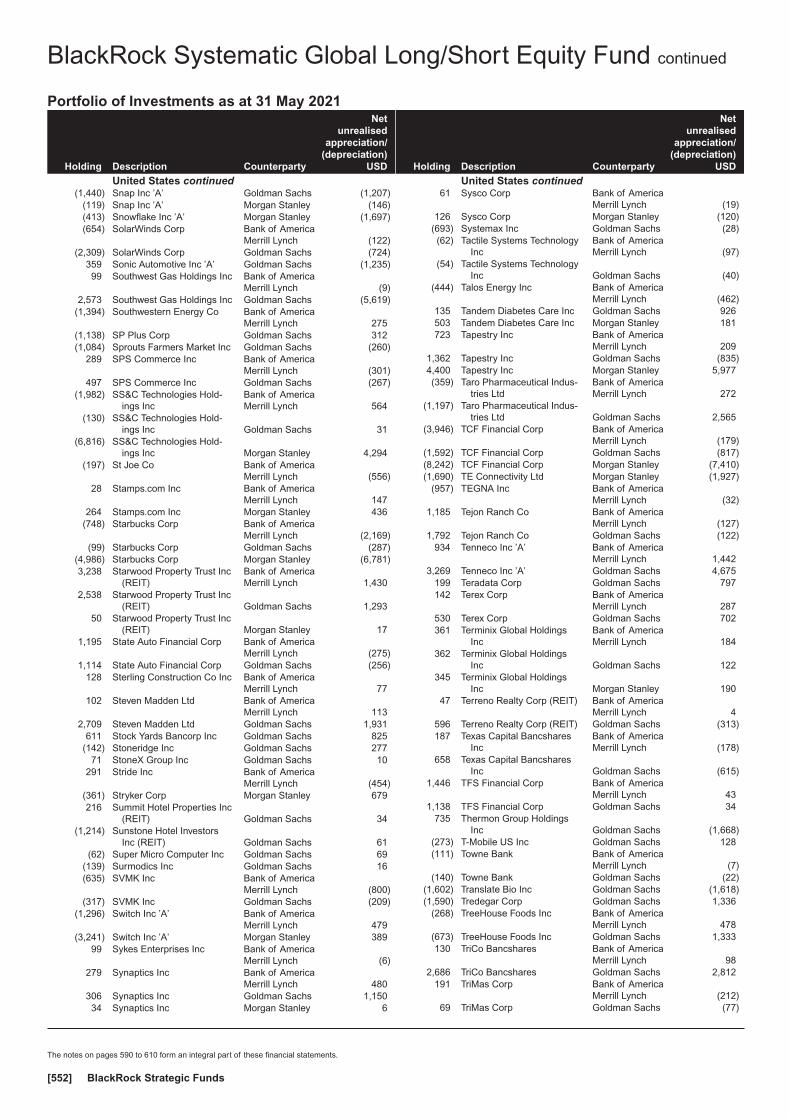
Holding Description Counterparty
Netunrealised
appreciation/(depreciation)
USD
United States continued(1,440) Snap Inc ’A’ Goldman Sachs (1,207)
(119) Snap Inc ’A’ Morgan Stanley (146)(413) Snowflake Inc ’A’ Morgan Stanley (1,697)(654) SolarWinds Corp Bank of America
Merrill Lynch (122)(2,309) SolarWinds Corp Goldman Sachs (724)
359 Sonic Automotive Inc ’A’ Goldman Sachs (1,235)99 Southwest Gas Holdings Inc Bank of America
Merrill Lynch (9)2,573 Southwest Gas Holdings Inc Goldman Sachs (5,619)
(1,394) Southwestern Energy Co Bank of AmericaMerrill Lynch 275
(1,138) SP Plus Corp Goldman Sachs 312(1,084) Sprouts Farmers Market Inc Goldman Sachs (260)
289 SPS Commerce Inc Bank of AmericaMerrill Lynch (301)
497 SPS Commerce Inc Goldman Sachs (267)(1,982) SS&C Technologies Hold-
ings IncBank of AmericaMerrill Lynch 564
(130) SS&C Technologies Hold-ings Inc Goldman Sachs 31
(6,816) SS&C Technologies Hold-ings Inc Morgan Stanley 4,294
(197) St Joe Co Bank of AmericaMerrill Lynch (556)
28 Stamps.com Inc Bank of AmericaMerrill Lynch 147
264 Stamps.com Inc Morgan Stanley 436(748) Starbucks Corp Bank of America
Merrill Lynch (2,169)(99) Starbucks Corp Goldman Sachs (287)
(4,986) Starbucks Corp Morgan Stanley (6,781)3,238 Starwood Property Trust Inc
(REIT)Bank of AmericaMerrill Lynch 1,430
2,538 Starwood Property Trust Inc(REIT) Goldman Sachs 1,293
50 Starwood Property Trust Inc(REIT) Morgan Stanley 17
1,195 State Auto Financial Corp Bank of AmericaMerrill Lynch (275)
1,114 State Auto Financial Corp Goldman Sachs (256)128 Sterling Construction Co Inc Bank of America
Merrill Lynch 77102 Steven Madden Ltd Bank of America
Merrill Lynch 1132,709 Steven Madden Ltd Goldman Sachs 1,931
611 Stock Yards Bancorp Inc Goldman Sachs 825(142) Stoneridge Inc Goldman Sachs 277
71 StoneX Group Inc Goldman Sachs 10291 Stride Inc Bank of America
Merrill Lynch (454)(361) Stryker Corp Morgan Stanley 679216 Summit Hotel Properties Inc
(REIT) Goldman Sachs 34(1,214) Sunstone Hotel Investors
Inc (REIT) Goldman Sachs 61(62) Super Micro Computer Inc Goldman Sachs 69
(139) Surmodics Inc Goldman Sachs 16(635) SVMK Inc Bank of America
Merrill Lynch (800)(317) SVMK Inc Goldman Sachs (209)
(1,296) Switch Inc ’A’ Bank of AmericaMerrill Lynch 479
(3,241) Switch Inc ’A’ Morgan Stanley 38999 Sykes Enterprises Inc Bank of America
Merrill Lynch (6)279 Synaptics Inc Bank of America
Merrill Lynch 480306 Synaptics Inc Goldman Sachs 1,15034 Synaptics Inc Morgan Stanley 6
Holding Description Counterparty
Netunrealised
appreciation/(depreciation)
USD
United States continued61 Sysco Corp Bank of America
Merrill Lynch (19)126 Sysco Corp Morgan Stanley (120)
(693) Systemax Inc Goldman Sachs (28)(62) Tactile Systems Technology
IncBank of AmericaMerrill Lynch (97)
(54) Tactile Systems TechnologyInc Goldman Sachs (40)
(444) Talos Energy Inc Bank of AmericaMerrill Lynch (462)
135 Tandem Diabetes Care Inc Goldman Sachs 926503 Tandem Diabetes Care Inc Morgan Stanley 181723 Tapestry Inc Bank of America
Merrill Lynch 2091,362 Tapestry Inc Goldman Sachs (835)4,400 Tapestry Inc Morgan Stanley 5,977(359) Taro Pharmaceutical Indus-
tries LtdBank of AmericaMerrill Lynch 272
(1,197) Taro Pharmaceutical Indus-tries Ltd Goldman Sachs 2,565
(3,946) TCF Financial Corp Bank of AmericaMerrill Lynch (179)
(1,592) TCF Financial Corp Goldman Sachs (817)(8,242) TCF Financial Corp Morgan Stanley (7,410)(1,690) TE Connectivity Ltd Morgan Stanley (1,927)
(957) TEGNA Inc Bank of AmericaMerrill Lynch (32)
1,185 Tejon Ranch Co Bank of AmericaMerrill Lynch (127)
1,792 Tejon Ranch Co Goldman Sachs (122)934 Tenneco Inc ’A’ Bank of America
Merrill Lynch 1,4423,269 Tenneco Inc ’A’ Goldman Sachs 4,675
199 Teradata Corp Goldman Sachs 797142 Terex Corp Bank of America
Merrill Lynch 287530 Terex Corp Goldman Sachs 702361 Terminix Global Holdings
IncBank of AmericaMerrill Lynch 184
362 Terminix Global HoldingsInc Goldman Sachs 122
345 Terminix Global HoldingsInc Morgan Stanley 190
47 Terreno Realty Corp (REIT) Bank of AmericaMerrill Lynch 4
596 Terreno Realty Corp (REIT) Goldman Sachs (313)187 Texas Capital Bancshares
IncBank of AmericaMerrill Lynch (178)
658 Texas Capital BancsharesInc Goldman Sachs (615)
1,446 TFS Financial Corp Bank of AmericaMerrill Lynch 43
1,138 TFS Financial Corp Goldman Sachs 34735 Thermon Group Holdings
Inc Goldman Sachs (1,668)(273) T-Mobile US Inc Goldman Sachs 128(111) Towne Bank Bank of America
Merrill Lynch (7)(140) Towne Bank Goldman Sachs (22)
(1,602) Translate Bio Inc Goldman Sachs (1,618)(1,590) Tredegar Corp Goldman Sachs 1,336
(268) TreeHouse Foods Inc Bank of AmericaMerrill Lynch 478
(673) TreeHouse Foods Inc Goldman Sachs 1,333130 TriCo Bancshares Bank of America
Merrill Lynch 982,686 TriCo Bancshares Goldman Sachs 2,812
191 TriMas Corp Bank of AmericaMerrill Lynch (212)
69 TriMas Corp Goldman Sachs (77)
BlackRock Systematic Global Long/Short Equity Fund continued
Portfolio of Investments as at 31 May 2021
The notes on pages 590 to 610 form an integral part of these financial statements.
BlackRock Strategic Funds[552]

Holding Description Counterparty
Netunrealised
appreciation/(depreciation)
USD
United States continued94 TriNet Group Inc Bank of America
Merrill Lynch (197)279 TriNet Group Inc Goldman Sachs (817)461 Trinity Industries Inc Goldman Sachs (212)593 Triple-S Management Corp Goldman Sachs 71187 TriState Capital Holdings Inc Bank of America
Merrill Lynch 180762 TriState Capital Holdings Inc Goldman Sachs 151494 Triton International Ltd Bank of America
Merrill Lynch 1,098436 Triton International Ltd Goldman Sachs 441705 Triumph Group Inc Goldman Sachs 1,833230 Tronox Holdings Plc ’A’ Bank of America
Merrill Lynch 105371 Tronox Holdings Plc ’A’ Goldman Sachs 12
1,110 TrueCar Inc Goldman Sachs 1,376162 Trustmark Corp Bank of America
Merrill Lynch (152)518 Trustmark Corp Goldman Sachs (487)
(358) TTEC Holdings Inc Bank of AmericaMerrill Lynch (2,418)
(1,530) TTEC Holdings Inc Goldman Sachs (8,752)1,569 TTM Technologies Inc Bank of America
Merrill Lynch 2811,010 TTM Technologies Inc Goldman Sachs 182
85 Tucows Inc ’A’ Bank of AmericaMerrill Lynch (85)
(537) Tupperware Brands Corp Goldman Sachs 1,338(5,755) TuSimple Holdings Inc ’A’ Morgan Stanley (9,411)1,387 UGI Corp Bank of America
Merrill Lynch 1,958914 UGI Corp Goldman Sachs 1,065
4,761 UGI Corp Morgan Stanley 5,470638 Ulta Salon Cosmetics & Fra-
grance Inc Morgan Stanley 18,847(71) UMB Financial Corp Bank of America
Merrill Lynch (6)(129) UMB Financial Corp Goldman Sachs 113
5,149 Umpqua Holdings Corp Bank of AmericaMerrill Lynch 984
3,934 Umpqua Holdings Corp Goldman Sachs 7012,837 Under Armour Inc ’A’ Bank of America
Merrill Lynch 7352,526 Under Armour Inc ’A’ Goldman Sachs 487
18,337 Under Armour Inc ’A’ Morgan Stanley 18,302316 Under Armour Inc ’C’ Bank of America
Merrill Lynch 2506,345 Under Armour Inc ’C’ Goldman Sachs (1,904)
(13) UniFirst Corp Goldman Sachs 30(118) Unisys Corp Bank of America
Merrill Lynch (41)(3,041) Unisys Corp Goldman Sachs (1,064)(1,172) United Airlines Holdings Inc Goldman Sachs (2,745)(2,324) United Airlines Holdings Inc Morgan Stanley (5,136)
(158) United Community BanksInc Goldman Sachs (134)
110 United Fire Group Inc Goldman Sachs (220)(11) United Natural Foods Inc Bank of America
Merrill Lynch (26)(1,024) United Natural Foods Inc Goldman Sachs (2,447)
16 United States Cellular Corp Bank of AmericaMerrill Lynch (1)
108 United States Cellular Corp Goldman Sachs (6)(437) Uniti Group Inc (REIT) Bank of America
Merrill Lynch (96)(3,477) Uniti Group Inc (REIT) Goldman Sachs (765)
(61) Unitil Corp Bank of AmericaMerrill Lynch 38
(1,077) Universal Corp Goldman Sachs 4,282
Holding Description Counterparty
Netunrealised
appreciation/(depreciation)
USD
United States continued(61) Universal Health Realty In-
come Trust (REIT) Goldman Sachs 1606 Univest Financial Corp Bank of America
Merrill Lynch 12569 Univest Financial Corp Goldman Sachs 93
(526) Upland Software Inc Goldman Sachs (763)(519) Upstart Holdings Inc Morgan Stanley (4,386)
1,483 Urban Outfitters Inc Goldman Sachs 291(579) Urstadt Biddle Properties
Inc ’A’ (REIT)Bank of AmericaMerrill Lynch 41
(1,327) Urstadt Biddle PropertiesInc ’A’ (REIT) Goldman Sachs 93
296 US Ecology Inc Bank of AmericaMerrill Lynch (465)
1,350 US Ecology Inc Goldman Sachs (1,810)821 US Physical Therapy Inc Goldman Sachs (148)
(139) USANA Health Sciences Inc Bank of AmericaMerrill Lynch (779)
(81) USANA Health Sciences Inc Goldman Sachs (375)(1,181) Utz Brands Inc Bank of America
Merrill Lynch (29)(3,779) Utz Brands Inc Goldman Sachs (113)(8,211) UWM Holdings Corp Goldman Sachs (6,322)(4,100) UWM Holdings Corp Morgan Stanley (2,665)
(23) Vapotherm Inc Bank of AmericaMerrill Lynch (61)
(450) Vapotherm Inc Goldman Sachs (1,188)154 Varex Imaging Corp Bank of America
Merrill Lynch 1711,116 Varonis Systems Inc Bank of America
Merrill Lynch 4,1291,602 Varonis Systems Inc Morgan Stanley 1,410(786) Vector Group Ltd Bank of America
Merrill Lynch 448(3,562) Vector Group Ltd Goldman Sachs 2,975
60 Vectrus Inc Bank of AmericaMerrill Lynch (10)
115 Vectrus Inc Goldman Sachs 36(315) Veeco Instruments Inc Goldman Sachs (209)
(4,149) Veoneer Inc Goldman Sachs (6,182)1,107 Verint Systems Inc Bank of America
Merrill Lynch 1,2053,228 Verint Systems Inc Goldman Sachs 3,249
676 VF Corp Morgan Stanley 1,174(4,586) Viatris Inc Goldman Sachs (588)
(461) Viatris Inc Morgan Stanley 552,730 Victory Capital Holdings Inc
’A’Bank of AmericaMerrill Lynch 1,661
2,040 Victory Capital Holdings Inc’A’ Goldman Sachs 920
(2,456) Vimeo Inc Morgan Stanley (103,152)(1,139) Virgin Galactic Holdings Inc Bank of America
Merrill Lynch (14,828)(354) Virgin Galactic Holdings Inc Goldman Sachs (1,457)472 Vishay Precision Group Inc Bank of America
Merrill Lynch (873)1,181 Vishay Precision Group Inc Goldman Sachs (2,185)
33 VMware Inc ’A’ Bank of AmericaMerrill Lynch (156)
289 VMware Inc ’A’ Goldman Sachs (971)764 VMware Inc ’A’ Morgan Stanley (3,188)738 Vocera Communications Inc Bank of America
Merrill Lynch 131682 Vocera Communications Inc Goldman Sachs 207
2,516 Voya Financial Inc Goldman Sachs (599)9,143 Voya Financial Inc Morgan Stanley (2,377)
(2,706) Voyager Therapeutics Inc Bank of AmericaMerrill Lynch 758
(2,786) Voyager Therapeutics Inc Goldman Sachs 619
BlackRock Systematic Global Long/Short Equity Fund continued
Portfolio of Investments as at 31 May 2021
The notes on pages 590 to 610 form an integral part of these financial statements.
Annual report and audited financial statements [553]
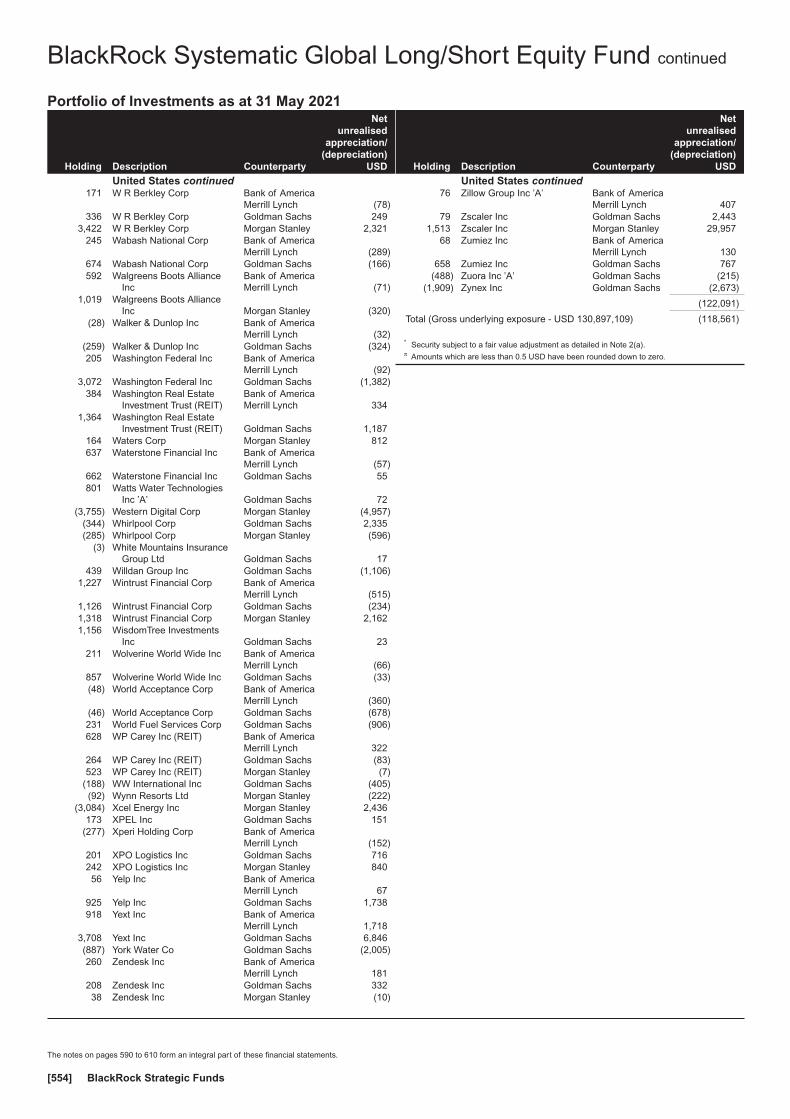
Holding Description Counterparty
Netunrealised
appreciation/(depreciation)
USD
United States continued171 W R Berkley Corp Bank of America
Merrill Lynch (78)336 W R Berkley Corp Goldman Sachs 249
3,422 W R Berkley Corp Morgan Stanley 2,321245 Wabash National Corp Bank of America
Merrill Lynch (289)674 Wabash National Corp Goldman Sachs (166)592 Walgreens Boots Alliance
IncBank of AmericaMerrill Lynch (71)
1,019 Walgreens Boots AllianceInc Morgan Stanley (320)
(28) Walker & Dunlop Inc Bank of AmericaMerrill Lynch (32)
(259) Walker & Dunlop Inc Goldman Sachs (324)205 Washington Federal Inc Bank of America
Merrill Lynch (92)3,072 Washington Federal Inc Goldman Sachs (1,382)
384 Washington Real EstateInvestment Trust (REIT)
Bank of AmericaMerrill Lynch 334
1,364 Washington Real EstateInvestment Trust (REIT) Goldman Sachs 1,187
164 Waters Corp Morgan Stanley 812637 Waterstone Financial Inc Bank of America
Merrill Lynch (57)662 Waterstone Financial Inc Goldman Sachs 55801 Watts Water Technologies
Inc ’A’ Goldman Sachs 72(3,755) Western Digital Corp Morgan Stanley (4,957)
(344) Whirlpool Corp Goldman Sachs 2,335(285) Whirlpool Corp Morgan Stanley (596)
(3) White Mountains InsuranceGroup Ltd Goldman Sachs 17
439 Willdan Group Inc Goldman Sachs (1,106)1,227 Wintrust Financial Corp Bank of America
Merrill Lynch (515)1,126 Wintrust Financial Corp Goldman Sachs (234)1,318 Wintrust Financial Corp Morgan Stanley 2,1621,156 WisdomTree Investments
Inc Goldman Sachs 23211 Wolverine World Wide Inc Bank of America
Merrill Lynch (66)857 Wolverine World Wide Inc Goldman Sachs (33)(48) World Acceptance Corp Bank of America
Merrill Lynch (360)(46) World Acceptance Corp Goldman Sachs (678)231 World Fuel Services Corp Goldman Sachs (906)628 WP Carey Inc (REIT) Bank of America
Merrill Lynch 322264 WP Carey Inc (REIT) Goldman Sachs (83)523 WP Carey Inc (REIT) Morgan Stanley (7)
(188) WW International Inc Goldman Sachs (405)(92) Wynn Resorts Ltd Morgan Stanley (222)
(3,084) Xcel Energy Inc Morgan Stanley 2,436173 XPEL Inc Goldman Sachs 151
(277) Xperi Holding Corp Bank of AmericaMerrill Lynch (152)
201 XPO Logistics Inc Goldman Sachs 716242 XPO Logistics Inc Morgan Stanley 84056 Yelp Inc Bank of America
Merrill Lynch 67925 Yelp Inc Goldman Sachs 1,738918 Yext Inc Bank of America
Merrill Lynch 1,7183,708 Yext Inc Goldman Sachs 6,846(887) York Water Co Goldman Sachs (2,005)260 Zendesk Inc Bank of America
Merrill Lynch 181208 Zendesk Inc Goldman Sachs 33238 Zendesk Inc Morgan Stanley (10)
Holding Description Counterparty
Netunrealised
appreciation/(depreciation)
USD
United States continued76 Zillow Group Inc ’A’ Bank of America
Merrill Lynch 40779 Zscaler Inc Goldman Sachs 2,443
1,513 Zscaler Inc Morgan Stanley 29,95768 Zumiez Inc Bank of America
Merrill Lynch 130658 Zumiez Inc Goldman Sachs 767
(488) Zuora Inc ’A’ Goldman Sachs (215)(1,909) Zynex Inc Goldman Sachs (2,673)
(122,091)
Total (Gross underlying exposure - USD 130,897,109) (118,561)
* Security subject to a fair value adjustment as detailed in Note 2(a).π Amounts which are less than 0.5 USD have been rounded down to zero.
BlackRock Systematic Global Long/Short Equity Fund continued
Portfolio of Investments as at 31 May 2021
The notes on pages 590 to 610 form an integral part of these financial statements.
BlackRock Strategic Funds[554]

Numberof
contractsCurrencyof contracts
Contract/Description
Expirationdate
Grossunderlying
exposureUSD
Net unrealisedappreciation/
(depreciation)USD
Financial Derivative Instruments
FUTURES
(18) EUR Amsterdam Index Futures June 2021 June 2021 3,124,836 (27,928)
32 EUR CAC 40 Index Futures June 2021 June 2021 2,522,812 43,369
9 USD E-mini Russell 2000 Index Futures June 2021 June 2021 1,017,810 (24,660)
35 USD E-Mini S&P 500 Index Futures June 2021 June 2021 7,359,800 208,316
(13) EUR EURO STOXX 50 Index Futures June 2021 June 2021 643,017 (41,488)
5 GBP FTSE 100 Index Futures June 2021 June 2021 497,615 (195)
7 EUR FTSE MIB Index Futures June 2021 June 2021 1,078,315 31,059
(12) EUR IBEX 35 Index Futures June 2021 June 2021 1,341,904 (911)
(5) EUR Mini-DAX Futures June 2021 June 2021 471,807 (680)
(15) SGD MSCI Singapore Index Futures June 2021 June 2021 408,039 (1,290)
(19) SEK OMX Stockholm 30 Index Futures June 2021 June 2021 515,618 (1,195)
(3) CAD S&P/TSX 60 Index Futures June 2021 June 2021 590,341 (14,210)
(8) AUD SPI 200 Index Futures June 2021 June 2021 1,109,225 (16,504)
6 JPY Topix Index Futures June 2021 June 2021 1,055,363 33,177
Total 21,736,502 186,860
Currency Purchases Currency Sales CounterpartyMaturity
date
Netunrealised
appreciation/(depreciation)
USD
Financial Derivative Instruments
OPEN FORWARD FOREIGN EXCHANGE TRANSACTIONS
AUD 1,911,000 USD 1,478,549 Deutsche Bank 21/6/2021 598CAD 1,567,000 USD 1,298,754 JP Morgan 21/6/2021 (1,774)EUR 1,411,346 CHF 1,545,000 Citibank 21/6/2021 6,387EUR 1,028,683 CHF 1,127,000 UBS 21/6/2021 3,654EUR 220,751 NOK 2,244,000 Deutsche Bank 21/6/2021 602EUR 101,940 NOK 1,035,000 UBS 21/6/2021 427EUR 264,469 SEK 2,682,000 JP Morgan 21/6/2021 (620)
EUR 241,185 USD 293,451State Street Bank& Trust Company 21/6/2021 999
GBP 405,000 USD 575,592 Morgan Stanley 21/6/2021 (1,694)JPY 41,294,000 USD 377,651 Morgan Stanley 21/6/2021 (964)NOK 7,981,000 EUR 795,118 JP Morgan 21/6/2021 (14,343)NZD 260,000 USD 187,568 Goldman Sachs 21/6/2021 1,405SEK 21,451 EUR 2,118 Citibank 21/6/2021 1SEK 7,274,549 EUR 718,859 Deutsche Bank 21/6/2021 (179)SEK 21,733,000 EUR 2,142,240 UBS 21/6/2021 6,032
USD 727,961 AUD 944,000Bank of America
Merrill Lynch 21/6/2021 (2,711)USD 252,117 AUD 323,000 Citibank 21/6/2021 2,110USD 212,516 CAD 258,000 BNP Paribas 21/6/2021 (1,026)
USD 1,915,251 EUR 1,566,000Bank of America
Merrill Lynch 21/6/2021 3,404USD 333,559 EUR 274,000 Citibank 21/6/2021 (954)USD 246,120 GBP 175,043 Barclays Bank 21/6/2021 (1,921)USD 2,924,927 NZD 4,061,000 Deutsche Bank 21/6/2021 (26,684)USD 97,931 NZD 135,000 Morgan Stanley 21/6/2021 (190)USD 6,743 SGD 9,000 HSBC 21/6/2021 (66)
(27,507)
EUR Hedged Share Class
EUR 31,200,308 USD 37,699,998State Street Bank& Trust Company 15/6/2021 386,349
USD 1,008,033 EUR 827,127State Street Bank& Trust Company 15/6/2021 (1,646)
384,703
Currency Purchases Currency Sales CounterpartyMaturity
date
Netunrealised
appreciation/(depreciation)
USD
Financial Derivative Instruments
OPEN FORWARD FOREIGN EXCHANGE TRANSACTIONS
GBP Hedged Share Class
GBP 402,708 USD 560,616State Street Bank& Trust Company 15/6/2021 10,029
USD 12,063 GBP 8,525State Street Bank& Trust Company 15/6/2021 (18)
10,011
SEK Hedged Share Class
SEK 585,260 USD 69,717State Street Bank& Trust Company 15/6/2021 872
USD 1,394 SEK 11,613State Street Bank& Trust Company 15/6/2021 (6)
866
Total (Gross underlying exposure - USD 67,011,109) 368,073
Sector Breakdownas at 31 May 2021
% of NetAssets
Government 88.16
Diversified 1.18
Consumer, Non-cyclical 0.46
Technology 0.37
Communications 0.30
Industrial 0.23
Financial 0.02
Securities portfolio at market value 90.72
Other Net Assets 9.28
100.00
BlackRock Systematic Global Long/Short Equity Fund continued
Portfolio of Investments as at 31 May 2021
The notes on pages 590 to 610 form an integral part of these financial statements.
Annual report and audited financial statements [555]

Holding Description
MarketValue
EUR
% ofNet
Assets
Transferable Securities and Money Market Instruments Admittedto an Official Stock Exchange Listing or Dealt in on AnotherRegulated Market
BONDSAustralia
AUD 167,000 Australia Government BondRegS 3.00% 20/9/2025 160,732 0.91
AUD 128,000 Australia Government BondRegS 0.75% 21/11/2027 96,140 0.54
AUD 123,000 Australia Government BondRegS 2.50% 20/9/2030 124,100 0.70
AUD 94,000 Australia Government BondRegS 2.00% 21/8/2035 88,949 0.50
AUD 79,000 Australia Government BondRegS 1.25% 21/8/2040 65,892 0.37
AUD 83,000 Australia Government BondRegS 1.00% 21/2/2050 64,412 0.37
600,225 3.39
CanadaCAD 81,052 Canadian Government Real
Return Bond 4.25%1/12/2026 71,973 0.41
CAD 88,589 Canadian Government RealReturn Bond 4.00%1/12/2031 88,670 0.50
CAD 84,907 Canadian Government RealReturn Bond 1.25%1/12/2047 72,384 0.41
233,027 1.32
FranceEUR 12,287 France Government Bond OAT
RegS 1.10% 25/7/2022 12,820 0.07EUR 10,753 France Government Bond OAT
RegS 0.25% 25/7/2024 11,564 0.06EUR 3,733 France Government Bond OAT
RegS 0.10% 1/3/2026 4,081 0.02EUR 12,674 France Government Bond OAT
RegS 1.85% 25/7/2027 15,643 0.09EUR 7,023 France Government Bond OAT
RegS 0.10% 1/3/2028 7,807 0.04EUR 6,011 France Government Bond OAT
RegS 0.10% 1/3/2029 6,809 0.04EUR 6,566 France Government Bond OAT
RegS 3.40% 25/7/2029 9,337 0.05EUR 1,212 France Government Bond OAT
RegS 0.10% 25/7/2031 1,404 0.01EUR 7,852 France Government Bond OAT
RegS 3.15% 25/7/2032 12,118 0.07EUR 2,913 France Government Bond OAT
RegS 0.10% 1/3/2036 3,419 0.02EUR 8,001 France Government Bond OAT
RegS 1.80% 25/7/2040 12,690 0.07EUR 700,000 France Treasury Bill BTF RegS
14/7/2021 (Zero Coupon) 700,525 3.96EUR 1,200,000 France Treasury Bill BTF RegS
4/11/2021 (Zero Coupon) 1,203,384 6.80EUR 1,100,000 France Treasury Bill BTF RegS
15/12/2021 (Zero Coupon) 1,103,927 6.24EUR 1,000,000 France Treasury Bill BTF RegS
23/2/2022 (Zero Coupon) 1,004,850 5.68EUR 9,101 French Republic Government
Bond OAT RegS 2.10%25/7/2023 9,861 0.06
EUR 7,875 French Republic GovernmentBond OAT RegS 0.10%1/3/2025 8,385 0.05
EUR 9,341 French Republic GovernmentBond OAT RegS 0.70%25/7/2030 11,312 0.06
Holding Description
MarketValue
EUR
% ofNet
Assets
France continuedEUR 3,748 French Republic Government
Bond OAT RegS 0.10%25/7/2036 4,488 0.02
EUR 6,445 French Republic GovernmentBond OAT RegS 0.10%25/7/2047 8,111 0.05
4,152,535 23.46
GermanyEUR 9,316 Deutsche Bundesrepublik In-
flation Linked Bond RegS0.10% 15/4/2023 9,622 0.05
EUR 9,833 Deutsche Bundesrepublik In-flation Linked Bond RegS0.10% 15/4/2026 10,812 0.06
EUR 11,766 Deutsche Bundesrepublik In-flation Linked Bond RegS0.50% 15/4/2030 14,223 0.08
EUR 1,117 Deutsche Bundesrepublik In-flation Linked Bond RegS0.10% 15/4/2033 1,350 0.01
EUR 5,953 Deutsche Bundesrepublik In-flation Linked Bond RegS0.10% 15/4/2046 8,361 0.05
EUR 2,500,000 German Treasury Bill RegS9/6/2021 (Zero Coupon) 2,500,325 14.13
EUR 2,000,000 German Treasury Bill RegS25/8/2021 (Zero Coupon) 2,003,040 11.32
4,547,733 25.70
ItalyEUR 3,300,000 Italy Buoni Ordinari del Tesoro
BOT RegS 13/8/2021 (ZeroCoupon) 3,303,432 18.66
3,303,432 18.66
United KingdomGBP 12,414 United Kingdom Gilt Inflation
Linked RegS 1.875%22/11/2022 15,729 0.09
GBP 10,409 United Kingdom Gilt InflationLinked RegS 0.125%22/3/2024 13,340 0.08
GBP 3,700 United Kingdom Gilt InflationLinked RegS 2.50%17/7/2024 15,371 0.09
GBP 8,392 United Kingdom Gilt InflationLinked RegS 0.125%22/3/2026 11,390 0.06
GBP 14,380 United Kingdom Gilt InflationLinked RegS 1.25%22/11/2027 21,799 0.12
GBP 11,057 United Kingdom Gilt InflationLinked RegS 0.125%10/8/2028 15,946 0.09
GBP 9,128 United Kingdom Gilt InflationLinked RegS 0.125%22/3/2029 13,306 0.08
GBP 2,600 United Kingdom Gilt InflationLinked RegS 4.125%22/7/2030 11,212 0.06
GBP 2,528 United Kingdom Gilt InflationLinked RegS 0.125%10/8/2031 3,898 0.02
GBP 11,075 United Kingdom Gilt InflationLinked RegS 1.25%22/11/2032 19,561 0.11
GBP 11,377 United Kingdom Gilt InflationLinked RegS 0.75%22/3/2034 19,729 0.11
BlackRock Total Advantage Fund
Portfolio of Investments as at 31 May 2021
The notes on pages 590 to 610 form an integral part of these financial statements.
BlackRock Strategic Funds[556]

Holding Description
MarketValue
EUR
% ofNet
Assets
United Kingdom continuedGBP 5,000 United Kingdom Gilt Inflation
Linked RegS 2.00%26/1/2035 16,945 0.10
GBP 10,504 United Kingdom Gilt InflationLinked RegS 0.125%22/11/2036 18,112 0.10
GBP 9,688 United Kingdom Gilt InflationLinked RegS 1.125%22/11/2037 19,382 0.11
GBP 10,557 United Kingdom Gilt InflationLinked RegS 0.625%22/3/2040 20,805 0.12
GBP 8,692 United Kingdom Gilt InflationLinked RegS 0.125%10/8/2041 16,336 0.09
GBP 9,222 United Kingdom Gilt InflationLinked RegS 0.625%22/11/2042 19,272 0.11
GBP 11,266 United Kingdom Gilt InflationLinked RegS 0.125%22/3/2044 22,113 0.13
GBP 9,098 United Kingdom Gilt InflationLinked RegS 0.125%22/3/2046 18,510 0.10
GBP 9,859 United Kingdom Gilt InflationLinked RegS 0.75%22/11/2047 23,462 0.13
GBP 6,914 United Kingdom Gilt InflationLinked RegS 0.125%10/8/2048 14,812 0.08
GBP 9,321 United Kingdom Gilt InflationLinked RegS 0.50%22/3/2050 22,182 0.13
GBP 2,019 United Kingdom Gilt InflationLinked RegS 0.125%22/3/2051 4,518 0.03
GBP 9,076 United Kingdom Gilt InflationLinked RegS 0.25%22/3/2052 21,388 0.12
GBP 8,495 United Kingdom Gilt InflationLinked RegS 1.25%22/11/2055 26,729 0.15
GBP 5,155 United Kingdom Gilt InflationLinked RegS 0.125%22/11/2056 13,014 0.07
GBP 6,613 United Kingdom Gilt InflationLinked RegS 0.125%22/3/2058 17,176 0.10
GBP 9,064 United Kingdom Gilt InflationLinked RegS 0.375%22/3/2062 27,155 0.15
GBP 5,016 United Kingdom Gilt InflationLinked RegS 0.125%22/11/2065 15,424 0.09
GBP 8,560 United Kingdom Gilt InflationLinked RegS 0.125%22/3/2068 28,385 0.16
527,001 2.98
United StatesUSD 17,734 United States Treasury Infla-
tion Indexed Bond 0.125%15/7/2022 15,132 0.09
USD 11,473 United States Treasury Infla-tion Indexed Bond 0.125%15/1/2023 9,868 0.06
USD 9,702 United States Treasury Infla-tion Indexed Bond 0.625%15/4/2023 8,460 0.05
USD 26,286 United States Treasury Infla-tion Indexed Bond 0.375%15/7/2023 23,079 0.13
Holding Description
MarketValue
EUR
% ofNet
Assets
United States continuedUSD 26,217 United States Treasury Infla-
tion Indexed Bond 0.625%15/1/2024 23,340 0.13
USD 14,280 United States Treasury Infla-tion Indexed Bond 0.50%15/4/2024 12,724 0.07
USD 9,591 United States Treasury Infla-tion Indexed Bond 0.125%15/7/2024 8,541 0.05
USD 6,709 United States Treasury Infla-tion Indexed Bond 0.125%15/10/2024 5,983 0.03
USD 25,827 United States Treasury Infla-tion Indexed Bond 0.25%15/1/2025 23,135 0.13
USD 16,999 United States Treasury Infla-tion Indexed Bond 2.375%15/1/2025 16,369 0.09
USD 9,637 United States Treasury Infla-tion Indexed Bond 0.125%15/4/2025 8,612 0.05
USD 11,725 United States Treasury Infla-tion Indexed Bond 0.375%15/7/2025 10,670 0.06
USD 14,901 United States Treasury Infla-tion Indexed Bond 0.125%15/10/2025 13,431 0.08
USD 14,154 United States Treasury Infla-tion Indexed Bond 0.625%15/1/2026 13,025 0.07
USD 13,876 United States Treasury Infla-tion Indexed Bond 2.00%15/1/2026 13,536 0.08
USD 13,531 United States Treasury Infla-tion Indexed Bond 0.125%15/4/2026 12,188 0.07
USD 13,699 United States Treasury Infla-tion Indexed Bond 0.125%15/7/2026 12,424 0.07
USD 15,019 United States Treasury Infla-tion Indexed Bond 0.375%15/1/2027 13,762 0.08
USD 10,374 United States Treasury Infla-tion Indexed Bond 2.375%15/1/2027 10,535 0.06
USD 12,774 United States Treasury Infla-tion Indexed Bond 0.375%15/7/2027 11,781 0.07
USD 17,178 United States Treasury Infla-tion Indexed Bond 0.50%15/1/2028 15,920 0.09
USD 2,655 United States Treasury Infla-tion Indexed Bond 1.75%15/1/2028 2,653 0.02
USD 12,935 United States Treasury Infla-tion Indexed Bond 3.625%15/4/2028 14,426 0.08
USD 15,719 United States Treasury Infla-tion Indexed Bond 0.75%15/7/2028 14,883 0.08
USD 13,634 United States Treasury Infla-tion Indexed Bond 0.875%15/1/2029 13,012 0.07
USD 8,387 United States Treasury Infla-tion Indexed Bond 2.50%15/1/2029 8,914 0.05
USD 17,720 United States Treasury Infla-tion Indexed Bond 3.875%15/4/2029 20,568 0.12
BlackRock Total Advantage Fund continued
Portfolio of Investments as at 31 May 2021
The notes on pages 590 to 610 form an integral part of these financial statements.
Annual report and audited financial statements [557]

Holding Description
MarketValue
EUR
% ofNet
Assets
United States continuedUSD 12,838 United States Treasury Infla-
tion Indexed Bond 0.25%15/7/2029 11,756 0.07
USD 12,454 United States Treasury Infla-tion Indexed Bond 0.125%15/1/2030 11,234 0.06
USD 13,531 United States Treasury Infla-tion Indexed Bond 0.125%15/7/2030 12,255 0.07
USD 13,632 United States Treasury Infla-tion Indexed Bond 0.125%15/1/2031 12,271 0.07
USD 2,835 United States Treasury Infla-tion Indexed Bond 3.375%15/4/2032 3,438 0.02
USD 6,249 United States Treasury Infla-tion Indexed Bond 2.125%15/2/2040 7,537 0.04
USD 10,762 United States Treasury Infla-tion Indexed Bond 2.125%15/2/2041 13,099 0.07
USD 11,602 United States Treasury Infla-tion Indexed Bond 0.75%15/2/2042 11,343 0.06
USD 9,560 United States Treasury Infla-tion Indexed Bond 0.625%15/2/2043 9,128 0.05
USD 9,431 United States Treasury Infla-tion Indexed Bond 1.375%15/2/2044 10,399 0.06
USD 9,334 United States Treasury Infla-tion Indexed Bond 0.75%15/2/2045 9,160 0.05
USD 8,718 United States Treasury Infla-tion Indexed Bond 1.00%15/2/2046 9,055 0.05
USD 8,447 United States Treasury Infla-tion Indexed Bond 0.875%15/2/2047 8,615 0.05
USD 7,195 United States Treasury Infla-tion Indexed Bond 1.00%15/2/2048 7,601 0.04
USD 5,788 United States Treasury Infla-tion Indexed Bond 1.00%15/2/2049 6,157 0.03
USD 5,768 United States Treasury Infla-tion Indexed Bond 0.25%15/2/2050 5,138 0.03
USD 3,560 United States Treasury Infla-tion Indexed Bond 0.125%15/2/2051 3,059 0.02
508,216 2.87
Total Bonds 13,872,169 78.38
Total Transferable Securities and Money MarketInstruments Admitted to an Official Stock ExchangeListing or Dealt in on Another Regulated Market 13,872,169 78.38
Other Transferable Securities and Money Market Instruments
BONDSCanada
CAD 78,603 Canadian Government RealReturn Bond 3.00%1/12/2036 78,451 0.44
CAD 80,319 Canadian Government RealReturn Bond 2.00%1/12/2041 74,913 0.42
Holding Description
MarketValue
EUR
% ofNet
Assets
Canada continuedCAD 92,972 Canadian Government Real
Return Bond 1.50%1/12/2044 80,988 0.46
CAD 81,620 Canadian Government RealReturn Bond 0.50%1/12/2050 59,765 0.34
294,117 1.66
Total Bonds 294,117 1.66
Total Other Transferable Securities and MoneyMarket Instruments 294,117 1.66
Securities portfolio at market value 14,166,286 80.04
Other Net Assets 3,532,242 19.96
Total Net Assets (EUR) 17,698,528 100.00
BlackRock Total Advantage Fund continued
Portfolio of Investments as at 31 May 2021
The notes on pages 590 to 610 form an integral part of these financial statements.
BlackRock Strategic Funds[558]

Holding Description Counterparty
Netunrealised
appreciation/(depreciation)
EUR
Financial Derivative Instruments
CONTRACTS FOR DIFFERENCEAustralia
(129) Afterpay Ltd Credit Suisse 386(52) Afterpay Ltd Deutsche Bank (208)
(3,230) AMP Ltd Bank of AmericaMerrill Lynch (61)
(1,557) AMP Ltd Citibank (40)(5,941) AMP Ltdπ Credit Suisse —
(19) AMP Ltdπ JP Morgan —(644) APA Group (Unit) Credit Suisse 241381 Aristocrat Leisure Ltd Citibank 85251 Aristocrat Leisure Ltd Deutsche Bank 339427 Aristocrat Leisure Ltd JP Morgan 82690 ASX Ltd Credit Suisse 248
1,832 Aurizon Holdings Ltd Citibank 812,666 Aurizon Holdings Ltd Credit Suisse (135)3,501 Aurizon Holdings Ltd Deutsche Bank —1,649 Aurizon Holdings Ltd JP Morgan (84)
(8,044) AusNet Services Ltd Credit Suisse 663(255) Australia & New Zealand
Banking Group Ltd Credit Suisse (215)1,372 Brambles Ltd Bank of America
Merrill Lynch 122680 Brambles Ltd Citibank 95
2,395 Brambles Ltd Credit Suisse 3492,675 Brambles Ltd Deutsche Bank 323(471) CIMIC Group Ltd Bank of America
Merrill Lynch (131)66 Cochlear Ltd Credit Suisse 359
(79) Commonwealth Bank ofAustralia Deutsche Bank (97)
(552) Crown Resorts Ltd Deutsche Bank 27(836) Crown Resorts Ltd JP Morgan 64(25) CSL Ltd Deutsche Bank (216)(1) Deterra Royalties Ltd Bank of America
Merrill Lynch —(2,312) Evolution Mining Ltd Deutsche Bank (425)
(824) Fortescue Metals Group Ltd Credit Suisse 1,233(136) Fortescue Metals Group Ltd JP Morgan 204
(2) Iluka Resources Ltd Bank of AmericaMerrill Lynch 1
(484) Insurance Australia GroupLtd
Bank of AmericaMerrill Lynch (58)
(312) Insurance Australia GroupLtd Citibank (28)
(1,711) Insurance Australia GroupLtd Credit Suisse 87
(3,628) Insurance Australia GroupLtd JP Morgan 184
866 James Hardie Industries Plc- CDI
Bank of AmericaMerrill Lynch 647
317 James Hardie Industries Plc- CDI Credit Suisse (163)
173 James Hardie Industries Plc- CDI Deutsche Bank 65
(31) Lendlease Corp Ltd (Unit) Bank of AmericaMerrill Lynch (7)
(1,331) Lendlease Corp Ltd (Unit) JP Morgan (127)(133) Magellan Financial Group
Ltd Deutsche Bank (152)(1,592) Medibank Pvt Ltd Bank of America
Merrill Lynch (151)(107) Medibank Pvt Ltd Citibank (2)
(2,509) Medibank Pvt Ltd Credit Suisse (111)(1,980) Medibank Pvt Ltd JP Morgan (88)
(320) National Australia Bank Ltd Bank of AmericaMerrill Lynch (183)
(579) Newcrest Mining Ltd Citibank 73(232) Newcrest Mining Ltd Deutsche Bank (33)
Holding Description Counterparty
Netunrealised
appreciation/(depreciation)
EUR
Australia continued(1,141) Northern Star Resources
Ltd Credit Suisse (148)(670) Northern Star Resources
Ltd Deutsche Bank (204)(1,660) Oil Search Ltd Citibank 42(2,460) Oil Search Ltd JP Morgan 499
(666) Orica Ltd Deutsche Bank 249(965) Orica Ltd JP Morgan 233
(1,428) Qantas Airways Ltd Deutsche Bank (145)(239) Ramsay Health Care Ltd Bank of America
Merrill Lynch 44(81) Ramsay Health Care Ltd Credit Suisse (30)(92) Ramsay Health Care Ltd JP Morgan (34)24 REA Group Ltd Bank of America
Merrill Lynch 213141 REA Group Ltd Credit Suisse 28860 REA Group Ltd JP Morgan 12285 Rio Tinto Ltd Credit Suisse (497)56 Rio Tinto Ltd Deutsche Bank (82)
185 Sonic Healthcare Ltd Bank of AmericaMerrill Lynch (36)
(1,140) Sydney Airport (Unit) Bank of AmericaMerrill Lynch (72)
(1,354) Sydney Airport (Unit) Credit Suisse 94(1,122) Sydney Airport (Unit) Deutsche Bank (64)3,121 Tabcorp Holdings Ltd Bank of America
Merrill Lynch 591,311 Tabcorp Holdings Ltd Citibank 916,945 Tabcorp Holdings Ltd Deutsche Bank 1322,350 Telstra Corp Ltd Deutsche Bank 1342,042 Telstra Corp Ltd JP Morgan 39
(2,446) TPG Telecom Ltd Deutsche Bank (258)(1,304) TPG Telecom Ltd JP Morgan (241)(1,090) Transurban Group (Unit) Citibank (21)
(533) Transurban Group (Unit) Deutsche Bank (23)(2,781) Transurban Group (Unit) JP Morgan 811
430 Wesfarmers Ltd Bank of AmericaMerrill Lynch 357
440 Wesfarmers Ltd JP Morgan 151(856) Westpac Banking Corp Credit Suisse —(679) Westpac Banking Corp Deutsche Bank (469)(216) WiseTech Global Ltd Deutsche Bank (342)(162) Woolworths Group Ltd Citibank (2)(82) Xero Ltd Deutsche Bank (562)
4,315
Austria(137) Erste Group Bank AG Deutsche Bank (14)272 OMV AG Citibank 212506 Raiffeisen Bank Interna-
tional AG Deutsche Bank (81)(80) Verbund AG Bank of America
Merrill Lynch (232)273 voestalpine AG Citibank 284
169
Belgium(34) Argenx SE Credit Suisse (554)(17) Argenx SE Deutsche Bank (34)
(189) Elia Group SA Bank of AmericaMerrill Lynch 385
(19) Elia Group SA Citibank 84(17) Elia Group SA Credit Suisse 20
(134) Elia Group SA Deutsche Bank 22884 Etablissements Franz Col-
ruyt NV JP Morgan (8)250 Proximus SADP Citibank (119)969 Proximus SADP Credit Suisse (814)51 UCB SA Deutsche Bank (134)48 UCB SA JP Morgan 27
BlackRock Total Advantage Fund continued
Portfolio of Investments as at 31 May 2021
The notes on pages 590 to 610 form an integral part of these financial statements.
Annual report and audited financial statements [559]

Holding Description Counterparty
Netunrealised
appreciation/(depreciation)
EUR
Belgium continued(197) Umicore SA Citibank 254(76) Umicore SA Credit Suisse 179
(486)
Canada(233) Air Canada Citibank (216)(701) Algonquin Power & Utilities
Corp Citibank 43(350) Algonquin Power & Utilities
Corp Credit Suisse (2)(445) Algonquin Power & Utilities
Corp JP Morgan 196640 AltaGas Ltd Citibank 96149 Atco Ltd ’I’ JP Morgan 126513 B2Gold Corp Bank of America
Merrill Lynch (83)6,700 B2Gold Corp Citibank 45
770 B2Gold Corp Credit Suisse 42(225) Ballard Power Systems Inc Bank of America
Merrill Lynch (589)(223) Ballard Power Systems Inc Credit Suisse (560)180 Bank of Montreal Credit Suisse 1,131164 Bank of Montreal JP Morgan 1,03088 Bank of Nova Scotia Bank of America
Merrill Lynch 92103 Bank of Nova Scotia JP Morgan 122
(362) Bausch Health Cos Inc Citibank (216)(110) BCE Inc Bank of America
Merrill Lynch (75)(338) Brookfield Asset Manage-
ment Inc ’A’ Credit Suisse (1,208)(125) Brookfield Renewable Corp
’A’Bank of AmericaMerrill Lynch (287)
(114) Brookfield Renewable Corp’A’ Credit Suisse (312)
(160) CAE Inc Credit Suisse (66)(492) Cameco Corp Citibank (380)122 Canadian Apartment Prop-
erties REIT (REIT) JP Morgan (108)66 Canadian Imperial Bank of
CommerceBank of AmericaMerrill Lynch 425
60 Canadian Imperial Bank ofCommerce Citibank 291
253 Canadian Imperial Bank ofCommerce Credit Suisse 2,056
59 Canadian Imperial Bank ofCommerce JP Morgan 479
45 Canadian National RailwayCo
Bank of AmericaMerrill Lynch 166
63 Canadian National RailwayCo JP Morgan (17)
(80) Canadian Pacific RailwayLtd Citibank 15
39 Canadian Tire Corp Ltd ’A’ Bank of AmericaMerrill Lynch (147)
94 Canadian Tire Corp Ltd ’A’ Citibank 534 Canadian Tire Corp Ltd ’A’ Credit Suisse 18737 Canadian Tire Corp Ltd ’A’ JP Morgan 203
(667) Canadian Utilities Ltd ’A’ Citibank 131(104) Canadian Utilities Ltd ’A’ Credit Suisse 25(515) Canadian Utilities Ltd ’A’ JP Morgan 122
93 CCL Industries Inc ’B’ Citibank 3777 CGI Inc Citibank (96)20 Constellation Software Inc Bank of America
Merrill Lynch 2146 Constellation Software Inc Citibank (103)
(144) Dollarama Inc Bank of AmericaMerrill Lynch 46
(133) Dollarama Inc Citibank 69(253) Dollarama Inc Credit Suisse 76(135) Dollarama Inc JP Morgan 111
Holding Description Counterparty
Netunrealised
appreciation/(depreciation)
EUR
Canada continued607 Empire Co Ltd ’A’ JP Morgan 276
(144) Enbridge Inc JP Morgan 204(300) First Quantum Minerals Ltd Bank of America
Merrill Lynch 142(57) FirstService Corp JP Morgan (6)
(291) Fortis Inc Bank of AmericaMerrill Lynch 17
(279) Fortis Inc Citibank 22(410) Fortis Inc Credit Suisse 13(875) Fortis Inc JP Morgan (46)(96) Franco-Nevada Corp JP Morgan (41)120 George Weston Ltd Bank of America
Merrill Lynch 2699 George Weston Ltd Citibank 2
230 George Weston Ltd JP Morgan 580(138) GFL Environmental Inc Bank of America
Merrill Lynch (119)(683) GFL Environmental Inc Citibank (79)(156) GFL Environmental Inc Credit Suisse (78)177 Gildan Activewear Inc Credit Suisse (8)
(498) Great-West Lifeco Inc Citibank (40)1,961 Hydro One Ltd Citibank 399
95 iA Financial Corp Inc Citibank (52)102 Intact Financial Corp Credit Suisse (156)
1,397 Kinross Gold Corp JP Morgan 389(505) Kirkland Lake Gold Ltd Citibank 255352 Loblaw Cos Ltd Citibank (129)88 Magna International Inc Citibank 334
430 Manulife Financial Corp Bank of AmericaMerrill Lynch (117)
578 Manulife Financial Corp Citibank 18822 Manulife Financial Corp Credit Suisse (11)
(255) Metro Inc Citibank (3)(459) Metro Inc JP Morgan 37
79 National Bank of Canada Bank of AmericaMerrill Lynch 80
101 National Bank of Canada Citibank (3)72 National Bank of Canada Credit Suisse 173
103 National Bank of Canada JP Morgan 248(357) Northland Power Inc Citibank (140)(199) Northland Power Inc JP Morgan (212)100 Nutrien Ltd JP Morgan 2087 Onex Corp Citibank 106
254 Open Text Corp Citibank 172160 Open Text Corp JP Morgan (6)
(319) Pan American Silver Corp Bank of AmericaMerrill Lynch 39
(155) Pan American Silver Corp Credit Suisse (2)(148) Pan American Silver Corp JP Morgan 118349 Parkland Corp Citibank 59
(198) Pembina Pipeline Corp Credit Suisse (154)438 Power Corp of Canada Citibank 193341 Quebecor Inc ’B’ Bank of America
Merrill Lynch (57)(84) Restaurant Brands Interna-
tional Inc Citibank (117)81 Ritchie Bros Auctioneers Inc Bank of America
Merrill Lynch (139)55 Royal Bank of Canada Bank of America
Merrill Lynch 120131 Royal Bank of Canada Citibank 182
(244) Saputo Inc JP Morgan (359)(9) Shopify Inc ’A’ Bank of America
Merrill Lynch (1,070)(4) Shopify Inc ’A’ Citibank (3)(5) Shopify Inc ’A’ JP Morgan (660)
(686) SSR Mining Inc Bank of AmericaMerrill Lynch (70)
(235) SSR Mining Inc Citibank 8(372) SSR Mining Inc Credit Suisse (23)
BlackRock Total Advantage Fund continued
Portfolio of Investments as at 31 May 2021
The notes on pages 590 to 610 form an integral part of these financial statements.
BlackRock Strategic Funds[560]

Holding Description Counterparty
Netunrealised
appreciation/(depreciation)
EUR
Canada continued(301) SSR Mining Inc JP Morgan (429)251 Sun Life Financial Inc Bank of America
Merrill Lynch (100)98 Sun Life Financial Inc Credit Suisse (44)
193 Sun Life Financial Inc JP Morgan (86)(106) TC Energy Corp Bank of America
Merrill Lynch 13(287) TC Energy Corp Citibank (88)(238) TC Energy Corp JP Morgan 121(319) TELUS Corp Citibank (61)(61) Thomson Reuters Corp JP Morgan (72)59 Toromont Industries Ltd Citibank 53
(85) Toronto-Dominion Bank Citibank 59(168) Toronto-Dominion Bank JP Morgan (147)
61 West Fraser Timber Co Ltd Bank of AmericaMerrill Lynch 69
84 West Fraser Timber Co Ltd Credit Suisse (629)60 West Fraser Timber Co Ltd JP Morgan (449)
173 Wheaton Precious MetalsCorp
Bank of AmericaMerrill Lynch 55
2,126
Denmark(105) Ambu A/S ’B’ Deutsche Bank 51(131) Ambu A/S ’B’ JP Morgan 1,732
5 AP Moller - Maersk A/S ’B’ Credit Suisse 2395 AP Moller - Maersk A/S ’B’ Deutsche Bank 8301 AP Moller - Maersk A/S ’B’ JP Morgan 48
98 Carlsberg A/S ’B’ JP Morgan (33)(289) Chr Hansen Holding A/S Credit Suisse 272(77) Chr Hansen Holding A/S Deutsche Bank 46(82) Chr Hansen Holding A/S JP Morgan 7746 Coloplast A/S ’B’ Bank of America
Merrill Lynch (88)25 Coloplast A/S ’B’ Citibank (50)32 Coloplast A/S ’B’ Credit Suisse 3557 Coloplast A/S ’B’ JP Morgan (9)
(30) DSV PANALPINA A/S Citibank (40)(44) DSV PANALPINA A/S JP Morgan (254)34 Genmab A/S Citibank 17834 Genmab A/S Deutsche Bank 53067 GN Store Nord AS Credit Suisse 113
(194) H Lundbeck A/S Bank of AmericaMerrill Lynch 258
(145) H Lundbeck A/S Credit Suisse (10)(175) H Lundbeck A/S Deutsche Bank 156
10 Novo Nordisk A/S ’B’ Bank of AmericaMerrill Lynch (15)
212 Novo Nordisk A/S ’B’ Credit Suisse 406740 Novo Nordisk A/S ’B’ Deutsche Bank (1,139)163 Novo Nordisk A/S ’B’ JP Morgan 31287 Novozymes A/S ’B’ Bank of America
Merrill Lynch (43)85 Novozymes A/S ’B’ Citibank (165)
164 Novozymes A/S ’B’ Deutsche Bank (82)211 Novozymes A/S ’B’ JP Morgan (176)(30) Orsted A/S Citibank 63101 Pandora A/S Deutsche Bank 915(13) ROCKWOOL International
A/S ’B’ Citibank (107)(29) ROCKWOOL International
A/S ’B’ Deutsche Bank (682)(210) Tryg A/S Credit Suisse 42(991) Tryg A/S Deutsche Bank 513(306) Tryg A/S JP Morgan 62(260) Vestas Wind Systems A/S Bank of America
Merrill Lynch (353)(609) Vestas Wind Systems A/S Citibank (176)
Holding Description Counterparty
Netunrealised
appreciation/(depreciation)
EUR
Denmark continued(127) Vestas Wind Systems A/S Deutsche Bank 31(140) Vestas Wind Systems A/S JP Morgan (25)
3,462
Finland206 Kesko Oyj ’B’ Bank of America
Merrill Lynch 305148 Kesko Oyj ’B’ Deutsche Bank 101(64) Kone Oyj ’B’ Citibank 8483 Neste Oyj Credit Suisse 287
358 Neste Oyj Deutsche Bank 995256 Stora Enso Oyj ’R’ Deutsche Bank (298)
(284) Wartsila Oyj Abp Citibank (186)(1,007) Wartsila Oyj Abp Credit Suisse (408)
880
France(126) Accor SA JP Morgan 20(42) Aeroports de Paris Bank of America
Merrill Lynch (109)(58) Aeroports de Paris Citibank (258)(91) Aeroports de Paris Deutsche Bank (237)(32) Air Liquide SA Bank of America
Merrill Lynch 2(64) Air Liquide SA Credit Suisse 241
(150) Air Liquide SA Deutsche Bank 3(100) Alstom SA Bank of America
Merrill Lynch (205)(93) Alstom SA Citibank (91)
(537) Alstom SA Deutsche Bank (1,101)69 Amundi SA JP Morgan (262)80 Arkema SA Deutsche Bank 850 BNP Paribas SA Citibank 26
151 BNP Paribas SA Credit Suisse 44117 BNP Paribas SA Deutsche Bank (102)82 BNP Paribas SA JP Morgan 24
471 Bollore SA Citibank 503,528 Bollore SA Deutsche Bank 423(187) Bouygues SA Citibank (18)
36 Capgemini SE Credit Suisse (52)393 Carrefour SA Deutsche Bank (216)109 Cie de Saint-Gobain Citibank (9)251 Cie de Saint-Gobain Deutsche Bank 9082 Cie de Saint-Gobain JP Morgan (79)55 Cie Generale des Etablisse-
ments Michelin SCA JP Morgan 4260 CNP Assurances JP Morgan (173)948 Credit Agricole SA Deutsche Bank (1,005)
(276) Danone SA Credit Suisse (237)(112) Danone SA Deutsche Bank (17)(23) Dassault Systemes SE Deutsche Bank (122)
(118) Eiffage SA Citibank 26(56) Eiffage SA Deutsche Bank (22)
(449) Electricite de France SA Credit Suisse 30405 Engie SA Citibank (177)338 Engie SA Deutsche Bank (173)
1,337 Engie SA JP Morgan (596)(30) EssilorLuxottica SA Credit Suisse (74)
(120) EssilorLuxottica SA Deutsche Bank (259)(41) EssilorLuxottica SA JP Morgan (102)43 Eurazeo SE Bank of America
Merrill Lynch 62272 Eurazeo SE Citibank 51722 Eurazeo SE Credit Suisse 54
(122) Eurofins Scientific SE JP Morgan (826)(211) Faurecia SE Citibank (74)(87) Faurecia SE Credit Suisse 45
(189) Faurecia SE Deutsche Bank (2)
BlackRock Total Advantage Fund continued
Portfolio of Investments as at 31 May 2021
The notes on pages 590 to 610 form an integral part of these financial statements.
Annual report and audited financial statements [561]

Holding Description Counterparty
Netunrealised
appreciation/(depreciation)
EUR
France continued(375) Getlink SE Bank of America
Merrill Lynch 56(369) Getlink SE Citibank 105(132) Getlink SE Deutsche Bank 20(374) Getlink SE JP Morgan 206
8 Hermes International Citibank 4804 Hermes International Deutsche Bank 364
(24) Iliad SA Credit Suisse 263(31) Iliad SA Deutsche Bank (49)53 Ipsen SA Credit Suisse 15753 Ipsen SA JP Morgan 157(7) Kering SA Citibank (195)
(17) Kering SA Deutsche Bank (726)(7) Kering SA JP Morgan (316)
159 La Francaise des JeuxSAEM
Bank of AmericaMerrill Lynch 466
431 La Francaise des JeuxSAEM Credit Suisse 1,177
(13) L’Oreal SA JP Morgan (216)(41) LVMH Moet Hennessy Louis
Vuitton SE Citibank (738)(7) LVMH Moet Hennessy Louis
Vuitton SE JP Morgan (214)1,624 Orange SA Bank of America
Merrill Lynch (409)400 Orange SA Citibank (42)
1,708 Orange SA Credit Suisse (287)2,155 Orange SA Deutsche Bank (543)
790 Orange SA JP Morgan (133)(16) Orpea SA Bank of America
Merrill Lynch 75(117) Orpea SA Citibank 228(69) Orpea SA Deutsche Bank 324(3) Orpea SA JP Morgan 683 Publicis Groupe SA Bank of America
Merrill Lynch 4679 Publicis Groupe SA Credit Suisse (54)
426 Publicis Groupe SA Deutsche Bank 239(20) Remy Cointreau SA Credit Suisse (72)(67) Remy Cointreau SA Deutsche Bank (261)
(112) Renault SA Bank of AmericaMerrill Lynch (41)
(506) Renault SA Deutsche Bank (187)(47) Sanofi Credit Suisse (35)(11) Sartorius Stedim Biotech Deutsche Bank (21)176 Schneider Electric SE Deutsche Bank (88)
(150) SCOR SE Credit Suisse 14934 SEB SA Bank of America
Merrill Lynch (82)811 SES SA Bank of America
Merrill Lynch 469234 Societe Generale SA JP Morgan 161(58) Sodexo SA JP Morgan 37537 Teleperformance Credit Suisse (70)
(11) TOTAL SE Bank of AmericaMerrill Lynch 21
(274) TOTAL SE JP Morgan 390(436) Veolia Environnement SA JP Morgan (30)
46 Vinci SA Citibank (29)426 Vivendi SE Bank of America
Merrill Lynch 29040 Wendel SE Bank of America
Merrill Lynch 28217 Wendel SE Citibank 108(55) Worldline SA Citibank (70)(55) Worldline SA Credit Suisse (86)
(259) Worldline SA Deutsche Bank (811)(136) Worldline SA JP Morgan (212)
(4,586)
Holding Description Counterparty
Netunrealised
appreciation/(depreciation)
EUR
Germany(15) adidas AG Credit Suisse (208)(38) adidas AG JP Morgan (526)25 Allianz SE Reg Citibank 1045 Allianz SE Reg Deutsche Bank (30)28 Allianz SE Reg JP Morgan 1576 BASF SE Bank of America
Merrill Lynch (172)160 BASF SE Citibank (34)67 BASF SE Credit Suisse (259)
191 BASF SE Deutsche Bank (432)66 Bechtle AG JP Morgan (69)
(45) Beiersdorf AG Bank of AmericaMerrill Lynch 3
(82) Beiersdorf AG Deutsche Bank 5110 Brenntag SE Citibank 18154 Brenntag SE Credit Suisse 95
(1,564) Commerzbank AG Deutsche Bank (224)(40) Continental AG Citibank (117)(75) Continental AG Deutsche Bank (518)(64) Continental AG JP Morgan (474)(34) Delivery Hero SE Bank of America
Merrill Lynch (308)(101) Delivery Hero SE Citibank (298)(40) Delivery Hero SE Credit Suisse 206
(155) Delivery Hero SE Deutsche Bank (1,403)(464) Deutsche Bank AG Bank of America
Merrill Lynch (228)(414) Deutsche Bank AG JP Morgan (256)
30 Deutsche Boerse AG Bank of AmericaMerrill Lynch (146)
31 Deutsche Boerse AG Deutsche Bank (150)(385) Deutsche Lufthansa AG
RegBank of AmericaMerrill Lynch (16)
26 Deutsche Post AG Reg Bank of AmericaMerrill Lynch 125
222 Deutsche Post AG Reg Citibank 479155 Deutsche Post AG Reg Credit Suisse 668
1,701 Deutsche Post AG Reg Deutsche Bank 8,165121 Deutsche Post AG Reg JP Morgan 521
(320) Deutsche Telekom AG Reg Bank of AmericaMerrill Lynch 79
(290) Deutsche Telekom AG Reg Credit Suisse (109)(807) Deutsche Telekom AG Reg Deutsche Bank 200
1,187 E.ON SE Credit Suisse (914)868 E.ON SE Deutsche Bank (385)(39) Fresenius Medical Care AG
& Co KGaA Citibank 16(70) Fresenius Medical Care AG
& Co KGaA Credit Suisse (53)(59) Fresenius Medical Care AG
& Co KGaA JP Morgan (45)(113) Fresenius SE & Co KGaA Bank of America
Merrill Lynch 11613 GEA Group AG Bank of America
Merrill Lynch 9120 GEA Group AG Citibank 9294 GEA Group AG Deutsche Bank 64
425 GEA Group AG JP Morgan (140)54 HeidelbergCement AG Citibank 69
130 HeidelbergCement AG Deutsche Bank (39)153 Henkel AG & Co KGaA
(Pref) Citibank (239)(434) Infineon Technologies AG Credit Suisse (807)
(1,309) Infineon Technologies AG Deutsche Bank (2,703)(126) Infineon Technologies AG JP Morgan (234)(23) KION Group AG Citibank (31)(11) KION Group AG Credit Suisse (34)
(163) KION Group AG JP Morgan (505)(123) Knorr-Bremse AG Deutsche Bank 166
BlackRock Total Advantage Fund continued
Portfolio of Investments as at 31 May 2021
The notes on pages 590 to 610 form an integral part of these financial statements.
BlackRock Strategic Funds[562]

Holding Description Counterparty
Netunrealised
appreciation/(depreciation)
EUR
Germany continued69 LANXESS AG Bank of America
Merrill Lynch (95)101 LEG Immobilien SE Bank of America
Merrill Lynch 37438 Merck KGaA Credit Suisse 241
(22) MTU Aero Engines AG Citibank (106)(16) Muenchener
Rueckversicherungs-Gesellschaft AG inMuenchen Reg Deutsche Bank 82
71 Nemetschek SE JP Morgan 283(80) Porsche Automobil Holding
SE (Pref)Bank of AmericaMerrill Lynch (557)
(17) Porsche Automobil HoldingSE (Pref) Credit Suisse (85)
(92) Porsche Automobil HoldingSE (Pref) Deutsche Bank (640)
(81) Porsche Automobil HoldingSE (Pref) JP Morgan (403)
(46) Puma SE Credit Suisse (250)(6) Rational AG Deutsche Bank 21738 SAP SE Citibank (43)
(12) Sartorius AG (Pref) Credit Suisse 220(29) Sartorius AG (Pref) Deutsche Bank (3)63 Scout24 AG Citibank (26)63 Scout24 AG Credit Suisse (166)62 Scout24 AG Deutsche Bank 195
140 Siemens AG Reg Bank of AmericaMerrill Lynch (1,207)
68 Siemens AG Reg Credit Suisse (604)33 Siemens AG Reg JP Morgan (363)
(158) Siemens Energy AG Deutsche Bank (41)(139) Siemens Healthineers AG Bank of America
Merrill Lynch 101(362) Siemens Healthineers AG Citibank 14(288) Siemens Healthineers AG Deutsche Bank 210(175) Siemens Healthineers AG JP Morgan 177
39 Symrise AG Credit Suisse 82(129) TeamViewer AG Citibank (99)(158) TeamViewer AG Deutsche Bank (229)(102) TeamViewer AG JP Morgan 129(98) Zalando SE Credit Suisse (345)
(3,922)
Hong Kong(11,212) Bank of East Asia Ltd Citibank 37910,000 BOC Hong Kong Holdings
Ltd Credit Suisse (1,531)500 BOC Hong Kong Holdings
Ltd JP Morgan (76)(6,800) Budweiser Brewing Co
APAC Ltd Citibank 723,000 CK Asset Holdings Ltd Credit Suisse 2853,500 CK Asset Holdings Ltd JP Morgan 3332,000 CK Hutchison Holdings Ltd Citibank —
500 CK Hutchison Holdings Ltd JP Morgan (264)(1,600) ESR Cayman Ltd Citibank 17(1,000) Galaxy Entertainment
Group Ltd Citibank (53)(300) Hang Seng Bank Ltd Citibank (9)
2,000 Henderson Land Develop-ment Co Ltd Citibank 285
3,000 Henderson Land Develop-ment Co Ltd JP Morgan 348
(13,000) HKT Trust & HKT Ltd (Unit) Citibank —(1,000) HKT Trust & HKT Ltd (Unit) JP Morgan 99(9,000) MTR Corp Ltd Citibank 8551,000 New World Development Co
Ltd JP Morgan (53)(1,600) Sands China Ltd Citibank (194)(5,000) SJM Holdings Ltd Citibank 58
Holding Description Counterparty
Netunrealised
appreciation/(depreciation)
EUR
Hong Kong continued2,000 Sun Hung Kai Properties
Ltd Credit Suisse (127)500 Swire Pacific Ltd ’A’ Citibank (29)
3,500 Swire Pacific Ltd ’A’ Credit Suisse (1,885)2,500 Swire Pacific Ltd ’A’ JP Morgan (1,346)
(6,000) Swire Properties Ltd Citibank 951,000 Techtronic Industries Co Ltd Credit Suisse (718)
(5,000) Wharf Real Estate Invest-ment Co Ltd Citibank (343)
(3,802)
Ireland103 CRH Plc Bank of America
Merrill Lynch 107217 CRH Plc Citibank 204103 CRH Plc Credit Suisse 72115 CRH Plc JP Morgan 81(39) Flutter Entertainment Plc Credit Suisse 382(25) Kerry Group Plc ’A’ Bank of America
Merrill Lynch (33)(11) Kerry Group Plc ’A’ Citibank (11)(99) Kerry Group Plc ’A’ JP Morgan (198)(56) Kingspan Group Plc Citibank 44118 Smurfit Kappa Group Plc JP Morgan (85)
563
Israel630 Bank Hapoalim BM JP Morgan 87
1,956 Israel Discount Bank Ltd ’A’ JP Morgan 267
354
Italy(17) Atlantia SpA Deutsche Bank (11)
(700) Atlantia SpA JP Morgan (18)296 CNH Industrial NV JP Morgan 33
2,317 Enel SpA Deutsche Bank (167)2,323 Eni SpA Citibank (74)
146 EXOR NV Credit Suisse 175(52) Ferrari NV Deutsche Bank (227)(48) Ferrari NV JP Morgan (401)
(2,159) Infrastrutture Wireless Ital-iane SpA
Bank of AmericaMerrill Lynch 635
(584) Infrastrutture Wireless Ital-iane SpA Citibank (40)
(440) Infrastrutture Wireless Ital-iane SpA Credit Suisse 143
(506) Infrastrutture Wireless Ital-iane SpA JP Morgan 164
3,710 Intesa Sanpaolo SpA Citibank 2269,107 Intesa Sanpaolo SpA JP Morgan 314
1 Mediaset SpA Citibank —1 Mediaset SpA Credit Suisse —
(942) Mediobanca Banca diCredito Finanziario SpA Credit Suisse (145)
(458) Mediobanca Banca diCredito Finanziario SpA JP Morgan (71)
(185) Moncler SpA Deutsche Bank (1,217)(75) Moncler SpA JP Morgan (283)(25) Nexi SpA Bank of America
Merrill Lynch (17)(275) Nexi SpA Citibank (65)(350) Nexi SpA Deutsche Bank (240)682 Poste Italiane SpA Deutsche Bank 188(94) Recordati Industria Chimica
e Farmaceutica SpABank of AmericaMerrill Lynch (61)
(468) Tenaris SA Bank of AmericaMerrill Lynch 193
(2,243) Tenaris SA Citibank (15)(669) Tenaris SA Deutsche Bank 276(921) Tenaris SA JP Morgan 372710 Terna SpA Citibank (30)
BlackRock Total Advantage Fund continued
Portfolio of Investments as at 31 May 2021
The notes on pages 590 to 610 form an integral part of these financial statements.
Annual report and audited financial statements [563]

Holding Description Counterparty
Netunrealised
appreciation/(depreciation)
EUR
Italy continued810 Terna SpA Credit Suisse 70
1,883 Terna SpA Deutsche Bank 11
(282)
Japan(100) ABC-Mart Inc JP Morgan (194)
(2,200) Acom Co Ltd Citibank (49)(4,500) Acom Co Ltd JP Morgan (572)
(100) Advantest Corp Credit Suisse 232(200) Aeon Co Ltd Credit Suisse 233500 AGC Inc JP Morgan (1,682)
(100) Aisin Corp Citibank (176)400 Ajinomoto Co Inc JP Morgan 394
1,600 Amada Co Ltd Bank of AmericaMerrill Lynch 753
400 Amada Co Ltd Citibank 123(300) ANA Holdings Inc Citibank (317)(400) Asahi Group Holdings Ltd Citibank (33)(200) Asahi Intecc Co Ltd Citibank 244600 Asahi Kasei Corp JP Morgan (11)
1,200 Astellas Pharma Inc Credit Suisse 677(100) Bandai Namco Holdings Inc JP Morgan 187(100) Bank of Kyoto Ltd Credit Suisse 456100 Bridgestone Corp Bank of America
Merrill Lynch 111200 Bridgestone Corp JP Morgan 266
1,000 Brother Industries Ltd Bank of AmericaMerrill Lynch 1,001
800 Brother Industries Ltd JP Morgan 711400 Calbee Inc Bank of America
Merrill Lynch (254)400 Calbee Inc Citibank (221)300 Calbee Inc JP Morgan (339)
(400) Canon Inc Credit Suisse 184(100) Central Japan Railway Co JP Morgan 4100 Chugai Pharmaceutical Co
LtdBank of AmericaMerrill Lynch 90
(100) Cosmos PharmaceuticalCorp
Bank of AmericaMerrill Lynch 50
300 Dai Nippon Printing Co Ltd Bank of AmericaMerrill Lynch 168
(200) Daifuku Co Ltd JP Morgan 3,049(600) Dai-ichi Life Holdings Inc Citibank 2(200) Dai-ichi Life Holdings Inc Credit Suisse (264)(100) Dai-ichi Life Holdings Inc JP Morgan (132)(200) Daiichi Sankyo Co Ltd Citibank 68(100) Daikin Industries Ltd Credit Suisse 1,128(300) Daiwa House Industry Co
LtdBank of AmericaMerrill Lynch 81
(400) Daiwa House Industry CoLtd Citibank (90)
(2,700) Daiwa Securities Group Inc Credit Suisse (95)(300) Denso Corp Credit Suisse (899)(200) East Japan Railway Co Bank of America
Merrill Lynch (160)(100) East Japan Railway Co Citibank (88)(100) East Japan Railway Co JP Morgan 25
2,800 ENEOS Holdings Inc Bank of AmericaMerrill Lynch (199)
1,900 ENEOS Holdings Inc Credit Suisse (781)4,600 ENEOS Holdings Inc JP Morgan (1,891)(100) FANUC Corp Citibank (605)300 Fuji Electric Co Ltd Bank of America
Merrill Lynch 729200 Fuji Electric Co Ltd JP Morgan (30)100 FUJIFILM Holdings Corp Citibank 203200 Fujitsu Ltd Citibank (351)
(300) Fukuoka Financial GroupInc
Bank of AmericaMerrill Lynch 54
Holding Description Counterparty
Netunrealised
appreciation/(depreciation)
EUR
Japan continued(400) Fukuoka Financial Group
Inc Citibank 84(200) Fukuoka Financial Group
Inc Credit Suisse (45)(100) Fukuoka Financial Group
Inc JP Morgan (22)(86) GMO Payment Gateway Inc Bank of America
Merrill Lynch (508)400 Hakuhodo DY Holdings Inc Bank of America
Merrill Lynch 871,400 Hakuhodo DY Holdings Inc JP Morgan (262)(100) Hamamatsu Photonics KK Citibank 105(300) Hankyu Hanshin Holdings
Inc JP Morgan 235(100) Harmonic Drive Systems Inc Credit Suisse 1,136(100) Hikari Tsushin Inc Credit Suisse 299
1,700 Hino Motors Ltd Bank of AmericaMerrill Lynch 661
100 Hirose Electric Co Ltd Credit Suisse 67300 Hisamitsu Pharmaceutical
Co Inc JP Morgan (1,256)(800) Hitachi Construction Ma-
chinery Co Ltd Credit Suisse 120100 Hitachi Ltd Bank of America
Merrill Lynch 263200 Honda Motor Co Ltd Citibank (9)200 Honda Motor Co Ltd Credit Suisse (117)
1,100 Honda Motor Co Ltd JP Morgan (641)100 Hoya Corp Citibank (235)
(100) Ibiden Co Ltd JP Morgan (153)500 Iida Group Holdings Co Ltd Citibank (34)600 Isuzu Motors Ltd Citibank 108100 Ito En Ltd Citibank (30)100 Ito En Ltd JP Morgan (135)
(100) ITOCHU Corp Citibank 30(400) ITOCHU Corp Credit Suisse 942(300) Japan Airlines Co Ltd Bank of America
Merrill Lynch (518)(400) Japan Airport Terminal Co
Ltd Credit Suisse (15)(400) Japan Exchange Group Inc Credit Suisse 351(300) Japan Post Bank Co Ltd Bank of America
Merrill Lynch 67(1,900) Japan Post Bank Co Ltd Credit Suisse 1,576
(700) Japan Post Bank Co Ltd JP Morgan 581100 Japan Post Holdings Co Ltd Bank of America
Merrill Lynch (11)200 JSR Corp Citibank (37)
1,300 Kajima Corp Credit Suisse (661)800 Kajima Corp JP Morgan (407)
(200) Kao Corp Credit Suisse 245200 KDDI Corp Bank of America
Merrill Lynch 39700 KDDI Corp Credit Suisse 1,119
(200) Keihan Holdings Co Ltd Bank of AmericaMerrill Lynch (75)
(400) Keihan Holdings Co Ltd Citibank (583)(300) Keikyu Corp Citibank (128)(400) Keio Corp Credit Suisse 1,226(200) Keisei Electric Railway Co
Ltd Credit Suisse (82)(100) Keyence Corp Credit Suisse (284)200 Kikkoman Corp Bank of America
Merrill Lynch 463(200) Kintetsu Group Holdings Co
LtdBank of AmericaMerrill Lynch 135
(300) Kintetsu Group Holdings CoLtd Citibank (280)
BlackRock Total Advantage Fund continued
Portfolio of Investments as at 31 May 2021
The notes on pages 590 to 610 form an integral part of these financial statements.
BlackRock Strategic Funds[564]

Holding Description Counterparty
Netunrealised
appreciation/(depreciation)
EUR
Japan continued(200) Kirin Holdings Co Ltd Bank of America
Merrill Lynch (103)(400) Kirin Holdings Co Ltd Credit Suisse (387)(100) Kobayashi Pharmaceutical
Co LtdBank of AmericaMerrill Lynch —
(100) Kobayashi PharmaceuticalCo Ltd JP Morgan 82
(500) Kobe Bussan Co Ltd Citibank 217(390) Koei Tecmo Holdings Co Ltd JP Morgan (1,530)(100) Koito Manufacturing Co Ltd Citibank (127)(300) Komatsu Ltd Citibank 81(200) Konami Holdings Corp JP Morgan (419)(100) Kose Corp JP Morgan (785)(100) Kubota Corp Bank of America
Merrill Lynch 53(200) Kubota Corp Citibank 106(300) Kubota Corp JP Morgan 517300 Kurita Water Industries Ltd Credit Suisse 22300 Kurita Water Industries Ltd JP Morgan 22300 Kyocera Corp Citibank 168
(300) Kyowa Kirin Co Ltd Credit Suisse 146(200) Kyushu Railway Co Credit Suisse 49(100) Lasertec Corp Credit Suisse (1,353)(300) Lion Corp Credit Suisse 276100 Lixil Corp Citibank (133)700 Lixil Corp Credit Suisse (303)
(100) M3 Inc Credit Suisse 41800 Marubeni Corp Bank of America
Merrill Lynch 271(1,100) Marui Group Co Ltd Citibank (822)
(100) Marui Group Co Ltd Credit Suisse 9(100) Marui Group Co Ltd JP Morgan 9100 McDonald’s Holdings Co
Japan Ltd Citibank (19)200 McDonald’s Holdings Co
Japan Ltd JP Morgan (67)300 MEIJI Holdings Co Ltd Credit Suisse (291)
(100) Mercari Inc Bank of AmericaMerrill Lynch (291)
(200) MISUMI Group Inc Citibank 7800 Mitsubishi Chemical Hold-
ings Corp Credit Suisse 38(700) Mitsubishi Corp Credit Suisse 141
1,300 Mitsubishi Electric Corp Bank of AmericaMerrill Lynch 515
400 Mitsubishi Electric Corp Credit Suisse (12)4,300 Mitsubishi Electric Corp JP Morgan (129)
300 Mitsubishi Gas Chemical CoInc JP Morgan (139)
(2,000) Mitsubishi HC Capital Inc Citibank 613(1,400) Mitsubishi HC Capital Inc Credit Suisse 324
(500) Mitsubishi Heavy IndustriesLtd Citibank 116
(200) Mitsubishi Heavy IndustriesLtd Credit Suisse 34
300 Mitsui & Co Ltd Citibank (47)200 Mitsui Chemicals Inc Citibank 194300 Mitsui Chemicals Inc Credit Suisse 22200 Mitsui Chemicals Inc JP Morgan 15
(100) Miura Co Ltd JP Morgan 6581,670 Mizuho Financial Group Inc Bank of America
Merrill Lynch 162(400) MonotaRO Co Ltd Credit Suisse 24(200) MS&AD Insurance Group
Holdings IncBank of AmericaMerrill Lynch (31)
(100) Murata Manufacturing CoLtd
Bank of AmericaMerrill Lynch (86)
(200) Murata Manufacturing CoLtd Citibank (81)
Holding Description Counterparty
Netunrealised
appreciation/(depreciation)
EUR
Japan continued(100) Murata Manufacturing Co
Ltd Credit Suisse 314(100) Murata Manufacturing Co
Ltd JP Morgan 314(200) Nagoya Railroad Co Ltd Bank of America
Merrill Lynch (10)200 NEC Corp Bank of America
Merrill Lynch (60)(200) Nexon Co Ltd Credit Suisse 1,324200 NGK Insulators Ltd Citibank (27)
1,700 NGK Insulators Ltd JP Morgan (1,614)400 NGK Spark Plug Co Ltd JP Morgan 48100 NH Foods Ltd Citibank (138)
(100) Nidec Corp Citibank (153)(300) Nihon M&A Center Inc JP Morgan 339100 Nippon Express Co Ltd Bank of America
Merrill Lynch 97100 Nippon Express Co Ltd Credit Suisse (37)
(1,500) Nippon Paint Holdings CoLtd Credit Suisse 1,895
(400) Nippon Sanso HoldingsCorp JP Morgan (78)
(100) Nippon Shinyaku Co Ltd Citibank (45)(500) Nippon Steel Corp Bank of America
Merrill Lynch 389(200) Nippon Steel Corp Citibank 90200 Nippon Telegraph & Tele-
phone CorpBank of AmericaMerrill Lynch 120
300 Nippon Telegraph & Tele-phone Corp Citibank 26
400 Nippon Telegraph & Tele-phone Corp Credit Suisse 232
1,600 Nippon Telegraph & Tele-phone Corp JP Morgan 822
300 Nippon Yusen KK Credit Suisse 224100 Nissan Chemical Corp JP Morgan (232)
(1,000) Nissan Motor Co Ltd Citibank (47)(3,500) Nissan Motor Co Ltd Credit Suisse 1,133
400 Nisshin Seifun Group Inc Citibank (54)100 Nissin Foods Holdings Co
LtdBank of AmericaMerrill Lynch (37)
100 Nissin Foods Holdings CoLtd JP Morgan 22
100 Nitori Holdings Co Ltd Bank of AmericaMerrill Lynch (262)
200 Nitto Denko Corp Bank of AmericaMerrill Lynch (60)
500 Nitto Denko Corp Citibank 271200 Nitto Denko Corp Credit Suisse (807)100 Nitto Denko Corp JP Morgan (128)
1,100 Nomura Holdings Inc Bank of AmericaMerrill Lynch 159
300 Nomura Real Estate Hold-ings Inc Credit Suisse (25)
200 Nomura Research InstituteLtd Credit Suisse 298
1,400 NSK Ltd JP Morgan (335)400 NTT Data Corp Bank of America
Merrill Lynch (25)700 Obayashi Corp Citibank (120)
(100) Obic Co Ltd Credit Suisse (419)(600) Odakyu Electric Railway Co
LtdBank of AmericaMerrill Lynch 417
(200) Odakyu Electric Railway CoLtd Credit Suisse 256
(2,400) Oji Holdings Corp Bank of AmericaMerrill Lynch 986
(1,100) Oji Holdings Corp Citibank 296300 Olympus Corp Citibank 242
BlackRock Total Advantage Fund continued
Portfolio of Investments as at 31 May 2021
The notes on pages 590 to 610 form an integral part of these financial statements.
Annual report and audited financial statements [565]

Holding Description Counterparty
Netunrealised
appreciation/(depreciation)
EUR
Japan continued300 Ono Pharmaceutical Co Ltd Citibank (101)400 Ono Pharmaceutical Co Ltd Credit Suisse (1,206)
(100) Oracle Corp Japan Bank of AmericaMerrill Lynch 209
(100) Oriental Land Co Ltd Bank of AmericaMerrill Lynch (770)
(100) Oriental Land Co Ltd JP Morgan (765)700 Osaka Gas Co Ltd Bank of America
Merrill Lynch (558)300 Osaka Gas Co Ltd Citibank (193)
1,200 Osaka Gas Co Ltd JP Morgan (807)(200) Otsuka Corp Bank of America
Merrill Lynch (149)(200) Otsuka Corp Citibank 224100 Otsuka Holdings Co Ltd Bank of America
Merrill Lynch 75200 Otsuka Holdings Co Ltd Credit Suisse 197
(700) Pan Pacific InternationalHoldings Corp Credit Suisse 1,072
1,600 Panasonic Corp Bank of AmericaMerrill Lynch 454
500 Panasonic Corp Citibank 2411,000 Panasonic Corp JP Morgan (325)(400) PeptiDream Inc Credit Suisse (777)300 Persol Holdings Co Ltd JP Morgan (96)
(600) Pigeon Corp Credit Suisse 2,758(1,300) Rakuten Group Inc Citibank 233(1,600) Resona Holdings Inc Citibank 171
(700) Resona Holdings Inc Credit Suisse 5(1,000) Resona Holdings Inc JP Morgan 7
(300) Ryohin Keikaku Co Ltd JP Morgan 576(500) SBI Holdings Inc Citibank (224)(200) SCSK Corp JP Morgan (30)100 Secom Co Ltd JP Morgan (558)500 Sega Sammy Holdings Inc Credit Suisse (788)900 Sega Sammy Holdings Inc JP Morgan (1,419)
(500) Seibu Holdings Inc Bank of AmericaMerrill Lynch (377)
(500) Seibu Holdings Inc Credit Suisse (370)1,000 Seiko Epson Corp JP Morgan 3291,700 Sekisui Chemical Co Ltd Citibank (711)
200 Sekisui Chemical Co Ltd Credit Suisse (208)500 Sekisui Chemical Co Ltd JP Morgan (519)
1,600 Sekisui House Ltd Citibank (311)(100) Sharp Corp Credit Suisse (132)(500) Sharp Corp JP Morgan (658)200 Shimadzu Corp Bank of America
Merrill Lynch —100 Shimamura Co Ltd JP Morgan (426)
(100) Shimano Inc Credit Suisse 303900 Shimizu Corp Credit Suisse (256)
(100) Shin-Etsu Chemical Co Ltd Bank of AmericaMerrill Lynch (561)
(100) Shin-Etsu Chemical Co Ltd JP Morgan (209)100 Shionogi & Co Ltd Credit Suisse (179)
(200) Shiseido Co Ltd Bank of AmericaMerrill Lynch (347)
(100) Shiseido Co Ltd Citibank (227)(200) Shiseido Co Ltd Credit Suisse (13)(100) Shiseido Co Ltd JP Morgan (7)700 Shizuoka Bank Ltd Citibank (225)
(100) SMC Corp Citibank (2,347)(400) SoftBank Corp Credit Suisse 127(136) SoftBank Group Corp Citibank 60300 Sohgo Security Services Co
Ltd Citibank —(300) Sompo Holdings Inc Bank of America
Merrill Lynch (119)100 Sony Group Corp Bank of America
Merrill Lynch 340
Holding Description Counterparty
Netunrealised
appreciation/(depreciation)
EUR
Japan continued200 Sony Group Corp Citibank 411200 Sony Group Corp Credit Suisse 7
(100) Square Enix Holdings CoLtd Citibank 67
600 Subaru Corp JP Morgan 11(300) SUMCO Corp Bank of America
Merrill Lynch (206)(300) SUMCO Corp Credit Suisse 242(400) SUMCO Corp JP Morgan 323(600) Sumitomo Corp Credit Suisse 143
(1,000) Sumitomo Corp JP Morgan 239(400) Sumitomo Electric Indus-
tries Ltd JP Morgan 3(100) Sumitomo Metal Mining Co
Ltd Citibank (210)200 Sumitomo Mitsui Financial
Group IncBank of AmericaMerrill Lynch (10)
100 Sumitomo Mitsui FinancialGroup Inc Citibank (59)
200 Sumitomo Mitsui FinancialGroup Inc JP Morgan (28)
200 Sumitomo Mitsui Trust Hold-ings Inc
Bank of AmericaMerrill Lynch (151)
300 Sundrug Co Ltd Citibank 202400 Suntory Beverage & Food
Ltd Credit Suisse 777400 Suntory Beverage & Food
Ltd JP Morgan 777(100) Suzuki Motor Corp Credit Suisse (333)100 Sysmex Corp JP Morgan —400 T&D Holdings Inc Bank of America
Merrill Lynch 2511,000 Taiheiyo Cement Corp Bank of America
Merrill Lynch (523)300 Taisei Corp Citibank (303)100 Taisho Pharmaceutical
Holdings Co Ltd Citibank (67)200 Taisho Pharmaceutical
Holdings Co Ltd Credit Suisse (822)100 Taisho Pharmaceutical
Holdings Co Ltd JP Morgan (411)(800) Takeda Pharmaceutical Co
LtdBank of AmericaMerrill Lynch 293
(700) Takeda Pharmaceutical CoLtd Citibank 225
(600) Takeda Pharmaceutical CoLtd Credit Suisse 49
(900) Takeda Pharmaceutical CoLtd JP Morgan 74
100 TDK Corp Bank of AmericaMerrill Lynch 374
3,100 Teijin Ltd Citibank (857)100 Terumo Corp Bank of America
Merrill Lynch 210(300) THK Co Ltd Citibank (370)(100) THK Co Ltd Credit Suisse 235(400) TIS Inc Bank of America
Merrill Lynch (777)(300) TIS Inc JP Morgan (300)(300) Tobu Railway Co Ltd Bank of America
Merrill Lynch 224(500) Toho Co Ltd Citibank (841)(100) Tokio Marine Holdings Inc Bank of America
Merrill Lynch 199(200) Tokio Marine Holdings Inc JP Morgan 438(200) Tokyo Century Corp Citibank 254700 Tokyo Gas Co Ltd Citibank (306)900 Tokyo Gas Co Ltd JP Morgan (1,130)
(400) Tokyu Corp Bank of AmericaMerrill Lynch (27)
BlackRock Total Advantage Fund continued
Portfolio of Investments as at 31 May 2021
The notes on pages 590 to 610 form an integral part of these financial statements.
BlackRock Strategic Funds[566]

Holding Description Counterparty
Netunrealised
appreciation/(depreciation)
EUR
Japan continued(500) Tokyu Corp Citibank (149)
(1,200) Tokyu Fudosan HoldingsCorp
Bank of AmericaMerrill Lynch (108)
(1,300) Tokyu Fudosan HoldingsCorp Citibank (223)
(1,200) Tokyu Fudosan HoldingsCorp Credit Suisse (63)
400 Toppan Printing Co Ltd Citibank 48300 Toppan Printing Co Ltd JP Morgan (78)
1,100 Toray Industries Inc Bank of AmericaMerrill Lynch 215
1,300 Toray Industries Inc Citibank 44900 Toray Industries Inc Credit Suisse 17800 Toray Industries Inc JP Morgan 15
(100) Toshiba Corp Citibank 18800 Tosoh Corp Citibank (454)300 TOTO Ltd Bank of America
Merrill Lynch 561500 Toyo Suisan Kaisha Ltd Citibank (224)100 Toyo Suisan Kaisha Ltd Credit Suisse (123)100 Toyoda Gosei Co Ltd Bank of America
Merrill Lynch 83800 Toyoda Gosei Co Ltd Credit Suisse 448500 Toyoda Gosei Co Ltd JP Morgan 280100 Toyota Industries Corp Credit Suisse 239
(100) Toyota Motor Corp Citibank (209)(100) Toyota Motor Corp Credit Suisse (455)100 Toyota Tsusho Corp Credit Suisse (153)
(300) Unicharm Corp Credit Suisse (155)(300) USS Co Ltd Credit Suisse 195(900) USS Co Ltd JP Morgan 585(200) Welcia Holdings Co Ltd Citibank 30(200) West Japan Railway Co Bank of America
Merrill Lynch (208)(100) West Japan Railway Co JP Morgan (7)
1,100 Yamada Holdings Co Ltd JP Morgan (27)300 Yamaha Corp JP Morgan 628300 Yamaha Motor Co Ltd Bank of America
Merrill Lynch 500400 Yamaha Motor Co Ltd Citibank 239200 Yamato Holdings Co Ltd JP Morgan (142)
(400) Yamazaki Baking Co Ltd Bank of AmericaMerrill Lynch 197
(100) Yaskawa Electric Corp JP Morgan (105)800 Yokogawa Electric Corp Credit Suisse (1,991)
(1,400) Z Holdings Corp Bank of AmericaMerrill Lynch (457)
(1,300) Z Holdings Corp Credit Suisse (383)
(4,083)
Netherlands(1,015) ABN AMRO Bank NV - CVA Bank of America
Merrill Lynch (341)2 Adyen NV Credit Suisse 1217 Adyen NV Deutsche Bank 1,017
(1,470) Aegon NV Bank of AmericaMerrill Lynch 212
(1,463) Aegon NV Credit Suisse 159(94) Aegon NV Deutsche Bank 14129 Akzo Nobel NV Deutsche Bank 368
(161) ArcelorMittal SA Credit Suisse 114(982) ArcelorMittal SA Deutsche Bank (2)(234) ArcelorMittal SA JP Morgan 166(62) Galapagos NV Deutsche Bank 137
(144) Heineken NV Bank of AmericaMerrill Lynch 104
(48) Heineken NV Citibank 38(31) Heineken NV Credit Suisse 47(46) Heineken NV Deutsche Bank 33
(137) JDE Peet’s NV Credit Suisse (36)
Holding Description Counterparty
Netunrealised
appreciation/(depreciation)
EUR
Netherlands continued(168) JDE Peet’s NV JP Morgan (44)(48) Just Eat Takeaway.com NV Bank of America
Merrill Lynch (131)(148) Just Eat Takeaway.com NV Citibank (360)(16) Just Eat Takeaway.com NV Credit Suisse 92
(283) Just Eat Takeaway.com NV Deutsche Bank (764)(62) Just Eat Takeaway.com NV JP Morgan 301309 Koninklijke Ahold Delhaize
NVBank of AmericaMerrill Lynch (82)
211 Koninklijke Ahold DelhaizeNV Citibank (64)
995 Koninklijke Ahold DelhaizeNV Credit Suisse 453
373 Koninklijke Ahold DelhaizeNV Deutsche Bank (99)
3,245 Koninklijke KPN NV Deutsche Bank (276)104 Koninklijke Philips NV Citibank (75)771 Koninklijke Philips NV Deutsche Bank (358)233 Koninklijke Philips NV JP Morgan (114)119 NN Group NV Credit Suisse (209)198 NN Group NV Deutsche Bank (384)709 NN Group NV JP Morgan (1,248)
(419) Prosus NV Bank of AmericaMerrill Lynch (373)
(51) Prosus NV Credit Suisse (17)(112) Prosus NV JP Morgan 155423 Randstad NV Bank of America
Merrill Lynch 1,015128 Randstad NV Citibank 277114 Randstad NV Credit Suisse 148491 Randstad NV Deutsche Bank 1,178211 Randstad NV JP Morgan 27417 Wolters Kluwer NV Bank of America
Merrill Lynch 1164 Wolters Kluwer NV Credit Suisse 2685 Wolters Kluwer NV Deutsche Bank 5681 Wolters Kluwer NV JP Morgan 32
1,571
New Zealand(1,158) a2 Milk Co Ltd Bank of America
Merrill Lynch (69)(4,277) Auckland International Air-
port Ltd JP Morgan 586174 Fisher & Paykel Healthcare
Corp LtdBank of AmericaMerrill Lynch (382)
770 Fisher & Paykel HealthcareCorp Ltd Citibank (1,931)
(2,701) Ryman Healthcare Ltd JP Morgan 1,8341,463 Spark New Zealand Ltd Deutsche Bank 52
90
Norway(91) Adevinta ASA Bank of America
Merrill Lynch (152)(330) Adevinta ASA Deutsche Bank (552)(110) Adevinta ASA JP Morgan (217)270 Equinor ASA Deutsche Bank (7)
(211) Gjensidige Forsikring ASA Credit Suisse 50(478) Mowi ASA Bank of America
Merrill Lynch (357)(599) Mowi ASA Citibank (147)(204) Mowi ASA Credit Suisse 62(97) Mowi ASA Deutsche Bank (72)
1,579 Norsk Hydro ASA Credit Suisse (267)1,069 Norsk Hydro ASA JP Morgan (181)
139 Orkla ASA Citibank 221,631 Orkla ASA JP Morgan 368
BlackRock Total Advantage Fund continued
Portfolio of Investments as at 31 May 2021
The notes on pages 590 to 610 form an integral part of these financial statements.
Annual report and audited financial statements [567]
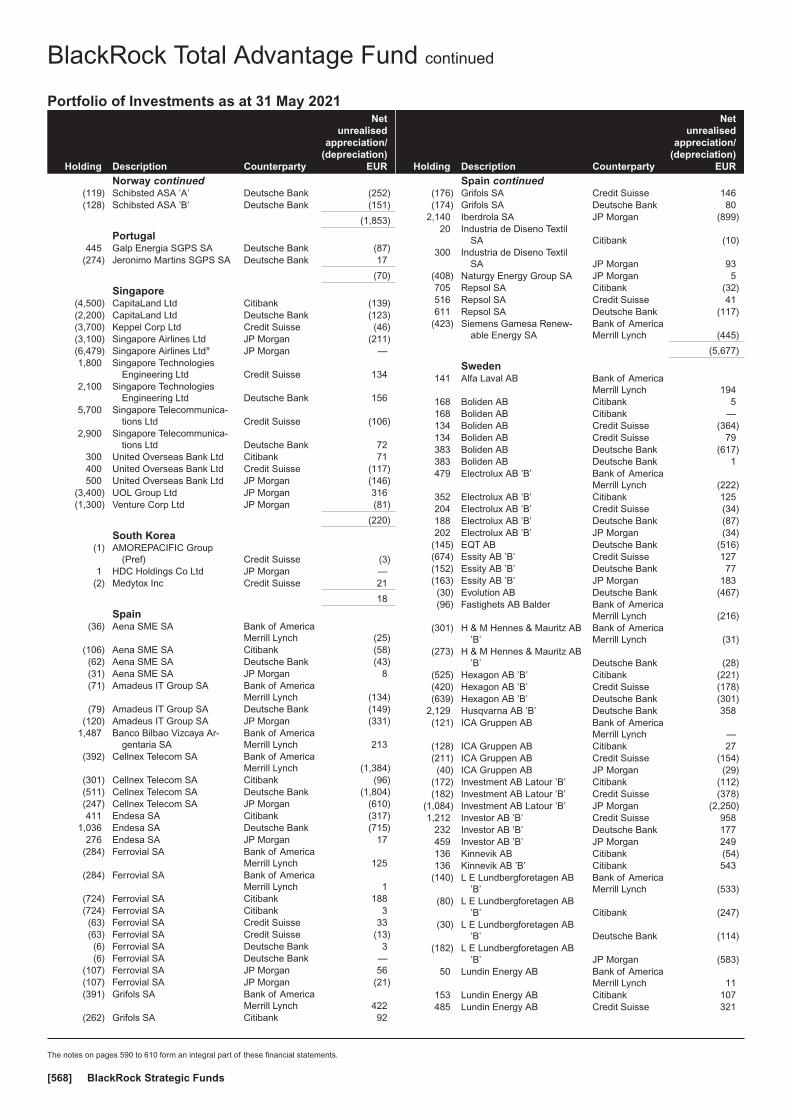
Holding Description Counterparty
Netunrealised
appreciation/(depreciation)
EUR
Norway continued(119) Schibsted ASA ’A’ Deutsche Bank (252)(128) Schibsted ASA ’B’ Deutsche Bank (151)
(1,853)
Portugal445 Galp Energia SGPS SA Deutsche Bank (87)
(274) Jeronimo Martins SGPS SA Deutsche Bank 17
(70)
Singapore(4,500) CapitaLand Ltd Citibank (139)(2,200) CapitaLand Ltd Deutsche Bank (123)(3,700) Keppel Corp Ltd Credit Suisse (46)(3,100) Singapore Airlines Ltd JP Morgan (211)(6,479) Singapore Airlines Ltdπ JP Morgan —1,800 Singapore Technologies
Engineering Ltd Credit Suisse 1342,100 Singapore Technologies
Engineering Ltd Deutsche Bank 1565,700 Singapore Telecommunica-
tions Ltd Credit Suisse (106)2,900 Singapore Telecommunica-
tions Ltd Deutsche Bank 72300 United Overseas Bank Ltd Citibank 71400 United Overseas Bank Ltd Credit Suisse (117)500 United Overseas Bank Ltd JP Morgan (146)
(3,400) UOL Group Ltd JP Morgan 316(1,300) Venture Corp Ltd JP Morgan (81)
(220)
South Korea(1) AMOREPACIFIC Group
(Pref) Credit Suisse (3)1 HDC Holdings Co Ltd JP Morgan —
(2) Medytox Inc Credit Suisse 21
18
Spain(36) Aena SME SA Bank of America
Merrill Lynch (25)(106) Aena SME SA Citibank (58)(62) Aena SME SA Deutsche Bank (43)(31) Aena SME SA JP Morgan 8(71) Amadeus IT Group SA Bank of America
Merrill Lynch (134)(79) Amadeus IT Group SA Deutsche Bank (149)
(120) Amadeus IT Group SA JP Morgan (331)1,487 Banco Bilbao Vizcaya Ar-
gentaria SABank of AmericaMerrill Lynch 213
(392) Cellnex Telecom SA Bank of AmericaMerrill Lynch (1,384)
(301) Cellnex Telecom SA Citibank (96)(511) Cellnex Telecom SA Deutsche Bank (1,804)(247) Cellnex Telecom SA JP Morgan (610)411 Endesa SA Citibank (317)
1,036 Endesa SA Deutsche Bank (715)276 Endesa SA JP Morgan 17
(284) Ferrovial SA Bank of AmericaMerrill Lynch 125
(284) Ferrovial SA Bank of AmericaMerrill Lynch 1
(724) Ferrovial SA Citibank 188(724) Ferrovial SA Citibank 3(63) Ferrovial SA Credit Suisse 33(63) Ferrovial SA Credit Suisse (13)(6) Ferrovial SA Deutsche Bank 3(6) Ferrovial SA Deutsche Bank —
(107) Ferrovial SA JP Morgan 56(107) Ferrovial SA JP Morgan (21)(391) Grifols SA Bank of America
Merrill Lynch 422(262) Grifols SA Citibank 92
Holding Description Counterparty
Netunrealised
appreciation/(depreciation)
EUR
Spain continued(176) Grifols SA Credit Suisse 146(174) Grifols SA Deutsche Bank 80
2,140 Iberdrola SA JP Morgan (899)20 Industria de Diseno Textil
SA Citibank (10)300 Industria de Diseno Textil
SA JP Morgan 93(408) Naturgy Energy Group SA JP Morgan 5705 Repsol SA Citibank (32)516 Repsol SA Credit Suisse 41611 Repsol SA Deutsche Bank (117)
(423) Siemens Gamesa Renew-able Energy SA
Bank of AmericaMerrill Lynch (445)
(5,677)
Sweden141 Alfa Laval AB Bank of America
Merrill Lynch 194168 Boliden AB Citibank 5168 Boliden AB Citibank —134 Boliden AB Credit Suisse (364)134 Boliden AB Credit Suisse 79383 Boliden AB Deutsche Bank (617)383 Boliden AB Deutsche Bank 1479 Electrolux AB ’B’ Bank of America
Merrill Lynch (222)352 Electrolux AB ’B’ Citibank 125204 Electrolux AB ’B’ Credit Suisse (34)188 Electrolux AB ’B’ Deutsche Bank (87)202 Electrolux AB ’B’ JP Morgan (34)
(145) EQT AB Deutsche Bank (516)(674) Essity AB ’B’ Credit Suisse 127(152) Essity AB ’B’ Deutsche Bank 77(163) Essity AB ’B’ JP Morgan 183(30) Evolution AB Deutsche Bank (467)(96) Fastighets AB Balder Bank of America
Merrill Lynch (216)(301) H & M Hennes & Mauritz AB
’B’Bank of AmericaMerrill Lynch (31)
(273) H & M Hennes & Mauritz AB’B’ Deutsche Bank (28)
(525) Hexagon AB ’B’ Citibank (221)(420) Hexagon AB ’B’ Credit Suisse (178)(639) Hexagon AB ’B’ Deutsche Bank (301)
2,129 Husqvarna AB ’B’ Deutsche Bank 358(121) ICA Gruppen AB Bank of America
Merrill Lynch —(128) ICA Gruppen AB Citibank 27(211) ICA Gruppen AB Credit Suisse (154)(40) ICA Gruppen AB JP Morgan (29)
(172) Investment AB Latour ’B’ Citibank (112)(182) Investment AB Latour ’B’ Credit Suisse (378)
(1,084) Investment AB Latour ’B’ JP Morgan (2,250)1,212 Investor AB ’B’ Credit Suisse 958
232 Investor AB ’B’ Deutsche Bank 177459 Investor AB ’B’ JP Morgan 249136 Kinnevik AB Citibank (54)136 Kinnevik AB ’B’ Citibank 543
(140) L E Lundbergforetagen AB’B’
Bank of AmericaMerrill Lynch (533)
(80) L E Lundbergforetagen AB’B’ Citibank (247)
(30) L E Lundbergforetagen AB’B’ Deutsche Bank (114)
(182) L E Lundbergforetagen AB’B’ JP Morgan (583)
50 Lundin Energy AB Bank of AmericaMerrill Lynch 11
153 Lundin Energy AB Citibank 107485 Lundin Energy AB Credit Suisse 321
BlackRock Total Advantage Fund continued
Portfolio of Investments as at 31 May 2021
The notes on pages 590 to 610 form an integral part of these financial statements.
BlackRock Strategic Funds[568]

Holding Description Counterparty
Netunrealised
appreciation/(depreciation)
EUR
Sweden continued184 Lundin Energy AB JP Morgan 122109 Nordea Bank Abp Deutsche Bank 27
2,109 Nordea Bank Abp JP Morgan 656(174) Sandvik AB Bank of America
Merrill Lynch 143(205) Sandvik AB Credit Suisse 288(462) Skandinaviska Enskilda
Banken AB ’A’ JP Morgan 176261 Skanska AB ’B’ Citibank (103)241 Skanska AB ’B’ Credit Suisse (131)430 Skanska AB ’B’ Deutsche Bank (183)
(186) SKF AB ’B’ Bank of AmericaMerrill Lynch 16
(10) Svenska Cellulosa AB SCA’B’
Bank of AmericaMerrill Lynch 9
(858) Svenska Cellulosa AB SCA’B’ Citibank 428
(1,754) Svenska Cellulosa AB SCA’B’ Deutsche Bank 1,551
(452) Svenska Handelsbanken AB’A’ JP Morgan 253
623 Telefonaktiebolaget LM Er-icsson ’B’
Bank of AmericaMerrill Lynch 2
516 Telefonaktiebolaget LM Er-icsson ’B’ Citibank (83)
485 Telefonaktiebolaget LM Er-icsson ’B’ Deutsche Bank (46)
1,451 Telia Co AB Bank of AmericaMerrill Lynch (47)
1,192 Telia Co AB Citibank (130)3,921 Telia Co AB Deutsche Bank (210)
(1,490)
Switzerland(367) ABB Ltd Reg Bank of America
Merrill Lynch (114)(301) ABB Ltd Reg Credit Suisse (107)348 Adecco Group AG Reg Bank of America
Merrill Lynch 47989 Adecco Group AG Reg Citibank 9173 Adecco Group AG Reg Credit Suisse 7670 Adecco Group AG Reg JP Morgan 6129 Baloise Holding AG Reg Bank of America
Merrill Lynch (42)44 Baloise Holding AG Reg JP Morgan (104)
(14) Banque Cantonale Vaudo-ise Reg
Bank of AmericaMerrill Lynch 43
(143) Banque Cantonale Vaudo-ise Reg Citibank 91
(38) Banque Cantonale Vaudo-ise Reg Credit Suisse 152
(182) Banque Cantonale Vaudo-ise Reg JP Morgan 729
(15) Barry Callebaut AG Reg Citibank (519)(1) Barry Callebaut AG Reg Credit Suisse (24)(3) Chocoladefabriken Lindt &
Spruengli AG JP Morgan (505)(470) Clariant AG Reg Bank of America
Merrill Lynch (58)(391) Clariant AG Reg Citibank (53)(353) Clariant AG Reg Deutsche Bank (43)(954) Credit Suisse Group AG
Reg JP Morgan (583)(23) EMS-Chemie Holding AG
Reg Citibank (387)(5) EMS-Chemie Holding AG
Reg JP Morgan 3618 Geberit AG Reg Citibank 1541 Givaudan SA Reg Credit Suisse (14)
372 Holcim Ltd Bank of AmericaMerrill Lynch (122)
Holding Description Counterparty
Netunrealised
appreciation/(depreciation)
EUR
Switzerland continued304 Holcim Ltd Citibank 55124 Holcim Ltd JP Morgan (174)142 Julius Baer Group Ltd Bank of America
Merrill Lynch 34632 Kuehne + Nagel Interna-
tional AG RegBank of AmericaMerrill Lynch 507
68 Kuehne + Nagel Interna-tional AG Reg Citibank 433
1 Kuehne + Nagel Interna-tional AG Reg Credit Suisse 21
46 Logitech International SAReg
Bank of AmericaMerrill Lynch 705
152 Logitech International SAReg Citibank 1,169
48 Logitech International SAReg Credit Suisse 601
(10) Lonza Group AG Reg Citibank (49)(39) Lonza Group AG Reg JP Morgan (596)130 Nestle SA Reg Bank of America
Merrill Lynch 16162 Novartis AG Reg Bank of America
Merrill Lynch (61)401 Novartis AG Reg JP Morgan (135)68 Roche Holding AG Citibank 6823 Roche Holding AG JP Morgan 244(4) Schindler Holding AG Citibank (14)
(65) Schindler Holding AG JP Morgan (396)5 SGS SA Reg JP Morgan 287
(94) Sika AG Reg Credit Suisse (984)27 Sonova Holding AG Reg Bank of America
Merrill Lynch 1,52643 Sonova Holding AG Reg Credit Suisse 2,2343 Straumann Holding AG Reg Citibank 945 Straumann Holding AG Reg JP Morgan 230
29 Swiss Life Holding AG Reg Bank of AmericaMerrill Lynch 164
51 Swisscom AG Reg JP Morgan 576(34) Temenos AG Reg Citibank (71)(34) Temenos AG Reg Credit Suisse (274)
1,126 UBS Group AG Reg Bank of AmericaMerrill Lynch 681
318 UBS Group AG Reg Citibank 69676 UBS Group AG Reg JP Morgan 345(37) Vifor Pharma AG Bank of America
Merrill Lynch (177)(128) Vifor Pharma AG Citibank (565)(118) Vifor Pharma AG Credit Suisse (912)(185) Vifor Pharma AG JP Morgan (962)
40 Zurich Insurance Group AG Citibank 87
4,470
Taiwan(2) Shin Kong Financial Holding
Co Ltd (Pref)Bank of AmericaMerrill Lynch —
—
United Kingdom304 3i Group Plc Bank of America
Merrill Lynch 74359 3i Group Plc Citibank (42)
1,017 3i Group Plc Credit Suisse 112790 3i Group Plc JP Morgan 87
(242) Admiral Group Plc Bank of AmericaMerrill Lynch 25
(156) Admiral Group Plc Citibank (56)(234) Admiral Group Plc Credit Suisse 106(114) Admiral Group Plc Deutsche Bank 12(386) Antofagasta Plc Bank of America
Merrill Lynch 114(206) Antofagasta Plc Credit Suisse 811(239) Antofagasta Plc Deutsche Bank 437
BlackRock Total Advantage Fund continued
Portfolio of Investments as at 31 May 2021
The notes on pages 590 to 610 form an integral part of these financial statements.
Annual report and audited financial statements [569]

Holding Description Counterparty
Netunrealised
appreciation/(depreciation)
EUR
United Kingdom continued(256) Antofagasta Plc JP Morgan 1,008
97 Ashtead Group Plc Deutsche Bank 194(65) Associated British Foods Plc Bank of America
Merrill Lynch (33)(71) AstraZeneca Plc Deutsche Bank (124)(98) AstraZeneca Plc JP Morgan (374)
1,241 Auto Trader Group Plc Bank of AmericaMerrill Lynch 202
(220) AVEVA Group Plc Credit Suisse (634)(350) AVEVA Group Plc Deutsche Bank (1,260)(198) AVEVA Group Plc JP Morgan (104)
1,633 Aviva Plc Bank of AmericaMerrill Lynch 85
3,516 Aviva Plc Citibank 225928 Aviva Plc Credit Suisse (22)368 Aviva Plc JP Morgan (9)
(4,154) Barclays Plc Citibank (165)694 Barratt Developments Plc Citibank 35926 Barratt Developments Plc Deutsche Bank (32)535 Barratt Developments Plc JP Morgan (154)
2,155 BP Plc Citibank (256)318 Bunzl Plc Citibank (11)56 Bunzl Plc Credit Suisse (20)
181 Burberry Group Plc Credit Suisse 70372 Coca-Cola HBC AG Citibank 138139 Coca-Cola HBC AG Credit Suisse 2
(462) Compass Group Plc Deutsche Bank (499)(109) Croda International Plc Deutsche Bank (409)
(1,211) Direct Line Insurance GroupPlc Deutsche Bank (62)
963 Evraz Plc Credit Suisse (678)38 Ferguson Plc Bank of America
Merrill Lynch 17171 Ferguson Plc Citibank (115)
250 Ferguson Plc Deutsche Bank 904(413) Fresnillo Plc Deutsche Bank 87(307) GlaxoSmithKline Plc JP Morgan 27
(2,744) Glencore Plc Citibank (390)(1,586) Glencore Plc JP Morgan (5)
(161) Halma Plc Bank of AmericaMerrill Lynch (232)
(258) Halma Plc Deutsche Bank (371)(361) Halma Plc JP Morgan (180)(499) Hargreaves Lansdown Plc Deutsche Bank 196(579) Hikma Pharmaceuticals Plc Credit Suisse (632)
(2,876) HSBC Holdings Plc Deutsche Bank (397)(625) Informa Plc Credit Suisse 177(118) InterContinental Hotels
Group PlcBank of AmericaMerrill Lynch (62)
(142) InterContinental HotelsGroup Plc Credit Suisse 97
(77) InterContinental HotelsGroup Plc Deutsche Bank (40)
88 Intertek Group Plc Citibank (478)219 Intertek Group Plc Deutsche Bank (954)
3 JD Sports Fashion Plc Bank of AmericaMerrill Lynch 2
202 JD Sports Fashion Plc JP Morgan 681,392 Kingfisher Plc Citibank (10)1,328 Kingfisher Plc Deutsche Bank (128)1,410 Kingfisher Plc JP Morgan (164)1,283 Legal & General Group Plc Credit Suisse 931,335 Legal & General Group Plc Deutsche Bank 641,268 Legal & General Group Plc JP Morgan 87(117) London Stock Exchange
Group PlcBank of AmericaMerrill Lynch (538)
(46) London Stock ExchangeGroup Plc Credit Suisse (266)
(109) London Stock ExchangeGroup Plc Deutsche Bank (501)
Holding Description Counterparty
Netunrealised
appreciation/(depreciation)
EUR
United Kingdom continued(48) London Stock Exchange
Group Plc JP Morgan (278)1,778 M&G Plc Deutsche Bank 165
(2,218) Melrose Industries Plc Credit Suisse (160)261 Mondi Plc Deutsche Bank (89)260 Mondi Plc JP Morgan (162)
(616) National Grid Plc JP Morgan 4064 Next Plc Credit Suisse (120)
(165) Ocado Group Plc Bank of AmericaMerrill Lynch 148
(876) Ocado Group Plc Deutsche Bank 783(172) Ocado Group Plc JP Morgan 165(406) Pearson Plc Deutsche Bank 163138 Persimmon Plc Bank of America
Merrill Lynch 83395 Persimmon Plc Deutsche Bank 238960 Phoenix Group Holdings Plc Deutsche Bank 67
(259) Prudential Plc Citibank 15(3) Reckitt Benckiser Group Plc Citibank 4
(54) Reckitt Benckiser Group Plc Credit Suisse (11)(184) Reckitt Benckiser Group Plc Deutsche Bank (13)(236) Reed Elsevier Plc Deutsche Bank 29151 Rio Tinto Plc JP Morgan (1,041)
(6,915) Rolls-Royce Holdings Plc Bank of AmericaMerrill Lynch (145)
(3,287) Rolls-Royce Holdings Plc Deutsche Bank (154)738 Sage Group Plc Credit Suisse (122)105 Schroders Plc JP Morgan (50)142 Severn Trent Plc Deutsche Bank (78)
(251) Smith & Nephew Plc Bank of AmericaMerrill Lynch (70)
(59) Spirax-Sarco EngineeringPlc
Bank of AmericaMerrill Lynch (397)
(9) Spirax-Sarco EngineeringPlc Deutsche Bank (61)
(27) Spirax-Sarco EngineeringPlc JP Morgan (282)
512 SSE Plc Deutsche Bank 131(278) St James’s Place Plc Bank of America
Merrill Lynch (126)(736) Standard Chartered Plc Deutsche Bank (82)(123) Unilever Plc Citibank 63(107) Unilever Plc Credit Suisse 65(489) Unilever Plc Deutsche Bank 477(298) Unilever Plc JP Morgan 180438 United Utilities Group Plc JP Morgan (22)
4,395 Vodafone Group Plc Bank of AmericaMerrill Lynch (684)
2,740 Vodafone Group Plc Deutsche Bank (426)7,559 Vodafone Group Plc JP Morgan (1,239)(119) Whitbread Plc Credit Suisse 8
(9,554) Wm Morrison SupermarketsPlc Citibank 277
(4,836) Wm Morrison SupermarketsPlc Credit Suisse 254
(3,073) Wm Morrison SupermarketsPlc Deutsche Bank 246
(4,073) Wm Morrison SupermarketsPlc JP Morgan 293
1,193 WPP Plc Bank of AmericaMerrill Lynch 33
1,132 WPP Plc Credit Suisse (229)2,360 WPP Plc Deutsche Bank 66
(6,745)
United States(28) 10X Genomics Inc ’A’ Bank of America
Merrill Lynch (830)(28) 3M Co Bank of America
Merrill Lynch 47
BlackRock Total Advantage Fund continued
Portfolio of Investments as at 31 May 2021
The notes on pages 590 to 610 form an integral part of these financial statements.
BlackRock Strategic Funds[570]

Holding Description Counterparty
Netunrealised
appreciation/(depreciation)
EUR
United States continued89 A O Smith Corp JP Morgan (86)
(51) Abbott Laboratories Bank of AmericaMerrill Lynch 4
(44) Abbott Laboratories Credit Suisse 83(89) Abbott Laboratories JP Morgan 167(55) AbbVie Inc Bank of America
Merrill Lynch 166(88) AbbVie Inc JP Morgan 17616 ABIOMED Inc Bank of America
Merrill Lynch 21827 ABIOMED Inc Citibank 11164 Accenture Plc ’A’ Bank of America
Merrill Lynch (254)72 Accenture Plc ’A’ Citibank (159)95 Accenture Plc ’A’ Credit Suisse (658)18 Accenture Plc ’A’ JP Morgan (125)49 Adobe Inc Bank of America
Merrill Lynch 87723 Adobe Inc Citibank 12741 Adobe Inc Credit Suisse 84755 Adobe Inc JP Morgan 1,136
488 Aflac Inc Citibank 124180 Aflac Inc JP Morgan 2280 Agilent Technologies Inc Bank of America
Merrill Lynch 41677 Agilent Technologies Inc Credit Suisse 219
209 Agilent Technologies Inc JP Morgan 1,011(8) Air Products and Chemicals
IncBank of AmericaMerrill Lynch 13
(107) Air Products and ChemicalsInc Citibank (8)
(18) Air Products and ChemicalsInc Credit Suisse (90)
(37) Air Products and ChemicalsInc JP Morgan (186)
(106) Akamai Technologies Inc JP Morgan (259)(32) Albemarle Corp Bank of America
Merrill Lynch (244)9 Align Technology Inc Bank of America
Merrill Lynch 22610 Align Technology Inc Citibank (117)(8) Alleghany Corp JP Morgan 4541 Allegion Plc Bank of America
Merrill Lynch 5235 Allegion Plc Citibank 5046 Allstate Corp Credit Suisse 80
118 Allstate Corp JP Morgan 205240 Ally Financial Inc Bank of America
Merrill Lynch 151218 Ally Financial Inc Credit Suisse 186(37) Alnylam Pharmaceuticals
IncBank of AmericaMerrill Lynch (185)
14 Alphabet Inc ’A’ Bank of AmericaMerrill Lynch 779
2 Alphabet Inc ’A’ Citibank (7)2 Alphabet Inc ’A’ Credit Suisse 1076 Alphabet Inc ’A’ JP Morgan 3552 Alphabet Inc ’C’ Bank of America
Merrill Lynch 1484 Amazon.com Inc Citibank (72)
34 AMERCO Citibank (86)8 AMERCO Credit Suisse (373)
(43) American Financial GroupInc
Bank of AmericaMerrill Lynch (124)
(40) American Water Works CoInc
Bank of AmericaMerrill Lynch (137)
(64) American Water Works CoInc Citibank (43)
(34) American Water Works CoInc Credit Suisse 27
Holding Description Counterparty
Netunrealised
appreciation/(depreciation)
EUR
United States continued20 Ameriprise Financial Inc Citibank 7320 Ameriprise Financial Inc Credit Suisse (70)49 Ameriprise Financial Inc JP Morgan 3
109 AmerisourceBergen Corp Citibank (338)43 AmerisourceBergen Corp Credit Suisse (300)48 AmerisourceBergen Corp JP Morgan (335)
(77) AMETEK Inc JP Morgan 12679 Amgen Inc Bank of America
Merrill Lynch (935)22 Amgen Inc Credit Suisse (265)
(76) Amphenol Corp ’A’ Bank of AmericaMerrill Lynch 8
(170) Amphenol Corp ’A’ Citibank (26)(80) Amphenol Corp ’A’ JP Morgan (13)
(173) Analog Devices Inc Bank of AmericaMerrill Lynch (2,339)
(73) Analog Devices Inc Citibank (125)(82) Analog Devices Inc Credit Suisse (928)(69) Analog Devices Inc JP Morgan (781)(31) ANSYS Inc Bank of America
Merrill Lynch (424)(36) ANSYS Inc Citibank 24(16) ANSYS Inc Credit Suisse (194)(15) Anthem Inc Credit Suisse 45(73) Aon Plc ’A’ Citibank (11)(17) Aon Plc ’A’ JP Morgan 71
(114) Apollo Global ManagementInc
Bank of AmericaMerrill Lynch 4
(179) Apollo Global ManagementInc Citibank 15
(106) Apollo Global ManagementInc JP Morgan 25
54 Apple Inc Bank of AmericaMerrill Lynch (73)
183 Apple Inc Citibank (373)21 Apple Inc Credit Suisse (39)
148 Apple Inc JP Morgan (272)109 Applied Materials Inc Bank of America
Merrill Lynch 1,30040 Applied Materials Inc Citibank 11649 Applied Materials Inc Credit Suisse 540
176 Applied Materials Inc JP Morgan 1,938(43) Aptiv Plc Bank of America
Merrill Lynch (401)(251) Aptiv Plc Citibank (1,843)(161) Aramark Bank of America
Merrill Lynch 169125 Arch Capital Group Ltd JP Morgan 35419 Archer-Daniels-Midland Co Bank of America
Merrill Lynch (381)340 Archer-Daniels-Midland Co Citibank (25)297 Archer-Daniels-Midland Co JP Morgan (268)18 Arista Networks Inc Credit Suisse 194
181 Arrow Electronics Inc Citibank (492)89 Arrow Electronics Inc JP Morgan 220
(78) Arthur J Gallagher & Co JP Morgan 11920 Assurant Inc Citibank 33
150 AT&T Inc Bank of AmericaMerrill Lynch (238)
361 AT&T Inc Citibank (95)184 AT&T Inc Credit Suisse (482)
(117) Atmos Energy Corp Bank of AmericaMerrill Lynch (61)
(49) Atmos Energy Corp Credit Suisse 174(174) Atmos Energy Corp JP Morgan 195102 Autodesk Inc Citibank (135)63 Autodesk Inc Credit Suisse 31418 Autodesk Inc JP Morgan 73
BlackRock Total Advantage Fund continued
Portfolio of Investments as at 31 May 2021
The notes on pages 590 to 610 form an integral part of these financial statements.
Annual report and audited financial statements [571]

Holding Description Counterparty
Netunrealised
appreciation/(depreciation)
EUR
United States continued27 Automatic Data Processing
Inc Citibank (23)26 Automatic Data Processing
Inc JP Morgan 354 AutoZone Inc JP Morgan (370)
(152) Avalara Inc Bank of AmericaMerrill Lynch (1,402)
(74) Avalara Inc Credit Suisse (401)(183) Avantor Inc JP Morgan (250)
73 Avery Dennison Corp Bank of AmericaMerrill Lynch (26)
152 Avery Dennison Corp Citibank 26428 Avery Dennison Corp Credit Suisse (24)17 Axalta Coating Systems Ltd Citibank 12
631 Axalta Coating Systems Ltd JP Morgan (641)(392) Baker Hughes Co Bank of America
Merrill Lynch 257(607) Baker Hughes Co Citibank 7(55) Ball Corp Bank of America
Merrill Lynch 292104 Bank of New York Mellon
CorpBank of AmericaMerrill Lynch (1)
100 Bank of New York MellonCorp Citibank 28
(179) Baxter International Inc Citibank 45(64) Baxter International Inc Credit Suisse 229
(145) Baxter International Inc JP Morgan 309(44) Becton Dickinson and Co Citibank 66(69) Becton Dickinson and Co JP Morgan 13731 Berkshire Hathaway Inc ’B’ Bank of America
Merrill Lynch 677 Berkshire Hathaway Inc ’B’ Citibank (18)21 Berkshire Hathaway Inc ’B’ JP Morgan (50)60 Best Buy Co Inc Bank of America
Merrill Lynch (190)117 Best Buy Co Inc Credit Suisse (916)96 Best Buy Co Inc JP Morgan (751)37 Biogen Inc Bank of America
Merrill Lynch (392)19 Biogen Inc JP Morgan (127)
(100) BioMarin PharmaceuticalInc
Bank of AmericaMerrill Lynch 3
(16) BioMarin PharmaceuticalInc Citibank 3
(129) BioMarin PharmaceuticalInc Credit Suisse (96)
(80) BioMarin PharmaceuticalInc JP Morgan (60)
(29) Bio-Rad Laboratories Inc ’A’ Bank of AmericaMerrill Lynch (300)
(189) Black Knight Inc Bank of AmericaMerrill Lynch (291)
(206) Black Knight Inc Citibank (37)(246) Black Knight Inc Credit Suisse 329(18) Black Knight Inc JP Morgan 24(67) Blackstone Group Inc Citibank (80)
(106) Blackstone Group Inc JP Morgan (353)(4) Booking Holdings Inc Citibank (43)60 Booz Allen Hamilton Hold-
ing Corp Citibank (40)71 Booz Allen Hamilton Hold-
ing Corp JP Morgan 91(495) BorgWarner Inc Bank of America
Merrill Lynch 146(367) Boston Scientific Corp Bank of America
Merrill Lynch (250)(15) Boston Scientific Corp Citibank 3(85) Boston Scientific Corp JP Morgan 49(82) Bristol-Myers Squibb Co Bank of America
Merrill Lynch (17)(118) Bristol-Myers Squibb Co Credit Suisse (99)
Holding Description Counterparty
Netunrealised
appreciation/(depreciation)
EUR
United States continued(27) Broadcom Inc Bank of America
Merrill Lynch (717)(31) Broadcom Inc Citibank (334)(11) Broadcom Inc Credit Suisse (327)(59) Broadcom Inc JP Morgan (1,744)
(106) Brown & Brown Inc Bank of AmericaMerrill Lynch (25)
(123) Brown-Forman Corp ’B’ Citibank (79)63 Bunge Ltd Bank of America
Merrill Lynch (140)69 Bunge Ltd Citibank 172 Bunge Ltd Credit Suisse (219)86 Bunge Ltd JP Morgan (262)
(20) Burlington Stores Inc Bank of AmericaMerrill Lynch 209
(20) Burlington Stores Inc Credit Suisse 87(7) Cable One Inc Bank of America
Merrill Lynch (580)(3) Cable One Inc Citibank (21)(3) Cable One Inc JP Morgan (180)77 Cadence Design Systems
IncBank of AmericaMerrill Lynch 325
89 Cadence Design SystemsInc Citibank 48
37 Cadence Design SystemsInc Credit Suisse 86
376 Cadence Design SystemsInc JP Morgan 878
(103) Campbell Soup Co Credit Suisse 12576 Capital One Financial Corp JP Morgan 212
308 Cardinal Health Inc Bank of AmericaMerrill Lynch (96)
119 Cardinal Health Inc Citibank (55)66 Cardinal Health Inc Credit Suisse (122)
250 Cardinal Health Inc JP Morgan (463)(32) CarMax Inc Bank of America
Merrill Lynch 243(70) CarMax Inc Citibank (75)(29) CarMax Inc JP Morgan 302
(444) Carnival Corp Citibank (604)(262) Carnival Corp Credit Suisse (706)(208) Carnival Corp JP Morgan (561)(18) Carvana Co Bank of America
Merrill Lynch (568)(19) Carvana Co Credit Suisse (357)(45) Carvana Co JP Morgan (845)(28) Catalent Inc Bank of America
Merrill Lynch (64)(182) Catalent Inc Citibank (339)(44) Catalent Inc Credit Suisse (1)
(139) Catalent Inc JP Morgan (3)(34) Caterpillar Inc Bank of America
Merrill Lynch (4)64 CBRE Group Inc ’A’ Bank of America
Merrill Lynch 58144 CBRE Group Inc ’A’ Credit Suisse 14028 CDW Corp JP Morgan (138)
(80) Centene Corp Bank of AmericaMerrill Lynch (199)
(743) CenterPoint Energy Inc Citibank (132)(462) CenterPoint Energy Inc JP Morgan (222)(165) Ceridian HCM Holding Inc Bank of America
Merrill Lynch (219)(113) Ceridian HCM Holding Inc Citibank (44)(55) Ceridian HCM Holding Inc Credit Suisse (249)
(209) Ceridian HCM Holding Inc JP Morgan (947)349 Cerner Corp Citibank 357142 Cerner Corp Credit Suisse 105285 Cerner Corp JP Morgan 19058 CH Robinson Worldwide Inc Citibank (33)
BlackRock Total Advantage Fund continued
Portfolio of Investments as at 31 May 2021
The notes on pages 590 to 610 form an integral part of these financial statements.
BlackRock Strategic Funds[572]

Holding Description Counterparty
Netunrealised
appreciation/(depreciation)
EUR
United States continued(86) Charles Schwab Corp Credit Suisse (194)(16) Charter Communications
Inc ’A’Bank of AmericaMerrill Lynch (101)
(8) Charter CommunicationsInc ’A’ Citibank 56
(15) Charter CommunicationsInc ’A’ JP Morgan 2
129 Check Point Software Tech-nologies Ltd Citibank (217)
43 Check Point Software Tech-nologies Ltd JP Morgan (101)
(130) Cheniere Energy Inc Bank of AmericaMerrill Lynch (85)
(66) Cheniere Energy Inc Citibank (42)(34) Cheniere Energy Inc JP Morgan (90)
(256) Chevron Corp Bank of AmericaMerrill Lynch 1,192
(181) Chevron Corp Citibank 151(96) Chevron Corp JP Morgan 455
(116) Chewy Inc ’A’ Citibank (182)(62) Chewy Inc ’A’ Credit Suisse (294)(50) Chewy Inc ’A’ JP Morgan (237)
4 Chipotle Mexican Grill Inc Credit Suisse (65)(182) Church & Dwight Co Inc Bank of America
Merrill Lynch 266(222) Church & Dwight Co Inc Citibank 267(118) Church & Dwight Co Inc Credit Suisse 213(57) Church & Dwight Co Inc JP Morgan 7526 Cigna Corp Bank of America
Merrill Lynch (125)20 Cigna Corp Citibank (44)20 Cigna Corp JP Morgan (132)
(51) Cincinnati Financial Corp Credit Suisse (42)37 Cintas Corp Bank of America
Merrill Lynch 451 Cintas Corp JP Morgan (6)
(176) Cisco Systems Inc - CDI JP Morgan 38272 Citigroup Inc Credit Suisse 798319 Citizens Financial Group Inc Citibank 15242 Citrix Systems Inc JP Morgan (149)
(30) Clorox Co Bank of AmericaMerrill Lynch 8
(69) Clorox Co Credit Suisse 637(74) Cloudflare Inc ’A’ JP Morgan (800)(45) CME Group Inc Bank of America
Merrill Lynch (86)(35) CME Group Inc Citibank (42)(24) CME Group Inc JP Morgan (32)144 Coca-Cola Co Credit Suisse 4559 Cognex Corp Citibank 99
261 Cognizant Technology Solu-tions Corp ’A’
Bank of AmericaMerrill Lynch 198
104 Cognizant Technology Solu-tions Corp ’A’ Credit Suisse (209)
(219) ConocoPhillips Citibank 18(170) ConocoPhillips Credit Suisse 19(71) Consolidated Edison Inc Credit Suisse 152
(116) Consolidated Edison Inc JP Morgan 622 Constellation Brands Inc ’A’ Credit Suisse 10
(20) Cooper Cos Inc Bank of AmericaMerrill Lynch (86)
(8) Cooper Cos Inc Citibank 7(19) Cooper Cos Inc JP Morgan 130119 Copart Inc Credit Suisse 224102 Copart Inc JP Morgan 264113 Corning Inc Bank of America
Merrill Lynch (52)128 Corteva Inc Bank of America
Merrill Lynch (76)243 Corteva Inc Citibank 70
Holding Description Counterparty
Netunrealised
appreciation/(depreciation)
EUR
United States continued106 Corteva Inc Credit Suisse (129)
(8) CoStar Group Inc Bank of AmericaMerrill Lynch (236)
(12) CoStar Group Inc Citibank (95)(20) CoStar Group Inc Credit Suisse (234)(8) CoStar Group Inc JP Morgan (266)13 Costco Wholesale Corp Bank of America
Merrill Lynch (63)(20) Coupa Software Inc Bank of America
Merrill Lynch (204)(21) Coupa Software Inc Citibank 16(22) Coupa Software Inc Credit Suisse (259)(89) Coupa Software Inc JP Morgan (197)(29) Crowdstrike Holdings Inc ’A’ Credit Suisse (821)(17) Crown Holdings Inc Citibank 104
(101) Crown Holdings Inc JP Morgan 775115 CSX Corp Citibank 73
8 CSX Corp Credit Suisse (20)9 Cummins Inc Bank of America
Merrill Lynch (67)80 Cummins Inc JP Morgan (882)66 CVS Health Corp Citibank (177)67 CVS Health Corp Credit Suisse 32
134 CVS Health Corp JP Morgan 65(48) CyberArk Software Ltd Bank of America
Merrill Lynch (402)(77) CyberArk Software Ltd Citibank (16)(37) CyberArk Software Ltd JP Morgan (206)(91) Danaher Corp Bank of America
Merrill Lynch (332)(28) Danaher Corp Citibank (93)(99) Danaher Corp Credit Suisse 234
(184) Danaher Corp JP Morgan 43689 Darden Restaurants Inc Citibank 13635 Darden Restaurants Inc Credit Suisse 73
(154) Datadog Inc ’A’ Citibank (163)(35) Datadog Inc ’A’ Credit Suisse (407)(55) Datadog Inc ’A’ JP Morgan (640)44 DaVita Inc Citibank (64)45 DaVita Inc JP Morgan (292)29 Deere & Co Bank of America
Merrill Lynch (533)108 Dell Technologies Inc ’C’ Bank of America
Merrill Lynch 2275 DENTSPLY SIRONA Inc Bank of America
Merrill Lynch (125)224 Devon Energy Corp Bank of America
Merrill Lynch (116)268 Devon Energy Corp Citibank 13444 Discover Financial Services JP Morgan 106
(182) DISH Network Corp ’A’ JP Morgan 438(24) DocuSign Inc Citibank (119)(29) DocuSign Inc JP Morgan (276)46 Dollar Tree Inc JP Morgan (699)14 Domino’s Pizza Inc Bank of America
Merrill Lynch (69)23 Domino’s Pizza Inc Citibank 113
186 Dover Corp Bank of AmericaMerrill Lynch 26
58 Dover Corp Citibank 4853 DR Horton Inc Citibank 182
(87) DraftKings Inc ’A’ Bank of AmericaMerrill Lynch (459)
(81) DraftKings Inc ’A’ JP Morgan (306)265 Dropbox Inc ’A’ Bank of America
Merrill Lynch 271135 Dropbox Inc ’A’ Citibank 2279 Dropbox Inc ’A’ Credit Suisse 124
203 Dropbox Inc ’A’ JP Morgan 73
BlackRock Total Advantage Fund continued
Portfolio of Investments as at 31 May 2021
The notes on pages 590 to 610 form an integral part of these financial statements.
Annual report and audited financial statements [573]

Holding Description Counterparty
Netunrealised
appreciation/(depreciation)
EUR
United States continued132 DuPont de Nemours Inc Bank of America
Merrill Lynch (77)68 DuPont de Nemours Inc Credit Suisse 162
(92) Dynatrace Inc Bank of AmericaMerrill Lynch (384)
(53) Eaton Corp Plc Bank of AmericaMerrill Lynch (7)
398 eBay Inc Bank of AmericaMerrill Lynch (264)
5 eBay Inc Citibank —179 eBay Inc JP Morgan (82)37 Ecolab Inc Credit Suisse (300)
(52) Edison International Bank of AmericaMerrill Lynch 81
(183) Edison International Citibank 375(110) Edison International JP Morgan (3)210 Edwards Lifesciences Corp Bank of America
Merrill Lynch 1,041153 Edwards Lifesciences Corp Citibank 5693 Edwards Lifesciences Corp Credit Suisse 41958 Edwards Lifesciences Corp JP Morgan 261
(110) Elanco Animal Health Inc Bank of AmericaMerrill Lynch (87)
(540) Elanco Animal Health Inc Citibank (89)(257) Elanco Animal Health Inc JP Morgan (788)186 Electronic Arts Inc Bank of America
Merrill Lynch 82350 Electronic Arts Inc Citibank 34
197 Electronic Arts Inc Credit Suisse 509235 Electronic Arts Inc JP Morgan 365(39) Eli Lilly & Co Bank of America
Merrill Lynch (135)(25) Eli Lilly & Co Credit Suisse (18)145 Emerson Electric Co Bank of America
Merrill Lynch 20170 Emerson Electric Co Credit Suisse 43
(113) Enphase Energy Inc Bank of AmericaMerrill Lynch (2,281)
14 EPAM Systems Inc JP Morgan 202(22) Equifax Inc JP Morgan 74196 Equitable Holdings Inc Bank of America
Merrill Lynch (337)(56) Erie Indemnity Co ’A’ Bank of America
Merrill Lynch (60)(77) Erie Indemnity Co ’A’ Citibank (209)
(445) Essential Utilities Inc Bank of AmericaMerrill Lynch (583)
(242) Essential Utilities Inc Citibank (59)(261) Essential Utilities Inc Credit Suisse (222)(341) Essential Utilities Inc JP Morgan (291)(17) Estee Lauder Cos Inc ’A’ Citibank (31)(23) Estee Lauder Cos Inc ’A’ JP Morgan (153)(58) Eversource Energy Bank of America
Merrill Lynch 136(62) Eversource Energy JP Morgan 8(42) Exact Sciences Corp Bank of America
Merrill Lynch (546)(41) Exact Sciences Corp Credit Suisse (393)
(101) Exact Sciences Corp JP Morgan (967)221 Exelon Corp Citibank (165)156 Exelon Corp JP Morgan 77(75) Expedia Group Inc Bank of America
Merrill Lynch (461)46 Expeditors International of
Washington IncBank of AmericaMerrill Lynch 190
59 Expeditors International ofWashington Inc Citibank 80
178 Expeditors International ofWashington Inc Credit Suisse 701
Holding Description Counterparty
Netunrealised
appreciation/(depreciation)
EUR
United States continued364 Expeditors International of
Washington Inc JP Morgan 1,682(193) Exxon Mobil Corp JP Morgan 666(38) F5 Networks Inc JP Morgan (297)124 Facebook Inc ’A’ Citibank 41712 Fair Isaac Corp Bank of America
Merrill Lynch (11)54 Fair Isaac Corp Credit Suisse 58211 Fair Isaac Corp JP Morgan 159
107 Fastenal Co Bank of AmericaMerrill Lynch (55)
37 FedEx Corp Bank of AmericaMerrill Lynch 168
41 FedEx Corp Citibank 10018 FedEx Corp Credit Suisse 82
(120) Fidelity National InformationServices Inc
Bank of AmericaMerrill Lynch (3)
(102) Fidelity National InformationServices Inc Citibank 172
(50) Fidelity National InformationServices Inc JP Morgan 20
40 First Republic Bank Credit Suisse 92(134) Fiserv Inc Bank of America
Merrill Lynch (261)(50) Fiserv Inc Citibank 27
(196) Fiserv Inc Credit Suisse 143(71) Fiserv Inc JP Morgan 55147 FMC Corp Citibank (6)31 Fortinet Inc Credit Suisse 36285 Fortinet Inc JP Morgan 99258 Fortune Brands Home &
Security Inc JP Morgan (418)36 Garmin Ltd Bank of America
Merrill Lynch 5757 Gartner Inc Citibank (41)27 Gartner Inc JP Morgan 15
(816) General Electric Co Credit Suisse (475)(902) General Electric Co JP Morgan (167)(113) General Mills Inc Bank of America
Merrill Lynch (6)(82) General Mills Inc Citibank 13
(175) General Mills Inc Credit Suisse 139(143) General Mills Inc JP Morgan 114102 Genuine Parts Co Citibank (23)149 Genuine Parts Co Credit Suisse (303)88 Genuine Parts Co JP Morgan (179)92 Gilead Sciences Inc Credit Suisse (103)
269 Gilead Sciences Inc JP Morgan (302)(63) Global Payments Inc Bank of America
Merrill Lynch 160(58) Global Payments Inc Citibank 73(3) Global Payments Inc JP Morgan 4
129 GoDaddy Inc ’A’ Citibank 101(48) Guidewire Software Inc Bank of America
Merrill Lynch (224)(962) Halliburton Co Citibank 60(36) Hasbro Inc Bank of America
Merrill Lynch 3(51) Hasbro Inc Citibank (77)(27) Hasbro Inc JP Morgan 7681 HCA Healthcare Inc Citibank 5759 HCA Healthcare Inc JP Morgan 21
75 Hershey Co Bank of AmericaMerrill Lynch 34
10 Hershey Co Citibank (9)(70) Hess Corp Bank of America
Merrill Lynch 149(72) Hess Corp Citibank 22
BlackRock Total Advantage Fund continued
Portfolio of Investments as at 31 May 2021
The notes on pages 590 to 610 form an integral part of these financial statements.
BlackRock Strategic Funds[574]

Holding Description Counterparty
Netunrealised
appreciation/(depreciation)
EUR
United States continued(135) Hess Corp JP Morgan (139)380 Hewlett Packard Enterprise
CoBank of AmericaMerrill Lynch (181)
313 Hewlett Packard EnterpriseCo JP Morgan (115)
(47) Hilton Worldwide HoldingsInc Citibank (65)
(41) Hilton Worldwide HoldingsInc JP Morgan (132)
66 Hologic Inc Bank of AmericaMerrill Lynch 23
149 Hologic Inc JP Morgan (248)43 Home Depot Inc Bank of America
Merrill Lynch 5537 Home Depot Inc Credit Suisse (244)
118 Home Depot Inc JP Morgan (2,147)(61) Horizon Therapeutics Plc Credit Suisse (271)
(421) Hormel Foods Corp Bank of AmericaMerrill Lynch (686)
(207) Hormel Foods Corp Citibank 122(45) Hormel Foods Corp JP Morgan (36)
(221) Howmet Aerospace Inc Bank of AmericaMerrill Lynch (321)
176 HP Inc Bank of AmericaMerrill Lynch (549)
685 HP Inc Citibank (1,729)419 HP Inc Credit Suisse (2,067)(10) HubSpot Inc Citibank 21
(430) Huntington Bancshares Inc Bank of AmericaMerrill Lynch 25
(246) Huntington Bancshares Inc Citibank (44)(196) Huntington Bancshares Inc JP Morgan (16)(95) IAC Via InterActive Corp Bank of America
Merrill Lynch 5,076(40) IAC Via InterActive Corp Citibank 2,747(34) IDEX Corp Credit Suisse 117
9 IDEXX Laboratories Inc Bank of AmericaMerrill Lynch 254
32 IDEXX Laboratories Inc Citibank 22010 IDEXX Laboratories Inc Credit Suisse 26926 IDEXX Laboratories Inc JP Morgan 459
122 Illinois Tool Works Inc Bank of AmericaMerrill Lynch (579)
49 Illinois Tool Works Inc Citibank (12)43 Illinois Tool Works Inc Credit Suisse (257)
(12) Illumina Inc JP Morgan (248)175 Incyte Corp Citibank 125(56) Ingersoll Rand Inc Bank of America
Merrill Lynch (40)(374) Ingersoll Rand Inc Citibank (15)(210) Ingersoll Rand Inc Credit Suisse 39(27) Ingersoll Rand Inc JP Morgan 11(19) Insulet Corp Credit Suisse (668)235 Intel Corp Bank of America
Merrill Lynch 34582 Intel Corp Credit Suisse 77
(38) International Business Ma-chines Corp JP Morgan 76
(36) International Flavors & Fra-grances Inc Citibank 6
(156) International Flavors & Fra-grances Inc Credit Suisse 133
(94) International Flavors & Fra-grances Inc JP Morgan 80
460 International Paper Co Bank of AmericaMerrill Lynch (377)
94 International Paper Co Credit Suisse 79479 Interpublic Group of Cos Inc Bank of America
Merrill Lynch 440167 Interpublic Group of Cos Inc JP Morgan 123
Holding Description Counterparty
Netunrealised
appreciation/(depreciation)
EUR
United States continued50 Intuit Inc Bank of America
Merrill Lynch 80614 Intuit Inc Citibank 5(6) Intuitive Surgical Inc Bank of America
Merrill Lynch (124)(7) Intuitive Surgical Inc Credit Suisse (42)
193 Invesco Ltd Citibank 242(100) Ionis Pharmaceuticals Inc JP Morgan (83)(48) IPG Photonics Corp JP Morgan (540)44 J M Smucker Co JP Morgan (59)
(32) Jack Henry & AssociatesInc
Bank of AmericaMerrill Lynch 61
106 Jazz Pharmaceuticals Plc Bank of AmericaMerrill Lynch 116
46 Jazz Pharmaceuticals Plc Citibank (31)77 JB Hunt Transport Services
IncBank of AmericaMerrill Lynch (286)
40 JB Hunt Transport ServicesInc Citibank 15
(130) Johnson & Johnson Citibank 138(110) Johnson & Johnson JP Morgan 54127 Johnson Controls Interna-
tional PlcBank of AmericaMerrill Lynch 66
97 Johnson Controls Interna-tional Plc Citibank 143
292 Johnson Controls Interna-tional Plc Credit Suisse 344
(472) Keurig Dr Pepper Inc Bank of AmericaMerrill Lynch (383)
(557) Keurig Dr Pepper Inc Citibank (46)(187) Keurig Dr Pepper Inc Credit Suisse (89)(179) Keurig Dr Pepper Inc JP Morgan (85)785 KeyCorp Bank of America
Merrill Lynch (309)109 Keysight Technologies Inc Bank of America
Merrill Lynch 254(48) Kimberly-Clark Corp Citibank 59(57) Kimberly-Clark Corp Credit Suisse 293
(170) Kimberly-Clark Corp JP Morgan 87398 KKR & Co Inc Citibank 3016 KLA Corp JP Morgan 223
244 Knight-Swift TransportationHoldings Inc
Bank of AmericaMerrill Lynch (232)
253 Knight-Swift TransportationHoldings Inc JP Morgan (489)
176 Kroger Co Citibank 55(26) L3Harris Technologies Inc Bank of America
Merrill Lynch (6)(25) L3Harris Technologies Inc Citibank (36)(23) L3Harris Technologies Inc Credit Suisse (27)
(105) L3Harris Technologies Inc JP Morgan (89)32 Laboratory Corp of America
Holdings JP Morgan (68)16 Lam Research Corp Bank of America
Merrill Lynch 7589 Lam Research Corp Credit Suisse 468
28 Lam Research Corp JP Morgan 1,455(162) Lamb Weston Holdings Inc Citibank (273)(12) Las Vegas Sands Corp Bank of America
Merrill Lynch (10)(581) Las Vegas Sands Corp Citibank (5)(195) Las Vegas Sands Corp JP Morgan (97)(27) Lear Corp Citibank (140)(33) Lear Corp JP Morgan (74)52 Lennar Corp ’A’ Credit Suisse (381)40 Lennox International Inc Credit Suisse (117)
(153) Liberty Broadband Corp Bank of AmericaMerrill Lynch (391)
(137) Liberty Broadband Corp Citibank 76
BlackRock Total Advantage Fund continued
Portfolio of Investments as at 31 May 2021
The notes on pages 590 to 610 form an integral part of these financial statements.
Annual report and audited financial statements [575]

Holding Description Counterparty
Netunrealised
appreciation/(depreciation)
EUR
United States continued(33) Liberty Broadband Corp Credit Suisse (14)
(130) Liberty Broadband Corp JP Morgan (101)(309) Liberty Media Corp-Liberty
Formula One ’C’ Citibank 86(17) Linde Plc Citibank 9(27) Linde Plc Credit Suisse 9(89) Linde Plc JP Morgan 30(68) Live Nation Entertainment
IncBank of AmericaMerrill Lynch (311)
(75) Live Nation EntertainmentInc Credit Suisse (433)
131 LKQ Corp Citibank 76100 LKQ Corp Credit Suisse 60163 LKQ Corp JP Morgan 134133 Loews Corp Bank of America
Merrill Lynch (8)196 Lowe’s Cos Inc Bank of America
Merrill Lynch 11227 Lowe’s Cos Inc Citibank 9233 Lowe’s Cos Inc JP Morgan (446)
(89) LyondellBasell IndustriesNV ’A’ Citibank (74)
(1) LyondellBasell IndustriesNV ’A’ Credit Suisse 1
(36) LyondellBasell IndustriesNV ’A’ JP Morgan 24
(94) Marathon Petroleum Corp Credit Suisse (153)(11) MarketAxess Holdings Inc Bank of America
Merrill Lynch (150)(11) MarketAxess Holdings Inc Citibank (91)
(106) Marriott International Inc ’A’ JP Morgan (254)(41) Marsh & McLennan Cos Inc Bank of America
Merrill Lynch (130)(149) Marsh & McLennan Cos Inc JP Morgan (68)(104) Marvell Technology Inc Credit Suisse (339)(220) Marvell Technology Inc JP Morgan (717)
76 Masco Corp Bank of AmericaMerrill Lynch (218)
283 Masco Corp Citibank (79)168 Masco Corp Credit Suisse (539)236 Masco Corp JP Morgan (1,315)21 Masimo Corp JP Morgan (22)
(34) Match Group Inc Credit Suisse (44)237 Maxim Integrated Products
IncBank of AmericaMerrill Lynch 2,055
52 Maxim Integrated ProductsInc Citibank 56
255 Maxim Integrated ProductsInc Credit Suisse 1,956
(53) McCormick & Co Inc Bank of AmericaMerrill Lynch 3
38 McDonald’s Corp JP Morgan (100)86 McKesson Corp Bank of America
Merrill Lynch (491)35 McKesson Corp Citibank (208)82 McKesson Corp JP Morgan (654)
(176) Medtronic Plc Bank of AmericaMerrill Lynch 2
(183) Medtronic Plc Citibank 134(82) Medtronic Plc Credit Suisse (36)
(218) Medtronic Plc JP Morgan 55(494) Melco Resorts & Entertain-
ment Ltd ADRBank of AmericaMerrill Lynch 45
(253) Melco Resorts & Entertain-ment Ltd ADR JP Morgan 272
(4) MercadoLibre Inc Citibank 28(5) MercadoLibre Inc Credit Suisse 106
(83) Merck & Co Inc JP Morgan 32296 MetLife Inc Citibank (2)244 MetLife Inc Credit Suisse (222)
Holding Description Counterparty
Netunrealised
appreciation/(depreciation)
EUR
United States continued281 MetLife Inc JP Morgan (256)
4 Mettler-Toledo InternationalInc
Bank of AmericaMerrill Lynch 57
6 Mettler-Toledo InternationalInc Citibank 102
16 Mettler-Toledo InternationalInc Credit Suisse 674
14 Mettler-Toledo InternationalInc JP Morgan 552
(1) MFA Financial Inc (REIT)π Bank of AmericaMerrill Lynch —
(89) Microchip Technology Inc Bank of AmericaMerrill Lynch (979)
(33) Microchip Technology Inc Citibank (77)(85) Microchip Technology Inc Credit Suisse (1,097)(86) Microchip Technology Inc JP Morgan (981)(64) Micron Technology Inc Credit Suisse (173)34 Microsoft Corp Bank of America
Merrill Lynch 125121 Microsoft Corp Citibank (109)129 Microsoft Corp JP Morgan 26430 Mohawk Industries Inc Citibank 5933 Mohawk Industries Inc JP Morgan (427)43 Molina Healthcare Inc Citibank (93)23 Molina Healthcare Inc Credit Suisse (328)10 Molson Coors Beverage Co
’B’ Citibank 5108 Mondelez International Inc
’A’ Citibank (13)(40) MongoDB Inc Bank of America
Merrill Lynch (910)(13) MongoDB Inc JP Morgan (400)48 Monolithic Power Systems
IncBank of AmericaMerrill Lynch 1,212
68 Monster Beverage Corp Citibank 5856 Monster Beverage Corp Credit Suisse 123
137 Monster Beverage Corp JP Morgan 30072 Morgan Stanley Citibank 74
180 Morgan Stanley Credit Suisse 661312 Mosaic Co JP Morgan 16129 Motorola Solutions Inc Bank of America
Merrill Lynch 111(11) MSCI Inc Credit Suisse 79(11) MSCI Inc JP Morgan 79(35) Nasdaq Inc Bank of America
Merrill Lynch (106)71 NetApp Inc Citibank (94)
243 NetApp Inc JP Morgan (297)(10) Netflix Inc Bank of America
Merrill Lynch 1(11) Netflix Inc Citibank 1(30) Netflix Inc JP Morgan (396)(54) Neurocrine Biosciences Inc Bank of America
Merrill Lynch (139)189 News Corp ’A’ Citibank 23(69) NextEra Energy Inc Bank of America
Merrill Lynch (75)(226) NextEra Energy Inc Citibank 50(71) NextEra Energy Inc Credit Suisse 92
(277) NextEra Energy Inc JP Morgan 35956 NIKE Inc ’B’ Bank of America
Merrill Lynch 238 NIKE Inc ’B’ Citibank 7570 Nordson Corp Citibank 1,10228 Norfolk Southern Corp Bank of America
Merrill Lynch (111)95 Northern Trust Corp Bank of America
Merrill Lynch 44(41) Nucor Corp Bank of America
Merrill Lynch 127
BlackRock Total Advantage Fund continued
Portfolio of Investments as at 31 May 2021
The notes on pages 590 to 610 form an integral part of these financial statements.
BlackRock Strategic Funds[576]

Holding Description Counterparty
Netunrealised
appreciation/(depreciation)
EUR
United States continued(21) Nucor Corp Citibank 14(13) Nucor Corp Credit Suisse (13)
(204) Nucor Corp JP Morgan (207)(9) NVIDIA Corp Bank of America
Merrill Lynch (613)(10) NVIDIA Corp Citibank (207)
1 NVR Inc Bank of AmericaMerrill Lynch 13
1 NVR Inc Citibank 1922 NVR Inc Credit Suisse (538)1 NVR Inc JP Morgan (269)
52 NXP Semiconductors NV Bank of AmericaMerrill Lynch 862
24 NXP Semiconductors NV Citibank 138(177) Occidental Petroleum Corp Credit Suisse 97(60) Okta Inc Bank of America
Merrill Lynch 123(23) Okta Inc Citibank 379(44) Okta Inc JP Morgan 300138 Old Dominion Freight Line
IncBank of AmericaMerrill Lynch (541)
19 Old Dominion Freight LineInc Citibank 12
20 Old Dominion Freight LineInc Credit Suisse (77)
23 Old Dominion Freight LineInc JP Morgan 54
130 Omnicom Group Inc Bank of AmericaMerrill Lynch (93)
88 Omnicom Group Inc Citibank (69)188 Omnicom Group Inc Credit Suisse (394)69 Omnicom Group Inc JP Morgan (145)
(210) ON Semiconductor Corp Citibank (120)(117) ON Semiconductor Corp JP Morgan (290)(64) Oracle Corp Bank of America
Merrill Lynch 18(144) Oracle Corp Citibank 76(95) Oracle Corp Credit Suisse 110(80) Oracle Corp JP Morgan 9211 O’Reilly Automotive Inc Citibank 119 O’Reilly Automotive Inc Credit Suisse (94)
23 O’Reilly Automotive Inc JP Morgan (341)128 Owens Corning Bank of America
Merrill Lynch 38154 Owens Corning Credit Suisse (198)58 PACCAR Inc JP Morgan (198)
(33) Packaging Corp of America Credit Suisse 30(17) Palo Alto Networks Inc Citibank 18(17) Palo Alto Networks Inc JP Morgan (305)22 Parker-Hannifin Corp Citibank 41
(22) Paycom Software Inc Citibank 123(57) PayPal Holdings Inc Credit Suisse (766)(23) PayPal Holdings Inc JP Morgan (309)(52) Peloton Interactive Inc ’A’ Citibank (390)(53) Peloton Interactive Inc ’A’ Credit Suisse (991)250 Pentair Plc Citibank 18651 PepsiCo Inc Bank of America
Merrill Lynch 74223 PepsiCo Inc Citibank 1635 PepsiCo Inc Credit Suisse 3548 PepsiCo Inc JP Morgan 48
(86) PerkinElmer Inc Bank of AmericaMerrill Lynch (130)
(38) PerkinElmer Inc Credit Suisse (158)(76) PerkinElmer Inc JP Morgan (316)
(154) Pfizer Inc Bank of AmericaMerrill Lynch —
(150) Pfizer Inc JP Morgan 139(116) Phillips 66 JP Morgan 130
Holding Description Counterparty
Netunrealised
appreciation/(depreciation)
EUR
United States continued81 Pinterest Inc ’A’ JP Morgan 461
(44) Pioneer Natural ResourcesCo
Bank of AmericaMerrill Lynch (36)
(32) Pioneer Natural ResourcesCo Credit Suisse 179
(34) Pioneer Natural ResourcesCo JP Morgan 429
(171) Plug Power Inc Bank of AmericaMerrill Lynch (807)
(127) Plug Power Inc Citibank (364)(163) Plug Power Inc Credit Suisse (1,420)(192) Plug Power Inc JP Morgan (1,672)
16 Pool Corp Citibank 7647 Pool Corp Credit Suisse (324)17 Pool Corp JP Morgan (117)
(44) PPG Industries Inc Bank of AmericaMerrill Lynch 9
(36) PPG Industries Inc JP Morgan (13)104 Principal Financial Group
Inc JP Morgan (121)(41) Procter & Gamble Co Citibank 104(37) Procter & Gamble Co JP Morgan 86
(135) Progressive Corp Bank of AmericaMerrill Lynch 827
(88) Progressive Corp JP Morgan 480180 Prudential Financial Inc Bank of America
Merrill Lynch (146)26 PTC Inc Bank of America
Merrill Lynch 138(85) Public Service Enterprise
Group Inc Citibank 2(79) Public Service Enterprise
Group Inc JP Morgan 7592 PulteGroup Inc Bank of America
Merrill Lynch (15)96 PulteGroup Inc Citibank 139
104 PulteGroup Inc JP Morgan (389)29 Qorvo Inc Citibank 9722 QUALCOMM Inc Bank of America
Merrill Lynch 85180 QUALCOMM Inc Citibank 235111 QUALCOMM Inc Credit Suisse 509189 QUALCOMM Inc JP Morgan 86743 Quest Diagnostics Inc JP Morgan (346)43 Raymond James Financial
IncBank of AmericaMerrill Lynch (47)
42 Raymond James FinancialInc Citibank (67)
254 Regions Financial Corp Bank of AmericaMerrill Lynch 2
381 Regions Financial Corp Citibank 169240 Regions Financial Corp Credit Suisse 149(37) Reinsurance Group of
America Inc Credit Suisse 60(8) RenaissanceRe Holdings
LtdBank of AmericaMerrill Lynch 9
(50) RenaissanceRe HoldingsLtd Citibank 2
(60) RenaissanceRe HoldingsLtd JP Morgan 415
(161) Republic Services Inc Bank of AmericaMerrill Lynch 112
(155) Republic Services Inc Citibank 27(102) Republic Services Inc JP Morgan 240(23) ResMed Inc Credit Suisse (238)(47) RingCentral Inc ’A’ Bank of America
Merrill Lynch (1,038)(15) RingCentral Inc ’A’ Citibank (194)(19) RingCentral Inc ’A’ JP Morgan (32)
BlackRock Total Advantage Fund continued
Portfolio of Investments as at 31 May 2021
The notes on pages 590 to 610 form an integral part of these financial statements.
Annual report and audited financial statements [577]

Holding Description Counterparty
Netunrealised
appreciation/(depreciation)
EUR
United States continued160 Robert Half International
IncBank of AmericaMerrill Lynch (123)
66 Robert Half InternationalInc Citibank 42
96 Robert Half InternationalInc Credit Suisse (158)
35 Rockwell Automation Inc Citibank 3828 Rockwell Automation Inc Credit Suisse (163)
(323) Rollins Inc Bank of AmericaMerrill Lynch 532
(64) Roper Technologies Inc Bank of AmericaMerrill Lynch (890)
(16) Roper Technologies Inc Citibank (73)(15) Roper Technologies Inc Credit Suisse (69)(78) Roper Technologies Inc JP Morgan (330)96 Ross Stores Inc Citibank 229
(64) Royal Caribbean CruisesLtd
Bank of AmericaMerrill Lynch (458)
(58) Royal Caribbean CruisesLtd Citibank (201)
(62) Royal Caribbean CruisesLtd Credit Suisse (475)
(121) Royalty Pharma Plc ’A’ JP Morgan 136(13) S&P Global Inc Bank of America
Merrill Lynch (48)(17) S&P Global Inc JP Morgan 152
(132) salesforce.com Inc Bank of AmericaMerrill Lynch (2,492)
(27) salesforce.com Inc Citibank (246)(47) salesforce.com Inc Credit Suisse (932)(87) salesforce.com Inc JP Morgan (1,446)
(223) Sarepta Therapeutics Inc Bank of AmericaMerrill Lynch 273
(70) Sarepta Therapeutics Inc Credit Suisse (322)(43) Sarepta Therapeutics Inc JP Morgan (198)
(922) Schlumberger NV JP Morgan 79(67) Seagen Inc Citibank (92)(36) Seagen Inc Credit Suisse (573)(40) Seagen Inc JP Morgan (637)109 Sealed Air Corp Bank of America
Merrill Lynch 29398 Sealed Air Corp JP Morgan 13(82) SEI Investments Co Citibank (37)(97) Sempra Energy Citibank 15
2 ServiceNow Inc Citibank (4)9 ServiceNow Inc Credit Suisse 52
31 ServiceNow Inc JP Morgan 18020 Sherwin-Williams Co Bank of America
Merrill Lynch (22)131 Sherwin-Williams Co Credit Suisse (412)60 Sherwin-Williams Co JP Morgan (191)
2,509 Sirius XM Holdings Inc Citibank 22668 Skyworks Solutions Inc JP Morgan 226
(179) Slack Technologies Inc ’A’ Bank of AmericaMerrill Lynch (422)
(95) Snap Inc ’A’ Credit Suisse (777)(16) Snowflake Inc ’A’ Bank of America
Merrill Lynch (333)(24) Snowflake Inc ’A’ JP Morgan (869)(38) SolarEdge Technologies Inc Credit Suisse (709)(42) SolarEdge Technologies Inc JP Morgan (1,537)(97) Southwest Airlines Co Bank of America
Merrill Lynch 51(78) Southwest Airlines Co Citibank (50)(82) Southwest Airlines Co JP Morgan (7)(41) Splunk Inc Bank of America
Merrill Lynch 8(51) Splunk Inc Citibank (63)(47) Splunk Inc JP Morgan (287)
Holding Description Counterparty
Netunrealised
appreciation/(depreciation)
EUR
United States continued(22) Square Inc ’A’ Bank of America
Merrill Lynch (353)(21) Square Inc ’A’ Citibank (199)(15) Square Inc ’A’ Credit Suisse (75)(68) SS&C Technologies Hold-
ings IncBank of AmericaMerrill Lynch 13
23 Stanley Black & Decker Inc Citibank 98177 Starbucks Corp Bank of America
Merrill Lynch 42184 Starbucks Corp Citibank 9446 Starbucks Corp Credit Suisse 46
277 Starbucks Corp JP Morgan (95)123 State Street Corp Citibank 57
(208) Steel Dynamics Inc Bank of AmericaMerrill Lynch 360
(112) Steel Dynamics Inc JP Morgan 142(30) STERIS Plc JP Morgan 412
(197) Sunrun Inc Bank of AmericaMerrill Lynch (380)
(103) Sunrun Inc Citibank 11(232) Sunrun Inc JP Morgan (745)116 Synchrony Financial JP Morgan 13252 Synopsys Inc Bank of America
Merrill Lynch 781107 Synopsys Inc Citibank 42420 Synopsys Inc Credit Suisse 360
160 Synopsys Inc JP Morgan 2,87827 T Rowe Price Group Inc Citibank 7752 Take-Two Interactive Soft-
ware Inc Credit Suisse 70538 Take-Two Interactive Soft-
ware Inc JP Morgan 51527 Target Corp Bank of America
Merrill Lynch 37452 Target Corp Citibank 6424 Target Corp Credit Suisse 25327 Target Corp JP Morgan 285
(52) TE Connectivity Ltd Citibank (49)(38) TE Connectivity Ltd Credit Suisse 26
(109) TE Connectivity Ltd JP Morgan 73(70) Teladoc Health Inc Bank of America
Merrill Lynch (534)(26) Teladoc Health Inc Credit Suisse (203)(90) Teladoc Health Inc JP Morgan (703)(12) Teledyne Technologies Inc Bank of America
Merrill Lynch (81)(24) Teledyne Technologies Inc Citibank (173)(32) Teleflex Inc Bank of America
Merrill Lynch (235)(17) Teleflex Inc Credit Suisse 76132 Teradyne Inc Citibank 504(15) Tesla Inc Bank of America
Merrill Lynch (595)(6) Tesla Inc Citibank (92)(9) Tesla Inc Credit Suisse (380)
(583) Teva Pharmaceutical Indus-tries Ltd ADR
Bank of AmericaMerrill Lynch 172
27 Texas Instruments Inc Bank of AmericaMerrill Lynch 199
26 Texas Instruments Inc Citibank 2468 Texas Instruments Inc JP Morgan 433
(11) Thermo Fisher Scientific Inc Bank of AmericaMerrill Lynch (149)
(11) Thermo Fisher Scientific Inc Credit Suisse (54)(41) Thermo Fisher Scientific Inc JP Morgan (203)129 TJX Cos Inc Bank of America
Merrill Lynch (472)91 TJX Cos Inc Citibank 2972 TJX Cos Inc Credit Suisse (322)
BlackRock Total Advantage Fund continued
Portfolio of Investments as at 31 May 2021
The notes on pages 590 to 610 form an integral part of these financial statements.
BlackRock Strategic Funds[578]

Holding Description Counterparty
Netunrealised
appreciation/(depreciation)
EUR
United States continued(298) T-Mobile US Inc Bank of America
Merrill Lynch (305)(145) T-Mobile US Inc Credit Suisse (607)(193) T-Mobile US Inc JP Morgan (892)
54 Tractor Supply Co Citibank (4)30 Tractor Supply Co JP Morgan (344)(7) Trade Desk Inc ’A’ Citibank (187)
(10) Trade Desk Inc ’A’ Credit Suisse (392)(75) Tradeweb Markets Inc ’A’ Bank of America
Merrill Lynch (1)68 Trane Technologies Plc Credit Suisse 57
(73) TransUnion Bank of AmericaMerrill Lynch 62
(66) TransUnion Credit Suisse (26)(52) TransUnion JP Morgan (20)(72) Travelers Cos Inc Bank of America
Merrill Lynch 3262 Trimble Inc Bank of America
Merrill Lynch 7964 Trimble Inc JP Morgan 286 Truist Financial Corp Citibank 40
(65) Twilio Inc ’A’ Bank of AmericaMerrill Lynch (2,067)
(15) Twilio Inc ’A’ Citibank (146)(28) Twilio Inc ’A’ Credit Suisse (948)(70) Twitter Inc Bank of America
Merrill Lynch (310)(75) Twitter Inc Citibank (58)(97) Twitter Inc JP Morgan (441)(1) Tyler Technologies Inc Bank of America
Merrill Lynch (9)(1) Tyler Technologies Inc Citibank 1
(13) Tyler Technologies Inc Credit Suisse (117)(29) Tyler Technologies Inc JP Morgan (260)65 Tyson Foods Inc ’A’ Bank of America
Merrill Lynch (59)104 Tyson Foods Inc ’A’ Citibank (90)65 Tyson Foods Inc ’A’ Credit Suisse 36
(199) Uber Technologies Inc Citibank (130)492 UGI Corp Credit Suisse (65)139 UGI Corp JP Morgan (18)15 Ulta Salon Cosmetics & Fra-
grance Inc Citibank 36325 Union Pacific Corp JP Morgan (76)29 United Parcel Service Inc ’B’ Citibank 2825 United Rentals Inc Citibank 165
(21) UnitedHealth Group Inc Bank of AmericaMerrill Lynch (57)
(13) UnitedHealth Group Inc JP Morgan 9645 Universal Health Services
Inc ’B’Bank of AmericaMerrill Lynch (36)
77 Universal Health ServicesInc ’B’ Citibank 40
36 Universal Health ServicesInc ’B’ JP Morgan 76
18 Vail Resorts Inc Credit Suisse 13117 Vail Resorts Inc JP Morgan 124
(130) Valero Energy Corp Bank of AmericaMerrill Lynch 130
(64) Valero Energy Corp Credit Suisse (160)(62) Valero Energy Corp JP Morgan (39)20 Veeva Systems Inc ’A’ Bank of America
Merrill Lynch 71217 Veeva Systems Inc ’A’ Credit Suisse 58819 Veeva Systems Inc ’A’ JP Morgan 65725 VeriSign Inc Citibank (94)
(30) Verisk Analytics Inc Bank of AmericaMerrill Lynch 3
(106) Verisk Analytics Inc Citibank 116
Holding Description Counterparty
Netunrealised
appreciation/(depreciation)
EUR
United States continued257 Verizon Communications
IncBank of AmericaMerrill Lynch (305)
90 Verizon CommunicationsInc Citibank (36)
261 Verizon CommunicationsInc Credit Suisse (648)
23 Vertex Pharmaceuticals Inc Bank of AmericaMerrill Lynch (145)
75 Vertex Pharmaceuticals Inc Citibank (159)26 Vertex Pharmaceuticals Inc Credit Suisse (91)90 Vertex Pharmaceuticals Inc JP Morgan (315)
(81) VF Corp Citibank (60)(719) Viatris Inc Bank of America
Merrill Lynch 536(765) Viatris Inc Credit Suisse (125)(613) Viatris Inc JP Morgan (100)(154) Vimeo Inc Bank of America
Merrill Lynch (5,300)(64) Vimeo Inc Citibank (2,203)
(378) Visa Inc ’A’ Citibank 537(11) Visa Inc ’A’ JP Morgan (12)33 VMware Inc ’A’ Bank of America
Merrill Lynch (151)76 Voya Financial Inc Bank of America
Merrill Lynch 12(73) W R Berkley Corp Credit Suisse 173(92) Walgreens Boots Alliance
Inc JP Morgan 185(99) Walt Disney Co Bank of America
Merrill Lynch (695)(36) Walt Disney Co Citibank (128)(27) Walt Disney Co Credit Suisse 125(16) Waste Connections Inc Bank of America
Merrill Lynch 7(71) Waste Connections Inc Citibank (34)(44) Waste Connections Inc Credit Suisse 79(48) Waste Connections Inc JP Morgan 86
(176) Waste Management Inc Bank of AmericaMerrill Lynch 120
(49) Waste Management Inc Citibank 17(143) Waste Management Inc Credit Suisse 302(99) Waste Management Inc JP Morgan 20916 Waters Corp Citibank 2718 Waters Corp Credit Suisse 6834 Waters Corp JP Morgan 129
(173) Wells Fargo & Co Bank of AmericaMerrill Lynch 167
(167) Wells Fargo & Co Citibank (66)62 West Pharmaceutical Ser-
vices IncBank of AmericaMerrill Lynch 1,057
32 West Pharmaceutical Ser-vices Inc Credit Suisse 201
47 West Pharmaceutical Ser-vices Inc JP Morgan 531
(26) Western Digital Corp Bank of AmericaMerrill Lynch 25
(49) Western Digital Corp Citibank (53)(79) Western Digital Corp Credit Suisse (428)231 Western Union Co Citibank (44)194 Western Union Co JP Morgan (211)
(150) Westinghouse Air BrakeTechnologies Corp JP Morgan (234)
110 Westrock Co Citibank 531 Whirlpool Corp Bank of America
Merrill Lynch (214)81 Whirlpool Corp Citibank 13921 Whirlpool Corp Credit Suisse (253)
(21) Willis Towers Watson Plc Citibank 27(24) Willis Towers Watson Plc JP Morgan 148
BlackRock Total Advantage Fund continued
Portfolio of Investments as at 31 May 2021
The notes on pages 590 to 610 form an integral part of these financial statements.
Annual report and audited financial statements [579]

Holding Description Counterparty
Netunrealised
appreciation/(depreciation)
EUR
United States continued(20) Wix.com Ltd Credit Suisse 356(23) Wix.com Ltd JP Morgan (669)48 Workday Inc ’A’ Credit Suisse (234)50 WW Grainger Inc Bank of America
Merrill Lynch (201)12 WW Grainger Inc JP Morgan (119)
(85) Wynn Resorts Ltd JP Morgan (428)83 Xilinx Inc Citibank 22078 Xilinx Inc JP Morgan 32964 Yum! Brands Inc Bank of America
Merrill Lynch 69227 Yum! Brands Inc Citibank (102)44 Yum! Brands Inc Credit Suisse (70)11 Zebra Technologies Corp ’A’ Citibank (41)11 Zebra Technologies Corp ’A’ JP Morgan 117
(147) Zendesk Inc JP Morgan (570)42 Zimmer Biomet Holdings Inc JP Morgan (125)
(77) Zoetis Inc Bank of AmericaMerrill Lynch (404)
(33) Zoetis Inc Citibank (8)(29) Zoetis Inc Credit Suisse (131)(13) Zoom Video Communica-
tions Inc ’A’Bank of AmericaMerrill Lynch (241)
(31) Zoom Video Communica-tions Inc ’A’ Credit Suisse (598)
(16) Zoom Video Communica-tions Inc ’A’ JP Morgan (564)
(26) Zscaler Inc Bank of AmericaMerrill Lynch (659)
(27) Zscaler Inc Citibank (438)(37) Zscaler Inc JP Morgan (862)
(50,542)
Total (Gross underlying exposure - EUR 18,343,112) (65,740)
π Amounts which are less than 0.5 USD have been rounded down to zero.
BlackRock Total Advantage Fund continued
Portfolio of Investments as at 31 May 2021
The notes on pages 590 to 610 form an integral part of these financial statements.
BlackRock Strategic Funds[580]

TypeNominal
Value Description CounterpartyExpiration
date
Net unrealisedappreciation/
(depreciation)EUR
MarketValue
EUR
Financial Derivative Instruments
SWAPS
TRS BRL 2 Fund receives Ibovespa Index and pays Fixed 0.000%Bank of America
Merrill Lynch 16/6/2021 2,344 2,344
TRS BRL 6 Fund receives Ibovespa Index and pays Fixed 0.000%Bank of America
Merrill Lynch 16/6/2021 4,756 4,756
TRS BRL 4 Fund receives Ibovespa Index and pays Fixed 0.000%Bank of America
Merrill Lynch 16/6/2021 1,383 1,383
TRS BRL 1 Fund receives Ibovespa Index and pays Fixed 0.000%Bank of America
Merrill Lynch 16/6/2021 51 51
TRS KRW 250,000 Fund receives KOSPI 200 Index and pays Fixed 0.000%Bank of America
Merrill Lynch 10/6/2021 4,539 4,539
TRS KRW 250,000 Fund receives KOSPI 200 Index and pays Fixed 0.000%Bank of America
Merrill Lynch 10/6/2021 2,464 2,464
TRS KRW 250,000 Fund receives KOSPI 200 Index and pays Fixed 0.000%Bank of America
Merrill Lynch 10/6/2021 1,590 1,590
TRS KRW 250,000 Fund receives KOSPI 200 Index and pays Fixed 0.000%Bank of America
Merrill Lynch 10/6/2021 (354) (354)
TRS KRW 250,000 Fund receives KOSPI 200 Index and pays Fixed 0.000%Bank of America
Merrill Lynch 10/6/2021 (14) (14)
TRS KRW 250,000 Fund receives KOSPI 200 Index and pays Fixed 0.000%Bank of America
Merrill Lynch 10/6/2021 (119) (119)
TRS KRW 250,000 Fund receives KOSPI 200 Index and pays Fixed 0.000%Bank of America
Merrill Lynch 10/6/2021 674 674
TRS KRW 250,000 Fund receives KOSPI 200 Index and pays Fixed 0.000%Bank of America
Merrill Lynch 10/6/2021 1,340 1,340
TRS KRW 500,000 Fund receives KOSPI 200 Index and pays Fixed 0.000%Bank of America
Merrill Lynch 10/6/2021 1,031 1,031
TRS TWD 2,400 Fund receives TAIEX Futures Index and pays Fixed 0.000%Bank of America
Merrill Lynch 16/6/2021 91,235 91,235
TRS TWD 800 Fund receives TAIEX Futures Index and pays Fixed 0.000%Bank of America
Merrill Lynch 16/6/2021 22,628 22,628
TRS THB 6,200 Fund receives SET50 Futures Index and pays Fixed 0.000% Credit Suisse 29/6/2021 (717) (717)
TRS THB 1,600 Fund receives SET50 Futures Index and pays Fixed 0.000% Credit Suisse 29/6/2021 (293) (293)
TRS USD 238,641Fund receives Fixed 1.000% and pays MSCI Hong Kong Net Total
Return US Goldman Sachs 16/2/2022 7,282 7,282
TRS PLN 60 Fund receives WIG20 Index and pays Fixed 0.000% HSBC 18/6/2021 3,009 3,009
TRS PLN 220 Fund receives WIG20 Index and pays Fixed 0.000% HSBC 18/6/2021 16,543 16,543
TRS PLN 120 Fund receives WIG20 Index and pays Fixed 0.000% HSBC 18/6/2021 7,996 7,996
TRS PLN 140 Fund receives WIG20 Index and pays Fixed 0.000% HSBC 18/6/2021 8,361 8,361
TRS PLN 180 Fund receives WIG20 Index and pays Fixed 0.000% HSBC 18/6/2021 9,946 9,946
TRS PLN 60 Fund receives WIG20 Index and pays Fixed 0.000% HSBC 18/6/2021 2,646 2,646
TRS PLN 60 Fund receives WIG20 Index and pays Fixed 0.000% HSBC 18/6/2021 2,459 2,459
TRS PLN 80 Fund receives WIG20 Index and pays Fixed 0.000% HSBC 18/6/2021 2,314 2,314
Total (Gross underlying exposure - EUR 3,413,424) 193,094 193,094
TRS: Total Return Swaps
Numberof
contractsCurrencyof contracts
Contract/Description
Expirationdate
Grossunderlying
exposureEUR
Net unrealisedappreciation/
(depreciation)EUR
Financial Derivative Instruments
FUTURES
91 AUD Australian 10 Year Bond Futures June 2021 June 2021 8,076,493 78,703
21 EUR CAC 40 Index Futures June 2021 June 2021 1,356,600 36,630
(19) CAD Canadian 10 Year Bond Futures September 2021 September 2021 1,857,569 (4,253)
3 USD E-Mini S&P 500 Index Futures June 2021 June 2021 516,912 15,922
44 EUR Euro Bund Futures June 2021 June 2021 7,471,640 (60,900)
BlackRock Total Advantage Fund continued
Portfolio of Investments as at 31 May 2021
The notes on pages 590 to 610 form an integral part of these financial statements.
Annual report and audited financial statements [581]

Numberof
contractsCurrencyof contracts
Contract/Description
Expirationdate
Grossunderlying
exposureEUR
Net unrealisedappreciation/
(depreciation)EUR
Financial Derivative Instruments
FUTURES
(11) GBP FTSE 100 Index Futures June 2021 June 2021 897,044 (13,620)
64 USD FTSE China A50 Futures June 2021 June 2021 952,238 13,610
12 EUR FTSE MIB Index Futures June 2021 June 2021 1,514,700 50,985
(15) ZAR FTSE/JSE Top 40 Index Futures June 2021 June 2021 553,338 (3,989)
(3) EUR IBEX 35 Index Futures June 2021 June 2021 274,890 (1,690)
21 USD MSCI Hong Kong Index Futures June 2021 June 2021 1,391,396 (2,147)
11 SGD MSCI Singapore Index Futures June 2021 June 2021 245,189 1,553
(21) SEK OMX Stockholm 30 Index Futures June 2021 June 2021 466,972 (3,096)
(4) CAD S&P/TSX 60 Index Futures June 2021 June 2021 644,969 (22,253)
(23) USD SGX NIFTY 50 Futures June 2021 June 2021 587,250 (10,862)
(6) AUD SPI 200 Index Futures June 2021 June 2021 681,677 (33,849)
15 CHF Swiss Market Index Futures June 2021 June 2021 1,553,767 88,899
6 JPY Topix Index Futures June 2021 June 2021 864,768 4,832
(1) GBP UK Long Gilt Bond Futures September 2021 September 2021 147,749 (279)
(12) USD US Treasury 10 Year Note Futures September 2021 September 2021 1,296,091 (652)
Total 31,351,252 133,544
Currency Purchases Currency Sales CounterpartyMaturity
date
Netunrealised
appreciation/(depreciation)
EUR
Financial Derivative Instruments
OPEN FORWARD FOREIGN EXCHANGE TRANSACTIONS
AUD 5,000 EUR 3,203 UBS 2/6/2021 (32)
AUD 17,000 EUR 10,856Bank of America
Merrill Lynch 16/6/2021 (77)AUD 104,000 EUR 66,631 Citibank 16/6/2021 (690)AUD 104,000 EUR 66,590 Citibank 21/7/2021 (683)
AUD 17,000 EUR 10,849Standard
Chartered Bank 21/7/2021 (76)BRL 1,466,000 USD 270,975 BNP Paribas 16/6/2021 8,021BRL 1,914,000 USD 334,616 Citibank 16/6/2021 26,173BRL 1,399,000 USD 254,841 Morgan Stanley 16/6/2021 10,726BRL 240,000 USD 44,888 Citibank 21/7/2021 756BRL 1,230,000 USD 225,958 Goldman Sachs 21/7/2021 7,227BRL 1,238,000 USD 215,570 HSBC 21/7/2021 16,981
BRL 1,405,000 USD 255,206Standard
Chartered Bank 21/7/2021 10,630BRL 2,012,000 USD 380,829 Citibank 18/8/2021 1,697
CAD 16,000 EUR 10,796Bank of America
Merrill Lynch 2/6/2021 56
CAD 1,280,423 EUR 849,266Bank of America
Merrill Lynch 16/6/2021 18,899
CAD 251,000 EUR 169,600Standard
Chartered Bank 16/6/2021 586CAD 1,411,000 EUR 944,393 Morgan Stanley 21/7/2021 11,627CAD 1,406,000 EUR 954,986 Westpac 18/8/2021 (2,894)CHF 156,000 EUR 141,148 Morgan Stanley 16/6/2021 824
CLP 138,359,000 USD 187,580Bank of America
Merrill Lynch 16/6/2021 3,462CLP 189,298,000 USD 268,234 Citibank 16/6/2021 (4,760)CLP 52,167,000 USD 72,497 Deutsche Bank 16/6/2021 (146)CLP 24,504,000 USD 33,581 Goldman Sachs 16/6/2021 318CLP 189,404,000 USD 268,388 Citibank 21/7/2021 (4,821)CLP 16,439,000 USD 22,446 Goldman Sachs 21/7/2021 276
Currency Purchases Currency Sales CounterpartyMaturity
date
Netunrealised
appreciation/(depreciation)
EUR
Financial Derivative Instruments
OPEN FORWARD FOREIGN EXCHANGE TRANSACTIONS
CLP 16,450,000 USD 22,457 Goldman Sachs 18/8/2021 275
EUR 130,878 AUD 204,000Bank of America
Merrill Lynch 2/6/2021 1,506EUR 118,734 AUD 185,000 Barclays Bank 2/6/2021 1,411EUR 118,665 AUD 185,000 Deutsche Bank 2/6/2021 1,342EUR 118,643 AUD 185,000 Goldman Sachs 2/6/2021 1,320EUR 120,064 AUD 187,217 Morgan Stanley 2/6/2021 1,336EUR 183,568 AUD 286,000 Deutsche Bank 16/6/2021 2,231EUR 66,898 AUD 104,000 Goldman Sachs 16/6/2021 957EUR 1,477,747 AUD 2,291,154 HSBC 16/6/2021 25,051
EUR 54,478 AUD 85,000Standard
Chartered Bank 16/6/2021 584
EUR 55,098 AUD 85,000State Street Bank& Trust Company 16/6/2021 1,204
EUR 66,860 AUD 104,000 Goldman Sachs 21/7/2021 953
EUR 54,446 AUD 85,000State Street Bank& Trust Company 21/7/2021 579
EUR 147,799 AUD 231,000 Westpac 21/7/2021 1,408EUR 66,825 AUD 104,000 Goldman Sachs 18/8/2021 946EUR 14,202 AUD 22,000 Westpac 18/8/2021 267
EUR 101,090 CAD 150,000Bank of America
Merrill Lynch 2/6/2021 (644)EUR 101,072 CAD 150,000 Barclays Bank 2/6/2021 (662)EUR 101,113 CAD 150,000 Deutsche Bank 2/6/2021 (621)EUR 101,767 CAD 151,000 Goldman Sachs 2/6/2021 (646)EUR 116,664 CAD 173,115 Morgan Stanley 2/6/2021 (748)EUR 11,460 CAD 17,000 Citibank 16/6/2021 (67)
EUR 325,133 CAD 482,000Standard
Chartered Bank 16/6/2021 (1,677)
EUR 134,329 CAD 198,000State Street Bank& Trust Company 16/6/2021 78
EUR 11,452 CAD 17,000 Citibank 21/7/2021 (66)
BlackRock Total Advantage Fund continued
Portfolio of Investments as at 31 May 2021
The notes on pages 590 to 610 form an integral part of these financial statements.
BlackRock Strategic Funds[582]

Currency Purchases Currency Sales CounterpartyMaturity
date
Netunrealised
appreciation/(depreciation)
EUR
Financial Derivative Instruments
OPEN FORWARD FOREIGN EXCHANGE TRANSACTIONS
EUR 255,696 CAD 379,000Standard
Chartered Bank 21/7/2021 (1,095)
EUR 119,492 CAD 176,000State Street Bank& Trust Company 21/7/2021 243
EUR 155,604 CAD 229,000 Goldman Sachs 18/8/2021 533
EUR 119,425 CAD 176,000State Street Bank& Trust Company 18/8/2021 244
EUR 158,962 CHF 176,185 Goldman Sachs 16/6/2021 (1,380)
EUR 50,067 CHF 55,000Standard
Chartered Bank 16/6/2021 13
EUR 119,270 CHF 132,000State Street Bank& Trust Company 16/6/2021 (859)
EUR 146,615 CNH 1,150,000 HSBC 16/6/2021 (1,156)EUR 144,904 CNH 1,140,000 HSBC 21/7/2021 (1,158)
EUR 145,826 CNH 1,150,000Toronto Dominion
Bank 18/8/2021 (1,194)
EUR 97,766 GBP 85,000Bank of America
Merrill Lynch 2/6/2021 (927)EUR 97,822 GBP 85,000 Barclays Bank 2/6/2021 (871)EUR 102,204 GBP 89,000 Deutsche Bank 2/6/2021 (1,134)EUR 97,665 GBP 85,000 Goldman Sachs 2/6/2021 (1,028)EUR 115,175 GBP 100,219 Morgan Stanley 2/6/2021 (1,188)
EUR 64,389 GBP 55,000Bank of America
Merrill Lynch 16/6/2021 545EUR 35,909 GBP 31,000 Citibank 16/6/2021 (76)EUR 84,972 GBP 73,000 Deutsche Bank 16/6/2021 234EUR 56,123 GBP 48,298 JP Morgan 16/6/2021 58EUR 37,044 GBP 32,000 Citibank 21/7/2021 (78)
EUR 84,918 GBP 73,000Standard
Chartered Bank 21/7/2021 234EUR 37,028 GBP 32,000 Morgan Stanley 18/8/2021 (75)
EUR 84,870 GBP 73,000State Street Bank& Trust Company 18/8/2021 230
EUR 13,997 HKD 129,468 Morgan Stanley 16/6/2021 331EUR 46,561 HUF 17,181,000 Barclays Bank 16/6/2021 (2,841)EUR 70,797 HUF 25,535,000 HSBC 16/6/2021 (2,626)
EUR 169,761 HUF 61,277,000Standard
Chartered Bank 16/6/2021 (6,434)EUR 70,774 HUF 25,561,000 HSBC 21/7/2021 (2,625)
EUR 73,267 HUF 26,632,000Standard
Chartered Bank 21/7/2021 (3,208)
EUR 96,447 HUF 34,708,000State Street Bank& Trust Company 21/7/2021 (3,218)
EUR 96,450 HUF 34,744,000Standard
Chartered Bank 18/8/2021 (3,201)
EUR 53,761 JPY 7,072,000Standard
Chartered Bank 16/6/2021 916
EUR 53,745 JPY 7,073,000Standard
Chartered Bank 21/7/2021 915
EUR 26,059 MXN 635,000Bank of America
Merrill Lynch 16/6/2021 (34)EUR 89,144 MXN 2,186,000 Citibank 16/6/2021 (680)EUR 41,120 MXN 1,027,000 Goldman Sachs 16/6/2021 (1,080)EUR 48,841 MXN 1,191,000 JP Morgan 16/6/2021 (97)
EUR 88,784 MXN 2,152,000State Street Bank& Trust Company 16/6/2021 356
EUR 26,057 MXN 638,000Bank of America
Merrill Lynch 21/7/2021 (39)EUR 89,130 MXN 2,196,000 Citibank 21/7/2021 (694)EUR 48,820 MXN 1,196,000 Goldman Sachs 21/7/2021 (101)
EUR 88,819 MXN 2,163,000State Street Bank& Trust Company 21/7/2021 344
EUR 258,888 MXN 6,346,000 Goldman Sachs 18/8/2021 256
Currency Purchases Currency Sales CounterpartyMaturity
date
Netunrealised
appreciation/(depreciation)
EUR
Financial Derivative Instruments
OPEN FORWARD FOREIGN EXCHANGE TRANSACTIONS
EUR 37,453 MXN 919,000State Street Bank& Trust Company 18/8/2021 (1)
EUR 278,798 NOK 2,833,000 Goldman Sachs 16/6/2021 702
EUR 190,076 NOK 1,905,000State Street Bank& Trust Company 16/6/2021 3,076
EUR 331,154 NOK 3,359,000 HSBC 21/7/2021 1,629EUR 79,672 NOK 798,000 JP Morgan 21/7/2021 1,387EUR 297,442 NOK 2,985,000 HSBC 18/8/2021 4,756EUR 380,128 NZD 634,000 Goldman Sachs 16/6/2021 2,641
EUR 27,684 NZD 47,000State Street Bank& Trust Company 16/6/2021 (300)
EUR 48,282 NZD 81,000Toronto Dominion
Bank 16/6/2021 54EUR 54,730 NZD 92,000 Westpac 16/6/2021 (47)EUR 236,249 NZD 400,000 Goldman Sachs 21/7/2021 (1,729)
EUR 48,236 NZD 81,000Standard
Chartered Bank 21/7/2021 46
EUR 27,659 NZD 47,000State Street Bank& Trust Company 21/7/2021 (303)
EUR 288,365 NZD 482,000 Morgan Stanley 18/8/2021 1,783EUR 82,878 PLN 378,000 HSBC 16/6/2021 (1,394)EUR 150,847 PLN 699,000 Morgan Stanley 16/6/2021 (4,990)
EUR 18,964 PLN 87,000Standard
Chartered Bank 16/6/2021 (432)
EUR 290,988 PLN 1,321,000State Street Bank& Trust Company 16/6/2021 (3,518)
EUR 20,227 PLN 92,000 UBS 16/6/2021 (284)EUR 82,832 PLN 378,000 HSBC 21/7/2021 (1,397)
EUR 258,335 PLN 1,167,000State Street Bank& Trust Company 21/7/2021 (1,706)
EUR 195,419 PLN 887,000 UBS 21/7/2021 (2,230)EUR 116,442 PLN 532,000 Goldman Sachs 18/8/2021 (2,048)EUR 142,364 PLN 640,000 UBS 18/8/2021 (180)EUR 99,111 SEK 1,013,000 Deutsche Bank 16/6/2021 (977)EUR 232,720 SEK 2,370,200 Goldman Sachs 16/6/2021 (1,465)EUR 9,241 SEK 94,000 HSBC 16/6/2021 (47)EUR 50,433 SEK 510,000 JP Morgan 16/6/2021 43EUR 169,975 SEK 1,726,000 Morgan Stanley 16/6/2021 (560)
EUR 30,940 SEK 315,000State Street Bank& Trust Company 16/6/2021 (183)
EUR 131,988 SEK 1,343,000 Goldman Sachs 21/7/2021 (653)EUR 9,237 SEK 94,000 HSBC 21/7/2021 (47)EUR 50,413 SEK 510,000 JP Morgan 21/7/2021 43EUR 146,665 SEK 1,490,000 Morgan Stanley 21/7/2021 (495)
EUR 99,166 SEK 1,014,000Standard
Chartered Bank 21/7/2021 (981)EUR 50,397 SEK 510,000 JP Morgan 18/8/2021 43EUR 146,617 SEK 1,490,000 Morgan Stanley 18/8/2021 (496)EUR 148,584 SEK 1,505,000 UBS 18/8/2021 (10)EUR 99,353 SGD 157,000 BNP Paribas 16/6/2021 2,054EUR 8,755 SGD 14,000 Goldman Sachs 16/6/2021 79EUR 125,582 SGD 202,000 HSBC 16/6/2021 394EUR 79,561 SGD 128,000 JP Morgan 16/6/2021 234EUR 8,748 SGD 14,000 Goldman Sachs 21/7/2021 78EUR 225,551 SGD 362,000 HSBC 21/7/2021 1,378EUR 332,181 THB 12,198,000 HSBC 16/6/2021 12,292EUR 80,820 THB 3,042,000 Citibank 21/7/2021 1,106
EUR 99,274 USD 120,000Bank of America
Merrill Lynch 2/6/2021 945EUR 99,290 USD 120,000 Barclays Bank 2/6/2021 962EUR 7,477 USD 9,000 Citibank 2/6/2021 102
BlackRock Total Advantage Fund continued
Portfolio of Investments as at 31 May 2021
The notes on pages 590 to 610 form an integral part of these financial statements.
Annual report and audited financial statements [583]

Currency Purchases Currency Sales CounterpartyMaturity
date
Netunrealised
appreciation/(depreciation)
EUR
Financial Derivative Instruments
OPEN FORWARD FOREIGN EXCHANGE TRANSACTIONS
EUR 99,257 USD 120,000 Deutsche Bank 2/6/2021 929EUR 99,281 USD 120,000 Goldman Sachs 2/6/2021 953EUR 105,438 USD 127,418 Morgan Stanley 2/6/2021 1,032EUR 4,746,546 USD 5,660,064 Barclays Bank 16/6/2021 109,916EUR 46,513 USD 57,000 Citibank 16/6/2021 (181)EUR 136,037 USD 161,000 Deutsche Bank 16/6/2021 4,148EUR 281,331 USD 330,000 JP Morgan 16/6/2021 11,001
EUR 234,849 USD 282,000Standard
Chartered Bank 16/6/2021 3,839
EUR 281,146 USD 339,000Standard
Chartered Bank 21/7/2021 3,629EUR 599,616 USD 715,240 Westpac 21/7/2021 14,099
EUR 46,455 USD 57,000Standard
Chartered Bank 18/8/2021 (182)EUR 12,702 ZAR 227,000 HSBC 17/6/2021 (794)EUR 40,025 ZAR 725,000 Morgan Stanley 17/6/2021 (3,081)EUR 190,979 ZAR 3,371,000 HSBC 21/7/2021 (8,417)GBP 19,000 EUR 21,900 Citibank 16/6/2021 155GBP 116,000 EUR 133,936 Deutsche Bank 16/6/2021 717
GBP 59,000 EUR 68,206Standard
Chartered Bank 16/6/2021 281GBP 153,000 EUR 176,232 UBS 16/6/2021 1,370
GBP 12,000 EUR 13,821Bank of America
Merrill Lynch 21/7/2021 100GBP 19,000 EUR 21,886 Citibank 21/7/2021 155GBP 127,000 EUR 145,825 JP Morgan 21/7/2021 1,503
GBP 116,000 EUR 133,859Standard
Chartered Bank 21/7/2021 708GBP 274,000 EUR 317,921 Westpac 18/8/2021 (231)
HUF 97,686,000 EUR 272,863Standard
Chartered Bank 16/6/2021 8,025HUF 15,508,000 EUR 43,073 UBS 16/6/2021 1,519HUF 15,526,000 EUR 43,064 BNP Paribas 21/7/2021 1,519HUF 32,640,000 EUR 90,990 Citibank 21/7/2021 2,737
HUF 36,196,000 EUR 104,086Standard
Chartered Bank 21/7/2021 (149)
HUF 11,497,000 EUR 32,031Toronto Dominion
Bank 21/7/2021 983HUF 7,276,000 EUR 20,273 Morgan Stanley 18/8/2021 595
HUF 36,239,000 EUR 104,087Standard
Chartered Bank 18/8/2021 (148)INR 124,964,000 USD 1,680,858 Barclays Bank 16/6/2021 30,891INR 5,325,000 USD 72,127 BNP Paribas 16/6/2021 905INR 28,847,000 USD 385,253 Morgan Stanley 16/6/2021 9,393INR 131,280,000 USD 1,733,833 BNP Paribas 22/7/2021 50,165INR 15,106,000 USD 199,694 UBS 22/7/2021 5,619INR 124,339,000 USD 1,667,232 Citibank 18/8/2021 21,241INR 5,383,000 USD 72,175 UBS 18/8/2021 923
JPY 2,897,000 EUR 22,475Bank of America
Merrill Lynch 16/6/2021 (828)JPY 10,867,000 EUR 82,705 Citibank 16/6/2021 (1,503)JPY 89,186,334 EUR 689,176 HSBC 16/6/2021 (22,745)JPY 13,683,000 EUR 104,845 Morgan Stanley 16/6/2021 (2,601)
JPY 22,405,000 EUR 172,499State Street Bank& Trust Company 16/6/2021 (5,081)
JPY 7,983,000 EUR 61,268 UBS 16/6/2021 (1,616)
JPY 124,404,000 EUR 952,721Bank of America
Merrill Lynch 21/7/2021 (23,508)JPY 10,868,000 EUR 82,679 Citibank 21/7/2021 (1,502)
JPY 13,685,000 EUR 104,817Standard
Chartered Bank 21/7/2021 (2,599)JPY 134,108,000 EUR 1,012,262 Westpac 18/8/2021 (10,893)
Currency Purchases Currency Sales CounterpartyMaturity
date
Netunrealised
appreciation/(depreciation)
EUR
Financial Derivative Instruments
OPEN FORWARD FOREIGN EXCHANGE TRANSACTIONS
KRW 128,509,000 USD 114,489 Barclays Bank 16/6/2021 1,200KRW 39,682,000 USD 35,326 Citibank 16/6/2021 392KRW 31,450,000 USD 27,965 HSBC 16/6/2021 338KRW 87,902,000 USD 77,986 Barclays Bank 21/7/2021 1,091KRW 31,464,000 USD 27,982 BNP Paribas 21/7/2021 336KRW 39,688,000 USD 35,336 Citibank 21/7/2021 391KRW 40,659,000 USD 36,562 UBS 21/7/2021 104KRW 71,194,000 USD 63,356 Citibank 18/8/2021 729
MXN 19,851,000 EUR 768,989Bank of America
Merrill Lynch 16/6/2021 46,699
MXN 500,000 EUR 20,535Standard
Chartered Bank 16/6/2021 10
MXN 102,000 EUR 4,200Bank of America
Merrill Lynch 21/7/2021 (28)NOK 553,000 EUR 54,444 Deutsche Bank 16/6/2021 (160)NOK 60,000 EUR 5,942 Goldman Sachs 16/6/2021 (52)NOK 822,000 EUR 82,106 HSBC 16/6/2021 (1,416)NOK 341,000 EUR 33,906 Morgan Stanley 16/6/2021 (432)
NOK 1,371,000 EUR 134,892State Street Bank& Trust Company 16/6/2021 (312)
NOK 822,000 EUR 82,048 HSBC 21/7/2021 (1,408)
NOK 1,013,000 EUR 99,449Standard
Chartered Bank 21/7/2021 (71)
NOK 700,000 EUR 69,337State Street Bank& Trust Company 21/7/2021 (665)
NOK 341,000 EUR 33,866 Deutsche Bank 18/8/2021 (430)
NOK 1,013,000 EUR 99,399Standard
Chartered Bank 18/8/2021 (72)
NZD 613,000 EUR 361,587Standard
Chartered Bank 16/6/2021 3,396NZD 23,000 EUR 13,848 Westpac 16/6/2021 (154)
NZD 266,000 EUR 157,083Standard
Chartered Bank 21/7/2021 1,172
NZD 266,000 EUR 156,981Standard
Chartered Bank 18/8/2021 1,174PLN 1,881,000 EUR 408,133 Morgan Stanley 16/6/2021 11,222
PLN 799,000 EUR 175,052State Street Bank& Trust Company 16/6/2021 3,079
PLN 396,000 EUR 86,903Standard
Chartered Bank 21/7/2021 1,337
PLN 403,000 EUR 88,061State Street Bank& Trust Company 21/7/2021 1,739
RUB 20,360,000 USD 269,442 Goldman Sachs 16/6/2021 6,291RUB 34,581,000 USD 461,945 HSBC 16/6/2021 7,161RUB 14,322,000 USD 189,457 JP Morgan 16/6/2021 4,491RUB 45,844,000 USD 584,189 BNP Paribas 21/7/2021 30,104RUB 10,936,000 USD 146,241 Goldman Sachs 21/7/2021 1,546RUB 14,399,000 USD 189,535 JP Morgan 21/7/2021 4,503RUB 46,941,000 USD 624,408 UBS 18/8/2021 7,247SEK 1,614,000 EUR 157,496 Morgan Stanley 16/6/2021 1,974
SEK 716,000 EUR 70,667State Street Bank& Trust Company 16/6/2021 77
SEK 716,000 EUR 70,638 JP Morgan 21/7/2021 78SGD 334,782 EUR 208,591 Goldman Sachs 16/6/2021 (1,112)SGD 513,000 EUR 319,852 HSBC 16/6/2021 (1,923)
SGD 485,000 EUR 300,896Standard
Chartered Bank 16/6/2021 (320)
SGD 130,000 EUR 80,097State Street Bank& Trust Company 16/6/2021 469
SGD 643,000 EUR 399,623State Street Bank& Trust Company 21/7/2021 (1,434)
SGD 485,000 EUR 300,621 Westpac 21/7/2021 (277)
BlackRock Total Advantage Fund continued
Portfolio of Investments as at 31 May 2021
The notes on pages 590 to 610 form an integral part of these financial statements.
BlackRock Strategic Funds[584]

Currency Purchases Currency Sales CounterpartyMaturity
date
Netunrealised
appreciation/(depreciation)
EUR
Financial Derivative Instruments
OPEN FORWARD FOREIGN EXCHANGE TRANSACTIONS
SGD 485,000 EUR 300,426 HSBC 18/8/2021 (263)
SGD 130,000 EUR 79,983State Street Bank& Trust Company 18/8/2021 473
SGD 158,000 EUR 97,867Toronto Dominion
Bank 18/8/2021 (82)THB 8,190,000 EUR 221,141 Barclays Bank 16/6/2021 (6,360)THB 3,099,000 EUR 84,033 Goldman Sachs 16/6/2021 (2,763)THB 8,134,000 EUR 214,014 HSBC 16/6/2021 (702)THB 4,052,000 EUR 107,015 JP Morgan 16/6/2021 (752)THB 784,000 EUR 20,661 Barclays Bank 21/7/2021 (117)THB 8,145,000 EUR 213,946 HSBC 21/7/2021 (510)THB 2,306,000 EUR 60,614 JP Morgan 21/7/2021 (186)
THB 1,751,000 EUR 46,369Standard
Chartered Bank 21/7/2021 (485)THB 10,304,000 EUR 270,199 HSBC 18/8/2021 (360)THB 785,000 EUR 20,668 JP Morgan 18/8/2021 (110)TWD 707,000 USD 25,350 BNP Paribas 16/6/2021 285TWD 364,000 USD 13,056 Morgan Stanley 16/6/2021 143TWD 705,000 USD 25,387 Barclays Bank 21/7/2021 301TWD 363,000 USD 13,076 Morgan Stanley 21/7/2021 151TWD 703,000 USD 25,403 Barclays Bank 18/8/2021 311TWD 362,000 USD 13,085 Morgan Stanley 18/8/2021 157USD 626,774 BRL 3,593,000 Goldman Sachs 16/6/2021 (50,258)USD 13,612 BRL 77,000 JP Morgan 16/6/2021 (930)USD 362,808 BRL 2,070,000 Citibank 21/7/2021 (26,458)USD 32,917 BRL 174,000 Goldman Sachs 21/7/2021 (243)USD 33,029 BRL 175,000 Goldman Sachs 18/8/2021 (225)USD 252,360 CLP 180,341,000 Citibank 16/6/2021 1,928USD 84,016 CLP 58,755,000 HSBC 16/6/2021 2,100USD 267,235 CLP 189,566,000 Goldman Sachs 21/7/2021 3,694USD 84,054 CLP 58,791,000 HSBC 21/7/2021 2,107USD 276,933 CLP 193,269,000 Goldman Sachs 18/8/2021 7,483USD 59,000 EUR 49,373 Barclays Bank 16/6/2021 (1,042)USD 214,000 EUR 177,942 Citibank 16/6/2021 (2,636)
USD 195,000 EUR 163,375Standard
Chartered Bank 16/6/2021 (3,634)
USD 140,521 EUR 117,802Bank of America
Merrill Lynch 21/7/2021 (2,767)USD 214,000 EUR 177,807 Citibank 21/7/2021 (2,620)
USD 195,000 EUR 163,249Standard
Chartered Bank 21/7/2021 (3,617)
USD 20,000 EUR 16,452Standard
Chartered Bank 18/8/2021 (88)
USD 563,932 EUR 463,072State Street Bank& Trust Company 18/8/2021 (1,666)
USD 12,373 INR 911,000 Citibank 16/6/2021 (128)USD 227,861 INR 16,993,000 JP Morgan 16/6/2021 (4,780)USD 24,302 INR 1,777,000 UBS 16/6/2021 (112)
USD 227,850 INR 17,102,000Standard
Chartered Bank 22/7/2021 (4,913)USD 24,329 INR 1,790,000 UBS 22/7/2021 (121)USD 24,335 INR 1,798,000 UBS 18/8/2021 (122)USD 216,185 KRW 243,149,000 Barclays Bank 16/6/2021 (2,629)USD 332,891 KRW 377,283,000 BNP Paribas 16/6/2021 (6,171)USD 774,656 KRW 881,133,000 Morgan Stanley 16/6/2021 (16,707)USD 148,814 KRW 166,779,000 Barclays Bank 21/7/2021 (1,376)
Currency Purchases Currency Sales CounterpartyMaturity
date
Netunrealised
appreciation/(depreciation)
EUR
Financial Derivative Instruments
OPEN FORWARD FOREIGN EXCHANGE TRANSACTIONS
USD 1,529,967 KRW 1,715,476,000 Deutsche Bank 21/7/2021 (14,742)USD 1,575,474 KRW 1,753,230,000 UBS 18/8/2021 (5,456)USD 79,296 RUB 5,984,000 Goldman Sachs 16/6/2021 (1,764)USD 13,582 RUB 1,060,000 HSBC 16/6/2021 (693)USD 297,168 RUB 22,572,000 UBS 16/6/2021 (8,243)USD 91,789 RUB 6,796,000 BNP Paribas 21/7/2021 (216)USD 205,511 RUB 15,895,000 Goldman Sachs 21/7/2021 (8,014)USD 92,907 RUB 7,081,000 UBS 21/7/2021 (2,461)USD 91,835 RUB 6,827,000 BNP Paribas 18/8/2021 (218)USD 258,849 TWD 7,341,957 Barclays Bank 16/6/2021 (6,562)USD 19,728 TWD 548,000 BNP Paribas 16/6/2021 (156)USD 1,377,914 TWD 38,617,043 HSBC 16/6/2021 (21,057)USD 19,695 TWD 545,000 Barclays Bank 21/7/2021 (176)
USD 510,901 TWD 14,412,000State Street Bank& Trust Company 21/7/2021 (12,771)
USD 174,127 TWD 4,919,000 UBS 21/7/2021 (4,563)USD 737,636 TWD 20,195,000 Deutsche Bank 18/8/2021 (2,487)ZAR 1,347,961 EUR 78,011 BNP Paribas 17/6/2021 2,134ZAR 2,479,000 EUR 133,230 Goldman Sachs 17/6/2021 14,162ZAR 361,000 EUR 20,433 UBS 17/6/2021 1,031ZAR 1,933,000 EUR 109,532 Goldman Sachs 21/7/2021 4,805ZAR 946,000 EUR 54,079 HSBC 21/7/2021 1,878ZAR 1,328,000 EUR 77,229 Morgan Stanley 21/7/2021 1,322ZAR 650,000 EUR 36,978 UBS 21/7/2021 1,468ZAR 148,000 EUR 8,550 Goldman Sachs 18/8/2021 168ZAR 2,668,000 EUR 154,488 Morgan Stanley 18/8/2021 2,662
ZAR 442,000 EUR 25,634State Street Bank& Trust Company 18/8/2021 400
260,832
GBP Hedged Share Class
EUR 65 GBP 56State Street Bank& Trust Company 15/6/2021 —
GBP 4,320 EUR 4,976State Street Bank& Trust Company 15/6/2021 39
39
USD Hedged Share Class
EUR 116 USD 141State Street Bank& Trust Company 15/6/2021 1
USD 6,045 EUR 5,002State Street Bank& Trust Company 15/6/2021 (51)
(50)
Total (Gross underlying exposure - EUR 75,447,900) 260,821
Sector Breakdownas at 31 May 2021
% of NetAssets
Government 80.04
Securities portfolio at market value 80.04
Other Net Assets 19.96
100.00
BlackRock Total Advantage Fund continued
Portfolio of Investments as at 31 May 2021
The notes on pages 590 to 610 form an integral part of these financial statements.
Annual report and audited financial statements [585]

Holding Description
MarketValueGBP
% ofNet
Assets
Transferable Securities and Money Market Instruments Admittedto an Official Stock Exchange Listing or Dealt in on AnotherRegulated Market
COMMON STOCKSBermuda
51,586 Hiscox Ltd 404,537 0.2958,129 Lancashire Holdings Ltd 366,213 0.26
770,750 0.55
United Kingdom41,341 J D Wetherspoon Plc 544,461 0.3868,625 JET2 Plc 926,438 0.65
188,041 Moonpig Group Plc 878,904 0.6215,131 SSP Group Plc 44,500 0.03
178,157 Taylor Wimpey Plc 305,361 0.22
2,699,664 1.90
Total Common Stocks 3,470,414 2.45
CERTIFICATE OF DEPOSITSBelgium
GBP 1,000,000 Sumitomo Mitsui Banking Corp6/7/2021 (Zero Coupon) 999,930 0.70
999,930 0.70
JapanGBP 4,000,000 Mitsubishi Ufj Trust And Bank-
ing Corp 1/7/2021 (ZeroCoupon) 3,999,747 2.82
GBP 3,000,000 Mizuho Bank Ltd 0.08%8/6/2021 3,000,000 2.11
GBP 2,000,000 Mizuho Bank Ltd 0.09%21/7/2021 2,000,000 1.41
GBP 2,000,000 Sumitomo Mitsui Trust BankLtd 11/6/2021 (Zero Cou-pon) 1,999,950 1.41
GBP 4,000,000 The Norinchukin Bank13/8/2021 (Zero Coupon) 3,999,443 2.81
GBP 2,000,000 The Norinchukin Bank24/8/2021 (Zero Coupon) 1,999,658 1.41
16,998,798 11.97
LuxembourgGBP 1,000,000 UBS AG 0.01% 17/6/2021 1,000,000 0.71
1,000,000 0.71
NetherlandsGBP 1,000,000 ABN Amro Bank NV
4/8/2021 (Zero Coupon) 999,884 0.70GBP 4,000,000 ABN Amro Bank NV
6/8/2021 (Zero Coupon) 3,999,517 2.82GBP 4,000,000 Cooperatieve Rabobank UA
RegS 9/8/2021 (Zero Cou-pon) 3,999,448 2.82
8,998,849 6.34
SingaporeGBP 3,000,000 Oversea-Chinese Banking
Corp 19/11/2021 (Zero Cou-pon) 2,998,577 2.11
2,998,577 2.11
SwitzerlandGBP 5,000,000 Zuercher Kantonalbank
22/6/2021 (Zero Coupon) 4,999,812 3.52
4,999,812 3.52
United KingdomGBP 4,000,000 Bank of America NA 0.03%
19/7/2021 4,000,000 2.82GBP 2,000,000 Bank of America NA 0.04%
3/8/2021 2,000,000 1.41
Holding Description
MarketValueGBP
% ofNet
Assets
United Kingdom continuedGBP 3,000,000 Citibank NA 0.065% 2/9/2021 3,000,000 2.11GBP 2,000,000 Goldman Sachs International
RegS 9/8/2021 (Zero Cou-pon) 1,999,704 1.41
GBP 2,000,000 Handelsbanken Plc 0.075%4/8/2021 2,000,000 1.41
GBP 3,000,000 National Bank of Canada0.03% 8/10/2021 3,000,000 2.11
GBP 5,000,000 Nationwide Building Society0.05% 1/6/2021 5,000,000 3.52
GBP 1,000,000 Skandinaviska Enskilda Ban-ken AB 0.10% 24/9/2021 1,000,000 0.71
GBP 2,000,000 Standard Chartered Bank12/8/2021 (Zero Coupon) 1,999,586 1.41
GBP 3,000,000 Sumitomo Mitsui Trust BankLtd 0.10% 20/9/2021 3,000,000 2.11
GBP 4,000,000 Toronto-Dominion Bank12/7/2021 (Zero Coupon) 3,999,730 2.82
30,999,020 21.84
Total Certificate of Deposits 66,994,986 47.19
COMMERCIAL PAPERBelgium
GBP 5,000,000 Sumitomo Mitsui Banking Corp14/6/2021 (Zero Coupon) 4,999,911 3.52
4,999,911 3.52
FinlandGBP 1,000,000 Nordea Bank Abp RegS
16/8/2021 (Zero Coupon) 999,833 0.71GBP 4,000,000 Nordea Bank Abp RegS
14/10/2021 (Zero Coupon) 3,998,595 2.82GBP 2,000,000 OP Corporate Bank Plc RegS
2/6/2021 (Zero Coupon) 1,999,997 1.41GBP 3,000,000 OP Corporate Bank Plc RegS
12/7/2021 (Zero Coupon) 2,999,831 2.11GBP 1,000,000 OP Corporate Bank Plc RegS
5/1/2022 (Zero Coupon) 999,702 0.70
10,997,958 7.75
FranceGBP 7,000,000 Agence Centrale Des Organ-
ismes De RegS8/6/2021 (Zero Coupon) 6,999,893 4.93
GBP 4,000,000 BRED Banque Populaire RegS11/8/2021 (Zero Coupon) 3,998,992 2.82
GBP 4,000,000 Dexia Credit Local RegS5/7/2021 (Zero Coupon) 3,999,758 2.82
GBP 1,000,000 Dexia Credit Local RegS26/8/2021 (Zero Coupon) 999,811 0.70
GBP 4,000,000 LMA SA RegS 3/6/2021 (ZeroCoupon) 3,999,991 2.82
GBP 1,000,000 LMA SA RegS14/6/2021 (Zero Coupon) 999,975 0.70
GBP 1,000,000 Managed And Enhanced TapMagenta Funding1/6/2021 (Zero Coupon) 1,000,000 0.71
GBP 1,000,000 Managed And Enhanced TapMagenta Funding2/6/2021 (Zero Coupon) 999,999 0.70
22,998,419 16.20
IrelandGBP 6,000,000 Matchpoint Finance Plc RegS
6/8/2021 (Zero Coupon) 5,998,807 4.22
5,998,807 4.22
BlackRock UK Equity Absolute Return Fund
Portfolio of Investments as at 31 May 2021
The notes on pages 590 to 610 form an integral part of these financial statements.
BlackRock Strategic Funds[586]

Holding Description
MarketValueGBP
% ofNet
Assets
LuxembourgGBP 1,000,000 Albion Capital Corp SA RegS
28/7/2021 (Zero Coupon) 999,860 0.71GBP 3,000,000 Sunderland Receivables SA
8/7/2021 (Zero Coupon) 2,999,726 2.11
3,999,586 2.82
NetherlandsGBP 2,000,000 Toyota Motor Finance Nether-
lands BV RegS29/6/2021 (Zero Coupon) 1,999,935 1.41
1,999,935 1.41
SwedenGBP 3,000,000 Svenska Handelsbanken AB
RegS 29/10/2021 (ZeroCoupon) 2,998,891 2.11
GBP 1,000,000 Swedbank AB RegS10/11/2021 (Zero Coupon) 999,556 0.71
3,998,447 2.82
United StatesGBP 1,000,000 Mont Blanc Capital Corp RegS
16/8/2021 (Zero Coupon) 999,834 0.70GBP 1,000,000 Sheffield Receivables Co LLC
1/6/2021 (Zero Coupon) 1,000,000 0.71GBP 1,000,000 Sheffield Receivables Co LLC
1/9/2021 (Zero Coupon) 999,798 0.70
2,999,632 2.11
Total Commercial Papers 57,992,695 40.85
Total Transferable Securities and Money MarketInstruments Admitted to an Official Stock ExchangeListing or Dealt in on Another Regulated Market 128,458,095 90.49
Collective Investment SchemesIreland
13,336,448 BlackRock ICS Sterling Liquid-ity Fund (Dist)~ 13,336,448 9.39
13,336,448 9.39
Total Collective Investment Schemes 13,336,448 9.39
Securities portfolio at market value 141,794,543 99.88
Other Net Assets 169,390 0.12
Total Net Assets (GBP) 141,963,933 100.00
~ Investment in related party fund.
BlackRock UK Equity Absolute Return Fund continued
Portfolio of Investments as at 31 May 2021
The notes on pages 590 to 610 form an integral part of these financial statements.
Annual report and audited financial statements [587]

Holding Description Counterparty
Netunrealised
appreciation/(depreciation)
GBP
Financial Derivative Instruments
CONTRACTS FOR DIFFERENCEFrance
(5,591) Sodexo SA Deutsche Bank 8,667(7,569) Sodexo SA HSBC 42,112
50,779
United Kingdom365,200 3i Group Plc JP Morgan 38,419(29,472) Admiral Group Plc HSBC 10,765(8,199) Anglo American Plc JP Morgan 22,42449,800 Associated British Foods Plc JP Morgan (12,427)74,455 AstraZeneca Plc JP Morgan 244,957
797,520 Auto Trader Group Plc HSBC 21,295(305,362) B&M European Value Retail
SA HSBC (1,050)(145,600) Babcock International
Group Plc HSBC 4,845517,514 Barclays Plc Deutsche Bank 20,583723,686 Barclays Plc HSBC (12,882)
(102,870) Barratt Developments Plc HSBC 25,512261,915 Better Capital PCC Ltd* JP Morgan (11,262)(89,686) BHP Group Plc JP Morgan 226,457206,060 Bodycote Plc HSBC 129,81896,243 BP Plc Deutsche Bank (8,343)
276,132 BP Plc HSBC (24,715)224,195 British American Tobacco
Plc JP Morgan (246,820)(136,945) Britvic Plc JP Morgan 8,916(46,512) Bunzl Plc JP Morgan 14,41947,288 Burberry Group Plc HSBC (184)
225,578 Capital & Counties Proper-ties Plc (REIT) JP Morgan (30,227)
110,514 CRH Plc JP Morgan 67,684(23,797) Croda International Plc JP Morgan (63,887)(7,333) DCC Plc HSBC 11,296
(90,587) Diageo Plc JP Morgan (120,992)(478,362) DS Smith Plc HSBC 46,645(22,990) Experian Plc JP Morgan 5,870
(181,524) GlaxoSmithKline Plc JP Morgan 13,796264,100 Grainger Plc HSBC (42,145)17,525 Hargreaves Lansdown Plc HSBC (18,215)
193,158 Hays Plc HSBC 10,62168,655 Hiscox Ltd HSBC (33,099)
(83,675) HSBC Holdings Plc HSBC (753)(1,048,387) HSBC Holdings Plc JP Morgan (9,435)
(56,843) IMI Plc HSBC (2,541)(1,939,155) J Sainsbury Plc JP Morgan (182,221)
27,296 JD Wetherspoon Plc HSBC (12,901)18,584 JET2 Plc HSBC (18,884)81,981 Lancashire Holdings Ltd HSBC (56,365)
(114,826) Land Securities Group Plc(REIT) HSBC 54,428
(1,137,349) Marks & Spencer Group Plc JP Morgan (33,543)104,450 Meggitt Plc HSBC 19,741170,800 Mondi Plc HSBC (86,926)13,065 Moonpig Group Plc HSBC 6,21421,575 Next Plc JP Morgan (31,923)
(34,201) Ocado Group Plc HSBC 28,216142,219 Pearson Plc HSBC (32,237)209,255 Prudential Plc JP Morgan (160,388)123,990 Reckitt Benckiser Group Plc HSBC 24,923389,245 Reed Elsevier Plc JP Morgan (126,392)
1,210,000 Rentokil Initial Plc JP Morgan (22,558)137,140 Rio Tinto Plc JP Morgan (717,037)
(988,576) Rolls-Royce Holdings Plc HSBC 23,291323,395 Royal Dutch Shell Plc ’B’ JP Morgan (246,776)
3,970,000 Serco Group Plc JP Morgan (247,286)178,845 Smiths Group Plc HSBC (57,568)35,153 Spectris Plc HSBC (554)
Holding Description Counterparty
Netunrealised
appreciation/(depreciation)
GBP
United Kingdom continued194,185 SSP Group Plc JP Morgan (76,897)
1,221,670 Standard Chartered Plc JP Morgan (151,141)1,395,926 Taylor Wimpey Plc HSBC (112,565)3,051,550 Tesco Plc JP Morgan (205,980)(108,192) TUI AG Deutsche Bank (12,737)(927,667) TUI AG JP Morgan 37,843(21,785) Unilever Plc HSBC 11,551
(645,487) Wm Morrison SupermarketsPlc JP Morgan 40,020
(2,061,307)
United States(25,050) Conagra Brands Inc HSBC 2,652(10,127) Royal Caribbean Cruises
Ltd HSBC (51,245)(7,028) WW Grainger Inc JP Morgan 59,815
11,222
Total (Gross underlying exposure - GBP 149,691,895) (1,999,306)
* Security subject to a fair value adjustment as detailed in Note 2(a).
BlackRock UK Equity Absolute Return Fund continued
Portfolio of Investments as at 31 May 2021
The notes on pages 590 to 610 form an integral part of these financial statements.
BlackRock Strategic Funds[588]

Numberof
contractsCurrencyof contracts
Contract/Description
Expirationdate
Grossunderlying
exposureGBP
Net unrealised(depreciation)
GBP
Financial Derivative Instruments
FUTURES
(480) GBP FTSE 100 Index Futures June 2021 June 2021 33,712,800 (1,353,294)
Total 33,712,800 (1,353,294)
Currency Purchases Currency Sales CounterpartyMaturity
date
Netunrealised
appreciation/(depreciation)
GBP
Financial Derivative Instruments
OPEN FORWARD FOREIGN EXCHANGE TRANSACTIONS
CHF Hedged Share Class
CHF 5,058 GBP 4,003State Street Bank& Trust Company 15/6/2021 (37)
GBP 20 CHF 26State Street Bank& Trust Company 15/6/2021 —
(37)
EUR Hedged Share Class
EUR 25,423,254 GBP 22,014,631State Street Bank& Trust Company 15/6/2021 (113,491)
GBP 112,991 EUR 131,371State Street Bank& Trust Company 15/6/2021 (180)
(113,671)
JPY Hedged Share Class
GBP 3,889,484 JPY 598,308,693State Street Bank& Trust Company 15/6/2021 38,045
JPY 17,164,872,487 GBP 113,019,282State Street Bank& Trust Company 15/6/2021 (2,525,392)
(2,487,347)
USD Hedged Share Class
GBP 218,523 USD 306,257State Street Bank& Trust Company 15/6/2021 2,395
USD 18,628,327 GBP 13,389,171State Street Bank& Trust Company 15/6/2021 (243,008)
(240,613)
Total (Gross underlying exposure - GBP 149,725,917) (2,841,668)
Sector Breakdownas at 31 May 2021
% of NetAssets
Financial 81.54
Collective Investment Schemes 9.39
Government 4.93
Consumer, Cyclical 2.66
Mortgage Securities 0.71
Communications 0.62
Consumer, Non-cyclical 0.03
Securities portfolio at market value 99.88
Other Net Assets 0.12
100.00
BlackRock UK Equity Absolute Return Fund continued
Portfolio of Investments as at 31 May 2021
The notes on pages 590 to 610 form an integral part of these financial statements.
Annual report and audited financial statements [589]

1. OrganisationBlackRock Strategic Funds (the “Company”) is a public limitedcompany (société anonyme) established under the laws of theGrand Duchy of Luxembourg as an open-ended variable capitalinvestment company (société d’investissement à capital variable).The Company has been authorised by the Commission deSurveillance du Secteur Financier (the “CSSF”) as a UCITSpursuant to the provisions of Part I of the 2010 Law and isregulated pursuant to such law.
The Company has appointed BlackRock (Luxembourg) S.A. asits Management Company.
As at 31 May 2021, the Company offered shares in 33 Funds(each a “Fund”, together the “Funds”). The Company is anumbrella structure comprising separate Funds with segregatedliability. Each Fund shall have segregated liability from the otherFunds and the Company shall not be liable as a whole to thirdparties for the liabilities of each Fund. Each Fund shall be madeup of a separate Portfolio of Investments maintained andinvested in accordance with the investment objectives applicableto such Fund. Each Fund is a separate pool of assets and isrepresented by separate shares of each Fund which are dividedinto share classes as detailed in Appendix I.
The classes of shares have equivalent rights in the Companybut carry different features and charging structures which aremore fully described in the Company’s Prospectus.
Share Classes LaunchedShare Classes launched during the year are disclosed inAppendix I.
Significant events during the year
� Effective 2 June 2020, BlackRock European Diversified EquityAbsolute Return Fund, denominated in EUR was terminated.
� Effective 17 June 2020, BlackRock Asia Extension Fund,denominated in USD was terminated.
� A new Prospectus was issued on 5 August 2020.
� Effective 7 September 2020, BlackRock UK EmergingCompanies Absolute Return Fund changed its name toBlackRock Emerging Companies Absolute Return Fund.
� Effective 12 October 2020, Robert Hayes resigned as Directorof the Board and Ursula Marchioni was appointed as Directorof the Board.
� Effective 20 October 2020, the management fee rate wasreduced from 1.50% to 1.10% for Classes A and E, from0.75% to 0.55% for Classes D and I and from 0.60% to 0.50%for Class Z of the BlackRock Style Advantage Fund.
� Effective 29 October 2020, Paul Freeman resigned asChairman of the Board and Denise Voss was appointed asChairwoman of the Board.
� Effective 4 November 2020, BlackRock Macro OpportunitiesFund, denominated in USD was terminated.
� A new Prospectus was issued on 30 November 2020.
� Effective 19 February 2021, BlackRock ESG Euro ShortDuration Bond Fund, denominated in EUR was launched.
� Effective 8 March 2021, BlackRock Global Long/Short EquityFund changed its name to BlackRock Systematic GlobalLong/Short Equity Fund.
� A new Prospectus was issued on 08 March 2021.
� A new Prospectus was issued on 10 March 2021.
� Effective 17 March 2021, Michael Gruener resigned asDirector of the Board.
� Effective 3 May 2021, Keith Saldanha was appointed asDirector of the Board.
� A new Prospectus was issued on 20 May 2021.
2. Summary of Significant Accounting PoliciesThe financial statements have been prepared in accordancewith generally accepted accounting principles in Luxembourgand with the legal and regulatory requirements relating to thepreparation of the financial statements as prescribed by theLuxembourg authorities for Luxembourg UCITS and include thefollowing significant accounting policies:
(a) Valuation of Investments, Other Assets and Other Liabilities
The Company’s investments, other assets and other liabilitiesare valued as follows:
� transferable securities which are admitted to an officialexchange listing or dealt in on another regulated market, arevalued on the basis of the latest available price prevailing onthe valuation date. For securities traded on markets closingafter the time of the valuation, last known prices as of thistime or such other time may be used. Where such securitiesor other assets are quoted or dealt in, on or by more than onestock exchange or regulated market, the Board may in itsdiscretion select one of such stock exchanges or regulatedmarkets for such purposes. Discrepancies in the value ofsecurities may result, for example, where the underlyingmarkets are closed for business at the time of calculating theNAV of certain Funds or where governments chose to imposefiscal or transaction charges on foreign investment. As aresult, the Board have implemented fair value techniques inorder to estimate the fair value of these investments. Suchsecurities and derivatives shall be valued at their probablerealisation value as determined by the competent persons(the Directors). Because of the inherent uncertainty in the fair
Notes to the Financial Statements
BlackRock Strategic Funds[590]

value process, these estimated values may significantly differfrom the values that would have been used had a readymarket for the securities existed, and from the values that maybe ultimately recovered;
� for non-quoted securities or securities not traded or dealt in onany stock exchange or other regulated market (includingsecurities of closed-ended investment funds), as well asquoted or non-quoted securities on such other markets forwhich no valuation price is available, or securities for whichthe quoted prices are, in the opinion of the Board, notrepresentative of the fair market value, the value shall bedetermined prudently and in good faith by the Board on thebasis of their expected disposal or acquisition price;
� if in any case a particular value is not ascertainable by themethods outlined above, or if the Board considers that someother method of valuation more accurately reflects the fairvalue of the relevant security or other asset for the purposeconcerned, the method of valuation of the security or otherasset will be such as the Board in their absolute discretiondecides. Discrepancies in the value of securities may result,for example, where the underlying markets are closed forbusiness at the time of calculating the NAV of certain Funds.In such cases the Board may set specific thresholds, that,where exceeded, result in an adjustment to the value of thesesecurities to their fair value by applying a specific indexadjustment. Additionally, where governments choose toimpose fiscal or transaction charges on foreign investment,the Board may adjust the NAV to reflect such charges;
� as at 31 May 2021, the adjusted fair value applied to certainsecurities and/or derivatives are disclosed in the table below:
Fund Currency Fair value% of Net
Assets
BlackRock Americas Diversified EquityAbsolute Return Fund USD (1,884,137) (0.27)BlackRock Asia Pacific Absolute ReturnFund USD 1,813,155 5.23BlackRock Asia Pacific Diversified EquityAbsolute Return Fund USD 121,991 0.35BlackRock European Absolute Return Fund EUR 10 0.00BlackRock European OpportunitiesExtension Fund EUR 0 0.00BlackRock Global Equity Absolute ReturnFund USD 1,300,780 1.84BlackRock Global Event Driven Fund USD 4,728,655 0.08BlackRock Style Advantage Screened Fund USD 0 0.00BlackRock Systematic Global Long/ShortEquity Fund USD 0 0.00BlackRock UK Equity Absolute ReturnFund GBP (11,262) (0.01)
� for certain Funds which have terminated operations and heldilliquid securities at the termination dates, the market value ofthe illiquid securities were provided for against the net assetvalue of each respective Fund. This effectively wrote down thevalue of the securities to zero, and recognised the loss in theStatement of Operations and Changes in Net Assets within�Net realised gain/(loss) on investments� during the financialyear in which the termination occurred. As at 31 May 2021,BlackRock Latin American Opportunities Fund (terminated on
8 March 2019) and BlackRock Multi-Manager AlternativeStrategies Fund (terminated on 13 May 2019) held openilliquid positions, which together accounted for less than1.00% of the net asset value of the Funds as at the lastValuation Point prior to each Fund’s date of termination. If theilliquid securities are subsequently disposed of, or a value isrealised, this will be distributed to the shareholders of therespective Funds proportionate to each shareholder’s holdingin the Fund as at the date of termination;
� investments in open-ended collective investment schemes arevalued on the basis of the last available NAV of the units orshares of such collective investment scheme;
� certain Funds may decide to issue Share Classes which havedifferent valuation points, termed “Snap” and “Close”. The“Snap” valuation point takes a value at a time other than atmarket close, and the “Close” valuation point takes the valuebased on market closing prices. Consequently, the net assetvalues and performance per Share of such Share Classes areexpected to differ from each other as a result of theapplication of different valuation points. During the year ended31 May 2021, X Class non-distributing AUD hedged ofBlackRock Style Advantage Fund adopted a dual valuationpoint. This has resulted in a variation between this Fund’sNAVs as calculated under Snap and Close valuation points.The NAV of this Fund presented in the Statement of NetAssets is calculated using the Snap valuation point. As at31 May 2021, the percentage variation between the Fund’sSnap and Close NAVs is 1.30%. As at 31 May 2021, the NAVand NAV per share of X Class non-distributing AUD hedged atthe Snap valuation point is AUD 28,272,345 and AUD 81.21.As at 31 May 2021, the NAV and NAV per share of X Classnon-distributing AUD hedged at the Close valuation point isAUD 31,262,857 and AUD 89.80;
� securities lending: securities are delivered to a third partybroker in accordance with lending agent instructions andcontinue to be valued as part of the portfolios of the Funds;
� liquid assets such as time deposits and money marketinstruments are valued at amortised cost which approximatestheir fair value;
� cash at bank and other assets are valued at their nominalamount;
� assets which include, in particular, cash owned to bank,interest and dividends receivable, receivable for investmentssold and receivable for Fund shares subscribed are valued atnominal value unless it appears unlikely that such nominalamount is obtainable;
� liabilities which include, in particular, interest and dividendspayable, income distribution payable, payable for investmentspurchased and payable for Fund shares redeemed are valuedat their nominal value.
� The financial statements have been prepared on a goingconcern basis of accounting, except for BlackRock TotalAdvantage Fund, which was put into liquidation on 24 August2021. The application of the non-going concern basis ofaccounting has not led to material adjustments to thePortfolio’s published NAV.
Notes to the Financial Statements continued
Annual report and audited financial statements [591]

(b) Net realised gains and losses on Investments
Net realised gains and losses on sales of investments havebeen determined on the basis of the average cost method.
(c) Income/Expense from Investments, Cash Accounts andfinancial derivatives instruments
The Company takes credit for income from its investments onthe following basis:
� interest income/expense is accrued daily and includes theamortisation on a straight line basis of premiums andaccretion on a straight line basis of discounts;
� bank interest, fixed deposit and money market deposit interestincome are recognised on an accrual basis;
� dividend income is accrued on the ex-dividend date and isshown net of withholding tax;
� securities lending income is recognised on an accrual basis;
� negative yield expense on financial assets relating to interestfrom a negative effective interest rate on assets held isaccreted daily and is recognised in the Statement ofOperations and Changes in Net Assets over the life of theunderlying instrument;
� when a bond has been identified as being in default, theinterest accrual on the defaulted security is stopped. Onconfirmation of default from relevant parties, the amountreceivable is written off;
� the interest rate of any perpetual bonds in the Portfolio ofInvestments disclosed under the description is the interestrate applicable at the year end and is for information only asthese are bonds with a variable interest rate.
(d) Financial Derivative Instruments
During the year, the Funds have entered into a number offorward foreign exchange transactions and futures contracts.Open forward foreign exchange transactions and futurescontracts are valued at the fair market value to close thecontracts on the valuation date. Surpluses/deficits arising fromthese and unsettled contracts are taken to unrealisedappreciation/(depreciation) and are included under assets orliabilities (as appropriate) in the Statement of Net Assets. Thenet change in unrealised appreciation or depreciation and thenet realised gains or losses on settlement or closingtransactions of forward foreign exchange transactions andfutures contracts are presented in the Statement of Operationsand Changes in Net Assets.
The Funds can write covered call and put options or swaptionsand purchase call and put options or swaptions. When theFunds write and/or purchase an option or a swaption, anamount equal to the premium received or paid by the Funds isreflected as a liability or an asset. The liability for a writtenoption or swaption and the asset for a purchased option orswaption is subsequently marked to market to reflect the currentvalue of the option or the swaption. When a security is sold orbought through an exercise of an option or a swaption, thepremium received (or paid) is deducted from (or added to) thebasis of the security sold or bought. When an option or aswaption expires (or the Funds enter into a closing transaction),
the Funds realise a gain or loss on the option or the swaption tothe extent of the premiums received or paid (or gain or loss tothe extent the cost of the closing transactions exceeds premiumpaid or received). For futures-style options, the Funds do notprepay the premium. The Funds post margin as in a futurescontract, and the option premium is marked to market daily. Thepurchased options/swaptions at market value and writtenoptions/swaptions at market value are included under assets orliabilities (as appropriate) in the Statement of Net Assets. Thenet change in unrealised appreciation or depreciation and thenet realised gains or losses on expiration or closing transactionsof options or swaptions are presented in the Statement ofOperations and Changes in Net Assets.
During the year, the Funds have entered into Contracts fordifference (“CFDs”). CFDs allow investors to take synthetic longor synthetic short positions with a variable margin. Unlikeshares, with CFDs the buyer is potentially liable for far morethan the amount they paid on margin.
CFDs positions are entered into subject to a daily financingcharge, applied at a previously agreed rate above or below theapplicable benchmark. The related interest income or expenseis accrued daily and disclosed as Contracts for differenceinterest in a net position in the Statement of Operations andChanges in Net Assets. Interest income receivable and expensepayable is disclosed in a net position as �Interest and dividendsreceivable� or �Interest and dividends payable� in the Statementof Net Assets.
CFDs positions are subject to dividend receipts or payments insuch cases where a position is held on the day a dividend hasbeen declared. The related dividend income or expense isaccrued on the ex-dividend date and disclosed net ofwithholding tax as Contracts for difference dividends, net ofwithholding taxes in the Statement of Operations and Changesin Net Assets. Dividend income receivable and expense payableis disclosed in a net position as �Interest and dividendsreceivable� or �Interest and dividends payable� in the Statementof Net Assets.
The fair market value of the CFDs is determined by the tradedprice on the exchange on which the underlying securities orother assets are traded or admitted for trading. For underlyingsecurities traded on markets closing after the time of thevaluation, last known prices as of this time or such other timemay be used.
The net unrealised appreciation and net unrealised depreciationon Contracts for difference is included under assets or liabilities(as appropriate) in the Statement of Net Assets.
The change in market value, if any, is recorded as net change inunrealised appreciation or depreciation in the Statement ofOperations and Changes in Net Assets. Net realised gains orlosses on reset or termination of the CFDs are presented in theStatement of Operations and Changes in Net Assets.
Net realised gains and losses on sales of CFDs have beendetermined on the basis of the First In First Out (“FIFO”) costmethod.
The Funds had unsettled CFD transactions as of 31 May 2021,which are included within �Receivable for investments sold� and�Payable for investments purchased� in the Statement of NetAssets. CFDs are separately disclosed in the Portfolio ofInvestments.
Notes to the Financial Statements continued
BlackRock Strategic Funds[592]

The Funds may enter into Swap transactions (“swaps”), in whichthe Funds and a counterparty agree to make periodic netpayments on a specified notional amount. Swap transactionsare privately negotiated in the OTC market and may be enteredinto as a bilateral contract (“OTC swaps”) or centrally cleared(“centrally cleared swaps”). These periodic payments receivedor made are recorded in the Statement of Operations andChanges in Net Assets as net realised gains or losses,respectively. Swaps are valued utilising quotes received daily bythe Funds’ pricing service, central clearing houses or brokers,which are derived using daily swap curves and models thatincorporate a number of market data factors, such asdiscounted cash flows, trades and values of the underlyingreference instruments. In a centrally cleared swap, immediatelyfollowing execution of the swap agreement, the swapagreement is novated to a clearing counterparty and the Fundfaces the clearing counterparty through a broker. Upon enteringinto a centrally cleared swap, the Fund is required to depositinitial margin with the broker in the form of cash or certaineligible securities in an amount that varies depending on thesize and risk profile of the particular swap. Any upfrontpayments made or received upon entering a swap contract aretreated as part of the swap’s net realised gain or loss. The dailychange in valuation of centrally cleared swaps is recorded as areceivable or payable for variation margin in “Cash at bank” or“Cash owed to bank” position of the Statement of Net Assetsuntil the centrally cleared swap is terminated at which time a netrealised gain or loss is recorded. The net change in unrealisedappreciation or depreciation and the net realised gains or losseson Swap transactions are disclosed in Statement of Operationsand Changes in Net Assets. Interest income receivable andexpense payable on swaps is accrued on a daily basis anddisclosed in a net position as �Interest and dividends receivable�or �Interest and dividends payable� in the Statement of NetAssets. The Funds had unsettled swap transactions as of31 May 2021, which are included within �Receivable forinvestments sold� and �Payable for investments purchased� inthe Statement of Net Assets. Swaps are separately disclosed inthe Portfolio of Investments.
Net realised gains and losses on sales of swaps have beendetermined on the basis of the First In First Out (“FIFO”) costmethod.
Funds may purchase “To Be Announced” securities contracts(“TBAs”). This refers to the common trading practice in themortgage-backed securities market whereby a contract ispurchased which entitles the buyer to a security from amortgage pool for a fixed price at a future date. At the time ofpurchase the exact security is not known, but its maincharacteristics are specified. Although the price has beenestablished at the time of purchase, the principal value has notbeen finalised. As a TBA is not settled at the time of purchase,this may lead to leveraged positions within a Fund. Purchasing aTBA involves a risk of loss if the value of the security to bepurchased declines prior to the settlement date. Risks may alsoarise upon entering into these contracts from the potentialinability of counterparties to meet the terms of their contracts.TBAs are separately disclosed at the end of the Portfolio ofInvestments.
The Funds may dispose of a commitment prior to settlement if itis deemed appropriate to do so. Proceeds of TBA sales are notreceived until the contractual settlement date. During the time a
TBA sale commitment is outstanding, equivalent deliverablesecurities, or an offsetting TBA purchase commitment(deliverable on or before the sale commitment date), are held ascover for the transaction.
If the TBA sale commitment is closed through the acquisition ofan offsetting purchase commitment, the Fund realises a gain orloss on the commitment without regard to any unrealised gain orloss on the underlying security. If the Fund delivers securitiesunder the commitment, the Fund realises a gain or loss from thesale of the securities upon the unit price established at the datethe commitment was entered into.
The Funds had unsettled TBA transactions as of 31 May 2021,which are included within �Receivable for investments sold� and�Payable for investments purchased� in the Statement of NetAssets.
The market values of the TBAs are presented in the Statementof Net Assets. The net change in unrealised appreciation ordepreciation and the net realised gains or losses on sales of theTBAs are presented in the Statement of Operations andChanges in Net Assets.
Net realised gains and losses on sales of TBA have beendetermined on the basis of the First In First Out (“FIFO”) costmethod.
(e) Foreign Exchange
The cost of investments in currencies other than the currency ofdenomination of the respective Fund has been translated at therates of exchange ruling at the time of purchase. Investmentsand other assets and liabilities in currencies other than thecurrency of denomination of the respective Fund have beentranslated at the exchange rate prevailing at the Fund’svaluation point in Luxembourg on 31 May 2021. The net changein unrealised appreciation or depreciation and the net realisedgains or losses on disposal or settlement of other assets orliabilities in currencies other than the currency of denominationof the respective Fund are presented in the Statement ofOperations and Changes in Net Assets.
Income and expenses in currencies other than the currency ofdenomination of the respective Fund have been translated atthe rates of exchange prevailing on transaction date.
The following exchange rates were used to translate theinvestments and other assets and other liabilities denominatedin currencies for all Funds other than the base currency of theFund at the respective Fund valuation point at 31 May 2021:
All Funds (except theBlackRock DynamicDiversified Growth Fund)
BlackRockDynamic
DiversifiedGrowthFund
BlackRockEmerging
CompaniesAbsoluteReturn
Fund andBlackRock UK
Equity AbsoluteReturn Fund
CCY EUR USD EUR GBP
AED 0.2231 0.2723 0.2227 0.1921ARS 0.0049 0.0060 0.0049 0.0042AUD 0.6342 0.7740 0.6331 0.5462BRL 0.1571 0.1917 0.1558 0.1353CAD 0.6782 0.8277 0.6770 0.5841
Notes to the Financial Statements continued
Annual report and audited financial statements [593]

All Funds (except theBlackRock DynamicDiversified Growth Fund)
BlackRockDynamic
DiversifiedGrowthFund
BlackRockEmerging
CompaniesAbsoluteReturn
Fund andBlackRock UK
Equity AbsoluteReturn Fund
CCY EUR USD EUR GBP
CHF 0.9100 1.1106 0.9094 0.7837CLP 0.0011 0.0014 0.0011 0.0010CNH 0.1286 0.1570 0.1283 0.1108CNY 0.1286 0.1570 0.1283 0.1108COP 0.0002 0.0003 0.0002 0.0002CZK 0.0393 0.0479 0.0393 0.0338DKK 0.1345 0.1641 0.1345 0.1158DOP 0.0145 0.0177 0.0145 0.0125EGP 0.0523 0.0638 0.0522 0.0450EUR 1.0000 1.2204 1.0000 0.8613GBP 1.1611 1.4170 1.1626 1.0000GHS 0.1412 0.1723 0.1409 0.1216HKD 0.1056 0.1288 0.1054 0.0909HUF 0.0029 0.0035 0.0029 0.0025IDR 0.0001 0.0001 0.0001 0.0000ILS 0.2523 0.3080 0.2518 0.2173INR 0.0113 0.0138 0.0113 0.0097JPY 0.0075 0.0091 0.0075 0.0064KRW 0.0007 0.0009 0.0007 0.0006KZT 0.0019 0.0023 0.0019 0.0016LKR 0.0041 0.0051 0.0041 0.0036MXN 0.0412 0.0502 0.0411 0.0355MYR 0.1987 0.2425 0.1983 0.1711NGN 0.0018 0.0022 0.0018 0.0015NOK 0.0982 0.1198 0.0983 0.0846NZD 0.5956 0.7268 0.5954 0.5129PEN 0.2159 0.2635 0.2142 0.1860PHP 0.0172 0.0210 0.0171 0.0148PLN 0.2230 0.2721 0.2233 0.1920QAR 0.2216 0.2705 0.2212 0.1909RON 0.2033 0.2481 0.2034 0.1751RUB 0.0112 0.0136 0.0111 0.0096SEK 0.0988 0.1206 0.0986 0.0851SGD 0.6199 0.7566 0.6192 0.5339THB 0.0262 0.0320 0.0262 0.0226TRY 0.0964 0.1177 0.0965 0.0831TWD 0.0297 0.0362 0.0296 0.0256UAH 0.0298 0.0364 0.0298 0.0257USD 0.8194 1.0000 0.8179 0.7057UYU 0.0187 0.0228 0.0187 0.0161ZAR 0.0596 0.0727 0.0596 0.0513ZMW 0.0364 0.0444 0.0363 0.0313
(f) Combined Financial Statements
The accounts of each Fund are expressed in the Fund’s basecurrency. The combined figures of the Company are expressedin USD and include the total of the financial statements of thedifferent Funds, translated if necessary. For the translation ofthe Statement of Net Assets, the exchange rate prevailing at theFunds’ valuation point in Luxembourg as at 31 May 2021 for allFunds expressed in EUR excluding BlackRock DynamicDiversified Growth Fund is:
EUR
USD 0.8194
For the BlackRock Dynamic Diversified Growth Fund, theexchange rate prevailing at the Fund’s valuation point inLuxembourg as at 31 May 2021 is:
EUR
USD 0.8179
For the BlackRock Emerging Companies Absolute Return Fundand BlackRock UK Equity Absolute Return Fund, the exchangerate prevailing at the Fund’s valuation point in Luxembourg as at31 May 2021 is:
GBP
USD 0.7057
For the Statement of Operations and Changes in Net Assets,the following exchange rate is the average rate calculated overthe year for all Funds expressed in Euros excluding BlackRockDynamic Diversified Growth Fund:
EUR
USD 0.8429
For the BlackRock Dynamic Diversified Growth Fund, thefollowing exchange rate is the average rate calculated over theyear:
EUR
USD 0.8430
For the BlackRock Emerging Companies Absolute Return Fundand BlackRock UK Equity Absolute Return Fund, the followingexchange rate is the average rate calculated over the year:
GBP
USD 0.7494
The combined figures in the Statement of Operations andChanges in Net Assets have been calculated using the averageexchange rates throughout the year. The resulting Foreignexchange adjustment of USD 1,486,007,339 represents themovement in exchange rates between 1 June 2020 and 31 May2021. This is a notional amount, which has no impact on the NetAssets of the individual Funds.
(g) Income Equalisation
The Company operates Income Equalisation arrangements witha view to ensure that the level of net income accrued within aFund and attributable to each share is not affected by the issue,conversion or redemption of Fund shares during an accountingyear.
The Income Equalisation is included in the Movements in sharecapital in the Statement of Operations and Changes in NetAssets.
(h) Dilution
The Directors may adjust the NAV per Share for a Fund in orderto reduce the effect of “dilution” on that Fund. Dilution occurswhen the actual cost of purchasing or selling the underlying
Notes to the Financial Statements continued
BlackRock Strategic Funds[594]

assets of a Fund deviates from the carrying value of theseassets in the Fund’s valuation, due to factors such as dealingand brokerage charges, taxes and duties, market movement andany spread between the buying and selling prices of theunderlying assets. Dilution may have an adverse effect on thevalue of a Fund and therefore impact Shareholders. Byadjusting the NAV per Share this effect can be reduced orprevented and Shareholders can be protected from the impactof dilution. The Directors may adjust the NAV of a Fund if onany Dealing Day the value of the aggregate transactions inShares of all Share Classes of that Fund results in a netincrease or decrease which exceeds one or more thresholdsthat are set by the Directors for that Fund. The amount by whichthe NAV of a Fund may be adjusted on any given Dealing Day isrelated to the anticipated cost of market dealing for that Fund. Insuch circumstances the NAV of the relevant Fund may beadjusted by an amount not exceeding 1.50%, or 3% in the caseof bond Funds, of that NAV. Under exceptional circumstancesthe Directors may, in the interest of Shareholders, decide totemporarily increase the maximum swing factor indicated aboveand inform investors thereof. The adjustment will be an additionwhen the net movement results in an increase in the value of allShares of the Fund and a deduction when it results in adecrease.
As certain stock markets and jurisdictions may have differentcharging structures on the buy and sell sides, particularly inrelation to duties and taxes, the resulting adjustment may bedifferent for net inflows than for net outflows. In addition, theDirectors may also agree to include extraordinary fiscal chargesin the amount of the adjustment. These extraordinary fiscalcharges vary from market to market and are currently expectednot to exceed 2.5% of that NAV. Where a Fund invests primarilyin certain asset types, such as government bonds or moneymarket securities, the Directors may decide that it is notappropriate to make such an adjustment. In accordance with theProspectus, such dilution adjustment was applied as at 31 May2021 to BlackRock Global Real Asset Securities Fund.
During the financial year from 1 June 2020 to 31 May2021 dilution adjustments were applied to all Funds.
The published/dealing NAV per share is disclosed in the ThreeYear Summary of Net Asset Values and may include a dilutionadjustment. This adjustment is not recognised in the Statementof Net Assets or the Statement of Operations and Changes inNet Assets.
(i) Transaction costs
Transaction costs are incremental costs that are directlyattributable to the acquisition, issue or disposal of securities andderivatives. An incremental cost is one that would not have beenincurred if the entity had not acquired, issued or disposed of thesecurity. When a security is recognised initially, it is measured atits market value, plus transaction costs that are directlyattributable to the acquisition or issue of the security.
Transaction costs excluding depositary transaction fees onpurchases or sales of securities are included within net realisedgain/(loss) or net change in unrealisedappreciation/(depreciation) within the Statement of Operationsand Changes in Net Assets of each Fund. Depositarytransaction fees are included in Depositary fees in theStatement of Operations and Changes in Net Assets of theFund. Refer to Note 6 for further information.
(j) Foreign currencies on other transactions
Foreign currencies on other transactions relate to realised andunrealised appreciation or depreciation on cash balances andspot contracts and are disclosed in the Statement of Operationsand Changes in Net Assets.
3. Management CompanyBlackRock (Luxembourg) S.A. (the “Management Company”)has been appointed by the Company to act as its ManagementCompany. The Management Company is authorised to act as afund management company in accordance with Chapter 15 ofthe 2010 Law.
The Company has signed a management company agreementwith the Management Company. Under this agreement, theManagement Company is entrusted with the day-to-daymanagement of the Company, with responsibility for performingdirectly or by way of delegation all operational functions relatingto the Company’s investment management, administration andmarketing of the Funds.
In agreement with the Company, the Management Companyhas decided to delegate several of its functions as is furtherdescribed in the Prospectus.
The Management Company is a wholly owned subsidiary withinthe BlackRock Group. It is regulated by the CSSF.
4. Management and Distribution FeesDuring the year, the Company paid management fees to theManagement Company.
The Company pays management fees at an annual rate asshown in Appendix F of the Prospectus. The level ofmanagement fee varies from 0.37% to 1.80% of the NAV, withthe exception of Class X shares, which do not pay amanagement fee but rather a fee to the Investment Advisers oraffiliates under an agreement. The level of management feevaries according to which Fund and Share Class the investorbuys. These fees accrue daily, are based on the NAV of therelevant Fund and are paid monthly. Certain costs and fees arepaid out of the management fees, including the fees of theInvestment Advisers.
Where a Fund invests a substantial proportion of its net assetsin other UCITS and other Undertakings for Collective Investment(“UCIs”), the Investment Adviser will ensure that the totalmanagement fee (excluding any performance fee, if any)charged to such Fund (including management fees from otherUCITS and UCIs in which it invests) shall not exceed 3.75% ofthe NAV of the Fund.
During the year, the following Funds were subject tomanagement fee rebate linked to investments into target fundsmanaged by BlackRock disclosed in the Statement ofOperations and Changes in Net Assets under the caption“Management fee rebate”:
BlackRock Dynamic Diversified Growth Fund, BlackRockEmerging Markets Flexi Dynamic Bond Fund, BlackRockEuropean Select Strategies Fund, BlackRock Fixed IncomeCredit Strategies Fund, BlackRock Fixed Income StrategiesFund, BlackRock Global Absolute Return Bond Fund,
Notes to the Financial Statements continued
Annual report and audited financial statements [595]

BlackRock Managed Index Portfolios – Conservative,BlackRock Managed Index Portfolios – Defensive, BlackRockManaged Index Portfolios – Growth and BlackRock ManagedIndex Portfolios – Moderate.
During the year, the Funds disclosed below were subject to feereimbursement from the Management Company, as disclosed inthe Statement of Operations and Changes in Net Assets underthe caption �Reimbursement of expenses�:
BlackRock Asia Pacific Diversified Equity Absolute Return Fund,BlackRock Emerging Companies Absolute Return Fund,BlackRock ESG Euro Corporate Bond Fund, BlackRock ESGEuro Short Duration Bond Fund, BlackRock EuropeanDiversified Equity Absolute Return Fund, BlackRock GlobalAbsolute Return Bond Fund, BlackRock Global Equity AbsoluteReturn Fund, BlackRock Style Advantage Screened Fund,BlackRock Systematic Global Long/Short Equity Fund,BlackRock Total Advantage Fund and BlackRock UK EquityAbsolute Return Fund.
During the year, the Company paid distribution fees toBlackRock Investment Management (UK) Limited who acted asPrincipal Distributor.
The Company pays annual distribution fees between 1.25% and1.00% of the NAV for Class C Shares and 0.50% of the NAV forClass E Shares. These fees accrue daily, are based on the NAVof the relevant Fund reflecting, when applicable, any adjustmentto the NAV of the relevant Fund, and are paid monthly.
The management and distribution fees per Share Class perFund are disclosed in detail in the Prospectus of the Companyand the relevant KIID. Management and distribution feespayable at 31 May 2021 are included in the Statement of NetAssets under the caption “Accrued expenses and otherliabilities”.
5. Annual Service ChargeThe Company pays an Annual Service Charge to theManagement Company.
The level of Annual Service Charge may vary at the Board’sdiscretion, as agreed with the Management Company, and willapply at different rates across the various Funds and ShareClasses issued by the Company. However, it has been agreedbetween the Board and the Management Company that theAnnual Service Charge currently paid shall not exceed 0.30%per annum. It is accrued daily, based on the NAV of the relevantShare Class and paid monthly.
The Board and the Management Company set the level of theAnnual Service Charge at a rate which aims to ensure that thetotal expense ratio of each Fund remains competitive whencompared across a broad market of similar investment productsavailable to investors in the Funds, taking into account a numberof criteria such as the market sector of each Fund and theFund’s performance relative to its peer group.
The Annual Service Charge is used by the ManagementCompany to meet all fixed and variable operating andadministrative costs and expenses incurred by the Company,with the exception of the depositary fees, distribution fees,securities lending fees, any fees arising from borrowings(including for the avoidance of doubt any commitment fee thatmay be due to the lender), any professional services costsrelating to withholding tax reclaims (plus any taxes or interest
thereon), and any taxes at an investment or Company level. Anycommitment fees arising from borrowings or professionalservices costs relating to withholding tax reclaims will beallocated between the relevant Funds on a fair and equitablebasis.
These operating and administrative costs and expenses includeall third party expenses and other recoverable costs incurred byor on behalf of the Company from time to time, including but notlimited to, fund accounting fees, transfer agency fees (includingsub-transfer agency and associated platform dealing charges),all professional costs, such as consultancy, legal, tax advisoryand audit fees, Directors’ fees, travel expenses, reasonableout-of-pocket expenses, printing, publication, translation and allother costs relating to shareholder reporting, regulatory filingand licence fees, correspondent and other banking charges,software support and maintenance, operational costs andexpenses attributed to the Investor Servicing teams and otherglobal administration services provided by various BlackRockGroup companies.
The Management Company bears the financial risk of ensuringthat the Funds’ total expense ratio remains competitive.Accordingly the Management Company is entitled to retain anyamount of the Annual Service Charge paid to it which is inexcess of the actual expenses incurred by the Company duringany year whereas any costs and expenses incurred by theCompany in any year which exceed the amount of AnnualService Charge that is paid to the Management Company, shallbe borne by the Management Company or another BlackRockGroup company.
Annual Service Charge payable at 31 May 2021 is included inthe Statement of Net Assets under the caption “Accruedexpenses and other liabilities”.
Directors of the Company who are not employees of theBlackRock Group received a fee of EUR 30,000 per annumgross of taxation in return for their duties performed during theyear ended 31 May 2021. The Chairwoman receives a fee ofEUR 33,500 per annum gross of taxation. Directors who areemployees of the BlackRock Group are not entitled to receive aDirectors fee.
Detailed below are the fees paid to Deloitte Audit, S.à r.l. for theyear ended 31 May 2021.
31 May 2021EUR
Audit and audit related services(excluding VAT) 440,500Non-audit services –
6. Depositary FeesThe Depositary receives a fee in respect of each Fund. Thesefees are to remunerate the Depositary for safekeeping andtransaction costs applicable to each Fund.
Safekeeping fees vary based on the value of assets undermanagement and the country in which the assets are held.Transaction fees vary based on the type of transaction and thecountry in which the transaction occurs.
Trading volumes and asset allocations for each Fund varyaccording to the investment strategy of each Fund. Thecombined Depositary fee to each Fund depends on its assetallocations and trading activity at any time.
Notes to the Financial Statements continued
BlackRock Strategic Funds[596]

Depositary fees payable at 31 May 2021 are included in theStatement of Net Assets under the caption “Accrued expensesand other liabilities”.
7. Performance FeesA performance fee may be payable out of each Share Class ofeach Fund with the exception of Class X shares which do notpay a performance fee, in addition to other fees and expensesmentioned in the Prospectus. The performance fee accrues oneach Valuation Day and is equal to 8%, 20% or 30% (asapplicable to the relevant Fund, as stated in Appendix E of theProspectus) of the amount by which the NAV per share returnexceeds the appropriate benchmark return described in furtherdetail in Appendix E of the Prospectus. Two methods ofcalculation are used and are referred to as Type A and Type B –the method applicable to each Fund is indicated in Appendix Eof the Prospectus. Further details may be obtained from theLocal Investor Servicing team and the registered office of theCompany.
Crystallisation of the performance fee occurs on the last day ofeach Performance Period or where a shareholder redeems orconverts all or part of his shares before the end of aPerformance Period.
Performance fees payable at 31 May 2021 are included in theStatement of Operations and Changes in Net Assets under thecaption �Performance fees�.
8. TaxesLuxembourg subscription tax, Belgian tax, realized andunrealized Capital Gain Tax are disclosed in the Statement ofOperations and Changes in Net Assets under caption “Taxes”.For the year ended 31 May 2021, USD 15,854,109 was chargedin relation to Taxes.
LuxembourgThe Company is registered under Luxembourg law as aninvestment company. Accordingly, no Luxembourg income orcapital gains tax is at present payable by the Company.However, it is subject to an annual subscription tax (“taxed’abonnement”) calculated at an annual rate of 0.05% of theNAV of each Fund at the end of each quarter, and in the case ofall Class I, Class I A, Class J, Class T and Class X Shares, of0.01% of the NAV of each Fund at the end of each quarter. Forthe year ended 31 May 2021, USD 7,586,755 was charged inrelation to Luxembourg subscription tax.
BelgiumThe Company is registered with the financial services andmarkets authorities in Belgium in accordance with Article 154 ofthe amended Law of 3 August 2012 relating to financialtransactions and the financial markets. Funds registered forpublic distribution in Belgium are subject to an annual tax of0.0925% on the NAV of units distributed in Belgium via Belgianintermediaries as at 31 December of the previous year. For theyear ended 31 May 2021, USD 449,073 was charged in relationto Belgian tax.
United KingdomReporting FundsThe UK Reporting Funds regime applies to the Company. Underthis regime, investors in UK Reporting Funds are subject to taxon the share of the UK Reporting Funds income attributable totheir holdings in the Fund, whether or not distributed, but anygains on disposal of their holdings are subject to capital gains
tax. A list of the Funds which currently have UK Reporting Fundstatus is available at: https://www.gov.uk/government/publications/offshore-funds-list-of-reporting-funds.
Other transaction taxesOther jurisdictions may impose taxes, financial transactionstaxes (“FTT”) or other transaction taxes on certain assets heldby the Funds (for example UK stamp duty, French FTT).
Withholding taxDividends, interest and capital gains (if any) received by theCompany on its investments may be subject to withholdingtaxes in the countries of origin which are generally irrecoverableas the Company itself is exempt from income tax. RecentEuropean Union case law may, however, reduce the amount ofsuch irrecoverable tax. Investors should inform themselves of,and when appropriate consult their professional advisers on, thepossible tax consequences of subscribing for, buying, holding,redeeming, converting or selling Shares under the laws of theircountry of citizenship, residence or domicile. Investors shouldnote that the levels and bases of, and reliefs from, taxation canchange. The potential of withholding tax charges is furtherdescribed in the Prospectus.
Withholding tax is included in the Statement of Operations andChanges in Net Assets under the caption �Dividends, net ofwithholding taxes�.
Dividends received by the Company on CFDs may be subject towithholding tax: in particular, withholding tax for CFDs on USequity instruments is regulated pursuant to Section 871(m) ofthe Internal Revenue Code (“IRC”). Such withholding tax isincluded in the Statement of Operations and Changes in NetAssets under the caption “Contracts for difference dividends, netof withholding taxes”.
9. Investment Advisers and Sub-Investment AdvisersThe Management Company, BlackRock (Luxembourg) S.A., hasdelegated the management and provision of investment adviceto the Investment Advisers: BlackRock Financial Management,Inc. (BFM Inc.), BlackRock Institutional Trust Company N.A.(BTC), BlackRock Investment Management LLC (BIMLLC),BlackRock Investment Management (UK) Limited (BIM UK) andBlackRock (Singapore) Limited (BLKSin) as described in theProspectus.
The Investment Advisers provide advice and management in theareas of stock and sector selection and strategic allocation. BIMUK has sub-delegated some of its functions to BlackRockJapan Co., Ltd. (BLKJap), BlackRock Investment Management(Australia) Limited (BLKAus) and BlackRock Asset ManagementNorth Asia Limited (BAMNA). Notwithstanding the appointmentof the Investment Advisers, the Management Company acceptsfull responsibility to the Company for all investment transactions.
FundInvestmentAdviser(s)
Sub-InvestmentAdviser(s)
BlackRock Americas Diversified Equity AbsoluteReturn Fund
BTC –
BlackRock Asia Extension Fund(1) BTC –BlackRock Asia Pacific Absolute Return Fund BIM UK BAMNABlackRock Asia Pacific Diversified Equity AbsoluteReturn Fund
BIM UK,BIMLLC
BAMNA
BlackRock Dynamic Diversified Growth Fund BIM UK –BlackRock Emerging Companies Absolute ReturnFund(2)
BIM UK –
Notes to the Financial Statements continued
Annual report and audited financial statements [597]

FundInvestmentAdviser(s)
Sub-InvestmentAdviser(s)
BlackRock Emerging Markets Absolute Return Fund BIM UK BAMNABlackRock Emerging Markets Equity Strategies Fund BIM UK BAMNABlackRock Emerging Markets Flexi Dynamic BondFund
BIM UK –
BlackRock Emerging Markets Short Duration BondFund
BIM UK –
BlackRock ESG Euro Bond Fund BIM UK –BlackRock ESG Euro Corporate Bond Fund BIM UK –BlackRock ESG Euro Short Duration Bond Fund(3) BIM UKBlackRock European Absolute Return Fund BIM UK –BlackRock European Diversified Equity AbsoluteReturn Fund(1)
BIM UK –
BlackRock European Opportunities Extension Fund BIM UK –BlackRock European Select Strategies Fund BIM UK –BlackRock European Unconstrained Equity Fund BIM UK –BlackRock Fixed Income Credit Strategies Fund BIM UKBlackRock Fixed Income Strategies Fund BIM UK,
BLKSin–
BlackRock Global Absolute Return Bond Fund BTC,BIM UK,
BFM Inc.,BLKSin
BAMNA,BLKJap
BlackRock Global Equity Absolute Return Fund BIM UKBlackRock Global Event Driven Fund BIMLLC –BlackRock Global Real Asset Securities Fund BIMLLC,
BIM UK,BFM Inc.,
BLKSin
–
BlackRock Macro Opportunities Fund(1) BFM Inc.,BIMLLC,
BLKSin
–
BlackRock Managed Index Portfolios − Conservative BIM UK,BIMLLC
BAMNA
BlackRock Managed Index Portfolios − Defensive BIM UK,BIMLLC
BAMNA
BlackRock Managed Index Portfolios − Growth BIM UK,BIMLLC
BAMNA
BlackRock Managed Index Portfolios − Moderate BIM UK,BIMLLC
BAMNA
BlackRock Style Advantage Fund BIMLLC –BlackRock Style Advantage Screened Fund BIM UK,
BIMLLC–
BlackRock Systematic ESG World Equity Fund BIMLLC –BlackRock Systematic Global Equity Fund BIMLLC –BlackRock Systematic Global Long/Short EquityFund(2)
BFM Inc. –
BlackRock Total Advantage Fund BIMLLC,BIM UK,
BFM Inc.
–
BlackRock UK Equity Absolute Return Fund BIM UK –(1) Fund terminated, see Note 1 for further details.(2) Fund name changed, see Note 1 for further details.(3) New Fund launched, see Note 1 for further details.
10. Transactions with related partiesThe ultimate holding company of the Management Company,the Principal Distributor and the Investment Advisers isBlackRock, Inc., a company incorporated in Delaware, USA.
During the year, there have been no significant transactionswhich were outside the ordinary course of business or whichwere not on normal commercial terms. There were notransactions of the Company effected through BlackRockcompanies.
The Company has appointed BlackRock Advisors (UK) Limited(the “Securities Lending Agent”), a related party to theCompany, as securities lending agent. The Securities LendingAgent bears all operational costs directly related to securitieslending transactions. The total income earned from securitieslending transactions is split between the relevant Fund and theSecurities Lending Agent. The Funds which undertakesecurities lending transactions receive at least 62.5%, while theSecurities Lending Agent receives up to 37.5% of such income.
Some of the Funds use cross investment techniques, meaningthat the Funds invest into other Funds within the Company’sumbrella structure. The combined Statement of Net Asset andcombined the Statement of Operations and Changes in NetAssets have not been adjusted to remove the impact of thecross investments. The commissions on subscriptions andredemptions, as well as management fees, were not applied tothe assets of the fund that has cross-invested into other Funds.
The table below provides the value of those cross-investmentsin the relevant Fund’s Portfolio of Investments as at 31 May2021:
FundCrossInvestment Fund Currency
MarketValue
% ofNet
Asset
BlackRockDynamicDiversifiedGrowth Fund
BlackRockStrategic Funds- BlackRockSystematicESG WorldEquity FundX2 (GBP) EUR 50,450,912 4.10
11. DividendsFor the Non-Distributing Share Classes, the Directors’ currentpolicy is to retain and reinvest all net income.
For the Distributing Share Classes, the policy is to distributesubstantially all the investment income (where available) for theyear after deduction of expenses (or gross income in the caseof Distributing (G) Shares). The Directors may also determine ifand to what extent dividends may include distributions from bothnet realised and net unrealised capital gains. Where DistributingShare Classes pay dividends that include net realised capitalgains or net unrealised capital gains, or, in the case of Fundswhich distribute income gross of expenses, dividends mayinclude initially subscribed capital. Shareholders should notethat dividends distributed in this manner may be taxable asincome, depending on the local tax legislation, and should seektheir own professional tax advice in this regard.
Where a Fund has UK Reporting Fund status and reportedincome exceeds distributions made then the surplus shall betreated as a deemed dividend and will be taxed as income,subject to the tax status of the investor.
The Company may operate income equalisation arrangementswith a view to ensuring that the level of net income accruedwithin a Fund (or gross income in the case of Distributing(G) Shares) and attributable to each Share is not affected by theissue, conversion or redemption of those Shares during anaccounting year.
Notes to the Financial Statements continued
BlackRock Strategic Funds[598]
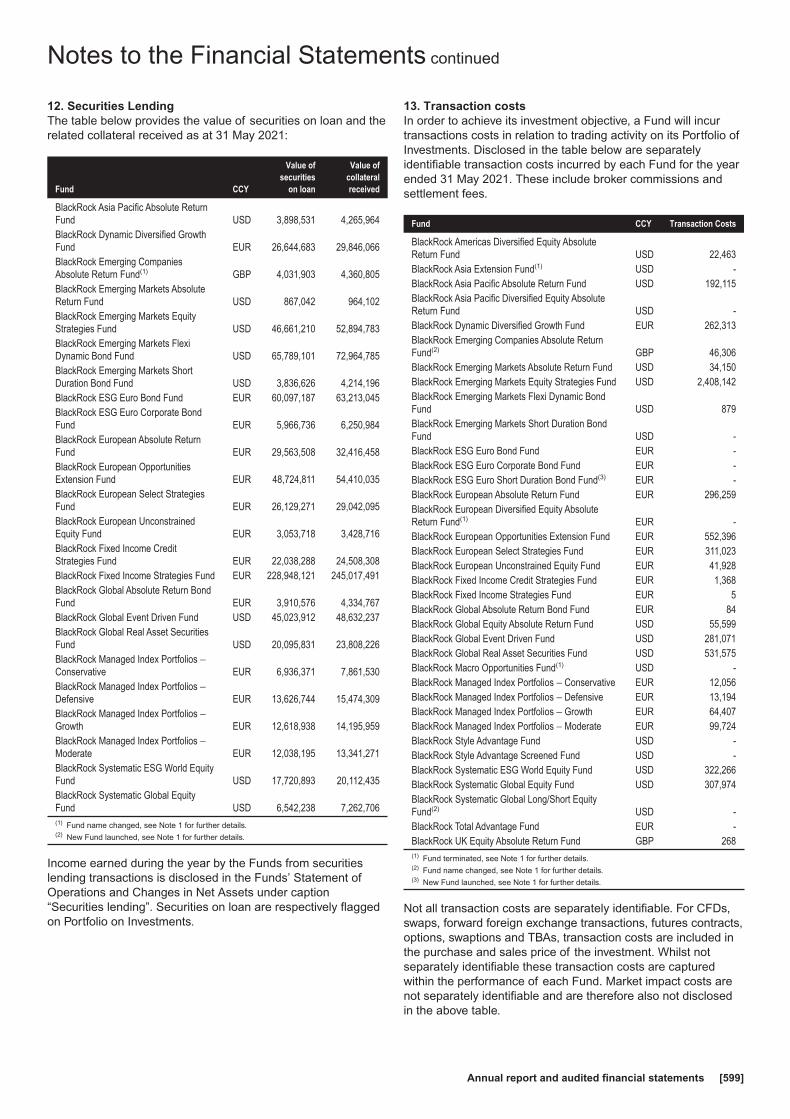
12. Securities LendingThe table below provides the value of securities on loan and therelated collateral received as at 31 May 2021:
Fund CCY
Value ofsecurities
on loan
Value ofcollateralreceived
BlackRock Asia Pacific Absolute ReturnFund USD 3,898,531 4,265,964BlackRock Dynamic Diversified GrowthFund EUR 26,644,683 29,846,066BlackRock Emerging CompaniesAbsolute Return Fund(1) GBP 4,031,903 4,360,805BlackRock Emerging Markets AbsoluteReturn Fund USD 867,042 964,102BlackRock Emerging Markets EquityStrategies Fund USD 46,661,210 52,894,783BlackRock Emerging Markets FlexiDynamic Bond Fund USD 65,789,101 72,964,785BlackRock Emerging Markets ShortDuration Bond Fund USD 3,836,626 4,214,196BlackRock ESG Euro Bond Fund EUR 60,097,187 63,213,045BlackRock ESG Euro Corporate BondFund EUR 5,966,736 6,250,984BlackRock European Absolute ReturnFund EUR 29,563,508 32,416,458BlackRock European OpportunitiesExtension Fund EUR 48,724,811 54,410,035BlackRock European Select StrategiesFund EUR 26,129,271 29,042,095BlackRock European UnconstrainedEquity Fund EUR 3,053,718 3,428,716BlackRock Fixed Income CreditStrategies Fund EUR 22,038,288 24,508,308BlackRock Fixed Income Strategies Fund EUR 228,948,121 245,017,491BlackRock Global Absolute Return BondFund EUR 3,910,576 4,334,767BlackRock Global Event Driven Fund USD 45,023,912 48,632,237BlackRock Global Real Asset SecuritiesFund USD 20,095,831 23,808,226BlackRock Managed Index Portfolios −Conservative EUR 6,936,371 7,861,530BlackRock Managed Index Portfolios −Defensive EUR 13,626,744 15,474,309BlackRock Managed Index Portfolios −Growth EUR 12,618,938 14,195,959BlackRock Managed Index Portfolios −Moderate EUR 12,038,195 13,341,271BlackRock Systematic ESG World EquityFund USD 17,720,893 20,112,435BlackRock Systematic Global EquityFund USD 6,542,238 7,262,706(1) Fund name changed, see Note 1 for further details.(2) New Fund launched, see Note 1 for further details.
Income earned during the year by the Funds from securitieslending transactions is disclosed in the Funds’ Statement ofOperations and Changes in Net Assets under caption“Securities lending”. Securities on loan are respectively flaggedon Portfolio on Investments.
13. Transaction costsIn order to achieve its investment objective, a Fund will incurtransactions costs in relation to trading activity on its Portfolio ofInvestments. Disclosed in the table below are separatelyidentifiable transaction costs incurred by each Fund for the yearended 31 May 2021. These include broker commissions andsettlement fees.
Fund CCY Transaction Costs
BlackRock Americas Diversified Equity AbsoluteReturn Fund USD 22,463BlackRock Asia Extension Fund(1) USD -BlackRock Asia Pacific Absolute Return Fund USD 192,115BlackRock Asia Pacific Diversified Equity AbsoluteReturn Fund USD -BlackRock Dynamic Diversified Growth Fund EUR 262,313BlackRock Emerging Companies Absolute ReturnFund(2) GBP 46,306BlackRock Emerging Markets Absolute Return Fund USD 34,150BlackRock Emerging Markets Equity Strategies Fund USD 2,408,142BlackRock Emerging Markets Flexi Dynamic BondFund USD 879BlackRock Emerging Markets Short Duration BondFund USD -BlackRock ESG Euro Bond Fund EUR -BlackRock ESG Euro Corporate Bond Fund EUR -BlackRock ESG Euro Short Duration Bond Fund(3) EUR -BlackRock European Absolute Return Fund EUR 296,259BlackRock European Diversified Equity AbsoluteReturn Fund(1) EUR -BlackRock European Opportunities Extension Fund EUR 552,396BlackRock European Select Strategies Fund EUR 311,023BlackRock European Unconstrained Equity Fund EUR 41,928BlackRock Fixed Income Credit Strategies Fund EUR 1,368BlackRock Fixed Income Strategies Fund EUR 5BlackRock Global Absolute Return Bond Fund EUR 84BlackRock Global Equity Absolute Return Fund USD 55,599BlackRock Global Event Driven Fund USD 281,071BlackRock Global Real Asset Securities Fund USD 531,575BlackRock Macro Opportunities Fund(1) USD -BlackRock Managed Index Portfolios − Conservative EUR 12,056BlackRock Managed Index Portfolios − Defensive EUR 13,194BlackRock Managed Index Portfolios − Growth EUR 64,407BlackRock Managed Index Portfolios − Moderate EUR 99,724BlackRock Style Advantage Fund USD -BlackRock Style Advantage Screened Fund USD -BlackRock Systematic ESG World Equity Fund USD 322,266BlackRock Systematic Global Equity Fund USD 307,974BlackRock Systematic Global Long/Short EquityFund(2) USD -BlackRock Total Advantage Fund EUR -BlackRock UK Equity Absolute Return Fund GBP 268(1) Fund terminated, see Note 1 for further details.(2) Fund name changed, see Note 1 for further details.(3) New Fund launched, see Note 1 for further details.
Not all transaction costs are separately identifiable. For CFDs,swaps, forward foreign exchange transactions, futures contracts,options, swaptions and TBAs, transaction costs are included inthe purchase and sales price of the investment. Whilst notseparately identifiable these transaction costs are capturedwithin the performance of each Fund. Market impact costs arenot separately identifiable and are therefore also not disclosedin the above table.
Notes to the Financial Statements continued
Annual report and audited financial statements [599]

14. Credit FacilityA USD 2 billion credit facility arranged by JPMorgan ChaseBank N.A. (�JPMorgan�) will allow the Company to avail of acommitted USD 1.23 billion tranche. The portion of the USD1.23 billion credit facility will be allocated to the Funds based onthe Allocation Notice dated 23 April 2021.
This credit facility will be utilised by the Funds for temporaryfunding purposes, including, without limitation, the funding ofinvestor redemptions. Any interest and commitment fees inrelation to drawdowns from such credit facility are paid out ofthe assets of the relevant Funds. Any new Funds will notautomatically be subject to a credit line and will therefore berequired to be added by way of a joinder process. This processincludes, inter alia, any necessary due diligence being carriedout by the lenders in order to approve the addition of the newFunds. During this for the year ended, such Funds will not besubject to, or able to draw down on, any credit line.Furthermore, there is no guarantee that the addition of any newFunds will be approved by the lenders, or that credit will beavailable to a Fund since the credit line is subject to availability(on an equitable allocation basis) between the Funds and otherBlackRock Funds participating in the credit agreement. As such,certain Funds may not be subject to the credit line and will notincur any fees with respect to same.
A loan commitment fee is charged in relation to this credit facilitywhich is included in the Statement of Operations and Changesin Net Assets under caption “Loan commitment fees”. The loancommitment fee is charged at 0.10% on the outstandingbalance.
No portion of the credit facility was used during the year ended31 May 2021.
15. Amounts due from/to brokerDue from/to broker on the Statement of Net Assets consists ofcash collateral and margin paid/received to/from Funds’ clearingbrokers and various counterparties.
16. Total Expense RatioTotal Expense Ratio (“TER”) is calculated as the total of allexpenses (excluding bank interest, negative yield expense onfinancial assets and expense reimbursements), divided by theaverage net assets of the share classes, expressed as apercentage. All data is annualised.
The Management fees may be used in part to pay remunerationfor distribution activities concerning the Company.Reimbursement may be made to institutional investors whichfrom a commercial perspective hold shares of the Company forthird parties.
The TERs for the year from 1 June 2020 to 31 May 2021 are asfollows:
Fund Name Share classes TER
Performance-related Fee (as
a percentageof the average
net assets)
BlackRock Americas Diversified Equity Absolute Return Fund A Class non-distributing share AUD 2.142% -
A Class non-distributing share EUR 2.129% -A Class non-distributing share SEK hedged 2.099% -A Class non-distributing UK reporting fund share 2.130% -A Class non-distributing UK reporting fund share EUR hedged 2.130% -A Class non-distributing UK reporting fund share GBP 2.147% -D Class non-distributing share 1.637% -D Class non-distributing share CHF hedged 1.607% -D Class non-distributing UK reporting fund share EUR hedged 1.634% -D Class non-distributing UK reporting fund share GBP hedged 1.632% -E Class non-distributing share EUR hedged 2.603% -I Class non-distributing share EUR hedged 1.326% -I Class non-distributing share JPY hedged 1.360% -I Class non-distributing share SEK hedged 1.364% -I Class non-distributing UK reporting fund share 1.331% -X Class non-distributing share 0.361% -
Notes to the Financial Statements continued
BlackRock Strategic Funds[600]

Fund Name Share classes TER
Performance-related Fee (as
a percentageof the average
net assets)
BlackRock Asia Pacific Absolute Return Fund A Class distributing share EUR hedged 2.819% 0.989%
A Class non-distributing share EUR 3.141% 1.274%A Class non-distributing UK reporting fund share GBP 3.108% 1.265%D Class non-distributing share 3.327% 1.959%D Class non-distributing share EUR 2.982% 1.637%D Class non-distributing share EUR hedged 2.537% 1.201%D Class non-distributing share GBP hedged 3.499% 2.128%E Class non-distributing share EUR 3.182% 0.818%E Class non-distributing share EUR hedged 3.377% 0.987%X Class non-distributing share 0.079% -Z Class non-distributing share 2.484% 1.367%Z Class non-distributing share CHF hedged 1.425% 0.355%Z Class non-distributing share EUR hedged 2.367% 1.255%
BlackRock Asia Pacific Diversified Equity Absolute Return Fund A Class non-distributing share 4.905% 3.002%
A Class non-distributing share EUR hedged 4.583% 2.696%D Class non-distributing share 1.643% -D Class non-distributing share EUR hedged 4.306% 2.911%E Class non-distributing share EUR hedged 5.372% 2.991%X Class non-distributing UK reporting fund share 0.140% -Z Class non-distributing share EUR hedged 3.572% 2.667%Z Class non-distributing UK reporting fund share 3.391% 2.467%Z Class non-distributing UK reporting fund share GBP hedged 3.848% 2.944%
BlackRock Dynamic Diversified Growth Fund A Class non-distributing share 1.552% -
A Class non-distributing share SEK hedged 1.546% -AI Class non-distributing share 1.575% -D Class non-distributing share 0.860% -E Class non-distributing share 2.052% -I Class non-distributing share 0.631% -I Class non-distributing share CAD hedged 0.615% -I Class non-distributing share JPY hedged 0.630% -I Class non-distributing share SEK hedged 0.608% -I Class non-distributing UK reporting share USD hedged 0.621% -X Class non-distributing share 0.082% -
BlackRock Emerging Companies Absolute Return Fund(1) A Class non-distributing share CHF hedged 3.544% 1.673%
A Class non-distributing share CNH hedged(2) 3.053% 1.125%A Class non-distributing share EUR hedged 3.353% 1.492%A Class non-distributing share USD hedged 3.311% 1.401%A Class non-distributing UK reporting fund share 3.675% 1.795%D Class non-distributing share CHF hedged 2.970% 1.595%D Class non-distributing share EUR hedged 3.131% 1.764%D Class non-distributing UK reporting fund share 3.230% 1.866%D Class non-distributing UK reporting fund share USD hedged 3.237% 1.865%I Class distributing UK reporting fund share 2.732% 1.666%I Class non-distributing share CHF hedged 3.147% 2.071%I Class non-distributing UK reporting fund share 3.168% 2.098%I Class non-distributing UK reporting fund share EUR hedged 3.069% 1.998%I Class non-distributing UK reporting fund share USD hedged 2.860% 1.783%S Class non-distributing UK reporting fund share 3.133% 2.069%X Class non-distributing UK reporting fund share 0.061% -Z Class non-distributing share CHF hedged 2.661% 1.548%Z Class non-distributing UK reporting fund share 2.812% 1.703%Z Class non-distributing UK reporting fund share EUR hedged 2.651% 1.545%Z Class non-distributing UK reporting fund share USD hedged 2.716% 1.598%
Notes to the Financial Statements continued
Annual report and audited financial statements [601]

Fund Name Share classes TER
Performance-related Fee (as
a percentageof the average
net assets)
BlackRock Emerging Markets Absolute Return Fund A Class distributing UK reporting fund share GBP hedged 1.965% -
A Class non-distributing share 1.738% -A Class non-distributing share EUR hedged 1.722% -D Class distributing UK reporting fund share GBP hedged 1.177% -D Class non-distributing UK reporting fund share 1.244% -D Class non-distributing UK reporting fund share EUR hedged 1.405% -E Class non-distributing share EUR hedged 2.237% -I Class distributing UK reporting fund share GBP 0.961% -I Class distributing UK reporting fund share GBP hedged 0.960% -I Class non-distributing share EUR 0.875% -I Class non-distributing share EUR hedged (0.481)% -I Class non-distributing UK reporting fund share 0.951% -X Class non-distributing share (0.096)% -
BlackRock Emerging Markets Equity Strategies Fund A Class non-distributing share 1.867% -
A Class non-distributing share CHF hedged 1.864% -D Class distributing share 1.325% -D Class non-distributing share CHF hedged 1.346% -D Class non-distributing share EUR hedged 1.350% -D Class non-distributing UK reporting fund share 1.359% -D Class non-distributing UK reporting fund share EUR 1.378% -D Class non-distributing UK reporting fund share GBP 1.382% -E Class non-distributing share EUR 2.363% -I Class non-distributing share 1.126% -I Class non-distributing share EUR 1.079% -X Class non-distributing share 0.076% -Z Class non-distributing share GBP 0.770% -Z Class non-distributing UK reporting fund share 0.765% -
BlackRock Emerging Markets Flexi Dynamic Bond Fund A Class distributing UK reporting fund share GBP hedged 1.756% -
A Class non-distributing share 1.765% -A Class non-distributing share EUR hedged 1.758% -A Class non-distributing share SEK hedged 1.753% -A Class non-distributing UK reporting fund share CHF hedged 1.745% -AI Class non-distributing share EUR hedged 1.743% -D Class distributing UK reporting fund share 1.017% -D Class distributing UK reporting fund share EUR 0.992% -D Class distributing UK reporting fund share EUR hedged 1.015% -D Class distributing UK reporting fund share GBP 1.013% -D Class distributing UK reporting fund share GBP hedged 1.006% -D Class non-distributing UK reporting fund share 1.017% -D Class non-distributing UK reporting fund share CHF hedged 1.011% -D Class non-distributing UK reporting fund share EUR hedged 1.011% -E Class non-distributing share 2.261% -E Class non-distributing share EUR hedged 2.248% -I Class distributing share EUR 0.828% -I Class distributing share EUR hedged 0.824% -I Class distributing share (G) EUR hedged 0.830% -I Class distributing UK reporting fund share 0.838% -I Class non-distributing share EUR hedged 0.833% -I Class non-distributing UK reporting fund share 0.831% -X Class distributing share EUR 0.067% -X Class non-distributing share 0.083% -X Class non-distributing share AUD hedged 0.082% -X Class non-distributing share CAD hedged 0.082% -
Notes to the Financial Statements continued
BlackRock Strategic Funds[602]

Fund Name Share classes TER
Performance-related Fee (as
a percentageof the average
net assets)
BlackRock Emerging Markets Short Duration Bond Fund A Class non-distributing share 1.008% -
AI Class distributing share EUR hedged 0.844% -AI Class non-distributing share EUR hedged 0.837% -D Class non-distributing UK reporting fund share 0.633% -D Class non-distributing UK reporting fund share EUR hedged 0.576% -E Class distributing share EUR 1.378% -E Class distributing share EUR hedged 1.407% -E Class non-distributing share EUR 1.345% -E Class non-distributing share EUR hedged 1.387% -I Class non-distributing share EUR hedged 0.421% -X Class non-distributing share 0.028% -
BlackRock ESG Euro Bond Fund A Class distributing share 0.980% -
A Class non-distributing share 0.966% -AI Class non-distributing share 0.953% -D Class non-distributing UK reporting fund share 0.628% -E Class non-distributing share 1.482% -I Class non-distributing share 0.483% -X Class distributing (G) share(2) 0.111% -X Class non-distributing share 0.083% -Z Class non-distributing share 0.328% -
BlackRock ESG Euro Corporate Bond Fund A Class non-distributing share 0.958% -
AI Class non-distributing share 0.897% -D Class distributing share(2) 0.615% -D Class non-distributing share 0.554% -E Class non-distributing share 1.456% -I Class non-distributing share 0.421% -X Class non-distributing share 0.018% -
BlackRock ESG Euro Short Duration Bond Fund(3) A Class non-distributing share 0.945% -
AI Class non-distributing share 0.839% -D Class non-distributing share 0.485% -E Class non-distributing share 1.283% -I Class non-distributing share 0.457% -X Class non-distributing share 0.059% -Z Class non-distributing share 0.229% -
BlackRock European Absolute Return Fund A Class distributing share 2.011% 0.152%
A Class non-distributing share 2.268% 0.421%D Class distributing share 1.403% 0.040%D Class non-distributing share CHF hedged 1.389% 0.017%D Class non-distributing UK reporting fund share 1.662% 0.310%D Class non-distributing UK reporting fund share GBP hedged 1.388% 0.000%D Class non-distributing UK reporting share USD hedged(2) 1.410% -E Class non-distributing share 2.437% 0.081%I Class non-distributing UK reporting fund share 1.130% 0.066%S Class non-distributing share 1.086% 0.011%X Class non-distributing share(2) 0.091% -
BlackRock European Opportunities Extension Fund A Class distributing UK reporting fund share GBP 3.451% 1.600%
A Class non-distributing share 3.007% 1.173%D Class distributing (G) share 3.006% 1.651%D Class distributing UK reporting fund share GBP 2.855% 1.510%D Class non-distributing share 2.771% 1.428%E Class non-distributing share 3.863% 1.515%I Class non-distributing share 2.388% 1.335%X Class non-distributing share 0.056% -
Notes to the Financial Statements continued
Annual report and audited financial statements [603]

Fund Name Share classes TER
Performance-related Fee (as
a percentageof the average
net assets)
BlackRock European Select Strategies Fund A Class distributing share 1.519% -
A Class non-distributing share 1.520% -A Class non-distributing share CZK hedged 1.516% -AI Class non-distributing share 1.521% -D Class distributing share USD hedged 0.929% -D Class non-distributing share 0.925% -E Class distributing share 2.010% -E Class non-distributing share 2.013% -I Class distributing share 0.715% -I Class non-distributing share 0.734% -X Class non-distributing share 0.084% -
BlackRock European Unconstrained Equity Fund A Class non-distributing share 1.805% 0.427%
D Class non-distributing UK reporting fund share 1.017% 0.127%D Class non-distributing UK reporting fund share GBP hedged 0.985% 0.104%E Class non-distributing share 1.920% 0.045%I Class non-distributing share USD hedged 0.956% 0.371%I Class non-distributing UK reporting fund share 0.576% 0.002%I Class non-distributing UK reporting fund share GBP hedged 0.574% -X Class non-distributing UK reporting fund share 0.088% -
BlackRock Fixed Income Credit Strategies Fund A Class distributing share 1.262% -
A Class non-distributing share 1.262% -AI Class non-distributing share 1.296% -D Class distributing share 0.867% -D Class non-distributing share 0.917% -E Class non-distributing share 1.766% -I Class non-distributing share 0.684% -X Class non-distributing share 0.083% -
BlackRock Fixed Income Strategies Fund A Class distributing share 1.255% -
A Class distributing share CHF hedged 1.261% -A Class distributing share USD hedged 1.272% -A Class non-distributing share CHF hedged 1.260% -A Class non-distributing share JPY hedged 1.259% -A Class non-distributing share USD hedged 1.270% -A Class non-distributing UK reporting fund share 1.257% -A Class non-distributing UK reporting fund share GBP hedged 1.258% -AI Class non-distributing share 1.289% -D Class distributing share 0.857% -D Class distributing UK reporting fund share GBP hedged 0.849% -D Class distributing UK reporting fund share USD hedged 0.888% -D Class non-distributing share CHF hedged 0.860% -D Class non-distributing share USD hedged 0.859% -D Class non-distributing UK reporting fund share 0.858% -D Class non-distributing UK reporting fund share GBP hedged 0.858% -E Class non-distributing share 1.752% -I Class distributing share 0.668% -I Class non-distributing share 0.669% -I Class non-distributing share USD hedged 0.669% -X Class distributing share 0.071% -X Class non-distributing share 0.070% -
Notes to the Financial Statements continued
BlackRock Strategic Funds[604]

Fund Name Share classes TER
Performance-related Fee (as
a percentageof the average
net assets)
BlackRock Global Absolute Return Bond Fund A Class non-distributing share 1.321% -
A Class non-distributing share SEK hedged 1.329% -A Class non-distributing share USD hedged 1.361% -D class distributing share GBP hedged(2) 0.834% -D Class non-distributing share 0.843% -D Class non-distributing share CHF hedged 0.310% -E Class non-distributing share 1.844% -I Class non-distributing share 0.656% -I Class non-distributing share GBP hedged 0.653% -I Class non-distributing share SEK hedged 0.653% -X Class non-distributing share 0.162% -
BlackRock Global Equity Absolute Return Fund A Class distributing share EUR hedged 4.738% 2.917%
D Class non-distributing share 1.999% 0.575%D Class non-distributing fund share EUR 4.556% 3.208%E Class non-distributing share EUR 5.064% 2.701%I Class non-distributing share EUR 3.441% 2.374%X Class non-distributing share 0.068% -X Class non-distributing share AUD hedged(2) 0.105% -Z Class non-distributing share 3.407% 2.506%Z Class non-distributing share CHF hedged 2.499% 1.547%Z Class non-distributing share EUR hedged 3.392% 2.515%Z Class non-distributing UK reporting fund share GBP hedged 3.467% 2.558%
BlackRock Global Event Driven Fund A Class distributing share EUR hedged 3.626% 1.688%
A Class non-distributing share 3.736% 1.854%A Class non-distributing share CHF hedged 3.774% 1.919%A Class non-distributing share HKD hedged 3.640% 1.800%A Class non-distributing share SGD hedged 3.713% 1.716%A Class non-distributing UK reporting fund share EUR hedged 3.756% 1.900%AI Class non-distributing share EUR hedged 3.584% 1.746%D Class distributing UK reporting fund share GBP hedged(2) 2.645% 1.228%D Class non-distributing share CHF hedged 3.363% 2.005%D Class non-distributing UK reporting fund share 3.344% 1.977%D Class non-distributing UK reporting fund share EUR hedged 3.368% 2.015%D Class non-distributing UK reporting fund share GBP hedged 3.400% 2.048%E Class non-distributing share EUR 4.173% 1.811%E Class non-distributing share EUR hedged 4.185% 1.831%I Class distributing UK reporting fund share 3.120% 2.054%I Class distributing UK reporting fund share EUR hedged 3.152% 2.043%I Class distributing UK reporting fund share GBP hedged 3.157% 2.094%I Class non-distributing share BRL 2.906% 1.822%I Class non-distributing share JPY hedged 3.161% 2.089%I Class non-distributing UK reporting fund share 3.055% 1.977%I Class non-distributing UK reporting fund share CHF hedged 3.107% 2.045%I Class non-distributing UK reporting fund share EUR hedged 3.111% 2.046%IA Class non-distributing share 3.532% 2.964%IA Class non-distributing share EUR hedged 3.640% 3.061%S Class non-distributing share 3.152% 2.011%S Class non-distributing share EUR hedged 2.878% 1.765%X Class non-distributing share 0.072% -Z Class non-distributing share CHF hedged 2.380% 1.524%Z Class non-distributing UK reporting fund share 2.494% 1.636%Z Class non-distributing UK reporting fund share EUR hedged 2.337% 1.495%Z Class non-distributing UK reporting fund share GBP hedged 2.538% 1.685%
Notes to the Financial Statements continued
Annual report and audited financial statements [605]

Fund Name Share classes TER
Performance-related Fee (as
a percentageof the average
net assets)
BlackRock Global Real Asset Securities Fund A Class distributing UK reporting fund share 1.551% -
A Class distributing UK reporting fund share HKD hedged 1.585% -A Class distributing UK reporting fund share EUR hedged 1.555% -A Class distributing UK reporting fund share SGD hedged 1.524% -A Class non-distributing share 1.540% -D Class distributing share 0.933% -D Class non-distributing UK reporting fund share 0.950% -E Class non-distributing share EUR 2.116% -X Class non-distributing UK reporting fund share 0.092% -Z Class non-distributing UK reporting fund share 0.633% -
BlackRock Managed Index Portfolios − Conservative(4) A Class distributing share 1.120% -
A Class non-distributing share 1.129% -A Class non-distributing share USD hedged 1.136% -D Class distributing share 0.488% -D Class non-distributing share 0.484% -D Class non-distributing share USD hedged 0.491% -D Class non-distributing UK reporting fund share GBP hedged 0.494% -E Class non-distributing share 1.627% -I Class non-distributing share(2) 0.501% -IndexInvest Balance Class distributing share 1.120% -Vermoegensstrategie Moderat - Ausgewogen Class distributingshare 0.481% -
BlackRock Managed Index Portfolios − Defensive(4) A Class distributing share 1.111% -
A Class non-distributing share GBP hedged 1.114% -A Class non-distributing share USD hedged 1.118% -A Class non-distributing UK reporting fund share 1.115% -D Class distributing UK reporting fund share 0.484% -D Class distributing UK reporting fund share GBP hedged 0.483% -D Class distributing UK reporting fund share USD hedged 0.492% -D Class non-distributing share CHF hedged 0.492% -D Class non-distributing share USD hedged 0.489% -D Class non-distributing UK reporting fund share 0.475% -D Class non-distributing UK reporting fund share GBP hedged 0.491% -E Class non-distributing share 1.637% -I Class non-distributing share(2) 0.514% -I Class non-distributing share USD hedged 0.424% -IndexInvest Substanz Class distributing share 1.114% -Vermoegensstrategie Defensiv Class distributing share 0.498% -X Class non-distributing share 0.015% -
BlackRock Managed Index Portfolios − Growth(4) A Class distributing share 1.122% -
A Class non-distributing share GBP hedged 1.123% -A Class non-distributing share USD hedged 1.127% -A Class non-distributing UK reporting fund share 1.127% -D Class distributing UK reporting fund share 0.496% -D Class distributing UK reporting fund share USD hedged 0.500% -D Class distributing UK reporting fund share GBP hedged 0.494% -D Class non-distributing share CHF hedged 0.495% -D Class non-distributing share USD hedged 0.492% -D Class non-distributing UK reporting fund share 0.495% -D Class non-distributing UK reporting fund share GBP hedged 0.504% -E Class non-distributing share 1.644% -I Class non-distributing share(2) 0.498% -I Class non-distributing share USD hedged 0.422% -IndexInvest Chance Class distributing share 1.119% -Vermoegensstrategie Wachstum Class distributing share 0.497% -X Class non-distributing share 0.028% -
Notes to the Financial Statements continued
BlackRock Strategic Funds[606]
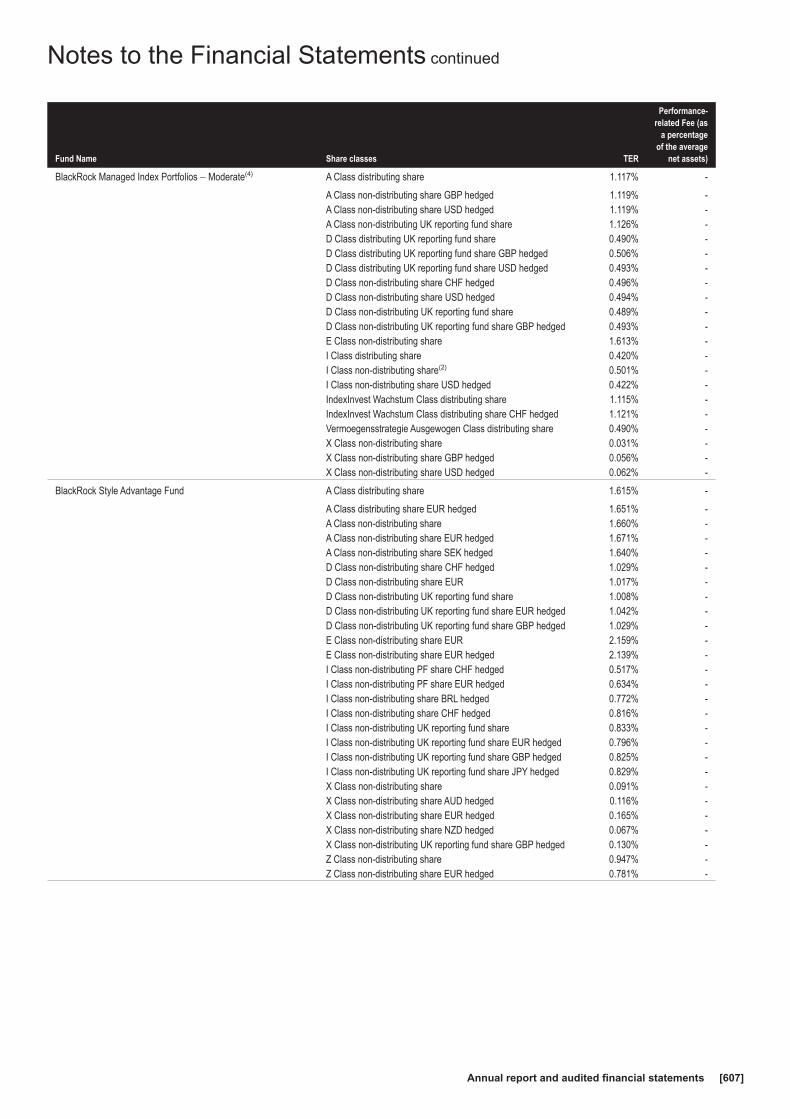
Fund Name Share classes TER
Performance-related Fee (as
a percentageof the average
net assets)
BlackRock Managed Index Portfolios − Moderate(4) A Class distributing share 1.117% -
A Class non-distributing share GBP hedged 1.119% -A Class non-distributing share USD hedged 1.119% -A Class non-distributing UK reporting fund share 1.126% -D Class distributing UK reporting fund share 0.490% -D Class distributing UK reporting fund share GBP hedged 0.506% -D Class distributing UK reporting fund share USD hedged 0.493% -D Class non-distributing share CHF hedged 0.496% -D Class non-distributing share USD hedged 0.494% -D Class non-distributing UK reporting fund share 0.489% -D Class non-distributing UK reporting fund share GBP hedged 0.493% -E Class non-distributing share 1.613% -I Class distributing share 0.420% -I Class non-distributing share(2) 0.501% -I Class non-distributing share USD hedged 0.422% -IndexInvest Wachstum Class distributing share 1.115% -IndexInvest Wachstum Class distributing share CHF hedged 1.121% -Vermoegensstrategie Ausgewogen Class distributing share 0.490% -X Class non-distributing share 0.031% -X Class non-distributing share GBP hedged 0.056% -X Class non-distributing share USD hedged 0.062% -
BlackRock Style Advantage Fund A Class distributing share 1.615% -
A Class distributing share EUR hedged 1.651% -A Class non-distributing share 1.660% -A Class non-distributing share EUR hedged 1.671% -A Class non-distributing share SEK hedged 1.640% -D Class non-distributing share CHF hedged 1.029% -D Class non-distributing share EUR 1.017% -D Class non-distributing UK reporting fund share 1.008% -D Class non-distributing UK reporting fund share EUR hedged 1.042% -D Class non-distributing UK reporting fund share GBP hedged 1.029% -E Class non-distributing share EUR 2.159% -E Class non-distributing share EUR hedged 2.139% -I Class non-distributing PF share CHF hedged 0.517% -I Class non-distributing PF share EUR hedged 0.634% -I Class non-distributing share BRL hedged 0.772% -I Class non-distributing share CHF hedged 0.816% -I Class non-distributing UK reporting fund share 0.833% -I Class non-distributing UK reporting fund share EUR hedged 0.796% -I Class non-distributing UK reporting fund share GBP hedged 0.825% -I Class non-distributing UK reporting fund share JPY hedged 0.829% -X Class non-distributing share 0.091% -X Class non-distributing share AUD hedged 0.116% -X Class non-distributing share EUR hedged 0.165% -X Class non-distributing share NZD hedged 0.067% -X Class non-distributing UK reporting fund share GBP hedged 0.130% -Z Class non-distributing share 0.947% -Z Class non-distributing share EUR hedged 0.781% -
Notes to the Financial Statements continued
Annual report and audited financial statements [607]

Fund Name Share classes TER
Performance-related Fee (as
a percentageof the average
net assets)
BlackRock Style Advantage Screened Fund A Class non-distributing share 1.462% -
D Class non-distributing share 0.859% -D Class non-distributing share EUR hedged 0.859% -D Class non-distributing share GBP hedged 0.858% -E Class non-distributing share EUR 1.944% -I Class non-distributing share 0.655% -I Class non-distributing share EUR 0.648% -I Class non-distributing share EUR hedged 0.654% -I Class non-distributing share GBP hedged 0.655% -X Class non-distributing share 0.070% -X Class non-distributing share AUD hedged 0.070% -
BlackRock Systematic ESG World Equity Fund A Class non-distributing share 1.033% -
D Class non-distributing share EUR 0.646% -E Class non-distributing share EUR 1.548% -I Class non-distributing share EUR hedged 0.470% -I Class non-distributing share JPY 0.493% -I Class non-distributing share JPY hedged 0.497% -X Class non-distributing UK reporting fund share GBP 0.089% -
BlackRock Systematic Global Equity Fund A Class non-distributing share 1.209% -
D Class non-distributing share EUR 0.727% -E Class non-distributing share EUR 1.639% -E Class non-distributing share EUR hedged 1.619% -I Class non-distributing share 0.479% -I Class non-distributing share EUR 0.452% -X Class non-distributing share 0.097% -X Class non-distributing share EUR 0.098% -X Class non-distributing share GBP 0.090% -X Class non-distributing share JPY 0.087% -
BlackRock Systematic Global Long/Short Equity Fund(1) A Class non-distributing share 2.271% -
A Class non-distributing share EUR hedged 2.222% -A Class non-distributing share SEK hedged 2.253% -AI Class non-distributing share EUR hedged 2.268% -C Class non-distributing share 3.271% -D Class non-distributing share 1.655% -D Class non-distributing UK reporting fund share EUR hedged 1.658% -D Class non-distributing UK reporting fund share GBP hedged 1.663% -E Class non-distributing share EUR hedged 2.754% -I Class non-distributing share EUR hedged 1.378% -J Class distributing share 1.684% -X Class non-distributing share 0.190% -
BlackRock Total Advantage Fund A Class non-distributing share 1.403% -
D Class non-distributing share 0.847% -D Class non-distributing share USD hedged 0.841% -D Class non-distributing UK reporting fund share GBP hedged 0.850% -E Class non-distributing share 1.397% -I Class non-distributing share 0.665% -X Class non-distributing share 0.109% -
Notes to the Financial Statements continued
BlackRock Strategic Funds[608]

Fund Name Share classes TER
Performance-related Fee (as
a percentageof the average
net assets)
BlackRock UK Equity Absolute Return Fund A Class distributing share EUR hedged 1.847% -
A Class non-distributing share EUR hedged 1.839% -A Class non-distributing UK reporting fund share 1.844% -D Class non-distributing share CHF hedged 1.098% -D Class non-distributing share EUR 1.104% -D Class non-distributing share EUR hedged 1.488% 0.386%D Class non-distributing share USD hedged 1.121% 0.026%D Class non-distributing UK reporting fund share 1.161% 0.066%E Class non-distributing share EUR 2.371% -E Class non-distributing share EUR hedged 2.344% -I Class non-distributing share EUR hedged 1.072% 0.240%I Class non-distributing share JPY hedged 0.854% 0.034%I Class non-distributing share USD hedged 0.956% 0.120%X Class non-distributing UK reporting fund share 0.072% -
(1) Fund name changed, see Note 1 for further details.(2) New Share Class launched, see Appendix I for further details.(3) New Fund launched, see Note 1 for further details.(4) Fund invests in underlying target funds which do not publish a TER in accordance with the SFAMA guidelines.
The TERs were calculated in accordance with the Swiss Funds and Asset Management Association (“SFAMA”) guidelines on thecalculation and disclosure of the TER for collective investment schemes. The SFAMA guidelines were last amended on 20 April2015.
Certain Funds, as indicated above, invest a significant portion of their net assets in underlying target funds which do not publish aTER in accordance with the SFAMA guidelines. Therefore, the prorated TER of the underlying target funds has not been included inthe TER of the Funds disclosed above. This waiver provision complies with the SFAMA guidelines.
Notes to the Financial Statements continued
Annual report and audited financial statements [609]

Notes to the Financial Statements continued
17. Subsequent EventsEffective 24 August 2021, BlackRock Total Advantage Fund, denominated in EUR was terminated.
There have been no events subsequent to the financial year end, and up to the date of the approval of the financial statements, which in the opinion of the Board may have had a material impact on the financial statements for the financial year ended 31 May 2021.
18. Approval dateThe financial statements were approved by the Board on 23 September 2021.
BlackRock Strategic Funds[610]

Annual report and audited financial statements [607]
To the Shareholders of
BlackRock Strategic Funds
49, avenue J.F. Kennedy,
L-1855 Luxembourg,
Grand Duchy of Luxembourg
INDEPENDENT AUDITOR’S REPORT
Opinion
We have audited the financial statements of BlackRock Strategic Funds (the “Company”) and of each of its sub-funds,
which comprise the statement of net assets and the portfolio of investments as at 31 May 2021 and the statement of
operations and changes in net assets for the year then ended, and notes to the financial statements, including a
summary of significant accounting policies.
In our opinion, the accompanying financial statements give a true and fair view of the financial position of the Company
and of each of its sub-funds as at 31 May 2021, and of the results of their operations and changes in their net assets for
the year then ended in accordance with Luxembourg legal and regulatory requirements relating to the preparation and
presentation of the financial statements.
Basis for Opinion
We conducted our audit in accordance with the Law of 23 July 2016 on the audit profession (Law of 23 July 2016) and
with International Standards on Auditing (ISAs) as adopted for Luxembourg by the Commission de Surveillance du
Secteur Financier (CSSF). Our responsibilities under the Law of 23 July 2016 and ISAs as adopted for Luxembourg by
the CSSF are further described in the “Responsibilities of the Independent Auditor for the Audit of the Financial
Statements” section of our report. We are also independent of the Company in accordance with the International Code
of Ethics for Professional Accountants, including International Independence Standards, issued by the International
Ethics Standards Board for Accountants (IESBA Code) as adopted for Luxembourg by the CSSF together with the
ethical requirements that are relevant to our audit of the financial statements, and have fulfilled our other ethical
responsibilities under those ethical requirements. We believe that the audit evidence we have obtained is sufficient and
appropriate to provide a basis for our opinion.
Other information
The Board of Directors of the Company is responsible for the other information. The other information comprises the
information stated in the annual report but does not include the financial statements and our Independent Auditor’s report
thereon.
Our opinion on the financial statements does not cover the other information and we do not express any form of
assurance conclusion thereon.

[608] BlackRock Strategic Funds
In connection with our audit of the financial statements, our responsibility is to read the other information and, in doing
so, consider whether the other information is materially inconsistent with the financial statements or our knowledge
obtained in the audit or otherwise appears to be materially misstated. If, based on the work we have performed, we
conclude that there is a material misstatement of this other information, we are required to report this fact. We have
nothing to report in this regard.
Responsibilities of the Board of Directors of the Company for the Financial Statements
The Board of Directors of the Company is responsible for the preparation and fair presentation of the financial
statements in accordance with Luxembourg legal and regulatory requirements relating to the preparation and
presentation of the financial statements, and for such internal control as the Board of Directors of the Company
determines is necessary to enable the preparation of financial statements that are free from material misstatement,
whether due to fraud or error.
In preparing the financial statements, the Board of Directors of the Company is responsible for assessing the
Company’s ability to continue as a going concern, disclosing, as applicable, matters related to going concern and using
the going concern basis of accounting unless the Board of Directors of the Company either intends to liquidate the
Company or to cease operations, or has no realistic alternative but to do so.
Responsibilities of the Independent Auditor for the Audit of the Financial Statements
The objectives of our audit are to obtain reasonable assurance about whether the financial statements as a whole are
free from material misstatement, whether due to fraud or error, and to issue a report of the Independent Auditor that
includes our opinion. Reasonable assurance is a high level of assurance, but is not a guarantee that an audit
conducted in accordance with the Law dated 23 July 2016 and with ISAs as adopted for Luxembourg by the CSSF will
always detect a material misstatement when it exists. Misstatements can arise from fraud or error and are considered
material if, individually or in the aggregate, they could reasonably be expected to influence the economic decisions of
users taken on the basis of these financial statements.
As part of an audit in accordance with the Law dated 23 July 2016 and with ISAs as adopted for Luxembourg by the
CSSF, we exercise professional judgment and maintain professional skepticism throughout the audit. We also:
• Identify and assess the risks of material misstatement of the financial statements, whether due to fraud or error,
design and perform audit procedures responsive to those risks, and obtain audit evidence that is sufficient and
appropriate to provide a basis for our opinion. The r isk of not detecting a material misstatement resulting from
fraud is higher than for one resulting from error, as fraud may involve collusion, forgery, intentional omissions,
misrepresentations, or the override of internal control.
• Obtain an understanding of internal control relevant to the audit in order to design audit procedures that are
appropriate in the circumstances, but not for the purpose of expressing an opinion on the effectiv eness of the
Company’s internal control.
• Evaluate the appropriateness of accounting policies used and the reasonableness of accounting estimates and
related disclosures made by the Board of Directors of the Company.
Annual report and audited financial statements [609]
• Conclude on the appropriateness of the Board of Directors of the Company use of the going concern basis of
accounting and, based on the audit evidence obtained, whether a material uncertainty exists related to events or
conditions that may cast significant doubt on the Company’s ability to continue as a going concern. If we
conclude that a material uncertainty exists, we are required to draw attention in our report of the Independent
Auditor to the related disclosures in the financial statements or, if such disclosures are inadequate, to modify our
opinion. Our conclusions are based on the audit evidence obtained up to the date of our report of the
Independent Auditor. However, future events or conditions may cause the Company to cease to continue as a
going concern.
• Evaluate the overall presentation, structure and content of the financial statements, including the disclosures,
and whether the financial statements represent the underlying transactions and events in a manner that
achieves fair presentation.
We communicate with those charged with governance regarding, among other matters, the planned scope and timing
of the audit and significant audit findings, including any significant deficiencies in internal control that we identify during
our audit.
For Deloitte Audit, Cabinet de Révision Agréé
Justin Griffiths, Réviseur d’entreprises agréé
Partner
23 September 2021

Share Classes In IssueAs at 31 May 2021, the Company offers the following shareclasses.
A ClassA Class distributing share CHF hedgedA Class distributing share EURA Class distributing share EUR hedgedA Class distributing share USDA Class distributing share USD hedgedA Class distributing UK reporting fund share EUR hedgedA Class distributing UK reporting fund share GBPA Class distributing UK reporting fund share GBP hedgedA Class distributing UK reporting fund share HKD hedgedA Class distributing UK reporting fund share SGD hedgedA Class distributing UK reporting fund share USDA Class non-distributing share AUDA Class non-distributing share CHF hedgedA Class non-distributing share CNH hedgedA Class non-distributing share CZK hedgedA Class non-distributing share EURA Class non-distributing share EUR hedgedA Class non-distributing share GBP hedgedA Class non-distributing share HKD hedgedA Class non-distributing share JPY hedgedA Class non-distributing share SEK hedgedA Class non-distributing share SGD hedgedA Class non-distributing share USDA Class non-distributing share USD hedgedA Class non-distributing UK reporting fund share CHF hedgedA Class non-distributing UK reporting fund share EURA Class non-distributing UK reporting fund share EUR hedgedA Class non-distributing UK reporting fund share GBPA Class non-distributing UK reporting fund share GBP hedgedA Class non-distributing UK reporting fund share USDAI Class(1)
AI Class distributing share EUR hedgedAI Class non-distributing share EURAI Class non-distributing share EUR hedgedC Class(1)
C Class non-distributing share USDD Class(1)
D Class distributing (G) share EURD Class distributing share EURD class distributing share GBP hedgedD Class distributing share USDD Class distributing share USD hedgedD Class distributing UK reporting fund share EURD Class distributing UK reporting fund share EUR hedgedD Class distributing UK reporting fund share GBPD Class distributing UK reporting fund share GBP hedgedD Class distributing UK reporting fund share USDD Class distributing UK reporting fund share USD hedgedD Class non-distributing fund share EURD Class non-distributing share CHF hedgedD Class non-distributing share EURD Class non-distributing share EUR hedgedD Class non-distributing share GBP hedgedD Class non-distributing share USDD Class non-distributing share USD hedgedD Class non-distributing UK reporting fund share CHF hedgedD Class non-distributing UK reporting fund share EURD Class non-distributing UK reporting fund share EUR hedged
D Class non-distributing UK reporting fund share GBPD Class non-distributing UK reporting fund share GBP hedgedD Class non-distributing UK reporting fund share USDD Class non-distributing UK reporting fund share USD hedgedE Class(1)
E Class distributing share EURE Class distributing share EUR hedgedE Class non-distributing share EURE Class non-distributing share EUR hedgedE Class non-distributing share USDI Class(1), (2)
I Class distributing share (G) EUR hedgedI Class distributing share EURI Class distributing share EUR hedgedI Class distributing UK reporting fund share EUR hedgedI Class distributing UK reporting fund share GBPI Class distributing UK reporting fund share GBP hedgedI Class distributing UK reporting fund share USDI Class non-distributing PF share CHF hedgedI Class non-distributing PF share EUR hedgedI Class non-distributing share BRLI Class non-distributing share BRL hedgedI Class non-distributing share CAD hedgedI Class non-distributing share CHF hedgedI Class non-distributing share EURI Class non-distributing share EUR hedgedI Class non-distributing share GBP hedgedI Class non-distributing share JPYI Class non-distributing share JPY hedgedI Class non-distributing share SEK hedgedI Class non-distributing share USDI Class non-distributing share USD hedgedI Class non-distributing UK reporting fund share CHF hedgedI Class non-distributing UK reporting fund share EURI Class non-distributing UK reporting fund share EUR hedgedI Class non-distributing UK reporting fund share GBPI Class non-distributing UK reporting fund share GBP hedgedI Class non-distributing UK reporting fund share JPY hedgedI Class non-distributing UK reporting fund share USDI Class non-distributing UK reporting fund share USD hedgedI Class non-distributing UK reporting share USD hedgedIA Class(1), (2)
IA Class non-distributing share EUR hedgedIA Class non-distributing share USDIndexInvest Balance Class(1)
IndexInvest Balance Class distributing share EURIndexInvest Chance Class distributing share EURIndexInvest Substanz Class distributing share EURIndexInvest Wachstum Class distributing share CHF hedgedIndexInvest Wachstum Class distributing share EURJ Class(2)
J Class distributing share USDS Class(1)
S Class non-distributing share EURS Class non-distributing share EUR hedgedS Class non-distributing share USDS Class non-distributing UK reporting fund share GBPVermoegensstrategie Class(1)
Vermoegensstrategie Ausgewogen Class distributing share EURVermoegensstrategie Defensiv Class distributing share EURVermoegensstrategie Moderat - Ausgewogen Class dist. sharesEURVermoegensstrategie Wachstum Class distributing share EUR
Appendix I – Share Classes (Unaudited)
BlackRock Strategic Funds[614]

X Class(2)
X Class distributing (G) share EURX Class distributing share EURX Class non-distributing share AUD hedgedX Class non-distributing share CAD hedgedX Class non-distributing share EURX Class non-distributing share EUR hedgedX Class non-distributing share GBPX Class non-distributing share GBP hedgedX Class non-distributing share JPYX Class non-distributing share NZD hedgedX Class non-distributing share USDX Class non-distributing share USD hedgedX Class non-distributing UK reporting fund share EURX Class non-distributing UK reporting fund share GBPX Class non-distributing UK reporting fund share GBP hedged
X Class non-distributing UK reporting fund share USDZ Class(1)
Z Class non-distributing share BRL hedgedZ Class non-distributing share CHF hedgedZ Class non-distributing share EURZ Class non-distributing share EUR hedgedZ Class non-distributing share GBPZ Class non-distributing share USDZ Class non-distributing UK reporting fund share EUR hedgedZ Class non-distributing UK reporting fund share GBPZ Class non-distributing UK reporting fund share GBP hedgedZ Class non-distributing UK reporting fund share USDZ Class non-distributing UK reporting fund share USD hedged
(1) Available at the Management Company’s discretion.(2) Available to institutional investors.
Share Classes LaunchedThe dates disclosed are the launch and reactivation dates but the classes may have been seeded at a later date.
Effective date Fund Type
26 August 2020 BlackRock European Absolute Return Fund D Class non-distributing UK reporting share USDhedged
2 September 2020 BlackRock Global Event Driven Fund D Class distributing UK reporting fund share GBPhedged
23 September 2020 BlackRock European Absolute Return Fund X Class non-distributing share28 October 2020 BlackRock Managed Index Portfolios − Conservative I Class non-distributing share28 October 2020 BlackRock Managed Index Portfolios − Defensive I Class non-distributing share28 October 2020 BlackRock Managed Index Portfolios − Growth I Class non-distributing share28 October 2020 BlackRock Managed Index Portfolios − Moderate I Class non-distributing share
25 November 2020 BlackRock Emerging Companies Absolute Return Fund A Class non-distributing share CNH hedged19 February 2021 BlackRock ESG Euro Short Duration Bond Fund A Class non-distributing share19 February 2021 BlackRock ESG Euro Short Duration Bond Fund AI Class non-distributing share19 February 2021 BlackRock ESG Euro Short Duration Bond Fund D Class non-distributing share19 February 2021 BlackRock ESG Euro Short Duration Bond Fund E Class non-distributing share19 February 2021 BlackRock ESG Euro Short Duration Bond Fund I Class non-distributing share19 February 2021 BlackRock ESG Euro Short Duration Bond Fund X Class non-distributing share19 February 2021 BlackRock ESG Euro Short Duration Bond Fund Z Class non-distributing share24 February 2021 BlackRock ESG Euro Corporate Bond Fund D Class distributing share
3 March 2021 BlackRock ESG Euro Bond Fund X Class distributing (G) share24 March 2021 BlackRock Global Equity Absolute Return Fund X Class non-distributing share AUD hedged
28 April 2021 BlackRock Global Absolute Return Bond Fund D class distributing share GBP hedged
Share Classes Closed
Effective date Fund Type
2 June 2020 BlackRock European Diversified Equity Absolute Return Fund A Class non-distributing share2 June 2020 BlackRock European Diversified Equity Absolute Return Fund A Class non-distributing share CHF hedged2 June 2020 BlackRock European Diversified Equity Absolute Return Fund A Class non-distributing share SEK hedged2 June 2020 BlackRock European Diversified Equity Absolute Return Fund A Class non-distributing UK reporting fund share
GBP hedged2 June 2020 BlackRock European Diversified Equity Absolute Return Fund D Class non-distributing share CHF hedged2 June 2020 BlackRock European Diversified Equity Absolute Return Fund D Class non-distributing share USD hedged2 June 2020 BlackRock European Diversified Equity Absolute Return Fund D Class non-distributing UK reporting fund share2 June 2020 BlackRock European Diversified Equity Absolute Return Fund D Class non-distributing UK reporting fund share
GBP hedged2 June 2020 BlackRock European Diversified Equity Absolute Return Fund E Class non-distributing share2 June 2020 BlackRock European Diversified Equity Absolute Return Fund I Class non-distributing share2 June 2020 BlackRock European Diversified Equity Absolute Return Fund X Class non-distributing share
17 June 2020 BlackRock Asia Extension Fund A Class non-distributing share17 June 2020 BlackRock Asia Extension Fund A Class non-distributing UK reporting fund share
GBP hedged
Appendix I – Share Classes (Unaudited) continued
Annual report and audited financial statements [615]

Effective date Fund Type
17 June 2020 BlackRock Asia Extension Fund E Class non-distributing share17 June 2020 BlackRock Asia Extension Fund X Class non-distributing share
4 November 2020 BlackRock Macro Opportunities Fund A Class non-distributing share4 November 2020 BlackRock Macro Opportunities Fund AI Class non-distributing share EUR hedged4 November 2020 BlackRock Macro Opportunities Fund D Class non-distributing share EUR4 November 2020 BlackRock Macro Opportunities Fund D Class non-distributing UK reporting fund share4 November 2020 BlackRock Macro Opportunities Fund D Class non-distributing UK reporting fund share
EUR hedged4 November 2020 BlackRock Macro Opportunities Fund D Class non-distributing UK reporting fund share
GBP hedged4 November 2020 BlackRock Macro Opportunities Fund E Class non-distributing share EUR4 November 2020 BlackRock Macro Opportunities Fund E Class non-distributing share EUR hedged4 November 2020 BlackRock Macro Opportunities Fund I Class non-distributing share BRL hedged4 November 2020 BlackRock Macro Opportunities Fund I Class non-distributing share EUR4 November 2020 BlackRock Macro Opportunities Fund X Class non-distributing share4 November 2020 BlackRock Macro Opportunities Fund Z Class non-distributing share BRL hedged4 November 2020 BlackRock Macro Opportunities Fund Z Class non-distributing share CHF hedged4 November 2020 BlackRock Macro Opportunities Fund Z Class non-distributing UK reporting fund share4 November 2020 BlackRock Macro Opportunities Fund Z Class non-distributing UK reporting fund share
EUR hedged4 November 2020 BlackRock Macro Opportunities Fund Z Class non-distributing UK reporting fund share
GBP hedged
Appendix I – Share Classes (Unaudited) continued
BlackRock Strategic Funds[616]

Global ExposureIn accordance with current BlackRock policy, global exposure is measured using the “Commitment Approach” or the Value at Risk(“VaR”) approach which considers the full constituents of the portfolio.
The Commitment Approach is a methodology that aggregates the underlying market or notional values of financial derivativeinstruments to determine the degree of global exposure of a Fund to financial derivative instruments.
Pursuant to the 2010 Law, the global exposure for a Fund under the Commitment Approach must not exceed 100% of that Fund’sNet Asset Value.
Below is the list of Funds that follow the Commitment Approach:
� BlackRock European Unconstrained Equity Fund� BlackRock Global Real Asset Securities Fund� BlackRock Managed Index Portfolios – Conservative� BlackRock Managed Index Portfolios – Defensive� BlackRock Managed Index Portfolios – Growth� BlackRock Managed Index Portfolios – Moderate� BlackRock Systematic ESG World Equity Fund� BlackRock Systematic Global Equity Fund
VaR is a statistical risk measure that estimates the potential loss from adverse market movements in an ordinary marketenvironment.
The VaR calculations for the BlackRock Strategic Funds, with the exception of the BlackRock Global Event Driven Fund, are basedon an adjusted historical simulation model. The VaR model used for the BlackRock Global Event Driven Fund is a Monte Carlosimulation model. Both models use a confidence level of 99%, a holding period of one day and a historical observation period ofnot less than one year (250 days). A VaR number is defined at a specified probability and a specified time horizon. A 99% one dayVaR means that the expectation is that 99% of the time over a one day period the Fund will lose no more than this number inpercentage terms. Therefore, higher VaR numbers indicate higher risk.
The VaR model used by BlackRock Risk & Quantitative Analysis (“RQA”) is an adjusted historical simulation model.
For Funds which use a relative VaR approach RQA determines a reference portfolio as the basis for the relative VaR calculation.The reference portfolio is typically the index benchmark also established as the reference point for performance data in respect ofthe relevant Fund. This is an index (or composite of indices) constructed by a recognised index provider(s) from relevant securitieswhich are eligible for investment by the Funds. This process gives appropriate consideration to the availability of indices withconstruction rules which are themselves compliant with diversification rules.
Where a Fund is monitored using VaR, the Investment Advisers will observe the regulatory limit and any internal risk limits whichmay be appropriate for the portfolio.
The table below details the highest, lowest and average utilisation of the VaR limit, expressed as a percentage of the respectiveabsolute or relative VaR regulatory limit. For relative VaR, the VaR of the respective Fund’s portfolio will not exceed twice the VaR ofthe reference portfolio. Utilisation refers to the level of risk taken in this context.
FundMarket
Risk Approach Risk Benchmark
Highestutilisationof the VaR
limit %
Lowestutilisationof the VaR
limit %
Averageutilisationof the VaR
limit %BlackRock Americas Diversified Equity Absolute Return Fund Absolute VaR n/a 27.95% 14.76% 20.68%BlackRock Asia Pacific Absolute Return Fund Absolute VaR n/a 39.13% 22.14% 30.17%BlackRock Asia Pacific Diversified Equity Absolute Return Fund Absolute VaR n/a 33.54% 22.14% 27.07%BlackRock Dynamic Diversified Growth Fund Absolute VaR n/a 49.42% 19.23% 31.38%BlackRock Emerging Companies Absolute Return Fund(1) Absolute VaR n/a 73.57% 46.96% 54.83%BlackRock Emerging Markets Absolute Return Fund Absolute VaR n/a 79.16% 40.70% 57.46%BlackRock Emerging Markets Equity Strategies Fund Relative VaR MSCI Emerging Markets Index 78.79% 51.01% 63.79%BlackRock Emerging Markets Flexi Dynamic Bond Fund Absolute VaR n/a 96.15% 19.45% 44.92%BlackRock Emerging Markets Short Duration Bond Fund Absolute VaR n/a 57.69% 8.50% 23.96%
BlackRock ESG Euro Bond Fund Relative VaRBloomberg Barclays MSCI Euro Aggregate
Sustainable SRI Index 53.12% 46.73% 50.01%
Appendix II – Global Market Risk Exposure (Unaudited)
(Unaudited) [617]

FundMarket
Risk Approach Risk Benchmark
Highestutilisationof the VaR
limit %
Lowestutilisationof the VaR
limit %
Averageutilisationof the VaR
limit %
BlackRock ESG Euro Corporate Bond Fund Relative VaRBloomberg Barclays MSCI Euro Corporate
Sustainable SRI Index 58.85% 46.54% 51.55%BlackRock ESG Euro Short Duration Bond Fund(2) Absolute VaR n/a 2.59% 1.34% 1.75%BlackRock European Absolute Return Fund Absolute VaR n/a 42.93% 20.57% 31.01%BlackRock European Opportunities Extension Fund Relative VaR S&P Europe BMI Index 66.80% 46.97% 55.43%
BlackRock European Select Strategies Fund Relative VaR
75% Barclays Pan European AggregateIndex (Hedged EUR) / 25% MSCI Europe
Index (Hedged EUR) 64.77% 44.81% 53.19%BlackRock Fixed Income Credit Strategies Fund Absolute VaR n/a 27.95% 3.80% 9.72%BlackRock Fixed Income Strategies Fund Absolute VaR n/a 17.66% 4.02% 8.07%BlackRock Global Absolute Return Bond Fund Absolute VaR n/a 20.80% 4.02% 9.00%BlackRock Global Equity Absolute Return Fund Absolute VaR n/a 59.48% 25.71% 33.46%BlackRock Global Event Driven Fund Absolute VaR n/a 56.92% 18.32% 30.97%BlackRock Macro Opportunities Fund(3) Absolute VaR n/a 16.77% 0.00% 5.86%BlackRock Style Advantage Fund Absolute VaR n/a 42.49% 13.86% 23.66%BlackRock Style Advantage Screened Fund Absolute VaR n/a 36.90% 18.34% 23.81%BlackRock Systematic Global Long/Short Equity Fund(1) Absolute VaR n/a 59.23% 16.55% 28.02%BlackRock Total Advantage Fund Absolute VaR n/a 31.53% 21.69% 26.54%BlackRock UK Equity Absolute Return Fund Absolute VaR n/a 33.76% 15.21% 22.61%(1) Fund name changed, see Note 1 for further details.(2) New Fund launched, see Note 1 for further details.(3) Fund terminated, see Note 1 for further details.
LeverageThe use of derivatives may expose Funds to a higher degree of risk. In particular, derivative contracts can be highly volatile, and theamount of initial margin is generally small relative to the size of the contract so that transactions may be leveraged in terms ofmarket exposure. A relatively small market movement may have a potentially larger impact on derivatives than on standard bonds orequities. Leveraged derivative positions can therefore increase Funds volatility.
For the purposes of this disclosure, leverage is the investment exposure gained through the use of financial derivative instruments.It is calculated using the sum of the notional values of all of the financial derivative instruments held by the relevant Fund, withoutnetting, and is expressed as a percentage of the NAV.
Disclosed in the table below is the level of leverage employed during the year.
FundAverage leverage employed
during the yearBlackRock Americas Diversified Equity Absolute Return Fund 599.14%BlackRock Asia Pacific Absolute Return Fund 87.61%BlackRock Asia Pacific Diversified Equity Absolute Return Fund 519.80%BlackRock Dynamic Diversified Growth Fund 114.83%BlackRock Emerging Companies Absolute Return Fund(1) 151.43%BlackRock Emerging Markets Absolute Return Fund 95.42%BlackRock Emerging Markets Equity Strategies Fund 76.08%BlackRock Emerging Markets Flexi Dynamic Bond Fund 648.15%BlackRock Emerging Markets Short Duration Bond Fund 143.32%BlackRock ESG Euro Bond Fund 35.34%BlackRock ESG Euro Corporate Bond Fund 49.34%BlackRock ESG Euro Short Duration Bond Fund(2) 46.42%BlackRock European Absolute Return Fund 68.11%BlackRock European Opportunities Extension Fund 95.45%BlackRock European Select Strategies Fund 99.88%BlackRock Fixed Income Credit Strategies Fund 112.62%BlackRock Fixed Income Strategies Fund 259.81%BlackRock Global Absolute Return Bond Fund 668.68%BlackRock Global Equity Absolute Return Fund 167.90%BlackRock Global Event Driven Fund 94.60%BlackRock Macro Opportunities Fund(3) 1,062.99%BlackRock Style Advantage Fund 1,134.05%BlackRock Style Advantage Screened Fund 779.51%BlackRock Systematic Global Long/Short Equity Fund(1) 455.39%
Appendix II – Global Market Risk Exposure (Unaudited)continued
BlackRock Strategic Funds[618]

FundAverage leverage employed
during the yearBlackRock Total Advantage Fund 746.28%BlackRock UK Equity Absolute Return Fund 113.74%(1) Fund name changed, see Note 1 for further details.(2) New Fund launched, see Note 1 for further details.(3) Fund terminated, see Note 1 for further details.
Appendix II – Global Market Risk Exposure (Unaudited)continued
(Unaudited) [619]

Efficient Portfolio Management TechniquesThe Company may, on behalf of each Fund and subject to the conditions and within the limits laid down by the CSSF and theProspectus, employ techniques and instruments relating to transferable securities, including investments in OTC Financial DerivativeInstruments (“FDIs”) provided that such techniques and instruments are used for efficient portfolio management purposes or toprovide protection against exchange risk or for direct investment purposes, where applicable.
Securities Lending and Total Return Swaps (including CFDs)All securities lending transactions entered into by the Funds are subject to a written legal agreement between the Funds and theSecurities Lending Agent, BlackRock Advisors (UK) Limited, a related party to the Company, and separately between the SecuritiesLending Agent and the approved borrowing counterparty. Collateral received in exchange for securities lent is transferred under atitle transfer arrangement and is delivered to and held in an account with a tri-party collateral manager in the name of theDepositary on behalf of the Funds. Collateral received is segregated from the assets belonging to the Funds’ Depositary or theSecurities Lending Agent.
All TRS (including CFDs) are entered into by the Funds under an International Swaps and Derivatives Associations, Inc. MasterAgreement (“ISDA Master Agreement”) or similar agreement. An ISDA Master Agreement is a bilateral agreement between theFunds and a counterparty that governs OTC FDIs (including TRS and CFDs) entered into by the parties. The parties’ exposuresunder the ISDA Master agreement are netted and collateralised together, therefore any collateral disclosures provided in this reportare in respect of all OTC FDIs entered into by the Funds under the ISDA Master Agreement, not just TRS and CFDs. All non-cashcollateral received/posted by the Funds under the ISDA Master Agreement is transferred bilaterally under a title transferarrangement.
The following table details the value of securities on loan as a proportion of the Funds’ total lendable assets and NAV and the valueof TRS (including CFDs) as a proportion of the Funds’ NAV, as at 31 May 2021 and the income/returns earned for the year ended31 May 2021. Total lendable assets represent the aggregate value of assets forming part of the Funds’ securities lendingprogramme. The value of TRS (including CFDs) is based on the underlying exposure value on a gross absolute basis.
Securities on loan TRS (including CFDs)
Fund Currency % of lendable assets % of NAV% of NAV
31 May 2021Net returns
earnedBlackRock Americas Diversified Equity Absolute Return Fund USD N/A N/A 707.82% (40,213,038)BlackRock Asia Extension Fund USD N/A N/A N/A 24,467BlackRock Asia Pacific Absolute Return Fund USD 23.82% 11.24% 75.11% (6,791,197)BlackRock Asia Pacific Diversified Equity Absolute Return Fund USD N/A N/A 451.77% 6,491,854BlackRock Dynamic Diversified Growth Fund EUR 6.72% 2.17% 17.84% 36,421,330BlackRock Emerging Companies Absolute Return Fund GBP 8.65% 0.49% 143.82% 159,914,593BlackRock Emerging Markets Absolute Return Fund USD 0.21% 6.87% 77.22% (3,934,104)BlackRock Emerging Markets Equity Strategies Fund USD 11.65% 5.15% 71.72% (34,328,157)BlackRock Emerging Markets Flexi Dynamic Bond Fund USD 5.66% 4.29% N/A N/ABlackRock Emerging Markets Short Duration Bond Fund USD 6.18% 4.94% N/A N/ABlackRock ESG Euro Bond Fund EUR 10.30% 9.35% N/A N/ABlackRock ESG Euro Corporate Bond Fund EUR 2.52% 2.20% N/A N/ABlackRock European Absolute Return Fund EUR 8.31% 1.93% 68.34% (185,337,439)BlackRock European Diversified Equity Absolute Return Fund EUR N/A N/A N/A 4,161BlackRock European Opportunities Extension Fund EUR 7.97% 7.38% 50.54% 13,001,543BlackRock European Select Strategies Fund EUR 7.30% 5.38% 0.15% (4,458,603)BlackRock European Unconstrained Equity Fund EUR 6.95% 6.53% N/A N/ABlackRock Fixed Income Credit Strategies Fund EUR 6.97% 5.72% 0.19% (286,666)BlackRock Fixed Income Strategies Fund EUR 6.45% 4.03% 0.35% (434,915)BlackRock Global Absolute Return Bond Fund EUR 4.18% 2.45% N/A 36,833BlackRock Global Equity Absolute Return Fund USD N/A N/A 61.87% (1,729,596)BlackRock Global Event Driven Fund USD 4.61% 0.75% 101.37% 119,823,367BlackRock Global Real Asset Securities Fund USD 7.27% 6.38% 0.05% 4,690BlackRock Managed Index Portfolios − Conservative EUR 8.74% 6.82% N/A N/ABlackRock Managed Index Portfolios − Defensive EUR 12.67% 8.56% N/A N/ABlackRock Managed Index Portfolios − Growth EUR 4.26% 3.41% N/A N/ABlackRock Managed Index Portfolios − Moderate EUR 2.26% 1.73% N/A N/ABlackRock Style Advantage Fund USD N/A N/A 228.94% (53,492,796)BlackRock Style Advantage Screened Fund USD N/A N/A 223.14% (448,724)BlackRock Systematic ESG World Equity Fund USD 5.36% 4.95% N/A N/ABlackRock Systematic Global Equity Fund USD 4.02% 3.54% N/A N/A
Supplementary Information (Unaudited)
BlackRock Strategic Funds[620]

Securities on loan TRS (including CFDs)
Fund Currency % of lendable assets % of NAV% of NAV
31 May 2021Net returns
earnedBlackRock Systematic Global Long/Short Equity Fund USD N/A N/A 273.47% 428,220BlackRock Total Advantage Fund EUR N/A N/A 122.93% 812,409BlackRock UK Equity Absolute Return Fund GBP N/A N/A 105.44% 5,150,182
The total income earned from securities lending transactions is split between the relevant Fund and the Securities Lending Agent.The Funds receives at least 62.5% while the Securities Lending Agent receives up to 37.5% of such income, with all operationalcosts borne out of the Securities Lending Agent’s share. Income earned during the year ended by the Funds from securities lendingtransactions is disclosed in the Funds’ Statement of Operations and Changes in Net Assets under caption “Securities lending”. Thetotal returns earned from total return swaps (including CFDs) is presented on a total return basis, including related interest anddividend income or expense and net gains/losses from fair value price movements. All returns and costs from TRS (including CFDs)will accrue to the Funds and are not subject to any returns or cost sharing arrangements with the Fund’s Management Company orany other third parties.
The following table details the value of securities on loan (individually identified in the relevant Funds’ Portfolio of Investments) andassociated collateral received and the underlying exposure value on a gross absolute basis for TRS (including CFDs), analysed bycounterparty, as at 31 May 2021.
Securities Lending
TRS(including
CFDs)
Counterparty
Counterparty'scountry of
establishmentAmount on
loanCollateralreceived
Underlyingexposure
31 May 2021
BlackRock Americas Diversified Equity Absolute Return Fund (in USD)Bank of America NA United States N/A N/A 715,633,209Barclays Bank Plc United Kingdom N/A N/A 626,513,814Goldman Sachs International United States N/A N/A 964,729,042HSBC Bank Plc United Kingdom N/A N/A 1,010,277,237Morgan Stanley Group Inc United States N/A N/A 1,546,509,786Total N/A N/A 4,863,663,088BlackRock Asia Pacific Absolute Return Fund (in USD)Bank of America NA United States N/A N/A 7,887,639Citigroup Global Markets Ltd United Kingdom 894,866 952,955 N/ADeutsche Bank AG Germany 1,639,000 1,816,253 N/AHSBC Bank Plc United Kingdom 565,586 620,243 N/AJP Morgan Securities Plc United Kingdom N/A N/A 8,557,881Morgan Stanley Group Inc United States N/A N/A 9,600,727The Bank of Nova Scotia Canada 154,425 170,043 N/AUBS AG Switzerland 644,654 706,470 N/ATotal 3,898,531 4,265,964 26,046,247BlackRock Asia Pacific Diversified Equity Absolute Return Fund (in USD)Citigroup Global Markets Ltd United Kingdom N/A N/A 52,992,986Goldman Sachs International United States N/A N/A 6,545,256HSBC Bank Plc United Kingdom N/A N/A 23,335,425JP Morgan Securities Plc United Kingdom N/A N/A 76,172,421Total N/A N/A 159,046,088BlackRock Dynamic Diversified Growth Fund (in EUR)Bank of America NA United States N/A N/A 27,616,047Barclays Bank Plc United Kingdom 17,664,962 19,814,500 17,126,560BNP Paribas SA France N/A N/A 25,354,080Citigroup Global Markets Ltd United Kingdom N/A N/A 36,886,720Goldman Sachs International United States 1,129,253 1,370,453 40,411,291HSBC Bank Plc United Kingdom 1,196,701 1,312,349 N/AMorgan Stanley Group Inc United States N/A N/A 72,023,616JP Morgan Securities Plc United Kingdom 1,728,936 1,941,250 N/AThe Bank of Nova Scotia Canada 1,990,223 2,191,508 N/AUBS AG Switzerland 2,934,608 3,216,006 N/ATotal 26,644,683 29,846,066 219,418,314
Supplementary Information (Unaudited) continued
Annual report and audited financial statements [621]

Securities Lending
TRS(including
CFDs)
Counterparty
Counterparty'scountry of
establishmentAmount on
loanCollateralreceived
Underlyingexposure
31 May 2021
BlackRock Emerging Companies Absolute Return Fund (in GBP)Citigroup Global Markets Ltd United Kingdom 2,582,989 2,750,656 N/AGoldman Sachs International United States N/A N/A 451,186,538HSBC Bank Plc United Kingdom N/A N/A 406,144,267JP Morgan Securities Plc United Kingdom N/A N/A 323,441,194Merrill Lynch International United States 1,395,457 1,551,566 N/AUBS AG Switzerland 53,457 58,583 N/ATotal 4,031,903 4,360,805 1,180,771,999BlackRock Emerging Markets Absolute Return Fund (in USD)Bank of America NA United States N/A N/A 851,888Citigroup Global Markets Ltd United Kingdom N/A N/A 1,862,428Credit Suisse Securities Ltd United Kingdom N/A N/A 665,868Deutsche Bank AG Germany 642,415 711,891 N/AGoldman Sachs International United States N/A N/A 1,210,693HSBC Bank Plc United Kingdom N/A N/A 4,654,480JP Morgan Securities Plc United Kingdom 224,627 252,211 N/AMorgan Stanley Group Inc United States N/A N/A 501,379Total 867,042 964,102 9,746,736BlackRock Emerging Markets Equity Strategies Fund (in USD)Bank of America NA United States N/A N/A 129,115,497Barclays Bank Plc United Kingdom 234,416 262,941 N/ACitigroup Global Markets Ltd United Kingdom 3,879,315 4,131,129 N/ACredit Suisse Securities Ltd United Kingdom N/A N/A 185,213,235Goldman Sachs International United States 2,398,427 2,910,712 66,901,989HSBC Bank Plc United Kingdom 13,405,472 14,700,955 228,529,072JP Morgan Securities Plc United Kingdom 16,860,341 18,930,816 N/ASociete Generale SA France 387,847 1,552,330 N/AUBS AG Switzerland 9,495,392 10,405,900 39,590,044Total 46,661,210 52,894,783 649,349,837BlackRock Emerging Markets Flexi Dynamic Bond Fund (in USD)Barclays Bank Plc United Kingdom 777,171 808,177 N/ABNP Paribas SA France 852,935 889,235 N/ACitigroup Global Markets Ltd United Kingdom 17,684,604 18,236,098 N/ACredit Suisse International Switzerland 2,915,577 3,526,291 N/ADeutsche Bank AG Germany 5,336,498 5,585,649 N/AHSBC Bank Plc United Kingdom 5,439,981 6,040,128 N/AJP Morgan Securities Plc United Kingdom 12,271 15,336 N/AMorgan Stanley Group Inc United States 25,881,913 30,418,609 N/ANomura International Plc United Kingdom 2,931,980 3,114,791 N/AZürcher Kantonalbank Switzerland 3,956,171 4,330,471 N/ATotal 65,789,101 72,964,785 N/ABlackRock Emerging Markets Short Duration Bond Fund (in USD)BNP Paribas SA France 1,068,774 1,114,260 N/AGoldman Sachs International United States 211,918 220,821 N/AJP Morgan Securities Plc United Kingdom 1,186,364 1,444,079 N/AMorgan Stanley Group Inc United States 1,369,570 1,435,036 N/ATotal 3,836,626 4,214,196 N/ABlackRock ESG Euro Bond Fund (in EUR)Barclays Bank Plc United Kingdom 3,460,321 3,598,371 N/ABNP Paribas SA France 7,274,296 7,511,207 N/AGoldman Sachs International United States 1,004,428 1,046,626 N/AJP Morgan Securities Plc United Kingdom 9,076,745 9,765,910 N/AMorgan Stanley Group Inc United States 23,472,317 24,216,492 N/ARBC Europe Limited United Kingdom 5,917,340 6,152,407 N/ASociete Generale SA France 8,868,635 9,772,735 N/AUBS AG Switzerland 1,023,105 1,149,297 N/ATotal 60,097,187 63,213,045 N/A
Supplementary Information (Unaudited) continued
BlackRock Strategic Funds[622]

Securities Lending
TRS(including
CFDs)
Counterparty
Counterparty'scountry of
establishmentAmount on
loanCollateralreceived
Underlyingexposure
31 May 2021
BlackRock ESG Euro Corporate Bond Fund (in EUR)Barclays Bank Plc United Kingdom 1,473,141 1,531,911 N/AGoldman Sachs International United States 1,578,291 1,644,597 N/AJP Morgan Securities Plc United Kingdom 2,053,199 2,171,163 N/AMorgan Stanley Group Inc United States 862,105 903,313 N/ATotal 5,966,736 6,250,984 N/ABlackRock European Absolute Return Fund (in EUR)Bank of America NA United States N/A N/A 379,633,891Barclays Bank Plc United Kingdom N/A N/A 21,143,863Citigroup Global Markets Ltd United Kingdom N/A N/A 322,876,822Deutsche Bank AG Germany N/A N/A 23,491,377JP Morgan Securities Plc United Kingdom 574,376 644,910 297,346,275Natixis S.A. France 28,989,132 31,771,548 N/ATotal 29,563,508 32,416,458 1,044,492,228BlackRock European Opportunities Extension Fund (in EUR)Bank of America NA United States N/A N/A 132,153,151Barclays Bank Plc United Kingdom N/A N/A 5,242,366BNP Paribas Arbitrage SNC France 11,714,705 13,501,880 N/ACitigroup Global Markets Ltd United Kingdom N/A N/A 95,936,752JP Morgan Securities Plc United Kingdom 12,892,632 14,475,853 100,221,823Natixis S.A. France 24,117,474 26,432,302 N/ATotal 48,724,811 54,410,035 333,554,092BlackRock European Select Strategies Fund (in EUR)Bank of America NA United States N/A N/A 740,523Barclays Bank Plc United Kingdom 890,602 926,132 N/ABNP Paribas Arbitrage SNC France 11,047,559 12,732,957 N/ABNP Paribas SA France 740,564 772,082 N/ACitigroup Global Markets Ltd United Kingdom 397,473 423,274 N/ADeutsche Bank AG Germany 173,750 181,861 N/AGoldman Sachs International United States 632,245 658,807 N/AHSBC Bank Plc United Kingdom 193,831 215,214 N/AJP Morgan Securities Plc United Kingdom 7,203,727 8,004,690 N/AMorgan Stanley Group Inc United States 3,106,495 3,216,915 N/AUBS AG Switzerland 1,743,025 1,910,163 N/ATotal 26,129,271 29,042,095 740,523BlackRock European Unconstrained Equity Fund (in EUR)JP Morgan Securities Plc United Kingdom 3,053,718 3,428,716 N/ATotal 3,053,718 3,428,716 N/ABlackRock Fixed Income Credit Strategies Fund (in EUR)Bank of America NA United States N/A N/A 739,211Barclays Bank Plc United Kingdom 4,366,847 4,786,495 N/ABNP Paribas SA France 894,313 932,374 N/ACitigroup Global Markets Ltd United Kingdom 3,112,347 3,209,405 N/AGoldman Sachs International United States 2,344,889 2,443,398 N/AHSBC Bank Plc United Kingdom 1,234,159 1,370,311 N/AJP Morgan Securities Plc United Kingdom 6,668,320 8,107,357 N/AMorgan Stanley Group Inc United States 516,560 541,251 N/ASociete Generale SA France 2,900,853 3,117,717 N/ATotal 22,038,288 24,508,308 739,211
Supplementary Information (Unaudited) continued
Annual report and audited financial statements [623]

Securities Lending
TRS(including
CFDs)
Counterparty
Counterparty'scountry of
establishmentAmount on
loanCollateralreceived
Underlyingexposure
31 May 2021
BlackRock Fixed Income Strategies Fund (in EUR)Barclays Bank Plc United Kingdom 28,436,073 30,815,239 5,450,718BNP Paribas SA France 29,129,248 30,348,933 N/ACitigroup Global Markets Ltd United Kingdom 9,497,087 9,793,255 N/ACredit Suisse Securities Ltd United Kingdom N/A N/A 7,541,769Deutsche Bank AG Germany 6,759,700 7,075,293 N/AGoldman Sachs International United States 16,159,773 16,838,654 N/AHSBC Bank Plc United Kingdom 1,827,230 2,028,808 N/AJP Morgan Securities Plc United Kingdom 56,957,150 62,008,087 6,952,933Morgan Stanley Group Inc United States 15,078,398 15,799,146 N/ANomura International Plc United Kingdom 1,575,863 1,674,117 N/ARBC Europe Limited United Kingdom 10,806,845 11,236,152 N/ASociete Generale SA France 13,380,900 14,796,614 N/AUBS AG Switzerland 226,013 254,273 N/AZürcher Kantonalbank Switzerland 39,113,841 42,348,920 N/ATotal 228,948,121 245,017,491 19,945,420BlackRock Global Absolute Return Bond Fund (in EUR)Barclays Bank Plc United Kingdom 3,468,199 3,873,391 N/ACitigroup Global Markets Ltd United Kingdom 53,311 54,973 N/AGoldman Sachs International United States 217,649 226,792 N/AMorgan Stanley Group Inc United States 171,417 179,611 N/ATotal 3,910,576 4,334,767 N/ABlackRock Global Equity Absolute Return Fund (in USD)Goldman Sachs International United States N/A N/A 15,927,746JP Morgan Securities Plc United Kingdom N/A N/A 12,501,610UBS AG Switzerland N/A N/A 15,220,074Total N/A N/A 43,649,430BlackRock Global Event Driven Fund (in USD)Barclays Bank Plc United Kingdom 2,393,564 2,684,822 671,826,460BNP Paribas SA France 3,695,683 3,852,970 N/ACitigroup Global Markets Ltd United Kingdom 2,137,680 2,204,343 740,044,927Credit Suisse AG Ireland 19,342,512 20,488,112 488,158,397Goldman Sachs International United States 1,370,226 1,662,896 1,665,500,047JP Morgan Securities Plc United Kingdom N/A N/A 1,742,581,071Merrill Lynch International United States 683,253 759,689 N/AMorgan Stanley Group Inc United States 1,065,658 1,196,979 559,661,714The Bank of Nova Scotia Canada 13,811,949 15,208,851 N/AUBS AG Switzerland 523,387 573,575 235,053,896Total 45,023,912 48,632,237 6,102,826,512BlackRock Global Real Asset Securities Fund (in USD)Barclays Bank Plc United Kingdom 3,028,131 4,131,021 N/ACitigroup Global Markets Ltd United Kingdom 1,098,358 1,169,655 N/ADeutsche Bank AG Germany N/A N/A 147,921Goldman Sachs International United States 7,801,314 9,467,614 N/AJP Morgan Securities Plc United Kingdom 3,288,184 3,692,167 N/AUBS AG Switzerland 4,879,844 5,347,769 N/ATotal 20,095,831 23,808,226 147,921BlackRock Managed Index Portfolios − Conservative (in EUR)Barclays Bank Plc United Kingdom 4,350,078 4,879,413 N/ABNP Paribas Arbitrage SNC France 2,565,577 2,956,976 N/AGoldman Sachs International United States 20,716 25,141 N/ATotal 6,936,371 7,861,530 N/A
Supplementary Information (Unaudited) continued
BlackRock Strategic Funds[624]

Securities Lending
TRS(including
CFDs)
Counterparty
Counterparty'scountry of
establishmentAmount on
loanCollateralreceived
Underlyingexposure
31 May 2021
BlackRock Managed Index Portfolios − Defensive (in EUR)Barclays Bank Plc United Kingdom N/A 30,968 N/ABNP Paribas Arbitrage SNC France 8,662,414 9,983,938 N/AGoldman Sachs International United States 133,043 161,460 N/AHSBC Bank Plc United Kingdom 4,522,907 4,959,993 N/AUBS AG Switzerland 308,380 337,950 N/ATotal 13,626,744 15,474,309 N/ABlackRock Managed Index Portfolios − Growth (in EUR)Barclays Bank Plc United Kingdom 12,167,380 13,647,952 N/AGoldman Sachs International United States 451,558 548,007 N/ATotal 12,618,938 14,195,959 N/ABlackRock Managed Index Portfolios − Moderate (in EUR)Barclays Bank Plc United Kingdom 3,540,275 3,971,069 N/AGoldman Sachs International United States 140,307 204,923 N/AHSBC Bank Plc United Kingdom 8,357,613 9,165,279 N/ATotal 12,038,195 13,341,271 N/ABlackRock Style Advantage Fund (in USD)Bank of America NA United States N/A N/A 91,974,885Barclays Bank Plc United Kingdom N/A N/A 105,354,868Citigroup Global Markets Ltd United Kingdom N/A N/A 18,710,266Credit Suisse Securities Ltd United Kingdom N/A N/A 18,549,302Deutsche Bank AG Germany N/A N/A 58,980,540Goldman Sachs International United States N/A N/A 63,475,308HSBC Bank Plc United Kingdom N/A N/A 26,974,804JP Morgan Securities Plc United Kingdom N/A N/A 19,250,872Total N/A N/A 403,270,845BlackRock Style Advantage Screened Fund (in USD)Bank of America NA United States N/A N/A 2,796,509Citigroup Global Markets Ltd United Kingdom N/A N/A 20,438,103Goldman Sachs International United States N/A N/A 81,022HSBC Bank Plc United Kingdom N/A N/A 20,439,434JP Morgan Securities Plc United Kingdom N/A N/A 16,609,713Total N/A N/A 60,364,781BlackRock Systematic ESG World Equity Fund (in USD)BNP Paribas Arbitrage SNC France N/A 200,324 N/ACitigroup Global Markets Ltd United Kingdom 2,183,652 2,325,397 N/ACredit Suisse AG Ireland 1,446,416 1,532,082 N/ADeutsche Bank AG Germany 12,354,842 13,690,987 N/AGoldman Sachs International United States 663,942 805,755 N/AJP Morgan Securities Plc United Kingdom 1,072,041 1,203,688 N/AMacquarie Bank Ltd Australia N/A 354,202 N/ATotal 17,720,893 20,112,435 N/ABlackRock Systematic Global Equity Fund (in USD)BNP Paribas Arbitrage SNC France 133,120 153,428 N/ACitigroup Global Markets Ltd United Kingdom 1,880,511 2,002,579 N/AGoldman Sachs International United States 413,218 501,479 N/AHSBC Bank Plc United Kingdom 48,356 53,030 N/AJP Morgan Securities Plc United Kingdom 2,641,992 2,966,430 N/AMacquarie Bank Ltd Australia 78,779 110,406 N/AUBS AG Switzerland 1,346,262 1,475,354 N/ATotal 6,542,238 7,262,706 N/ABlackRock Systematic Global Long/Short Equity Fund (in USD)Bank of America NA United States N/A N/A 31,856,736Goldman Sachs International United States N/A N/A 48,829,760Morgan Stanley Group Inc United States N/A N/A 50,210,613Total N/A N/A 130,897,109
Supplementary Information (Unaudited) continued
Annual report and audited financial statements [625]

Securities Lending
TRS(including
CFDs)
Counterparty
Counterparty'scountry of
establishmentAmount on
loanCollateralreceived
Underlyingexposure
31 May 2021
BlackRock Total Advantage Fund (in EUR)Bank of America NA United States N/A N/A 6,450,729Citigroup Global Markets Ltd United Kingdom N/A N/A 4,595,640Credit Suisse Securities Ltd United Kingdom N/A N/A 3,561,260Deutsche Bank AG Germany N/A N/A 1,825,510Goldman Sachs International United States N/A N/A 203,575HSBC Bank Plc United Kingdom N/A N/A 458,878JP Morgan Securities Plc United Kingdom N/A N/A 4,660,944Total N/A N/A 21,756,536BlackRock UK Equity Absolute Return Fund (in GBP)Deutsche Bank AG Germany N/A N/A 2,092,722HSBC Bank Plc United Kingdom N/A N/A 44,585,142JP Morgan Securities Plc United Kingdom N/A N/A 103,014,031Total N/A N/A 149,691,895
All securities on loan have an open maturity tenor as they are recallable or terminable on a daily basis.
The following table provides an analysis of the maturity tenor of TRS (including CFDs) as at 31 May 2021:
Maturity Tenor
1 day 2 to 7 days 8 to 30 days 31 to 90 days91 to
365 daysMore than365 days
Opentransactions Total
BlackRock Americas Diversified Equity Absolute Return Fund (in USD)TRS (including CFDs) - - - - - - 4,863,663,088 4,863,663,088BlackRock Asia Pacific Absolute Return Fund (in USD)TRS (including CFDs) - - - - - - 26,046,247 26,046,247BlackRock Asia Pacific Diversified Equity Absolute Return Fund (in USD)TRS (including CFDs) - - - 1,349,081 5,196,175 - 152,500,832 159,046,088BlackRock Dynamic Diversified Growth Fund (in EUR)TRS (including CFDs) - - - - 219,418,314 - - 219,418,314BlackRock Emerging Companies Absolute Return Fund (in GBP)TRS (including CFDs) - - - - - - 1,180,771,999 1,180,771,999BlackRock Emerging Markets Absolute Return Fund (in USD)TRS (including CFDs) - - - - - - 9,746,736 9,746,736BlackRock Emerging Markets Equity Strategies Fund (in USD)TRS (including CFDs) - - - - - - 649,349,837 649,349,837BlackRock European Absolute Return Fund (in EUR)TRS (including CFDs) - - - - - - 1,044,492,228 1,044,492,228BlackRock European Opportunities Extension Fund (in EUR)TRS (including CFDs) - - - - - - 333,554,092 333,554,092BlackRock European Select Strategies Fund (in EUR)TRS (including CFDs) - - - - - - 740,523 740,523BlackRock Fixed Income Credit Strategies Fund (in EUR)TRS (including CFDs) - - - - - - 739,211 739,211BlackRock Fixed Income Strategies Fund (in EUR)TRS (including CFDs) - - - 1,815,507 9,981,374 8,148,539 - 19,945,420BlackRock Global Equity Absolute Return Fund (in USD)TRS (including CFDs) - - - - - - 43,649,430 43,649,430BlackRock Global Event Driven Fund (in USD)TRS (including CFDs) - - - - - - 6,102,826,512 6,102,826,512BlackRock Global Real Asset Securities Fund (in USD)TRS (including CFDs) - - - - - - 147,921 147,921BlackRock Style Advantage Fund (in USD)TRS (including CFDs) - - 28,858,432 - - - 374,412,413 403,270,845BlackRock Style Advantage Screened Fund (in USD)TRS (including CFDs) - - 2,877,531 - - - 57,487,250 60,364,781
Supplementary Information (Unaudited) continued
BlackRock Strategic Funds[626]

Maturity Tenor
1 day 2 to 7 days 8 to 30 days 31 to 90 days91 to
365 daysMore than365 days
Opentransactions Total
BlackRock Systematic Global Long/Short Equity Fund (in USD)TRS (including CFDs) - - - - - - 130,897,109 130,897,109BlackRock Total Advantage Fund (in EUR)TRS (including CFDs) - - 3,209,849 - 203,575 - 18,343,112 21,756,536BlackRock UK Equity Absolute Return Fund (in GBP)TRS (including CFDs) - - - - - - 149,691,895 149,691,895
The above maturity tenor analysis has been based on therespective transaction contractual maturity date. Opentransactions are those transactions that are recallable orterminable on a daily basis and include CFDs.
CollateralThe Funds engage in activities which may require collateral tobe provided to a counterparty (“collateral posted”) or may holdcollateral received (“collateral received”) from a counterparty.
The following table provides an analysis by currency of the cashand underlying non-cash collateral received/posted by way oftitle transfer collateral arrangement by the Funds, in respect ofsecurities lending transactions and OTC FDIs (including TRSand CFDs), as at 31 May 2021.
Currency
Cashcollateralreceived
Cashcollateral
posted
Non-cashcollateralreceived
Non-cashcollateral
posted
BlackRock Americas Diversified Equity Absolute Return Fund (in USD)OTC derivative transactions
USD 1,245,000 1,290,000 - -Total 1,245,000 1,290,000 - -BlackRock Asia Pacific Absolute Return Fund (in USD)Securities lending transactions
AUD - - 17 -CAD - - 153,476 -CHF - - 156,375 -EUR - - 862,396 -GBP - - 730,307 -JPY - - 419,824 -USD - - 1,885,590 -SEK - - 57,979 -OTC derivative transactions
USD 473,000 440,000 - -Total 473,000 440,000 4,265,964 -BlackRock Asia Pacific Diversified Equity Absolute Return Fund (in USD)OTC derivative transactions
USD 660,000 - - -Total 660,000 - - -
Currency
Cashcollateralreceived
Cashcollateral
posted
Non-cashcollateralreceived
Non-cashcollateral
posted
BlackRock Dynamic Diversified Growth Fund (in EUR)Securities lending transactions
AUD - - 217 -CAD - - 2,585,519 -CHF - - 703,104 -EUR - - 4,523,630 -GBP - - 10,449,384 -JPY - - 7,173,413 -USD - - 4,288,124 -SEK - - 122,675 -OTC derivative transactions
EUR 8,090,000 2,400,000 - -Total 8,090,000 2,400,000 29,846,066 -BlackRock Emerging Companies Absolute Return Fund (in GBP)Securities lending transactions
CAD - - 6,689 -CHF - - 97,629 -EUR - - 2,059,169 -GBP - - 807,574 -JPY - - 67,714 -USD - - 1,184,731 -SEK - - 137,299 -OTC derivative transactions
GBP 18,580,000 - - -Total 18,580,000 - 4,360,805 -BlackRock Emerging Markets Absolute Return Fund (in USD)Securities lending transactions
CAD - - 28,379 -CHF - - 82,027 -EUR - - 93,795 -GBP - - 95,255 -JPY - - 173,702 -USD - - 490,944 -OTC derivative transactions
USD - 369,700 - -Total - 369,700 964,102 -
Supplementary Information (Unaudited) continued
Annual report and audited financial statements [627]

Currency
Cashcollateralreceived
Cashcollateral
posted
Non-cashcollateralreceived
Non-cashcollateral
posted
BlackRock Emerging Markets Equity Strategies Fund (in USD)Securities lending transactions
CAD - - 1,222,807 -CHF - - 4,536,122 -DKK - - 9,562 -EUR - - 7,064,213 -GBP - - 9,323,357 -JPY - - 14,607,443 -MXN - - 70 -USD - - 14,756,794 -SEK - - 1,374,415 -OTC derivative transactions
USD 11,080,000 12,270,000 - -Total 11,080,000 12,270,000 52,894,783 -BlackRock Emerging Markets Flexi Dynamic Bond Fund (in USD)Securities lending transactions
AUD - - 215,425 -CAD - - 524,672 -CHF - - 1,429,688 -DKK - - 390 -EUR - - 39,977,138 -GBP 2,182,305 - 10,713,969 -JPY - - 555,093 -USD - - 17,366,105 -OTC derivative transactions
USD 6,010,000 64,802,000 - -Total 8,192,305 64,802,000 70,782,480 -BlackRock Emerging Markets Short Duration Bond Fund (in USD)Securities lending transactions
CHF - - 45,048 -EUR - - 2,276,204 -GBP - - 756,065 -JPY - - 763,884 -USD - - 372,995 -OTC derivative transactions
USD - 451,000 - -Total - 451,000 4,214,196 -BlackRock ESG Euro Bond Fund (in EUR)Securities lending transactions
CAD - - 9 -CHF - - 771,150 -DKK - - 874,240 -EUR - - 35,881,379 -GBP - - 11,715,760 -JPY - - 3,721,567 -NOK - - 21,830 -USD - - 10,227,110 -OTC derivative transactions
EUR - 1,566,000 - -Total - 1,566,000 63,213,045 -
Currency
Cashcollateralreceived
Cashcollateral
posted
Non-cashcollateralreceived
Non-cashcollateral
posted
BlackRock ESG Euro Corporate Bond Fund (in EUR)Securities lending transactions
EUR - - 2,752,956 -GBP - - 2,179,200 -USD - - 1,318,828 -OTC derivative transactions
EUR - 385,000 - -Total - 385,000 6,250,984 -BlackRock ESG Euro Short Duration Bond Fund (in EUR)OTC derivative transactions
EUR - 320,000 - -Total - 320,000 - -BlackRock European Absolute Return Fund (in EUR)Securities lending transactions
AUD - - 4,369,364 -CHF - - 121,670 -EUR - - 3,003,010 -GBP - - 6,669,853 -JPY - - 16,415,180 -USD - - 1,347,219 -SEK - - 490,162 -OTC derivative transactions
EUR 580,000 10,425,500 - -Total 580,000 10,425,500 32,416,458 -BlackRock European Opportunities Extension Fund (in EUR)Securities lending transactions
AUD - - 5,222,323 -CHF - - 2,731,031 -EUR - - 4,713,053 -GBP - - 7,540,847 -JPY - - 29,554,729 -USD - - 4,240,262 -SEK - - 407,790 -OTC derivative transactions
EUR 2,527,000 2,440,000 - -Total 2,527,000 2,440,000 54,410,035 -BlackRock European Select Strategies Fund (in EUR)Securities lending transactions
AUD - - 1,504,521 -CAD - - 234,963 -CHF - - 1,440,688 -EUR - - 6,484,923 -GBP - - 4,191,682 -JPY - - 12,214,192 -USD - - 2,971,126 -OTC derivative transactions
EUR - 919,000 - 39,112,775Total - 919,000 29,042,095 39,112,775BlackRock European Unconstrained Equity Fund (in EUR)Securities lending transactions
CHF - - 646,865 -EUR - - 211,426 -GBP - - 330,061 -JPY - - 1,556,277 -USD - - 684,087 -Total - - 3,428,716 -
Supplementary Information (Unaudited) continued
BlackRock Strategic Funds[628]

Currency
Cashcollateralreceived
Cashcollateral
posted
Non-cashcollateralreceived
Non-cashcollateral
posted
BlackRock Fixed Income Credit Strategies Fund (in EUR)Securities lending transactions
AUD - - 48,873 -CAD - - 850,113 -CHF - - 141,807 -DKK - - 106,065 -EUR - - 9,228,597 -GBP - - 9,448,723 -JPY - - 1,293,824 -USD - - 3,390,306 -OTC derivative transactions
EUR - 2,959,000 - -Total - 2,959,000 24,508,308 -BlackRock Fixed Income Strategies Fund (in EUR)Securities lending transactions
AUD - - 72,358 -CAD - - 2,113,557 -CHF - - 1,568,376 -DKK - - 210 -EUR - - 101,146,729 -GBP 312,227 - 55,944,563 -JPY - - 28,579,291 -NOK - - 39,867 -USD - - 55,240,313 -OTC derivative transactions
EUR 2,020,000 33,878,400 - 2,198,719,701Total 2,332,227 33,878,400 244,705,264 2,198,719,701BlackRock Global Absolute Return Bond Fund (in EUR)Securities lending transactions
CAD - - 408,721 -EUR - - 1,059,207 -GBP - - 1,616,067 -JPY - - 1,022,335 -USD - - 228,437 -OTC derivative transactions
EUR - 3,085,000 4,788,968 -Total - 3,085,000 9,123,735 -BlackRock Global Equity Absolute Return Fund (in USD)OTC derivative transactions
USD 270,000 - - -Total 270,000 - - -BlackRock Global Event Driven Fund (in USD)Securities lending transactions
AUD - - 1,506 -CAD - - 432,257 -CHF - - 367,236 -EUR - - 11,260,333 -GBP - - 5,693,635 -JPY - - 2,918,957 -USD - - 27,891,087 -SEK - - 67,226 -OTC derivative transactions
USD 12,302,000 11,921,000 - -Total 12,302,000 11,921,000 48,632,237 -
Currency
Cashcollateralreceived
Cashcollateral
posted
Non-cashcollateralreceived
Non-cashcollateral
posted
BlackRock Global Real Asset Securities Fund (in USD)Securities lending transactions
CAD - - 1,072,047 -CHF - - 1,192,288 -EUR - - 5,428,533 -GBP - - 6,862,196 -JPY - - 3,249,474 -USD - - 6,003,688 -OTC derivative transactions
USD - 1,041,000 - -Total - 1,041,000 23,808,226 -BlackRock Managed Index Portfolios − Conservative (in EUR)Securities lending transactions
AUD - - 347,613 -CAD - - 544,989 -EUR - - 1,189,405 -GBP - - 2,187,718 -JPY - - 3,459,308 -USD - - 132,497 -Total - - 7,861,530 -BlackRock Managed Index Portfolios − Defensive (in EUR)Securities lending transactions
AUD - - 1,173,680 -CAD - - 42,049 -CHF - - 31,327 -EUR - - 1,536,796 -GBP - - 703,342 -JPY - - 8,778,953 -USD - - 2,744,515 -SEK - - 463,647 -Total - - 15,474,309 -BlackRock Managed Index Portfolios − Growth (in EUR)Securities lending transactions
CAD - - 1,524,359 -EUR - - 2,669,718 -GBP - - 5,807,356 -JPY - - 3,812,882 -USD - - 381,644 -Total - - 14,195,959 -BlackRock Managed Index Portfolios − Moderate (in EUR)Securities lending transactions
CAD - - 443,534 -EUR - - 1,624,014 -GBP - - 1,697,957 -JPY - - 4,188,699 -USD - - 4,530,321 -SEK - - 856,746 -Total - - 13,341,271 -BlackRock Style Advantage Fund (in USD)OTC derivative transactions
USD 4,510,000 3,482,000 - -Total 4,510,000 3,482,000 - -BlackRock Style Advantage Screened Fund (in USD)OTC derivative transactions
USD 550,000 181,000 - -Total 550,000 181,000 - -
Supplementary Information (Unaudited) continued
Annual report and audited financial statements [629]

Currency
Cashcollateralreceived
Cashcollateral
posted
Non-cashcollateralreceived
Non-cashcollateral
posted
BlackRock Systematic ESG World Equity Fund (in USD)Securities lending transactions
AUD - - 23,550 -CAD - - 548,100 -CHF - - 889,537 -EUR - - 3,591,293 -GBP - - 2,286,841 -JPY - - 2,185,254 -USD - - 10,587,860 -Total - - 20,112,435 -BlackRock Systematic Global Equity Fund (in USD)Securities lending transactions
AUD - - 18,036 -CAD - - 168,467 -CHF - - 696,409 -EUR - - 1,668,986 -GBP - - 1,531,356 -JPY - - 1,661,803 -USD - - 1,512,692 -SEK - - 4,957 -Total - - 7,262,706 -BlackRock Systematic Global Long/Short Equity Fund (in USD)OTC derivative transactions
USD 300,000 198,300 - -Total 300,000 198,300 - -BlackRock Total Advantage Fund (in EUR)OTC derivative transactions
EUR - 8,000 - -Total - 8,000 - -BlackRock UK Equity Absolute Return Fund (in GBP)OTC derivative transactions
GBP 530,000 910,000 - -Total 530,000 910,000 - -
As at 31 May 2021, part of cash collateral received by theFunds was re-invested in money market funds managed by theaffiliates of the Management Company, as disclosed in theFunds’ Portfolio of Investments. The Funds are the legal ownerof inbound collateral and can sell the assets and withhold thecash in the case of default. All cash received or posted ascollateral has an open maturity tenor as it’s not subject to acontractual maturity date.
Non-cash collateral received by way of title transfer collateralarrangement in relation to securities lending transactions andOTC FDIs, cannot be sold, re-invested or pledged.
The returns earned by the Funds from the reinvestment of cashcollateral in money market funds during the year ended 31 May2021 is summarised below. These returns represent theaccumulative total return of the respective money market fundfor the 1 year year ended 31 May 2021. These returns do nottake into account any interest payable to the counterparty underthe relevant collateral arrangements.
Money market fund Total returns
Institutional Cash Series plc
- Institutional Euro Liquidity Fund (0.76)%
- Institutional GBP Liquidity Fund (0.01)%
- Institutional US Dollar Liquidity Fund 0.01%
Supplementary Information (Unaudited) continued
BlackRock Strategic Funds[630]

The following table provides an analysis of the type, quality and maturity tenor of non-cash collateral received by the Funds by wayof title transfer collateral arrangement in respect of securities lending transactions, as at 31 May 2021.
Maturity Tenor
Collateral type and quality 1 day2 to 7days
8 to 30days
31 to 90days
91 to 365days
More than365 days Open Total
BlackRock Asia Pacific Absolute Return Fund (in USD)Collateral received –securities lendingFixed IncomeInvestment grade - - - - 5,938 991,280 - 997,218EquitiesRecognised equity index - - - - - - 3,268,746 3,268,746Total - - - - 5,938 991,280 3,268,746 4,265,964BlackRock Dynamic Diversified Growth Fund (in EUR)Collateral received –securities lendingFixed IncomeInvestment grade - - 59,170 - 549,986 6,625,103 - 7,234,259EquitiesRecognised equity index - - - - - - 22,611,807 22,611,807Total - - 59,170 - 549,986 6,625,103 22,611,807 29,846,066BlackRock Emerging Companies Absolute Return Fund (in GBP)Collateral received –securities lendingFixed IncomeInvestment grade - - - - - 2,356,664 - 2,356,664EquitiesRecognised equity index - - - - - - 2,004,141 2,004,141Total - - - - - 2,356,664 2,004,141 4,360,805BlackRock Emerging Markets Absolute Return Fund (in USD)Collateral received –securities lendingFixed IncomeInvestment grade - - - - 626 32,657 - 33,283EquitiesRecognised equity index - - - - - - 930,819 930,819Total - - - - 626 32,657 930,819 964,102BlackRock Emerging Markets Equity Strategies Fund (in USD)Collateral received –securities lendingFixed IncomeInvestment grade - - 125,672 - 1,049,274 6,691,358 - 7,866,304EquitiesRecognised equity index - - - - - - 45,028,479 45,028,479Total - - 125,672 - 1,049,274 6,691,358 45,028,479 52,894,783BlackRock Emerging Markets Flexi Dynamic Bond Fund (in USD)Collateral received –securities lendingFixed IncomeInvestment grade - - - 672,379 1,239,569 59,236,954 - 61,148,902EquitiesRecognised equity index - - - - - - 9,633,578 9,633,578Total - - - 672,379 1,239,569 59,236,954 9,633,578 70,782,480BlackRock Emerging Markets Short Duration Bond Fund (in USD)Collateral received –securities lendingFixed IncomeInvestment grade - - 6,278 - 228,731 2,747,558 - 2,982,567EquitiesRecognised equity index - - - - - - 1,231,629 1,231,629Total - - 6,278 - 228,731 2,747,558 1,231,629 4,214,196
Supplementary Information (Unaudited) continued
Annual report and audited financial statements [631]

Maturity Tenor
Collateral type and quality 1 day2 to 7days
8 to 30days
31 to 90days
91 to 365days
More than365 days Open Total
BlackRock ESG Euro Bond Fund (in EUR)Collateral received –securities lendingFixed IncomeInvestment grade - - 29,758 74 1,415,140 46,623,561 - 48,068,533EquitiesRecognised equity index - - - - - - 15,144,512 15,144,512Total - - 29,758 74 1,415,140 46,623,561 15,144,512 63,213,045BlackRock ESG Euro Corporate Bond Fund (in EUR)Collateral received –securities lendingFixed IncomeInvestment grade - - 46,760 - 31,800 6,172,424 - 6,250,984EquitiesTotal - - 46,760 - 31,800 6,172,424 - 6,250,984BlackRock European Absolute Return Fund (in EUR)Collateral received –securities lendingFixed IncomeInvestment grade - - - - - 1,218,549 - 1,218,549EquitiesRecognised equity index - - - - - - 31,197,909 31,197,909Total - - - - - 1,218,549 31,197,909 32,416,458BlackRock European Opportunities Extension Fund (in EUR)Collateral received –securities lendingFixed IncomeInvestment grade - - - - - 1,013,771 - 1,013,771EquitiesRecognised equity index - - - - - - 53,396,264 53,396,264Total - - - - - 1,013,771 53,396,264 54,410,035BlackRock European Select Strategies Fund (in EUR)Collateral received –securities lendingFixed IncomeInvestment grade - - 18,731 7 202,783 7,498,933 - 7,720,454EquitiesRecognised equity index - - - - - - 21,321,641 21,321,641Total - - 18,731 7 202,783 7,498,933 21,321,641 29,042,095BlackRock European Unconstrained Equity Fund (in EUR)Collateral received –securities lendingFixed IncomeEquitiesRecognised equity index - - - - - - 3,428,716 3,428,716Total - - - - - - 3,428,716 3,428,716BlackRock Fixed Income Credit Strategies Fund (in EUR)Collateral received –securities lendingFixed IncomeInvestment grade - - 69,471 98,480 601,959 18,727,781 - 19,497,691EquitiesRecognised equity index - - - - - - 5,010,617 5,010,617Total - - 69,471 98,480 601,959 18,727,781 5,010,617 24,508,308BlackRock Fixed Income Strategies Fund (in EUR)Collateral received –securities lendingFixed IncomeInvestment grade - - 478,762 361,135 7,749,282 134,640,795 - 143,229,974EquitiesRecognised equity index - - - - - - 101,475,290 101,475,290Total - - 478,762 361,135 7,749,282 134,640,795 101,475,290 244,705,264
Supplementary Information (Unaudited) continued
BlackRock Strategic Funds[632]

Maturity Tenor
Collateral type and quality 1 day2 to 7days
8 to 30days
31 to 90days
91 to 365days
More than365 days Open Total
BlackRock Global Absolute Return Bond Fund (in EUR)Collateral received –securities lendingFixed IncomeInvestment grade - - 6,448 1,687 4,385 1,653,627 - 1,666,147EquitiesRecognised equity index - - - - - - 2,668,620 2,668,620Total - - 6,448 1,687 4,385 1,653,627 2,668,620 4,334,767BlackRock Global Event Driven Fund (in USD)Collateral received –securities lendingFixed IncomeInvestment grade - - 3,964,498 282,447 3,385,856 16,855,128 - 24,487,929EquitiesRecognised equity index - - - - - - 24,144,308 24,144,308Total - - 3,964,498 282,447 3,385,856 16,855,128 24,144,308 48,632,237BlackRock Global Real Asset Securities Fund (in USD)Collateral received –securities lendingFixed IncomeInvestment grade - - 408,770 - 3,412,955 8,453,473 - 12,275,198EquitiesRecognised equity index - - - - - - 11,533,028 11,533,028Total - - 408,770 - 3,412,955 8,453,473 11,533,028 23,808,226BlackRock Managed Index Portfolios − Conservative (in EUR)Collateral received –securities lendingFixed IncomeInvestment grade - - 1,085 - 9,063 1,336,049 - 1,346,197EquitiesRecognised equity index - - - - - - 6,515,333 6,515,333Total - - 1,085 - 9,063 1,336,049 6,515,333 7,861,530BlackRock Managed Index Portfolios − Defensive (in EUR)Collateral received –securities lendingFixed IncomeInvestment grade - - 6,971 - 58,205 148,666 - 213,842EquitiesRecognised equity index - - - - - - 15,260,467 15,260,467Total - - 6,971 - 58,205 148,666 15,260,467 15,474,309BlackRock Managed Index Portfolios − Growth (in EUR)Collateral received –securities lendingFixed IncomeInvestment grade - - 23,661 - 197,550 4,021,443 - 4,242,654EquitiesRecognised equity index - - - - - - 9,953,305 9,953,305Total - - 23,661 - 197,550 4,021,443 9,953,305 14,195,959BlackRock Managed Index Portfolios − Moderate (in EUR)Collateral received –securities lendingFixed IncomeInvestment grade - - 8,848 - 73,872 1,197,174 - 1,279,894EquitiesRecognised equity index - - - - - - 12,061,377 12,061,377Total - - 8,848 - 73,872 1,197,174 12,061,377 13,341,271
Supplementary Information (Unaudited) continued
Annual report and audited financial statements [633]

Maturity Tenor
Collateral type and quality 1 day2 to 7days
8 to 30days
31 to 90days
91 to 365days
More than365 days Open Total
BlackRock Systematic ESG World Equity Fund (in USD)Collateral received –securities lendingFixed IncomeInvestment grade - - 325,881 - 423,788 3,744,174 - 4,493,843EquitiesRecognised equity index - - - - - - 15,618,592 15,618,592Total - - 325,881 - 423,788 3,744,174 15,618,592 20,112,435BlackRock Systematic Global Equity Fund (in USD)Collateral received –securities lendingFixed IncomeInvestment grade - - 21,652 - 180,777 2,201,468 - 2,403,897EquitiesRecognised equity index - - - - - - 4,858,809 4,858,809Total - - 21,652 - 180,777 2,201,468 4,858,809 7,262,706
The following table provides an analysis of the type, quality and maturity tenor of non-cash collateral received/posted by the Fundsby way of title transfer collateral arrangement in respect of OTC FDIs, as at 31 May 2021.
Maturty Tenor
Collateral type and quality 1 day2 to 7days
8 to 30days
31 to 90days
91 to 365days
More than365 days
Opentransactions Total
BlackRock European Select Strategies Fund (in EUR)Fixed IncomeInvestment grade - - - - - 39,112,775 - 39,112,775Total - - - - - 39,112,775 - 39,112,775BlackRock Fixed Income Strategies Fund (in EUR)Fixed IncomeInvestment grade - - - - 74,716,080 2,124,003,621 - 2,198,719,701Total - - - - 74,716,080 2,124,003,621 - 2,198,719,701BlackRock Global Absolute Return Bond Fund (in EUR)Fixed IncomeInvestment grade - - - - - 4,788,968 - 4,788,968Total - - - - - 4,788,968 - 4,788,968
Investment grade securities are those issued by an entity with a minimum investment grade credit rating from at least one globallyrecognised credit rating agency; Standard & Poor’s, Moody’s or Fitch.
A recognised equity index contains at least 20 equities where no single equity represents more than 20% of the total index and nofive equities combined represent more than 60% of the total index.
The maturity tenor analysis for fixed income securities received or posted as collateral is based on the respective contractualmaturity date, while for equity securities, ETFs and money market funds received or posted as collateral are presented as opentransactions as they are not subject to a contractual maturity date.
The following table provides an analysis of the amounts of non-cash collateral received by the Fund in respect of securities lendingtransactions and held by the Funds’ Depositary (or through its delegates) or through a securities settlement system, as at 31 May2021.
Non-cashcollateral received
DepositarySecurities
lending
BlackRock Asia Pacific Absolute Return Fund (in USD)State Street Bank International GmbH, Luxembourg Branch (or its delegates) 4,265,964BlackRock Dynamic Diversified Growth Fund (in EUR)State Street Bank International GmbH, Luxembourg Branch (or its delegates) 29,846,066
Supplementary Information (Unaudited) continued
BlackRock Strategic Funds[634]
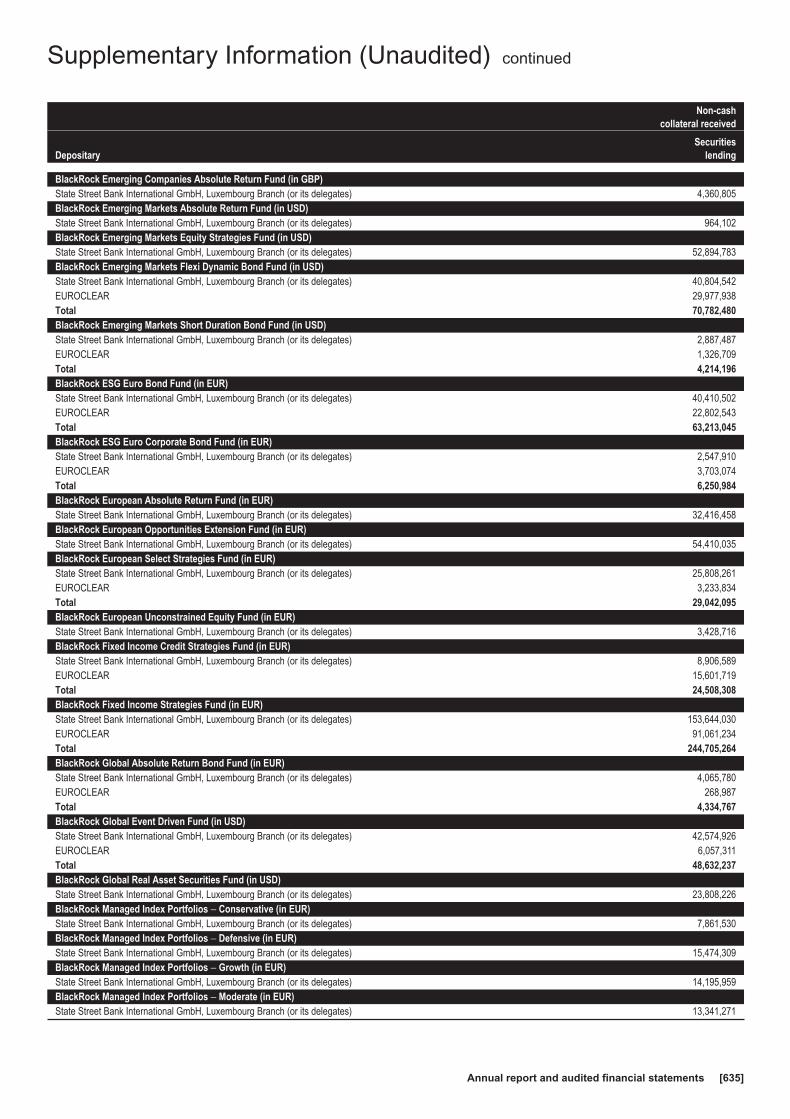
Non-cashcollateral received
DepositarySecurities
lending
BlackRock Emerging Companies Absolute Return Fund (in GBP)State Street Bank International GmbH, Luxembourg Branch (or its delegates) 4,360,805BlackRock Emerging Markets Absolute Return Fund (in USD)State Street Bank International GmbH, Luxembourg Branch (or its delegates) 964,102BlackRock Emerging Markets Equity Strategies Fund (in USD)State Street Bank International GmbH, Luxembourg Branch (or its delegates) 52,894,783BlackRock Emerging Markets Flexi Dynamic Bond Fund (in USD)State Street Bank International GmbH, Luxembourg Branch (or its delegates) 40,804,542EUROCLEAR 29,977,938Total 70,782,480BlackRock Emerging Markets Short Duration Bond Fund (in USD)State Street Bank International GmbH, Luxembourg Branch (or its delegates) 2,887,487EUROCLEAR 1,326,709Total 4,214,196BlackRock ESG Euro Bond Fund (in EUR)State Street Bank International GmbH, Luxembourg Branch (or its delegates) 40,410,502EUROCLEAR 22,802,543Total 63,213,045BlackRock ESG Euro Corporate Bond Fund (in EUR)State Street Bank International GmbH, Luxembourg Branch (or its delegates) 2,547,910EUROCLEAR 3,703,074Total 6,250,984BlackRock European Absolute Return Fund (in EUR)State Street Bank International GmbH, Luxembourg Branch (or its delegates) 32,416,458BlackRock European Opportunities Extension Fund (in EUR)State Street Bank International GmbH, Luxembourg Branch (or its delegates) 54,410,035BlackRock European Select Strategies Fund (in EUR)State Street Bank International GmbH, Luxembourg Branch (or its delegates) 25,808,261EUROCLEAR 3,233,834Total 29,042,095BlackRock European Unconstrained Equity Fund (in EUR)State Street Bank International GmbH, Luxembourg Branch (or its delegates) 3,428,716BlackRock Fixed Income Credit Strategies Fund (in EUR)State Street Bank International GmbH, Luxembourg Branch (or its delegates) 8,906,589EUROCLEAR 15,601,719Total 24,508,308BlackRock Fixed Income Strategies Fund (in EUR)State Street Bank International GmbH, Luxembourg Branch (or its delegates) 153,644,030EUROCLEAR 91,061,234Total 244,705,264BlackRock Global Absolute Return Bond Fund (in EUR)State Street Bank International GmbH, Luxembourg Branch (or its delegates) 4,065,780EUROCLEAR 268,987Total 4,334,767BlackRock Global Event Driven Fund (in USD)State Street Bank International GmbH, Luxembourg Branch (or its delegates) 42,574,926EUROCLEAR 6,057,311Total 48,632,237BlackRock Global Real Asset Securities Fund (in USD)State Street Bank International GmbH, Luxembourg Branch (or its delegates) 23,808,226BlackRock Managed Index Portfolios − Conservative (in EUR)State Street Bank International GmbH, Luxembourg Branch (or its delegates) 7,861,530BlackRock Managed Index Portfolios − Defensive (in EUR)State Street Bank International GmbH, Luxembourg Branch (or its delegates) 15,474,309BlackRock Managed Index Portfolios − Growth (in EUR)State Street Bank International GmbH, Luxembourg Branch (or its delegates) 14,195,959BlackRock Managed Index Portfolios − Moderate (in EUR)State Street Bank International GmbH, Luxembourg Branch (or its delegates) 13,341,271
Supplementary Information (Unaudited) continued
Annual report and audited financial statements [635]

Non-cashcollateral received
DepositarySecurities
lending
BlackRock Systematic ESG World Equity Fund (in USD)State Street Bank International GmbH, Luxembourg Branch (or its delegates) 20,112,435BlackRock Systematic Global Equity Fund (in USD)State Street Bank International GmbH, Luxembourg Branch (or its delegates) 7,262,706
The following table lists the ten largest issuers by value ofnon-cash collateral received by the Funds by way of title transfercollateral arrangement across securities lending transactionsand OTC FDIs as at 31 May 2021.
Issuers Value% of the
Fund's NAV
BlackRock Asia Pacific Absolute Return Fund (in USD)Vodafone Group Plc 222,794 0.64%United Kingdom 183,236 0.53%United States Treasury 181,305 0.52%French Republic 172,707 0.50%Republic of Austria 171,188 0.49%Novartis AG 156,375 0.45%PepsiCo Inc 156,097 0.45%Walt Disney Co 144,334 0.42%Republic of Germany 128,788 0.37%Kohnan Shoji Co Ltd 110,332 0.32%Other issuers 2,638,808 7.61%Total 4,265,964 12.30%BlackRock Dynamic Diversified Growth Fund (in EUR)United Kingdom 3,775,240 0.31%Rentokil Initial Plc 1,825,512 0.15%Kingdom of Netherlands 1,802,515 0.15%Imperial Brands Plc 1,683,052 0.14%George Weston Ltd 1,544,899 0.13%Asahi Holdings Inc 1,455,078 0.12%Just Eat Takeaway.com NV 1,074,679 0.09%Intertek Group Plc 964,716 0.08%Manulife Financial Corp 668,209 0.05%Government of Canada 367,227 0.03%Other issuers 14,684,939 1.19%Total 29,846,066 2.44%BlackRock Emerging Companies Absolute Return Fund (in GBP)French Republic 498,510 0.06%United Kingdom 494,830 0.06%Republic of Austria 494,125 0.06%United States Treasury 490,770 0.06%Republic of Germany 371,740 0.05%Schlumberger NV 259,245 0.03%ACS Actividades de Construccion y ServiciosSA 142,466 0.02%Wuestenrot & Wuerttembergische AG 141,661 0.02%Ashmore Group Plc 141,205 0.02%HomeServe Plc 141,203 0.02%Other issuers 1,185,050 0.14%Total 4,360,805 0.54%
Issuers Value% of the
Fund's NAV
BlackRock Emerging Markets Absolute Return Fund (in USD)Vodafone Group Plc 70,976 0.56%PepsiCo Inc 61,183 0.48%Walt Disney Co 56,573 0.45%Kohnan Shoji Co Ltd 43,245 0.34%Pegasystems Inc 42,904 0.34%Novartis AG 34,445 0.27%QUALCOMM Inc 31,568 0.25%Kingdom of Netherlands 30,934 0.25%Credit Agricole SA 30,602 0.24%Spin Master Corp 28,379 0.22%Other issuers 533,293 4.23%Total 964,102 7.63%BlackRock Emerging Markets Equity Strategies Fund (in USD)United Kingdom 1,484,870 0.16%Amazon.com Inc 1,380,718 0.15%Evolution AB 1,374,398 0.15%Apple Inc 1,353,536 0.15%NVIDIA Corp 1,335,963 0.15%Vivendi SE 1,332,512 0.15%West Japan Railway Co 1,327,626 0.15%Ricoh Co Ltd 1,323,813 0.15%BHP Group Plc 1,288,876 0.14%HSBC Holdings Plc 1,288,706 0.14%Other issuers 39,403,765 4.35%Total 52,894,783 5.84%BlackRock Emerging Markets Flexi Dynamic Bond Fund (in USD)United States Treasury 10,541,761 0.69%Republic of Germany 9,777,008 0.64%United Kingdom 9,765,074 0.64%French Republic 9,706,983 0.63%Kingdom of Belgium 8,329,757 0.54%Kingdom of Netherlands 6,070,319 0.40%Republic of Austria 1,441,395 0.09%Kreditanstalt fuer Wiederaufbau 1,132,977 0.07%European Investment Bank 1,098,506 0.07%Government of Canada 1,060,827 0.07%Other issuers 11,857,873 0.77%Total 70,782,480 4.61%
Supplementary Information (Unaudited) continued
BlackRock Strategic Funds[636]

Issuers Value% of the
Fund's NAV
BlackRock Emerging Markets Short Duration Bond Fund (in USD)French Republic 512,895 0.66%United Kingdom 475,285 0.61%Kingdom of Belgium 473,017 0.61%Republic of Germany 401,678 0.52%Kingdom of Netherlands 335,398 0.43%United States Treasury 307,085 0.40%Republic of Austria 214,956 0.28%Kreditanstalt fuer Wiederaufbau 119,028 0.15%Sony Corp 116,164 0.15%Weir Group Plc 113,829 0.15%Other issuers 1,144,861 1.48%Total 4,214,196 5.44%BlackRock ESG Euro Bond Fund (in EUR)United Kingdom 10,196,120 1.59%Republic of Germany 8,621,566 1.34%French Republic 8,011,574 1.25%Kingdom of Netherlands 6,399,443 1.00%Kingdom of Belgium 5,405,442 0.84%United States Treasury 2,537,743 0.39%Kreditanstalt fuer Wiederaufbau 1,794,362 0.28%Republic of Finland 1,782,131 0.28%Republic of Austria 1,642,807 0.26%European Investment Bank 1,472,368 0.23%Other issuers 15,349,489 2.39%Total 63,213,045 9.85%BlackRock ESG Euro Corporate Bond Fund (in EUR)United Kingdom 2,179,200 0.80%Republic of Germany 1,077,385 0.40%United States Treasury 823,845 0.30%French Republic 707,289 0.26%Kingdom of Belgium 455,548 0.17%Kingdom of Netherlands 232,248 0.09%Kreditanstalt fuer Wiederaufbau 217,171 0.08%Asian Development Bank 210,932 0.08%Republic of Finland 188,402 0.07%Republic of Austria 92,083 0.03%Other issuers 66,881 0.02%Total 6,250,984 2.30%BlackRock European Absolute Return Fund (in EUR)International Consolidated Airlines Group SA 2,909,147 0.19%Taylor Wimpey Plc 2,909,018 0.19%Murata Manufacturing Co Ltd 2,891,862 0.19%Ampol Ltd 2,851,438 0.19%Hoya Corp 2,456,461 0.16%Mabuchi Motor Co Ltd 2,079,793 0.14%ConvaTec Group Plc 2,002,794 0.13%Keyence Corp 1,756,490 0.11%SHO-BOND Holdings Co Ltd 1,595,702 0.10%Daiwabo Holdings Co Ltd 1,285,221 0.08%Other issuers 9,678,532 0.63%Total 32,416,458 2.11%
Issuers Value% of the
Fund's NAV
BlackRock European Opportunities Extension Fund (in EUR)International Consolidated Airlines Group SA 2,420,262 0.37%Taylor Wimpey Plc 2,420,154 0.37%Murata Manufacturing Co Ltd 2,405,881 0.36%Ampol Ltd 2,372,250 0.36%Hoya Corp 2,043,650 0.31%Mabuchi Motor Co Ltd 1,730,281 0.26%ConvaTec Group Plc 1,666,222 0.25%Keyence Corp 1,461,310 0.22%SHO-BOND Holdings Co Ltd 1,327,542 0.20%Toyota Industries Corp 1,261,077 0.19%Other issuers 35,301,406 5.35%Total 54,410,035 8.24%BlackRock European Select Strategies Fund (in EUR)United Kingdom 1,889,193 0.39%Republic of Germany 1,192,363 0.25%Toyota Industries Corp 1,189,260 0.24%Kao Corp 1,101,780 0.23%French Republic 1,098,442 0.23%Shin-Etsu Chemical Co Ltd 1,019,208 0.21%East Japan Railway Co 939,153 0.19%Mitsubishi Heavy Industries Ltd 923,837 0.19%Kingdom of Belgium 919,783 0.19%Kingdom of Netherlands 747,567 0.15%Other issuers 18,021,509 3.71%Total 29,042,095 5.98%BlackRock European Unconstrained Equity Fund (in EUR)HSBC Holdings Plc 233,408 0.50%BHP Group Plc 232,916 0.50%Duke Energy Corp 226,118 0.48%Amazon.com Inc 225,051 0.48%NET One Systems Co Ltd 224,025 0.48%Furukawa Electric Co Ltd 223,420 0.48%Amada Co Ltd 217,976 0.47%Bucher Industries AG 189,330 0.40%Anheuser-Busch InBev SA 184,499 0.39%Maeda Road Construction Co Ltd 142,698 0.30%Other issuers 1,329,275 2.84%Total 3,428,716 7.32%BlackRock Fixed Income Credit Strategies Fund (in EUR)United Kingdom 8,505,495 2.21%Republic of Germany 3,096,455 0.80%French Republic 1,899,432 0.49%United States Treasury 1,679,167 0.44%Kingdom of Netherlands 1,051,816 0.27%Kingdom of Belgium 934,627 0.24%Republic of Austria 723,222 0.19%Kreditanstalt fuer Wiederaufbau 397,853 0.10%Government of Canada 366,894 0.10%Asian Development Bank 318,242 0.08%Other issuers 5,535,105 1.44%Total 24,508,308 6.36%
Supplementary Information (Unaudited) continued
Annual report and audited financial statements [637]

Issuers Value% of the
Fund's NAV
BlackRock Fixed Income Strategies Fund (in EUR)United Kingdom 34,353,719 0.61%United States Treasury 18,386,251 0.32%French Republic 18,209,858 0.32%Republic of Germany 17,440,510 0.31%Kingdom of Netherlands 13,298,549 0.23%Kingdom of Belgium 12,238,963 0.22%Kreditanstalt fuer Wiederaufbau 8,004,970 0.14%Republic of Austria 7,697,757 0.14%Republic of Finland 4,827,924 0.09%KDDI Corp 4,441,545 0.08%Other issuers 105,805,218 1.86%Total 244,705,264 4.32%BlackRock Global Absolute Return Bond Fund (in EUR)United Kingdom 725,942 0.46%Kingdom of Netherlands 376,364 0.24%Rentokil Initial Plc 337,139 0.21%Imperial Brands Plc 310,829 0.19%George Weston Ltd 285,315 0.18%Asahi Holdings Inc 268,726 0.17%Just Eat Takeaway.com NV 198,474 0.12%Intertek Group Plc 178,165 0.11%United States Treasury 124,985 0.08%Manulife Financial Corp 123,406 0.08%Other issuers 1,405,422 0.88%Total 4,334,767 2.72%BlackRock Global Event Driven Fund (in USD)United States Treasury 8,940,012 0.15%French Republic 5,580,016 0.09%United Kingdom 4,249,307 0.07%RH 1,555,201 0.03%CoreLogic Inc 1,524,617 0.03%Starbucks Corp 1,523,437 0.03%Apple Inc 1,523,429 0.03%Amazon.com Inc 1,522,632 0.03%Kingdom of Netherlands 1,345,957 0.02%Peloton Interactive Inc 1,305,780 0.02%Other issuers 19,561,849 0.32%Total 48,632,237 0.82%BlackRock Global Real Asset Securities Fund (in USD)United Kingdom 2,732,785 0.87%French Republic 1,925,671 0.61%United States Treasury 1,916,192 0.61%Republic of Germany 1,865,440 0.59%Province of Ontario Canada 1,705,924 0.54%Kreditanstalt fuer Wiederaufbau 746,656 0.24%Government of Canada 610,647 0.19%GVC Holdings Plc 503,259 0.16%Novartis AG 495,718 0.16%Quilter Plc 479,241 0.15%Other issuers 10,826,693 3.43%Total 23,808,226 7.55%
Issuers Value% of the
Fund's NAV
BlackRock Managed Index Portfolios − Conservative (in EUR)United Kingdom 858,469 0.84%Rentokil Initial Plc 449,541 0.44%Kingdom of Netherlands 443,878 0.44%Imperial Brands Plc 414,459 0.41%George Weston Ltd 380,439 0.37%Asahi Holdings Inc 358,320 0.35%Toyota Industries Corp 276,182 0.27%Just Eat Takeaway.com NV 264,645 0.26%Kao Corp 255,867 0.25%Intertek Group Plc 237,566 0.23%Other issuers 3,922,164 3.86%Total 7,861,530 7.72%BlackRock Managed Index Portfolios − Defensive (in EUR)Toyota Industries Corp 932,501 0.59%Kao Corp 863,908 0.54%Shin-Etsu Chemical Co Ltd 799,163 0.50%Tokio Marine Holdings Inc 738,588 0.46%East Japan Railway Co 736,392 0.46%Mitsubishi Heavy Industries Ltd 724,383 0.46%Aurizon Holdings Ltd 529,827 0.33%SAP SE 515,318 0.32%CSL Ltd 477,136 0.30%Evolution AB 463,647 0.29%Other issuers 8,693,446 5.46%Total 15,474,309 9.71%BlackRock Managed Index Portfolios − Growth (in EUR)United Kingdom 2,487,561 0.67%Rentokil Initial Plc 1,257,387 0.34%Kingdom of Netherlands 1,241,548 0.34%Imperial Brands Plc 1,159,263 0.31%George Weston Ltd 1,064,105 0.29%Asahi Holdings Inc 1,002,237 0.27%Just Eat Takeaway.com NV 740,224 0.20%Intertek Group Plc 664,483 0.18%Manulife Financial Corp 460,254 0.12%Informa Plc 238,663 0.06%Other issuers 3,880,234 1.05%Total 14,195,959 3.83%BlackRock Managed Index Portfolios − Moderate (in EUR)Evolution AB 856,746 0.12%Apple Inc 833,946 0.12%NVIDIA Corp 832,903 0.12%Vivendi SE 830,752 0.12%West Japan Railway Co 827,706 0.12%Ricoh Co Ltd 825,328 0.12%Z Holdings Corp 753,714 0.11%United Kingdom 732,015 0.11%Slack Technologies Inc 700,681 0.10%Monolithic Power Systems Inc 675,672 0.10%Other issuers 5,471,808 0.79%Total 13,341,271 1.93%
Supplementary Information (Unaudited) continued
BlackRock Strategic Funds[638]

Issuers Value% of the
Fund's NAV
BlackRock Systematic ESG World Equity Fund (in USD)Vodafone Group Plc 1,365,001 0.38%PepsiCo Inc 1,176,663 0.33%United States Treasury 1,168,876 0.33%Walt Disney Co 1,087,996 0.30%French Republic 858,381 0.24%Kohnan Shoji Co Ltd 831,684 0.23%Pegasystems Inc 825,129 0.23%United Kingdom 770,850 0.22%Novartis AG 662,449 0.18%QUALCOMM Inc 607,115 0.17%Other issuers 10,758,291 3.00%Total 20,112,435 5.61%BlackRock Systematic Global Equity Fund (in USD)United Kingdom 474,451 0.26%French Republic 453,704 0.25%United States Treasury 447,742 0.24%Republic of Germany 361,075 0.20%Republic of Austria 359,741 0.19%HSBC Holdings Plc 201,938 0.11%BHP Group Plc 201,513 0.11%Duke Energy Corp 195,631 0.11%Amazon.com Inc 194,708 0.11%NET One Systems Co Ltd 193,820 0.10%Other issuers 4,178,383 2.26%Total 7,262,706 3.94%
Non-cash collateral issuer(OTC derivatives transactions) Value
% of theFund's NAV
BlackRock Global Absolute Return Bond Fund (in EUR)French Republic 4,788,968 3.00%
No securities collateral received from a single issuer, in relationto efficient portfolio management and OTC FDIs, has exceeded20% of any of the respective Funds’ NAV at the year end.
None of the Funds has been fully collateralised in securitiesissued or guaranteed by an EU member state at the year end.
Supplementary Information (Unaudited) continued
Annual report and audited financial statements [639]

Want to know more?blackrockinternational.com | +44 (0)20 7743 3000
© 2021 BlackRock, Inc. All Rights reserved. BLACKROCK, BLACKROCK SOLUTIONS, iSHARES, BUILD ON BLACKROCKand SO WHAT DO I DO WITH MY MONEY are trademarks of BlackRock, Inc. or its subsidiaries in the United States andelsewhere. All other trademarks are those of their respective owners.