Annual report, including Audited Financial Statements as at 31st ...
309
Annual report, including Audited Financial Statements as at 31st December 2013 UBAM Variable Capital Investment Company Luxembourg R.C.S. Luxembourg B 35 412
-
Upload
khangminh22 -
Category
Documents
-
view
0 -
download
0
Transcript of Annual report, including Audited Financial Statements as at 31st ...
Annual report, including Audited Financial Statements as at 31st December 2013
UBAM Variable Capital Investment Company Luxembourg
R.C.S. Luxembourg B 35 412

No subscription can be received on the basis of this report. Subscriptions are only valid if made on the basis of the current prospectus and the Key Investor Information Documents (KIIDs) supplemented by the subscription form, the latest annual report and the most recent semi-annual report, if published thereafter.
UBAM
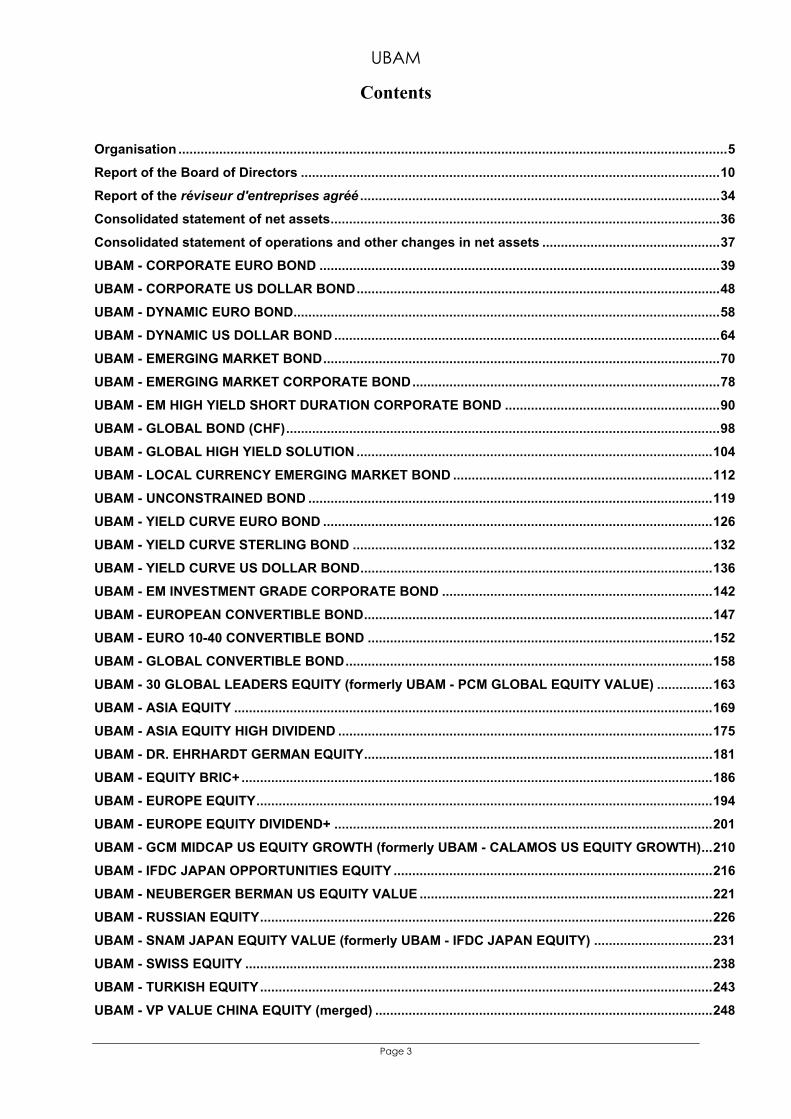
Contents
Page 3
Organisation ....................................................................................................................................................5
Report of the Board of Directors .................................................................................................................10
Report of the réviseur d'entreprises agréé .................................................................................................34
Consolidated statement of net assets.........................................................................................................36
Consolidated statement of operations and other changes in net assets ................................................37 UBAM - CORPORATE EURO BOND ............................................................................................................39 UBAM - CORPORATE US DOLLAR BOND..................................................................................................48 UBAM - DYNAMIC EURO BOND...................................................................................................................58 UBAM - DYNAMIC US DOLLAR BOND ........................................................................................................64 UBAM - EMERGING MARKET BOND...........................................................................................................70 UBAM - EMERGING MARKET CORPORATE BOND...................................................................................78 UBAM - EM HIGH YIELD SHORT DURATION CORPORATE BOND ..........................................................90 UBAM - GLOBAL BOND (CHF).....................................................................................................................98 UBAM - GLOBAL HIGH YIELD SOLUTION ................................................................................................104 UBAM - LOCAL CURRENCY EMERGING MARKET BOND ......................................................................112 UBAM - UNCONSTRAINED BOND .............................................................................................................119 UBAM - YIELD CURVE EURO BOND .........................................................................................................126 UBAM - YIELD CURVE STERLING BOND .................................................................................................132 UBAM - YIELD CURVE US DOLLAR BOND...............................................................................................136 UBAM - EM INVESTMENT GRADE CORPORATE BOND .........................................................................142 UBAM - EUROPEAN CONVERTIBLE BOND..............................................................................................147 UBAM - EURO 10-40 CONVERTIBLE BOND .............................................................................................152 UBAM - GLOBAL CONVERTIBLE BOND...................................................................................................158 UBAM - 30 GLOBAL LEADERS EQUITY (formerly UBAM - PCM GLOBAL EQUITY VALUE) ...............163 UBAM - ASIA EQUITY .................................................................................................................................169 UBAM - ASIA EQUITY HIGH DIVIDEND .....................................................................................................175
UBAM - DR. EHRHARDT GERMAN EQUITY..............................................................................................181 UBAM - EQUITY BRIC+ ...............................................................................................................................186 UBAM - EUROPE EQUITY...........................................................................................................................194 UBAM - EUROPE EQUITY DIVIDEND+ ......................................................................................................201 UBAM - GCM MIDCAP US EQUITY GROWTH (formerly UBAM - CALAMOS US EQUITY GROWTH)...210 UBAM - IFDC JAPAN OPPORTUNITIES EQUITY ......................................................................................216 UBAM - NEUBERGER BERMAN US EQUITY VALUE ...............................................................................221 UBAM - RUSSIAN EQUITY..........................................................................................................................226 UBAM - SNAM JAPAN EQUITY VALUE (formerly UBAM - IFDC JAPAN EQUITY) ................................231 UBAM - SWISS EQUITY ..............................................................................................................................238
UBAM - TURKISH EQUITY..........................................................................................................................243 UBAM - VP VALUE CHINA EQUITY (merged) ...........................................................................................248
UBAM
Contents (continued)
Page 4
UBAM - MULTIFUNDS EMERGING MARKETS..........................................................................................250 Notes to the financial statements ..............................................................................................................255 Unaudited information................................................................................................................................306
UBAM
Organisation
Page 5
REGISTERED OFFICE 287-289 route d’Arlon L-1150 Luxembourg Grand Duchy of Luxembourg BOARD OF DIRECTORS OF THE SICAV
Mr. Pierre BERGER
Managing Director UBP Gestion Institutionnelle SA Geneva, Switzerland Chairman of the Board of Directors
Mr. Daniel VAN HOVE
Managing Director Orionis Management S.A. Luxembourg, Grand Duchy of Luxembourg Director
Mr. Christian ASSEL
Managing Director UBP Asset Management (Europe) S.A. Luxembourg, Grand Duchy of Luxembourg Director
MANAGERS APPOINTED BY THE BOARD OF DIRECTORS OF THE SICAV (until 31st August 2013) Mr. Pierre BERGER Mr. Daniel VAN HOVE MANAGEMENT COMPANY (since 1st September 2013) UBP Asset Management (Europe) S.A. 287-289 route d’Arlon L-1150 Luxembourg Grand Duchy of Luxembourg MANAGEMENT COMPANY’S BOARD OF DIRECTORS (since 1st September 2013) Mr. Ian CRAMB Executive Managing Director
Union Bancaire Privée, UBP SA 96-98, rue du Rhône, CH-1211 Genève 1 Switzerland Chairman of the Board of Directors
Mr. Christian ASSEL
Managing Director UBP Asset Management (Europe) S.A. 287-289, route d’Arlon, L-1150 Luxembourg
Ms. Isabelle ASSERAY
Grand Duchy of Luxembourg Managing Director UBP Asset Management (Europe) S.A. 287-289, route d’Arlon, L-1150 Luxembourg Grand Duchy of Luxembourg
Mr. André GIGON
Senior Managing Director Union Bancaire Privée, UBP SA 96-98, rue du Rhône, CH-1211 Genève 1 Switzerland

UBAM
Organisation (continued)
Page 6
Mr. Patrick PALFFY
Managing Director Union Bancaire Privée, UBP SA 96-98, rue du Rhône, CH-1211 Genève 1 Switzerland
MANAGEMENT COMPANY’S CONDUCTING OFFICERS (since 1st September 2013) Mr. Christian ASSEL
Managing Director UBP Asset Management (Europe) S.A. 287-289, route d’Arlon, L-1150 Luxembourg Grand Duchy of Luxembourg
Ms. Isabelle ASSERAY
Managing Director UBP Asset Management (Europe) S.A. 287-289, route d’Arlon, L-1150 Luxembourg Grand Duchy of Luxembourg
Mr. Pierre BERGER
Managing Director UBP Gestion Institutionnelle SA 8, rue Robert-Estienne, CH-1211 Genève 1 Switzerland
INVESTMENT MANAGERS (until 31st August 2013) Union Bancaire Privée, UBP SA 96-98 rue du Rhône CH-1211 Geneva 1 Switzerland Union Bancaire Privée, UBP S.A., London Branch 26 St James’s Square Londres SW1Y 4JH United Kingdom Union Bancaire Privée, UBP SA, Zurich Branch Bahnhofstrasse 1 CH-8022 Zurich Switzerland
UBAM
Organisation (continued)
Page 7
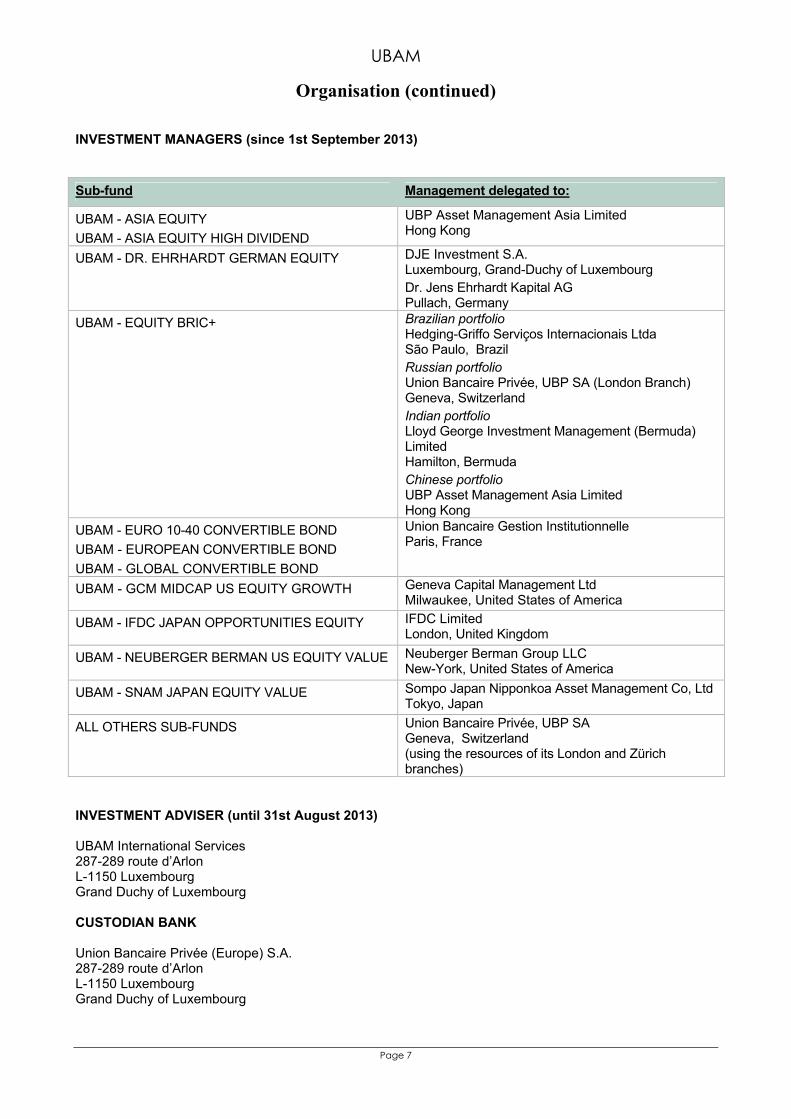
INVESTMENT MANAGERS (since 1st September 2013) Sub-fund Management delegated to:
UBAM - ASIA EQUITY UBAM - ASIA EQUITY HIGH DIVIDEND
UBP Asset Management Asia Limited Hong Kong
UBAM - DR. EHRHARDT GERMAN EQUITY DJE Investment S.A. Luxembourg, Grand-Duchy of Luxembourg Dr. Jens Ehrhardt Kapital AG Pullach, Germany
UBAM - EQUITY BRIC+ Brazilian portfolio Hedging-Griffo Serviços Internacionais Ltda São Paulo, Brazil Russian portfolio Union Bancaire Privée, UBP SA (London Branch) Geneva, Switzerland Indian portfolio Lloyd George Investment Management (Bermuda) Limited Hamilton, Bermuda Chinese portfolio UBP Asset Management Asia Limited Hong Kong
UBAM - EURO 10-40 CONVERTIBLE BOND UBAM - EUROPEAN CONVERTIBLE BOND UBAM - GLOBAL CONVERTIBLE BOND
Union Bancaire Gestion Institutionnelle Paris, France
UBAM - GCM MIDCAP US EQUITY GROWTH Geneva Capital Management Ltd Milwaukee, United States of America
UBAM - IFDC JAPAN OPPORTUNITIES EQUITY IFDC Limited London, United Kingdom
UBAM - NEUBERGER BERMAN US EQUITY VALUE Neuberger Berman Group LLC New-York, United States of America
UBAM - SNAM JAPAN EQUITY VALUE Sompo Japan Nipponkoa Asset Management Co, Ltd Tokyo, Japan
ALL OTHERS SUB-FUNDS Union Bancaire Privée, UBP SA Geneva, Switzerland (using the resources of its London and Zürich branches)
INVESTMENT ADVISER (until 31st August 2013) UBAM International Services 287-289 route d’Arlon L-1150 Luxembourg Grand Duchy of Luxembourg CUSTODIAN BANK Union Bancaire Privée (Europe) S.A. 287-289 route d’Arlon L-1150 Luxembourg Grand Duchy of Luxembourg
UBAM
Organisation (continued)
Page 8
ADMINISTRATIVE AGENT, REGISTRAR AND TRANSFER AGENT CACEIS Bank Luxembourg 5, allée Scheffer L-2520 Luxembourg Grand Duchy of Luxembourg GENERAL DISTRIBUTOR, REPRESENTATIVE AND PAYING AGENT IN SWITZERLAND Union Bancaire Privée, UBP SA 96-98 rue du Rhône CH-1211 Geneva 1 Switzerland CABINET DE REVISION AGREE Deloitte Audit, Société à responsabilité limitée 560, rue de Neudorf L-2220 Luxembourg Grand Duchy of Luxembourg INFORMATION ON THE MAIN REPRESENTATIVE OFFICES ABROAD The information documents concerning the SICAV, including the articles of incorporation, the complete prospectus and the Key Investor Information Documents (KIIDs), the annual reports and audited financial statements and semi-annual unaudited reports and the statement of changes in investments for the period referring to this report are available free of charge at the office of the SICAV, 287-289 route d’Arlon, L-1150 Luxembourg and at the office of the following financial intermediaries:
UBAM
Organisation (continued)
Page 9
- General distributor, representative and paying agent in Switzerland Union Bancaire Privée, UBP SA, 96-98, rue du Rhône, CH-1211 Geneva 1 Tél: + 41 (0) 58 819 21 11 Payment services, execution place and jurisdiction place are established, for the shares distributed in Switzerland, in the place here-above mentioned. Supplementary information concerning the distribution of the different types and classes of shares of the SICAV in Switzerland are specified in the complete prospectus and the Key Investor Information Documents (KIIDs). Announcements in Switzerland concerning the SICAV are published in the "Swiss Official Gazette of Commerce" and in the Swiss Fund Data (www.swissfunddata.ch) (Switzerland). The subscription and redemption prices of the shares of the different sub-funds are daily published on the electronic platform Swiss Fund Data at the time of each issue and redemption. Investors liable to a tax in Switzerland are hereby warned that transactions made on the SICAV’s shares may be subject to a different tax treatment depending on the canton in which the investor is taxed. Potential investors in the SICAV’s shares must nevertheless inquire about the legislation and rules applicable to the acquisition, holding, selling and redemption of shares, in the light of their place of residence. Additional information for Swiss investors in accordance with the guide lines on transparency with regard to management fees as of 7th June 2005 of the Swiss Funds & Asset Management Association (SFAMA): Trailer fees for the commercialisation of the SICAV to distributors and investment managers are taken directly from the management and advisory fees. Rebates from the management and advisory fees are granted to institutional investors who, from a commercial perspective are holding shares of the SICAV for third parties. - Paying agent and information place in Germany SAL. OPPENHEIM JR. & CIE. AG & Co., 4, Unter Sachsenhausen, D-50667 Cologne - Paying agent in Austria ERSTE BANK DER OESTERREICHISCHEN SPARKASSEN AG, Graben 21, A-1010 Vienna - Financial agent in Belgium CACEIS BELGIUM FUND ADMINISTRATION SERVICE & TECHNOLOGY NETWORK BELGIUM (FASTNET) Avenue du Port, 86 C b320, B-1000 Brussels - Official distributor agent in Spain ALLFUNDS BANKS S.A., Nuria 57, E-28034 Madrid The information documents concerning the SICAV can be obtained by the shareholders from the distributor agent or from UBP GESTION INSTITUCIONAL S.A., Avenida Diagonal 520, 2°2aB, E-08006 Barcelona. - Correspondant bank in France CACEIS BANK, 1-3, Place Valhubert, F-75206 Paris Cedex 13 The correspondent is also in charge of the subscriptions / redemptions processing and of the dividend payments of the shares of the SICAV. - Paying agent in Italy State Street Bank S.p.A., Via Ferrante Aporti 10, I-20125 Milan - Official distributor agent in Portugal BEST - Banco Electronico de Serviço Total, S.A., Praça Marquês de Pombal, no. 3 - 3°, 1250-161 Lisbon - Representative in United Kingdom UNION BANCAIRE PRIVEE, UBP SA, 26 St James's Square, GB-London SW1Y4JH - Distributor agent in Singapore UNION BANCAIRE PRIVEE (Singapore) Ltd, OUE Bayfront, 50 Collyer Quay #08-03, SG-Singapore 049321 - Distributor agent in Sweden Carnegie Investment Bank AB, Gustav Adolfs Torg 18, SE Stockholm 103 38
UBAM
Report of the Board of Directors
Page 10
1. MANAGER'S REPORT 1.1 Retrospective on financial markets World economic recovery World growth in 2013 was moderate but the economic outlook for developed countries brightened. And this in spite of the prevailing uncertainty early in the year due to such factors as the budget cuts in the US, the political crisis in Italy and the financial crisis in Cyprus. Corporate and consumer confidence increased markedly at the beginning of the summer, bearing out the scenario of a rising growth rate in the second half of the year, particularly in the US. Private demand in the US was boosted by the wealth effect (a sharp rise in equity and real estate prices) and receding inflation, but also and above all by the improvement on the employment front, where the jobless rate fell from 7.9% in January to 6.7% in December. Even the three-week partial government shut-down couldn’t dampen this positive momentum. The eurozone’s emergence from the recession half-way through the year was of course the highlight, but the continuing adjustments to current account balances in the peripheral countries and the progress on the banking union project also deserve a mention. Over in Asia, Japan’s growth was underpinned by ‘Abenomics’, a strategy named after the new Prime Minister comprising a monetary policy aiming to double the monetary base, and a particularly aggressive budget policy to extricate the country from 15 years of deflation. As for the promised structural reforms, they were delayed by fierce opposition. Beijing’s unveiling of its ambitious package of reforms in mid-November was well-received, and in particular the plans to give greater importance to the market economy. China’s economic activity figures, on the other hand, came as a disappointment to those who had anticipated a growth pick-up in 2013. But downward economic forecast revisions were much more severe in many other emerging countries, both in Asia and in Latin America. One effect of the FED’s hints in May at its tapering plans was that large capital outflows from countries with current account deficits (India, Indonesia, Brazil, South Africa and also Turkey) caused their currencies to depreciate and to face the threat of heightened inflation. This forced those countries’ central banks to tighten their monetary policies. The drop in commodity prices was another negative factor for some of those countries, although it helped lower inflation in Europe and the US to levels well below those targeted by central banks (1.4% and 1.5% respectively). The risk of deflation in fact prompted the ECB to reduce its key rate, which after two cuts was down to 0.25%, a record low. Although less decisive than the firm action it took in the summer of 2012, the ECB’s decision to instigate ‘forward guidance’ to curb volatility at the short end of the yield curve was nevertheless a clear break from its past policy of never committing ahead to any actions. The FED also had a considerable impact on financial markets by repeatedly dashing investors’ anticipations as to its tapering plans in 2013. It finally announced in December that tapering would start in January, and the news came with assurances that the key rate would stay close to 0% even though the unemployment rate had fallen faster than expected. Bonds: credit risk paid off With its initial hints about tapering, the FED caused long yields to start rising in May (the US 10-year Treasury yield went from only 1.6% in early May to 3% at the end of the year), which weighed heavily on the performance of sovereign bonds in most developed countries: US Treasuries lost 3.3% according to BofA Merrill Lynch, German Bunds 2.3%, UK Gilts 4.3% and Swiss government bonds 4.0%. Peripheral eurozone bonds performed surprisingly well, with Spanish ones gaining 11.1% and Italian ones 7.3%. In credit, the renewed spread-narrowing was particularly propitious for thehigh-yield segment (+7.4% in USD) but was not sufficient to offset the sharp steepening of the yield curve for investment-grade corporate bonds in USD, which dropped 1.5%. Furthermore, emerging bonds suffered a rise in risk premiums, so both external debt (-5.3%) and local debt in USD (-9.0%) plummeted.
UBAM
Report of the Board of Directors (continued)
Page 11
Currencies and commodities On the foreign exchange market, 2013 saw the sharpest fall of the yen against the dollar (-18%) since 1979. This depreciation was not unexpected, unlike the euro’s rise, by 4% against the dollar and 2% against the pound, despite the ECB’s rate cuts and the prospect of the FED’s tapering. Emerging currencies were also on the slippery slope, with the Indonesian rupee and the South African rand sliding nearly 20% and the Turkish lira 17% against the dollar. As regards commodities, the price of corn dropped the most (-40%) but industrial metals also recorded some sharp declines (mainly due to the dwindling demand in China), as did precious metals – silver lost 36% and gold recorded its first year-on-year loss since the year 2000 (-28%). The energy segment, on the other hand, was lifted slightly by the end-of-year rebound in the price of oil (+7% for 2013) and natural gas (+26%). Last year was great for equities The improving growth outlook and the continuing expansionist approach by central banks provided a particularly propitious environment for equity markets, as attested by the 25.5% year-on-year rise of the MSCI All Country World in local currency (net dividends reinvested), and with remarkably low volatility. Furthermore, the S&P 500 did not dip a single time below the level where it had started the year – an unusual occurrence. There were, however, wide disparities in performance between regions. Lightened by the depreciation of its currency and energised by the success of Abenomics, the Japanese market shot up by 54.5% (MSCI index in local currency), its sharpest rise since 1986. The US (+31.8%) outperformed most of Europe, although the eurozone equity market’s +23.4% is not to be sneezed at either. Emerging markets as a whole gained only 3.4%, with a handful of markets ending in the red, including Turkey(-11.8%) and Brazil (-3.3%) and also some Chinese indices, such as the Shanghai Composite (-6.7%). Of the major sectors, basic materials (+2.9%) posted the most modest rise, whilst consumer discretionary (+39.9%), health care (+36.4%) and manufacturing (+32.9%) performed well above average.
UBAM
Report of the Board of Directors (continued)
Page 12
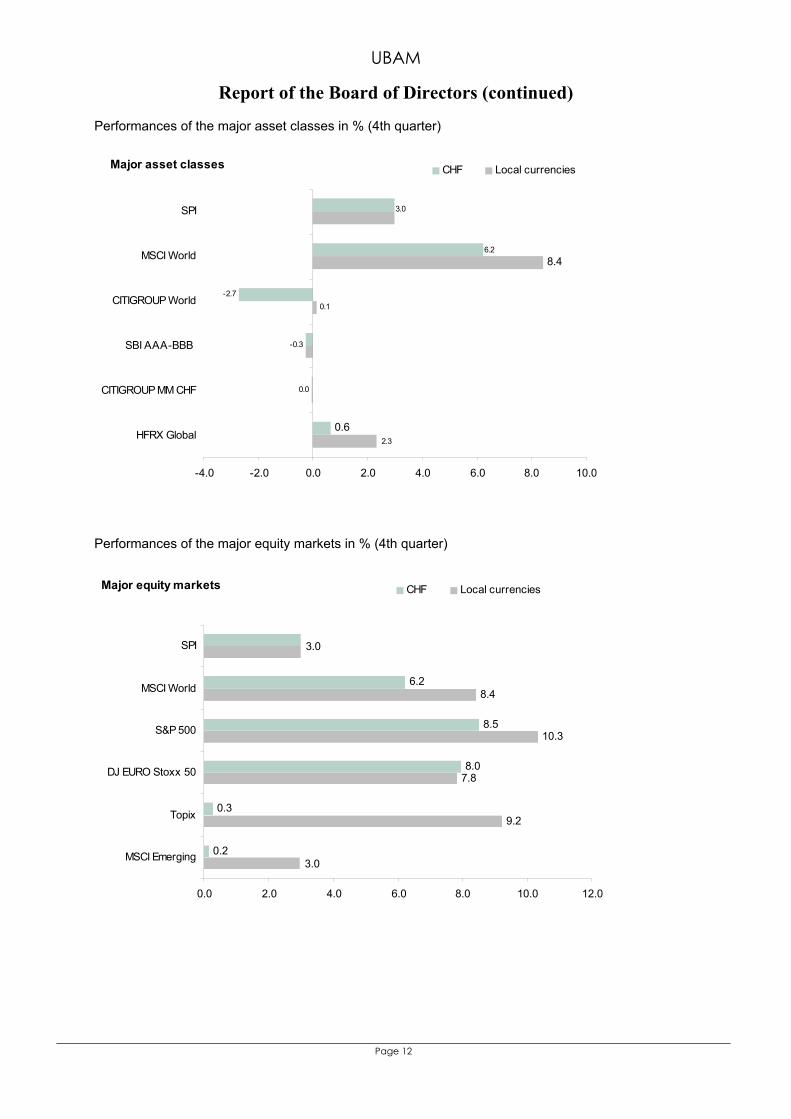
Performances of the major asset classes in % (4th quarter)
Major asset classes
-2.70.1
3.0
0.6
6.2
-0.3
0.0
2.3
8.4
-4.0 -2.0 0.0 2.0 4.0 6.0 8.0 10.0
SPI
MSCI World
CITIGROUP World
SBI AAA-BBB
CITIGROUP MM CHF
HFRX Global
CHF Local currencies
Performances of the major equity markets in % (4th quarter)
Major equity markets
6.2
8.5
8.0
0.3
8.4
10.3
7.8
9.2
3.0
0.23.0
0.0 2.0 4.0 6.0 8.0 10.0 12.0
SPI
MSCI World
S&P 500
DJ EURO Stoxx 50
Topix
MSCI Emerging
CHF Local currencies
UBAM
Report of the Board of Directors (continued)
Page 13
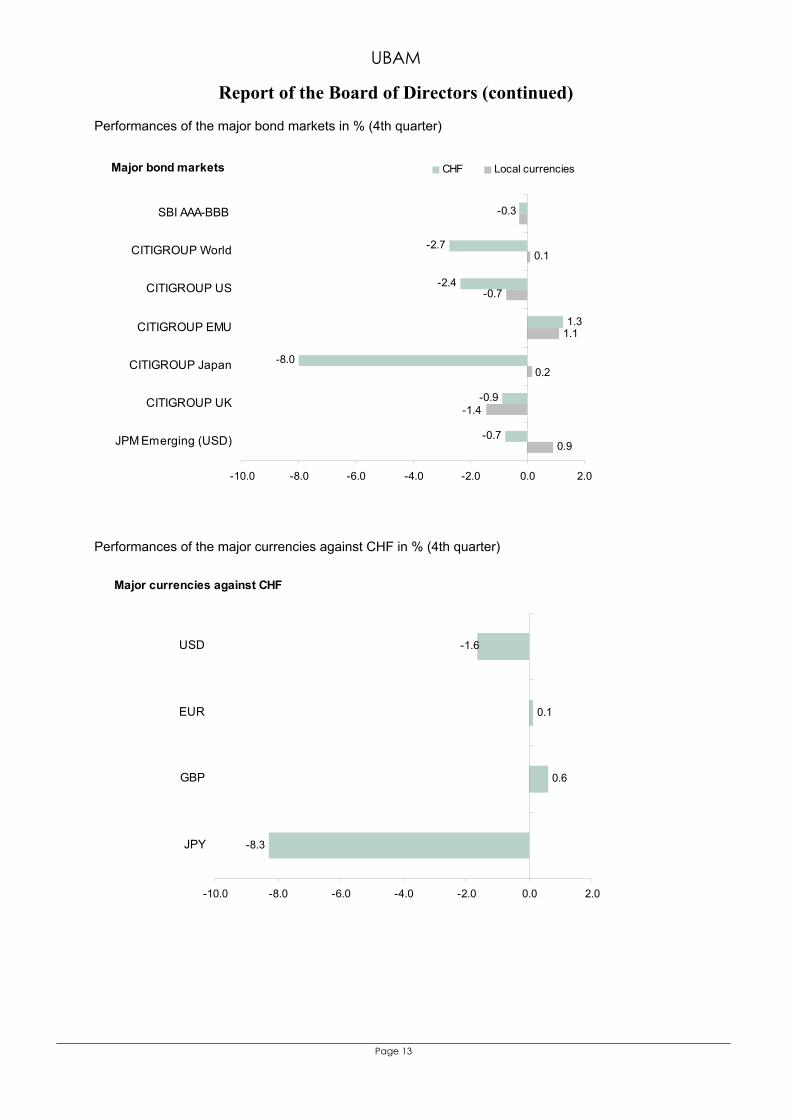
Performances of the major bond markets in % (4th quarter)
Major bond markets
-2.7
-2.4
1.3
-8.0
-0.7
0.1
-0.7
0.9
-0.9
-0.3
0.2
1.1
-1.4
-10.0 -8.0 -6.0 -4.0 -2.0 0.0 2.0
SBI AAA-BBB
CITIGROUP World
CITIGROUP US
CITIGROUP EMU
CITIGROUP Japan
CITIGROUP UK
JPM Emerging (USD)
CHF Local currencies
Performances of the major currencies against CHF in % (4th quarter)
Major currencies against CHF
0.6
-8.3
-1.6
0.1
-10.0 -8.0 -6.0 -4.0 -2.0 0.0 2.0
USD
EUR
GBP
JPY
UBAM
Report of the Board of Directors (continued)
Page 14
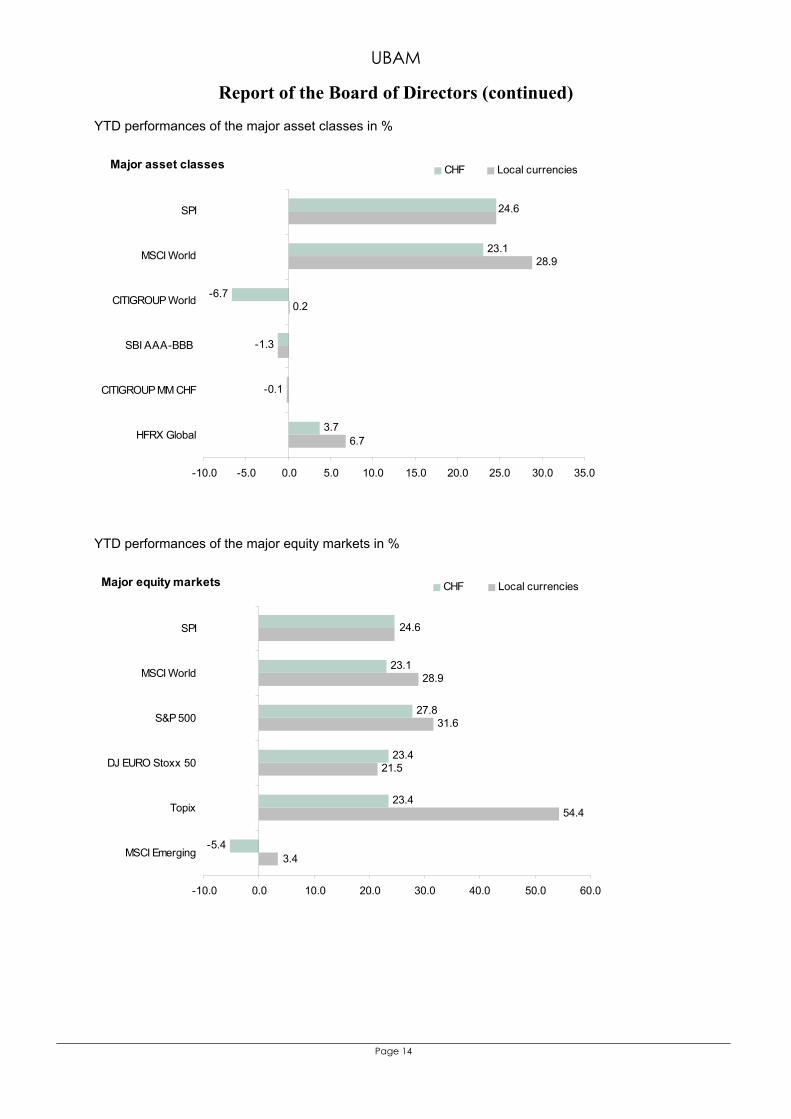
YTD performances of the major asset classes in %
Major asset classes
-6.70.2
24.6
3.7
23.1
-1.3
-0.1
6.7
28.9
-10.0 -5.0 0.0 5.0 10.0 15.0 20.0 25.0 30.0 35.0
SPI
MSCI World
CITIGROUP World
SBI AAA-BBB
CITIGROUP MM CHF
HFRX Global
CHF Local currencies
YTD performances of the major equity markets in %
Major equity markets
23.1
27.8
23.4
23.4
28.9
31.6
21.5
54.4
24.6
-5.43.4
-10.0 0.0 10.0 20.0 30.0 40.0 50.0 60.0
SPI
MSCI World
S&P 500
DJ EURO Stoxx 50
Topix
MSCI Emerging
CHF Local currencies

UBAM
Report of the Board of Directors (continued)
Page 15
YTD performances of the major bond markets in %
Major bond markets
-5.4
3.8
-18.3
-9.2
-2.7
-6.6
-6.7
-5.1
-1.3
0.2
2.2
2.2
-4.1
-20.0 -15.0 -10.0 -5.0 0.0 5.0
SBI AAA-BBB
CITIGROUP World
CITIGROUP US
CITIGROUP EMU
CITIGROUP Japan
CITIGROUP UK
JPM Emerging (USD)
CHF Local currencies
YTD performances of the major currencies against CHF in %
Major currencies against CHF
-2.8
1.5
-1.0
-20.2
-25.0 -20.0 -15.0 -10.0 -5.0 0.0 5.0
USD
EUR
GBP
JPY

UBAM
Report of the Board of Directors (continued)
Page 16
1.2 Sub-funds' report UBAM - CORPORATE EURO BOND The last quarter of 2013 was marked by two major turning points: firstly, growth improved decisively in the US and in Europe, especially the euro-zone periphery, and secondly the FED finally announced it was going to start reducing the pace of its bond-buying in Q1 2014. Against this backdrop, interest rates tightened again, going back to where they had been in September, when the markets had expected QE (Quantitative Easing) tapering to begin, which had failed to materialise. The fourth quarter was more positive, with risk assets such as credit being swept up in a strong upward movement. In this credit-friendly environment the sub-fund's positioning on financial and hybrid institutions' debt paid off, as did its underweight on interest rates. In 2013, the sub-fund returned a performance of +1.68% (AC share). UBAM - CORPORATE US DOLLAR BOND The last quarter of 2013 was marked by two major turning points: firstly, growth improved decisively in the US and in Europe, especially the euro-zone periphery, and secondly the FED finally announced it was going to start reducing the pace of its bond-buying in Q1 2014. Against this backdrop, interest rates tightened again, going back to where they had been in September, when the markets had expected QE tapering to begin, which had failed to materialise. The fourth quarter was more positive, with risk assets such as credit being swept up in a strong upward movement. In this credit-friendly environment the sub-fund's positioning on financial and hybrid institutions' debt paid off, as did its underweight on interest rates. In 2013, the sub-fund returned a performance of +0.19% (AC share). UBAM - DYNAMIC EURO BOND The last quarter of 2013 was marked by two major turning points: firstly, growth improved decisively in the US and in Europe, especially the euro-zone periphery, and secondly the FED finally announced it was going to start reducing the pace of its bond-buying in Q1 2014. Against this backdrop, interest rates tightened again, going back to where they had been in September, when the markets had expected QE tapering to begin, which had failed to materialise. The fourth quarter was more positive, with risk assets such as credit being swept up in a strong upward movement. In this credit-friendly environment, credit spreads on short-maturity investment-grade bonds have tightened significantly. In 2013, the sub-fund returned a performance of +0.89% (AC share). UBAM - DYNAMIC US DOLLAR BOND The last quarter of 2013 was marked by two major turning points: firstly, growth improved decisively in the US and in Europe, especially the euro-zone periphery, and secondly the FED finally announced it was going to start reducing the pace of its bond-buying in Q1 2014. Against this backdrop, interest rates tightened again, going back to where they had been in September, when the markets had expected QE tapering to begin, which had failed to materialise. The fourth quarter was more positive, with risk assets such as credit being swept up in a strong upward movement. In this credit-friendly environment, credit spreads on short-maturity investment-grade bonds have tightened significantly. In 2013, the sub-fund returned a performance of +1.36% (AC share).
UBAM
Report of the Board of Directors (continued)
Page 17
UBAM - EMERGING MARKET BOND UBAM - EMERGING MARKET BOND gained 1.17% (net of fees, IC USD share class) in Q4 2013, compared to 0.91% for the benchmark JP Morgan EMBI Global USD. In 2013, the sub-fund outperformed the benchmark index by 30 bp. Emerging sovereign bonds performed positively in December and Q4 in spite of adverse global bond markets. The US Treasury yield curve further steepened and 10-year German bond yields also ticked higher after two months of range trading. On the other hand, latest EM macro data lent further support to the view that economic activity continued to improve after the slowdown in summer. The sub-fund's underweight in longer-dated investment grade rated issuers was the main driver behind the relative outperformance. The allocations to high-yield rated sovereign issuers and to corporate issuers boosted its carry and also added to relative performance. The cautious approach to countries with large current account and budget deficits further underpinned relative performance. In 2013, the sub-fund returned a performance of -7.16% (AC share). UBAM - EMERGING MARKET CORPORATE BOND UBAM - EMERGING MARKET CORPORATE BOND gained 1.81% in Q4 2013 (net of fees, IC USD share class) compared to 1.93% for the benchmark JP Morgan CEMBI Diversified. In 2013, the sub-fund outperformed the benchmark by 37 bp net of fees. Emerging corporate bonds further recovered in the last quarter of 2013. The improving macro situation in major emerging economies and a global fixed income re-allocation from government to corporate issuers boosted EM corporate bond returns. As a consequence, EM corporate bonds performed positively and the JP Morgan CEMBI Diversified gained 3.11% in the second half of 2013. The main reason for the sub-fund's positive performance in Q4 and for outperforming the benchmark in 2013 was the overweight allocation to the high yield and in particular the BB-rated segment. Other important contributors were the underweight to BBB-rated bonds and the underweight in long-dated bonds. In 2013, the sub-fund returned a performance of -2.28% (AC share). UBAM - EM HIGH YIELD SHORT DURATION CORPORATE BOND UBAM - EM HIGH YIELD SHORT DURATION CORPORATE BOND gained 2.57% in Q4 2013 net of fees (AC USD share class). The improving macro situation in major emerging economies and a global fixed income reallocation from investment grade to high yield corporate issuers also boosted the performance of this particular segment. The sub-fund's duration was kept at around 2.5 in 2013 since launch and this turned out to be the main driver of performance. High emphasis on issuers with a stable or improving credit profile also added to return, whilst the broad diversification across countries and sectors mitigated downside risks. UBAM - GLOBAL BOND (CHF) The last quarter of 2013 was marked by two major turning points: firstly, growth improved decisively in the US and in Europe, especially the euro-zone periphery, and secondly the FED finally announced it was going to start reducing the pace of its bond-buying in Q1 2014. Against this backdrop, interest rates tightened again, going back to where they had been in September, when the markets had expected QE tapering to begin, which had failed to materialise. The fourth quarter was more positive, with risk assets such as credit being swept up in a strong upward movement. The sub-fund's positioning – underweight interest rates and overweight short-maturity, high-quality credit - paid off. In 2013, the sub-fund returned a performance of -1.78% (AC share). UBAM - GLOBAL HIGH YIELD SOLUTION UBAM - GLOBAL HIGH YIELD SOLUTION is managed by UBP’s Global & Absolute Return Fixed Income team in Geneva. The sub-fund’s managers have successfully managed credit and interest rate strategies for the past ten years. The sub-fund is exposed to high yield through credit default swaps on indices, providing access to 150 of the segment’s most liquid issuers in Europe (50 issuers) and the US (100 issuers). In 2013, the sub-fund returned a performance of +16.43% (AC share).
UBAM
Report of the Board of Directors (continued)
Page 18
UBAM - LOCAL CURRENCY EMERGING MARKET BOND UBAM - LOCAL CURRENCY EMERGING MARKET BOND decreased 1.77% (net of fees, IC USD share class) in Q4 2013, compared to a decrease of 1.54% for the benchmark JP Morgan GBI-EM Global Diversified USD. In 2013, the sub-fund outperformed the benchmark by 51 bp net of fees. The FOMC announcement to start tapering in January not only fuelled renewed steepening of the US Treasury curve but also prompted the US dollar to strengthen against several EM currencies in December. On balance, weaker EM currencies, in particular the Indonesian rupiah, South African rand, Turkish lira and Brazilian real, caused a sharp decrease in overall return from EM local currency government bonds in 2013. The main reasons for the sub-fund's outperformance in 2013 were the underweight in long-dated bonds relative to the benchmark and the positive contribution of the FX positioning. The impact from carry on relative performance was very moderately negative. In 2013, the sub-fund returned a performance of -9.32% (AC share). UBAM - UNCONSTRAINED BOND The last quarter of 2013 was marked by two major turning points: firstly, growth improved decisively in the US and in Europe, especially the euro-zone periphery, and secondly the FED finally announced it was going to start reducing the pace of its bond-buying in Q1 2014. Against this backdrop, interest rates tightened again, going back to where they had been in September, when the markets had expected QE tapering to begin, which had failed to materialise. The fourth quarter was more positive, with risk assets such as credit being swept up in a strong upward movement. The sub-fund's exposure to financial and high-yield debt paid off, as did the fact that its interest rate sensitivity was near, or even below, zero. Overall, since its inception on 19 June 2013, the sub-fund has delivered a strong and steady performance in a volatile environment. UBAM - YIELD CURVE EURO BOND The last quarter of 2013 was marked by two major turning points: firstly, growth improved decisively in the US and in Europe, especially the euro-zone periphery, and secondly the FED finally announced it was going to start reducing the pace of its bond-buying in Q1 2014. Against this backdrop, interest rates tightened again, going back to where they had been in September, when the markets had expected QE tapering to begin, which had failed to materialise. The fourth quarter was more positive, with risk assets such as credit being swept up in a strong upward movement. The sub-fund's positioning – underweight interest rates and overweight short-maturity, high-quality credit and Italian sovereign debt - paid off. In 2013, the sub-fund returned a performance of +1.73% (AC share). UBAM - YIELD CURVE STERLING BOND The last quarter of 2013 was marked by two major turning points: firstly, growth improved decisively in the US and in Europe, especially the euro-zone periphery, and secondly the FED finally announced it was going to start reducing the pace of its bond-buying in Q1 2014. Against this backdrop, interest rates tightened again, going back to where they had been in September, when the markets had expected QE tapering to begin, which had failed to materialise. The fourth quarter was more positive, with risk assets such as credit being swept up in a strong upward movement. The sub-fund's positioning – underweight interest rates and overweight short-maturity, high-quality credit - paid off. In 2013, the sub-fund returned a performance of -5.17% (AC share). UBAM - YIELD CURVE US DOLLAR BOND The last quarter of 2013 was marked by two major turning points: firstly, growth improved decisively in the US and in Europe, especially the euro-zone periphery, and secondly the FED finally announced it was going to start reducing the pace of its bond-buying in Q1 2014. Against this backdrop, interest rates tightened again, going back to where they had been in September, when the markets had expected QE tapering to begin, which had failed to materialise. The fourth quarter was more positive, with risk assets such as credit being swept up in a strong upward movement. The sub-fund's positioning – underweight interest rates and overweight short-maturity, high-quality credit - paid off. In 2013, the sub-fund returned a performance of -3.81% (AC share).
UBAM
Report of the Board of Directors (continued)
Page 19
UBAM - EM INVESTMENT GRADE CORPORATE BOND UBAM - EM INVESTMENT GRADE CORPORATE BOND is a new sub-fund and acts as Feeder sub-fund of UBAM FCP - EM INVESTMENT GRADE CORPORATE BOND. UBAM - EM INVESTMENT GRADE CORPORATE BOND gained 1.64% in Q4 2013 (net of fees, IC USD share class) compared to 1.54% for the benchmark JP Morgan CEMBI Diversified Investment Grade. In 2013 the sub-fund performed more or less in line with the benchmark. Emerging investment grade corporate bonds further recovered in the last quarter of 2013. The improving macro situation in major emerging economies and a global fixed income reallocation from government to corporate issuers boosted EM corporate bond returns. As a consequence, EM investment grade corporate bonds performed positively and the JP Morgan CEMBI Diversified Investment Grade gained 2.72% in the second half of 2013. The sub-fund's underweight in long-dated bonds mitigated the negative spill-over from the sharp steepening of the US Treasury curve in May-August and November-December. The overweight in BBB-rated issuers also added to relative performance. UBAM - EUROPEAN CONVERTIBLE BOND UBAM - EUROPEAN CONVERTIBLE BOND acts as Feeder sub-fund of UBAM CONVERTIBLES EUROPE. European stock markets ended the year on a high note. Over Q4, the Euro Stoxx 50 NR climbed 7.8% and the Stoxx Europe 50 NR 5.2%. Volatility in Europe further decreased, from 19 to 17 pts. The positive equity momentum came with a broad spread-tightening trend over Q4. Within peripheral countries, Portugal's spread tightened by 143 bp, down to 352 bp at year-end, Italy's by 100 bp to168 bp, Ireland's by 23 bp to 119 bp and Spain's by 71 bp to 157 bp. Meanwhile France's spread narrowed by 15 bp to 54 bp, while Germany's remained stable at around 25 bp. On the private issuers' front, the iTraxx Main (investment-grade issues) tightened by 34 bp to 70 bp while the Cross Over index (below IG) tightened by 120 bp down to 287 bp. The European primary market closed a strong year with a bright finish. 23 new deals were added to the region's supply over the quarter, totalling around EUR 9 bn, which represents more than 40% of the total amount issued in 2013 in Europe (EUR 22 bn). In 2013, the sub-fund returned a performance of +13.38% (AC share). UBAM - EURO 10-40 CONVERTIBLE BOND UBAM - EURO 10-40 CONVERTIBLE BOND acts as Feeder sub-fund of UBAM CONVERTIBLES EURO 10-40. European stock markets ended the year on a high note. Over Q4, the Euro Stoxx 50 NR climbed 7.8% and the Stoxx Europe 50 NR 5.2%. Volatility in Europe further decreased, from 19 to 17 pts. The positive equity momentum came with a broad spread -tightening trend over Q4. Within peripheral countries, Portugal's spread tightened by 143 bp, down to 352 bp at year-end, Italy's by 100 bp to168 bp, Ireland's by 23 bp to 119 bp and Spain's by 71 bp to 157 bp. Meanwhile France's spread narrowed by 15 bp to 54 bp, while Germany's remained stable at around 25 bp. On the private issuers' front, the iTraxx Main (investment-grade issues) tightened by 34 bp to 70 bp while the Cross Over index (below IG) tightened by 120 bp down to 287 bp. The European primary market closed a strong year with a bright finish. 23 new deals were added to the region's supply over the quarter, totalling around EUR 9 bn, which represents more than 40% of the total amount issued in 2013 in Europe (EUR 22 bn). In 2013, the sub-fund returned a performance of +8.87% (AC share).

UBAM
Report of the Board of Directors (continued)
Page 20
UBAM - GLOBAL CONVERTIBLE BOND UBAM - GLOBAL CONVERTIBLE BOND is a new sub-fund and acts as Feeder sub-fund of UBAM CONVERTIBLES GLOBAL. At the end of the year, the sub-fund was overweight in terms of equity sensitivity compared to its benchmark, at 55% vs 51%. The sub-fund's equity sensitivity is mainly driven by overweighs in Europe (20% vs 15%) and Asia (8% vs 5%) while it is underweight in America (27% vs 31%). Our equity sensitivity allocation choices reflect our views on the main convertible bond markets and our assessment of the opportunities in each region. Global equity markets reported strong gains in Q4. The Stoxx Europe 50 NR gained 5.23%, the S&P 500 9.59% and the Nikkei 12.70%. The sub-fund gained 4.15% net of fees over the quarter while the benchmark added 4.52%. The sub-fund's overall performance was mainly driven by the equity sensitivity of the portfolio (+3.53%). The fixed-income bucket and optional features also contributed positively, +0.83% and +0.12 % respectively. In Q4, the global supply increased by around USD 35 bn. The US and European primary markets especially demonstrated strong dynamism over the quarter. UBAM - 30 GLOBAL LEADERS EQUITY (formerly UBAM - PCM GLOBAL EQUITY VALUE) The MSCI AC World Net USD gained 7.31% in Q4 because relevant. October was a good month for equity markets worldwide. Developed markets were up with a total return of 3.9%. In November markets were again fairly supportive. The decision to delay tapering in the US prolonged its positive effects and removed a short-term uncertainty. The second half of December was very propitious for all equities except those of emerging markets. In Europe equities already rallied ahead of the FED's decision to taper during the first half of December's de-risking, and the confirmation of the tapering triggered further outperformance. Economic data in Europe was as much a catalyst as the FED's announcement, with the December flash PMIs and German IFO ahead of expectations and suggesting upside surprises for Q4 GDP growth estimates. The S&P closed at the year's peak on31 December 2013, recording a gain of 32% for the year. Over the quarter, UBAM - 30 Global Leaders Equity (I USD) gained 8.22%, outperforming its benchmark by 91 bp. UBAM - ASIA EQUITY Over Q4 2013, UBAM - ASIA EQUITY gained 10.1%, outperforming its index by 6.7%. Asian markets were choppy, rallying at first on momentum from a dovish September FOMC statement, only to fall back and then rally again on strong resolutions from China's Third Plenum (which outlined comprehensive market-driven reform plans), and then to fade once again as the FED announced it would begin tapering asset purchases. North Asia performed well while South Asia generally declined. Indonesia's under-pressure currency continued to depreciate whereas India managed to steady the rupee. And in Thailand political tensions erupted into large street protests. UBAM - Asia Equity performed well throughout the quarter, driven by strong stock selection and our overweight in the North Asian markets. In 2013, the sub-fund returned a performance of +7.65% (AC share). UBAM - ASIA EQUITY HIGH DIVIDEND UBAM - ASIA EQUITY HIGH DIVIDEND was launched on 5th September 2013. Over Q4 2013, UBAM - ASIA EQUITY HIGH DIVIDEND gained 0.2%, outperforming its benchmark index by 0.5%. Asian markets were choppy, rallying at first on momentum from a dovish September FOMC statement, only to fall back and then rally again on strong resolutions from China's Third Plenum (which outlined comprehensive market-driven reform plans), and then to fade once again as the FED announced it would begin tapering asset purchases. This last event had more of a negative effect on high-dividend stocks than on others. UBAM - Asia Equity High Dividend's positive relative performance was driven by strong returns in our off-benchmark names in China and Malaysia.
UBAM
Report of the Board of Directors (continued)
Page 21
UBAM - DR. EHRHARDT GERMAN EQUITY UBAM - DR. EHRHARDT GERMAN EQUITY underperformed the DAX in the fourth quarter. Since the beginning of the year, we had matched the DAX but this changed in November and December, partly because the DAX outperformed the broad market and partly because the sub-fund management kept a more cautious stance (more cash) due to deteriorating sentiment figures. Extreme optimism in the US and in Germany is a serious warning flag for us. The German advance/decline line, for example, showed a steep drop while the index was still going up. This line closed the year no higher than at the beginning of the year, which is usually a sign of deterioration in the market. Like in the year 2000 the advance of the DAX was mainly due to a few extremely strong stocks like Deutsche Post or Continental. On the other hand some weak stocks performed more like in a bear than a bull market. We think the bull market will continue but there are some short-term risks. In 2013, the sub-fund returned a performance of +20.47% (AC share). UBAM - EQUITY BRIC+ In Brazil, there are concerns about an expansionist fiscal policy while inflation is persistently high and forcing the central bank to raise rates. The positive news is that a weaker currency will benefit some investments in the Brazilian portfolio, namely capital goods exporters. The currently stable economic environment in Russia is allowing the government to push for higher dividend payouts and better efficiency, and to freeze natural monopoly tariffs. In India investors are keenly evaluating the likely outcome of the 2014 general elections. The market's confidence in China's structural reforms increased in Q4. Policy actions and implementation will be the keys to the success of the reforms, and it is still crucial to watch for further concrete details and timeframes. The sub-fund gained 6.93% in Q4, outperforming the MSCI BRIC Net Return USD by 527 bp. India was the best-performing of the four countries while Brazil was the worst. All four managers beat their respective country benchmarks. In 2013, the sub-fund returned a performance of +0.28% (AC share). UBAM - EUROPE EQUITY Equities once again outperformed a broad range of assets in Q4, as they had throughout 2013. The MSCI Europe EUR gained 5.98%. In October peripheral equity markets continued to outperform core equities after the Italian vote of confidence win. European equities traded sideways for most of November but eurozone names did rally in the last week boosted by signs of on-going political stability such as the comprehensive coalition deal reached by Germany's party leaders. Meanwhile the Italian Senate voted to expel ex-PM Berlusconi and ban him from public office. The second half of December was very propitious for all equities except those of emerging markets. In Europe equities already rallied ahead of the FED's decision to taper; the first half of December's de-risking and the confirmation of the tapering triggered further outperformance. Economic data in Europe was as much a catalyst as the FED's announcement. Over the quarter, UBAM – Europe Equity (IC) rose by 9.39%, outperforming the MSCI Europe EUR by 3.41%. In 2013, the sub-fund returned a performance of +24.53% (AC share). UBAM - EUROPE EQUITY DIVIDEND+ Equities once again outperformed a broad range of assets in Q4, as they had throughout 2013. The MSCI Europe EUR gained 5.98%. In October peripheral equity markets continued to outperform core equities after the Italian vote of confidence win. European equities traded sideways for most of November but euro-zone names did rally in the last week boosted by signs of on-going political stability such as the comprehensive coalition deal reached by Germany’s party leaders. Meanwhile the Italian Senate voted to expel ex-PM Berlusconi and ban him from public office. The second half of December was very propitious for all equities except those of emerging markets. In Europe equities already rallied ahead of the FED’s decision to taper; the first half of December’s de-risking and the confirmation of the tapering triggered further outperformance. Economic data in Europe was as much a catalyst as the FED’s announcement. Over the quarter, UBAM – Europe Equity Dividend+ (IC) gained 2.9%. In 2013, the sub-fund returned a performance of +4.45% (AC share).
UBAM
Report of the Board of Directors (continued)
Page 22
UBAM - GCM MIDCAP US EQUITY GROWTH (formerly UBAM - CALAMOS US EQUITY GROWTH) In Q4 2013, the US and global economies showed signs of a broad and more synchronized recovery and markets gained momentum. In the US, both housing activity and the manufacturing sector expanded. Employment gains have led to a chronic decline in the unemployment rate, and consumer confidence has increased steadily. The FED has announced it will reduce its bond-buying program, housing starts have exceeded one million units and an optimistic view is now broadly shared as we enter the New Year. The S&P 500 TR rose by 10.33% in Q4. All sectors were positive during the quarter with industrials, IT and consumer discretionary leading. The worst sectors were utilities and telecommunications. The sub-fund gained 7.76%, underperforming the S&P 500 TR by 257 bp. GCM took over the management of the UBAM - Calamos US Growth Fund on 1 November 2013. The sub-fund was renamed UBAM - GCM Midcap US Equity Growth. The transition was very efficient and the sub-fund was repositioned within one business day. In 2013, the sub-fund returned a performance of +26.89% (AC share). UBAM - IFDC JAPAN OPPORTUNITIES EQUITY Q4 2013 was very constructive for Japanese equities. Abenomics and its 3 arrows of aggressive monetary policy (with additional BoJ balance-sheet expansion expected in 2014), flexible fiscal policy (setting public finances onto a sustainable path whilst buffering the short-term negative impact with a procyclical fiscal package) and growth strategy (through structural reforms and deregulation) provided strong support helping Japanese equities to perform well. The yen weakened by 7.16% against the USD in Q4, moving to 105.31. The Topix rose by 9.21%. With the exception of utilities, all sectors gained value. The best-performing sectors were telecommunication services (+23.81%), IT (+15.47%) and financials (+10.26%). The sub-fund gained 6.41%, underperforming the TSE Topix Total Return JPY by 280 bp. Our cash position was detrimental during this very strong quarter. Holdings in the IT sector weighed on the performance. The overweight in telecommunications, a strong sector, failed to contribute due to the stock selection. In 2013, the sub-fund returned a performance of +39.25% (AC share). UBAM - NEUBERGER BERMAN US EQUITY VALUE In Q4 2013, the US and global economies showed signs of a broad and more synchronized recovery and markets gained momentum. In the US, both housing activity and the manufacturing sector expanded. Employment gains have led to a chronic decline in the unemployment rate, and consumer confidence has increased steadily. The FED has announced it will reduce its bond-buying program, housing starts have exceeded one million units and an optimistic view is now broadly shared as we enter the New Year. The S&P 500 NR rose by 10.33% in Q4. All sectors were positive during the quarter with industrials, IT and consumer discretionary leading. The worst sectors were utilities and telecommunications. The sub-fund gained 6.79%, underperforming the S&P 500 NR by 354 bp. The main detractors were the energy holdings, more precisely Anadarko, Pioneer, Seadrill and EOG. The sub-fund's underperformance was partially offset by the very strong performance of its airline exposure, built over Q3 and Q4. In 2013, the sub-fund returned a performance of +29.16% (AC share). UBAM - RUSSIAN EQUITY The MSCI Russia 10/40 NR posted +1.18% in Q4. October was a benign month for Russian equities which stayed on their positive trend and followed the general outperformance of EM markets. In terms of sectors, financials, telecoms, and consumer segments showed strong returns. In November the main equity indices were among the leaders of the decline in the EM universe. The rouble declined, counter-intuitively going against the strengthening Brent. US QE tapering fears occupied the minds of investors more and more. The Russian equity market ended December in the black supported by higher oil, a stronger currency, and Christmas. The smallcap segment of the market did particularly well. In terms of sectors, industrials, materials, real estate and utilities were the top performers. Besides economics, the news is gradually being dominated by the Winter Olympics, to take place in Sochi in February 2014. Over the quarter UBAM - Russian Equity (IC share class) rose by 4.87%, outperforming the MSCI 10/40 NR by 364 bp. In 2013, the sub-fund returned a performance of +4.42% (AC share).
UBAM
Report of the Board of Directors (continued)
Page 23
UBAM - SNAM JAPAN EQUITY VALUE (formerly UBAM - IFDC JAPAN EQUITY) Q4 2013 was very constructive for Japanese equities. Abenomics and its 3 arrows of aggressive monetary policy (with additional BoJ balance-sheet expansion expected in 2014), flexible fiscal policy (setting public finances onto a sustainable path whilst buffering the short-term negative impact with a pro-cyclical fiscal package) and growth strategy (through structural reforms and deregulation) provided strong support helping Japanese equities to perform well. The yen weakened by 7.16% against the USD in Q4, moving to 105.31. The Topix rose by 9.21%. With the exception of utilities, all sectors gained value. The best-performing sectors were telecommunication services (+23.81%), IT (+15.47%) and financials (+10.26%). The sub-fund gained 8.56%, slightly underperforming the TSE Topix Total Return JPY by 65 bp. While only being an outcome of the stock-picking, the large overweight in materials (mostly steel) and the small underweight in telecommunication services weighed the most on the relative performance. In 2013, the sub-fund returned a performance of +56.94% (AC share). UBAM - SWISS EQUITY The Swiss equity index closed the year up by 24.6%, mainly supported by the upward revisions to Swiss economic growth forecasts and by Switzerland's trading partners. The Swiss index put in other strong performance in Q4, which consolidated its position among the leading global indices. We are confident for 2014 and see the Swiss market developing further, with the SPI gaining around 20% again, underpinned by double-digit earnings growth, favourable forex markets, lower risk premiums on the equity market and dividend yields still attractive. As regards sectors, technology gained 22.4%, telecoms 8.3% and industrials 6.3% over the quarter. In 2013, the sub-fund returned a performance of +27.18% (AC share). UBAM - TURKISH EQUITY Turkish equities had a poor fourth quarter with the MSCI Turkey 10/40 IMI USD Net Return down 13.88%. The quarter started well and Turkish financial market sentiment was still improving in October. We believe the main reason behind the improvement was the expectation that QE tapering would be delayed further. In November the main highlight of the month was the Monetary Policy Meeting, where the Central Bank of Turkey signalled that the BIST interbank O/N rate would be the -new- policy rate. In December, the main index plummeted 10%, mainly due to local political events coupled with the FED's decision to start tapering. The lira performed poorly, two-year yields increased and the 5-year CDS spread increased to 244 bp. Over the quarter the UBAM - Turkish Equity (IC) sub-fund lost 12.68%, outperforming its benchmark by 120 bp. In 2013, the sub-fund returned a performance of -25.43% (AC share). UBAM - MULTIFUNDS EMERGING MARKETS UBAM - MULTIFUNDS EMERGING MARKETS is a new sub-fund. UBAM - MULTIFUNDS EMERGING MARKETS aims at achieving long-term capital appreciation that outperforms the EM equities markets, with a comparable risk. UBAM - Multifunds Emerging Markets is a portfolio of sub-funds in EM equities, run by the top specialists of each region. The assets are allocated to five asset classes, according to geographic area i.e. "Global EM", "Asia", "Latin America", "Eastern Europe" and "Middle East & Africa". In each of these categories, the managers are selected for the quality of their management and their adherence to an investment strategy. Geographical asset allocation among different emerging countries is dynamic. The combination is a result of our risk management, which takes into account each manager's individual bets, while avoiding accumulation or compensation.
UBAM
Report of the Board of Directors (continued)
Page 24
1.3. Outlook World growth should reach 3.6% in 2014 as the recovery that started in the second half of 2013 in developed countries takes root. The US should achieve a growth rate close to 3% as consumer spending carries on strengthening and corporate investment resumes. Unlike in 2013, fiscal policy should not be a drag on economic actors and, under the impulse of the wealth effect and the receding unemployment, the economy should settle into a cycle of steady, self-sustained growth. The eurozone is expected to start growing again in 2014, driven by the rebound in Germany, which still has excellent fundamentals, but also by the spreading recovery in the peripheral countries. Their reforms have paid off and will allow some countries to gradually pull out of the European aid programmes and retrieve their place on the financial markets in 2014. The average economic growth rate in emerging countries is still higher than in the developed world, but there are big differences between countries and weak spots remain. China, for instance, has launched an ambitious medium-term reform package, but its economy will remain slack for several quarters, with growth stuck between 7% and 7.5%. India and Brazil have yet to implement their reforms, so they are still plagued by risks to activity and the refinancing of their economies. Inflation is set to stay low in 2014 and despite the recovery wages will stay contained in developed countries. The lack of a sharp rebound in emerging countries should keep commodity prices low, which will fuel pronounced disinflation in developed countries. Given this, central banks will maintain their monetary stimulus and accommodative policies. Whilst gradually winding down its bond purchasing in 2014, the FED will keep a close eye on the stability of the recovery and make it clear in its communications that there will be no interest rate hikes in 2014. The ECB and the BoJ are expected to continue their aggressive stimulus: further liquidity injections in the eurozone and stepped-up bond-buying in Japan. The central banks in emerging countries still have to battle against inflation and stabilise their currencies or, as in the case of China, strengthen their banking sector, before they can think about boosting economic activity. The financial and monetary context should therefore remain favourable to equities this year, especially in developed countries, as economic activity resumes, helped by low inflation and accommodative monetary policy. Earnings growth should near 10% and, thanks to low short-term interest rates, valuations still have room to increase in 2014. The best opportunities will be in areas and companies that offer the most attractive growth prospects. Two main themes stand out: one is the recovery of the eurozone’s peripheral countries, which should see their spreads ease further and their markets normalise; the other is the digitalisation of the economy with new products and new production processes promising firm growth both in the developed countries – by creating a new productivity cycle – and in the emerging world – with the development of e-commerce and m-commerce. The corporate bond sector is still likely to generate better opportunities than sovereign debt. Long-term interest rates should gradually rise as developed countries recover, while corporate balance sheets should stay generally sound. Against this backdrop the default rate should remain very low in the high-yield segment. In 2014 the dollar should at last appreciate against the other major currencies. The stronger economic growth in the US, the less aggressive FED monetary policy and the more decisive stimulus in Europe and Japan should help the dollar break out of the channel it was stuck in against the euro towards the end of the year. Lastly, gold’s prospects are not appealing as systemic risks are waning and inflation is not a threat for the time being. The metal can be an insurance policy against any unforeseen events that could upset the economic and financial recovery scenario.

UBAM
Report of the Board of Directors (continued)
Page 25
2. EVOLUTION OF ACTIVITY AND OF THE FINANCIAL SITUATION
NET ASSETS AND PERFORMANCES Sub-fund
Ccy Net assets as at
31/12/11 (mios)
Net assets as at
31/12/12 (mios)
Net assets as at
31/12/13 (mios)
Net Asset Value per
AC share as at 31/12/11
Net Asset Value per
AC share as at 31/12/12
Net Asset Value per
AC share as at 31/12/13
Performance 2012
Performance 2013
UBAM - CORPORATE EURO BOND EUR 177.68 207.79 225.86 150.57 169.53 172.37 12.59% 1.68%
UBAM - CORPORATE US DOLLAR BOND USD 404.22 494.62 421.45 156.92 172.45 172.77 9.90% 0.19%
UBAM - DYNAMIC EURO BOND EUR 152.19 318.16 519.81 242.35 251.47 253.72 3.76% 0.89%
UBAM - DYNAMIC US DOLLAR BOND USD 154.91 188.86 433.68 200.79 207.78 210.61 3.48% 1.36%
UBAM - EMERGING MARKET BOND USD 165.74 219.26 169.13 143.13 166.34 154.43 16.22% -7.16%
UBAM - EMERGING MARKET CORPORATE BOND USD 139.03 169.00 228.08 107.08 122.95 120.15 14.82% -2.28%
UBAM - EM HIGH YIELD SHORT DURATION CORPORATE BOND (1) USD - - 105.23 - - 103.11 - N.R.
UBAM - GLOBAL BOND (CHF) CHF 35.79 36.11 32.85 1,399.75 1,474.91 1,448.64 5.37% -1.78%
UBAM - GLOBAL HIGH YIELD SOLUTION USD 353.60 482.93 1,253.49 99.80 116.65 135.81 16.88% 16.43%
UBAM - LOCAL CURRENCY EMERGING MARKET BOND USD 236.79 286.25 171.91 118.64 133.63 121.18 12.63% -9.32%
UBAM - UNCONSTRAINED BOND (2) EUR - - 198.98 - - 101.08 - N.R.
UBAM - YIELD CURVE EURO BOND EUR 89.53 90.73 104.69 770.30 854.61 869.39 10.95% 1.73%
UBAM - YIELD CURVE STERLING BOND GBP 10.86 10.76 15.16 278.35 284.15 269.45 2.08% -5.17%
UBAM - YIELD CURVE US DOLLAR BOND USD 197.14 183.98 172.95 2,433.73 2,484.47 2,389.73 2.08% -3.81%
UBAM - EM INVESTMENT GRADE CORPORATE BOND (3) USD - - 8.51 - - 96.26 - N.R.
UBAM - EUROPEAN CONVERTIBLE BOND EUR 12.42 8.42 30.18 90.74 104.73 118.74 15.42% 13.38%
UBAM - EURO 10-40 CONVERTIBLE BOND EUR 31.91 178.17 443.31 95.14 110.41 120.20 16.05% 8.87%
UBAM - GLOBAL CONVERTIBLE BOND (4) EUR - - 27.31 - - 106.49 - N.R.
UBAM - 30 GLOBAL LEADERS EQUITY (formerly UBAM - PCM GLOBAL EQUITY VALUE) (5)
EUR - - 123.85 - - 76.51 - N.R.
UBAM - ASIA EQUITY USD 18.44 20.20 26.97 15.67 20.51 22.08 30.89% 7.65%
UBAM - ASIA EQUITY HIGH DIVIDEND (6) USD - - 47.73 - - 172.17 - N.R.
UBAM - DR. EHRHARDT GERMAN EQUITY EUR 83.94 74.41 83.04 1,017.20 1,226.03 1,476.99 20.53% 20.47%
UBAM - EQUITY BRIC+ USD 87.21 124.87 67.33 68.15 81.13 81.36 19.05% 0.28%
UBAM - EUROPE EQUITY EUR 93.60 154.62 237.88 240.75 281.49 350.53 16.92% 24.53%
UBAM - EUROPE EQUITY DIVIDEND+ EUR 36.81 128.14 93.70 100.56 107.37 112.15 6.77% 4.45%
UBAM - GCM MID CAP US EQUITY GROWTH (formerly UBAM - CALAMOS US EQUITY GROWTH)
USD 257.85 171.54 119.92 248.05 271.29 344.25 9.37% 26.89%
UBAM - IFDC JAPAN OPPORTUNITIES EQUITY JPY 986.05 4,544.60 6,493.20 6,333 7,491 10,431 18.29% 39.25%
UBAM - NEUBERGER BERMAN US EQUITY VALUE USD 956.46 829.26 821.65 637.57 742.64 959.18 16.48% 29.16%
UBAM - RUSSIAN EQUITY USD 28.34 20.58 17.26 85.85 95.47 99.69 11.21% 4.42%
UBAM - SNAM JAPAN EQUITY VALUE (formerly UBAM - IFDC JAPAN EQUITY)
JPY 26,771.91 21,058.68 44,393.46 619 720 1,130 16.32% 56.94%
UBAM - SWISS EQUITY CHF 108.54 156.28 307.07 148.16 180.16 229.12 21.60% 27.18%
UBAM - TURKISH EQUITY USD 44.33 59.86 14.64 77.50 127.60 95.15 64.65% -25.43%
UBAM - MULTIFUNDS EMERGING MARKETS (7) USD - - 52.61 - - 364.41 - N.R.
UBAM
Report of the Board of Directors (continued)
Page 26
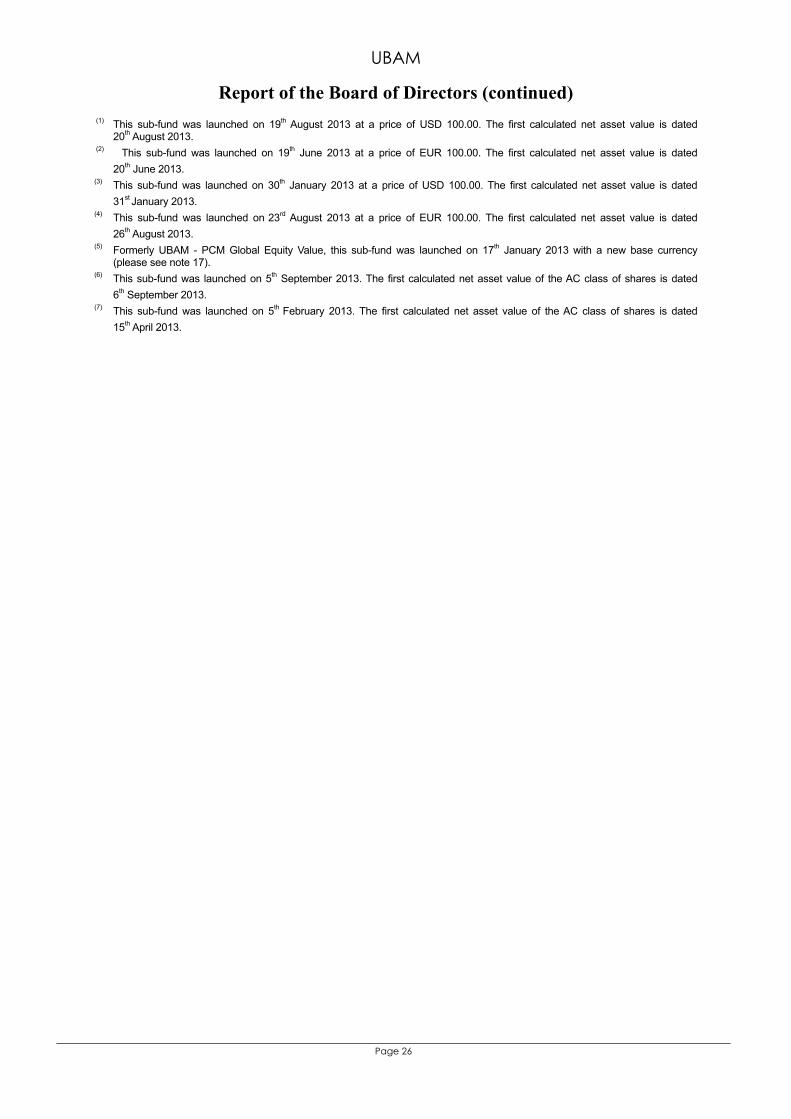
(1) This sub-fund was launched on 19th August 2013 at a price of USD 100.00. The first calculated net asset value is dated 20th August 2013.
(2) This sub-fund was launched on 19th June 2013 at a price of EUR 100.00. The first calculated net asset value is dated 20th June 2013.
(3) This sub-fund was launched on 30th January 2013 at a price of USD 100.00. The first calculated net asset value is dated 31st January 2013.
(4) This sub-fund was launched on 23rd August 2013 at a price of EUR 100.00. The first calculated net asset value is dated 26th August 2013.
(5) Formerly UBAM - PCM Global Equity Value, this sub-fund was launched on 17th January 2013 with a new base currency (please see note 17).
(6) This sub-fund was launched on 5th September 2013. The first calculated net asset value of the AC class of shares is dated 6th September 2013.
(7) This sub-fund was launched on 5th February 2013. The first calculated net asset value of the AC class of shares is dated 15th April 2013.
UBAM
Report of the Board of Directors (continued)
Page 27
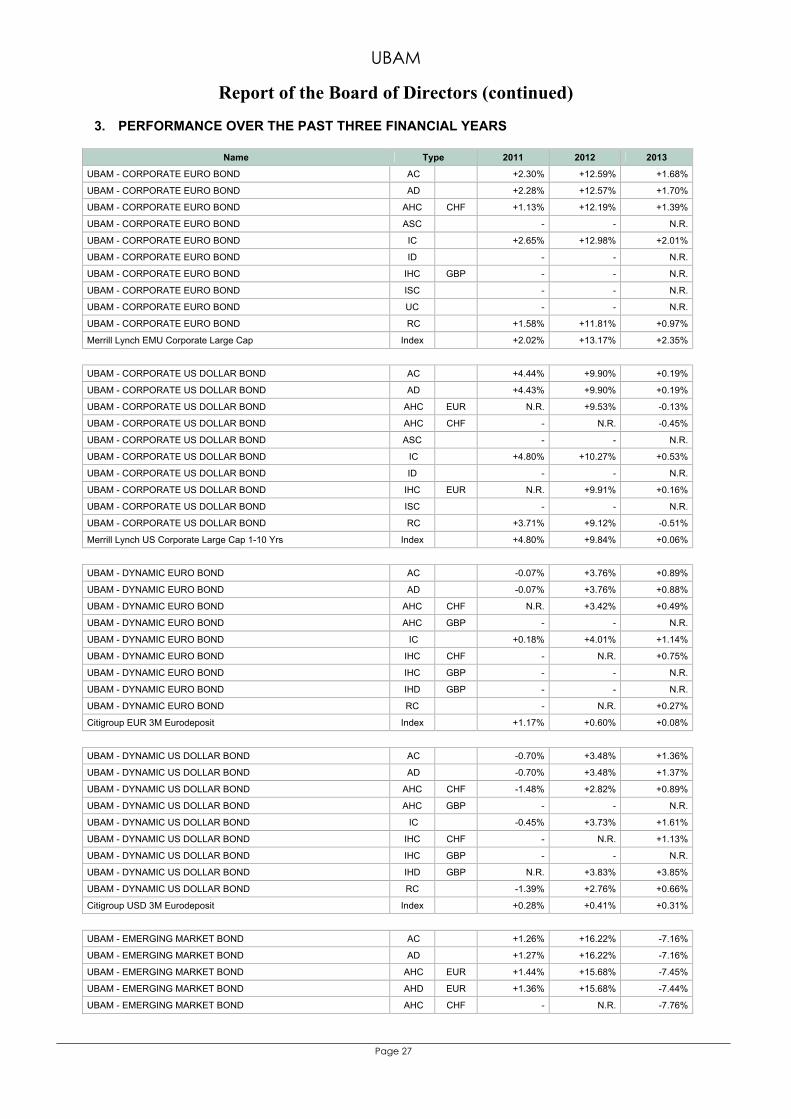
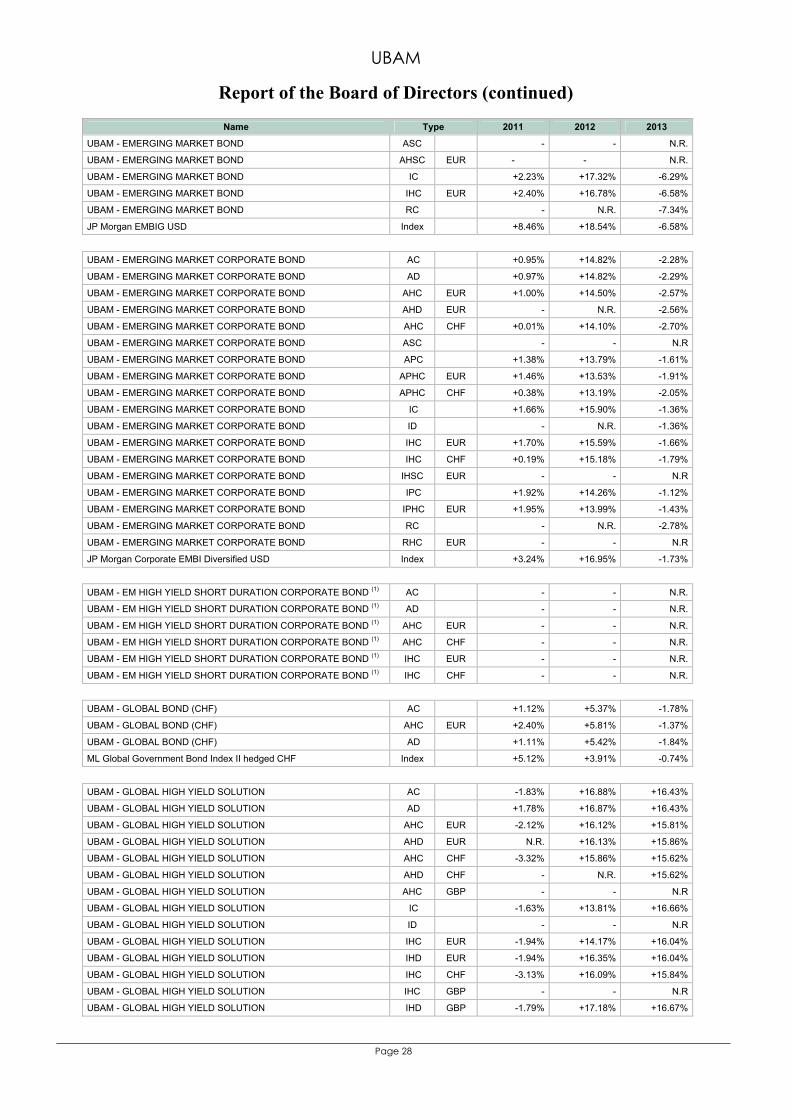
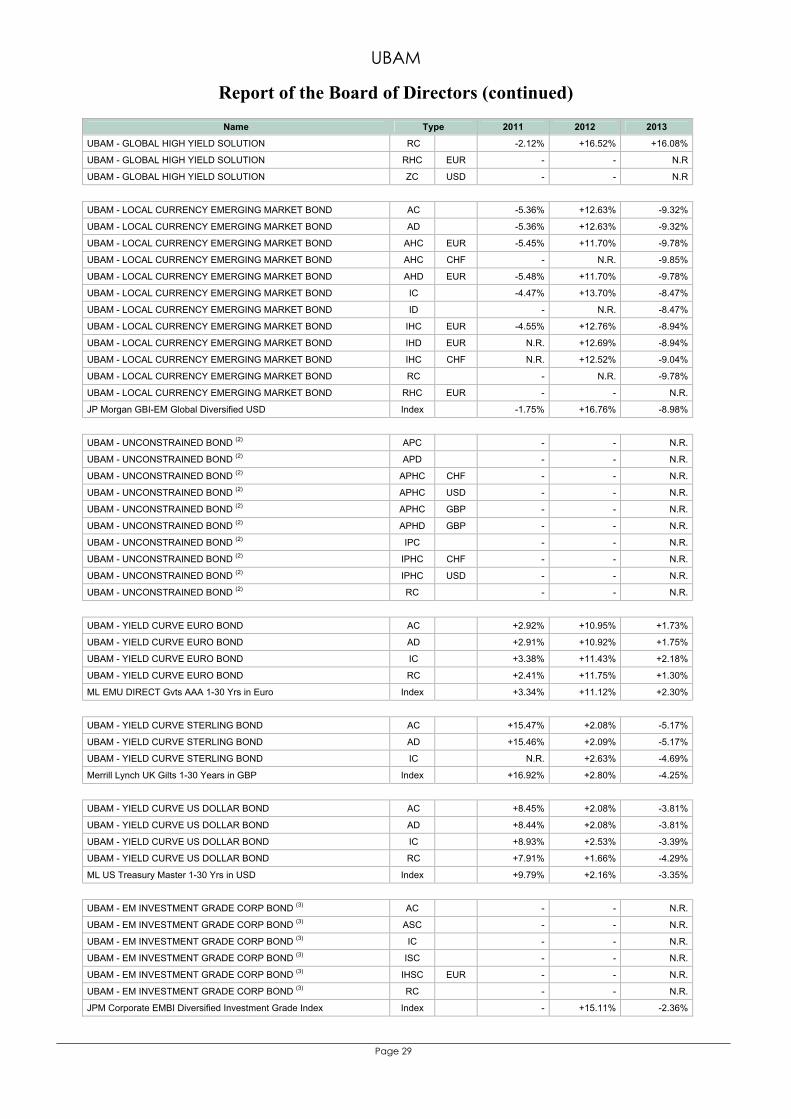
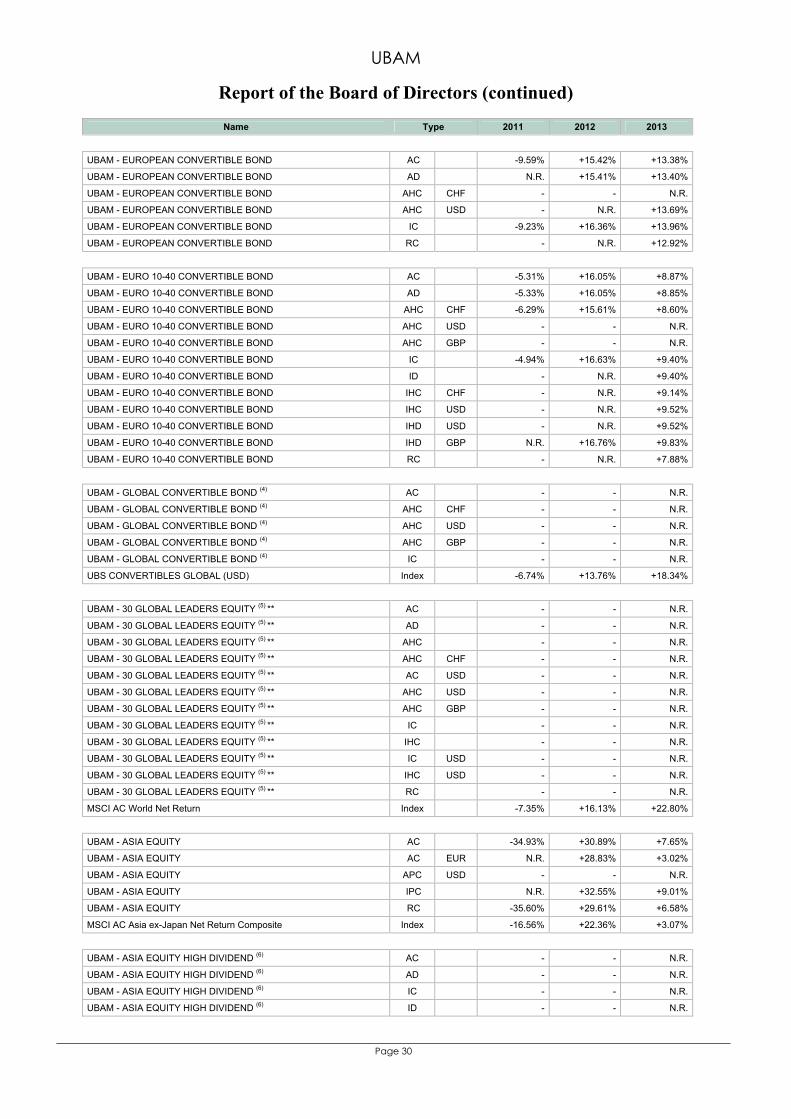
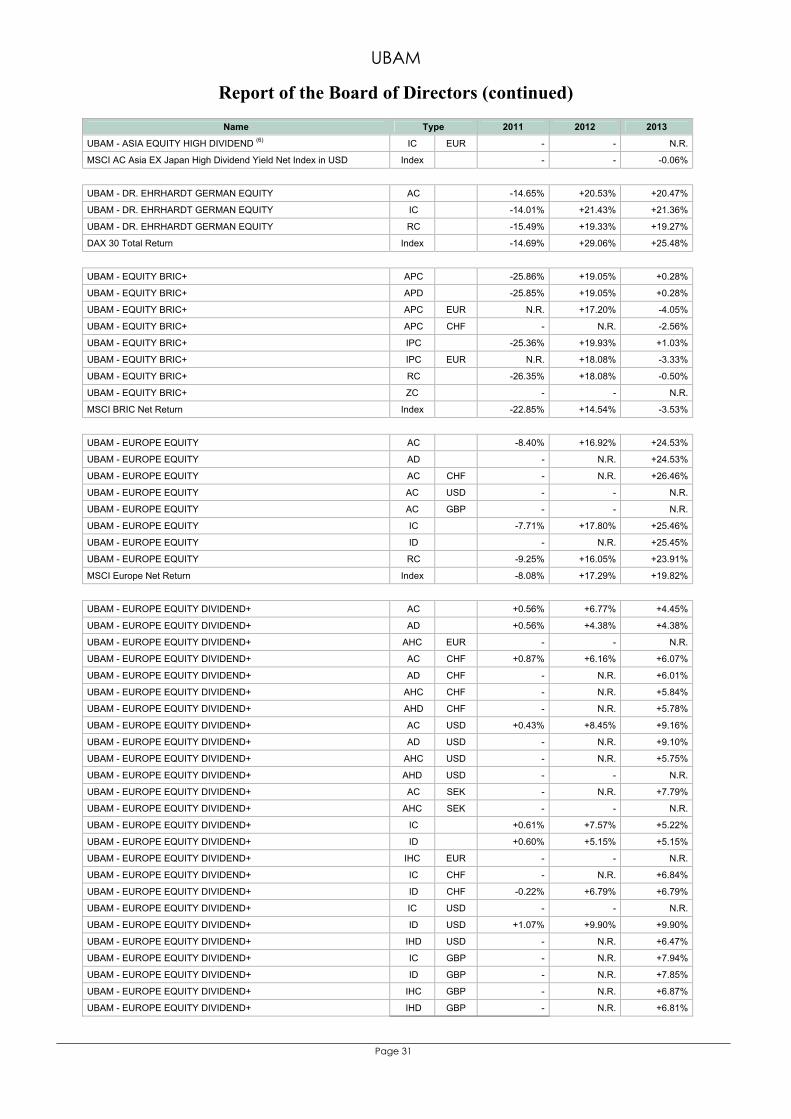
3. PERFORMANCE OVER THE PAST THREE FINANCIAL YEARS
Name Type 2011 2012 2013
UBAM - CORPORATE EURO BOND AC +2.30% +12.59% +1.68%
UBAM - CORPORATE EURO BOND AD +2.28% +12.57% +1.70%
UBAM - CORPORATE EURO BOND AHC CHF +1.13% +12.19% +1.39%
UBAM - CORPORATE EURO BOND ASC - - N.R.
UBAM - CORPORATE EURO BOND IC +2.65% +12.98% +2.01%
UBAM - CORPORATE EURO BOND ID - - N.R.
UBAM - CORPORATE EURO BOND IHC GBP - - N.R.
UBAM - CORPORATE EURO BOND ISC - - N.R.
UBAM - CORPORATE EURO BOND UC - - N.R.
UBAM - CORPORATE EURO BOND RC +1.58% +11.81% +0.97%
Merrill Lynch EMU Corporate Large Cap Index +2.02% +13.17% +2.35%
UBAM - CORPORATE US DOLLAR BOND AC +4.44% +9.90% +0.19%
UBAM - CORPORATE US DOLLAR BOND AD +4.43% +9.90% +0.19%
UBAM - CORPORATE US DOLLAR BOND AHC EUR N.R. +9.53% -0.13%
UBAM - CORPORATE US DOLLAR BOND AHC CHF - N.R. -0.45%
UBAM - CORPORATE US DOLLAR BOND ASC - - N.R.
UBAM - CORPORATE US DOLLAR BOND IC +4.80% +10.27% +0.53%
UBAM - CORPORATE US DOLLAR BOND ID - - N.R.
UBAM - CORPORATE US DOLLAR BOND IHC EUR N.R. +9.91% +0.16%
UBAM - CORPORATE US DOLLAR BOND ISC - - N.R.
UBAM - CORPORATE US DOLLAR BOND RC +3.71% +9.12% -0.51%
Merrill Lynch US Corporate Large Cap 1-10 Yrs Index +4.80% +9.84% +0.06%
UBAM - DYNAMIC EURO BOND AC -0.07% +3.76% +0.89%
UBAM - DYNAMIC EURO BOND AD -0.07% +3.76% +0.88%
UBAM - DYNAMIC EURO BOND AHC CHF N.R. +3.42% +0.49%
UBAM - DYNAMIC EURO BOND AHC GBP - - N.R.
UBAM - DYNAMIC EURO BOND IC +0.18% +4.01% +1.14%
UBAM - DYNAMIC EURO BOND IHC CHF - N.R. +0.75%
UBAM - DYNAMIC EURO BOND IHC GBP - - N.R.
UBAM - DYNAMIC EURO BOND IHD GBP - - N.R.
UBAM - DYNAMIC EURO BOND RC - N.R. +0.27%
Citigroup EUR 3M Eurodeposit Index +1.17% +0.60% +0.08%
UBAM - DYNAMIC US DOLLAR BOND AC -0.70% +3.48% +1.36%
UBAM - DYNAMIC US DOLLAR BOND AD -0.70% +3.48% +1.37%
UBAM - DYNAMIC US DOLLAR BOND AHC CHF -1.48% +2.82% +0.89%
UBAM - DYNAMIC US DOLLAR BOND AHC GBP - - N.R.
UBAM - DYNAMIC US DOLLAR BOND IC -0.45% +3.73% +1.61%
UBAM - DYNAMIC US DOLLAR BOND IHC CHF - N.R. +1.13%
UBAM - DYNAMIC US DOLLAR BOND IHC GBP - - N.R.
UBAM - DYNAMIC US DOLLAR BOND IHD GBP N.R. +3.83% +3.85%
UBAM - DYNAMIC US DOLLAR BOND RC -1.39% +2.76% +0.66%
Citigroup USD 3M Eurodeposit Index +0.28% +0.41% +0.31%
UBAM - EMERGING MARKET BOND AC +1.26% +16.22% -7.16%
UBAM - EMERGING MARKET BOND AD +1.27% +16.22% -7.16%
UBAM - EMERGING MARKET BOND AHC EUR +1.44% +15.68% -7.45%
UBAM - EMERGING MARKET BOND AHD EUR +1.36% +15.68% -7.44%
UBAM - EMERGING MARKET BOND AHC CHF - N.R. -7.76%
UBAM
Report of the Board of Directors (continued)
Page 28
Name Type 2011 2012 2013
UBAM - EMERGING MARKET BOND ASC - - N.R.
UBAM - EMERGING MARKET BOND AHSC EUR - - N.R.
UBAM - EMERGING MARKET BOND IC +2.23% +17.32% -6.29%
UBAM - EMERGING MARKET BOND IHC EUR +2.40% +16.78% -6.58%
UBAM - EMERGING MARKET BOND RC - N.R. -7.34%
JP Morgan EMBIG USD Index +8.46% +18.54% -6.58%
UBAM - EMERGING MARKET CORPORATE BOND AC +0.95% +14.82% -2.28%
UBAM - EMERGING MARKET CORPORATE BOND AD +0.97% +14.82% -2.29%
UBAM - EMERGING MARKET CORPORATE BOND AHC EUR +1.00% +14.50% -2.57%
UBAM - EMERGING MARKET CORPORATE BOND AHD EUR - N.R. -2.56%
UBAM - EMERGING MARKET CORPORATE BOND AHC CHF +0.01% +14.10% -2.70%
UBAM - EMERGING MARKET CORPORATE BOND ASC - - N.R
UBAM - EMERGING MARKET CORPORATE BOND APC +1.38% +13.79% -1.61%
UBAM - EMERGING MARKET CORPORATE BOND APHC EUR +1.46% +13.53% -1.91%
UBAM - EMERGING MARKET CORPORATE BOND APHC CHF +0.38% +13.19% -2.05%
UBAM - EMERGING MARKET CORPORATE BOND IC +1.66% +15.90% -1.36%
UBAM - EMERGING MARKET CORPORATE BOND ID - N.R. -1.36%
UBAM - EMERGING MARKET CORPORATE BOND IHC EUR +1.70% +15.59% -1.66%
UBAM - EMERGING MARKET CORPORATE BOND IHC CHF +0.19% +15.18% -1.79%
UBAM - EMERGING MARKET CORPORATE BOND IHSC EUR - - N.R
UBAM - EMERGING MARKET CORPORATE BOND IPC +1.92% +14.26% -1.12%
UBAM - EMERGING MARKET CORPORATE BOND IPHC EUR +1.95% +13.99% -1.43%
UBAM - EMERGING MARKET CORPORATE BOND RC - N.R. -2.78%
UBAM - EMERGING MARKET CORPORATE BOND RHC EUR - - N.R
JP Morgan Corporate EMBI Diversified USD Index +3.24% +16.95% -1.73%
UBAM - EM HIGH YIELD SHORT DURATION CORPORATE BOND (1) AC - - N.R.
UBAM - EM HIGH YIELD SHORT DURATION CORPORATE BOND (1) AD - - N.R.
UBAM - EM HIGH YIELD SHORT DURATION CORPORATE BOND (1) AHC EUR - - N.R.
UBAM - EM HIGH YIELD SHORT DURATION CORPORATE BOND (1) AHC CHF - - N.R.
UBAM - EM HIGH YIELD SHORT DURATION CORPORATE BOND (1) IHC EUR - - N.R.
UBAM - EM HIGH YIELD SHORT DURATION CORPORATE BOND (1) IHC CHF - - N.R.
UBAM - GLOBAL BOND (CHF) AC +1.12% +5.37% -1.78%
UBAM - GLOBAL BOND (CHF) AHC EUR +2.40% +5.81% -1.37%
UBAM - GLOBAL BOND (CHF) AD +1.11% +5.42% -1.84%
ML Global Government Bond Index II hedged CHF Index +5.12% +3.91% -0.74%
UBAM - GLOBAL HIGH YIELD SOLUTION AC -1.83% +16.88% +16.43%
UBAM - GLOBAL HIGH YIELD SOLUTION AD +1.78% +16.87% +16.43%
UBAM - GLOBAL HIGH YIELD SOLUTION AHC EUR -2.12% +16.12% +15.81%
UBAM - GLOBAL HIGH YIELD SOLUTION AHD EUR N.R. +16.13% +15.86%
UBAM - GLOBAL HIGH YIELD SOLUTION AHC CHF -3.32% +15.86% +15.62%
UBAM - GLOBAL HIGH YIELD SOLUTION AHD CHF - N.R. +15.62%
UBAM - GLOBAL HIGH YIELD SOLUTION AHC GBP - - N.R
UBAM - GLOBAL HIGH YIELD SOLUTION IC -1.63% +13.81% +16.66%
UBAM - GLOBAL HIGH YIELD SOLUTION ID - - N.R
UBAM - GLOBAL HIGH YIELD SOLUTION IHC EUR -1.94% +14.17% +16.04%
UBAM - GLOBAL HIGH YIELD SOLUTION IHD EUR -1.94% +16.35% +16.04%
UBAM - GLOBAL HIGH YIELD SOLUTION IHC CHF -3.13% +16.09% +15.84%
UBAM - GLOBAL HIGH YIELD SOLUTION IHC GBP - - N.R
UBAM - GLOBAL HIGH YIELD SOLUTION IHD GBP -1.79% +17.18% +16.67%
UBAM
Report of the Board of Directors (continued)
Page 29
Name Type 2011 2012 2013
UBAM - GLOBAL HIGH YIELD SOLUTION RC -2.12% +16.52% +16.08%
UBAM - GLOBAL HIGH YIELD SOLUTION RHC EUR - - N.R
UBAM - GLOBAL HIGH YIELD SOLUTION ZC USD - - N.R
UBAM - LOCAL CURRENCY EMERGING MARKET BOND AC -5.36% +12.63% -9.32%
UBAM - LOCAL CURRENCY EMERGING MARKET BOND AD -5.36% +12.63% -9.32%
UBAM - LOCAL CURRENCY EMERGING MARKET BOND AHC EUR -5.45% +11.70% -9.78%
UBAM - LOCAL CURRENCY EMERGING MARKET BOND AHC CHF - N.R. -9.85%
UBAM - LOCAL CURRENCY EMERGING MARKET BOND AHD EUR -5.48% +11.70% -9.78%
UBAM - LOCAL CURRENCY EMERGING MARKET BOND IC -4.47% +13.70% -8.47%
UBAM - LOCAL CURRENCY EMERGING MARKET BOND ID - N.R. -8.47%
UBAM - LOCAL CURRENCY EMERGING MARKET BOND IHC EUR -4.55% +12.76% -8.94%
UBAM - LOCAL CURRENCY EMERGING MARKET BOND IHD EUR N.R. +12.69% -8.94%
UBAM - LOCAL CURRENCY EMERGING MARKET BOND IHC CHF N.R. +12.52% -9.04%
UBAM - LOCAL CURRENCY EMERGING MARKET BOND RC - N.R. -9.78%
UBAM - LOCAL CURRENCY EMERGING MARKET BOND RHC EUR - - N.R.
JP Morgan GBI-EM Global Diversified USD Index -1.75% +16.76% -8.98%
UBAM - UNCONSTRAINED BOND (2) APC - - N.R.
UBAM - UNCONSTRAINED BOND (2) APD - - N.R.
UBAM - UNCONSTRAINED BOND (2) APHC CHF - - N.R.
UBAM - UNCONSTRAINED BOND (2) APHC USD - - N.R.
UBAM - UNCONSTRAINED BOND (2) APHC GBP - - N.R.
UBAM - UNCONSTRAINED BOND (2) APHD GBP - - N.R.
UBAM - UNCONSTRAINED BOND (2) IPC - - N.R.
UBAM - UNCONSTRAINED BOND (2) IPHC CHF - - N.R.
UBAM - UNCONSTRAINED BOND (2) IPHC USD - - N.R.
UBAM - UNCONSTRAINED BOND (2) RC - - N.R.
UBAM - YIELD CURVE EURO BOND AC +2.92% +10.95% +1.73%
UBAM - YIELD CURVE EURO BOND AD +2.91% +10.92% +1.75%
UBAM - YIELD CURVE EURO BOND IC +3.38% +11.43% +2.18%
UBAM - YIELD CURVE EURO BOND RC +2.41% +11.75% +1.30%
ML EMU DIRECT Gvts AAA 1-30 Yrs in Euro Index +3.34% +11.12% +2.30%
UBAM - YIELD CURVE STERLING BOND AC +15.47% +2.08% -5.17%
UBAM - YIELD CURVE STERLING BOND AD +15.46% +2.09% -5.17%
UBAM - YIELD CURVE STERLING BOND IC N.R. +2.63% -4.69%
Merrill Lynch UK Gilts 1-30 Years in GBP Index +16.92% +2.80% -4.25%
UBAM - YIELD CURVE US DOLLAR BOND AC +8.45% +2.08% -3.81%
UBAM - YIELD CURVE US DOLLAR BOND AD +8.44% +2.08% -3.81%
UBAM - YIELD CURVE US DOLLAR BOND IC +8.93% +2.53% -3.39%
UBAM - YIELD CURVE US DOLLAR BOND RC +7.91% +1.66% -4.29%
ML US Treasury Master 1-30 Yrs in USD Index +9.79% +2.16% -3.35%
UBAM - EM INVESTMENT GRADE CORP BOND (3) AC - - N.R.
UBAM - EM INVESTMENT GRADE CORP BOND (3) ASC - - N.R.
UBAM - EM INVESTMENT GRADE CORP BOND (3) IC - - N.R.
UBAM - EM INVESTMENT GRADE CORP BOND (3) ISC - - N.R.
UBAM - EM INVESTMENT GRADE CORP BOND (3) IHSC EUR - - N.R.
UBAM - EM INVESTMENT GRADE CORP BOND (3) RC - - N.R.
JPM Corporate EMBI Diversified Investment Grade Index Index - +15.11% -2.36%
UBAM
Report of the Board of Directors (continued)
Page 30
Name Type 2011 2012 2013
UBAM - EUROPEAN CONVERTIBLE BOND AC -9.59% +15.42% +13.38%
UBAM - EUROPEAN CONVERTIBLE BOND AD N.R. +15.41% +13.40%
UBAM - EUROPEAN CONVERTIBLE BOND AHC CHF - - N.R.
UBAM - EUROPEAN CONVERTIBLE BOND AHC USD - N.R. +13.69%
UBAM - EUROPEAN CONVERTIBLE BOND IC -9.23% +16.36% +13.96%
UBAM - EUROPEAN CONVERTIBLE BOND RC - N.R. +12.92%
UBAM - EURO 10-40 CONVERTIBLE BOND AC -5.31% +16.05% +8.87%
UBAM - EURO 10-40 CONVERTIBLE BOND AD -5.33% +16.05% +8.85%
UBAM - EURO 10-40 CONVERTIBLE BOND AHC CHF -6.29% +15.61% +8.60%
UBAM - EURO 10-40 CONVERTIBLE BOND AHC USD - - N.R.
UBAM - EURO 10-40 CONVERTIBLE BOND AHC GBP - - N.R.
UBAM - EURO 10-40 CONVERTIBLE BOND IC -4.94% +16.63% +9.40%
UBAM - EURO 10-40 CONVERTIBLE BOND ID - N.R. +9.40%
UBAM - EURO 10-40 CONVERTIBLE BOND IHC CHF - N.R. +9.14%
UBAM - EURO 10-40 CONVERTIBLE BOND IHC USD - N.R. +9.52%
UBAM - EURO 10-40 CONVERTIBLE BOND IHD USD - N.R. +9.52%
UBAM - EURO 10-40 CONVERTIBLE BOND IHD GBP N.R. +16.76% +9.83%
UBAM - EURO 10-40 CONVERTIBLE BOND RC - N.R. +7.88%
UBAM - GLOBAL CONVERTIBLE BOND (4) AC - - N.R.
UBAM - GLOBAL CONVERTIBLE BOND (4) AHC CHF - - N.R.
UBAM - GLOBAL CONVERTIBLE BOND (4) AHC USD - - N.R.
UBAM - GLOBAL CONVERTIBLE BOND (4) AHC GBP - - N.R.
UBAM - GLOBAL CONVERTIBLE BOND (4) IC - - N.R.
UBS CONVERTIBLES GLOBAL (USD) Index -6.74% +13.76% +18.34%
UBAM - 30 GLOBAL LEADERS EQUITY (5) ** AC - - N.R.
UBAM - 30 GLOBAL LEADERS EQUITY (5) ** AD - - N.R.
UBAM - 30 GLOBAL LEADERS EQUITY (5) ** AHC - - N.R.
UBAM - 30 GLOBAL LEADERS EQUITY (5) ** AHC CHF - - N.R.
UBAM - 30 GLOBAL LEADERS EQUITY (5) ** AC USD - - N.R.
UBAM - 30 GLOBAL LEADERS EQUITY (5) ** AHC USD - - N.R.
UBAM - 30 GLOBAL LEADERS EQUITY (5) ** AHC GBP - - N.R.
UBAM - 30 GLOBAL LEADERS EQUITY (5) ** IC - - N.R.
UBAM - 30 GLOBAL LEADERS EQUITY (5) ** IHC - - N.R.
UBAM - 30 GLOBAL LEADERS EQUITY (5) ** IC USD - - N.R.
UBAM - 30 GLOBAL LEADERS EQUITY (5) ** IHC USD - - N.R.
UBAM - 30 GLOBAL LEADERS EQUITY (5) ** RC - - N.R.
MSCI AC World Net Return Index -7.35% +16.13% +22.80%
UBAM - ASIA EQUITY AC -34.93% +30.89% +7.65%
UBAM - ASIA EQUITY AC EUR N.R. +28.83% +3.02%
UBAM - ASIA EQUITY APC USD - - N.R.
UBAM - ASIA EQUITY IPC N.R. +32.55% +9.01%
UBAM - ASIA EQUITY RC -35.60% +29.61% +6.58%
MSCI AC Asia ex-Japan Net Return Composite Index -16.56% +22.36% +3.07%
UBAM - ASIA EQUITY HIGH DIVIDEND (6) AC - - N.R.
UBAM - ASIA EQUITY HIGH DIVIDEND (6) AD - - N.R.
UBAM - ASIA EQUITY HIGH DIVIDEND (6) IC - - N.R.
UBAM - ASIA EQUITY HIGH DIVIDEND (6) ID - - N.R.
UBAM
Report of the Board of Directors (continued)
Page 31
Name Type 2011 2012 2013
UBAM - ASIA EQUITY HIGH DIVIDEND (6) IC EUR - - N.R.
MSCI AC Asia EX Japan High Dividend Yield Net Index in USD Index - - -0.06%
UBAM - DR. EHRHARDT GERMAN EQUITY AC -14.65% +20.53% +20.47%
UBAM - DR. EHRHARDT GERMAN EQUITY IC -14.01% +21.43% +21.36%
UBAM - DR. EHRHARDT GERMAN EQUITY RC -15.49% +19.33% +19.27%
DAX 30 Total Return Index -14.69% +29.06% +25.48%
UBAM - EQUITY BRIC+ APC -25.86% +19.05% +0.28%
UBAM - EQUITY BRIC+ APD -25.85% +19.05% +0.28%
UBAM - EQUITY BRIC+ APC EUR N.R. +17.20% -4.05%
UBAM - EQUITY BRIC+ APC CHF - N.R. -2.56%
UBAM - EQUITY BRIC+ IPC -25.36% +19.93% +1.03%
UBAM - EQUITY BRIC+ IPC EUR N.R. +18.08% -3.33%
UBAM - EQUITY BRIC+ RC -26.35% +18.08% -0.50%
UBAM - EQUITY BRIC+ ZC - - N.R.
MSCI BRIC Net Return Index -22.85% +14.54% -3.53%
UBAM - EUROPE EQUITY AC -8.40% +16.92% +24.53%
UBAM - EUROPE EQUITY AD - N.R. +24.53%
UBAM - EUROPE EQUITY AC CHF - N.R. +26.46%
UBAM - EUROPE EQUITY AC USD - - N.R.
UBAM - EUROPE EQUITY AC GBP - - N.R.
UBAM - EUROPE EQUITY IC -7.71% +17.80% +25.46%
UBAM - EUROPE EQUITY ID - N.R. +25.45%
UBAM - EUROPE EQUITY RC -9.25% +16.05% +23.91%
MSCI Europe Net Return Index -8.08% +17.29% +19.82%
UBAM - EUROPE EQUITY DIVIDEND+ AC +0.56% +6.77% +4.45%
UBAM - EUROPE EQUITY DIVIDEND+ AD +0.56% +4.38% +4.38%
UBAM - EUROPE EQUITY DIVIDEND+ AHC EUR - - N.R.
UBAM - EUROPE EQUITY DIVIDEND+ AC CHF +0.87% +6.16% +6.07%
UBAM - EUROPE EQUITY DIVIDEND+ AD CHF - N.R. +6.01%
UBAM - EUROPE EQUITY DIVIDEND+ AHC CHF - N.R. +5.84%
UBAM - EUROPE EQUITY DIVIDEND+ AHD CHF - N.R. +5.78%
UBAM - EUROPE EQUITY DIVIDEND+ AC USD +0.43% +8.45% +9.16%
UBAM - EUROPE EQUITY DIVIDEND+ AD USD - N.R. +9.10%
UBAM - EUROPE EQUITY DIVIDEND+ AHC USD - N.R. +5.75%
UBAM - EUROPE EQUITY DIVIDEND+ AHD USD - - N.R.
UBAM - EUROPE EQUITY DIVIDEND+ AC SEK - N.R. +7.79%
UBAM - EUROPE EQUITY DIVIDEND+ AHC SEK - - N.R.
UBAM - EUROPE EQUITY DIVIDEND+ IC +0.61% +7.57% +5.22%
UBAM - EUROPE EQUITY DIVIDEND+ ID +0.60% +5.15% +5.15%
UBAM - EUROPE EQUITY DIVIDEND+ IHC EUR - - N.R.
UBAM - EUROPE EQUITY DIVIDEND+ IC CHF - N.R. +6.84%
UBAM - EUROPE EQUITY DIVIDEND+ ID CHF -0.22% +6.79% +6.79%
UBAM - EUROPE EQUITY DIVIDEND+ IC USD - - N.R.
UBAM - EUROPE EQUITY DIVIDEND+ ID USD +1.07% +9.90% +9.90%
UBAM - EUROPE EQUITY DIVIDEND+ IHD USD - N.R. +6.47%
UBAM - EUROPE EQUITY DIVIDEND+ IC GBP - N.R. +7.94%
UBAM - EUROPE EQUITY DIVIDEND+ ID GBP - N.R. +7.85%
UBAM - EUROPE EQUITY DIVIDEND+ IHC GBP - N.R. +6.87%
UBAM - EUROPE EQUITY DIVIDEND+ IHD GBP - N.R. +6.81%
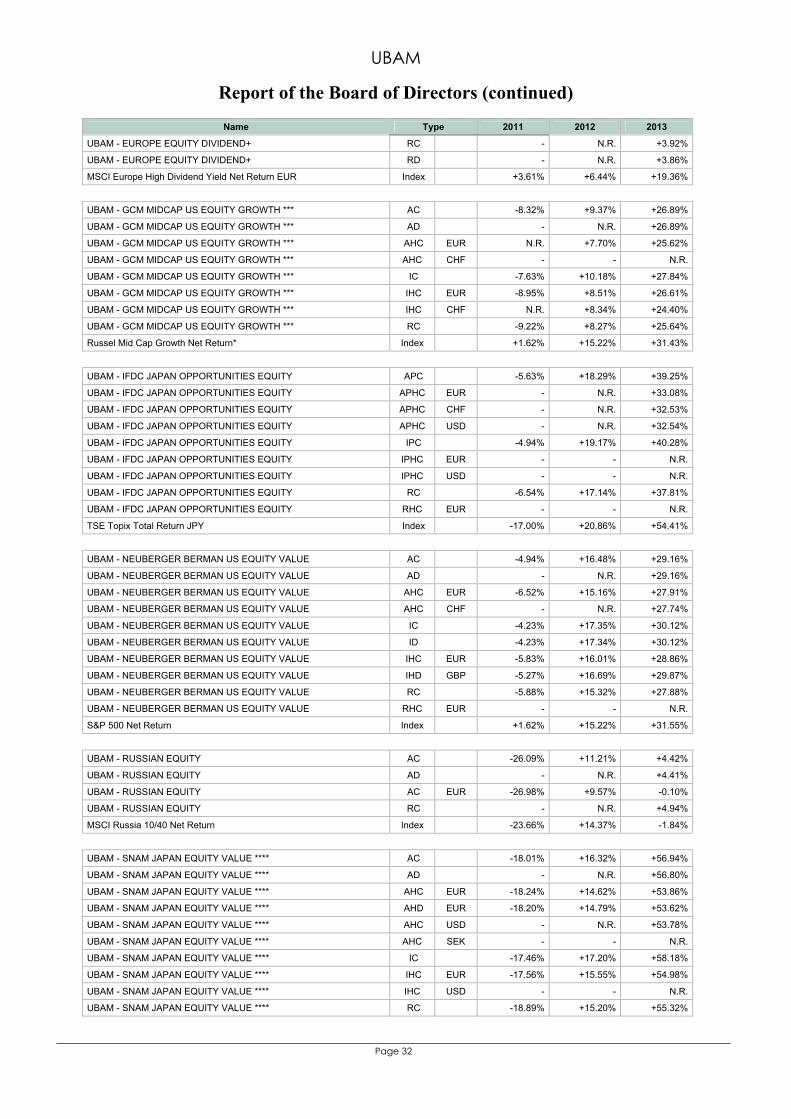
UBAM
Report of the Board of Directors (continued)
Page 32
Name Type 2011 2012 2013
UBAM - EUROPE EQUITY DIVIDEND+ RC - N.R. +3.92%
UBAM - EUROPE EQUITY DIVIDEND+ RD - N.R. +3.86%
MSCI Europe High Dividend Yield Net Return EUR Index +3.61% +6.44% +19.36%
UBAM - GCM MIDCAP US EQUITY GROWTH *** AC -8.32% +9.37% +26.89%
UBAM - GCM MIDCAP US EQUITY GROWTH *** AD - N.R. +26.89%
UBAM - GCM MIDCAP US EQUITY GROWTH *** AHC EUR N.R. +7.70% +25.62%
UBAM - GCM MIDCAP US EQUITY GROWTH *** AHC CHF - - N.R.
UBAM - GCM MIDCAP US EQUITY GROWTH *** IC -7.63% +10.18% +27.84%
UBAM - GCM MIDCAP US EQUITY GROWTH *** IHC EUR -8.95% +8.51% +26.61%
UBAM - GCM MIDCAP US EQUITY GROWTH *** IHC CHF N.R. +8.34% +24.40%
UBAM - GCM MIDCAP US EQUITY GROWTH *** RC -9.22% +8.27% +25.64%
Russel Mid Cap Growth Net Return* Index +1.62% +15.22% +31.43%
UBAM - IFDC JAPAN OPPORTUNITIES EQUITY APC -5.63% +18.29% +39.25%
UBAM - IFDC JAPAN OPPORTUNITIES EQUITY APHC EUR - N.R. +33.08%
UBAM - IFDC JAPAN OPPORTUNITIES EQUITY APHC CHF - N.R. +32.53%
UBAM - IFDC JAPAN OPPORTUNITIES EQUITY APHC USD - N.R. +32.54%
UBAM - IFDC JAPAN OPPORTUNITIES EQUITY IPC -4.94% +19.17% +40.28%
UBAM - IFDC JAPAN OPPORTUNITIES EQUITY IPHC EUR - - N.R.
UBAM - IFDC JAPAN OPPORTUNITIES EQUITY IPHC USD - - N.R.
UBAM - IFDC JAPAN OPPORTUNITIES EQUITY RC -6.54% +17.14% +37.81%
UBAM - IFDC JAPAN OPPORTUNITIES EQUITY RHC EUR - - N.R.
TSE Topix Total Return JPY Index -17.00% +20.86% +54.41%
UBAM - NEUBERGER BERMAN US EQUITY VALUE AC -4.94% +16.48% +29.16%
UBAM - NEUBERGER BERMAN US EQUITY VALUE AD - N.R. +29.16%
UBAM - NEUBERGER BERMAN US EQUITY VALUE AHC EUR -6.52% +15.16% +27.91%
UBAM - NEUBERGER BERMAN US EQUITY VALUE AHC CHF - N.R. +27.74%
UBAM - NEUBERGER BERMAN US EQUITY VALUE IC -4.23% +17.35% +30.12%
UBAM - NEUBERGER BERMAN US EQUITY VALUE ID -4.23% +17.34% +30.12%
UBAM - NEUBERGER BERMAN US EQUITY VALUE IHC EUR -5.83% +16.01% +28.86%
UBAM - NEUBERGER BERMAN US EQUITY VALUE IHD GBP -5.27% +16.69% +29.87%
UBAM - NEUBERGER BERMAN US EQUITY VALUE RC -5.88% +15.32% +27.88%
UBAM - NEUBERGER BERMAN US EQUITY VALUE RHC EUR - - N.R.
S&P 500 Net Return Index +1.62% +15.22% +31.55%
UBAM - RUSSIAN EQUITY AC -26.09% +11.21% +4.42%
UBAM - RUSSIAN EQUITY AD - N.R. +4.41%
UBAM - RUSSIAN EQUITY AC EUR -26.98% +9.57% -0.10%
UBAM - RUSSIAN EQUITY RC - N.R. +4.94%
MSCI Russia 10/40 Net Return Index -23.66% +14.37% -1.84%
UBAM - SNAM JAPAN EQUITY VALUE **** AC -18.01% +16.32% +56.94%
UBAM - SNAM JAPAN EQUITY VALUE **** AD - N.R. +56.80%
UBAM - SNAM JAPAN EQUITY VALUE **** AHC EUR -18.24% +14.62% +53.86%
UBAM - SNAM JAPAN EQUITY VALUE **** AHD EUR -18.20% +14.79% +53.62%
UBAM - SNAM JAPAN EQUITY VALUE **** AHC USD - N.R. +53.78%
UBAM - SNAM JAPAN EQUITY VALUE **** AHC SEK - - N.R.
UBAM - SNAM JAPAN EQUITY VALUE **** IC -17.46% +17.20% +58.18%
UBAM - SNAM JAPAN EQUITY VALUE **** IHC EUR -17.56% +15.55% +54.98%
UBAM - SNAM JAPAN EQUITY VALUE **** IHC USD - - N.R.
UBAM - SNAM JAPAN EQUITY VALUE **** RC -18.89% +15.20% +55.32%
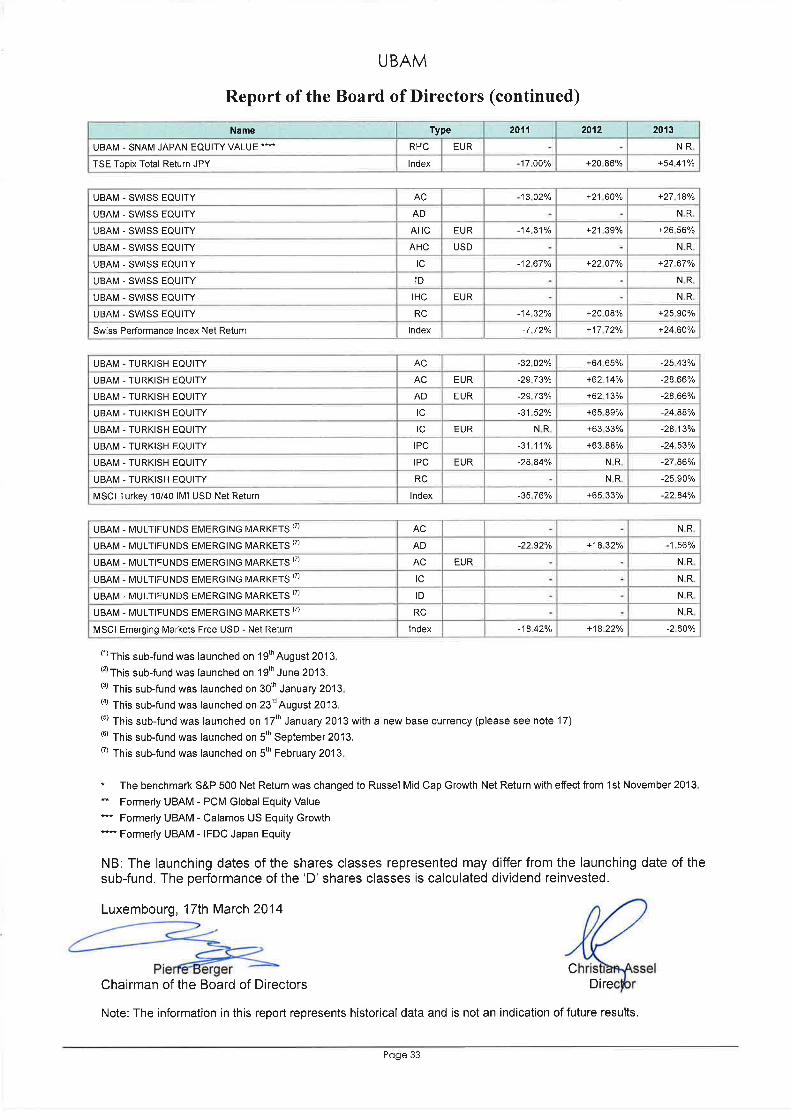
Deloitte Audit Société à responsabilité limitée 560, rue de Neudorf L-2220 Luxembourg B.P.1173 L-1011 Luxembourg Tel: +352 451 451 Fax: +352 451 452 992 www.deloitte.lu
Société à responsabilité limitée au capital de 35.000 EUR RCS Luxembourg B 67.895
Page 34
REPORT OF THE RÉVISEUR D’ENTREPRISES AGRÉÉ
To the Shareholders of UBAM Following our appointment by the general meeting of the shareholders of 17th April 2013, we have audited the accompanying financial statements of UBAM (the ‘’SICAV’’) and of each of its sub-funds, which comprise the consolidated statement of net assets, the statement of net assets and the statement of investments and other net assets as at 31st December 2013 and the consolidated statement of operations, the statement of operations and other changes in net assets for the year then ended, and a summary of significant accounting policies and other explanatory notes to the financial statements. Board of Directors of the SICAV’s responsibility for the financial statements The Board of Directors of the SICAV is responsible for the preparation and fair presentation of these financial statements in accordance with Luxembourg legal and regulatory requirements relating to the preparation of the financial statements and for such internal control as the Board of Directors of the SICAV determines is necessary to enable the preparation of financial statements that are free from material misstatement, whether due to fraud or error. Responsibility of the réviseur d’entreprises agréé Our responsibility is to express an opinion on these financial statements based on our audit. We conducted our audit in accordance with International Standards on Auditing as adopted for Luxembourg by the Commission de Surveillance du Secteur Financier. Those standards require that we comply with ethical requirements and plan and perform the audit to obtain reasonable assurance whether the financial statements are free from material misstatement. An audit involves performing procedures to obtain audit evidence about the amounts and disclosures in the financial statements. The procedures selected depend on the réviseur d’entreprises agréé’s judgement, including the assessment of the risks of material misstatement of the financial statements, whether due to fraud or error. In making those risk assessments, the réviseur d’entreprises agréé considers internal control relevant to the entity’s preparation and fair presentation of the financial statements in order to design audit procedures that are appropriate in the circumstances, but not for the purpose of expressing an opinion on the effectiveness of the entity’s internal control. An audit also includes evaluating the appropriateness of accounting policies used and the reasonableness of accounting estimates made by the Board of Directors of the SICAV, as well as evaluating the overall presentation of the financial statements. We believe that the audit evidence we have obtained is sufficient and appropriate to provide a basis for our audit opinion.
Deloitte.
Opinion
In our opinion, the financial statements give a true and fair view of the financial position of UBAM and of each of its sub-funds as of 31st December 2013, and of the results of their operations and changes in their net assets for the year then ended in accordance with the Luxembourg legal and regulatory requirements relating to the preparation of the financial statements.
Other matter
Supplementary information included in the annual report has been reviewed in the context of our mandate but has not been subject to specific audit procedures carried out in accordance with the standards described above. Consequently, we express no opinion on such information. However, we have no observation to make concerning such information in the context of the financial statements taken as a whole.
For Deloitte Audit, Cabinet de revision agree
Luxembourg, 15th April 2014 560, rue de Neudorf L-2220 Luxembourg
Societe a responsabilite limitee au capital de 35.000 EUR RCS Luxembourg B 67.895
Page 35

The accompanying notes are an integral part of these financial statements.
36Page
5,834,893,182.52Assets5,418,399,982.76Securities portfolio at market value 2Note
8,816.83Options contracts at market value 2, 12Note11,393,467.74Deposits on futures and options contracts
203,853,658.71Cash at banks68,534,918.84Other liquid assets1,584,019.11Interest receivable on swap contracts
31,175,894.95Interest receivable on bonds and other debt securities6,318.29Formation expenses, net 2Note
3,462,455.68Receivable on issues of shares1,130,621.85Dividends receivable
10,349,155.37Unrealised gain on forward foreign exchange contracts 2, 9Note2,356,323.33Unrealised gain on futures contracts 2, 10Note
82,154,464.44Unrealised gain on swap contracts 2, 11Note15,160.72Receivable on treasury transactions 2Note
467,923.90Other receivables
100,263,476.66Liabilities2,932,249.67Short option contracts at market value 2, 12Note
10,251,726.40Bank liabilities68,740,679.33Other liquid liabilities2,916,102.21Payable on redemptions of shares
172,298.70Unrealised loss on forward foreign exchange contracts 2, 9Note524,173.20Unrealised loss on futures contracts 2, 10Note
1,607.30Unrealised loss on swap contracts 2, 11Note177.48Payable on treasury transactions 2Note
61,075.51Payable on swap contracts14,663,386.86Interest payable on bank liabilities and expenses payable
5,734,629,705.86Net assets at the end of the year
UBAM
Financial Statements as at 31/12/2013
Expressed in EUR
Statement of net assets as at 31/12/2013
Combined
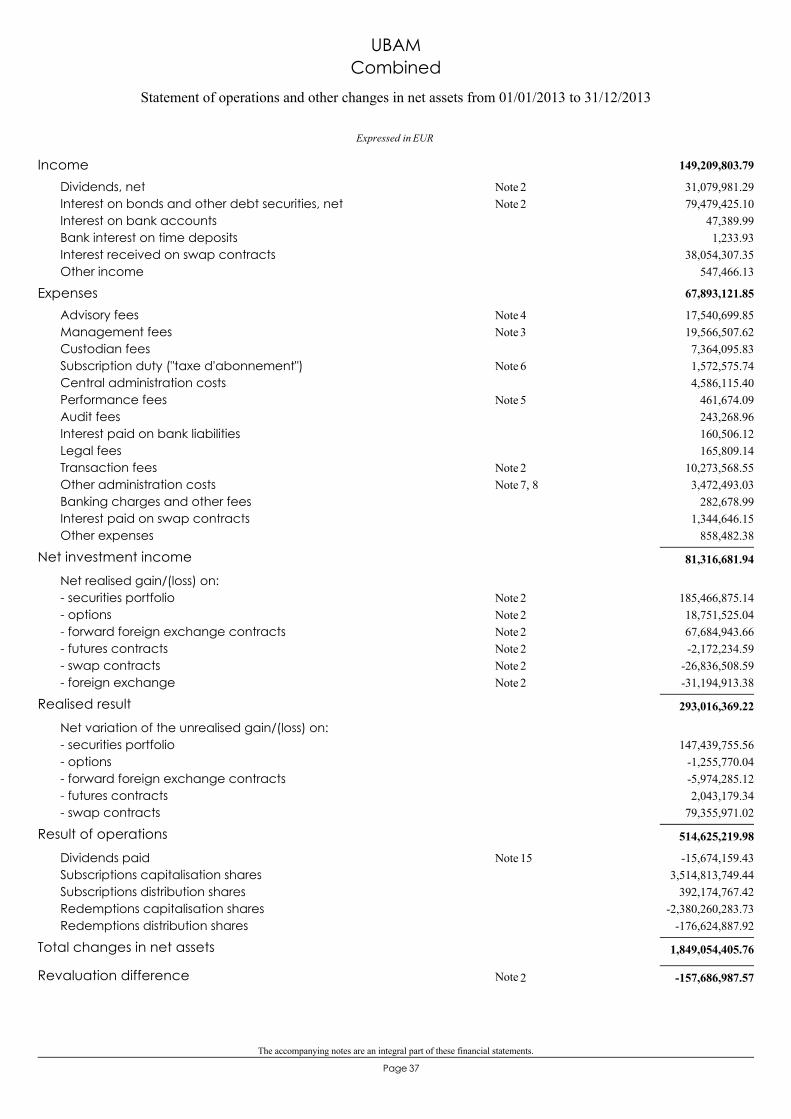
The accompanying notes are an integral part of these financial statements.
37Page
149,209,803.79Income31,079,981.29Dividends, net 2Note79,479,425.10Interest on bonds and other debt securities, net 2Note
47,389.99Interest on bank accounts1,233.93Bank interest on time deposits
38,054,307.35Interest received on swap contracts547,466.13Other income
67,893,121.85Expenses17,540,699.85Advisory fees 4Note19,566,507.62Management fees 3Note7,364,095.83Custodian fees1,572,575.74Subscription duty ("taxe d'abonnement") 6Note4,586,115.40Central administration costs
461,674.09Performance fees 5Note243,268.96Audit fees160,506.12Interest paid on bank liabilities165,809.14Legal fees
10,273,568.55Transaction fees 2Note3,472,493.03Other administration costs 7, 8Note
282,678.99Banking charges and other fees1,344,646.15Interest paid on swap contracts
858,482.38Other expenses
81,316,681.94Net investment income
Net realised gain/(loss) on:185,466,875.14- securities portfolio 2Note18,751,525.04- options 2Note67,684,943.66- forward foreign exchange contracts 2Note-2,172,234.59- futures contracts 2Note
-26,836,508.59- swap contracts 2Note-31,194,913.38- foreign exchange 2Note
293,016,369.22Realised result
Net variation of the unrealised gain/(loss) on:147,439,755.56- securities portfolio
-1,255,770.04- options-5,974,285.12- forward foreign exchange contracts2,043,179.34- futures contracts
79,355,971.02- swap contracts
514,625,219.98Result of operations
-15,674,159.43Dividends paid 15Note3,514,813,749.44Subscriptions capitalisation shares
392,174,767.42Subscriptions distribution shares-2,380,260,283.73Redemptions capitalisation shares
-176,624,887.92Redemptions distribution shares
1,849,054,405.76Total changes in net assets
-157,686,987.572NoteRevaluation difference
EUR
Statement of operations and other changes in net assets from 01/01/2013 to 31/12/2013
UBAMCombined
Expressed in
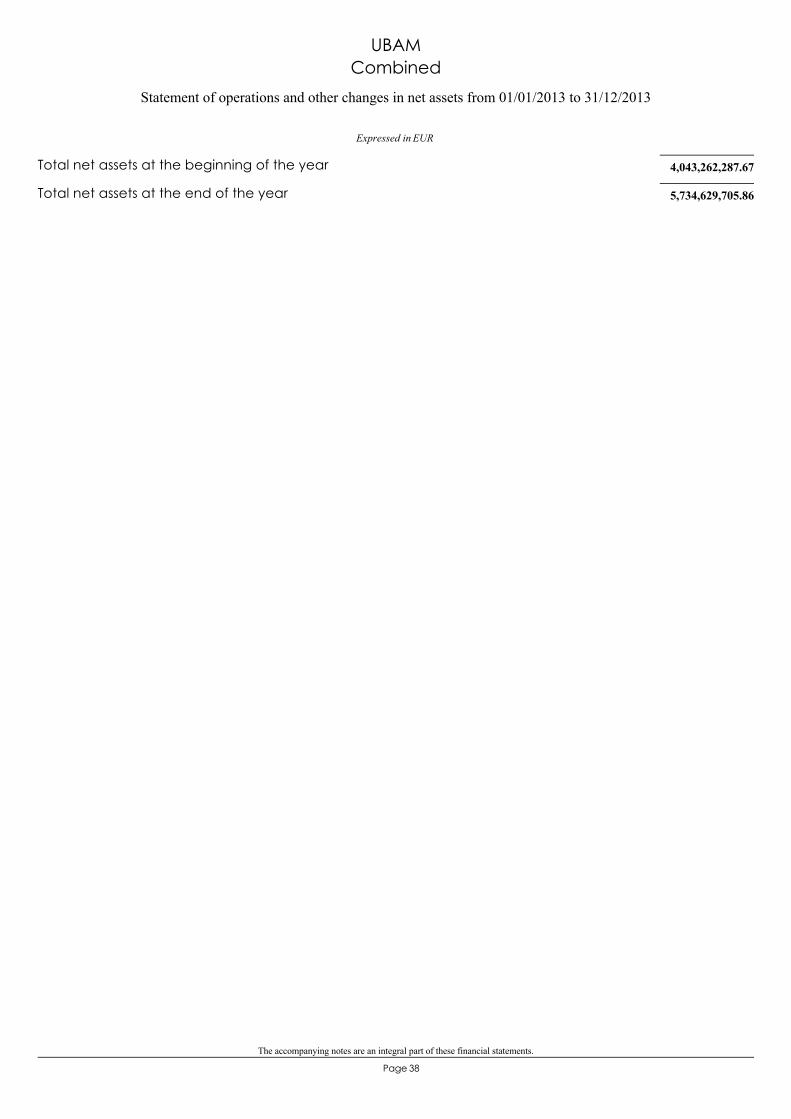
The accompanying notes are an integral part of these financial statements.
38Page
4,043,262,287.67Total net assets at the beginning of the year
5,734,629,705.86Total net assets at the end of the year
EUR
Statement of operations and other changes in net assets from 01/01/2013 to 31/12/2013
UBAMCombined
Expressed in
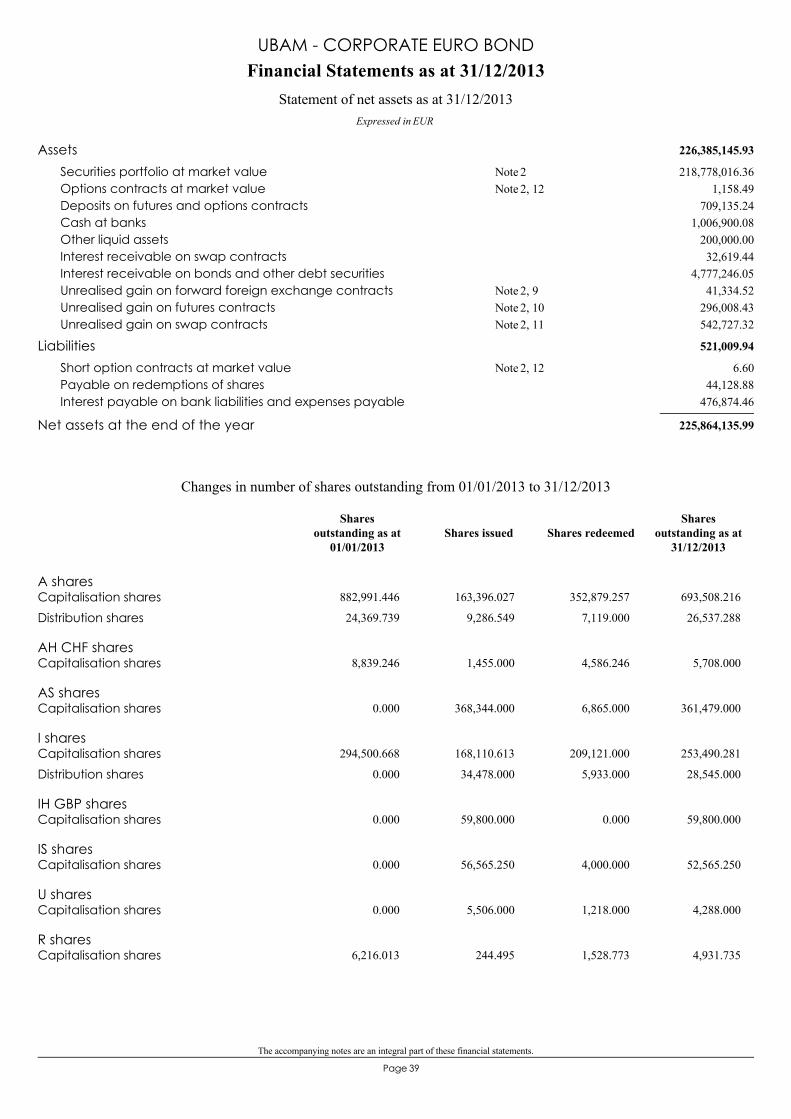
The accompanying notes are an integral part of these financial statements.
39Page
226,385,145.93Assets218,778,016.36Securities portfolio at market value 2Note
1,158.49Options contracts at market value 2, 12Note709,135.24Deposits on futures and options contracts
1,006,900.08Cash at banks200,000.00Other liquid assets32,619.44Interest receivable on swap contracts
4,777,246.05Interest receivable on bonds and other debt securities41,334.52Unrealised gain on forward foreign exchange contracts 2, 9Note
296,008.43Unrealised gain on futures contracts 2, 10Note542,727.32Unrealised gain on swap contracts 2, 11Note
521,009.94Liabilities6.60Short option contracts at market value 2, 12Note
44,128.88Payable on redemptions of shares476,874.46Interest payable on bank liabilities and expenses payable
225,864,135.99Net assets at the end of the year
Financial Statements as at 31/12/2013
Expressed in EUR
Statement of net assets as at 31/12/2013
UBAM - CORPORATE EURO BOND
A sharesCapitalisation shares 882,991.446 163,396.027 352,879.257 693,508.216
Distribution shares 24,369.739 9,286.549 7,119.000 26,537.288
AH CHF sharesCapitalisation shares 8,839.246 1,455.000 4,586.246 5,708.000
AS sharesCapitalisation shares 0.000 368,344.000 6,865.000 361,479.000
I sharesCapitalisation shares 294,500.668 168,110.613 209,121.000 253,490.281
Distribution shares 0.000 34,478.000 5,933.000 28,545.000
IH GBP sharesCapitalisation shares 0.000 59,800.000 0.000 59,800.000
IS sharesCapitalisation shares 0.000 56,565.250 4,000.000 52,565.250
U sharesCapitalisation shares 0.000 5,506.000 1,218.000 4,288.000
R sharesCapitalisation shares 6,216.013 244.495 1,528.773 4,931.735
Changes in number of shares outstanding from 01/01/2013 to 31/12/2013
Shares issued Shares redeemedShares
outstanding as at31/12/2013
Sharesoutstanding as at
01/01/2013
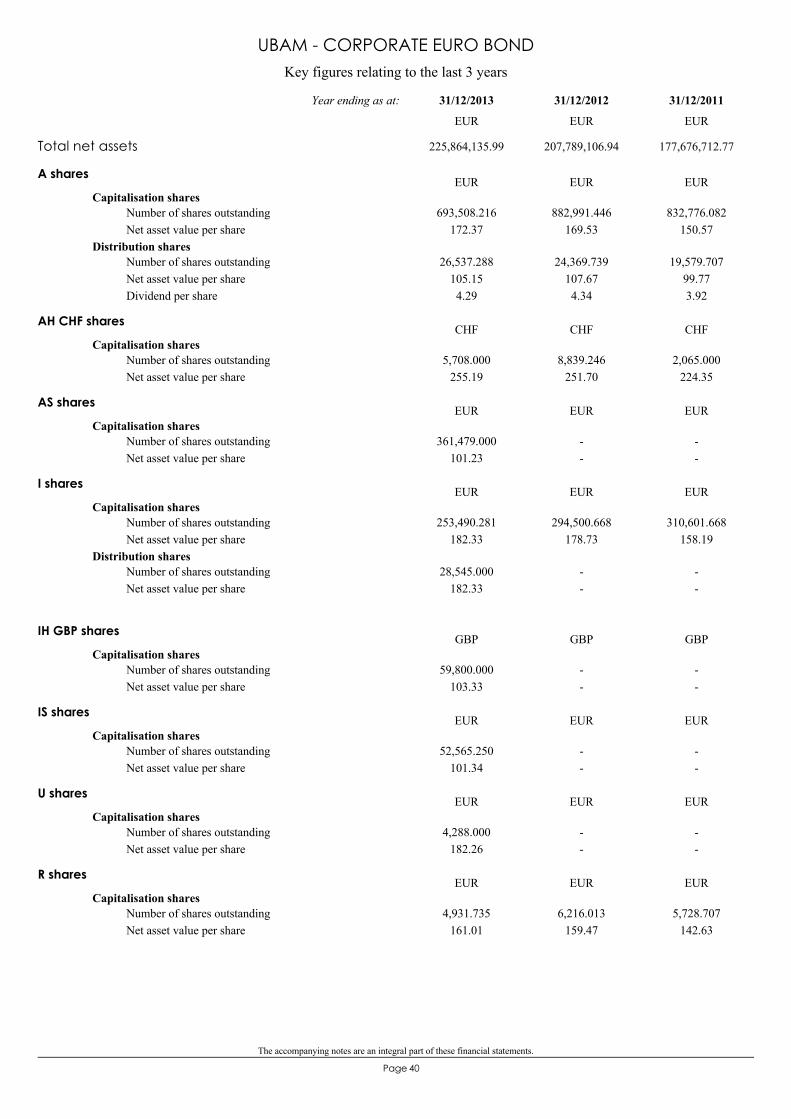
The accompanying notes are an integral part of these financial statements.
40Page
Key figures relating to the last 3 years
UBAM - CORPORATE EURO BOND
A shares
Capitalisation shares693,508.216
172.37882,991.446
169.53832,776.082
150.57Number of shares outstandingNet asset value per share
Distribution shares26,537.288
105.154.29
24,369.739107.674.34
19,579.70799.773.92
Number of shares outstandingNet asset value per shareDividend per share
EUR EUR EUR
AH CHF shares
Capitalisation shares5,708.000
255.198,839.246
251.702,065.000
224.35Number of shares outstandingNet asset value per share
CHF CHF CHF
AS shares
Capitalisation shares361,479.000
101.23--
--
Number of shares outstandingNet asset value per share
EUR EUR EUR
I shares
Capitalisation shares253,490.281
182.33294,500.668
178.73310,601.668
158.19Number of shares outstandingNet asset value per share
Distribution shares28,545.000
182.33--
--
Number of shares outstandingNet asset value per share
EUR EUR EUR
IH GBP shares
Capitalisation shares59,800.000
103.33--
--
Number of shares outstandingNet asset value per share
GBP GBP GBP
IS shares
Capitalisation shares52,565.250
101.34--
--
Number of shares outstandingNet asset value per share
EUR EUR EUR
U shares
Capitalisation shares4,288.000
182.26--
--
Number of shares outstandingNet asset value per share
EUR EUR EUR
R shares
Capitalisation shares4,931.735
161.016,216.013
159.475,728.707
142.63Number of shares outstandingNet asset value per share
EUR EUR EUR
Total net assets 225,864,135.99 207,789,106.94 177,676,712.77
31/12/201131/12/201231/12/2013Year ending as at:
EUR EUR EUR
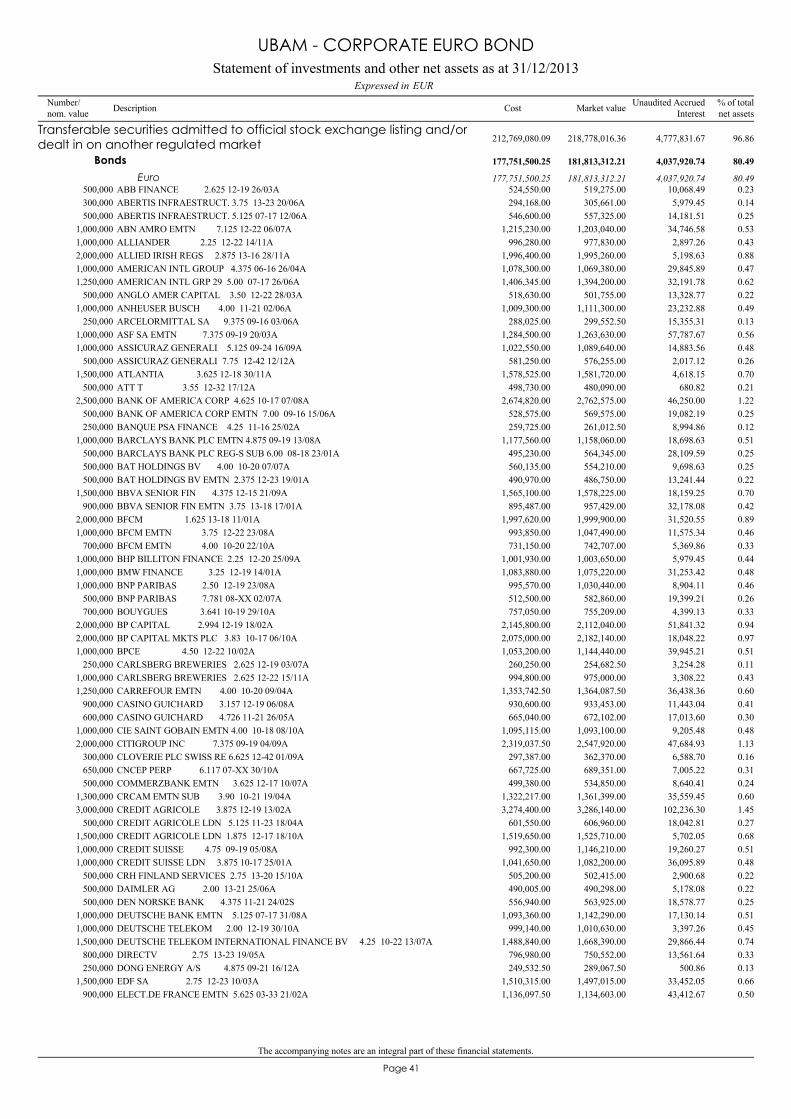
The accompanying notes are an integral part of these financial statements.
41Page
ABB FINANCE 2.625 12-19 26/03A500,000 519,275.00 0.23524,550.00 10,068.49
Transferable securities admitted to official stock exchange listing and/ordealt in on another regulated market 218,778,016.36 96.86212,769,080.09 4,777,831.67
Bonds 181,813,312.21 80.49177,751,500.25 4,037,920.74
Euro 181,813,312.21 80.49177,751,500.25 4,037,920.74
ABERTIS INFRAESTRUCT. 3.75 13-23 20/06A300,000 305,661.00 0.14294,168.00 5,979.45ABERTIS INFRAESTRUCT. 5.125 07-17 12/06A500,000 557,325.00 0.25546,600.00 14,181.51ABN AMRO EMTN 7.125 12-22 06/07A1,000,000 1,203,040.00 0.531,215,230.00 34,746.58ALLIANDER 2.25 12-22 14/11A1,000,000 977,830.00 0.43996,280.00 2,897.26ALLIED IRISH REGS 2.875 13-16 28/11A2,000,000 1,995,260.00 0.881,996,400.00 5,198.63AMERICAN INTL GROUP 4.375 06-16 26/04A1,000,000 1,069,380.00 0.471,078,300.00 29,845.89AMERICAN INTL GRP 29 5.00 07-17 26/06A1,250,000 1,394,200.00 0.621,406,345.00 32,191.78ANGLO AMER CAPITAL 3.50 12-22 28/03A500,000 501,755.00 0.22518,630.00 13,328.77ANHEUSER BUSCH 4.00 11-21 02/06A1,000,000 1,111,300.00 0.491,009,300.00 23,232.88ARCELORMITTAL SA 9.375 09-16 03/06A250,000 299,552.50 0.13288,025.00 15,355.31ASF SA EMTN 7.375 09-19 20/03A1,000,000 1,263,630.00 0.561,284,500.00 57,787.67ASSICURAZ GENERALI 5.125 09-24 16/09A1,000,000 1,089,640.00 0.481,022,550.00 14,883.56ASSICURAZ GENERALI 7.75 12-42 12/12A500,000 576,255.00 0.26581,250.00 2,017.12ATLANTIA 3.625 12-18 30/11A1,500,000 1,581,720.00 0.701,578,525.00 4,618.15ATT T 3.55 12-32 17/12A500,000 480,090.00 0.21498,730.00 680.82BANK OF AMERICA CORP 4.625 10-17 07/08A2,500,000 2,762,575.00 1.222,674,820.00 46,250.00BANK OF AMERICA CORP EMTN 7.00 09-16 15/06A500,000 569,575.00 0.25528,575.00 19,082.19BANQUE PSA FINANCE 4.25 11-16 25/02A250,000 261,012.50 0.12259,725.00 8,994.86BARCLAYS BANK PLC EMTN 4.875 09-19 13/08A1,000,000 1,158,060.00 0.511,177,560.00 18,698.63BARCLAYS BANK PLC REG-S SUB 6.00 08-18 23/01A500,000 564,345.00 0.25495,230.00 28,109.59BAT HOLDINGS BV 4.00 10-20 07/07A500,000 554,210.00 0.25560,135.00 9,698.63BAT HOLDINGS BV EMTN 2.375 12-23 19/01A500,000 486,750.00 0.22490,970.00 13,241.44BBVA SENIOR FIN 4.375 12-15 21/09A1,500,000 1,578,225.00 0.701,565,100.00 18,159.25BBVA SENIOR FIN EMTN 3.75 13-18 17/01A900,000 957,429.00 0.42895,487.00 32,178.08BFCM 1.625 13-18 11/01A2,000,000 1,999,900.00 0.891,997,620.00 31,520.55BFCM EMTN 3.75 12-22 23/08A1,000,000 1,047,490.00 0.46993,850.00 11,575.34BFCM EMTN 4.00 10-20 22/10A700,000 742,707.00 0.33731,150.00 5,369.86BHP BILLITON FINANCE 2.25 12-20 25/09A1,000,000 1,003,650.00 0.441,001,930.00 5,979.45BMW FINANCE 3.25 12-19 14/01A1,000,000 1,075,220.00 0.481,083,880.00 31,253.42BNP PARIBAS 2.50 12-19 23/08A1,000,000 1,030,440.00 0.46995,570.00 8,904.11BNP PARIBAS 7.781 08-XX 02/07A500,000 582,860.00 0.26512,500.00 19,399.21BOUYGUES 3.641 10-19 29/10A700,000 755,209.00 0.33757,050.00 4,399.13BP CAPITAL 2.994 12-19 18/02A2,000,000 2,112,040.00 0.942,145,800.00 51,841.32BP CAPITAL MKTS PLC 3.83 10-17 06/10A2,000,000 2,182,140.00 0.972,075,000.00 18,048.22BPCE 4.50 12-22 10/02A1,000,000 1,144,440.00 0.511,053,200.00 39,945.21CARLSBERG BREWERIES 2.625 12-19 03/07A250,000 254,682.50 0.11260,250.00 3,254.28CARLSBERG BREWERIES 2.625 12-22 15/11A1,000,000 975,000.00 0.43994,800.00 3,308.22CARREFOUR EMTN 4.00 10-20 09/04A1,250,000 1,364,087.50 0.601,353,742.50 36,438.36CASINO GUICHARD 3.157 12-19 06/08A900,000 933,453.00 0.41930,600.00 11,443.04CASINO GUICHARD 4.726 11-21 26/05A600,000 672,102.00 0.30665,040.00 17,013.60CIE SAINT GOBAIN EMTN 4.00 10-18 08/10A1,000,000 1,093,100.00 0.481,095,115.00 9,205.48CITIGROUP INC 7.375 09-19 04/09A2,000,000 2,547,920.00 1.132,319,037.50 47,684.93CLOVERIE PLC SWISS RE 6.625 12-42 01/09A300,000 362,370.00 0.16297,387.00 6,588.70CNCEP PERP 6.117 07-XX 30/10A650,000 689,351.00 0.31667,725.00 7,005.22COMMERZBANK EMTN 3.625 12-17 10/07A500,000 534,850.00 0.24499,380.00 8,640.41CRCAM EMTN SUB 3.90 10-21 19/04A1,300,000 1,361,399.00 0.601,322,217.00 35,559.45CREDIT AGRICOLE 3.875 12-19 13/02A3,000,000 3,286,140.00 1.453,274,400.00 102,236.30CREDIT AGRICOLE LDN 5.125 11-23 18/04A500,000 606,960.00 0.27601,550.00 18,042.81CREDIT AGRICOLE LDN 1.875 12-17 18/10A1,500,000 1,525,710.00 0.681,519,650.00 5,702.05CREDIT SUISSE 4.75 09-19 05/08A1,000,000 1,146,210.00 0.51992,300.00 19,260.27CREDIT SUISSE LDN 3.875 10-17 25/01A1,000,000 1,082,200.00 0.481,041,650.00 36,095.89CRH FINLAND SERVICES 2.75 13-20 15/10A500,000 502,415.00 0.22505,200.00 2,900.68DAIMLER AG 2.00 13-21 25/06A500,000 490,298.00 0.22490,005.00 5,178.08DEN NORSKE BANK 4.375 11-21 24/02S500,000 563,925.00 0.25556,940.00 18,578.77DEUTSCHE BANK EMTN 5.125 07-17 31/08A1,000,000 1,142,290.00 0.511,093,360.00 17,130.14DEUTSCHE TELEKOM 2.00 12-19 30/10A1,000,000 1,010,630.00 0.45999,140.00 3,397.26DEUTSCHE TELEKOM INTERNATIONAL FINANCE BV 4.25 10-22 13/07A1,500,000 1,668,390.00 0.741,488,840.00 29,866.44DIRECTV 2.75 13-23 19/05A800,000 750,552.00 0.33796,980.00 13,561.64DONG ENERGY A/S 4.875 09-21 16/12A250,000 289,067.50 0.13249,532.50 500.86EDF SA 2.75 12-23 10/03A1,500,000 1,497,015.00 0.661,510,315.00 33,452.05ELECT.DE FRANCE EMTN 5.625 03-33 21/02A900,000 1,134,603.00 0.501,136,097.50 43,412.67
Statement of investments and other net assets as at 31/12/2013EURExpressed in
UBAM - CORPORATE EURO BOND
Number/nom. value Description % of total
net assetsMarket valueCost Unaudited AccruedInterest
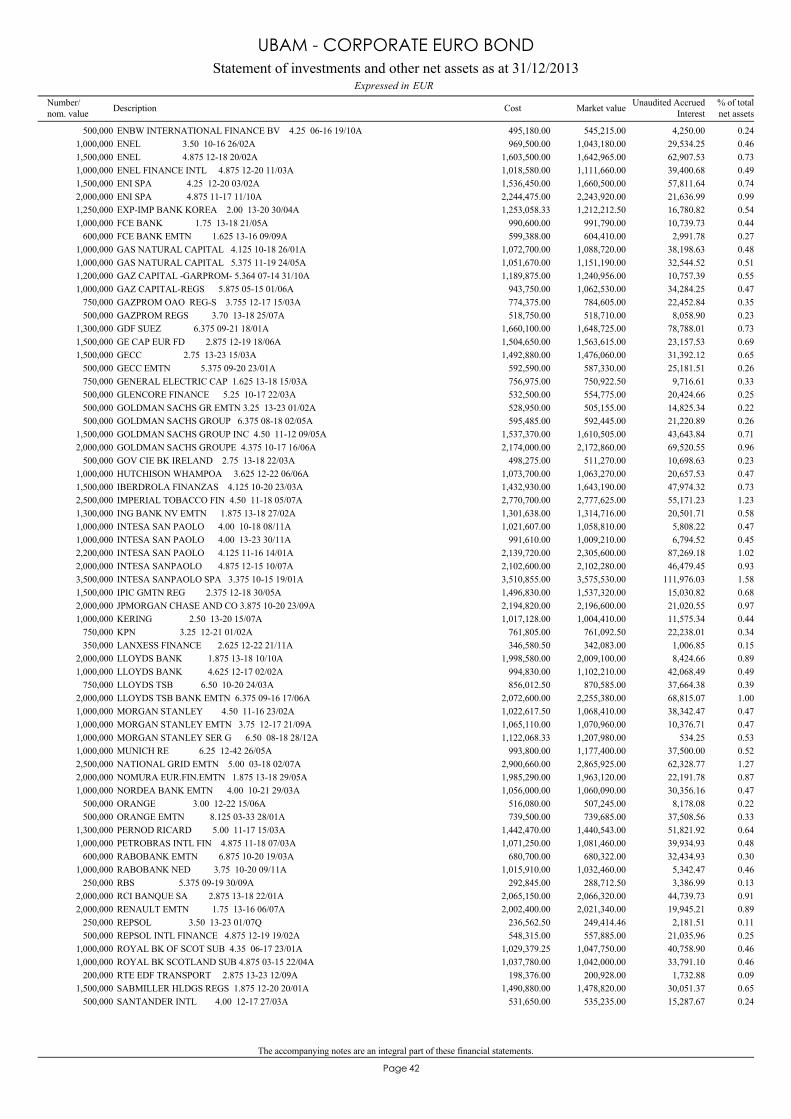
The accompanying notes are an integral part of these financial statements.
42Page
ENBW INTERNATIONAL FINANCE BV 4.25 06-16 19/10A500,000 545,215.00 0.24495,180.00 4,250.00ENEL 3.50 10-16 26/02A1,000,000 1,043,180.00 0.46969,500.00 29,534.25ENEL 4.875 12-18 20/02A1,500,000 1,642,965.00 0.731,603,500.00 62,907.53ENEL FINANCE INTL 4.875 12-20 11/03A1,000,000 1,111,660.00 0.491,018,580.00 39,400.68ENI SPA 4.25 12-20 03/02A1,500,000 1,660,500.00 0.741,536,450.00 57,811.64ENI SPA 4.875 11-17 11/10A2,000,000 2,243,920.00 0.992,244,475.00 21,636.99EXP-IMP BANK KOREA 2.00 13-20 30/04A1,250,000 1,212,212.50 0.541,253,058.33 16,780.82FCE BANK 1.75 13-18 21/05A1,000,000 991,790.00 0.44990,600.00 10,739.73FCE BANK EMTN 1.625 13-16 09/09A600,000 604,410.00 0.27599,388.00 2,991.78GAS NATURAL CAPITAL 4.125 10-18 26/01A1,000,000 1,088,720.00 0.481,072,700.00 38,198.63GAS NATURAL CAPITAL 5.375 11-19 24/05A1,000,000 1,151,190.00 0.511,051,670.00 32,544.52GAZ CAPITAL -GARPROM- 5.364 07-14 31/10A1,200,000 1,240,956.00 0.551,189,875.00 10,757.39GAZ CAPITAL-REGS 5.875 05-15 01/06A1,000,000 1,062,530.00 0.47943,750.00 34,284.25GAZPROM OAO REG-S 3.755 12-17 15/03A750,000 784,605.00 0.35774,375.00 22,452.84GAZPROM REGS 3.70 13-18 25/07A500,000 518,710.00 0.23518,750.00 8,058.90GDF SUEZ 6.375 09-21 18/01A1,300,000 1,648,725.00 0.731,660,100.00 78,788.01GE CAP EUR FD 2.875 12-19 18/06A1,500,000 1,563,615.00 0.691,504,650.00 23,157.53GECC 2.75 13-23 15/03A1,500,000 1,476,060.00 0.651,492,880.00 31,392.12GECC EMTN 5.375 09-20 23/01A500,000 587,330.00 0.26592,590.00 25,181.51GENERAL ELECTRIC CAP 1.625 13-18 15/03A750,000 750,922.50 0.33756,975.00 9,716.61GLENCORE FINANCE 5.25 10-17 22/03A500,000 554,775.00 0.25532,500.00 20,424.66GOLDMAN SACHS GR EMTN 3.25 13-23 01/02A500,000 505,155.00 0.22528,950.00 14,825.34GOLDMAN SACHS GROUP 6.375 08-18 02/05A500,000 592,445.00 0.26595,485.00 21,220.89GOLDMAN SACHS GROUP INC 4.50 11-12 09/05A1,500,000 1,610,505.00 0.711,537,370.00 43,643.84GOLDMAN SACHS GROUPE 4.375 10-17 16/06A2,000,000 2,172,860.00 0.962,174,000.00 69,520.55GOV CIE BK IRELAND 2.75 13-18 22/03A500,000 511,270.00 0.23498,275.00 10,698.63HUTCHISON WHAMPOA 3.625 12-22 06/06A1,000,000 1,063,270.00 0.471,073,700.00 20,657.53IBERDROLA FINANZAS 4.125 10-20 23/03A1,500,000 1,643,190.00 0.731,432,930.00 47,974.32IMPERIAL TOBACCO FIN 4.50 11-18 05/07A2,500,000 2,777,625.00 1.232,770,700.00 55,171.23ING BANK NV EMTN 1.875 13-18 27/02A1,300,000 1,314,716.00 0.581,301,638.00 20,501.71INTESA SAN PAOLO 4.00 10-18 08/11A1,000,000 1,058,810.00 0.471,021,607.00 5,808.22INTESA SAN PAOLO 4.00 13-23 30/11A1,000,000 1,009,210.00 0.45991,610.00 6,794.52INTESA SAN PAOLO 4.125 11-16 14/01A2,200,000 2,305,600.00 1.022,139,720.00 87,269.18INTESA SANPAOLO 4.875 12-15 10/07A2,000,000 2,102,280.00 0.932,102,600.00 46,479.45INTESA SANPAOLO SPA 3.375 10-15 19/01A3,500,000 3,575,530.00 1.583,510,855.00 111,976.03IPIC GMTN REG 2.375 12-18 30/05A1,500,000 1,537,320.00 0.681,496,830.00 15,030.82JPMORGAN CHASE AND CO 3.875 10-20 23/09A2,000,000 2,196,600.00 0.972,194,820.00 21,020.55KERING 2.50 13-20 15/07A1,000,000 1,004,410.00 0.441,017,128.00 11,575.34KPN 3.25 12-21 01/02A750,000 761,092.50 0.34761,805.00 22,238.01LANXESS FINANCE 2.625 12-22 21/11A350,000 342,083.00 0.15346,580.50 1,006.85LLOYDS BANK 1.875 13-18 10/10A2,000,000 2,009,100.00 0.891,998,580.00 8,424.66LLOYDS BANK 4.625 12-17 02/02A1,000,000 1,102,210.00 0.49994,830.00 42,068.49LLOYDS TSB 6.50 10-20 24/03A750,000 870,585.00 0.39856,012.50 37,664.38LLOYDS TSB BANK EMTN 6.375 09-16 17/06A2,000,000 2,255,380.00 1.002,072,600.00 68,815.07MORGAN STANLEY 4.50 11-16 23/02A1,000,000 1,068,410.00 0.471,022,617.50 38,342.47MORGAN STANLEY EMTN 3.75 12-17 21/09A1,000,000 1,070,960.00 0.471,065,110.00 10,376.71MORGAN STANLEY SER G 6.50 08-18 28/12A1,000,000 1,207,980.00 0.531,122,068.33 534.25MUNICH RE 6.25 12-42 26/05A1,000,000 1,177,400.00 0.52993,800.00 37,500.00NATIONAL GRID EMTN 5.00 03-18 02/07A2,500,000 2,865,925.00 1.272,900,660.00 62,328.77NOMURA EUR.FIN.EMTN 1.875 13-18 29/05A2,000,000 1,963,120.00 0.871,985,290.00 22,191.78NORDEA BANK EMTN 4.00 10-21 29/03A1,000,000 1,060,090.00 0.471,056,000.00 30,356.16ORANGE 3.00 12-22 15/06A500,000 507,245.00 0.22516,080.00 8,178.08ORANGE EMTN 8.125 03-33 28/01A500,000 739,685.00 0.33739,500.00 37,508.56PERNOD RICARD 5.00 11-17 15/03A1,300,000 1,440,543.00 0.641,442,470.00 51,821.92PETROBRAS INTL FIN 4.875 11-18 07/03A1,000,000 1,081,460.00 0.481,071,250.00 39,934.93RABOBANK EMTN 6.875 10-20 19/03A600,000 680,322.00 0.30680,700.00 32,434.93RABOBANK NED 3.75 10-20 09/11A1,000,000 1,032,460.00 0.461,015,910.00 5,342.47RBS 5.375 09-19 30/09A250,000 288,712.50 0.13292,845.00 3,386.99RCI BANQUE SA 2.875 13-18 22/01A2,000,000 2,066,320.00 0.912,065,150.00 44,739.73RENAULT EMTN 1.75 13-16 06/07A2,000,000 2,021,340.00 0.892,002,400.00 19,945.21REPSOL 3.50 13-23 01/07Q250,000 249,414.46 0.11236,562.50 2,181.51REPSOL INTL FINANCE 4.875 12-19 19/02A500,000 557,885.00 0.25548,315.00 21,035.96ROYAL BK OF SCOT SUB 4.35 06-17 23/01A1,000,000 1,047,750.00 0.461,029,379.25 40,758.90ROYAL BK SCOTLAND SUB 4.875 03-15 22/04A1,000,000 1,042,000.00 0.461,037,780.00 33,791.10RTE EDF TRANSPORT 2.875 13-23 12/09A200,000 200,928.00 0.09198,376.00 1,732.88SABMILLER HLDGS REGS 1.875 12-20 20/01A1,500,000 1,478,820.00 0.651,490,880.00 30,051.37SANTANDER INTL 4.00 12-17 27/03A500,000 535,235.00 0.24531,650.00 15,287.67
Statement of investments and other net assets as at 31/12/2013EURExpressed in
UBAM - CORPORATE EURO BOND
Number/nom. value Description % of total
net assetsMarket valueCost Unaudited AccruedInterest
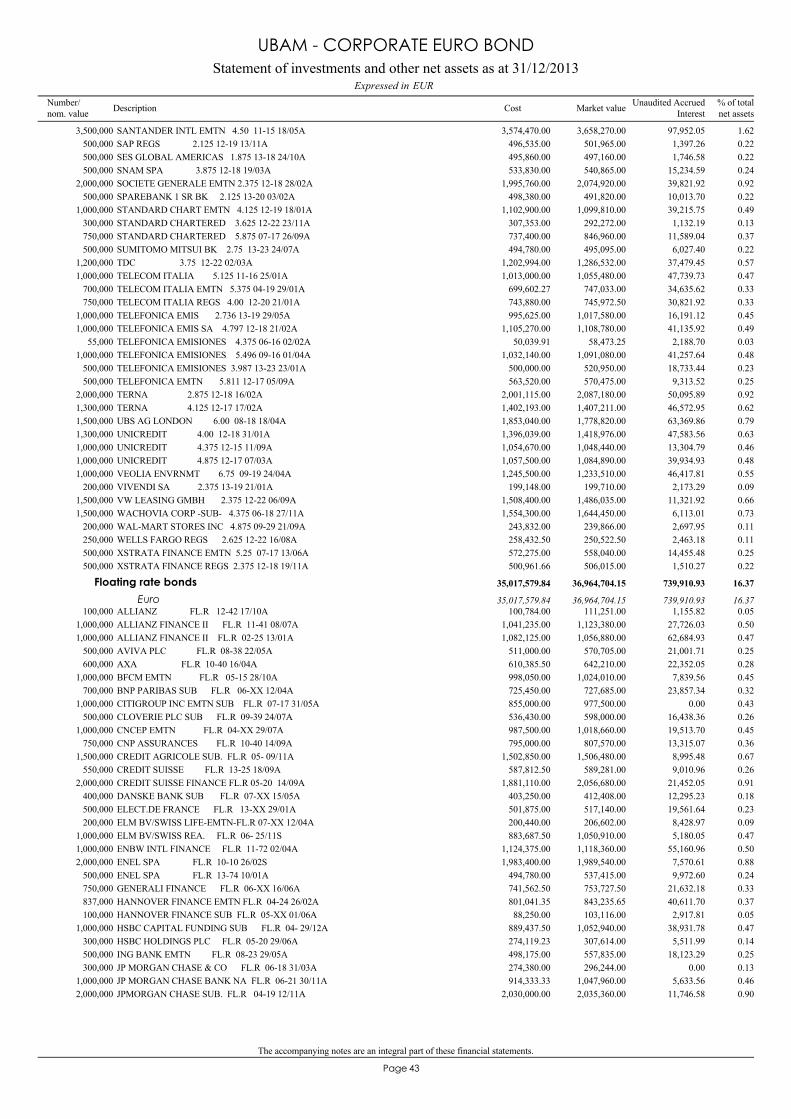
The accompanying notes are an integral part of these financial statements.
43Page
SANTANDER INTL EMTN 4.50 11-15 18/05A3,500,000 3,658,270.00 1.623,574,470.00 97,952.05SAP REGS 2.125 12-19 13/11A500,000 501,965.00 0.22496,535.00 1,397.26SES GLOBAL AMERICAS 1.875 13-18 24/10A500,000 497,160.00 0.22495,860.00 1,746.58SNAM SPA 3.875 12-18 19/03A500,000 540,865.00 0.24533,830.00 15,234.59SOCIETE GENERALE EMTN 2.375 12-18 28/02A2,000,000 2,074,920.00 0.921,995,760.00 39,821.92SPAREBANK 1 SR BK 2.125 13-20 03/02A500,000 491,820.00 0.22498,380.00 10,013.70STANDARD CHART EMTN 4.125 12-19 18/01A1,000,000 1,099,810.00 0.491,102,900.00 39,215.75STANDARD CHARTERED 3.625 12-22 23/11A300,000 292,272.00 0.13307,353.00 1,132.19STANDARD CHARTERED 5.875 07-17 26/09A750,000 846,960.00 0.37737,400.00 11,589.04SUMITOMO MITSUI BK 2.75 13-23 24/07A500,000 495,095.00 0.22494,780.00 6,027.40TDC 3.75 12-22 02/03A1,200,000 1,286,532.00 0.571,202,994.00 37,479.45TELECOM ITALIA 5.125 11-16 25/01A1,000,000 1,055,480.00 0.471,013,000.00 47,739.73TELECOM ITALIA EMTN 5.375 04-19 29/01A700,000 747,033.00 0.33699,602.27 34,635.62TELECOM ITALIA REGS 4.00 12-20 21/01A750,000 745,972.50 0.33743,880.00 30,821.92TELEFONICA EMIS 2.736 13-19 29/05A1,000,000 1,017,580.00 0.45995,625.00 16,191.12TELEFONICA EMIS SA 4.797 12-18 21/02A1,000,000 1,108,780.00 0.491,105,270.00 41,135.92TELEFONICA EMISIONES 4.375 06-16 02/02A55,000 58,473.25 0.0350,039.91 2,188.70TELEFONICA EMISIONES 5.496 09-16 01/04A1,000,000 1,091,080.00 0.481,032,140.00 41,257.64TELEFONICA EMISIONES 3.987 13-23 23/01A500,000 520,950.00 0.23500,000.00 18,733.44TELEFONICA EMTN 5.811 12-17 05/09A500,000 570,475.00 0.25563,520.00 9,313.52TERNA 2.875 12-18 16/02A2,000,000 2,087,180.00 0.922,001,115.00 50,095.89TERNA 4.125 12-17 17/02A1,300,000 1,407,211.00 0.621,402,193.00 46,572.95UBS AG LONDON 6.00 08-18 18/04A1,500,000 1,778,820.00 0.791,853,040.00 63,369.86UNICREDIT 4.00 12-18 31/01A1,300,000 1,418,976.00 0.631,396,039.00 47,583.56UNICREDIT 4.375 12-15 11/09A1,000,000 1,048,440.00 0.461,054,670.00 13,304.79UNICREDIT 4.875 12-17 07/03A1,000,000 1,084,890.00 0.481,057,500.00 39,934.93VEOLIA ENVRNMT 6.75 09-19 24/04A1,000,000 1,233,510.00 0.551,245,500.00 46,417.81VIVENDI SA 2.375 13-19 21/01A200,000 199,710.00 0.09199,148.00 2,173.29VW LEASING GMBH 2.375 12-22 06/09A1,500,000 1,486,035.00 0.661,508,400.00 11,321.92WACHOVIA CORP -SUB- 4.375 06-18 27/11A1,500,000 1,644,450.00 0.731,554,300.00 6,113.01WAL-MART STORES INC 4.875 09-29 21/09A200,000 239,866.00 0.11243,832.00 2,697.95WELLS FARGO REGS 2.625 12-22 16/08A250,000 250,522.50 0.11258,432.50 2,463.18XSTRATA FINANCE EMTN 5.25 07-17 13/06A500,000 558,040.00 0.25572,275.00 14,455.48XSTRATA FINANCE REGS 2.375 12-18 19/11A500,000 506,015.00 0.22500,961.66 1,510.27
ALLIANZ FL.R 12-42 17/10A100,000 111,251.00 0.05100,784.00 1,155.82
Floating rate bonds 36,964,704.15 16.3735,017,579.84 739,910.93
Euro 36,964,704.15 16.3735,017,579.84 739,910.93
ALLIANZ FINANCE II FL.R 11-41 08/07A1,000,000 1,123,380.00 0.501,041,235.00 27,726.03ALLIANZ FINANCE II FL.R 02-25 13/01A1,000,000 1,056,880.00 0.471,082,125.00 62,684.93AVIVA PLC FL.R 08-38 22/05A500,000 570,705.00 0.25511,000.00 21,001.71AXA FL.R 10-40 16/04A600,000 642,210.00 0.28610,385.50 22,352.05BFCM EMTN FL.R 05-15 28/10A1,000,000 1,024,010.00 0.45998,050.00 7,839.56BNP PARIBAS SUB FL.R 06-XX 12/04A700,000 727,685.00 0.32725,450.00 23,857.34CITIGROUP INC EMTN SUB FL.R 07-17 31/05A1,000,000 977,500.00 0.43855,000.00 0.00CLOVERIE PLC SUB FL.R 09-39 24/07A500,000 598,000.00 0.26536,430.00 16,438.36CNCEP EMTN FL.R 04-XX 29/07A1,000,000 1,018,660.00 0.45987,500.00 19,513.70CNP ASSURANCES FL.R 10-40 14/09A750,000 807,570.00 0.36795,000.00 13,315.07CREDIT AGRICOLE SUB. FL.R 05- 09/11A1,500,000 1,506,480.00 0.671,502,850.00 8,995.48CREDIT SUISSE FL.R 13-25 18/09A550,000 589,281.00 0.26587,812.50 9,010.96CREDIT SUISSE FINANCE FL.R 05-20 14/09A2,000,000 2,056,680.00 0.911,881,110.00 21,452.05DANSKE BANK SUB FL.R 07-XX 15/05A400,000 412,408.00 0.18403,250.00 12,295.23ELECT.DE FRANCE FL.R 13-XX 29/01A500,000 517,140.00 0.23501,875.00 19,561.64ELM BV/SWISS LIFE-EMTN-FL.R 07-XX 12/04A200,000 206,602.00 0.09200,440.00 8,428.97ELM BV/SWISS REA. FL.R 06- 25/11S1,000,000 1,050,910.00 0.47883,687.50 5,180.05ENBW INTL FINANCE FL.R 11-72 02/04A1,000,000 1,118,360.00 0.501,124,375.00 55,160.96ENEL SPA FL.R 10-10 26/02S2,000,000 1,989,540.00 0.881,983,400.00 7,570.61ENEL SPA FL.R 13-74 10/01A500,000 537,415.00 0.24494,780.00 9,972.60GENERALI FINANCE FL.R 06-XX 16/06A750,000 753,727.50 0.33741,562.50 21,632.18HANNOVER FINANCE EMTN FL.R 04-24 26/02A837,000 843,235.65 0.37801,041.35 40,611.70HANNOVER FINANCE SUB FL.R 05-XX 01/06A100,000 103,116.00 0.0588,250.00 2,917.81HSBC CAPITAL FUNDING SUB FL.R 04- 29/12A1,000,000 1,052,940.00 0.47889,437.50 38,931.78HSBC HOLDINGS PLC FL.R 05-20 29/06A300,000 307,614.00 0.14274,119.23 5,511.99ING BANK EMTN FL.R 08-23 29/05A500,000 557,835.00 0.25498,175.00 18,123.29JP MORGAN CHASE & CO FL.R 06-18 31/03A300,000 296,244.00 0.13274,380.00 0.00JP MORGAN CHASE BANK NA FL.R 06-21 30/11A1,000,000 1,047,960.00 0.46914,333.33 5,633.56JPMORGAN CHASE SUB. FL.R 04-19 12/11A2,000,000 2,035,360.00 0.902,030,000.00 11,746.58
Statement of investments and other net assets as at 31/12/2013EURExpressed in
UBAM - CORPORATE EURO BOND
Number/nom. value Description % of total
net assetsMarket valueCost Unaudited AccruedInterest
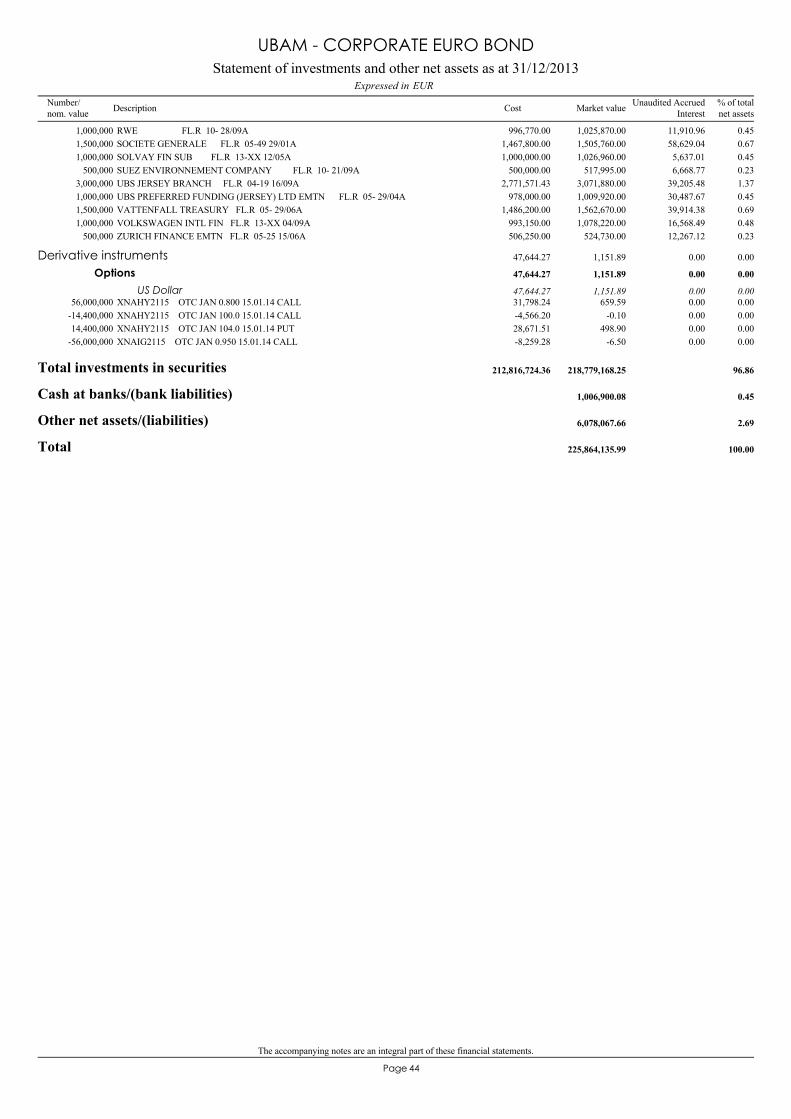
The accompanying notes are an integral part of these financial statements.
44Page
RWE FL.R 10- 28/09A1,000,000 1,025,870.00 0.45996,770.00 11,910.96SOCIETE GENERALE FL.R 05-49 29/01A1,500,000 1,505,760.00 0.671,467,800.00 58,629.04SOLVAY FIN SUB FL.R 13-XX 12/05A1,000,000 1,026,960.00 0.451,000,000.00 5,637.01SUEZ ENVIRONNEMENT COMPANY FL.R 10- 21/09A500,000 517,995.00 0.23500,000.00 6,668.77UBS JERSEY BRANCH FL.R 04-19 16/09A3,000,000 3,071,880.00 1.372,771,571.43 39,205.48UBS PREFERRED FUNDING (JERSEY) LTD EMTN FL.R 05- 29/04A1,000,000 1,009,920.00 0.45978,000.00 30,487.67VATTENFALL TREASURY FL.R 05- 29/06A1,500,000 1,562,670.00 0.691,486,200.00 39,914.38VOLKSWAGEN INTL FIN FL.R 13-XX 04/09A1,000,000 1,078,220.00 0.48993,150.00 16,568.49ZURICH FINANCE EMTN FL.R 05-25 15/06A500,000 524,730.00 0.23506,250.00 12,267.12
XNAHY2115 OTC JAN 0.800 15.01.14 CALL56,000,000 659.59 0.0031,798.24 0.00
Derivative instruments 1,151.89 0.0047,644.27 0.00
Options 1,151.89 0.0047,644.27 0.00
US Dollar 1,151.89 0.0047,644.27 0.00
XNAHY2115 OTC JAN 100.0 15.01.14 CALL-14,400,000 -0.10 0.00-4,566.20 0.00XNAHY2115 OTC JAN 104.0 15.01.14 PUT14,400,000 498.90 0.0028,671.51 0.00XNAIG2115 OTC JAN 0.950 15.01.14 CALL-56,000,000 -6.50 0.00-8,259.28 0.00
Total investments in securities 218,779,168.25 96.86212,816,724.36
Cash at banks/(bank liabilities) 1,006,900.08 0.45
Other net assets/(liabilities) 6,078,067.66 2.69
Total 225,864,135.99 100.00
Statement of investments and other net assets as at 31/12/2013EURExpressed in
UBAM - CORPORATE EURO BOND
Number/nom. value Description % of total
net assetsMarket valueCost Unaudited AccruedInterest

45Page
France 17.70United Kingdom 15.48Italy 14.41United States of America 13.70The Netherlands 9.60Spain 7.13Ireland 3.46Germany 3.37Luxembourg 2.40Jersey Island 2.29Cayman Islands 1.63Denmark 1.42Sweden 1.16South Korea 0.54Belgium 0.49Norway 0.47Australia 0.44Switzerland 0.26Canada 0.25Finland 0.22Japan 0.22United Arab Emirates 0.22
96.86
(by domicile of the issuer) % of net assets
Geographical classification of investments
UBAM - CORPORATE EURO BOND
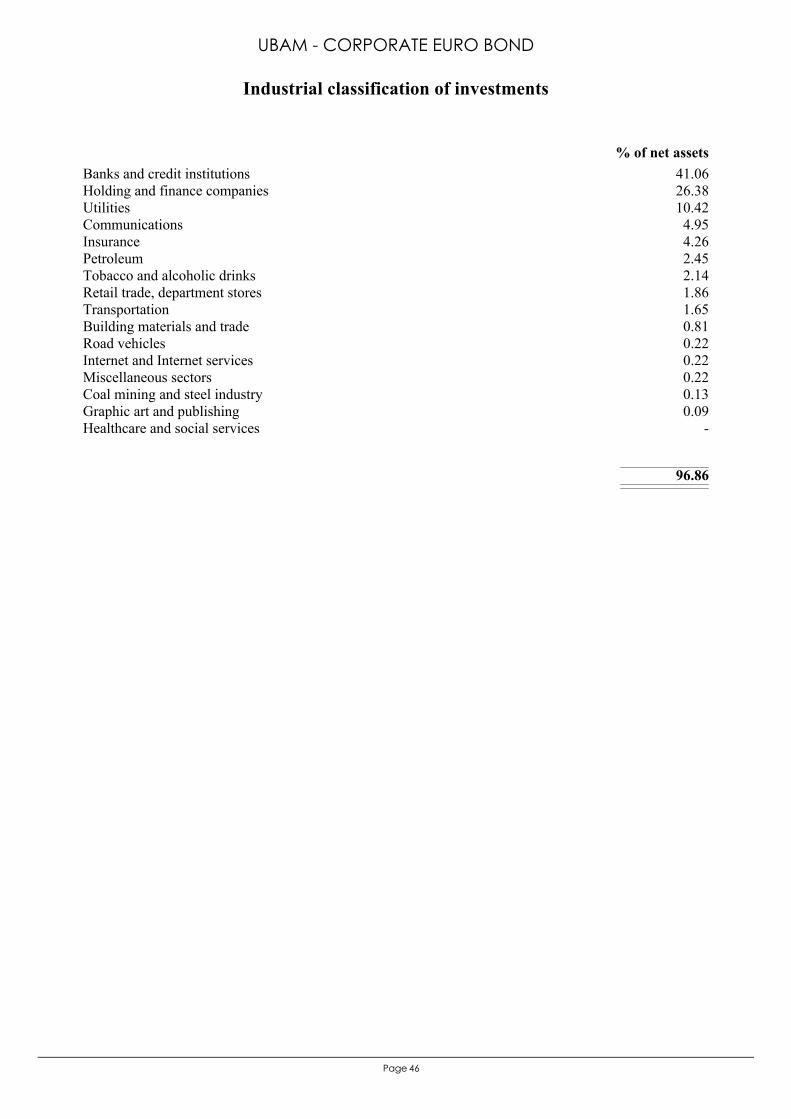
46Page
Banks and credit institutions 41.06Holding and finance companies 26.38Utilities 10.42Communications 4.95Insurance 4.26Petroleum 2.45Tobacco and alcoholic drinks 2.14Retail trade, department stores 1.86Transportation 1.65Building materials and trade 0.81Road vehicles 0.22Internet and Internet services 0.22Miscellaneous sectors 0.22Coal mining and steel industry 0.13Graphic art and publishing 0.09Healthcare and social services -
96.86
% of net assets
Industrial classification of investments
UBAM - CORPORATE EURO BOND
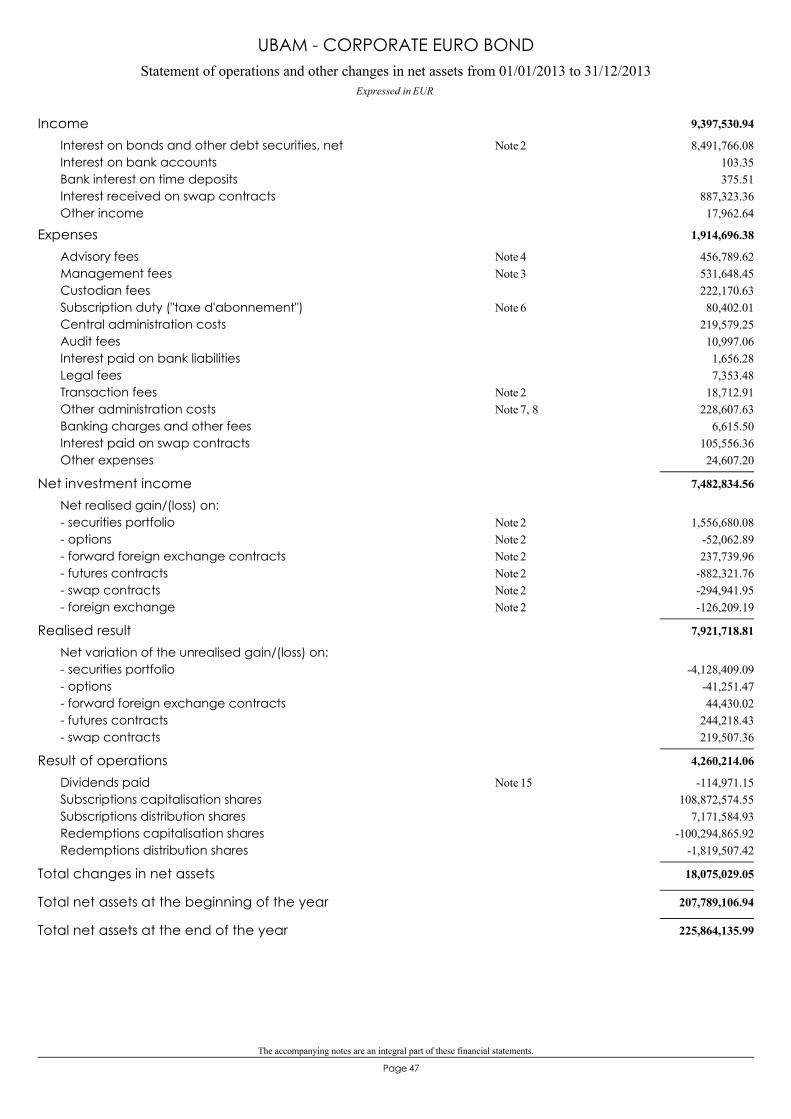
The accompanying notes are an integral part of these financial statements.
47Page
Statement of operations and other changes in net assets from 01/01/2013 to 31/12/2013Expressed in EUR
UBAM - CORPORATE EURO BOND
9,397,530.94Income8,491,766.08Interest on bonds and other debt securities, net 2Note
103.35Interest on bank accounts375.51Bank interest on time deposits
887,323.36Interest received on swap contracts17,962.64Other income
1,914,696.38Expenses456,789.62Advisory fees 4Note531,648.45Management fees 3Note222,170.63Custodian fees80,402.01Subscription duty ("taxe d'abonnement") 6Note
219,579.25Central administration costs10,997.06Audit fees1,656.28Interest paid on bank liabilities7,353.48Legal fees
18,712.91Transaction fees 2Note228,607.63Other administration costs 7, 8Note
6,615.50Banking charges and other fees105,556.36Interest paid on swap contracts24,607.20Other expenses
7,482,834.56Net investment incomeNet realised gain/(loss) on:
1,556,680.08- securities portfolio 2Note-52,062.89- options 2Note237,739.96- forward foreign exchange contracts 2Note
-882,321.76- futures contracts 2Note-294,941.95- swap contracts 2Note-126,209.19- foreign exchange 2Note
7,921,718.81Realised resultNet variation of the unrealised gain/(loss) on:
-4,128,409.09- securities portfolio-41,251.47- options44,430.02- forward foreign exchange contracts
244,218.43- futures contracts219,507.36- swap contracts
4,260,214.06Result of operations-114,971.15Dividends paid 15Note
108,872,574.55Subscriptions capitalisation shares7,171,584.93Subscriptions distribution shares
-100,294,865.92Redemptions capitalisation shares-1,819,507.42Redemptions distribution shares
18,075,029.05Total changes in net assets
207,789,106.94Total net assets at the beginning of the year
225,864,135.99Total net assets at the end of the year
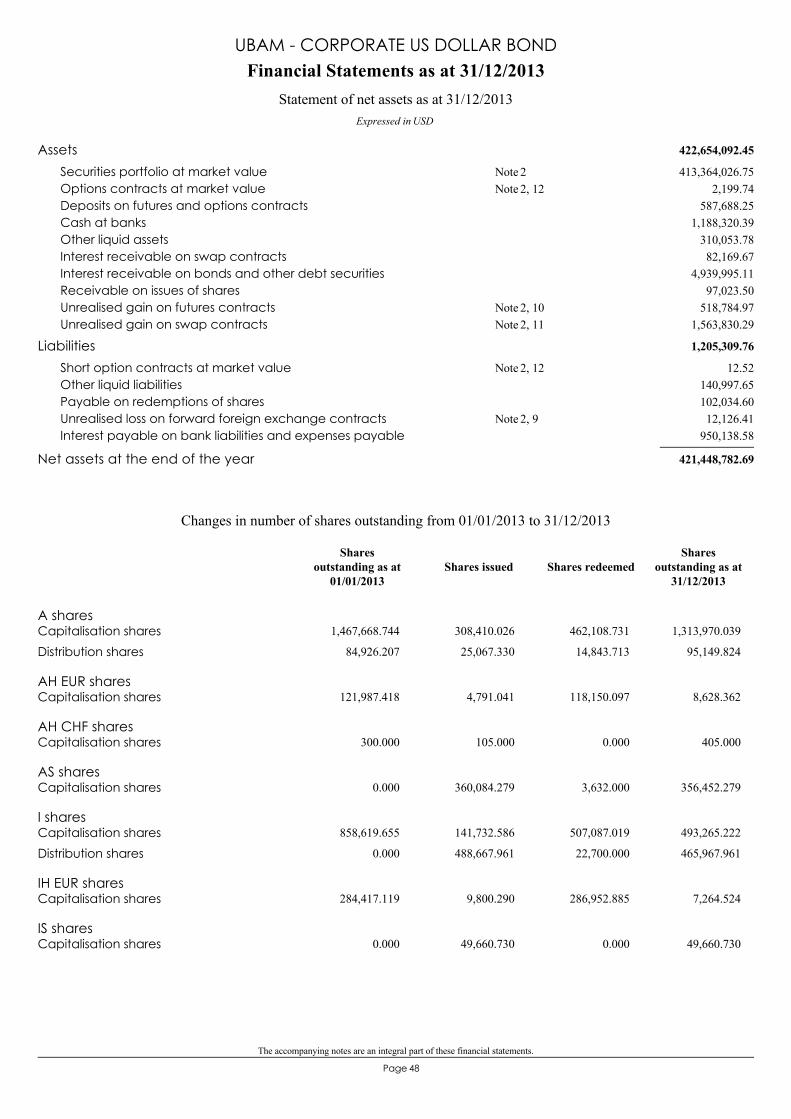
The accompanying notes are an integral part of these financial statements.
48Page
422,654,092.45Assets413,364,026.75Securities portfolio at market value 2Note
2,199.74Options contracts at market value 2, 12Note587,688.25Deposits on futures and options contracts
1,188,320.39Cash at banks310,053.78Other liquid assets82,169.67Interest receivable on swap contracts
4,939,995.11Interest receivable on bonds and other debt securities97,023.50Receivable on issues of shares
518,784.97Unrealised gain on futures contracts 2, 10Note1,563,830.29Unrealised gain on swap contracts 2, 11Note
1,205,309.76Liabilities12.52Short option contracts at market value 2, 12Note
140,997.65Other liquid liabilities102,034.60Payable on redemptions of shares12,126.41Unrealised loss on forward foreign exchange contracts 2, 9Note
950,138.58Interest payable on bank liabilities and expenses payable
421,448,782.69Net assets at the end of the year
Financial Statements as at 31/12/2013
Expressed in USD
Statement of net assets as at 31/12/2013
UBAM - CORPORATE US DOLLAR BOND
A sharesCapitalisation shares 1,467,668.744 308,410.026 462,108.731 1,313,970.039
Distribution shares 84,926.207 25,067.330 14,843.713 95,149.824
AH EUR sharesCapitalisation shares 121,987.418 4,791.041 118,150.097 8,628.362
AH CHF sharesCapitalisation shares 300.000 105.000 0.000 405.000
AS sharesCapitalisation shares 0.000 360,084.279 3,632.000 356,452.279
I sharesCapitalisation shares 858,619.655 141,732.586 507,087.019 493,265.222
Distribution shares 0.000 488,667.961 22,700.000 465,967.961
IH EUR sharesCapitalisation shares 284,417.119 9,800.290 286,952.885 7,264.524
IS sharesCapitalisation shares 0.000 49,660.730 0.000 49,660.730
Changes in number of shares outstanding from 01/01/2013 to 31/12/2013
Shares issued Shares redeemedShares
outstanding as at31/12/2013
Sharesoutstanding as at
01/01/2013
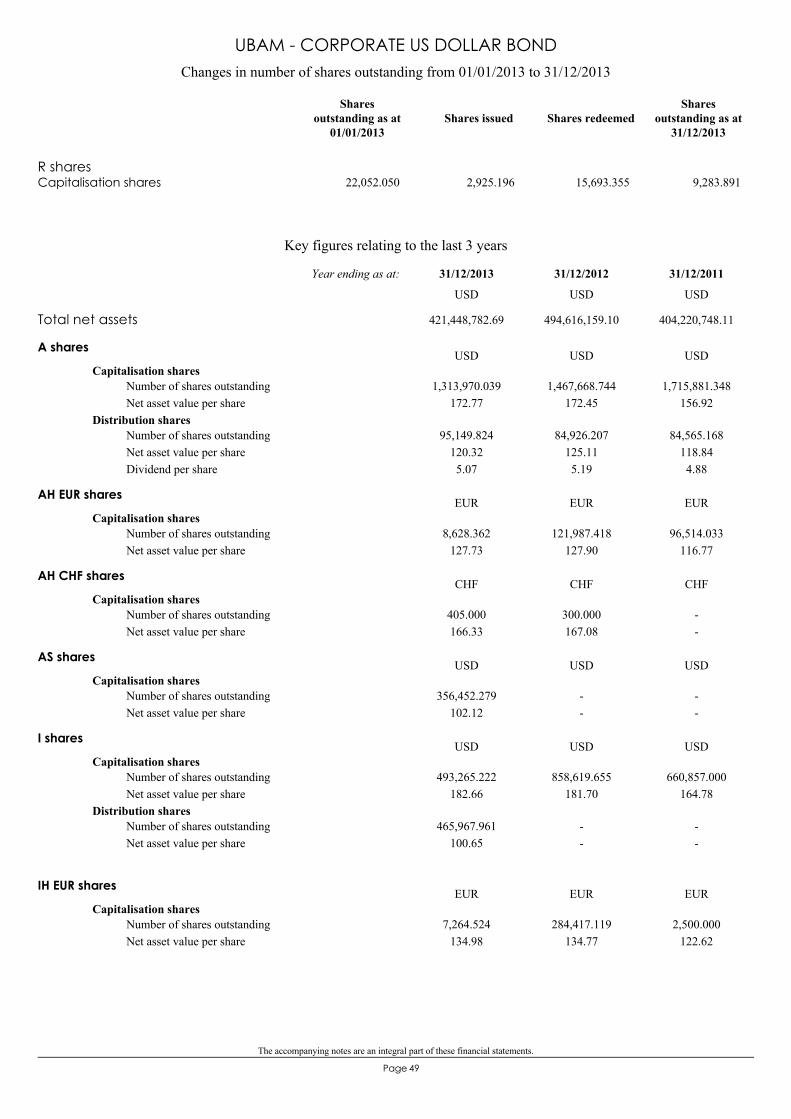
The accompanying notes are an integral part of these financial statements.
49Page
R sharesCapitalisation shares 22,052.050 2,925.196 15,693.355 9,283.891
Changes in number of shares outstanding from 01/01/2013 to 31/12/2013
Shares issued Shares redeemedShares
outstanding as at31/12/2013
Sharesoutstanding as at
01/01/2013
UBAM - CORPORATE US DOLLAR BOND
Key figures relating to the last 3 years
A shares
Capitalisation shares1,313,970.039
172.771,467,668.744
172.451,715,881.348
156.92Number of shares outstandingNet asset value per share
Distribution shares95,149.824
120.325.07
84,926.207125.115.19
84,565.168118.844.88
Number of shares outstandingNet asset value per shareDividend per share
USD USD USD
AH EUR shares
Capitalisation shares8,628.362
127.73121,987.418
127.9096,514.033
116.77Number of shares outstandingNet asset value per share
EUR EUR EUR
AH CHF shares
Capitalisation shares405.000166.33
300.000167.08
--
Number of shares outstandingNet asset value per share
CHF CHF CHF
AS shares
Capitalisation shares356,452.279
102.12--
--
Number of shares outstandingNet asset value per share
USD USD USD
I shares
Capitalisation shares493,265.222
182.66858,619.655
181.70660,857.000
164.78Number of shares outstandingNet asset value per share
Distribution shares465,967.961
100.65--
--
Number of shares outstandingNet asset value per share
USD USD USD
IH EUR shares
Capitalisation shares7,264.524
134.98284,417.119
134.772,500.000
122.62Number of shares outstandingNet asset value per share
EUR EUR EUR
Total net assets 421,448,782.69 494,616,159.10 404,220,748.11
31/12/201131/12/201231/12/2013Year ending as at:
USD USD USD
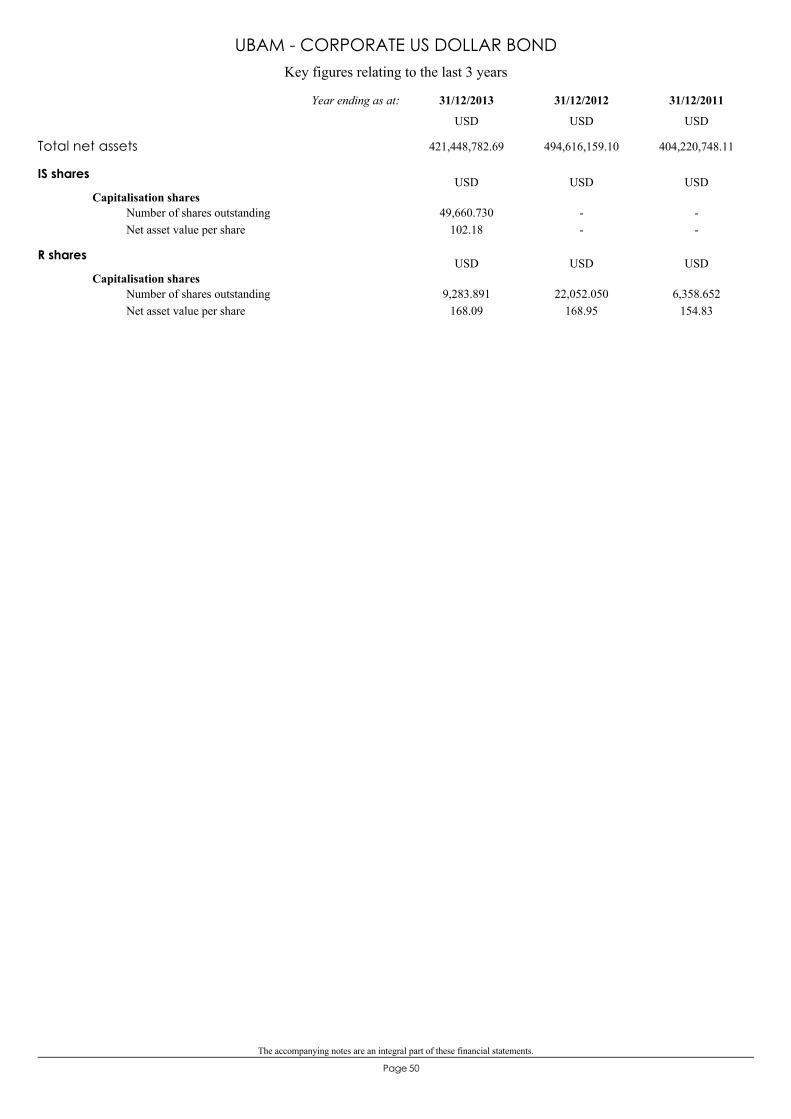
The accompanying notes are an integral part of these financial statements.
50Page
Key figures relating to the last 3 years
UBAM - CORPORATE US DOLLAR BOND
IS shares
Capitalisation shares49,660.730
102.18--
--
Number of shares outstandingNet asset value per share
USD USD USD
R shares
Capitalisation shares9,283.891
168.0922,052.050
168.956,358.652
154.83Number of shares outstandingNet asset value per share
USD USD USD
Total net assets 421,448,782.69 494,616,159.10 404,220,748.11
31/12/201131/12/201231/12/2013Year ending as at:
USD USD USD

The accompanying notes are an integral part of these financial statements.
51Page
ABBVIE 2.90 13-22 06/11S500,000 467,930.00 0.11496,780.00 2,175.00
Transferable securities admitted to official stock exchange listing and/ordealt in on another regulated market 400,113,142.60 94.94394,047,722.18 4,715,429.83
Bonds 377,688,468.95 89.62373,164,169.88 4,520,807.92
US Dollar 377,688,468.95 89.62373,164,169.88 4,520,807.92
ABN AMRO BANK REGS 2.50 13-18 30/10S5,000,000 4,989,650.00 1.184,992,050.00 20,833.33ABN AMRO REGS 4.25 12-17 02/02S500,000 537,025.00 0.13499,510.00 8,736.11ABU DHABI NAT.EN. 2.50 12-18 12/01S5,000,000 5,012,100.00 1.185,046,457.50 58,333.33ALCOA INC 5.55 07-17 01/02S3,000,000 3,247,740.00 0.773,087,500.00 68,912.50ALTRIA GROUP INC 2.85 12-22 09/08S1,000,000 921,070.00 0.22998,880.00 11,162.50ALTRIA GROUP INC 9.25 09-19 06/08S2,000,000 2,637,180.00 0.632,443,206.79 74,000.00ALTRIA GROUP INC 9.70 08-18 10/11S2,000,000 2,640,140.00 0.632,462,970.00 26,944.44AMERICA MOVIL 5.00 10-20 30/03S2,000,000 2,182,420.00 0.522,282,000.00 25,000.00AMERICAN EXPRESS CO 8.125 09-19 20/05S2,000,000 2,560,740.00 0.612,412,205.00 18,055.56AMERICAN HONDA REGS 2.125 12-17 28/02S300,000 306,849.00 0.07309,960.00 2,160.42AMERICAN INTL GROUP 3.375 13-20 15/08S3,000,000 3,030,900.00 0.722,999,250.00 39,656.25AMERICAN INTL GROUP 4.875 12-22 01/06S1,500,000 1,612,230.00 0.381,573,092.00 5,890.63AMGEN 5.70 09-19 01/02S2,000,000 2,313,080.00 0.552,269,000.00 47,183.33ANADARKO PETROLEUM 5.95 06-16 15/09S1,000,000 1,115,100.00 0.261,153,300.00 17,354.17ANGLO AMER CAPITAL 2.625 12-17 03/04S2,100,000 2,122,386.00 0.502,097,756.50 13,321.88ANHEUSER BUSCH INBEV 7.75 11-19 15/01S4,000,000 4,994,600.00 1.195,089,140.00 142,083.33ANZ BKING GROUP EMTN 3.45 12-22 08/08S1,500,000 1,526,760.00 0.361,497,750.00 20,412.50APACHE CORP 2.625 12-23 15/01S500,000 463,570.00 0.11481,050.00 6,015.63ARCELORMITTAL 3.75 12-15 25/02S250,000 256,627.50 0.06249,462.50 3,255.21ARCELORMITTAL 5.00 12-17 25/02S1,000,000 1,074,260.00 0.25987,500.00 17,361.11ARCELORMITTAL 9.85 09-19 01/06S700,000 888,342.00 0.21895,252.65 5,554.31AT&T INC 5.60 08-18 15/05S2,700,000 3,076,137.00 0.733,023,872.00 18,900.00AVON PRODUCTS 6.50 09-19 01/03S1,000,000 1,102,980.00 0.26987,460.00 21,486.11BAKER HUGHES INC 3.20 11-21 15/08S3,000,000 2,982,780.00 0.713,038,400.00 36,000.00BANK OF AMERICA 3.30 13-23 11/01A250,000 236,565.00 0.06248,610.00 3,872.92BANK OF AMERICA 5.875 10-21 05/01S2,500,000 2,873,450.00 0.682,629,750.00 71,397.57BANK OF AMERICA CORP 6.50 09-16 01/08S2,000,000 2,258,160.00 0.542,247,440.00 53,805.56BANK OF AMERICA CORP 5.65 08-18 01/05S1,150,000 1,308,999.00 0.311,108,475.00 10,648.68BANK OF AMERICA CORP 7.625 09-19 01/06S1,500,000 1,860,480.00 0.441,916,100.00 9,213.54BANK OF MONTREAL 2.50 12-17 11/01S500,000 516,480.00 0.12498,975.00 5,868.06BARCLAYS BANK 6.05 07-17 04/12S2,000,000 2,245,600.00 0.532,240,000.00 8,738.89BARCLAYS BANK PLC 6.75 09-19 22/05S700,000 843,689.00 0.20770,763.00 4,987.50BAT INTERNATIONAL FINANCE PLC REG S 9.50 08-18 15/11S2,000,000 2,639,169.50 0.632,594,000.00 23,750.00BBVA US SENIOR 4.664 12-15 09/10S4,970,000 5,229,185.50 1.235,216,716.10 52,155.18BCO DO BRASIL CAYMAN 3.875 11-17 23/01S1,500,000 1,541,370.00 0.371,582,500.00 25,348.96BFCM REGS 2.50 13-18 29/10S5,000,000 4,947,850.00 1.174,981,350.00 21,180.56BG ENERGY CAPITAL 4.00 11-21 15/10S2,000,000 2,044,040.00 0.492,096,800.00 16,666.67BHP BILLITON FINANCE 6.50 09-19 01/04S2,500,000 3,009,950.00 0.713,060,230.00 40,173.61BNP PARIBAS 714 5.00 11-21 15/01S2,000,000 2,194,800.00 0.522,263,740.00 45,833.33BNY MELLON 3.55 11-21 23/09S2,000,000 2,046,280.00 0.491,955,380.00 19,130.56BPCE SUB REGS 5.70 13-23 22/10S2,000,000 2,071,060.00 0.492,007,600.00 21,533.33BRASKEM SA REG-S 7.25 08-18 05/06S1,270,000 1,420,710.90 0.341,421,130.00 6,394.10CA LONDON REGS 1.625 13-16 15/04S3,000,000 3,017,880.00 0.722,998,350.00 10,156.25CATERPILLAR 3.90 11-21 27/05S2,000,000 2,094,520.00 0.502,091,700.00 7,150.00CATERPILLAR FIN SERV 5.45 08-18 15/04S500,000 569,525.00 0.14491,845.00 5,677.08CBS CORP 3.375 12-22 01/03S1,000,000 958,540.00 0.23960,550.00 11,156.25CITIGROUP 4.50 11-22 14/01S3,000,000 3,179,130.00 0.753,030,690.00 62,250.00CITIGROUP INC 6.125 08-18 15/05S2,000,000 2,318,120.00 0.552,032,941.82 15,312.50CITIGROUP INC 1.70 13-16 25/07S2,000,000 2,021,400.00 0.481,999,500.00 14,638.89COMCAST 3.125 12-22 15/07S1,500,000 1,434,285.00 0.341,542,217.50 21,484.38COMCAST CORP 5.70 08-18 15/05S800,000 919,760.00 0.22798,295.00 5,700.00COMMONWEALTH BANK OF AUSTRALIA REG S 5.00 09-19 15/10S2,000,000 2,231,560.00 0.532,008,400.00 20,833.33CS NY MTN SUB TR.6 4.375 10-20 05/08S2,000,000 2,153,420.00 0.512,192,040.00 35,243.06CVS CAREMARK 5.75 07-17 01/06S3,000,000 3,402,330.00 0.813,392,800.00 13,895.83DAIMLER FIN NA REGS 2.625 11-16 15/09S250,000 258,797.50 0.06261,204.50 1,914.06DAIMLER FINANCE REGS 1.875 13-18 11/01S2,000,000 1,979,500.00 0.472,005,800.00 17,604.17DELL INC 5.875 09-19 15/06S1,275,000 1,285,047.00 0.301,379,524.50 3,121.09DEUTSCHE TELEKOM INTERNATIONAL FINANCE BV 6.75 08-18 20/08S1,000,000 1,187,330.00 0.28995,000.00 24,375.00DIAGEO CAPITAL 2.875 12-22 11/05S500,000 477,445.00 0.11498,190.00 1,956.60DIRECT TV 3.80 12-22 15/03S1,500,000 1,440,945.00 0.341,531,490.00 16,625.00DOW CHEMICAL 3.00 12-22 15/11S1,000,000 932,640.00 0.22982,660.00 3,750.00
Statement of investments and other net assets as at 31/12/2013USDExpressed in
UBAM - CORPORATE US DOLLAR BOND
Number/nom. value Description % of total
net assetsMarket valueCost Unaudited AccruedInterest
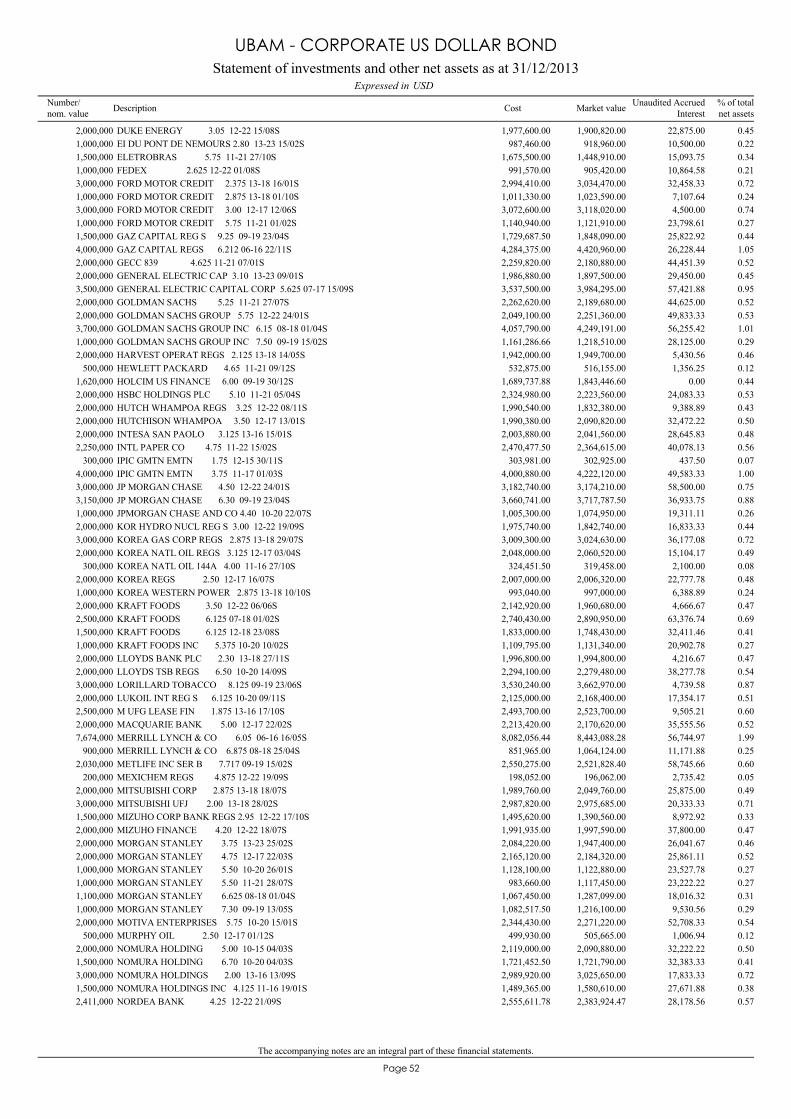
The accompanying notes are an integral part of these financial statements.
52Page
DUKE ENERGY 3.05 12-22 15/08S2,000,000 1,900,820.00 0.451,977,600.00 22,875.00EI DU PONT DE NEMOURS 2.80 13-23 15/02S1,000,000 918,960.00 0.22987,460.00 10,500.00ELETROBRAS 5.75 11-21 27/10S1,500,000 1,448,910.00 0.341,675,500.00 15,093.75FEDEX 2.625 12-22 01/08S1,000,000 905,420.00 0.21991,570.00 10,864.58FORD MOTOR CREDIT 2.375 13-18 16/01S3,000,000 3,034,470.00 0.722,994,410.00 32,458.33FORD MOTOR CREDIT 2.875 13-18 01/10S1,000,000 1,023,590.00 0.241,011,330.00 7,107.64FORD MOTOR CREDIT 3.00 12-17 12/06S3,000,000 3,118,020.00 0.743,072,600.00 4,500.00FORD MOTOR CREDIT 5.75 11-21 01/02S1,000,000 1,121,910.00 0.271,140,940.00 23,798.61GAZ CAPITAL REG S 9.25 09-19 23/04S1,500,000 1,848,090.00 0.441,729,687.50 25,822.92GAZ CAPITAL REGS 6.212 06-16 22/11S4,000,000 4,420,960.00 1.054,284,375.00 26,228.44GECC 839 4.625 11-21 07/01S2,000,000 2,180,880.00 0.522,259,820.00 44,451.39GENERAL ELECTRIC CAP 3.10 13-23 09/01S2,000,000 1,897,500.00 0.451,986,880.00 29,450.00GENERAL ELECTRIC CAPITAL CORP 5.625 07-17 15/09S3,500,000 3,984,295.00 0.953,537,500.00 57,421.88GOLDMAN SACHS 5.25 11-21 27/07S2,000,000 2,189,680.00 0.522,262,620.00 44,625.00GOLDMAN SACHS GROUP 5.75 12-22 24/01S2,000,000 2,251,360.00 0.532,049,100.00 49,833.33GOLDMAN SACHS GROUP INC 6.15 08-18 01/04S3,700,000 4,249,191.00 1.014,057,790.00 56,255.42GOLDMAN SACHS GROUP INC 7.50 09-19 15/02S1,000,000 1,218,510.00 0.291,161,286.66 28,125.00HARVEST OPERAT REGS 2.125 13-18 14/05S2,000,000 1,949,700.00 0.461,942,000.00 5,430.56HEWLETT PACKARD 4.65 11-21 09/12S500,000 516,155.00 0.12532,875.00 1,356.25HOLCIM US FINANCE 6.00 09-19 30/12S1,620,000 1,843,446.60 0.441,689,737.88 0.00HSBC HOLDINGS PLC 5.10 11-21 05/04S2,000,000 2,223,560.00 0.532,324,980.00 24,083.33HUTCH WHAMPOA REGS 3.25 12-22 08/11S2,000,000 1,832,380.00 0.431,990,540.00 9,388.89HUTCHISON WHAMPOA 3.50 12-17 13/01S2,000,000 2,090,820.00 0.501,990,380.00 32,472.22INTESA SAN PAOLO 3.125 13-16 15/01S2,000,000 2,041,560.00 0.482,003,880.00 28,645.83INTL PAPER CO 4.75 11-22 15/02S2,250,000 2,364,615.00 0.562,470,477.50 40,078.13IPIC GMTN EMTN 1.75 12-15 30/11S300,000 302,925.00 0.07303,981.00 437.50IPIC GMTN EMTN 3.75 11-17 01/03S4,000,000 4,222,120.00 1.004,000,880.00 49,583.33JP MORGAN CHASE 4.50 12-22 24/01S3,000,000 3,174,210.00 0.753,182,740.00 58,500.00JP MORGAN CHASE 6.30 09-19 23/04S3,150,000 3,717,787.50 0.883,660,741.00 36,933.75JPMORGAN CHASE AND CO 4.40 10-20 22/07S1,000,000 1,074,950.00 0.261,005,300.00 19,311.11KOR HYDRO NUCL REG S 3.00 12-22 19/09S2,000,000 1,842,740.00 0.441,975,740.00 16,833.33KOREA GAS CORP REGS 2.875 13-18 29/07S3,000,000 3,024,630.00 0.723,009,300.00 36,177.08KOREA NATL OIL REGS 3.125 12-17 03/04S2,000,000 2,060,520.00 0.492,048,000.00 15,104.17KOREA NATL OIL 144A 4.00 11-16 27/10S300,000 319,458.00 0.08324,451.50 2,100.00KOREA REGS 2.50 12-17 16/07S2,000,000 2,006,320.00 0.482,007,000.00 22,777.78KOREA WESTERN POWER 2.875 13-18 10/10S1,000,000 997,000.00 0.24993,040.00 6,388.89KRAFT FOODS 3.50 12-22 06/06S2,000,000 1,960,680.00 0.472,142,920.00 4,666.67KRAFT FOODS 6.125 07-18 01/02S2,500,000 2,890,950.00 0.692,740,430.00 63,376.74KRAFT FOODS 6.125 12-18 23/08S1,500,000 1,748,430.00 0.411,833,000.00 32,411.46KRAFT FOODS INC 5.375 10-20 10/02S1,000,000 1,131,340.00 0.271,109,795.00 20,902.78LLOYDS BANK PLC 2.30 13-18 27/11S2,000,000 1,994,800.00 0.471,996,800.00 4,216.67LLOYDS TSB REGS 6.50 10-20 14/09S2,000,000 2,279,480.00 0.542,294,100.00 38,277.78LORILLARD TOBACCO 8.125 09-19 23/06S3,000,000 3,662,970.00 0.873,530,240.00 4,739.58LUKOIL INT REG S 6.125 10-20 09/11S2,000,000 2,168,400.00 0.512,125,000.00 17,354.17M UFG LEASE FIN 1.875 13-16 17/10S2,500,000 2,523,700.00 0.602,493,700.00 9,505.21MACQUARIE BANK 5.00 12-17 22/02S2,000,000 2,170,620.00 0.522,213,420.00 35,555.56MERRILL LYNCH & CO 6.05 06-16 16/05S7,674,000 8,443,088.28 1.998,082,056.44 56,744.97MERRILL LYNCH & CO 6.875 08-18 25/04S900,000 1,064,124.00 0.25851,965.00 11,171.88METLIFE INC SER B 7.717 09-19 15/02S2,030,000 2,521,828.40 0.602,550,275.00 58,745.66MEXICHEM REGS 4.875 12-22 19/09S200,000 196,062.00 0.05198,052.00 2,735.42MITSUBISHI CORP 2.875 13-18 18/07S2,000,000 2,049,760.00 0.491,989,760.00 25,875.00MITSUBISHI UFJ 2.00 13-18 28/02S3,000,000 2,975,685.00 0.712,987,820.00 20,333.33MIZUHO CORP BANK REGS 2.95 12-22 17/10S1,500,000 1,390,560.00 0.331,495,620.00 8,972.92MIZUHO FINANCE 4.20 12-22 18/07S2,000,000 1,997,590.00 0.471,991,935.00 37,800.00MORGAN STANLEY 3.75 13-23 25/02S2,000,000 1,947,400.00 0.462,084,220.00 26,041.67MORGAN STANLEY 4.75 12-17 22/03S2,000,000 2,184,320.00 0.522,165,120.00 25,861.11MORGAN STANLEY 5.50 10-20 26/01S1,000,000 1,122,880.00 0.271,128,100.00 23,527.78MORGAN STANLEY 5.50 11-21 28/07S1,000,000 1,117,450.00 0.27983,660.00 23,222.22MORGAN STANLEY 6.625 08-18 01/04S1,100,000 1,287,099.00 0.311,067,450.00 18,016.32MORGAN STANLEY 7.30 09-19 13/05S1,000,000 1,216,100.00 0.291,082,517.50 9,530.56MOTIVA ENTERPRISES 5.75 10-20 15/01S2,000,000 2,271,220.00 0.542,344,430.00 52,708.33MURPHY OIL 2.50 12-17 01/12S500,000 505,665.00 0.12499,930.00 1,006.94NOMURA HOLDING 5.00 10-15 04/03S2,000,000 2,090,880.00 0.502,119,000.00 32,222.22NOMURA HOLDING 6.70 10-20 04/03S1,500,000 1,721,790.00 0.411,721,452.50 32,383.33NOMURA HOLDINGS 2.00 13-16 13/09S3,000,000 3,025,650.00 0.722,989,920.00 17,833.33NOMURA HOLDINGS INC 4.125 11-16 19/01S1,500,000 1,580,610.00 0.381,489,365.00 27,671.88NORDEA BANK 4.25 12-22 21/09S2,411,000 2,383,924.47 0.572,555,611.78 28,178.56
Statement of investments and other net assets as at 31/12/2013USDExpressed in
UBAM - CORPORATE US DOLLAR BOND
Number/nom. value Description % of total
net assetsMarket valueCost Unaudited AccruedInterest

The accompanying notes are an integral part of these financial statements.
53Page
NORDEA BANK 9 REGS 4.875 10-20 27/01S1,000,000 1,108,360.00 0.261,017,230.00 20,718.75ORANGE 4.125 11-21 14/09S432,000 437,361.12 0.10473,495.32 5,247.00PEMEX 8.00 09-19 03/05S3,500,000 4,251,030.00 1.014,417,150.00 44,333.33PERNOD RICARD REGS 5.75 11-21 07/04S1,000,000 1,103,210.00 0.261,180,470.00 13,256.94PETROBRAS INTL FIN CO 5.875 07-18 01/03S3,500,000 3,737,230.00 0.893,863,710.00 67,970.49PETROBRAS INTL FIN CO 2.875 12-15 06/02S250,000 253,997.50 0.06248,747.50 2,875.00PETROBRAS INTL FIN CO 3.875 11-16 27/01S4,000,000 4,123,480.00 0.984,103,450.00 65,875.00PHILIP MORRIS 5.65 08-18 16/05S4,000,000 4,597,160.00 1.094,280,000.00 27,622.22PRUDENTIAL FINANCIAL 4.50 10-20 15/11S1,000,000 1,076,630.00 0.261,037,620.00 5,625.00PRUDENTIAL FINANCIAL 5.875 12-42 15/09S1,000,000 1,017,430.00 0.241,016,250.00 17,135.42PRUDENTIAL FINANCIAL INC SER D TR 31 7.375 09-19 15/06S500,000 614,080.00 0.15507,670.00 1,536.46PRUDENTIAL FINANCIAL TR 27 6.00 07-17 01/12S300,000 344,970.00 0.08216,000.00 1,450.00QTEL INTL REGS 3.25 12-23 21/02S1,200,000 1,078,392.00 0.261,188,442.00 13,975.00RAS LAFFAN REGS 6.75 09-19 30/09S500,000 588,865.00 0.14521,750.00 8,437.50REYNOLDS AMERICAN 3.25 12-22 01/11S2,000,000 1,846,460.00 0.442,020,620.00 10,652.78REYNOLDS AMERICAN INC 6.75 07-17 15/06S1,000,000 1,150,321.30 0.271,213,850.00 2,812.50RIO TINTO FIN USA 2.25 11-16 20/09S1,000,000 1,029,170.00 0.241,019,380.00 6,250.00RIO TINTO FINANCE USA LTD 9.00 09-19 01/05S2,000,000 2,618,980.00 0.622,485,880.00 29,500.00RIO TINTO FINANCE USA LTD 6.50 08-18 15/07S2,000,000 2,367,080.00 0.562,237,080.00 59,583.33ROCKWELL COLLINS 5.25 09-19 15/07S500,000 567,197.18 0.13497,355.00 12,031.25SABMILLER HLDGS 2.45 12-17 15/01S5,000,000 5,136,762.50 1.214,996,750.00 56,145.83SABMILLER HLDGS REGS 2.45 12-17 15/01S100,000 102,456.00 0.02104,189.50 1,122.92SABMILLER HOLDINGS 3.75 12-22 15/01S1,000,000 1,009,619.80 0.241,072,600.00 17,187.50SANTANDER UK REGS SUB 5.00 13-23 07/11S1,000,000 1,008,260.00 0.24996,810.00 7,361.11SBERBANK LUX REGS 4.95 12-17 07/02S2,000,000 2,124,420.00 0.502,142,500.00 39,325.00SINGTEL GROUP TREAS 2.375 12-17 08/09S2,000,000 2,030,860.00 0.481,995,900.00 14,777.78SK TELECOM REGS 2.125 12-18 01/05S500,000 485,725.00 0.12497,115.00 1,741.32STANDARD CHARTERED 5.70 12-22 25/01S1,000,000 1,054,110.00 0.251,108,780.00 24,541.67STANDARD CHARTERED REGS 6.40 07-17 26/09S1,000,000 1,126,040.00 0.271,073,780.00 16,711.11STATOILHYDRO ASA 5.25 09-19 15/04S2,000,000 2,278,500.00 0.542,312,560.00 21,875.00SUMITOMO BANK 4.85 12-22 01/03S2,000,000 2,117,580.00 0.501,999,585.00 32,063.89SWEDBANK REGS 1.75 13-18 12/03S1,000,000 983,340.00 0.23995,810.00 5,250.00SWISS RE CAPITAL REGS 6.854 06-XX 25/05S3,000,000 3,182,100.00 0.762,965,000.00 19,990.83TELEFONICA EMIS SA 3.729 10-15 27/04S2,000,000 2,066,280.00 0.492,062,740.00 13,051.50TELEFONICA EMIS SA 3.992 11-16 16/02S1,000,000 1,050,390.00 0.251,031,080.00 14,859.11TELEFONICA EMIS SA 4.949 09-15 15/01S1,000,000 1,039,590.00 0.251,051,930.00 22,682.92TELEFONICA EMISIONES 6.421 06-16 20/06S1,500,000 1,674,150.00 0.401,577,500.00 2,675.42TEVA PHARMA FINANCE 2.95 12-22 18/02S2,000,000 1,822,860.00 0.431,896,000.00 1,966.67TI CAPITAL 6.175 09-14 18/06S1,000,000 1,021,120.00 0.241,025,000.00 2,058.33TIME WARNER CABLE INC 6.75 08-18 01/04S1,500,000 1,691,280.00 0.401,650,580.00 50,343.75TIME WARNER CABLE INC 8.25 09-19 01/04S1,500,000 1,762,470.00 0.421,831,713.75 30,593.75TOKYO MITSUBISHI UF 2.70 13-18 09/09S500,000 506,430.00 0.12499,560.00 4,162.50TRANSCANADA PIPELINES 2.50 12-22 01/08S2,000,000 1,824,140.00 0.431,876,060.00 20,694.44TRANSCANADA PIPELINES 7.125 09-19 15/01S750,000 909,292.50 0.22915,384.00 24,492.19TRANSOCEAN INC 6.00 07-18 15/03S2,000,000 2,249,200.00 0.532,289,400.00 35,000.00UBS AG STAMFORD 5.875 06-16 15/07A3,000,000 3,335,790.00 0.793,152,700.00 80,781.25UBS AG STAMFORD -108- 5.875 07-17 20/12S872,000 1,001,823.36 0.24819,156.80 1,423.06UBS AG STAMFORD-DPNT- 5.75 08-18 25/04S1,500,000 1,722,075.00 0.411,589,100.00 15,572.92UNITED PARCEL SVC 3.125 10-21 15/01S750,000 754,860.00 0.18757,500.00 10,742.19UNITED PARCEL SVC 5.125 09-19 01/04S1,000,000 1,141,270.00 0.271,153,200.00 12,670.14UNITED TECH CORP 6.125 08-19 01/02S1,500,000 1,777,575.00 0.421,873,800.00 38,026.04UNITED TECHNOLOGIES 3.1 12-22 01/06S1,000,000 981,190.00 0.231,024,200.00 2,497.22VALE OVERSEAS GTD 6.25 06-17 23/01S4,000,000 4,455,560.00 1.064,575,600.00 109,027.78VERIZON COMMUNICATION 4.50 13-20 15/09S6,000,000 6,423,360.00 1.516,479,640.00 76,500.00VERIZON COMMUNICATION 8.75 08-18 01/11S1,278,000 1,638,945.54 0.391,647,968.22 18,326.88VERIZON WIRELESS 8.50 08-18 15/11S2,000,000 2,549,280.00 0.602,531,126.67 21,250.00VODAFONE GROUP 2.50 12-22 26/09S250,000 222,535.00 0.05246,747.50 1,631.94VODAFONE GROUP 5.625 07-17 27/02S700,000 785,904.00 0.19689,808.00 13,453.13WELLS FARGO & CO 5.125 04-16 15/09S600,000 661,542.00 0.16572,676.00 8,968.75WELLS FARGO & CO 5.625 06-16 15/10S1,000,000 1,123,250.00 0.27965,840.00 11,718.75WELLS FARGO & CO 5.625 07-17 11/12S500,000 573,095.00 0.14461,750.00 1,484.38WELLS FARGO & CO 4.60 11-21 01/04S500,000 548,110.00 0.13498,965.00 5,686.11WM WRIGLEY JR REGS 2.90 13-19 21/10S1,000,000 992,290.00 0.24997,810.00 5,558.33WOORI BANK REG S 7.00 09-15 02/02S1,000,000 1,061,400.00 0.251,032,104.00 29,166.67WOORI BANK REGS 5.875 11-21 13/04S500,000 549,990.00 0.13577,000.00 6,282.99WOORI BANK 144A TR 8 2.875 13-18 02/10S2,500,000 2,508,300.00 0.602,483,525.00 17,569.44WPP FINANCE 3.625 12-22 07/09S250,000 241,110.00 0.06247,907.50 2,844.62
Statement of investments and other net assets as at 31/12/2013USDExpressed in
UBAM - CORPORATE US DOLLAR BOND
Number/nom. value Description % of total
net assetsMarket valueCost Unaudited AccruedInterest
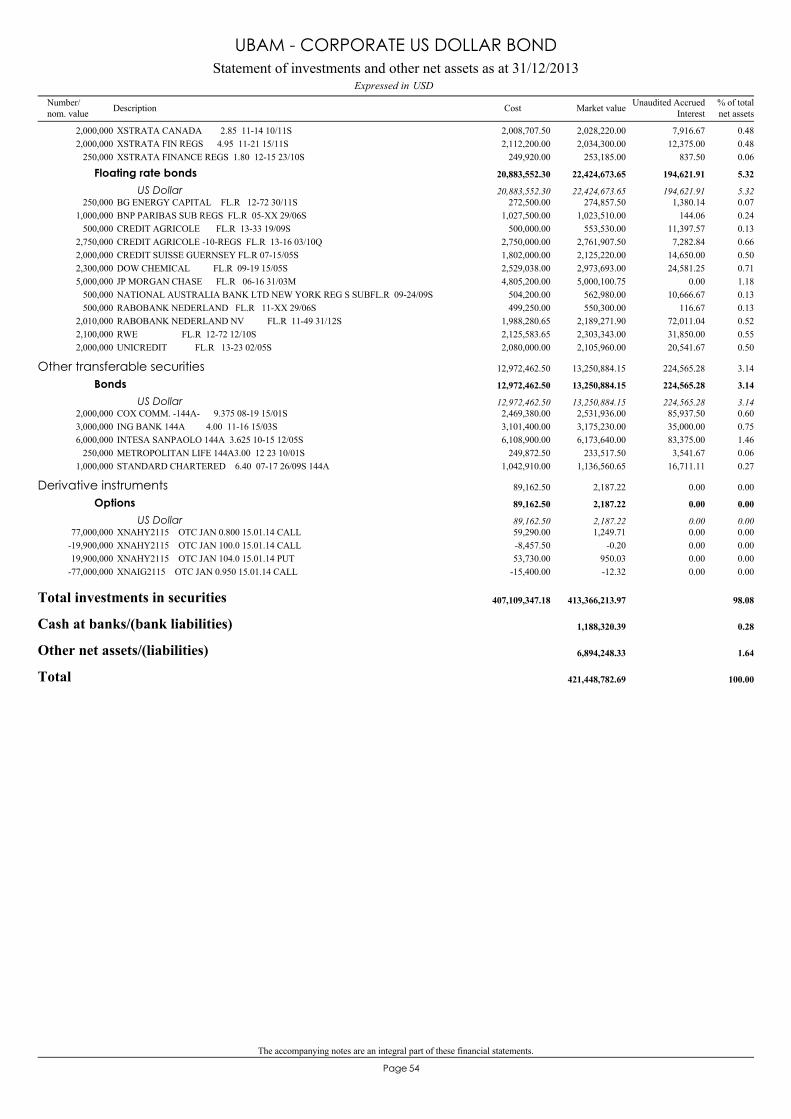
The accompanying notes are an integral part of these financial statements.
54Page
XSTRATA CANADA 2.85 11-14 10/11S2,000,000 2,028,220.00 0.482,008,707.50 7,916.67XSTRATA FIN REGS 4.95 11-21 15/11S2,000,000 2,034,300.00 0.482,112,200.00 12,375.00XSTRATA FINANCE REGS 1.80 12-15 23/10S250,000 253,185.00 0.06249,920.00 837.50
BG ENERGY CAPITAL FL.R 12-72 30/11S250,000 274,857.50 0.07272,500.00 1,380.14
Floating rate bonds 22,424,673.65 5.3220,883,552.30 194,621.91
US Dollar 22,424,673.65 5.3220,883,552.30 194,621.91
BNP PARIBAS SUB REGS FL.R 05-XX 29/06S1,000,000 1,023,510.00 0.241,027,500.00 144.06CREDIT AGRICOLE FL.R 13-33 19/09S500,000 553,530.00 0.13500,000.00 11,397.57CREDIT AGRICOLE -10-REGS FL.R 13-16 03/10Q2,750,000 2,761,907.50 0.662,750,000.00 7,282.84CREDIT SUISSE GUERNSEY FL.R 07-15/05S2,000,000 2,125,220.00 0.501,802,000.00 14,650.00DOW CHEMICAL FL.R 09-19 15/05S2,300,000 2,973,693.00 0.712,529,038.00 24,581.25JP MORGAN CHASE FL.R 06-16 31/03M5,000,000 5,000,100.75 1.184,805,200.00 0.00NATIONAL AUSTRALIA BANK LTD NEW YORK REG S SUBFL.R 09-24/09S500,000 562,980.00 0.13504,200.00 10,666.67RABOBANK NEDERLAND FL.R 11-XX 29/06S500,000 550,300.00 0.13499,250.00 116.67RABOBANK NEDERLAND NV FL.R 11-49 31/12S2,010,000 2,189,271.90 0.521,988,280.65 72,011.04RWE FL.R 12-72 12/10S2,100,000 2,303,343.00 0.552,125,583.65 31,850.00UNICREDIT FL.R 13-23 02/05S2,000,000 2,105,960.00 0.502,080,000.00 20,541.67
COX COMM. -144A- 9.375 08-19 15/01S2,000,000 2,531,936.00 0.602,469,380.00 85,937.50
Other transferable securities 13,250,884.15 3.1412,972,462.50 224,565.28
Bonds 13,250,884.15 3.1412,972,462.50 224,565.28
US Dollar 13,250,884.15 3.1412,972,462.50 224,565.28
ING BANK 144A 4.00 11-16 15/03S3,000,000 3,175,230.00 0.753,101,400.00 35,000.00INTESA SANPAOLO 144A 3.625 10-15 12/05S6,000,000 6,173,640.00 1.466,108,900.00 83,375.00METROPOLITAN LIFE 144A3.00 12 23 10/01S250,000 233,517.50 0.06249,872.50 3,541.67STANDARD CHARTERED 6.40 07-17 26/09S 144A1,000,000 1,136,560.65 0.271,042,910.00 16,711.11
XNAHY2115 OTC JAN 0.800 15.01.14 CALL77,000,000 1,249.71 0.0059,290.00 0.00
Derivative instruments 2,187.22 0.0089,162.50 0.00
Options 2,187.22 0.0089,162.50 0.00
US Dollar 2,187.22 0.0089,162.50 0.00
XNAHY2115 OTC JAN 100.0 15.01.14 CALL-19,900,000 -0.20 0.00-8,457.50 0.00XNAHY2115 OTC JAN 104.0 15.01.14 PUT19,900,000 950.03 0.0053,730.00 0.00XNAIG2115 OTC JAN 0.950 15.01.14 CALL-77,000,000 -12.32 0.00-15,400.00 0.00
Total investments in securities 413,366,213.97 98.08407,109,347.18
Cash at banks/(bank liabilities) 1,188,320.39 0.28
Other net assets/(liabilities) 6,894,248.33 1.64
Total 421,448,782.69 100.00
Statement of investments and other net assets as at 31/12/2013USDExpressed in
UBAM - CORPORATE US DOLLAR BOND
Number/nom. value Description % of total
net assetsMarket valueCost Unaudited AccruedInterest
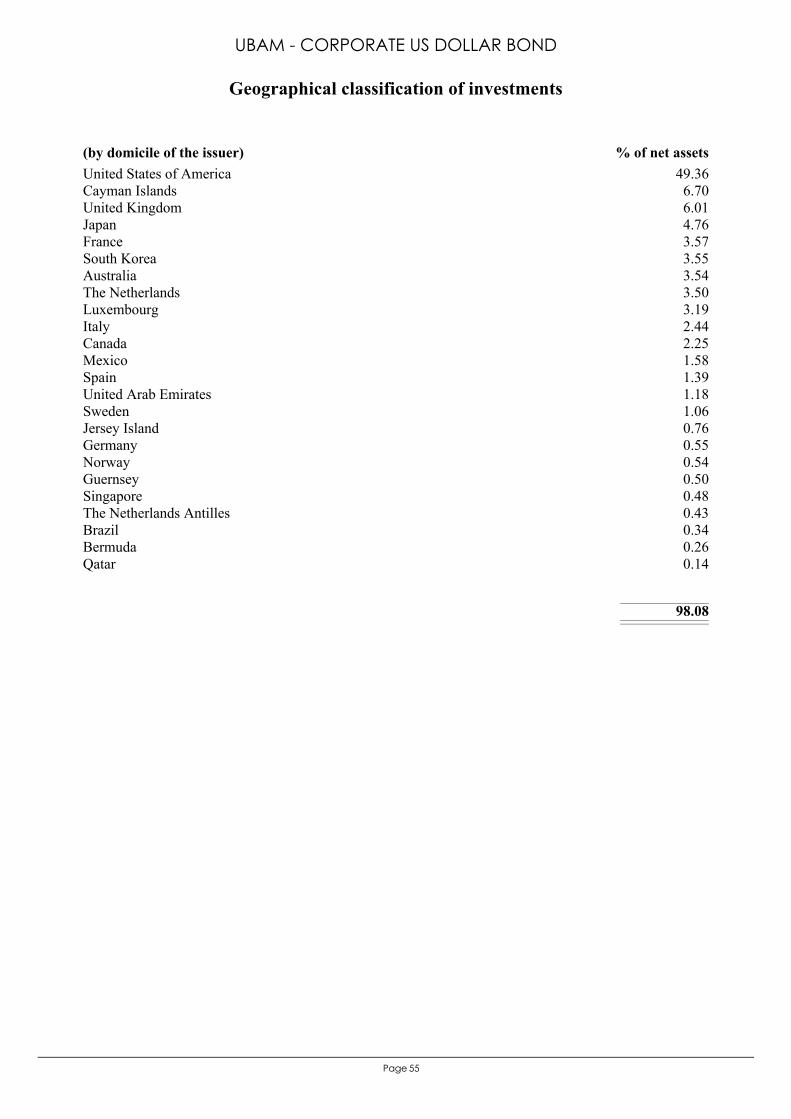
55Page
United States of America 49.36Cayman Islands 6.70United Kingdom 6.01Japan 4.76France 3.57South Korea 3.55Australia 3.54The Netherlands 3.50Luxembourg 3.19Italy 2.44Canada 2.25Mexico 1.58Spain 1.39United Arab Emirates 1.18Sweden 1.06Jersey Island 0.76Germany 0.55Norway 0.54Guernsey 0.50Singapore 0.48The Netherlands Antilles 0.43Brazil 0.34Bermuda 0.26Qatar 0.14
98.08
(by domicile of the issuer) % of net assets
Geographical classification of investments
UBAM - CORPORATE US DOLLAR BOND

56Page
Banks and credit institutions 35.50Holding and finance companies 24.38Communications 7.51Petroleum 5.92Tobacco and alcoholic drinks 5.60Utilities 4.48Foods and non alcoholic drinks 2.08Insurance 1.70Pharmaceuticals and cosmetics 1.35Miscellaneous sectors 1.20Chemicals 1.15Miscellaneous services 0.90Aerospace industry 0.78Non-ferrous metals 0.77Transportation 0.66Graphic art and publishing 0.56Paper and forest products 0.56Biotechnology 0.55Coal mining and steel industry 0.52Machine and apparatus construction 0.50Miscellaneous trading companies 0.49Office supplies and computing 0.42Miscellaneous consumer goods 0.26Electrical engineering and electronics 0.24Healthcare and social services -
98.08
% of net assets
Industrial classification of investments
UBAM - CORPORATE US DOLLAR BOND
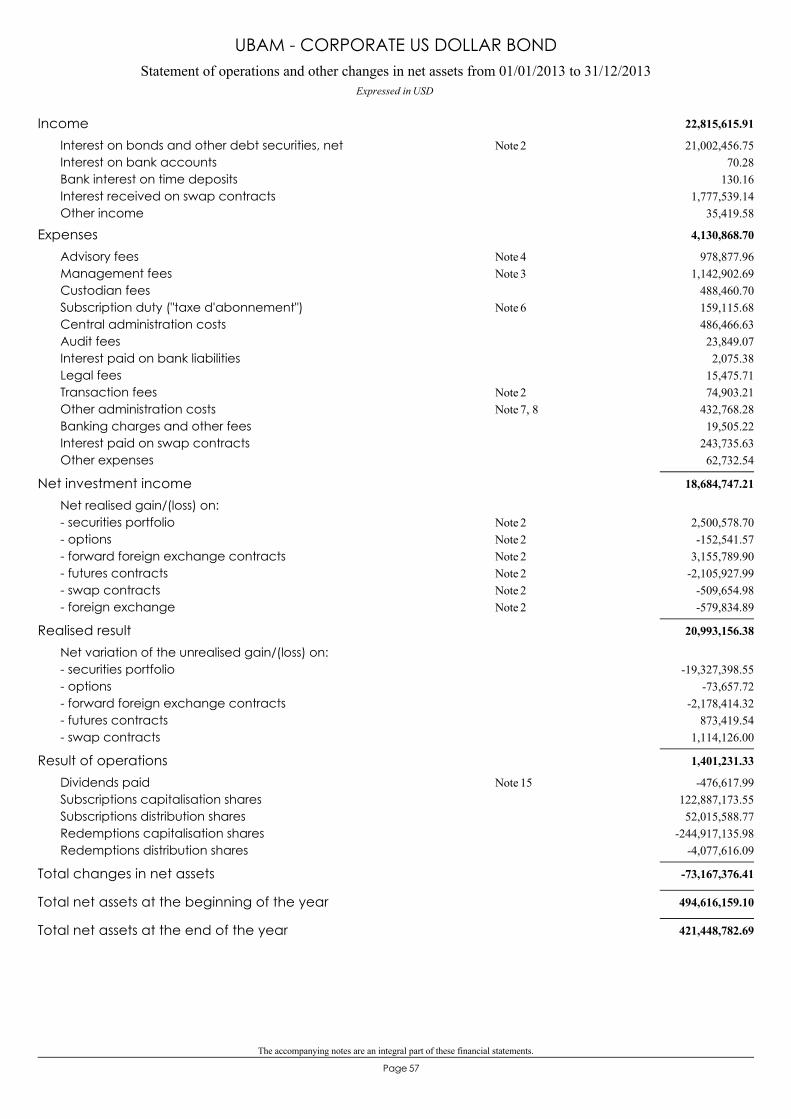
The accompanying notes are an integral part of these financial statements.
57Page
Statement of operations and other changes in net assets from 01/01/2013 to 31/12/2013Expressed in USD
UBAM - CORPORATE US DOLLAR BOND
22,815,615.91Income21,002,456.75Interest on bonds and other debt securities, net 2Note
70.28Interest on bank accounts130.16Bank interest on time deposits
1,777,539.14Interest received on swap contracts35,419.58Other income
4,130,868.70Expenses978,877.96Advisory fees 4Note
1,142,902.69Management fees 3Note488,460.70Custodian fees159,115.68Subscription duty ("taxe d'abonnement") 6Note486,466.63Central administration costs23,849.07Audit fees2,075.38Interest paid on bank liabilities
15,475.71Legal fees74,903.21Transaction fees 2Note
432,768.28Other administration costs 7, 8Note19,505.22Banking charges and other fees
243,735.63Interest paid on swap contracts62,732.54Other expenses
18,684,747.21Net investment incomeNet realised gain/(loss) on:
2,500,578.70- securities portfolio 2Note-152,541.57- options 2Note
3,155,789.90- forward foreign exchange contracts 2Note-2,105,927.99- futures contracts 2Note
-509,654.98- swap contracts 2Note-579,834.89- foreign exchange 2Note
20,993,156.38Realised resultNet variation of the unrealised gain/(loss) on:
-19,327,398.55- securities portfolio-73,657.72- options
-2,178,414.32- forward foreign exchange contracts873,419.54- futures contracts
1,114,126.00- swap contracts
1,401,231.33Result of operations-476,617.99Dividends paid 15Note
122,887,173.55Subscriptions capitalisation shares52,015,588.77Subscriptions distribution shares
-244,917,135.98Redemptions capitalisation shares-4,077,616.09Redemptions distribution shares
-73,167,376.41Total changes in net assets
494,616,159.10Total net assets at the beginning of the year
421,448,782.69Total net assets at the end of the year
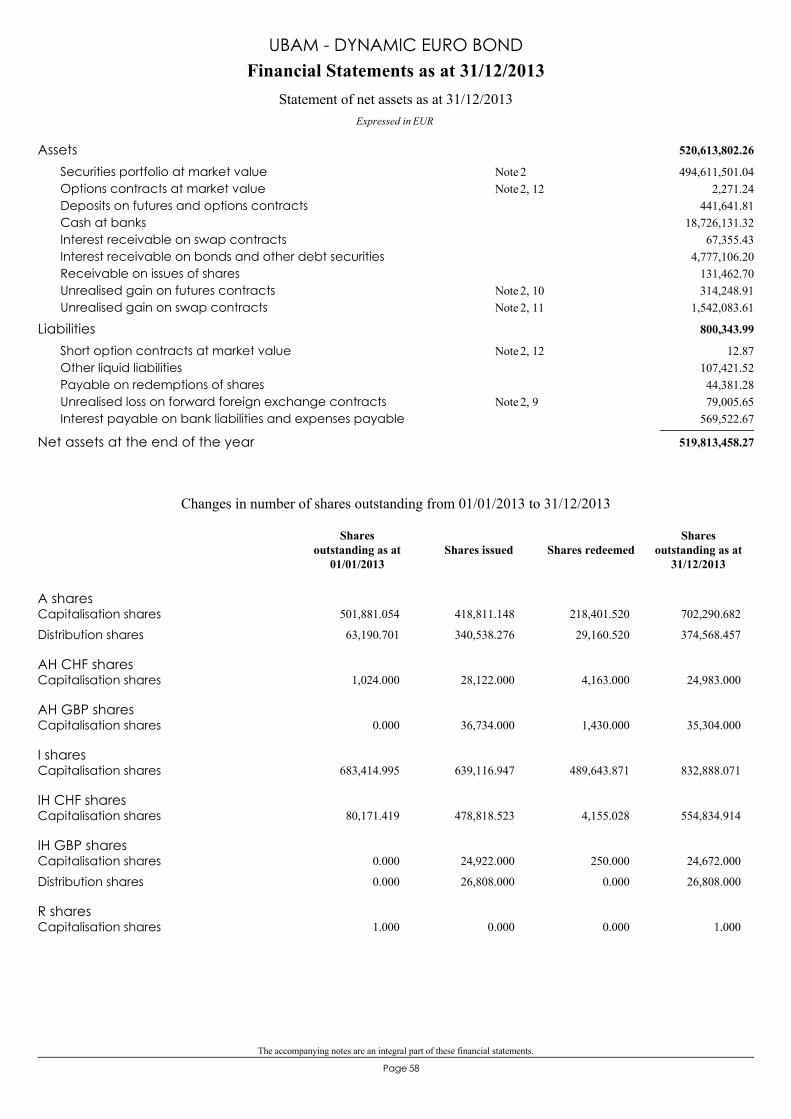
The accompanying notes are an integral part of these financial statements.
58Page
520,613,802.26Assets494,611,501.04Securities portfolio at market value 2Note
2,271.24Options contracts at market value 2, 12Note441,641.81Deposits on futures and options contracts
18,726,131.32Cash at banks67,355.43Interest receivable on swap contracts
4,777,106.20Interest receivable on bonds and other debt securities131,462.70Receivable on issues of shares314,248.91Unrealised gain on futures contracts 2, 10Note
1,542,083.61Unrealised gain on swap contracts 2, 11Note
800,343.99Liabilities12.87Short option contracts at market value 2, 12Note
107,421.52Other liquid liabilities44,381.28Payable on redemptions of shares79,005.65Unrealised loss on forward foreign exchange contracts 2, 9Note
569,522.67Interest payable on bank liabilities and expenses payable
519,813,458.27Net assets at the end of the year
Financial Statements as at 31/12/2013
Expressed in EUR
Statement of net assets as at 31/12/2013
UBAM - DYNAMIC EURO BOND
A sharesCapitalisation shares 501,881.054 418,811.148 218,401.520 702,290.682
Distribution shares 63,190.701 340,538.276 29,160.520 374,568.457
AH CHF sharesCapitalisation shares 1,024.000 28,122.000 4,163.000 24,983.000
AH GBP sharesCapitalisation shares 0.000 36,734.000 1,430.000 35,304.000
I sharesCapitalisation shares 683,414.995 639,116.947 489,643.871 832,888.071
IH CHF sharesCapitalisation shares 80,171.419 478,818.523 4,155.028 554,834.914
IH GBP sharesCapitalisation shares 0.000 24,922.000 250.000 24,672.000
Distribution shares 0.000 26,808.000 0.000 26,808.000
R sharesCapitalisation shares 1.000 0.000 0.000 1.000
Changes in number of shares outstanding from 01/01/2013 to 31/12/2013
Shares issued Shares redeemedShares
outstanding as at31/12/2013
Sharesoutstanding as at
01/01/2013
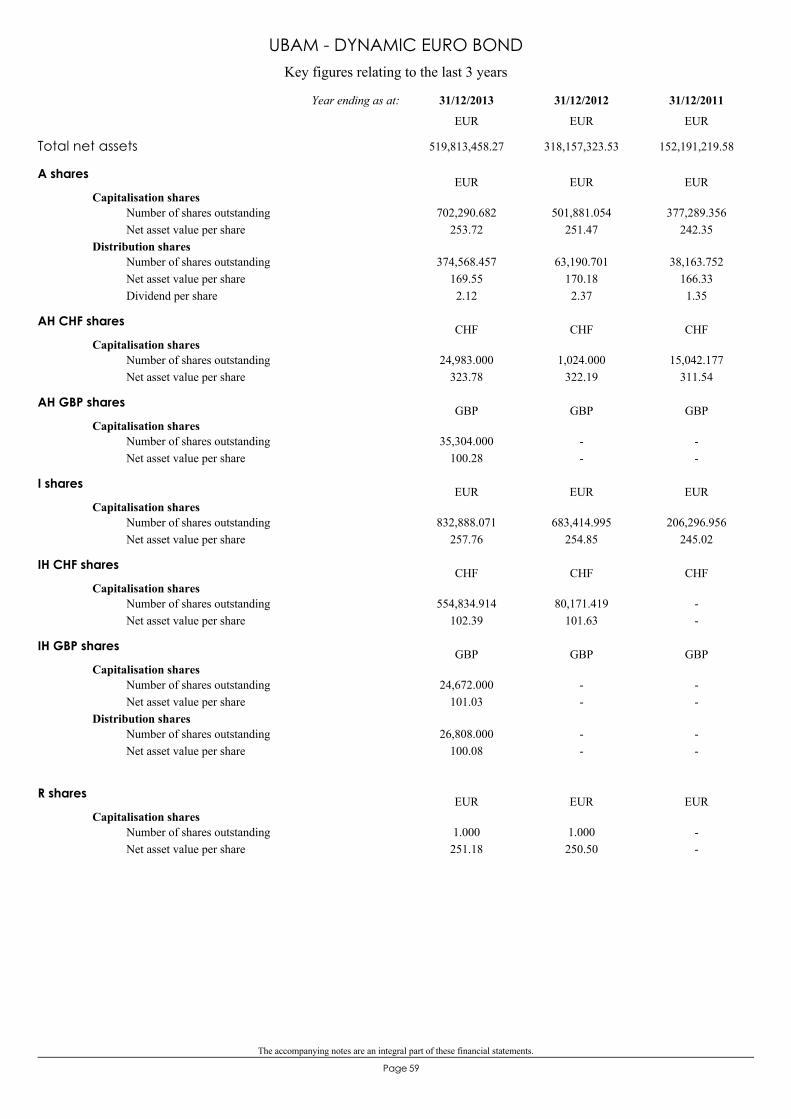
The accompanying notes are an integral part of these financial statements.
59Page
Key figures relating to the last 3 years
UBAM - DYNAMIC EURO BOND
A shares
Capitalisation shares702,290.682
253.72501,881.054
251.47377,289.356
242.35Number of shares outstandingNet asset value per share
Distribution shares374,568.457
169.552.12
63,190.701170.182.37
38,163.752166.331.35
Number of shares outstandingNet asset value per shareDividend per share
EUR EUR EUR
AH CHF shares
Capitalisation shares24,983.000
323.781,024.000
322.1915,042.177
311.54Number of shares outstandingNet asset value per share
CHF CHF CHF
AH GBP shares
Capitalisation shares35,304.000
100.28--
--
Number of shares outstandingNet asset value per share
GBP GBP GBP
I shares
Capitalisation shares832,888.071
257.76683,414.995
254.85206,296.956
245.02Number of shares outstandingNet asset value per share
EUR EUR EUR
IH CHF shares
Capitalisation shares554,834.914
102.3980,171.419
101.63--
Number of shares outstandingNet asset value per share
CHF CHF CHF
IH GBP shares
Capitalisation shares24,672.000
101.03--
--
Number of shares outstandingNet asset value per share
Distribution shares26,808.000
100.08--
--
Number of shares outstandingNet asset value per share
GBP GBP GBP
R shares
Capitalisation shares1.000251.18
1.000250.50
--
Number of shares outstandingNet asset value per share
EUR EUR EUR
Total net assets 519,813,458.27 318,157,323.53 152,191,219.58
31/12/201131/12/201231/12/2013Year ending as at:
EUR EUR EUR
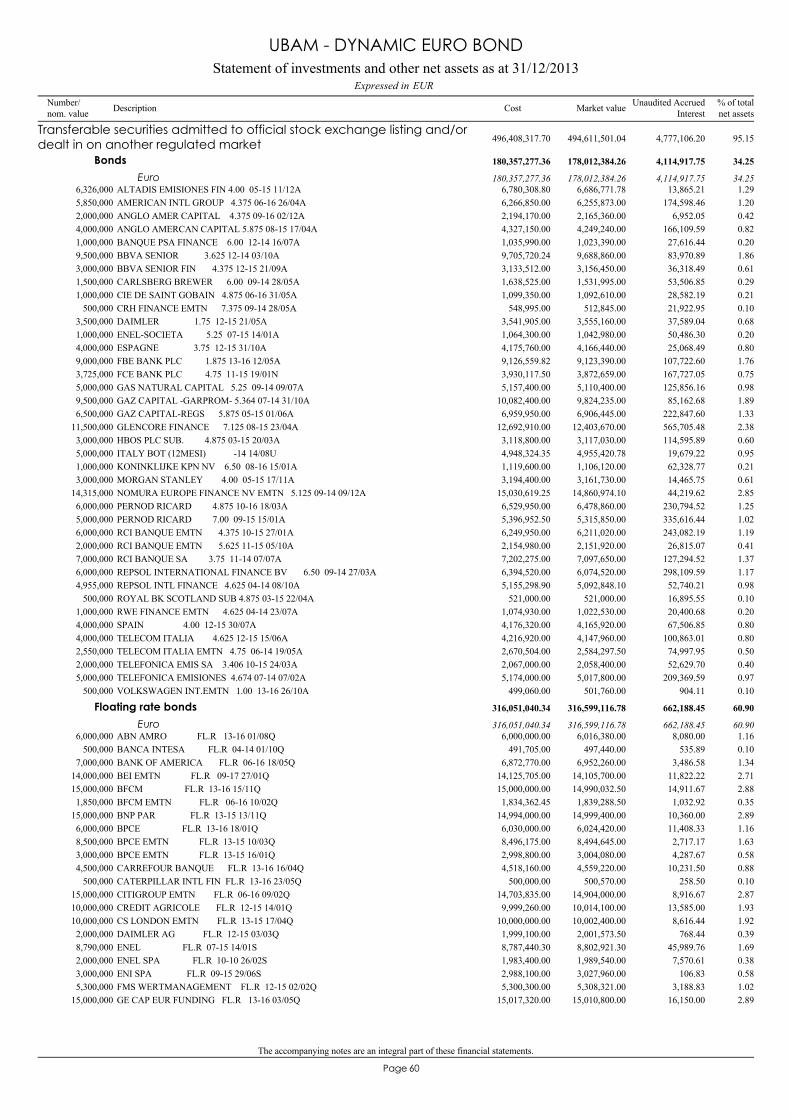
The accompanying notes are an integral part of these financial statements.
60Page
ALTADIS EMISIONES FIN 4.00 05-15 11/12A6,326,000 6,686,771.78 1.296,780,308.80 13,865.21
Transferable securities admitted to official stock exchange listing and/ordealt in on another regulated market 494,611,501.04 95.15496,408,317.70 4,777,106.20
Bonds 178,012,384.26 34.25180,357,277.36 4,114,917.75
Euro 178,012,384.26 34.25180,357,277.36 4,114,917.75
AMERICAN INTL GROUP 4.375 06-16 26/04A5,850,000 6,255,873.00 1.206,266,850.00 174,598.46ANGLO AMER CAPITAL 4.375 09-16 02/12A2,000,000 2,165,360.00 0.422,194,170.00 6,952.05ANGLO AMERCAN CAPITAL 5.875 08-15 17/04A4,000,000 4,249,240.00 0.824,327,150.00 166,109.59BANQUE PSA FINANCE 6.00 12-14 16/07A1,000,000 1,023,390.00 0.201,035,990.00 27,616.44BBVA SENIOR 3.625 12-14 03/10A9,500,000 9,688,860.00 1.869,705,720.24 83,970.89BBVA SENIOR FIN 4.375 12-15 21/09A3,000,000 3,156,450.00 0.613,133,512.00 36,318.49CARLSBERG BREWER 6.00 09-14 28/05A1,500,000 1,531,995.00 0.291,638,525.00 53,506.85CIE DE SAINT GOBAIN 4.875 06-16 31/05A1,000,000 1,092,610.00 0.211,099,350.00 28,582.19CRH FINANCE EMTN 7.375 09-14 28/05A500,000 512,845.00 0.10548,995.00 21,922.95DAIMLER 1.75 12-15 21/05A3,500,000 3,555,160.00 0.683,541,905.00 37,589.04ENEL-SOCIETA 5.25 07-15 14/01A1,000,000 1,042,980.00 0.201,064,300.00 50,486.30ESPAGNE 3.75 12-15 31/10A4,000,000 4,166,440.00 0.804,175,760.00 25,068.49FBE BANK PLC 1.875 13-16 12/05A9,000,000 9,123,390.00 1.769,126,559.82 107,722.60FCE BANK PLC 4.75 11-15 19/01N3,725,000 3,872,659.00 0.753,930,117.50 167,727.05GAS NATURAL CAPITAL 5.25 09-14 09/07A5,000,000 5,110,400.00 0.985,157,400.00 125,856.16GAZ CAPITAL -GARPROM- 5.364 07-14 31/10A9,500,000 9,824,235.00 1.8910,082,400.00 85,162.68GAZ CAPITAL-REGS 5.875 05-15 01/06A6,500,000 6,906,445.00 1.336,959,950.00 222,847.60GLENCORE FINANCE 7.125 08-15 23/04A11,500,000 12,403,670.00 2.3812,692,910.00 565,705.48HBOS PLC SUB. 4.875 03-15 20/03A3,000,000 3,117,030.00 0.603,118,800.00 114,595.89ITALY BOT (12MESI) -14 14/08U5,000,000 4,955,420.78 0.954,948,324.35 19,679.22KONINKLIJKE KPN NV 6.50 08-16 15/01A1,000,000 1,106,120.00 0.211,119,600.00 62,328.77MORGAN STANLEY 4.00 05-15 17/11A3,000,000 3,161,730.00 0.613,194,400.00 14,465.75NOMURA EUROPE FINANCE NV EMTN 5.125 09-14 09/12A14,315,000 14,860,974.10 2.8515,030,619.25 44,219.62PERNOD RICARD 4.875 10-16 18/03A6,000,000 6,478,860.00 1.256,529,950.00 230,794.52PERNOD RICARD 7.00 09-15 15/01A5,000,000 5,315,850.00 1.025,396,952.50 335,616.44RCI BANQUE EMTN 4.375 10-15 27/01A6,000,000 6,211,020.00 1.196,249,950.00 243,082.19RCI BANQUE EMTN 5.625 11-15 05/10A2,000,000 2,151,920.00 0.412,154,980.00 26,815.07RCI BANQUE SA 3.75 11-14 07/07A7,000,000 7,097,650.00 1.377,202,275.00 127,294.52REPSOL INTERNATIONAL FINANCE BV 6.50 09-14 27/03A6,000,000 6,074,520.00 1.176,394,520.00 298,109.59REPSOL INTL FINANCE 4.625 04-14 08/10A4,955,000 5,092,848.10 0.985,155,298.90 52,740.21ROYAL BK SCOTLAND SUB 4.875 03-15 22/04A500,000 521,000.00 0.10521,000.00 16,895.55RWE FINANCE EMTN 4.625 04-14 23/07A1,000,000 1,022,530.00 0.201,074,930.00 20,400.68SPAIN 4.00 12-15 30/07A4,000,000 4,165,920.00 0.804,176,320.00 67,506.85TELECOM ITALIA 4.625 12-15 15/06A4,000,000 4,147,960.00 0.804,216,920.00 100,863.01TELECOM ITALIA EMTN 4.75 06-14 19/05A2,550,000 2,584,297.50 0.502,670,504.00 74,997.95TELEFONICA EMIS SA 3.406 10-15 24/03A2,000,000 2,058,400.00 0.402,067,000.00 52,629.70TELEFONICA EMISIONES 4.674 07-14 07/02A5,000,000 5,017,800.00 0.975,174,000.00 209,369.59VOLKSWAGEN INT.EMTN 1.00 13-16 26/10A500,000 501,760.00 0.10499,060.00 904.11
ABN AMRO FL.R 13-16 01/08Q6,000,000 6,016,380.00 1.166,000,000.00 8,080.00
Floating rate bonds 316,599,116.78 60.90316,051,040.34 662,188.45
Euro 316,599,116.78 60.90316,051,040.34 662,188.45
BANCA INTESA FL.R 04-14 01/10Q500,000 497,440.00 0.10491,705.00 535.89BANK OF AMERICA FL.R 06-16 18/05Q7,000,000 6,952,260.00 1.346,872,770.00 3,486.58BEI EMTN FL.R 09-17 27/01Q14,000,000 14,105,700.00 2.7114,125,705.00 11,822.22BFCM FL.R 13-16 15/11Q15,000,000 14,990,032.50 2.8815,000,000.00 14,911.67BFCM EMTN FL.R 06-16 10/02Q1,850,000 1,839,288.50 0.351,834,362.45 1,032.92BNP PAR FL.R 13-15 13/11Q15,000,000 14,999,400.00 2.8914,994,000.00 10,360.00BPCE FL.R 13-16 18/01Q6,000,000 6,024,420.00 1.166,030,000.00 11,408.33BPCE EMTN FL.R 13-15 10/03Q8,500,000 8,494,645.00 1.638,496,175.00 2,717.17BPCE EMTN FL.R 13-15 16/01Q3,000,000 3,004,080.00 0.582,998,800.00 4,287.67CARREFOUR BANQUE FL.R 13-16 16/04Q4,500,000 4,559,220.00 0.884,518,160.00 10,231.50CATERPILLAR INTL FIN FL.R 13-16 23/05Q500,000 500,570.00 0.10500,000.00 258.50CITIGROUP EMTN FL.R 06-16 09/02Q15,000,000 14,904,000.00 2.8714,703,835.00 8,916.67CREDIT AGRICOLE FL.R 12-15 14/01Q10,000,000 10,014,100.00 1.939,999,260.00 13,585.00CS LONDON EMTN FL.R 13-15 17/04Q10,000,000 10,002,400.00 1.9210,000,000.00 8,616.44DAIMLER AG FL.R 12-15 03/03Q2,000,000 2,001,573.50 0.391,999,100.00 768.44ENEL FL.R 07-15 14/01S8,790,000 8,802,921.30 1.698,787,440.30 45,989.76ENEL SPA FL.R 10-10 26/02S2,000,000 1,989,540.00 0.381,983,400.00 7,570.61ENI SPA FL.R 09-15 29/06S3,000,000 3,027,960.00 0.582,988,100.00 106.83FMS WERTMANAGEMENT FL.R 12-15 02/02Q5,300,000 5,308,321.00 1.025,300,300.00 3,188.83GE CAP EUR FUNDING FL.R 13-16 03/05Q15,000,000 15,010,800.00 2.8915,017,320.00 16,150.00
Statement of investments and other net assets as at 31/12/2013EURExpressed in
UBAM - DYNAMIC EURO BOND
Number/nom. value Description % of total
net assetsMarket valueCost Unaudited AccruedInterest
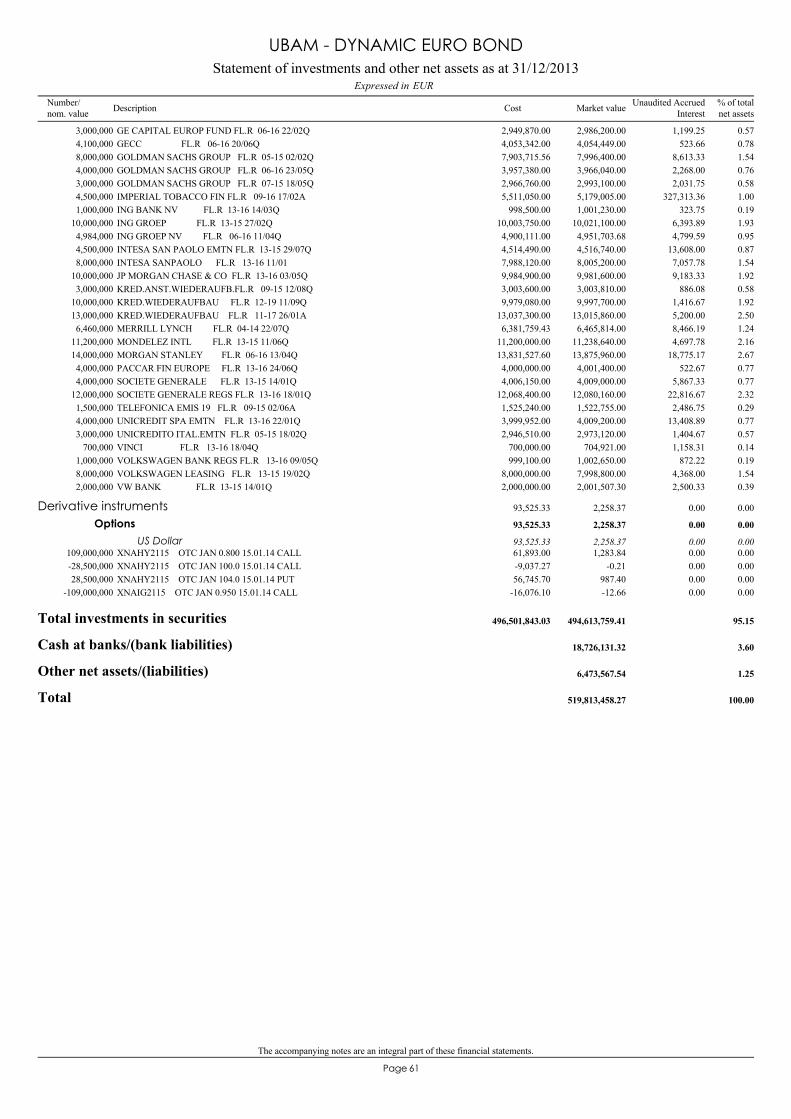
The accompanying notes are an integral part of these financial statements.
61Page
GE CAPITAL EUROP FUND FL.R 06-16 22/02Q3,000,000 2,986,200.00 0.572,949,870.00 1,199.25GECC FL.R 06-16 20/06Q4,100,000 4,054,449.00 0.784,053,342.00 523.66GOLDMAN SACHS GROUP FL.R 05-15 02/02Q8,000,000 7,996,400.00 1.547,903,715.56 8,613.33GOLDMAN SACHS GROUP FL.R 06-16 23/05Q4,000,000 3,966,040.00 0.763,957,380.00 2,268.00GOLDMAN SACHS GROUP FL.R 07-15 18/05Q3,000,000 2,993,100.00 0.582,966,760.00 2,031.75IMPERIAL TOBACCO FIN FL.R 09-16 17/02A4,500,000 5,179,005.00 1.005,511,050.00 327,313.36ING BANK NV FL.R 13-16 14/03Q1,000,000 1,001,230.00 0.19998,500.00 323.75ING GROEP FL.R 13-15 27/02Q10,000,000 10,021,100.00 1.9310,003,750.00 6,393.89ING GROEP NV FL.R 06-16 11/04Q4,984,000 4,951,703.68 0.954,900,111.00 4,799.59INTESA SAN PAOLO EMTN FL.R 13-15 29/07Q4,500,000 4,516,740.00 0.874,514,490.00 13,608.00INTESA SANPAOLO FL.R 13-16 11/018,000,000 8,005,200.00 1.547,988,120.00 7,057.78JP MORGAN CHASE & CO FL.R 13-16 03/05Q10,000,000 9,981,600.00 1.929,984,900.00 9,183.33KRED.ANST.WIEDERAUFB.FL.R 09-15 12/08Q3,000,000 3,003,810.00 0.583,003,600.00 886.08KRED.WIEDERAUFBAU FL.R 12-19 11/09Q10,000,000 9,997,700.00 1.929,979,080.00 1,416.67KRED.WIEDERAUFBAU FL.R 11-17 26/01A13,000,000 13,015,860.00 2.5013,037,300.00 5,200.00MERRILL LYNCH FL.R 04-14 22/07Q6,460,000 6,465,814.00 1.246,381,759.43 8,466.19MONDELEZ INTL FL.R 13-15 11/06Q11,200,000 11,238,640.00 2.1611,200,000.00 4,697.78MORGAN STANLEY FL.R 06-16 13/04Q14,000,000 13,875,960.00 2.6713,831,527.60 18,775.17PACCAR FIN EUROPE FL.R 13-16 24/06Q4,000,000 4,001,400.00 0.774,000,000.00 522.67SOCIETE GENERALE FL.R 13-15 14/01Q4,000,000 4,009,000.00 0.774,006,150.00 5,867.33SOCIETE GENERALE REGS FL.R 13-16 18/01Q12,000,000 12,080,160.00 2.3212,068,400.00 22,816.67TELEFONICA EMIS 19 FL.R 09-15 02/06A1,500,000 1,522,755.00 0.291,525,240.00 2,486.75UNICREDIT SPA EMTN FL.R 13-16 22/01Q4,000,000 4,009,200.00 0.773,999,952.00 13,408.89UNICREDITO ITAL.EMTN FL.R 05-15 18/02Q3,000,000 2,973,120.00 0.572,946,510.00 1,404.67VINCI FL.R 13-16 18/04Q700,000 704,921.00 0.14700,000.00 1,158.31VOLKSWAGEN BANK REGS FL.R 13-16 09/05Q1,000,000 1,002,650.00 0.19999,100.00 872.22VOLKSWAGEN LEASING FL.R 13-15 19/02Q8,000,000 7,998,800.00 1.548,000,000.00 4,368.00VW BANK FL.R 13-15 14/01Q2,000,000 2,001,507.30 0.392,000,000.00 2,500.33
XNAHY2115 OTC JAN 0.800 15.01.14 CALL109,000,000 1,283.84 0.0061,893.00 0.00
Derivative instruments 2,258.37 0.0093,525.33 0.00
Options 2,258.37 0.0093,525.33 0.00
US Dollar 2,258.37 0.0093,525.33 0.00
XNAHY2115 OTC JAN 100.0 15.01.14 CALL-28,500,000 -0.21 0.00-9,037.27 0.00XNAHY2115 OTC JAN 104.0 15.01.14 PUT28,500,000 987.40 0.0056,745.70 0.00XNAIG2115 OTC JAN 0.950 15.01.14 CALL-109,000,000 -12.66 0.00-16,076.10 0.00
Total investments in securities 494,613,759.41 95.15496,501,843.03
Cash at banks/(bank liabilities) 18,726,131.32 3.60
Other net assets/(liabilities) 6,473,567.54 1.25
Total 519,813,458.27 100.00
Statement of investments and other net assets as at 31/12/2013EURExpressed in
UBAM - DYNAMIC EURO BOND
Number/nom. value Description % of total
net assetsMarket valueCost Unaudited AccruedInterest
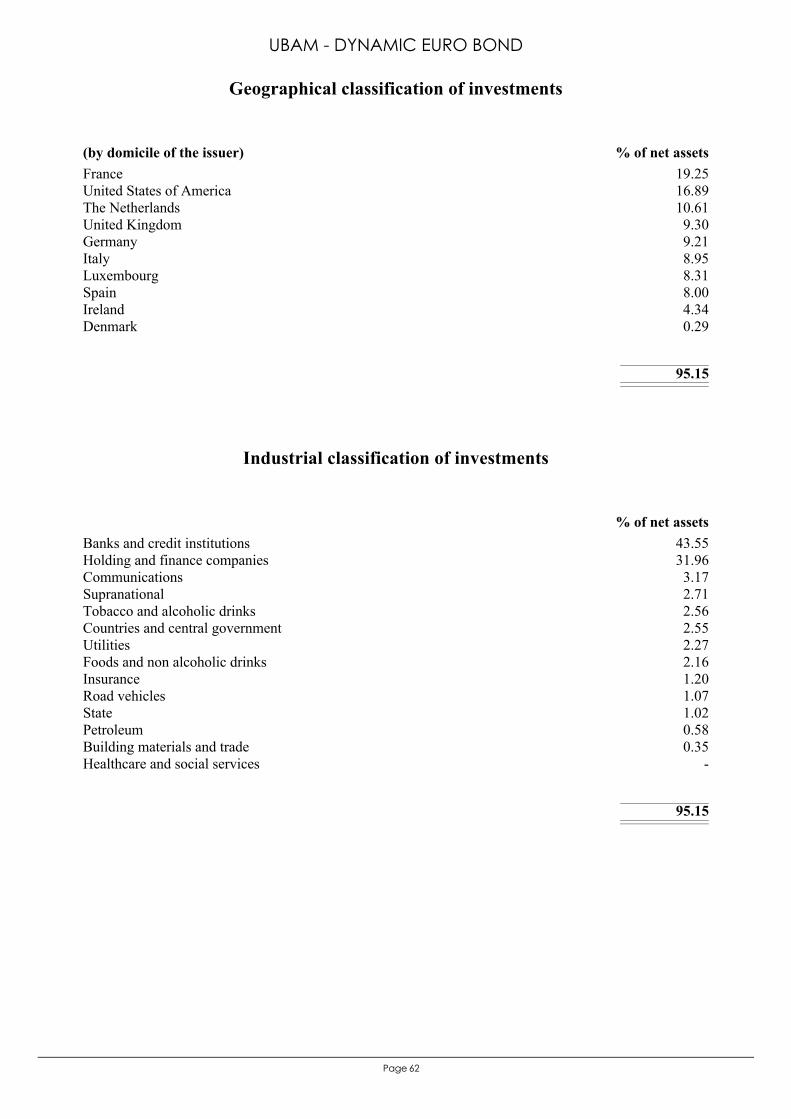
62Page
France 19.25United States of America 16.89The Netherlands 10.61United Kingdom 9.30Germany 9.21Italy 8.95Luxembourg 8.31Spain 8.00Ireland 4.34Denmark 0.29
95.15
(by domicile of the issuer) % of net assets
Geographical classification of investments
UBAM - DYNAMIC EURO BOND
Banks and credit institutions 43.55Holding and finance companies 31.96Communications 3.17Supranational 2.71Tobacco and alcoholic drinks 2.56Countries and central government 2.55Utilities 2.27Foods and non alcoholic drinks 2.16Insurance 1.20Road vehicles 1.07State 1.02Petroleum 0.58Building materials and trade 0.35Healthcare and social services -
95.15
% of net assets
Industrial classification of investments

The accompanying notes are an integral part of these financial statements.
63Page
Statement of operations and other changes in net assets from 01/01/2013 to 31/12/2013Expressed in EUR
UBAM - DYNAMIC EURO BOND
8,125,887.03Income6,519,150.85Interest on bonds and other debt securities, net 2Note
73.93Interest on bank accounts148.45Bank interest on time deposits
1,592,526.52Interest received on swap contracts13,987.28Other income
2,141,151.57Expenses312,281.37Advisory fees 4Note527,144.69Management fees 3Note383,832.95Custodian fees120,846.33Subscription duty ("taxe d'abonnement") 6Note375,064.07Central administration costs19,643.60Audit fees
948.50Interest paid on bank liabilities12,495.62Legal fees23,059.41Transaction fees 2Note
108,349.11Other administration costs 7, 8Note11,222.00Banking charges and other fees
180,694.93Interest paid on swap contracts65,568.99Other expenses
5,984,735.46Net investment incomeNet realised gain/(loss) on:
1,206,889.93- securities portfolio 2Note-119,816.58- options 2Note
-2,776.21- forward foreign exchange contracts 2Note-421,781.27- futures contracts 2Note
-1,381,448.71- swap contracts 2Note42,455.94- foreign exchange 2Note
5,308,258.56Realised resultNet variation of the unrealised gain/(loss) on:
-3,065,960.39- securities portfolio-83,929.69- options-75,917.70- forward foreign exchange contracts338,328.91- futures contracts
1,255,015.96- swap contracts
3,675,795.65Result of operations-315,103.84Dividends paid 15Note
324,711,917.32Subscriptions capitalisation shares60,904,194.21Subscriptions distribution shares
-182,377,808.14Redemptions capitalisation shares-4,942,860.46Redemptions distribution shares
201,656,134.74Total changes in net assets
318,157,323.53Total net assets at the beginning of the year
519,813,458.27Total net assets at the end of the year
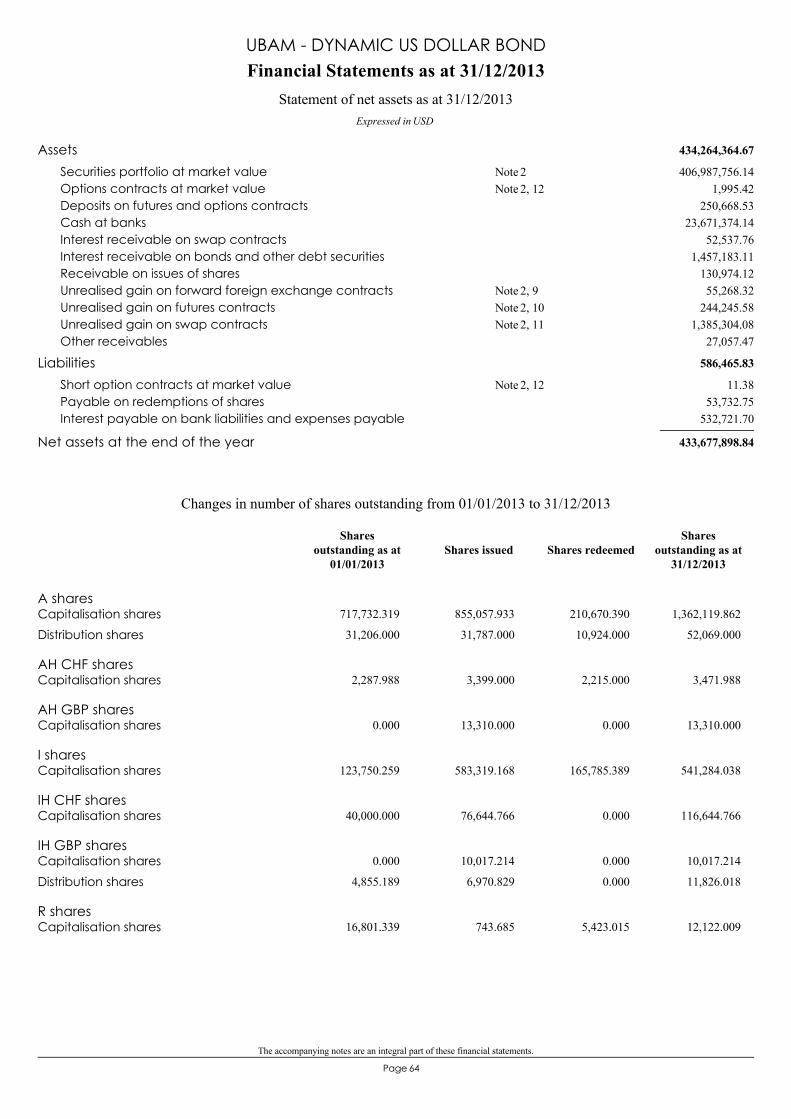
The accompanying notes are an integral part of these financial statements.
64Page
434,264,364.67Assets406,987,756.14Securities portfolio at market value 2Note
1,995.42Options contracts at market value 2, 12Note250,668.53Deposits on futures and options contracts
23,671,374.14Cash at banks52,537.76Interest receivable on swap contracts
1,457,183.11Interest receivable on bonds and other debt securities130,974.12Receivable on issues of shares55,268.32Unrealised gain on forward foreign exchange contracts 2, 9Note
244,245.58Unrealised gain on futures contracts 2, 10Note1,385,304.08Unrealised gain on swap contracts 2, 11Note
27,057.47Other receivables
586,465.83Liabilities11.38Short option contracts at market value 2, 12Note
53,732.75Payable on redemptions of shares532,721.70Interest payable on bank liabilities and expenses payable
433,677,898.84Net assets at the end of the year
Financial Statements as at 31/12/2013
Expressed in USD
Statement of net assets as at 31/12/2013
UBAM - DYNAMIC US DOLLAR BOND
A sharesCapitalisation shares 717,732.319 855,057.933 210,670.390 1,362,119.862
Distribution shares 31,206.000 31,787.000 10,924.000 52,069.000
AH CHF sharesCapitalisation shares 2,287.988 3,399.000 2,215.000 3,471.988
AH GBP sharesCapitalisation shares 0.000 13,310.000 0.000 13,310.000
I sharesCapitalisation shares 123,750.259 583,319.168 165,785.389 541,284.038
IH CHF sharesCapitalisation shares 40,000.000 76,644.766 0.000 116,644.766
IH GBP sharesCapitalisation shares 0.000 10,017.214 0.000 10,017.214
Distribution shares 4,855.189 6,970.829 0.000 11,826.018
R sharesCapitalisation shares 16,801.339 743.685 5,423.015 12,122.009
Changes in number of shares outstanding from 01/01/2013 to 31/12/2013
Shares issued Shares redeemedShares
outstanding as at31/12/2013
Sharesoutstanding as at
01/01/2013
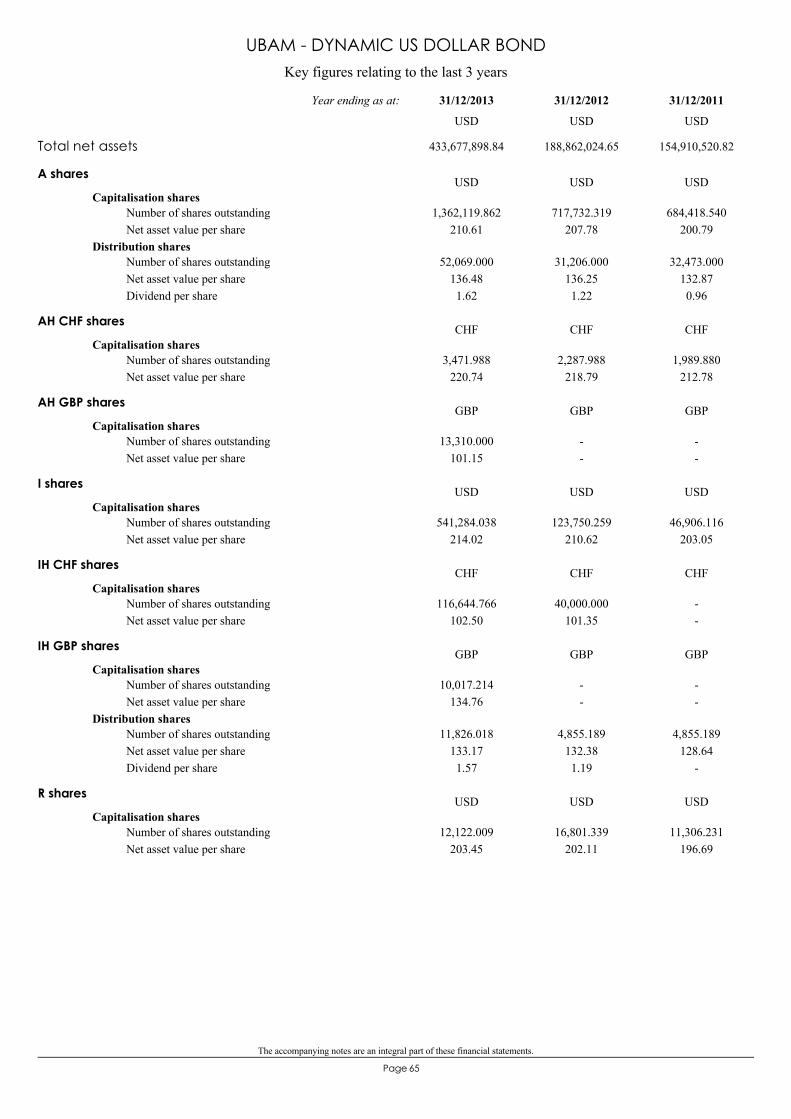
The accompanying notes are an integral part of these financial statements.
65Page
Key figures relating to the last 3 years
UBAM - DYNAMIC US DOLLAR BOND
A shares
Capitalisation shares1,362,119.862
210.61717,732.319
207.78684,418.540
200.79Number of shares outstandingNet asset value per share
Distribution shares52,069.000
136.481.62
31,206.000136.251.22
32,473.000132.870.96
Number of shares outstandingNet asset value per shareDividend per share
USD USD USD
AH CHF shares
Capitalisation shares3,471.988
220.742,287.988
218.791,989.880
212.78Number of shares outstandingNet asset value per share
CHF CHF CHF
AH GBP shares
Capitalisation shares13,310.000
101.15--
--
Number of shares outstandingNet asset value per share
GBP GBP GBP
I shares
Capitalisation shares541,284.038
214.02123,750.259
210.6246,906.116
203.05Number of shares outstandingNet asset value per share
USD USD USD
IH CHF shares
Capitalisation shares116,644.766
102.5040,000.000
101.35--
Number of shares outstandingNet asset value per share
CHF CHF CHF
IH GBP shares
Capitalisation shares10,017.214
134.76--
--
Number of shares outstandingNet asset value per share
Distribution shares11,826.018
133.171.57
4,855.189132.381.19
4,855.189128.64
-
Number of shares outstandingNet asset value per shareDividend per share
GBP GBP GBP
R shares
Capitalisation shares12,122.009
203.4516,801.339
202.1111,306.231
196.69Number of shares outstandingNet asset value per share
USD USD USD
Total net assets 433,677,898.84 188,862,024.65 154,910,520.82
31/12/201131/12/201231/12/2013Year ending as at:
USD USD USD
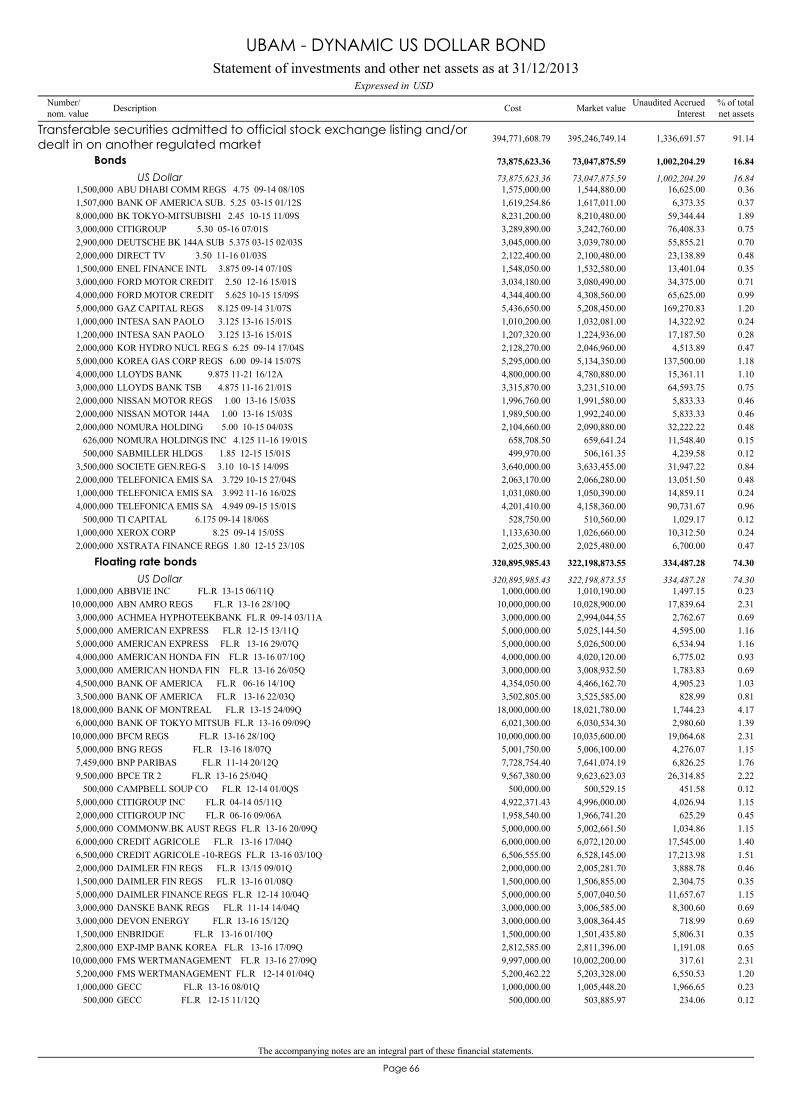
The accompanying notes are an integral part of these financial statements.
66Page
ABU DHABI COMM REGS 4.75 09-14 08/10S1,500,000 1,544,880.00 0.361,575,000.00 16,625.00
Transferable securities admitted to official stock exchange listing and/ordealt in on another regulated market 395,246,749.14 91.14394,771,608.79 1,336,691.57
Bonds 73,047,875.59 16.8473,875,623.36 1,002,204.29
US Dollar 73,047,875.59 16.8473,875,623.36 1,002,204.29
BANK OF AMERICA SUB. 5.25 03-15 01/12S1,507,000 1,617,011.00 0.371,619,254.86 6,373.35BK TOKYO-MITSUBISHI 2.45 10-15 11/09S8,000,000 8,210,480.00 1.898,231,200.00 59,344.44CITIGROUP 5.30 05-16 07/01S3,000,000 3,242,760.00 0.753,289,890.00 76,408.33DEUTSCHE BK 144A SUB 5.375 03-15 02/03S2,900,000 3,039,780.00 0.703,045,000.00 55,855.21DIRECT TV 3.50 11-16 01/03S2,000,000 2,100,480.00 0.482,122,400.00 23,138.89ENEL FINANCE INTL 3.875 09-14 07/10S1,500,000 1,532,580.00 0.351,548,050.00 13,401.04FORD MOTOR CREDIT 2.50 12-16 15/01S3,000,000 3,080,490.00 0.713,034,180.00 34,375.00FORD MOTOR CREDIT 5.625 10-15 15/09S4,000,000 4,308,560.00 0.994,344,400.00 65,625.00GAZ CAPITAL REGS 8.125 09-14 31/07S5,000,000 5,208,450.00 1.205,436,650.00 169,270.83INTESA SAN PAOLO 3.125 13-16 15/01S1,000,000 1,032,081.00 0.241,010,200.00 14,322.92INTESA SAN PAOLO 3.125 13-16 15/01S1,200,000 1,224,936.00 0.281,207,320.00 17,187.50KOR HYDRO NUCL REG S 6.25 09-14 17/04S2,000,000 2,046,960.00 0.472,128,270.00 4,513.89KOREA GAS CORP REGS 6.00 09-14 15/07S5,000,000 5,134,350.00 1.185,295,000.00 137,500.00LLOYDS BANK 9.875 11-21 16/12A4,000,000 4,780,880.00 1.104,800,000.00 15,361.11LLOYDS BANK TSB 4.875 11-16 21/01S3,000,000 3,231,510.00 0.753,315,870.00 64,593.75NISSAN MOTOR REGS 1.00 13-16 15/03S2,000,000 1,991,580.00 0.461,996,760.00 5,833.33NISSAN MOTOR 144A 1.00 13-16 15/03S2,000,000 1,992,240.00 0.461,989,500.00 5,833.33NOMURA HOLDING 5.00 10-15 04/03S2,000,000 2,090,880.00 0.482,104,660.00 32,222.22NOMURA HOLDINGS INC 4.125 11-16 19/01S626,000 659,641.24 0.15658,708.50 11,548.40SABMILLER HLDGS 1.85 12-15 15/01S500,000 506,161.35 0.12499,970.00 4,239.58SOCIETE GEN.REG-S 3.10 10-15 14/09S3,500,000 3,633,455.00 0.843,640,000.00 31,947.22TELEFONICA EMIS SA 3.729 10-15 27/04S2,000,000 2,066,280.00 0.482,063,170.00 13,051.50TELEFONICA EMIS SA 3.992 11-16 16/02S1,000,000 1,050,390.00 0.241,031,080.00 14,859.11TELEFONICA EMIS SA 4.949 09-15 15/01S4,000,000 4,158,360.00 0.964,201,410.00 90,731.67TI CAPITAL 6.175 09-14 18/06S500,000 510,560.00 0.12528,750.00 1,029.17XEROX CORP 8.25 09-14 15/05S1,000,000 1,026,660.00 0.241,133,630.00 10,312.50XSTRATA FINANCE REGS 1.80 12-15 23/10S2,000,000 2,025,480.00 0.472,025,300.00 6,700.00
ABBVIE INC FL.R 13-15 06/11Q1,000,000 1,010,190.00 0.231,000,000.00 1,497.15
Floating rate bonds 322,198,873.55 74.30320,895,985.43 334,487.28
US Dollar 322,198,873.55 74.30320,895,985.43 334,487.28
ABN AMRO REGS FL.R 13-16 28/10Q10,000,000 10,028,900.00 2.3110,000,000.00 17,839.64ACHMEA HYPHOTEEKBANK FL.R 09-14 03/11A3,000,000 2,994,044.55 0.693,000,000.00 2,762.67AMERICAN EXPRESS FL.R 12-15 13/11Q5,000,000 5,025,144.50 1.165,000,000.00 4,595.00AMERICAN EXPRESS FL.R 13-16 29/07Q5,000,000 5,026,500.00 1.165,000,000.00 6,534.94AMERICAN HONDA FIN FL.R 13-16 07/10Q4,000,000 4,020,120.00 0.934,000,000.00 6,775.02AMERICAN HONDA FIN FL.R 13-16 26/05Q3,000,000 3,008,932.50 0.693,000,000.00 1,783.83BANK OF AMERICA FL.R 06-16 14/10Q4,500,000 4,466,162.70 1.034,354,050.00 4,905.23BANK OF AMERICA FL.R 13-16 22/03Q3,500,000 3,525,585.00 0.813,502,805.00 828.99BANK OF MONTREAL FL.R 13-15 24/09Q18,000,000 18,021,780.00 4.1718,000,000.00 1,744.23BANK OF TOKYO MITSUB FL.R 13-16 09/09Q6,000,000 6,030,534.30 1.396,021,300.00 2,980.60BFCM REGS FL.R 13-16 28/10Q10,000,000 10,035,600.00 2.3110,000,000.00 19,064.68BNG REGS FL.R 13-16 18/07Q5,000,000 5,006,100.00 1.155,001,750.00 4,276.07BNP PARIBAS FL.R 11-14 20/12Q7,459,000 7,641,074.19 1.767,728,754.40 6,826.25BPCE TR 2 FL.R 13-16 25/04Q9,500,000 9,623,623.03 2.229,567,380.00 26,314.85CAMPBELL SOUP CO FL.R 12-14 01/0QS500,000 500,529.15 0.12500,000.00 451.58CITIGROUP INC FL.R 04-14 05/11Q5,000,000 4,996,000.00 1.154,922,371.43 4,026.94CITIGROUP INC FL.R 06-16 09/06A2,000,000 1,966,741.20 0.451,958,540.00 625.29COMMONW.BK AUST REGS FL.R 13-16 20/09Q5,000,000 5,002,661.50 1.155,000,000.00 1,034.86CREDIT AGRICOLE FL.R 13-16 17/04Q6,000,000 6,072,120.00 1.406,000,000.00 17,545.00CREDIT AGRICOLE -10-REGS FL.R 13-16 03/10Q6,500,000 6,528,145.00 1.516,506,555.00 17,213.98DAIMLER FIN REGS FL.R 13/15 09/01Q2,000,000 2,005,281.70 0.462,000,000.00 3,888.78DAIMLER FIN REGS FL.R 13-16 01/08Q1,500,000 1,506,855.00 0.351,500,000.00 2,304.75DAIMLER FINANCE REGS FL.R 12-14 10/04Q5,000,000 5,007,040.50 1.155,000,000.00 11,657.67DANSKE BANK REGS FL.R 11-14 14/04Q3,000,000 3,006,585.00 0.693,000,000.00 8,300.60DEVON ENERGY FL.R 13-16 15/12Q3,000,000 3,008,364.45 0.693,000,000.00 718.99ENBRIDGE FL.R 13-16 01/10Q1,500,000 1,501,435.80 0.351,500,000.00 5,806.31EXP-IMP BANK KOREA FL.R 13-16 17/09Q2,800,000 2,811,396.00 0.652,812,585.00 1,191.08FMS WERTMANAGEMENT FL.R 13-16 27/09Q10,000,000 10,002,200.00 2.319,997,000.00 317.61FMS WERTMANAGEMENT FL.R 12-14 01/04Q5,200,000 5,203,328.00 1.205,200,462.22 6,550.53GECC FL.R 13-16 08/01Q1,000,000 1,005,448.20 0.231,000,000.00 1,966.65GECC FL.R 12-15 11/12Q500,000 503,885.97 0.12500,000.00 234.06
Statement of investments and other net assets as at 31/12/2013USDExpressed in
UBAM - DYNAMIC US DOLLAR BOND
Number/nom. value Description % of total
net assetsMarket valueCost Unaudited AccruedInterest

The accompanying notes are an integral part of these financial statements.
67Page
GECC EMTN -A-TR788 FL.R 07-16 11/05Q1,000,000 996,919.90 0.23988,840.00 598.07GECC MTN TR 899 FL.R 13-16 12/07Q5,000,000 5,039,120.75 1.165,000,000.00 9,556.56GENERAL ELECTRIC CAP FL.R 04-14 15/09Q1,000,000 1,001,670.00 0.23985,550.00 209.52GLENCORE FUNDING LLC FL.R 13-16 27/05Q1,250,000 1,245,737.50 0.291,250,000.00 1,599.41GOLDMAN SACHS GR MTNB FL.R 05-15 22/07Q10,958,000 10,929,618.78 2.5310,797,523.58 13,648.34HANA BANK REGS FL.R 13-16 09/11Q3,000,000 3,011,670.00 0.693,000,000.00 6,022.79HEWLETT PACKARD FL.R 11-14 30/05Q4,000,000 3,999,227.60 0.923,937,120.00 2,267.02ING BANK NV REGS FL.R 13-16 07/03Q6,000,000 6,059,880.00 1.406,004,500.00 0.00ING REGS FL.R 12-15 25/09Q2,000,000 2,042,391.80 0.472,033,600.00 419.08JFM FL.R 13-14 28/11Q5,000,000 4,999,275.00 1.155,000,000.00 1,811.56JP MORGAN CHASE FL.R 06-16 13/06Q8,000,000 7,944,320.00 1.837,918,480.00 2,295.40JP MORGAN CHASE FL.R 13-16 26/02Q8,000,000 8,025,040.00 1.858,021,600.00 6,662.44KOOKMIN BANK FL.R 13-16 11/10Q2,500,000 2,518,125.00 0.582,500,000.00 8,412.75KRED.ANST.WIEDERAUFB. FL.R 12-15 13/03Q5,000,000 5,004,500.00 1.154,999,000.00 784.63KROGER CO FL.R 13-16 17/10Q5,000,000 5,003,428.50 1.155,000,000.00 893.56MERRILL LYNCH EMTN FL.R 04-15 15/01Q1,075,000 1,074,946.25 0.251,058,982.50 1,617.79MORGAN STANLEY FL.R 05-15 15/10Q10,500,000 10,470,180.00 2.4210,295,690.00 16,250.85NIBC BANK REG S FL.R 09-1 02/12Q4,890,000 4,902,560.21 1.134,894,725.00 2,438.74NISSAN MOTOR REGS FL.R 13-16 26/09Q6,000,000 6,015,469.80 1.396,000,000.00 630.57NOMURA HOLDINGS FL.R 13-16 13/09Q8,000,000 8,005,177.60 1.858,092,080.00 6,775.40NORDEA BANK FL.R 13-16 13/05Q5,000,000 5,013,900.00 1.165,000,000.00 4,564.55NORTH RHINE WESTFALE FL.R 13-15 06/03Q10,000,000 10,009,100.00 2.3110,000,800.00 2,582.29NRW BANK EMTN FL.R 13-17 16/10Q5,000,000 5,010,075.00 1.165,000,000.00 5,127.89NWB REGS FL.R 13-16 18/10Q10,000,000 10,015,700.00 2.3110,000,000.00 7,558.07RABOBANL NL FL.R 13-16 18/03Q1,000,000 1,003,870.00 0.231,000,000.00 240.95RIO TINTO FIN USA FL.R 13-15 19/06Q5,000,000 5,001,782.25 1.155,000,000.00 1,323.92SOCIETE GENERAL REGS FL.R 11-14 11/04Q5,000,000 5,012,800.00 1.164,958,320.00 16,961.06SUMITOMO MITSUI REGS FL.R 13-16 16/09Q4,500,000 4,525,740.00 1.044,500,000.00 1,791.74VERIZON COMMUNICATION FL.R 11-14 28/03Q2,000,000 2,001,840.00 0.462,000,000.00 142.81VERIZON COMMUNICATION FL.R 13-16 15/09Q1,000,000 1,029,430.00 0.241,000,000.00 738.69VW INTL FINANCE REGS FL.R 12-14 20/11Q3,000,000 3,010,260.00 0.693,000,000.00 2,791.17VW INTL FINANCE REGS FL.R 13-15 18/11Q3,000,000 3,004,005.00 0.693,000,000.00 1,932.06VW INTL FINANCE REGS FL.R 13-16 18/11Q3,000,000 3,008,340.00 0.693,000,000.00 2,307.89WELLS FARGO CO FL.R 13-16 20/07Q5,000,000 5,020,450.00 1.165,000,000.00 7,720.50WELLS FARGO CO FL.R 06-15 28/10Q2,000,000 1,998,120.00 0.461,961,200.00 1,557.69WELLS FARGO MTN FL.R 12-15 26/06Q2,000,000 2,020,400.00 0.472,009,100.00 259.08XEROX CORP FL.R 11-14 16/05Q1,130,000 1,131,494.37 0.261,115,321.30 1,428.61
INTESA SANPAOLO 144A 3.625 10-15 12/05S8,000,000 8,231,520.00 1.908,126,890.00 111,166.67
Other transferable securities 11,741,007.00 2.7111,602,406.43 120,491.54
Bonds 8,231,520.00 1.908,126,890.00 111,166.67
US Dollar 8,231,520.00 1.908,126,890.00 111,166.67
INTESA SAN PAOLO 144A FL.R 11-14 24/02Q2,000,000 2,004,840.00 0.461,970,751.43 5,275.20
Floating rate bonds 3,509,487.00 0.813,475,516.43 9,324.87
US Dollar 3,509,487.00 0.813,475,516.43 9,324.87
NBCUNIVERSAL ENTERP. 0.817 13-16 15/04Q1,000,000 1,003,697.00 0.231,001,130.00 1,669.62RCI BANQUE SA 144A FL.R 11-14 11/04Q500,000 500,950.00 0.12503,635.00 2,380.05
XNAHY2115 OTC JAN 0.800 15.01.14 CALL70,000,000 1,136.10 0.0053,900.00 0.00
Derivative instruments 1,984.04 0.0080,850.00 0.00
Options 1,984.04 0.0080,850.00 0.00
US Dollar 1,984.04 0.0080,850.00 0.00
XNAHY2115 OTC JAN 100.0 15.01.14 CALL-18,000,000 -0.18 0.00-7,650.00 0.00XNAHY2115 OTC JAN 104.0 15.01.14 PUT18,000,000 859.32 0.0048,600.00 0.00XNAIG2115 OTC JAN 0.950 15.01.14 CALL-70,000,000 -11.20 0.00-14,000.00 0.00
Total investments in securities 406,989,740.18 93.85406,454,865.22
Cash at banks/(bank liabilities) 23,671,374.14 5.46
Other net assets/(liabilities) 3,016,784.52 0.69
Total 433,677,898.84 100.00
Statement of investments and other net assets as at 31/12/2013USDExpressed in
UBAM - DYNAMIC US DOLLAR BOND
Number/nom. value Description % of total
net assetsMarket valueCost Unaudited AccruedInterest

68Page
United States of America 33.54The Netherlands 12.11France 9.92Germany 8.13Japan 7.95Canada 4.99United Kingdom 4.40South Korea 3.57Italy 2.88Spain 1.68Luxembourg 1.32Sweden 1.16Australia 1.15Denmark 0.69Cayman Islands 0.36
93.85
(by domicile of the issuer) % of net assets
Geographical classification of investments
UBAM - DYNAMIC US DOLLAR BOND
Banks and credit institutions 53.42Holding and finance companies 24.59State 3.51Communications 2.38Cantons, Federal States, Provinces 2.31Utilities 1.53Miscellaneous sectors 1.51Retail trade, department stores 1.15Office supplies and computing 0.92Miscellaneous services 0.70Petroleum 0.69Electronics and semiconductors 0.50Coal mining and steel industry 0.29Pharmaceuticals and cosmetics 0.23Foods and non alcoholic drinks 0.12Healthcare and social services -
93.85
% of net assets
Industrial classification of investments

The accompanying notes are an integral part of these financial statements.
69Page
Statement of operations and other changes in net assets from 01/01/2013 to 31/12/2013Expressed in USD
UBAM - DYNAMIC US DOLLAR BOND
5,339,704.35Income4,359,149.91Interest on bonds and other debt securities, net 2Note
49.73Interest on bank accounts107.57Bank interest on time deposits
966,479.15Interest received on swap contracts13,917.99Other income
1,854,050.90Expenses324,664.20Advisory fees 4Note454,115.45Management fees 3Note299,887.46Custodian fees131,522.06Subscription duty ("taxe d'abonnement") 6Note287,586.31Central administration costs15,254.27Audit fees
946.01Interest paid on bank liabilities7,999.59Legal fees
15,705.95Transaction fees 2Note126,071.94Other administration costs 7, 8Note
7,363.26Banking charges and other fees153,729.32Interest paid on swap contracts29,205.08Other expenses
3,485,653.45Net investment incomeNet realised gain/(loss) on:
511,527.07- securities portfolio 2Note-132,396.64- options 2Note791,025.70- forward foreign exchange contracts 2Note
-369,973.33- futures contracts 2Note-990,877.11- swap contracts 2Note-55,529.89- foreign exchange 2Note
3,239,429.25Realised resultNet variation of the unrealised gain/(loss) on:
64,531.13- securities portfolio-74,870.69- options
-111,844.61- forward foreign exchange contracts247,354.96- futures contracts
1,310,332.28- swap contracts
4,674,932.32Result of operations-76,744.63Dividends paid 15Note
316,904,895.95Subscriptions capitalisation shares5,817,411.56Subscriptions distribution shares
-81,017,875.74Redemptions capitalisation shares-1,486,745.27Redemptions distribution shares
244,815,874.19Total changes in net assets
188,862,024.65Total net assets at the beginning of the year
433,677,898.84Total net assets at the end of the year
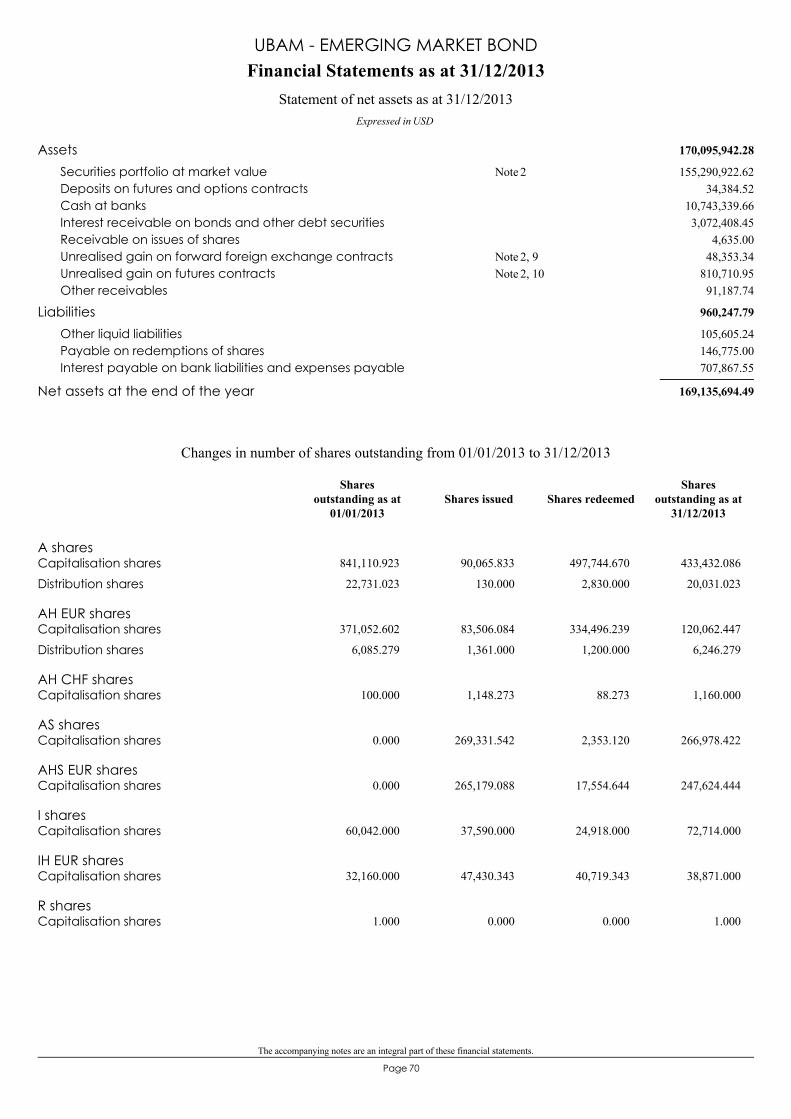
The accompanying notes are an integral part of these financial statements.
70Page
170,095,942.28Assets155,290,922.62Securities portfolio at market value 2Note
34,384.52Deposits on futures and options contracts10,743,339.66Cash at banks3,072,408.45Interest receivable on bonds and other debt securities
4,635.00Receivable on issues of shares48,353.34Unrealised gain on forward foreign exchange contracts 2, 9Note
810,710.95Unrealised gain on futures contracts 2, 10Note91,187.74Other receivables
960,247.79Liabilities105,605.24Other liquid liabilities146,775.00Payable on redemptions of shares707,867.55Interest payable on bank liabilities and expenses payable
169,135,694.49Net assets at the end of the year
Financial Statements as at 31/12/2013
Expressed in USD
Statement of net assets as at 31/12/2013
UBAM - EMERGING MARKET BOND
A sharesCapitalisation shares 841,110.923 90,065.833 497,744.670 433,432.086
Distribution shares 22,731.023 130.000 2,830.000 20,031.023
AH EUR sharesCapitalisation shares 371,052.602 83,506.084 334,496.239 120,062.447
Distribution shares 6,085.279 1,361.000 1,200.000 6,246.279
AH CHF sharesCapitalisation shares 100.000 1,148.273 88.273 1,160.000
AS sharesCapitalisation shares 0.000 269,331.542 2,353.120 266,978.422
AHS EUR sharesCapitalisation shares 0.000 265,179.088 17,554.644 247,624.444
I sharesCapitalisation shares 60,042.000 37,590.000 24,918.000 72,714.000
IH EUR sharesCapitalisation shares 32,160.000 47,430.343 40,719.343 38,871.000
R sharesCapitalisation shares 1.000 0.000 0.000 1.000
Changes in number of shares outstanding from 01/01/2013 to 31/12/2013
Shares issued Shares redeemedShares
outstanding as at31/12/2013
Sharesoutstanding as at
01/01/2013
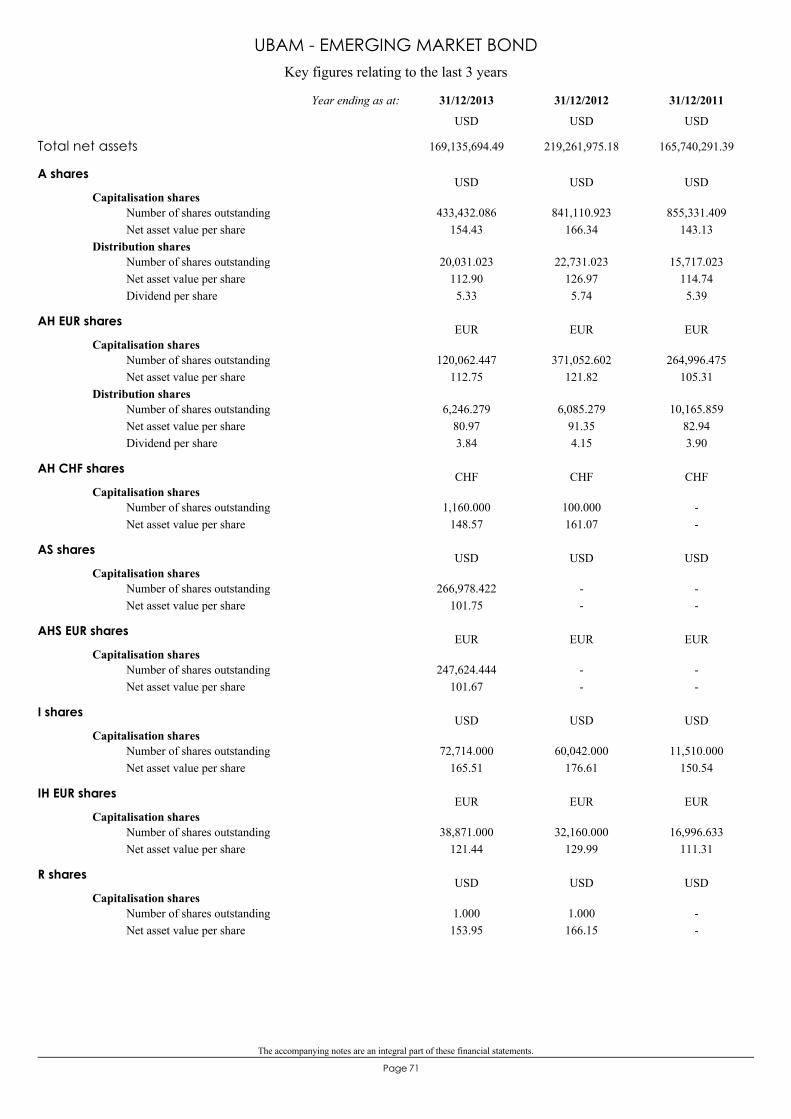
The accompanying notes are an integral part of these financial statements.
71Page
Key figures relating to the last 3 years
UBAM - EMERGING MARKET BOND
A shares
Capitalisation shares433,432.086
154.43841,110.923
166.34855,331.409
143.13Number of shares outstandingNet asset value per share
Distribution shares20,031.023
112.905.33
22,731.023126.975.74
15,717.023114.745.39
Number of shares outstandingNet asset value per shareDividend per share
USD USD USD
AH EUR shares
Capitalisation shares120,062.447
112.75371,052.602
121.82264,996.475
105.31Number of shares outstandingNet asset value per share
Distribution shares6,246.279
80.973.84
6,085.27991.354.15
10,165.85982.943.90
Number of shares outstandingNet asset value per shareDividend per share
EUR EUR EUR
AH CHF shares
Capitalisation shares1,160.000
148.57100.000161.07
--
Number of shares outstandingNet asset value per share
CHF CHF CHF
AS shares
Capitalisation shares266,978.422
101.75--
--
Number of shares outstandingNet asset value per share
USD USD USD
AHS EUR shares
Capitalisation shares247,624.444
101.67--
--
Number of shares outstandingNet asset value per share
EUR EUR EUR
I shares
Capitalisation shares72,714.000
165.5160,042.000
176.6111,510.000
150.54Number of shares outstandingNet asset value per share
USD USD USD
IH EUR shares
Capitalisation shares38,871.000
121.4432,160.000
129.9916,996.633
111.31Number of shares outstandingNet asset value per share
EUR EUR EUR
R shares
Capitalisation shares1.000153.95
1.000166.15
--
Number of shares outstandingNet asset value per share
USD USD USD
Total net assets 169,135,694.49 219,261,975.18 165,740,291.39
31/12/201131/12/201231/12/2013Year ending as at:
USD USD USD
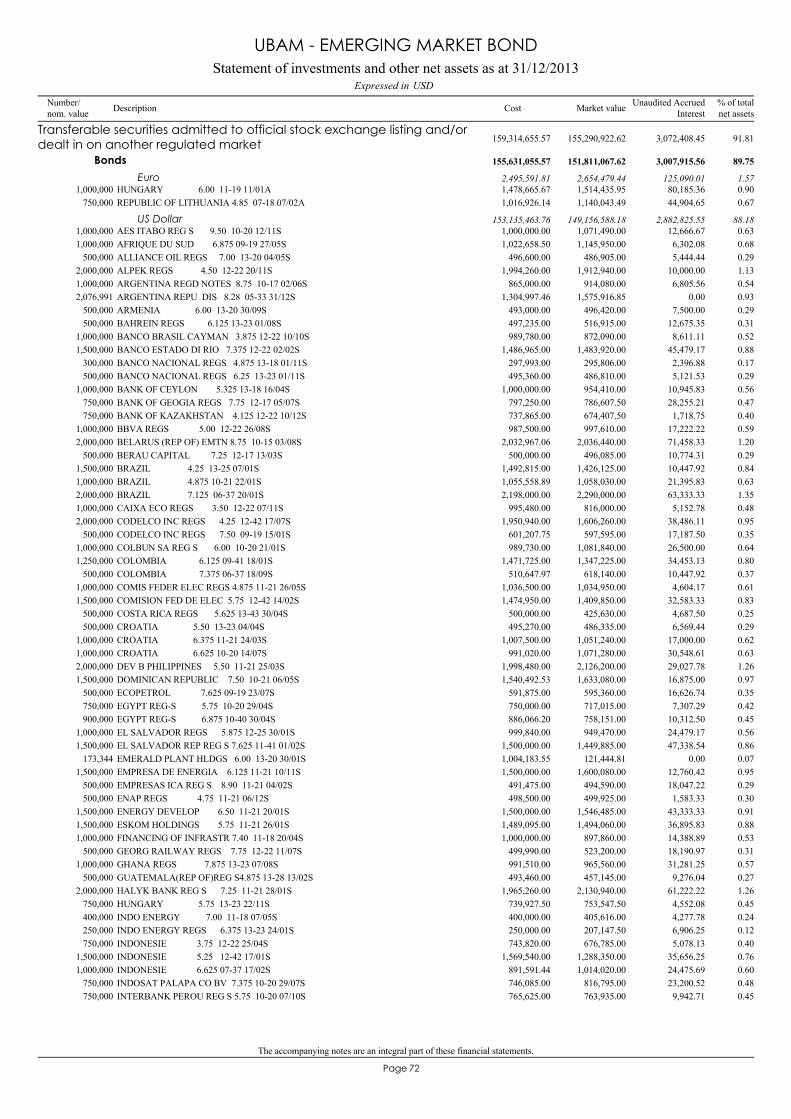
The accompanying notes are an integral part of these financial statements.
72Page
HUNGARY 6.00 11-19 11/01A1,000,000 1,514,435.95 0.901,478,665.67 80,185.36
Transferable securities admitted to official stock exchange listing and/ordealt in on another regulated market 155,290,922.62 91.81159,314,655.57 3,072,408.45
Bonds 151,811,067.62 89.75155,631,055.57 3,007,915.56
Euro 2,654,479.44 1.572,495,591.81 125,090.01
REPUBLIC OF LITHUANIA 4.85 07-18 07/02A750,000 1,140,043.49 0.671,016,926.14 44,904.65
AES ITABO REG S 9.50 10-20 12/11S1,000,000 1,071,490.00 0.631,000,000.00 12,666.67US Dollar 149,156,588.18 88.18153,135,463.76 2,882,825.55
AFRIQUE DU SUD 6.875 09-19 27/05S1,000,000 1,145,950.00 0.681,022,658.50 6,302.08ALLIANCE OIL REGS 7.00 13-20 04/05S500,000 486,905.00 0.29496,600.00 5,444.44ALPEK REGS 4.50 12-22 20/11S2,000,000 1,912,940.00 1.131,994,260.00 10,000.00ARGENTINA REGD NOTES 8.75 10-17 02/06S1,000,000 914,080.00 0.54865,000.00 6,805.56ARGENTINA REPU DIS 8.28 05-33 31/12S2,076,991 1,575,916.85 0.931,304,997.46 0.00ARMENIA 6.00 13-20 30/09S500,000 496,420.00 0.29493,000.00 7,500.00BAHREIN REGS 6.125 13-23 01/08S500,000 516,915.00 0.31497,235.00 12,675.35BANCO BRASIL CAYMAN 3.875 12-22 10/10S1,000,000 872,090.00 0.52989,780.00 8,611.11BANCO ESTADO DI RIO 7.375 12-22 02/02S1,500,000 1,483,920.00 0.881,486,965.00 45,479.17BANCO NACIONAL REGS 4.875 13-18 01/11S300,000 295,806.00 0.17297,993.00 2,396.88BANCO NACIONAL REGS 6.25 13-23 01/11S500,000 486,810.00 0.29495,360.00 5,121.53BANK OF CEYLON 5.325 13-18 16/04S1,000,000 954,410.00 0.561,000,000.00 10,945.83BANK OF GEOGIA REGS 7.75 12-17 05/07S750,000 786,607.50 0.47797,250.00 28,255.21BANK OF KAZAKHSTAN 4.125 12-22 10/12S750,000 674,407.50 0.40737,865.00 1,718.75BBVA REGS 5.00 12-22 26/08S1,000,000 997,610.00 0.59987,500.00 17,222.22BELARUS (REP OF) EMTN 8.75 10-15 03/08S2,000,000 2,036,440.00 1.202,032,967.06 71,458.33BERAU CAPITAL 7.25 12-17 13/03S500,000 496,085.00 0.29500,000.00 10,774.31BRAZIL 4.25 13-25 07/01S1,500,000 1,426,125.00 0.841,492,815.00 10,447.92BRAZIL 4.875 10-21 22/01S1,000,000 1,058,030.00 0.631,055,558.89 21,395.83BRAZIL 7.125 06-37 20/01S2,000,000 2,290,000.00 1.352,198,000.00 63,333.33CAIXA ECO REGS 3.50 12-22 07/11S1,000,000 816,000.00 0.48995,480.00 5,152.78CODELCO INC REGS 4.25 12-42 17/07S2,000,000 1,606,260.00 0.951,950,940.00 38,486.11CODELCO INC REGS 7.50 09-19 15/01S500,000 597,595.00 0.35601,207.75 17,187.50COLBUN SA REG S 6.00 10-20 21/01S1,000,000 1,081,840.00 0.64989,730.00 26,500.00COLOMBIA 6.125 09-41 18/01S1,250,000 1,347,225.00 0.801,471,725.00 34,453.13COLOMBIA 7.375 06-37 18/09S500,000 618,140.00 0.37510,647.97 10,447.92COMIS FEDER ELEC REGS 4.875 11-21 26/05S1,000,000 1,034,950.00 0.611,036,500.00 4,604.17COMISION FED DE ELEC 5.75 12-42 14/02S1,500,000 1,409,850.00 0.831,474,950.00 32,583.33COSTA RICA REGS 5.625 13-43 30/04S500,000 425,630.00 0.25500,000.00 4,687.50CROATIA 5.50 13-23 04/04S500,000 486,335.00 0.29495,270.00 6,569.44CROATIA 6.375 11-21 24/03S1,000,000 1,051,240.00 0.621,007,500.00 17,000.00CROATIA 6.625 10-20 14/07S1,000,000 1,071,280.00 0.63991,020.00 30,548.61DEV B PHILIPPINES 5.50 11-21 25/03S2,000,000 2,126,200.00 1.261,998,480.00 29,027.78DOMINICAN REPUBLIC 7.50 10-21 06/05S1,500,000 1,633,080.00 0.971,540,492.53 16,875.00ECOPETROL 7.625 09-19 23/07S500,000 595,360.00 0.35591,875.00 16,626.74EGYPT REG-S 5.75 10-20 29/04S750,000 717,015.00 0.42750,000.00 7,307.29EGYPT REG-S 6.875 10-40 30/04S900,000 758,151.00 0.45886,066.20 10,312.50EL SALVADOR REGS 5.875 12-25 30/01S1,000,000 949,470.00 0.56999,840.00 24,479.17EL SALVADOR REP REG S 7.625 11-41 01/02S1,500,000 1,449,885.00 0.861,500,000.00 47,338.54EMERALD PLANT HLDGS 6.00 13-20 30/01S173,344 121,444.81 0.071,004,183.55 0.00EMPRESA DE ENERGIA 6.125 11-21 10/11S1,500,000 1,600,080.00 0.951,500,000.00 12,760.42EMPRESAS ICA REG S 8.90 11-21 04/02S500,000 494,590.00 0.29491,475.00 18,047.22ENAP REGS 4.75 11-21 06/12S500,000 499,925.00 0.30498,500.00 1,583.33ENERGY DEVELOP 6.50 11-21 20/01S1,500,000 1,546,485.00 0.911,500,000.00 43,333.33ESKOM HOLDINGS 5.75 11-21 26/01S1,500,000 1,494,060.00 0.881,489,095.00 36,895.83FINANCING OF INFRASTR 7.40 11-18 20/04S1,000,000 897,860.00 0.531,000,000.00 14,388.89GEORG RAILWAY REGS 7.75 12-22 11/07S500,000 523,200.00 0.31499,990.00 18,190.97GHANA REGS 7.875 13-23 07/08S1,000,000 965,560.00 0.57991,510.00 31,281.25GUATEMALA(REP OF)REG S4.875 13-28 13/02S500,000 457,145.00 0.27493,460.00 9,276.04HALYK BANK REG S 7.25 11-21 28/01S2,000,000 2,130,940.00 1.261,965,260.00 61,222.22HUNGARY 5.75 13-23 22/11S750,000 753,547.50 0.45739,927.50 4,552.08INDO ENERGY 7.00 11-18 07/05S400,000 405,616.00 0.24400,000.00 4,277.78INDO ENERGY REGS 6.375 13-23 24/01S250,000 207,147.50 0.12250,000.00 6,906.25INDONESIE 3.75 12-22 25/04S750,000 676,785.00 0.40743,820.00 5,078.13INDONESIE 5.25 12-42 17/01S1,500,000 1,288,350.00 0.761,569,540.00 35,656.25INDONESIE 6.625 07-37 17/02S1,000,000 1,014,020.00 0.60891,591.44 24,475.69INDOSAT PALAPA CO BV 7.375 10-20 29/07S750,000 816,795.00 0.48746,085.00 23,200.52INTERBANK PEROU REG S 5.75 10-20 07/10S750,000 763,935.00 0.45765,625.00 9,942.71
Statement of investments and other net assets as at 31/12/2013USDExpressed in
UBAM - EMERGING MARKET BOND
Number/nom. value Description % of total
net assetsMarket valueCost Unaudited AccruedInterest
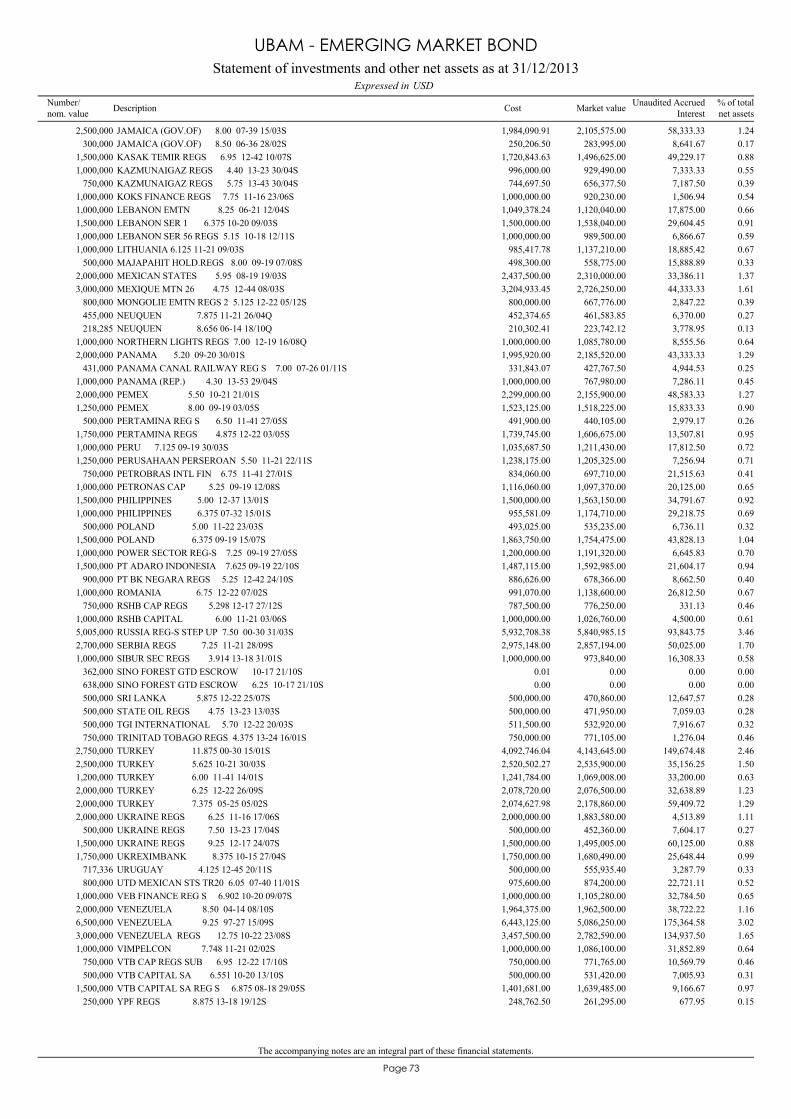
The accompanying notes are an integral part of these financial statements.
73Page
JAMAICA (GOV.OF) 8.00 07-39 15/03S2,500,000 2,105,575.00 1.241,984,090.91 58,333.33JAMAICA (GOV.OF) 8.50 06-36 28/02S300,000 283,995.00 0.17250,206.50 8,641.67KASAK TEMIR REGS 6.95 12-42 10/07S1,500,000 1,496,625.00 0.881,720,843.63 49,229.17KAZMUNAIGAZ REGS 4.40 13-23 30/04S1,000,000 929,490.00 0.55996,000.00 7,333.33KAZMUNAIGAZ REGS 5.75 13-43 30/04S750,000 656,377.50 0.39744,697.50 7,187.50KOKS FINANCE REGS 7.75 11-16 23/06S1,000,000 920,230.00 0.541,000,000.00 1,506.94LEBANON EMTN 8.25 06-21 12/04S1,000,000 1,120,040.00 0.661,049,378.24 17,875.00LEBANON SER 1 6.375 10-20 09/03S1,500,000 1,538,040.00 0.911,500,000.00 29,604.45LEBANON SER 56 REGS 5.15 10-18 12/11S1,000,000 989,500.00 0.591,000,000.00 6,866.67LITHUANIA 6.125 11-21 09/03S1,000,000 1,137,210.00 0.67985,417.78 18,885.42MAJAPAHIT HOLD.REGS 8.00 09-19 07/08S500,000 558,775.00 0.33498,300.00 15,888.89MEXICAN STATES 5.95 08-19 19/03S2,000,000 2,310,000.00 1.372,437,500.00 33,386.11MEXIQUE MTN 26 4.75 12-44 08/03S3,000,000 2,726,250.00 1.613,204,933.45 44,333.33MONGOLIE EMTN REGS 2 5.125 12-22 05/12S800,000 667,776.00 0.39800,000.00 2,847.22NEUQUEN 7.875 11-21 26/04Q455,000 461,583.85 0.27452,374.65 6,370.00NEUQUEN 8.656 06-14 18/10Q218,285 223,742.12 0.13210,302.41 3,778.95NORTHERN LIGHTS REGS 7.00 12-19 16/08Q1,000,000 1,085,780.00 0.641,000,000.00 8,555.56PANAMA 5.20 09-20 30/01S2,000,000 2,185,520.00 1.291,995,920.00 43,333.33PANAMA CANAL RAILWAY REG S 7.00 07-26 01/11S431,000 427,767.50 0.25331,843.07 4,944.53PANAMA (REP.) 4.30 13-53 29/04S1,000,000 767,980.00 0.451,000,000.00 7,286.11PEMEX 5.50 10-21 21/01S2,000,000 2,155,900.00 1.272,299,000.00 48,583.33PEMEX 8.00 09-19 03/05S1,250,000 1,518,225.00 0.901,523,125.00 15,833.33PERTAMINA REG S 6.50 11-41 27/05S500,000 440,105.00 0.26491,900.00 2,979.17PERTAMINA REGS 4.875 12-22 03/05S1,750,000 1,606,675.00 0.951,739,745.00 13,507.81PERU 7.125 09-19 30/03S1,000,000 1,211,430.00 0.721,035,687.50 17,812.50PERUSAHAAN PERSEROAN 5.50 11-21 22/11S1,250,000 1,205,325.00 0.711,238,175.00 7,256.94PETROBRAS INTL FIN 6.75 11-41 27/01S750,000 697,710.00 0.41834,060.00 21,515.63PETRONAS CAP 5.25 09-19 12/08S1,000,000 1,097,370.00 0.651,116,060.00 20,125.00PHILIPPINES 5.00 12-37 13/01S1,500,000 1,563,150.00 0.921,500,000.00 34,791.67PHILIPPINES 6.375 07-32 15/01S1,000,000 1,174,710.00 0.69955,581.09 29,218.75POLAND 5.00 11-22 23/03S500,000 535,235.00 0.32493,025.00 6,736.11POLAND 6.375 09-19 15/07S1,500,000 1,754,475.00 1.041,863,750.00 43,828.13POWER SECTOR REG-S 7.25 09-19 27/05S1,000,000 1,191,320.00 0.701,200,000.00 6,645.83PT ADARO INDONESIA 7.625 09-19 22/10S1,500,000 1,592,985.00 0.941,487,115.00 21,604.17PT BK NEGARA REGS 5.25 12-42 24/10S900,000 678,366.00 0.40886,626.00 8,662.50ROMANIA 6.75 12-22 07/02S1,000,000 1,138,600.00 0.67991,070.00 26,812.50RSHB CAP REGS 5.298 12-17 27/12S750,000 776,250.00 0.46787,500.00 331.13RSHB CAPITAL 6.00 11-21 03/06S1,000,000 1,026,760.00 0.611,000,000.00 4,500.00RUSSIA REG-S STEP UP 7.50 00-30 31/03S5,005,000 5,840,985.15 3.465,932,708.38 93,843.75SERBIA REGS 7.25 11-21 28/09S2,700,000 2,857,194.00 1.702,975,148.00 50,025.00SIBUR SEC REGS 3.914 13-18 31/01S1,000,000 973,840.00 0.581,000,000.00 16,308.33SINO FOREST GTD ESCROW 10-17 21/10S362,000 0.00 0.000.01 0.00SINO FOREST GTD ESCROW 6.25 10-17 21/10S638,000 0.00 0.000.00 0.00SRI LANKA 5.875 12-22 25/07S500,000 470,860.00 0.28500,000.00 12,647.57STATE OIL REGS 4.75 13-23 13/03S500,000 471,950.00 0.28500,000.00 7,059.03TGI INTERNATIONAL 5.70 12-22 20/03S500,000 532,920.00 0.32511,500.00 7,916.67TRINITAD TOBAGO REGS 4.375 13-24 16/01S750,000 771,105.00 0.46750,000.00 1,276.04TURKEY 11.875 00-30 15/01S2,750,000 4,143,645.00 2.464,092,746.04 149,674.48TURKEY 5.625 10-21 30/03S2,500,000 2,535,900.00 1.502,520,502.27 35,156.25TURKEY 6.00 11-41 14/01S1,200,000 1,069,008.00 0.631,241,784.00 33,200.00TURKEY 6.25 12-22 26/09S2,000,000 2,076,500.00 1.232,078,720.00 32,638.89TURKEY 7.375 05-25 05/02S2,000,000 2,178,860.00 1.292,074,627.98 59,409.72UKRAINE REGS 6.25 11-16 17/06S2,000,000 1,883,580.00 1.112,000,000.00 4,513.89UKRAINE REGS 7.50 13-23 17/04S500,000 452,360.00 0.27500,000.00 7,604.17UKRAINE REGS 9.25 12-17 24/07S1,500,000 1,495,005.00 0.881,500,000.00 60,125.00UKREXIMBANK 8.375 10-15 27/04S1,750,000 1,680,490.00 0.991,750,000.00 25,648.44URUGUAY 4.125 12-45 20/11S717,336 555,935.40 0.33500,000.00 3,287.79UTD MEXICAN STS TR20 6.05 07-40 11/01S800,000 874,200.00 0.52975,600.00 22,721.11VEB FINANCE REG S 6.902 10-20 09/07S1,000,000 1,105,280.00 0.651,000,000.00 32,784.50VENEZUELA 8.50 04-14 08/10S2,000,000 1,962,500.00 1.161,964,375.00 38,722.22VENEZUELA 9.25 97-27 15/09S6,500,000 5,086,250.00 3.026,443,125.00 175,364.58VENEZUELA REGS 12.75 10-22 23/08S3,000,000 2,782,590.00 1.653,457,500.00 134,937.50VIMPELCON 7.748 11-21 02/02S1,000,000 1,086,100.00 0.641,000,000.00 31,852.89VTB CAP REGS SUB 6.95 12-22 17/10S750,000 771,765.00 0.46750,000.00 10,569.79VTB CAPITAL SA 6.551 10-20 13/10S500,000 531,420.00 0.31500,000.00 7,005.93VTB CAPITAL SA REG S 6.875 08-18 29/05S1,500,000 1,639,485.00 0.971,401,681.00 9,166.67YPF REGS 8.875 13-18 19/12S250,000 261,295.00 0.15248,762.50 677.95
Statement of investments and other net assets as at 31/12/2013USDExpressed in
UBAM - EMERGING MARKET BOND
Number/nom. value Description % of total
net assetsMarket valueCost Unaudited AccruedInterest
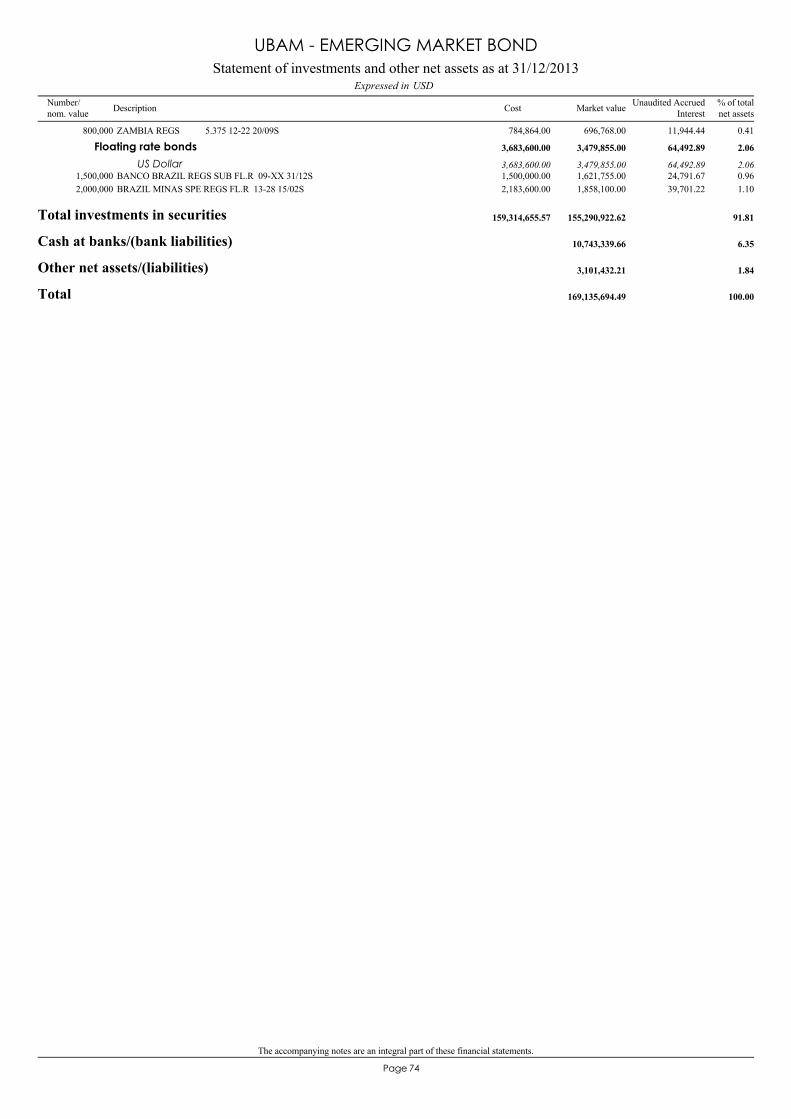
The accompanying notes are an integral part of these financial statements.
74Page
ZAMBIA REGS 5.375 12-22 20/09S800,000 696,768.00 0.41784,864.00 11,944.44
BANCO BRAZIL REGS SUB FL.R 09-XX 31/12S1,500,000 1,621,755.00 0.961,500,000.00 24,791.67
Floating rate bonds 3,479,855.00 2.063,683,600.00 64,492.89
US Dollar 3,479,855.00 2.063,683,600.00 64,492.89
BRAZIL MINAS SPE REGS FL.R 13-28 15/02S2,000,000 1,858,100.00 1.102,183,600.00 39,701.22
Total investments in securities 155,290,922.62 91.81159,314,655.57
Cash at banks/(bank liabilities) 10,743,339.66 6.35
Other net assets/(liabilities) 3,101,432.21 1.84
Total 169,135,694.49 100.00
Statement of investments and other net assets as at 31/12/2013USDExpressed in
UBAM - EMERGING MARKET BOND
Number/nom. value Description % of total
net assetsMarket valueCost Unaudited AccruedInterest
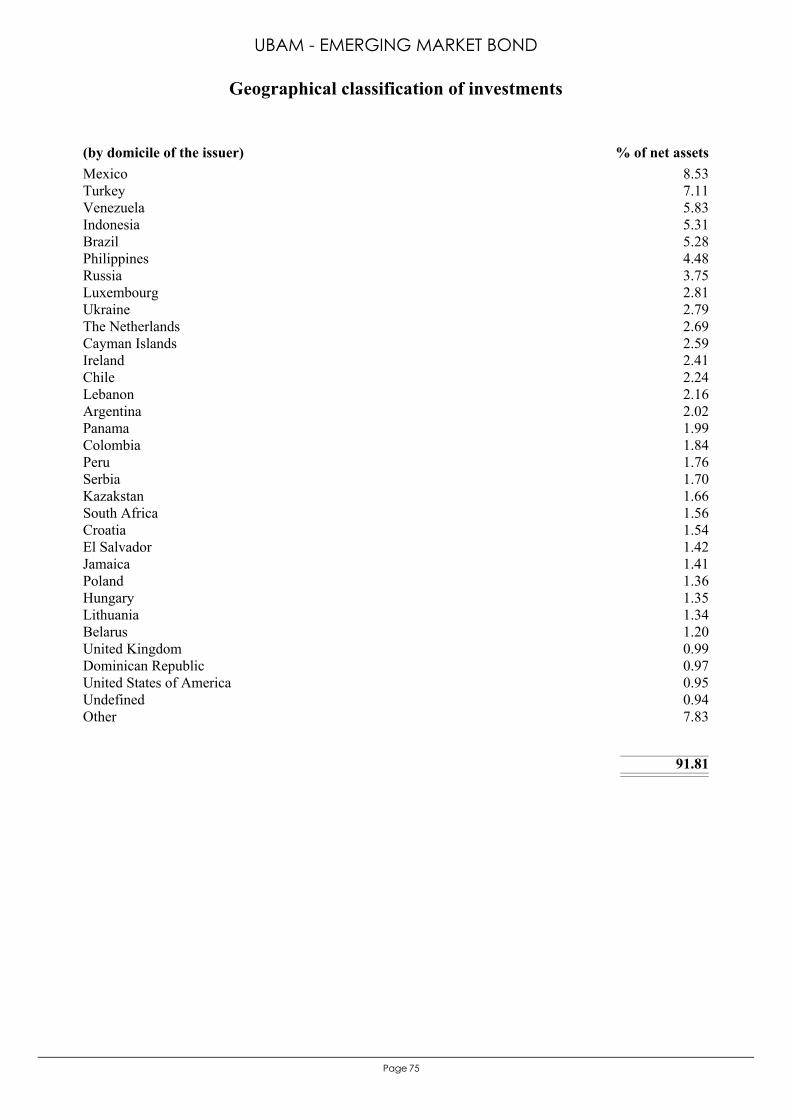
75Page
Mexico 8.53Turkey 7.11Venezuela 5.83Indonesia 5.31Brazil 5.28Philippines 4.48Russia 3.75Luxembourg 2.81Ukraine 2.79The Netherlands 2.69Cayman Islands 2.59Ireland 2.41Chile 2.24Lebanon 2.16Argentina 2.02Panama 1.99Colombia 1.84Peru 1.76Serbia 1.70Kazakstan 1.66South Africa 1.56Croatia 1.54El Salvador 1.42Jamaica 1.41Poland 1.36Hungary 1.35Lithuania 1.34Belarus 1.20United Kingdom 0.99Dominican Republic 0.97United States of America 0.95Undefined 0.94Other 7.83
91.81
(by domicile of the issuer) % of net assets
Geographical classification of investments
UBAM - EMERGING MARKET BOND

76Page
Countries and central government 53.68Banks and credit institutions 10.03Utilities 7.26Holding and finance companies 6.89Petroleum 5.16Coal mining and steel industry 2.53Miscellaneous sectors 2.29Chemicals 1.13Miscellaneous services 0.88Electronics and semiconductors 0.64Transportation 0.63Cantons, Federal States, Provinces 0.40Building materials and trade 0.29
91.81
% of net assets
Industrial classification of investments
UBAM - EMERGING MARKET BOND
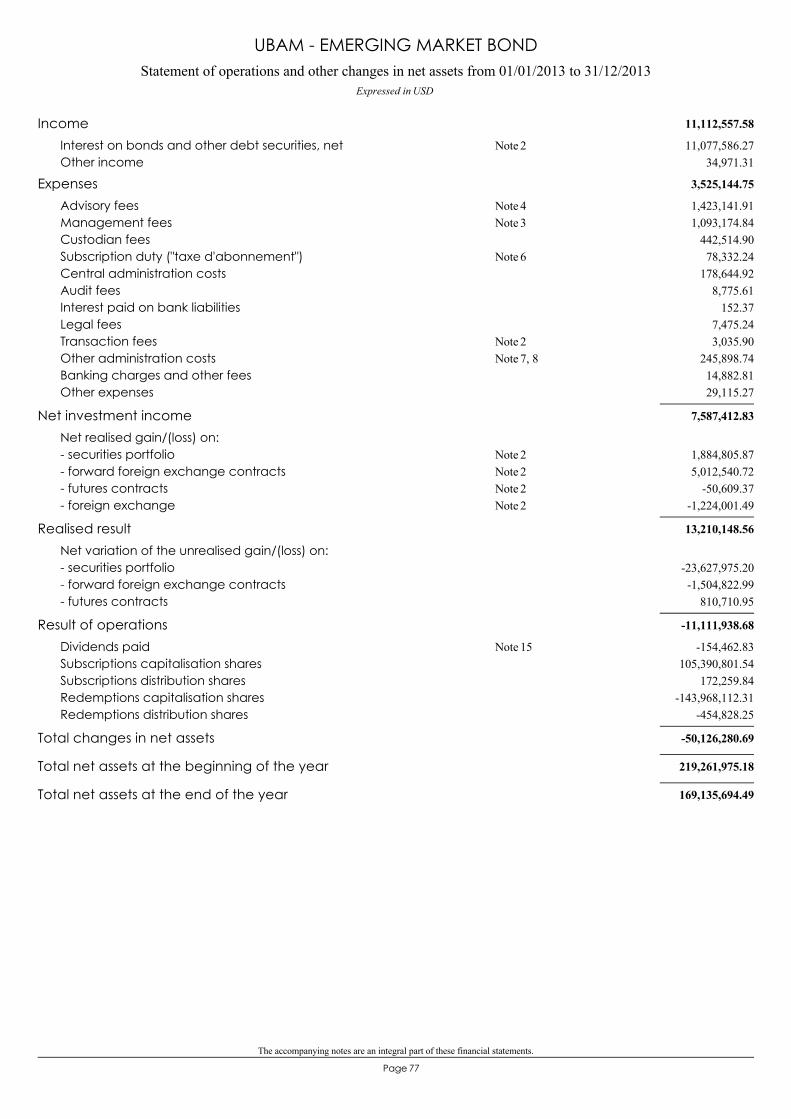
The accompanying notes are an integral part of these financial statements.
77Page
Statement of operations and other changes in net assets from 01/01/2013 to 31/12/2013Expressed in USD
UBAM - EMERGING MARKET BOND
11,112,557.58Income11,077,586.27Interest on bonds and other debt securities, net 2Note
34,971.31Other income
3,525,144.75Expenses1,423,141.91Advisory fees 4Note1,093,174.84Management fees 3Note
442,514.90Custodian fees78,332.24Subscription duty ("taxe d'abonnement") 6Note
178,644.92Central administration costs8,775.61Audit fees
152.37Interest paid on bank liabilities7,475.24Legal fees3,035.90Transaction fees 2Note
245,898.74Other administration costs 7, 8Note14,882.81Banking charges and other fees29,115.27Other expenses
7,587,412.83Net investment incomeNet realised gain/(loss) on:
1,884,805.87- securities portfolio 2Note5,012,540.72- forward foreign exchange contracts 2Note
-50,609.37- futures contracts 2Note-1,224,001.49- foreign exchange 2Note
13,210,148.56Realised resultNet variation of the unrealised gain/(loss) on:
-23,627,975.20- securities portfolio-1,504,822.99- forward foreign exchange contracts
810,710.95- futures contracts
-11,111,938.68Result of operations-154,462.83Dividends paid 15Note
105,390,801.54Subscriptions capitalisation shares172,259.84Subscriptions distribution shares
-143,968,112.31Redemptions capitalisation shares-454,828.25Redemptions distribution shares
-50,126,280.69Total changes in net assets
219,261,975.18Total net assets at the beginning of the year
169,135,694.49Total net assets at the end of the year
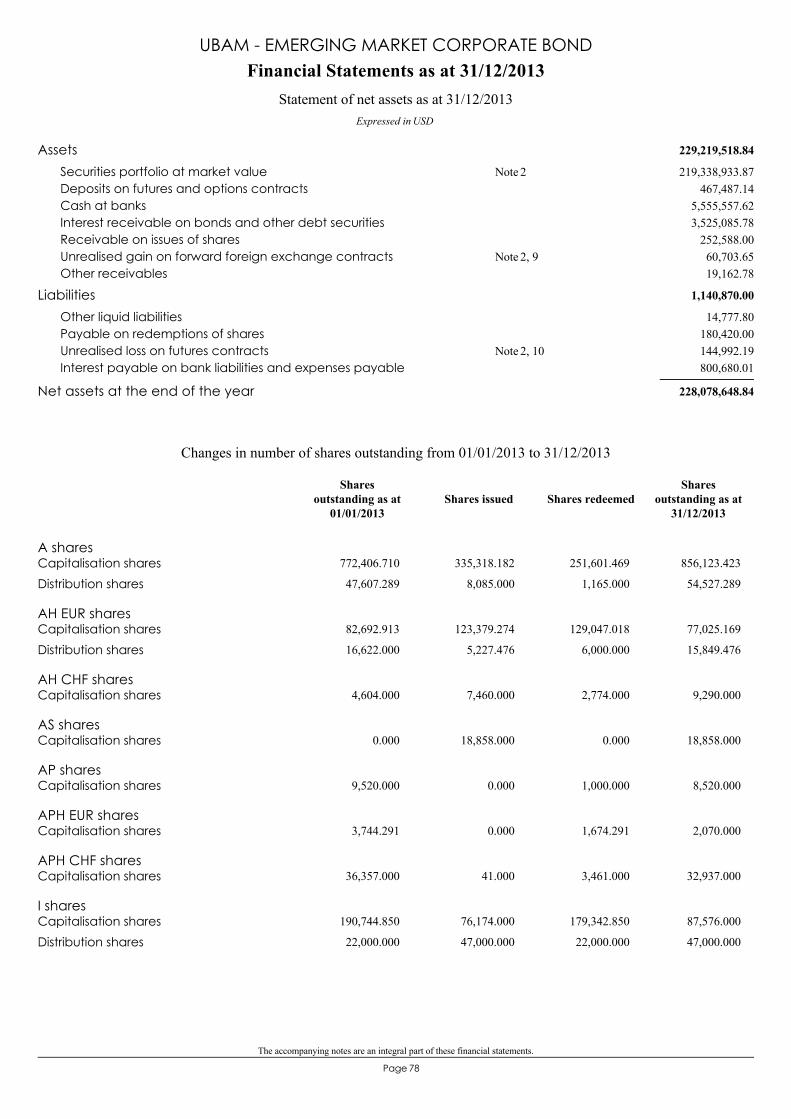
The accompanying notes are an integral part of these financial statements.
78Page
229,219,518.84Assets219,338,933.87Securities portfolio at market value 2Note
467,487.14Deposits on futures and options contracts5,555,557.62Cash at banks3,525,085.78Interest receivable on bonds and other debt securities
252,588.00Receivable on issues of shares60,703.65Unrealised gain on forward foreign exchange contracts 2, 9Note19,162.78Other receivables
1,140,870.00Liabilities14,777.80Other liquid liabilities
180,420.00Payable on redemptions of shares144,992.19Unrealised loss on futures contracts 2, 10Note800,680.01Interest payable on bank liabilities and expenses payable
228,078,648.84Net assets at the end of the year
Financial Statements as at 31/12/2013
Expressed in USD
Statement of net assets as at 31/12/2013
UBAM - EMERGING MARKET CORPORATE BOND
A sharesCapitalisation shares 772,406.710 335,318.182 251,601.469 856,123.423
Distribution shares 47,607.289 8,085.000 1,165.000 54,527.289
AH EUR sharesCapitalisation shares 82,692.913 123,379.274 129,047.018 77,025.169
Distribution shares 16,622.000 5,227.476 6,000.000 15,849.476
AH CHF sharesCapitalisation shares 4,604.000 7,460.000 2,774.000 9,290.000
AS sharesCapitalisation shares 0.000 18,858.000 0.000 18,858.000
AP sharesCapitalisation shares 9,520.000 0.000 1,000.000 8,520.000
APH EUR sharesCapitalisation shares 3,744.291 0.000 1,674.291 2,070.000
APH CHF sharesCapitalisation shares 36,357.000 41.000 3,461.000 32,937.000
I sharesCapitalisation shares 190,744.850 76,174.000 179,342.850 87,576.000
Distribution shares 22,000.000 47,000.000 22,000.000 47,000.000
Changes in number of shares outstanding from 01/01/2013 to 31/12/2013
Shares issued Shares redeemedShares
outstanding as at31/12/2013
Sharesoutstanding as at
01/01/2013
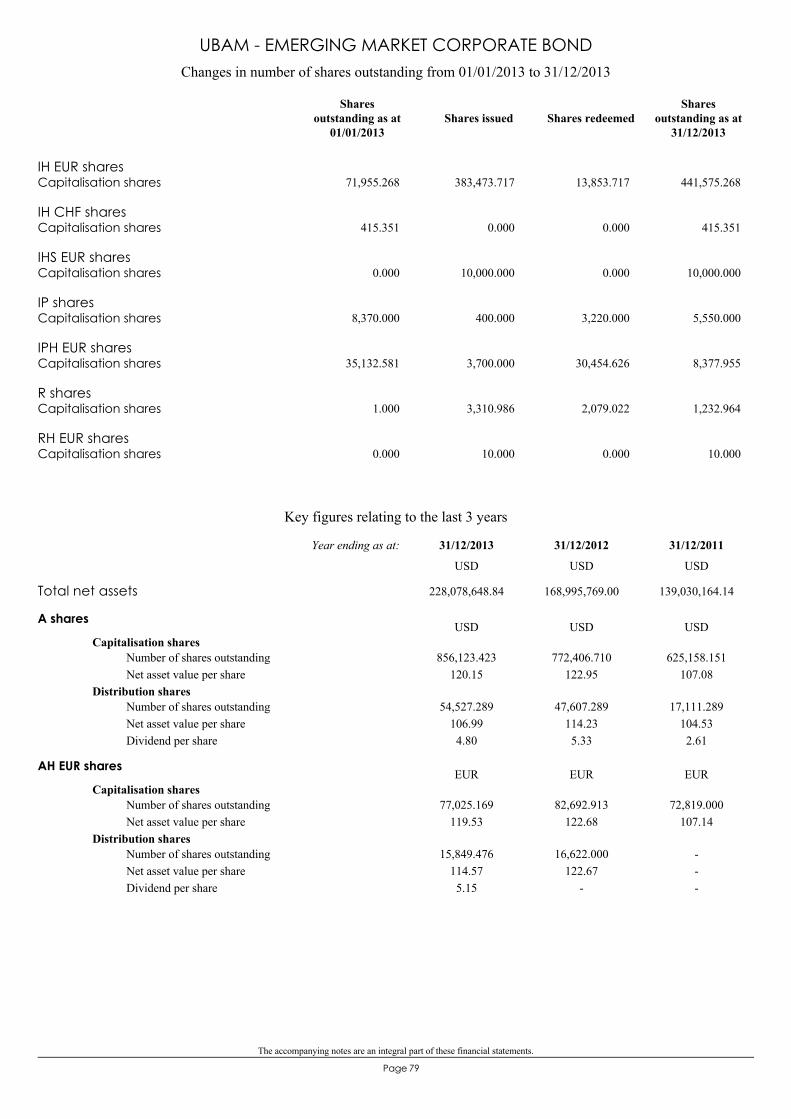
The accompanying notes are an integral part of these financial statements.
79Page
IH EUR sharesCapitalisation shares 71,955.268 383,473.717 13,853.717 441,575.268
IH CHF sharesCapitalisation shares 415.351 0.000 0.000 415.351
IHS EUR sharesCapitalisation shares 0.000 10,000.000 0.000 10,000.000
IP sharesCapitalisation shares 8,370.000 400.000 3,220.000 5,550.000
IPH EUR sharesCapitalisation shares 35,132.581 3,700.000 30,454.626 8,377.955
R sharesCapitalisation shares 1.000 3,310.986 2,079.022 1,232.964
RH EUR sharesCapitalisation shares 0.000 10.000 0.000 10.000
Changes in number of shares outstanding from 01/01/2013 to 31/12/2013
Shares issued Shares redeemedShares
outstanding as at31/12/2013
Sharesoutstanding as at
01/01/2013
UBAM - EMERGING MARKET CORPORATE BOND
Key figures relating to the last 3 years
A shares
Capitalisation shares856,123.423
120.15772,406.710
122.95625,158.151
107.08Number of shares outstandingNet asset value per share
Distribution shares54,527.289
106.994.80
47,607.289114.235.33
17,111.289104.532.61
Number of shares outstandingNet asset value per shareDividend per share
USD USD USD
AH EUR shares
Capitalisation shares77,025.169
119.5382,692.913
122.6872,819.000
107.14Number of shares outstandingNet asset value per share
Distribution shares15,849.476
114.575.15
16,622.000122.67
-
---
Number of shares outstandingNet asset value per shareDividend per share
EUR EUR EUR
Total net assets 228,078,648.84 168,995,769.00 139,030,164.14
31/12/201131/12/201231/12/2013Year ending as at:
USD USD USD
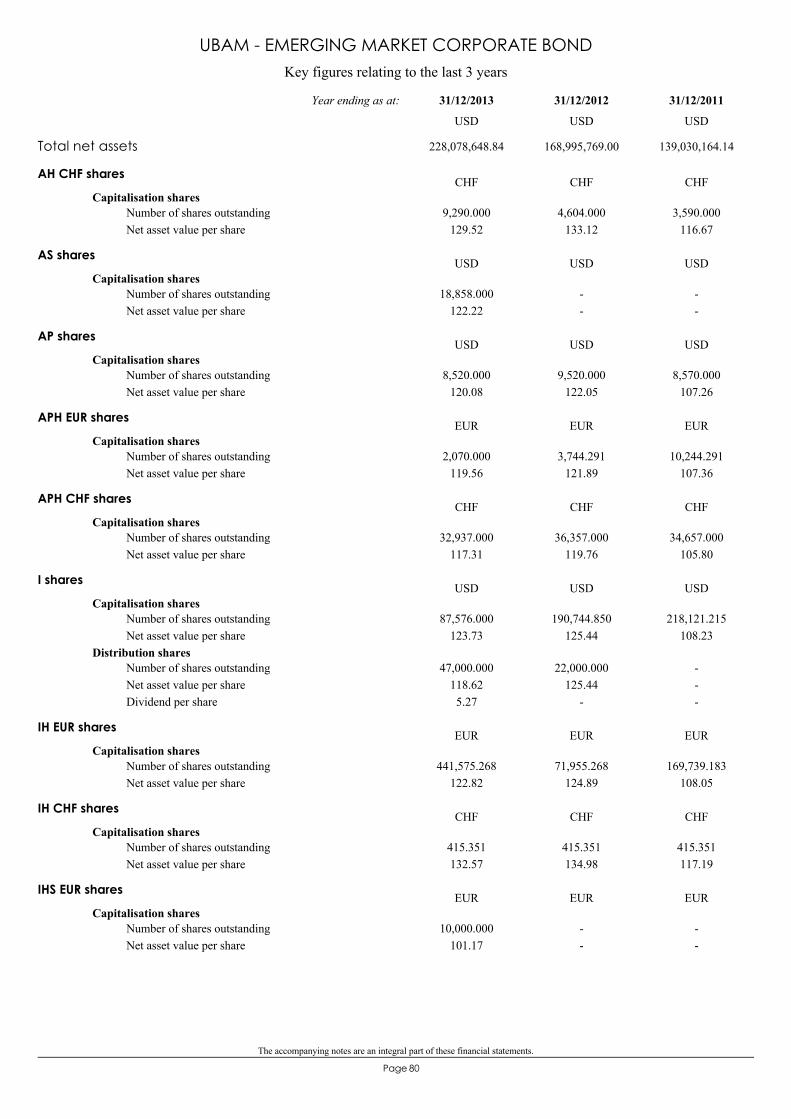
The accompanying notes are an integral part of these financial statements.
80Page
Key figures relating to the last 3 years
UBAM - EMERGING MARKET CORPORATE BOND
AH CHF shares
Capitalisation shares9,290.000
129.524,604.000
133.123,590.000
116.67Number of shares outstandingNet asset value per share
CHF CHF CHF
AS shares
Capitalisation shares18,858.000
122.22--
--
Number of shares outstandingNet asset value per share
USD USD USD
AP shares
Capitalisation shares8,520.000
120.089,520.000
122.058,570.000
107.26Number of shares outstandingNet asset value per share
USD USD USD
APH EUR shares
Capitalisation shares2,070.000
119.563,744.291
121.8910,244.291
107.36Number of shares outstandingNet asset value per share
EUR EUR EUR
APH CHF shares
Capitalisation shares32,937.000
117.3136,357.000
119.7634,657.000
105.80Number of shares outstandingNet asset value per share
CHF CHF CHF
I shares
Capitalisation shares87,576.000
123.73190,744.850
125.44218,121.215
108.23Number of shares outstandingNet asset value per share
Distribution shares47,000.000
118.625.27
22,000.000125.44
-
---
Number of shares outstandingNet asset value per shareDividend per share
USD USD USD
IH EUR shares
Capitalisation shares441,575.268
122.8271,955.268
124.89169,739.183
108.05Number of shares outstandingNet asset value per share
EUR EUR EUR
IH CHF shares
Capitalisation shares415.351132.57
415.351134.98
415.351117.19
Number of shares outstandingNet asset value per share
CHF CHF CHF
IHS EUR shares
Capitalisation shares10,000.000
101.17--
--
Number of shares outstandingNet asset value per share
EUR EUR EUR
Total net assets 228,078,648.84 168,995,769.00 139,030,164.14
31/12/201131/12/201231/12/2013Year ending as at:
USD USD USD
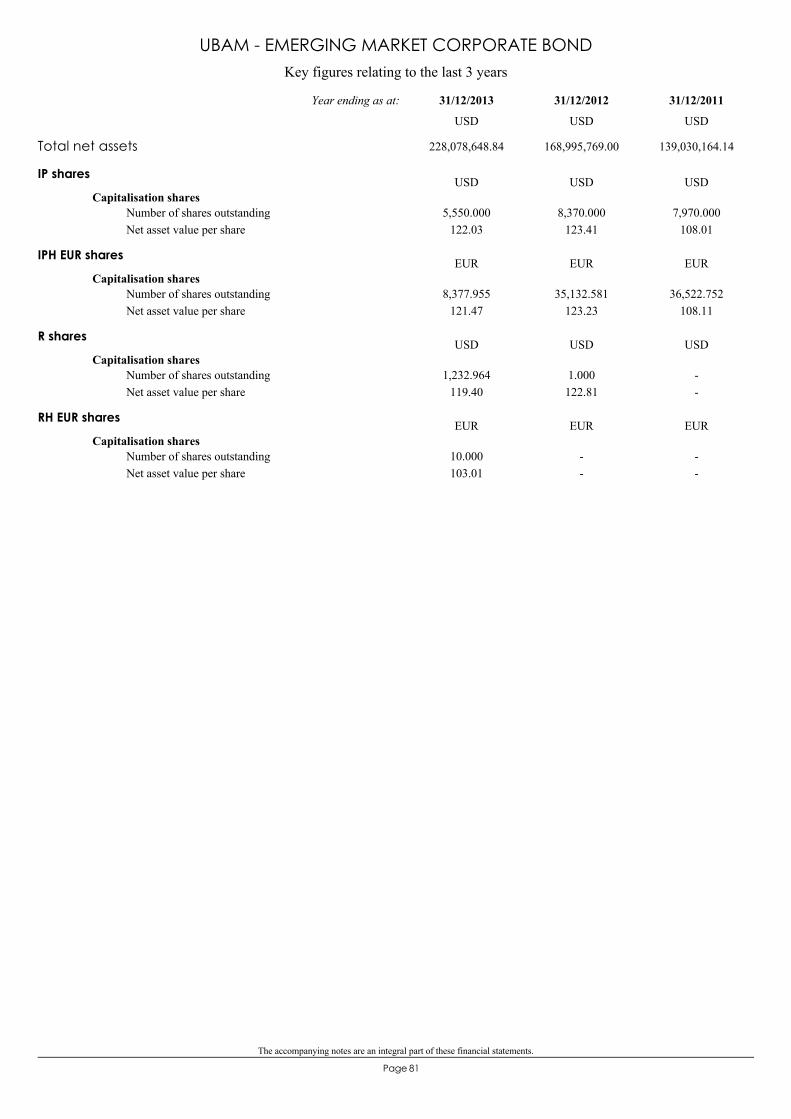
The accompanying notes are an integral part of these financial statements.
81Page
Key figures relating to the last 3 years
UBAM - EMERGING MARKET CORPORATE BOND
IP shares
Capitalisation shares5,550.000
122.038,370.000
123.417,970.000
108.01Number of shares outstandingNet asset value per share
USD USD USD
IPH EUR shares
Capitalisation shares8,377.955
121.4735,132.581
123.2336,522.752
108.11Number of shares outstandingNet asset value per share
EUR EUR EUR
R shares
Capitalisation shares1,232.964
119.401.000122.81
--
Number of shares outstandingNet asset value per share
USD USD USD
RH EUR shares
Capitalisation shares10.000103.01
--
--
Number of shares outstandingNet asset value per share
EUR EUR EUR
Total net assets 228,078,648.84 168,995,769.00 139,030,164.14
31/12/201131/12/201231/12/2013Year ending as at:
USD USD USD
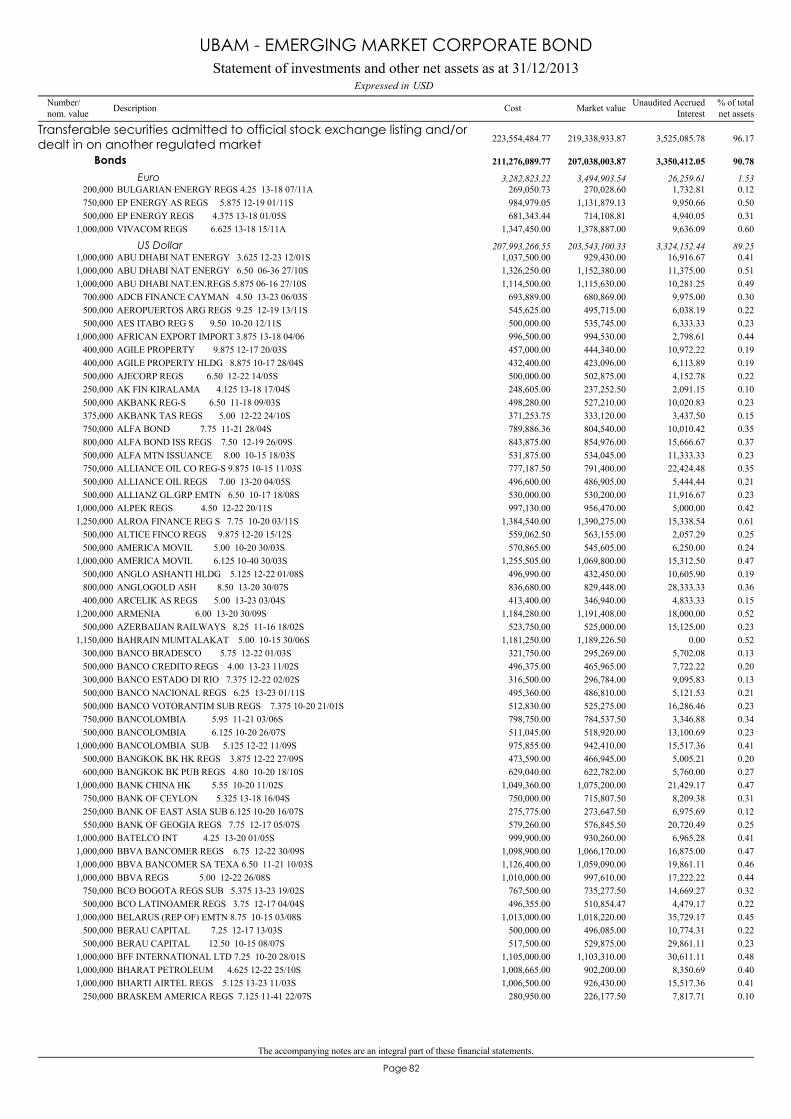
The accompanying notes are an integral part of these financial statements.
82Page
BULGARIAN ENERGY REGS 4.25 13-18 07/11A200,000 270,028.60 0.12269,050.73 1,732.81
Transferable securities admitted to official stock exchange listing and/ordealt in on another regulated market 219,338,933.87 96.17223,554,484.77 3,525,085.78
Bonds 207,038,003.87 90.78211,276,089.77 3,350,412.05
Euro 3,494,903.54 1.533,282,823.22 26,259.61
EP ENERGY AS REGS 5.875 12-19 01/11S750,000 1,131,879.13 0.50984,979.05 9,950.66EP ENERGY REGS 4.375 13-18 01/05S500,000 714,108.81 0.31681,343.44 4,940.05VIVACOM REGS 6.625 13-18 15/11A1,000,000 1,378,887.00 0.601,347,450.00 9,636.09
ABU DHABI NAT ENERGY 3.625 12-23 12/01S1,000,000 929,430.00 0.411,037,500.00 16,916.67US Dollar 203,543,100.33 89.25207,993,266.55 3,324,152.44
ABU DHABI NAT ENERGY 6.50 06-36 27/10S1,000,000 1,152,380.00 0.511,326,250.00 11,375.00ABU DHABI NAT.EN.REGS 5.875 06-16 27/10S1,000,000 1,115,630.00 0.491,114,500.00 10,281.25ADCB FINANCE CAYMAN 4.50 13-23 06/03S700,000 680,869.00 0.30693,889.00 9,975.00AEROPUERTOS ARG REGS 9.25 12-19 13/11S500,000 495,715.00 0.22545,625.00 6,038.19AES ITABO REG S 9.50 10-20 12/11S500,000 535,745.00 0.23500,000.00 6,333.33AFRICAN EXPORT IMPORT 3.875 13-18 04/061,000,000 994,530.00 0.44996,500.00 2,798.61AGILE PROPERTY 9.875 12-17 20/03S400,000 444,340.00 0.19457,000.00 10,972.22AGILE PROPERTY HLDG 8.875 10-17 28/04S400,000 423,096.00 0.19432,400.00 6,113.89AJECORP REGS 6.50 12-22 14/05S500,000 502,875.00 0.22500,000.00 4,152.78AK FIN KIRALAMA 4.125 13-18 17/04S250,000 237,252.50 0.10248,605.00 2,091.15AKBANK REG-S 6.50 11-18 09/03S500,000 527,210.00 0.23498,280.00 10,020.83AKBANK TAS REGS 5.00 12-22 24/10S375,000 333,120.00 0.15371,253.75 3,437.50ALFA BOND 7.75 11-21 28/04S750,000 804,540.00 0.35789,886.36 10,010.42ALFA BOND ISS REGS 7.50 12-19 26/09S800,000 854,976.00 0.37843,875.00 15,666.67ALFA MTN ISSUANCE 8.00 10-15 18/03S500,000 534,045.00 0.23531,875.00 11,333.33ALLIANCE OIL CO REG-S 9.875 10-15 11/03S750,000 791,400.00 0.35777,187.50 22,424.48ALLIANCE OIL REGS 7.00 13-20 04/05S500,000 486,905.00 0.21496,600.00 5,444.44ALLIANZ GL.GRP EMTN 6.50 10-17 18/08S500,000 530,200.00 0.23530,000.00 11,916.67ALPEK REGS 4.50 12-22 20/11S1,000,000 956,470.00 0.42997,130.00 5,000.00ALROA FINANCE REG S 7.75 10-20 03/11S1,250,000 1,390,275.00 0.611,384,540.00 15,338.54ALTICE FINCO REGS 9.875 12-20 15/12S500,000 563,155.00 0.25559,062.50 2,057.29AMERICA MOVIL 5.00 10-20 30/03S500,000 545,605.00 0.24570,865.00 6,250.00AMERICA MOVIL 6.125 10-40 30/03S1,000,000 1,069,800.00 0.471,255,505.00 15,312.50ANGLO ASHANTI HLDG 5.125 12-22 01/08S500,000 432,450.00 0.19496,990.00 10,605.90ANGLOGOLD ASH 8.50 13-20 30/07S800,000 829,448.00 0.36836,680.00 28,333.33ARCELIK AS REGS 5.00 13-23 03/04S400,000 346,940.00 0.15413,400.00 4,833.33ARMENIA 6.00 13-20 30/09S1,200,000 1,191,408.00 0.521,184,280.00 18,000.00AZERBAIJAN RAILWAYS 8.25 11-16 18/02S500,000 525,000.00 0.23523,750.00 15,125.00BAHRAIN MUMTALAKAT 5.00 10-15 30/06S1,150,000 1,189,226.50 0.521,181,250.00 0.00BANCO BRADESCO 5.75 12-22 01/03S300,000 295,269.00 0.13321,750.00 5,702.08BANCO CREDITO REGS 4.00 13-23 11/02S500,000 465,965.00 0.20496,375.00 7,722.22BANCO ESTADO DI RIO 7.375 12-22 02/02S300,000 296,784.00 0.13316,500.00 9,095.83BANCO NACIONAL REGS 6.25 13-23 01/11S500,000 486,810.00 0.21495,360.00 5,121.53BANCO VOTORANTIM SUB REGS 7.375 10-20 21/01S500,000 525,275.00 0.23512,830.00 16,286.46BANCOLOMBIA 5.95 11-21 03/06S750,000 784,537.50 0.34798,750.00 3,346.88BANCOLOMBIA 6.125 10-20 26/07S500,000 518,920.00 0.23511,045.00 13,100.69BANCOLOMBIA SUB 5.125 12-22 11/09S1,000,000 942,410.00 0.41975,855.00 15,517.36BANGKOK BK HK REGS 3.875 12-22 27/09S500,000 466,945.00 0.20473,590.00 5,005.21BANGKOK BK PUB REGS 4.80 10-20 18/10S600,000 622,782.00 0.27629,040.00 5,760.00BANK CHINA HK 5.55 10-20 11/02S1,000,000 1,075,200.00 0.471,049,360.00 21,429.17BANK OF CEYLON 5.325 13-18 16/04S750,000 715,807.50 0.31750,000.00 8,209.38BANK OF EAST ASIA SUB 6.125 10-20 16/07S250,000 273,647.50 0.12275,775.00 6,975.69BANK OF GEOGIA REGS 7.75 12-17 05/07S550,000 576,845.50 0.25579,260.00 20,720.49BATELCO INT 4.25 13-20 01/05S1,000,000 930,260.00 0.41999,900.00 6,965.28BBVA BANCOMER REGS 6.75 12-22 30/09S1,000,000 1,066,170.00 0.471,098,900.00 16,875.00BBVA BANCOMER SA TEXA 6.50 11-21 10/03S1,000,000 1,059,090.00 0.461,126,400.00 19,861.11BBVA REGS 5.00 12-22 26/08S1,000,000 997,610.00 0.441,010,000.00 17,222.22BCO BOGOTA REGS SUB 5.375 13-23 19/02S750,000 735,277.50 0.32767,500.00 14,669.27BCO LATINOAMER REGS 3.75 12-17 04/04S500,000 510,854.47 0.22496,355.00 4,479.17BELARUS (REP OF) EMTN 8.75 10-15 03/08S1,000,000 1,018,220.00 0.451,013,000.00 35,729.17BERAU CAPITAL 7.25 12-17 13/03S500,000 496,085.00 0.22500,000.00 10,774.31BERAU CAPITAL 12.50 10-15 08/07S500,000 529,875.00 0.23517,500.00 29,861.11BFF INTERNATIONAL LTD 7.25 10-20 28/01S1,000,000 1,103,310.00 0.481,105,000.00 30,611.11BHARAT PETROLEUM 4.625 12-22 25/10S1,000,000 902,200.00 0.401,008,665.00 8,350.69BHARTI AIRTEL REGS 5.125 13-23 11/03S1,000,000 926,430.00 0.411,006,500.00 15,517.36BRASKEM AMERICA REGS 7.125 11-41 22/07S250,000 226,177.50 0.10280,950.00 7,817.71
Statement of investments and other net assets as at 31/12/2013USDExpressed in
UBAM - EMERGING MARKET CORPORATE BOND
Number/nom. value Description % of total
net assetsMarket valueCost Unaudited AccruedInterest
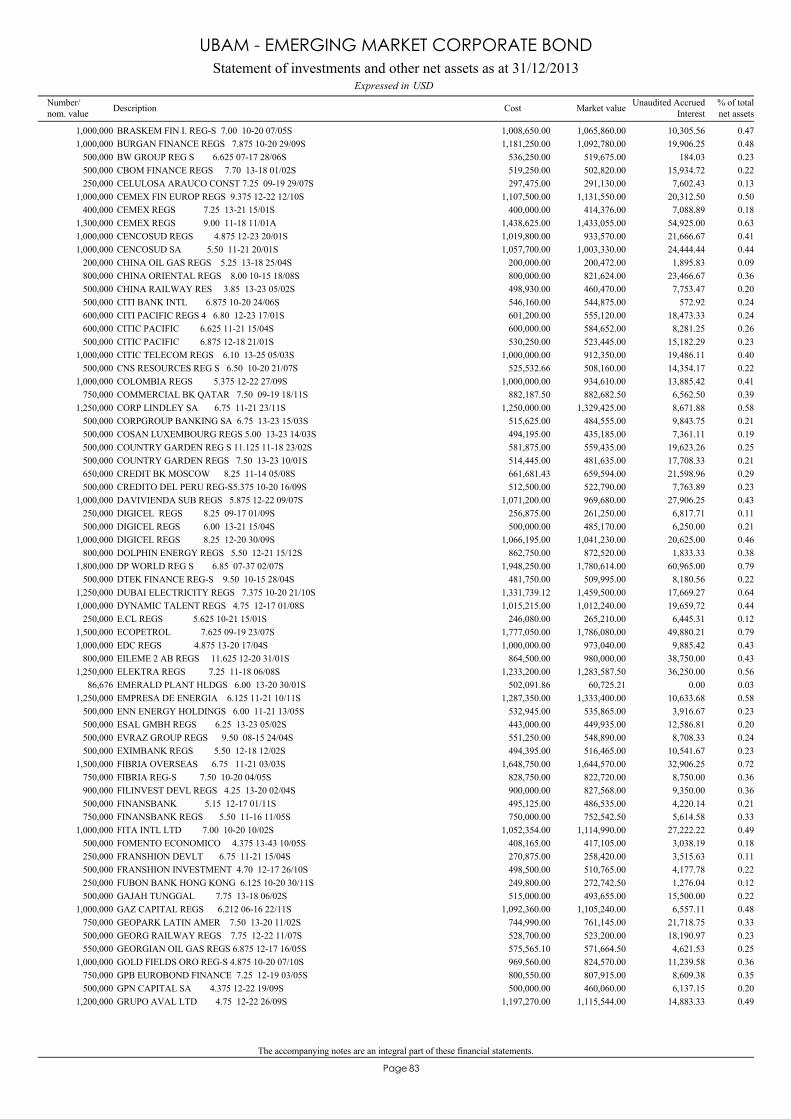
The accompanying notes are an integral part of these financial statements.
83Page
BRASKEM FIN I. REG-S 7.00 10-20 07/05S1,000,000 1,065,860.00 0.471,008,650.00 10,305.56BURGAN FINANCE REGS 7.875 10-20 29/09S1,000,000 1,092,780.00 0.481,181,250.00 19,906.25BW GROUP REG S 6.625 07-17 28/06S500,000 519,675.00 0.23536,250.00 184.03CBOM FINANCE REGS 7.70 13-18 01/02S500,000 502,820.00 0.22519,250.00 15,934.72CELULOSA ARAUCO CONST 7.25 09-19 29/07S250,000 291,130.00 0.13297,475.00 7,602.43CEMEX FIN EUROP REGS 9.375 12-22 12/10S1,000,000 1,131,550.00 0.501,107,500.00 20,312.50CEMEX REGS 7.25 13-21 15/01S400,000 414,376.00 0.18400,000.00 7,088.89CEMEX REGS 9.00 11-18 11/01A1,300,000 1,433,055.00 0.631,438,625.00 54,925.00CENCOSUD REGS 4.875 12-23 20/01S1,000,000 933,570.00 0.411,019,800.00 21,666.67CENCOSUD SA 5.50 11-21 20/01S1,000,000 1,003,330.00 0.441,057,700.00 24,444.44CHINA OIL GAS REGS 5.25 13-18 25/04S200,000 200,472.00 0.09200,000.00 1,895.83CHINA ORIENTAL REGS 8.00 10-15 18/08S800,000 821,624.00 0.36800,000.00 23,466.67CHINA RAILWAY RES 3.85 13-23 05/02S500,000 460,470.00 0.20498,930.00 7,753.47CITI BANK INTL 6.875 10-20 24/06S500,000 544,875.00 0.24546,160.00 572.92CITI PACIFIC REGS 4 6.80 12-23 17/01S600,000 555,120.00 0.24601,200.00 18,473.33CITIC PACIFIC 6.625 11-21 15/04S600,000 584,652.00 0.26600,000.00 8,281.25CITIC PACIFIC 6.875 12-18 21/01S500,000 523,445.00 0.23530,250.00 15,182.29CITIC TELECOM REGS 6.10 13-25 05/03S1,000,000 912,350.00 0.401,000,000.00 19,486.11CNS RESOURCES REG S 6.50 10-20 21/07S500,000 508,160.00 0.22525,532.66 14,354.17COLOMBIA REGS 5.375 12-22 27/09S1,000,000 934,610.00 0.411,000,000.00 13,885.42COMMERCIAL BK QATAR 7.50 09-19 18/11S750,000 882,682.50 0.39882,187.50 6,562.50CORP LINDLEY SA 6.75 11-21 23/11S1,250,000 1,329,425.00 0.581,250,000.00 8,671.88CORPGROUP BANKING SA 6.75 13-23 15/03S500,000 484,555.00 0.21515,625.00 9,843.75COSAN LUXEMBOURG REGS 5.00 13-23 14/03S500,000 435,185.00 0.19494,195.00 7,361.11COUNTRY GARDEN REG S 11.125 11-18 23/02S500,000 559,435.00 0.25581,875.00 19,623.26COUNTRY GARDEN REGS 7.50 13-23 10/01S500,000 481,635.00 0.21514,445.00 17,708.33CREDIT BK MOSCOW 8.25 11-14 05/08S650,000 659,594.00 0.29661,681.43 21,598.96CREDITO DEL PERU REG-S5.375 10-20 16/09S500,000 522,790.00 0.23512,500.00 7,763.89DAVIVIENDA SUB REGS 5.875 12-22 09/07S1,000,000 969,680.00 0.431,071,200.00 27,906.25DIGICEL REGS 8.25 09-17 01/09S250,000 261,250.00 0.11256,875.00 6,817.71DIGICEL REGS 6.00 13-21 15/04S500,000 485,170.00 0.21500,000.00 6,250.00DIGICEL REGS 8.25 12-20 30/09S1,000,000 1,041,230.00 0.461,066,195.00 20,625.00DOLPHIN ENERGY REGS 5.50 12-21 15/12S800,000 872,520.00 0.38862,750.00 1,833.33DP WORLD REG S 6.85 07-37 02/07S1,800,000 1,780,614.00 0.791,948,250.00 60,965.00DTEK FINANCE REG-S 9.50 10-15 28/04S500,000 509,995.00 0.22481,750.00 8,180.56DUBAI ELECTRICITY REGS 7.375 10-20 21/10S1,250,000 1,459,500.00 0.641,331,739.12 17,669.27DYNAMIC TALENT REGS 4.75 12-17 01/08S1,000,000 1,012,240.00 0.441,015,215.00 19,659.72E.CL REGS 5.625 10-21 15/01S250,000 265,210.00 0.12246,080.00 6,445.31ECOPETROL 7.625 09-19 23/07S1,500,000 1,786,080.00 0.791,777,050.00 49,880.21EDC REGS 4.875 13-20 17/04S1,000,000 973,040.00 0.431,000,000.00 9,885.42EILEME 2 AB REGS 11.625 12-20 31/01S800,000 980,000.00 0.43864,500.00 38,750.00ELEKTRA REGS 7.25 11-18 06/08S1,250,000 1,283,587.50 0.561,233,200.00 36,250.00EMERALD PLANT HLDGS 6.00 13-20 30/01S86,676 60,725.21 0.03502,091.86 0.00EMPRESA DE ENERGIA 6.125 11-21 10/11S1,250,000 1,333,400.00 0.581,287,350.00 10,633.68ENN ENERGY HOLDINGS 6.00 11-21 13/05S500,000 535,865.00 0.23532,945.00 3,916.67ESAL GMBH REGS 6.25 13-23 05/02S500,000 449,935.00 0.20443,000.00 12,586.81EVRAZ GROUP REGS 9.50 08-15 24/04S500,000 548,890.00 0.24551,250.00 8,708.33EXIMBANK REGS 5.50 12-18 12/02S500,000 516,465.00 0.23494,395.00 10,541.67FIBRIA OVERSEAS 6.75 11-21 03/03S1,500,000 1,644,570.00 0.721,648,750.00 32,906.25FIBRIA REG-S 7.50 10-20 04/05S750,000 822,720.00 0.36828,750.00 8,750.00FILINVEST DEVL REGS 4.25 13-20 02/04S900,000 827,568.00 0.36900,000.00 9,350.00FINANSBANK 5.15 12-17 01/11S500,000 486,535.00 0.21495,125.00 4,220.14FINANSBANK REGS 5.50 11-16 11/05S750,000 752,542.50 0.33750,000.00 5,614.58FITA INTL LTD 7.00 10-20 10/02S1,000,000 1,114,990.00 0.491,052,354.00 27,222.22FOMENTO ECONOMICO 4.375 13-43 10/05S500,000 417,105.00 0.18408,165.00 3,038.19FRANSHION DEVLT 6.75 11-21 15/04S250,000 258,420.00 0.11270,875.00 3,515.63FRANSHION INVESTMENT 4.70 12-17 26/10S500,000 510,765.00 0.22498,500.00 4,177.78FUBON BANK HONG KONG 6.125 10-20 30/11S250,000 272,742.50 0.12249,800.00 1,276.04GAJAH TUNGGAL 7.75 13-18 06/02S500,000 493,655.00 0.22515,000.00 15,500.00GAZ CAPITAL REGS 6.212 06-16 22/11S1,000,000 1,105,240.00 0.481,092,360.00 6,557.11GEOPARK LATIN AMER 7.50 13-20 11/02S750,000 761,145.00 0.33744,990.00 21,718.75GEORG RAILWAY REGS 7.75 12-22 11/07S500,000 523,200.00 0.23528,700.00 18,190.97GEORGIAN OIL GAS REGS 6.875 12-17 16/05S550,000 571,664.50 0.25575,565.10 4,621.53GOLD FIELDS ORO REG-S 4.875 10-20 07/10S1,000,000 824,570.00 0.36969,560.00 11,239.58GPB EUROBOND FINANCE 7.25 12-19 03/05S750,000 807,915.00 0.35800,550.00 8,609.38GPN CAPITAL SA 4.375 12-22 19/09S500,000 460,060.00 0.20500,000.00 6,137.15GRUPO AVAL LTD 4.75 12-22 26/09S1,200,000 1,115,544.00 0.491,197,270.00 14,883.33
Statement of investments and other net assets as at 31/12/2013USDExpressed in
UBAM - EMERGING MARKET CORPORATE BOND
Number/nom. value Description % of total
net assetsMarket valueCost Unaudited AccruedInterest
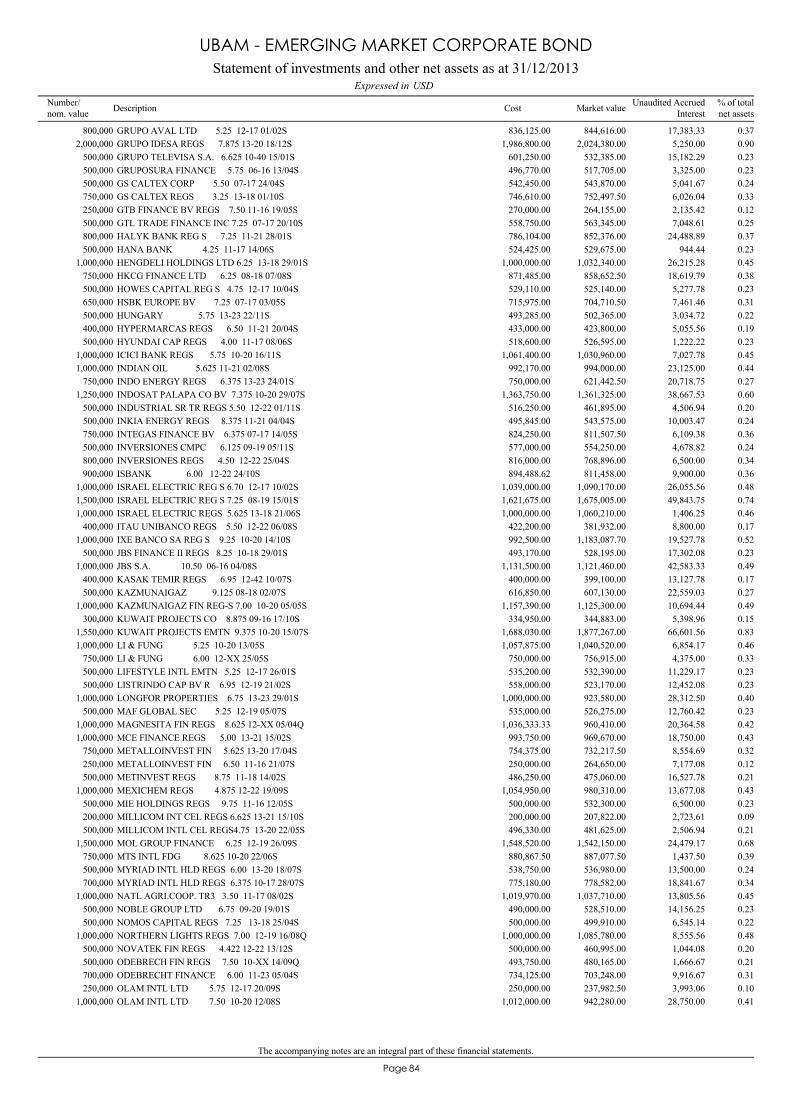
The accompanying notes are an integral part of these financial statements.
84Page
GRUPO AVAL LTD 5.25 12-17 01/02S800,000 844,616.00 0.37836,125.00 17,383.33GRUPO IDESA REGS 7.875 13-20 18/12S2,000,000 2,024,380.00 0.901,986,800.00 5,250.00GRUPO TELEVISA S.A. 6.625 10-40 15/01S500,000 532,385.00 0.23601,250.00 15,182.29GRUPOSURA FINANCE 5.75 06-16 13/04S500,000 517,705.00 0.23496,770.00 3,325.00GS CALTEX CORP 5.50 07-17 24/04S500,000 543,870.00 0.24542,450.00 5,041.67GS CALTEX REGS 3.25 13-18 01/10S750,000 752,497.50 0.33746,610.00 6,026.04GTB FINANCE BV REGS 7.50 11-16 19/05S250,000 264,155.00 0.12270,000.00 2,135.42GTL TRADE FINANCE INC 7.25 07-17 20/10S500,000 563,345.00 0.25558,750.00 7,048.61HALYK BANK REG S 7.25 11-21 28/01S800,000 852,376.00 0.37786,104.00 24,488.89HANA BANK 4.25 11-17 14/06S500,000 529,675.00 0.23524,425.00 944.44HENGDELI HOLDINGS LTD 6.25 13-18 29/01S1,000,000 1,032,340.00 0.451,000,000.00 26,215.28HKCG FINANCE LTD 6.25 08-18 07/08S750,000 858,652.50 0.38871,485.00 18,619.79HOWES CAPITAL REG S 4.75 12-17 10/04S500,000 525,140.00 0.23529,110.00 5,277.78HSBK EUROPE BV 7.25 07-17 03/05S650,000 704,710.50 0.31715,975.00 7,461.46HUNGARY 5.75 13-23 22/11S500,000 502,365.00 0.22493,285.00 3,034.72HYPERMARCAS REGS 6.50 11-21 20/04S400,000 423,800.00 0.19433,000.00 5,055.56HYUNDAI CAP REGS 4.00 11-17 08/06S500,000 526,595.00 0.23518,600.00 1,222.22ICICI BANK REGS 5.75 10-20 16/11S1,000,000 1,030,960.00 0.451,061,400.00 7,027.78INDIAN OIL 5.625 11-21 02/08S1,000,000 994,000.00 0.44992,170.00 23,125.00INDO ENERGY REGS 6.375 13-23 24/01S750,000 621,442.50 0.27750,000.00 20,718.75INDOSAT PALAPA CO BV 7.375 10-20 29/07S1,250,000 1,361,325.00 0.601,363,750.00 38,667.53INDUSTRIAL SR TR REGS 5.50 12-22 01/11S500,000 461,895.00 0.20516,250.00 4,506.94INKIA ENERGY REGS 8.375 11-21 04/04S500,000 543,575.00 0.24495,845.00 10,003.47INTEGAS FINANCE BV 6.375 07-17 14/05S750,000 811,507.50 0.36824,250.00 6,109.38INVERSIONES CMPC 6.125 09-19 05/11S500,000 554,250.00 0.24577,000.00 4,678.82INVERSIONES REGS 4.50 12-22 25/04S800,000 768,896.00 0.34816,000.00 6,500.00ISBANK 6.00 12-22 24/10S900,000 811,458.00 0.36894,488.62 9,900.00ISRAEL ELECTRIC REG S 6.70 12-17 10/02S1,000,000 1,090,170.00 0.481,039,000.00 26,055.56ISRAEL ELECTRIC REG S 7.25 08-19 15/01S1,500,000 1,675,005.00 0.741,621,675.00 49,843.75ISRAEL ELECTRIC REGS 5.625 13-18 21/06S1,000,000 1,060,210.00 0.461,000,000.00 1,406.25ITAU UNIBANCO REGS 5.50 12-22 06/08S400,000 381,932.00 0.17422,200.00 8,800.00IXE BANCO SA REG S 9.25 10-20 14/10S1,000,000 1,183,087.70 0.52992,500.00 19,527.78JBS FINANCE II REGS 8.25 10-18 29/01S500,000 528,195.00 0.23493,170.00 17,302.08JBS S.A. 10.50 06-16 04/08S1,000,000 1,121,460.00 0.491,131,500.00 42,583.33KASAK TEMIR REGS 6.95 12-42 10/07S400,000 399,100.00 0.17400,000.00 13,127.78KAZMUNAIGAZ 9.125 08-18 02/07S500,000 607,130.00 0.27616,850.00 22,559.03KAZMUNAIGAZ FIN REG-S 7.00 10-20 05/05S1,000,000 1,125,300.00 0.491,157,390.00 10,694.44KUWAIT PROJECTS CO 8.875 09-16 17/10S300,000 344,883.00 0.15334,950.00 5,398.96KUWAIT PROJECTS EMTN 9.375 10-20 15/07S1,550,000 1,877,267.00 0.831,688,030.00 66,601.56LI & FUNG 5.25 10-20 13/05S1,000,000 1,040,520.00 0.461,057,875.00 6,854.17LI & FUNG 6.00 12-XX 25/05S750,000 756,915.00 0.33750,000.00 4,375.00LIFESTYLE INTL EMTN 5.25 12-17 26/01S500,000 532,390.00 0.23535,200.00 11,229.17LISTRINDO CAP BV R 6.95 12-19 21/02S500,000 523,170.00 0.23558,000.00 12,452.08LONGFOR PROPERTIES 6.75 13-23 29/01S1,000,000 923,580.00 0.401,000,000.00 28,312.50MAF GLOBAL SEC 5.25 12-19 05/07S500,000 526,275.00 0.23535,000.00 12,760.42MAGNESITA FIN REGS 8.625 12-XX 05/04Q1,000,000 960,410.00 0.421,036,333.33 20,364.58MCE FINANCE REGS 5.00 13-21 15/02S1,000,000 969,670.00 0.43993,750.00 18,750.00METALLOINVEST FIN 5.625 13-20 17/04S750,000 732,217.50 0.32754,375.00 8,554.69METALLOINVEST FIN 6.50 11-16 21/07S250,000 264,650.00 0.12250,000.00 7,177.08METINVEST REGS 8.75 11-18 14/02S500,000 475,060.00 0.21486,250.00 16,527.78MEXICHEM REGS 4.875 12-22 19/09S1,000,000 980,310.00 0.431,054,950.00 13,677.08MIE HOLDINGS REGS 9.75 11-16 12/05S500,000 532,300.00 0.23500,000.00 6,500.00MILLICOM INT CEL REGS 6.625 13-21 15/10S200,000 207,822.00 0.09200,000.00 2,723.61MILLICOM INTL CEL REGS4.75 13-20 22/05S500,000 481,625.00 0.21496,330.00 2,506.94MOL GROUP FINANCE 6.25 12-19 26/09S1,500,000 1,542,150.00 0.681,548,520.00 24,479.17MTS INTL FDG 8.625 10-20 22/06S750,000 887,077.50 0.39880,867.50 1,437.50MYRIAD INTL HLD REGS 6.00 13-20 18/07S500,000 536,980.00 0.24538,750.00 13,500.00MYRIAD INTL HLD REGS 6.375 10-17 28/07S700,000 778,582.00 0.34775,180.00 18,841.67NATL AGRI.COOP. TR3 3.50 11-17 08/02S1,000,000 1,037,710.00 0.451,019,970.00 13,805.56NOBLE GROUP LTD 6.75 09-20 19/01S500,000 528,510.00 0.23490,000.00 14,156.25NOMOS CAPITAL REGS 7.25 13-18 25/04S500,000 499,910.00 0.22500,000.00 6,545.14NORTHERN LIGHTS REGS 7.00 12-19 16/08Q1,000,000 1,085,780.00 0.481,000,000.00 8,555.56NOVATEK FIN REGS 4.422 12-22 13/12S500,000 460,995.00 0.20500,000.00 1,044.08ODEBRECH FIN REGS 7.50 10-XX 14/09Q500,000 480,165.00 0.21493,750.00 1,666.67ODEBRECHT FINANCE 6.00 11-23 05/04S700,000 703,248.00 0.31734,125.00 9,916.67OLAM INTL LTD 5.75 12-17 20/09S250,000 237,982.50 0.10250,000.00 3,993.06OLAM INTL LTD 7.50 10-20 12/08S1,000,000 942,280.00 0.411,012,000.00 28,750.00
Statement of investments and other net assets as at 31/12/2013USDExpressed in
UBAM - EMERGING MARKET CORPORATE BOND
Number/nom. value Description % of total
net assetsMarket valueCost Unaudited AccruedInterest
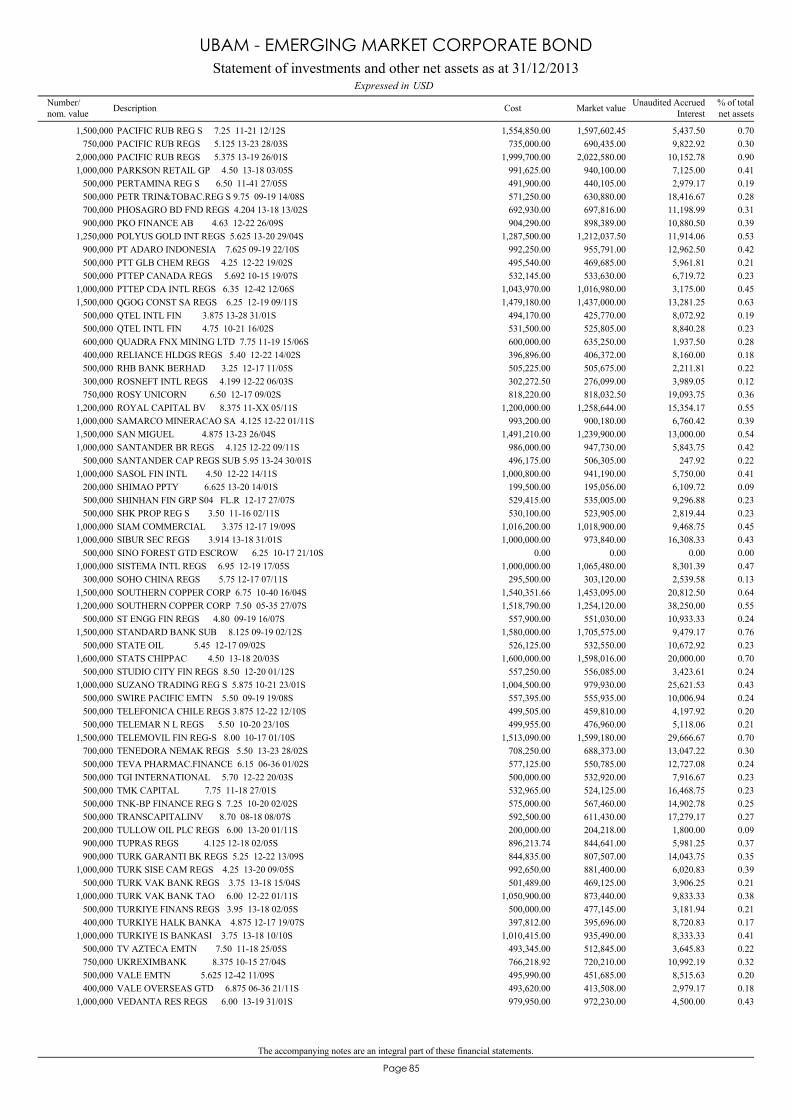
The accompanying notes are an integral part of these financial statements.
85Page
PACIFIC RUB REG S 7.25 11-21 12/12S1,500,000 1,597,602.45 0.701,554,850.00 5,437.50PACIFIC RUB REGS 5.125 13-23 28/03S750,000 690,435.00 0.30735,000.00 9,822.92PACIFIC RUB REGS 5.375 13-19 26/01S2,000,000 2,022,580.00 0.901,999,700.00 10,152.78PARKSON RETAIL GP 4.50 13-18 03/05S1,000,000 940,100.00 0.41991,625.00 7,125.00PERTAMINA REG S 6.50 11-41 27/05S500,000 440,105.00 0.19491,900.00 2,979.17PETR TRIN&TOBAC.REG S 9.75 09-19 14/08S500,000 630,880.00 0.28571,250.00 18,416.67PHOSAGRO BD FND REGS 4.204 13-18 13/02S700,000 697,816.00 0.31692,930.00 11,198.99PKO FINANCE AB 4.63 12-22 26/09S900,000 898,389.00 0.39904,290.00 10,880.50POLYUS GOLD INT REGS 5.625 13-20 29/04S1,250,000 1,212,037.50 0.531,287,500.00 11,914.06PT ADARO INDONESIA 7.625 09-19 22/10S900,000 955,791.00 0.42992,250.00 12,962.50PTT GLB CHEM REGS 4.25 12-22 19/02S500,000 469,685.00 0.21495,540.00 5,961.81PTTEP CANADA REGS 5.692 10-15 19/07S500,000 533,630.00 0.23532,145.00 6,719.72PTTEP CDA INTL REGS 6.35 12-42 12/06S1,000,000 1,016,980.00 0.451,043,970.00 3,175.00QGOG CONST SA REGS 6.25 12-19 09/11S1,500,000 1,437,000.00 0.631,479,180.00 13,281.25QTEL INTL FIN 3.875 13-28 31/01S500,000 425,770.00 0.19494,170.00 8,072.92QTEL INTL FIN 4.75 10-21 16/02S500,000 525,805.00 0.23531,500.00 8,840.28QUADRA FNX MINING LTD 7.75 11-19 15/06S600,000 635,250.00 0.28600,000.00 1,937.50RELIANCE HLDGS REGS 5.40 12-22 14/02S400,000 406,372.00 0.18396,896.00 8,160.00RHB BANK BERHAD 3.25 12-17 11/05S500,000 505,675.00 0.22505,225.00 2,211.81ROSNEFT INTL REGS 4.199 12-22 06/03S300,000 276,099.00 0.12302,272.50 3,989.05ROSY UNICORN 6.50 12-17 09/02S750,000 818,032.50 0.36818,220.00 19,093.75ROYAL CAPITAL BV 8.375 11-XX 05/11S1,200,000 1,258,644.00 0.551,200,000.00 15,354.17SAMARCO MINERACAO SA 4.125 12-22 01/11S1,000,000 900,180.00 0.39993,200.00 6,760.42SAN MIGUEL 4.875 13-23 26/04S1,500,000 1,239,900.00 0.541,491,210.00 13,000.00SANTANDER BR REGS 4.125 12-22 09/11S1,000,000 947,730.00 0.42986,000.00 5,843.75SANTANDER CAP REGS SUB 5.95 13-24 30/01S500,000 506,305.00 0.22496,175.00 247.92SASOL FIN INTL 4.50 12-22 14/11S1,000,000 941,190.00 0.411,000,800.00 5,750.00SHIMAO PPTY 6.625 13-20 14/01S200,000 195,056.00 0.09199,500.00 6,109.72SHINHAN FIN GRP S04 FL.R 12-17 27/07S500,000 535,005.00 0.23529,415.00 9,296.88SHK PROP REG S 3.50 11-16 02/11S500,000 523,905.00 0.23530,100.00 2,819.44SIAM COMMERCIAL 3.375 12-17 19/09S1,000,000 1,018,900.00 0.451,016,200.00 9,468.75SIBUR SEC REGS 3.914 13-18 31/01S1,000,000 973,840.00 0.431,000,000.00 16,308.33SINO FOREST GTD ESCROW 6.25 10-17 21/10S500,000 0.00 0.000.00 0.00SISTEMA INTL REGS 6.95 12-19 17/05S1,000,000 1,065,480.00 0.471,000,000.00 8,301.39SOHO CHINA REGS 5.75 12-17 07/11S300,000 303,120.00 0.13295,500.00 2,539.58SOUTHERN COPPER CORP 6.75 10-40 16/04S1,500,000 1,453,095.00 0.641,540,351.66 20,812.50SOUTHERN COPPER CORP 7.50 05-35 27/07S1,200,000 1,254,120.00 0.551,518,790.00 38,250.00ST ENGG FIN REGS 4.80 09-19 16/07S500,000 551,030.00 0.24557,900.00 10,933.33STANDARD BANK SUB 8.125 09-19 02/12S1,500,000 1,705,575.00 0.761,580,000.00 9,479.17STATE OIL 5.45 12-17 09/02S500,000 532,550.00 0.23526,125.00 10,672.92STATS CHIPPAC 4.50 13-18 20/03S1,600,000 1,598,016.00 0.701,600,000.00 20,000.00STUDIO CITY FIN REGS 8.50 12-20 01/12S500,000 556,085.00 0.24557,250.00 3,423.61SUZANO TRADING REG S 5.875 10-21 23/01S1,000,000 979,930.00 0.431,004,500.00 25,621.53SWIRE PACIFIC EMTN 5.50 09-19 19/08S500,000 555,935.00 0.24557,395.00 10,006.94TELEFONICA CHILE REGS 3.875 12-22 12/10S500,000 459,810.00 0.20499,505.00 4,197.92TELEMAR N L REGS 5.50 10-20 23/10S500,000 476,960.00 0.21499,955.00 5,118.06TELEMOVIL FIN REG-S 8.00 10-17 01/10S1,500,000 1,599,180.00 0.701,513,090.00 29,666.67TENEDORA NEMAK REGS 5.50 13-23 28/02S700,000 688,373.00 0.30708,250.00 13,047.22TEVA PHARMAC.FINANCE 6.15 06-36 01/02S500,000 550,785.00 0.24577,125.00 12,727.08TGI INTERNATIONAL 5.70 12-22 20/03S500,000 532,920.00 0.23500,000.00 7,916.67TMK CAPITAL 7.75 11-18 27/01S500,000 524,125.00 0.23532,965.00 16,468.75TNK-BP FINANCE REG S 7.25 10-20 02/02S500,000 567,460.00 0.25575,000.00 14,902.78TRANSCAPITALINV 8.70 08-18 08/07S500,000 611,430.00 0.27592,500.00 17,279.17TULLOW OIL PLC REGS 6.00 13-20 01/11S200,000 204,218.00 0.09200,000.00 1,800.00TUPRAS REGS 4.125 12-18 02/05S900,000 844,641.00 0.37896,213.74 5,981.25TURK GARANTI BK REGS 5.25 12-22 13/09S900,000 807,507.00 0.35844,835.00 14,043.75TURK SISE CAM REGS 4.25 13-20 09/05S1,000,000 881,400.00 0.39992,650.00 6,020.83TURK VAK BANK REGS 3.75 13-18 15/04S500,000 469,125.00 0.21501,489.00 3,906.25TURK VAK BANK TAO 6.00 12-22 01/11S1,000,000 873,440.00 0.381,050,900.00 9,833.33TURKIYE FINANS REGS 3.95 13-18 02/05S500,000 477,145.00 0.21500,000.00 3,181.94TURKIYE HALK BANKA 4.875 12-17 19/07S400,000 395,696.00 0.17397,812.00 8,720.83TURKIYE IS BANKASI 3.75 13-18 10/10S1,000,000 935,490.00 0.411,010,415.00 8,333.33TV AZTECA EMTN 7.50 11-18 25/05S500,000 512,845.00 0.22493,345.00 3,645.83UKREXIMBANK 8.375 10-15 27/04S750,000 720,210.00 0.32766,218.92 10,992.19VALE EMTN 5.625 12-42 11/09S500,000 451,685.00 0.20495,990.00 8,515.63VALE OVERSEAS GTD 6.875 06-36 21/11S400,000 413,508.00 0.18493,620.00 2,979.17VEDANTA RES REGS 6.00 13-19 31/01S1,000,000 972,230.00 0.43979,950.00 4,500.00
Statement of investments and other net assets as at 31/12/2013USDExpressed in
UBAM - EMERGING MARKET CORPORATE BOND
Number/nom. value Description % of total
net assetsMarket valueCost Unaudited AccruedInterest
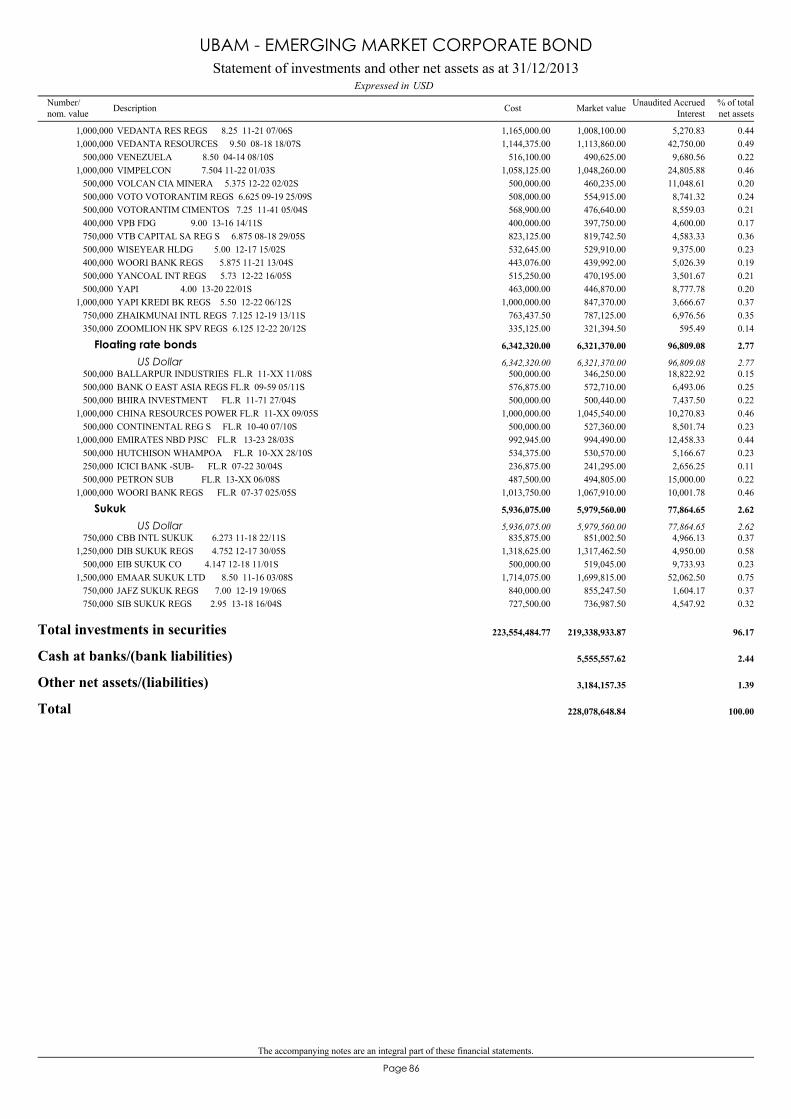
The accompanying notes are an integral part of these financial statements.
86Page
VEDANTA RES REGS 8.25 11-21 07/06S1,000,000 1,008,100.00 0.441,165,000.00 5,270.83VEDANTA RESOURCES 9.50 08-18 18/07S1,000,000 1,113,860.00 0.491,144,375.00 42,750.00VENEZUELA 8.50 04-14 08/10S500,000 490,625.00 0.22516,100.00 9,680.56VIMPELCON 7.504 11-22 01/03S1,000,000 1,048,260.00 0.461,058,125.00 24,805.88VOLCAN CIA MINERA 5.375 12-22 02/02S500,000 460,235.00 0.20500,000.00 11,048.61VOTO VOTORANTIM REGS 6.625 09-19 25/09S500,000 554,915.00 0.24508,000.00 8,741.32VOTORANTIM CIMENTOS 7.25 11-41 05/04S500,000 476,640.00 0.21568,900.00 8,559.03VPB FDG 9.00 13-16 14/11S400,000 397,750.00 0.17400,000.00 4,600.00VTB CAPITAL SA REG S 6.875 08-18 29/05S750,000 819,742.50 0.36823,125.00 4,583.33WISEYEAR HLDG 5.00 12-17 15/02S500,000 529,910.00 0.23532,645.00 9,375.00WOORI BANK REGS 5.875 11-21 13/04S400,000 439,992.00 0.19443,076.00 5,026.39YANCOAL INT REGS 5.73 12-22 16/05S500,000 470,195.00 0.21515,250.00 3,501.67YAPI 4.00 13-20 22/01S500,000 446,870.00 0.20463,000.00 8,777.78YAPI KREDI BK REGS 5.50 12-22 06/12S1,000,000 847,370.00 0.371,000,000.00 3,666.67ZHAIKMUNAI INTL REGS 7.125 12-19 13/11S750,000 787,125.00 0.35763,437.50 6,976.56ZOOMLION HK SPV REGS 6.125 12-22 20/12S350,000 321,394.50 0.14335,125.00 595.49
BALLARPUR INDUSTRIES FL.R 11-XX 11/08S500,000 346,250.00 0.15500,000.00 18,822.92
Floating rate bonds 6,321,370.00 2.776,342,320.00 96,809.08
US Dollar 6,321,370.00 2.776,342,320.00 96,809.08
BANK O EAST ASIA REGS FL.R 09-59 05/11S500,000 572,710.00 0.25576,875.00 6,493.06BHIRA INVESTMENT FL.R 11-71 27/04S500,000 500,440.00 0.22500,000.00 7,437.50CHINA RESOURCES POWER FL.R 11-XX 09/05S1,000,000 1,045,540.00 0.461,000,000.00 10,270.83CONTINENTAL REG S FL.R 10-40 07/10S500,000 527,360.00 0.23500,000.00 8,501.74EMIRATES NBD PJSC FL.R 13-23 28/03S1,000,000 994,490.00 0.44992,945.00 12,458.33HUTCHISON WHAMPOA FL.R 10-XX 28/10S500,000 530,570.00 0.23534,375.00 5,166.67ICICI BANK -SUB- FL.R 07-22 30/04S250,000 241,295.00 0.11236,875.00 2,656.25PETRON SUB FL.R 13-XX 06/08S500,000 494,805.00 0.22487,500.00 15,000.00WOORI BANK REGS FL.R 07-37 025/05S1,000,000 1,067,910.00 0.461,013,750.00 10,001.78
CBB INTL SUKUK 6.273 11-18 22/11S750,000 851,002.50 0.37835,875.00 4,966.13
Sukuk 5,979,560.00 2.625,936,075.00 77,864.65
US Dollar 5,979,560.00 2.625,936,075.00 77,864.65
DIB SUKUK REGS 4.752 12-17 30/05S1,250,000 1,317,462.50 0.581,318,625.00 4,950.00EIB SUKUK CO 4.147 12-18 11/01S500,000 519,045.00 0.23500,000.00 9,733.93EMAAR SUKUK LTD 8.50 11-16 03/08S1,500,000 1,699,815.00 0.751,714,075.00 52,062.50JAFZ SUKUK REGS 7.00 12-19 19/06S750,000 855,247.50 0.37840,000.00 1,604.17SIB SUKUK REGS 2.95 13-18 16/04S750,000 736,987.50 0.32727,500.00 4,547.92
Total investments in securities 219,338,933.87 96.17223,554,484.77
Cash at banks/(bank liabilities) 5,555,557.62 2.44
Other net assets/(liabilities) 3,184,157.35 1.39
Total 228,078,648.84 100.00
Statement of investments and other net assets as at 31/12/2013USDExpressed in
UBAM - EMERGING MARKET CORPORATE BOND
Number/nom. value Description % of total
net assetsMarket valueCost Unaudited AccruedInterest
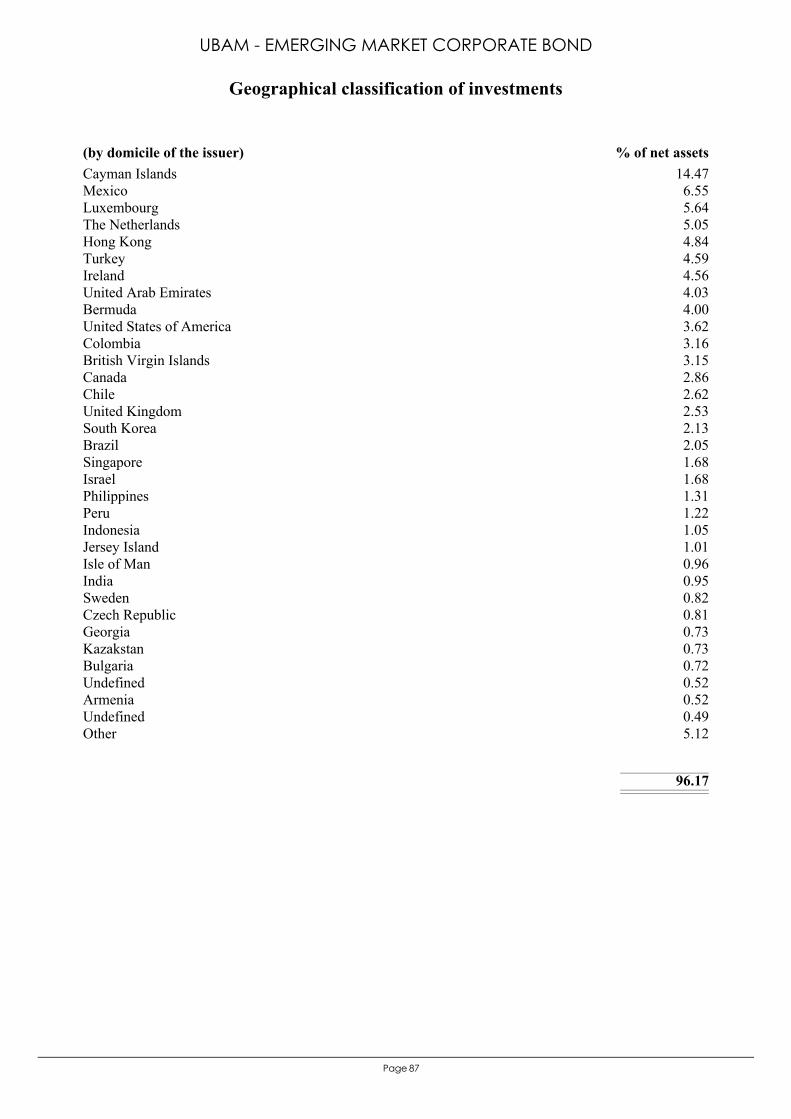
87Page
Cayman Islands 14.47Mexico 6.55Luxembourg 5.64The Netherlands 5.05Hong Kong 4.84Turkey 4.59Ireland 4.56United Arab Emirates 4.03Bermuda 4.00United States of America 3.62Colombia 3.16British Virgin Islands 3.15Canada 2.86Chile 2.62United Kingdom 2.53South Korea 2.13Brazil 2.05Singapore 1.68Israel 1.68Philippines 1.31Peru 1.22Indonesia 1.05Jersey Island 1.01Isle of Man 0.96India 0.95Sweden 0.82Czech Republic 0.81Georgia 0.73Kazakstan 0.73Bulgaria 0.72Undefined 0.52Armenia 0.52Undefined 0.49Other 5.12
96.17
(by domicile of the issuer) % of net assets
Geographical classification of investments
UBAM - EMERGING MARKET CORPORATE BOND

88Page
Holding and finance companies 33.13Banks and credit institutions 14.95Petroleum 8.51Miscellaneous sectors 5.99Communications 4.08Coal mining and steel industry 3.73Utilities 3.62Real estate companies 2.22Miscellaneous services 2.13Electrical engineering and electronics 1.97Transportation 1.67Building materials and trade 1.64Countries and central government 1.41Non-ferrous metals 1.39Miscellaneous consumer goods 1.31Miscellaneous trading companies 1.30Paper and forest products 1.29Electronics and semiconductors 1.18Foods and non alcoholic drinks 0.93Precious metals and stones 0.92Tobacco and alcoholic drinks 0.72Pharmaceuticals and cosmetics 0.58Agriculture and fishery 0.45Chemicals 0.42Retail trade, department stores 0.41Tires and rubber 0.22
96.17
% of net assets
Industrial classification of investments
UBAM - EMERGING MARKET CORPORATE BOND
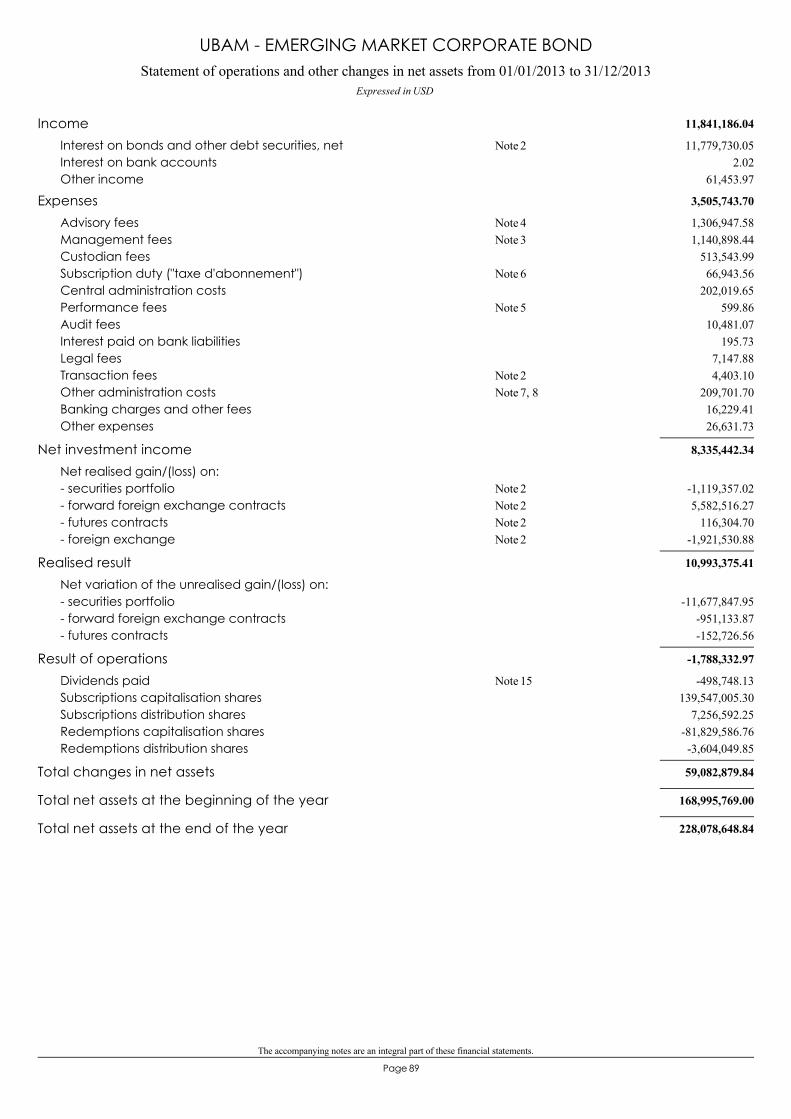
The accompanying notes are an integral part of these financial statements.
89Page
Statement of operations and other changes in net assets from 01/01/2013 to 31/12/2013Expressed in USD
UBAM - EMERGING MARKET CORPORATE BOND
11,841,186.04Income11,779,730.05Interest on bonds and other debt securities, net 2Note
2.02Interest on bank accounts61,453.97Other income
3,505,743.70Expenses1,306,947.58Advisory fees 4Note1,140,898.44Management fees 3Note
513,543.99Custodian fees66,943.56Subscription duty ("taxe d'abonnement") 6Note
202,019.65Central administration costs599.86Performance fees 5Note
10,481.07Audit fees195.73Interest paid on bank liabilities
7,147.88Legal fees4,403.10Transaction fees 2Note
209,701.70Other administration costs 7, 8Note16,229.41Banking charges and other fees26,631.73Other expenses
8,335,442.34Net investment incomeNet realised gain/(loss) on:
-1,119,357.02- securities portfolio 2Note5,582,516.27- forward foreign exchange contracts 2Note
116,304.70- futures contracts 2Note-1,921,530.88- foreign exchange 2Note
10,993,375.41Realised resultNet variation of the unrealised gain/(loss) on:
-11,677,847.95- securities portfolio-951,133.87- forward foreign exchange contracts-152,726.56- futures contracts
-1,788,332.97Result of operations-498,748.13Dividends paid 15Note
139,547,005.30Subscriptions capitalisation shares7,256,592.25Subscriptions distribution shares
-81,829,586.76Redemptions capitalisation shares-3,604,049.85Redemptions distribution shares
59,082,879.84Total changes in net assets
168,995,769.00Total net assets at the beginning of the year
228,078,648.84Total net assets at the end of the year
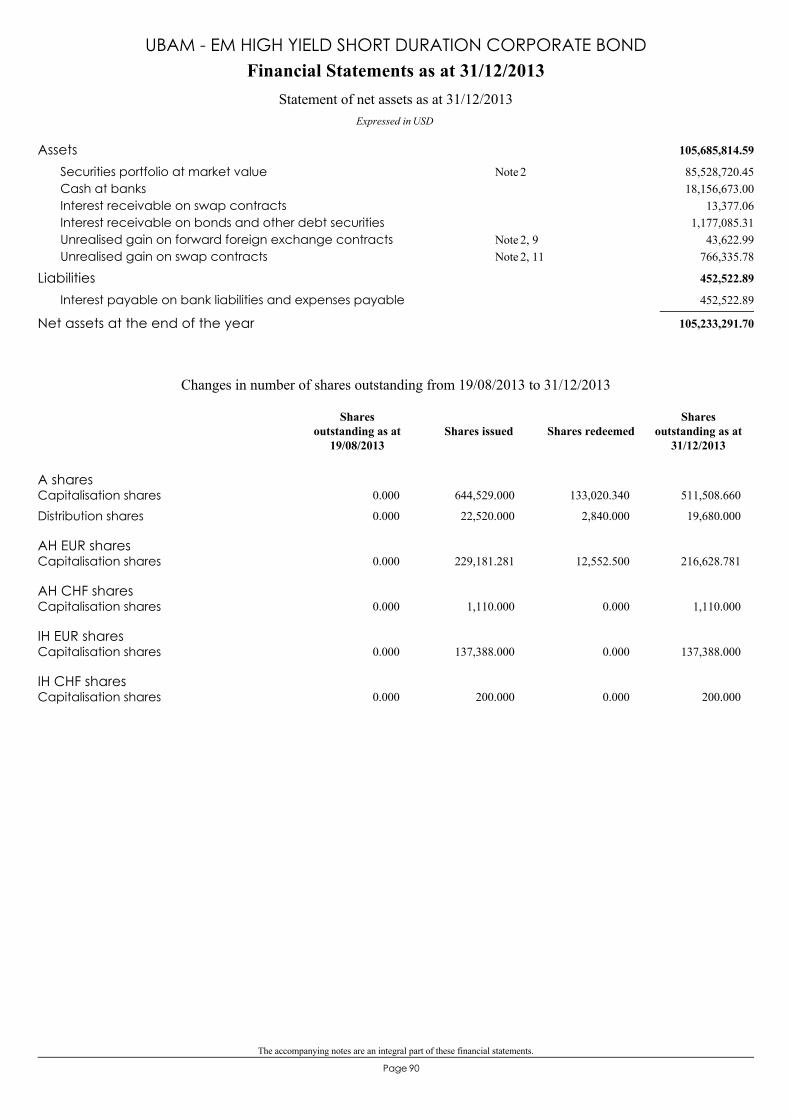
The accompanying notes are an integral part of these financial statements.
90Page
105,685,814.59Assets85,528,720.45Securities portfolio at market value 2Note18,156,673.00Cash at banks
13,377.06Interest receivable on swap contracts1,177,085.31Interest receivable on bonds and other debt securities
43,622.99Unrealised gain on forward foreign exchange contracts 2, 9Note766,335.78Unrealised gain on swap contracts 2, 11Note
452,522.89Liabilities452,522.89Interest payable on bank liabilities and expenses payable
105,233,291.70Net assets at the end of the year
Financial Statements as at 31/12/2013
Expressed in USD
Statement of net assets as at 31/12/2013
UBAM - EM HIGH YIELD SHORT DURATION CORPORATE BOND
A sharesCapitalisation shares 0.000 644,529.000 133,020.340 511,508.660
Distribution shares 0.000 22,520.000 2,840.000 19,680.000
AH EUR sharesCapitalisation shares 0.000 229,181.281 12,552.500 216,628.781
AH CHF sharesCapitalisation shares 0.000 1,110.000 0.000 1,110.000
IH EUR sharesCapitalisation shares 0.000 137,388.000 0.000 137,388.000
IH CHF sharesCapitalisation shares 0.000 200.000 0.000 200.000
Changes in number of shares outstanding from 19/08/2013 to 31/12/2013
Shares issued Shares redeemedShares
outstanding as at31/12/2013
Sharesoutstanding as at
19/08/2013
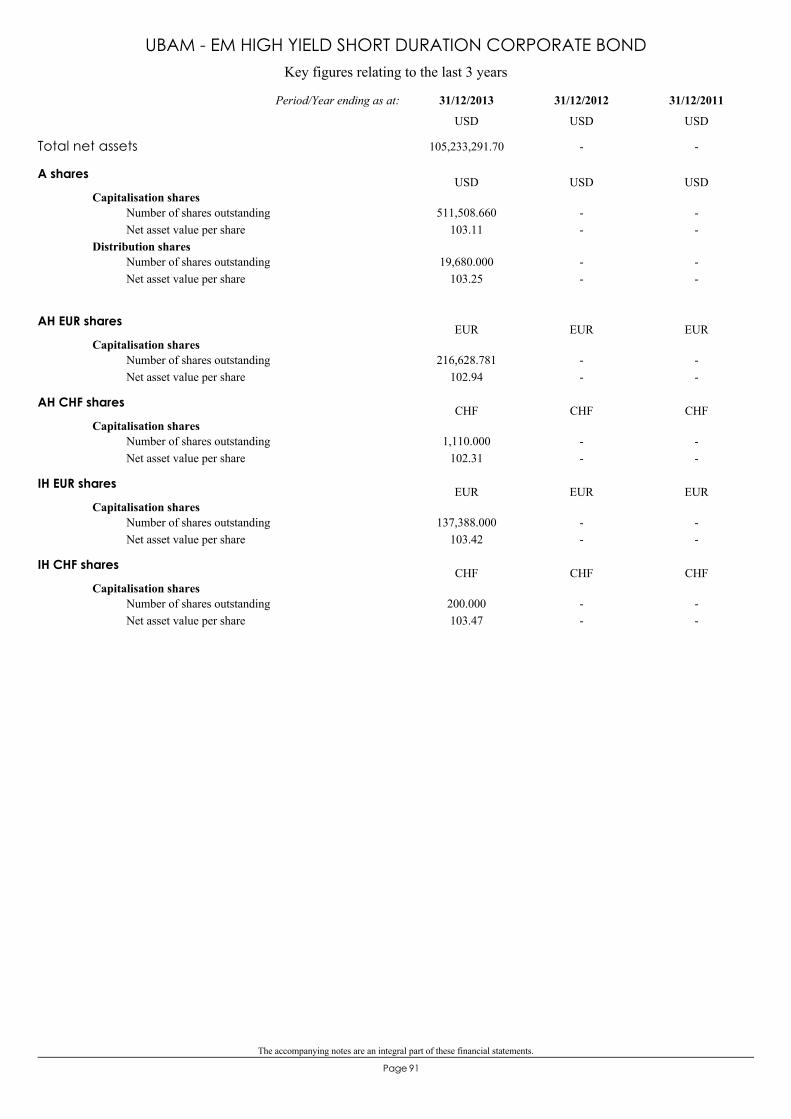
The accompanying notes are an integral part of these financial statements.
91Page
Key figures relating to the last 3 years
UBAM - EM HIGH YIELD SHORT DURATION CORPORATE BOND
A shares
Capitalisation shares511,508.660
103.11--
--
Number of shares outstandingNet asset value per share
Distribution shares19,680.000
103.25--
--
Number of shares outstandingNet asset value per share
USD USD USD
AH EUR shares
Capitalisation shares216,628.781
102.94--
--
Number of shares outstandingNet asset value per share
EUR EUR EUR
AH CHF shares
Capitalisation shares1,110.000
102.31--
--
Number of shares outstandingNet asset value per share
CHF CHF CHF
IH EUR shares
Capitalisation shares137,388.000
103.42--
--
Number of shares outstandingNet asset value per share
EUR EUR EUR
IH CHF shares
Capitalisation shares200.000103.47
--
--
Number of shares outstandingNet asset value per share
CHF CHF CHF
Total net assets 105,233,291.70 - -
31/12/201131/12/201231/12/2013Period/Year ending as at:
USD USD USD
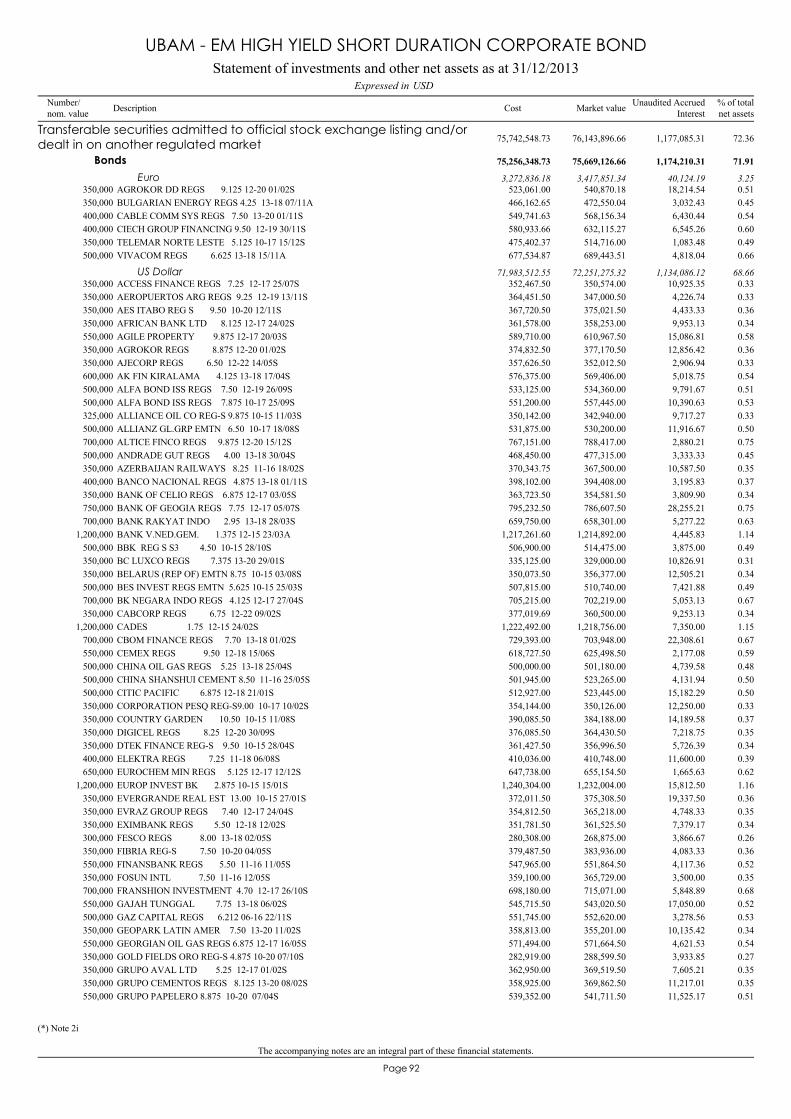
The accompanying notes are an integral part of these financial statements.
92Page
(*) Note 2i
AGROKOR DD REGS 9.125 12-20 01/02S350,000 540,870.18 0.51523,061.00 18,214.54
Transferable securities admitted to official stock exchange listing and/ordealt in on another regulated market 76,143,896.66 72.3675,742,548.73 1,177,085.31
Bonds 75,669,126.66 71.9175,256,348.73 1,174,210.31
Euro 3,417,851.34 3.253,272,836.18 40,124.19
BULGARIAN ENERGY REGS 4.25 13-18 07/11A350,000 472,550.04 0.45466,162.65 3,032.43CABLE COMM SYS REGS 7.50 13-20 01/11S400,000 568,156.34 0.54549,741.63 6,430.44CIECH GROUP FINANCING 9.50 12-19 30/11S400,000 632,115.27 0.60580,933.66 6,545.26TELEMAR NORTE LESTE 5.125 10-17 15/12S350,000 514,716.00 0.49475,402.37 1,083.48VIVACOM REGS 6.625 13-18 15/11A500,000 689,443.51 0.66677,534.87 4,818.04
ACCESS FINANCE REGS 7.25 12-17 25/07S350,000 350,574.00 0.33352,467.50 10,925.35US Dollar 72,251,275.32 68.6671,983,512.55 1,134,086.12
AEROPUERTOS ARG REGS 9.25 12-19 13/11S350,000 347,000.50 0.33364,451.50 4,226.74AES ITABO REG S 9.50 10-20 12/11S350,000 375,021.50 0.36367,720.50 4,433.33AFRICAN BANK LTD 8.125 12-17 24/02S350,000 358,253.00 0.34361,578.00 9,953.13AGILE PROPERTY 9.875 12-17 20/03S550,000 610,967.50 0.58589,710.00 15,086.81AGROKOR REGS 8.875 12-20 01/02S350,000 377,170.50 0.36374,832.50 12,856.42AJECORP REGS 6.50 12-22 14/05S350,000 352,012.50 0.33357,626.50 2,906.94AK FIN KIRALAMA 4.125 13-18 17/04S600,000 569,406.00 0.54576,375.00 5,018.75ALFA BOND ISS REGS 7.50 12-19 26/09S500,000 534,360.00 0.51533,125.00 9,791.67ALFA BOND ISS REGS 7.875 10-17 25/09S500,000 557,445.00 0.53551,200.00 10,390.63ALLIANCE OIL CO REG-S 9.875 10-15 11/03S325,000 342,940.00 0.33350,142.00 9,717.27ALLIANZ GL.GRP EMTN 6.50 10-17 18/08S500,000 530,200.00 0.50531,875.00 11,916.67ALTICE FINCO REGS 9.875 12-20 15/12S700,000 788,417.00 0.75767,151.00 2,880.21ANDRADE GUT REGS 4.00 13-18 30/04S500,000 477,315.00 0.45468,450.00 3,333.33AZERBAIJAN RAILWAYS 8.25 11-16 18/02S350,000 367,500.00 0.35370,343.75 10,587.50BANCO NACIONAL REGS 4.875 13-18 01/11S400,000 394,408.00 0.37398,102.00 3,195.83BANK OF CELIO REGS 6.875 12-17 03/05S350,000 354,581.50 0.34363,723.50 3,809.90BANK OF GEOGIA REGS 7.75 12-17 05/07S750,000 786,607.50 0.75795,232.50 28,255.21BANK RAKYAT INDO 2.95 13-18 28/03S700,000 658,301.00 0.63659,750.00 5,277.22BANK V.NED.GEM. 1.375 12-15 23/03A1,200,000 1,214,892.00 1.141,217,261.60 4,445.83BBK REG S S3 4.50 10-15 28/10S500,000 514,475.00 0.49506,900.00 3,875.00BC LUXCO REGS 7.375 13-20 29/01S350,000 329,000.00 0.31335,125.00 10,826.91BELARUS (REP OF) EMTN 8.75 10-15 03/08S350,000 356,377.00 0.34350,073.50 12,505.21BES INVEST REGS EMTN 5.625 10-15 25/03S500,000 510,740.00 0.49507,815.00 7,421.88BK NEGARA INDO REGS 4.125 12-17 27/04S700,000 702,219.00 0.67705,215.00 5,053.13CABCORP REGS 6.75 12-22 09/02S350,000 360,500.00 0.34377,019.69 9,253.13CADES 1.75 12-15 24/02S1,200,000 1,218,756.00 1.151,222,492.00 7,350.00CBOM FINANCE REGS 7.70 13-18 01/02S700,000 703,948.00 0.67729,393.00 22,308.61CEMEX REGS 9.50 12-18 15/06S550,000 625,498.50 0.59618,727.50 2,177.08CHINA OIL GAS REGS 5.25 13-18 25/04S500,000 501,180.00 0.48500,000.00 4,739.58CHINA SHANSHUI CEMENT 8.50 11-16 25/05S500,000 523,265.00 0.50501,945.00 4,131.94CITIC PACIFIC 6.875 12-18 21/01S500,000 523,445.00 0.50512,927.00 15,182.29CORPORATION PESQ REG-S9.00 10-17 10/02S350,000 350,126.00 0.33354,144.00 12,250.00COUNTRY GARDEN 10.50 10-15 11/08S350,000 384,188.00 0.37390,085.50 14,189.58DIGICEL REGS 8.25 12-20 30/09S350,000 364,430.50 0.35376,085.50 7,218.75DTEK FINANCE REG-S 9.50 10-15 28/04S350,000 356,996.50 0.34361,427.50 5,726.39ELEKTRA REGS 7.25 11-18 06/08S400,000 410,748.00 0.39410,036.00 11,600.00EUROCHEM MIN REGS 5.125 12-17 12/12S650,000 655,154.50 0.62647,738.00 1,665.63EUROP INVEST BK 2.875 10-15 15/01S1,200,000 1,232,004.00 1.161,240,304.00 15,812.50EVERGRANDE REAL EST 13.00 10-15 27/01S350,000 375,308.50 0.36372,011.50 19,337.50EVRAZ GROUP REGS 7.40 12-17 24/04S350,000 365,218.00 0.35354,812.50 4,748.33EXIMBANK REGS 5.50 12-18 12/02S350,000 361,525.50 0.34351,781.50 7,379.17FESCO REGS 8.00 13-18 02/05S300,000 268,875.00 0.26280,308.00 3,866.67FIBRIA REG-S 7.50 10-20 04/05S350,000 383,936.00 0.36379,487.50 4,083.33FINANSBANK REGS 5.50 11-16 11/05S550,000 551,864.50 0.52547,965.00 4,117.36FOSUN INTL 7.50 11-16 12/05S350,000 365,729.00 0.35359,100.00 3,500.00FRANSHION INVESTMENT 4.70 12-17 26/10S700,000 715,071.00 0.68698,180.00 5,848.89GAJAH TUNGGAL 7.75 13-18 06/02S550,000 543,020.50 0.52545,715.50 17,050.00GAZ CAPITAL REGS 6.212 06-16 22/11S500,000 552,620.00 0.53551,745.00 3,278.56GEOPARK LATIN AMER 7.50 13-20 11/02S350,000 355,201.00 0.34358,813.00 10,135.42GEORGIAN OIL GAS REGS 6.875 12-17 16/05S550,000 571,664.50 0.54571,494.00 4,621.53GOLD FIELDS ORO REG-S 4.875 10-20 07/10S350,000 288,599.50 0.27282,919.00 3,933.85GRUPO AVAL LTD 5.25 12-17 01/02S350,000 369,519.50 0.35362,950.00 7,605.21GRUPO CEMENTOS REGS 8.125 13-20 08/02S350,000 369,862.50 0.35358,925.00 11,217.01GRUPO PAPELERO 8.875 10-20 07/04S550,000 541,711.50 0.51539,352.00 11,525.17
Statement of investments and other net assets as at 31/12/2013USDExpressed in
UBAM - EM HIGH YIELD SHORT DURATION CORPORATE BOND
Number/nom. value Description % of total
net assetsMarket valueCost Unaudited AccruedInterest
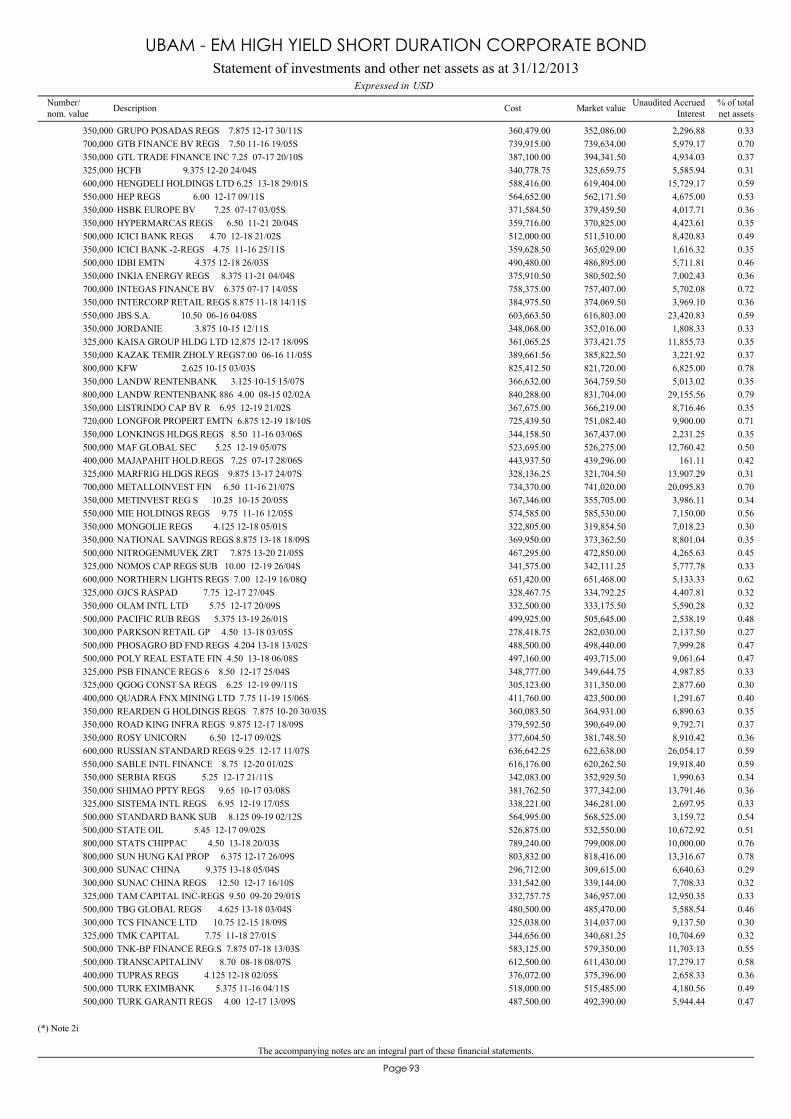
The accompanying notes are an integral part of these financial statements.
93Page
(*) Note 2i
GRUPO POSADAS REGS 7.875 12-17 30/11S350,000 352,086.00 0.33360,479.00 2,296.88GTB FINANCE BV REGS 7.50 11-16 19/05S700,000 739,634.00 0.70739,915.00 5,979.17GTL TRADE FINANCE INC 7.25 07-17 20/10S350,000 394,341.50 0.37387,100.00 4,934.03HCFB 9.375 12-20 24/04S325,000 325,659.75 0.31340,778.75 5,585.94HENGDELI HOLDINGS LTD 6.25 13-18 29/01S600,000 619,404.00 0.59588,416.00 15,729.17HEP REGS 6.00 12-17 09/11S550,000 562,171.50 0.53564,652.00 4,675.00HSBK EUROPE BV 7.25 07-17 03/05S350,000 379,459.50 0.36371,584.50 4,017.71HYPERMARCAS REGS 6.50 11-21 20/04S350,000 370,825.00 0.35359,716.00 4,423.61ICICI BANK REGS 4.70 12-18 21/02S500,000 511,510.00 0.49512,000.00 8,420.83ICICI BANK -2-REGS 4.75 11-16 25/11S350,000 365,029.00 0.35359,628.50 1,616.32IDBI EMTN 4.375 12-18 26/03S500,000 486,895.00 0.46490,480.00 5,711.81INKIA ENERGY REGS 8.375 11-21 04/04S350,000 380,502.50 0.36375,910.50 7,002.43INTEGAS FINANCE BV 6.375 07-17 14/05S700,000 757,407.00 0.72758,375.00 5,702.08INTERCORP RETAIL REGS 8.875 11-18 14/11S350,000 374,069.50 0.36384,975.50 3,969.10JBS S.A. 10.50 06-16 04/08S550,000 616,803.00 0.59603,663.50 23,420.83JORDANIE 3.875 10-15 12/11S350,000 352,016.00 0.33348,068.00 1,808.33KAISA GROUP HLDG LTD 12.875 12-17 18/09S325,000 373,421.75 0.35361,065.25 11,855.73KAZAK TEMIR ZHOLY REGS7.00 06-16 11/05S350,000 385,822.50 0.37389,661.56 3,221.92KFW 2.625 10-15 03/03S800,000 821,720.00 0.78825,412.50 6,825.00LANDW RENTENBANK 3.125 10-15 15/07S350,000 364,759.50 0.35366,632.00 5,013.02LANDW RENTENBANK 886 4.00 08-15 02/02A800,000 831,704.00 0.79840,288.00 29,155.56LISTRINDO CAP BV R 6.95 12-19 21/02S350,000 366,219.00 0.35367,675.00 8,716.46LONGFOR PROPERT EMTN 6.875 12-19 18/10S720,000 751,082.40 0.71725,439.50 9,900.00LONKINGS HLDGS REGS 8.50 11-16 03/06S350,000 367,437.00 0.35344,158.50 2,231.25MAF GLOBAL SEC 5.25 12-19 05/07S500,000 526,275.00 0.50523,695.00 12,760.42MAJAPAHIT HOLD.REGS 7.25 07-17 28/06S400,000 439,296.00 0.42443,937.50 161.11MARFRIG HLDGS REGS 9.875 13-17 24/07S325,000 321,704.50 0.31328,136.25 13,907.29METALLOINVEST FIN 6.50 11-16 21/07S700,000 741,020.00 0.70734,370.00 20,095.83METINVEST REG S 10.25 10-15 20/05S350,000 355,705.00 0.34367,346.00 3,986.11MIE HOLDINGS REGS 9.75 11-16 12/05S550,000 585,530.00 0.56574,585.00 7,150.00MONGOLIE REGS 4.125 12-18 05/01S350,000 319,854.50 0.30322,805.00 7,018.23NATIONAL SAVINGS REGS 8.875 13-18 18/09S350,000 373,362.50 0.35369,950.00 8,801.04NITROGENMUVEK ZRT 7.875 13-20 21/05S500,000 472,850.00 0.45467,295.00 4,265.63NOMOS CAP REGS SUB 10.00 12-19 26/04S325,000 342,111.25 0.33341,575.00 5,777.78NORTHERN LIGHTS REGS 7.00 12-19 16/08Q600,000 651,468.00 0.62651,420.00 5,133.33OJCS RASPAD 7.75 12-17 27/04S325,000 334,792.25 0.32328,467.75 4,407.81OLAM INTL LTD 5.75 12-17 20/09S350,000 333,175.50 0.32332,500.00 5,590.28PACIFIC RUB REGS 5.375 13-19 26/01S500,000 505,645.00 0.48499,925.00 2,538.19PARKSON RETAIL GP 4.50 13-18 03/05S300,000 282,030.00 0.27278,418.75 2,137.50PHOSAGRO BD FND REGS 4.204 13-18 13/02S500,000 498,440.00 0.47488,500.00 7,999.28POLY REAL ESTATE FIN 4.50 13-18 06/08S500,000 493,715.00 0.47497,160.00 9,061.64PSB FINANCE REGS 6 8.50 12-17 25/04S325,000 349,644.75 0.33348,777.00 4,987.85QGOG CONST SA REGS 6.25 12-19 09/11S325,000 311,350.00 0.30305,123.00 2,877.60QUADRA FNX MINING LTD 7.75 11-19 15/06S400,000 423,500.00 0.40411,760.00 1,291.67REARDEN G HOLDINGS REGS 7.875 10-20 30/03S350,000 364,931.00 0.35360,083.50 6,890.63ROAD KING INFRA REGS 9.875 12-17 18/09S350,000 390,649.00 0.37379,592.50 9,792.71ROSY UNICORN 6.50 12-17 09/02S350,000 381,748.50 0.36377,604.50 8,910.42RUSSIAN STANDARD REGS 9.25 12-17 11/07S600,000 622,638.00 0.59636,642.25 26,054.17SABLE INTL FINANCE 8.75 12-20 01/02S550,000 620,262.50 0.59616,176.00 19,918.40SERBIA REGS 5.25 12-17 21/11S350,000 352,929.50 0.34342,083.00 1,990.63SHIMAO PPTY REGS 9.65 10-17 03/08S350,000 377,342.00 0.36381,762.50 13,791.46SISTEMA INTL REGS 6.95 12-19 17/05S325,000 346,281.00 0.33338,221.00 2,697.95STANDARD BANK SUB 8.125 09-19 02/12S500,000 568,525.00 0.54564,995.00 3,159.72STATE OIL 5.45 12-17 09/02S500,000 532,550.00 0.51526,875.00 10,672.92STATS CHIPPAC 4.50 13-18 20/03S800,000 799,008.00 0.76789,240.00 10,000.00SUN HUNG KAI PROP 6.375 12-17 26/09S800,000 818,416.00 0.78803,832.00 13,316.67SUNAC CHINA 9.375 13-18 05/04S300,000 309,615.00 0.29296,712.00 6,640.63SUNAC CHINA REGS 12.50 12-17 16/10S300,000 339,144.00 0.32331,542.00 7,708.33TAM CAPITAL INC-REGS 9.50 09-20 29/01S325,000 346,957.00 0.33332,757.75 12,950.35TBG GLOBAL REGS 4.625 13-18 03/04S500,000 485,470.00 0.46480,500.00 5,588.54TCS FINANCE LTD 10.75 12-15 18/09S300,000 314,037.00 0.30325,038.00 9,137.50TMK CAPITAL 7.75 11-18 27/01S325,000 340,681.25 0.32344,656.00 10,704.69TNK-BP FINANCE REG.S 7.875 07-18 13/03S500,000 579,350.00 0.55583,125.00 11,703.13TRANSCAPITALINV 8.70 08-18 08/07S500,000 611,430.00 0.58612,500.00 17,279.17TUPRAS REGS 4.125 12-18 02/05S400,000 375,396.00 0.36376,072.00 2,658.33TURK EXIMBANK 5.375 11-16 04/11S500,000 515,485.00 0.49518,000.00 4,180.56TURK GARANTI REGS 4.00 12-17 13/09S500,000 492,390.00 0.47487,500.00 5,944.44
Statement of investments and other net assets as at 31/12/2013USDExpressed in
UBAM - EM HIGH YIELD SHORT DURATION CORPORATE BOND
Number/nom. value Description % of total
net assetsMarket valueCost Unaudited AccruedInterest
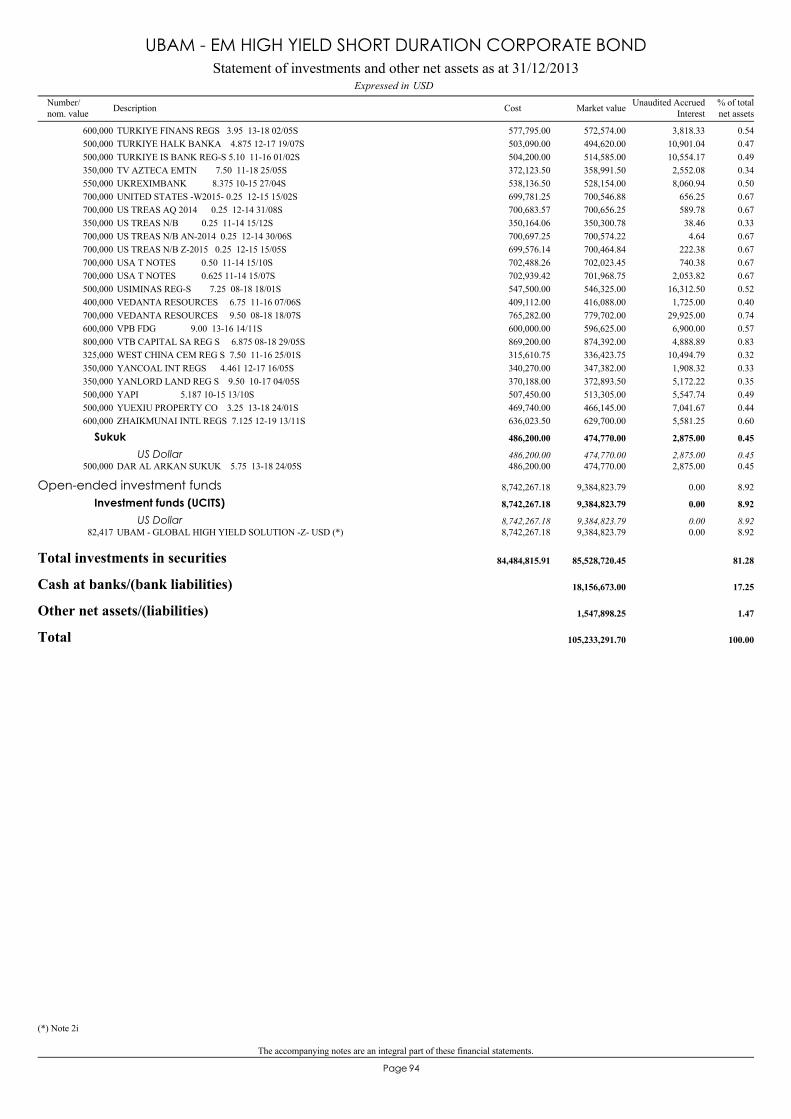
The accompanying notes are an integral part of these financial statements.
94Page
(*) Note 2i
TURKIYE FINANS REGS 3.95 13-18 02/05S600,000 572,574.00 0.54577,795.00 3,818.33TURKIYE HALK BANKA 4.875 12-17 19/07S500,000 494,620.00 0.47503,090.00 10,901.04TURKIYE IS BANK REG-S 5.10 11-16 01/02S500,000 514,585.00 0.49504,200.00 10,554.17TV AZTECA EMTN 7.50 11-18 25/05S350,000 358,991.50 0.34372,123.50 2,552.08UKREXIMBANK 8.375 10-15 27/04S550,000 528,154.00 0.50538,136.50 8,060.94UNITED STATES -W2015- 0.25 12-15 15/02S700,000 700,546.88 0.67699,781.25 656.25US TREAS AQ 2014 0.25 12-14 31/08S700,000 700,656.25 0.67700,683.57 589.78US TREAS N/B 0.25 11-14 15/12S350,000 350,300.78 0.33350,164.06 38.46US TREAS N/B AN-2014 0.25 12-14 30/06S700,000 700,574.22 0.67700,697.25 4.64US TREAS N/B Z-2015 0.25 12-15 15/05S700,000 700,464.84 0.67699,576.14 222.38USA T NOTES 0.50 11-14 15/10S700,000 702,023.45 0.67702,488.26 740.38USA T NOTES 0.625 11-14 15/07S700,000 701,968.75 0.67702,939.42 2,053.82USIMINAS REG-S 7.25 08-18 18/01S500,000 546,325.00 0.52547,500.00 16,312.50VEDANTA RESOURCES 6.75 11-16 07/06S400,000 416,088.00 0.40409,112.00 1,725.00VEDANTA RESOURCES 9.50 08-18 18/07S700,000 779,702.00 0.74765,282.00 29,925.00VPB FDG 9.00 13-16 14/11S600,000 596,625.00 0.57600,000.00 6,900.00VTB CAPITAL SA REG S 6.875 08-18 29/05S800,000 874,392.00 0.83869,200.00 4,888.89WEST CHINA CEM REG S 7.50 11-16 25/01S325,000 336,423.75 0.32315,610.75 10,494.79YANCOAL INT REGS 4.461 12-17 16/05S350,000 347,382.00 0.33340,270.00 1,908.32YANLORD LAND REG S 9.50 10-17 04/05S350,000 372,893.50 0.35370,188.00 5,172.22YAPI 5.187 10-15 13/10S500,000 513,305.00 0.49507,450.00 5,547.74YUEXIU PROPERTY CO 3.25 13-18 24/01S500,000 466,145.00 0.44469,740.00 7,041.67ZHAIKMUNAI INTL REGS 7.125 12-19 13/11S600,000 629,700.00 0.60636,023.50 5,581.25
DAR AL ARKAN SUKUK 5.75 13-18 24/05S500,000 474,770.00 0.45486,200.00 2,875.00
Sukuk 474,770.00 0.45486,200.00 2,875.00
US Dollar 474,770.00 0.45486,200.00 2,875.00
UBAM - GLOBAL HIGH YIELD SOLUTION -Z- USD (*)82,417 9,384,823.79 8.928,742,267.18 0.00
Open-ended investment funds 9,384,823.79 8.928,742,267.18 0.00
Investment funds (UCITS) 9,384,823.79 8.928,742,267.18 0.00
US Dollar 9,384,823.79 8.928,742,267.18 0.00
Total investments in securities 85,528,720.45 81.2884,484,815.91
Cash at banks/(bank liabilities) 18,156,673.00 17.25
Other net assets/(liabilities) 1,547,898.25 1.47
Total 105,233,291.70 100.00
Statement of investments and other net assets as at 31/12/2013USDExpressed in
UBAM - EM HIGH YIELD SHORT DURATION CORPORATE BOND
Number/nom. value Description % of total
net assetsMarket valueCost Unaudited AccruedInterest
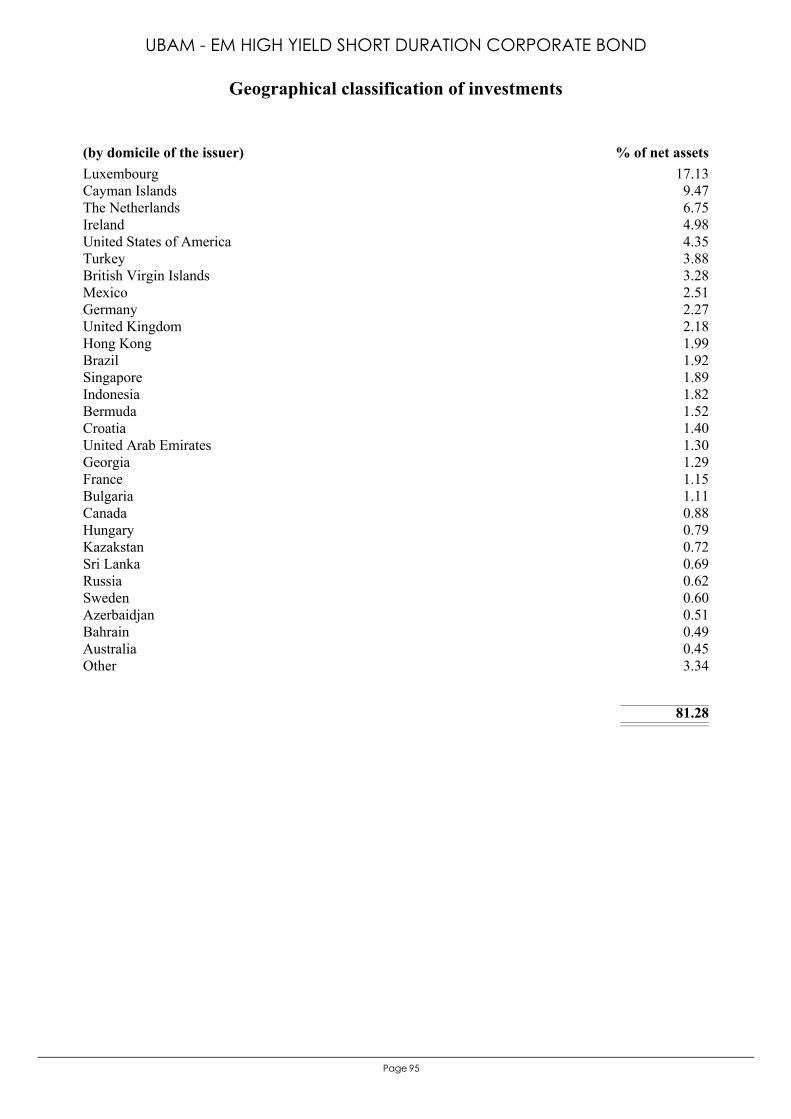
95Page
Luxembourg 17.13Cayman Islands 9.47The Netherlands 6.75Ireland 4.98United States of America 4.35Turkey 3.88British Virgin Islands 3.28Mexico 2.51Germany 2.27United Kingdom 2.18Hong Kong 1.99Brazil 1.92Singapore 1.89Indonesia 1.82Bermuda 1.52Croatia 1.40United Arab Emirates 1.30Georgia 1.29France 1.15Bulgaria 1.11Canada 0.88Hungary 0.79Kazakstan 0.72Sri Lanka 0.69Russia 0.62Sweden 0.60Azerbaidjan 0.51Bahrain 0.49Australia 0.45Other 3.34
81.28
(by domicile of the issuer) % of net assets
Geographical classification of investments
UBAM - EM HIGH YIELD SHORT DURATION CORPORATE BOND
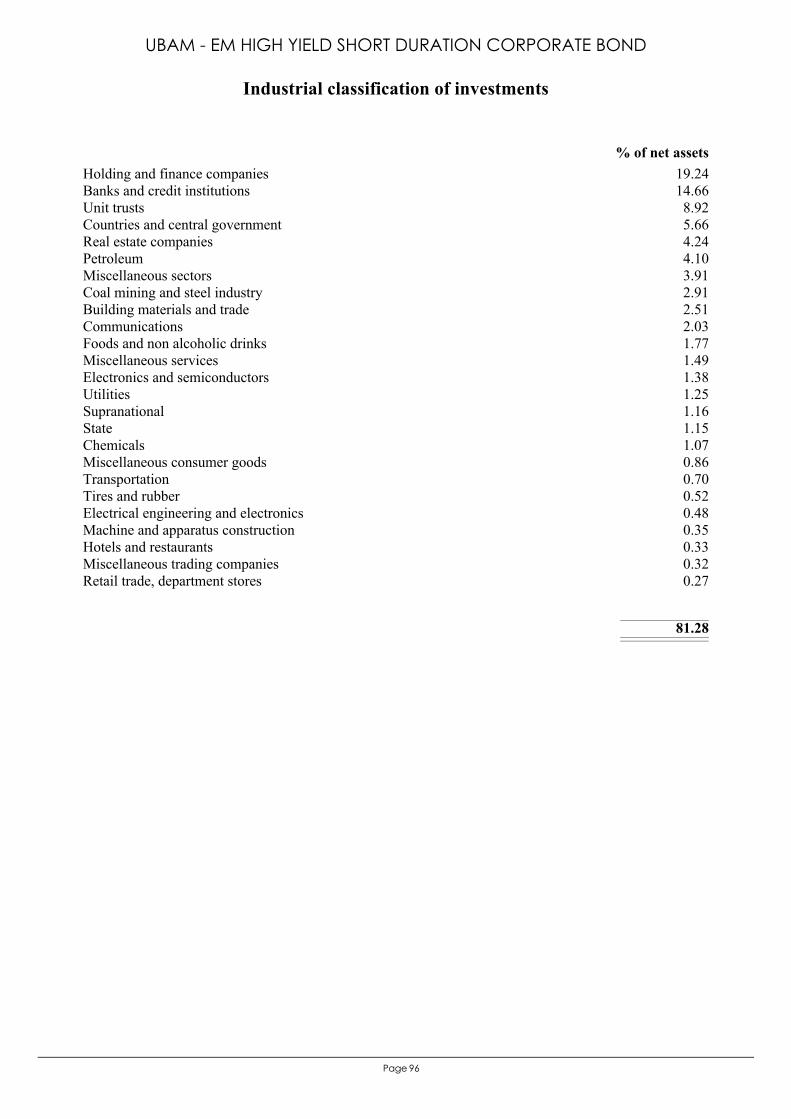
96Page
Holding and finance companies 19.24Banks and credit institutions 14.66Unit trusts 8.92Countries and central government 5.66Real estate companies 4.24Petroleum 4.10Miscellaneous sectors 3.91Coal mining and steel industry 2.91Building materials and trade 2.51Communications 2.03Foods and non alcoholic drinks 1.77Miscellaneous services 1.49Electronics and semiconductors 1.38Utilities 1.25Supranational 1.16State 1.15Chemicals 1.07Miscellaneous consumer goods 0.86Transportation 0.70Tires and rubber 0.52Electrical engineering and electronics 0.48Machine and apparatus construction 0.35Hotels and restaurants 0.33Miscellaneous trading companies 0.32Retail trade, department stores 0.27
81.28
% of net assets
Industrial classification of investments
UBAM - EM HIGH YIELD SHORT DURATION CORPORATE BOND
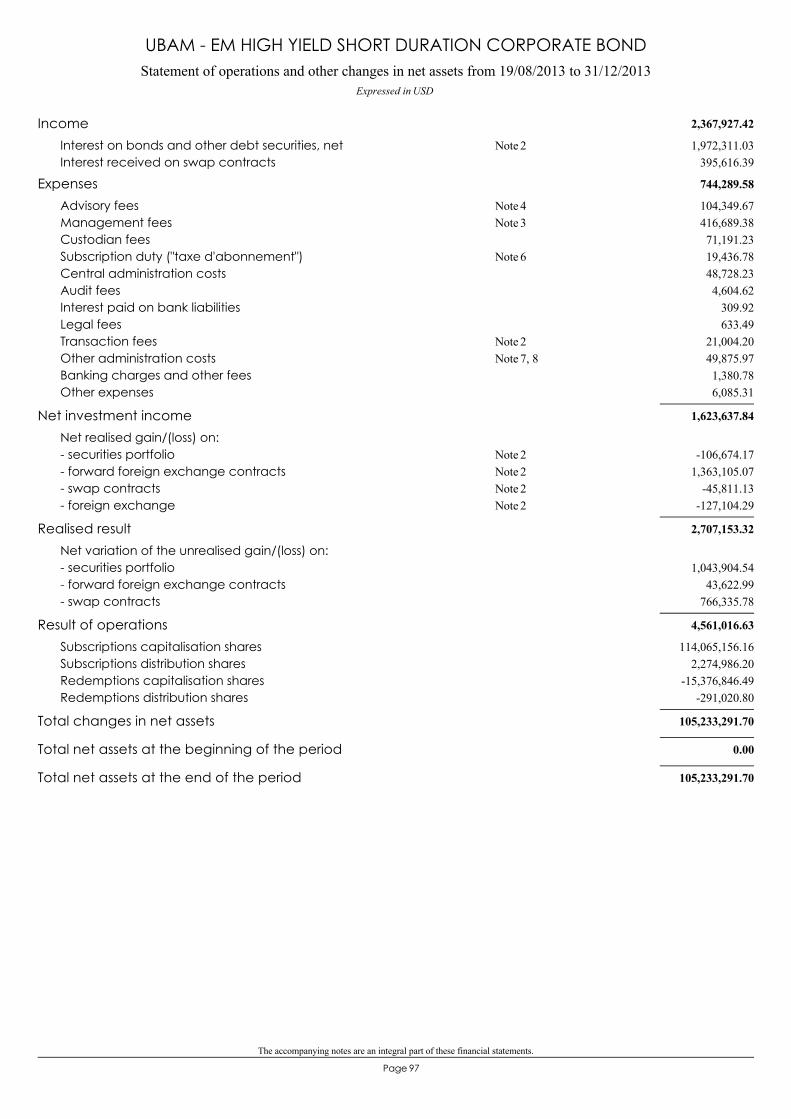
The accompanying notes are an integral part of these financial statements.
97Page
Statement of operations and other changes in net assets from 19/08/2013 to 31/12/2013Expressed in USD
UBAM - EM HIGH YIELD SHORT DURATION CORPORATE BOND
2,367,927.42Income1,972,311.03Interest on bonds and other debt securities, net 2Note
395,616.39Interest received on swap contracts
744,289.58Expenses104,349.67Advisory fees 4Note416,689.38Management fees 3Note71,191.23Custodian fees19,436.78Subscription duty ("taxe d'abonnement") 6Note48,728.23Central administration costs4,604.62Audit fees
309.92Interest paid on bank liabilities633.49Legal fees
21,004.20Transaction fees 2Note49,875.97Other administration costs 7, 8Note1,380.78Banking charges and other fees6,085.31Other expenses
1,623,637.84Net investment incomeNet realised gain/(loss) on:
-106,674.17- securities portfolio 2Note1,363,105.07- forward foreign exchange contracts 2Note
-45,811.13- swap contracts 2Note-127,104.29- foreign exchange 2Note
2,707,153.32Realised resultNet variation of the unrealised gain/(loss) on:
1,043,904.54- securities portfolio43,622.99- forward foreign exchange contracts
766,335.78- swap contracts
4,561,016.63Result of operations114,065,156.16Subscriptions capitalisation shares
2,274,986.20Subscriptions distribution shares-15,376,846.49Redemptions capitalisation shares
-291,020.80Redemptions distribution shares
105,233,291.70Total changes in net assets
0.00Total net assets at the beginning of the period
105,233,291.70Total net assets at the end of the period
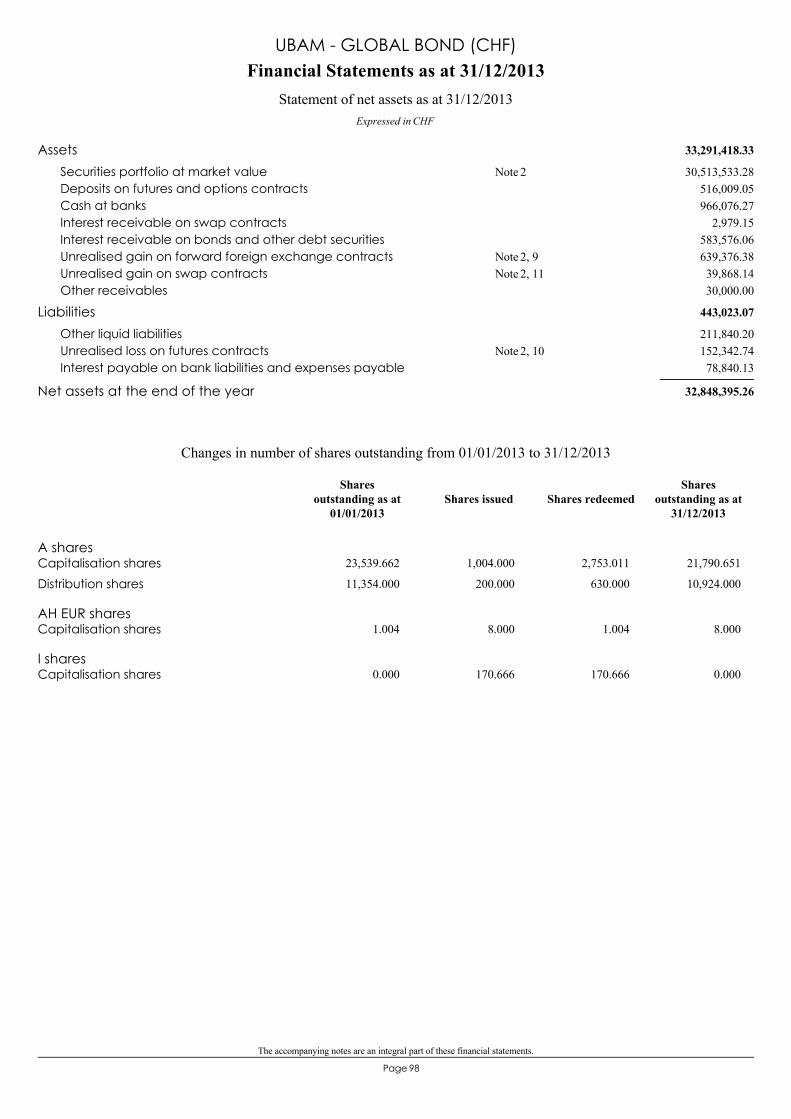
The accompanying notes are an integral part of these financial statements.
98Page
33,291,418.33Assets30,513,533.28Securities portfolio at market value 2Note
516,009.05Deposits on futures and options contracts966,076.27Cash at banks
2,979.15Interest receivable on swap contracts583,576.06Interest receivable on bonds and other debt securities639,376.38Unrealised gain on forward foreign exchange contracts 2, 9Note39,868.14Unrealised gain on swap contracts 2, 11Note30,000.00Other receivables
443,023.07Liabilities211,840.20Other liquid liabilities152,342.74Unrealised loss on futures contracts 2, 10Note78,840.13Interest payable on bank liabilities and expenses payable
32,848,395.26Net assets at the end of the year
Financial Statements as at 31/12/2013
Expressed in CHF
Statement of net assets as at 31/12/2013
UBAM - GLOBAL BOND (CHF)
A sharesCapitalisation shares 23,539.662 1,004.000 2,753.011 21,790.651
Distribution shares 11,354.000 200.000 630.000 10,924.000
AH EUR sharesCapitalisation shares 1.004 8.000 1.004 8.000
I sharesCapitalisation shares 0.000 170.666 170.666 0.000
Changes in number of shares outstanding from 01/01/2013 to 31/12/2013
Shares issued Shares redeemedShares
outstanding as at31/12/2013
Sharesoutstanding as at
01/01/2013

The accompanying notes are an integral part of these financial statements.
99Page
Key figures relating to the last 3 years
UBAM - GLOBAL BOND (CHF)
A shares
Capitalisation shares21,790.6511,448.64
23,539.6621,474.91
24,895.2791,399.75
Number of shares outstandingNet asset value per share
Distribution shares10,924.000
116.254.00
11,354.000122.322.00
4,070.000118.072.03
Number of shares outstandingNet asset value per shareDividend per share
CHF CHF CHF
AH EUR shares
Capitalisation shares8.000
1,184.151.004
1,200.601.004
1,134.68Number of shares outstandingNet asset value per share
EUR EUR EUR
I shares
Capitalisation shares--
--
315.0001,448.54
Number of shares outstandingNet asset value per share
CHF CHF CHF
Total net assets 32,848,395.26 36,109,169.03 35,785,437.21
31/12/201131/12/201231/12/2013Year ending as at:
CHF CHF CHF
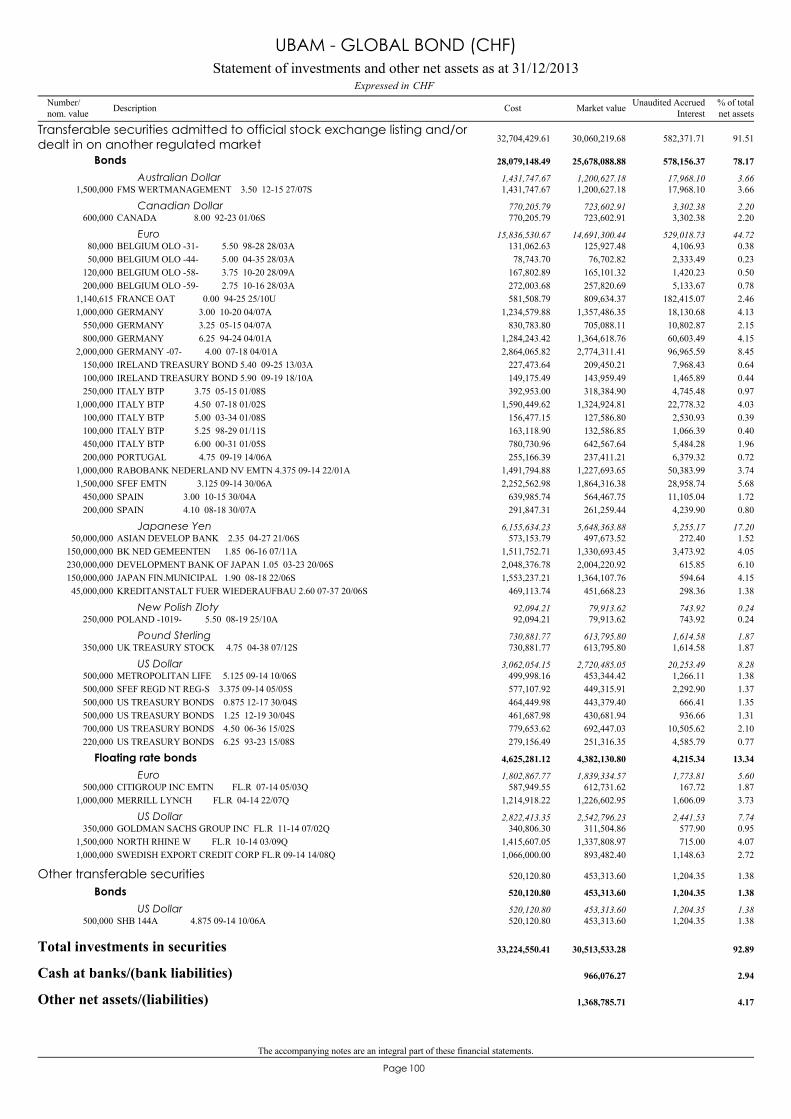
The accompanying notes are an integral part of these financial statements.
100Page
FMS WERTMANAGEMENT 3.50 12-15 27/07S1,500,000 1,200,627.18 3.661,431,747.67 17,968.10
Transferable securities admitted to official stock exchange listing and/ordealt in on another regulated market 30,060,219.68 91.5132,704,429.61 582,371.71
Bonds 25,678,088.88 78.1728,079,148.49 578,156.37
Australian Dollar 1,200,627.18 3.661,431,747.67 17,968.10
CANADA 8.00 92-23 01/06S600,000 723,602.91 2.20770,205.79 3,302.38Canadian Dollar 723,602.91 2.20770,205.79 3,302.38
BELGIUM OLO -31- 5.50 98-28 28/03A80,000 125,927.48 0.38131,062.63 4,106.93Euro 14,691,300.44 44.7215,836,530.67 529,018.73
BELGIUM OLO -44- 5.00 04-35 28/03A50,000 76,702.82 0.2378,743.70 2,333.49BELGIUM OLO -58- 3.75 10-20 28/09A120,000 165,101.32 0.50167,802.89 1,420.23BELGIUM OLO -59- 2.75 10-16 28/03A200,000 257,820.69 0.78272,003.68 5,133.67FRANCE OAT 0.00 94-25 25/10U1,140,615 809,634.37 2.46581,508.79 182,415.07GERMANY 3.00 10-20 04/07A1,000,000 1,357,486.35 4.131,234,579.88 18,130.68GERMANY 3.25 05-15 04/07A550,000 705,088.11 2.15830,783.80 10,802.87GERMANY 6.25 94-24 04/01A800,000 1,364,618.76 4.151,284,243.42 60,603.49GERMANY -07- 4.00 07-18 04/01A2,000,000 2,774,311.41 8.452,864,065.82 96,965.59IRELAND TREASURY BOND 5.40 09-25 13/03A150,000 209,450.21 0.64227,473.64 7,968.43IRELAND TREASURY BOND 5.90 09-19 18/10A100,000 143,959.49 0.44149,175.49 1,465.89ITALY BTP 3.75 05-15 01/08S250,000 318,384.90 0.97392,953.00 4,745.48ITALY BTP 4.50 07-18 01/02S1,000,000 1,324,924.81 4.031,590,449.62 22,778.32ITALY BTP 5.00 03-34 01/08S100,000 127,586.80 0.39156,477.15 2,530.93ITALY BTP 5.25 98-29 01/11S100,000 132,586.85 0.40163,118.90 1,066.39ITALY BTP 6.00 00-31 01/05S450,000 642,567.64 1.96780,730.96 5,484.28PORTUGAL 4.75 09-19 14/06A200,000 237,411.21 0.72255,166.39 6,379.32RABOBANK NEDERLAND NV EMTN 4.375 09-14 22/01A1,000,000 1,227,693.65 3.741,491,794.88 50,383.99SFEF EMTN 3.125 09-14 30/06A1,500,000 1,864,316.38 5.682,252,562.98 28,958.74SPAIN 3.00 10-15 30/04A450,000 564,467.75 1.72639,985.74 11,105.04SPAIN 4.10 08-18 30/07A200,000 261,259.44 0.80291,847.31 4,239.90
ASIAN DEVELOP BANK 2.35 04-27 21/06S50,000,000 497,673.52 1.52573,153.79 272.40Japanese Yen 5,648,363.88 17.206,155,634.23 5,255.17
BK NED GEMEENTEN 1.85 06-16 07/11A150,000,000 1,330,693.45 4.051,511,752.71 3,473.92DEVELOPMENT BANK OF JAPAN 1.05 03-23 20/06S230,000,000 2,004,220.92 6.102,048,376.78 615.85JAPAN FIN.MUNICIPAL 1.90 08-18 22/06S150,000,000 1,364,107.76 4.151,553,237.21 594.64KREDITANSTALT FUER WIEDERAUFBAU 2.60 07-37 20/06S45,000,000 451,668.23 1.38469,113.74 298.36
POLAND -1019- 5.50 08-19 25/10A250,000 79,913.62 0.2492,094.21 743.92New Polish Zloty 79,913.62 0.2492,094.21 743.92
UK TREASURY STOCK 4.75 04-38 07/12S350,000 613,795.80 1.87730,881.77 1,614.58Pound Sterling 613,795.80 1.87730,881.77 1,614.58
METROPOLITAN LIFE 5.125 09-14 10/06S500,000 453,344.42 1.38499,998.16 1,266.11US Dollar 2,720,485.05 8.283,062,054.15 20,253.49
SFEF REGD NT REG-S 3.375 09-14 05/05S500,000 449,315.91 1.37577,107.92 2,292.90US TREASURY BONDS 0.875 12-17 30/04S500,000 443,379.40 1.35464,449.98 666.41US TREASURY BONDS 1.25 12-19 30/04S500,000 430,681.94 1.31461,687.98 936.66US TREASURY BONDS 4.50 06-36 15/02S700,000 692,447.03 2.10779,653.62 10,505.62US TREASURY BONDS 6.25 93-23 15/08S220,000 251,316.35 0.77279,156.49 4,585.79
CITIGROUP INC EMTN FL.R 07-14 05/03Q500,000 612,731.62 1.87587,949.55 167.72
Floating rate bonds 4,382,130.80 13.344,625,281.12 4,215.34
Euro 1,839,334.57 5.601,802,867.77 1,773.81
MERRILL LYNCH FL.R 04-14 22/07Q1,000,000 1,226,602.95 3.731,214,918.22 1,606.09
GOLDMAN SACHS GROUP INC FL.R 11-14 07/02Q350,000 311,504.86 0.95340,806.30 577.90US Dollar 2,542,796.23 7.742,822,413.35 2,441.53
NORTH RHINE W FL.R 10-14 03/09Q1,500,000 1,337,808.97 4.071,415,607.05 715.00SWEDISH EXPORT CREDIT CORP FL.R 09-14 14/08Q1,000,000 893,482.40 2.721,066,000.00 1,148.63
SHB 144A 4.875 09-14 10/06A500,000 453,313.60 1.38520,120.80 1,204.35
Other transferable securities 453,313.60 1.38520,120.80 1,204.35
Bonds 453,313.60 1.38520,120.80 1,204.35
US Dollar 453,313.60 1.38520,120.80 1,204.35
Total investments in securities 30,513,533.28 92.8933,224,550.41
Cash at banks/(bank liabilities) 966,076.27 2.94
Other net assets/(liabilities) 1,368,785.71 4.17
Statement of investments and other net assets as at 31/12/2013CHFExpressed in
UBAM - GLOBAL BOND (CHF)
Number/nom. value Description % of total
net assetsMarket valueCost Unaudited AccruedInterest
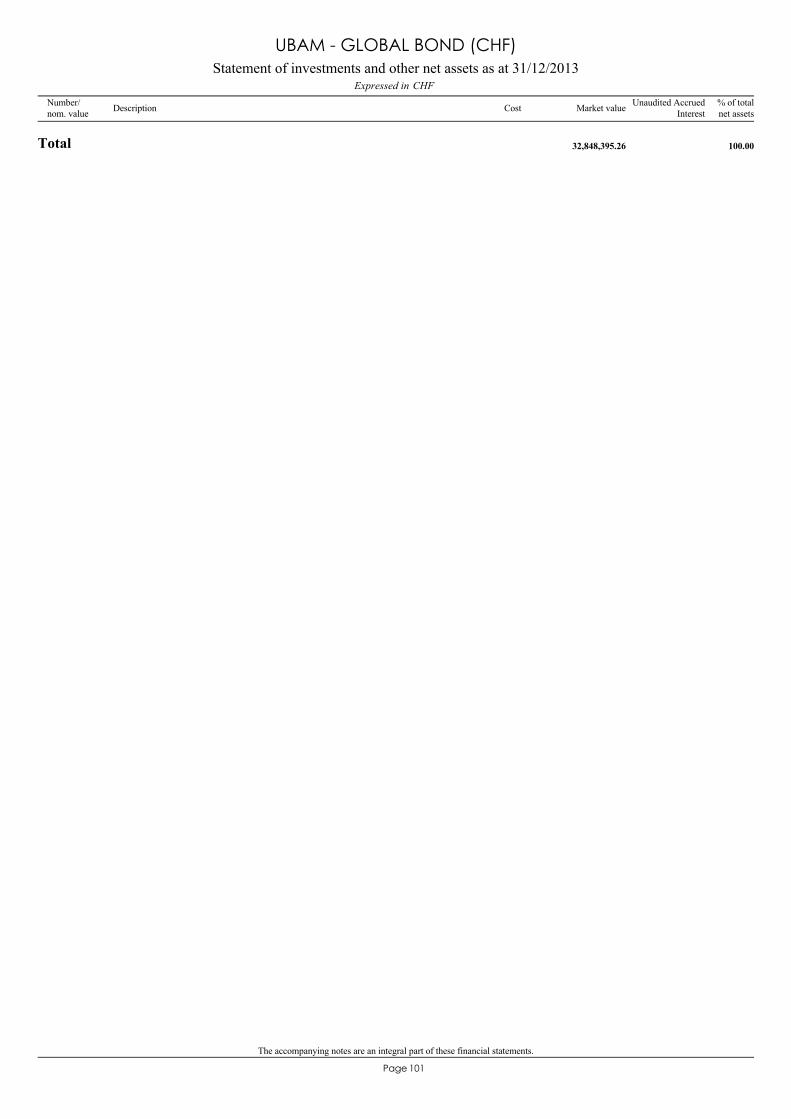
The accompanying notes are an integral part of these financial statements.
101Page
Total 32,848,395.26 100.00
Statement of investments and other net assets as at 31/12/2013CHFExpressed in
UBAM - GLOBAL BOND (CHF)
Number/nom. value Description % of total
net assetsMarket valueCost Unaudited AccruedInterest
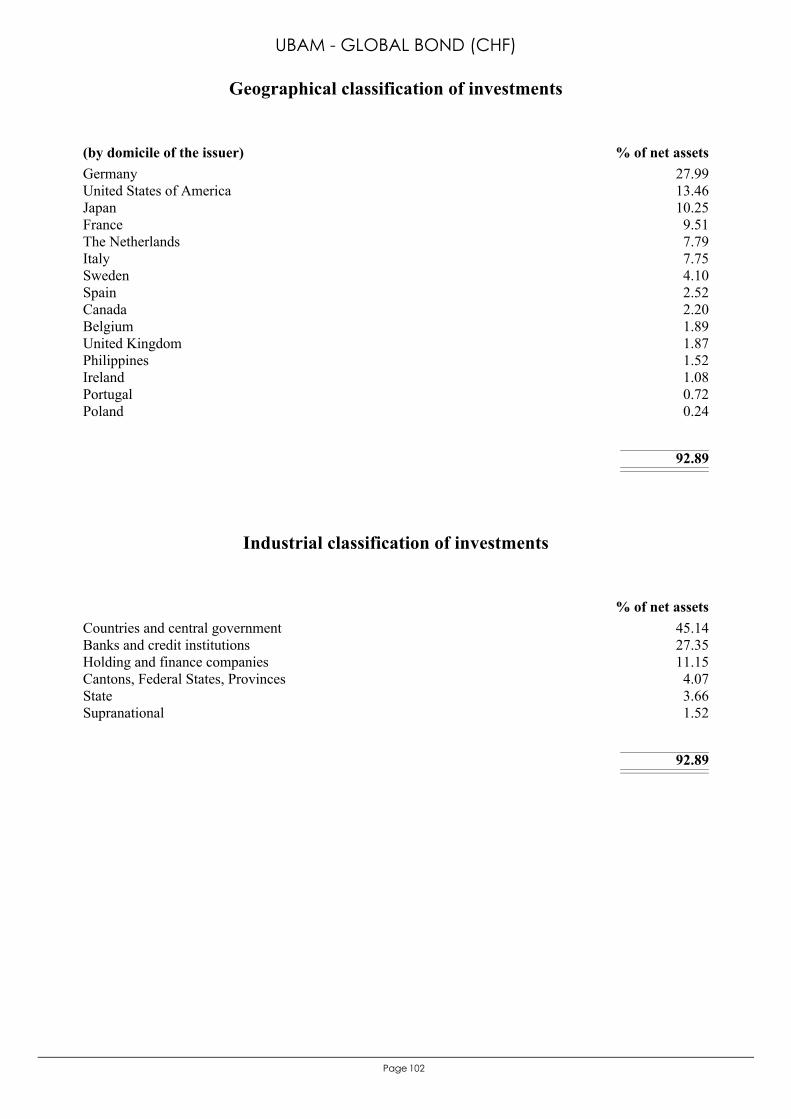
102Page
Germany 27.99United States of America 13.46Japan 10.25France 9.51The Netherlands 7.79Italy 7.75Sweden 4.10Spain 2.52Canada 2.20Belgium 1.89United Kingdom 1.87Philippines 1.52Ireland 1.08Portugal 0.72Poland 0.24
92.89
(by domicile of the issuer) % of net assets
Geographical classification of investments
UBAM - GLOBAL BOND (CHF)
Countries and central government 45.14Banks and credit institutions 27.35Holding and finance companies 11.15Cantons, Federal States, Provinces 4.07State 3.66Supranational 1.52
92.89
% of net assets
Industrial classification of investments
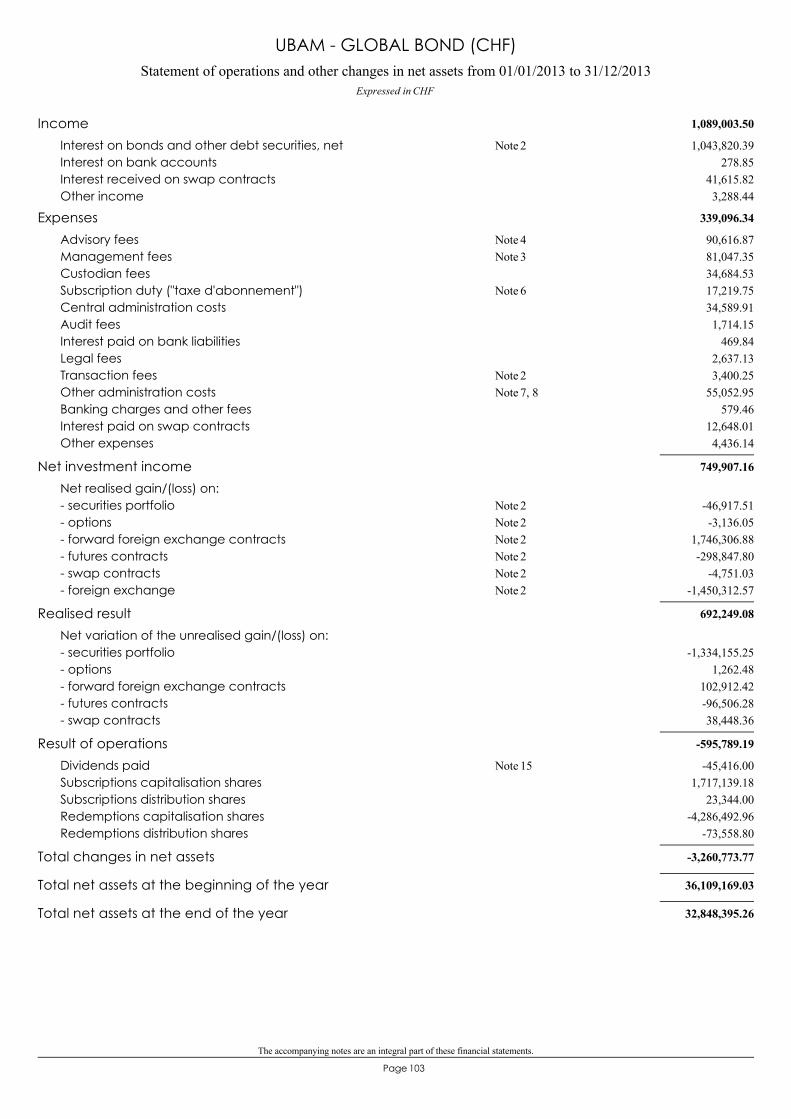
The accompanying notes are an integral part of these financial statements.
103Page
Statement of operations and other changes in net assets from 01/01/2013 to 31/12/2013Expressed in CHF
UBAM - GLOBAL BOND (CHF)
1,089,003.50Income1,043,820.39Interest on bonds and other debt securities, net 2Note
278.85Interest on bank accounts41,615.82Interest received on swap contracts3,288.44Other income
339,096.34Expenses90,616.87Advisory fees 4Note81,047.35Management fees 3Note34,684.53Custodian fees17,219.75Subscription duty ("taxe d'abonnement") 6Note34,589.91Central administration costs1,714.15Audit fees
469.84Interest paid on bank liabilities2,637.13Legal fees3,400.25Transaction fees 2Note
55,052.95Other administration costs 7, 8Note579.46Banking charges and other fees
12,648.01Interest paid on swap contracts4,436.14Other expenses
749,907.16Net investment incomeNet realised gain/(loss) on:
-46,917.51- securities portfolio 2Note-3,136.05- options 2Note
1,746,306.88- forward foreign exchange contracts 2Note-298,847.80- futures contracts 2Note
-4,751.03- swap contracts 2Note-1,450,312.57- foreign exchange 2Note
692,249.08Realised resultNet variation of the unrealised gain/(loss) on:
-1,334,155.25- securities portfolio1,262.48- options
102,912.42- forward foreign exchange contracts-96,506.28- futures contracts38,448.36- swap contracts
-595,789.19Result of operations-45,416.00Dividends paid 15Note
1,717,139.18Subscriptions capitalisation shares23,344.00Subscriptions distribution shares
-4,286,492.96Redemptions capitalisation shares-73,558.80Redemptions distribution shares
-3,260,773.77Total changes in net assets
36,109,169.03Total net assets at the beginning of the year
32,848,395.26Total net assets at the end of the year
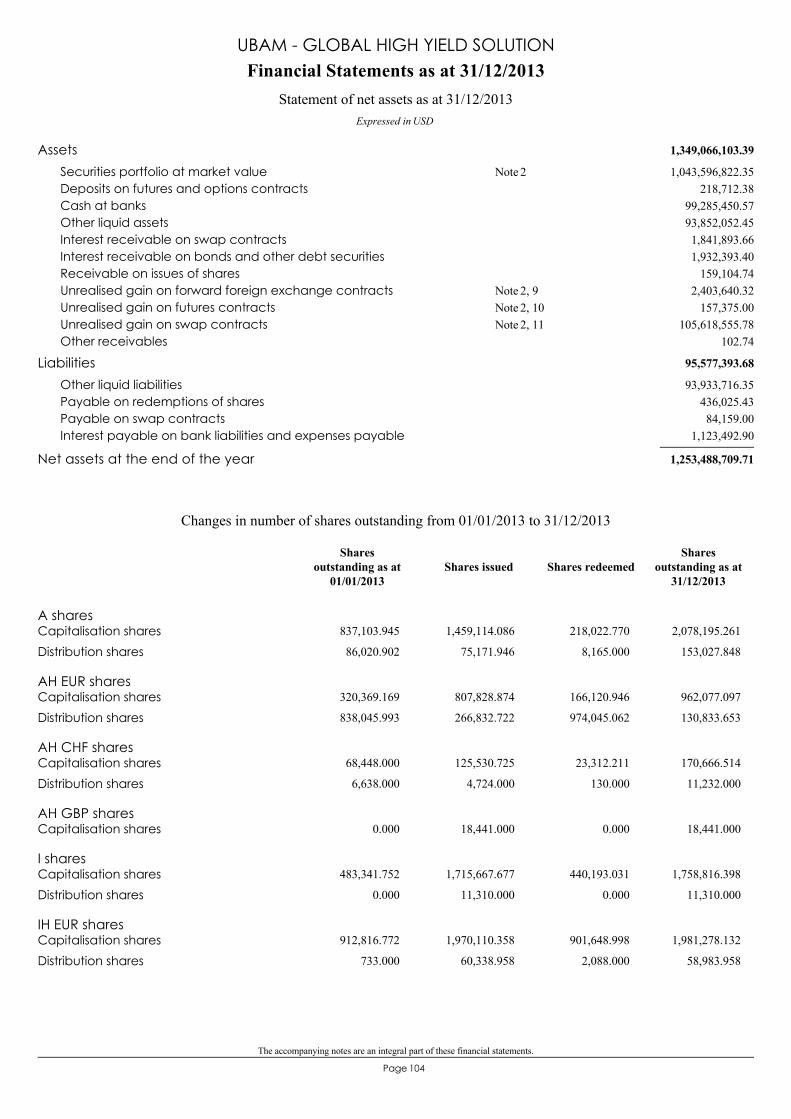
The accompanying notes are an integral part of these financial statements.
104Page
1,349,066,103.39Assets1,043,596,822.35Securities portfolio at market value 2Note
218,712.38Deposits on futures and options contracts99,285,450.57Cash at banks93,852,052.45Other liquid assets1,841,893.66Interest receivable on swap contracts1,932,393.40Interest receivable on bonds and other debt securities
159,104.74Receivable on issues of shares2,403,640.32Unrealised gain on forward foreign exchange contracts 2, 9Note
157,375.00Unrealised gain on futures contracts 2, 10Note105,618,555.78Unrealised gain on swap contracts 2, 11Note
102.74Other receivables
95,577,393.68Liabilities93,933,716.35Other liquid liabilities
436,025.43Payable on redemptions of shares84,159.00Payable on swap contracts
1,123,492.90Interest payable on bank liabilities and expenses payable
1,253,488,709.71Net assets at the end of the year
Financial Statements as at 31/12/2013
Expressed in USD
Statement of net assets as at 31/12/2013
UBAM - GLOBAL HIGH YIELD SOLUTION
A sharesCapitalisation shares 837,103.945 1,459,114.086 218,022.770 2,078,195.261
Distribution shares 86,020.902 75,171.946 8,165.000 153,027.848
AH EUR sharesCapitalisation shares 320,369.169 807,828.874 166,120.946 962,077.097
Distribution shares 838,045.993 266,832.722 974,045.062 130,833.653
AH CHF sharesCapitalisation shares 68,448.000 125,530.725 23,312.211 170,666.514
Distribution shares 6,638.000 4,724.000 130.000 11,232.000
AH GBP sharesCapitalisation shares 0.000 18,441.000 0.000 18,441.000
I sharesCapitalisation shares 483,341.752 1,715,667.677 440,193.031 1,758,816.398
Distribution shares 0.000 11,310.000 0.000 11,310.000
IH EUR sharesCapitalisation shares 912,816.772 1,970,110.358 901,648.998 1,981,278.132
Distribution shares 733.000 60,338.958 2,088.000 58,983.958
Changes in number of shares outstanding from 01/01/2013 to 31/12/2013
Shares issued Shares redeemedShares
outstanding as at31/12/2013
Sharesoutstanding as at
01/01/2013
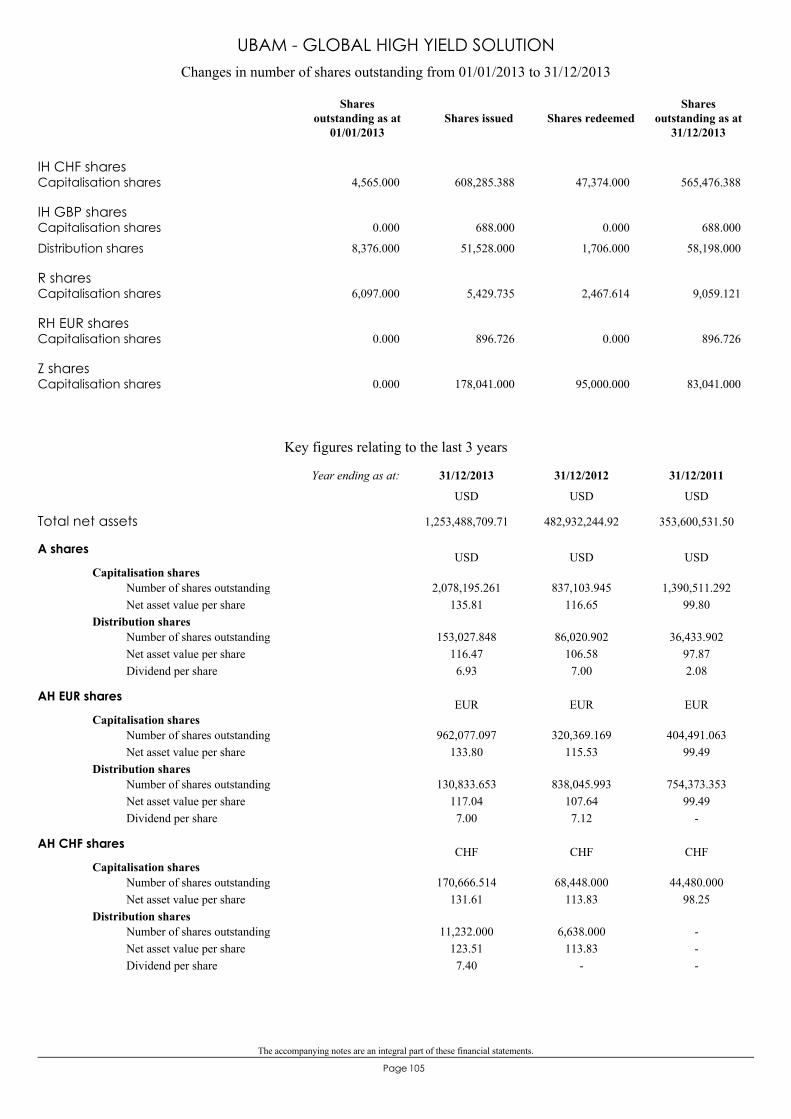
The accompanying notes are an integral part of these financial statements.
105Page
IH CHF sharesCapitalisation shares 4,565.000 608,285.388 47,374.000 565,476.388
IH GBP sharesCapitalisation shares 0.000 688.000 0.000 688.000
Distribution shares 8,376.000 51,528.000 1,706.000 58,198.000
R sharesCapitalisation shares 6,097.000 5,429.735 2,467.614 9,059.121
RH EUR sharesCapitalisation shares 0.000 896.726 0.000 896.726
Z sharesCapitalisation shares 0.000 178,041.000 95,000.000 83,041.000
Changes in number of shares outstanding from 01/01/2013 to 31/12/2013
Shares issued Shares redeemedShares
outstanding as at31/12/2013
Sharesoutstanding as at
01/01/2013
UBAM - GLOBAL HIGH YIELD SOLUTION
Key figures relating to the last 3 years
A shares
Capitalisation shares2,078,195.261
135.81837,103.945
116.651,390,511.292
99.80Number of shares outstandingNet asset value per share
Distribution shares153,027.848
116.476.93
86,020.902106.587.00
36,433.90297.872.08
Number of shares outstandingNet asset value per shareDividend per share
USD USD USD
AH EUR shares
Capitalisation shares962,077.097
133.80320,369.169
115.53404,491.063
99.49Number of shares outstandingNet asset value per share
Distribution shares130,833.653
117.047.00
838,045.993107.647.12
754,373.35399.49
-
Number of shares outstandingNet asset value per shareDividend per share
EUR EUR EUR
AH CHF shares
Capitalisation shares170,666.514
131.6168,448.000
113.8344,480.000
98.25Number of shares outstandingNet asset value per share
Distribution shares11,232.000
123.517.40
6,638.000113.83
-
---
Number of shares outstandingNet asset value per shareDividend per share
CHF CHF CHF
Total net assets 1,253,488,709.71 482,932,244.92 353,600,531.50
31/12/201131/12/201231/12/2013Year ending as at:
USD USD USD
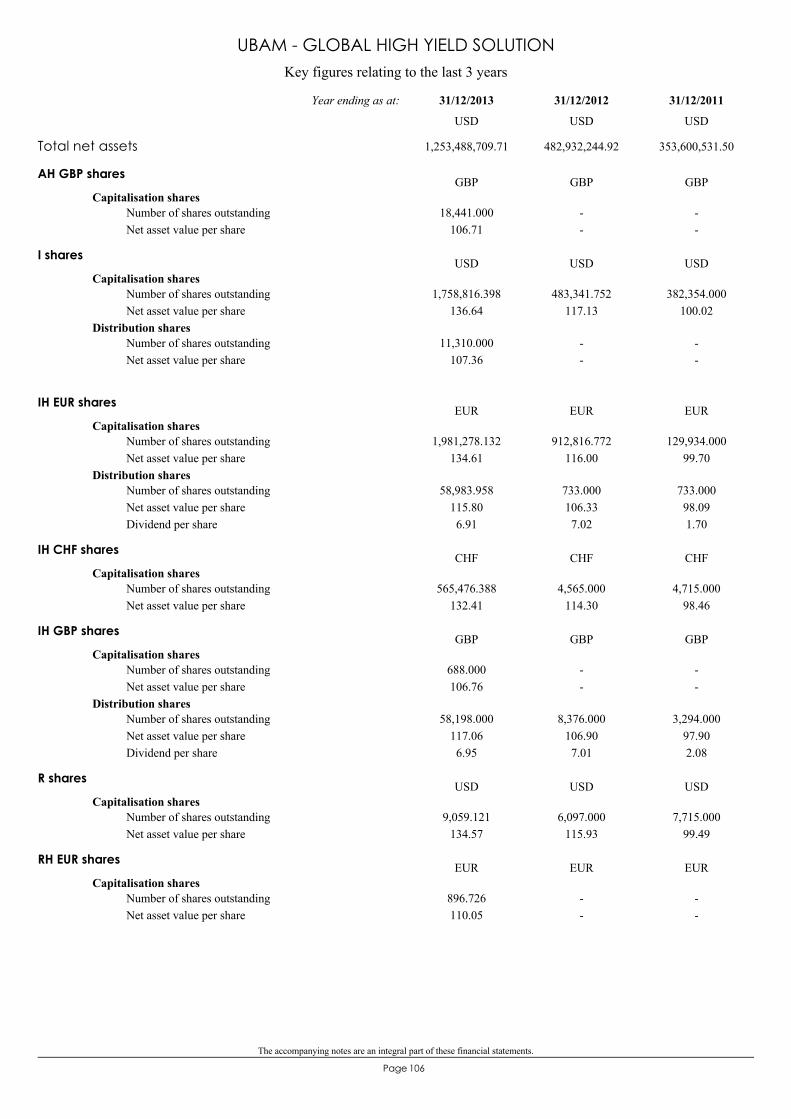
The accompanying notes are an integral part of these financial statements.
106Page
Key figures relating to the last 3 years
UBAM - GLOBAL HIGH YIELD SOLUTION
AH GBP shares
Capitalisation shares18,441.000
106.71--
--
Number of shares outstandingNet asset value per share
GBP GBP GBP
I shares
Capitalisation shares1,758,816.398
136.64483,341.752
117.13382,354.000
100.02Number of shares outstandingNet asset value per share
Distribution shares11,310.000
107.36--
--
Number of shares outstandingNet asset value per share
USD USD USD
IH EUR shares
Capitalisation shares1,981,278.132
134.61912,816.772
116.00129,934.000
99.70Number of shares outstandingNet asset value per share
Distribution shares58,983.958
115.806.91
733.000106.337.02
733.00098.091.70
Number of shares outstandingNet asset value per shareDividend per share
EUR EUR EUR
IH CHF shares
Capitalisation shares565,476.388
132.414,565.000
114.304,715.000
98.46Number of shares outstandingNet asset value per share
CHF CHF CHF
IH GBP shares
Capitalisation shares688.000106.76
--
--
Number of shares outstandingNet asset value per share
Distribution shares58,198.000
117.066.95
8,376.000106.907.01
3,294.00097.902.08
Number of shares outstandingNet asset value per shareDividend per share
GBP GBP GBP
R shares
Capitalisation shares9,059.121
134.576,097.000
115.937,715.000
99.49Number of shares outstandingNet asset value per share
USD USD USD
RH EUR shares
Capitalisation shares896.726110.05
--
--
Number of shares outstandingNet asset value per share
EUR EUR EUR
Total net assets 1,253,488,709.71 482,932,244.92 353,600,531.50
31/12/201131/12/201231/12/2013Year ending as at:
USD USD USD

The accompanying notes are an integral part of these financial statements.
107Page
Key figures relating to the last 3 years
UBAM - GLOBAL HIGH YIELD SOLUTION
Z shares
Capitalisation shares83,041.000
114.09--
--
Number of shares outstandingNet asset value per share
USD USD USD
Total net assets 1,253,488,709.71 482,932,244.92 353,600,531.50
31/12/201131/12/201231/12/2013Year ending as at:
USD USD USD
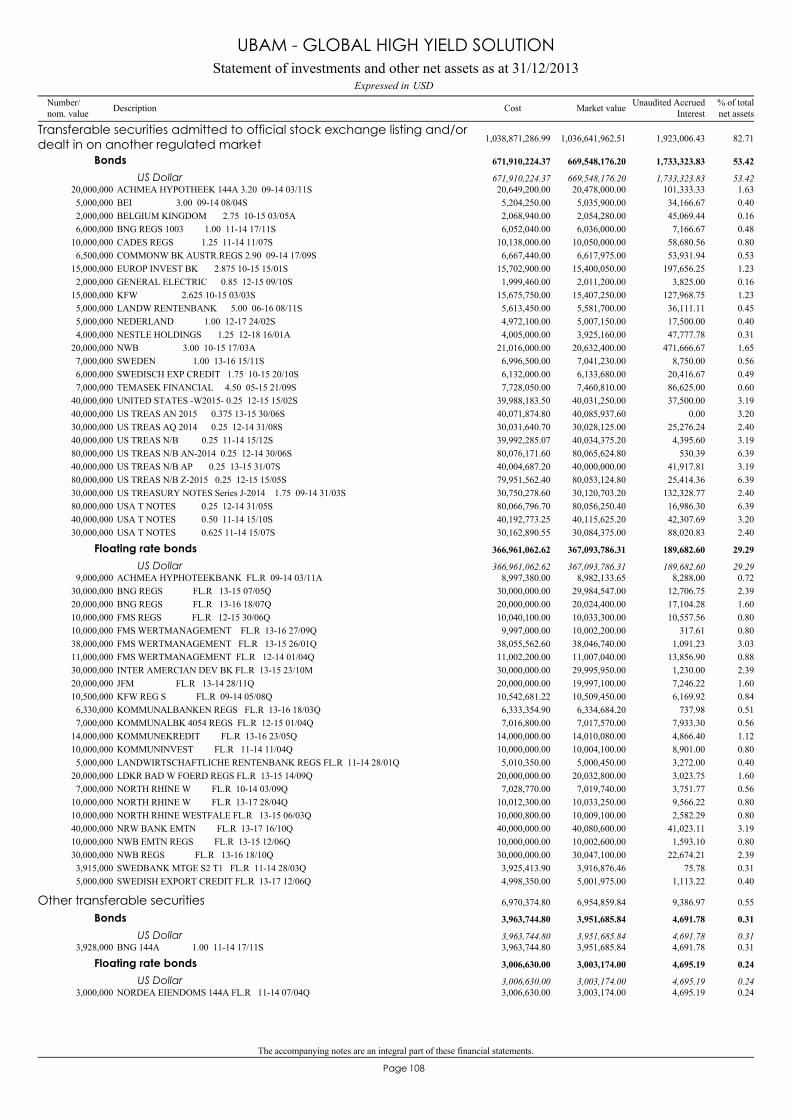
The accompanying notes are an integral part of these financial statements.
108Page
ACHMEA HYPOTHEEK 144A 3.20 09-14 03/11S20,000,000 20,478,000.00 1.6320,649,200.00 101,333.33
Transferable securities admitted to official stock exchange listing and/ordealt in on another regulated market 1,036,641,962.51 82.711,038,871,286.99 1,923,006.43
Bonds 669,548,176.20 53.42671,910,224.37 1,733,323.83
US Dollar 669,548,176.20 53.42671,910,224.37 1,733,323.83
BEI 3.00 09-14 08/04S5,000,000 5,035,900.00 0.405,204,250.00 34,166.67BELGIUM KINGDOM 2.75 10-15 03/05A2,000,000 2,054,280.00 0.162,068,940.00 45,069.44BNG REGS 1003 1.00 11-14 17/11S6,000,000 6,036,000.00 0.486,052,040.00 7,166.67CADES REGS 1.25 11-14 11/07S10,000,000 10,050,000.00 0.8010,138,000.00 58,680.56COMMONW BK AUSTR.REGS 2.90 09-14 17/09S6,500,000 6,617,975.00 0.536,667,440.00 53,931.94EUROP INVEST BK 2.875 10-15 15/01S15,000,000 15,400,050.00 1.2315,702,900.00 197,656.25GENERAL ELECTRIC 0.85 12-15 09/10S2,000,000 2,011,200.00 0.161,999,460.00 3,825.00KFW 2.625 10-15 03/03S15,000,000 15,407,250.00 1.2315,675,750.00 127,968.75LANDW RENTENBANK 5.00 06-16 08/11S5,000,000 5,581,700.00 0.455,613,450.00 36,111.11NEDERLAND 1.00 12-17 24/02S5,000,000 5,007,150.00 0.404,972,100.00 17,500.00NESTLE HOLDINGS 1.25 12-18 16/01A4,000,000 3,925,160.00 0.314,005,000.00 47,777.78NWB 3.00 10-15 17/03A20,000,000 20,632,400.00 1.6521,016,000.00 471,666.67SWEDEN 1.00 13-16 15/11S7,000,000 7,041,230.00 0.566,996,500.00 8,750.00SWEDISCH EXP CREDIT 1.75 10-15 20/10S6,000,000 6,133,680.00 0.496,132,000.00 20,416.67TEMASEK FINANCIAL 4.50 05-15 21/09S7,000,000 7,460,810.00 0.607,728,050.00 86,625.00UNITED STATES -W2015- 0.25 12-15 15/02S40,000,000 40,031,250.00 3.1939,988,183.50 37,500.00US TREAS AN 2015 0.375 13-15 30/06S40,000,000 40,085,937.60 3.2040,071,874.80 0.00US TREAS AQ 2014 0.25 12-14 31/08S30,000,000 30,028,125.00 2.4030,031,640.70 25,276.24US TREAS N/B 0.25 11-14 15/12S40,000,000 40,034,375.20 3.1939,992,285.07 4,395.60US TREAS N/B AN-2014 0.25 12-14 30/06S80,000,000 80,065,624.80 6.3980,076,171.60 530.39US TREAS N/B AP 0.25 13-15 31/07S40,000,000 40,000,000.00 3.1940,004,687.20 41,917.81US TREAS N/B Z-2015 0.25 12-15 15/05S80,000,000 80,053,124.80 6.3979,951,562.40 25,414.36US TREASURY NOTES Series J-2014 1.75 09-14 31/03S30,000,000 30,120,703.20 2.4030,750,278.60 132,328.77USA T NOTES 0.25 12-14 31/05S80,000,000 80,056,250.40 6.3980,066,796.70 16,986.30USA T NOTES 0.50 11-14 15/10S40,000,000 40,115,625.20 3.2040,192,773.25 42,307.69USA T NOTES 0.625 11-14 15/07S30,000,000 30,084,375.00 2.4030,162,890.55 88,020.83
ACHMEA HYPHOTEEKBANK FL.R 09-14 03/11A9,000,000 8,982,133.65 0.728,997,380.00 8,288.00
Floating rate bonds 367,093,786.31 29.29366,961,062.62 189,682.60
US Dollar 367,093,786.31 29.29366,961,062.62 189,682.60
BNG REGS FL.R 13-15 07/05Q30,000,000 29,984,547.00 2.3930,000,000.00 12,706.75BNG REGS FL.R 13-16 18/07Q20,000,000 20,024,400.00 1.6020,000,000.00 17,104.28FMS REGS FL.R 12-15 30/06Q10,000,000 10,033,300.00 0.8010,040,100.00 10,557.56FMS WERTMANAGEMENT FL.R 13-16 27/09Q10,000,000 10,002,200.00 0.809,997,000.00 317.61FMS WERTMANAGEMENT FL.R 13-15 26/01Q38,000,000 38,046,740.00 3.0338,055,562.60 1,091.23FMS WERTMANAGEMENT FL.R 12-14 01/04Q11,000,000 11,007,040.00 0.8811,002,200.00 13,856.90INTER AMERCIAN DEV BK FL.R 13-15 23/10M30,000,000 29,995,950.00 2.3930,000,000.00 1,230.00JFM FL.R 13-14 28/11Q20,000,000 19,997,100.00 1.6020,000,000.00 7,246.22KFW REG S FL.R 09-14 05/08Q10,500,000 10,509,450.00 0.8410,542,681.22 6,169.92KOMMUNALBANKEN REGS FL.R 13-16 18/03Q6,330,000 6,334,684.20 0.516,333,354.90 737.98KOMMUNALBK 4054 REGS FL.R 12-15 01/04Q7,000,000 7,017,570.00 0.567,016,800.00 7,933.30KOMMUNEKREDIT FL.R 13-16 23/05Q14,000,000 14,010,080.00 1.1214,000,000.00 4,866.40KOMMUNINVEST FL.R 11-14 11/04Q10,000,000 10,004,100.00 0.8010,000,000.00 8,901.00LANDWIRTSCHAFTLICHE RENTENBANK REGS FL.R 11-14 28/01Q5,000,000 5,000,450.00 0.405,010,350.00 3,272.00LDKR BAD W FOERD REGS FL.R 13-15 14/09Q20,000,000 20,032,800.00 1.6020,000,000.00 3,023.75NORTH RHINE W FL.R 10-14 03/09Q7,000,000 7,019,740.00 0.567,028,770.00 3,751.77NORTH RHINE W FL.R 13-17 28/04Q10,000,000 10,033,250.00 0.8010,012,300.00 9,566.22NORTH RHINE WESTFALE FL.R 13-15 06/03Q10,000,000 10,009,100.00 0.8010,000,800.00 2,582.29NRW BANK EMTN FL.R 13-17 16/10Q40,000,000 40,080,600.00 3.1940,000,000.00 41,023.11NWB EMTN REGS FL.R 13-15 12/06Q10,000,000 10,002,600.00 0.8010,000,000.00 1,593.10NWB REGS FL.R 13-16 18/10Q30,000,000 30,047,100.00 2.3930,000,000.00 22,674.21SWEDBANK MTGE S2 T1 FL.R 11-14 28/03Q3,915,000 3,916,876.46 0.313,925,413.90 75.78SWEDISH EXPORT CREDIT FL.R 13-17 12/06Q5,000,000 5,001,975.00 0.404,998,350.00 1,113.22
BNG 144A 1.00 11-14 17/11S3,928,000 3,951,685.84 0.313,963,744.80 4,691.78
Other transferable securities 6,954,859.84 0.556,970,374.80 9,386.97
Bonds 3,951,685.84 0.313,963,744.80 4,691.78
US Dollar 3,951,685.84 0.313,963,744.80 4,691.78
NORDEA EIENDOMS 144A FL.R 11-14 07/04Q3,000,000 3,003,174.00 0.243,006,630.00 4,695.19
Floating rate bonds 3,003,174.00 0.243,006,630.00 4,695.19
US Dollar 3,003,174.00 0.243,006,630.00 4,695.19
Statement of investments and other net assets as at 31/12/2013USDExpressed in
UBAM - GLOBAL HIGH YIELD SOLUTION
Number/nom. value Description % of total
net assetsMarket valueCost Unaudited AccruedInterest

The accompanying notes are an integral part of these financial statements.
109Page
Total investments in securities 1,043,596,822.35 83.261,045,841,661.79
Cash at banks/(bank liabilities) 99,285,450.57 7.92
Other net assets/(liabilities) 110,606,436.79 8.82
Total 1,253,488,709.71 100.00
Statement of investments and other net assets as at 31/12/2013USDExpressed in
UBAM - GLOBAL HIGH YIELD SOLUTION
Number/nom. value Description % of total
net assetsMarket valueCost Unaudited AccruedInterest
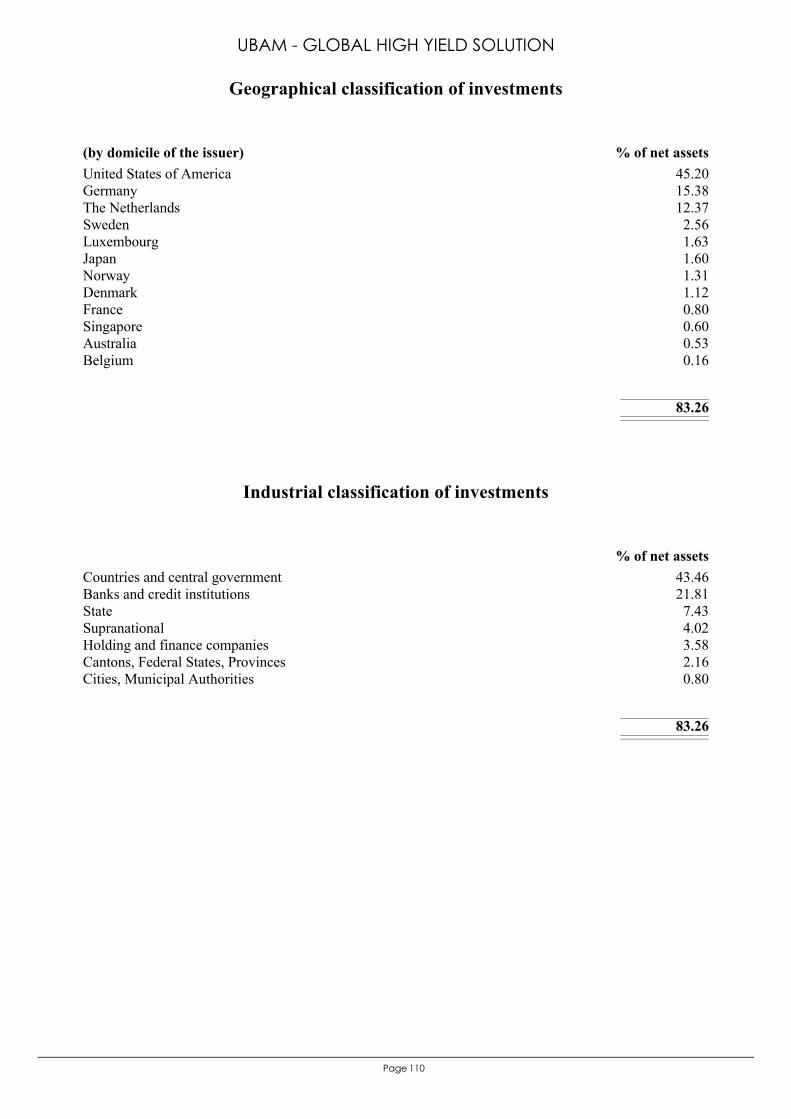
110Page
United States of America 45.20Germany 15.38The Netherlands 12.37Sweden 2.56Luxembourg 1.63Japan 1.60Norway 1.31Denmark 1.12France 0.80Singapore 0.60Australia 0.53Belgium 0.16
83.26
(by domicile of the issuer) % of net assets
Geographical classification of investments
UBAM - GLOBAL HIGH YIELD SOLUTION
Countries and central government 43.46Banks and credit institutions 21.81State 7.43Supranational 4.02Holding and finance companies 3.58Cantons, Federal States, Provinces 2.16Cities, Municipal Authorities 0.80
83.26
% of net assets
Industrial classification of investments
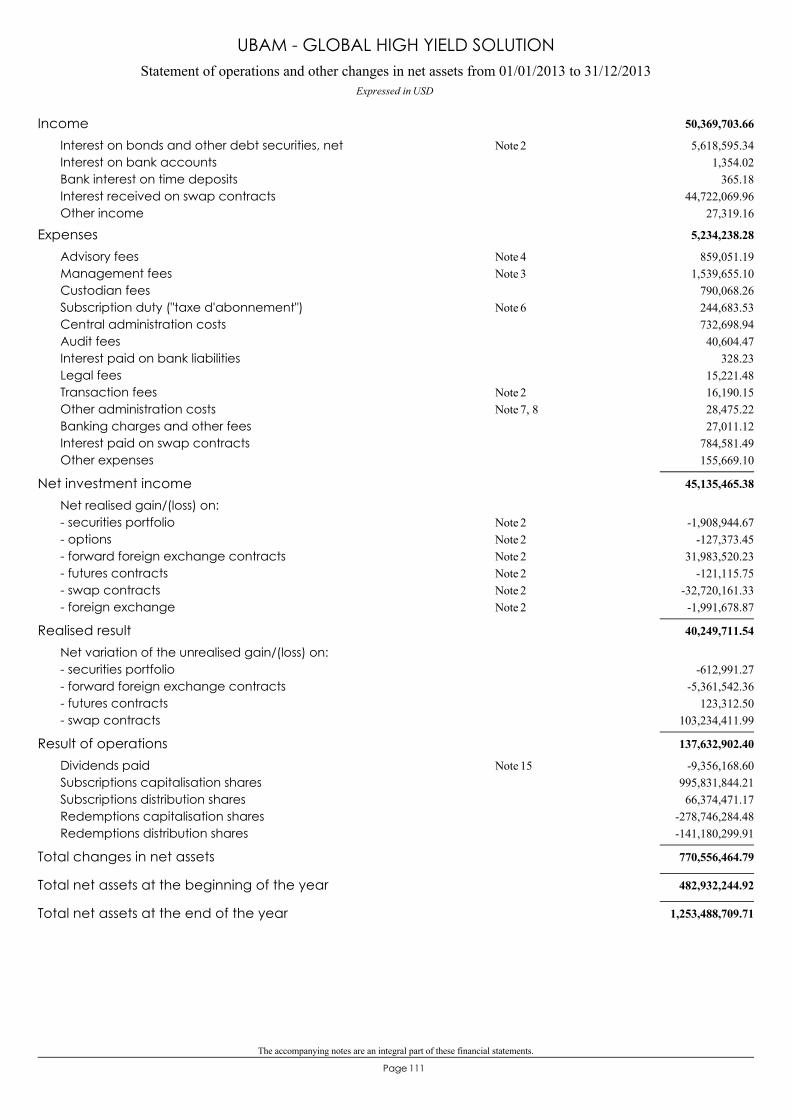
The accompanying notes are an integral part of these financial statements.
111Page
Statement of operations and other changes in net assets from 01/01/2013 to 31/12/2013Expressed in USD
UBAM - GLOBAL HIGH YIELD SOLUTION
50,369,703.66Income5,618,595.34Interest on bonds and other debt securities, net 2Note
1,354.02Interest on bank accounts365.18Bank interest on time deposits
44,722,069.96Interest received on swap contracts27,319.16Other income
5,234,238.28Expenses859,051.19Advisory fees 4Note
1,539,655.10Management fees 3Note790,068.26Custodian fees244,683.53Subscription duty ("taxe d'abonnement") 6Note732,698.94Central administration costs40,604.47Audit fees
328.23Interest paid on bank liabilities15,221.48Legal fees16,190.15Transaction fees 2Note28,475.22Other administration costs 7, 8Note27,011.12Banking charges and other fees
784,581.49Interest paid on swap contracts155,669.10Other expenses
45,135,465.38Net investment incomeNet realised gain/(loss) on:
-1,908,944.67- securities portfolio 2Note-127,373.45- options 2Note
31,983,520.23- forward foreign exchange contracts 2Note-121,115.75- futures contracts 2Note
-32,720,161.33- swap contracts 2Note-1,991,678.87- foreign exchange 2Note
40,249,711.54Realised resultNet variation of the unrealised gain/(loss) on:
-612,991.27- securities portfolio-5,361,542.36- forward foreign exchange contracts
123,312.50- futures contracts103,234,411.99- swap contracts
137,632,902.40Result of operations-9,356,168.60Dividends paid 15Note
995,831,844.21Subscriptions capitalisation shares66,374,471.17Subscriptions distribution shares
-278,746,284.48Redemptions capitalisation shares-141,180,299.91Redemptions distribution shares
770,556,464.79Total changes in net assets
482,932,244.92Total net assets at the beginning of the year
1,253,488,709.71Total net assets at the end of the year
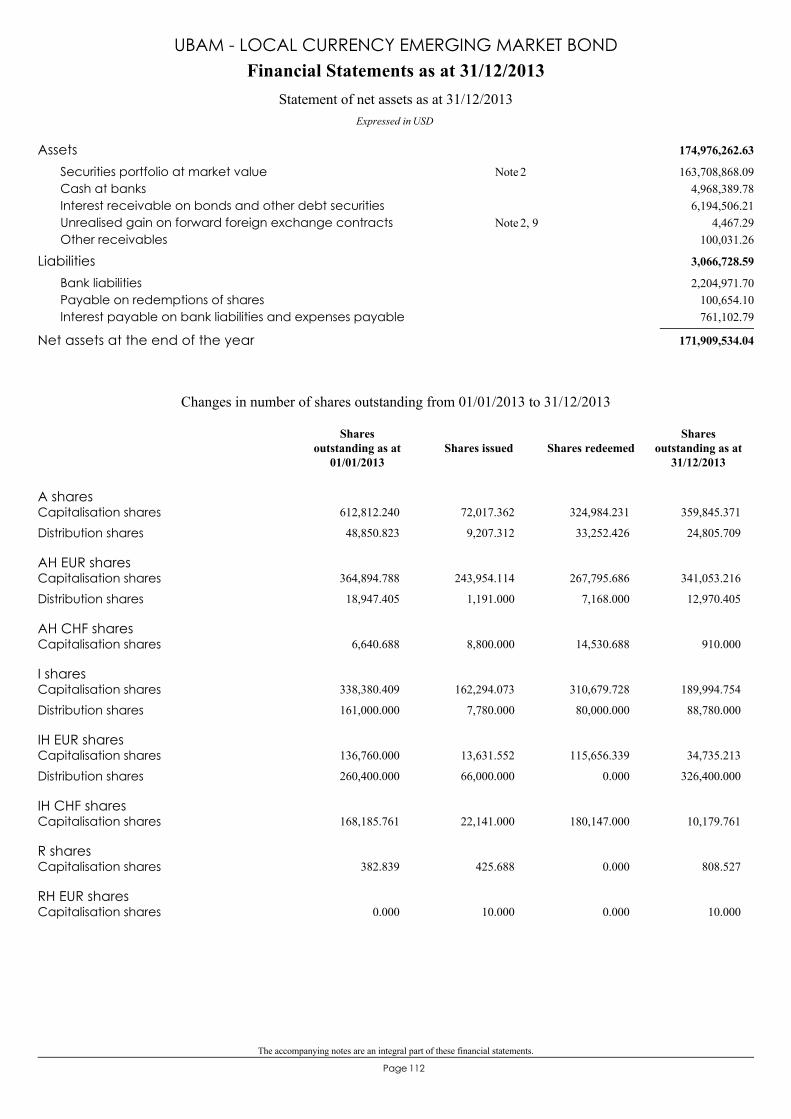
The accompanying notes are an integral part of these financial statements.
112Page
174,976,262.63Assets163,708,868.09Securities portfolio at market value 2Note
4,968,389.78Cash at banks6,194,506.21Interest receivable on bonds and other debt securities
4,467.29Unrealised gain on forward foreign exchange contracts 2, 9Note100,031.26Other receivables
3,066,728.59Liabilities2,204,971.70Bank liabilities
100,654.10Payable on redemptions of shares761,102.79Interest payable on bank liabilities and expenses payable
171,909,534.04Net assets at the end of the year
Financial Statements as at 31/12/2013
Expressed in USD
Statement of net assets as at 31/12/2013
UBAM - LOCAL CURRENCY EMERGING MARKET BOND
A sharesCapitalisation shares 612,812.240 72,017.362 324,984.231 359,845.371
Distribution shares 48,850.823 9,207.312 33,252.426 24,805.709
AH EUR sharesCapitalisation shares 364,894.788 243,954.114 267,795.686 341,053.216
Distribution shares 18,947.405 1,191.000 7,168.000 12,970.405
AH CHF sharesCapitalisation shares 6,640.688 8,800.000 14,530.688 910.000
I sharesCapitalisation shares 338,380.409 162,294.073 310,679.728 189,994.754
Distribution shares 161,000.000 7,780.000 80,000.000 88,780.000
IH EUR sharesCapitalisation shares 136,760.000 13,631.552 115,656.339 34,735.213
Distribution shares 260,400.000 66,000.000 0.000 326,400.000
IH CHF sharesCapitalisation shares 168,185.761 22,141.000 180,147.000 10,179.761
R sharesCapitalisation shares 382.839 425.688 0.000 808.527
RH EUR sharesCapitalisation shares 0.000 10.000 0.000 10.000
Changes in number of shares outstanding from 01/01/2013 to 31/12/2013
Shares issued Shares redeemedShares
outstanding as at31/12/2013
Sharesoutstanding as at
01/01/2013
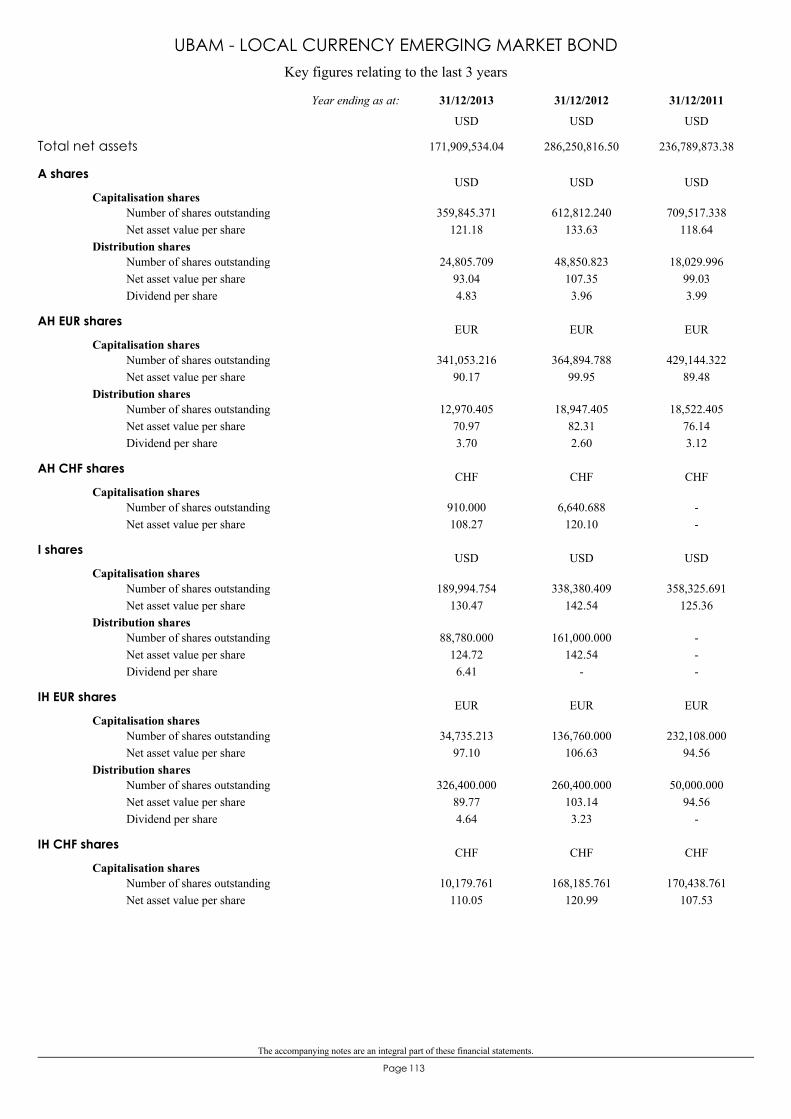
The accompanying notes are an integral part of these financial statements.
113Page
Key figures relating to the last 3 years
UBAM - LOCAL CURRENCY EMERGING MARKET BOND
A shares
Capitalisation shares359,845.371
121.18612,812.240
133.63709,517.338
118.64Number of shares outstandingNet asset value per share
Distribution shares24,805.709
93.044.83
48,850.823107.353.96
18,029.99699.033.99
Number of shares outstandingNet asset value per shareDividend per share
USD USD USD
AH EUR shares
Capitalisation shares341,053.216
90.17364,894.788
99.95429,144.322
89.48Number of shares outstandingNet asset value per share
Distribution shares12,970.405
70.973.70
18,947.40582.312.60
18,522.40576.143.12
Number of shares outstandingNet asset value per shareDividend per share
EUR EUR EUR
AH CHF shares
Capitalisation shares910.000108.27
6,640.688120.10
--
Number of shares outstandingNet asset value per share
CHF CHF CHF
I shares
Capitalisation shares189,994.754
130.47338,380.409
142.54358,325.691
125.36Number of shares outstandingNet asset value per share
Distribution shares88,780.000
124.726.41
161,000.000142.54
-
---
Number of shares outstandingNet asset value per shareDividend per share
USD USD USD
IH EUR shares
Capitalisation shares34,735.213
97.10136,760.000
106.63232,108.000
94.56Number of shares outstandingNet asset value per share
Distribution shares326,400.000
89.774.64
260,400.000103.143.23
50,000.00094.56
-
Number of shares outstandingNet asset value per shareDividend per share
EUR EUR EUR
IH CHF shares
Capitalisation shares10,179.761
110.05168,185.761
120.99170,438.761
107.53Number of shares outstandingNet asset value per share
CHF CHF CHF
Total net assets 171,909,534.04 286,250,816.50 236,789,873.38
31/12/201131/12/201231/12/2013Year ending as at:
USD USD USD
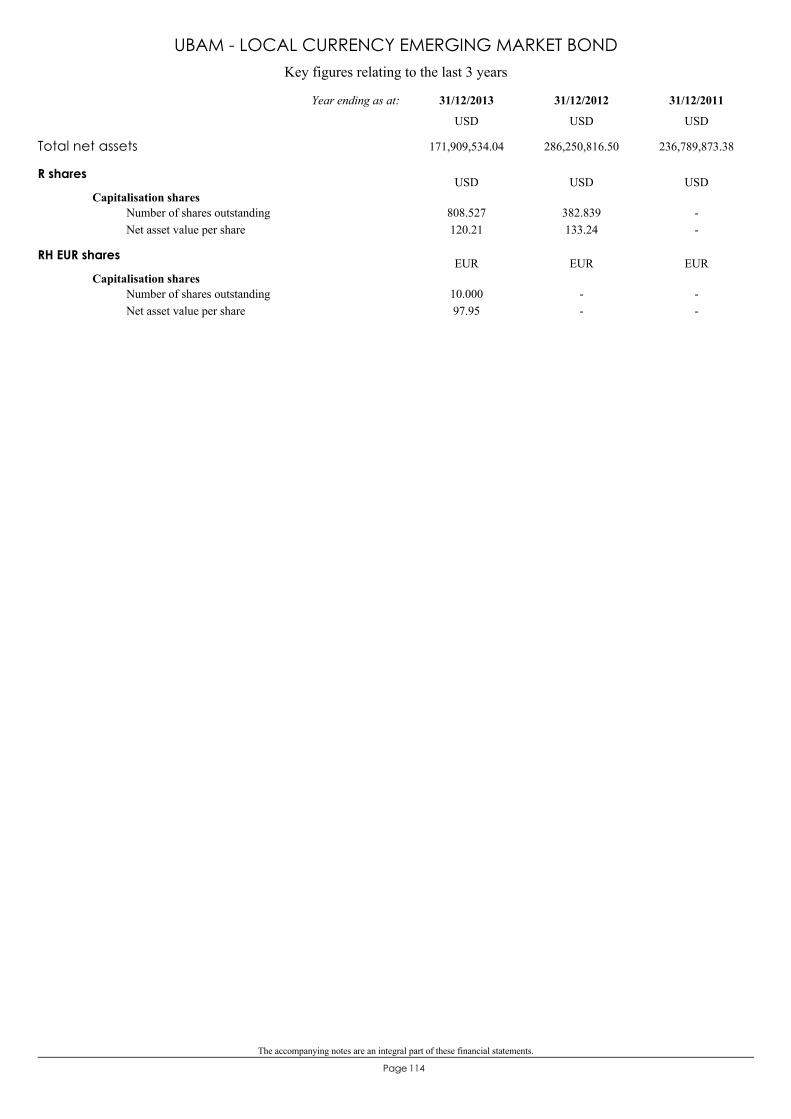
The accompanying notes are an integral part of these financial statements.
114Page
Key figures relating to the last 3 years
UBAM - LOCAL CURRENCY EMERGING MARKET BOND
R shares
Capitalisation shares808.527120.21
382.839133.24
--
Number of shares outstandingNet asset value per share
USD USD USD
RH EUR shares
Capitalisation shares10.00097.95
--
--
Number of shares outstandingNet asset value per share
EUR EUR EUR
Total net assets 171,909,534.04 286,250,816.50 236,789,873.38
31/12/201131/12/201231/12/2013Year ending as at:
USD USD USD
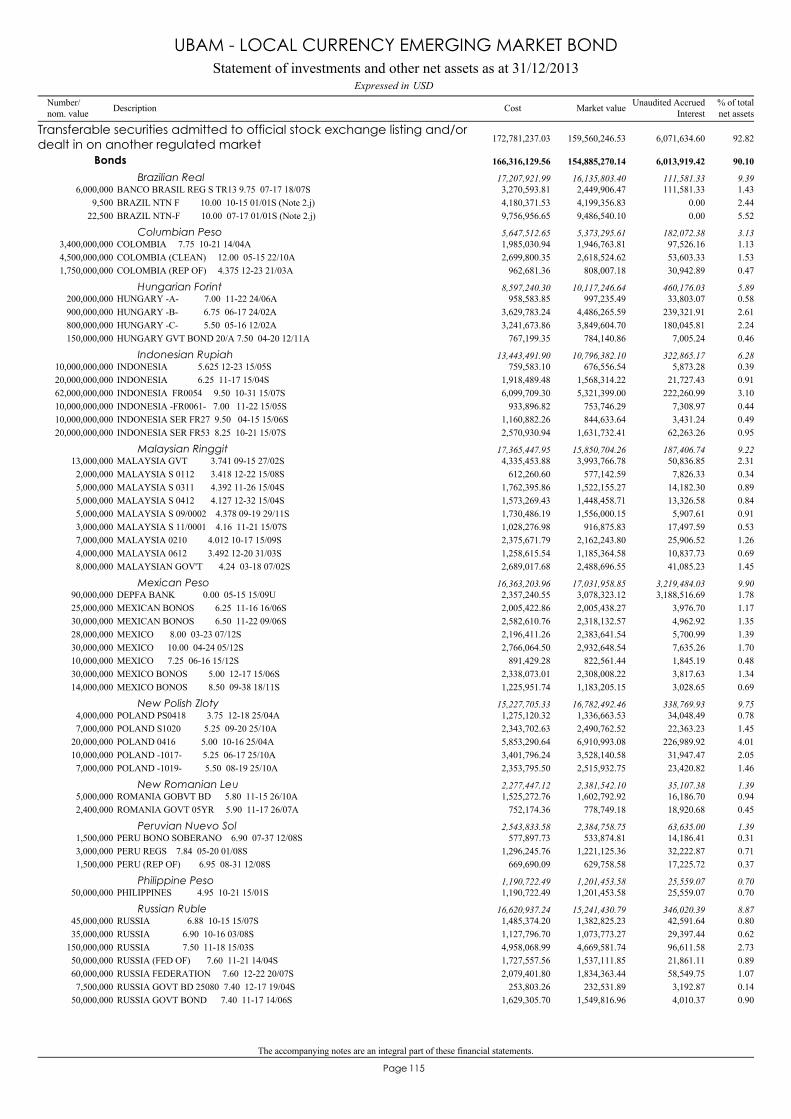
The accompanying notes are an integral part of these financial statements.
115Page
BANCO BRASIL REG S TR13 9.75 07-17 18/07S6,000,000 2,449,906.47 1.433,270,593.81 111,581.33
Transferable securities admitted to official stock exchange listing and/ordealt in on another regulated market 159,560,246.53 92.82172,781,237.03 6,071,634.60
Bonds 154,885,270.14 90.10166,316,129.56 6,013,919.42
Brazilian Real 16,135,803.40 9.3917,207,921.99 111,581.33
BRAZIL NTN F 10.00 10-15 01/01S (Note 2.j)9,500 4,199,356.83 2.444,180,371.53 0.00BRAZIL NTN-F 10.00 07-17 01/01S (Note 2.j)22,500 9,486,540.10 5.529,756,956.65 0.00
COLOMBIA 7.75 10-21 14/04A3,400,000,000 1,946,763.81 1.131,985,030.94 97,526.16Columbian Peso 5,373,295.61 3.135,647,512.65 182,072.38
COLOMBIA (CLEAN) 12.00 05-15 22/10A4,500,000,000 2,618,524.62 1.532,699,800.35 53,603.33COLOMBIA (REP OF) 4.375 12-23 21/03A1,750,000,000 808,007.18 0.47962,681.36 30,942.89
HUNGARY -A- 7.00 11-22 24/06A200,000,000 997,235.49 0.58958,583.85 33,803.07Hungarian Forint 10,117,246.64 5.898,597,240.30 460,176.03
HUNGARY -B- 6.75 06-17 24/02A900,000,000 4,486,265.59 2.613,629,783.24 239,321.91HUNGARY -C- 5.50 05-16 12/02A800,000,000 3,849,604.70 2.243,241,673.86 180,045.81HUNGARY GVT BOND 20/A 7.50 04-20 12/11A150,000,000 784,140.86 0.46767,199.35 7,005.24
INDONESIA 5.625 12-23 15/05S10,000,000,000 676,556.54 0.39759,583.10 5,873.28Indonesian Rupiah 10,796,382.10 6.2813,443,491.90 322,865.17
INDONESIA 6.25 11-17 15/04S20,000,000,000 1,568,314.22 0.911,918,489.48 21,727.43INDONESIA FR0054 9.50 10-31 15/07S62,000,000,000 5,321,399.00 3.106,099,709.30 222,260.99INDONESIA -FR0061- 7.00 11-22 15/05S10,000,000,000 753,746.29 0.44933,896.82 7,308.97INDONESIA SER FR27 9.50 04-15 15/06S10,000,000,000 844,633.64 0.491,160,882.26 3,431.24INDONESIA SER FR53 8.25 10-21 15/07S20,000,000,000 1,631,732.41 0.952,570,930.94 62,263.26
MALAYSIA GVT 3.741 09-15 27/02S13,000,000 3,993,766.78 2.314,335,453.88 50,836.85Malaysian Ringgit 15,850,704.26 9.2217,365,447.95 187,406.74
MALAYSIA S 0112 3.418 12-22 15/08S2,000,000 577,142.59 0.34612,260.60 7,826.33MALAYSIA S 0311 4.392 11-26 15/04S5,000,000 1,522,155.27 0.891,762,395.86 14,182.30MALAYSIA S 0412 4.127 12-32 15/04S5,000,000 1,448,458.71 0.841,573,269.43 13,326.58MALAYSIA S 09/0002 4.378 09-19 29/11S5,000,000 1,556,000.15 0.911,730,486.19 5,907.61MALAYSIA S 11/0001 4.16 11-21 15/07S3,000,000 916,875.83 0.531,028,276.98 17,497.59MALAYSIA 0210 4.012 10-17 15/09S7,000,000 2,162,243.80 1.262,375,671.79 25,906.52MALAYSIA 0612 3.492 12-20 31/03S4,000,000 1,185,364.58 0.691,258,615.54 10,837.73MALAYSIAN GOV'T 4.24 03-18 07/02S8,000,000 2,488,696.55 1.452,689,017.68 41,085.23
DEPFA BANK 0.00 05-15 15/09U90,000,000 3,078,323.12 1.782,357,240.55 3,188,516.69Mexican Peso 17,031,958.85 9.9016,363,203.96 3,219,484.03
MEXICAN BONOS 6.25 11-16 16/06S25,000,000 2,005,438.27 1.172,005,422.86 3,976.70MEXICAN BONOS 6.50 11-22 09/06S30,000,000 2,318,132.57 1.352,582,610.76 4,962.92MEXICO 8.00 03-23 07/12S28,000,000 2,383,641.54 1.392,196,411.26 5,700.99MEXICO 10.00 04-24 05/12S30,000,000 2,932,648.54 1.702,766,064.50 7,635.26MEXICO 7.25 06-16 15/12S10,000,000 822,561.44 0.48891,429.28 1,845.19MEXICO BONOS 5.00 12-17 15/06S30,000,000 2,308,008.22 1.342,338,073.01 3,817.63MEXICO BONOS 8.50 09-38 18/11S14,000,000 1,183,205.15 0.691,225,951.74 3,028.65
POLAND PS0418 3.75 12-18 25/04A4,000,000 1,336,663.53 0.781,275,120.32 34,048.49New Polish Zloty 16,782,492.46 9.7515,227,705.33 338,769.93
POLAND S1020 5.25 09-20 25/10A7,000,000 2,490,762.52 1.452,343,702.63 22,363.23POLAND 0416 5.00 10-16 25/04A20,000,000 6,910,993.08 4.015,853,290.64 226,989.92POLAND -1017- 5.25 06-17 25/10A10,000,000 3,528,140.58 2.053,401,796.24 31,947.47POLAND -1019- 5.50 08-19 25/10A7,000,000 2,515,932.75 1.462,353,795.50 23,420.82
ROMANIA GOBVT BD 5.80 11-15 26/10A5,000,000 1,602,792.92 0.941,525,272.76 16,186.70New Romanian Leu 2,381,542.10 1.392,277,447.12 35,107.38
ROMANIA GOVT 05YR 5.90 11-17 26/07A2,400,000 778,749.18 0.45752,174.36 18,920.68
PERU BONO SOBERANO 6.90 07-37 12/08S1,500,000 533,874.81 0.31577,897.73 14,186.41Peruvian Nuevo Sol 2,384,758.75 1.392,543,833.58 63,635.00
PERU REGS 7.84 05-20 01/08S3,000,000 1,221,125.36 0.711,296,245.76 32,222.87PERU (REP OF) 6.95 08-31 12/08S1,500,000 629,758.58 0.37669,690.09 17,225.72
PHILIPPINES 4.95 10-21 15/01S50,000,000 1,201,453.58 0.701,190,722.49 25,559.07Philippine Peso 1,201,453.58 0.701,190,722.49 25,559.07
RUSSIA 6.88 10-15 15/07S45,000,000 1,382,825.23 0.801,485,374.20 42,591.64Russian Ruble 15,241,430.79 8.8716,620,937.24 346,020.39
RUSSIA 6.90 10-16 03/08S35,000,000 1,073,773.27 0.621,127,796.70 29,397.44RUSSIA 7.50 11-18 15/03S150,000,000 4,669,581.74 2.734,958,068.99 96,611.58RUSSIA (FED OF) 7.60 11-21 14/04S50,000,000 1,537,111.85 0.891,727,557.56 21,861.11RUSSIA FEDERATION 7.60 12-22 20/07S60,000,000 1,834,363.44 1.072,079,401.80 58,549.75RUSSIA GOVT BD 25080 7.40 12-17 19/04S7,500,000 232,531.89 0.14253,803.26 3,192.87RUSSIA GOVT BOND 7.40 11-17 14/06S50,000,000 1,549,816.96 0.901,629,305.70 4,010.37
Statement of investments and other net assets as at 31/12/2013USDExpressed in
UBAM - LOCAL CURRENCY EMERGING MARKET BOND
Number/nom. value Description % of total
net assetsMarket valueCost Unaudited AccruedInterest
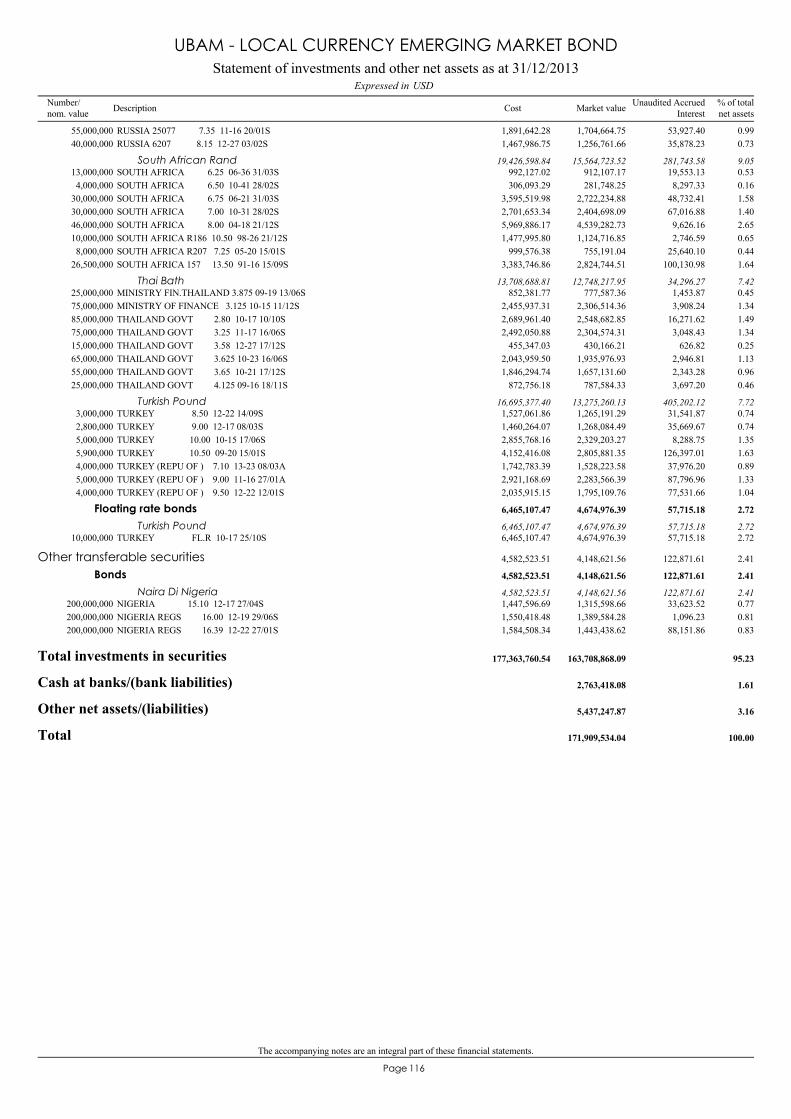
The accompanying notes are an integral part of these financial statements.
116Page
RUSSIA 25077 7.35 11-16 20/01S55,000,000 1,704,664.75 0.991,891,642.28 53,927.40RUSSIA 6207 8.15 12-27 03/02S40,000,000 1,256,761.66 0.731,467,986.75 35,878.23
SOUTH AFRICA 6.25 06-36 31/03S13,000,000 912,107.17 0.53992,127.02 19,553.13South African Rand 15,564,723.52 9.0519,426,598.84 281,743.58
SOUTH AFRICA 6.50 10-41 28/02S4,000,000 281,748.25 0.16306,093.29 8,297.33SOUTH AFRICA 6.75 06-21 31/03S30,000,000 2,722,234.88 1.583,595,519.98 48,732.41SOUTH AFRICA 7.00 10-31 28/02S30,000,000 2,404,698.09 1.402,701,653.34 67,016.88SOUTH AFRICA 8.00 04-18 21/12S46,000,000 4,539,282.73 2.655,969,886.17 9,626.16SOUTH AFRICA R186 10.50 98-26 21/12S10,000,000 1,124,716.85 0.651,477,995.80 2,746.59SOUTH AFRICA R207 7.25 05-20 15/01S8,000,000 755,191.04 0.44999,576.38 25,640.10SOUTH AFRICA 157 13.50 91-16 15/09S26,500,000 2,824,744.51 1.643,383,746.86 100,130.98
MINISTRY FIN.THAILAND 3.875 09-19 13/06S25,000,000 777,587.36 0.45852,381.77 1,453.87Thai Bath 12,748,217.95 7.4213,708,688.81 34,296.27
MINISTRY OF FINANCE 3.125 10-15 11/12S75,000,000 2,306,514.36 1.342,455,937.31 3,908.24THAILAND GOVT 2.80 10-17 10/10S85,000,000 2,548,682.85 1.492,689,961.40 16,271.62THAILAND GOVT 3.25 11-17 16/06S75,000,000 2,304,574.31 1.342,492,050.88 3,048.43THAILAND GOVT 3.58 12-27 17/12S15,000,000 430,166.21 0.25455,347.03 626.82THAILAND GOVT 3.625 10-23 16/06S65,000,000 1,935,976.93 1.132,043,959.50 2,946.81THAILAND GOVT 3.65 10-21 17/12S55,000,000 1,657,131.60 0.961,846,294.74 2,343.28THAILAND GOVT 4.125 09-16 18/11S25,000,000 787,584.33 0.46872,756.18 3,697.20
TURKEY 8.50 12-22 14/09S3,000,000 1,265,191.29 0.741,527,061.86 31,541.87Turkish Pound 13,275,260.13 7.7216,695,377.40 405,202.12
TURKEY 9.00 12-17 08/03S2,800,000 1,268,084.49 0.741,460,264.07 35,669.67TURKEY 10.00 10-15 17/06S5,000,000 2,329,203.27 1.352,855,768.16 8,288.75TURKEY 10.50 09-20 15/01S5,900,000 2,805,881.35 1.634,152,416.08 126,397.01TURKEY (REPU OF ) 7.10 13-23 08/03A4,000,000 1,528,223.58 0.891,742,783.39 37,976.20TURKEY (REPU OF ) 9.00 11-16 27/01A5,000,000 2,283,566.39 1.332,921,168.69 87,796.96TURKEY (REPU OF ) 9.50 12-22 12/01S4,000,000 1,795,109.76 1.042,035,915.15 77,531.66
TURKEY FL.R 10-17 25/10S10,000,000 4,674,976.39 2.726,465,107.47 57,715.18
Floating rate bonds 4,674,976.39 2.726,465,107.47 57,715.18
Turkish Pound 4,674,976.39 2.726,465,107.47 57,715.18
NIGERIA 15.10 12-17 27/04S200,000,000 1,315,598.66 0.771,447,596.69 33,623.52
Other transferable securities 4,148,621.56 2.414,582,523.51 122,871.61
Bonds 4,148,621.56 2.414,582,523.51 122,871.61
Naira Di Nigeria 4,148,621.56 2.414,582,523.51 122,871.61
NIGERIA REGS 16.00 12-19 29/06S200,000,000 1,389,584.28 0.811,550,418.48 1,096.23NIGERIA REGS 16.39 12-22 27/01S200,000,000 1,443,438.62 0.831,584,508.34 88,151.86
Total investments in securities 163,708,868.09 95.23177,363,760.54
Cash at banks/(bank liabilities) 2,763,418.08 1.61
Other net assets/(liabilities) 5,437,247.87 3.16
Total 171,909,534.04 100.00
Statement of investments and other net assets as at 31/12/2013USDExpressed in
UBAM - LOCAL CURRENCY EMERGING MARKET BOND
Number/nom. value Description % of total
net assetsMarket valueCost Unaudited AccruedInterest
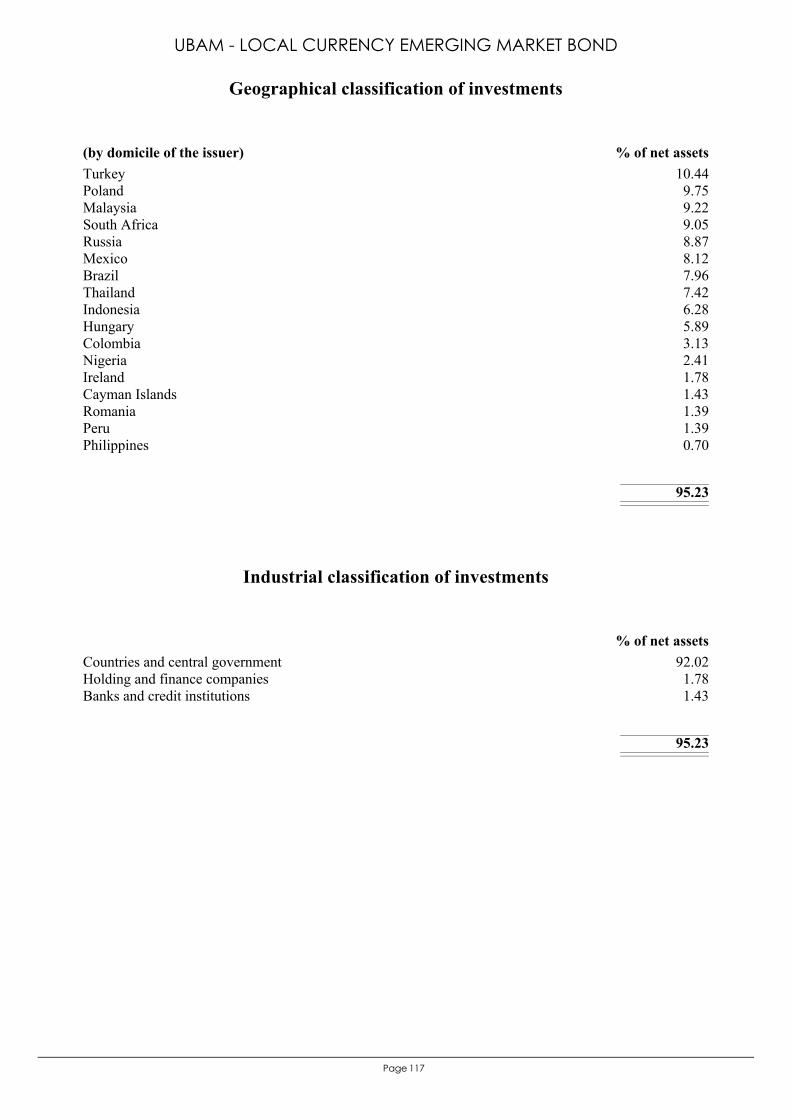
117Page
Turkey 10.44Poland 9.75Malaysia 9.22South Africa 9.05Russia 8.87Mexico 8.12Brazil 7.96Thailand 7.42Indonesia 6.28Hungary 5.89Colombia 3.13Nigeria 2.41Ireland 1.78Cayman Islands 1.43Romania 1.39Peru 1.39Philippines 0.70
95.23
(by domicile of the issuer) % of net assets
Geographical classification of investments
UBAM - LOCAL CURRENCY EMERGING MARKET BOND
Countries and central government 92.02Holding and finance companies 1.78Banks and credit institutions 1.43
95.23
% of net assets
Industrial classification of investments

The accompanying notes are an integral part of these financial statements.
118Page
Statement of operations and other changes in net assets from 01/01/2013 to 31/12/2013Expressed in USD
UBAM - LOCAL CURRENCY EMERGING MARKET BOND
18,832,266.00Income18,723,357.37Interest on bonds and other debt securities, net 2Note
48,454.61Interest on bank accounts68.13Bank interest on time deposits
48,637.79Interest received on swap contracts11,748.10Other income
4,524,104.03Expenses1,794,426.11Advisory fees 4Note1,294,125.20Management fees 3Note
686,363.70Custodian fees78,730.48Subscription duty ("taxe d'abonnement") 6Note
277,600.33Central administration costs13,231.45Audit fees5,250.04Interest paid on bank liabilities
10,019.88Legal fees19,226.81Transaction fees 2Note
215,317.95Other administration costs 7, 8Note10,823.79Banking charges and other fees49,747.36Interest paid on swap contracts69,240.93Other expenses
14,308,161.97Net investment incomeNet realised gain/(loss) on:
925,879.04- securities portfolio 2Note12,151,837.02- forward foreign exchange contracts 2Note
-20,803,612.58- foreign exchange 2Note
6,582,265.45Realised resultNet variation of the unrealised gain/(loss) on:
-24,852,841.59- securities portfolio-3,579,035.62- forward foreign exchange contracts
-21,849,611.76Result of operations-2,847,743.46Dividends paid 15Note69,713,091.85Subscriptions capitalisation shares9,888,768.68Subscriptions distribution shares
-154,963,547.65Redemptions capitalisation shares-14,282,240.12Redemptions distribution shares
-114,341,282.46Total changes in net assets
286,250,816.50Total net assets at the beginning of the year
171,909,534.04Total net assets at the end of the year

The accompanying notes are an integral part of these financial statements.
119Page
199,577,459.46Assets181,417,328.63Securities portfolio at market value 2Note
1,741.19Options contracts at market value 2, 12Note217,482.54Deposits on futures and options contracts
13,838,355.68Cash at banks15,373.63Interest receivable on swap contracts
1,848,290.77Interest receivable on bonds and other debt securities1,518,944.11Unrealised gain on forward foreign exchange contracts 2, 9Note
376,357.32Unrealised gain on futures contracts 2, 10Note340,137.72Unrealised gain on swap contracts 2, 11Note
3,447.87Other receivables
591,342.34Liabilities9.91Short option contracts at market value 2, 12Note
93,359.07Other liquid liabilities12,111.11Payable on redemptions of shares
485,862.25Interest payable on bank liabilities and expenses payable
198,986,117.12Net assets at the end of the year
Financial Statements as at 31/12/2013
Expressed in EUR
Statement of net assets as at 31/12/2013
UBAM - UNCONSTRAINED BOND
AP sharesCapitalisation shares 0.000 1,002,929.816 48,566.000 954,363.816
Distribution shares 0.000 1,545.000 0.000 1,545.000
APH CHF sharesCapitalisation shares 0.000 78,583.000 365.000 78,218.000
APH USD sharesCapitalisation shares 0.000 655,022.724 20,782.000 634,240.724
APH GBP sharesCapitalisation shares 0.000 32,416.000 332.000 32,084.000
Distribution shares 0.000 6,310.000 420.000 5,890.000
IP sharesCapitalisation shares 0.000 358,362.522 27,742.126 330,620.396
IPH CHF sharesCapitalisation shares 0.000 109,745.000 0.000 109,745.000
IPH USD sharesCapitalisation shares 0.000 31,484.000 1,050.033 30,433.967
R sharesCapitalisation shares 0.000 10.000 0.000 10.000
Changes in number of shares outstanding from 19/06/2013 to 31/12/2013
Shares issued Shares redeemedShares
outstanding as at31/12/2013
Sharesoutstanding as at
19/06/2013

The accompanying notes are an integral part of these financial statements.
120Page
Key figures relating to the last 3 years
UBAM - UNCONSTRAINED BOND
AP shares
Capitalisation shares954,363.816
101.08--
--
Number of shares outstandingNet asset value per share
Distribution shares1,545.000
100.71--
--
Number of shares outstandingNet asset value per share
EUR EUR EUR
APH CHF shares
Capitalisation shares78,218.000
100.92--
--
Number of shares outstandingNet asset value per share
CHF CHF CHF
APH USD shares
Capitalisation shares634,240.724
101.12--
--
Number of shares outstandingNet asset value per share
USD USD USD
APH GBP shares
Capitalisation shares32,084.000
101.19--
--
Number of shares outstandingNet asset value per share
Distribution shares5,890.000
101.19--
--
Number of shares outstandingNet asset value per share
GBP GBP GBP
IP shares
Capitalisation shares330,620.396
101.24--
--
Number of shares outstandingNet asset value per share
EUR EUR EUR
IPH CHF shares
Capitalisation shares109,745.000
101.07--
--
Number of shares outstandingNet asset value per share
CHF CHF CHF
IPH USD shares
Capitalisation shares30,433.967
101.28--
--
Number of shares outstandingNet asset value per share
USD USD USD
R shares
Capitalisation shares10.000101.03
--
--
Number of shares outstandingNet asset value per share
EUR EUR EUR
Total net assets 198,986,117.12 - -
31/12/201131/12/201231/12/2013Period/Year ending as at:
EUR EUR EUR
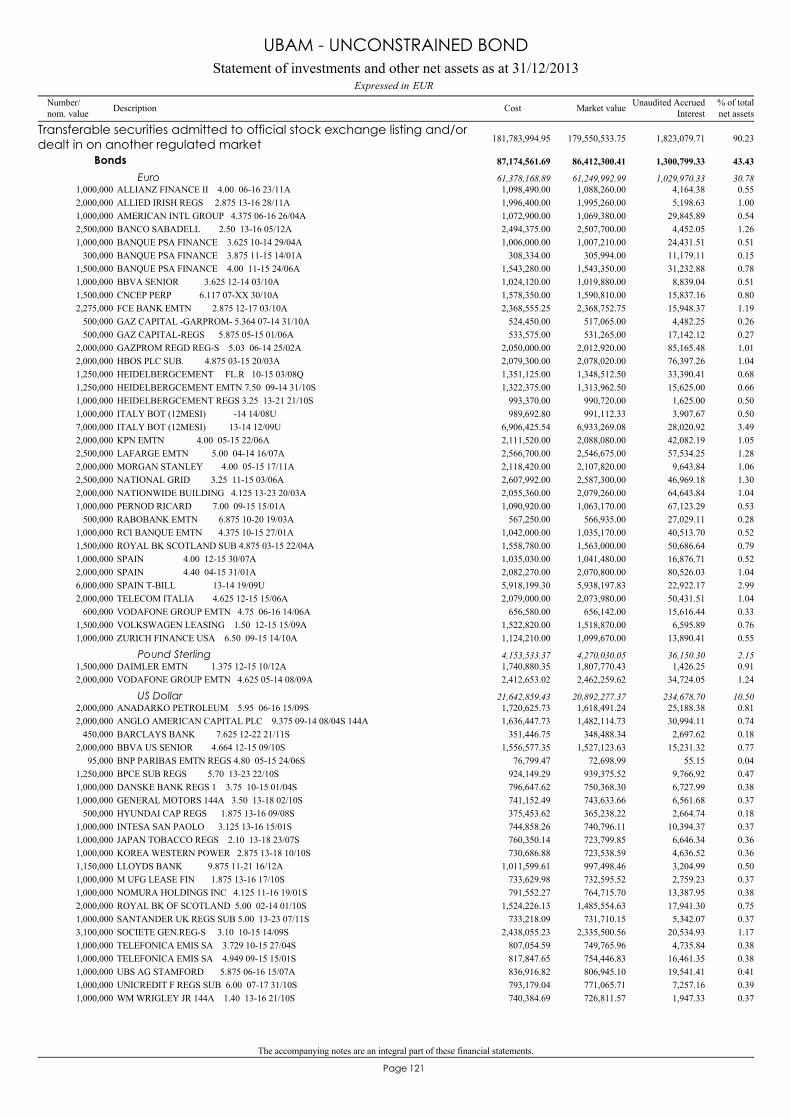
The accompanying notes are an integral part of these financial statements.
121Page
ALLIANZ FINANCE II 4.00 06-16 23/11A1,000,000 1,088,260.00 0.551,098,490.00 4,164.38
Transferable securities admitted to official stock exchange listing and/ordealt in on another regulated market 179,550,533.75 90.23181,783,994.95 1,823,079.71
Bonds 86,412,300.41 43.4387,174,561.69 1,300,799.33
Euro 61,249,992.99 30.7861,378,168.89 1,029,970.33
ALLIED IRISH REGS 2.875 13-16 28/11A2,000,000 1,995,260.00 1.001,996,400.00 5,198.63AMERICAN INTL GROUP 4.375 06-16 26/04A1,000,000 1,069,380.00 0.541,072,900.00 29,845.89BANCO SABADELL 2.50 13-16 05/12A2,500,000 2,507,700.00 1.262,494,375.00 4,452.05BANQUE PSA FINANCE 3.625 10-14 29/04A1,000,000 1,007,210.00 0.511,006,000.00 24,431.51BANQUE PSA FINANCE 3.875 11-15 14/01A300,000 305,994.00 0.15308,334.00 11,179.11BANQUE PSA FINANCE 4.00 11-15 24/06A1,500,000 1,543,350.00 0.781,543,280.00 31,232.88BBVA SENIOR 3.625 12-14 03/10A1,000,000 1,019,880.00 0.511,024,120.00 8,839.04CNCEP PERP 6.117 07-XX 30/10A1,500,000 1,590,810.00 0.801,578,350.00 15,837.16FCE BANK EMTN 2.875 12-17 03/10A2,275,000 2,368,752.75 1.192,368,555.25 15,948.37GAZ CAPITAL -GARPROM- 5.364 07-14 31/10A500,000 517,065.00 0.26524,450.00 4,482.25GAZ CAPITAL-REGS 5.875 05-15 01/06A500,000 531,265.00 0.27533,575.00 17,142.12GAZPROM REGD REG-S 5.03 06-14 25/02A2,000,000 2,012,920.00 1.012,050,000.00 85,165.48HBOS PLC SUB. 4.875 03-15 20/03A2,000,000 2,078,020.00 1.042,079,300.00 76,397.26HEIDELBERGCEMENT FL.R 10-15 03/08Q1,250,000 1,348,512.50 0.681,351,125.00 33,390.41HEIDELBERGCEMENT EMTN 7.50 09-14 31/10S1,250,000 1,313,962.50 0.661,322,375.00 15,625.00HEIDELBERGCEMENT REGS 3.25 13-21 21/10S1,000,000 990,720.00 0.50993,370.00 1,625.00ITALY BOT (12MESI) -14 14/08U1,000,000 991,112.33 0.50989,692.80 3,907.67ITALY BOT (12MESI) 13-14 12/09U7,000,000 6,933,269.08 3.496,906,425.54 28,020.92KPN EMTN 4.00 05-15 22/06A2,000,000 2,088,080.00 1.052,111,520.00 42,082.19LAFARGE EMTN 5.00 04-14 16/07A2,500,000 2,546,675.00 1.282,566,700.00 57,534.25MORGAN STANLEY 4.00 05-15 17/11A2,000,000 2,107,820.00 1.062,118,420.00 9,643.84NATIONAL GRID 3.25 11-15 03/06A2,500,000 2,587,300.00 1.302,607,992.00 46,969.18NATIONWIDE BUILDING 4.125 13-23 20/03A2,000,000 2,079,260.00 1.042,055,360.00 64,643.84PERNOD RICARD 7.00 09-15 15/01A1,000,000 1,063,170.00 0.531,090,920.00 67,123.29RABOBANK EMTN 6.875 10-20 19/03A500,000 566,935.00 0.28567,250.00 27,029.11RCI BANQUE EMTN 4.375 10-15 27/01A1,000,000 1,035,170.00 0.521,042,000.00 40,513.70ROYAL BK SCOTLAND SUB 4.875 03-15 22/04A1,500,000 1,563,000.00 0.791,558,780.00 50,686.64SPAIN 4.00 12-15 30/07A1,000,000 1,041,480.00 0.521,035,030.00 16,876.71SPAIN 4.40 04-15 31/01A2,000,000 2,070,800.00 1.042,082,270.00 80,526.03SPAIN T-BILL 13-14 19/09U6,000,000 5,938,197.83 2.995,918,199.30 22,922.17TELECOM ITALIA 4.625 12-15 15/06A2,000,000 2,073,980.00 1.042,079,000.00 50,431.51VODAFONE GROUP EMTN 4.75 06-16 14/06A600,000 656,142.00 0.33656,580.00 15,616.44VOLKSWAGEN LEASING 1.50 12-15 15/09A1,500,000 1,518,870.00 0.761,522,820.00 6,595.89ZURICH FINANCE USA 6.50 09-15 14/10A1,000,000 1,099,670.00 0.551,124,210.00 13,890.41
DAIMLER EMTN 1.375 12-15 10/12A1,500,000 1,807,770.43 0.911,740,880.35 1,426.25Pound Sterling 4,270,030.05 2.154,153,533.37 36,150.30
VODAFONE GROUP EMTN 4.625 05-14 08/09A2,000,000 2,462,259.62 1.242,412,653.02 34,724.05
ANADARKO PETROLEUM 5.95 06-16 15/09S2,000,000 1,618,491.24 0.811,720,625.73 25,188.38US Dollar 20,892,277.37 10.5021,642,859.43 234,678.70
ANGLO AMERICAN CAPITAL PLC 9.375 09-14 08/04S 144A2,000,000 1,482,114.73 0.741,636,447.73 30,994.11BARCLAYS BANK 7.625 12-22 21/11S450,000 348,488.34 0.18351,446.75 2,697.62BBVA US SENIOR 4.664 12-15 09/10S2,000,000 1,527,123.63 0.771,556,577.35 15,231.32BNP PARIBAS EMTN REGS 4.80 05-15 24/06S95,000 72,698.99 0.0476,799.47 55.15BPCE SUB REGS 5.70 13-23 22/10S1,250,000 939,375.52 0.47924,149.29 9,766.92DANSKE BANK REGS 1 3.75 10-15 01/04S1,000,000 750,368.30 0.38796,647.62 6,727.99GENERAL MOTORS 144A 3.50 13-18 02/10S1,000,000 743,633.66 0.37741,152.49 6,561.68HYUNDAI CAP REGS 1.875 13-16 09/08S500,000 365,238.22 0.18375,453.62 2,664.74INTESA SAN PAOLO 3.125 13-16 15/01S1,000,000 740,796.11 0.37744,858.26 10,394.37JAPAN TOBACCO REGS 2.10 13-18 23/07S1,000,000 723,799.85 0.36760,350.14 6,646.34KOREA WESTERN POWER 2.875 13-18 10/10S1,000,000 723,538.59 0.36730,686.88 4,636.52LLOYDS BANK 9.875 11-21 16/12A1,150,000 997,498.46 0.501,011,599.61 3,204.99M UFG LEASE FIN 1.875 13-16 17/10S1,000,000 732,595.52 0.37733,629.98 2,759.23NOMURA HOLDINGS INC 4.125 11-16 19/01S1,000,000 764,715.70 0.38791,552.27 13,387.95ROYAL BK OF SCOTLAND 5.00 02-14 01/10S2,000,000 1,485,554.63 0.751,524,226.13 17,941.30SANTANDER UK REGS SUB 5.00 13-23 07/11S1,000,000 731,710.15 0.37733,218.09 5,342.07SOCIETE GEN.REG-S 3.10 10-15 14/09S3,100,000 2,335,500.56 1.172,438,055.23 20,534.93TELEFONICA EMIS SA 3.729 10-15 27/04S1,000,000 749,765.96 0.38807,054.59 4,735.84TELEFONICA EMIS SA 4.949 09-15 15/01S1,000,000 754,446.83 0.38817,847.65 16,461.35UBS AG STAMFORD 5.875 06-16 15/07A1,000,000 806,945.10 0.41836,916.82 19,541.41UNICREDIT F REGS SUB 6.00 07-17 31/10S1,000,000 771,065.71 0.39793,179.04 7,257.16WM WRIGLEY JR 144A 1.40 13-16 21/10S1,000,000 726,811.57 0.37740,384.69 1,947.33
Statement of investments and other net assets as at 31/12/2013EURExpressed in
UBAM - UNCONSTRAINED BOND
Number/nom. value Description % of total
net assetsMarket valueCost Unaudited AccruedInterest
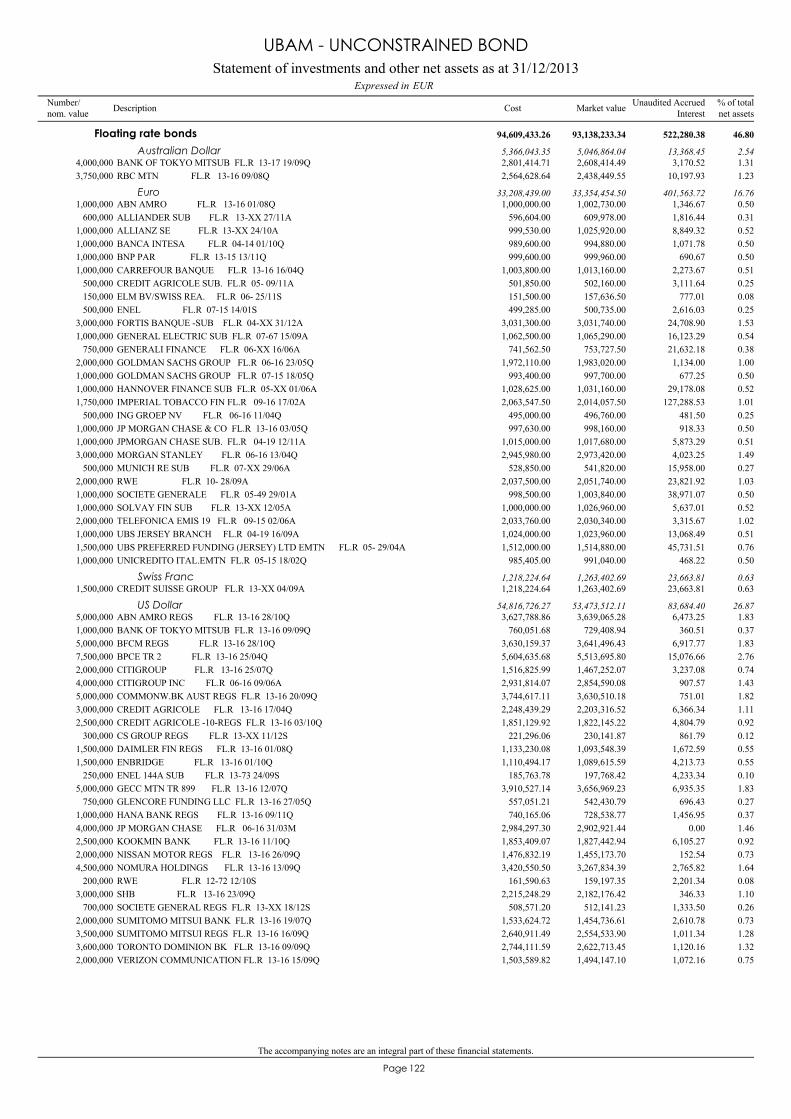
The accompanying notes are an integral part of these financial statements.
122Page
BANK OF TOKYO MITSUB FL.R 13-17 19/09Q4,000,000 2,608,414.49 1.312,801,414.71 3,170.52
Floating rate bonds 93,138,233.34 46.8094,609,433.26 522,280.38
Australian Dollar 5,046,864.04 2.545,366,043.35 13,368.45
RBC MTN FL.R 13-16 09/08Q3,750,000 2,438,449.55 1.232,564,628.64 10,197.93
ABN AMRO FL.R 13-16 01/08Q1,000,000 1,002,730.00 0.501,000,000.00 1,346.67Euro 33,354,454.50 16.7633,208,439.00 401,563.72
ALLIANDER SUB FL.R 13-XX 27/11A600,000 609,978.00 0.31596,604.00 1,816.44ALLIANZ SE FL.R 13-XX 24/10A1,000,000 1,025,920.00 0.52999,530.00 8,849.32BANCA INTESA FL.R 04-14 01/10Q1,000,000 994,880.00 0.50989,600.00 1,071.78BNP PAR FL.R 13-15 13/11Q1,000,000 999,960.00 0.50999,600.00 690.67CARREFOUR BANQUE FL.R 13-16 16/04Q1,000,000 1,013,160.00 0.511,003,800.00 2,273.67CREDIT AGRICOLE SUB. FL.R 05- 09/11A500,000 502,160.00 0.25501,850.00 3,111.64ELM BV/SWISS REA. FL.R 06- 25/11S150,000 157,636.50 0.08151,500.00 777.01ENEL FL.R 07-15 14/01S500,000 500,735.00 0.25499,285.00 2,616.03FORTIS BANQUE -SUB FL.R 04-XX 31/12A3,000,000 3,031,740.00 1.533,031,300.00 24,708.90GENERAL ELECTRIC SUB FL.R 07-67 15/09A1,000,000 1,065,290.00 0.541,062,500.00 16,123.29GENERALI FINANCE FL.R 06-XX 16/06A750,000 753,727.50 0.38741,562.50 21,632.18GOLDMAN SACHS GROUP FL.R 06-16 23/05Q2,000,000 1,983,020.00 1.001,972,110.00 1,134.00GOLDMAN SACHS GROUP FL.R 07-15 18/05Q1,000,000 997,700.00 0.50993,400.00 677.25HANNOVER FINANCE SUB FL.R 05-XX 01/06A1,000,000 1,031,160.00 0.521,028,625.00 29,178.08IMPERIAL TOBACCO FIN FL.R 09-16 17/02A1,750,000 2,014,057.50 1.012,063,547.50 127,288.53ING GROEP NV FL.R 06-16 11/04Q500,000 496,760.00 0.25495,000.00 481.50JP MORGAN CHASE & CO FL.R 13-16 03/05Q1,000,000 998,160.00 0.50997,630.00 918.33JPMORGAN CHASE SUB. FL.R 04-19 12/11A1,000,000 1,017,680.00 0.511,015,000.00 5,873.29MORGAN STANLEY FL.R 06-16 13/04Q3,000,000 2,973,420.00 1.492,945,980.00 4,023.25MUNICH RE SUB FL.R 07-XX 29/06A500,000 541,820.00 0.27528,850.00 15,958.00RWE FL.R 10- 28/09A2,000,000 2,051,740.00 1.032,037,500.00 23,821.92SOCIETE GENERALE FL.R 05-49 29/01A1,000,000 1,003,840.00 0.50998,500.00 38,971.07SOLVAY FIN SUB FL.R 13-XX 12/05A1,000,000 1,026,960.00 0.521,000,000.00 5,637.01TELEFONICA EMIS 19 FL.R 09-15 02/06A2,000,000 2,030,340.00 1.022,033,760.00 3,315.67UBS JERSEY BRANCH FL.R 04-19 16/09A1,000,000 1,023,960.00 0.511,024,000.00 13,068.49UBS PREFERRED FUNDING (JERSEY) LTD EMTN FL.R 05- 29/04A1,500,000 1,514,880.00 0.761,512,000.00 45,731.51UNICREDITO ITAL.EMTN FL.R 05-15 18/02Q1,000,000 991,040.00 0.50985,405.00 468.22
CREDIT SUISSE GROUP FL.R 13-XX 04/09A1,500,000 1,263,402.69 0.631,218,224.64 23,663.81Swiss Franc 1,263,402.69 0.631,218,224.64 23,663.81
ABN AMRO REGS FL.R 13-16 28/10Q5,000,000 3,639,065.28 1.833,627,788.86 6,473.25US Dollar 53,473,512.11 26.8754,816,726.27 83,684.40
BANK OF TOKYO MITSUB FL.R 13-16 09/09Q1,000,000 729,408.94 0.37760,051.68 360.51BFCM REGS FL.R 13-16 28/10Q5,000,000 3,641,496.43 1.833,630,159.37 6,917.77BPCE TR 2 FL.R 13-16 25/04Q7,500,000 5,513,695.80 2.765,604,635.68 15,076.66CITIGROUP FL.R 13-16 25/07Q2,000,000 1,467,252.07 0.741,516,825.99 3,237.08CITIGROUP INC FL.R 06-16 09/06A4,000,000 2,854,590.08 1.432,931,814.07 907.57COMMONW.BK AUST REGS FL.R 13-16 20/09Q5,000,000 3,630,510.18 1.823,744,617.11 751.01CREDIT AGRICOLE FL.R 13-16 17/04Q3,000,000 2,203,316.52 1.112,248,439.29 6,366.34CREDIT AGRICOLE -10-REGS FL.R 13-16 03/10Q2,500,000 1,822,145.22 0.921,851,129.92 4,804.79CS GROUP REGS FL.R 13-XX 11/12S300,000 230,141.87 0.12221,296.06 861.79DAIMLER FIN REGS FL.R 13-16 01/08Q1,500,000 1,093,548.39 0.551,133,230.08 1,672.59ENBRIDGE FL.R 13-16 01/10Q1,500,000 1,089,615.59 0.551,110,494.17 4,213.73ENEL 144A SUB FL.R 13-73 24/09S250,000 197,768.42 0.10185,763.78 4,233.34GECC MTN TR 899 FL.R 13-16 12/07Q5,000,000 3,656,969.23 1.833,910,527.14 6,935.35GLENCORE FUNDING LLC FL.R 13-16 27/05Q750,000 542,430.79 0.27557,051.21 696.43HANA BANK REGS FL.R 13-16 09/11Q1,000,000 728,538.77 0.37740,165.06 1,456.95JP MORGAN CHASE FL.R 06-16 31/03M4,000,000 2,902,921.44 1.462,984,297.30 0.00KOOKMIN BANK FL.R 13-16 11/10Q2,500,000 1,827,442.94 0.921,853,409.07 6,105.27NISSAN MOTOR REGS FL.R 13-16 26/09Q2,000,000 1,455,173.70 0.731,476,832.19 152.54NOMURA HOLDINGS FL.R 13-16 13/09Q4,500,000 3,267,834.39 1.643,420,550.50 2,765.82RWE FL.R 12-72 12/10S200,000 159,197.35 0.08161,590.63 2,201.34SHB FL.R 13-16 23/09Q3,000,000 2,182,176.42 1.102,215,248.29 346.33SOCIETE GENERAL REGS FL.R 13-XX 18/12S700,000 512,141.23 0.26508,571.20 1,333.50SUMITOMO MITSUI BANK FL.R 13-16 19/07Q2,000,000 1,454,736.61 0.731,533,624.72 2,610.78SUMITOMO MITSUI REGS FL.R 13-16 16/09Q3,500,000 2,554,533.90 1.282,640,911.49 1,011.34TORONTO DOMINION BK FL.R 13-16 09/09Q3,600,000 2,622,713.45 1.322,744,111.59 1,120.16VERIZON COMMUNICATION FL.R 13-16 15/09Q2,000,000 1,494,147.10 0.751,503,589.82 1,072.16
Statement of investments and other net assets as at 31/12/2013EURExpressed in
UBAM - UNCONSTRAINED BOND
Number/nom. value Description % of total
net assetsMarket valueCost Unaudited AccruedInterest
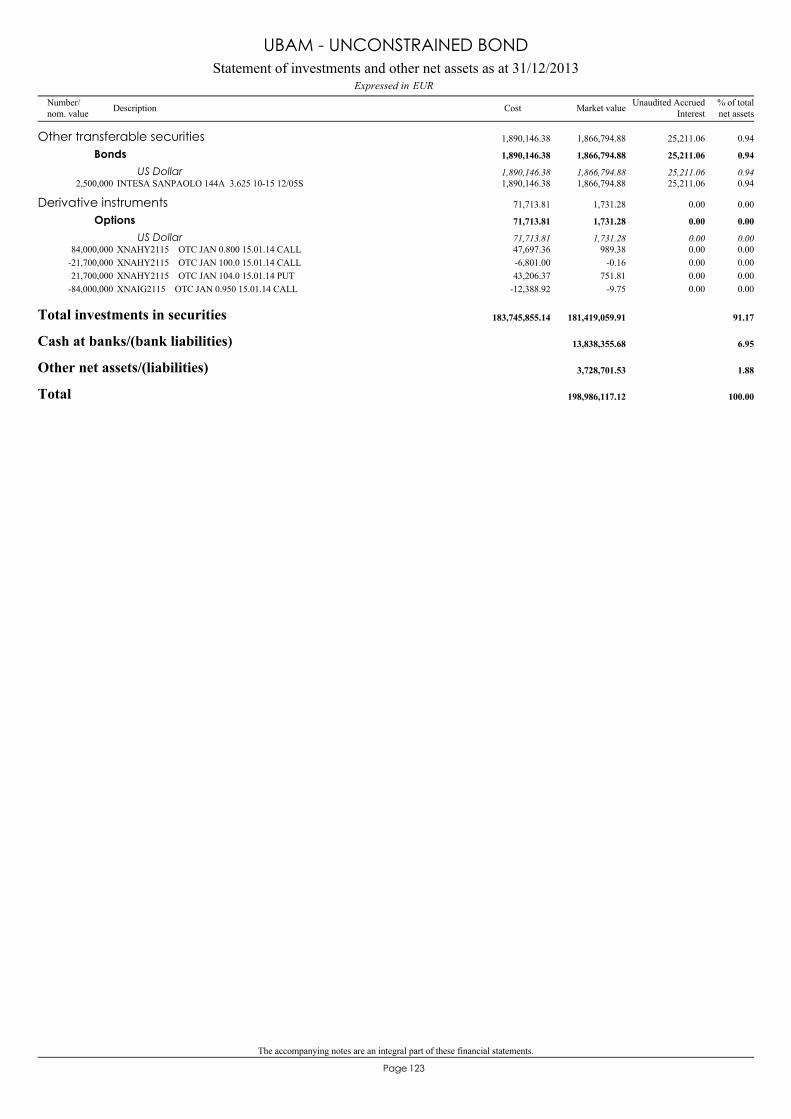
The accompanying notes are an integral part of these financial statements.
123Page
INTESA SANPAOLO 144A 3.625 10-15 12/05S2,500,000 1,866,794.88 0.941,890,146.38 25,211.06
Other transferable securities 1,866,794.88 0.941,890,146.38 25,211.06
Bonds 1,866,794.88 0.941,890,146.38 25,211.06
US Dollar 1,866,794.88 0.941,890,146.38 25,211.06
XNAHY2115 OTC JAN 0.800 15.01.14 CALL84,000,000 989.38 0.0047,697.36 0.00
Derivative instruments 1,731.28 0.0071,713.81 0.00
Options 1,731.28 0.0071,713.81 0.00
US Dollar 1,731.28 0.0071,713.81 0.00
XNAHY2115 OTC JAN 100.0 15.01.14 CALL-21,700,000 -0.16 0.00-6,801.00 0.00XNAHY2115 OTC JAN 104.0 15.01.14 PUT21,700,000 751.81 0.0043,206.37 0.00XNAIG2115 OTC JAN 0.950 15.01.14 CALL-84,000,000 -9.75 0.00-12,388.92 0.00
Total investments in securities 181,419,059.91 91.17183,745,855.14
Cash at banks/(bank liabilities) 13,838,355.68 6.95
Other net assets/(liabilities) 3,728,701.53 1.88
Total 198,986,117.12 100.00
Statement of investments and other net assets as at 31/12/2013EURExpressed in
UBAM - UNCONSTRAINED BOND
Number/nom. value Description % of total
net assetsMarket valueCost Unaudited AccruedInterest

124Page
United States of America 18.66France 14.30United Kingdom 10.29Spain 8.10Italy 7.69The Netherlands 5.23Japan 5.13Luxembourg 4.29Germany 3.57Australia 3.13Canada 3.10South Korea 1.65Belgium 1.53Jersey Island 1.27Sweden 1.10Ireland 1.00Switzerland 0.75Denmark 0.38
91.17
(by domicile of the issuer) % of net assets
Geographical classification of investments
UBAM - UNCONSTRAINED BOND
Banks and credit institutions 44.29Holding and finance companies 20.47Countries and central government 8.54Communications 6.19Utilities 3.62Insurance 1.88Road vehicles 1.28Building materials and trade 1.28Miscellaneous sectors 0.92Tobacco and alcoholic drinks 0.89Petroleum 0.81Foods and non alcoholic drinks 0.37Electrical engineering and electronics 0.36Coal mining and steel industry 0.27Healthcare and social services -
91.17
% of net assets
Industrial classification of investments
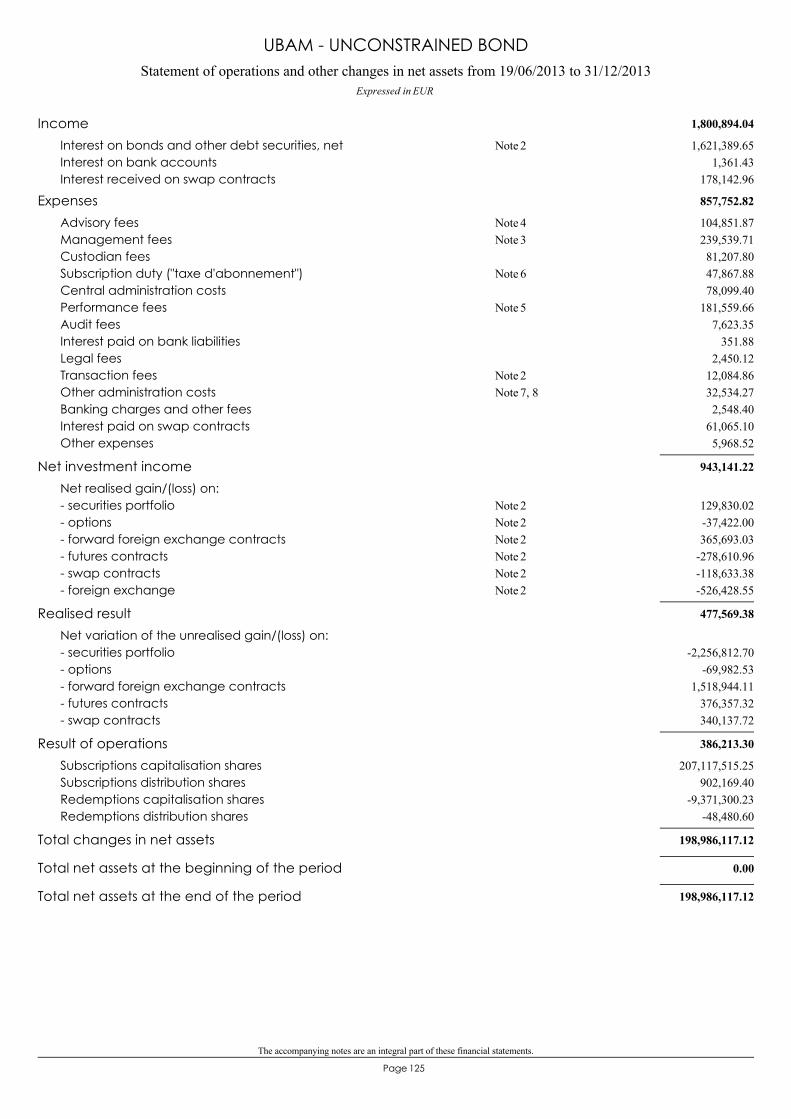
The accompanying notes are an integral part of these financial statements.
125Page
Statement of operations and other changes in net assets from 19/06/2013 to 31/12/2013Expressed in EUR
UBAM - UNCONSTRAINED BOND
1,800,894.04Income1,621,389.65Interest on bonds and other debt securities, net 2Note
1,361.43Interest on bank accounts178,142.96Interest received on swap contracts
857,752.82Expenses104,851.87Advisory fees 4Note239,539.71Management fees 3Note81,207.80Custodian fees47,867.88Subscription duty ("taxe d'abonnement") 6Note78,099.40Central administration costs
181,559.66Performance fees 5Note7,623.35Audit fees
351.88Interest paid on bank liabilities2,450.12Legal fees
12,084.86Transaction fees 2Note32,534.27Other administration costs 7, 8Note2,548.40Banking charges and other fees
61,065.10Interest paid on swap contracts5,968.52Other expenses
943,141.22Net investment incomeNet realised gain/(loss) on:
129,830.02- securities portfolio 2Note-37,422.00- options 2Note365,693.03- forward foreign exchange contracts 2Note
-278,610.96- futures contracts 2Note-118,633.38- swap contracts 2Note-526,428.55- foreign exchange 2Note
477,569.38Realised resultNet variation of the unrealised gain/(loss) on:
-2,256,812.70- securities portfolio-69,982.53- options
1,518,944.11- forward foreign exchange contracts376,357.32- futures contracts340,137.72- swap contracts
386,213.30Result of operations207,117,515.25Subscriptions capitalisation shares
902,169.40Subscriptions distribution shares-9,371,300.23Redemptions capitalisation shares
-48,480.60Redemptions distribution shares
198,986,117.12Total changes in net assets
0.00Total net assets at the beginning of the period
198,986,117.12Total net assets at the end of the period
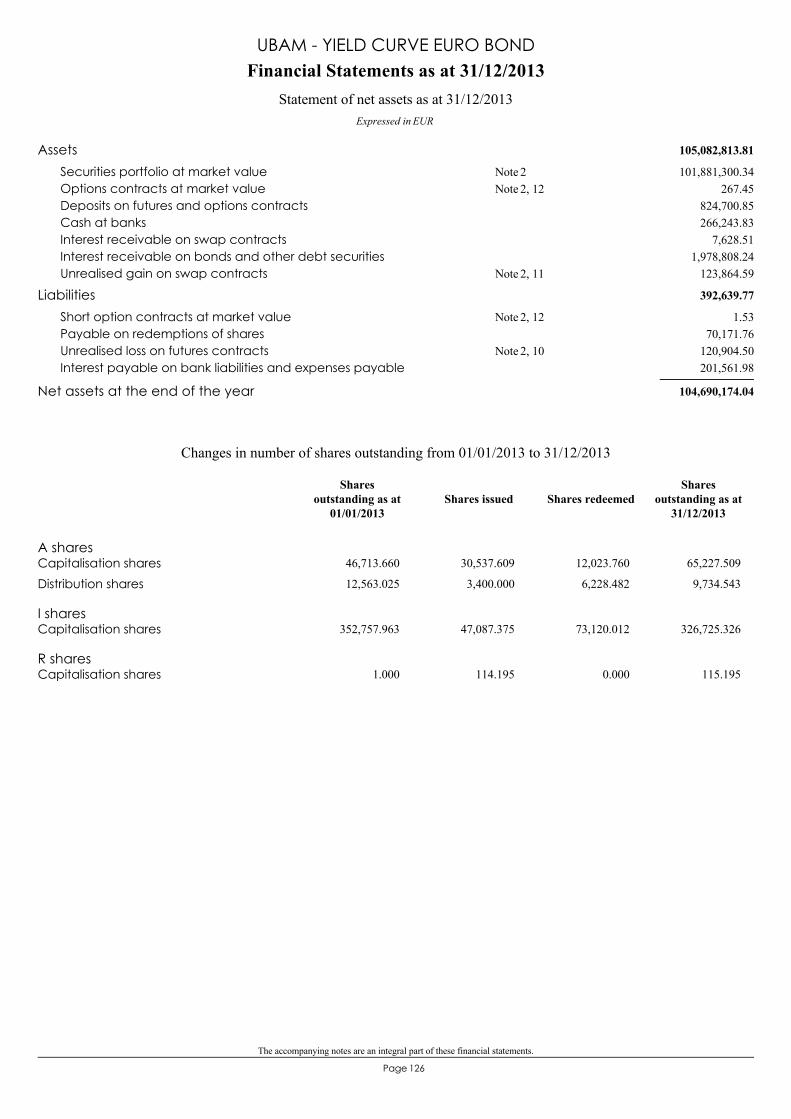
The accompanying notes are an integral part of these financial statements.
126Page
105,082,813.81Assets101,881,300.34Securities portfolio at market value 2Note
267.45Options contracts at market value 2, 12Note824,700.85Deposits on futures and options contracts266,243.83Cash at banks
7,628.51Interest receivable on swap contracts1,978,808.24Interest receivable on bonds and other debt securities
123,864.59Unrealised gain on swap contracts 2, 11Note
392,639.77Liabilities1.53Short option contracts at market value 2, 12Note
70,171.76Payable on redemptions of shares120,904.50Unrealised loss on futures contracts 2, 10Note201,561.98Interest payable on bank liabilities and expenses payable
104,690,174.04Net assets at the end of the year
Financial Statements as at 31/12/2013
Expressed in EUR
Statement of net assets as at 31/12/2013
UBAM - YIELD CURVE EURO BOND
A sharesCapitalisation shares 46,713.660 30,537.609 12,023.760 65,227.509
Distribution shares 12,563.025 3,400.000 6,228.482 9,734.543
I sharesCapitalisation shares 352,757.963 47,087.375 73,120.012 326,725.326
R sharesCapitalisation shares 1.000 114.195 0.000 115.195
Changes in number of shares outstanding from 01/01/2013 to 31/12/2013
Shares issued Shares redeemedShares
outstanding as at31/12/2013
Sharesoutstanding as at
01/01/2013
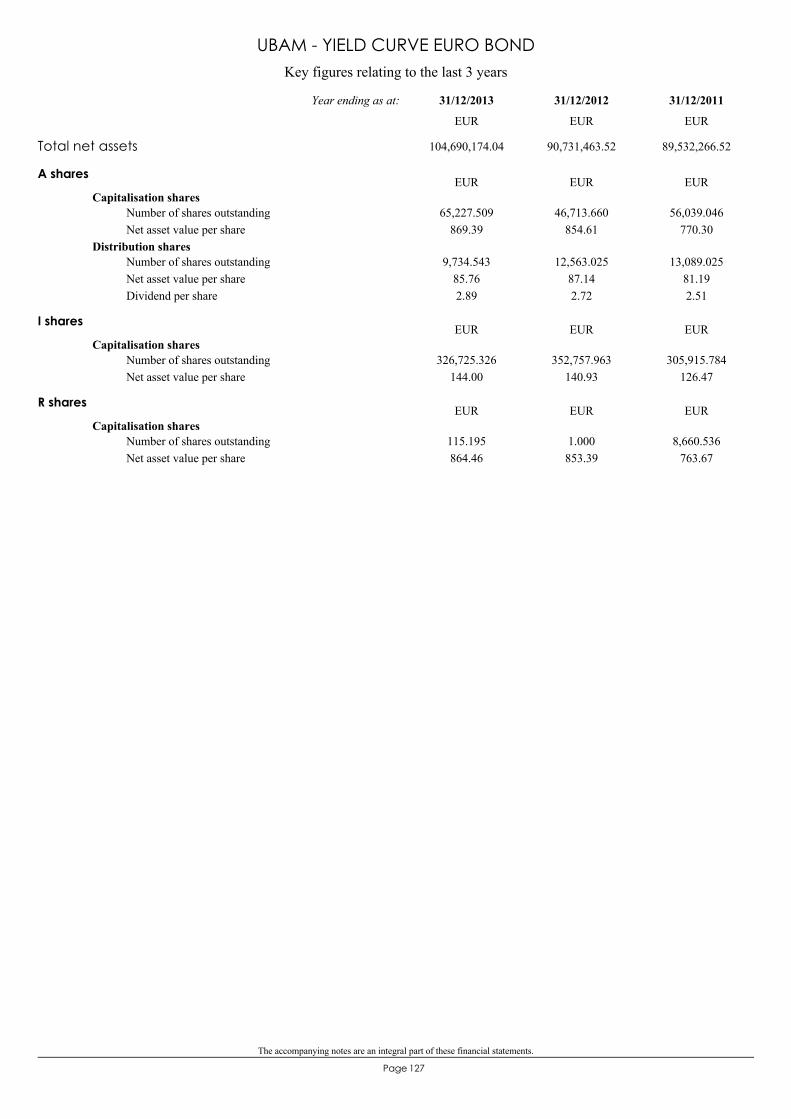
The accompanying notes are an integral part of these financial statements.
127Page
Key figures relating to the last 3 years
UBAM - YIELD CURVE EURO BOND
A shares
Capitalisation shares65,227.509
869.3946,713.660
854.6156,039.046
770.30Number of shares outstandingNet asset value per share
Distribution shares9,734.543
85.762.89
12,563.02587.142.72
13,089.02581.192.51
Number of shares outstandingNet asset value per shareDividend per share
EUR EUR EUR
I shares
Capitalisation shares326,725.326
144.00352,757.963
140.93305,915.784
126.47Number of shares outstandingNet asset value per share
EUR EUR EUR
R shares
Capitalisation shares115.195864.46
1.000853.39
8,660.536763.67
Number of shares outstandingNet asset value per share
EUR EUR EUR
Total net assets 104,690,174.04 90,731,463.52 89,532,266.52
31/12/201131/12/201231/12/2013Year ending as at:
EUR EUR EUR
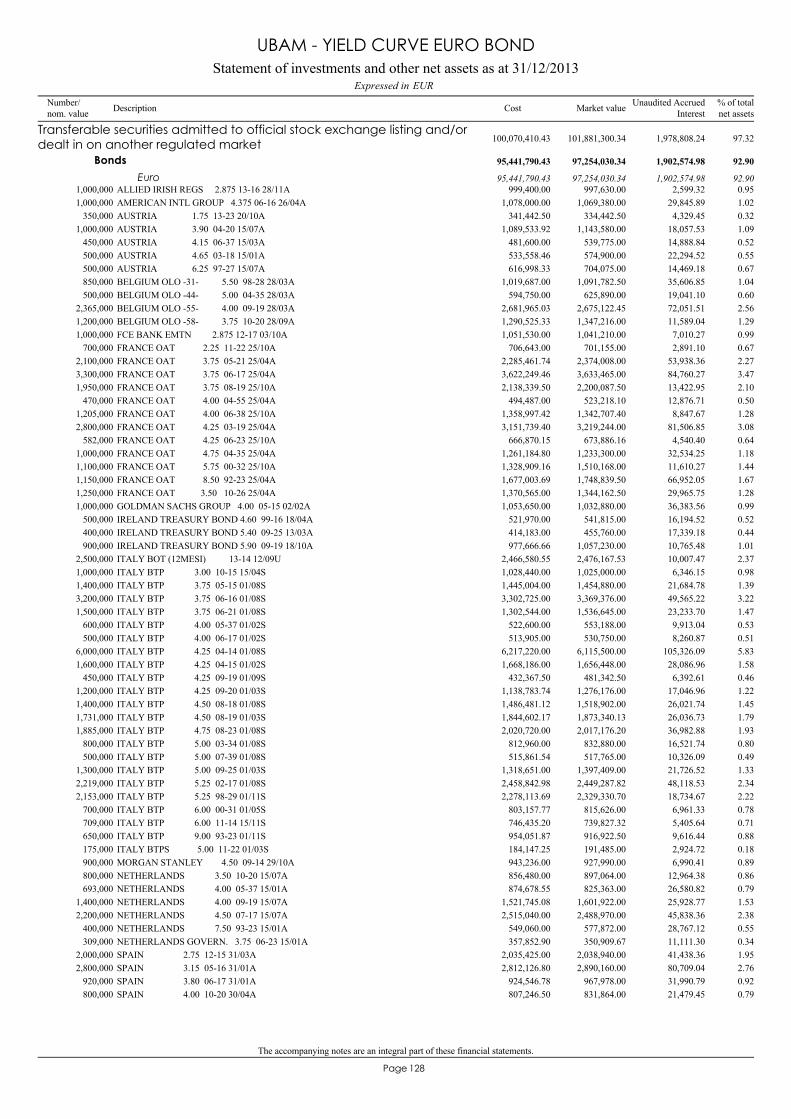
The accompanying notes are an integral part of these financial statements.
128Page
ALLIED IRISH REGS 2.875 13-16 28/11A1,000,000 997,630.00 0.95999,400.00 2,599.32
Transferable securities admitted to official stock exchange listing and/ordealt in on another regulated market 101,881,300.34 97.32100,070,410.43 1,978,808.24
Bonds 97,254,030.34 92.9095,441,790.43 1,902,574.98
Euro 97,254,030.34 92.9095,441,790.43 1,902,574.98
AMERICAN INTL GROUP 4.375 06-16 26/04A1,000,000 1,069,380.00 1.021,078,000.00 29,845.89AUSTRIA 1.75 13-23 20/10A350,000 334,442.50 0.32341,442.50 4,329.45AUSTRIA 3.90 04-20 15/07A1,000,000 1,143,580.00 1.091,089,533.92 18,057.53AUSTRIA 4.15 06-37 15/03A450,000 539,775.00 0.52481,600.00 14,888.84AUSTRIA 4.65 03-18 15/01A500,000 574,900.00 0.55533,558.46 22,294.52AUSTRIA 6.25 97-27 15/07A500,000 704,075.00 0.67616,998.33 14,469.18BELGIUM OLO -31- 5.50 98-28 28/03A850,000 1,091,782.50 1.041,019,687.00 35,606.85BELGIUM OLO -44- 5.00 04-35 28/03A500,000 625,890.00 0.60594,750.00 19,041.10BELGIUM OLO -55- 4.00 09-19 28/03A2,365,000 2,675,122.45 2.562,681,965.03 72,051.51BELGIUM OLO -58- 3.75 10-20 28/09A1,200,000 1,347,216.00 1.291,290,525.33 11,589.04FCE BANK EMTN 2.875 12-17 03/10A1,000,000 1,041,210.00 0.991,051,530.00 7,010.27FRANCE OAT 2.25 11-22 25/10A700,000 701,155.00 0.67706,643.00 2,891.10FRANCE OAT 3.75 05-21 25/04A2,100,000 2,374,008.00 2.272,285,461.74 53,938.36FRANCE OAT 3.75 06-17 25/04A3,300,000 3,633,465.00 3.473,622,249.46 84,760.27FRANCE OAT 3.75 08-19 25/10A1,950,000 2,200,087.50 2.102,138,339.50 13,422.95FRANCE OAT 4.00 04-55 25/04A470,000 523,218.10 0.50494,487.00 12,876.71FRANCE OAT 4.00 06-38 25/10A1,205,000 1,342,707.40 1.281,358,997.42 8,847.67FRANCE OAT 4.25 03-19 25/04A2,800,000 3,219,244.00 3.083,151,739.40 81,506.85FRANCE OAT 4.25 06-23 25/10A582,000 673,886.16 0.64666,870.15 4,540.40FRANCE OAT 4.75 04-35 25/04A1,000,000 1,233,300.00 1.181,261,184.80 32,534.25FRANCE OAT 5.75 00-32 25/10A1,100,000 1,510,168.00 1.441,328,909.16 11,610.27FRANCE OAT 8.50 92-23 25/04A1,150,000 1,748,839.50 1.671,677,003.69 66,952.05FRANCE OAT 3.50 10-26 25/04A1,250,000 1,344,162.50 1.281,370,565.00 29,965.75GOLDMAN SACHS GROUP 4.00 05-15 02/02A1,000,000 1,032,880.00 0.991,053,650.00 36,383.56IRELAND TREASURY BOND 4.60 99-16 18/04A500,000 541,815.00 0.52521,970.00 16,194.52IRELAND TREASURY BOND 5.40 09-25 13/03A400,000 455,760.00 0.44414,183.00 17,339.18IRELAND TREASURY BOND 5.90 09-19 18/10A900,000 1,057,230.00 1.01977,666.66 10,765.48ITALY BOT (12MESI) 13-14 12/09U2,500,000 2,476,167.53 2.372,466,580.55 10,007.47ITALY BTP 3.00 10-15 15/04S1,000,000 1,025,000.00 0.981,028,440.00 6,346.15ITALY BTP 3.75 05-15 01/08S1,400,000 1,454,880.00 1.391,445,004.00 21,684.78ITALY BTP 3.75 06-16 01/08S3,200,000 3,369,376.00 3.223,302,725.00 49,565.22ITALY BTP 3.75 06-21 01/08S1,500,000 1,536,645.00 1.471,302,544.00 23,233.70ITALY BTP 4.00 05-37 01/02S600,000 553,188.00 0.53522,600.00 9,913.04ITALY BTP 4.00 06-17 01/02S500,000 530,750.00 0.51513,905.00 8,260.87ITALY BTP 4.25 04-14 01/08S6,000,000 6,115,500.00 5.836,217,220.00 105,326.09ITALY BTP 4.25 04-15 01/02S1,600,000 1,656,448.00 1.581,668,186.00 28,086.96ITALY BTP 4.25 09-19 01/09S450,000 481,342.50 0.46432,367.50 6,392.61ITALY BTP 4.25 09-20 01/03S1,200,000 1,276,176.00 1.221,138,783.74 17,046.96ITALY BTP 4.50 08-18 01/08S1,400,000 1,518,902.00 1.451,486,481.12 26,021.74ITALY BTP 4.50 08-19 01/03S1,731,000 1,873,340.13 1.791,844,602.17 26,036.73ITALY BTP 4.75 08-23 01/08S1,885,000 2,017,176.20 1.932,020,720.00 36,982.88ITALY BTP 5.00 03-34 01/08S800,000 832,880.00 0.80812,960.00 16,521.74ITALY BTP 5.00 07-39 01/08S500,000 517,765.00 0.49515,861.54 10,326.09ITALY BTP 5.00 09-25 01/03S1,300,000 1,397,409.00 1.331,318,651.00 21,726.52ITALY BTP 5.25 02-17 01/08S2,219,000 2,449,287.82 2.342,458,842.98 48,118.53ITALY BTP 5.25 98-29 01/11S2,153,000 2,329,330.70 2.222,278,113.69 18,734.67ITALY BTP 6.00 00-31 01/05S700,000 815,626.00 0.78803,157.77 6,961.33ITALY BTP 6.00 11-14 15/11S709,000 739,827.32 0.71746,435.20 5,405.64ITALY BTP 9.00 93-23 01/11S650,000 916,922.50 0.88954,051.87 9,616.44ITALY BTPS 5.00 11-22 01/03S175,000 191,485.00 0.18184,147.25 2,924.72MORGAN STANLEY 4.50 09-14 29/10A900,000 927,990.00 0.89943,236.00 6,990.41NETHERLANDS 3.50 10-20 15/07A800,000 897,064.00 0.86856,480.00 12,964.38NETHERLANDS 4.00 05-37 15/01A693,000 825,363.00 0.79874,678.55 26,580.82NETHERLANDS 4.00 09-19 15/07A1,400,000 1,601,922.00 1.531,521,745.08 25,928.77NETHERLANDS 4.50 07-17 15/07A2,200,000 2,488,970.00 2.382,515,040.00 45,838.36NETHERLANDS 7.50 93-23 15/01A400,000 577,872.00 0.55549,060.00 28,767.12NETHERLANDS GOVERN. 3.75 06-23 15/01A309,000 350,909.67 0.34357,852.90 11,111.30SPAIN 2.75 12-15 31/03A2,000,000 2,038,940.00 1.952,035,425.00 41,438.36SPAIN 3.15 05-16 31/01A2,800,000 2,890,160.00 2.762,812,126.80 80,709.04SPAIN 3.80 06-17 31/01A920,000 967,978.00 0.92924,546.78 31,990.79SPAIN 4.00 10-20 30/04A800,000 831,864.00 0.79807,246.50 21,479.45
Statement of investments and other net assets as at 31/12/2013EURExpressed in
UBAM - YIELD CURVE EURO BOND
Number/nom. value Description % of total
net assetsMarket valueCost Unaudited AccruedInterest
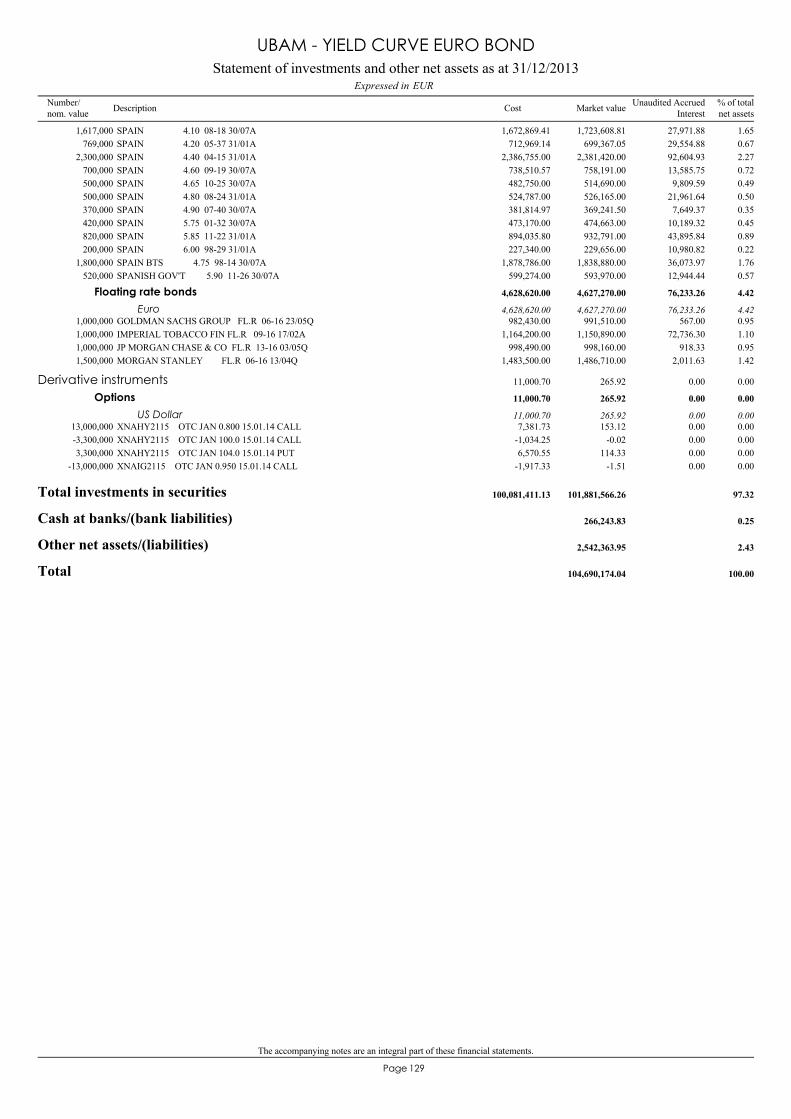
The accompanying notes are an integral part of these financial statements.
129Page
SPAIN 4.10 08-18 30/07A1,617,000 1,723,608.81 1.651,672,869.41 27,971.88SPAIN 4.20 05-37 31/01A769,000 699,367.05 0.67712,969.14 29,554.88SPAIN 4.40 04-15 31/01A2,300,000 2,381,420.00 2.272,386,755.00 92,604.93SPAIN 4.60 09-19 30/07A700,000 758,191.00 0.72738,510.57 13,585.75SPAIN 4.65 10-25 30/07A500,000 514,690.00 0.49482,750.00 9,809.59SPAIN 4.80 08-24 31/01A500,000 526,165.00 0.50524,787.00 21,961.64SPAIN 4.90 07-40 30/07A370,000 369,241.50 0.35381,814.97 7,649.37SPAIN 5.75 01-32 30/07A420,000 474,663.00 0.45473,170.00 10,189.32SPAIN 5.85 11-22 31/01A820,000 932,791.00 0.89894,035.80 43,895.84SPAIN 6.00 98-29 31/01A200,000 229,656.00 0.22227,340.00 10,980.82SPAIN BTS 4.75 98-14 30/07A1,800,000 1,838,880.00 1.761,878,786.00 36,073.97SPANISH GOV'T 5.90 11-26 30/07A520,000 593,970.00 0.57599,274.00 12,944.44
GOLDMAN SACHS GROUP FL.R 06-16 23/05Q1,000,000 991,510.00 0.95982,430.00 567.00
Floating rate bonds 4,627,270.00 4.424,628,620.00 76,233.26
Euro 4,627,270.00 4.424,628,620.00 76,233.26
IMPERIAL TOBACCO FIN FL.R 09-16 17/02A1,000,000 1,150,890.00 1.101,164,200.00 72,736.30JP MORGAN CHASE & CO FL.R 13-16 03/05Q1,000,000 998,160.00 0.95998,490.00 918.33MORGAN STANLEY FL.R 06-16 13/04Q1,500,000 1,486,710.00 1.421,483,500.00 2,011.63
XNAHY2115 OTC JAN 0.800 15.01.14 CALL13,000,000 153.12 0.007,381.73 0.00
Derivative instruments 265.92 0.0011,000.70 0.00
Options 265.92 0.0011,000.70 0.00
US Dollar 265.92 0.0011,000.70 0.00
XNAHY2115 OTC JAN 100.0 15.01.14 CALL-3,300,000 -0.02 0.00-1,034.25 0.00XNAHY2115 OTC JAN 104.0 15.01.14 PUT3,300,000 114.33 0.006,570.55 0.00XNAIG2115 OTC JAN 0.950 15.01.14 CALL-13,000,000 -1.51 0.00-1,917.33 0.00
Total investments in securities 101,881,566.26 97.32100,081,411.13
Cash at banks/(bank liabilities) 266,243.83 0.25
Other net assets/(liabilities) 2,542,363.95 2.43
Total 104,690,174.04 100.00
Statement of investments and other net assets as at 31/12/2013EURExpressed in
UBAM - YIELD CURVE EURO BOND
Number/nom. value Description % of total
net assetsMarket valueCost Unaudited AccruedInterest
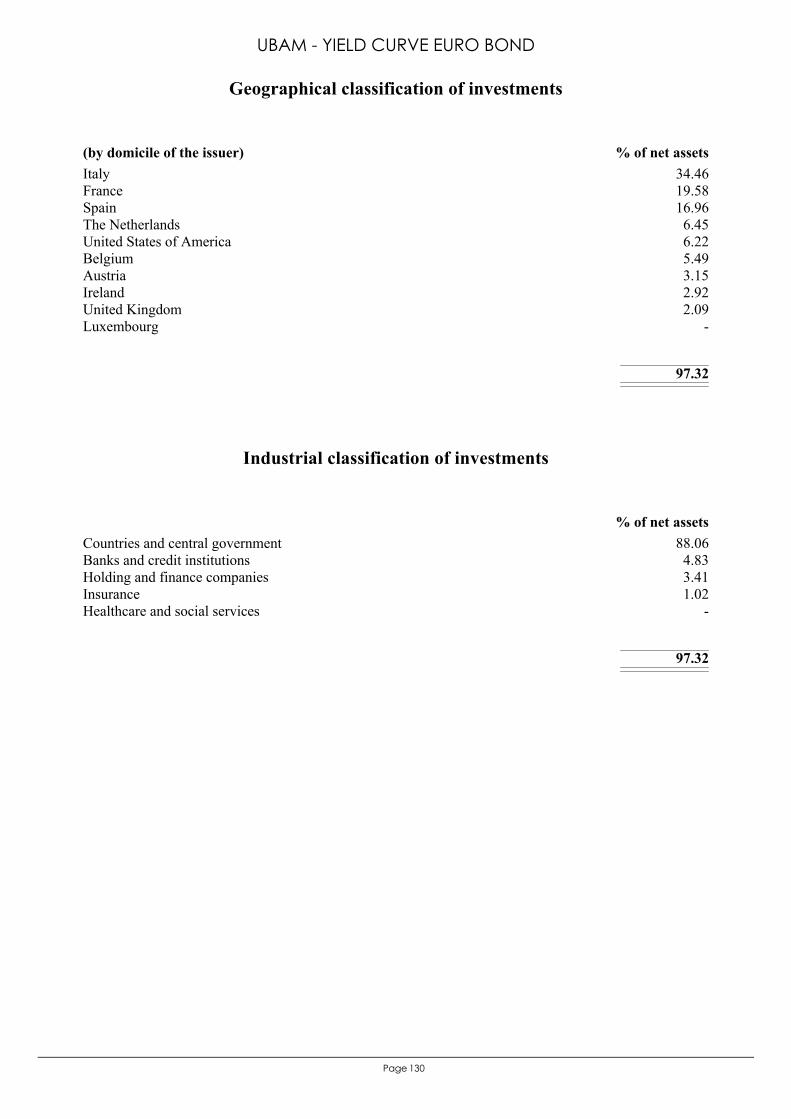
130Page
Italy 34.46France 19.58Spain 16.96The Netherlands 6.45United States of America 6.22Belgium 5.49Austria 3.15Ireland 2.92United Kingdom 2.09Luxembourg -
97.32
(by domicile of the issuer) % of net assets
Geographical classification of investments
UBAM - YIELD CURVE EURO BOND
Countries and central government 88.06Banks and credit institutions 4.83Holding and finance companies 3.41Insurance 1.02Healthcare and social services -
97.32
% of net assets
Industrial classification of investments
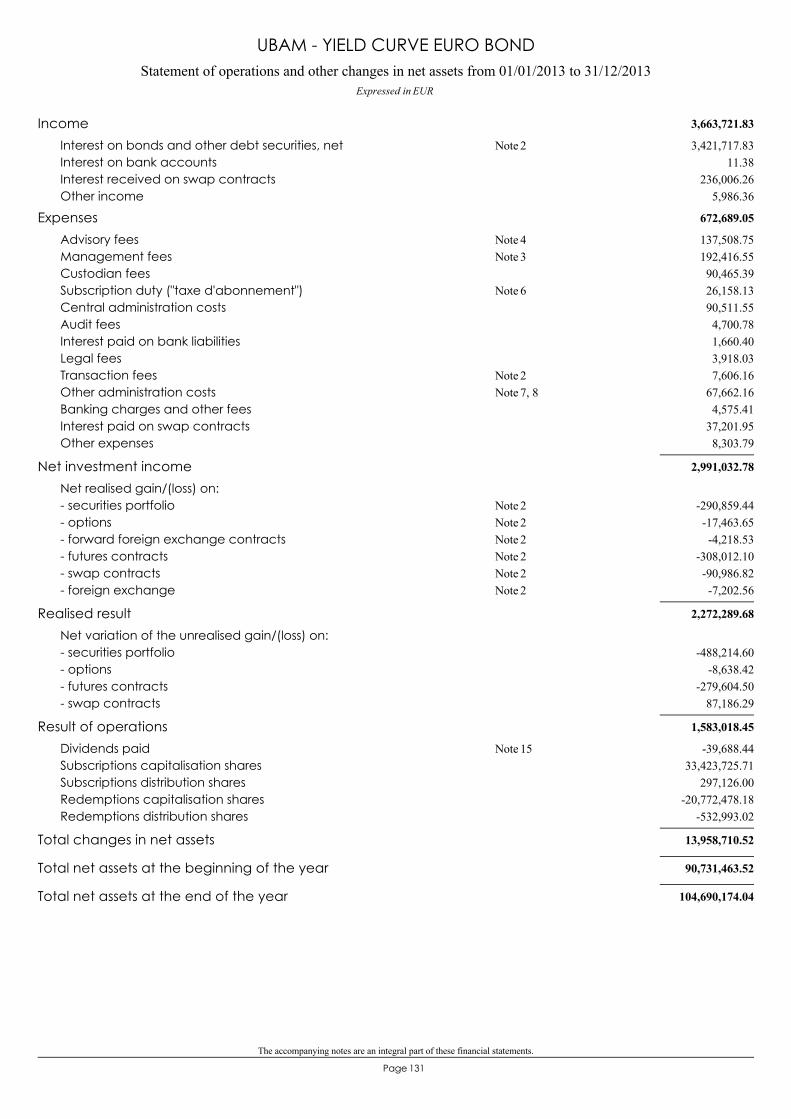
The accompanying notes are an integral part of these financial statements.
131Page
Statement of operations and other changes in net assets from 01/01/2013 to 31/12/2013Expressed in EUR
UBAM - YIELD CURVE EURO BOND
3,663,721.83Income3,421,717.83Interest on bonds and other debt securities, net 2Note
11.38Interest on bank accounts236,006.26Interest received on swap contracts
5,986.36Other income
672,689.05Expenses137,508.75Advisory fees 4Note192,416.55Management fees 3Note90,465.39Custodian fees26,158.13Subscription duty ("taxe d'abonnement") 6Note90,511.55Central administration costs4,700.78Audit fees1,660.40Interest paid on bank liabilities3,918.03Legal fees7,606.16Transaction fees 2Note
67,662.16Other administration costs 7, 8Note4,575.41Banking charges and other fees
37,201.95Interest paid on swap contracts8,303.79Other expenses
2,991,032.78Net investment incomeNet realised gain/(loss) on:
-290,859.44- securities portfolio 2Note-17,463.65- options 2Note-4,218.53- forward foreign exchange contracts 2Note
-308,012.10- futures contracts 2Note-90,986.82- swap contracts 2Note-7,202.56- foreign exchange 2Note
2,272,289.68Realised resultNet variation of the unrealised gain/(loss) on:
-488,214.60- securities portfolio-8,638.42- options
-279,604.50- futures contracts87,186.29- swap contracts
1,583,018.45Result of operations-39,688.44Dividends paid 15Note
33,423,725.71Subscriptions capitalisation shares297,126.00Subscriptions distribution shares
-20,772,478.18Redemptions capitalisation shares-532,993.02Redemptions distribution shares
13,958,710.52Total changes in net assets
90,731,463.52Total net assets at the beginning of the year
104,690,174.04Total net assets at the end of the year
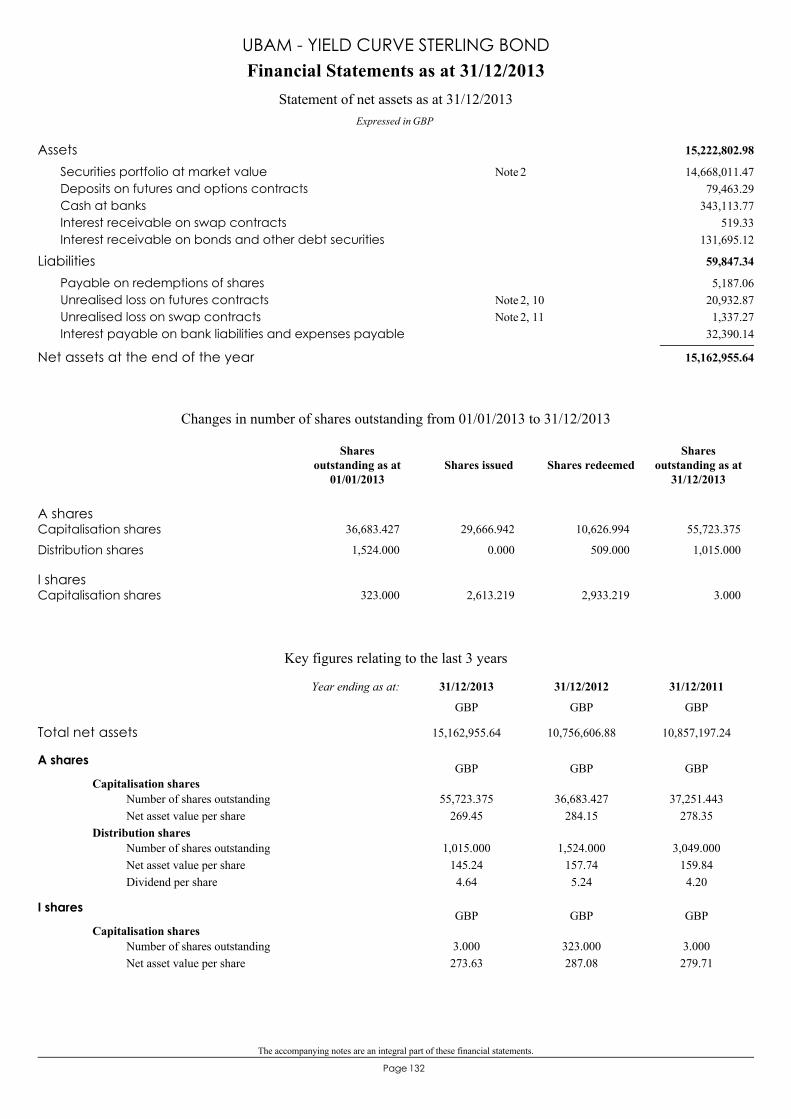
The accompanying notes are an integral part of these financial statements.
132Page
15,222,802.98Assets14,668,011.47Securities portfolio at market value 2Note
79,463.29Deposits on futures and options contracts343,113.77Cash at banks
519.33Interest receivable on swap contracts131,695.12Interest receivable on bonds and other debt securities
59,847.34Liabilities5,187.06Payable on redemptions of shares
20,932.87Unrealised loss on futures contracts 2, 10Note1,337.27Unrealised loss on swap contracts 2, 11Note
32,390.14Interest payable on bank liabilities and expenses payable
15,162,955.64Net assets at the end of the year
Financial Statements as at 31/12/2013
Expressed in GBP
Statement of net assets as at 31/12/2013
UBAM - YIELD CURVE STERLING BOND
A sharesCapitalisation shares 36,683.427 29,666.942 10,626.994 55,723.375
Distribution shares 1,524.000 0.000 509.000 1,015.000
I sharesCapitalisation shares 323.000 2,613.219 2,933.219 3.000
Changes in number of shares outstanding from 01/01/2013 to 31/12/2013
Shares issued Shares redeemedShares
outstanding as at31/12/2013
Sharesoutstanding as at
01/01/2013
Key figures relating to the last 3 years
A shares
Capitalisation shares55,723.375
269.4536,683.427
284.1537,251.443
278.35Number of shares outstandingNet asset value per share
Distribution shares1,015.000
145.244.64
1,524.000157.745.24
3,049.000159.844.20
Number of shares outstandingNet asset value per shareDividend per share
GBP GBP GBP
I shares
Capitalisation shares3.000273.63
323.000287.08
3.000279.71
Number of shares outstandingNet asset value per share
GBP GBP GBP
Total net assets 15,162,955.64 10,756,606.88 10,857,197.24
31/12/201131/12/201231/12/2013Year ending as at:
GBP GBP GBP
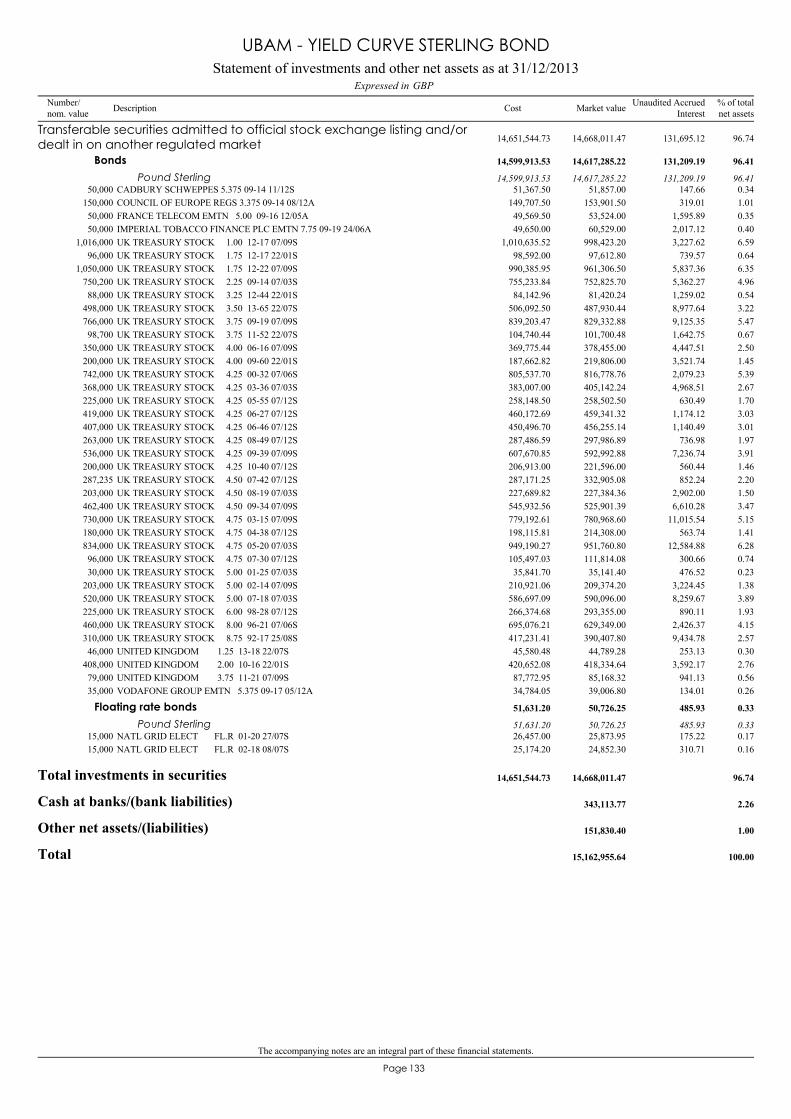
The accompanying notes are an integral part of these financial statements.
133Page
CADBURY SCHWEPPES 5.375 09-14 11/12S50,000 51,857.00 0.3451,367.50 147.66
Transferable securities admitted to official stock exchange listing and/ordealt in on another regulated market 14,668,011.47 96.7414,651,544.73 131,695.12
Bonds 14,617,285.22 96.4114,599,913.53 131,209.19
Pound Sterling 14,617,285.22 96.4114,599,913.53 131,209.19
COUNCIL OF EUROPE REGS 3.375 09-14 08/12A150,000 153,901.50 1.01149,707.50 319.01FRANCE TELECOM EMTN 5.00 09-16 12/05A50,000 53,524.00 0.3549,569.50 1,595.89IMPERIAL TOBACCO FINANCE PLC EMTN 7.75 09-19 24/06A50,000 60,529.00 0.4049,650.00 2,017.12UK TREASURY STOCK 1.00 12-17 07/09S1,016,000 998,423.20 6.591,010,635.52 3,227.62UK TREASURY STOCK 1.75 12-17 22/01S96,000 97,612.80 0.6498,592.00 739.57UK TREASURY STOCK 1.75 12-22 07/09S1,050,000 961,306.50 6.35990,385.95 5,837.36UK TREASURY STOCK 2.25 09-14 07/03S750,200 752,825.70 4.96755,233.84 5,362.27UK TREASURY STOCK 3.25 12-44 22/01S88,000 81,420.24 0.5484,142.96 1,259.02UK TREASURY STOCK 3.50 13-65 22/07S498,000 487,930.44 3.22506,092.50 8,977.64UK TREASURY STOCK 3.75 09-19 07/09S766,000 829,332.88 5.47839,203.47 9,125.35UK TREASURY STOCK 3.75 11-52 22/07S98,700 101,700.48 0.67104,740.44 1,642.75UK TREASURY STOCK 4.00 06-16 07/09S350,000 378,455.00 2.50369,775.44 4,447.51UK TREASURY STOCK 4.00 09-60 22/01S200,000 219,806.00 1.45187,662.82 3,521.74UK TREASURY STOCK 4.25 00-32 07/06S742,000 816,778.76 5.39805,537.70 2,079.23UK TREASURY STOCK 4.25 03-36 07/03S368,000 405,142.24 2.67383,007.00 4,968.51UK TREASURY STOCK 4.25 05-55 07/12S225,000 258,502.50 1.70258,148.50 630.49UK TREASURY STOCK 4.25 06-27 07/12S419,000 459,341.32 3.03460,172.69 1,174.12UK TREASURY STOCK 4.25 06-46 07/12S407,000 456,255.14 3.01450,496.70 1,140.49UK TREASURY STOCK 4.25 08-49 07/12S263,000 297,986.89 1.97287,486.59 736.98UK TREASURY STOCK 4.25 09-39 07/09S536,000 592,992.88 3.91607,670.85 7,236.74UK TREASURY STOCK 4.25 10-40 07/12S200,000 221,596.00 1.46206,913.00 560.44UK TREASURY STOCK 4.50 07-42 07/12S287,235 332,905.08 2.20287,171.25 852.24UK TREASURY STOCK 4.50 08-19 07/03S203,000 227,384.36 1.50227,689.82 2,902.00UK TREASURY STOCK 4.50 09-34 07/09S462,400 525,901.39 3.47545,932.56 6,610.28UK TREASURY STOCK 4.75 03-15 07/09S730,000 780,968.60 5.15779,192.61 11,015.54UK TREASURY STOCK 4.75 04-38 07/12S180,000 214,308.00 1.41198,115.81 563.74UK TREASURY STOCK 4.75 05-20 07/03S834,000 951,760.80 6.28949,190.27 12,584.88UK TREASURY STOCK 4.75 07-30 07/12S96,000 111,814.08 0.74105,497.03 300.66UK TREASURY STOCK 5.00 01-25 07/03S30,000 35,141.40 0.2335,841.70 476.52UK TREASURY STOCK 5.00 02-14 07/09S203,000 209,374.20 1.38210,921.06 3,224.45UK TREASURY STOCK 5.00 07-18 07/03S520,000 590,096.00 3.89586,697.09 8,259.67UK TREASURY STOCK 6.00 98-28 07/12S225,000 293,355.00 1.93266,374.68 890.11UK TREASURY STOCK 8.00 96-21 07/06S460,000 629,349.00 4.15695,076.21 2,426.37UK TREASURY STOCK 8.75 92-17 25/08S310,000 390,407.80 2.57417,231.41 9,434.78UNITED KINGDOM 1.25 13-18 22/07S46,000 44,789.28 0.3045,580.48 253.13UNITED KINGDOM 2.00 10-16 22/01S408,000 418,334.64 2.76420,652.08 3,592.17UNITED KINGDOM 3.75 11-21 07/09S79,000 85,168.32 0.5687,772.95 941.13VODAFONE GROUP EMTN 5.375 09-17 05/12A35,000 39,006.80 0.2634,784.05 134.01
NATL GRID ELECT FL.R 01-20 27/07S15,000 25,873.95 0.1726,457.00 175.22
Floating rate bonds 50,726.25 0.3351,631.20 485.93
Pound Sterling 50,726.25 0.3351,631.20 485.93
NATL GRID ELECT FL.R 02-18 08/07S15,000 24,852.30 0.1625,174.20 310.71
Total investments in securities 14,668,011.47 96.7414,651,544.73
Cash at banks/(bank liabilities) 343,113.77 2.26
Other net assets/(liabilities) 151,830.40 1.00
Total 15,162,955.64 100.00
Statement of investments and other net assets as at 31/12/2013GBPExpressed in
UBAM - YIELD CURVE STERLING BOND
Number/nom. value Description % of total
net assetsMarket valueCost Unaudited AccruedInterest
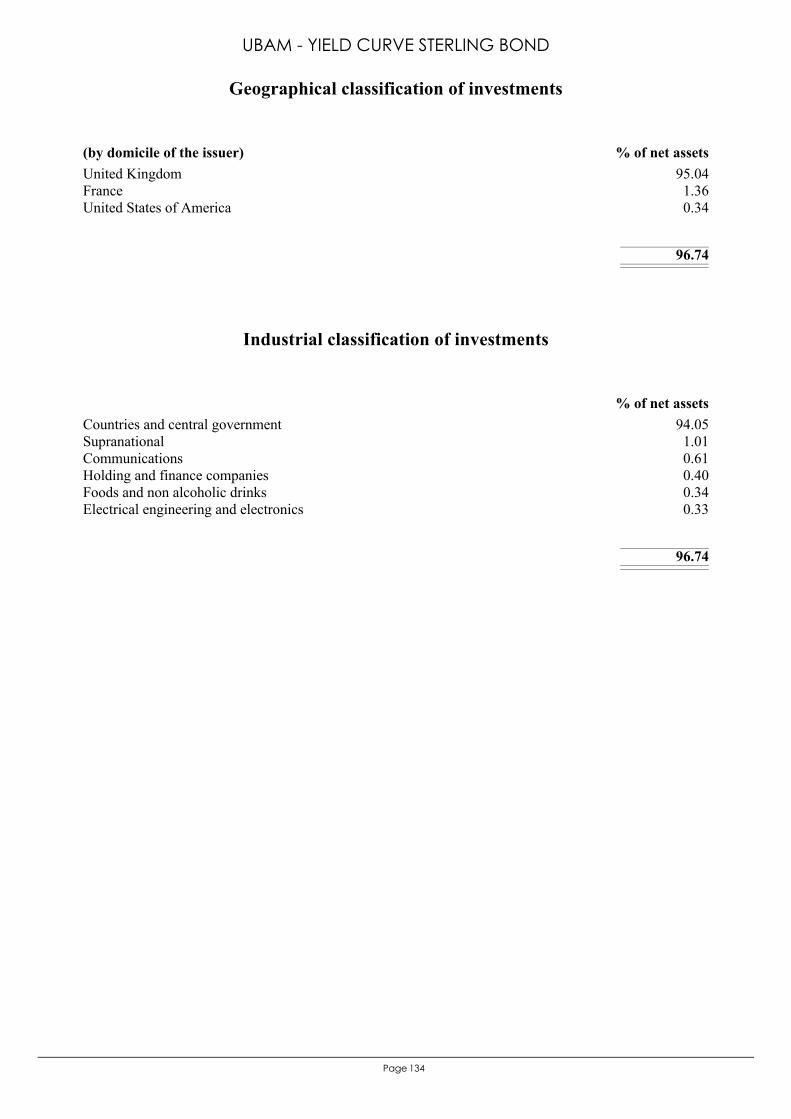
134Page
United Kingdom 95.04France 1.36United States of America 0.34
96.74
(by domicile of the issuer) % of net assets
Geographical classification of investments
UBAM - YIELD CURVE STERLING BOND
Countries and central government 94.05Supranational 1.01Communications 0.61Holding and finance companies 0.40Foods and non alcoholic drinks 0.34Electrical engineering and electronics 0.33
96.74
% of net assets
Industrial classification of investments
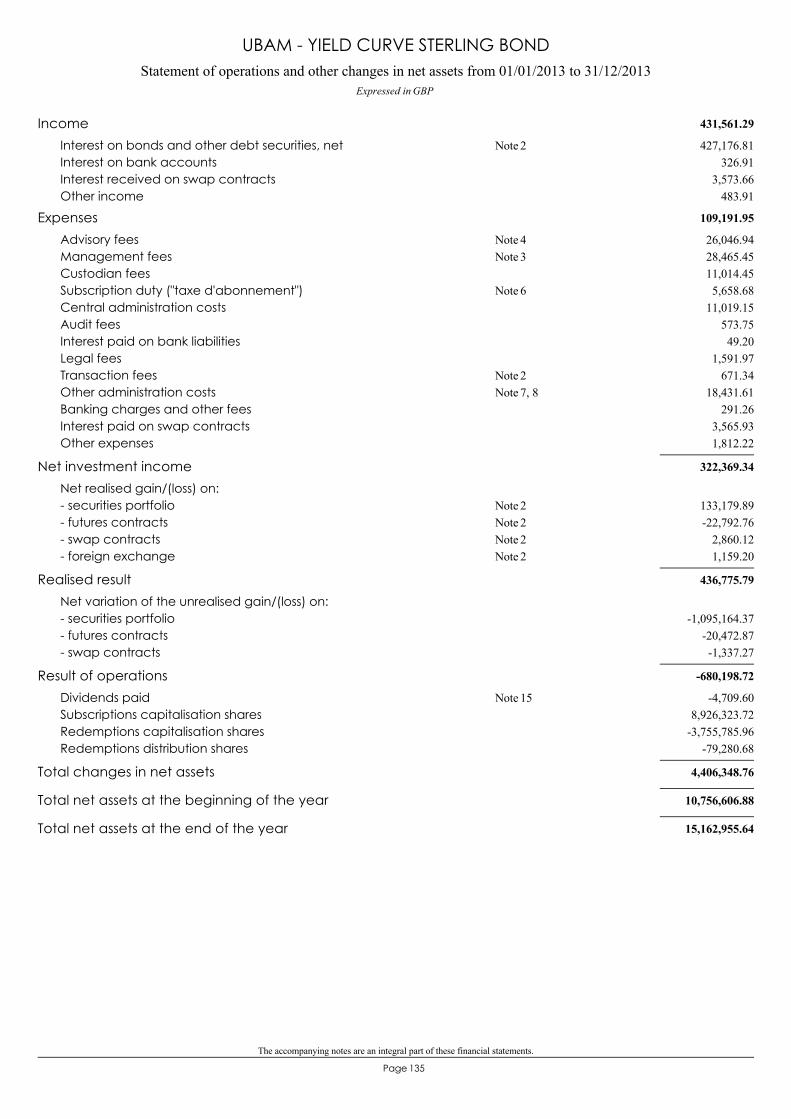
The accompanying notes are an integral part of these financial statements.
135Page
Statement of operations and other changes in net assets from 01/01/2013 to 31/12/2013Expressed in GBP
UBAM - YIELD CURVE STERLING BOND
431,561.29Income427,176.81Interest on bonds and other debt securities, net 2Note
326.91Interest on bank accounts3,573.66Interest received on swap contracts
483.91Other income
109,191.95Expenses26,046.94Advisory fees 4Note28,465.45Management fees 3Note11,014.45Custodian fees5,658.68Subscription duty ("taxe d'abonnement") 6Note
11,019.15Central administration costs573.75Audit fees49.20Interest paid on bank liabilities
1,591.97Legal fees671.34Transaction fees 2Note
18,431.61Other administration costs 7, 8Note291.26Banking charges and other fees
3,565.93Interest paid on swap contracts1,812.22Other expenses
322,369.34Net investment incomeNet realised gain/(loss) on:
133,179.89- securities portfolio 2Note-22,792.76- futures contracts 2Note
2,860.12- swap contracts 2Note1,159.20- foreign exchange 2Note
436,775.79Realised resultNet variation of the unrealised gain/(loss) on:
-1,095,164.37- securities portfolio-20,472.87- futures contracts-1,337.27- swap contracts
-680,198.72Result of operations-4,709.60Dividends paid 15Note
8,926,323.72Subscriptions capitalisation shares-3,755,785.96Redemptions capitalisation shares
-79,280.68Redemptions distribution shares
4,406,348.76Total changes in net assets
10,756,606.88Total net assets at the beginning of the year
15,162,955.64Total net assets at the end of the year
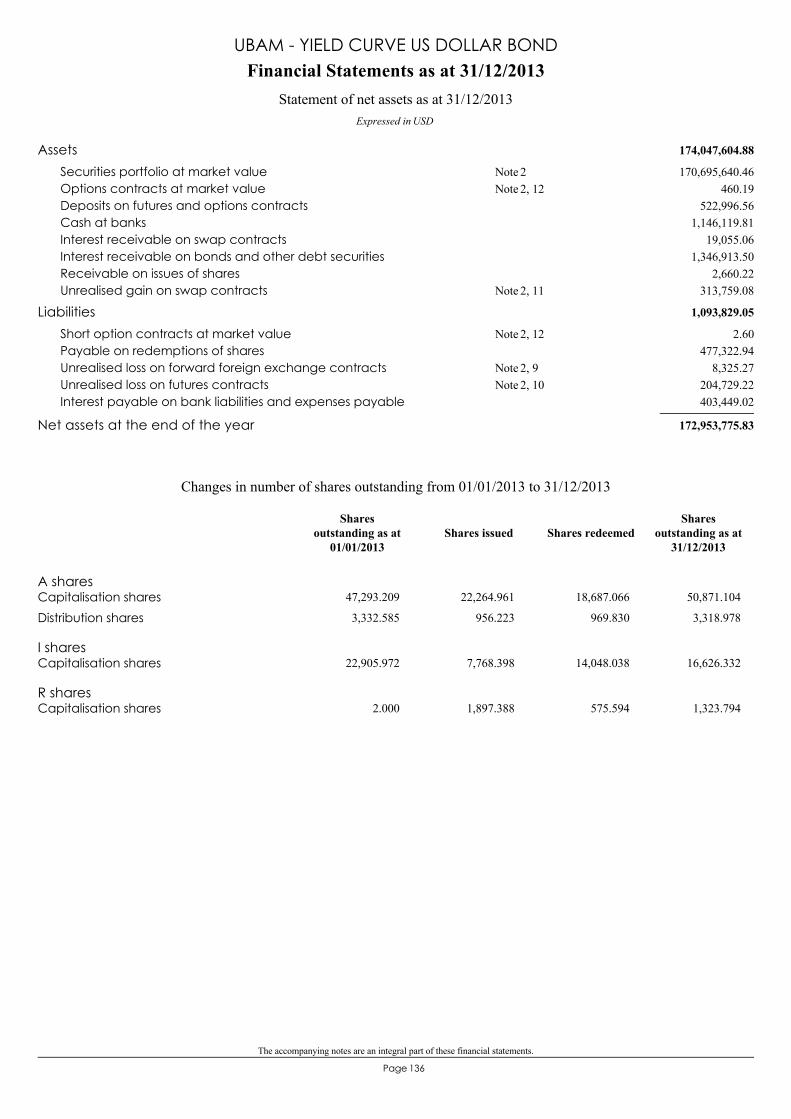
The accompanying notes are an integral part of these financial statements.
136Page
174,047,604.88Assets170,695,640.46Securities portfolio at market value 2Note
460.19Options contracts at market value 2, 12Note522,996.56Deposits on futures and options contracts
1,146,119.81Cash at banks19,055.06Interest receivable on swap contracts
1,346,913.50Interest receivable on bonds and other debt securities2,660.22Receivable on issues of shares
313,759.08Unrealised gain on swap contracts 2, 11Note
1,093,829.05Liabilities2.60Short option contracts at market value 2, 12Note
477,322.94Payable on redemptions of shares8,325.27Unrealised loss on forward foreign exchange contracts 2, 9Note
204,729.22Unrealised loss on futures contracts 2, 10Note403,449.02Interest payable on bank liabilities and expenses payable
172,953,775.83Net assets at the end of the year
Financial Statements as at 31/12/2013
Expressed in USD
Statement of net assets as at 31/12/2013
UBAM - YIELD CURVE US DOLLAR BOND
A sharesCapitalisation shares 47,293.209 22,264.961 18,687.066 50,871.104
Distribution shares 3,332.585 956.223 969.830 3,318.978
I sharesCapitalisation shares 22,905.972 7,768.398 14,048.038 16,626.332
R sharesCapitalisation shares 2.000 1,897.388 575.594 1,323.794
Changes in number of shares outstanding from 01/01/2013 to 31/12/2013
Shares issued Shares redeemedShares
outstanding as at31/12/2013
Sharesoutstanding as at
01/01/2013
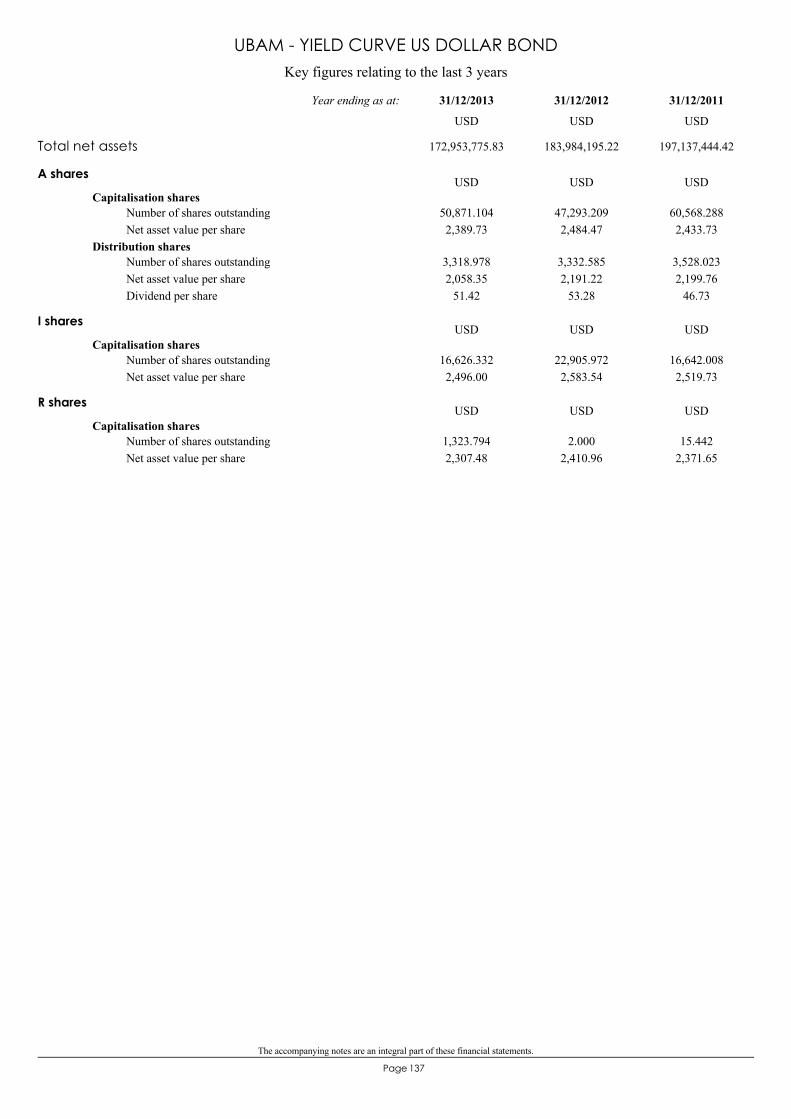
The accompanying notes are an integral part of these financial statements.
137Page
Key figures relating to the last 3 years
UBAM - YIELD CURVE US DOLLAR BOND
A shares
Capitalisation shares50,871.1042,389.73
47,293.2092,484.47
60,568.2882,433.73
Number of shares outstandingNet asset value per share
Distribution shares3,318.9782,058.35
51.42
3,332.5852,191.22
53.28
3,528.0232,199.76
46.73
Number of shares outstandingNet asset value per shareDividend per share
USD USD USD
I shares
Capitalisation shares16,626.3322,496.00
22,905.9722,583.54
16,642.0082,519.73
Number of shares outstandingNet asset value per share
USD USD USD
R shares
Capitalisation shares1,323.7942,307.48
2.0002,410.96
15.4422,371.65
Number of shares outstandingNet asset value per share
USD USD USD
Total net assets 172,953,775.83 183,984,195.22 197,137,444.42
31/12/201131/12/201231/12/2013Year ending as at:
USD USD USD
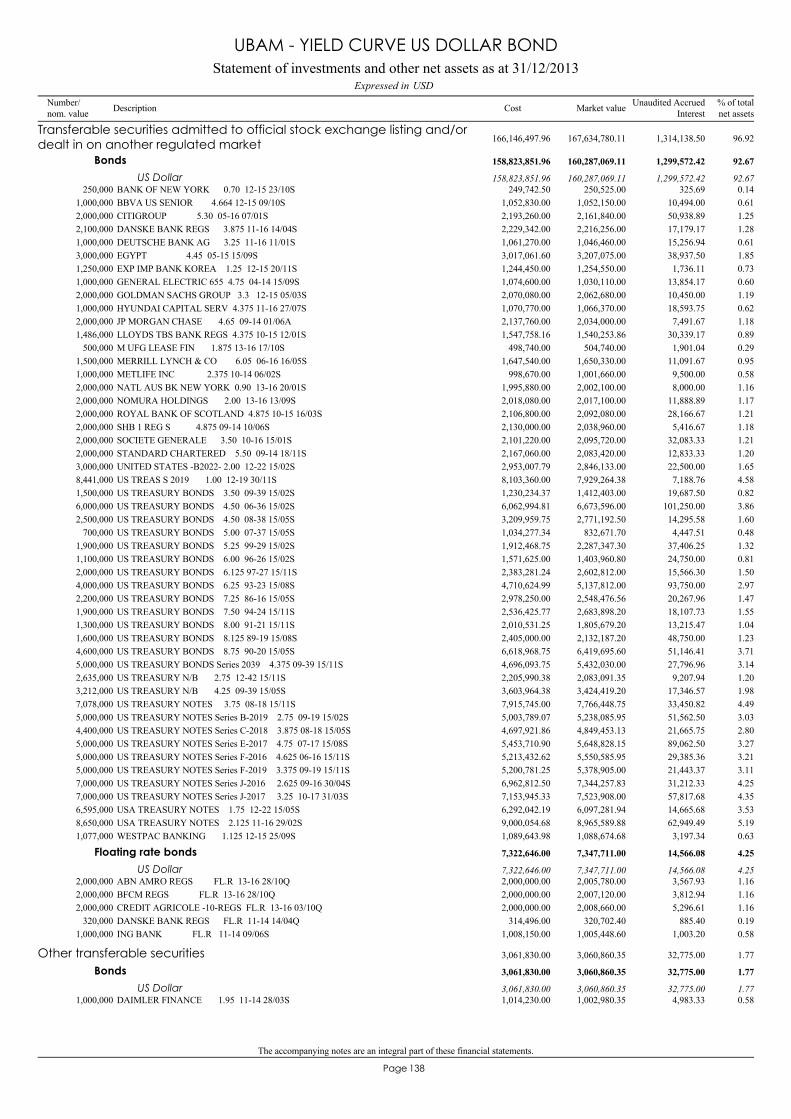
The accompanying notes are an integral part of these financial statements.
138Page
BANK OF NEW YORK 0.70 12-15 23/10S250,000 250,525.00 0.14249,742.50 325.69
Transferable securities admitted to official stock exchange listing and/ordealt in on another regulated market 167,634,780.11 96.92166,146,497.96 1,314,138.50
Bonds 160,287,069.11 92.67158,823,851.96 1,299,572.42
US Dollar 160,287,069.11 92.67158,823,851.96 1,299,572.42
BBVA US SENIOR 4.664 12-15 09/10S1,000,000 1,052,150.00 0.611,052,830.00 10,494.00CITIGROUP 5.30 05-16 07/01S2,000,000 2,161,840.00 1.252,193,260.00 50,938.89DANSKE BANK REGS 3.875 11-16 14/04S2,100,000 2,216,256.00 1.282,229,342.00 17,179.17DEUTSCHE BANK AG 3.25 11-16 11/01S1,000,000 1,046,460.00 0.611,061,270.00 15,256.94EGYPT 4.45 05-15 15/09S3,000,000 3,207,075.00 1.853,017,061.60 38,937.50EXP IMP BANK KOREA 1.25 12-15 20/11S1,250,000 1,254,550.00 0.731,244,450.00 1,736.11GENERAL ELECTRIC 655 4.75 04-14 15/09S1,000,000 1,030,110.00 0.601,074,600.00 13,854.17GOLDMAN SACHS GROUP 3.3 12-15 05/03S2,000,000 2,062,680.00 1.192,070,080.00 10,450.00HYUNDAI CAPITAL SERV 4.375 11-16 27/07S1,000,000 1,066,370.00 0.621,070,770.00 18,593.75JP MORGAN CHASE 4.65 09-14 01/06A2,000,000 2,034,000.00 1.182,137,760.00 7,491.67LLOYDS TBS BANK REGS 4.375 10-15 12/01S1,486,000 1,540,253.86 0.891,547,758.16 30,339.17M UFG LEASE FIN 1.875 13-16 17/10S500,000 504,740.00 0.29498,740.00 1,901.04MERRILL LYNCH & CO 6.05 06-16 16/05S1,500,000 1,650,330.00 0.951,647,540.00 11,091.67METLIFE INC 2.375 10-14 06/02S1,000,000 1,001,660.00 0.58998,670.00 9,500.00NATL AUS BK NEW YORK 0.90 13-16 20/01S2,000,000 2,002,100.00 1.161,995,880.00 8,000.00NOMURA HOLDINGS 2.00 13-16 13/09S2,000,000 2,017,100.00 1.172,018,080.00 11,888.89ROYAL BANK OF SCOTLAND 4.875 10-15 16/03S2,000,000 2,092,080.00 1.212,106,800.00 28,166.67SHB 1 REG S 4.875 09-14 10/06S2,000,000 2,038,960.00 1.182,130,000.00 5,416.67SOCIETE GENERALE 3.50 10-16 15/01S2,000,000 2,095,720.00 1.212,101,220.00 32,083.33STANDARD CHARTERED 5.50 09-14 18/11S2,000,000 2,083,420.00 1.202,167,060.00 12,833.33UNITED STATES -B2022- 2.00 12-22 15/02S3,000,000 2,846,133.00 1.652,953,007.79 22,500.00US TREAS S 2019 1.00 12-19 30/11S8,441,000 7,929,264.38 4.588,103,360.00 7,188.76US TREASURY BONDS 3.50 09-39 15/02S1,500,000 1,412,403.00 0.821,230,234.37 19,687.50US TREASURY BONDS 4.50 06-36 15/02S6,000,000 6,673,596.00 3.866,062,994.81 101,250.00US TREASURY BONDS 4.50 08-38 15/05S2,500,000 2,771,192.50 1.603,209,959.75 14,295.58US TREASURY BONDS 5.00 07-37 15/05S700,000 832,671.70 0.481,034,277.34 4,447.51US TREASURY BONDS 5.25 99-29 15/02S1,900,000 2,287,347.30 1.321,912,468.75 37,406.25US TREASURY BONDS 6.00 96-26 15/02S1,100,000 1,403,960.80 0.811,571,625.00 24,750.00US TREASURY BONDS 6.125 97-27 15/11S2,000,000 2,602,812.00 1.502,383,281.24 15,566.30US TREASURY BONDS 6.25 93-23 15/08S4,000,000 5,137,812.00 2.974,710,624.99 93,750.00US TREASURY BONDS 7.25 86-16 15/05S2,200,000 2,548,476.56 1.472,978,250.00 20,267.96US TREASURY BONDS 7.50 94-24 15/11S1,900,000 2,683,898.20 1.552,536,425.77 18,107.73US TREASURY BONDS 8.00 91-21 15/11S1,300,000 1,805,679.20 1.042,010,531.25 13,215.47US TREASURY BONDS 8.125 89-19 15/08S1,600,000 2,132,187.20 1.232,405,000.00 48,750.00US TREASURY BONDS 8.75 90-20 15/05S4,600,000 6,419,695.60 3.716,618,968.75 51,146.41US TREASURY BONDS Series 2039 4.375 09-39 15/11S5,000,000 5,432,030.00 3.144,696,093.75 27,796.96US TREASURY N/B 2.75 12-42 15/11S2,635,000 2,083,091.35 1.202,205,990.38 9,207.94US TREASURY N/B 4.25 09-39 15/05S3,212,000 3,424,419.20 1.983,603,964.38 17,346.57US TREASURY NOTES 3.75 08-18 15/11S7,078,000 7,766,448.75 4.497,915,745.00 33,450.82US TREASURY NOTES Series B-2019 2.75 09-19 15/02S5,000,000 5,238,085.95 3.035,003,789.07 51,562.50US TREASURY NOTES Series C-2018 3.875 08-18 15/05S4,400,000 4,849,453.13 2.804,697,921.86 21,665.75US TREASURY NOTES Series E-2017 4.75 07-17 15/08S5,000,000 5,648,828.15 3.275,453,710.90 89,062.50US TREASURY NOTES Series F-2016 4.625 06-16 15/11S5,000,000 5,550,585.95 3.215,213,432.62 29,385.36US TREASURY NOTES Series F-2019 3.375 09-19 15/11S5,000,000 5,378,905.00 3.115,200,781.25 21,443.37US TREASURY NOTES Series J-2016 2.625 09-16 30/04S7,000,000 7,344,257.83 4.256,962,812.50 31,212.33US TREASURY NOTES Series J-2017 3.25 10-17 31/03S7,000,000 7,523,908.00 4.357,153,945.33 57,817.68USA TREASURY NOTES 1.75 12-22 15/05S6,595,000 6,097,281.94 3.536,292,042.19 14,665.68USA TREASURY NOTES 2.125 11-16 29/02S8,650,000 8,965,589.88 5.199,000,054.68 62,949.49WESTPAC BANKING 1.125 12-15 25/09S1,077,000 1,088,674.68 0.631,089,643.98 3,197.34
ABN AMRO REGS FL.R 13-16 28/10Q2,000,000 2,005,780.00 1.162,000,000.00 3,567.93
Floating rate bonds 7,347,711.00 4.257,322,646.00 14,566.08
US Dollar 7,347,711.00 4.257,322,646.00 14,566.08
BFCM REGS FL.R 13-16 28/10Q2,000,000 2,007,120.00 1.162,000,000.00 3,812.94CREDIT AGRICOLE -10-REGS FL.R 13-16 03/10Q2,000,000 2,008,660.00 1.162,000,000.00 5,296.61DANSKE BANK REGS FL.R 11-14 14/04Q320,000 320,702.40 0.19314,496.00 885.40ING BANK FL.R 11-14 09/06S1,000,000 1,005,448.60 0.581,008,150.00 1,003.20
DAIMLER FINANCE 1.95 11-14 28/03S1,000,000 1,002,980.35 0.581,014,230.00 4,983.33
Other transferable securities 3,060,860.35 1.773,061,830.00 32,775.00
Bonds 3,060,860.35 1.773,061,830.00 32,775.00
US Dollar 3,060,860.35 1.773,061,830.00 32,775.00
Statement of investments and other net assets as at 31/12/2013USDExpressed in
UBAM - YIELD CURVE US DOLLAR BOND
Number/nom. value Description % of total
net assetsMarket valueCost Unaudited AccruedInterest

The accompanying notes are an integral part of these financial statements.
139Page
INTESA SANPAOLO 144A 3.625 10-15 12/05S2,000,000 2,057,880.00 1.192,047,600.00 27,791.67
XNAHY2115 OTC JAN 0.800 15.01.14 CALL16,000,000 259.68 0.0012,320.00 0.00
Derivative instruments 457.59 0.0018,654.00 0.00
Options 457.59 0.0018,654.00 0.00
US Dollar 457.59 0.0018,654.00 0.00
XNAHY2115 OTC JAN 100.0 15.01.14 CALL-4,200,000 -0.04 0.00-1,806.00 0.00XNAHY2115 OTC JAN 104.0 15.01.14 PUT4,200,000 200.51 0.0011,340.00 0.00XNAIG2115 OTC JAN 0.950 15.01.14 CALL-16,000,000 -2.56 0.00-3,200.00 0.00
Total investments in securities 170,696,098.05 98.69169,226,981.96
Cash at banks/(bank liabilities) 1,146,119.81 0.66
Other net assets/(liabilities) 1,111,557.97 0.65
Total 172,953,775.83 100.00
Statement of investments and other net assets as at 31/12/2013USDExpressed in
UBAM - YIELD CURVE US DOLLAR BOND
Number/nom. value Description % of total
net assetsMarket valueCost Unaudited AccruedInterest
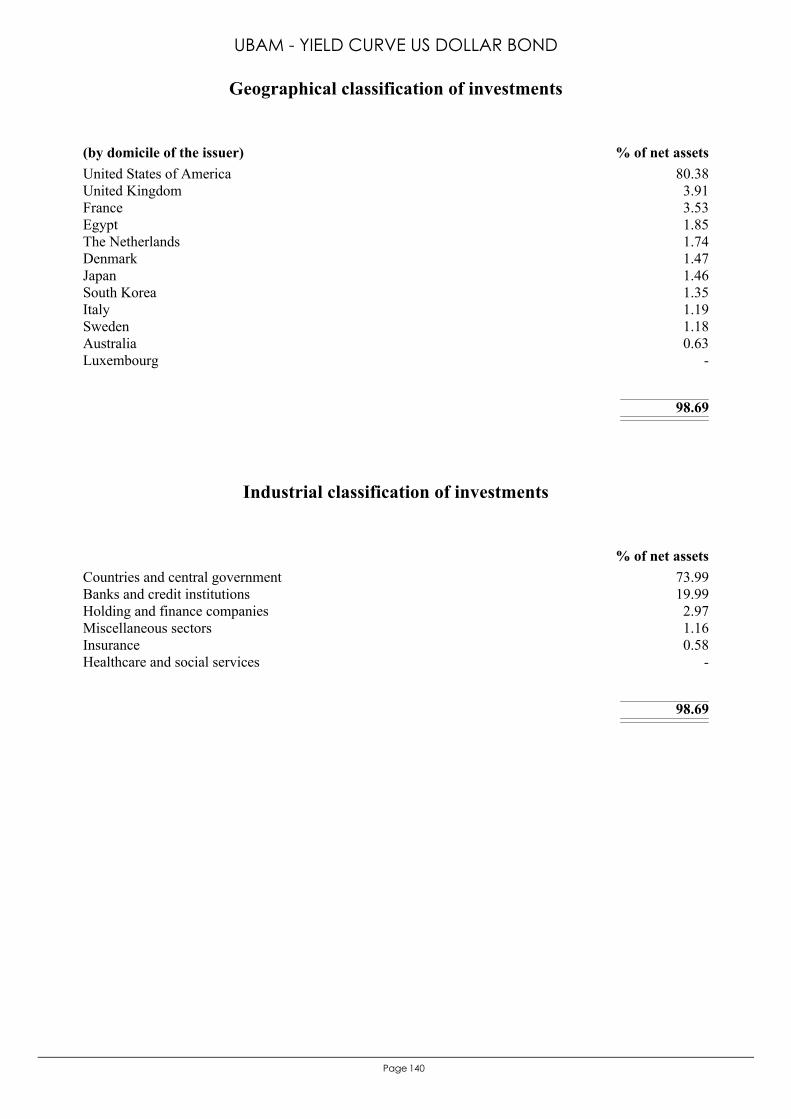
140Page
United States of America 80.38United Kingdom 3.91France 3.53Egypt 1.85The Netherlands 1.74Denmark 1.47Japan 1.46South Korea 1.35Italy 1.19Sweden 1.18Australia 0.63Luxembourg -
98.69
(by domicile of the issuer) % of net assets
Geographical classification of investments
UBAM - YIELD CURVE US DOLLAR BOND
Countries and central government 73.99Banks and credit institutions 19.99Holding and finance companies 2.97Miscellaneous sectors 1.16Insurance 0.58Healthcare and social services -
98.69
% of net assets
Industrial classification of investments

The accompanying notes are an integral part of these financial statements.
141Page
Statement of operations and other changes in net assets from 01/01/2013 to 31/12/2013Expressed in USD
UBAM - YIELD CURVE US DOLLAR BOND
5,961,992.88Income5,469,631.54Interest on bonds and other debt securities, net 2Note
12.02Interest on bank accounts486,095.39Interest received on swap contracts
6,253.93Other income
1,406,696.05Expenses336,746.15Advisory fees 4Note370,179.13Management fees 3Note162,535.20Custodian fees61,888.64Subscription duty ("taxe d'abonnement") 6Note
163,510.10Central administration costs8,188.17Audit fees
244.83Interest paid on bank liabilities6,682.25Legal fees
15,243.48Transaction fees 2Note177,433.26Other administration costs 7, 8Note
3,707.40Banking charges and other fees71,087.13Interest paid on swap contracts29,250.31Other expenses
4,555,296.83Net investment incomeNet realised gain/(loss) on:
-1,247,964.66- securities portfolio 2Note-42,352.86- options 2Note-3,019.83- forward foreign exchange contracts 2Note
-437,470.48- futures contracts 2Note-113,430.41- swap contracts 2Note
12,816.53- foreign exchange 2Note
2,723,875.12Realised resultNet variation of the unrealised gain/(loss) on:
-9,416,908.28- securities portfolio-14,201.14- options-8,325.27- forward foreign exchange contracts
-122,112.32- futures contracts261,692.66- swap contracts
-6,575,979.23Result of operations-192,311.62Dividends paid 15Note
78,282,391.19Subscriptions capitalisation shares2,048,373.94Subscriptions distribution shares
-82,552,831.51Redemptions capitalisation shares-2,040,062.16Redemptions distribution shares
-11,030,419.39Total changes in net assets
183,984,195.22Total net assets at the beginning of the year
172,953,775.83Total net assets at the end of the year
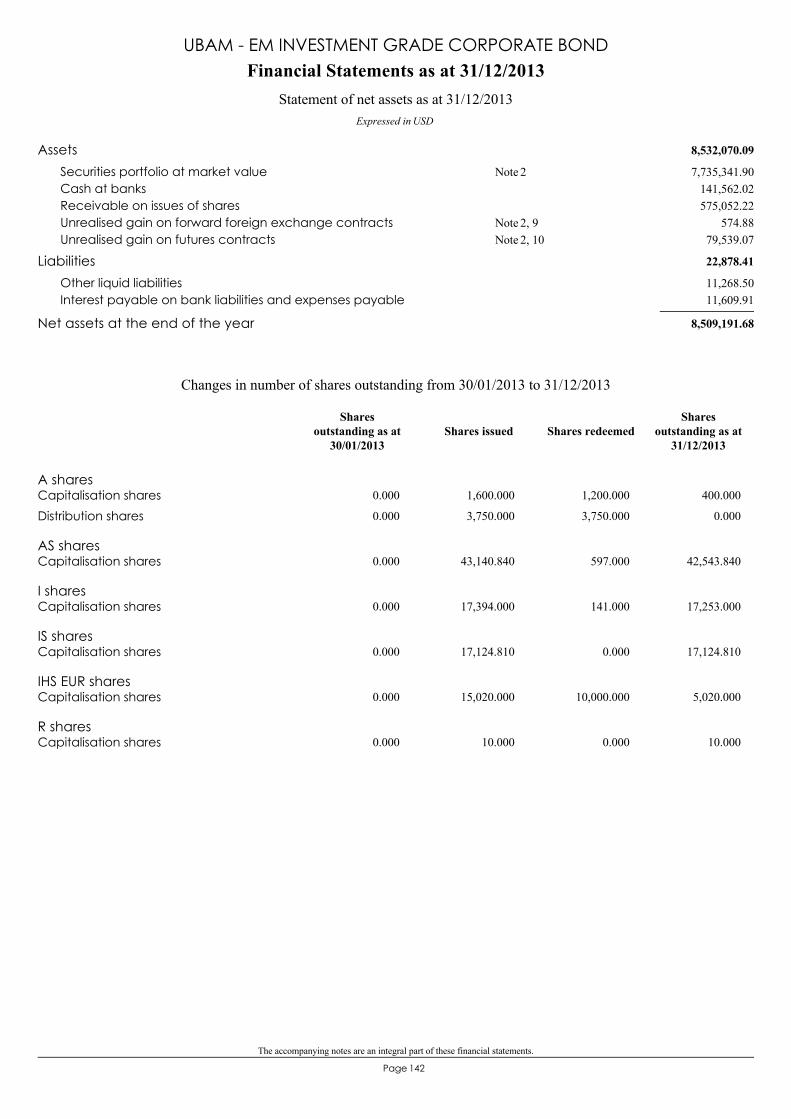
The accompanying notes are an integral part of these financial statements.
142Page
8,532,070.09Assets7,735,341.90Securities portfolio at market value 2Note
141,562.02Cash at banks575,052.22Receivable on issues of shares
574.88Unrealised gain on forward foreign exchange contracts 2, 9Note79,539.07Unrealised gain on futures contracts 2, 10Note
22,878.41Liabilities11,268.50Other liquid liabilities11,609.91Interest payable on bank liabilities and expenses payable
8,509,191.68Net assets at the end of the year
Financial Statements as at 31/12/2013
Expressed in USD
Statement of net assets as at 31/12/2013
UBAM - EM INVESTMENT GRADE CORPORATE BOND
A sharesCapitalisation shares 0.000 1,600.000 1,200.000 400.000
Distribution shares 0.000 3,750.000 3,750.000 0.000
AS sharesCapitalisation shares 0.000 43,140.840 597.000 42,543.840
I sharesCapitalisation shares 0.000 17,394.000 141.000 17,253.000
IS sharesCapitalisation shares 0.000 17,124.810 0.000 17,124.810
IHS EUR sharesCapitalisation shares 0.000 15,020.000 10,000.000 5,020.000
R sharesCapitalisation shares 0.000 10.000 0.000 10.000
Changes in number of shares outstanding from 30/01/2013 to 31/12/2013
Shares issued Shares redeemedShares
outstanding as at31/12/2013
Sharesoutstanding as at
30/01/2013
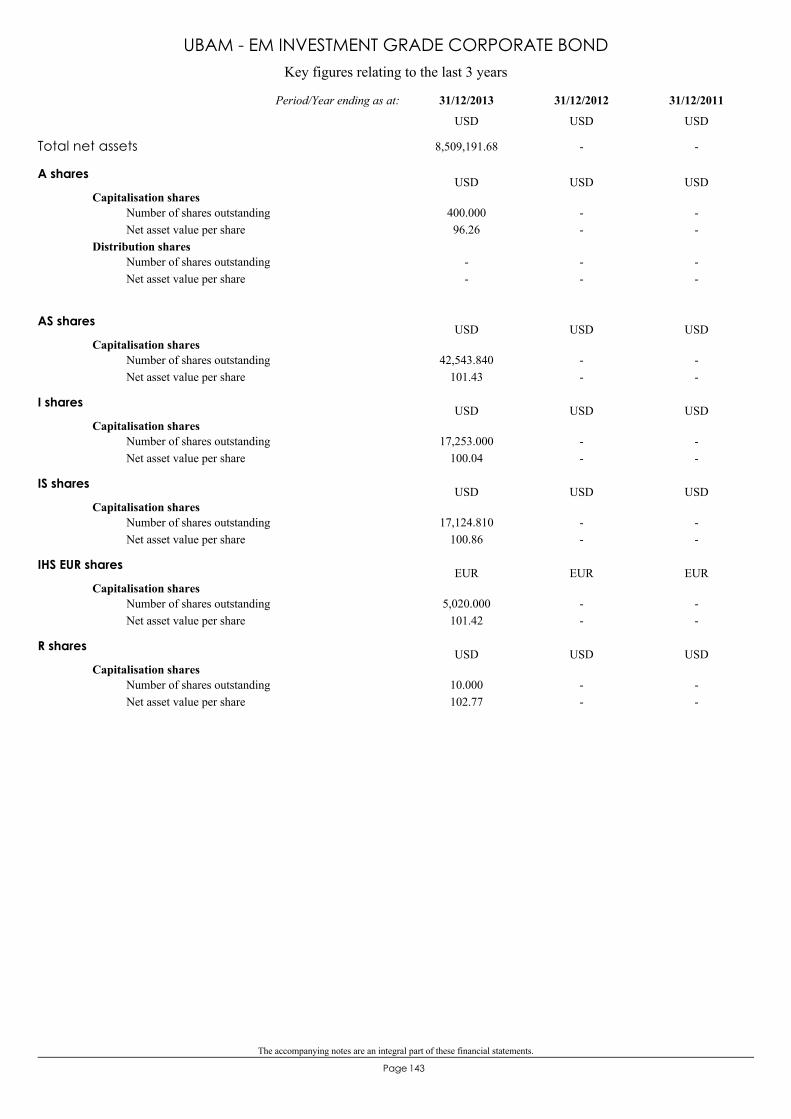
The accompanying notes are an integral part of these financial statements.
143Page
Key figures relating to the last 3 years
UBAM - EM INVESTMENT GRADE CORPORATE BOND
A shares
Capitalisation shares400.00096.26
--
--
Number of shares outstandingNet asset value per share
Distribution shares--
--
--
Number of shares outstandingNet asset value per share
USD USD USD
AS shares
Capitalisation shares42,543.840
101.43--
--
Number of shares outstandingNet asset value per share
USD USD USD
I shares
Capitalisation shares17,253.000
100.04--
--
Number of shares outstandingNet asset value per share
USD USD USD
IS shares
Capitalisation shares17,124.810
100.86--
--
Number of shares outstandingNet asset value per share
USD USD USD
IHS EUR shares
Capitalisation shares5,020.000
101.42--
--
Number of shares outstandingNet asset value per share
EUR EUR EUR
R shares
Capitalisation shares10.000102.77
--
--
Number of shares outstandingNet asset value per share
USD USD USD
Total net assets 8,509,191.68 - -
31/12/201131/12/201231/12/2013Period/Year ending as at:
USD USD USD
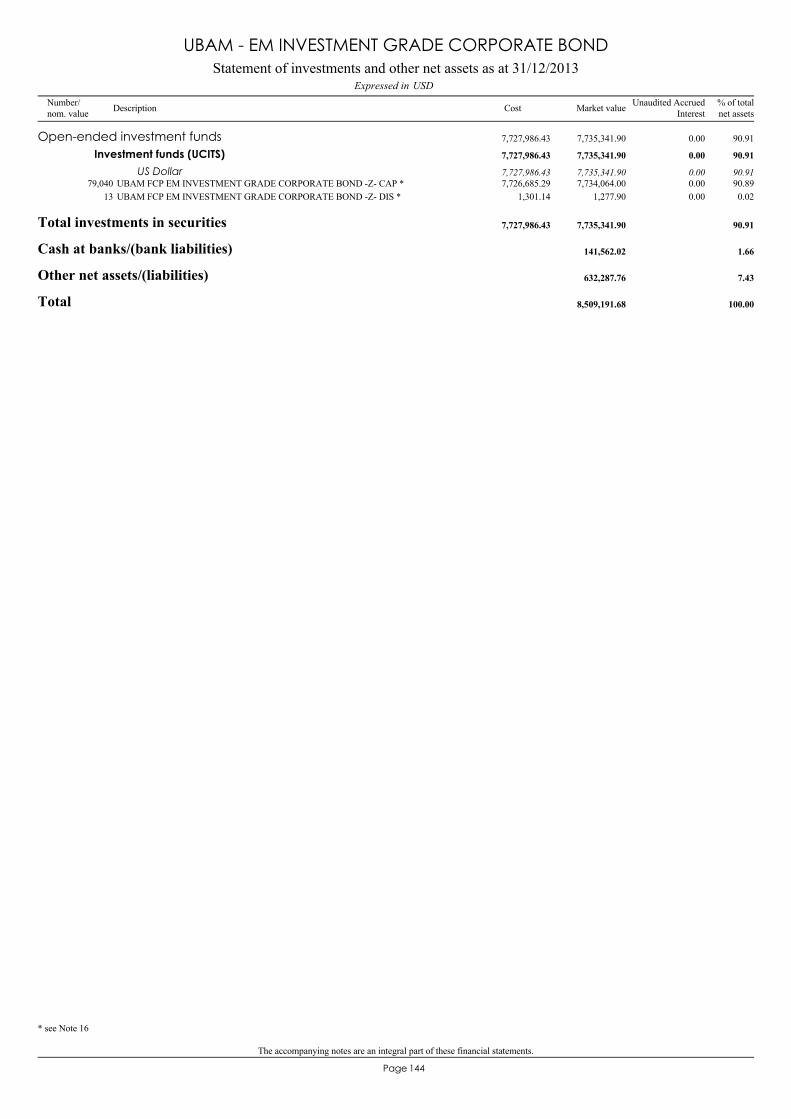
The accompanying notes are an integral part of these financial statements.
144Page
* see Note 16
UBAM FCP EM INVESTMENT GRADE CORPORATE BOND -Z- CAP *79,040 7,734,064.00 90.897,726,685.29 0.00
Open-ended investment funds 7,735,341.90 90.917,727,986.43 0.00
Investment funds (UCITS) 7,735,341.90 90.917,727,986.43 0.00
US Dollar 7,735,341.90 90.917,727,986.43 0.00
UBAM FCP EM INVESTMENT GRADE CORPORATE BOND -Z- DIS *13 1,277.90 0.021,301.14 0.00
Total investments in securities 7,735,341.90 90.917,727,986.43
Cash at banks/(bank liabilities) 141,562.02 1.66
Other net assets/(liabilities) 632,287.76 7.43
Total 8,509,191.68 100.00
Statement of investments and other net assets as at 31/12/2013USDExpressed in
UBAM - EM INVESTMENT GRADE CORPORATE BOND
Number/nom. value Description % of total
net assetsMarket valueCost Unaudited AccruedInterest

145Page
France 90.91
90.91
(by domicile of the issuer) % of net assets
Geographical classification of investments
UBAM - EM INVESTMENT GRADE CORPORATE BOND
Unit trusts 90.91
90.91
% of net assets
Industrial classification of investments
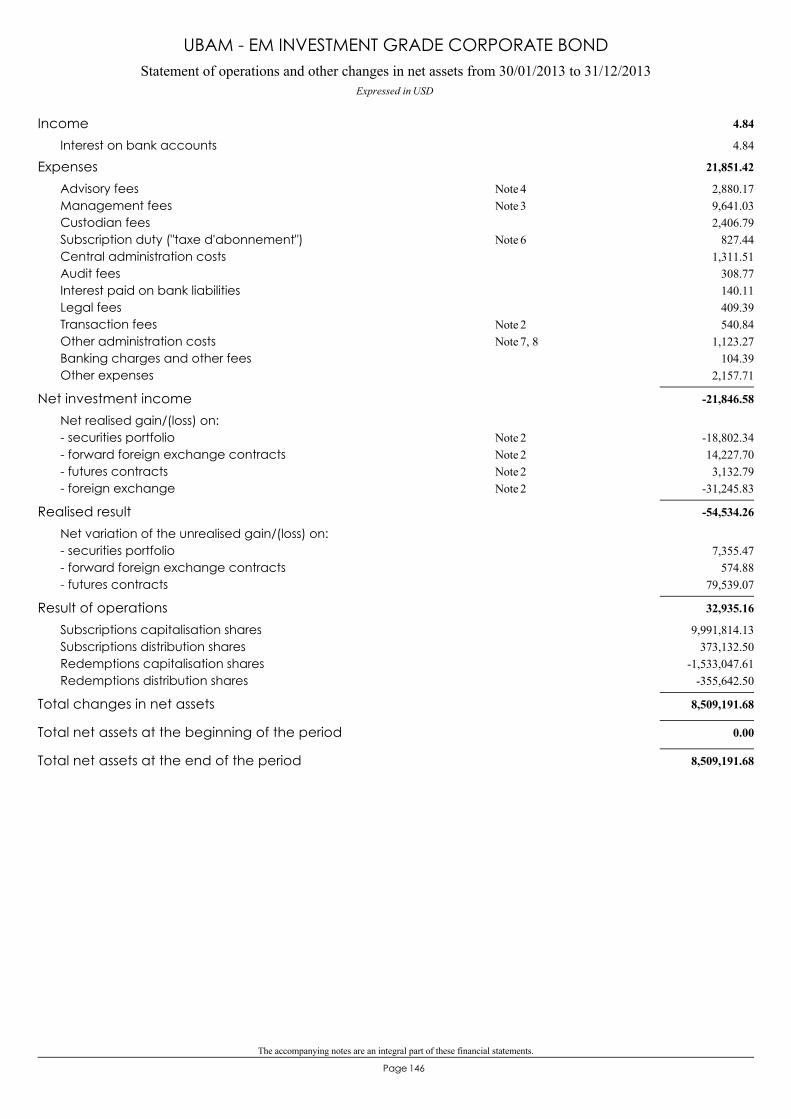
The accompanying notes are an integral part of these financial statements.
146Page
Statement of operations and other changes in net assets from 30/01/2013 to 31/12/2013Expressed in USD
UBAM - EM INVESTMENT GRADE CORPORATE BOND
4.84Income4.84Interest on bank accounts
21,851.42Expenses2,880.17Advisory fees 4Note9,641.03Management fees 3Note2,406.79Custodian fees
827.44Subscription duty ("taxe d'abonnement") 6Note1,311.51Central administration costs
308.77Audit fees140.11Interest paid on bank liabilities409.39Legal fees540.84Transaction fees 2Note
1,123.27Other administration costs 7, 8Note104.39Banking charges and other fees
2,157.71Other expenses
-21,846.58Net investment incomeNet realised gain/(loss) on:
-18,802.34- securities portfolio 2Note14,227.70- forward foreign exchange contracts 2Note3,132.79- futures contracts 2Note
-31,245.83- foreign exchange 2Note
-54,534.26Realised resultNet variation of the unrealised gain/(loss) on:
7,355.47- securities portfolio574.88- forward foreign exchange contracts
79,539.07- futures contracts
32,935.16Result of operations9,991,814.13Subscriptions capitalisation shares
373,132.50Subscriptions distribution shares-1,533,047.61Redemptions capitalisation shares
-355,642.50Redemptions distribution shares
8,509,191.68Total changes in net assets
0.00Total net assets at the beginning of the period
8,509,191.68Total net assets at the end of the period

The accompanying notes are an integral part of these financial statements.
147Page
30,305,527.25Assets30,144,196.65Securities portfolio at market value 2Note
161,330.60Cash at banks
127,835.49Liabilities15,736.69Unrealised loss on forward foreign exchange contracts 2, 9Note
112,098.80Interest payable on bank liabilities and expenses payable
30,177,691.76Net assets at the end of the year
Financial Statements as at 31/12/2013
Expressed in EUR
Statement of net assets as at 31/12/2013
UBAM - EUROPEAN CONVERTIBLE BOND
A sharesCapitalisation shares 39,591.080 111,837.927 19,568.080 131,860.927
Distribution shares 3,996.000 1,262.000 2,357.000 2,901.000
AH CHF sharesCapitalisation shares 0.000 58,402.169 7,288.669 51,113.500
AH USD sharesCapitalisation shares 2,431.195 28,482.000 0.000 30,913.195
I sharesCapitalisation shares 33,901.000 171,118.520 157,521.097 47,498.423
R sharesCapitalisation shares 1.000 908.390 0.000 909.390
Changes in number of shares outstanding from 01/01/2013 to 31/12/2013
Shares issued Shares redeemedShares
outstanding as at31/12/2013
Sharesoutstanding as at
01/01/2013

The accompanying notes are an integral part of these financial statements.
148Page
Key figures relating to the last 3 years
UBAM - EUROPEAN CONVERTIBLE BOND
A shares
Capitalisation shares131,860.927
118.7439,591.080
104.7327,479.299
90.74Number of shares outstandingNet asset value per share
Distribution shares2,901.000
114.732.07
3,996.000103.281.33
3,696.00090.73
-
Number of shares outstandingNet asset value per shareDividend per share
EUR EUR EUR
AH CHF shares
Capitalisation shares51,113.500
115.28--
--
Number of shares outstandingNet asset value per share
CHF CHF CHF
AH USD shares
Capitalisation shares30,913.195
156.742,431.195
137.87--
Number of shares outstandingNet asset value per share
USD USD USD
I shares
Capitalisation shares47,498.423
121.1533,901.000
106.31105,000.000
91.36Number of shares outstandingNet asset value per share
EUR EUR EUR
R shares
Capitalisation shares909.390118.98
1.000105.37
--
Number of shares outstandingNet asset value per share
EUR EUR EUR
Total net assets 30,177,691.76 8,417,573.63 12,421,149.08
31/12/201131/12/201231/12/2013Year ending as at:
EUR EUR EUR

The accompanying notes are an integral part of these financial statements.
149Page
* see Note 16
UBAM CONVERTIBLE SICAV - UBAM CONVERTIBLES EUROPE -ZC- *23,315 30,144,196.65 99.8927,555,595.74 0.00
Open-ended investment funds 30,144,196.65 99.8927,555,595.74 0.00
Investment funds (UCITS) 30,144,196.65 99.8927,555,595.74 0.00
Euro 30,144,196.65 99.8927,555,595.74 0.00
Total investments in securities 30,144,196.65 99.8927,555,595.74
Cash at banks/(bank liabilities) 161,330.60 0.53
Other net assets/(liabilities) -127,835.49 -0.42
Total 30,177,691.76 100.00
Statement of investments and other net assets as at 31/12/2013EURExpressed in
UBAM - EUROPEAN CONVERTIBLE BOND
Number/nom. value Description % of total
net assetsMarket valueCost Unaudited AccruedInterest
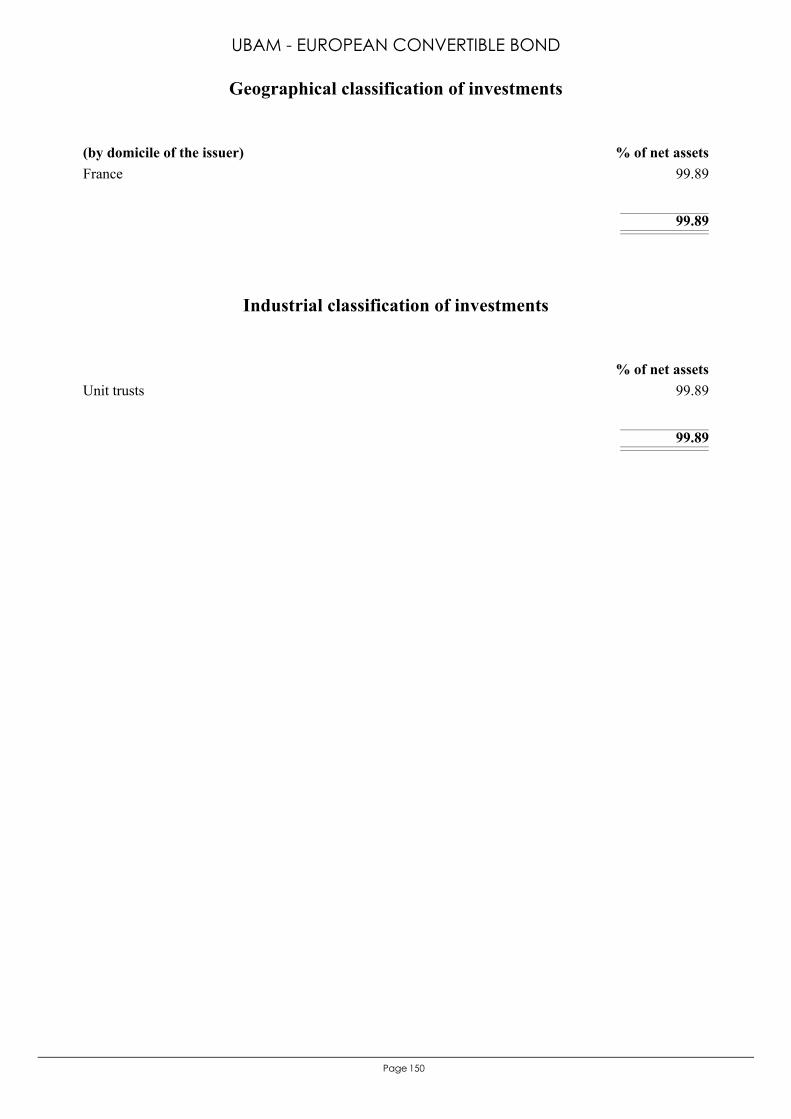
150Page
France 99.89
99.89
(by domicile of the issuer) % of net assets
Geographical classification of investments
UBAM - EUROPEAN CONVERTIBLE BOND
Unit trusts 99.89
99.89
% of net assets
Industrial classification of investments
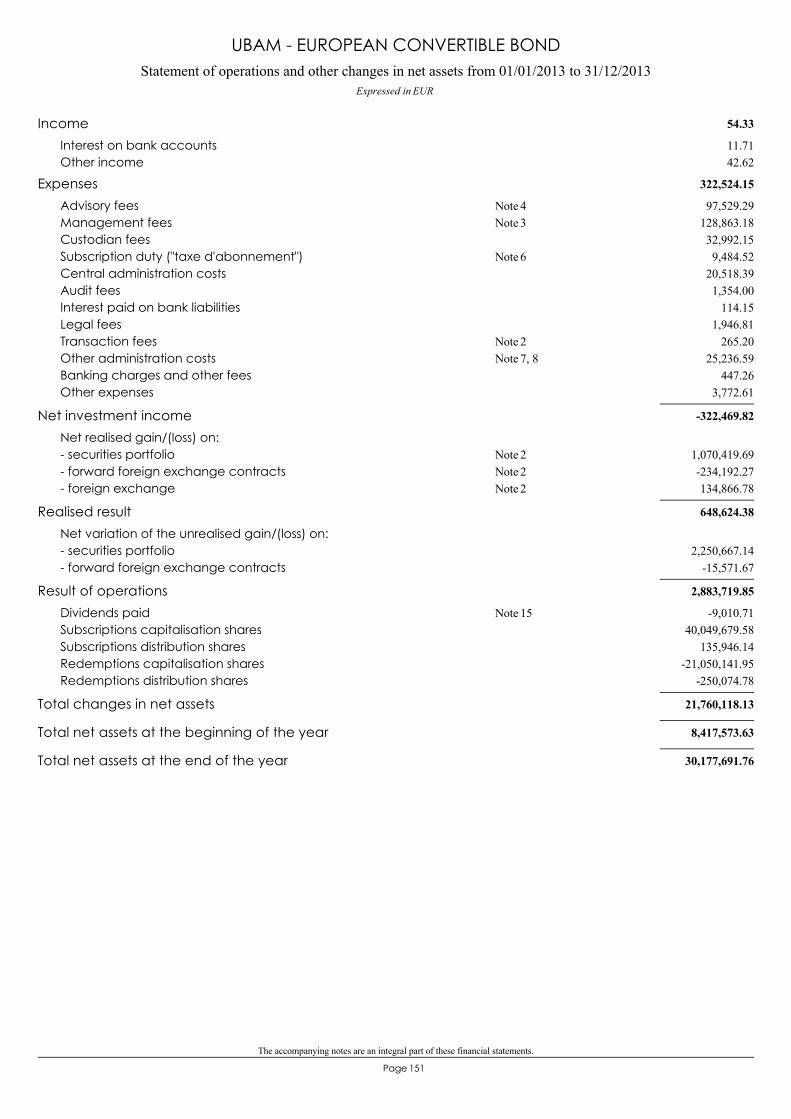
The accompanying notes are an integral part of these financial statements.
151Page
Statement of operations and other changes in net assets from 01/01/2013 to 31/12/2013Expressed in EUR
UBAM - EUROPEAN CONVERTIBLE BOND
54.33Income11.71Interest on bank accounts42.62Other income
322,524.15Expenses97,529.29Advisory fees 4Note
128,863.18Management fees 3Note32,992.15Custodian fees9,484.52Subscription duty ("taxe d'abonnement") 6Note
20,518.39Central administration costs1,354.00Audit fees
114.15Interest paid on bank liabilities1,946.81Legal fees
265.20Transaction fees 2Note25,236.59Other administration costs 7, 8Note
447.26Banking charges and other fees3,772.61Other expenses
-322,469.82Net investment incomeNet realised gain/(loss) on:
1,070,419.69- securities portfolio 2Note-234,192.27- forward foreign exchange contracts 2Note134,866.78- foreign exchange 2Note
648,624.38Realised resultNet variation of the unrealised gain/(loss) on:
2,250,667.14- securities portfolio-15,571.67- forward foreign exchange contracts
2,883,719.85Result of operations-9,010.71Dividends paid 15Note
40,049,679.58Subscriptions capitalisation shares135,946.14Subscriptions distribution shares
-21,050,141.95Redemptions capitalisation shares-250,074.78Redemptions distribution shares
21,760,118.13Total changes in net assets
8,417,573.63Total net assets at the beginning of the year
30,177,691.76Total net assets at the end of the year
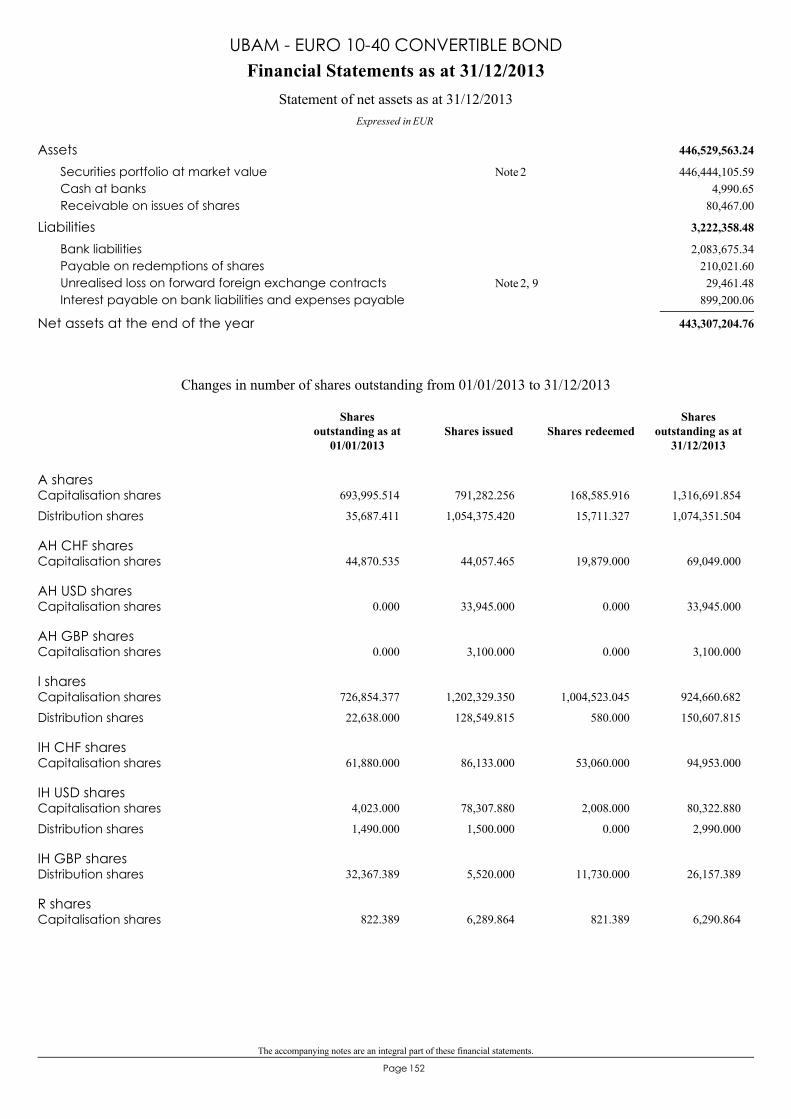
The accompanying notes are an integral part of these financial statements.
152Page
446,529,563.24Assets446,444,105.59Securities portfolio at market value 2Note
4,990.65Cash at banks80,467.00Receivable on issues of shares
3,222,358.48Liabilities2,083,675.34Bank liabilities
210,021.60Payable on redemptions of shares29,461.48Unrealised loss on forward foreign exchange contracts 2, 9Note
899,200.06Interest payable on bank liabilities and expenses payable
443,307,204.76Net assets at the end of the year
Financial Statements as at 31/12/2013
Expressed in EUR
Statement of net assets as at 31/12/2013
UBAM - EURO 10-40 CONVERTIBLE BOND
A sharesCapitalisation shares 693,995.514 791,282.256 168,585.916 1,316,691.854
Distribution shares 35,687.411 1,054,375.420 15,711.327 1,074,351.504
AH CHF sharesCapitalisation shares 44,870.535 44,057.465 19,879.000 69,049.000
AH USD sharesCapitalisation shares 0.000 33,945.000 0.000 33,945.000
AH GBP sharesCapitalisation shares 0.000 3,100.000 0.000 3,100.000
I sharesCapitalisation shares 726,854.377 1,202,329.350 1,004,523.045 924,660.682
Distribution shares 22,638.000 128,549.815 580.000 150,607.815
IH CHF sharesCapitalisation shares 61,880.000 86,133.000 53,060.000 94,953.000
IH USD sharesCapitalisation shares 4,023.000 78,307.880 2,008.000 80,322.880
Distribution shares 1,490.000 1,500.000 0.000 2,990.000
IH GBP sharesDistribution shares 32,367.389 5,520.000 11,730.000 26,157.389
R sharesCapitalisation shares 822.389 6,289.864 821.389 6,290.864
Changes in number of shares outstanding from 01/01/2013 to 31/12/2013
Shares issued Shares redeemedShares
outstanding as at31/12/2013
Sharesoutstanding as at
01/01/2013

The accompanying notes are an integral part of these financial statements.
153Page
Key figures relating to the last 3 years
UBAM - EURO 10-40 CONVERTIBLE BOND
A shares
Capitalisation shares1,316,691.854
120.20693,995.514
110.41245,074.975
95.14Number of shares outstandingNet asset value per share
Distribution shares1,074,351.504
115.531.29
35,687.411107.431.63
4,123.88394.091.13
Number of shares outstandingNet asset value per shareDividend per share
EUR EUR EUR
AH CHF shares
Capitalisation shares69,049.000
118.0044,870.535
108.6619,875.000
93.99Number of shares outstandingNet asset value per share
CHF CHF CHF
AH USD shares
Capitalisation shares33,945.000
104.39--
--
Number of shares outstandingNet asset value per share
USD USD USD
AH GBP shares
Capitalisation shares3,100.000
104.56--
--
Number of shares outstandingNet asset value per share
GBP GBP GBP
I shares
Capitalisation shares924,660.682
122.22726,854.377
111.7251,076.301
95.79Number of shares outstandingNet asset value per share
Distribution shares150,607.815
120.751.34
22,638.000111.71
-
---
Number of shares outstandingNet asset value per shareDividend per share
EUR EUR EUR
IH CHF shares
Capitalisation shares94,953.000
118.7161,880.000
108.77--
Number of shares outstandingNet asset value per share
CHF CHF CHF
IH USD shares
Capitalisation shares80,322.880
113.984,023.000
104.07--
Number of shares outstandingNet asset value per share
Distribution shares2,990.000
112.611.25
1,490.000104.07
-
---
Number of shares outstandingNet asset value per shareDividend per share
USD USD USD
Total net assets 443,307,204.76 178,167,326.85 31,912,658.24
31/12/201131/12/201231/12/2013Year ending as at:
EUR EUR EUR
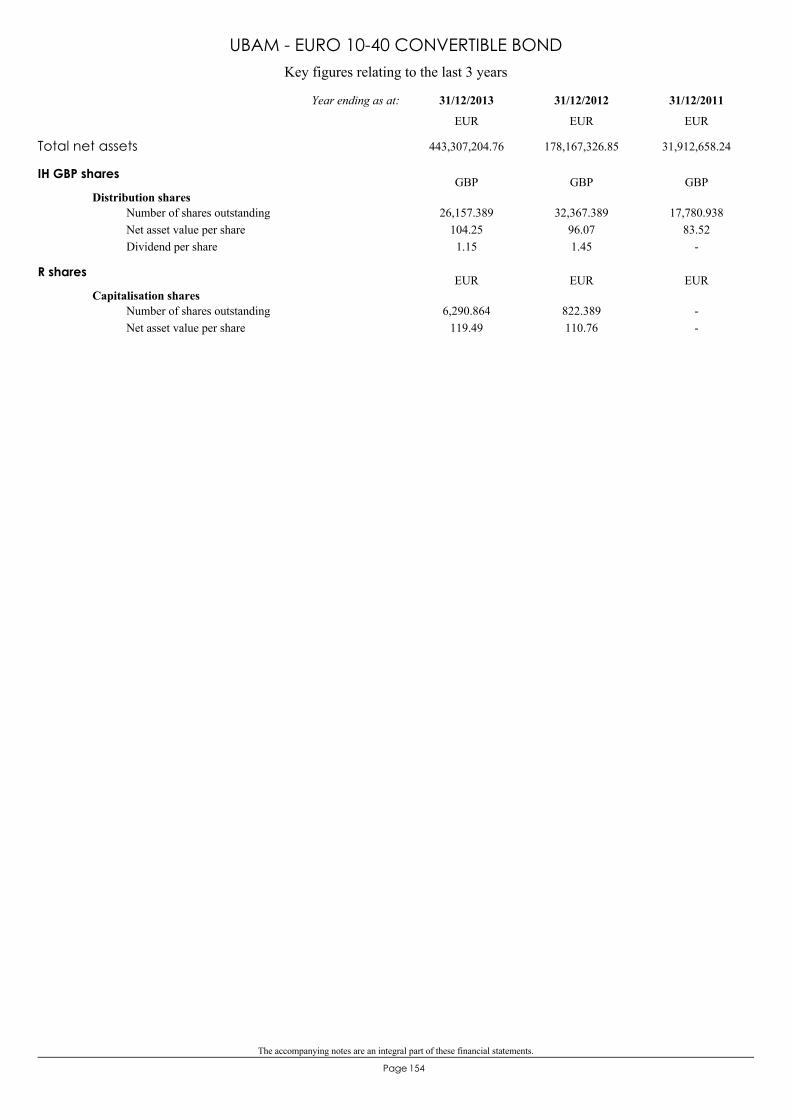
The accompanying notes are an integral part of these financial statements.
154Page
Key figures relating to the last 3 years
UBAM - EURO 10-40 CONVERTIBLE BOND
IH GBP shares
Distribution shares26,157.389
104.251.15
32,367.38996.071.45
17,780.93883.52
-
Number of shares outstandingNet asset value per shareDividend per share
GBP GBP GBP
R shares
Capitalisation shares6,290.864
119.49822.389110.76
--
Number of shares outstandingNet asset value per share
EUR EUR EUR
Total net assets 443,307,204.76 178,167,326.85 31,912,658.24
31/12/201131/12/201231/12/2013Year ending as at:
EUR EUR EUR
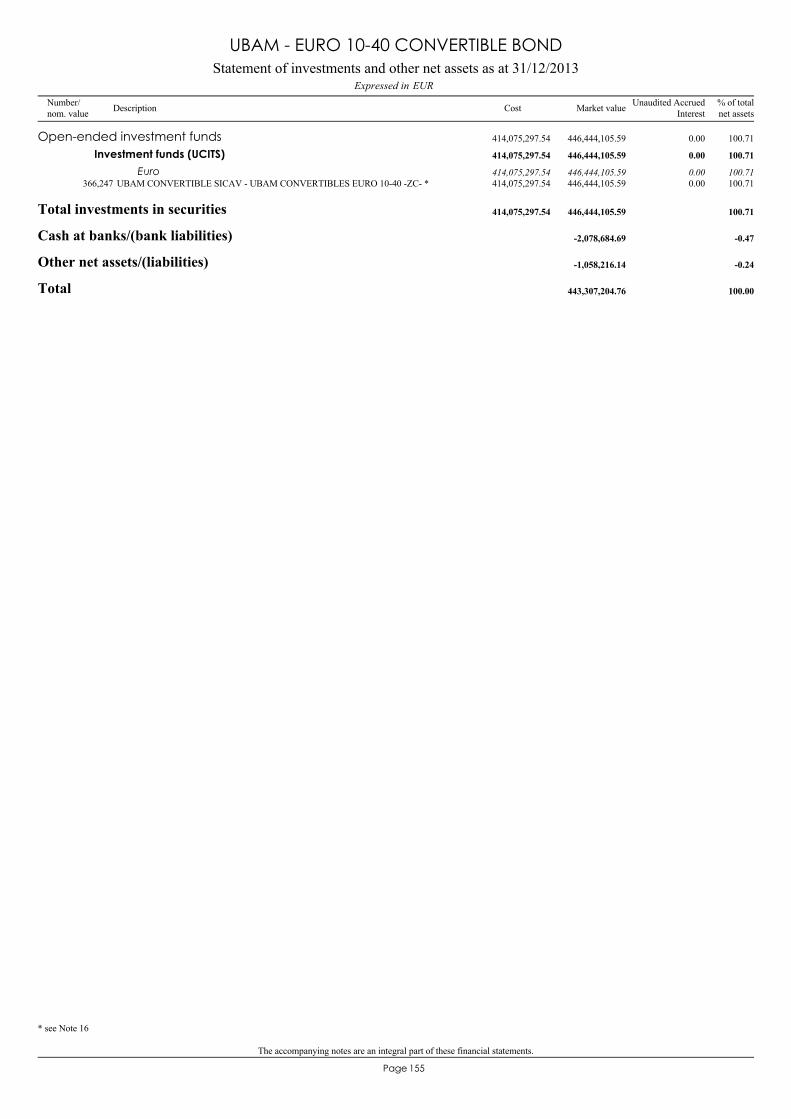
The accompanying notes are an integral part of these financial statements.
155Page
* see Note 16
UBAM CONVERTIBLE SICAV - UBAM CONVERTIBLES EURO 10-40 -ZC- *366,247 446,444,105.59 100.71414,075,297.54 0.00
Open-ended investment funds 446,444,105.59 100.71414,075,297.54 0.00
Investment funds (UCITS) 446,444,105.59 100.71414,075,297.54 0.00
Euro 446,444,105.59 100.71414,075,297.54 0.00
Total investments in securities 446,444,105.59 100.71414,075,297.54
Cash at banks/(bank liabilities) -2,078,684.69 -0.47
Other net assets/(liabilities) -1,058,216.14 -0.24
Total 443,307,204.76 100.00
Statement of investments and other net assets as at 31/12/2013EURExpressed in
UBAM - EURO 10-40 CONVERTIBLE BOND
Number/nom. value Description % of total
net assetsMarket valueCost Unaudited AccruedInterest

156Page
France 100.71
100.71
(by domicile of the issuer) % of net assets
Geographical classification of investments
UBAM - EURO 10-40 CONVERTIBLE BOND
Unit trusts 100.71
100.71
% of net assets
Industrial classification of investments
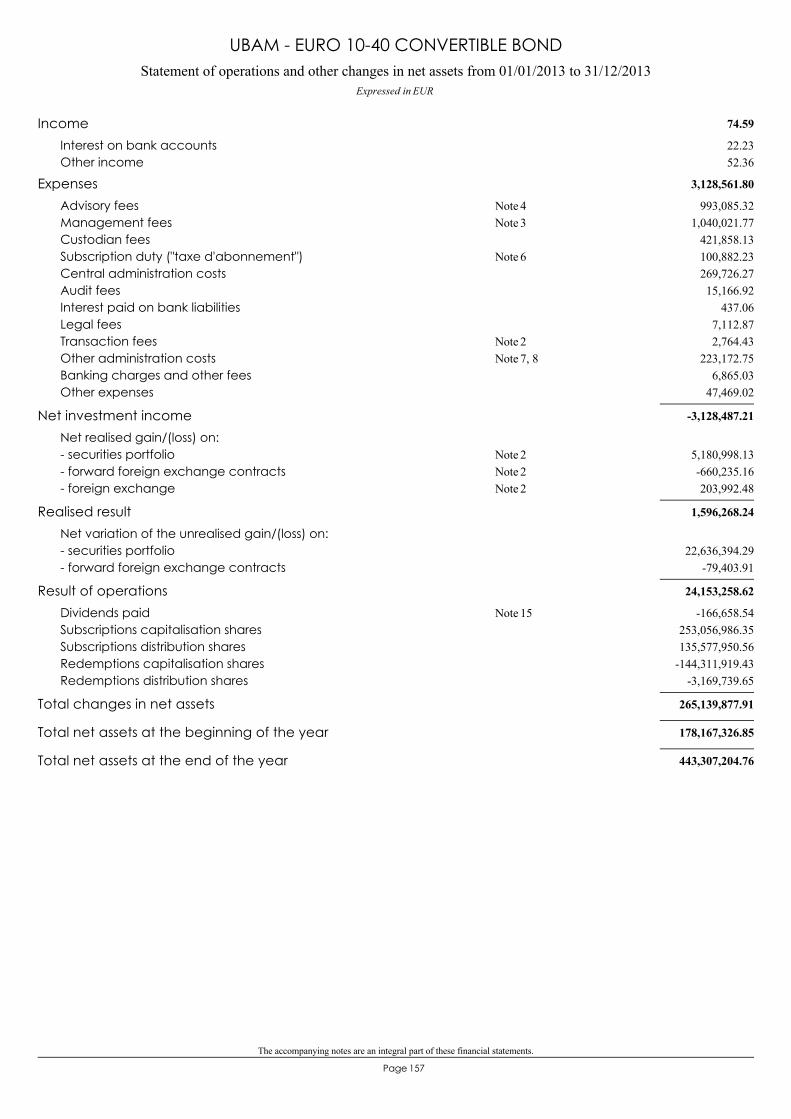
The accompanying notes are an integral part of these financial statements.
157Page
Statement of operations and other changes in net assets from 01/01/2013 to 31/12/2013Expressed in EUR
UBAM - EURO 10-40 CONVERTIBLE BOND
74.59Income22.23Interest on bank accounts52.36Other income
3,128,561.80Expenses993,085.32Advisory fees 4Note
1,040,021.77Management fees 3Note421,858.13Custodian fees100,882.23Subscription duty ("taxe d'abonnement") 6Note269,726.27Central administration costs15,166.92Audit fees
437.06Interest paid on bank liabilities7,112.87Legal fees2,764.43Transaction fees 2Note
223,172.75Other administration costs 7, 8Note6,865.03Banking charges and other fees
47,469.02Other expenses
-3,128,487.21Net investment incomeNet realised gain/(loss) on:
5,180,998.13- securities portfolio 2Note-660,235.16- forward foreign exchange contracts 2Note203,992.48- foreign exchange 2Note
1,596,268.24Realised resultNet variation of the unrealised gain/(loss) on:
22,636,394.29- securities portfolio-79,403.91- forward foreign exchange contracts
24,153,258.62Result of operations-166,658.54Dividends paid 15Note
253,056,986.35Subscriptions capitalisation shares135,577,950.56Subscriptions distribution shares
-144,311,919.43Redemptions capitalisation shares-3,169,739.65Redemptions distribution shares
265,139,877.91Total changes in net assets
178,167,326.85Total net assets at the beginning of the year
443,307,204.76Total net assets at the end of the year
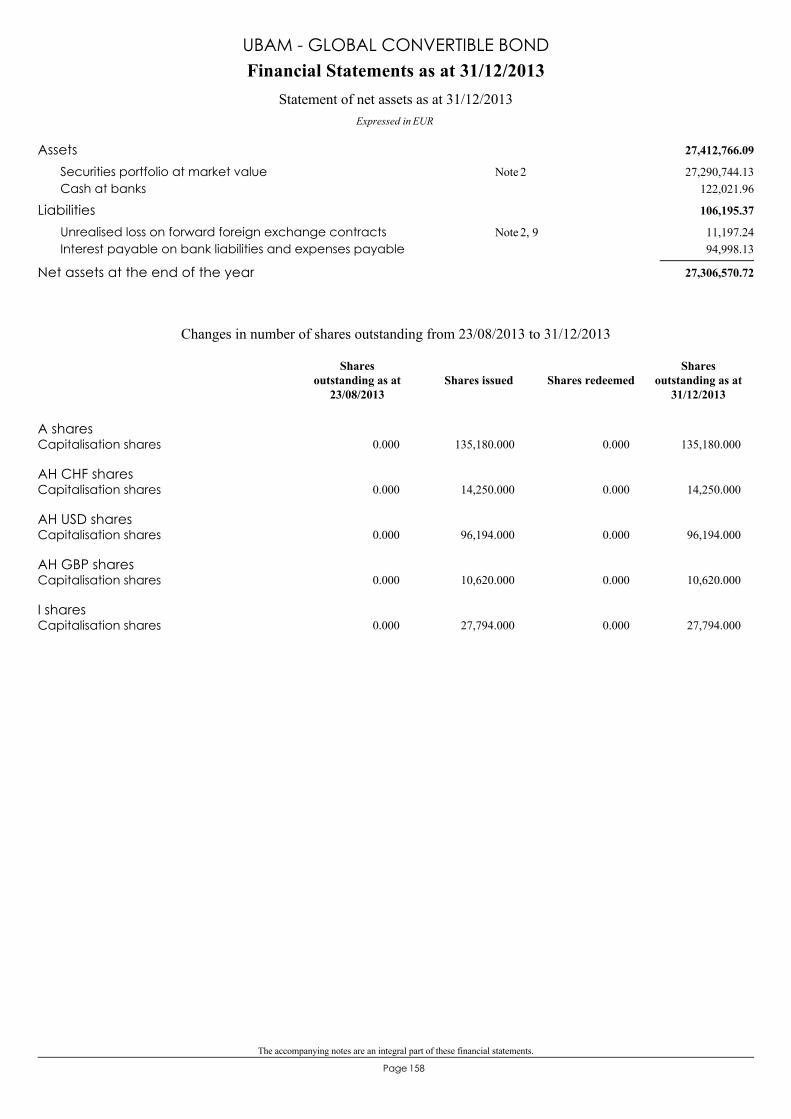
The accompanying notes are an integral part of these financial statements.
158Page
27,412,766.09Assets27,290,744.13Securities portfolio at market value 2Note
122,021.96Cash at banks
106,195.37Liabilities11,197.24Unrealised loss on forward foreign exchange contracts 2, 9Note94,998.13Interest payable on bank liabilities and expenses payable
27,306,570.72Net assets at the end of the year
Financial Statements as at 31/12/2013
Expressed in EUR
Statement of net assets as at 31/12/2013
UBAM - GLOBAL CONVERTIBLE BOND
A sharesCapitalisation shares 0.000 135,180.000 0.000 135,180.000
AH CHF sharesCapitalisation shares 0.000 14,250.000 0.000 14,250.000
AH USD sharesCapitalisation shares 0.000 96,194.000 0.000 96,194.000
AH GBP sharesCapitalisation shares 0.000 10,620.000 0.000 10,620.000
I sharesCapitalisation shares 0.000 27,794.000 0.000 27,794.000
Changes in number of shares outstanding from 23/08/2013 to 31/12/2013
Shares issued Shares redeemedShares
outstanding as at31/12/2013
Sharesoutstanding as at
23/08/2013
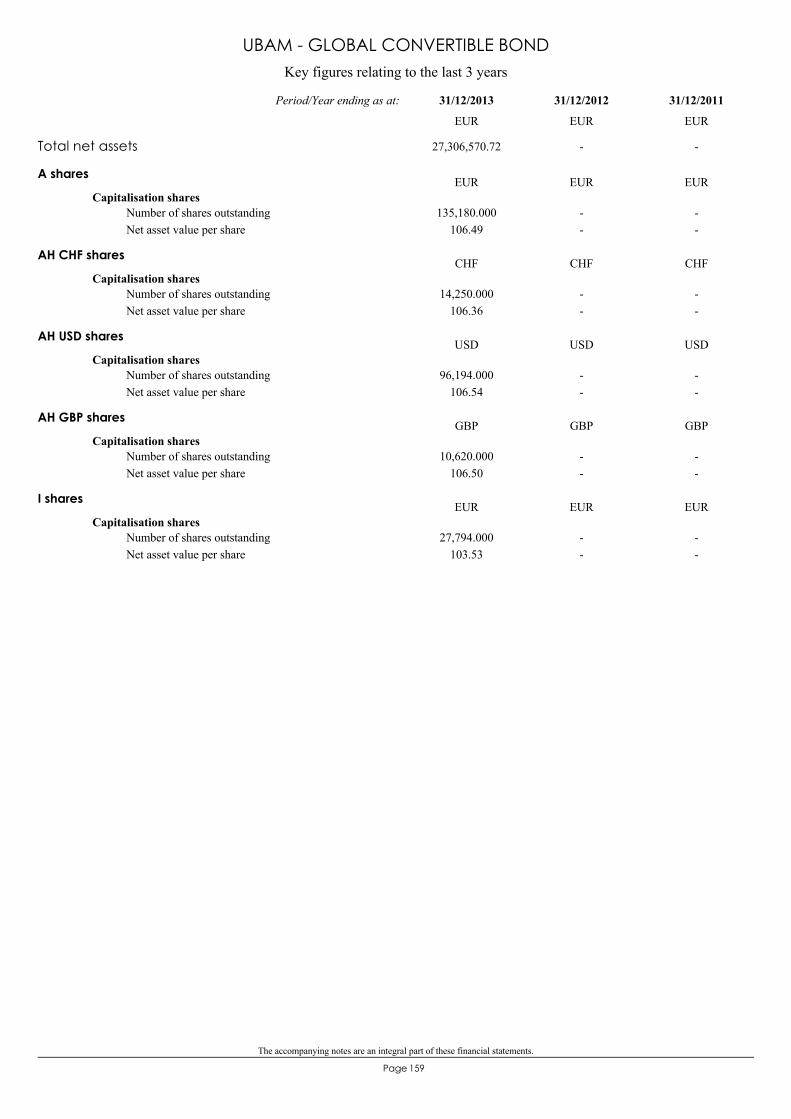
The accompanying notes are an integral part of these financial statements.
159Page
Key figures relating to the last 3 years
UBAM - GLOBAL CONVERTIBLE BOND
A shares
Capitalisation shares135,180.000
106.49--
--
Number of shares outstandingNet asset value per share
EUR EUR EUR
AH CHF shares
Capitalisation shares14,250.000
106.36--
--
Number of shares outstandingNet asset value per share
CHF CHF CHF
AH USD shares
Capitalisation shares96,194.000
106.54--
--
Number of shares outstandingNet asset value per share
USD USD USD
AH GBP shares
Capitalisation shares10,620.000
106.50--
--
Number of shares outstandingNet asset value per share
GBP GBP GBP
I shares
Capitalisation shares27,794.000
103.53--
--
Number of shares outstandingNet asset value per share
EUR EUR EUR
Total net assets 27,306,570.72 - -
31/12/201131/12/201231/12/2013Period/Year ending as at:
EUR EUR EUR

The accompanying notes are an integral part of these financial statements.
160Page
* see Note 16
UBAM CONVERTIBLE SICAV - UBAM CONVERTIBLES GLOBAL -ZC- EUR *25,449 27,290,744.13 99.9425,614,590.44 0.00
Open-ended investment funds 27,290,744.13 99.9425,614,590.44 0.00
Investment funds (UCITS) 27,290,744.13 99.9425,614,590.44 0.00
Euro 27,290,744.13 99.9425,614,590.44 0.00
Total investments in securities 27,290,744.13 99.9425,614,590.44
Cash at banks/(bank liabilities) 122,021.96 0.45
Other net assets/(liabilities) -106,195.37 -0.39
Total 27,306,570.72 100.00
Statement of investments and other net assets as at 31/12/2013EURExpressed in
UBAM - GLOBAL CONVERTIBLE BOND
Number/nom. value Description % of total
net assetsMarket valueCost Unaudited AccruedInterest
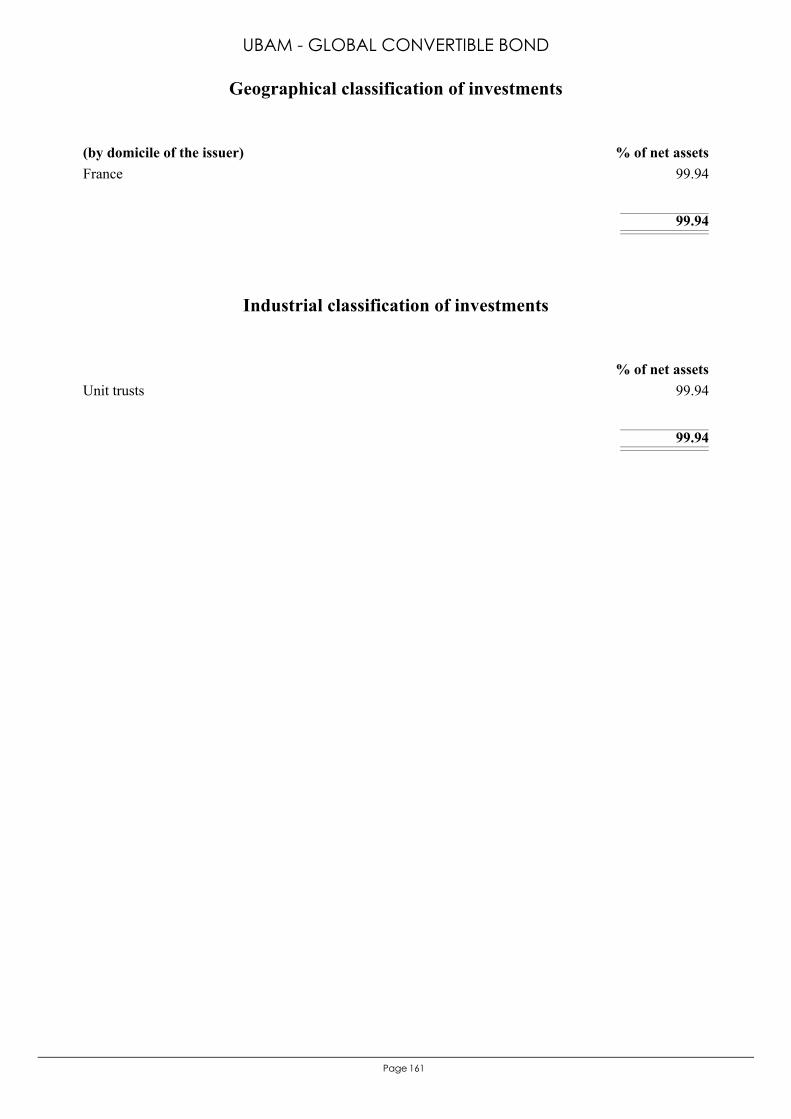
161Page
France 99.94
99.94
(by domicile of the issuer) % of net assets
Geographical classification of investments
UBAM - GLOBAL CONVERTIBLE BOND
Unit trusts 99.94
99.94
% of net assets
Industrial classification of investments
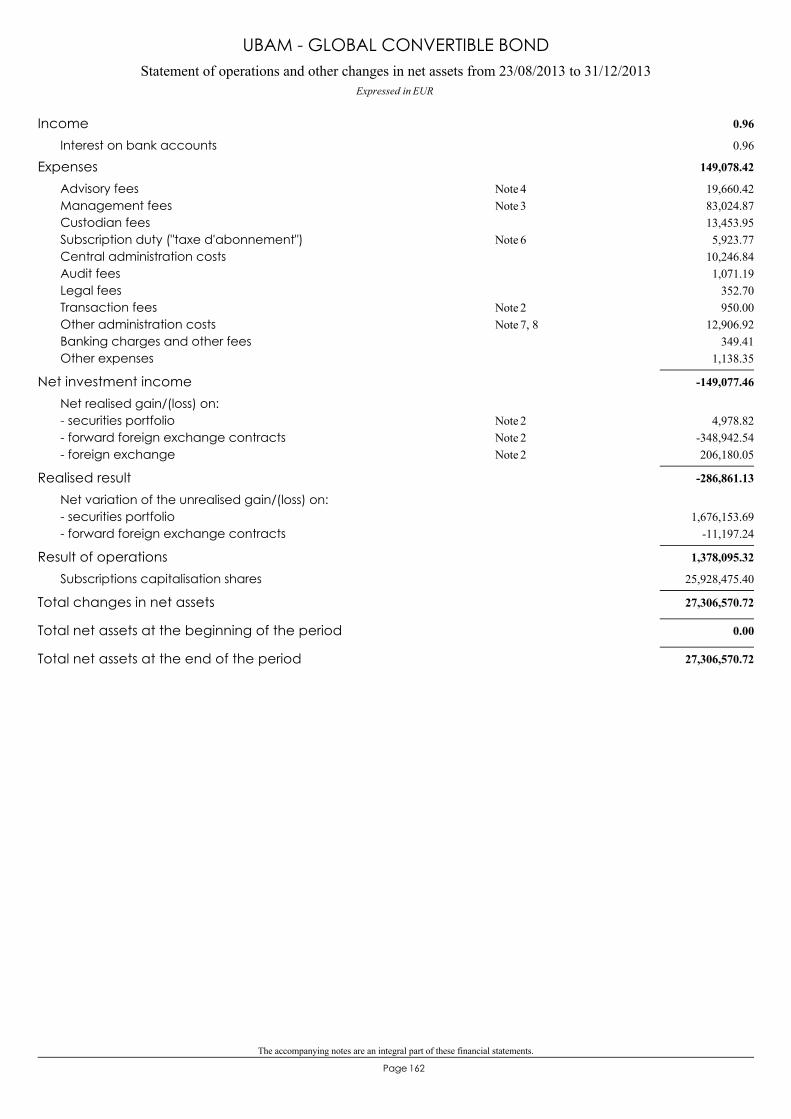
The accompanying notes are an integral part of these financial statements.
162Page
Statement of operations and other changes in net assets from 23/08/2013 to 31/12/2013Expressed in EUR
UBAM - GLOBAL CONVERTIBLE BOND
0.96Income0.96Interest on bank accounts
149,078.42Expenses19,660.42Advisory fees 4Note83,024.87Management fees 3Note13,453.95Custodian fees5,923.77Subscription duty ("taxe d'abonnement") 6Note
10,246.84Central administration costs1,071.19Audit fees
352.70Legal fees950.00Transaction fees 2Note
12,906.92Other administration costs 7, 8Note349.41Banking charges and other fees
1,138.35Other expenses
-149,077.46Net investment incomeNet realised gain/(loss) on:
4,978.82- securities portfolio 2Note-348,942.54- forward foreign exchange contracts 2Note206,180.05- foreign exchange 2Note
-286,861.13Realised resultNet variation of the unrealised gain/(loss) on:
1,676,153.69- securities portfolio-11,197.24- forward foreign exchange contracts
1,378,095.32Result of operations25,928,475.40Subscriptions capitalisation shares
27,306,570.72Total changes in net assets
0.00Total net assets at the beginning of the period
27,306,570.72Total net assets at the end of the period
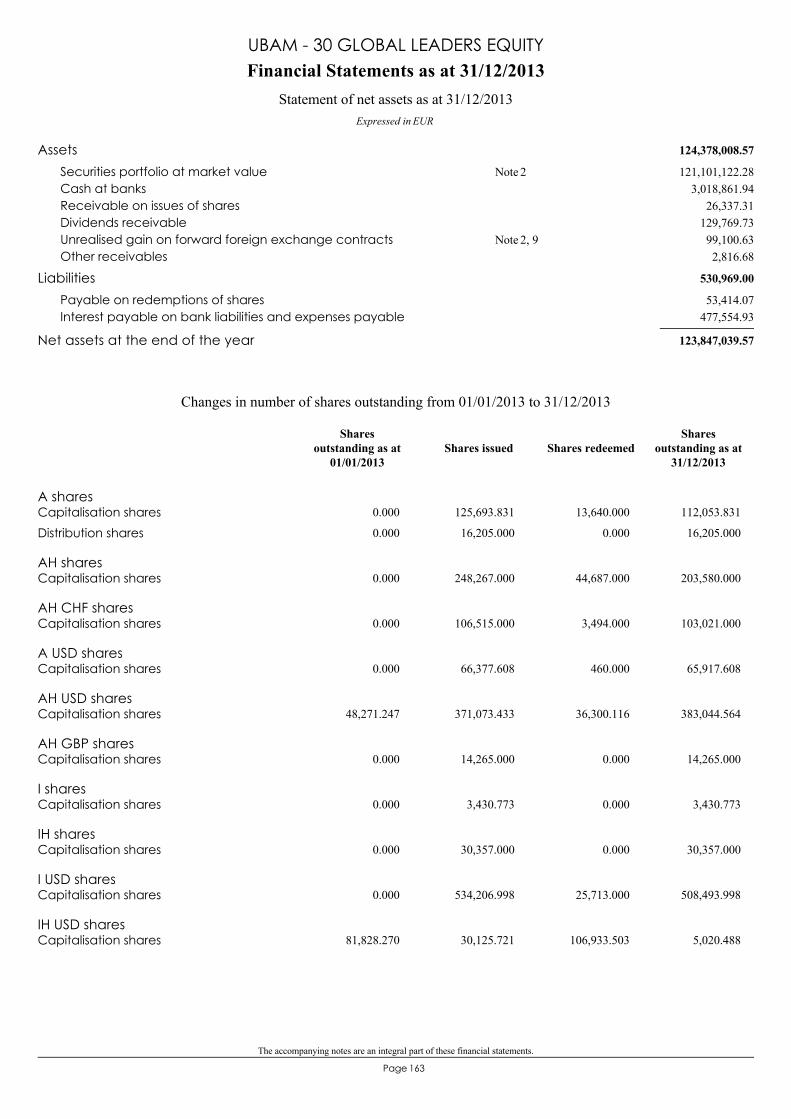
The accompanying notes are an integral part of these financial statements.
163Page
124,378,008.57Assets121,101,122.28Securities portfolio at market value 2Note
3,018,861.94Cash at banks26,337.31Receivable on issues of shares
129,769.73Dividends receivable99,100.63Unrealised gain on forward foreign exchange contracts 2, 9Note2,816.68Other receivables
530,969.00Liabilities53,414.07Payable on redemptions of shares
477,554.93Interest payable on bank liabilities and expenses payable
123,847,039.57Net assets at the end of the year
Financial Statements as at 31/12/2013
Expressed in EUR
Statement of net assets as at 31/12/2013
UBAM - 30 GLOBAL LEADERS EQUITY
A sharesCapitalisation shares 0.000 125,693.831 13,640.000 112,053.831
Distribution shares 0.000 16,205.000 0.000 16,205.000
AH sharesCapitalisation shares 0.000 248,267.000 44,687.000 203,580.000
AH CHF sharesCapitalisation shares 0.000 106,515.000 3,494.000 103,021.000
A USD sharesCapitalisation shares 0.000 66,377.608 460.000 65,917.608
AH USD sharesCapitalisation shares 48,271.247 371,073.433 36,300.116 383,044.564
AH GBP sharesCapitalisation shares 0.000 14,265.000 0.000 14,265.000
I sharesCapitalisation shares 0.000 3,430.773 0.000 3,430.773
IH sharesCapitalisation shares 0.000 30,357.000 0.000 30,357.000
I USD sharesCapitalisation shares 0.000 534,206.998 25,713.000 508,493.998
IH USD sharesCapitalisation shares 81,828.270 30,125.721 106,933.503 5,020.488
Changes in number of shares outstanding from 01/01/2013 to 31/12/2013
Shares issued Shares redeemedShares
outstanding as at31/12/2013
Sharesoutstanding as at
01/01/2013

The accompanying notes are an integral part of these financial statements.
164Page
R sharesCapitalisation shares 1.000 84,655.224 16,122.190 68,534.034
Changes in number of shares outstanding from 01/01/2013 to 31/12/2013
Shares issued Shares redeemedShares
outstanding as at31/12/2013
Sharesoutstanding as at
01/01/2013
UBAM - 30 GLOBAL LEADERS EQUITY
Key figures relating to the last 3 years
A shares
Capitalisation shares112,053.831
76.51--
--
Number of shares outstandingNet asset value per share
Distribution shares16,205.000
76.51--
--
Number of shares outstandingNet asset value per share
EUR EUR EUR
AH shares
Capitalisation shares203,580.000
77.93--
--
Number of shares outstandingNet asset value per share
EUR EUR EUR
AH CHF shares
Capitalisation shares103,021.000
96.68--
--
Number of shares outstandingNet asset value per share
CHF CHF CHF
A USD shares
Capitalisation shares65,917.608
114.33--
--
Number of shares outstandingNet asset value per share
USD USD USD
AH USD shares
Capitalisation shares383,044.564
103.9948,271.247
88.3456,079.817
75.14Number of shares outstandingNet asset value per share
USD USD USD
AH GBP shares
Capitalisation shares14,265.000
110.59--
--
Number of shares outstandingNet asset value per share
GBP GBP GBP
I shares
Capitalisation shares3,430.773
76.95--
--
Number of shares outstandingNet asset value per share
EUR EUR EUR
Total net assets 123,847,039.57 11,823,651.08 13,073,279.68
31/12/201131/12/201231/12/2013Year ending as at:
EUR USD USD
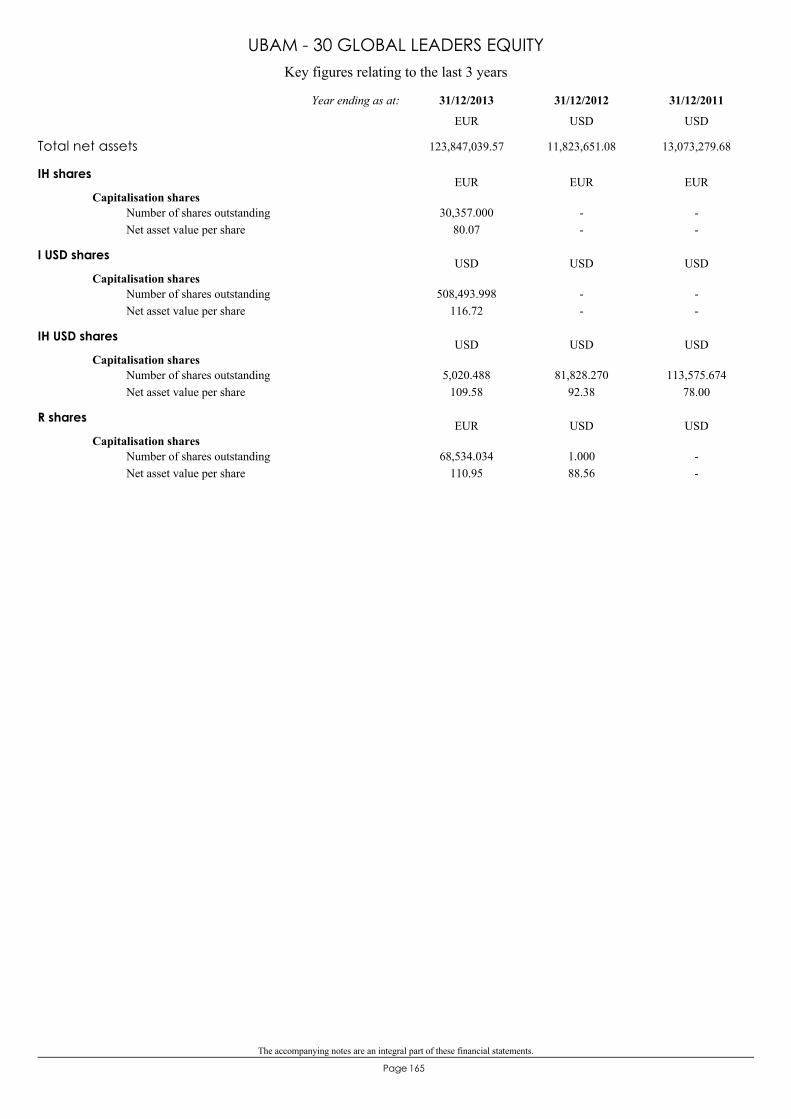
The accompanying notes are an integral part of these financial statements.
165Page
Key figures relating to the last 3 years
UBAM - 30 GLOBAL LEADERS EQUITY
IH shares
Capitalisation shares30,357.000
80.07--
--
Number of shares outstandingNet asset value per share
EUR EUR EUR
I USD shares
Capitalisation shares508,493.998
116.72--
--
Number of shares outstandingNet asset value per share
USD USD USD
IH USD shares
Capitalisation shares5,020.488
109.5881,828.270
92.38113,575.674
78.00Number of shares outstandingNet asset value per share
USD USD USD
R shares
Capitalisation shares68,534.034
110.951.00088.56
--
Number of shares outstandingNet asset value per share
EUR USD USD
Total net assets 123,847,039.57 11,823,651.08 13,073,279.68
31/12/201131/12/201231/12/2013Year ending as at:
EUR USD USD
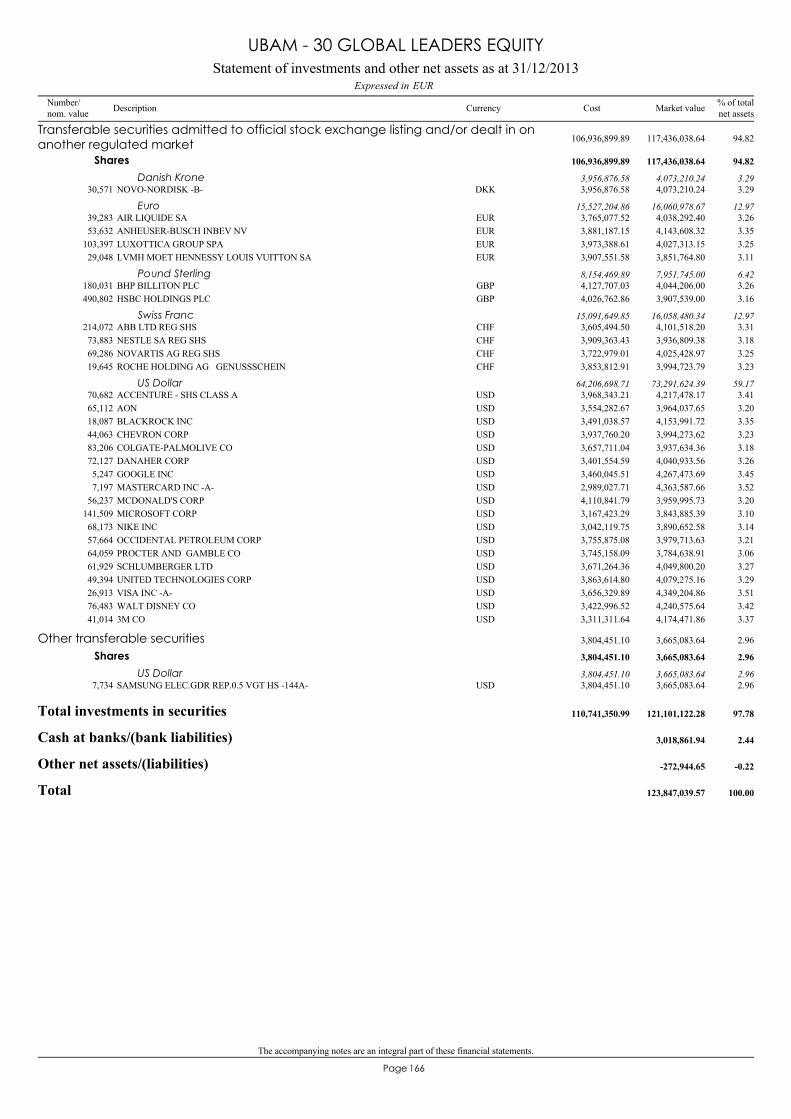
The accompanying notes are an integral part of these financial statements.
166Page
NOVO-NORDISK -B-30,571 4,073,210.24 3.29DKK 3,956,876.58
Transferable securities admitted to official stock exchange listing and/or dealt in onanother regulated market 117,436,038.64 94.82106,936,899.89
Shares 117,436,038.64 94.82106,936,899.89
Danish Krone 4,073,210.24 3.293,956,876.58
AIR LIQUIDE SA39,283 4,038,292.40 3.26EUR 3,765,077.52Euro 16,060,978.67 12.9715,527,204.86
ANHEUSER-BUSCH INBEV NV53,632 4,143,608.32 3.35EUR 3,881,187.15LUXOTTICA GROUP SPA103,397 4,027,313.15 3.25EUR 3,973,388.61LVMH MOET HENNESSY LOUIS VUITTON SA29,048 3,851,764.80 3.11EUR 3,907,551.58
BHP BILLITON PLC180,031 4,044,206.00 3.26GBP 4,127,707.03Pound Sterling 7,951,745.00 6.428,154,469.89
HSBC HOLDINGS PLC490,802 3,907,539.00 3.16GBP 4,026,762.86
ABB LTD REG SHS214,072 4,101,518.20 3.31CHF 3,605,494.50Swiss Franc 16,058,480.34 12.9715,091,649.85
NESTLE SA REG SHS73,883 3,936,809.38 3.18CHF 3,909,363.43NOVARTIS AG REG SHS69,286 4,025,428.97 3.25CHF 3,722,979.01ROCHE HOLDING AG GENUSSSCHEIN19,645 3,994,723.79 3.23CHF 3,853,812.91
ACCENTURE - SHS CLASS A70,682 4,217,478.17 3.41USD 3,968,343.21US Dollar 73,291,624.39 59.1764,206,698.71
AON65,112 3,964,037.65 3.20USD 3,554,282.67BLACKROCK INC18,087 4,153,991.72 3.35USD 3,491,038.57CHEVRON CORP44,063 3,994,273.62 3.23USD 3,937,760.20COLGATE-PALMOLIVE CO83,206 3,937,634.36 3.18USD 3,657,711.04DANAHER CORP72,127 4,040,933.56 3.26USD 3,401,554.59GOOGLE INC5,247 4,267,473.69 3.45USD 3,460,045.51MASTERCARD INC -A-7,197 4,363,587.66 3.52USD 2,989,027.71MCDONALD'S CORP56,237 3,959,995.73 3.20USD 4,110,841.79MICROSOFT CORP141,509 3,843,885.39 3.10USD 3,167,423.29NIKE INC68,173 3,890,652.58 3.14USD 3,042,119.75OCCIDENTAL PETROLEUM CORP57,664 3,979,713.63 3.21USD 3,755,875.08PROCTER AND GAMBLE CO64,059 3,784,638.91 3.06USD 3,745,158.09SCHLUMBERGER LTD61,929 4,049,800.20 3.27USD 3,671,264.36UNITED TECHNOLOGIES CORP49,394 4,079,275.16 3.29USD 3,863,614.80VISA INC -A-26,913 4,349,204.86 3.51USD 3,656,329.89WALT DISNEY CO76,483 4,240,575.64 3.42USD 3,422,996.523M CO41,014 4,174,471.86 3.37USD 3,311,311.64
SAMSUNG ELEC.GDR REP.0.5 VGT HS -144A-7,734 3,665,083.64 2.96USD 3,804,451.10
Other transferable securities 3,665,083.64 2.963,804,451.10
Shares 3,665,083.64 2.963,804,451.10
US Dollar 3,665,083.64 2.963,804,451.10
Total investments in securities 121,101,122.28 97.78110,741,350.99
Cash at banks/(bank liabilities) 3,018,861.94 2.44
Other net assets/(liabilities) -272,944.65 -0.22
Total 123,847,039.57 100.00
Statement of investments and other net assets as at 31/12/2013EURExpressed in
UBAM - 30 GLOBAL LEADERS EQUITY
Number/nom. value Description Currency % of total
net assetsMarket valueCost
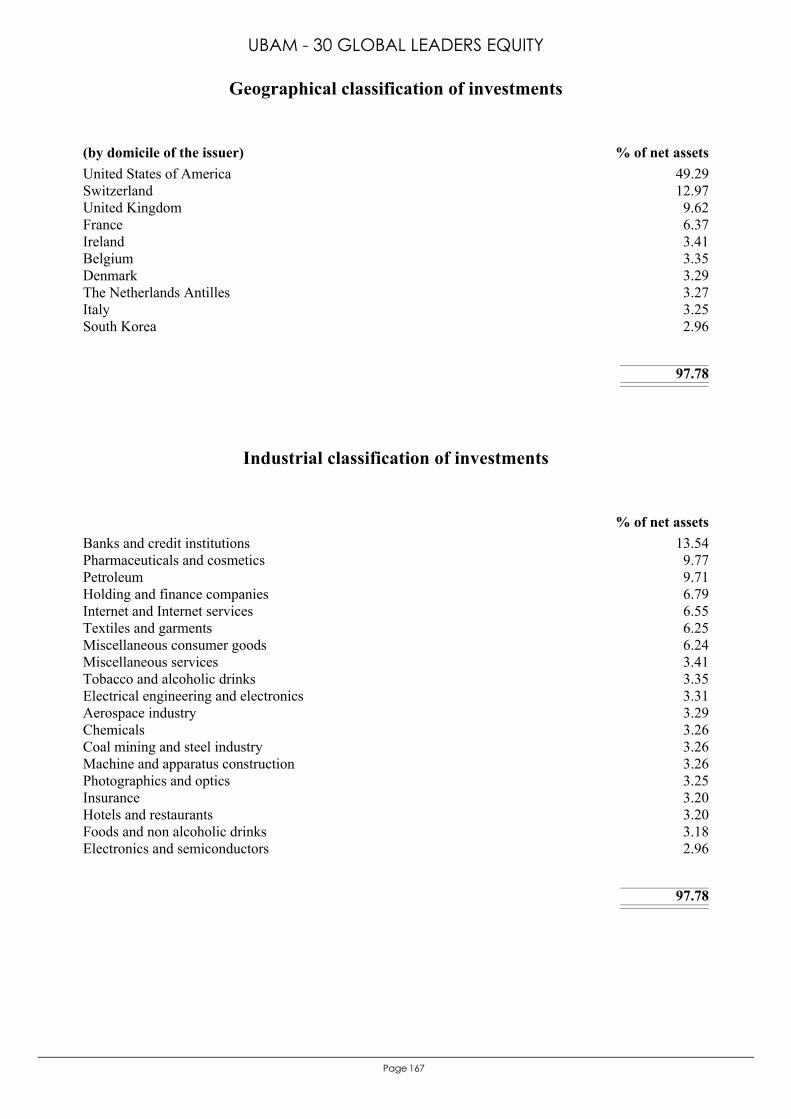
167Page
United States of America 49.29Switzerland 12.97United Kingdom 9.62France 6.37Ireland 3.41Belgium 3.35Denmark 3.29The Netherlands Antilles 3.27Italy 3.25South Korea 2.96
97.78
(by domicile of the issuer) % of net assets
Geographical classification of investments
UBAM - 30 GLOBAL LEADERS EQUITY
Banks and credit institutions 13.54Pharmaceuticals and cosmetics 9.77Petroleum 9.71Holding and finance companies 6.79Internet and Internet services 6.55Textiles and garments 6.25Miscellaneous consumer goods 6.24Miscellaneous services 3.41Tobacco and alcoholic drinks 3.35Electrical engineering and electronics 3.31Aerospace industry 3.29Chemicals 3.26Coal mining and steel industry 3.26Machine and apparatus construction 3.26Photographics and optics 3.25Insurance 3.20Hotels and restaurants 3.20Foods and non alcoholic drinks 3.18Electronics and semiconductors 2.96
97.78
% of net assets
Industrial classification of investments
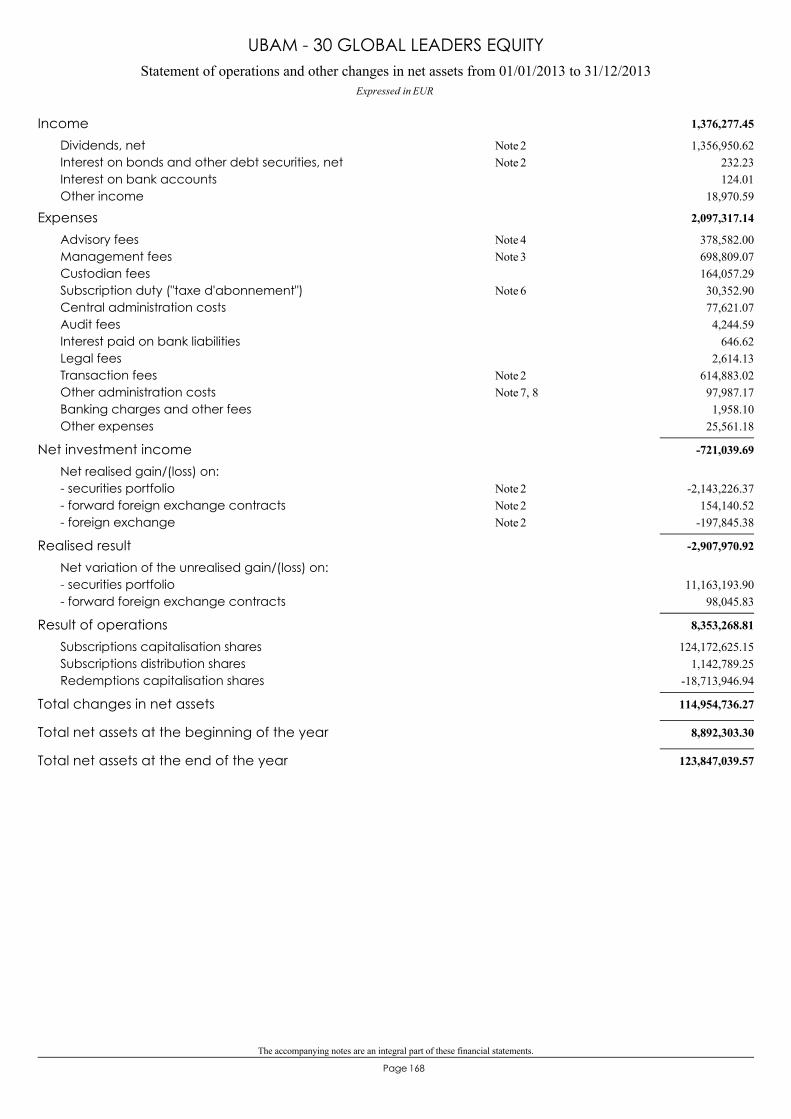
The accompanying notes are an integral part of these financial statements.
168Page
Statement of operations and other changes in net assets from 01/01/2013 to 31/12/2013Expressed in EUR
UBAM - 30 GLOBAL LEADERS EQUITY
1,376,277.45Income1,356,950.62Dividends, net 2Note
232.23Interest on bonds and other debt securities, net 2Note124.01Interest on bank accounts
18,970.59Other income
2,097,317.14Expenses378,582.00Advisory fees 4Note698,809.07Management fees 3Note164,057.29Custodian fees30,352.90Subscription duty ("taxe d'abonnement") 6Note77,621.07Central administration costs4,244.59Audit fees
646.62Interest paid on bank liabilities2,614.13Legal fees
614,883.02Transaction fees 2Note97,987.17Other administration costs 7, 8Note1,958.10Banking charges and other fees
25,561.18Other expenses
-721,039.69Net investment incomeNet realised gain/(loss) on:
-2,143,226.37- securities portfolio 2Note154,140.52- forward foreign exchange contracts 2Note
-197,845.38- foreign exchange 2Note
-2,907,970.92Realised resultNet variation of the unrealised gain/(loss) on:
11,163,193.90- securities portfolio98,045.83- forward foreign exchange contracts
8,353,268.81Result of operations124,172,625.15Subscriptions capitalisation shares
1,142,789.25Subscriptions distribution shares-18,713,946.94Redemptions capitalisation shares
114,954,736.27Total changes in net assets
8,892,303.30Total net assets at the beginning of the year
123,847,039.57Total net assets at the end of the year

The accompanying notes are an integral part of these financial statements.
169Page
27,152,935.54Assets26,229,916.07Securities portfolio at market value 2Note
921,442.66Cash at banks1,576.81Dividends receivable
177,765.36Liabilities244.56Payable on treasury transactions 2Note
177,520.80Interest payable on bank liabilities and expenses payable
26,975,170.18Net assets at the end of the year
Financial Statements as at 31/12/2013
Expressed in USD
Statement of net assets as at 31/12/2013
UBAM - ASIA EQUITY
A sharesCapitalisation shares 799,891.870 214,973.249 248,856.392 766,008.727
A EUR sharesCapitalisation shares 8,080.000 24,093.000 14,430.000 17,743.000
AP sharesCapitalisation shares 0.000 417,366.658 58,597.923 358,768.735
IP sharesCapitalisation shares 137,250.000 148,407.107 285,397.153 259.954
R sharesCapitalisation shares 40,100.266 65,443.222 17,997.101 87,546.387
Changes in number of shares outstanding from 01/01/2013 to 31/12/2013
Shares issued Shares redeemedShares
outstanding as at31/12/2013
Sharesoutstanding as at
01/01/2013

The accompanying notes are an integral part of these financial statements.
170Page
Key figures relating to the last 3 years
UBAM - ASIA EQUITY
A shares
Capitalisation shares766,008.727
22.08799,891.870
20.51948,088.477
15.67Number of shares outstandingNet asset value per share
USD USD USD
A EUR shares
Capitalisation shares17,743.000
16.028,080.000
15.557,580.000
12.07Number of shares outstandingNet asset value per share
EUR EUR EUR
AP shares
Capitalisation shares358,768.735
22.07--
--
Number of shares outstandingNet asset value per share
USD USD USD
IP shares
Capitalisation shares259.95422.86
137,250.00020.97
177,740.00015.82
Number of shares outstandingNet asset value per share
USD USD USD
R shares
Capitalisation shares87,546.387
19.9240,100.266
18.6945,674.198
14.42Number of shares outstandingNet asset value per share
USD USD USD
Total net assets 26,975,170.18 20,199,522.62 18,442,738.89
31/12/201131/12/201231/12/2013Year ending as at:
USD USD USD

The accompanying notes are an integral part of these financial statements.
171Page
AGRICULTURAL BANK OF CHINA -H-794,000 390,151.12 1.45HKD 325,670.27
Transferable securities admitted to official stock exchange listing and/or dealt in onanother regulated market 26,229,916.07 97.2424,038,906.41
Shares 26,229,916.07 97.2424,038,906.41
Hong Kong Dollar 9,374,233.21 34.758,592,665.77
BOER POWER HOLDINGS LTD1,024,500 940,761.08 3.49HKD 533,228.71CHINA AUTOMATION GROUP LTD3,252,500 738,273.63 2.74HKD 1,235,597.74CHINA HUIRONG FINANCIAL HOLDINGS LTD562,000 121,767.95 0.45HKD 122,190.36CHINA PETROLEUM AND CHEMICAL -H-480,000 391,861.26 1.45HKD 398,830.85CN MACHINERY -H-811,000 655,806.60 2.43HKD 529,410.85EMBRY HOLDINGS LTD1,189,400 823,738.96 3.05HKD 817,284.54FAR EAST HORIZON LTD942,000 805,474.54 2.99HKD 636,505.85HAITONG SECURITIES CO LTD -H-224,800 391,396.97 1.45HKD 350,739.77HUISHANG BANK CORPORATION LTD1,439,000 656,978.93 2.44HKD 664,381.09LI NING CO1,251,000 987,406.81 3.65HKD 699,826.45NEW WORLD DEPARTMENT STORE CHINA LTD1,295,500 728,469.36 2.70HKD 860,550.41PING AN INS (GRP) CO -H-55,000 492,631.67 1.83HKD 419,114.83SHANGAI FOSUN PHARMACEUTICAL H174,000 523,990.63 1.94HKD 313,423.91SUNNY OPTI TECH SHS347,000 337,433.51 1.25HKD 356,035.67ZTE CORPORATION -H-195,400 388,090.19 1.44HKD 329,874.47
BALLARPUR INDUSTRIES1,117,459 237,565.04 0.88INR 390,811.38Indian Rupee 2,305,375.19 8.552,473,441.88
MCX INDIA35,373 273,954.17 1.02INR 389,603.99OIL AND NATURAL GAS CORP125,000 583,825.05 2.16INR 595,446.65PRESTIGE ESTATES PROJECTS LTD343,684 902,618.44 3.35INR 789,187.97SUN TV NETWORK50,000 307,412.49 1.14INR 308,391.89
BANK RAKYAT INDONESIA361,500 215,355.20 0.80IDR 266,971.30Indonesian Rupiah 564,276.85 2.09749,048.87
PT TIPHONE MOBILE INDONESIA TBK6,849,000 348,921.65 1.29IDR 482,077.57
AMOREPACIFIC CORP752 712,559.86 2.64KRW 631,206.34Korean Won 5,363,973.68 19.884,787,950.96
DSHM13,511 243,245.38 0.90KRW 337,762.24HANA FINANCIAL GROUP INC6,750 280,783.64 1.04KRW 267,251.69HYUNDAI HEAVY INDUSTRIES CO LTD3,367 819,935.61 3.04KRW 859,239.62HYUNDAI MOTOR CO LTD3,727 835,206.85 3.10KRW 749,876.19KGINICIS CO LTD14,223 223,718.97 0.83KRW 282,985.25NAVER739 506,974.97 1.88KRW 289,508.16SHINHAN FINANCIAL GROUP15,190 680,804.51 2.52KRW 644,019.38SK HYNIX INC30,420 1,060,743.89 3.93KRW 726,102.09
MEDIA PRIMA BHD695,000 555,918.23 2.06MYR 587,711.63Malaysian Ringgit 1,239,329.16 4.591,146,156.74
QL RESOURCES550,000 683,410.93 2.53MYR 558,445.11
CHINA DEVELOPMENT BANK FINANCIAL HDG CO3,430,000 1,035,785.21 3.85TWD 952,290.85New Taiwan Dollar 3,003,941.88 11.142,681,666.92
FORMOSA LABORATORIES INC399,092 903,878.12 3.35TWD 765,010.21NOVATEK ELECTRONICS132,000 540,339.65 2.00TWD 501,904.45TA CHONG BANK1,439,189 523,938.90 1.94TWD 462,461.41
CONCEPCION INDUSTRIAL CORP375,000 207,007.32 0.77PHP 222,272.76Philippine Peso 207,007.32 0.77222,272.76
OLAM INTERNATIONAL LTD544,000 661,365.31 2.45SGD 851,416.27Singapore Dollar 922,176.29 3.421,123,237.93
SEMBCORP MARINE LTD74,000 260,810.98 0.97SGD 271,821.66
CHAROEN POKPHAND N.VTG DEP.RECEIPT806,100 785,003.68 2.91THB 832,333.82Thai Bath 785,003.68 2.91832,333.82
HOLLYSYS AUTOMATION TECHNOLOGIES44,300 838,599.00 3.11USD 449,083.17US Dollar 2,464,598.81 9.141,430,130.76
RDA MICROELECTRONICS INC74,613 1,334,080.44 4.95USD 700,124.54SHANGHAI FRIENDSHIP OVS CHINESE CO -B-208,365 291,919.37 1.08USD 280,923.05
Total investments in securities 26,229,916.07 97.2424,038,906.41
Cash at banks/(bank liabilities) 921,442.66 3.42
Other net assets/(liabilities) -176,188.55 -0.66
Statement of investments and other net assets as at 31/12/2013USDExpressed in
UBAM - ASIA EQUITY
Number/nom. value Description Currency % of total
net assetsMarket valueCost
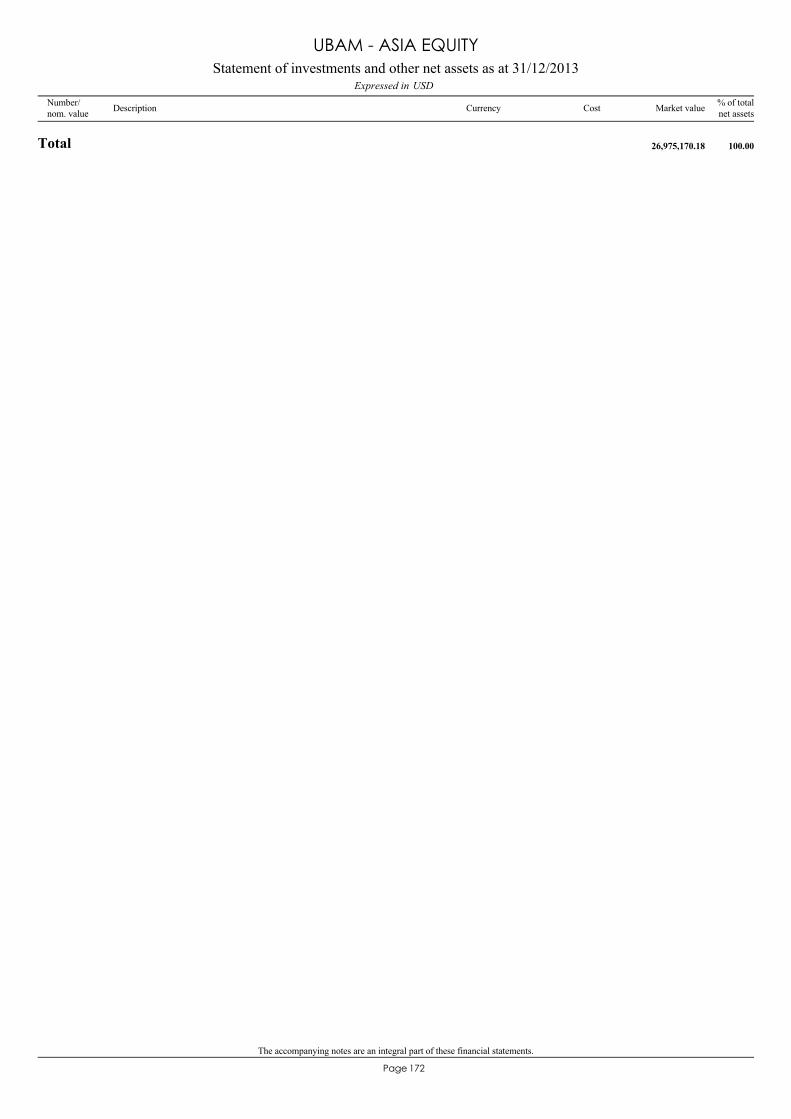
The accompanying notes are an integral part of these financial statements.
172Page
Total 26,975,170.18 100.00
Statement of investments and other net assets as at 31/12/2013USDExpressed in
UBAM - ASIA EQUITY
Number/nom. value Description Currency % of total
net assetsMarket valueCost
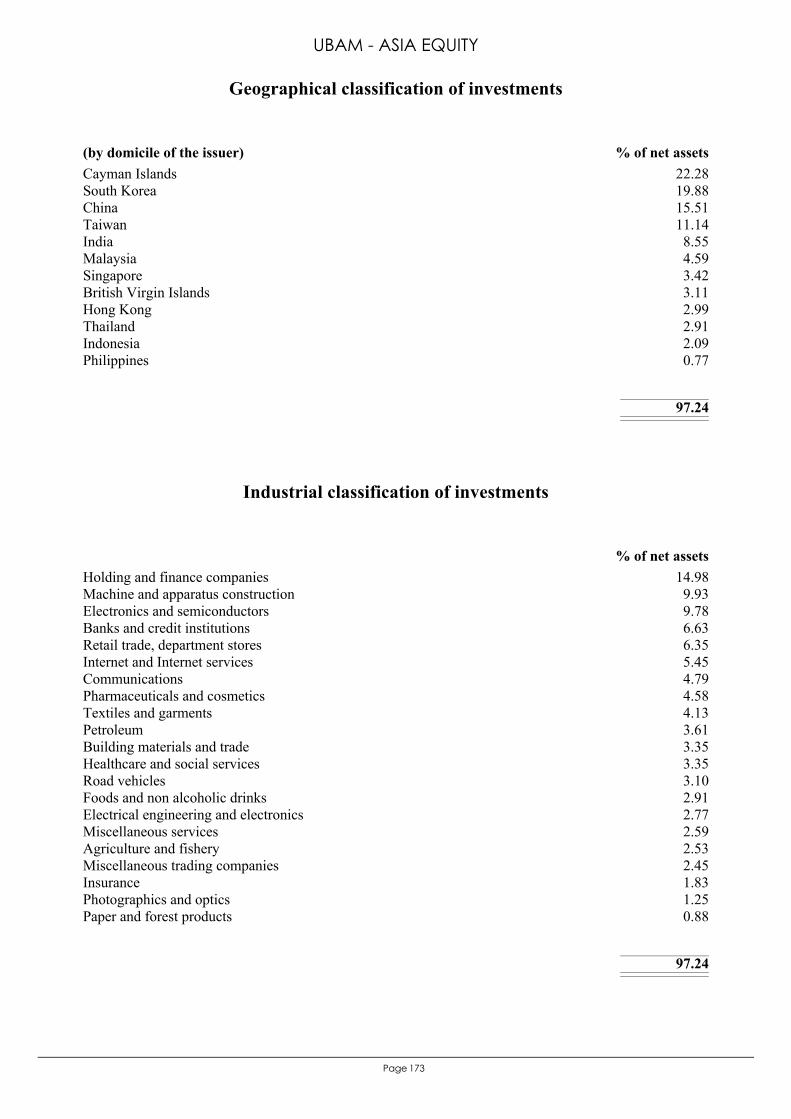
173Page
Cayman Islands 22.28South Korea 19.88China 15.51Taiwan 11.14India 8.55Malaysia 4.59Singapore 3.42British Virgin Islands 3.11Hong Kong 2.99Thailand 2.91Indonesia 2.09Philippines 0.77
97.24
(by domicile of the issuer) % of net assets
Geographical classification of investments
UBAM - ASIA EQUITY
Holding and finance companies 14.98Machine and apparatus construction 9.93Electronics and semiconductors 9.78Banks and credit institutions 6.63Retail trade, department stores 6.35Internet and Internet services 5.45Communications 4.79Pharmaceuticals and cosmetics 4.58Textiles and garments 4.13Petroleum 3.61Building materials and trade 3.35Healthcare and social services 3.35Road vehicles 3.10Foods and non alcoholic drinks 2.91Electrical engineering and electronics 2.77Miscellaneous services 2.59Agriculture and fishery 2.53Miscellaneous trading companies 2.45Insurance 1.83Photographics and optics 1.25Paper and forest products 0.88
97.24
% of net assets
Industrial classification of investments
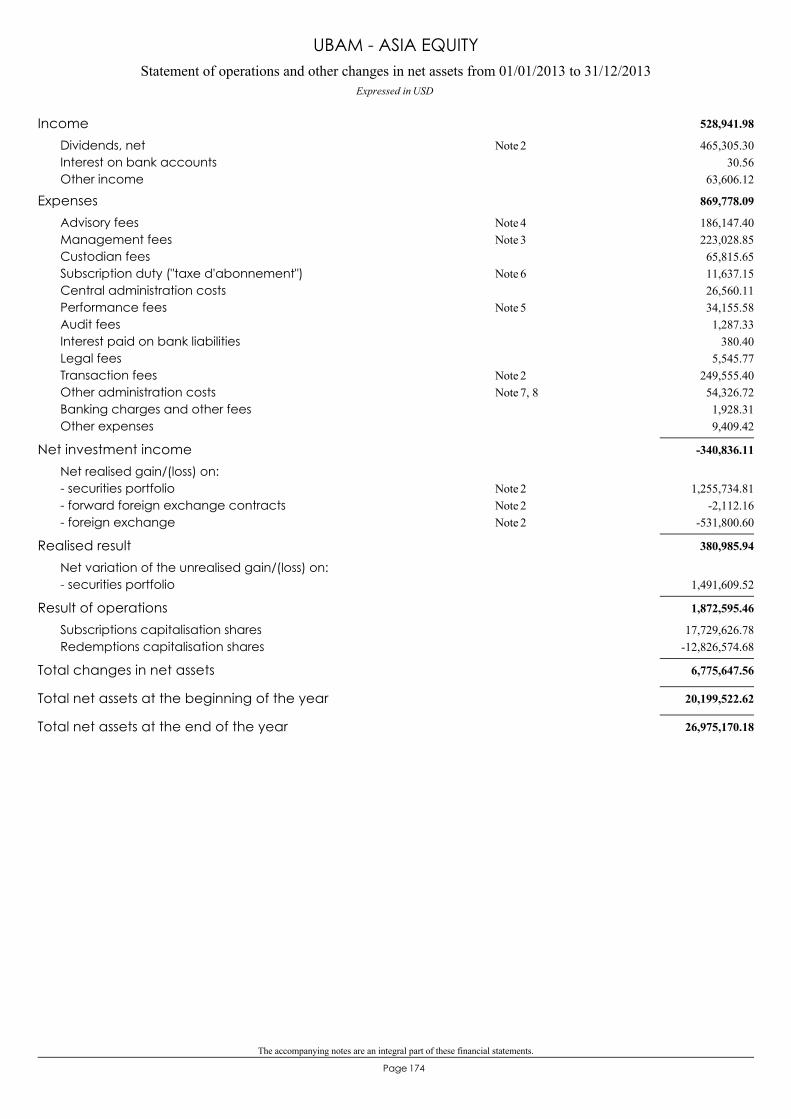
The accompanying notes are an integral part of these financial statements.
174Page
Statement of operations and other changes in net assets from 01/01/2013 to 31/12/2013Expressed in USD
UBAM - ASIA EQUITY
528,941.98Income465,305.30Dividends, net 2Note
30.56Interest on bank accounts63,606.12Other income
869,778.09Expenses186,147.40Advisory fees 4Note223,028.85Management fees 3Note65,815.65Custodian fees11,637.15Subscription duty ("taxe d'abonnement") 6Note26,560.11Central administration costs34,155.58Performance fees 5Note1,287.33Audit fees
380.40Interest paid on bank liabilities5,545.77Legal fees
249,555.40Transaction fees 2Note54,326.72Other administration costs 7, 8Note1,928.31Banking charges and other fees9,409.42Other expenses
-340,836.11Net investment incomeNet realised gain/(loss) on:
1,255,734.81- securities portfolio 2Note-2,112.16- forward foreign exchange contracts 2Note
-531,800.60- foreign exchange 2Note
380,985.94Realised resultNet variation of the unrealised gain/(loss) on:
1,491,609.52- securities portfolio
1,872,595.46Result of operations17,729,626.78Subscriptions capitalisation shares
-12,826,574.68Redemptions capitalisation shares
6,775,647.56Total changes in net assets
20,199,522.62Total net assets at the beginning of the year
26,975,170.18Total net assets at the end of the year
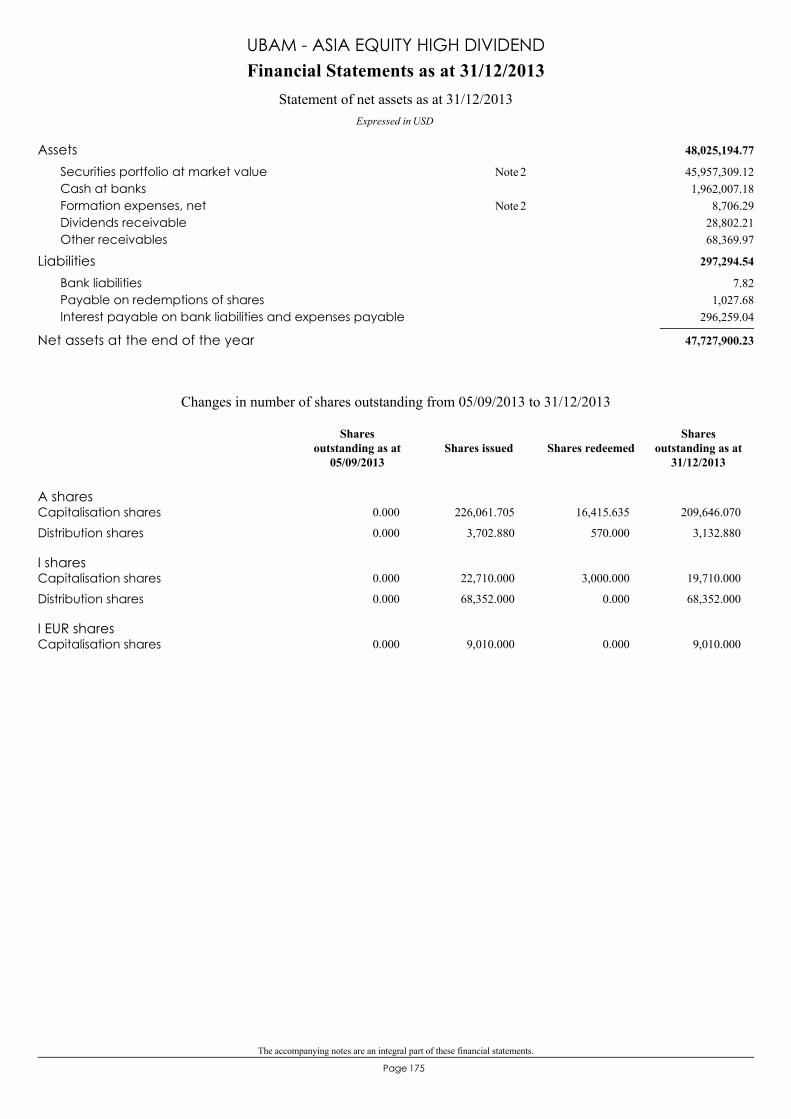
The accompanying notes are an integral part of these financial statements.
175Page
48,025,194.77Assets45,957,309.12Securities portfolio at market value 2Note1,962,007.18Cash at banks
8,706.29Formation expenses, net 2Note28,802.21Dividends receivable68,369.97Other receivables
297,294.54Liabilities7.82Bank liabilities
1,027.68Payable on redemptions of shares296,259.04Interest payable on bank liabilities and expenses payable
47,727,900.23Net assets at the end of the year
Financial Statements as at 31/12/2013
Expressed in USD
Statement of net assets as at 31/12/2013
UBAM - ASIA EQUITY HIGH DIVIDEND
A sharesCapitalisation shares 0.000 226,061.705 16,415.635 209,646.070
Distribution shares 0.000 3,702.880 570.000 3,132.880
I sharesCapitalisation shares 0.000 22,710.000 3,000.000 19,710.000
Distribution shares 0.000 68,352.000 0.000 68,352.000
I EUR sharesCapitalisation shares 0.000 9,010.000 0.000 9,010.000
Changes in number of shares outstanding from 05/09/2013 to 31/12/2013
Shares issued Shares redeemedShares
outstanding as at31/12/2013
Sharesoutstanding as at
05/09/2013
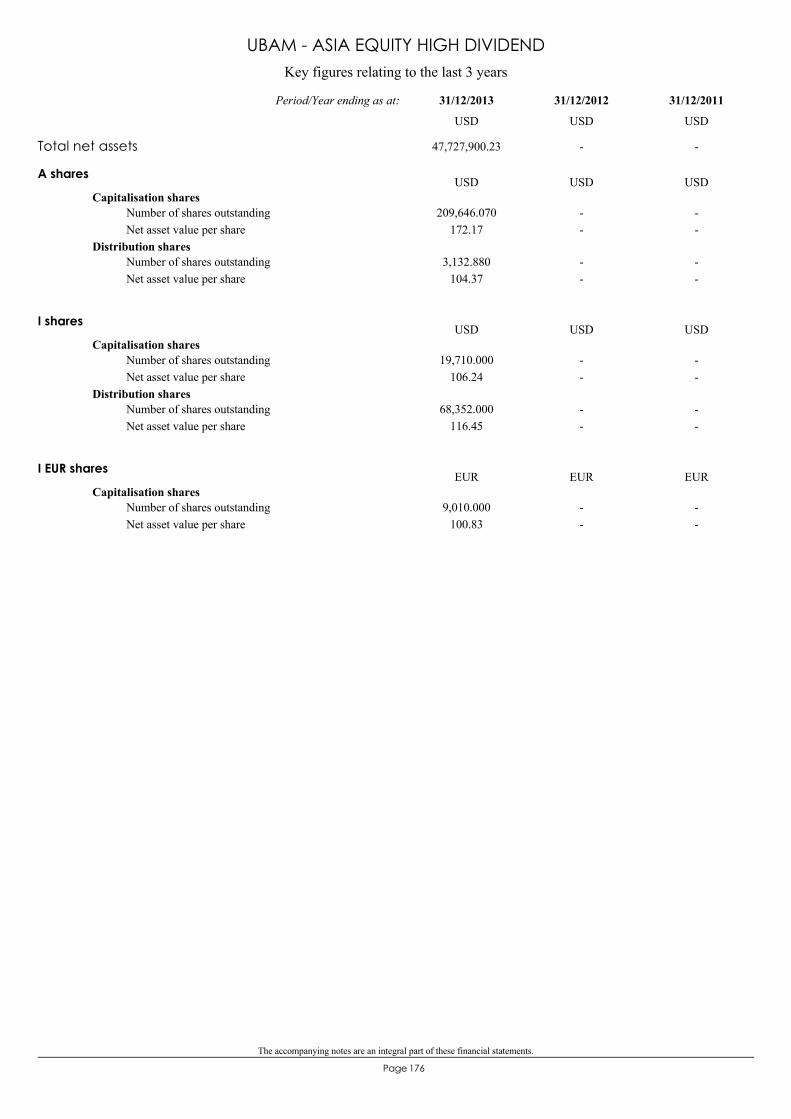
The accompanying notes are an integral part of these financial statements.
176Page
Key figures relating to the last 3 years
UBAM - ASIA EQUITY HIGH DIVIDEND
A shares
Capitalisation shares209,646.070
172.17--
--
Number of shares outstandingNet asset value per share
Distribution shares3,132.880
104.37--
--
Number of shares outstandingNet asset value per share
USD USD USD
I shares
Capitalisation shares19,710.000
106.24--
--
Number of shares outstandingNet asset value per share
Distribution shares68,352.000
116.45--
--
Number of shares outstandingNet asset value per share
USD USD USD
I EUR shares
Capitalisation shares9,010.000
100.83--
--
Number of shares outstandingNet asset value per share
EUR EUR EUR
Total net assets 47,727,900.23 - -
31/12/201131/12/201231/12/2013Period/Year ending as at:
USD USD USD
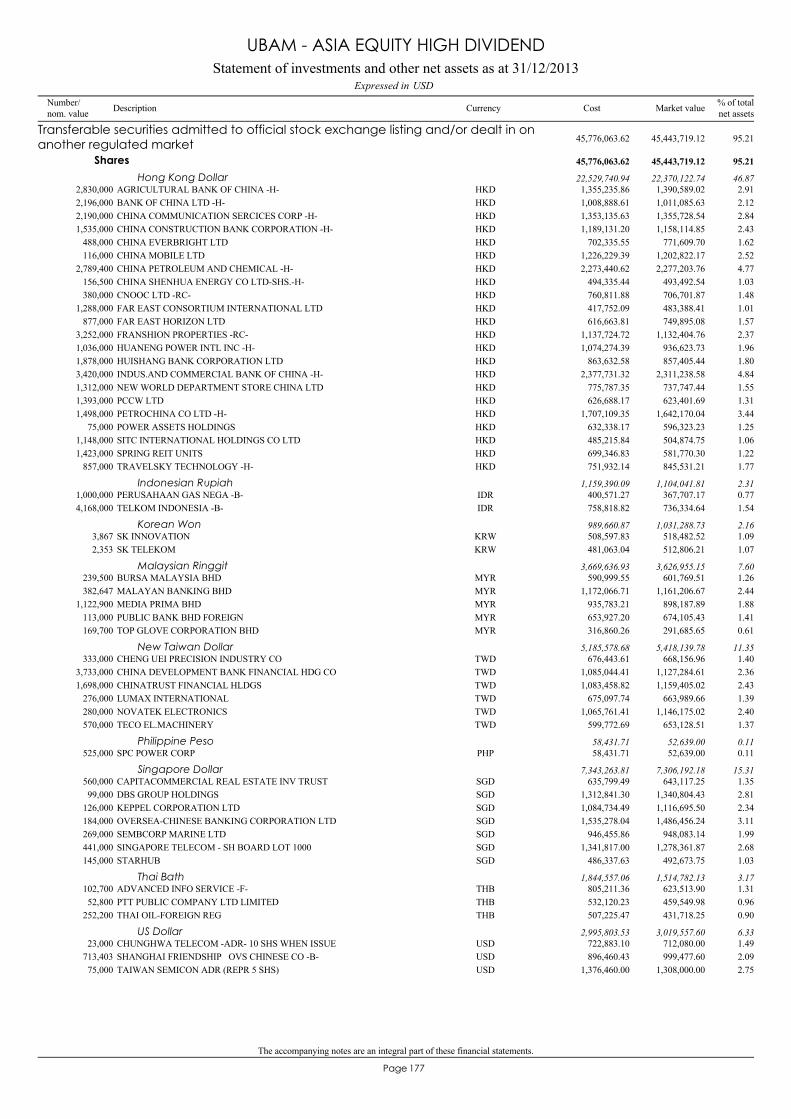
The accompanying notes are an integral part of these financial statements.
177Page
AGRICULTURAL BANK OF CHINA -H-2,830,000 1,390,589.02 2.91HKD 1,355,235.86
Transferable securities admitted to official stock exchange listing and/or dealt in onanother regulated market 45,443,719.12 95.2145,776,063.62
Shares 45,443,719.12 95.2145,776,063.62
Hong Kong Dollar 22,370,122.74 46.8722,529,740.94
BANK OF CHINA LTD -H-2,196,000 1,011,085.63 2.12HKD 1,008,888.61CHINA COMMUNICATION SERCICES CORP -H-2,190,000 1,355,728.54 2.84HKD 1,353,135.63CHINA CONSTRUCTION BANK CORPORATION -H-1,535,000 1,158,114.85 2.43HKD 1,189,131.20CHINA EVERBRIGHT LTD488,000 771,609.70 1.62HKD 702,335.55CHINA MOBILE LTD116,000 1,202,822.17 2.52HKD 1,226,229.39CHINA PETROLEUM AND CHEMICAL -H-2,789,400 2,277,203.76 4.77HKD 2,273,440.62CHINA SHENHUA ENERGY CO LTD-SHS.-H-156,500 493,492.54 1.03HKD 494,335.44CNOOC LTD -RC-380,000 706,701.87 1.48HKD 760,811.88FAR EAST CONSORTIUM INTERNATIONAL LTD1,288,000 483,388.41 1.01HKD 417,752.09FAR EAST HORIZON LTD877,000 749,895.08 1.57HKD 616,663.81FRANSHION PROPERTIES -RC-3,252,000 1,132,404.76 2.37HKD 1,137,724.72HUANENG POWER INTL INC -H-1,036,000 936,623.73 1.96HKD 1,074,274.39HUISHANG BANK CORPORATION LTD1,878,000 857,405.44 1.80HKD 863,632.58INDUS.AND COMMERCIAL BANK OF CHINA -H-3,420,000 2,311,238.58 4.84HKD 2,377,731.32NEW WORLD DEPARTMENT STORE CHINA LTD1,312,000 737,747.44 1.55HKD 775,787.35PCCW LTD1,393,000 623,401.69 1.31HKD 626,688.17PETROCHINA CO LTD -H-1,498,000 1,642,170.04 3.44HKD 1,707,109.35POWER ASSETS HOLDINGS75,000 596,323.23 1.25HKD 632,338.17SITC INTERNATIONAL HOLDINGS CO LTD1,148,000 504,874.75 1.06HKD 485,215.84SPRING REIT UNITS1,423,000 581,770.30 1.22HKD 699,346.83TRAVELSKY TECHNOLOGY -H-857,000 845,531.21 1.77HKD 751,932.14
PERUSAHAAN GAS NEGA -B-1,000,000 367,707.17 0.77IDR 400,571.27Indonesian Rupiah 1,104,041.81 2.311,159,390.09
TELKOM INDONESIA -B-4,168,000 736,334.64 1.54IDR 758,818.82
SK INNOVATION3,867 518,482.52 1.09KRW 508,597.83Korean Won 1,031,288.73 2.16989,660.87
SK TELEKOM2,353 512,806.21 1.07KRW 481,063.04
BURSA MALAYSIA BHD239,500 601,769.51 1.26MYR 590,999.55Malaysian Ringgit 3,626,955.15 7.603,669,636.93
MALAYAN BANKING BHD382,647 1,161,206.67 2.44MYR 1,172,066.71MEDIA PRIMA BHD1,122,900 898,187.89 1.88MYR 935,783.21PUBLIC BANK BHD FOREIGN113,000 674,105.43 1.41MYR 653,927.20TOP GLOVE CORPORATION BHD169,700 291,685.65 0.61MYR 316,860.26
CHENG UEI PRECISION INDUSTRY CO333,000 668,156.96 1.40TWD 676,443.61New Taiwan Dollar 5,418,139.78 11.355,185,578.68
CHINA DEVELOPMENT BANK FINANCIAL HDG CO3,733,000 1,127,284.61 2.36TWD 1,085,044.41CHINATRUST FINANCIAL HLDGS1,698,000 1,159,405.02 2.43TWD 1,083,458.82LUMAX INTERNATIONAL276,000 663,989.66 1.39TWD 675,097.74NOVATEK ELECTRONICS280,000 1,146,175.02 2.40TWD 1,065,761.41TECO EL.MACHINERY570,000 653,128.51 1.37TWD 599,772.69
SPC POWER CORP525,000 52,639.00 0.11PHP 58,431.71Philippine Peso 52,639.00 0.1158,431.71
CAPITACOMMERCIAL REAL ESTATE INV TRUST560,000 643,117.25 1.35SGD 635,799.49Singapore Dollar 7,306,192.18 15.317,343,263.81
DBS GROUP HOLDINGS99,000 1,340,804.43 2.81SGD 1,312,841.30KEPPEL CORPORATION LTD126,000 1,116,695.50 2.34SGD 1,084,734.49OVERSEA-CHINESE BANKING CORPORATION LTD184,000 1,486,456.24 3.11SGD 1,535,278.04SEMBCORP MARINE LTD269,000 948,083.14 1.99SGD 946,455.86SINGAPORE TELECOM - SH BOARD LOT 1000441,000 1,278,361.87 2.68SGD 1,341,817.00STARHUB145,000 492,673.75 1.03SGD 486,337.63
ADVANCED INFO SERVICE -F-102,700 623,513.90 1.31THB 805,211.36Thai Bath 1,514,782.13 3.171,844,557.06
PTT PUBLIC COMPANY LTD LIMITED52,800 459,549.98 0.96THB 532,120.23THAI OIL-FOREIGN REG252,200 431,718.25 0.90THB 507,225.47
CHUNGHWA TELECOM -ADR- 10 SHS WHEN ISSUE23,000 712,080.00 1.49USD 722,883.10US Dollar 3,019,557.60 6.332,995,803.53
SHANGHAI FRIENDSHIP OVS CHINESE CO -B-713,403 999,477.60 2.09USD 896,460.43TAIWAN SEMICON ADR (REPR 5 SHS)75,000 1,308,000.00 2.75USD 1,376,460.00
Statement of investments and other net assets as at 31/12/2013USDExpressed in
UBAM - ASIA EQUITY HIGH DIVIDEND
Number/nom. value Description Currency % of total
net assetsMarket valueCost
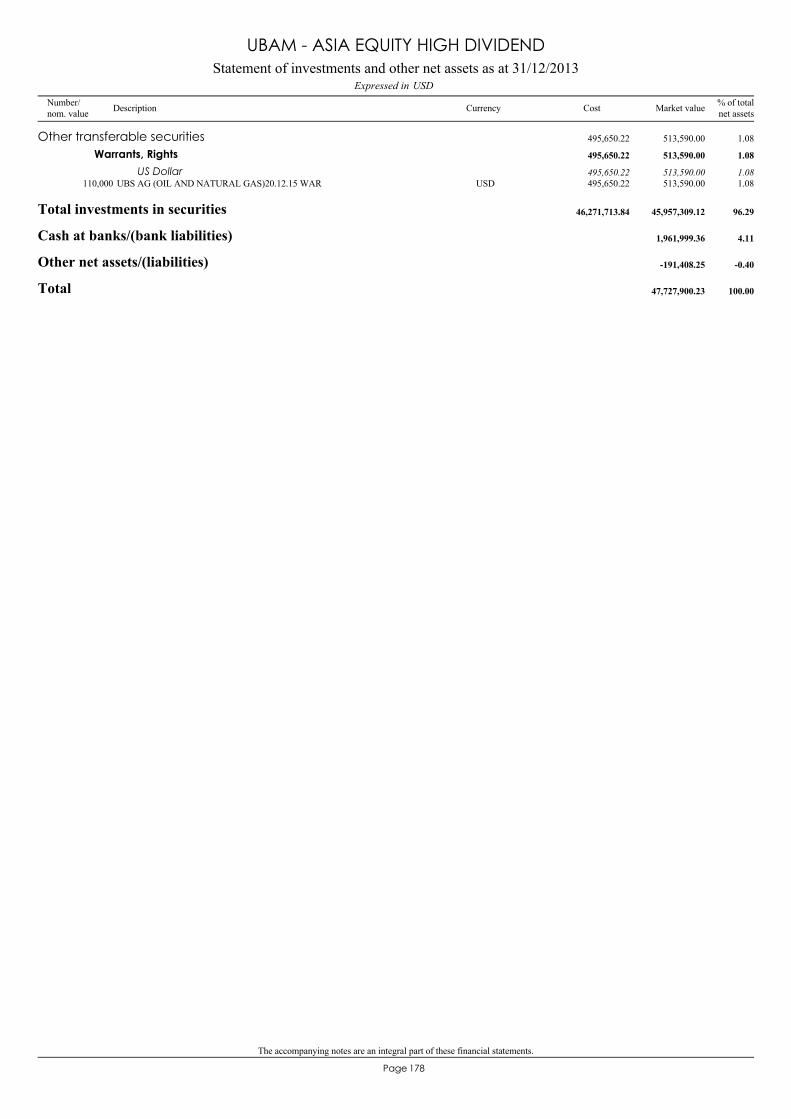
The accompanying notes are an integral part of these financial statements.
178Page
UBS AG (OIL AND NATURAL GAS)20.12.15 WAR110,000 513,590.00 1.08USD 495,650.22
Other transferable securities 513,590.00 1.08495,650.22
Warrants, Rights 513,590.00 1.08495,650.22
US Dollar 513,590.00 1.08495,650.22
Total investments in securities 45,957,309.12 96.2946,271,713.84
Cash at banks/(bank liabilities) 1,961,999.36 4.11
Other net assets/(liabilities) -191,408.25 -0.40
Total 47,727,900.23 100.00
Statement of investments and other net assets as at 31/12/2013USDExpressed in
UBAM - ASIA EQUITY HIGH DIVIDEND
Number/nom. value Description Currency % of total
net assetsMarket valueCost

179Page
China 32.00Taiwan 15.59Singapore 15.31Hong Kong 13.34Malaysia 7.60Cayman Islands 3.62Thailand 3.17Indonesia 2.31South Korea 2.16United Kingdom 1.08Philippines 0.11
96.29
(by domicile of the issuer) % of net assets
Geographical classification of investments
UBAM - ASIA EQUITY HIGH DIVIDEND
Banks and credit institutions 26.21Communications 17.67Petroleum 12.32Holding and finance companies 12.02Electrical engineering and electronics 6.94Real estate companies 5.95Electronics and semiconductors 4.14Utilities 3.32Textiles and garments 2.09Machine and apparatus construction 1.99Retail trade, department stores 1.55Transportation 1.06Coal mining and steel industry 1.03
96.29
% of net assets
Industrial classification of investments
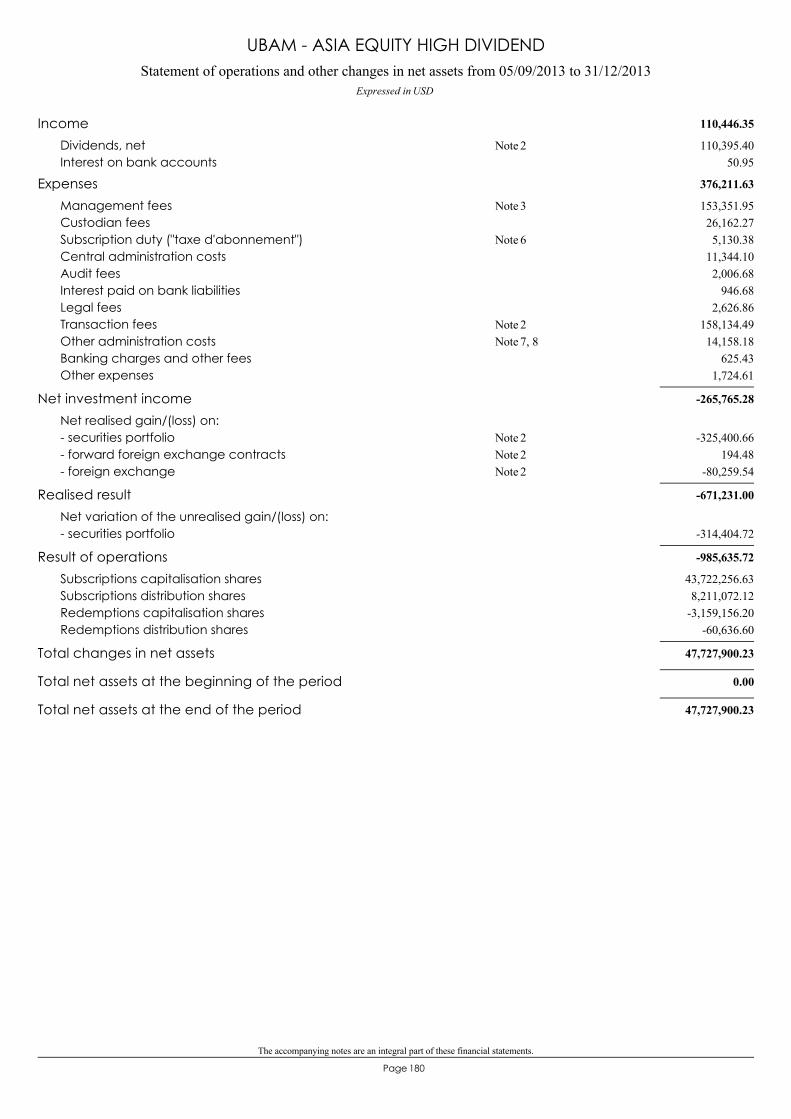
The accompanying notes are an integral part of these financial statements.
180Page
Statement of operations and other changes in net assets from 05/09/2013 to 31/12/2013Expressed in USD
UBAM - ASIA EQUITY HIGH DIVIDEND
110,446.35Income110,395.40Dividends, net 2Note
50.95Interest on bank accounts
376,211.63Expenses153,351.95Management fees 3Note26,162.27Custodian fees5,130.38Subscription duty ("taxe d'abonnement") 6Note
11,344.10Central administration costs2,006.68Audit fees
946.68Interest paid on bank liabilities2,626.86Legal fees
158,134.49Transaction fees 2Note14,158.18Other administration costs 7, 8Note
625.43Banking charges and other fees1,724.61Other expenses
-265,765.28Net investment incomeNet realised gain/(loss) on:
-325,400.66- securities portfolio 2Note194.48- forward foreign exchange contracts 2Note
-80,259.54- foreign exchange 2Note
-671,231.00Realised resultNet variation of the unrealised gain/(loss) on:
-314,404.72- securities portfolio
-985,635.72Result of operations43,722,256.63Subscriptions capitalisation shares8,211,072.12Subscriptions distribution shares
-3,159,156.20Redemptions capitalisation shares-60,636.60Redemptions distribution shares
47,727,900.23Total changes in net assets
0.00Total net assets at the beginning of the period
47,727,900.23Total net assets at the end of the period
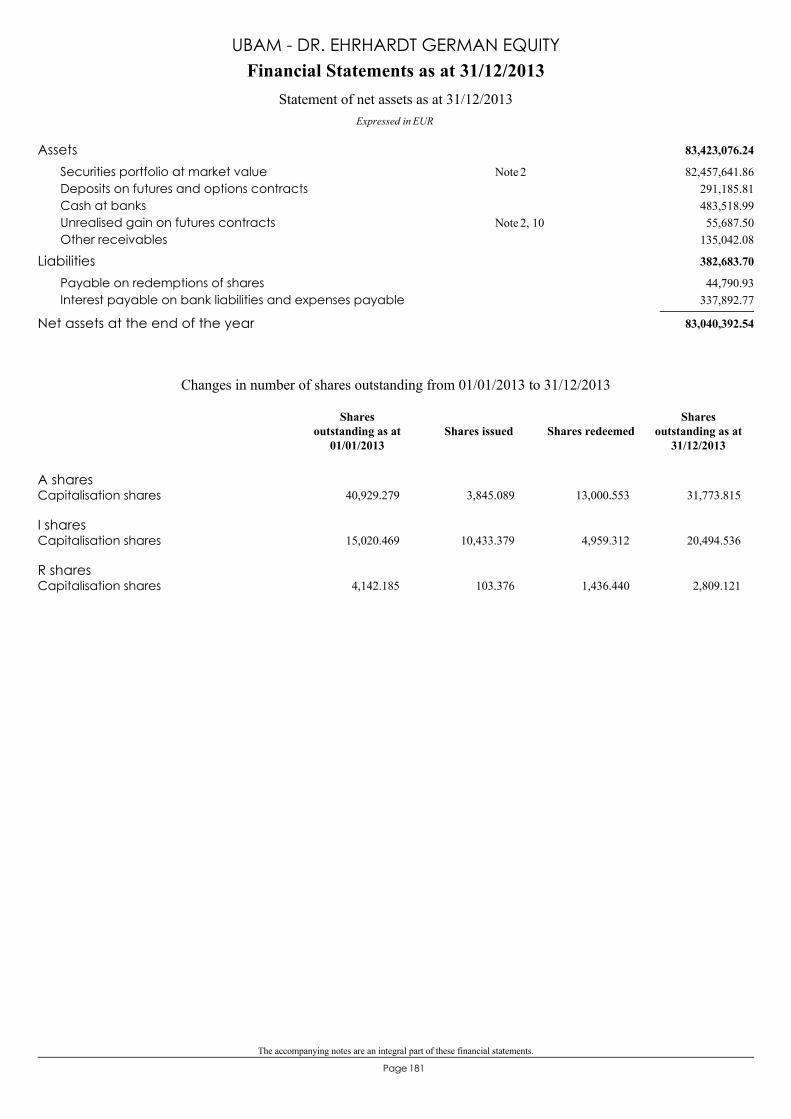
The accompanying notes are an integral part of these financial statements.
181Page
83,423,076.24Assets82,457,641.86Securities portfolio at market value 2Note
291,185.81Deposits on futures and options contracts483,518.99Cash at banks55,687.50Unrealised gain on futures contracts 2, 10Note
135,042.08Other receivables
382,683.70Liabilities44,790.93Payable on redemptions of shares
337,892.77Interest payable on bank liabilities and expenses payable
83,040,392.54Net assets at the end of the year
Financial Statements as at 31/12/2013
Expressed in EUR
Statement of net assets as at 31/12/2013
UBAM - DR. EHRHARDT GERMAN EQUITY
A sharesCapitalisation shares 40,929.279 3,845.089 13,000.553 31,773.815
I sharesCapitalisation shares 15,020.469 10,433.379 4,959.312 20,494.536
R sharesCapitalisation shares 4,142.185 103.376 1,436.440 2,809.121
Changes in number of shares outstanding from 01/01/2013 to 31/12/2013
Shares issued Shares redeemedShares
outstanding as at31/12/2013
Sharesoutstanding as at
01/01/2013
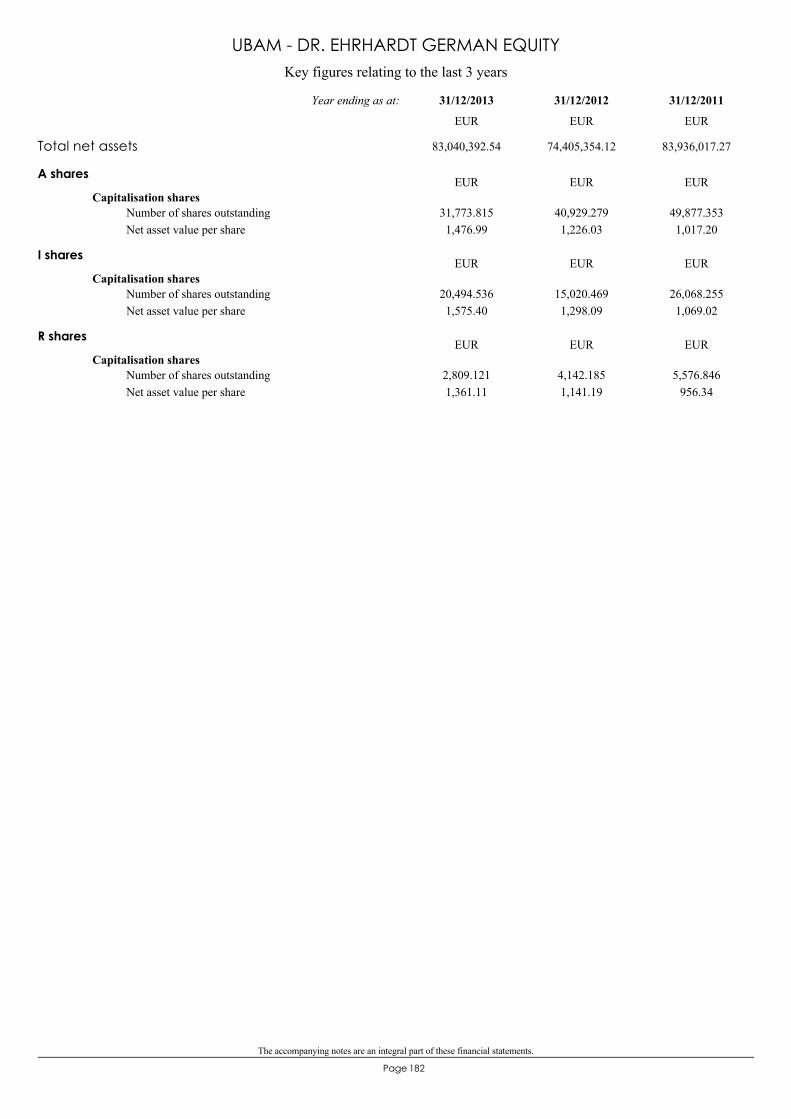
The accompanying notes are an integral part of these financial statements.
182Page
Key figures relating to the last 3 years
UBAM - DR. EHRHARDT GERMAN EQUITY
A shares
Capitalisation shares31,773.8151,476.99
40,929.2791,226.03
49,877.3531,017.20
Number of shares outstandingNet asset value per share
EUR EUR EUR
I shares
Capitalisation shares20,494.5361,575.40
15,020.4691,298.09
26,068.2551,069.02
Number of shares outstandingNet asset value per share
EUR EUR EUR
R shares
Capitalisation shares2,809.1211,361.11
4,142.1851,141.19
5,576.846956.34
Number of shares outstandingNet asset value per share
EUR EUR EUR
Total net assets 83,040,392.54 74,405,354.12 83,936,017.27
31/12/201131/12/201231/12/2013Year ending as at:
EUR EUR EUR
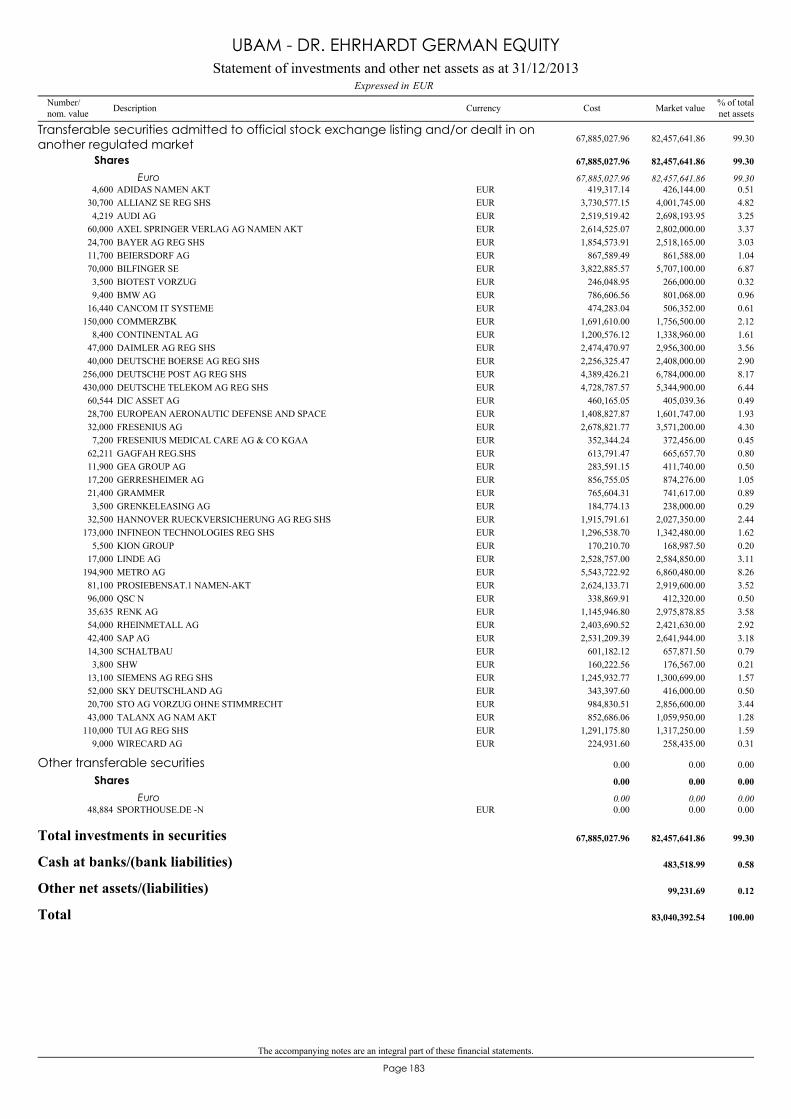
The accompanying notes are an integral part of these financial statements.
183Page
ADIDAS NAMEN AKT4,600 426,144.00 0.51EUR 419,317.14
Transferable securities admitted to official stock exchange listing and/or dealt in onanother regulated market 82,457,641.86 99.3067,885,027.96
Shares 82,457,641.86 99.3067,885,027.96
Euro 82,457,641.86 99.3067,885,027.96
ALLIANZ SE REG SHS30,700 4,001,745.00 4.82EUR 3,730,577.15AUDI AG4,219 2,698,193.95 3.25EUR 2,519,519.42AXEL SPRINGER VERLAG AG NAMEN AKT60,000 2,802,000.00 3.37EUR 2,614,525.07BAYER AG REG SHS24,700 2,518,165.00 3.03EUR 1,854,573.91BEIERSDORF AG11,700 861,588.00 1.04EUR 867,589.49BILFINGER SE70,000 5,707,100.00 6.87EUR 3,822,885.57BIOTEST VORZUG3,500 266,000.00 0.32EUR 246,048.95BMW AG9,400 801,068.00 0.96EUR 786,606.56CANCOM IT SYSTEME16,440 506,352.00 0.61EUR 474,283.04COMMERZBK150,000 1,756,500.00 2.12EUR 1,691,610.00CONTINENTAL AG8,400 1,338,960.00 1.61EUR 1,200,576.12DAIMLER AG REG SHS47,000 2,956,300.00 3.56EUR 2,474,470.97DEUTSCHE BOERSE AG REG SHS40,000 2,408,000.00 2.90EUR 2,256,325.47DEUTSCHE POST AG REG SHS256,000 6,784,000.00 8.17EUR 4,389,426.21DEUTSCHE TELEKOM AG REG SHS430,000 5,344,900.00 6.44EUR 4,728,787.57DIC ASSET AG60,544 405,039.36 0.49EUR 460,165.05EUROPEAN AERONAUTIC DEFENSE AND SPACE28,700 1,601,747.00 1.93EUR 1,408,827.87FRESENIUS AG32,000 3,571,200.00 4.30EUR 2,678,821.77FRESENIUS MEDICAL CARE AG & CO KGAA7,200 372,456.00 0.45EUR 352,344.24GAGFAH REG.SHS62,211 665,657.70 0.80EUR 613,791.47GEA GROUP AG11,900 411,740.00 0.50EUR 283,591.15GERRESHEIMER AG17,200 874,276.00 1.05EUR 856,755.05GRAMMER21,400 741,617.00 0.89EUR 765,604.31GRENKELEASING AG3,500 238,000.00 0.29EUR 184,774.13HANNOVER RUECKVERSICHERUNG AG REG SHS32,500 2,027,350.00 2.44EUR 1,915,791.61INFINEON TECHNOLOGIES REG SHS173,000 1,342,480.00 1.62EUR 1,296,538.70KION GROUP5,500 168,987.50 0.20EUR 170,210.70LINDE AG17,000 2,584,850.00 3.11EUR 2,528,757.00METRO AG194,900 6,860,480.00 8.26EUR 5,543,722.92PROSIEBENSAT.1 NAMEN-AKT81,100 2,919,600.00 3.52EUR 2,624,133.71QSC N96,000 412,320.00 0.50EUR 338,869.91RENK AG35,635 2,975,878.85 3.58EUR 1,145,946.80RHEINMETALL AG54,000 2,421,630.00 2.92EUR 2,403,690.52SAP AG42,400 2,641,944.00 3.18EUR 2,531,209.39SCHALTBAU14,300 657,871.50 0.79EUR 601,182.12SHW3,800 176,567.00 0.21EUR 160,222.56SIEMENS AG REG SHS13,100 1,300,699.00 1.57EUR 1,245,932.77SKY DEUTSCHLAND AG52,000 416,000.00 0.50EUR 343,397.60STO AG VORZUG OHNE STIMMRECHT20,700 2,856,600.00 3.44EUR 984,830.51TALANX AG NAM AKT43,000 1,059,950.00 1.28EUR 852,686.06TUI AG REG SHS110,000 1,317,250.00 1.59EUR 1,291,175.80WIRECARD AG9,000 258,435.00 0.31EUR 224,931.60
SPORTHOUSE.DE -N48,884 0.00 0.00EUR 0.00
Other transferable securities 0.00 0.000.00
Shares 0.00 0.000.00
Euro 0.00 0.000.00
Total investments in securities 82,457,641.86 99.3067,885,027.96
Cash at banks/(bank liabilities) 483,518.99 0.58
Other net assets/(liabilities) 99,231.69 0.12
Total 83,040,392.54 100.00
Statement of investments and other net assets as at 31/12/2013EURExpressed in
UBAM - DR. EHRHARDT GERMAN EQUITY
Number/nom. value Description Currency % of total
net assetsMarket valueCost
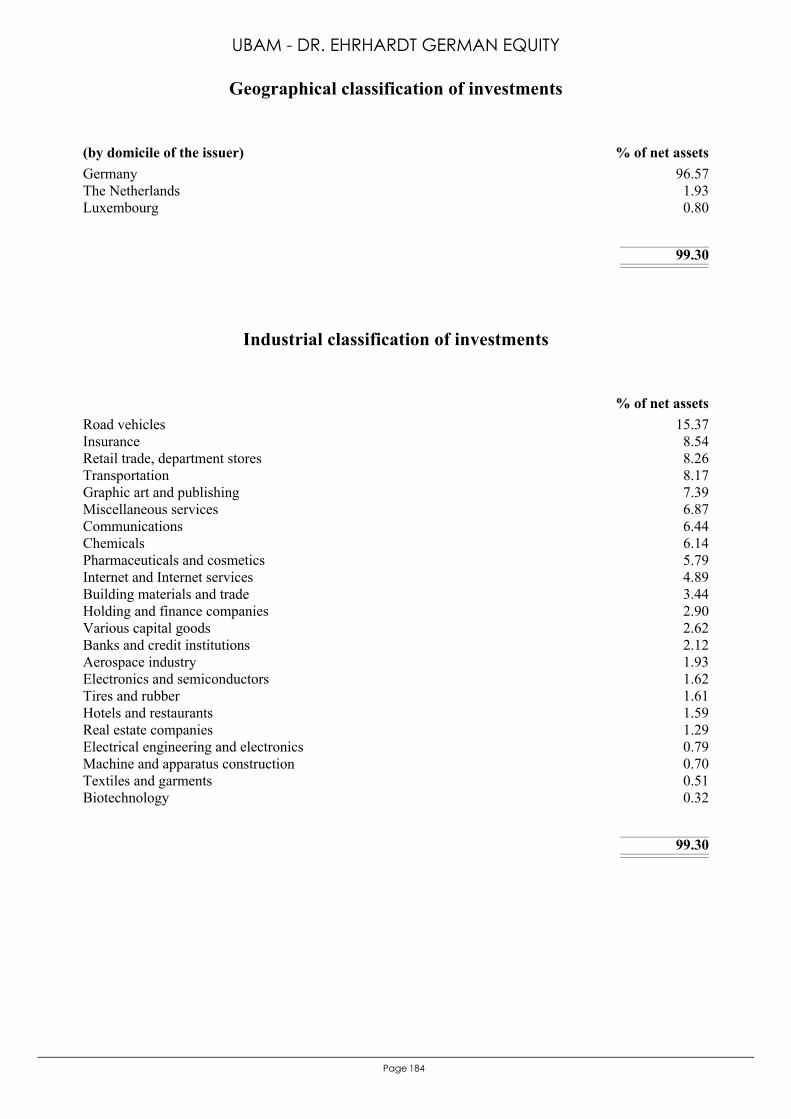
184Page
Germany 96.57The Netherlands 1.93Luxembourg 0.80
99.30
(by domicile of the issuer) % of net assets
Geographical classification of investments
UBAM - DR. EHRHARDT GERMAN EQUITY
Road vehicles 15.37Insurance 8.54Retail trade, department stores 8.26Transportation 8.17Graphic art and publishing 7.39Miscellaneous services 6.87Communications 6.44Chemicals 6.14Pharmaceuticals and cosmetics 5.79Internet and Internet services 4.89Building materials and trade 3.44Holding and finance companies 2.90Various capital goods 2.62Banks and credit institutions 2.12Aerospace industry 1.93Electronics and semiconductors 1.62Tires and rubber 1.61Hotels and restaurants 1.59Real estate companies 1.29Electrical engineering and electronics 0.79Machine and apparatus construction 0.70Textiles and garments 0.51Biotechnology 0.32
99.30
% of net assets
Industrial classification of investments
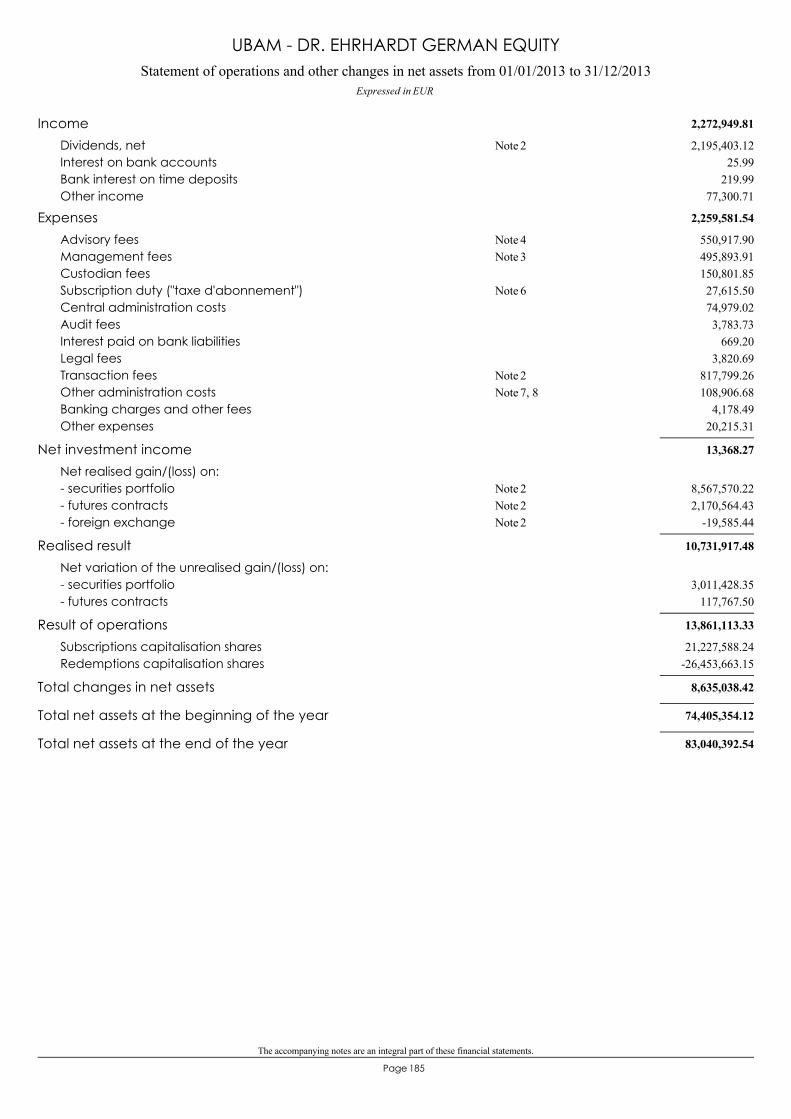
The accompanying notes are an integral part of these financial statements.
185Page
Statement of operations and other changes in net assets from 01/01/2013 to 31/12/2013Expressed in EUR
UBAM - DR. EHRHARDT GERMAN EQUITY
2,272,949.81Income2,195,403.12Dividends, net 2Note
25.99Interest on bank accounts219.99Bank interest on time deposits
77,300.71Other income
2,259,581.54Expenses550,917.90Advisory fees 4Note495,893.91Management fees 3Note150,801.85Custodian fees27,615.50Subscription duty ("taxe d'abonnement") 6Note74,979.02Central administration costs3,783.73Audit fees
669.20Interest paid on bank liabilities3,820.69Legal fees
817,799.26Transaction fees 2Note108,906.68Other administration costs 7, 8Note
4,178.49Banking charges and other fees20,215.31Other expenses
13,368.27Net investment incomeNet realised gain/(loss) on:
8,567,570.22- securities portfolio 2Note2,170,564.43- futures contracts 2Note
-19,585.44- foreign exchange 2Note
10,731,917.48Realised resultNet variation of the unrealised gain/(loss) on:
3,011,428.35- securities portfolio117,767.50- futures contracts
13,861,113.33Result of operations21,227,588.24Subscriptions capitalisation shares
-26,453,663.15Redemptions capitalisation shares
8,635,038.42Total changes in net assets
74,405,354.12Total net assets at the beginning of the year
83,040,392.54Total net assets at the end of the year
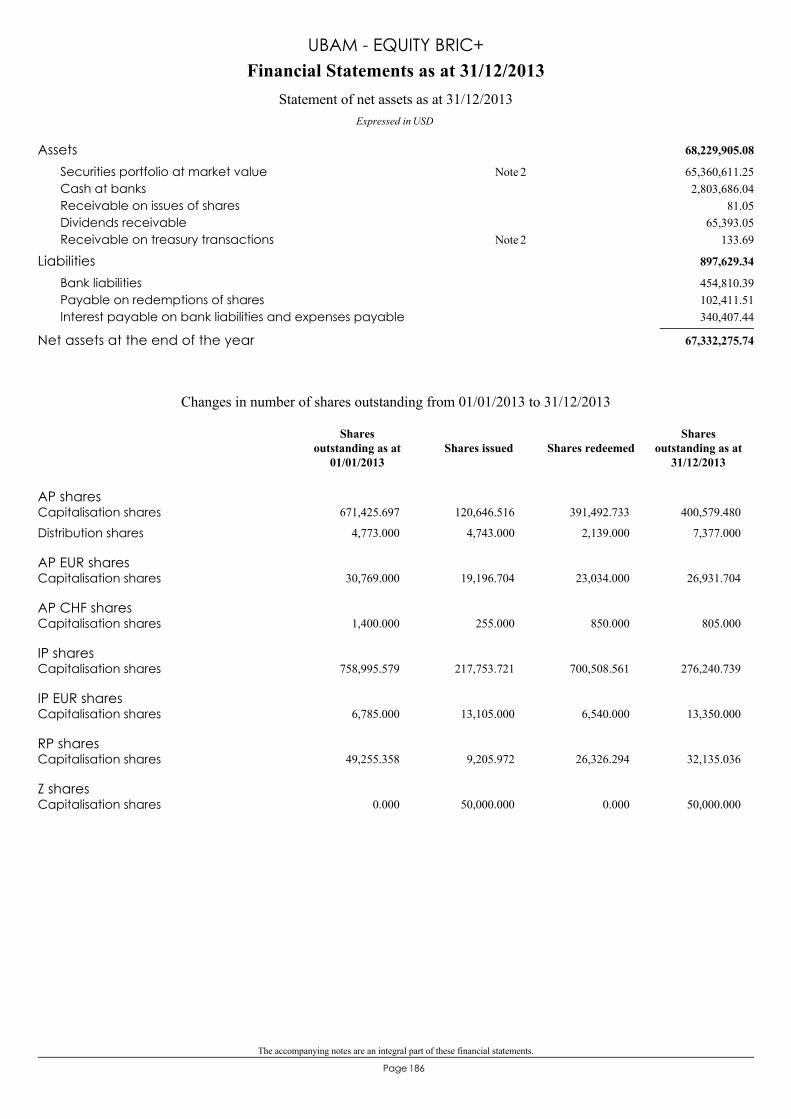
The accompanying notes are an integral part of these financial statements.
186Page
68,229,905.08Assets65,360,611.25Securities portfolio at market value 2Note2,803,686.04Cash at banks
81.05Receivable on issues of shares65,393.05Dividends receivable
133.69Receivable on treasury transactions 2Note
897,629.34Liabilities454,810.39Bank liabilities102,411.51Payable on redemptions of shares340,407.44Interest payable on bank liabilities and expenses payable
67,332,275.74Net assets at the end of the year
Financial Statements as at 31/12/2013
Expressed in USD
Statement of net assets as at 31/12/2013
UBAM - EQUITY BRIC+
AP sharesCapitalisation shares 671,425.697 120,646.516 391,492.733 400,579.480
Distribution shares 4,773.000 4,743.000 2,139.000 7,377.000
AP EUR sharesCapitalisation shares 30,769.000 19,196.704 23,034.000 26,931.704
AP CHF sharesCapitalisation shares 1,400.000 255.000 850.000 805.000
IP sharesCapitalisation shares 758,995.579 217,753.721 700,508.561 276,240.739
IP EUR sharesCapitalisation shares 6,785.000 13,105.000 6,540.000 13,350.000
RP sharesCapitalisation shares 49,255.358 9,205.972 26,326.294 32,135.036
Z sharesCapitalisation shares 0.000 50,000.000 0.000 50,000.000
Changes in number of shares outstanding from 01/01/2013 to 31/12/2013
Shares issued Shares redeemedShares
outstanding as at31/12/2013
Sharesoutstanding as at
01/01/2013
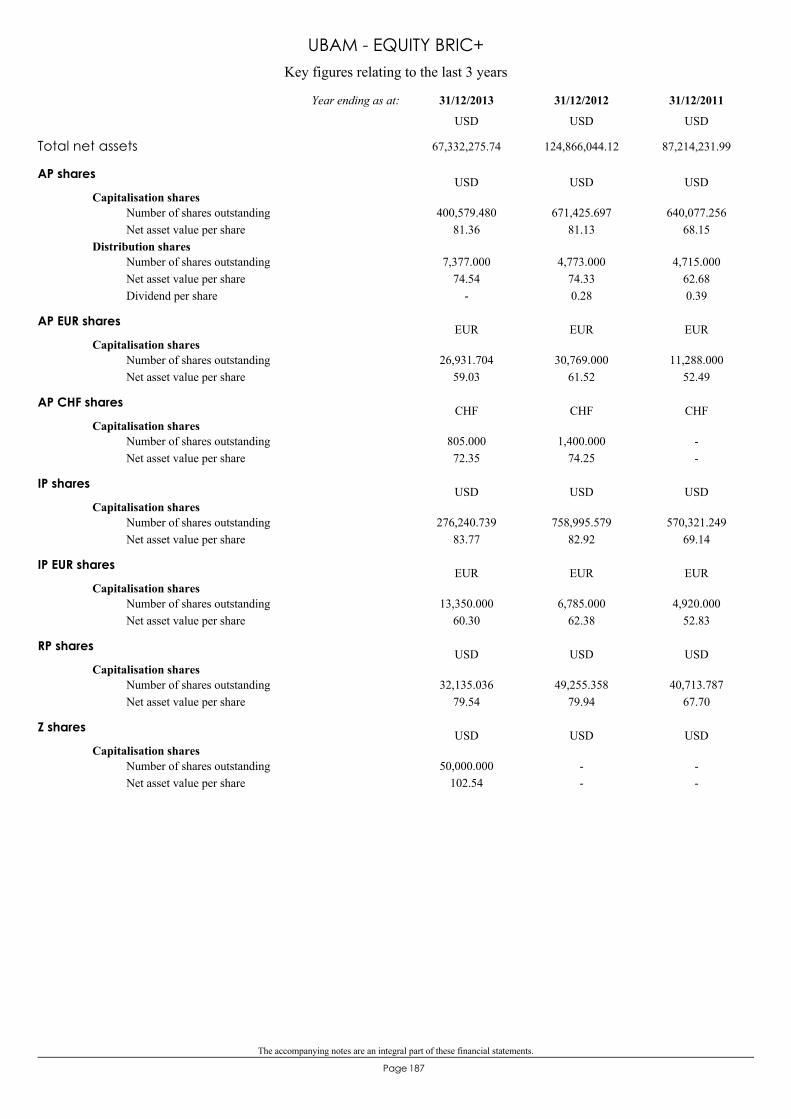
The accompanying notes are an integral part of these financial statements.
187Page
Key figures relating to the last 3 years
UBAM - EQUITY BRIC+
AP shares
Capitalisation shares400,579.480
81.36671,425.697
81.13640,077.256
68.15Number of shares outstandingNet asset value per share
Distribution shares7,377.000
74.54-
4,773.00074.330.28
4,715.00062.680.39
Number of shares outstandingNet asset value per shareDividend per share
USD USD USD
AP EUR shares
Capitalisation shares26,931.704
59.0330,769.000
61.5211,288.000
52.49Number of shares outstandingNet asset value per share
EUR EUR EUR
AP CHF shares
Capitalisation shares805.00072.35
1,400.00074.25
--
Number of shares outstandingNet asset value per share
CHF CHF CHF
IP shares
Capitalisation shares276,240.739
83.77758,995.579
82.92570,321.249
69.14Number of shares outstandingNet asset value per share
USD USD USD
IP EUR shares
Capitalisation shares13,350.000
60.306,785.000
62.384,920.000
52.83Number of shares outstandingNet asset value per share
EUR EUR EUR
RP shares
Capitalisation shares32,135.036
79.5449,255.358
79.9440,713.787
67.70Number of shares outstandingNet asset value per share
USD USD USD
Z shares
Capitalisation shares50,000.000
102.54--
--
Number of shares outstandingNet asset value per share
USD USD USD
Total net assets 67,332,275.74 124,866,044.12 87,214,231.99
31/12/201131/12/201231/12/2013Year ending as at:
USD USD USD

The accompanying notes are an integral part of these financial statements.
188Page
ALLIANSCE SHOPPING90,400 701,201.26 1.04BRL 843,969.36
Transferable securities admitted to official stock exchange listing and/or dealt in onanother regulated market 65,360,611.25 97.0761,457,500.46
Shares 65,360,611.25 97.0761,457,500.46
Brazilian Real 13,901,699.94 20.6514,775,951.03
AMBEV SA100,500 737,797.40 1.10BRL 905,243.12ANHANGUERA EDUCACIONAL PARTICIPACOES SA79,200 500,189.56 0.74BRL 476,774.92ARTERIS SA7,700 62,174.01 0.09BRL 59,391.27AX PART - UNITS CONS OF 1 SH - 4 PFD SHS62,550 530,249.76 0.79BRL 773,658.03BANCO DO BRASIL SA64,100 662,935.12 0.98BRL 750,772.44COSAN CERT DEP BRAS REPR 1 SHS -A-18,500 258,766.97 0.38BRL 270,928.71COSAN SA INDUSTRIA73,000 1,224,677.73 1.83BRL 1,309,829.31EQUATORIAL ENERGIA SA119,200 1,169,635.17 1.75BRL 928,135.37ESTACIO PART71,000 614,220.80 0.91BRL 549,845.27GUARARAPES CONFECCOES SA12,700 565,218.27 0.84BRL 558,095.14IOCHPE MAXION71,300 790,286.19 1.17BRL 852,691.85ITAUSA INVESTIMENTOS ITAU SA-PREF80,408 303,327.95 0.45BRL 376,415.59ITAUUNIBANCO PFD SHS24,890 330,739.15 0.49BRL 372,070.04LOCALIZA RENT A CAR SA38,230 539,275.62 0.80BRL 648,664.87MAHLE-METAL LEVE SA76,500 888,454.45 1.32BRL 939,732.24PETROLEO BRASILEIRO106,400 721,129.50 1.07BRL 908,889.41PETROLEO BRASILEIRO -PETROBRAS- PREF.41,000 296,821.18 0.44BRL 297,507.82QUALICORP SA77,100 735,292.38 1.09BRL 565,419.30SIERRABRASIL41,100 317,578.91 0.47BRL 575,321.82TEGMA GESTAO -SHS-3,100 23,651.43 0.04BRL 53,180.89TELEF BRASIL PFD SHS14,500 275,524.30 0.41BRL 394,232.38ULTRAPAR30,800 730,422.22 1.08BRL 564,387.09USIMINAS PREF. -A-153,100 922,130.61 1.37BRL 800,794.79
AGRICULTURAL BANK OF CHINA -H-360,000 176,894.72 0.26HKD 147,659.07Hong Kong Dollar 15,589,415.20 23.1513,669,503.48
AVICHINA INDUSTRY AND TECHNOLOGY CO LTD1,004,000 583,979.55 0.87HKD 510,464.92BOER POWER HOLDINGS LTD861,000 790,624.98 1.17HKD 581,394.92BRILLIANCE CHINA AUTO HLDGS330,000 537,958.04 0.80HKD 390,091.10CHINA AGRI-INDUSTRIES LTD -RC-1,439,000 718,222.73 1.07HKD 720,952.41CHINA AUTOMATION GROUP LTD2,696,000 611,955.64 0.91HKD 603,496.82CHINA BLUECHEMICAL SHS.H-560,000 350,281.46 0.52HKD 347,192.52CHINA COMMUNICATION SERCICES CORP -H-539,293 333,851.56 0.50HKD 346,668.58CHINA EVERBRIGHT LTD320,000 505,973.57 0.75HKD 503,443.08CHINA HUIRONG FINANCIAL HOLDINGS LTD1,606,000 347,970.32 0.52HKD 398,791.40CHINA MINSHENG BANKING CORPORATION -H-449,500 499,137.54 0.74HKD 460,127.35CHINA MODERN DAIRY HOLDINGS LTD477,000 258,377.72 0.38HKD 182,517.23CHINA PETROLEUM AND CHEMICAL -H-678,000 553,504.03 0.82HKD 563,348.57CHINA UNICO HK370,000 553,537.56 0.82HKD 524,212.49CN CINDA AM -H-50,000 31,210.65 0.05HKD 23,084.97CN MACHINERY -H-914,000 739,096.46 1.10HKD 627,188.25FAR EAST HORIZON LTD763,000 652,417.27 0.97HKD 494,076.63FRANSHION PROPERTIES -RC-2,338,000 814,133.56 1.22HKD 751,441.08GOODBABY INTL743,000 412,045.01 0.61HKD 312,171.32GUODIAN TECH -H-984,000 251,274.07 0.37HKD 287,096.65HAITONG SECURITIES CO LTD -H-419,200 729,864.81 1.08HKD 561,374.46HUISHANG BANK CORPORATION LTD940,000 429,159.27 0.64HKD 432,191.32LI NING CO941,500 743,120.31 1.10HKD 537,832.58PETROCHINA CO LTD -H-598,000 655,552.53 0.97HKD 762,229.26PING AN INS (GRP) CO -H-52,000 465,760.85 0.69HKD 399,689.55SHANGAI FOSUN PHARMACEUTICAL H239,500 721,239.97 1.07HKD 424,522.42SITC INTERNATIONAL HOLDINGS CO LTD854,000 375,577.56 0.56HKD 314,351.34SUNNY OPTI TECH SHS417,000 405,503.67 0.60HKD 428,403.17TRAVELSKY TECHNOLOGY -H-544,000 536,719.93 0.80HKD 362,323.95WEICHAI POWER -H-111,000 447,363.33 0.66HKD 374,719.81ZTE CORPORATION -H-179,800 357,106.53 0.53HKD 296,446.26
BAJAJ AUTO LTD11,330 350,010.99 0.52INR 334,295.51Indian Rupee 17,121,445.35 25.4315,898,236.10
BAJAJ FINANCE7,030 179,713.64 0.27INR 151,576.64BATA INDIA DEMATERIALISED27,672 471,414.90 0.70INR 394,954.20BHARAT PETROLEUM CORP DEMATERIALISED32,370 182,063.25 0.27INR 179,725.66BHARTI AIRTEL LTD(DEMATERIALISED)34,380 183,558.23 0.27INR 178,045.83
Statement of investments and other net assets as at 31/12/2013USDExpressed in
UBAM - EQUITY BRIC+
Number/nom. value Description Currency % of total
net assetsMarket valueCost
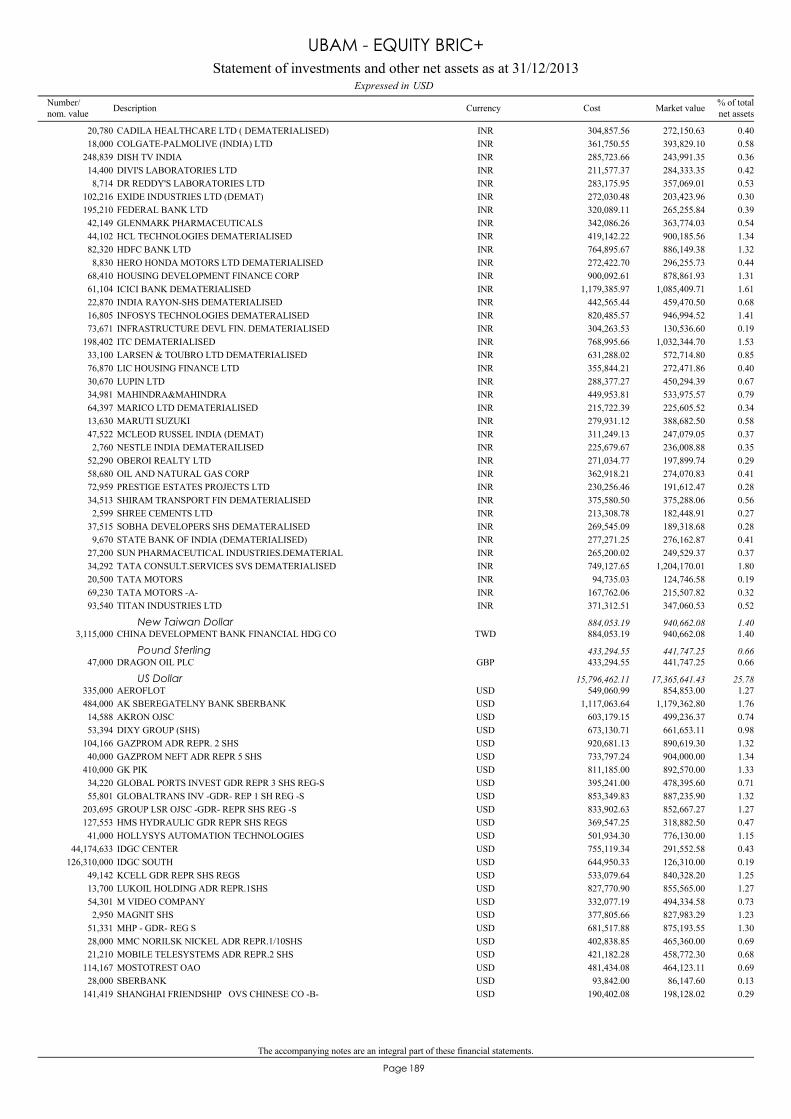
The accompanying notes are an integral part of these financial statements.
189Page
CADILA HEALTHCARE LTD ( DEMATERIALISED)20,780 272,150.63 0.40INR 304,857.56COLGATE-PALMOLIVE (INDIA) LTD18,000 393,829.10 0.58INR 361,750.55DISH TV INDIA248,839 243,991.35 0.36INR 285,723.66DIVI'S LABORATORIES LTD14,400 284,333.35 0.42INR 211,577.37DR REDDY'S LABORATORIES LTD8,714 357,069.01 0.53INR 283,175.95EXIDE INDUSTRIES LTD (DEMAT)102,216 203,423.96 0.30INR 272,030.48FEDERAL BANK LTD195,210 265,255.84 0.39INR 320,089.11GLENMARK PHARMACEUTICALS42,149 363,774.03 0.54INR 342,086.26HCL TECHNOLOGIES DEMATERIALISED44,102 900,185.56 1.34INR 419,142.22HDFC BANK LTD82,320 886,149.38 1.32INR 764,895.67HERO HONDA MOTORS LTD DEMATERIALISED8,830 296,255.73 0.44INR 272,422.70HOUSING DEVELOPMENT FINANCE CORP68,410 878,861.93 1.31INR 900,092.61ICICI BANK DEMATERIALISED61,104 1,085,409.71 1.61INR 1,179,385.97INDIA RAYON-SHS DEMATERIALISED22,870 459,470.50 0.68INR 442,565.44INFOSYS TECHNOLOGIES DEMATERALISED16,805 946,994.52 1.41INR 820,485.57INFRASTRUCTURE DEVL FIN. DEMATERIALISED73,671 130,536.60 0.19INR 304,263.53ITC DEMATERIALISED198,402 1,032,344.70 1.53INR 768,995.66LARSEN & TOUBRO LTD DEMATERIALISED33,100 572,714.80 0.85INR 631,288.02LIC HOUSING FINANCE LTD76,870 272,471.86 0.40INR 355,844.21LUPIN LTD30,670 450,294.39 0.67INR 288,377.27MAHINDRA&MAHINDRA34,981 533,975.57 0.79INR 449,953.81MARICO LTD DEMATERIALISED64,397 225,605.52 0.34INR 215,722.39MARUTI SUZUKI13,630 388,682.50 0.58INR 279,931.12MCLEOD RUSSEL INDIA (DEMAT)47,522 247,079.05 0.37INR 311,249.13NESTLE INDIA DEMATERAILISED2,760 236,008.88 0.35INR 225,679.67OBEROI REALTY LTD52,290 197,899.74 0.29INR 271,034.77OIL AND NATURAL GAS CORP58,680 274,070.83 0.41INR 362,918.21PRESTIGE ESTATES PROJECTS LTD72,959 191,612.47 0.28INR 230,256.46SHIRAM TRANSPORT FIN DEMATERIALISED34,513 375,288.06 0.56INR 375,580.50SHREE CEMENTS LTD2,599 182,448.91 0.27INR 213,308.78SOBHA DEVELOPERS SHS DEMATERALISED37,515 189,318.68 0.28INR 269,545.09STATE BANK OF INDIA (DEMATERIALISED)9,670 276,162.87 0.41INR 277,271.25SUN PHARMACEUTICAL INDUSTRIES.DEMATERIAL27,200 249,529.37 0.37INR 265,200.02TATA CONSULT.SERVICES SVS DEMATERIALISED34,292 1,204,170.01 1.80INR 749,127.65TATA MOTORS20,500 124,746.58 0.19INR 94,735.03TATA MOTORS -A-69,230 215,507.82 0.32INR 167,762.06TITAN INDUSTRIES LTD93,540 347,060.53 0.52INR 371,312.51
CHINA DEVELOPMENT BANK FINANCIAL HDG CO3,115,000 940,662.08 1.40TWD 884,053.19New Taiwan Dollar 940,662.08 1.40884,053.19
DRAGON OIL PLC47,000 441,747.25 0.66GBP 433,294.55Pound Sterling 441,747.25 0.66433,294.55
AEROFLOT335,000 854,853.00 1.27USD 549,060.99US Dollar 17,365,641.43 25.7815,796,462.11
AK SBEREGATELNY BANK SBERBANK484,000 1,179,362.80 1.76USD 1,117,063.64AKRON OJSC14,588 499,236.37 0.74USD 603,179.15DIXY GROUP (SHS)53,394 661,653.11 0.98USD 673,130.71GAZPROM ADR REPR. 2 SHS104,166 890,619.30 1.32USD 920,681.13GAZPROM NEFT ADR REPR 5 SHS40,000 904,000.00 1.34USD 733,797.24GK PIK410,000 892,570.00 1.33USD 811,185.00GLOBAL PORTS INVEST GDR REPR 3 SHS REG-S34,220 478,395.60 0.71USD 395,241.00GLOBALTRANS INV -GDR- REP 1 SH REG -S55,801 887,235.90 1.32USD 853,349.83GROUP LSR OJSC -GDR- REPR SHS REG -S203,695 852,667.27 1.27USD 833,902.63HMS HYDRAULIC GDR REPR SHS REGS127,553 318,882.50 0.47USD 369,547.25HOLLYSYS AUTOMATION TECHNOLOGIES41,000 776,130.00 1.15USD 501,934.30IDGC CENTER44,174,633 291,552.58 0.43USD 755,119.34IDGC SOUTH126,310,000 126,310.00 0.19USD 644,950.33KCELL GDR REPR SHS REGS49,142 840,328.20 1.25USD 533,079.64LUKOIL HOLDING ADR REPR.1SHS13,700 855,565.00 1.27USD 827,770.90M VIDEO COMPANY54,301 494,334.58 0.73USD 332,077.19MAGNIT SHS2,950 827,983.29 1.23USD 377,805.66MHP - GDR- REG S51,331 875,193.55 1.30USD 681,517.88MMC NORILSK NICKEL ADR REPR.1/10SHS28,000 465,360.00 0.69USD 402,838.85MOBILE TELESYSTEMS ADR REPR.2 SHS21,210 458,772.30 0.68USD 421,182.28MOSTOTREST OAO114,167 464,123.11 0.69USD 481,434.08SBERBANK28,000 86,147.60 0.13USD 93,842.00SHANGHAI FRIENDSHIP OVS CHINESE CO -B-141,419 198,128.02 0.29USD 190,402.08
Statement of investments and other net assets as at 31/12/2013USDExpressed in
UBAM - EQUITY BRIC+
Number/nom. value Description Currency % of total
net assetsMarket valueCost
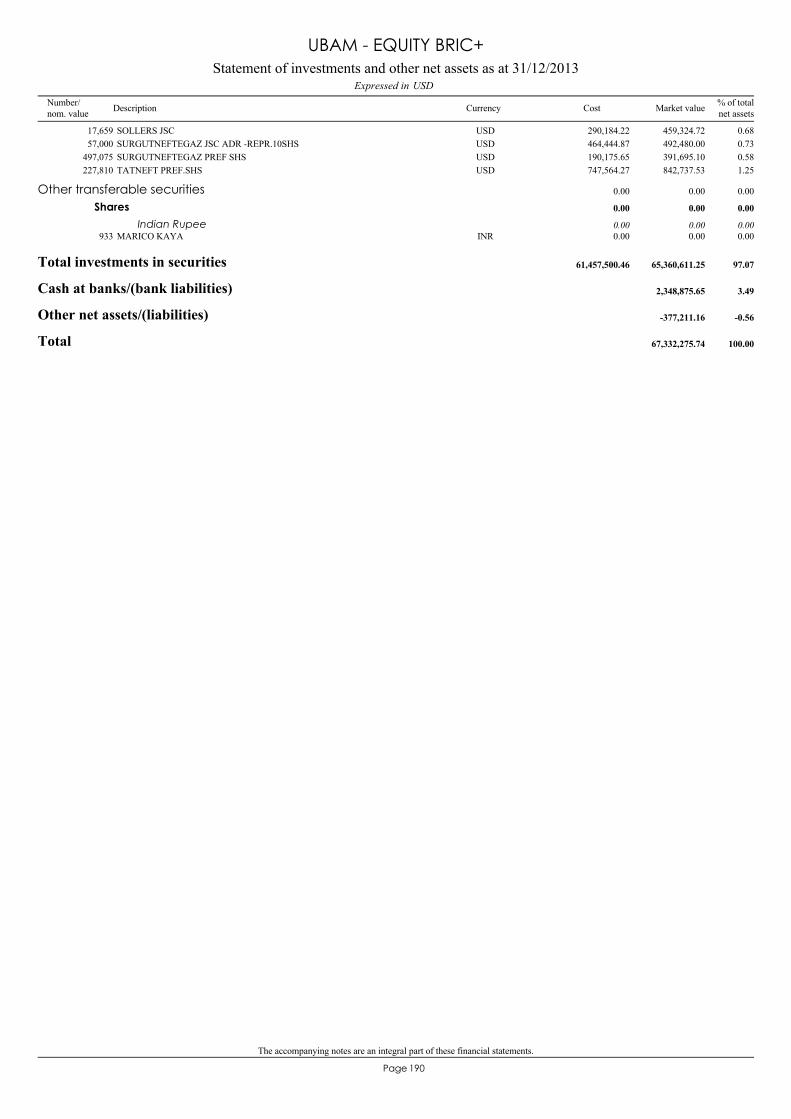
The accompanying notes are an integral part of these financial statements.
190Page
SOLLERS JSC17,659 459,324.72 0.68USD 290,184.22SURGUTNEFTEGAZ JSC ADR -REPR.10SHS57,000 492,480.00 0.73USD 464,444.87SURGUTNEFTEGAZ PREF SHS497,075 391,695.10 0.58USD 190,175.65TATNEFT PREF.SHS227,810 842,737.53 1.25USD 747,564.27
MARICO KAYA933 0.00 0.00INR 0.00
Other transferable securities 0.00 0.000.00
Shares 0.00 0.000.00
Indian Rupee 0.00 0.000.00
Total investments in securities 65,360,611.25 97.0761,457,500.46
Cash at banks/(bank liabilities) 2,348,875.65 3.49
Other net assets/(liabilities) -377,211.16 -0.56
Total 67,332,275.74 100.00
Statement of investments and other net assets as at 31/12/2013USDExpressed in
UBAM - EQUITY BRIC+
Number/nom. value Description Currency % of total
net assetsMarket valueCost

191Page
India 25.43Brazil 20.27Russia 19.29China 11.96Cayman Islands 5.85Hong Kong 4.83Cyprus 2.03Taiwan 1.40Luxembourg 1.30Kazakstan 1.25Bermuda 1.18British Virgin Islands 1.15Ireland 0.66United Kingdom 0.47
97.07
(by domicile of the issuer) % of net assets
Geographical classification of investments
UBAM - EQUITY BRIC+

192Page
Petroleum 11.84Banks and credit institutions 9.82Holding and finance companies 8.94Machine and apparatus construction 6.10Road vehicles 5.61Internet and Internet services 5.46Pharmaceuticals and cosmetics 4.65Communications 4.46Transportation 3.97Miscellaneous services 3.74Miscellaneous sectors 3.39Foods and non alcoholic drinks 3.28Building materials and trade 2.95Utilities 2.82Tobacco and alcoholic drinks 2.63Agriculture and fishery 2.37Chemicals 2.27Real estate companies 1.98Textiles and garments 1.83Insurance 1.78Coal mining and steel industry 1.37Retail trade, department stores 1.10Miscellaneous consumer goods 0.99Miscellaneous trading companies 0.89Electrical engineering and electronics 0.80Healthcare and social services 0.74Non-ferrous metals 0.69Photographics and optics 0.60
97.07
% of net assets
Industrial classification of investments
UBAM - EQUITY BRIC+

The accompanying notes are an integral part of these financial statements.
193Page
Statement of operations and other changes in net assets from 01/01/2013 to 31/12/2013Expressed in USD
UBAM - EQUITY BRIC+
2,420,154.57Income2,391,851.97Dividends, net 2Note
1,278.95Interest on bank accounts27,023.65Other income
3,136,860.69Expenses625,903.37Advisory fees 4Note856,423.43Management fees 3Note207,010.56Custodian fees29,798.04Subscription duty ("taxe d'abonnement") 6Note98,374.46Central administration costs9,099.92Performance fees 5Note4,814.46Audit fees2,211.08Interest paid on bank liabilities5,443.91Legal fees
1,066,661.23Transaction fees 2Note114,051.84Other administration costs 7, 8Note87,179.68Banking charges and other fees29,888.71Other expenses
-716,706.12Net investment incomeNet realised gain/(loss) on:
6,027,928.32- securities portfolio 2Note-39,401.53- futures contracts 2Note
-4,618,308.02- foreign exchange 2Note
653,512.65Realised resultNet variation of the unrealised gain/(loss) on:
-3,159,752.10- securities portfolio
-2,506,239.45Result of operations36,814,166.79Subscriptions capitalisation shares
341,664.32Subscriptions distribution shares-92,027,141.82Redemptions capitalisation shares
-156,218.22Redemptions distribution shares
-57,533,768.38Total changes in net assets
124,866,044.12Total net assets at the beginning of the year
67,332,275.74Total net assets at the end of the year
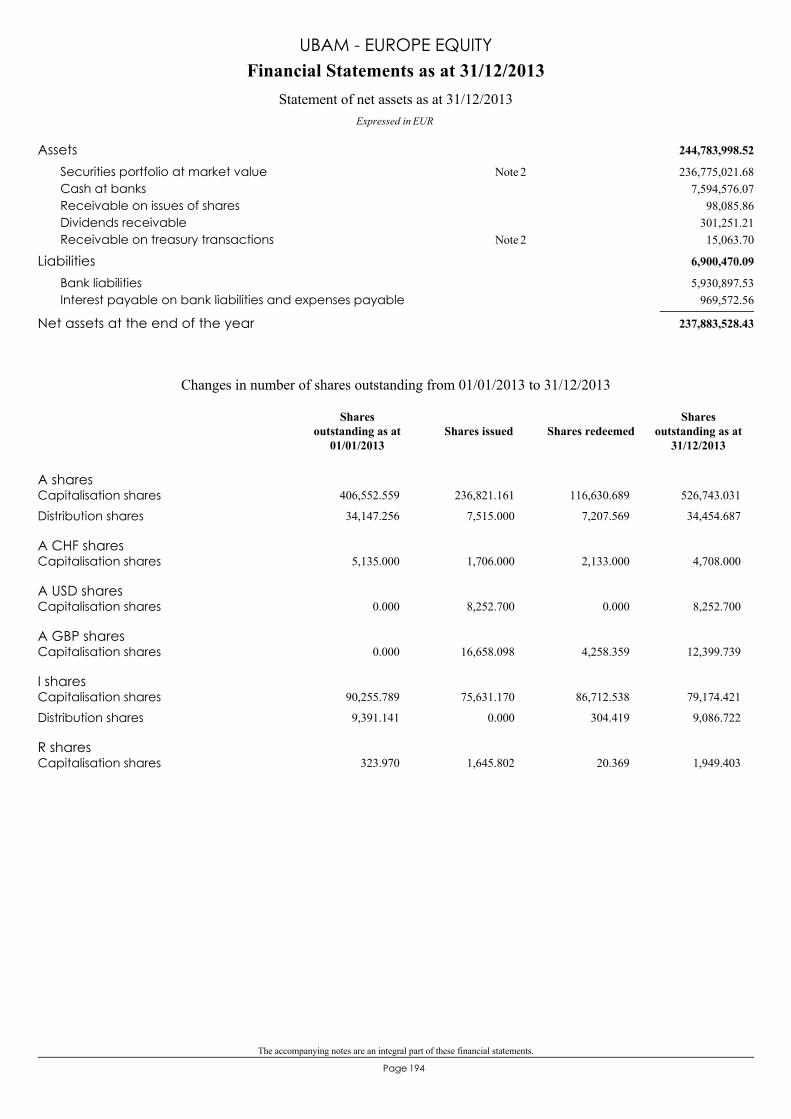
The accompanying notes are an integral part of these financial statements.
194Page
244,783,998.52Assets236,775,021.68Securities portfolio at market value 2Note
7,594,576.07Cash at banks98,085.86Receivable on issues of shares
301,251.21Dividends receivable15,063.70Receivable on treasury transactions 2Note
6,900,470.09Liabilities5,930,897.53Bank liabilities
969,572.56Interest payable on bank liabilities and expenses payable
237,883,528.43Net assets at the end of the year
Financial Statements as at 31/12/2013
Expressed in EUR
Statement of net assets as at 31/12/2013
UBAM - EUROPE EQUITY
A sharesCapitalisation shares 406,552.559 236,821.161 116,630.689 526,743.031
Distribution shares 34,147.256 7,515.000 7,207.569 34,454.687
A CHF sharesCapitalisation shares 5,135.000 1,706.000 2,133.000 4,708.000
A USD sharesCapitalisation shares 0.000 8,252.700 0.000 8,252.700
A GBP sharesCapitalisation shares 0.000 16,658.098 4,258.359 12,399.739
I sharesCapitalisation shares 90,255.789 75,631.170 86,712.538 79,174.421
Distribution shares 9,391.141 0.000 304.419 9,086.722
R sharesCapitalisation shares 323.970 1,645.802 20.369 1,949.403
Changes in number of shares outstanding from 01/01/2013 to 31/12/2013
Shares issued Shares redeemedShares
outstanding as at31/12/2013
Sharesoutstanding as at
01/01/2013

The accompanying notes are an integral part of these financial statements.
195Page
Key figures relating to the last 3 years
UBAM - EUROPE EQUITY
A shares
Capitalisation shares526,743.031
350.53406,552.559
281.49196,276.407
240.75Number of shares outstandingNet asset value per share
Distribution shares34,454.687
349.420.92
34,147.256281.49
-
---
Number of shares outstandingNet asset value per shareDividend per share
EUR EUR EUR
A CHF shares
Capitalisation shares4,708.000
429.525,135.000
339.65--
Number of shares outstandingNet asset value per share
CHF CHF CHF
A USD shares
Capitalisation shares8,252.700
482.91--
--
Number of shares outstandingNet asset value per share
USD USD USD
A GBP shares
Capitalisation shares12,399.739
252.79--
--
Number of shares outstandingNet asset value per share
GBP GBP GBP
I shares
Capitalisation shares79,174.421
365.5990,255.789
291.41186,970.478
247.38Number of shares outstandingNet asset value per share
Distribution shares9,086.722
364.420.95
9,391.141291.40
-
---
Number of shares outstandingNet asset value per shareDividend per share
EUR EUR EUR
R shares
Capitalisation shares1,949.403
328.24323.970264.91
397.210228.27
Number of shares outstandingNet asset value per share
EUR EUR EUR
Total net assets 237,883,528.43 154,621,793.18 93,596,910.29
31/12/201131/12/201231/12/2013Year ending as at:
EUR EUR EUR
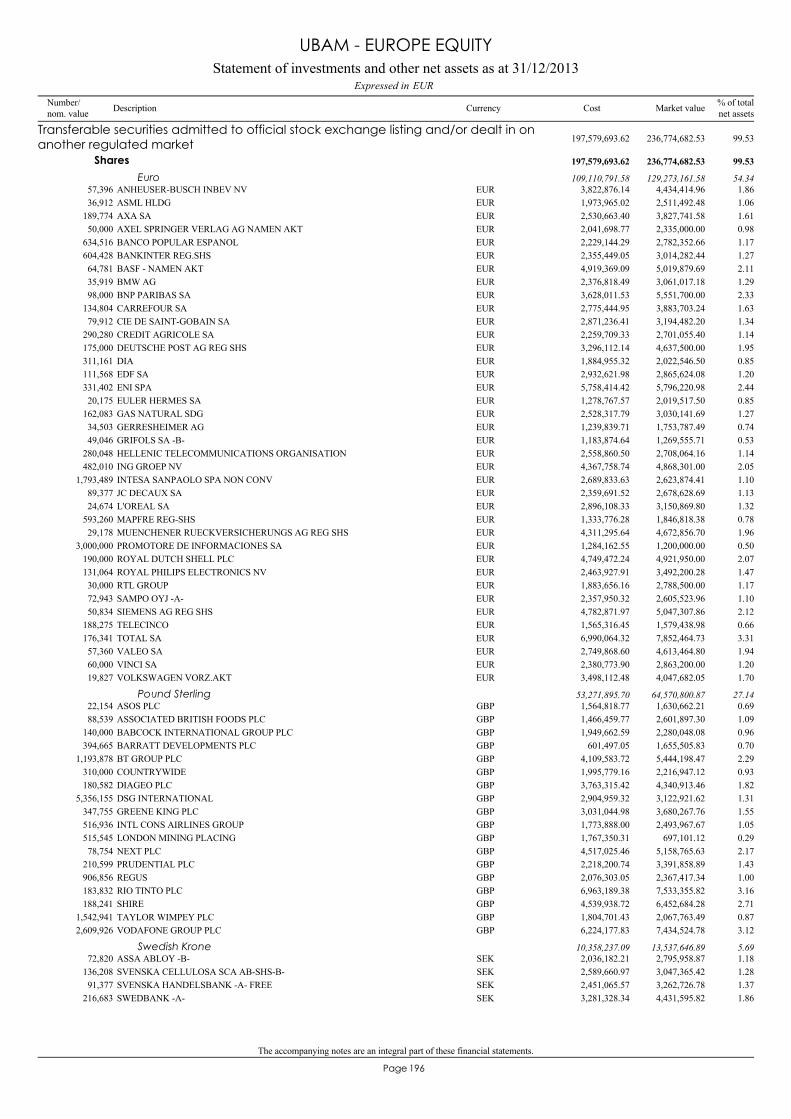
The accompanying notes are an integral part of these financial statements.
196Page
ANHEUSER-BUSCH INBEV NV57,396 4,434,414.96 1.86EUR 3,822,876.14
Transferable securities admitted to official stock exchange listing and/or dealt in onanother regulated market 236,774,682.53 99.53197,579,693.62
Shares 236,774,682.53 99.53197,579,693.62
Euro 129,273,161.58 54.34109,110,791.58
ASML HLDG36,912 2,511,492.48 1.06EUR 1,973,965.02AXA SA189,774 3,827,741.58 1.61EUR 2,530,663.40AXEL SPRINGER VERLAG AG NAMEN AKT50,000 2,335,000.00 0.98EUR 2,041,698.77BANCO POPULAR ESPANOL634,516 2,782,352.66 1.17EUR 2,229,144.29BANKINTER REG.SHS604,428 3,014,282.44 1.27EUR 2,355,449.05BASF - NAMEN AKT64,781 5,019,879.69 2.11EUR 4,919,369.09BMW AG35,919 3,061,017.18 1.29EUR 2,376,818.49BNP PARIBAS SA98,000 5,551,700.00 2.33EUR 3,628,011.53CARREFOUR SA134,804 3,883,703.24 1.63EUR 2,775,444.95CIE DE SAINT-GOBAIN SA79,912 3,194,482.20 1.34EUR 2,871,236.41CREDIT AGRICOLE SA290,280 2,701,055.40 1.14EUR 2,259,709.33DEUTSCHE POST AG REG SHS175,000 4,637,500.00 1.95EUR 3,296,112.14DIA311,161 2,022,546.50 0.85EUR 1,884,955.32EDF SA111,568 2,865,624.08 1.20EUR 2,932,621.98ENI SPA331,402 5,796,220.98 2.44EUR 5,758,414.42EULER HERMES SA20,175 2,019,517.50 0.85EUR 1,278,767.57GAS NATURAL SDG162,083 3,030,141.69 1.27EUR 2,528,317.79GERRESHEIMER AG34,503 1,753,787.49 0.74EUR 1,239,839.71GRIFOLS SA -B-49,046 1,269,555.71 0.53EUR 1,183,874.64HELLENIC TELECOMMUNICATIONS ORGANISATION280,048 2,708,064.16 1.14EUR 2,558,860.50ING GROEP NV482,010 4,868,301.00 2.05EUR 4,367,758.74INTESA SANPAOLO SPA NON CONV1,793,489 2,623,874.41 1.10EUR 2,689,833.63JC DECAUX SA89,377 2,678,628.69 1.13EUR 2,359,691.52L'OREAL SA24,674 3,150,869.80 1.32EUR 2,896,108.33MAPFRE REG-SHS593,260 1,846,818.38 0.78EUR 1,333,776.28MUENCHENER RUECKVERSICHERUNGS AG REG SHS29,178 4,672,856.70 1.96EUR 4,311,295.64PROMOTORE DE INFORMACIONES SA3,000,000 1,200,000.00 0.50EUR 1,284,162.55ROYAL DUTCH SHELL PLC190,000 4,921,950.00 2.07EUR 4,749,472.24ROYAL PHILIPS ELECTRONICS NV131,064 3,492,200.28 1.47EUR 2,463,927.91RTL GROUP30,000 2,788,500.00 1.17EUR 1,883,656.16SAMPO OYJ -A-72,943 2,605,523.96 1.10EUR 2,357,950.32SIEMENS AG REG SHS50,834 5,047,307.86 2.12EUR 4,782,871.97TELECINCO188,275 1,579,438.98 0.66EUR 1,565,316.45TOTAL SA176,341 7,852,464.73 3.31EUR 6,990,064.32VALEO SA57,360 4,613,464.80 1.94EUR 2,749,868.60VINCI SA60,000 2,863,200.00 1.20EUR 2,380,773.90VOLKSWAGEN VORZ.AKT19,827 4,047,682.05 1.70EUR 3,498,112.48
ASOS PLC22,154 1,630,662.21 0.69GBP 1,564,818.77Pound Sterling 64,570,800.87 27.1453,271,895.70
ASSOCIATED BRITISH FOODS PLC88,539 2,601,897.30 1.09GBP 1,466,459.77BABCOCK INTERNATIONAL GROUP PLC140,000 2,280,048.08 0.96GBP 1,949,662.59BARRATT DEVELOPMENTS PLC394,665 1,655,505.83 0.70GBP 601,497.05BT GROUP PLC1,193,878 5,444,198.47 2.29GBP 4,109,583.72COUNTRYWIDE310,000 2,216,947.12 0.93GBP 1,995,779.16DIAGEO PLC180,582 4,340,913.46 1.82GBP 3,763,315.42DSG INTERNATIONAL5,356,155 3,122,921.62 1.31GBP 2,904,959.32GREENE KING PLC347,755 3,680,267.76 1.55GBP 3,031,044.98INTL CONS AIRLINES GROUP516,936 2,493,967.67 1.05GBP 1,773,888.00LONDON MINING PLACING515,545 697,101.12 0.29GBP 1,767,350.31NEXT PLC78,754 5,158,765.63 2.17GBP 4,517,025.46PRUDENTIAL PLC210,599 3,391,858.89 1.43GBP 2,218,200.74REGUS906,856 2,367,417.34 1.00GBP 2,076,303.05RIO TINTO PLC183,832 7,533,355.82 3.16GBP 6,963,189.38SHIRE188,241 6,452,684.28 2.71GBP 4,539,938.72TAYLOR WIMPEY PLC1,542,941 2,067,763.49 0.87GBP 1,804,701.43VODAFONE GROUP PLC2,609,926 7,434,524.78 3.12GBP 6,224,177.83
ASSA ABLOY -B-72,820 2,795,958.87 1.18SEK 2,036,182.21Swedish Krone 13,537,646.89 5.6910,358,237.09
SVENSKA CELLULOSA SCA AB-SHS-B-136,208 3,047,365.42 1.28SEK 2,589,660.97SVENSKA HANDELSBANK -A- FREE91,377 3,262,726.78 1.37SEK 2,451,065.57SWEDBANK -A-216,683 4,431,595.82 1.86SEK 3,281,328.34
Statement of investments and other net assets as at 31/12/2013EURExpressed in
UBAM - EUROPE EQUITY
Number/nom. value Description Currency % of total
net assetsMarket valueCost

The accompanying notes are an integral part of these financial statements.
197Page
NESTLE SA REG SHS160,316 8,542,337.66 3.59CHF 8,292,844.80Swiss Franc 29,393,073.19 12.3624,838,769.25
NOVARTIS AG REG SHS177,679 10,322,925.17 4.34CHF 8,806,787.05ROCHE HOLDING AG GENUSSSCHEIN51,773 10,527,810.36 4.43CHF 7,739,137.40
ROLLS ROYCE HLD -C- ENTITLEMENT JAN 2014282,166 339.15 0.00GBP 333.45
Other transferable securities 339.15 0.00333.45
Shares 339.15 0.00333.45
Pound Sterling 339.15 0.00333.45
Total investments in securities 236,775,021.68 99.53197,580,027.07
Cash at banks/(bank liabilities) 1,663,678.54 0.70
Other net assets/(liabilities) -555,171.79 -0.23
Total 237,883,528.43 100.00
Statement of investments and other net assets as at 31/12/2013EURExpressed in
UBAM - EUROPE EQUITY
Number/nom. value Description Currency % of total
net assetsMarket valueCost
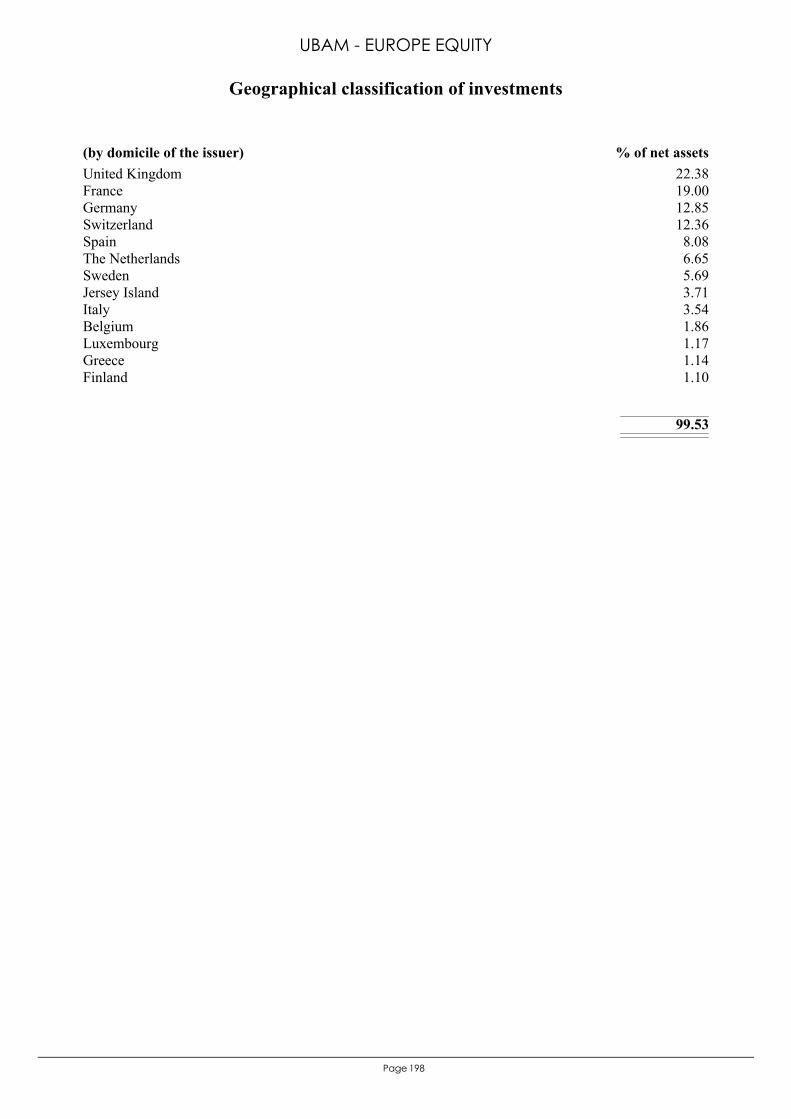
198Page
United Kingdom 22.38France 19.00Germany 12.85Switzerland 12.36Spain 8.08The Netherlands 6.65Sweden 5.69Jersey Island 3.71Italy 3.54Belgium 1.86Luxembourg 1.17Greece 1.14Finland 1.10
99.53
(by domicile of the issuer) % of net assets
Geographical classification of investments
UBAM - EUROPE EQUITY
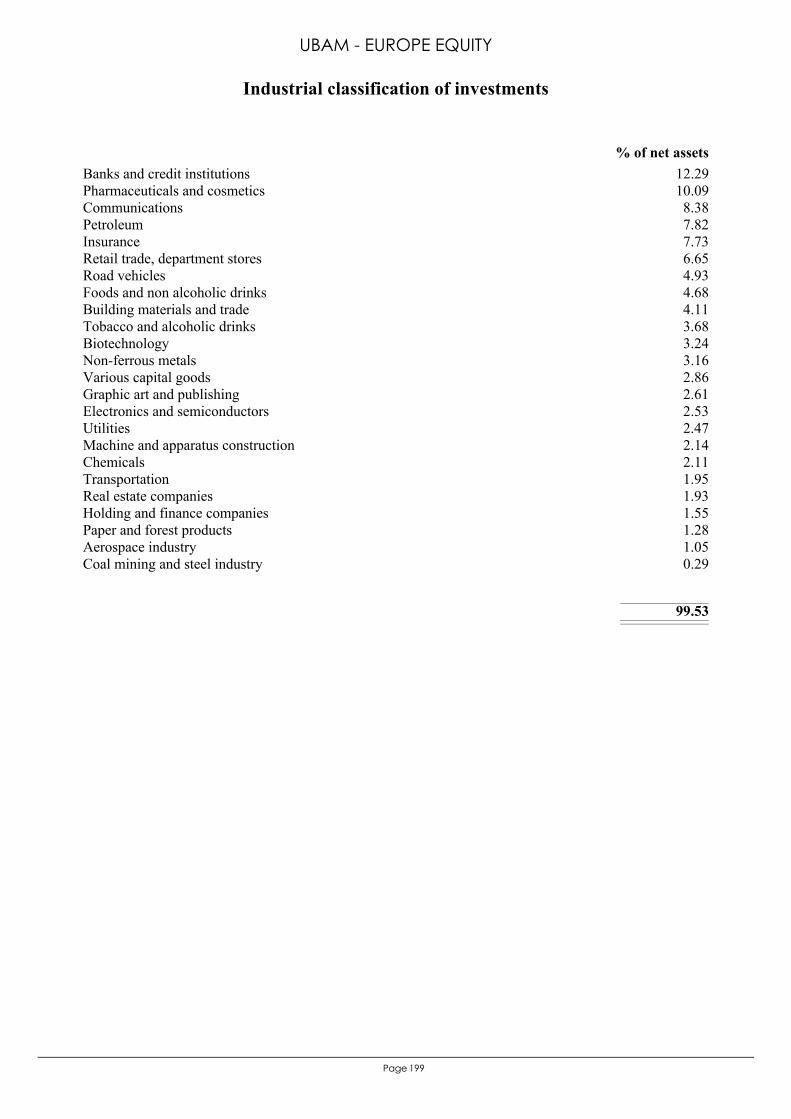
199Page
Banks and credit institutions 12.29Pharmaceuticals and cosmetics 10.09Communications 8.38Petroleum 7.82Insurance 7.73Retail trade, department stores 6.65Road vehicles 4.93Foods and non alcoholic drinks 4.68Building materials and trade 4.11Tobacco and alcoholic drinks 3.68Biotechnology 3.24Non-ferrous metals 3.16Various capital goods 2.86Graphic art and publishing 2.61Electronics and semiconductors 2.53Utilities 2.47Machine and apparatus construction 2.14Chemicals 2.11Transportation 1.95Real estate companies 1.93Holding and finance companies 1.55Paper and forest products 1.28Aerospace industry 1.05Coal mining and steel industry 0.29
99.53
% of net assets
Industrial classification of investments
UBAM - EUROPE EQUITY
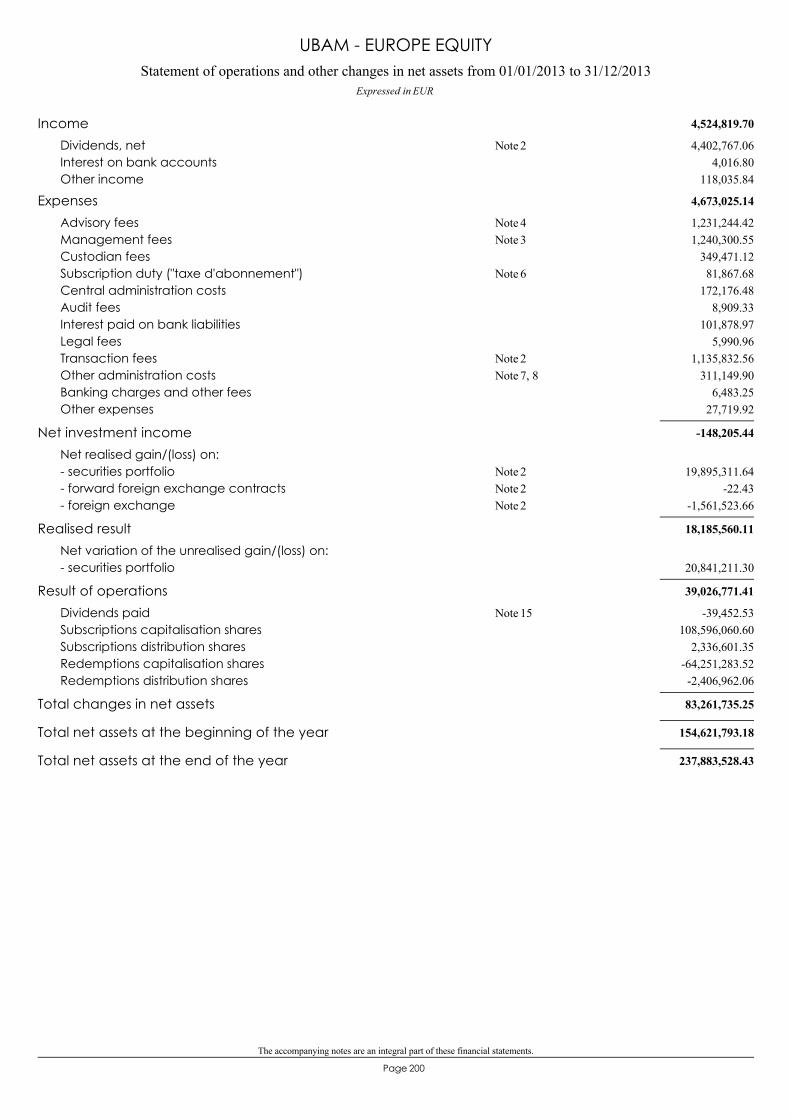
The accompanying notes are an integral part of these financial statements.
200Page
Statement of operations and other changes in net assets from 01/01/2013 to 31/12/2013Expressed in EUR
UBAM - EUROPE EQUITY
4,524,819.70Income4,402,767.06Dividends, net 2Note
4,016.80Interest on bank accounts118,035.84Other income
4,673,025.14Expenses1,231,244.42Advisory fees 4Note1,240,300.55Management fees 3Note
349,471.12Custodian fees81,867.68Subscription duty ("taxe d'abonnement") 6Note
172,176.48Central administration costs8,909.33Audit fees
101,878.97Interest paid on bank liabilities5,990.96Legal fees
1,135,832.56Transaction fees 2Note311,149.90Other administration costs 7, 8Note
6,483.25Banking charges and other fees27,719.92Other expenses
-148,205.44Net investment incomeNet realised gain/(loss) on:
19,895,311.64- securities portfolio 2Note-22.43- forward foreign exchange contracts 2Note
-1,561,523.66- foreign exchange 2Note
18,185,560.11Realised resultNet variation of the unrealised gain/(loss) on:
20,841,211.30- securities portfolio
39,026,771.41Result of operations-39,452.53Dividends paid 15Note
108,596,060.60Subscriptions capitalisation shares2,336,601.35Subscriptions distribution shares
-64,251,283.52Redemptions capitalisation shares-2,406,962.06Redemptions distribution shares
83,261,735.25Total changes in net assets
154,621,793.18Total net assets at the beginning of the year
237,883,528.43Total net assets at the end of the year
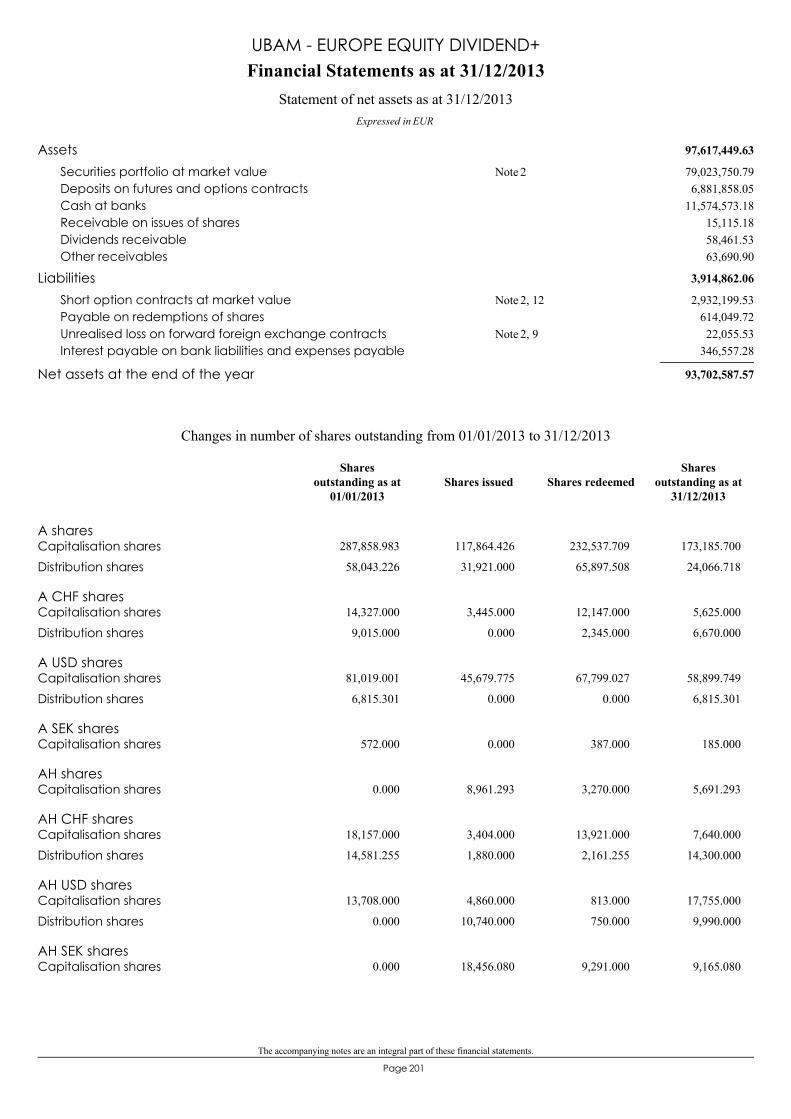
The accompanying notes are an integral part of these financial statements.
201Page
97,617,449.63Assets79,023,750.79Securities portfolio at market value 2Note6,881,858.05Deposits on futures and options contracts
11,574,573.18Cash at banks15,115.18Receivable on issues of shares58,461.53Dividends receivable63,690.90Other receivables
3,914,862.06Liabilities2,932,199.53Short option contracts at market value 2, 12Note
614,049.72Payable on redemptions of shares22,055.53Unrealised loss on forward foreign exchange contracts 2, 9Note
346,557.28Interest payable on bank liabilities and expenses payable
93,702,587.57Net assets at the end of the year
Financial Statements as at 31/12/2013
Expressed in EUR
Statement of net assets as at 31/12/2013
UBAM - EUROPE EQUITY DIVIDEND+
A sharesCapitalisation shares 287,858.983 117,864.426 232,537.709 173,185.700
Distribution shares 58,043.226 31,921.000 65,897.508 24,066.718
A CHF sharesCapitalisation shares 14,327.000 3,445.000 12,147.000 5,625.000
Distribution shares 9,015.000 0.000 2,345.000 6,670.000
A USD sharesCapitalisation shares 81,019.001 45,679.775 67,799.027 58,899.749
Distribution shares 6,815.301 0.000 0.000 6,815.301
A SEK sharesCapitalisation shares 572.000 0.000 387.000 185.000
AH sharesCapitalisation shares 0.000 8,961.293 3,270.000 5,691.293
AH CHF sharesCapitalisation shares 18,157.000 3,404.000 13,921.000 7,640.000
Distribution shares 14,581.255 1,880.000 2,161.255 14,300.000
AH USD sharesCapitalisation shares 13,708.000 4,860.000 813.000 17,755.000
Distribution shares 0.000 10,740.000 750.000 9,990.000
AH SEK sharesCapitalisation shares 0.000 18,456.080 9,291.000 9,165.080
Changes in number of shares outstanding from 01/01/2013 to 31/12/2013
Shares issued Shares redeemedShares
outstanding as at31/12/2013
Sharesoutstanding as at
01/01/2013

The accompanying notes are an integral part of these financial statements.
202Page
AH GBP sharesDistribution shares 0.000 3,520.000 3,520.000 0.000
I sharesCapitalisation shares 437,459.853 78,011.674 371,891.130 143,580.397
Distribution shares 275,931.424 317,581.218 251,512.011 342,000.631
I CHF sharesCapitalisation shares 20,000.000 0.000 0.000 20,000.000
Distribution shares 1,000.000 520.000 500.000 1,020.000
I USD sharesCapitalisation shares 0.000 145.000 0.000 145.000
Distribution shares 2,500.000 0.000 0.000 2,500.000
I GBP sharesCapitalisation shares 720.947 126.984 119.189 728.742
Distribution shares 6,439.902 21,896.406 4,185.957 24,150.351
IH sharesCapitalisation shares 0.000 27,595.126 9,893.814 17,701.312
IH USD sharesDistribution shares 500.000 203.476 250.000 453.476
IH GBP sharesCapitalisation shares 480.019 0.000 0.000 480.019
Distribution shares 3,920.196 35,438.605 0.000 39,358.801
R sharesCapitalisation shares 233.000 4,616.649 2,014.223 2,835.426
Distribution shares 600.570 247.145 240.012 607.703
Changes in number of shares outstanding from 01/01/2013 to 31/12/2013
Shares issued Shares redeemedShares
outstanding as at31/12/2013
Sharesoutstanding as at
01/01/2013
UBAM - EUROPE EQUITY DIVIDEND+
Key figures relating to the last 3 years
A shares
Capitalisation shares173,185.700
112.15287,858.983
107.3785,538.369
100.56Number of shares outstandingNet asset value per share
Distribution shares24,066.718
94.049.59
58,043.22699.597.58
4,800.000100.56
-
Number of shares outstandingNet asset value per shareDividend per share
EUR EUR EUR
Total net assets 93,702,587.57 128,143,611.06 36,811,110.62
31/12/201131/12/201231/12/2013Year ending as at:
EUR EUR EUR
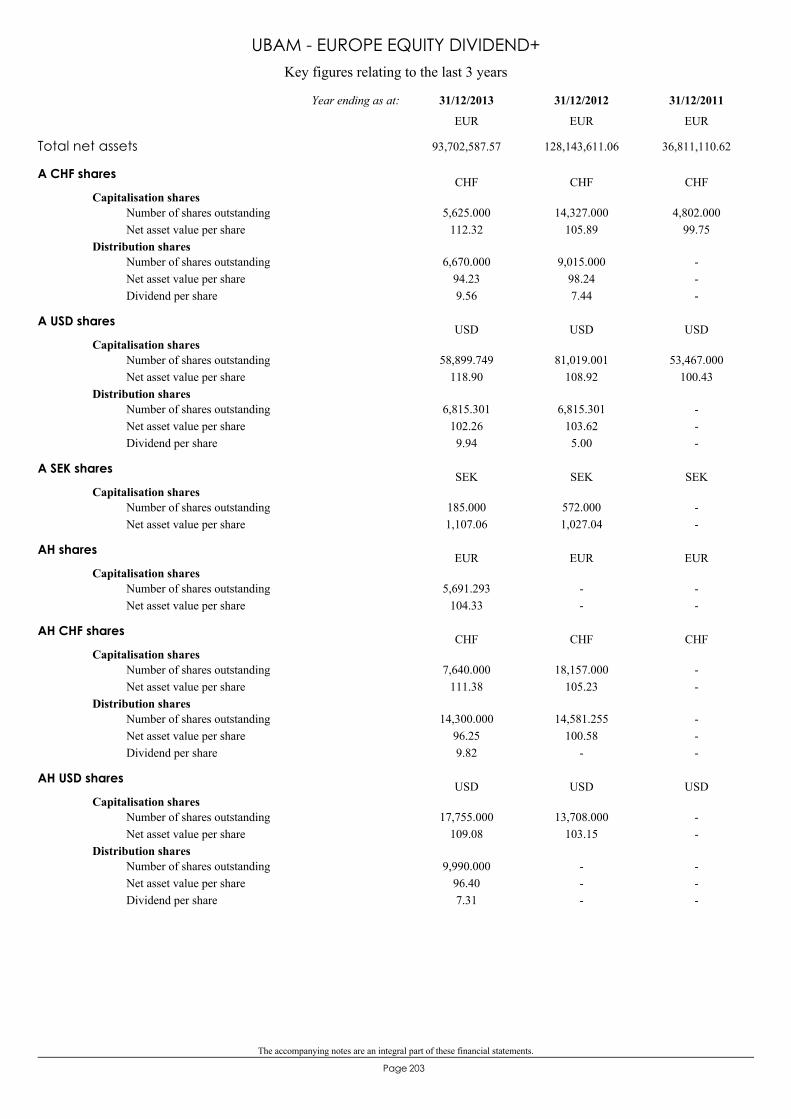
The accompanying notes are an integral part of these financial statements.
203Page
Key figures relating to the last 3 years
UBAM - EUROPE EQUITY DIVIDEND+
A CHF shares
Capitalisation shares5,625.000
112.3214,327.000
105.894,802.000
99.75Number of shares outstandingNet asset value per share
Distribution shares6,670.000
94.239.56
9,015.00098.247.44
---
Number of shares outstandingNet asset value per shareDividend per share
CHF CHF CHF
A USD shares
Capitalisation shares58,899.749
118.9081,019.001
108.9253,467.000
100.43Number of shares outstandingNet asset value per share
Distribution shares6,815.301
102.269.94
6,815.301103.625.00
---
Number of shares outstandingNet asset value per shareDividend per share
USD USD USD
A SEK shares
Capitalisation shares185.0001,107.06
572.0001,027.04
--
Number of shares outstandingNet asset value per share
SEK SEK SEK
AH shares
Capitalisation shares5,691.293
104.33--
--
Number of shares outstandingNet asset value per share
EUR EUR EUR
AH CHF shares
Capitalisation shares7,640.000
111.3818,157.000
105.23--
Number of shares outstandingNet asset value per share
Distribution shares14,300.000
96.259.82
14,581.255100.58
-
---
Number of shares outstandingNet asset value per shareDividend per share
CHF CHF CHF
AH USD shares
Capitalisation shares17,755.000
109.0813,708.000
103.15--
Number of shares outstandingNet asset value per share
Distribution shares9,990.000
96.407.31
---
---
Number of shares outstandingNet asset value per shareDividend per share
USD USD USD
Total net assets 93,702,587.57 128,143,611.06 36,811,110.62
31/12/201131/12/201231/12/2013Year ending as at:
EUR EUR EUR

The accompanying notes are an integral part of these financial statements.
204Page
Key figures relating to the last 3 years
UBAM - EUROPE EQUITY DIVIDEND+
AH SEK shares
Capitalisation shares9,165.0801,050.66
--
--
Number of shares outstandingNet asset value per share
SEK SEK SEK
AH GBP shares
Distribution shares--
2.52
---
---
Number of shares outstandingNet asset value per shareDividend per share
GBP GBP GBP
I shares
Capitalisation shares143,580.397
113.88437,459.853
108.23111,700.000
100.61Number of shares outstandingNet asset value per share
Distribution shares342,000.631
95.509.69
275,931.424100.397.61
110,350.000100.60
-
Number of shares outstandingNet asset value per shareDividend per share
EUR EUR EUR
I CHF shares
Capitalisation shares20,000.000
106.7920,000.000
99.95--
Number of shares outstandingNet asset value per share
Distribution shares1,020.000
95.629.64
1,000.00098.957.52
1,000.00099.78
-
Number of shares outstandingNet asset value per shareDividend per share
CHF CHF CHF
I USD shares
Capitalisation shares145.000111.62
--
--
Number of shares outstandingNet asset value per share
Distribution shares2,500.000
101.279.80
2,500.000101.877.53
10,000.000100.47
-
Number of shares outstandingNet asset value per shareDividend per share
USD USD USD
I GBP shares
Capitalisation shares728.74294.75
720.94787.78
--
Number of shares outstandingNet asset value per share
Distribution shares24,150.351
81.478.32
6,439.90283.504.13
---
Number of shares outstandingNet asset value per shareDividend per share
GBP GBP GBP
Total net assets 93,702,587.57 128,143,611.06 36,811,110.62
31/12/201131/12/201231/12/2013Year ending as at:
EUR EUR EUR
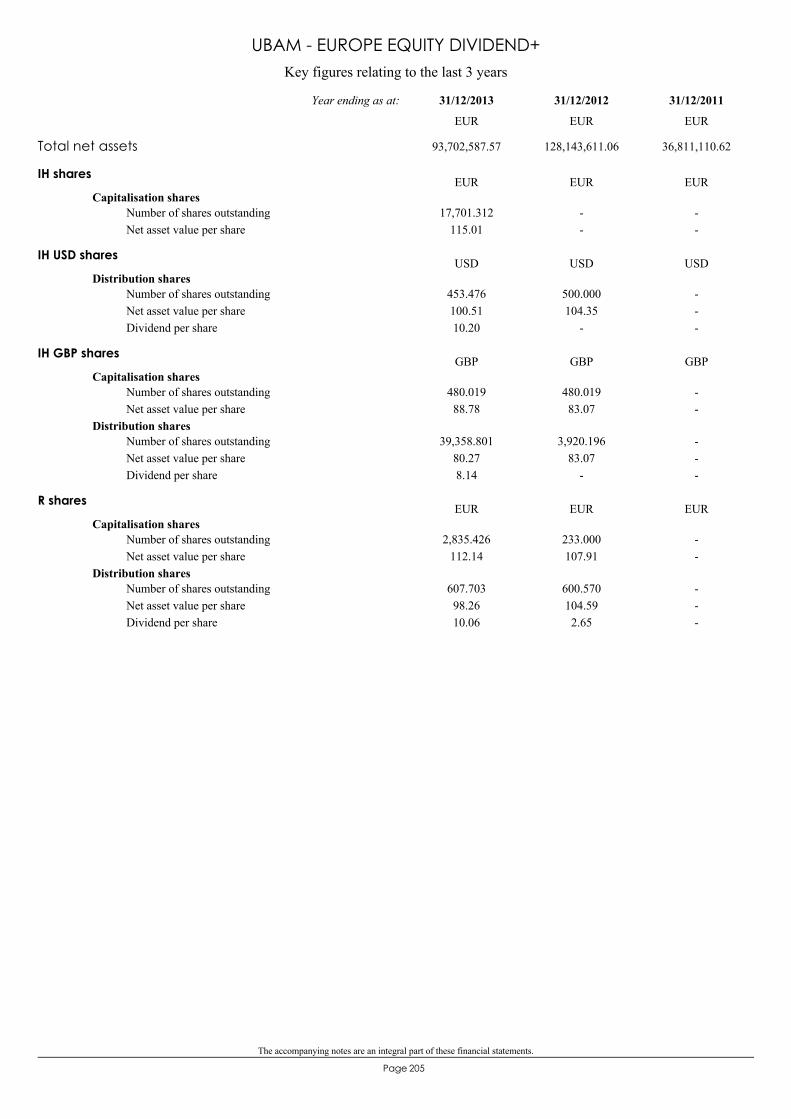
The accompanying notes are an integral part of these financial statements.
205Page
Key figures relating to the last 3 years
UBAM - EUROPE EQUITY DIVIDEND+
IH shares
Capitalisation shares17,701.312
115.01--
--
Number of shares outstandingNet asset value per share
EUR EUR EUR
IH USD shares
Distribution shares453.476100.5110.20
500.000104.35
-
---
Number of shares outstandingNet asset value per shareDividend per share
USD USD USD
IH GBP shares
Capitalisation shares480.01988.78
480.01983.07
--
Number of shares outstandingNet asset value per share
Distribution shares39,358.801
80.278.14
3,920.19683.07
-
---
Number of shares outstandingNet asset value per shareDividend per share
GBP GBP GBP
R shares
Capitalisation shares2,835.426
112.14233.000107.91
--
Number of shares outstandingNet asset value per share
Distribution shares607.70398.2610.06
600.570104.592.65
---
Number of shares outstandingNet asset value per shareDividend per share
EUR EUR EUR
Total net assets 93,702,587.57 128,143,611.06 36,811,110.62
31/12/201131/12/201231/12/2013Year ending as at:
EUR EUR EUR
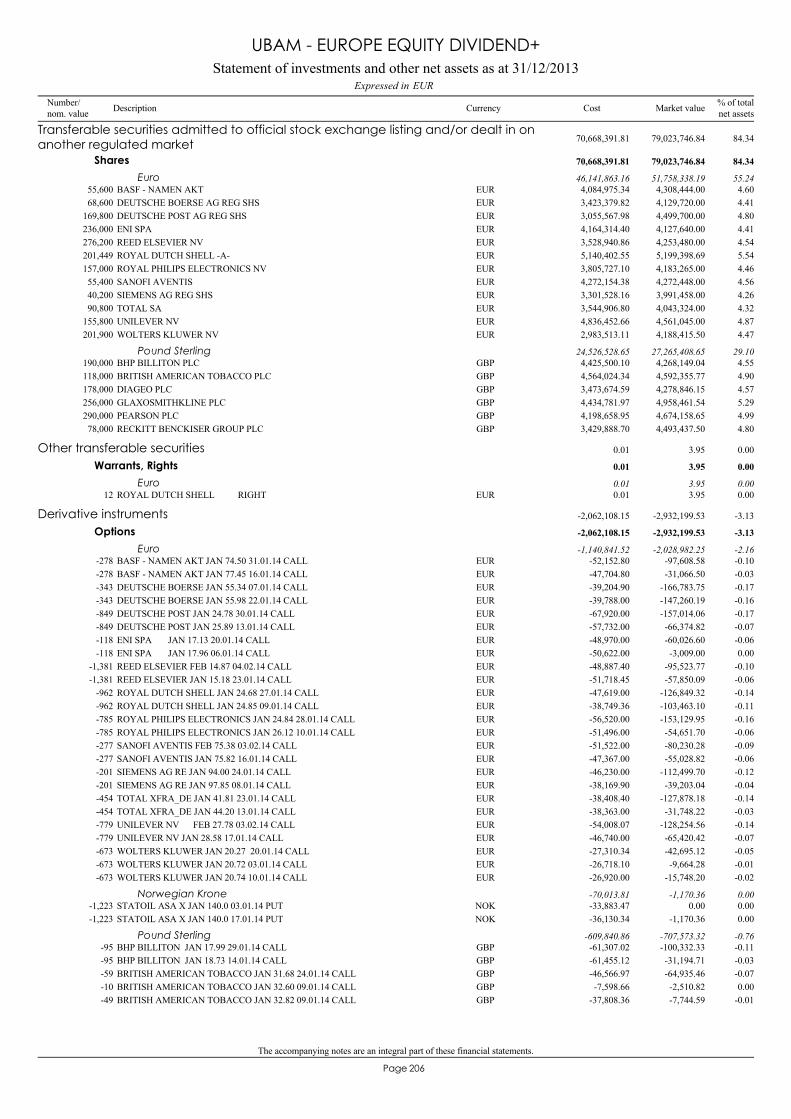
The accompanying notes are an integral part of these financial statements.
206Page
BASF - NAMEN AKT55,600 4,308,444.00 4.60EUR 4,084,975.34
Transferable securities admitted to official stock exchange listing and/or dealt in onanother regulated market 79,023,746.84 84.3470,668,391.81
Shares 79,023,746.84 84.3470,668,391.81
Euro 51,758,338.19 55.2446,141,863.16
DEUTSCHE BOERSE AG REG SHS68,600 4,129,720.00 4.41EUR 3,423,379.82DEUTSCHE POST AG REG SHS169,800 4,499,700.00 4.80EUR 3,055,567.98ENI SPA236,000 4,127,640.00 4.41EUR 4,164,314.40REED ELSEVIER NV276,200 4,253,480.00 4.54EUR 3,528,940.86ROYAL DUTCH SHELL -A-201,449 5,199,398.69 5.54EUR 5,140,402.55ROYAL PHILIPS ELECTRONICS NV157,000 4,183,265.00 4.46EUR 3,805,727.10SANOFI AVENTIS55,400 4,272,448.00 4.56EUR 4,272,154.38SIEMENS AG REG SHS40,200 3,991,458.00 4.26EUR 3,301,528.16TOTAL SA90,800 4,043,324.00 4.32EUR 3,544,906.80UNILEVER NV155,800 4,561,045.00 4.87EUR 4,836,452.66WOLTERS KLUWER NV201,900 4,188,415.50 4.47EUR 2,983,513.11
BHP BILLITON PLC190,000 4,268,149.04 4.55GBP 4,425,500.10Pound Sterling 27,265,408.65 29.1024,526,528.65
BRITISH AMERICAN TOBACCO PLC118,000 4,592,355.77 4.90GBP 4,564,024.34DIAGEO PLC178,000 4,278,846.15 4.57GBP 3,473,674.59GLAXOSMITHKLINE PLC256,000 4,958,461.54 5.29GBP 4,434,781.97PEARSON PLC290,000 4,674,158.65 4.99GBP 4,198,658.95RECKITT BENCKISER GROUP PLC78,000 4,493,437.50 4.80GBP 3,429,888.70
ROYAL DUTCH SHELL RIGHT12 3.95 0.00EUR 0.01
Other transferable securities 3.95 0.000.01
Warrants, Rights 3.95 0.000.01
Euro 3.95 0.000.01
BASF - NAMEN AKT JAN 74.50 31.01.14 CALL-278 -97,608.58 -0.10EUR -52,152.80
Derivative instruments -2,932,199.53 -3.13-2,062,108.15
Options -2,932,199.53 -3.13-2,062,108.15
Euro -2,028,982.25 -2.16-1,140,841.52
BASF - NAMEN AKT JAN 77.45 16.01.14 CALL-278 -31,066.50 -0.03EUR -47,704.80DEUTSCHE BOERSE JAN 55.34 07.01.14 CALL-343 -166,783.75 -0.17EUR -39,204.90DEUTSCHE BOERSE JAN 55.98 22.01.14 CALL-343 -147,260.19 -0.16EUR -39,788.00DEUTSCHE POST JAN 24.78 30.01.14 CALL-849 -157,014.06 -0.17EUR -67,920.00DEUTSCHE POST JAN 25.89 13.01.14 CALL-849 -66,374.82 -0.07EUR -57,732.00ENI SPA JAN 17.13 20.01.14 CALL-118 -60,026.60 -0.06EUR -48,970.00ENI SPA JAN 17.96 06.01.14 CALL-118 -3,009.00 0.00EUR -50,622.00REED ELSEVIER FEB 14.87 04.02.14 CALL-1,381 -95,523.77 -0.10EUR -48,887.40REED ELSEVIER JAN 15.18 23.01.14 CALL-1,381 -57,850.09 -0.06EUR -51,718.45ROYAL DUTCH SHELL JAN 24.68 27.01.14 CALL-962 -126,849.32 -0.14EUR -47,619.00ROYAL DUTCH SHELL JAN 24.85 09.01.14 CALL-962 -103,463.10 -0.11EUR -38,749.36ROYAL PHILIPS ELECTRONICS JAN 24.84 28.01.14 CALL-785 -153,129.95 -0.16EUR -56,520.00ROYAL PHILIPS ELECTRONICS JAN 26.12 10.01.14 CALL-785 -54,651.70 -0.06EUR -51,496.00SANOFI AVENTIS FEB 75.38 03.02.14 CALL-277 -80,230.28 -0.09EUR -51,522.00SANOFI AVENTIS JAN 75.82 16.01.14 CALL-277 -55,028.82 -0.06EUR -47,367.00SIEMENS AG RE JAN 94.00 24.01.14 CALL-201 -112,499.70 -0.12EUR -46,230.00SIEMENS AG RE JAN 97.85 08.01.14 CALL-201 -39,203.04 -0.04EUR -38,169.90TOTAL XFRA_DE JAN 41.81 23.01.14 CALL-454 -127,878.18 -0.14EUR -38,408.40TOTAL XFRA_DE JAN 44.20 13.01.14 CALL-454 -31,748.22 -0.03EUR -38,363.00UNILEVER NV FEB 27.78 03.02.14 CALL-779 -128,254.56 -0.14EUR -54,008.07UNILEVER NV JAN 28.58 17.01.14 CALL-779 -65,420.42 -0.07EUR -46,740.00WOLTERS KLUWER JAN 20.27 20.01.14 CALL-673 -42,695.12 -0.05EUR -27,310.34WOLTERS KLUWER JAN 20.72 03.01.14 CALL-673 -9,664.28 -0.01EUR -26,718.10WOLTERS KLUWER JAN 20.74 10.01.14 CALL-673 -15,748.20 -0.02EUR -26,920.00
STATOIL ASA X JAN 140.0 03.01.14 PUT-1,223 0.00 0.00NOK -33,883.47Norwegian Krone -1,170.36 0.00-70,013.81
STATOIL ASA X JAN 140.0 17.01.14 PUT-1,223 -1,170.36 0.00NOK -36,130.34
BHP BILLITON JAN 17.99 29.01.14 CALL-95 -100,332.33 -0.11GBP -61,307.02Pound Sterling -707,573.32 -0.76-609,840.86
BHP BILLITON JAN 18.73 14.01.14 CALL-95 -31,194.71 -0.03GBP -61,455.12BRITISH AMERICAN TOBACCO JAN 31.68 24.01.14 CALL-59 -64,935.46 -0.07GBP -46,566.97BRITISH AMERICAN TOBACCO JAN 32.60 09.01.14 CALL-10 -2,510.82 0.00GBP -7,598.66BRITISH AMERICAN TOBACCO JAN 32.82 09.01.14 CALL-49 -7,744.59 -0.01GBP -37,808.36
Statement of investments and other net assets as at 31/12/2013EURExpressed in
UBAM - EUROPE EQUITY DIVIDEND+
Number/nom. value Description Currency % of total
net assetsMarket valueCost
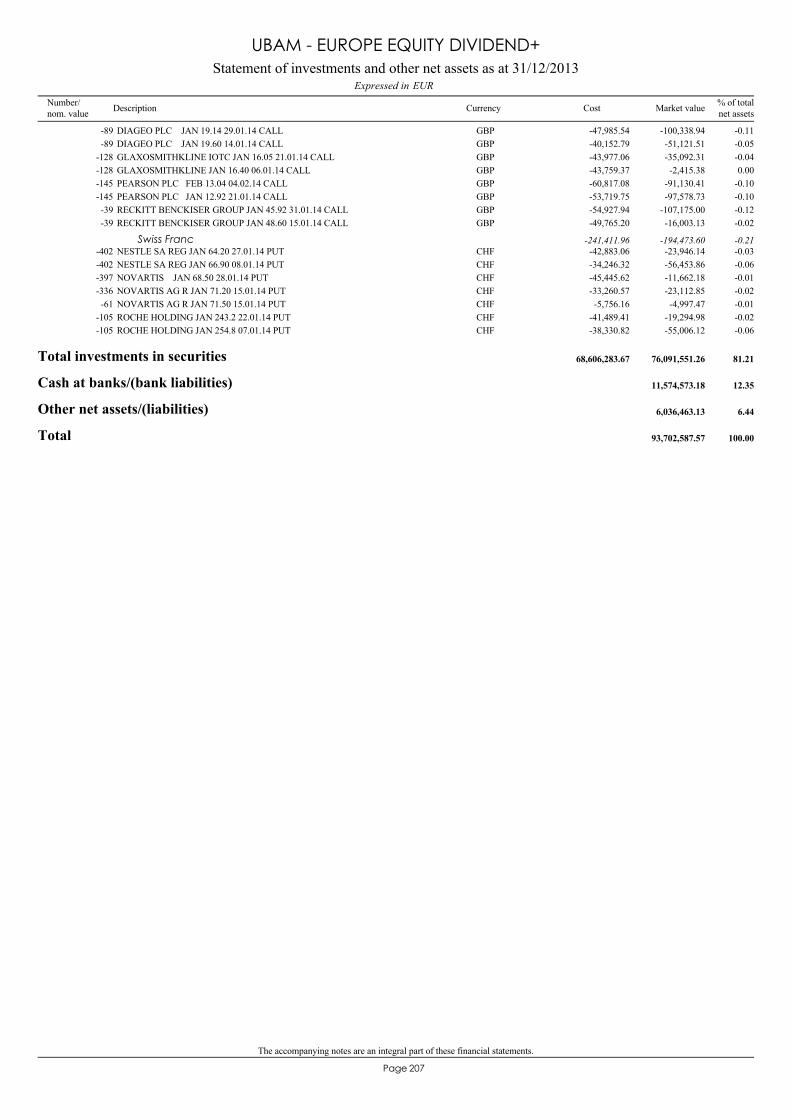
The accompanying notes are an integral part of these financial statements.
207Page
DIAGEO PLC JAN 19.14 29.01.14 CALL-89 -100,338.94 -0.11GBP -47,985.54DIAGEO PLC JAN 19.60 14.01.14 CALL-89 -51,121.51 -0.05GBP -40,152.79GLAXOSMITHKLINE IOTC JAN 16.05 21.01.14 CALL-128 -35,092.31 -0.04GBP -43,977.06GLAXOSMITHKLINE JAN 16.40 06.01.14 CALL-128 -2,415.38 0.00GBP -43,759.37PEARSON PLC FEB 13.04 04.02.14 CALL-145 -91,130.41 -0.10GBP -60,817.08PEARSON PLC JAN 12.92 21.01.14 CALL-145 -97,578.73 -0.10GBP -53,719.75RECKITT BENCKISER GROUP JAN 45.92 31.01.14 CALL-39 -107,175.00 -0.12GBP -54,927.94RECKITT BENCKISER GROUP JAN 48.60 15.01.14 CALL-39 -16,003.13 -0.02GBP -49,765.20
NESTLE SA REG JAN 64.20 27.01.14 PUT-402 -23,946.14 -0.03CHF -42,883.06Swiss Franc -194,473.60 -0.21-241,411.96
NESTLE SA REG JAN 66.90 08.01.14 PUT-402 -56,453.86 -0.06CHF -34,246.32NOVARTIS JAN 68.50 28.01.14 PUT-397 -11,662.18 -0.01CHF -45,445.62NOVARTIS AG R JAN 71.20 15.01.14 PUT-336 -23,112.85 -0.02CHF -33,260.57NOVARTIS AG R JAN 71.50 15.01.14 PUT-61 -4,997.47 -0.01CHF -5,756.16ROCHE HOLDING JAN 243.2 22.01.14 PUT-105 -19,294.98 -0.02CHF -41,489.41ROCHE HOLDING JAN 254.8 07.01.14 PUT-105 -55,006.12 -0.06CHF -38,330.82
Total investments in securities 76,091,551.26 81.2168,606,283.67
Cash at banks/(bank liabilities) 11,574,573.18 12.35
Other net assets/(liabilities) 6,036,463.13 6.44
Total 93,702,587.57 100.00
Statement of investments and other net assets as at 31/12/2013EURExpressed in
UBAM - EUROPE EQUITY DIVIDEND+
Number/nom. value Description Currency % of total
net assetsMarket valueCost
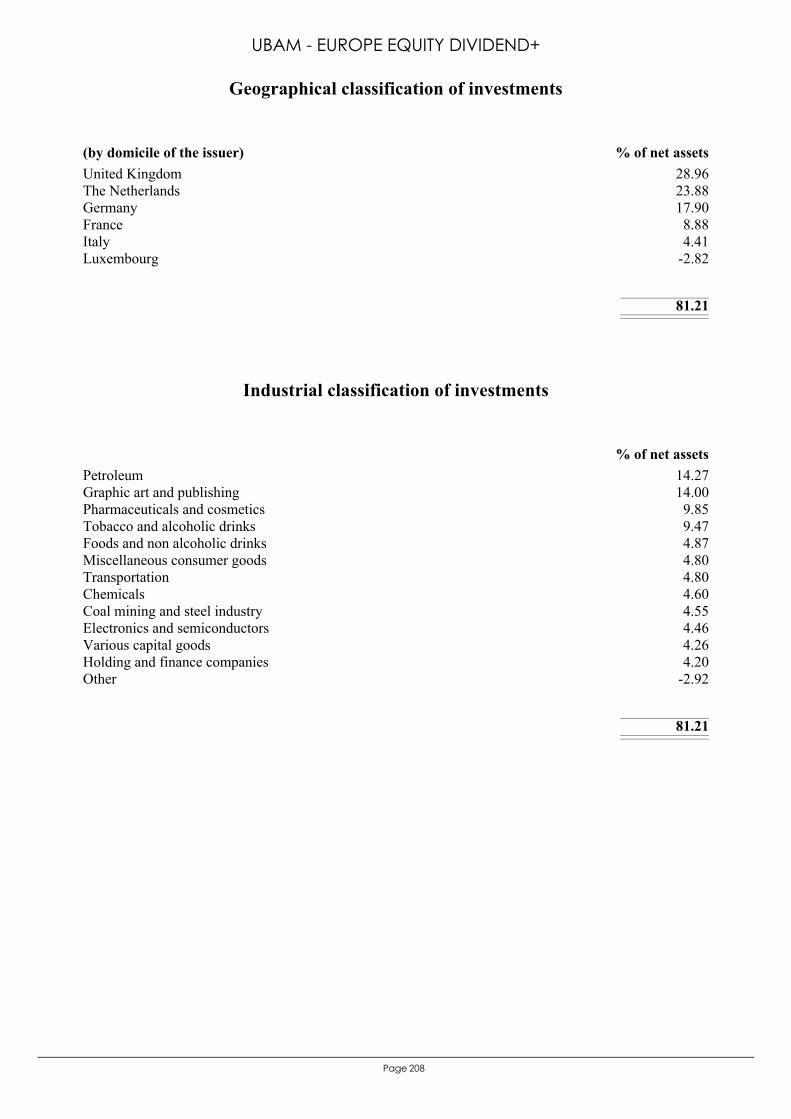
208Page
United Kingdom 28.96The Netherlands 23.88Germany 17.90France 8.88Italy 4.41Luxembourg -2.82
81.21
(by domicile of the issuer) % of net assets
Geographical classification of investments
UBAM - EUROPE EQUITY DIVIDEND+
Petroleum 14.27Graphic art and publishing 14.00Pharmaceuticals and cosmetics 9.85Tobacco and alcoholic drinks 9.47Foods and non alcoholic drinks 4.87Miscellaneous consumer goods 4.80Transportation 4.80Chemicals 4.60Coal mining and steel industry 4.55Electronics and semiconductors 4.46Various capital goods 4.26Holding and finance companies 4.20Other -2.92
81.21
% of net assets
Industrial classification of investments
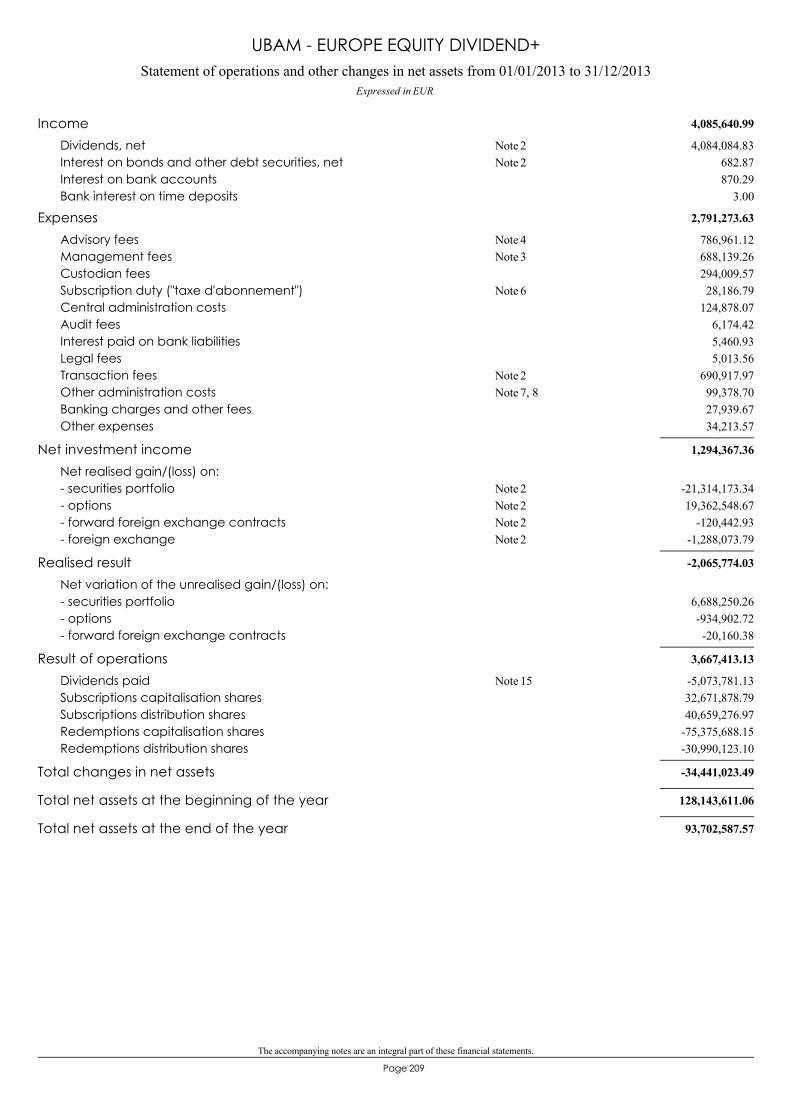
The accompanying notes are an integral part of these financial statements.
209Page
Statement of operations and other changes in net assets from 01/01/2013 to 31/12/2013Expressed in EUR
UBAM - EUROPE EQUITY DIVIDEND+
4,085,640.99Income4,084,084.83Dividends, net 2Note
682.87Interest on bonds and other debt securities, net 2Note870.29Interest on bank accounts
3.00Bank interest on time deposits
2,791,273.63Expenses786,961.12Advisory fees 4Note688,139.26Management fees 3Note294,009.57Custodian fees28,186.79Subscription duty ("taxe d'abonnement") 6Note
124,878.07Central administration costs6,174.42Audit fees5,460.93Interest paid on bank liabilities5,013.56Legal fees
690,917.97Transaction fees 2Note99,378.70Other administration costs 7, 8Note27,939.67Banking charges and other fees34,213.57Other expenses
1,294,367.36Net investment incomeNet realised gain/(loss) on:
-21,314,173.34- securities portfolio 2Note19,362,548.67- options 2Note
-120,442.93- forward foreign exchange contracts 2Note-1,288,073.79- foreign exchange 2Note
-2,065,774.03Realised resultNet variation of the unrealised gain/(loss) on:
6,688,250.26- securities portfolio-934,902.72- options-20,160.38- forward foreign exchange contracts
3,667,413.13Result of operations-5,073,781.13Dividends paid 15Note32,671,878.79Subscriptions capitalisation shares40,659,276.97Subscriptions distribution shares
-75,375,688.15Redemptions capitalisation shares-30,990,123.10Redemptions distribution shares
-34,441,023.49Total changes in net assets
128,143,611.06Total net assets at the beginning of the year
93,702,587.57Total net assets at the end of the year
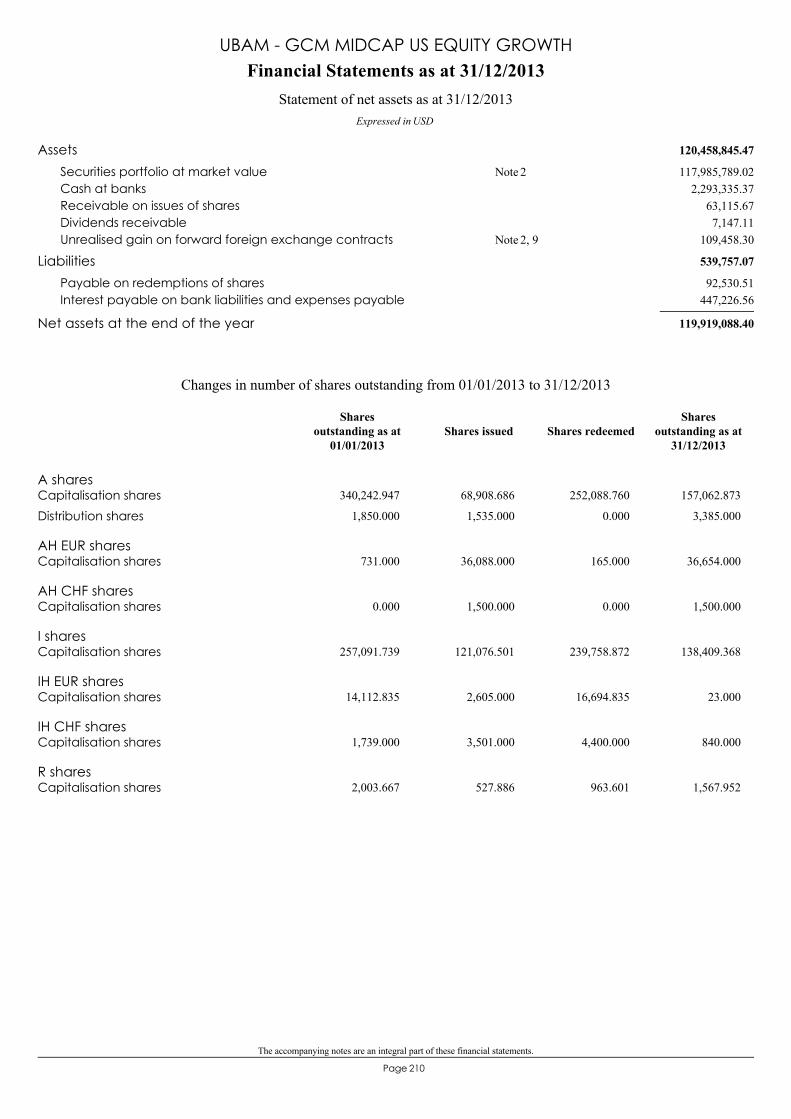
The accompanying notes are an integral part of these financial statements.
210Page
120,458,845.47Assets117,985,789.02Securities portfolio at market value 2Note
2,293,335.37Cash at banks63,115.67Receivable on issues of shares7,147.11Dividends receivable
109,458.30Unrealised gain on forward foreign exchange contracts 2, 9Note
539,757.07Liabilities92,530.51Payable on redemptions of shares
447,226.56Interest payable on bank liabilities and expenses payable
119,919,088.40Net assets at the end of the year
Financial Statements as at 31/12/2013
Expressed in USD
Statement of net assets as at 31/12/2013
UBAM - GCM MIDCAP US EQUITY GROWTH
A sharesCapitalisation shares 340,242.947 68,908.686 252,088.760 157,062.873
Distribution shares 1,850.000 1,535.000 0.000 3,385.000
AH EUR sharesCapitalisation shares 731.000 36,088.000 165.000 36,654.000
AH CHF sharesCapitalisation shares 0.000 1,500.000 0.000 1,500.000
I sharesCapitalisation shares 257,091.739 121,076.501 239,758.872 138,409.368
IH EUR sharesCapitalisation shares 14,112.835 2,605.000 16,694.835 23.000
IH CHF sharesCapitalisation shares 1,739.000 3,501.000 4,400.000 840.000
R sharesCapitalisation shares 2,003.667 527.886 963.601 1,567.952
Changes in number of shares outstanding from 01/01/2013 to 31/12/2013
Shares issued Shares redeemedShares
outstanding as at31/12/2013
Sharesoutstanding as at
01/01/2013
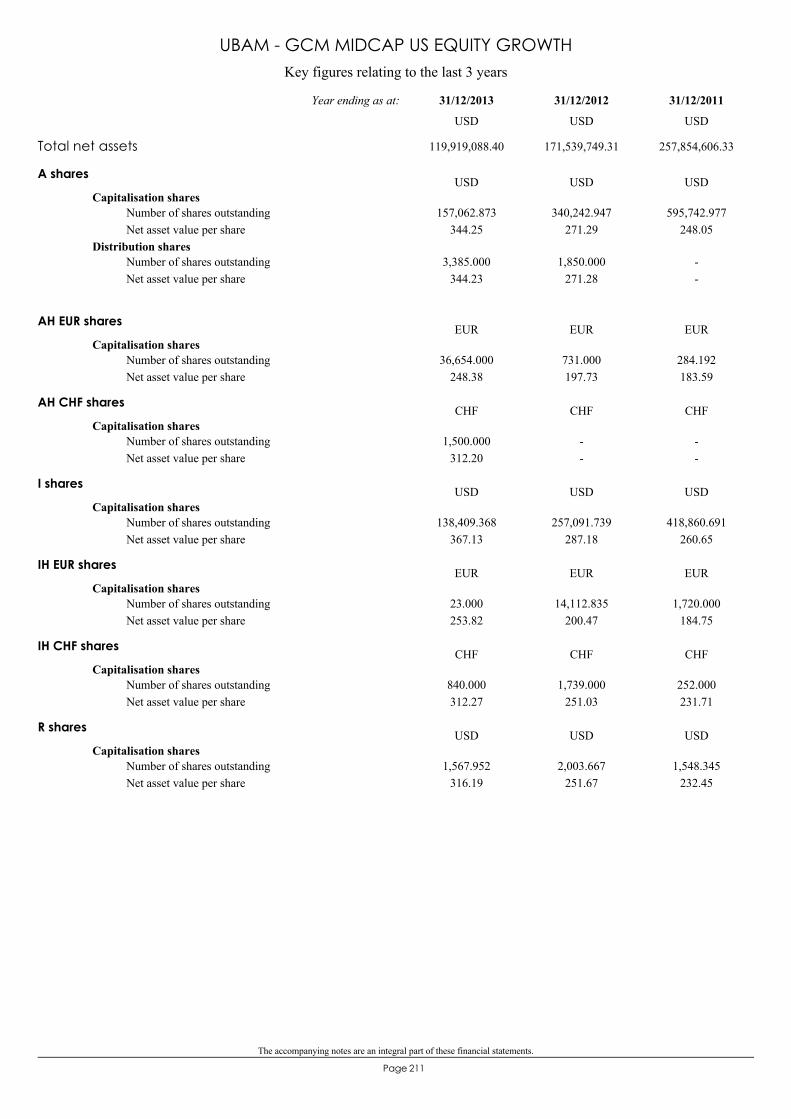
The accompanying notes are an integral part of these financial statements.
211Page
Key figures relating to the last 3 years
UBAM - GCM MIDCAP US EQUITY GROWTH
A shares
Capitalisation shares157,062.873
344.25340,242.947
271.29595,742.977
248.05Number of shares outstandingNet asset value per share
Distribution shares3,385.000
344.231,850.000
271.28--
Number of shares outstandingNet asset value per share
USD USD USD
AH EUR shares
Capitalisation shares36,654.000
248.38731.000197.73
284.192183.59
Number of shares outstandingNet asset value per share
EUR EUR EUR
AH CHF shares
Capitalisation shares1,500.000
312.20--
--
Number of shares outstandingNet asset value per share
CHF CHF CHF
I shares
Capitalisation shares138,409.368
367.13257,091.739
287.18418,860.691
260.65Number of shares outstandingNet asset value per share
USD USD USD
IH EUR shares
Capitalisation shares23.000253.82
14,112.835200.47
1,720.000184.75
Number of shares outstandingNet asset value per share
EUR EUR EUR
IH CHF shares
Capitalisation shares840.000312.27
1,739.000251.03
252.000231.71
Number of shares outstandingNet asset value per share
CHF CHF CHF
R shares
Capitalisation shares1,567.952
316.192,003.667
251.671,548.345
232.45Number of shares outstandingNet asset value per share
USD USD USD
Total net assets 119,919,088.40 171,539,749.31 257,854,606.33
31/12/201131/12/201231/12/2013Year ending as at:
USD USD USD
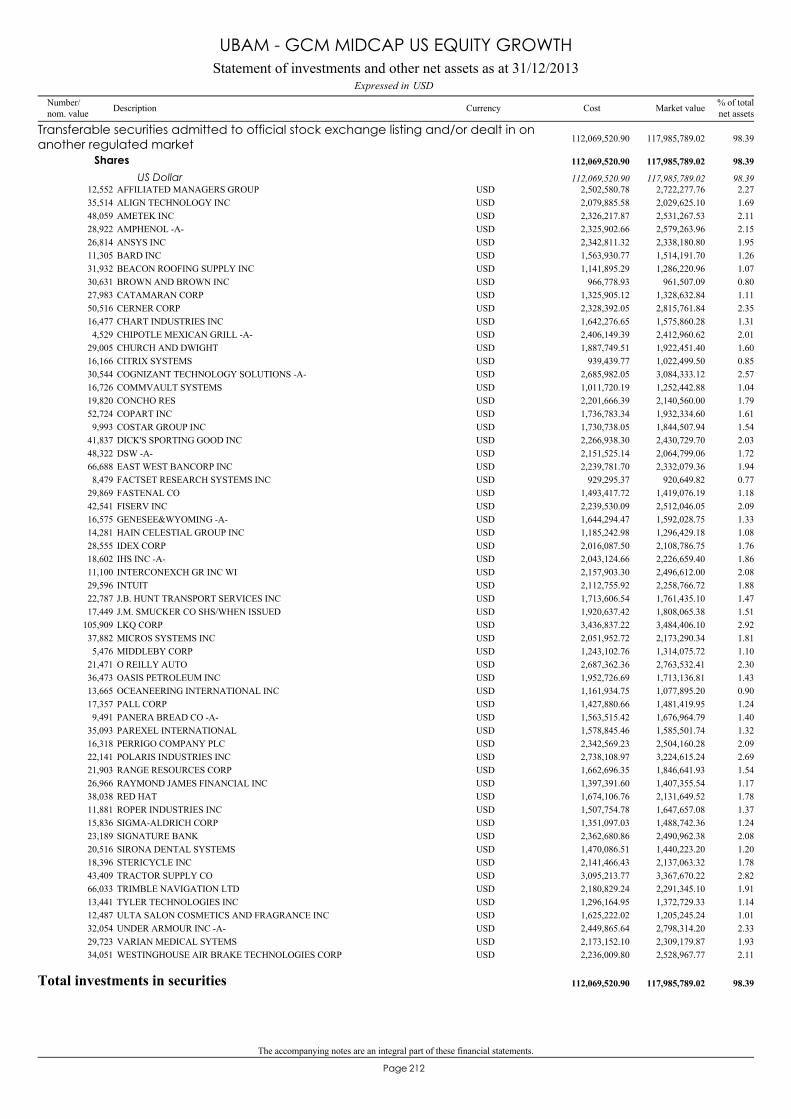
The accompanying notes are an integral part of these financial statements.
212Page
AFFILIATED MANAGERS GROUP12,552 2,722,277.76 2.27USD 2,502,580.78
Transferable securities admitted to official stock exchange listing and/or dealt in onanother regulated market 117,985,789.02 98.39112,069,520.90
Shares 117,985,789.02 98.39112,069,520.90
US Dollar 117,985,789.02 98.39112,069,520.90
ALIGN TECHNOLOGY INC35,514 2,029,625.10 1.69USD 2,079,885.58AMETEK INC48,059 2,531,267.53 2.11USD 2,326,217.87AMPHENOL -A-28,922 2,579,263.96 2.15USD 2,325,902.66ANSYS INC26,814 2,338,180.80 1.95USD 2,342,811.32BARD INC11,305 1,514,191.70 1.26USD 1,563,930.77BEACON ROOFING SUPPLY INC31,932 1,286,220.96 1.07USD 1,141,895.29BROWN AND BROWN INC30,631 961,507.09 0.80USD 966,778.93CATAMARAN CORP27,983 1,328,632.84 1.11USD 1,325,905.12CERNER CORP50,516 2,815,761.84 2.35USD 2,328,392.05CHART INDUSTRIES INC16,477 1,575,860.28 1.31USD 1,642,276.65CHIPOTLE MEXICAN GRILL -A-4,529 2,412,960.62 2.01USD 2,406,149.39CHURCH AND DWIGHT29,005 1,922,451.40 1.60USD 1,887,749.51CITRIX SYSTEMS16,166 1,022,499.50 0.85USD 939,439.77COGNIZANT TECHNOLOGY SOLUTIONS -A-30,544 3,084,333.12 2.57USD 2,685,982.05COMMVAULT SYSTEMS16,726 1,252,442.88 1.04USD 1,011,720.19CONCHO RES19,820 2,140,560.00 1.79USD 2,201,666.39COPART INC52,724 1,932,334.60 1.61USD 1,736,783.34COSTAR GROUP INC9,993 1,844,507.94 1.54USD 1,730,738.05DICK'S SPORTING GOOD INC41,837 2,430,729.70 2.03USD 2,266,938.30DSW -A-48,322 2,064,799.06 1.72USD 2,151,525.14EAST WEST BANCORP INC66,688 2,332,079.36 1.94USD 2,239,781.70FACTSET RESEARCH SYSTEMS INC8,479 920,649.82 0.77USD 929,295.37FASTENAL CO29,869 1,419,076.19 1.18USD 1,493,417.72FISERV INC42,541 2,512,046.05 2.09USD 2,239,530.09GENESEE&WYOMING -A-16,575 1,592,028.75 1.33USD 1,644,294.47HAIN CELESTIAL GROUP INC14,281 1,296,429.18 1.08USD 1,185,242.98IDEX CORP28,555 2,108,786.75 1.76USD 2,016,087.50IHS INC -A-18,602 2,226,659.40 1.86USD 2,043,124.66INTERCONEXCH GR INC WI11,100 2,496,612.00 2.08USD 2,157,903.30INTUIT29,596 2,258,766.72 1.88USD 2,112,755.92J.B. HUNT TRANSPORT SERVICES INC22,787 1,761,435.10 1.47USD 1,713,606.54J.M. SMUCKER CO SHS/WHEN ISSUED17,449 1,808,065.38 1.51USD 1,920,637.42LKQ CORP105,909 3,484,406.10 2.92USD 3,436,837.22MICROS SYSTEMS INC37,882 2,173,290.34 1.81USD 2,051,952.72MIDDLEBY CORP5,476 1,314,075.72 1.10USD 1,243,102.76O REILLY AUTO21,471 2,763,532.41 2.30USD 2,687,362.36OASIS PETROLEUM INC36,473 1,713,136.81 1.43USD 1,952,726.69OCEANEERING INTERNATIONAL INC13,665 1,077,895.20 0.90USD 1,161,934.75PALL CORP17,357 1,481,419.95 1.24USD 1,427,880.66PANERA BREAD CO -A-9,491 1,676,964.79 1.40USD 1,563,515.42PAREXEL INTERNATIONAL35,093 1,585,501.74 1.32USD 1,578,845.46PERRIGO COMPANY PLC16,318 2,504,160.28 2.09USD 2,342,569.23POLARIS INDUSTRIES INC22,141 3,224,615.24 2.69USD 2,738,108.97RANGE RESOURCES CORP21,903 1,846,641.93 1.54USD 1,662,696.35RAYMOND JAMES FINANCIAL INC26,966 1,407,355.54 1.17USD 1,397,391.60RED HAT38,038 2,131,649.52 1.78USD 1,674,106.76ROPER INDUSTRIES INC11,881 1,647,657.08 1.37USD 1,507,754.78SIGMA-ALDRICH CORP15,836 1,488,742.36 1.24USD 1,351,097.03SIGNATURE BANK23,189 2,490,962.38 2.08USD 2,362,680.86SIRONA DENTAL SYSTEMS20,516 1,440,223.20 1.20USD 1,470,086.51STERICYCLE INC18,396 2,137,063.32 1.78USD 2,141,466.43TRACTOR SUPPLY CO43,409 3,367,670.22 2.82USD 3,095,213.77TRIMBLE NAVIGATION LTD66,033 2,291,345.10 1.91USD 2,180,829.24TYLER TECHNOLOGIES INC13,441 1,372,729.33 1.14USD 1,296,164.95ULTA SALON COSMETICS AND FRAGRANCE INC12,487 1,205,245.24 1.01USD 1,625,222.02UNDER ARMOUR INC -A-32,054 2,798,314.20 2.33USD 2,449,865.64VARIAN MEDICAL SYTEMS29,723 2,309,179.87 1.93USD 2,173,152.10WESTINGHOUSE AIR BRAKE TECHNOLOGIES CORP34,051 2,528,967.77 2.11USD 2,236,009.80
Total investments in securities 117,985,789.02 98.39112,069,520.90
Statement of investments and other net assets as at 31/12/2013USDExpressed in
UBAM - GCM MIDCAP US EQUITY GROWTH
Number/nom. value Description Currency % of total
net assetsMarket valueCost
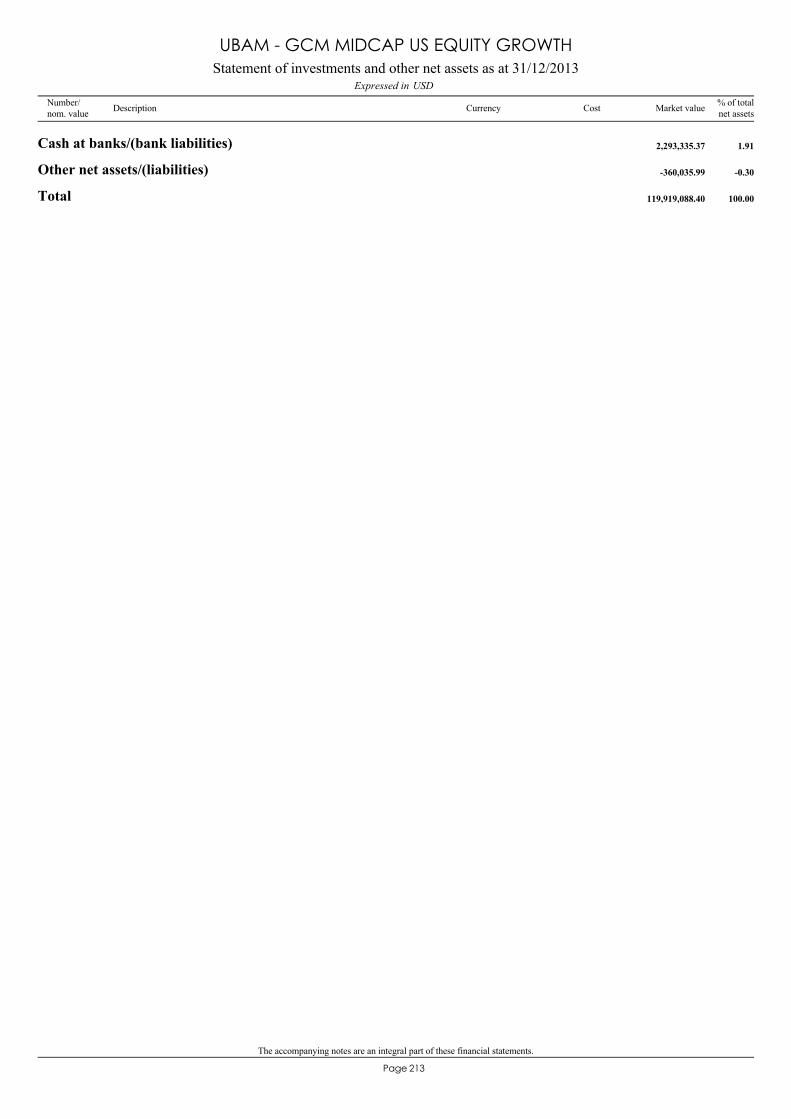
The accompanying notes are an integral part of these financial statements.
213Page
Cash at banks/(bank liabilities) 2,293,335.37 1.91
Other net assets/(liabilities) -360,035.99 -0.30
Total 119,919,088.40 100.00
Statement of investments and other net assets as at 31/12/2013USDExpressed in
UBAM - GCM MIDCAP US EQUITY GROWTH
Number/nom. value Description Currency % of total
net assetsMarket valueCost
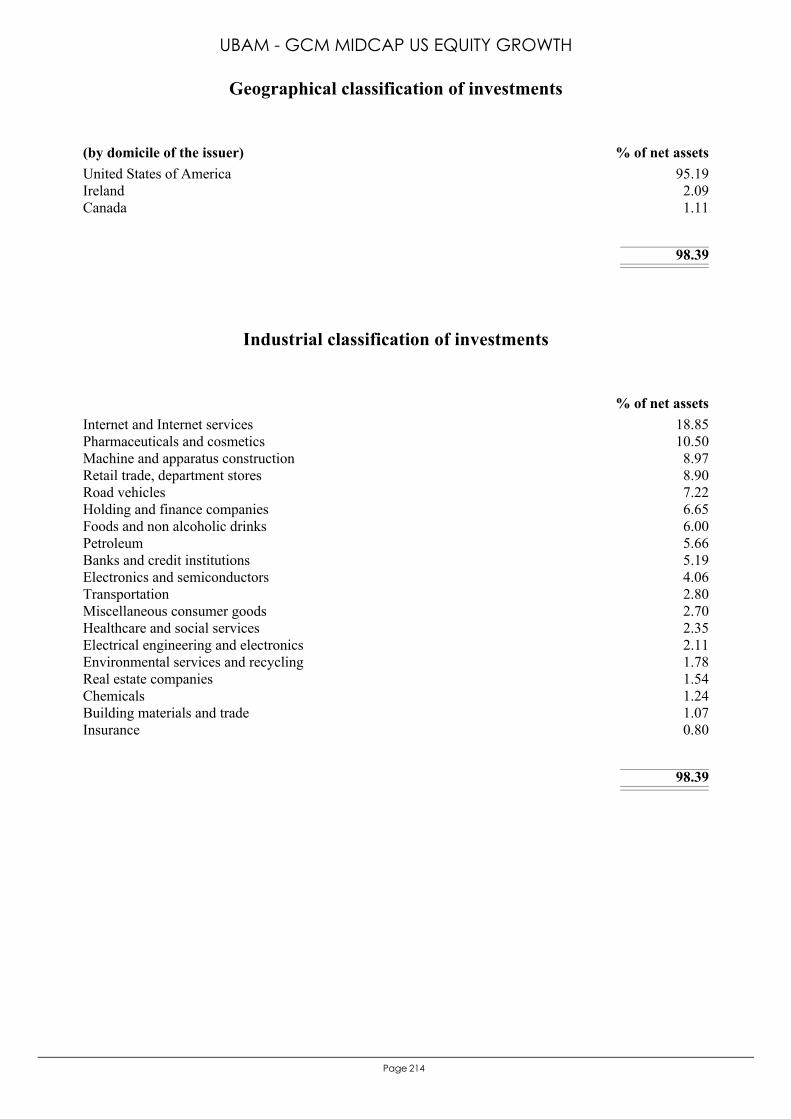
214Page
United States of America 95.19Ireland 2.09Canada 1.11
98.39
(by domicile of the issuer) % of net assets
Geographical classification of investments
UBAM - GCM MIDCAP US EQUITY GROWTH
Internet and Internet services 18.85Pharmaceuticals and cosmetics 10.50Machine and apparatus construction 8.97Retail trade, department stores 8.90Road vehicles 7.22Holding and finance companies 6.65Foods and non alcoholic drinks 6.00Petroleum 5.66Banks and credit institutions 5.19Electronics and semiconductors 4.06Transportation 2.80Miscellaneous consumer goods 2.70Healthcare and social services 2.35Electrical engineering and electronics 2.11Environmental services and recycling 1.78Real estate companies 1.54Chemicals 1.24Building materials and trade 1.07Insurance 0.80
98.39
% of net assets
Industrial classification of investments
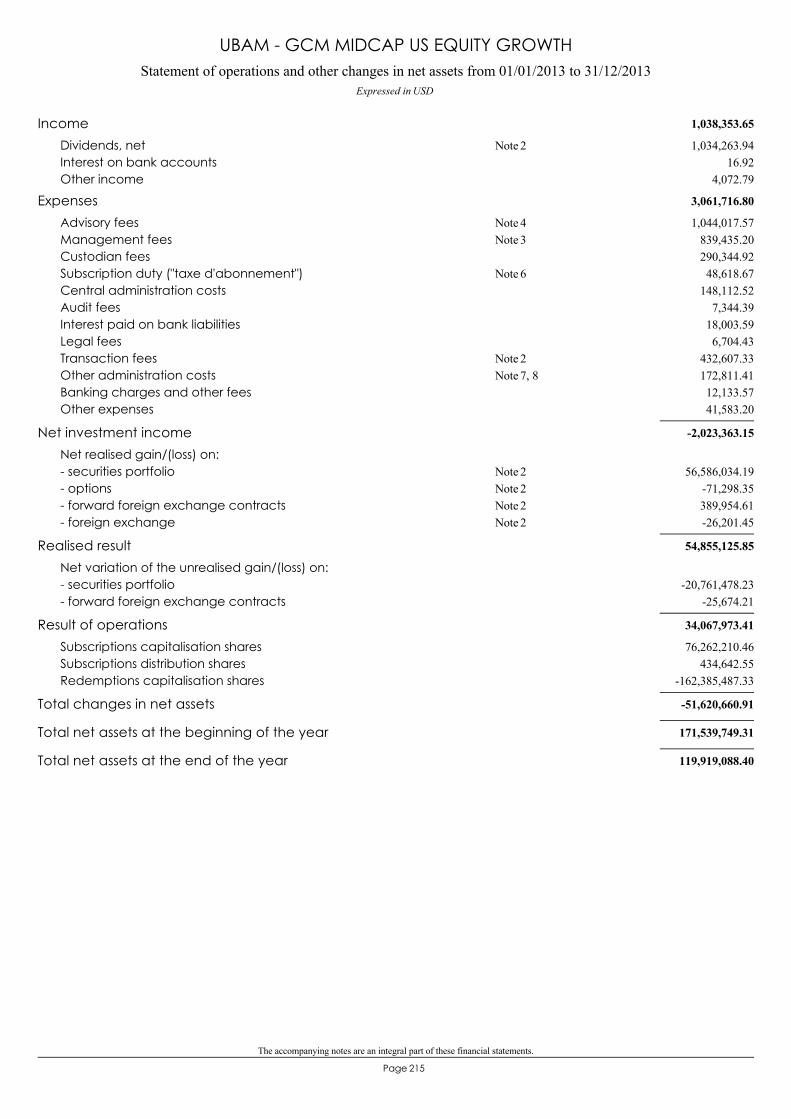
The accompanying notes are an integral part of these financial statements.
215Page
Statement of operations and other changes in net assets from 01/01/2013 to 31/12/2013Expressed in USD
UBAM - GCM MIDCAP US EQUITY GROWTH
1,038,353.65Income1,034,263.94Dividends, net 2Note
16.92Interest on bank accounts4,072.79Other income
3,061,716.80Expenses1,044,017.57Advisory fees 4Note
839,435.20Management fees 3Note290,344.92Custodian fees48,618.67Subscription duty ("taxe d'abonnement") 6Note
148,112.52Central administration costs7,344.39Audit fees
18,003.59Interest paid on bank liabilities6,704.43Legal fees
432,607.33Transaction fees 2Note172,811.41Other administration costs 7, 8Note12,133.57Banking charges and other fees41,583.20Other expenses
-2,023,363.15Net investment incomeNet realised gain/(loss) on:
56,586,034.19- securities portfolio 2Note-71,298.35- options 2Note389,954.61- forward foreign exchange contracts 2Note-26,201.45- foreign exchange 2Note
54,855,125.85Realised resultNet variation of the unrealised gain/(loss) on:
-20,761,478.23- securities portfolio-25,674.21- forward foreign exchange contracts
34,067,973.41Result of operations76,262,210.46Subscriptions capitalisation shares
434,642.55Subscriptions distribution shares-162,385,487.33Redemptions capitalisation shares
-51,620,660.91Total changes in net assets
171,539,749.31Total net assets at the beginning of the year
119,919,088.40Total net assets at the end of the year
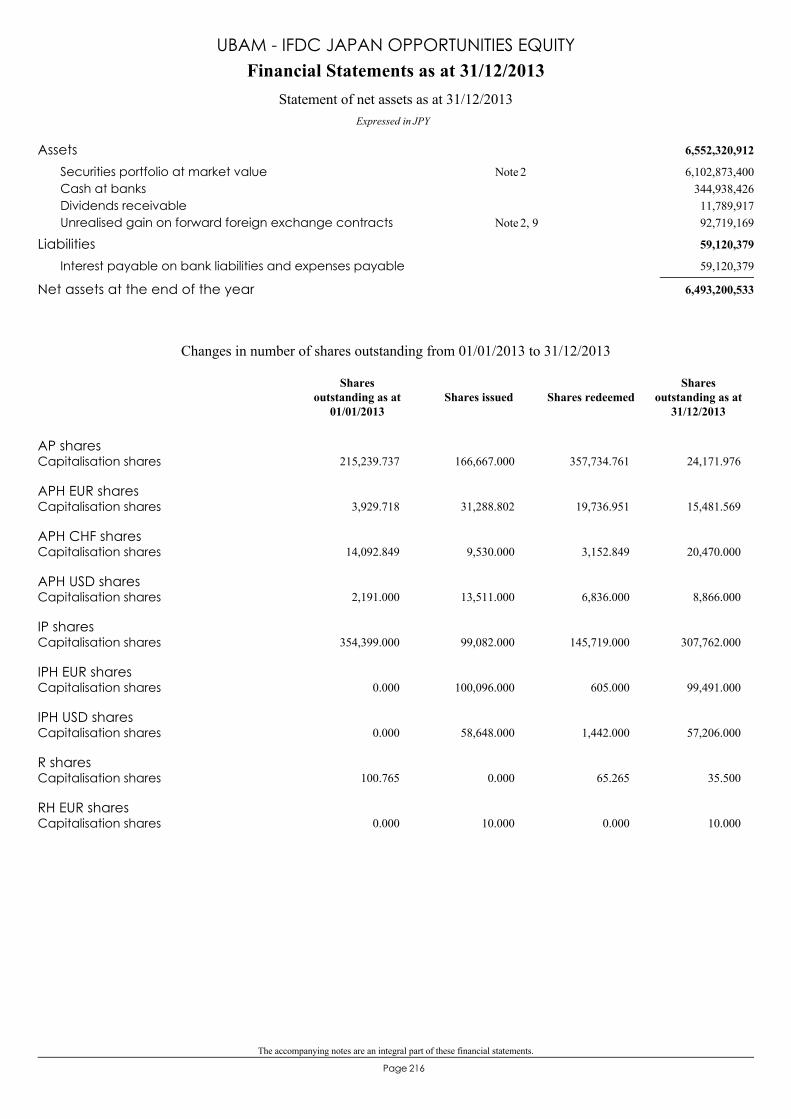
The accompanying notes are an integral part of these financial statements.
216Page
6,552,320,912Assets6,102,873,400Securities portfolio at market value 2Note
344,938,426Cash at banks11,789,917Dividends receivable92,719,169Unrealised gain on forward foreign exchange contracts 2, 9Note
59,120,379Liabilities59,120,379Interest payable on bank liabilities and expenses payable
6,493,200,533Net assets at the end of the year
Financial Statements as at 31/12/2013
Expressed in JPY
Statement of net assets as at 31/12/2013
UBAM - IFDC JAPAN OPPORTUNITIES EQUITY
AP sharesCapitalisation shares 215,239.737 166,667.000 357,734.761 24,171.976
APH EUR sharesCapitalisation shares 3,929.718 31,288.802 19,736.951 15,481.569
APH CHF sharesCapitalisation shares 14,092.849 9,530.000 3,152.849 20,470.000
APH USD sharesCapitalisation shares 2,191.000 13,511.000 6,836.000 8,866.000
IP sharesCapitalisation shares 354,399.000 99,082.000 145,719.000 307,762.000
IPH EUR sharesCapitalisation shares 0.000 100,096.000 605.000 99,491.000
IPH USD sharesCapitalisation shares 0.000 58,648.000 1,442.000 57,206.000
R sharesCapitalisation shares 100.765 0.000 65.265 35.500
RH EUR sharesCapitalisation shares 0.000 10.000 0.000 10.000
Changes in number of shares outstanding from 01/01/2013 to 31/12/2013
Shares issued Shares redeemedShares
outstanding as at31/12/2013
Sharesoutstanding as at
01/01/2013

The accompanying notes are an integral part of these financial statements.
217Page
Key figures relating to the last 3 years
UBAM - IFDC JAPAN OPPORTUNITIES EQUITY
AP shares
Capitalisation shares24,171.976
10,431215,239.737
7,49183,491.737
6,333Number of shares outstandingNet asset value per share
JPY JPY JPY
APH EUR shares
Capitalisation shares15,481.569
90.153,929.718
67.74--
Number of shares outstandingNet asset value per share
EUR EUR EUR
APH CHF shares
Capitalisation shares20,470.000
117.7014,092.849
88.81--
Number of shares outstandingNet asset value per share
CHF CHF CHF
APH USD shares
Capitalisation shares8,866.000
128.022,191.000
96.59--
Number of shares outstandingNet asset value per share
USD USD USD
IP shares
Capitalisation shares307,762.000
10,943354,399.000
7,80169,765.000
6,546Number of shares outstandingNet asset value per share
JPY JPY JPY
IPH EUR shares
Capitalisation shares99,491.000
110.93--
--
Number of shares outstandingNet asset value per share
EUR EUR EUR
IPH USD shares
Capitalisation shares57,206.000
111.10--
--
Number of shares outstandingNet asset value per share
USD USD USD
R shares
Capitalisation shares35.5009,786
100.7657,101
98.6746,062
Number of shares outstandingNet asset value per share
JPY JPY JPY
RH EUR shares
Capitalisation shares10.000113.85
--
--
Number of shares outstandingNet asset value per share
EUR EUR EUR
Total net assets 6,493,200,533 4,544,598,696 986,052,954
31/12/201131/12/201231/12/2013Year ending as at:
JPY JPY JPY
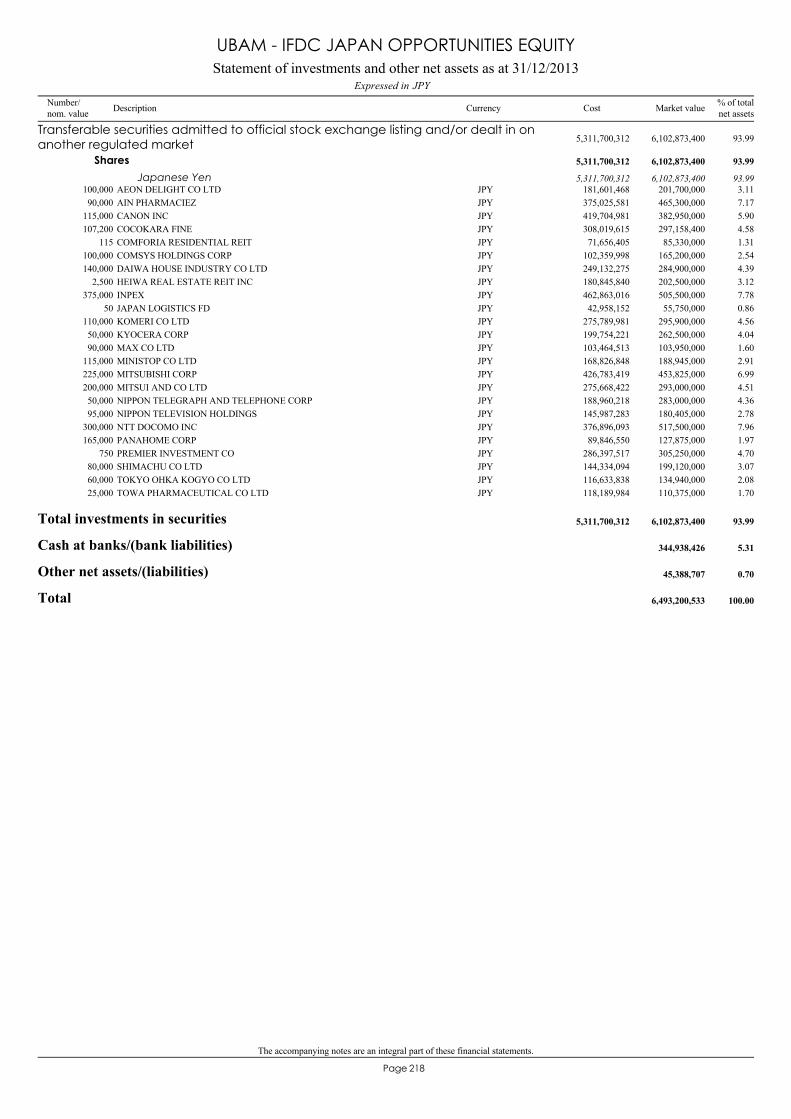
The accompanying notes are an integral part of these financial statements.
218Page
AEON DELIGHT CO LTD100,000 201,700,000 3.11JPY 181,601,468
Transferable securities admitted to official stock exchange listing and/or dealt in onanother regulated market 6,102,873,400 93.995,311,700,312
Shares 6,102,873,400 93.995,311,700,312
Japanese Yen 6,102,873,400 93.995,311,700,312
AIN PHARMACIEZ90,000 465,300,000 7.17JPY 375,025,581CANON INC115,000 382,950,000 5.90JPY 419,704,981COCOKARA FINE107,200 297,158,400 4.58JPY 308,019,615COMFORIA RESIDENTIAL REIT115 85,330,000 1.31JPY 71,656,405COMSYS HOLDINGS CORP100,000 165,200,000 2.54JPY 102,359,998DAIWA HOUSE INDUSTRY CO LTD140,000 284,900,000 4.39JPY 249,132,275HEIWA REAL ESTATE REIT INC2,500 202,500,000 3.12JPY 180,845,840INPEX375,000 505,500,000 7.78JPY 462,863,016JAPAN LOGISTICS FD50 55,750,000 0.86JPY 42,958,152KOMERI CO LTD110,000 295,900,000 4.56JPY 275,789,981KYOCERA CORP50,000 262,500,000 4.04JPY 199,754,221MAX CO LTD90,000 103,950,000 1.60JPY 103,464,513MINISTOP CO LTD115,000 188,945,000 2.91JPY 168,826,848MITSUBISHI CORP225,000 453,825,000 6.99JPY 426,783,419MITSUI AND CO LTD200,000 293,000,000 4.51JPY 275,668,422NIPPON TELEGRAPH AND TELEPHONE CORP50,000 283,000,000 4.36JPY 188,960,218NIPPON TELEVISION HOLDINGS95,000 180,405,000 2.78JPY 145,987,283NTT DOCOMO INC300,000 517,500,000 7.96JPY 376,896,093PANAHOME CORP165,000 127,875,000 1.97JPY 89,846,550PREMIER INVESTMENT CO750 305,250,000 4.70JPY 286,397,517SHIMACHU CO LTD80,000 199,120,000 3.07JPY 144,334,094TOKYO OHKA KOGYO CO LTD60,000 134,940,000 2.08JPY 116,633,838TOWA PHARMACEUTICAL CO LTD25,000 110,375,000 1.70JPY 118,189,984
Total investments in securities 6,102,873,400 93.995,311,700,312
Cash at banks/(bank liabilities) 344,938,426 5.31
Other net assets/(liabilities) 45,388,707 0.70
Total 6,493,200,533 100.00
Statement of investments and other net assets as at 31/12/2013JPYExpressed in
UBAM - IFDC JAPAN OPPORTUNITIES EQUITY
Number/nom. value Description Currency % of total
net assetsMarket valueCost
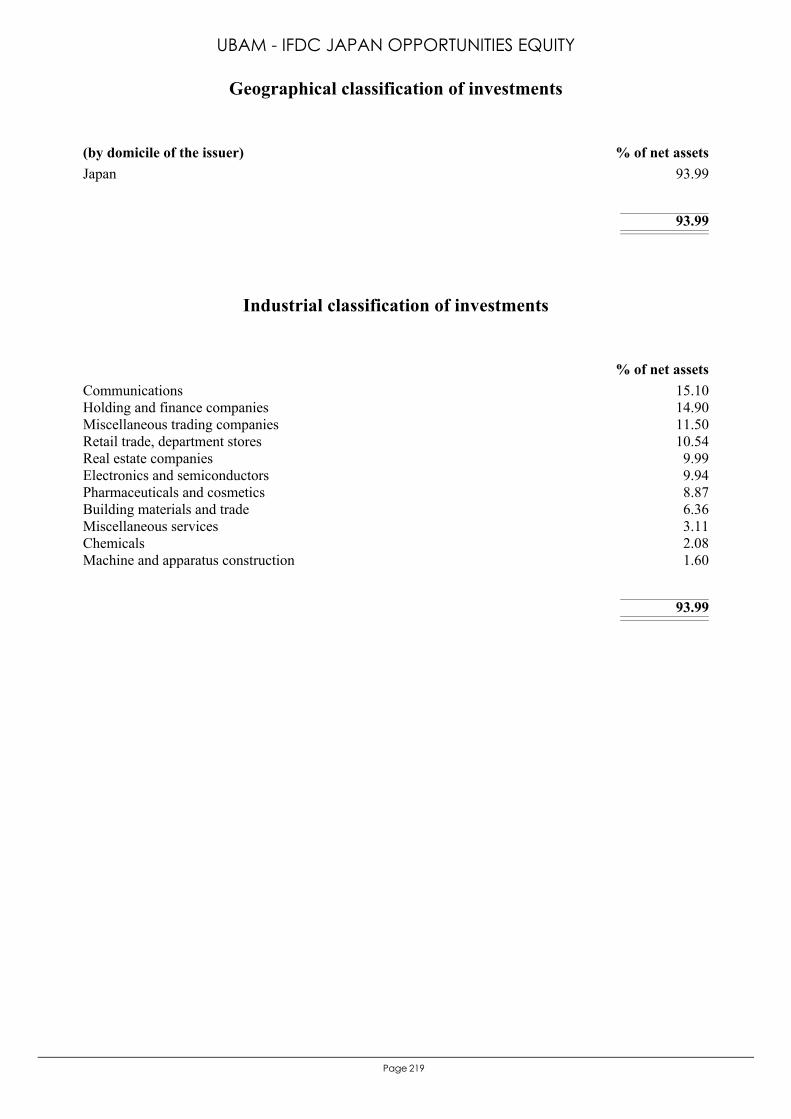
219Page
Japan 93.99
93.99
(by domicile of the issuer) % of net assets
Geographical classification of investments
UBAM - IFDC JAPAN OPPORTUNITIES EQUITY
Communications 15.10Holding and finance companies 14.90Miscellaneous trading companies 11.50Retail trade, department stores 10.54Real estate companies 9.99Electronics and semiconductors 9.94Pharmaceuticals and cosmetics 8.87Building materials and trade 6.36Miscellaneous services 3.11Chemicals 2.08Machine and apparatus construction 1.60
93.99
% of net assets
Industrial classification of investments
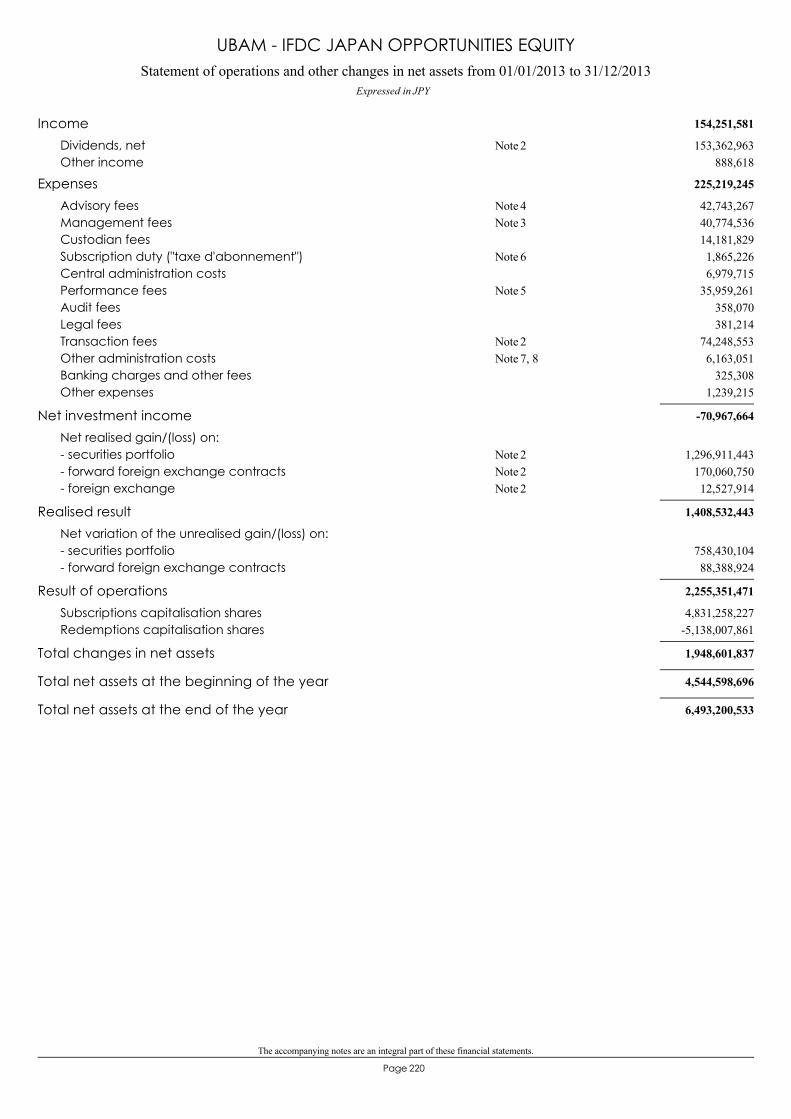
The accompanying notes are an integral part of these financial statements.
220Page
Statement of operations and other changes in net assets from 01/01/2013 to 31/12/2013Expressed in JPY
UBAM - IFDC JAPAN OPPORTUNITIES EQUITY
154,251,581Income153,362,963Dividends, net 2Note
888,618Other income
225,219,245Expenses42,743,267Advisory fees 4Note40,774,536Management fees 3Note14,181,829Custodian fees1,865,226Subscription duty ("taxe d'abonnement") 6Note6,979,715Central administration costs
35,959,261Performance fees 5Note358,070Audit fees381,214Legal fees
74,248,553Transaction fees 2Note6,163,051Other administration costs 7, 8Note
325,308Banking charges and other fees1,239,215Other expenses
-70,967,664Net investment incomeNet realised gain/(loss) on:
1,296,911,443- securities portfolio 2Note170,060,750- forward foreign exchange contracts 2Note12,527,914- foreign exchange 2Note
1,408,532,443Realised resultNet variation of the unrealised gain/(loss) on:
758,430,104- securities portfolio88,388,924- forward foreign exchange contracts
2,255,351,471Result of operations4,831,258,227Subscriptions capitalisation shares
-5,138,007,861Redemptions capitalisation shares
1,948,601,837Total changes in net assets
4,544,598,696Total net assets at the beginning of the year
6,493,200,533Total net assets at the end of the year

The accompanying notes are an integral part of these financial statements.
221Page
825,038,063.09Assets820,589,450.00Securities portfolio at market value 2Note
3,810,963.21Cash at banks109,720.84Receivable on issues of shares265,583.79Dividends receivable262,056.98Unrealised gain on forward foreign exchange contracts 2, 9Note
288.27Other receivables
3,388,986.73Liabilities294,852.15Payable on redemptions of shares
3,094,134.58Interest payable on bank liabilities and expenses payable
821,649,076.36Net assets at the end of the year
Financial Statements as at 31/12/2013
Expressed in USD
Statement of net assets as at 31/12/2013
UBAM - NEUBERGER BERMAN US EQUITY VALUE
A sharesCapitalisation shares 340,547.290 133,425.380 96,924.921 377,047.749
Distribution shares 1,225.000 1,475.000 885.000 1,815.000
AH EUR sharesCapitalisation shares 2,495.932 2,258.350 283.000 4,471.282
AH CHF sharesCapitalisation shares 60.000 1,165.000 20.000 1,205.000
I sharesCapitalisation shares 686,123.540 142,691.868 427,356.800 401,458.608
Distribution shares 5,508.000 72.000 0.000 5,580.000
IH EUR sharesCapitalisation shares 25,990.524 11,983.765 10,110.500 27,863.789
IH GBP sharesDistribution shares 1,798.630 360.000 1,986.310 172.320
R sharesCapitalisation shares 7,607.825 2,317.670 3,231.527 6,693.968
RH EUR sharesCapitalisation shares 0.000 10.000 0.000 10.000
Changes in number of shares outstanding from 01/01/2013 to 31/12/2013
Shares issued Shares redeemedShares
outstanding as at31/12/2013
Sharesoutstanding as at
01/01/2013
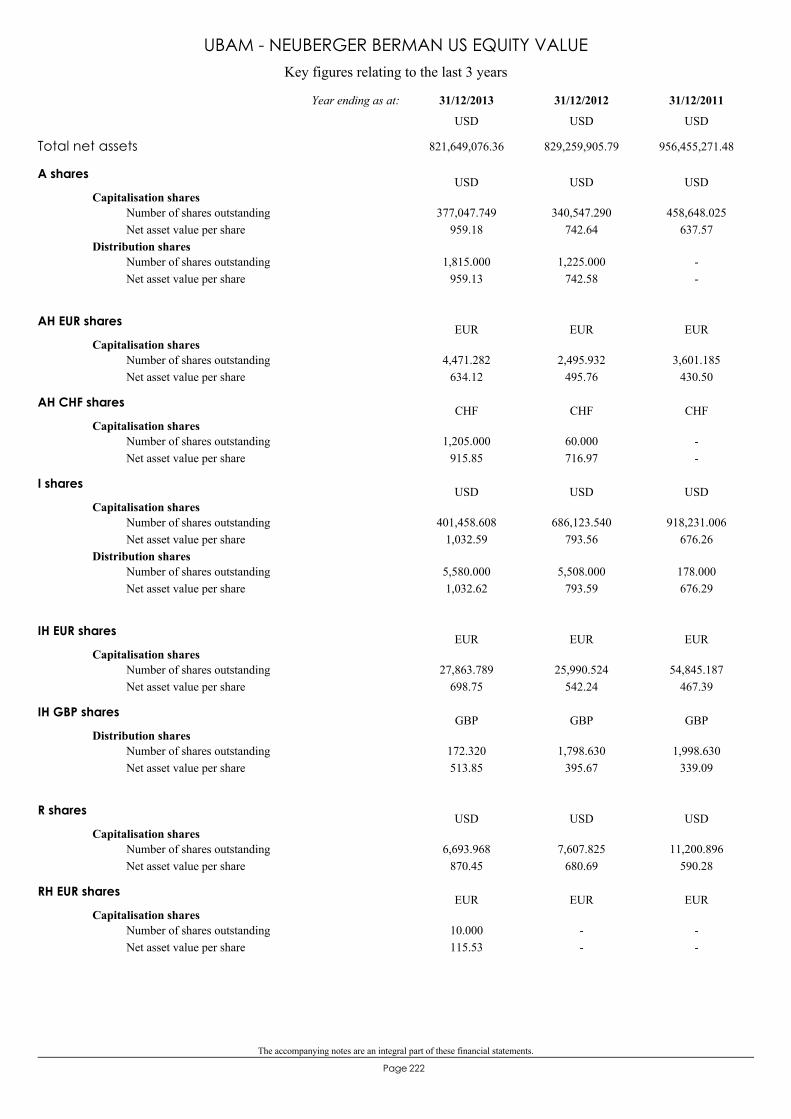
The accompanying notes are an integral part of these financial statements.
222Page
Key figures relating to the last 3 years
UBAM - NEUBERGER BERMAN US EQUITY VALUE
A shares
Capitalisation shares377,047.749
959.18340,547.290
742.64458,648.025
637.57Number of shares outstandingNet asset value per share
Distribution shares1,815.000
959.131,225.000
742.58--
Number of shares outstandingNet asset value per share
USD USD USD
AH EUR shares
Capitalisation shares4,471.282
634.122,495.932
495.763,601.185
430.50Number of shares outstandingNet asset value per share
EUR EUR EUR
AH CHF shares
Capitalisation shares1,205.000
915.8560.000716.97
--
Number of shares outstandingNet asset value per share
CHF CHF CHF
I shares
Capitalisation shares401,458.608
1,032.59686,123.540
793.56918,231.006
676.26Number of shares outstandingNet asset value per share
Distribution shares5,580.0001,032.62
5,508.000793.59
178.000676.29
Number of shares outstandingNet asset value per share
USD USD USD
IH EUR shares
Capitalisation shares27,863.789
698.7525,990.524
542.2454,845.187
467.39Number of shares outstandingNet asset value per share
EUR EUR EUR
IH GBP shares
Distribution shares172.320513.85
1,798.630395.67
1,998.630339.09
Number of shares outstandingNet asset value per share
GBP GBP GBP
R shares
Capitalisation shares6,693.968
870.457,607.825
680.6911,200.896
590.28Number of shares outstandingNet asset value per share
USD USD USD
RH EUR shares
Capitalisation shares10.000115.53
--
--
Number of shares outstandingNet asset value per share
EUR EUR EUR
Total net assets 821,649,076.36 829,259,905.79 956,455,271.48
31/12/201131/12/201231/12/2013Year ending as at:
USD USD USD
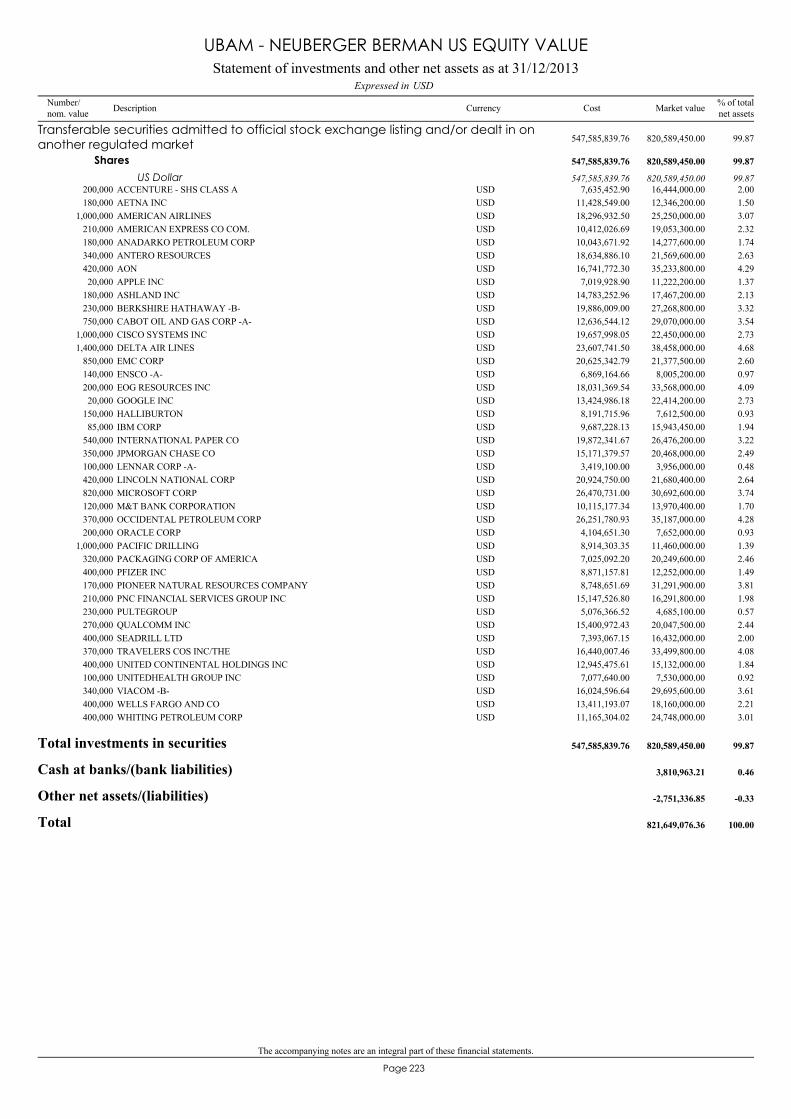
The accompanying notes are an integral part of these financial statements.
223Page
ACCENTURE - SHS CLASS A200,000 16,444,000.00 2.00USD 7,635,452.90
Transferable securities admitted to official stock exchange listing and/or dealt in onanother regulated market 820,589,450.00 99.87547,585,839.76
Shares 820,589,450.00 99.87547,585,839.76
US Dollar 820,589,450.00 99.87547,585,839.76
AETNA INC180,000 12,346,200.00 1.50USD 11,428,549.00AMERICAN AIRLINES1,000,000 25,250,000.00 3.07USD 18,296,932.50AMERICAN EXPRESS CO COM.210,000 19,053,300.00 2.32USD 10,412,026.69ANADARKO PETROLEUM CORP180,000 14,277,600.00 1.74USD 10,043,671.92ANTERO RESOURCES340,000 21,569,600.00 2.63USD 18,634,886.10AON420,000 35,233,800.00 4.29USD 16,741,772.30APPLE INC20,000 11,222,200.00 1.37USD 7,019,928.90ASHLAND INC180,000 17,467,200.00 2.13USD 14,783,252.96BERKSHIRE HATHAWAY -B-230,000 27,268,800.00 3.32USD 19,886,009.00CABOT OIL AND GAS CORP -A-750,000 29,070,000.00 3.54USD 12,636,544.12CISCO SYSTEMS INC1,000,000 22,450,000.00 2.73USD 19,657,998.05DELTA AIR LINES1,400,000 38,458,000.00 4.68USD 23,607,741.50EMC CORP850,000 21,377,500.00 2.60USD 20,625,342.79ENSCO -A-140,000 8,005,200.00 0.97USD 6,869,164.66EOG RESOURCES INC200,000 33,568,000.00 4.09USD 18,031,369.54GOOGLE INC20,000 22,414,200.00 2.73USD 13,424,986.18HALLIBURTON150,000 7,612,500.00 0.93USD 8,191,715.96IBM CORP85,000 15,943,450.00 1.94USD 9,687,228.13INTERNATIONAL PAPER CO540,000 26,476,200.00 3.22USD 19,872,341.67JPMORGAN CHASE CO350,000 20,468,000.00 2.49USD 15,171,379.57LENNAR CORP -A-100,000 3,956,000.00 0.48USD 3,419,100.00LINCOLN NATIONAL CORP420,000 21,680,400.00 2.64USD 20,924,750.00MICROSOFT CORP820,000 30,692,600.00 3.74USD 26,470,731.00M&T BANK CORPORATION120,000 13,970,400.00 1.70USD 10,115,177.34OCCIDENTAL PETROLEUM CORP370,000 35,187,000.00 4.28USD 26,251,780.93ORACLE CORP200,000 7,652,000.00 0.93USD 4,104,651.30PACIFIC DRILLING1,000,000 11,460,000.00 1.39USD 8,914,303.35PACKAGING CORP OF AMERICA320,000 20,249,600.00 2.46USD 7,025,092.20PFIZER INC400,000 12,252,000.00 1.49USD 8,871,157.81PIONEER NATURAL RESOURCES COMPANY170,000 31,291,900.00 3.81USD 8,748,651.69PNC FINANCIAL SERVICES GROUP INC210,000 16,291,800.00 1.98USD 15,147,526.80PULTEGROUP230,000 4,685,100.00 0.57USD 5,076,366.52QUALCOMM INC270,000 20,047,500.00 2.44USD 15,400,972.43SEADRILL LTD400,000 16,432,000.00 2.00USD 7,393,067.15TRAVELERS COS INC/THE370,000 33,499,800.00 4.08USD 16,440,007.46UNITED CONTINENTAL HOLDINGS INC400,000 15,132,000.00 1.84USD 12,945,475.61UNITEDHEALTH GROUP INC100,000 7,530,000.00 0.92USD 7,077,640.00VIACOM -B-340,000 29,695,600.00 3.61USD 16,024,596.64WELLS FARGO AND CO400,000 18,160,000.00 2.21USD 13,411,193.07WHITING PETROLEUM CORP400,000 24,748,000.00 3.01USD 11,165,304.02
Total investments in securities 820,589,450.00 99.87547,585,839.76
Cash at banks/(bank liabilities) 3,810,963.21 0.46
Other net assets/(liabilities) -2,751,336.85 -0.33
Total 821,649,076.36 100.00
Statement of investments and other net assets as at 31/12/2013USDExpressed in
UBAM - NEUBERGER BERMAN US EQUITY VALUE
Number/nom. value Description Currency % of total
net assetsMarket valueCost
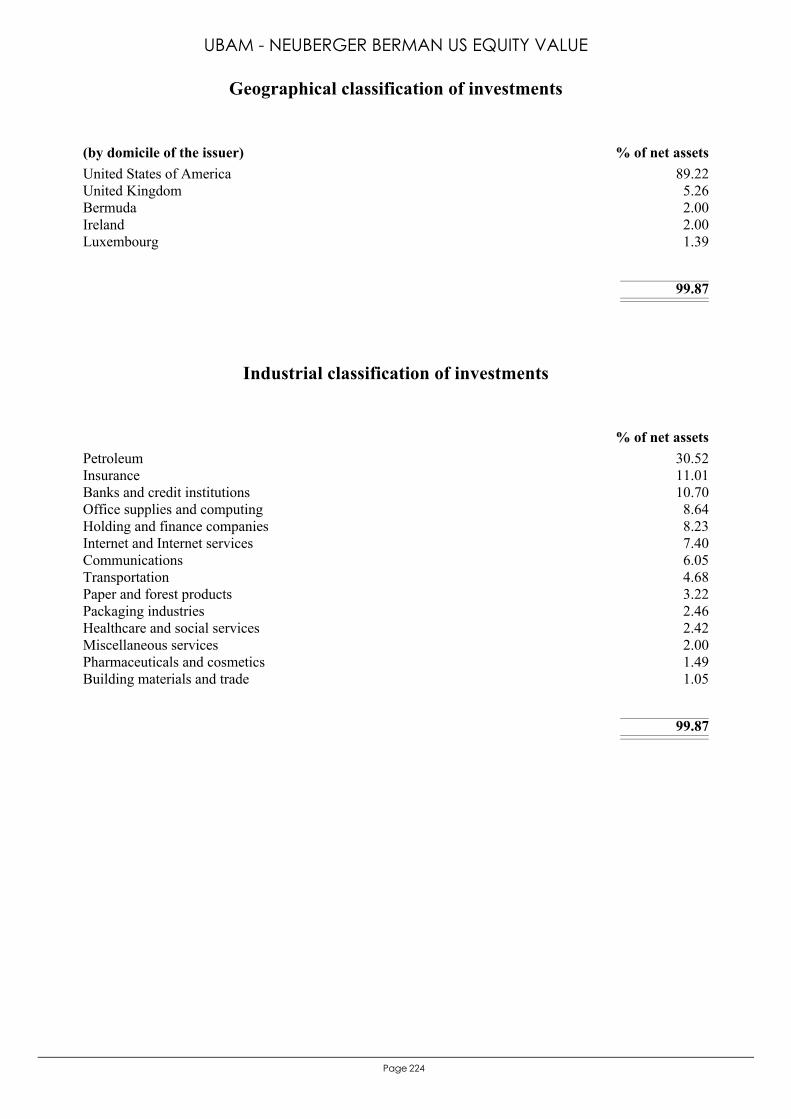
224Page
United States of America 89.22United Kingdom 5.26Bermuda 2.00Ireland 2.00Luxembourg 1.39
99.87
(by domicile of the issuer) % of net assets
Geographical classification of investments
UBAM - NEUBERGER BERMAN US EQUITY VALUE
Petroleum 30.52Insurance 11.01Banks and credit institutions 10.70Office supplies and computing 8.64Holding and finance companies 8.23Internet and Internet services 7.40Communications 6.05Transportation 4.68Paper and forest products 3.22Packaging industries 2.46Healthcare and social services 2.42Miscellaneous services 2.00Pharmaceuticals and cosmetics 1.49Building materials and trade 1.05
99.87
% of net assets
Industrial classification of investments
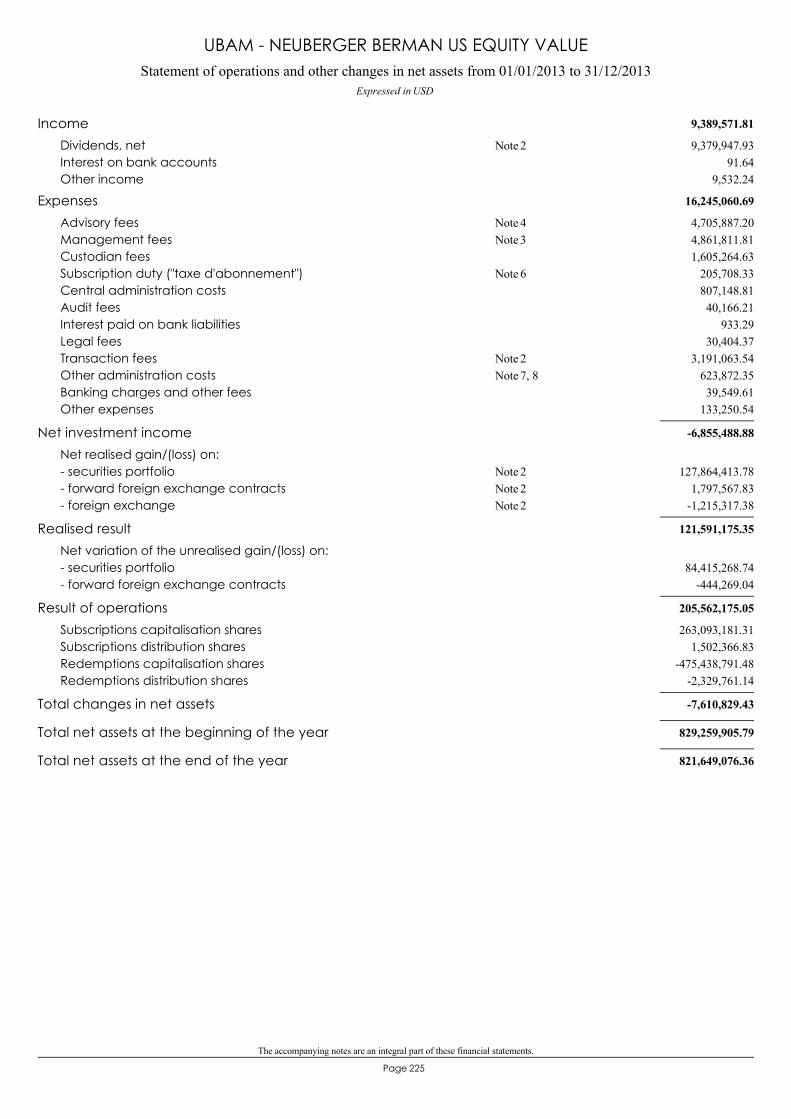
The accompanying notes are an integral part of these financial statements.
225Page
Statement of operations and other changes in net assets from 01/01/2013 to 31/12/2013Expressed in USD
UBAM - NEUBERGER BERMAN US EQUITY VALUE
9,389,571.81Income9,379,947.93Dividends, net 2Note
91.64Interest on bank accounts9,532.24Other income
16,245,060.69Expenses4,705,887.20Advisory fees 4Note4,861,811.81Management fees 3Note1,605,264.63Custodian fees
205,708.33Subscription duty ("taxe d'abonnement") 6Note807,148.81Central administration costs40,166.21Audit fees
933.29Interest paid on bank liabilities30,404.37Legal fees
3,191,063.54Transaction fees 2Note623,872.35Other administration costs 7, 8Note39,549.61Banking charges and other fees
133,250.54Other expenses
-6,855,488.88Net investment incomeNet realised gain/(loss) on:
127,864,413.78- securities portfolio 2Note1,797,567.83- forward foreign exchange contracts 2Note
-1,215,317.38- foreign exchange 2Note
121,591,175.35Realised resultNet variation of the unrealised gain/(loss) on:
84,415,268.74- securities portfolio-444,269.04- forward foreign exchange contracts
205,562,175.05Result of operations263,093,181.31Subscriptions capitalisation shares
1,502,366.83Subscriptions distribution shares-475,438,791.48Redemptions capitalisation shares
-2,329,761.14Redemptions distribution shares
-7,610,829.43Total changes in net assets
829,259,905.79Total net assets at the beginning of the year
821,649,076.36Total net assets at the end of the year
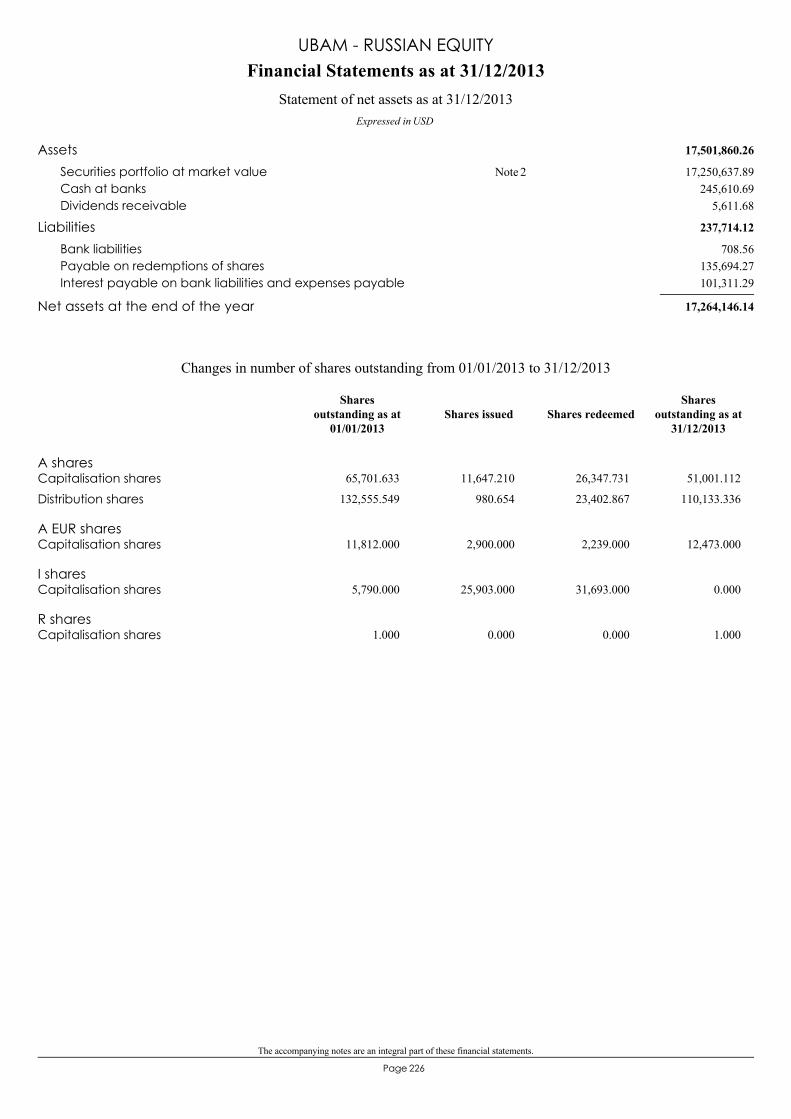
The accompanying notes are an integral part of these financial statements.
226Page
17,501,860.26Assets17,250,637.89Securities portfolio at market value 2Note
245,610.69Cash at banks5,611.68Dividends receivable
237,714.12Liabilities708.56Bank liabilities
135,694.27Payable on redemptions of shares101,311.29Interest payable on bank liabilities and expenses payable
17,264,146.14Net assets at the end of the year
Financial Statements as at 31/12/2013
Expressed in USD
Statement of net assets as at 31/12/2013
UBAM - RUSSIAN EQUITY
A sharesCapitalisation shares 65,701.633 11,647.210 26,347.731 51,001.112
Distribution shares 132,555.549 980.654 23,402.867 110,133.336
A EUR sharesCapitalisation shares 11,812.000 2,900.000 2,239.000 12,473.000
I sharesCapitalisation shares 5,790.000 25,903.000 31,693.000 0.000
R sharesCapitalisation shares 1.000 0.000 0.000 1.000
Changes in number of shares outstanding from 01/01/2013 to 31/12/2013
Shares issued Shares redeemedShares
outstanding as at31/12/2013
Sharesoutstanding as at
01/01/2013
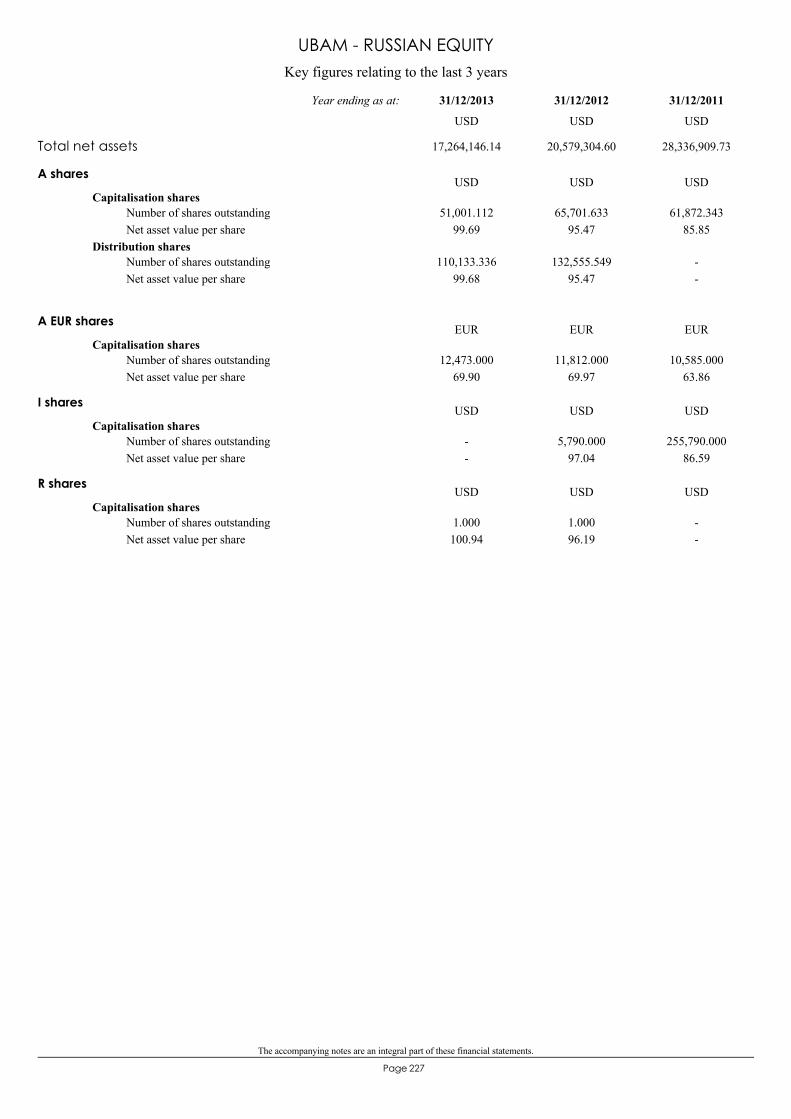
The accompanying notes are an integral part of these financial statements.
227Page
Key figures relating to the last 3 years
UBAM - RUSSIAN EQUITY
A shares
Capitalisation shares51,001.112
99.6965,701.633
95.4761,872.343
85.85Number of shares outstandingNet asset value per share
Distribution shares110,133.336
99.68132,555.549
95.47--
Number of shares outstandingNet asset value per share
USD USD USD
A EUR shares
Capitalisation shares12,473.000
69.9011,812.000
69.9710,585.000
63.86Number of shares outstandingNet asset value per share
EUR EUR EUR
I shares
Capitalisation shares--
5,790.00097.04
255,790.00086.59
Number of shares outstandingNet asset value per share
USD USD USD
R shares
Capitalisation shares1.000100.94
1.00096.19
--
Number of shares outstandingNet asset value per share
USD USD USD
Total net assets 17,264,146.14 20,579,304.60 28,336,909.73
31/12/201131/12/201231/12/2013Year ending as at:
USD USD USD
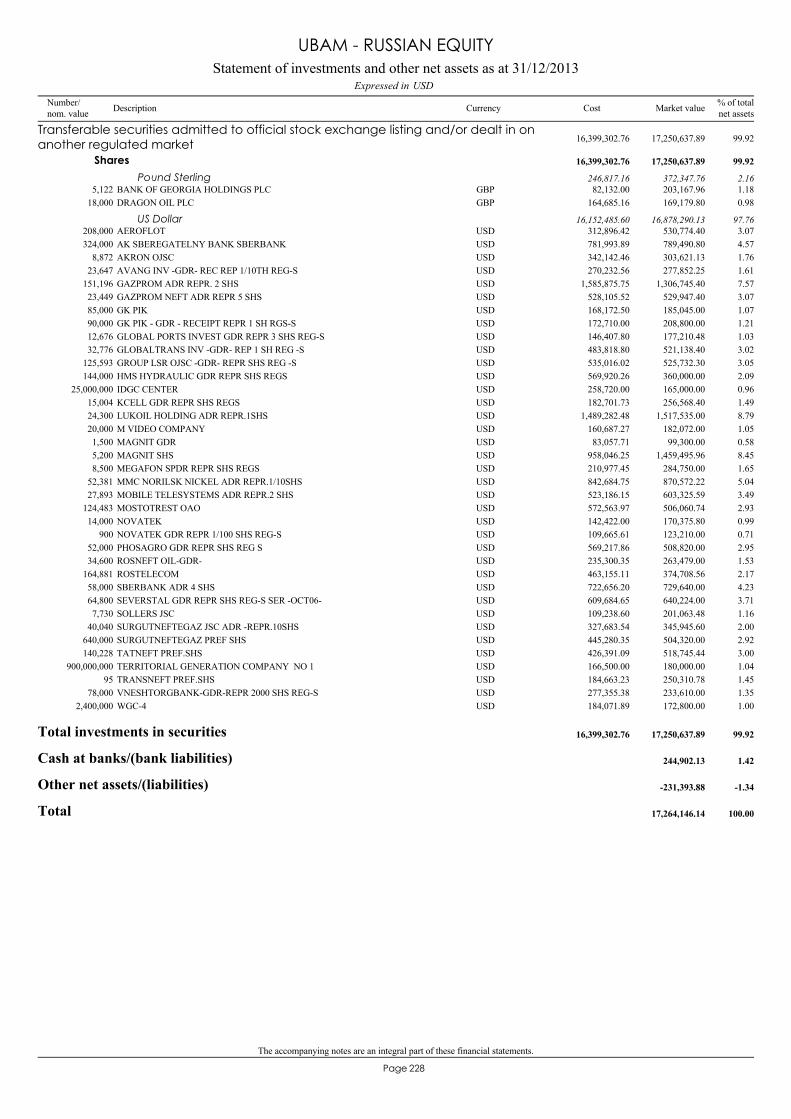
The accompanying notes are an integral part of these financial statements.
228Page
BANK OF GEORGIA HOLDINGS PLC5,122 203,167.96 1.18GBP 82,132.00
Transferable securities admitted to official stock exchange listing and/or dealt in onanother regulated market 17,250,637.89 99.9216,399,302.76
Shares 17,250,637.89 99.9216,399,302.76
Pound Sterling 372,347.76 2.16246,817.16
DRAGON OIL PLC18,000 169,179.80 0.98GBP 164,685.16
AEROFLOT208,000 530,774.40 3.07USD 312,896.42US Dollar 16,878,290.13 97.7616,152,485.60
AK SBEREGATELNY BANK SBERBANK324,000 789,490.80 4.57USD 781,993.89AKRON OJSC8,872 303,621.13 1.76USD 342,142.46AVANG INV -GDR- REC REP 1/10TH REG-S23,647 277,852.25 1.61USD 270,232.56GAZPROM ADR REPR. 2 SHS151,196 1,306,745.40 7.57USD 1,585,875.75GAZPROM NEFT ADR REPR 5 SHS23,449 529,947.40 3.07USD 528,105.52GK PIK85,000 185,045.00 1.07USD 168,172.50GK PIK - GDR - RECEIPT REPR 1 SH RGS-S90,000 208,800.00 1.21USD 172,710.00GLOBAL PORTS INVEST GDR REPR 3 SHS REG-S12,676 177,210.48 1.03USD 146,407.80GLOBALTRANS INV -GDR- REP 1 SH REG -S32,776 521,138.40 3.02USD 483,818.80GROUP LSR OJSC -GDR- REPR SHS REG -S125,593 525,732.30 3.05USD 535,016.02HMS HYDRAULIC GDR REPR SHS REGS144,000 360,000.00 2.09USD 569,920.26IDGC CENTER25,000,000 165,000.00 0.96USD 258,720.00KCELL GDR REPR SHS REGS15,004 256,568.40 1.49USD 182,701.73LUKOIL HOLDING ADR REPR.1SHS24,300 1,517,535.00 8.79USD 1,489,282.48M VIDEO COMPANY20,000 182,072.00 1.05USD 160,687.27MAGNIT GDR1,500 99,300.00 0.58USD 83,057.71MAGNIT SHS5,200 1,459,495.96 8.45USD 958,046.25MEGAFON SPDR REPR SHS REGS8,500 284,750.00 1.65USD 210,977.45MMC NORILSK NICKEL ADR REPR.1/10SHS52,381 870,572.22 5.04USD 842,684.75MOBILE TELESYSTEMS ADR REPR.2 SHS27,893 603,325.59 3.49USD 523,186.15MOSTOTREST OAO124,483 506,060.74 2.93USD 572,563.97NOVATEK14,000 170,375.80 0.99USD 142,422.00NOVATEK GDR REPR 1/100 SHS REG-S900 123,210.00 0.71USD 109,665.61PHOSAGRO GDR REPR SHS REG S52,000 508,820.00 2.95USD 569,217.86ROSNEFT OIL-GDR-34,600 263,479.00 1.53USD 235,300.35ROSTELECOM164,881 374,708.56 2.17USD 463,155.11SBERBANK ADR 4 SHS58,000 729,640.00 4.23USD 722,656.20SEVERSTAL GDR REPR SHS REG-S SER -OCT06-64,800 640,224.00 3.71USD 609,684.65SOLLERS JSC7,730 201,063.48 1.16USD 109,238.60SURGUTNEFTEGAZ JSC ADR -REPR.10SHS40,040 345,945.60 2.00USD 327,683.54SURGUTNEFTEGAZ PREF SHS640,000 504,320.00 2.92USD 445,280.35TATNEFT PREF.SHS140,228 518,745.44 3.00USD 426,391.09TERRITORIAL GENERATION COMPANY NO 1900,000,000 180,000.00 1.04USD 166,500.00TRANSNEFT PREF.SHS95 250,310.78 1.45USD 184,663.23VNESHTORGBANK-GDR-REPR 2000 SHS REG-S78,000 233,610.00 1.35USD 277,355.38WGC-42,400,000 172,800.00 1.00USD 184,071.89
Total investments in securities 17,250,637.89 99.9216,399,302.76
Cash at banks/(bank liabilities) 244,902.13 1.42
Other net assets/(liabilities) -231,393.88 -1.34
Total 17,264,146.14 100.00
Statement of investments and other net assets as at 31/12/2013USDExpressed in
UBAM - RUSSIAN EQUITY
Number/nom. value Description Currency % of total
net assetsMarket valueCost

229Page
Russia 88.52Cyprus 5.66United Kingdom 3.27Kazakstan 1.49Ireland 0.98
99.92
(by domicile of the issuer) % of net assets
Geographical classification of investments
UBAM - RUSSIAN EQUITY
Petroleum 30.89Banks and credit institutions 11.33Transportation 10.47Foods and non alcoholic drinks 9.03Communications 7.15Holding and finance companies 5.63Non-ferrous metals 5.04Coal mining and steel industry 3.71Building materials and trade 3.05Chemicals 2.95Miscellaneous services 2.09Miscellaneous sectors 2.05Utilities 2.00Pharmaceuticals and cosmetics 1.76Agriculture and fishery 1.61Machine and apparatus construction 1.16
99.92
% of net assets
Industrial classification of investments

The accompanying notes are an integral part of these financial statements.
230Page
Statement of operations and other changes in net assets from 01/01/2013 to 31/12/2013Expressed in USD
UBAM - RUSSIAN EQUITY
757,071.03Income754,545.70Dividends, net 2Note
630.88Interest on bank accounts1,894.45Other income
510,336.30Expenses152,693.88Advisory fees 4Note169,245.20Management fees 3Note46,065.63Custodian fees8,908.78Subscription duty ("taxe d'abonnement") 6Note
18,634.43Central administration costs914.99Audit fees117.30Interest paid on bank liabilities229.73Legal fees
69,011.49Transaction fees 2Note41,016.78Other administration costs 7, 8Note
290.09Banking charges and other fees3,208.00Other expenses
246,734.73Net investment incomeNet realised gain/(loss) on:
-397,937.74- securities portfolio 2Note-957.51- forward foreign exchange contracts 2Note
-236,651.84- foreign exchange 2Note
-388,812.36Realised resultNet variation of the unrealised gain/(loss) on:
908,352.47- securities portfolio-620.96- forward foreign exchange contracts
518,919.15Result of operations4,027,988.46Subscriptions capitalisation shares
96,934.65Subscriptions distribution shares-5,754,978.16Redemptions capitalisation shares-2,204,022.56Redemptions distribution shares
-3,315,158.46Total changes in net assets
20,579,304.60Total net assets at the beginning of the year
17,264,146.14Total net assets at the end of the year
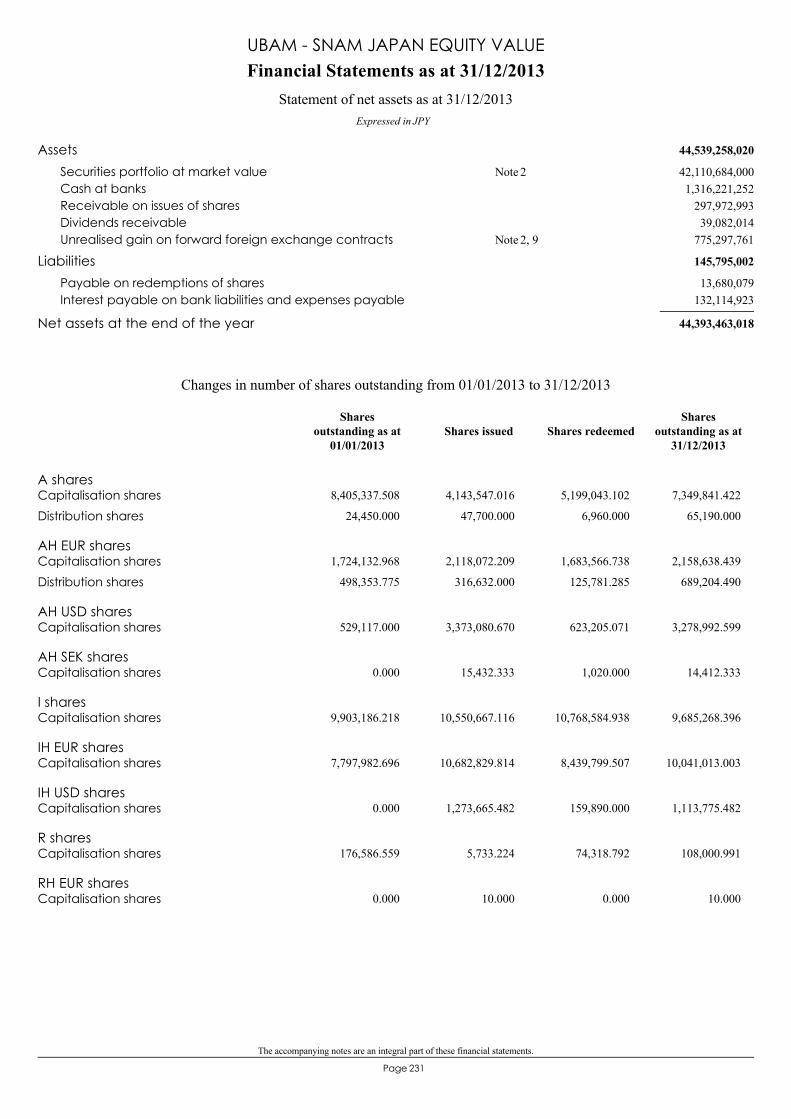
The accompanying notes are an integral part of these financial statements.
231Page
44,539,258,020Assets42,110,684,000Securities portfolio at market value 2Note1,316,221,252Cash at banks
297,972,993Receivable on issues of shares39,082,014Dividends receivable
775,297,761Unrealised gain on forward foreign exchange contracts 2, 9Note
145,795,002Liabilities13,680,079Payable on redemptions of shares
132,114,923Interest payable on bank liabilities and expenses payable
44,393,463,018Net assets at the end of the year
Financial Statements as at 31/12/2013
Expressed in JPY
Statement of net assets as at 31/12/2013
UBAM - SNAM JAPAN EQUITY VALUE
A sharesCapitalisation shares 8,405,337.508 4,143,547.016 5,199,043.102 7,349,841.422
Distribution shares 24,450.000 47,700.000 6,960.000 65,190.000
AH EUR sharesCapitalisation shares 1,724,132.968 2,118,072.209 1,683,566.738 2,158,638.439
Distribution shares 498,353.775 316,632.000 125,781.285 689,204.490
AH USD sharesCapitalisation shares 529,117.000 3,373,080.670 623,205.071 3,278,992.599
AH SEK sharesCapitalisation shares 0.000 15,432.333 1,020.000 14,412.333
I sharesCapitalisation shares 9,903,186.218 10,550,667.116 10,768,584.938 9,685,268.396
IH EUR sharesCapitalisation shares 7,797,982.696 10,682,829.814 8,439,799.507 10,041,013.003
IH USD sharesCapitalisation shares 0.000 1,273,665.482 159,890.000 1,113,775.482
R sharesCapitalisation shares 176,586.559 5,733.224 74,318.792 108,000.991
RH EUR sharesCapitalisation shares 0.000 10.000 0.000 10.000
Changes in number of shares outstanding from 01/01/2013 to 31/12/2013
Shares issued Shares redeemedShares
outstanding as at31/12/2013
Sharesoutstanding as at
01/01/2013
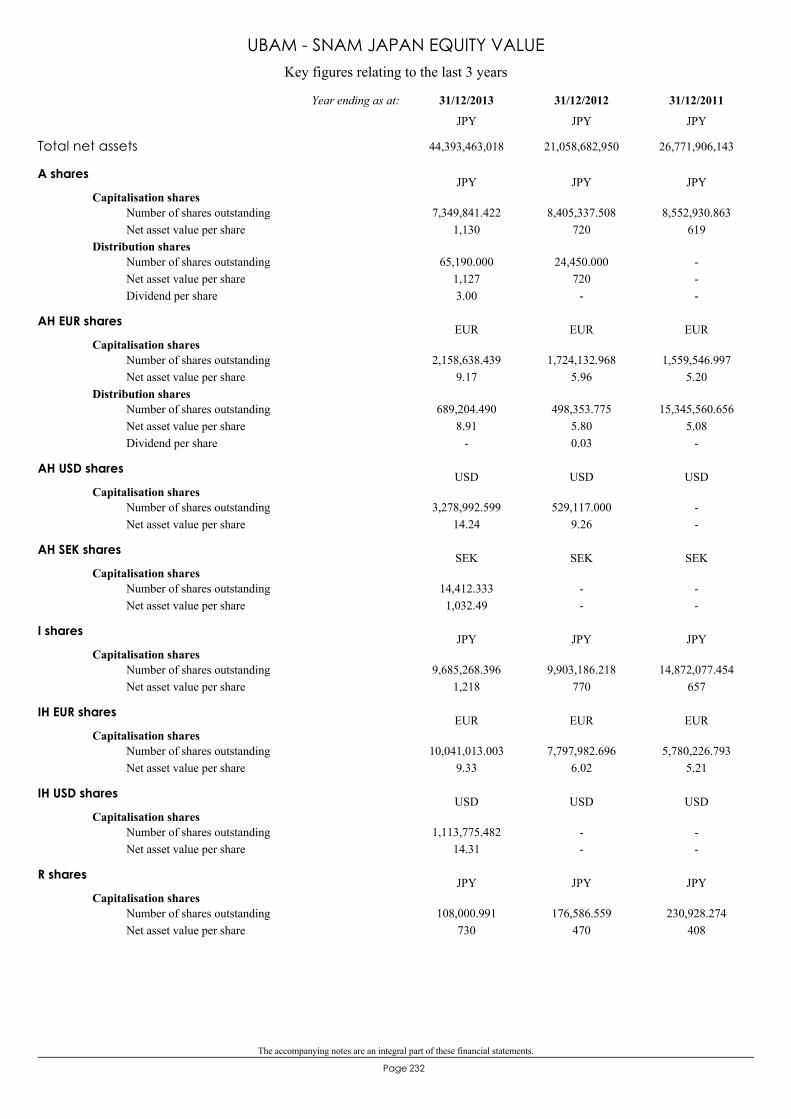
The accompanying notes are an integral part of these financial statements.
232Page
Key figures relating to the last 3 years
UBAM - SNAM JAPAN EQUITY VALUE
A shares
Capitalisation shares7,349,841.422
1,1308,405,337.508
7208,552,930.863
619Number of shares outstandingNet asset value per share
Distribution shares65,190.000
1,1273.00
24,450.000720
-
---
Number of shares outstandingNet asset value per shareDividend per share
JPY JPY JPY
AH EUR shares
Capitalisation shares2,158,638.439
9.171,724,132.968
5.961,559,546.997
5.20Number of shares outstandingNet asset value per share
Distribution shares689,204.490
8.91-
498,353.7755.800.03
15,345,560.6565.08
-
Number of shares outstandingNet asset value per shareDividend per share
EUR EUR EUR
AH USD shares
Capitalisation shares3,278,992.599
14.24529,117.000
9.26--
Number of shares outstandingNet asset value per share
USD USD USD
AH SEK shares
Capitalisation shares14,412.3331,032.49
--
--
Number of shares outstandingNet asset value per share
SEK SEK SEK
I shares
Capitalisation shares9,685,268.396
1,2189,903,186.218
77014,872,077.454
657Number of shares outstandingNet asset value per share
JPY JPY JPY
IH EUR shares
Capitalisation shares10,041,013.003
9.337,797,982.696
6.025,780,226.793
5.21Number of shares outstandingNet asset value per share
EUR EUR EUR
IH USD shares
Capitalisation shares1,113,775.482
14.31--
--
Number of shares outstandingNet asset value per share
USD USD USD
R shares
Capitalisation shares108,000.991
730176,586.559
470230,928.274
408Number of shares outstandingNet asset value per share
JPY JPY JPY
Total net assets 44,393,463,018 21,058,682,950 26,771,906,143
31/12/201131/12/201231/12/2013Year ending as at:
JPY JPY JPY
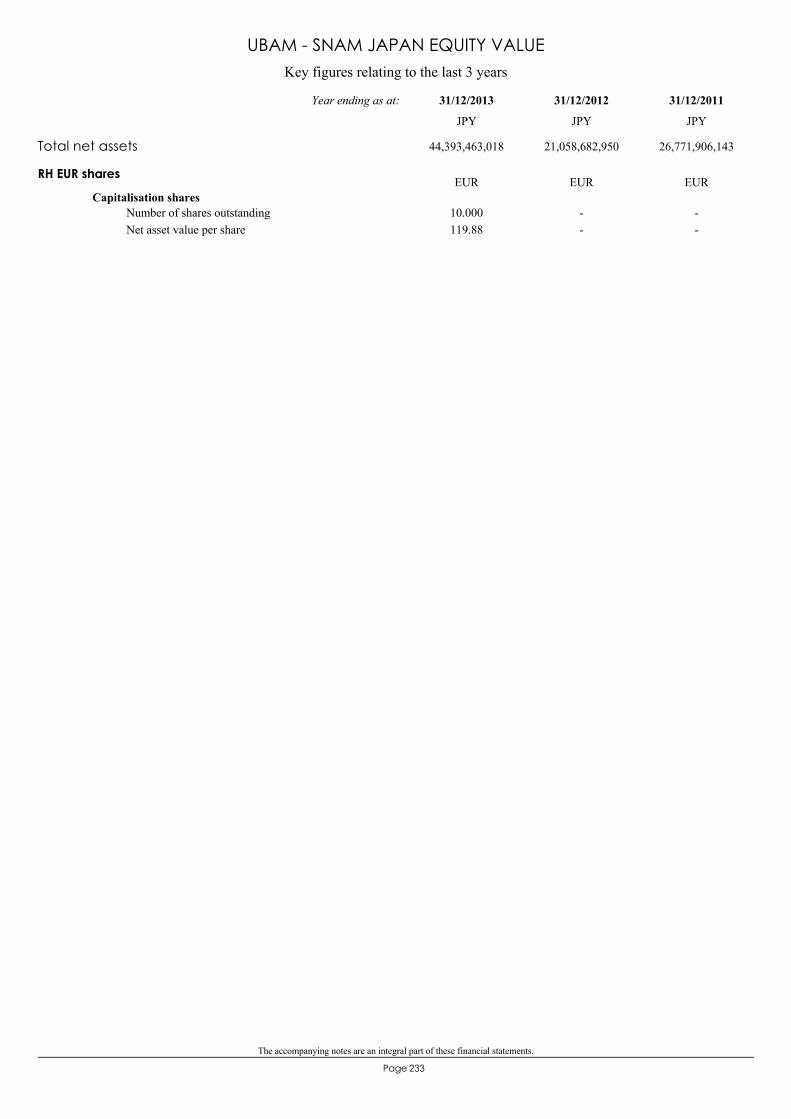
The accompanying notes are an integral part of these financial statements.
233Page
Key figures relating to the last 3 years
UBAM - SNAM JAPAN EQUITY VALUE
RH EUR shares
Capitalisation shares10.000119.88
--
--
Number of shares outstandingNet asset value per share
EUR EUR EUR
Total net assets 44,393,463,018 21,058,682,950 26,771,906,143
31/12/201131/12/201231/12/2013Year ending as at:
JPY JPY JPY
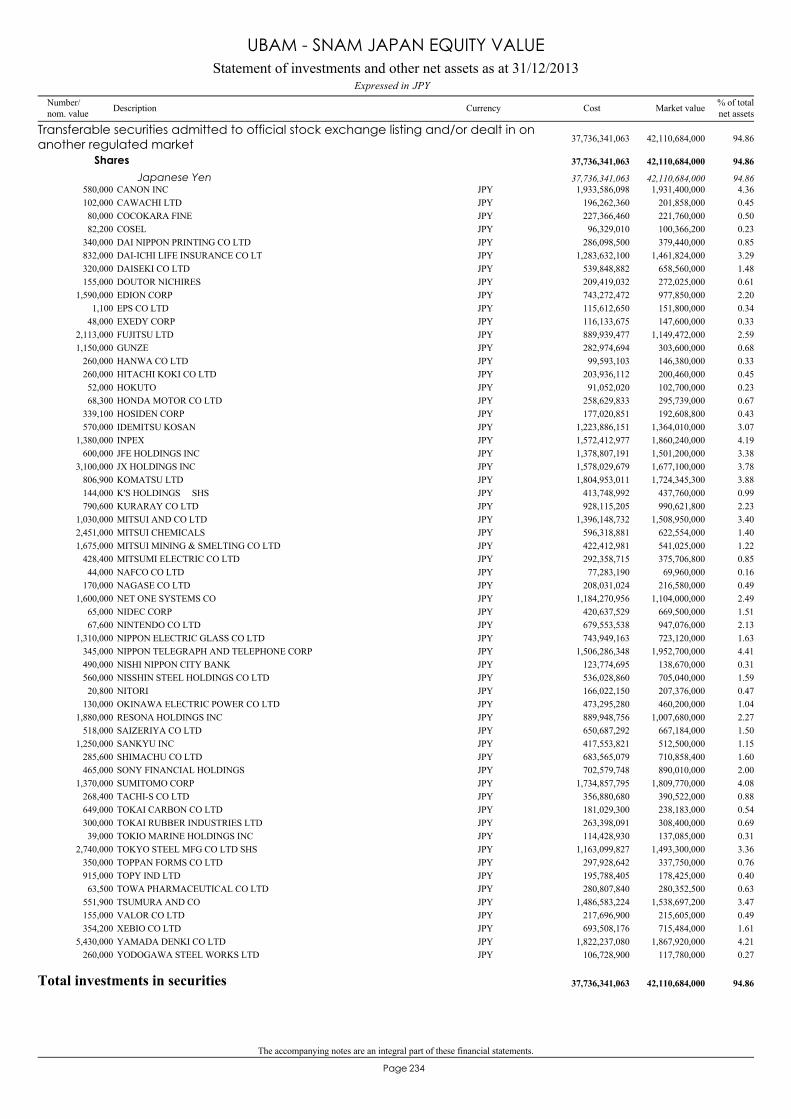
The accompanying notes are an integral part of these financial statements.
234Page
CANON INC580,000 1,931,400,000 4.36JPY 1,933,586,098
Transferable securities admitted to official stock exchange listing and/or dealt in onanother regulated market 42,110,684,000 94.8637,736,341,063
Shares 42,110,684,000 94.8637,736,341,063
Japanese Yen 42,110,684,000 94.8637,736,341,063
CAWACHI LTD102,000 201,858,000 0.45JPY 196,262,360COCOKARA FINE80,000 221,760,000 0.50JPY 227,366,460COSEL82,200 100,366,200 0.23JPY 96,329,010DAI NIPPON PRINTING CO LTD340,000 379,440,000 0.85JPY 286,098,500DAI-ICHI LIFE INSURANCE CO LT832,000 1,461,824,000 3.29JPY 1,283,632,100DAISEKI CO LTD320,000 658,560,000 1.48JPY 539,848,882DOUTOR NICHIRES155,000 272,025,000 0.61JPY 209,419,032EDION CORP1,590,000 977,850,000 2.20JPY 743,272,472EPS CO LTD1,100 151,800,000 0.34JPY 115,612,650EXEDY CORP48,000 147,600,000 0.33JPY 116,133,675FUJITSU LTD2,113,000 1,149,472,000 2.59JPY 889,939,477GUNZE1,150,000 303,600,000 0.68JPY 282,974,694HANWA CO LTD260,000 146,380,000 0.33JPY 99,593,103HITACHI KOKI CO LTD260,000 200,460,000 0.45JPY 203,936,112HOKUTO52,000 102,700,000 0.23JPY 91,052,020HONDA MOTOR CO LTD68,300 295,739,000 0.67JPY 258,629,833HOSIDEN CORP339,100 192,608,800 0.43JPY 177,020,851IDEMITSU KOSAN570,000 1,364,010,000 3.07JPY 1,223,886,151INPEX1,380,000 1,860,240,000 4.19JPY 1,572,412,977JFE HOLDINGS INC600,000 1,501,200,000 3.38JPY 1,378,807,191JX HOLDINGS INC3,100,000 1,677,100,000 3.78JPY 1,578,029,679KOMATSU LTD806,900 1,724,345,300 3.88JPY 1,804,953,011K'S HOLDINGS SHS144,000 437,760,000 0.99JPY 413,748,992KURARAY CO LTD790,600 990,621,800 2.23JPY 928,115,205MITSUI AND CO LTD1,030,000 1,508,950,000 3.40JPY 1,396,148,732MITSUI CHEMICALS2,451,000 622,554,000 1.40JPY 596,318,881MITSUI MINING & SMELTING CO LTD1,675,000 541,025,000 1.22JPY 422,412,981MITSUMI ELECTRIC CO LTD428,400 375,706,800 0.85JPY 292,358,715NAFCO CO LTD44,000 69,960,000 0.16JPY 77,283,190NAGASE CO LTD170,000 216,580,000 0.49JPY 208,031,024NET ONE SYSTEMS CO1,600,000 1,104,000,000 2.49JPY 1,184,270,956NIDEC CORP65,000 669,500,000 1.51JPY 420,637,529NINTENDO CO LTD67,600 947,076,000 2.13JPY 679,553,538NIPPON ELECTRIC GLASS CO LTD1,310,000 723,120,000 1.63JPY 743,949,163NIPPON TELEGRAPH AND TELEPHONE CORP345,000 1,952,700,000 4.41JPY 1,506,286,348NISHI NIPPON CITY BANK490,000 138,670,000 0.31JPY 123,774,695NISSHIN STEEL HOLDINGS CO LTD560,000 705,040,000 1.59JPY 536,028,860NITORI20,800 207,376,000 0.47JPY 166,022,150OKINAWA ELECTRIC POWER CO LTD130,000 460,200,000 1.04JPY 473,295,280RESONA HOLDINGS INC1,880,000 1,007,680,000 2.27JPY 889,948,756SAIZERIYA CO LTD518,000 667,184,000 1.50JPY 650,687,292SANKYU INC1,250,000 512,500,000 1.15JPY 417,553,821SHIMACHU CO LTD285,600 710,858,400 1.60JPY 683,565,079SONY FINANCIAL HOLDINGS465,000 890,010,000 2.00JPY 702,579,748SUMITOMO CORP1,370,000 1,809,770,000 4.08JPY 1,734,857,795TACHI-S CO LTD268,400 390,522,000 0.88JPY 356,880,680TOKAI CARBON CO LTD649,000 238,183,000 0.54JPY 181,029,300TOKAI RUBBER INDUSTRIES LTD300,000 308,400,000 0.69JPY 263,398,091TOKIO MARINE HOLDINGS INC39,000 137,085,000 0.31JPY 114,428,930TOKYO STEEL MFG CO LTD SHS2,740,000 1,493,300,000 3.36JPY 1,163,099,827TOPPAN FORMS CO LTD350,000 337,750,000 0.76JPY 297,928,642TOPY IND LTD915,000 178,425,000 0.40JPY 195,788,405TOWA PHARMACEUTICAL CO LTD63,500 280,352,500 0.63JPY 280,807,840TSUMURA AND CO551,900 1,538,697,200 3.47JPY 1,486,583,224VALOR CO LTD155,000 215,605,000 0.49JPY 217,696,900XEBIO CO LTD354,200 715,484,000 1.61JPY 693,508,176YAMADA DENKI CO LTD5,430,000 1,867,920,000 4.21JPY 1,822,237,080YODOGAWA STEEL WORKS LTD260,000 117,780,000 0.27JPY 106,728,900
Total investments in securities 42,110,684,000 94.8637,736,341,063
Statement of investments and other net assets as at 31/12/2013JPYExpressed in
UBAM - SNAM JAPAN EQUITY VALUE
Number/nom. value Description Currency % of total
net assetsMarket valueCost
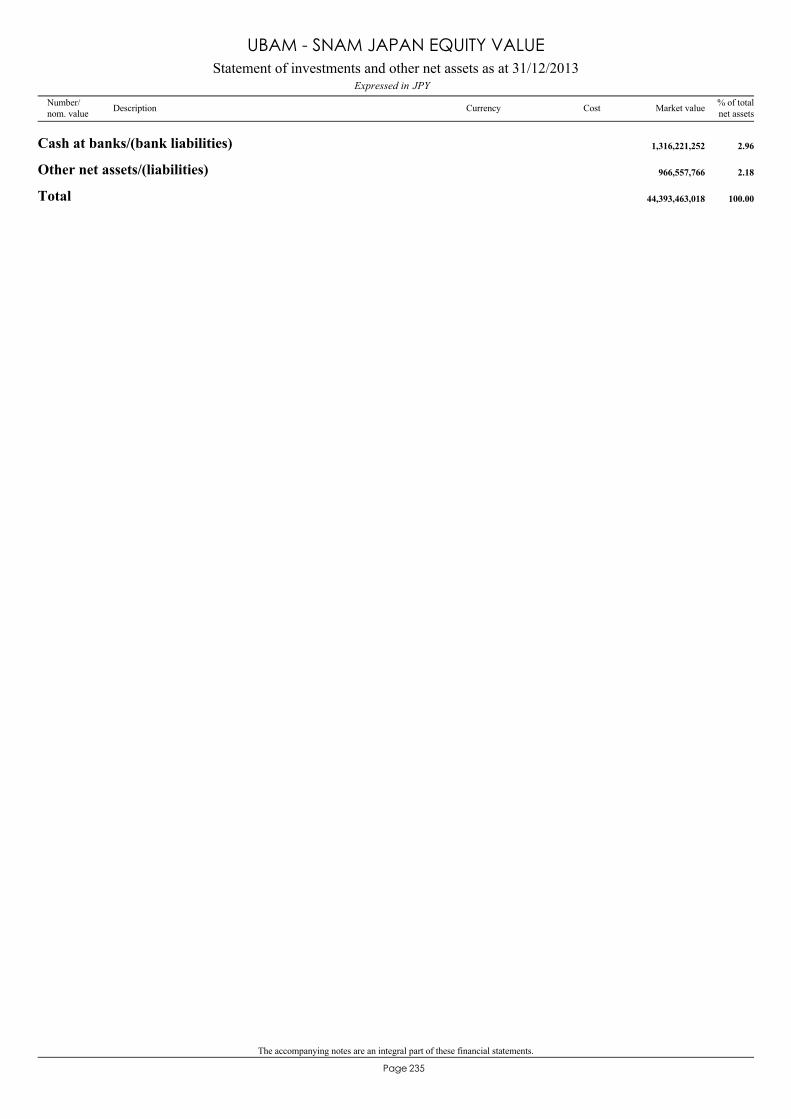
The accompanying notes are an integral part of these financial statements.
235Page
Cash at banks/(bank liabilities) 1,316,221,252 2.96
Other net assets/(liabilities) 966,557,766 2.18
Total 44,393,463,018 100.00
Statement of investments and other net assets as at 31/12/2013JPYExpressed in
UBAM - SNAM JAPAN EQUITY VALUE
Number/nom. value Description Currency % of total
net assetsMarket valueCost

236Page
Japan 94.86
94.86
(by domicile of the issuer) % of net assets
Geographical classification of investments
UBAM - SNAM JAPAN EQUITY VALUE
Holding and finance companies 18.50Electronics and semiconductors 10.06Retail trade, department stores 8.52Miscellaneous trading companies 8.30Coal mining and steel industry 5.22Machine and apparatus construction 4.73Communications 4.41Chemicals 4.17Pharmaceuticals and cosmetics 4.10Insurance 3.29Electrical engineering and electronics 3.28Petroleum 3.07Office supplies and computing 2.59Internet and Internet services 2.49Road vehicles 1.88Graphic art and publishing 1.61Hotels and restaurants 1.50Environmental services and recycling 1.48Non-ferrous metals 1.22Transportation 1.15Utilities 1.04Tires and rubber 0.69Textiles and garments 0.68Healthcare and social services 0.34Banks and credit institutions 0.31Agriculture and fishery 0.23
94.86
% of net assets
Industrial classification of investments
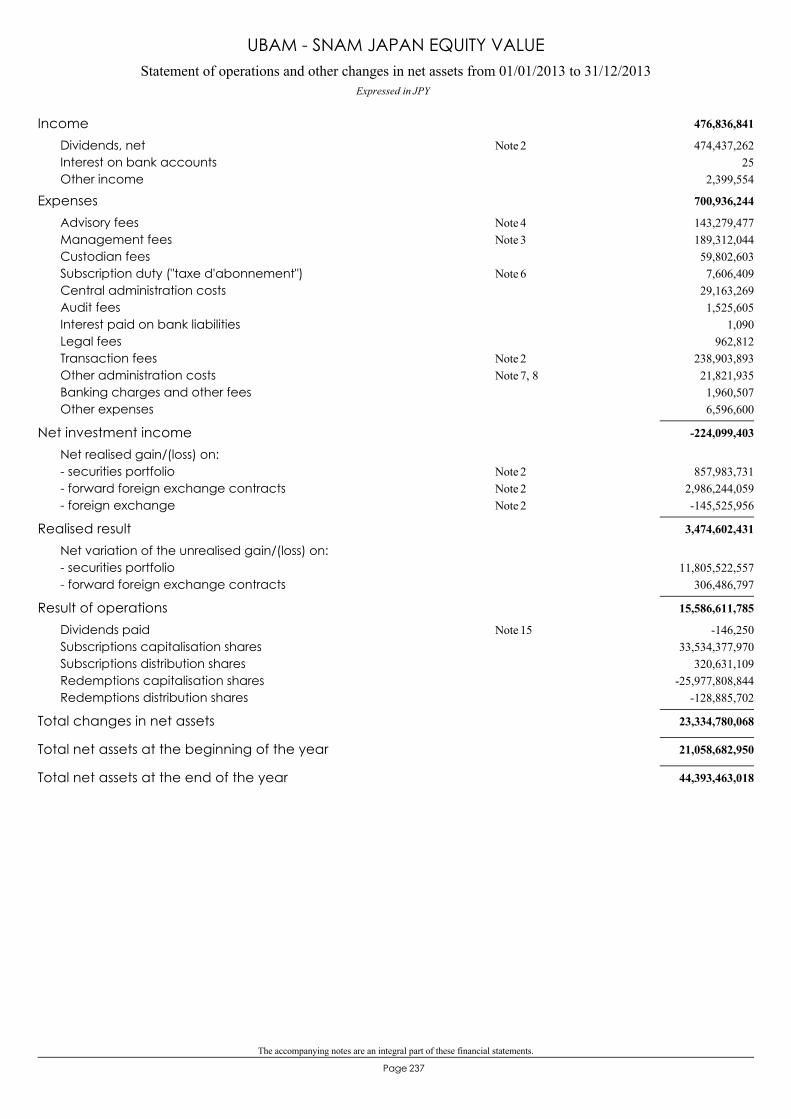
The accompanying notes are an integral part of these financial statements.
237Page
Statement of operations and other changes in net assets from 01/01/2013 to 31/12/2013Expressed in JPY
UBAM - SNAM JAPAN EQUITY VALUE
476,836,841Income474,437,262Dividends, net 2Note
25Interest on bank accounts2,399,554Other income
700,936,244Expenses143,279,477Advisory fees 4Note189,312,044Management fees 3Note59,802,603Custodian fees7,606,409Subscription duty ("taxe d'abonnement") 6Note
29,163,269Central administration costs1,525,605Audit fees
1,090Interest paid on bank liabilities962,812Legal fees
238,903,893Transaction fees 2Note21,821,935Other administration costs 7, 8Note1,960,507Banking charges and other fees6,596,600Other expenses
-224,099,403Net investment incomeNet realised gain/(loss) on:
857,983,731- securities portfolio 2Note2,986,244,059- forward foreign exchange contracts 2Note-145,525,956- foreign exchange 2Note
3,474,602,431Realised resultNet variation of the unrealised gain/(loss) on:
11,805,522,557- securities portfolio306,486,797- forward foreign exchange contracts
15,586,611,785Result of operations-146,250Dividends paid 15Note
33,534,377,970Subscriptions capitalisation shares320,631,109Subscriptions distribution shares
-25,977,808,844Redemptions capitalisation shares-128,885,702Redemptions distribution shares
23,334,780,068Total changes in net assets
21,058,682,950Total net assets at the beginning of the year
44,393,463,018Total net assets at the end of the year
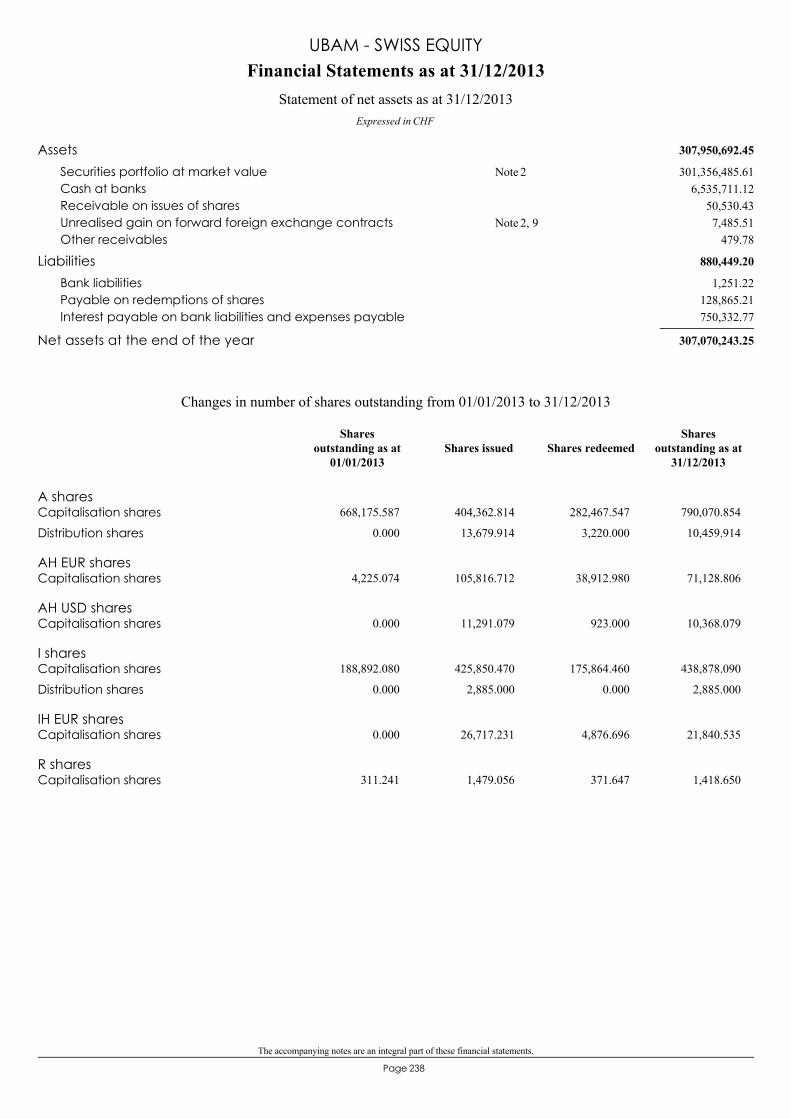
The accompanying notes are an integral part of these financial statements.
238Page
307,950,692.45Assets301,356,485.61Securities portfolio at market value 2Note
6,535,711.12Cash at banks50,530.43Receivable on issues of shares7,485.51Unrealised gain on forward foreign exchange contracts 2, 9Note
479.78Other receivables
880,449.20Liabilities1,251.22Bank liabilities
128,865.21Payable on redemptions of shares750,332.77Interest payable on bank liabilities and expenses payable
307,070,243.25Net assets at the end of the year
Financial Statements as at 31/12/2013
Expressed in CHF
Statement of net assets as at 31/12/2013
UBAM - SWISS EQUITY
A sharesCapitalisation shares 668,175.587 404,362.814 282,467.547 790,070.854
Distribution shares 0.000 13,679.914 3,220.000 10,459.914
AH EUR sharesCapitalisation shares 4,225.074 105,816.712 38,912.980 71,128.806
AH USD sharesCapitalisation shares 0.000 11,291.079 923.000 10,368.079
I sharesCapitalisation shares 188,892.080 425,850.470 175,864.460 438,878.090
Distribution shares 0.000 2,885.000 0.000 2,885.000
IH EUR sharesCapitalisation shares 0.000 26,717.231 4,876.696 21,840.535
R sharesCapitalisation shares 311.241 1,479.056 371.647 1,418.650
Changes in number of shares outstanding from 01/01/2013 to 31/12/2013
Shares issued Shares redeemedShares
outstanding as at31/12/2013
Sharesoutstanding as at
01/01/2013
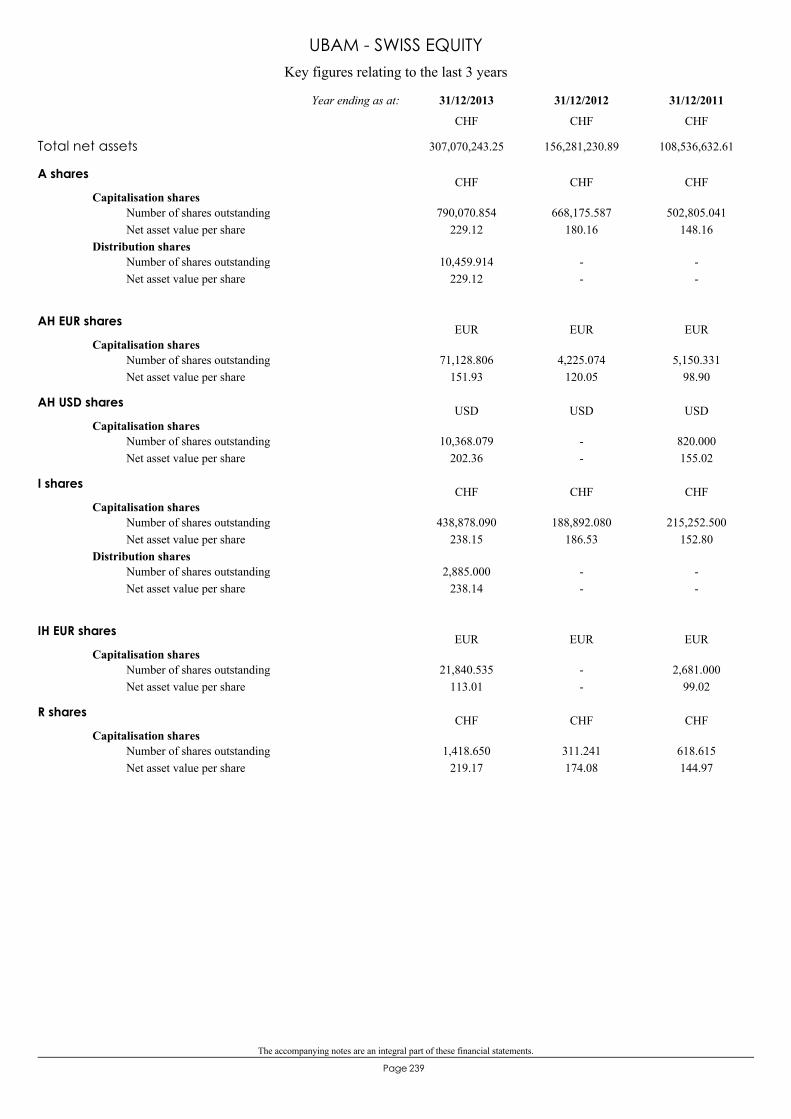
The accompanying notes are an integral part of these financial statements.
239Page
Key figures relating to the last 3 years
UBAM - SWISS EQUITY
A shares
Capitalisation shares790,070.854
229.12668,175.587
180.16502,805.041
148.16Number of shares outstandingNet asset value per share
Distribution shares10,459.914
229.12--
--
Number of shares outstandingNet asset value per share
CHF CHF CHF
AH EUR shares
Capitalisation shares71,128.806
151.934,225.074
120.055,150.331
98.90Number of shares outstandingNet asset value per share
EUR EUR EUR
AH USD shares
Capitalisation shares10,368.079
202.36--
820.000155.02
Number of shares outstandingNet asset value per share
USD USD USD
I shares
Capitalisation shares438,878.090
238.15188,892.080
186.53215,252.500
152.80Number of shares outstandingNet asset value per share
Distribution shares2,885.000
238.14--
--
Number of shares outstandingNet asset value per share
CHF CHF CHF
IH EUR shares
Capitalisation shares21,840.535
113.01--
2,681.00099.02
Number of shares outstandingNet asset value per share
EUR EUR EUR
R shares
Capitalisation shares1,418.650
219.17311.241174.08
618.615144.97
Number of shares outstandingNet asset value per share
CHF CHF CHF
Total net assets 307,070,243.25 156,281,230.89 108,536,632.61
31/12/201131/12/201231/12/2013Year ending as at:
CHF CHF CHF
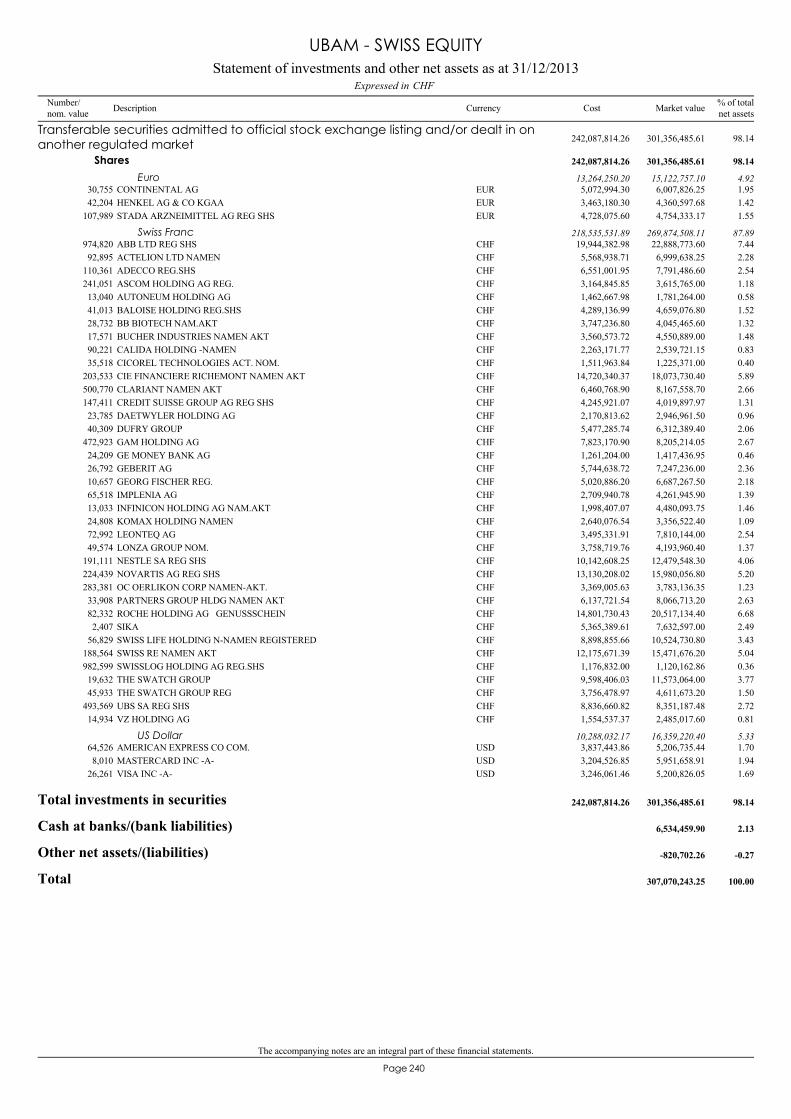
The accompanying notes are an integral part of these financial statements.
240Page
CONTINENTAL AG30,755 6,007,826.25 1.95EUR 5,072,994.30
Transferable securities admitted to official stock exchange listing and/or dealt in onanother regulated market 301,356,485.61 98.14242,087,814.26
Shares 301,356,485.61 98.14242,087,814.26
Euro 15,122,757.10 4.9213,264,250.20
HENKEL AG & CO KGAA42,204 4,360,597.68 1.42EUR 3,463,180.30STADA ARZNEIMITTEL AG REG SHS107,989 4,754,333.17 1.55EUR 4,728,075.60
ABB LTD REG SHS974,820 22,888,773.60 7.44CHF 19,944,382.98Swiss Franc 269,874,508.11 87.89218,535,531.89
ACTELION LTD NAMEN92,895 6,999,638.25 2.28CHF 5,568,938.71ADECCO REG.SHS110,361 7,791,486.60 2.54CHF 6,551,001.95ASCOM HOLDING AG REG.241,051 3,615,765.00 1.18CHF 3,164,845.85AUTONEUM HOLDING AG13,040 1,781,264.00 0.58CHF 1,462,667.98BALOISE HOLDING REG.SHS41,013 4,659,076.80 1.52CHF 4,289,136.99BB BIOTECH NAM.AKT28,732 4,045,465.60 1.32CHF 3,747,236.80BUCHER INDUSTRIES NAMEN AKT17,571 4,550,889.00 1.48CHF 3,560,573.72CALIDA HOLDING -NAMEN90,221 2,539,721.15 0.83CHF 2,263,171.77CICOREL TECHNOLOGIES ACT. NOM.35,518 1,225,371.00 0.40CHF 1,511,963.84CIE FINANCIERE RICHEMONT NAMEN AKT203,533 18,073,730.40 5.89CHF 14,720,340.37CLARIANT NAMEN AKT500,770 8,167,558.70 2.66CHF 6,460,768.90CREDIT SUISSE GROUP AG REG SHS147,411 4,019,897.97 1.31CHF 4,245,921.07DAETWYLER HOLDING AG23,785 2,946,961.50 0.96CHF 2,170,813.62DUFRY GROUP40,309 6,312,389.40 2.06CHF 5,477,285.74GAM HOLDING AG472,923 8,205,214.05 2.67CHF 7,823,170.90GE MONEY BANK AG24,209 1,417,436.95 0.46CHF 1,261,204.00GEBERIT AG26,792 7,247,236.00 2.36CHF 5,744,638.72GEORG FISCHER REG.10,657 6,687,267.50 2.18CHF 5,020,886.20IMPLENIA AG65,518 4,261,945.90 1.39CHF 2,709,940.78INFINICON HOLDING AG NAM.AKT13,033 4,480,093.75 1.46CHF 1,998,407.07KOMAX HOLDING NAMEN24,808 3,356,522.40 1.09CHF 2,640,076.54LEONTEQ AG72,992 7,810,144.00 2.54CHF 3,495,331.91LONZA GROUP NOM.49,574 4,193,960.40 1.37CHF 3,758,719.76NESTLE SA REG SHS191,111 12,479,548.30 4.06CHF 10,142,608.25NOVARTIS AG REG SHS224,439 15,980,056.80 5.20CHF 13,130,208.02OC OERLIKON CORP NAMEN-AKT.283,381 3,783,136.35 1.23CHF 3,369,005.63PARTNERS GROUP HLDG NAMEN AKT33,908 8,066,713.20 2.63CHF 6,137,721.54ROCHE HOLDING AG GENUSSSCHEIN82,332 20,517,134.40 6.68CHF 14,801,730.43SIKA2,407 7,632,597.00 2.49CHF 5,365,389.61SWISS LIFE HOLDING N-NAMEN REGISTERED56,829 10,524,730.80 3.43CHF 8,898,855.66SWISS RE NAMEN AKT188,564 15,471,676.20 5.04CHF 12,175,671.39SWISSLOG HOLDING AG REG.SHS982,599 1,120,162.86 0.36CHF 1,176,832.00THE SWATCH GROUP19,632 11,573,064.00 3.77CHF 9,598,406.03THE SWATCH GROUP REG45,933 4,611,673.20 1.50CHF 3,756,478.97UBS SA REG SHS493,569 8,351,187.48 2.72CHF 8,836,660.82VZ HOLDING AG14,934 2,485,017.60 0.81CHF 1,554,537.37
AMERICAN EXPRESS CO COM.64,526 5,206,735.44 1.70USD 3,837,443.86US Dollar 16,359,220.40 5.3310,288,032.17
MASTERCARD INC -A-8,010 5,951,658.91 1.94USD 3,204,526.85VISA INC -A-26,261 5,200,826.05 1.69USD 3,246,061.46
Total investments in securities 301,356,485.61 98.14242,087,814.26
Cash at banks/(bank liabilities) 6,534,459.90 2.13
Other net assets/(liabilities) -820,702.26 -0.27
Total 307,070,243.25 100.00
Statement of investments and other net assets as at 31/12/2013CHFExpressed in
UBAM - SWISS EQUITY
Number/nom. value Description Currency % of total
net assetsMarket valueCost
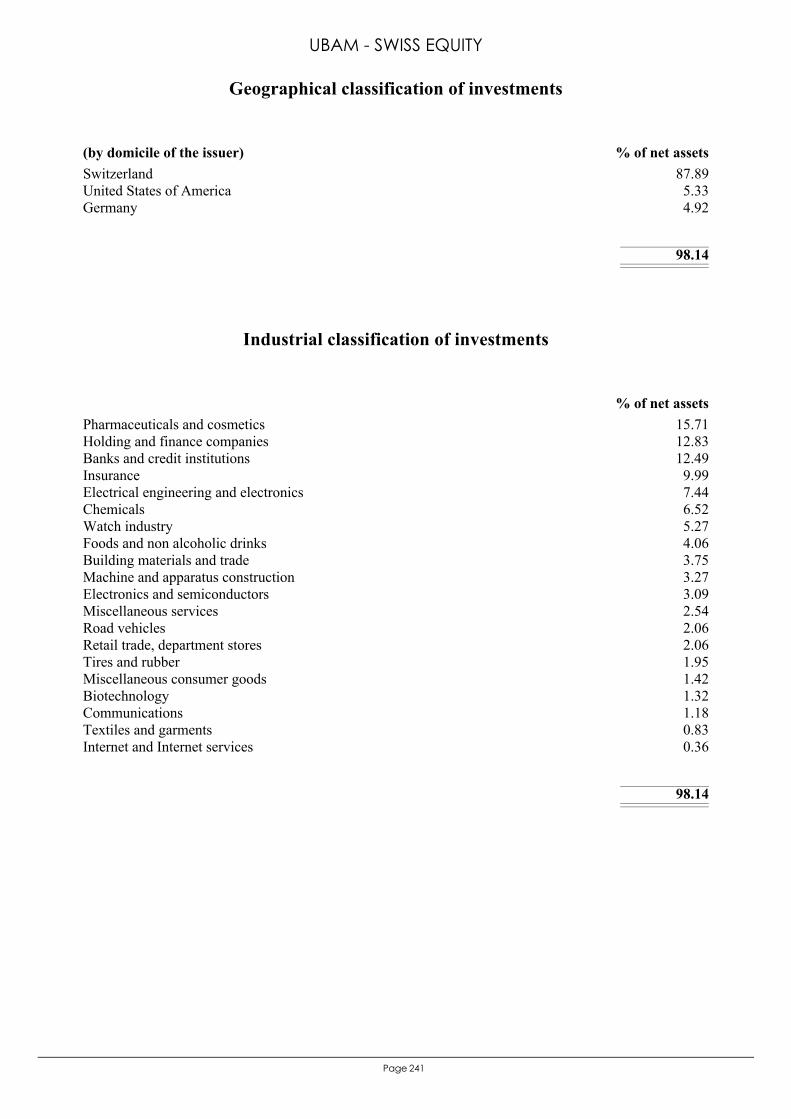
241Page
Switzerland 87.89United States of America 5.33Germany 4.92
98.14
(by domicile of the issuer) % of net assets
Geographical classification of investments
UBAM - SWISS EQUITY
Pharmaceuticals and cosmetics 15.71Holding and finance companies 12.83Banks and credit institutions 12.49Insurance 9.99Electrical engineering and electronics 7.44Chemicals 6.52Watch industry 5.27Foods and non alcoholic drinks 4.06Building materials and trade 3.75Machine and apparatus construction 3.27Electronics and semiconductors 3.09Miscellaneous services 2.54Road vehicles 2.06Retail trade, department stores 2.06Tires and rubber 1.95Miscellaneous consumer goods 1.42Biotechnology 1.32Communications 1.18Textiles and garments 0.83Internet and Internet services 0.36
98.14
% of net assets
Industrial classification of investments
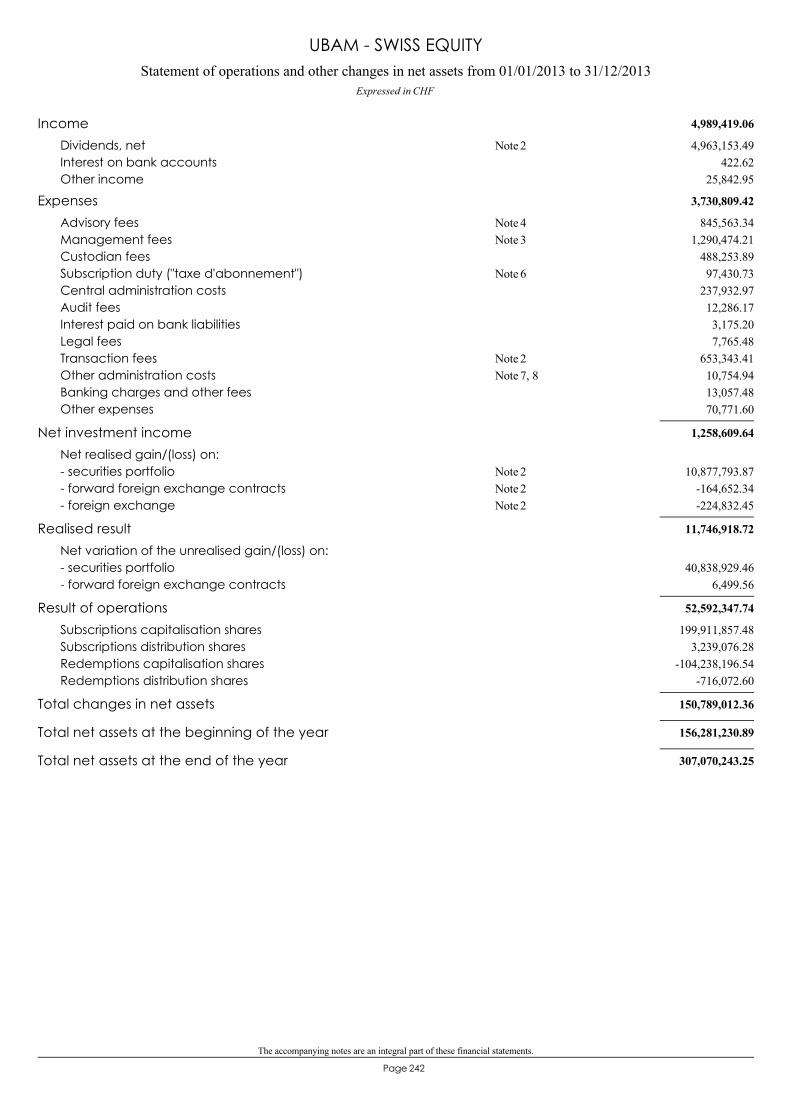
The accompanying notes are an integral part of these financial statements.
242Page
Statement of operations and other changes in net assets from 01/01/2013 to 31/12/2013Expressed in CHF
UBAM - SWISS EQUITY
4,989,419.06Income4,963,153.49Dividends, net 2Note
422.62Interest on bank accounts25,842.95Other income
3,730,809.42Expenses845,563.34Advisory fees 4Note
1,290,474.21Management fees 3Note488,253.89Custodian fees97,430.73Subscription duty ("taxe d'abonnement") 6Note
237,932.97Central administration costs12,286.17Audit fees3,175.20Interest paid on bank liabilities7,765.48Legal fees
653,343.41Transaction fees 2Note10,754.94Other administration costs 7, 8Note13,057.48Banking charges and other fees70,771.60Other expenses
1,258,609.64Net investment incomeNet realised gain/(loss) on:
10,877,793.87- securities portfolio 2Note-164,652.34- forward foreign exchange contracts 2Note-224,832.45- foreign exchange 2Note
11,746,918.72Realised resultNet variation of the unrealised gain/(loss) on:
40,838,929.46- securities portfolio6,499.56- forward foreign exchange contracts
52,592,347.74Result of operations199,911,857.48Subscriptions capitalisation shares
3,239,076.28Subscriptions distribution shares-104,238,196.54Redemptions capitalisation shares
-716,072.60Redemptions distribution shares
150,789,012.36Total changes in net assets
156,281,230.89Total net assets at the beginning of the year
307,070,243.25Total net assets at the end of the year
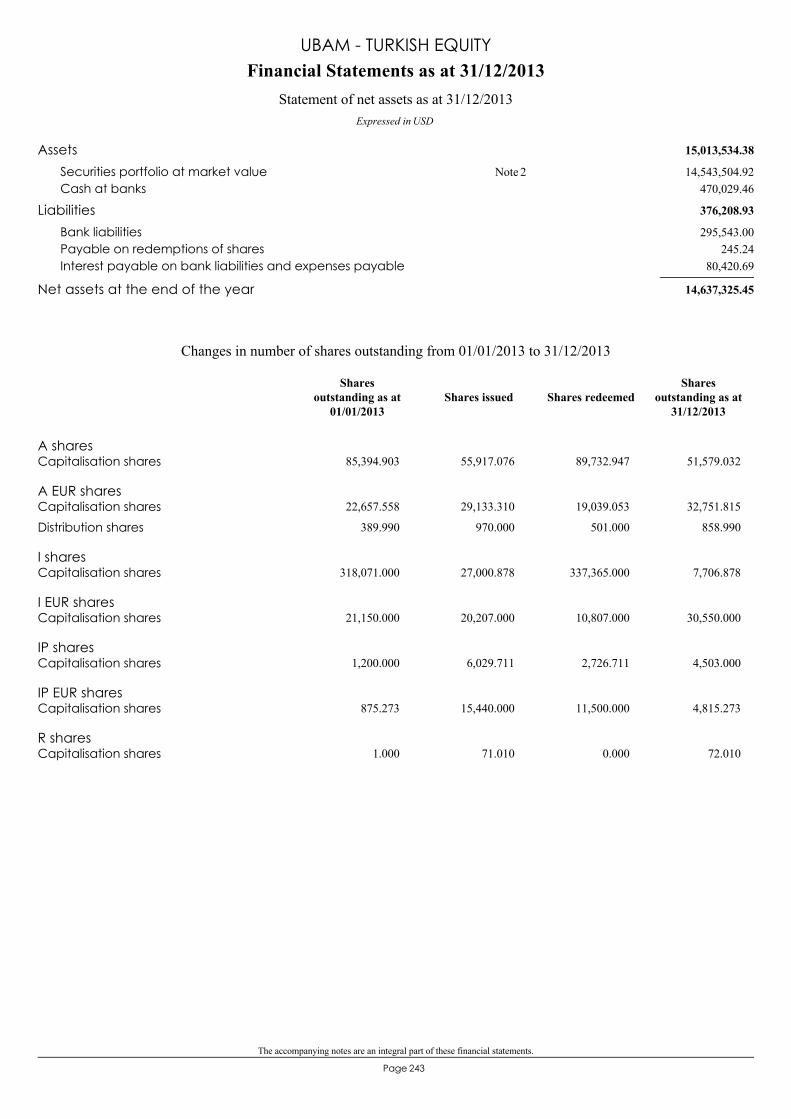
The accompanying notes are an integral part of these financial statements.
243Page
15,013,534.38Assets14,543,504.92Securities portfolio at market value 2Note
470,029.46Cash at banks
376,208.93Liabilities295,543.00Bank liabilities
245.24Payable on redemptions of shares80,420.69Interest payable on bank liabilities and expenses payable
14,637,325.45Net assets at the end of the year
Financial Statements as at 31/12/2013
Expressed in USD
Statement of net assets as at 31/12/2013
UBAM - TURKISH EQUITY
A sharesCapitalisation shares 85,394.903 55,917.076 89,732.947 51,579.032
A EUR sharesCapitalisation shares 22,657.558 29,133.310 19,039.053 32,751.815
Distribution shares 389.990 970.000 501.000 858.990
I sharesCapitalisation shares 318,071.000 27,000.878 337,365.000 7,706.878
I EUR sharesCapitalisation shares 21,150.000 20,207.000 10,807.000 30,550.000
IP sharesCapitalisation shares 1,200.000 6,029.711 2,726.711 4,503.000
IP EUR sharesCapitalisation shares 875.273 15,440.000 11,500.000 4,815.273
R sharesCapitalisation shares 1.000 71.010 0.000 72.010
Changes in number of shares outstanding from 01/01/2013 to 31/12/2013
Shares issued Shares redeemedShares
outstanding as at31/12/2013
Sharesoutstanding as at
01/01/2013

The accompanying notes are an integral part of these financial statements.
244Page
Key figures relating to the last 3 years
UBAM - TURKISH EQUITY
A shares
Capitalisation shares51,579.032
95.1585,394.903
127.6063,922.056
77.50Number of shares outstandingNet asset value per share
USD USD USD
A EUR shares
Capitalisation shares32,751.815
88.2322,657.558
123.6830,287.558
76.28Number of shares outstandingNet asset value per share
Distribution shares858.99087.55
-
389.990122.720.73
310.99076.29
-
Number of shares outstandingNet asset value per shareDividend per share
EUR EUR EUR
I shares
Capitalisation shares7,706.878
97.69318,071.000
130.04426,343.000
78.39Number of shares outstandingNet asset value per share
USD USD USD
I EUR shares
Capitalisation shares30,550.000
91.1721,150.000
126.8621,150.000
77.67Number of shares outstandingNet asset value per share
EUR EUR EUR
IP shares
Capitalisation shares4,503.000
97.411,200.000
129.071,200.000
78.76Number of shares outstandingNet asset value per share
USD USD USD
IP EUR shares
Capitalisation shares4,815.273
91.63875.273127.02
6,900.00077.86
Number of shares outstandingNet asset value per share
EUR EUR EUR
R shares
Capitalisation shares72.01094.22
1.000127.15
--
Number of shares outstandingNet asset value per share
USD USD USD
Total net assets 14,637,325.45 59,856,077.45 44,329,820.78
31/12/201131/12/201231/12/2013Year ending as at:
USD USD USD
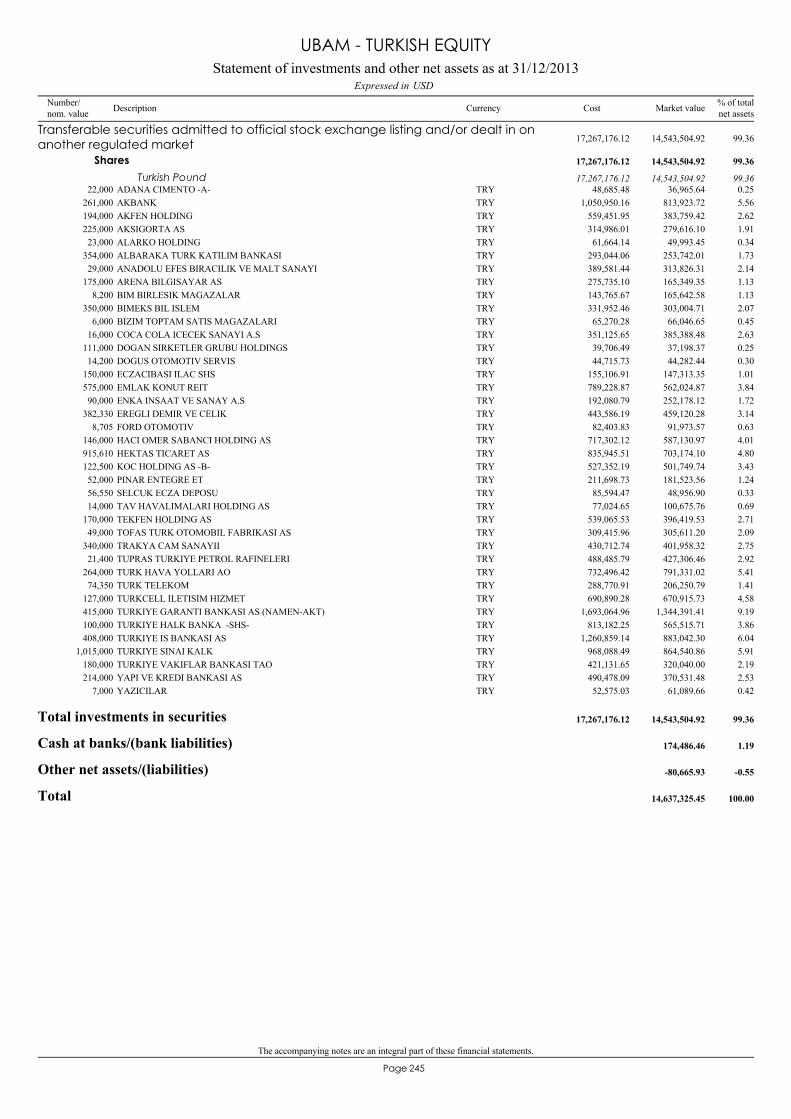
The accompanying notes are an integral part of these financial statements.
245Page
ADANA CIMENTO -A-22,000 36,965.64 0.25TRY 48,685.48
Transferable securities admitted to official stock exchange listing and/or dealt in onanother regulated market 14,543,504.92 99.3617,267,176.12
Shares 14,543,504.92 99.3617,267,176.12
Turkish Pound 14,543,504.92 99.3617,267,176.12
AKBANK261,000 813,923.72 5.56TRY 1,050,950.16AKFEN HOLDING194,000 383,759.42 2.62TRY 559,451.95AKSIGORTA AS225,000 279,616.10 1.91TRY 314,986.01ALARKO HOLDING23,000 49,993.45 0.34TRY 61,664.14ALBARAKA TURK KATILIM BANKASI354,000 253,742.01 1.73TRY 293,044.06ANADOLU EFES BIRACILIK VE MALT SANAYI29,000 313,826.31 2.14TRY 389,581.44ARENA BILGISAYAR AS175,000 165,349.35 1.13TRY 275,735.10BIM BIRLESIK MAGAZALAR8,200 165,642.58 1.13TRY 143,765.67BIMEKS BIL ISLEM350,000 303,004.71 2.07TRY 331,952.46BIZIM TOPTAM SATIS MAGAZALARI6,000 66,046.65 0.45TRY 65,270.28COCA COLA ICECEK SANAYI A.S16,000 385,388.48 2.63TRY 351,125.65DOGAN SIRKETLER GRUBU HOLDINGS111,000 37,198.37 0.25TRY 39,706.49DOGUS OTOMOTIV SERVIS14,200 44,282.44 0.30TRY 44,715.73ECZACIBASI ILAC SHS150,000 147,313.35 1.01TRY 155,106.91EMLAK KONUT REIT575,000 562,024.87 3.84TRY 789,228.87ENKA INSAAT VE SANAY A.S90,000 252,178.12 1.72TRY 192,080.79EREGLI DEMIR VE CELIK382,330 459,120.28 3.14TRY 443,586.19FORD OTOMOTIV8,705 91,973.57 0.63TRY 82,403.83HACI OMER SABANCI HOLDING AS146,000 587,130.97 4.01TRY 717,302.12HEKTAS TICARET AS915,610 703,174.10 4.80TRY 835,945.51KOC HOLDING AS -B-122,500 501,749.74 3.43TRY 527,352.19PINAR ENTEGRE ET52,000 181,523.56 1.24TRY 211,698.73SELCUK ECZA DEPOSU56,550 48,956.90 0.33TRY 85,594.47TAV HAVALIMALARI HOLDING AS14,000 100,675.76 0.69TRY 77,024.65TEKFEN HOLDING AS170,000 396,419.53 2.71TRY 539,065.53TOFAS TURK OTOMOBIL FABRIKASI AS49,000 305,611.20 2.09TRY 309,415.96TRAKYA CAM SANAYII340,000 401,958.32 2.75TRY 430,712.74TUPRAS TURKIYE PETROL RAFINELERI21,400 427,306.46 2.92TRY 488,485.79TURK HAVA YOLLARI AO264,000 791,331.02 5.41TRY 732,496.42TURK TELEKOM74,350 206,250.79 1.41TRY 288,770.91TURKCELL ILETISIM HIZMET127,000 670,915.73 4.58TRY 690,890.28TURKIYE GARANTI BANKASI AS (NAMEN-AKT)415,000 1,344,391.41 9.19TRY 1,693,064.96TURKIYE HALK BANKA -SHS-100,000 565,515.71 3.86TRY 813,182.25TURKIYE IS BANKASI AS408,000 883,042.30 6.04TRY 1,260,859.14TURKIYE SINAI KALK1,015,000 864,540.86 5.91TRY 968,088.49TURKIYE VAKIFLAR BANKASI TAO180,000 320,040.00 2.19TRY 421,131.65YAPI VE KREDI BANKASI AS214,000 370,531.48 2.53TRY 490,478.09YAZICILAR7,000 61,089.66 0.42TRY 52,575.03
Total investments in securities 14,543,504.92 99.3617,267,176.12
Cash at banks/(bank liabilities) 174,486.46 1.19
Other net assets/(liabilities) -80,665.93 -0.55
Total 14,637,325.45 100.00
Statement of investments and other net assets as at 31/12/2013USDExpressed in
UBAM - TURKISH EQUITY
Number/nom. value Description Currency % of total
net assetsMarket valueCost
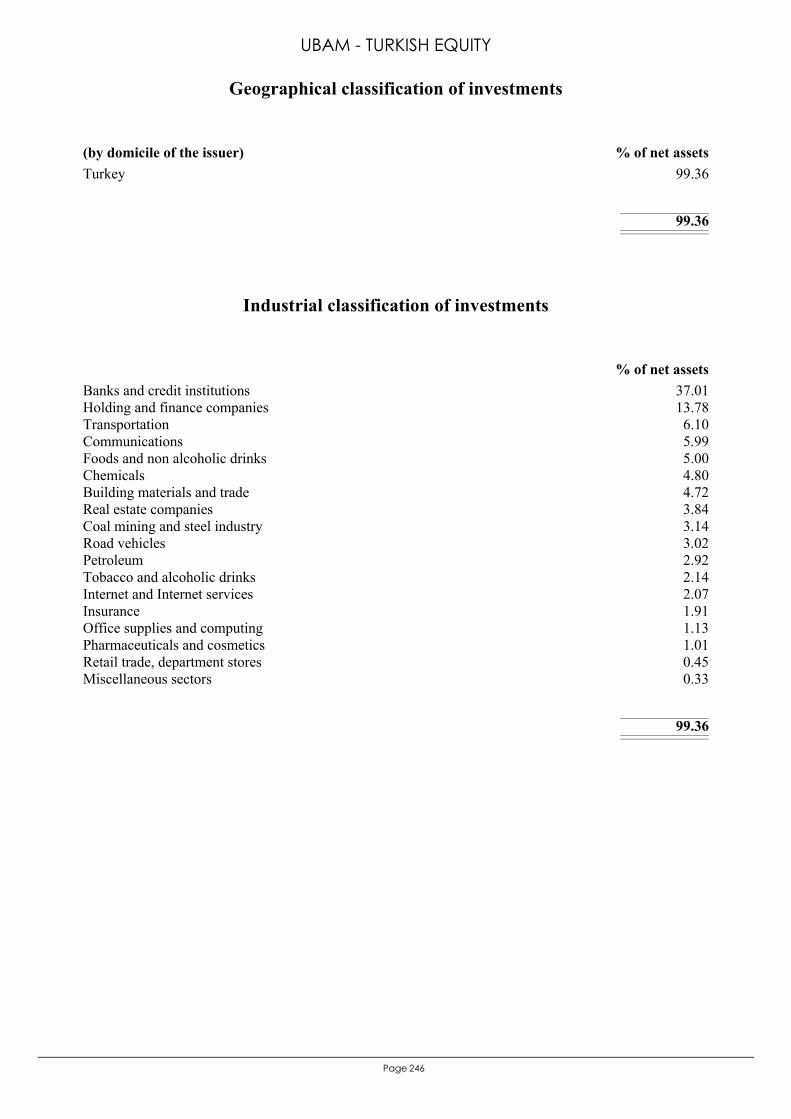
246Page
Turkey 99.36
99.36
(by domicile of the issuer) % of net assets
Geographical classification of investments
UBAM - TURKISH EQUITY
Banks and credit institutions 37.01Holding and finance companies 13.78Transportation 6.10Communications 5.99Foods and non alcoholic drinks 5.00Chemicals 4.80Building materials and trade 4.72Real estate companies 3.84Coal mining and steel industry 3.14Road vehicles 3.02Petroleum 2.92Tobacco and alcoholic drinks 2.14Internet and Internet services 2.07Insurance 1.91Office supplies and computing 1.13Pharmaceuticals and cosmetics 1.01Retail trade, department stores 0.45Miscellaneous sectors 0.33
99.36
% of net assets
Industrial classification of investments
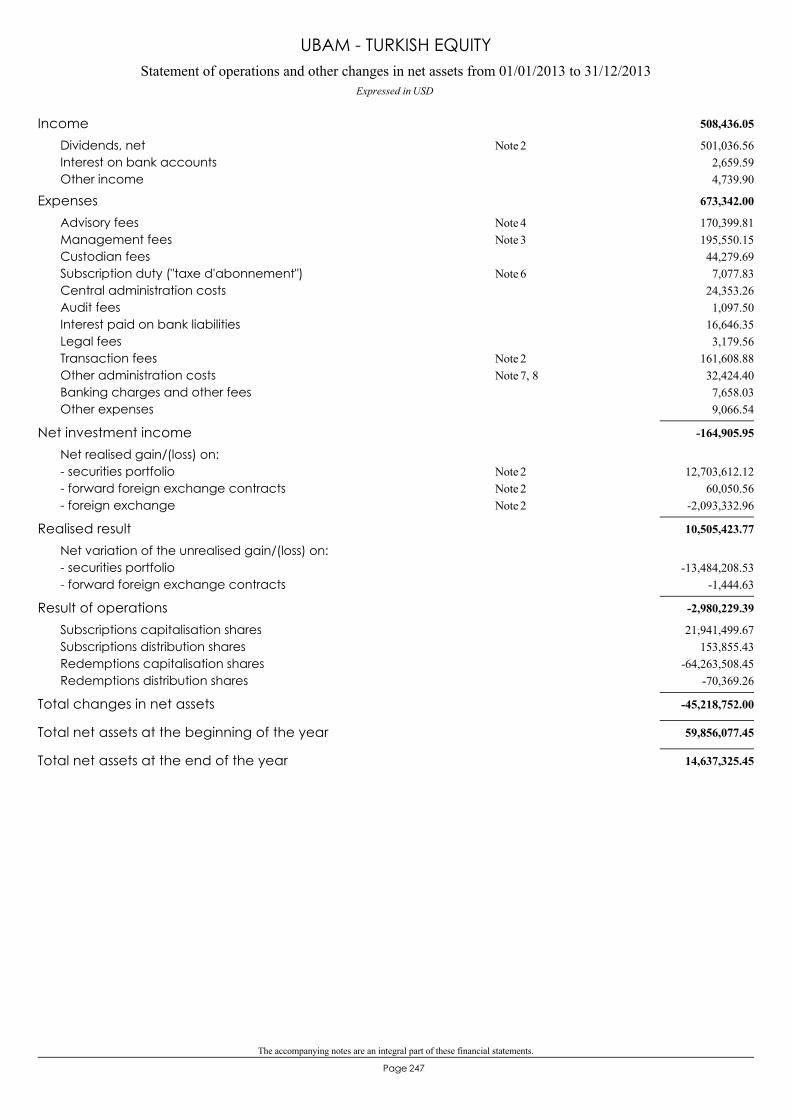
The accompanying notes are an integral part of these financial statements.
247Page
Statement of operations and other changes in net assets from 01/01/2013 to 31/12/2013Expressed in USD
UBAM - TURKISH EQUITY
508,436.05Income501,036.56Dividends, net 2Note
2,659.59Interest on bank accounts4,739.90Other income
673,342.00Expenses170,399.81Advisory fees 4Note195,550.15Management fees 3Note44,279.69Custodian fees7,077.83Subscription duty ("taxe d'abonnement") 6Note
24,353.26Central administration costs1,097.50Audit fees
16,646.35Interest paid on bank liabilities3,179.56Legal fees
161,608.88Transaction fees 2Note32,424.40Other administration costs 7, 8Note7,658.03Banking charges and other fees9,066.54Other expenses
-164,905.95Net investment incomeNet realised gain/(loss) on:
12,703,612.12- securities portfolio 2Note60,050.56- forward foreign exchange contracts 2Note
-2,093,332.96- foreign exchange 2Note
10,505,423.77Realised resultNet variation of the unrealised gain/(loss) on:
-13,484,208.53- securities portfolio-1,444.63- forward foreign exchange contracts
-2,980,229.39Result of operations21,941,499.67Subscriptions capitalisation shares
153,855.43Subscriptions distribution shares-64,263,508.45Redemptions capitalisation shares
-70,369.26Redemptions distribution shares
-45,218,752.00Total changes in net assets
59,856,077.45Total net assets at the beginning of the year
14,637,325.45Total net assets at the end of the year

The accompanying notes are an integral part of these financial statements.
248Page
AP sharesCapitalisation shares 124,855.759 7,289.949 132,145.708 0.000
IP sharesCapitalisation shares 58,060.000 10,000.000 68,060.000 0.000
R sharesCapitalisation shares 13,146.011 1,379.048 14,525.059 0.000
Changes in number of shares outstanding from 01/01/2013 to 26/04/2013
Shares issued Shares redeemedShares
outstanding as at26/04/2013
Sharesoutstanding as at
01/01/2013
UBAM - VP VALUE CHINA EQUITY (merged)
Key figures relating to the last 3 years
AP shares
Capitalisation shares--
124,855.75970.94
148,029.99564.57
Number of shares outstandingNet asset value per share
USD USD USD
AP EUR shares
Capitalisation shares--
--
500.00049.52
Number of shares outstandingNet asset value per share
EUR EUR EUR
IP shares
Capitalisation shares--
58,060.00072.12
297,723.64665.16
Number of shares outstandingNet asset value per share
USD USD USD
R shares
Capitalisation shares--
13,146.01166.25
14,818.67860.91
Number of shares outstandingNet asset value per share
USD USD USD
Total net assets - 13,915,782.62 29,892,092.89
31/12/201131/12/201226/04/2013Period/Year ending as at:
USD USD USD

The accompanying notes are an integral part of these financial statements.
249Page
Statement of operations and other changes in net assets from 01/01/2013 to 26/04/2013Expressed in USD
UBAM - VP VALUE CHINA EQUITY (merged)
22,954.84Income12,445.83Dividends, net 2Note
78.05Interest on bank accounts10,430.96Other income
319,446.42Expenses43,277.71Advisory fees 4Note16,280.57Management fees 3Note10,270.70Custodian fees1,671.56Subscription duty ("taxe d'abonnement") 6Note4,083.09Central administration costs
161.61Audit fees152.48Interest paid on bank liabilities342.14Legal fees
219,956.88Transaction fees 2Note9,049.69Other administration costs 7, 8Note
2.37Banking charges and other fees14,197.62Other expenses
-296,491.58Net investment incomeNet realised gain/(loss) on:
1,170,609.37- securities portfolio 2Note-40,345.39- foreign exchange 2Note
833,772.40Realised resultNet variation of the unrealised gain/(loss) on:
-655,886.81- securities portfolio
177,885.59Result of operations1,376,718.09Subscriptions capitalisation shares
-15,470,386.30Redemptions capitalisation shares
-13,915,782.62Total changes in net assets
13,915,782.62Total net assets at the beginning of the period
0.00Total net assets at the end of the period
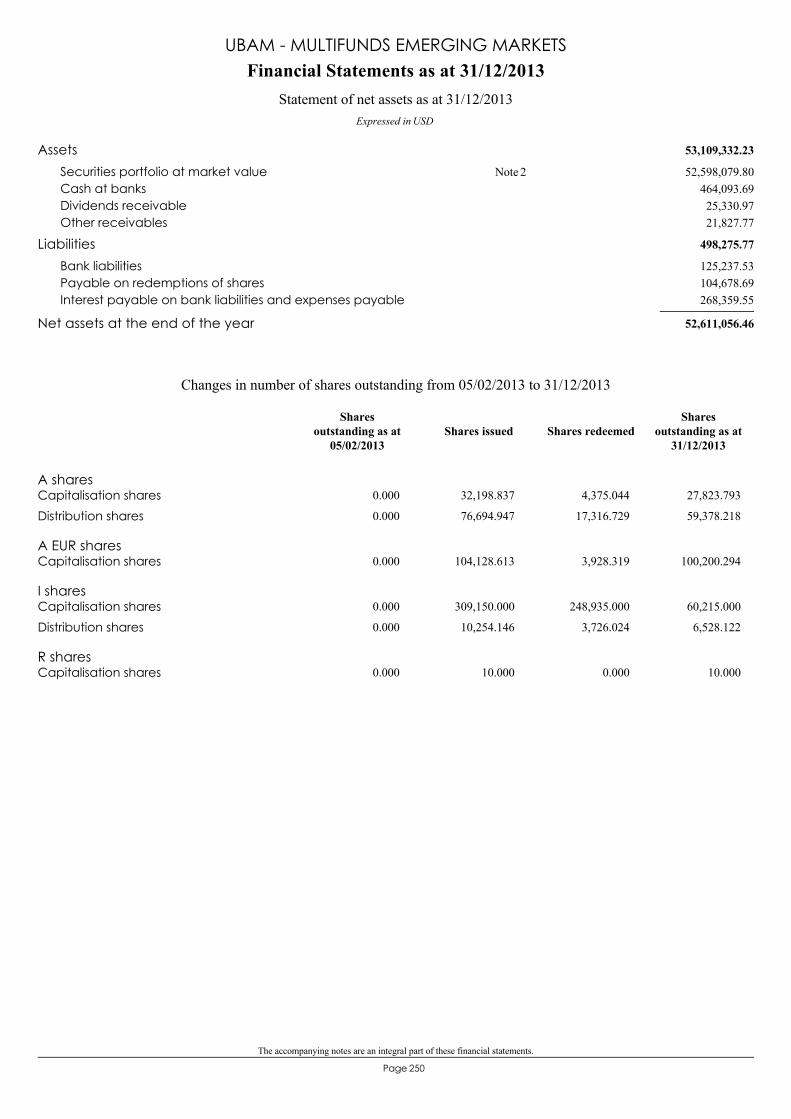
The accompanying notes are an integral part of these financial statements.
250Page
53,109,332.23Assets52,598,079.80Securities portfolio at market value 2Note
464,093.69Cash at banks25,330.97Dividends receivable21,827.77Other receivables
498,275.77Liabilities125,237.53Bank liabilities104,678.69Payable on redemptions of shares268,359.55Interest payable on bank liabilities and expenses payable
52,611,056.46Net assets at the end of the year
Financial Statements as at 31/12/2013
Expressed in USD
Statement of net assets as at 31/12/2013
UBAM - MULTIFUNDS EMERGING MARKETS
A sharesCapitalisation shares 0.000 32,198.837 4,375.044 27,823.793
Distribution shares 0.000 76,694.947 17,316.729 59,378.218
A EUR sharesCapitalisation shares 0.000 104,128.613 3,928.319 100,200.294
I sharesCapitalisation shares 0.000 309,150.000 248,935.000 60,215.000
Distribution shares 0.000 10,254.146 3,726.024 6,528.122
R sharesCapitalisation shares 0.000 10.000 0.000 10.000
Changes in number of shares outstanding from 05/02/2013 to 31/12/2013
Shares issued Shares redeemedShares
outstanding as at31/12/2013
Sharesoutstanding as at
05/02/2013
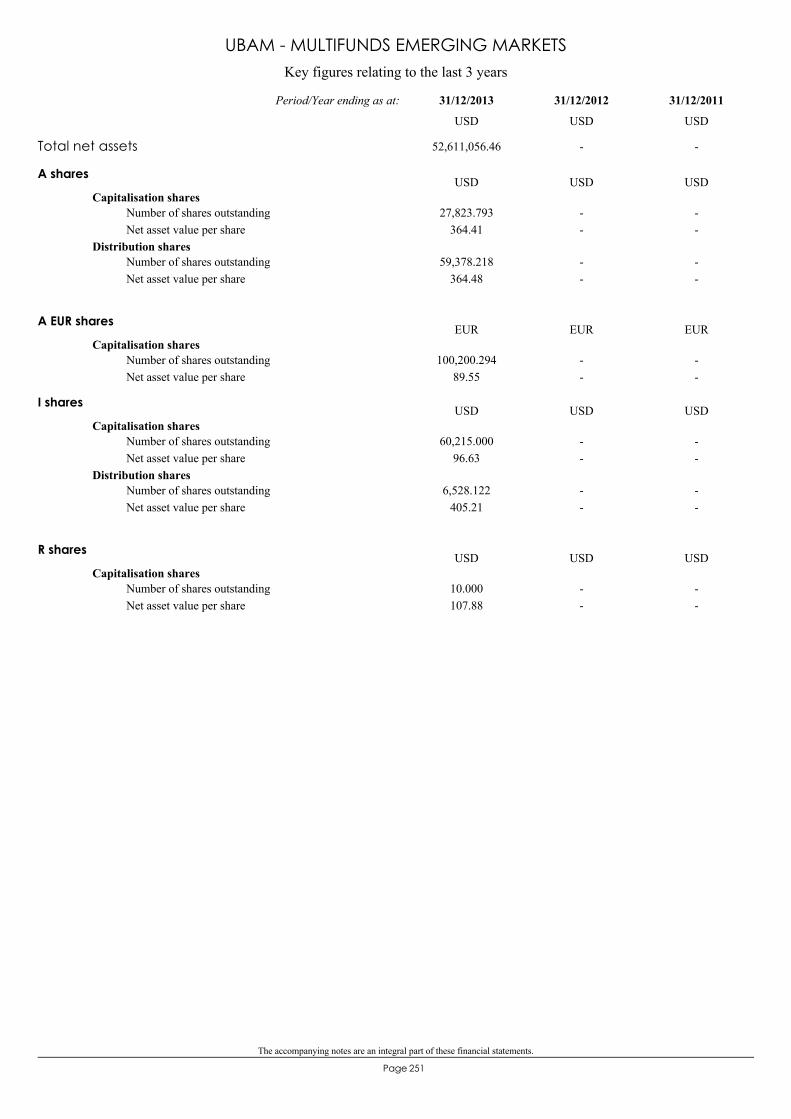
The accompanying notes are an integral part of these financial statements.
251Page
Key figures relating to the last 3 years
UBAM - MULTIFUNDS EMERGING MARKETS
A shares
Capitalisation shares27,823.793
364.41--
--
Number of shares outstandingNet asset value per share
Distribution shares59,378.218
364.48--
--
Number of shares outstandingNet asset value per share
USD USD USD
A EUR shares
Capitalisation shares100,200.294
89.55--
--
Number of shares outstandingNet asset value per share
EUR EUR EUR
I shares
Capitalisation shares60,215.000
96.63--
--
Number of shares outstandingNet asset value per share
Distribution shares6,528.122
405.21--
--
Number of shares outstandingNet asset value per share
USD USD USD
R shares
Capitalisation shares10.000107.88
--
--
Number of shares outstandingNet asset value per share
USD USD USD
Total net assets 52,611,056.46 - -
31/12/201131/12/201231/12/2013Period/Year ending as at:
USD USD USD
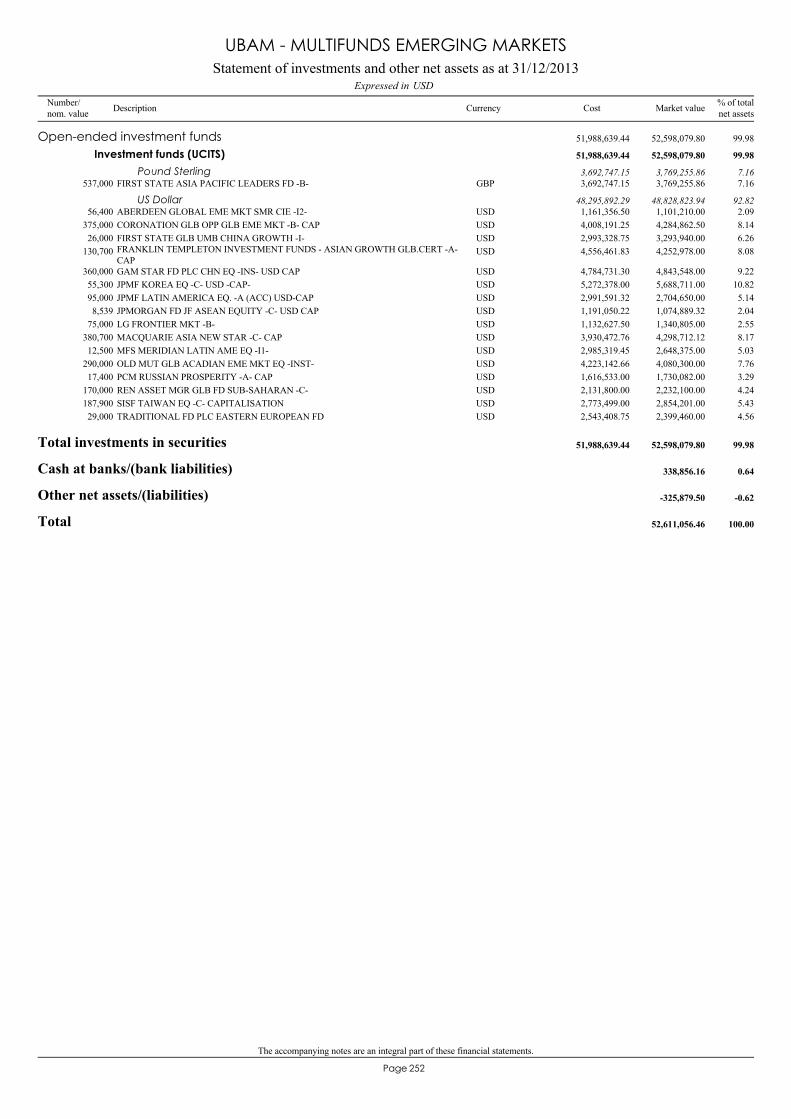
The accompanying notes are an integral part of these financial statements.
252Page
FIRST STATE ASIA PACIFIC LEADERS FD -B-537,000 3,769,255.86 7.16GBP 3,692,747.15
Open-ended investment funds 52,598,079.80 99.9851,988,639.44
Investment funds (UCITS) 52,598,079.80 99.9851,988,639.44
Pound Sterling 3,769,255.86 7.163,692,747.15
ABERDEEN GLOBAL EME MKT SMR CIE -I2-56,400 1,101,210.00 2.09USD 1,161,356.50US Dollar 48,828,823.94 92.8248,295,892.29
CORONATION GLB OPP GLB EME MKT -B- CAP375,000 4,284,862.50 8.14USD 4,008,191.25FIRST STATE GLB UMB CHINA GROWTH -I-26,000 3,293,940.00 6.26USD 2,993,328.75FRANKLIN TEMPLETON INVESTMENT FUNDS - ASIAN GROWTH GLB.CERT -A-CAP
130,700 4,252,978.00 8.08USD 4,556,461.83
GAM STAR FD PLC CHN EQ -INS- USD CAP360,000 4,843,548.00 9.22USD 4,784,731.30JPMF KOREA EQ -C- USD -CAP-55,300 5,688,711.00 10.82USD 5,272,378.00JPMF LATIN AMERICA EQ. -A (ACC) USD-CAP95,000 2,704,650.00 5.14USD 2,991,591.32JPMORGAN FD JF ASEAN EQUITY -C- USD CAP8,539 1,074,889.32 2.04USD 1,191,050.22LG FRONTIER MKT -B-75,000 1,340,805.00 2.55USD 1,132,627.50MACQUARIE ASIA NEW STAR -C- CAP380,700 4,298,712.12 8.17USD 3,930,472.76MFS MERIDIAN LATIN AME EQ -I1-12,500 2,648,375.00 5.03USD 2,985,319.45OLD MUT GLB ACADIAN EME MKT EQ -INST-290,000 4,080,300.00 7.76USD 4,223,142.66PCM RUSSIAN PROSPERITY -A- CAP17,400 1,730,082.00 3.29USD 1,616,533.00REN ASSET MGR GLB FD SUB-SAHARAN -C-170,000 2,232,100.00 4.24USD 2,131,800.00SISF TAIWAN EQ -C- CAPITALISATION187,900 2,854,201.00 5.43USD 2,773,499.00TRADITIONAL FD PLC EASTERN EUROPEAN FD29,000 2,399,460.00 4.56USD 2,543,408.75
Total investments in securities 52,598,079.80 99.9851,988,639.44
Cash at banks/(bank liabilities) 338,856.16 0.64
Other net assets/(liabilities) -325,879.50 -0.62
Total 52,611,056.46 100.00
Statement of investments and other net assets as at 31/12/2013USDExpressed in
UBAM - MULTIFUNDS EMERGING MARKETS
Number/nom. value Description Currency % of total
net assetsMarket valueCost
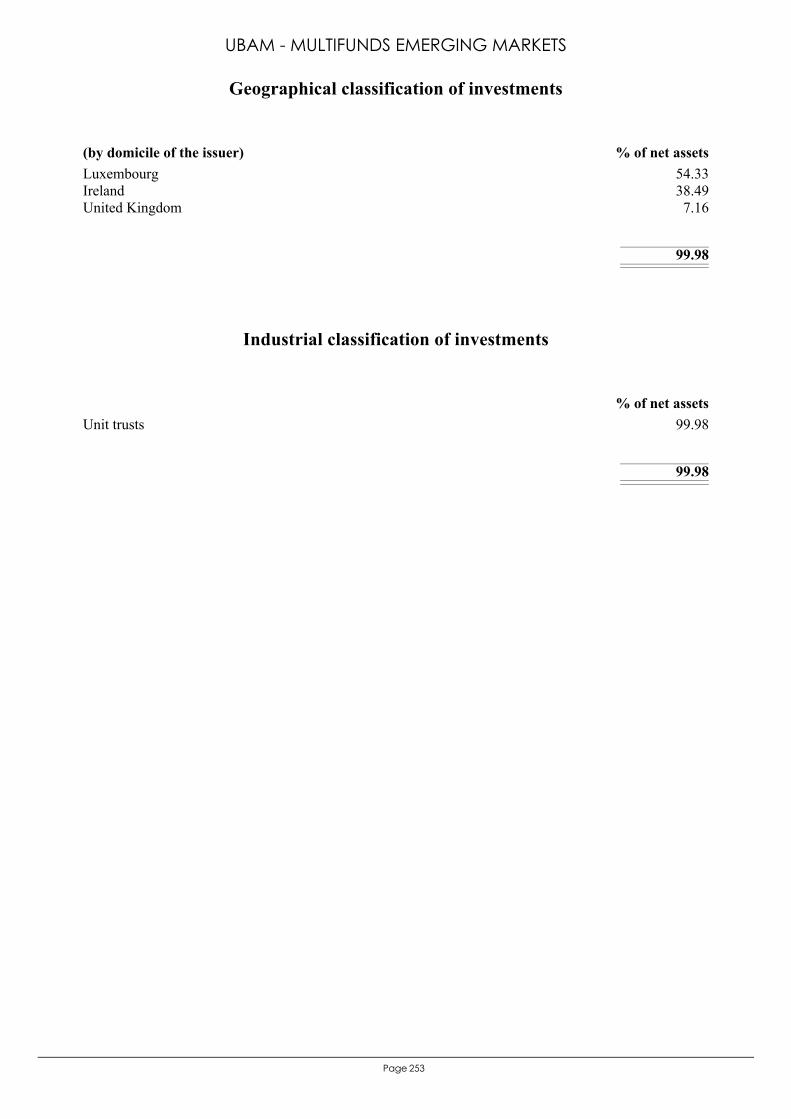
253Page
Luxembourg 54.33Ireland 38.49United Kingdom 7.16
99.98
(by domicile of the issuer) % of net assets
Geographical classification of investments
UBAM - MULTIFUNDS EMERGING MARKETS
Unit trusts 99.98
99.98
% of net assets
Industrial classification of investments
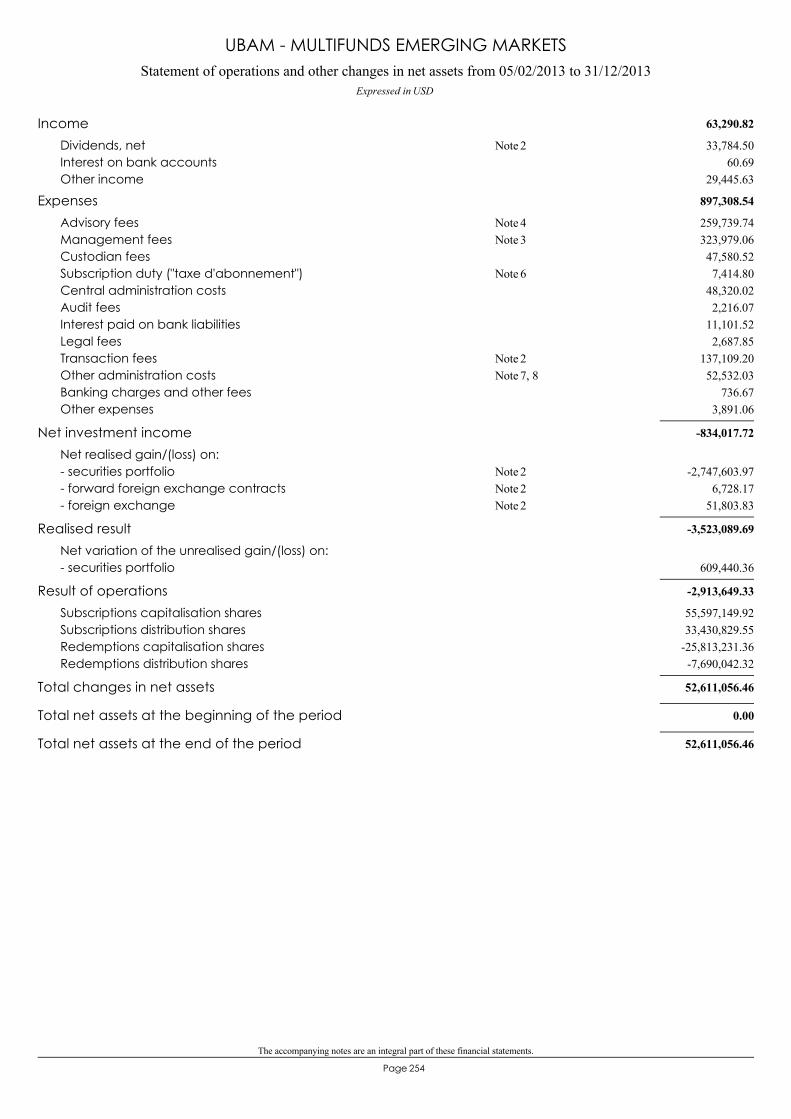
The accompanying notes are an integral part of these financial statements.
254Page
Statement of operations and other changes in net assets from 05/02/2013 to 31/12/2013Expressed in USD
UBAM - MULTIFUNDS EMERGING MARKETS
63,290.82Income33,784.50Dividends, net 2Note
60.69Interest on bank accounts29,445.63Other income
897,308.54Expenses259,739.74Advisory fees 4Note323,979.06Management fees 3Note47,580.52Custodian fees7,414.80Subscription duty ("taxe d'abonnement") 6Note
48,320.02Central administration costs2,216.07Audit fees
11,101.52Interest paid on bank liabilities2,687.85Legal fees
137,109.20Transaction fees 2Note52,532.03Other administration costs 7, 8Note
736.67Banking charges and other fees3,891.06Other expenses
-834,017.72Net investment incomeNet realised gain/(loss) on:
-2,747,603.97- securities portfolio 2Note6,728.17- forward foreign exchange contracts 2Note
51,803.83- foreign exchange 2Note
-3,523,089.69Realised resultNet variation of the unrealised gain/(loss) on:
609,440.36- securities portfolio
-2,913,649.33Result of operations55,597,149.92Subscriptions capitalisation shares33,430,829.55Subscriptions distribution shares
-25,813,231.36Redemptions capitalisation shares-7,690,042.32Redemptions distribution shares
52,611,056.46Total changes in net assets
0.00Total net assets at the beginning of the period
52,611,056.46Total net assets at the end of the period
UBAM
Notes to the financial statements as at 31st December 2013
Page 255
Note 1 - General Information UBAM (hereinafter the "SICAV") is a variable capital investment company incorporated in Luxembourg on 6th December 1990 in accordance with the legislation of the Grand Duchy of Luxembourg, subject to Part I of the law of 17th December 2010 relating to undertakings for collective investment (the "2010 Law"), as amended.
The SICAV complied with article 27 of the 2010 Law and had the status of a self-managed SICAV until 31st August 2013, on 1st September UBP Asset Management (Europe) S.A. was appointed as the Management Company of the SICAV. The objective of the SICAV is to offer its shareholders the possibility to invest in an investment vehicle oriented towards the growth of capital invested in various transferable securities. The SICAV offers investors a choice between various sub-funds, each having different investment objectives. Each sub-fund constitutes a distinct set of assets, represented by different classes of shares. The SICAV thus constitutes a company with multiple sub-funds. The Board of Directors may at any time and in conformity with the articles of incorporation, issue classes of shares falling within other sub-funds, whose investment aims differ from those of already existing sub-funds. At the closing date, the following sub-funds are active:
- UBAM - CORPORATE EURO BOND expressed in EUR - UBAM - CORPORATE US DOLLAR BOND expressed in USD - UBAM - DYNAMIC EURO BOND (3) expressed in EUR - UBAM - DYNAMIC US DOLLAR BOND expressed in USD - UBAM - EMERGING MARKET BOND expressed in USD - UBAM - EMERGING MARKET CORPORATE BOND expressed in USD - UBAM - EM HIGH YIELD SHORT DURATION CORPORATE BOND (2)(3) expressed in USD - UBAM - GLOBAL BOND (CHF) expressed in CHF - UBAM - GLOBAL HIGH YIELD SOLUTION expressed in USD - UBAM - LOCAL CURRENCY EMERGING MARKET BOND expressed in USD - UBAM - UNCONSTRAINED BOND (2) expressed in EUR - UBAM - YIELD CURVE EURO BOND (3) expressed in EUR - UBAM - YIELD CURVE STERLING BOND (3) expressed in GBP - UBAM - YIELD CURVE US DOLLAR BOND (3) expressed in USD - UBAM - EM INVESTMENT GRADE CORPORATE BOND (2) expressed in USD - UBAM - EUROPEAN CONVERTIBLE BOND expressed in EUR - UBAM - EURO 10-40 CONVERTIBLE BOND expressed in EUR - UBAM - GLOBAL CONVERTIBLE BOND (2) expressed in EUR - UBAM - 30 GLOBAL LEADERS EQUITY (formerly UBAM - PCM GLOBAL EQUITY VALUE) (1)(3) expressed in EUR - UBAM - ASIA EQUITY (3) expressed in USD - UBAM - ASIA EQUITY HIGH DIVIDEND (2)(3) expressed in USD - UBAM - DR. EHRHARDT GERMAN EQUITY expressed in EUR - UBAM - EQUITY BRIC+ expressed in USD - UBAM - EUROPE EQUITY (3) expressed in EUR - UBAM - EUROPE EQUITY DIVIDEND+ (3) expressed in EUR - UBAM - GCM MIDCAP US EQUITY GROWTH (formerly UBAM - CALAMOS US EQUITY GROWTH) (1) expressed in USD - UBAM - IFDC JAPAN OPPORTUNITIES EQUITY expressed in JPY - UBAM - NEUBERGER BERMAN US EQUITY VALUE (3) expressed in USD - UBAM - RUSSIAN EQUITY expressed in USD - UBAM - SNAM JAPAN EQUITY VALUE (formerly UBAM - IFDC JAPAN EQUITY) (1) expressed in JPY - UBAM - SWISS EQUITY (3) expressed in CHF - UBAM - TURKISH EQUITY expressed in USD - UBAM - MULTIFUNDS EMERGING MARKETS (2)(3) expressed in USD
(1) This sub-fund’s denomination has been changed during the year, please refer to Note 17 for more details. (2) This sub-fund has been launched during the year, please refer to Note 17 for more details. (3) This sub-fund has been subject to a merger or a contribution-in-kind during the year, please refer to Note 17 for more details.
UBAM
Notes to the financial statements as at 31st December 2013 (continued)
Page 256
The sub-fund UBAM - VP VALUE CHINA EQUITY has been absorbed during the year. Please refer to Note 17 for more details. Types of shares Within each sub-fund, shareholders may be offered various Types of shares: - Type A shares; - Type I shares, reserved exclusively for institutional investors who may subscribe on their own behalf or on behalf of third parties, who must also be institutional investors. - Type R shares; - Type U shares are only available for: • United Kingdom resident investors who purchase the shares directly or; • investors who indirectly purchase the shares through a business organisation located in the United
Kingdom (such as a fund platform or wealth management firm) which provides fee based investment advisory services to investors under a separate investment management agreement; and which are pre-approved by the General Distributor, Union Bancaire Privée, UBP SA;
• others investors having received a specific approval given by the SICAV’s Board of Directors. - Type Z shares, which are reserved for institutional investors who have signed a specific
remuneration agreement with Union Bancaire Privée, UBP SA or with any other member of the UBP Group.
Shares with performance fees The Types of shares which include the letter “P” in their name bear a performance fee. Shares in currencies other than the sub-fund's base currency Classes in currencies other than the base currency of each sub-fund will be offered in EUR/CHF/USD/SEK/GBP. Depending on the sub-funds, the currency risk for the shares denominated in EUR/CHF/USD/SEK/GBP against the base currency of the sub-fund may or may not be hedged. The hedged shares will be covered largely by hedging transactions. All the costs and risks resulting from hedging transactions against the EUR/CHF/USD/SEK/GBP will be borne by the shares denominated in these currencies respectively. The shares, hedged against currency risk, are denominated with the letter “H”. The objective of the hedging transactions is to cover the exchange-related risks between the base currency of a sub-fund and the share’s currency. As an exception for UBAM - EUROPE EQUITY DIVIDEND+ and UBAM - 30 GLOBAL LEADERS EQUITY, the objective of the hedging transactions is to cover the exchange-related risks between the currencies of the sub-fund’s underlyings and the share’s currency. Shares with Duration Hedging “Duration hedged shares” will allow investors to benefit from the management of the concerned sub-fund by limiting possible impacts linked to exchange rate movements. The Duration hedged shares are denominated with the letter “S”. In 2013, the sub-funds concerned by Duration Hedging are UBAM - CORPORATE EURO BOND, UBAM - CORPORATE US DOLLAR BOND, UBAM - EMERGING MARKET BOND, UBAM - EMERGING MARKET CORPORATE BOND and UBAM - EM INVESTMENTGRADE CORPORATE BOND.
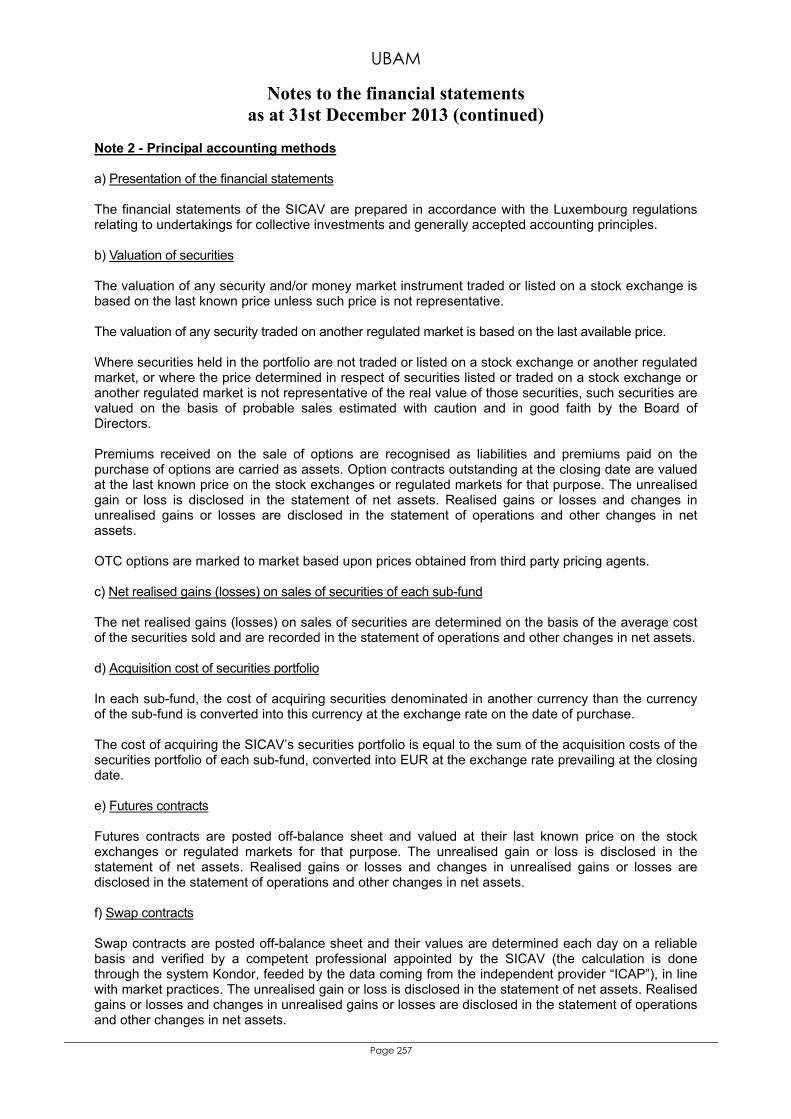
UBAM
Notes to the financial statements as at 31st December 2013 (continued)
Page 257
Note 2 - Principal accounting methods a) Presentation of the financial statements The financial statements of the SICAV are prepared in accordance with the Luxembourg regulations relating to undertakings for collective investments and generally accepted accounting principles. b) Valuation of securities The valuation of any security and/or money market instrument traded or listed on a stock exchange is based on the last known price unless such price is not representative. The valuation of any security traded on another regulated market is based on the last available price. Where securities held in the portfolio are not traded or listed on a stock exchange or another regulated market, or where the price determined in respect of securities listed or traded on a stock exchange or another regulated market is not representative of the real value of those securities, such securities are valued on the basis of probable sales estimated with caution and in good faith by the Board of Directors. Premiums received on the sale of options are recognised as liabilities and premiums paid on the purchase of options are carried as assets. Option contracts outstanding at the closing date are valued at the last known price on the stock exchanges or regulated markets for that purpose. The unrealised gain or loss is disclosed in the statement of net assets. Realised gains or losses and changes in unrealised gains or losses are disclosed in the statement of operations and other changes in net assets. OTC options are marked to market based upon prices obtained from third party pricing agents. c) Net realised gains (losses) on sales of securities of each sub-fund The net realised gains (losses) on sales of securities are determined on the basis of the average cost of the securities sold and are recorded in the statement of operations and other changes in net assets. d) Acquisition cost of securities portfolio In each sub-fund, the cost of acquiring securities denominated in another currency than the currency of the sub-fund is converted into this currency at the exchange rate on the date of purchase. The cost of acquiring the SICAV’s securities portfolio is equal to the sum of the acquisition costs of the securities portfolio of each sub-fund, converted into EUR at the exchange rate prevailing at the closing date. e) Futures contracts Futures contracts are posted off-balance sheet and valued at their last known price on the stock exchanges or regulated markets for that purpose. The unrealised gain or loss is disclosed in the statement of net assets. Realised gains or losses and changes in unrealised gains or losses are disclosed in the statement of operations and other changes in net assets. f) Swap contracts Swap contracts are posted off-balance sheet and their values are determined each day on a reliable basis and verified by a competent professional appointed by the SICAV (the calculation is done through the system Kondor, feeded by the data coming from the independent provider “ICAP”), in line with market practices. The unrealised gain or loss is disclosed in the statement of net assets. Realised gains or losses and changes in unrealised gains or losses are disclosed in the statement of operations and other changes in net assets.

UBAM
Notes to the financial statements as at 31st December 2013 (continued)
Page 258
Valuation of CDS (Credit Default Swaps) contracts is essentially depending on the issuer’s credit risk, this being defined via a spread listed in basis points. The interests to be received and to be paid on swap contracts are accrued for each net asset value calculation according to their rate, the coupon payments frequency and the maturity date of the contracts. An interest rate swap is a bilateral agreement in which each party agrees to exchange a series of interest payments for another series of interest payments (usually fixed/floating) based on notional amount that serves as a computation basis which is usually not exchanged. Interest rate swaps are marked to market at each Net Asset Value calculation date. The unrealised gain or loss is disclosed in the statement of net assets. Realised gains or losses and changes in unrealised gains or losses are disclosed in the statement of operations and other changes in net assets. g) Forward foreign exchange contracts Forward foreign exchange contracts that have not matured on the valuation date are valued on the basis of the forward rates applicable on that date. Resulting unrealised gains and losses are recorded in the statement of net assets and in the statement of operations and other changes in net assets. h) Conversion of foreign currencies Bank balances, other net assets and the valuation price of the securities portfolio expressed in currencies other than the currency of the sub-fund are converted into this currency at the exchange rate prevailing at the closing date. Income and charges expressed in currencies other than the currency of the sub-fund are converted into this currency at the exchange rate prevailing on the date of the transaction. Exchange gains and losses are recorded in the statement of operations and other changes in net assets. i) Combined statements
The various items appearing in the combined financial statements of the SICAV are equal to the sum of the corresponding items in the financial statements of each sub-fund and are drawn up in EUR.
At the closing date, the exchange rates prevailing are the following: 1 EUR = 1.22550 CHF Swiss Franc 0.83200 GBP Pound Sterling 144.82945 JPY Japanese Yen 1.37795 USD US Dollar
As at 31st December 2013, the total of cross-sub-funds’ investments amounts to EUR 6,810,714.31 and therefore total consolidated NAV at the level of the SICAV at year-end without cross-investments would amount to EUR 5,727,818,991.55 j) Income
Dividends are accounted at the ex-date. Interests are accounted on a prorata temporis basis and include amortization on zero coupon bonds. As at 31st December 2013, several bonds held in certain sub-funds of the SICAV are valued using the “dirty price” methodology (i.e. price which includes the accrued interest since the last coupon payment).
k) Receivable / payable on treasury transactions The caption "Receivable on treasury transactions" comprises maturities of time deposits, new borrowings and foreign exchange transactions not yet recorded under the caption "Cash at banks". The caption "Payable on treasury transactions" comprises new time deposits, maturities of borrowings and foreign exchange transactions not yet recorded under the caption "Cash at banks".
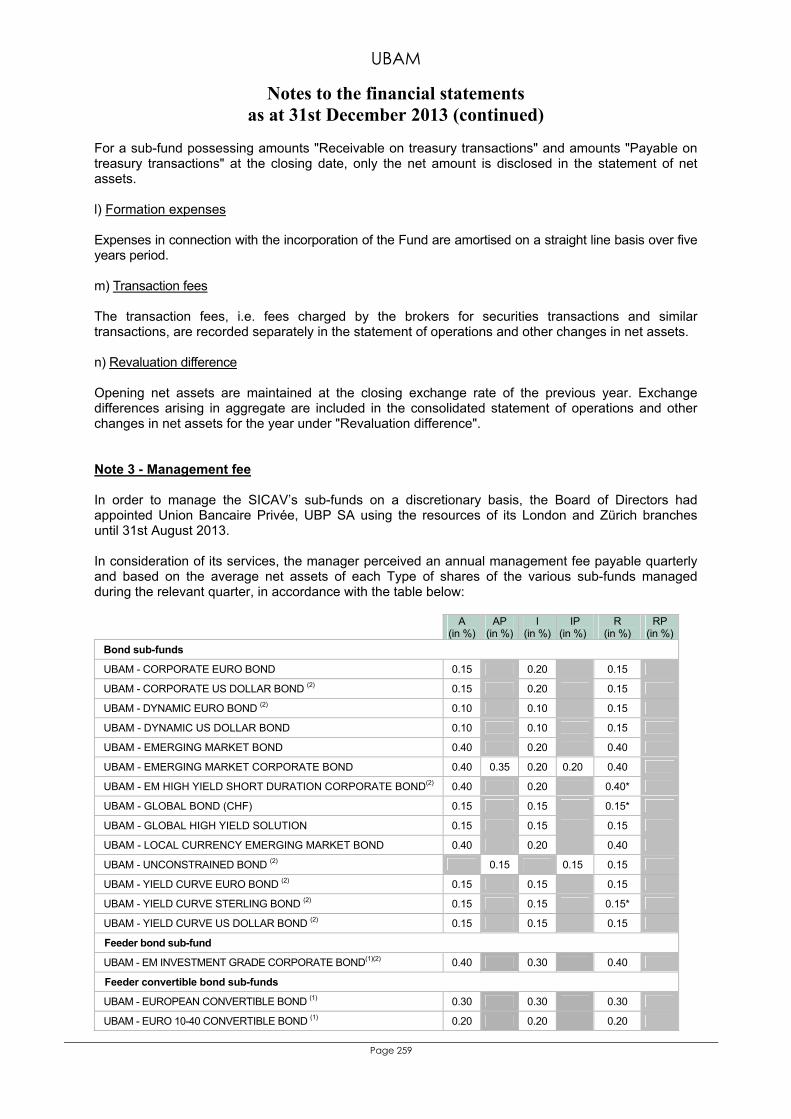
UBAM
Notes to the financial statements as at 31st December 2013 (continued)
Page 259
For a sub-fund possessing amounts "Receivable on treasury transactions" and amounts "Payable on treasury transactions" at the closing date, only the net amount is disclosed in the statement of net assets. l) Formation expenses Expenses in connection with the incorporation of the Fund are amortised on a straight line basis over five years period. m) Transaction fees The transaction fees, i.e. fees charged by the brokers for securities transactions and similar transactions, are recorded separately in the statement of operations and other changes in net assets. n) Revaluation difference Opening net assets are maintained at the closing exchange rate of the previous year. Exchange differences arising in aggregate are included in the consolidated statement of operations and other changes in net assets for the year under "Revaluation difference". Note 3 - Management fee In order to manage the SICAV’s sub-funds on a discretionary basis, the Board of Directors had appointed Union Bancaire Privée, UBP SA using the resources of its London and Zürich branches until 31st August 2013. In consideration of its services, the manager perceived an annual management fee payable quarterly and based on the average net assets of each Type of shares of the various sub-funds managed during the relevant quarter, in accordance with the table below: A
(in %)AP
(in %)I
(in %)IP
(in %) R
(in %) RP
(in %)Bond sub-funds
UBAM - CORPORATE EURO BOND 0.15 0.20 0.15
UBAM - CORPORATE US DOLLAR BOND (2) 0.15 0.20 0.15
UBAM - DYNAMIC EURO BOND (2) 0.10 0.10 0.15
UBAM - DYNAMIC US DOLLAR BOND 0.10 0.10 0.15
UBAM - EMERGING MARKET BOND 0.40 0.20 0.40
UBAM - EMERGING MARKET CORPORATE BOND 0.40 0.35 0.20 0.20 0.40
UBAM - EM HIGH YIELD SHORT DURATION CORPORATE BOND(2) 0.40 0.20 0.40*
UBAM - GLOBAL BOND (CHF) 0.15 0.15 0.15*
UBAM - GLOBAL HIGH YIELD SOLUTION 0.15 0.15 0.15
UBAM - LOCAL CURRENCY EMERGING MARKET BOND 0.40 0.20 0.40
UBAM - UNCONSTRAINED BOND (2) 0.15 0.15 0.15
UBAM - YIELD CURVE EURO BOND (2) 0.15 0.15 0.15
UBAM - YIELD CURVE STERLING BOND (2) 0.15 0.15 0.15*
UBAM - YIELD CURVE US DOLLAR BOND (2) 0.15 0.15 0.15
Feeder bond sub-fund
UBAM - EM INVESTMENT GRADE CORPORATE BOND(1)(2) 0.40 0.30 0.40
Feeder convertible bond sub-funds
UBAM - EUROPEAN CONVERTIBLE BOND (1) 0.30 0.30 0.30
UBAM - EURO 10-40 CONVERTIBLE BOND (1) 0.20 0.20 0.20
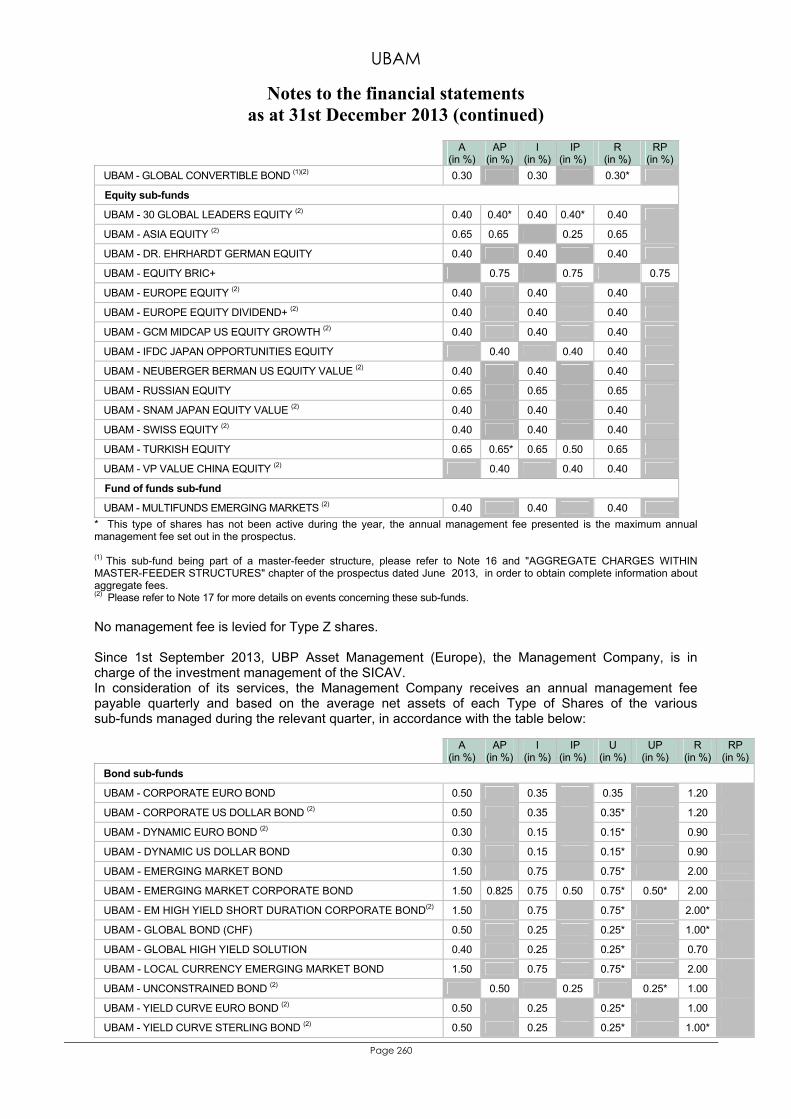
UBAM
Notes to the financial statements as at 31st December 2013 (continued)
Page 260
A (in %)
AP (in %)
I (in %)
IP (in %)
R (in %)
RP (in %)
UBAM - GLOBAL CONVERTIBLE BOND (1)(2) 0.30 0.30 0.30*
Equity sub-funds
UBAM - 30 GLOBAL LEADERS EQUITY (2) 0.40 0.40* 0.40 0.40* 0.40
UBAM - ASIA EQUITY (2) 0.65 0.65 0.25 0.65
UBAM - DR. EHRHARDT GERMAN EQUITY 0.40 0.40 0.40
UBAM - EQUITY BRIC+ 0.75 0.75 0.75
UBAM - EUROPE EQUITY (2) 0.40 0.40 0.40
UBAM - EUROPE EQUITY DIVIDEND+ (2) 0.40 0.40 0.40
UBAM - GCM MIDCAP US EQUITY GROWTH (2) 0.40 0.40 0.40
UBAM - IFDC JAPAN OPPORTUNITIES EQUITY 0.40 0.40 0.40
UBAM - NEUBERGER BERMAN US EQUITY VALUE (2) 0.40 0.40 0.40
UBAM - RUSSIAN EQUITY 0.65 0.65 0.65
UBAM - SNAM JAPAN EQUITY VALUE (2) 0.40 0.40 0.40
UBAM - SWISS EQUITY (2) 0.40 0.40 0.40
UBAM - TURKISH EQUITY 0.65 0.65* 0.65 0.50 0.65
UBAM - VP VALUE CHINA EQUITY (2) 0.40 0.40 0.40
Fund of funds sub-fund
UBAM - MULTIFUNDS EMERGING MARKETS (2) 0.40 0.40 0.40 * This type of shares has not been active during the year, the annual management fee presented is the maximum annual management fee set out in the prospectus. (1) This sub-fund being part of a master-feeder structure, please refer to Note 16 and "AGGREGATE CHARGES WITHIN MASTER-FEEDER STRUCTURES" chapter of the prospectus dated June 2013, in order to obtain complete information about aggregate fees. (2) Please refer to Note 17 for more details on events concerning these sub-funds. No management fee is levied for Type Z shares. Since 1st September 2013, UBP Asset Management (Europe), the Management Company, is in charge of the investment management of the SICAV. In consideration of its services, the Management Company receives an annual management fee payable quarterly and based on the average net assets of each Type of Shares of the varioussub-funds managed during the relevant quarter, in accordance with the table below:
A (in %)
AP (in %)
I (in %)
IP (in %)
U (in %)
UP (in %)
R (in %)
RP (in %)
Bond sub-funds
UBAM - CORPORATE EURO BOND 0.50 0.35 0.35 1.20
UBAM - CORPORATE US DOLLAR BOND (2) 0.50 0.35 0.35* 1.20
UBAM - DYNAMIC EURO BOND (2) 0.30 0.15 0.15* 0.90
UBAM - DYNAMIC US DOLLAR BOND 0.30 0.15 0.15* 0.90
UBAM - EMERGING MARKET BOND 1.50 0.75 0.75* 2.00
UBAM - EMERGING MARKET CORPORATE BOND 1.50 0.825 0.75 0.50 0.75* 0.50* 2.00
UBAM - EM HIGH YIELD SHORT DURATION CORPORATE BOND(2) 1.50 0.75 0.75* 2.00*
UBAM - GLOBAL BOND (CHF) 0.50 0.25 0.25* 1.00*
UBAM - GLOBAL HIGH YIELD SOLUTION 0.40 0.25 0.25* 0.70
UBAM - LOCAL CURRENCY EMERGING MARKET BOND 1.50 0.75 0.75* 2.00
UBAM - UNCONSTRAINED BOND (2) 0.50 0.25 0.25* 1.00
UBAM - YIELD CURVE EURO BOND (2) 0.50 0.25 0.25* 1.00
UBAM - YIELD CURVE STERLING BOND (2) 0.50 0.25 0.25* 1.00*
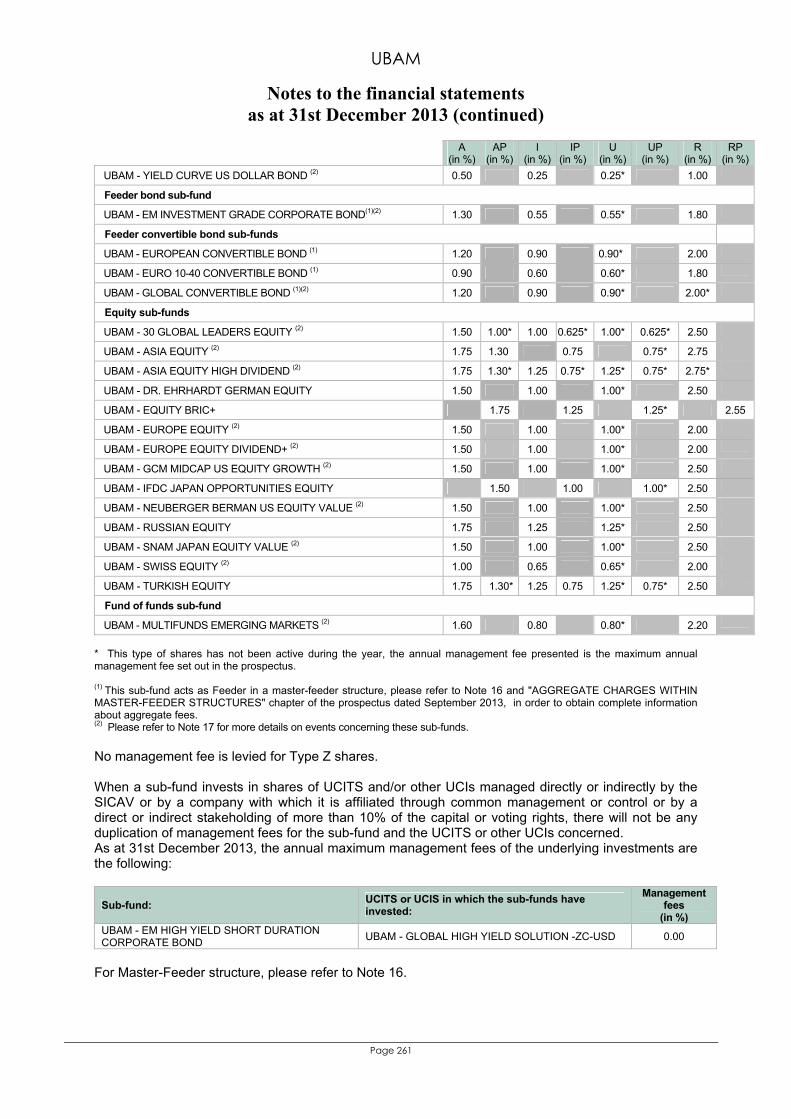
UBAM
Notes to the financial statements as at 31st December 2013 (continued)
Page 261
A (in %)
AP (in %)
I (in %)
IP (in %)
U (in %)
UP (in %)
R (in %)
RP (in %)
UBAM - YIELD CURVE US DOLLAR BOND (2) 0.50 0.25 0.25* 1.00
Feeder bond sub-fund
UBAM - EM INVESTMENT GRADE CORPORATE BOND(1)(2) 1.30 0.55 0.55* 1.80
Feeder convertible bond sub-funds
UBAM - EUROPEAN CONVERTIBLE BOND (1) 1.20 0.90 0.90* 2.00
UBAM - EURO 10-40 CONVERTIBLE BOND (1) 0.90 0.60 0.60* 1.80
UBAM - GLOBAL CONVERTIBLE BOND (1)(2) 1.20 0.90 0.90* 2.00*
Equity sub-funds
UBAM - 30 GLOBAL LEADERS EQUITY (2) 1.50 1.00* 1.00 0.625* 1.00* 0.625* 2.50
UBAM - ASIA EQUITY (2) 1.75 1.30 0.75 0.75* 2.75
UBAM - ASIA EQUITY HIGH DIVIDEND (2) 1.75 1.30* 1.25 0.75* 1.25* 0.75* 2.75*
UBAM - DR. EHRHARDT GERMAN EQUITY 1.50 1.00 1.00* 2.50
UBAM - EQUITY BRIC+ 1.75 1.25 1.25* 2.55
UBAM - EUROPE EQUITY (2) 1.50 1.00 1.00* 2.00
UBAM - EUROPE EQUITY DIVIDEND+ (2) 1.50 1.00 1.00* 2.00
UBAM - GCM MIDCAP US EQUITY GROWTH (2) 1.50 1.00 1.00* 2.50
UBAM - IFDC JAPAN OPPORTUNITIES EQUITY 1.50 1.00 1.00* 2.50
UBAM - NEUBERGER BERMAN US EQUITY VALUE (2) 1.50 1.00 1.00* 2.50
UBAM - RUSSIAN EQUITY 1.75 1.25 1.25* 2.50
UBAM - SNAM JAPAN EQUITY VALUE (2) 1.50 1.00 1.00* 2.50
UBAM - SWISS EQUITY (2) 1.00 0.65 0.65* 2.00
UBAM - TURKISH EQUITY 1.75 1.30* 1.25 0.75 1.25* 0.75* 2.50
Fund of funds sub-fund
UBAM - MULTIFUNDS EMERGING MARKETS (2) 1.60 0.80 0.80* 2.20
* This type of shares has not been active during the year, the annual management fee presented is the maximum annual management fee set out in the prospectus. (1) This sub-fund acts as Feeder in a master-feeder structure, please refer to Note 16 and "AGGREGATE CHARGES WITHIN MASTER-FEEDER STRUCTURES" chapter of the prospectus dated September 2013, in order to obtain complete information about aggregate fees. (2) Please refer to Note 17 for more details on events concerning these sub-funds. No management fee is levied for Type Z shares. When a sub-fund invests in shares of UCITS and/or other UCIs managed directly or indirectly by the SICAV or by a company with which it is affiliated through common management or control or by a direct or indirect stakeholding of more than 10% of the capital or voting rights, there will not be any duplication of management fees for the sub-fund and the UCITS or other UCIs concerned. As at 31st December 2013, the annual maximum management fees of the underlying investments are the following:
Sub-fund: UCITS or UCIS in which the sub-funds have invested:
Management fees
(in %) UBAM - EM HIGH YIELD SHORT DURATION CORPORATE BOND UBAM - GLOBAL HIGH YIELD SOLUTION -ZC-USD 0.00
For Master-Feeder structure, please refer to Note 16.
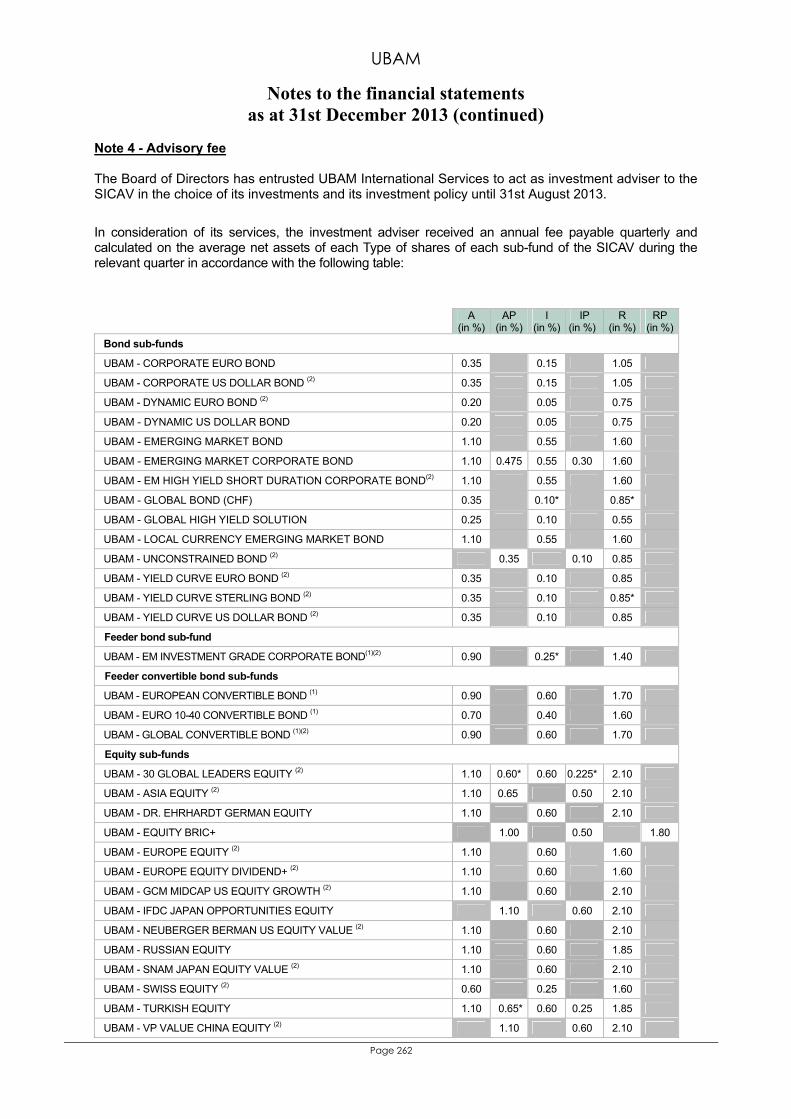
UBAM
Notes to the financial statements as at 31st December 2013 (continued)
Page 262
Note 4 - Advisory fee The Board of Directors has entrusted UBAM International Services to act as investment adviser to the SICAV in the choice of its investments and its investment policy until 31st August 2013.
In consideration of its services, the investment adviser received an annual fee payable quarterly and calculated on the average net assets of each Type of shares of each sub-fund of the SICAV during the relevant quarter in accordance with the following table:
A (in %)
AP (in %)
I (in %)
IP (in %)
R (in %)
RP (in %)
Bond sub-funds
UBAM - CORPORATE EURO BOND 0.35 0.15 1.05
UBAM - CORPORATE US DOLLAR BOND (2) 0.35 0.15 1.05
UBAM - DYNAMIC EURO BOND (2) 0.20 0.05 0.75
UBAM - DYNAMIC US DOLLAR BOND 0.20 0.05 0.75
UBAM - EMERGING MARKET BOND 1.10 0.55 1.60
UBAM - EMERGING MARKET CORPORATE BOND 1.10 0.475 0.55 0.30 1.60
UBAM - EM HIGH YIELD SHORT DURATION CORPORATE BOND(2) 1.10 0.55 1.60
UBAM - GLOBAL BOND (CHF) 0.35 0.10* 0.85*
UBAM - GLOBAL HIGH YIELD SOLUTION 0.25 0.10 0.55
UBAM - LOCAL CURRENCY EMERGING MARKET BOND 1.10 0.55 1.60
UBAM - UNCONSTRAINED BOND (2) 0.35 0.10 0.85
UBAM - YIELD CURVE EURO BOND (2) 0.35 0.10 0.85
UBAM - YIELD CURVE STERLING BOND (2) 0.35 0.10 0.85*
UBAM - YIELD CURVE US DOLLAR BOND (2) 0.35 0.10 0.85
Feeder bond sub-fund
UBAM - EM INVESTMENT GRADE CORPORATE BOND(1)(2) 0.90 0.25* 1.40
Feeder convertible bond sub-funds
UBAM - EUROPEAN CONVERTIBLE BOND (1) 0.90 0.60 1.70
UBAM - EURO 10-40 CONVERTIBLE BOND (1) 0.70 0.40 1.60
UBAM - GLOBAL CONVERTIBLE BOND (1)(2) 0.90 0.60 1.70
Equity sub-funds
UBAM - 30 GLOBAL LEADERS EQUITY (2) 1.10 0.60* 0.60 0.225* 2.10
UBAM - ASIA EQUITY (2) 1.10 0.65 0.50 2.10
UBAM - DR. EHRHARDT GERMAN EQUITY 1.10 0.60 2.10
UBAM - EQUITY BRIC+ 1.00 0.50 1.80
UBAM - EUROPE EQUITY (2) 1.10 0.60 1.60
UBAM - EUROPE EQUITY DIVIDEND+ (2) 1.10 0.60 1.60
UBAM - GCM MIDCAP US EQUITY GROWTH (2) 1.10 0.60 2.10
UBAM - IFDC JAPAN OPPORTUNITIES EQUITY 1.10 0.60 2.10
UBAM - NEUBERGER BERMAN US EQUITY VALUE (2) 1.10 0.60 2.10
UBAM - RUSSIAN EQUITY 1.10 0.60 1.85
UBAM - SNAM JAPAN EQUITY VALUE (2) 1.10 0.60 2.10
UBAM - SWISS EQUITY (2) 0.60 0.25 1.60
UBAM - TURKISH EQUITY 1.10 0.65* 0.60 0.25 1.85
UBAM - VP VALUE CHINA EQUITY (2) 1.10 0.60 2.10
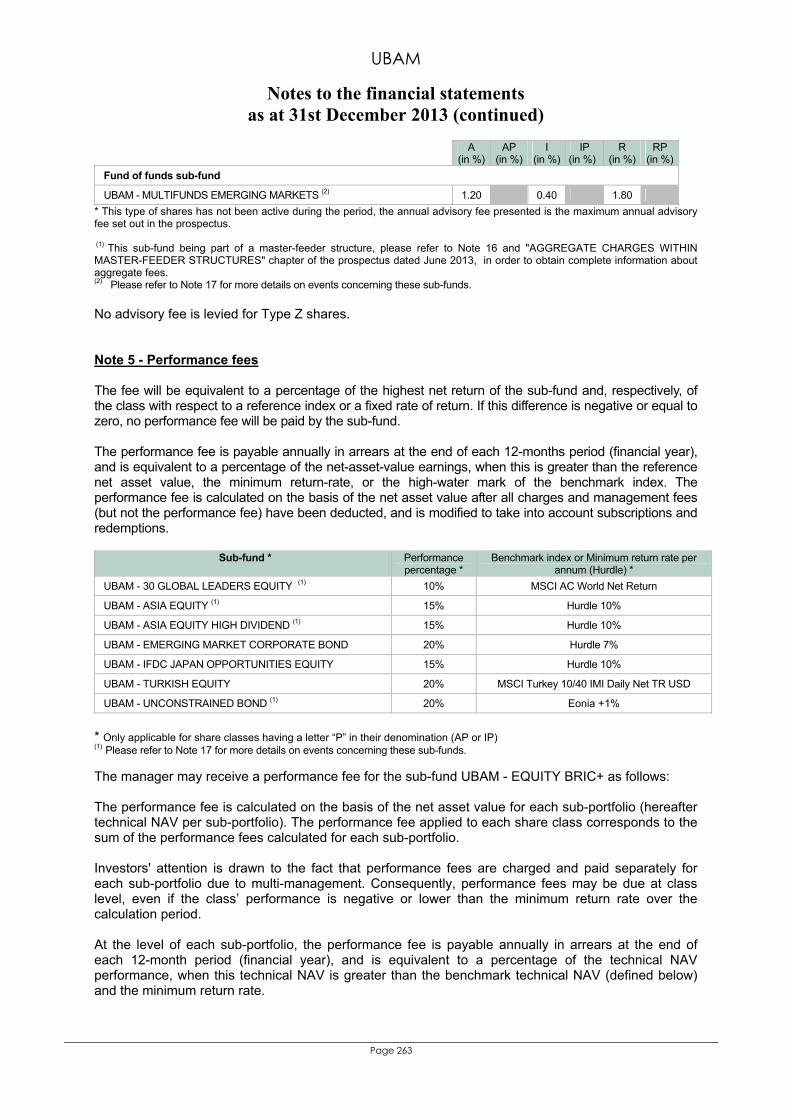
UBAM
Notes to the financial statements as at 31st December 2013 (continued)
Page 263
A (in %)
AP (in %)
I (in %)
IP (in %)
R (in %)
RP (in %)
Fund of funds sub-fund
UBAM - MULTIFUNDS EMERGING MARKETS (2) 1.20 0.40 1.80 * This type of shares has not been active during the period, the annual advisory fee presented is the maximum annual advisory fee set out in the prospectus.
(1) This sub-fund being part of a master-feeder structure, please refer to Note 16 and "AGGREGATE CHARGES WITHIN MASTER-FEEDER STRUCTURES" chapter of the prospectus dated June 2013, in order to obtain complete information about aggregate fees. (2) Please refer to Note 17 for more details on events concerning these sub-funds. No advisory fee is levied for Type Z shares. Note 5 - Performance fees
The fee will be equivalent to a percentage of the highest net return of the sub-fund and, respectively, of the class with respect to a reference index or a fixed rate of return. If this difference is negative or equal to zero, no performance fee will be paid by the sub-fund. The performance fee is payable annually in arrears at the end of each 12-months period (financial year), and is equivalent to a percentage of the net-asset-value earnings, when this is greater than the reference net asset value, the minimum return-rate, or the high-water mark of the benchmark index. The performance fee is calculated on the basis of the net asset value after all charges and management fees (but not the performance fee) have been deducted, and is modified to take into account subscriptions and redemptions.
Sub-fund * Performance percentage *
Benchmark index or Minimum return rate per annum (Hurdle) *
UBAM - 30 GLOBAL LEADERS EQUITY (1) 10% MSCI AC World Net Return
UBAM - ASIA EQUITY (1) 15% Hurdle 10%
UBAM - ASIA EQUITY HIGH DIVIDEND (1) 15% Hurdle 10%
UBAM - EMERGING MARKET CORPORATE BOND 20% Hurdle 7%
UBAM - IFDC JAPAN OPPORTUNITIES EQUITY 15% Hurdle 10%
UBAM - TURKISH EQUITY 20% MSCI Turkey 10/40 IMI Daily Net TR USD
UBAM - UNCONSTRAINED BOND (1) 20% Eonia +1%
* Only applicable for share classes having a letter “P” in their denomination (AP or IP) (1) Please refer to Note 17 for more details on events concerning these sub-funds. The manager may receive a performance fee for the sub-fund UBAM - EQUITY BRIC+ as follows: The performance fee is calculated on the basis of the net asset value for each sub-portfolio (hereafter technical NAV per sub-portfolio). The performance fee applied to each share class corresponds to the sum of the performance fees calculated for each sub-portfolio. Investors' attention is drawn to the fact that performance fees are charged and paid separately for each sub-portfolio due to multi-management. Consequently, performance fees may be due at class level, even if the class’ performance is negative or lower than the minimum return rate over the calculation period. At the level of each sub-portfolio, the performance fee is payable annually in arrears at the end of each 12-month period (financial year), and is equivalent to a percentage of the technical NAV performance, when this technical NAV is greater than the benchmark technical NAV (defined below) and the minimum return rate.
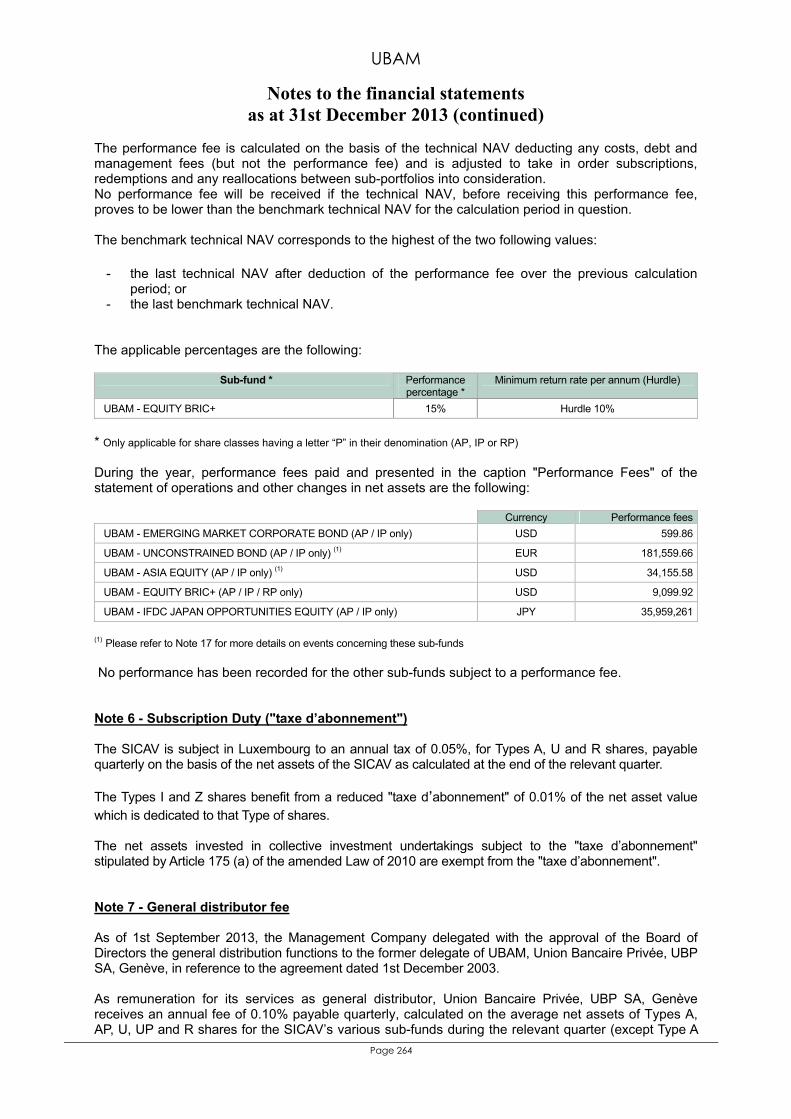
UBAM
Notes to the financial statements as at 31st December 2013 (continued)
Page 264
The performance fee is calculated on the basis of the technical NAV deducting any costs, debt and management fees (but not the performance fee) and is adjusted to take in order subscriptions, redemptions and any reallocations between sub-portfolios into consideration. No performance fee will be received if the technical NAV, before receiving this performance fee, proves to be lower than the benchmark technical NAV for the calculation period in question. The benchmark technical NAV corresponds to the highest of the two following values:
- the last technical NAV after deduction of the performance fee over the previous calculation
period; or - the last benchmark technical NAV.
The applicable percentages are the following:
Sub-fund * Performance percentage *
Minimum return rate per annum (Hurdle)
UBAM - EQUITY BRIC+ 15% Hurdle 10%
* Only applicable for share classes having a letter “P” in their denomination (AP, IP or RP) During the year, performance fees paid and presented in the caption "Performance Fees" of the statement of operations and other changes in net assets are the following: Currency Performance feesUBAM - EMERGING MARKET CORPORATE BOND (AP / IP only) USD 599.86
UBAM - UNCONSTRAINED BOND (AP / IP only) (1) EUR 181,559.66
UBAM - ASIA EQUITY (AP / IP only) (1) USD 34,155.58
UBAM - EQUITY BRIC+ (AP / IP / RP only) USD 9,099.92
UBAM - IFDC JAPAN OPPORTUNITIES EQUITY (AP / IP only) JPY 35,959,261
(1) Please refer to Note 17 for more details on events concerning these sub-funds No performance has been recorded for the other sub-funds subject to a performance fee. Note 6 - Subscription Duty ("taxe d’abonnement") The SICAV is subject in Luxembourg to an annual tax of 0.05%, for Types A, U and R shares, payable quarterly on the basis of the net assets of the SICAV as calculated at the end of the relevant quarter. The Types I and Z shares benefit from a reduced "taxe d’abonnement" of 0.01% of the net asset value which is dedicated to that Type of shares. The net assets invested in collective investment undertakings subject to the "taxe d’abonnement" stipulated by Article 175 (a) of the amended Law of 2010 are exempt from the "taxe d’abonnement". Note 7 - General distributor fee As of 1st September 2013, the Management Company delegated with the approval of the Board of Directors the general distribution functions to the former delegate of UBAM, Union Bancaire Privée, UBP SA, Genève, in reference to the agreement dated 1st December 2003. As remuneration for its services as general distributor, Union Bancaire Privée, UBP SA, Genève receives an annual fee of 0.10% payable quarterly, calculated on the average net assets of Types A, AP, U, UP and R shares for the SICAV’s various sub-funds during the relevant quarter (except Type A
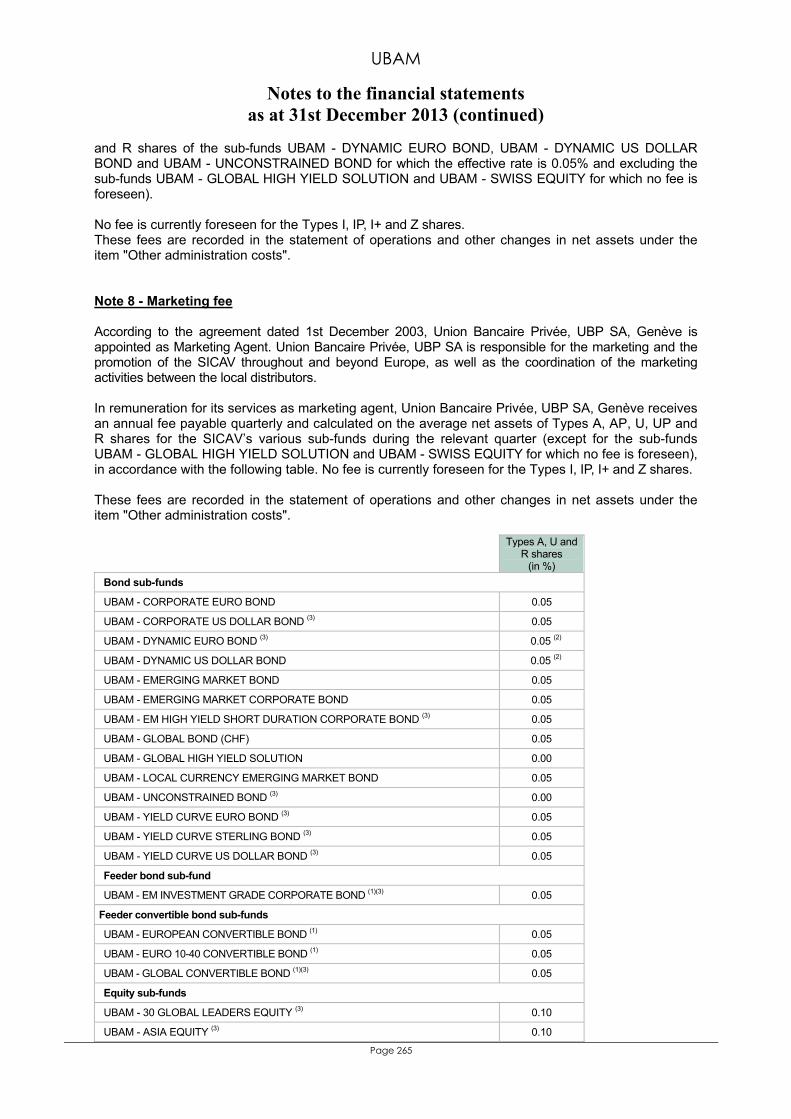
UBAM
Notes to the financial statements as at 31st December 2013 (continued)
Page 265
and R shares of the sub-funds UBAM - DYNAMIC EURO BOND, UBAM - DYNAMIC US DOLLAR BOND and UBAM - UNCONSTRAINED BOND for which the effective rate is 0.05% and excluding the sub-funds UBAM - GLOBAL HIGH YIELD SOLUTION and UBAM - SWISS EQUITY for which no fee is foreseen). No fee is currently foreseen for the Types I, IP, I+ and Z shares. These fees are recorded in the statement of operations and other changes in net assets under the item "Other administration costs". Note 8 - Marketing fee According to the agreement dated 1st December 2003, Union Bancaire Privée, UBP SA, Genève is appointed as Marketing Agent. Union Bancaire Privée, UBP SA is responsible for the marketing and the promotion of the SICAV throughout and beyond Europe, as well as the coordination of the marketing activities between the local distributors.
In remuneration for its services as marketing agent, Union Bancaire Privée, UBP SA, Genève receives an annual fee payable quarterly and calculated on the average net assets of Types A, AP, U, UP and R shares for the SICAV’s various sub-funds during the relevant quarter (except for the sub-funds UBAM - GLOBAL HIGH YIELD SOLUTION and UBAM - SWISS EQUITY for which no fee is foreseen), in accordance with the following table. No fee is currently foreseen for the Types I, IP, I+ and Z shares. These fees are recorded in the statement of operations and other changes in net assets under the item "Other administration costs". Types A, U and
R shares (in %)
Bond sub-funds
UBAM - CORPORATE EURO BOND 0.05
UBAM - CORPORATE US DOLLAR BOND (3) 0.05
UBAM - DYNAMIC EURO BOND (3) 0.05 (2)
UBAM - DYNAMIC US DOLLAR BOND 0.05 (2)
UBAM - EMERGING MARKET BOND 0.05
UBAM - EMERGING MARKET CORPORATE BOND 0.05
UBAM - EM HIGH YIELD SHORT DURATION CORPORATE BOND (3) 0.05
UBAM - GLOBAL BOND (CHF) 0.05
UBAM - GLOBAL HIGH YIELD SOLUTION 0.00
UBAM - LOCAL CURRENCY EMERGING MARKET BOND 0.05
UBAM - UNCONSTRAINED BOND (3) 0.00
UBAM - YIELD CURVE EURO BOND (3) 0.05
UBAM - YIELD CURVE STERLING BOND (3) 0.05
UBAM - YIELD CURVE US DOLLAR BOND (3) 0.05
Feeder bond sub-fund
UBAM - EM INVESTMENT GRADE CORPORATE BOND (1)(3) 0.05
Feeder convertible bond sub-funds
UBAM - EUROPEAN CONVERTIBLE BOND (1) 0.05
UBAM - EURO 10-40 CONVERTIBLE BOND (1) 0.05
UBAM - GLOBAL CONVERTIBLE BOND (1)(3) 0.05
Equity sub-funds
UBAM - 30 GLOBAL LEADERS EQUITY (3) 0.10
UBAM - ASIA EQUITY (3) 0.10
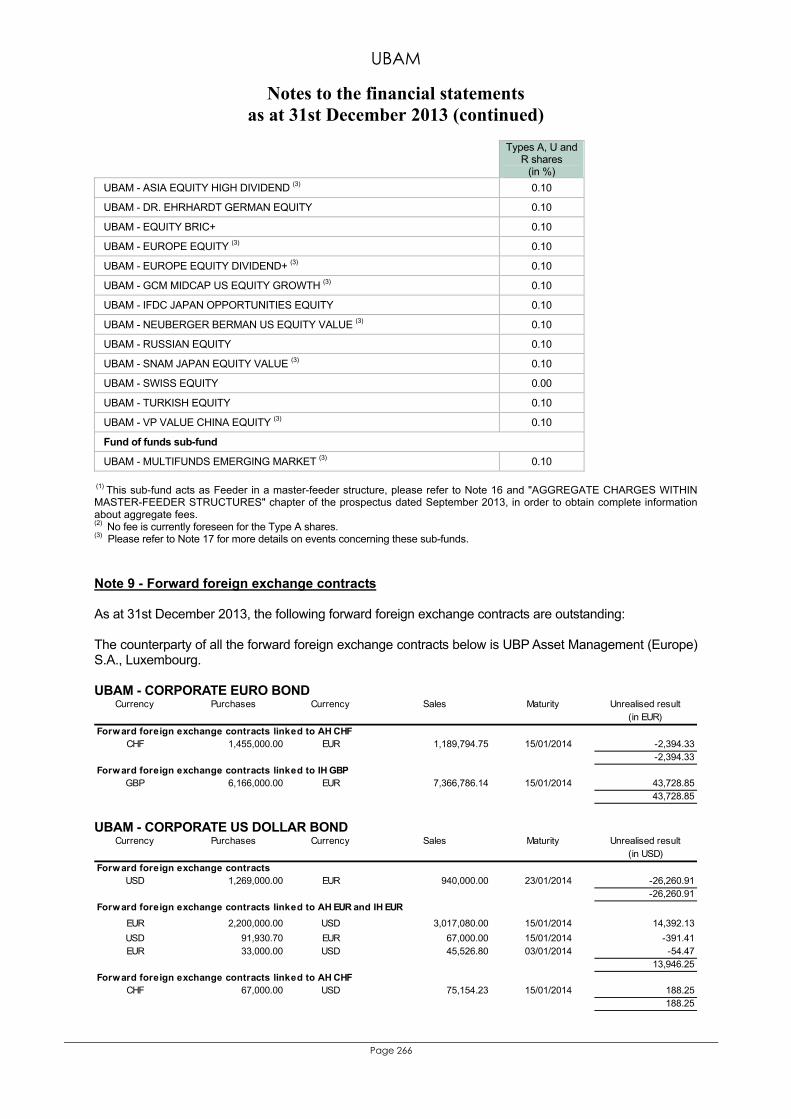
UBAM
Notes to the financial statements as at 31st December 2013 (continued)
Page 266
Types A, U and R shares
(in %) UBAM - ASIA EQUITY HIGH DIVIDEND (3) 0.10
UBAM - DR. EHRHARDT GERMAN EQUITY 0.10
UBAM - EQUITY BRIC+ 0.10
UBAM - EUROPE EQUITY (3) 0.10
UBAM - EUROPE EQUITY DIVIDEND+ (3) 0.10
UBAM - GCM MIDCAP US EQUITY GROWTH (3) 0.10
UBAM - IFDC JAPAN OPPORTUNITIES EQUITY 0.10
UBAM - NEUBERGER BERMAN US EQUITY VALUE (3) 0.10
UBAM - RUSSIAN EQUITY 0.10
UBAM - SNAM JAPAN EQUITY VALUE (3) 0.10
UBAM - SWISS EQUITY 0.00
UBAM - TURKISH EQUITY 0.10
UBAM - VP VALUE CHINA EQUITY (3) 0.10
Fund of funds sub-fund
UBAM - MULTIFUNDS EMERGING MARKET (3) 0.10
(1) This sub-fund acts as Feeder in a master-feeder structure, please refer to Note 16 and "AGGREGATE CHARGES WITHIN MASTER-FEEDER STRUCTURES" chapter of the prospectus dated September 2013, in order to obtain complete information about aggregate fees. (2) No fee is currently foreseen for the Type A shares. (3) Please refer to Note 17 for more details on events concerning these sub-funds. Note 9 - Forward foreign exchange contracts As at 31st December 2013, the following forward foreign exchange contracts are outstanding: The counterparty of all the forward foreign exchange contracts below is UBP Asset Management (Europe) S.A., Luxembourg. UBAM - CORPORATE EURO BOND
Unrealised result(in EUR)
Forward foreign exchange contracts linked to AH CHFCHF 1,455,000.00 EUR 1,189,794.75 15/01/2014 -2,394.33
-2,394.33Forward foreign exchange contracts linked to IH GBP
GBP 6,166,000.00 EUR 7,366,786.14 15/01/2014 43,728.8543,728.85
Currency Purchases Currency Sales Maturity
UBAM - CORPORATE US DOLLAR BOND
Unrealised result(in USD)
USD 1,269,000.00 EUR 940,000.00 23/01/2014 -26,260.91-26,260.91
EUR 2,200,000.00 USD 3,017,080.00 15/01/2014 14,392.13USD 91,930.70 EUR 67,000.00 15/01/2014 -391.41EUR 33,000.00 USD 45,526.80 03/01/2014 -54.47
13,946.25Forward foreign exchange contracts linked to AH CHF
CHF 67,000.00 USD 75,154.23 15/01/2014 188.25188.25
Forward foreign exchange contracts
Currency SalesCurrency Purchases Maturity
Forward foreign exchange contracts linked to AH EUR and IH EUR
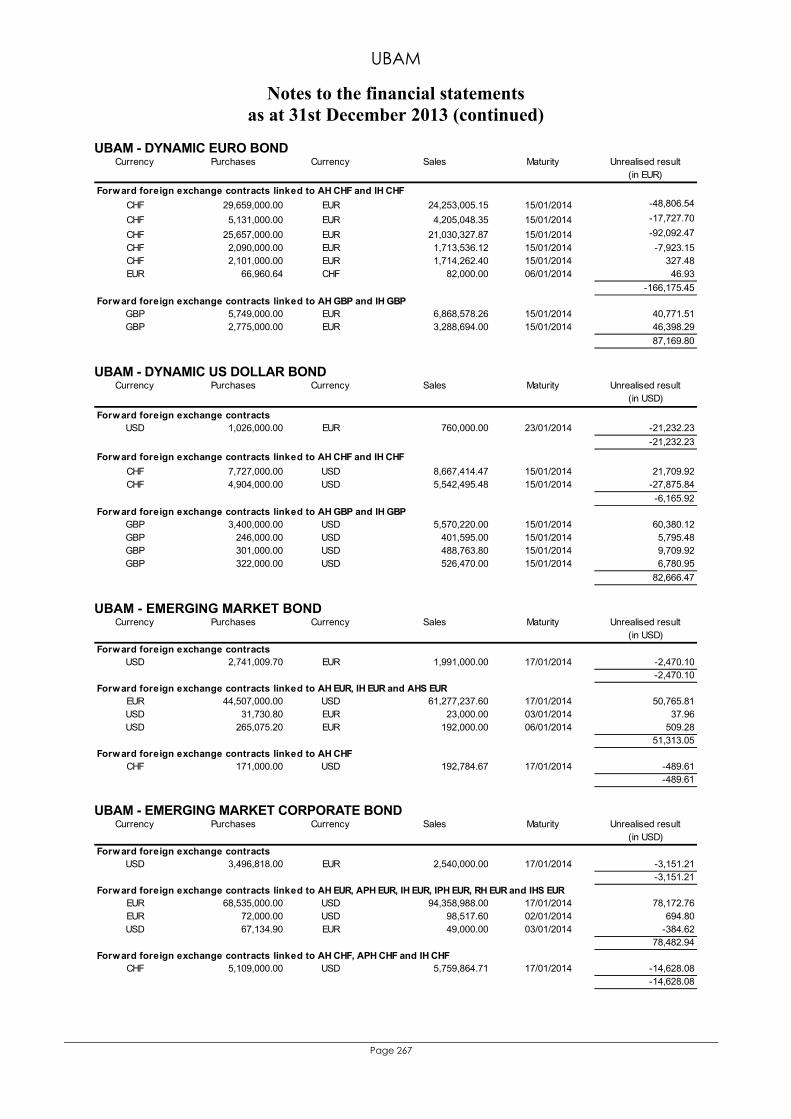
UBAM
Notes to the financial statements as at 31st December 2013 (continued)
Page 267
UBAM - DYNAMIC EURO BOND Unrealised result
(in EUR)
CHF 29,659,000.00 EUR 24,253,005.15 15/01/2014 -48,806.54
CHF 5,131,000.00 EUR 4,205,048.35 15/01/2014 -17,727.70
CHF 25,657,000.00 EUR 21,030,327.87 15/01/2014 -92,092.47CHF 2,090,000.00 EUR 1,713,536.12 15/01/2014 -7,923.15CHF 2,101,000.00 EUR 1,714,262.40 15/01/2014 327.48EUR 66,960.64 CHF 82,000.00 06/01/2014 46.93
-166,175.45
GBP 5,749,000.00 EUR 6,868,578.26 15/01/2014 40,771.51GBP 2,775,000.00 EUR 3,288,694.00 15/01/2014 46,398.29
87,169.80
Currency Currency MaturitySales
Forward foreign exchange contracts linked to AH GBP and IH GBP
Purchases
Forward foreign exchange contracts linked to AH CHF and IH CHF
UBAM - DYNAMIC US DOLLAR BOND
Unrealised result(in USD)
USD 1,026,000.00 EUR 760,000.00 23/01/2014 -21,232.23-21,232.23
CHF 7,727,000.00 USD 8,667,414.47 15/01/2014 21,709.92CHF 4,904,000.00 USD 5,542,495.48 15/01/2014 -27,875.84
-6,165.92
GBP 3,400,000.00 USD 5,570,220.00 15/01/2014 60,380.12GBP 246,000.00 USD 401,595.00 15/01/2014 5,795.48GBP 301,000.00 USD 488,763.80 15/01/2014 9,709.92GBP 322,000.00 USD 526,470.00 15/01/2014 6,780.95
82,666.47
CurrencyPurchases
Forward foreign exchange contracts linked to AH CHF and IH CHF
Sales Maturity
Forward foreign exchange contracts
Currency
Forward foreign exchange contracts linked to AH GBP and IH GBP
UBAM - EMERGING MARKET BOND
Unrealised result(in USD)
Forward foreign exchange contractsUSD 2,741,009.70 EUR 1,991,000.00 17/01/2014 -2,470.10
-2,470.10Forward foreign exchange contracts linked to AH EUR, IH EUR and AHS EUR
EUR 44,507,000.00 USD 61,277,237.60 17/01/2014 50,765.81USD 31,730.80 EUR 23,000.00 03/01/2014 37.96USD 265,075.20 EUR 192,000.00 06/01/2014 509.28
51,313.05Forward foreign exchange contracts linked to AH CHF
CHF 171,000.00 USD 192,784.67 17/01/2014 -489.61-489.61
Currency Purchases Currency Sales Maturity
UBAM - EMERGING MARKET CORPORATE BOND
Unrealised result(in USD)
Forward foreign exchange contractsUSD 3,496,818.00 EUR 2,540,000.00 17/01/2014 -3,151.21
-3,151.21Forward foreign exchange contracts linked to AH EUR, APH EUR, IH EUR, IPH EUR, RH EUR and IHS EUR
EUR 68,535,000.00 USD 94,358,988.00 17/01/2014 78,172.76EUR 72,000.00 USD 98,517.60 02/01/2014 694.80USD 67,134.90 EUR 49,000.00 03/01/2014 -384.62
78,482.94Forward foreign exchange contracts linked to AH CHF, APH CHF and IH CHF
CHF 5,109,000.00 USD 5,759,864.71 17/01/2014 -14,628.08-14,628.08
Currency Purchases Currency Sales Maturity
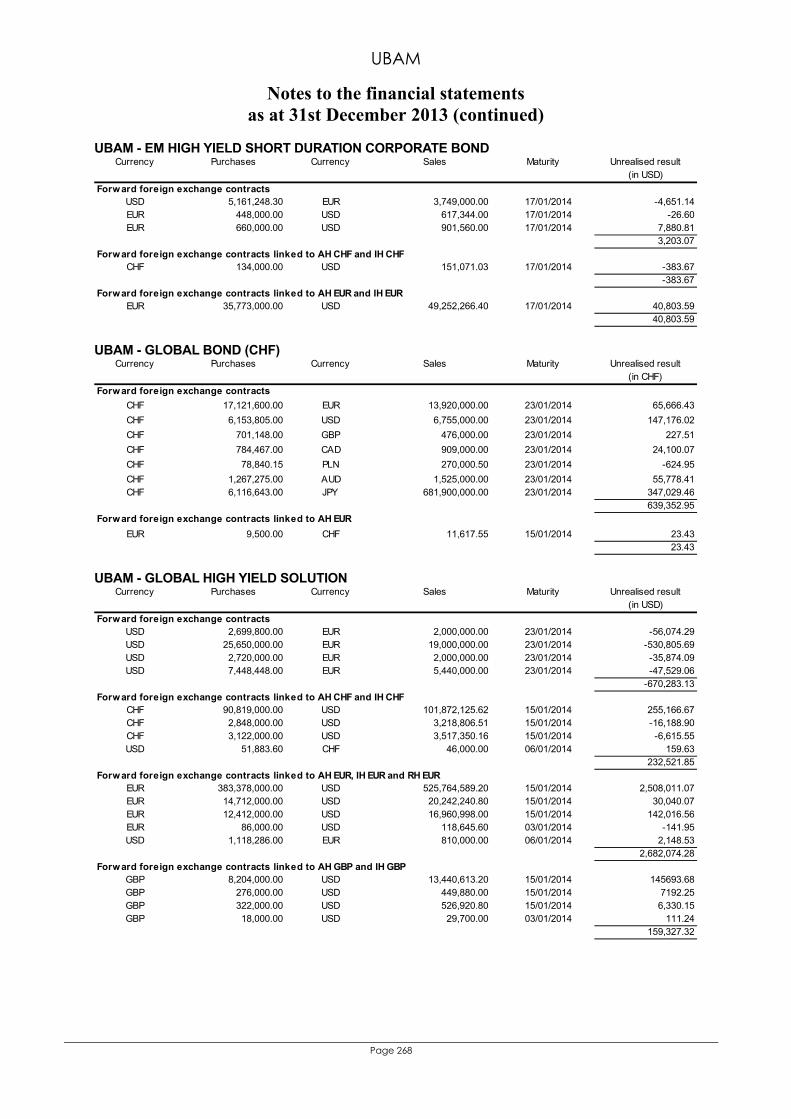
UBAM
Notes to the financial statements as at 31st December 2013 (continued)
Page 268
UBAM - EM HIGH YIELD SHORT DURATION CORPORATE BOND Unrealised result
(in USD)
USD 5,161,248.30 EUR 3,749,000.00 17/01/2014 -4,651.14EUR 448,000.00 USD 617,344.00 17/01/2014 -26.60EUR 660,000.00 USD 901,560.00 17/01/2014 7,880.81
3,203.07Forward foreign exchange contracts linked to AH CHF and IH CHF
CHF 134,000.00 USD 151,071.03 17/01/2014 -383.67-383.67
Forward foreign exchange contracts linked to AH EUR and IH EUREUR 35,773,000.00 USD 49,252,266.40 17/01/2014 40,803.59
40,803.59
Currency Sales MaturityPurchases
Forward foreign exchange contracts
Currency
UBAM - GLOBAL BOND (CHF)
Unrealised result(in CHF)
CHF 17,121,600.00 EUR 13,920,000.00 23/01/2014 65,666.43CHF 6,153,805.00 USD 6,755,000.00 23/01/2014 147,176.02CHF 701,148.00 GBP 476,000.00 23/01/2014 227.51CHF 784,467.00 CAD 909,000.00 23/01/2014 24,100.07CHF 78,840.15 PLN 270,000.50 23/01/2014 -624.95CHF 1,267,275.00 AUD 1,525,000.00 23/01/2014 55,778.41CHF 6,116,643.00 JPY 681,900,000.00 23/01/2014 347,029.46
639,352.95
EUR 9,500.00 CHF 11,617.55 15/01/2014 23.4323.43
Currency Purchases Currency Sales Maturity
Forward foreign exchange contracts
Forward foreign exchange contracts linked to AH EUR
UBAM - GLOBAL HIGH YIELD SOLUTION
Unrealised result(in USD)
USD 2,699,800.00 EUR 2,000,000.00 23/01/2014 -56,074.29USD 25,650,000.00 EUR 19,000,000.00 23/01/2014 -530,805.69USD 2,720,000.00 EUR 2,000,000.00 23/01/2014 -35,874.09USD 7,448,448.00 EUR 5,440,000.00 23/01/2014 -47,529.06
-670,283.13Forward foreign exchange contracts linked to AH CHF and IH CHF
CHF 90,819,000.00 USD 101,872,125.62 15/01/2014 255,166.67CHF 2,848,000.00 USD 3,218,806.51 15/01/2014 -16,188.90CHF 3,122,000.00 USD 3,517,350.16 15/01/2014 -6,615.55USD 51,883.60 CHF 46,000.00 06/01/2014 159.63
232,521.85Forward foreign exchange contracts linked to AH EUR, IH EUR and RH EUR
EUR 383,378,000.00 USD 525,764,589.20 15/01/2014 2,508,011.07EUR 14,712,000.00 USD 20,242,240.80 15/01/2014 30,040.07EUR 12,412,000.00 USD 16,960,998.00 15/01/2014 142,016.56EUR 86,000.00 USD 118,645.60 03/01/2014 -141.95USD 1,118,286.00 EUR 810,000.00 06/01/2014 2,148.53
2,682,074.28Forward foreign exchange contracts linked to AH GBP and IH GBP
GBP 8,204,000.00 USD 13,440,613.20 15/01/2014 145693.68GBP 276,000.00 USD 449,880.00 15/01/2014 7192.25GBP 322,000.00 USD 526,920.80 15/01/2014 6,330.15GBP 18,000.00 USD 29,700.00 03/01/2014 111.24
159,327.32
Currency SalesCurrency Purchases
Forward foreign exchange contracts
Maturity
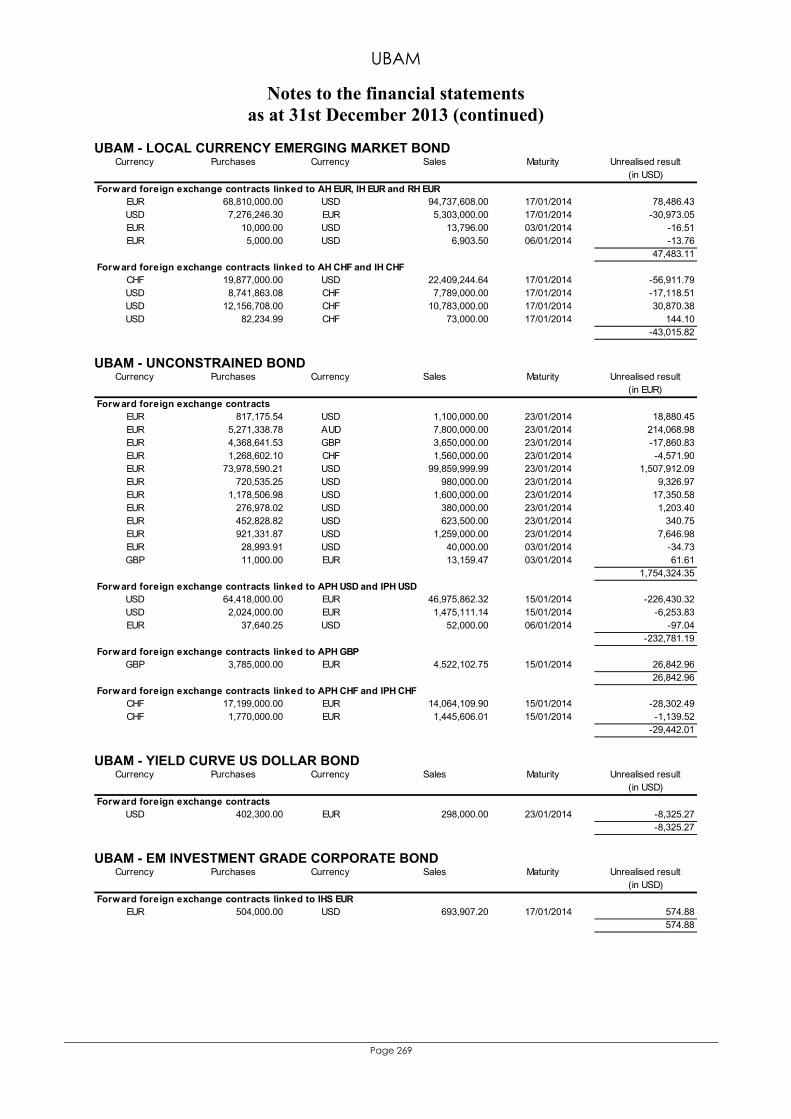
UBAM
Notes to the financial statements as at 31st December 2013 (continued)
Page 269
UBAM - LOCAL CURRENCY EMERGING MARKET BOND Unrealised result
(in USD)Forward foreign exchange contracts linked to AH EUR, IH EUR and RH EUR
EUR 68,810,000.00 USD 94,737,608.00 17/01/2014 78,486.43USD 7,276,246.30 EUR 5,303,000.00 17/01/2014 -30,973.05EUR 10,000.00 USD 13,796.00 03/01/2014 -16.51EUR 5,000.00 USD 6,903.50 06/01/2014 -13.76
47,483.11Forward foreign exchange contracts linked to AH CHF and IH CHF
CHF 19,877,000.00 USD 22,409,244.64 17/01/2014 -56,911.79USD 8,741,863.08 CHF 7,789,000.00 17/01/2014 -17,118.51USD 12,156,708.00 CHF 10,783,000.00 17/01/2014 30,870.38USD 82,234.99 CHF 73,000.00 17/01/2014 144.10
-43,015.82
Currency Purchases Currency Sales Maturity
UBAM - UNCONSTRAINED BOND
Unrealised result(in EUR)
EUR 817,175.54 USD 1,100,000.00 23/01/2014 18,880.45EUR 5,271,338.78 AUD 7,800,000.00 23/01/2014 214,068.98EUR 4,368,641.53 GBP 3,650,000.00 23/01/2014 -17,860.83EUR 1,268,602.10 CHF 1,560,000.00 23/01/2014 -4,571.90EUR 73,978,590.21 USD 99,859,999.99 23/01/2014 1,507,912.09EUR 720,535.25 USD 980,000.00 23/01/2014 9,326.97EUR 1,178,506.98 USD 1,600,000.00 23/01/2014 17,350.58EUR 276,978.02 USD 380,000.00 23/01/2014 1,203.40EUR 452,828.82 USD 623,500.00 23/01/2014 340.75EUR 921,331.87 USD 1,259,000.00 23/01/2014 7,646.98EUR 28,993.91 USD 40,000.00 03/01/2014 -34.73GBP 11,000.00 EUR 13,159.47 03/01/2014 61.61
1,754,324.35Forward foreign exchange contracts linked to APH USD and IPH USD
USD 64,418,000.00 EUR 46,975,862.32 15/01/2014 -226,430.32USD 2,024,000.00 EUR 1,475,111.14 15/01/2014 -6,253.83EUR 37,640.25 USD 52,000.00 06/01/2014 -97.04
-232,781.19Forward foreign exchange contracts linked to APH GBP
GBP 3,785,000.00 EUR 4,522,102.75 15/01/2014 26,842.9626,842.96
Forward foreign exchange contracts linked to APH CHF and IPH CHFCHF 17,199,000.00 EUR 14,064,109.90 15/01/2014 -28,302.49CHF 1,770,000.00 EUR 1,445,606.01 15/01/2014 -1,139.52
-29,442.01
Forward foreign exchange contracts
MaturityCurrency Purchases Currency Sales
UBAM - YIELD CURVE US DOLLAR BOND
Unrealised result(in USD)
USD 402,300.00 EUR 298,000.00 23/01/2014 -8,325.27-8,325.27
Sales Maturity
Forward foreign exchange contracts
Purchases CurrencyCurrency
UBAM - EM INVESTMENT GRADE CORPORATE BOND
Unrealised result(in USD)
EUR 504,000.00 USD 693,907.20 17/01/2014 574.88574.88
Forward foreign exchange contracts linked to IHS EUR
Currency Sales MaturityCurrency Purchases
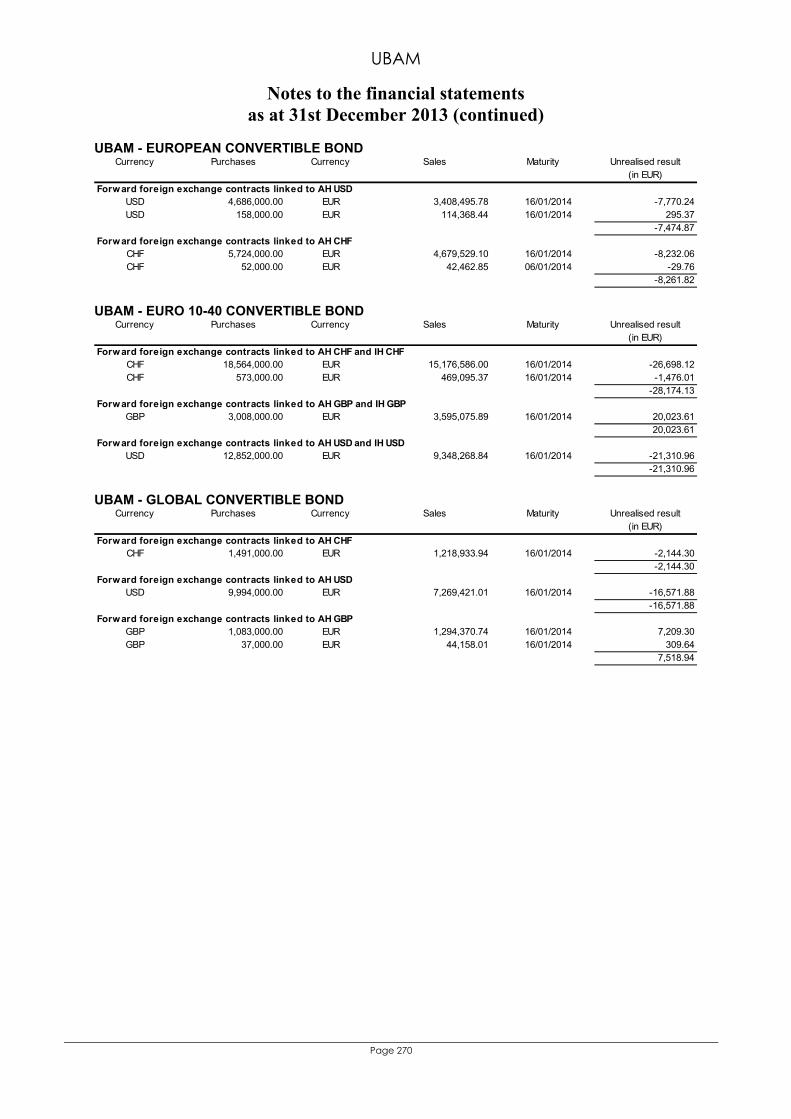
UBAM
Notes to the financial statements as at 31st December 2013 (continued)
Page 270
UBAM - EUROPEAN CONVERTIBLE BOND Unrealised result
(in EUR)
USD 4,686,000.00 EUR 3,408,495.78 16/01/2014 -7,770.24USD 158,000.00 EUR 114,368.44 16/01/2014 295.37
-7,474.87
CHF 5,724,000.00 EUR 4,679,529.10 16/01/2014 -8,232.06CHF 52,000.00 EUR 42,462.85 06/01/2014 -29.76
-8,261.82
Currency Purchases Currency Sales Maturity
Forward foreign exchange contracts linked to AH CHF
Forward foreign exchange contracts linked to AH USD
UBAM - EURO 10-40 CONVERTIBLE BOND
Unrealised result(in EUR)
CHF 18,564,000.00 EUR 15,176,586.00 16/01/2014 -26,698.12CHF 573,000.00 EUR 469,095.37 16/01/2014 -1,476.01
-28,174.13Forward foreign exchange contracts linked to AH GBP and IH GBP
GBP 3,008,000.00 EUR 3,595,075.89 16/01/2014 20,023.6120,023.61
Forward foreign exchange contracts linked to AH USD and IH USDUSD 12,852,000.00 EUR 9,348,268.84 16/01/2014 -21,310.96
-21,310.96
Currency Purchases Currency Sales Maturity
Forward foreign exchange contracts linked to AH CHF and IH CHF
UBAM - GLOBAL CONVERTIBLE BOND
Unrealised result(in EUR)
CHF 1,491,000.00 EUR 1,218,933.94 16/01/2014 -2,144.30-2,144.30
Forward foreign exchange contracts linked to AH USDUSD 9,994,000.00 EUR 7,269,421.01 16/01/2014 -16,571.88
-16,571.88Forward foreign exchange contracts linked to AH GBP
GBP 1,083,000.00 EUR 1,294,370.74 16/01/2014 7,209.30GBP 37,000.00 EUR 44,158.01 16/01/2014 309.64
7,518.94
Currency Sales Maturity
Forward foreign exchange contracts linked to AH CHF
Purchases Currency
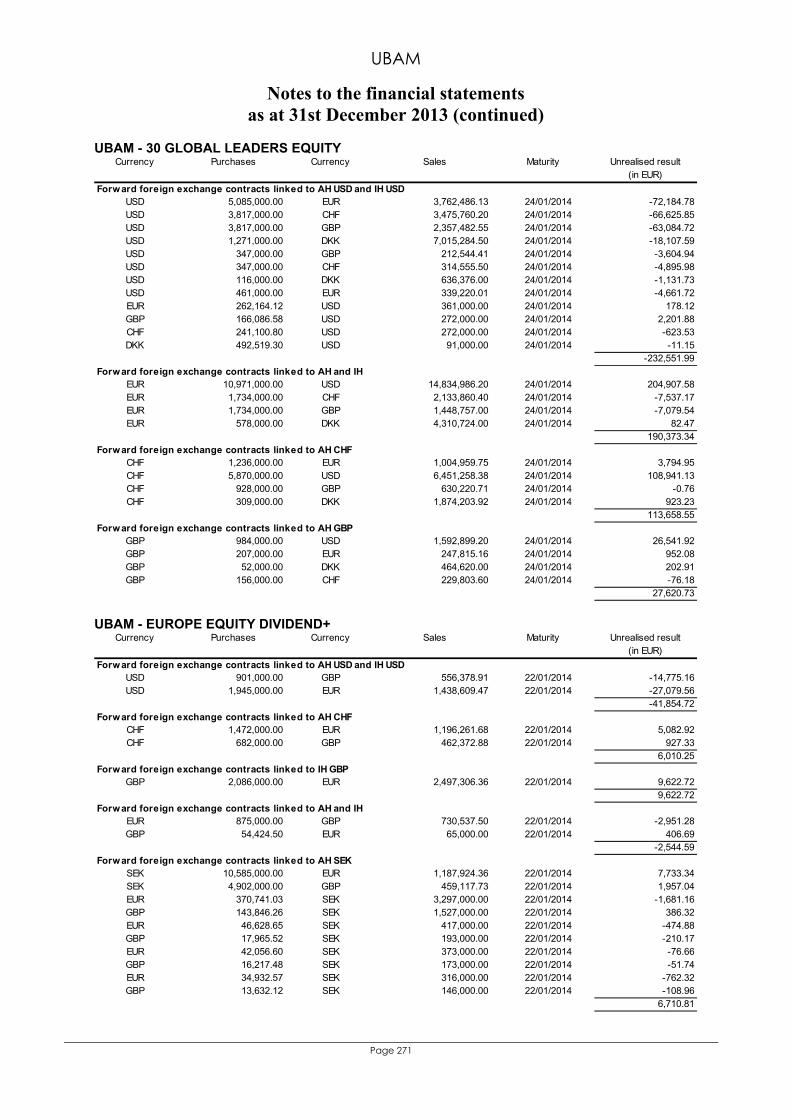
UBAM
Notes to the financial statements as at 31st December 2013 (continued)
Page 271
UBAM - 30 GLOBAL LEADERS EQUITY Unrealised result
(in EUR)
USD 5,085,000.00 EUR 3,762,486.13 24/01/2014 -72,184.78USD 3,817,000.00 CHF 3,475,760.20 24/01/2014 -66,625.85USD 3,817,000.00 GBP 2,357,482.55 24/01/2014 -63,084.72USD 1,271,000.00 DKK 7,015,284.50 24/01/2014 -18,107.59USD 347,000.00 GBP 212,544.41 24/01/2014 -3,604.94USD 347,000.00 CHF 314,555.50 24/01/2014 -4,895.98USD 116,000.00 DKK 636,376.00 24/01/2014 -1,131.73USD 461,000.00 EUR 339,220.01 24/01/2014 -4,661.72EUR 262,164.12 USD 361,000.00 24/01/2014 178.12GBP 166,086.58 USD 272,000.00 24/01/2014 2,201.88CHF 241,100.80 USD 272,000.00 24/01/2014 -623.53DKK 492,519.30 USD 91,000.00 24/01/2014 -11.15
-232,551.99
EUR 10,971,000.00 USD 14,834,986.20 24/01/2014 204,907.58EUR 1,734,000.00 CHF 2,133,860.40 24/01/2014 -7,537.17EUR 1,734,000.00 GBP 1,448,757.00 24/01/2014 -7,079.54EUR 578,000.00 DKK 4,310,724.00 24/01/2014 82.47
190,373.34
CHF 1,236,000.00 EUR 1,004,959.75 24/01/2014 3,794.95CHF 5,870,000.00 USD 6,451,258.38 24/01/2014 108,941.13CHF 928,000.00 GBP 630,220.71 24/01/2014 -0.76CHF 309,000.00 DKK 1,874,203.92 24/01/2014 923.23
113,658.55
GBP 984,000.00 USD 1,592,899.20 24/01/2014 26,541.92GBP 207,000.00 EUR 247,815.16 24/01/2014 952.08GBP 52,000.00 DKK 464,620.00 24/01/2014 202.91GBP 156,000.00 CHF 229,803.60 24/01/2014 -76.18
27,620.73
Currency Purchases Currency
Forward foreign exchange contracts linked to AH GBP
Sales
Forward foreign exchange contracts linked to AH USD and IH USD
Maturity
Forward foreign exchange contracts linked to AH and IH
Forward foreign exchange contracts linked to AH CHF
UBAM - EUROPE EQUITY DIVIDEND+
Unrealised result(in EUR)
Forward foreign exchange contracts linked to AH USD and IH USDUSD 901,000.00 GBP 556,378.91 22/01/2014 -14,775.16USD 1,945,000.00 EUR 1,438,609.47 22/01/2014 -27,079.56
-41,854.72Forward foreign exchange contracts linked to AH CHF
CHF 1,472,000.00 EUR 1,196,261.68 22/01/2014 5,082.92CHF 682,000.00 GBP 462,372.88 22/01/2014 927.33
6,010.25Forward foreign exchange contracts linked to IH GBP
GBP 2,086,000.00 EUR 2,497,306.36 22/01/2014 9,622.729,622.72
Forward foreign exchange contracts linked to AH and IH EUR 875,000.00 GBP 730,537.50 22/01/2014 -2,951.28GBP 54,424.50 EUR 65,000.00 22/01/2014 406.69
-2,544.59Forward foreign exchange contracts linked to AH SEK
SEK 10,585,000.00 EUR 1,187,924.36 22/01/2014 7,733.34SEK 4,902,000.00 GBP 459,117.73 22/01/2014 1,957.04EUR 370,741.03 SEK 3,297,000.00 22/01/2014 -1,681.16GBP 143,846.26 SEK 1,527,000.00 22/01/2014 386.32EUR 46,628.65 SEK 417,000.00 22/01/2014 -474.88GBP 17,965.52 SEK 193,000.00 22/01/2014 -210.17EUR 42,056.60 SEK 373,000.00 22/01/2014 -76.66GBP 16,217.48 SEK 173,000.00 22/01/2014 -51.74EUR 34,932.57 SEK 316,000.00 22/01/2014 -762.32GBP 13,632.12 SEK 146,000.00 22/01/2014 -108.96
6,710.81
Currency Sales MaturityCurrency Purchases
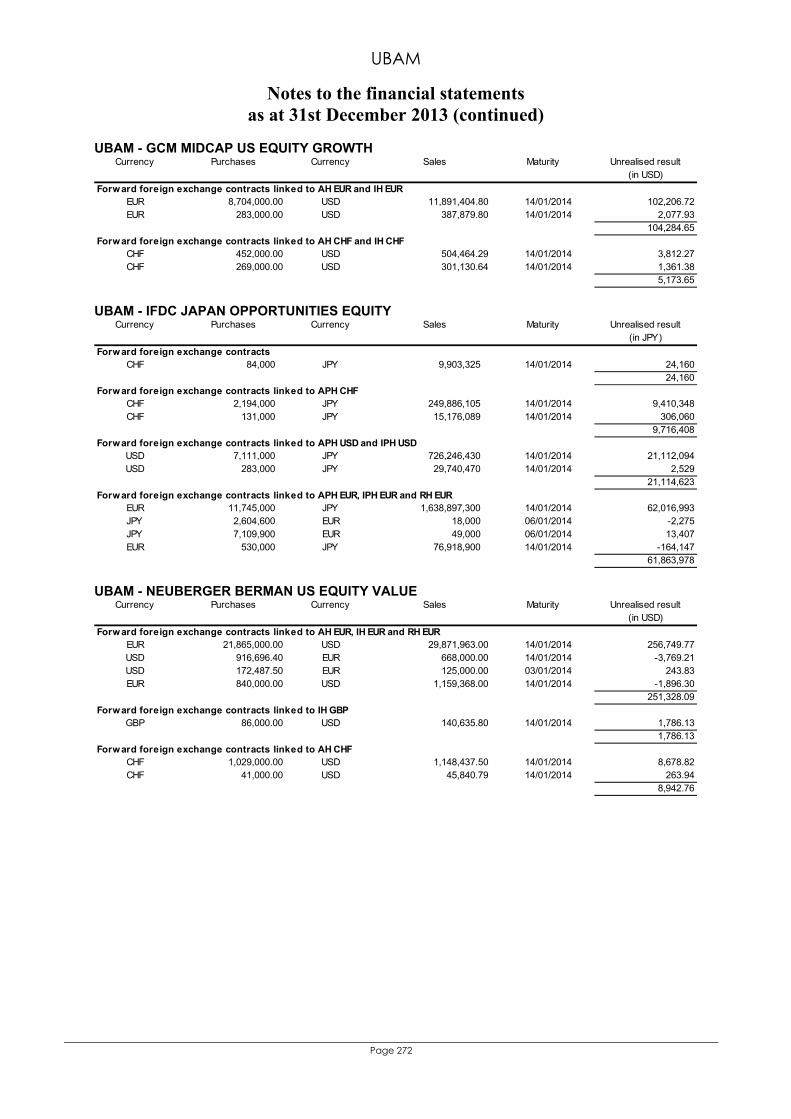
UBAM
Notes to the financial statements as at 31st December 2013 (continued)
Page 272
UBAM - GCM MIDCAP US EQUITY GROWTH Unrealised result
(in USD)
EUR 8,704,000.00 USD 11,891,404.80 14/01/2014 102,206.72EUR 283,000.00 USD 387,879.80 14/01/2014 2,077.93
104,284.65Forward foreign exchange contracts linked to AH CHF and IH CHF
CHF 452,000.00 USD 504,464.29 14/01/2014 3,812.27CHF 269,000.00 USD 301,130.64 14/01/2014 1,361.38
5,173.65
Currency Purchases Currency Sales Maturity
Forward foreign exchange contracts linked to AH EUR and IH EUR
UBAM - IFDC JAPAN OPPORTUNITIES EQUITY
Unrealised result(in JPY)
CHF 84,000 JPY 9,903,325 14/01/2014 24,16024,160
CHF 2,194,000 JPY 249,886,105 14/01/2014 9,410,348CHF 131,000 JPY 15,176,089 14/01/2014 306,060
9,716,408Forward foreign exchange contracts linked to APH USD and IPH USD
USD 7,111,000 JPY 726,246,430 14/01/2014 21,112,094USD 283,000 JPY 29,740,470 14/01/2014 2,529
21,114,623Forward foreign exchange contracts linked to APH EUR, IPH EUR and RH EUR
EUR 11,745,000 JPY 1,638,897,300 14/01/2014 62,016,993JPY 2,604,600 EUR 18,000 06/01/2014 -2,275JPY 7,109,900 EUR 49,000 06/01/2014 13,407EUR 530,000 JPY 76,918,900 14/01/2014 -164,147
61,863,978
Forward foreign exchange contracts
Currency Purchases Currency Sales Maturity
Forward foreign exchange contracts linked to APH CHF
UBAM - NEUBERGER BERMAN US EQUITY VALUE
Unrealised result(in USD)
EUR 21,865,000.00 USD 29,871,963.00 14/01/2014 256,749.77USD 916,696.40 EUR 668,000.00 14/01/2014 -3,769.21USD 172,487.50 EUR 125,000.00 03/01/2014 243.83EUR 840,000.00 USD 1,159,368.00 14/01/2014 -1,896.30
251,328.09Forward foreign exchange contracts linked to IH GBP
GBP 86,000.00 USD 140,635.80 14/01/2014 1,786.131,786.13
Forward foreign exchange contracts linked to AH CHFCHF 1,029,000.00 USD 1,148,437.50 14/01/2014 8,678.82CHF 41,000.00 USD 45,840.79 14/01/2014 263.94
8,942.76
Currency Purchases Currency Sales Maturity
Forward foreign exchange contracts linked to AH EUR, IH EUR and RH EUR
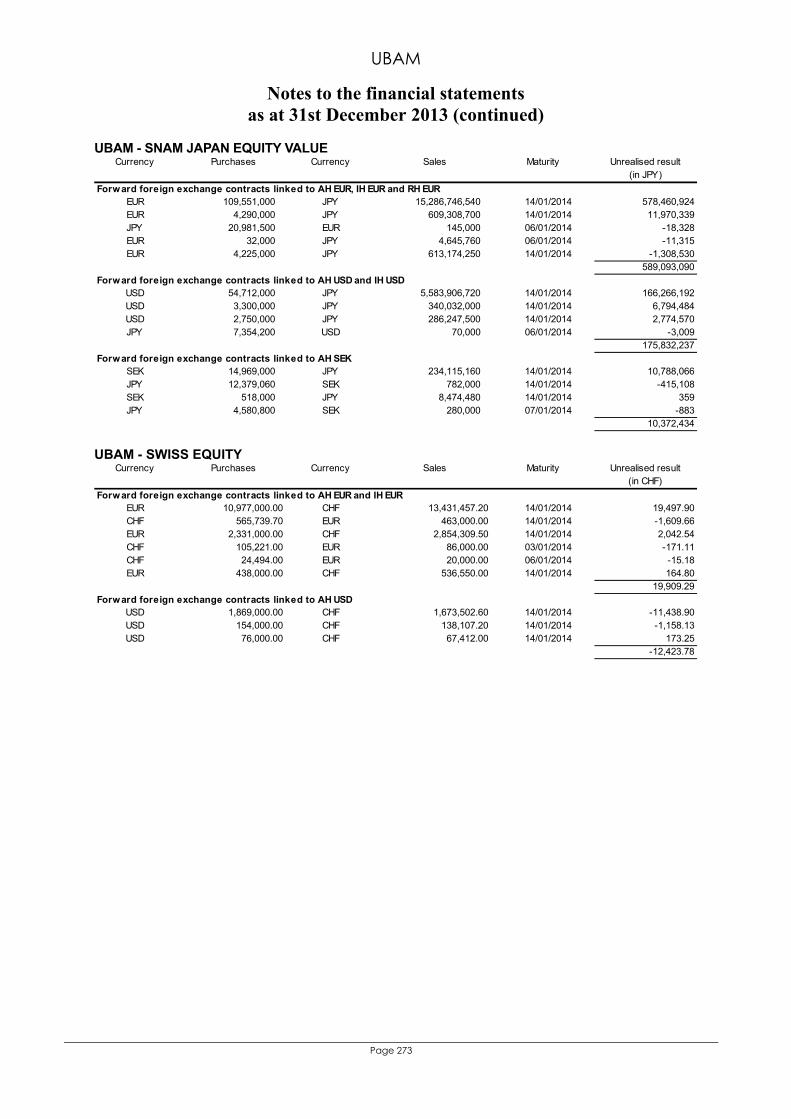
UBAM
Notes to the financial statements as at 31st December 2013 (continued)
Page 273
UBAM - SNAM JAPAN EQUITY VALUE Unrealised result
(in JPY)
EUR 109,551,000 JPY 15,286,746,540 14/01/2014 578,460,924EUR 4,290,000 JPY 609,308,700 14/01/2014 11,970,339JPY 20,981,500 EUR 145,000 06/01/2014 -18,328EUR 32,000 JPY 4,645,760 06/01/2014 -11,315EUR 4,225,000 JPY 613,174,250 14/01/2014 -1,308,530
589,093,090Forward foreign exchange contracts linked to AH USD and IH USD
USD 54,712,000 JPY 5,583,906,720 14/01/2014 166,266,192USD 3,300,000 JPY 340,032,000 14/01/2014 6,794,484USD 2,750,000 JPY 286,247,500 14/01/2014 2,774,570JPY 7,354,200 USD 70,000 06/01/2014 -3,009
175,832,237Forward foreign exchange contracts linked to AH SEK
SEK 14,969,000 JPY 234,115,160 14/01/2014 10,788,066JPY 12,379,060 SEK 782,000 14/01/2014 -415,108SEK 518,000 JPY 8,474,480 14/01/2014 359JPY 4,580,800 SEK 280,000 07/01/2014 -883
10,372,434
Currency Purchases Currency Sales Maturity
Forward foreign exchange contracts linked to AH EUR, IH EUR and RH EUR
UBAM - SWISS EQUITY
Unrealised result(in CHF)
EUR 10,977,000.00 CHF 13,431,457.20 14/01/2014 19,497.90CHF 565,739.70 EUR 463,000.00 14/01/2014 -1,609.66EUR 2,331,000.00 CHF 2,854,309.50 14/01/2014 2,042.54CHF 105,221.00 EUR 86,000.00 03/01/2014 -171.11CHF 24,494.00 EUR 20,000.00 06/01/2014 -15.18EUR 438,000.00 CHF 536,550.00 14/01/2014 164.80
19,909.29
USD 1,869,000.00 CHF 1,673,502.60 14/01/2014 -11,438.90USD 154,000.00 CHF 138,107.20 14/01/2014 -1,158.13USD 76,000.00 CHF 67,412.00 14/01/2014 173.25
-12,423.78
Forward foreign exchange contracts linked to AH EUR and IH EUR
Currency Purchases Currency Sales Maturity
Forward foreign exchange contracts linked to AH USD

UBAM
Notes to the financial statements as at 31st December 2013 (continued)
Page 274
Note 10 - Futures contracts As at 31st December 2013, the following futures contracts are outstanding: All futures are traded with the broker Morgan Stanley and Co. International PLC., excepted the sub-fund UBAM - DR. EHRHARDT GERMAN EQUITY for which the broker is UBP Europe S.A.. UBAM - CORPORATE EURO BOND
Commitment
Unrealised result
Number of contracts
Denomination Currency
(in EUR)
(in EUR)
Sale 13 EURO BOBL FUTURE 03/14 EUX EUR -1,617,590.00 16,640.00
Sale 87 EURO BOBL FUTURE 03/14 EUX EUR -10,825,410.00 111,360.00
Sale 88 EURO BOBL FUTURE 03/14 EUX EUR -10,949,840.00 56,222.00
Sale 10 EURO BUND FUTURE 03/14 EUX EUR -1,391,700.00 20,500.00
Purchase 64 EURO BUND FUTURE 03/14 EUX EUR 8,906,880.00 -134,400.00
Sale 66 EURO BUND FUTURE 03/14 EUX EUR -9,185,220.00 135,300.00
Sale 3 EURO BUXL FUTURE 03/14 EUX EUR -366,060.00 5,460.00
Purchase 23 EURO BUXL FUTURE 03/14 EUX EUR 2,806,460.00 -45,080.00
Sale 14 EURO SCHATZ FUTURE 03/14 EUX EUR -1,544,200.00 3,080.00
Purchase 226 EURO SCHATZ FUTURE 03/14 EUX EUR 24,927,800.00 -33,075.00
Sale 88 EURO SCHATZ FUTURE 03/14 EUX EUR -9,706,400.00 19,360.00
Sale 99 US 10 YEARS NOTE 03/14 CBOT USD -8,840,408.31 152,785.84
Sale 149 US 2 YEARS NOTE 03/14 CBOT USD -23,768,687.18 47,307.59
Purchase 49 US 5 YEARS NOTE 03/14 CBOT USD 4,242,760.99 -59,452.00 296,008.43
UBAM - CORPORATE US DOLLAR BOND
Commitment
Unrealised result
Number of contracts
Denomination Currency
(in USD)
(in USD)
Purchase 29 EURO BOBL FUTURE 03/14 EUX EUR 4,972,291.24 -50,749.90
Purchase 13 EURO BUND FUTURE 03/14 EUX EUR 2,493,000.92 -37,618.04
Purchase 140 EURO SCHATZ FUTURE 03/14 EUX EUR 21,278,303.90 -42,440.86
Sale 95 US 10 YEARS NOTE 03/14 CBOT USD -11,689,453.13 167,796.88
Sale 85 US 10 YEARS NOTE 03/14 CBOT USD -10,458,984.38 192,968.75
Sale 12 US 10 YEARS NOTE 03/14 CBOT USD -1,476,562.50 27,937.50
Sale 63 US 2 YEARS NOTE 03/14 CBOT USD -13,848,187.50 27,562.50
Sale 38 US 2 YEARS NOTE 03/14 CBOT USD -8,352,875.00 14,843.75
Sale 5 US 2 YEARS NOTE 03/14 CBOT USD -1,099,062.50 1,953.13
Sale 173 US 5 YEARS NOTE 03/14 CBOT USD -20,641,062.50 264,312.50
Sale 67 US 5 YEARS NOTE 03/14 CBOT USD -7,993,937.50 98,671.88
Sale 10 US 5 YEARS NOTE 03/14 CBOT USD -1,193,125.00 15,625.00
Sale 23 US TREASURY BOND 03/14 CBOT USD -2,951,187.50 50,492.19
Purchase 82 US TREASURY BOND 03/14 CBOT USD 10,521,625.00 -225,125.00
Sale 3 US TREASURY BOND 03/14 CBOT USD -384,937.50 6,585.94
Sale 2 US ULTRA BOND 30 YEARS 03/14 CBOT USD -272,500.00 5,968.75 518,784.97
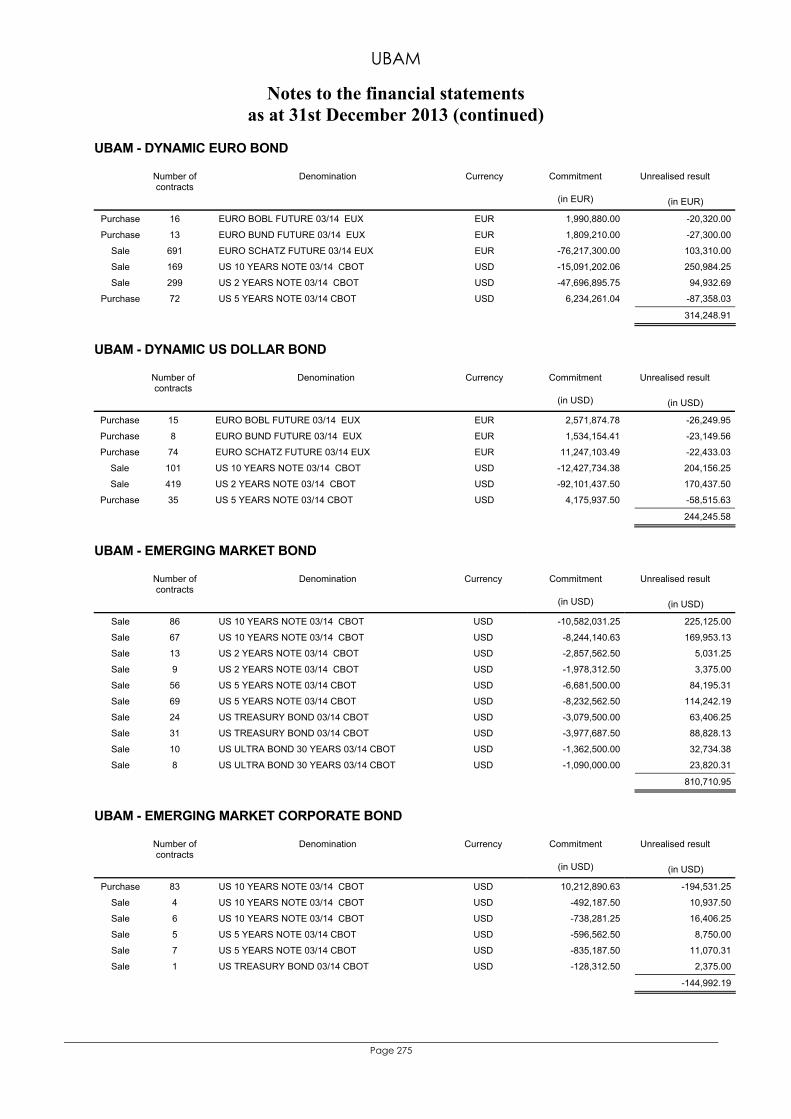
UBAM
Notes to the financial statements as at 31st December 2013 (continued)
Page 275
UBAM - DYNAMIC EURO BOND
Commitment
Unrealised result
Number of contracts
Denomination Currency
(in EUR)
(in EUR)
Purchase 16 EURO BOBL FUTURE 03/14 EUX EUR 1,990,880.00 -20,320.00
Purchase 13 EURO BUND FUTURE 03/14 EUX EUR 1,809,210.00 -27,300.00
Sale 691 EURO SCHATZ FUTURE 03/14 EUX EUR -76,217,300.00 103,310.00
Sale 169 US 10 YEARS NOTE 03/14 CBOT USD -15,091,202.06 250,984.25
Sale 299 US 2 YEARS NOTE 03/14 CBOT USD -47,696,895.75 94,932.69
Purchase 72 US 5 YEARS NOTE 03/14 CBOT USD 6,234,261.04 -87,358.03 314,248.91
UBAM - DYNAMIC US DOLLAR BOND
Commitment
Unrealised result
Number of contracts
Denomination Currency
(in USD)
(in USD)
Purchase 15 EURO BOBL FUTURE 03/14 EUX EUR 2,571,874.78 -26,249.95
Purchase 8 EURO BUND FUTURE 03/14 EUX EUR 1,534,154.41 -23,149.56
Purchase 74 EURO SCHATZ FUTURE 03/14 EUX EUR 11,247,103.49 -22,433.03
Sale 101 US 10 YEARS NOTE 03/14 CBOT USD -12,427,734.38 204,156.25
Sale 419 US 2 YEARS NOTE 03/14 CBOT USD -92,101,437.50 170,437.50
Purchase 35 US 5 YEARS NOTE 03/14 CBOT USD 4,175,937.50 -58,515.63 244,245.58
UBAM - EMERGING MARKET BOND
Commitment
Unrealised result
Number of contracts
Denomination Currency
(in USD)
(in USD)
Sale 86 US 10 YEARS NOTE 03/14 CBOT USD -10,582,031.25 225,125.00
Sale 67 US 10 YEARS NOTE 03/14 CBOT USD -8,244,140.63 169,953.13
Sale 13 US 2 YEARS NOTE 03/14 CBOT USD -2,857,562.50 5,031.25
Sale 9 US 2 YEARS NOTE 03/14 CBOT USD -1,978,312.50 3,375.00
Sale 56 US 5 YEARS NOTE 03/14 CBOT USD -6,681,500.00 84,195.31
Sale 69 US 5 YEARS NOTE 03/14 CBOT USD -8,232,562.50 114,242.19
Sale 24 US TREASURY BOND 03/14 CBOT USD -3,079,500.00 63,406.25
Sale 31 US TREASURY BOND 03/14 CBOT USD -3,977,687.50 88,828.13
Sale 10 US ULTRA BOND 30 YEARS 03/14 CBOT USD -1,362,500.00 32,734.38
Sale 8 US ULTRA BOND 30 YEARS 03/14 CBOT USD -1,090,000.00 23,820.31 810,710.95
UBAM - EMERGING MARKET CORPORATE BOND
Commitment
Unrealised result
Number of contracts
Denomination Currency
(in USD)
(in USD)
Purchase 83 US 10 YEARS NOTE 03/14 CBOT USD 10,212,890.63 -194,531.25
Sale 4 US 10 YEARS NOTE 03/14 CBOT USD -492,187.50 10,937.50
Sale 6 US 10 YEARS NOTE 03/14 CBOT USD -738,281.25 16,406.25
Sale 5 US 5 YEARS NOTE 03/14 CBOT USD -596,562.50 8,750.00
Sale 7 US 5 YEARS NOTE 03/14 CBOT USD -835,187.50 11,070.31
Sale 1 US TREASURY BOND 03/14 CBOT USD -128,312.50 2,375.00 -144,992.19
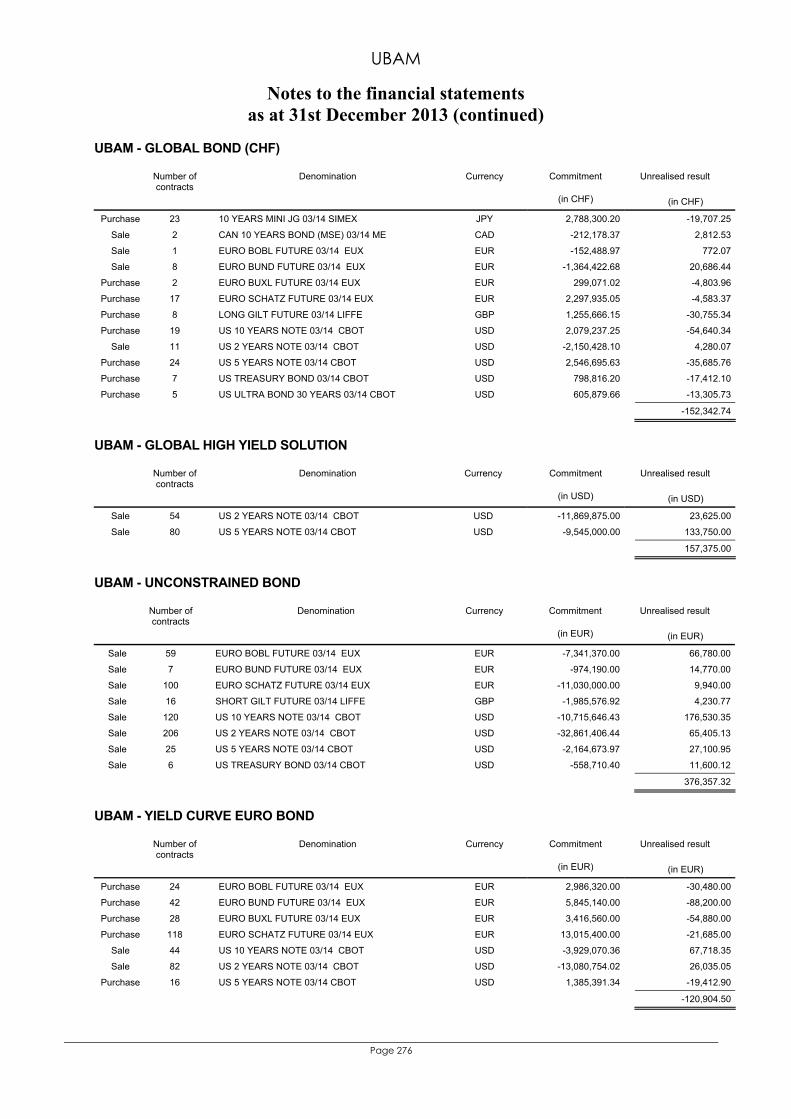
UBAM
Notes to the financial statements as at 31st December 2013 (continued)
Page 276
UBAM - GLOBAL BOND (CHF)
Commitment
Unrealised result
Number of contracts
Denomination Currency
(in CHF)
(in CHF)
Purchase 23 10 YEARS MINI JG 03/14 SIMEX JPY 2,788,300.20 -19,707.25
Sale 2 CAN 10 YEARS BOND (MSE) 03/14 ME CAD -212,178.37 2,812.53
Sale 1 EURO BOBL FUTURE 03/14 EUX EUR -152,488.97 772.07
Sale 8 EURO BUND FUTURE 03/14 EUX EUR -1,364,422.68 20,686.44
Purchase 2 EURO BUXL FUTURE 03/14 EUX EUR 299,071.02 -4,803.96
Purchase 17 EURO SCHATZ FUTURE 03/14 EUX EUR 2,297,935.05 -4,583.37
Purchase 8 LONG GILT FUTURE 03/14 LIFFE GBP 1,255,666.15 -30,755.34
Purchase 19 US 10 YEARS NOTE 03/14 CBOT USD 2,079,237.25 -54,640.34
Sale 11 US 2 YEARS NOTE 03/14 CBOT USD -2,150,428.10 4,280.07
Purchase 24 US 5 YEARS NOTE 03/14 CBOT USD 2,546,695.63 -35,685.76
Purchase 7 US TREASURY BOND 03/14 CBOT USD 798,816.20 -17,412.10
Purchase 5 US ULTRA BOND 30 YEARS 03/14 CBOT USD 605,879.66 -13,305.73 -152,342.74
UBAM - GLOBAL HIGH YIELD SOLUTION
Commitment
Unrealised result
Number of contracts
Denomination Currency
(in USD)
(in USD)
Sale 54 US 2 YEARS NOTE 03/14 CBOT USD -11,869,875.00 23,625.00
Sale 80 US 5 YEARS NOTE 03/14 CBOT USD -9,545,000.00 133,750.00 157,375.00
UBAM - UNCONSTRAINED BOND
Commitment
Unrealised result
Number of contracts
Denomination Currency
(in EUR)
(in EUR)
Sale 59 EURO BOBL FUTURE 03/14 EUX EUR -7,341,370.00 66,780.00
Sale 7 EURO BUND FUTURE 03/14 EUX EUR -974,190.00 14,770.00
Sale 100 EURO SCHATZ FUTURE 03/14 EUX EUR -11,030,000.00 9,940.00
Sale 16 SHORT GILT FUTURE 03/14 LIFFE GBP -1,985,576.92 4,230.77
Sale 120 US 10 YEARS NOTE 03/14 CBOT USD -10,715,646.43 176,530.35
Sale 206 US 2 YEARS NOTE 03/14 CBOT USD -32,861,406.44 65,405.13
Sale 25 US 5 YEARS NOTE 03/14 CBOT USD -2,164,673.97 27,100.95
Sale 6 US TREASURY BOND 03/14 CBOT USD -558,710.40 11,600.12 376,357.32
UBAM - YIELD CURVE EURO BOND
Commitment
Unrealised result
Number of contracts
Denomination Currency
(in EUR)
(in EUR)
Purchase 24 EURO BOBL FUTURE 03/14 EUX EUR 2,986,320.00 -30,480.00
Purchase 42 EURO BUND FUTURE 03/14 EUX EUR 5,845,140.00 -88,200.00
Purchase 28 EURO BUXL FUTURE 03/14 EUX EUR 3,416,560.00 -54,880.00
Purchase 118 EURO SCHATZ FUTURE 03/14 EUX EUR 13,015,400.00 -21,685.00
Sale 44 US 10 YEARS NOTE 03/14 CBOT USD -3,929,070.36 67,718.35
Sale 82 US 2 YEARS NOTE 03/14 CBOT USD -13,080,754.02 26,035.05
Purchase 16 US 5 YEARS NOTE 03/14 CBOT USD 1,385,391.34 -19,412.90 -120,904.50
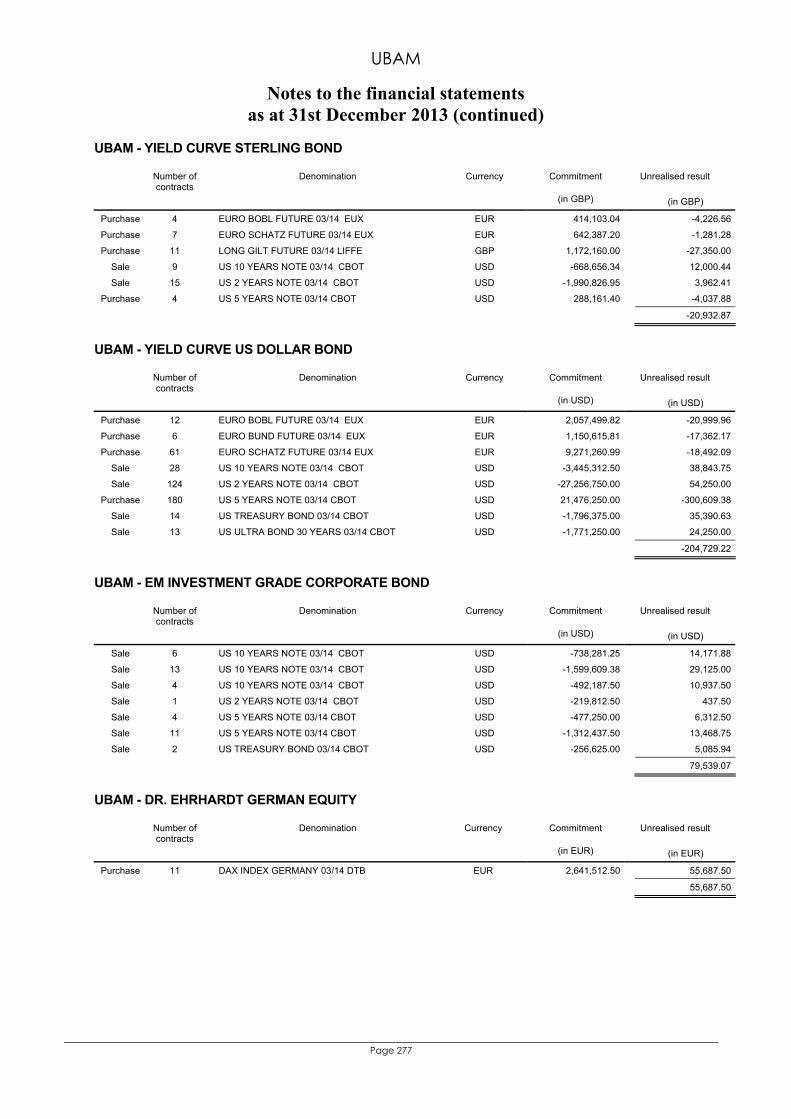
UBAM
Notes to the financial statements as at 31st December 2013 (continued)
Page 277
UBAM - YIELD CURVE STERLING BOND
Commitment
Unrealised result
Number of contracts
Denomination Currency
(in GBP)
(in GBP)
Purchase 4 EURO BOBL FUTURE 03/14 EUX EUR 414,103.04 -4,226.56
Purchase 7 EURO SCHATZ FUTURE 03/14 EUX EUR 642,387.20 -1,281.28
Purchase 11 LONG GILT FUTURE 03/14 LIFFE GBP 1,172,160.00 -27,350.00
Sale 9 US 10 YEARS NOTE 03/14 CBOT USD -668,656.34 12,000.44
Sale 15 US 2 YEARS NOTE 03/14 CBOT USD -1,990,826.95 3,962.41
Purchase 4 US 5 YEARS NOTE 03/14 CBOT USD 288,161.40 -4,037.88 -20,932.87
UBAM - YIELD CURVE US DOLLAR BOND
Commitment
Unrealised result
Number of contracts
Denomination Currency
(in USD)
(in USD)
Purchase 12 EURO BOBL FUTURE 03/14 EUX EUR 2,057,499.82 -20,999.96
Purchase 6 EURO BUND FUTURE 03/14 EUX EUR 1,150,615.81 -17,362.17
Purchase 61 EURO SCHATZ FUTURE 03/14 EUX EUR 9,271,260.99 -18,492.09
Sale 28 US 10 YEARS NOTE 03/14 CBOT USD -3,445,312.50 38,843.75
Sale 124 US 2 YEARS NOTE 03/14 CBOT USD -27,256,750.00 54,250.00
Purchase 180 US 5 YEARS NOTE 03/14 CBOT USD 21,476,250.00 -300,609.38
Sale 14 US TREASURY BOND 03/14 CBOT USD -1,796,375.00 35,390.63
Sale 13 US ULTRA BOND 30 YEARS 03/14 CBOT USD -1,771,250.00 24,250.00 -204,729.22
UBAM - EM INVESTMENT GRADE CORPORATE BOND
Commitment
Unrealised result
Number of contracts
Denomination Currency
(in USD)
(in USD)
Sale 6 US 10 YEARS NOTE 03/14 CBOT USD -738,281.25 14,171.88
Sale 13 US 10 YEARS NOTE 03/14 CBOT USD -1,599,609.38 29,125.00
Sale 4 US 10 YEARS NOTE 03/14 CBOT USD -492,187.50 10,937.50
Sale 1 US 2 YEARS NOTE 03/14 CBOT USD -219,812.50 437.50
Sale 4 US 5 YEARS NOTE 03/14 CBOT USD -477,250.00 6,312.50
Sale 11 US 5 YEARS NOTE 03/14 CBOT USD -1,312,437.50 13,468.75
Sale 2 US TREASURY BOND 03/14 CBOT USD -256,625.00 5,085.94 79,539.07
UBAM - DR. EHRHARDT GERMAN EQUITY
Commitment
Unrealised result
Number of contracts
Denomination Currency
(in EUR)
(in EUR)
Purchase 11 DAX INDEX GERMANY 03/14 DTB EUR 2,641,512.50 55,687.50 55,687.50
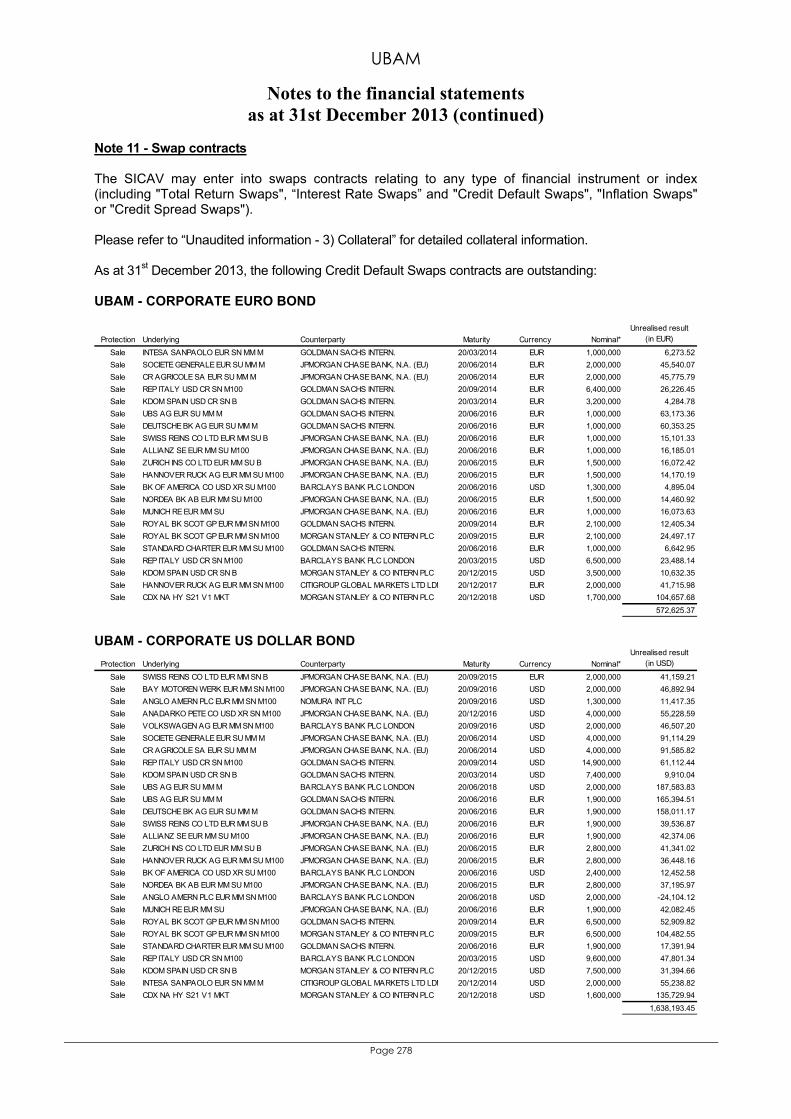
UBAM
Notes to the financial statements as at 31st December 2013 (continued)
Page 278
Note 11 - Swap contracts The SICAV may enter into swaps contracts relating to any type of financial instrument or index (including "Total Return Swaps", “Interest Rate Swaps” and "Credit Default Swaps", "Inflation Swaps" or "Credit Spread Swaps"). Please refer to “Unaudited information - 3) Collateral” for detailed collateral information. As at 31st December 2013, the following Credit Default Swaps contracts are outstanding: UBAM - CORPORATE EURO BOND
Protection Underlying Counterparty Maturity Currency Nominal*Unrealised result
(in EUR)
Sale INTESA SANPAOLO EUR SN MM M GOLDMAN SACHS INTERN. 20/03/2014 EUR 1,000,000 6,273.52Sale SOCIETE GENERALE EUR SU MM M JPMORGAN CHASE BANK, N.A. (EU) 20/06/2014 EUR 2,000,000 45,540.07Sale CR AGRICOLE SA EUR SU MM M JPMORGAN CHASE BANK, N.A. (EU) 20/06/2014 EUR 2,000,000 45,775.79Sale REP ITALY USD CR SN M100 GOLDMAN SACHS INTERN. 20/09/2014 EUR 6,400,000 26,226.45Sale KDOM SPAIN USD CR SN B GOLDMAN SACHS INTERN. 20/03/2014 EUR 3,200,000 4,284.78Sale UBS AG EUR SU MM M GOLDMAN SACHS INTERN. 20/06/2016 EUR 1,000,000 63,173.36Sale DEUTSCHE BK AG EUR SU MM M GOLDMAN SACHS INTERN. 20/06/2016 EUR 1,000,000 60,353.25Sale SWISS REINS CO LTD EUR MM SU B JPMORGAN CHASE BANK, N.A. (EU) 20/06/2016 EUR 1,000,000 15,101.33Sale ALLIANZ SE EUR MM SU M100 JPMORGAN CHASE BANK, N.A. (EU) 20/06/2016 EUR 1,000,000 16,185.01Sale ZURICH INS CO LTD EUR MM SU B JPMORGAN CHASE BANK, N.A. (EU) 20/06/2015 EUR 1,500,000 16,072.42Sale HANNOVER RUCK AG EUR MM SU M100 JPMORGAN CHASE BANK, N.A. (EU) 20/06/2015 EUR 1,500,000 14,170.19Sale BK OF AMERICA CO USD XR SU M100 BARCLAYS BANK PLC LONDON 20/06/2016 USD 1,300,000 4,895.04Sale NORDEA BK AB EUR MM SU M100 JPMORGAN CHASE BANK, N.A. (EU) 20/06/2015 EUR 1,500,000 14,460.92Sale MUNICH RE EUR MM SU JPMORGAN CHASE BANK, N.A. (EU) 20/06/2016 EUR 1,000,000 16,073.63Sale ROYAL BK SCOT GP EUR MM SN M100 GOLDMAN SACHS INTERN. 20/09/2014 EUR 2,100,000 12,405.34Sale ROYAL BK SCOT GP EUR MM SN M100 MORGAN STANLEY & CO INTERN PLC 20/09/2015 EUR 2,100,000 24,497.17Sale STANDARD CHARTER EUR MM SU M100 GOLDMAN SACHS INTERN. 20/06/2016 EUR 1,000,000 6,642.95Sale REP ITALY USD CR SN M100 BARCLAYS BANK PLC LONDON 20/03/2015 USD 6,500,000 23,488.14Sale KDOM SPAIN USD CR SN B MORGAN STANLEY & CO INTERN PLC 20/12/2015 USD 3,500,000 10,632.35Sale HANNOVER RUCK AG EUR MM SN M100 CITIGROUP GLOBAL MARKETS LTD LDN 20/12/2017 EUR 2,000,000 41,715.98Sale CDX NA HY S21 V1 MKT MORGAN STANLEY & CO INTERN PLC 20/12/2018 USD 1,700,000 104,657.68
572,625.37 UBAM - CORPORATE US DOLLAR BOND
Protection Underlying Counterparty Maturity Currency Nominal*Unrealised result
(in USD)
Sale SWISS REINS CO LTD EUR MM SN B JPMORGAN CHASE BANK, N.A. (EU) 20/09/2015 EUR 2,000,000 41,159.21Sale BAY MOTOREN WERK EUR MM SN M100 JPMORGAN CHASE BANK, N.A. (EU) 20/09/2016 USD 2,000,000 46,892.94Sale ANGLO AMERN PLC EUR MM SN M100 NOMURA INT PLC 20/09/2016 USD 1,300,000 11,417.35Sale ANADARKO PETE CO USD XR SN M100 JPMORGAN CHASE BANK, N.A. (EU) 20/12/2016 USD 4,000,000 55,228.59Sale VOLKSWAGEN AG EUR MM SN M100 BARCLAYS BANK PLC LONDON 20/09/2016 USD 2,000,000 46,507.20Sale SOCIETE GENERALE EUR SU MM M JPMORGAN CHASE BANK, N.A. (EU) 20/06/2014 USD 4,000,000 91,114.29Sale CR AGRICOLE SA EUR SU MM M JPMORGAN CHASE BANK, N.A. (EU) 20/06/2014 USD 4,000,000 91,585.82Sale REP ITALY USD CR SN M100 GOLDMAN SACHS INTERN. 20/09/2014 USD 14,900,000 61,112.44Sale KDOM SPAIN USD CR SN B GOLDMAN SACHS INTERN. 20/03/2014 USD 7,400,000 9,910.04Sale UBS AG EUR SU MM M BARCLAYS BANK PLC LONDON 20/06/2018 USD 2,000,000 187,583.83Sale UBS AG EUR SU MM M GOLDMAN SACHS INTERN. 20/06/2016 EUR 1,900,000 165,394.51Sale DEUTSCHE BK AG EUR SU MM M GOLDMAN SACHS INTERN. 20/06/2016 EUR 1,900,000 158,011.17Sale SWISS REINS CO LTD EUR MM SU B JPMORGAN CHASE BANK, N.A. (EU) 20/06/2016 EUR 1,900,000 39,536.87Sale ALLIANZ SE EUR MM SU M100 JPMORGAN CHASE BANK, N.A. (EU) 20/06/2016 EUR 1,900,000 42,374.06Sale ZURICH INS CO LTD EUR MM SU B JPMORGAN CHASE BANK, N.A. (EU) 20/06/2015 EUR 2,800,000 41,341.02Sale HANNOVER RUCK AG EUR MM SU M100 JPMORGAN CHASE BANK, N.A. (EU) 20/06/2015 EUR 2,800,000 36,448.16Sale BK OF AMERICA CO USD XR SU M100 BARCLAYS BANK PLC LONDON 20/06/2016 USD 2,400,000 12,452.58Sale NORDEA BK AB EUR MM SU M100 JPMORGAN CHASE BANK, N.A. (EU) 20/06/2015 EUR 2,800,000 37,195.97Sale ANGLO AMERN PLC EUR MM SN M100 BARCLAYS BANK PLC LONDON 20/06/2018 USD 2,000,000 -24,104.12Sale MUNICH RE EUR MM SU JPMORGAN CHASE BANK, N.A. (EU) 20/06/2016 EUR 1,900,000 42,082.45Sale ROYAL BK SCOT GP EUR MM SN M100 GOLDMAN SACHS INTERN. 20/09/2014 EUR 6,500,000 52,909.82Sale ROYAL BK SCOT GP EUR MM SN M100 MORGAN STANLEY & CO INTERN PLC 20/09/2015 EUR 6,500,000 104,482.55Sale STANDARD CHARTER EUR MM SU M100 GOLDMAN SACHS INTERN. 20/06/2016 EUR 1,900,000 17,391.94Sale REP ITALY USD CR SN M100 BARCLAYS BANK PLC LONDON 20/03/2015 USD 9,600,000 47,801.34Sale KDOM SPAIN USD CR SN B MORGAN STANLEY & CO INTERN PLC 20/12/2015 USD 7,500,000 31,394.66Sale INTESA SANPAOLO EUR SN MM M CITIGROUP GLOBAL MARKETS LTD LDN 20/12/2014 USD 2,000,000 55,238.82Sale CDX NA HY S21 V1 MKT MORGAN STANLEY & CO INTERN PLC 20/12/2018 USD 1,600,000 135,729.94
1,638,193.45
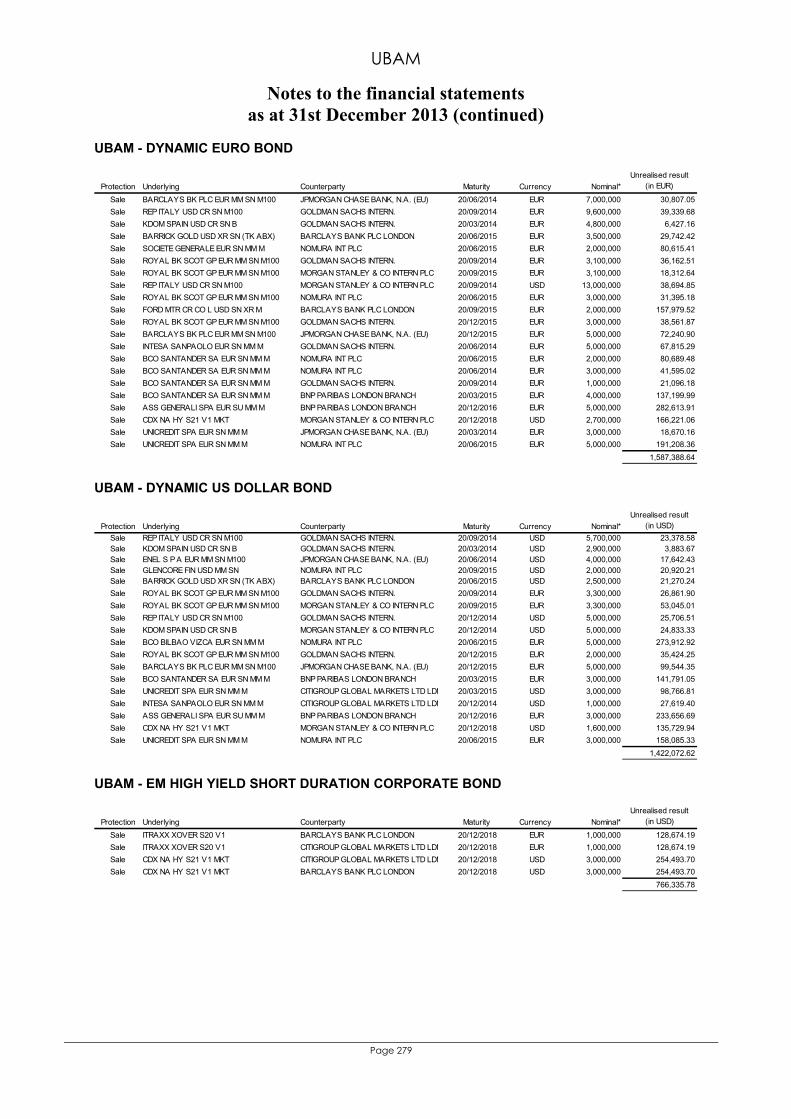
UBAM
Notes to the financial statements as at 31st December 2013 (continued)
Page 279
UBAM - DYNAMIC EURO BOND
Protection Underlying Counterparty Maturity Currency Nominal*Unrealised result
(in EUR)
Sale BARCLAYS BK PLC EUR MM SN M100 JPMORGAN CHASE BANK, N.A. (EU) 20/06/2014 EUR 7,000,000 30,807.05Sale REP ITALY USD CR SN M100 GOLDMAN SACHS INTERN. 20/09/2014 EUR 9,600,000 39,339.68Sale KDOM SPAIN USD CR SN B GOLDMAN SACHS INTERN. 20/03/2014 EUR 4,800,000 6,427.16Sale BARRICK GOLD USD XR SN (TK ABX) BARCLAYS BANK PLC LONDON 20/06/2015 EUR 3,500,000 29,742.42Sale SOCIETE GENERALE EUR SN MM M NOMURA INT PLC 20/06/2015 EUR 2,000,000 80,615.41Sale ROYAL BK SCOT GP EUR MM SN M100 GOLDMAN SACHS INTERN. 20/09/2014 EUR 3,100,000 36,162.51Sale ROYAL BK SCOT GP EUR MM SN M100 MORGAN STANLEY & CO INTERN PLC 20/09/2015 EUR 3,100,000 18,312.64Sale REP ITALY USD CR SN M100 MORGAN STANLEY & CO INTERN PLC 20/09/2014 USD 13,000,000 38,694.85Sale ROYAL BK SCOT GP EUR MM SN M100 NOMURA INT PLC 20/06/2015 EUR 3,000,000 31,395.18Sale FORD MTR CR CO L USD SN XR M BARCLAYS BANK PLC LONDON 20/09/2015 EUR 2,000,000 157,979.52Sale ROYAL BK SCOT GP EUR MM SN M100 GOLDMAN SACHS INTERN. 20/12/2015 EUR 3,000,000 38,561.87Sale BARCLAYS BK PLC EUR MM SN M100 JPMORGAN CHASE BANK, N.A. (EU) 20/12/2015 EUR 5,000,000 72,240.90Sale INTESA SANPAOLO EUR SN MM M GOLDMAN SACHS INTERN. 20/06/2014 EUR 5,000,000 67,815.29Sale BCO SANTANDER SA EUR SN MM M NOMURA INT PLC 20/06/2015 EUR 2,000,000 80,689.48Sale BCO SANTANDER SA EUR SN MM M NOMURA INT PLC 20/06/2014 EUR 3,000,000 41,595.02Sale BCO SANTANDER SA EUR SN MM M GOLDMAN SACHS INTERN. 20/09/2014 EUR 1,000,000 21,096.18Sale BCO SANTANDER SA EUR SN MM M BNP PARIBAS LONDON BRANCH 20/03/2015 EUR 4,000,000 137,199.99Sale ASS GENERALI SPA EUR SU MM M BNP PARIBAS LONDON BRANCH 20/12/2016 EUR 5,000,000 282,613.91Sale CDX NA HY S21 V1 MKT MORGAN STANLEY & CO INTERN PLC 20/12/2018 USD 2,700,000 166,221.06Sale UNICREDIT SPA EUR SN MM M JPMORGAN CHASE BANK, N.A. (EU) 20/03/2014 EUR 3,000,000 18,670.16Sale UNICREDIT SPA EUR SN MM M NOMURA INT PLC 20/06/2015 EUR 5,000,000 191,208.36
1,587,388.64 UBAM - DYNAMIC US DOLLAR BOND
Protection Underlying Counterparty Maturity Currency Nominal*Unrealised result
(in USD)Sale REP ITALY USD CR SN M100 GOLDMAN SACHS INTERN. 20/09/2014 USD 5,700,000 23,378.58Sale KDOM SPAIN USD CR SN B GOLDMAN SACHS INTERN. 20/03/2014 USD 2,900,000 3,883.67Sale ENEL S P A EUR MM SN M100 JPMORGAN CHASE BANK, N.A. (EU) 20/06/2014 USD 4,000,000 17,642.43Sale GLENCORE FIN USD MM SN NOMURA INT PLC 20/09/2015 USD 2,000,000 20,920.21Sale BARRICK GOLD USD XR SN (TK ABX) BARCLAYS BANK PLC LONDON 20/06/2015 USD 2,500,000 21,270.24Sale ROYAL BK SCOT GP EUR MM SN M100 GOLDMAN SACHS INTERN. 20/09/2014 EUR 3,300,000 26,861.90Sale ROYAL BK SCOT GP EUR MM SN M100 MORGAN STANLEY & CO INTERN PLC 20/09/2015 EUR 3,300,000 53,045.01Sale REP ITALY USD CR SN M100 GOLDMAN SACHS INTERN. 20/12/2014 USD 5,000,000 25,706.51Sale KDOM SPAIN USD CR SN B MORGAN STANLEY & CO INTERN PLC 20/12/2014 USD 5,000,000 24,833.33Sale BCO BILBAO VIZCA EUR SN MM M NOMURA INT PLC 20/06/2015 EUR 5,000,000 273,912.92Sale ROYAL BK SCOT GP EUR MM SN M100 GOLDMAN SACHS INTERN. 20/12/2015 EUR 2,000,000 35,424.25Sale BARCLAYS BK PLC EUR MM SN M100 JPMORGAN CHASE BANK, N.A. (EU) 20/12/2015 EUR 5,000,000 99,544.35Sale BCO SANTANDER SA EUR SN MM M BNP PARIBAS LONDON BRANCH 20/03/2015 EUR 3,000,000 141,791.05Sale UNICREDIT SPA EUR SN MM M CITIGROUP GLOBAL MARKETS LTD LDN 20/03/2015 USD 3,000,000 98,766.81Sale INTESA SANPAOLO EUR SN MM M CITIGROUP GLOBAL MARKETS LTD LDN 20/12/2014 USD 1,000,000 27,619.40Sale ASS GENERALI SPA EUR SU MM M BNP PARIBAS LONDON BRANCH 20/12/2016 EUR 3,000,000 233,656.69Sale CDX NA HY S21 V1 MKT MORGAN STANLEY & CO INTERN PLC 20/12/2018 USD 1,600,000 135,729.94Sale UNICREDIT SPA EUR SN MM M NOMURA INT PLC 20/06/2015 EUR 3,000,000 158,085.33
1,422,072.62 UBAM - EM HIGH YIELD SHORT DURATION CORPORATE BOND
Protection Underlying Counterparty Maturity Currency Nominal*Unrealised result
(in USD)
Sale ITRAXX XOVER S20 V1 BARCLAYS BANK PLC LONDON 20/12/2018 EUR 1,000,000 128,674.19Sale ITRAXX XOVER S20 V1 CITIGROUP GLOBAL MARKETS LTD LDN 20/12/2018 EUR 1,000,000 128,674.19Sale CDX NA HY S21 V1 MKT CITIGROUP GLOBAL MARKETS LTD LDN 20/12/2018 USD 3,000,000 254,493.70Sale CDX NA HY S21 V1 MKT BARCLAYS BANK PLC LONDON 20/12/2018 USD 3,000,000 254,493.70
766,335.78
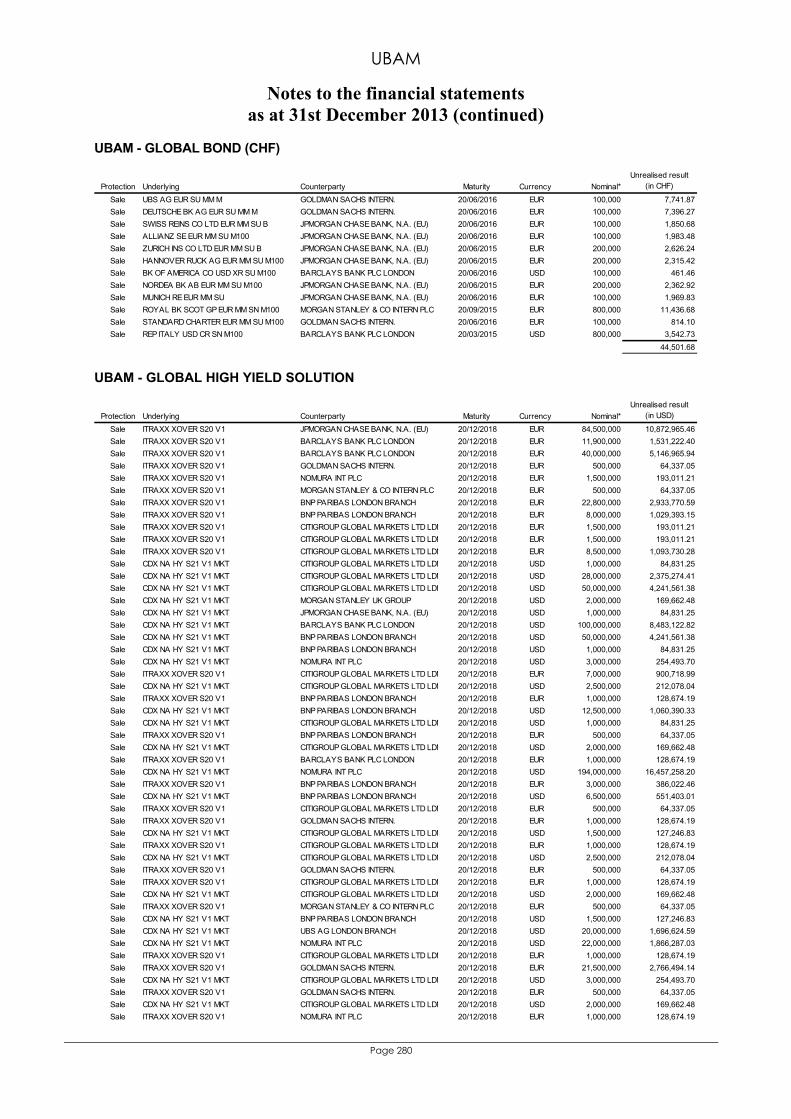
UBAM
Notes to the financial statements as at 31st December 2013 (continued)
Page 280
UBAM - GLOBAL BOND (CHF)
Protection Underlying Counterparty Maturity Currency Nominal*Unrealised result
(in CHF)
Sale UBS AG EUR SU MM M GOLDMAN SACHS INTERN. 20/06/2016 EUR 100,000 7,741.87Sale DEUTSCHE BK AG EUR SU MM M GOLDMAN SACHS INTERN. 20/06/2016 EUR 100,000 7,396.27Sale SWISS REINS CO LTD EUR MM SU B JPMORGAN CHASE BANK, N.A. (EU) 20/06/2016 EUR 100,000 1,850.68Sale ALLIANZ SE EUR MM SU M100 JPMORGAN CHASE BANK, N.A. (EU) 20/06/2016 EUR 100,000 1,983.48Sale ZURICH INS CO LTD EUR MM SU B JPMORGAN CHASE BANK, N.A. (EU) 20/06/2015 EUR 200,000 2,626.24Sale HANNOVER RUCK AG EUR MM SU M100 JPMORGAN CHASE BANK, N.A. (EU) 20/06/2015 EUR 200,000 2,315.42Sale BK OF AMERICA CO USD XR SU M100 BARCLAYS BANK PLC LONDON 20/06/2016 USD 100,000 461.46Sale NORDEA BK AB EUR MM SU M100 JPMORGAN CHASE BANK, N.A. (EU) 20/06/2015 EUR 200,000 2,362.92Sale MUNICH RE EUR MM SU JPMORGAN CHASE BANK, N.A. (EU) 20/06/2016 EUR 100,000 1,969.83Sale ROYAL BK SCOT GP EUR MM SN M100 MORGAN STANLEY & CO INTERN PLC 20/09/2015 EUR 800,000 11,436.68Sale STANDARD CHARTER EUR MM SU M100 GOLDMAN SACHS INTERN. 20/06/2016 EUR 100,000 814.10Sale REP ITALY USD CR SN M100 BARCLAYS BANK PLC LONDON 20/03/2015 USD 800,000 3,542.73
44,501.68 UBAM - GLOBAL HIGH YIELD SOLUTION
Protection Underlying Counterparty Maturity Currency Nominal*Unrealised result
(in USD)
Sale ITRAXX XOVER S20 V1 JPMORGAN CHASE BANK, N.A. (EU) 20/12/2018 EUR 84,500,000 10,872,965.46Sale ITRAXX XOVER S20 V1 BARCLAYS BANK PLC LONDON 20/12/2018 EUR 11,900,000 1,531,222.40Sale ITRAXX XOVER S20 V1 BARCLAYS BANK PLC LONDON 20/12/2018 EUR 40,000,000 5,146,965.94Sale ITRAXX XOVER S20 V1 GOLDMAN SACHS INTERN. 20/12/2018 EUR 500,000 64,337.05Sale ITRAXX XOVER S20 V1 NOMURA INT PLC 20/12/2018 EUR 1,500,000 193,011.21Sale ITRAXX XOVER S20 V1 MORGAN STANLEY & CO INTERN PLC 20/12/2018 EUR 500,000 64,337.05Sale ITRAXX XOVER S20 V1 BNP PARIBAS LONDON BRANCH 20/12/2018 EUR 22,800,000 2,933,770.59Sale ITRAXX XOVER S20 V1 BNP PARIBAS LONDON BRANCH 20/12/2018 EUR 8,000,000 1,029,393.15Sale ITRAXX XOVER S20 V1 CITIGROUP GLOBAL MARKETS LTD LDN 20/12/2018 EUR 1,500,000 193,011.21Sale ITRAXX XOVER S20 V1 CITIGROUP GLOBAL MARKETS LTD LDN 20/12/2018 EUR 1,500,000 193,011.21Sale ITRAXX XOVER S20 V1 CITIGROUP GLOBAL MARKETS LTD LDN 20/12/2018 EUR 8,500,000 1,093,730.28Sale CDX NA HY S21 V1 MKT CITIGROUP GLOBAL MARKETS LTD LDN 20/12/2018 USD 1,000,000 84,831.25Sale CDX NA HY S21 V1 MKT CITIGROUP GLOBAL MARKETS LTD LDN 20/12/2018 USD 28,000,000 2,375,274.41Sale CDX NA HY S21 V1 MKT CITIGROUP GLOBAL MARKETS LTD LDN 20/12/2018 USD 50,000,000 4,241,561.38Sale CDX NA HY S21 V1 MKT MORGAN STANLEY UK GROUP 20/12/2018 USD 2,000,000 169,662.48Sale CDX NA HY S21 V1 MKT JPMORGAN CHASE BANK, N.A. (EU) 20/12/2018 USD 1,000,000 84,831.25Sale CDX NA HY S21 V1 MKT BARCLAYS BANK PLC LONDON 20/12/2018 USD 100,000,000 8,483,122.82Sale CDX NA HY S21 V1 MKT BNP PARIBAS LONDON BRANCH 20/12/2018 USD 50,000,000 4,241,561.38Sale CDX NA HY S21 V1 MKT BNP PARIBAS LONDON BRANCH 20/12/2018 USD 1,000,000 84,831.25Sale CDX NA HY S21 V1 MKT NOMURA INT PLC 20/12/2018 USD 3,000,000 254,493.70Sale ITRAXX XOVER S20 V1 CITIGROUP GLOBAL MARKETS LTD LDN 20/12/2018 EUR 7,000,000 900,718.99Sale CDX NA HY S21 V1 MKT CITIGROUP GLOBAL MARKETS LTD LDN 20/12/2018 USD 2,500,000 212,078.04Sale ITRAXX XOVER S20 V1 BNP PARIBAS LONDON BRANCH 20/12/2018 EUR 1,000,000 128,674.19Sale CDX NA HY S21 V1 MKT BNP PARIBAS LONDON BRANCH 20/12/2018 USD 12,500,000 1,060,390.33Sale CDX NA HY S21 V1 MKT CITIGROUP GLOBAL MARKETS LTD LDN 20/12/2018 USD 1,000,000 84,831.25Sale ITRAXX XOVER S20 V1 BNP PARIBAS LONDON BRANCH 20/12/2018 EUR 500,000 64,337.05Sale CDX NA HY S21 V1 MKT CITIGROUP GLOBAL MARKETS LTD LDN 20/12/2018 USD 2,000,000 169,662.48Sale ITRAXX XOVER S20 V1 BARCLAYS BANK PLC LONDON 20/12/2018 EUR 1,000,000 128,674.19Sale CDX NA HY S21 V1 MKT NOMURA INT PLC 20/12/2018 USD 194,000,000 16,457,258.20Sale ITRAXX XOVER S20 V1 BNP PARIBAS LONDON BRANCH 20/12/2018 EUR 3,000,000 386,022.46Sale CDX NA HY S21 V1 MKT BNP PARIBAS LONDON BRANCH 20/12/2018 USD 6,500,000 551,403.01Sale ITRAXX XOVER S20 V1 CITIGROUP GLOBAL MARKETS LTD LDN 20/12/2018 EUR 500,000 64,337.05Sale ITRAXX XOVER S20 V1 GOLDMAN SACHS INTERN. 20/12/2018 EUR 1,000,000 128,674.19Sale CDX NA HY S21 V1 MKT CITIGROUP GLOBAL MARKETS LTD LDN 20/12/2018 USD 1,500,000 127,246.83Sale ITRAXX XOVER S20 V1 CITIGROUP GLOBAL MARKETS LTD LDN 20/12/2018 EUR 1,000,000 128,674.19Sale CDX NA HY S21 V1 MKT CITIGROUP GLOBAL MARKETS LTD LDN 20/12/2018 USD 2,500,000 212,078.04Sale ITRAXX XOVER S20 V1 GOLDMAN SACHS INTERN. 20/12/2018 EUR 500,000 64,337.05Sale ITRAXX XOVER S20 V1 CITIGROUP GLOBAL MARKETS LTD LDN 20/12/2018 EUR 1,000,000 128,674.19Sale CDX NA HY S21 V1 MKT CITIGROUP GLOBAL MARKETS LTD LDN 20/12/2018 USD 2,000,000 169,662.48Sale ITRAXX XOVER S20 V1 MORGAN STANLEY & CO INTERN PLC 20/12/2018 EUR 500,000 64,337.05Sale CDX NA HY S21 V1 MKT BNP PARIBAS LONDON BRANCH 20/12/2018 USD 1,500,000 127,246.83Sale CDX NA HY S21 V1 MKT UBS AG LONDON BRANCH 20/12/2018 USD 20,000,000 1,696,624.59Sale CDX NA HY S21 V1 MKT NOMURA INT PLC 20/12/2018 USD 22,000,000 1,866,287.03Sale ITRAXX XOVER S20 V1 CITIGROUP GLOBAL MARKETS LTD LDN 20/12/2018 EUR 1,000,000 128,674.19Sale ITRAXX XOVER S20 V1 GOLDMAN SACHS INTERN. 20/12/2018 EUR 21,500,000 2,766,494.14Sale CDX NA HY S21 V1 MKT CITIGROUP GLOBAL MARKETS LTD LDN 20/12/2018 USD 3,000,000 254,493.70Sale ITRAXX XOVER S20 V1 GOLDMAN SACHS INTERN. 20/12/2018 EUR 500,000 64,337.05Sale CDX NA HY S21 V1 MKT CITIGROUP GLOBAL MARKETS LTD LDN 20/12/2018 USD 2,000,000 169,662.48Sale ITRAXX XOVER S20 V1 NOMURA INT PLC 20/12/2018 EUR 1,000,000 128,674.19
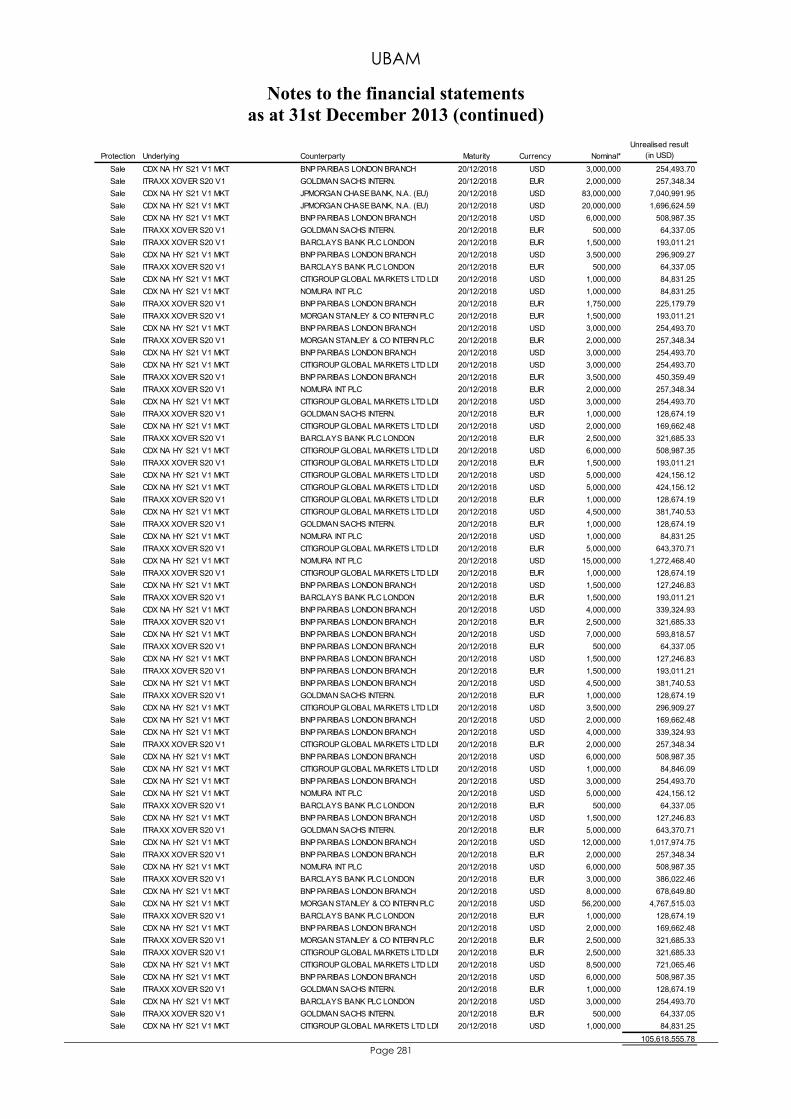
UBAM
Notes to the financial statements as at 31st December 2013 (continued)
Page 281
Protection Underlying Counterparty Maturity Currency Nominal*Unrealised result
(in USD)
Sale CDX NA HY S21 V1 MKT BNP PARIBAS LONDON BRANCH 20/12/2018 USD 3,000,000 254,493.70Sale ITRAXX XOVER S20 V1 GOLDMAN SACHS INTERN. 20/12/2018 EUR 2,000,000 257,348.34Sale CDX NA HY S21 V1 MKT JPMORGAN CHASE BANK, N.A. (EU) 20/12/2018 USD 83,000,000 7,040,991.95Sale CDX NA HY S21 V1 MKT JPMORGAN CHASE BANK, N.A. (EU) 20/12/2018 USD 20,000,000 1,696,624.59Sale CDX NA HY S21 V1 MKT BNP PARIBAS LONDON BRANCH 20/12/2018 USD 6,000,000 508,987.35Sale ITRAXX XOVER S20 V1 GOLDMAN SACHS INTERN. 20/12/2018 EUR 500,000 64,337.05Sale ITRAXX XOVER S20 V1 BARCLAYS BANK PLC LONDON 20/12/2018 EUR 1,500,000 193,011.21Sale CDX NA HY S21 V1 MKT BNP PARIBAS LONDON BRANCH 20/12/2018 USD 3,500,000 296,909.27Sale ITRAXX XOVER S20 V1 BARCLAYS BANK PLC LONDON 20/12/2018 EUR 500,000 64,337.05Sale CDX NA HY S21 V1 MKT CITIGROUP GLOBAL MARKETS LTD LDN 20/12/2018 USD 1,000,000 84,831.25Sale CDX NA HY S21 V1 MKT NOMURA INT PLC 20/12/2018 USD 1,000,000 84,831.25Sale ITRAXX XOVER S20 V1 BNP PARIBAS LONDON BRANCH 20/12/2018 EUR 1,750,000 225,179.79Sale ITRAXX XOVER S20 V1 MORGAN STANLEY & CO INTERN PLC 20/12/2018 EUR 1,500,000 193,011.21Sale CDX NA HY S21 V1 MKT BNP PARIBAS LONDON BRANCH 20/12/2018 USD 3,000,000 254,493.70Sale ITRAXX XOVER S20 V1 MORGAN STANLEY & CO INTERN PLC 20/12/2018 EUR 2,000,000 257,348.34Sale CDX NA HY S21 V1 MKT BNP PARIBAS LONDON BRANCH 20/12/2018 USD 3,000,000 254,493.70Sale CDX NA HY S21 V1 MKT CITIGROUP GLOBAL MARKETS LTD LDN 20/12/2018 USD 3,000,000 254,493.70Sale ITRAXX XOVER S20 V1 BNP PARIBAS LONDON BRANCH 20/12/2018 EUR 3,500,000 450,359.49Sale ITRAXX XOVER S20 V1 NOMURA INT PLC 20/12/2018 EUR 2,000,000 257,348.34Sale CDX NA HY S21 V1 MKT CITIGROUP GLOBAL MARKETS LTD LDN 20/12/2018 USD 3,000,000 254,493.70Sale ITRAXX XOVER S20 V1 GOLDMAN SACHS INTERN. 20/12/2018 EUR 1,000,000 128,674.19Sale CDX NA HY S21 V1 MKT CITIGROUP GLOBAL MARKETS LTD LDN 20/12/2018 USD 2,000,000 169,662.48Sale ITRAXX XOVER S20 V1 BARCLAYS BANK PLC LONDON 20/12/2018 EUR 2,500,000 321,685.33Sale CDX NA HY S21 V1 MKT CITIGROUP GLOBAL MARKETS LTD LDN 20/12/2018 USD 6,000,000 508,987.35Sale ITRAXX XOVER S20 V1 CITIGROUP GLOBAL MARKETS LTD LDN 20/12/2018 EUR 1,500,000 193,011.21Sale CDX NA HY S21 V1 MKT CITIGROUP GLOBAL MARKETS LTD LDN 20/12/2018 USD 5,000,000 424,156.12Sale CDX NA HY S21 V1 MKT CITIGROUP GLOBAL MARKETS LTD LDN 20/12/2018 USD 5,000,000 424,156.12Sale ITRAXX XOVER S20 V1 CITIGROUP GLOBAL MARKETS LTD LDN 20/12/2018 EUR 1,000,000 128,674.19Sale CDX NA HY S21 V1 MKT CITIGROUP GLOBAL MARKETS LTD LDN 20/12/2018 USD 4,500,000 381,740.53Sale ITRAXX XOVER S20 V1 GOLDMAN SACHS INTERN. 20/12/2018 EUR 1,000,000 128,674.19Sale CDX NA HY S21 V1 MKT NOMURA INT PLC 20/12/2018 USD 1,000,000 84,831.25Sale ITRAXX XOVER S20 V1 CITIGROUP GLOBAL MARKETS LTD LDN 20/12/2018 EUR 5,000,000 643,370.71Sale CDX NA HY S21 V1 MKT NOMURA INT PLC 20/12/2018 USD 15,000,000 1,272,468.40Sale ITRAXX XOVER S20 V1 CITIGROUP GLOBAL MARKETS LTD LDN 20/12/2018 EUR 1,000,000 128,674.19Sale CDX NA HY S21 V1 MKT BNP PARIBAS LONDON BRANCH 20/12/2018 USD 1,500,000 127,246.83Sale ITRAXX XOVER S20 V1 BARCLAYS BANK PLC LONDON 20/12/2018 EUR 1,500,000 193,011.21Sale CDX NA HY S21 V1 MKT BNP PARIBAS LONDON BRANCH 20/12/2018 USD 4,000,000 339,324.93Sale ITRAXX XOVER S20 V1 BNP PARIBAS LONDON BRANCH 20/12/2018 EUR 2,500,000 321,685.33Sale CDX NA HY S21 V1 MKT BNP PARIBAS LONDON BRANCH 20/12/2018 USD 7,000,000 593,818.57Sale ITRAXX XOVER S20 V1 BNP PARIBAS LONDON BRANCH 20/12/2018 EUR 500,000 64,337.05Sale CDX NA HY S21 V1 MKT BNP PARIBAS LONDON BRANCH 20/12/2018 USD 1,500,000 127,246.83Sale ITRAXX XOVER S20 V1 BNP PARIBAS LONDON BRANCH 20/12/2018 EUR 1,500,000 193,011.21Sale CDX NA HY S21 V1 MKT BNP PARIBAS LONDON BRANCH 20/12/2018 USD 4,500,000 381,740.53Sale ITRAXX XOVER S20 V1 GOLDMAN SACHS INTERN. 20/12/2018 EUR 1,000,000 128,674.19Sale CDX NA HY S21 V1 MKT CITIGROUP GLOBAL MARKETS LTD LDN 20/12/2018 USD 3,500,000 296,909.27Sale CDX NA HY S21 V1 MKT BNP PARIBAS LONDON BRANCH 20/12/2018 USD 2,000,000 169,662.48Sale CDX NA HY S21 V1 MKT BNP PARIBAS LONDON BRANCH 20/12/2018 USD 4,000,000 339,324.93Sale ITRAXX XOVER S20 V1 CITIGROUP GLOBAL MARKETS LTD LDN 20/12/2018 EUR 2,000,000 257,348.34Sale CDX NA HY S21 V1 MKT BNP PARIBAS LONDON BRANCH 20/12/2018 USD 6,000,000 508,987.35Sale CDX NA HY S21 V1 MKT CITIGROUP GLOBAL MARKETS LTD LDN 20/12/2018 USD 1,000,000 84,846.09Sale CDX NA HY S21 V1 MKT BNP PARIBAS LONDON BRANCH 20/12/2018 USD 3,000,000 254,493.70Sale CDX NA HY S21 V1 MKT NOMURA INT PLC 20/12/2018 USD 5,000,000 424,156.12Sale ITRAXX XOVER S20 V1 BARCLAYS BANK PLC LONDON 20/12/2018 EUR 500,000 64,337.05Sale CDX NA HY S21 V1 MKT BNP PARIBAS LONDON BRANCH 20/12/2018 USD 1,500,000 127,246.83Sale ITRAXX XOVER S20 V1 GOLDMAN SACHS INTERN. 20/12/2018 EUR 5,000,000 643,370.71Sale CDX NA HY S21 V1 MKT BNP PARIBAS LONDON BRANCH 20/12/2018 USD 12,000,000 1,017,974.75Sale ITRAXX XOVER S20 V1 BNP PARIBAS LONDON BRANCH 20/12/2018 EUR 2,000,000 257,348.34Sale CDX NA HY S21 V1 MKT NOMURA INT PLC 20/12/2018 USD 6,000,000 508,987.35Sale ITRAXX XOVER S20 V1 BARCLAYS BANK PLC LONDON 20/12/2018 EUR 3,000,000 386,022.46Sale CDX NA HY S21 V1 MKT BNP PARIBAS LONDON BRANCH 20/12/2018 USD 8,000,000 678,649.80Sale CDX NA HY S21 V1 MKT MORGAN STANLEY & CO INTERN PLC 20/12/2018 USD 56,200,000 4,767,515.03Sale ITRAXX XOVER S20 V1 BARCLAYS BANK PLC LONDON 20/12/2018 EUR 1,000,000 128,674.19Sale CDX NA HY S21 V1 MKT BNP PARIBAS LONDON BRANCH 20/12/2018 USD 2,000,000 169,662.48Sale ITRAXX XOVER S20 V1 MORGAN STANLEY & CO INTERN PLC 20/12/2018 EUR 2,500,000 321,685.33Sale ITRAXX XOVER S20 V1 CITIGROUP GLOBAL MARKETS LTD LDN 20/12/2018 EUR 2,500,000 321,685.33Sale CDX NA HY S21 V1 MKT CITIGROUP GLOBAL MARKETS LTD LDN 20/12/2018 USD 8,500,000 721,065.46Sale CDX NA HY S21 V1 MKT BNP PARIBAS LONDON BRANCH 20/12/2018 USD 6,000,000 508,987.35Sale ITRAXX XOVER S20 V1 GOLDMAN SACHS INTERN. 20/12/2018 EUR 1,000,000 128,674.19Sale CDX NA HY S21 V1 MKT BARCLAYS BANK PLC LONDON 20/12/2018 USD 3,000,000 254,493.70Sale ITRAXX XOVER S20 V1 GOLDMAN SACHS INTERN. 20/12/2018 EUR 500,000 64,337.05Sale CDX NA HY S21 V1 MKT CITIGROUP GLOBAL MARKETS LTD LDN 20/12/2018 USD 1,000,000 84,831.25
105,618,555.78
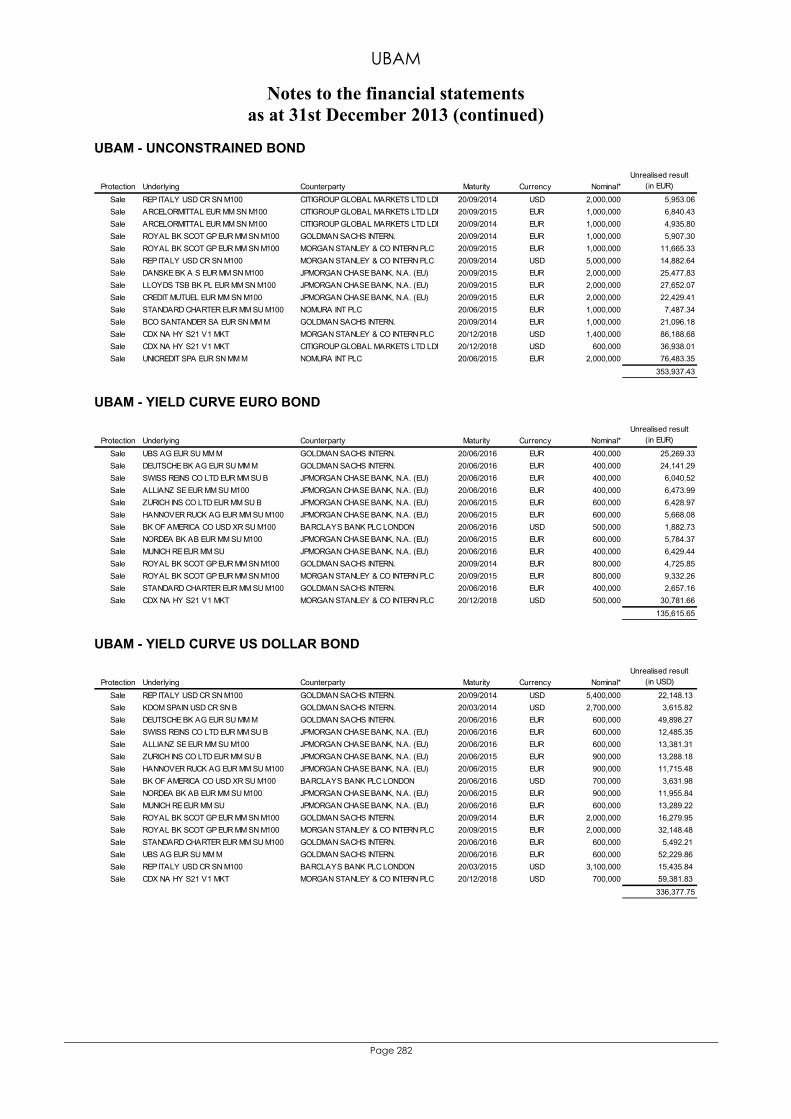
UBAM
Notes to the financial statements as at 31st December 2013 (continued)
Page 282
UBAM - UNCONSTRAINED BOND
Protection Underlying Counterparty Maturity Currency Nominal*Unrealised result
(in EUR)
Sale REP ITALY USD CR SN M100 CITIGROUP GLOBAL MARKETS LTD LDN 20/09/2014 USD 2,000,000 5,953.06Sale ARCELORMITTAL EUR MM SN M100 CITIGROUP GLOBAL MARKETS LTD LDN 20/09/2015 EUR 1,000,000 6,840.43Sale ARCELORMITTAL EUR MM SN M100 CITIGROUP GLOBAL MARKETS LTD LDN 20/09/2014 EUR 1,000,000 4,935.80Sale ROYAL BK SCOT GP EUR MM SN M100 GOLDMAN SACHS INTERN. 20/09/2014 EUR 1,000,000 5,907.30Sale ROYAL BK SCOT GP EUR MM SN M100 MORGAN STANLEY & CO INTERN PLC 20/09/2015 EUR 1,000,000 11,665.33Sale REP ITALY USD CR SN M100 MORGAN STANLEY & CO INTERN PLC 20/09/2014 USD 5,000,000 14,882.64Sale DANSKE BK A S EUR MM SN M100 JPMORGAN CHASE BANK, N.A. (EU) 20/09/2015 EUR 2,000,000 25,477.83Sale LLOYDS TSB BK PL EUR MM SN M100 JPMORGAN CHASE BANK, N.A. (EU) 20/09/2015 EUR 2,000,000 27,652.07Sale CREDIT MUTUEL EUR MM SN M100 JPMORGAN CHASE BANK, N.A. (EU) 20/09/2015 EUR 2,000,000 22,429.41Sale STANDARD CHARTER EUR MM SU M100 NOMURA INT PLC 20/06/2015 EUR 1,000,000 7,487.34Sale BCO SANTANDER SA EUR SN MM M GOLDMAN SACHS INTERN. 20/09/2014 EUR 1,000,000 21,096.18Sale CDX NA HY S21 V1 MKT MORGAN STANLEY & CO INTERN PLC 20/12/2018 USD 1,400,000 86,188.68Sale CDX NA HY S21 V1 MKT CITIGROUP GLOBAL MARKETS LTD LDN 20/12/2018 USD 600,000 36,938.01Sale UNICREDIT SPA EUR SN MM M NOMURA INT PLC 20/06/2015 EUR 2,000,000 76,483.35
353,937.43 UBAM - YIELD CURVE EURO BOND
Protection Underlying Counterparty Maturity Currency Nominal*Unrealised result
(in EUR)
Sale UBS AG EUR SU MM M GOLDMAN SACHS INTERN. 20/06/2016 EUR 400,000 25,269.33Sale DEUTSCHE BK AG EUR SU MM M GOLDMAN SACHS INTERN. 20/06/2016 EUR 400,000 24,141.29Sale SWISS REINS CO LTD EUR MM SU B JPMORGAN CHASE BANK, N.A. (EU) 20/06/2016 EUR 400,000 6,040.52Sale ALLIANZ SE EUR MM SU M100 JPMORGAN CHASE BANK, N.A. (EU) 20/06/2016 EUR 400,000 6,473.99Sale ZURICH INS CO LTD EUR MM SU B JPMORGAN CHASE BANK, N.A. (EU) 20/06/2015 EUR 600,000 6,428.97Sale HANNOVER RUCK AG EUR MM SU M100 JPMORGAN CHASE BANK, N.A. (EU) 20/06/2015 EUR 600,000 5,668.08Sale BK OF AMERICA CO USD XR SU M100 BARCLAYS BANK PLC LONDON 20/06/2016 USD 500,000 1,882.73Sale NORDEA BK AB EUR MM SU M100 JPMORGAN CHASE BANK, N.A. (EU) 20/06/2015 EUR 600,000 5,784.37Sale MUNICH RE EUR MM SU JPMORGAN CHASE BANK, N.A. (EU) 20/06/2016 EUR 400,000 6,429.44Sale ROYAL BK SCOT GP EUR MM SN M100 GOLDMAN SACHS INTERN. 20/09/2014 EUR 800,000 4,725.85Sale ROYAL BK SCOT GP EUR MM SN M100 MORGAN STANLEY & CO INTERN PLC 20/09/2015 EUR 800,000 9,332.26Sale STANDARD CHARTER EUR MM SU M100 GOLDMAN SACHS INTERN. 20/06/2016 EUR 400,000 2,657.16Sale CDX NA HY S21 V1 MKT MORGAN STANLEY & CO INTERN PLC 20/12/2018 USD 500,000 30,781.66
135,615.65 UBAM - YIELD CURVE US DOLLAR BOND
Protection Underlying Counterparty Maturity Currency Nominal*Unrealised result
(in USD)
Sale REP ITALY USD CR SN M100 GOLDMAN SACHS INTERN. 20/09/2014 USD 5,400,000 22,148.13Sale KDOM SPAIN USD CR SN B GOLDMAN SACHS INTERN. 20/03/2014 USD 2,700,000 3,615.82Sale DEUTSCHE BK AG EUR SU MM M GOLDMAN SACHS INTERN. 20/06/2016 EUR 600,000 49,898.27Sale SWISS REINS CO LTD EUR MM SU B JPMORGAN CHASE BANK, N.A. (EU) 20/06/2016 EUR 600,000 12,485.35Sale ALLIANZ SE EUR MM SU M100 JPMORGAN CHASE BANK, N.A. (EU) 20/06/2016 EUR 600,000 13,381.31Sale ZURICH INS CO LTD EUR MM SU B JPMORGAN CHASE BANK, N.A. (EU) 20/06/2015 EUR 900,000 13,288.18Sale HANNOVER RUCK AG EUR MM SU M100 JPMORGAN CHASE BANK, N.A. (EU) 20/06/2015 EUR 900,000 11,715.48Sale BK OF AMERICA CO USD XR SU M100 BARCLAYS BANK PLC LONDON 20/06/2016 USD 700,000 3,631.98Sale NORDEA BK AB EUR MM SU M100 JPMORGAN CHASE BANK, N.A. (EU) 20/06/2015 EUR 900,000 11,955.84Sale MUNICH RE EUR MM SU JPMORGAN CHASE BANK, N.A. (EU) 20/06/2016 EUR 600,000 13,289.22Sale ROYAL BK SCOT GP EUR MM SN M100 GOLDMAN SACHS INTERN. 20/09/2014 EUR 2,000,000 16,279.95Sale ROYAL BK SCOT GP EUR MM SN M100 MORGAN STANLEY & CO INTERN PLC 20/09/2015 EUR 2,000,000 32,148.48Sale STANDARD CHARTER EUR MM SU M100 GOLDMAN SACHS INTERN. 20/06/2016 EUR 600,000 5,492.21Sale UBS AG EUR SU MM M GOLDMAN SACHS INTERN. 20/06/2016 EUR 600,000 52,229.86Sale REP ITALY USD CR SN M100 BARCLAYS BANK PLC LONDON 20/03/2015 USD 3,100,000 15,435.84Sale CDX NA HY S21 V1 MKT MORGAN STANLEY & CO INTERN PLC 20/12/2018 USD 700,000 59,381.83
336,377.75
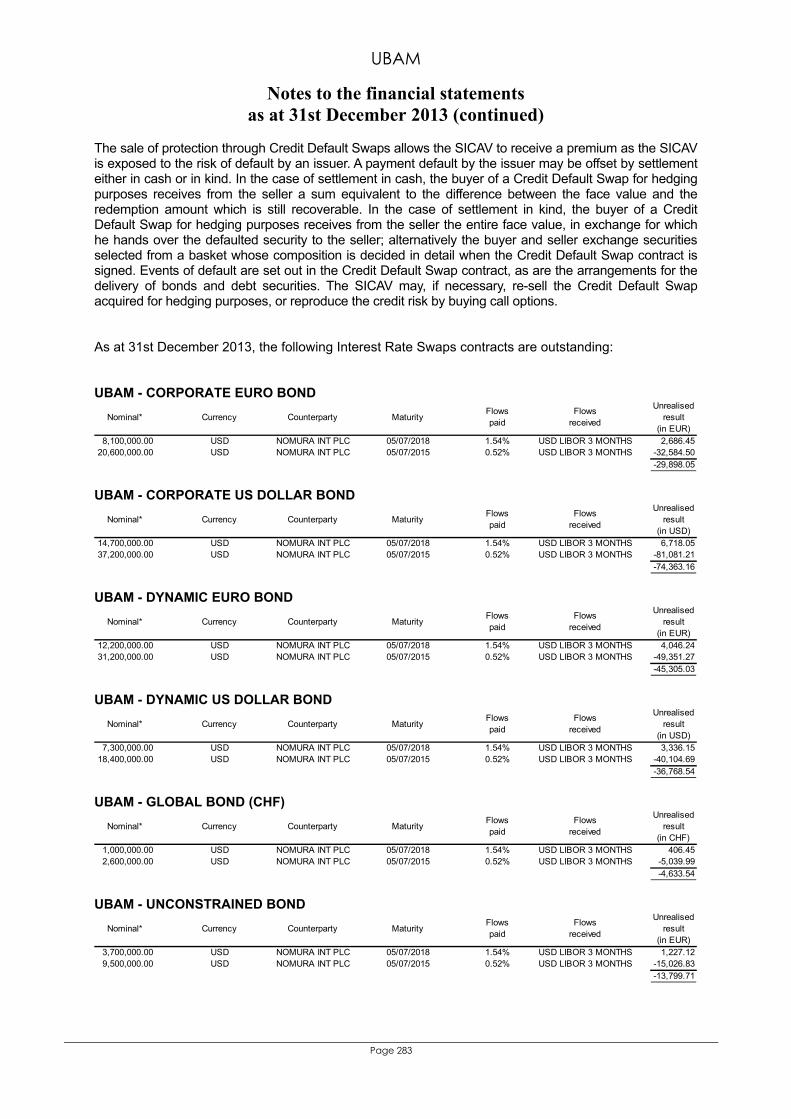
UBAM
Notes to the financial statements as at 31st December 2013 (continued)
Page 283
The sale of protection through Credit Default Swaps allows the SICAV to receive a premium as the SICAV is exposed to the risk of default by an issuer. A payment default by the issuer may be offset by settlement either in cash or in kind. In the case of settlement in cash, the buyer of a Credit Default Swap for hedging purposes receives from the seller a sum equivalent to the difference between the face value and the redemption amount which is still recoverable. In the case of settlement in kind, the buyer of a Credit Default Swap for hedging purposes receives from the seller the entire face value, in exchange for which he hands over the defaulted security to the seller; alternatively the buyer and seller exchange securities selected from a basket whose composition is decided in detail when the Credit Default Swap contract is signed. Events of default are set out in the Credit Default Swap contract, as are the arrangements for the delivery of bonds and debt securities. The SICAV may, if necessary, re-sell the Credit Default Swap acquired for hedging purposes, or reproduce the credit risk by buying call options. As at 31st December 2013, the following Interest Rate Swaps contracts are outstanding: UBAM - CORPORATE EURO BOND
Unrealised result
(in EUR)8,100,000.00 USD NOMURA INT PLC 05/07/2018 1.54% USD LIBOR 3 MONTHS 2,686.45
20,600,000.00 USD NOMURA INT PLC 05/07/2015 0.52% USD LIBOR 3 MONTHS -32,584.50-29,898.05
MaturityFlows paid
Flows receivedNominal* Currency Counterparty
UBAM - CORPORATE US DOLLAR BOND
Unrealised result
(in USD)14,700,000.00 USD NOMURA INT PLC 05/07/2018 1.54% USD LIBOR 3 MONTHS 6,718.0537,200,000.00 USD NOMURA INT PLC 05/07/2015 0.52% USD LIBOR 3 MONTHS -81,081.21
-74,363.16
MaturityFlows paid
Flows receivedNominal* Currency Counterparty
UBAM - DYNAMIC EURO BOND
Unrealised result
(in EUR)12,200,000.00 USD NOMURA INT PLC 05/07/2018 1.54% USD LIBOR 3 MONTHS 4,046.2431,200,000.00 USD NOMURA INT PLC 05/07/2015 0.52% USD LIBOR 3 MONTHS -49,351.27
-45,305.03
MaturityFlows paid
Flows receivedNominal* Currency Counterparty
UBAM - DYNAMIC US DOLLAR BOND
Unrealised result
(in USD)7,300,000.00 USD NOMURA INT PLC 05/07/2018 1.54% USD LIBOR 3 MONTHS 3,336.15
18,400,000.00 USD NOMURA INT PLC 05/07/2015 0.52% USD LIBOR 3 MONTHS -40,104.69-36,768.54
Flows receivedNominal* Currency Counterparty Maturity
Flows paid
UBAM - GLOBAL BOND (CHF)
Unrealised result
(in CHF)1,000,000.00 USD NOMURA INT PLC 05/07/2018 1.54% USD LIBOR 3 MONTHS 406.452,600,000.00 USD NOMURA INT PLC 05/07/2015 0.52% USD LIBOR 3 MONTHS -5,039.99
-4,633.54
MaturityFlows paid
Flows receivedNominal* Currency Counterparty
UBAM - UNCONSTRAINED BOND
Unrealised result
(in EUR)3,700,000.00 USD NOMURA INT PLC 05/07/2018 1.54% USD LIBOR 3 MONTHS 1,227.129,500,000.00 USD NOMURA INT PLC 05/07/2015 0.52% USD LIBOR 3 MONTHS -15,026.83
-13,799.71
MaturityFlows paid
Flows receivedNominal* Currency Counterparty
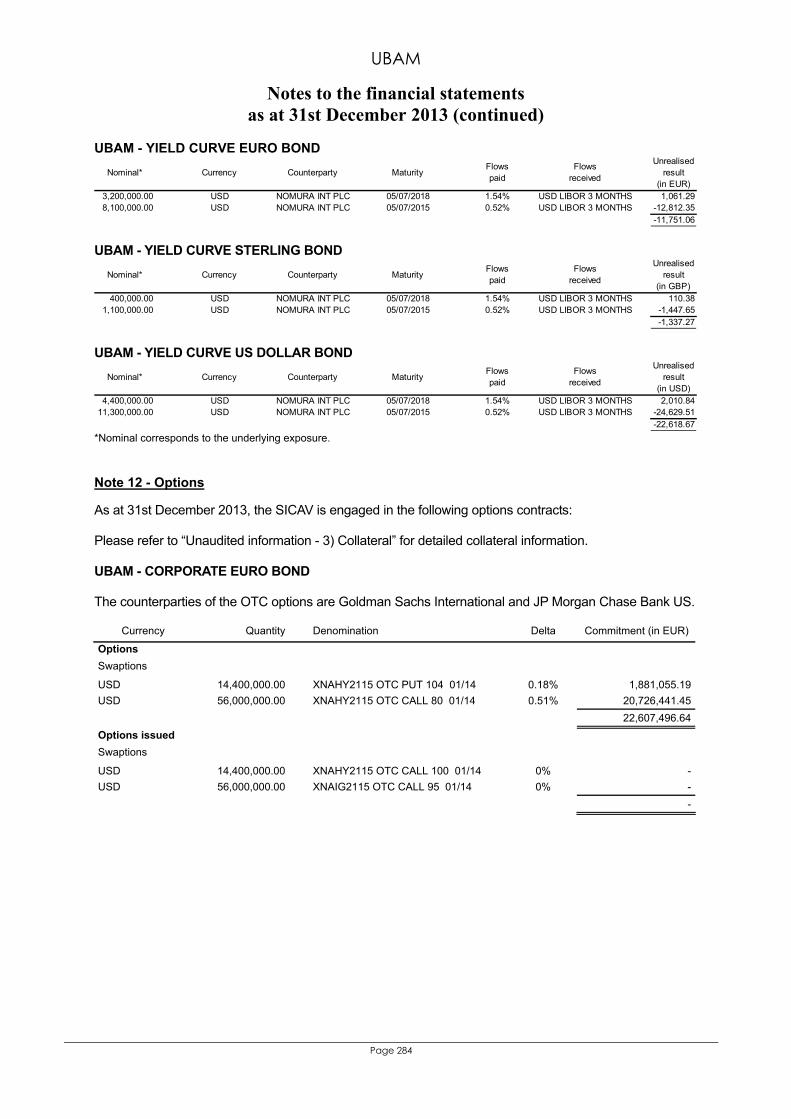
UBAM
Notes to the financial statements as at 31st December 2013 (continued)
Page 284
UBAM - YIELD CURVE EURO BOND Unrealised
result(in EUR)
3,200,000.00 USD NOMURA INT PLC 05/07/2018 1.54% USD LIBOR 3 MONTHS 1,061.298,100,000.00 USD NOMURA INT PLC 05/07/2015 0.52% USD LIBOR 3 MONTHS -12,812.35
-11,751.06
MaturityFlows paid
Flows receivedNominal* Currency Counterparty
UBAM - YIELD CURVE STERLING BOND
Unrealised result
(in GBP)400,000.00 USD NOMURA INT PLC 05/07/2018 1.54% USD LIBOR 3 MONTHS 110.38
1,100,000.00 USD NOMURA INT PLC 05/07/2015 0.52% USD LIBOR 3 MONTHS -1,447.65-1,337.27
MaturityFlows paid
Flows receivedNominal* Currency Counterparty
UBAM - YIELD CURVE US DOLLAR BOND
Unrealised result
(in USD)4,400,000.00 USD NOMURA INT PLC 05/07/2018 1.54% USD LIBOR 3 MONTHS 2,010.84
11,300,000.00 USD NOMURA INT PLC 05/07/2015 0.52% USD LIBOR 3 MONTHS -24,629.51-22,618.67
MaturityFlows paid
Flows receivedNominal* Currency Counterparty
*Nominal corresponds to the underlying exposure. Note 12 - Options As at 31st December 2013, the SICAV is engaged in the following options contracts: Please refer to “Unaudited information - 3) Collateral” for detailed collateral information. UBAM - CORPORATE EURO BOND The counterparties of the OTC options are Goldman Sachs International and JP Morgan Chase Bank US.
Currency Quantity Denomination Delta Commitment (in EUR)
Options Swaptions
USD 14,400,000.00 XNAHY2115 OTC PUT 104 01/14 0.18% 1,881,055.19USD 56,000,000.00 XNAHY2115 OTC CALL 80 01/14 0.51% 20,726,441.45 22,607,496.64Options issued Swaptions
USD 14,400,000.00 XNAHY2115 OTC CALL 100 01/14 0% -USD 56,000,000.00 XNAIG2115 OTC CALL 95 01/14 0% - -
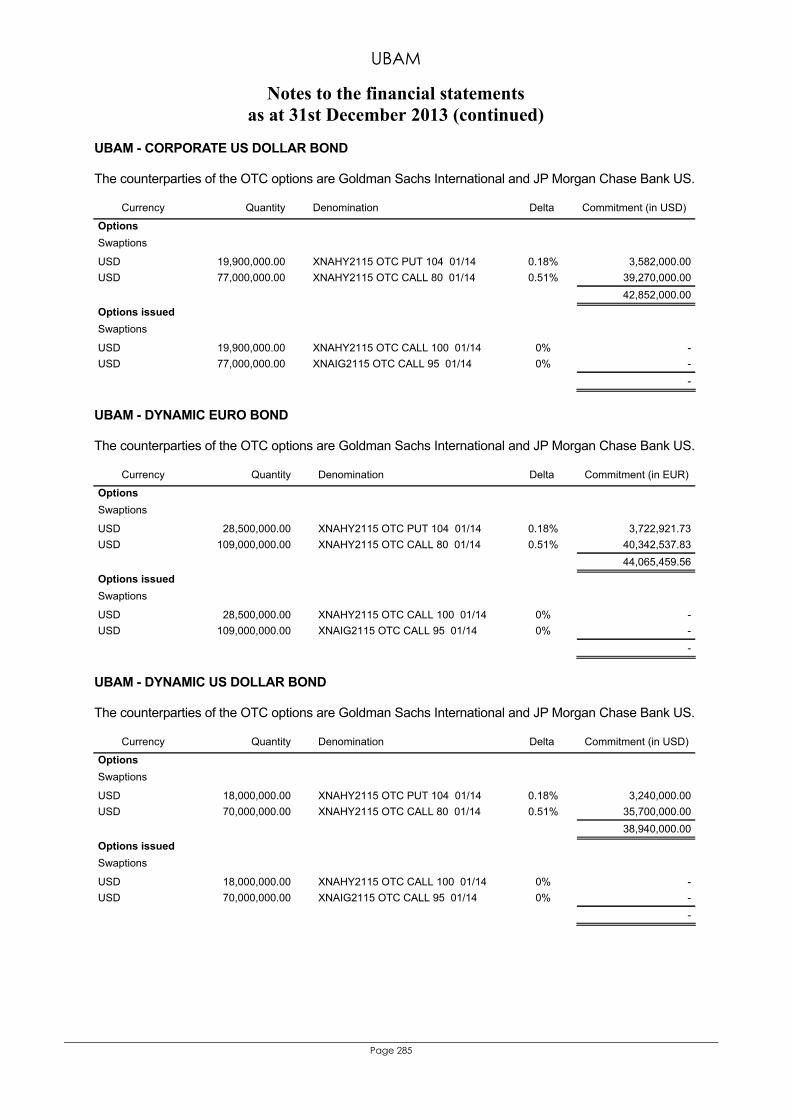
UBAM
Notes to the financial statements as at 31st December 2013 (continued)
Page 285
UBAM - CORPORATE US DOLLAR BOND The counterparties of the OTC options are Goldman Sachs International and JP Morgan Chase Bank US.
Currency Quantity Denomination Delta Commitment (in USD)
Options Swaptions
USD 19,900,000.00 XNAHY2115 OTC PUT 104 01/14 0.18% 3,582,000.00USD 77,000,000.00 XNAHY2115 OTC CALL 80 01/14 0.51% 39,270,000.00 42,852,000.00Options issued Swaptions
USD 19,900,000.00 XNAHY2115 OTC CALL 100 01/14 0% -USD 77,000,000.00 XNAIG2115 OTC CALL 95 01/14 0% - -
UBAM - DYNAMIC EURO BOND The counterparties of the OTC options are Goldman Sachs International and JP Morgan Chase Bank US.
Currency Quantity Denomination Delta Commitment (in EUR)
Options Swaptions
USD 28,500,000.00 XNAHY2115 OTC PUT 104 01/14 0.18% 3,722,921.73USD 109,000,000.00 XNAHY2115 OTC CALL 80 01/14 0.51% 40,342,537.83 44,065,459.56Options issued Swaptions
USD 28,500,000.00 XNAHY2115 OTC CALL 100 01/14 0% -USD 109,000,000.00 XNAIG2115 OTC CALL 95 01/14 0% - -
UBAM - DYNAMIC US DOLLAR BOND The counterparties of the OTC options are Goldman Sachs International and JP Morgan Chase Bank US.
Currency Quantity Denomination Delta Commitment (in USD)
Options Swaptions
USD 18,000,000.00 XNAHY2115 OTC PUT 104 01/14 0.18% 3,240,000.00USD 70,000,000.00 XNAHY2115 OTC CALL 80 01/14 0.51% 35,700,000.00 38,940,000.00Options issued Swaptions
USD 18,000,000.00 XNAHY2115 OTC CALL 100 01/14 0% -USD 70,000,000.00 XNAIG2115 OTC CALL 95 01/14 0% - -
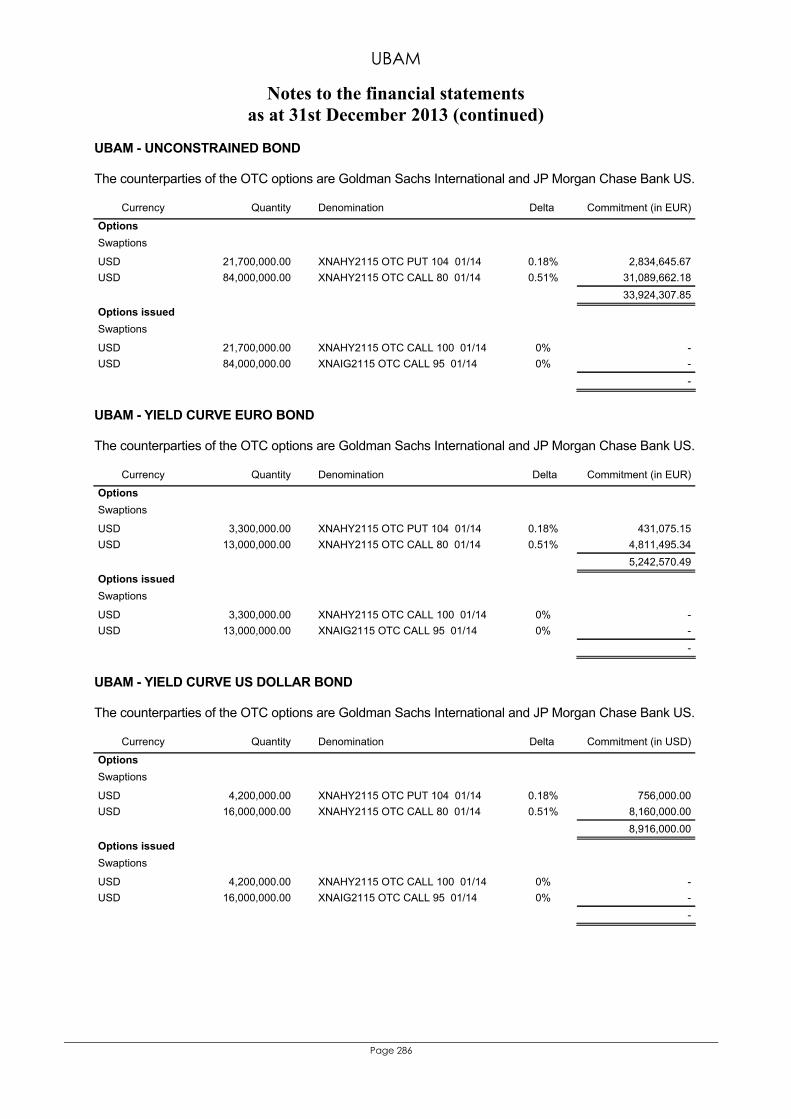
UBAM
Notes to the financial statements as at 31st December 2013 (continued)
Page 286
UBAM - UNCONSTRAINED BOND The counterparties of the OTC options are Goldman Sachs International and JP Morgan Chase Bank US.
Currency Quantity Denomination Delta Commitment (in EUR)
Options Swaptions
USD 21,700,000.00 XNAHY2115 OTC PUT 104 01/14 0.18% 2,834,645.67USD 84,000,000.00 XNAHY2115 OTC CALL 80 01/14 0.51% 31,089,662.18 33,924,307.85Options issued Swaptions
USD 21,700,000.00 XNAHY2115 OTC CALL 100 01/14 0% -USD 84,000,000.00 XNAIG2115 OTC CALL 95 01/14 0% - -
UBAM - YIELD CURVE EURO BOND The counterparties of the OTC options are Goldman Sachs International and JP Morgan Chase Bank US.
Currency Quantity Denomination Delta Commitment (in EUR)
Options Swaptions
USD 3,300,000.00 XNAHY2115 OTC PUT 104 01/14 0.18% 431,075.15USD 13,000,000.00 XNAHY2115 OTC CALL 80 01/14 0.51% 4,811,495.34 5,242,570.49Options issued Swaptions
USD 3,300,000.00 XNAHY2115 OTC CALL 100 01/14 0% -USD 13,000,000.00 XNAIG2115 OTC CALL 95 01/14 0% - -
UBAM - YIELD CURVE US DOLLAR BOND The counterparties of the OTC options are Goldman Sachs International and JP Morgan Chase Bank US.
Currency Quantity Denomination Delta Commitment (in USD)
Options Swaptions
USD 4,200,000.00 XNAHY2115 OTC PUT 104 01/14 0.18% 756,000.00USD 16,000,000.00 XNAHY2115 OTC CALL 80 01/14 0.51% 8,160,000.00 8,916,000.00Options issued Swaptions
USD 4,200,000.00 XNAHY2115 OTC CALL 100 01/14 0% -USD 16,000,000.00 XNAIG2115 OTC CALL 95 01/14 0% - -

UBAM
Notes to the financial statements as at 31st December 2013 (continued)
Page 287
UBAM - EUROPE EQUITY DIVIDEND+ The below options are listed with the broker Morgan Stanley and Co. International PLC.
Currency Quantity Denomination Commitment (in EUR)
Options issued Flexoptions
GBP 128.00 GLAXOSMITHKLINE (FLEX) CALL 16.40 01/14 2,523,076.92
EUR 118.00 ENI SPA OTC CALL 17.96 01/14 2,119,280.00
NOK 1,223.00 STATOIL OTC PUT 140. 01/14 2,048,122.87
EUR 673.00 WOLTERS KLUWER OTC CALL 20.72 01/14 1,394,456.00
CHF 105.00 ROCHE HLDG OTC PUT 254.80 01/14 2,183,108.94
EUR 343.00 DEUTSCHE BOERSE OTC CALL 55.34 01/14 1,898,162.00
CHF 402.00 NESTLE SA OTC PUT 66.90 01/14 2,194,516.52
EUR 201.00 SIEMENS AG OTC CALL 97.85 01/14 1,966,785.00
GBP 49.00 BRITISH AMERICAN OTC CALL 32.82 01/14 1,932,908.65
EUR 962.00 ROYAL DUTCH OTC CALL 24.85 01/14 2,390,570.00
EUR 454.00 TOTAL OTC CALL 44.20 01/14 2,006,680.00
EUR 785.00 ROYAL PHILIPS OTC CALL 26.12 01/14 2,050,420.00
EUR 849.00 DEUTSCHE POST OTC CALL 25.89 01/14 2,198,061.00
CHF 336.00 NOVARTIS AG OTC PUT 71.20 01/14 1,952,117.50
GBP 95.00 BHP BILLITON OTC CALL 18.73 01/14 2,138,641.83
GBP 89.00 DIAGEO PLC OTC CALL 19.60 01/14 2,096,634.62
GBP 10.00 BRITISH AMERICAN OTC CALL 32.60 01/14 391,826.92
CHF 61.00 NOVARTIS AG OTC PUT 71.50 01/14 355,895.55
GBP 39.00 RECKITT BENCK OTC CALL 48.6 01/14 2,278,125.00
EUR 673.00 WOLTERS KLUWE OTC CALL 20.74 01/14 1,395,802.00
EUR 278.00 BASF NAMEN OTC CALL 77.45 01/14 2,153,110.00
EUR 277.00 SANOFI-AVENTIS OTC CALL 75.82 01/14 2,100,214.00
EUR 779.00 UNILEVER OTC CALL 28.58 01/14 2,226,382.00
EUR 118.00 ENI SPA OTC CALL 17.13 01/14 2,021,340.00
GBP 145.00 PEARSON PLC OTC CALL 12.92 01/14 2,251,682.69
NOK 1,223.00 STATOIL OTC PUT 140. 01/14 2,048,122.87
EUR 1,381.00 REED ELSEVIER OTC CALL 15.18 01/14 2,096,358.00
GBP 128.00 GLAXOSMITHKLINE OTC CALL 16.05 01/14 2,469,230.77
CHF 105.00 ROCHE HLDG OTC PUT 243.2 01/14 2,083,720.93
EUR 343.00 DEUTSCHE BOERSE OTC CALL 55.98 01/14 1,920,114.00
EUR 673.00 WOLTERS KLUWE OTC CALL 20.27 01/14 1,364,171.00
EUR 454.00 TOTAL OTC CALL 41.81 01/14 1,898,174.00
GBP 59.00 BRITISH AMERICAN OTC CALL 31.68 01/14 2,246,538.46
EUR 201.00 SIEMENS AG OTC CALL 94.00 01/14 1,889,400.00
EUR 962.00 ROYAL DUTCH OTC CALL 24.68 01/14 2,374,216.00
CHF 402.00 NESTLE SA OTC PUT 64.20 01/14 2,105,948.59
CHF 397.00 NOVARTIS OTC PUT 68.50 01/14 2,219,053.45
EUR 785.00 ROYAL PHILIPS OTC CALL 24.84 01/14 1,949,940.00
GBP 89.00 DIAGEO PLC OTC CALL 19.14 01/14 2,047,427.88
GBP 95.00 BHP BILLITON OTC CALL 17.99 01/14 2,054,146.63
EUR 849.00 DEUTSCHE POST OTC CALL 24.78 01/14 2,103,822.00
GBP 39.00 RECKITT BENCK OTC CALL 45.92 01/14 2,152,500.00
EUR 278.00 BASF NAMEN OTC CALL 74.50 01/14 2,071,100.00
EUR 779.00 UNILEVER OTC CALL 27.78 02/14 2,164,062.00
GBP 145.00 PEARSON PLC OTC CALL 13.04 02/14 2,272,596.15
EUR 277.00 SANOFI-AVENTIS OTC CALL 75.38 02/14 2,088,026.00
EUR 1,381.00 REED ELSEVIER OTC CALL 14.87 02/14 2,053,547.00 93,940,135.74
UBAM
Notes to the financial statements as at 31st December 2013 (continued)
Page 288
Note 13 - Total expense ratio ("TER") and portfolio turnover rate ("PTR") The TER and the PTR are calculated for the last 12 months preceding the closing date. Transaction fees are not taken into account in the calculation of the TER. The PTR has been calculated according to the following formula (Total 1 - Total 2)/M*100 with Total 1 = Total securities transactions = X + Y
X = Securities purchases Y = Securities sales
Total 2 = Total subscriptions and redemptions = S + T S = subscriptions T = redemptions
M = average net assets
If a performance-related fee is foreseen and has been calculated, the TER is disclosed including this fee. Moreover the performance fee ratio is calculated in percentage of the average net assets for the last 12 months preceding 31st December 2013.

UBAM
Notes to the financial statements as at 31st December 2013 (continued)
Page 289
TER As at 31st December 2013, the TER calculated for each Class of Shares is as follows:
Codes ISIN Sub-Fund and Class of share TER in %
UBAM - CORPORATE EURO BOND LU0095453105 A C 0.92 LU0103635438 A D 0.93 LU0447826933 AH CHF C 0.92 LU0943504927 AS C 0.96* LU0132673327 I C 0.58 LU0132673590 I D 0.59* LU0782384613 IH GBP C 0.59* LU0943505577 IS C 0.61* LU0862299863 U C -** LU0132659920 R C 1.62
UBAM - CORPORATE US DOLLAR BOND LU0146923718 A C 0.92 LU0146926141 A D 0.92 LU0352160062 AH EUR C 0.90 LU0447826263 AH CHF C 0.93 LU0943506468 AS C 0.97* LU0146925176 I C 0.58 LU0146927388 I D 0.59* LU0192064839 IH EUR C 0.57 LU0943506971 IS C 0.60* LU0146924799 R C 1.61
UBAM - DYNAMIC EURO BOND LU0029761706 A C 0.63 LU0103636592 A D 0.64 LU0447824136 AH CHF C 0.66 LU0782382328 AH GBP C 0.66* LU0132662635 I C 0.39 LU0447824482 IH CHF C 0.40 LU0782382831 IH GBP C 0.39* LU0573557435 IH GBP D -** LU0132636399 R C -***
UBAM - DYNAMIC US DOLLAR BOND LU0029761532 A C 0.63 LU0103636329 A D 0.63 LU0447823757 AH CHF C 0.63 LU0782382088 AH GBP C 0.64* LU0132661827 I C 0.39 LU0447823914 IH CHF C 0.39 LU0782382245 IH GBP C 0.39* LU0573557518 IH GBP D 0.39 LU0132635235 R C 1.32

UBAM
Notes to the financial statements as at 31st December 2013 (continued)
Page 290
Codes ISIN Sub-Fund and Class of share TER in %
UBAM - EMERGING MARKET BOND LU0244149497 A C 2.07 LU0244149653 A D 2.08 LU0352160815 AH EUR C 2.06 LU0352161037 AH EUR D 2.08 LU0447828558 AH CHF C 2.09 LU0943513324 AS C -** LU0943513597 AHS EUR C -** LU0244149901 I C 1.14 LU0371556324 IH EUR C 1.14 LU0371557215 R C -***
UBAM - EMERGING MARKET CORPORATE BOND LU0520928416 A C 2.08 LU0520928507 A D 2.08 LU0520929653 AH EUR C 2.07 LU0520929737 AH EUR D 2.07 LU0520930404 AH CHF C 2.08 LU0943514561 AS C -** LU0520928689 AP C 1.40 LU0520929810 APH EUR C 1.40 Ratio of performance fee (in % of average net assets) 0.01 LU0520930669 APH CHF C 1.40 LU0520928846 I C 1.14 LU0520928929 I D 1.15 LU0520930073 IH EUR C 1.16 LU0520930826 IH CHF C 1.15 LU0943515618 IHS EUR C -** LU0520929141 IP C 0.89 LU0520930230 IPH EUR C 0.90 Ratio of performance fee (in % of average net assets) 0.01 LU0520929497 R C 2.57 LU0943516343 RH EUR C 2.53*
UBAM - EM HIGH YIELD SHORT DURATION CORPORATE BOND LU0943508167 A C 2.08* LU0943508324 A D 2.11* LU0943508597 AH EUR C 2.10* LU0943508910 AH CHF C 2.12* LU0943510148 IH EUR C 1.14* LU0943510494 IH CHF C 1.13*
UBAM - GLOBAL BOND (CHF) LU0068133486 A C 0.93 LU0103636758 A D 0.93 LU0352159569 AH EUR C 0.88
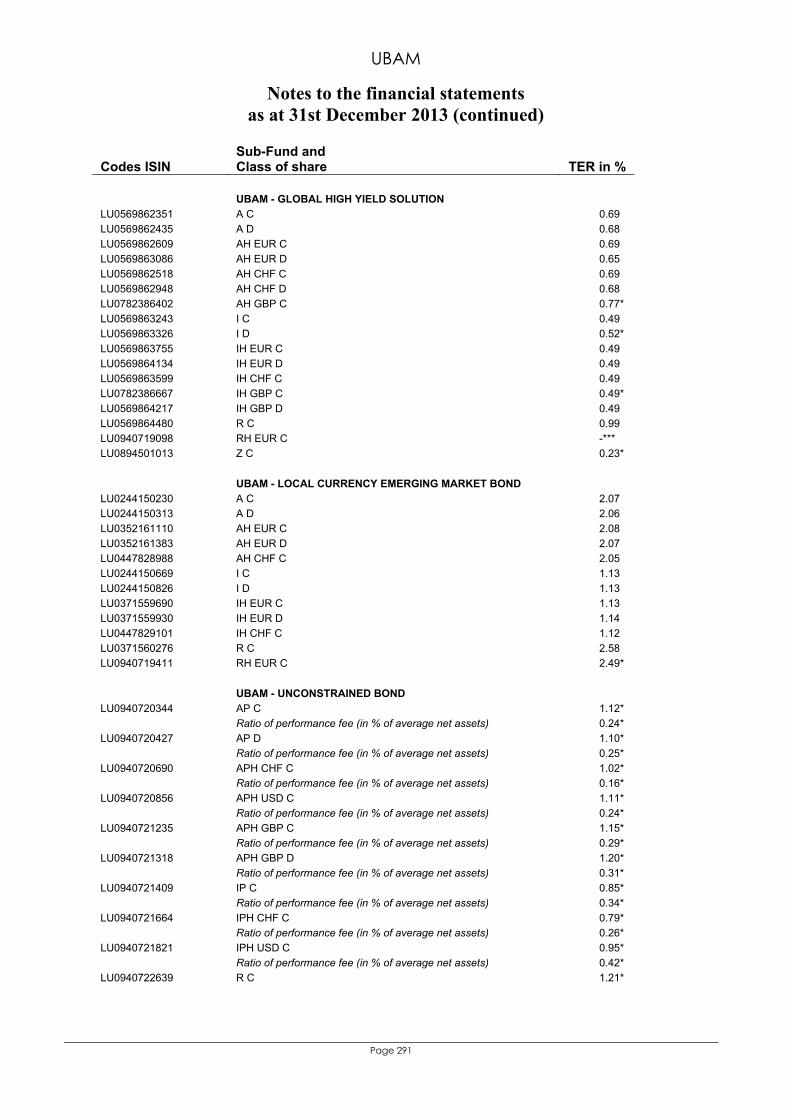
UBAM
Notes to the financial statements as at 31st December 2013 (continued)
Page 291
Codes ISIN Sub-Fund and Class of share TER in %
UBAM - GLOBAL HIGH YIELD SOLUTION LU0569862351 A C 0.69 LU0569862435 A D 0.68 LU0569862609 AH EUR C 0.69 LU0569863086 AH EUR D 0.65 LU0569862518 AH CHF C 0.69 LU0569862948 AH CHF D 0.68 LU0782386402 AH GBP C 0.77* LU0569863243 I C 0.49 LU0569863326 I D 0.52* LU0569863755 IH EUR C 0.49 LU0569864134 IH EUR D 0.49 LU0569863599 IH CHF C 0.49 LU0782386667 IH GBP C 0.49* LU0569864217 IH GBP D 0.49 LU0569864480 R C 0.99 LU0940719098 RH EUR C -*** LU0894501013 Z C 0.23*
UBAM - LOCAL CURRENCY EMERGING MARKET BOND LU0244150230 A C 2.07 LU0244150313 A D 2.06 LU0352161110 AH EUR C 2.08 LU0352161383 AH EUR D 2.07 LU0447828988 AH CHF C 2.05 LU0244150669 I C 1.13 LU0244150826 I D 1.13 LU0371559690 IH EUR C 1.13 LU0371559930 IH EUR D 1.14 LU0447829101 IH CHF C 1.12 LU0371560276 R C 2.58 LU0940719411 RH EUR C 2.49*
UBAM - UNCONSTRAINED BOND LU0940720344 AP C 1.12* Ratio of performance fee (in % of average net assets) 0.24* LU0940720427 AP D 1.10* Ratio of performance fee (in % of average net assets) 0.25* LU0940720690 APH CHF C 1.02* Ratio of performance fee (in % of average net assets) 0.16* LU0940720856 APH USD C 1.11* Ratio of performance fee (in % of average net assets) 0.24* LU0940721235 APH GBP C 1.15* Ratio of performance fee (in % of average net assets) 0.29* LU0940721318 APH GBP D 1.20* Ratio of performance fee (in % of average net assets) 0.31* LU0940721409 IP C 0.85* Ratio of performance fee (in % of average net assets) 0.34* LU0940721664 IPH CHF C 0.79* Ratio of performance fee (in % of average net assets) 0.26* LU0940721821 IPH USD C 0.95* Ratio of performance fee (in % of average net assets) 0.42* LU0940722639 R C 1.21*

UBAM
Notes to the financial statements as at 31st December 2013 (continued)
Page 292
Codes ISIN Sub-Fund and Class of share TER in %
UBAM - YIELD CURVE EURO BOND LU0100809085 A C 0.93 LU0103634621 A D 0.93 LU0132663286 I C 0.49 LU0132637017 R C 1.43
UBAM - YIELD CURVE STERLING BOND LU0051100765 A C 0.96 LU0103635602 A D 0.95 LU0132664094 I C 0.52
UBAM - YIELD CURVE US DOLLAR BOND LU0068133569 A C 0.93 LU0181360743 A D 0.92 LU0181361394 I C 0.48 LU0181361048 R C 1.43
UBAM - EM INVESTMENT GRADE CORPORATE BOND LU0862302675 A C 1.95* LU0943512359 AS C -** LU0862303640 I C -** LU0943512789 IS C -** LU0943512946 IHS EUR C -** LU0862305348 R C 2.14*
UBAM - EUROPEAN CONVERTIBLE BOND LU0500228894 A C 1.73 LU0500229199 A D 1.72 LU0500229603 AH CHF C 1.72* LU0570471275 AH USD C 1.72 LU0500229272 I C 1.22 LU0500229439 R C 2.69
UBAM - EURO 10-40 CONVERTIBLE BOND LU0500231252 A C 1.39 LU0500231336 A D 1.57 LU0500231922 AH CHF C 1.38 LU0570469378 AH USD C 1.44* LU0782395908 AH GBP C 1.45* LU0500231500 I C 0.89 LU0500231682 I D 0.91 LU0500232144 IH CHF C 0.89 LU0570469881 IH USD C 0.91 LU0570470038 IH USD D 0.89 LU0500232573 IH GBP D 0.89 LU0500231765 R C 2.31
UBAM - GLOBAL CONVERTIBLE BOND LU0940716078 A C 1.71* LU0940716235 AH CHF C 1.71* LU0940716409 AH USD C 1.72* LU0940716821 AH GBP C 1.77* LU0940717126 I C -**
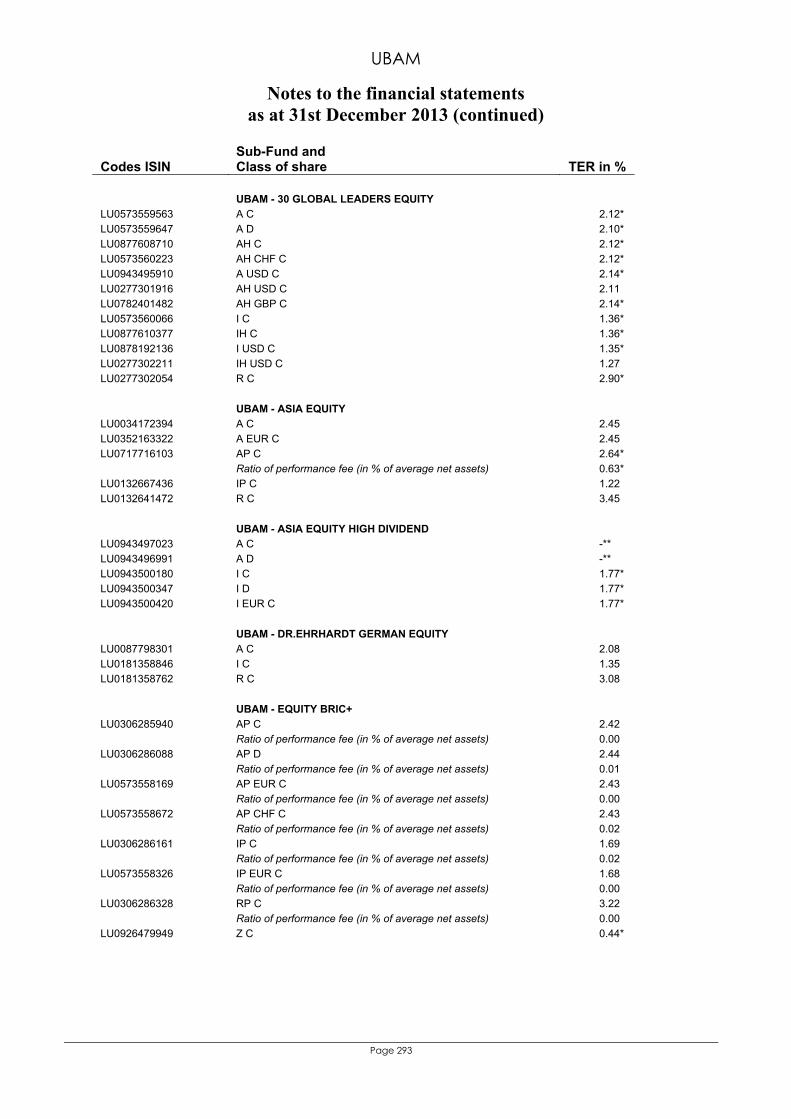
UBAM
Notes to the financial statements as at 31st December 2013 (continued)
Page 293
Codes ISIN Sub-Fund and Class of share TER in %
UBAM - 30 GLOBAL LEADERS EQUITY LU0573559563 A C 2.12* LU0573559647 A D 2.10* LU0877608710 AH C 2.12* LU0573560223 AH CHF C 2.12* LU0943495910 A USD C 2.14* LU0277301916 AH USD C 2.11 LU0782401482 AH GBP C 2.14* LU0573560066 I C 1.36* LU0877610377 IH C 1.36* LU0878192136 I USD C 1.35* LU0277302211 IH USD C 1.27 LU0277302054 R C 2.90*
UBAM - ASIA EQUITY LU0034172394 A C 2.45 LU0352163322 A EUR C 2.45 LU0717716103 AP C 2.64* Ratio of performance fee (in % of average net assets) 0.63* LU0132667436 IP C 1.22 LU0132641472 R C 3.45
UBAM - ASIA EQUITY HIGH DIVIDEND LU0943497023 A C -** LU0943496991 A D -** LU0943500180 I C 1.77* LU0943500347 I D 1.77* LU0943500420 I EUR C 1.77*
UBAM - DR.EHRHARDT GERMAN EQUITY LU0087798301 A C 2.08 LU0181358846 I C 1.35 LU0181358762 R C 3.08
UBAM - EQUITY BRIC+ LU0306285940 AP C 2.42 Ratio of performance fee (in % of average net assets) 0.00 LU0306286088 AP D 2.44 Ratio of performance fee (in % of average net assets) 0.01 LU0573558169 AP EUR C 2.43 Ratio of performance fee (in % of average net assets) 0.00 LU0573558672 AP CHF C 2.43 Ratio of performance fee (in % of average net assets) 0.02 LU0306286161 IP C 1.69 Ratio of performance fee (in % of average net assets) 0.02 LU0573558326 IP EUR C 1.68 Ratio of performance fee (in % of average net assets) 0.00 LU0306286328 RP C 3.22 Ratio of performance fee (in % of average net assets) 0.00 LU0926479949 Z C 0.44*
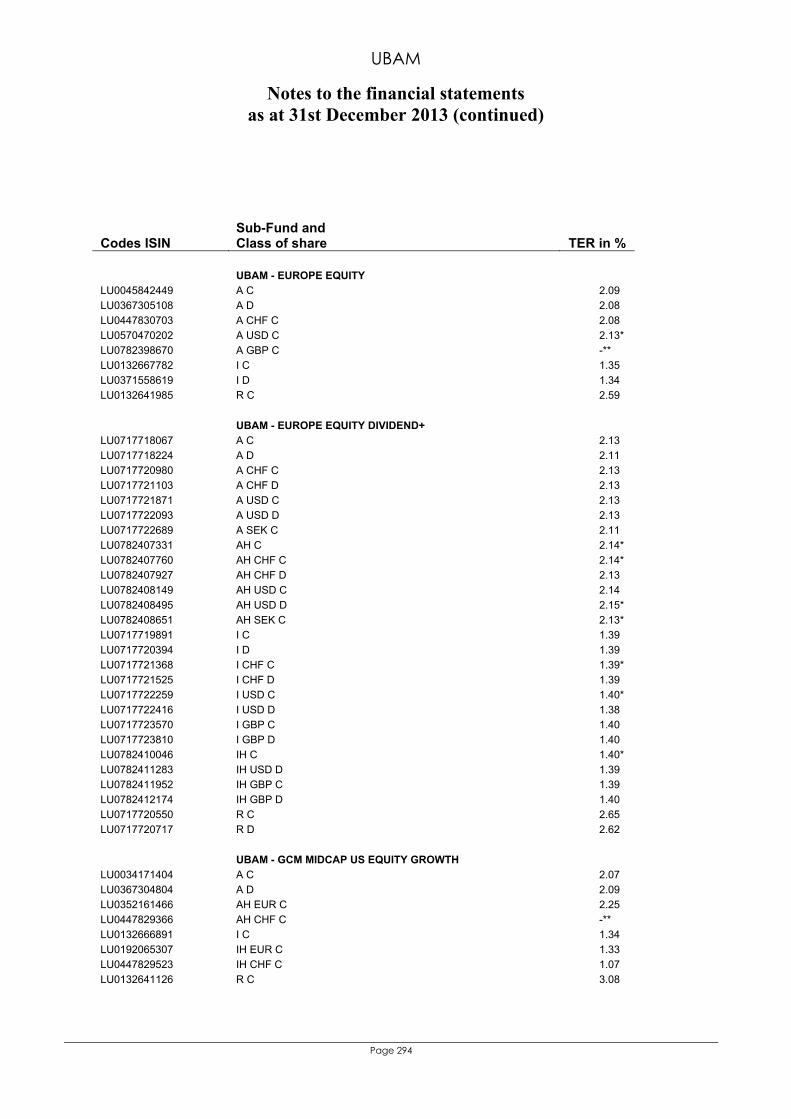
UBAM
Notes to the financial statements as at 31st December 2013 (continued)
Page 294
Codes ISIN Sub-Fund and Class of share TER in %
UBAM - EUROPE EQUITY LU0045842449 A C 2.09 LU0367305108 A D 2.08 LU0447830703 A CHF C 2.08 LU0570470202 A USD C 2.13* LU0782398670 A GBP C -** LU0132667782 I C 1.35 LU0371558619 I D 1.34 LU0132641985 R C 2.59
UBAM - EUROPE EQUITY DIVIDEND+ LU0717718067 A C 2.13 LU0717718224 A D 2.11 LU0717720980 A CHF C 2.13 LU0717721103 A CHF D 2.13 LU0717721871 A USD C 2.13 LU0717722093 A USD D 2.13 LU0717722689 A SEK C 2.11 LU0782407331 AH C 2.14* LU0782407760 AH CHF C 2.14* LU0782407927 AH CHF D 2.13 LU0782408149 AH USD C 2.14 LU0782408495 AH USD D 2.15* LU0782408651 AH SEK C 2.13* LU0717719891 I C 1.39 LU0717720394 I D 1.39 LU0717721368 I CHF C 1.39* LU0717721525 I CHF D 1.39 LU0717722259 I USD C 1.40* LU0717722416 I USD D 1.38 LU0717723570 I GBP C 1.40 LU0717723810 I GBP D 1.40 LU0782410046 IH C 1.40* LU0782411283 IH USD D 1.39 LU0782411952 IH GBP C 1.39 LU0782412174 IH GBP D 1.40 LU0717720550 R C 2.65 LU0717720717 R D 2.62
UBAM - GCM MIDCAP US EQUITY GROWTH LU0034171404 A C 2.07 LU0367304804 A D 2.09 LU0352161466 AH EUR C 2.25 LU0447829366 AH CHF C -** LU0132666891 I C 1.34 LU0192065307 IH EUR C 1.33 LU0447829523 IH CHF C 1.07 LU0132641126 R C 3.08
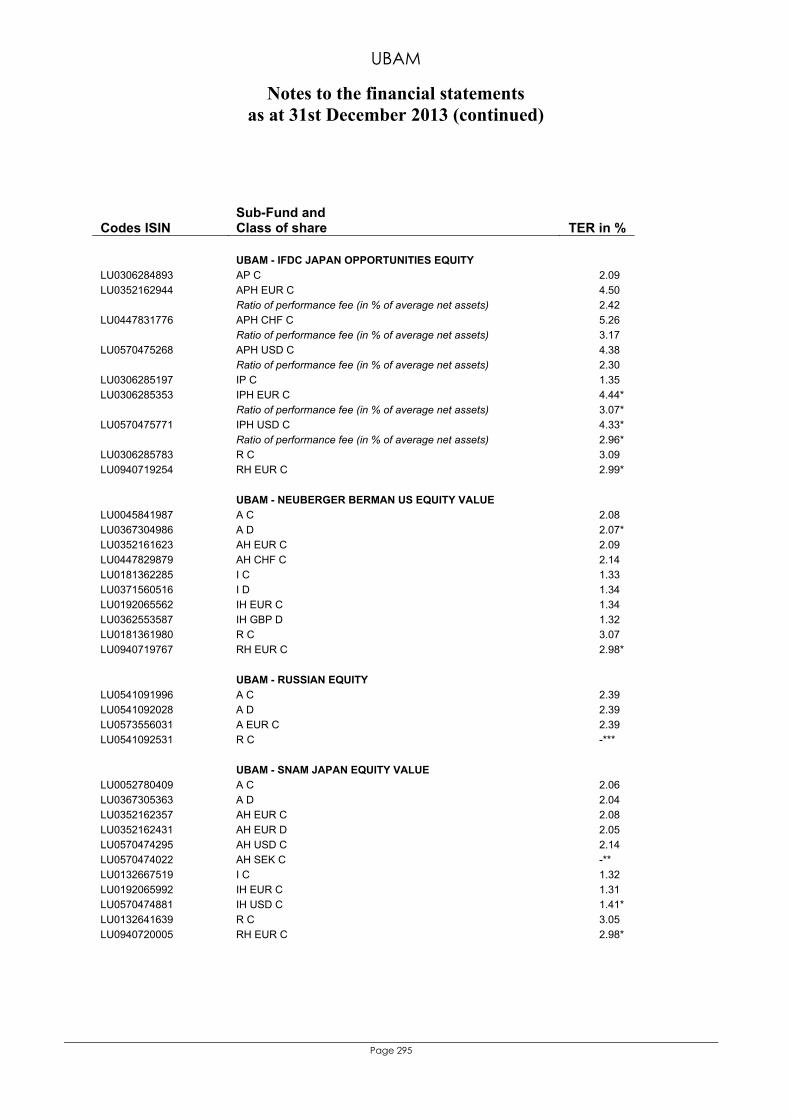
UBAM
Notes to the financial statements as at 31st December 2013 (continued)
Page 295
Codes ISIN Sub-Fund and Class of share TER in %
UBAM - IFDC JAPAN OPPORTUNITIES EQUITY LU0306284893 AP C 2.09 LU0352162944 APH EUR C 4.50 Ratio of performance fee (in % of average net assets) 2.42 LU0447831776 APH CHF C 5.26 Ratio of performance fee (in % of average net assets) 3.17 LU0570475268 APH USD C 4.38 Ratio of performance fee (in % of average net assets) 2.30 LU0306285197 IP C 1.35 LU0306285353 IPH EUR C 4.44* Ratio of performance fee (in % of average net assets) 3.07* LU0570475771 IPH USD C 4.33* Ratio of performance fee (in % of average net assets) 2.96* LU0306285783 R C 3.09 LU0940719254 RH EUR C 2.99*
UBAM - NEUBERGER BERMAN US EQUITY VALUE LU0045841987 A C 2.08 LU0367304986 A D 2.07* LU0352161623 AH EUR C 2.09 LU0447829879 AH CHF C 2.14 LU0181362285 I C 1.33 LU0371560516 I D 1.34 LU0192065562 IH EUR C 1.34 LU0362553587 IH GBP D 1.32 LU0181361980 R C 3.07 LU0940719767 RH EUR C 2.98*
UBAM - RUSSIAN EQUITY LU0541091996 A C 2.39 LU0541092028 A D 2.39 LU0573556031 A EUR C 2.39 LU0541092531 R C -***
UBAM - SNAM JAPAN EQUITY VALUE LU0052780409 A C 2.06 LU0367305363 A D 2.04 LU0352162357 AH EUR C 2.08 LU0352162431 AH EUR D 2.05 LU0570474295 AH USD C 2.14 LU0570474022 AH SEK C -** LU0132667519 I C 1.32 LU0192065992 IH EUR C 1.31 LU0570474881 IH USD C 1.41* LU0132641639 R C 3.05 LU0940720005 RH EUR C 2.98*
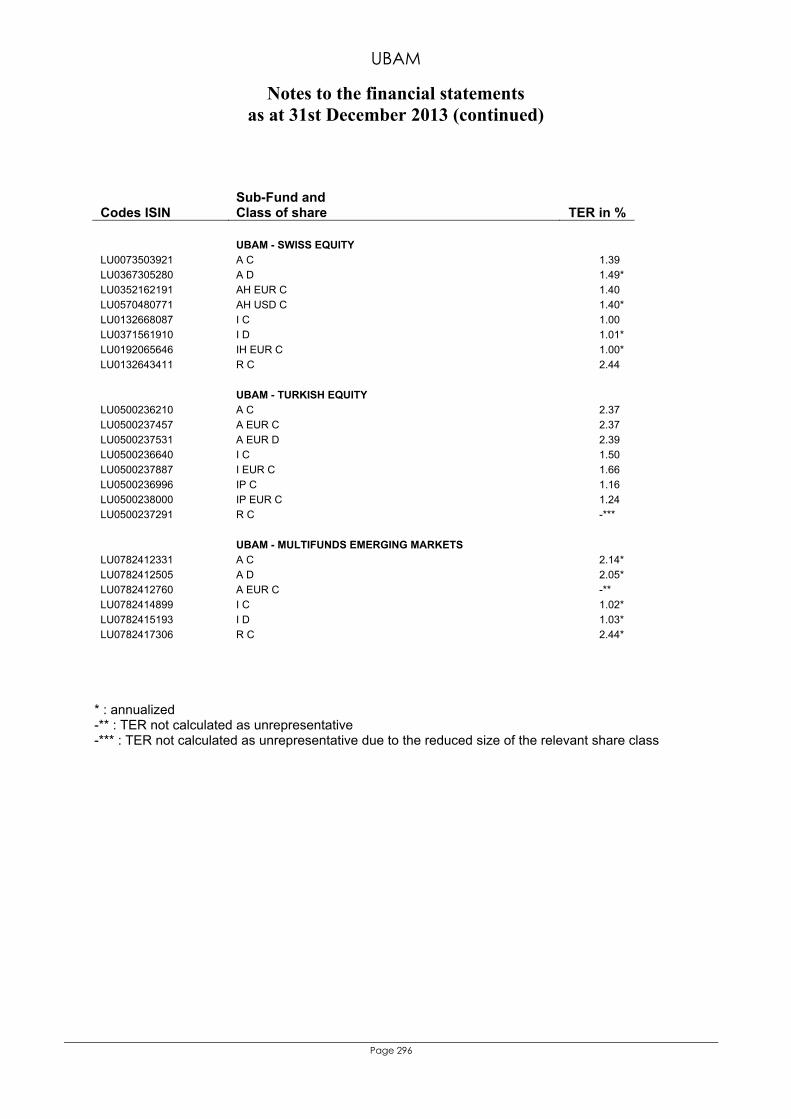
UBAM
Notes to the financial statements as at 31st December 2013 (continued)
Page 296
Codes ISIN Sub-Fund and Class of share TER in %
UBAM - SWISS EQUITY LU0073503921 A C 1.39 LU0367305280 A D 1.49* LU0352162191 AH EUR C 1.40 LU0570480771 AH USD C 1.40* LU0132668087 I C 1.00 LU0371561910 I D 1.01* LU0192065646 IH EUR C 1.00* LU0132643411 R C 2.44
UBAM - TURKISH EQUITY LU0500236210 A C 2.37 LU0500237457 A EUR C 2.37 LU0500237531 A EUR D 2.39 LU0500236640 I C 1.50 LU0500237887 I EUR C 1.66 LU0500236996 IP C 1.16 LU0500238000 IP EUR C 1.24 LU0500237291 R C -***
UBAM - MULTIFUNDS EMERGING MARKETS LU0782412331 A C 2.14* LU0782412505 A D 2.05* LU0782412760 A EUR C -** LU0782414899 I C 1.02* LU0782415193 I D 1.03* LU0782417306 R C 2.44*
* : annualized -** : TER not calculated as unrepresentative -*** : TER not calculated as unrepresentative due to the reduced size of the relevant share class

UBAM
Notes to the financial statements as at 31st December 2013 (continued)
Page 297
Portfolio Turnover Ratio “PTR” As at 31st December 2013, the PTR calculated for each sub-funds is:
Currency Portfolio Turnover Ratio Bond sub-funds UBAM - CORPORATE EURO BOND EUR 34.48%UBAM - CORPORATE US DOLLAR BOND (2) USD 17.52%UBAM - DYNAMIC EURO BOND (2) EUR 95.47%UBAM - DYNAMIC US DOLLAR BOND USD 100.96%UBAM - EMERGING MARKET BOND USD -54.89%UBAM - EMERGING MARKET CORPORATE BOND USD 20.84%UBAM - EM HIGH YIELD SHORT DURATION CORPORATE BOND (2) USD 13.06%UBAM - GLOBAL BOND (CHF) CHF 44.15%UBAM - GLOBAL HIGH YIELD SOLUTION USD -47.33%UBAM - LOCAL CURRENCY EMERGING MARKET BOND USD 22.62%UBAM - UNCONSTRAINED BOND (2) EUR 209.26%UBAM - YIELD CURVE EURO BOND (2) EUR 49.39%UBAM - YIELD CURVE STERLING BOND (2) GBP -73.86%UBAM - YIELD CURVE US DOLLAR BOND (2) USD -28.10%Feeder bond sub-fund UBAM - EM INVESTMENT GRADE CORPORATE BOND (1)(2) USD -117.25%Feeder convertible bond sub-funds UBAM - EUROPEAN CONVERTIBLE BOND (1) EUR -27.94%UBAM - EURO 10-40 CONVERTIBLE BOND (1) EUR -48.72%UBAM - GLOBAL CONVERTIBLE BOND (1)(2) EUR -0.33%Equity sub-funds UBAM - 30 GLOBAL LEADERS EQUITY (2) EUR 32.04%UBAM - ASIA EQUITY (2) USD 147.81%UBAM - ASIA EQUITY HIGH DIVIDEND (2) USD 76.02%UBAM - DR. EHRHARDT GERMAN EQUITY EUR 293.63%UBAM - EQUITY BRIC+ USD 102.66%UBAM - EUROPE EQUITY (2) EUR 129.64%UBAM - EUROPE EQUITY DIVIDEND+ (2) EUR 184.20%UBAM - GCM MIDCAP US EQUITY GROWTH (2) USD 188.22%UBAM - IFDC JAPAN OPPORTUNITIES EQUITY JPY 94.86%UBAM - NEUBERGER BERMAN US EQUITY VALUE (2) USD 14.17%UBAM - RUSSIAN EQUITY USD 124.74%UBAM - SNAM JAPAN EQUITY VALUE (2) JPY 105.69%UBAM - SWISS EQUITY (2) CHF 15.87%UBAM - TURKISH EQUITY USD -1.73%Fund of funds sub-fund UBAM - MULTIFUNDS EMERGING MARKETS (2) USD 176.52% (1) This sub-fund acts as Feeder in a master-feeder structure, please refer to Note 16 and "AGGREGATE CHARGES WITHIN MASTER-FEEDER STRUCTURES" chapter of the prospectus dated September 2013, in order to obtain complete information about aggregate fees. (2) Please refer to Note 17 for more details on events concerning these sub-funds. Note 14 - Changes of the investment portfolio Details of changes in the securities portfolio for the year referring to this report are available upon request - free of charge - at the SICAV's registered office, and at the office of the financial intermediaries as described in the Organisation chapter of this report.
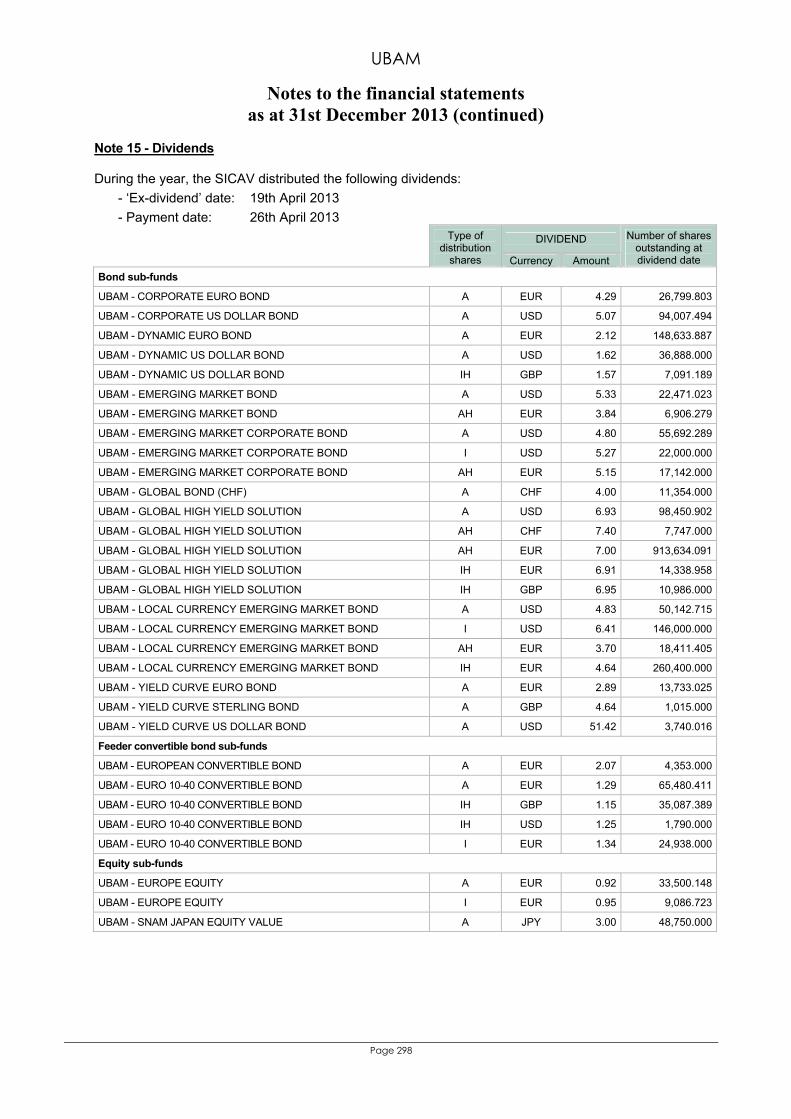
UBAM
Notes to the financial statements as at 31st December 2013 (continued)
Page 298
Note 15 - Dividends During the year, the SICAV distributed the following dividends:
- ‘Ex-dividend’ date: 19th April 2013 - Payment date: 26th April 2013
DIVIDEND
Type of distribution
shares Currency Amount
Number of shares outstanding at dividend date
Bond sub-funds
UBAM - CORPORATE EURO BOND A EUR 4.29 26,799.803
UBAM - CORPORATE US DOLLAR BOND A USD 5.07 94,007.494
UBAM - DYNAMIC EURO BOND A EUR 2.12 148,633.887
UBAM - DYNAMIC US DOLLAR BOND A USD 1.62 36,888.000
UBAM - DYNAMIC US DOLLAR BOND IH GBP 1.57 7,091.189
UBAM - EMERGING MARKET BOND A USD 5.33 22,471.023
UBAM - EMERGING MARKET BOND AH EUR 3.84 6,906.279
UBAM - EMERGING MARKET CORPORATE BOND A USD 4.80 55,692.289
UBAM - EMERGING MARKET CORPORATE BOND I USD 5.27 22,000.000
UBAM - EMERGING MARKET CORPORATE BOND AH EUR 5.15 17,142.000
UBAM - GLOBAL BOND (CHF) A CHF 4.00 11,354.000
UBAM - GLOBAL HIGH YIELD SOLUTION A USD 6.93 98,450.902
UBAM - GLOBAL HIGH YIELD SOLUTION AH CHF 7.40 7,747.000
UBAM - GLOBAL HIGH YIELD SOLUTION AH EUR 7.00 913,634.091
UBAM - GLOBAL HIGH YIELD SOLUTION IH EUR 6.91 14,338.958
UBAM - GLOBAL HIGH YIELD SOLUTION IH GBP 6.95 10,986.000
UBAM - LOCAL CURRENCY EMERGING MARKET BOND A USD 4.83 50,142.715
UBAM - LOCAL CURRENCY EMERGING MARKET BOND I USD 6.41 146,000.000
UBAM - LOCAL CURRENCY EMERGING MARKET BOND AH EUR 3.70 18,411.405
UBAM - LOCAL CURRENCY EMERGING MARKET BOND IH EUR 4.64 260,400.000
UBAM - YIELD CURVE EURO BOND A EUR 2.89 13,733.025
UBAM - YIELD CURVE STERLING BOND A GBP 4.64 1,015.000
UBAM - YIELD CURVE US DOLLAR BOND A USD 51.42 3,740.016
Feeder convertible bond sub-funds
UBAM - EUROPEAN CONVERTIBLE BOND A EUR 2.07 4,353.000
UBAM - EURO 10-40 CONVERTIBLE BOND A EUR 1.29 65,480.411
UBAM - EURO 10-40 CONVERTIBLE BOND IH GBP 1.15 35,087.389
UBAM - EURO 10-40 CONVERTIBLE BOND IH USD 1.25 1,790.000
UBAM - EURO 10-40 CONVERTIBLE BOND I EUR 1.34 24,938.000
Equity sub-funds
UBAM - EUROPE EQUITY A EUR 0.92 33,500.148
UBAM - EUROPE EQUITY I EUR 0.95 9,086.723
UBAM - SNAM JAPAN EQUITY VALUE A JPY 3.00 48,750.000
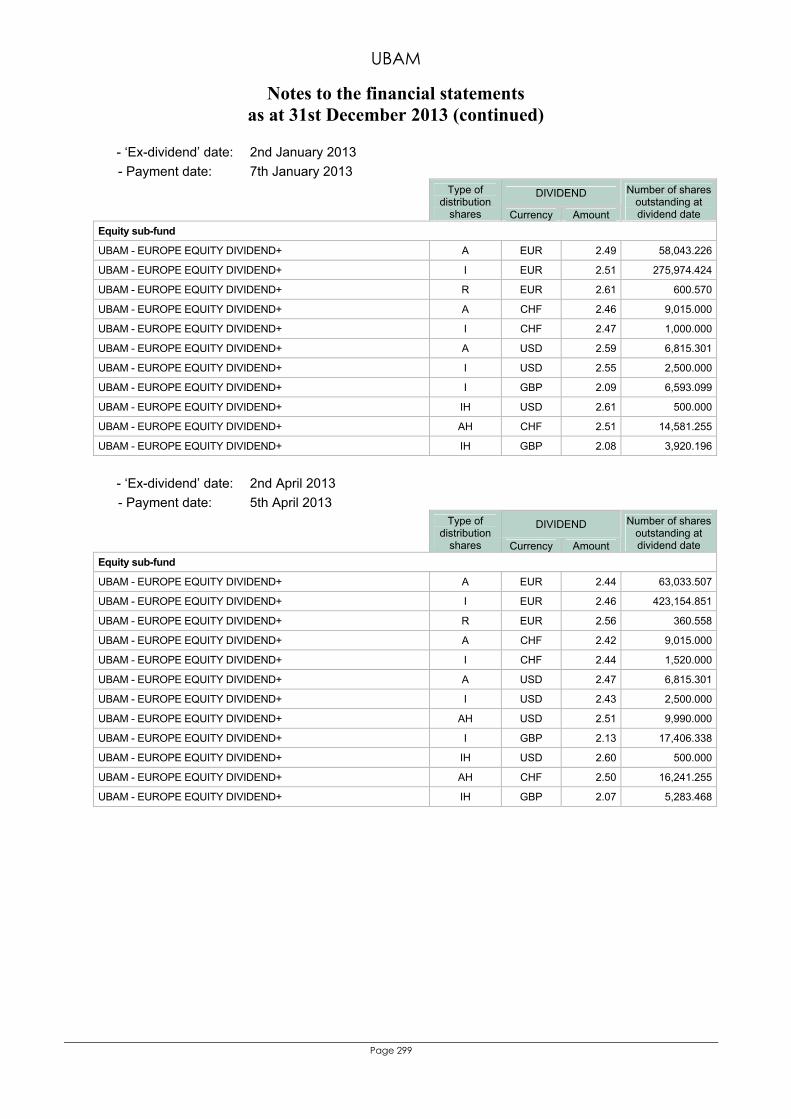
UBAM
Notes to the financial statements as at 31st December 2013 (continued)
Page 299
- ‘Ex-dividend’ date: 2nd January 2013 - Payment date: 7th January 2013
DIVIDEND
Type of distribution
shares Currency Amount
Number of shares outstanding at dividend date
Equity sub-fund
UBAM - EUROPE EQUITY DIVIDEND+ A EUR 2.49 58,043.226
UBAM - EUROPE EQUITY DIVIDEND+ I EUR 2.51 275,974.424
UBAM - EUROPE EQUITY DIVIDEND+ R EUR 2.61 600.570
UBAM - EUROPE EQUITY DIVIDEND+ A CHF 2.46 9,015.000
UBAM - EUROPE EQUITY DIVIDEND+ I CHF 2.47 1,000.000
UBAM - EUROPE EQUITY DIVIDEND+ A USD 2.59 6,815.301
UBAM - EUROPE EQUITY DIVIDEND+ I USD 2.55 2,500.000
UBAM - EUROPE EQUITY DIVIDEND+ I GBP 2.09 6,593.099
UBAM - EUROPE EQUITY DIVIDEND+ IH USD 2.61 500.000
UBAM - EUROPE EQUITY DIVIDEND+ AH CHF 2.51 14,581.255
UBAM - EUROPE EQUITY DIVIDEND+ IH GBP 2.08 3,920.196
- ‘Ex-dividend’ date: 2nd April 2013
- Payment date: 5th April 2013 DIVIDEND
Type of distribution
shares Currency Amount
Number of shares outstanding at dividend date
Equity sub-fund
UBAM - EUROPE EQUITY DIVIDEND+ A EUR 2.44 63,033.507
UBAM - EUROPE EQUITY DIVIDEND+ I EUR 2.46 423,154.851
UBAM - EUROPE EQUITY DIVIDEND+ R EUR 2.56 360.558
UBAM - EUROPE EQUITY DIVIDEND+ A CHF 2.42 9,015.000
UBAM - EUROPE EQUITY DIVIDEND+ I CHF 2.44 1,520.000
UBAM - EUROPE EQUITY DIVIDEND+ A USD 2.47 6,815.301
UBAM - EUROPE EQUITY DIVIDEND+ I USD 2.43 2,500.000
UBAM - EUROPE EQUITY DIVIDEND+ AH USD 2.51 9,990.000
UBAM - EUROPE EQUITY DIVIDEND+ I GBP 2.13 17,406.338
UBAM - EUROPE EQUITY DIVIDEND+ IH USD 2.60 500.000
UBAM - EUROPE EQUITY DIVIDEND+ AH CHF 2.50 16,241.255
UBAM - EUROPE EQUITY DIVIDEND+ IH GBP 2.07 5,283.468
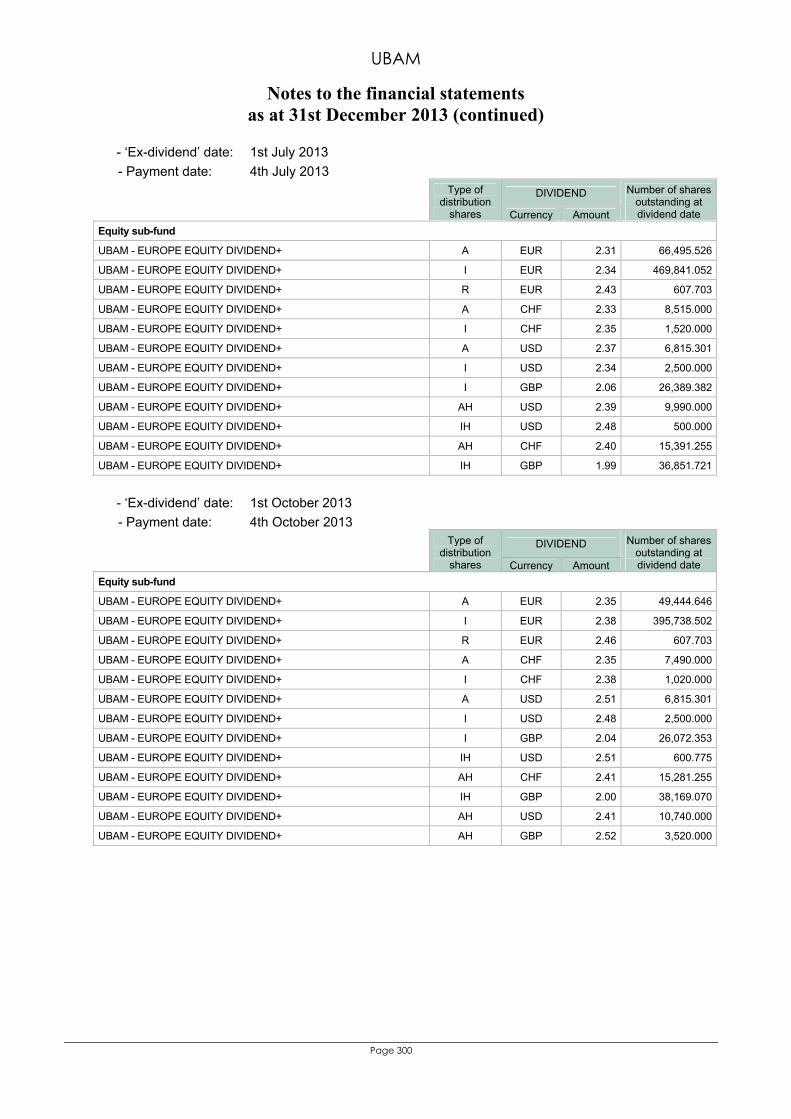
UBAM
Notes to the financial statements as at 31st December 2013 (continued)
Page 300
- ‘Ex-dividend’ date: 1st July 2013 - Payment date: 4th July 2013
DIVIDEND
Type of distribution
shares Currency Amount
Number of shares outstanding at dividend date
Equity sub-fund
UBAM - EUROPE EQUITY DIVIDEND+ A EUR 2.31 66,495.526
UBAM - EUROPE EQUITY DIVIDEND+ I EUR 2.34 469,841.052
UBAM - EUROPE EQUITY DIVIDEND+ R EUR 2.43 607.703
UBAM - EUROPE EQUITY DIVIDEND+ A CHF 2.33 8,515.000
UBAM - EUROPE EQUITY DIVIDEND+ I CHF 2.35 1,520.000
UBAM - EUROPE EQUITY DIVIDEND+ A USD 2.37 6,815.301
UBAM - EUROPE EQUITY DIVIDEND+ I USD 2.34 2,500.000
UBAM - EUROPE EQUITY DIVIDEND+ I GBP 2.06 26,389.382
UBAM - EUROPE EQUITY DIVIDEND+ AH USD 2.39 9,990.000
UBAM - EUROPE EQUITY DIVIDEND+ IH USD 2.48 500.000
UBAM - EUROPE EQUITY DIVIDEND+ AH CHF 2.40 15,391.255
UBAM - EUROPE EQUITY DIVIDEND+ IH GBP 1.99 36,851.721
- ‘Ex-dividend’ date: 1st October 2013
- Payment date: 4th October 2013 DIVIDEND
Type of distribution
shares Currency Amount
Number of shares outstanding at dividend date
Equity sub-fund
UBAM - EUROPE EQUITY DIVIDEND+ A EUR 2.35 49,444.646
UBAM - EUROPE EQUITY DIVIDEND+ I EUR 2.38 395,738.502
UBAM - EUROPE EQUITY DIVIDEND+ R EUR 2.46 607.703
UBAM - EUROPE EQUITY DIVIDEND+ A CHF 2.35 7,490.000
UBAM - EUROPE EQUITY DIVIDEND+ I CHF 2.38 1,020.000
UBAM - EUROPE EQUITY DIVIDEND+ A USD 2.51 6,815.301
UBAM - EUROPE EQUITY DIVIDEND+ I USD 2.48 2,500.000
UBAM - EUROPE EQUITY DIVIDEND+ I GBP 2.04 26,072.353
UBAM - EUROPE EQUITY DIVIDEND+ IH USD 2.51 600.775
UBAM - EUROPE EQUITY DIVIDEND+ AH CHF 2.41 15,281.255
UBAM - EUROPE EQUITY DIVIDEND+ IH GBP 2.00 38,169.070
UBAM - EUROPE EQUITY DIVIDEND+ AH USD 2.41 10,740.000
UBAM - EUROPE EQUITY DIVIDEND+ AH GBP 2.52 3,520.000

UBAM
Notes to the financial statements as at 31st December 2013 (continued)
Page 301
Note 16 - Master-Feeder structures Each sub-fund of the SICAV is eligible, subject to the approval of the CSSF, to become a Feeder sub-fund by investing at least 85% of its assets in securities of other Master UCITS, notwithstanding articles 2, 41, 43, 46 and 48 of the 2010 Law. At the closing date, the sub-fund UBAM - EM INVESTMENT GRADE CORPORATE BOND acts as Feeder sub-fund of the “Master UCITS” UBAM FCP - EM INVESTMENT GRADE CORPORATE BOND, a FCP authorized and regulated by the French Autorité des Marchés Financiers. The three sub-funds UBAM - EUROPEAN CONVERTIBLE BOND, UBAM - EURO 10-40 CONVERTIBLE BOND and UBAM - GLOBAL CONVERTIBLE BOND act as Feeder sub-funds of the “Master sub-funds” respectively UBAM CONVERTIBLES EUROPE, UBAM CONVERTIBLES EURO 10-40 and UBAM CONVERTIBLES GLOBAL part of UBAM CONVERTIBLES, a SICAV authorized and regulated by the French Autorités des Marchés Financiers. The Feeder sub-funds are investing in Type Z shares of their respective Master sub-funds. The % of ownership is as follows:
Feeder sub-funds Master sub-funds % of Z shares
UBAM - EM INVESTMENT GRADE CORPORATE BOND
UBAM FCP - EM INVESTMENT GRADE CORPORATE BOND
100.00
UBAM - EUROPEAN CONVERTIBLE BOND UBAM CONVERTIBLES EUROPE 99.81 UBAM - EURO 10-40 CONVERTIBLE BOND UBAM CONVERTIBLES EURO 10-40 100.55 UBAM - GLOBAL CONVERTIBLE BOND UBAM CONVERTIBLES GLOBAL 100.00 A redemption of 2,008.00 shares is recorded in the net asset value as at 3rd January 2014 in the Feeder sub-fund UBAM - EURO 10-40 CONVERTIBLE BOND whereas it is already recorded in the net asset value as at 31st December 2013 in the Master sub-fund UBAM CONVERTIBLES EURO10-40. The investment objective of the Master sub-fund UBAM FCP - EM INVESTMENT GRADE CORPORATE BOND is to offer to the investor exposure to investment-grade emerging market bonds with a minimum rating of BBB- (Fitch) or BBB- (S&P) or Baa3 (Moody’s). The investment objective of the Master sub-fund UBAM CONVERTIBLES EUROPE is to enable the investor to benefit from the specific risk/return ratio of European convertible bonds. The investment objective of the Master sub-fund UBAM CONVERTIBLES EURO 10-40 is to enable the investor to benefit from the specific risk/return ratio of Eurozone convertible bonds. The investment objective of the Master sub-fund UBAM CONVERTIBLES GLOBAL is to enable the investor to benefit from the specific risk/return ratio of international convertible bonds. Please refer to the Master sub-funds’ prospectus for additional information regarding their respective investment policy. At the level of the Master sub-funds, the fees, charges and expenses associated with the investments are an operating and management fee covering all the expenses invoiced directly to the Master sub-funds, with the exception of transaction charges. As at 31st December 2013, the maximum operating and management fees charged by the Mastersub-funds for the classes of shares held by the Feeder sub-funds are as follows :
Feeder sub-funds Master sub-funds Operating and
management feesUBAM - EM INVESTMENT GRADE CORPORATE BOND
UBAM FCP - EM INVESTMENT GRADE CORPORATE BOND
0.20%
UBAM - EUROPEAN CONVERTIBLE BOND UBAM CONVERTIBLES EUROPE 0.20% UBAM - EURO 10-40 CONVERTIBLE BOND UBAM CONVERTIBLES EURO 10-40 0.20% UBAM - GLOBAL CONVERTIBLE BOND UBAM CONVERTIBLES GLOBAL 0.20%
The operating and management fee, as described by the UBAM FCP - EM INVESTMENT GRADE CORPORATE BOND and UBAM CONVERTIBLES prospectuses, may be increased by performance fees, transaction fees and by a part of the income from sale and repurchase agreements.
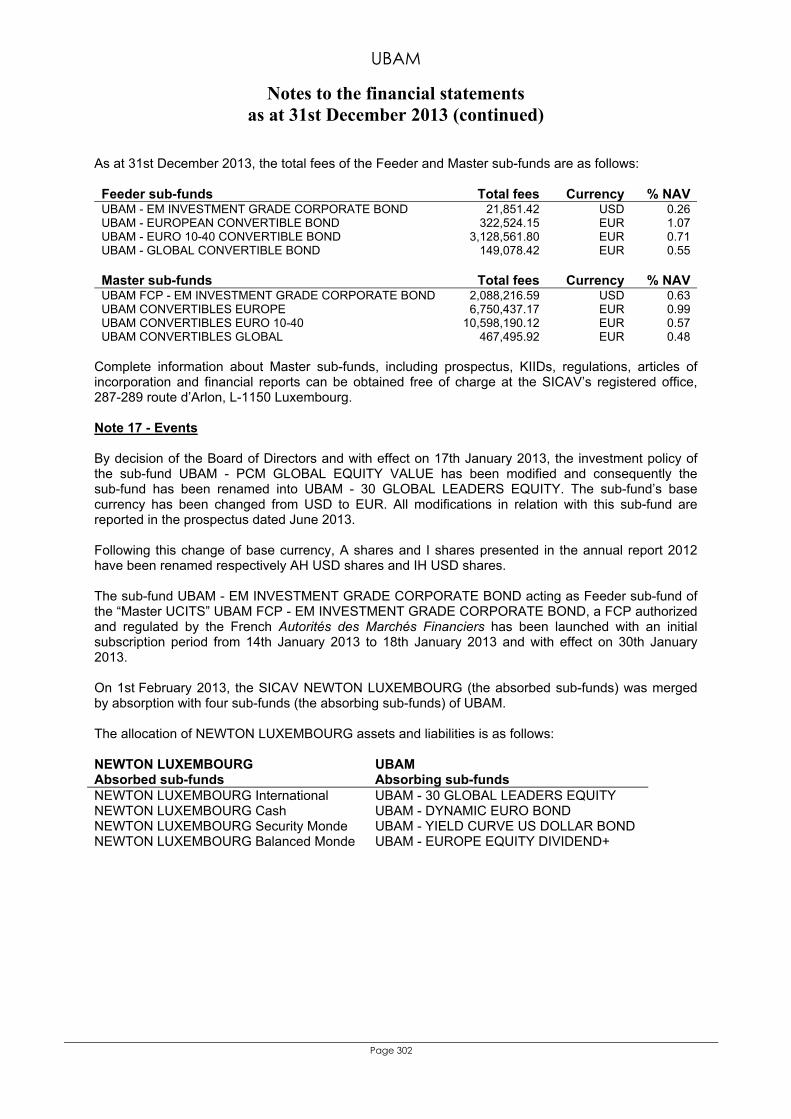
UBAM
Notes to the financial statements as at 31st December 2013 (continued)
Page 302
As at 31st December 2013, the total fees of the Feeder and Master sub-funds are as follows: Feeder sub-funds Total fees Currency % NAVUBAM - EM INVESTMENT GRADE CORPORATE BOND 21,851.42 USD 0.26 UBAM - EUROPEAN CONVERTIBLE BOND 322,524.15 EUR 1.07 UBAM - EURO 10-40 CONVERTIBLE BOND 3,128,561.80 EUR 0.71 UBAM - GLOBAL CONVERTIBLE BOND 149,078.42 EUR 0.55
Master sub-funds Total fees Currency % NAVUBAM FCP - EM INVESTMENT GRADE CORPORATE BOND 2,088,216.59 USD 0.63 UBAM CONVERTIBLES EUROPE 6,750,437.17 EUR 0.99 UBAM CONVERTIBLES EURO 10-40 10,598,190.12 EUR 0.57 UBAM CONVERTIBLES GLOBAL 467,495.92 EUR 0.48
Complete information about Master sub-funds, including prospectus, KIIDs, regulations, articles of incorporation and financial reports can be obtained free of charge at the SICAV’s registered office, 287-289 route d’Arlon, L-1150 Luxembourg. Note 17 - Events By decision of the Board of Directors and with effect on 17th January 2013, the investment policy of the sub-fund UBAM - PCM GLOBAL EQUITY VALUE has been modified and consequently thesub-fund has been renamed into UBAM - 30 GLOBAL LEADERS EQUITY. The sub-fund’s base currency has been changed from USD to EUR. All modifications in relation with this sub-fund are reported in the prospectus dated June 2013. Following this change of base currency, A shares and I shares presented in the annual report 2012 have been renamed respectively AH USD shares and IH USD shares. The sub-fund UBAM - EM INVESTMENT GRADE CORPORATE BOND acting as Feeder sub-fund of the “Master UCITS” UBAM FCP - EM INVESTMENT GRADE CORPORATE BOND, a FCP authorized and regulated by the French Autorités des Marchés Financiers has been launched with an initial subscription period from 14th January 2013 to 18th January 2013 and with effect on 30th January 2013. On 1st February 2013, the SICAV NEWTON LUXEMBOURG (the absorbed sub-funds) was merged by absorption with four sub-funds (the absorbing sub-funds) of UBAM. The allocation of NEWTON LUXEMBOURG assets and liabilities is as follows: NEWTON LUXEMBOURG UBAM Absorbed sub-funds Absorbing sub-funds NEWTON LUXEMBOURG International UBAM - 30 GLOBAL LEADERS EQUITY NEWTON LUXEMBOURG Cash UBAM - DYNAMIC EURO BOND NEWTON LUXEMBOURG Security Monde UBAM - YIELD CURVE US DOLLAR BOND NEWTON LUXEMBOURG Balanced Monde UBAM - EUROPE EQUITY DIVIDEND+
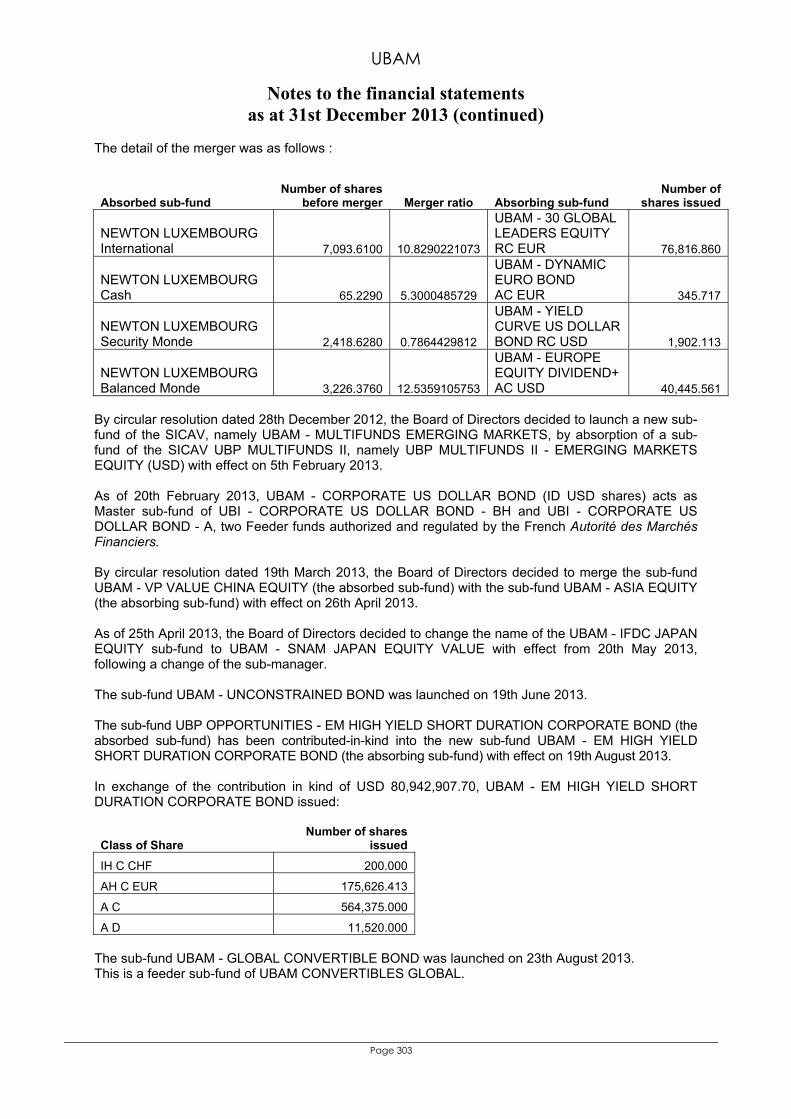
UBAM
Notes to the financial statements as at 31st December 2013 (continued)
Page 303
The detail of the merger was as follows :
Absorbed sub-fund Number of shares
before merger Merger ratio Absorbing sub-fund Number of
shares issued
NEWTON LUXEMBOURG International 7,093.6100 10.8290221073
UBAM - 30 GLOBAL LEADERS EQUITY RC EUR 76,816.860
NEWTON LUXEMBOURG Cash 65.2290 5.3000485729
UBAM - DYNAMIC EURO BOND AC EUR 345.717
NEWTON LUXEMBOURG Security Monde 2,418.6280 0.7864429812
UBAM - YIELD CURVE US DOLLAR BOND RC USD 1,902.113
NEWTON LUXEMBOURG Balanced Monde 3,226.3760 12.5359105753
UBAM - EUROPE EQUITY DIVIDEND+ AC USD 40,445.561
By circular resolution dated 28th December 2012, the Board of Directors decided to launch a new sub-fund of the SICAV, namely UBAM - MULTIFUNDS EMERGING MARKETS, by absorption of a sub-fund of the SICAV UBP MULTIFUNDS II, namely UBP MULTIFUNDS II - EMERGING MARKETS EQUITY (USD) with effect on 5th February 2013. As of 20th February 2013, UBAM - CORPORATE US DOLLAR BOND (ID USD shares) acts as Master sub-fund of UBI - CORPORATE US DOLLAR BOND - BH and UBI - CORPORATE US DOLLAR BOND - A, two Feeder funds authorized and regulated by the French Autorité des Marchés Financiers. By circular resolution dated 19th March 2013, the Board of Directors decided to merge the sub-fund UBAM - VP VALUE CHINA EQUITY (the absorbed sub-fund) with the sub-fund UBAM - ASIA EQUITY (the absorbing sub-fund) with effect on 26th April 2013. As of 25th April 2013, the Board of Directors decided to change the name of the UBAM - IFDC JAPAN EQUITY sub-fund to UBAM - SNAM JAPAN EQUITY VALUE with effect from 20th May 2013, following a change of the sub-manager. The sub-fund UBAM - UNCONSTRAINED BOND was launched on 19th June 2013. The sub-fund UBP OPPORTUNITIES - EM HIGH YIELD SHORT DURATION CORPORATE BOND (the absorbed sub-fund) has been contributed-in-kind into the new sub-fund UBAM - EM HIGH YIELD SHORT DURATION CORPORATE BOND (the absorbing sub-fund) with effect on 19th August 2013. In exchange of the contribution in kind of USD 80,942,907.70, UBAM - EM HIGH YIELD SHORT DURATION CORPORATE BOND issued:
Class of Share Number of shares
issued IH C CHF 200.000
AH C EUR 175,626.413
A C 564,375.000
A D 11,520.000 The sub-fund UBAM - GLOBAL CONVERTIBLE BOND was launched on 23th August 2013. This is a feeder sub-fund of UBAM CONVERTIBLES GLOBAL.

UBAM
Notes to the financial statements as at 31st December 2013 (continued)
Page 304
By circular resolution dated 31st August 2013, the Board of Directors decided to appoint UBP Asset Management (Europe) S.A. as its management company (the “Management Company”) as of 1st September 2013. The Management Company is wholly owned by Union Bancaire Privée, UBP SA, Geneva. The Management Company will delegate with the approval of the Board of Directors the investment management, central administration and general distribution functions to the former delegates of UBAM. The advisory fee payable to UBAM International Services has been merged with the management fee payable to the Management Company in consideration of its services with effect on 1st September 2013. The sub-fund UBP OPPORTUNITIES - ASIA HIGH DIVIDEND (the absorbed sub-fund) has been contributed-in-kind into the new sub-fund UBAM - ASIA EQUITY HIGH DIVIDEND (the absorbing sub-fund) with effect on 5th September 2013. In exchange of the contribution in kind of USD 11,368,007.46, UBAM - ASIA EQUITY HIGH DIVIDEND issued:
Class of Share Number of shares
issued I C EUR 9,010.000
I C 22,310.000
I D 68,352.000
Certain sub-funds of Lloyds TSB International Portfolio (the absorbed sub-funds) have been merged with existing sub-funds of UBAM (the absorbing sub-funds) with effect on 31st October 2013 as follows:
Absorbed sub-fund
Number of shares before
merger Merger ratio Absorbing sub-fund Number of
shares issued LIP - GLOBAL EMERGING MARKETS EQUITY FUND 26,983.187 1.0212227576
UBAM - MULTIFUNDS EMERGING MARKETS AC 27,555.845
LIP - GLOBAL EMERGING MARKETS EQUITY FUND 104,128.613 1.0000000000
UBAM - MULTIFUNDS EMERGING MARKETS AC EUR 104,128.613
LIP - EURO BOND FUND 72,215.876 0.4025773846
UBAM - YIELD CURVE EURO BOND AC 29,072.478
LIP - STERLING BOND FUND 18,087.858 1.4821466017
UBAM - YIELD CURVE STERLING BOND AC 26,808.857
LIP - US DOLLAR BOND FUND 158,402.124 0.1294202830
UBAM - YIELD CURVE US DOLLAR BOND AC 20,500.448
LIP - NORTH AMERICA EQUITY FUND 192,072.313 0.3331113361
UBAM - NEUBERGER BERMAN US EQUITY VALUE AC 63,981.465
LIP - SWISS EQUITY FUND 61,448.585 0.8598607725
UBAM - SWISS EQUITY AC 52,837.228
LIP - SWISS EQUITY FUND 260.000 0.6150550670
UBAM - SWISS EQUITY AD 159.914
LIP - UK EQUITY FUND 16,208.098 1.0000000000
UBAM - EUROPE EQUITY AC GBP 16,208.098
LIP - WORLD EQUITY FUND 37,729.594 3.1069746435
UBAM - 30 GLOBAL LEADERS EQUITY AHC USD 117,224.892
LIP - ASIA PACIFIC FUND 225,704.893 1.0000000000
UBAM - ASIA EQUITY HIGH DIVIDEND AC 225,704.893
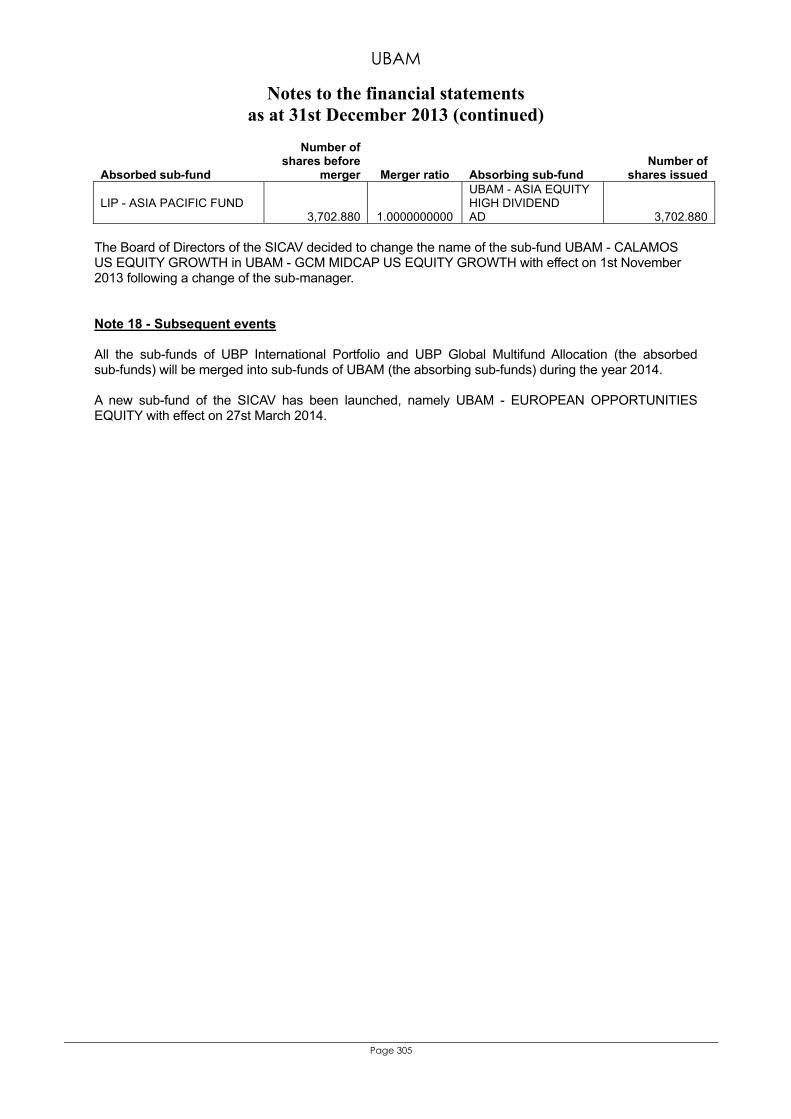
UBAM
Notes to the financial statements as at 31st December 2013 (continued)
Page 305
Absorbed sub-fund
Number of shares before
merger Merger ratio Absorbing sub-fund Number of
shares issued
LIP - ASIA PACIFIC FUND 3,702.880 1.0000000000
UBAM - ASIA EQUITY HIGH DIVIDEND AD 3,702.880
The Board of Directors of the SICAV decided to change the name of the sub-fund UBAM - CALAMOS US EQUITY GROWTH in UBAM - GCM MIDCAP US EQUITY GROWTH with effect on 1st November 2013 following a change of the sub-manager. Note 18 - Subsequent events All the sub-funds of UBP International Portfolio and UBP Global Multifund Allocation (the absorbedsub-funds) will be merged into sub-funds of UBAM (the absorbing sub-funds) during the year 2014. A new sub-fund of the SICAV has been launched, namely UBAM - EUROPEAN OPPORTUNITIES EQUITY with effect on 27st March 2014.
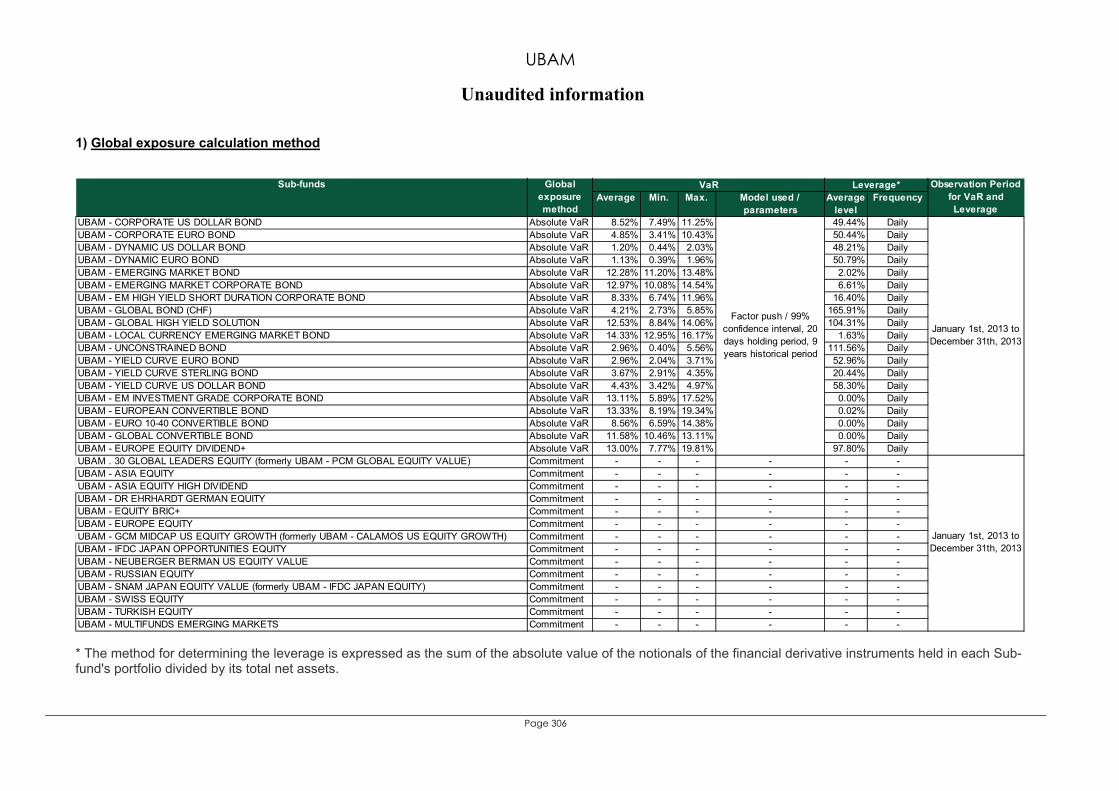
UBAM
Unaudited information
Page 306
1) Global exposure calculation method
Average Min. Max. Model used / parameters
Average level
Frequency
UBAM - CORPORATE US DOLLAR BOND Absolute VaR 8.52% 7.49% 11.25% 49.44% DailyUBAM - CORPORATE EURO BOND Absolute VaR 4.85% 3.41% 10.43% 50.44% DailyUBAM - DYNAMIC US DOLLAR BOND Absolute VaR 1.20% 0.44% 2.03% 48.21% DailyUBAM - DYNAMIC EURO BOND Absolute VaR 1.13% 0.39% 1.96% 50.79% DailyUBAM - EMERGING MARKET BOND Absolute VaR 12.28% 11.20% 13.48% 2.02% DailyUBAM - EMERGING MARKET CORPORATE BOND Absolute VaR 12.97% 10.08% 14.54% 6.61% DailyUBAM - EM HIGH YIELD SHORT DURATION CORPORATE BOND Absolute VaR 8.33% 6.74% 11.96% 16.40% DailyUBAM - GLOBAL BOND (CHF) Absolute VaR 4.21% 2.73% 5.85% 165.91% DailyUBAM - GLOBAL HIGH YIELD SOLUTION Absolute VaR 12.53% 8.84% 14.06% 104.31% DailyUBAM - LOCAL CURRENCY EMERGING MARKET BOND Absolute VaR 14.33% 12.95% 16.17% 1.63% DailyUBAM - UNCONSTRAINED BOND Absolute VaR 2.96% 0.40% 5.56% 111.56% DailyUBAM - YIELD CURVE EURO BOND Absolute VaR 2.96% 2.04% 3.71% 52.96% DailyUBAM - YIELD CURVE STERLING BOND Absolute VaR 3.67% 2.91% 4.35% 20.44% DailyUBAM - YIELD CURVE US DOLLAR BOND Absolute VaR 4.43% 3.42% 4.97% 58.30% DailyUBAM - EM INVESTMENT GRADE CORPORATE BOND Absolute VaR 13.11% 5.89% 17.52% 0.00% DailyUBAM - EUROPEAN CONVERTIBLE BOND Absolute VaR 13.33% 8.19% 19.34% 0.02% DailyUBAM - EURO 10-40 CONVERTIBLE BOND Absolute VaR 8.56% 6.59% 14.38% 0.00% DailyUBAM - GLOBAL CONVERTIBLE BOND Absolute VaR 11.58% 10.46% 13.11% 0.00% DailyUBAM - EUROPE EQUITY DIVIDEND+ Absolute VaR 13.00% 7.77% 19.81% 97.80% DailyUBAM . 30 GLOBAL LEADERS EQUITY (formerly UBAM - PCM GLOBAL EQUITY VALUE) Commitment - - - - - -UBAM - ASIA EQUITY Commitment - - - - - -UBAM - ASIA EQUITY HIGH DIVIDEND Commitment - - - - - -UBAM - DR EHRHARDT GERMAN EQUITY Commitment - - - - - -UBAM - EQUITY BRIC+ Commitment - - - - - -UBAM - EUROPE EQUITY Commitment - - - - - -UBAM - GCM MIDCAP US EQUITY GROWTH (formerly UBAM - CALAMOS US EQUITY GROWTH) Commitment - - - - - -UBAM - IFDC JAPAN OPPORTUNITIES EQUITY Commitment - - - - - -UBAM - NEUBERGER BERMAN US EQUITY VALUE Commitment - - - - - -UBAM - RUSSIAN EQUITY Commitment - - - - - -UBAM - SNAM JAPAN EQUITY VALUE (formerly UBAM - IFDC JAPAN EQUITY) Commitment - - - - - -UBAM - SWISS EQUITY Commitment - - - - - -UBAM - TURKISH EQUITY Commitment - - - - - -UBAM - MULTIFUNDS EMERGING MARKETS Commitment - - - - - -
Factor push / 99% confidence interval, 20 days holding period, 9 years historical period
January 1st, 2013 to December 31th, 2013
January 1st, 2013 to December 31th, 2013
Sub-funds Global exposure method
VaR Leverage* Observation Period for VaR and Leverage
* The method for determining the leverage is expressed as the sum of the absolute value of the notionals of the financial derivative instruments held in each Sub-fund's portfolio divided by its total net assets.
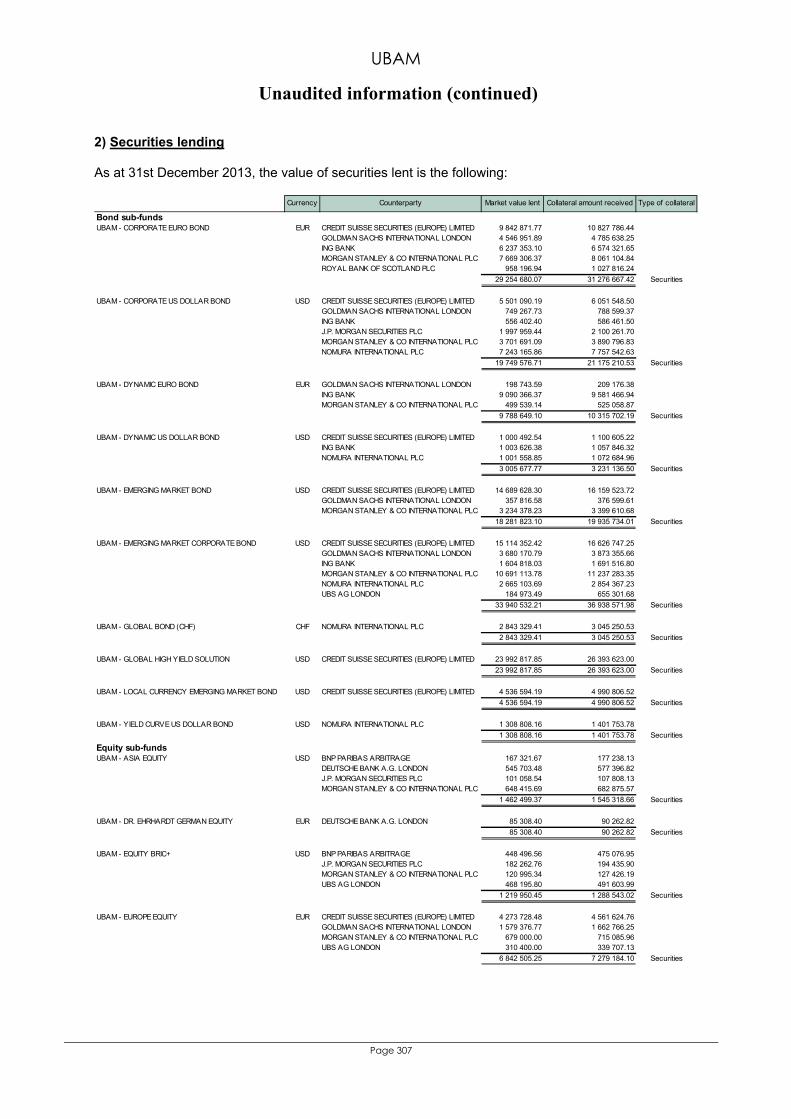
UBAM
Unaudited information (continued)
Page 307
2) Securities lending As at 31st December 2013, the value of securities lent is the following:
Currency Counterparty Market value lent Collateral amount received Type of collateral
Bond sub-fundsUBAM - CORPORATE EURO BOND EUR CREDIT SUISSE SECURITIES (EUROPE) LIMITED 9 842 871.77 10 827 786.44
GOLDMAN SACHS INTERNATIONAL LONDON 4 546 951.89 4 785 638.25ING BANK 6 237 353.10 6 574 321.65MORGAN STANLEY & CO INTERNATIONAL PLC 7 669 306.37 8 061 104.84ROYAL BANK OF SCOTLAND PLC 958 196.94 1 027 816.24
29 254 680.07 31 276 667.42 Securities
UBAM - CORPORATE US DOLLAR BOND USD CREDIT SUISSE SECURITIES (EUROPE) LIMITED 5 501 090.19 6 051 548.50GOLDMAN SACHS INTERNATIONAL LONDON 749 267.73 788 599.37ING BANK 556 402.40 586 461.50J.P. MORGAN SECURITIES PLC 1 997 959.44 2 100 261.70MORGAN STANLEY & CO INTERNATIONAL PLC 3 701 691.09 3 890 796.83NOMURA INTERNATIONAL PLC 7 243 165.86 7 757 542.63
19 749 576.71 21 175 210.53 Securities
UBAM - DYNAMIC EURO BOND EUR GOLDMAN SACHS INTERNATIONAL LONDON 198 743.59 209 176.38ING BANK 9 090 366.37 9 581 466.94MORGAN STANLEY & CO INTERNATIONAL PLC 499 539.14 525 058.87
9 788 649.10 10 315 702.19 Securities
UBAM - DYNAMIC US DOLLAR BOND USD CREDIT SUISSE SECURITIES (EUROPE) LIMITED 1 000 492.54 1 100 605.22ING BANK 1 003 626.38 1 057 846.32NOMURA INTERNATIONAL PLC 1 001 558.85 1 072 684.96
3 005 677.77 3 231 136.50 Securities
UBAM - EMERGING MARKET BOND USD CREDIT SUISSE SECURITIES (EUROPE) LIMITED 14 689 628.30 16 159 523.72GOLDMAN SACHS INTERNATIONAL LONDON 357 816.58 376 599.61MORGAN STANLEY & CO INTERNATIONAL PLC 3 234 378.23 3 399 610.68
18 281 823.10 19 935 734.01 Securities
UBAM - EMERGING MARKET CORPORATE BOND USD CREDIT SUISSE SECURITIES (EUROPE) LIMITED 15 114 352.42 16 626 747.25GOLDMAN SACHS INTERNATIONAL LONDON 3 680 170.79 3 873 355.66ING BANK 1 604 818.03 1 691 516.80MORGAN STANLEY & CO INTERNATIONAL PLC 10 691 113.78 11 237 283.35NOMURA INTERNATIONAL PLC 2 665 103.69 2 854 367.23UBS AG LONDON 184 973.49 655 301.68
33 940 532.21 36 938 571.98 Securities
UBAM - GLOBAL BOND (CHF) CHF NOMURA INTERNATIONAL PLC 2 843 329.41 3 045 250.532 843 329.41 3 045 250.53 Securities
UBAM - GLOBAL HIGH YIELD SOLUTION USD CREDIT SUISSE SECURITIES (EUROPE) LIMITED 23 992 817.85 26 393 623.0023 992 817.85 26 393 623.00 Securities
UBAM - LOCAL CURRENCY EMERGING MARKET BOND USD CREDIT SUISSE SECURITIES (EUROPE) LIMITED 4 536 594.19 4 990 806.524 536 594.19 4 990 806.52 Securities
UBAM - YIELD CURVE US DOLLAR BOND USD NOMURA INTERNATIONAL PLC 1 308 808.16 1 401 753.781 308 808.16 1 401 753.78 Securities
Equity sub-fundsUBAM - ASIA EQUITY USD BNP PARIBAS ARBITRAGE 167 321.67 177 238.13
DEUTSCHE BANK A.G. LONDON 545 703.48 577 396.82J.P. MORGAN SECURITIES PLC 101 058.54 107 808.13MORGAN STANLEY & CO INTERNATIONAL PLC 648 415.69 682 875.57
1 462 499.37 1 545 318.66 Securities
UBAM - DR. EHRHARDT GERMAN EQUITY EUR DEUTSCHE BANK A.G. LONDON 85 308.40 90 262.8285 308.40 90 262.82 Securities
UBAM - EQUITY BRIC+ USD BNP PARIBAS ARBITRAGE 448 496.56 475 076.95J.P. MORGAN SECURITIES PLC 182 262.76 194 435.90MORGAN STANLEY & CO INTERNATIONAL PLC 120 995.34 127 426.19UBS AG LONDON 468 195.80 491 603.99
1 219 950.45 1 288 543.02 Securities
UBAM - EUROPE EQUITY EUR CREDIT SUISSE SECURITIES (EUROPE) LIMITED 4 273 728.48 4 561 624.76GOLDMAN SACHS INTERNATIONAL LONDON 1 579 376.77 1 662 766.25MORGAN STANLEY & CO INTERNATIONAL PLC 679 000.00 715 085.96UBS AG LONDON 310 400.00 339 707.13
6 842 505.25 7 279 184.10 Securities
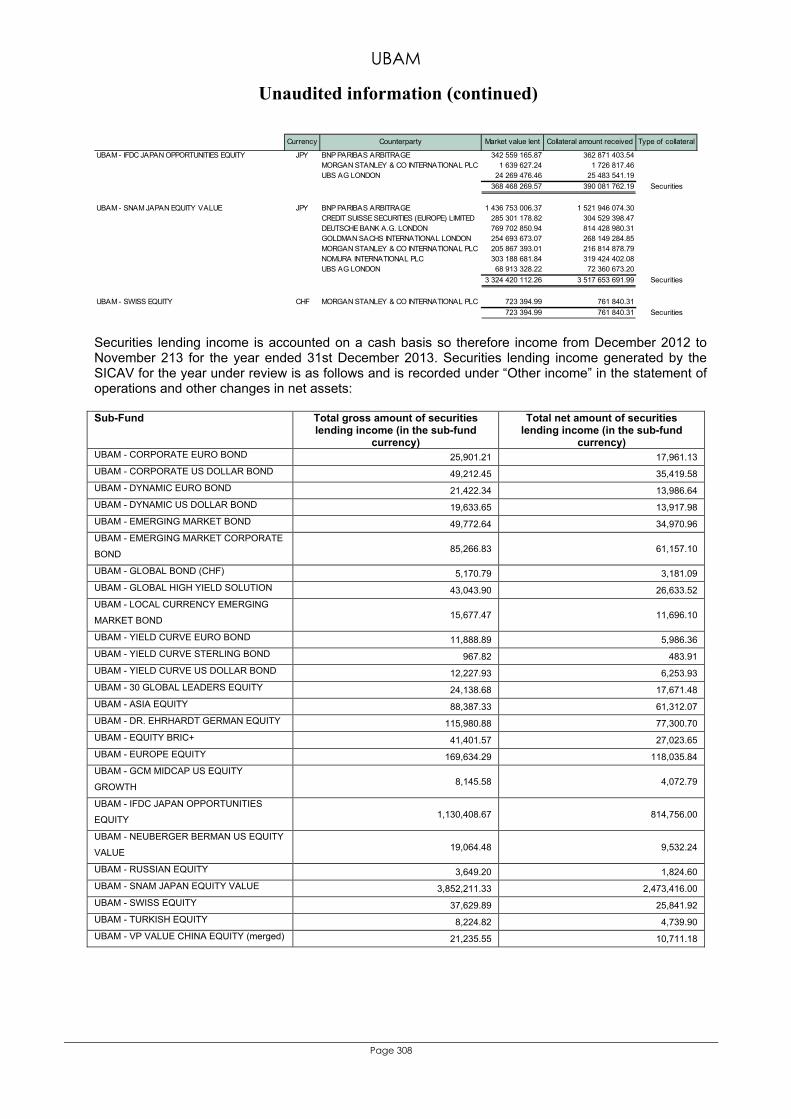
UBAM
Unaudited information (continued)
Page 308
Currency Counterparty Market value lent Collateral amount received Type of collateral
UBAM - IFDC JAPAN OPPORTUNITIES EQUITY JPY BNP PARIBAS ARBITRAGE 342 559 165.87 362 871 403.54MORGAN STANLEY & CO INTERNATIONAL PLC 1 639 627.24 1 726 817.46UBS AG LONDON 24 269 476.46 25 483 541.19
368 468 269.57 390 081 762.19 Securities
UBAM - SNAM JAPAN EQUITY VALUE JPY BNP PARIBAS ARBITRAGE 1 436 753 006.37 1 521 946 074.30CREDIT SUISSE SECURITIES (EUROPE) LIMITED 285 301 178.82 304 529 398.47DEUTSCHE BANK A.G. LONDON 769 702 850.94 814 428 980.31GOLDMAN SACHS INTERNATIONAL LONDON 254 693 673.07 268 149 284.85MORGAN STANLEY & CO INTERNATIONAL PLC 205 867 393.01 216 814 878.79NOMURA INTERNATIONAL PLC 303 188 681.84 319 424 402.08UBS AG LONDON 68 913 328.22 72 360 673.20
3 324 420 112.26 3 517 653 691.99 Securities
UBAM - SWISS EQUITY CHF MORGAN STANLEY & CO INTERNATIONAL PLC 723 394.99 761 840.31723 394.99 761 840.31 Securities
Securities lending income is accounted on a cash basis so therefore income from December 2012 to November 213 for the year ended 31st December 2013. Securities lending income generated by the SICAV for the year under review is as follows and is recorded under “Other income” in the statement of operations and other changes in net assets: Sub-Fund Total gross amount of securities
lending income (in the sub-fund currency)
Total net amount of securities lending income (in the sub-fund
currency) UBAM - CORPORATE EURO BOND 25,901.21 17,961.13 UBAM - CORPORATE US DOLLAR BOND 49,212.45 35,419.58 UBAM - DYNAMIC EURO BOND 21,422.34 13,986.64 UBAM - DYNAMIC US DOLLAR BOND 19,633.65 13,917.98 UBAM - EMERGING MARKET BOND 49,772.64 34,970.96 UBAM - EMERGING MARKET CORPORATE
BOND 85,266.83 61,157.10
UBAM - GLOBAL BOND (CHF) 5,170.79 3,181.09 UBAM - GLOBAL HIGH YIELD SOLUTION 43,043.90 26,633.52 UBAM - LOCAL CURRENCY EMERGING
MARKET BOND 15,677.47 11,696.10
UBAM - YIELD CURVE EURO BOND 11,888.89 5,986.36 UBAM - YIELD CURVE STERLING BOND 967.82 483.91 UBAM - YIELD CURVE US DOLLAR BOND 12,227.93 6,253.93 UBAM - 30 GLOBAL LEADERS EQUITY 24,138.68 17,671.48 UBAM - ASIA EQUITY 88,387.33 61,312.07 UBAM - DR. EHRHARDT GERMAN EQUITY 115,980.88 77,300.70 UBAM - EQUITY BRIC+ 41,401.57 27,023.65 UBAM - EUROPE EQUITY 169,634.29 118,035.84 UBAM - GCM MIDCAP US EQUITY
GROWTH 8,145.58 4,072.79
UBAM - IFDC JAPAN OPPORTUNITIES
EQUITY 1,130,408.67 814,756.00
UBAM - NEUBERGER BERMAN US EQUITY
VALUE 19,064.48 9,532.24
UBAM - RUSSIAN EQUITY 3,649.20 1,824.60 UBAM - SNAM JAPAN EQUITY VALUE 3,852,211.33 2,473,416.00 UBAM - SWISS EQUITY 37,629.89 25,841.92 UBAM - TURKISH EQUITY 8,224.82 4,739.90 UBAM - VP VALUE CHINA EQUITY (merged) 21,235.55 10,711.18
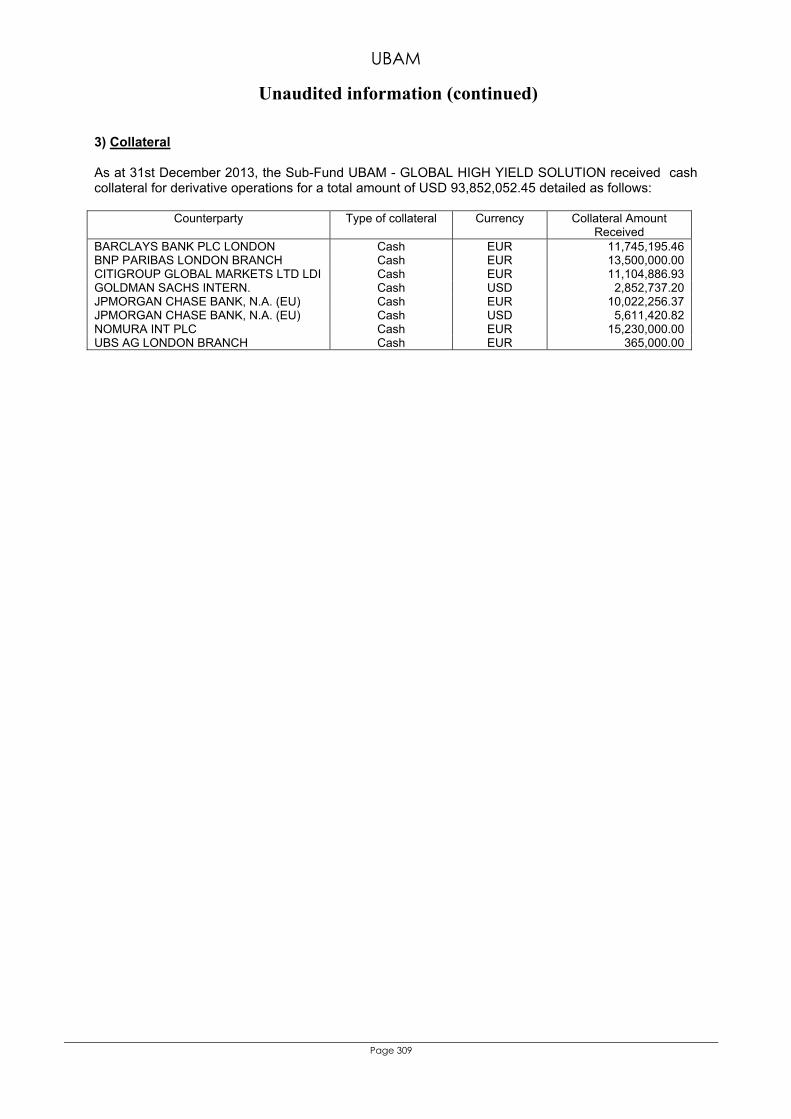
UBAM
Unaudited information (continued)
Page 309
3) Collateral As at 31st December 2013, the Sub-Fund UBAM - GLOBAL HIGH YIELD SOLUTION received cash collateral for derivative operations for a total amount of USD 93,852,052.45 detailed as follows:
Counterparty Type of collateral Currency Collateral Amount Received
BARCLAYS BANK PLC LONDON Cash EUR 11,745,195.46 BNP PARIBAS LONDON BRANCH Cash EUR 13,500,000.00 CITIGROUP GLOBAL MARKETS LTD LDI Cash EUR 11,104,886.93 GOLDMAN SACHS INTERN. Cash USD 2,852,737.20 JPMORGAN CHASE BANK, N.A. (EU) Cash EUR 10,022,256.37 JPMORGAN CHASE BANK, N.A. (EU) Cash USD 5,611,420.82 NOMURA INT PLC Cash EUR 15,230,000.00 UBS AG LONDON BRANCH Cash EUR 365,000.00