Annual Report (Audited) BEA Union Investment Series
163
Annual Report (Audited) For the year ended 31 December 2018 BEA Union Investment Series BEA Union Investment Japan Growth Fund* BEA Union Investment Global Themes Fund* BEA Union Investment Global Resources Fund* BEA Union Investment Asian Bond and Currency Fund BEA Union Investment Four Seasons Fund* BEA Union Investment China A-Share Equity Fund BEA Union Investment Asia Pacific Multi Income Fund BEA Union Investment China Phoenix Fund BEA Union Investment RMB Core Bond Fund BEA Union Investment Asia Pacific Flexi Allocation Fund BEA Union Investment Global Flexi Allocation Fund BEA Union Investment China High Yield Income Fund BEA Union Investment Asian Strategic Bond Fund BEA Union Investment Asia Pacific Equity Dividend Fund BEA Union Investment China Gateway Fund (*Not authorised in Hong Kong and not available for Hong Kong retail investors)
-
Upload
khangminh22 -
Category
Documents
-
view
0 -
download
0
Transcript of Annual Report (Audited) BEA Union Investment Series

Annual Report (Audited)
For the year ended 31 December 2018
BEA Union Investment Series
BEA Union Investment Japan Growth Fund*
BEA Union Investment Global Themes Fund*
BEA Union Investment Global Resources Fund*
BEA Union Investment Asian Bond and Currency Fund
BEA Union Investment Four Seasons Fund*
BEA Union Investment China A-Share Equity Fund
BEA Union Investment Asia Pacific Multi Income Fund
BEA Union Investment China Phoenix Fund
BEA Union Investment RMB Core Bond Fund
BEA Union Investment Asia Pacific Flexi Allocation Fund
BEA Union Investment Global Flexi Allocation Fund
BEA Union Investment China High Yield Income Fund
BEA Union Investment Asian Strategic Bond Fund
BEA Union Investment Asia Pacific Equity Dividend Fund
BEA Union Investment China Gateway Fund
(*Not authorised in Hong Kong and not available for Hong Kong retail investors)
The Fund may obtain leverage exposure through borrowing and the use of financial derivative instruments. The expected maximum leverage of each Sub-Fund is 45% (except for BEA Union Investment Asian Bond and Currency Fund, BEA Union Investment Asia Pacific Multi Income Fund and BEA Union Investment RMB Core Bond Fund, where each of the expected maximum leverage is 30%). Leverage arising from derivatives is calculated based on commitment approach (i.e. in accordance with CSSF Circular 11/512), and factors in the market value of the equivalent positions in the underlying assets of the financial derivative instruments held by a Sub-Fund (sometimes referred to as “effective notional exposure”), after taking into account netting and hedging arrangements where the market value of underlying security positions may be offset by other commitments related to the same underlying positions. In addition, the actual leverage of the Fund may be lower than the above mentioned expected maximum leverage.
BEA UNION INVESTMENT SERIESYEAR ENDED 31 DECEMBER 2018
CONTENTS PAGE(S)
MARKET COMMENTARY 1-3
TRUSTEE’S REPORT 4
INVESTMENT REPORT 5-62
PERFORMANCE REPORT 63-73
INDEPENDENT AUDITOR’S REPORT 74-77
STATEMENT OF COMPREHENSIVE INCOME 78
STATEMENT OF ASSETS AND LIABILITIES 79-81
STATEMENT OF CHANGES IN NET ASSETS ATTRIBUTABLE TO UNITHOLDERS 82
CASH FLOW STATEMENT 83
DISTRIBUTION STATEMENT 84-108
NOTES TO THE FINANCIAL STATEMENTS 109-190
EAM017-AN (2018)
MANAGEMENT AND ADMINISTRATION
Trustee and Registrar
Bank of East Asia (Trustees) Limited
32nd Floor, BEA Tower
Millennium City 5
418 Kwun Tong Road
Kwun Tong, Kowloon,
Hong Kong
Manager
BEA Union Investment Management Limited
5th Floor, The Bank of East Asia Building
10 Des Voeux Road Central
Hong Kong
Auditor
KPMG
8th Floor, Prince’s Building
10 Chater Road
Central, Hong Kong
Legal Adviser
Deacons
5th Floor, Alexandra House
18 Chater Road
Central, Hong Kong
BEA UNION INVESTMENT SERIES
MARKET COMMENTARY (CONTINUED)
2
A5請縮小打印70.5%
BEA UNION INVESTMENT SERIES
MARKET COMMENTARY
1
A5請縮小打印70.5%
BEA Union Investment Asian Bond and Currency Fund
Asian bond markets have been volatile in 2018 due to rising interest rates in the U.S., emerging-market shocks and bond defaults in China. Within Asian high yield bond segments, Chinese property outperformed as yields for B-rated names dipped slightly. Chinese industrial bond yields further increased due to headline news and concerns about refinancing. In the Southeast Asian markets, Indonesian high yield industrial and property bonds yields continue their gradual rise since October, mainly as a result of weaker third-quarter results. Indian bonds have largely remained flat.
We remain cautious due to trade war concerns, volatility in emerging market currencies, and tight onshore funding. We continue to see attractive valuations across some higher-quality names.
BEA Union Investment China A-Share Equity Fund
China’s economy continues to send mixed signals. On the one hand, sales on Alibaba’s Singles Day in 2018 reach a record RMB213 billion, an increase of 27% year-on-year. On the other hand, the government’s push for deleveraging continues to manifest in decelerating growth in fixed asset investment, previously a key driver of the economy. Controls on real estate have reduced demand for basic materials in China, leading to renewed pressure on the Producer Price Index, a key barometer of the health of the country’s ‘overcapacity’ industries.
BEA Union Investment Asia Pacific Multi Income Fund
Asian bond markets have been volatile in 2018 due to rising interest rates in the U.S., emerging-market shocks and bond defaults in China. Chinese high yield industrial bond yields further increased due to headline news and concerns about refinancing. Indonesian high yield industrial and property bonds yields continue their gradual rise since October, mainly as a result of weaker third-quarter results.
Asian equities generally underperformed developed markets in 2018. Market sentiment improved following a sell-off in October, Asian and Hong Kong equities outperformed, as emerging market currencies strengthened. China’s onshore and offshore equity markets experienced a strong rally in November, with trade war concerns receding after a meeting between presidents Trump and Xi following the G20 summit. Australian equities also recovered but underperformed the region as a whole.
BEA Union Investment China Phoenix Fund
China’s economy continues to send mixed signals. On the one hand, sales on Alibaba’s Singles Day in 2018 reach a record RMB213 billion, an increase of 27% year-on-year. On the other hand, the government’s push for deleveraging continues to manifest in decelerating growth in fixed asset investment, previously a key driver of the economy. Controls on real estate have reduced demand for basic materials in China, leading to renewed pressure on the Producer Price Index, a key barometer of the health of the country’s ‘overcapacity’ industries.
The central government is continuing to provide support for small and medium-sized enterprises as well as private companies by instituting further financial measures, including government-led investment fund, equity and bond financing and bank loan allocation.
BEA Union Investment RMB Core Bond Fund
The renminbi has depreciated significantly during 2018 due to trade war concern and weakened China economic data. Looking ahead, the development of trade war between the U.S. and China will continue to be a major factor to affect the renminbi exchange rate. Offshore renminbi bond market was holding up well in 2018 as new bond supply to the market was limited.
BEA Union Investment Asia Pacific Flexi Allocation Fund
Asian equities generally underperformed developed markets in 2018. Market sentiment improved following a sell-off in October, Asian and Hong Kong equities outperformed, as emerging market currencies strengthened. ASEAN markets trended up but underperformance against the region. Indonesia and Philippines led performance in ASEAN and were mainly led by meaningful inflows on the back of currency appreciation. Moderating ASEAN GDP, continued softness in the region’s manufacturing PMIs, coupled with lukewarm earnings will all weigh on investor sentiments going forward.
Within Asian high yield bond segments, markets have been volatile in 2018 due to rising interest rates in the U.S., emerging-market shocks and bond defaults in China. Chinese industrial bond yields further increased due to headline news and concerns about refinancing. In the Southeast Asian markets, Indonesian high yield industrial and property bonds yields continue their gradual rise since October, mainly as a result of weaker third-quarter results. Indian bonds have largely remained flat.
BEA Union Investment Global Flexi Allocation Fund
Emerging market equities eventually rebounded after underperforming the developed markets for over half year. Market stabilized ahead of the G20 summit expecting for more constructive negotiation over trade conflicts. The rebound in developed markets suggested investors’ conservatism as it was led by defensive sectors like healthcare, utilities and telecommunication.
The U.S. economy continues to show signs it is moving into the late stages of the cycle. For example, due to a tight labour market, wage growth has reaccelerated and remains meaningfully higher than core inflation rates.
European equities underperformed with uncertainty over the Brexit deal still the major concern. At the same time, core inflation in the eurozone fell short of market expectation, with economic confidence continuing to decline.
The U.S. credit spread has started to widen recently due to stretched valuations, risk-off sentiment, and increased supply. On the other hand, dovish comments from the Federal Reserve’s chairman have boosted market sentiment by encouraging expectations of a slower rate hike schedule.
BEA Union Investment China High Yield Income Fund
Chinese high yield bond market has been volatile in 2018 due to rising interest rates in the U.S., emerging-market shocks and bond defaults in China. Chinese high yield industrial bond yields further increased due to headline news and concerns about refinancing. We remain cautious on the Chinese high yield bond market due to trade war concerns, volatility in emerging market currencies, and tight onshore funding.
We have been picking up bonds in the primary market, as we are seeing attractive new issue premiums in both Chinese investment grade and high yield segments. We will continue to monitor the trade negotiations and continue our defensive strategy of investing in selected Asian bonds.
BEA UNION INVESTMENT SERIES
MARKET COMMENTARY (CONTINUED)
3 4
A5請縮小打印70.5%
BEA Union Investment Asian Strategic Bond Fund
Asian bond markets have been volatile in 2018 due to rising interest rates in the U.S., emerging-market shocks and bond defaults in China. Within Asian high yield bond segments, Chinese property outperformed as yields for B-rated names dipped slightly. Chinese industrial bond yields further increased due to headline news and concerns about refinancing.
In the Southeast Asian markets, Indonesian high yield industrial and property bonds yields continue their gradual rise since October, mainly as a result of weaker third-quarter results. Indian bonds have largely remained flat.
We remain cautious due to trade war concerns, volatility in emerging market currencies, and tight onshore funding. We continue to see attractive valuations across some higher-quality names.
BEA Union Investment Asia Pacific Equity Dividend Fund
Emerging markets eventually rebounded after underperforming the developed markets for over half year. Market stabilized ahead of the G20 Summit expecting for more constructive negotiation over trade conflicts. China’s onshore and offshore equity markets experienced a strong rally in November, with trade war concerns receding. Australian equities also recovered but underperformed the region as a whole. The recovery was led by the financial and industrial sectors as investors rotated into defensive stocks.
BEA Union Investment China Gateway Fund
Trade war concerns receding after a meeting between presidents Trump and Xi at the G20 summit. The central government is continuing to provide support for small and medium-sized enterprises as well as private companies by instituting further financial measures, including government-led investment fund, equity and bond financing and bank loan allocation.
We now have a more positive view towards the consumer discretionary sector, as we see investment value in some oversold consumers names after the huge sell-off. We have an overweight in the consumer staples sector, which is less impacted by the macro economy and is expected to benefit from the upward trend of consumer prices in China.
We remain cautious on the Chinese high yield bond market due to trade war concerns, volatility in emerging market currencies, and tight onshore funding.
We hereby confirm that, in our opinion, the Manager of the Fund and its Sub-funds has in all material respects managed the Fund and its Sub-funds in accordance with the provisions of the Trust Deed, as amended, during the year/period ended 31 December 2018.
Bank of East Asia (Trustees) Limited東亞銀行 (信託) 有限公司
24 April 2019
BEA UNION INVESTMENT SERIES
TRUSTEE’S REPORT TO THE UNITHOLDERS OFBEA UNION INVESTMENT SERIES (“THE FUND”)
BEA UNION INVESTMENT SERIES
INVESTMENT REPORTAS AT 31 DECEMBER 2018 (CONTINUED)
6
A5請縮小打印70.5%
BEA UNION INVESTMENT SERIES
INVESTMENT REPORTAS AT 31 DECEMBER 2018
5
A5請縮小打印70.5%
BEA Union Investment Asian Bond and Currency Fund (continued)
Investment portfolio (continued)
Nominal value Market value % of net assetsUS$
Listed/quoted investments (97.76%) (continued)
Debt securities (97.76%) (continued)
Denominated in United States Dollar (97.76%) (continued)
Future Land Development Holdings Ltd 6.50% 12/09/2020 3,000,000 3,022,952 0.78
FUXIANG Investment Management Ltd 5.10% 04/06/2019 3,000,000 3,022,625 0.78
Global Prime Capital Pte Ltd 7.25% 26/04/2021 8,000,000 8,151,762 2.10Greenland Global Investment Ltd 4.375%
03/07/2019 1,300,000 1,315,239 0.34Greenland Global Investment Ltd 6.75%
22/05/2019 5,800,000 5,853,404 1.51Greenland Global Investment Ltd 9.125%
27/05/2020 4,500,000 4,574,646 1.18Hilong Holding Ltd 7.25% 22/06/2020 2,300,000 2,039,370 0.53Honghua Group Ltd 7.45% 25/09/2019 2,925,000 3,012,769 0.78HSBC Holdings PLC FRN 11/09/2021 2,600,000 2,585,111 0.67HT Global IT Solutions Holdings Ltd 7.00%
14/07/2021 6,300,000 6,573,812 1.70ICBCIL Finance Co Ltd FRN 15/05/2021 4,500,000 4,499,396 1.16Indika Energy Capital II Pte Ltd 6.875% 10/04/2022 9,300,000 9,370,296 2.42Indo Energy Finance II BV 6.375% 24/01/2023 1,000,000 966,242 0.25Indonesia Asahan Aluminium Persero PT 5.23%
15/11/2021 2,200,000 2,248,208 0.58Indonesia Asahan Aluminium Persero PT 5.71%
15/11/2023 3,000,000 3,078,918 0.79Indonesia Government International Bond 4.75%
11/02/2029 1,600,000 1,629,246 0.42Industrial & Commercial Bank of China Ltd (Sydney
Branch) FRN 21/05/2021 4,500,000 4,511,239 1.16Inventive Global Investments Ltd 3.875%
19/09/2021 1,400,000 1,430,407 0.37Jababeka International BV 6.50% 05/10/2023 3,200,000 2,703,705 0.70JGC Ventures Pte Ltd 10.75% 30/08/2021 7,500,000 8,004,390 2.06JSW Steel Ltd 4.75% 12/11/2019 1,250,000 1,255,619 0.32Kookmin Bank FRN 03/04/2023 1,000,000 1,005,980 0.26Korea National Oil Corp FRN 16/07/2023 2,000,000 2,023,206 0.52Korean Air Lines Co Ltd 5.875% 06/03/2021 2,500,000 2,505,693 0.65KWG Property Holdings Ltd 7.875% 09/08/2021 2,000,000 2,050,345 0.53KWG Property Holdings Ltd 8.975% 14/01/2019 4,900,000 5,117,139 1.32KWG Property Holdings Ltd 9.85% 26/11/2020 5,400,000 5,651,350 1.46Lai Fung Bonds 2018 Ltd 5.65% 18/01/2023 2,500,000 2,385,880 0.62Logan Property Holdings Co Ltd 6.875%
24/04/2021 3,100,000 3,076,766 0.79
BEA Union Investment Asian Bond and Currency Fund
Investment portfolio
Nominal value Market value % of net assetsUS$
Listed/quoted investments (97.76)
Debt securities (97.76%)
Denominated in United States Dollar (97.76%)
ABJA Investment Co Pte Ltd 5.95% 31/07/2024 3,800,000 3,821,648 0.99Agile Group Holdings Ltd 8.50% 18/07/2021 4,200,000 4,441,232 1.15Agile Group Holdings Ltd 9.00% 21/05/2020 1,000,000 1,039,320 0.27Agile Group Holdings Ltd 9.50% 23/11/2020 4,000,000 4,194,511 1.08Azure Power Energy Ltd 5.50% 03/11/2022 1,500,000 1,425,272 0.37Bank of China Hong Kong Ltd 5.90% Perpetual
Callable – 14/09/2023 8,500,000 8,672,857 2.24Bank of China Ltd FRN 07/06/2021 1,000,000 1,000,908 0.26Bank of China Ltd FRN 07/06/2023 2,000,000 1,997,694 0.51Barminco Finance Pty Ltd 6.625% 15/05/2022 1,000,000 983,045 0.25Bluestar Finance Holdings Ltd 6.25% Perpetual
Callable – 07/11/2021 900,000 923,369 0.24Bukit Makmur Mandiri Utama PT 7.75%
13/02/2022 7,300,000 7,504,607 1.94China Aoyuan Group Ltd 6.35% 11/01/2020 5,700,000 5,852,510 1.51China Aoyuan Group Ltd 6.525% 25/04/2019 3,500,000 3,550,864 0.92China Aoyuan Group Ltd 7.50% 10/05/2021 2,600,000 2,586,415 0.67China Aoyuan Group Ltd 7.95% 07/09/2021 2,000,000 2,078,490 0.54China Construction Bank Corp FRN 08/06/2021 2,000,000 2,001,954 0.52China Merchants Bank Co Ltd FRN 01/06/2021 5,000,000 5,010,200 1.29China SCE Group Holdings Ltd 10.00% 02/07/2020 4,000,000 4,329,809 1.12China SCE Group Holdings Ltd 7.45% 17/04/2021 4,700,000 4,688,832 1.21China State Construction Finance Cayman I Ltd
6.00% Perpetual Callable- 03/12/2021 3,000,000 3,055,250 0.79CICC Hong Kong Finance 2016 MTN Ltd FRN
11/09/2021 1,350,000 1,351,129 0.35CIFI Holdings Group Co Ltd 6.375% 02/05/2020 8,000,000 8,057,023 2.08CIFI Holdings Group Co Ltd 6.875% 23/04/2021 3,150,000 3,134,301 0.81CIFI Holdings Group Co Ltd 7.75% 05/06/2020 4,200,000 4,284,660 1.10Commonwealth Bank of Australia FRN 16/03/2023 1,400,000 1,391,661 0.36CSSC Capital One Ltd 4.125% 27/09/2021 2,000,000 2,032,242 0.52Eterna Capital Pte Ltd 7.50% 11/12/2022 8,809,525 8,724,601 2.25Export-Import Bank of Korea FRN 01/06/2021 1,000,000 1,003,059 0.26Export-Import Bank of Korea FRN 01/06/2023 4,500,000 4,515,165 1.16Export-Import Bank of Korea FRN 22/03/2023 1,000,000 1,000,232 0.26Future Land Development Holdings Ltd 5.00%
16/02/2020 4,000,000 4,004,080 1.03
BEA UNION INVESTMENT SERIES
INVESTMENT REPORTAS AT 31 DECEMBER 2018 (CONTINUED)
BEA UNION INVESTMENT SERIES
INVESTMENT REPORTAS AT 31 DECEMBER 2018 (CONTINUED)
7 8
A5請縮小打印70.5%
BEA Union Investment Asian Bond and Currency Fund (continued)
Investment portfolio (continued)
Nominal value Market value % of net assetsUS$
Listed/quoted investments (97.76%) (continued)
Debt securities (97.76%) (continued)
Denominated in United States Dollar (97.76%) (continued)
Logan Property Holdings Co Ltd 7.50% 27/08/2021 4,500,000 4,548,750 1.17Logan Property Holdings Co Ltd 8.75% 12/12/2020 1,600,000 1,644,077 0.42LSD Bonds 2017 Ltd 4.60% 13/09/2022 2,800,000 2,692,816 0.69Marble II Pte Ltd 5.30% 20/06/2022 7,000,000 6,784,326 1.75Medco Straits Services Pte Ltd 8.50% 17/08/2022 14,400,000 14,566,592 3.76Mitsubishi UFJ Financial Group Inc FRN 26/07/2023 6,150,000 6,139,780 1.58Mizuho Financial Group Inc FRN 11/09/2024 2,000,000 1,999,940 0.52Moon Wise Global Ltd 9.00% Perpetual
Callable-28/01/2019 3,400,000 3,515,158 0.91National Australia Bank Ltd (New York Branch) FRN
04/11/2021 800,000 801,360 0.21New Metro Global Ltd 4.75% 11/02/2019 3,000,000 3,055,591 0.79New Metro Global Ltd 6.50% 23/04/2021 4,600,000 4,526,528 1.17Perusahaan Listrik Negara Persero PT 5.375%
25/01/2029 4,200,000 4,250,039 1.10Powerlong Real Estate Holdings Ltd 5.95%
19/07/2020 5,000,000 4,940,075 1.27Press Metal Labuan Ltd 4.80% 30/10/2022 4,800,000 4,490,416 1.16RKI Overseas Finance 2016 A Ltd 5.00%
09/08/2019 3,000,000 3,048,457 0.79Shimao Property Holdings Ltd 6.375% 15/10/2021 3,100,000 3,137,226 0.81Shimao Property Holdings Ltd 8.375% 10/02/2022 3,100,000 3,321,563 0.86Shougang Group Co Ltd 3.95% 04/04/2019 1,000,000 1,008,807 0.26Studio City Co Ltd 5.875% 30/11/2019 2,000,000 2,040,538 0.53Sunac China Holdings Ltd 6.875% 08/08/2020 2,100,000 2,126,395 0.55Sunac China Holdings Ltd 8.625% 27/07/2020 5,000,000 5,220,229 1.35Sunac China Holdings Ltd 8.75% 05/12/2019 1,000,000 1,028,319 0.26Times Property Holdings Ltd 6.25% 23/01/2020 4,700,000 4,785,778 1.23Times Property Holdings Ltd 6.25% 17/01/2021 4,200,000 4,164,267 1.07Times Property Holdings Ltd 7.85% 04/06/2021 3,000,000 2,963,122 0.76Times Property Holdings Ltd 10.95% 27/11/2020 4,000,000 4,223,327 1.09Trillion Chance Ltd 5.00% 13/02/2019 5,500,000 5,604,219 1.45Trillion Chance Ltd 7.50% 08/10/2019 5,000,000 5,109,825 1.32United States Treasury Bill 0.00% 15/01/2019 4,000,000 3,996,759 1.03Vedanta Resources PLC 6.375% 30/07/2022 9,400,000 8,703,644 2.24
BEA Union Investment Asian Bond and Currency Fund (continued)
Investment portfolio (continued)
Nominal value Market value % of net assetsUS$
Listed/quoted investments (97.76%) (continued)
Debt securities (97.76%) (continued)
Denominated in United States Dollar (97.76%) (continued)
Vedanta Resources plc 7.125% 31/05/2023 900,000 816,616 0.21Vedanta Resources plc 8.25% 07/06/2021 9,400,000 9,420,774 2.43West China Cement Ltd 6.50% 11/09/2019 7,300,000 5,999,621 1.55Wisdom Glory Group Ltd 5.25% Perpetual
Callable-19/07/2020 1,500,000 1,483,792 0.38WTT Investment Ltd 5.50% 21/11/2022 7,000,000 6,872,328 1.77Yancoal International Resources Development Co
Ltd 5.75% Perpetual Callable-13/04/2020 4,500,000 4,511,512 1.16Yuzhou Properties Co Ltd 6.375% 06/03/2021 4,600,000 4,576,193 1.18Yuzhou Properties Co Ltd 7.90% 11/05/2021 8,400,000 8,448,655 2.18
Total debt securities 378,890,069 97.76
Total investments 378,890,069 97.76
Total investments, at cost 377,180,814
BEA UNION INVESTMENT SERIES
INVESTMENT REPORTAS AT 31 DECEMBER 2018 (CONTINUED)
BEA UNION INVESTMENT SERIES
INVESTMENT REPORTAS AT 31 DECEMBER 2018 (CONTINUED)
9 10
A5請縮小打印70.5%
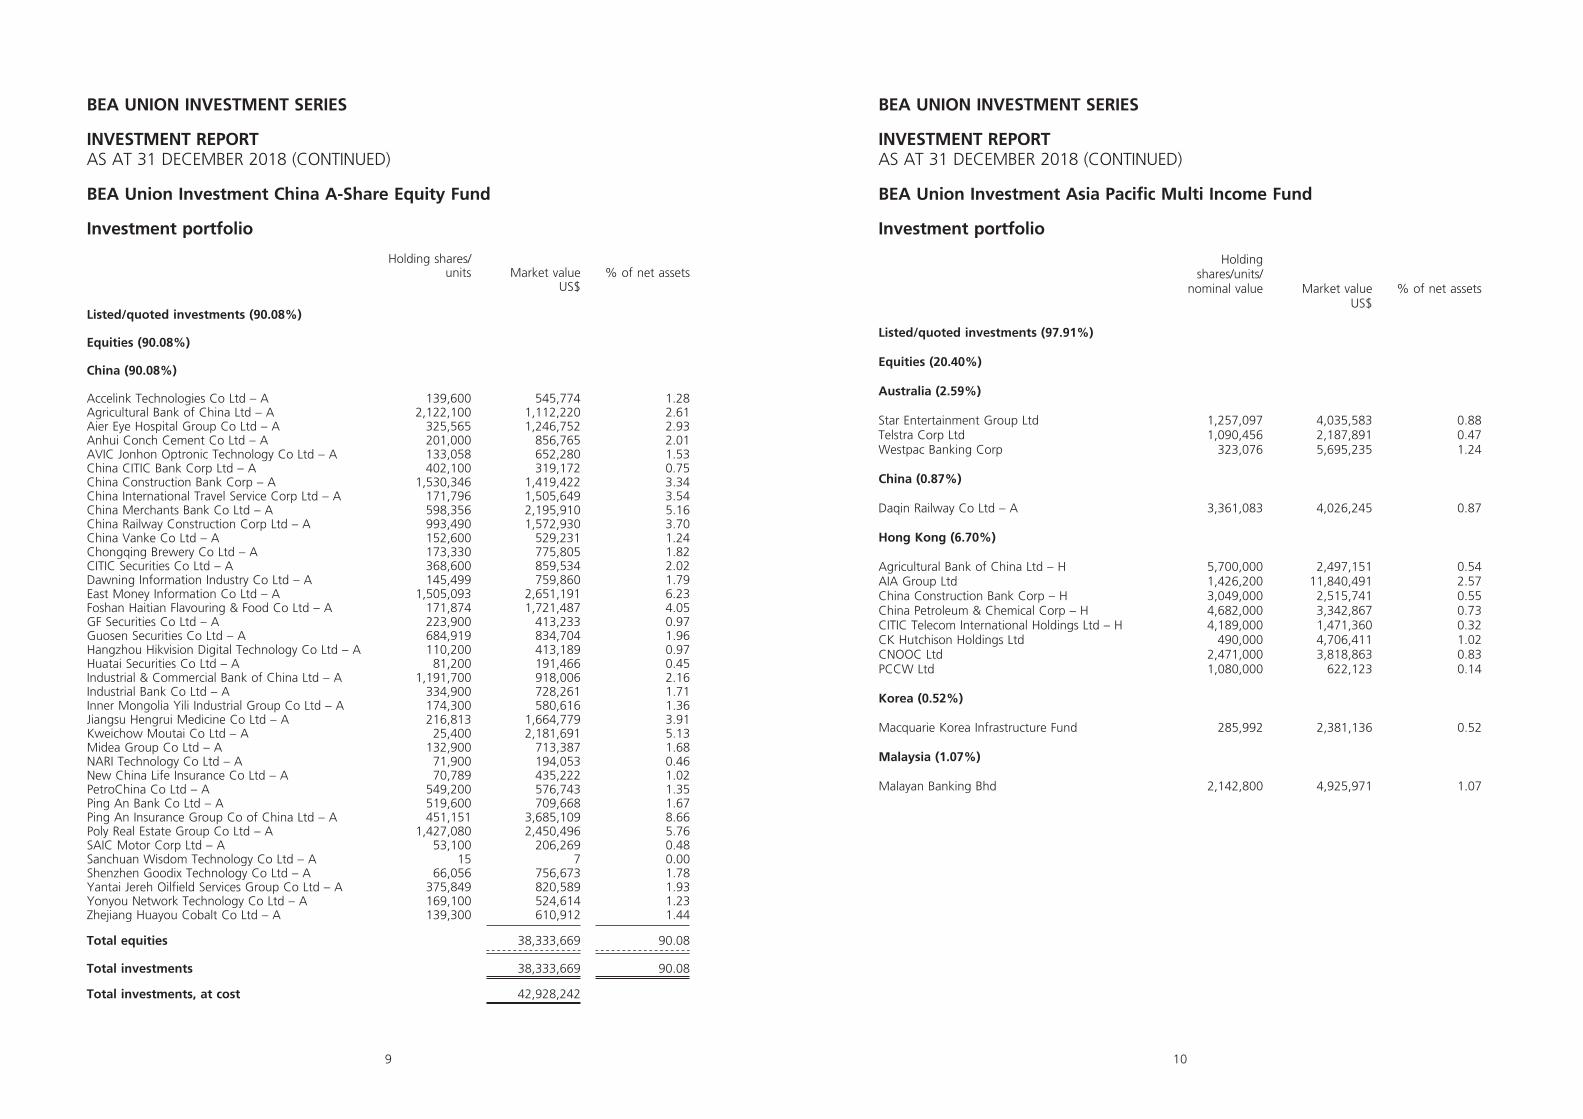
BEA Union Investment China A-Share Equity Fund
Investment portfolio
Holding shares/ units Market value % of net assets
US$
Listed/quoted investments (90.08%)
Equities (90.08%)
China (90.08%)
Accelink Technologies Co Ltd – A 139,600 545,774 1.28Agricultural Bank of China Ltd – A 2,122,100 1,112,220 2.61Aier Eye Hospital Group Co Ltd – A 325,565 1,246,752 2.93Anhui Conch Cement Co Ltd – A 201,000 856,765 2.01AVIC Jonhon Optronic Technology Co Ltd – A 133,058 652,280 1.53China CITIC Bank Corp Ltd – A 402,100 319,172 0.75China Construction Bank Corp – A 1,530,346 1,419,422 3.34China International Travel Service Corp Ltd – A 171,796 1,505,649 3.54China Merchants Bank Co Ltd – A 598,356 2,195,910 5.16China Railway Construction Corp Ltd – A 993,490 1,572,930 3.70China Vanke Co Ltd – A 152,600 529,231 1.24Chongqing Brewery Co Ltd – A 173,330 775,805 1.82CITIC Securities Co Ltd – A 368,600 859,534 2.02Dawning Information Industry Co Ltd – A 145,499 759,860 1.79East Money Information Co Ltd – A 1,505,093 2,651,191 6.23Foshan Haitian Flavouring & Food Co Ltd – A 171,874 1,721,487 4.05GF Securities Co Ltd – A 223,900 413,233 0.97Guosen Securities Co Ltd – A 684,919 834,704 1.96Hangzhou Hikvision Digital Technology Co Ltd – A 110,200 413,189 0.97Huatai Securities Co Ltd – A 81,200 191,466 0.45Industrial & Commercial Bank of China Ltd – A 1,191,700 918,006 2.16Industrial Bank Co Ltd – A 334,900 728,261 1.71Inner Mongolia Yili Industrial Group Co Ltd – A 174,300 580,616 1.36Jiangsu Hengrui Medicine Co Ltd – A 216,813 1,664,779 3.91Kweichow Moutai Co Ltd – A 25,400 2,181,691 5.13Midea Group Co Ltd – A 132,900 713,387 1.68NARI Technology Co Ltd – A 71,900 194,053 0.46New China Life Insurance Co Ltd – A 70,789 435,222 1.02PetroChina Co Ltd – A 549,200 576,743 1.35Ping An Bank Co Ltd – A 519,600 709,668 1.67Ping An Insurance Group Co of China Ltd – A 451,151 3,685,109 8.66Poly Real Estate Group Co Ltd – A 1,427,080 2,450,496 5.76SAIC Motor Corp Ltd – A 53,100 206,269 0.48Sanchuan Wisdom Technology Co Ltd – A 15 7 0.00Shenzhen Goodix Technology Co Ltd – A 66,056 756,673 1.78Yantai Jereh Oilfield Services Group Co Ltd – A 375,849 820,589 1.93Yonyou Network Technology Co Ltd – A 169,100 524,614 1.23Zhejiang Huayou Cobalt Co Ltd – A 139,300 610,912 1.44
Total equities 38,333,669 90.08
Total investments 38,333,669 90.08
Total investments, at cost 42,928,242
BEA Union Investment Asia Pacific Multi Income Fund
Investment portfolio
Holding shares/units/
nominal value Market value % of net assetsUS$
Listed/quoted investments (97.91%)
Equities (20.40%)
Australia (2.59%)
Star Entertainment Group Ltd 1,257,097 4,035,583 0.88Telstra Corp Ltd 1,090,456 2,187,891 0.47Westpac Banking Corp 323,076 5,695,235 1.24
China (0.87%)
Daqin Railway Co Ltd – A 3,361,083 4,026,245 0.87
Hong Kong (6.70%)
Agricultural Bank of China Ltd – H 5,700,000 2,497,151 0.54AIA Group Ltd 1,426,200 11,840,491 2.57China Construction Bank Corp – H 3,049,000 2,515,741 0.55China Petroleum & Chemical Corp – H 4,682,000 3,342,867 0.73CITIC Telecom International Holdings Ltd – H 4,189,000 1,471,360 0.32CK Hutchison Holdings Ltd 490,000 4,706,411 1.02CNOOC Ltd 2,471,000 3,818,863 0.83PCCW Ltd 1,080,000 622,123 0.14
Korea (0.52%)
Macquarie Korea Infrastructure Fund 285,992 2,381,136 0.52
Malaysia (1.07%)
Malayan Banking Bhd 2,142,800 4,925,971 1.07
BEA UNION INVESTMENT SERIES
INVESTMENT REPORTAS AT 31 DECEMBER 2018 (CONTINUED)
BEA UNION INVESTMENT SERIES
INVESTMENT REPORTAS AT 31 DECEMBER 2018 (CONTINUED)
11 12
A5請縮小打印70.5%
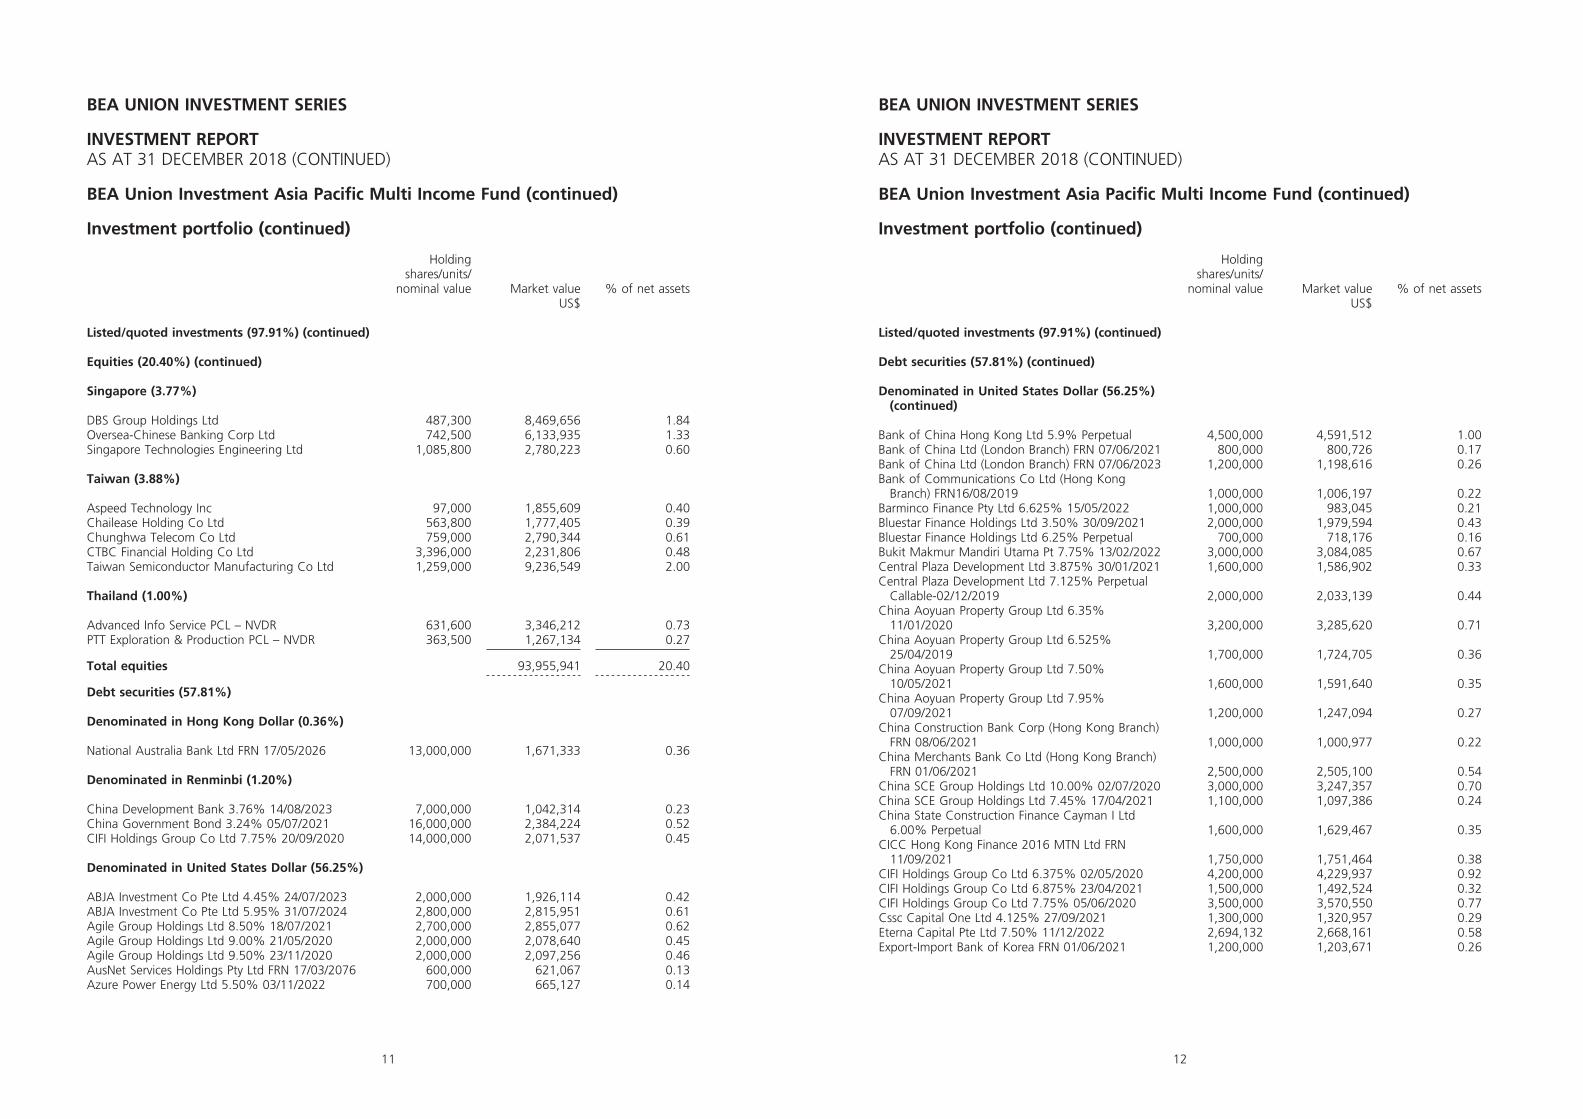
BEA Union Investment Asia Pacific Multi Income Fund (continued)
Investment portfolio (continued)
Holding shares/units/
nominal value Market value % of net assetsUS$
Listed/quoted investments (97.91%) (continued)
Equities (20.40%) (continued)
Singapore (3.77%)
DBS Group Holdings Ltd 487,300 8,469,656 1.84Oversea-Chinese Banking Corp Ltd 742,500 6,133,935 1.33Singapore Technologies Engineering Ltd 1,085,800 2,780,223 0.60
Taiwan (3.88%)
Aspeed Technology Inc 97,000 1,855,609 0.40Chailease Holding Co Ltd 563,800 1,777,405 0.39Chunghwa Telecom Co Ltd 759,000 2,790,344 0.61CTBC Financial Holding Co Ltd 3,396,000 2,231,806 0.48Taiwan Semiconductor Manufacturing Co Ltd 1,259,000 9,236,549 2.00
Thailand (1.00%)
Advanced Info Service PCL – NVDR 631,600 3,346,212 0.73PTT Exploration & Production PCL – NVDR 363,500 1,267,134 0.27
Total equities 93,955,941 20.40
Debt securities (57.81%)
Denominated in Hong Kong Dollar (0.36%)
National Australia Bank Ltd FRN 17/05/2026 13,000,000 1,671,333 0.36
Denominated in Renminbi (1.20%)
China Development Bank 3.76% 14/08/2023 7,000,000 1,042,314 0.23China Government Bond 3.24% 05/07/2021 16,000,000 2,384,224 0.52CIFI Holdings Group Co Ltd 7.75% 20/09/2020 14,000,000 2,071,537 0.45
Denominated in United States Dollar (56.25%)
ABJA Investment Co Pte Ltd 4.45% 24/07/2023 2,000,000 1,926,114 0.42ABJA Investment Co Pte Ltd 5.95% 31/07/2024 2,800,000 2,815,951 0.61Agile Group Holdings Ltd 8.50% 18/07/2021 2,700,000 2,855,077 0.62Agile Group Holdings Ltd 9.00% 21/05/2020 2,000,000 2,078,640 0.45Agile Group Holdings Ltd 9.50% 23/11/2020 2,000,000 2,097,256 0.46AusNet Services Holdings Pty Ltd FRN 17/03/2076 600,000 621,067 0.13Azure Power Energy Ltd 5.50% 03/11/2022 700,000 665,127 0.14
BEA Union Investment Asia Pacific Multi Income Fund (continued)
Investment portfolio (continued)
Holding shares/units/
nominal value Market value % of net assetsUS$
Listed/quoted investments (97.91%) (continued)
Debt securities (57.81%) (continued)
Denominated in United States Dollar (56.25%) (continued)
Bank of China Hong Kong Ltd 5.9% Perpetual 4,500,000 4,591,512 1.00Bank of China Ltd (London Branch) FRN 07/06/2021 800,000 800,726 0.17Bank of China Ltd (London Branch) FRN 07/06/2023 1,200,000 1,198,616 0.26Bank of Communications Co Ltd (Hong Kong
Branch) FRN16/08/2019 1,000,000 1,006,197 0.22Barminco Finance Pty Ltd 6.625% 15/05/2022 1,000,000 983,045 0.21Bluestar Finance Holdings Ltd 3.50% 30/09/2021 2,000,000 1,979,594 0.43Bluestar Finance Holdings Ltd 6.25% Perpetual 700,000 718,176 0.16Bukit Makmur Mandiri Utama Pt 7.75% 13/02/2022 3,000,000 3,084,085 0.67Central Plaza Development Ltd 3.875% 30/01/2021 1,600,000 1,586,902 0.33Central Plaza Development Ltd 7.125% Perpetual
Callable-02/12/2019 2,000,000 2,033,139 0.44China Aoyuan Property Group Ltd 6.35%
11/01/2020 3,200,000 3,285,620 0.71China Aoyuan Property Group Ltd 6.525%
25/04/2019 1,700,000 1,724,705 0.36China Aoyuan Property Group Ltd 7.50%
10/05/2021 1,600,000 1,591,640 0.35China Aoyuan Property Group Ltd 7.95%
07/09/2021 1,200,000 1,247,094 0.27China Construction Bank Corp (Hong Kong Branch)
FRN 08/06/2021 1,000,000 1,000,977 0.22China Merchants Bank Co Ltd (Hong Kong Branch)
FRN 01/06/2021 2,500,000 2,505,100 0.54China SCE Group Holdings Ltd 10.00% 02/07/2020 3,000,000 3,247,357 0.70China SCE Group Holdings Ltd 7.45% 17/04/2021 1,100,000 1,097,386 0.24China State Construction Finance Cayman I Ltd
6.00% Perpetual 1,600,000 1,629,467 0.35CICC Hong Kong Finance 2016 MTN Ltd FRN
11/09/2021 1,750,000 1,751,464 0.38CIFI Holdings Group Co Ltd 6.375% 02/05/2020 4,200,000 4,229,937 0.92CIFI Holdings Group Co Ltd 6.875% 23/04/2021 1,500,000 1,492,524 0.32CIFI Holdings Group Co Ltd 7.75% 05/06/2020 3,500,000 3,570,550 0.77Cssc Capital One Ltd 4.125% 27/09/2021 1,300,000 1,320,957 0.29Eterna Capital Pte Ltd 7.50% 11/12/2022 2,694,132 2,668,161 0.58Export-Import Bank of Korea FRN 01/06/2021 1,200,000 1,203,671 0.26
BEA UNION INVESTMENT SERIES
INVESTMENT REPORTAS AT 31 DECEMBER 2018 (CONTINUED)
BEA UNION INVESTMENT SERIES
INVESTMENT REPORTAS AT 31 DECEMBER 2018 (CONTINUED)
13 14
A5請縮小打印70.5%
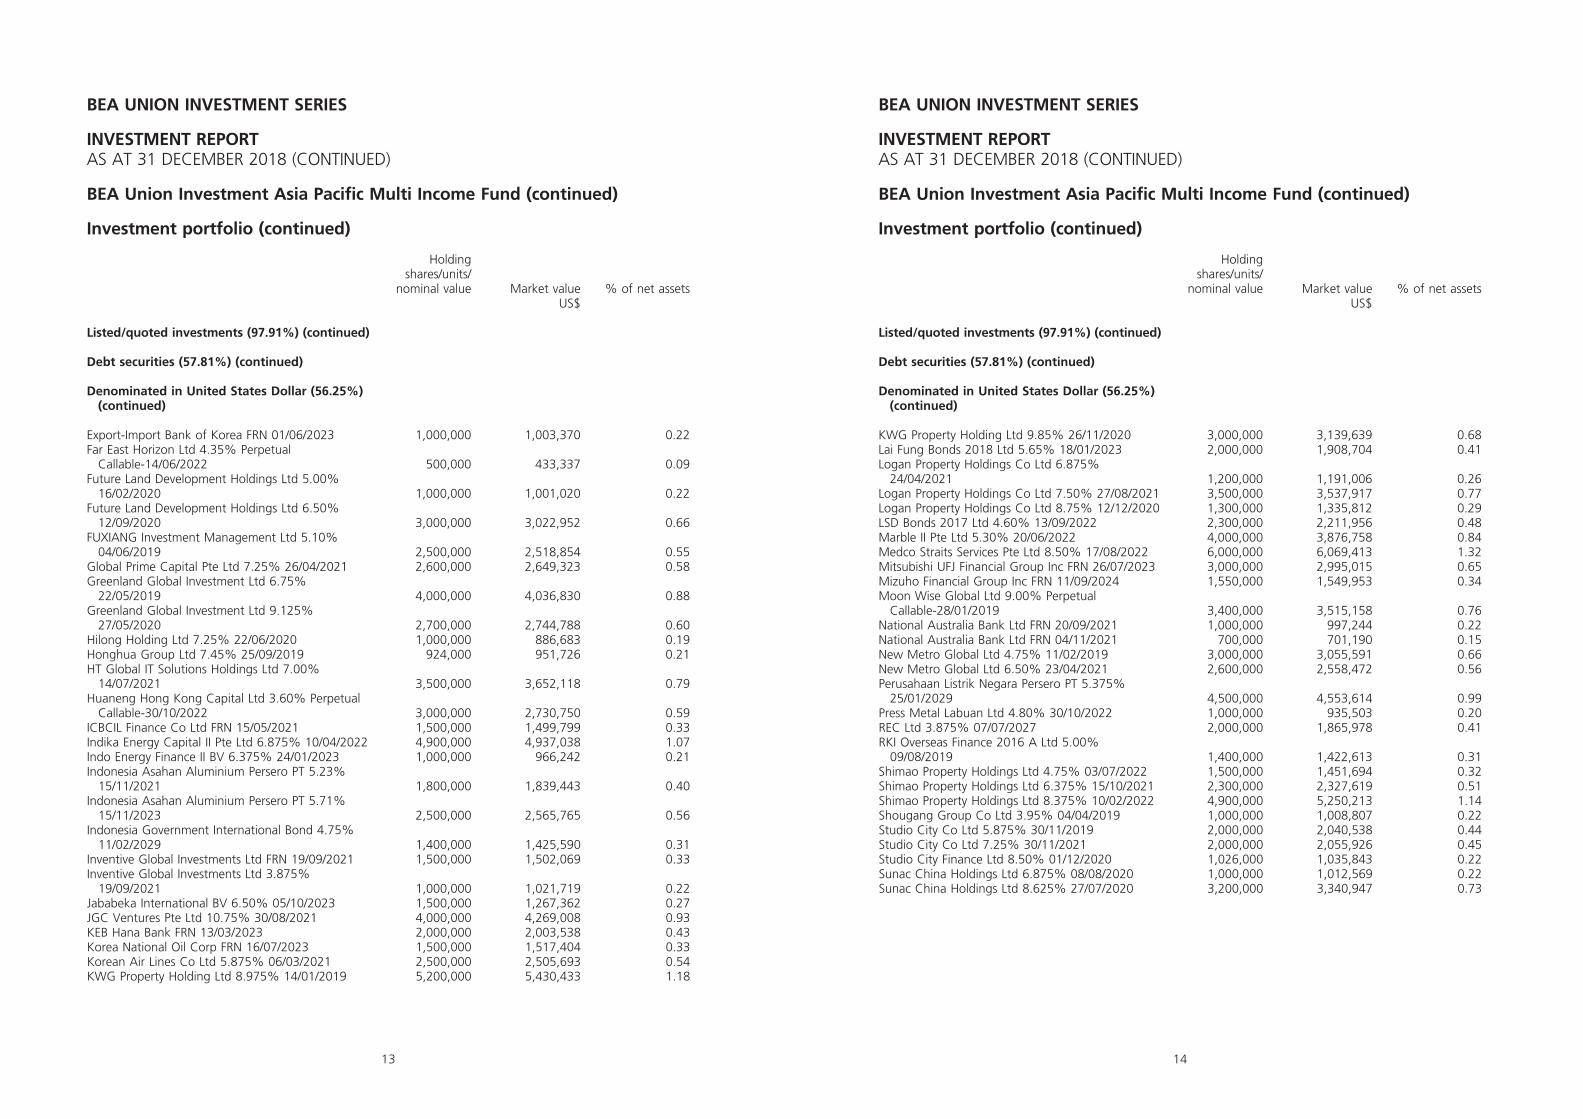
BEA Union Investment Asia Pacific Multi Income Fund (continued)
Investment portfolio (continued)
Holding shares/units/
nominal value Market value % of net assetsUS$
Listed/quoted investments (97.91%) (continued)
Debt securities (57.81%) (continued)
Denominated in United States Dollar (56.25%) (continued)
Export-Import Bank of Korea FRN 01/06/2023 1,000,000 1,003,370 0.22Far East Horizon Ltd 4.35% Perpetual
Callable-14/06/2022 500,000 433,337 0.09Future Land Development Holdings Ltd 5.00%
16/02/2020 1,000,000 1,001,020 0.22Future Land Development Holdings Ltd 6.50%
12/09/2020 3,000,000 3,022,952 0.66FUXIANG Investment Management Ltd 5.10%
04/06/2019 2,500,000 2,518,854 0.55Global Prime Capital Pte Ltd 7.25% 26/04/2021 2,600,000 2,649,323 0.58Greenland Global Investment Ltd 6.75%
22/05/2019 4,000,000 4,036,830 0.88Greenland Global Investment Ltd 9.125%
27/05/2020 2,700,000 2,744,788 0.60Hilong Holding Ltd 7.25% 22/06/2020 1,000,000 886,683 0.19Honghua Group Ltd 7.45% 25/09/2019 924,000 951,726 0.21HT Global IT Solutions Holdings Ltd 7.00%
14/07/2021 3,500,000 3,652,118 0.79Huaneng Hong Kong Capital Ltd 3.60% Perpetual
Callable-30/10/2022 3,000,000 2,730,750 0.59ICBCIL Finance Co Ltd FRN 15/05/2021 1,500,000 1,499,799 0.33Indika Energy Capital II Pte Ltd 6.875% 10/04/2022 4,900,000 4,937,038 1.07Indo Energy Finance II BV 6.375% 24/01/2023 1,000,000 966,242 0.21Indonesia Asahan Aluminium Persero PT 5.23%
15/11/2021 1,800,000 1,839,443 0.40Indonesia Asahan Aluminium Persero PT 5.71%
15/11/2023 2,500,000 2,565,765 0.56Indonesia Government International Bond 4.75%
11/02/2029 1,400,000 1,425,590 0.31Inventive Global Investments Ltd FRN 19/09/2021 1,500,000 1,502,069 0.33Inventive Global Investments Ltd 3.875%
19/09/2021 1,000,000 1,021,719 0.22Jababeka International BV 6.50% 05/10/2023 1,500,000 1,267,362 0.27JGC Ventures Pte Ltd 10.75% 30/08/2021 4,000,000 4,269,008 0.93KEB Hana Bank FRN 13/03/2023 2,000,000 2,003,538 0.43Korea National Oil Corp FRN 16/07/2023 1,500,000 1,517,404 0.33Korean Air Lines Co Ltd 5.875% 06/03/2021 2,500,000 2,505,693 0.54KWG Property Holding Ltd 8.975% 14/01/2019 5,200,000 5,430,433 1.18
BEA Union Investment Asia Pacific Multi Income Fund (continued)
Investment portfolio (continued)
Holding shares/units/
nominal value Market value % of net assetsUS$
Listed/quoted investments (97.91%) (continued)
Debt securities (57.81%) (continued)
Denominated in United States Dollar (56.25%) (continued)
KWG Property Holding Ltd 9.85% 26/11/2020 3,000,000 3,139,639 0.68Lai Fung Bonds 2018 Ltd 5.65% 18/01/2023 2,000,000 1,908,704 0.41Logan Property Holdings Co Ltd 6.875%
24/04/2021 1,200,000 1,191,006 0.26Logan Property Holdings Co Ltd 7.50% 27/08/2021 3,500,000 3,537,917 0.77Logan Property Holdings Co Ltd 8.75% 12/12/2020 1,300,000 1,335,812 0.29LSD Bonds 2017 Ltd 4.60% 13/09/2022 2,300,000 2,211,956 0.48Marble II Pte Ltd 5.30% 20/06/2022 4,000,000 3,876,758 0.84Medco Straits Services Pte Ltd 8.50% 17/08/2022 6,000,000 6,069,413 1.32Mitsubishi UFJ Financial Group Inc FRN 26/07/2023 3,000,000 2,995,015 0.65Mizuho Financial Group Inc FRN 11/09/2024 1,550,000 1,549,953 0.34Moon Wise Global Ltd 9.00% Perpetual
Callable-28/01/2019 3,400,000 3,515,158 0.76National Australia Bank Ltd FRN 20/09/2021 1,000,000 997,244 0.22National Australia Bank Ltd FRN 04/11/2021 700,000 701,190 0.15New Metro Global Ltd 4.75% 11/02/2019 3,000,000 3,055,591 0.66New Metro Global Ltd 6.50% 23/04/2021 2,600,000 2,558,472 0.56Perusahaan Listrik Negara Persero PT 5.375%
25/01/2029 4,500,000 4,553,614 0.99Press Metal Labuan Ltd 4.80% 30/10/2022 1,000,000 935,503 0.20REC Ltd 3.875% 07/07/2027 2,000,000 1,865,978 0.41RKI Overseas Finance 2016 A Ltd 5.00%
09/08/2019 1,400,000 1,422,613 0.31Shimao Property Holdings Ltd 4.75% 03/07/2022 1,500,000 1,451,694 0.32Shimao Property Holdings Ltd 6.375% 15/10/2021 2,300,000 2,327,619 0.51Shimao Property Holdings Ltd 8.375% 10/02/2022 4,900,000 5,250,213 1.14Shougang Group Co Ltd 3.95% 04/04/2019 1,000,000 1,008,807 0.22Studio City Co Ltd 5.875% 30/11/2019 2,000,000 2,040,538 0.44Studio City Co Ltd 7.25% 30/11/2021 2,000,000 2,055,926 0.45Studio City Finance Ltd 8.50% 01/12/2020 1,026,000 1,035,843 0.22Sunac China Holdings Ltd 6.875% 08/08/2020 1,000,000 1,012,569 0.22Sunac China Holdings Ltd 8.625% 27/07/2020 3,200,000 3,340,947 0.73
BEA UNION INVESTMENT SERIES
INVESTMENT REPORTAS AT 31 DECEMBER 2018 (CONTINUED)
BEA UNION INVESTMENT SERIES
INVESTMENT REPORTAS AT 31 DECEMBER 2018 (CONTINUED)
15 16
A5請縮小打印70.5%
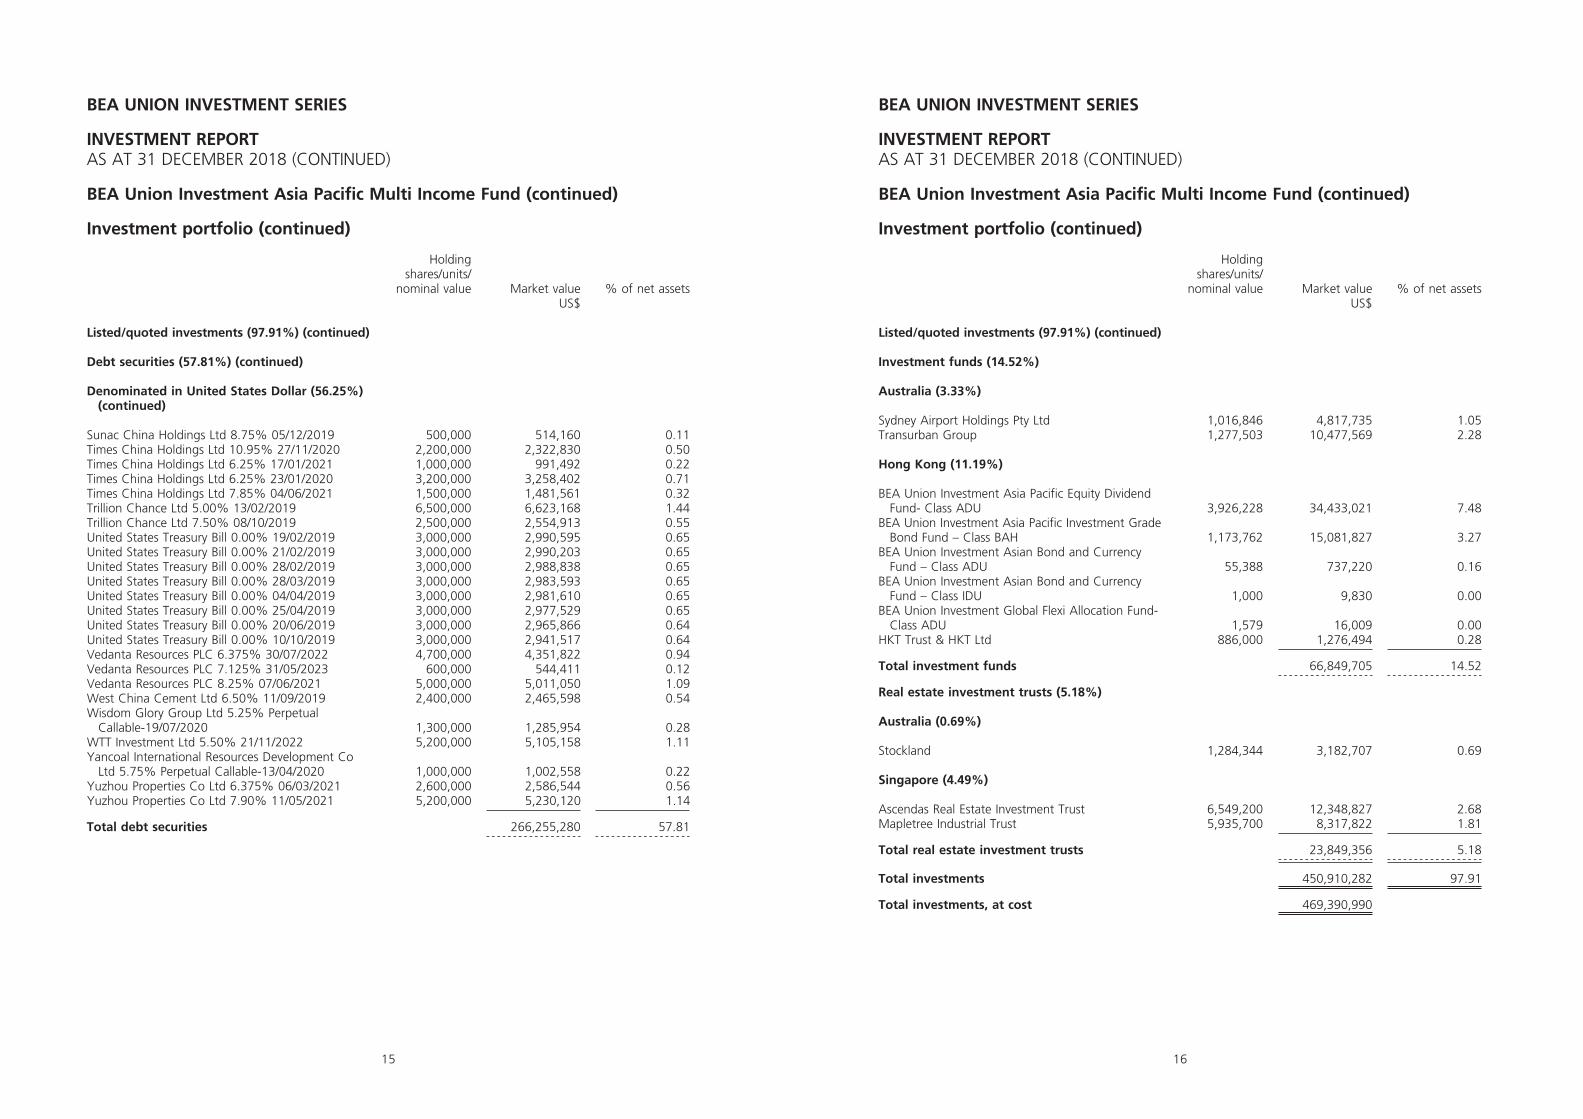
BEA Union Investment Asia Pacific Multi Income Fund (continued)
Investment portfolio (continued)
Holding shares/units/
nominal value Market value % of net assetsUS$
Listed/quoted investments (97.91%) (continued)
Debt securities (57.81%) (continued)
Denominated in United States Dollar (56.25%) (continued)
Sunac China Holdings Ltd 8.75% 05/12/2019 500,000 514,160 0.11Times China Holdings Ltd 10.95% 27/11/2020 2,200,000 2,322,830 0.50Times China Holdings Ltd 6.25% 17/01/2021 1,000,000 991,492 0.22Times China Holdings Ltd 6.25% 23/01/2020 3,200,000 3,258,402 0.71Times China Holdings Ltd 7.85% 04/06/2021 1,500,000 1,481,561 0.32Trillion Chance Ltd 5.00% 13/02/2019 6,500,000 6,623,168 1.44Trillion Chance Ltd 7.50% 08/10/2019 2,500,000 2,554,913 0.55United States Treasury Bill 0.00% 19/02/2019 3,000,000 2,990,595 0.65United States Treasury Bill 0.00% 21/02/2019 3,000,000 2,990,203 0.65United States Treasury Bill 0.00% 28/02/2019 3,000,000 2,988,838 0.65United States Treasury Bill 0.00% 28/03/2019 3,000,000 2,983,593 0.65United States Treasury Bill 0.00% 04/04/2019 3,000,000 2,981,610 0.65United States Treasury Bill 0.00% 25/04/2019 3,000,000 2,977,529 0.65United States Treasury Bill 0.00% 20/06/2019 3,000,000 2,965,866 0.64United States Treasury Bill 0.00% 10/10/2019 3,000,000 2,941,517 0.64Vedanta Resources PLC 6.375% 30/07/2022 4,700,000 4,351,822 0.94Vedanta Resources PLC 7.125% 31/05/2023 600,000 544,411 0.12Vedanta Resources PLC 8.25% 07/06/2021 5,000,000 5,011,050 1.09West China Cement Ltd 6.50% 11/09/2019 2,400,000 2,465,598 0.54Wisdom Glory Group Ltd 5.25% Perpetual
Callable-19/07/2020 1,300,000 1,285,954 0.28WTT Investment Ltd 5.50% 21/11/2022 5,200,000 5,105,158 1.11Yancoal International Resources Development Co
Ltd 5.75% Perpetual Callable-13/04/2020 1,000,000 1,002,558 0.22Yuzhou Properties Co Ltd 6.375% 06/03/2021 2,600,000 2,586,544 0.56Yuzhou Properties Co Ltd 7.90% 11/05/2021 5,200,000 5,230,120 1.14
Total debt securities 266,255,280 57.81
BEA Union Investment Asia Pacific Multi Income Fund (continued)
Investment portfolio (continued)
Holding shares/units/
nominal value Market value % of net assetsUS$
Listed/quoted investments (97.91%) (continued)
Investment funds (14.52%)
Australia (3.33%)
Sydney Airport Holdings Pty Ltd 1,016,846 4,817,735 1.05Transurban Group 1,277,503 10,477,569 2.28
Hong Kong (11.19%)
BEA Union Investment Asia Pacific Equity Dividend Fund- Class ADU 3,926,228 34,433,021 7.48
BEA Union Investment Asia Pacific Investment Grade Bond Fund – Class BAH 1,173,762 15,081,827 3.27
BEA Union Investment Asian Bond and Currency Fund – Class ADU 55,388 737,220 0.16
BEA Union Investment Asian Bond and Currency Fund – Class IDU 1,000 9,830 0.00
BEA Union Investment Global Flexi Allocation Fund- Class ADU 1,579 16,009 0.00
HKT Trust & HKT Ltd 886,000 1,276,494 0.28
Total investment funds 66,849,705 14.52
Real estate investment trusts (5.18%)
Australia (0.69%)
Stockland 1,284,344 3,182,707 0.69
Singapore (4.49%)
Ascendas Real Estate Investment Trust 6,549,200 12,348,827 2.68Mapletree Industrial Trust 5,935,700 8,317,822 1.81
Total real estate investment trusts 23,849,356 5.18
Total investments 450,910,282 97.91
Total investments, at cost 469,390,990
BEA UNION INVESTMENT SERIES
INVESTMENT REPORTAS AT 31 DECEMBER 2018 (CONTINUED)
BEA UNION INVESTMENT SERIES
INVESTMENT REPORTAS AT 31 DECEMBER 2018 (CONTINUED)
17 18
A5請縮小打印70.5%
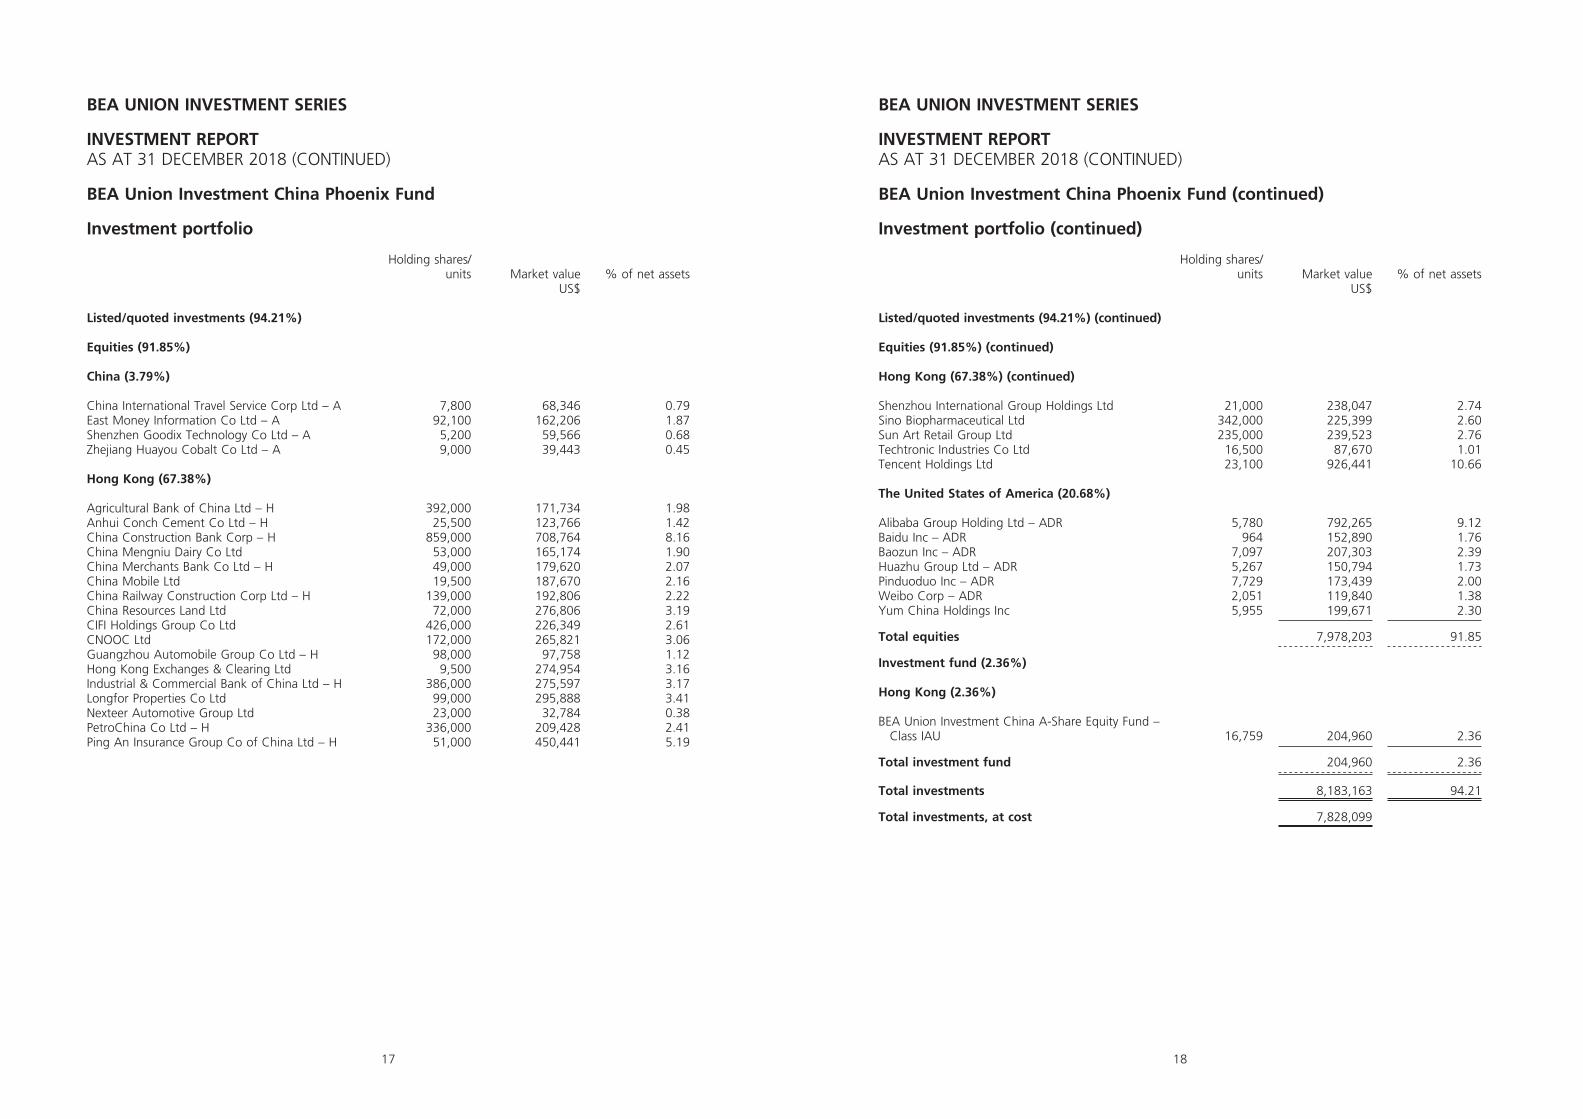
BEA Union Investment China Phoenix Fund
Investment portfolio
Holding shares/ units Market value % of net assets
US$
Listed/quoted investments (94.21%)
Equities (91.85%)
China (3.79%)
China International Travel Service Corp Ltd – A 7,800 68,346 0.79East Money Information Co Ltd – A 92,100 162,206 1.87Shenzhen Goodix Technology Co Ltd – A 5,200 59,566 0.68Zhejiang Huayou Cobalt Co Ltd – A 9,000 39,443 0.45
Hong Kong (67.38%)
Agricultural Bank of China Ltd – H 392,000 171,734 1.98Anhui Conch Cement Co Ltd – H 25,500 123,766 1.42China Construction Bank Corp – H 859,000 708,764 8.16China Mengniu Dairy Co Ltd 53,000 165,174 1.90China Merchants Bank Co Ltd – H 49,000 179,620 2.07China Mobile Ltd 19,500 187,670 2.16China Railway Construction Corp Ltd – H 139,000 192,806 2.22China Resources Land Ltd 72,000 276,806 3.19CIFI Holdings Group Co Ltd 426,000 226,349 2.61CNOOC Ltd 172,000 265,821 3.06Guangzhou Automobile Group Co Ltd – H 98,000 97,758 1.12Hong Kong Exchanges & Clearing Ltd 9,500 274,954 3.16Industrial & Commercial Bank of China Ltd – H 386,000 275,597 3.17Longfor Properties Co Ltd 99,000 295,888 3.41Nexteer Automotive Group Ltd 23,000 32,784 0.38PetroChina Co Ltd – H 336,000 209,428 2.41Ping An Insurance Group Co of China Ltd – H 51,000 450,441 5.19
BEA Union Investment China Phoenix Fund (continued)
Investment portfolio (continued)
Holding shares/ units Market value % of net assets
US$
Listed/quoted investments (94.21%) (continued)
Equities (91.85%) (continued)
Hong Kong (67.38%) (continued)
Shenzhou International Group Holdings Ltd 21,000 238,047 2.74Sino Biopharmaceutical Ltd 342,000 225,399 2.60Sun Art Retail Group Ltd 235,000 239,523 2.76Techtronic Industries Co Ltd 16,500 87,670 1.01Tencent Holdings Ltd 23,100 926,441 10.66
The United States of America (20.68%)
Alibaba Group Holding Ltd – ADR 5,780 792,265 9.12Baidu Inc – ADR 964 152,890 1.76Baozun Inc – ADR 7,097 207,303 2.39Huazhu Group Ltd – ADR 5,267 150,794 1.73Pinduoduo Inc – ADR 7,729 173,439 2.00Weibo Corp – ADR 2,051 119,840 1.38Yum China Holdings Inc 5,955 199,671 2.30
Total equities 7,978,203 91.85
Investment fund (2.36%)
Hong Kong (2.36%)
BEA Union Investment China A-Share Equity Fund – Class IAU 16,759 204,960 2.36
Total investment fund 204,960 2.36
Total investments 8,183,163 94.21
Total investments, at cost 7,828,099
BEA UNION INVESTMENT SERIES
INVESTMENT REPORTAS AT 31 DECEMBER 2018 (CONTINUED)
BEA UNION INVESTMENT SERIES
INVESTMENT REPORTAS AT 31 DECEMBER 2018 (CONTINUED)
19 20
A5請縮小打印70.5%
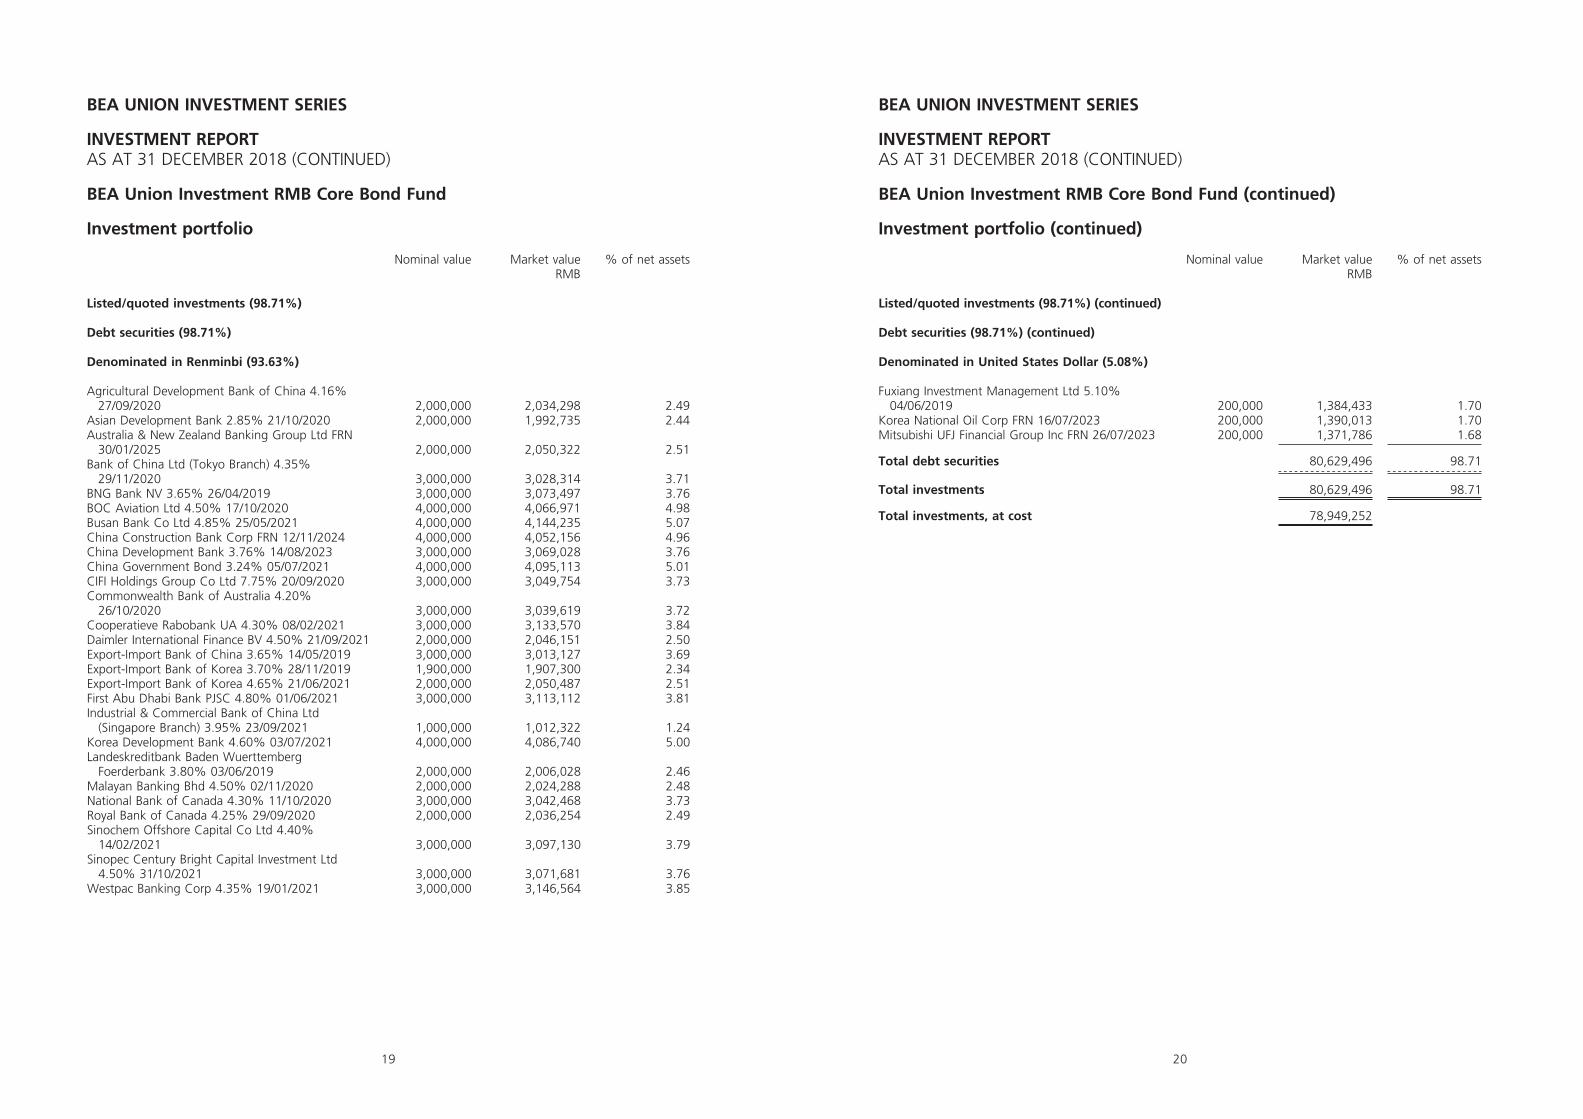
BEA Union Investment RMB Core Bond Fund
Investment portfolio
Nominal value Market value % of net assetsRMB
Listed/quoted investments (98.71%)
Debt securities (98.71%)
Denominated in Renminbi (93.63%)
Agricultural Development Bank of China 4.16% 27/09/2020 2,000,000 2,034,298 2.49
Asian Development Bank 2.85% 21/10/2020 2,000,000 1,992,735 2.44Australia & New Zealand Banking Group Ltd FRN
30/01/2025 2,000,000 2,050,322 2.51Bank of China Ltd (Tokyo Branch) 4.35%
29/11/2020 3,000,000 3,028,314 3.71BNG Bank NV 3.65% 26/04/2019 3,000,000 3,073,497 3.76BOC Aviation Ltd 4.50% 17/10/2020 4,000,000 4,066,971 4.98Busan Bank Co Ltd 4.85% 25/05/2021 4,000,000 4,144,235 5.07China Construction Bank Corp FRN 12/11/2024 4,000,000 4,052,156 4.96China Development Bank 3.76% 14/08/2023 3,000,000 3,069,028 3.76China Government Bond 3.24% 05/07/2021 4,000,000 4,095,113 5.01CIFI Holdings Group Co Ltd 7.75% 20/09/2020 3,000,000 3,049,754 3.73Commonwealth Bank of Australia 4.20%
26/10/2020 3,000,000 3,039,619 3.72Cooperatieve Rabobank UA 4.30% 08/02/2021 3,000,000 3,133,570 3.84Daimler International Finance BV 4.50% 21/09/2021 2,000,000 2,046,151 2.50Export-Import Bank of China 3.65% 14/05/2019 3,000,000 3,013,127 3.69Export-Import Bank of Korea 3.70% 28/11/2019 1,900,000 1,907,300 2.34Export-Import Bank of Korea 4.65% 21/06/2021 2,000,000 2,050,487 2.51First Abu Dhabi Bank PJSC 4.80% 01/06/2021 3,000,000 3,113,112 3.81Industrial & Commercial Bank of China Ltd
(Singapore Branch) 3.95% 23/09/2021 1,000,000 1,012,322 1.24Korea Development Bank 4.60% 03/07/2021 4,000,000 4,086,740 5.00Landeskreditbank Baden Wuerttemberg
Foerderbank 3.80% 03/06/2019 2,000,000 2,006,028 2.46Malayan Banking Bhd 4.50% 02/11/2020 2,000,000 2,024,288 2.48National Bank of Canada 4.30% 11/10/2020 3,000,000 3,042,468 3.73Royal Bank of Canada 4.25% 29/09/2020 2,000,000 2,036,254 2.49Sinochem Offshore Capital Co Ltd 4.40%
14/02/2021 3,000,000 3,097,130 3.79Sinopec Century Bright Capital Investment Ltd
4.50% 31/10/2021 3,000,000 3,071,681 3.76Westpac Banking Corp 4.35% 19/01/2021 3,000,000 3,146,564 3.85
BEA Union Investment RMB Core Bond Fund (continued)
Investment portfolio (continued)
Nominal value Market value % of net assetsRMB
Listed/quoted investments (98.71%) (continued)
Debt securities (98.71%) (continued)
Denominated in United States Dollar (5.08%)
Fuxiang Investment Management Ltd 5.10% 04/06/2019 200,000 1,384,433 1.70
Korea National Oil Corp FRN 16/07/2023 200,000 1,390,013 1.70Mitsubishi UFJ Financial Group Inc FRN 26/07/2023 200,000 1,371,786 1.68
Total debt securities 80,629,496 98.71
Total investments 80,629,496 98.71
Total investments, at cost 78,949,252

BEA UNION INVESTMENT SERIES
INVESTMENT REPORTAS AT 31 DECEMBER 2018 (CONTINUED)
BEA UNION INVESTMENT SERIES
INVESTMENT REPORTAS AT 31 DECEMBER 2018 (CONTINUED)
21 22
A5請縮小打印70.5%
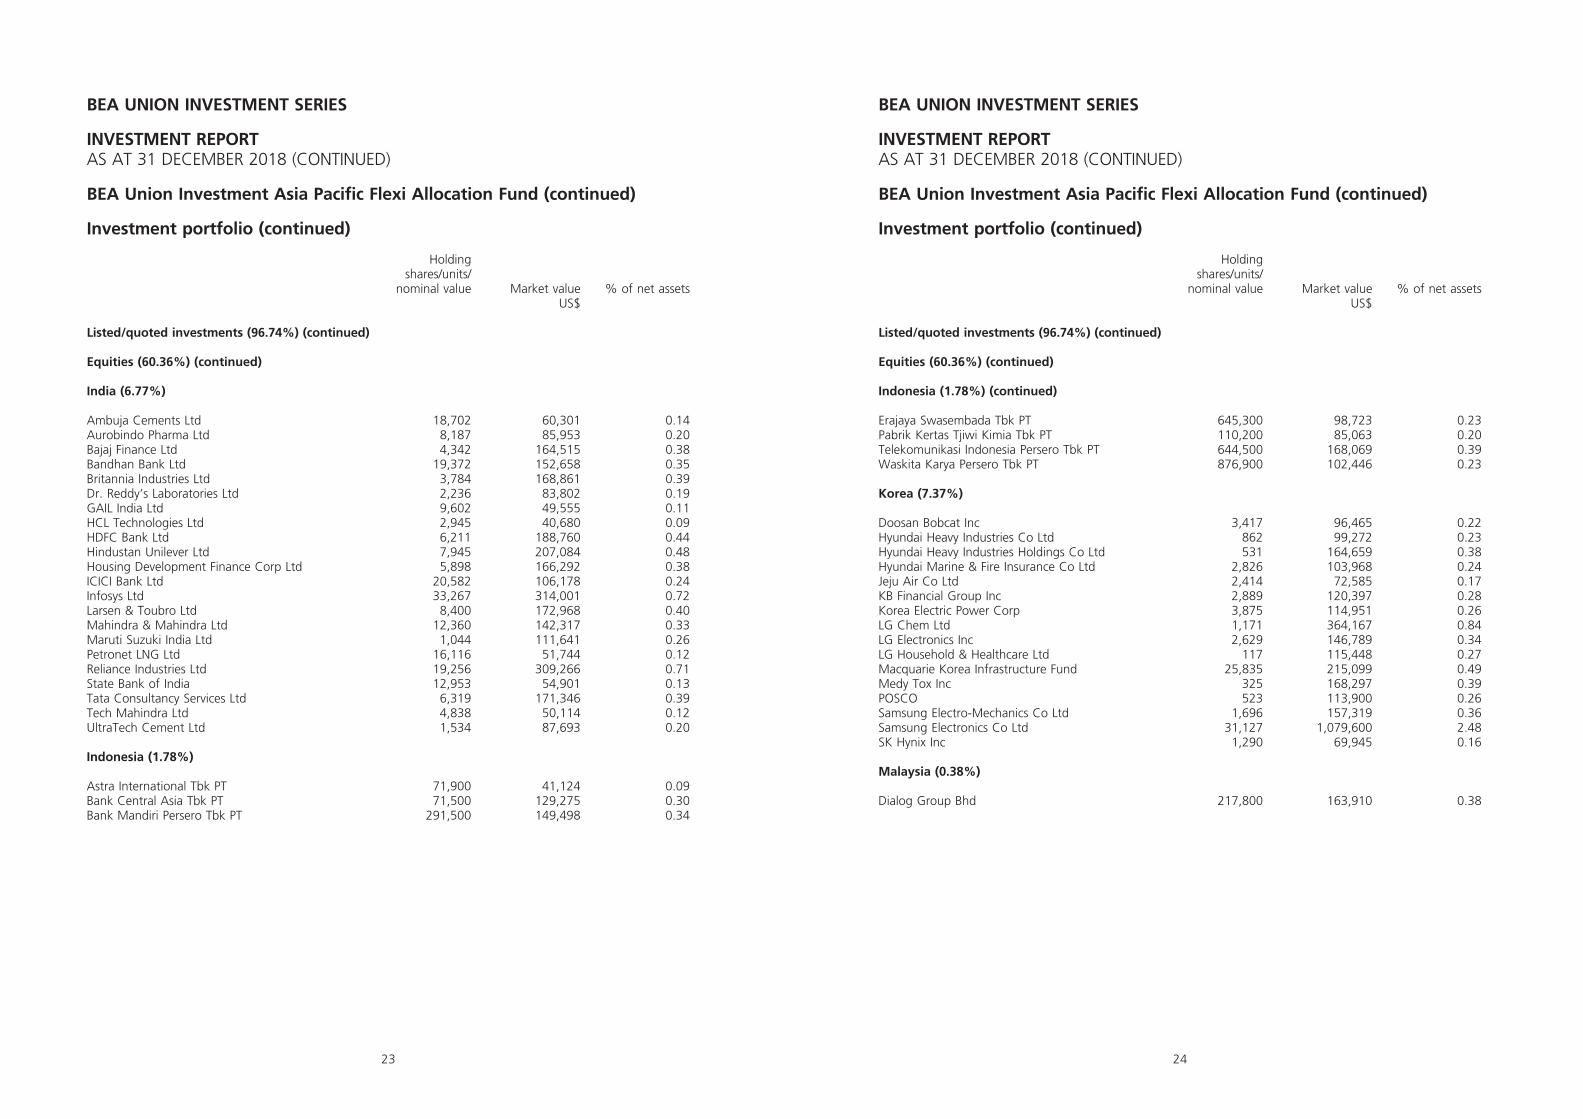
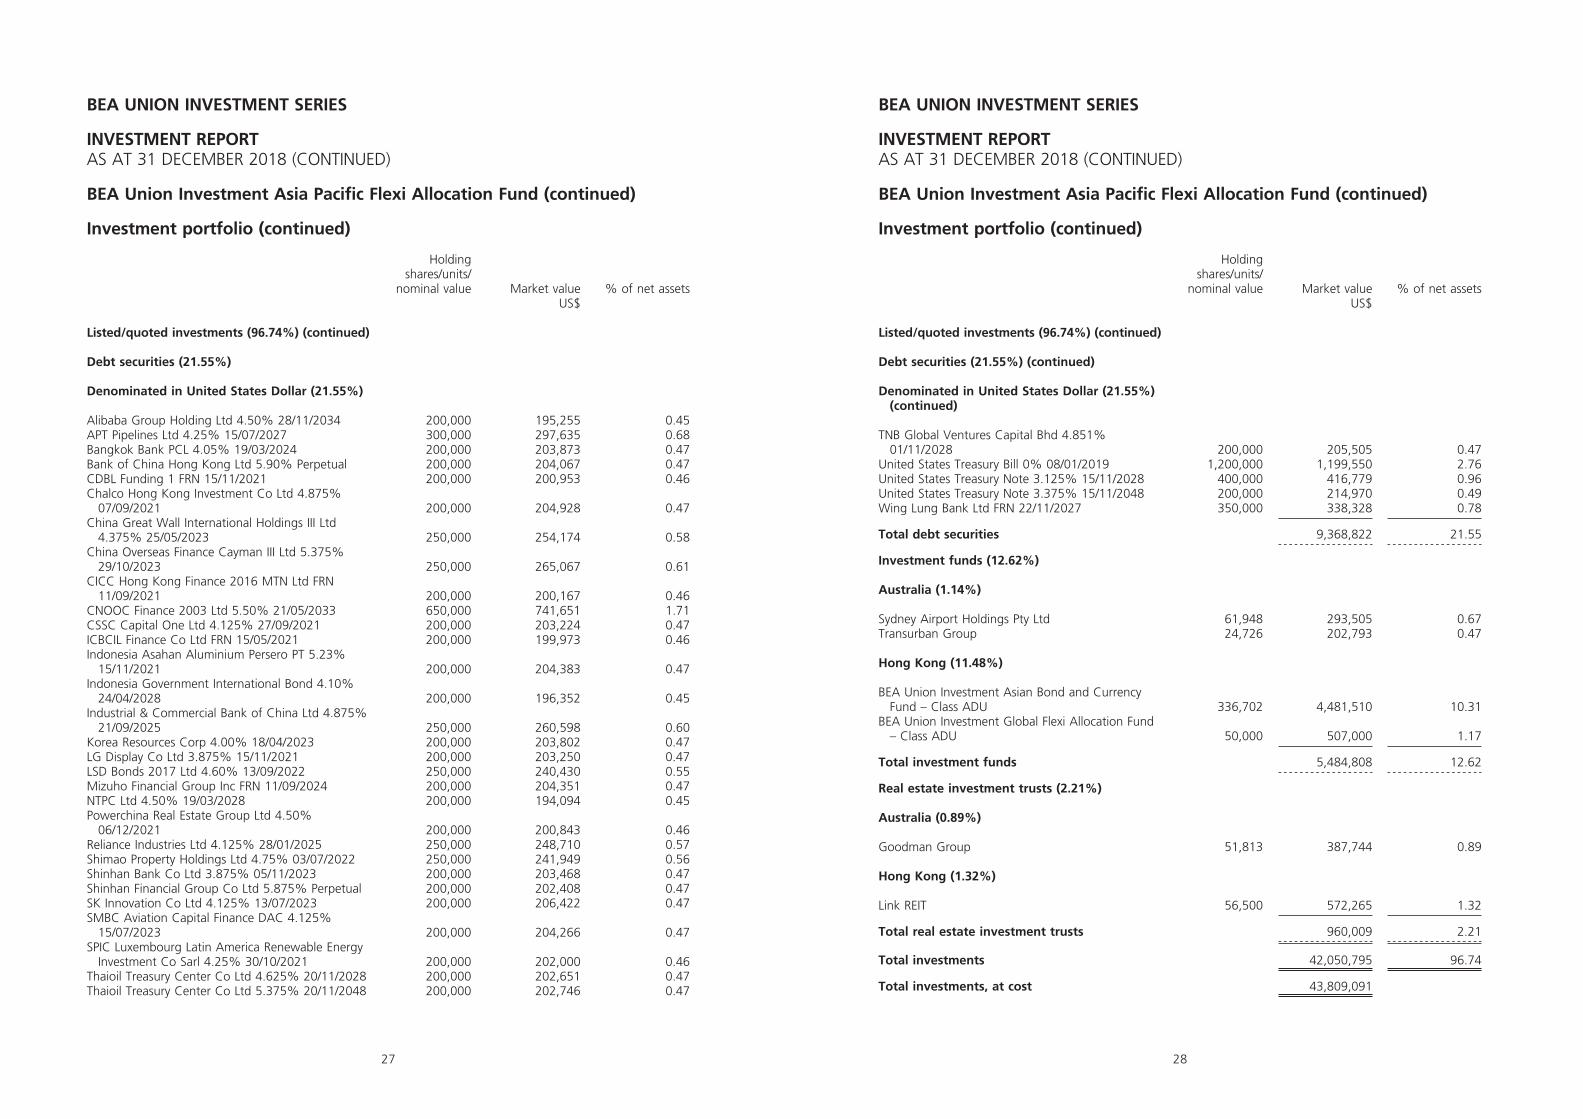
BEA Union Investment Asia Pacific Flexi Allocation Fund
Investment portfolio
Holding shares/units/
nominal value Market value % of net assetsUS$
Listed/quoted investments (96.74%)
Equities (60.36%)
Australia (8.68%)
Amcor Ltd 15,795 147,336 0.34ASX Ltd 2,786 117,563 0.27Australia & New Zealand Banking Group Ltd 15,798 272,039 0.63BHP Group Ltd 21,160 509,912 1.17Boral Ltd 34,819 121,092 0.28Brambles Ltd 20,915 149,450 0.34Cochlear Ltd 1,363 166,549 0.38CSL Ltd 4,185 545,526 1.26Macquarie Group Ltd 2,884 220,596 0.51Northern Star Resources Ltd 38,769 252,191 0.58Oil Search Ltd 27,130 136,753 0.32Rio Tinto Ltd 4,191 231,523 0.53Telstra Corp Ltd 63,543 127,493 0.29Westpac Banking Corp 14,632 257,935 0.59Woodside Petroleum Ltd 8,982 198,047 0.46Woolworths Group Ltd 15,397 318,898 0.73
China (1.53%)
China International Travel Service Corp Ltd – A 15,600 136,692 0.32Daqin Railway Co Ltd – A 108,899 130,450 0.30Foshan Haitian Flavouring & Food Co Ltd – A 20,300 203,285 0.47Jiangsu Hengrui Medicine Co Ltd – A 11,500 88,296 0.20Ping An Insurance Group Co of China Ltd – A 12,900 105,335 0.24
Hong Kong (19.91%)
Agricultural Bank of China Ltd – H 407,000 178,305 0.41AIA Group Ltd 121,800 1,011,199 2.33
BEA Union Investment Asia Pacific Flexi Allocation Fund (continued)
Investment portfolio (continued)
Holding shares/units/
nominal value Market value % of net assetsUS$
Listed/quoted investments (96.74%) (continued)
Equities (60.36%) (continued)
Hong Kong (19.91%) (continued)
Air China Ltd – H 110,000 95,819 0.22Anhui Conch Cement Co Ltd – H 33,500 162,594 0.37China Communications Services Corp Ltd – H 164,000 135,736 0.31China Construction Bank Corp – H 768,000 633,680 1.46China Gas Holdings Ltd 61,400 218,801 0.50China Mengniu Dairy Co Ltd 26,000 81,029 0.19China Merchants Bank Co Ltd – H 51,500 188,784 0.44China Mobile Ltd 11,000 105,865 0.24China Overseas Land & Investment Ltd 78,000 267,993 0.62China Railway Group Ltd – H 146,000 132,959 0.31China Unicom Hong Kong Ltd 38,000 40,576 0.09CNOOC Ltd 127,000 196,275 0.45Country Garden Services Holdings Co Ltd 51,287 81,490 0.19CSPC Pharmaceutical Group Ltd 30,000 43,299 0.10ENN Energy Holdings Ltd 22,300 197,812 0.45Galaxy Entertainment Group Ltd 44,000 279,871 0.64Hong Kong Exchanges & Clearing Ltd 19,400 561,484 1.29Industrial & Commercial Bank of China Ltd – H 631,000 450,523 1.04Longfor Properties Co Ltd 100,500 300,371 0.69PetroChina Co Ltd – H 838,000 522,324 1.20Ping An Insurance Group Co of China Ltd – H 69,000 609,421 1.40Shenzhou International Group Holdings Ltd 13,000 147,363 0.34Sino Biopharmaceutical Ltd 173,000 114,018 0.26Sun Art Retail Group Ltd 69,500 70,838 0.16Swire Properties Ltd 76,800 269,755 0.62Tencent Holdings Ltd 35,200 1,411,719 3.25Wharf Real Estate Investment Co Ltd 25,000 149,598 0.34
BEA UNION INVESTMENT SERIES
INVESTMENT REPORTAS AT 31 DECEMBER 2018 (CONTINUED)
BEA UNION INVESTMENT SERIES
INVESTMENT REPORTAS AT 31 DECEMBER 2018 (CONTINUED)
23 24
A5請縮小打印70.5%
BEA Union Investment Asia Pacific Flexi Allocation Fund (continued)
Investment portfolio (continued)
Holding shares/units/
nominal value Market value % of net assetsUS$
Listed/quoted investments (96.74%) (continued)
Equities (60.36%) (continued)
India (6.77%)
Ambuja Cements Ltd 18,702 60,301 0.14Aurobindo Pharma Ltd 8,187 85,953 0.20Bajaj Finance Ltd 4,342 164,515 0.38Bandhan Bank Ltd 19,372 152,658 0.35Britannia Industries Ltd 3,784 168,861 0.39Dr. Reddy’s Laboratories Ltd 2,236 83,802 0.19GAIL India Ltd 9,602 49,555 0.11HCL Technologies Ltd 2,945 40,680 0.09HDFC Bank Ltd 6,211 188,760 0.44Hindustan Unilever Ltd 7,945 207,084 0.48Housing Development Finance Corp Ltd 5,898 166,292 0.38ICICI Bank Ltd 20,582 106,178 0.24Infosys Ltd 33,267 314,001 0.72Larsen & Toubro Ltd 8,400 172,968 0.40Mahindra & Mahindra Ltd 12,360 142,317 0.33Maruti Suzuki India Ltd 1,044 111,641 0.26Petronet LNG Ltd 16,116 51,744 0.12Reliance Industries Ltd 19,256 309,266 0.71State Bank of India 12,953 54,901 0.13Tata Consultancy Services Ltd 6,319 171,346 0.39Tech Mahindra Ltd 4,838 50,114 0.12UltraTech Cement Ltd 1,534 87,693 0.20
Indonesia (1.78%)
Astra International Tbk PT 71,900 41,124 0.09Bank Central Asia Tbk PT 71,500 129,275 0.30Bank Mandiri Persero Tbk PT 291,500 149,498 0.34
BEA Union Investment Asia Pacific Flexi Allocation Fund (continued)
Investment portfolio (continued)
Holding shares/units/
nominal value Market value % of net assetsUS$
Listed/quoted investments (96.74%) (continued)
Equities (60.36%) (continued)
Indonesia (1.78%) (continued)
Erajaya Swasembada Tbk PT 645,300 98,723 0.23Pabrik Kertas Tjiwi Kimia Tbk PT 110,200 85,063 0.20Telekomunikasi Indonesia Persero Tbk PT 644,500 168,069 0.39Waskita Karya Persero Tbk PT 876,900 102,446 0.23
Korea (7.37%)
Doosan Bobcat Inc 3,417 96,465 0.22Hyundai Heavy Industries Co Ltd 862 99,272 0.23Hyundai Heavy Industries Holdings Co Ltd 531 164,659 0.38Hyundai Marine & Fire Insurance Co Ltd 2,826 103,968 0.24Jeju Air Co Ltd 2,414 72,585 0.17KB Financial Group Inc 2,889 120,397 0.28Korea Electric Power Corp 3,875 114,951 0.26LG Chem Ltd 1,171 364,167 0.84LG Electronics Inc 2,629 146,789 0.34LG Household & Healthcare Ltd 117 115,448 0.27Macquarie Korea Infrastructure Fund 25,835 215,099 0.49Medy Tox Inc 325 168,297 0.39POSCO 523 113,900 0.26Samsung Electro-Mechanics Co Ltd 1,696 157,319 0.36Samsung Electronics Co Ltd 31,127 1,079,600 2.48SK Hynix Inc 1,290 69,945 0.16
Malaysia (0.38%)
Dialog Group Bhd 217,800 163,910 0.38
BEA UNION INVESTMENT SERIES
INVESTMENT REPORTAS AT 31 DECEMBER 2018 (CONTINUED)
BEA UNION INVESTMENT SERIES
INVESTMENT REPORTAS AT 31 DECEMBER 2018 (CONTINUED)
25 26
A5請縮小打印70.5%
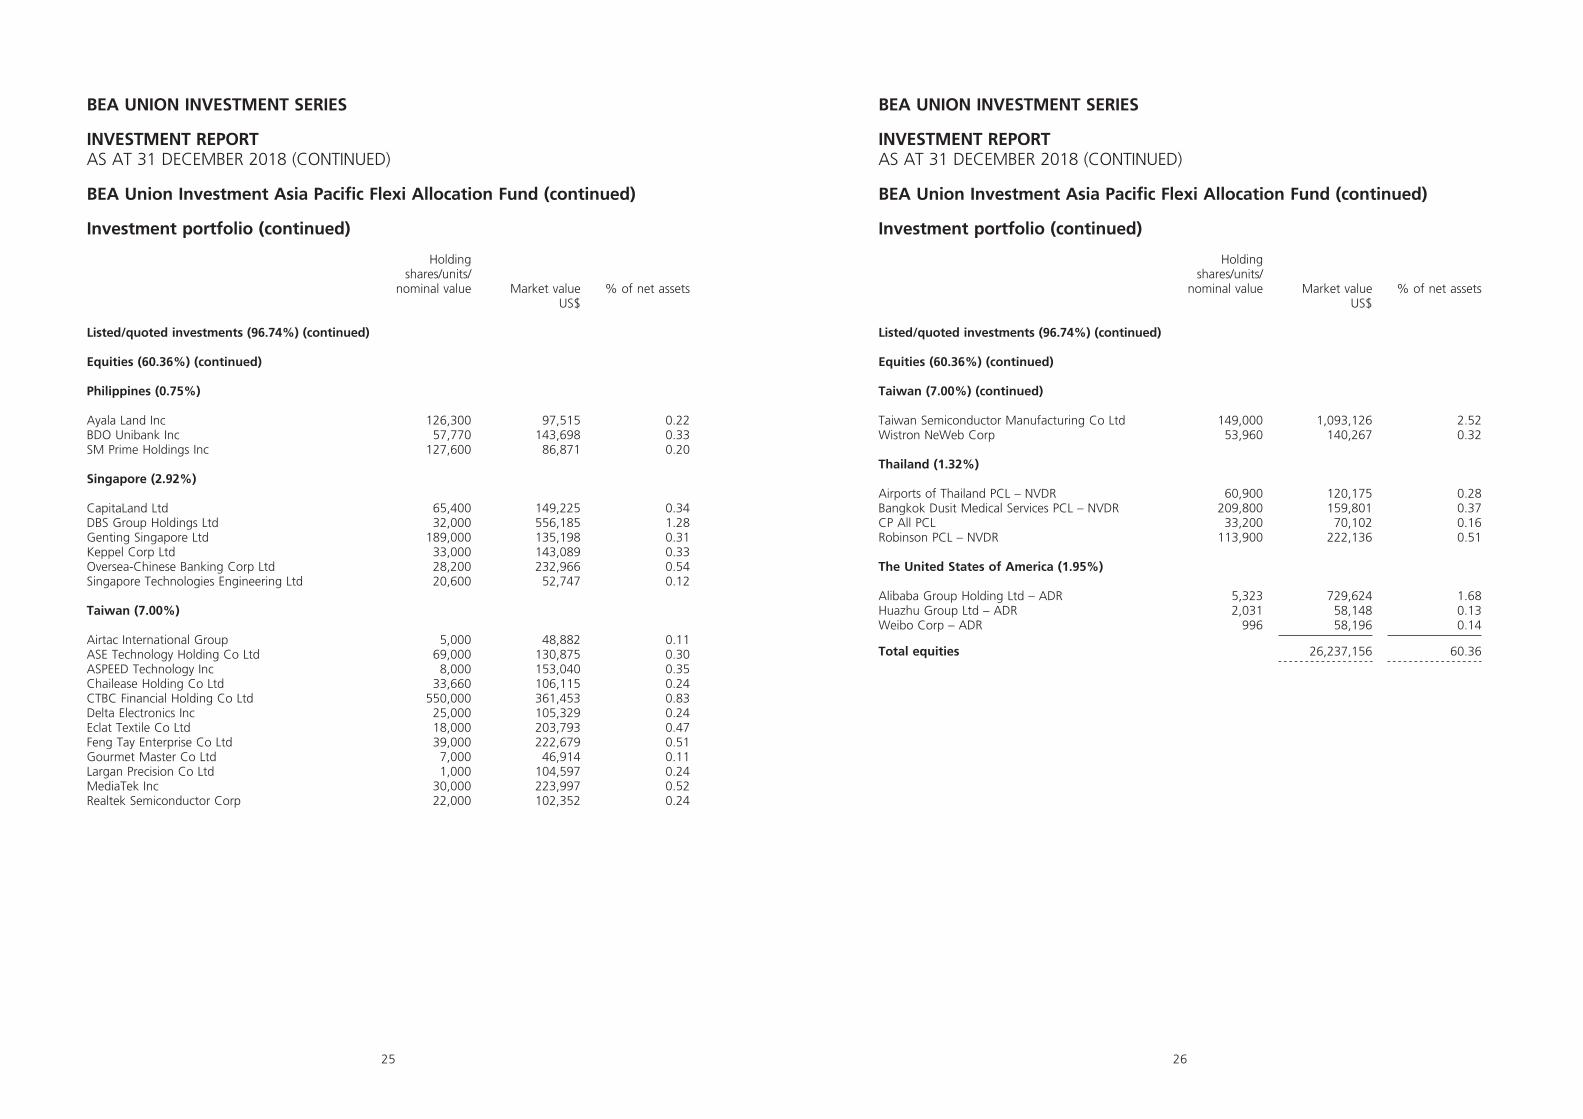
BEA Union Investment Asia Pacific Flexi Allocation Fund (continued)
Investment portfolio (continued)
Holding shares/units/
nominal value Market value % of net assetsUS$
Listed/quoted investments (96.74%) (continued)
Equities (60.36%) (continued)
Philippines (0.75%)
Ayala Land Inc 126,300 97,515 0.22BDO Unibank Inc 57,770 143,698 0.33SM Prime Holdings Inc 127,600 86,871 0.20
Singapore (2.92%)
CapitaLand Ltd 65,400 149,225 0.34DBS Group Holdings Ltd 32,000 556,185 1.28Genting Singapore Ltd 189,000 135,198 0.31Keppel Corp Ltd 33,000 143,089 0.33Oversea-Chinese Banking Corp Ltd 28,200 232,966 0.54Singapore Technologies Engineering Ltd 20,600 52,747 0.12
Taiwan (7.00%)
Airtac International Group 5,000 48,882 0.11ASE Technology Holding Co Ltd 69,000 130,875 0.30ASPEED Technology Inc 8,000 153,040 0.35Chailease Holding Co Ltd 33,660 106,115 0.24CTBC Financial Holding Co Ltd 550,000 361,453 0.83Delta Electronics Inc 25,000 105,329 0.24Eclat Textile Co Ltd 18,000 203,793 0.47Feng Tay Enterprise Co Ltd 39,000 222,679 0.51Gourmet Master Co Ltd 7,000 46,914 0.11Largan Precision Co Ltd 1,000 104,597 0.24MediaTek Inc 30,000 223,997 0.52Realtek Semiconductor Corp 22,000 102,352 0.24
BEA Union Investment Asia Pacific Flexi Allocation Fund (continued)
Investment portfolio (continued)
Holding shares/units/
nominal value Market value % of net assetsUS$
Listed/quoted investments (96.74%) (continued)
Equities (60.36%) (continued)
Taiwan (7.00%) (continued)
Taiwan Semiconductor Manufacturing Co Ltd 149,000 1,093,126 2.52Wistron NeWeb Corp 53,960 140,267 0.32
Thailand (1.32%)
Airports of Thailand PCL – NVDR 60,900 120,175 0.28Bangkok Dusit Medical Services PCL – NVDR 209,800 159,801 0.37CP All PCL 33,200 70,102 0.16Robinson PCL – NVDR 113,900 222,136 0.51
The United States of America (1.95%)
Alibaba Group Holding Ltd – ADR 5,323 729,624 1.68Huazhu Group Ltd – ADR 2,031 58,148 0.13Weibo Corp – ADR 996 58,196 0.14
Total equities 26,237,156 60.36
BEA UNION INVESTMENT SERIES
INVESTMENT REPORTAS AT 31 DECEMBER 2018 (CONTINUED)
BEA UNION INVESTMENT SERIES
INVESTMENT REPORTAS AT 31 DECEMBER 2018 (CONTINUED)
27 28
A5請縮小打印70.5%
BEA Union Investment Asia Pacific Flexi Allocation Fund (continued)
Investment portfolio (continued)
Holding shares/units/
nominal value Market value % of net assetsUS$
Listed/quoted investments (96.74%) (continued)
Debt securities (21.55%)
Denominated in United States Dollar (21.55%)
Alibaba Group Holding Ltd 4.50% 28/11/2034 200,000 195,255 0.45APT Pipelines Ltd 4.25% 15/07/2027 300,000 297,635 0.68Bangkok Bank PCL 4.05% 19/03/2024 200,000 203,873 0.47Bank of China Hong Kong Ltd 5.90% Perpetual 200,000 204,067 0.47CDBL Funding 1 FRN 15/11/2021 200,000 200,953 0.46Chalco Hong Kong Investment Co Ltd 4.875%
07/09/2021 200,000 204,928 0.47China Great Wall International Holdings III Ltd
4.375% 25/05/2023 250,000 254,174 0.58China Overseas Finance Cayman III Ltd 5.375%
29/10/2023 250,000 265,067 0.61CICC Hong Kong Finance 2016 MTN Ltd FRN
11/09/2021 200,000 200,167 0.46CNOOC Finance 2003 Ltd 5.50% 21/05/2033 650,000 741,651 1.71CSSC Capital One Ltd 4.125% 27/09/2021 200,000 203,224 0.47ICBCIL Finance Co Ltd FRN 15/05/2021 200,000 199,973 0.46Indonesia Asahan Aluminium Persero PT 5.23%
15/11/2021 200,000 204,383 0.47Indonesia Government International Bond 4.10%
24/04/2028 200,000 196,352 0.45Industrial & Commercial Bank of China Ltd 4.875%
21/09/2025 250,000 260,598 0.60Korea Resources Corp 4.00% 18/04/2023 200,000 203,802 0.47LG Display Co Ltd 3.875% 15/11/2021 200,000 203,250 0.47LSD Bonds 2017 Ltd 4.60% 13/09/2022 250,000 240,430 0.55Mizuho Financial Group Inc FRN 11/09/2024 200,000 204,351 0.47NTPC Ltd 4.50% 19/03/2028 200,000 194,094 0.45Powerchina Real Estate Group Ltd 4.50%
06/12/2021 200,000 200,843 0.46Reliance Industries Ltd 4.125% 28/01/2025 250,000 248,710 0.57Shimao Property Holdings Ltd 4.75% 03/07/2022 250,000 241,949 0.56Shinhan Bank Co Ltd 3.875% 05/11/2023 200,000 203,468 0.47Shinhan Financial Group Co Ltd 5.875% Perpetual 200,000 202,408 0.47SK Innovation Co Ltd 4.125% 13/07/2023 200,000 206,422 0.47SMBC Aviation Capital Finance DAC 4.125%
15/07/2023 200,000 204,266 0.47SPIC Luxembourg Latin America Renewable Energy
Investment Co Sarl 4.25% 30/10/2021 200,000 202,000 0.46Thaioil Treasury Center Co Ltd 4.625% 20/11/2028 200,000 202,651 0.47Thaioil Treasury Center Co Ltd 5.375% 20/11/2048 200,000 202,746 0.47
BEA Union Investment Asia Pacific Flexi Allocation Fund (continued)
Investment portfolio (continued)
Holding shares/units/
nominal value Market value % of net assetsUS$
Listed/quoted investments (96.74%) (continued)
Debt securities (21.55%) (continued)
Denominated in United States Dollar (21.55%) (continued)
TNB Global Ventures Capital Bhd 4.851% 01/11/2028 200,000 205,505 0.47
United States Treasury Bill 0% 08/01/2019 1,200,000 1,199,550 2.76United States Treasury Note 3.125% 15/11/2028 400,000 416,779 0.96United States Treasury Note 3.375% 15/11/2048 200,000 214,970 0.49Wing Lung Bank Ltd FRN 22/11/2027 350,000 338,328 0.78
Total debt securities 9,368,822 21.55
Investment funds (12.62%)
Australia (1.14%)
Sydney Airport Holdings Pty Ltd 61,948 293,505 0.67Transurban Group 24,726 202,793 0.47
Hong Kong (11.48%)
BEA Union Investment Asian Bond and Currency Fund – Class ADU 336,702 4,481,510 10.31
BEA Union Investment Global Flexi Allocation Fund – Class ADU 50,000 507,000 1.17
Total investment funds 5,484,808 12.62
Real estate investment trusts (2.21%)
Australia (0.89%)
Goodman Group 51,813 387,744 0.89
Hong Kong (1.32%)
Link REIT 56,500 572,265 1.32
Total real estate investment trusts 960,009 2.21
Total investments 42,050,795 96.74
Total investments, at cost 43,809,091
BEA UNION INVESTMENT SERIES
INVESTMENT REPORTAS AT 31 DECEMBER 2018 (CONTINUED)
BEA UNION INVESTMENT SERIES
INVESTMENT REPORTAS AT 31 DECEMBER 2018 (CONTINUED)
29 30
A5請縮小打印70.5%
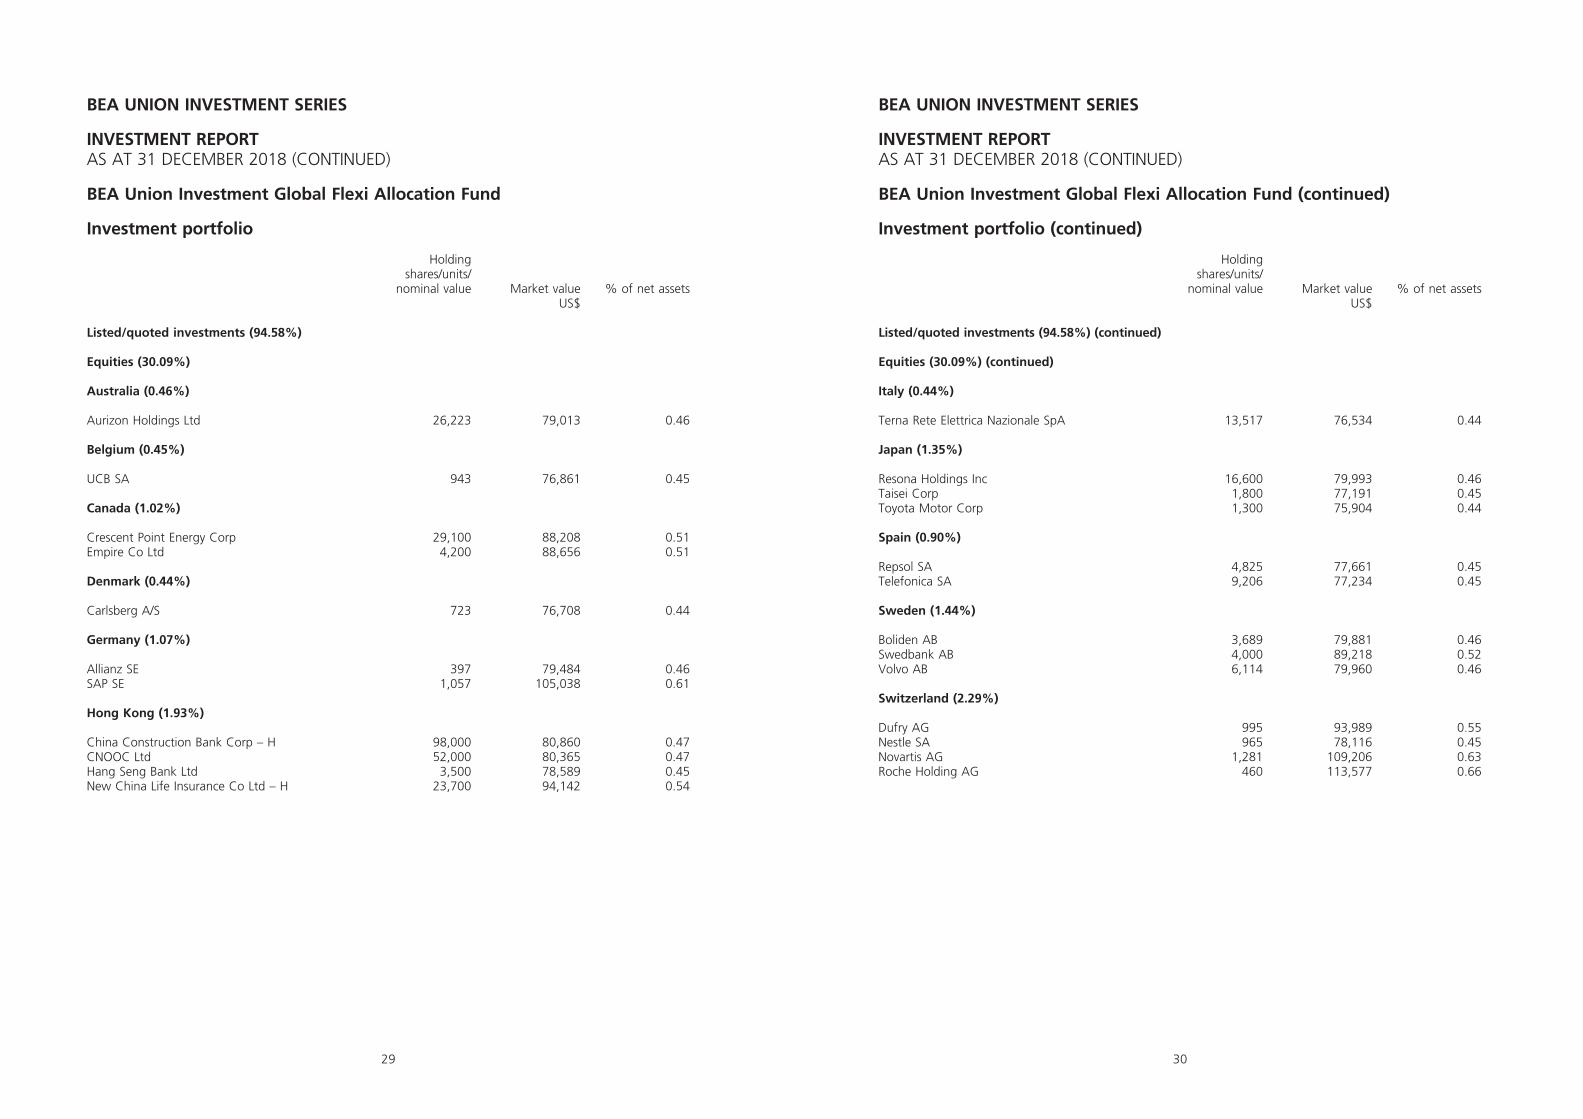
BEA Union Investment Global Flexi Allocation Fund
Investment portfolio
Holding shares/units/
nominal value Market value % of net assetsUS$
Listed/quoted investments (94.58%)
Equities (30.09%)
Australia (0.46%)
Aurizon Holdings Ltd 26,223 79,013 0.46
Belgium (0.45%)
UCB SA 943 76,861 0.45
Canada (1.02%)
Crescent Point Energy Corp 29,100 88,208 0.51Empire Co Ltd 4,200 88,656 0.51
Denmark (0.44%)
Carlsberg A/S 723 76,708 0.44
Germany (1.07%)
Allianz SE 397 79,484 0.46SAP SE 1,057 105,038 0.61
Hong Kong (1.93%)
China Construction Bank Corp – H 98,000 80,860 0.47CNOOC Ltd 52,000 80,365 0.47Hang Seng Bank Ltd 3,500 78,589 0.45New China Life Insurance Co Ltd – H 23,700 94,142 0.54
BEA Union Investment Global Flexi Allocation Fund (continued)
Investment portfolio (continued)
Holding shares/units/
nominal value Market value % of net assetsUS$
Listed/quoted investments (94.58%) (continued)
Equities (30.09%) (continued)
Italy (0.44%)
Terna Rete Elettrica Nazionale SpA 13,517 76,534 0.44
Japan (1.35%)
Resona Holdings Inc 16,600 79,993 0.46Taisei Corp 1,800 77,191 0.45Toyota Motor Corp 1,300 75,904 0.44
Spain (0.90%)
Repsol SA 4,825 77,661 0.45Telefonica SA 9,206 77,234 0.45
Sweden (1.44%)
Boliden AB 3,689 79,881 0.46Swedbank AB 4,000 89,218 0.52Volvo AB 6,114 79,960 0.46
Switzerland (2.29%)
Dufry AG 995 93,989 0.55Nestle SA 965 78,116 0.45Novartis AG 1,281 109,206 0.63Roche Holding AG 460 113,577 0.66
BEA UNION INVESTMENT SERIES
INVESTMENT REPORTAS AT 31 DECEMBER 2018 (CONTINUED)
BEA UNION INVESTMENT SERIES
INVESTMENT REPORTAS AT 31 DECEMBER 2018 (CONTINUED)
31 32
A5請縮小打印70.5%
BEA Union Investment Global Flexi Allocation Fund (continued)
Investment portfolio (continued)
Holding shares/units/
nominal value Market value % of net assetsUS$
Listed/quoted investments (94.58%) (continued)
Equities (30.09%) (continued)
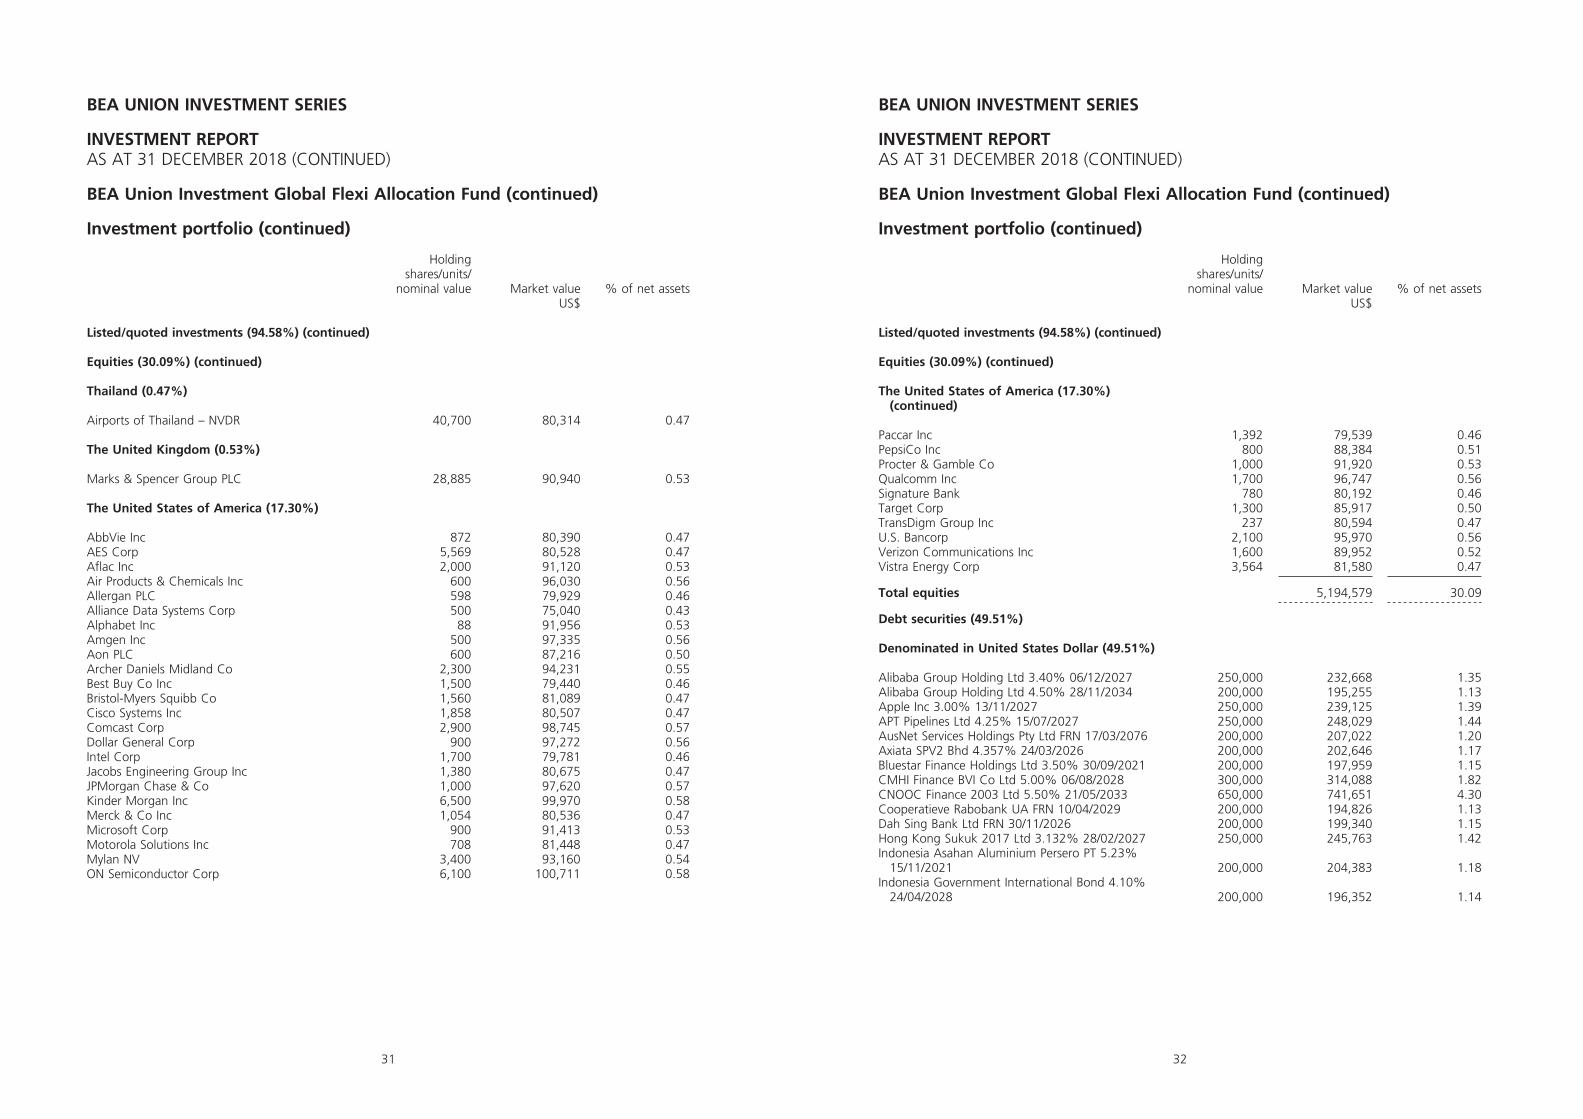
Thailand (0.47%)
Airports of Thailand – NVDR 40,700 80,314 0.47
The United Kingdom (0.53%)
Marks & Spencer Group PLC 28,885 90,940 0.53
The United States of America (17.30%)
AbbVie Inc 872 80,390 0.47AES Corp 5,569 80,528 0.47Aflac Inc 2,000 91,120 0.53Air Products & Chemicals Inc 600 96,030 0.56Allergan PLC 598 79,929 0.46Alliance Data Systems Corp 500 75,040 0.43Alphabet Inc 88 91,956 0.53Amgen Inc 500 97,335 0.56Aon PLC 600 87,216 0.50Archer Daniels Midland Co 2,300 94,231 0.55Best Buy Co Inc 1,500 79,440 0.46Bristol-Myers Squibb Co 1,560 81,089 0.47Cisco Systems Inc 1,858 80,507 0.47Comcast Corp 2,900 98,745 0.57Dollar General Corp 900 97,272 0.56Intel Corp 1,700 79,781 0.46Jacobs Engineering Group Inc 1,380 80,675 0.47JPMorgan Chase & Co 1,000 97,620 0.57Kinder Morgan Inc 6,500 99,970 0.58Merck & Co Inc 1,054 80,536 0.47Microsoft Corp 900 91,413 0.53Motorola Solutions Inc 708 81,448 0.47Mylan NV 3,400 93,160 0.54ON Semiconductor Corp 6,100 100,711 0.58
BEA Union Investment Global Flexi Allocation Fund (continued)
Investment portfolio (continued)
Holding shares/units/
nominal value Market value % of net assetsUS$
Listed/quoted investments (94.58%) (continued)
Equities (30.09%) (continued)
The United States of America (17.30%) (continued)
Paccar Inc 1,392 79,539 0.46PepsiCo Inc 800 88,384 0.51Procter & Gamble Co 1,000 91,920 0.53Qualcomm Inc 1,700 96,747 0.56Signature Bank 780 80,192 0.46Target Corp 1,300 85,917 0.50TransDigm Group Inc 237 80,594 0.47U.S. Bancorp 2,100 95,970 0.56Verizon Communications Inc 1,600 89,952 0.52Vistra Energy Corp 3,564 81,580 0.47
Total equities 5,194,579 30.09
Debt securities (49.51%)
Denominated in United States Dollar (49.51%)
Alibaba Group Holding Ltd 3.40% 06/12/2027 250,000 232,668 1.35Alibaba Group Holding Ltd 4.50% 28/11/2034 200,000 195,255 1.13Apple Inc 3.00% 13/11/2027 250,000 239,125 1.39APT Pipelines Ltd 4.25% 15/07/2027 250,000 248,029 1.44AusNet Services Holdings Pty Ltd FRN 17/03/2076 200,000 207,022 1.20Axiata SPV2 Bhd 4.357% 24/03/2026 200,000 202,646 1.17Bluestar Finance Holdings Ltd 3.50% 30/09/2021 200,000 197,959 1.15CMHI Finance BVI Co Ltd 5.00% 06/08/2028 300,000 314,088 1.82CNOOC Finance 2003 Ltd 5.50% 21/05/2033 650,000 741,651 4.30Cooperatieve Rabobank UA FRN 10/04/2029 200,000 194,826 1.13Dah Sing Bank Ltd FRN 30/11/2026 200,000 199,340 1.15Hong Kong Sukuk 2017 Ltd 3.132% 28/02/2027 250,000 245,763 1.42Indonesia Asahan Aluminium Persero PT 5.23%
15/11/2021 200,000 204,383 1.18Indonesia Government International Bond 4.10%
24/04/2028 200,000 196,352 1.14

BEA UNION INVESTMENT SERIES
INVESTMENT REPORTAS AT 31 DECEMBER 2018 (CONTINUED)
BEA UNION INVESTMENT SERIES
INVESTMENT REPORTAS AT 31 DECEMBER 2018 (CONTINUED)
33 34
A5請縮小打印70.5%
BEA Union Investment Global Flexi Allocation Fund (continued)
Investment portfolio (continued)
Holding shares/units/
nominal value Market value % of net assetsUS$
Listed/quoted investments (94.58%) (continued)
Debt securities (49.51%) (continued)
Denominated in United States Dollar (49.51%) (continued)
JPMorgan Chase & Co 4.25% 01/10/2027 200,000 198,899 1.15Korea Resources Corp 4.00% 18/04/2023 200,000 203,802 1.18Lembaga Pembiayaan Ekspor Indonesia 3.875%
06/04/2024 250,000 240,450 1.39Lloyds Banking Group PLC 4.55% 16/08/2028 200,000 196,159 1.14NTPC Ltd 4.50% 19/03/2028 200,000 194,094 1.12Oversea-Chinese Banking Corp Ltd FRN 15/10/2024
Callable-15/10/2019 5,000 5,057 0.03OVPH Ltd 5.875% Perpetual Callable-03/01/2021 300,000 288,049 1.67Pertamina Persero PT 5.625% 20/05/2043 300,000 285,986 1.66Shimao Property Holdings Ltd 4.75% 03/07/2022 300,000 290,339 1.68SK Innovation Co Ltd 4.125% 13/07/2023 200,000 206,422 1.20SMBC Aviation Capital Finance DAC 4.125%
15/07/2023 200,000 204,266 1.18Tencent Holdings Ltd 3.595% 19/01/2028 450,000 430,901 2.50Thaioil Treasury Center Co Ltd 4.625% 20/11/2028 200,000 202,651 1.17Thaioil Treasury Center Co Ltd 5.375% 20/11/2048 200,000 202,746 1.17TNB Global Ventures Capital Bhd 4.851%
01/11/2028 200,000 205,505 1.19United States Treasury Note 2.875% 15/08/2028 500,000 513,398 2.97United States Treasury Note 3.125% 15/11/2028 350,000 364,742 2.11Vodafone Group PLC 4.125% 30/05/2025 300,000 297,790 1.73Wing Lung Bank Ltd FRN 22/11/2027 200,000 193,331 1.12Woori Bank 4.75% 30/04/2024 200,000 203,380 1.18
Total debt securities 8,547,074 49.51
BEA Union Investment Global Flexi Allocation Fund (continued)
Investment portfolio (continued)
Holding shares/units/
nominal value Market value % of net assetsUS$
Listed/quoted investments (94.58%) (continued)
Investment fund (14.97%)
Hong Kong (14.97%)
BEA Union Investment Asian Bond and Currency Fund – Class ADU 194,225 2,585,130 14.97
Total investment fund 2,585,130 14.97
Rights (0.01%)
Spain (0.01%)
Repsol SA 4,825 2,206 0.01
Total rights 2,206 0.01
Total investments 16,328,989 94.58
Total investments, at cost 16,606,066
BEA UNION INVESTMENT SERIES
INVESTMENT REPORTAS AT 31 DECEMBER 2018 (CONTINUED)
BEA UNION INVESTMENT SERIES
INVESTMENT REPORTAS AT 31 DECEMBER 2018 (CONTINUED)
35 36
A5請縮小打印70.5%
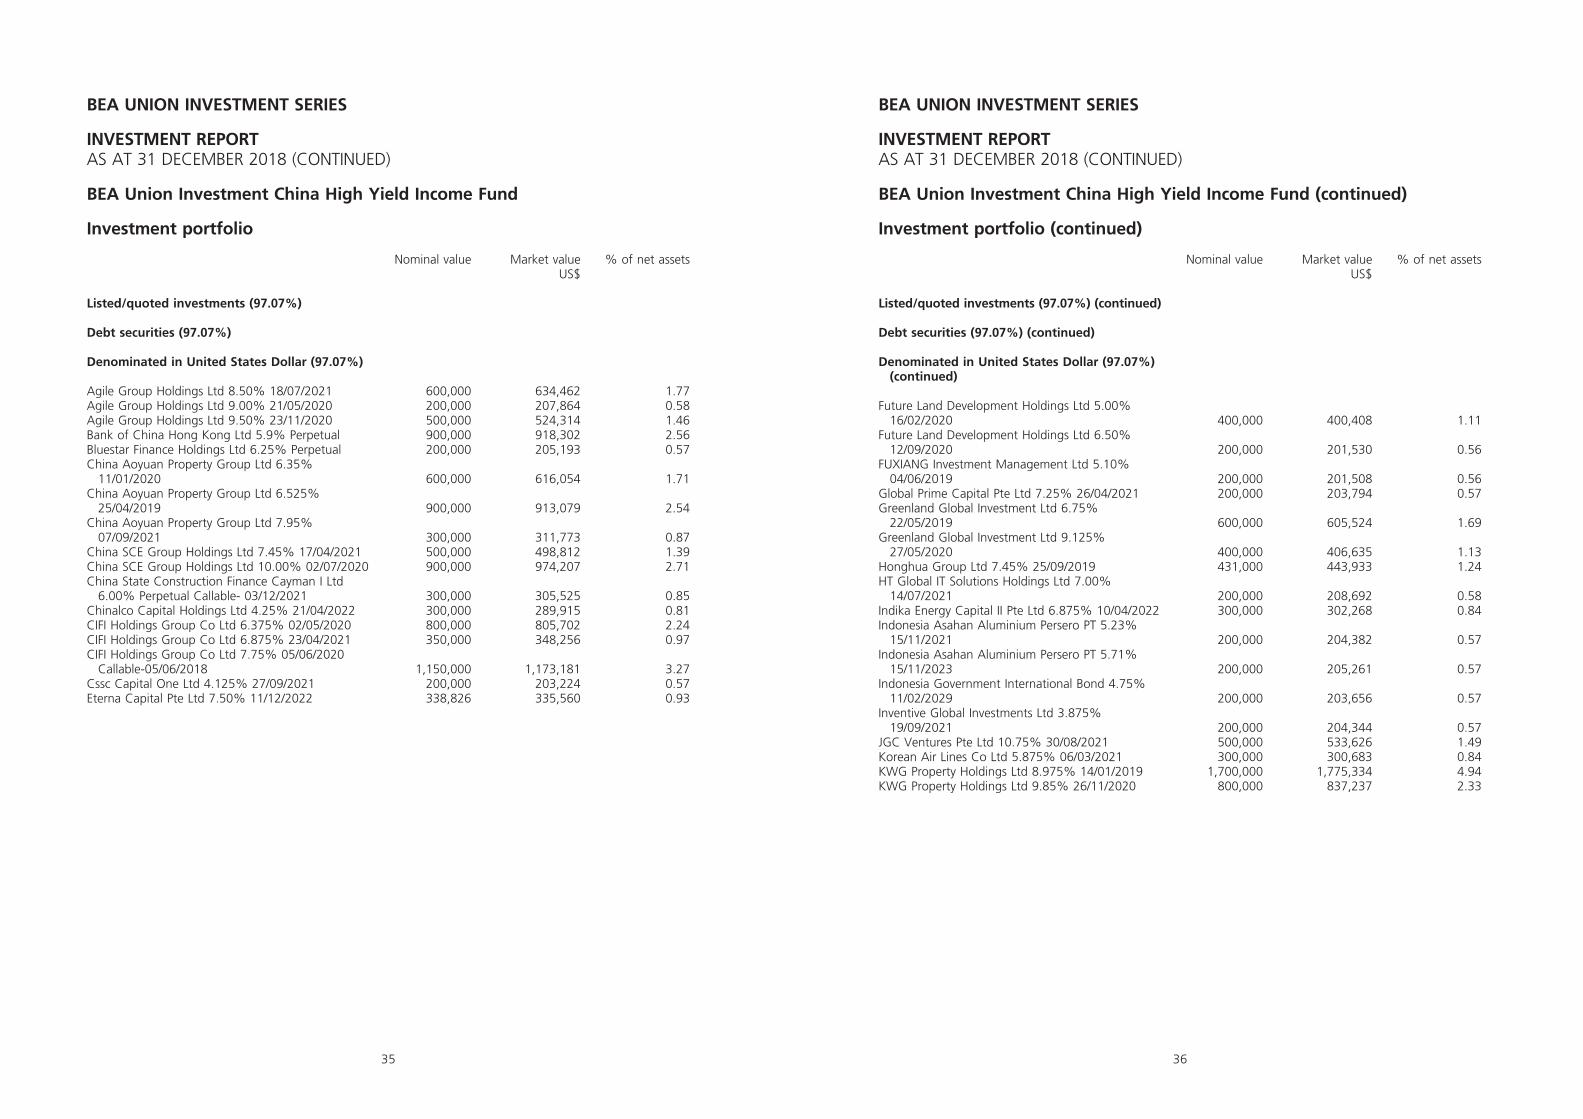
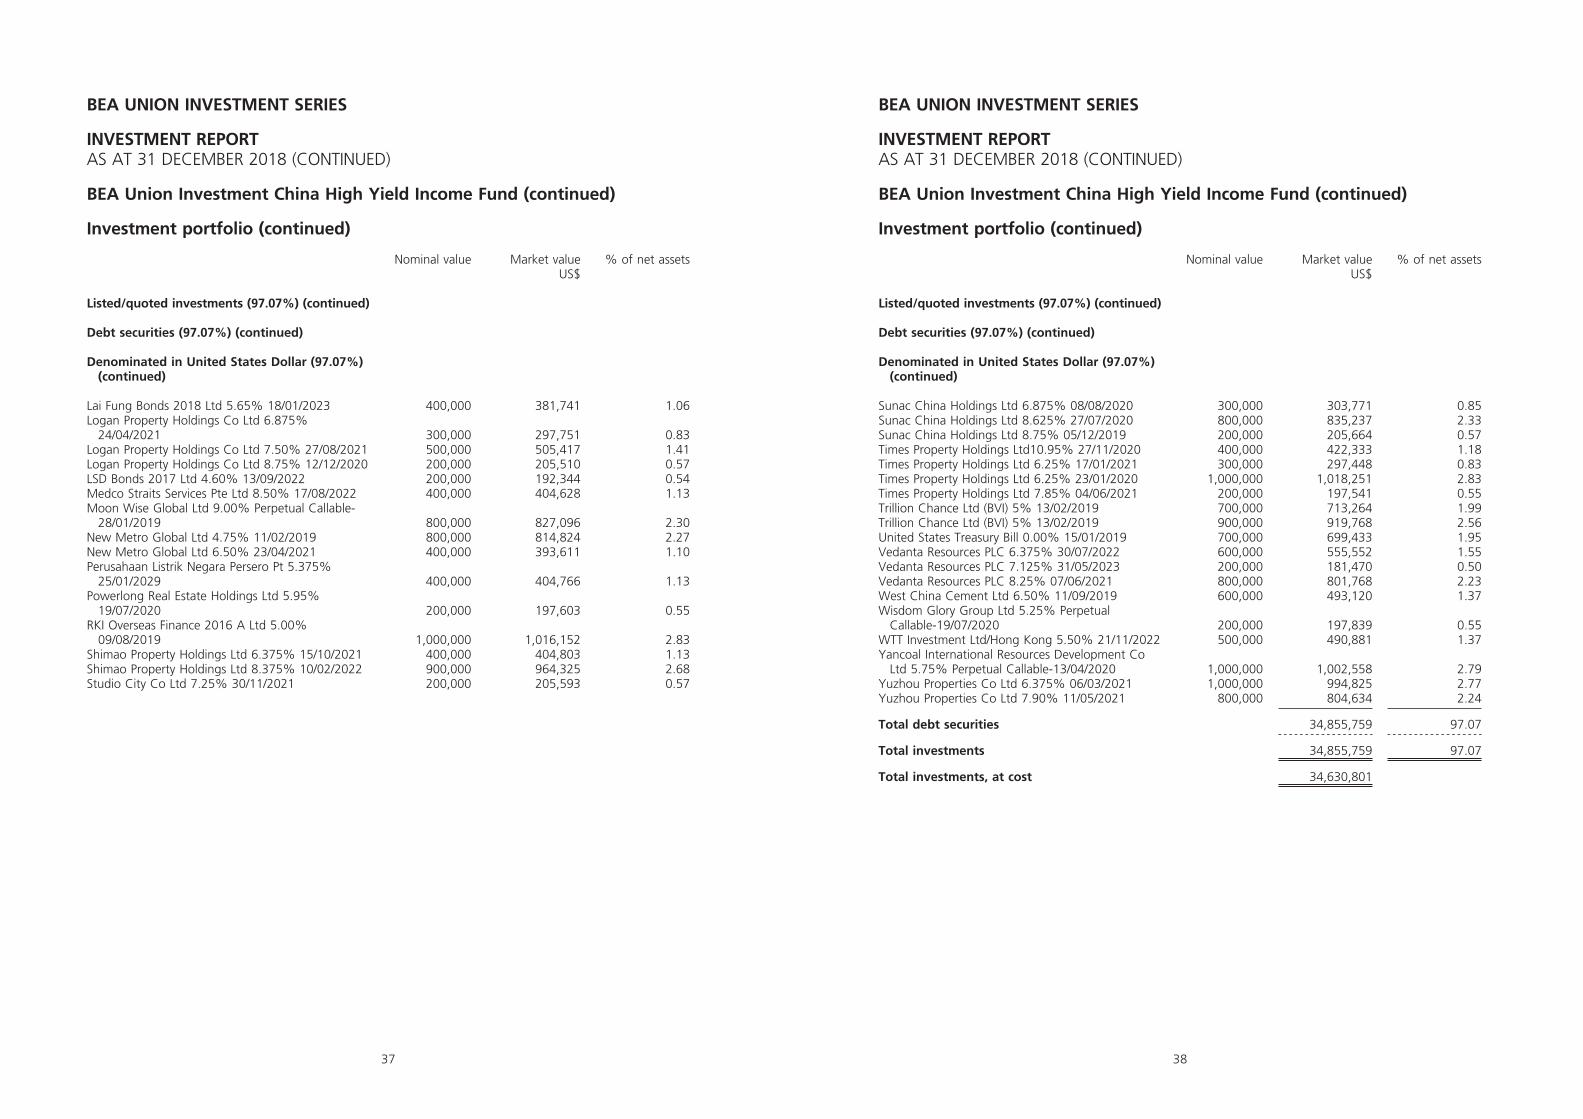
BEA Union Investment China High Yield Income Fund
Investment portfolio
Nominal value Market value % of net assetsUS$
Listed/quoted investments (97.07%)
Debt securities (97.07%)
Denominated in United States Dollar (97.07%)
Agile Group Holdings Ltd 8.50% 18/07/2021 600,000 634,462 1.77Agile Group Holdings Ltd 9.00% 21/05/2020 200,000 207,864 0.58Agile Group Holdings Ltd 9.50% 23/11/2020 500,000 524,314 1.46Bank of China Hong Kong Ltd 5.9% Perpetual 900,000 918,302 2.56Bluestar Finance Holdings Ltd 6.25% Perpetual 200,000 205,193 0.57China Aoyuan Property Group Ltd 6.35%
11/01/2020 600,000 616,054 1.71China Aoyuan Property Group Ltd 6.525%
25/04/2019 900,000 913,079 2.54China Aoyuan Property Group Ltd 7.95%
07/09/2021 300,000 311,773 0.87China SCE Group Holdings Ltd 7.45% 17/04/2021 500,000 498,812 1.39China SCE Group Holdings Ltd 10.00% 02/07/2020 900,000 974,207 2.71China State Construction Finance Cayman I Ltd
6.00% Perpetual Callable- 03/12/2021 300,000 305,525 0.85Chinalco Capital Holdings Ltd 4.25% 21/04/2022 300,000 289,915 0.81CIFI Holdings Group Co Ltd 6.375% 02/05/2020 800,000 805,702 2.24CIFI Holdings Group Co Ltd 6.875% 23/04/2021 350,000 348,256 0.97CIFI Holdings Group Co Ltd 7.75% 05/06/2020
Callable-05/06/2018 1,150,000 1,173,181 3.27Cssc Capital One Ltd 4.125% 27/09/2021 200,000 203,224 0.57Eterna Capital Pte Ltd 7.50% 11/12/2022 338,826 335,560 0.93
BEA Union Investment China High Yield Income Fund (continued)
Investment portfolio (continued)
Nominal value Market value % of net assetsUS$
Listed/quoted investments (97.07%) (continued)
Debt securities (97.07%) (continued)
Denominated in United States Dollar (97.07%) (continued)
Future Land Development Holdings Ltd 5.00% 16/02/2020 400,000 400,408 1.11
Future Land Development Holdings Ltd 6.50% 12/09/2020 200,000 201,530 0.56
FUXIANG Investment Management Ltd 5.10% 04/06/2019 200,000 201,508 0.56
Global Prime Capital Pte Ltd 7.25% 26/04/2021 200,000 203,794 0.57Greenland Global Investment Ltd 6.75%
22/05/2019 600,000 605,524 1.69Greenland Global Investment Ltd 9.125%
27/05/2020 400,000 406,635 1.13Honghua Group Ltd 7.45% 25/09/2019 431,000 443,933 1.24HT Global IT Solutions Holdings Ltd 7.00%
14/07/2021 200,000 208,692 0.58Indika Energy Capital II Pte Ltd 6.875% 10/04/2022 300,000 302,268 0.84Indonesia Asahan Aluminium Persero PT 5.23%
15/11/2021 200,000 204,382 0.57Indonesia Asahan Aluminium Persero PT 5.71%
15/11/2023 200,000 205,261 0.57Indonesia Government International Bond 4.75%
11/02/2029 200,000 203,656 0.57Inventive Global Investments Ltd 3.875%
19/09/2021 200,000 204,344 0.57JGC Ventures Pte Ltd 10.75% 30/08/2021 500,000 533,626 1.49Korean Air Lines Co Ltd 5.875% 06/03/2021 300,000 300,683 0.84KWG Property Holdings Ltd 8.975% 14/01/2019 1,700,000 1,775,334 4.94KWG Property Holdings Ltd 9.85% 26/11/2020 800,000 837,237 2.33
BEA UNION INVESTMENT SERIES
INVESTMENT REPORTAS AT 31 DECEMBER 2018 (CONTINUED)
BEA UNION INVESTMENT SERIES
INVESTMENT REPORTAS AT 31 DECEMBER 2018 (CONTINUED)
37 38
A5請縮小打印70.5%
BEA Union Investment China High Yield Income Fund (continued)
Investment portfolio (continued)
Nominal value Market value % of net assetsUS$
Listed/quoted investments (97.07%) (continued)
Debt securities (97.07%) (continued)
Denominated in United States Dollar (97.07%) (continued)
Lai Fung Bonds 2018 Ltd 5.65% 18/01/2023 400,000 381,741 1.06Logan Property Holdings Co Ltd 6.875%
24/04/2021 300,000 297,751 0.83Logan Property Holdings Co Ltd 7.50% 27/08/2021 500,000 505,417 1.41Logan Property Holdings Co Ltd 8.75% 12/12/2020 200,000 205,510 0.57LSD Bonds 2017 Ltd 4.60% 13/09/2022 200,000 192,344 0.54Medco Straits Services Pte Ltd 8.50% 17/08/2022 400,000 404,628 1.13Moon Wise Global Ltd 9.00% Perpetual Callable-
28/01/2019 800,000 827,096 2.30New Metro Global Ltd 4.75% 11/02/2019 800,000 814,824 2.27New Metro Global Ltd 6.50% 23/04/2021 400,000 393,611 1.10Perusahaan Listrik Negara Persero Pt 5.375%
25/01/2029 400,000 404,766 1.13Powerlong Real Estate Holdings Ltd 5.95%
19/07/2020 200,000 197,603 0.55RKI Overseas Finance 2016 A Ltd 5.00%
09/08/2019 1,000,000 1,016,152 2.83Shimao Property Holdings Ltd 6.375% 15/10/2021 400,000 404,803 1.13Shimao Property Holdings Ltd 8.375% 10/02/2022 900,000 964,325 2.68Studio City Co Ltd 7.25% 30/11/2021 200,000 205,593 0.57
BEA Union Investment China High Yield Income Fund (continued)
Investment portfolio (continued)
Nominal value Market value % of net assetsUS$
Listed/quoted investments (97.07%) (continued)
Debt securities (97.07%) (continued)
Denominated in United States Dollar (97.07%) (continued)
Sunac China Holdings Ltd 6.875% 08/08/2020 300,000 303,771 0.85Sunac China Holdings Ltd 8.625% 27/07/2020 800,000 835,237 2.33Sunac China Holdings Ltd 8.75% 05/12/2019 200,000 205,664 0.57Times Property Holdings Ltd10.95% 27/11/2020 400,000 422,333 1.18Times Property Holdings Ltd 6.25% 17/01/2021 300,000 297,448 0.83Times Property Holdings Ltd 6.25% 23/01/2020 1,000,000 1,018,251 2.83Times Property Holdings Ltd 7.85% 04/06/2021 200,000 197,541 0.55Trillion Chance Ltd (BVI) 5% 13/02/2019 700,000 713,264 1.99Trillion Chance Ltd (BVI) 5% 13/02/2019 900,000 919,768 2.56United States Treasury Bill 0.00% 15/01/2019 700,000 699,433 1.95Vedanta Resources PLC 6.375% 30/07/2022 600,000 555,552 1.55Vedanta Resources PLC 7.125% 31/05/2023 200,000 181,470 0.50Vedanta Resources PLC 8.25% 07/06/2021 800,000 801,768 2.23West China Cement Ltd 6.50% 11/09/2019 600,000 493,120 1.37Wisdom Glory Group Ltd 5.25% Perpetual
Callable-19/07/2020 200,000 197,839 0.55WTT Investment Ltd/Hong Kong 5.50% 21/11/2022 500,000 490,881 1.37Yancoal International Resources Development Co
Ltd 5.75% Perpetual Callable-13/04/2020 1,000,000 1,002,558 2.79Yuzhou Properties Co Ltd 6.375% 06/03/2021 1,000,000 994,825 2.77Yuzhou Properties Co Ltd 7.90% 11/05/2021 800,000 804,634 2.24
Total debt securities 34,855,759 97.07
Total investments 34,855,759 97.07
Total investments, at cost 34,630,801
BEA UNION INVESTMENT SERIES
INVESTMENT REPORTAS AT 31 DECEMBER 2018 (CONTINUED)
BEA UNION INVESTMENT SERIES
INVESTMENT REPORTAS AT 31 DECEMBER 2018 (CONTINUED)
39 40
A5請縮小打印70.5%
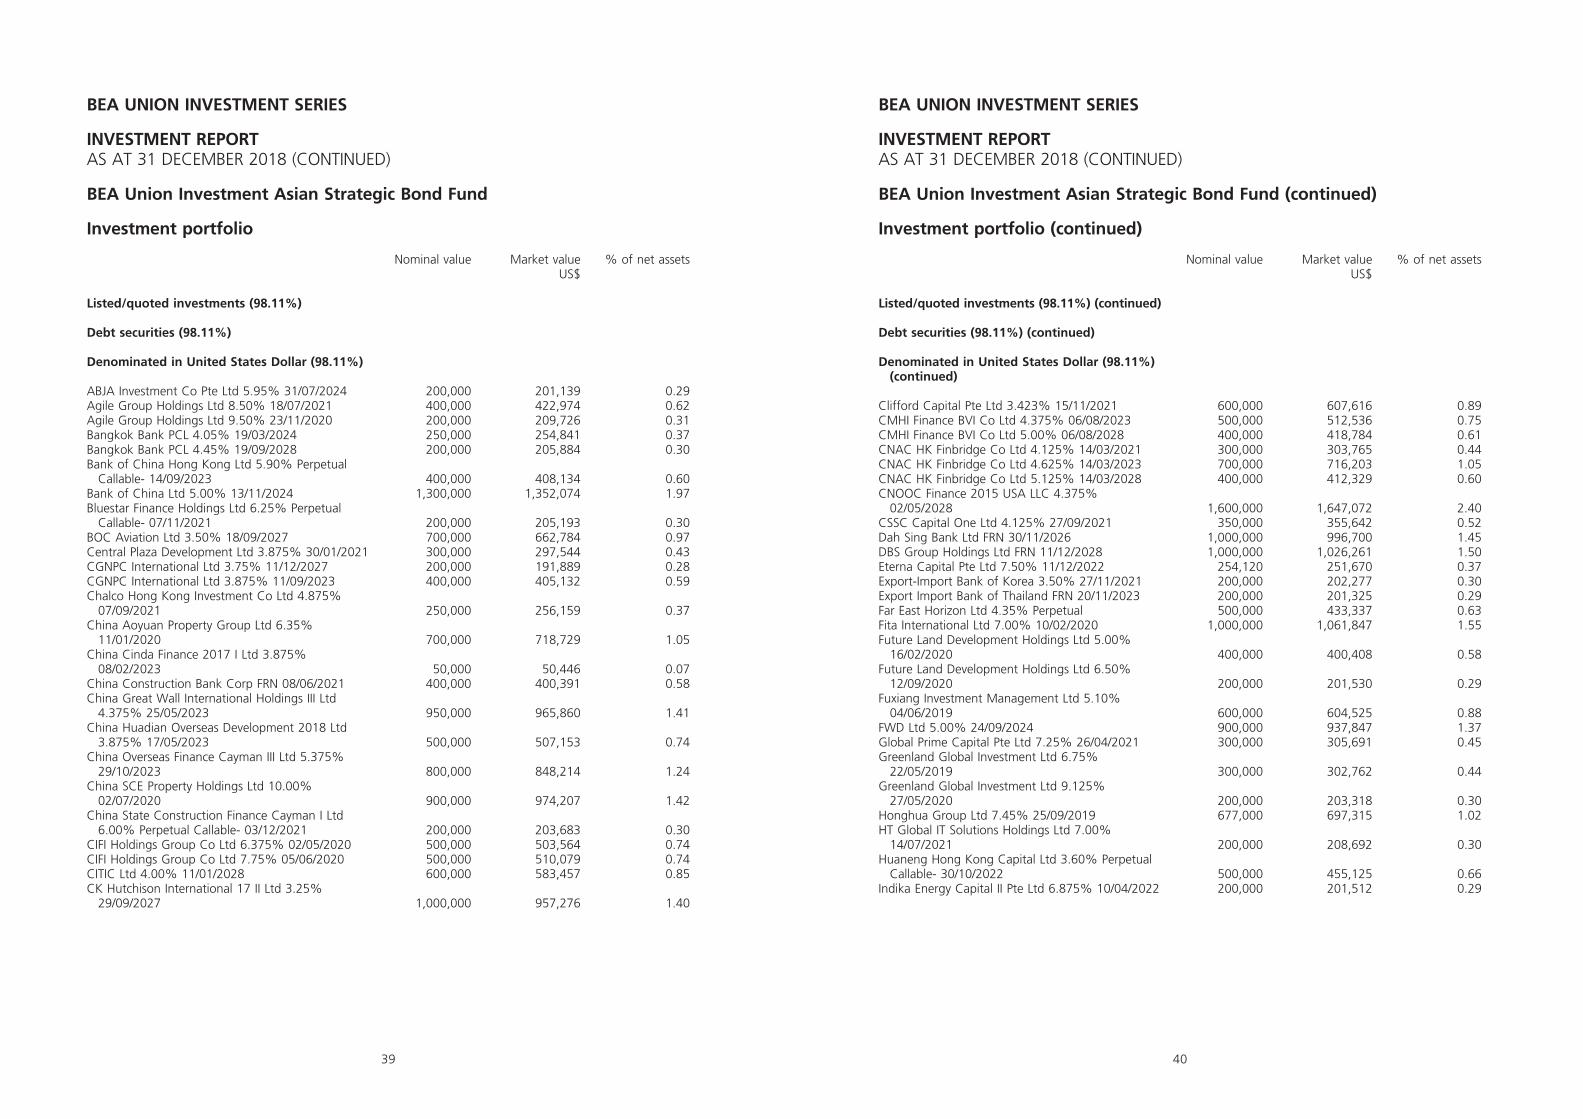
BEA Union Investment Asian Strategic Bond Fund
Investment portfolio
Nominal value Market value % of net assetsUS$
Listed/quoted investments (98.11%)
Debt securities (98.11%)
Denominated in United States Dollar (98.11%)
ABJA Investment Co Pte Ltd 5.95% 31/07/2024 200,000 201,139 0.29Agile Group Holdings Ltd 8.50% 18/07/2021 400,000 422,974 0.62Agile Group Holdings Ltd 9.50% 23/11/2020 200,000 209,726 0.31Bangkok Bank PCL 4.05% 19/03/2024 250,000 254,841 0.37Bangkok Bank PCL 4.45% 19/09/2028 200,000 205,884 0.30Bank of China Hong Kong Ltd 5.90% Perpetual
Callable- 14/09/2023 400,000 408,134 0.60Bank of China Ltd 5.00% 13/11/2024 1,300,000 1,352,074 1.97Bluestar Finance Holdings Ltd 6.25% Perpetual
Callable- 07/11/2021 200,000 205,193 0.30BOC Aviation Ltd 3.50% 18/09/2027 700,000 662,784 0.97Central Plaza Development Ltd 3.875% 30/01/2021 300,000 297,544 0.43CGNPC International Ltd 3.75% 11/12/2027 200,000 191,889 0.28CGNPC International Ltd 3.875% 11/09/2023 400,000 405,132 0.59Chalco Hong Kong Investment Co Ltd 4.875%
07/09/2021 250,000 256,159 0.37China Aoyuan Property Group Ltd 6.35%
11/01/2020 700,000 718,729 1.05China Cinda Finance 2017 I Ltd 3.875%
08/02/2023 50,000 50,446 0.07China Construction Bank Corp FRN 08/06/2021 400,000 400,391 0.58China Great Wall International Holdings III Ltd
4.375% 25/05/2023 950,000 965,860 1.41China Huadian Overseas Development 2018 Ltd
3.875% 17/05/2023 500,000 507,153 0.74China Overseas Finance Cayman III Ltd 5.375%
29/10/2023 800,000 848,214 1.24China SCE Property Holdings Ltd 10.00%
02/07/2020 900,000 974,207 1.42China State Construction Finance Cayman I Ltd
6.00% Perpetual Callable- 03/12/2021 200,000 203,683 0.30CIFI Holdings Group Co Ltd 6.375% 02/05/2020 500,000 503,564 0.74CIFI Holdings Group Co Ltd 7.75% 05/06/2020 500,000 510,079 0.74CITIC Ltd 4.00% 11/01/2028 600,000 583,457 0.85CK Hutchison International 17 II Ltd 3.25%
29/09/2027 1,000,000 957,276 1.40
BEA Union Investment Asian Strategic Bond Fund (continued)
Investment portfolio (continued)
Nominal value Market value % of net assetsUS$
Listed/quoted investments (98.11%) (continued)
Debt securities (98.11%) (continued)
Denominated in United States Dollar (98.11%) (continued)
Clifford Capital Pte Ltd 3.423% 15/11/2021 600,000 607,616 0.89CMHI Finance BVI Co Ltd 4.375% 06/08/2023 500,000 512,536 0.75CMHI Finance BVI Co Ltd 5.00% 06/08/2028 400,000 418,784 0.61CNAC HK Finbridge Co Ltd 4.125% 14/03/2021 300,000 303,765 0.44CNAC HK Finbridge Co Ltd 4.625% 14/03/2023 700,000 716,203 1.05CNAC HK Finbridge Co Ltd 5.125% 14/03/2028 400,000 412,329 0.60CNOOC Finance 2015 USA LLC 4.375%
02/05/2028 1,600,000 1,647,072 2.40CSSC Capital One Ltd 4.125% 27/09/2021 350,000 355,642 0.52Dah Sing Bank Ltd FRN 30/11/2026 1,000,000 996,700 1.45DBS Group Holdings Ltd FRN 11/12/2028 1,000,000 1,026,261 1.50Eterna Capital Pte Ltd 7.50% 11/12/2022 254,120 251,670 0.37Export-Import Bank of Korea 3.50% 27/11/2021 200,000 202,277 0.30Export Import Bank of Thailand FRN 20/11/2023 200,000 201,325 0.29Far East Horizon Ltd 4.35% Perpetual 500,000 433,337 0.63Fita International Ltd 7.00% 10/02/2020 1,000,000 1,061,847 1.55Future Land Development Holdings Ltd 5.00%
16/02/2020 400,000 400,408 0.58Future Land Development Holdings Ltd 6.50%
12/09/2020 200,000 201,530 0.29Fuxiang Investment Management Ltd 5.10%
04/06/2019 600,000 604,525 0.88FWD Ltd 5.00% 24/09/2024 900,000 937,847 1.37Global Prime Capital Pte Ltd 7.25% 26/04/2021 300,000 305,691 0.45Greenland Global Investment Ltd 6.75%
22/05/2019 300,000 302,762 0.44Greenland Global Investment Ltd 9.125%
27/05/2020 200,000 203,318 0.30Honghua Group Ltd 7.45% 25/09/2019 677,000 697,315 1.02HT Global IT Solutions Holdings Ltd 7.00%
14/07/2021 200,000 208,692 0.30Huaneng Hong Kong Capital Ltd 3.60% Perpetual
Callable- 30/10/2022 500,000 455,125 0.66Indika Energy Capital II Pte Ltd 6.875% 10/04/2022 200,000 201,512 0.29
BEA UNION INVESTMENT SERIES
INVESTMENT REPORTAS AT 31 DECEMBER 2018 (CONTINUED)
BEA UNION INVESTMENT SERIES
INVESTMENT REPORTAS AT 31 DECEMBER 2018 (CONTINUED)
41 42
A5請縮小打印70.5%
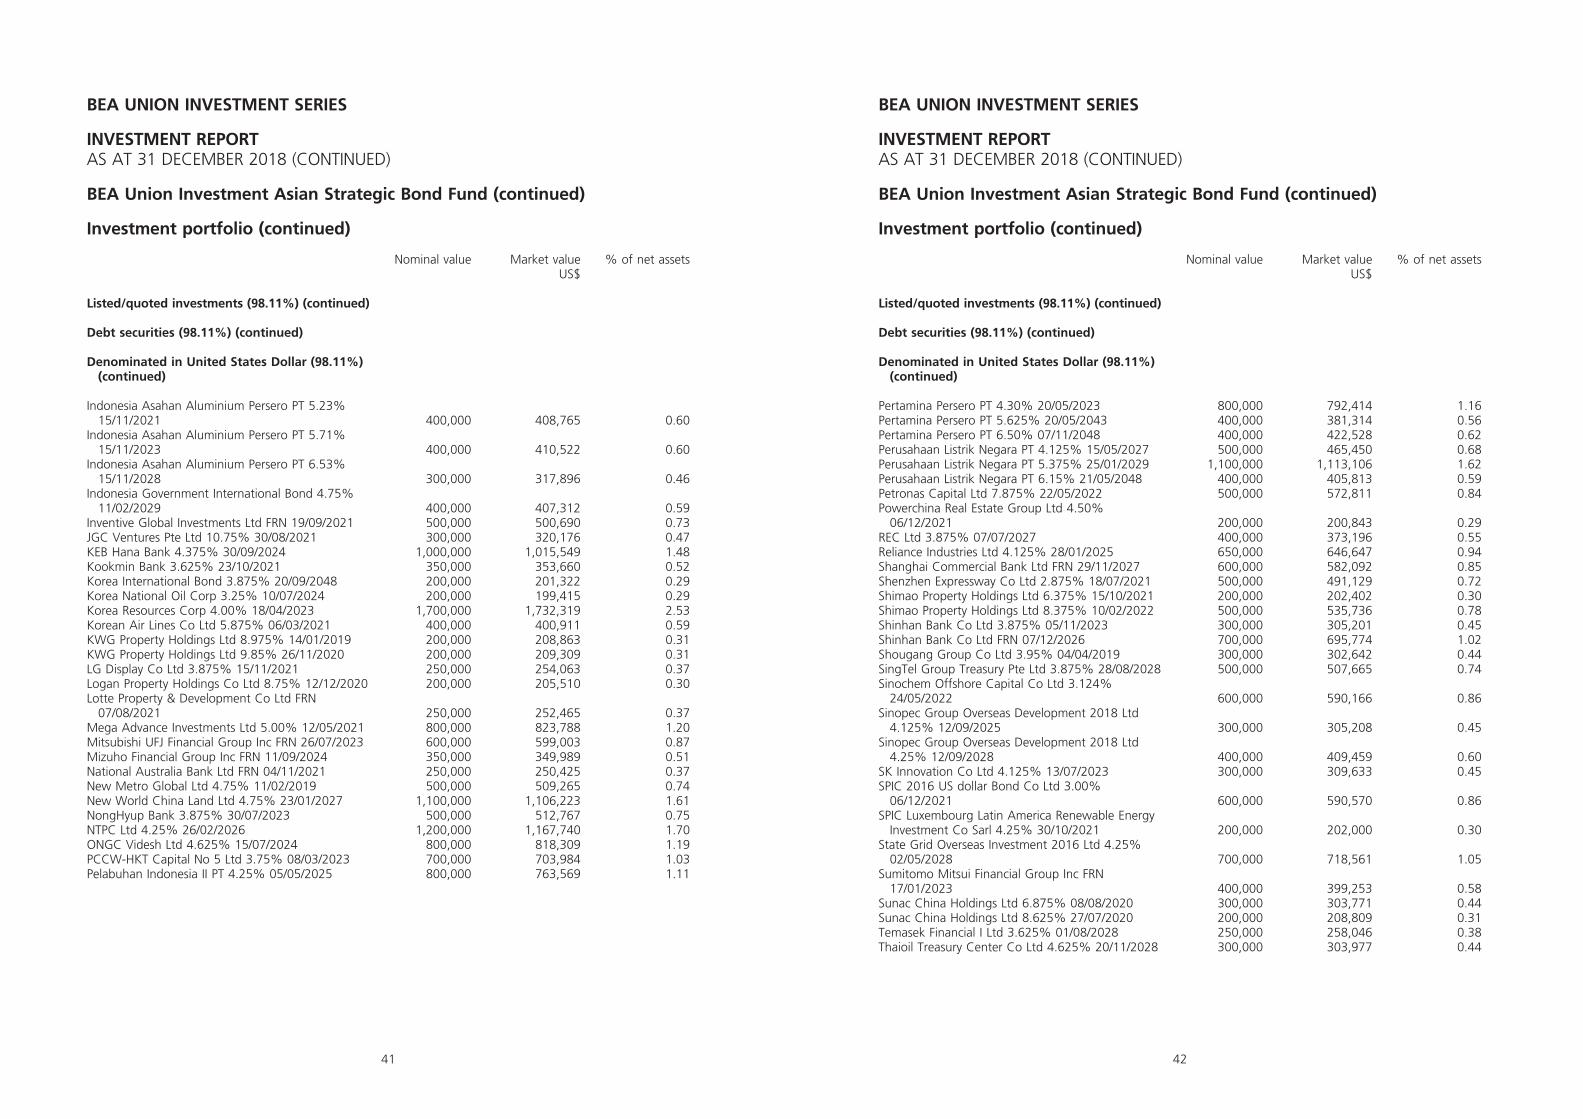
BEA Union Investment Asian Strategic Bond Fund (continued)
Investment portfolio (continued)
Nominal value Market value % of net assetsUS$
Listed/quoted investments (98.11%) (continued)
Debt securities (98.11%) (continued)
Denominated in United States Dollar (98.11%) (continued)
Indonesia Asahan Aluminium Persero PT 5.23% 15/11/2021 400,000 408,765 0.60
Indonesia Asahan Aluminium Persero PT 5.71% 15/11/2023 400,000 410,522 0.60
Indonesia Asahan Aluminium Persero PT 6.53% 15/11/2028 300,000 317,896 0.46
Indonesia Government International Bond 4.75% 11/02/2029 400,000 407,312 0.59
Inventive Global Investments Ltd FRN 19/09/2021 500,000 500,690 0.73JGC Ventures Pte Ltd 10.75% 30/08/2021 300,000 320,176 0.47KEB Hana Bank 4.375% 30/09/2024 1,000,000 1,015,549 1.48Kookmin Bank 3.625% 23/10/2021 350,000 353,660 0.52Korea International Bond 3.875% 20/09/2048 200,000 201,322 0.29Korea National Oil Corp 3.25% 10/07/2024 200,000 199,415 0.29Korea Resources Corp 4.00% 18/04/2023 1,700,000 1,732,319 2.53Korean Air Lines Co Ltd 5.875% 06/03/2021 400,000 400,911 0.59KWG Property Holdings Ltd 8.975% 14/01/2019 200,000 208,863 0.31KWG Property Holdings Ltd 9.85% 26/11/2020 200,000 209,309 0.31LG Display Co Ltd 3.875% 15/11/2021 250,000 254,063 0.37Logan Property Holdings Co Ltd 8.75% 12/12/2020 200,000 205,510 0.30Lotte Property & Development Co Ltd FRN
07/08/2021 250,000 252,465 0.37Mega Advance Investments Ltd 5.00% 12/05/2021 800,000 823,788 1.20Mitsubishi UFJ Financial Group Inc FRN 26/07/2023 600,000 599,003 0.87Mizuho Financial Group Inc FRN 11/09/2024 350,000 349,989 0.51National Australia Bank Ltd FRN 04/11/2021 250,000 250,425 0.37New Metro Global Ltd 4.75% 11/02/2019 500,000 509,265 0.74New World China Land Ltd 4.75% 23/01/2027 1,100,000 1,106,223 1.61NongHyup Bank 3.875% 30/07/2023 500,000 512,767 0.75NTPC Ltd 4.25% 26/02/2026 1,200,000 1,167,740 1.70ONGC Videsh Ltd 4.625% 15/07/2024 800,000 818,309 1.19PCCW-HKT Capital No 5 Ltd 3.75% 08/03/2023 700,000 703,984 1.03Pelabuhan Indonesia II PT 4.25% 05/05/2025 800,000 763,569 1.11
BEA Union Investment Asian Strategic Bond Fund (continued)
Investment portfolio (continued)
Nominal value Market value % of net assetsUS$
Listed/quoted investments (98.11%) (continued)
Debt securities (98.11%) (continued)
Denominated in United States Dollar (98.11%) (continued)
Pertamina Persero PT 4.30% 20/05/2023 800,000 792,414 1.16Pertamina Persero PT 5.625% 20/05/2043 400,000 381,314 0.56Pertamina Persero PT 6.50% 07/11/2048 400,000 422,528 0.62Perusahaan Listrik Negara PT 4.125% 15/05/2027 500,000 465,450 0.68Perusahaan Listrik Negara PT 5.375% 25/01/2029 1,100,000 1,113,106 1.62Perusahaan Listrik Negara PT 6.15% 21/05/2048 400,000 405,813 0.59Petronas Capital Ltd 7.875% 22/05/2022 500,000 572,811 0.84Powerchina Real Estate Group Ltd 4.50%
06/12/2021 200,000 200,843 0.29REC Ltd 3.875% 07/07/2027 400,000 373,196 0.55Reliance Industries Ltd 4.125% 28/01/2025 650,000 646,647 0.94Shanghai Commercial Bank Ltd FRN 29/11/2027 600,000 582,092 0.85Shenzhen Expressway Co Ltd 2.875% 18/07/2021 500,000 491,129 0.72Shimao Property Holdings Ltd 6.375% 15/10/2021 200,000 202,402 0.30Shimao Property Holdings Ltd 8.375% 10/02/2022 500,000 535,736 0.78Shinhan Bank Co Ltd 3.875% 05/11/2023 300,000 305,201 0.45Shinhan Bank Co Ltd FRN 07/12/2026 700,000 695,774 1.02Shougang Group Co Ltd 3.95% 04/04/2019 300,000 302,642 0.44SingTel Group Treasury Pte Ltd 3.875% 28/08/2028 500,000 507,665 0.74Sinochem Offshore Capital Co Ltd 3.124%
24/05/2022 600,000 590,166 0.86Sinopec Group Overseas Development 2018 Ltd
4.125% 12/09/2025 300,000 305,208 0.45Sinopec Group Overseas Development 2018 Ltd
4.25% 12/09/2028 400,000 409,459 0.60SK Innovation Co Ltd 4.125% 13/07/2023 300,000 309,633 0.45SPIC 2016 US dollar Bond Co Ltd 3.00%
06/12/2021 600,000 590,570 0.86SPIC Luxembourg Latin America Renewable Energy
Investment Co Sarl 4.25% 30/10/2021 200,000 202,000 0.30State Grid Overseas Investment 2016 Ltd 4.25%
02/05/2028 700,000 718,561 1.05Sumitomo Mitsui Financial Group Inc FRN
17/01/2023 400,000 399,253 0.58Sunac China Holdings Ltd 6.875% 08/08/2020 300,000 303,771 0.44Sunac China Holdings Ltd 8.625% 27/07/2020 200,000 208,809 0.31Temasek Financial I Ltd 3.625% 01/08/2028 250,000 258,046 0.38Thaioil Treasury Center Co Ltd 4.625% 20/11/2028 300,000 303,977 0.44

BEA UNION INVESTMENT SERIES
INVESTMENT REPORTAS AT 31 DECEMBER 2018 (CONTINUED)
BEA UNION INVESTMENT SERIES
INVESTMENT REPORTAS AT 31 DECEMBER 2018 (CONTINUED)
43 44
A5請縮小打印70.5%
BEA Union Investment Asian Strategic Bond Fund (continued)
Investment portfolio (continued)
Nominal value Market value % of net assetsUS$
Listed/quoted investments (98.11%) (continued)
Debt securities (98.11%) (continued)
Denominated in United States Dollar (98.11%) (continued)
Thaioil Treasury Center Co Ltd 4.875% 23/01/2043 1,450,000 1,441,700 2.10Times Property Holdings Ltd10.95% 27/11/2020 200,000 211,166 0.31Times Property Holdings Ltd 6.25% 23/01/2020 400,000 407,300 0.59TNB Global Ventures Capital Bhd 4.851%
01/11/2028 800,000 822,020 1.20Trillion Chance Ltd (BVI) 5.00% 13/02/2019 500,000 509,474 0.74Trillion Chance Ltd (BVI) 7.50% 08/10/2019 300,000 306,589 0.45United States Treasury Bill 0.00% 15/01/2019 500,000 499,595 0.73United States Treasury Bill 0.00% 19/02/2019 500,000 498,432 0.73United States Treasury Bill 0.00% 21/02/2019 500,000 498,367 0.73United States Treasury Bill 0.00% 28/02/2019 500,000 498,140 0.73United States Treasury Note 2.875% 15/08/2028 1,000,000 1,026,797 1.50United States Treasury Note 3.125% 15/11/2028 700,000 729,364 1.06United States Treasury Note 3.375% 15/11/2048 200,000 214,970 0.31Vedanta Resources PLC 8.25% 07/06/2021 900,000 901,989 1.32West China Cement Ltd 6.50% 11/09/2019 600,000 493,120 0.72Wisdom Glory Group Ltd 5.25% Perpetual Callable-
19/07/2020 500,000 494,597 0.72Woori Bank 4.75% 30/04/2024 1,000,000 1,016,899 1.48WTT Investment Ltd 5.50% 21/11/2022 500,000 490,881 0.72Yancoal International Resources Development Co
Ltd 5.75% Perpetual Callable- 13/04/2020 800,000 802,047 1.17Yuzhou Properties Co Ltd 7.90% 11/05/2021 800,000 804,634 1.17
Total debt securities 67,230,727 98.11
Total investments 67,230,727 98.11
Total investments, at cost 66,936,291
BEA Union Investment Asia Pacific Equity Dividend Fund
Investment portfolio
Holding shares/units Market value % of net assets
US$
Listed/quoted investments (94.85%)
Equities (92.36%)
Australia (1.23%)
Northern Star Resources Ltd 34,411 223,842 0.65Rio Tinto Ltd 3,662 202,299 0.58
China (1.96%)
China International Travel Service Corp Ltd – A 18,300 160,350 0.46Daqin Railway Co Ltd – A 89,699 107,451 0.31Foshan Haitian Flavouring & Food Co Ltd – A 19,600 196,275 0.57Jiangsu Hengrui Medicine Co Ltd – A 11,400 87,528 0.25Ping An Insurance Group Co of China Ltd – A 15,700 128,199 0.37
Hong Kong (35.51%)
Agricultural Bank of China Ltd – H 690,000 302,287 0.87AIA Group Ltd 171,200 1,421,324 4.11Air China Ltd – H 142,000 123,694 0.36Anhui Conch Cement Co Ltd – H 51,000 247,531 0.71China Communications Services Corp Ltd – H 194,000 160,566 0.46China Construction Bank Corp – H 1,194,000 985,174 2.85China Gas Holdings Ltd 77,200 275,104 0.79China Mengniu Dairy Co Ltd 28,000 87,262 0.25China Merchants Bank Co Ltd – H 75,500 276,761 0.80China Mobile Ltd 20,500 197,294 0.57China Overseas Land & Investment Ltd 100,000 343,580 0.99China Railway Group Ltd – H 202,000 183,957 0.53China Unicom Hong Kong Ltd 34,000 36,305 0.10
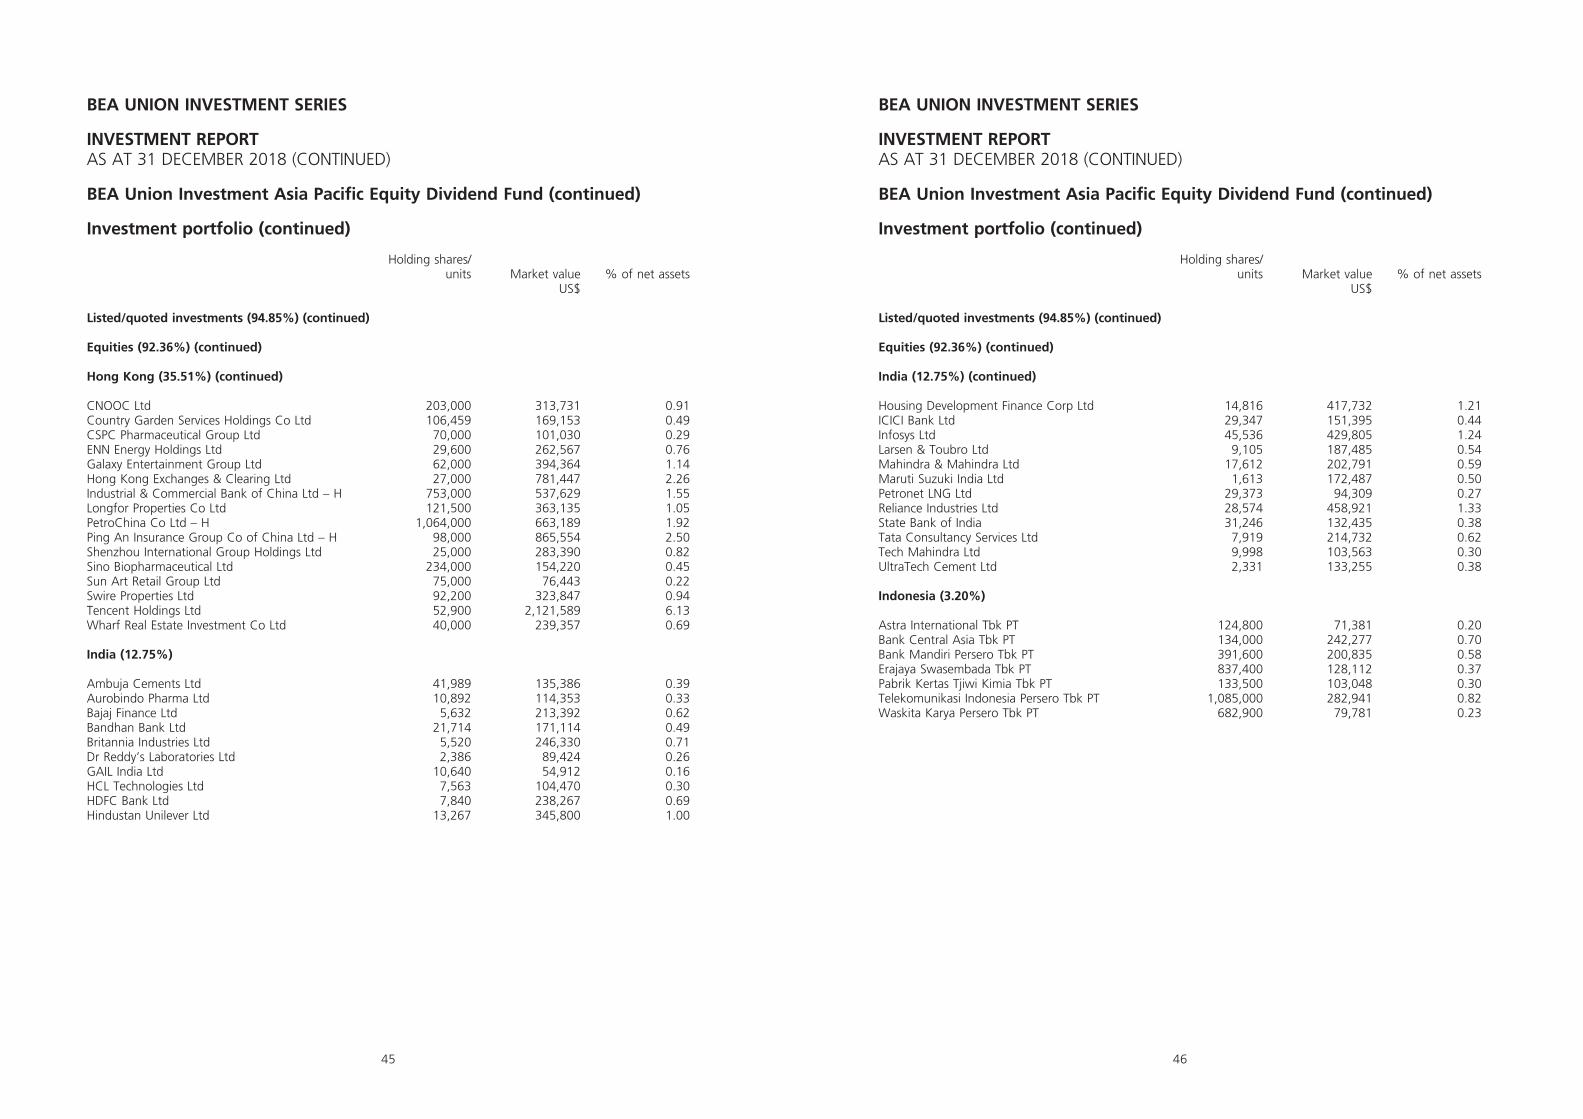
BEA UNION INVESTMENT SERIES
INVESTMENT REPORTAS AT 31 DECEMBER 2018 (CONTINUED)
BEA UNION INVESTMENT SERIES
INVESTMENT REPORTAS AT 31 DECEMBER 2018 (CONTINUED)
45 46
A5請縮小打印70.5%
BEA Union Investment Asia Pacific Equity Dividend Fund (continued)
Investment portfolio (continued)
Holding shares/units Market value % of net assets
US$
Listed/quoted investments (94.85%) (continued)
Equities (92.36%) (continued)
Hong Kong (35.51%) (continued)
CNOOC Ltd 203,000 313,731 0.91Country Garden Services Holdings Co Ltd 106,459 169,153 0.49CSPC Pharmaceutical Group Ltd 70,000 101,030 0.29ENN Energy Holdings Ltd 29,600 262,567 0.76Galaxy Entertainment Group Ltd 62,000 394,364 1.14Hong Kong Exchanges & Clearing Ltd 27,000 781,447 2.26Industrial & Commercial Bank of China Ltd – H 753,000 537,629 1.55Longfor Properties Co Ltd 121,500 363,135 1.05PetroChina Co Ltd – H 1,064,000 663,189 1.92Ping An Insurance Group Co of China Ltd – H 98,000 865,554 2.50Shenzhou International Group Holdings Ltd 25,000 283,390 0.82Sino Biopharmaceutical Ltd 234,000 154,220 0.45Sun Art Retail Group Ltd 75,000 76,443 0.22Swire Properties Ltd 92,200 323,847 0.94Tencent Holdings Ltd 52,900 2,121,589 6.13Wharf Real Estate Investment Co Ltd 40,000 239,357 0.69
India (12.75%)
Ambuja Cements Ltd 41,989 135,386 0.39Aurobindo Pharma Ltd 10,892 114,353 0.33Bajaj Finance Ltd 5,632 213,392 0.62Bandhan Bank Ltd 21,714 171,114 0.49Britannia Industries Ltd 5,520 246,330 0.71Dr Reddy’s Laboratories Ltd 2,386 89,424 0.26GAIL India Ltd 10,640 54,912 0.16HCL Technologies Ltd 7,563 104,470 0.30HDFC Bank Ltd 7,840 238,267 0.69Hindustan Unilever Ltd 13,267 345,800 1.00
BEA Union Investment Asia Pacific Equity Dividend Fund (continued)
Investment portfolio (continued)
Holding shares/units Market value % of net assets
US$
Listed/quoted investments (94.85%) (continued)
Equities (92.36%) (continued)
India (12.75%) (continued)
Housing Development Finance Corp Ltd 14,816 417,732 1.21ICICI Bank Ltd 29,347 151,395 0.44Infosys Ltd 45,536 429,805 1.24Larsen & Toubro Ltd 9,105 187,485 0.54Mahindra & Mahindra Ltd 17,612 202,791 0.59Maruti Suzuki India Ltd 1,613 172,487 0.50Petronet LNG Ltd 29,373 94,309 0.27Reliance Industries Ltd 28,574 458,921 1.33State Bank of India 31,246 132,435 0.38Tata Consultancy Services Ltd 7,919 214,732 0.62Tech Mahindra Ltd 9,998 103,563 0.30UltraTech Cement Ltd 2,331 133,255 0.38
Indonesia (3.20%)
Astra International Tbk PT 124,800 71,381 0.20Bank Central Asia Tbk PT 134,000 242,277 0.70Bank Mandiri Persero Tbk PT 391,600 200,835 0.58Erajaya Swasembada Tbk PT 837,400 128,112 0.37Pabrik Kertas Tjiwi Kimia Tbk PT 133,500 103,048 0.30Telekomunikasi Indonesia Persero Tbk PT 1,085,000 282,941 0.82Waskita Karya Persero Tbk PT 682,900 79,781 0.23

BEA UNION INVESTMENT SERIES
INVESTMENT REPORTAS AT 31 DECEMBER 2018 (CONTINUED)
BEA UNION INVESTMENT SERIES
INVESTMENT REPORTAS AT 31 DECEMBER 2018 (CONTINUED)
47 48
A5請縮小打印70.5%
BEA Union Investment Asia Pacific Equity Dividend Fund (continued)
Investment portfolio (continued)
Holding shares/units Market value % of net assets
US$
Listed/quoted investments (94.85%) (continued)
Equities (92.36%) (continued)
Korea (12.55%)
Doosan Bobcat Inc 5,002 141,211 0.41Hyundai Heavy Industries Co Ltd 1,107 127,487 0.37Hyundai Heavy Industries Holdings Co Ltd 670 207,762 0.60Hyundai Marine & Fire Insurance Co Ltd 2,705 99,516 0.29Jeju Air Co Ltd 3,073 92,400 0.27KB Financial Group Inc 4,088 170,364 0.49Korea Electric Power Corp 4,526 134,263 0.39LG Chem Ltd 1,496 465,239 1.34LG Electronics Inc 4,536 253,265 0.73LG Household & Health Care Ltd 103 101,634 0.29Macquarie Korea Infrastructure Fund 27,704 230,660 0.67Medy-Tox Inc 452 234,062 0.67POSCO 722 157,238 0.45Samsung Electro-Mechanics Co Ltd 2,011 186,538 0.54Samsung Electronics Co Ltd 45,975 1,594,584 4.61SK Hynix Inc 2,736 148,349 0.43
Malaysia (0.69%)
Dialog Group Bhd 315,900 237,737 0.69
Philippines (0.90%)
Ayala Land Inc 95,600 73,812 0.21BDO Unibank Inc 58,220 144,818 0.42SM Prime Holdings Inc 138,300 94,156 0.27
BEA Union Investment Asia Pacific Equity Dividend Fund (continued)
Investment portfolio (continued)
Holding shares/units Market value % of net assets
US$
Listed/quoted investments (94.85%) (continued)
Equities (92.36%) (continued)
Singapore (4.93%)
CapitaLand Ltd 60,700 138,501 0.40DBS Group Holdings Ltd 41,400 719,564 2.08Genting Singapore Ltd 322,000 230,338 0.66Keppel Corp Ltd 31,800 137,886 0.40Oversea-Chinese Banking Corp Ltd 46,400 383,319 1.11Singapore Technologies Engineering Ltd 37,700 96,532 0.28
Taiwan (12.09%)
Airtac International Group 8,000 78,212 0.23ASE Technology Holding Co Ltd 103,000 195,363 0.56ASPEED Technology Inc 10,000 191,300 0.55Chailease Holding Co Ltd 71,960 226,857 0.66CTBC Financial Holding Co Ltd 561,000 368,682 1.07Delta Electronics Inc 46,000 193,805 0.56Eclat Textile Co Ltd 25,000 283,046 0.82Feng TAY Enterprise Co Ltd 47,000 268,357 0.78Gourmet Master Co Ltd 11,000 73,722 0.21Largan Precision Co Ltd 1,000 104,597 0.30MediaTek Inc 37,000 276,262 0.80Realtek Semiconductor Corp 24,000 111,657 0.32Taiwan Semiconductor Manufacturing Co Ltd 230,000 1,687,376 4.87Wistron NeWeb Corp 47,920 124,566 0.36
Thailand (2.45%)
Airports of Thailand – NVDR 100,700 198,712 0.57Bangkok Dusit Medical Services PCL – NVDR 259,200 197,428 0.57CP All PCL 51,200 108,110 0.31Robinson PCL – NVDR 176,600 344,419 1.00
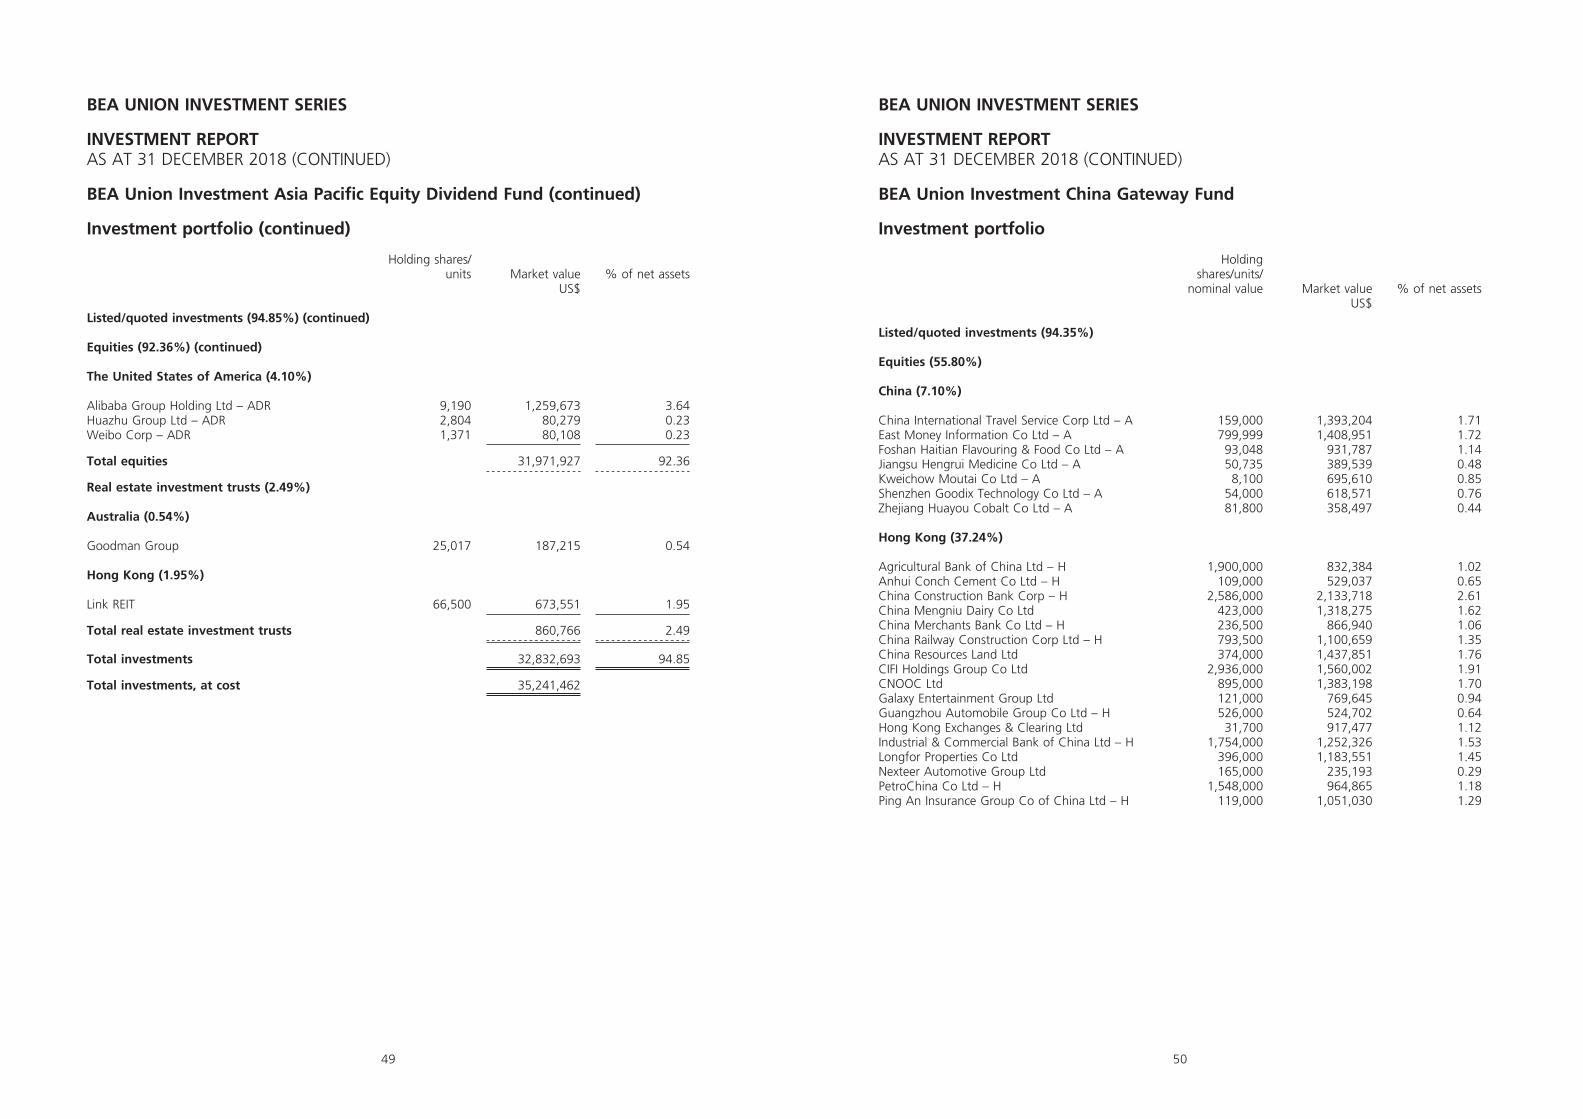
BEA UNION INVESTMENT SERIES
INVESTMENT REPORTAS AT 31 DECEMBER 2018 (CONTINUED)
BEA UNION INVESTMENT SERIES
INVESTMENT REPORTAS AT 31 DECEMBER 2018 (CONTINUED)
49 50
A5請縮小打印70.5%
BEA Union Investment Asia Pacific Equity Dividend Fund (continued)
Investment portfolio (continued)
Holding shares/units Market value % of net assets
US$
Listed/quoted investments (94.85%) (continued)
Equities (92.36%) (continued)
The United States of America (4.10%)
Alibaba Group Holding Ltd – ADR 9,190 1,259,673 3.64Huazhu Group Ltd – ADR 2,804 80,279 0.23Weibo Corp – ADR 1,371 80,108 0.23
Total equities 31,971,927 92.36
Real estate investment trusts (2.49%)
Australia (0.54%)
Goodman Group 25,017 187,215 0.54
Hong Kong (1.95%)
Link REIT 66,500 673,551 1.95
Total real estate investment trusts 860,766 2.49
Total investments 32,832,693 94.85
Total investments, at cost 35,241,462
BEA Union Investment China Gateway Fund
Investment portfolio
Holding shares/units/
nominal value Market value % of net assetsUS$
Listed/quoted investments (94.35%)
Equities (55.80%)
China (7.10%)
China International Travel Service Corp Ltd – A 159,000 1,393,204 1.71East Money Information Co Ltd – A 799,999 1,408,951 1.72Foshan Haitian Flavouring & Food Co Ltd – A 93,048 931,787 1.14Jiangsu Hengrui Medicine Co Ltd – A 50,735 389,539 0.48Kweichow Moutai Co Ltd – A 8,100 695,610 0.85Shenzhen Goodix Technology Co Ltd – A 54,000 618,571 0.76Zhejiang Huayou Cobalt Co Ltd – A 81,800 358,497 0.44
Hong Kong (37.24%)
Agricultural Bank of China Ltd – H 1,900,000 832,384 1.02Anhui Conch Cement Co Ltd – H 109,000 529,037 0.65China Construction Bank Corp – H 2,586,000 2,133,718 2.61China Mengniu Dairy Co Ltd 423,000 1,318,275 1.62China Merchants Bank Co Ltd – H 236,500 866,940 1.06China Railway Construction Corp Ltd – H 793,500 1,100,659 1.35China Resources Land Ltd 374,000 1,437,851 1.76CIFI Holdings Group Co Ltd 2,936,000 1,560,002 1.91CNOOC Ltd 895,000 1,383,198 1.70Galaxy Entertainment Group Ltd 121,000 769,645 0.94Guangzhou Automobile Group Co Ltd – H 526,000 524,702 0.64Hong Kong Exchanges & Clearing Ltd 31,700 917,477 1.12Industrial & Commercial Bank of China Ltd – H 1,754,000 1,252,326 1.53Longfor Properties Co Ltd 396,000 1,183,551 1.45Nexteer Automotive Group Ltd 165,000 235,193 0.29PetroChina Co Ltd – H 1,548,000 964,865 1.18Ping An Insurance Group Co of China Ltd – H 119,000 1,051,030 1.29
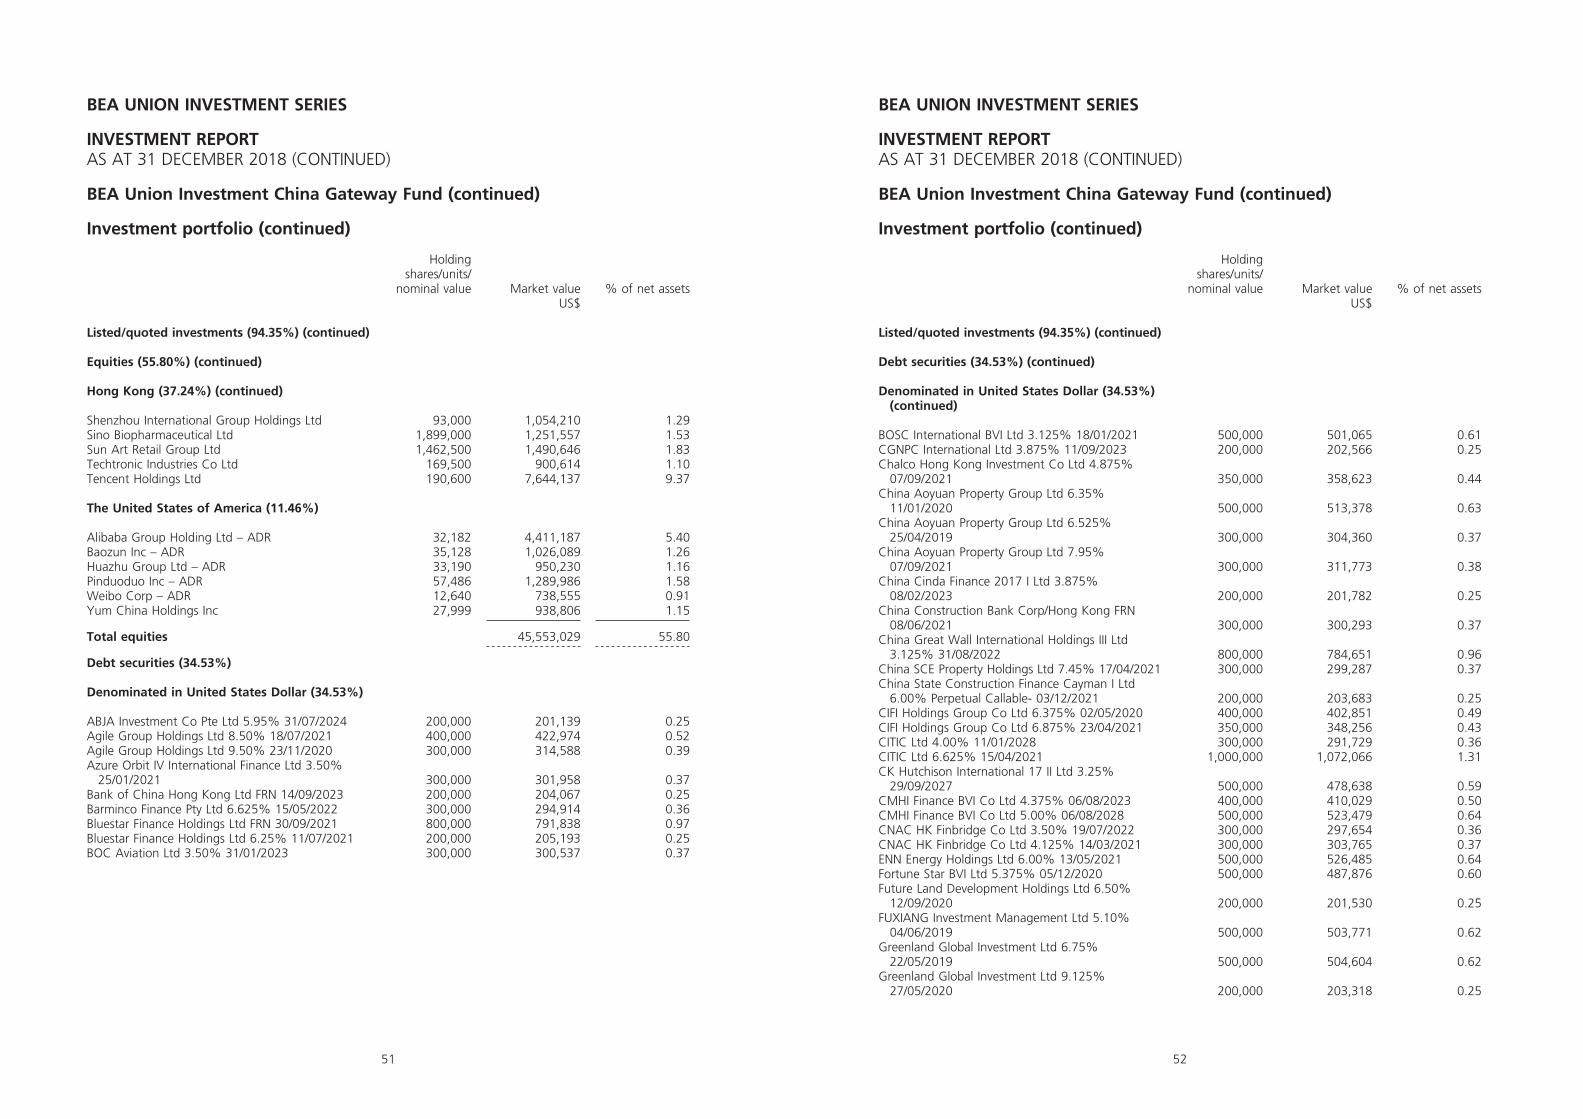
BEA UNION INVESTMENT SERIES
INVESTMENT REPORTAS AT 31 DECEMBER 2018 (CONTINUED)
BEA UNION INVESTMENT SERIES
INVESTMENT REPORTAS AT 31 DECEMBER 2018 (CONTINUED)
51 52
A5請縮小打印70.5%
BEA Union Investment China Gateway Fund (continued)
Investment portfolio (continued)
Holding shares/units/
nominal value Market value % of net assetsUS$
Listed/quoted investments (94.35%) (continued)
Equities (55.80%) (continued)
Hong Kong (37.24%) (continued)
Shenzhou International Group Holdings Ltd 93,000 1,054,210 1.29Sino Biopharmaceutical Ltd 1,899,000 1,251,557 1.53Sun Art Retail Group Ltd 1,462,500 1,490,646 1.83Techtronic Industries Co Ltd 169,500 900,614 1.10Tencent Holdings Ltd 190,600 7,644,137 9.37
The United States of America (11.46%)
Alibaba Group Holding Ltd – ADR 32,182 4,411,187 5.40Baozun Inc – ADR 35,128 1,026,089 1.26Huazhu Group Ltd – ADR 33,190 950,230 1.16Pinduoduo Inc – ADR 57,486 1,289,986 1.58Weibo Corp – ADR 12,640 738,555 0.91Yum China Holdings Inc 27,999 938,806 1.15
Total equities 45,553,029 55.80
Debt securities (34.53%)
Denominated in United States Dollar (34.53%)
ABJA Investment Co Pte Ltd 5.95% 31/07/2024 200,000 201,139 0.25Agile Group Holdings Ltd 8.50% 18/07/2021 400,000 422,974 0.52Agile Group Holdings Ltd 9.50% 23/11/2020 300,000 314,588 0.39Azure Orbit IV International Finance Ltd 3.50%
25/01/2021 300,000 301,958 0.37Bank of China Hong Kong Ltd FRN 14/09/2023 200,000 204,067 0.25Barminco Finance Pty Ltd 6.625% 15/05/2022 300,000 294,914 0.36Bluestar Finance Holdings Ltd FRN 30/09/2021 800,000 791,838 0.97Bluestar Finance Holdings Ltd 6.25% 11/07/2021 200,000 205,193 0.25BOC Aviation Ltd 3.50% 31/01/2023 300,000 300,537 0.37
BEA Union Investment China Gateway Fund (continued)
Investment portfolio (continued)
Holding shares/units/
nominal value Market value % of net assetsUS$
Listed/quoted investments (94.35%) (continued)
Debt securities (34.53%) (continued)
Denominated in United States Dollar (34.53%) (continued)
BOSC International BVI Ltd 3.125% 18/01/2021 500,000 501,065 0.61CGNPC International Ltd 3.875% 11/09/2023 200,000 202,566 0.25Chalco Hong Kong Investment Co Ltd 4.875%
07/09/2021 350,000 358,623 0.44China Aoyuan Property Group Ltd 6.35%
11/01/2020 500,000 513,378 0.63China Aoyuan Property Group Ltd 6.525%
25/04/2019 300,000 304,360 0.37China Aoyuan Property Group Ltd 7.95%
07/09/2021 300,000 311,773 0.38China Cinda Finance 2017 I Ltd 3.875%
08/02/2023 200,000 201,782 0.25China Construction Bank Corp/Hong Kong FRN
08/06/2021 300,000 300,293 0.37China Great Wall International Holdings III Ltd
3.125% 31/08/2022 800,000 784,651 0.96China SCE Property Holdings Ltd 7.45% 17/04/2021 300,000 299,287 0.37China State Construction Finance Cayman I Ltd
6.00% Perpetual Callable- 03/12/2021 200,000 203,683 0.25CIFI Holdings Group Co Ltd 6.375% 02/05/2020 400,000 402,851 0.49CIFI Holdings Group Co Ltd 6.875% 23/04/2021 350,000 348,256 0.43CITIC Ltd 4.00% 11/01/2028 300,000 291,729 0.36CITIC Ltd 6.625% 15/04/2021 1,000,000 1,072,066 1.31CK Hutchison International 17 II Ltd 3.25%
29/09/2027 500,000 478,638 0.59CMHI Finance BVI Co Ltd 4.375% 06/08/2023 400,000 410,029 0.50CMHI Finance BVI Co Ltd 5.00% 06/08/2028 500,000 523,479 0.64CNAC HK Finbridge Co Ltd 3.50% 19/07/2022 300,000 297,654 0.36CNAC HK Finbridge Co Ltd 4.125% 14/03/2021 300,000 303,765 0.37ENN Energy Holdings Ltd 6.00% 13/05/2021 500,000 526,485 0.64Fortune Star BVI Ltd 5.375% 05/12/2020 500,000 487,876 0.60Future Land Development Holdings Ltd 6.50%
12/09/2020 200,000 201,530 0.25FUXIANG Investment Management Ltd 5.10%
04/06/2019 500,000 503,771 0.62Greenland Global Investment Ltd 6.75%
22/05/2019 500,000 504,604 0.62Greenland Global Investment Ltd 9.125%
27/05/2020 200,000 203,318 0.25
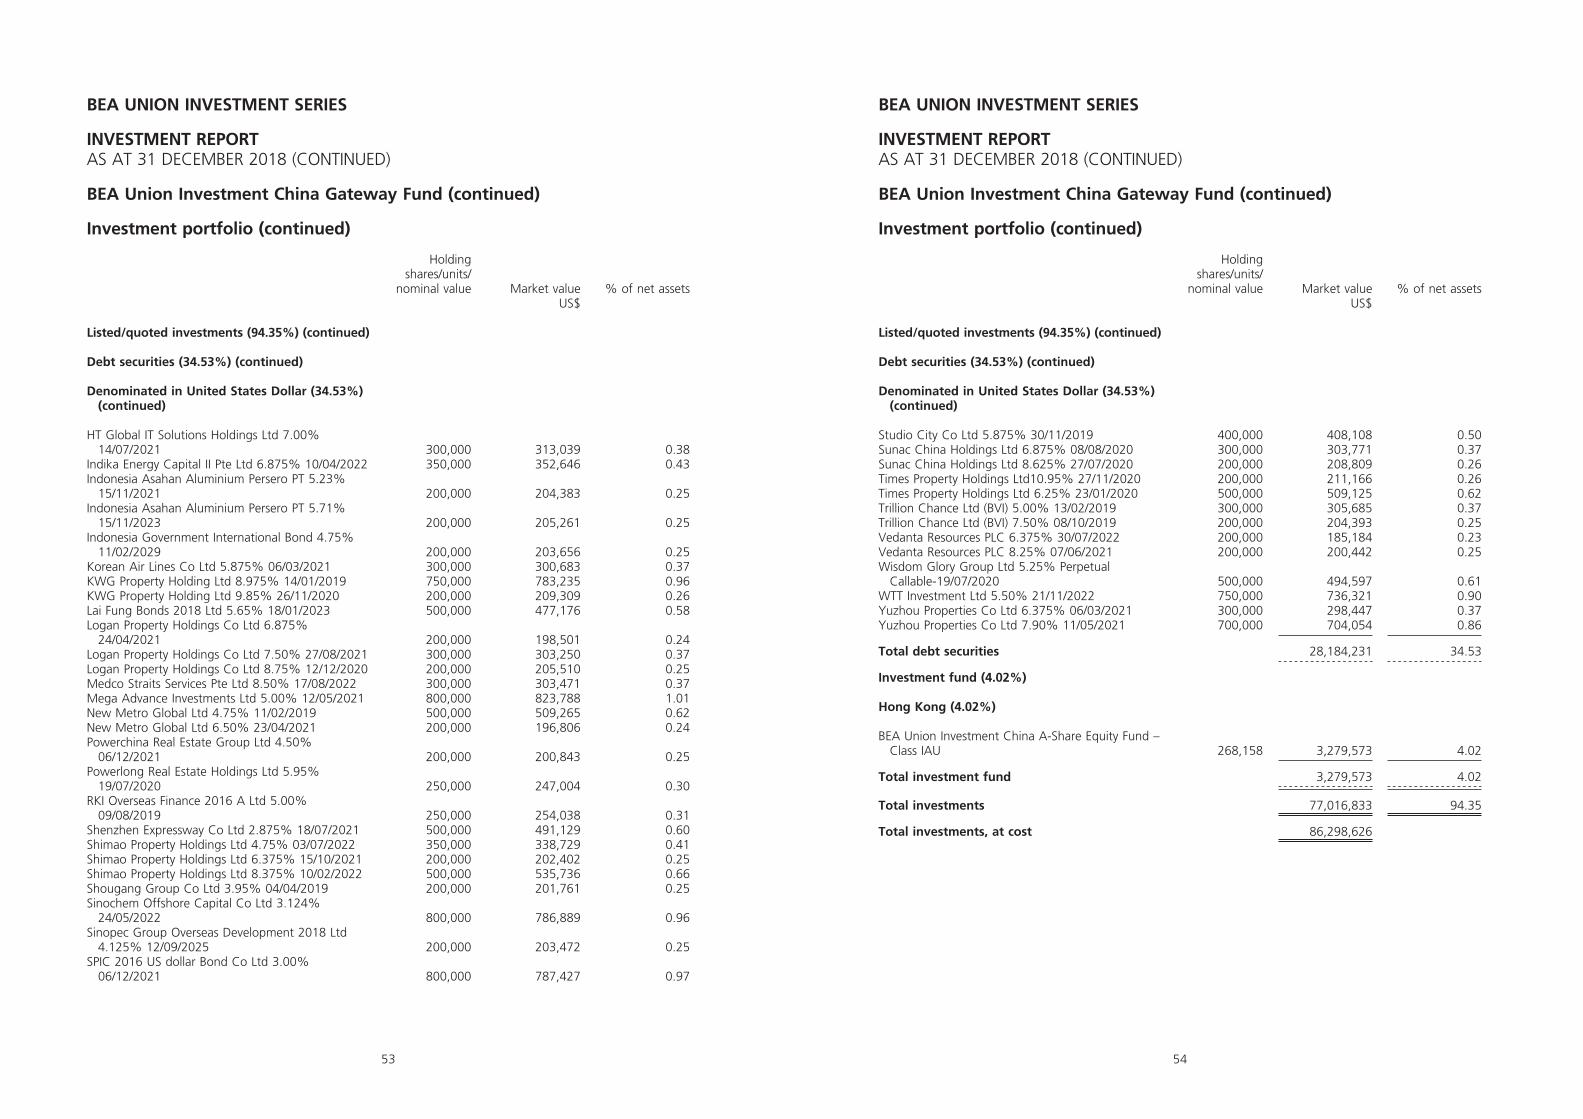
BEA UNION INVESTMENT SERIES
INVESTMENT REPORTAS AT 31 DECEMBER 2018 (CONTINUED)
BEA UNION INVESTMENT SERIES
INVESTMENT REPORTAS AT 31 DECEMBER 2018 (CONTINUED)
53 54
A5請縮小打印70.5%
BEA Union Investment China Gateway Fund (continued)
Investment portfolio (continued)
Holding shares/units/
nominal value Market value % of net assetsUS$
Listed/quoted investments (94.35%) (continued)
Debt securities (34.53%) (continued)
Denominated in United States Dollar (34.53%) (continued)
HT Global IT Solutions Holdings Ltd 7.00% 14/07/2021 300,000 313,039 0.38
Indika Energy Capital II Pte Ltd 6.875% 10/04/2022 350,000 352,646 0.43Indonesia Asahan Aluminium Persero PT 5.23%
15/11/2021 200,000 204,383 0.25Indonesia Asahan Aluminium Persero PT 5.71%
15/11/2023 200,000 205,261 0.25Indonesia Government International Bond 4.75%
11/02/2029 200,000 203,656 0.25Korean Air Lines Co Ltd 5.875% 06/03/2021 300,000 300,683 0.37KWG Property Holding Ltd 8.975% 14/01/2019 750,000 783,235 0.96KWG Property Holding Ltd 9.85% 26/11/2020 200,000 209,309 0.26Lai Fung Bonds 2018 Ltd 5.65% 18/01/2023 500,000 477,176 0.58Logan Property Holdings Co Ltd 6.875%
24/04/2021 200,000 198,501 0.24Logan Property Holdings Co Ltd 7.50% 27/08/2021 300,000 303,250 0.37Logan Property Holdings Co Ltd 8.75% 12/12/2020 200,000 205,510 0.25Medco Straits Services Pte Ltd 8.50% 17/08/2022 300,000 303,471 0.37Mega Advance Investments Ltd 5.00% 12/05/2021 800,000 823,788 1.01New Metro Global Ltd 4.75% 11/02/2019 500,000 509,265 0.62New Metro Global Ltd 6.50% 23/04/2021 200,000 196,806 0.24Powerchina Real Estate Group Ltd 4.50%
06/12/2021 200,000 200,843 0.25Powerlong Real Estate Holdings Ltd 5.95%
19/07/2020 250,000 247,004 0.30RKI Overseas Finance 2016 A Ltd 5.00%
09/08/2019 250,000 254,038 0.31Shenzhen Expressway Co Ltd 2.875% 18/07/2021 500,000 491,129 0.60Shimao Property Holdings Ltd 4.75% 03/07/2022 350,000 338,729 0.41Shimao Property Holdings Ltd 6.375% 15/10/2021 200,000 202,402 0.25Shimao Property Holdings Ltd 8.375% 10/02/2022 500,000 535,736 0.66Shougang Group Co Ltd 3.95% 04/04/2019 200,000 201,761 0.25Sinochem Offshore Capital Co Ltd 3.124%
24/05/2022 800,000 786,889 0.96Sinopec Group Overseas Development 2018 Ltd
4.125% 12/09/2025 200,000 203,472 0.25SPIC 2016 US dollar Bond Co Ltd 3.00%
06/12/2021 800,000 787,427 0.97
BEA Union Investment China Gateway Fund (continued)
Investment portfolio (continued)
Holding shares/units/
nominal value Market value % of net assetsUS$
Listed/quoted investments (94.35%) (continued)
Debt securities (34.53%) (continued)
Denominated in United States Dollar (34.53%) (continued)
Studio City Co Ltd 5.875% 30/11/2019 400,000 408,108 0.50Sunac China Holdings Ltd 6.875% 08/08/2020 300,000 303,771 0.37Sunac China Holdings Ltd 8.625% 27/07/2020 200,000 208,809 0.26Times Property Holdings Ltd10.95% 27/11/2020 200,000 211,166 0.26Times Property Holdings Ltd 6.25% 23/01/2020 500,000 509,125 0.62Trillion Chance Ltd (BVI) 5.00% 13/02/2019 300,000 305,685 0.37Trillion Chance Ltd (BVI) 7.50% 08/10/2019 200,000 204,393 0.25Vedanta Resources PLC 6.375% 30/07/2022 200,000 185,184 0.23Vedanta Resources PLC 8.25% 07/06/2021 200,000 200,442 0.25Wisdom Glory Group Ltd 5.25% Perpetual
Callable-19/07/2020 500,000 494,597 0.61WTT Investment Ltd 5.50% 21/11/2022 750,000 736,321 0.90Yuzhou Properties Co Ltd 6.375% 06/03/2021 300,000 298,447 0.37Yuzhou Properties Co Ltd 7.90% 11/05/2021 700,000 704,054 0.86
Total debt securities 28,184,231 34.53
Investment fund (4.02%)
Hong Kong (4.02%)
BEA Union Investment China A-Share Equity Fund – Class IAU 268,158 3,279,573 4.02
Total investment fund 3,279,573 4.02
Total investments 77,016,833 94.35
Total investments, at cost 86,298,626
BEA UNION INVESTMENT SERIES
INVESTMENT REPORTAS AT 31 DECEMBER 2018 (CONTINUED)
BEA UNION INVESTMENT SERIES
INVESTMENT REPORTAS AT 31 DECEMBER 2018 (CONTINUED)
55 56
A5請縮小打印70.5%
Statement of movements in portfolio holdings
BEA Union Investment Japan Growth Fund
Holdings as at 31 December 2017 Additions Disposals
Holdings as at 31 December 2018
Units Units Units Units
Fidelity Global Investment Fund – Japanese Equity Fund – Class A 25,875.1670 – 25,875.1670 –
BEA Union Investment Global Themes Fund
% of net assetsAt 31 December
2017
Equities
Belgium 1.15Canada 6.13China 1.13Denmark 2.37France 1.15Hong Kong 2.31Indonesia 1.16Ireland 2.18Italy 1.20Japan 7.36Korea 1.13Norway 2.46South Africa 1.17Spain 4.58Sweden 5.69Switzerland 3.23Taiwan 0.95The United Kingdom 2.37The United States of America 41.73Turkey 1.22
Investment fund
Hong Kong 8.20
Real estate investment trust
The United States of America 2.13
Rights
Spain 0.03
101.03
Statement of movements in portfolio holdings (continued)
BEA Union Investment Global Resources Fund
% of net assetsAt 31 December
2017
Equities
Australia 5.91Canada 14.82Denmark 5.62Germany 3.99Ireland 5.96Norway 2.93The United Kingdom 34.36The United States of America 25.53
99.12
BEA Union Investment Asian Bond and Currency Fund
% of net assetsAt 31 December
2018At 31 December
2017
Debt securities
Indonesian Rupiah – 0.54Renminbi – 3.19United States Dollar 97.76 92.51
97.76 96.24
BEA Union Investment Four Seasons Fund
% of net assetsAt 31 December
2017
Equities
Singapore 26.88
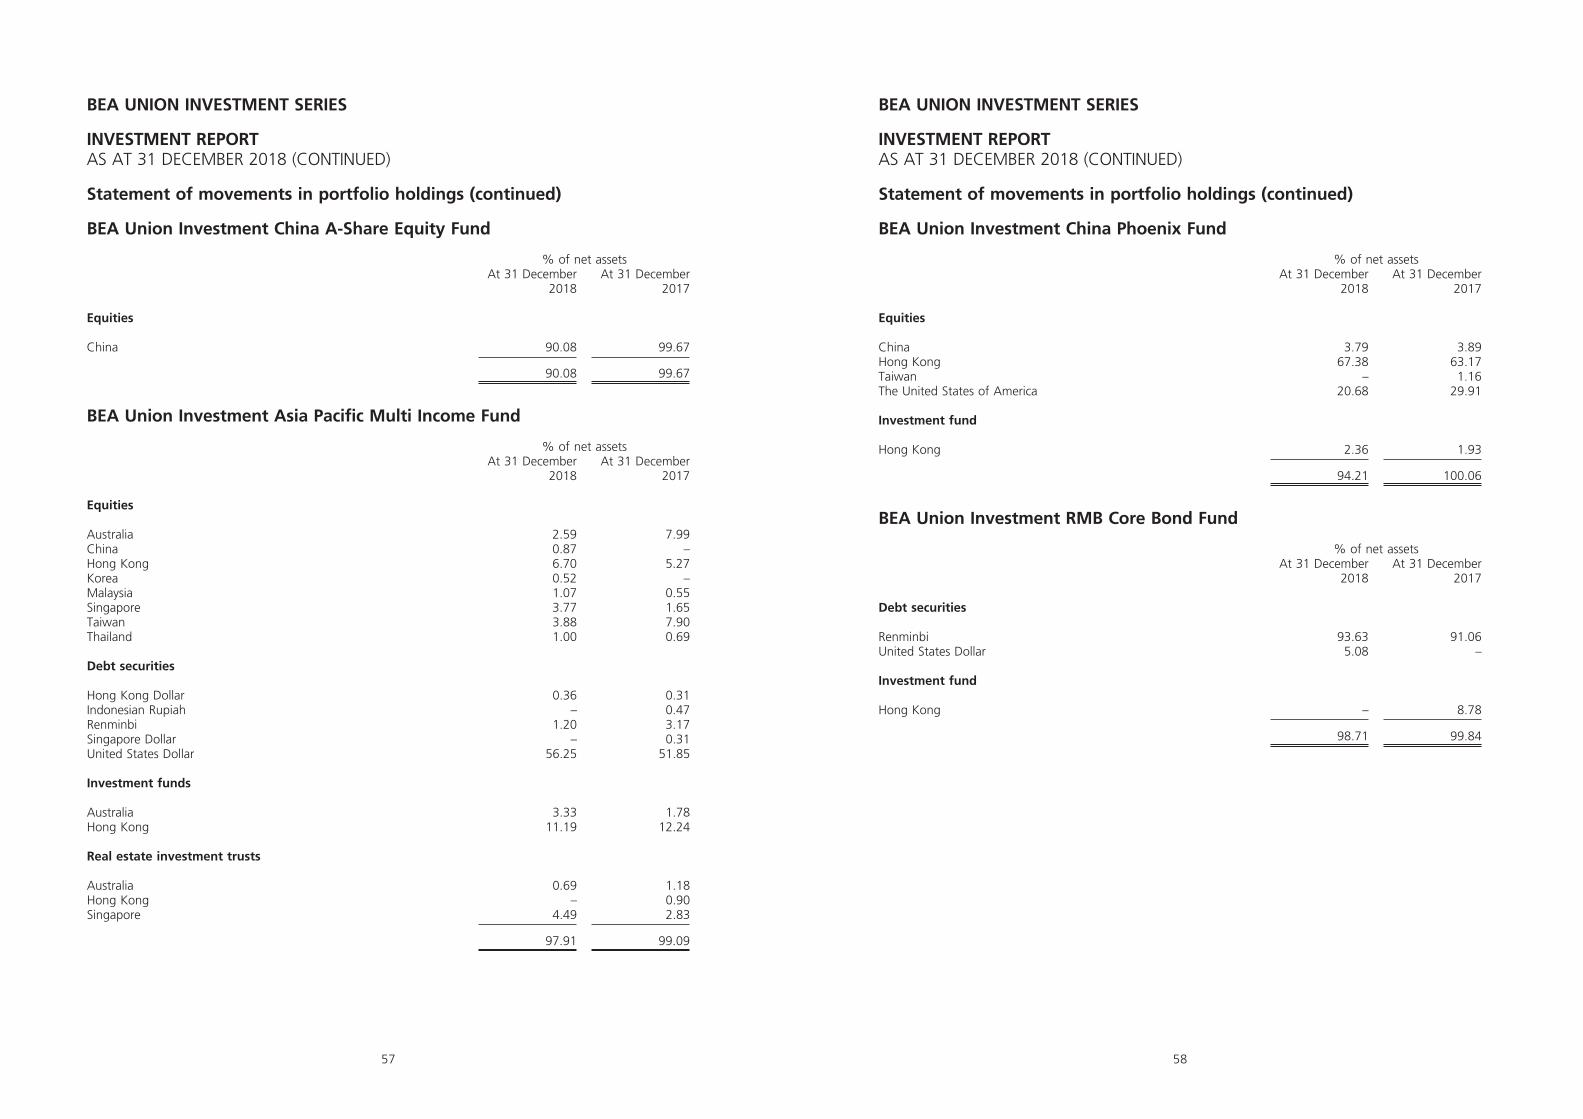
BEA UNION INVESTMENT SERIES
INVESTMENT REPORTAS AT 31 DECEMBER 2018 (CONTINUED)
BEA UNION INVESTMENT SERIES
INVESTMENT REPORTAS AT 31 DECEMBER 2018 (CONTINUED)
57 58
A5請縮小打印70.5%
Statement of movements in portfolio holdings (continued)
BEA Union Investment China A-Share Equity Fund
% of net assetsAt 31 December
2018At 31 December
2017
Equities
China 90.08 99.67
90.08 99.67
BEA Union Investment Asia Pacific Multi Income Fund
% of net assetsAt 31 December
2018At 31 December
2017
Equities
Australia 2.59 7.99China 0.87 –Hong Kong 6.70 5.27Korea 0.52 –Malaysia 1.07 0.55Singapore 3.77 1.65Taiwan 3.88 7.90Thailand 1.00 0.69
Debt securities
Hong Kong Dollar 0.36 0.31Indonesian Rupiah – 0.47Renminbi 1.20 3.17Singapore Dollar – 0.31United States Dollar 56.25 51.85
Investment funds
Australia 3.33 1.78Hong Kong 11.19 12.24
Real estate investment trusts
Australia 0.69 1.18Hong Kong – 0.90Singapore 4.49 2.83
97.91 99.09
Statement of movements in portfolio holdings (continued)
BEA Union Investment China Phoenix Fund
% of net assetsAt 31 December
2018At 31 December
2017
Equities
China 3.79 3.89Hong Kong 67.38 63.17Taiwan – 1.16The United States of America 20.68 29.91
Investment fund
Hong Kong 2.36 1.93
94.21 100.06
BEA Union Investment RMB Core Bond Fund
% of net assetsAt 31 December
2018At 31 December
2017
Debt securities
Renminbi 93.63 91.06United States Dollar 5.08 –
Investment fund
Hong Kong – 8.78
98.71 99.84
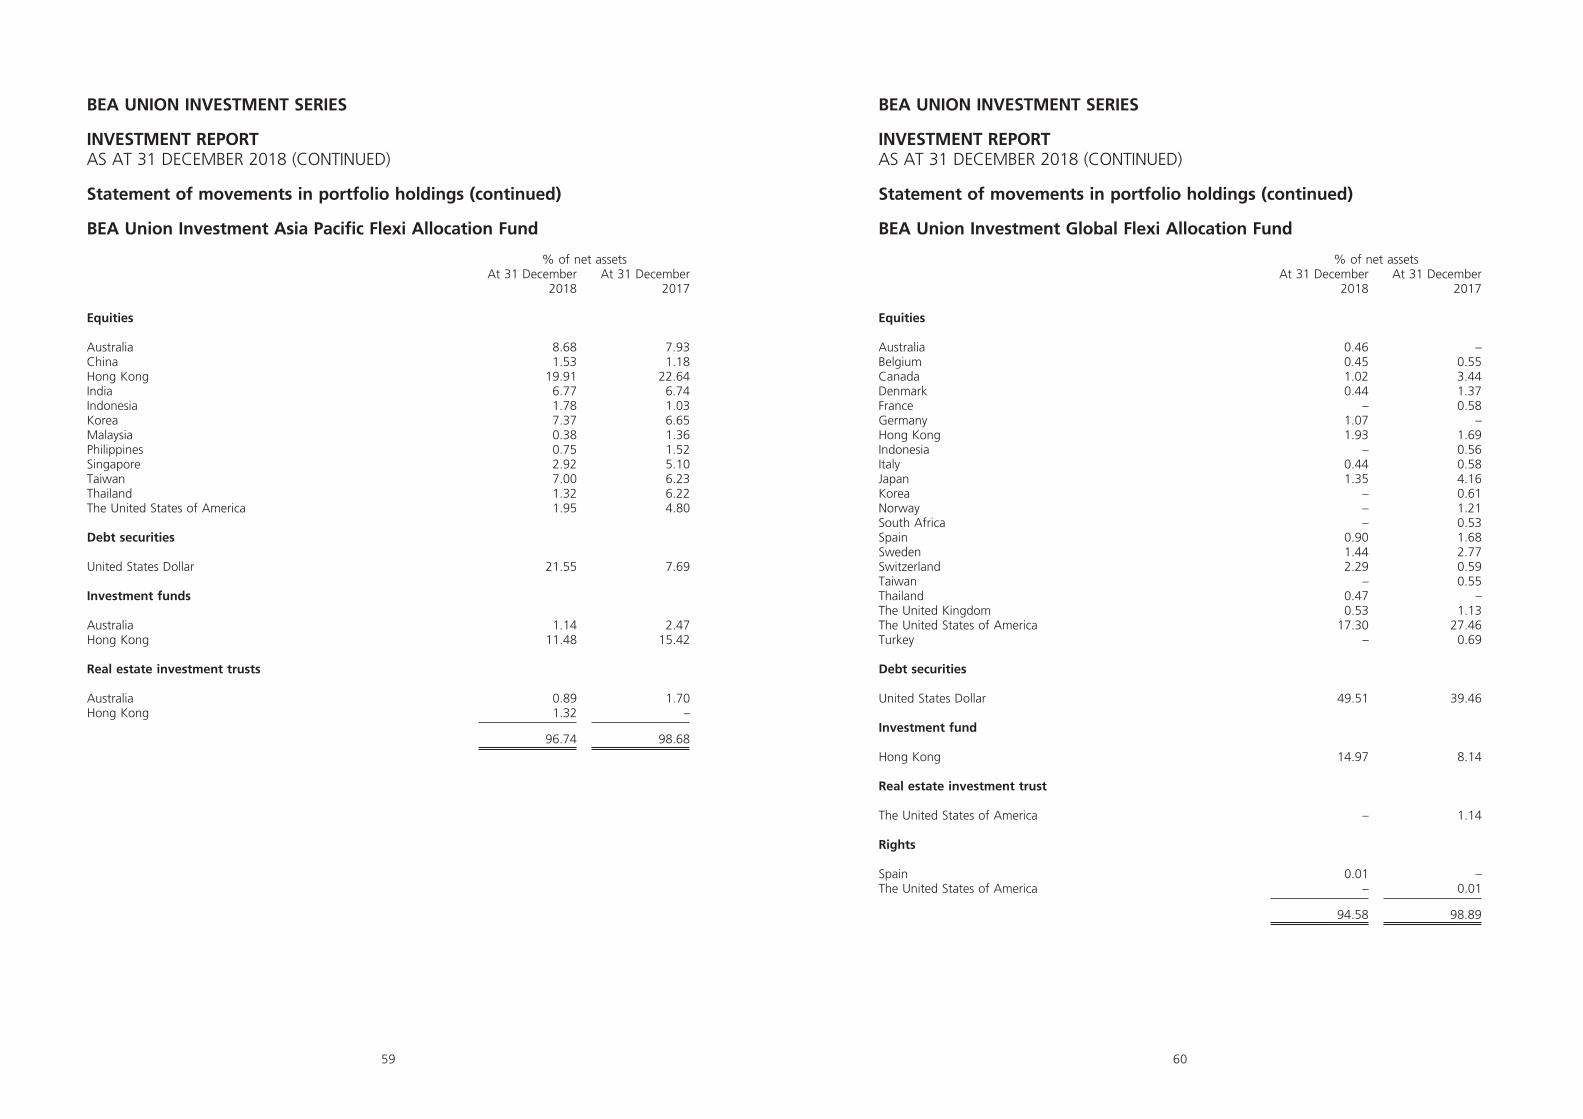
BEA UNION INVESTMENT SERIES
INVESTMENT REPORTAS AT 31 DECEMBER 2018 (CONTINUED)
BEA UNION INVESTMENT SERIES
INVESTMENT REPORTAS AT 31 DECEMBER 2018 (CONTINUED)
59 60
A5請縮小打印70.5%
Statement of movements in portfolio holdings (continued)
BEA Union Investment Asia Pacific Flexi Allocation Fund
% of net assetsAt 31 December
2018At 31 December
2017
Equities
Australia 8.68 7.93China 1.53 1.18Hong Kong 19.91 22.64India 6.77 6.74Indonesia 1.78 1.03Korea 7.37 6.65Malaysia 0.38 1.36Philippines 0.75 1.52Singapore 2.92 5.10Taiwan 7.00 6.23Thailand 1.32 6.22The United States of America 1.95 4.80
Debt securities
United States Dollar 21.55 7.69
Investment funds
Australia 1.14 2.47Hong Kong 11.48 15.42
Real estate investment trusts
Australia 0.89 1.70Hong Kong 1.32 –
96.74 98.68
Statement of movements in portfolio holdings (continued)
BEA Union Investment Global Flexi Allocation Fund
% of net assetsAt 31 December
2018At 31 December
2017
Equities
Australia 0.46 –Belgium 0.45 0.55Canada 1.02 3.44Denmark 0.44 1.37France – 0.58Germany 1.07 –Hong Kong 1.93 1.69Indonesia – 0.56Italy 0.44 0.58Japan 1.35 4.16Korea – 0.61Norway – 1.21South Africa – 0.53Spain 0.90 1.68Sweden 1.44 2.77Switzerland 2.29 0.59Taiwan – 0.55Thailand 0.47 –The United Kingdom 0.53 1.13The United States of America 17.30 27.46Turkey – 0.69
Debt securities
United States Dollar 49.51 39.46
Investment fund
Hong Kong 14.97 8.14
Real estate investment trust
The United States of America – 1.14
Rights
Spain 0.01 –The United States of America – 0.01
94.58 98.89
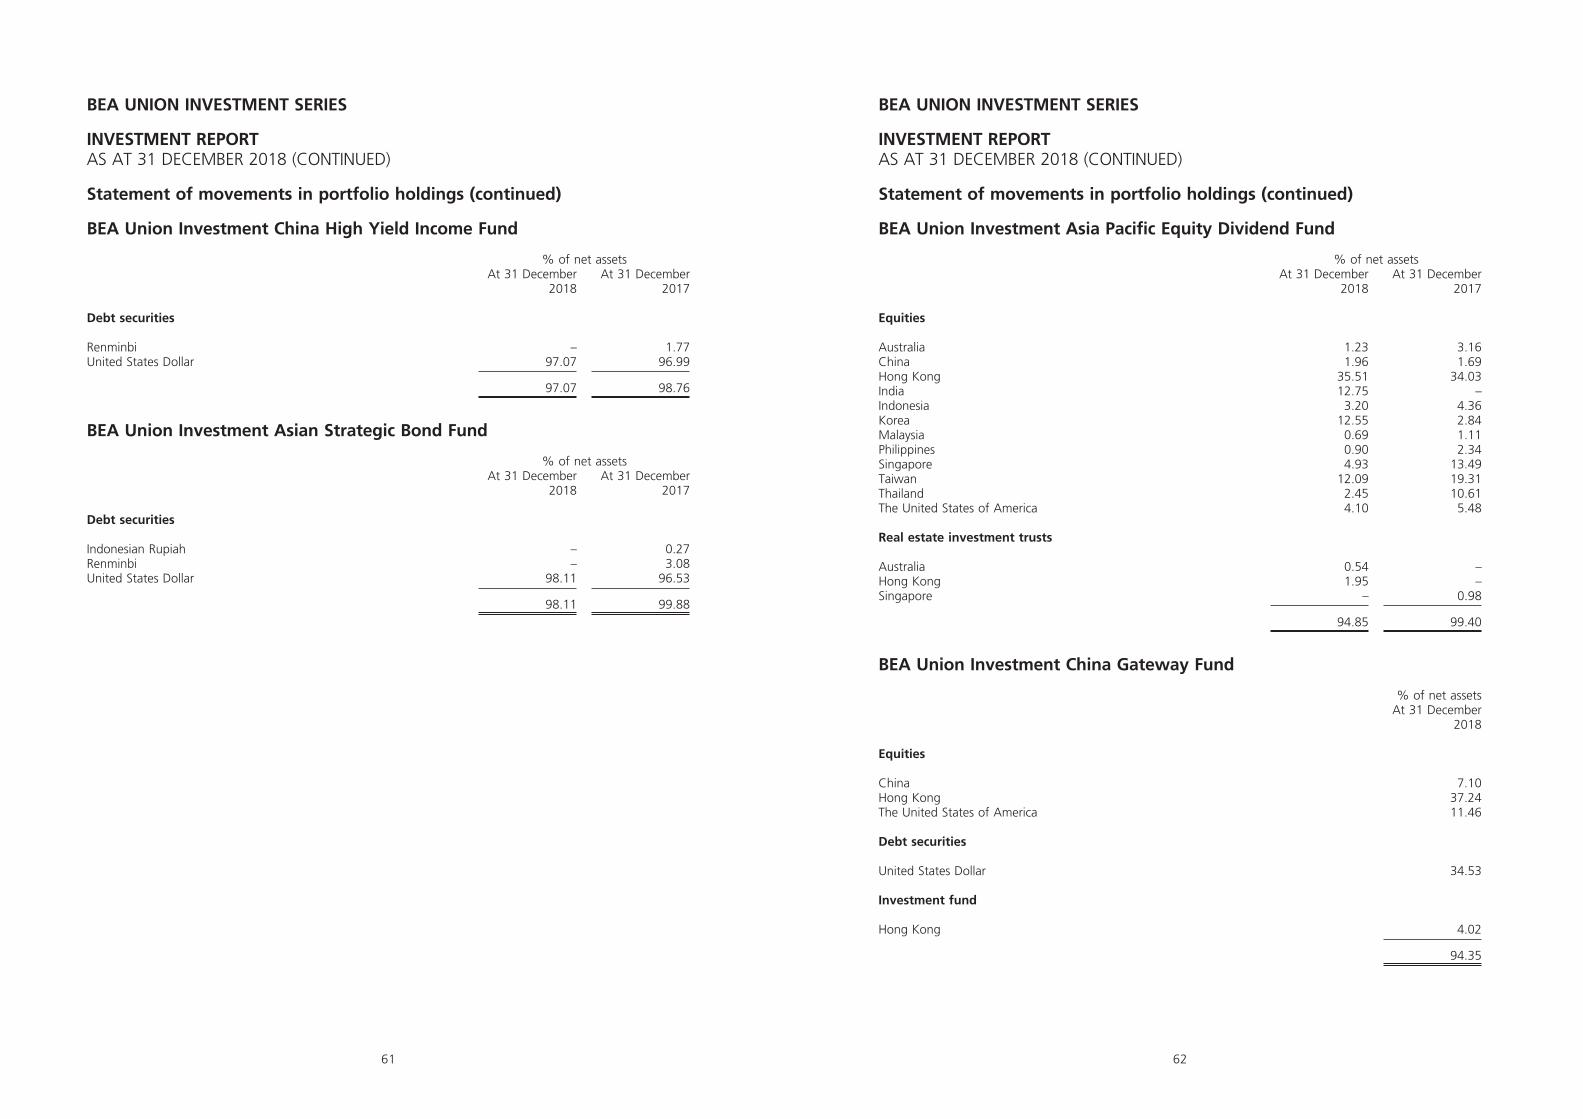
BEA UNION INVESTMENT SERIES
INVESTMENT REPORTAS AT 31 DECEMBER 2018 (CONTINUED)
BEA UNION INVESTMENT SERIES
INVESTMENT REPORTAS AT 31 DECEMBER 2018 (CONTINUED)
61 62
A5請縮小打印70.5%
Statement of movements in portfolio holdings (continued)
BEA Union Investment China High Yield Income Fund
% of net assetsAt 31 December
2018At 31 December
2017
Debt securities
Renminbi – 1.77United States Dollar 97.07 96.99
97.07 98.76
BEA Union Investment Asian Strategic Bond Fund
% of net assetsAt 31 December
2018At 31 December
2017
Debt securities
Indonesian Rupiah – 0.27Renminbi – 3.08United States Dollar 98.11 96.53
98.11 99.88
Statement of movements in portfolio holdings (continued)
BEA Union Investment Asia Pacific Equity Dividend Fund
% of net assetsAt 31 December
2018At 31 December
2017
Equities
Australia 1.23 3.16China 1.96 1.69Hong Kong 35.51 34.03India 12.75 –Indonesia 3.20 4.36Korea 12.55 2.84Malaysia 0.69 1.11Philippines 0.90 2.34Singapore 4.93 13.49Taiwan 12.09 19.31Thailand 2.45 10.61The United States of America 4.10 5.48
Real estate investment trusts
Australia 0.54 –Hong Kong 1.95 –Singapore – 0.98
94.85 99.40
BEA Union Investment China Gateway Fund
% of net assetsAt 31 December
2018
Equities
China 7.10Hong Kong 37.24The United States of America 11.46
Debt securities
United States Dollar 34.53
Investment fund
Hong Kong 4.02
94.35
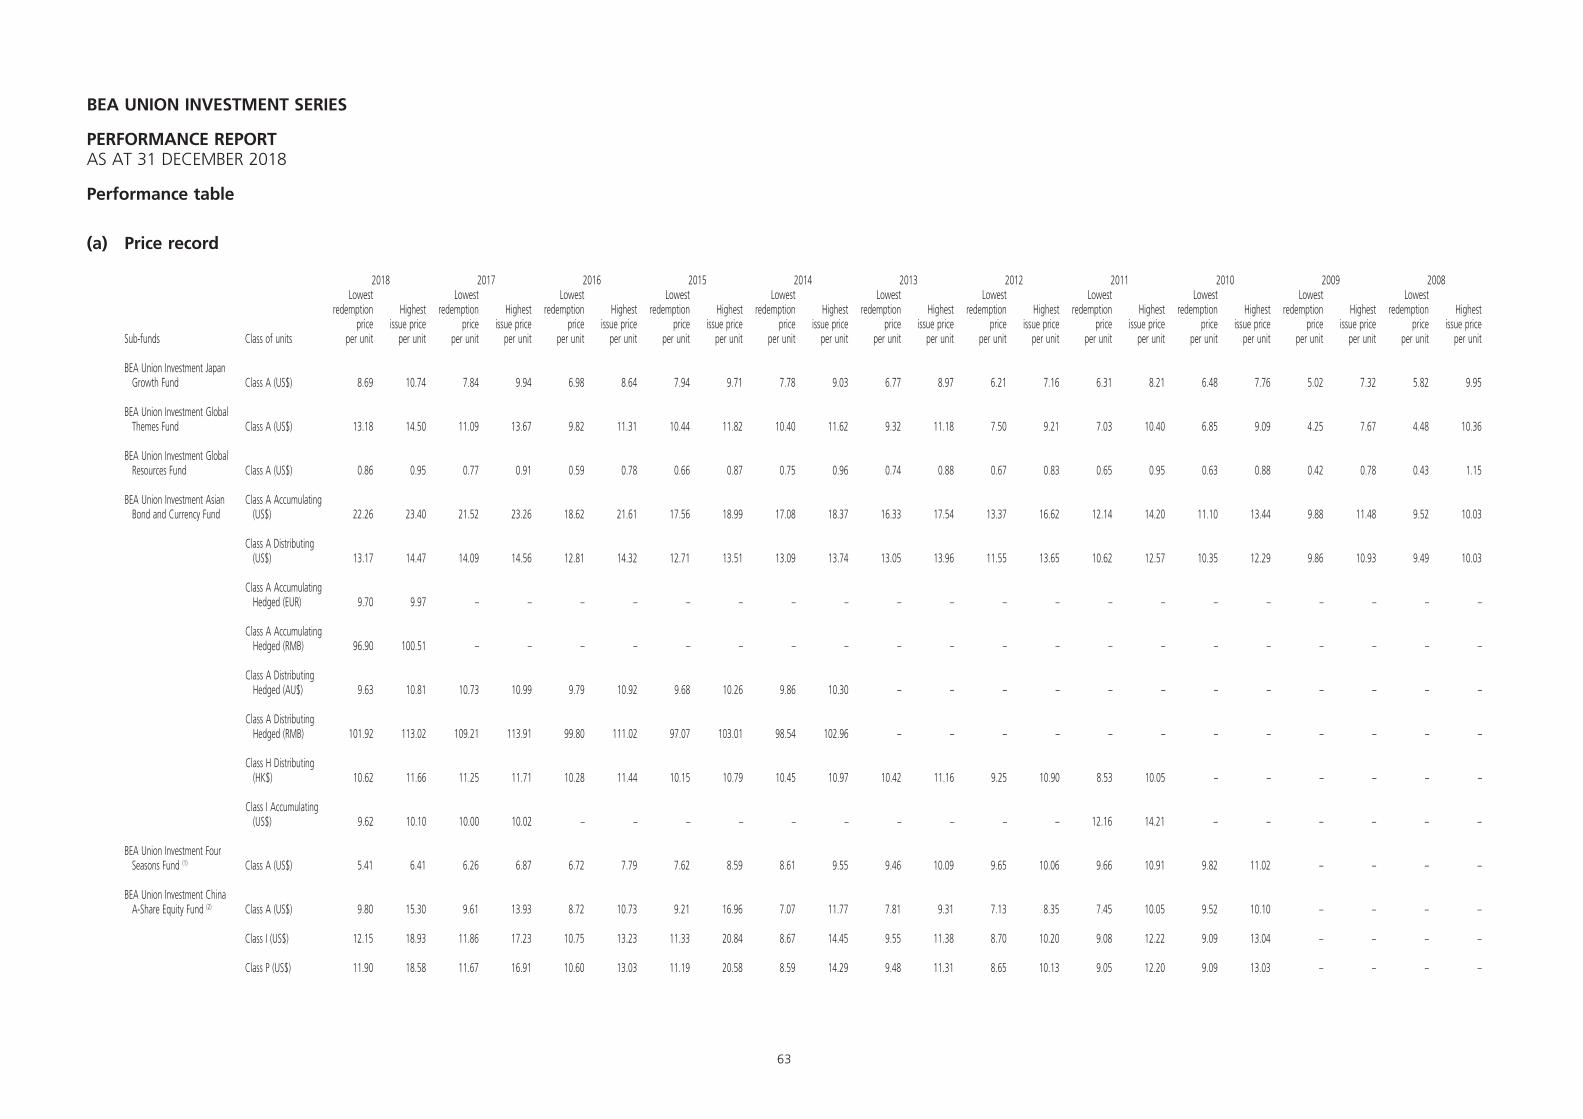
BEA UNION INVESTMENT SERIES
PERFORMANCE REPORTAS AT 31 DECEMBER 2018
63
A5請縮小打印70.5%
Performance table
(a) Price record
2018 2017 2016 2015 2014 2013 2012 2011 2010 2009 2008
Sub-funds Class of units
Lowest redemption
price per unit
Highest issue price
per unit
Lowest redemption
price per unit
Highest issue price
per unit
Lowest redemption
price per unit
Highest issue price
per unit
Lowest redemption
price per unit
Highest issue price
per unit
Lowest redemption
price per unit
Highest issue price
per unit
Lowest redemption
price per unit
Highest issue price
per unit
Lowest redemption
price per unit
Highest issue price
per unit
Lowest redemption
price per unit
Highest issue price
per unit
Lowest redemption
price per unit
Highest issue price
per unit
Lowest redemption
price per unit
Highest issue price
per unit
Lowest redemption
price per unit
Highest issue price
per unit
BEA Union Investment Japan Growth Fund Class A (US$) 8.69 10.74 7.84 9.94 6.98 8.64 7.94 9.71 7.78 9.03 6.77 8.97 6.21 7.16 6.31 8.21 6.48 7.76 5.02 7.32 5.82 9.95
BEA Union Investment Global Themes Fund Class A (US$) 13.18 14.50 11.09 13.67 9.82 11.31 10.44 11.82 10.40 11.62 9.32 11.18 7.50 9.21 7.03 10.40 6.85 9.09 4.25 7.67 4.48 10.36
BEA Union Investment Global Resources Fund Class A (US$) 0.86 0.95 0.77 0.91 0.59 0.78 0.66 0.87 0.75 0.96 0.74 0.88 0.67 0.83 0.65 0.95 0.63 0.88 0.42 0.78 0.43 1.15
BEA Union Investment Asian Bond and Currency Fund
Class A Accumulating (US$) 22.26 23.40 21.52 23.26 18.62 21.61 17.56 18.99 17.08 18.37 16.33 17.54 13.37 16.62 12.14 14.20 11.10 13.44 9.88 11.48 9.52 10.03
Class A Distributing (US$) 13.17 14.47 14.09 14.56 12.81 14.32 12.71 13.51 13.09 13.74 13.05 13.96 11.55 13.65 10.62 12.57 10.35 12.29 9.86 10.93 9.49 10.03
Class A Accumulating Hedged (EUR) 9.70 9.97 – – – – – – – – – – – – – – – – – – – –
Class A Accumulating Hedged (RMB) 96.90 100.51 – – – – – – – – – – – – – – – – – – – –
Class A Distributing Hedged (AU$) 9.63 10.81 10.73 10.99 9.79 10.92 9.68 10.26 9.86 10.30 – – – – – – – – – – – –
Class A Distributing Hedged (RMB) 101.92 113.02 109.21 113.91 99.80 111.02 97.07 103.01 98.54 102.96 – – – – – – – – – – – –
Class H Distributing (HK$) 10.62 11.66 11.25 11.71 10.28 11.44 10.15 10.79 10.45 10.97 10.42 11.16 9.25 10.90 8.53 10.05 – – – – – –
Class I Accumulating (US$) 9.62 10.10 10.00 10.02 – – – – – – – – – – 12.16 14.21 – – – – – –
BEA Union Investment Four Seasons Fund (1) Class A (US$) 5.41 6.41 6.26 6.87 6.72 7.79 7.62 8.59 8.61 9.55 9.46 10.09 9.65 10.06 9.66 10.91 9.82 11.02 – – – –
BEA Union Investment China A-Share Equity Fund (2) Class A (US$) 9.80 15.30 9.61 13.93 8.72 10.73 9.21 16.96 7.07 11.77 7.81 9.31 7.13 8.35 7.45 10.05 9.52 10.10 – – – –
Class I (US$) 12.15 18.93 11.86 17.23 10.75 13.23 11.33 20.84 8.67 14.45 9.55 11.38 8.70 10.20 9.08 12.22 9.09 13.04 – – – –
Class P (US$) 11.90 18.58 11.67 16.91 10.60 13.03 11.19 20.58 8.59 14.29 9.48 11.31 8.65 10.13 9.05 12.20 9.09 13.03 – – – –
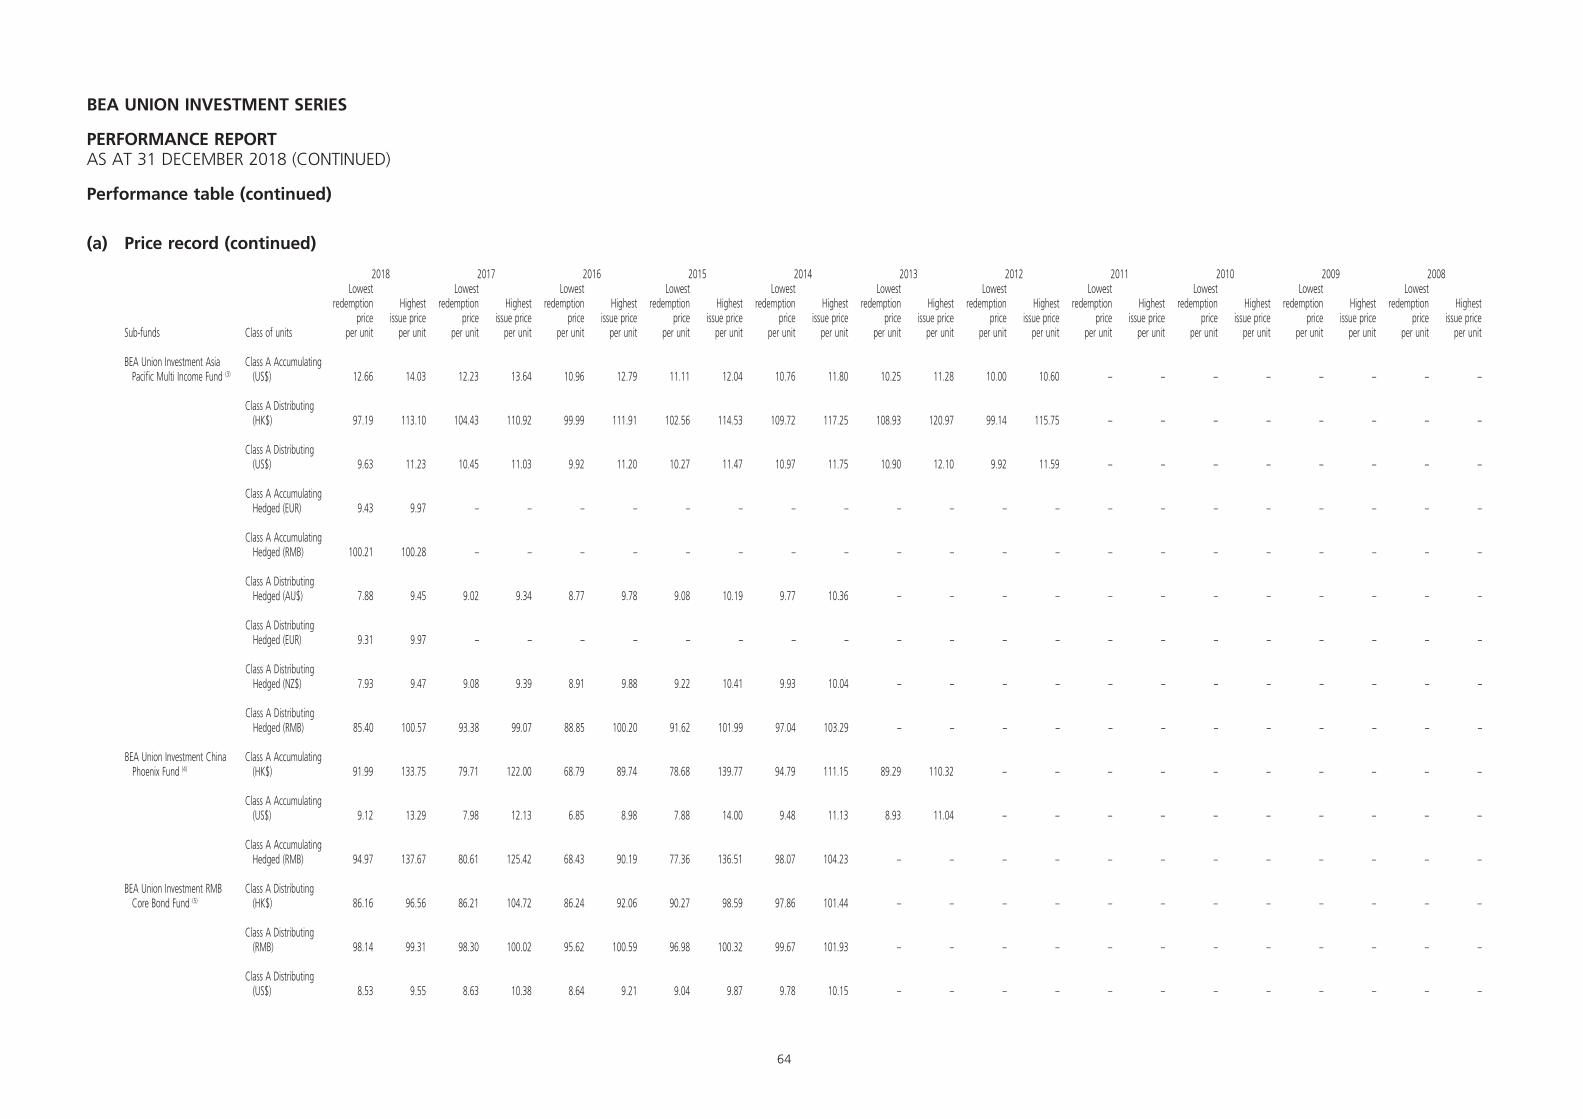
BEA UNION INVESTMENT SERIES
PERFORMANCE REPORTAS AT 31 DECEMBER 2018 (CONTINUED)
64
A5請縮小打印70.5%
Performance table (continued)
(a) Price record (continued)
2018 2017 2016 2015 2014 2013 2012 2011 2010 2009 2008
Sub-funds Class of units
Lowest redemption
price per unit
Highest issue price
per unit
Lowest redemption
price per unit
Highest issue price
per unit
Lowest redemption
price per unit
Highest issue price
per unit
Lowest redemption
price per unit
Highest issue price
per unit
Lowest redemption
price per unit
Highest issue price
per unit
Lowest redemption
price per unit
Highest issue price
per unit
Lowest redemption
price per unit
Highest issue price
per unit
Lowest redemption
price per unit
Highest issue price
per unit
Lowest redemption
price per unit
Highest issue price
per unit
Lowest redemption
price per unit
Highest issue price
per unit
Lowest redemption
price per unit
Highest issue price
per unit
BEA Union Investment Asia Pacific Multi Income Fund (3)
Class A Accumulating (US$) 12.66 14.03 12.23 13.64 10.96 12.79 11.11 12.04 10.76 11.80 10.25 11.28 10.00 10.60 – – – – – – – –
Class A Distributing (HK$) 97.19 113.10 104.43 110.92 99.99 111.91 102.56 114.53 109.72 117.25 108.93 120.97 99.14 115.75 – – – – – – – –
Class A Distributing (US$) 9.63 11.23 10.45 11.03 9.92 11.20 10.27 11.47 10.97 11.75 10.90 12.10 9.92 11.59 – – – – – – – –
Class A Accumulating Hedged (EUR) 9.43 9.97 – – – – – – – – – – – – – – – – – – – –
Class A Accumulating Hedged (RMB) 100.21 100.28 – – – – – – – – – – – – – – – – – – – –
Class A Distributing Hedged (AU$) 7.88 9.45 9.02 9.34 8.77 9.78 9.08 10.19 9.77 10.36 – – – – – – – – – – – –
Class A Distributing Hedged (EUR) 9.31 9.97 – – – – – – – – – – – – – – – – – – – –
Class A Distributing Hedged (NZ$) 7.93 9.47 9.08 9.39 8.91 9.88 9.22 10.41 9.93 10.04 – – – – – – – – – – – –
Class A Distributing Hedged (RMB) 85.40 100.57 93.38 99.07 88.85 100.20 91.62 101.99 97.04 103.29 – – – – – – – – – – – –
BEA Union Investment China Phoenix Fund (4)
Class A Accumulating (HK$) 91.99 133.75 79.71 122.00 68.79 89.74 78.68 139.77 94.79 111.15 89.29 110.32 – – – – – – – – – –
Class A Accumulating (US$) 9.12 13.29 7.98 12.13 6.85 8.98 7.88 14.00 9.48 11.13 8.93 11.04 – – – – – – – – – –
Class A Accumulating Hedged (RMB) 94.97 137.67 80.61 125.42 68.43 90.19 77.36 136.51 98.07 104.23 – – – – – – – – – – – –
BEA Union Investment RMB Core Bond Fund (5)
Class A Distributing (HK$) 86.16 96.56 86.21 104.72 86.24 92.06 90.27 98.59 97.86 101.44 – – – – – – – – – – – –
Class A Distributing (RMB) 98.14 99.31 98.30 100.02 95.62 100.59 96.98 100.32 99.67 101.93 – – – – – – – – – – – –
Class A Distributing (US$) 8.53 9.55 8.63 10.38 8.64 9.21 9.04 9.87 9.78 10.15 – – – – – – – – – – – –
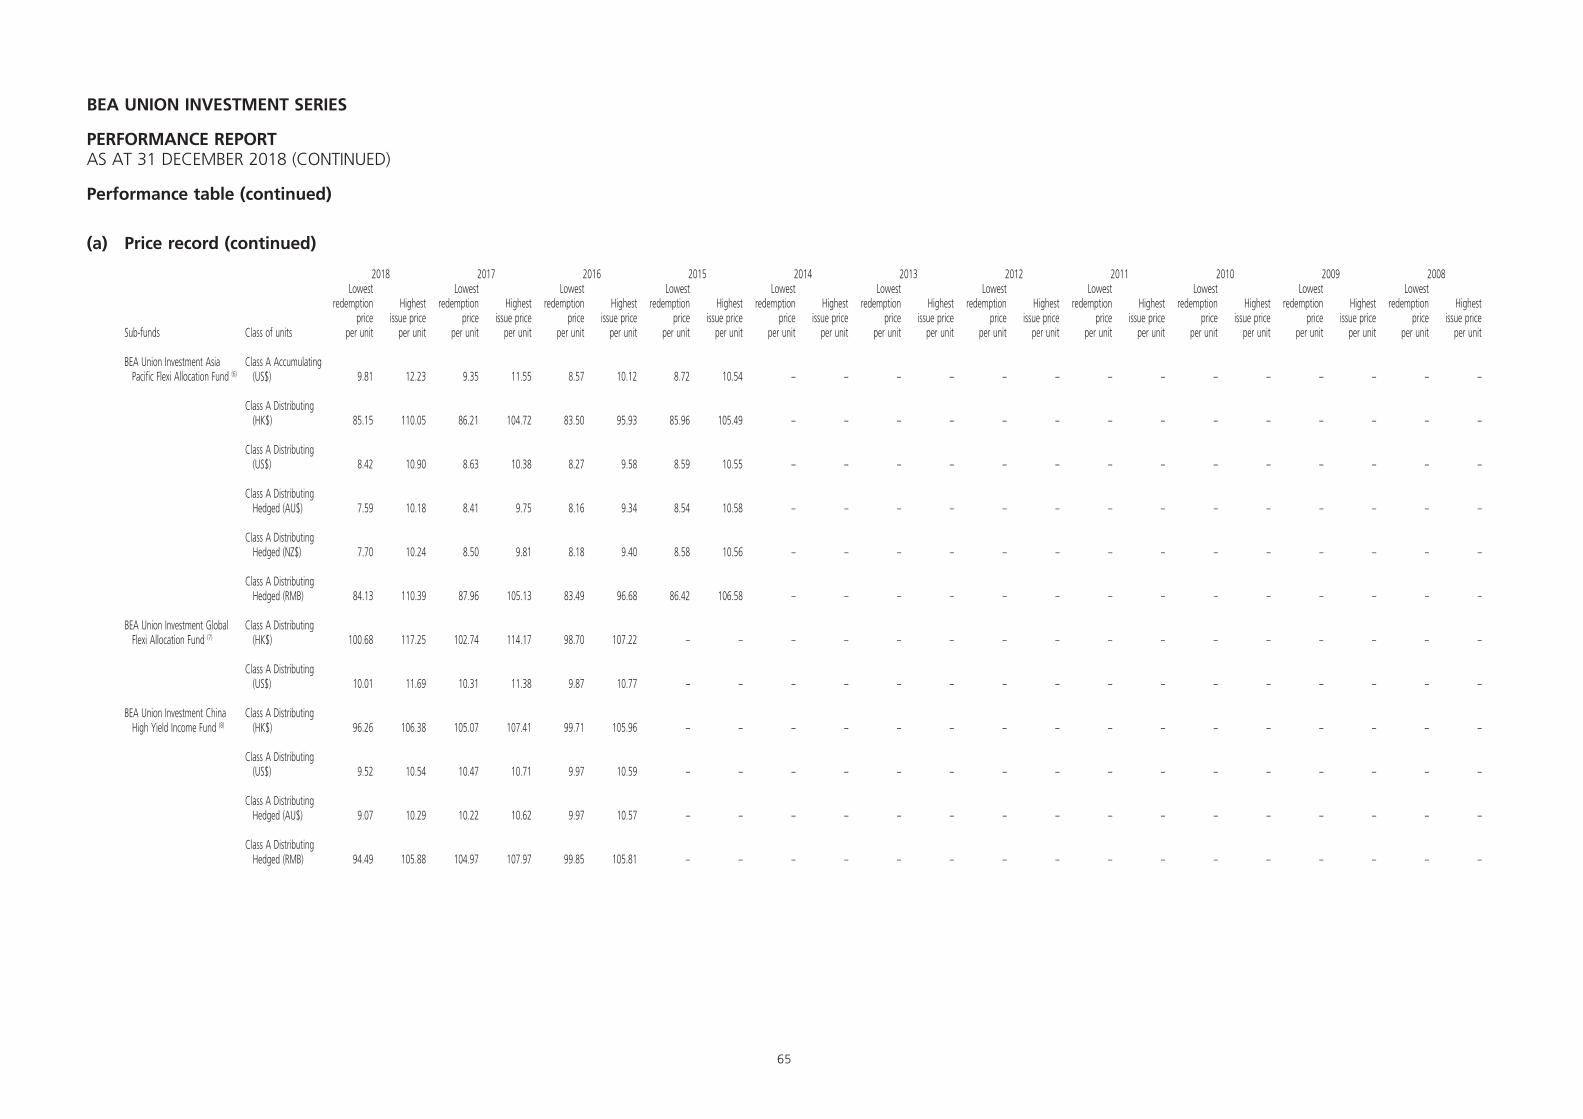
BEA UNION INVESTMENT SERIES
PERFORMANCE REPORTAS AT 31 DECEMBER 2018 (CONTINUED)
65
A5請縮小打印70.5%
Performance table (continued)
(a) Price record (continued)
2018 2017 2016 2015 2014 2013 2012 2011 2010 2009 2008
Sub-funds Class of units
Lowest redemption
price per unit
Highest issue price
per unit
Lowest redemption
price per unit
Highest issue price
per unit
Lowest redemption
price per unit
Highest issue price
per unit
Lowest redemption
price per unit
Highest issue price
per unit
Lowest redemption
price per unit
Highest issue price
per unit
Lowest redemption
price per unit
Highest issue price
per unit
Lowest redemption
price per unit
Highest issue price
per unit
Lowest redemption
price per unit
Highest issue price
per unit
Lowest redemption
price per unit
Highest issue price
per unit
Lowest redemption
price per unit
Highest issue price
per unit
Lowest redemption
price per unit
Highest issue price
per unit
BEA Union Investment Asia Pacific Flexi Allocation Fund (6)
Class A Accumulating (US$) 9.81 12.23 9.35 11.55 8.57 10.12 8.72 10.54 – – – – – – – – – – – – – –
Class A Distributing (HK$) 85.15 110.05 86.21 104.72 83.50 95.93 85.96 105.49 – – – – – – – – – – – – – –
Class A Distributing (US$) 8.42 10.90 8.63 10.38 8.27 9.58 8.59 10.55 – – – – – – – – – – – – – –
Class A Distributing Hedged (AU$) 7.59 10.18 8.41 9.75 8.16 9.34 8.54 10.58 – – – – – – – – – – – – – –
Class A Distributing Hedged (NZ$) 7.70 10.24 8.50 9.81 8.18 9.40 8.58 10.56 – – – – – – – – – – – – – –
Class A Distributing Hedged (RMB) 84.13 110.39 87.96 105.13 83.49 96.68 86.42 106.58 – – – – – – – – – – – – – –
BEA Union Investment Global Flexi Allocation Fund (7)
Class A Distributing (HK$) 100.68 117.25 102.74 114.17 98.70 107.22 – – – – – – – – – – – – – – – –
Class A Distributing (US$) 10.01 11.69 10.31 11.38 9.87 10.77 – – – – – – – – – – – – – – – –
BEA Union Investment China High Yield Income Fund (8)
Class A Distributing (HK$) 96.26 106.38 105.07 107.41 99.71 105.96 – – – – – – – – – – – – – – – –
Class A Distributing (US$) 9.52 10.54 10.47 10.71 9.97 10.59 – – – – – – – – – – – – – – – –
Class A Distributing Hedged (AU$) 9.07 10.29 10.22 10.62 9.97 10.57 – – – – – – – – – – – – – – – –
Class A Distributing Hedged (RMB) 94.49 105.88 104.97 107.97 99.85 105.81 – – – – – – – – – – – – – – – –
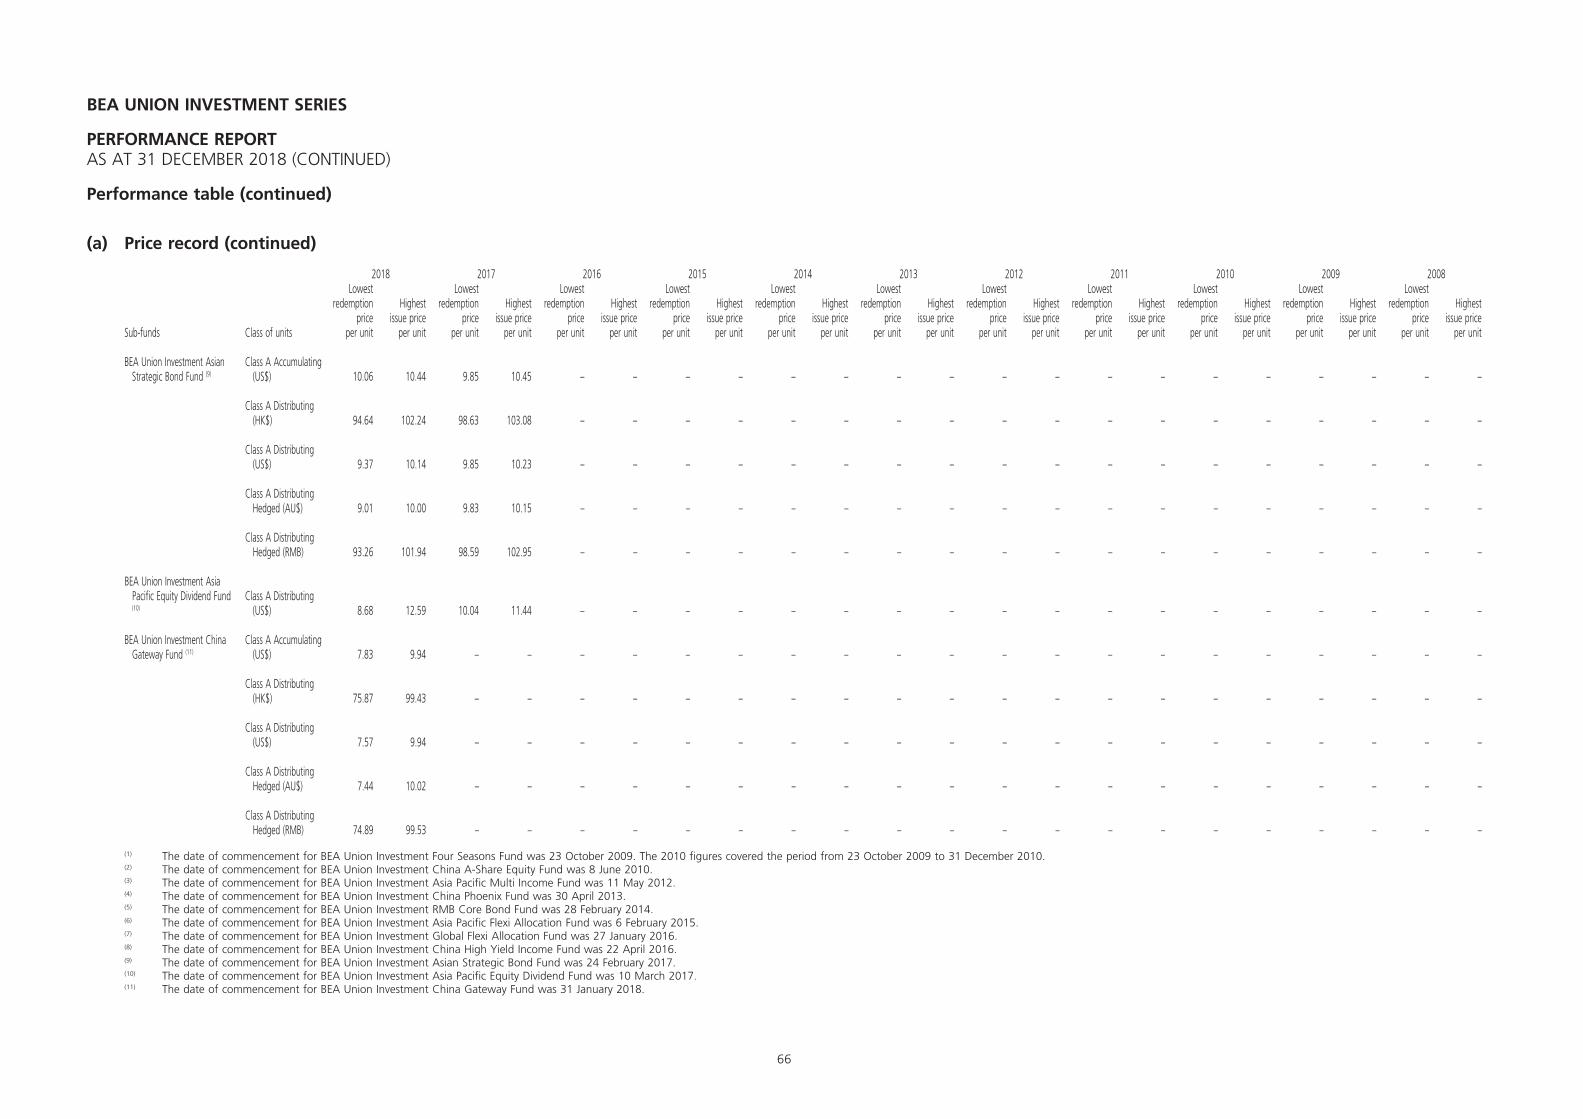
BEA UNION INVESTMENT SERIES
PERFORMANCE REPORTAS AT 31 DECEMBER 2018 (CONTINUED)
66
A5請縮小打印70.5%
Performance table (continued)
(a) Price record (continued)
2018 2017 2016 2015 2014 2013 2012 2011 2010 2009 2008
Sub-funds Class of units
Lowest redemption
price per unit
Highest issue price
per unit
Lowest redemption
price per unit
Highest issue price
per unit
Lowest redemption
price per unit
Highest issue price
per unit
Lowest redemption
price per unit
Highest issue price
per unit
Lowest redemption
price per unit
Highest issue price
per unit
Lowest redemption
price per unit
Highest issue price
per unit
Lowest redemption
price per unit
Highest issue price
per unit
Lowest redemption
price per unit
Highest issue price
per unit
Lowest redemption
price per unit
Highest issue price
per unit
Lowest redemption
price per unit
Highest issue price
per unit
Lowest redemption
price per unit
Highest issue price
per unit
BEA Union Investment Asian Strategic Bond Fund (9)
Class A Accumulating (US$) 10.06 10.44 9.85 10.45 – – – – – – – – – – – – – – – – – –
Class A Distributing (HK$) 94.64 102.24 98.63 103.08 – – – – – – – – – – – – – – – – – –
Class A Distributing (US$) 9.37 10.14 9.85 10.23 – – – – – – – – – – – – – – – – – –
Class A Distributing Hedged (AU$) 9.01 10.00 9.83 10.15 – – – – – – – – – – – – – – – – – –
Class A Distributing Hedged (RMB) 93.26 101.94 98.59 102.95 – – – – – – – – – – – – – – – – – –
BEA Union Investment Asia Pacific Equity Dividend Fund (10)
Class A Distributing (US$) 8.68 12.59 10.04 11.44 – – – – – – – – – – – – – – – – – –
BEA Union Investment China Gateway Fund (11)
Class A Accumulating (US$) 7.83 9.94 – – – – – – – – – – – – – – – – – – – –
Class A Distributing (HK$) 75.87 99.43 – – – – – – – – – – – – – – – – – – – –
Class A Distributing (US$) 7.57 9.94 – – – – – – – – – – – – – – – – – – – –
Class A Distributing Hedged (AU$) 7.44 10.02 – – – – – – – – – – – – – – – – – – – –
Class A Distributing Hedged (RMB) 74.89 99.53 – – – – – – – – – – – – – – – – – – – –
(1) The date of commencement for BEA Union Investment Four Seasons Fund was 23 October 2009. The 2010 figures covered the period from 23 October 2009 to 31 December 2010.(2) The date of commencement for BEA Union Investment China A-Share Equity Fund was 8 June 2010.(3) The date of commencement for BEA Union Investment Asia Pacific Multi Income Fund was 11 May 2012.(4) The date of commencement for BEA Union Investment China Phoenix Fund was 30 April 2013.(5) The date of commencement for BEA Union Investment RMB Core Bond Fund was 28 February 2014.(6) The date of commencement for BEA Union Investment Asia Pacific Flexi Allocation Fund was 6 February 2015.(7) The date of commencement for BEA Union Investment Global Flexi Allocation Fund was 27 January 2016.(8) The date of commencement for BEA Union Investment China High Yield Income Fund was 22 April 2016.(9) The date of commencement for BEA Union Investment Asian Strategic Bond Fund was 24 February 2017.(10) The date of commencement for BEA Union Investment Asia Pacific Equity Dividend Fund was 10 March 2017.(11) The date of commencement for BEA Union Investment China Gateway Fund was 31 January 2018.
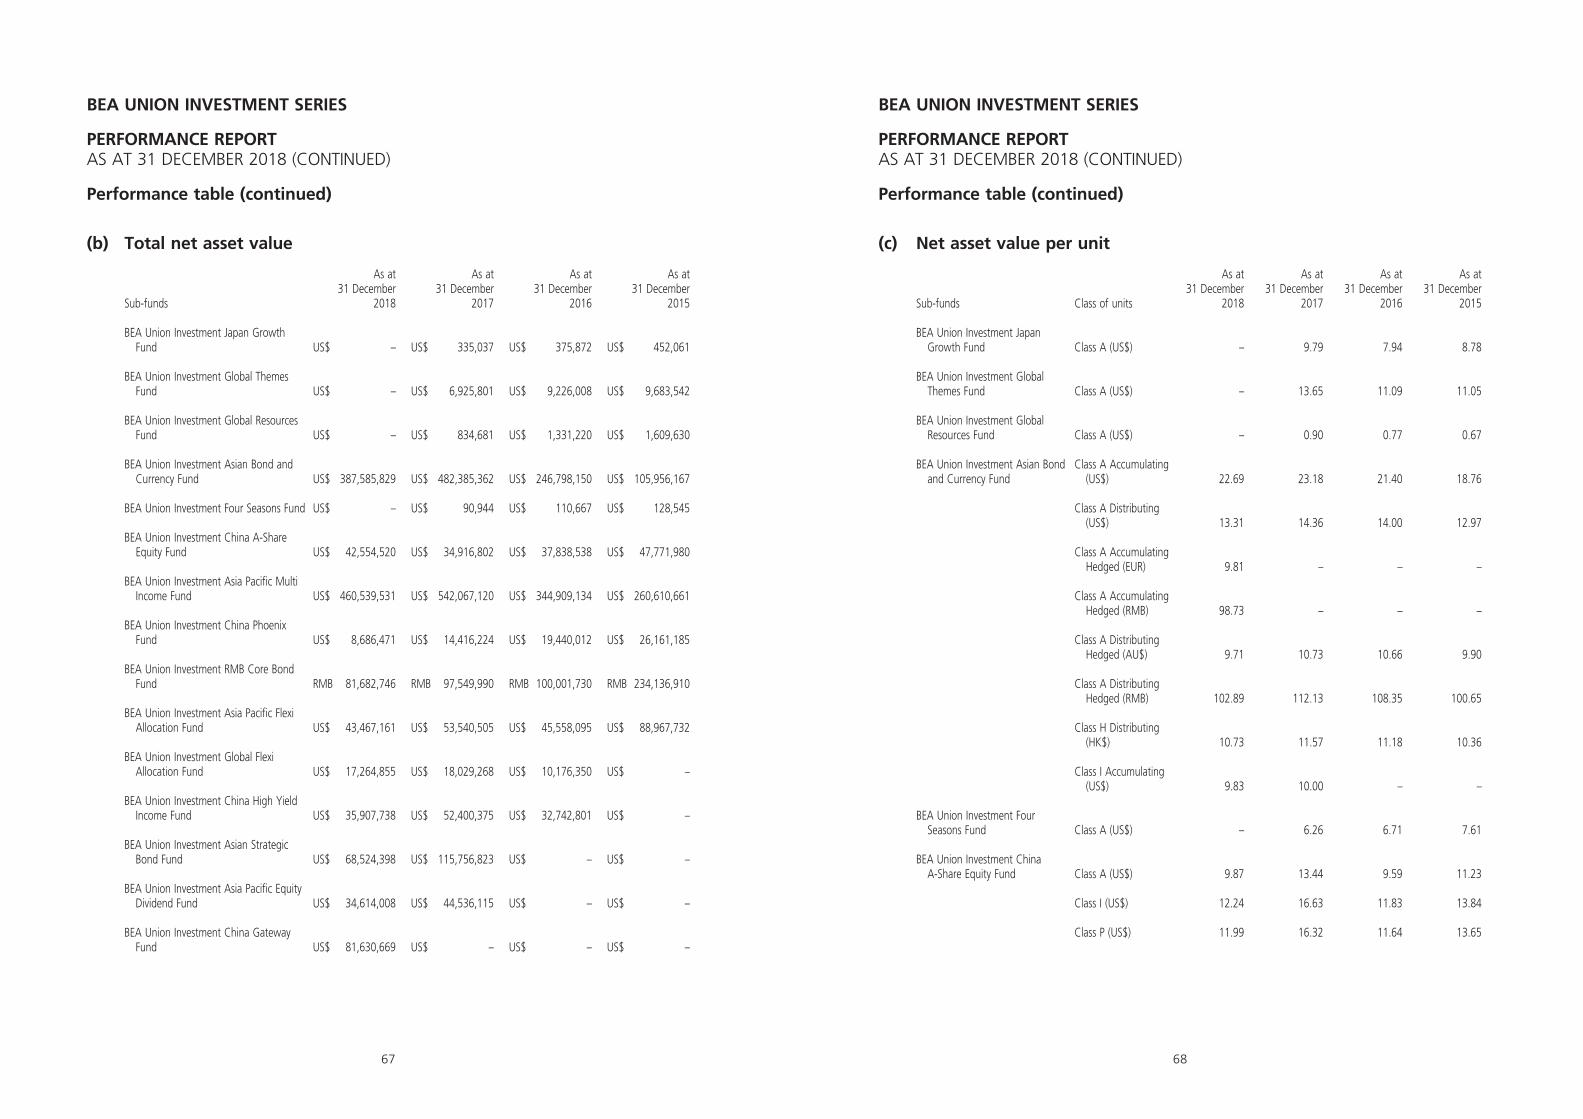
BEA UNION INVESTMENT SERIES
PERFORMANCE REPORTAS AT 31 DECEMBER 2018 (CONTINUED)
BEA UNION INVESTMENT SERIES
PERFORMANCE REPORTAS AT 31 DECEMBER 2018 (CONTINUED)
67 68
A5請縮小打印70.5%
Performance table (continued)
(b) Total net asset value
Sub-funds
As at 31 December
2018
As at 31 December
2017
As at 31 December
2016
As at 31 December
2015
BEA Union Investment Japan Growth Fund US$ – US$ 335,037 US$ 375,872 US$ 452,061
BEA Union Investment Global Themes Fund US$ – US$ 6,925,801 US$ 9,226,008 US$ 9,683,542
BEA Union Investment Global Resources Fund US$ – US$ 834,681 US$ 1,331,220 US$ 1,609,630
BEA Union Investment Asian Bond and Currency Fund US$ 387,585,829 US$ 482,385,362 US$ 246,798,150 US$ 105,956,167
BEA Union Investment Four Seasons Fund US$ – US$ 90,944 US$ 110,667 US$ 128,545
BEA Union Investment China A-Share Equity Fund US$ 42,554,520 US$ 34,916,802 US$ 37,838,538 US$ 47,771,980
BEA Union Investment Asia Pacific Multi Income Fund US$ 460,539,531 US$ 542,067,120 US$ 344,909,134 US$ 260,610,661
BEA Union Investment China Phoenix Fund US$ 8,686,471 US$ 14,416,224 US$ 19,440,012 US$ 26,161,185
BEA Union Investment RMB Core Bond Fund RMB 81,682,746 RMB 97,549,990 RMB 100,001,730 RMB 234,136,910
BEA Union Investment Asia Pacific Flexi Allocation Fund US$ 43,467,161 US$ 53,540,505 US$ 45,558,095 US$ 88,967,732
BEA Union Investment Global Flexi Allocation Fund US$ 17,264,855 US$ 18,029,268 US$ 10,176,350 US$ –
BEA Union Investment China High Yield Income Fund US$ 35,907,738 US$ 52,400,375 US$ 32,742,801 US$ –
BEA Union Investment Asian Strategic Bond Fund US$ 68,524,398 US$ 115,756,823 US$ – US$ –
BEA Union Investment Asia Pacific Equity Dividend Fund US$ 34,614,008 US$ 44,536,115 US$ – US$ –
BEA Union Investment China Gateway Fund US$ 81,630,669 US$ – US$ – US$ –
Performance table (continued)
(c) Net asset value per unit
Sub-funds Class of units
As at 31 December
2018
As at 31 December
2017
As at 31 December
2016
As at 31 December
2015
BEA Union Investment Japan Growth Fund Class A (US$) – 9.79 7.94 8.78
BEA Union Investment Global Themes Fund Class A (US$) – 13.65 11.09 11.05
BEA Union Investment Global Resources Fund Class A (US$) – 0.90 0.77 0.67
BEA Union Investment Asian Bond and Currency Fund
Class A Accumulating (US$) 22.69 23.18 21.40 18.76
Class A Distributing (US$) 13.31 14.36 14.00 12.97
Class A Accumulating Hedged (EUR) 9.81 – – –
Class A Accumulating Hedged (RMB) 98.73 – – –
Class A Distributing Hedged (AU$) 9.71 10.73 10.66 9.90
Class A Distributing Hedged (RMB) 102.89 112.13 108.35 100.65
Class H Distributing (HK$) 10.73 11.57 11.18 10.36
Class I Accumulating (US$) 9.83 10.00 – –
BEA Union Investment Four Seasons Fund Class A (US$) – 6.26 6.71 7.61
BEA Union Investment China A-Share Equity Fund Class A (US$) 9.87 13.44 9.59 11.23
Class I (US$) 12.24 16.63 11.83 13.84
Class P (US$) 11.99 16.32 11.64 13.65
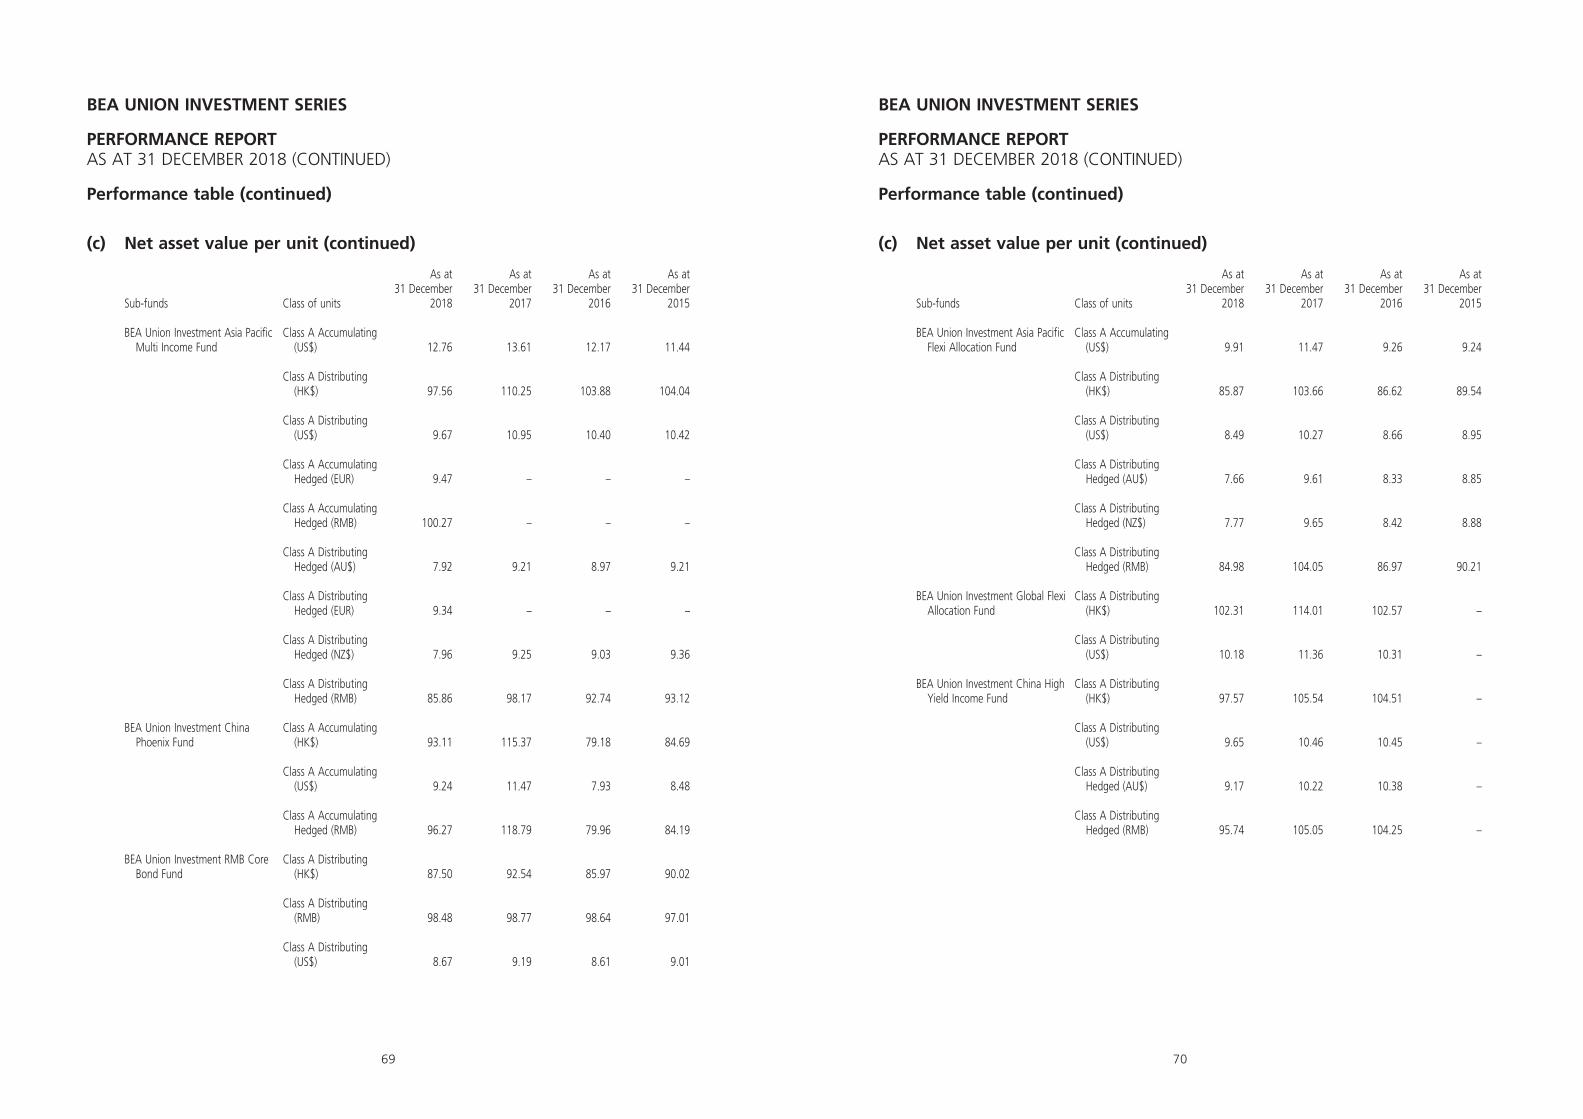
BEA UNION INVESTMENT SERIES
PERFORMANCE REPORTAS AT 31 DECEMBER 2018 (CONTINUED)
BEA UNION INVESTMENT SERIES
PERFORMANCE REPORTAS AT 31 DECEMBER 2018 (CONTINUED)
69 70
A5請縮小打印70.5%
Performance table (continued)
(c) Net asset value per unit (continued)
Sub-funds Class of units
As at 31 December
2018
As at 31 December
2017
As at 31 December
2016
As at 31 December
2015
BEA Union Investment Asia Pacific Multi Income Fund
Class A Accumulating (US$) 12.76 13.61 12.17 11.44
Class A Distributing (HK$) 97.56 110.25 103.88 104.04
Class A Distributing (US$) 9.67 10.95 10.40 10.42
Class A Accumulating Hedged (EUR) 9.47 – – –
Class A Accumulating Hedged (RMB) 100.27 – – –
Class A Distributing Hedged (AU$) 7.92 9.21 8.97 9.21
Class A Distributing Hedged (EUR) 9.34 – – –
Class A Distributing Hedged (NZ$) 7.96 9.25 9.03 9.36
Class A Distributing Hedged (RMB) 85.86 98.17 92.74 93.12
BEA Union Investment China Phoenix Fund
Class A Accumulating (HK$) 93.11 115.37 79.18 84.69
Class A Accumulating (US$) 9.24 11.47 7.93 8.48
Class A Accumulating Hedged (RMB) 96.27 118.79 79.96 84.19
BEA Union Investment RMB Core Bond Fund
Class A Distributing (HK$) 87.50 92.54 85.97 90.02
Class A Distributing (RMB) 98.48 98.77 98.64 97.01
Class A Distributing (US$) 8.67 9.19 8.61 9.01
Performance table (continued)
(c) Net asset value per unit (continued)
Sub-funds Class of units
As at 31 December
2018
As at 31 December
2017
As at 31 December
2016
As at 31 December
2015
BEA Union Investment Asia Pacific Flexi Allocation Fund
Class A Accumulating (US$) 9.91 11.47 9.26 9.24
Class A Distributing (HK$) 85.87 103.66 86.62 89.54
Class A Distributing (US$) 8.49 10.27 8.66 8.95
Class A Distributing Hedged (AU$) 7.66 9.61 8.33 8.85
Class A Distributing Hedged (NZ$) 7.77 9.65 8.42 8.88
Class A Distributing Hedged (RMB) 84.98 104.05 86.97 90.21
BEA Union Investment Global Flexi Allocation Fund
Class A Distributing (HK$) 102.31 114.01 102.57 –
Class A Distributing (US$) 10.18 11.36 10.31 –
BEA Union Investment China High Yield Income Fund
Class A Distributing (HK$) 97.57 105.54 104.51 –
Class A Distributing (US$) 9.65 10.46 10.45 –
Class A Distributing Hedged (AU$) 9.17 10.22 10.38 –
Class A Distributing Hedged (RMB) 95.74 105.05 104.25 –
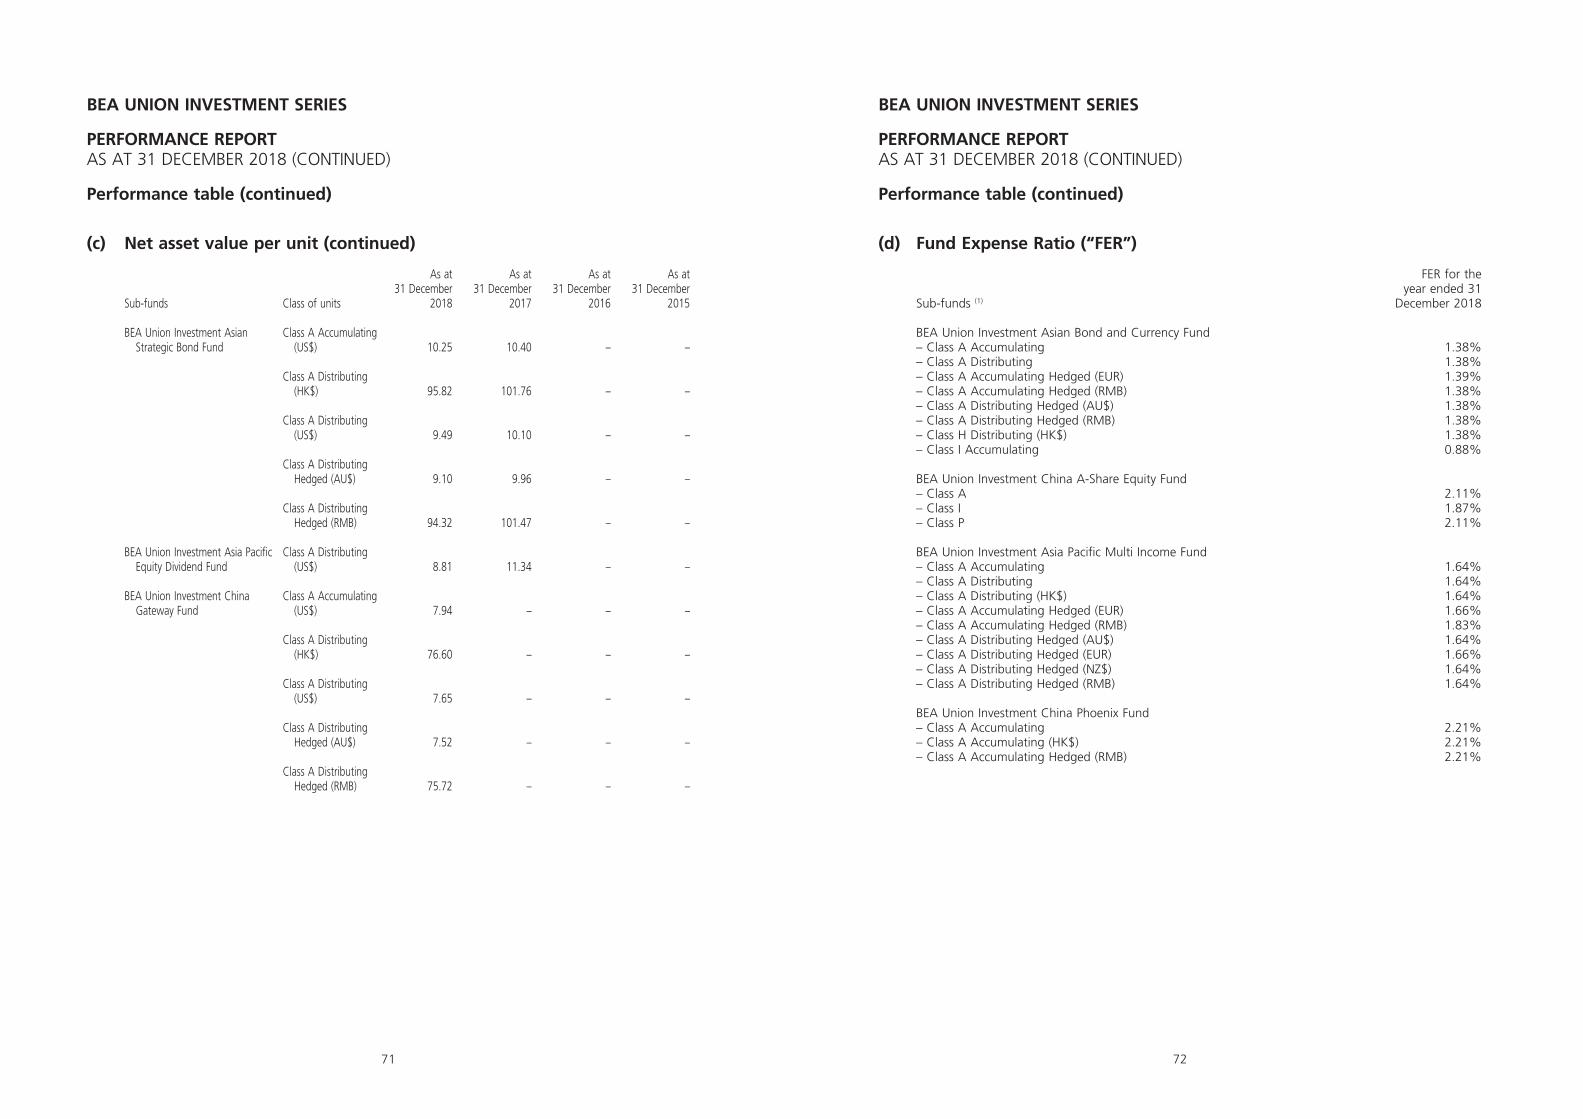
BEA UNION INVESTMENT SERIES
PERFORMANCE REPORTAS AT 31 DECEMBER 2018 (CONTINUED)
BEA UNION INVESTMENT SERIES
PERFORMANCE REPORTAS AT 31 DECEMBER 2018 (CONTINUED)
71 72
A5請縮小打印70.5%
Performance table (continued)
(c) Net asset value per unit (continued)
Sub-funds Class of units
As at 31 December
2018
As at 31 December
2017
As at 31 December
2016
As at 31 December
2015
BEA Union Investment Asian Strategic Bond Fund
Class A Accumulating (US$) 10.25 10.40 – –
Class A Distributing (HK$) 95.82 101.76 – –
Class A Distributing (US$) 9.49 10.10 – –
Class A Distributing Hedged (AU$) 9.10 9.96 – –
Class A Distributing Hedged (RMB) 94.32 101.47 – –
BEA Union Investment Asia Pacific Equity Dividend Fund
Class A Distributing (US$) 8.81 11.34 – –
BEA Union Investment China Gateway Fund
Class A Accumulating (US$) 7.94 – – –
Class A Distributing (HK$) 76.60 – – –
Class A Distributing (US$) 7.65 – – –
Class A Distributing Hedged (AU$) 7.52 – – –
Class A Distributing Hedged (RMB) 75.72 – – –
Performance table (continued)
(d) Fund Expense Ratio (“FER”)
Sub-funds (1)
FER for the year ended 31
December 2018
BEA Union Investment Asian Bond and Currency Fund– Class A Accumulating 1.38%– Class A Distributing 1.38%– Class A Accumulating Hedged (EUR) 1.39%– Class A Accumulating Hedged (RMB) 1.38%– Class A Distributing Hedged (AU$) 1.38%– Class A Distributing Hedged (RMB) 1.38%– Class H Distributing (HK$) 1.38%– Class I Accumulating 0.88%
BEA Union Investment China A-Share Equity Fund– Class A 2.11%– Class I 1.87%– Class P 2.11%
BEA Union Investment Asia Pacific Multi Income Fund– Class A Accumulating 1.64%– Class A Distributing 1.64%– Class A Distributing (HK$) 1.64%– Class A Accumulating Hedged (EUR) 1.66%– Class A Accumulating Hedged (RMB) 1.83%– Class A Distributing Hedged (AU$) 1.64%– Class A Distributing Hedged (EUR) 1.66%– Class A Distributing Hedged (NZ$) 1.64%– Class A Distributing Hedged (RMB) 1.64%
BEA Union Investment China Phoenix Fund– Class A Accumulating 2.21%– Class A Accumulating (HK$) 2.21%– Class A Accumulating Hedged (RMB) 2.21%
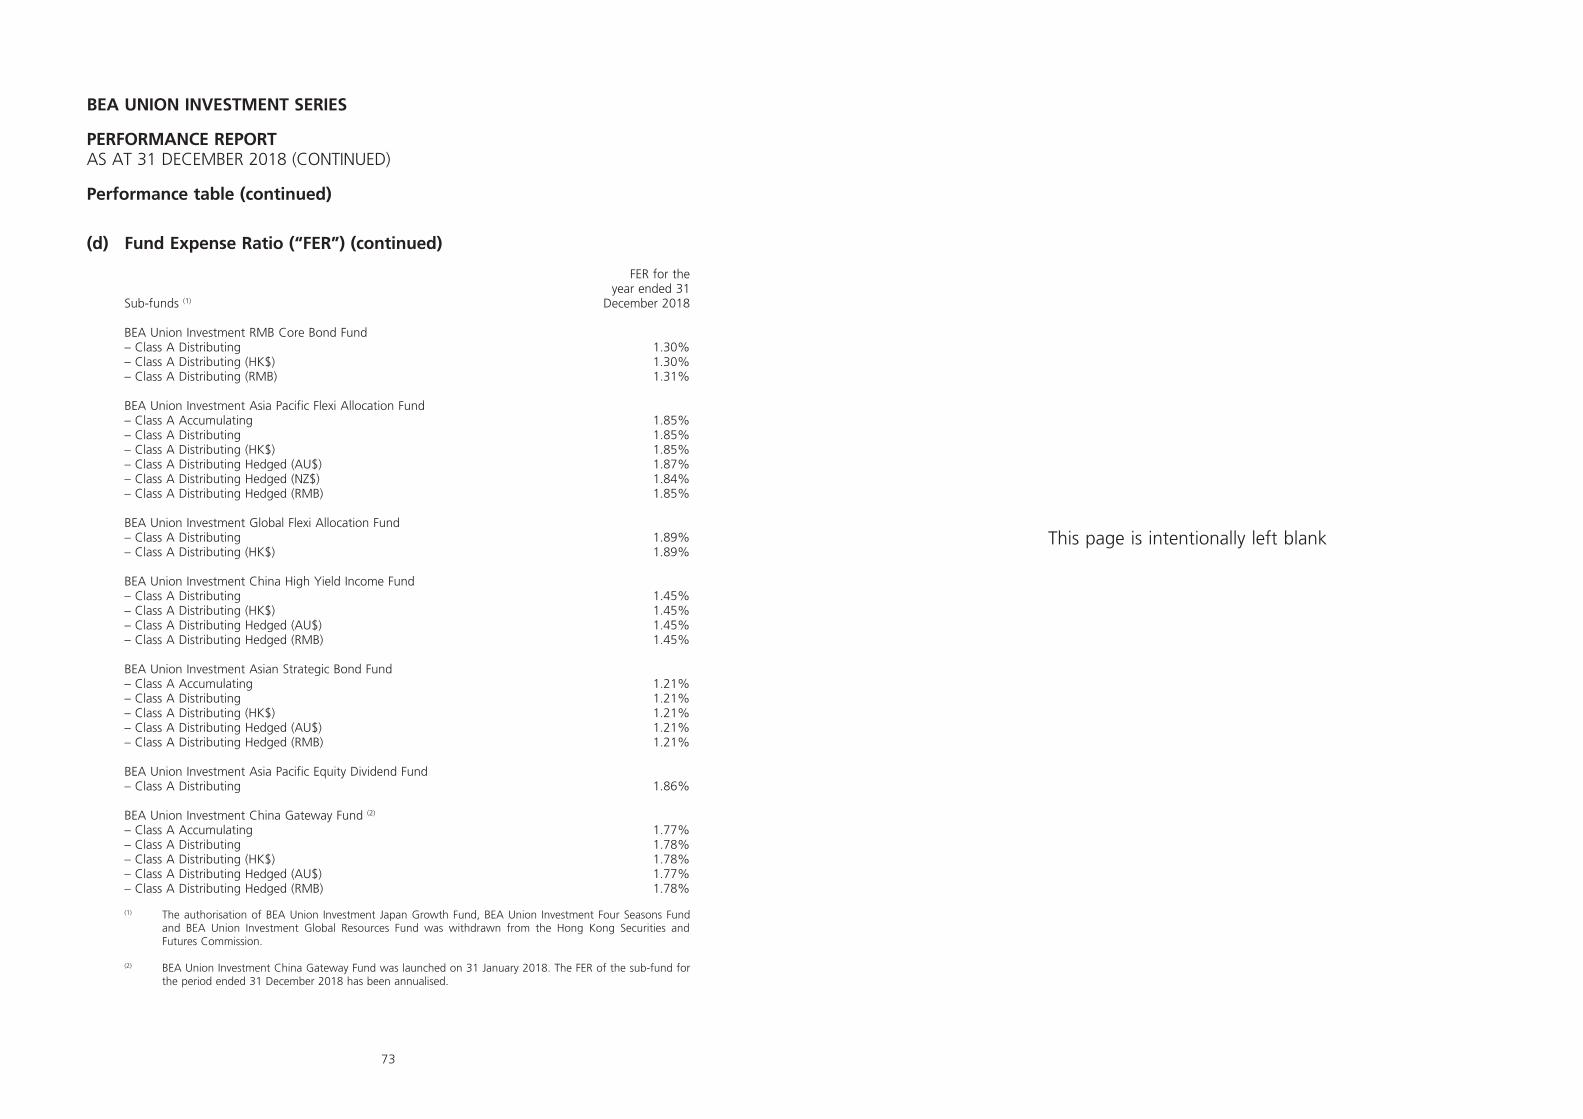
A5請縮小打印70.5%
This page is intentionally left blank
BEA UNION INVESTMENT SERIES
PERFORMANCE REPORTAS AT 31 DECEMBER 2018 (CONTINUED)
73
A5請縮小打印70.5%
Performance table (continued)
(d) Fund Expense Ratio (“FER”) (continued)
Sub-funds (1)
FER for the year ended 31
December 2018
BEA Union Investment RMB Core Bond Fund– Class A Distributing 1.30%– Class A Distributing (HK$) 1.30%– Class A Distributing (RMB) 1.31%
BEA Union Investment Asia Pacific Flexi Allocation Fund– Class A Accumulating 1.85%– Class A Distributing 1.85%– Class A Distributing (HK$) 1.85%– Class A Distributing Hedged (AU$) 1.87%– Class A Distributing Hedged (NZ$) 1.84%– Class A Distributing Hedged (RMB) 1.85%
BEA Union Investment Global Flexi Allocation Fund– Class A Distributing 1.89%– Class A Distributing (HK$) 1.89%
BEA Union Investment China High Yield Income Fund– Class A Distributing 1.45%– Class A Distributing (HK$) 1.45%– Class A Distributing Hedged (AU$) 1.45%– Class A Distributing Hedged (RMB) 1.45%
BEA Union Investment Asian Strategic Bond Fund– Class A Accumulating 1.21%– Class A Distributing 1.21%– Class A Distributing (HK$) 1.21%– Class A Distributing Hedged (AU$) 1.21%– Class A Distributing Hedged (RMB) 1.21%
BEA Union Investment Asia Pacific Equity Dividend Fund– Class A Distributing 1.86%
BEA Union Investment China Gateway Fund (2)
– Class A Accumulating 1.77%– Class A Distributing 1.78%– Class A Distributing (HK$) 1.78%– Class A Distributing Hedged (AU$) 1.77%– Class A Distributing Hedged (RMB) 1.78%
(1) The authorisation of BEA Union Investment Japan Growth Fund, BEA Union Investment Four Seasons Fund and BEA Union Investment Global Resources Fund was withdrawn from the Hong Kong Securities and Futures Commission.
(2) BEA Union Investment China Gateway Fund was launched on 31 January 2018. The FER of the sub-fund for the period ended 31 December 2018 has been annualised.
BEA UNION INVESTMENT SERIES
INDEPENDENT AUDITOR’S REPORT TO THE UNITHOLDERS OFBEA UNION INVESTMENT SERIES (“THE FUND”) (CONTINUED)
75
A5請縮小打印70.5%
BEA UNION INVESTMENT SERIES
INDEPENDENT AUDITOR’S REPORT TO THE UNITHOLDERS OFBEA UNION INVESTMENT SERIES (“THE FUND”)
74
A5請縮小打印70.5%
Report on the Audit of Financial Statements
Opinion
We have audited the financial statements of the sub-funds within the Fund (“the Sub-funds”) set out on pages 78 to 190, which comprise the statement of assets and liabilities as at 31 December 2018, the statement of comprehensive income, the statement of changes in net assets attributable to unitholders, the cash flow statement and the distribution statement for the year/period then ended and notes to the financial statements, including a summary of significant accounting policies.
In our opinion, the financial statements give a true and fair view of the financial disposition of the Sub-funds as at 31 December 2018 and of their financial transactions and cash flows for the year/period then ended in accordance with Hong Kong Financial Reporting Standards (“HKFRSs”) issued by the Hong Kong Institute of Certified Public Accountants (“HKICPA”).
Basis for Opinion
We conducted our audit in accordance with Hong Kong Standards on Auditing (“HKSAs”) issued by the HKICPA. Our responsibilities under those standards are further described in the Auditor’s Responsibilities for the Audit of the Financial Statements section of our report. We are independent of the Fund in accordance with the HKICPA’s Code of Ethics for Professional Accountants (“the Code”), and we have fulfilled our other ethical responsibilities in accordance with the Code. We believe that the audit evidence we have obtained is sufficient and appropriate to provide a basis for our opinion.
Information Other than the Financial Statements and Auditor’s Report Thereon
The Manager and the Trustee of the Fund are responsible for the other information. The other information comprises all the information included in the annual report, other than the financial statements and our auditor’s report thereon.
Our opinion on the financial statements does not cover the other information and we do not express any form of assurance conclusion thereon.
In connection with our audit of the financial statements, our responsibility is to read the other information and, in doing so, consider whether the other information is materially inconsistent with the financial statements or our knowledge obtained in the audit or otherwise appears to be materially misstated.
If, based on the work we have performed, we conclude that there is a material misstatement of this other information, we are required to report that fact. We have nothing to report in this regard.
Report on the Audit of Financial Statements (continued)
Responsibilities of the Manager and the Trustee of the Fund for the Financial Statements
The Manager and the Trustee of the Fund are responsible for the preparation of the financial statements that give a true and fair view in accordance with HKFRSs issued by the HKICPA and for such internal control as the Manager and the Trustee of the Fund determine is necessary to enable the preparation of financial statements that are free from material misstatement, whether due to fraud or error.
In preparing the financial statements, the Manager and the Trustee of the Fund are responsible for assessing the Sub-funds’ ability to continue as a going concern, disclosing, as applicable, matters related to going concern and using the going concern basis of accounting unless the Manager and the Trustee of the Fund either intend to liquidate the Sub-funds or to cease operations, or have no realistic alternative but to do so.
In addition, the Manager and the Trustee of the Fund are required to ensure that the financial statements have been properly prepared in accordance with the relevant provisions of the Trust Deed of the Fund, as amended, and the relevant disclosure provisions of Appendix E of the Code on Unit Trusts and Mutual Funds (“the SFC Code”) issued by the Hong Kong Securities and Futures Commission.
Auditor’s Responsibilities for the Audit of the Financial Statements
Our objectives are to obtain reasonable assurance about whether the financial statements as a whole are free from material misstatement, whether due to fraud or error, and to issue an auditor’s report that includes our opinion. This report is made solely to you, as a body, and for no other purpose. We do not assume responsibility towards or accept liability to any other person for the contents of this report.
Reasonable assurance is a high level of assurance but is not a guarantee that an audit conducted in accordance with HKSAs will always detect a material misstatement when it exists. Misstatements can arise from fraud or error and are considered material if, individually or in the aggregate, they could reasonably be expected to influence the economic decisions of users taken on the basis of these financial statements. In addition, we are required to assess whether the financial statements of the Fund have been properly prepared, in all material respects, in accordance with the relevant provisions of the Trust Deed and the relevant disclosure provisions of Appendix E of the SFC Code.
BEA UNION INVESTMENT SERIES
INDEPENDENT AUDITOR’S REPORT TO THE UNITHOLDERS OFBEA UNION INVESTMENT SERIES (“THE FUND”) (CONTINUED)
BEA UNION INVESTMENT SERIES
INDEPENDENT AUDITOR’S REPORT TO THE UNITHOLDERS OFBEA UNION INVESTMENT SERIES (“THE FUND”) (CONTINUED)
76 77
A5請縮小打印70.5%
Report on the Audit of Financial Statements (continued)
Auditor’s Responsibilities for the Audit of the Financial Statements (continued)
As part of an audit in accordance with HKSAs, we exercise professional judgement and maintain professional scepticism throughout the audit. We also:
• Identify and assess the risks of material misstatement of the financial statements, whether due to fraud or error, design and perform audit procedures responsive to those risks, and obtain audit evidence that is sufficient and appropriate to provide a basis for our opinion. The risk of not detecting a material misstatement resulting from fraud is higher than for one resulting from error, as fraud may involve collusion, forgery, intentional omissions, misrepresentations or the override of internal control.
• Obtain an understanding of internal control relevant to the audit in order to design audit procedures that are appropriate in the circumstances but not for the purpose of expressing an opinion on the effectiveness of the Fund’s internal control.
• Evaluate the appropriateness of accounting policies used and the reasonableness of accounting estimates and related disclosures made by the Manager and the Trustee of the Fund.
• Conclude on the appropriateness of the Manager’s and the Trustee’s use of the going concern basis of accounting and, based on the audit evidence obtained, whether a material uncertainty exists related to events or conditions that may cast significant doubt on the Sub-funds’ ability to continue as a going concern. If we conclude that a material uncertainty exists, we are required to draw attention in our auditor’s report to the related disclosures in the financial statements or, if such disclosures are inadequate, to modify our opinion. Our conclusions are based on the audit evidence obtained up to the date of our auditor’s report. However, future events or conditions may cause the Sub-funds to cease to continue as a going concern.
• Evaluate the overall presentation, structure and content of the financial statements, including the disclosures, and whether the financial statements represent the underlying transactions and events in a manner that achieves fair presentation.
We communicate with the Manager and the Trustee of the Fund regarding, among other matters, the planned scope and timing of the audit and significant audit findings, including any significant deficiencies in internal control that we identify during our audit.
Report on matters under the relevant provisions of the Trust Deed and the relevant disclosure provisions of Appendix E of the SFC Code
In our opinion, the financial statements have been properly prepared, in all material respects, in accordance with the relevant provisions of the Trust Deed and the relevant disclosure provisions of Appendix E of the SFC Code.
KPMGCertified Public Accountants
8th Floor, Prince’s Building10 Chater RoadCentral, Hong Kong
24 April 2019
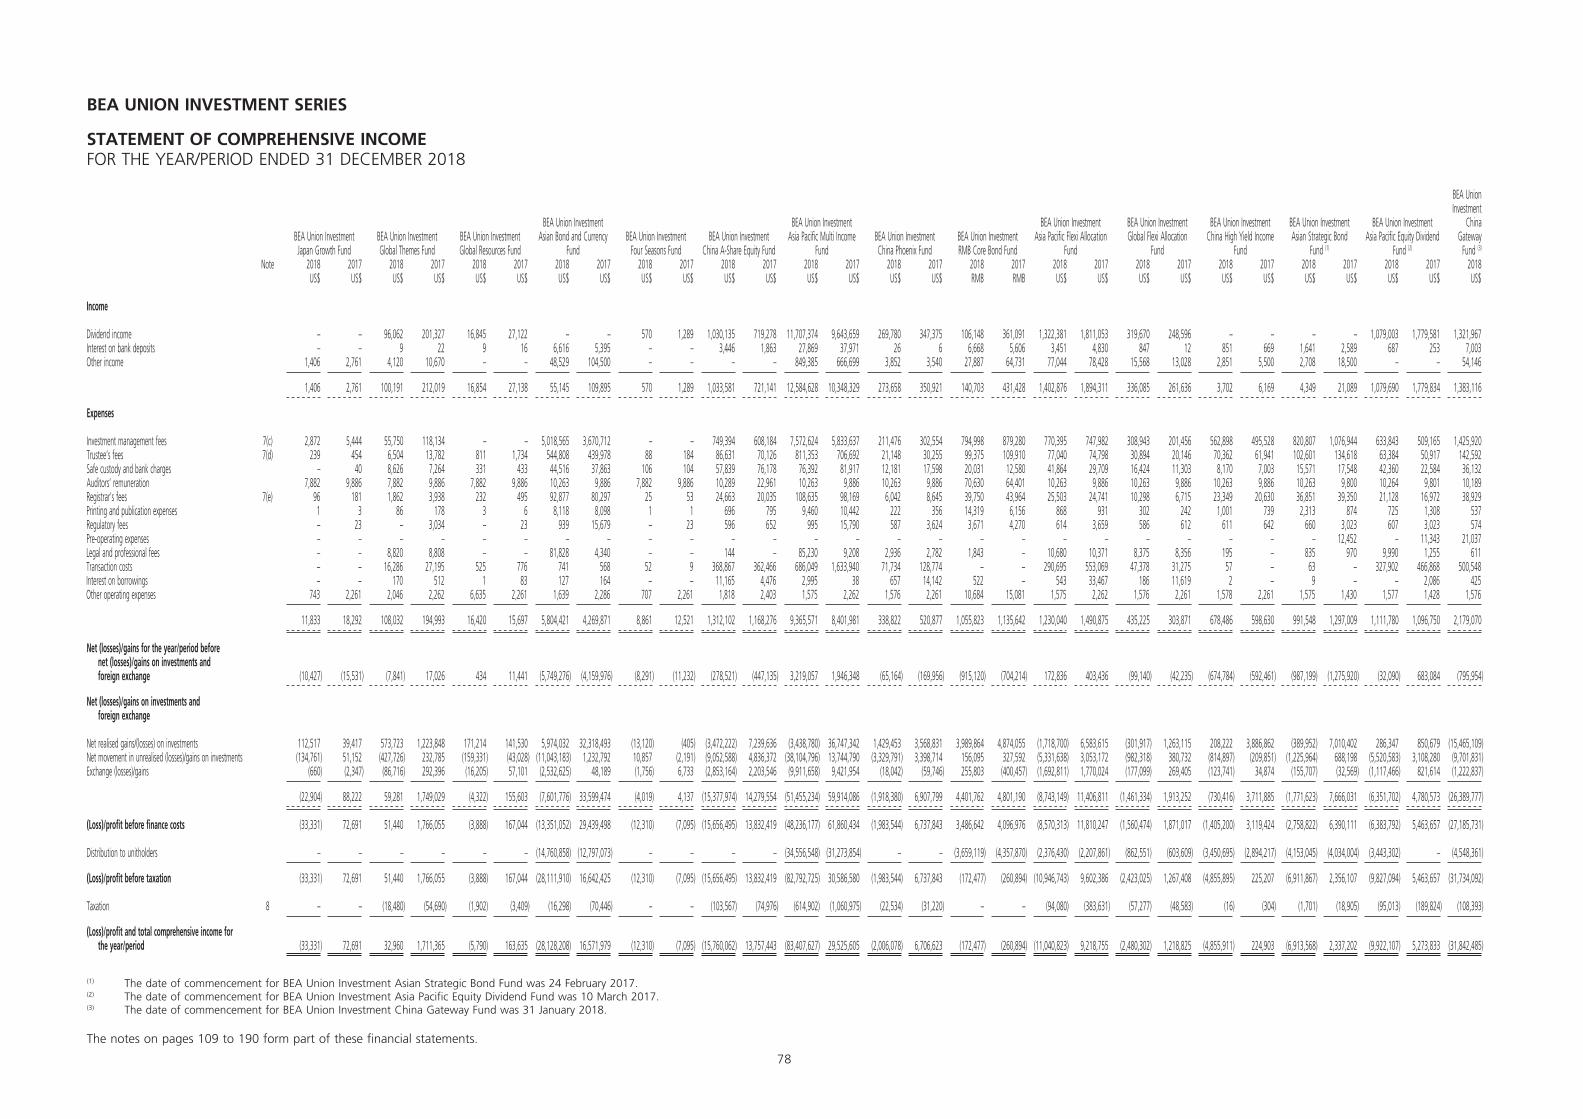
BEA UNION INVESTMENT SERIES
STATEMENT OF COMPREHENSIVE INCOME FOR THE YEAR/PERIOD ENDED 31 DECEMBER 2018
78
A5請縮小打印70.5%
BEA Union Investment Japan Growth Fund
BEA Union Investment Global Themes Fund
BEA Union Investment Global Resources Fund
BEA Union Investment Asian Bond and Currency
FundBEA Union Investment
Four Seasons FundBEA Union Investment
China A-Share Equity Fund
BEA Union Investment Asia Pacific Multi Income
FundBEA Union Investment China Phoenix Fund
BEA Union Investment RMB Core Bond Fund
BEA Union Investment Asia Pacific Flexi Allocation
Fund
BEA Union Investment Global Flexi Allocation
Fund
BEA Union Investment China High Yield Income
Fund
BEA Union Investment Asian Strategic Bond
Fund (1)
BEA Union Investment Asia Pacific Equity Dividend
Fund (2)
BEA Union Investment
China Gateway
Fund (3)
Note 2018 2017 2018 2017 2018 2017 2018 2017 2018 2017 2018 2017 2018 2017 2018 2017 2018 2017 2018 2017 2018 2017 2018 2017 2018 2017 2018 2017 2018US$ US$ US$ US$ US$ US$ US$ US$ US$ US$ US$ US$ US$ US$ US$ US$ RMB RMB US$ US$ US$ US$ US$ US$ US$ US$ US$ US$ US$
Income
Dividend income – – 96,062 201,327 16,845 27,122 – – 570 1,289 1,030,135 719,278 11,707,374 9,643,659 269,780 347,375 106,148 361,091 1,322,381 1,811,053 319,670 248,596 – – – – 1,079,003 1,779,581 1,321,967Interest on bank deposits – – 9 22 9 16 6,616 5,395 – – 3,446 1,863 27,869 37,971 26 6 6,668 5,606 3,451 4,830 847 12 851 669 1,641 2,589 687 253 7,003Other income 1,406 2,761 4,120 10,670 – – 48,529 104,500 – – – – 849,385 666,699 3,852 3,540 27,887 64,731 77,044 78,428 15,568 13,028 2,851 5,500 2,708 18,500 – – 54,146
1,406 2,761 100,191 212,019 16,854 27,138 55,145 109,895 570 1,289 1,033,581 721,141 12,584,628 10,348,329 273,658 350,921 140,703 431,428 1,402,876 1,894,311 336,085 261,636 3,702 6,169 4,349 21,089 1,079,690 1,779,834 1,383,116
Expenses
Investment management fees 7(c) 2,872 5,444 55,750 118,134 – – 5,018,565 3,670,712 – – 749,394 608,184 7,572,624 5,833,637 211,476 302,554 794,998 879,280 770,395 747,982 308,943 201,456 562,898 495,528 820,807 1,076,944 633,843 509,165 1,425,920Trustee’s fees 7(d) 239 454 6,504 13,782 811 1,734 544,808 439,978 88 184 86,631 70,126 811,353 706,692 21,148 30,255 99,375 109,910 77,040 74,798 30,894 20,146 70,362 61,941 102,601 134,618 63,384 50,917 142,592Safe custody and bank charges – 40 8,626 7,264 331 433 44,516 37,863 106 104 57,839 76,178 76,392 81,917 12,181 17,598 20,031 12,580 41,864 29,709 16,424 11,303 8,170 7,003 15,571 17,548 42,360 22,584 36,132Auditors’ remuneration 7,882 9,886 7,882 9,886 7,882 9,886 10,263 9,886 7,882 9,886 10,289 22,961 10,263 9,886 10,263 9,886 70,630 64,401 10,263 9,886 10,263 9,886 10,263 9,886 10,263 9,800 10,264 9,801 10,189Registrar’s fees 7(e) 96 181 1,862 3,938 232 495 92,877 80,297 25 53 24,663 20,035 108,635 98,169 6,042 8,645 39,750 43,964 25,503 24,741 10,298 6,715 23,349 20,630 36,851 39,350 21,128 16,972 38,929Printing and publication expenses 1 3 86 178 3 6 8,118 8,098 1 1 696 795 9,460 10,442 222 356 14,319 6,156 868 931 302 242 1,001 739 2,313 874 725 1,308 537Regulatory fees – 23 – 3,034 – 23 939 15,679 – 23 596 652 995 15,790 587 3,624 3,671 4,270 614 3,659 586 612 611 642 660 3,023 607 3,023 574Pre-operating expenses – – – – – – – – – – – – – – – – – – – – – – – – – 12,452 – 11,343 21,037Legal and professional fees – – 8,820 8,808 – – 81,828 4,340 – – 144 – 85,230 9,208 2,936 2,782 1,843 – 10,680 10,371 8,375 8,356 195 – 835 970 9,990 1,255 611Transaction costs – – 16,286 27,195 525 776 741 568 52 9 368,867 362,466 686,049 1,633,940 71,734 128,774 – – 290,695 553,069 47,378 31,275 57 – 63 – 327,902 466,868 500,548Interest on borrowings – – 170 512 1 83 127 164 – – 11,165 4,476 2,995 38 657 14,142 522 – 543 33,467 186 11,619 2 – 9 – – 2,086 425Other operating expenses 743 2,261 2,046 2,262 6,635 2,261 1,639 2,286 707 2,261 1,818 2,403 1,575 2,262 1,576 2,261 10,684 15,081 1,575 2,262 1,576 2,261 1,578 2,261 1,575 1,430 1,577 1,428 1,576
11,833 18,292 108,032 194,993 16,420 15,697 5,804,421 4,269,871 8,861 12,521 1,312,102 1,168,276 9,365,571 8,401,981 338,822 520,877 1,055,823 1,135,642 1,230,040 1,490,875 435,225 303,871 678,486 598,630 991,548 1,297,009 1,111,780 1,096,750 2,179,070
Net (losses)/gains for the year/period before net (losses)/gains on investments and foreign exchange (10,427) (15,531) (7,841) 17,026 434 11,441 (5,749,276) (4,159,976) (8,291) (11,232) (278,521) (447,135) 3,219,057 1,946,348 (65,164) (169,956) (915,120) (704,214) 172,836 403,436 (99,140) (42,235) (674,784) (592,461) (987,199) (1,275,920) (32,090) 683,084 (795,954)
Net (losses)/gains on investments and foreign exchange
Net realised gains/(losses) on investments 112,517 39,417 573,723 1,223,848 171,214 141,530 5,974,032 32,318,493 (13,120) (405) (3,472,222) 7,239,636 (3,438,780) 36,747,342 1,429,453 3,568,831 3,989,864 4,874,055 (1,718,700) 6,583,615 (301,917) 1,263,115 208,222 3,886,862 (389,952) 7,010,402 286,347 850,679 (15,465,109)Net movement in unrealised (losses)/gains on investments (134,761) 51,152 (427,726) 232,785 (159,331) (43,028) (11,043,183) 1,232,792 10,857 (2,191) (9,052,588) 4,836,372 (38,104,796) 13,744,790 (3,329,791) 3,398,714 156,095 327,592 (5,331,638) 3,053,172 (982,318) 380,732 (814,897) (209,851) (1,225,964) 688,198 (5,520,583) 3,108,280 (9,701,831)Exchange (losses)/gains (660) (2,347) (86,716) 292,396 (16,205) 57,101 (2,532,625) 48,189 (1,756) 6,733 (2,853,164) 2,203,546 (9,911,658) 9,421,954 (18,042) (59,746) 255,803 (400,457) (1,692,811) 1,770,024 (177,099) 269,405 (123,741) 34,874 (155,707) (32,569) (1,117,466) 821,614 (1,222,837)
(22,904) 88,222 59,281 1,749,029 (4,322) 155,603 (7,601,776) 33,599,474 (4,019) 4,137 (15,377,974) 14,279,554 (51,455,234) 59,914,086 (1,918,380) 6,907,799 4,401,762 4,801,190 (8,743,149) 11,406,811 (1,461,334) 1,913,252 (730,416) 3,711,885 (1,771,623) 7,666,031 (6,351,702) 4,780,573 (26,389,777)
(Loss)/profit before finance costs (33,331) 72,691 51,440 1,766,055 (3,888) 167,044 (13,351,052) 29,439,498 (12,310) (7,095) (15,656,495) 13,832,419 (48,236,177) 61,860,434 (1,983,544) 6,737,843 3,486,642 4,096,976 (8,570,313) 11,810,247 (1,560,474) 1,871,017 (1,405,200) 3,119,424 (2,758,822) 6,390,111 (6,383,792) 5,463,657 (27,185,731)
Distribution to unitholders – – – – – – (14,760,858) (12,797,073) – – – – (34,556,548) (31,273,854) – – (3,659,119) (4,357,870) (2,376,430) (2,207,861) (862,551) (603,609) (3,450,695) (2,894,217) (4,153,045) (4,034,004) (3,443,302) – (4,548,361)
(Loss)/profit before taxation (33,331) 72,691 51,440 1,766,055 (3,888) 167,044 (28,111,910) 16,642,425 (12,310) (7,095) (15,656,495) 13,832,419 (82,792,725) 30,586,580 (1,983,544) 6,737,843 (172,477) (260,894) (10,946,743) 9,602,386 (2,423,025) 1,267,408 (4,855,895) 225,207 (6,911,867) 2,356,107 (9,827,094) 5,463,657 (31,734,092)
Taxation 8 – – (18,480) (54,690) (1,902) (3,409) (16,298) (70,446) – – (103,567) (74,976) (614,902) (1,060,975) (22,534) (31,220) – – (94,080) (383,631) (57,277) (48,583) (16) (304) (1,701) (18,905) (95,013) (189,824) (108,393)
(Loss)/profit and total comprehensive income for the year/period (33,331) 72,691 32,960 1,711,365 (5,790) 163,635 (28,128,208) 16,571,979 (12,310) (7,095) (15,760,062) 13,757,443 (83,407,627) 29,525,605 (2,006,078) 6,706,623 (172,477) (260,894) (11,040,823) 9,218,755 (2,480,302) 1,218,825 (4,855,911) 224,903 (6,913,568) 2,337,202 (9,922,107) 5,273,833 (31,842,485)
(1) The date of commencement for BEA Union Investment Asian Strategic Bond Fund was 24 February 2017.(2) The date of commencement for BEA Union Investment Asia Pacific Equity Dividend Fund was 10 March 2017.(3) The date of commencement for BEA Union Investment China Gateway Fund was 31 January 2018.
The notes on pages 109 to 190 form part of these financial statements.
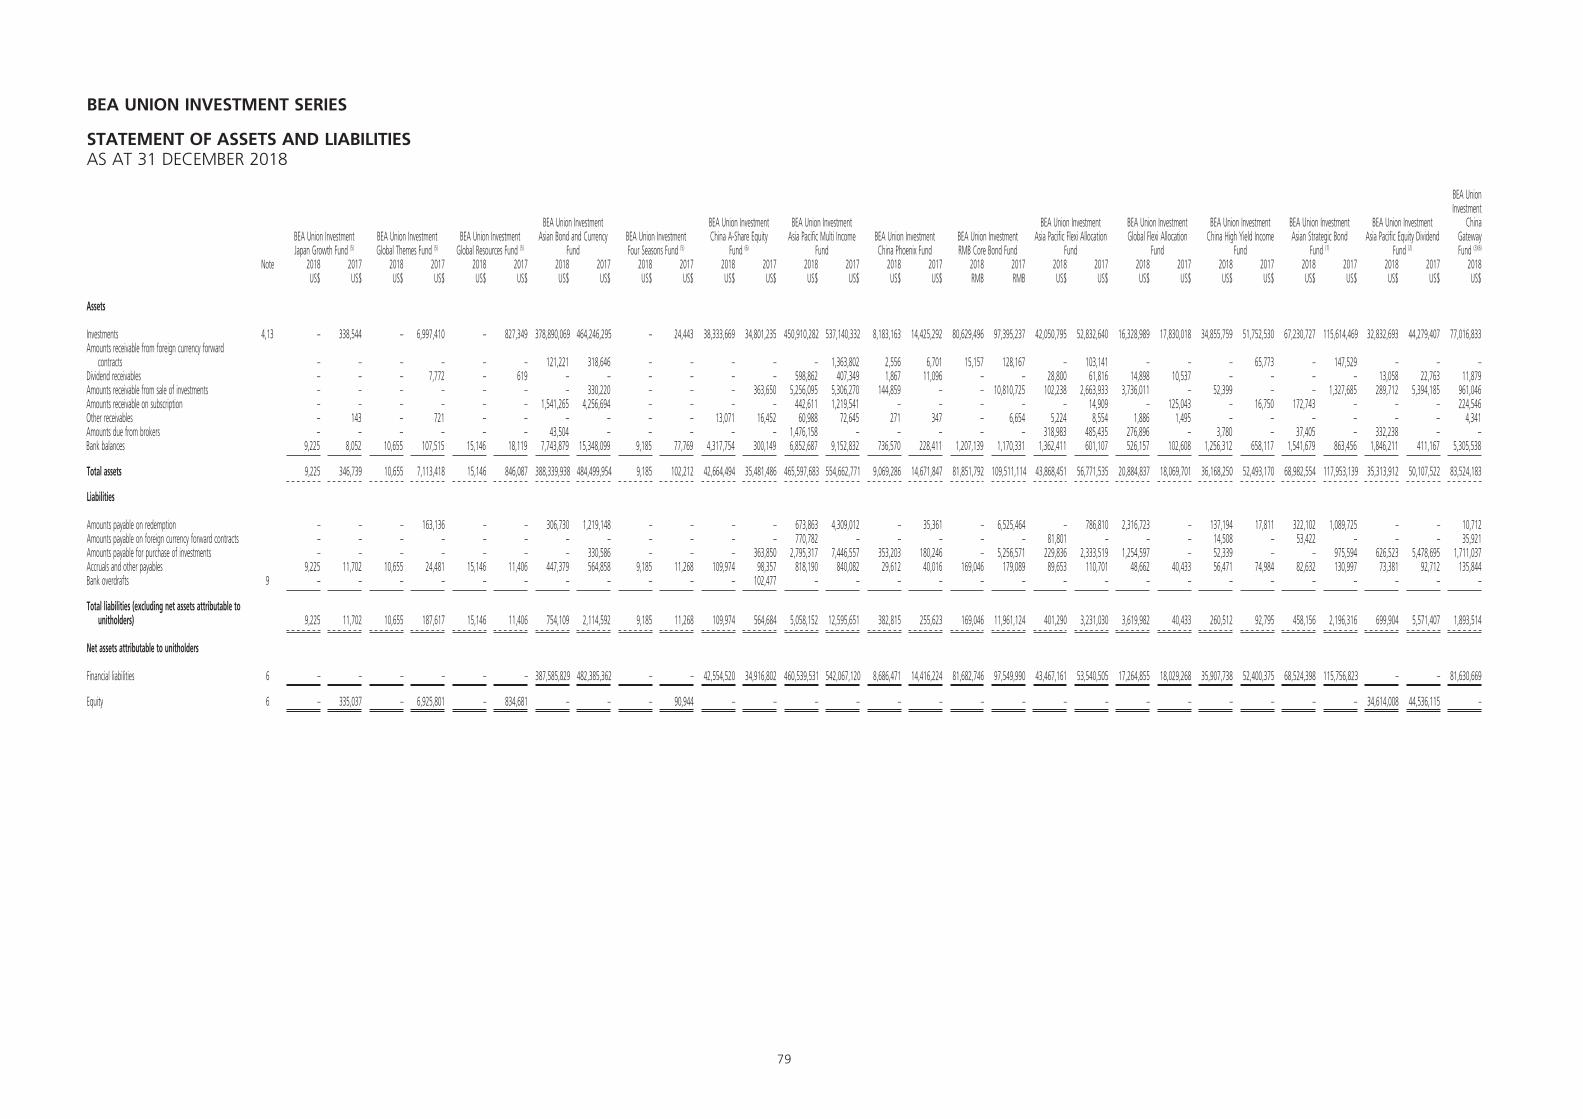
BEA UNION INVESTMENT SERIES
STATEMENT OF ASSETS AND LIABILITIES AS AT 31 DECEMBER 2018
79
A5請縮小打印70.5%
BEA Union Investment Japan Growth Fund (5)
BEA Union Investment Global Themes Fund (5)
BEA Union Investment Global Resources Fund (5)
BEA Union Investment Asian Bond and Currency
FundBEA Union Investment Four Seasons Fund (5)
BEA Union Investment China A-Share Equity
Fund (6)
BEA Union Investment Asia Pacific Multi Income
FundBEA Union Investment China Phoenix Fund
BEA Union Investment RMB Core Bond Fund
BEA Union Investment Asia Pacific Flexi Allocation
Fund
BEA Union Investment Global Flexi Allocation
Fund
BEA Union Investment China High Yield Income
Fund
BEA Union Investment Asian Strategic Bond
Fund (1)
BEA Union Investment Asia Pacific Equity Dividend
Fund (2)
BEA Union Investment
China Gateway Fund (3)(6)
Note 2018 2017 2018 2017 2018 2017 2018 2017 2018 2017 2018 2017 2018 2017 2018 2017 2018 2017 2018 2017 2018 2017 2018 2017 2018 2017 2018 2017 2018US$ US$ US$ US$ US$ US$ US$ US$ US$ US$ US$ US$ US$ US$ US$ US$ RMB RMB US$ US$ US$ US$ US$ US$ US$ US$ US$ US$ US$
Assets
Investments 4,13 – 338,544 – 6,997,410 – 827,349 378,890,069 464,246,295 – 24,443 38,333,669 34,801,235 450,910,282 537,140,332 8,183,163 14,425,292 80,629,496 97,395,237 42,050,795 52,832,640 16,328,989 17,830,018 34,855,759 51,752,530 67,230,727 115,614,469 32,832,693 44,279,407 77,016,833Amounts receivable from foreign currency forward
contracts – – – – – – 121,221 318,646 – – – – – 1,363,802 2,556 6,701 15,157 128,167 – 103,141 – – – 65,773 – 147,529 – – –Dividend receivables – – – 7,772 – 619 – – – – – – 598,862 407,349 1,867 11,096 – – 28,800 61,816 14,898 10,537 – – – – 13,058 22,763 11,879Amounts receivable from sale of investments – – – – – – – 330,220 – – – 363,650 5,256,095 5,306,270 144,859 – – 10,810,725 102,238 2,663,933 3,736,011 – 52,399 – – 1,327,685 289,712 5,394,185 961,046Amounts receivable on subscription – – – – – – 1,541,265 4,256,694 – – – – 442,611 1,219,541 – – – – – 14,909 – 125,043 – 16,750 172,743 – – – 224,546Other receivables – 143 – 721 – – – – – – 13,071 16,452 60,988 72,645 271 347 – 6,654 5,224 8,554 1,886 1,495 – – – – – – 4,341Amounts due from brokers – – – – – – 43,504 – – – – – 1,476,158 – – – – – 318,983 485,435 276,896 – 3,780 – 37,405 – 332,238 – –Bank balances 9,225 8,052 10,655 107,515 15,146 18,119 7,743,879 15,348,099 9,185 77,769 4,317,754 300,149 6,852,687 9,152,832 736,570 228,411 1,207,139 1,170,331 1,362,411 601,107 526,157 102,608 1,256,312 658,117 1,541,679 863,456 1,846,211 411,167 5,305,538
Total assets 9,225 346,739 10,655 7,113,418 15,146 846,087 388,339,938 484,499,954 9,185 102,212 42,664,494 35,481,486 465,597,683 554,662,771 9,069,286 14,671,847 81,851,792 109,511,114 43,868,451 56,771,535 20,884,837 18,069,701 36,168,250 52,493,170 68,982,554 117,953,139 35,313,912 50,107,522 83,524,183
Liabilities
Amounts payable on redemption – – – 163,136 – – 306,730 1,219,148 – – – – 673,863 4,309,012 – 35,361 – 6,525,464 – 786,810 2,316,723 – 137,194 17,811 322,102 1,089,725 – – 10,712Amounts payable on foreign currency forward contracts – – – – – – – – – – – – 770,782 – – – – – 81,801 – – – 14,508 – 53,422 – – – 35,921Amounts payable for purchase of investments – – – – – – – 330,586 – – – 363,850 2,795,317 7,446,557 353,203 180,246 – 5,256,571 229,836 2,333,519 1,254,597 – 52,339 – – 975,594 626,523 5,478,695 1,711,037Accruals and other payables 9,225 11,702 10,655 24,481 15,146 11,406 447,379 564,858 9,185 11,268 109,974 98,357 818,190 840,082 29,612 40,016 169,046 179,089 89,653 110,701 48,662 40,433 56,471 74,984 82,632 130,997 73,381 92,712 135,844Bank overdrafts 9 – – – – – – – – – – – 102,477 – – – – – – – – – – – – – – – – –
Total liabilities (excluding net assets attributable to unitholders) 9,225 11,702 10,655 187,617 15,146 11,406 754,109 2,114,592 9,185 11,268 109,974 564,684 5,058,152 12,595,651 382,815 255,623 169,046 11,961,124 401,290 3,231,030 3,619,982 40,433 260,512 92,795 458,156 2,196,316 699,904 5,571,407 1,893,514
Net assets attributable to unitholders
Financial liabilities 6 – – – – – – 387,585,829 482,385,362 – – 42,554,520 34,916,802 460,539,531 542,067,120 8,686,471 14,416,224 81,682,746 97,549,990 43,467,161 53,540,505 17,264,855 18,029,268 35,907,738 52,400,375 68,524,398 115,756,823 – – 81,630,669
Equity 6 – 335,037 – 6,925,801 – 834,681 – – – 90,944 – – – – – – – – – – – – – – – – 34,614,008 44,536,115 –
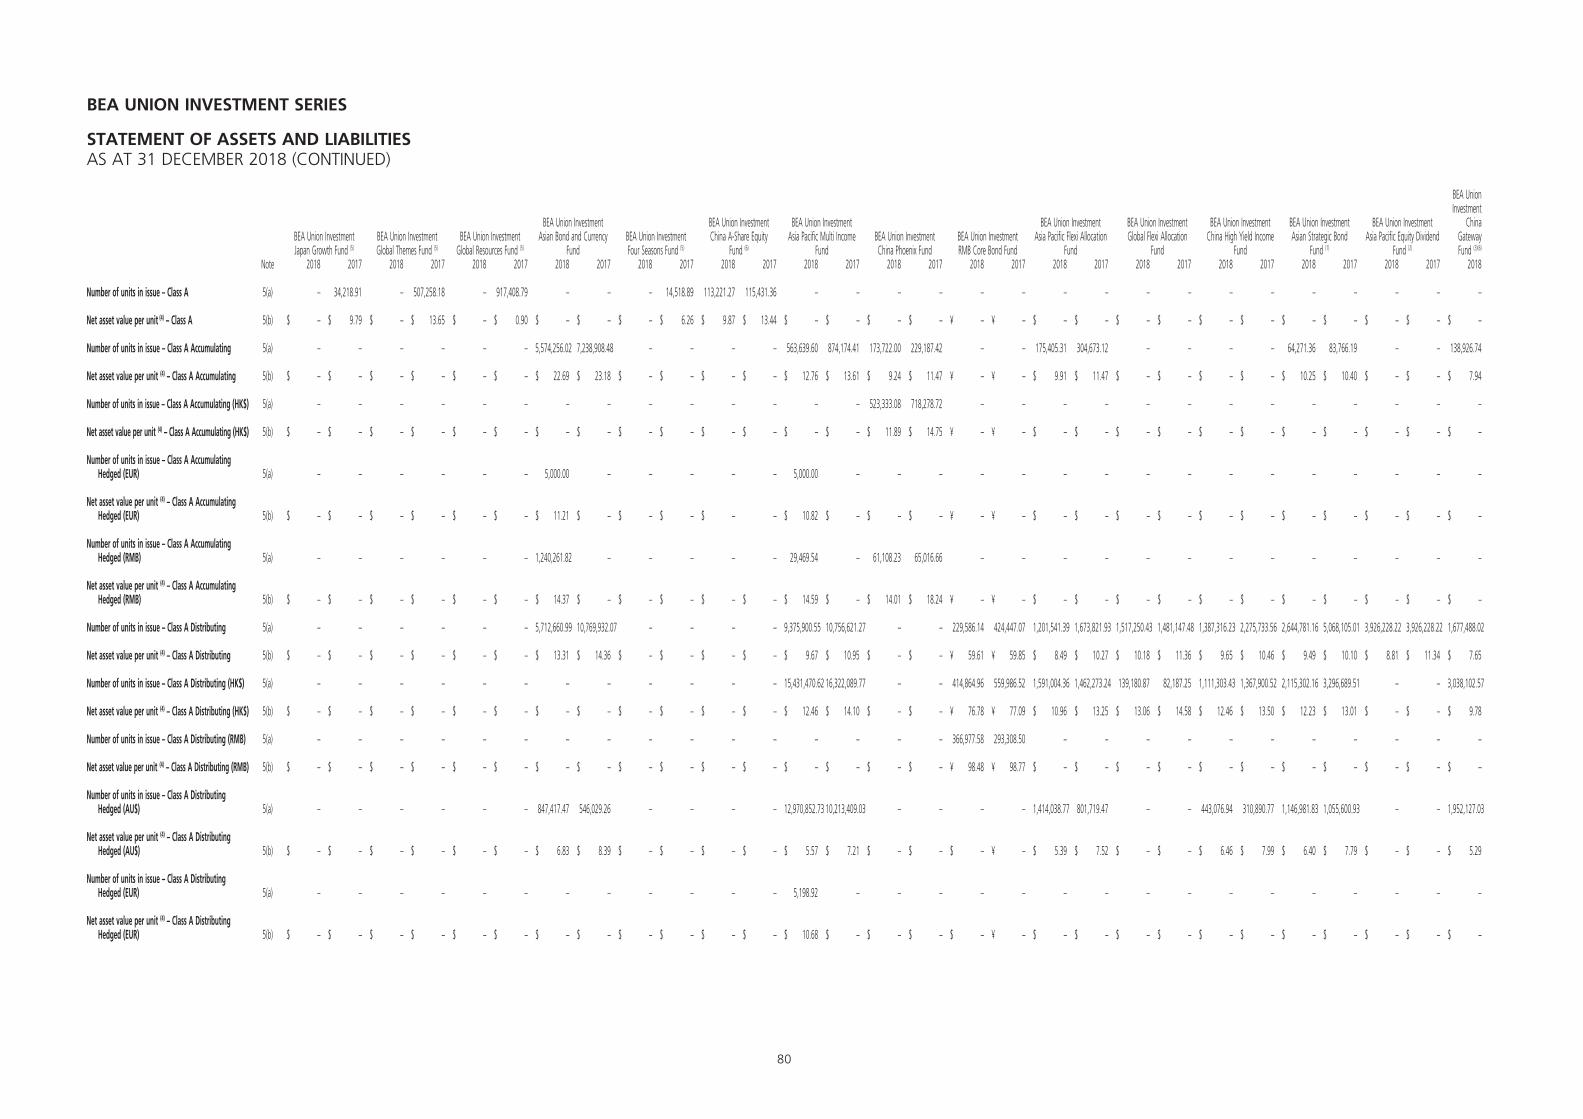
BEA UNION INVESTMENT SERIES
STATEMENT OF ASSETS AND LIABILITIES AS AT 31 DECEMBER 2018 (CONTINUED)
80
A5請縮小打印70.5%
BEA Union Investment Japan Growth Fund (5)
BEA Union Investment Global Themes Fund (5)
BEA Union Investment Global Resources Fund (5)
BEA Union Investment Asian Bond and Currency
FundBEA Union Investment Four Seasons Fund (5)
BEA Union Investment China A-Share Equity
Fund (6)
BEA Union Investment Asia Pacific Multi Income
FundBEA Union Investment China Phoenix Fund
BEA Union Investment RMB Core Bond Fund
BEA Union Investment Asia Pacific Flexi Allocation
Fund
BEA Union Investment Global Flexi Allocation
Fund
BEA Union Investment China High Yield Income
Fund
BEA Union Investment Asian Strategic Bond
Fund (1)
BEA Union Investment Asia Pacific Equity Dividend
Fund (2)
BEA Union Investment
China Gateway Fund (3)(6)
Note 2018 2017 2018 2017 2018 2017 2018 2017 2018 2017 2018 2017 2018 2017 2018 2017 2018 2017 2018 2017 2018 2017 2018 2017 2018 2017 2018 2017 2018
Number of units in issue – Class A 5(a) – 34,218.91 – 507,258.18 – 917,408.79 – – – 14,518.89 113,221.27 115,431.36 – – – – – – – – – – – – – – – – –
Net asset value per unit (4) – Class A 5(b) $ – $ 9.79 $ – $ 13.65 $ – $ 0.90 $ – $ – $ – $ 6.26 $ 9.87 $ 13.44 $ – $ – $ – $ – ¥ – ¥ – $ – $ – $ – $ – $ – $ – $ – $ – $ – $ – $ –
Number of units in issue – Class A Accumulating 5(a) – – – – – – 5,574,256.02 7,238,908.48 – – – – 563,639.60 874,174.41 173,722.00 229,187.42 – – 175,405.31 304,673.12 – – – – 64,271.36 83,766.19 – – 138,926.74
Net asset value per unit (4) – Class A Accumulating 5(b) $ – $ – $ – $ – $ – $ – $ 22.69 $ 23.18 $ – $ – $ – $ – $ 12.76 $ 13.61 $ 9.24 $ 11.47 ¥ – ¥ – $ 9.91 $ 11.47 $ – $ – $ – $ – $ 10.25 $ 10.40 $ – $ – $ 7.94
Number of units in issue – Class A Accumulating (HK$) 5(a) – – – – – – – – – – – – – – 523,333.08 718,278.72 – – – – – – – – – – – – –
Net asset value per unit (4) – Class A Accumulating (HK$) 5(b) $ – $ – $ – $ – $ – $ – $ – $ – $ – $ – $ – $ – $ – $ – $ 11.89 $ 14.75 ¥ – ¥ – $ – $ – $ – $ – $ – $ – $ – $ – $ – $ – $ –
Number of units in issue – Class A Accumulating Hedged (EUR) 5(a) – – – – – – 5,000.00 – – – – – 5,000.00 – – – – – – – – – – – – – – – –
Net asset value per unit (4) – Class A Accumulating Hedged (EUR) 5(b) $ – $ – $ – $ – $ – $ – $ 11.21 $ – $ – $ – $ – – $ 10.82 $ – $ – $ – ¥ – ¥ – $ – $ – $ – $ – $ – $ – $ – $ – $ – $ – $ –
Number of units in issue – Class A Accumulating Hedged (RMB) 5(a) – – – – – – 1,240,261.82 – – – – – 29,469.54 – 61,108.23 65,016.66 – – – – – – – – – – – – –
Net asset value per unit (4) – Class A Accumulating Hedged (RMB) 5(b) $ – $ – $ – $ – $ – $ – $ 14.37 $ – $ – $ – $ – $ – $ 14.59 $ – $ 14.01 $ 18.24 ¥ – ¥ – $ – $ – $ – $ – $ – $ – $ – $ – $ – $ – $ –
Number of units in issue – Class A Distributing 5(a) – – – – – – 5,712,660.99 10,769,932.07 – – – – 9,375,900.55 10,756,621.27 – – 229,586.14 424,447.07 1,201,541.39 1,673,821.93 1,517,250.43 1,481,147.48 1,387,316.23 2,275,733.56 2,644,781.16 5,068,105.01 3,926,228.22 3,926,228.22 1,677,488.02
Net asset value per unit (4) – Class A Distributing 5(b) $ – $ – $ – $ – $ – $ – $ 13.31 $ 14.36 $ – $ – $ – $ – $ 9.67 $ 10.95 $ – $ – ¥ 59.61 ¥ 59.85 $ 8.49 $ 10.27 $ 10.18 $ 11.36 $ 9.65 $ 10.46 $ 9.49 $ 10.10 $ 8.81 $ 11.34 $ 7.65
Number of units in issue – Class A Distributing (HK$) 5(a) – – – – – – – – – – – – 15,431,470.62 16,322,089.77 – – 414,864.96 559,986.52 1,591,004.36 1,462,273.24 139,180.87 82,187.25 1,111,303.43 1,367,900.52 2,115,302.16 3,296,689.51 – – 3,038,102.57
Net asset value per unit (4) – Class A Distributing (HK$) 5(b) $ – $ – $ – $ – $ – $ – $ – $ – $ – $ – $ – $ – $ 12.46 $ 14.10 $ – $ – ¥ 76.78 ¥ 77.09 $ 10.96 $ 13.25 $ 13.06 $ 14.58 $ 12.46 $ 13.50 $ 12.23 $ 13.01 $ – $ – $ 9.78
Number of units in issue – Class A Distributing (RMB) 5(a) – – – – – – – – – – – – – – – – 366,977.58 293,308.50 – – – – – – – – – – –
Net asset value per unit (4) – Class A Distributing (RMB) 5(b) $ – $ – $ – $ – $ – $ – $ – $ – $ – $ – $ – $ – $ – $ – $ – $ – ¥ 98.48 ¥ 98.77 $ – $ – $ – $ – $ – $ – $ – $ – $ – $ – $ –
Number of units in issue – Class A Distributing Hedged (AU$) 5(a) – – – – – – 847,417.47 546,029.26 – – – – 12,970,852.73 10,213,409.03 – – – – 1,414,038.77 801,719.47 – – 443,076.94 310,890.77 1,146,981.83 1,055,600.93 – – 1,952,127.03
Net asset value per unit (4) – Class A Distributing Hedged (AU$) 5(b) $ – $ – $ – $ – $ – $ – $ 6.83 $ 8.39 $ – $ – $ – $ – $ 5.57 $ 7.21 $ – $ – $ – ¥ – $ 5.39 $ 7.52 $ – $ – $ 6.46 $ 7.99 $ 6.40 $ 7.79 $ – $ – $ 5.29
Number of units in issue – Class A Distributing Hedged (EUR) 5(a) – – – – – – – – – – – – 5,198.92 – – – – – – – – – – – – – – – –
Net asset value per unit (4) – Class A Distributing Hedged (EUR) 5(b) $ – $ – $ – $ – $ – $ – $ – $ – $ – $ – $ – $ – $ 10.68 $ – $ – $ – $ – ¥ – $ – $ – $ – $ – $ – $ – $ – $ – $ – $ – $ –
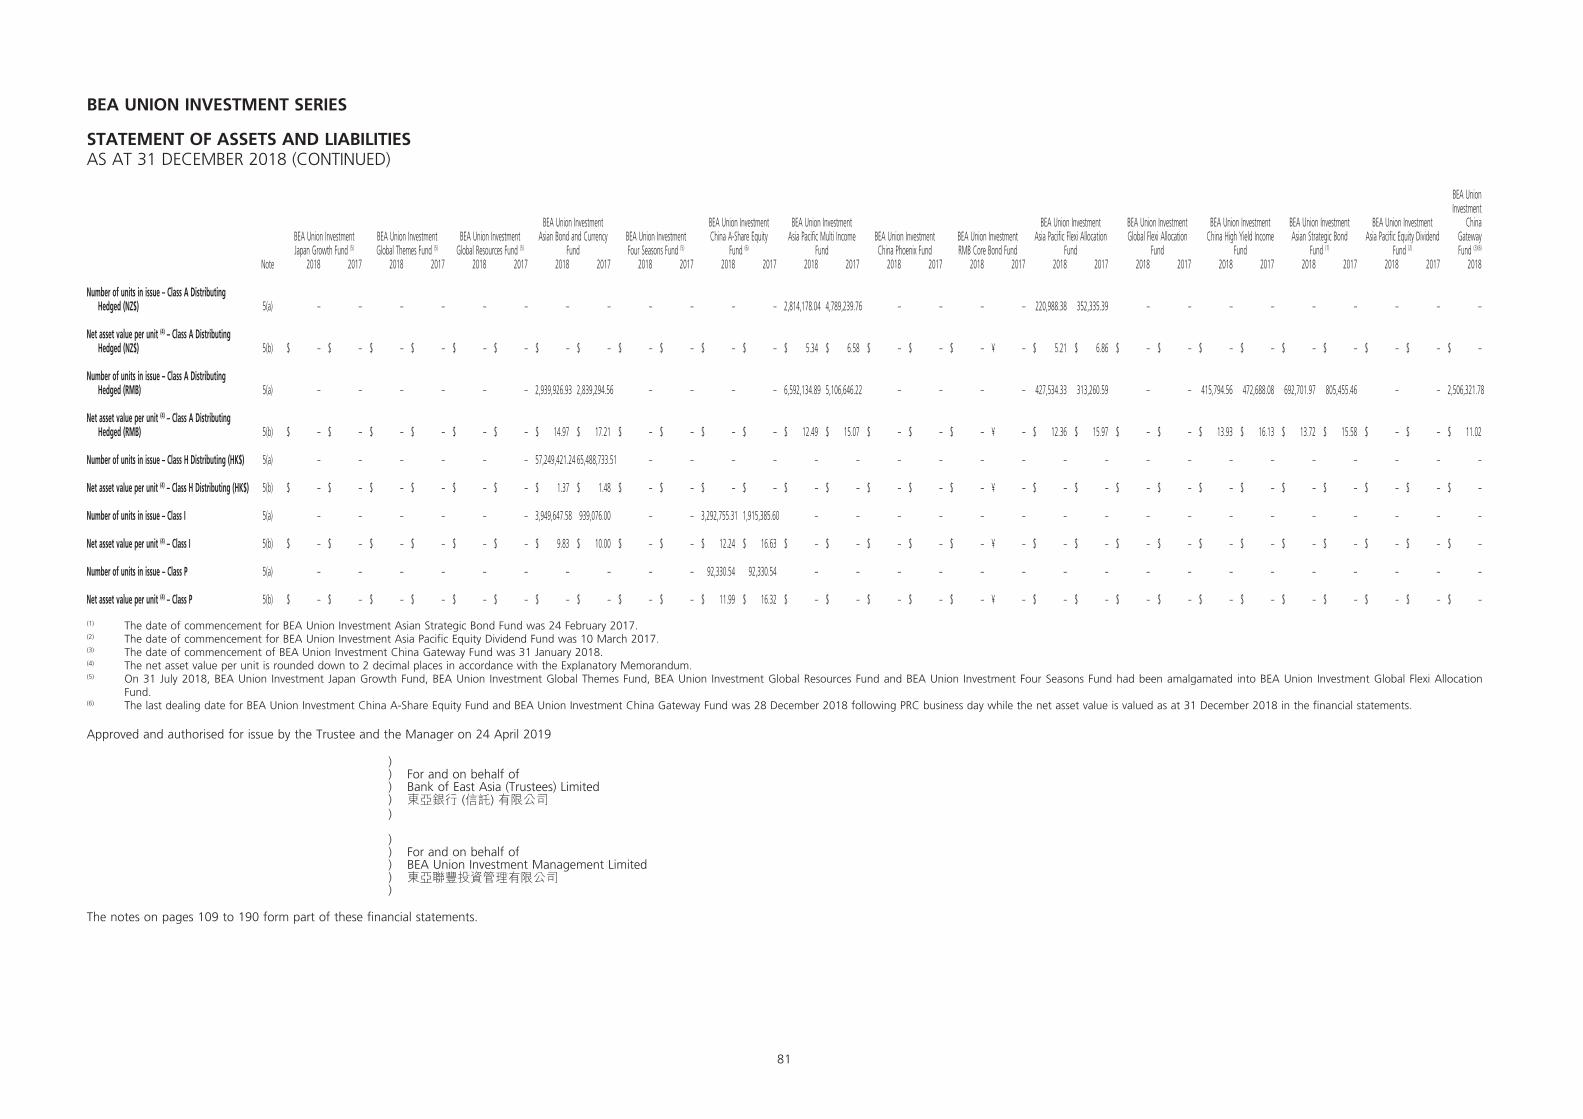
BEA UNION INVESTMENT SERIES
STATEMENT OF ASSETS AND LIABILITIES AS AT 31 DECEMBER 2018 (CONTINUED)
81
A5請縮小打印70.5%
BEA Union Investment Japan Growth Fund (5)
BEA Union Investment Global Themes Fund (5)
BEA Union Investment Global Resources Fund (5)
BEA Union Investment Asian Bond and Currency
FundBEA Union Investment Four Seasons Fund (5)
BEA Union Investment China A-Share Equity
Fund (6)
BEA Union Investment Asia Pacific Multi Income
FundBEA Union Investment China Phoenix Fund
BEA Union Investment RMB Core Bond Fund
BEA Union Investment Asia Pacific Flexi Allocation
Fund
BEA Union Investment Global Flexi Allocation
Fund
BEA Union Investment China High Yield Income
Fund
BEA Union Investment Asian Strategic Bond
Fund (1)
BEA Union Investment Asia Pacific Equity Dividend
Fund (2)
BEA Union Investment
China Gateway Fund (3)(6)
Note 2018 2017 2018 2017 2018 2017 2018 2017 2018 2017 2018 2017 2018 2017 2018 2017 2018 2017 2018 2017 2018 2017 2018 2017 2018 2017 2018 2017 2018
Number of units in issue – Class A Distributing Hedged (NZ$) 5(a) – – – – – – – – – – – – 2,814,178.04 4,789,239.76 – – – – 220,988.38 352,335.39 – – – – – – – – –
Net asset value per unit (4) – Class A Distributing Hedged (NZ$) 5(b) $ – $ – $ – $ – $ – $ – $ – $ – $ – $ – $ – $ – $ 5.34 $ 6.58 $ – $ – $ – ¥ – $ 5.21 $ 6.86 $ – $ – $ – $ – $ – $ – $ – $ – $ –
Number of units in issue – Class A Distributing Hedged (RMB) 5(a) – – – – – – 2,939,926.93 2,839,294.56 – – – – 6,592,134.89 5,106,646.22 – – – – 427,534.33 313,260.59 – – 415,794.56 472,688.08 692,701.97 805,455.46 – – 2,506,321.78
Net asset value per unit (4) – Class A Distributing Hedged (RMB) 5(b) $ – $ – $ – $ – $ – $ – $ 14.97 $ 17.21 $ – $ – $ – $ – $ 12.49 $ 15.07 $ – $ – $ – ¥ – $ 12.36 $ 15.97 $ – $ – $ 13.93 $ 16.13 $ 13.72 $ 15.58 $ – $ – $ 11.02
Number of units in issue – Class H Distributing (HK$) 5(a) – – – – – – 57,249,421.24 65,488,733.51 – – – – – – – – – – – – – – – – – – – – –
Net asset value per unit (4) – Class H Distributing (HK$) 5(b) $ – $ – $ – $ – $ – $ – $ 1.37 $ 1.48 $ – $ – $ – $ – $ – $ – $ – $ – $ – ¥ – $ – $ – $ – $ – $ – $ – $ – $ – $ – $ – $ –
Number of units in issue – Class I 5(a) – – – – – – 3,949,647.58 939,076.00 – – 3,292,755.31 1,915,385.60 – – – – – – – – – – – – – – – – –
Net asset value per unit (4) – Class I 5(b) $ – $ – $ – $ – $ – $ – $ 9.83 $ 10.00 $ – $ – $ 12.24 $ 16.63 $ – $ – $ – $ – $ – ¥ – $ – $ – $ – $ – $ – $ – $ – $ – $ – $ – $ –
Number of units in issue – Class P 5(a) – – – – – – – – – – 92,330.54 92,330.54 – – – – – – – – – – – – – – – – –
Net asset value per unit (4) – Class P 5(b) $ – $ – $ – $ – $ – $ – $ – $ – $ – $ – $ 11.99 $ 16.32 $ – $ – $ – $ – $ – ¥ – $ – $ – $ – $ – $ – $ – $ – $ – $ – $ – $ –
(1) The date of commencement for BEA Union Investment Asian Strategic Bond Fund was 24 February 2017.(2) The date of commencement for BEA Union Investment Asia Pacific Equity Dividend Fund was 10 March 2017.(3) The date of commencement of BEA Union Investment China Gateway Fund was 31 January 2018.(4) The net asset value per unit is rounded down to 2 decimal places in accordance with the Explanatory Memorandum.(5) On 31 July 2018, BEA Union Investment Japan Growth Fund, BEA Union Investment Global Themes Fund, BEA Union Investment Global Resources Fund and BEA Union Investment Four Seasons Fund had been amalgamated into BEA Union Investment Global Flexi Allocation
Fund.(6) The last dealing date for BEA Union Investment China A-Share Equity Fund and BEA Union Investment China Gateway Fund was 28 December 2018 following PRC business day while the net asset value is valued as at 31 December 2018 in the financial statements.
Approved and authorised for issue by the Trustee and the Manager on 24 April 2019
)) For and on behalf of) Bank of East Asia (Trustees) Limited) 東亞銀行 (信託) 有限公司)
)) For and on behalf of) BEA Union Investment Management Limited) 東亞聯豐投資管理有限公司)
The notes on pages 109 to 190 form part of these financial statements.
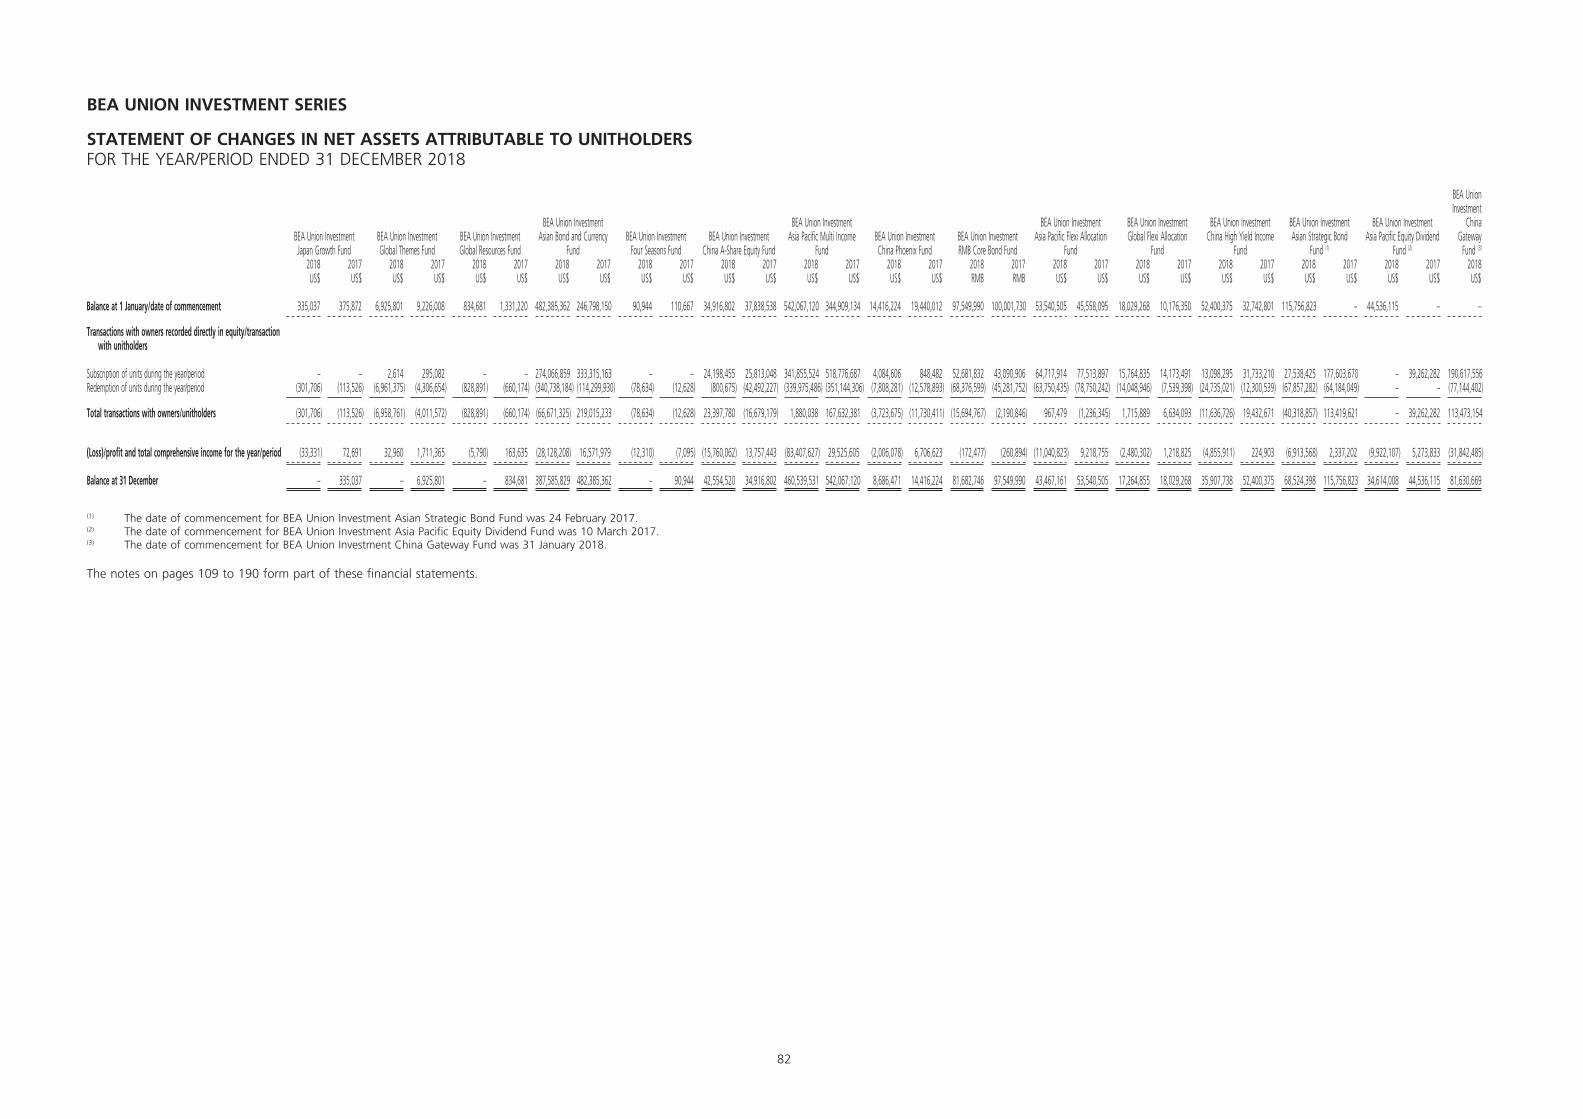
BEA UNION INVESTMENT SERIES
STATEMENT OF CHANGES IN NET ASSETS ATTRIBUTABLE TO UNITHOLDERS FOR THE YEAR/PERIOD ENDED 31 DECEMBER 2018
82
A5請縮小打印70.5%
BEA Union Investment Japan Growth Fund
BEA Union Investment Global Themes Fund
BEA Union Investment Global Resources Fund
BEA Union Investment Asian Bond and Currency
FundBEA Union Investment
Four Seasons FundBEA Union Investment
China A-Share Equity Fund
BEA Union Investment Asia Pacific Multi Income
FundBEA Union Investment China Phoenix Fund
BEA Union Investment RMB Core Bond Fund
BEA Union Investment Asia Pacific Flexi Allocation
Fund
BEA Union Investment Global Flexi Allocation
Fund
BEA Union Investment China High Yield Income
Fund
BEA Union Investment Asian Strategic Bond
Fund (1)
BEA Union Investment Asia Pacific Equity Dividend
Fund (2)
BEA Union Investment
China Gateway
Fund (3)
2018 2017 2018 2017 2018 2017 2018 2017 2018 2017 2018 2017 2018 2017 2018 2017 2018 2017 2018 2017 2018 2017 2018 2017 2018 2017 2018 2017 2018US$ US$ US$ US$ US$ US$ US$ US$ US$ US$ US$ US$ US$ US$ US$ US$ RMB RMB US$ US$ US$ US$ US$ US$ US$ US$ US$ US$ US$
Balance at 1 January/date of commencement 335,037 375,872 6,925,801 9,226,008 834,681 1,331,220 482,385,362 246,798,150 90,944 110,667 34,916,802 37,838,538 542,067,120 344,909,134 14,416,224 19,440,012 97,549,990 100,001,730 53,540,505 45,558,095 18,029,268 10,176,350 52,400,375 32,742,801 115,756,823 – 44,536,115 – –
Transactions with owners recorded directly in equity/transaction with unitholders
Subscription of units during the year/period – – 2,614 295,082 – – 274,066,859 333,315,163 – – 24,198,455 25,813,048 341,855,524 518,776,687 4,084,606 848,482 52,681,832 43,090,906 64,717,914 77,513,897 15,764,835 14,173,491 13,098,295 31,733,210 27,538,425 177,603,670 – 39,262,282 190,617,556Redemption of units during the year/period (301,706) (113,526) (6,961,375) (4,306,654) (828,891) (660,174) (340,738,184) (114,299,930) (78,634) (12,628) (800,675) (42,492,227) (339,975,486) (351,144,306) (7,808,281) (12,578,893) (68,376,599) (45,281,752) (63,750,435) (78,750,242) (14,048,946) (7,539,398) (24,735,021) (12,300,539) (67,857,282) (64,184,049) – – (77,144,402)
Total transactions with owners/unitholders (301,706) (113,526) (6,958,761) (4,011,572) (828,891) (660,174) (66,671,325) 219,015,233 (78,634) (12,628) 23,397,780 (16,679,179) 1,880,038 167,632,381 (3,723,675) (11,730,411) (15,694,767) (2,190,846) 967,479 (1,236,345) 1,715,889 6,634,093 (11,636,726) 19,432,671 (40,318,857) 113,419,621 – 39,262,282 113,473,154
(Loss)/profit and total comprehensive income for the year/period (33,331) 72,691 32,960 1,711,365 (5,790) 163,635 (28,128,208) 16,571,979 (12,310) (7,095) (15,760,062) 13,757,443 (83,407,627) 29,525,605 (2,006,078) 6,706,623 (172,477) (260,894) (11,040,823) 9,218,755 (2,480,302) 1,218,825 (4,855,911) 224,903 (6,913,568) 2,337,202 (9,922,107) 5,273,833 (31,842,485)
Balance at 31 December – 335,037 – 6,925,801 – 834,681 387,585,829 482,385,362 – 90,944 42,554,520 34,916,802 460,539,531 542,067,120 8,686,471 14,416,224 81,682,746 97,549,990 43,467,161 53,540,505 17,264,855 18,029,268 35,907,738 52,400,375 68,524,398 115,756,823 34,614,008 44,536,115 81,630,669
(1) The date of commencement for BEA Union Investment Asian Strategic Bond Fund was 24 February 2017.(2) The date of commencement for BEA Union Investment Asia Pacific Equity Dividend Fund was 10 March 2017.(3) The date of commencement for BEA Union Investment China Gateway Fund was 31 January 2018.
The notes on pages 109 to 190 form part of these financial statements.
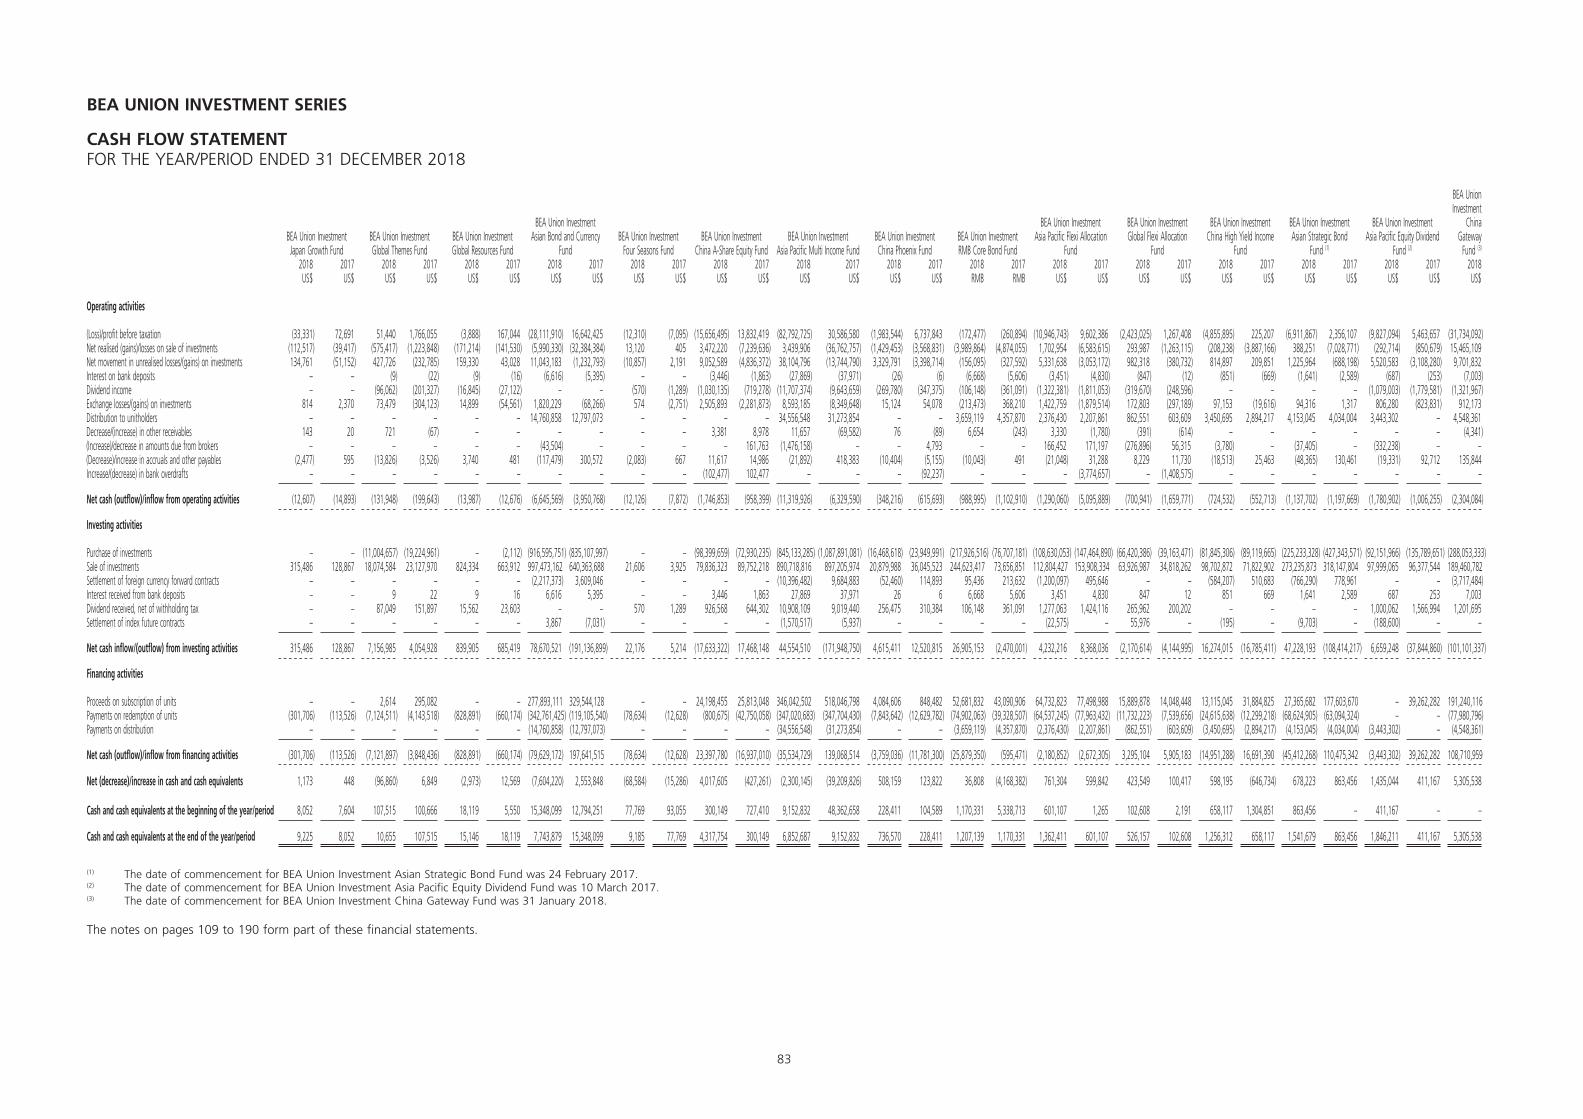
BEA UNION INVESTMENT SERIES
CASH FLOW STATEMENT FOR THE YEAR/PERIOD ENDED 31 DECEMBER 2018
83
A5請縮小打印70.5%
BEA Union Investment Japan Growth Fund
BEA Union Investment Global Themes Fund
BEA Union Investment Global Resources Fund
BEA Union Investment Asian Bond and Currency
FundBEA Union Investment
Four Seasons FundBEA Union Investment
China A-Share Equity FundBEA Union Investment
Asia Pacific Multi Income FundBEA Union Investment China Phoenix Fund
BEA Union Investment RMB Core Bond Fund
BEA Union Investment Asia Pacific Flexi Allocation
Fund
BEA Union Investment Global Flexi Allocation
Fund
BEA Union Investment China High Yield Income
Fund
BEA Union Investment Asian Strategic Bond
Fund (1)
BEA Union Investment Asia Pacific Equity Dividend
Fund (2)
BEA Union Investment
China Gateway
Fund (3)
2018 2017 2018 2017 2018 2017 2018 2017 2018 2017 2018 2017 2018 2017 2018 2017 2018 2017 2018 2017 2018 2017 2018 2017 2018 2017 2018 2017 2018US$ US$ US$ US$ US$ US$ US$ US$ US$ US$ US$ US$ US$ US$ US$ US$ RMB RMB US$ US$ US$ US$ US$ US$ US$ US$ US$ US$ US$
Operating activities
(Loss)/profit before taxation (33,331) 72,691 51,440 1,766,055 (3,888) 167,044 (28,111,910) 16,642,425 (12,310) (7,095) (15,656,495) 13,832,419 (82,792,725) 30,586,580 (1,983,544) 6,737,843 (172,477) (260,894) (10,946,743) 9,602,386 (2,423,025) 1,267,408 (4,855,895) 225,207 (6,911,867) 2,356,107 (9,827,094) 5,463,657 (31,734,092)Net realised (gains)/losses on sale of investments (112,517) (39,417) (575,417) (1,223,848) (171,214) (141,530) (5,990,330) (32,384,384) 13,120 405 3,472,220 (7,239,636) 3,439,906 (36,762,757) (1,429,453) (3,568,831) (3,989,864) (4,874,055) 1,702,954 (6,583,615) 293,987 (1,263,115) (208,238) (3,887,166) 388,251 (7,028,771) (292,714) (850,679) 15,465,109Net movement in unrealised losses/(gains) on investments 134,761 (51,152) 427,726 (232,785) 159,330 43,028 11,043,183 (1,232,793) (10,857) 2,191 9,052,589 (4,836,372) 38,104,796 (13,744,790) 3,329,791 (3,398,714) (156,095) (327,592) 5,331,638 (3,053,172) 982,318 (380,732) 814,897 209,851 1,225,964 (688,198) 5,520,583 (3,108,280) 9,701,832Interest on bank deposits – – (9) (22) (9) (16) (6,616) (5,395) – – (3,446) (1,863) (27,869) (37,971) (26) (6) (6,668) (5,606) (3,451) (4,830) (847) (12) (851) (669) (1,641) (2,589) (687) (253) (7,003)Dividend income – – (96,062) (201,327) (16,845) (27,122) – – (570) (1,289) (1,030,135) (719,278) (11,707,374) (9,643,659) (269,780) (347,375) (106,148) (361,091) (1,322,381) (1,811,053) (319,670) (248,596) – – – – (1,079,003) (1,779,581) (1,321,967)Exchange losses/(gains) on investments 814 2,370 73,479 (304,123) 14,899 (54,561) 1,820,229 (68,266) 574 (2,751) 2,505,893 (2,281,873) 8,593,185 (8,349,648) 15,124 54,078 (213,473) 368,210 1,422,759 (1,879,514) 172,803 (297,189) 97,153 (19,616) 94,316 1,317 806,280 (823,831) 912,173Distribution to unitholders – – – – – – 14,760,858 12,797,073 – – – – 34,556,548 31,273,854 – – 3,659,119 4,357,870 2,376,430 2,207,861 862,551 603,609 3,450,695 2,894,217 4,153,045 4,034,004 3,443,302 – 4,548,361Decrease/(increase) in other receivables 143 20 721 (67) – – – – – – 3,381 8,978 11,657 (69,582) 76 (89) 6,654 (243) 3,330 (1,780) (391) (614) – – – – – – (4,341)(Increase)/decrease in amounts due from brokers – – – – – – (43,504) – – – – 161,763 (1,476,158) – – 4,793 – – 166,452 171,197 (276,896) 56,315 (3,780) – (37,405) – (332,238) – –(Decrease)/increase in accruals and other payables (2,477) 595 (13,826) (3,526) 3,740 481 (117,479) 300,572 (2,083) 667 11,617 14,986 (21,892) 418,383 (10,404) (5,155) (10,043) 491 (21,048) 31,288 8,229 11,730 (18,513) 25,463 (48,365) 130,461 (19,331) 92,712 135,844Increase/(decrease) in bank overdrafts – – – – – – – – – – (102,477) 102,477 – – – (92,237) – – – (3,774,657) – (1,408,575) – – – – – – –
Net cash (outflow)/inflow from operating activities (12,607) (14,893) (131,948) (199,643) (13,987) (12,676) (6,645,569) (3,950,768) (12,126) (7,872) (1,746,853) (958,399) (11,319,926) (6,329,590) (348,216) (615,693) (988,995) (1,102,910) (1,290,060) (5,095,889) (700,941) (1,659,771) (724,532) (552,713) (1,137,702) (1,197,669) (1,780,902) (1,006,255) (2,304,084)
Investing activities
Purchase of investments – – (11,004,657) (19,224,961) – (2,112) (916,595,751) (835,107,997) – – (98,399,659) (72,930,235) (845,133,285) (1,087,891,081) (16,468,618) (23,949,991) (217,926,516) (76,707,181) (108,630,053) (147,464,890) (66,420,386) (39,163,471) (81,845,306) (89,119,665) (225,233,328) (427,343,571) (92,151,966) (135,789,651) (288,053,333)Sale of investments 315,486 128,867 18,074,584 23,127,970 824,334 663,912 997,473,162 640,363,688 21,606 3,925 79,836,323 89,752,218 890,718,816 897,205,974 20,879,988 36,045,523 244,623,417 73,656,851 112,804,427 153,908,334 63,926,987 34,818,262 98,702,872 71,822,902 273,235,873 318,147,804 97,999,065 96,377,544 189,460,782Settlement of foreign currency forward contracts – – – – – – (2,217,373) 3,609,046 – – – – (10,396,482) 9,684,883 (52,460) 114,893 95,436 213,632 (1,200,097) 495,646 – – (584,207) 510,683 (766,290) 778,961 – – (3,717,484)Interest received from bank deposits – – 9 22 9 16 6,616 5,395 – – 3,446 1,863 27,869 37,971 26 6 6,668 5,606 3,451 4,830 847 12 851 669 1,641 2,589 687 253 7,003Dividend received, net of withholding tax – – 87,049 151,897 15,562 23,603 – – 570 1,289 926,568 644,302 10,908,109 9,019,440 256,475 310,384 106,148 361,091 1,277,063 1,424,116 265,962 200,202 – – – – 1,000,062 1,566,994 1,201,695Settlement of index future contracts – – – – – – 3,867 (7,031) – – – – (1,570,517) (5,937) – – – – (22,575) – 55,976 – (195) – (9,703) – (188,600) – –
Net cash inflow/(outflow) from investing activities 315,486 128,867 7,156,985 4,054,928 839,905 685,419 78,670,521 (191,136,899) 22,176 5,214 (17,633,322) 17,468,148 44,554,510 (171,948,750) 4,615,411 12,520,815 26,905,153 (2,470,001) 4,232,216 8,368,036 (2,170,614) (4,144,995) 16,274,015 (16,785,411) 47,228,193 (108,414,217) 6,659,248 (37,844,860) (101,101,337)
Financing activities
Proceeds on subscription of units – – 2,614 295,082 – – 277,893,111 329,544,128 – – 24,198,455 25,813,048 346,042,502 518,046,798 4,084,606 848,482 52,681,832 43,090,906 64,732,823 77,498,988 15,889,878 14,048,448 13,115,045 31,884,825 27,365,682 177,603,670 – 39,262,282 191,240,116Payments on redemption of units (301,706) (113,526) (7,124,511) (4,143,518) (828,891) (660,174) (342,761,425) (119,105,540) (78,634) (12,628) (800,675) (42,750,058) (347,020,683) (347,704,430) (7,843,642) (12,629,782) (74,902,063) (39,328,507) (64,537,245) (77,963,432) (11,732,223) (7,539,656) (24,615,638) (12,299,218) (68,624,905) (63,094,324) – – (77,980,796)Payments on distribution – – – – – – (14,760,858) (12,797,073) – – – – (34,556,548) (31,273,854) – – (3,659,119) (4,357,870) (2,376,430) (2,207,861) (862,551) (603,609) (3,450,695) (2,894,217) (4,153,045) (4,034,004) (3,443,302) – (4,548,361)
Net cash (outflow)/inflow from financing activities (301,706) (113,526) (7,121,897) (3,848,436) (828,891) (660,174) (79,629,172) 197,641,515 (78,634) (12,628) 23,397,780 (16,937,010) (35,534,729) 139,068,514 (3,759,036) (11,781,300) (25,879,350) (595,471) (2,180,852) (2,672,305) 3,295,104 5,905,183 (14,951,288) 16,691,390 (45,412,268) 110,475,342 (3,443,302) 39,262,282 108,710,959
Net (decrease)/increase in cash and cash equivalents 1,173 448 (96,860) 6,849 (2,973) 12,569 (7,604,220) 2,553,848 (68,584) (15,286) 4,017,605 (427,261) (2,300,145) (39,209,826) 508,159 123,822 36,808 (4,168,382) 761,304 599,842 423,549 100,417 598,195 (646,734) 678,223 863,456 1,435,044 411,167 5,305,538
Cash and cash equivalents at the beginning of the year/period 8,052 7,604 107,515 100,666 18,119 5,550 15,348,099 12,794,251 77,769 93,055 300,149 727,410 9,152,832 48,362,658 228,411 104,589 1,170,331 5,338,713 601,107 1,265 102,608 2,191 658,117 1,304,851 863,456 – 411,167 – –
Cash and cash equivalents at the end of the year/period 9,225 8,052 10,655 107,515 15,146 18,119 7,743,879 15,348,099 9,185 77,769 4,317,754 300,149 6,852,687 9,152,832 736,570 228,411 1,207,139 1,170,331 1,362,411 601,107 526,157 102,608 1,256,312 658,117 1,541,679 863,456 1,846,211 411,167 5,305,538
(1) The date of commencement for BEA Union Investment Asian Strategic Bond Fund was 24 February 2017.(2) The date of commencement for BEA Union Investment Asia Pacific Equity Dividend Fund was 10 March 2017.(3) The date of commencement for BEA Union Investment China Gateway Fund was 31 January 2018.
The notes on pages 109 to 190 form part of these financial statements.
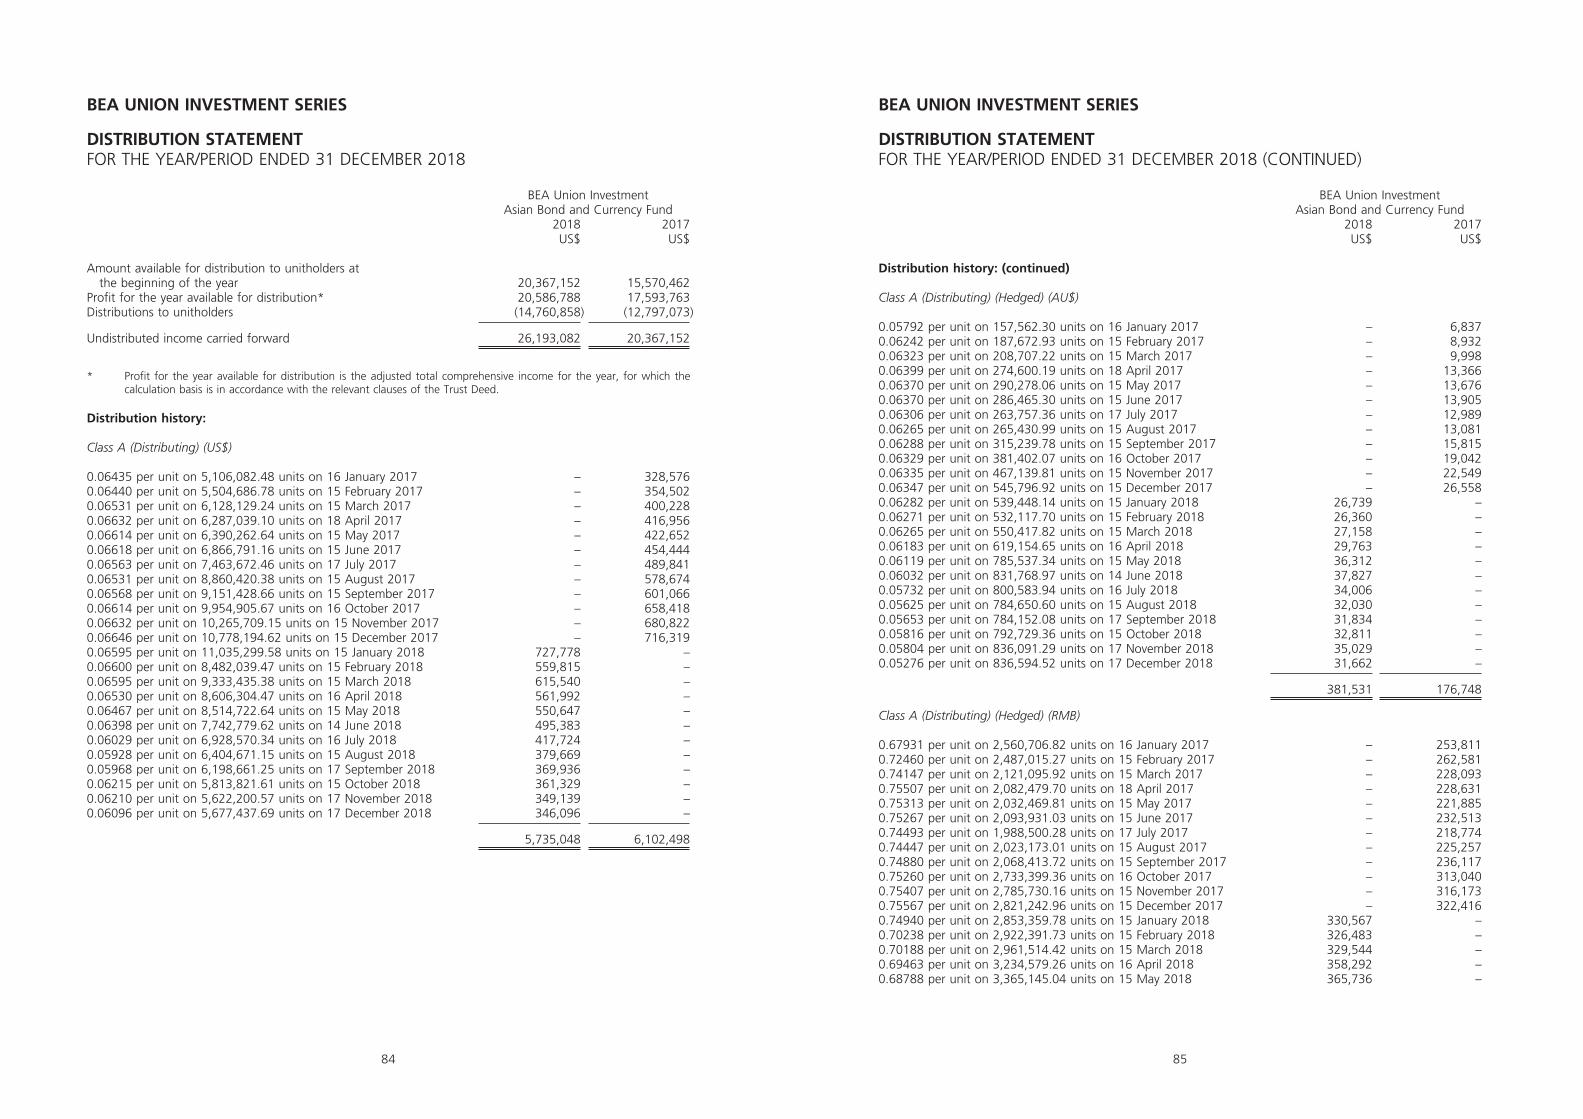
BEA UNION INVESTMENT SERIES
DISTRIBUTION STATEMENT FOR THE YEAR/PERIOD ENDED 31 DECEMBER 2018 (CONTINUED)
85
A5請縮小打印70.5%
BEA UNION INVESTMENT SERIES
DISTRIBUTION STATEMENT FOR THE YEAR/PERIOD ENDED 31 DECEMBER 2018
84
A5請縮小打印70.5%
BEA Union Investment Asian Bond and Currency Fund
2018 2017US$ US$
Amount available for distribution to unitholders at the beginning of the year 20,367,152 15,570,462Profit for the year available for distribution* 20,586,788 17,593,763Distributions to unitholders (14,760,858) (12,797,073)
Undistributed income carried forward 26,193,082 20,367,152
* Profit for the year available for distribution is the adjusted total comprehensive income for the year, for which the calculation basis is in accordance with the relevant clauses of the Trust Deed.
Distribution history:
Class A (Distributing) (US$)
0.06435 per unit on 5,106,082.48 units on 16 January 2017 – 328,5760.06440 per unit on 5,504,686.78 units on 15 February 2017 – 354,5020.06531 per unit on 6,128,129.24 units on 15 March 2017 – 400,2280.06632 per unit on 6,287,039.10 units on 18 April 2017 – 416,9560.06614 per unit on 6,390,262.64 units on 15 May 2017 – 422,6520.06618 per unit on 6,866,791.16 units on 15 June 2017 – 454,4440.06563 per unit on 7,463,672.46 units on 17 July 2017 – 489,8410.06531 per unit on 8,860,420.38 units on 15 August 2017 – 578,6740.06568 per unit on 9,151,428.66 units on 15 September 2017 – 601,0660.06614 per unit on 9,954,905.67 units on 16 October 2017 – 658,4180.06632 per unit on 10,265,709.15 units on 15 November 2017 – 680,8220.06646 per unit on 10,778,194.62 units on 15 December 2017 – 716,3190.06595 per unit on 11,035,299.58 units on 15 January 2018 727,778 –0.06600 per unit on 8,482,039.47 units on 15 February 2018 559,815 –0.06595 per unit on 9,333,435.38 units on 15 March 2018 615,540 –0.06530 per unit on 8,606,304.47 units on 16 April 2018 561,992 –0.06467 per unit on 8,514,722.64 units on 15 May 2018 550,647 –0.06398 per unit on 7,742,779.62 units on 14 June 2018 495,383 –0.06029 per unit on 6,928,570.34 units on 16 July 2018 417,724 –0.05928 per unit on 6,404,671.15 units on 15 August 2018 379,669 –0.05968 per unit on 6,198,661.25 units on 17 September 2018 369,936 –0.06215 per unit on 5,813,821.61 units on 15 October 2018 361,329 –0.06210 per unit on 5,622,200.57 units on 17 November 2018 349,139 –0.06096 per unit on 5,677,437.69 units on 17 December 2018 346,096 –
5,735,048 6,102,498
BEA Union Investment Asian Bond and Currency Fund
2018 2017US$ US$
Distribution history: (continued)
Class A (Distributing) (Hedged) (AU$)
0.05792 per unit on 157,562.30 units on 16 January 2017 – 6,8370.06242 per unit on 187,672.93 units on 15 February 2017 – 8,9320.06323 per unit on 208,707.22 units on 15 March 2017 – 9,9980.06399 per unit on 274,600.19 units on 18 April 2017 – 13,3660.06370 per unit on 290,278.06 units on 15 May 2017 – 13,6760.06370 per unit on 286,465.30 units on 15 June 2017 – 13,9050.06306 per unit on 263,757.36 units on 17 July 2017 – 12,9890.06265 per unit on 265,430.99 units on 15 August 2017 – 13,0810.06288 per unit on 315,239.78 units on 15 September 2017 – 15,8150.06329 per unit on 381,402.07 units on 16 October 2017 – 19,0420.06335 per unit on 467,139.81 units on 15 November 2017 – 22,5490.06347 per unit on 545,796.92 units on 15 December 2017 – 26,5580.06282 per unit on 539,448.14 units on 15 January 2018 26,739 –0.06271 per unit on 532,117.70 units on 15 February 2018 26,360 –0.06265 per unit on 550,417.82 units on 15 March 2018 27,158 –0.06183 per unit on 619,154.65 units on 16 April 2018 29,763 –0.06119 per unit on 785,537.34 units on 15 May 2018 36,312 –0.06032 per unit on 831,768.97 units on 14 June 2018 37,827 –0.05732 per unit on 800,583.94 units on 16 July 2018 34,006 –0.05625 per unit on 784,650.60 units on 15 August 2018 32,030 –0.05653 per unit on 784,152.08 units on 17 September 2018 31,834 –0.05816 per unit on 792,729.36 units on 15 October 2018 32,811 –0.05804 per unit on 836,091.29 units on 17 November 2018 35,029 –0.05276 per unit on 836,594.52 units on 17 December 2018 31,662 –
381,531 176,748
Class A (Distributing) (Hedged) (RMB)
0.67931 per unit on 2,560,706.82 units on 16 January 2017 – 253,8110.72460 per unit on 2,487,015.27 units on 15 February 2017 – 262,5810.74147 per unit on 2,121,095.92 units on 15 March 2017 – 228,0930.75507 per unit on 2,082,479.70 units on 18 April 2017 – 228,6310.75313 per unit on 2,032,469.81 units on 15 May 2017 – 221,8850.75267 per unit on 2,093,931.03 units on 15 June 2017 – 232,5130.74493 per unit on 1,988,500.28 units on 17 July 2017 – 218,7740.74447 per unit on 2,023,173.01 units on 15 August 2017 – 225,2570.74880 per unit on 2,068,413.72 units on 15 September 2017 – 236,1170.75260 per unit on 2,733,399.36 units on 16 October 2017 – 313,0400.75407 per unit on 2,785,730.16 units on 15 November 2017 – 316,1730.75567 per unit on 2,821,242.96 units on 15 December 2017 – 322,4160.74940 per unit on 2,853,359.78 units on 15 January 2018 330,567 –0.70238 per unit on 2,922,391.73 units on 15 February 2018 326,483 –0.70188 per unit on 2,961,514.42 units on 15 March 2018 329,544 –0.69463 per unit on 3,234,579.26 units on 16 April 2018 358,292 –0.68788 per unit on 3,365,145.04 units on 15 May 2018 365,736 –
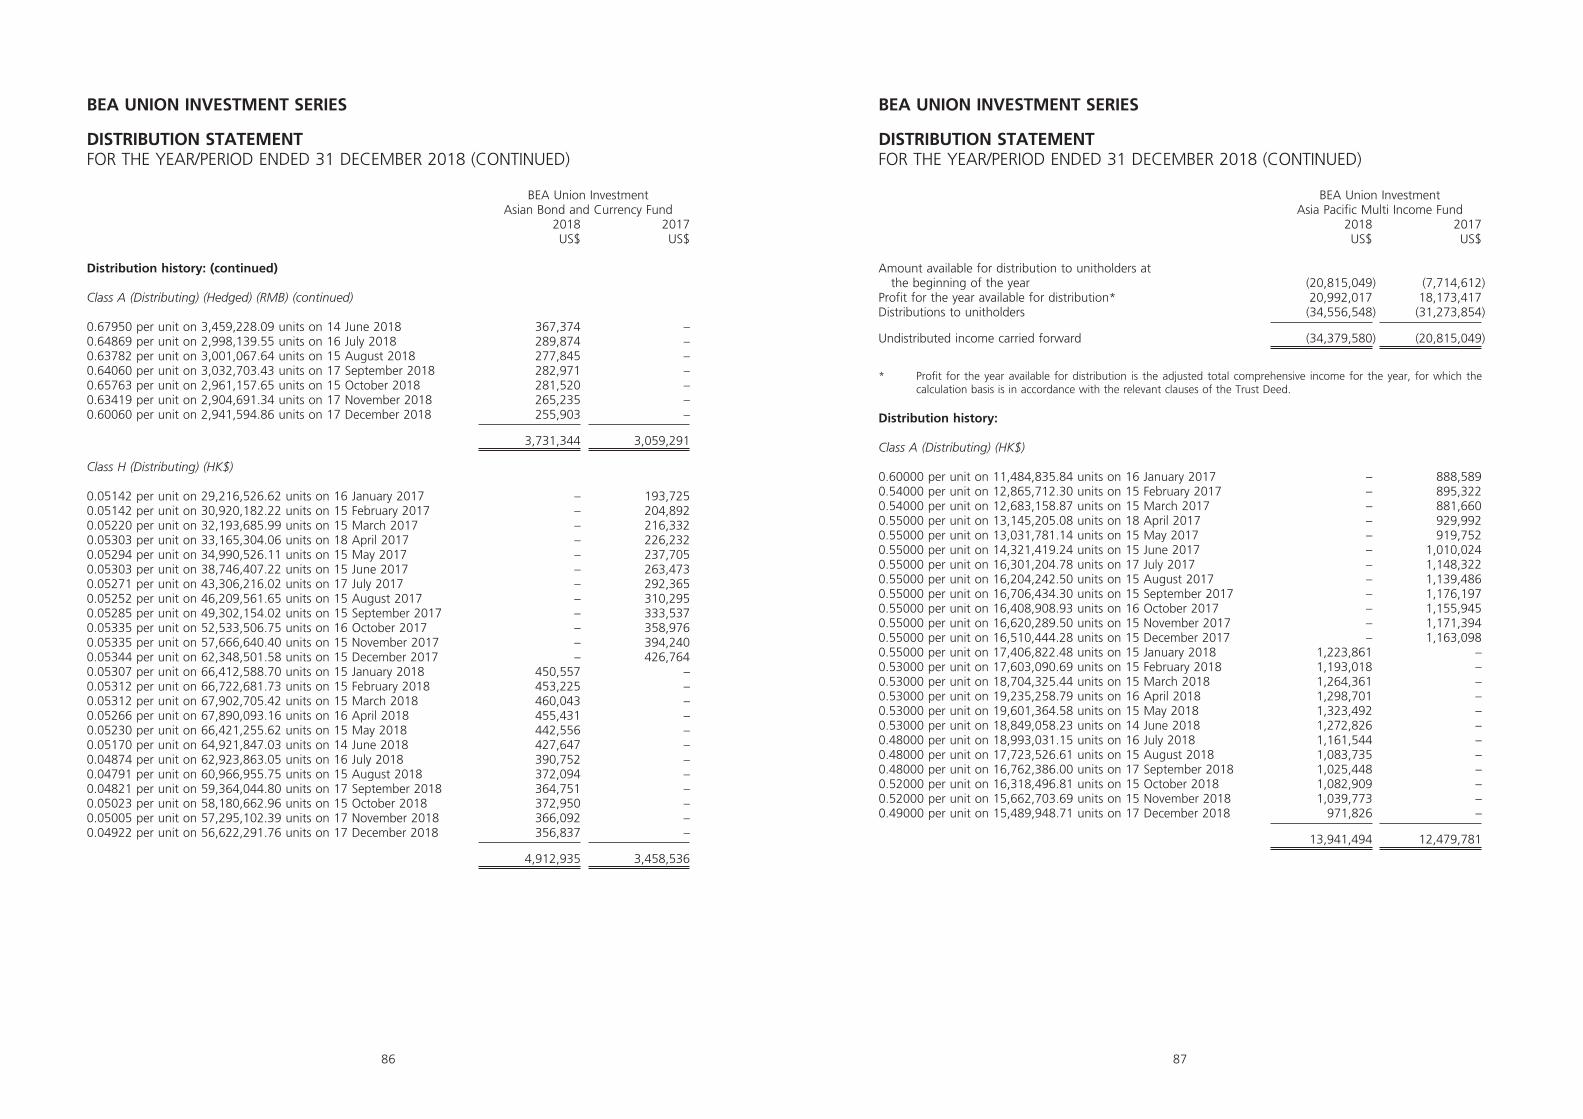
BEA UNION INVESTMENT SERIES
DISTRIBUTION STATEMENT FOR THE YEAR/PERIOD ENDED 31 DECEMBER 2018 (CONTINUED)
BEA UNION INVESTMENT SERIES
DISTRIBUTION STATEMENT FOR THE YEAR/PERIOD ENDED 31 DECEMBER 2018 (CONTINUED)
86 87
A5請縮小打印70.5%
BEA Union Investment Asian Bond and Currency Fund
2018 2017US$ US$
Distribution history: (continued)
Class A (Distributing) (Hedged) (RMB) (continued)
0.67950 per unit on 3,459,228.09 units on 14 June 2018 367,374 –0.64869 per unit on 2,998,139.55 units on 16 July 2018 289,874 –0.63782 per unit on 3,001,067.64 units on 15 August 2018 277,845 –0.64060 per unit on 3,032,703.43 units on 17 September 2018 282,971 –0.65763 per unit on 2,961,157.65 units on 15 October 2018 281,520 –0.63419 per unit on 2,904,691.34 units on 17 November 2018 265,235 –0.60060 per unit on 2,941,594.86 units on 17 December 2018 255,903 –
3,731,344 3,059,291
Class H (Distributing) (HK$)
0.05142 per unit on 29,216,526.62 units on 16 January 2017 – 193,7250.05142 per unit on 30,920,182.22 units on 15 February 2017 – 204,8920.05220 per unit on 32,193,685.99 units on 15 March 2017 – 216,3320.05303 per unit on 33,165,304.06 units on 18 April 2017 – 226,2320.05294 per unit on 34,990,526.11 units on 15 May 2017 – 237,7050.05303 per unit on 38,746,407.22 units on 15 June 2017 – 263,4730.05271 per unit on 43,306,216.02 units on 17 July 2017 – 292,3650.05252 per unit on 46,209,561.65 units on 15 August 2017 – 310,2950.05285 per unit on 49,302,154.02 units on 15 September 2017 – 333,5370.05335 per unit on 52,533,506.75 units on 16 October 2017 – 358,9760.05335 per unit on 57,666,640.40 units on 15 November 2017 – 394,2400.05344 per unit on 62,348,501.58 units on 15 December 2017 – 426,7640.05307 per unit on 66,412,588.70 units on 15 January 2018 450,557 –0.05312 per unit on 66,722,681.73 units on 15 February 2018 453,225 –0.05312 per unit on 67,902,705.42 units on 15 March 2018 460,043 –0.05266 per unit on 67,890,093.16 units on 16 April 2018 455,431 –0.05230 per unit on 66,421,255.62 units on 15 May 2018 442,556 –0.05170 per unit on 64,921,847.03 units on 14 June 2018 427,647 –0.04874 per unit on 62,923,863.05 units on 16 July 2018 390,752 –0.04791 per unit on 60,966,955.75 units on 15 August 2018 372,094 –0.04821 per unit on 59,364,044.80 units on 17 September 2018 364,751 –0.05023 per unit on 58,180,662.96 units on 15 October 2018 372,950 –0.05005 per unit on 57,295,102.39 units on 17 November 2018 366,092 –0.04922 per unit on 56,622,291.76 units on 17 December 2018 356,837 –
4,912,935 3,458,536
BEA Union Investment Asia Pacific Multi Income Fund
2018 2017US$ US$
Amount available for distribution to unitholders at the beginning of the year (20,815,049) (7,714,612)Profit for the year available for distribution* 20,992,017 18,173,417Distributions to unitholders (34,556,548) (31,273,854)
Undistributed income carried forward (34,379,580) (20,815,049)
* Profit for the year available for distribution is the adjusted total comprehensive income for the year, for which the calculation basis is in accordance with the relevant clauses of the Trust Deed.
Distribution history:
Class A (Distributing) (HK$)
0.60000 per unit on 11,484,835.84 units on 16 January 2017 – 888,5890.54000 per unit on 12,865,712.30 units on 15 February 2017 – 895,3220.54000 per unit on 12,683,158.87 units on 15 March 2017 – 881,6600.55000 per unit on 13,145,205.08 units on 18 April 2017 – 929,9920.55000 per unit on 13,031,781.14 units on 15 May 2017 – 919,7520.55000 per unit on 14,321,419.24 units on 15 June 2017 – 1,010,0240.55000 per unit on 16,301,204.78 units on 17 July 2017 – 1,148,3220.55000 per unit on 16,204,242.50 units on 15 August 2017 – 1,139,4860.55000 per unit on 16,706,434.30 units on 15 September 2017 – 1,176,1970.55000 per unit on 16,408,908.93 units on 16 October 2017 – 1,155,9450.55000 per unit on 16,620,289.50 units on 15 November 2017 – 1,171,3940.55000 per unit on 16,510,444.28 units on 15 December 2017 – 1,163,0980.55000 per unit on 17,406,822.48 units on 15 January 2018 1,223,861 –0.53000 per unit on 17,603,090.69 units on 15 February 2018 1,193,018 –0.53000 per unit on 18,704,325.44 units on 15 March 2018 1,264,361 –0.53000 per unit on 19,235,258.79 units on 16 April 2018 1,298,701 –0.53000 per unit on 19,601,364.58 units on 15 May 2018 1,323,492 –0.53000 per unit on 18,849,058.23 units on 14 June 2018 1,272,826 –0.48000 per unit on 18,993,031.15 units on 16 July 2018 1,161,544 –0.48000 per unit on 17,723,526.61 units on 15 August 2018 1,083,735 –0.48000 per unit on 16,762,386.00 units on 17 September 2018 1,025,448 –0.52000 per unit on 16,318,496.81 units on 15 October 2018 1,082,909 –0.52000 per unit on 15,662,703.69 units on 15 November 2018 1,039,773 –0.49000 per unit on 15,489,948.71 units on 17 December 2018 971,826 –
13,941,494 12,479,781
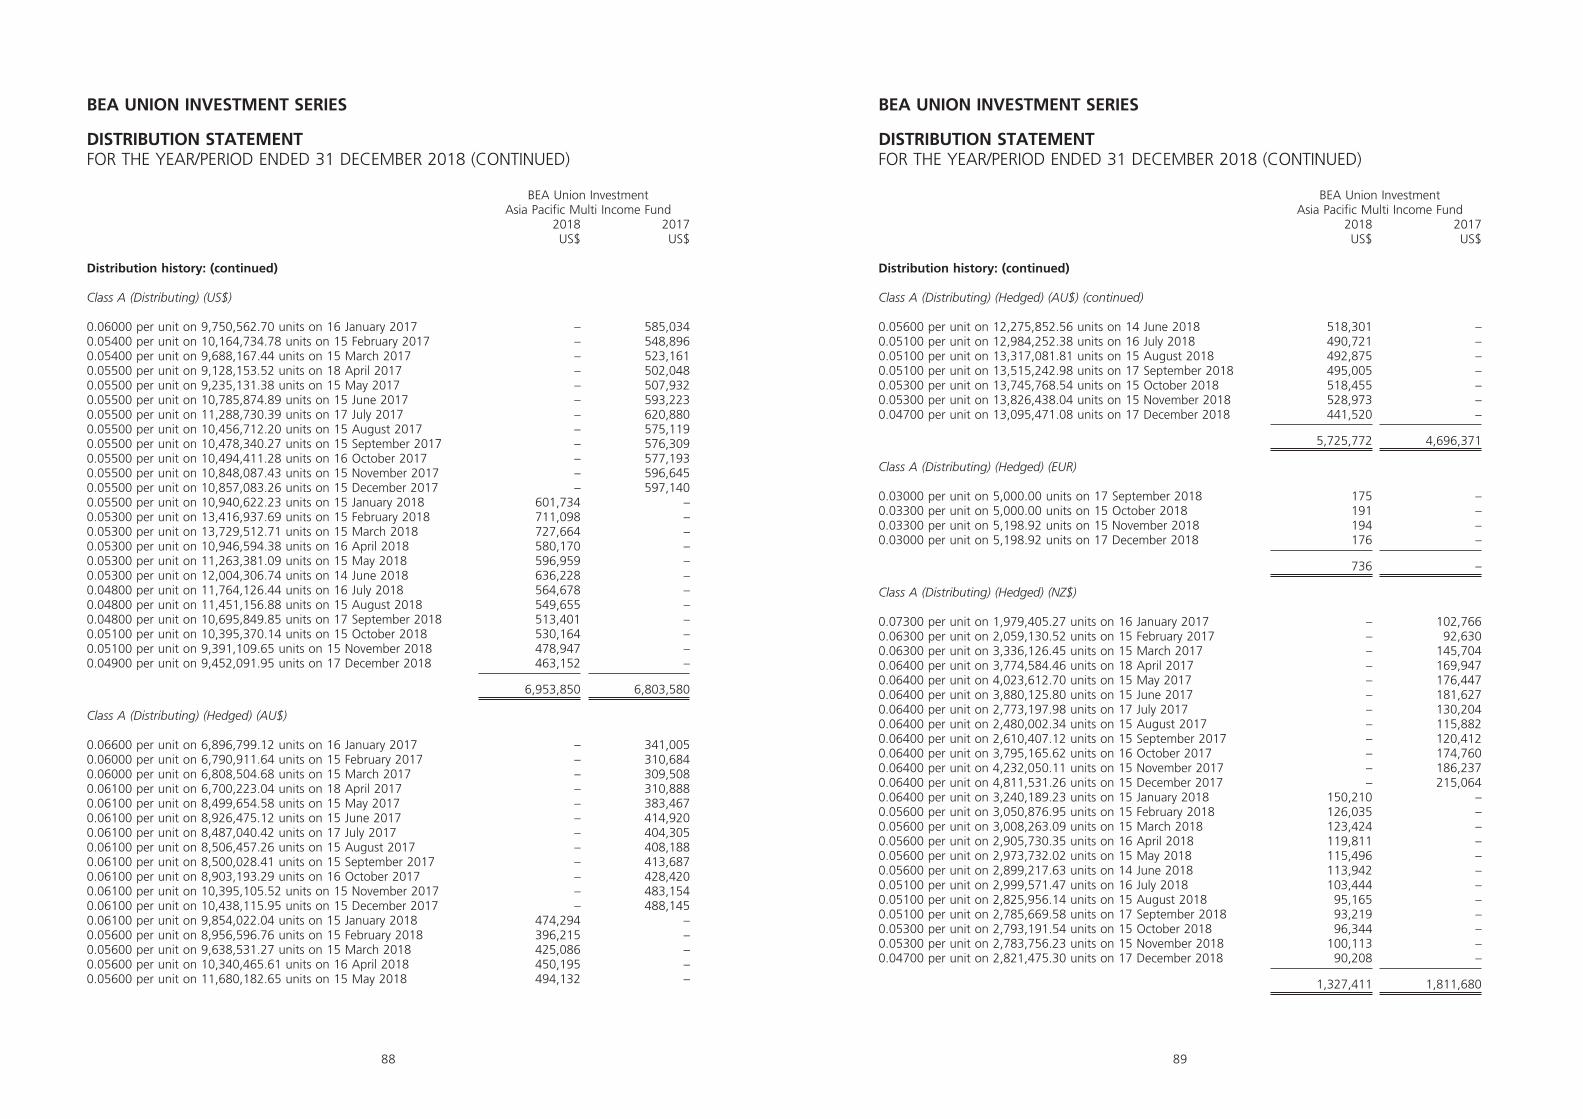
BEA UNION INVESTMENT SERIES
DISTRIBUTION STATEMENT FOR THE YEAR/PERIOD ENDED 31 DECEMBER 2018 (CONTINUED)
BEA UNION INVESTMENT SERIES
DISTRIBUTION STATEMENT FOR THE YEAR/PERIOD ENDED 31 DECEMBER 2018 (CONTINUED)
88 89
A5請縮小打印70.5%
BEA Union Investment Asia Pacific Multi Income Fund
2018 2017US$ US$
Distribution history: (continued)
Class A (Distributing) (US$)
0.06000 per unit on 9,750,562.70 units on 16 January 2017 – 585,0340.05400 per unit on 10,164,734.78 units on 15 February 2017 – 548,8960.05400 per unit on 9,688,167.44 units on 15 March 2017 – 523,1610.05500 per unit on 9,128,153.52 units on 18 April 2017 – 502,0480.05500 per unit on 9,235,131.38 units on 15 May 2017 – 507,9320.05500 per unit on 10,785,874.89 units on 15 June 2017 – 593,2230.05500 per unit on 11,288,730.39 units on 17 July 2017 – 620,8800.05500 per unit on 10,456,712.20 units on 15 August 2017 – 575,1190.05500 per unit on 10,478,340.27 units on 15 September 2017 – 576,3090.05500 per unit on 10,494,411.28 units on 16 October 2017 – 577,1930.05500 per unit on 10,848,087.43 units on 15 November 2017 – 596,6450.05500 per unit on 10,857,083.26 units on 15 December 2017 – 597,1400.05500 per unit on 10,940,622.23 units on 15 January 2018 601,734 –0.05300 per unit on 13,416,937.69 units on 15 February 2018 711,098 –0.05300 per unit on 13,729,512.71 units on 15 March 2018 727,664 –0.05300 per unit on 10,946,594.38 units on 16 April 2018 580,170 –0.05300 per unit on 11,263,381.09 units on 15 May 2018 596,959 –0.05300 per unit on 12,004,306.74 units on 14 June 2018 636,228 –0.04800 per unit on 11,764,126.44 units on 16 July 2018 564,678 –0.04800 per unit on 11,451,156.88 units on 15 August 2018 549,655 –0.04800 per unit on 10,695,849.85 units on 17 September 2018 513,401 –0.05100 per unit on 10,395,370.14 units on 15 October 2018 530,164 –0.05100 per unit on 9,391,109.65 units on 15 November 2018 478,947 –0.04900 per unit on 9,452,091.95 units on 17 December 2018 463,152 –
6,953,850 6,803,580
Class A (Distributing) (Hedged) (AU$)
0.06600 per unit on 6,896,799.12 units on 16 January 2017 – 341,0050.06000 per unit on 6,790,911.64 units on 15 February 2017 – 310,6840.06000 per unit on 6,808,504.68 units on 15 March 2017 – 309,5080.06100 per unit on 6,700,223.04 units on 18 April 2017 – 310,8880.06100 per unit on 8,499,654.58 units on 15 May 2017 – 383,4670.06100 per unit on 8,926,475.12 units on 15 June 2017 – 414,9200.06100 per unit on 8,487,040.42 units on 17 July 2017 – 404,3050.06100 per unit on 8,506,457.26 units on 15 August 2017 – 408,1880.06100 per unit on 8,500,028.41 units on 15 September 2017 – 413,6870.06100 per unit on 8,903,193.29 units on 16 October 2017 – 428,4200.06100 per unit on 10,395,105.52 units on 15 November 2017 – 483,1540.06100 per unit on 10,438,115.95 units on 15 December 2017 – 488,1450.06100 per unit on 9,854,022.04 units on 15 January 2018 474,294 –0.05600 per unit on 8,956,596.76 units on 15 February 2018 396,215 –0.05600 per unit on 9,638,531.27 units on 15 March 2018 425,086 –0.05600 per unit on 10,340,465.61 units on 16 April 2018 450,195 –0.05600 per unit on 11,680,182.65 units on 15 May 2018 494,132 –
BEA Union Investment Asia Pacific Multi Income Fund
2018 2017US$ US$
Distribution history: (continued)
Class A (Distributing) (Hedged) (AU$) (continued)
0.05600 per unit on 12,275,852.56 units on 14 June 2018 518,301 –0.05100 per unit on 12,984,252.38 units on 16 July 2018 490,721 –0.05100 per unit on 13,317,081.81 units on 15 August 2018 492,875 –0.05100 per unit on 13,515,242.98 units on 17 September 2018 495,005 –0.05300 per unit on 13,745,768.54 units on 15 October 2018 518,455 –0.05300 per unit on 13,826,438.04 units on 15 November 2018 528,973 –0.04700 per unit on 13,095,471.08 units on 17 December 2018 441,520 –
5,725,772 4,696,371
Class A (Distributing) (Hedged) (EUR)
0.03000 per unit on 5,000.00 units on 17 September 2018 175 –0.03300 per unit on 5,000.00 units on 15 October 2018 191 –0.03300 per unit on 5,198.92 units on 15 November 2018 194 –0.03000 per unit on 5,198.92 units on 17 December 2018 176 –
736 –
Class A (Distributing) (Hedged) (NZ$)
0.07300 per unit on 1,979,405.27 units on 16 January 2017 – 102,7660.06300 per unit on 2,059,130.52 units on 15 February 2017 – 92,6300.06300 per unit on 3,336,126.45 units on 15 March 2017 – 145,7040.06400 per unit on 3,774,584.46 units on 18 April 2017 – 169,9470.06400 per unit on 4,023,612.70 units on 15 May 2017 – 176,4470.06400 per unit on 3,880,125.80 units on 15 June 2017 – 181,6270.06400 per unit on 2,773,197.98 units on 17 July 2017 – 130,2040.06400 per unit on 2,480,002.34 units on 15 August 2017 – 115,8820.06400 per unit on 2,610,407.12 units on 15 September 2017 – 120,4120.06400 per unit on 3,795,165.62 units on 16 October 2017 – 174,7600.06400 per unit on 4,232,050.11 units on 15 November 2017 – 186,2370.06400 per unit on 4,811,531.26 units on 15 December 2017 – 215,0640.06400 per unit on 3,240,189.23 units on 15 January 2018 150,210 –0.05600 per unit on 3,050,876.95 units on 15 February 2018 126,035 –0.05600 per unit on 3,008,263.09 units on 15 March 2018 123,424 –0.05600 per unit on 2,905,730.35 units on 16 April 2018 119,811 –0.05600 per unit on 2,973,732.02 units on 15 May 2018 115,496 –0.05600 per unit on 2,899,217.63 units on 14 June 2018 113,942 –0.05100 per unit on 2,999,571.47 units on 16 July 2018 103,444 –0.05100 per unit on 2,825,956.14 units on 15 August 2018 95,165 –0.05100 per unit on 2,785,669.58 units on 17 September 2018 93,219 –0.05300 per unit on 2,793,191.54 units on 15 October 2018 96,344 –0.05300 per unit on 2,783,756.23 units on 15 November 2018 100,113 –0.04700 per unit on 2,821,475.30 units on 17 December 2018 90,208 –
1,327,411 1,811,680
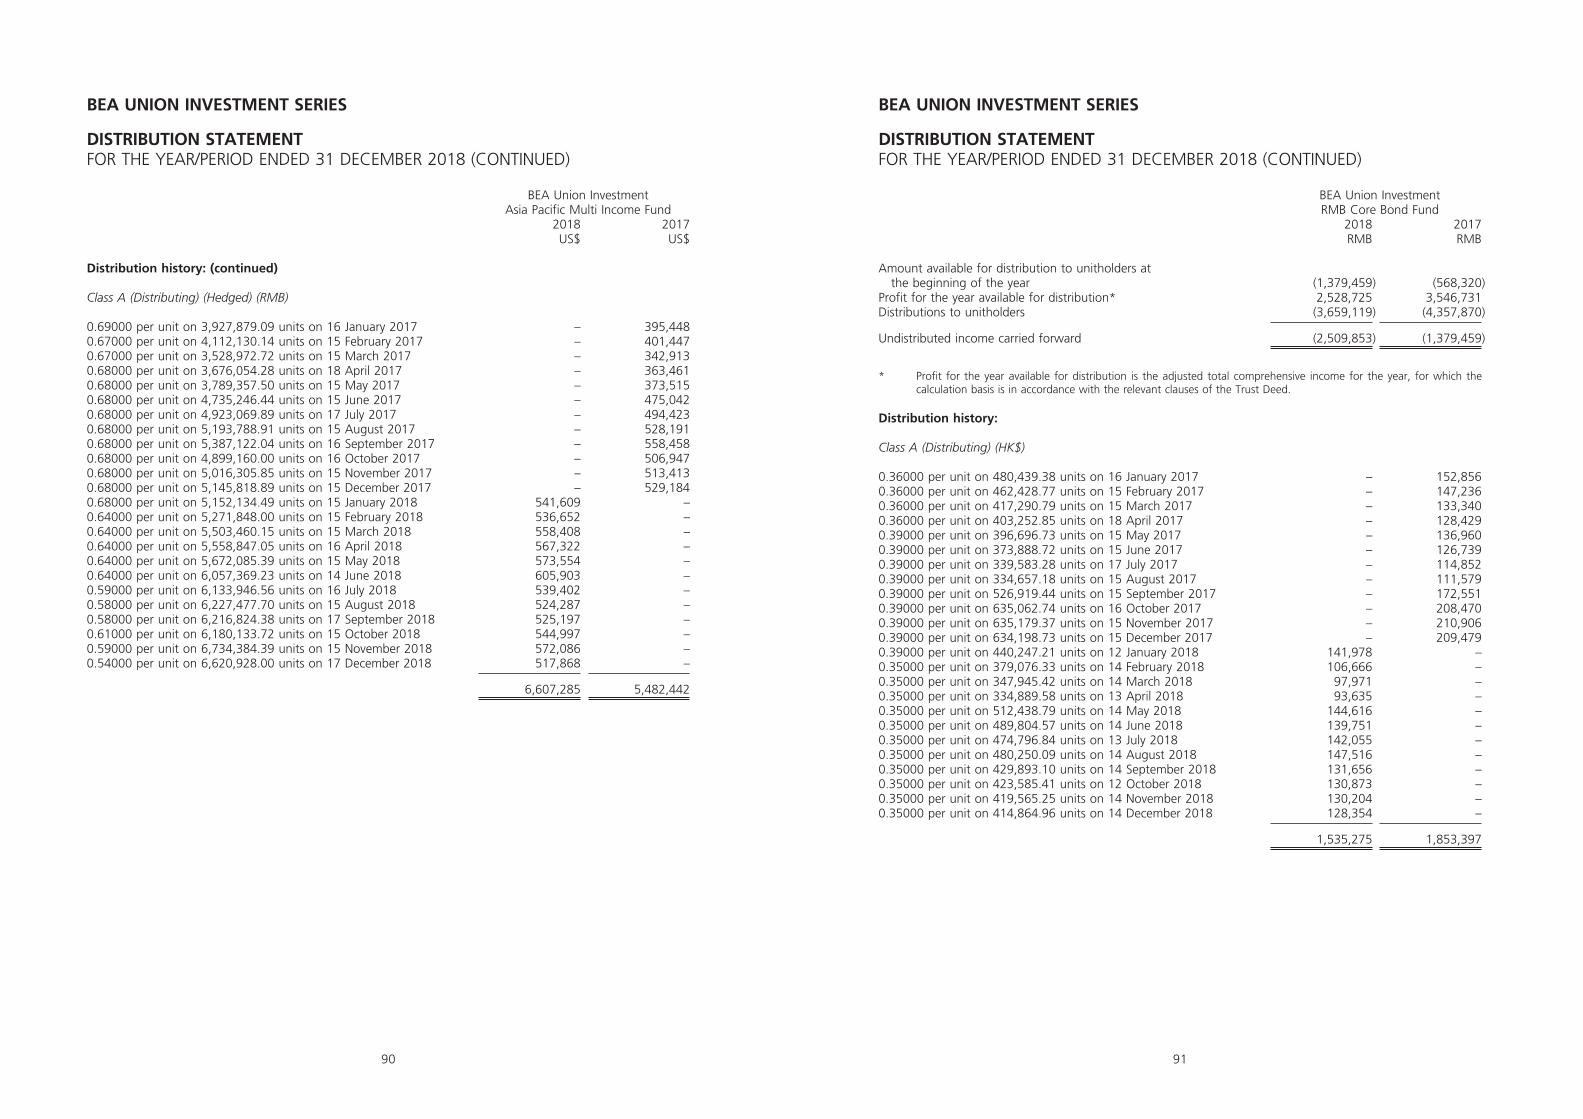
BEA UNION INVESTMENT SERIES
DISTRIBUTION STATEMENT FOR THE YEAR/PERIOD ENDED 31 DECEMBER 2018 (CONTINUED)
BEA UNION INVESTMENT SERIES
DISTRIBUTION STATEMENT FOR THE YEAR/PERIOD ENDED 31 DECEMBER 2018 (CONTINUED)
90 91
A5請縮小打印70.5%
BEA Union Investment Asia Pacific Multi Income Fund
2018 2017US$ US$
Distribution history: (continued)
Class A (Distributing) (Hedged) (RMB)
0.69000 per unit on 3,927,879.09 units on 16 January 2017 – 395,4480.67000 per unit on 4,112,130.14 units on 15 February 2017 – 401,4470.67000 per unit on 3,528,972.72 units on 15 March 2017 – 342,9130.68000 per unit on 3,676,054.28 units on 18 April 2017 – 363,4610.68000 per unit on 3,789,357.50 units on 15 May 2017 – 373,5150.68000 per unit on 4,735,246.44 units on 15 June 2017 – 475,0420.68000 per unit on 4,923,069.89 units on 17 July 2017 – 494,4230.68000 per unit on 5,193,788.91 units on 15 August 2017 – 528,1910.68000 per unit on 5,387,122.04 units on 16 September 2017 – 558,4580.68000 per unit on 4,899,160.00 units on 16 October 2017 – 506,9470.68000 per unit on 5,016,305.85 units on 15 November 2017 – 513,4130.68000 per unit on 5,145,818.89 units on 15 December 2017 – 529,1840.68000 per unit on 5,152,134.49 units on 15 January 2018 541,609 –0.64000 per unit on 5,271,848.00 units on 15 February 2018 536,652 –0.64000 per unit on 5,503,460.15 units on 15 March 2018 558,408 –0.64000 per unit on 5,558,847.05 units on 16 April 2018 567,322 –0.64000 per unit on 5,672,085.39 units on 15 May 2018 573,554 –0.64000 per unit on 6,057,369.23 units on 14 June 2018 605,903 –0.59000 per unit on 6,133,946.56 units on 16 July 2018 539,402 –0.58000 per unit on 6,227,477.70 units on 15 August 2018 524,287 –0.58000 per unit on 6,216,824.38 units on 17 September 2018 525,197 –0.61000 per unit on 6,180,133.72 units on 15 October 2018 544,997 –0.59000 per unit on 6,734,384.39 units on 15 November 2018 572,086 –0.54000 per unit on 6,620,928.00 units on 17 December 2018 517,868 –
6,607,285 5,482,442
BEA Union Investment RMB Core Bond Fund
2018 2017RMB RMB
Amount available for distribution to unitholders at the beginning of the year (1,379,459) (568,320)Profit for the year available for distribution* 2,528,725 3,546,731Distributions to unitholders (3,659,119) (4,357,870)
Undistributed income carried forward (2,509,853) (1,379,459)
* Profit for the year available for distribution is the adjusted total comprehensive income for the year, for which the calculation basis is in accordance with the relevant clauses of the Trust Deed.
Distribution history:
Class A (Distributing) (HK$)
0.36000 per unit on 480,439.38 units on 16 January 2017 – 152,8560.36000 per unit on 462,428.77 units on 15 February 2017 – 147,2360.36000 per unit on 417,290.79 units on 15 March 2017 – 133,3400.36000 per unit on 403,252.85 units on 18 April 2017 – 128,4290.39000 per unit on 396,696.73 units on 15 May 2017 – 136,9600.39000 per unit on 373,888.72 units on 15 June 2017 – 126,7390.39000 per unit on 339,583.28 units on 17 July 2017 – 114,8520.39000 per unit on 334,657.18 units on 15 August 2017 – 111,5790.39000 per unit on 526,919.44 units on 15 September 2017 – 172,5510.39000 per unit on 635,062.74 units on 16 October 2017 – 208,4700.39000 per unit on 635,179.37 units on 15 November 2017 – 210,9060.39000 per unit on 634,198.73 units on 15 December 2017 – 209,4790.39000 per unit on 440,247.21 units on 12 January 2018 141,978 –0.35000 per unit on 379,076.33 units on 14 February 2018 106,666 –0.35000 per unit on 347,945.42 units on 14 March 2018 97,971 –0.35000 per unit on 334,889.58 units on 13 April 2018 93,635 –0.35000 per unit on 512,438.79 units on 14 May 2018 144,616 –0.35000 per unit on 489,804.57 units on 14 June 2018 139,751 –0.35000 per unit on 474,796.84 units on 13 July 2018 142,055 –0.35000 per unit on 480,250.09 units on 14 August 2018 147,516 –0.35000 per unit on 429,893.10 units on 14 September 2018 131,656 –0.35000 per unit on 423,585.41 units on 12 October 2018 130,873 –0.35000 per unit on 419,565.25 units on 14 November 2018 130,204 –0.35000 per unit on 414,864.96 units on 14 December 2018 128,354 –
1,535,275 1,853,397
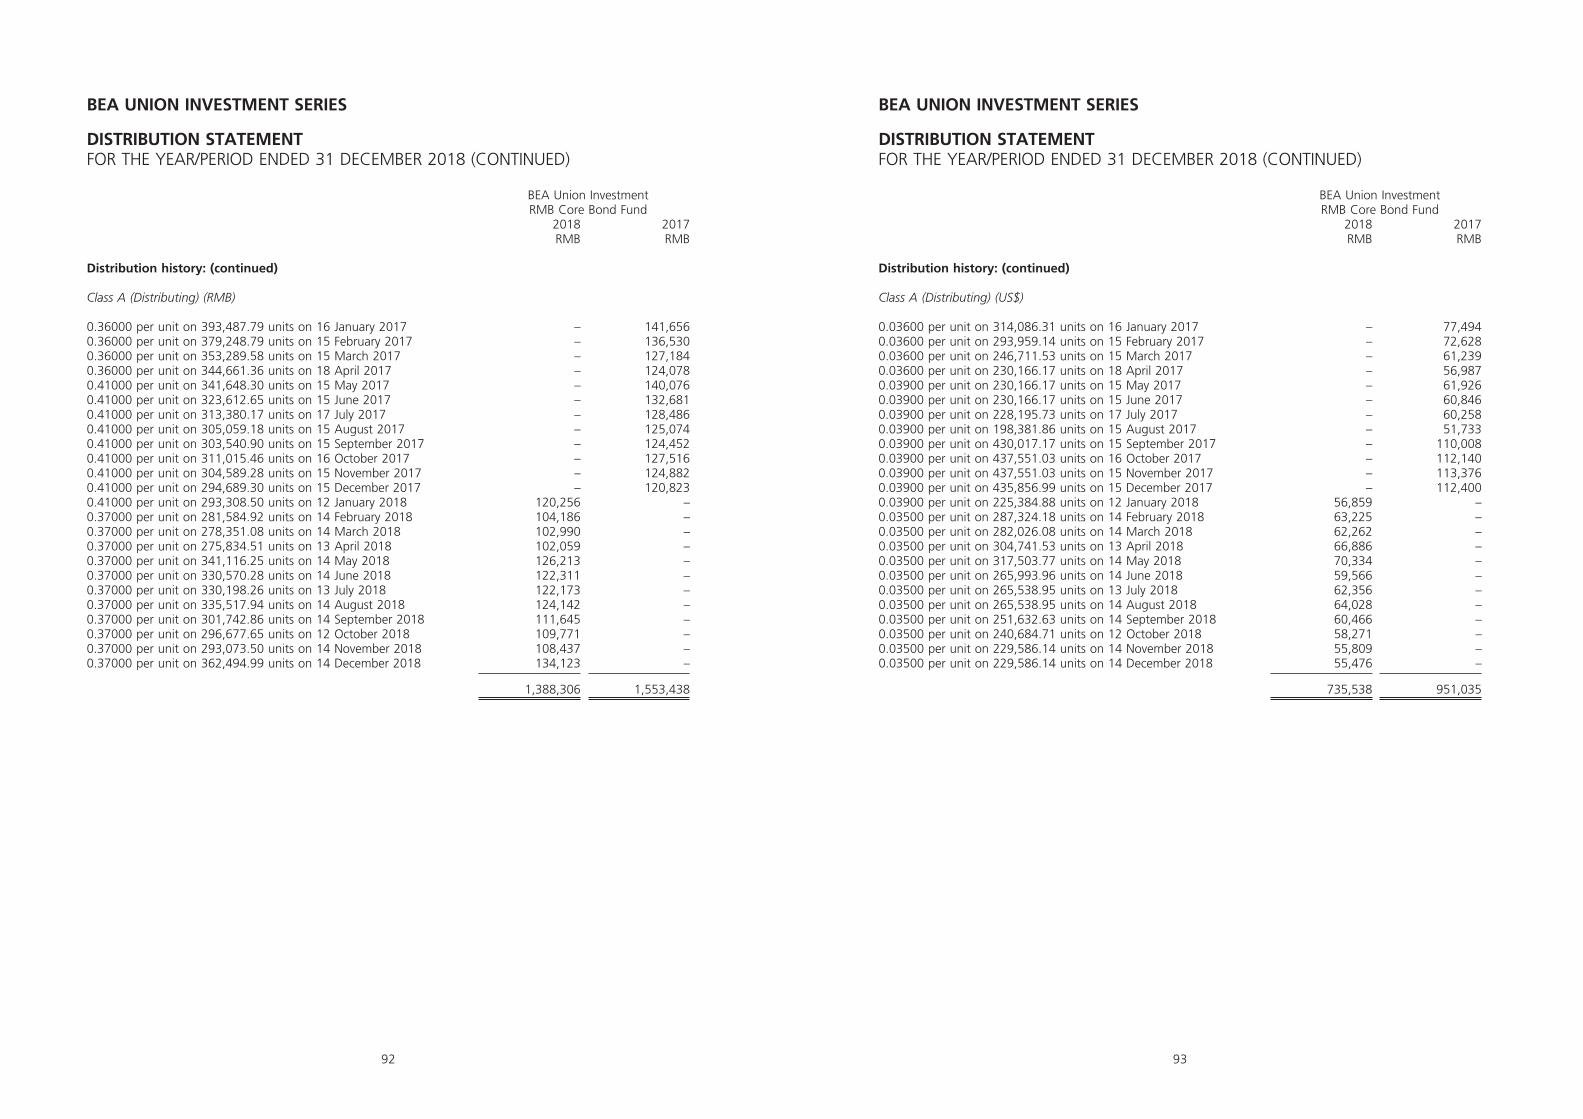
BEA UNION INVESTMENT SERIES
DISTRIBUTION STATEMENT FOR THE YEAR/PERIOD ENDED 31 DECEMBER 2018 (CONTINUED)
BEA UNION INVESTMENT SERIES
DISTRIBUTION STATEMENT FOR THE YEAR/PERIOD ENDED 31 DECEMBER 2018 (CONTINUED)
92 93
A5請縮小打印70.5%
BEA Union Investment RMB Core Bond Fund
2018 2017RMB RMB
Distribution history: (continued)
Class A (Distributing) (RMB)
0.36000 per unit on 393,487.79 units on 16 January 2017 – 141,6560.36000 per unit on 379,248.79 units on 15 February 2017 – 136,5300.36000 per unit on 353,289.58 units on 15 March 2017 – 127,1840.36000 per unit on 344,661.36 units on 18 April 2017 – 124,0780.41000 per unit on 341,648.30 units on 15 May 2017 – 140,0760.41000 per unit on 323,612.65 units on 15 June 2017 – 132,6810.41000 per unit on 313,380.17 units on 17 July 2017 – 128,4860.41000 per unit on 305,059.18 units on 15 August 2017 – 125,0740.41000 per unit on 303,540.90 units on 15 September 2017 – 124,4520.41000 per unit on 311,015.46 units on 16 October 2017 – 127,5160.41000 per unit on 304,589.28 units on 15 November 2017 – 124,8820.41000 per unit on 294,689.30 units on 15 December 2017 – 120,8230.41000 per unit on 293,308.50 units on 12 January 2018 120,256 –0.37000 per unit on 281,584.92 units on 14 February 2018 104,186 –0.37000 per unit on 278,351.08 units on 14 March 2018 102,990 –0.37000 per unit on 275,834.51 units on 13 April 2018 102,059 –0.37000 per unit on 341,116.25 units on 14 May 2018 126,213 –0.37000 per unit on 330,570.28 units on 14 June 2018 122,311 –0.37000 per unit on 330,198.26 units on 13 July 2018 122,173 –0.37000 per unit on 335,517.94 units on 14 August 2018 124,142 –0.37000 per unit on 301,742.86 units on 14 September 2018 111,645 –0.37000 per unit on 296,677.65 units on 12 October 2018 109,771 –0.37000 per unit on 293,073.50 units on 14 November 2018 108,437 –0.37000 per unit on 362,494.99 units on 14 December 2018 134,123 –
1,388,306 1,553,438
BEA Union Investment RMB Core Bond Fund
2018 2017RMB RMB
Distribution history: (continued)
Class A (Distributing) (US$)
0.03600 per unit on 314,086.31 units on 16 January 2017 – 77,4940.03600 per unit on 293,959.14 units on 15 February 2017 – 72,6280.03600 per unit on 246,711.53 units on 15 March 2017 – 61,2390.03600 per unit on 230,166.17 units on 18 April 2017 – 56,9870.03900 per unit on 230,166.17 units on 15 May 2017 – 61,9260.03900 per unit on 230,166.17 units on 15 June 2017 – 60,8460.03900 per unit on 228,195.73 units on 17 July 2017 – 60,2580.03900 per unit on 198,381.86 units on 15 August 2017 – 51,7330.03900 per unit on 430,017.17 units on 15 September 2017 – 110,0080.03900 per unit on 437,551.03 units on 16 October 2017 – 112,1400.03900 per unit on 437,551.03 units on 15 November 2017 – 113,3760.03900 per unit on 435,856.99 units on 15 December 2017 – 112,4000.03900 per unit on 225,384.88 units on 12 January 2018 56,859 –0.03500 per unit on 287,324.18 units on 14 February 2018 63,225 –0.03500 per unit on 282,026.08 units on 14 March 2018 62,262 –0.03500 per unit on 304,741.53 units on 13 April 2018 66,886 –0.03500 per unit on 317,503.77 units on 14 May 2018 70,334 –0.03500 per unit on 265,993.96 units on 14 June 2018 59,566 –0.03500 per unit on 265,538.95 units on 13 July 2018 62,356 –0.03500 per unit on 265,538.95 units on 14 August 2018 64,028 –0.03500 per unit on 251,632.63 units on 14 September 2018 60,466 –0.03500 per unit on 240,684.71 units on 12 October 2018 58,271 –0.03500 per unit on 229,586.14 units on 14 November 2018 55,809 –0.03500 per unit on 229,586.14 units on 14 December 2018 55,476 –
735,538 951,035

BEA UNION INVESTMENT SERIES
DISTRIBUTION STATEMENT FOR THE YEAR/PERIOD ENDED 31 DECEMBER 2018 (CONTINUED)
BEA UNION INVESTMENT SERIES
DISTRIBUTION STATEMENT FOR THE YEAR/PERIOD ENDED 31 DECEMBER 2018 (CONTINUED)
94 95
A5請縮小打印70.5%
BEA Union Investment Asia Pacific Flexi Allocation Fund
2018 2017US$ US$
Amount available for distribution to unitholders at the beginning of the year (6,776,934) (5,094,772)Profit for the year available for distribution* 427,312 525,699Distributions to unitholders (2,376,430) (2,207,861)
Undistributed income carried forward (8,726,052) (6,776,934)
* Profit for the year available for distribution is the adjusted total comprehensive income for the year, for which the calculation basis is in accordance with the relevant clauses of the Trust Deed.
Distribution history:
Class A (Distributing) (HK$)
0.24000 per unit on 1,253,964.67 units on 16 January 2017 – 38,8080.24000 per unit on 1,251,101.67 units on 15 February 2017 – 38,6950.24000 per unit on 1,135,704.32 units on 15 March 2017 – 35,0880.28000 per unit on 1,116,415.22 units on 18 April 2017 – 40,2100.32000 per unit on 1,025,310.23 units on 15 May 2017 – 42,1030.32000 per unit on 956,020.27 units on 14 June 2017 – 39,2280.40000 per unit on 967,302.51 units on 17 July 2017 – 49,5570.40000 per unit on 1,203,217.24 units on 15 August 2017 – 61,5350.40000 per unit on 1,436,307.89 units on 15 September 2017 – 73,5430.42000 per unit on 1,640,923.99 units on 16 October 2017 – 88,2740.42000 per unit on 1,482,802.61 units on 15 November 2017 – 79,8060.42000 per unit on 1,544,617.38 units on 15 December 2017 – 83,0930.42000 per unit on 1,404,875.10 units on 15 January 2018 75,429 –0.35000 per unit on 1,687,426.03 units on 15 February 2018 75,522 –0.35000 per unit on 1,486,386.12 units on 16 March 2018 66,352 –0.35000 per unit on 1,655,278.03 units on 16 April 2018 73,803 –0.35000 per unit on 1,585,214.43 units on 15 May 2018 70,683 –0.35000 per unit on 1,892,395.22 units on 14 June 2018 84,389 –0.35000 per unit on 1,859,528.17 units on 16 July 2018 82,922 –0.35000 per unit on 1,805,639.89 units on 15 August 2018 80,507 –0.35000 per unit on 1,680,473.57 units on 17 September 2018 74,961 –0.35000 per unit on 1,644,555.36 units on 15 October 2018 73,456 –0.35000 per unit on 1,602,834.83 units on 15 November 2018 71,619 –0.32000 per unit on 1,593,039.56 units on 17 December 2018 65,270 –
894,913 669,940
BEA Union Investment Asia Pacific Flexi Allocation Fund
2018 2017US$ US$
Distribution history: (continued)
Class A (Distributing) (US$)
0.02400 per unit on 2,396,394.80 units on 16 January 2017 – 57,5130.02400 per unit on 2,375,828.27 units on 15 February 2017 – 57,0200.02400 per unit on 2,308,142.20 units on 15 March 2017 – 55,3950.02800 per unit on 2,309,199.63 units on 18 April 2017 – 64,6580.03200 per unit on 2,286,269.12 units on 15 May 2017 – 73,1610.03200 per unit on 2,272,392.22 units on 15 June 2017 – 72,7170.04000 per unit on 2,255,847.52 units on 17 July 2017 – 90,2340.04000 per unit on 2,767,100.41 units on 15 August 2017 – 110,6840.04000 per unit on 3,376,661.34 units on 15 September 2017 – 135,0660.04200 per unit on 2,743,261.11 units on 16 October 2017 – 115,2170.04200 per unit on 1,793,603.98 units on 15 November 2017 – 75,3310.04200 per unit on 1,793,566.58 units on 15 December 2017 – 75,3290.04200 per unit on 1,690,675.27 units on 15 January 2018 71,008 –0.03500 per unit on 1,138,024.11 units on 15 February 2018 39,831 –0.03500 per unit on 1,173,698.09 units on 16 March 2018 41,079 –0.03500 per unit on 1,311,255.77 units on 16 April 2018 45,894 –0.03500 per unit on 1,332,444.48 units on 15 May 2018 46,636 –0.03500 per unit on 1,348,656.48 units on 14 June 2018 47,203 –0.03500 per unit on 1,344,069.04 units on 16 July 2018 47,042 –0.03500 per unit on 1,293,821.98 units on 15 August 2018 45,284 –0.03500 per unit on 1,232,663.34 units on 17 September 2018 43,143 –0.03500 per unit on 1,220,867.44 units on 15 October 2018 42,730 –0.03500 per unit on 1,206,257.67 units on 15 November 2018 42,219 –0.03200 per unit on 1,201,541.39 units on 17 December 2018 38,448 –
550,517 982,325
Class A (Distributing) (Hedged) (AU$)
0.03700 per unit on 564,715.91 units on 16 January 2017 – 15,6530.03700 per unit on 569,030.20 units on 15 February 2017 – 16,0540.03700 per unit on 444,358.92 units on 15 March 2017 – 12,4570.04100 per unit on 447,070.70 units on 18 April 2017 – 13,9430.04200 per unit on 460,046.68 units on 15 May 2017 – 14,2910.04200 per unit on 365,884.93 units on 14 June 2017 – 11,7100.05000 per unit on 350,889.25 units on 17 July 2017 – 13,7010.05000 per unit on 367,800.34 units on 15 August 2017 – 14,4670.05000 per unit on 367,013.38 units on 15 September 2017 – 14,6410.05200 per unit on 771,837.10 units on 16 October 2017 – 31,6620.05200 per unit on 726,286.49 units on 15 November 2017 – 28,7760.05200 per unit on 814,127.04 units on 15 December 2017 – 32,4560.05200 per unit on 1,098,623.37 units on 15 January 2018 45,077 –0.04500 per unit on 567,628.60 units on 15 February 2018 20,178 –0.04500 per unit on 953,380.73 units on 16 March 2018 33,788 –
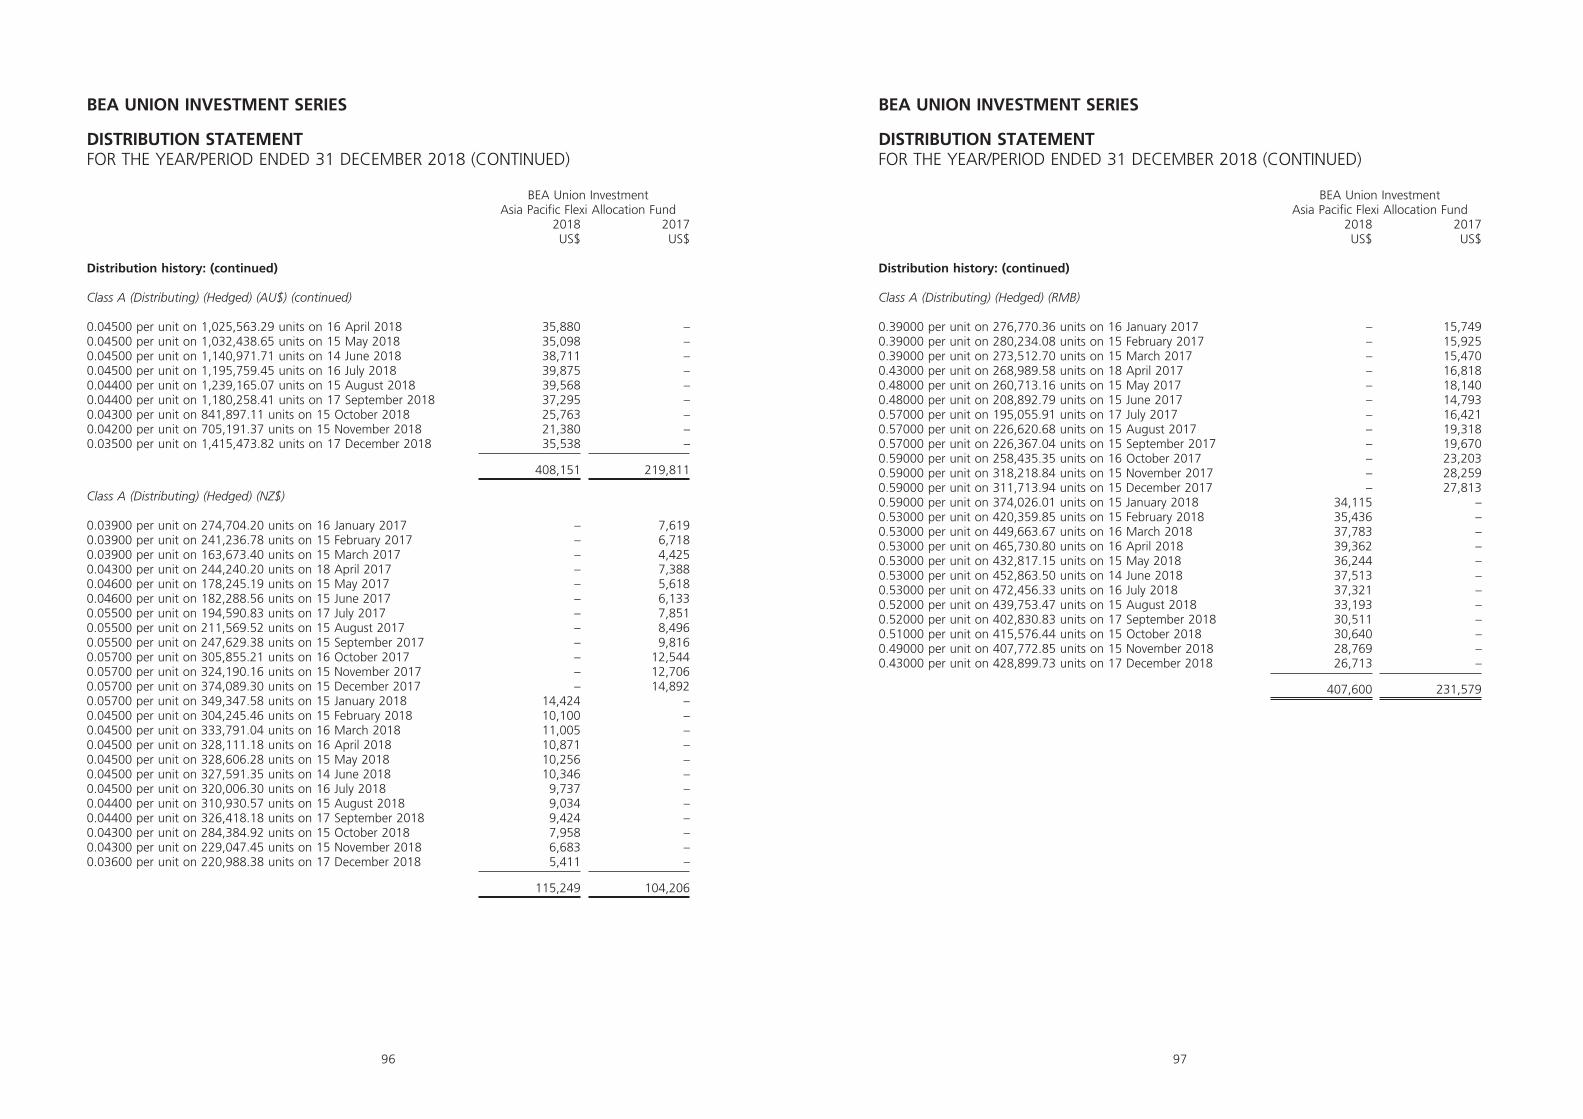
BEA UNION INVESTMENT SERIES
DISTRIBUTION STATEMENT FOR THE YEAR/PERIOD ENDED 31 DECEMBER 2018 (CONTINUED)
BEA UNION INVESTMENT SERIES
DISTRIBUTION STATEMENT FOR THE YEAR/PERIOD ENDED 31 DECEMBER 2018 (CONTINUED)
96 97
A5請縮小打印70.5%
BEA Union Investment Asia Pacific Flexi Allocation Fund
2018 2017US$ US$
Distribution history: (continued)
Class A (Distributing) (Hedged) (AU$) (continued)
0.04500 per unit on 1,025,563.29 units on 16 April 2018 35,880 –0.04500 per unit on 1,032,438.65 units on 15 May 2018 35,098 –0.04500 per unit on 1,140,971.71 units on 14 June 2018 38,711 –0.04500 per unit on 1,195,759.45 units on 16 July 2018 39,875 –0.04400 per unit on 1,239,165.07 units on 15 August 2018 39,568 –0.04400 per unit on 1,180,258.41 units on 17 September 2018 37,295 –0.04300 per unit on 841,897.11 units on 15 October 2018 25,763 –0.04200 per unit on 705,191.37 units on 15 November 2018 21,380 –0.03500 per unit on 1,415,473.82 units on 17 December 2018 35,538 –
408,151 219,811
Class A (Distributing) (Hedged) (NZ$)
0.03900 per unit on 274,704.20 units on 16 January 2017 – 7,6190.03900 per unit on 241,236.78 units on 15 February 2017 – 6,7180.03900 per unit on 163,673.40 units on 15 March 2017 – 4,4250.04300 per unit on 244,240.20 units on 18 April 2017 – 7,3880.04600 per unit on 178,245.19 units on 15 May 2017 – 5,6180.04600 per unit on 182,288.56 units on 15 June 2017 – 6,1330.05500 per unit on 194,590.83 units on 17 July 2017 – 7,8510.05500 per unit on 211,569.52 units on 15 August 2017 – 8,4960.05500 per unit on 247,629.38 units on 15 September 2017 – 9,8160.05700 per unit on 305,855.21 units on 16 October 2017 – 12,5440.05700 per unit on 324,190.16 units on 15 November 2017 – 12,7060.05700 per unit on 374,089.30 units on 15 December 2017 – 14,8920.05700 per unit on 349,347.58 units on 15 January 2018 14,424 –0.04500 per unit on 304,245.46 units on 15 February 2018 10,100 –0.04500 per unit on 333,791.04 units on 16 March 2018 11,005 –0.04500 per unit on 328,111.18 units on 16 April 2018 10,871 –0.04500 per unit on 328,606.28 units on 15 May 2018 10,256 –0.04500 per unit on 327,591.35 units on 14 June 2018 10,346 –0.04500 per unit on 320,006.30 units on 16 July 2018 9,737 –0.04400 per unit on 310,930.57 units on 15 August 2018 9,034 –0.04400 per unit on 326,418.18 units on 17 September 2018 9,424 –0.04300 per unit on 284,384.92 units on 15 October 2018 7,958 –0.04300 per unit on 229,047.45 units on 15 November 2018 6,683 –0.03600 per unit on 220,988.38 units on 17 December 2018 5,411 –
115,249 104,206
BEA Union Investment Asia Pacific Flexi Allocation Fund
2018 2017US$ US$
Distribution history: (continued)
Class A (Distributing) (Hedged) (RMB)
0.39000 per unit on 276,770.36 units on 16 January 2017 – 15,7490.39000 per unit on 280,234.08 units on 15 February 2017 – 15,9250.39000 per unit on 273,512.70 units on 15 March 2017 – 15,4700.43000 per unit on 268,989.58 units on 18 April 2017 – 16,8180.48000 per unit on 260,713.16 units on 15 May 2017 – 18,1400.48000 per unit on 208,892.79 units on 15 June 2017 – 14,7930.57000 per unit on 195,055.91 units on 17 July 2017 – 16,4210.57000 per unit on 226,620.68 units on 15 August 2017 – 19,3180.57000 per unit on 226,367.04 units on 15 September 2017 – 19,6700.59000 per unit on 258,435.35 units on 16 October 2017 – 23,2030.59000 per unit on 318,218.84 units on 15 November 2017 – 28,2590.59000 per unit on 311,713.94 units on 15 December 2017 – 27,8130.59000 per unit on 374,026.01 units on 15 January 2018 34,115 –0.53000 per unit on 420,359.85 units on 15 February 2018 35,436 –0.53000 per unit on 449,663.67 units on 16 March 2018 37,783 –0.53000 per unit on 465,730.80 units on 16 April 2018 39,362 –0.53000 per unit on 432,817.15 units on 15 May 2018 36,244 –0.53000 per unit on 452,863.50 units on 14 June 2018 37,513 –0.53000 per unit on 472,456.33 units on 16 July 2018 37,321 –0.52000 per unit on 439,753.47 units on 15 August 2018 33,193 –0.52000 per unit on 402,830.83 units on 17 September 2018 30,511 –0.51000 per unit on 415,576.44 units on 15 October 2018 30,640 –0.49000 per unit on 407,772.85 units on 15 November 2018 28,769 –0.43000 per unit on 428,899.73 units on 17 December 2018 26,713 –
407,600 231,579
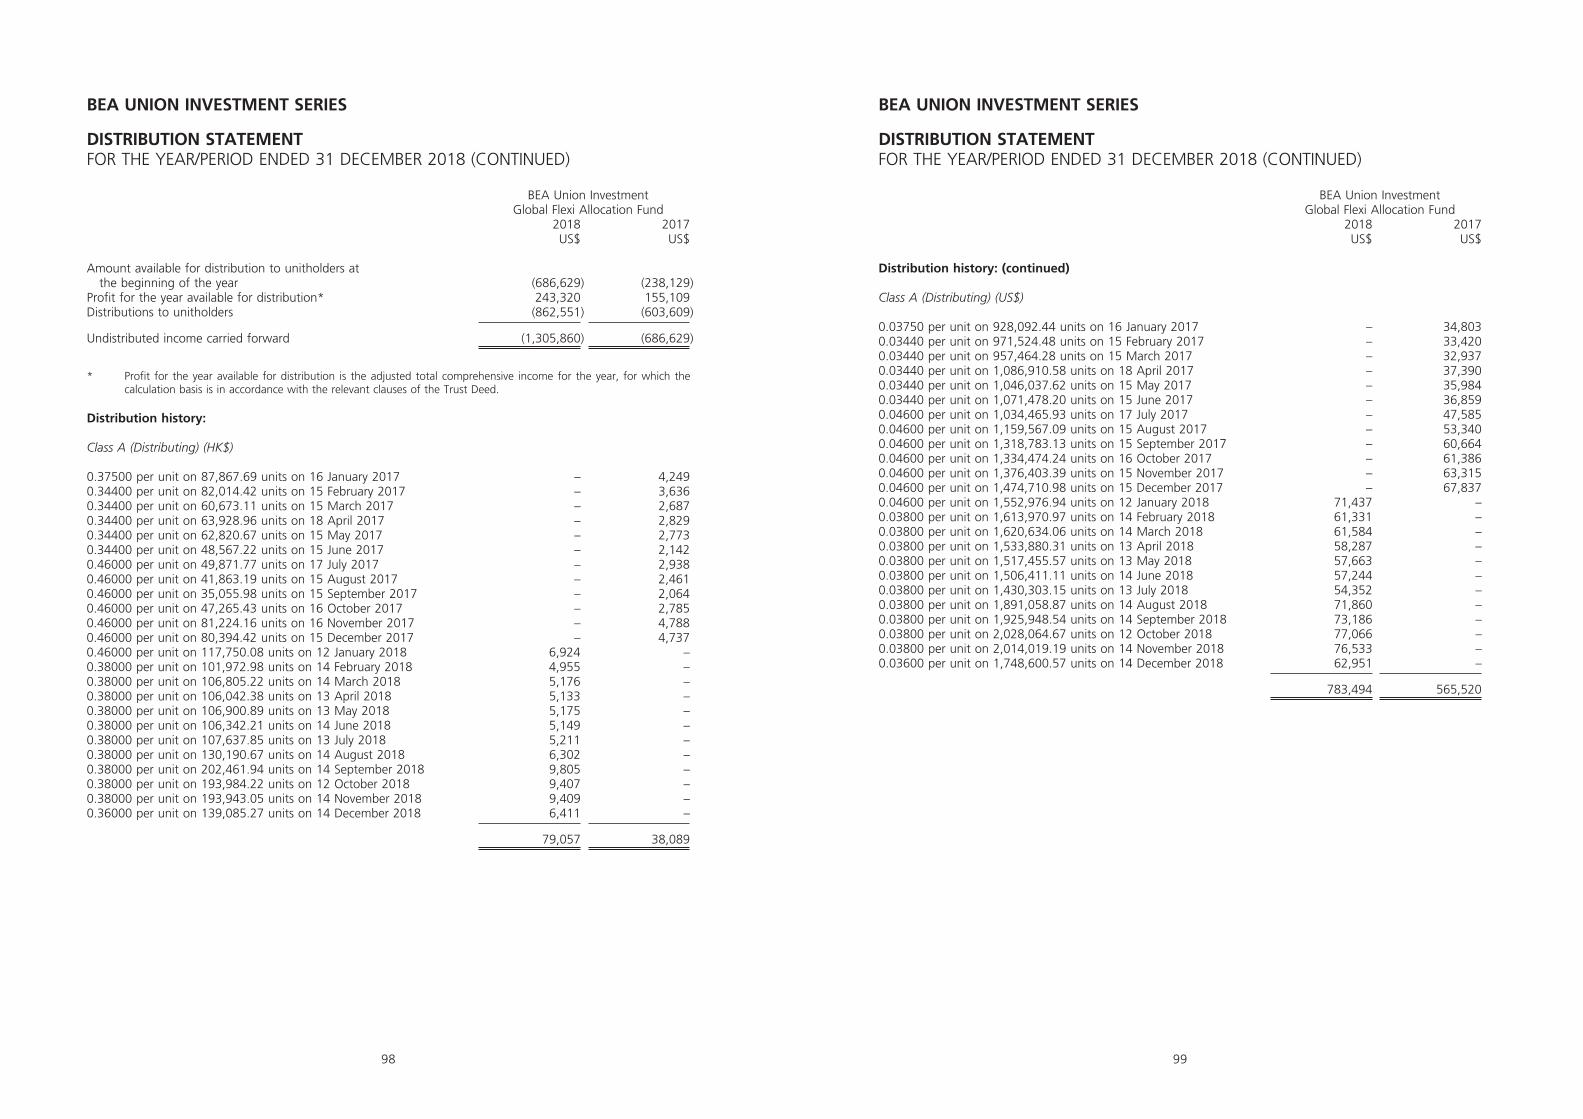
BEA UNION INVESTMENT SERIES
DISTRIBUTION STATEMENT FOR THE YEAR/PERIOD ENDED 31 DECEMBER 2018 (CONTINUED)
BEA UNION INVESTMENT SERIES
DISTRIBUTION STATEMENT FOR THE YEAR/PERIOD ENDED 31 DECEMBER 2018 (CONTINUED)
98 99
A5請縮小打印70.5%
BEA Union Investment Global Flexi Allocation Fund
2018 2017US$ US$
Amount available for distribution to unitholders at the beginning of the year (686,629) (238,129)Profit for the year available for distribution* 243,320 155,109Distributions to unitholders (862,551) (603,609)
Undistributed income carried forward (1,305,860) (686,629)
* Profit for the year available for distribution is the adjusted total comprehensive income for the year, for which the calculation basis is in accordance with the relevant clauses of the Trust Deed.
Distribution history:
Class A (Distributing) (HK$)
0.37500 per unit on 87,867.69 units on 16 January 2017 – 4,2490.34400 per unit on 82,014.42 units on 15 February 2017 – 3,6360.34400 per unit on 60,673.11 units on 15 March 2017 – 2,6870.34400 per unit on 63,928.96 units on 18 April 2017 – 2,8290.34400 per unit on 62,820.67 units on 15 May 2017 – 2,7730.34400 per unit on 48,567.22 units on 15 June 2017 – 2,1420.46000 per unit on 49,871.77 units on 17 July 2017 – 2,9380.46000 per unit on 41,863.19 units on 15 August 2017 – 2,4610.46000 per unit on 35,055.98 units on 15 September 2017 – 2,0640.46000 per unit on 47,265.43 units on 16 October 2017 – 2,7850.46000 per unit on 81,224.16 units on 16 November 2017 – 4,7880.46000 per unit on 80,394.42 units on 15 December 2017 – 4,7370.46000 per unit on 117,750.08 units on 12 January 2018 6,924 –0.38000 per unit on 101,972.98 units on 14 February 2018 4,955 –0.38000 per unit on 106,805.22 units on 14 March 2018 5,176 –0.38000 per unit on 106,042.38 units on 13 April 2018 5,133 –0.38000 per unit on 106,900.89 units on 13 May 2018 5,175 –0.38000 per unit on 106,342.21 units on 14 June 2018 5,149 –0.38000 per unit on 107,637.85 units on 13 July 2018 5,211 –0.38000 per unit on 130,190.67 units on 14 August 2018 6,302 –0.38000 per unit on 202,461.94 units on 14 September 2018 9,805 –0.38000 per unit on 193,984.22 units on 12 October 2018 9,407 –0.38000 per unit on 193,943.05 units on 14 November 2018 9,409 –0.36000 per unit on 139,085.27 units on 14 December 2018 6,411 –
79,057 38,089
BEA Union Investment Global Flexi Allocation Fund
2018 2017US$ US$
Distribution history: (continued)
Class A (Distributing) (US$)
0.03750 per unit on 928,092.44 units on 16 January 2017 – 34,8030.03440 per unit on 971,524.48 units on 15 February 2017 – 33,4200.03440 per unit on 957,464.28 units on 15 March 2017 – 32,9370.03440 per unit on 1,086,910.58 units on 18 April 2017 – 37,3900.03440 per unit on 1,046,037.62 units on 15 May 2017 – 35,9840.03440 per unit on 1,071,478.20 units on 15 June 2017 – 36,8590.04600 per unit on 1,034,465.93 units on 17 July 2017 – 47,5850.04600 per unit on 1,159,567.09 units on 15 August 2017 – 53,3400.04600 per unit on 1,318,783.13 units on 15 September 2017 – 60,6640.04600 per unit on 1,334,474.24 units on 16 October 2017 – 61,3860.04600 per unit on 1,376,403.39 units on 15 November 2017 – 63,3150.04600 per unit on 1,474,710.98 units on 15 December 2017 – 67,8370.04600 per unit on 1,552,976.94 units on 12 January 2018 71,437 –0.03800 per unit on 1,613,970.97 units on 14 February 2018 61,331 –0.03800 per unit on 1,620,634.06 units on 14 March 2018 61,584 –0.03800 per unit on 1,533,880.31 units on 13 April 2018 58,287 –0.03800 per unit on 1,517,455.57 units on 13 May 2018 57,663 –0.03800 per unit on 1,506,411.11 units on 14 June 2018 57,244 –0.03800 per unit on 1,430,303.15 units on 13 July 2018 54,352 –0.03800 per unit on 1,891,058.87 units on 14 August 2018 71,860 –0.03800 per unit on 1,925,948.54 units on 14 September 2018 73,186 –0.03800 per unit on 2,028,064.67 units on 12 October 2018 77,066 –0.03800 per unit on 2,014,019.19 units on 14 November 2018 76,533 –0.03600 per unit on 1,748,600.57 units on 14 December 2018 62,951 –
783,494 565,520
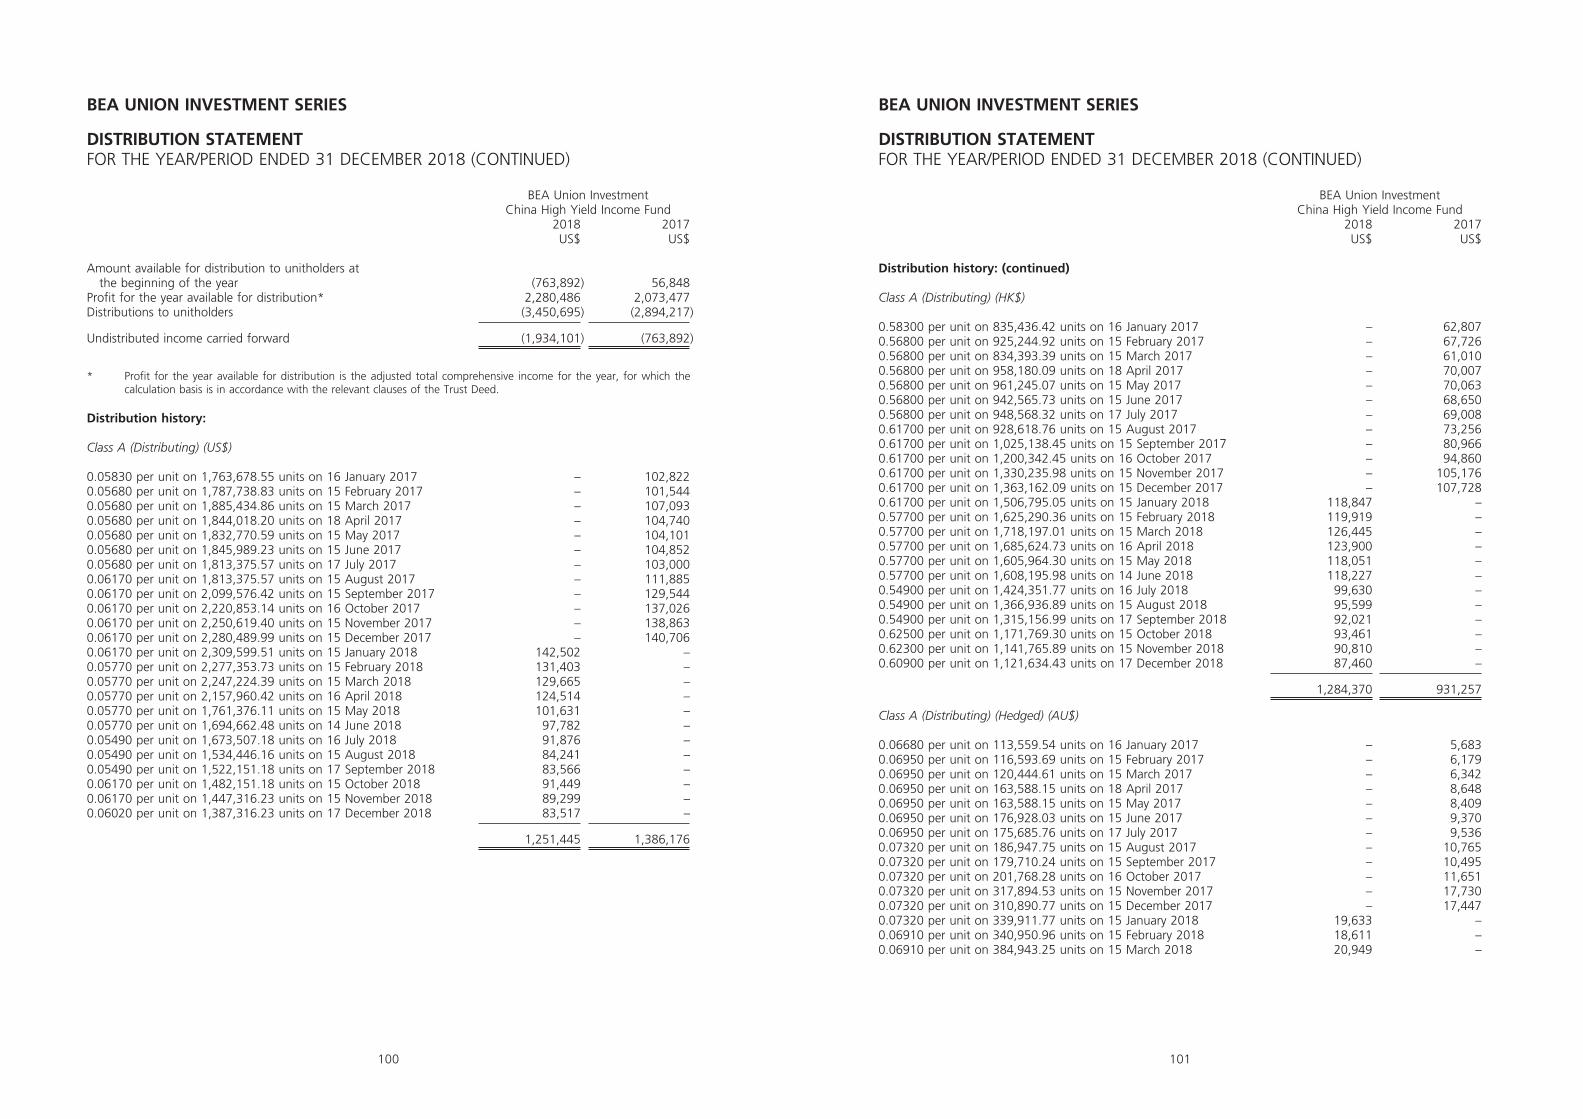
BEA UNION INVESTMENT SERIES
DISTRIBUTION STATEMENT FOR THE YEAR/PERIOD ENDED 31 DECEMBER 2018 (CONTINUED)
BEA UNION INVESTMENT SERIES
DISTRIBUTION STATEMENT FOR THE YEAR/PERIOD ENDED 31 DECEMBER 2018 (CONTINUED)
100 101
A5請縮小打印70.5%
BEA Union Investment China High Yield Income Fund
2018 2017US$ US$
Amount available for distribution to unitholders at the beginning of the year (763,892) 56,848Profit for the year available for distribution* 2,280,486 2,073,477Distributions to unitholders (3,450,695) (2,894,217)
Undistributed income carried forward (1,934,101) (763,892)
* Profit for the year available for distribution is the adjusted total comprehensive income for the year, for which the calculation basis is in accordance with the relevant clauses of the Trust Deed.
Distribution history:
Class A (Distributing) (US$)
0.05830 per unit on 1,763,678.55 units on 16 January 2017 – 102,8220.05680 per unit on 1,787,738.83 units on 15 February 2017 – 101,5440.05680 per unit on 1,885,434.86 units on 15 March 2017 – 107,0930.05680 per unit on 1,844,018.20 units on 18 April 2017 – 104,7400.05680 per unit on 1,832,770.59 units on 15 May 2017 – 104,1010.05680 per unit on 1,845,989.23 units on 15 June 2017 – 104,8520.05680 per unit on 1,813,375.57 units on 17 July 2017 – 103,0000.06170 per unit on 1,813,375.57 units on 15 August 2017 – 111,8850.06170 per unit on 2,099,576.42 units on 15 September 2017 – 129,5440.06170 per unit on 2,220,853.14 units on 16 October 2017 – 137,0260.06170 per unit on 2,250,619.40 units on 15 November 2017 – 138,8630.06170 per unit on 2,280,489.99 units on 15 December 2017 – 140,7060.06170 per unit on 2,309,599.51 units on 15 January 2018 142,502 –0.05770 per unit on 2,277,353.73 units on 15 February 2018 131,403 –0.05770 per unit on 2,247,224.39 units on 15 March 2018 129,665 –0.05770 per unit on 2,157,960.42 units on 16 April 2018 124,514 –0.05770 per unit on 1,761,376.11 units on 15 May 2018 101,631 –0.05770 per unit on 1,694,662.48 units on 14 June 2018 97,782 –0.05490 per unit on 1,673,507.18 units on 16 July 2018 91,876 –0.05490 per unit on 1,534,446.16 units on 15 August 2018 84,241 –0.05490 per unit on 1,522,151.18 units on 17 September 2018 83,566 –0.06170 per unit on 1,482,151.18 units on 15 October 2018 91,449 –0.06170 per unit on 1,447,316.23 units on 15 November 2018 89,299 –0.06020 per unit on 1,387,316.23 units on 17 December 2018 83,517 –
1,251,445 1,386,176
BEA Union Investment China High Yield Income Fund
2018 2017US$ US$
Distribution history: (continued)
Class A (Distributing) (HK$)
0.58300 per unit on 835,436.42 units on 16 January 2017 – 62,8070.56800 per unit on 925,244.92 units on 15 February 2017 – 67,7260.56800 per unit on 834,393.39 units on 15 March 2017 – 61,0100.56800 per unit on 958,180.09 units on 18 April 2017 – 70,0070.56800 per unit on 961,245.07 units on 15 May 2017 – 70,0630.56800 per unit on 942,565.73 units on 15 June 2017 – 68,6500.56800 per unit on 948,568.32 units on 17 July 2017 – 69,0080.61700 per unit on 928,618.76 units on 15 August 2017 – 73,2560.61700 per unit on 1,025,138.45 units on 15 September 2017 – 80,9660.61700 per unit on 1,200,342.45 units on 16 October 2017 – 94,8600.61700 per unit on 1,330,235.98 units on 15 November 2017 – 105,1760.61700 per unit on 1,363,162.09 units on 15 December 2017 – 107,7280.61700 per unit on 1,506,795.05 units on 15 January 2018 118,847 –0.57700 per unit on 1,625,290.36 units on 15 February 2018 119,919 –0.57700 per unit on 1,718,197.01 units on 15 March 2018 126,445 –0.57700 per unit on 1,685,624.73 units on 16 April 2018 123,900 –0.57700 per unit on 1,605,964.30 units on 15 May 2018 118,051 –0.57700 per unit on 1,608,195.98 units on 14 June 2018 118,227 –0.54900 per unit on 1,424,351.77 units on 16 July 2018 99,630 –0.54900 per unit on 1,366,936.89 units on 15 August 2018 95,599 –0.54900 per unit on 1,315,156.99 units on 17 September 2018 92,021 –0.62500 per unit on 1,171,769.30 units on 15 October 2018 93,461 –0.62300 per unit on 1,141,765.89 units on 15 November 2018 90,810 –0.60900 per unit on 1,121,634.43 units on 17 December 2018 87,460 –
1,284,370 931,257
Class A (Distributing) (Hedged) (AU$)
0.06680 per unit on 113,559.54 units on 16 January 2017 – 5,6830.06950 per unit on 116,593.69 units on 15 February 2017 – 6,1790.06950 per unit on 120,444.61 units on 15 March 2017 – 6,3420.06950 per unit on 163,588.15 units on 18 April 2017 – 8,6480.06950 per unit on 163,588.15 units on 15 May 2017 – 8,4090.06950 per unit on 176,928.03 units on 15 June 2017 – 9,3700.06950 per unit on 175,685.76 units on 17 July 2017 – 9,5360.07320 per unit on 186,947.75 units on 15 August 2017 – 10,7650.07320 per unit on 179,710.24 units on 15 September 2017 – 10,4950.07320 per unit on 201,768.28 units on 16 October 2017 – 11,6510.07320 per unit on 317,894.53 units on 15 November 2017 – 17,7300.07320 per unit on 310,890.77 units on 15 December 2017 – 17,4470.07320 per unit on 339,911.77 units on 15 January 2018 19,633 –0.06910 per unit on 340,950.96 units on 15 February 2018 18,611 –0.06910 per unit on 384,943.25 units on 15 March 2018 20,949 –
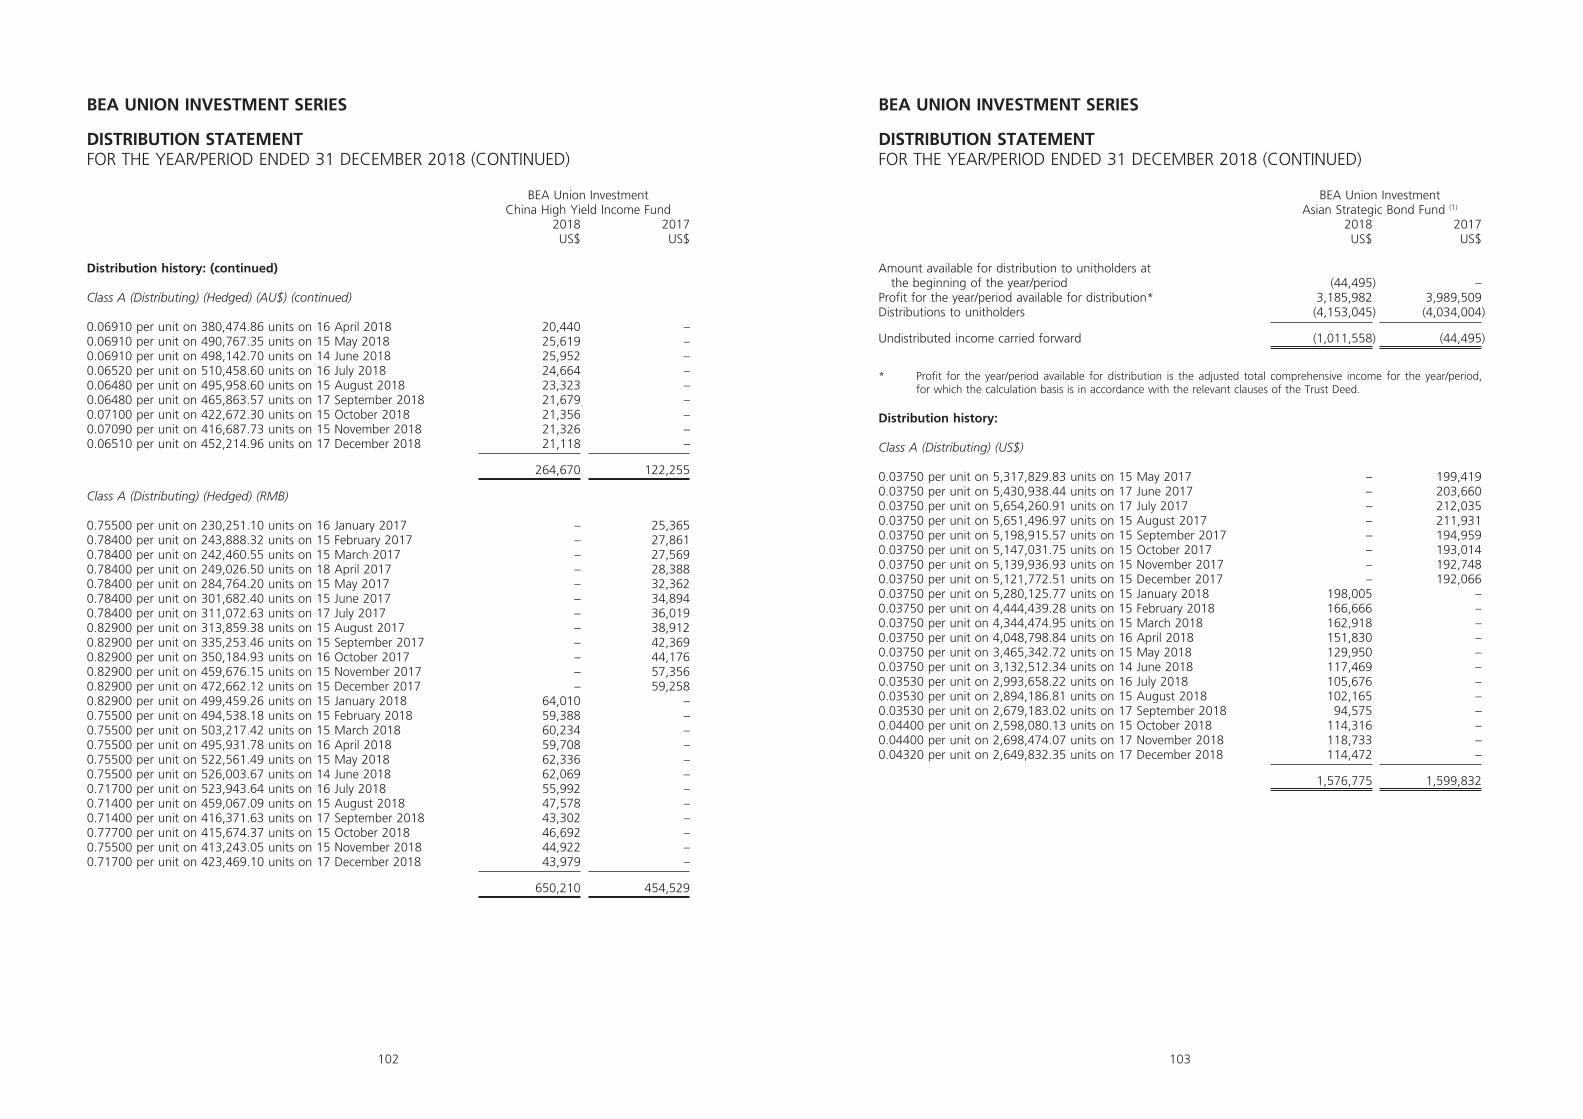
BEA UNION INVESTMENT SERIES
DISTRIBUTION STATEMENT FOR THE YEAR/PERIOD ENDED 31 DECEMBER 2018 (CONTINUED)
BEA UNION INVESTMENT SERIES
DISTRIBUTION STATEMENT FOR THE YEAR/PERIOD ENDED 31 DECEMBER 2018 (CONTINUED)
102 103
A5請縮小打印70.5%
BEA Union Investment China High Yield Income Fund
2018 2017US$ US$
Distribution history: (continued)
Class A (Distributing) (Hedged) (AU$) (continued)
0.06910 per unit on 380,474.86 units on 16 April 2018 20,440 –0.06910 per unit on 490,767.35 units on 15 May 2018 25,619 –0.06910 per unit on 498,142.70 units on 14 June 2018 25,952 –0.06520 per unit on 510,458.60 units on 16 July 2018 24,664 –0.06480 per unit on 495,958.60 units on 15 August 2018 23,323 –0.06480 per unit on 465,863.57 units on 17 September 2018 21,679 –0.07100 per unit on 422,672.30 units on 15 October 2018 21,356 –0.07090 per unit on 416,687.73 units on 15 November 2018 21,326 –0.06510 per unit on 452,214.96 units on 17 December 2018 21,118 –
264,670 122,255
Class A (Distributing) (Hedged) (RMB)
0.75500 per unit on 230,251.10 units on 16 January 2017 – 25,3650.78400 per unit on 243,888.32 units on 15 February 2017 – 27,8610.78400 per unit on 242,460.55 units on 15 March 2017 – 27,5690.78400 per unit on 249,026.50 units on 18 April 2017 – 28,3880.78400 per unit on 284,764.20 units on 15 May 2017 – 32,3620.78400 per unit on 301,682.40 units on 15 June 2017 – 34,8940.78400 per unit on 311,072.63 units on 17 July 2017 – 36,0190.82900 per unit on 313,859.38 units on 15 August 2017 – 38,9120.82900 per unit on 335,253.46 units on 15 September 2017 – 42,3690.82900 per unit on 350,184.93 units on 16 October 2017 – 44,1760.82900 per unit on 459,676.15 units on 15 November 2017 – 57,3560.82900 per unit on 472,662.12 units on 15 December 2017 – 59,2580.82900 per unit on 499,459.26 units on 15 January 2018 64,010 –0.75500 per unit on 494,538.18 units on 15 February 2018 59,388 –0.75500 per unit on 503,217.42 units on 15 March 2018 60,234 –0.75500 per unit on 495,931.78 units on 16 April 2018 59,708 –0.75500 per unit on 522,561.49 units on 15 May 2018 62,336 –0.75500 per unit on 526,003.67 units on 14 June 2018 62,069 –0.71700 per unit on 523,943.64 units on 16 July 2018 55,992 –0.71400 per unit on 459,067.09 units on 15 August 2018 47,578 –0.71400 per unit on 416,371.63 units on 17 September 2018 43,302 –0.77700 per unit on 415,674.37 units on 15 October 2018 46,692 –0.75500 per unit on 413,243.05 units on 15 November 2018 44,922 –0.71700 per unit on 423,469.10 units on 17 December 2018 43,979 –
650,210 454,529
BEA Union Investment Asian Strategic Bond Fund (1)
2018 2017US$ US$
Amount available for distribution to unitholders at the beginning of the year/period (44,495) –Profit for the year/period available for distribution* 3,185,982 3,989,509Distributions to unitholders (4,153,045) (4,034,004)
Undistributed income carried forward (1,011,558) (44,495)
* Profit for the year/period available for distribution is the adjusted total comprehensive income for the year/period, for which the calculation basis is in accordance with the relevant clauses of the Trust Deed.
Distribution history:
Class A (Distributing) (US$)
0.03750 per unit on 5,317,829.83 units on 15 May 2017 – 199,4190.03750 per unit on 5,430,938.44 units on 17 June 2017 – 203,6600.03750 per unit on 5,654,260.91 units on 17 July 2017 – 212,0350.03750 per unit on 5,651,496.97 units on 15 August 2017 – 211,9310.03750 per unit on 5,198,915.57 units on 15 September 2017 – 194,9590.03750 per unit on 5,147,031.75 units on 15 October 2017 – 193,0140.03750 per unit on 5,139,936.93 units on 15 November 2017 – 192,7480.03750 per unit on 5,121,772.51 units on 15 December 2017 – 192,0660.03750 per unit on 5,280,125.77 units on 15 January 2018 198,005 –0.03750 per unit on 4,444,439.28 units on 15 February 2018 166,666 –0.03750 per unit on 4,344,474.95 units on 15 March 2018 162,918 –0.03750 per unit on 4,048,798.84 units on 16 April 2018 151,830 –0.03750 per unit on 3,465,342.72 units on 15 May 2018 129,950 –0.03750 per unit on 3,132,512.34 units on 14 June 2018 117,469 –0.03530 per unit on 2,993,658.22 units on 16 July 2018 105,676 –0.03530 per unit on 2,894,186.81 units on 15 August 2018 102,165 –0.03530 per unit on 2,679,183.02 units on 17 September 2018 94,575 –0.04400 per unit on 2,598,080.13 units on 15 October 2018 114,316 –0.04400 per unit on 2,698,474.07 units on 17 November 2018 118,733 –0.04320 per unit on 2,649,832.35 units on 17 December 2018 114,472 –
1,576,775 1,599,832
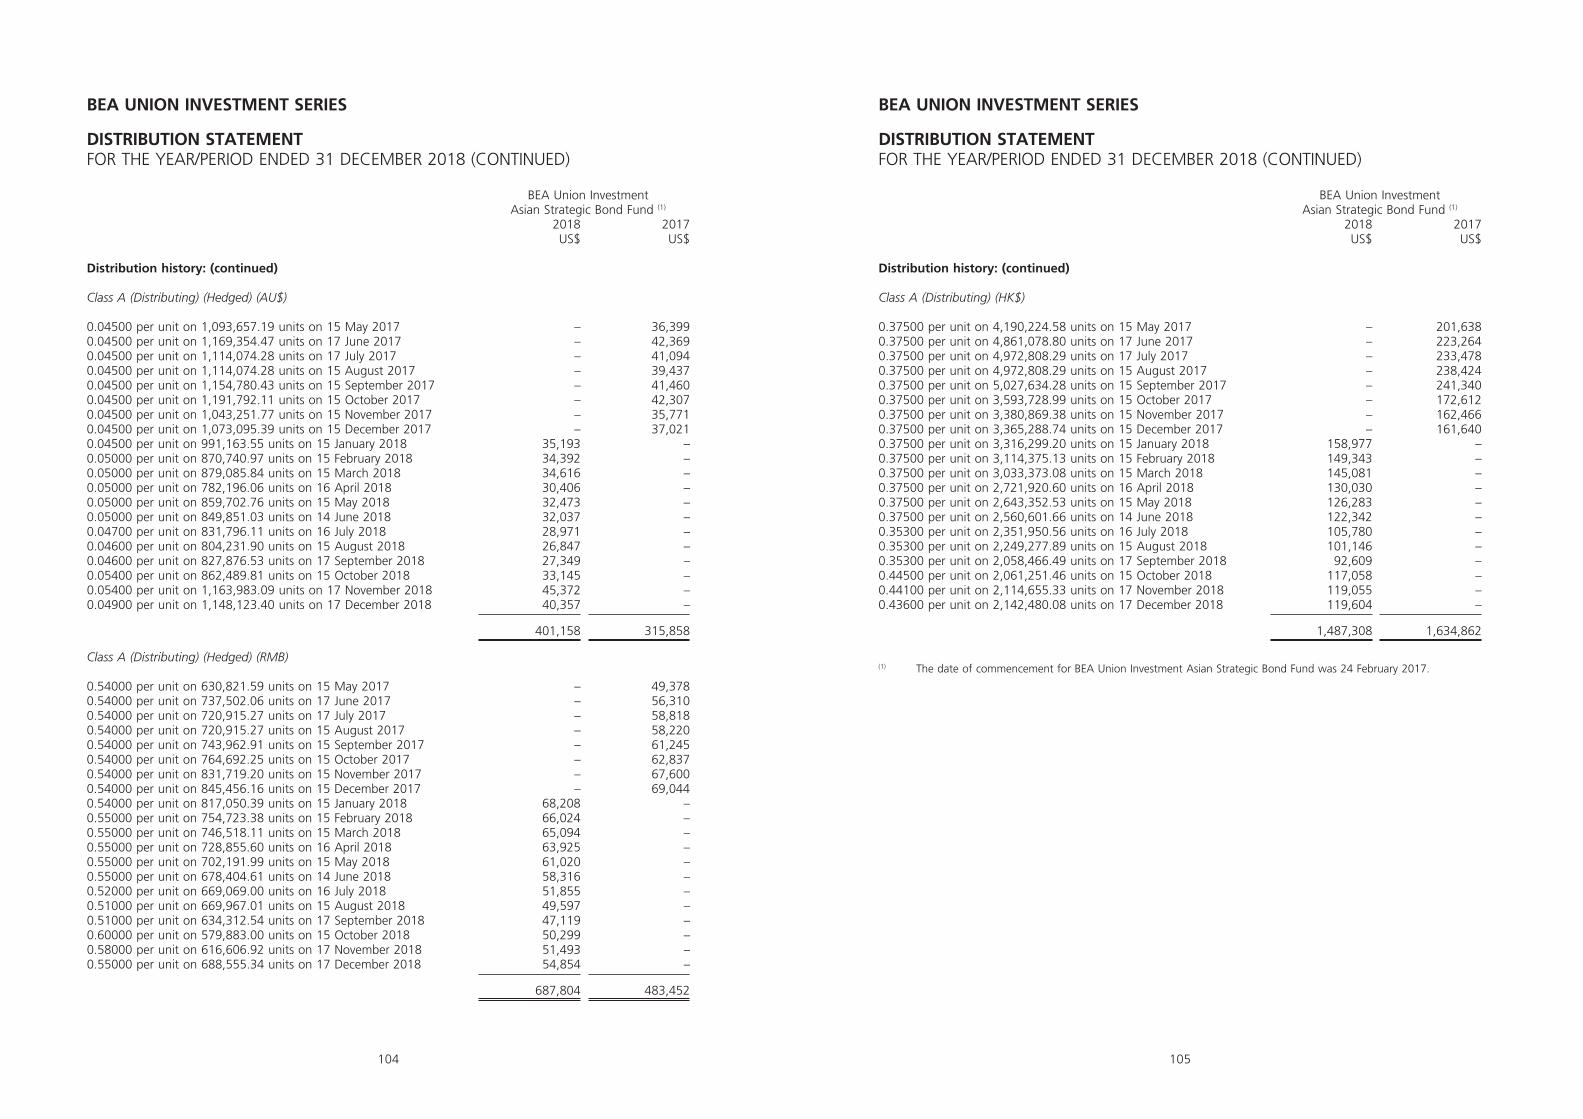
BEA UNION INVESTMENT SERIES
DISTRIBUTION STATEMENT FOR THE YEAR/PERIOD ENDED 31 DECEMBER 2018 (CONTINUED)
BEA UNION INVESTMENT SERIES
DISTRIBUTION STATEMENT FOR THE YEAR/PERIOD ENDED 31 DECEMBER 2018 (CONTINUED)
104 105
A5請縮小打印70.5%
BEA Union Investment Asian Strategic Bond Fund (1)
2018 2017US$ US$
Distribution history: (continued)
Class A (Distributing) (Hedged) (AU$)
0.04500 per unit on 1,093,657.19 units on 15 May 2017 – 36,3990.04500 per unit on 1,169,354.47 units on 17 June 2017 – 42,3690.04500 per unit on 1,114,074.28 units on 17 July 2017 – 41,0940.04500 per unit on 1,114,074.28 units on 15 August 2017 – 39,4370.04500 per unit on 1,154,780.43 units on 15 September 2017 – 41,4600.04500 per unit on 1,191,792.11 units on 15 October 2017 – 42,3070.04500 per unit on 1,043,251.77 units on 15 November 2017 – 35,7710.04500 per unit on 1,073,095.39 units on 15 December 2017 – 37,0210.04500 per unit on 991,163.55 units on 15 January 2018 35,193 –0.05000 per unit on 870,740.97 units on 15 February 2018 34,392 –0.05000 per unit on 879,085.84 units on 15 March 2018 34,616 –0.05000 per unit on 782,196.06 units on 16 April 2018 30,406 –0.05000 per unit on 859,702.76 units on 15 May 2018 32,473 –0.05000 per unit on 849,851.03 units on 14 June 2018 32,037 –0.04700 per unit on 831,796.11 units on 16 July 2018 28,971 –0.04600 per unit on 804,231.90 units on 15 August 2018 26,847 –0.04600 per unit on 827,876.53 units on 17 September 2018 27,349 –0.05400 per unit on 862,489.81 units on 15 October 2018 33,145 –0.05400 per unit on 1,163,983.09 units on 17 November 2018 45,372 –0.04900 per unit on 1,148,123.40 units on 17 December 2018 40,357 –
401,158 315,858
Class A (Distributing) (Hedged) (RMB)
0.54000 per unit on 630,821.59 units on 15 May 2017 – 49,3780.54000 per unit on 737,502.06 units on 17 June 2017 – 56,3100.54000 per unit on 720,915.27 units on 17 July 2017 – 58,8180.54000 per unit on 720,915.27 units on 15 August 2017 – 58,2200.54000 per unit on 743,962.91 units on 15 September 2017 – 61,2450.54000 per unit on 764,692.25 units on 15 October 2017 – 62,8370.54000 per unit on 831,719.20 units on 15 November 2017 – 67,6000.54000 per unit on 845,456.16 units on 15 December 2017 – 69,0440.54000 per unit on 817,050.39 units on 15 January 2018 68,208 –0.55000 per unit on 754,723.38 units on 15 February 2018 66,024 –0.55000 per unit on 746,518.11 units on 15 March 2018 65,094 –0.55000 per unit on 728,855.60 units on 16 April 2018 63,925 –0.55000 per unit on 702,191.99 units on 15 May 2018 61,020 –0.55000 per unit on 678,404.61 units on 14 June 2018 58,316 –0.52000 per unit on 669,069.00 units on 16 July 2018 51,855 –0.51000 per unit on 669,967.01 units on 15 August 2018 49,597 –0.51000 per unit on 634,312.54 units on 17 September 2018 47,119 –0.60000 per unit on 579,883.00 units on 15 October 2018 50,299 –0.58000 per unit on 616,606.92 units on 17 November 2018 51,493 –0.55000 per unit on 688,555.34 units on 17 December 2018 54,854 –
687,804 483,452
BEA Union Investment Asian Strategic Bond Fund (1)
2018 2017US$ US$
Distribution history: (continued)
Class A (Distributing) (HK$)
0.37500 per unit on 4,190,224.58 units on 15 May 2017 – 201,6380.37500 per unit on 4,861,078.80 units on 17 June 2017 – 223,2640.37500 per unit on 4,972,808.29 units on 17 July 2017 – 233,4780.37500 per unit on 4,972,808.29 units on 15 August 2017 – 238,4240.37500 per unit on 5,027,634.28 units on 15 September 2017 – 241,3400.37500 per unit on 3,593,728.99 units on 15 October 2017 – 172,6120.37500 per unit on 3,380,869.38 units on 15 November 2017 – 162,4660.37500 per unit on 3,365,288.74 units on 15 December 2017 – 161,6400.37500 per unit on 3,316,299.20 units on 15 January 2018 158,977 –0.37500 per unit on 3,114,375.13 units on 15 February 2018 149,343 –0.37500 per unit on 3,033,373.08 units on 15 March 2018 145,081 –0.37500 per unit on 2,721,920.60 units on 16 April 2018 130,030 –0.37500 per unit on 2,643,352.53 units on 15 May 2018 126,283 –0.37500 per unit on 2,560,601.66 units on 14 June 2018 122,342 –0.35300 per unit on 2,351,950.56 units on 16 July 2018 105,780 –0.35300 per unit on 2,249,277.89 units on 15 August 2018 101,146 –0.35300 per unit on 2,058,466.49 units on 17 September 2018 92,609 –0.44500 per unit on 2,061,251.46 units on 15 October 2018 117,058 –0.44100 per unit on 2,114,655.33 units on 17 November 2018 119,055 –0.43600 per unit on 2,142,480.08 units on 17 December 2018 119,604 –
1,487,308 1,634,862
(1) The date of commencement for BEA Union Investment Asian Strategic Bond Fund was 24 February 2017.
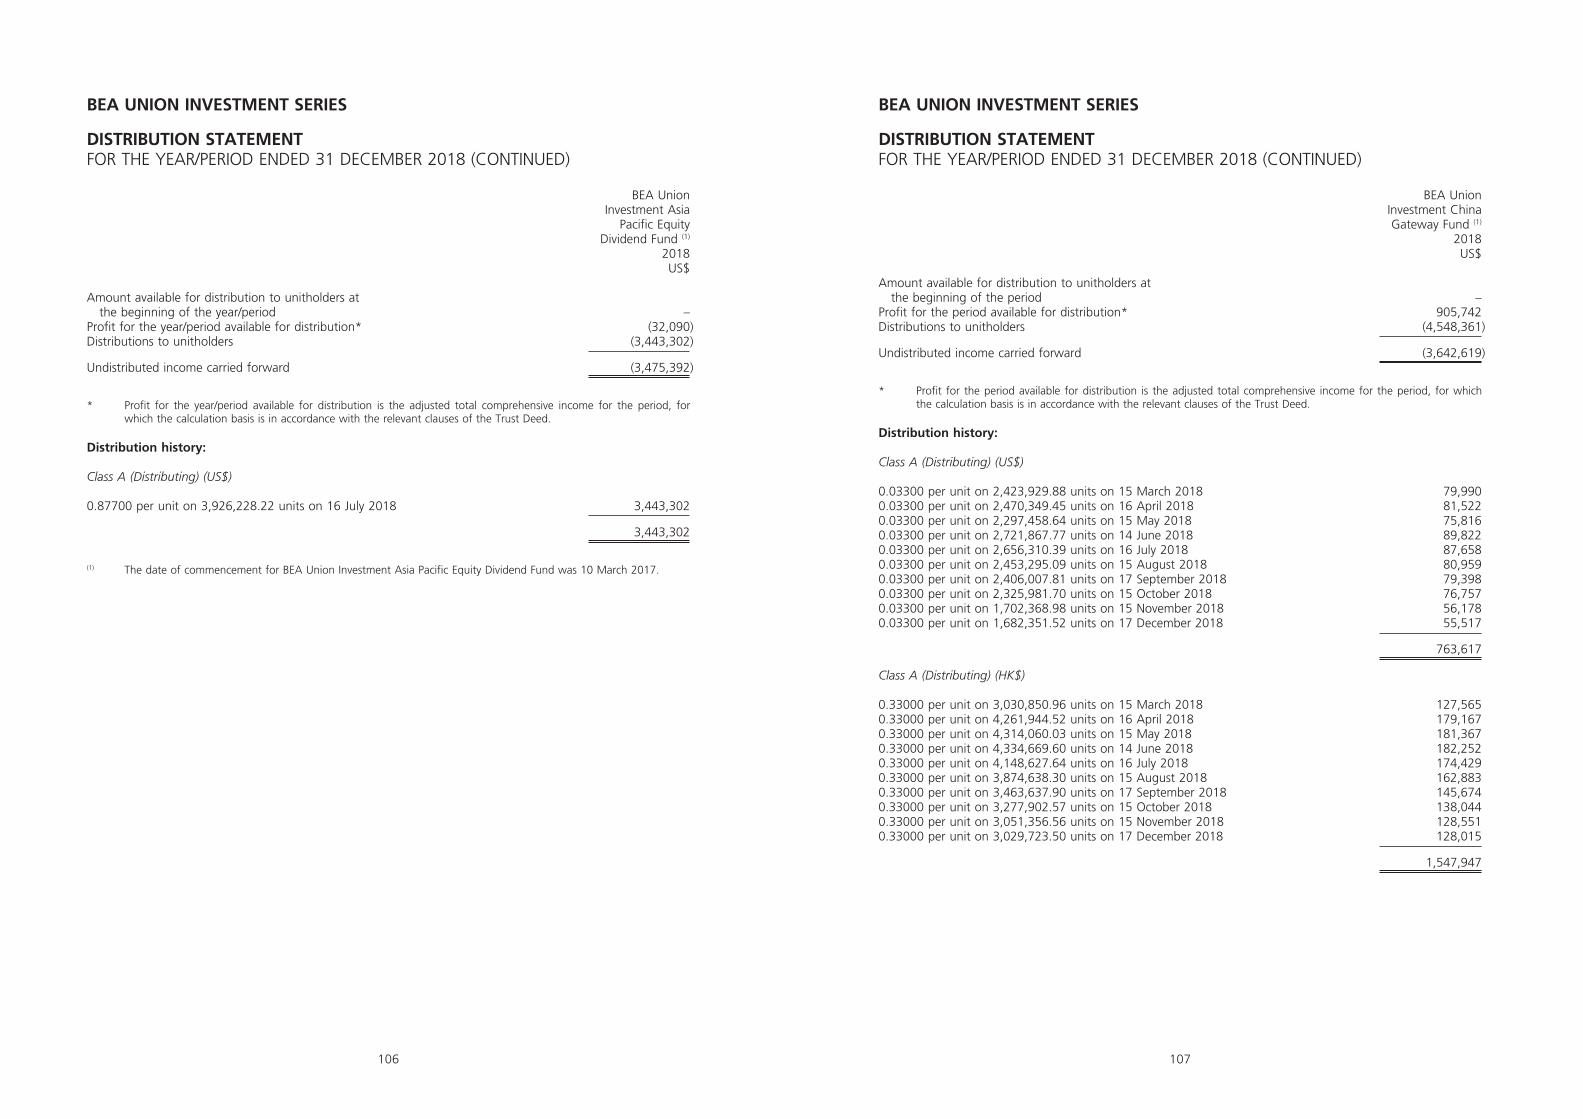
BEA UNION INVESTMENT SERIES
DISTRIBUTION STATEMENT FOR THE YEAR/PERIOD ENDED 31 DECEMBER 2018 (CONTINUED)
BEA UNION INVESTMENT SERIES
DISTRIBUTION STATEMENT FOR THE YEAR/PERIOD ENDED 31 DECEMBER 2018 (CONTINUED)
106 107
A5請縮小打印70.5%
BEA Union Investment Asia
Pacific Equity Dividend Fund (1)
2018US$
Amount available for distribution to unitholders at the beginning of the year/period –Profit for the year/period available for distribution* (32,090)Distributions to unitholders (3,443,302)
Undistributed income carried forward (3,475,392)
* Profit for the year/period available for distribution is the adjusted total comprehensive income for the period, for which the calculation basis is in accordance with the relevant clauses of the Trust Deed.
Distribution history:
Class A (Distributing) (US$)
0.87700 per unit on 3,926,228.22 units on 16 July 2018 3,443,302
3,443,302
(1) The date of commencement for BEA Union Investment Asia Pacific Equity Dividend Fund was 10 March 2017.
BEA Union Investment China Gateway Fund (1)
2018US$
Amount available for distribution to unitholders at the beginning of the period –Profit for the period available for distribution* 905,742Distributions to unitholders (4,548,361)
Undistributed income carried forward (3,642,619)
* Profit for the period available for distribution is the adjusted total comprehensive income for the period, for which the calculation basis is in accordance with the relevant clauses of the Trust Deed.
Distribution history:
Class A (Distributing) (US$)
0.03300 per unit on 2,423,929.88 units on 15 March 2018 79,9900.03300 per unit on 2,470,349.45 units on 16 April 2018 81,5220.03300 per unit on 2,297,458.64 units on 15 May 2018 75,8160.03300 per unit on 2,721,867.77 units on 14 June 2018 89,8220.03300 per unit on 2,656,310.39 units on 16 July 2018 87,6580.03300 per unit on 2,453,295.09 units on 15 August 2018 80,9590.03300 per unit on 2,406,007.81 units on 17 September 2018 79,3980.03300 per unit on 2,325,981.70 units on 15 October 2018 76,7570.03300 per unit on 1,702,368.98 units on 15 November 2018 56,1780.03300 per unit on 1,682,351.52 units on 17 December 2018 55,517
763,617
Class A (Distributing) (HK$)
0.33000 per unit on 3,030,850.96 units on 15 March 2018 127,5650.33000 per unit on 4,261,944.52 units on 16 April 2018 179,1670.33000 per unit on 4,314,060.03 units on 15 May 2018 181,3670.33000 per unit on 4,334,669.60 units on 14 June 2018 182,2520.33000 per unit on 4,148,627.64 units on 16 July 2018 174,4290.33000 per unit on 3,874,638.30 units on 15 August 2018 162,8830.33000 per unit on 3,463,637.90 units on 17 September 2018 145,6740.33000 per unit on 3,277,902.57 units on 15 October 2018 138,0440.33000 per unit on 3,051,356.56 units on 15 November 2018 128,5510.33000 per unit on 3,029,723.50 units on 17 December 2018 128,015
1,547,947
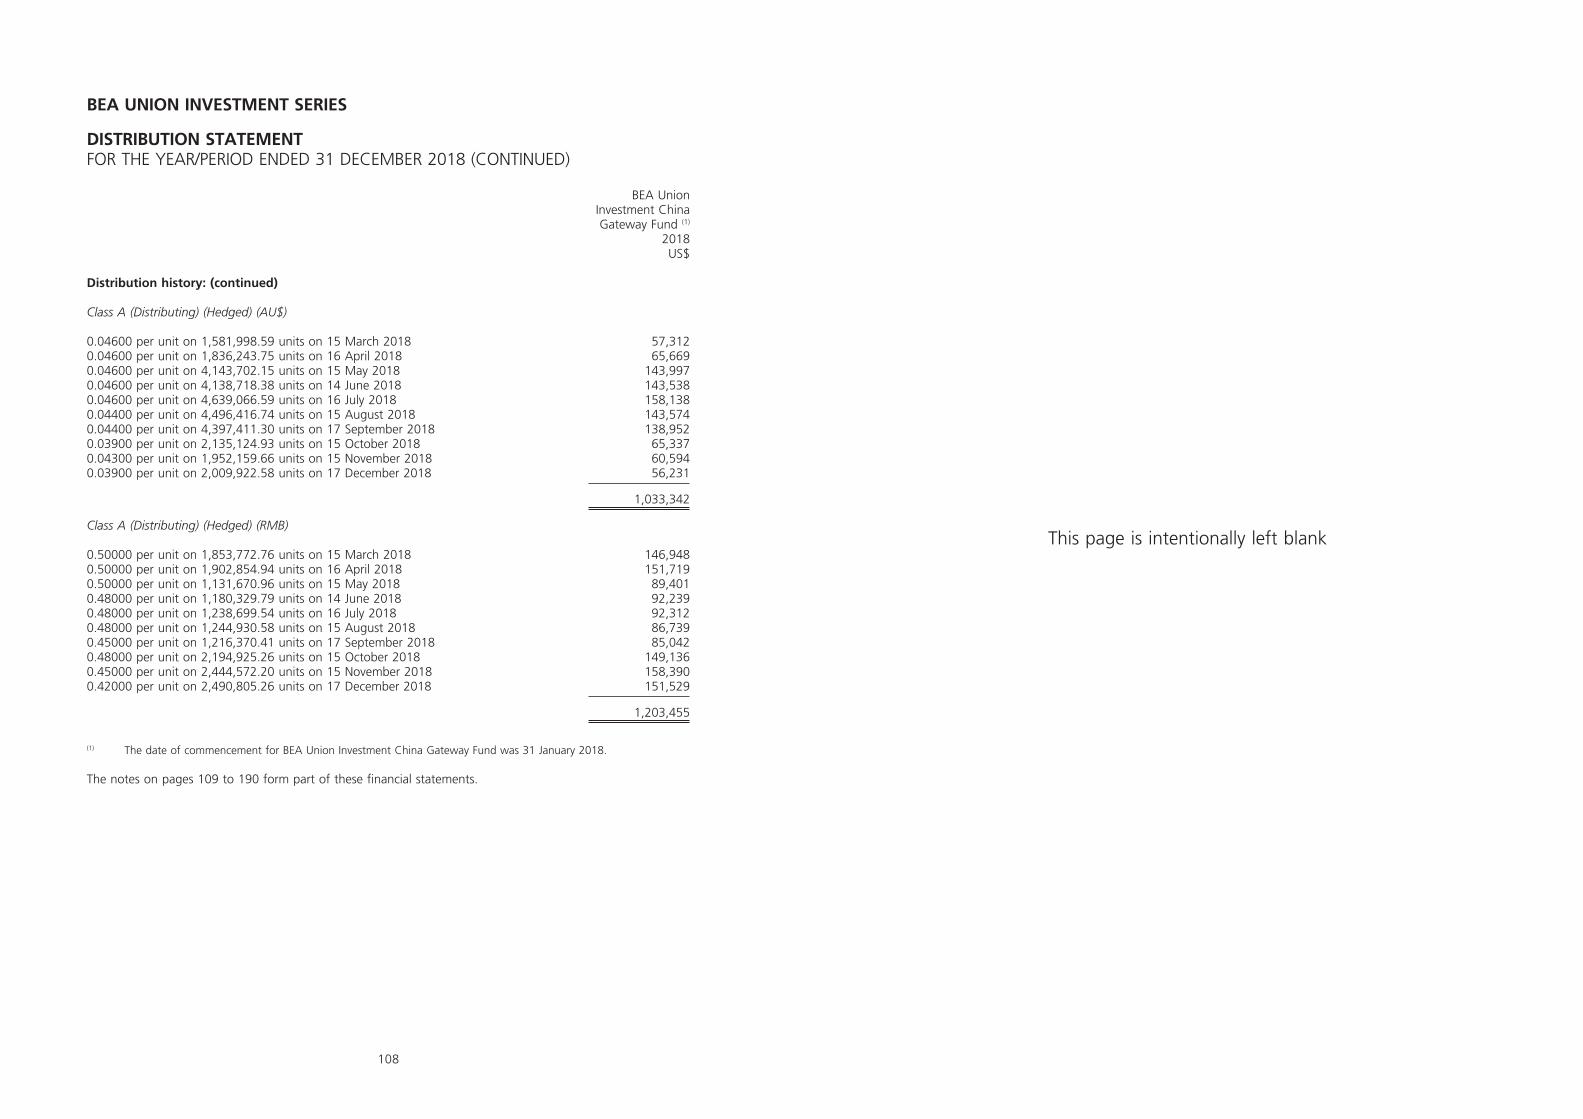
A5請縮小打印70.5%
This page is intentionally left blank
BEA UNION INVESTMENT SERIES
DISTRIBUTION STATEMENT FOR THE YEAR/PERIOD ENDED 31 DECEMBER 2018 (CONTINUED)
108
A5請縮小打印70.5%
BEA Union Investment China Gateway Fund (1)
2018US$
Distribution history: (continued)
Class A (Distributing) (Hedged) (AU$)
0.04600 per unit on 1,581,998.59 units on 15 March 2018 57,3120.04600 per unit on 1,836,243.75 units on 16 April 2018 65,6690.04600 per unit on 4,143,702.15 units on 15 May 2018 143,9970.04600 per unit on 4,138,718.38 units on 14 June 2018 143,5380.04600 per unit on 4,639,066.59 units on 16 July 2018 158,1380.04400 per unit on 4,496,416.74 units on 15 August 2018 143,5740.04400 per unit on 4,397,411.30 units on 17 September 2018 138,9520.03900 per unit on 2,135,124.93 units on 15 October 2018 65,3370.04300 per unit on 1,952,159.66 units on 15 November 2018 60,5940.03900 per unit on 2,009,922.58 units on 17 December 2018 56,231
1,033,342
Class A (Distributing) (Hedged) (RMB)
0.50000 per unit on 1,853,772.76 units on 15 March 2018 146,9480.50000 per unit on 1,902,854.94 units on 16 April 2018 151,7190.50000 per unit on 1,131,670.96 units on 15 May 2018 89,4010.48000 per unit on 1,180,329.79 units on 14 June 2018 92,2390.48000 per unit on 1,238,699.54 units on 16 July 2018 92,3120.48000 per unit on 1,244,930.58 units on 15 August 2018 86,7390.45000 per unit on 1,216,370.41 units on 17 September 2018 85,0420.48000 per unit on 2,194,925.26 units on 15 October 2018 149,1360.45000 per unit on 2,444,572.20 units on 15 November 2018 158,3900.42000 per unit on 2,490,805.26 units on 17 December 2018 151,529
1,203,455
(1) The date of commencement for BEA Union Investment China Gateway Fund was 31 January 2018.
The notes on pages 109 to 190 form part of these financial statements.
BEA UNION INVESTMENT SERIES
NOTES TO THE FINANCIAL STATEMENTS(EXPRESSED IN UNITED STATES DOLLARS) (CONTINUED)
110
A5請縮小打印70.5%
BEA UNION INVESTMENT SERIES
NOTES TO THE FINANCIAL STATEMENTS(EXPRESSED IN UNITED STATES DOLLARS)
109
A5請縮小打印70.5%
1 The Fund
BEA Union Investment Series (“the Fund”) is an umbrella unit trust established in Hong Kong pursuant to a trust deed dated 18 January 2002 and supplemental trust deeds dated 18 January 2002, 17 February 2006, 30 January 2007, 8 January 2008, 3 July 2008, 4 July 2008, 4 September 2009, 3 June 2010, 6 April 2011, 29 March 2012, 30 March 2012, 2 April 2012, 27 March 2013, 31 October 2014, 13 April 2015, 15 May 2015, 30 June 2015, 27 November 2015, 24 March 2016, 5 December 2016 and 1 November 2018 (“Trust Deed, as amended”). There were fifteen sub-funds created under the Fund (collectively “the Sub-funds”) as at 31 December 2018. These Sub-funds were established on the date set out below:
Name of Sub-funds Establishment date
BEA Union Investment Japan Growth Fund 20 February 2006
BEA Union Investment Global Themes Fund 15 March 2007
BEA Union Investment Global Resources Fund 5 March 2008
BEA Union Investment Asian Bond and Currency Fund 25 August 2008
BEA Union Investment Four Seasons Fund 23 October 2009
BEA Union Investment China A-Share Equity Fund 8 June 2010
BEA Union Investment Asia Pacific Multi Income Fund 11 May 2012
BEA Union Investment China Phoenix Fund 30 April 2013
BEA Union Investment RMB Core Bond Fund 28 February 2014
BEA Union Investment Asia Pacific Flexi Allocation Fund 6 February 2015
BEA Union Investment Global Flexi Allocation Fund 27 January 2016
BEA Union Investment China High Yield Income Fund 22 April 2016
BEA Union Investment Asian Strategic Bond Fund 24 February 2017
BEA Union Investment Asia Pacific Equity Dividend Fund 10 March 2017
BEA Union Investment China Gateway Fund 31 January 2018
As at 31 December 2018, three different classes of units, namely Class A, Class H and Class I had been created for BEA Union Investment Asian Bond and Currency Fund while the sub-fund had further separated its units into accumulating units, accumulating hedged units, distributing units and distributing hedged units. Class A, Class H and Class I had been subscribed and were in issue as at 31 December 2018 for this sub-fund.
As at 31 December 2018, three different classes of units, namely Class A, Class I and Class P had been created for BEA Union Investment China A-Share Equity Fund. Class A, Class I and Class P had been subscribed and were in issue as at 31 December 2018 for this sub-fund.
1 The Fund (continued)
As at 31 December 2018, two different classes of units, namely Class A and Class I had been created for BEA Union Investment Asia Pacific Multi Income Fund, BEA Union Investment RMB Core Bond Fund, BEA Union Investment Asia Pacific Flexi Allocation Fund, BEA Union Investment Global Flexi Allocation Fund, BEA Union Investment China High Yield Income Fund, BEA Union Investment Asian Strategic Bond Fund and BEA Union Investment China Gateway Fund while Class A of these sub-funds had further separated their units into accumulating units, accumulating hedged units, distributing units and distributing hedged units. Only Class A had been subscribed and was in issue as at 31 December 2018 for these sub-funds.
As at 31 December 2018, two different classes of units, namely Class A and Class I had been created for BEA Union Investment China Phoenix Fund while Class A of the sub-fund had further separated its units into accumulating units and accumulating hedged units. Only Class A had been subscribed and was in issue as at 31 December 2018 for this sub-fund.
As at 31 December 2018, two different classes of units, namely Class A and Class I had been created for BEA Union Investment Asia Pacific Equity Dividend Fund while Class A of the sub-fund had further separated its units into accumulating units and distributing units. Only Class A distributing units had been subscribed and was in issue as at 31 December 2018 for this sub-fund.
The Sub-funds are authorised by the Hong Kong Securities and Futures Commission (“the SFC”) under Section 104 of the Hong Kong Securities and Futures Ordinance (“the HKSFO”). They are governed by the relevant provisions of the Code on Unit Trusts and Mutual Funds issued by the Hong Kong Securities and Futures Commission (“the Code”).
The Trust Deed, as amended, does not contain any requirement that a combined set of financial statements for the Fund itself be prepared. These financial statements are prepared for BEA Union Investment Japan Growth Fund, BEA Union Investment Global Themes Fund, BEA Union Investment Global Resources Fund, BEA Union Investment Asian Bond and Currency Fund, BEA Union Investment Four Seasons Fund, BEA Union Investment China A-Share Equity Fund, BEA Union Investment Asia Pacific Multi Income Fund, BEA Union Investment China Phoenix Fund, BEA Union Investment RMB Core Bond Fund, BEA Union Investment Asia Pacific Flexi Allocation Fund, BEA Union Investment Global Flexi Allocation Fund, BEA Union Investment China High Yield Income Fund, BEA Union Investment Asian Strategic Bond Fund, BEA Union Investment Asia Pacific Equity Dividend Fund and BEA Union Investment China Gateway Fund only.
On 5 December 2012, the SFC approved the withdrawal of the authorisation of BEA Union Investment Japan Growth Fund with effect from 28 February 2013.
On 20 June 2013, the SFC approved the withdrawal of the authorisation of BEA Union Investment Four Seasons Fund with effect from 23 August 2013.
On 30 November 2016, the SFC approved the withdrawal of the authorisation of BEA Union Investment Global Resources Fund with effect from 17 February 2017.
On 16 April 2018, the SFC approved the withdrawal of the authorisation of BEA Union Investment Global Themes Fund with effect from 16 April 2018.
On 31 July 2018, BEA Union Investment Japan Growth Fund, BEA Union Investment Global Themes Fund, BEA Union Investment Global Resources Fund and BEA Union Investment Four Seasons Fund had been amalgamated into BEA Union Investment Global Flexi Allocation Fund.
BEA UNION INVESTMENT SERIES
NOTES TO THE FINANCIAL STATEMENTS(EXPRESSED IN UNITED STATES DOLLARS) (CONTINUED)
BEA UNION INVESTMENT SERIES
NOTES TO THE FINANCIAL STATEMENTS(EXPRESSED IN UNITED STATES DOLLARS) (CONTINUED)
111 112
A5請縮小打印70.5%
2 Significant accounting policies
The principal accounting policies applied in the preparation of these financial statements are set out below. These policies have been applied consistently and are consistent with those used in the previous year, unless otherwise stated.
This is the first set of the Sub-funds’ annual financial statements in which HKFRS 9 Financial Instruments has been applied. Changes to significant accounting policies are described in note 3.
(a) Statement of compliance
These financial statements have been prepared in accordance with all applicable Hong Kong Financial Reporting Standards (“HKFRSs”), which collective term includes all applicable individual Hong Kong Financial Reporting Standards, Hong Kong Accounting Standards (“HKASs”) and Interpretations issued by the Hong Kong Institute of Certified Public Accountants (“HKICPA”), accounting principles generally accepted in Hong Kong, the relevant provisions of the Trust Deed, as amended, and the relevant provisions of the Code issued by the HKSFC. A summary of the significant accounting policies adopted by the Sub-funds is set out below.
The HKICPA has issued certain new and revised HKFRSs that are first effective or available for early adoption for the current accounting period of the Sub-funds. Note 3 provides information on any changes in accounting policies resulting from initial application of these developments to the extent that they are relevant to the Sub-funds for the current and prior accounting periods reflected in these financial statements.
(b) Basis of preparation of the financial statements
The financial statements of the Sub-funds are presented in United States dollars (“USD”) and rounded to the nearest dollar except for BEA Union Investment RMB Core Bond Fund which the financial statements are presented in Renminbi (“RMB”) and rounded to the nearest yuan.
The measurement basis used in the preparation of these financial statements is the historical cost basis except that financial instruments classified as designated at fair value through profit or loss are stated at their fair value as explained in the accounting policies set out below.
The preparation of financial statements in conformity with HKFRSs requires management to make judgements, estimates and assumptions that affect the application of policies and reported amounts of assets, liabilities, income and expenses. The estimates and associated assumptions are based on historical experience and various other factors that are believed to be reasonable under the circumstances, the results of which form the basis of making the judgements about carrying values of assets and liabilities that are not readily apparent from other sources. Actual results may differ from these estimates.
The estimates and underlying assumptions are reviewed on an ongoing basis. Revisions to accounting estimates are recognised in the period in which the estimate is revised if the revision affects only that period, or in the period of the revision and future periods if the revision affects both current and future periods.
(c) Income and expenses
Interest income is recognised as it accrues using effective interest method. Interest on bank deposits is separately disclosed on the face of profit or loss. Interest income on debt securities is included in net (losses)/gains on investments and foreign exchange. Dividend income is recognised when the underlying securities are quoted ex-dividend. Dividend is presented gross of any non-recoverable withholding taxes, which are separately disclosed in profit or loss. All other income and expenses are accounted for on an accrual basis.
2 Significant accounting policies (continued)
(d) Investments
(i) Classification of financial assets
(A) Policy applicable from 1 January 2018
On initial recognition, the Sub-funds classify financial assets as measured at amortised cost or fair value through profit or loss (“FVTPL”).
A financial asset is measured at amortised cost if it meets both of the following conditions and is not designated as at FVTPL:
– it is held within a business model whose objective is to hold assets to collect contractual cash flows; and
– its contractual terms give rise on specified dates to cash flows that are solely payments of principal and interest (“SPPI”).
All other financial assets of the Sub-funds are measured at FVTPL.
Business model assessment
In making an assessment of the objective of the business model in which a financial asset is held, the Sub-funds consider all of the relevant information about how the business is managed, including:
– the documented investment strategy and the execution of this strategy in practice. This includes whether the investment strategy focuses on earning contractual interest income, maintaining a particular interest rate profile, matching the duration of the financial assets to the duration of any related liabilities or expected cash outflows or realising cash flows through the sale of the assets;
– how the performance of the portfolio is evaluated and reported to the Sub-fund’s management;
– the risks that affect the performance of the business model (and the financial assets held within that business model) and how those risks are managed;
– how the investment manager is compensated: e.g. whether compensation is based on the fair value of the assets managed or the contractual cash flows collected; and
– the frequency, volume and timing of sales of financial assets in prior periods, the reasons for such sales and expectations about future sales activity.
Transfers of financial assets to third parties in transactions that do not qualify for derecognition are not considered sales for this purpose, consistent with the Sub-funds’ continuing recognition of the assets.
BEA UNION INVESTMENT SERIES
NOTES TO THE FINANCIAL STATEMENTS(EXPRESSED IN UNITED STATES DOLLARS) (CONTINUED)
BEA UNION INVESTMENT SERIES
NOTES TO THE FINANCIAL STATEMENTS(EXPRESSED IN UNITED STATES DOLLARS) (CONTINUED)
113 114
A5請縮小打印70.5%
2 Significant accounting policies (continued)
(d) Investments (continued)
(i) Classification of financial assets (continued)
(A) Policy applicable from 1 January 2018 (continued)
Business model assessment (continued)
The Sub-funds have determined that they have two business models.
– Held-to-collect business model: this includes dividend receivables, amounts receivable from sales of investments, amounts receivable on subscriptions, other receivables, amounts due from brokers and bank balances. These financial assets are held to collect contractual cash flow.
– Other business model: this includes debt security and equity instruments. These financial assets are managed and their performance is evaluated, on a fair value basis, with frequent sales taking place.
Assessment whether contractual cash flows are SPPI
For the purposes of this assessment, “principal” is defined as the fair value of the financial asset on initial recognition. “Interest” is defined as consideration for the time value of money and for the credit risk associated with the principal amount outstanding during a particular period of time and for other basic lending risks and costs (e.g. liquidity risk and administrative costs), as well as a profit margin.
In assessing whether the contractual cash flows are SPPI, the Sub-funds consider the contractual terms of the instrument. This includes assessing whether the financial asset contains a contractual term that could change the timing or amount of contractual cash flows such that it would not meet this condition. In making this assessment, the Sub-funds consider:
– contingent events that would change the amount or timing of cash flows;
– leverage features;
– prepayment and extension features;
– terms that limit the Sub-funds’ claim to cash flows from specified assets (e.g. non-recourse features); and
– features that modify consideration for of the time value of money (e.g. periodical reset of interest rates).
The Sub-funds classify their investments based on the business model and contractual cash flows assessment. Accordingly, the Sub-funds classify all their equity instruments, debt securities and derivative financial instruments into financial assets at FVTPL category. Financial assets measured at amortised cost include dividend receivables, amounts receivable from sales of investments, amounts receivable on subscription, other receivables, amounts dur from brokers and bank balances.
2 Significant accounting policies (continued)
(d) Investments (continued)
(i) Classification of financial assets (continued)
(A) Policy applicable from 1 January 2018 (continued)
Reclassifications
Financial assets are not reclassified subsequent to their initial recognition unless the Sub-funds were to change their business model for managing financial assets, in which case all affected financial assets would be reclassified on the first day of the first reporting period following the change in the business model.
(B) Policy applicable prior to 1 January 2018
All investments had been classified by the Sub-funds as “financial assets at fair value through profit or loss” at inception.
Purchases and sales of investments were accounted for on the trade date basis. Investments were initially recognised at fair value, excluding transaction costs which were expensed as incurred, and were subsequently re-measured at fair value. “Fair value” is the price that would be received to sell an asset in an orderly transaction between market participants at the measurement date in the principal or, in its absence, the most advantageous market to which the Sub-funds have access at that date.
When available, the Sub-funds measured the fair value of an investment using the quoted price in an active market for that investment. A market is regarded as “active” if transactions for the asset take place with sufficient frequency and volume to provide pricing information on an ongoing basis. The fair values of the Sub-funds’ investments were measured on the following bases:
– Investments that were listed or traded on an exchange are fair valued based on quoted bid prices.
– Investments which were not listed on an exchange are valued by using quoted bid prices from brokers.
– Debt securities were fair valued based on quoted bid prices.
Realised and unrealised gains and losses on investments are included in profit or loss in the year in which they arise. Investments are derecognised when the rights to receive cash flows from the investments have expired or the Sub-funds have transferred substantially all risks and rewards of ownership.
BEA UNION INVESTMENT SERIES
NOTES TO THE FINANCIAL STATEMENTS(EXPRESSED IN UNITED STATES DOLLARS) (CONTINUED)
BEA UNION INVESTMENT SERIES
NOTES TO THE FINANCIAL STATEMENTS(EXPRESSED IN UNITED STATES DOLLARS) (CONTINUED)
115 116
A5請縮小打印70.5%
2 Significant accounting policies (continued)
(d) Investments (continued)
(ii) Classification of financial liabilities
Financial liabilities are classified as measured at amortised cost or FVTPL.
A financial liability is classified as at FVTPL if it is a derivative. Financial liabilities at FVTPL are measured at fair value and net gains and losses are recognised in profit or loss.
Other financial liabilities are subsequently measured at amortised cost using the effective interest method. Interest expense and foreign exchange gains and losses are recognised in profit or loss.
Any gain or loss on derecognition is also recognised in profit or loss.
Accordingly, the Sub-funds classify all their derivative financial instrument into financial liabilities at FVTPL category. Financial liabilities measured at amortised cost include amounts payable on redemption, amounts payable for purchase of investments, accruals and other payables and bank overdrafts.
(iii) Recognition
The Sub-funds recognise financial assets and financial liabilities on the date they becomes a party to the contractual provisions of the instruments.
A regular way purchase or sale of financial assets or financial liabilities at fair value through profit or loss is recognised on a trade date basis. From this date, any gains or losses arising from changes in fair value of the financial assets or financial liabilities at fair value through profit or loss are recorded.
Financial liabilities are not recognised unless one of the parties has performed their obligations under the contract or the contract is a derivative contract not exempted from the scope of HKFRS 9.
(iv) Measurement
Financial instruments are measured initially at fair value (transaction price). Transaction costs on financial assets and liabilities at fair value through profit or loss are expensed immediately.
Subsequent to initial recognition, all instruments classified at fair value through profit or loss are measured at fair value with changes in their fair values recognised in profit or loss.
Financial assets classified as loans and receivables are carried at amortised cost using the effective interest rate method, less impairment losses, if any.
Financial liabilities, other than those at fair value through profit or loss, are measured at amortised cost using the effective interest rate method.
2 Significant accounting policies (continued)
(d) Investments (continued)
(v) Fair value measurement principles
Fair value is the price that would be received to sell an asset or paid to transfer a liability in an orderly transaction between market participants at the measurement date in the principal or, in its absence, the most advantageous market to which the Sub-funds have access at that date. The fair value of a liability reflects its non-performance risk.
When available, the Sub-funds measure the fair value of an instrument using the quoted price in an active market for that instrument. A market is regarded as active if transactions for the asset or liability take place with sufficient frequency and volume to provide pricing information on an ongoing basis.
If there is no quoted price in an active market, then the Sub-funds use valuation techniques that maximise the use of relevant observable inputs and minimise the use of unobservable inputs. The chosen valuation technique incorporates all of the factors that market participants would take into account in pricing a transaction.
As at 31 December 2018, investments that are listed or traded on an exchanged are valued based on their quoted last-traded prices. As at 31 December 2017, investments that are listed or traded on an exchange are valued based on their quoted bid prices. The change in valuation inputs is considered to be a change in estimate in accordance with HKAS 8, Accounting Policies, Changes in Accounting Estimates and Errors. The effect of the change in valuation inputs for current period is disclosed in note 5.
The Sub-funds recognise transfers between levels of the fair value hierarchy as at the end of the reporting period during which the change has occurred.
Net gains or losses on investments are included in profit or loss. Realised gains or losses on investments and unrealised gains or losses on investments arising from a change in fair value. Net realised gains or losses from financial instruments at fair value through profit or loss is calculated using the average cost method.
(vi) Amortised cost measurement
The “amortised cost” of a financial asset or financial liability is the amount at which the financial asset or financial liability is measured on initial recognition minus the principal repayments, plus or minus the cumulative amortisation using the effective interest method of any difference between that initial amount and the maturity amount and, for financial assets, adjusted for any loss allowance.
BEA UNION INVESTMENT SERIES
NOTES TO THE FINANCIAL STATEMENTS(EXPRESSED IN UNITED STATES DOLLARS) (CONTINUED)
BEA UNION INVESTMENT SERIES
NOTES TO THE FINANCIAL STATEMENTS(EXPRESSED IN UNITED STATES DOLLARS) (CONTINUED)
117 118
A5請縮小打印70.5%
2 Significant accounting policies (continued)
(d) Investments (continued)
(vii) Impairment
(A) Policy applicable from 1 January 2018
The Sub-funds recognise loss allowances for expected credit losses (“ECLs”) on financial assets measured at amortised cost.
The Sub-funds measure loss allowances at an amount equal to lifetime ECLs, except for the following, which are measured at 12-month ECLs:
– financial assets that are determined to have low credit risk at the reporting date; and
– other financial assets for which credit risk (i.e. the risk of default occurring over the expected life of the asset) has not increased significantly since initial recognition.
When determining whether the credit risk of a financial asset has increased significantly since initial recognition and when estimating ECLs, the Sub-funds consider reasonable and supportable information that is relevant and available without undue cost or effort. This includes both quantitative and qualitative information and analysis, based on the Sub-funds’ historical experience and informed credit assessment and including forward-looking information.
The Sub-funds assume that the credit risk on a financial asset has increased significantly if it is more than 30 days past due.
The Sub-funds consider a financial asset to be in default when:
– the borrower is unlikely to pay its credit obligations to the Sub-funds in full, without recourse by the Sub-funds to actions such as realising security (if any is held); or
– the financial asset is more than 90 days past due.
The Sub-funds consider a financial asset to have low credit risk when the credit rating of the counterparty is equivalent to the globally understood definition of ‘investment grade’. The Sub-funds consider this to be Baa3 or higher per Moody’s or BBB- or higher per Standard & Poor’s.
Lifetime ECLs are the ECLs that result from all possible default events over the expected life of a financial instrument.
12-month ECLs are the portion of ECLs that result from default events that are possible within the 12 months after the reporting date (or a shorter period if the expected life of the instrument is less than 12 months).
The maximum period considered when estimating ECLs is the maximum contractual period over which the Sub-funds are exposed to credit risk.
2 Significant accounting policies (continued)
(d) Investments (continued)
(vii) Impairment (continued)
(A) Policy applicable from 1 January 2018 (continued)
Measurement of ECLs
ECLs are a probability-weighted estimate of credit losses. Credit losses are measured as the present value of all cash shortfalls (i.e. the difference between the cash flows due to the entity in accordance with the contract and the cash flows that the Sub-funds expect to receive).
ECLs are discounted at the effective interest rate of the financial asset.
Credit-impaired financial assets
At each reporting date, the Sub-funds assess whether financial assets carried at amortised cost are credit-impaired. A financial asset is ‘credit-impaired’ when one or more events that have a detrimental impact on the estimated future cash flows of the financial asset have occurred.
Evidence that a financial asset is credit-impaired includes the following observable data:
– significant financial difficulty of the borrower or issuer;
– a breach of contract such as a default or being more than 90 days past due; or
– it is probable that the borrower will enter bankruptcy or other financial reorganisation.
Presentation of allowance for ECLs in the statement of assets and liabilities
Loss allowances for financial assets measured at amortised cost are deducted from the gross carrying amount of the assets.
Write-off
The gross carrying amount of a financial asset is written off when the Sub-funds have no reasonable expectations of recovering a financial asset in its entirety or a portion thereof.
BEA UNION INVESTMENT SERIES
NOTES TO THE FINANCIAL STATEMENTS(EXPRESSED IN UNITED STATES DOLLARS) (CONTINUED)
BEA UNION INVESTMENT SERIES
NOTES TO THE FINANCIAL STATEMENTS(EXPRESSED IN UNITED STATES DOLLARS) (CONTINUED)
119 120
A5請縮小打印70.5%
2 Significant accounting policies (continued)
(d) Investments (continued)
(vii) Impairment (continued)
(B) Policy applicable prior to 1 January 2018
Financial assets that were stated at cost or amortised cost are were reviewed at each reporting date to determine whether there is objective evidence of impairment. If any such indication existed, an impairment loss was recognised in profit or loss as the difference between the asset’s carrying amount and the present value of estimated future cash flows discounted at the financial asset’s original effective interest rate.
If in a subsequent period the amount of an impairment loss recognised on a financial asset carried at amortised cost decreased and the decrease could be linked objectively to an event occurring after the write-down, the write-down was reversed through profit or loss.
(viii) Derecognition
A financial asset is derecognised when the contractual rights to receive the cash flows from the financial asset expire, or where the financial asset together with substantially all the risks and rewards of ownership, have been transferred.
Assets held for trading that are sold are derecognised and corresponding receivables from brokers are recognised as of the date the Sub-funds commit to sell the assets.
A financial liability is derecognised when the obligation specified in the contract is discharged, cancelled or expires.
On derecognition of a financial asset, the difference between the carrying value of the asset and the consideration received is recognised in profit or loss.
(ix) Offsetting
Financial assets and financial liabilities are offset and the net amount is reported in the statement of assets and liabilities when the Sub-funds have a legally enforceable right to offset the recognised amounts and the transactions are intended to be settled on a net basis or simultaneously, e.g. through a market clearing mechanism.
(e) Forward foreign exchange contracts
Outstanding forward foreign exchange contracts are valued at the year end date by reference to the forward rate of exchange applicable to the outstanding term of the contracts. Unrealised gains and losses on outstanding contracts and realised gains and losses on closed contracts are included in profit or loss under the heading “exchange (losses)/gains”.
2 Significant accounting policies (continued)
(f) Translation of foreign currencies
Foreign currency transactions during the year/period are translated at the foreign exchange rates ruling at the transaction dates. Monetary assets and liabilities of all the Sub-funds denominated in foreign currencies are translated into USD except for BEA Union Investment RMB Core Bond Fund which is translated into RMB at the foreign exchange rates ruling at the end of the reporting period. Differences arising on foreign currency translation are recorded in the statement of comprehensive income.
(g) Related parties
(a) A person, or a close member of that person’s family, is related to the Sub-funds if that person:
(i) has control or joint control over the Sub-funds;
(ii) has significant influence over the Sub-funds; or
(iii) is a member of the key management personnel of the Sub-funds or the Sub-funds’ parent.
(b) An entity is related to the Sub-funds if any of the following conditions applies:
(i) The entity and the Sub-funds are members of the same group (which means that each parent, subsidiary and fellow subsidiary is related to the others).
(ii) One entity is an associate or joint venture of the other entity (or an associate or joint venture of a member of a group of which the other entity is a member).
(iii) Both entities are joint ventures of the same third party.
(iv) One entity is a joint venture of a third entity and the other entity is an associate of the third entity.
(v) The entity is a post-employment benefit plan for the benefit of employees of an entity related to the Sub-funds.
(vi) The entity is controlled or jointly controlled by a person identified in (a).
(vii) A person identified in (a)(i) has significant influence over the entity or is a member of the key management personnel of the entity (or of a parent of the entity).
(viii) The entity, or any member of a group which it is a part, provides key management personnel services to the Sub-funds or to the Sub-fund’s parent.
Close members of the family of a person are those family members who may be expected to influence, or be influenced by, that person in their dealings with the entity.
BEA UNION INVESTMENT SERIES
NOTES TO THE FINANCIAL STATEMENTS(EXPRESSED IN UNITED STATES DOLLARS) (CONTINUED)
BEA UNION INVESTMENT SERIES
NOTES TO THE FINANCIAL STATEMENTS(EXPRESSED IN UNITED STATES DOLLARS) (CONTINUED)
121 122
A5請縮小打印70.5%
2 Significant accounting policies (continued)
(h) Cash and cash equivalents
Cash and cash equivalents comprise cash at bank and on hand, demand deposits with banks and other financial institutions, and short-term, highly liquid investments that are readily convertible into known amounts of cash and which are subject to an insignificant risk of changes in value, having been within three months of maturity at acquisition.
(i) Taxation
Taxation for the year/period comprises current tax and movements in deferred tax assets and liabilities. Current tax and movements in deferred tax assets and liabilities are recognised in the statement of comprehensive income.
Current tax is the expected tax payable on the taxable income for the year/period, using tax rates enacted or substantively enacted at the end of the reporting period, and any adjustment to tax payable in respect of previous years. Current tax also includes non-recoverable withholding taxes on investment income, capital gains and share dividends.
Deferred tax assets and liabilities arise from deductible and taxable temporary differences respectively, being the differences between the carrying amounts of assets and liabilities for financial reporting purposes and their tax bases.
All deferred tax liabilities, and all deferred tax assets to the extent that it is probable that future taxable capital gains will be available against which the asset can be utilised, are recognised.
The amounts of deferred tax recognised is measured based on the expected manner of realisation or settlement of the carrying amount of the assets and liabilities, using tax rates enacted or substantively enacted at the end of the reporting period. Deferred tax assets and liabilities are not discounted.
2 Significant accounting policies (continued)
(j) Units in issue
The Sub-funds classify capital instruments as financial liabilities or equity instruments in accordance with the substance of the contractual terms of the instruments.
A puttable financial instrument is classified as an equity instrument if it has all of the following features:
– It entitles the holder to a pro rata share of the sub-fund’s net assets in the event of the sub-fund’s liquidation.
– The instrument is in the class of instruments that is subordinate to all other classes of instruments.
– All financial instruments in the class of instruments that is subordinate to all other classes of instruments have identical features.
– The instrument does not include any contractual obligation to deliver cash or another financial asset other than the holder’s rights to a pro rata share of the sub fund’s net assets.
– The total expected cash flows attributable to the instrument over the life of the instrument are based substantially on the profit or loss, the change in the recognised net assets or the change in the fair value of the recognised and unrecognised net assets of the sub-fund over the life of the instrument.
In addition to the instrument having all the above features, the sub-fund must have no other financial instrument or contract that has:
– Total cash flows based substantially on the profit or loss, the change in the recognised net assets or the change in the fair value of the recognised and unrecognised net assets of the sub-fund; and
– The effect of substantially restricting or fixing the residual return to the puttable instrument holders.
BEA Union Investment Japan Growth Fund, BEA Union Investment Global Themes Fund and BEA Union Investment Global Resources Fund have two classes of redeemable units: Class A and Class I. Class A units were in issue.
BEA Union Investment Asian Bond and Currency Fund has three classes of redeemable units: Class A, Class H and Class I while the sub-fund has further separated its units into accumulating units, accumulating hedged units, distributing units and distributing hedged units. Class A Accumulating, Class A Distributing, Class A Accumulating Hedged (EUR), Class A Accumulating Hedged (RMB), Class A Distributing Hedged (AUD), Class A Distributing Hedged (RMB), Class H Distributing (HKD) and Class I Accumulating units were in issue.
BEA Union Investment Four Seasons Fund has one class of redeemable units: Class A, which were in issue.
BEA UNION INVESTMENT SERIES
NOTES TO THE FINANCIAL STATEMENTS(EXPRESSED IN UNITED STATES DOLLARS) (CONTINUED)
BEA UNION INVESTMENT SERIES
NOTES TO THE FINANCIAL STATEMENTS(EXPRESSED IN UNITED STATES DOLLARS) (CONTINUED)
123 124
A5請縮小打印70.5%
2 Significant accounting policies (continued)
(j) Units in issue (continued)
BEA Union Investment China A-Share Equity Fund has three classes of redeemable units: Class A, Class I and Class P. Class A, Class I and Class P units were in issue.
BEA Union Investment Asia Pacific Multi Income Fund has two classes of redeemable units: Class A and Class I while Class A of the sub-fund has further separated its units into accumulating units, accumulating hedged units, distributing units and distributing hedged units. Class A Accumulating, Class A Distributing, Class A Distributing (HKD), Class A Accumulating Hedged (EUR), Class A Accumulating Hedged (RMB), Class A Distributing Hedged (AUD), Class A Distributing Hedged (EUR), Class A Distributing Hedged (NZD) and Class A Distributing Hedged (RMB) units were in issue.
BEA Union Investment China Phoenix Fund has two classes of redeemable units: Class A and Class I while Class A has further separated its units into accumulating units and accumulating hedged units. Class A Accumulating, Class A Accumulating (HKD) and Class A Accumulating Hedged (RMB) units were in issue.
BEA Union Investment RMB Core Bond Fund has two classes of redeemable units: Class A and Class I while Class A of the sub-fund had further separated its units into accumulating units, accumulating hedged units, distributing units and distributing hedged units. Class A Distributing, Class A Distributing (HKD) and Class A Distributing (RMB) units were in issue.
BEA Union Investment Asia Pacific Flexi Allocation Fund, has two classes of redeemable units: Class A and Class I while Class A of the sub-fund had further separated its units into accumulating units, accumulating hedged units, distributing units and distributing hedged units. Class A Accumulating, Class A Distributing, Class A Distributing (HKD), Class A Distributing Hedged (AUD), Class A Distributing Hedged (NZD) and Class A Distributing Hedged (RMB) units were in issue.
BEA Union Investment Global Flexi Allocation Fund, has two classes of redeemable units: Class A and Class I while Class A of the sub-fund had further separated its units into accumulating units, accumulating hedged units, distributing units and distributing hedged units. Class A Distributing and Class A Distributing (HKD) units were in issue.
BEA Union Investment China High Yield Income Fund, has two classes of redeemable units: Class A and Class I while Class A of the sub-fund had further separated its units into accumulating units, accumulating hedged units, distributing units and distributing hedged units. Class A Distributing, Class A Distributing (HKD), Class A Distributing Hedged (AUD) and Class A Distributing Hedged (RMB) units were in issue.
BEA Union Investment Asian Strategic Bond Fund has two classes of redeemable units: Class A and Class I while Class A of the sub-fund had further separated its units into accumulating units, accumulating hedged units, distributing units and distributing hedged units. Class A Accumulating, Class A Distributing, Class A Distributing (HKD), Class A Distributing Hedged (AUD) and Class A Distributing Hedged (RMB) units were in issue.
2 Significant accounting policies (continued)
(j) Units in issue (continued)
BEA Union Investment Asia Pacific Equity Dividend Fund has two classes of redeemable units: Class A and Class I while Class A of the sub-fund had further separated its units into accumulating and distributing units. Class A Distributing units were in issue.
BEA Union Investment China Gateway Fund has two classes of redeemable units: Class A and Class I while Class A of the sub-fund had further separated its unit into accumulating units, accumulating hedged units, distributing units and distributing hedged units. Class A Accumulating, Class A Distributing, Class A Distributing (HKD), Class A Distributing Hedged (AUD) and Class A Distributing Hedged (RMB) units were in issue.
All redeemable units issued by the Sub-funds provide the investors with the right to require redemption for cash at a value proportionate to the investor’s share in the corresponding sub-fund’s net assets at each daily redemption date and also in the event of the corresponding sub-fund’s liquidation.
Consequently, the redeemable units of BEA Union Investment Japan Growth Fund, BEA Union Investment Global Themes Fund, BEA Union Investment Global Resources Fund, BEA Union Investment Four Seasons Fund and BEA Union Investment Asia Pacific Equity Dividend Fund meet the definition of puttable instruments and being classified as equity instruments as at 31 December 2018.
BEA Union Investment Asian Bond and Currency Fund’s Class A, Class H and Class I units have been further separated into accumulating units, accumulating hedged units, distributing units and distributing hedged units, which rank pari passu in all material respects but have different distribution policy as set out in the Explanatory Memorandum. Those redeemable units are the most subordinate classes of financial instruments in BEA Union Investment Asian Bond and Currency Fund. However, as the different classes of redeemable units do not have identical features, they do not meet the criteria for equity classification and therefore are classified as financial liabilities. They are measured at the present value of the redemption amounts.
BEA Union Investment China A-Share Equity Fund has created multiple classes of units, which rank pari passu in all material respects but have different terms and conditions as set out in the Explanatory Memorandum, which include minimum investment amounts, management fees, preliminary charges, realisation charges and holders’ servicing fees. Those redeemable units are the most subordinate classes of financial instruments in the sub-fund. However, as the different classes of redeemable units do not have identical features, they do not meet the criteria for equity classification and therefore are classified as financial liabilities. They are measured at the present value of the redemption amounts.
BEA Union Investment Asia Pacific Multi Income Fund’s Class A units have been further separated into accumulating units, accumulating hedged units, distributing units and distributing hedged units, which rank pari passu in all material respects but have different distribution policy as set out in the Explanatory Memorandum. Those redeemable units are the most subordinate classes of financial instruments in BEA Union Investment Asia Pacific Multi Income Fund. However, as the different classes of redeemable units do not have identical features, they do not meet the criteria for equity classification and therefore are classified as financial liabilities. They are measured at the present value of the redemption amounts.

BEA UNION INVESTMENT SERIES
NOTES TO THE FINANCIAL STATEMENTS(EXPRESSED IN UNITED STATES DOLLARS) (CONTINUED)
BEA UNION INVESTMENT SERIES
NOTES TO THE FINANCIAL STATEMENTS(EXPRESSED IN UNITED STATES DOLLARS) (CONTINUED)
125 126
A5請縮小打印70.5%
2 Significant accounting policies (continued)
(j) Units in issue (continued)
BEA Union Investment China Phoenix Fund’s Class A units have been further separated into accumulating units and accumulating hedged units, which rank pari passu in all material respects and have the same terms and conditions as set out in the Explanatory Memorandum other than different currencies. The redeemable units provide unitholders with the right to require redemption for cash at a value proportionate to the unitholders’ share in the sub-fund’s net assets at each redemption date, and also in the event of the sub-fund’s liquidation. The redeemable units of the sub-fund are classified as financial liabilities and are measured at the present value of the redemption amounts.
BEA Union Investment RMB Core Bond Fund’s Class A units has multiple classes of redeemable units in issue, namely Class A distributing units in USD, Class A distributing units in HKD and Class A distributing units in RMB. All the classes are the most subordinate classes of financial instruments in the sub-fund and rank pari passu in all material respects and have the same terms and conditions as set out in the Explanatory Memorandum other than different currencies. The redeemable units provide unitholders with the right to require redemption for cash at a value proportionate to the unitholders’ share in the sub-fund’s net assets at each redemption date, and also in the event of the sub-fund’s liquidation. The redeemable units of the sub-fund are classified as financial liabilities and are measured at the present value of the redemption amounts.
BEA Union Investment Asia Pacific Flexi Allocation Fund’s Class A units have been further separated into accumulating units, accumulating hedged units, distributing units and distributing hedged units, which rank pari passu in all material respects but have different distribution policy as set out in the Explanatory Memorandum. Those redeemable units are the most subordinate classes of financial instruments in BEA Union Investment Asia Pacific Flexi Allocation Fund. However, as the different classes of redeemable units do not have identical features, they do not meet the criteria for equity classification and therefore are classified as financial liabilities. They are measured at the present value of the redemption amounts.
BEA Union investment Global Flexi Allocation Fund’s Class A units have multiple classes of redeemable units in issue, namely Class A distributing units in USD and Class A distributing units in HKD. All the classes are the most subordinate classes of financial instruments in the sub-fund and rank pari passu in all material respects and have the same terms and conditions as set out in the Explanatory Memorandum other than different currencies. The redeemable units provide unitholders with the right to require redemption for cash at a value proportionate to the unitholders’ share in the sub-fund’s net assets at each redemption date, and also in the event of the sub-fund’s liquidation. The redeemable units of the sub-fund are classified as financial liabilities and are measured at the present value of the redemption amounts.
BEA Union Investment China High Yield Income Fund’s Class A units have been further separated into accumulating units, accumulating hedged units, distributing units and distributing hedged units, which rank pari passu in all material respects but have different distribution policy as set out in the Explanatory Memorandum. Those redeemable units are the most subordinate classes of financial instruments in BEA Union Investment High Yield Income Fund. However, as the different classes of redeemable units do not have identical features, they do not meet the criteria for equity classification and therefore are classified as financial liabilities. They are measured at the present value of the redemption amounts.
2 Significant accounting policies (continued)
(j) Units in issue (continued)
BEA Union Investment Asian Strategic Bond Fund’s Class A units have been further separated into accumulating units, accumulating hedged units, distributing units and distributing hedged units, which rank pari passu in all material respects but have different distribution policy as set out in the Explanatory Memorandum. Those redeemable units are the most subordinate classes of financial instruments in BEA Union Investment Asian Strategic Bond Fund. However, as the different classes of redeemable units do not have identical features, they do not meet the criteria for equity classification and therefore are classified as financial liabilities. They are measured at the present value of the redemption amounts.
BEA Union Investment China Gateway Fund’s Class A have been further separated into accumulating units, accumulating hedged units, distributing units and distributing hedged units, which rank pari passu in all material respects but have different distribution policy as set out in the Explanatory Memorandum. Those redeemable units are the most subordinate classes of financial instruments in BEA Union Investment China Gateway Fund. However, as the different classes of redeemable units do not have identical features, they do not meet the criteria for equity classification and therefore are classified as financial liabilities. They are measured at the present value of the redemption amounts.
The Trustee continuously assesses the classification of the redeemable units. If the redeemable units cease to have all the features or meet all the conditions set out in paragraphs 16A and 16B of HKAS 32, the Trustee will reclassify them as financial liabilities and measure them at fair value at the date of reclassification, with any differences from the previous carrying amount recognised in equity. If the redeemable units subsequently have all the features and meet the conditions set out in paragraphs 16A and 16B of HKAS 32, the Trustee will reclassify them as equity instruments and measure them at the carrying amount of the liabilities at the date of the reclassification.
(k) Distributions to holders of redeemable units
Distributions to holders of redeemable units classified as financial liabilities are recognised in the statement of comprehensive income as finance costs when they are authorised and no longer at the discretion of the Sub-funds. Distributions to holders of redeemable units classified as equity are classified as transactions with owners recorded directly in equity and recorded in the statement of changes in net assets attributable to unitholders.
(l) Segment reporting
Operating segments are reported in a manner consistent with the internal reporting used by the chief operating decision-maker. The chief operating decision-maker, who is responsible for allocating resources and assessing performance of the operating segments, has been identified as BEA Union Investment Management Limited (“the Manager”).
(m) Foreign currency forward contract
A foreign currency forward contract involves an obligation to purchase or sell a specific currency at a future date at a price set at the time the contract is made. Outstanding foreign currency forward contracts are valued at the date of the statement of assets and liabilities by reference to the forward rate of exchange applicable to the outstanding term of the contracts. The unrealised gains or losses on open foreign currency forward contracts are calculated as the difference between the contract rate and this forward price and are recognised in the statement of comprehensive income.
BEA UNION INVESTMENT SERIES
NOTES TO THE FINANCIAL STATEMENTS(EXPRESSED IN UNITED STATES DOLLARS) (CONTINUED)
BEA UNION INVESTMENT SERIES
NOTES TO THE FINANCIAL STATEMENTS(EXPRESSED IN UNITED STATES DOLLARS) (CONTINUED)
127 128
A5請縮小打印70.5%
3 Changes in accounting policies
The HKICPA has issued a number of new HKFRSs and amendments to HKFRSs that are first effective for the current accounting period of the Sub-funds. Of these, the following developments are relevant to the Sub-funds’ financial statements:
(i) HKFRS 9, Financial instruments
The Sub-funds have not applied any new standard or interpretation that is not yet effective for the current accounting period (see note 17), except for the amendments to HKFRS 9, Prepayment features with negative compensation which have been adopted at the same time as HKFRS 9.
As permitted by the transition provisions of HKFRS 9, comparative information throughout these financial statements has not generally been restated to reflect the requirements of the standard.
Except for the changes below, the Sub-funds have consistently applied the accounting policies as set out in note 2 (d) to all periods presented in these financial statements.
HKFRS 9, Financial Instruments
HKFRS 9 sets out requirements for recognising and measuring financial assets, financial liabilities and some contracts to buy or sell non-financial items. This standard replaces HKAS 39 Financial Instruments: Recognition and Measurement.
As a result of the adoption of HKFRS 9, the Sub-funds have adopted consequential amendments to HKAS 1 Presentation of Financial Statements, which require:
– impairment of financial assets to be presented in a separate line item in the statement of comprehensive income. Under HKAS 39, impairment was recognised when losses were incurred. The Sub-funds did not previously report any incurred losses; and
– separate presentation in the statement of comprehensive income of interest revenue from financial assets measured at amortised cost or fair value through other comprehensive income (“FVOCI”) calculated using the effective interest method.
Additionally, the Sub-funds have adopted consequential amendments to HKFRS 7 Financial Instruments: Disclosures, which are applied to disclosures about 2018 but have not generally been applied to comparative information.
The adoption of HKFRS 9 had no material impact on the net assets attributable to unitholders of the Sub-funds.
3 Changes in accounting policies (continued)
(i) HKFRS 9, Financial instruments (continued)
i. Classification and measurement of financial assets and financial liabilities
HKFRS 9 contains three principal classification categories for financial assets: measured at amortised cost, FVOCI and FVTPL. The classification of financial assets under HKFRS 9 is generally based on the business model in which a financial asset is managed and its contractual cash flow characteristics. HKFRS 9 eliminates the previous HKAS 39 categories of held to maturity, loans and receivables and available for sale. Under HKFRS 9, derivatives embedded in contracts where the host is a financial asset in the scope of the standard are never separated. Instead, the hybrid financial instrument as a whole is assessed for classification.
HKFRS 9 largely retains the existing requirements in HKAS 39 for the classification and measurement of financial liabilities.
The adoption of HKFRS 9 has not had a significant effect on the Sub-funds’ accounting policies related to financial liabilities and derivative financial instruments.
For an explanation of how the Sub-funds classify and measure financial instruments and account for related gains and losses under HKFRS 9, see Note 2 (d).
The following table and the accompanying notes explain the original measurement categories under HKAS 39 and the new measurement categories under HKFRS 9 for each class of the Sub-funds financial assets as at 1 January 2018.
Original classification under HKAS 39
New classification under HKFRS 9
Financial assetsBank balances Loans and receivables Amortised costAmounts due from brokers Loans and receivables Amortised costOther receivables Loans and receivables Amortised costAmounts receivable on subcription Loans and receivables Amortised costAmounts receivable from sales of investments Loans and receivables Amortised costDividend receivables Loans and receivables Amortised costAmounts receivable from foreign currency forward contracts Held-for-trading Mandatorily at FVTPLInvestments Designated as at FVTPL Mandatorily at FVTPL
Financial liabilitiesBank overdrafts Amortised cost Amortised costAccruals and other payables Amortised cost Amortised costAmounts payable for purchase of investments Amortised cost Amortised costAmounts payable on redemption Amortised cost Amortised costAmounts payable on foreign currency forward contracts Designated as at FVTPL Designated as at FVTPLNet assets attributable to holders of redeemable shares Amortised cost Amortised cost
Note: Under HKAS 39, unit trust was designated as at FVTPL. They are classified as at FVTPL under HKFRS 9.
The measurement categories for all financial liabilities remain the same. The carrying amounts for all financial liabilities at 1 January 2018 have not been impacted by the initial application of HKFRS 9.
A5請縮小打印70.5%
This page is intentionally left blank
BEA UNION INVESTMENT SERIES
NOTES TO THE FINANCIAL STATEMENTS(EXPRESSED IN UNITED STATES DOLLARS) (CONTINUED)
129
A5請縮小打印70.5%
3 Changes in accounting policies (continued)
(i) HKFRS 9, Financial instruments (continued)
ii. Impairment of financial assets
HKFRS 9 replaces the “incurred loss” model in HKAS 39 with an ECL model. The new impairment model applies to financial assets measured at amortised cost and debt instruments at FVOCI, but not to investments in equity instruments. Under HKFRS 9, credit losses are recognised earlier than under HKAS 39.
The effect of adopting HKFRS 9 on the carrying amounts of financial assets at 1 January 2018 relates solely to the new impairment requirements. The Manager considers the probability of default to be close to zero as the counterparties have a strong capacity to meet their contractual obligations in the near term. There is no impairment allowance recognised on dividend receivables, amounts receivable from sales of investments, amounts receivable on subscription, other receivables, amounts due from brokers and bank balances on the initial application of HKFRS 9’s impairment requirements as at 1 January 2018. Therefore, the carrying amounts of the financial assets remain the same.
iii. Transition
Changes in accounting policies resulting from the adoption of HKFRS 9 have been applied retrospectively, except as described below.
– Comparative periods have not generally been restated. Differences in the carrying amounts of financial asssets resulting from the adoption of HKFRS 9 are recognised in the net assets attributable to unitholders as at 1 January 2018. Accordingly, the information presented for 2017 does not reflect the requirements of HKFRS 9, but rather those of HKAS 39.
– The following assessments have been made on the basis of the facts and circumstances that existed at the date of initial application.
– The determination of the business model within which a financial asset is held.
– The revocation of previous designations of certain financial assets as measured at FVTPL.
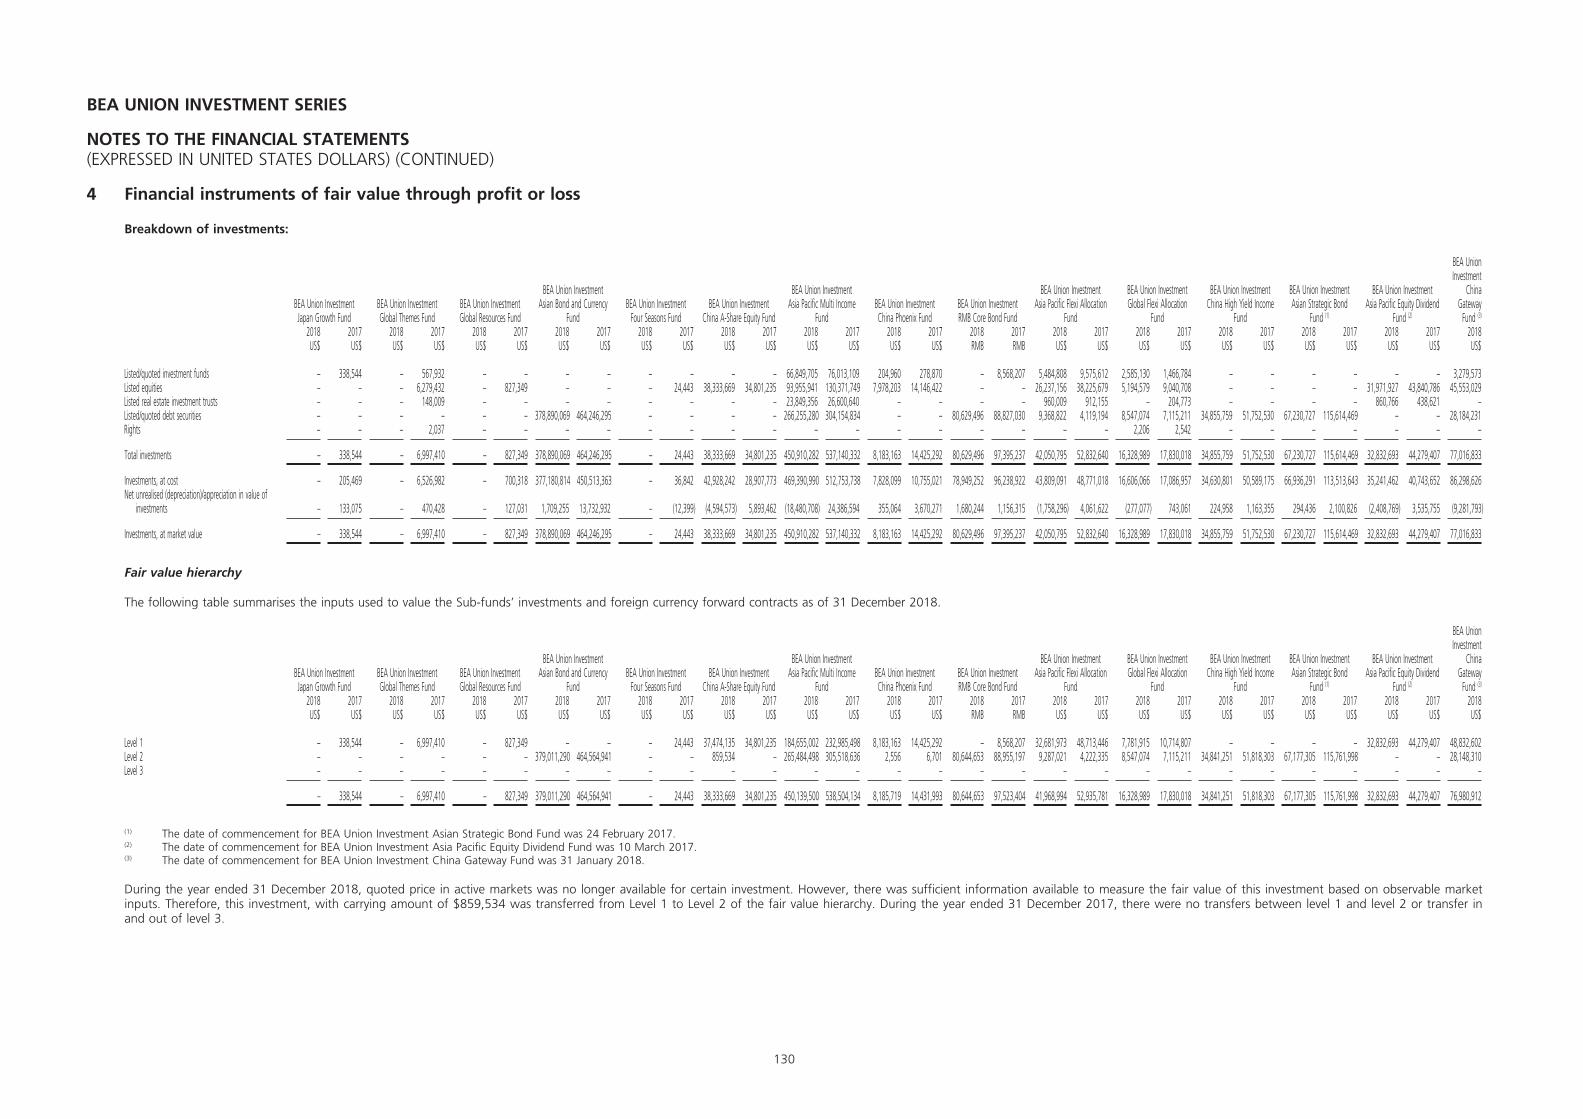
BEA UNION INVESTMENT SERIES
NOTES TO THE FINANCIAL STATEMENTS(EXPRESSED IN UNITED STATES DOLLARS) (CONTINUED)
130
A5請縮小打印70.5%
4 Financial instruments of fair value through profit or loss
Breakdown of investments:
BEA Union Investment Japan Growth Fund
BEA Union Investment Global Themes Fund
BEA Union Investment Global Resources Fund
BEA Union Investment Asian Bond and Currency
FundBEA Union Investment
Four Seasons FundBEA Union Investment
China A-Share Equity Fund
BEA Union Investment Asia Pacific Multi Income
FundBEA Union Investment China Phoenix Fund
BEA Union Investment RMB Core Bond Fund
BEA Union Investment Asia Pacific Flexi Allocation
Fund
BEA Union Investment Global Flexi Allocation
Fund
BEA Union Investment China High Yield Income
Fund
BEA Union Investment Asian Strategic Bond
Fund (1)
BEA Union Investment Asia Pacific Equity Dividend
Fund (2)
BEA Union Investment
China Gateway
Fund (3)
2018 2017 2018 2017 2018 2017 2018 2017 2018 2017 2018 2017 2018 2017 2018 2017 2018 2017 2018 2017 2018 2017 2018 2017 2018 2017 2018 2017 2018US$ US$ US$ US$ US$ US$ US$ US$ US$ US$ US$ US$ US$ US$ US$ US$ RMB RMB US$ US$ US$ US$ US$ US$ US$ US$ US$ US$ US$
Listed/quoted investment funds – 338,544 – 567,932 – – – – – – – – 66,849,705 76,013,109 204,960 278,870 – 8,568,207 5,484,808 9,575,612 2,585,130 1,466,784 – – – – – – 3,279,573Listed equities – – – 6,279,432 – 827,349 – – – 24,443 38,333,669 34,801,235 93,955,941 130,371,749 7,978,203 14,146,422 – – 26,237,156 38,225,679 5,194,579 9,040,708 – – – – 31,971,927 43,840,786 45,553,029Listed real estate investment trusts – – – 148,009 – – – – – – – – 23,849,356 26,600,640 – – – – 960,009 912,155 – 204,773 – – – – 860,766 438,621 –Listed/quoted debt securities – – – – – – 378,890,069 464,246,295 – – – – 266,255,280 304,154,834 – – 80,629,496 88,827,030 9,368,822 4,119,194 8,547,074 7,115,211 34,855,759 51,752,530 67,230,727 115,614,469 – – 28,184,231Rights – – – 2,037 – – – – – – – – – – – – – – – – 2,206 2,542 – – – – – – –
Total investments – 338,544 – 6,997,410 – 827,349 378,890,069 464,246,295 – 24,443 38,333,669 34,801,235 450,910,282 537,140,332 8,183,163 14,425,292 80,629,496 97,395,237 42,050,795 52,832,640 16,328,989 17,830,018 34,855,759 51,752,530 67,230,727 115,614,469 32,832,693 44,279,407 77,016,833
Investments, at cost – 205,469 – 6,526,982 – 700,318 377,180,814 450,513,363 – 36,842 42,928,242 28,907,773 469,390,990 512,753,738 7,828,099 10,755,021 78,949,252 96,238,922 43,809,091 48,771,018 16,606,066 17,086,957 34,630,801 50,589,175 66,936,291 113,513,643 35,241,462 40,743,652 86,298,626Net unrealised (depreciation)/appreciation in value of
investments – 133,075 – 470,428 – 127,031 1,709,255 13,732,932 – (12,399) (4,594,573) 5,893,462 (18,480,708) 24,386,594 355,064 3,670,271 1,680,244 1,156,315 (1,758,296) 4,061,622 (277,077) 743,061 224,958 1,163,355 294,436 2,100,826 (2,408,769) 3,535,755 (9,281,793)
Investments, at market value – 338,544 – 6,997,410 – 827,349 378,890,069 464,246,295 – 24,443 38,333,669 34,801,235 450,910,282 537,140,332 8,183,163 14,425,292 80,629,496 97,395,237 42,050,795 52,832,640 16,328,989 17,830,018 34,855,759 51,752,530 67,230,727 115,614,469 32,832,693 44,279,407 77,016,833
Fair value hierarchy
The following table summarises the inputs used to value the Sub-funds’ investments and foreign currency forward contracts as of 31 December 2018.
BEA Union Investment Japan Growth Fund
BEA Union Investment Global Themes Fund
BEA Union Investment Global Resources Fund
BEA Union Investment Asian Bond and Currency
FundBEA Union Investment
Four Seasons FundBEA Union Investment
China A-Share Equity Fund
BEA Union Investment Asia Pacific Multi Income
FundBEA Union Investment China Phoenix Fund
BEA Union Investment RMB Core Bond Fund
BEA Union Investment Asia Pacific Flexi Allocation
Fund
BEA Union Investment Global Flexi Allocation
Fund
BEA Union Investment China High Yield Income
Fund
BEA Union Investment Asian Strategic Bond
Fund (1)
BEA Union Investment Asia Pacific Equity Dividend
Fund (2)
BEA Union Investment
China Gateway
Fund (3)
2018 2017 2018 2017 2018 2017 2018 2017 2018 2017 2018 2017 2018 2017 2018 2017 2018 2017 2018 2017 2018 2017 2018 2017 2018 2017 2018 2017 2018US$ US$ US$ US$ US$ US$ US$ US$ US$ US$ US$ US$ US$ US$ US$ US$ RMB RMB US$ US$ US$ US$ US$ US$ US$ US$ US$ US$ US$
Level 1 – 338,544 – 6,997,410 – 827,349 – – – 24,443 37,474,135 34,801,235 184,655,002 232,985,498 8,183,163 14,425,292 – 8,568,207 32,681,973 48,713,446 7,781,915 10,714,807 – – – – 32,832,693 44,279,407 48,832,602Level 2 – – – – – – 379,011,290 464,564,941 – – 859,534 – 265,484,498 305,518,636 2,556 6,701 80,644,653 88,955,197 9,287,021 4,222,335 8,547,074 7,115,211 34,841,251 51,818,303 67,177,305 115,761,998 – – 28,148,310Level 3 – – – – – – – – – – – – – – – – – – – – – – – – – – – – –
– 338,544 – 6,997,410 – 827,349 379,011,290 464,564,941 – 24,443 38,333,669 34,801,235 450,139,500 538,504,134 8,185,719 14,431,993 80,644,653 97,523,404 41,968,994 52,935,781 16,328,989 17,830,018 34,841,251 51,818,303 67,177,305 115,761,998 32,832,693 44,279,407 76,980,912
(1) The date of commencement for BEA Union Investment Asian Strategic Bond Fund was 24 February 2017.(2) The date of commencement for BEA Union Investment Asia Pacific Equity Dividend Fund was 10 March 2017.(3) The date of commencement for BEA Union Investment China Gateway Fund was 31 January 2018.
During the year ended 31 December 2018, quoted price in active markets was no longer available for certain investment. However, there was sufficient information available to measure the fair value of this investment based on observable market inputs. Therefore, this investment, with carrying amount of $859,534 was transferred from Level 1 to Level 2 of the fair value hierarchy. During the year ended 31 December 2017, there were no transfers between level 1 and level 2 or transfer in and out of level 3.

BEA UNION INVESTMENT SERIES
NOTES TO THE FINANCIAL STATEMENTS(EXPRESSED IN UNITED STATES DOLLARS) (CONTINUED)
BEA UNION INVESTMENT SERIES
NOTES TO THE FINANCIAL STATEMENTS(EXPRESSED IN UNITED STATES DOLLARS) (CONTINUED)
131 132
A5請縮小打印70.5%
4 Financial instruments of fair value through profit or loss (continued)
Breakdown of investments: (continued)
Fair value hierarchy (continued)
The Sub-funds measure fair values using the following fair value hierarchy that reflects the significance of the inputs used in making the measurements:
Level 1: Inputs that are quoted market prices (unadjusted) in active markets for identical instruments.
Level 2: Inputs other than quoted prices included within Level 1 that are observable either directly (i.e. as prices) or indirectly (i.e. derived from prices). This category includes instruments valued using: quoted market prices in active markets for similar instruments; quoted prices for identical or similar instruments in markets that are considered less than active; or other valuation techniques in which all significant inputs are directly or indirectly observable from market data.
Level 3: Inputs that are unobservable. This category includes all instruments for which the valuation technique includes inputs not based on observable data and the unobservable inputs have a significant effect on the instrument’s valuation. This category includes instruments that are valued based on quoted prices for similar instruments but for which significant unobservable adjustments or assumptions are required to reflect differences between the instruments.
When fair values of listed and quoted investments at the reporting date are based on quoted market prices or binding dealer price quotations in an active market, without any deduction for transaction costs, the instruments are included within Level 1 of the hierarchy. When fair values of fixed income instruments at the reporting date represent quoted prices on markets that are considered less than active, those fixed income instruments are included within Level 2 of the hierarchy.
For investment funds that are not listed, transactions may or may not occur on a regular basis and they are valued by the Sub-funds based on the net asset value (“NAV”) per unit published by the administrators of those underlying investment funds. Such NAV is adjusted when necessary, to reflect the effect of the time passed since the calculation date, liquidity risk, limitations on redemptions and other factors. Depending on the fair value level of the underlying investment funds’ assets and liabilities and whether adjustments are needed, the Sub-funds classify the fair value of those underlying investment funds as either Level 1 or Level 2.
Over-the-counter (“OTC”) derivative contracts include forward contracts related to foreign currencies. Depending on the product and the terms of the transaction, the fair value of the OTC derive products can be modelled taking into account the counterparties’ creditworthiness and using a series of techniques, including simulation models. Many pricing models do not entail material subjectivity because the methodologies employed do not necessitate significant judgements and the pricing inputs are observed from actively quoted markets. Forward foreign exchange contracts valued by the Sub-funds using pricing models fall into this category and are categorised with Level 2 of the fair value hierarchy.
5 Capital management and units in issue
The Sub-funds’ capital is represented by the net assets attributable to unitholders. The Sub-funds have no restrictions on the subscription and redemption of units. Subscriptions and redemptions of units during the year are shown on the statement of changes in net assets attributable to unitholders. In order to achieve the investment objectives, the Sub-funds endeavor to invest subscriptions received in accordance with the investment policies as outlined in the investment report. Redemptions are met by disposals of investments where necessary.
In accordance with the provisions of the Trust Deed, as amended, listed investments and investments with prices quoted in over-the-counter markets or by market makers are stated at the last traded price on the valuation day for the purpose of determining net asset value per unit for subscriptions and redemptions and for various fee calculations. However, as stated in note 2 (d), the accounting policy of the Sub-funds for the purpose of financial statements preparation was to value their investments at the relevant bid market prices at the year end date prior to 1 January 2018. The trustee decided to change the value its investment at the relevant last-traded market prices at the year end date starting from31 December 2018.
In the following table, the 2017 column represents difference between the accounting policy and valuation methodology prescribed in the Trust Deed resulted in the Sub-funds net asset value as at the year end as reported in the financial statements being different from what would have been under the Trust Deed. The 2018 column represents impacts on NAV due to the change of valuing the investments from bid market prices to last-traded market prices.
2018 2017US$ US$
BEA Union Investment Japan Growth Fund US$ – US$ –
BEA Union Investment Global Themes Fund US$ – US$ 2,797
BEA Union Investment Global Resources Fund US$ – US$ 418
BEA Union Investment Asian Bond and Currency Fund US$ 913,219 US$ 1,184,296
BEA Union Investment Four Seasons Fund US$ – US$ 24
BEA Union Investment China A-Share Equity Fund US$ 9,068 US$ 18,585
BEA Union Investment Asia Pacific Multi Income Fund US$ 649,400 US$ 938,006
BEA Union Investment China Phoenix Fund US$ 6,925 US$ 4,131
BEA Union Investment RMB Core Bond Fund RMB 150,707 RMB 216,427
BEA Union Investment Asia Pacific Flexi Allocation Fund US$ 54,035 US$ 60,488
BEA Union Investment Global Flexi Allocation Fund US$ 30,742 US$ 19,089
BEA Union Investment China High Yield Income Fund US$ 89,312 US$ 130,938
BEA Union Investment Asian Strategic Bond Fund (1) US$ 142,549 US$ 286,056
BEA Union Investment Asia Pacific Equity Dividend Fund (2) US$ 34,405 US$ 54,583
BEA Union Investment China Gateway Fund (3) US$ 102,385 US$ –
(1) The date of commencement for BEA Union Investment Asian Strategic Bond Fund was 24 February 2017.(2) The date of commencement for BEA Union Investment Asia Pacific Equity Dividend Fund was 10 March
2017.(3) The date of commencement for BEA Union Investment China Gateway Fund was 31 January 2018.

BEA UNION INVESTMENT SERIES
NOTES TO THE FINANCIAL STATEMENTS(EXPRESSED IN UNITED STATES DOLLARS) (CONTINUED)
133
A5請縮小打印70.5%
5 Capital management and units in issue (continued)
(a) Movement in units in issue
BEA Union Investment Japan Growth Fund
BEA Union Investment Global Themes Fund
BEA Union Investment Global Resources Fund
BEA Union Investment Asian Bond and Currency Fund
BEA Union Investment Four Seasons Fund
BEA Union Investment China A-Share Equity Fund
BEA Union Investment Asia Pacific Multi Income Fund
BEA Union Investment China Phoenix Fund
BEA Union Investment RMB Core Bond Fund
BEA Union Investment Asia Pacific Flexi Allocation
Fund
BEA Union Investment Global Flexi Allocation
Fund
BEA Union Investment China High Yield Income
Fund
BEA Union Investment Asian Strategic Bond
Fund (1)
BEA Union Investment Asia Pacific Equity Dividend
Fund (2)
BEA Union Investment
China Gateway
Fund (3)
2018 2017 2018 2017 2018 2017 2018 2017 2018 2017 2018 2017 2018 2017 2018 2017 2018 2017 2018 2017 2018 2017 2018 2017 2018 2017 2018 2017 2018
Class A
Number of units in issue at beginning of the year/period 34,218.91 47,300.33 507,258.18 831,461.45 917,408.79 1,725,357.54 – – 14,518.89 16,479.67 115,431.36 133,330.96 – – – – – – – – – – – – – – – – –
Units issued during the year/period – – 187.78 25,945.54 – – – – – – 27,512.85 8,303.52 – – – – – – – – – – – – – – – – –Units redeemed during the year/period (34,218.91) (13,081.42) (507,445.96) (350,148.81) (917,408.79) (807,948.75) – – (14,518.89) (1,960.78) (29,722.94) (26,203.12) – – – – – – – – – – – – – – – – –
Number of units in issue at end of the year/period – 34,218.91 – 507,258.18 – 917,408.79 – – – 14,518.89 113,221.27 115,431.36 – – – – – – – – – – – – – – – – –
Class A Accumulating (US$)
Number of units in issue at beginning of the year/period – – – – – – 7,238,908.48 4,563,332.12 – – – – 874,174.41 441,503.73 229,187.42 747,278.74 – – 304,673.12 271,642.32 – – – – 83,766.19 – – – –
Units issued during the year/period – – – – – – 4,018,044.88 5,050,508.36 – – – – 227,173.60 760,488.50 89,932.71 18,687.13 – – 1,126,686.04 682,832.53 – – – – 1,305.92 125,285.47 – – 507,358.65Units redeemed during the year/period – – – – – – (5,682,697.34) (2,374,932.00) – – – – (537,708.41) (327,817.82) (145,398.13) (536,778.45) – – (1,255,953.85) (649,801.73) – – – – (20,800.75) (41,519.28) – – (368,431.91)
Number of units in issue at end of the year/period – – – – – – 5,574,256.02 7,238,908.48 – – – – 563,639.60 874,174.41 173,722.00 229,187.42 – – 175,405.31 304,673.12 – – – – 64,271.36 83,766.19 – – 138,926.74
Class A Accumulating (HK$)
Number of units in issue at beginning of the year/period – – – – – – – – – – – – – – 718,278.72 1,173,782.84 – – – – – – – – – – – – –
Units issued during the year/period – – – – – – – – – – – – – – 160,469.55 34,002.59 – – – – – – – – – – – – –Units redeemed during the year/period – – – – – – – – – – – – – – (355,415.19) (489,506.71) – – – – – – – – – – – – –
Number of units in issue at end of the year/period – – – – – – – – – – – – – – 523,333.08 718,278.72 – – – – – – – – – – – – –
Class A Accumulating Hedged (EUR)
Number of units in issue at beginning of the year/period – – – – – – – – – – – – – – – – – – – – – – – – – – – – –
Units issued during the year/period – – – – – – 5,000.00 – – – – – 5,000.00 – – – – – – – – – – – – – – – –Units redeemed during the year/period – – – – – – – – – – – – – – – – – – – – – – – – – – – – –
Number of units in issue at end of the year/period – – – – – – 5,000.00 – – – – – 5,000.00 – – – – – – – – – – – – – – – –
Class A Accumulating Hedged (RMB)
Number of units in issue at beginning of the year/period – – – – – – – – – – – – – – 65,016.66 132,820.04 – – – – – – – – – – – – –
Units issued during the year/period – – – – – – 1,377,066.03 – – – – – 29,469.54 – 50,364.06 13,249.14 – – – – – – – – – – – – –Units redeemed during the year/period – – – – – – (136,804.21) – – – – – – – (54,272.49) (81,052.52) – – – – – – – – – – – – –
Number of units in issue at end of the year/period – – – – – – 1,240,261.82 – – – – – 29,469.54 – 61,108.23 65,016.66 – – – – – – – – – – – – –
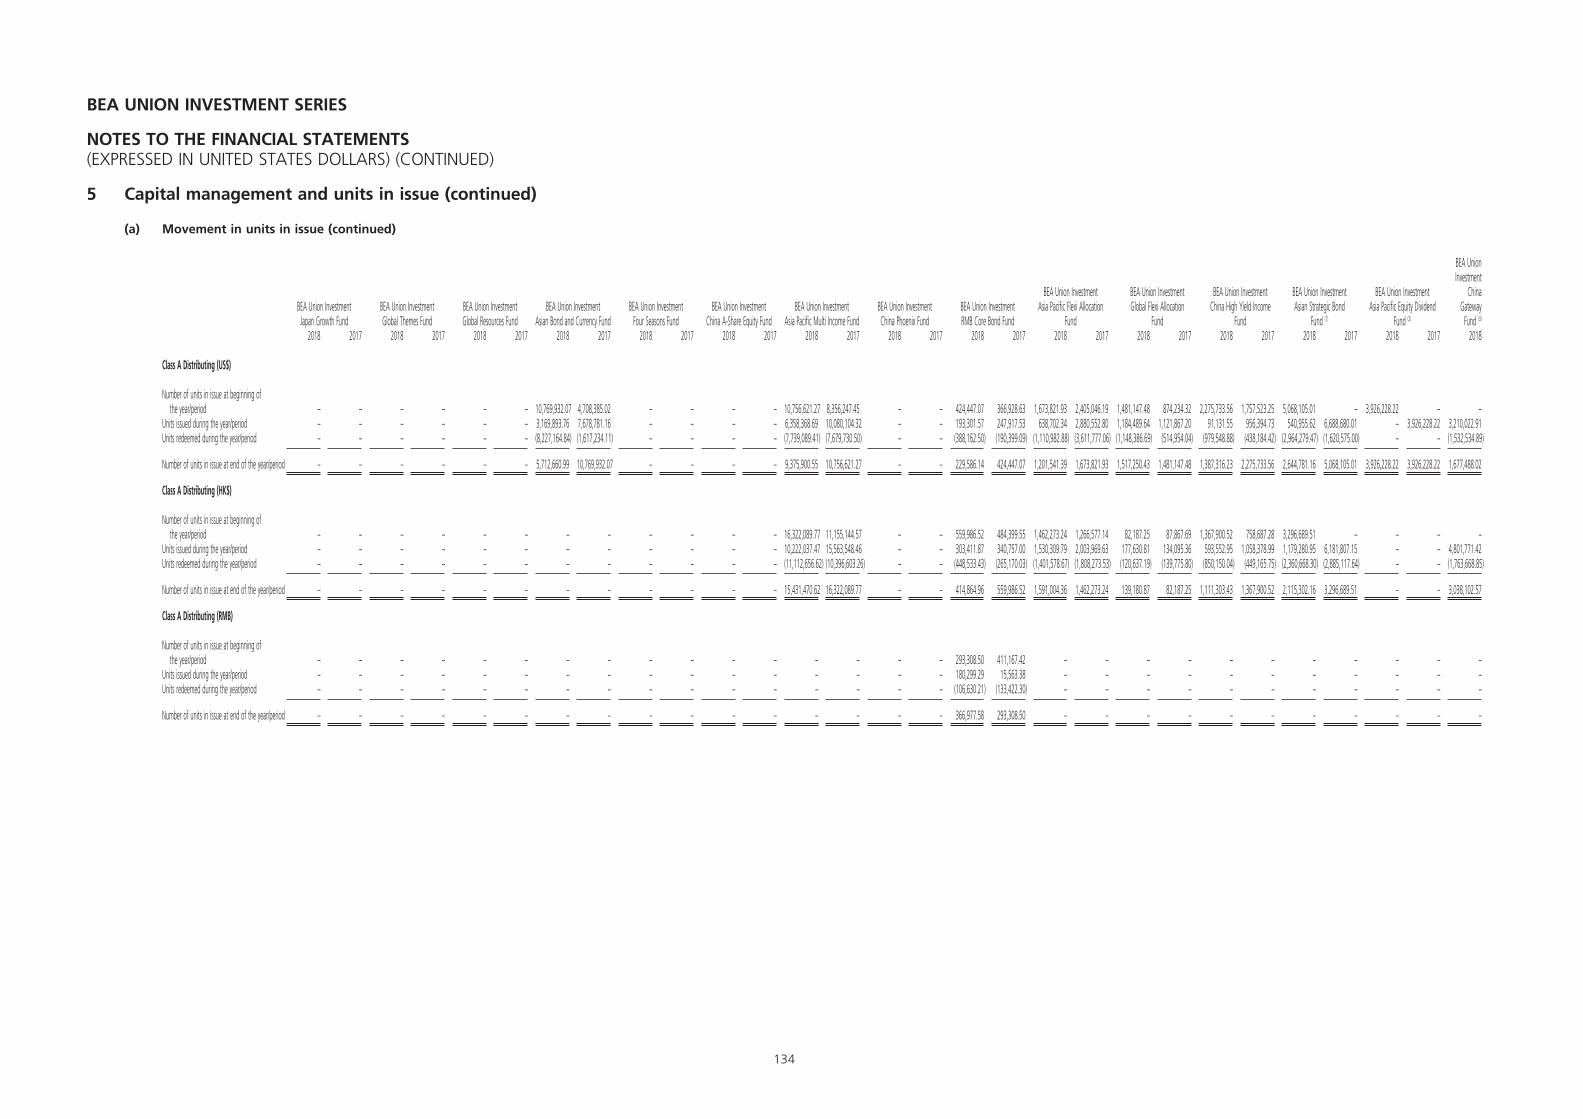
BEA UNION INVESTMENT SERIES
NOTES TO THE FINANCIAL STATEMENTS(EXPRESSED IN UNITED STATES DOLLARS) (CONTINUED)
134
A5請縮小打印70.5%
5 Capital management and units in issue (continued)
(a) Movement in units in issue (continued)
BEA Union Investment Japan Growth Fund
BEA Union Investment Global Themes Fund
BEA Union Investment Global Resources Fund
BEA Union Investment Asian Bond and Currency Fund
BEA Union Investment Four Seasons Fund
BEA Union Investment China A-Share Equity Fund
BEA Union Investment Asia Pacific Multi Income Fund
BEA Union Investment China Phoenix Fund
BEA Union Investment RMB Core Bond Fund
BEA Union Investment Asia Pacific Flexi Allocation
Fund
BEA Union Investment Global Flexi Allocation
Fund
BEA Union Investment China High Yield Income
Fund
BEA Union Investment Asian Strategic Bond
Fund (1)
BEA Union Investment Asia Pacific Equity Dividend
Fund (2)
BEA Union Investment
China Gateway
Fund (3)
2018 2017 2018 2017 2018 2017 2018 2017 2018 2017 2018 2017 2018 2017 2018 2017 2018 2017 2018 2017 2018 2017 2018 2017 2018 2017 2018 2017 2018
Class A Distributing (US$)
Number of units in issue at beginning of the year/period – – – – – – 10,769,932.07 4,708,385.02 – – – – 10,756,621.27 8,356,247.45 – – 424,447.07 366,928.63 1,673,821.93 2,405,046.19 1,481,147.48 874,234.32 2,275,733.56 1,757,523.25 5,068,105.01 – 3,926,228.22 – –
Units issued during the year/period – – – – – – 3,169,893.76 7,678,781.16 – – – – 6,358,368.69 10,080,104.32 – – 193,301.57 247,917.53 638,702.34 2,880,552.80 1,184,489.64 1,121,867.20 91,131.55 956,394.73 540,955.62 6,688,680.01 – 3,926,228.22 3,210,022.91Units redeemed during the year/period – – – – – – (8,227,164.84) (1,617,234.11) – – – – (7,739,089.41) (7,679,730.50) – – (388,162.50) (190,399.09) (1,110,982.88) (3,611,777.06) (1,148,386.69) (514,954.04) (979,548.88) (438,184.42) (2,964,279.47) (1,620,575.00) – – (1,532,534.89)
Number of units in issue at end of the year/period – – – – – – 5,712,660.99 10,769,932.07 – – – – 9,375,900.55 10,756,621.27 – – 229,586.14 424,447.07 1,201,541.39 1,673,821.93 1,517,250.43 1,481,147.48 1,387,316.23 2,275,733.56 2,644,781.16 5,068,105.01 3,926,228.22 3,926,228.22 1,677,488.02
Class A Distributing (HK$)
Number of units in issue at beginning of the year/period – – – – – – – – – – – – 16,322,089.77 11,155,144.57 – – 559,986.52 484,399.55 1,462,273.24 1,266,577.14 82,187.25 87,867.69 1,367,900.52 758,687.28 3,296,689.51 – – – –
Units issued during the year/period – – – – – – – – – – – – 10,222,037.47 15,563,548.46 – – 303,411.87 340,757.00 1,530,309.79 2,003,969.63 177,630.81 134,095.36 593,552.95 1,058,378.99 1,179,280.95 6,181,807.15 – – 4,801,771.42Units redeemed during the year/period – – – – – – – – – – – – (11,112,656.62) (10,396,603.26) – – (448,533.43) (265,170.03) (1,401,578.67) (1,808,273.53) (120,637.19) (139,775.80) (850,150.04) (449,165.75) (2,360,668.30) (2,885,117.64) – – (1,763,668.85)
Number of units in issue at end of the year/period – – – – – – – – – – – – 15,431,470.62 16,322,089.77 – – 414,864.96 559,986.52 1,591,004.36 1,462,273.24 139,180.87 82,187.25 1,111,303.43 1,367,900.52 2,115,302.16 3,296,689.51 – – 3,038,102.57
Class A Distributing (RMB)
Number of units in issue at beginning of the year/period – – – – – – – – – – – – – – – – 293,308.50 411,167.42 – – – – – – – – – – –
Units issued during the year/period – – – – – – – – – – – – – – – – 180,299.29 15,563.38 – – – – – – – – – – –Units redeemed during the year/period – – – – – – – – – – – – – – – – (106,630.21) (133,422.30) – – – – – – – – – – –
Number of units in issue at end of the year/period – – – – – – – – – – – – – – – – 366,977.58 293,308.50 – – – – – – – – – – –
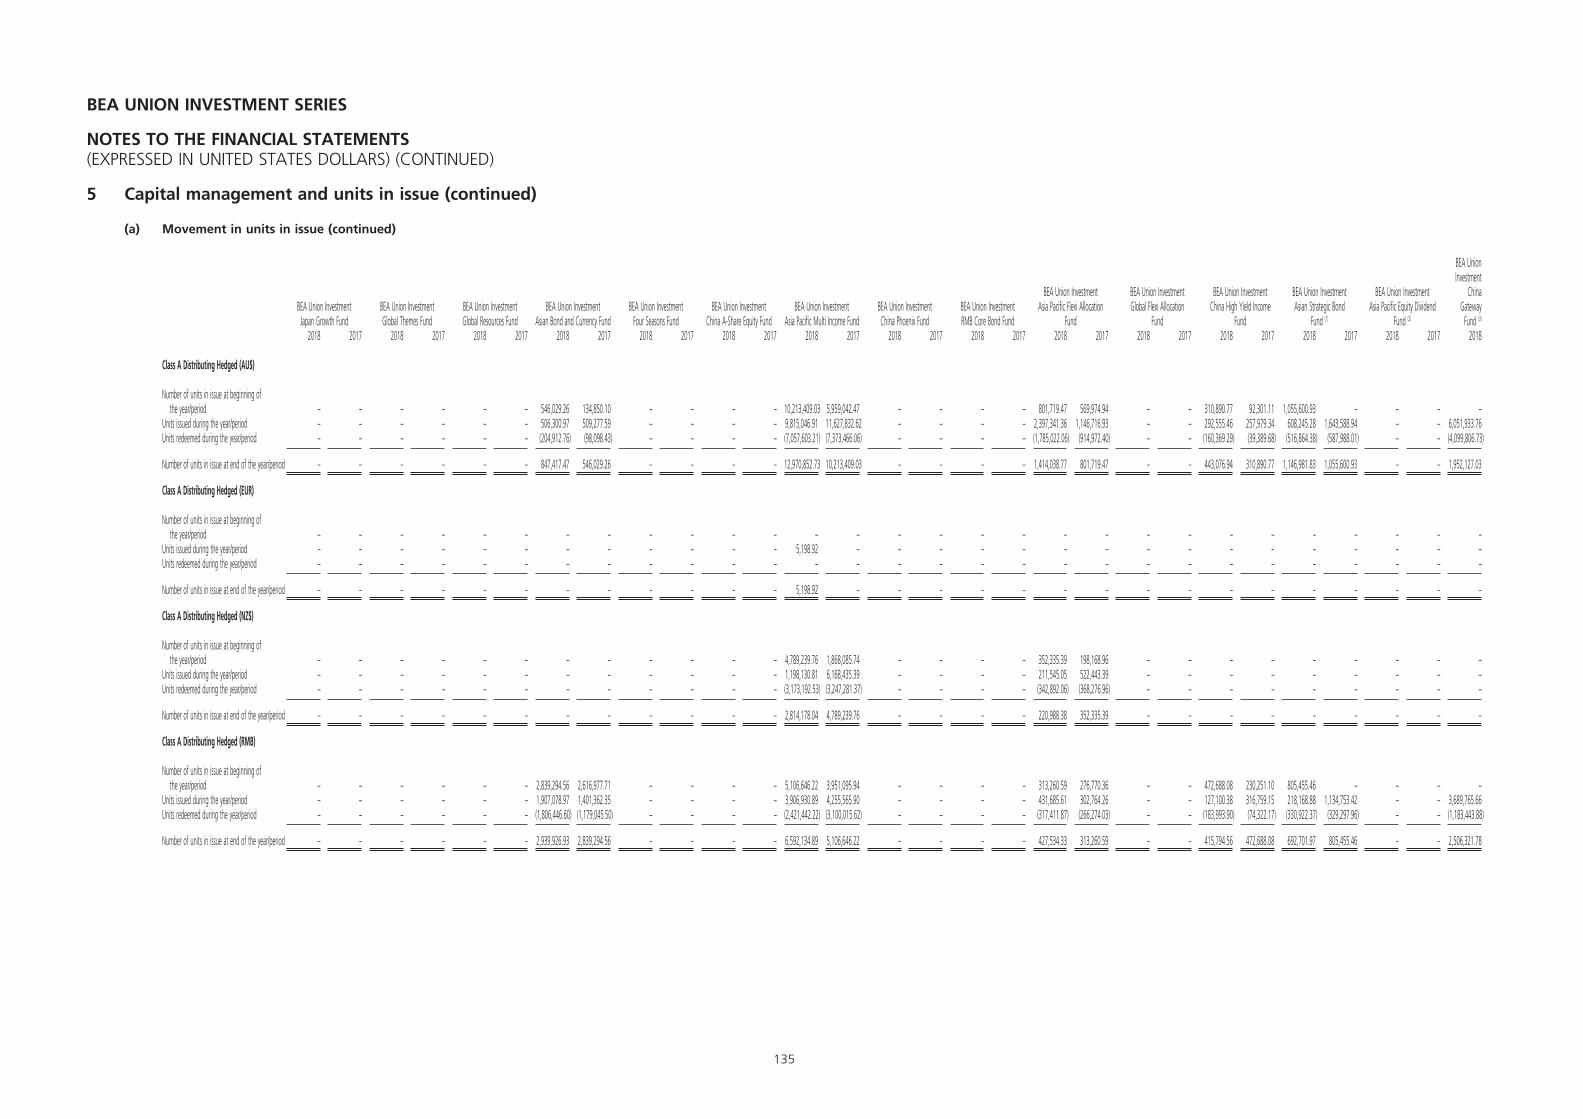
BEA UNION INVESTMENT SERIES
NOTES TO THE FINANCIAL STATEMENTS(EXPRESSED IN UNITED STATES DOLLARS) (CONTINUED)
135
A5請縮小打印70.5%
5 Capital management and units in issue (continued)
(a) Movement in units in issue (continued)
BEA Union Investment Japan Growth Fund
BEA Union Investment Global Themes Fund
BEA Union Investment Global Resources Fund
BEA Union Investment Asian Bond and Currency Fund
BEA Union Investment Four Seasons Fund
BEA Union Investment China A-Share Equity Fund
BEA Union Investment Asia Pacific Multi Income Fund
BEA Union Investment China Phoenix Fund
BEA Union Investment RMB Core Bond Fund
BEA Union Investment Asia Pacific Flexi Allocation
Fund
BEA Union Investment Global Flexi Allocation
Fund
BEA Union Investment China High Yield Income
Fund
BEA Union Investment Asian Strategic Bond
Fund (1)
BEA Union Investment Asia Pacific Equity Dividend
Fund (2)
BEA Union Investment
China Gateway
Fund (3)
2018 2017 2018 2017 2018 2017 2018 2017 2018 2017 2018 2017 2018 2017 2018 2017 2018 2017 2018 2017 2018 2017 2018 2017 2018 2017 2018 2017 2018
Class A Distributing Hedged (AU$)
Number of units in issue at beginning of the year/period – – – – – – 546,029.26 134,850.10 – – – – 10,213,409.03 5,959,042.47 – – – – 801,719.47 569,974.94 – – 310,890.77 92,301.11 1,055,600.93 – – – –
Units issued during the year/period – – – – – – 506,300.97 509,277.59 – – – – 9,815,046.91 11,627,832.62 – – – – 2,397,341.36 1,146,716.93 – – 292,555.46 257,979.34 608,245.28 1,643,588.94 – – 6,051,933.76Units redeemed during the year/period – – – – – – (204,912.76) (98,098.43) – – – – (7,057,603.21) (7,373,466.06) – – – – (1,785,022.06) (914,972.40) – – (160,369.29) (39,389.68) (516,864.38) (587,988.01) – – (4,099,806.73)
Number of units in issue at end of the year/period – – – – – – 847,417.47 546,029.26 – – – – 12,970,852.73 10,213,409.03 – – – – 1,414,038.77 801,719.47 – – 443,076.94 310,890.77 1,146,981.83 1,055,600.93 – – 1,952,127.03
Class A Distributing Hedged (EUR)
Number of units in issue at beginning of the year/period – – – – – – – – – – – – – – – – – – – – – – – – – – – – –
Units issued during the year/period – – – – – – – – – – – – 5,198.92 – – – – – – – – – – – – – – – –Units redeemed during the year/period – – – – – – – – – – – – – – – – – – – – – – – – – – – – –
Number of units in issue at end of the year/period – – – – – – – – – – – – 5,198.92 – – – – – – – – – – – – – – – –
Class A Distributing Hedged (NZ$)
Number of units in issue at beginning of the year/period – – – – – – – – – – – – 4,789,239.76 1,868,085.74 – – – – 352,335.39 198,168.96 – – – – – – – – –
Units issued during the year/period – – – – – – – – – – – – 1,198,130.81 6,168,435.39 – – – – 211,545.05 522,443.39 – – – – – – – – –Units redeemed during the year/period – – – – – – – – – – – – (3,173,192.53) (3,247,281.37) – – – – (342,892.06) (368,276.96) – – – – – – – – –
Number of units in issue at end of the year/period – – – – – – – – – – – – 2,814,178.04 4,789,239.76 – – – – 220,988.38 352,335.39 – – – – – – – – –
Class A Distributing Hedged (RMB)
Number of units in issue at beginning of the year/period – – – – – – 2,839,294.56 2,616,977.71 – – – – 5,106,646.22 3,951,095.94 – – – – 313,260.59 276,770.36 – – 472,688.08 230,251.10 805,455.46 – – – –
Units issued during the year/period – – – – – – 1,907,078.97 1,401,362.35 – – – – 3,906,930.89 4,255,565.90 – – – – 431,685.61 302,764.26 – – 127,100.38 316,759.15 218,168.88 1,134,753.42 – – 3,689,765.66Units redeemed during the year/period – – – – – – (1,806,446.60) (1,179,045.50) – – – – (2,421,442.22) (3,100,015.62) – – – – (317,411.87) (266,274.03) – – (183,993.90) (74,322.17) (330,922.37) (329,297.96) – – (1,183,443.88)
Number of units in issue at end of the year/period – – – – – – 2,939,926.93 2,839,294.56 – – – – 6,592,134.89 5,106,646.22 – – – – 427,534.33 313,260.59 – – 415,794.56 472,688.08 692,701.97 805,455.46 – – 2,506,321.78
BEA UNION INVESTMENT SERIES
NOTES TO THE FINANCIAL STATEMENTS(EXPRESSED IN UNITED STATES DOLLARS) (CONTINUED)
136
A5請縮小打印70.5%
5 Capital management and units in issue (continued)
(a) Movement in units in issue (continued)
BEA Union Investment Japan Growth Fund
BEA Union Investment Global Themes Fund
BEA Union Investment Global Resources Fund
BEA Union Investment Asian Bond and Currency Fund
BEA Union Investment Four Seasons Fund
BEA Union Investment China A-Share Equity Fund
BEA Union Investment Asia Pacific Multi Income Fund
BEA Union Investment China Phoenix Fund
BEA Union Investment RMB Core Bond Fund
BEA Union Investment Asia Pacific Flexi Allocation
Fund
BEA Union Investment Global Flexi Allocation
Fund
BEA Union Investment China High Yield Income
Fund
BEA Union Investment Asian Strategic Bond
Fund (1)
BEA Union Investment Asia Pacific Equity Dividend
Fund (2)
BEA Union Investment
China Gateway
Fund (3)
2018 2017 2018 2017 2018 2017 2018 2017 2018 2017 2018 2017 2018 2017 2018 2017 2018 2017 2018 2017 2018 2017 2018 2017 2018 2017 2018 2017 2018
Class H Distributing (HK$)
Number of units in issue at beginning of the year/period – – – – – – 65,488,733.51 28,711,011.93 – – – – – – – – – – – – – – – – – – – – –
Units issued during the year/period – – – – – – 20,448,499.82 48,222,983.81 – – – – – – – – – – – – – – – – – – – – –Units redeemed during the year/period – – – – – – (28,687,812.09) (11,445,262.23) – – – – – – – – – – – – – – – – – – – – –
Number of units in issue at end of the year/period – – – – – – 57,249,421.24 65,488,733.51 – – – – – – – – – – – – – – – – – – – – –
Class I
Number of units in issue at beginning of the year/period – – – – – – 939,076.00 – – – 1,915,385.60 2,972,983.80 – – – – – – – – – – – – – – – – –
Units issued during the year/period – – – – – – 5,177,981.02 939,076.00 – – 1,399,068.90 1,625,073.74 – – – – – – – – – – – – – – – – –Units redeemed during the year/period – – – – – – (2,167,409.44) – – – (21,699.19) (2,682,671.94) – – – – – – – – – – – – – – – – –
Number of units in issue at end of the year/period – – – – – – 3,949,647.58 939,076.00 – – 3,292,755.31 1,915,385.60 – – – – – – – – – – – – – – – – –
Class P
Number of units in issue at beginning of the year/period – – – – – – – – – – 92,330.54 117,330.54 – – – – – – – – – – – – – – – – –
Units issued during the year/period – – – – – – – – – – – – – – – – – – – – – – – – – – – – –Units redeemed during the year/period – – – – – – – – – – – (25,000.00) – – – – – – – – – – – – – – – – –
Number of units in issue at end of the year/period – – – – – – – – – – 92,330.54 92,330.54 – – – – – – – – – – – – – – – – –
(1) The date of commencement for BEA Union Investment Asian Strategic Bond Fund was 24 February 2017.(2) The date of commencement for BEA Union Investment Asia Pacific Equity Dividend Fund was 10 March 2017.(3) The date of commencement for BEA Union Investment China Gateway Fund was 31 January 2018.
BEA UNION INVESTMENT SERIES
NOTES TO THE FINANCIAL STATEMENTS(EXPRESSED IN UNITED STATES DOLLARS) (CONTINUED)
BEA UNION INVESTMENT SERIES
NOTES TO THE FINANCIAL STATEMENTS(EXPRESSED IN UNITED STATES DOLLARS) (CONTINUED)
137 138
A5請縮小打印70.5%
5 Capital management and units in issue (continued)
(a) Movement in units in issue (continued)
The capital of the Sub-funds is represented by redeemable participating units. As a result of the ability to issue and redeem units, the capital of the Sub-funds can vary depending on the demand for redemptions and subscriptions to the Sub-funds. The Sub-funds are not subject to externally imposed capital requirements and restrictions on the issue and redemption of units.
The Sub-funds’ objectives for managing capital are:
– To safeguard capital while achieving returns by investing in accordance with the Sub-funds’ investment objectives, descriptions, risk exposures and expected returns indicated in the Explanatory Memorandum.
– To maintain sufficient liquidity to meet the expenses of the Sub-funds, and to meet redemption requests as they arise.
– To maintain sufficient size to make the operation of the Sub-funds cost-efficient.
The Manager manages the capital of the Sub-funds in accordance with the Sub-funds’ investment objectives and policies. With a view to protecting the interests of unitholders, the Manager is entitled at its discretion and with the approval of the Bank of East Asia (Trustees) Limited (“the Trustee”) to limit the number of units in any sub-fund redeemed on any dealing day to 10% of the total number of units of that sub-fund in issue.
(b) According to the Explanatory Memorandum of the Sub-funds, Class A Distributing (HK$) of BEA Union Investment Asia Pacific Multi Income Fund, Class H Distributing (HK$) of BEA Union Investment Asian Bond and Currency Fund, Class A Accumulating (HK$) of BEA Union Investment China Phoenix Fund, Class A Distributing (HK$) of BEA Union Investment RMB Core Bond Fund, Class A Distributing (HK$) of BEA Union Investment Asia Pacific Flexi Allocation Fund, Class A Distributing (HK$) of BEA Union Investment Global Flexi Allocation Fund, Class A Distributing (HK$) of BEA Union Investment China High Yield Income Fund, Class A Distributing (HK$) of BEA Union Investment Asian Strategic Bond Fund and Class A Distributing (HK$) of BEA Union Investment China Gateway Fund are denominated in Hong Kong dollar for dealing, which is different from the presentation currency of these Sub-funds. The net asset values per unit for Class A Distributing (HK$) of BEA Union Investment Asia Pacific Multi Income Fund, Class H Distributing (HK$) of BEA Union Investment Asian Bond and Currency Fund, Class A Accumulating (HK$) of BEA Union Investment China Phoenix Fund, Class A Distributing (HK$) of BEA Union Investment RMB Core Bond Fund, Class A Distributing (HK$) of BEA Union Investment Asia Pacific Flexi Allocation Fund, Class A Distributing (HK$) of BEA Union Investment Global Flexi Allocation Fund, Class A Distributing (HK$) of BEA Union Investment China High Yield Income Fund, Class A Distributing (HK$) of BEA Union Investment Asian Strategic Bond Fund and Class A Distributing (HK$) of BEA Union Invesment China Gateway Fund in their denomination currency at the end of the reporting period are HK$97.56, HK$10.73, HK$93.11, HK$87.50, HK$85.87, HK$102.31, HK$97.57, HK$95.82 and HK$76.60 (2017: HK$110.25, HK$11.57, HK$115.37, HK$92.54, HK$103.66, HK$114.01, HK$105.54, HK$101.76 and HK$nil) respectively.
5 Capital management and units in issue (continued)
(b) (continued)
Class A Distributing Hedged (AU$) of BEA Union Investment Asia Pacific Multi Income Fund, Class A Distributing Hedged (AU$) of BEA Union Investment Asian Bond and Currency Fund, Class A Distributing Hedged (AU$) of BEA Union Investment Asia Pacific Flexi Allocation Fund, Class A Distributing Hedged (AU$) of BEA Union Investment China High Yield Income Fund, Class A Distributing Hedged (AU$) of BEA Union Investment Asian Strategic Bond Fund and Class A Distributing Hedged (AU$) of BEA Union Investment China Gateway Fund are denominated in Australian dollar for dealing, which is different from the presentation currency of these sub-funds. The net asset value per unit for Class A Distributing Hedged (AU$) of BEA Union Investment Asia Pacific Multi Income Fund, Class A Distributing Hedged (AU$) of BEA Union Investment Asian Bond and Currency Fund, Class A Distributing Hedged (AU$) of BEA Union Investment Asia Pacific Flexi Allocation Fund, Class A Distributing Hedged (AU$) of BEA Union Investment China High Yield Income Fund, Class A Distributing Hedged (AU$) of BEA Union Investment Asian Strategic Bond Fund and Class A Distributing Hedge (AU$) of BEA Union Investment China Gateway Fund at the end of the reporting period are AU$7.92, AU$9.71, AU$7.66, AU$9.17, AU$9.10 and AU$7.52 (2017: AU$9.21, AU$10.73, AU$9.61, AU$10.22, AU$9.96 and AU$nil) respectively.
Class A Accumulating Hedged (EUR) and Class A Distributing Hedged (EUR) of BEA Union Investment Asia Pacific Multi Income Fund and Class A Accumulating Hedged (EUR) of BEA Union Investment Asian Bond and Currency Fund are denominated in Euro for dealing, which is different from the presentation currency of these sub-funds. The net value per unit for Class A Accumulating Hedged (EUR) and Class A Distributing Hedged (EUR) of BEA Union Investment Asia Pacific Multi Income Fund and Class A Accumulating Hedged (EUR) of BEA Union Investment Asian Bond and Currency Fund at the end of the reporting period are €9.47, €9.34 and €9.81 (2017: €nil, €nil and €nil) respectively.
Class A Distributing Hedged (NZ$) of BEA Union Investment Asia Pacific Multi Income Fund and Class A Distributing Hedged (NZ$) of BEA Union Investment Asia Pacific Flexi Allocation Fund are denominated in New Zealand dollar, which is different from the presentation currency of these sub-funds. The net asset value per unit for Class A Distributing Hedged (NZ$) of BEA Union Investment Asia Pacific Multi Income Fund and Class A Distributing Hedged (NZ$) of BEA Union Investment Asia Pacific Flexi Allocation Fund at the end of the reporting period are NZ$7.96 and NZ$7.77 (2017: NZ$9.25 and NZ$9.65) respectively.
A5請縮小打印70.5%
This page is intentionally left blank
BEA UNION INVESTMENT SERIES
NOTES TO THE FINANCIAL STATEMENTS(EXPRESSED IN UNITED STATES DOLLARS) (CONTINUED)
139
A5請縮小打印70.5%
5 Capital management and units in issue (continued)
(b) (continued)
Class A Accumulating Hedged (RMB) and Class A Distributing Hedged (RMB) of BEA Union Investment Asia Pacific Multi Income Fund, Class A Accumulating Hedged (RMB) and Class A Distributing Hedged (RMB) of BEA Union Investment Asian Bond and Currency Fund, Class A Accumulating Hedged (RMB) of BEA Union Investment China Phoenix Fund, Class A Distributing Hedged (RMB) of BEA Union Investment Asia Pacific Flexi Allocation Fund, Class A Distributing Hedged (RMB) of BEA Union Investment China High Yield Income Fund, Class A Distributing Hedged (RMB) of BEA Union Investment Asian Strategic Bond Fund and Class A Distributing Hedged (RMB) of BEA Union Invesment China Gateway Fund are denominated in RMB, which is different from the presentation currency of these sub-funds. The net asset value per unit for Class A Accumulating Hedged (RMB) and Class A Distributing Hedged (RMB) of BEA Union Investment Asia Pacific Multi Income Fund, Class A Accumulating Hedged (RMB) and Class A Distributing Hedged (RMB) of BEA Union Investment Asian Bond and Currency Fund, Class A Accumulating Hedged (RMB) of BEA Union Investment China Phoenix Fund, Class A Distributing Hedged (RMB) of BEA Union Investment Asia Pacific Flexi Allocation Fund, Class A Distributing Hedged (RMB) of BEA Union Investment China High Yield Income Fund, Class A Distributing Hedged (RMB) of BEA Union Investment Asian Strategic Bond Fund, and Class A Distributing Hedged (RMB) of BEA Union Investment China Gateway Fund at the end of the reporting period are ¥100.27, ¥85.86, ¥98.73, ¥102.89, ¥96.27, ¥84.98, ¥95.74, ¥94.32 and ¥75.72 (2017: ¥nil, ¥98.17, ¥nil, ¥112.13, ¥118.79, ¥104.05, ¥105.05, ¥101.47 and ¥nil) respectively.
Class A Distributing (US$) of BEA Union Investment RMB Core Bond Fund is denominated in USD, which is different from the presentation currency of the sub-fund. The net asset value per unit for Class A Distributing (US$) of BEA Union Investment RMB Core Bond Fund at the end of the reporting period is US$8.67 (2017: US$9.19).
BEA UNION INVESTMENT SERIES
NOTES TO THE FINANCIAL STATEMENTS(EXPRESSED IN UNITED STATES DOLLARS) (CONTINUED)
140
A5請縮小打印70.5%
6 Net asset value of the Sub-funds
The Trustee and the Manager would like to highlight that the net asset value presented in the financial statements and that quoted for pricing purposes at the date of the statement of assets and liabilities (“Dealing NAV”) are different due to the principles for calculating the Dealing NAV as set out in the Explanatory Memorandum document being different from that as stated in note 2 (d) and required for financial reporting purposes. The following reconciliation provides details of these differences:
BEA Union Investment Japan Growth Fund
BEA Union Investment Global Themes Fund
BEA Union Investment Global Resources Fund
BEA Union Investment Asian Bond and Currency Fund
BEA Union Investment Four Seasons Fund
BEA Union Investment China A-Share Equity Fund
BEA Union Investment Asia Pacific Multi Income Fund
BEA Union Investment China Phoenix Fund
BEA Union Investment RMB Core Bond Fund
BEA Union Investment Asia Pacific Flexi Allocation
Fund
BEA Union Investment Global Flexi Allocation
Fund
BEA Union Investment China High Yield Income
Fund
BEA Union Investment Asian Strategic Bond
Fund (1)
BEA Union Investment Asia Pacific Equity Dividend
Fund (2)
BEA Union Investment
China Gateway
Fund (3)
2018 2017 2018 2017 2018 2017 2018 2017 2018 2017 2018 2017 2018 2017 2018 2017 2018 2017 2018 2017 2018 2017 2018 2017 2018 2017 2018 2017 2018US$ US$ US$ US$ US$ US$ US$ US$ US$ US$ US$ US$ US$ US$ US$ US$ RMB RMB US$ US$ US$ US$ US$ US$ US$ US$ US$ US$ US$
NAV as reported in the financial statements as at 31 December – 335,037 – 6,925,801 – 834,681 387,585,829 482,385,362 – 90,944 42,554,520 34,916,802 460,539,531 542,067,120 8,686,471 14,416,224 81,682,746 97,549,990 43,467,161 53,540,505 17,264,855 18,029,268 35,907,738 52,400,375 68,524,398 115,756,823 34,614,008 44,536,115 81,630,669Use of latest available traded pricing instead of bid pricing in
valuing investment – – – 2,797 – 418 – 1,184,296 – 24 – 18,585 – 938,006 – 4,131 – 216,427 – 60,488 – 19,089 – 130,938 – 286,056 – 54,583 –
Dealing NAV as at 31 December – 335,037 – 6,928,598 – 835,099 387,585,829 483,569,658 – 90,968 42,554,520 34,935,387 460,539,531 543,005,126 8,686,471 14,420,355 81,682,746 97,766,417 43,467,161 53,600,993 17,264,855 18,048,357 35,907,738 52,531,313 68,524,398 116,042,879 34,614,008 44,590,698 81,630,669
(1) The date of commencement for BEA Union Investment Asian Strategic Bond Fund was 24 February 2017.(2) The date of commencement for BEA Union Investment Asia Pacific Equity Dividend Fund was 10 March 2017.(3) The date of commencement for BEA Union Investment China Gateway Fund was 31 January 2018.
7 Transactions with the Manager, the Trustee and Connected Persons
The following is a summary of significant related party transactions or transactions entered into during the year between the Sub-funds and the Manager, the Trustee and their Connected Persons. Connected Persons are those as defined in the Code on Unit Trusts and Mutual Funds issued by the SFC. All transactions during the year between the Sub-funds and the Manager, the Trustee and their Connected Persons were entered into in the ordinary course of business and under normal commercial terms. To the best of the knowledge of the Manager and the Trustee, the Sub-funds did not have any other transactions with Connected Persons except for those disclosed below.
(a) Bank accounts are maintained with The Bank of East Asia, Limited which is the immediate parent and ultimate holding company of the Manager and the Trustee. There are no balances of these accounts arising therefrom for the year ended 31 December 2018 and 31 December 2017.
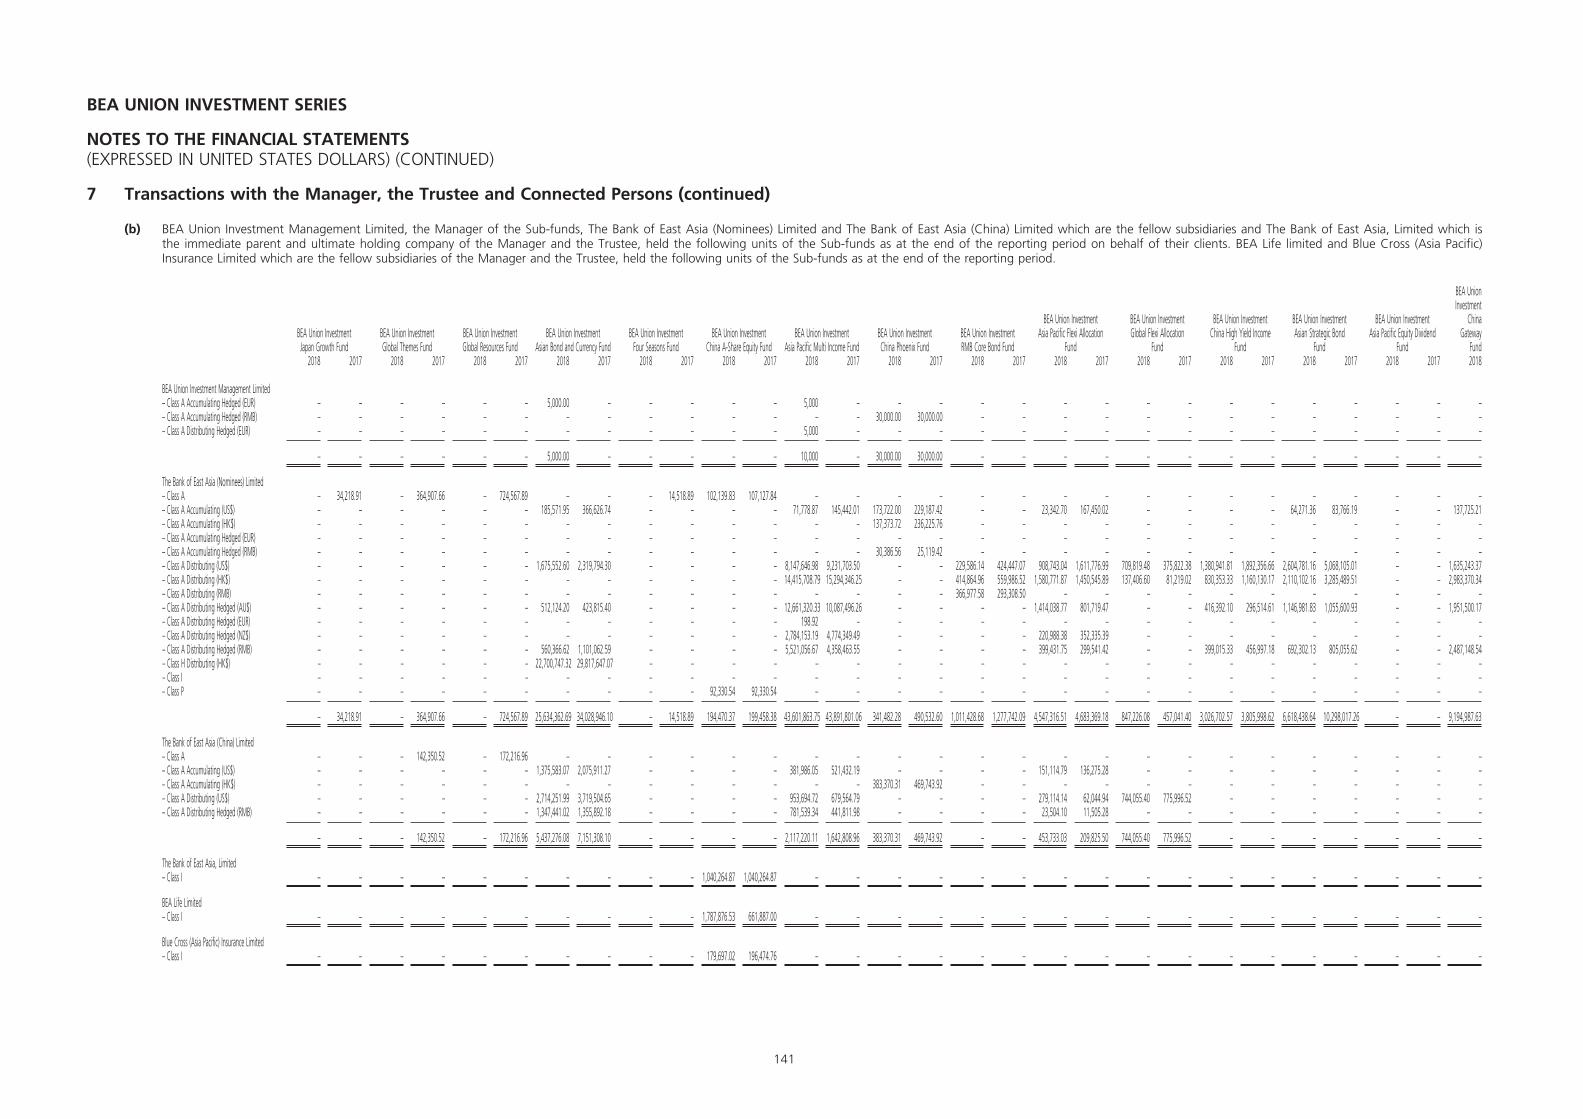
BEA UNION INVESTMENT SERIES
NOTES TO THE FINANCIAL STATEMENTS(EXPRESSED IN UNITED STATES DOLLARS) (CONTINUED)
141
A5請縮小打印70.5%
7 Transactions with the Manager, the Trustee and Connected Persons (continued)
(b) BEA Union Investment Management Limited, the Manager of the Sub-funds, The Bank of East Asia (Nominees) Limited and The Bank of East Asia (China) Limited which are the fellow subsidiaries and The Bank of East Asia, Limited which is the immediate parent and ultimate holding company of the Manager and the Trustee, held the following units of the Sub-funds as at the end of the reporting period on behalf of their clients. BEA Life limited and Blue Cross (Asia Pacific) Insurance Limited which are the fellow subsidiaries of the Manager and the Trustee, held the following units of the Sub-funds as at the end of the reporting period.
BEA Union Investment Japan Growth Fund
BEA Union Investment Global Themes Fund
BEA Union Investment Global Resources Fund
BEA Union Investment Asian Bond and Currency Fund
BEA Union Investment Four Seasons Fund
BEA Union Investment China A-Share Equity Fund
BEA Union Investment Asia Pacific Multi Income Fund
BEA Union Investment China Phoenix Fund
BEA Union Investment RMB Core Bond Fund
BEA Union Investment Asia Pacific Flexi Allocation
Fund
BEA Union Investment Global Flexi Allocation
Fund
BEA Union Investment China High Yield Income
Fund
BEA Union Investment Asian Strategic Bond
Fund
BEA Union Investment Asia Pacific Equity Dividend
Fund
BEA Union Investment
China Gateway
Fund2018 2017 2018 2017 2018 2017 2018 2017 2018 2017 2018 2017 2018 2017 2018 2017 2018 2017 2018 2017 2018 2017 2018 2017 2018 2017 2018 2017 2018
BEA Union Investment Management Limited– Class A Accumulating Hedged (EUR) – – – – – – 5,000.00 – – – – – 5,000 – – – – – – – – – – – – – – – –– Class A Accumulating Hedged (RMB) – – – – – – – – – – – – – – 30,000.00 30,000.00 – – – – – – – – – – – – –– Class A Distributing Hedged (EUR) – – – – – – – – – – – – 5,000 – – – – – – – – – – – – – – – –
– – – – – – 5,000.00 – – – – – 10,000 – 30,000.00 30,000.00 – – – – – – – – – – – – –
The Bank of East Asia (Nominees) Limited– Class A – 34,218.91 – 364,907.66 – 724,567.89 – – – 14,518.89 102,139.83 107,127.84 – – – – – – – – – – – – – – – – –– Class A Accumulating (US$) – – – – – – 185,571.95 366,626.74 – – – – 71,778.87 145,442.01 173,722.00 229,187.42 – – 23,342.70 167,450.02 – – – – 64,271.36 83,766.19 – – 137,725.21– Class A Accumulating (HK$) – – – – – – – – – – – – – – 137,373.72 236,225.76 – – – – – – – – – – – – –– Class A Accumulating Hedged (EUR) – – – – – – – – – – – – – – – – – – – – – – – – – – – – –– Class A Accumulating Hedged (RMB) – – – – – – – – – – – – – – 30,386.56 25,119.42 – – – – – – – – – – – – –– Class A Distributing (US$) – – – – – – 1,675,552.60 2,319,794.30 – – – – 8,147,646.98 9,231,703.50 – – 229,586.14 424,447.07 908,743.04 1,611,776.99 709,819.48 375,822.38 1,380,941.81 1,892,356.66 2,604,781.16 5,068,105.01 – – 1,635,243.37– Class A Distributing (HK$) – – – – – – – – – – – – 14,415,708.79 15,294,346.25 – – 414,864.96 559,986.52 1,580,771.87 1,450,545.89 137,406.60 81,219.02 830,353.33 1,160,130.17 2,110,102.16 3,285,489.51 – – 2,983,370.34– Class A Distributing (RMB) – – – – – – – – – – – – – – – – 366,977.58 293,308.50 – – – – – – – – – – –– Class A Distributing Hedged (AU$) – – – – – – 512,124.20 423,815.40 – – – – 12,661,320.33 10,087,496.26 – – – – 1,414,038.77 801,719.47 – – 416,392.10 296,514.61 1,146,981.83 1,055,600.93 – – 1,951,500.17– Class A Distributing Hedged (EUR) – – – – – – – – – – – – 198.92 – – – – – – – – – – – – – – – –– Class A Distributing Hedged (NZ$) – – – – – – – – – – – – 2,784,153.19 4,774,349.49 – – – – 220,988.38 352,335.39 – – – – – – – – –– Class A Distributing Hedged (RMB) – – – – – – 560,366.62 1,101,062.59 – – – – 5,521,056.67 4,358,463.55 – – – – 399,431.75 299,541.42 – – 399,015.33 456,997.18 692,302.13 805,055.62 – – 2,487,148.54– Class H Distributing (HK$) – – – – – – 22,700,747.32 29,817,647.07 – – – – – – – – – – – – – – – – – – – – –– Class I – – – – – – – – – – – – – – – – – – – – – – – – – – – – –– Class P – – – – – – – – – – 92,330.54 92,330.54 – – – – – – – – – – – – – – – – –
– 34,218.91 – 364,907.66 – 724,567.89 25,634,362.69 34,028,946.10 – 14,518.89 194,470.37 199,458.38 43,601,863.75 43,891,801.06 341,482.28 490,532.60 1,011,428.68 1,277,742.09 4,547,316.51 4,683,369.18 847,226.08 457,041.40 3,026,702.57 3,805,998.62 6,618,438.64 10,298,017.26 – – 9,194,987.63
The Bank of East Asia (China) Limited– Class A – – – 142,350.52 – 172,216.96 – – – – – – – – – – – – – – – – – – – – – – –– Class A Accumulating (US$) – – – – – – 1,375,583.07 2,075,911.27 – – – – 381,986.05 521,432.19 – – – – 151,114.79 136,275.28 – – – – – – – – –– Class A Accumulating (HK$) – – – – – – – – – – – – – – 383,370.31 469,743.92 – – – – – – – – – – – – –– Class A Distributing (US$) – – – – – – 2,714,251.99 3,719,504.65 – – – – 953,694.72 679,564.79 – – – – 279,114.14 62,044.94 744,055.40 775,996.52 – – – – – – –– Class A Distributing Hedged (RMB) – – – – – – 1,347,441.02 1,355,892.18 – – – – 781,539.34 441,811.98 – – – – 23,504.10 11,505.28 – – – – – – – – –
– – – 142,350.52 – 172,216.96 5,437,276.08 7,151,308.10 – – – – 2,117,220.11 1,642,808.96 383,370.31 469,743.92 – – 453,733.03 209,825.50 744,055.40 775,996.52 – – – – – – –
The Bank of East Asia, Limited– Class I – – – – – – – – – – 1,040,264.87 1,040,264.87 – – – – – – – – – – – – – – – – –
BEA Life Limited– Class I – – – – – – – – – – 1,787,876.53 661,887.00 – – – – – – – – – – – – – – – – –
Blue Cross (Asia Pacific) Insurance Limited– Class I – – – – – – – – – – 179,697.02 196,474.76 – – – – – – – – – – – – – – – – –
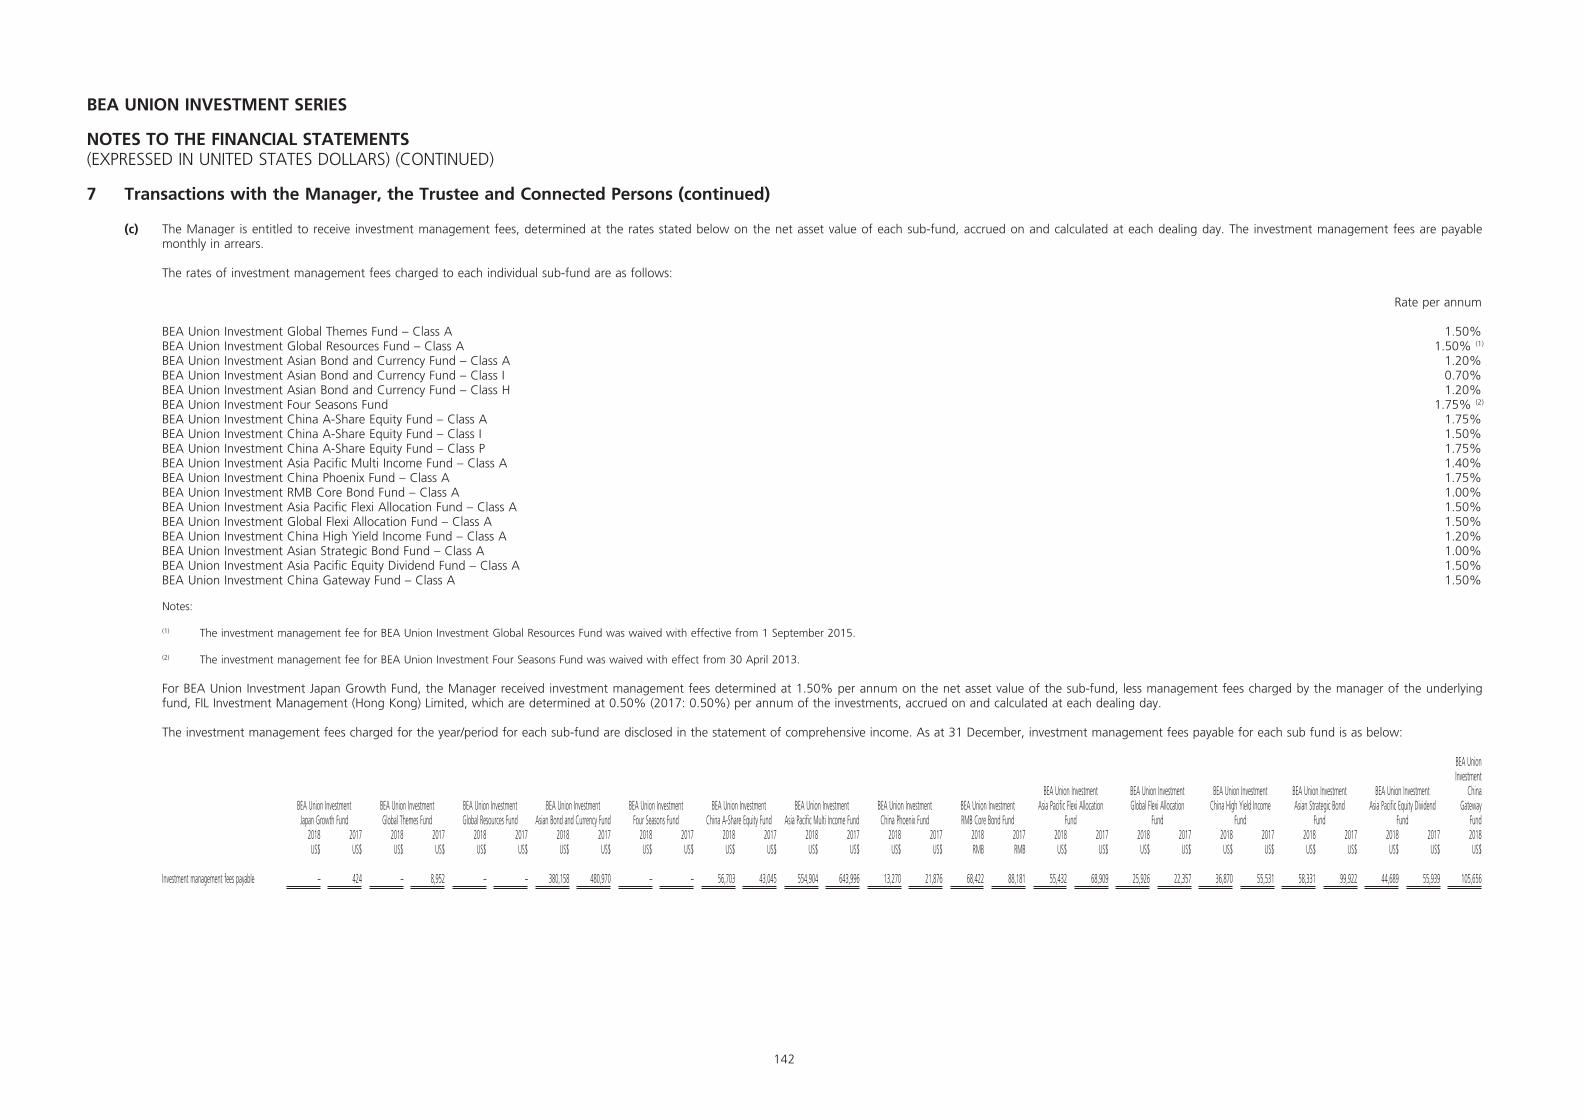
BEA UNION INVESTMENT SERIES
NOTES TO THE FINANCIAL STATEMENTS(EXPRESSED IN UNITED STATES DOLLARS) (CONTINUED)
142
A5請縮小打印70.5%
7 Transactions with the Manager, the Trustee and Connected Persons (continued)
(c) The Manager is entitled to receive investment management fees, determined at the rates stated below on the net asset value of each sub-fund, accrued on and calculated at each dealing day. The investment management fees are payable monthly in arrears.
The rates of investment management fees charged to each individual sub-fund are as follows:
Rate per annum
BEA Union Investment Global Themes Fund – Class A 1.50%BEA Union Investment Global Resources Fund – Class A 1.50% (1)
BEA Union Investment Asian Bond and Currency Fund – Class A 1.20%BEA Union Investment Asian Bond and Currency Fund – Class I 0.70%BEA Union Investment Asian Bond and Currency Fund – Class H 1.20%BEA Union Investment Four Seasons Fund 1.75% (2)
BEA Union Investment China A-Share Equity Fund – Class A 1.75%BEA Union Investment China A-Share Equity Fund – Class I 1.50%BEA Union Investment China A-Share Equity Fund – Class P 1.75%BEA Union Investment Asia Pacific Multi Income Fund – Class A 1.40%BEA Union Investment China Phoenix Fund – Class A 1.75%BEA Union Investment RMB Core Bond Fund – Class A 1.00%BEA Union Investment Asia Pacific Flexi Allocation Fund – Class A 1.50%BEA Union Investment Global Flexi Allocation Fund – Class A 1.50%BEA Union Investment China High Yield Income Fund – Class A 1.20%BEA Union Investment Asian Strategic Bond Fund – Class A 1.00%BEA Union Investment Asia Pacific Equity Dividend Fund – Class A 1.50%BEA Union Investment China Gateway Fund – Class A 1.50%
Notes:
(1) The investment management fee for BEA Union Investment Global Resources Fund was waived with effective from 1 September 2015.
(2) The investment management fee for BEA Union Investment Four Seasons Fund was waived with effect from 30 April 2013.
For BEA Union Investment Japan Growth Fund, the Manager received investment management fees determined at 1.50% per annum on the net asset value of the sub-fund, less management fees charged by the manager of the underlying fund, FIL Investment Management (Hong Kong) Limited, which are determined at 0.50% (2017: 0.50%) per annum of the investments, accrued on and calculated at each dealing day.
The investment management fees charged for the year/period for each sub-fund are disclosed in the statement of comprehensive income. As at 31 December, investment management fees payable for each sub fund is as below:
BEA Union Investment Japan Growth Fund
BEA Union Investment Global Themes Fund
BEA Union Investment Global Resources Fund
BEA Union Investment Asian Bond and Currency Fund
BEA Union Investment Four Seasons Fund
BEA Union Investment China A-Share Equity Fund
BEA Union Investment Asia Pacific Multi Income Fund
BEA Union Investment China Phoenix Fund
BEA Union Investment RMB Core Bond Fund
BEA Union Investment Asia Pacific Flexi Allocation
Fund
BEA Union Investment Global Flexi Allocation
Fund
BEA Union Investment China High Yield Income
Fund
BEA Union Investment Asian Strategic Bond
Fund
BEA Union Investment Asia Pacific Equity Dividend
Fund
BEA Union Investment
China Gateway
Fund
2018 2017 2018 2017 2018 2017 2018 2017 2018 2017 2018 2017 2018 2017 2018 2017 2018 2017 2018 2017 2018 2017 2018 2017 2018 2017 2018 2017 2018US$ US$ US$ US$ US$ US$ US$ US$ US$ US$ US$ US$ US$ US$ US$ US$ RMB RMB US$ US$ US$ US$ US$ US$ US$ US$ US$ US$ US$
Investment management fees payable – 424 – 8,952 – – 380,158 480,970 – – 56,703 43,045 554,904 643,996 13,270 21,876 68,422 88,181 55,432 68,909 25,926 22,357 36,870 55,531 58,331 99,922 44,689 55,939 105,656
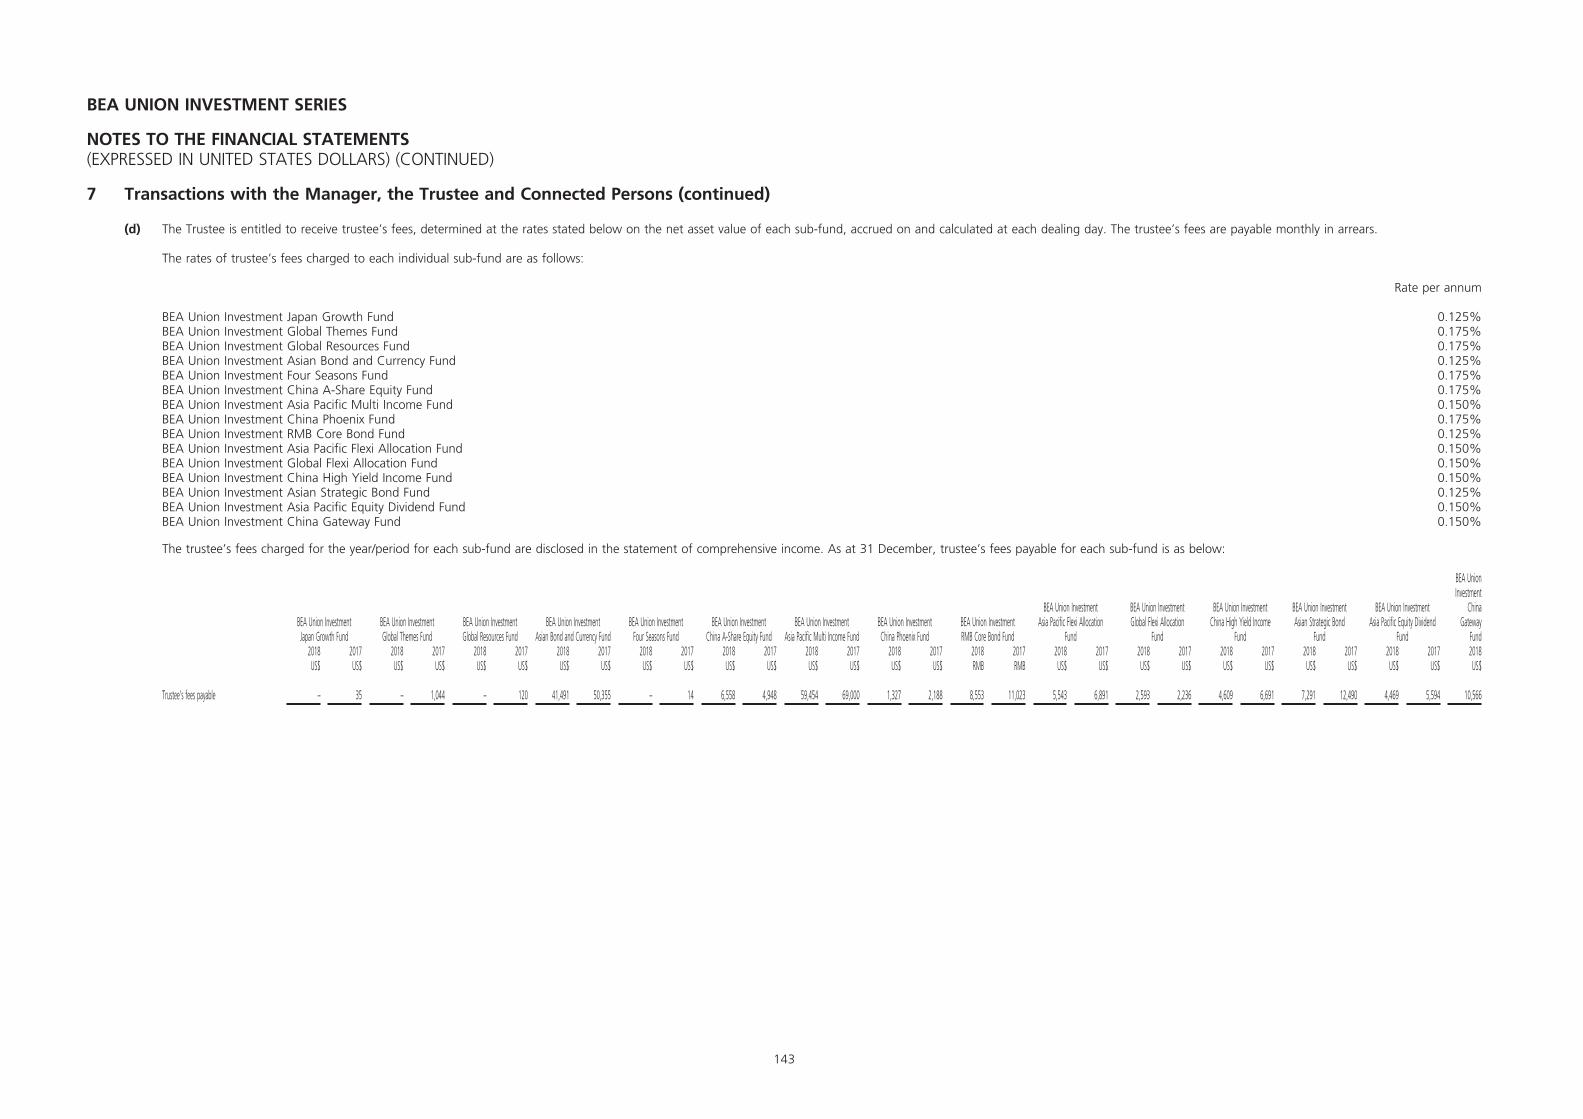
BEA UNION INVESTMENT SERIES
NOTES TO THE FINANCIAL STATEMENTS(EXPRESSED IN UNITED STATES DOLLARS) (CONTINUED)
143
A5請縮小打印70.5%
7 Transactions with the Manager, the Trustee and Connected Persons (continued)
(d) The Trustee is entitled to receive trustee’s fees, determined at the rates stated below on the net asset value of each sub-fund, accrued on and calculated at each dealing day. The trustee’s fees are payable monthly in arrears.
The rates of trustee’s fees charged to each individual sub-fund are as follows:
Rate per annum
BEA Union Investment Japan Growth Fund 0.125%BEA Union Investment Global Themes Fund 0.175%BEA Union Investment Global Resources Fund 0.175%BEA Union Investment Asian Bond and Currency Fund 0.125%BEA Union Investment Four Seasons Fund 0.175%BEA Union Investment China A-Share Equity Fund 0.175%BEA Union Investment Asia Pacific Multi Income Fund 0.150%BEA Union Investment China Phoenix Fund 0.175%BEA Union Investment RMB Core Bond Fund 0.125%BEA Union Investment Asia Pacific Flexi Allocation Fund 0.150%BEA Union Investment Global Flexi Allocation Fund 0.150%BEA Union Investment China High Yield Income Fund 0.150%BEA Union Investment Asian Strategic Bond Fund 0.125%BEA Union Investment Asia Pacific Equity Dividend Fund 0.150%BEA Union Investment China Gateway Fund 0.150%
The trustee’s fees charged for the year/period for each sub-fund are disclosed in the statement of comprehensive income. As at 31 December, trustee’s fees payable for each sub-fund is as below:
BEA Union Investment Japan Growth Fund
BEA Union Investment Global Themes Fund
BEA Union Investment Global Resources Fund
BEA Union Investment Asian Bond and Currency Fund
BEA Union Investment Four Seasons Fund
BEA Union Investment China A-Share Equity Fund
BEA Union Investment Asia Pacific Multi Income Fund
BEA Union Investment China Phoenix Fund
BEA Union Investment RMB Core Bond Fund
BEA Union Investment Asia Pacific Flexi Allocation
Fund
BEA Union Investment Global Flexi Allocation
Fund
BEA Union Investment China High Yield Income
Fund
BEA Union Investment Asian Strategic Bond
Fund
BEA Union Investment Asia Pacific Equity Dividend
Fund
BEA Union Investment
China Gateway
Fund
2018 2017 2018 2017 2018 2017 2018 2017 2018 2017 2018 2017 2018 2017 2018 2017 2018 2017 2018 2017 2018 2017 2018 2017 2018 2017 2018 2017 2018US$ US$ US$ US$ US$ US$ US$ US$ US$ US$ US$ US$ US$ US$ US$ US$ RMB RMB US$ US$ US$ US$ US$ US$ US$ US$ US$ US$ US$
Trustee’s fees payable – 35 – 1,044 – 120 41,491 50,355 – 14 6,558 4,948 59,454 69,000 1,327 2,188 8,553 11,023 5,543 6,891 2,593 2,236 4,609 6,691 7,291 12,490 4,469 5,594 10,566
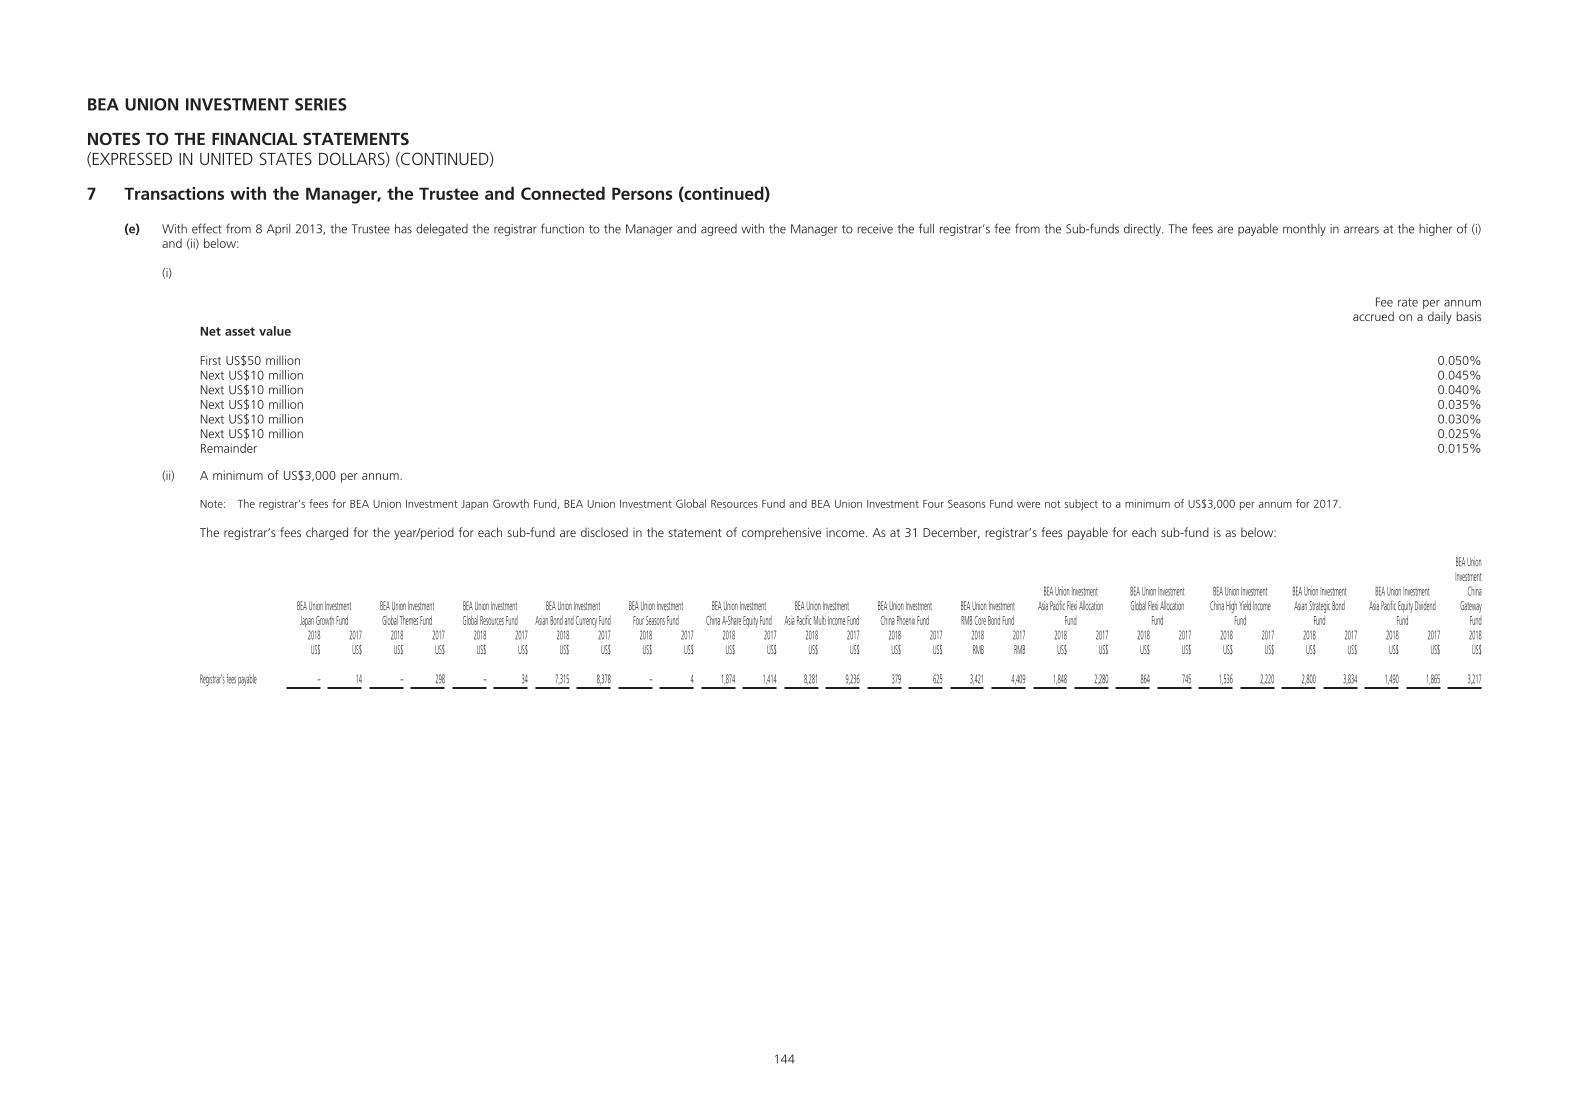
BEA UNION INVESTMENT SERIES
NOTES TO THE FINANCIAL STATEMENTS(EXPRESSED IN UNITED STATES DOLLARS) (CONTINUED)
144
A5請縮小打印70.5%
7 Transactions with the Manager, the Trustee and Connected Persons (continued)
(e) With effect from 8 April 2013, the Trustee has delegated the registrar function to the Manager and agreed with the Manager to receive the full registrar’s fee from the Sub-funds directly. The fees are payable monthly in arrears at the higher of (i) and (ii) below:
(i)
Fee rate per annum accrued on a daily basis
Net asset value
First US$50 million 0.050%Next US$10 million 0.045%Next US$10 million 0.040%Next US$10 million 0.035%Next US$10 million 0.030%Next US$10 million 0.025%Remainder 0.015%
(ii) A minimum of US$3,000 per annum.
Note: The registrar’s fees for BEA Union Investment Japan Growth Fund, BEA Union Investment Global Resources Fund and BEA Union Investment Four Seasons Fund were not subject to a minimum of US$3,000 per annum for 2017.
The registrar’s fees charged for the year/period for each sub-fund are disclosed in the statement of comprehensive income. As at 31 December, registrar’s fees payable for each sub-fund is as below:
BEA Union Investment Japan Growth Fund
BEA Union Investment Global Themes Fund
BEA Union Investment Global Resources Fund
BEA Union Investment Asian Bond and Currency Fund
BEA Union Investment Four Seasons Fund
BEA Union Investment China A-Share Equity Fund
BEA Union Investment Asia Pacific Multi Income Fund
BEA Union Investment China Phoenix Fund
BEA Union Investment RMB Core Bond Fund
BEA Union Investment Asia Pacific Flexi Allocation
Fund
BEA Union Investment Global Flexi Allocation
Fund
BEA Union Investment China High Yield Income
Fund
BEA Union Investment Asian Strategic Bond
Fund
BEA Union Investment Asia Pacific Equity Dividend
Fund
BEA Union Investment
China Gateway
Fund
2018 2017 2018 2017 2018 2017 2018 2017 2018 2017 2018 2017 2018 2017 2018 2017 2018 2017 2018 2017 2018 2017 2018 2017 2018 2017 2018 2017 2018US$ US$ US$ US$ US$ US$ US$ US$ US$ US$ US$ US$ US$ US$ US$ US$ RMB RMB US$ US$ US$ US$ US$ US$ US$ US$ US$ US$ US$
Registrar’s fees payable – 14 – 298 – 34 7,315 8,378 – 4 1,874 1,414 8,281 9,236 379 625 3,421 4,409 1,848 2,280 864 745 1,536 2,220 2,800 3,834 1,490 1,865 3,217
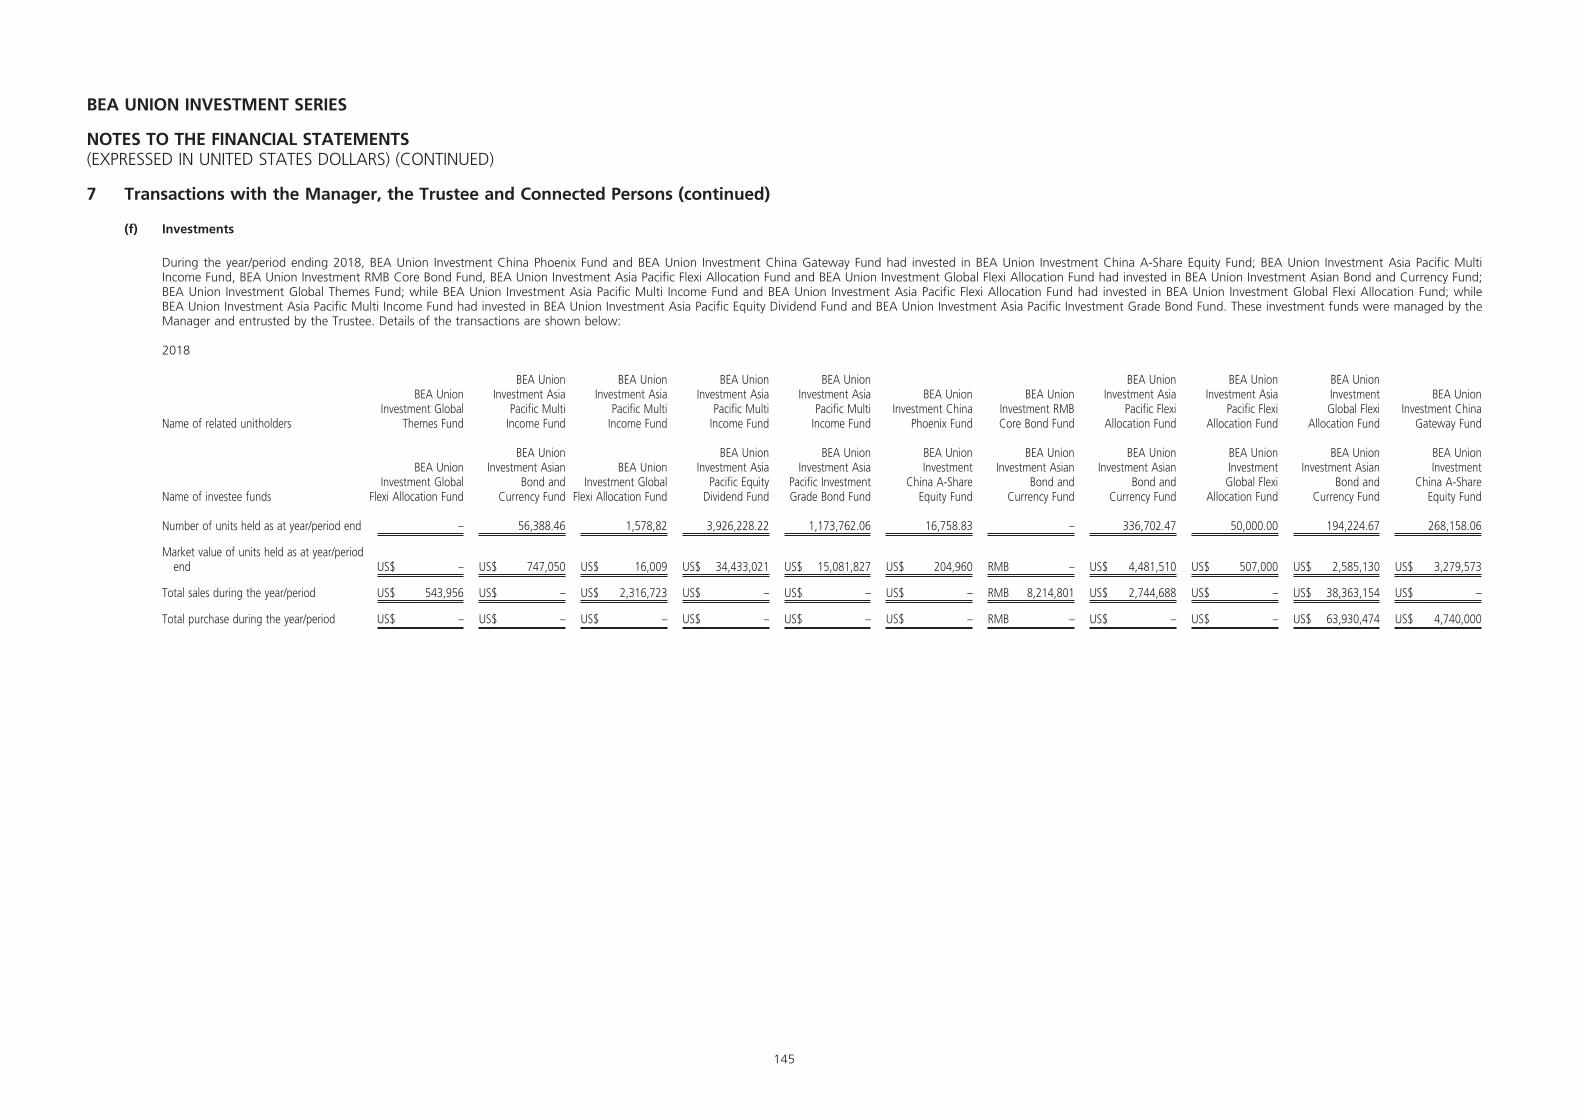
BEA UNION INVESTMENT SERIES
NOTES TO THE FINANCIAL STATEMENTS(EXPRESSED IN UNITED STATES DOLLARS) (CONTINUED)
145
A5請縮小打印70.5%
7 Transactions with the Manager, the Trustee and Connected Persons (continued)
(f) Investments
During the year/period ending 2018, BEA Union Investment China Phoenix Fund and BEA Union Investment China Gateway Fund had invested in BEA Union Investment China A-Share Equity Fund; BEA Union Investment Asia Pacific Multi Income Fund, BEA Union Investment RMB Core Bond Fund, BEA Union Investment Asia Pacific Flexi Allocation Fund and BEA Union Investment Global Flexi Allocation Fund had invested in BEA Union Investment Asian Bond and Currency Fund; BEA Union Investment Global Themes Fund; while BEA Union Investment Asia Pacific Multi Income Fund and BEA Union Investment Asia Pacific Flexi Allocation Fund had invested in BEA Union Investment Global Flexi Allocation Fund; while BEA Union Investment Asia Pacific Multi Income Fund had invested in BEA Union Investment Asia Pacific Equity Dividend Fund and BEA Union Investment Asia Pacific Investment Grade Bond Fund. These investment funds were managed by the Manager and entrusted by the Trustee. Details of the transactions are shown below:
2018
Name of related unitholders
BEA Union Investment Global
Themes Fund
BEA Union Investment Asia
Pacific Multi Income Fund
BEA Union Investment Asia
Pacific Multi Income Fund
BEA Union Investment Asia
Pacific Multi Income Fund
BEA Union Investment Asia
Pacific Multi Income Fund
BEA Union Investment China
Phoenix Fund
BEA Union Investment RMB Core Bond Fund
BEA Union Investment Asia
Pacific Flexi Allocation Fund
BEA Union Investment Asia
Pacific Flexi Allocation Fund
BEA Union Investment Global Flexi
Allocation Fund
BEA Union Investment China
Gateway Fund
Name of investee funds
BEA Union Investment Global
Flexi Allocation Fund
BEA Union Investment Asian
Bond and Currency Fund
BEA Union Investment Global
Flexi Allocation Fund
BEA Union Investment Asia
Pacific Equity Dividend Fund
BEA Union Investment Asia
Pacific Investment Grade Bond Fund
BEA Union Investment
China A-Share Equity Fund
BEA Union Investment Asian
Bond and Currency Fund
BEA Union Investment Asian
Bond and Currency Fund
BEA Union Investment Global Flexi
Allocation Fund
BEA Union Investment Asian
Bond and Currency Fund
BEA Union Investment
China A-Share Equity Fund
Number of units held as at year/period end – 56,388.46 1,578,82 3,926,228.22 1,173,762.06 16,758.83 – 336,702.47 50,000.00 194,224.67 268,158.06
Market value of units held as at year/period end US$ – US$ 747,050 US$ 16,009 US$ 34,433,021 US$ 15,081,827 US$ 204,960 RMB – US$ 4,481,510 US$ 507,000 US$ 2,585,130 US$ 3,279,573
Total sales during the year/period US$ 543,956 US$ – US$ 2,316,723 US$ – US$ – US$ – RMB 8,214,801 US$ 2,744,688 US$ – US$ 38,363,154 US$ –
Total purchase during the year/period US$ – US$ – US$ – US$ – US$ – US$ – RMB – US$ – US$ – US$ 63,930,474 US$ 4,740,000
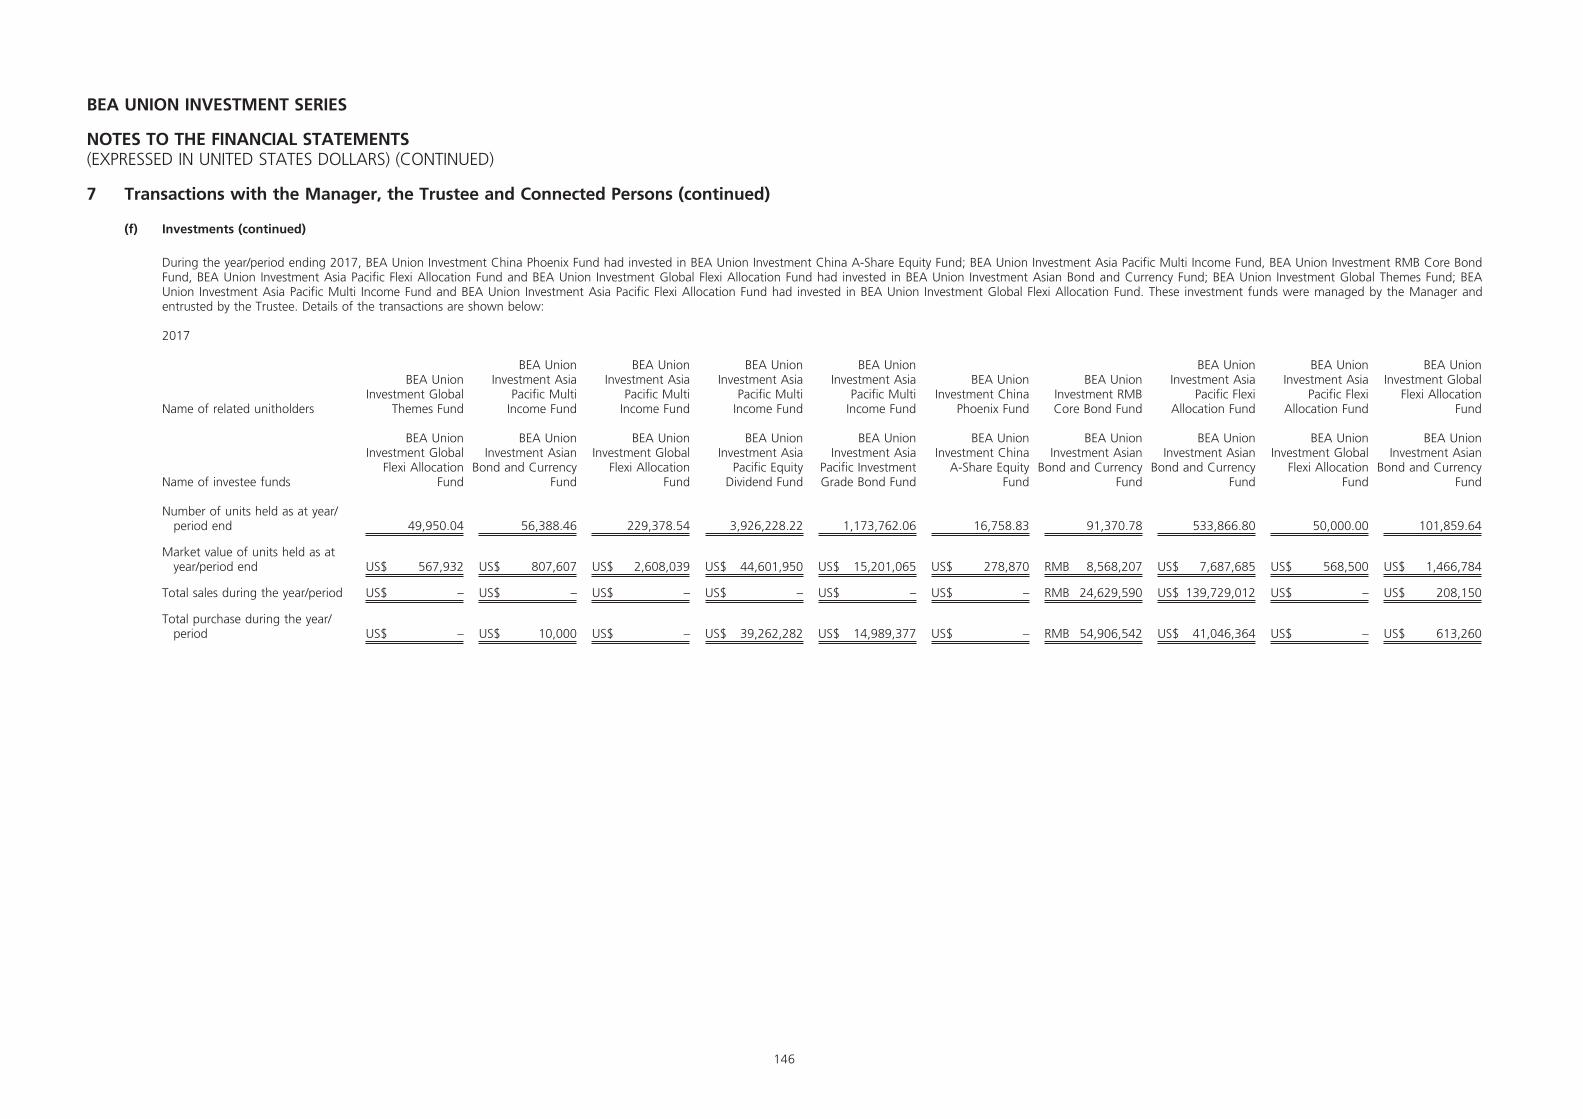
BEA UNION INVESTMENT SERIES
NOTES TO THE FINANCIAL STATEMENTS(EXPRESSED IN UNITED STATES DOLLARS) (CONTINUED)
146
A5請縮小打印70.5%
7 Transactions with the Manager, the Trustee and Connected Persons (continued)
(f) Investments (continued)
During the year/period ending 2017, BEA Union Investment China Phoenix Fund had invested in BEA Union Investment China A-Share Equity Fund; BEA Union Investment Asia Pacific Multi Income Fund, BEA Union Investment RMB Core Bond Fund, BEA Union Investment Asia Pacific Flexi Allocation Fund and BEA Union Investment Global Flexi Allocation Fund had invested in BEA Union Investment Asian Bond and Currency Fund; BEA Union Investment Global Themes Fund; BEA Union Investment Asia Pacific Multi Income Fund and BEA Union Investment Asia Pacific Flexi Allocation Fund had invested in BEA Union Investment Global Flexi Allocation Fund. These investment funds were managed by the Manager and entrusted by the Trustee. Details of the transactions are shown below:
2017
Name of related unitholders
BEA Union Investment Global
Themes Fund
BEA Union Investment Asia
Pacific Multi Income Fund
BEA Union Investment Asia
Pacific Multi Income Fund
BEA Union Investment Asia
Pacific Multi Income Fund
BEA Union Investment Asia
Pacific Multi Income Fund
BEA Union Investment China
Phoenix Fund
BEA Union Investment RMB Core Bond Fund
BEA Union Investment Asia
Pacific Flexi Allocation Fund
BEA Union Investment Asia
Pacific Flexi Allocation Fund
BEA Union Investment Global
Flexi Allocation Fund
Name of investee funds
BEA Union Investment Global
Flexi Allocation Fund
BEA Union Investment Asian
Bond and Currency Fund
BEA Union Investment Global
Flexi Allocation Fund
BEA Union Investment Asia
Pacific Equity Dividend Fund
BEA Union Investment Asia
Pacific Investment Grade Bond Fund
BEA Union Investment China
A-Share Equity Fund
BEA Union Investment Asian
Bond and Currency Fund
BEA Union Investment Asian
Bond and Currency Fund
BEA Union Investment Global
Flexi Allocation Fund
BEA Union Investment Asian
Bond and Currency Fund
Number of units held as at year/period end 49,950.04 56,388.46 229,378.54 3,926,228.22 1,173,762.06 16,758.83 91,370.78 533,866.80 50,000.00 101,859.64
Market value of units held as at year/period end US$ 567,932 US$ 807,607 US$ 2,608,039 US$ 44,601,950 US$ 15,201,065 US$ 278,870 RMB 8,568,207 US$ 7,687,685 US$ 568,500 US$ 1,466,784
Total sales during the year/period US$ – US$ – US$ – US$ – US$ – US$ – RMB 24,629,590 US$ 139,729,012 US$ – US$ 208,150
Total purchase during the year/period US$ – US$ 10,000 US$ – US$ 39,262,282 US$ 14,989,377 US$ – RMB 54,906,542 US$ 41,046,364 US$ – US$ 613,260
A5請縮小打印70.5%
This page is intentionally left blank
BEA UNION INVESTMENT SERIES
NOTES TO THE FINANCIAL STATEMENTS(EXPRESSED IN UNITED STATES DOLLARS) (CONTINUED)
147
A5請縮小打印70.5%
8 Taxation
No provision for Hong Kong Profits Tax has been made in the financial statements as the income of the Sub-funds is exempt from taxation under S26A(1A) of the Hong Kong Inland Revenue Ordinance.
Capital gains, interest and dividend income including share dividend received by the Sub-funds may be subject to non-recoverable withholding tax imposed on the country of origin. Capital gains and investment income are recorded gross of withholding tax in profit or loss.
Under the general provisions of the PRC Corporate Income Tax Law and published tax circulars, the Sub-funds would be subject to PRC withholding tax at the rate of 10% in respect of its PRC sourced income earned, including capital gains realised on the sale of PRC listed companies (subject to the special tax treatment under Caishui [2014] No.79 (“Circular 79”) as discussed below), dividend income derived from PRC listed companies and interest income earned in respect of PRC bank deposits and corporate bonds. This withholding taxation basis should apply as it is intended that the Sub-funds would be managed and operated in such a manner that they would not be considered as a tax resident enterprise in China or otherwise as having a taxable establishment in the PRC.
The Ministry of Finance, the State Administration of Taxation and the China Securities Regulatory Commission of the PRC have jointly issued Circular 79 dated 31 October 2014 – “The Circular on issues concerning the temporary exemption from the imposition of PRC Corporate Income Tax (“PRC CIT”) on gains derived by Qualified Foreign Institutional Investors (“QFIIs”) and RMB Qualified Foreign Institutional Investors (“RQFIIs”) from the transfer of PRC equity interest investments such as PRC domestic stocks”. Circular 79 states that:
(i) with effect from 17 November 2014, gains derived by QFIIs and RQFIIs from the transfer of PRC equity interest investments such as PRC domestic stocks are temporarily exempt from the PRC CIT; and
(ii) PRC CIT is imposed on the said gains derived by QFIIs and RQFIIs prior to 17 November 2014 in accordance with law.
Circular 79 applies to QFIIs and RQFIIs without an establishment or place of business, or permanent establishment (“PE”) under an applicable tax treaty, in mainland China or QFII/RQFII that has a PE in mainland China but the said gains are not actually connected to such PE.
The Sub-funds’ Explanatory Memorandum gives the Manager the right to provide for withholding tax on such gains or income and withhold the tax for the account of the Sub-funds. On the basis of the available information, the Manager has determined that it is appropriate to provide for PRC taxation at the withholding tax rate of 10% on realised gains on A-shares through QFII prior to 17 November 2014; dividend income from A shares and H-shares; and interest income from corporate bonds in the financial statements. On 4 February 2016, the PRC capital gain tax of BEA Union Investment China A-Share Equity Fund has been finalised to report to PRC tax authorities. The Manager has determined and agreed with the Trustee that the reported amount is the required amount to discharge the sub-fund’s PRC capital gain tax liabilities, under the independent professional advice from the tax advisor of the sub-fund. During the year/period ending 2018 and 2017, only BEA Union Investment China A-Share Equity Fund obtained exposure to A shares by using the QFII quota of the Manager. Details of taxation in profit or loss and the statement of assets and liabilities and the movement of deferred tax liabilities during the year/period for the Sub-funds are disclosed as below.
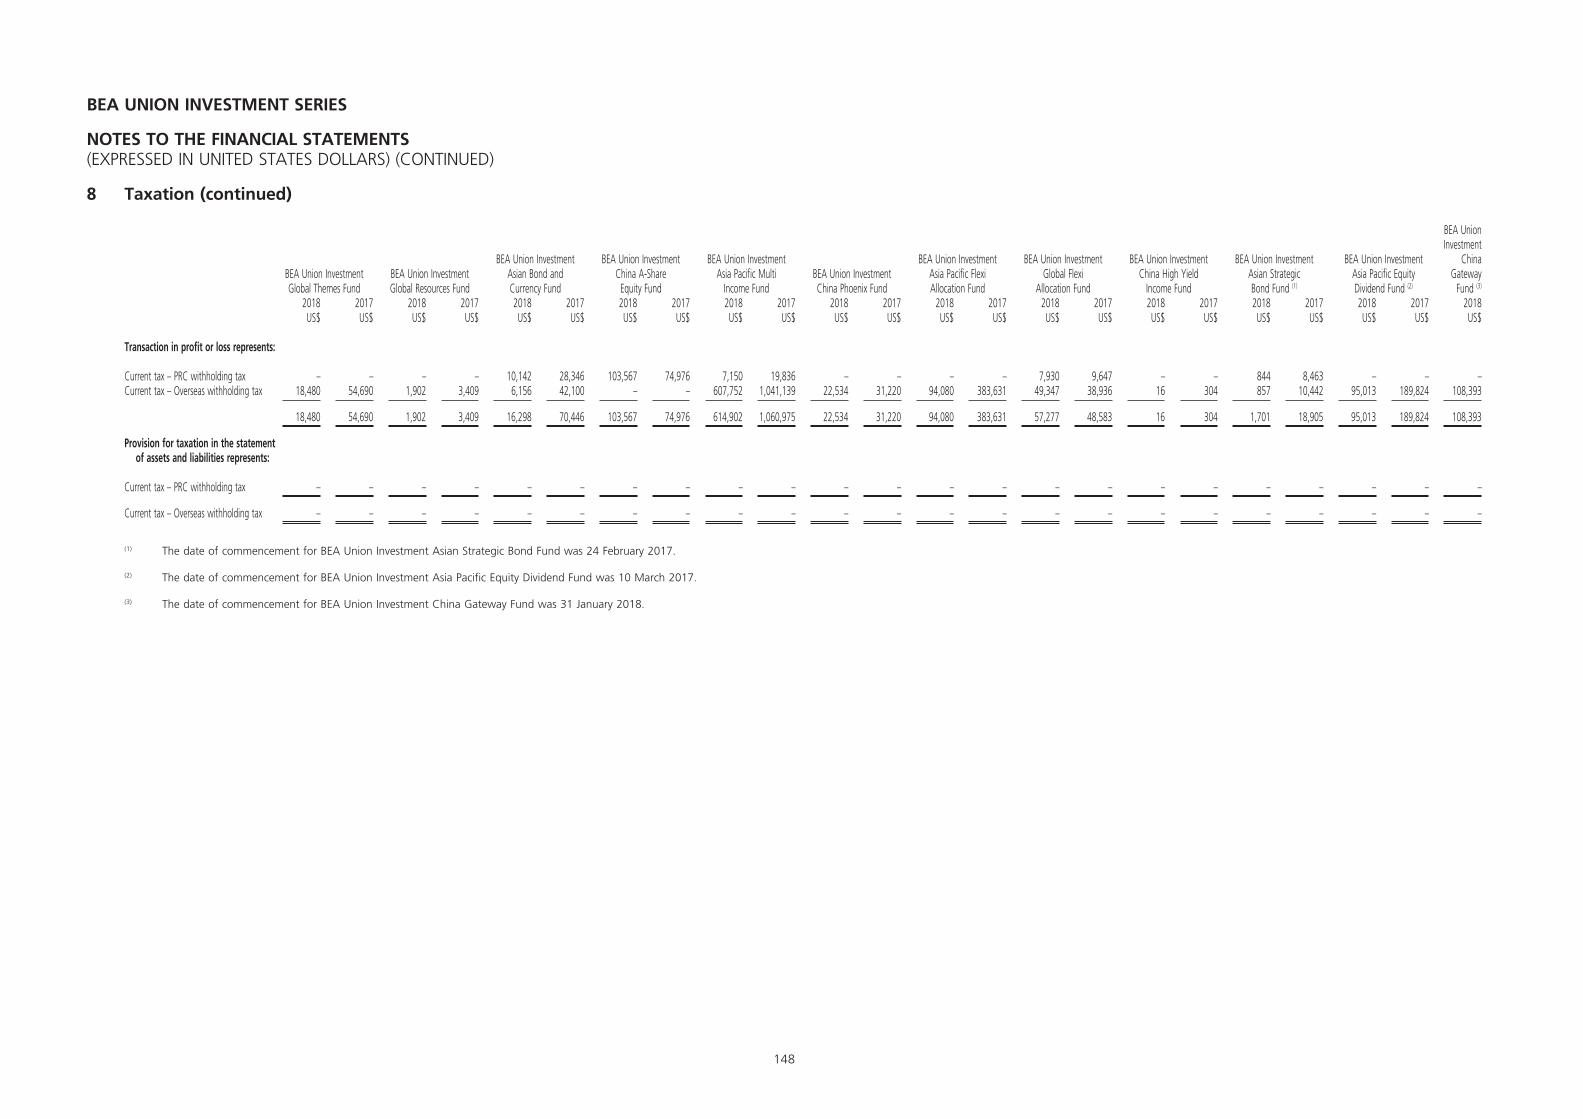
BEA UNION INVESTMENT SERIES
NOTES TO THE FINANCIAL STATEMENTS(EXPRESSED IN UNITED STATES DOLLARS) (CONTINUED)
148
A5請縮小打印70.5%
8 Taxation (continued)
BEA Union Investment Global Themes Fund
BEA Union Investment Global Resources Fund
BEA Union Investment Asian Bond and Currency Fund
BEA Union Investment China A-Share
Equity Fund
BEA Union Investment Asia Pacific Multi
Income FundBEA Union Investment China Phoenix Fund
BEA Union Investment Asia Pacific Flexi Allocation Fund
BEA Union Investment Global Flexi
Allocation Fund
BEA Union Investment China High Yield
Income Fund
BEA Union Investment Asian Strategic Bond Fund (1)
BEA Union Investment Asia Pacific Equity Dividend Fund (2)
BEA Union Investment
China Gateway
Fund (3)
2018 2017 2018 2017 2018 2017 2018 2017 2018 2017 2018 2017 2018 2017 2018 2017 2018 2017 2018 2017 2018 2017 2018US$ US$ US$ US$ US$ US$ US$ US$ US$ US$ US$ US$ US$ US$ US$ US$ US$ US$ US$ US$ US$ US$ US$
Transaction in profit or loss represents:
Current tax – PRC withholding tax – – – – 10,142 28,346 103,567 74,976 7,150 19,836 – – – – 7,930 9,647 – – 844 8,463 – – –Current tax – Overseas withholding tax 18,480 54,690 1,902 3,409 6,156 42,100 – – 607,752 1,041,139 22,534 31,220 94,080 383,631 49,347 38,936 16 304 857 10,442 95,013 189,824 108,393
18,480 54,690 1,902 3,409 16,298 70,446 103,567 74,976 614,902 1,060,975 22,534 31,220 94,080 383,631 57,277 48,583 16 304 1,701 18,905 95,013 189,824 108,393
Provision for taxation in the statement of assets and liabilities represents:
Current tax – PRC withholding tax – – – – – – – – – – – – – – – – – – – – – – –
Current tax – Overseas withholding tax – – – – – – – – – – – – – – – – – – – – – – –
(1) The date of commencement for BEA Union Investment Asian Strategic Bond Fund was 24 February 2017.
(2) The date of commencement for BEA Union Investment Asia Pacific Equity Dividend Fund was 10 March 2017.
(3) The date of commencement for BEA Union Investment China Gateway Fund was 31 January 2018.
BEA UNION INVESTMENT SERIES
NOTES TO THE FINANCIAL STATEMENTS(EXPRESSED IN UNITED STATES DOLLARS) (CONTINUED)
BEA UNION INVESTMENT SERIES
NOTES TO THE FINANCIAL STATEMENTS(EXPRESSED IN UNITED STATES DOLLARS) (CONTINUED)
149 150
A5請縮小打印70.5%
9 Bank overdraft
The overdraft is interest-bearing, unsecured and repayable on demand.
10 Soft commission arrangements
During the year/period, the Sub-funds had no soft commission arrangements with the brokers.
11 Contingent liabilities and commitment
The Sub-funds had no contingent liabilities or commitment as at 31 December 2018 and 2017.
12 Fair value information
The Sub-funds’ financial instruments are measured at fair value on the date of the statement of assets and liabilities. Fair value estimates are made at a specified point in time, based on market conditions and information about the financial instruments. Usually, fair values can be reliably determined within a reasonable range of estimates. For certain other financial instruments, including dividend receivables, amounts receivable from sale of investments, amounts receivable on subscription, other receivables, amounts due from brokers, amounts payable on redemption, amounts payable for purchase of investments and accruals and other payables, the carrying amounts approximate fair value due to the immediate or short-term nature of these financial instruments.
13 Financial instruments and associated risks
The Sub-funds maintain positions in a variety of financial instruments as dictated by its investment management strategy. The Sub-funds’ investment portfolios comprise listed equity investments, listed real estate investment trusts, listed and quoted debt securities, participatory notes, investment funds, non-voting depository receipts and rights that the Sub-funds intend to hold for an indefinite period of time.
Asset allocation is determined by the Manager to achieve the investment objectives. Divergence from target asset allocations and the composition of the portfolio is monitored by the Manager. In instances where the portfolio has diverged from target asset allocation, the Manager will rebalance the portfolio to align with the target asset allocation.
The nature and extent of the financial instruments outstanding at the date of the statement of assets and liabilities and the risk management policies employed by the Sub-funds are discussed below.
13 Financial instruments and associated risks (continued)
(a) Market risk
Market risk embodies the potential for both losses and gains and includes currency risk, interest rate risk and price risk. The Sub-funds’ strategies on the management of market risk is driven by the Sub-funds’ investment objectives.
The investment objective of the BEA Union Investment Japan Growth Fund is to achieve long-term capital growth through investing in a Japan equity fund (Fidelity Global Investment Fund – Japanese Equity Fund) managed by reputable specialist fund manager and aiming to focus investment into the equity market of Japan, to produce returns that are related to those achieved on the major stock market indices of Japan, to have the flexibility to invest in bonds in a limited manner, and to manage the volatility of returns in the short-term.
The investment objective of the BEA Union Investment Global Themes Fund is to seek long-term growth of capital through a diversified international portfolio of marketable securities, primarily equity securities, including common stocks, preferred stocks, warrants and debt securities convertible into common stocks.
The investment objective of the BEA Union Investment Global Resources Fund is to seek long-term growth of capital through a diversified international portfolio of marketable securities, primarily equity securities and equity linked securities, including common stocks, preferred stocks, warrants, equity deposits, equity linked notes and debt securities convertible into common stocks with a business focus on mining, agriculture, forestry, extraction of energy, oil and gas, exploration, processing and distribution, commodity-related industries, recycling, and renewable energy.
The investment objective of the BEA Union Investment Asian Bond and Currency Fund is to seek regular interest income, capital gains and currency appreciation from an actively managed portfolio of debt securities denominated in Asian or other currencies and primarily issued by Asian governments and corporate entities. Debt securities invested by the sub-fund may include capital securities and preference shares with fixed income features, convertible, exchangeable and non-exchangeable and non-convertible debt securities, fixed and floating rate bonds, zero coupons and discount bonds, transferable notes, asset-backed securities, commercial papers, certificates of deposits of variable or fixed interest rates listed, traded, or dealt in regulated markets or exchanges; as well as bank deposits, negotiated term deposits, short-term bills and notes.
The investment objective of the BEA Union Investment Four Seasons Fund is to seek to achieve short-term capital stability, and the potential for capital growth over the medium to long-term through investing in a dynamically allocated portfolio of marketable equity and debt securities consisting of equity securities and equity linked securities, including common stocks, preferred stocks, warrants, equity deposits, equity linked notes, and debt securities issued by government or corporate entities.
BEA UNION INVESTMENT SERIES
NOTES TO THE FINANCIAL STATEMENTS(EXPRESSED IN UNITED STATES DOLLARS) (CONTINUED)
BEA UNION INVESTMENT SERIES
NOTES TO THE FINANCIAL STATEMENTS(EXPRESSED IN UNITED STATES DOLLARS) (CONTINUED)
151 152
A5請縮小打印70.5%
13 Financial instruments and associated risks (continued)
(a) Market risk (continued)
The investment objective of the BEA Union Investment China A-Share Equity Fund is to seek long-term capital growth by investing primarily in a diversified portfolio of securities of companies which have their principal place of business or key assets located in China or which derive a substantial part of their revenue from China. The sub-fund invests at least 70% of its total assets in China A-Shares listed on the Shanghai Stock Exchange or the Shenzhen Stock Exchange (“Equity Securities”), and not more than 30% of its total assets in Renminbi denominated government and corporate bonds (“RMB Bonds”), China B-Shares, China H-Shares, securities investment funds or collective investment schemes, warrants listed and traded on a stock exchange, initial public offerings, money market instruments and cash or cash equivalents in accordance with applicable investment restrictions. Currently, the sub-fund obtains exposure to Equity Securities and RMB Bonds primarily by using the QFII quotas of the Manager and via the Stock Connects.
The investment objective of the BEA Union Investment Asia Pacific Multi Income Fund is to seek income and long-term capital growth through investing in an actively managed portfolio of debt securities, listed real estate investment trusts and other listed securities including equities and managed funds, that are issued or traded in the Asia Pacific region or which have significant operations in, or derive or are expected to derive a significant portion of their revenues from, the Asia Pacific region. Debt securities invested by the sub-fund are primarily capital securities and preference shares with fixed income features, convertible, exchangeable and non-exchangeable and non-convertible debt securities, fixed and floating rate bonds, zero coupon and discount bonds, transferable notes, asset-backed securities, commercial paper, certificates of deposits of variable or fixed interest rates, listed, traded or dealt in regulated markets or exchanges, as well as bank deposits, negotiated term deposits, short-term bills and notes.
The investment objective of the BEA Union Investment China Phoenix Fund is to seek long-term capital appreciation through investing primarily (i.e. at least 70% of its non-cash assets) in equity securities that are either (a) traded in Hong Kong or China, or (b) issued by entities incorporated in China or entities which have significant operations in or assets in, or derive significant portion or revenue or profits from China. The Sub-fund shall invest at least 70% of its total assets in equity securities. The securities that may be invested by the sub-fund will be primarily equity securities and equity linked securities, including common stocks, preferred stocks, warrants, equity deposits, equity linked notes, debt securities convertible into common stocks and managed funds. The sub-fund may also invest in money market instruments and cash. The sub-fund will focus on active management by stock selection, timing, management of exposure and sector allocation.
The investment objective of the BEA Union Investment RMB Core Bond Fund is to seek income and long-term capital growth by investing in debt securities and other assets that are denominated in RMB and other currencies. The sub-fund’s assets will be invested at least 70% of its non-cash assets primarily in debt securities, bonds and deposits that are denominated and settled in RMB. Up to 30% of its non-cash assets may be invested in debt securities and other securities that are denominated in currencies other that RMB. Debt securities invested by the sub-fund are primarily capital securities and preference shares with fixed income features convertible, exchangeable and non-exchangeable and non-convertible debt securities, fixed and floating rate bonds, zero coupon and discount bonds, transferable notes, commercial paper, certificates of deposits of variable or fixed interest rates, listed, traded or dealt in regulated markets or exchanges, as well as bank deposits, negotiated term deposits, short-term bills and notes.
13 Financial instruments and associated risks (continued)
(a) Market risk (continued)
The investment objective of the BEA Union Investment Asia Pacific Flexi Allocation Fund is to seek long-term capital growth and income through investing in equity securities or debt securities, that are either (a) traded in the Asia Pacific region or (b) issued by companies incorporated in the Asia Pacific region or companies which have significant operations in or derive significant portion of revenue from the Asia Pacific region. Equity Securities include but are not limited to equities (e.g. ordinary shares and preferred shares), real estate investment trusts (“REITs”), exchange traded funds (“ETFs”) and managed funds. Debt Securities will be primarily capital securities and preference shares with fixed income features, convertible, exchangeable and non-exchangeable and non-convertible debt securities, fixed and floating rate bonds, zero coupon and discount bonds, transferable notes, commercial paper, certificates of deposits of variable or fixed interest rates, listed, traded or dealt in regulated markets or exchanges, short-term bills and notes, as well as managed funds.
The investment objective of the BEA Union Investment Global Flexi Allocation Fund is to seek medium to long-term capital growth and income through investing in a diversified portfolio consisting of global equity securities and/or debt securities in global markets, mainly developed markets, but may also in emerging markets. Equity securities include but are not limited to equities (e.g. ordinary shares and preferred shares), real estate investment trusts (“REITs”), exchange traded funds (“ETFs”) and managed funds. Debt Securities include capital securities and preference shares with fixed income features, convertible, exchangeable and non-exchangeable and non-convertible debt securities, fixed and floating rate bonds, zero coupon and discount bonds, transferable notes, commercial papers, certificates of deposits of variable or fixed interest rates, listed, traded or dealt in regulated markets or exchanges, short-term bills and notes, as well as managed funds.
The investment objective of the BEA Union Investment China High Yield Income Fund is to seek medium to long-term capital growth and regular income by primarily (i.e. at least 70% of its non-cash assets) investing in high yield debt securities that are issued or guaranteed by entities which are incorporated in China or have significant operations in or assets in, or derive significant portion of revenue or profits from China. Debt Securities are primarily issued outside mainland China, and include but not limited to convertible, exchangeable and non-exchangeable and non-convertible debt securities, fixed and floating rate bonds, zero coupon and discount bonds, transferable notes, commercial papers, certificates of deposits of variable or fixed interest rates, listed, traded or dealt in regulated markets or exchanges, capital securities with fixed income features (e.g. perpetual bonds and subordinated debts), preference shares with fixed income features, as well as short-term bills and notes.
The investment objective of the BEA Union Investment Asian Strategic Bond Fund is to seek medium to long-term capital growth and regular income by primarily (i.e. at least 70% of its non-cash assets) investing in debt securities that are (a) denominated in Asian currencies, or (b) issued or guaranteed by Asian governments or entities incorporated in Asia or have significant operations or assets in, or derive significant portion of revenue or profits from Asia, and denominated in USD or other currencies including Asian currencies. Debt Securities include but are not limited to convertible, exchangeable and non-exchangeable and non-convertible debt securities, fixed and floating rate bonds, zero coupon and discount bonds, transferable notes, commercial papers, certificates of deposits of variable or fixed interest rates, listed, traded or dealt in regulated markets or exchanges, capital securities with fixed income features (e.g. perpetual bonds and subordinated debts), preference shares with fixed income features, as well as short-term bills and notes.
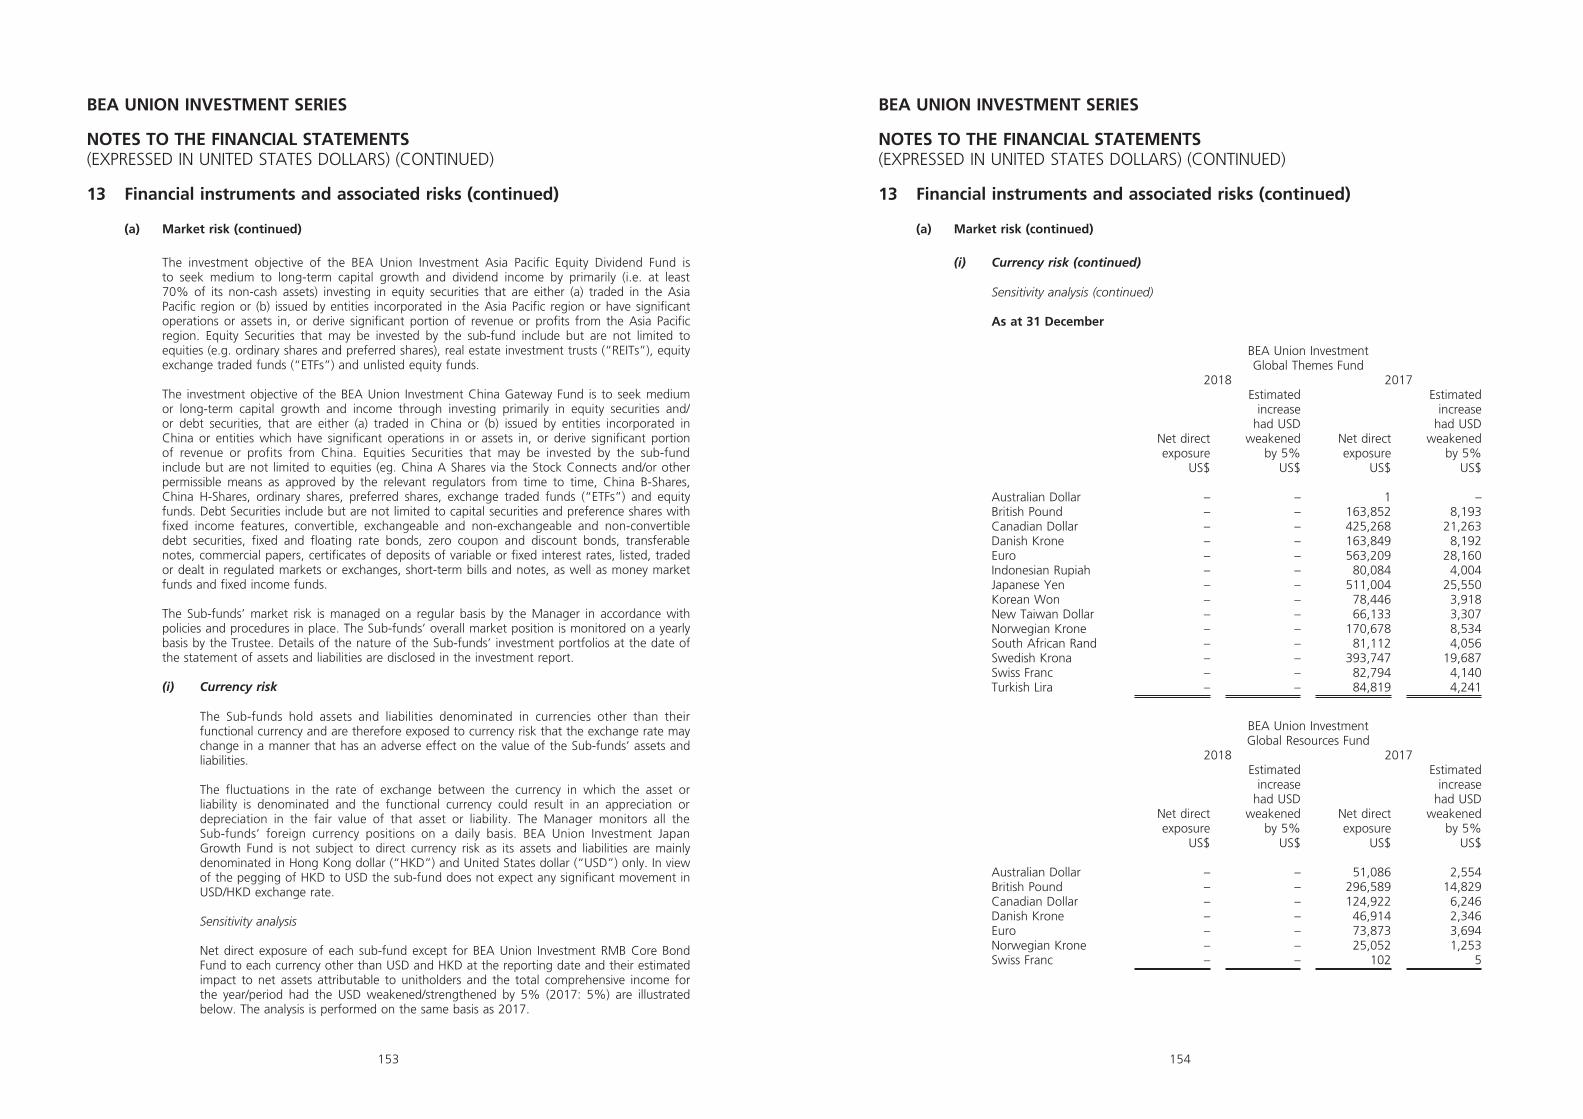
BEA UNION INVESTMENT SERIES
NOTES TO THE FINANCIAL STATEMENTS(EXPRESSED IN UNITED STATES DOLLARS) (CONTINUED)
BEA UNION INVESTMENT SERIES
NOTES TO THE FINANCIAL STATEMENTS(EXPRESSED IN UNITED STATES DOLLARS) (CONTINUED)
153 154
A5請縮小打印70.5%
13 Financial instruments and associated risks (continued)
(a) Market risk (continued)
The investment objective of the BEA Union Investment Asia Pacific Equity Dividend Fund is to seek medium to long-term capital growth and dividend income by primarily (i.e. at least 70% of its non-cash assets) investing in equity securities that are either (a) traded in the Asia Pacific region or (b) issued by entities incorporated in the Asia Pacific region or have significant operations or assets in, or derive significant portion of revenue or profits from the Asia Pacific region. Equity Securities that may be invested by the sub-fund include but are not limited to equities (e.g. ordinary shares and preferred shares), real estate investment trusts (“REITs”), equity exchange traded funds (“ETFs”) and unlisted equity funds.
The investment objective of the BEA Union Investment China Gateway Fund is to seek medium or long-term capital growth and income through investing primarily in equity securities and/or debt securities, that are either (a) traded in China or (b) issued by entities incorporated in China or entities which have significant operations in or assets in, or derive significant portion of revenue or profits from China. Equities Securities that may be invested by the sub-fund include but are not limited to equities (eg. China A Shares via the Stock Connects and/or other permissible means as approved by the relevant regulators from time to time, China B-Shares, China H-Shares, ordinary shares, preferred shares, exchange traded funds (“ETFs”) and equity funds. Debt Securities include but are not limited to capital securities and preference shares with fixed income features, convertible, exchangeable and non-exchangeable and non-convertible debt securities, fixed and floating rate bonds, zero coupon and discount bonds, transferable notes, commercial papers, certificates of deposits of variable or fixed interest rates, listed, traded or dealt in regulated markets or exchanges, short-term bills and notes, as well as money market funds and fixed income funds.
The Sub-funds’ market risk is managed on a regular basis by the Manager in accordance with policies and procedures in place. The Sub-funds’ overall market position is monitored on a yearly basis by the Trustee. Details of the nature of the Sub-funds’ investment portfolios at the date of the statement of assets and liabilities are disclosed in the investment report.
(i) Currency risk
The Sub-funds hold assets and liabilities denominated in currencies other than their functional currency and are therefore exposed to currency risk that the exchange rate may change in a manner that has an adverse effect on the value of the Sub-funds’ assets and liabilities.
The fluctuations in the rate of exchange between the currency in which the asset or liability is denominated and the functional currency could result in an appreciation or depreciation in the fair value of that asset or liability. The Manager monitors all the Sub-funds’ foreign currency positions on a daily basis. BEA Union Investment Japan Growth Fund is not subject to direct currency risk as its assets and liabilities are mainly denominated in Hong Kong dollar (“HKD”) and United States dollar (“USD”) only. In view of the pegging of HKD to USD the sub-fund does not expect any significant movement in USD/HKD exchange rate.
Sensitivity analysis
Net direct exposure of each sub-fund except for BEA Union Investment RMB Core Bond Fund to each currency other than USD and HKD at the reporting date and their estimated impact to net assets attributable to unitholders and the total comprehensive income for the year/period had the USD weakened/strengthened by 5% (2017: 5%) are illustrated below. The analysis is performed on the same basis as 2017.
13 Financial instruments and associated risks (continued)
(a) Market risk (continued)
(i) Currency risk (continued)
Sensitivity analysis (continued)
As at 31 December
BEA Union Investment Global Themes Fund
2018 2017
Net direct exposure
Estimated increase
had USD weakened
by 5%Net direct exposure
Estimated increase
had USD weakened
by 5%US$ US$ US$ US$
Australian Dollar – – 1 –British Pound – – 163,852 8,193Canadian Dollar – – 425,268 21,263Danish Krone – – 163,849 8,192Euro – – 563,209 28,160Indonesian Rupiah – – 80,084 4,004Japanese Yen – – 511,004 25,550Korean Won – – 78,446 3,918New Taiwan Dollar – – 66,133 3,307Norwegian Krone – – 170,678 8,534South African Rand – – 81,112 4,056Swedish Krona – – 393,747 19,687Swiss Franc – – 82,794 4,140Turkish Lira – – 84,819 4,241
BEA Union Investment Global Resources Fund
2018 2017
Net direct exposure
Estimated increase
had USD weakened
by 5%Net direct exposure
Estimated increase
had USD weakened
by 5%US$ US$ US$ US$
Australian Dollar – – 51,086 2,554British Pound – – 296,589 14,829Canadian Dollar – – 124,922 6,246Danish Krone – – 46,914 2,346Euro – – 73,873 3,694Norwegian Krone – – 25,052 1,253Swiss Franc – – 102 5
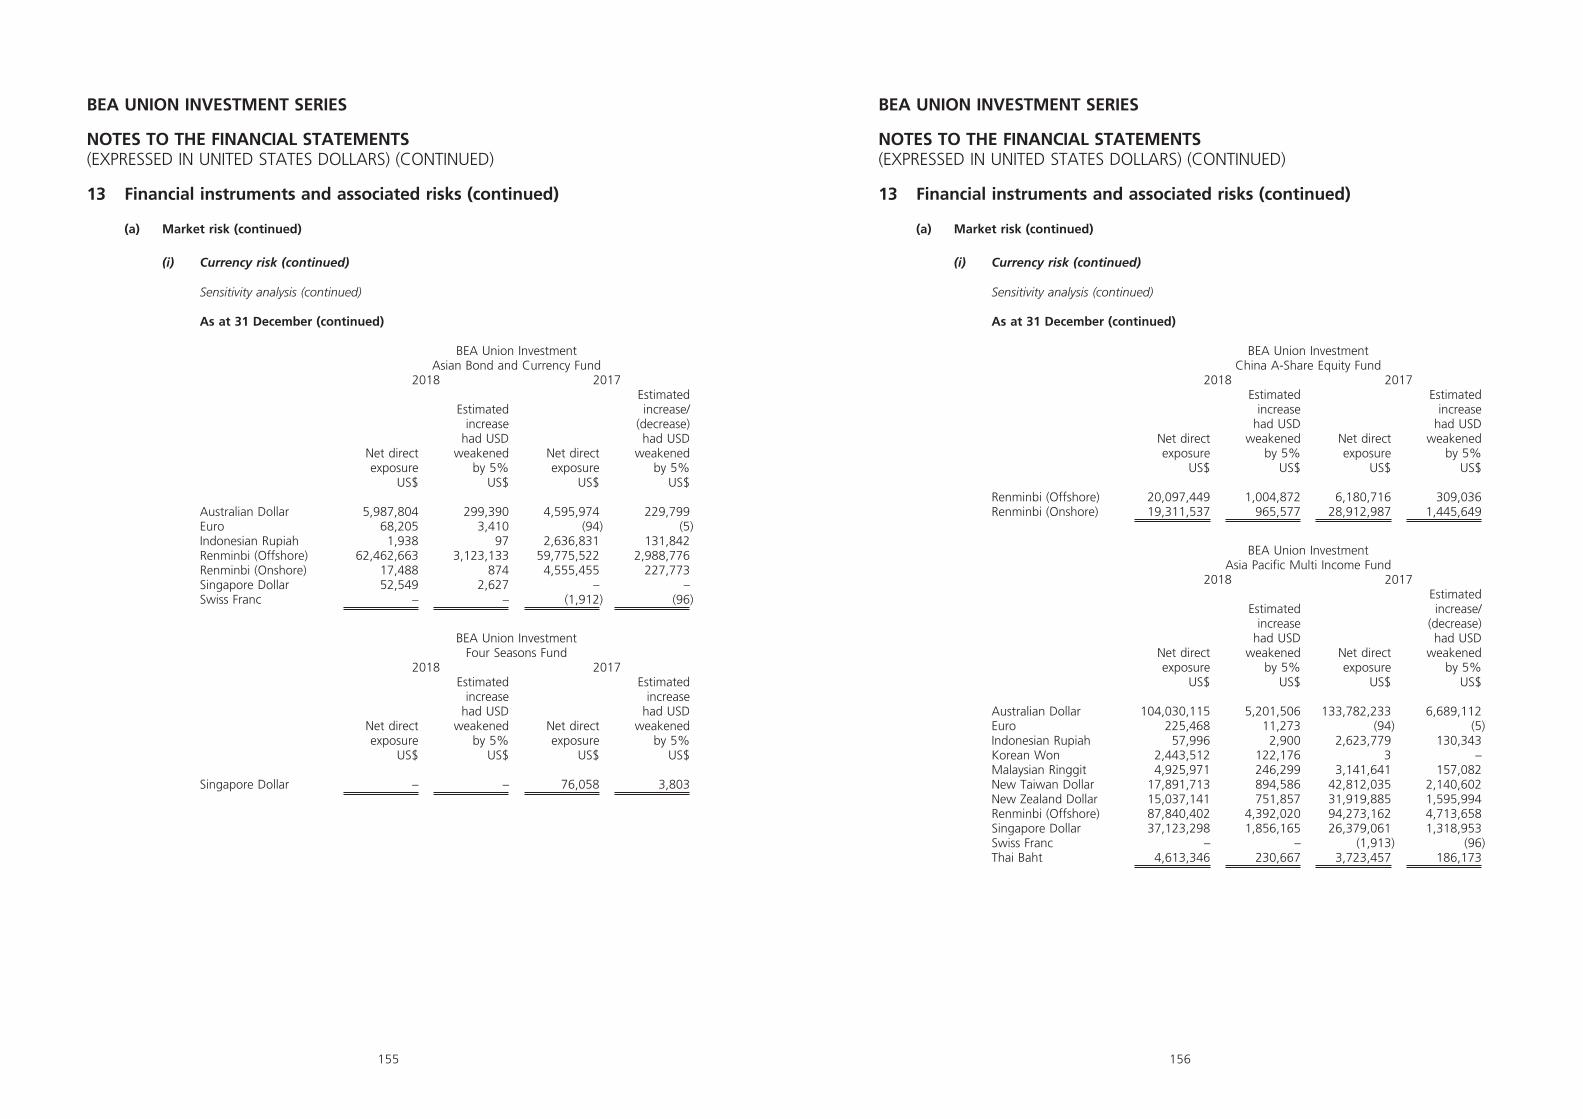
BEA UNION INVESTMENT SERIES
NOTES TO THE FINANCIAL STATEMENTS(EXPRESSED IN UNITED STATES DOLLARS) (CONTINUED)
BEA UNION INVESTMENT SERIES
NOTES TO THE FINANCIAL STATEMENTS(EXPRESSED IN UNITED STATES DOLLARS) (CONTINUED)
155 156
A5請縮小打印70.5%
13 Financial instruments and associated risks (continued)
(a) Market risk (continued)
(i) Currency risk (continued)
Sensitivity analysis (continued)
As at 31 December (continued)
BEA Union Investment Asian Bond and Currency Fund
2018 2017
Net direct exposure
Estimated increase
had USD weakened
by 5%Net direct exposure
Estimated increase/
(decrease) had USD
weakened by 5%
US$ US$ US$ US$
Australian Dollar 5,987,804 299,390 4,595,974 229,799Euro 68,205 3,410 (94) (5)Indonesian Rupiah 1,938 97 2,636,831 131,842Renminbi (Offshore) 62,462,663 3,123,133 59,775,522 2,988,776Renminbi (Onshore) 17,488 874 4,555,455 227,773Singapore Dollar 52,549 2,627 – –Swiss Franc – – (1,912) (96)
BEA Union Investment Four Seasons Fund
2018 2017
Net direct exposure
Estimated increase
had USD weakened
by 5%Net direct exposure
Estimated increase
had USD weakened
by 5%US$ US$ US$ US$
Singapore Dollar – – 76,058 3,803
13 Financial instruments and associated risks (continued)
(a) Market risk (continued)
(i) Currency risk (continued)
Sensitivity analysis (continued)
As at 31 December (continued)
BEA Union Investment China A-Share Equity Fund
2018 2017
Net direct exposure
Estimated increase
had USD weakened
by 5%Net direct exposure
Estimated increase
had USD weakened
by 5%US$ US$ US$ US$
Renminbi (Offshore) 20,097,449 1,004,872 6,180,716 309,036Renminbi (Onshore) 19,311,537 965,577 28,912,987 1,445,649
BEA Union Investment Asia Pacific Multi Income Fund
2018 2017
Net direct exposure
Estimated increase
had USD weakened
by 5%Net direct exposure
Estimated increase/
(decrease) had USD
weakened by 5%
US$ US$ US$ US$
Australian Dollar 104,030,115 5,201,506 133,782,233 6,689,112Euro 225,468 11,273 (94) (5)Indonesian Rupiah 57,996 2,900 2,623,779 130,343Korean Won 2,443,512 122,176 3 –Malaysian Ringgit 4,925,971 246,299 3,141,641 157,082New Taiwan Dollar 17,891,713 894,586 42,812,035 2,140,602New Zealand Dollar 15,037,141 751,857 31,919,885 1,595,994Renminbi (Offshore) 87,840,402 4,392,020 94,273,162 4,713,658Singapore Dollar 37,123,298 1,856,165 26,379,061 1,318,953Swiss Franc – – (1,913) (96)Thai Baht 4,613,346 230,667 3,723,457 186,173
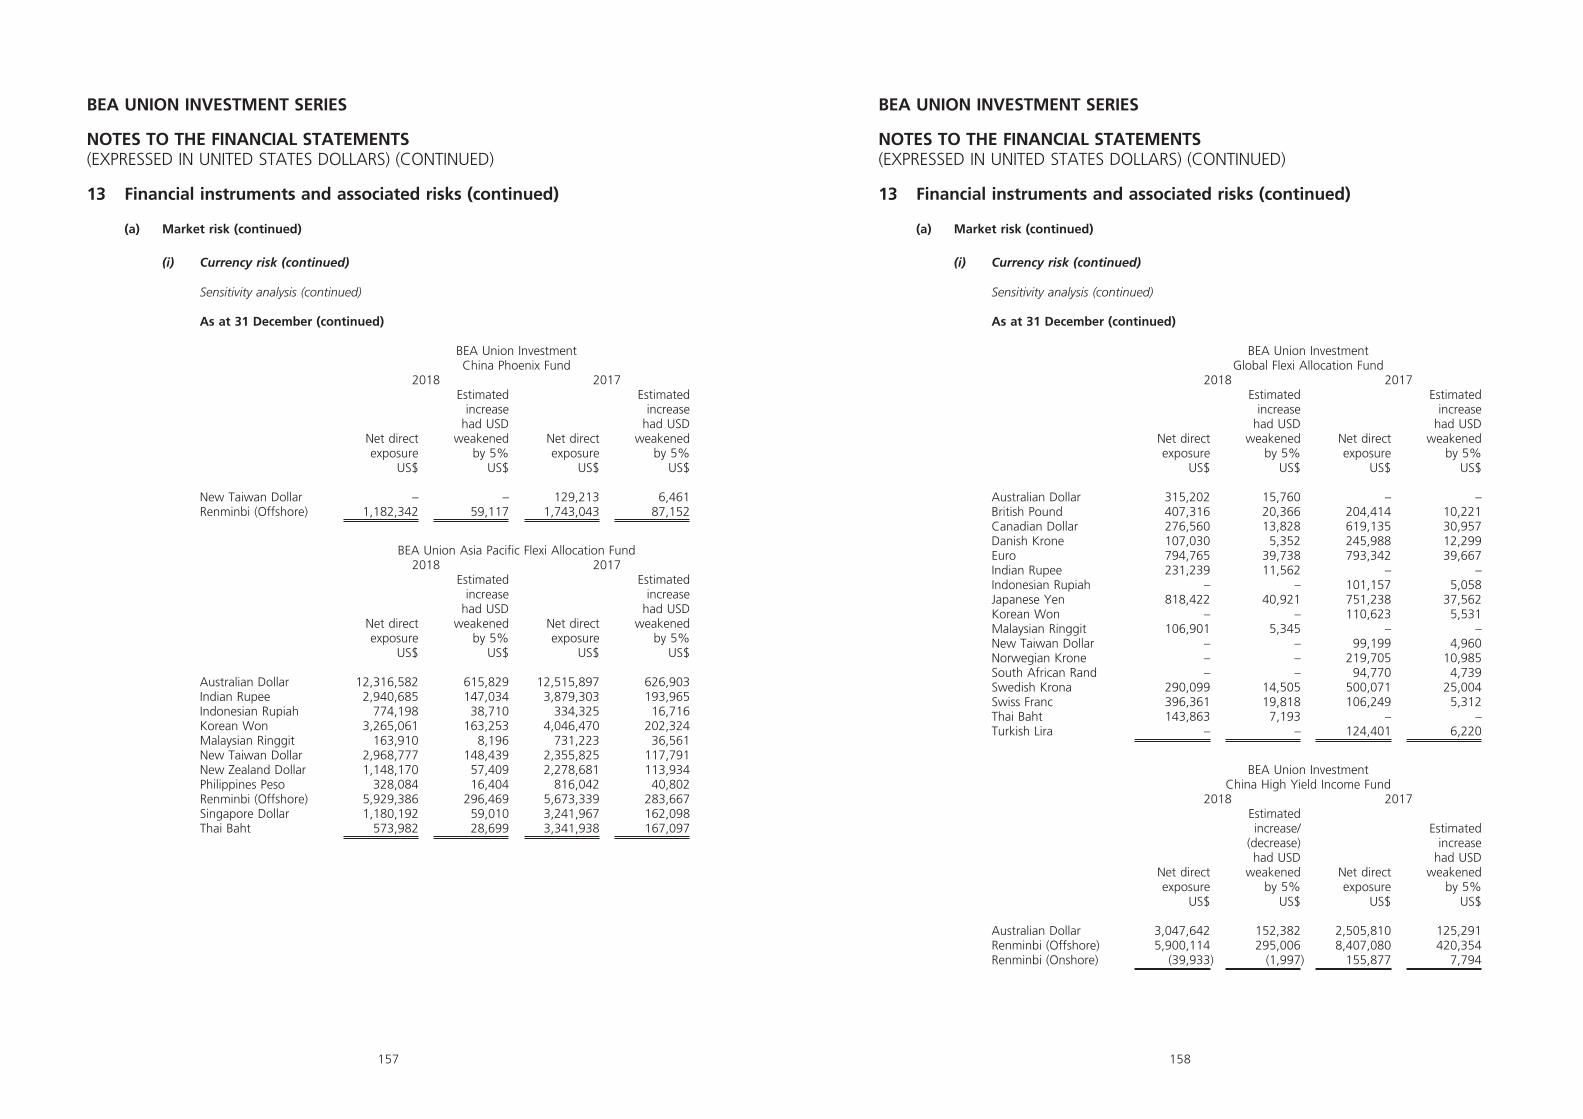
BEA UNION INVESTMENT SERIES
NOTES TO THE FINANCIAL STATEMENTS(EXPRESSED IN UNITED STATES DOLLARS) (CONTINUED)
BEA UNION INVESTMENT SERIES
NOTES TO THE FINANCIAL STATEMENTS(EXPRESSED IN UNITED STATES DOLLARS) (CONTINUED)
157 158
A5請縮小打印70.5%
13 Financial instruments and associated risks (continued)
(a) Market risk (continued)
(i) Currency risk (continued)
Sensitivity analysis (continued)
As at 31 December (continued)
BEA Union Investment China Phoenix Fund
2018 2017
Net direct exposure
Estimated increase
had USD weakened
by 5%Net direct exposure
Estimated increase
had USD weakened
by 5%US$ US$ US$ US$
New Taiwan Dollar – – 129,213 6,461Renminbi (Offshore) 1,182,342 59,117 1,743,043 87,152
BEA Union Asia Pacific Flexi Allocation Fund2018 2017
Net direct exposure
Estimated increase
had USD weakened
by 5%Net direct exposure
Estimated increase
had USD weakened
by 5%US$ US$ US$ US$
Australian Dollar 12,316,582 615,829 12,515,897 626,903Indian Rupee 2,940,685 147,034 3,879,303 193,965Indonesian Rupiah 774,198 38,710 334,325 16,716Korean Won 3,265,061 163,253 4,046,470 202,324Malaysian Ringgit 163,910 8,196 731,223 36,561New Taiwan Dollar 2,968,777 148,439 2,355,825 117,791New Zealand Dollar 1,148,170 57,409 2,278,681 113,934Philippines Peso 328,084 16,404 816,042 40,802Renminbi (Offshore) 5,929,386 296,469 5,673,339 283,667Singapore Dollar 1,180,192 59,010 3,241,967 162,098Thai Baht 573,982 28,699 3,341,938 167,097
13 Financial instruments and associated risks (continued)
(a) Market risk (continued)
(i) Currency risk (continued)
Sensitivity analysis (continued)
As at 31 December (continued)
BEA Union Investment Global Flexi Allocation Fund
2018 2017
Net direct exposure
Estimated increase
had USD weakened
by 5%Net direct exposure
Estimated increase
had USD weakened
by 5%US$ US$ US$ US$
Australian Dollar 315,202 15,760 – –British Pound 407,316 20,366 204,414 10,221Canadian Dollar 276,560 13,828 619,135 30,957Danish Krone 107,030 5,352 245,988 12,299Euro 794,765 39,738 793,342 39,667Indian Rupee 231,239 11,562 – –Indonesian Rupiah – – 101,157 5,058Japanese Yen 818,422 40,921 751,238 37,562Korean Won – – 110,623 5,531Malaysian Ringgit 106,901 5,345 – –New Taiwan Dollar – – 99,199 4,960Norwegian Krone – – 219,705 10,985South African Rand – – 94,770 4,739Swedish Krona 290,099 14,505 500,071 25,004Swiss Franc 396,361 19,818 106,249 5,312Thai Baht 143,863 7,193 – –Turkish Lira – – 124,401 6,220
BEA Union Investment China High Yield Income Fund
2018 2017
Net direct exposure
Estimated increase/
(decrease) had USD
weakened by 5%
Net direct exposure
Estimated increase
had USD weakened
by 5%US$ US$ US$ US$
Australian Dollar 3,047,642 152,382 2,505,810 125,291Renminbi (Offshore) 5,900,114 295,006 8,407,080 420,354Renminbi (Onshore) (39,933) (1,997) 155,877 7,794
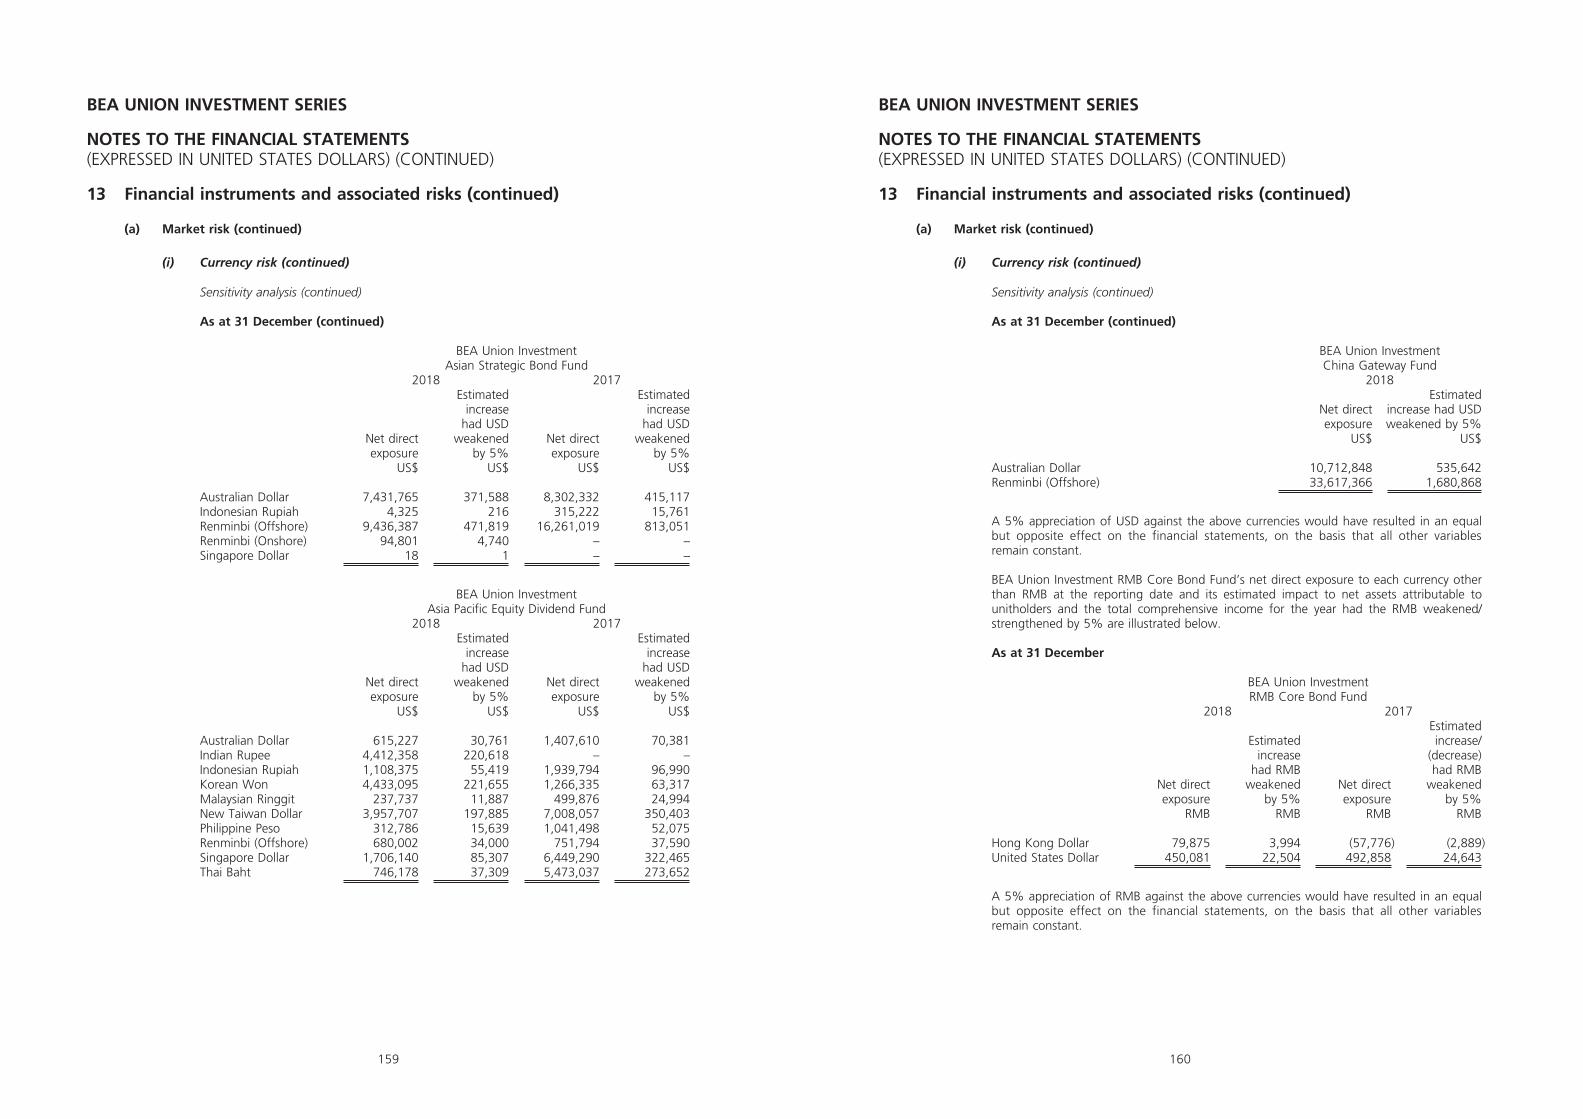
BEA UNION INVESTMENT SERIES
NOTES TO THE FINANCIAL STATEMENTS(EXPRESSED IN UNITED STATES DOLLARS) (CONTINUED)
BEA UNION INVESTMENT SERIES
NOTES TO THE FINANCIAL STATEMENTS(EXPRESSED IN UNITED STATES DOLLARS) (CONTINUED)
159 160
A5請縮小打印70.5%
13 Financial instruments and associated risks (continued)
(a) Market risk (continued)
(i) Currency risk (continued)
Sensitivity analysis (continued)
As at 31 December (continued)
BEA Union Investment Asian Strategic Bond Fund
2018 2017
Net direct exposure
Estimated increase
had USD weakened
by 5%Net direct exposure
Estimated increase
had USD weakened
by 5%US$ US$ US$ US$
Australian Dollar 7,431,765 371,588 8,302,332 415,117Indonesian Rupiah 4,325 216 315,222 15,761Renminbi (Offshore) 9,436,387 471,819 16,261,019 813,051Renminbi (Onshore) 94,801 4,740 – –Singapore Dollar 18 1 – –
BEA Union Investment Asia Pacific Equity Dividend Fund
2018 2017
Net direct exposure
Estimated increase
had USD weakened
by 5%Net direct exposure
Estimated increase
had USD weakened
by 5%US$ US$ US$ US$
Australian Dollar 615,227 30,761 1,407,610 70,381Indian Rupee 4,412,358 220,618 – –Indonesian Rupiah 1,108,375 55,419 1,939,794 96,990Korean Won 4,433,095 221,655 1,266,335 63,317Malaysian Ringgit 237,737 11,887 499,876 24,994New Taiwan Dollar 3,957,707 197,885 7,008,057 350,403Philippine Peso 312,786 15,639 1,041,498 52,075Renminbi (Offshore) 680,002 34,000 751,794 37,590Singapore Dollar 1,706,140 85,307 6,449,290 322,465Thai Baht 746,178 37,309 5,473,037 273,652
13 Financial instruments and associated risks (continued)
(a) Market risk (continued)
(i) Currency risk (continued)
Sensitivity analysis (continued)
As at 31 December (continued)
BEA Union Investment China Gateway Fund
2018
Net direct exposure
Estimated increase had USD weakened by 5%
US$ US$
Australian Dollar 10,712,848 535,642Renminbi (Offshore) 33,617,366 1,680,868
A 5% appreciation of USD against the above currencies would have resulted in an equal but opposite effect on the financial statements, on the basis that all other variables remain constant.
BEA Union Investment RMB Core Bond Fund’s net direct exposure to each currency other than RMB at the reporting date and its estimated impact to net assets attributable to unitholders and the total comprehensive income for the year had the RMB weakened/strengthened by 5% are illustrated below.
As at 31 December
BEA Union Investment RMB Core Bond Fund
2018 2017
Net direct exposure
Estimated increase
had RMB weakened
by 5%Net direct exposure
Estimated increase/
(decrease) had RMB
weakened by 5%
RMB RMB RMB RMB
Hong Kong Dollar 79,875 3,994 (57,776) (2,889)United States Dollar 450,081 22,504 492,858 24,643
A 5% appreciation of RMB against the above currencies would have resulted in an equal but opposite effect on the financial statements, on the basis that all other variables remain constant.
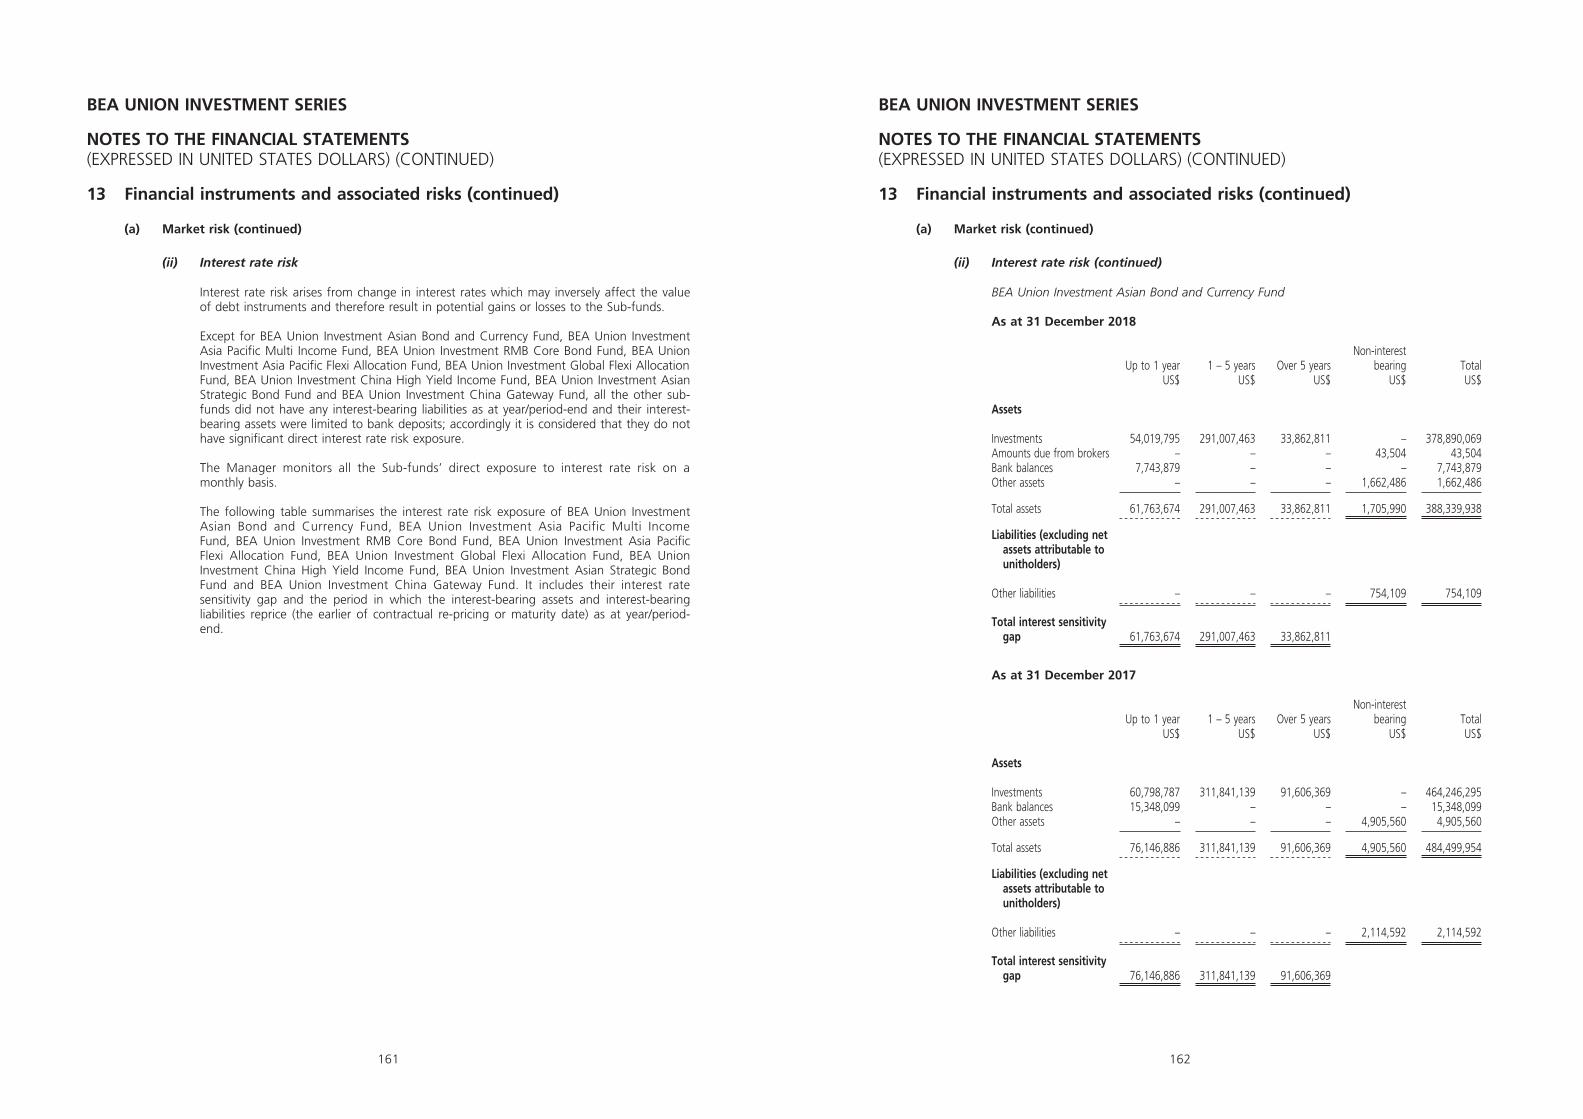
BEA UNION INVESTMENT SERIES
NOTES TO THE FINANCIAL STATEMENTS(EXPRESSED IN UNITED STATES DOLLARS) (CONTINUED)
BEA UNION INVESTMENT SERIES
NOTES TO THE FINANCIAL STATEMENTS(EXPRESSED IN UNITED STATES DOLLARS) (CONTINUED)
161 162
A5請縮小打印70.5%
13 Financial instruments and associated risks (continued)
(a) Market risk (continued)
(ii) Interest rate risk
Interest rate risk arises from change in interest rates which may inversely affect the value of debt instruments and therefore result in potential gains or losses to the Sub-funds.
Except for BEA Union Investment Asian Bond and Currency Fund, BEA Union Investment Asia Pacific Multi Income Fund, BEA Union Investment RMB Core Bond Fund, BEA Union Investment Asia Pacific Flexi Allocation Fund, BEA Union Investment Global Flexi Allocation Fund, BEA Union Investment China High Yield Income Fund, BEA Union Investment Asian Strategic Bond Fund and BEA Union Investment China Gateway Fund, all the other sub-funds did not have any interest-bearing liabilities as at year/period-end and their interest-bearing assets were limited to bank deposits; accordingly it is considered that they do not have significant direct interest rate risk exposure.
The Manager monitors all the Sub-funds’ direct exposure to interest rate risk on a monthly basis.
The following table summarises the interest rate risk exposure of BEA Union Investment Asian Bond and Currency Fund, BEA Union Investment Asia Pacific Multi Income Fund, BEA Union Investment RMB Core Bond Fund, BEA Union Investment Asia Pacific Flexi Allocation Fund, BEA Union Investment Global Flexi Allocation Fund, BEA Union Investment China High Yield Income Fund, BEA Union Investment Asian Strategic Bond Fund and BEA Union Investment China Gateway Fund. It includes their interest rate sensitivity gap and the period in which the interest-bearing assets and interest-bearing liabilities reprice (the earlier of contractual re-pricing or maturity date) as at year/period-end.
13 Financial instruments and associated risks (continued)
(a) Market risk (continued)
(ii) Interest rate risk (continued)
BEA Union Investment Asian Bond and Currency Fund
As at 31 December 2018
Up to 1 year 1 – 5 years Over 5 yearsNon-interest
bearing TotalUS$ US$ US$ US$ US$
Assets
Investments 54,019,795 291,007,463 33,862,811 – 378,890,069Amounts due from brokers – – – 43,504 43,504Bank balances 7,743,879 – – – 7,743,879Other assets – – – 1,662,486 1,662,486
Total assets 61,763,674 291,007,463 33,862,811 1,705,990 388,339,938
Liabilities (excluding net assets attributable to unitholders)
Other liabilities – – – 754,109 754,109
Total interest sensitivity gap 61,763,674 291,007,463 33,862,811
As at 31 December 2017
Up to 1 year 1 – 5 years Over 5 yearsNon-interest
bearing TotalUS$ US$ US$ US$ US$
Assets
Investments 60,798,787 311,841,139 91,606,369 – 464,246,295Bank balances 15,348,099 – – – 15,348,099Other assets – – – 4,905,560 4,905,560
Total assets 76,146,886 311,841,139 91,606,369 4,905,560 484,499,954
Liabilities (excluding net assets attributable to unitholders)
Other liabilities – – – 2,114,592 2,114,592
Total interest sensitivity gap 76,146,886 311,841,139 91,606,369
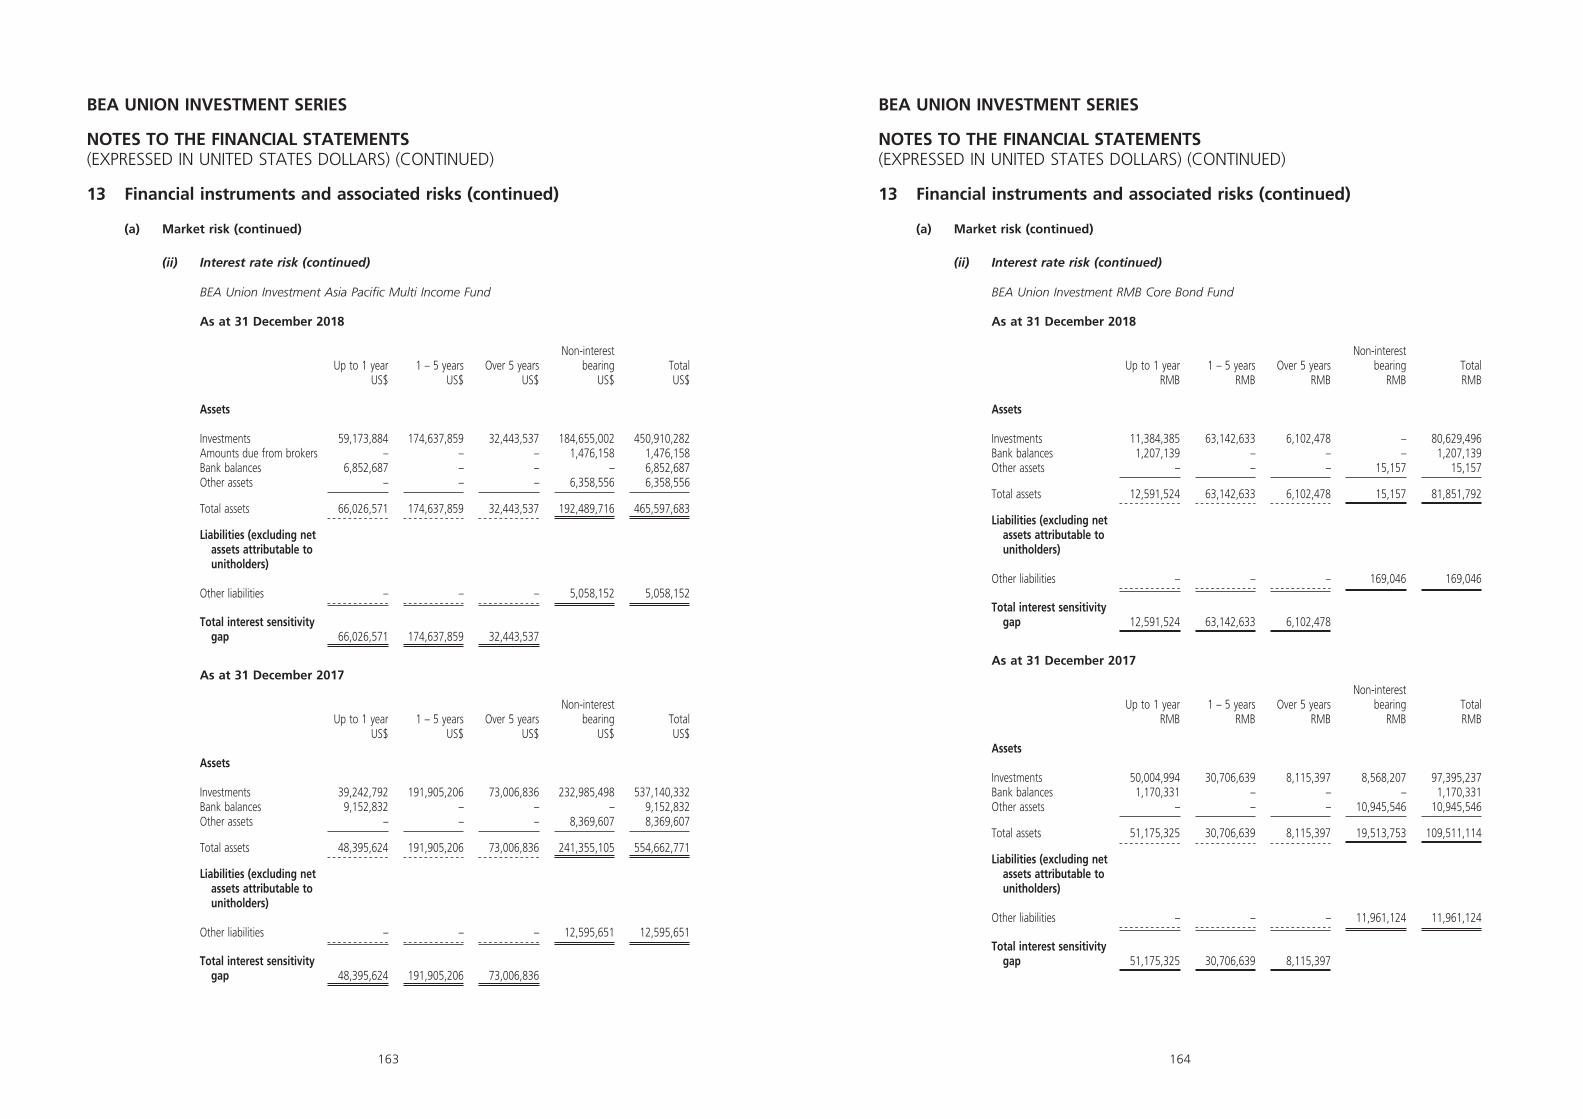
BEA UNION INVESTMENT SERIES
NOTES TO THE FINANCIAL STATEMENTS(EXPRESSED IN UNITED STATES DOLLARS) (CONTINUED)
BEA UNION INVESTMENT SERIES
NOTES TO THE FINANCIAL STATEMENTS(EXPRESSED IN UNITED STATES DOLLARS) (CONTINUED)
163 164
A5請縮小打印70.5%
13 Financial instruments and associated risks (continued)
(a) Market risk (continued)
(ii) Interest rate risk (continued)
BEA Union Investment Asia Pacific Multi Income Fund
As at 31 December 2018
Up to 1 year 1 – 5 years Over 5 yearsNon-interest
bearing TotalUS$ US$ US$ US$ US$
Assets
Investments 59,173,884 174,637,859 32,443,537 184,655,002 450,910,282Amounts due from brokers – – – 1,476,158 1,476,158Bank balances 6,852,687 – – – 6,852,687Other assets – – – 6,358,556 6,358,556
Total assets 66,026,571 174,637,859 32,443,537 192,489,716 465,597,683
Liabilities (excluding net assets attributable to unitholders)
Other liabilities – – – 5,058,152 5,058,152
Total interest sensitivity gap 66,026,571 174,637,859 32,443,537
As at 31 December 2017
Up to 1 year 1 – 5 years Over 5 yearsNon-interest
bearing TotalUS$ US$ US$ US$ US$
Assets
Investments 39,242,792 191,905,206 73,006,836 232,985,498 537,140,332Bank balances 9,152,832 – – – 9,152,832Other assets – – – 8,369,607 8,369,607
Total assets 48,395,624 191,905,206 73,006,836 241,355,105 554,662,771
Liabilities (excluding net assets attributable to unitholders)
Other liabilities – – – 12,595,651 12,595,651
Total interest sensitivity gap 48,395,624 191,905,206 73,006,836
13 Financial instruments and associated risks (continued)
(a) Market risk (continued)
(ii) Interest rate risk (continued)
BEA Union Investment RMB Core Bond Fund
As at 31 December 2018
Up to 1 year 1 – 5 years Over 5 yearsNon-interest
bearing TotalRMB RMB RMB RMB RMB
Assets
Investments 11,384,385 63,142,633 6,102,478 – 80,629,496Bank balances 1,207,139 – – – 1,207,139Other assets – – – 15,157 15,157
Total assets 12,591,524 63,142,633 6,102,478 15,157 81,851,792
Liabilities (excluding net assets attributable to unitholders)
Other liabilities – – – 169,046 169,046
Total interest sensitivity gap 12,591,524 63,142,633 6,102,478
As at 31 December 2017
Up to 1 year 1 – 5 years Over 5 yearsNon-interest
bearing TotalRMB RMB RMB RMB RMB
Assets
Investments 50,004,994 30,706,639 8,115,397 8,568,207 97,395,237Bank balances 1,170,331 – – – 1,170,331Other assets – – – 10,945,546 10,945,546
Total assets 51,175,325 30,706,639 8,115,397 19,513,753 109,511,114
Liabilities (excluding net assets attributable to unitholders)
Other liabilities – – – 11,961,124 11,961,124
Total interest sensitivity gap 51,175,325 30,706,639 8,115,397
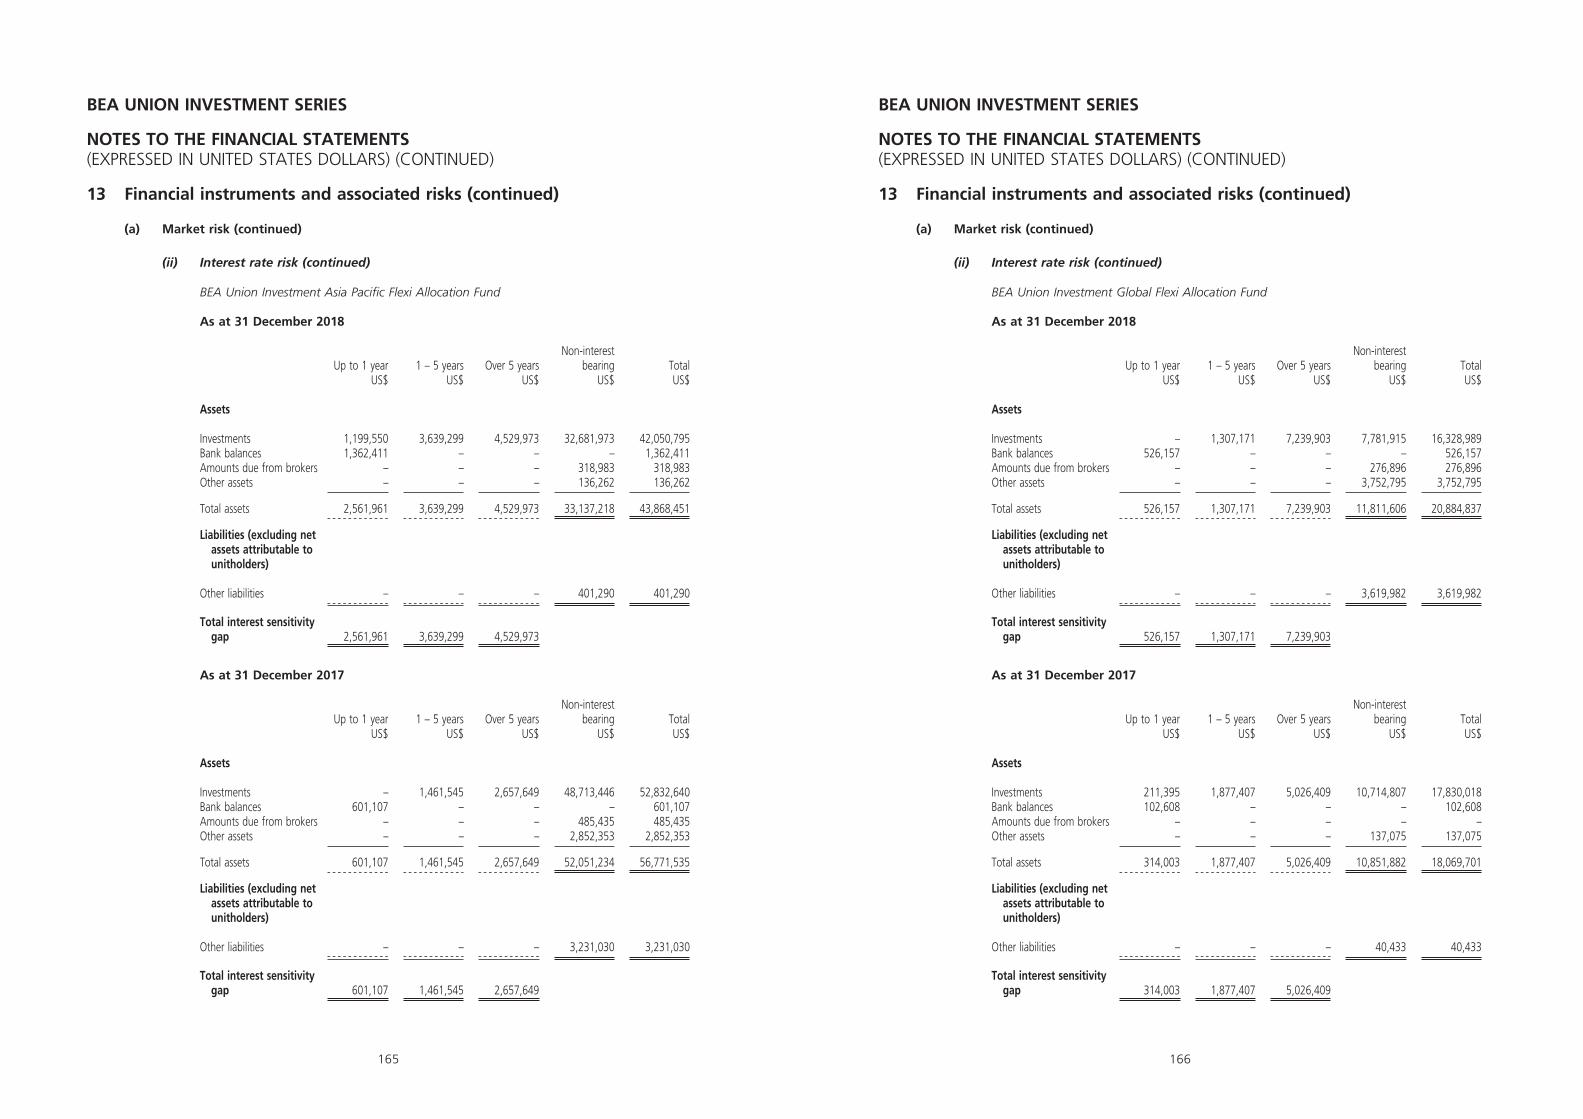
BEA UNION INVESTMENT SERIES
NOTES TO THE FINANCIAL STATEMENTS(EXPRESSED IN UNITED STATES DOLLARS) (CONTINUED)
BEA UNION INVESTMENT SERIES
NOTES TO THE FINANCIAL STATEMENTS(EXPRESSED IN UNITED STATES DOLLARS) (CONTINUED)
165 166
A5請縮小打印70.5%
13 Financial instruments and associated risks (continued)
(a) Market risk (continued)
(ii) Interest rate risk (continued)
BEA Union Investment Asia Pacific Flexi Allocation Fund
As at 31 December 2018
Up to 1 year 1 – 5 years Over 5 yearsNon-interest
bearing TotalUS$ US$ US$ US$ US$
Assets
Investments 1,199,550 3,639,299 4,529,973 32,681,973 42,050,795Bank balances 1,362,411 – – – 1,362,411Amounts due from brokers – – – 318,983 318,983Other assets – – – 136,262 136,262
Total assets 2,561,961 3,639,299 4,529,973 33,137,218 43,868,451
Liabilities (excluding net assets attributable to unitholders)
Other liabilities – – – 401,290 401,290
Total interest sensitivity gap 2,561,961 3,639,299 4,529,973
As at 31 December 2017
Up to 1 year 1 – 5 years Over 5 yearsNon-interest
bearing TotalUS$ US$ US$ US$ US$
Assets
Investments – 1,461,545 2,657,649 48,713,446 52,832,640Bank balances 601,107 – – – 601,107Amounts due from brokers – – – 485,435 485,435Other assets – – – 2,852,353 2,852,353
Total assets 601,107 1,461,545 2,657,649 52,051,234 56,771,535
Liabilities (excluding net assets attributable to unitholders)
Other liabilities – – – 3,231,030 3,231,030
Total interest sensitivity gap 601,107 1,461,545 2,657,649
13 Financial instruments and associated risks (continued)
(a) Market risk (continued)
(ii) Interest rate risk (continued)
BEA Union Investment Global Flexi Allocation Fund
As at 31 December 2018
Up to 1 year 1 – 5 years Over 5 yearsNon-interest
bearing TotalUS$ US$ US$ US$ US$
Assets
Investments – 1,307,171 7,239,903 7,781,915 16,328,989Bank balances 526,157 – – – 526,157Amounts due from brokers – – – 276,896 276,896Other assets – – – 3,752,795 3,752,795
Total assets 526,157 1,307,171 7,239,903 11,811,606 20,884,837
Liabilities (excluding net assets attributable to unitholders)
Other liabilities – – – 3,619,982 3,619,982
Total interest sensitivity gap 526,157 1,307,171 7,239,903
As at 31 December 2017
Up to 1 year 1 – 5 years Over 5 yearsNon-interest
bearing TotalUS$ US$ US$ US$ US$
Assets
Investments 211,395 1,877,407 5,026,409 10,714,807 17,830,018Bank balances 102,608 – – – 102,608Amounts due from brokers – – – – –Other assets – – – 137,075 137,075
Total assets 314,003 1,877,407 5,026,409 10,851,882 18,069,701
Liabilities (excluding net assets attributable to unitholders)
Other liabilities – – – 40,433 40,433
Total interest sensitivity gap 314,003 1,877,407 5,026,409
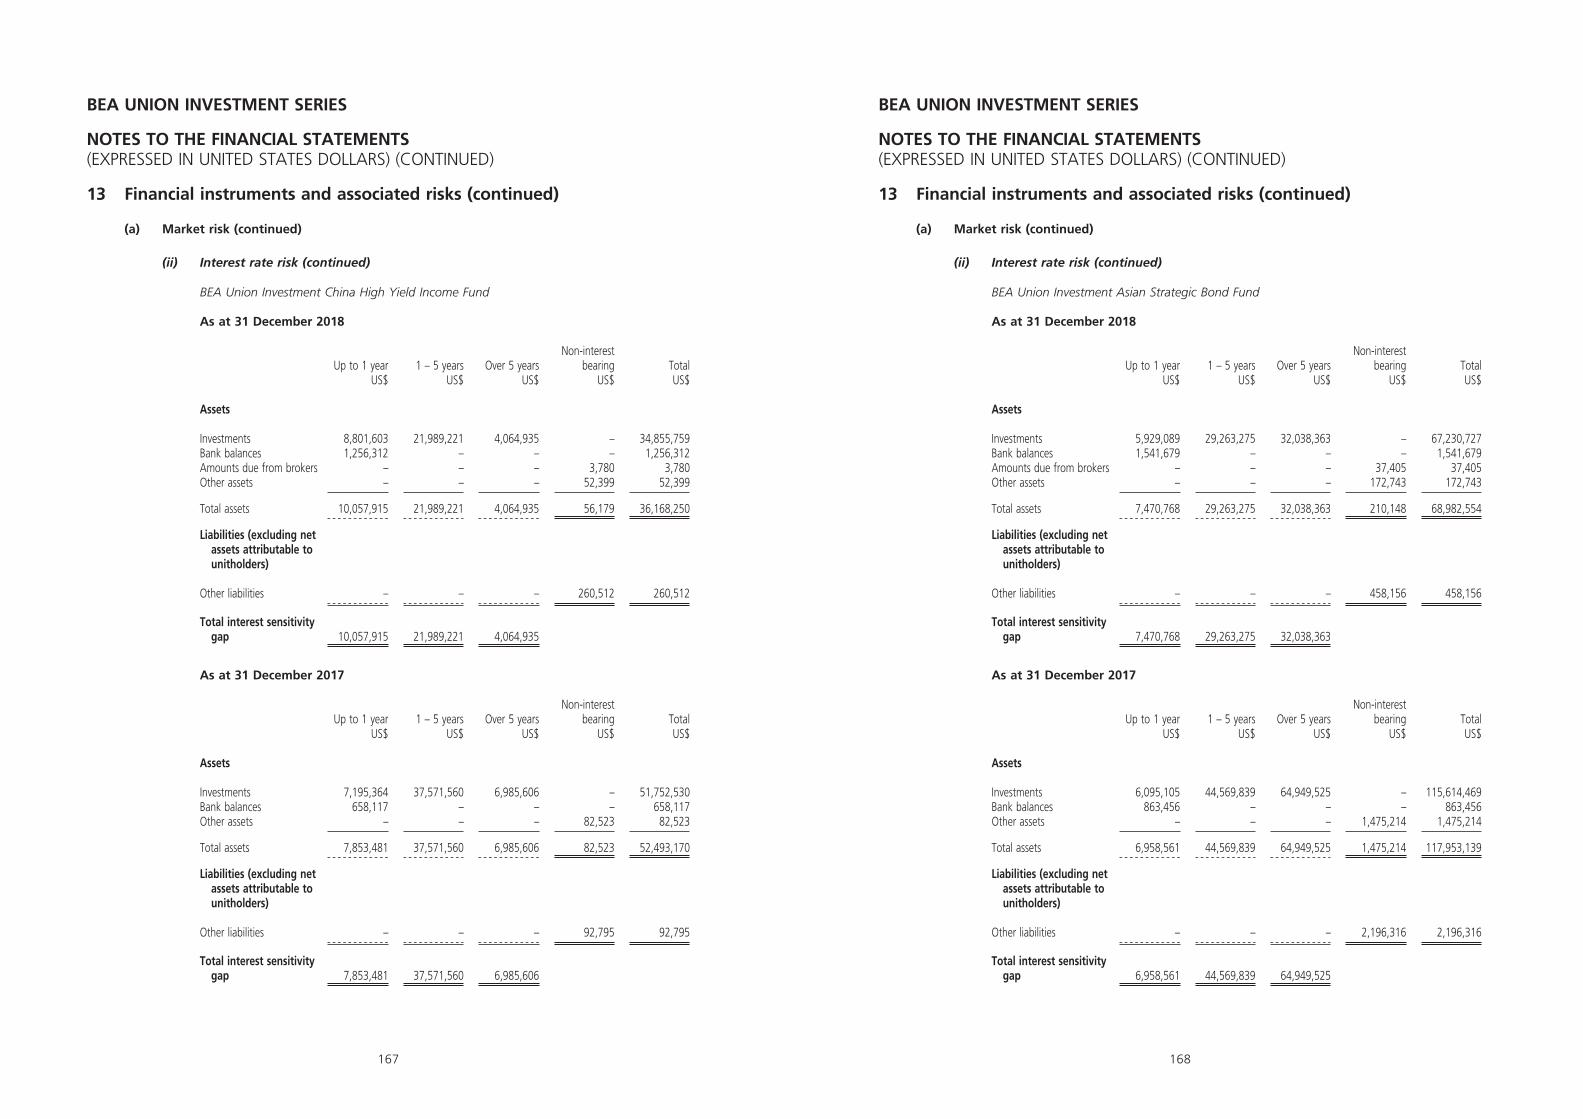
BEA UNION INVESTMENT SERIES
NOTES TO THE FINANCIAL STATEMENTS(EXPRESSED IN UNITED STATES DOLLARS) (CONTINUED)
BEA UNION INVESTMENT SERIES
NOTES TO THE FINANCIAL STATEMENTS(EXPRESSED IN UNITED STATES DOLLARS) (CONTINUED)
167 168
A5請縮小打印70.5%
13 Financial instruments and associated risks (continued)
(a) Market risk (continued)
(ii) Interest rate risk (continued)
BEA Union Investment China High Yield Income Fund
As at 31 December 2018
Up to 1 year 1 – 5 years Over 5 yearsNon-interest
bearing TotalUS$ US$ US$ US$ US$
Assets
Investments 8,801,603 21,989,221 4,064,935 – 34,855,759Bank balances 1,256,312 – – – 1,256,312Amounts due from brokers – – – 3,780 3,780Other assets – – – 52,399 52,399
Total assets 10,057,915 21,989,221 4,064,935 56,179 36,168,250
Liabilities (excluding net assets attributable to unitholders)
Other liabilities – – – 260,512 260,512
Total interest sensitivity gap 10,057,915 21,989,221 4,064,935
As at 31 December 2017
Up to 1 year 1 – 5 years Over 5 yearsNon-interest
bearing TotalUS$ US$ US$ US$ US$
Assets
Investments 7,195,364 37,571,560 6,985,606 – 51,752,530Bank balances 658,117 – – – 658,117Other assets – – – 82,523 82,523
Total assets 7,853,481 37,571,560 6,985,606 82,523 52,493,170
Liabilities (excluding net assets attributable to unitholders)
Other liabilities – – – 92,795 92,795
Total interest sensitivity gap 7,853,481 37,571,560 6,985,606
13 Financial instruments and associated risks (continued)
(a) Market risk (continued)
(ii) Interest rate risk (continued)
BEA Union Investment Asian Strategic Bond Fund
As at 31 December 2018
Up to 1 year 1 – 5 years Over 5 yearsNon-interest
bearing TotalUS$ US$ US$ US$ US$
Assets
Investments 5,929,089 29,263,275 32,038,363 – 67,230,727Bank balances 1,541,679 – – – 1,541,679Amounts due from brokers – – – 37,405 37,405Other assets – – – 172,743 172,743
Total assets 7,470,768 29,263,275 32,038,363 210,148 68,982,554
Liabilities (excluding net assets attributable to unitholders)
Other liabilities – – – 458,156 458,156
Total interest sensitivity gap 7,470,768 29,263,275 32,038,363
As at 31 December 2017
Up to 1 year 1 – 5 years Over 5 yearsNon-interest
bearing TotalUS$ US$ US$ US$ US$
Assets
Investments 6,095,105 44,569,839 64,949,525 – 115,614,469Bank balances 863,456 – – – 863,456Other assets – – – 1,475,214 1,475,214
Total assets 6,958,561 44,569,839 64,949,525 1,475,214 117,953,139
Liabilities (excluding net assets attributable to unitholders)
Other liabilities – – – 2,196,316 2,196,316
Total interest sensitivity gap 6,958,561 44,569,839 64,949,525
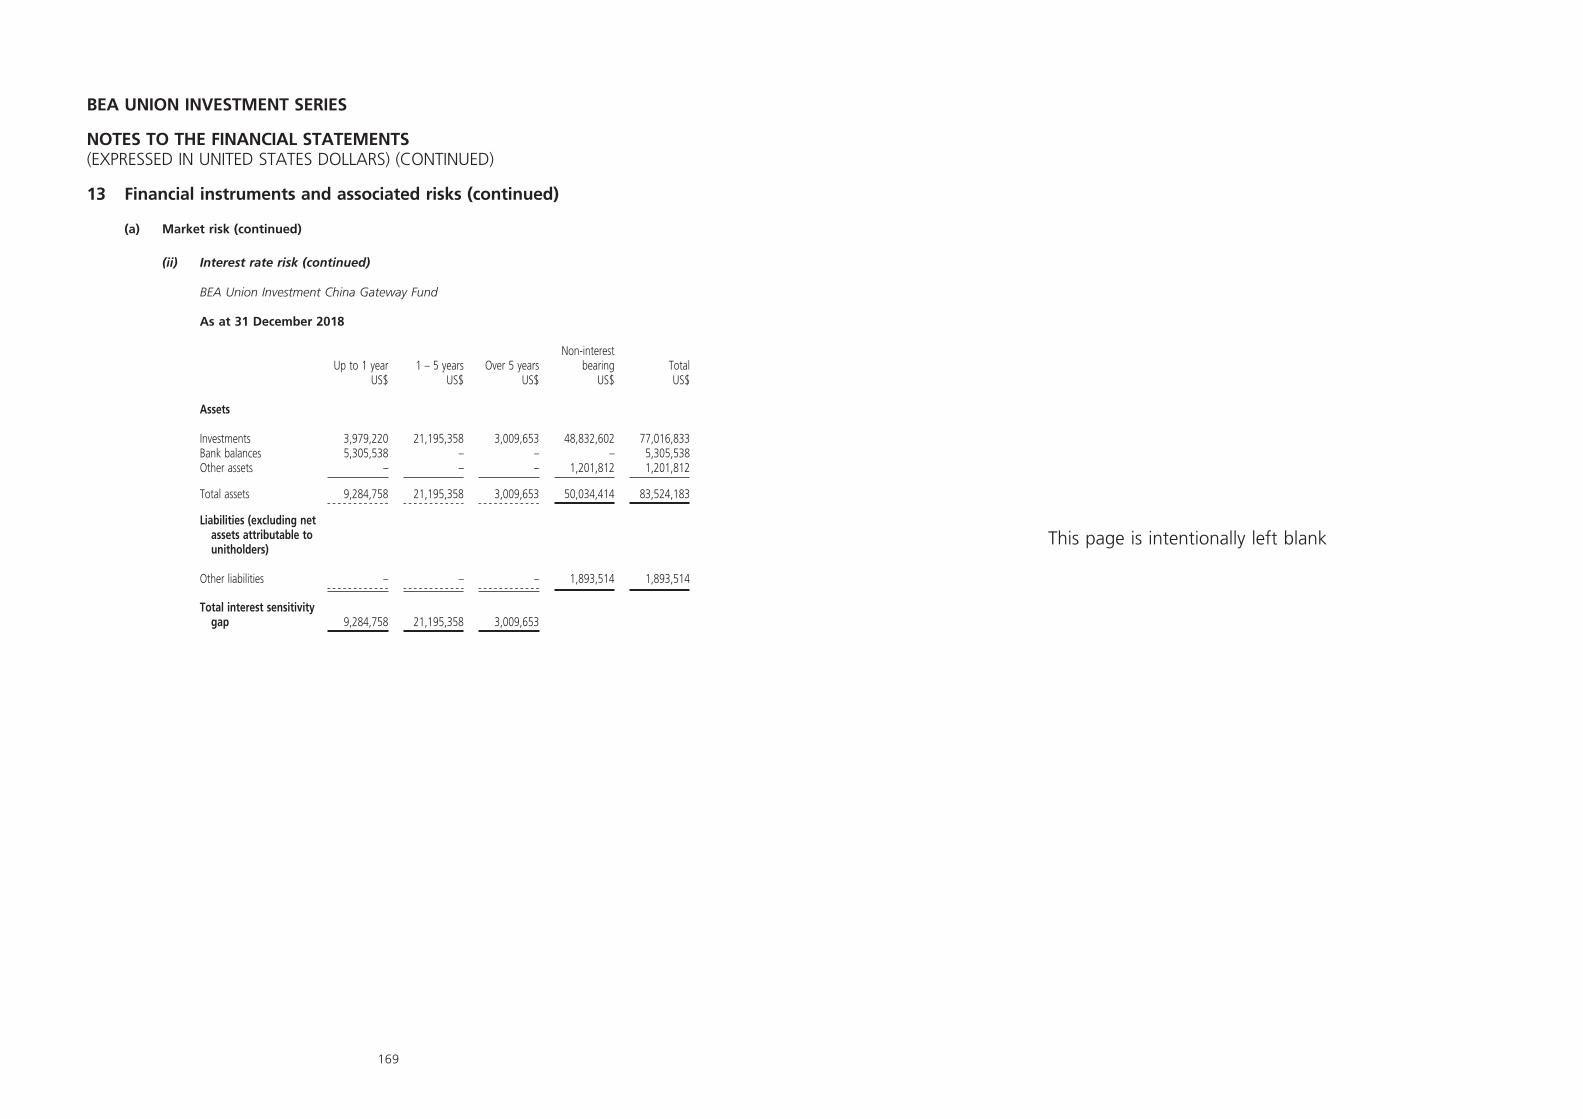
A5請縮小打印70.5%
This page is intentionally left blank
BEA UNION INVESTMENT SERIES
NOTES TO THE FINANCIAL STATEMENTS(EXPRESSED IN UNITED STATES DOLLARS) (CONTINUED)
169
A5請縮小打印70.5%
13 Financial instruments and associated risks (continued)
(a) Market risk (continued)
(ii) Interest rate risk (continued)
BEA Union Investment China Gateway Fund
As at 31 December 2018
Up to 1 year 1 – 5 years Over 5 yearsNon-interest
bearing TotalUS$ US$ US$ US$ US$
Assets
Investments 3,979,220 21,195,358 3,009,653 48,832,602 77,016,833Bank balances 5,305,538 – – – 5,305,538Other assets – – – 1,201,812 1,201,812
Total assets 9,284,758 21,195,358 3,009,653 50,034,414 83,524,183
Liabilities (excluding net assets attributable to unitholders)
Other liabilities – – – 1,893,514 1,893,514
Total interest sensitivity gap 9,284,758 21,195,358 3,009,653
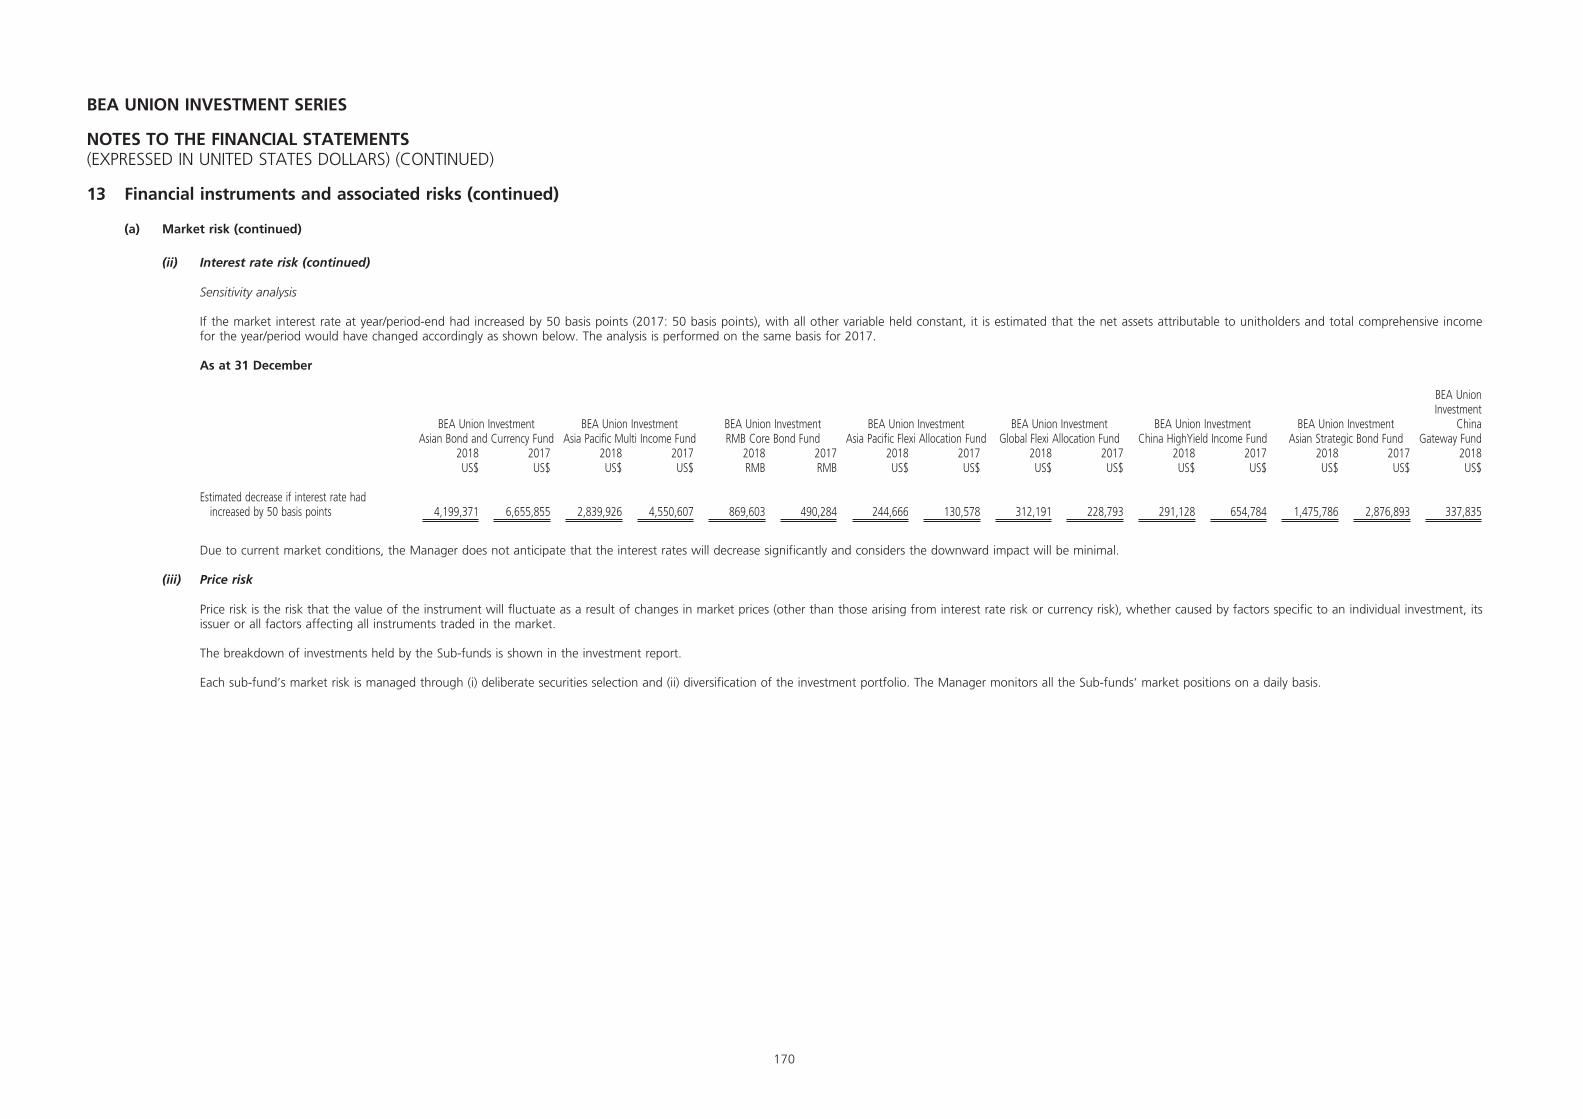
BEA UNION INVESTMENT SERIES
NOTES TO THE FINANCIAL STATEMENTS(EXPRESSED IN UNITED STATES DOLLARS) (CONTINUED)
170
A5請縮小打印70.5%
13 Financial instruments and associated risks (continued)
(a) Market risk (continued)
(ii) Interest rate risk (continued)
Sensitivity analysis
If the market interest rate at year/period-end had increased by 50 basis points (2017: 50 basis points), with all other variable held constant, it is estimated that the net assets attributable to unitholders and total comprehensive income for the year/period would have changed accordingly as shown below. The analysis is performed on the same basis for 2017.
As at 31 December
BEA Union Investment Asian Bond and Currency Fund
BEA Union Investment Asia Pacific Multi Income Fund
BEA Union Investment RMB Core Bond Fund
BEA Union Investment Asia Pacific Flexi Allocation Fund
BEA Union Investment Global Flexi Allocation Fund
BEA Union Investment China HighYield Income Fund
BEA Union Investment Asian Strategic Bond Fund
BEA Union Investment
China Gateway Fund
2018 2017 2018 2017 2018 2017 2018 2017 2018 2017 2018 2017 2018 2017 2018US$ US$ US$ US$ RMB RMB US$ US$ US$ US$ US$ US$ US$ US$ US$
Estimated decrease if interest rate had increased by 50 basis points 4,199,371 6,655,855 2,839,926 4,550,607 869,603 490,284 244,666 130,578 312,191 228,793 291,128 654,784 1,475,786 2,876,893 337,835
Due to current market conditions, the Manager does not anticipate that the interest rates will decrease significantly and considers the downward impact will be minimal.
(iii) Price risk
Price risk is the risk that the value of the instrument will fluctuate as a result of changes in market prices (other than those arising from interest rate risk or currency risk), whether caused by factors specific to an individual investment, its issuer or all factors affecting all instruments traded in the market.
The breakdown of investments held by the Sub-funds is shown in the investment report.
Each sub-fund’s market risk is managed through (i) deliberate securities selection and (ii) diversification of the investment portfolio. The Manager monitors all the Sub-funds’ market positions on a daily basis.
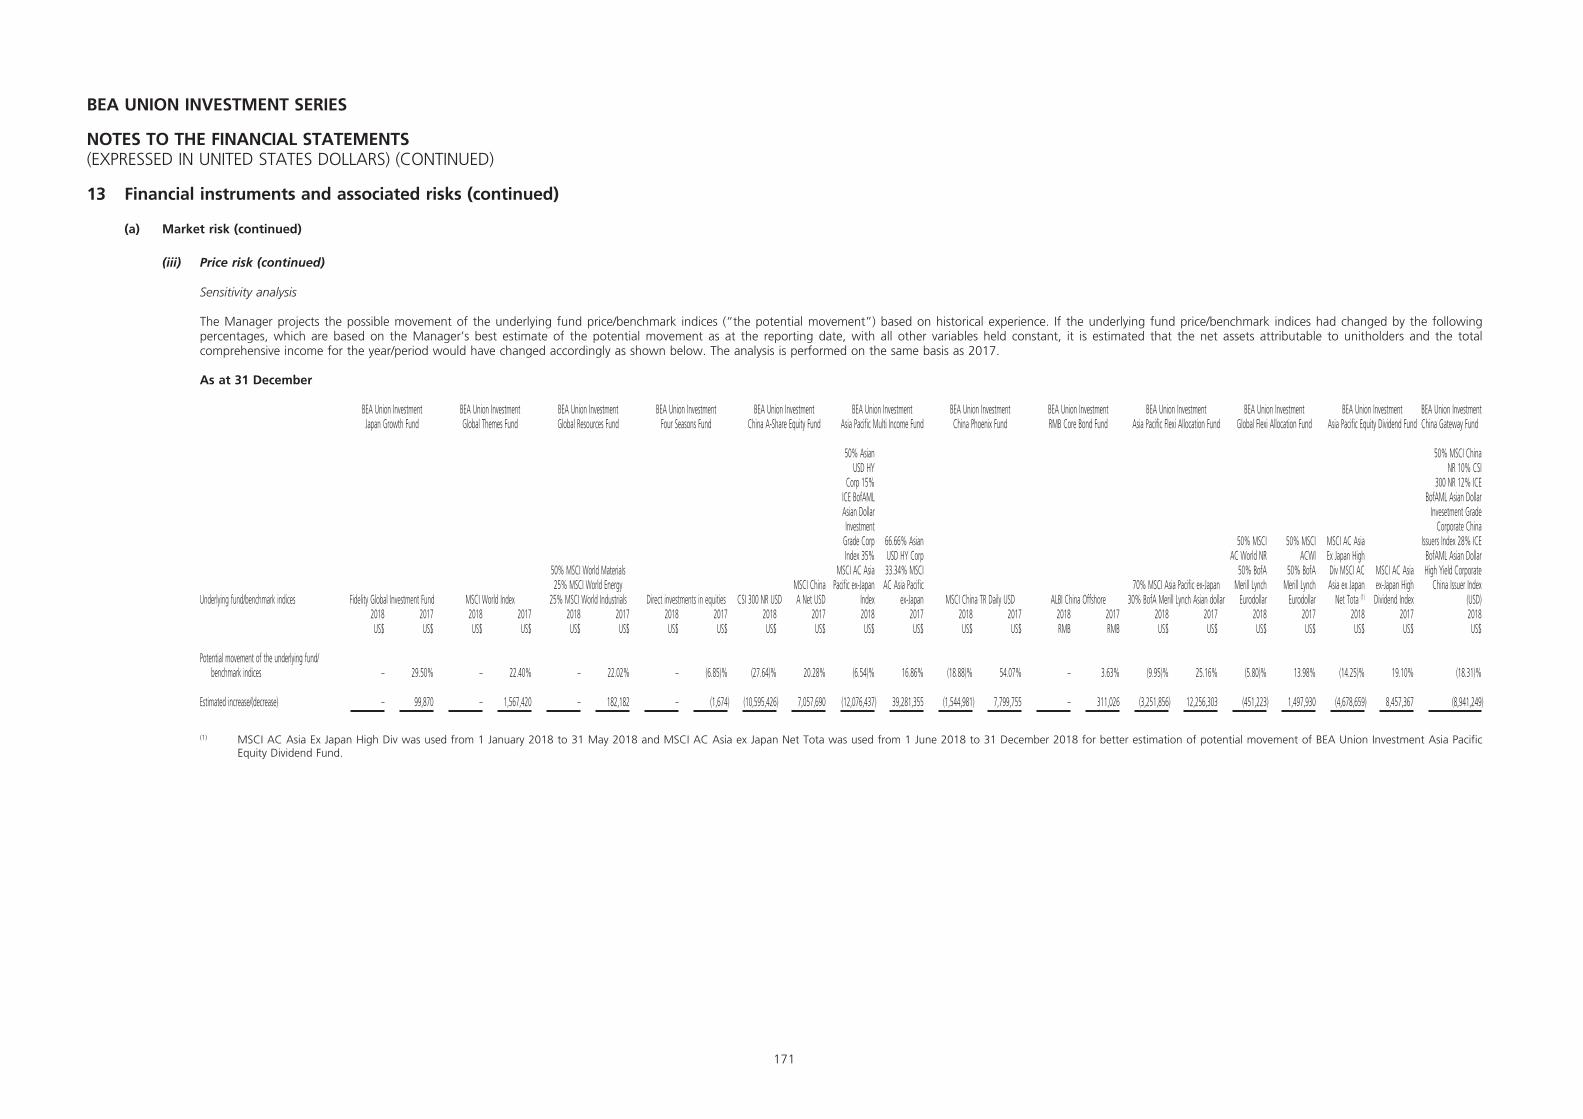
BEA UNION INVESTMENT SERIES
NOTES TO THE FINANCIAL STATEMENTS(EXPRESSED IN UNITED STATES DOLLARS) (CONTINUED)
171
A5請縮小打印70.5%
13 Financial instruments and associated risks (continued)
(a) Market risk (continued)
(iii) Price risk (continued)
Sensitivity analysis
The Manager projects the possible movement of the underlying fund price/benchmark indices (“the potential movement”) based on historical experience. If the underlying fund price/benchmark indices had changed by the following percentages, which are based on the Manager’s best estimate of the potential movement as at the reporting date, with all other variables held constant, it is estimated that the net assets attributable to unitholders and the total comprehensive income for the year/period would have changed accordingly as shown below. The analysis is performed on the same basis as 2017.
As at 31 December
BEA Union Investment Japan Growth Fund
BEA Union Investment Global Themes Fund
BEA Union Investment Global Resources Fund
BEA Union Investment Four Seasons Fund
BEA Union Investment China A-Share Equity Fund
BEA Union Investment Asia Pacific Multi Income Fund
BEA Union Investment China Phoenix Fund
BEA Union Investment RMB Core Bond Fund
BEA Union Investment Asia Pacific Flexi Allocation Fund
BEA Union Investment Global Flexi Allocation Fund
BEA Union Investment Asia Pacific Equity Dividend Fund
BEA Union Investment China Gateway Fund
Underlying fund/benchmark indices Fidelity Global Investment Fund MSCI World Index
50% MSCI World Materials 25% MSCI World Energy
25% MSCI World Industrials Direct investments in equities CSI 300 NR USDMSCI China A Net USD
50% Asian USD HY
Corp 15% ICE BofAML Asian Dollar Investment
Grade Corp Index 35%
MSCI AC Asia Pacific ex-Japan
Index
66.66% Asian USD HY Corp 33.34% MSCI
AC Asia Pacific ex-Japan MSCI China TR Daily USD ALBI China Offshore
70% MSCI Asia Pacific ex-Japan 30% BofA Merill Lynch Asian dollar
50% MSCI AC World NR
50% BofA Merill Lynch
Eurodollar
50% MSCI ACWI
50% BofA Merill Lynch
Eurodollar
MSCI AC Asia Ex Japan High Div MSCI AC Asia ex Japan
Net Tota (1)
MSCI AC Asia ex-Japan High Dividend Index
50% MSCI China NR 10% CSI
300 NR 12% ICE BofAML Asian Dollar
Invesetment Grade Corporate China
Issuers Index 28% ICE BofAML Asian Dollar High Yield Corporate
China Issuer Index (USD)
2018 2017 2018 2017 2018 2017 2018 2017 2018 2017 2018 2017 2018 2017 2018 2017 2018 2017 2018 2017 2018 2017 2018US$ US$ US$ US$ US$ US$ US$ US$ US$ US$ US$ US$ US$ US$ RMB RMB US$ US$ US$ US$ US$ US$ US$
Potential movement of the underlying fund/benchmark indices – 29.50% – 22.40% – 22.02% – (6.85)% (27.64)% 20.28% (6.54)% 16.86% (18.88)% 54.07% – 3.63% (9.95)% 25.16% (5.80)% 13.98% (14.25)% 19.10% (18.31)%
Estimated increase/(decrease) – 99,870 – 1,567,420 – 182,182 – (1,674) (10,595,426) 7,057,690 (12,076,437) 39,281,355 (1,544,981) 7,799,755 – 311,026 (3,251,856) 12,256,303 (451,223) 1,497,930 (4,678,659) 8,457,367 (8,941,249)
(1) MSCI AC Asia Ex Japan High Div was used from 1 January 2018 to 31 May 2018 and MSCI AC Asia ex Japan Net Tota was used from 1 June 2018 to 31 December 2018 for better estimation of potential movement of BEA Union Investment Asia Pacific Equity Dividend Fund.
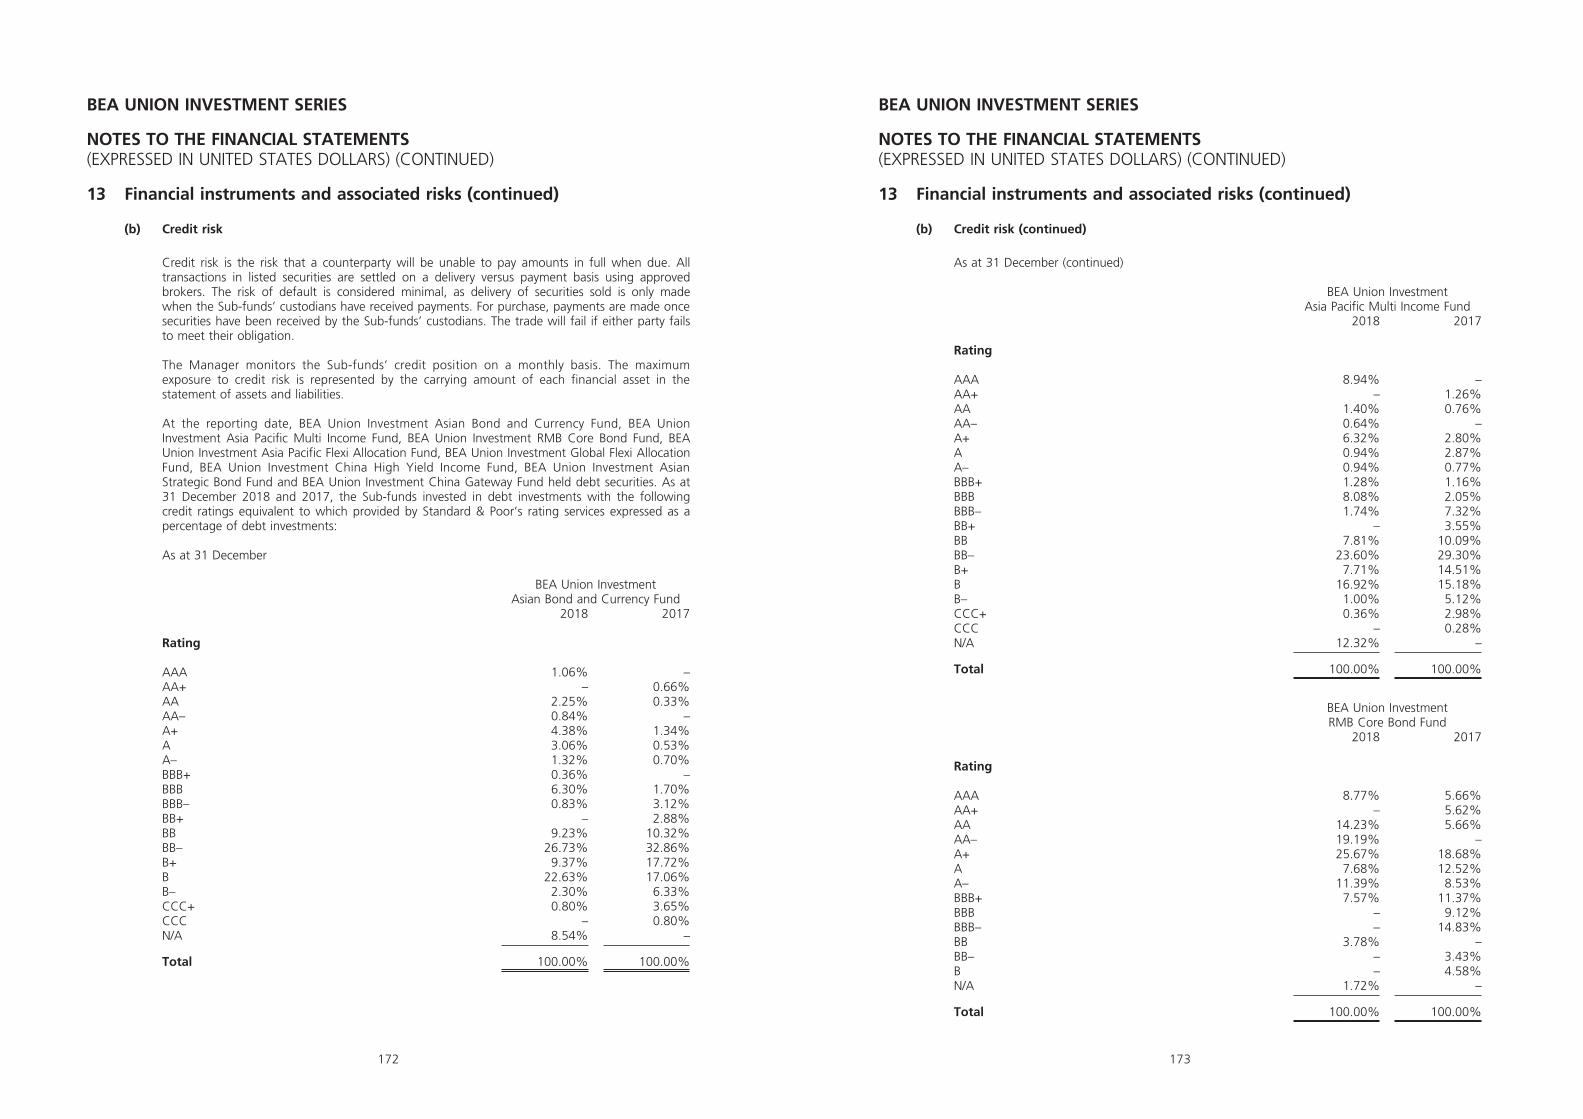
BEA UNION INVESTMENT SERIES
NOTES TO THE FINANCIAL STATEMENTS(EXPRESSED IN UNITED STATES DOLLARS) (CONTINUED)
BEA UNION INVESTMENT SERIES
NOTES TO THE FINANCIAL STATEMENTS(EXPRESSED IN UNITED STATES DOLLARS) (CONTINUED)
172 173
A5請縮小打印70.5%
13 Financial instruments and associated risks (continued)
(b) Credit risk
Credit risk is the risk that a counterparty will be unable to pay amounts in full when due. All transactions in listed securities are settled on a delivery versus payment basis using approved brokers. The risk of default is considered minimal, as delivery of securities sold is only made when the Sub-funds’ custodians have received payments. For purchase, payments are made once securities have been received by the Sub-funds’ custodians. The trade will fail if either party fails to meet their obligation.
The Manager monitors the Sub-funds’ credit position on a monthly basis. The maximum exposure to credit risk is represented by the carrying amount of each financial asset in the statement of assets and liabilities.
At the reporting date, BEA Union Investment Asian Bond and Currency Fund, BEA Union Investment Asia Pacific Multi Income Fund, BEA Union Investment RMB Core Bond Fund, BEA Union Investment Asia Pacific Flexi Allocation Fund, BEA Union Investment Global Flexi Allocation Fund, BEA Union Investment China High Yield Income Fund, BEA Union Investment Asian Strategic Bond Fund and BEA Union Investment China Gateway Fund held debt securities. As at 31 December 2018 and 2017, the Sub-funds invested in debt investments with the following credit ratings equivalent to which provided by Standard & Poor’s rating services expressed as a percentage of debt investments:
As at 31 December
BEA Union Investment Asian Bond and Currency Fund
2018 2017
Rating
AAA 1.06% –AA+ – 0.66%AA 2.25% 0.33%AA– 0.84% –A+ 4.38% 1.34%A 3.06% 0.53%A– 1.32% 0.70%BBB+ 0.36% –BBB 6.30% 1.70%BBB– 0.83% 3.12%BB+ – 2.88%BB 9.23% 10.32%BB– 26.73% 32.86%B+ 9.37% 17.72%B 22.63% 17.06%B– 2.30% 6.33%CCC+ 0.80% 3.65%CCC – 0.80%N/A 8.54% –
Total 100.00% 100.00%
13 Financial instruments and associated risks (continued)
(b) Credit risk (continued)
As at 31 December (continued)
BEA Union Investment Asia Pacific Multi Income Fund
2018 2017
Rating
AAA 8.94% –AA+ – 1.26%AA 1.40% 0.76%AA– 0.64% –A+ 6.32% 2.80%A 0.94% 2.87%A– 0.94% 0.77%BBB+ 1.28% 1.16%BBB 8.08% 2.05%BBB– 1.74% 7.32%BB+ – 3.55%BB 7.81% 10.09%BB– 23.60% 29.30%B+ 7.71% 14.51%B 16.92% 15.18%B– 1.00% 5.12%CCC+ 0.36% 2.98%CCC – 0.28%N/A 12.32% –
Total 100.00% 100.00%
BEA Union Investment RMB Core Bond Fund
2018 2017
Rating
AAA 8.77% 5.66%AA+ – 5.62%AA 14.23% 5.66%AA– 19.19% –A+ 25.67% 18.68%A 7.68% 12.52%A– 11.39% 8.53%BBB+ 7.57% 11.37%BBB – 9.12%BBB– – 14.83%BB 3.78% –BB– – 3.43%B – 4.58%N/A 1.72% –
Total 100.00% 100.00%
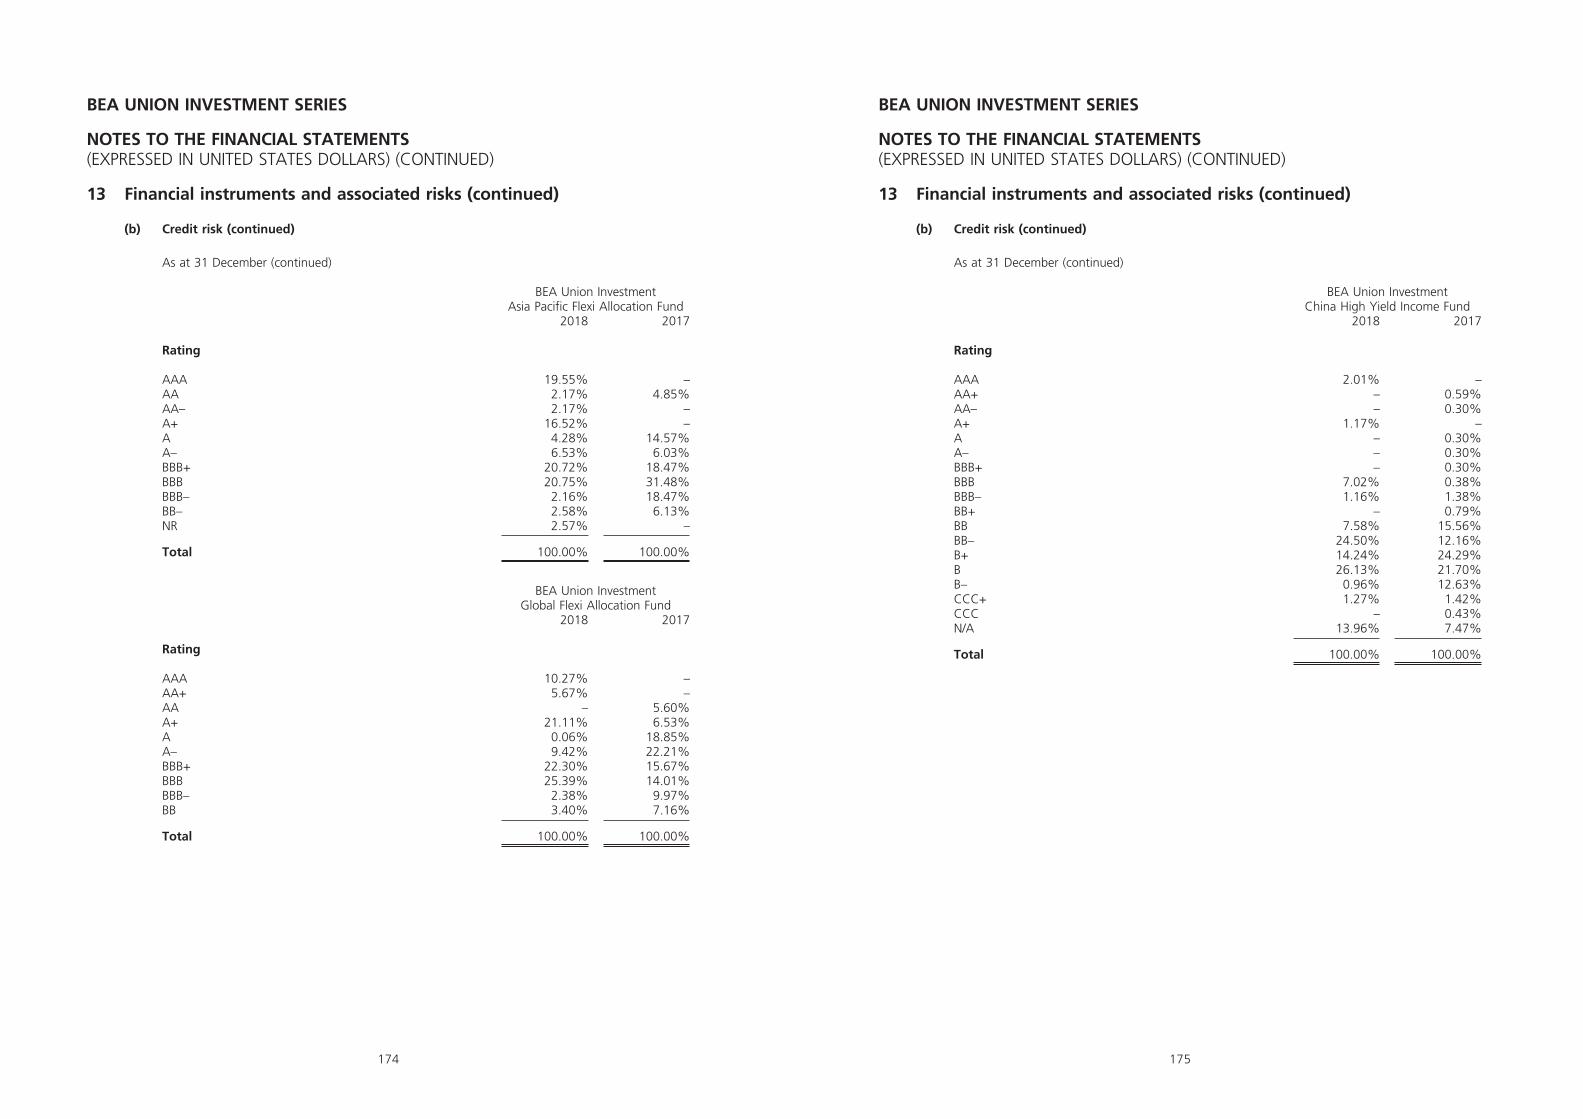
BEA UNION INVESTMENT SERIES
NOTES TO THE FINANCIAL STATEMENTS(EXPRESSED IN UNITED STATES DOLLARS) (CONTINUED)
BEA UNION INVESTMENT SERIES
NOTES TO THE FINANCIAL STATEMENTS(EXPRESSED IN UNITED STATES DOLLARS) (CONTINUED)
174 175
A5請縮小打印70.5%
13 Financial instruments and associated risks (continued)
(b) Credit risk (continued)
As at 31 December (continued)
BEA Union Investment Asia Pacific Flexi Allocation Fund
2018 2017
Rating
AAA 19.55% –AA 2.17% 4.85%AA– 2.17% –A+ 16.52% –A 4.28% 14.57%A– 6.53% 6.03%BBB+ 20.72% 18.47%BBB 20.75% 31.48%BBB– 2.16% 18.47%BB– 2.58% 6.13%NR 2.57% –
Total 100.00% 100.00%
BEA Union Investment Global Flexi Allocation Fund
2018 2017
Rating
AAA 10.27% –AA+ 5.67% –AA – 5.60%A+ 21.11% 6.53%A 0.06% 18.85%A– 9.42% 22.21%BBB+ 22.30% 15.67%BBB 25.39% 14.01%BBB– 2.38% 9.97%BB 3.40% 7.16%
Total 100.00% 100.00%
13 Financial instruments and associated risks (continued)
(b) Credit risk (continued)
As at 31 December (continued)
BEA Union Investment China High Yield Income Fund
2018 2017
Rating
AAA 2.01% –AA+ – 0.59%AA– – 0.30%A+ 1.17% –A – 0.30%A– – 0.30%BBB+ – 0.30%BBB 7.02% 0.38%BBB– 1.16% 1.38%BB+ – 0.79%BB 7.58% 15.56%BB– 24.50% 12.16%B+ 14.24% 24.29%B 26.13% 21.70%B– 0.96% 12.63%CCC+ 1.27% 1.42%CCC – 0.43%N/A 13.96% 7.47%
Total 100.00% 100.00%
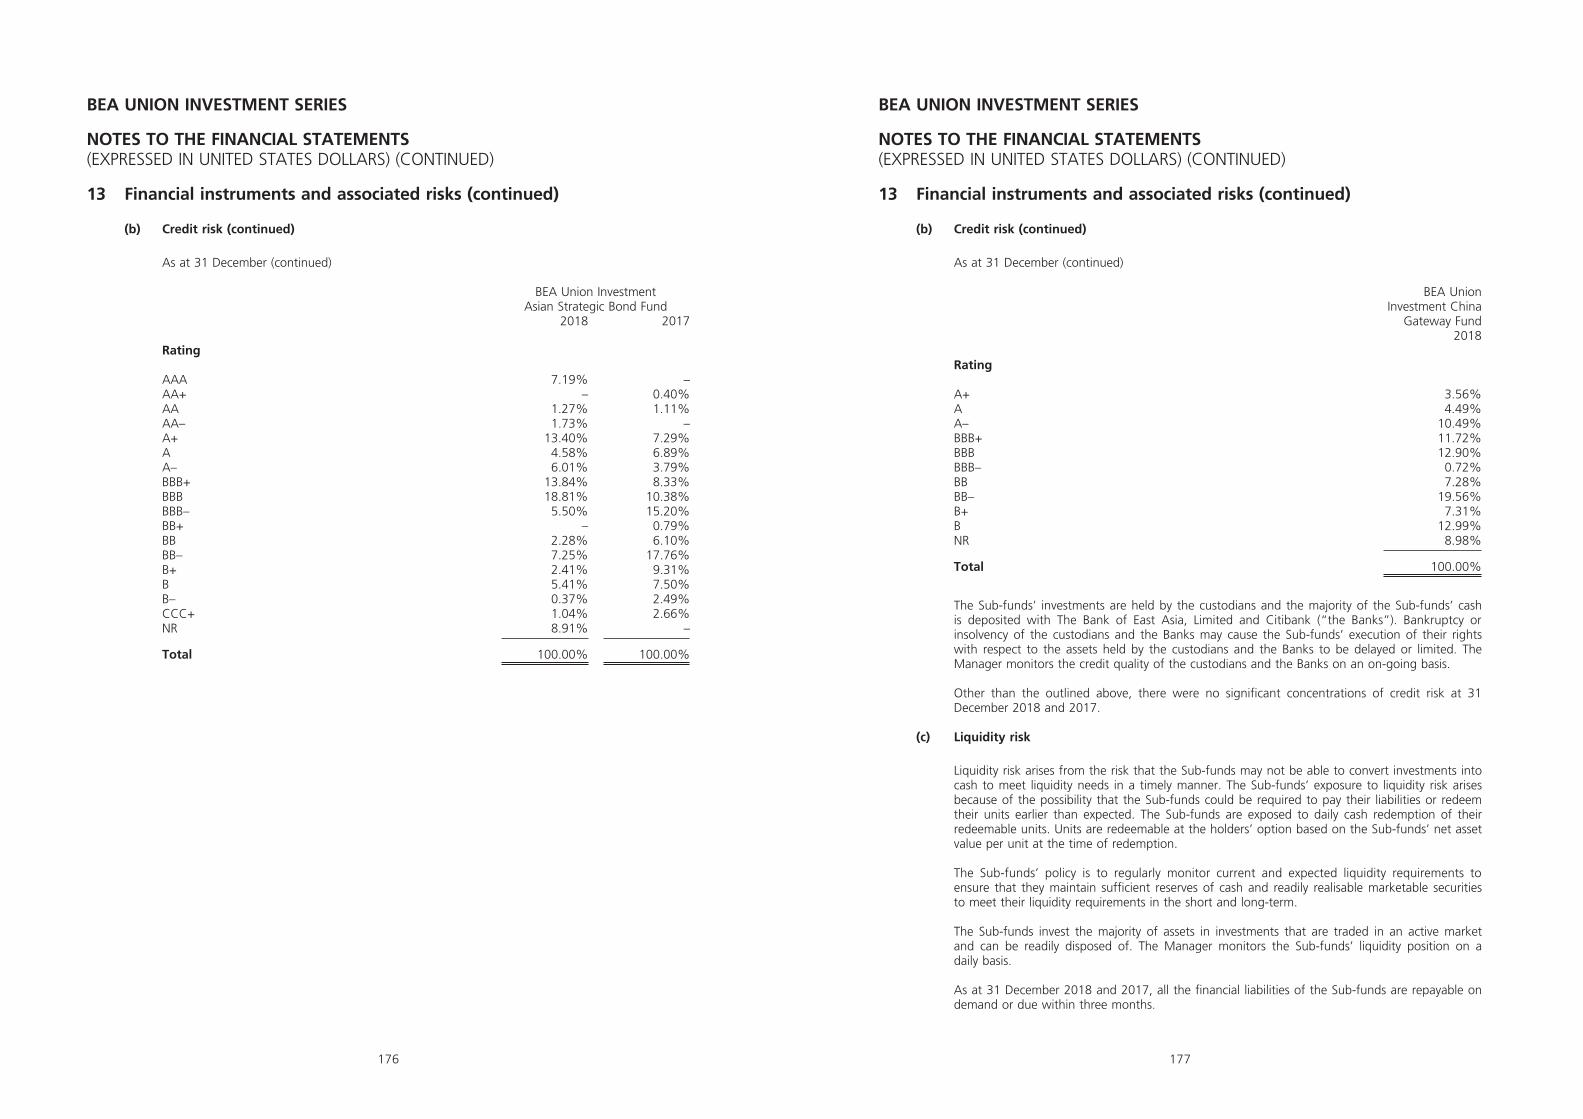
BEA UNION INVESTMENT SERIES
NOTES TO THE FINANCIAL STATEMENTS(EXPRESSED IN UNITED STATES DOLLARS) (CONTINUED)
BEA UNION INVESTMENT SERIES
NOTES TO THE FINANCIAL STATEMENTS(EXPRESSED IN UNITED STATES DOLLARS) (CONTINUED)
176 177
A5請縮小打印70.5%
13 Financial instruments and associated risks (continued)
(b) Credit risk (continued)
As at 31 December (continued)
BEA Union Investment Asian Strategic Bond Fund
2018 2017
Rating
AAA 7.19% –AA+ – 0.40%AA 1.27% 1.11%AA– 1.73% –A+ 13.40% 7.29%A 4.58% 6.89%A– 6.01% 3.79%BBB+ 13.84% 8.33%BBB 18.81% 10.38%BBB– 5.50% 15.20%BB+ – 0.79%BB 2.28% 6.10%BB– 7.25% 17.76%B+ 2.41% 9.31%B 5.41% 7.50%B– 0.37% 2.49%CCC+ 1.04% 2.66%NR 8.91% –
Total 100.00% 100.00%
13 Financial instruments and associated risks (continued)
(b) Credit risk (continued)
As at 31 December (continued)
BEA Union Investment China
Gateway Fund2018
Rating
A+ 3.56%A 4.49%A– 10.49%BBB+ 11.72%BBB 12.90%BBB– 0.72%BB 7.28%BB– 19.56%B+ 7.31%B 12.99%NR 8.98%
Total 100.00%
The Sub-funds’ investments are held by the custodians and the majority of the Sub-funds’ cash is deposited with The Bank of East Asia, Limited and Citibank (“the Banks”). Bankruptcy or insolvency of the custodians and the Banks may cause the Sub-funds’ execution of their rights with respect to the assets held by the custodians and the Banks to be delayed or limited. The Manager monitors the credit quality of the custodians and the Banks on an on-going basis.
Other than the outlined above, there were no significant concentrations of credit risk at 31 December 2018 and 2017.
(c) Liquidity risk
Liquidity risk arises from the risk that the Sub-funds may not be able to convert investments into cash to meet liquidity needs in a timely manner. The Sub-funds’ exposure to liquidity risk arises because of the possibility that the Sub-funds could be required to pay their liabilities or redeem their units earlier than expected. The Sub-funds are exposed to daily cash redemption of their redeemable units. Units are redeemable at the holders’ option based on the Sub-funds’ net asset value per unit at the time of redemption.
The Sub-funds’ policy is to regularly monitor current and expected liquidity requirements to ensure that they maintain sufficient reserves of cash and readily realisable marketable securities to meet their liquidity requirements in the short and long-term.
The Sub-funds invest the majority of assets in investments that are traded in an active market and can be readily disposed of. The Manager monitors the Sub-funds’ liquidity position on a daily basis.
As at 31 December 2018 and 2017, all the financial liabilities of the Sub-funds are repayable on demand or due within three months.
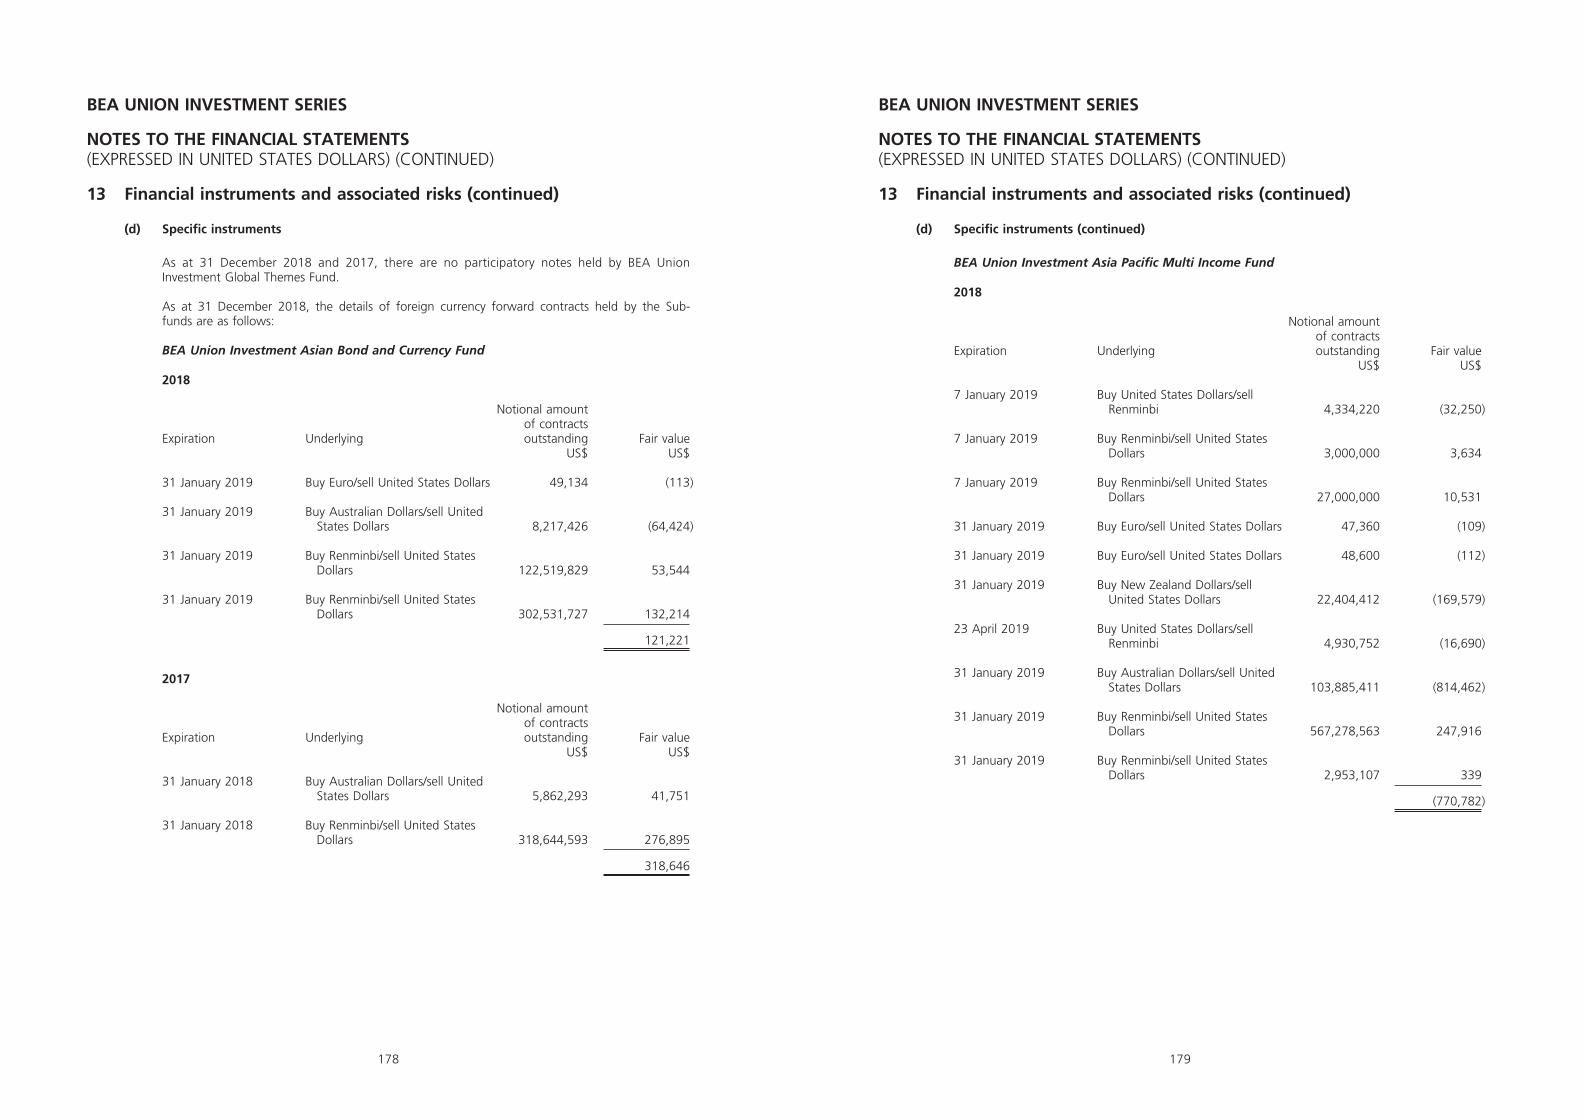
BEA UNION INVESTMENT SERIES
NOTES TO THE FINANCIAL STATEMENTS(EXPRESSED IN UNITED STATES DOLLARS) (CONTINUED)
BEA UNION INVESTMENT SERIES
NOTES TO THE FINANCIAL STATEMENTS(EXPRESSED IN UNITED STATES DOLLARS) (CONTINUED)
178 179
A5請縮小打印70.5%
13 Financial instruments and associated risks (continued)
(d) Specific instruments
As at 31 December 2018 and 2017, there are no participatory notes held by BEA Union Investment Global Themes Fund.
As at 31 December 2018, the details of foreign currency forward contracts held by the Sub-funds are as follows:
BEA Union Investment Asian Bond and Currency Fund
2018
Expiration Underlying
Notional amount of contracts outstanding Fair value
US$ US$
31 January 2019 Buy Euro/sell United States Dollars 49,134 (113)
31 January 2019 Buy Australian Dollars/sell United States Dollars 8,217,426 (64,424)
31 January 2019 Buy Renminbi/sell United States Dollars 122,519,829 53,544
31 January 2019 Buy Renminbi/sell United States Dollars 302,531,727 132,214
121,221
2017
Expiration Underlying
Notional amount of contracts outstanding Fair value
US$ US$
31 January 2018 Buy Australian Dollars/sell United States Dollars 5,862,293 41,751
31 January 2018 Buy Renminbi/sell United States Dollars 318,644,593 276,895
318,646
13 Financial instruments and associated risks (continued)
(d) Specific instruments (continued)
BEA Union Investment Asia Pacific Multi Income Fund
2018
Expiration Underlying
Notional amount of contracts outstanding Fair value
US$ US$
7 January 2019 Buy United States Dollars/sell Renminbi 4,334,220 (32,250)
7 January 2019 Buy Renminbi/sell United States Dollars 3,000,000 3,634
7 January 2019 Buy Renminbi/sell United States Dollars 27,000,000 10,531
31 January 2019 Buy Euro/sell United States Dollars 47,360 (109)
31 January 2019 Buy Euro/sell United States Dollars 48,600 (112)
31 January 2019 Buy New Zealand Dollars/sell United States Dollars 22,404,412 (169,579)
23 April 2019 Buy United States Dollars/sell Renminbi 4,930,752 (16,690)
31 January 2019 Buy Australian Dollars/sell United States Dollars 103,885,411 (814,462)
31 January 2019 Buy Renminbi/sell United States Dollars 567,278,563 247,916
31 January 2019 Buy Renminbi/sell United States Dollars 2,953,107 339
(770,782)
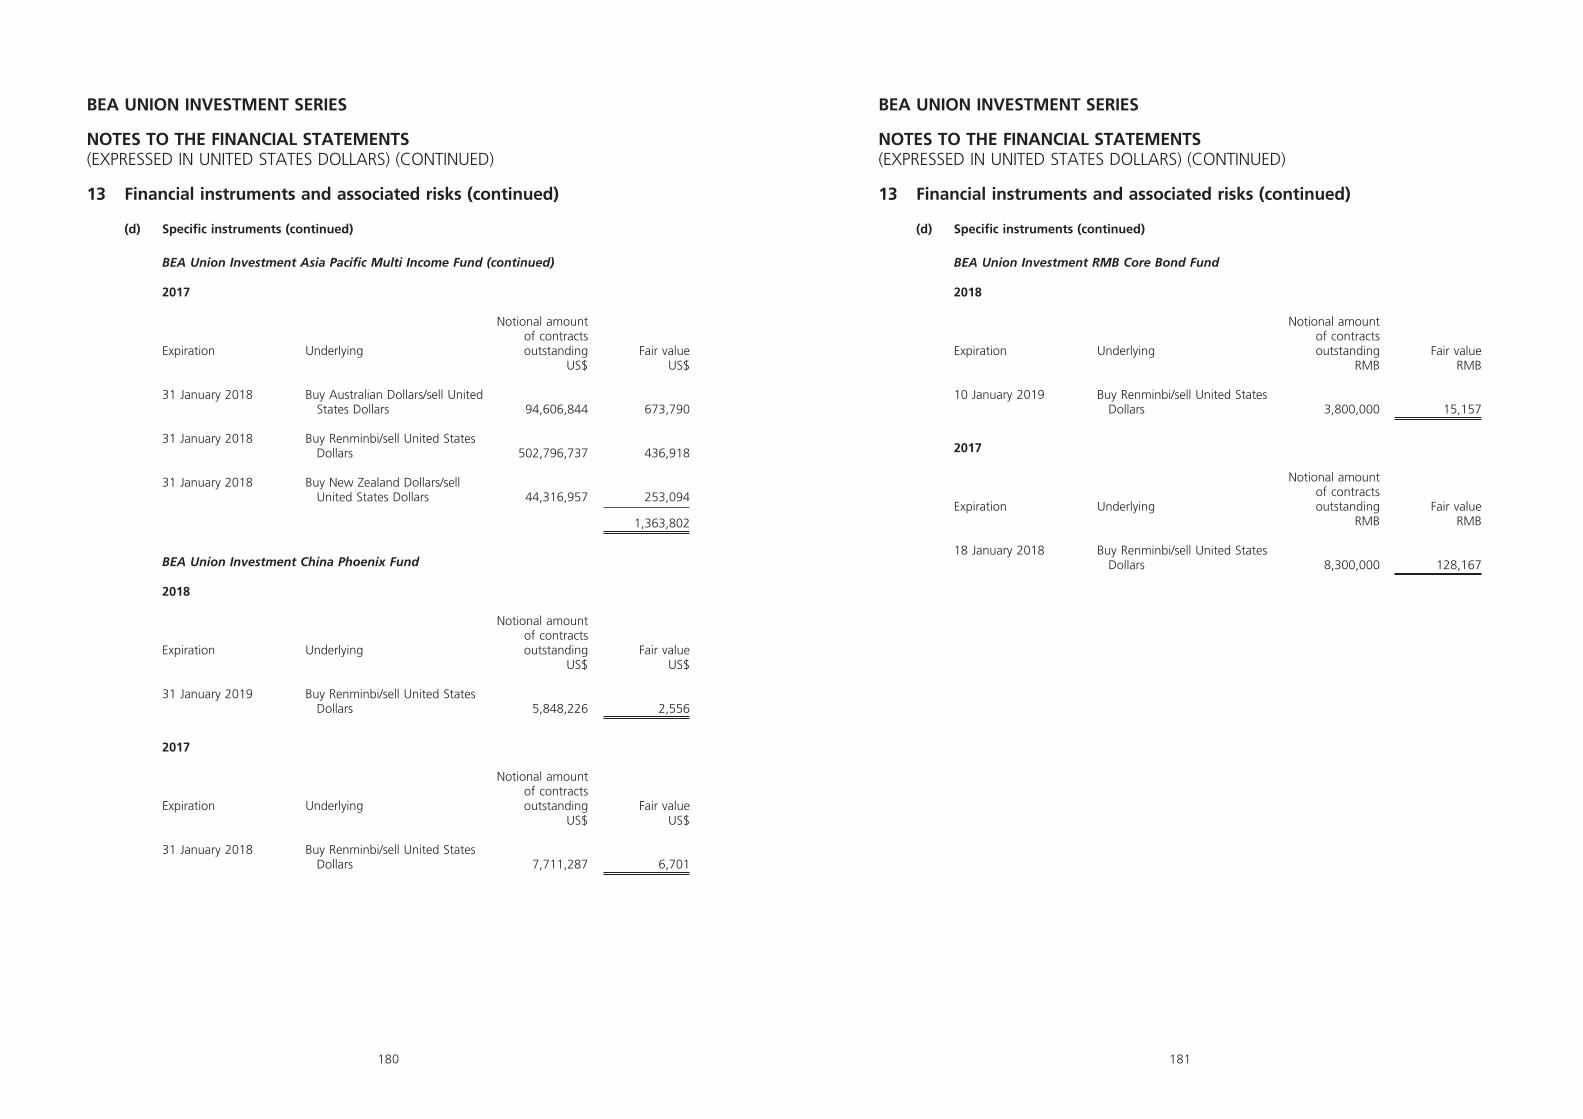
BEA UNION INVESTMENT SERIES
NOTES TO THE FINANCIAL STATEMENTS(EXPRESSED IN UNITED STATES DOLLARS) (CONTINUED)
BEA UNION INVESTMENT SERIES
NOTES TO THE FINANCIAL STATEMENTS(EXPRESSED IN UNITED STATES DOLLARS) (CONTINUED)
180 181
A5請縮小打印70.5%
13 Financial instruments and associated risks (continued)
(d) Specific instruments (continued)
BEA Union Investment Asia Pacific Multi Income Fund (continued)
2017
Expiration Underlying
Notional amount of contracts outstanding Fair value
US$ US$
31 January 2018 Buy Australian Dollars/sell United States Dollars 94,606,844 673,790
31 January 2018 Buy Renminbi/sell United States Dollars 502,796,737 436,918
31 January 2018 Buy New Zealand Dollars/sell United States Dollars 44,316,957 253,094
1,363,802
BEA Union Investment China Phoenix Fund
2018
Expiration Underlying
Notional amount of contracts outstanding Fair value
US$ US$
31 January 2019 Buy Renminbi/sell United States Dollars 5,848,226 2,556
2017
Expiration Underlying
Notional amount of contracts outstanding Fair value
US$ US$
31 January 2018 Buy Renminbi/sell United States Dollars 7,711,287 6,701
13 Financial instruments and associated risks (continued)
(d) Specific instruments (continued)
BEA Union Investment RMB Core Bond Fund
2018
Expiration Underlying
Notional amount of contracts outstanding Fair value
RMB RMB
10 January 2019 Buy Renminbi/sell United States Dollars 3,800,000 15,157
2017
Expiration Underlying
Notional amount of contracts outstanding Fair value
RMB RMB
18 January 2018 Buy Renminbi/sell United States Dollars 8,300,000 128,167
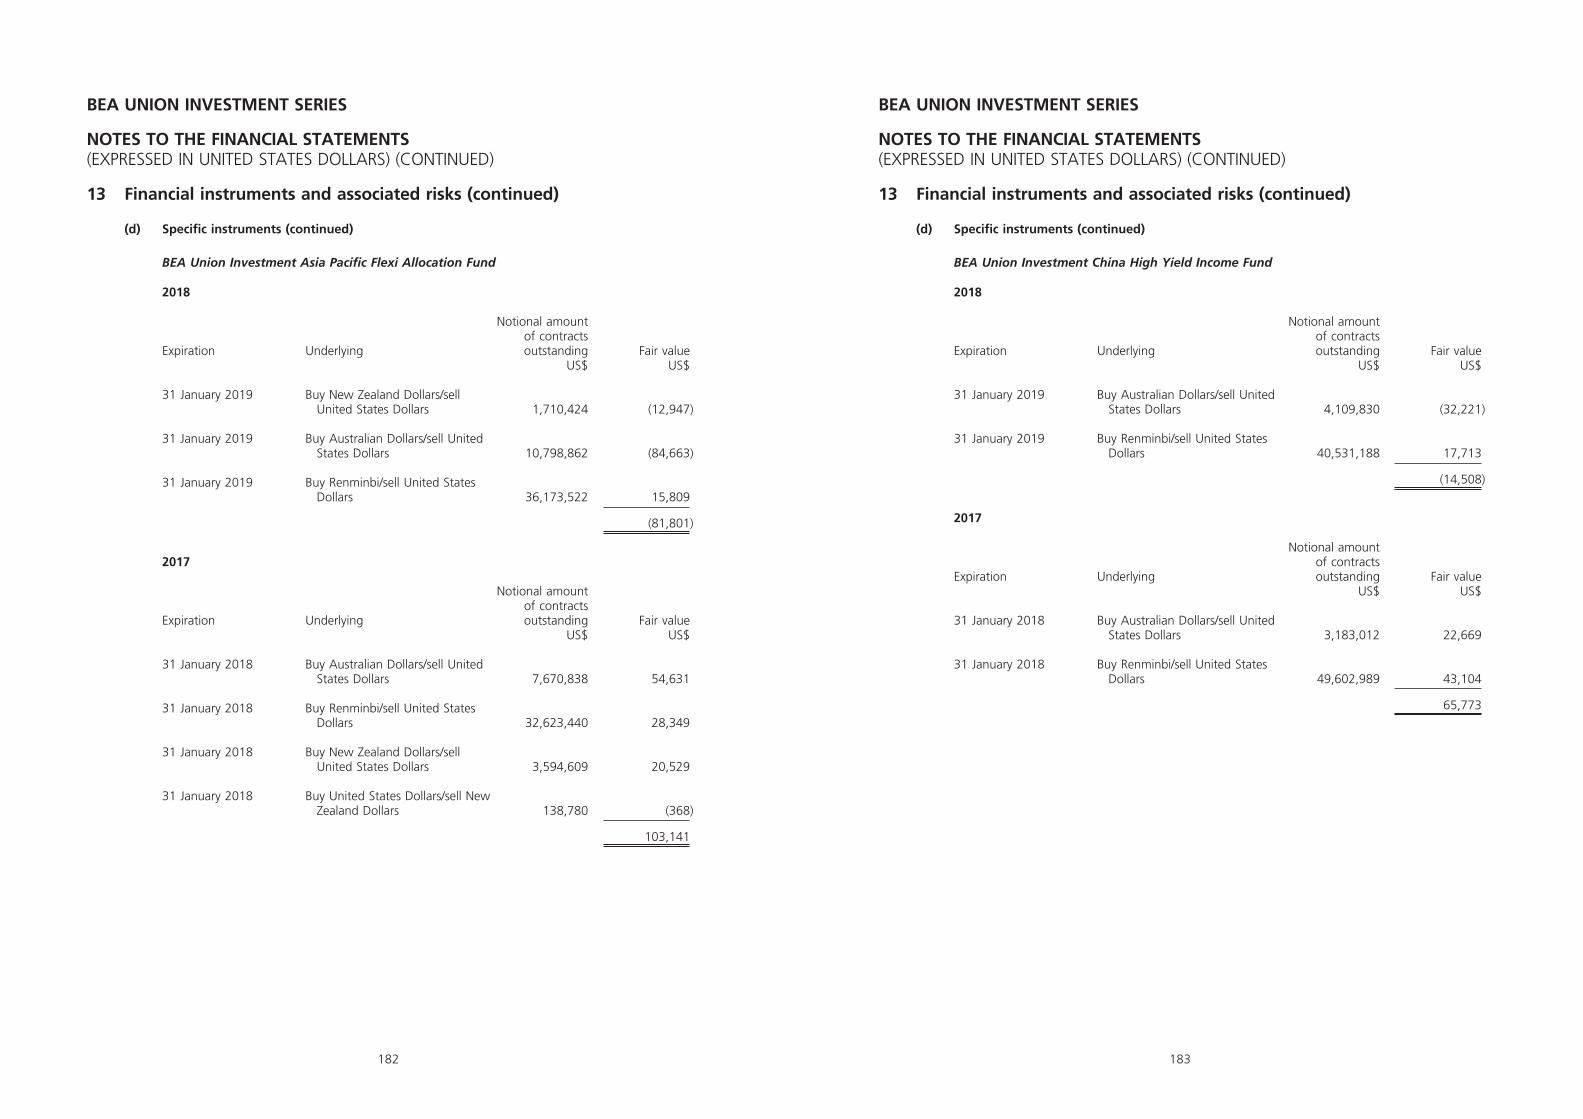
BEA UNION INVESTMENT SERIES
NOTES TO THE FINANCIAL STATEMENTS(EXPRESSED IN UNITED STATES DOLLARS) (CONTINUED)
BEA UNION INVESTMENT SERIES
NOTES TO THE FINANCIAL STATEMENTS(EXPRESSED IN UNITED STATES DOLLARS) (CONTINUED)
182 183
A5請縮小打印70.5%
13 Financial instruments and associated risks (continued)
(d) Specific instruments (continued)
BEA Union Investment Asia Pacific Flexi Allocation Fund
2018
Expiration Underlying
Notional amount of contracts outstanding Fair value
US$ US$
31 January 2019 Buy New Zealand Dollars/sell United States Dollars 1,710,424 (12,947)
31 January 2019 Buy Australian Dollars/sell United States Dollars 10,798,862 (84,663)
31 January 2019 Buy Renminbi/sell United States Dollars 36,173,522 15,809
(81,801)
2017
Expiration Underlying
Notional amount of contracts outstanding Fair value
US$ US$
31 January 2018 Buy Australian Dollars/sell United States Dollars 7,670,838 54,631
31 January 2018 Buy Renminbi/sell United States Dollars 32,623,440 28,349
31 January 2018 Buy New Zealand Dollars/sell United States Dollars 3,594,609 20,529
31 January 2018 Buy United States Dollars/sell New Zealand Dollars 138,780 (368)
103,141
13 Financial instruments and associated risks (continued)
(d) Specific instruments (continued)
BEA Union Investment China High Yield Income Fund
2018
Expiration Underlying
Notional amount of contracts outstanding Fair value
US$ US$
31 January 2019 Buy Australian Dollars/sell United States Dollars 4,109,830 (32,221)
31 January 2019 Buy Renminbi/sell United States Dollars 40,531,188 17,713
(14,508)
2017
Expiration Underlying
Notional amount of contracts outstanding Fair value
US$ US$
31 January 2018 Buy Australian Dollars/sell United States Dollars 3,183,012 22,669
31 January 2018 Buy Renminbi/sell United States Dollars 49,602,989 43,104
65,773
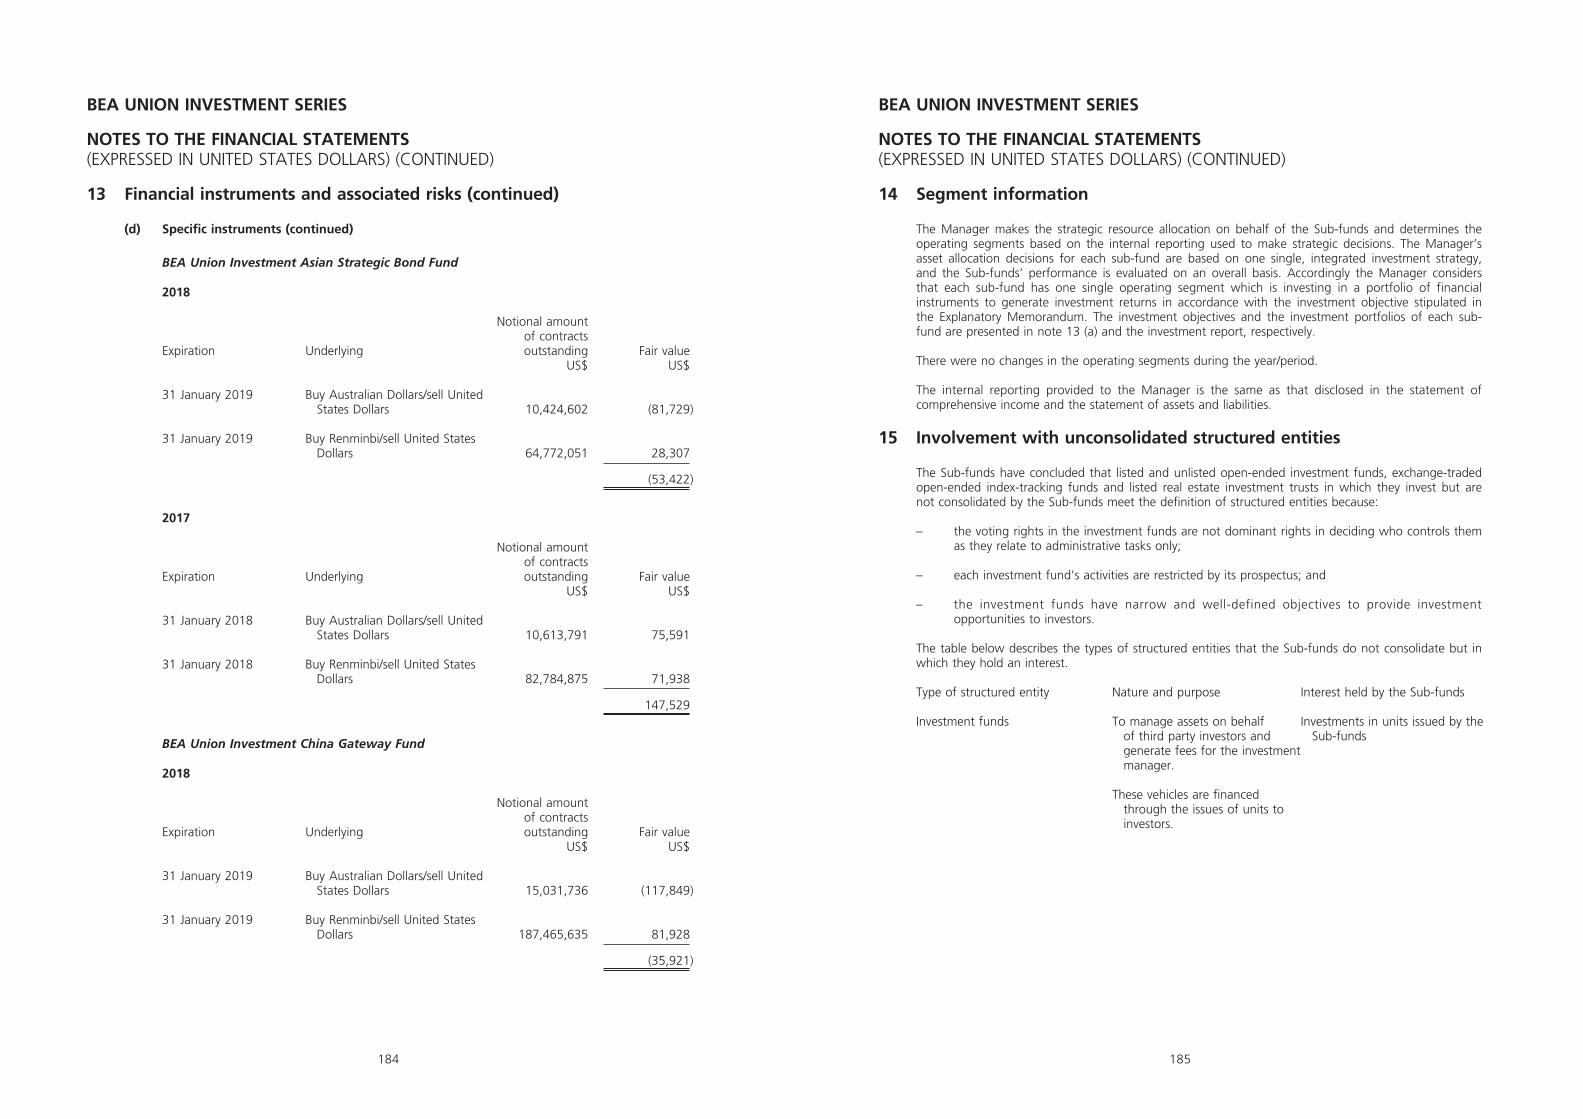
BEA UNION INVESTMENT SERIES
NOTES TO THE FINANCIAL STATEMENTS(EXPRESSED IN UNITED STATES DOLLARS) (CONTINUED)
BEA UNION INVESTMENT SERIES
NOTES TO THE FINANCIAL STATEMENTS(EXPRESSED IN UNITED STATES DOLLARS) (CONTINUED)
184 185
A5請縮小打印70.5%
13 Financial instruments and associated risks (continued)
(d) Specific instruments (continued)
BEA Union Investment Asian Strategic Bond Fund
2018
Expiration Underlying
Notional amount of contracts outstanding Fair value
US$ US$
31 January 2019 Buy Australian Dollars/sell United States Dollars 10,424,602 (81,729)
31 January 2019 Buy Renminbi/sell United States Dollars 64,772,051 28,307
(53,422)
2017
Expiration Underlying
Notional amount of contracts outstanding Fair value
US$ US$
31 January 2018 Buy Australian Dollars/sell United States Dollars 10,613,791 75,591
31 January 2018 Buy Renminbi/sell United States Dollars 82,784,875 71,938
147,529
BEA Union Investment China Gateway Fund
2018
Expiration Underlying
Notional amount of contracts outstanding Fair value
US$ US$
31 January 2019 Buy Australian Dollars/sell United States Dollars 15,031,736 (117,849)
31 January 2019 Buy Renminbi/sell United States Dollars 187,465,635 81,928
(35,921)
14 Segment information
The Manager makes the strategic resource allocation on behalf of the Sub-funds and determines the operating segments based on the internal reporting used to make strategic decisions. The Manager’s asset allocation decisions for each sub-fund are based on one single, integrated investment strategy, and the Sub-funds’ performance is evaluated on an overall basis. Accordingly the Manager considers that each sub-fund has one single operating segment which is investing in a portfolio of financial instruments to generate investment returns in accordance with the investment objective stipulated in the Explanatory Memorandum. The investment objectives and the investment portfolios of each sub-fund are presented in note 13 (a) and the investment report, respectively.
There were no changes in the operating segments during the year/period.
The internal reporting provided to the Manager is the same as that disclosed in the statement of comprehensive income and the statement of assets and liabilities.
15 Involvement with unconsolidated structured entities
The Sub-funds have concluded that listed and unlisted open-ended investment funds, exchange-traded open-ended index-tracking funds and listed real estate investment trusts in which they invest but are not consolidated by the Sub-funds meet the definition of structured entities because:
– the voting rights in the investment funds are not dominant rights in deciding who controls them as they relate to administrative tasks only;
– each investment fund’s activities are restricted by its prospectus; and
– the investment funds have narrow and well-defined objectives to provide investment opportunities to investors.
The table below describes the types of structured entities that the Sub-funds do not consolidate but in which they hold an interest.
Type of structured entity Nature and purpose Interest held by the Sub-funds
Investment funds To manage assets on behalf of third party investors and generate fees for the investment manager.
Investments in units issued by the Sub-funds
These vehicles are financed through the issues of units to investors.
BEA UNION INVESTMENT SERIES
NOTES TO THE FINANCIAL STATEMENTS(EXPRESSED IN UNITED STATES DOLLARS) (CONTINUED)
BEA UNION INVESTMENT SERIES
NOTES TO THE FINANCIAL STATEMENTS(EXPRESSED IN UNITED STATES DOLLARS) (CONTINUED)
186 187
A5請縮小打印70.5%
15 Involvement with unconsolidated structured entities (continued)
The table below sets out interests held by the Sub-funds in unconsolidated structured entities. The maximum exposure to loss is the carrying amount of the financial assets held by the Sub-funds.
As at 31 December 2018
Number of investee funds Total net assets
Carrying amount included in
“investments”US$ (in million) US$ (in million)
BEA Union Investment Asia Pacific Multi Income Fund
Investment in unlisted open-ended investment funds 4 1,435 50.3
– Equity long
Investment in listed open-ended investment funds 3 43,515 16.6
– Equity long
Investment in listed real estate investment trust 3 14,490 23.8– Long position
BEA Union Investment China Phoenix Fund
Investment in unlisted open-ended investment fund 1 43 0.2
– Equity long
BEA Union Investment Asia Pacific Flexi Allocation Fund
Investment in unlisted open-ended investment funds
– Equity long 2 405 5.0
Investment in listed open-ended investment funds
– Equity long 2 32,611 0.5
Investment in listed real estate investment trust– Long position 2 34,964 1.0
15 Involvement with unconsolidated structured entities (continued)
As at 31 December 2018 (continued)
Number of investee funds Total net assets
Carrying amount included in
“investments”US$ (in million) US$ (in million)
BEA Union Investment Global Flexi Allocation Fund
Investment in unlisted open-ended investment fund
– Equity long 1 388 2.6
BEA Union Investment Asia Pacific Equity Dividend Fund
Investment in listed real estate investment trust– Long position 2 34,964 0.9
BEA Union Investment China Gateway Fund
Investment in unlisted open-ended investment fund
– Equity long 1 43 3.3
BEA Union Investment Japan Growth Fund
Investment in unlisted open-ended investment fund
– Equity long 1 1,161 0.3
BEA Union Investment Global Themes Fund
Investment in unlisted open-ended investment fund
– Equity long 1 18 0.6
Investment in listed real estate investment trust– Equity long 2 25,975 0.1
BEA UNION INVESTMENT SERIES
NOTES TO THE FINANCIAL STATEMENTS(EXPRESSED IN UNITED STATES DOLLARS) (CONTINUED)
BEA UNION INVESTMENT SERIES
NOTES TO THE FINANCIAL STATEMENTS(EXPRESSED IN UNITED STATES DOLLARS) (CONTINUED)
188 189
A5請縮小打印70.5%
15 Involvement with unconsolidated structured entities (continued)
As at 31 December 2017
Number of investee funds Total net assets
Carrying amount included in
“investments”US$ (in million) US$ (in million)
BEA Union Investment Asia Pacific Multi Income Fund
Investment in unlisted open-ended investment funds
– Equity long 4 645 63.2
Investment in listed open-ended investment funds
– Equity long 2 9,531 12.8
Investment in listed real estate investment trust– Long position 4 16,349 26.6
BEA Union Investment China Phoenix Fund
Investment in unlisted open-ended investment fund
– Equity long 1 35 0.3
BEA Union Investment RMB Core Bond Fund
Investment in unlisted open-ended investment fund
– Equity long 1 482 8.6
BEA Union Investment Asia Pacific Flexi Allocation Fund
Investment in unlisted open-ended investment funds
– Equity long 2 500 8.3
Investment in listed open-ended investment funds
– Equity long 1 4,531 1.3
Investment in listed real estate investment trust– Long position 1 6,728 0.9
15 Involvement with unconsolidated structured entities (continued)
As at 31 December 2017 (continued)
Number of investee funds Total net assets
Carrying amount included in
“investments”US$ (in million) US$ (in million)
BEA Union Investment Global Flexi Allocation Fund
Investment in unlisted open-ended investment fund
– Equity long 1 482 1.5
Investment in listed real estate investment trust– Long position 2 25,975 0.2
BEA Union Investment Asia Pacific Equity Dividend Fund
Investment in listed real estate investment trust– Long position 1 6,335 0.4
During the year/period, the Sub-funds did not provide financial support to unconsolidated structured entities and have no intention of providing financial or other support.
16 Charge on the Sub-funds’ assets
As at 31 December 2018, the Sub-funds did not obtain any overdraft facility from The Bank of East Asia, Limited.
A5請縮小打印70.5%
This page is intentionally left blank
BEA UNION INVESTMENT SERIES
NOTES TO THE FINANCIAL STATEMENTS(EXPRESSED IN UNITED STATES DOLLARS) (CONTINUED)
190
A5請縮小打印70.5%
17 Possible impact of amendments, new standards and interpretations issued but not yet effective for the year/period ended 31 December 2018
Up to the date of issue of these financial statements, the HKICPA has issued a number of amendments and new standards which are not yet effective for the year/period ended 31 December 2018 and which have not been adopted in these financial statements. These include the following which may be relevant to the Sub-funds.
Effective for accounting periods
beginning on or after
HK(IFRIC) 23, Uncertainty over income tax treatments 1 January 2019
The Manager and the Trustee are in the process of making an assessment of what the impact of these amendments and new standards is expected to be in the period of initial application. So far the Company has concluded that the adoption of them is unlikely to have a significant impact on the financial statements.
18 Subsequent event
With effect from 18 January 2019, a new sub-fund namely BEA Union Investment Asian Bond Target Maturity Fund 2022 was offered for subscription.
The launch of the new sub-fund has no financial effect to the financial statements for the year ended 31 December 2018.
Interim Report (Unaudited)
For the period ended 30 June 2018
BEA Union Investment Series
BEA Union Investment Japan Growth Fund*
BEA Union Investment Global Themes Fund*
BEA Union Investment Global Resources Fund*
BEA Union Investment Asian Bond and Currency Fund
BEA Union Investment Four Seasons Fund*
BEA Union Investment China A-Share Equity Fund
BEA Union Investment Asia Pacific Multi Income Fund
BEA Union Investment China Phoenix Fund
BEA Union Investment RMB Core Bond Fund
BEA Union Investment Asia Pacific Flexi Allocation Fund
BEA Union Investment Global Flexi Allocation Fund
BEA Union Investment China High Yield Income Fund
BEA Union Investment Asian Strategic Bond Fund
BEA Union Investment Asia Pacific Equity Dividend Fund
BEA Union Investment China Gateway Fund
(*Not authorised in Hong Kong and not available for Hong Kong
retail investors)
BEA UNION INVESTMENT SERIESFOR THE PERIOD ENDED 30 JUNE 2018
CONTENTS PAGE(S)
INVESTMENT REPORT 1-67
STATEMENT OF COMPREHENSIVE INCOME 68-70
STATEMENT OF ASSETS AND LIABILITIES 71-76
STATEMENT OF CHANGES IN NET ASSETS ATTRIBUTABLE TO UNITHOLDERS 77-78
MANAGEMENT AND ADMINISTRATION
EAM017-IT (2018)
The Fund may obtain leverage exposure through borrowing and the use of financial derivative instruments. The expected maximum leverage of each Sub-Fund is 45% (except for BEA Union Investment Asian Bond and Currency Fund, BEA Union Investment Asia Pacific Multi Income Fund and BEA Union Investment RMB Core Bond Fund, where each of the expected maximum leverage is 30%). Leverage arising from derivatives is calculated based on commitment approach (i.e. in accordance with CSSF Circular 11/512), and factors in the market value of the equivalent positions in the underlying assets of the financial derivative instruments held by a Sub-Fund (sometimes referred to as “effective notional exposure”), after taking into account netting and hedging arrangements where the market value of underlying security positions may be offset by other commitments related to the same underlying positions. In addition, the actual leverage of the Fund may be lower than the above mentioned expected maximum leverage.
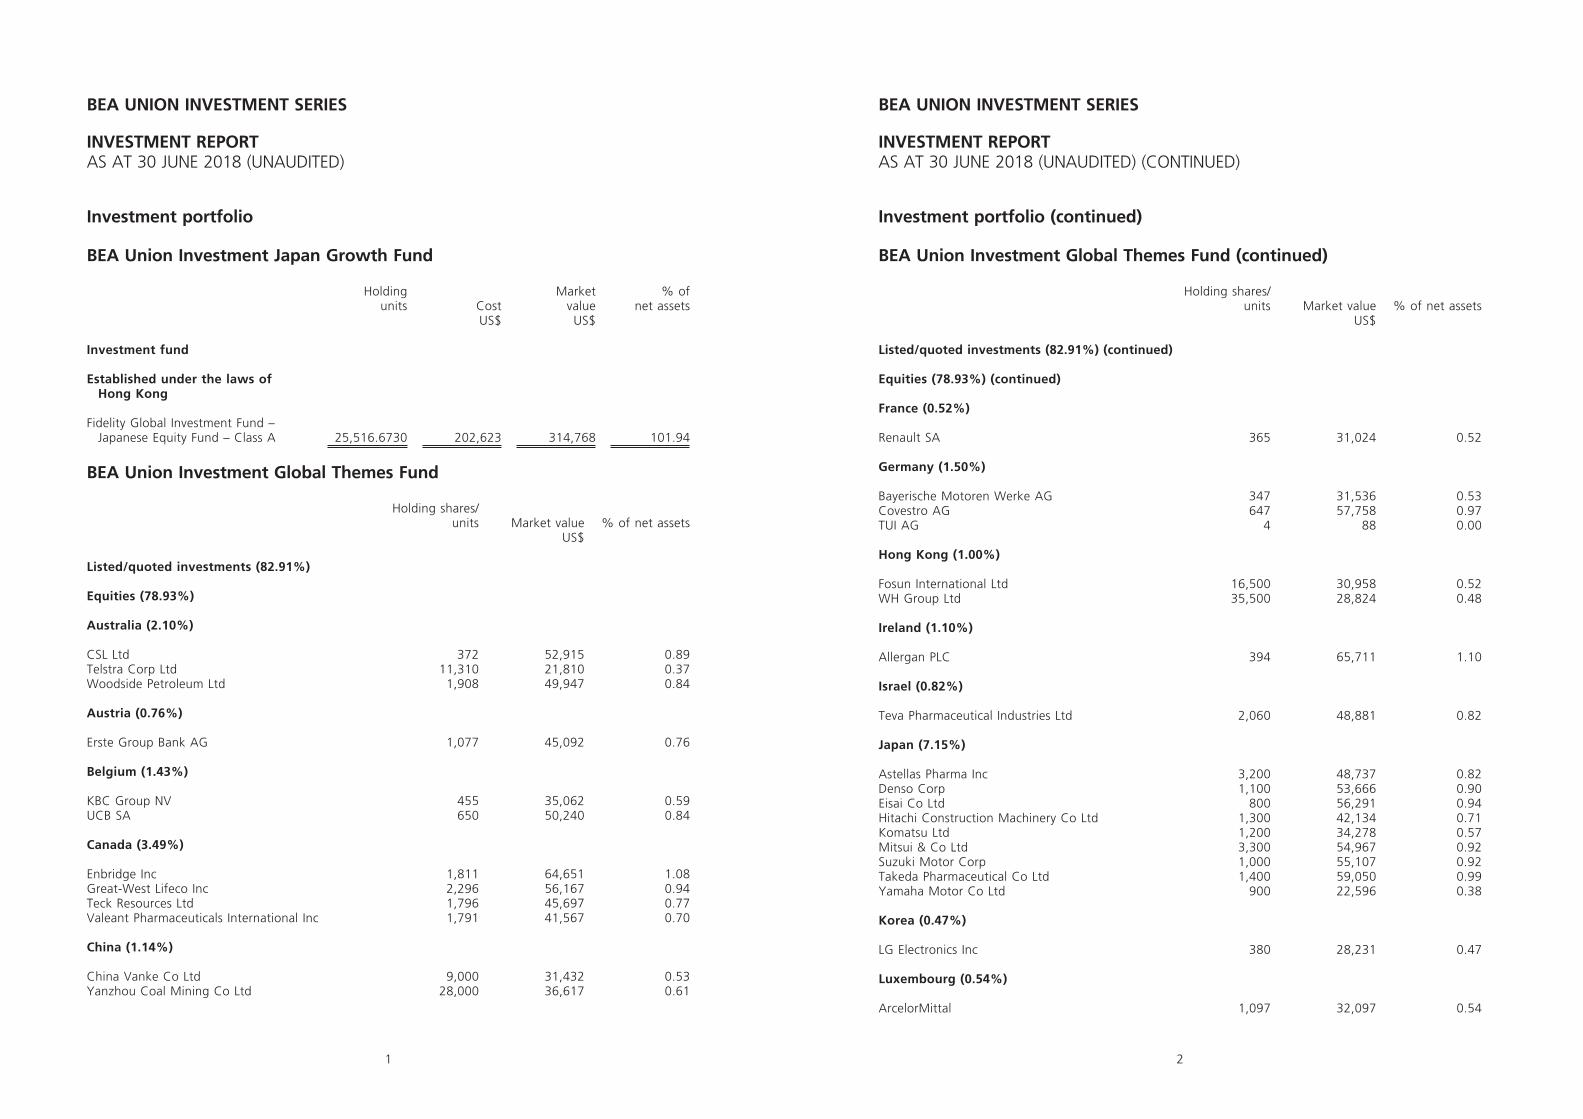
2
A5請縮小打印70.5%
BEA UNION INVESTMENT SERIES
INVESTMENT REPORTAS AT 30 JUNE 2018 (UNAUDITED) (CONTINUED)
BEA UNION INVESTMENT SERIES
INVESTMENT REPORTAS AT 30 JUNE 2018 (UNAUDITED)
1
A5請縮小打印70.5%
Investment portfolio
BEA Union Investment Japan Growth Fund
Holding units Cost
Market value
% of net assets
US$ US$
Investment fund
Established under the laws of Hong Kong
Fidelity Global Investment Fund – Japanese Equity Fund – Class A 25,516.6730 202,623 314,768 101.94
BEA Union Investment Global Themes Fund
Holding shares/units Market value % of net assets
US$
Listed/quoted investments (82.91%)
Equities (78.93%)
Australia (2.10%)
CSL Ltd 372 52,915 0.89Telstra Corp Ltd 11,310 21,810 0.37Woodside Petroleum Ltd 1,908 49,947 0.84
Austria (0.76%)
Erste Group Bank AG 1,077 45,092 0.76
Belgium (1.43%)
KBC Group NV 455 35,062 0.59UCB SA 650 50,240 0.84
Canada (3.49%)
Enbridge Inc 1,811 64,651 1.08Great-West Lifeco Inc 2,296 56,167 0.94Teck Resources Ltd 1,796 45,697 0.77Valeant Pharmaceuticals International Inc 1,791 41,567 0.70
China (1.14%)
China Vanke Co Ltd 9,000 31,432 0.53Yanzhou Coal Mining Co Ltd 28,000 36,617 0.61
Holding shares/units Market value % of net assets
US$
Listed/quoted investments (82.91%) (continued)
Equities (78.93%) (continued)
France (0.52%)
Renault SA 365 31,024 0.52
Germany (1.50%)
Bayerische Motoren Werke AG 347 31,536 0.53Covestro AG 647 57,758 0.97TUI AG 4 88 0.00
Hong Kong (1.00%)
Fosun International Ltd 16,500 30,958 0.52WH Group Ltd 35,500 28,824 0.48
Ireland (1.10%)
Allergan PLC 394 65,711 1.10
Israel (0.82%)
Teva Pharmaceutical Industries Ltd 2,060 48,881 0.82
Japan (7.15%)
Astellas Pharma Inc 3,200 48,737 0.82Denso Corp 1,100 53,666 0.90Eisai Co Ltd 800 56,291 0.94Hitachi Construction Machinery Co Ltd 1,300 42,134 0.71Komatsu Ltd 1,200 34,278 0.57Mitsui & Co Ltd 3,300 54,967 0.92Suzuki Motor Corp 1,000 55,107 0.92Takeda Pharmaceutical Co Ltd 1,400 59,050 0.99Yamaha Motor Co Ltd 900 22,596 0.38
Korea (0.47%)
LG Electronics Inc 380 28,231 0.47
Luxembourg (0.54%)
ArcelorMittal 1,097 32,097 0.54
Investment portfolio (continued)
BEA Union Investment Global Themes Fund (continued)
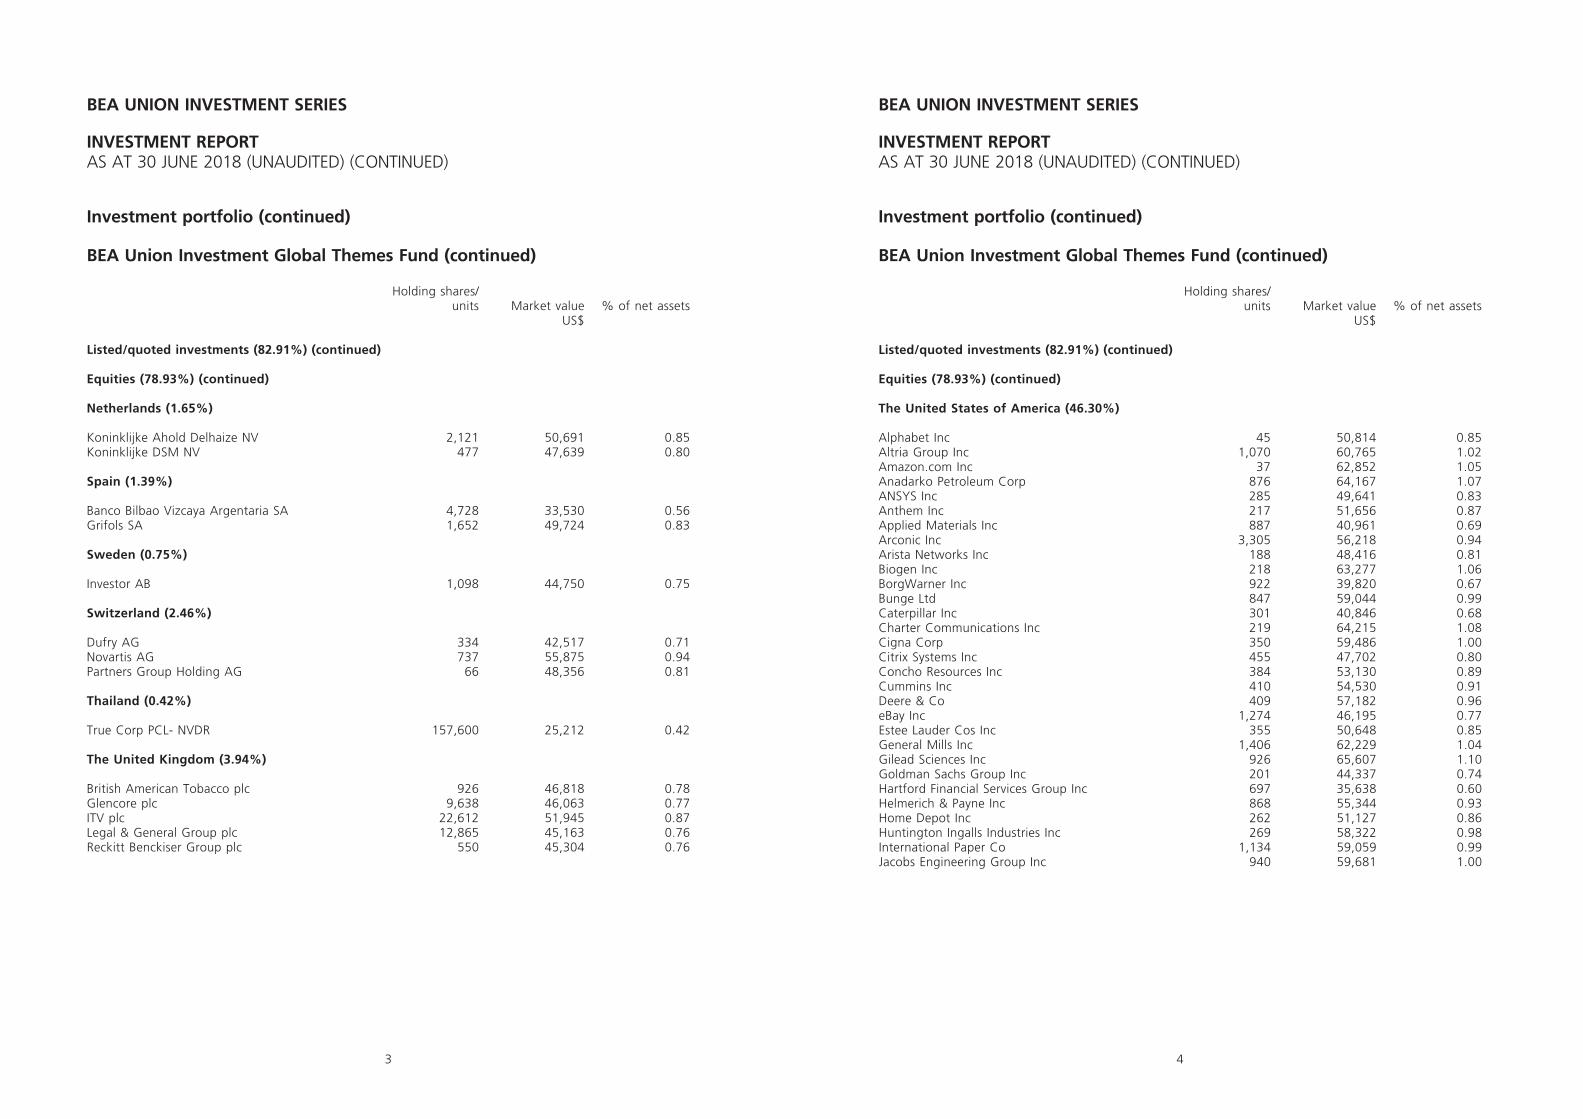
3 4
A5請縮小打印70.5% A5請縮小打印70.5%
BEA UNION INVESTMENT SERIES
INVESTMENT REPORTAS AT 30 JUNE 2018 (UNAUDITED) (CONTINUED)
BEA UNION INVESTMENT SERIES
INVESTMENT REPORTAS AT 30 JUNE 2018 (UNAUDITED) (CONTINUED)
Holding shares/units Market value % of net assets
US$
Listed/quoted investments (82.91%) (continued)
Equities (78.93%) (continued)
Netherlands (1.65%)
Koninklijke Ahold Delhaize NV 2,121 50,691 0.85Koninklijke DSM NV 477 47,639 0.80
Spain (1.39%)
Banco Bilbao Vizcaya Argentaria SA 4,728 33,530 0.56Grifols SA 1,652 49,724 0.83
Sweden (0.75%)
Investor AB 1,098 44,750 0.75
Switzerland (2.46%)
Dufry AG 334 42,517 0.71Novartis AG 737 55,875 0.94Partners Group Holding AG 66 48,356 0.81
Thailand (0.42%)
True Corp PCL- NVDR 157,600 25,212 0.42
The United Kingdom (3.94%)
British American Tobacco plc 926 46,818 0.78Glencore plc 9,638 46,063 0.77ITV plc 22,612 51,945 0.87Legal & General Group plc 12,865 45,163 0.76Reckitt Benckiser Group plc 550 45,304 0.76
Holding shares/units Market value % of net assets
US$
Listed/quoted investments (82.91%) (continued)
Equities (78.93%) (continued)
The United States of America (46.30%)
Alphabet Inc 45 50,814 0.85Altria Group Inc 1,070 60,765 1.02Amazon.com Inc 37 62,852 1.05Anadarko Petroleum Corp 876 64,167 1.07ANSYS Inc 285 49,641 0.83Anthem Inc 217 51,656 0.87Applied Materials Inc 887 40,961 0.69Arconic Inc 3,305 56,218 0.94Arista Networks Inc 188 48,416 0.81Biogen Inc 218 63,277 1.06BorgWarner Inc 922 39,820 0.67Bunge Ltd 847 59,044 0.99Caterpillar Inc 301 40,846 0.68Charter Communications Inc 219 64,215 1.08Cigna Corp 350 59,486 1.00Citrix Systems Inc 455 47,702 0.80Concho Resources Inc 384 53,130 0.89Cummins Inc 410 54,530 0.91Deere & Co 409 57,182 0.96eBay Inc 1,274 46,195 0.77Estee Lauder Cos Inc 355 50,648 0.85General Mills Inc 1,406 62,229 1.04Gilead Sciences Inc 926 65,607 1.10Goldman Sachs Group Inc 201 44,337 0.74Hartford Financial Services Group Inc 697 35,638 0.60Helmerich & Payne Inc 868 55,344 0.93Home Depot Inc 262 51,127 0.86Huntington Ingalls Industries Inc 269 58,322 0.98International Paper Co 1,134 59,059 0.99Jacobs Engineering Group Inc 940 59,681 1.00
Investment portfolio (continued)
BEA Union Investment Global Themes Fund (continued)
Investment portfolio (continued)
BEA Union Investment Global Themes Fund (continued)
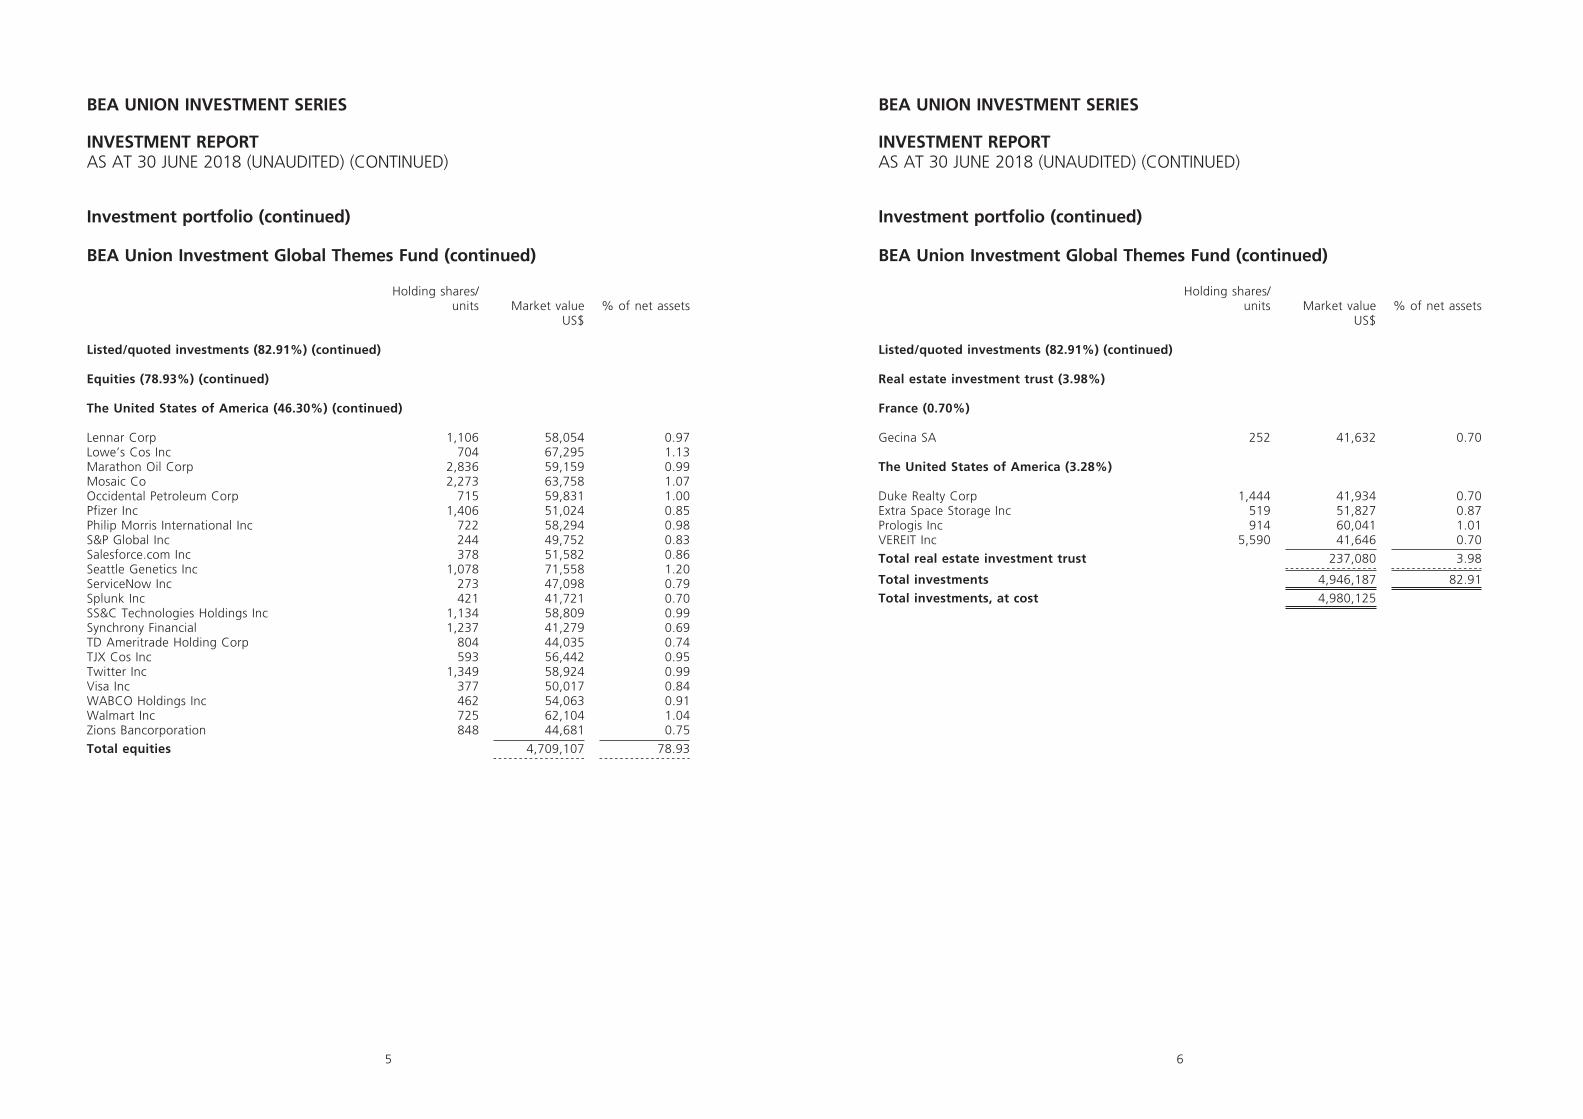
5 6
A5請縮小打印70.5% A5請縮小打印70.5%
BEA UNION INVESTMENT SERIES
INVESTMENT REPORTAS AT 30 JUNE 2018 (UNAUDITED) (CONTINUED)
BEA UNION INVESTMENT SERIES
INVESTMENT REPORTAS AT 30 JUNE 2018 (UNAUDITED) (CONTINUED)
Holding shares/units Market value % of net assets
US$
Listed/quoted investments (82.91%) (continued)
Equities (78.93%) (continued)
The United States of America (46.30%) (continued)
Lennar Corp 1,106 58,054 0.97Lowe’s Cos Inc 704 67,295 1.13Marathon Oil Corp 2,836 59,159 0.99Mosaic Co 2,273 63,758 1.07Occidental Petroleum Corp 715 59,831 1.00Pfizer Inc 1,406 51,024 0.85Philip Morris International Inc 722 58,294 0.98S&P Global Inc 244 49,752 0.83Salesforce.com Inc 378 51,582 0.86Seattle Genetics Inc 1,078 71,558 1.20ServiceNow Inc 273 47,098 0.79Splunk Inc 421 41,721 0.70SS&C Technologies Holdings Inc 1,134 58,809 0.99Synchrony Financial 1,237 41,279 0.69TD Ameritrade Holding Corp 804 44,035 0.74TJX Cos Inc 593 56,442 0.95Twitter Inc 1,349 58,924 0.99Visa Inc 377 50,017 0.84WABCO Holdings Inc 462 54,063 0.91Walmart Inc 725 62,104 1.04Zions Bancorporation 848 44,681 0.75
Total equities 4,709,107 78.93
Holding shares/units Market value % of net assets
US$
Listed/quoted investments (82.91%) (continued)
Real estate investment trust (3.98%)
France (0.70%)
Gecina SA 252 41,632 0.70
The United States of America (3.28%)
Duke Realty Corp 1,444 41,934 0.70Extra Space Storage Inc 519 51,827 0.87Prologis Inc 914 60,041 1.01VEREIT Inc 5,590 41,646 0.70
Total real estate investment trust 237,080 3.98
Total investments 4,946,187 82.91
Total investments, at cost 4,980,125
Investment portfolio (continued)
BEA Union Investment Global Themes Fund (continued)
Investment portfolio (continued)
BEA Union Investment Global Themes Fund (continued)
7 8
A5請縮小打印70.5% A5請縮小打印70.5%
BEA UNION INVESTMENT SERIES
INVESTMENT REPORTAS AT 30 JUNE 2018 (UNAUDITED) (CONTINUED)
BEA UNION INVESTMENT SERIES
INVESTMENT REPORTAS AT 30 JUNE 2018 (UNAUDITED) (CONTINUED)
Investment portfolio (continued)
BEA Union Investment Global Resources Fund
Holding shares/units Market value % of net assets
US$
Listed/quoted investments (100.35%)
Equities (100.35%)
Australia (7.14%)
BHP Billiton Ltd 2,133 53,425 7.14
Canada (16.71%)
ARC Resources Ltd 3,888 40,108 5.36Goldcorp Inc 2,743 37,596 5.02Suncor Energy Inc 1,165 47,372 6.33
Denmark (5.61%)
Vestas Wind Systems A/S 678 41,999 5.61
Germany (4.38%)
Lanxess AG 420 32,767 4.38
Ireland (7.98%)
Smurfit Kappa Group plc 1,471 59,726 7.98
Norway (3.83%)
Marine Harvest ASA 1,440 28,657 3.83
The United Kingdom (31.35%)
British American Tobacco plc 405 20,476 2.74Keller Group plc 3,613 48,368 6.46Mondi plc 1,097 29,676 3.97Randgold Resources Ltd 403 30,966 4.14Rio Tinto plc 848 47,028 6.28Royal Dutch Shell plc 1,034 37,043 4.95RPC Group plc 2,129 21,019 2.81
Holding shares/units Market value % of net assets
US$
Listed/quoted investments (100.35%) (continued)
Equities (100.35%) (continued)
The United States of America (23.35%)
3M Co 216 42,495 5.68International Paper Co 700 36,456 4.87Phillips 66 414 46,496 6.21Snap-on Inc 307 49,344 6.59
Total equities 751,017 100.35
Total investments 751,017 100.35
Total investments, at cost 647,689
Investment portfolio (continued)
BEA Union Investment Global Resources Fund (continued)

9 10
A5請縮小打印70.5% A5請縮小打印70.5%
BEA UNION INVESTMENT SERIES
INVESTMENT REPORTAS AT 30 JUNE 2018 (UNAUDITED) (CONTINUED)
BEA UNION INVESTMENT SERIES
INVESTMENT REPORTAS AT 30 JUNE 2018 (UNAUDITED) (CONTINUED)
Investment portfolio (continued)
BEA Union Investment Asian Bond and Currency Fund
Nominal value Market value % of net assetsUS$
Listed/quoted investments (98.65%)
Debt securities (98.65%)
Denominated in Indonesian Rupiah (1.47%)
Indonesia Treasury Bond 5.625% 15/05/2023 102,500,000,000 6,644,155 1.47
Denominated in Renminbi (5.02%)
Busan Bank Co Ltd 4.85% 25/05/2021 6,000,000 909,405 0.20China Development Bank 4.69% 23/03/2023 65,000,000 10,174,963 2.25China Government Bond 3.17% 19/04/2023 30,000,000 4,515,356 1.00Greenland Global Investment Ltd 7.125%
20/03/2021 21,000,000 3,156,301 0.70QNB Finance Ltd 5.10% 14/05/2021 5,000,000 758,916 0.17Shimao Property Holdings Ltd 5.75% 15/03/2021 15,000,000 2,276,779 0.50Shui On Development Holding Ltd 6.875%
02/03/2021 6,000,000 912,786 0.20
Denominated in United States Dollar (92.16%)
ABJA Investment Co Pte Ltd 5.95% 31/07/2024 2,500,000 2,468,017 0.55Agile Group Holdings Ltd 9.00% 21/05/2020 1,000,000 1,044,820 0.23Anton Oilfield Services Group 9.75% 05/12/2020 4,700,000 4,764,492 1.05Azure Power Energy Ltd 5.50% 03/11/2022 5,100,000 4,702,206 1.04Bank of China Ltd 3.04919% 07/06/2021 1,000,000 1,001,573 0.22Bank of China Ltd/London 3.14919% 07/06/2023 2,000,000 2,001,239 0.44Baoxin Auto Finance I Ltd 6.625% 02/04/2019 4,900,000 4,905,804 1.08Baoxin Auto Finance I Ltd 8.75% Perpetual
Callable-15/12/2019 2,800,000 2,764,885 0.61Barminco Finance Pty Ltd 6.625% 15/05/2022 1,000,000 960,655 0.21Beijing Capital Polaris Investment Co Ltd 4.25%
26/03/2021 2,500,000 2,522,913 0.56Bukit Makmur Mandiri Utama PT 7.75%
13/02/2022 10,900,000 10,969,088 2.42China Aoyuan Property Group Ltd 6.35%
11/01/2020 2,200,000 2,227,865 0.49China Aoyuan Property Group Ltd 6.525%
25/04/2019 3,500,000 3,542,359 0.78China Aoyuan Property Group Ltd 7.50%
10/05/2021 6,600,000 6,443,085 1.42China Construction Bank Corp 3.05088%
08/06/2021 2,000,000 2,002,198 0.44China Evergrande Group 7.00% 23/03/2020 3,900,000 3,925,060 0.87China Evergrande Group 8.25% 23/03/2022 4,600,000 4,492,030 0.99China Huadian Overseas Development 2018 Ltd
3.875% 17/05/2023 1,000,000 1,005,486 0.22
Nominal value Market value % of net assetsUS$
Listed/quoted investments (98.65%) (continued)
Debt securities (98.65%) (continued)
Denominated in United States Dollar (92.16%) (continued)
China Merchants Bank Co Ltd 3.07531% 01/06/2021 5,000,000 5,009,064 1.11
China SCE Property Holdings Ltd 10.00% 02/07/2020 4,000,000 4,377,049 0.97
China SCE Property Holdings Ltd 5.875% 10/03/2022 1,500,000 1,376,767 0.30
China SCE Property Holdings Ltd 7.45% 17/04/2021 4,700,000 4,674,732 1.03CIFI Holdings Group Co Ltd 6.375% 02/05/2020 6,000,000 6,007,068 1.33CIFI Holdings Group Co Ltd 6.875% 23/04/2021 2,850,000 2,858,881 0.63CIFI Holdings Group Co Ltd 7.75% 05/06/2020 4,200,000 4,272,522 0.94Commonwealth Bank of Australia 3.03469%
16/03/2023 1,400,000 1,399,210 0.31Country Garden Holdings Co Ltd 3.875%
20/11/2018 3,000,000 2,983,210 0.66Eterna Capital Pte Ltd 7.50% 01/12/2022 7,885,372 8,028,938 1.77Export-Import Bank of Korea 2.87531% 01/06/2021 1,000,000 1,002,656 0.22Export-Import Bank of Korea 3.07188% 22/03/2023 1,000,000 999,378 0.22Export-Import Bank of Korea 3.07531% 01/06/2023 4,500,000 4,512,297 1.00Fantasia Holdings Group Co Ltd 7.25% 13/02/2019 2,100,000 2,095,151 0.46Fortune Star BVI Ltd 5.375% 05/12/2020 2,600,000 2,581,831 0.57Future Land Development Holdings Ltd 5.00%
16/02/2020 3,000,000 2,968,320 0.66FUXIANG Investment Management Ltd 5.10%
04/06/2019 3,000,000 3,025,595 0.67Global Prime Capital Pte Ltd 7.25% 26/04/2021 8,700,000 8,752,985 1.93Golden Eagle Retail Group Ltd 4.625% 21/05/2023 8,300,000 7,112,261 1.57Golden Legacy Pte Ltd 8.25% 07/06/2021 4,900,000 4,863,348 1.07Goldman Sachs Group Inc 3.49063% 15/05/2026 2,500,000 2,477,683 0.55GOME Retail Holdings Ltd 5.00% 10/03/2020 2,000,000 1,932,833 0.43Greenland Global Investment Ltd 5.25%
12/02/2021 1,000,000 960,221 0.21Greenland Global Investment Ltd 6.75%
22/05/2019 5,800,000 5,847,894 1.29Greenland Global Investment Ltd 7.18888%
26/09/2021 4,500,000 4,508,183 1.00Hilong Holding Ltd 7.25% 22/06/2020 3,100,000 2,987,106 0.66Hong Seng Ltd 8.50% 02/11/2018 2,700,000 2,670,373 0.59Honghua Group Ltd 7.45% 25/09/2019 2,925,000 3,039,738 0.67HSBC Holdings PLC 2.92563% 18/05/2021 1,000,000 1,004,346 0.22HT Global IT Solutions Holdings Ltd 7.00%
14/07/2021 7,300,000 7,519,819 1.66
Investment portfolio (continued)
BEA Union Investment Asian Bond and Currency Fund (continued)

11 12
A5請縮小打印70.5% A5請縮小打印70.5%
BEA UNION INVESTMENT SERIES
INVESTMENT REPORTAS AT 30 JUNE 2018 (UNAUDITED) (CONTINUED)
BEA UNION INVESTMENT SERIES
INVESTMENT REPORTAS AT 30 JUNE 2018 (UNAUDITED) (CONTINUED)
Nominal value Market value % of net assetsUS$
Listed/quoted investments (98.65%) (continued)
Debt securities (98.65%) (continued)
Denominated in United States Dollar (92.16%) (continued)
Huarong Finance 2017 Co Ltd 3.51075% 03/07/2021 2,500,000 2,495,425 0.55
ICBCIL Finance Co Ltd 3.2925% 15/05/2021 4,500,000 4,512,008 1.00Indika Energy Capital II Pte Ltd 6.875% 10/04/2022 12,500,000 12,503,234 2.76Indo Energy Finance II BV 6.375% 24/01/2023 4,300,000 4,175,266 0.92Industrial & Commercial Bank of China Ltd
3.08125% 21/05/2021 4,500,000 4,513,586 1.00Jababeka International BV 6.50% 05/10/2023 3,000,000 2,586,743 0.57Japfa Comfeed Indonesia Tbk PT 5.50% 31/03/2022 2,000,000 1,894,986 0.42JSW Steel Ltd 4.75% 12/11/2019 1,250,000 1,250,757 0.28Kookmin Bank 3.11575% 03/04/2023 1,000,000 1,007,254 0.22Korea National Oil Corp 3.21363% 16/07/2023 2,000,000 2,000,000 0.44Korean Air Lines Co Ltd 5.875% 06/03/2021 2,500,000 2,421,818 0.54KWG Property Holding Ltd 8.975% 14/01/2019 2,500,000 2,635,885 0.58Lai Fung Bonds 2018 Ltd 5.65% 18/01/2023 2,500,000 2,438,255 0.54Lodha Developers International Ltd 12.00%
13/03/2020 3,200,000 3,410,880 0.75Logan Property Holdings Co Ltd 5.125%
02/11/2018 8,400,000 8,427,526 1.86Logan Property Holdings Co Ltd 5.375%
03/12/2018 3,000,000 3,001,354 0.66Logan Property Holdings Co Ltd 6.875%
24/04/2021 1,800,000 1,774,143 0.39LSD Bonds 2017 Ltd 4.60% 13/09/2022 2,800,000 2,709,308 0.60Marble II Pte Ltd 5.30% 20/06/2022 2,000,000 1,893,619 0.42Marquee Land Pte Ltd 9.75% 05/08/2019 881,000 935,676 0.21Medco Straits Services Pte Ltd 8.50% 17/08/2022 9,000,000 9,243,800 2.04Modernland Overseas Pte Ltd 6.95% 13/04/2024 4,900,000 4,290,677 0.95Moon Wise Global Ltd 9.00% Perpetual
Callable-28/01/2019 3,400,000 3,562,860 0.79New Metro Global Ltd 4.75% 11/02/2019 3,000,000 3,025,051 0.67New Metro Global Ltd 6.50% 23/04/2021 6,900,000 6,779,787 1.50Pakuwon Prima Pte Ltd 5.00% 14/02/2024 2,000,000 1,891,356 0.42PB International BV 7.625% 26/01/2022 5,600,000 5,483,127 1.21Poseidon Finance 1 Ltd 0.00% 01/02/2025 5,000,000 5,054,100 1.12Powerlong Real Estate Holdings Ltd 4.875%
15/09/2021 3,100,000 2,760,718 0.61
Nominal value Market value % of net assetsUS$
Listed/quoted investments (98.65%) (continued)
Debt securities (98.65%) (continued)
Denominated in United States Dollar (92.16%) (continued)
Powerlong Real Estate Holdings Ltd 5.95% 19/07/2020 5,000,000 4,887,925 1.08
Powerlong Real Estate Holdings Ltd 6.95% 17/04/2021 3,000,000 2,866,128 0.63
Powerlong Real Estate Holdings Ltd 7.625% 26/11/2018 7,950,000 8,010,604 1.77
Prime Bloom Holdings Ltd 6.95% 05/07/2022 3,900,000 3,070,968 0.68QNB Finance Ltd 3.65719% 31/05/2021 2,000,000 2,012,298 0.44Redco Group 6.375% 27/02/2019 2,000,000 1,953,746 0.43RKI Overseas Finance 2016 A Ltd 5.00%
09/08/2019 3,000,000 3,029,317 0.67Shimao Property Holdings Ltd 4.75% 03/07/2022 2,150,000 2,095,554 0.46Shougang Group Co Ltd 3.95% 04/04/2019 1,000,000 1,010,727 0.22Studio City Co Ltd 5.875% 03/11/2019 2,000,000 2,028,038 0.45Sunac China Holdings Ltd 6.875% 08/08/2020 2,100,000 2,099,074 0.46Sunac China Holdings Ltd 7.35% 19/07/2021 4,700,000 4,508,868 1.00Times China Holdings Ltd 5.75% 26/04/2022 600,000 538,441 0.12Times China Holdings Ltd 6.25% 17/01/2021 4,200,000 4,098,621 0.91Times China Holdings Ltd 6.25% 23/01/2020 3,200,000 3,241,922 0.72Times China Holdings Ltd 7.85% 04/06/2021 10,000,000 9,801,775 2.17Trillion Chance Ltd 5.00% 13/02/2019 5,500,000 5,523,589 1.22Trillion Chance Ltd 5.25% 11/10/2018 1,110,000 1,114,523 0.25Tsinghua Unic Ltd 4.75% 31/01/2021 500,000 484,438 0.11Unigroup International Holdings Ltd 6.00%
10/12/2020 1,500,000 1,493,535 0.33United States Treasury Bill 0.00% 16/08/2018 5,000,000 4,988,655 1.10United States Treasury Bill 0.00% 27/09/2018 7,000,000 6,968,073 1.54United States Treasury Bill 0.00% 30/08/2018 8,000,000 7,975,584 1.76United States Treasury Note 2.875% 15/05/2028 5,000,000 5,023,828 1.11Vedanta Resources plc 6.375% 30/07/2022 4,400,000 4,282,034 0.95Vedanta Resources plc 8.25% 07/06/2021 9,400,000 9,746,954 2.15VLL International Inc 5.75% 28/11/2024 2,200,000 2,085,778 0.46West China Cement Ltd 6.50% 11/09/2019 6,300,000 6,428,023 1.42Westpac Banking Corp 3.0625% 15/05/2023 2,000,000 2,006,437 0.44Wisdom Glory Group Ltd 5.25% Perpetual
Callable-19/07/2020 1,500,000 1,463,228 0.32WTT Investment Ltd 5.50% 21/11/2022 6,000,000 5,742,007 1.27
Investment portfolio (continued)
BEA Union Investment Asian Bond and Currency Fund (continued)
Investment portfolio (continued)
BEA Union Investment Asian Bond and Currency Fund (continued)
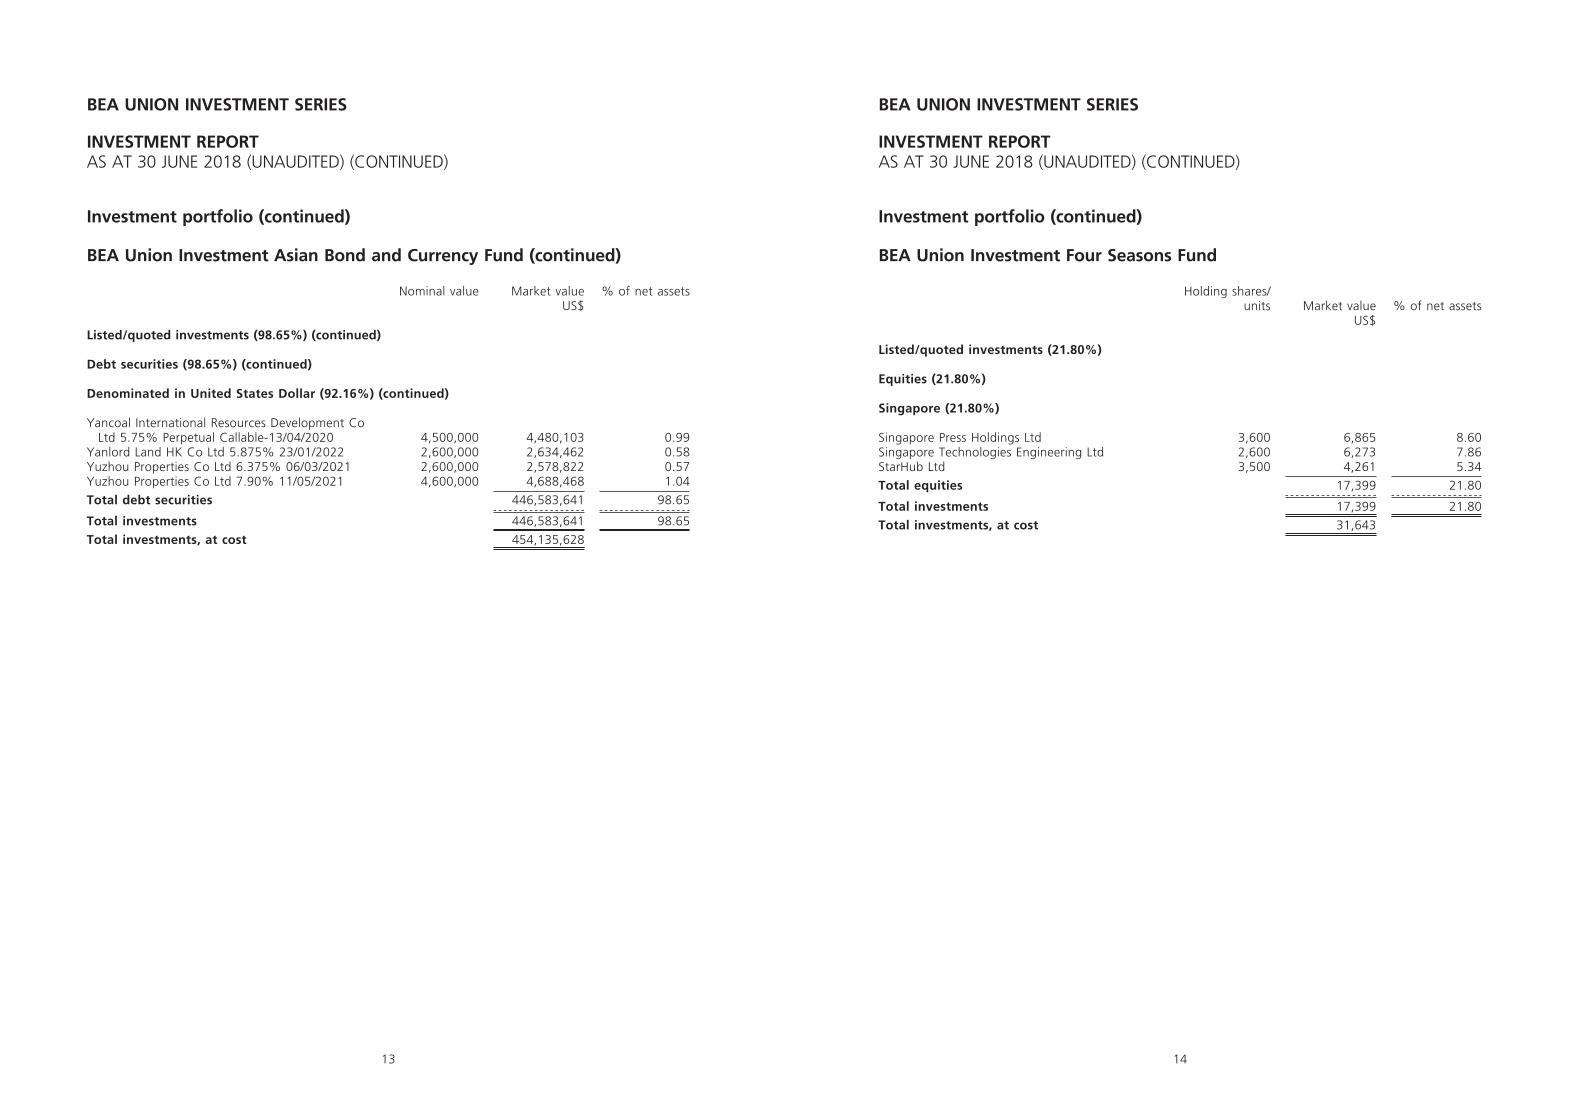
13 14
A5請縮小打印70.5% A5請縮小打印70.5%
BEA UNION INVESTMENT SERIES
INVESTMENT REPORTAS AT 30 JUNE 2018 (UNAUDITED) (CONTINUED)
BEA UNION INVESTMENT SERIES
INVESTMENT REPORTAS AT 30 JUNE 2018 (UNAUDITED) (CONTINUED)
Nominal value Market value % of net assetsUS$
Listed/quoted investments (98.65%) (continued)
Debt securities (98.65%) (continued)
Denominated in United States Dollar (92.16%) (continued)
Yancoal International Resources Development Co Ltd 5.75% Perpetual Callable-13/04/2020 4,500,000 4,480,103 0.99
Yanlord Land HK Co Ltd 5.875% 23/01/2022 2,600,000 2,634,462 0.58Yuzhou Properties Co Ltd 6.375% 06/03/2021 2,600,000 2,578,822 0.57Yuzhou Properties Co Ltd 7.90% 11/05/2021 4,600,000 4,688,468 1.04
Total debt securities 446,583,641 98.65
Total investments 446,583,641 98.65
Total investments, at cost 454,135,628
Investment portfolio (continued)
BEA Union Investment Four Seasons Fund
Holding shares/units Market value % of net assets
US$
Listed/quoted investments (21.80%)
Equities (21.80%)
Singapore (21.80%)
Singapore Press Holdings Ltd 3,600 6,865 8.60Singapore Technologies Engineering Ltd 2,600 6,273 7.86StarHub Ltd 3,500 4,261 5.34
Total equities 17,399 21.80
Total investments 17,399 21.80
Total investments, at cost 31,643
Investment portfolio (continued)
BEA Union Investment Asian Bond and Currency Fund (continued)
15 16
A5請縮小打印70.5% A5請縮小打印70.5%
BEA UNION INVESTMENT SERIES
INVESTMENT REPORTAS AT 30 JUNE 2018 (UNAUDITED) (CONTINUED)
BEA UNION INVESTMENT SERIES
INVESTMENT REPORTAS AT 30 JUNE 2018 (UNAUDITED) (CONTINUED)
Investment portfolio (continued)
BEA Union Investment China A-Share Equity Fund
Holding shares/units Market value % of net assets
US$
Listed/quoted investments (92.70%)
Equities (92.70%)
China (92.70%)
Accelink Technologies Co Ltd – A 104,100 332,823 0.69Agricultural Bank of China Ltd – A 1,981,000 1,028,421 2.12Aier Eye Hospital Group Co Ltd – A 204,415 995,960 2.06Angel Yeast Co Ltd – A 139,920 753,318 1.55Anhui Conch Cement Co Ltd – A 123,800 625,794 1.29AVIC Jonhon OptronicTechnology Co Ltd – A 123,758 727,858 1.50Bank of Ningbo Co Ltd – A 89,700 220,551 0.46Baoshan Iron & Steel Co Ltd – A 205,100 241,156 0.50Beijing Yanjing Brewery Co Ltd – A 522,280 529,547 1.09China CITIC Bank Corp Ltd – A 371,600 348,308 0.72China Construction Bank Corp – A 1,414,646 1,396,221 2.88China International Travel Service Corp Ltd – A 166,596 1,621,350 3.35China Jushi Co Ltd – A 332,360 512,561 1.06China Merchants Bank Co Ltd – A 675,356 2,693,868 5.56China Merchants Shekou Industrial Zone Holdings
Co Ltd – A 87,600 251,881 0.52China Petroleum & Chemical Corp – A 1,332,714 1,302,998 2.69China Vanke Co Ltd – A 189,300 702,127 1.45Chongqing Brewery Co Ltd – A 267,930 1,119,394 2.31CITIC Securities Co Ltd – A 432,600 1,081,231 2.23Dawning Information Industry Co Ltd – A 48,699 336,819 0.70East Money Information Co Ltd – A 840,094 1,670,874 3.45Gree Electric Appliances Inc of Zhuhai – A 148,800 1,058,562 2.18Guangdong Fenghua Advanced Technology Holding
Co Ltd – A 350,985 840,951 1.74Hangzhou Hikvision Digital Technology Co Ltd – A 382,525 2,143,127 4.42Hangzhou Robam Appliances Co Ltd – A 74,000 341,893 0.71Han’s Laser Technology Industry Group Co Ltd – A 106,162 851,983 1.76Huatai Securities Co Ltd – A 401,262 906,465 1.87Industrial & Commercial Bank of China Ltd – A 1,101,600 882,818 1.82Industrial Bank Co Ltd – A 512,600 1,112,938 2.30Inner Mongolia Yili Industrial Group Co Ltd – A 67,700 285,197 0.59Jiangsu Hengrui Medicine Co Ltd – A 230,448 2,634,053 5.43Kweichow Moutai Co Ltd – A 24,699 2,727,821 5.63Lepu Medical Technology Beijing Co Ltd – A 77,700 429,896 0.89Midea Group Co Ltd – A 203,000 1,599,395 3.30NavInfo Co Ltd – A 147,500 450,437 0.93Oppein Home Group Inc – A 42,000 810,423 1.67Ping An Bank Co Ltd – A 630,800 865,289 1.79Ping An Insurance Group Co of China Ltd – A 401,310 3,546,567 7.32
Holding shares/units Market value % of net assets
US$
Listed/quoted investments (92.70%) (continued)
Equities (92.70%) (continued)
China (92.70%) (continued)
Poly Real Estate Group Co Ltd – A 301,449 554,643 1.14Sanchuan Wisdom Technology Co Ltd – A 15 8 –Shandong Sun Paper Industry JSC Ltd – A 507,100 741,587 1.53Sichuan Kelun Pharmaceutical Co Ltd – A 221,020 1,070,699 2.21Wuliangye Yibin Co Ltd – A 91,700 1,051,910 2.17Wuxi Little Swan Co Ltd – A 96,111 1,005,515 2.08Yantai Jereh Oilfield Services Group Co Ltd – A 94,449 231,570 0.48Zhejiang Huayou Cobalt Co Ltd – A 18,400 270,540 0.56
Total equities 44,907,347 92.70
Total investments 44,907,347 92.70
Total investments, at cost 45,606,260
Investment portfolio (continued)
BEA Union Investment China A-Share Equity Fund (continued)

17 18
A5請縮小打印70.5% A5請縮小打印70.5%
BEA UNION INVESTMENT SERIES
INVESTMENT REPORTAS AT 30 JUNE 2018 (UNAUDITED) (CONTINUED)
BEA UNION INVESTMENT SERIES
INVESTMENT REPORTAS AT 30 JUNE 2018 (UNAUDITED) (CONTINUED)
Investment portfolio (continued)
BEA Union Investment Asia Pacific Multi Income Fund
Holding shares/units/nominal
value Market value % of net assetsUS$
Listed/quoted investments (91.50%)
Equities (16.59%)
Australia (4.42%)
National Australia Bank Ltd 441,739 8,942,781 1.62Star Entertainment Group Ltd 1,257,097 4,551,150 0.82Westpac Banking Corp 505,970 10,938,439 1.98
Hong Kong (4.60%)
AIA Group Ltd 936,400 8,187,782 1.48China Petroleum & Chemical Corp – H 3,802,000 3,392,274 0.61CK Hutchison Holdings Ltd 490,000 5,196,371 0.94CNOOC Ltd 2,159,000 3,720,575 0.67KWG Property Holding Ltd 1,812,500 2,264,044 0.41PCCW Ltd 4,843,000 2,722,286 0.49
Malaysia (1.57%)
Malayan Banking Bhd 3,901,200 8,672,539 1.57
Singapore (2.11%)
DBS Group Holdings Ltd 139,700 2,726,380 0.49Oversea-Chinese Banking Corp Ltd 742,500 6,338,617 1.15Singapore Technologies Engineering Ltd 1,085,800 2,619,937 0.47
Taiwan (2.33%)
Taiwan Semiconductor Manufacturing Co Ltd 1,820,000 12,893,943 2.33
Thailand (1.56%)
Advanced Info Service – NVDR 1,075,400 6,005,077 1.09PTT Exploration & Production – NVDR 621,000 2,624,197 0.47
Total equities 91,796,392 16.59
Holding shares/units/nominal
value Market value % of net assetsUS$
Listed/quoted investments (91.50%) (continued)
Debt securities (57.81%)
Denominated in Hong Kong Dollar (0.30%)
National Australia Bank Ltd 3.73% 17/05/2026 13,000,000 1,649,116 0.30
Denominated in Indonesian Rupiah (1.18%)
Indonesia Treasury Bond 5.625% 15/05/2023 101,000,000,000 6,546,923 1.18
Denominated in Renminbi (3.62%)
Bank of China Ltd 3.60% 12/07/2018 6,000,000 920,160 0.17Busan Bank Co Ltd 4.85% 25/05/2021 10,000,000 1,515,675 0.27China Development Bank 4.69% 23/03/2023 20,000,000 3,130,758 0.57China Government Bond 3.17% 19/04/2023 30,000,000 4,515,356 0.82China Government Bond 3.77% 08/03/2025 6,000,000 929,096 0.17Export-Import Bank of Korea 4.65% 21/06/2021 5,000,000 757,058 0.14Greenland Global Investment Ltd 7.125%
20/03/2021 21,000,000 3,156,301 0.57Long Profit Group Ltd Via Ocean Wealth II Ltd 5.50%
10/06/2019 13,000,000 1,983,733 0.36QNB Finance Ltd 5.10% 14/05/2021 5,000,000 758,916 0.14Shimao Property Holdings Ltd 5.75% 15/03/2021 15,000,000 2,276,779 0.41
Denominated in United States Dollar (52.71%)
ABJA Investment Co Pte Ltd 4.45% 24/07/2023 2,000,000 1,867,474 0.34Agile Group Holdings Ltd 9.00% 21/05/2020 2,000,000 2,089,640 0.38Anton Oilfield Services Group/Hong Kong 9.75%
05/12/2020 1,500,000 1,520,582 0.27AusNet Services Holdings Pty Ltd 5.75%
17/03/2076 600,000 630,151 0.11AVIC International Finance & Investment Ltd 4.375%
23/05/2021 500,000 504,478 0.09Azure Power Energy Ltd 5.50% 03/11/2022 2,100,000 1,936,202 0.35Bank of China Ltd 3.04919% 07/06/2021 800,000 801,258 0.14Bank of China Ltd 3.14919% 07/06/2023 1,200,000 1,200,743 0.22
Investment portfolio (continued)
BEA Union Investment Asia Pacific Multi Income Fund (continued)
19 20
A5請縮小打印70.5% A5請縮小打印70.5%
BEA UNION INVESTMENT SERIES
INVESTMENT REPORTAS AT 30 JUNE 2018 (UNAUDITED) (CONTINUED)
BEA UNION INVESTMENT SERIES
INVESTMENT REPORTAS AT 30 JUNE 2018 (UNAUDITED) (CONTINUED)
Holding shares/units/nominal
value Market value % of net assetsUS$
Listed/quoted investments (91.50%) (continued)
Debt securities (57.81%) (continued)
Denominated in United States Dollar (52.71%) (continued)
Bank of Communications Co Ltd 3.205% 16/08/2019 1,000,000 1,006,095 0.18
Baoxin Auto Finance I Ltd 6.625% 02/04/2019 2,800,000 2,803,316 0.51Baoxin Auto Finance I Ltd 8.75% Perpetual
Callable-15/12/2019 1,700,000 1,678,680 0.30Barminco Finance Pty Ltd 6.625% 15/05/2022 1,000,000 960,655 0.17Beijing Capital Polaris Investment Co Ltd 4.25%
26/03/2021 2,500,000 2,522,913 0.46Bluestar Finance Holdings Ltd 3.50% 30/09/2021 2,000,000 1,968,314 0.36Bukit Makmur Mandiri Utama PT 7.75%
13/02/2022 4,500,000 4,528,523 0.82Central Plaza Development Ltd 3.875% 30/01/2021 2,000,000 1,991,867 0.36Central Plaza Development Ltd 7.125% Perpetual
Callable-02/12/2019 2,000,000 2,036,359 0.37China Aoyuan Property Group Ltd 6.35%
11/01/2020 2,000,000 2,025,332 0.37China Aoyuan Property Group Ltd 6.525%
25/04/2019 1,700,000 1,720,574 0.31China Aoyuan Property Group Ltd 7.50%
10/05/2021 3,600,000 3,514,410 0.64China Construction Bank Corp 3.05088%
08/06/2021 1,000,000 1,001,099 0.18China Construction Bank Corp 3.15088%
08/06/2023 500,000 500,492 0.09China Evergrande Group 7.00% 23/03/2020 2,000,000 2,012,851 0.36China Evergrande Group 8.25% 23/03/2022 3,700,000 3,613,155 0.65China Huadian Overseas Development 2018 Ltd
3.875% 17/05/2023 2,000,000 2,010,972 0.36China Merchants Bank Co Ltd 3.07531%
01/06/2021 2,500,000 2,504,532 0.45China SCE Property Holdings Ltd 10.00%
02/07/2020 3,000,000 3,282,787 0.59China SCE Property Holdings Ltd 5.875%
10/03/2022 500,000 458,922 0.08China SCE Property Holdings Ltd 7.45% 17/04/2021 1,100,000 1,094,086 0.20Chong Hing Bank Ltd 3.876% 26/07/2027 2,000,000 1,952,517 0.35CIFI Holdings Group Co Ltd 5.50% 23/01/2022 2,000,000 1,894,478 0.34CIFI Holdings Group Co Ltd 6.375% 02/05/2020 4,200,000 4,204,947 0.76
Holding shares/units/nominal
value Market value % of net assetsUS$
Listed/quoted investments (91.50%) (continued)
Debt securities (57.81%) (continued)
Denominated in United States Dollar (52.71%) (continued)
CIFI Holdings Group Co Ltd 6.875% 23/04/2021 2,100,000 2,106,544 0.38CIFI Holdings Group Co Ltd 7.75% 05/06/2020 3,500,000 3,560,435 0.64Country Garden Holdings Co Ltd 3.875%
20/11/2018 5,000,000 4,972,016 0.90Country Garden Holdings Co Ltd 4.75%
25/07/2022 2,000,000 1,938,427 0.35Country Garden Holdings Co Ltd 7.50%
09/03/2020 1,700,000 1,766,136 0.32Eterna Capital Pte Ltd 7.50% 11/12/2022 1,961,791 1,997,509 0.36Export-Import Bank of Korea 2.87531% 01/06/2021 1,200,000 1,203,187 0.22Export-Import Bank of Korea 3.07531% 01/06/2023 1,000,000 1,002,733 0.18Fantasia Holdings Group Co Ltd 7.25% 13/02/2019 1,900,000 1,895,612 0.34Far East Horizon Ltd 4.35% Perpetual
Callable-14/06/2022 500,000 463,937 0.08Fortune Star BVI Ltd 5.375% 05/12/2020 2,600,000 2,581,831 0.47Future Land Development Holdings Ltd 5.00%
16/02/2020 1,000,000 989,440 0.18FUXIANG Investment Management Ltd 5.10%
04/06/2019 2,500,000 2,521,329 0.46Global Prime Capital Pte Ltd 7.25% 26/04/2021 3,000,000 3,018,271 0.55Golden Eagle Retail Group Ltd 4.625% 21/05/2023 2,500,000 2,142,247 0.39Golden Legacy Pte Ltd 8.25% 07/06/2021 2,500,000 2,481,300 0.45Goldman Sachs Group Inc 3.49063% 15/05/2026 3,000,000 2,973,220 0.54GOME Retail Holdings Ltd 5.00% 10/03/2020 3,800,000 3,672,383 0.66Greenland Global Investment Ltd 5.25%
12/02/2021 1,600,000 1,536,353 0.28Greenland Global Investment Ltd 6.75%
22/05/2019 4,000,000 4,033,030 0.73Greenland Global Investment Ltd 7.18888%
26/09/2021 4,000,000 4,007,274 0.72Hilong Holding Ltd 7.25% 22/06/2020 1,200,000 1,156,299 0.21Hong Seng Ltd 8.50% 20/11/2018 1,100,000 1,088,057 0.20Honghua Group Ltd 7.45% 25/09/2019 924,000 960,245 0.17HT Global IT Solutions Holdings Ltd 7.00%
14/07/2021 3,700,000 3,811,415 0.69Huaneng Hong Kong Capital Ltd 3.60% Perpetual
Callable-30/10/2022 3,000,000 2,752,230 0.50
Investment portfolio (continued)
BEA Union Investment Asia Pacific Multi Income Fund (continued)
Investment portfolio (continued)
BEA Union Investment Asia Pacific Multi Income Fund (continued)
21 22
A5請縮小打印70.5% A5請縮小打印70.5%
BEA UNION INVESTMENT SERIES
INVESTMENT REPORTAS AT 30 JUNE 2018 (UNAUDITED) (CONTINUED)
BEA UNION INVESTMENT SERIES
INVESTMENT REPORTAS AT 30 JUNE 2018 (UNAUDITED) (CONTINUED)
Holding shares/units/nominal
value Market value % of net assetsUS$
Listed/quoted investments (91.50%) (continued)
Debt securities (57.81%) (continued)
Denominated in United States Dollar (52.71%) (continued)
Huarong Finance 2017 Co Ltd 3.51075% 03/07/2021 2,000,000 1,996,340 0.36
ICBCIL Finance Co Ltd 3.2925% 15/05/2021 5,500,000 5,514,677 1.00Indika Energy Capital II Pte Ltd 6.875% 10/04/2022 6,400,000 6,401,656 1.16Indo Energy Finance II BV 6.375% 24/01/2023 1,300,000 1,262,290 0.23Industrial & Commercial Bank of China Ltd
3.06563% 14/06/2021 1,000,000 999,988 0.18Industrial & Commercial Bank of China Ltd
3.16781% 05/03/2023 2,000,000 2,001,916 0.36Jababeka International BV 6.50% 05/10/2023 2,000,000 1,724,496 0.31KEB Hana Bank 3.13263% 13/03/2023 2,000,000 2,004,779 0.36Korea National Oil Corp 3.20644% 16/07/2023 1,500,000 1,500,000 0.27Korean Air Lines Co Ltd 5.875% 06/03/2021 2,500,000 2,421,818 0.44KWG Property Holding Ltd 8.975% 14/01/2019 2,500,000 2,635,885 0.48Lai Fung Bonds 2018 Ltd 5.65% 18/01/2023 2,000,000 1,950,604 0.35Lodha Developers International Ltd 12.00%
13/03/2020 1,300,000 1,385,670 0.25Logan Property Holdings Co Ltd 5.125%
02/11/2018 4,800,000 4,815,729 0.87Logan Property Holdings Co Ltd 6.875%
24/04/2021 1,200,000 1,182,762 0.21LSD Bonds 2017 Ltd 4.60% 13/09/2022 2,300,000 2,225,503 0.40Marble II Pte Ltd 5.30% 20/06/2022 4,000,000 3,787,238 0.68Marquee Land Pte Ltd 9.75% 05/08/2019 469,000 498,107 0.09Medco Straits Services Pte Ltd 8.50% 17/08/2022 3,000,000 3,081,267 0.56Modernland Overseas Pte Ltd 6.95% 13/04/2024 1,600,000 1,401,037 0.25Moon Wise Global Ltd 9.00% Perpetual
Callable-14/06/2022 3,400,000 3,562,860 0.64National Australia Bank Ltd 2.90469% 20/09/2021 1,000,000 1,000,548 0.18New Metro Global Ltd 4.75% 11/02/2019 3,000,000 3,025,051 0.55New Metro Global Ltd 6.50% 23/04/2021 3,800,000 3,733,796 0.67Pakuwon Prima Pte Ltd 5.00% 14/02/2024 1,000,000 945,678 0.17PB International BV 7.625% 26/01/2022 1,300,000 1,272,869 0.23Poseidon Finance 1 Ltd 0.00% 01/02/2025 2,500,000 2,527,050 0.46Powerlong Real Estate Holdings Ltd 4.875%
15/09/2021 2,100,000 1,870,164 0.34Powerlong Real Estate Holdings Ltd 6.95%
17/04/2021 2,800,000 2,675,053 0.48
Holding shares/units/nominal
value Market value % of net assetsUS$
Listed/quoted investments (91.50%) (continued)
Debt securities (57.81%) (continued)
Denominated in United States Dollar (52.71%) (continued)
Powerlong Real Estate Holdings Ltd 7.625% 26/11/2018 5,250,000 5,290,022 0.96
Prime Bloom Holdings Ltd 6.95% 05/07/2022 3,300,000 2,598,512 0.47QNB Finance Ltd 3.65719% 31/05/2021 2,500,000 2,515,373 0.45Redco Group 6.375% 27/02/2019 1,300,000 1,269,923 0.23RKI Overseas Finance 2016 A Ltd 5.00%
09/08/2019 1,400,000 1,413,681 0.26Shimao Property Holdings Ltd 4.75% 03/07/2022 3,000,000 2,924,028 0.53Shimao Property Holdings Ltd 8.375% 10/02/2022 2,300,000 2,495,045 0.45Shougang Group Co Ltd 3.95% 04/04/2019 1,000,000 1,010,727 0.18Studio City Co Ltd 5.875% 30/11/2019 2,000,000 2,028,038 0.37Studio City Co Ltd 7.25% 30/11/2021 2,000,000 2,083,726 0.38Studio City Finance Ltd 8.50% 01/12/2020 2,000,000 2,024,127 0.37Sunac China Holdings Ltd 6.875% 08/08/2020 1,000,000 999,559 0.18Sunac China Holdings Ltd 7.35% 19/07/2021 2,400,000 2,302,414 0.42Times China Holdings Ltd 6.25% 17/01/2021 1,000,000 975,862 0.18Times China Holdings Ltd 6.25% 23/01/2020 2,400,000 2,431,441 0.44Times China Holdings Ltd 7.85% 04/06/2021 5,500,000 5,390,976 0.97Trillion Chance Ltd 5.00% 13/02/2019 6,500,000 6,527,878 1.18Tsinghua Unic Ltd 4.75% 31/01/2021 700,000 678,239 0.12United States Treasury Bill 0.00% 01/11/2018 3,000,000 2,979,945 0.54United States Treasury Bill 0.00% 06/12/2018 3,000,000 2,973,507 0.54United States Treasury Bill 0.00% 08/11/2018 3,000,000 2,978,676 0.54United States Treasury Bill 0.00% 09/08/2018 3,000,000 2,994,261 0.54United States Treasury Bill 0.00% 16/08/2018 4,000,000 3,990,924 0.72United States Treasury Bill 0.00% 20/06/2019 3,000,000 2,933,886 0.53United States Treasury Bill 0.00% 20/12/2018 3,000,000 2,971,107 0.54United States Treasury Note 2.875% 15/05/2028 6,000,000 6,028,594 1.09Vedanta Resources plc 6.375% 30/07/2022 2,400,000 2,335,655 0.42Vedanta Resources plc 8.25% 07/06/2021 5,000,000 5,184,550 0.94VLL International Inc 5.75% 28/11/2024 2,200,000 2,085,778 0.38West China Cement Ltd 6.50% 11/09/2019 3,000,000 3,060,963 0.55Westpac Banking Corp 3.0625% 15/05/2023 2,000,000 2,006,437 0.36Wisdom Glory Group Ltd 5.25% Perpetual
Callable-19/07/2020 1,300,000 1,268,131 0.23WTT Investment Ltd 5.50% 21/11/2022 5,200,000 4,976,406 0.90Yancoal International Resources Development Co
Ltd 5.75% Perpetual Callable-13/04/2020 1,000,000 995,578 0.18
Investment portfolio (continued)
BEA Union Investment Asia Pacific Multi Income Fund (continued)
Investment portfolio (continued)
BEA Union Investment Asia Pacific Multi Income Fund (continued)
23 24
A5請縮小打印70.5% A5請縮小打印70.5%
BEA UNION INVESTMENT SERIES
INVESTMENT REPORTAS AT 30 JUNE 2018 (UNAUDITED) (CONTINUED)
BEA UNION INVESTMENT SERIES
INVESTMENT REPORTAS AT 30 JUNE 2018 (UNAUDITED) (CONTINUED)
Holding shares/units/nominal
value Market value % of net assetsUS$
Listed/quoted investments (91.50%) (continued)
Debt securities (57.81%) (continued)
Denominated in United States Dollar (52.71%) (continued)
Yanlord Land HK Co Ltd 5.875% 23/01/2022 1,000,000 1,013,255 0.18Yuzhou Properties Co Ltd 6.375% 06/03/2021 2,600,000 2,578,822 0.47Yuzhou Properties Co Ltd 7.90% 11/05/2021 1,400,000 1,426,925 0.26
Total debt securities 319,757,537 57.81
Investment funds (13.50%)
Australia (1.73%)
Transurban Group 1,086,831 9,595,911 1.73
Hong Kong (11.77%)
BEA Union Investment – Asia Pacific Investment Grade Bond Fund 1,173,762 14,829,348 2.68
BEA Union Investment Asia Pacific Equity Dividend Fund 3,926,228 43,895,229 7.93
BEA Union Investment Asian Bond and Currency Fund – Class ADU 55,388 750,507 0.14
BEA Union Investment Asian Bond and Currency Fund – Class IAU 1,000 9,710 0.00
BEA Union Investment Global Flexi Allocation Fund 229,379 2,502,525 0.45HKT Trust & HKT Ltd 2,463,000 3,126,832 0.57
Total investment funds 74,710,062 13.50
Real estate investment trust (3.60%)
Australia (0.48%)
Stockland 913,773 2,680,310 0.48
Singapore (3.12%)
Ascendas Real Estate Investment Trust 5,865,300 11,356,361 2.05Mapletree Industrial Trust 4,215,900 5,936,583 1.07
Total real estate investment trust 19,973,254 3.60
Total investments 506,237,245 91.50
Total investments, at cost 520,130,004
Investment portfolio (continued)
BEA Union Investment China Phoenix Fund
Holding shares/units Market value % of net assets
US$
Listed/quoted investments (94.83%)
Equities (92.72%)
China (2.67%)
Hangzhou Hikvision Digital Technology Co Ltd – A 45,608 255,435 2.14Wuliangye Yibin Co Ltd – A 5,500 63,068 0.53
Hong Kong (70.78%)
Agricultural Bank of China Ltd – H 600,000 280,671 2.35Anhui Conch Cement Co Ltd – H 31,000 177,611 1.49ANTA Sports Products Ltd 38,000 201,250 1.69China CITIC Bank Corp Ltd – H 338,000 211,103 1.77China Construction Bank Corp – H 1,037,000 956,969 8.03China Gas Holdings Ltd 89,200 358,142 3.00China Mengniu Dairy Co Ltd 85,000 287,650 2.41China Merchants Bank Co Ltd – H 61,000 224,703 1.88China Overseas Land & Investment Ltd 26,000 85,502 0.72China Petroleum & Chemical Corp – H 338,000 301,575 2.53China Railway Group Ltd – H 200,000 150,660 1.26China Telecom Corp Ltd – H 202,000 94,493 0.79China Unicom Hong Kong Ltd 164,000 204,648 1.72China Vanke Co Ltd – H 16,200 56,578 0.47CNOOC Ltd 450,000 775,479 6.50CSPC Pharmaceutical Group Ltd 150,000 452,171 3.79Geely Automobile Holdings Ltd 50,000 129,374 1.09Industrial & Commercial Bank of China Ltd – H 779,000 581,856 4.88Ping An Insurance Group Co of China Ltd – H 69,000 634,550 5.32Shimao Property Holdings Ltd 106,000 278,326 2.33Sino Biopharmaceutical Ltd 156,000 238,609 2.00Sun Art Retail Group Ltd 125,500 164,124 1.38Sunny Optical Technology Group Co Ltd 7,800 145,054 1.22Tencent Holdings Ltd 23,800 1,194,023 10.02Tingyi Cayman Islands Holding Corp 110,000 254,899 2.14
Taiwan (0.63%)
Chroma ATE Inc 14,000 74,618 0.63
Investment portfolio (continued)
BEA Union Investment Asia Pacific Multi Income Fund (continued)
25 26
A5請縮小打印70.5% A5請縮小打印70.5%
BEA UNION INVESTMENT SERIES
INVESTMENT REPORTAS AT 30 JUNE 2018 (UNAUDITED) (CONTINUED)
BEA UNION INVESTMENT SERIES
INVESTMENT REPORTAS AT 30 JUNE 2018 (UNAUDITED) (CONTINUED)
Holding shares/units Market value % of net assets
US$
Listed/quoted investments (94.83%) (continued)
Equities (92.72%) (continued)
The United States of America (18.64%)
Alibaba Group Holding Ltd – ADR 5,700 1,056,780 8.86Baidu Inc – ADR 2,580 626,966 5.26Baozun Inc – ADR 3,194 174,616 1.46Fanhua Inc – ADR 7,446 211,690 1.78Yum China Holdings Inc 2,393 92,059 0.77YY Inc – ADR 600 60,270 0.51
Total equities 11,055,522 92.72
Investment fund (2.11%)
Hong Kong (2.11%)
BEA Union Investment – China A-Share Equity Fund 16,759 251,553 2.11
Total investment fund 251,553 2.11
Total investments 11,307,075 94.83
Total investments, at cost 9,106,988
Investment portfolio (continued)
BEA Union Investment RMB Core Bond Fund
Nominal value Market value % of net assetsRMB
Listed/quoted investments (99.54%)
Debt securities (99.54%)
Denominated in Renminbi (93.27%)
Australia & New Zealand Banking Group Ltd 4.75% 30/01/2025 2,000,000 2,033,682 2.40
Bank of China Ltd 4.65% 05/03/2021 3,000,000 3,055,089 3.60BOC Aviation Ltd 4.50% 17/10/2020 5,000,000 5,041,733 5.94Busan Bank Co Ltd 4.85% 25/05/2021 4,000,000 4,018,226 4.73China Construction Bank Corp 4.90% 12/11/2024 4,000,000 4,031,495 4.75China Development Bank 4.69% 23/03/2023 5,000,000 5,187,497 6.11China Government Bond 3.17% 19/04/2023 3,000,000 2,992,680 3.53China Government Bond 3.77% 08/03/2025 4,000,000 4,105,232 4.84CNI Capital Ltd 4.30% 11/11/2019 4,000,000 3,989,273 4.70Commonwealth Bank of Australia 4.20%
26/10/2020 3,000,000 3,073,161 3.62Export-Import Bank of Korea 4.10% 06/08/2018 2,000,000 2,072,868 2.44Export-Import Bank of Korea 4.65% 21/06/2021 2,000,000 2,007,048 2.36First Abu Dhabi Bank PJSC 4.80% 01/06/2021 3,000,000 3,026,311 3.57Greenland Global Investment Ltd 7.125%
20/03/2021 2,000,000 1,992,312 2.35Industrial & Commercial Bank of China Ltd 3.20%
19/09/2018 3,000,000 3,018,623 3.56Industrial & Commercial Bank of China Ltd 3.90%
17/07/2018 3,000,000 3,111,149 3.67KEB Hana Bank 4.05% 30/07/2018 5,000,000 5,184,156 6.11Korea Development Bank 4.60% 03/07/2021 4,000,000 4,000,480 4.71Landeskreditbank Baden-Wuerttemberg
Foerderbank 3.80% 03/06/2019 2,000,000 1,998,330 2.35Long Profit Group Ltd Via Ocean Wealth II Ltd 5.50%
10/06/2019 3,000,000 3,034,097 3.57National Bank of Canada 4.30% 11/10/2020 3,000,000 3,089,201 3.64QNB Finance Ltd 5.10% 14/05/2021 2,000,000 2,011,974 2.37Shimao Property Holdings Ltd 5.75% 15/03/2021 2,000,000 2,012,000 2.37Shui On Development Holding Ltd 6.875%
02/03/2021 2,000,000 2,022,122 2.38Westpac Banking Corp 4.35% 19/01/2021 3,000,000 3,054,768 3.60
Investment portfolio (continued)
BEA Union Investment China Phoenix Fund (continued)

27 28
A5請縮小打印70.5% A5請縮小打印70.5%
BEA UNION INVESTMENT SERIES
INVESTMENT REPORTAS AT 30 JUNE 2018 (UNAUDITED) (CONTINUED)
BEA UNION INVESTMENT SERIES
INVESTMENT REPORTAS AT 30 JUNE 2018 (UNAUDITED) (CONTINUED)
Nominal value Market value % of net assetsRMB
Listed/quoted investments (99.54%) (continued)
Debt securities (99.54%) (continued)
Denominated in United States Dollar (6.27%)
FUXIANG Investment Management Ltd 5.10% 04/06/2019 200,000 1,336,866 1.58
Greenland Global Investment Ltd 7.18888% 26/09/2021 200,000 1,327,967 1.56
Korea National Oil Corp 3.21231% 16/07/2023 200,000 1,325,557 1.56QNB Finance Ltd 3.65719% 31/05/2021 200,000 1,333,708 1.57
Total debt securities 84,487,605 99.54
Total investments 84,487,605 99.54
Total investments, at cost 83,296,930
Investment portfolio (continued)
BEA Union Investment Asia Pacific Flexi Allocation Fund
Holding shares/units/nominal
value Market value % of net assetsUS$
Listed/quoted investments (99.24%)
Equities (73.44%)
Australia (9.01%)
Alumina Ltd 166,291 342,791 0.60Amcor Ltd 23,675 251,889 0.44Aristocrat Leisure Ltd 26,274 593,053 1.05BlueScope Steel Ltd 18,544 236,346 0.42Boral Ltd 51,032 245,837 0.43CSL Ltd 6,911 983,044 1.73Macquarie Group Ltd 7,657 699,251 1.23OZ Minerals Ltd 27,361 189,623 0.33Tabcorp Holdings Ltd 106,639 349,829 0.62Treasury Wine Estates Ltd 22,019 281,449 0.50Westpac Banking Corp 43,422 938,729 1.66
China (1.49%)
Baoshan Iron & Steel Co Ltd – A 125,900 147,977 0.26China International Travel Service Corp Ltd – A 26,700 259,798 0.46Jiangsu Hengrui Medicine Co Ltd – A 38,376 438,548 0.77
Hong Kong (24.62%)
Agricultural Bank of China Ltd – H 500,000 233,893 0.41AIA Group Ltd 165,800 1,449,737 2.56Anhui Conch Cement Co Ltd – H 21,000 120,318 0.21ANTA Sports Products Ltd 27,000 142,993 0.25Beijing Enterprises Water Group Ltd 216,000 117,561 0.21BOC Hong Kong Holdings Ltd 60,000 282,583 0.50China Construction Bank Corp – H 1,026,000 946,818 1.67China Gas Holdings Ltd 63,000 252,948 0.45China Longyuan Power Group Corp Ltd – H 161,000 129,490 0.23China Mengniu Dairy Co Ltd 65,000 219,968 0.39China Merchants Bank Co Ltd – H 51,500 189,708 0.33China Oilfield Services Ltd – H 466,000 438,946 0.77China Overseas Land & Investment Ltd 36,000 118,387 0.21China Pacific Insurance Group Co Ltd – H 18,200 70,406 0.12China Petroleum & Chemical Corp – H 510,000 455,039 0.80China Railway Group Ltd – H 205,000 154,427 0.27China Unicom Hong Kong Ltd 254,000 316,955 0.56CK Hutchison Holdings Ltd 15,500 164,375 0.29CNOOC Ltd 406,000 699,654 1.23
Investment portfolio (continued)
BEA Union Investment RMB Core Bond Fund (continued)

29 30
A5請縮小打印70.5% A5請縮小打印70.5%
BEA UNION INVESTMENT SERIES
INVESTMENT REPORTAS AT 30 JUNE 2018 (UNAUDITED) (CONTINUED)
BEA UNION INVESTMENT SERIES
INVESTMENT REPORTAS AT 30 JUNE 2018 (UNAUDITED) (CONTINUED)
Holding shares/units/nominal
value Market value % of net assetsUS$
Listed/quoted investments (99.24%) (continued)
Equities (73.44%) (continued)
Hong Kong (24.62%) (continued)
Country Garden Holdings Co Ltd 46,000 80,796 0.14Country Garden Services Holdings Co Ltd 5,287 6,779 0.01CSPC Pharmaceutical Group Ltd 112,000 337,621 0.60ENN Energy Holdings Ltd 16,000 157,135 0.28Galaxy Entertainment Group Ltd 25,000 193,583 0.34Geely Automobile Holdings Ltd 53,000 137,136 0.24Hang Seng Bank Ltd 12,200 305,098 0.54Hong Kong Exchanges & Clearing Ltd 8,200 246,455 0.43Industrial & Commercial Bank of China Ltd – H 323,000 241,258 0.43Longfor Properties Co Ltd 33,500 90,310 0.16MMG Ltd 320,000 221,478 0.39PCCW Ltd 225,000 126,474 0.22Ping An Insurance Group Co of China Ltd – H 61,500 565,578 1.00Shenzhou International Group Holdings Ltd 24,000 296,273 0.52Shimao Property Holdings Ltd 89,500 235,002 0.41Sun Art Retail Group Ltd 226,500 296,208 0.52Sunny Optical Technology Group Co Ltd 18,400 342,179 0.60Swire Properties Ltd 121,000 446,493 0.79Tencent Holdings Ltd 51,300 2,573,672 4.54Wharf Real Estate Investment Co Ltd 57,000 405,769 0.72Wynn Macau Ltd 49,200 158,346 0.28
India (6.45%)
Aurobindo Pharma Ltd 23,821 210,461 0.37Britannia Industries Ltd 2,069 187,981 0.33Cipla Ltd 17,614 158,873 0.28Container Corp Of India Ltd 27,506 260,742 0.46Dabur India Ltd 21,434 121,925 0.22Edelweiss Financial Services Ltd 35,088 151,994 0.27HDFC Bank Ltd 18,798 578,673 1.02ICICI Prudential Life Insurance Co Ltd 21,539 118,546 0.21Indian Oil Corp Ltd 109,016 248,130 0.44Infosys Ltd 23,318 446,049 0.79Larsen & Toubro Ltd 5,684 105,771 0.19Mahindra & Mahindra Ltd 27,793 363,675 0.64Maruti Suzuki India Ltd 1,769 227,598 0.40State Bank of India 49,390 186,808 0.33Titan Co Ltd 22,311 285,349 0.50
Holding shares/units/nominal
value Market value % of net assetsUS$
Listed/quoted investments (99.24%) (continued)
Equities (73.44%) (continued)
Indonesia (1.52%)
Bank Central Asia Tbk PT 71,500 106,271 0.19Bank Mandiri Persero Tbk PT 283,800 134,664 0.24Bank Rakyat Indonesia Persero Tbk PT 620,100 122,456 0.22Indah Kiat Pulp & Paper Corp Tbk PT 175,600 227,300 0.40Telekomunikasi Indonesia Persero Tbk PT 1,018,800 265,884 0.47
Korea (7.39%)
Doosan Bobcat Inc 8,354 239,863 0.42Fila Korea Ltd 4,114 124,213 0.22Hotel Shilla Co Ltd 1,498 165,324 0.29Korea Investment Holdings Co Ltd 1,448 109,265 0.19Korean Reinsurance Co 15,197 160,901 0.28LG Household & Health Care Ltd 173 216,695 0.38Medy-Tox Inc 170 117,039 0.21POSCO 1,023 301,529 0.53Samsung Biologics Co Ltd 427 159,765 0.28Samsung Electro-Mechanics Co Ltd 3,191 423,747 0.75Samsung Electronics Co Ltd 36,396 1,523,434 2.69SK Hynix Inc 5,491 421,739 0.74SK Innovation Co Ltd 791 143,011 0.25S-Oil Corp 913 89,702 0.16
Malaysia (1.99%)
British American Tobacco Malaysia Bhd 17,800 151,759 0.27Dialog Group Bhd 749,700 573,479 1.01Malayan Banking Bhd 23,700 52,686 0.09Public Bank Bhd 44,300 252,892 0.45Tenaga Nasional Bhd 23,000 83,243 0.15ViTrox Corp Bhd 9,700 13,255 0.02
Philippines (0.25%)
Ayala Land Inc 202,400 143,549 0.25
Investment portfolio (continued)
BEA Union Investment Asia Pacific Flexi Allocation Fund (continued)
Investment portfolio (continued)
BEA Union Investment Asia Pacific Flexi Allocation Fund (continued)
31 32
A5請縮小打印70.5% A5請縮小打印70.5%
BEA UNION INVESTMENT SERIES
INVESTMENT REPORTAS AT 30 JUNE 2018 (UNAUDITED) (CONTINUED)
BEA UNION INVESTMENT SERIES
INVESTMENT REPORTAS AT 30 JUNE 2018 (UNAUDITED) (CONTINUED)
Holding shares/units/nominal
value Market value % of net assetsUS$
Listed/quoted investments (99.24%) (continued)
Equities (73.44%) (continued)
Singapore (3.23%)
CapitaLand Ltd 65,400 151,569 0.27DBS Group Holdings Ltd 31,200 608,898 1.07Keppel Corp Ltd 52,600 275,441 0.49Oversea-Chinese Banking Corp Ltd 36,000 307,327 0.54Sembcorp Marine Ltd 116,900 174,043 0.31Singapore Technologies Engineering Ltd 91,200 220,057 0.39UOL Group Ltd 16,700 93,329 0.16
Taiwan (8.92%)
ASE Technology Holding Co Ltd 93,000 218,097 0.38Cathay Financial Holding Co Ltd 173,000 305,273 0.54Chunghwa Telecom Co Ltd 51,000 183,166 0.32CTBC Financial Holding Co Ltd 675,000 484,851 0.86Episil-Precision Inc 72,000 171,683 0.30Globalwafers Co Ltd 18,000 298,733 0.53Largan Precision Co Ltd 5,000 731,418 1.29MediaTek Inc 29,000 284,876 0.50Nanya Technology Corp 70,000 191,021 0.34Pan Jit International Inc 66,000 123,390 0.22TaiMed Biologics Inc 26,000 265,639 0.47Taiwan Semiconductor Manufacturing Co Ltd 89,000 630,528 1.11Uni-President Enterprises Corp 101,000 256,072 0.45Visual Photonics Epitaxy Co Ltd 23,000 86,753 0.15Wafer Works Corp 60,000 122,603 0.22Wistron NeWeb Corp 98,000 233,359 0.41Wiwynn Corp 6,036 103,741 0.18Yageo Corp 10,000 368,989 0.65
Thailand (2.62%)
Advanced Info Service – NVDR 21,900 122,290 0.22Airports of Thailand – NVDR 32,300 61,178 0.11CP ALL PCL 111,800 248,031 0.44Indorama Ventures – NVDR 284,000 467,188 0.82Land & Houses – NVDR 169,000 57,132 0.10PTT Exploration & Production – NVDR 60,500 255,658 0.45PTT – NVDR 187,200 269,809 0.48
Holding shares/units/nominal
value Market value % of net assetsUS$
Listed/quoted investments (99.24%) (continued)
Equities (73.44%) (continued)
The United States of America (5.95%)
Alibaba Group Holding Ltd – ADR 9,489 1,759,261 3.10Amazon.com Inc 234 397,498 0.70Baidu Inc – ADR 2,252 547,259 0.97GDS Holdings Ltd – ADR 2,452 98,080 0.17Micron Technology Inc 2,983 156,429 0.28Valero Energy Corp 808 89,551 0.16WNS Holdings Ltd – ADR 6,147 320,873 0.57
Total equities 41,643,346 73.44
Debt securities (13.23%)
Denominated in United States Dollar (13.23%)
APT Pipelines Ltd 4.25% 15/07/2027 300,000 300,110 0.53Beijing Capital Polaris Investment Co Ltd 4.25%
26/03/2021 200,000 201,833 0.36BPRL International Singapore Pte Ltd 4.375%
18/01/2027 250,000 242,247 0.43China Great Wall International Holdings III Ltd
4.375% 25/05/2023 250,000 251,549 0.44China Huadian Overseas Development 2018 Ltd
3.875% 17/05/2023 200,000 201,097 0.35China Overseas Finance Cayman III Ltd 5.375%
29/10/2023 250,000 263,424 0.46CNOOC Finance 2015 USA LLC 4.375% 02/05/2028 250,000 253,168 0.45Export-Import Bank of Korea 3.07188% 22/03/2023 300,000 299,813 0.53Export-Import Bank of Korea 3.07531% 01/06/2023 300,000 300,820 0.53Far East Horizon Ltd 4.33575% 03/07/2021 200,000 199,642 0.35GS Caltex Corp 3.875% 27/06/2023 200,000 198,380 0.35ICBCIL Finance Co Ltd 3.2925% 15/05/2021 400,000 401,067 0.71ICBCIL Finance Co Ltd 3.4425% 15/05/2023 200,000 200,585 0.35Industrial & Commercial Bank of China Ltd 4.875%
21/09/2025 250,000 256,593 0.45Korea Development Bank 2.87631% 12/03/2021 200,000 200,138 0.35Korea Resources Corp 4.00% 18/04/2023 200,000 201,540 0.36LSD Bonds 2017 Ltd 4.60% 13/09/2022 250,000 241,903 0.43Nan Fung Treasury Ltd 3.875% 03/10/2027 500,000 469,641 0.83NTPC Ltd 4.50% 19/03/2028 200,000 197,034 0.35QNB Finance Ltd 3.65719% 31/05/2021 200,000 201,230 0.35
Investment portfolio (continued)
BEA Union Investment Asia Pacific Flexi Allocation Fund (continued)
Investment portfolio (continued)
BEA Union Investment Asia Pacific Flexi Allocation Fund (continued)
33 34
A5請縮小打印70.5% A5請縮小打印70.5%
BEA UNION INVESTMENT SERIES
INVESTMENT REPORTAS AT 30 JUNE 2018 (UNAUDITED) (CONTINUED)
BEA UNION INVESTMENT SERIES
INVESTMENT REPORTAS AT 30 JUNE 2018 (UNAUDITED) (CONTINUED)
Holding shares/units/nominal
value Market value % of net assetsUS$
Listed/quoted investments (99.24%) (continued)
Debt securities (13.23%) (continued)
Denominated in United States Dollar (13.23%) (continued)
Shimao Property Holdings Ltd 4.75% 03/07/2022 250,000 243,669 0.43United States Treasury Note/Bond 2.875%
15/05/2028 400,000 401,906 0.71United States Treasury Note/Bond 3.125%
15/05/2048 1,400,000 1,442,338 2.54Wing Lung Bank Ltd 3.75% 22/11/2027 350,000 335,014 0.59
Total debt securities 7,504,741 13.23
Index future (0.16%)
Hong Kong (0.16%)
HANG SENG INDEX 30/07/2018 (10) 42,553 0.08HSCEI INDEX 30/07/2018 (15) 43,165 0.08
Total index future 85,718 0.16
Investment funds (11.36%)
Australia (0.42%)
Transurban Group 27,172 239,909 0.42
Hong Kong (10.94%)
BEA Union Investment Asian Bond and Currency Fund – Class ADU 417,574 5,658,128 9.98
BEA Union Investment Global Flexi Allocation Fund – Class ADU 50,000 545,500 0.96
Total investment funds 6,443,537 11.36
Real estate investment trust (1.05%)
Australia (1.05%)
Goodman Group 84,781 598,216 1.05
Total real estate investment trust 598,216 1.05
Total investments 56,275,558 99.24
Total investments, at cost 56,063,474
Investment portfolio (continued)
BEA Union Investment Global Flexi Allocation Fund
Holding shares/units/nominal
value Market value % of net assetsUS$
Listed/quoted investments (98.12%)
Equities (47.57%)
Australia (1.32%)
CSL Ltd 695 98,859 0.57Telstra Corp Ltd 19,231 37,085 0.21Woodside Petroleum Ltd 3,590 93,976 0.54
Austria (0.49%)
Erste Group Bank AG 2,028 84,909 0.49
Belgium (0.81%)
KBC Group NV 607 46,774 0.27UCB SA 1,224 94,605 0.54
Canada (1.98%)
Enbridge Inc 3,067 109,488 0.63Great-West Lifeco Inc 3,888 95,113 0.55Teck Resources Ltd 3,380 86,000 0.50Valeant Pharmaceuticals International Inc 2,274 52,777 0.30
France (0.23%)
Renault SA 463 39,354 0.23
Germany (0.79%)
Bayerische Motoren Werke AG 445 40,443 0.23Covestro AG 1,096 97,841 0.56
Hong Kong (1.05%)
China Vanke Co Ltd – H 13,600 47,497 0.27Fosun International Ltd 24,000 45,030 0.26WH Group Ltd 49,500 40,191 0.23Yanzhou Coal Mining Co Ltd – H 38,000 49,695 0.29
Investment portfolio (continued)
BEA Union Investment Asia Pacific Flexi Allocation Fund (continued)
35 36
A5請縮小打印70.5% A5請縮小打印70.5%
BEA UNION INVESTMENT SERIES
INVESTMENT REPORTAS AT 30 JUNE 2018 (UNAUDITED) (CONTINUED)
BEA UNION INVESTMENT SERIES
INVESTMENT REPORTAS AT 30 JUNE 2018 (UNAUDITED) (CONTINUED)
Holding shares/units/nominal
value Market value % of net assetsUS$
Listed/quoted investments (98.12%) (continued)
Equities (47.57%) (continued)
India (1.64%)
Bajaj Finance Ltd 3,709 124,322 0.72Sun Pharmaceutical Industries Ltd 13,709 112,787 0.65Tata Steel Ltd 5,762 47,683 0.27
Israel (0.34%)
Teva Pharmaceutical Industries Ltd 2,460 58,373 0.34
Japan (4.18%)
Astellas Pharma Inc 6,000 91,382 0.53Denso Corp 1,900 92,697 0.53Eisai Co Ltd 1,400 98,511 0.57Hitachi Construction Machinery Co Ltd 1,600 51,858 0.30Komatsu Ltd 1,900 54,273 0.31Mitsui & Co Ltd 5,600 93,279 0.54Suzuki Motor Corp 1,800 99,194 0.57Takeda Pharmaceutical Co Ltd 2,300 97,012 0.56Yamaha Motor Co Ltd 1,900 47,704 0.27
Korea (0.23%)
LG Electronics Inc 543 40,341 0.23
Netherlands (1.29%)
ArcelorMittal 1,606 46,990 0.27Koninklijke Ahold Delhaize NV 3,993 95,432 0.55Koninklijke DSM NV 809 80,797 0.47
Spain (0.79%)
Banco Bilbao Vizcaya Argentaria SA 6,171 43,763 0.25Grifols SA 3,110 93,609 0.54
Sweden (0.49%)
Investor AB 2,066 84,201 0.49
Holding shares/units/nominal
value Market value % of net assetsUS$
Listed/quoted investments (98.12%) (continued)
Equities (47.57%) (continued)
Switzerland (1.50%)
Dufry AG 629 80,070 0.46Novartis AG 1,191 90,295 0.52Partners Group Holding AG 124 90,850 0.52
Thailand (0.21%)
True Corp PCL- NVDR 225,400 36,058 0.21
The United Kingdom (2.36%)
British American Tobacco plc 1,742 88,074 0.51Glencore plc 18,135 86,673 0.50ITV plc 42,547 97,740 0.56Legal & General Group plc 24,366 85,538 0.49Reckitt Benckiser Group plc 640 52,717 0.30
The United States of America (27.87%)
Allergan plc 668 111,409 0.64Alphabet Inc 83 93,723 0.54Altria Group Inc 1,812 102,903 0.59Amazon.com Inc 63 107,019 0.62Anadarko Petroleum Corp 1,484 108,703 0.63ANSYS Inc 535 93,186 0.54Anthem Inc 409 97,362 0.56Applied Materials Inc 892 41,193 0.24Arconic Inc 5,598 95,222 0.55Arista Networks Inc 354 91,166 0.53Biogen Inc 370 107,396 0.62BorgWarner Inc 1,211 52,303 0.30Bunge Ltd 1,435 100,034 0.58Caterpillar Inc 394 53,466 0.31Charter Communications Inc 372 109,078 0.63Cigna Corp 593 100,786 0.58Citrix Systems Inc 853 89,429 0.52Concho Resources Inc 335 46,351 0.27Cummins Inc 694 92,302 0.53Deere & Co 692 96,749 0.56eBay Inc 2,397 86,915 0.50
Investment portfolio (continued)
BEA Union Investment Global Flexi Allocation Fund (continued)
Investment portfolio (continued)
BEA Union Investment Global Flexi Allocation Fund (continued)
37 38
A5請縮小打印70.5% A5請縮小打印70.5%
BEA UNION INVESTMENT SERIES
INVESTMENT REPORTAS AT 30 JUNE 2018 (UNAUDITED) (CONTINUED)
BEA UNION INVESTMENT SERIES
INVESTMENT REPORTAS AT 30 JUNE 2018 (UNAUDITED) (CONTINUED)
Holding shares/units/nominal
value Market value % of net assetsUS$
Listed/quoted investments (98.12%) (continued)
Equities (47.57%) (continued)
The United States of America (27.87%) (continued)
Estee Lauder Cos Inc 666 95,018 0.55General Mills Inc 2,382 105,427 0.61Gilead Sciences Inc 1,812 128,380 0.74Goldman Sachs Group Inc 379 83,600 0.48Hartford Financial Services Group Inc 877 44,841 0.26Helmerich & Payne Inc 1,471 93,791 0.54Home Depot Inc 493 96,203 0.55Huntington Ingalls Industries Inc 456 98,865 0.57International Paper Co 1,921 100,046 0.58Jacobs Engineering Group Inc 1,592 101,076 0.58Lennar Corp 1,873 98,314 0.57Lowe’s Cos Inc 1,193 114,039 0.66Marathon Oil Corp 4,803 100,191 0.58Mosaic Co 3,849 107,964 0.62Occidental Petroleum Corp 1,210 101,253 0.58Pfizer Inc 2,634 95,588 0.55Philip Morris International Inc 1,223 98,745 0.57S&P Global Inc 460 93,793 0.54salesforce.com Inc 706 96,341 0.55Seattle Genetics Inc 1,826 121,210 0.70ServiceNow Inc 515 88,848 0.51Splunk Inc 790 78,289 0.45SS&C Technologies Holdings Inc 2,147 111,343 0.64Synchrony Financial 1,505 50,222 0.29TD Ameritrade Holding Corp 1,504 82,374 0.47TJX Cos Inc 1,108 105,459 0.61Twitter Inc 2,071 90,461 0.52Visa Inc 704 93,400 0.54WABCO Holdings Inc 782 91,510 0.53Walmart Inc 1,228 105,190 0.61Zions Bancorporation 1,597 84,146 0.48
Total equities 8,254,482 47.57
Debt securities (40.52%)
Denominated in United States Dollar (40.52%)
APT Pipelines Ltd 4.25% 15/07/2027 250,000 250,092 1.44AusNet Services Holdings Pty Ltd 5.75%
17/03/2076 200,000 210,050 1.21
Holding shares/units/nominal
value Market value % of net assetsUS$
Listed/quoted investments (98.12%) (continued)
Debt securities (40.52%) (continued)
Denominated in United States Dollar (40.52%) (continued)
Axiata SPV2 Bhd 4.357% 24/03/2026 200,000 201,312 1.16Beijing Capital Polaris Investment Co Ltd 4.25%
26/03/2021 200,000 201,833 1.16Bluestar Finance Holdings Ltd 3.50% 30/09/2021 200,000 196,831 1.13China Overseas Finance Cayman III Ltd 6.375%
29/10/2043 200,000 239,226 1.38Cooperatieve Rabobank UA 4.00% 10/04/2029 200,000 194,596 1.12Dah Sing Bank Ltd 4.25% 30/11/2026 200,000 198,708 1.14Doosan Infracore Co Ltd 2.375% 21/11/2019 200,000 197,736 1.14Export-Import Bank of Malaysia Bhd 2.48%
20/10/2021 200,000 193,562 1.12Friends Life Holdings plc 7.875% Perpetual
Callable- 08/11/2018 200,000 204,319 1.18Goldman Sachs Group Inc 3.49063% 15/05/2026 400,000 396,429 2.28JPMorgan Chase & Co 4.25% 01/10/2027 200,000 199,983 1.15Korea Resources Corp 4.00% 18/04/2023 200,000 201,540 1.16Lembaga Pembiayaan Ekspor Indonesia 3.875%
06/04/2024 250,000 242,690 1.40NTPC Ltd 4.50% 19/03/2028 200,000 197,034 1.14Oversea-Chinese Banking Corp Ltd 4.00%
15/10/2024 5,000 5,048 0.03OVPH Ltd 5.875% Perpetual Callable- 01/03/2021 300,000 297,244 1.71Pertamina Persero PT 5.625% 20/05/2043 300,000 286,157 1.65Qatar Government International Bond 4.50%
23/04/2028 200,000 203,468 1.17QNB Finance Ltd 3.65719% 31/05/2021 200,000 201,230 1.16Shimao Property Holdings Ltd 4.75% 03/07/2022 300,000 292,403 1.68United States Treasury Note/Bond 2.875%
15/05/2028 800,000 803,813 4.63United States Treasury Note/Bond 3.125%
15/05/2048 800,000 824,193 4.75Wells Fargo & Co 4.125% 15/08/2023 200,000 203,933 1.17Wing Lung Bank Ltd 3.75% 22/11/2027 200,000 191,437 1.10Woori Bank 4.75% 30/04/2024 200,000 201,294 1.16
Total debt securities 7,036,161 40.52
Investment portfolio (continued)
BEA Union Investment Global Flexi Allocation Fund (continued)
Investment portfolio (continued)
BEA Union Investment Global Flexi Allocation Fund (continued)
39 40
A5請縮小打印70.5% A5請縮小打印70.5%
BEA UNION INVESTMENT SERIES
INVESTMENT REPORTAS AT 30 JUNE 2018 (UNAUDITED) (CONTINUED)
BEA UNION INVESTMENT SERIES
INVESTMENT REPORTAS AT 30 JUNE 2018 (UNAUDITED) (CONTINUED)
Holding shares/units/nominal
value Market value % of net assetsUS$
Listed/quoted investments (98.12%) (continued)
Investment fund (7.49%)
Hong Kong (7.49%)
BEA Union Investment Asian Bond and Currency Fund 95,996 1,300,746 7.49
Total investment fund 1,300,746 7.49
Real estate investment trust (2.54%)
France (0.46%)
Gecina SA 488 80,621 0.46
The United States of America (2.08%)
Duke Realty Corp 2,795 81,167 0.47Extra Space Storage Inc 970 96,864 0.56Prologis Inc 1,548 101,688 0.59VEREIT Inc 10,820 80,609 0.46
Total real estate investment trust 440,949 2.54
Total investments 17,032,338 98.12
Total investments, at cost 17,088,184
Investment portfolio (continued)
BEA Union Investment China High Yield Income Fund
Nominal value Market value % of net assetsUS$
Listed/quoted investments (97.64%)
Debt securities (97.64%)
Denominated in Indonesian Rupiah (1.25%)
Indonesia Treasury Bond 5.625% 15/05/2023 9,000,000,000 583,389 1.25
Denominated in Renminbi (2.60%)
China Government Bond 3.17% 19/04/2023 3,000,000 451,535 0.97Greenland Global Investment Ltd 7.125%
20/03/2021 1,000,000 150,300 0.32Long Profit Group Ltd Via Ocean Wealth II Ltd 5.50%
10/06/2019 1,000,000 152,595 0.33Shimao Property Holdings Ltd 5.75% 15/03/2021 2,000,000 303,570 0.65Shui On Development Holding Ltd 6.875%
02/03/2021 1,000,000 152,131 0.33
Denominated in United States Dollar (93.79%)
Agile Group Holdings Ltd 9.00% 21/05/2020 200,000 208,964 0.45Anton Oilfield Services Group 9.75% 05/12/2020 300,000 304,117 0.65Baoxin Auto Finance I Ltd 6.625% 02/04/2019 500,000 500,592 1.08Baoxin Auto Finance I Ltd 8.75% Perpetual
Callable- 15/12/2019 500,000 493,729 1.06Beijing Capital Polaris Investment Co Ltd 4.25%
26/03/2021 300,000 302,750 0.65Bukit Makmur Mandiri Utama PT 7.75%
13/02/2022 1,000,000 1,006,338 2.16China Aoyuan Property Group Ltd 6.35%
11/01/2020 400,000 405,066 0.87China Aoyuan Property Group Ltd 6.525%
25/04/2019 900,000 910,983 1.96China Aoyuan Property Group Ltd 7.50%
10/05/2021 600,000 585,735 1.26China Construction Bank Corp 3.05088%
08/06/2021 200,000 200,220 0.43China Evergrande Group 7.00% 23/03/2020 700,000 704,498 1.51China Evergrande Group 8.25% 23/03/2022 1,100,000 1,074,181 2.31China Merchants Bank Co Ltd 3.07531%
01/06/2021 500,000 500,906 1.08China SCE Property Holdings Ltd 10.00%
02/07/2020 900,000 984,836 2.12China SCE Property Holdings Ltd 7.45% 17/04/2021 500,000 497,312 1.07Chinalco Capital Holdings Ltd 4.25% 21/04/2022 300,000 286,399 0.62CIFI Holdings Group Co Ltd 5.50% 23/01/2022 200,000 189,448 0.41
Investment portfolio (continued)
BEA Union Investment Global Flexi Allocation Fund (continued)
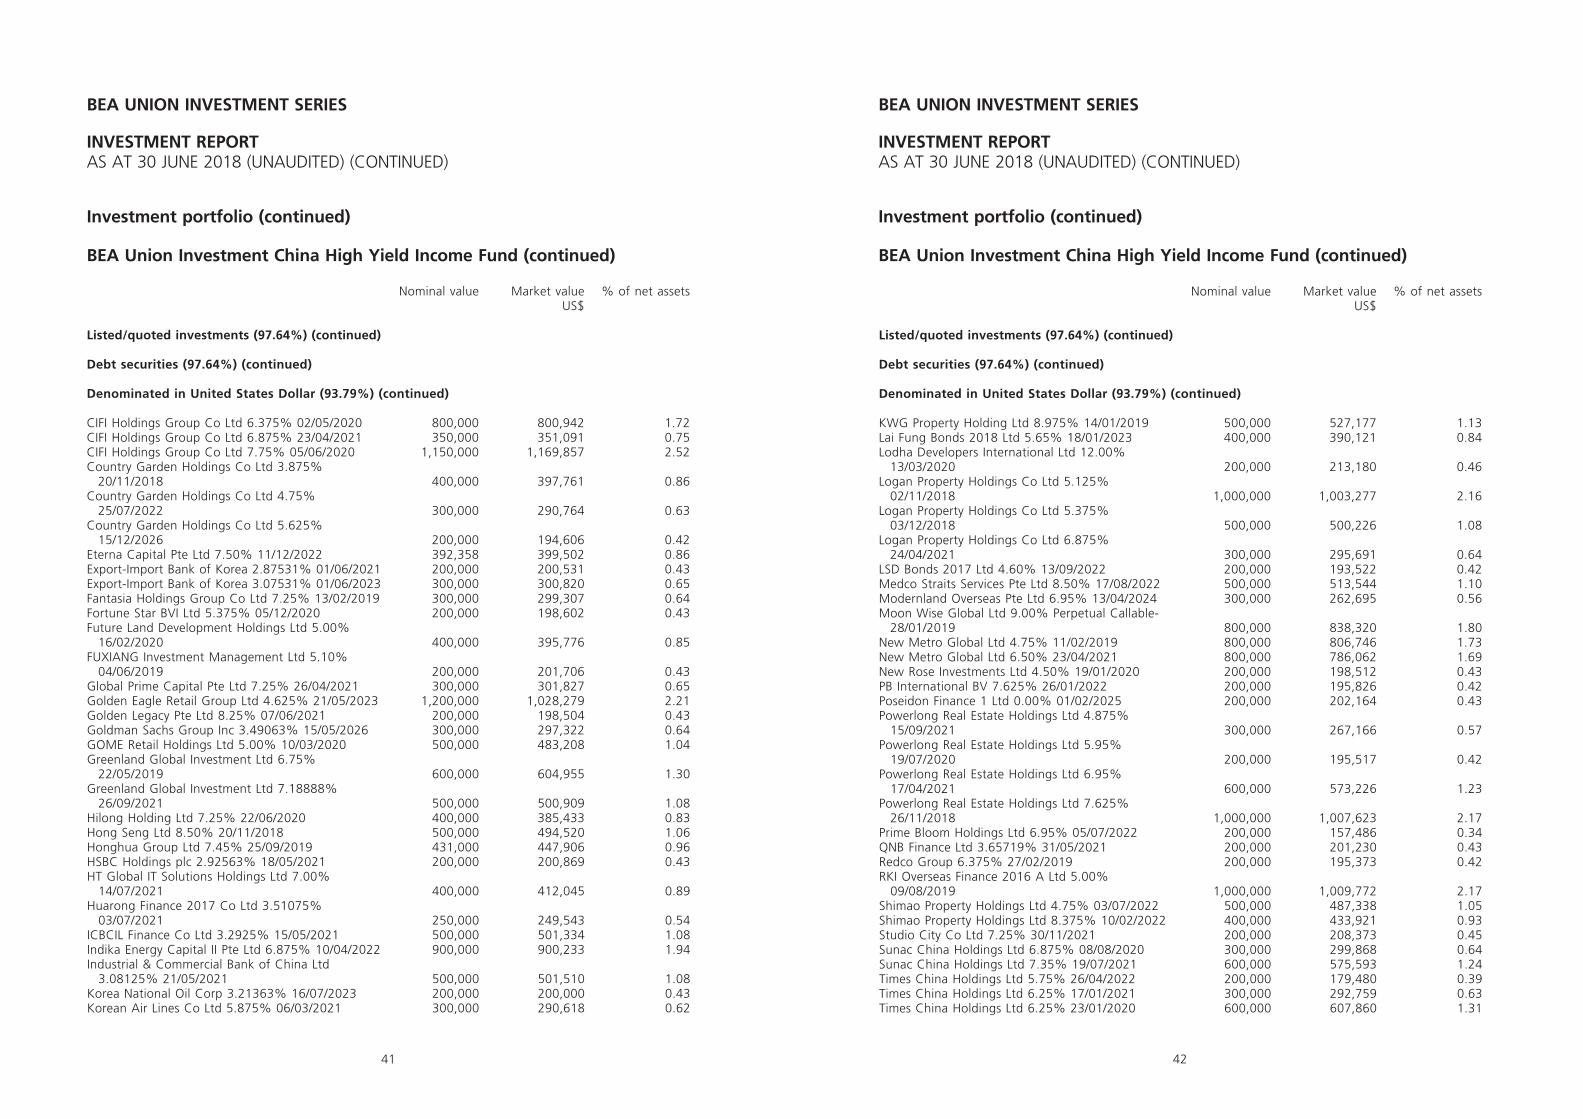
41 42
A5請縮小打印70.5% A5請縮小打印70.5%
BEA UNION INVESTMENT SERIES
INVESTMENT REPORTAS AT 30 JUNE 2018 (UNAUDITED) (CONTINUED)
BEA UNION INVESTMENT SERIES
INVESTMENT REPORTAS AT 30 JUNE 2018 (UNAUDITED) (CONTINUED)
Nominal value Market value % of net assetsUS$
Listed/quoted investments (97.64%) (continued)
Debt securities (97.64%) (continued)
Denominated in United States Dollar (93.79%) (continued)
CIFI Holdings Group Co Ltd 6.375% 02/05/2020 800,000 800,942 1.72CIFI Holdings Group Co Ltd 6.875% 23/04/2021 350,000 351,091 0.75CIFI Holdings Group Co Ltd 7.75% 05/06/2020 1,150,000 1,169,857 2.52Country Garden Holdings Co Ltd 3.875%
20/11/2018 400,000 397,761 0.86Country Garden Holdings Co Ltd 4.75%
25/07/2022 300,000 290,764 0.63Country Garden Holdings Co Ltd 5.625%
15/12/2026 200,000 194,606 0.42Eterna Capital Pte Ltd 7.50% 11/12/2022 392,358 399,502 0.86Export-Import Bank of Korea 2.87531% 01/06/2021 200,000 200,531 0.43Export-Import Bank of Korea 3.07531% 01/06/2023 300,000 300,820 0.65Fantasia Holdings Group Co Ltd 7.25% 13/02/2019 300,000 299,307 0.64Fortune Star BVI Ltd 5.375% 05/12/2020 200,000 198,602 0.43Future Land Development Holdings Ltd 5.00%
16/02/2020 400,000 395,776 0.85FUXIANG Investment Management Ltd 5.10%
04/06/2019 200,000 201,706 0.43Global Prime Capital Pte Ltd 7.25% 26/04/2021 300,000 301,827 0.65Golden Eagle Retail Group Ltd 4.625% 21/05/2023 1,200,000 1,028,279 2.21Golden Legacy Pte Ltd 8.25% 07/06/2021 200,000 198,504 0.43Goldman Sachs Group Inc 3.49063% 15/05/2026 300,000 297,322 0.64GOME Retail Holdings Ltd 5.00% 10/03/2020 500,000 483,208 1.04Greenland Global Investment Ltd 6.75%
22/05/2019 600,000 604,955 1.30Greenland Global Investment Ltd 7.18888%
26/09/2021 500,000 500,909 1.08Hilong Holding Ltd 7.25% 22/06/2020 400,000 385,433 0.83Hong Seng Ltd 8.50% 20/11/2018 500,000 494,520 1.06Honghua Group Ltd 7.45% 25/09/2019 431,000 447,906 0.96HSBC Holdings plc 2.92563% 18/05/2021 200,000 200,869 0.43HT Global IT Solutions Holdings Ltd 7.00%
14/07/2021 400,000 412,045 0.89Huarong Finance 2017 Co Ltd 3.51075%
03/07/2021 250,000 249,543 0.54ICBCIL Finance Co Ltd 3.2925% 15/05/2021 500,000 501,334 1.08Indika Energy Capital II Pte Ltd 6.875% 10/04/2022 900,000 900,233 1.94Industrial & Commercial Bank of China Ltd
3.08125% 21/05/2021 500,000 501,510 1.08Korea National Oil Corp 3.21363% 16/07/2023 200,000 200,000 0.43Korean Air Lines Co Ltd 5.875% 06/03/2021 300,000 290,618 0.62
Nominal value Market value % of net assetsUS$
Listed/quoted investments (97.64%) (continued)
Debt securities (97.64%) (continued)
Denominated in United States Dollar (93.79%) (continued)
KWG Property Holding Ltd 8.975% 14/01/2019 500,000 527,177 1.13Lai Fung Bonds 2018 Ltd 5.65% 18/01/2023 400,000 390,121 0.84Lodha Developers International Ltd 12.00%
13/03/2020 200,000 213,180 0.46Logan Property Holdings Co Ltd 5.125%
02/11/2018 1,000,000 1,003,277 2.16Logan Property Holdings Co Ltd 5.375%
03/12/2018 500,000 500,226 1.08Logan Property Holdings Co Ltd 6.875%
24/04/2021 300,000 295,691 0.64LSD Bonds 2017 Ltd 4.60% 13/09/2022 200,000 193,522 0.42Medco Straits Services Pte Ltd 8.50% 17/08/2022 500,000 513,544 1.10Modernland Overseas Pte Ltd 6.95% 13/04/2024 300,000 262,695 0.56Moon Wise Global Ltd 9.00% Perpetual Callable-
28/01/2019 800,000 838,320 1.80New Metro Global Ltd 4.75% 11/02/2019 800,000 806,746 1.73New Metro Global Ltd 6.50% 23/04/2021 800,000 786,062 1.69New Rose Investments Ltd 4.50% 19/01/2020 200,000 198,512 0.43PB International BV 7.625% 26/01/2022 200,000 195,826 0.42Poseidon Finance 1 Ltd 0.00% 01/02/2025 200,000 202,164 0.43Powerlong Real Estate Holdings Ltd 4.875%
15/09/2021 300,000 267,166 0.57Powerlong Real Estate Holdings Ltd 5.95%
19/07/2020 200,000 195,517 0.42Powerlong Real Estate Holdings Ltd 6.95%
17/04/2021 600,000 573,226 1.23Powerlong Real Estate Holdings Ltd 7.625%
26/11/2018 1,000,000 1,007,623 2.17Prime Bloom Holdings Ltd 6.95% 05/07/2022 200,000 157,486 0.34QNB Finance Ltd 3.65719% 31/05/2021 200,000 201,230 0.43Redco Group 6.375% 27/02/2019 200,000 195,373 0.42RKI Overseas Finance 2016 A Ltd 5.00%
09/08/2019 1,000,000 1,009,772 2.17Shimao Property Holdings Ltd 4.75% 03/07/2022 500,000 487,338 1.05Shimao Property Holdings Ltd 8.375% 10/02/2022 400,000 433,921 0.93Studio City Co Ltd 7.25% 30/11/2021 200,000 208,373 0.45Sunac China Holdings Ltd 6.875% 08/08/2020 300,000 299,868 0.64Sunac China Holdings Ltd 7.35% 19/07/2021 600,000 575,593 1.24Times China Holdings Ltd 5.75% 26/04/2022 200,000 179,480 0.39Times China Holdings Ltd 6.25% 17/01/2021 300,000 292,759 0.63Times China Holdings Ltd 6.25% 23/01/2020 600,000 607,860 1.31
Investment portfolio (continued)
BEA Union Investment China High Yield Income Fund (continued)
Investment portfolio (continued)
BEA Union Investment China High Yield Income Fund (continued)
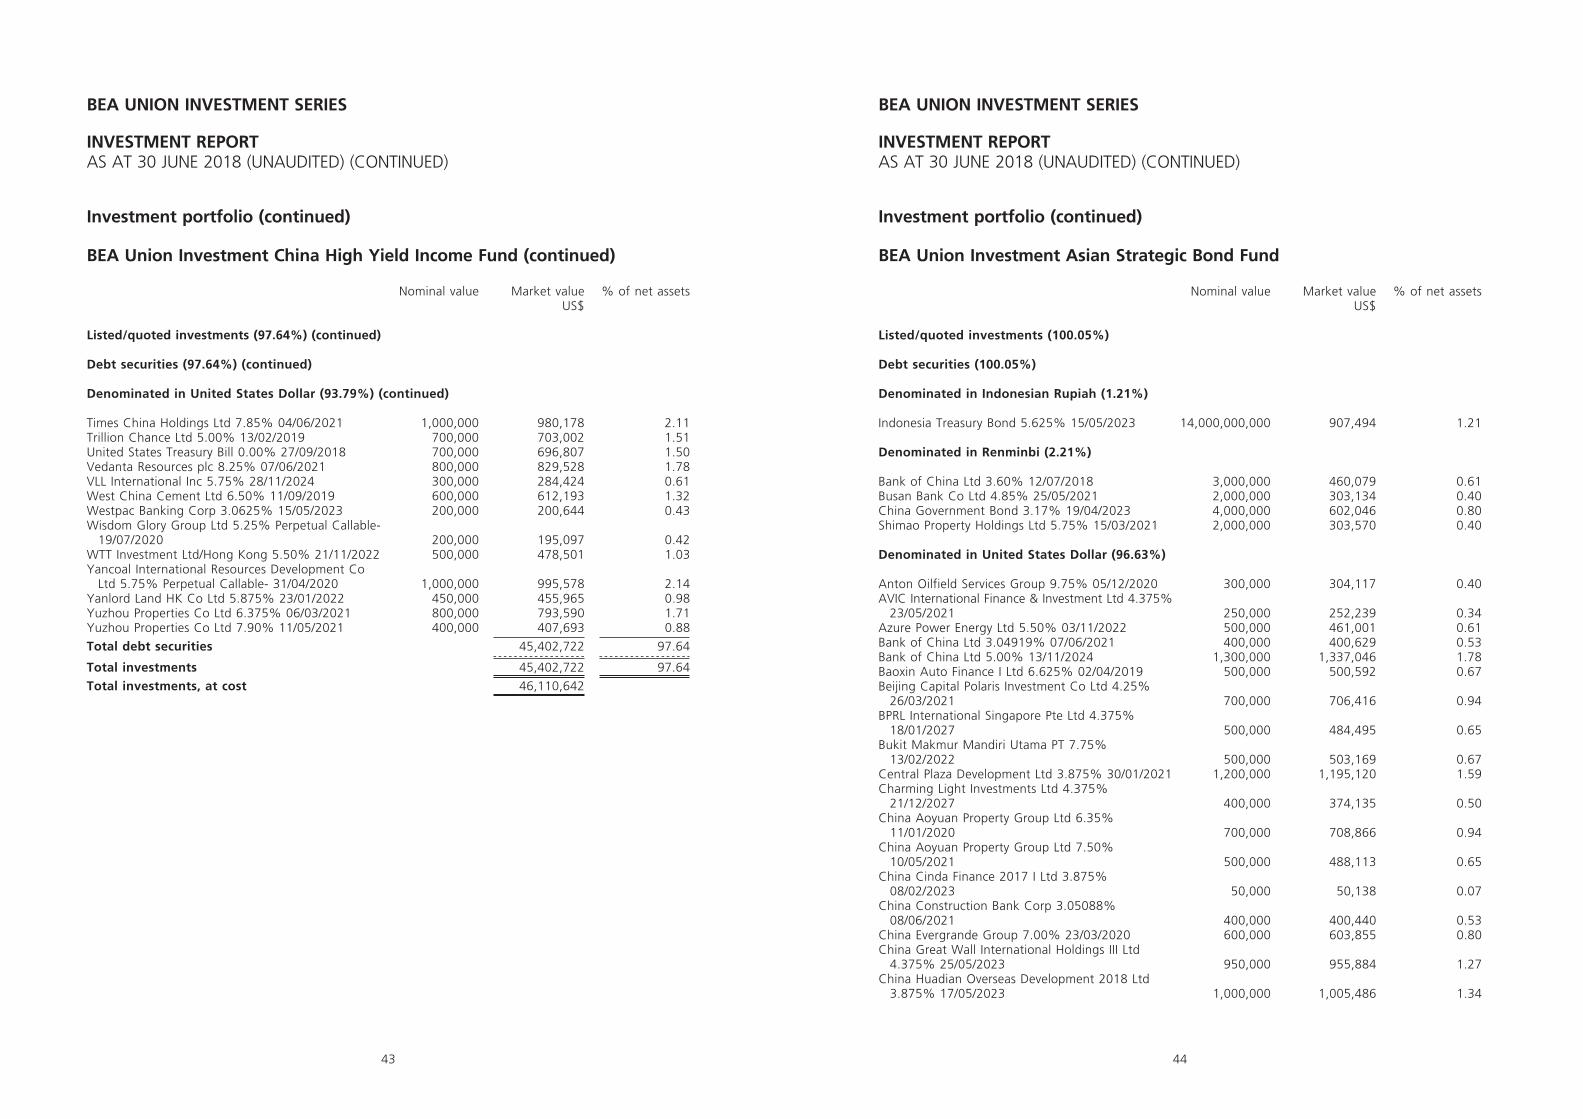
43 44
A5請縮小打印70.5% A5請縮小打印70.5%
BEA UNION INVESTMENT SERIES
INVESTMENT REPORTAS AT 30 JUNE 2018 (UNAUDITED) (CONTINUED)
BEA UNION INVESTMENT SERIES
INVESTMENT REPORTAS AT 30 JUNE 2018 (UNAUDITED) (CONTINUED)
Nominal value Market value % of net assetsUS$
Listed/quoted investments (97.64%) (continued)
Debt securities (97.64%) (continued)
Denominated in United States Dollar (93.79%) (continued)
Times China Holdings Ltd 7.85% 04/06/2021 1,000,000 980,178 2.11Trillion Chance Ltd 5.00% 13/02/2019 700,000 703,002 1.51United States Treasury Bill 0.00% 27/09/2018 700,000 696,807 1.50Vedanta Resources plc 8.25% 07/06/2021 800,000 829,528 1.78VLL International Inc 5.75% 28/11/2024 300,000 284,424 0.61West China Cement Ltd 6.50% 11/09/2019 600,000 612,193 1.32Westpac Banking Corp 3.0625% 15/05/2023 200,000 200,644 0.43Wisdom Glory Group Ltd 5.25% Perpetual Callable-
19/07/2020 200,000 195,097 0.42WTT Investment Ltd/Hong Kong 5.50% 21/11/2022 500,000 478,501 1.03Yancoal International Resources Development Co
Ltd 5.75% Perpetual Callable- 31/04/2020 1,000,000 995,578 2.14Yanlord Land HK Co Ltd 5.875% 23/01/2022 450,000 455,965 0.98Yuzhou Properties Co Ltd 6.375% 06/03/2021 800,000 793,590 1.71Yuzhou Properties Co Ltd 7.90% 11/05/2021 400,000 407,693 0.88
Total debt securities 45,402,722 97.64
Total investments 45,402,722 97.64
Total investments, at cost 46,110,642
Investment portfolio (continued)
BEA Union Investment Asian Strategic Bond Fund
Nominal value Market value % of net assetsUS$
Listed/quoted investments (100.05%)
Debt securities (100.05%)
Denominated in Indonesian Rupiah (1.21%)
Indonesia Treasury Bond 5.625% 15/05/2023 14,000,000,000 907,494 1.21
Denominated in Renminbi (2.21%)
Bank of China Ltd 3.60% 12/07/2018 3,000,000 460,079 0.61Busan Bank Co Ltd 4.85% 25/05/2021 2,000,000 303,134 0.40China Government Bond 3.17% 19/04/2023 4,000,000 602,046 0.80Shimao Property Holdings Ltd 5.75% 15/03/2021 2,000,000 303,570 0.40
Denominated in United States Dollar (96.63%)
Anton Oilfield Services Group 9.75% 05/12/2020 300,000 304,117 0.40AVIC International Finance & Investment Ltd 4.375%
23/05/2021 250,000 252,239 0.34Azure Power Energy Ltd 5.50% 03/11/2022 500,000 461,001 0.61Bank of China Ltd 3.04919% 07/06/2021 400,000 400,629 0.53Bank of China Ltd 5.00% 13/11/2024 1,300,000 1,337,046 1.78Baoxin Auto Finance I Ltd 6.625% 02/04/2019 500,000 500,592 0.67Beijing Capital Polaris Investment Co Ltd 4.25%
26/03/2021 700,000 706,416 0.94BPRL International Singapore Pte Ltd 4.375%
18/01/2027 500,000 484,495 0.65Bukit Makmur Mandiri Utama PT 7.75%
13/02/2022 500,000 503,169 0.67Central Plaza Development Ltd 3.875% 30/01/2021 1,200,000 1,195,120 1.59Charming Light Investments Ltd 4.375%
21/12/2027 400,000 374,135 0.50China Aoyuan Property Group Ltd 6.35%
11/01/2020 700,000 708,866 0.94China Aoyuan Property Group Ltd 7.50%
10/05/2021 500,000 488,113 0.65China Cinda Finance 2017 I Ltd 3.875%
08/02/2023 50,000 50,138 0.07China Construction Bank Corp 3.05088%
08/06/2021 400,000 400,440 0.53China Evergrande Group 7.00% 23/03/2020 600,000 603,855 0.80China Great Wall International Holdings III Ltd
4.375% 25/05/2023 950,000 955,884 1.27China Huadian Overseas Development 2018 Ltd
3.875% 17/05/2023 1,000,000 1,005,486 1.34
Investment portfolio (continued)
BEA Union Investment China High Yield Income Fund (continued)
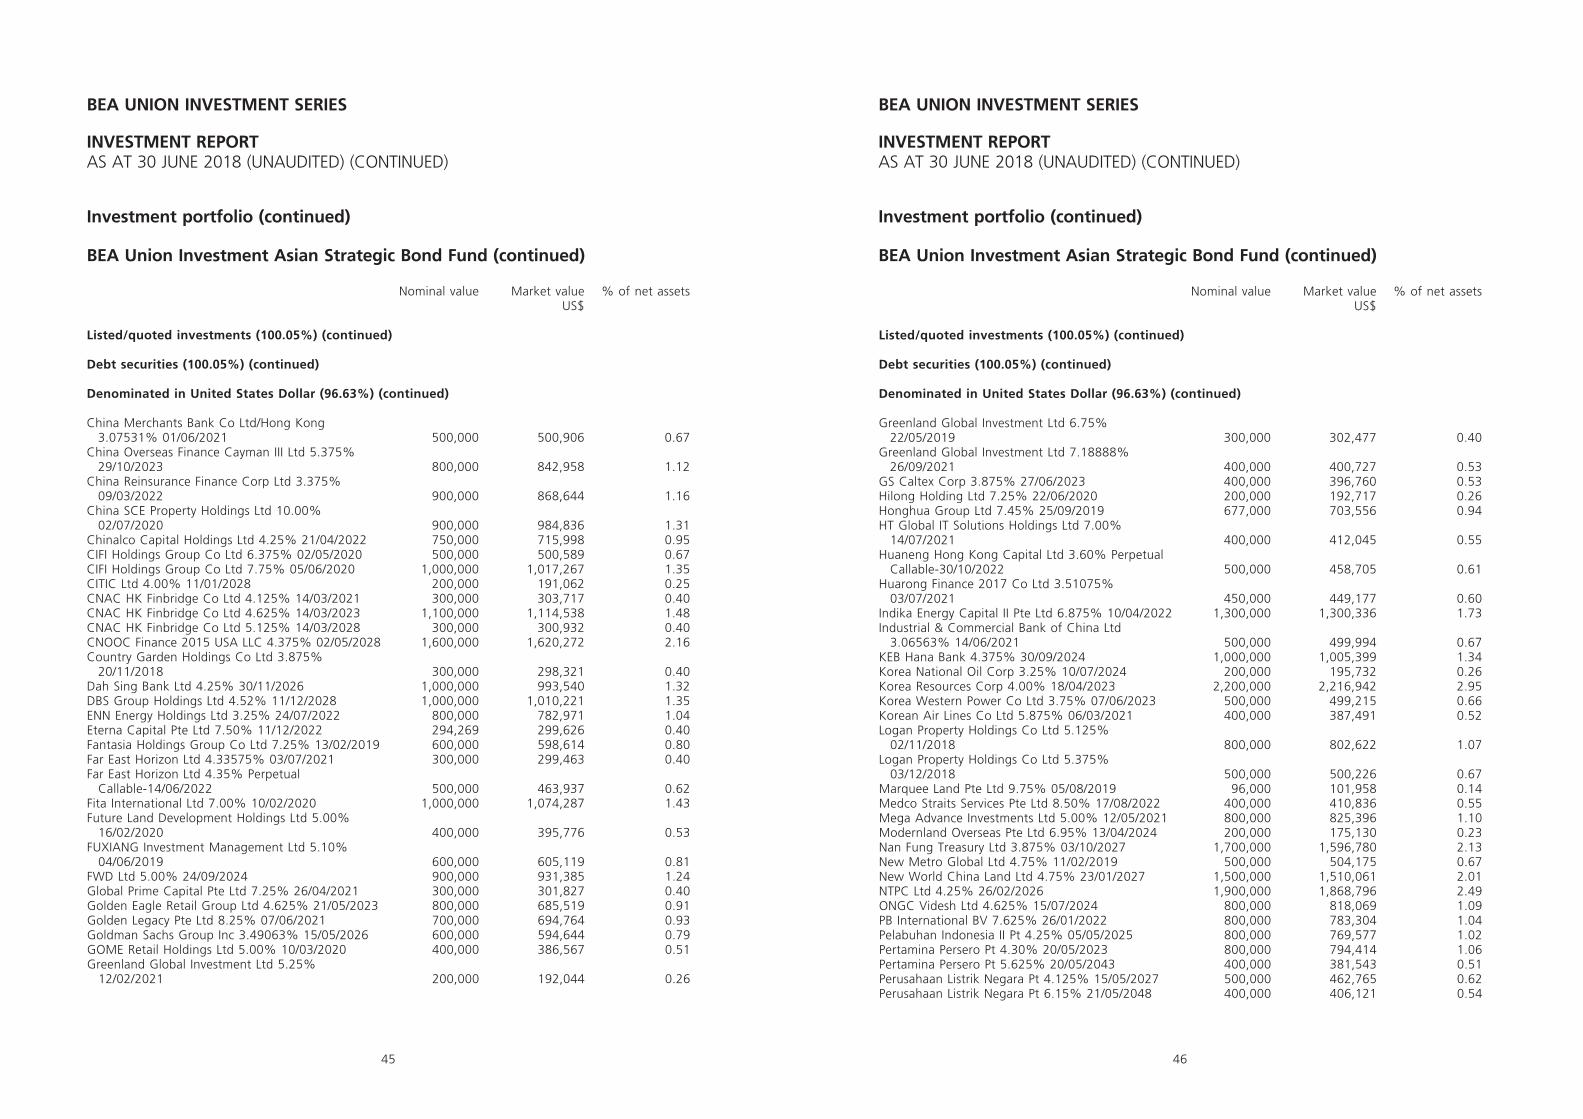
45 46
A5請縮小打印70.5% A5請縮小打印70.5%
BEA UNION INVESTMENT SERIES
INVESTMENT REPORTAS AT 30 JUNE 2018 (UNAUDITED) (CONTINUED)
BEA UNION INVESTMENT SERIES
INVESTMENT REPORTAS AT 30 JUNE 2018 (UNAUDITED) (CONTINUED)
Nominal value Market value % of net assetsUS$
Listed/quoted investments (100.05%) (continued)
Debt securities (100.05%) (continued)
Denominated in United States Dollar (96.63%) (continued)
China Merchants Bank Co Ltd/Hong Kong 3.07531% 01/06/2021 500,000 500,906 0.67
China Overseas Finance Cayman III Ltd 5.375% 29/10/2023 800,000 842,958 1.12
China Reinsurance Finance Corp Ltd 3.375% 09/03/2022 900,000 868,644 1.16
China SCE Property Holdings Ltd 10.00% 02/07/2020 900,000 984,836 1.31
Chinalco Capital Holdings Ltd 4.25% 21/04/2022 750,000 715,998 0.95CIFI Holdings Group Co Ltd 6.375% 02/05/2020 500,000 500,589 0.67CIFI Holdings Group Co Ltd 7.75% 05/06/2020 1,000,000 1,017,267 1.35CITIC Ltd 4.00% 11/01/2028 200,000 191,062 0.25CNAC HK Finbridge Co Ltd 4.125% 14/03/2021 300,000 303,717 0.40CNAC HK Finbridge Co Ltd 4.625% 14/03/2023 1,100,000 1,114,538 1.48CNAC HK Finbridge Co Ltd 5.125% 14/03/2028 300,000 300,932 0.40CNOOC Finance 2015 USA LLC 4.375% 02/05/2028 1,600,000 1,620,272 2.16Country Garden Holdings Co Ltd 3.875%
20/11/2018 300,000 298,321 0.40Dah Sing Bank Ltd 4.25% 30/11/2026 1,000,000 993,540 1.32DBS Group Holdings Ltd 4.52% 11/12/2028 1,000,000 1,010,221 1.35ENN Energy Holdings Ltd 3.25% 24/07/2022 800,000 782,971 1.04Eterna Capital Pte Ltd 7.50% 11/12/2022 294,269 299,626 0.40Fantasia Holdings Group Co Ltd 7.25% 13/02/2019 600,000 598,614 0.80Far East Horizon Ltd 4.33575% 03/07/2021 300,000 299,463 0.40Far East Horizon Ltd 4.35% Perpetual
Callable-14/06/2022 500,000 463,937 0.62Fita International Ltd 7.00% 10/02/2020 1,000,000 1,074,287 1.43Future Land Development Holdings Ltd 5.00%
16/02/2020 400,000 395,776 0.53FUXIANG Investment Management Ltd 5.10%
04/06/2019 600,000 605,119 0.81FWD Ltd 5.00% 24/09/2024 900,000 931,385 1.24Global Prime Capital Pte Ltd 7.25% 26/04/2021 300,000 301,827 0.40Golden Eagle Retail Group Ltd 4.625% 21/05/2023 800,000 685,519 0.91Golden Legacy Pte Ltd 8.25% 07/06/2021 700,000 694,764 0.93Goldman Sachs Group Inc 3.49063% 15/05/2026 600,000 594,644 0.79GOME Retail Holdings Ltd 5.00% 10/03/2020 400,000 386,567 0.51Greenland Global Investment Ltd 5.25%
12/02/2021 200,000 192,044 0.26
Nominal value Market value % of net assetsUS$
Listed/quoted investments (100.05%) (continued)
Debt securities (100.05%) (continued)
Denominated in United States Dollar (96.63%) (continued)
Greenland Global Investment Ltd 6.75% 22/05/2019 300,000 302,477 0.40
Greenland Global Investment Ltd 7.18888% 26/09/2021 400,000 400,727 0.53
GS Caltex Corp 3.875% 27/06/2023 400,000 396,760 0.53Hilong Holding Ltd 7.25% 22/06/2020 200,000 192,717 0.26Honghua Group Ltd 7.45% 25/09/2019 677,000 703,556 0.94HT Global IT Solutions Holdings Ltd 7.00%
14/07/2021 400,000 412,045 0.55Huaneng Hong Kong Capital Ltd 3.60% Perpetual
Callable-30/10/2022 500,000 458,705 0.61Huarong Finance 2017 Co Ltd 3.51075%
03/07/2021 450,000 449,177 0.60Indika Energy Capital II Pte Ltd 6.875% 10/04/2022 1,300,000 1,300,336 1.73Industrial & Commercial Bank of China Ltd
3.06563% 14/06/2021 500,000 499,994 0.67KEB Hana Bank 4.375% 30/09/2024 1,000,000 1,005,399 1.34Korea National Oil Corp 3.25% 10/07/2024 200,000 195,732 0.26Korea Resources Corp 4.00% 18/04/2023 2,200,000 2,216,942 2.95Korea Western Power Co Ltd 3.75% 07/06/2023 500,000 499,215 0.66Korean Air Lines Co Ltd 5.875% 06/03/2021 400,000 387,491 0.52Logan Property Holdings Co Ltd 5.125%
02/11/2018 800,000 802,622 1.07Logan Property Holdings Co Ltd 5.375%
03/12/2018 500,000 500,226 0.67Marquee Land Pte Ltd 9.75% 05/08/2019 96,000 101,958 0.14Medco Straits Services Pte Ltd 8.50% 17/08/2022 400,000 410,836 0.55Mega Advance Investments Ltd 5.00% 12/05/2021 800,000 825,396 1.10Modernland Overseas Pte Ltd 6.95% 13/04/2024 200,000 175,130 0.23Nan Fung Treasury Ltd 3.875% 03/10/2027 1,700,000 1,596,780 2.13New Metro Global Ltd 4.75% 11/02/2019 500,000 504,175 0.67New World China Land Ltd 4.75% 23/01/2027 1,500,000 1,510,061 2.01NTPC Ltd 4.25% 26/02/2026 1,900,000 1,868,796 2.49ONGC Videsh Ltd 4.625% 15/07/2024 800,000 818,069 1.09PB International BV 7.625% 26/01/2022 800,000 783,304 1.04Pelabuhan Indonesia II Pt 4.25% 05/05/2025 800,000 769,577 1.02Pertamina Persero Pt 4.30% 20/05/2023 800,000 794,414 1.06Pertamina Persero Pt 5.625% 20/05/2043 400,000 381,543 0.51Perusahaan Listrik Negara Pt 4.125% 15/05/2027 500,000 462,765 0.62Perusahaan Listrik Negara Pt 6.15% 21/05/2048 400,000 406,121 0.54
Investment portfolio (continued)
BEA Union Investment Asian Strategic Bond Fund (continued)
Investment portfolio (continued)
BEA Union Investment Asian Strategic Bond Fund (continued)
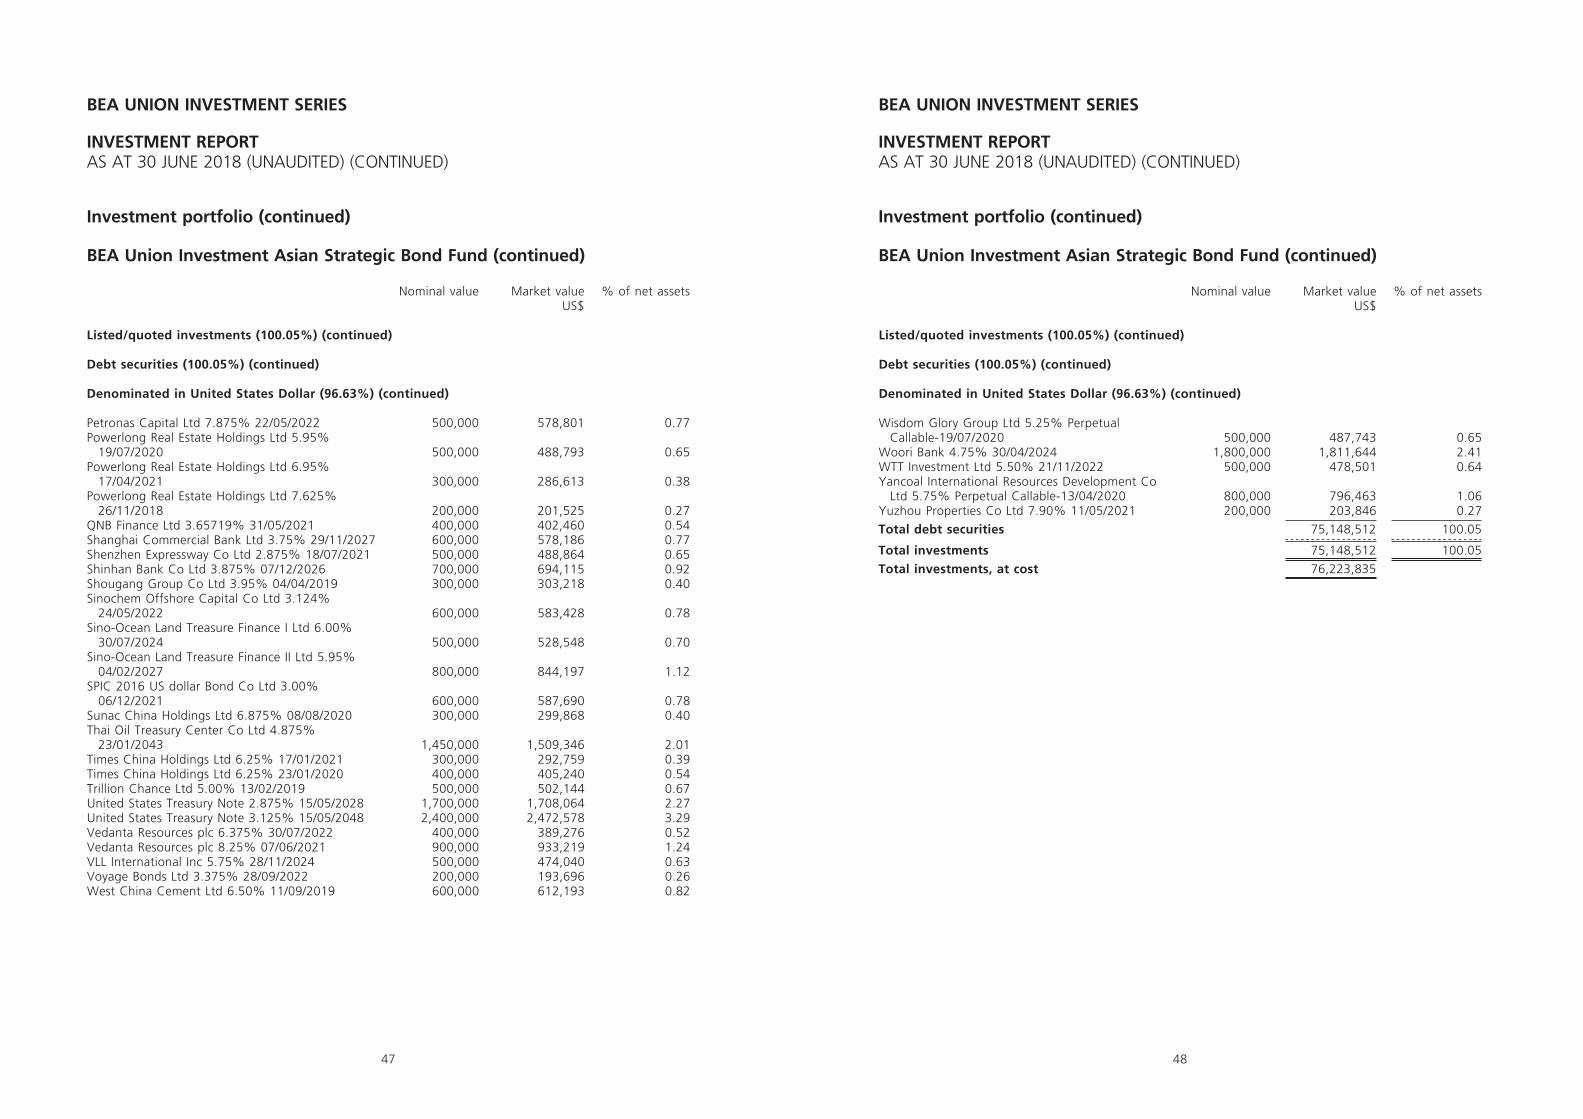
47 48
A5請縮小打印70.5% A5請縮小打印70.5%
BEA UNION INVESTMENT SERIES
INVESTMENT REPORTAS AT 30 JUNE 2018 (UNAUDITED) (CONTINUED)
BEA UNION INVESTMENT SERIES
INVESTMENT REPORTAS AT 30 JUNE 2018 (UNAUDITED) (CONTINUED)
Nominal value Market value % of net assetsUS$
Listed/quoted investments (100.05%) (continued)
Debt securities (100.05%) (continued)
Denominated in United States Dollar (96.63%) (continued)
Petronas Capital Ltd 7.875% 22/05/2022 500,000 578,801 0.77Powerlong Real Estate Holdings Ltd 5.95%
19/07/2020 500,000 488,793 0.65Powerlong Real Estate Holdings Ltd 6.95%
17/04/2021 300,000 286,613 0.38Powerlong Real Estate Holdings Ltd 7.625%
26/11/2018 200,000 201,525 0.27QNB Finance Ltd 3.65719% 31/05/2021 400,000 402,460 0.54Shanghai Commercial Bank Ltd 3.75% 29/11/2027 600,000 578,186 0.77Shenzhen Expressway Co Ltd 2.875% 18/07/2021 500,000 488,864 0.65Shinhan Bank Co Ltd 3.875% 07/12/2026 700,000 694,115 0.92Shougang Group Co Ltd 3.95% 04/04/2019 300,000 303,218 0.40Sinochem Offshore Capital Co Ltd 3.124%
24/05/2022 600,000 583,428 0.78Sino-Ocean Land Treasure Finance I Ltd 6.00%
30/07/2024 500,000 528,548 0.70Sino-Ocean Land Treasure Finance II Ltd 5.95%
04/02/2027 800,000 844,197 1.12SPIC 2016 US dollar Bond Co Ltd 3.00%
06/12/2021 600,000 587,690 0.78Sunac China Holdings Ltd 6.875% 08/08/2020 300,000 299,868 0.40Thai Oil Treasury Center Co Ltd 4.875%
23/01/2043 1,450,000 1,509,346 2.01Times China Holdings Ltd 6.25% 17/01/2021 300,000 292,759 0.39Times China Holdings Ltd 6.25% 23/01/2020 400,000 405,240 0.54Trillion Chance Ltd 5.00% 13/02/2019 500,000 502,144 0.67United States Treasury Note 2.875% 15/05/2028 1,700,000 1,708,064 2.27United States Treasury Note 3.125% 15/05/2048 2,400,000 2,472,578 3.29Vedanta Resources plc 6.375% 30/07/2022 400,000 389,276 0.52Vedanta Resources plc 8.25% 07/06/2021 900,000 933,219 1.24VLL International Inc 5.75% 28/11/2024 500,000 474,040 0.63Voyage Bonds Ltd 3.375% 28/09/2022 200,000 193,696 0.26West China Cement Ltd 6.50% 11/09/2019 600,000 612,193 0.82
Nominal value Market value % of net assetsUS$
Listed/quoted investments (100.05%) (continued)
Debt securities (100.05%) (continued)
Denominated in United States Dollar (96.63%) (continued)
Wisdom Glory Group Ltd 5.25% Perpetual Callable-19/07/2020 500,000 487,743 0.65
Woori Bank 4.75% 30/04/2024 1,800,000 1,811,644 2.41WTT Investment Ltd 5.50% 21/11/2022 500,000 478,501 0.64Yancoal International Resources Development Co
Ltd 5.75% Perpetual Callable-13/04/2020 800,000 796,463 1.06Yuzhou Properties Co Ltd 7.90% 11/05/2021 200,000 203,846 0.27
Total debt securities 75,148,512 100.05
Total investments 75,148,512 100.05
Total investments, at cost 76,223,835
Investment portfolio (continued)
BEA Union Investment Asian Strategic Bond Fund (continued)
Investment portfolio (continued)
BEA Union Investment Asian Strategic Bond Fund (continued)
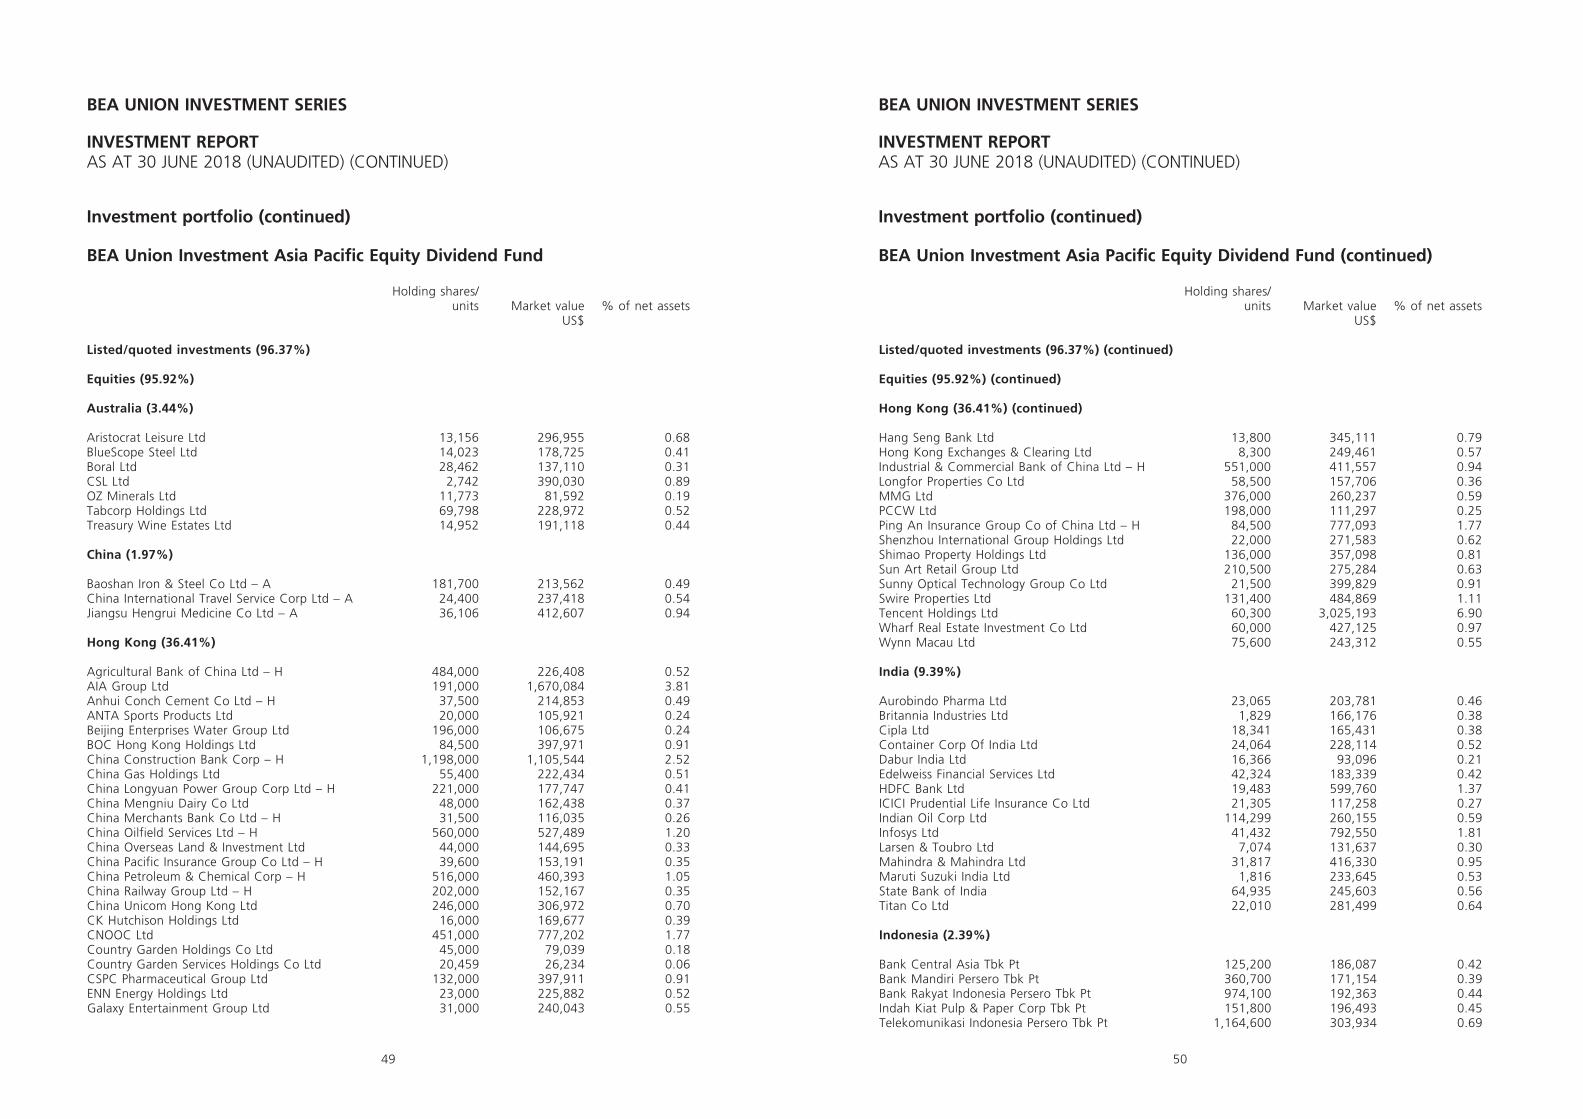
49 50
A5請縮小打印70.5% A5請縮小打印70.5%
BEA UNION INVESTMENT SERIES
INVESTMENT REPORTAS AT 30 JUNE 2018 (UNAUDITED) (CONTINUED)
BEA UNION INVESTMENT SERIES
INVESTMENT REPORTAS AT 30 JUNE 2018 (UNAUDITED) (CONTINUED)
Investment portfolio (continued)
BEA Union Investment Asia Pacific Equity Dividend Fund
Holding shares/units Market value % of net assets
US$
Listed/quoted investments (96.37%)
Equities (95.92%)
Australia (3.44%)
Aristocrat Leisure Ltd 13,156 296,955 0.68BlueScope Steel Ltd 14,023 178,725 0.41Boral Ltd 28,462 137,110 0.31CSL Ltd 2,742 390,030 0.89OZ Minerals Ltd 11,773 81,592 0.19Tabcorp Holdings Ltd 69,798 228,972 0.52Treasury Wine Estates Ltd 14,952 191,118 0.44
China (1.97%)
Baoshan Iron & Steel Co Ltd – A 181,700 213,562 0.49China International Travel Service Corp Ltd – A 24,400 237,418 0.54Jiangsu Hengrui Medicine Co Ltd – A 36,106 412,607 0.94
Hong Kong (36.41%)
Agricultural Bank of China Ltd – H 484,000 226,408 0.52AIA Group Ltd 191,000 1,670,084 3.81Anhui Conch Cement Co Ltd – H 37,500 214,853 0.49ANTA Sports Products Ltd 20,000 105,921 0.24Beijing Enterprises Water Group Ltd 196,000 106,675 0.24BOC Hong Kong Holdings Ltd 84,500 397,971 0.91China Construction Bank Corp – H 1,198,000 1,105,544 2.52China Gas Holdings Ltd 55,400 222,434 0.51China Longyuan Power Group Corp Ltd – H 221,000 177,747 0.41China Mengniu Dairy Co Ltd 48,000 162,438 0.37China Merchants Bank Co Ltd – H 31,500 116,035 0.26China Oilfield Services Ltd – H 560,000 527,489 1.20China Overseas Land & Investment Ltd 44,000 144,695 0.33China Pacific Insurance Group Co Ltd – H 39,600 153,191 0.35China Petroleum & Chemical Corp – H 516,000 460,393 1.05China Railway Group Ltd – H 202,000 152,167 0.35China Unicom Hong Kong Ltd 246,000 306,972 0.70CK Hutchison Holdings Ltd 16,000 169,677 0.39CNOOC Ltd 451,000 777,202 1.77Country Garden Holdings Co Ltd 45,000 79,039 0.18Country Garden Services Holdings Co Ltd 20,459 26,234 0.06CSPC Pharmaceutical Group Ltd 132,000 397,911 0.91ENN Energy Holdings Ltd 23,000 225,882 0.52Galaxy Entertainment Group Ltd 31,000 240,043 0.55
Holding shares/units Market value % of net assets
US$
Listed/quoted investments (96.37%) (continued)
Equities (95.92%) (continued)
Hong Kong (36.41%) (continued)
Hang Seng Bank Ltd 13,800 345,111 0.79Hong Kong Exchanges & Clearing Ltd 8,300 249,461 0.57Industrial & Commercial Bank of China Ltd – H 551,000 411,557 0.94Longfor Properties Co Ltd 58,500 157,706 0.36MMG Ltd 376,000 260,237 0.59PCCW Ltd 198,000 111,297 0.25Ping An Insurance Group Co of China Ltd – H 84,500 777,093 1.77Shenzhou International Group Holdings Ltd 22,000 271,583 0.62Shimao Property Holdings Ltd 136,000 357,098 0.81Sun Art Retail Group Ltd 210,500 275,284 0.63Sunny Optical Technology Group Co Ltd 21,500 399,829 0.91Swire Properties Ltd 131,400 484,869 1.11Tencent Holdings Ltd 60,300 3,025,193 6.90Wharf Real Estate Investment Co Ltd 60,000 427,125 0.97Wynn Macau Ltd 75,600 243,312 0.55
India (9.39%)
Aurobindo Pharma Ltd 23,065 203,781 0.46Britannia Industries Ltd 1,829 166,176 0.38Cipla Ltd 18,341 165,431 0.38Container Corp Of India Ltd 24,064 228,114 0.52Dabur India Ltd 16,366 93,096 0.21Edelweiss Financial Services Ltd 42,324 183,339 0.42HDFC Bank Ltd 19,483 599,760 1.37ICICI Prudential Life Insurance Co Ltd 21,305 117,258 0.27Indian Oil Corp Ltd 114,299 260,155 0.59Infosys Ltd 41,432 792,550 1.81Larsen & Toubro Ltd 7,074 131,637 0.30Mahindra & Mahindra Ltd 31,817 416,330 0.95Maruti Suzuki India Ltd 1,816 233,645 0.53State Bank of India 64,935 245,603 0.56Titan Co Ltd 22,010 281,499 0.64
Indonesia (2.39%)
Bank Central Asia Tbk Pt 125,200 186,087 0.42Bank Mandiri Persero Tbk Pt 360,700 171,154 0.39Bank Rakyat Indonesia Persero Tbk Pt 974,100 192,363 0.44Indah Kiat Pulp & Paper Corp Tbk Pt 151,800 196,493 0.45Telekomunikasi Indonesia Persero Tbk Pt 1,164,600 303,934 0.69
Investment portfolio (continued)
BEA Union Investment Asia Pacific Equity Dividend Fund (continued)
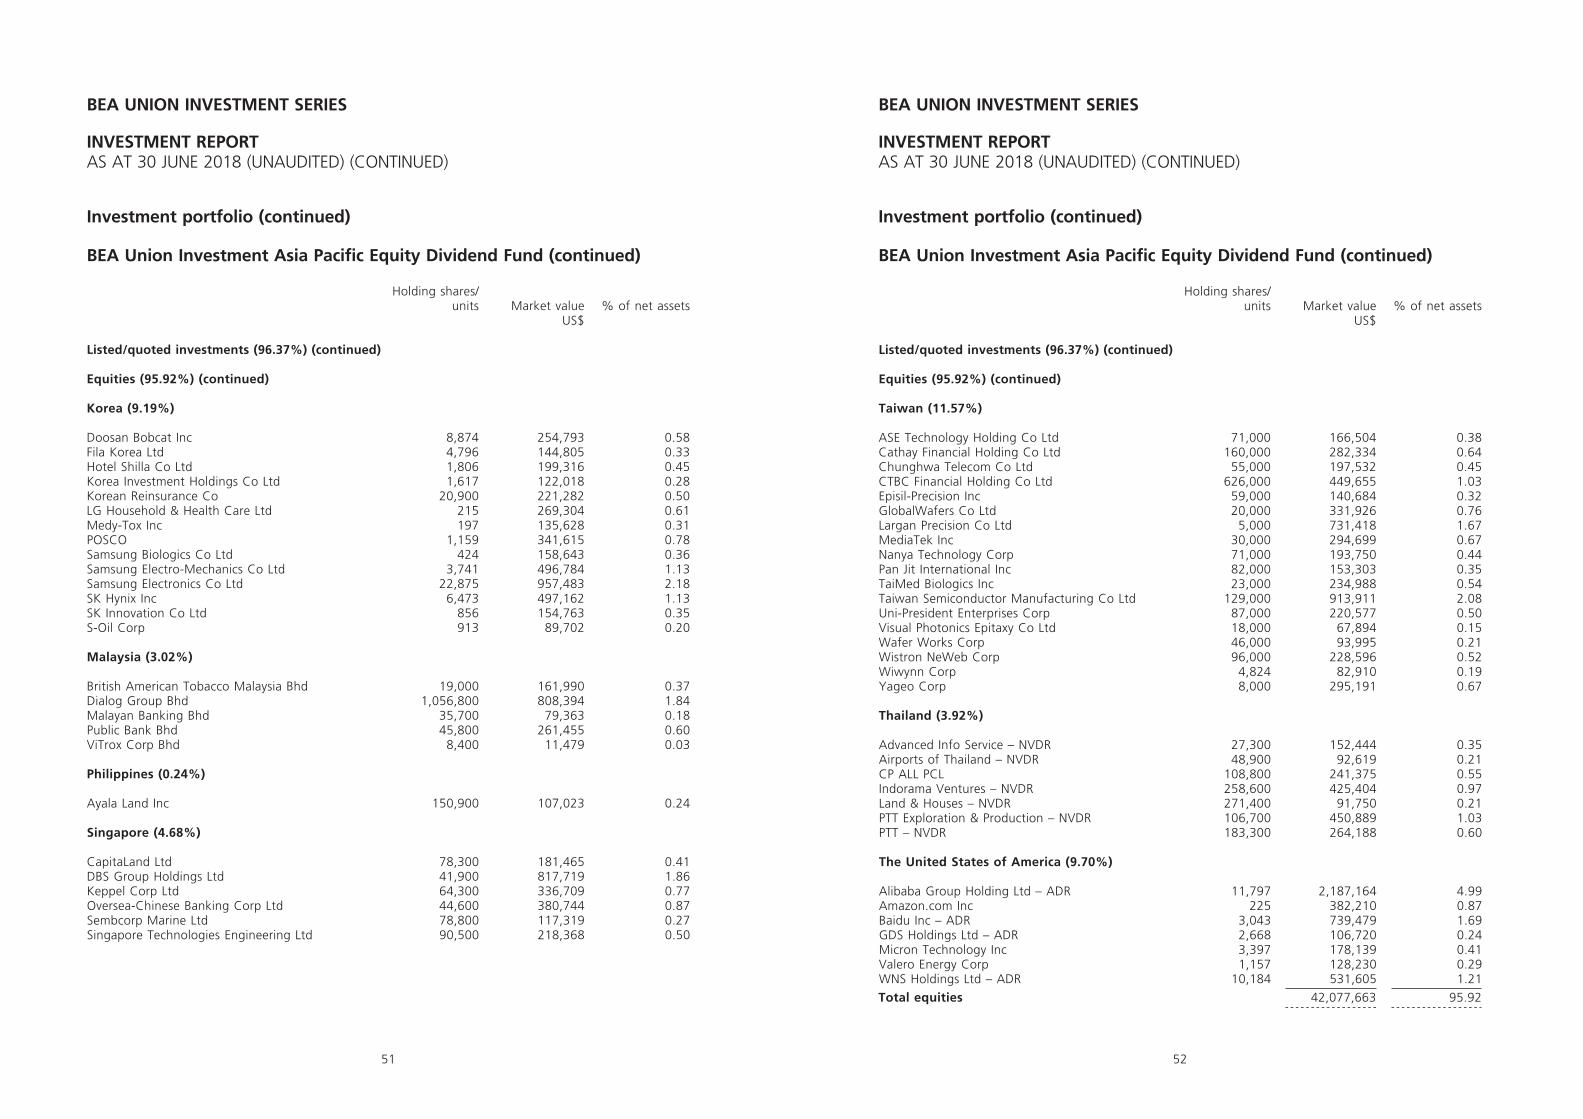
51 52
A5請縮小打印70.5% A5請縮小打印70.5%
BEA UNION INVESTMENT SERIES
INVESTMENT REPORTAS AT 30 JUNE 2018 (UNAUDITED) (CONTINUED)
BEA UNION INVESTMENT SERIES
INVESTMENT REPORTAS AT 30 JUNE 2018 (UNAUDITED) (CONTINUED)
Holding shares/units Market value % of net assets
US$
Listed/quoted investments (96.37%) (continued)
Equities (95.92%) (continued)
Korea (9.19%)
Doosan Bobcat Inc 8,874 254,793 0.58Fila Korea Ltd 4,796 144,805 0.33Hotel Shilla Co Ltd 1,806 199,316 0.45Korea Investment Holdings Co Ltd 1,617 122,018 0.28Korean Reinsurance Co 20,900 221,282 0.50LG Household & Health Care Ltd 215 269,304 0.61Medy-Tox Inc 197 135,628 0.31POSCO 1,159 341,615 0.78Samsung Biologics Co Ltd 424 158,643 0.36Samsung Electro-Mechanics Co Ltd 3,741 496,784 1.13Samsung Electronics Co Ltd 22,875 957,483 2.18SK Hynix Inc 6,473 497,162 1.13SK Innovation Co Ltd 856 154,763 0.35S-Oil Corp 913 89,702 0.20
Malaysia (3.02%)
British American Tobacco Malaysia Bhd 19,000 161,990 0.37Dialog Group Bhd 1,056,800 808,394 1.84Malayan Banking Bhd 35,700 79,363 0.18Public Bank Bhd 45,800 261,455 0.60ViTrox Corp Bhd 8,400 11,479 0.03
Philippines (0.24%)
Ayala Land Inc 150,900 107,023 0.24
Singapore (4.68%)
CapitaLand Ltd 78,300 181,465 0.41DBS Group Holdings Ltd 41,900 817,719 1.86Keppel Corp Ltd 64,300 336,709 0.77Oversea-Chinese Banking Corp Ltd 44,600 380,744 0.87Sembcorp Marine Ltd 78,800 117,319 0.27Singapore Technologies Engineering Ltd 90,500 218,368 0.50
Holding shares/units Market value % of net assets
US$
Listed/quoted investments (96.37%) (continued)
Equities (95.92%) (continued)
Taiwan (11.57%)
ASE Technology Holding Co Ltd 71,000 166,504 0.38Cathay Financial Holding Co Ltd 160,000 282,334 0.64Chunghwa Telecom Co Ltd 55,000 197,532 0.45CTBC Financial Holding Co Ltd 626,000 449,655 1.03Episil-Precision Inc 59,000 140,684 0.32GlobalWafers Co Ltd 20,000 331,926 0.76Largan Precision Co Ltd 5,000 731,418 1.67MediaTek Inc 30,000 294,699 0.67Nanya Technology Corp 71,000 193,750 0.44Pan Jit International Inc 82,000 153,303 0.35TaiMed Biologics Inc 23,000 234,988 0.54Taiwan Semiconductor Manufacturing Co Ltd 129,000 913,911 2.08Uni-President Enterprises Corp 87,000 220,577 0.50Visual Photonics Epitaxy Co Ltd 18,000 67,894 0.15Wafer Works Corp 46,000 93,995 0.21Wistron NeWeb Corp 96,000 228,596 0.52Wiwynn Corp 4,824 82,910 0.19Yageo Corp 8,000 295,191 0.67
Thailand (3.92%)
Advanced Info Service – NVDR 27,300 152,444 0.35Airports of Thailand – NVDR 48,900 92,619 0.21CP ALL PCL 108,800 241,375 0.55Indorama Ventures – NVDR 258,600 425,404 0.97Land & Houses – NVDR 271,400 91,750 0.21PTT Exploration & Production – NVDR 106,700 450,889 1.03PTT – NVDR 183,300 264,188 0.60
The United States of America (9.70%)
Alibaba Group Holding Ltd – ADR 11,797 2,187,164 4.99Amazon.com Inc 225 382,210 0.87Baidu Inc – ADR 3,043 739,479 1.69GDS Holdings Ltd – ADR 2,668 106,720 0.24Micron Technology Inc 3,397 178,139 0.41Valero Energy Corp 1,157 128,230 0.29WNS Holdings Ltd – ADR 10,184 531,605 1.21
Total equities 42,077,663 95.92
Investment portfolio (continued)
BEA Union Investment Asia Pacific Equity Dividend Fund (continued)
Investment portfolio (continued)
BEA Union Investment Asia Pacific Equity Dividend Fund (continued)
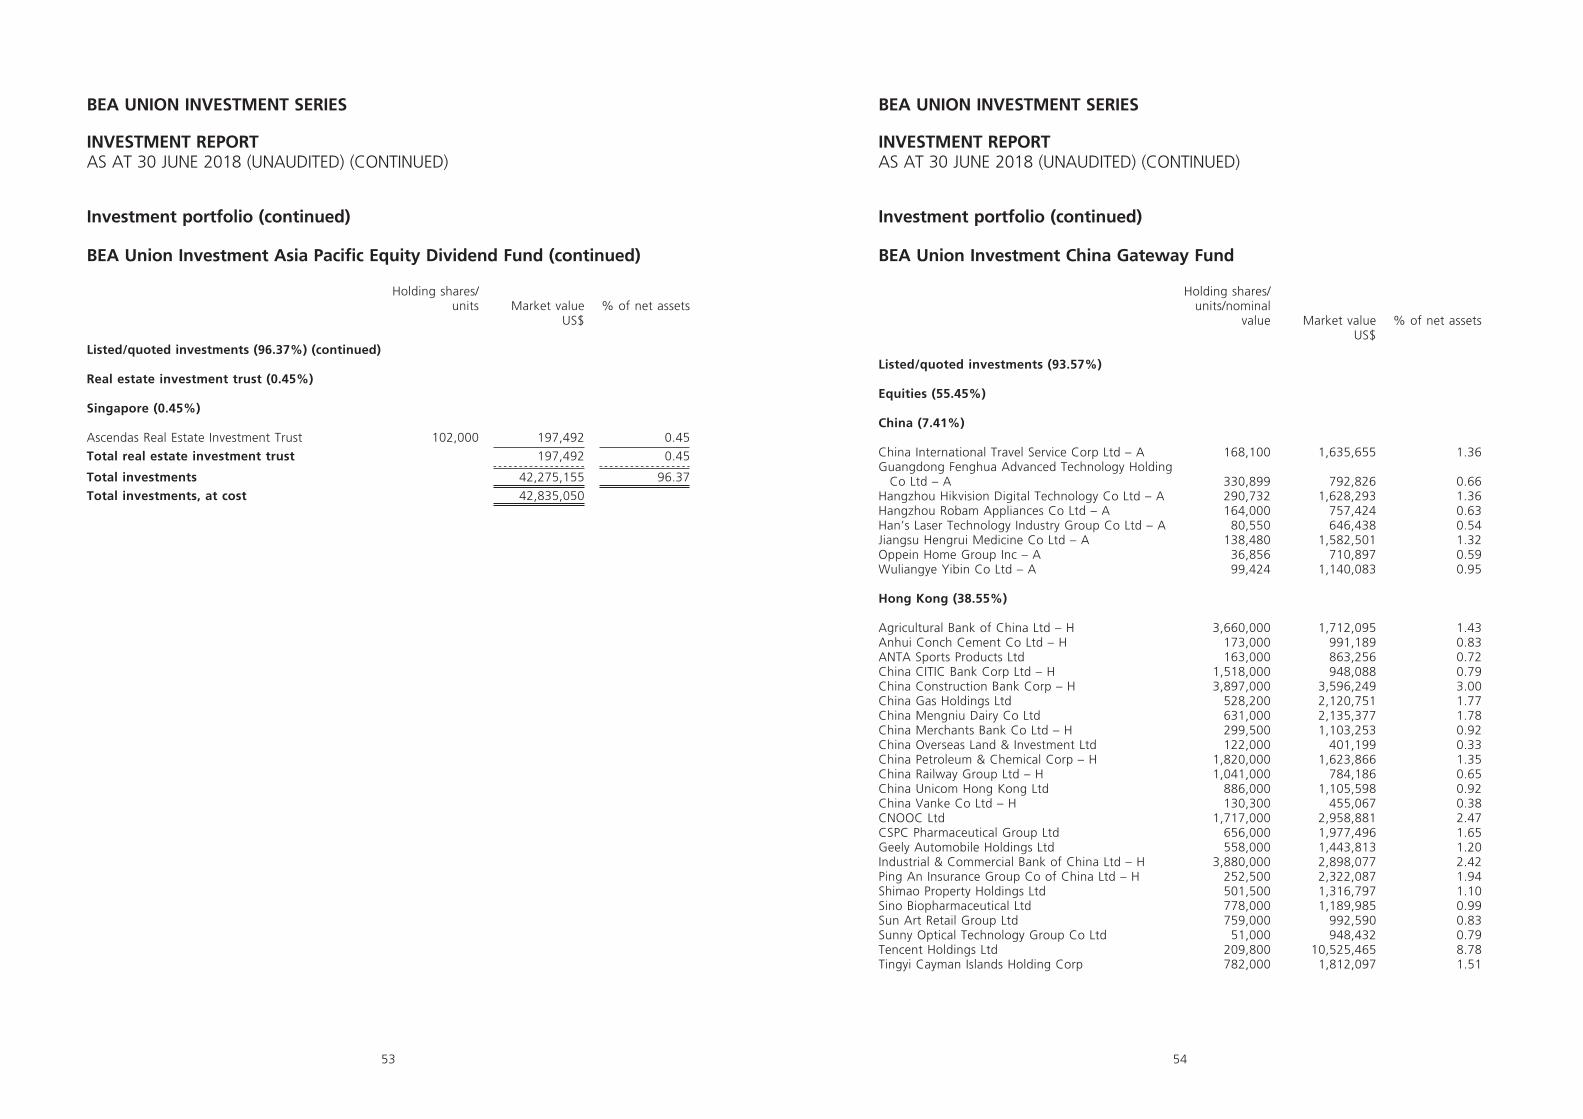
53 54
A5請縮小打印70.5% A5請縮小打印70.5%
BEA UNION INVESTMENT SERIES
INVESTMENT REPORTAS AT 30 JUNE 2018 (UNAUDITED) (CONTINUED)
BEA UNION INVESTMENT SERIES
INVESTMENT REPORTAS AT 30 JUNE 2018 (UNAUDITED) (CONTINUED)
Holding shares/units Market value % of net assets
US$
Listed/quoted investments (96.37%) (continued)
Real estate investment trust (0.45%)
Singapore (0.45%)
Ascendas Real Estate Investment Trust 102,000 197,492 0.45
Total real estate investment trust 197,492 0.45
Total investments 42,275,155 96.37
Total investments, at cost 42,835,050
Investment portfolio (continued)
BEA Union Investment China Gateway Fund
Holding shares/units/nominal
value Market value % of net assetsUS$
Listed/quoted investments (93.57%)
Equities (55.45%)
China (7.41%)
China International Travel Service Corp Ltd – A 168,100 1,635,655 1.36Guangdong Fenghua Advanced Technology Holding
Co Ltd – A 330,899 792,826 0.66Hangzhou Hikvision Digital Technology Co Ltd – A 290,732 1,628,293 1.36Hangzhou Robam Appliances Co Ltd – A 164,000 757,424 0.63Han’s Laser Technology Industry Group Co Ltd – A 80,550 646,438 0.54Jiangsu Hengrui Medicine Co Ltd – A 138,480 1,582,501 1.32Oppein Home Group Inc – A 36,856 710,897 0.59Wuliangye Yibin Co Ltd – A 99,424 1,140,083 0.95
Hong Kong (38.55%)
Agricultural Bank of China Ltd – H 3,660,000 1,712,095 1.43Anhui Conch Cement Co Ltd – H 173,000 991,189 0.83ANTA Sports Products Ltd 163,000 863,256 0.72China CITIC Bank Corp Ltd – H 1,518,000 948,088 0.79China Construction Bank Corp – H 3,897,000 3,596,249 3.00China Gas Holdings Ltd 528,200 2,120,751 1.77China Mengniu Dairy Co Ltd 631,000 2,135,377 1.78China Merchants Bank Co Ltd – H 299,500 1,103,253 0.92China Overseas Land & Investment Ltd 122,000 401,199 0.33China Petroleum & Chemical Corp – H 1,820,000 1,623,866 1.35China Railway Group Ltd – H 1,041,000 784,186 0.65China Unicom Hong Kong Ltd 886,000 1,105,598 0.92China Vanke Co Ltd – H 130,300 455,067 0.38CNOOC Ltd 1,717,000 2,958,881 2.47CSPC Pharmaceutical Group Ltd 656,000 1,977,496 1.65Geely Automobile Holdings Ltd 558,000 1,443,813 1.20Industrial & Commercial Bank of China Ltd – H 3,880,000 2,898,077 2.42Ping An Insurance Group Co of China Ltd – H 252,500 2,322,087 1.94Shimao Property Holdings Ltd 501,500 1,316,797 1.10Sino Biopharmaceutical Ltd 778,000 1,189,985 0.99Sun Art Retail Group Ltd 759,000 992,590 0.83Sunny Optical Technology Group Co Ltd 51,000 948,432 0.79Tencent Holdings Ltd 209,800 10,525,465 8.78Tingyi Cayman Islands Holding Corp 782,000 1,812,097 1.51
Investment portfolio (continued)
BEA Union Investment Asia Pacific Equity Dividend Fund (continued)
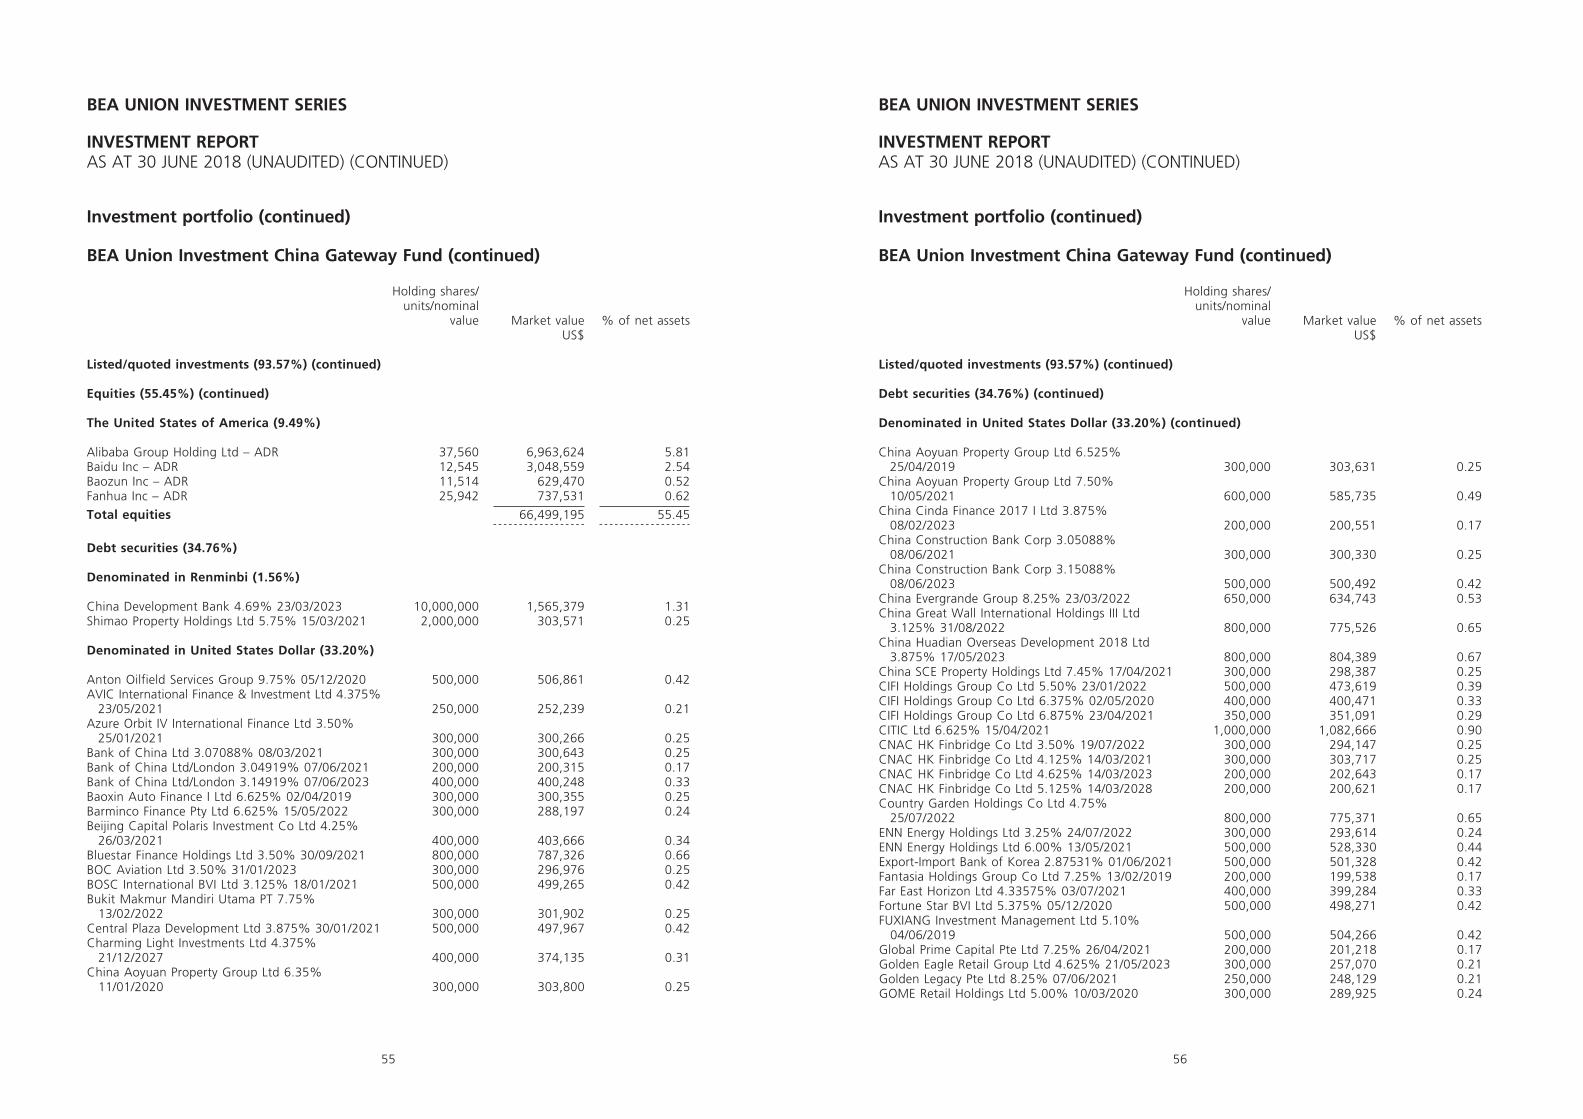
55 56
A5請縮小打印70.5% A5請縮小打印70.5%
BEA UNION INVESTMENT SERIES
INVESTMENT REPORTAS AT 30 JUNE 2018 (UNAUDITED) (CONTINUED)
BEA UNION INVESTMENT SERIES
INVESTMENT REPORTAS AT 30 JUNE 2018 (UNAUDITED) (CONTINUED)
Holding shares/units/nominal
value Market value % of net assetsUS$
Listed/quoted investments (93.57%) (continued)
Equities (55.45%) (continued)
The United States of America (9.49%)
Alibaba Group Holding Ltd – ADR 37,560 6,963,624 5.81Baidu Inc – ADR 12,545 3,048,559 2.54Baozun Inc – ADR 11,514 629,470 0.52Fanhua Inc – ADR 25,942 737,531 0.62
Total equities 66,499,195 55.45
Debt securities (34.76%)
Denominated in Renminbi (1.56%)
China Development Bank 4.69% 23/03/2023 10,000,000 1,565,379 1.31Shimao Property Holdings Ltd 5.75% 15/03/2021 2,000,000 303,571 0.25
Denominated in United States Dollar (33.20%)
Anton Oilfield Services Group 9.75% 05/12/2020 500,000 506,861 0.42AVIC International Finance & Investment Ltd 4.375%
23/05/2021 250,000 252,239 0.21Azure Orbit IV International Finance Ltd 3.50%
25/01/2021 300,000 300,266 0.25Bank of China Ltd 3.07088% 08/03/2021 300,000 300,643 0.25Bank of China Ltd/London 3.04919% 07/06/2021 200,000 200,315 0.17Bank of China Ltd/London 3.14919% 07/06/2023 400,000 400,248 0.33Baoxin Auto Finance I Ltd 6.625% 02/04/2019 300,000 300,355 0.25Barminco Finance Pty Ltd 6.625% 15/05/2022 300,000 288,197 0.24Beijing Capital Polaris Investment Co Ltd 4.25%
26/03/2021 400,000 403,666 0.34Bluestar Finance Holdings Ltd 3.50% 30/09/2021 800,000 787,326 0.66BOC Aviation Ltd 3.50% 31/01/2023 300,000 296,976 0.25BOSC International BVI Ltd 3.125% 18/01/2021 500,000 499,265 0.42Bukit Makmur Mandiri Utama PT 7.75%
13/02/2022 300,000 301,902 0.25Central Plaza Development Ltd 3.875% 30/01/2021 500,000 497,967 0.42Charming Light Investments Ltd 4.375%
21/12/2027 400,000 374,135 0.31China Aoyuan Property Group Ltd 6.35%
11/01/2020 300,000 303,800 0.25
Holding shares/units/nominal
value Market value % of net assetsUS$
Listed/quoted investments (93.57%) (continued)
Debt securities (34.76%) (continued)
Denominated in United States Dollar (33.20%) (continued)
China Aoyuan Property Group Ltd 6.525% 25/04/2019 300,000 303,631 0.25
China Aoyuan Property Group Ltd 7.50% 10/05/2021 600,000 585,735 0.49
China Cinda Finance 2017 I Ltd 3.875% 08/02/2023 200,000 200,551 0.17
China Construction Bank Corp 3.05088% 08/06/2021 300,000 300,330 0.25
China Construction Bank Corp 3.15088% 08/06/2023 500,000 500,492 0.42
China Evergrande Group 8.25% 23/03/2022 650,000 634,743 0.53China Great Wall International Holdings III Ltd
3.125% 31/08/2022 800,000 775,526 0.65China Huadian Overseas Development 2018 Ltd
3.875% 17/05/2023 800,000 804,389 0.67China SCE Property Holdings Ltd 7.45% 17/04/2021 300,000 298,387 0.25CIFI Holdings Group Co Ltd 5.50% 23/01/2022 500,000 473,619 0.39CIFI Holdings Group Co Ltd 6.375% 02/05/2020 400,000 400,471 0.33CIFI Holdings Group Co Ltd 6.875% 23/04/2021 350,000 351,091 0.29CITIC Ltd 6.625% 15/04/2021 1,000,000 1,082,666 0.90CNAC HK Finbridge Co Ltd 3.50% 19/07/2022 300,000 294,147 0.25CNAC HK Finbridge Co Ltd 4.125% 14/03/2021 300,000 303,717 0.25CNAC HK Finbridge Co Ltd 4.625% 14/03/2023 200,000 202,643 0.17CNAC HK Finbridge Co Ltd 5.125% 14/03/2028 200,000 200,621 0.17Country Garden Holdings Co Ltd 4.75%
25/07/2022 800,000 775,371 0.65ENN Energy Holdings Ltd 3.25% 24/07/2022 300,000 293,614 0.24ENN Energy Holdings Ltd 6.00% 13/05/2021 500,000 528,330 0.44Export-Import Bank of Korea 2.87531% 01/06/2021 500,000 501,328 0.42Fantasia Holdings Group Co Ltd 7.25% 13/02/2019 200,000 199,538 0.17Far East Horizon Ltd 4.33575% 03/07/2021 400,000 399,284 0.33Fortune Star BVI Ltd 5.375% 05/12/2020 500,000 498,271 0.42FUXIANG Investment Management Ltd 5.10%
04/06/2019 500,000 504,266 0.42Global Prime Capital Pte Ltd 7.25% 26/04/2021 200,000 201,218 0.17Golden Eagle Retail Group Ltd 4.625% 21/05/2023 300,000 257,070 0.21Golden Legacy Pte Ltd 8.25% 07/06/2021 250,000 248,129 0.21GOME Retail Holdings Ltd 5.00% 10/03/2020 300,000 289,925 0.24
Investment portfolio (continued)
BEA Union Investment China Gateway Fund (continued)
Investment portfolio (continued)
BEA Union Investment China Gateway Fund (continued)
57 58
A5請縮小打印70.5% A5請縮小打印70.5%
BEA UNION INVESTMENT SERIES
INVESTMENT REPORTAS AT 30 JUNE 2018 (UNAUDITED) (CONTINUED)
BEA UNION INVESTMENT SERIES
INVESTMENT REPORTAS AT 30 JUNE 2018 (UNAUDITED) (CONTINUED)
Holding shares/units/nominal
value Market value % of net assetsUS$
Listed/quoted investments (93.57%) (continued)
Debt securities (34.76%) (continued)
Denominated in United States Dollar (33.20%) (continued)
Greenland Global Investment Ltd 5.25% 12/02/2021 200,000 192,044 0.16
Greenland Global Investment Ltd 6.75% 22/05/2019 500,000 504,129 0.42
Greenland Global Investment Ltd 7.18888% 26/09/2021 400,000 400,727 0.33
Hilong Holding Ltd 7.25% 22/06/2020 400,000 385,433 0.32HT Global IT Solutions Holdings Ltd 7.00%
14/07/2021 300,000 309,034 0.25Huarong Finance 2017 Co Ltd 3.51075%
03/07/2021 500,000 499,085 0.42ICBCIL Finance Co Ltd 3.2925% 15/05/2021 500,000 501,334 0.42ICBCIL Finance Co Ltd 3.4425% 15/05/2023 500,000 501,462 0.42Indika Energy Capital II Pte Ltd 6.875% 10/04/2022 550,000 550,142 0.46Industrial & Commercial Bank of China Ltd
3.16781% 05/03/2023 1,000,000 1,000,958 0.83KEB Hana Bank 3.13263% 13/03/2023 700,000 701,673 0.59Korea Resources Corp 4.00% 18/04/2023 300,000 302,310 0.25Korea Western Power Co Ltd 3.75% 07/06/2023 300,000 299,529 0.25Korean Air Lines Co Ltd 5.875% 06/03/2021 300,000 290,618 0.24KWG Property Holding Ltd 8.975% 14/01/2019 250,000 263,589 0.22Lai Fung Bonds 2018 Ltd 5.65% 18/01/2023 500,000 487,651 0.41Lodha Developers International Ltd 12.00%
13/03/2020 250,000 266,475 0.22Logan Property Holdings Co Ltd 6.875%
24/04/2021 200,000 197,127 0.16Medco Straits Services Pte Ltd 8.50% 17/08/2022 400,000 410,836 0.34Mega Advance Investments Ltd 5.00% 12/05/2021 800,000 825,396 0.69Modernland Overseas Pte Ltd 6.95% 13/04/2024 300,000 262,695 0.22Nan Fung Treasury Ltd 3.875% 03/10/2027 300,000 281,785 0.24New Metro Global Ltd 4.75% 11/02/2019 500,000 504,175 0.42New Metro Global Ltd 6.50% 23/04/2021 400,000 393,031 0.33NTPC Ltd 4.25% 26/02/2026 250,000 245,894 0.21ONGC Videsh Ltd 4.625% 15/07/2024 500,000 511,293 0.43Powerlong Real Estate Holdings Ltd 4.875%
15/09/2021 250,000 222,639 0.19Powerlong Real Estate Holdings Ltd 5.95%
19/07/2020 250,000 244,396 0.20
Investment portfolio (continued)
BEA Union Investment China Gateway Fund (continued)
Holding shares/units/nominal
value Market value % of net assetsUS$
Listed/quoted investments (93.57%) (continued)
Debt securities (34.76%) (continued)
Denominated in United States Dollar (33.20%) (continued)
Powerlong Real Estate Holdings Ltd 6.95% 17/04/2021 300,000 286,613 0.24
QNB Finance Ltd 3.65719% 31/05/2021 500,000 503,075 0.42Redco Group 6.375% 27/02/2019 300,000 293,112 0.24RKI Overseas Finance 2016 A Ltd 5.00%
09/08/2019 250,000 252,443 0.21Shenzhen Expressway Co Ltd 2.875% 18/07/2021 500,000 488,864 0.41Shimao Property Holdings Ltd 4.75% 03/07/2022 350,000 341,137 0.28Shougang Group Co Ltd 3.95% 04/04/2019 200,000 202,145 0.17Sinochem Offshore Capital Co Ltd 3.124%
24/05/2022 800,000 777,905 0.65SPIC 2016 US dollar Bond Co Ltd 3.00%
06/12/2021 800,000 783,587 0.65Studio City Co Ltd 5.875% 30/11/2019 400,000 405,608 0.34Sunac China Holdings Ltd 6.875% 08/08/2020 300,000 291,600 0.24Times China Holdings Ltd 6.25% 23/01/2020 500,000 506,550 0.42Times China Holdings Ltd 7.85% 04/06/2021 500,000 490,089 0.41Trillion Chance Ltd 5.00% 13/02/2019 300,000 301,287 0.25United States Treasury Bill 0.00% 06/12/2018 400,000 396,468 0.33United States Treasury Note/Bond 2.875%
15/05/2028 700,000 703,297 0.59Vedanta Resources plc 6.375% 30/07/2022 500,000 486,595 0.41Vedanta Resources plc 8.25% 07/06/2021 200,000 207,382 0.17Voyage Bonds Ltd 3.375% 28/09/2022 300,000 290,544 0.24Wisdom Glory Group Ltd 5.25% Perpetual
Callable-19/07/2020 500,000 487,743 0.41WTT Investment Ltd 5.50% 21/11/2022 750,000 717,751 0.60Yuzhou Properties Co Ltd 6.375% 06/03/2021 300,000 297,556 0.25Yuzhou Properties Co Ltd 7.90% 11/05/2021 300,000 305,770 0.26
Total debt securities 41,664,795 34.76
Investment portfolio (continued)
BEA Union Investment China Gateway Fund (continued)
59
A5請縮小打印70.5%
BEA UNION INVESTMENT SERIES
INVESTMENT REPORTAS AT 30 JUNE 2018 (UNAUDITED) (CONTINUED)
Holding shares/units/nominal
value Market value % of net assetsUS$
Listed/quoted investments (93.57%) (continued)
Investment fund (3.36%)
Hong Kong (3.36%)
BEA Union Investment – China A-Share Equity Fund 268,158 4,025,051 3.36
Total Investment fund 4,025,051 3.36
Total investments 112,189,041 93.57
Total investments, at cost 117,891,108
Investment portfolio (continued)
BEA Union Investment China Gateway Fund (continued)
This page is intentionally left blank
60 61
A5請縮小打印70.5% A5請縮小打印70.5%
BEA UNION INVESTMENT SERIES
INVESTMENT REPORTAS AT 30 JUNE 2018 (UNAUDITED) (CONTINUED)
BEA UNION INVESTMENT SERIES
INVESTMENT REPORTAS AT 30 JUNE 2018 (UNAUDITED) (CONTINUED)
Statement of movements in portfolio holdings
BEA Union Investment Japan Growth Fund
Holdings as at 31 December
2017 Additions DisposalsHoldings as at 30 June 2018
Units Units Units Units
Fidelity Global Investment Fund – Japanese Equity Fund – Class A 25,875.1670 – 358.4940 25,516.6730
BEA Union Investment Global Themes Fund
% of net assetsAt 30 June
2018At 31 December
2017
Equities
Australia 2.10 –Austria 0.76 –Belgium 1.43 1.15Canada 3.49 6.13China 1.14 1.13Denmark – 2.37France 0.52 1.15Germany 1.50 –Hong Kong 1.00 2.31Indonesia – 1.16Ireland 1.10 2.18Israel 0.82 –Italy – 1.20Japan 7.15 7.36Korea 0.47 1.13Luxembourg 0.54 –Netherlands 1.65 –Norway – 2.46South Africa – 1.17Spain 1.39 4.58Sweden 0.75 5.69Switzerland 2.46 3.23Taiwan – 0.95Thailand 0.42 –The United Kingdom 3.94 2.37The United States of America 46.30 41.73Turkey – 1.22
Investment fund
Hong Kong – 8.20
% of net assetsAt 30 June
2018At 31 December
2017
Real estate investment trust
France 0.70 –The United States of America 3.28 2.13
Rights
Spain – 0.03
82.91 101.03
BEA Union Investment Global Resources Fund
% of net assetsAt 30 June
2018At 31 December
2017
Equities
Australia 7.14 5.91Canada 16.71 14.82Denmark 5.61 5.62Germany 4.38 3.99Ireland 7.98 5.96Norway 3.83 2.93The United Kingdom 31.35 34.36The United States of America 23.35 25.53
100.35 99.12
BEA Union Investment Asian Bond and Currency Fund
% of net assetsAt 30 June
2018At 31 December
2017
Debt securities
Indonesian Rupiah 1.47 0.54Renminbi 5.02 3.19United States Dollar 92.16 92.51
98.65 96.24
Statement of movements in portfolio holdings (continued)
BEA Union Investment Global Themes Fund (continued)
62 63
A5請縮小打印70.5% A5請縮小打印70.5%
BEA UNION INVESTMENT SERIES
INVESTMENT REPORTAS AT 30 JUNE 2018 (UNAUDITED) (CONTINUED)
BEA UNION INVESTMENT SERIES
INVESTMENT REPORTAS AT 30 JUNE 2018 (UNAUDITED) (CONTINUED)
Statement of movements in portfolio holdings (continued)
BEA Union Investment Four Seasons Fund
% of net assetsAt 30 June
2018At 31 December
2017
Equities
Singapore 21.80 26.88
BEA Union Investment China A-Share Equity Fund
% of net assetsAt 30 June
2018At 31 December
2017
Equities
China 92.70 99.67
Statement of movements in portfolio holdings (continued)
BEA Union Investment Asia Pacific Multi Income Fund
% of net assetsAt 30 June
2018At 31 December
2017
Equities
Australia 4.42 7.99Hong Kong 4.60 5.27Malaysia 1.57 0.55Singapore 2.11 1.65Taiwan 2.33 7.90Thailand 1.56 0.69
Debt securities
Hong Kong Dollar 0.30 0.31Indonesian Rupiah 1.18 0.47Renminbi 3.62 3.17Singapore Dollar – 0.31United States Dollar 52.71 51.85
Investment funds
Australia 1.73 1.78Hong Kong 11.77 12.24
Real estate investment trusts
Australia 0.48 1.18Hong Kong – 0.90Singapore 3.12 2.83
91.50 99.09
BEA Union Investment China Phoenix Fund
% of net assetsAt 30 June
2018At 31 December
2017
Equities
China 2.67 3.89Hong Kong 70.78 63.17Taiwan 0.63 1.16The United States of America 18.64 29.91
Investment fund
Hong Kong 2.11 1.93
94.83 100.06
64 65
A5請縮小打印70.5% A5請縮小打印70.5%
BEA UNION INVESTMENT SERIES
INVESTMENT REPORTAS AT 30 JUNE 2018 (UNAUDITED) (CONTINUED)
BEA UNION INVESTMENT SERIES
INVESTMENT REPORTAS AT 30 JUNE 2018 (UNAUDITED) (CONTINUED)
Statement of movements in portfolio holdings (continued)
BEA Union Investment RMB Core Bond Fund
% of net assetsAt 30 June
2018At 31 December
2017
Debt securities
Renminbi 93.27 91.06United States Dollar 6.27 –
Investment fund
Hong Kong – 8.78
99.54 99.84
BEA Union Investment Asia Pacific Flexi Allocation Fund
% of net assetsAt 30 June
2018At 31 December
2017
Equities
Australia 9.01 7.93China 1.49 1.18Hong Kong 24.62 22.64India 6.45 6.74Indonesia 1.52 1.03Korea 7.39 6.65Malaysia 1.99 1.36Philippines 0.25 1.52Singapore 3.23 5.10Taiwan 8.92 6.23Thailand 2.62 6.22The United States of America 5.95 4.80
Debt securities
United States Dollar 13.23 7.69
Index future
Hong Kong 0.16 –
Investment funds
Australia 0.42 2.47Hong Kong 10.94 15.42
Real estate investment trust
Australia 1.05 1.70
99.24 98.68
Statement of movements in portfolio holdings (continued)
BEA Union Investment Global Flexi Allocation Fund
% of net assetsAt 30 June
2018At 31 December
2017
Equities
Australia 1.32 –Austria 0.49 –Belgium 0.81 0.55Canada 1.98 3.44Denmark – 1.37France 0.23 0.58Germany 0.79 –Hong Kong 1.05 1.69India 1.64 –Indonesia – 0.56Israel 0.34 –Italy – 0.58Japan 4.18 4.16Korea 0.23 0.61Netherlands 1.29 –Norway – 1.21South Africa – 0.53Spain 0.79 1.68Sweden 0.49 2.77Switzerland 1.50 0.59Taiwan – 0.55Thailand 0.21 –The United Kingdom 2.36 1.13The United States of America 27.87 27.46Turkey – 0.69
Debt securities
United States Dollar 40.52 39.46
Investment fund
Hong Kong 7.49 8.14
Real estate investment trust
France 0.46 –The United States of America 2.08 1.14
Rights
The United States of America – 0.01
98.12 98.89

66 67
A5請縮小打印70.5% A5請縮小打印70.5%
BEA UNION INVESTMENT SERIES
INVESTMENT REPORTAS AT 30 JUNE 2018 (UNAUDITED) (CONTINUED)
BEA UNION INVESTMENT SERIES
INVESTMENT REPORTAS AT 30 JUNE 2018 (UNAUDITED) (CONTINUED)
Statement of movements in portfolio holdings (continued)
BEA Union Investment China High Yield Income Fund
% of net assetsAt 30 June
2018At 31 December
2017
Debt securities
Indonesian Rupiah 1.25 –Renminbi 2.60 1.77United States Dollar 93.79 96.99
97.64 98.76
BEA Union Investment Asian Strategic Bond Fund
% of net assetsAt 30 June
2018At 31 December
2017
Debt securities
Indonesia Rupiah 1.21 0.27Renminbi 2.21 3.08United States Dollar 96.63 96.53
100.05 99.88
Statement of movements in portfolio holdings (continued)
BEA Union Investment Asia Pacific Equity Dividend Fund
% of net assetsAt 30 June
2018At 31 December
2017
Equities
Australia 3.44 3.16China 1.97 1.69Hong Kong 36.41 34.03India 9.39 –Indonesia 2.39 4.36Korea 9.19 2.84Malaysia 3.02 1.11Philippines 0.24 2.34Singapore 4.68 13.49Taiwan 11.57 19.31Thailand 3.92 10.61The United States of America 9.70 5.48
Real estate investment trust
Singapore 0.45 0.98
96.37 99.40
BEA Union Investment China Gateway Fund
% of net assetsAt 30 June
2018
Equities
China 7.41Hong Kong 38.55The United State of America 9.49
Debt securities
Renminbi 1.56United States Dollar 33.20
Investment fund
Hong Kong 3.36
93.57
BEA UNION INVESTMENT SERIES
STATEMENT OF COMPREHENSIVE INCOMEFOR THE PERIOD ENDED 30 JUNE 2018 (UNAUDITED)
68
A5請縮小打印70.5%
BEA Union Investment Japan Growth Fund
BEA Union Investment Global Themes Fund
BEA Union Investment Global Resources Fund
BEA Union Investment Asian Bond and Currency Fund
BEA Union Investment Four Seasons Fund
2018 2017 2018 2017 2018 2017 2018 2017 2018 2017US$ US$ US$ US$ US$ US$ US$ US$ US$ US$
Income
Dividend income – – 95,330 131,197 16,845 15,649 – – 569 663Interest on bank deposits – – 2 6 7 11 4,224 2,430 – –Other income 1,273 1,498 4,120 6,441 – – 2,000 – – –
1,273 1,498 99,452 137,644 16,852 15,660 6,224 2,430 569 663
Expenses
Investment management fees 2,492 2,956 48,176 65,996 – – 2,672,977 1,461,691 – –Trustee’s fees 208 246 5,621 7,700 706 963 287,746 182,711 76 97Safe custody and bank charges – – 7,357 2,450 47 256 20,738 11,933 61 30Auditors’ remuneration 4,920 4,815 4,920 4,900 4,920 4,900 4,920 4,900 4,920 4,900Registrar’s fees 83 99 1,606 2,200 202 275 48,167 35,562 22 27Printing and publication expenses 1 – 86 176 2 5 8,291 5,709 – 1Regulatory fees – – – 11 – – 902 895 – –Pre-operating expenses – – – – – – – – – –Legal and professional fees – – 869 745 – – 66,052 52 – –Transaction costs – – 13,836 17,413 43 664 741 206 8 9Interest on borrowings – – 170 445 1 79 12 54 – –Other operating expenses 667 714 667 714 667 714 727 715 667 714
8,371 8,830 83,308 102,750 6,588 7,856 3,111,273 1,704,428 5,754 5,778
Net (losses)/gains for the period before net (losses)/gains on investments and foreign exchange (7,098) (7,332) 16,144 34,894 10,264 7,804 (3,105,049) (1,701,998) (5,185) (5,115)
Net (losses)/gains on investments and foreign exchange
Net realised gains/(losses) on investments 1,774 3,056 441,380 988,945 18,710 117,241 7,556,075 15,612,921 (1,587) (405)Net movement in unrealised (losses)/gains on investments (20,232) 39,052 (414,356) (89,709) (10,938) (75,829) (19,103,606) (695,511) (1,459) 448Exchange (losses)/gains (715) (1,990) (80,326) 217,985 (15,903) 36,588 (1,556,762) (8,349) (1,725) 4,064
(19,173) 40,118 (53,302) 1,117,221 (8,131) 78,000 (13,104,293) 14,909,061 (4,771) 4,107
(Loss)/profit before finance costs (26,271) 32,786 (37,158) 1,152,115 2,133 85,804 (16,209,342) 13,207,063 (9,956) (1,008)
Distribution to unitholders – – – – – – (8,462,767) (5,213,948) – –
(Loss)/profit before taxation (26,271) 32,786 (37,158) 1,152,115 2,133 85,804 (24,672,109) 7,993,115 (9,956) (1,008)
Taxation – – (16,566) (36,436) (1,902) (2,164) (21,971) (3,285) – –
(Loss)/profit and total comprehensive income for the period (26,271) 32,786 (53,724) 1,115,679 231 83,640 (24,694,080) 7,989,830 (9,956) (1,008)
BEA UNION INVESTMENT SERIES
STATEMENT OF COMPREHENSIVE INCOMEFOR THE PERIOD ENDED 30 JUNE 2018 (UNAUDITED) (CONTINUED)
69
A5請縮小打印70.5%
BEA Union Investment China A-Share Equity Fund
BEA Union Investment Asia Pacific Multi Income Fund
BEA Union Investment China Phoenix Fund
BEA Union Investment RMB Core Bond Fund
BEA Union Investment Asia Pacific Flexi Allocation Fund
2018 2017 2018 2017 2018 2017 2018 2017 2018 2017US$ US$ US$ US$ US$ US$ RMB RMB US$ US$
Income
Dividend income 591,813 416,030 4,541,870 3,725,110 125,919 161,905 106,148 163,006 717,217 948,325Interest on bank deposits 1,631 543 9,330 24,474 9 3 3,367 3,318 2,490 1,724Other income – – 450,111 202,977 2,122 1,586 17,886 28,726 44,411 39,293
593,444 416,573 5,001,311 3,952,561 128,050 163,494 127,401 195,050 764,118 989,342
Expenses
Investment management fees 395,310 297,993 3,991,910 2,502,829 119,568 157,954 393,055 415,443 412,059 333,395Trustee’s fees 45,683 34,370 427,705 312,854 11,957 15,795 49,132 51,930 41,206 33,339Safe custody and bank charges 17,067 22,200 32,126 28,401 4,344 7,853 7,335 3,153 15,232 8,898Auditors’ remuneration 4,947 11,947 4,920 4,900 4,920 4,900 31,334 33,605 4,920 4,900Registrar’s fees 12,964 9,820 56,407 44,922 3,416 4,513 19,653 20,772 13,593 11,113Printing and publication expenses 705 776 9,626 8,097 224 352 14,353 6,131 898 900Regulatory fees 596 629 958 1,006 11 26 3,671 4,121 38 60Pre-operating expenses – – – – – – – – – –Legal and professional fees 143 – 66,329 290 143 52 1,490 – 1,907 963Transaction costs 171,557 101,827 403,466 1,071,590 29,700 70,506 – – 137,877 241,418Interest on borrowings 10,931 3,775 – 8 644 7,211 – – 288 31,743Other operating expenses 804 714 666 715 667 714 4,425 4,851 666 715
660,707 484,051 4,994,113 3,975,612 175,594 269,876 524,448 540,006 628,684 667,444
Net (losses)/gains for the period before net (losses)/gains on investments and foreign exchange (67,263) (67,478) 7,198 (23,051) (47,544) (106,382) (397,047) (344,956) 135,434 321,898
Net (losses)/gains on investments and foreign exchange
Net realised gains/(losses) on investments (473,251) (832,237) 9,205,340 18,724,608 1,533,924 1,486,385 2,277,852 2,456,328 1,320,373 3,319,834Net movement in unrealised (losses)/gains on investments (4,774,172) 7,466,739 (32,179,207) 7,846,693 (1,457,904) 2,415,164 (327,406) 648,653 (2,873,961) 1,005,990Exchange (losses)/gains (1,138,461) 865,563 (6,862,482) 6,206,986 (30,010) (56,784) 50,236 (184,429) (1,069,817) 1,227,519
(6,385,884) 7,500,065 (29,836,349) 32,778,287 46,010 3,844,765 2,000,682 2,920,552 (2,623,405) 5,553,343
(Loss)/profit before finance costs (6,453,147) 7,432,587 (29,829,151) 32,755,236 (1,534) 3,738,383 1,603,635 2,575,596 (2,487,971) 5,875,241
Distribution to unitholders – – (18,320,705) (14,077,052) – – (1,781,765) (2,018,884) (1,234,014) (833,499)
(Loss)/profit before taxation (6,453,147) 7,432,587 (48,149,856) 18,678,184 (1,534) 3,738,383 (178,130) 556,712 (3,721,985) 5,041,742
Taxation (59,735) (44,651) (301,165) (345,792) (7,079) (16,757) – – (37,252) (269,126)
(Loss)/profit and total comprehensive income for the period (6,512,882) 7,387,936 (48,451,021) 18,332,392 (8,613) 3,721,626 (178,130) 556,712 (3,759,237) 4,772,616
BEA UNION INVESTMENT SERIES
STATEMENT OF COMPREHENSIVE INCOMEFOR THE PERIOD ENDED 30 JUNE 2018 (UNAUDITED) (CONTINUED)
70
A5請縮小打印70.5%
BEA Union Investment Global Flexi Allocation Fund
BEA Union Investment China High Yield Income Fund
BEA Union Investment Asian Strategic Bond Fund(1)
BEA Union Investment Asia Pacific Equity Dividend Fund(2)
BEA Union Investment China
Gateway Fund(3)
2018 2017 2018 2017 2018 2017 2018 2017 2018US$ US$ US$ US$ US$ US$ US$ US$ US$
Income
Dividend income 185,277 140,082 – – – – 646,319 727,056 683,355Interest on bank deposits 29 4 586 188 677 1,477 17 204 4,406Other income 8,817 5,742 400 – – – – – 25,718
194,123 145,828 986 188 677 1,477 646,336 727,260 713,479
Expenses
Investment management fees 141,698 87,171 321,468 220,503 476,318 414,943 349,716 183,197 692,383Trustee’s fees 14,170 8,717 40,184 27,563 59,540 51,868 34,972 18,320 69,238Safe custody and bank charges 8,381 2,884 3,945 2,192 8,163 5,135 12,132 4,636 15,215Auditors’ remuneration 4,920 4,900 4,920 4,900 4,920 3,905 4,920 3,628 4,388Registrar’s fees 4,723 2,906 13,290 9,188 20,318 15,557 11,657 6,107 18,161Printing and publication expenses 296 236 1,020 727 2,346 845 741 1,299 588Regulatory fees 586 589 611 619 660 – 607 – 574Pre-operating expenses – – – – – 12,452 – – 21,037Legal and professional fees 936 748 143 – 702 732 702 1,016 611Transaction costs 26,677 16,636 57 – 210 – 159,627 165,895 230,417Interest on borrowings 56 11,551 2 – 9 1 – – 256Other operating expenses 667 714 668 714 666 715 667 714 667
203,110 137,052 386,308 266,406 573,852 506,153 575,741 384,812 1,053,535
Net (losses)/gains for the period before net (losses)/gains on investments and foreign exchange (8,987) 8,776 (385,322) (266,218) (573,175) (504,676) 70,595 342,448 (340,056)
Net (losses)/gains on investments and foreign exchange
Net realised gains/(losses) on investments 402,435 852,891 591,571 1,972,026 (151,589) 2,043,353 3,315,544 (180,306) (5,985,348)Net movement in unrealised (losses)/gains on investments (642,597) (16,055) (1,707,065) (272,154) (2,573,591) 104,086 (3,221,199) 1,653,950 (5,626,246)Exchange (losses)/gains (135,366) 188,305 (76,877) (654) (109,350) (41,043) (795,826) 288,400 (927,310)
(375,528) 1,025,141 (1,192,371) 1,699,218 (2,834,530) 2,106,396 (701,481) 1,762,044 (12,538,904)
(Loss)/profit before finance costs (384,515) 1,033,917 (1,577,693) 1,433,000 (3,407,705) 1,601,720 (630,886) 2,104,492 (12,878,960)
Distribution to unitholders (400,059) (229,709) (1,951,836) (1,246,484) (2,340,599) (1,012,437) – – (1,888,322)
(Loss)/profit before taxation (784,574) 804,208 (3,529,529) 186,516 (5,748,304) 589,283 (630,886) 2,104,492 (14,767,282)
Taxation (28,843) (28,406) (501) (299) (2,453) (1,441) (47,478) (62,658) (41,828)
(Loss)/profit and total comprehensive income for the period (813,417) 775,802 (3,530,030) 186,217 (5,750,757) 587,842 (678,364) 2,041,834 (14,809,110)
(1) The date of commencement for BEA Union Investment Asian Strategic Bond Fund was 24 February 2017.(2) The date of commencement for BEA Union Investment Asia Pacific Equity Dividend Fund was 10 March 2017.(3) The date of commencement for BEA Union Investment China Gateway Fund was 31 January 2018.
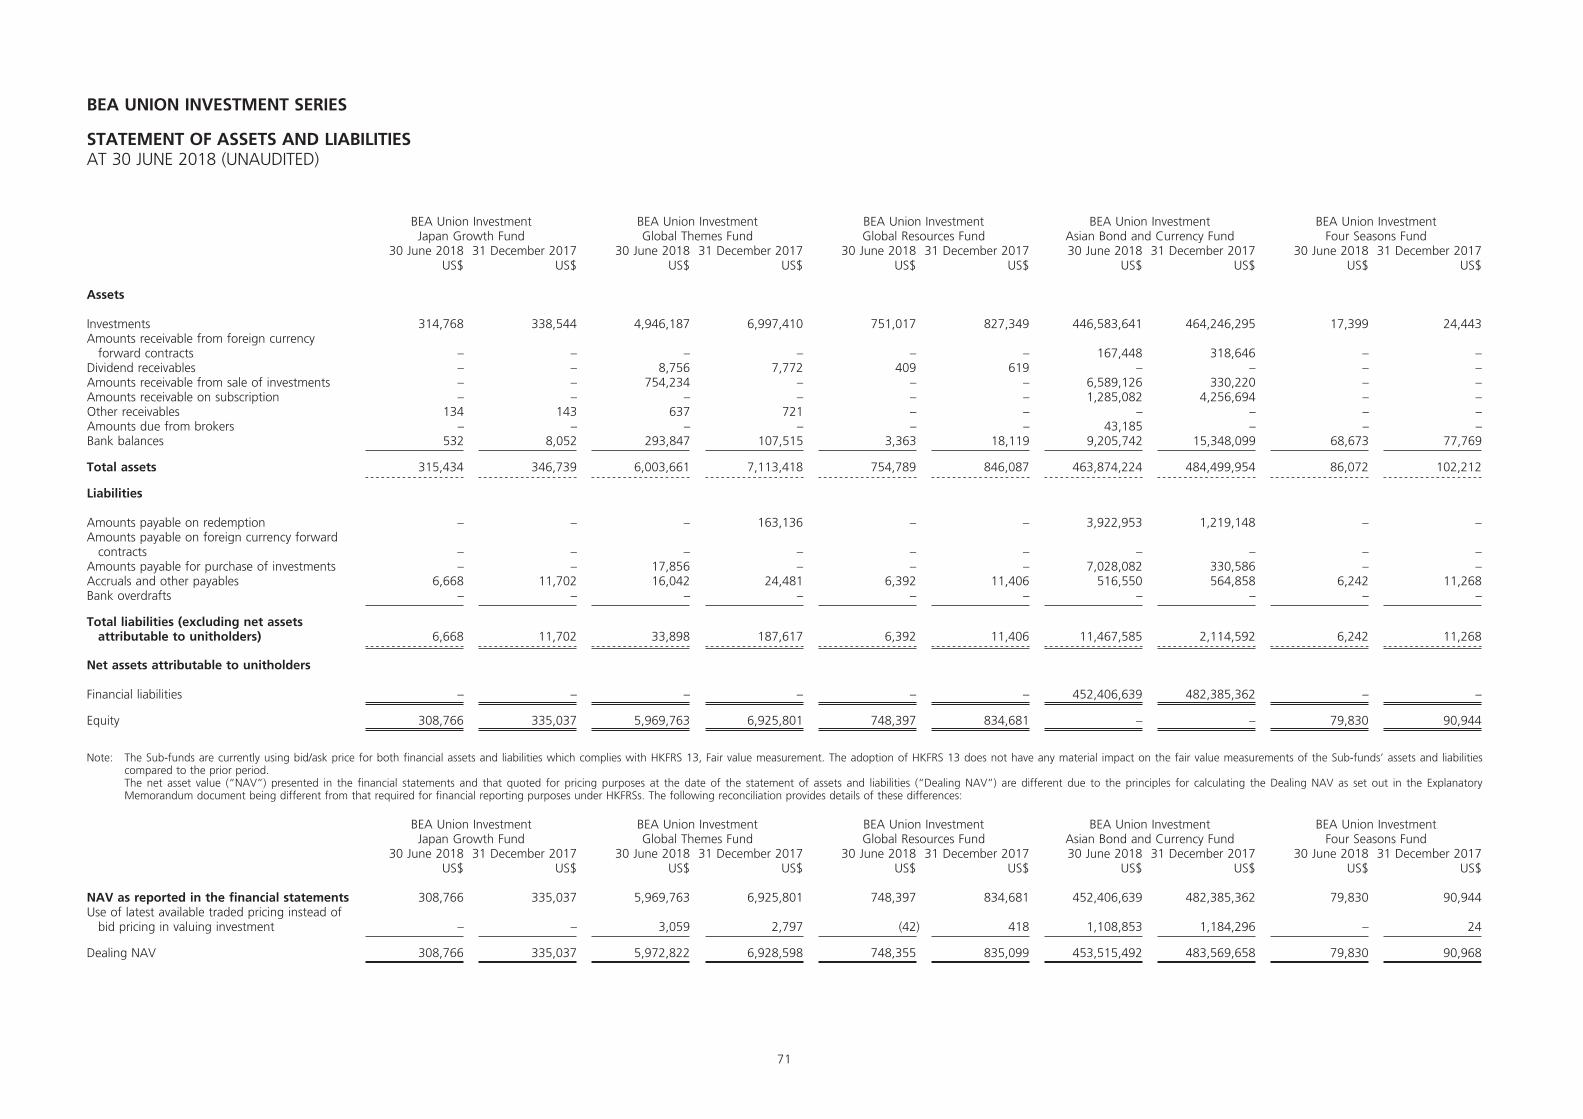
BEA UNION INVESTMENT SERIES
STATEMENT OF ASSETS AND LIABILITIESAT 30 JUNE 2018 (UNAUDITED)
71
A5請縮小打印70.5%
BEA Union Investment Japan Growth Fund
BEA Union Investment Global Themes Fund
BEA Union Investment Global Resources Fund
BEA Union Investment Asian Bond and Currency Fund
BEA Union Investment Four Seasons Fund
30 June 2018 31 December 2017 30 June 2018 31 December 2017 30 June 2018 31 December 2017 30 June 2018 31 December 2017 30 June 2018 31 December 2017US$ US$ US$ US$ US$ US$ US$ US$ US$ US$
Assets
Investments 314,768 338,544 4,946,187 6,997,410 751,017 827,349 446,583,641 464,246,295 17,399 24,443Amounts receivable from foreign currency
forward contracts – – – – – – 167,448 318,646 – –Dividend receivables – – 8,756 7,772 409 619 – – – –Amounts receivable from sale of investments – – 754,234 – – – 6,589,126 330,220 – –Amounts receivable on subscription – – – – – – 1,285,082 4,256,694 – –Other receivables 134 143 637 721 – – – – – –Amounts due from brokers – – – – – – 43,185 – – –Bank balances 532 8,052 293,847 107,515 3,363 18,119 9,205,742 15,348,099 68,673 77,769
Total assets 315,434 346,739 6,003,661 7,113,418 754,789 846,087 463,874,224 484,499,954 86,072 102,212
Liabilities
Amounts payable on redemption – – – 163,136 – – 3,922,953 1,219,148 – –Amounts payable on foreign currency forward
contracts – – – – – – – – – –Amounts payable for purchase of investments – – 17,856 – – – 7,028,082 330,586 – –Accruals and other payables 6,668 11,702 16,042 24,481 6,392 11,406 516,550 564,858 6,242 11,268Bank overdrafts – – – – – – – – – –
Total liabilities (excluding net assets attributable to unitholders) 6,668 11,702 33,898 187,617 6,392 11,406 11,467,585 2,114,592 6,242 11,268
Net assets attributable to unitholders
Financial liabilities – – – – – – 452,406,639 482,385,362 – –
Equity 308,766 335,037 5,969,763 6,925,801 748,397 834,681 – – 79,830 90,944
Note: The Sub-funds are currently using bid/ask price for both financial assets and liabilities which complies with HKFRS 13, Fair value measurement. The adoption of HKFRS 13 does not have any material impact on the fair value measurements of the Sub-funds’ assets and liabilities compared to the prior period.The net asset value (“NAV”) presented in the financial statements and that quoted for pricing purposes at the date of the statement of assets and liabilities (“Dealing NAV”) are different due to the principles for calculating the Dealing NAV as set out in the Explanatory Memorandum document being different from that required for financial reporting purposes under HKFRSs. The following reconciliation provides details of these differences:
BEA Union Investment Japan Growth Fund
BEA Union Investment Global Themes Fund
BEA Union Investment Global Resources Fund
BEA Union Investment Asian Bond and Currency Fund
BEA Union Investment Four Seasons Fund
30 June 2018 31 December 2017 30 June 2018 31 December 2017 30 June 2018 31 December 2017 30 June 2018 31 December 2017 30 June 2018 31 December 2017US$ US$ US$ US$ US$ US$ US$ US$ US$ US$
NAV as reported in the financial statements 308,766 335,037 5,969,763 6,925,801 748,397 834,681 452,406,639 482,385,362 79,830 90,944Use of latest available traded pricing instead of
bid pricing in valuing investment – – 3,059 2,797 (42) 418 1,108,853 1,184,296 – 24
Dealing NAV 308,766 335,037 5,972,822 6,928,598 748,355 835,099 453,515,492 483,569,658 79,830 90,968
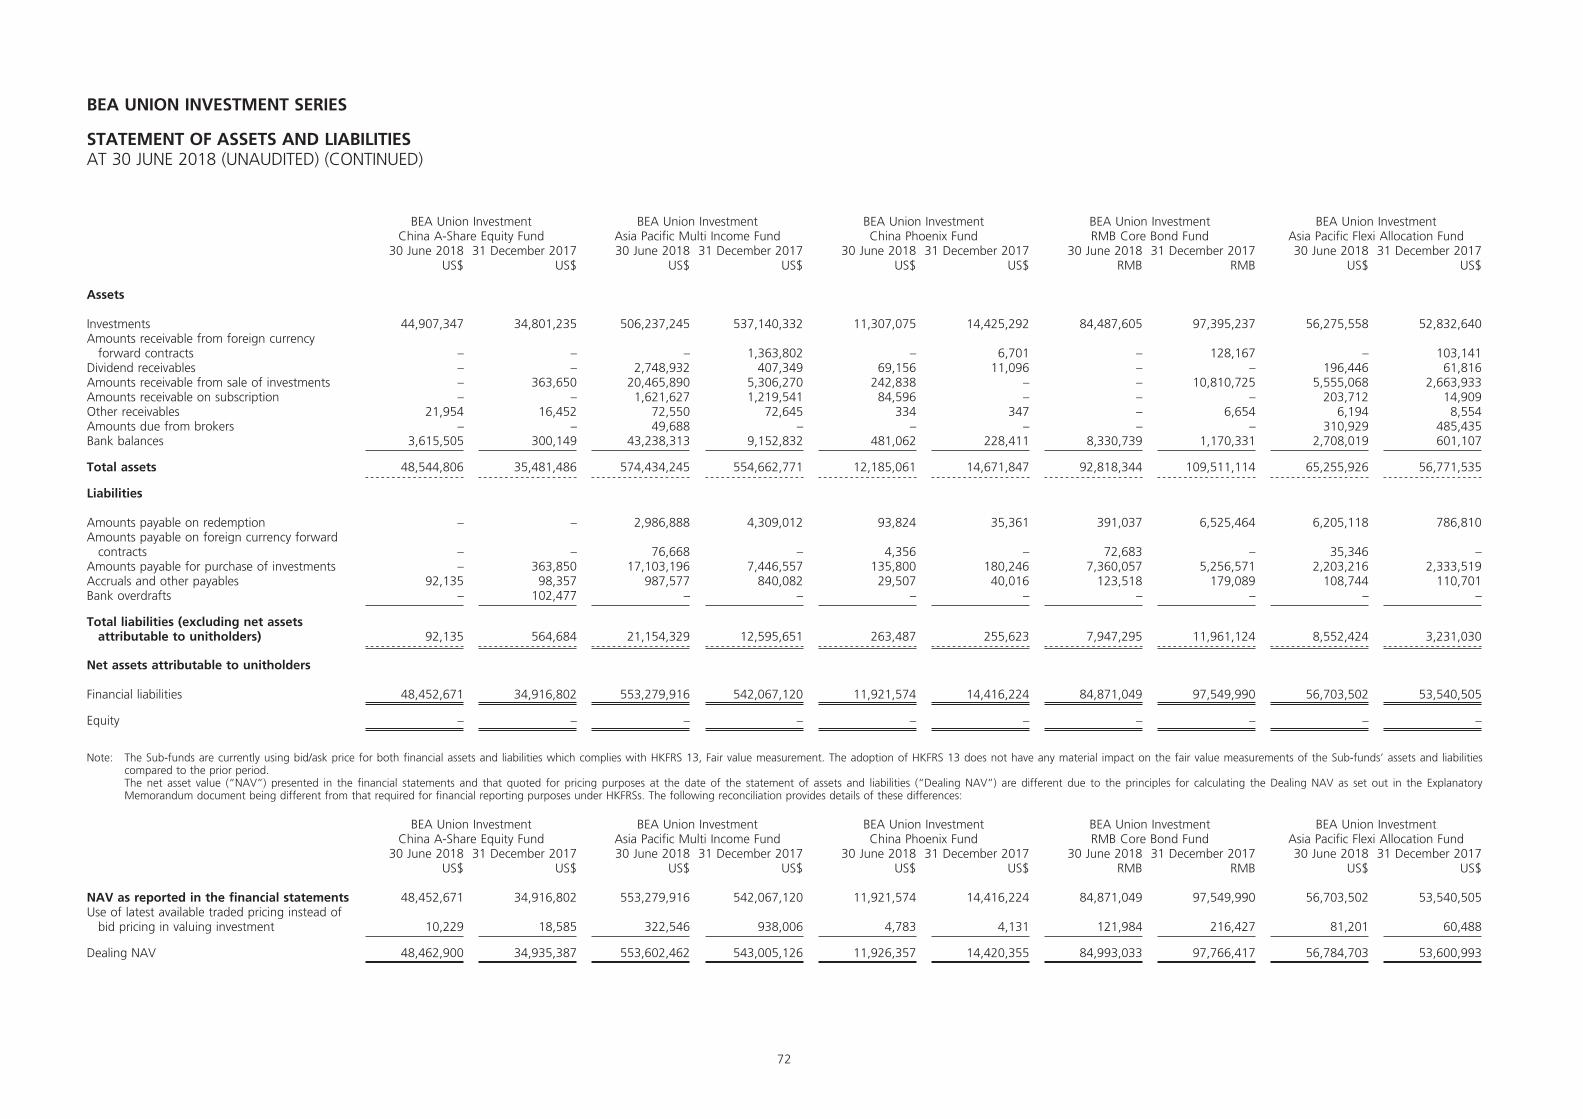
BEA UNION INVESTMENT SERIES
STATEMENT OF ASSETS AND LIABILITIESAT 30 JUNE 2018 (UNAUDITED) (CONTINUED)
72
A5請縮小打印70.5%
BEA Union Investment China A-Share Equity Fund
BEA Union Investment Asia Pacific Multi Income Fund
BEA Union Investment China Phoenix Fund
BEA Union Investment RMB Core Bond Fund
BEA Union Investment Asia Pacific Flexi Allocation Fund
30 June 2018 31 December 2017 30 June 2018 31 December 2017 30 June 2018 31 December 2017 30 June 2018 31 December 2017 30 June 2018 31 December 2017US$ US$ US$ US$ US$ US$ RMB RMB US$ US$
Assets
Investments 44,907,347 34,801,235 506,237,245 537,140,332 11,307,075 14,425,292 84,487,605 97,395,237 56,275,558 52,832,640Amounts receivable from foreign currency
forward contracts – – – 1,363,802 – 6,701 – 128,167 – 103,141Dividend receivables – – 2,748,932 407,349 69,156 11,096 – – 196,446 61,816Amounts receivable from sale of investments – 363,650 20,465,890 5,306,270 242,838 – – 10,810,725 5,555,068 2,663,933Amounts receivable on subscription – – 1,621,627 1,219,541 84,596 – – – 203,712 14,909Other receivables 21,954 16,452 72,550 72,645 334 347 – 6,654 6,194 8,554Amounts due from brokers – – 49,688 – – – – – 310,929 485,435Bank balances 3,615,505 300,149 43,238,313 9,152,832 481,062 228,411 8,330,739 1,170,331 2,708,019 601,107
Total assets 48,544,806 35,481,486 574,434,245 554,662,771 12,185,061 14,671,847 92,818,344 109,511,114 65,255,926 56,771,535
Liabilities
Amounts payable on redemption – – 2,986,888 4,309,012 93,824 35,361 391,037 6,525,464 6,205,118 786,810Amounts payable on foreign currency forward
contracts – – 76,668 – 4,356 – 72,683 – 35,346 –Amounts payable for purchase of investments – 363,850 17,103,196 7,446,557 135,800 180,246 7,360,057 5,256,571 2,203,216 2,333,519Accruals and other payables 92,135 98,357 987,577 840,082 29,507 40,016 123,518 179,089 108,744 110,701Bank overdrafts – 102,477 – – – – – – – –
Total liabilities (excluding net assets attributable to unitholders) 92,135 564,684 21,154,329 12,595,651 263,487 255,623 7,947,295 11,961,124 8,552,424 3,231,030
Net assets attributable to unitholders
Financial liabilities 48,452,671 34,916,802 553,279,916 542,067,120 11,921,574 14,416,224 84,871,049 97,549,990 56,703,502 53,540,505
Equity – – – – – – – – – –
Note: The Sub-funds are currently using bid/ask price for both financial assets and liabilities which complies with HKFRS 13, Fair value measurement. The adoption of HKFRS 13 does not have any material impact on the fair value measurements of the Sub-funds’ assets and liabilities compared to the prior period.The net asset value (“NAV”) presented in the financial statements and that quoted for pricing purposes at the date of the statement of assets and liabilities (“Dealing NAV”) are different due to the principles for calculating the Dealing NAV as set out in the Explanatory Memorandum document being different from that required for financial reporting purposes under HKFRSs. The following reconciliation provides details of these differences:
BEA Union Investment China A-Share Equity Fund
BEA Union Investment Asia Pacific Multi Income Fund
BEA Union Investment China Phoenix Fund
BEA Union Investment RMB Core Bond Fund
BEA Union Investment Asia Pacific Flexi Allocation Fund
30 June 2018 31 December 2017 30 June 2018 31 December 2017 30 June 2018 31 December 2017 30 June 2018 31 December 2017 30 June 2018 31 December 2017US$ US$ US$ US$ US$ US$ RMB RMB US$ US$
NAV as reported in the financial statements 48,452,671 34,916,802 553,279,916 542,067,120 11,921,574 14,416,224 84,871,049 97,549,990 56,703,502 53,540,505Use of latest available traded pricing instead of
bid pricing in valuing investment 10,229 18,585 322,546 938,006 4,783 4,131 121,984 216,427 81,201 60,488
Dealing NAV 48,462,900 34,935,387 553,602,462 543,005,126 11,926,357 14,420,355 84,993,033 97,766,417 56,784,703 53,600,993
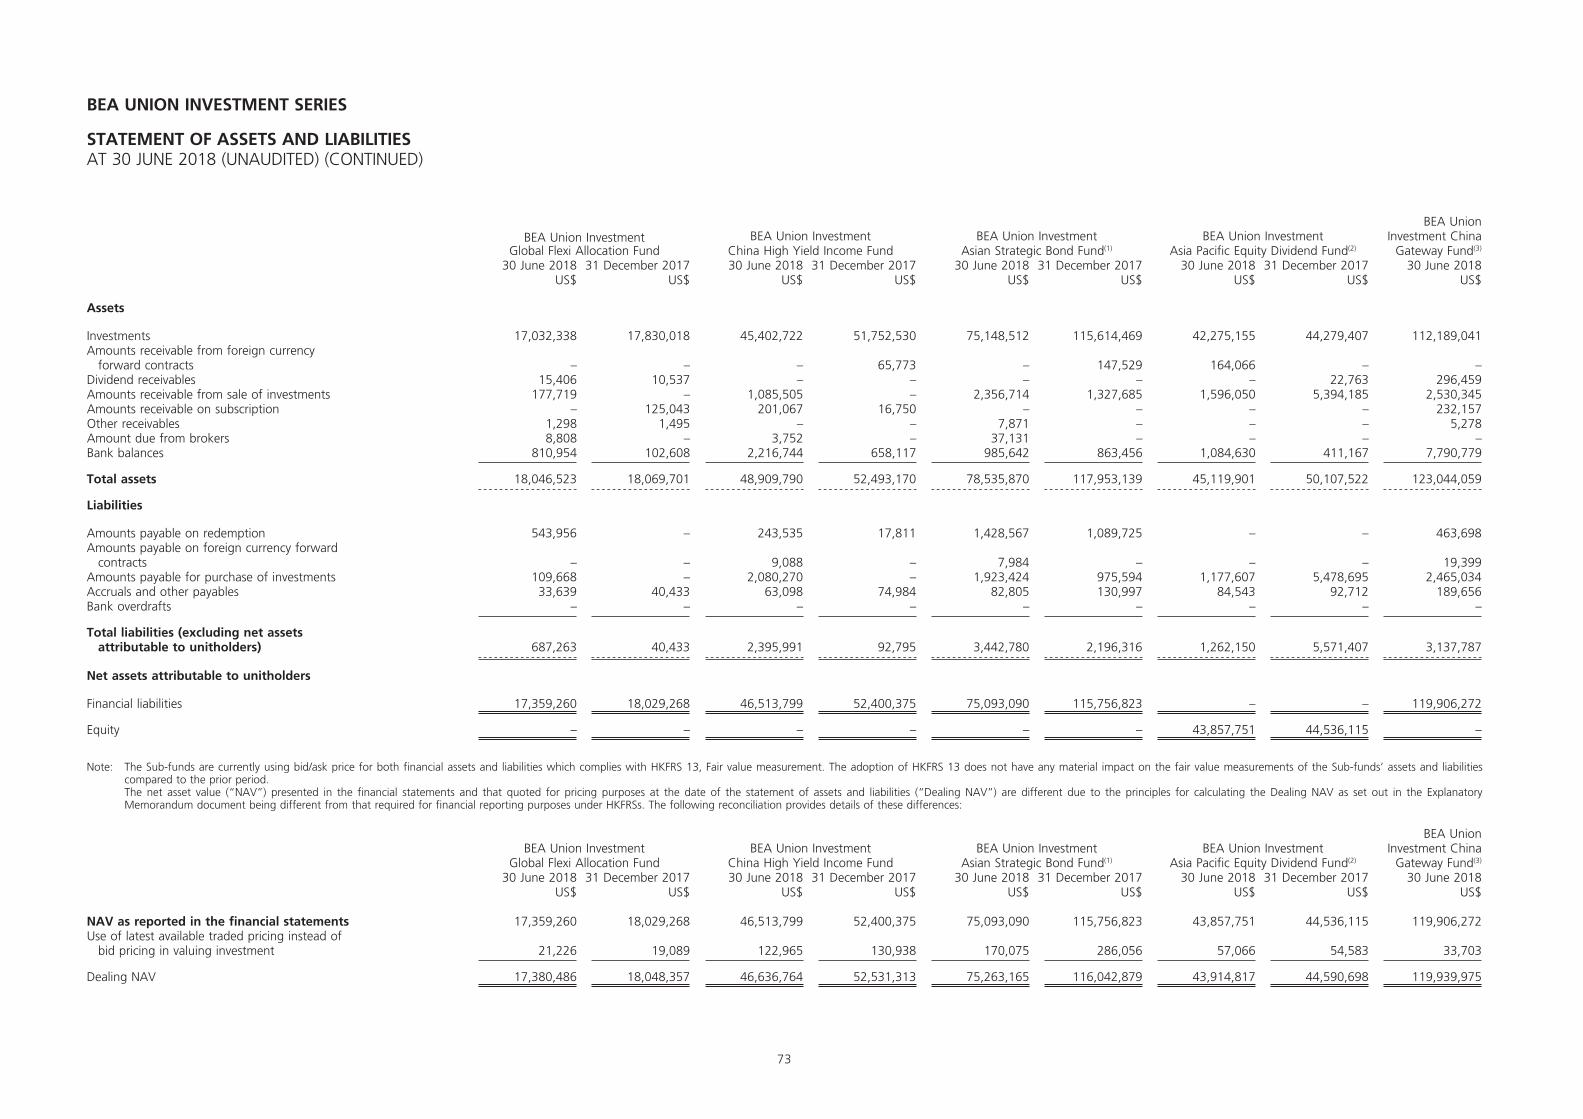
BEA UNION INVESTMENT SERIES
STATEMENT OF ASSETS AND LIABILITIESAT 30 JUNE 2018 (UNAUDITED) (CONTINUED)
A5請縮小打印70.5%
73
BEA Union Investment Global Flexi Allocation Fund
BEA Union Investment China High Yield Income Fund
BEA Union Investment Asian Strategic Bond Fund(1)
BEA Union Investment Asia Pacific Equity Dividend Fund(2)
BEA Union Investment China
Gateway Fund(3)
30 June 2018 31 December 2017 30 June 2018 31 December 2017 30 June 2018 31 December 2017 30 June 2018 31 December 2017 30 June 2018US$ US$ US$ US$ US$ US$ US$ US$ US$
Assets
Investments 17,032,338 17,830,018 45,402,722 51,752,530 75,148,512 115,614,469 42,275,155 44,279,407 112,189,041Amounts receivable from foreign currency
forward contracts – – – 65,773 – 147,529 164,066 – –Dividend receivables 15,406 10,537 – – – – – 22,763 296,459Amounts receivable from sale of investments 177,719 – 1,085,505 – 2,356,714 1,327,685 1,596,050 5,394,185 2,530,345Amounts receivable on subscription – 125,043 201,067 16,750 – – – – 232,157Other receivables 1,298 1,495 – – 7,871 – – – 5,278Amount due from brokers 8,808 – 3,752 – 37,131 – – – –Bank balances 810,954 102,608 2,216,744 658,117 985,642 863,456 1,084,630 411,167 7,790,779
Total assets 18,046,523 18,069,701 48,909,790 52,493,170 78,535,870 117,953,139 45,119,901 50,107,522 123,044,059
Liabilities
Amounts payable on redemption 543,956 – 243,535 17,811 1,428,567 1,089,725 – – 463,698Amounts payable on foreign currency forward
contracts – – 9,088 – 7,984 – – – 19,399Amounts payable for purchase of investments 109,668 – 2,080,270 – 1,923,424 975,594 1,177,607 5,478,695 2,465,034Accruals and other payables 33,639 40,433 63,098 74,984 82,805 130,997 84,543 92,712 189,656Bank overdrafts – – – – – – – – –
Total liabilities (excluding net assets attributable to unitholders) 687,263 40,433 2,395,991 92,795 3,442,780 2,196,316 1,262,150 5,571,407 3,137,787
Net assets attributable to unitholders
Financial liabilities 17,359,260 18,029,268 46,513,799 52,400,375 75,093,090 115,756,823 – – 119,906,272
Equity – – – – – – 43,857,751 44,536,115 –
Note: The Sub-funds are currently using bid/ask price for both financial assets and liabilities which complies with HKFRS 13, Fair value measurement. The adoption of HKFRS 13 does not have any material impact on the fair value measurements of the Sub-funds’ assets and liabilities compared to the prior period.The net asset value (“NAV”) presented in the financial statements and that quoted for pricing purposes at the date of the statement of assets and liabilities (“Dealing NAV”) are different due to the principles for calculating the Dealing NAV as set out in the Explanatory Memorandum document being different from that required for financial reporting purposes under HKFRSs. The following reconciliation provides details of these differences:
BEA Union Investment Global Flexi Allocation Fund
BEA Union Investment China High Yield Income Fund
BEA Union Investment Asian Strategic Bond Fund(1)
BEA Union Investment Asia Pacific Equity Dividend Fund(2)
BEA Union Investment China
Gateway Fund(3)
30 June 2018 31 December 2017 30 June 2018 31 December 2017 30 June 2018 31 December 2017 30 June 2018 31 December 2017 30 June 2018US$ US$ US$ US$ US$ US$ US$ US$ US$
NAV as reported in the financial statements 17,359,260 18,029,268 46,513,799 52,400,375 75,093,090 115,756,823 43,857,751 44,536,115 119,906,272Use of latest available traded pricing instead of
bid pricing in valuing investment 21,226 19,089 122,965 130,938 170,075 286,056 57,066 54,583 33,703
Dealing NAV 17,380,486 18,048,357 46,636,764 52,531,313 75,263,165 116,042,879 43,914,817 44,590,698 119,939,975
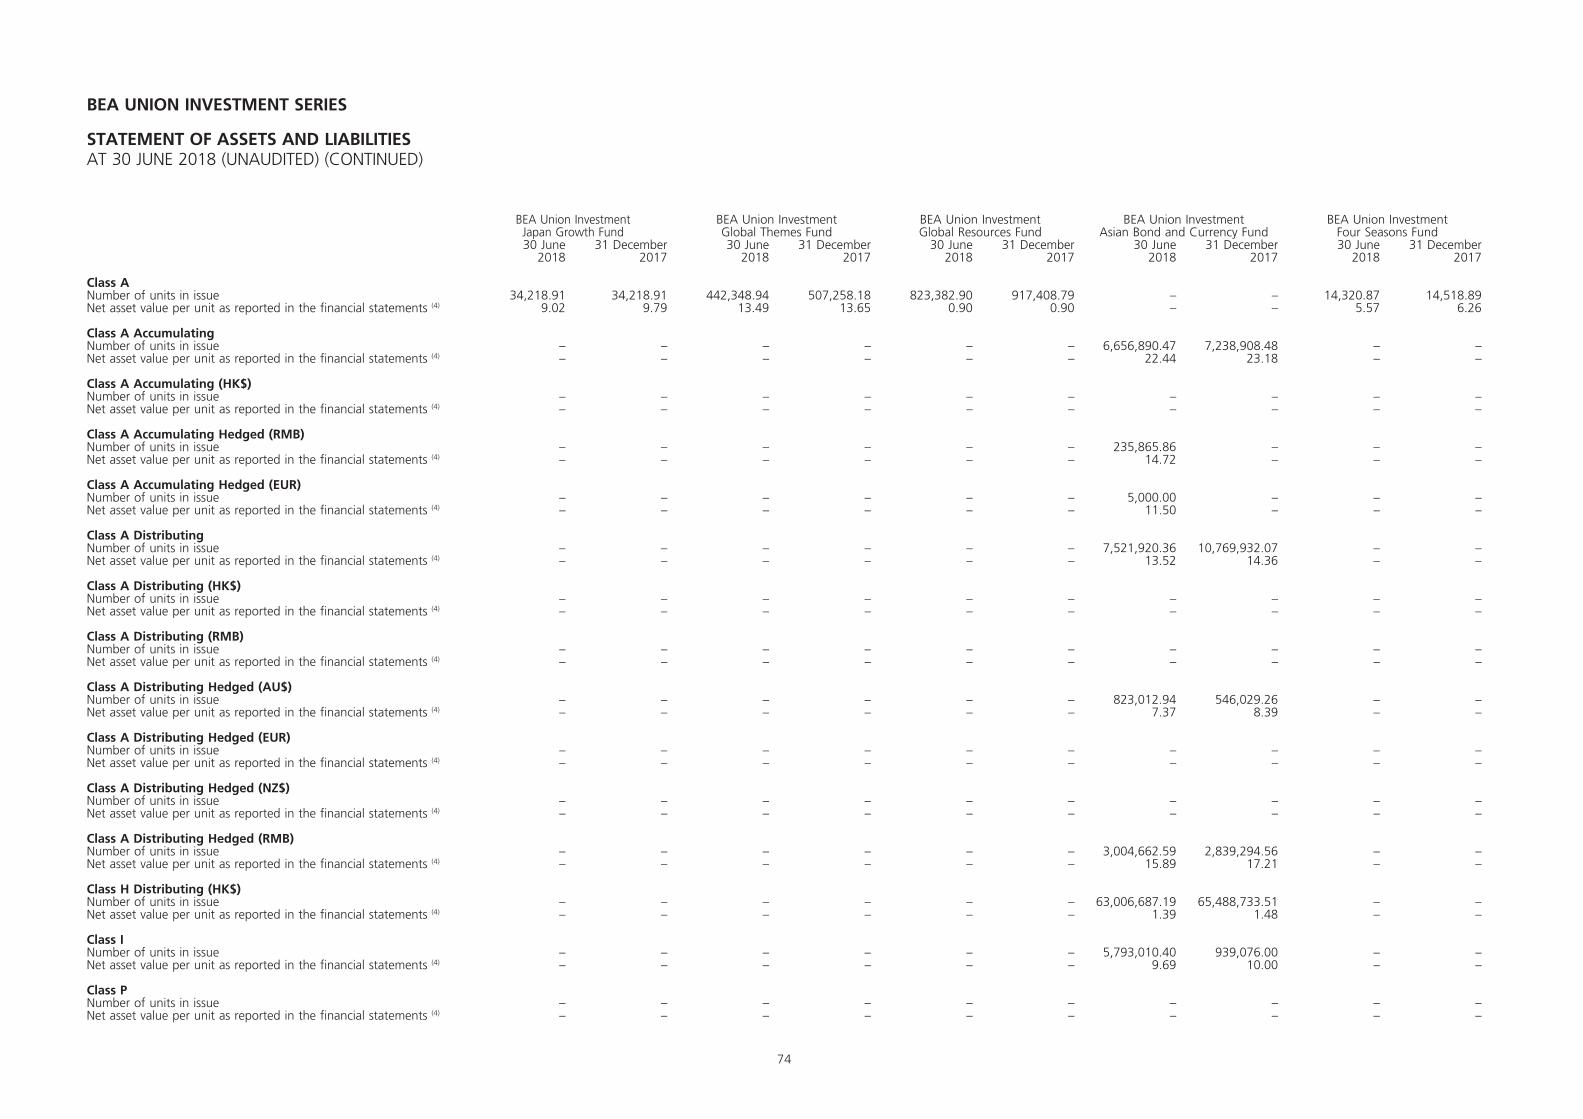
BEA UNION INVESTMENT SERIES
STATEMENT OF ASSETS AND LIABILITIESAT 30 JUNE 2018 (UNAUDITED) (CONTINUED)
A5請縮小打印70.5%
74
BEA Union Investment Japan Growth Fund
BEA Union Investment Global Themes Fund
BEA Union Investment Global Resources Fund
BEA Union Investment Asian Bond and Currency Fund
BEA Union Investment Four Seasons Fund
30 June 2018
31 December 2017
30 June 2018
31 December 2017
30 June 2018
31 December 2017
30 June 2018
31 December 2017
30 June 2018
31 December 2017
Class ANumber of units in issue 34,218.91 34,218.91 442,348.94 507,258.18 823,382.90 917,408.79 – – 14,320.87 14,518.89Net asset value per unit as reported in the financial statements (4) 9.02 9.79 13.49 13.65 0.90 0.90 – – 5.57 6.26
Class A AccumulatingNumber of units in issue – – – – – – 6,656,890.47 7,238,908.48 – –Net asset value per unit as reported in the financial statements (4) – – – – – – 22.44 23.18 – –
Class A Accumulating (HK$)Number of units in issue – – – – – – – – – –Net asset value per unit as reported in the financial statements (4) – – – – – – – – – –
Class A Accumulating Hedged (RMB)Number of units in issue – – – – – – 235,865.86 – – –Net asset value per unit as reported in the financial statements (4) – – – – – – 14.72 – – –
Class A Accumulating Hedged (EUR)Number of units in issue – – – – – – 5,000.00 – – –Net asset value per unit as reported in the financial statements (4) – – – – – – 11.50 – – –
Class A DistributingNumber of units in issue – – – – – – 7,521,920.36 10,769,932.07 – –Net asset value per unit as reported in the financial statements (4) – – – – – – 13.52 14.36 – –
Class A Distributing (HK$)Number of units in issue – – – – – – – – – –Net asset value per unit as reported in the financial statements (4) – – – – – – – – – –
Class A Distributing (RMB)Number of units in issue – – – – – – – – – –Net asset value per unit as reported in the financial statements (4) – – – – – – – – – –
Class A Distributing Hedged (AU$)Number of units in issue – – – – – – 823,012.94 546,029.26 – –Net asset value per unit as reported in the financial statements (4) – – – – – – 7.37 8.39 – –
Class A Distributing Hedged (EUR)Number of units in issue – – – – – – – – – –Net asset value per unit as reported in the financial statements (4) – – – – – – – – – –
Class A Distributing Hedged (NZ$)Number of units in issue – – – – – – – – – –Net asset value per unit as reported in the financial statements (4) – – – – – – – – – –
Class A Distributing Hedged (RMB)Number of units in issue – – – – – – 3,004,662.59 2,839,294.56 – –Net asset value per unit as reported in the financial statements (4) – – – – – – 15.89 17.21 – –
Class H Distributing (HK$)Number of units in issue – – – – – – 63,006,687.19 65,488,733.51 – –Net asset value per unit as reported in the financial statements (4) – – – – – – 1.39 1.48 – –
Class INumber of units in issue – – – – – – 5,793,010.40 939,076.00 – –Net asset value per unit as reported in the financial statements (4) – – – – – – 9.69 10.00 – –
Class PNumber of units in issue – – – – – – – – – –Net asset value per unit as reported in the financial statements (4) – – – – – – – – – –
BEA UNION INVESTMENT SERIES
STATEMENT OF ASSETS AND LIABILITIESAT 30 JUNE 2018 (UNAUDITED) (CONTINUED)
A5請縮小打印70.5%
75
BEA Union Investment China A-Share Equity Fund
BEA Union Investment Asia Pacific Multi Income Fund
BEA Union Investment China Phoenix Fund
BEA Union Investment RMB Core Bond Fund
BEA Union Investment Asia Pacific Flexi Allocation Fund
30 June 2018
31 December 2017
30 June 2018
31 December 2017
30 June 2018
31 December 2017
30 June 2018
31 December 2017
30 June 2018
31 December 2017
Class ANumber of units in issue 111,958.25 115,431.36 – – – – – – – –Net asset value per unit as reported in the financial statements (4) 12.12 13.44 – – – – – – – –
Class A AccumulatingNumber of units in issue – – 698,371.76 874,174.41 194,701.25 229,187.42 – – 261,983.33 304,673.12Net asset value per unit as reported in the financial statements (4) – – 13.07 13.61 11.26 11.47 – – 11.06 11.47
Class A Accumulating (HK$)Number of units in issue – – – – 581,812.05 718,278.72 – – – –Net asset value per unit as reported in the financial statements (4) – – – – 14.49 14.75 – – – –
Class A Accumulating Hedged (RMB)Number of units in issue – – – – 73,142.53 65,016.66 – – – –Net asset value per unit as reported in the financial statements (4) – – – – 17.67 18.24 – – – –
Class A Accumulating Hedged (EUR)Number of units in issue – – 5,000.00 – – – – – – –Net asset value per unit as reported in the financial statements (4) – – 11.51 – – – – – – –
Class A DistributingNumber of units in issue – – 11,925,146.83 10,756,621.27 – – 265,538.95 424,447.07 1,336,730.01 1,673,821.93Net asset value per unit as reported in the financial statements (4) – – 10.20 10.95 – – 59.68 59.85 9.69 10.27
Class A Distributing (HK$)Number of units in issue – – 18,619,477.19 16,322,089.77 – – 479,789.15 559,986.52 1,878,030.15 1,462,273.24Net asset value per unit as reported in the financial statements (4) – – 13.14 14.10 – – 76.85 77.09 12.51 13.25
Class A Distributing (RMB)Number of units in issue – – – – – – 326,600.36 293,308.50 – –Net asset value per unit as reported in the financial statements (4) – – – – – – 98.43 98.77 – –
Class A Distributing Hedged (AU$)Number of units in issue – – 12,182,477.94 10,213,409.03 – – – – 1,305,259.85 801,719.47Net asset value per unit as reported in the financial statements (4) – – 6.26 7.21 – – – – 6.54 7.52
Class A Distributing Hedged (EUR)Number of units in issue – – 5,000.00 – – – – – – –Net asset value per unit as reported in the financial statements (4) – – 11.51 – – – – – – –
Class A Distributing Hedged (NZ$)Number of units in issue – – 2,902,641.93 4,789,239.76 – – – – 320,006.30 352,335.39Net asset value per unit as reported in the financial statements (4) – – 5.76 6.58 – – – – 6.08 6.86
Class A Distributing Hedged (RMB)Number of units in issue – – 6,134,181.17 5,106,646.22 – – – – 462,946.77 313,260.59Net asset value per unit as reported in the financial statements (4) – – 13.75 15.07 – – – – 14.76 15.97
Class H Distributing (HK$)Number of units in issue – – – – – – – – – –Net asset value per unit as reported in the financial statements (4) – – – – – – – – – –
Class INumber of units in issue 3,046,622.78 1,915,385.60 – – – – – – – –Net asset value per unit as reported in the financial statements (4) 15.01 16.63 – – – – – – – –
Class PNumber of units in issue 92,330.54 92,330.54 – – – – – – – –Net asset value per unit as reported in the financial statements (4) 14.71 16.32 – – – – – – – –
BEA UNION INVESTMENT SERIES
STATEMENT OF ASSETS AND LIABILITIESAT 30 JUNE 2018 (UNAUDITED) (CONTINUED)
A5請縮小打印70.5%
76
BEA Union Investment Global Flexi Allocation Fund
BEA Union Investment China High Yield Income Fund
BEA Union Investment Asian Strategic Bond Fund(1)
BEA Union Investment Asia Pacific Equity Dividend Fund(2)
BEA Union Investment China
Gateway Fund(3)
30 June2018
31 December2017
30 June2018
31 December2017
30 June2018
31 December2017
30 June2018
31 December2017
30 June2018
Class ANumber of units in issue – – – – – – – – –Net asset value per unit as reported in the financial statements (4) – – – – – – – – –
Class A AccumulatingNumber of units in issue – – – – 64,271.36 83,766.19 – – 208,458.23Net asset value per unit as reported in the financial statements (4) – – – – 10.07 10.40 – – 9.02
Class A Accumulating (HK$)Number of units in issue – – – – – – – – –Net asset value per unit as reported in the financial statements (4) – – – – – – – – –
Class A Accumulating Hedged (RMB)Number of units in issue – – – – – – – – –Net asset value per unit as reported in the financial statements (4) – – – – – – – – –
Class A Accumulating Hedged (EUR)Number of units in issue – – – – – – – – –Net asset value per unit as reported in the financial statements (4) – – – – – – – – –
Class A DistributingNumber of units in issue 1,455,053.20 1,481,147.48 1,694,662.48 2,275,733.56 3,027,831.19 5,068,105.01 3,926,228.22 3,926,228.22 2,690,068.52Net asset value per unit as reported in the financial statements (4) 10.90 11.36 9.86 10.46 9.56 10.10 11.17 11.34 8.89
Class A Distributing (HK$)Number of units in issue 106,394.81 82,187.25 1,447,357.35 1,367,900.52 2,426,511.11 3,296,689.51 – – 4,209,956.53Net asset value per unit as reported in the financial statements (4) 14.00 14.58 12.72 13.50 12.32 13.01 – – 11.38
Class A Distributing (RMB)Number of units in issue – – – – – – – – –Net asset value per unit as reported in the financial statements (4) – – – – – – – – –
Class A Distributing Hedged (AU$)Number of units in issue – – 510,458.60 310,890.77 846,782.23 1,055,600.93 – – 4,545,212.85Net asset value per unit as reported in the financial statements (4) – – 7.01 7.99 6.87 7.79 – – 6.55
Class A Distributing Hedged (EUR)Number of units in issue – – – – – – – – –Net asset value per unit as reported in the financial statements (4) – – – – – – – – –
Class A Distributing Hedged (NZ$)Number of units in issue – – – – – – – – –Net asset value per unit as reported in the financial statements (4) – – – – – – – – –
Class A Distributing Hedged (RMB)Number of units in issue – – 524,471.93 472,688.08 675,826.86 805,455.46 – – 1,221,689.48Net asset value per unit as reported in the financial statements (4) – – 14.87 16.13 14.44 15.58 – – 13.42
Class H Distributing (HK$)Number of units in issue – – – – – – – – –Net asset value per unit as reported in the financial statements (4) – – – – – – – – –
Class INumber of units in issue – – – – – – – – –Net asset value per unit as reported in the financial statements (4) – – – – – – – – –
Class PNumber of units in issue – – – – – – – – –Net asset value per unit as reported in the financial statements (4) – – – – – – – – –
(1) The date of commencement for BEA Union Investment Asian Strategic Bond Fund was 24 February 2017.(2) The date of commencement for BEA Union Investment Asia Pacific Equity Dividend Fund was 10 March 2017.(3) The date of commencement for BEA Union Investment China Gateway Fund was 31 January 2018.(4) The net asset value per unit is rounded down to 2 decimal places in accordance with the Explanatory Memorandum.

BEA UNION INVESTMENT SERIES
STATEMENT OF CHANGES IN NET ASSETS ATTRIBUTABLE TO UNITHOLDERSFOR THE PERIOD ENDED 30 JUNE 2018 (UNAUDITED)
77
A5請縮小打印70.5%
BEA Union Investment Japan Growth Fund
BEA Union Investment Global Themes Fund
BEA Union Investment Global Resources Fund
BEA Union Investment Asian Bond and Currency Fund
BEA Union Investment Four Seasons Fund
2018 2017 2018 2017 2018 2017 2018 2017 2018 2017US$ US$ US$ US$ US$ US$ US$ US$ US$ US$
Balance at 1 January/date of commencement 335,037 375,872 6,925,801 9,226,008 834,681 1,331,220 482,385,362 246,798,150 90,944 110,667
Transactions with owners recorded directly in equity/transactions with unitholders
Subscription of units during the period – – 2,614 288,345 – – 224,970,521 128,511,350 – –Redemption of units during the period – – (904,928) (3,840,587) (86,515) (475,354) (230,255,164) (60,096,347) (1,158) –
Total transactions with owners/unitholders – – (902,314) (3,552,242) (86,515) (475,354) (5,284,643) 68,415,003 (1,158) –
(Loss)/profit and total comprehensive income for the period (26,271) 32,786 (53,724) 1,115,679 231 83,640 (24,694,080) 7,989,830 (9,956) (1,008)
Balance at 30 June 308,766 408,658 5,969,763 6,789,445 748,397 939,506 452,406,639 323,202,983 79,830 109,659
BEA Union Investment China A-Share Equity Fund
BEA Union Investment Asia Pacific Multi Income Fund
BEA Union Investment China Phoenix Fund
BEA Union Investment RMB Core Bond Fund
BEA Union Investment Asia Pacific Flexi Allocation Fund
2018 2017 2018 2017 2018 2017 2018 2017 2018 2017US$ US$ US$ US$ US$ US$ RMB RMB US$ US$
Balance at 1 January/date of commencement 34,916,802 37,838,538 542,067,120 344,909,134 14,416,224 19,440,012 97,549,990 100,001,730 53,540,505 45,558,095
Transactions with owners recorded directly in equity/transactions with unitholders
Subscription of units during the period 20,829,093 627,929 271,410,070 308,972,382 1,995,021 158,154 38,094,685 933,940 57,441,313 11,998,027Redemption of units during the period (780,342) (2,352,489) (211,746,253) (183,383,457) (4,481,058) (7,096,551) (50,595,496) (28,681,764) (50,519,079) (19,644,798)
Total transactions with owners/unitholders 20,048,751 (1,724,560) 59,663,817 125,588,925 (2,486,037) (6,938,397) (12,500,811) (27,747,824) 6,922,234 (7,646,771)
(Loss)/profit and total comprehensive income for the period (6,512,882) 7,387,936 (48,451,021) 18,332,392 (8,613) 3,721,626 (178,130) 556,712 (3,759,237) 4,772,616
Balance at 30 June 48,452,671 43,501,914 553,279,916 488,830,451 11,921,574 16,223,241 84,871,049 72,810,618 56,703,502 42,683,940

BEA UNION INVESTMENT SERIES
STATEMENT OF CHANGES IN NET ASSETS ATTRIBUTABLE TO UNITHOLDERSFOR THE PERIOD ENDED 30 JUNE 2018 (UNAUDITED) (CONTINUED)
78
A5請縮小打印70.5%
BEA Union Investment Global Flexi Allocation Fund
BEA Union Investment China High Yield Income Fund
BEA Union Investment Asian Strategic Bond Fund(1)
BEA Union Investment Asia Pacific Equity Dividend Fund(2)
BEA Union Investment China
Gateway Fund(3)
2018 2017 2018 2017 2018 2017 2018 2017 2018US$ US$ US$ US$ US$ US$ US$ US$ US$
Balance at 1 January/date of commencement 18,029,268 10,176,350 52,400,375 32,742,801 115,756,823 – 44,536,115 – –
Transactions with owners recorded directly in equity/transactions with unitholders
Subscription of units during the period 4,605,083 7,325,866 12,401,689 11,391,027 17,102,323 146,757,934 – 39,262,282 165,014,936Redemption of units during the period (4,461,674) (6,577,902) (14,758,235) (6,067,872) (52,015,299) (7,586,545) – – (30,299,554)
Total transactions with owners/unitholders 143,409 747,964 (2,356,546) 5,323,155 (34,912,976) 139,171,389 – 39,262,282 134,715,382
(Loss)/profit and total comprehensive income for the period (813,417) 775,802 (3,530,030) 186,217 (5,750,757) 587,842 (678,364) 2,041,834 (14,809,110)
Balance at 30 June 17,359,260 11,700,116 46,513,799 38,252,173 75,093,090 139,759,231 43,857,751 41,304,116 119,906,272
(1) The date of commencement for BEA Union Investment Asian Strategic Bond Fund was 24 February 2017.(2) The date of commencement for BEA Union Investment Asia Pacific Equity Dividend Fund was 10 March 2017.(3) The date of commencement for BEA Union Investment China Gateway Fund was 31 January 2018.

MANAGEMENT AND ADMINISTRATION
Trustee and Registrar
Bank of East Asia (Trustees) Limited32nd Floor, BEA Tower
Millennium City 5418 Kwun Tong RoadKwun Tong, Kowloon,
Hong Kong
Manager
BEA Union Investment Management Limited5th Floor, The Bank of East Asia Building
10 Des Voeux Road CentralHong Kong
Auditor
KPMG8th Floor, Prince’s Building
10 Chater RoadCentral, Hong Kong
Legal Adviser
Deacons5th Floor, Alexandra House
18 Chater RoadCentral, Hong Kong