31st December 2021 - L&T Finance
58
1 Data as on December 31, 2021 FUND FACTS Product labelling overleaf. 31 st December 2021
-
Upload
khangminh22 -
Category
Documents
-
view
0 -
download
0
Transcript of 31st December 2021 - L&T Finance

1
Data as on December 31, 2021
FUNDFACTS
Product labelling overleaf.
31st December 2021

2
Data as on December 31, 2021
Product Label 3
Potential Risk matrix for Debt schemes 5
CEO’S View 7
Glossary 8
How to read a Factsheet 9
Equity Market Review 10
Debt Market Review 11
L&T Flexicap Fund 12
L&T Tax Advantage Fund 13
L&T Large and Midcap Fund 14
L&T Infrastructure Fund 15
L&T India Large Cap Fund 16
L&T India Value Fund 17
L&T Midcap Fund 18
L&T Emerging Businesses Fund 19
L&T Business Cycles Fund 20
L&T Focused Equity Fund 21
L&T Nifty 50 Index Fund 22
L&T Nifty Next 50 Index Fund 23
L&T Balanced Advantage Fund 24
L&T Hybrid Equity Fund 25
L&T Arbitrage Opportunities Fund 26
L&T Equity Savings Fund 27
Equity Fund Snapshot 28
Debt Fund Snapshot 29
L&T Overnight Fund 30
L&T Liquid Fund 31
L&T Ultra Short Term Fund 32
L&T Money Market Fund 33
L&T Banking and PSU Debt Fund 34
L&T Short Term Bond Fund 35
L&T Low Duration Fund 36
L&T Credit Risk Fund 37
L&T Flexi Bond Fund 38
L&T Triple Ace Bond Fund 39
L&T Gilt Fund 40
L&T Conservative Hybrid Fund 41
L&T Resurgent India Bond Fund 42
Fund Manager wise Scheme Details 43
SIP Performance Of Growth Option 44
NAV 46
Performance of Schemes 48
Minimum Investment Amount Details 52
Total Expense Ratio 52
IDCW History 53
Branches details of the Company 56
CONTENTS PG. NO CONTENTS PG. NO

3
Data as on December 31, 2021
L&T Overnight Fund - An open-ended debt scheme investing in overnight securities. A relatively low interest rate risk and relatively low credit risk:• Reasonable returns with lower volatility and higher liquidity over short term • Investment in debt and money market instruments with overnight maturity
L&T Arbitrage Opportunities Fund - An open ended scheme investing in arbitrage opportunities: • Generation of reasonable returns over short to medium term • Investment predominantly in arbitrage opportunities in the cash and derivatives segments of the equity markets; and debt and money market instruments
Product Labels
*Investors should consult their financial advisers if in doubt about whether the product is suitable for them.#The Macaulay duration is the weighted average term to maturity of the cash flows from a bond. The weight of each cash flow is determined by dividing the present value of the cash flow by the price.
Scheme name and Type of scheme This product is suitable for investors who are seeking* Riskometer of the Scheme Riskometer of the benchmark
Low
Low to
Moderate Moderate Moderately
Low
Low to
Moderate Moderate
High
Very High
High
VERYHIGHLOW
Investors understand that their principal will be at low risk
Low
Low to
Moderate Moderate Moderately
Low
Low to
Moderate Moderate
High
Very High
High
VERYHIGHLOW
Investors understand that their principal will be at low risk
Low
Low
to
ModerateModerate Moderately
Low
Low
to
ModerateModerate
High
VeryHigh
High
VERYHIGHLOW
Investors understand that their principal will be at moderately high risk
Low
Low
to
ModerateModerate Moderately
Low
Low
to
ModerateModerate
High
VeryHigh
High
VERYHIGHLOW
Investors understand that their principal will be from low to moderate risk
Low
Low
to
ModerateModerate Moderately
Low
Low
to
ModerateModerate
High
VeryHigh
High
VERYHIGHLOW
Investors understand that their principal will be from low to moderate risk
Low
Low
to
ModerateModerate Moderately
Low
Low
to
ModerateModerate
High
VeryHigh
High
VERYHIGHLOW
Investors understand that their principal will be at moderate risk
L&T Triple Ace Bond Fund - An open-ended debt scheme predominantly investing in AA+ and above rated corporate bonds. A relatively high interest rate risk and relatively low credit risk: • Generation of regular and stable income over medium to long term • Investment predominantly in AA+ and above rated corporate bonds and money market instruments
L&T Resurgent India Bond Fund - An open ended medium term debt scheme investing in instruments such that the Macaulay duration of the portfolio is between 3 years to 4 years (please refer to page no. 18 under the section “Asset Allocation Pattern” in the SID for details on Macaulay’s Duration)#. A relatively high interest rate risk and moderate credit risk: • Generation of income over medium term • Investment primarily in debt and money market securities
L&T Equity Savings Fund - An open ended scheme investing in equity, arbitrage and debt: • Generation of regular income by predominantly investing in arbitrage opportunities in the cash and derivatives segment and long–term capital appreciation through unhedged exposure to equity and equity related instruments. • Investment in equity and equity related instruments, derivatives and debt and money market instruments
L&T Flexi Bond Fund - An open-ended dynamic debt scheme investing across duration. A relatively high interest rate risk and relatively low credit risk: • Generation of reasonable returns over medium to long term • Investment in fixed income securities
L&T Gilt Fund - An open-ended debt scheme investing in government securities across maturity. A relatively high interest rate risk and relatively low credit risk: • Generation of returns over medium to long term • Investment in Government Securities
L&T Money Market Fund - An open-ended debt scheme investing in money market instruments. A relatively low interest rate risk and moderate credit risk: • Generation of regular income over short to medium term • Investment in money market instruments
L&T Ultra Short Term Fund - An open ended ultra-short term debt scheme investing in instruments such that the Macaulay duration of the portfolio is between 3 months to 6 months (please refer to page no. 18 under the section “Asset Allocation Pattern” in the SID for details on Macaulay’s Duration)#. A relatively low interest rate risk and moderate credit risk: • Generation of reasonable and stable income and liquidity over short term • Investments predominantly in highly liquid money market instruments, government securities and corporate debt
L&T Liquid Fund - An open-ended liquid scheme. A relatively low interest rate risk and moderate credit risk: • Generation of reasonable returns while maintaining safety and superior liquidity over short term • Investment predominantly in highly liquid money market instruments, government securities and corporate debt.
L&T Low Duration Fund - An open ended low duration debt scheme investing in instruments such that the Macaulay duration of the portfolio is between 6 months to 12 months (please refer to page no.17 under the section “Asset Allocation Pattern” in the SID for details on Macaulay’s Duration)#. A relatively low interest rate risk and moderate credit risk. • Generation of reasonable returns over short to medium term • Investment in fixed income securities and money market instruments
L&T Short Term Bond Fund - An open ended short term debt scheme investing in instruments such that the Macaulay duration of the portfolio is between 1 year to 3 years (please refer to page no. 16 under the section “Asset Allocation Pattern” in the SID for details on Macaulay’s Duration)#. A moderate interest rate risk and moderate credit risk: • Generation of regular returns over short term • Investment in fixed income securities of shorter term maturity.
L&T Banking and PSU Debt Fund - An open-ended debt scheme primarily investing in debt instruments of banks, public sector undertakings, public financial institutions and municipal bonds. A relatively high interest rate risk and relatively low credit risk: • Generation of reasonable returns and liquidity over short term • Investment predominantly in securities issued by Banks, Public Sector Undertakings and Public Financial Institutions and municipal corporations in India
Low
Low
to
ModerateModerate Moderately
Low
Low
to
ModerateModerate
High
VeryHigh
High
VERYHIGHLOW
Investors understand that their principal will be at moderate risk
Low
Low
to
ModerateModerate Moderately
Low
Low
to
ModerateModerate
High
VeryHigh
High
VERYHIGHLOW
Investors understand that their principal will be at moderate risk

4
Data as on December 31, 2021
Low
Low
to
ModerateModerate Moderately
Low
Low
to
ModerateModerate
High
VeryHigh
High
VERYHIGHLOW
Investors understand that their principal will be at moderately high risk
Low
Low
to
ModerateModerate Moderately
Low
Low
to
ModerateModerate
High
VeryHigh
High
VERYHIGHLOW
Investors understand that their principal will be at moderately high risk
Low
Low
to
ModerateModerate Moderately
Low
Low
to
ModerateModerate
High
VeryHigh
High
VERYHIGHLOW
Investors understand that their principal will be at moderately high risk
Product Labels
Scheme name and Type of scheme This product is suitable for investors who are seeking* Riskometer of the Scheme Riskometer of the benchmark
Low
Low
to
ModerateModerate Moderately
Low
Low
to
ModerateModerate
High
VeryHigh
High
VERYHIGHLOW
Investors understand that their principal will be at low risk
Low
Low
to
ModerateModerate Moderately
Low
Low
to
ModerateModerate
High
VeryHigh
High
VERYHIGHLOW
Investors understand that their principal will be at very high risk
Low
Low
to
ModerateModerate Moderately
Low
Low
to
ModerateModerate
High
VeryHigh
High
VERYHIGHLOW
Investors understand that their principal will be at very high risk
L&T Midcap Fund - An open ended equity scheme predominantly investing in mid cap stocks: • Long term capital appreciation • Investment primarily in midcap equity and equity-related securities
L&T Flexicap Fund - An open ended dynamic equity scheme investing across large cap, mid cap, small cap stocks: • Long term capital growth • Investment predominantly in equity and equity-related securities
L&T Large and Midcap Fund - An open ended equity scheme investing in both large cap and mid cap stocks: • Long term capital growth • Investment predominantly in equity and equity-related securities, with minimum allocation of at least 35% each to large cap and mid cap companies
L&T Tax Advantage Fund - An open ended equity linked saving scheme with a statutory lock in of 3 years and tax benefit: • Long term capital growth • Investment predominantly in equity and equity-related securities
L&T Infrastructure Fund - An open-ended equity scheme investing in infrastructure sector: • Long term capital appreciation • Investment predominantly in equity and equity-related instruments of companies in the infrastructure sectorL&T India Large Cap Fund - An open ended equity scheme predominantly investing in large cap stocks: • Long term capital appreciation • Investment in equity and equity related securities, including equity derivatives in the Indian markets and foreign securities; with predominant investments in large cap stocks
L&T India Value Fund - An open ended equity scheme following a value investment strategy: • Long term capital appreciation • Investment predominantly in equity and equity-related securities in Indian markets and foreign securities, with higher focus on undervalued securities
L&T Business Cycles Fund - An open–ended equity scheme following business cycles based investing theme: • Long term capital appreciation • Investment predominantly in equity and equity-related securities, including equity derivatives in Indian markets with focus on riding business cycles through dynamic allocation between various sectors and stocks at different stages of business cycles in the economyL&T Emerging Businesses Fund - An open-ended equity scheme predominantly investing in small cap stocks: • Long term capital appreciation • Investment predominantly in equity and equity-related securities, including equity derivatives in Indian markets with key theme focus being emerging companies (small cap stocks); and foreign securities
L&T Focused Equity Fund - An open ended equity scheme investing in maximum 30 stocks in large, mid and smallcap companies: • Long term capital appreciation • Investment in a concentrated portfolio of equity and equity related instruments of maximum 30 stocks.
L&T Nifty 50 Index Fund - An open-ended Equity Scheme tracking NIFTY 50 Index: • Long term capital appreciation • Investment in equity securities covered by the NIFTY 50.
L&T Nifty Next 50 Index Fund - An open-ended Equity Scheme tracking Nifty Next 50 Index: •Long term capital appreciation • Investment in equity securities covered by the NIFTY NEXT 50
L&T Hybrid Equity Fund - An open ended hybrid scheme investing predominantly in equity and equity related instruments: • Long term capital appreciation and generation of reasonable returns • Investment in equity and equity-related securities and debt and money market instruments.
L&T Conservative Hybrid Fund - An open ended hybrid scheme investing predominantly in debt instruments: • Generation of regular income over medium to long term • Investment in debt, equity and money market securities
L&T Balanced Advantage Fund - An open ended dynamic asset allocation fund: • Long term capital appreciation and generation of reasonable returns • Investment in equity and equity related instruments, derivatives and debt and money market instruments.
L&T Credit Risk Fund - An open-ended debt scheme predominantly investing in AA and below rated corporate bonds (excluding AA+ rated corporate bonds). A relatively high interest rate risk and relatively high credit risk: • Generation of regular returns and capital appreciation over medium to long term • Investment in debt instruments(including securitized debt), government and money market securities
Low
Low
to
ModerateModerate Moderately
Low
Low
to
ModerateModerate
High
VeryHigh
High
VERYHIGHLOW
Investors understand that their principal will be at moderate risk
*Investors should consult their financial advisers if in doubt about whether the product is suitable for them.#The Macaulay duration is the weighted average term to maturity of the cash flows from a bond. The weight of each cash flow is determined by dividing the present value of the cash flow by the price.
Low
Low
to
ModerateModerate Moderately
Low
Low
to
ModerateModerate
High
VeryHigh
High
VERYHIGHLOW
Investors understand that their principal will be at low risk

5
Data as on December 31, 2021Potential Risk Class (PRC) Matrix for Debt schemes
Sr. No Scheme Type of the scheme PRC matrix
1 L&T Overnight Fund
An open-ended debt scheme investing in overnight securities. A relatively low interest rate risk and relatively low credit risk Potential Risk Class
Credit Risk → RelativelyLow (Class A)
Moderate(Class B)
RelativelyHigh (Class C)Interest Rate
Risk ↓
Relatively Low(Class I)
A-I
Moderate(Class II)
RelativelyHigh (Class III)
2L&T FMP – SERIES
XVIII Plan B (1229 Days)
A close-ended debt fund. A relatively low interest rate risk and relatively low credit risk
3L&T FMP – SERIES
XVIII Plan D (1155 Days)
A close-ended debt fund. A relatively low interest rate risk and relatively low credit risk
4L&T FMP - Series
XVII - Plan B (1452 days)
A close-ended debt fund. A relatively low interest rate risk and relatively low credit risk
5 L&T Gilt FundAn open-ended debt scheme investing in government securities across maturity. A relatively high interest rate risk and relatively low credit risk. Potential Risk Class
Credit Risk → RelativelyLow (Class A)
Moderate(Class B)
RelativelyHigh (Class C)Interest Rate
Risk ↓
Relatively Low(Class I)
Moderate(Class II)
RelativelyHigh (Class III)
A-III
6 L&T Flexi Bond Fund
An open-ended dynamic debt scheme investing across duration. A relatively high interest rate risk and relatively low credit risk.
7 L&T Triple Ace Bond Fund
An open-ended debt scheme predominantly investing in AA+ and above rated corporate bonds. A relatively high interest rate risk and relatively low credit risk.
8 L&T Banking and PSU Debt Fund
An open-ended debt scheme primarily investing in debt instruments of banks, public sector undertakings, public financial institutions and municipal bonds. A relatively high interest rate risk and relatively low credit risk.
9 L&T Low Duration Fund
An open ended low duration debt scheme investing in instruments such that the Macaulay duration of the portfolio is between 6 months to 12 months (please refer to page no.17 under the section “Asset Allocation Pattern” in the SID for details on Macaulay’s Duration)#. A relatively low interest rate risk and moderate credit risk.
Potential Risk Class
Credit Risk → RelativelyLow (Class A)
Moderate(Class B)
RelativelyHigh (Class C)Interest Rate
Risk ↓
Relatively Low(Class I)
B-I
Moderate(Class II)
RelativelyHigh (Class III)
10 L&T Liquid Fund An open-ended liquid scheme. A relatively low interest rate risk and moderate credit risk.
11 L&T Ultra Short Term Fund
An open ended ultra-short term debt scheme investing in instruments such that the Macaulay duration of the portfolio is between 3 months to 6 months (please refer to page no. 18 under the section “Asset Allocation Pattern” in the SID for details on Macaulay’s Duration)#. A relatively low interest rate risk and moderate credit risk.
12 L&T Money Market Fund
An open-ended debt scheme investing in money market instruments. A relatively low interest rate risk and moderate credit risk.
13L&T FMP SERIES
XVIII Plan C (1178 Days)
A close-ended debt fund. A relatively low interest rate risk and moderate credit risk.
#The Macaulay duration is the weighted average term to maturity of the cash flows from a bond. The weight of each cash flow is determined by dividing the present value of the cash flow by the price.

6
Data as on December 31, 2021Potential Risk Class (PRC) Matrix for Debt schemes
Sr. No Scheme Type of the scheme PRC matrix
14 L&T Short Term Bond Fund
An open ended short term debt scheme investing in instruments such that the Macaulay duration of the portfolio is between 1 year to 3 years (please refer to page no. 16 under the section “Asset Allocation Pattern” in the SID for details on Macaulay’s Duration)#. A moderate interest rate risk and moderate credit risk
Potential Risk Class
Credit Risk → RelativelyLow (Class A)
Moderate(Class B)
RelativelyHigh (Class C)Interest Rate
Risk ↓
Relatively Low(Class I)
Moderate(Class II) B-II
RelativelyHigh (Class III)
15 L&T Resurgent India Bond Fund
An open ended medium term debt scheme investing in instruments such that the Macaulay duration of the portfolio is between 3 years to 4 years (please refer to page no. 18 under the section “Asset Allocation Pattern” in the SID for details on Macaulay’s Duration)#. A relatively high interest rate risk and moderate credit risk.
Potential Risk Class
Credit Risk → RelativelyLow (Class A)
Moderate(Class B)
RelativelyHigh (Class C)Interest Rate
Risk ↓
Relatively Low(Class I)
Moderate(Class II)
RelativelyHigh (Class III)
B-III
16 L&T Credit Risk Fund
An open-ended debt scheme predominantly investing in AA and below rated corporate bonds (excluding AA+ rated corporate bonds). A relatively high interest rate risk and relatively high credit risk.
Potential Risk Class
Credit Risk → RelativelyLow (Class A)
Moderate(Class B)
RelativelyHigh (Class C)Interest Rate
Risk ↓
Relatively Low(Class I)
Moderate(Class II)
RelativelyHigh (Class III)
C-III
#The Macaulay duration is the weighted average term to maturity of the cash flows from a bond. The weight of each cash flow is determined by dividing the present value of the cash flow by the price.

7
Data as on December 31, 2021
CEO’s VIEW
KAILASH KULKARNI
CEO, L&T Mutual Fund
CEO Speak December 2021
Resilience and adoption to the new ways of working and living were the hallmarks of 2021. The raging second wave of the pandemic in India caused unimaginable human suffering, yet our collective resilience to move on sums up the indomitable spirit of humankind. While 2020 came as a shocker when the whole world went into lockdown, 2021 was the continuum of the pandemic. But this time around we also showed resilience in bouncing back when the situation calmed down. Industries and sectors found ways of working during the lockdown and those who couldn’t also get around to their businesses as soon as they were allowed to.
Markets created history by hitting one milestone after another in 2021. Among the frontline indices, the S&P BSE Sensex surpassed the magical 60,000 mark on September 24, 2021, while the Nifty50 surpassed the 18,000 mark on October 11, 2021. The Sensex rose 29.4% to hit a record high of 61,766 on October 18, 2021. The Nifty 50 index surged 32.2% to a lifetime high of 18,477. The Sensex returned almost 21% while Nifty returned 23% between January 1 and December 31, 2021.
The equity assets under management (AUM) increased at a two-year compounded annual rate of 25% to Rs 17.43 lakh crore as of November 30, 2021. The total folio count of the equity funds reached 7.8 crore of which 20% were added in the current year. Individuals constituted about 54.9% of the total mutual funds’ assets in November 2021 compared with 52.2% a year ago, the data from AMFI show.
The cumulative inflows from Systematic Investment Plans (SIPs) have crossed Rs 1 lakh crore in a year for the first time, data from the Association of Mutual Funds in India (AMFI) show.
This not only substantiates the faith and trust of the retail investors in the mutual funds but also has been largely possible because of the continuous efforts of our distributors who have been educating the investors and building confidence in these uncertain times.
We thank our investors and distributors for their continuous support through this dramatic and tough year.
When I said “new ways of working” early on, the increased participation from all the key stakeholders of the financial world is a glorious example of it. From banks and financial institutions who have put their might behind upgrading their systems to bring digital convenience to our investors , distributors who have adopted the digital ways of transactions and the investors who have embraced the digital ways of investing so beautifully.
We at L&T Mutual Fund believe in our strong investment philosophy which is further complemented by our internal processes and guidelines. We believe our funds have and will stand the test of challenging times as they are guided by fundamentals of objective-based investing, asset quality management and our quality of stock selection.
Season’s Greeting and New Year Wishes to you on behalf of the entire team at L&T Mutual Fund. We hope to continue partnering with you in your financial journey and thus achieve your life goals.
Stay Safe. Stay healthy.
Mutual Fund investments are subject to market risks, read all scheme related documents carefully.
Disclaimer – The article (including market views expressed herein) is for general information only and does not have regard to specific investment objectives, financial situation and the particular needs of any specific person who may receive this information. The article provides general information and comparisons made (if any) are only for illustration purposes. Investments in mutual funds and secondary markets inherently involve risks and the recipient should consult their legal, tax and financial advisors before investing. Recipients of this document should understand that statements made herein regarding future prospects may not be realized. Recipient should also understand that any reference to the indices/ sectors/ securities/ schemes etc. in the article is only for illustration purpose and are NOT stock recommendation(s) from the author or L&T Investment Management Limited, the asset management company of L&T Mutual Fund (“the Fund”) or any of its associates. Any performance information shown refers to the past and should not be seen as an indication of future returns. The value of investments and any income from them can go down as well as up. The distribution of the article in certain jurisdictions may be restricted or totally prohibited and accordingly, persons who come into possession of the article are required to inform themselves about, and to observe, any such restrictions.
Source: AMFI, BSE, NSE, Internal

8
Data as on December 31, 2021
GLOSSARYData as on June 30, 2020
GLOSSARY
SHARPE RATIOSharpe Ratio is a risk to reward ratio, it measures portfolio returns generated in excess to the investment in risk-free asset, for per unit of total risk taken. While, positive Sharpe ratio indicates, portfolio compensating investors with excess returns (over risk-free rate) for the commensurate risk taken; negative Sharpe ratio indicates, investors are better off investing in risk-free assets.
PORTFOLIO YIELD (YIELD TO MATURITY)Weighted average yield of the securities in scheme portfolio.
YTM is calculated considering the entire debt portfolio including accrued interest, investments in Cash component (TREPS/RREPO) and Net Receivable/Payable.
RISK FREE RETURNThe theoretical rate of return of an investment with safest (zero risk) investment in a country.
BETABeta (B) of a portfolio is a number indicating the relation between portfolio returns with that of the market index i.e. it measure the volatility, or systematic risk, of a portfolio in comparison to the market as a whole.
STANDARD DEVIATIONA statistical measure that defines expected volatility/risk associated with a portfolio. This explains the variation/deviation from the average returns delivered by the portfolio. A higher standard deviation means higher volatility (risk) and a lower standard deviation means lower volatility.
The Macaulay duration is the weighted average term to maturity of the cash flows from a bond. The weight of each cash flow is determined by dividing the present value of the cash flow by the price. It is a measure of how long it takes for the priceof a bond to be repaid by the cash flows from it.
MACAULAY DURATION
A formula that expresses the measurable change in the value of a security in response to a change in interest rates. Modified duration of portfolio can be used to anticipate the change in market value of portfolio for every change in portfolio yield.
MODIFIED DURATION
TRACKING ERRORTracking error indicates how closely the portfolio return is tracking the benchmark Index return. It measures the deviation between portfolio return and benchmark index return. A lower tracking error indicates portfolio closely tracking benchmark index and higher tracking error indicates portfolio returns with higher deviation from benchmark index returns.
TOTAL EXPENSE RATIOTotal expenses charged to scheme for the month expressed as a percentage to average monthly net assets.
AVERAGE MATURITYWeighted average maturity of the securities in scheme.
IDCWIDCW stands for ‘Income Distribution cum Capital Withdrawal option’. The amounts can be distributed out of investors’ capital (Equalization Reserve), which is part of the sale price that represents realized gains, as may be declared by the Trustees at its discretion from time to time (subject to the availability of distributable surplus as calculated in accordance with the Regulations).Refer our notice no. 55 and addendum no. 56 dated March 26, 2021 for details on IDCW.

9
Data as on December 31, 2021
HOW TO READ A FACTSHEET
FUND MANAGERAn employee of the asset management company such as a mutual fund or life insurer, who manages investments of the scheme. He is usually part of a larger team of fund managers and research analysts.
APPLICATION AMOUNT FOR FRESH SUBSCRIPTIONThis is the minimum investment amount for a new investor in a mutual fund scheme.
MINIMUM ADDITIONAL AMOUNTThis is the minimum investment amount for an existing investor in a mutual fund scheme.
YIELD TO MATURITYThe Yield to Maturity or the YTM is the rate of return anticipated on a bond if held until maturity. YTM is expressed as an annual rate. The YTM factors in the bond’s current market price, par value, coupon interest rate and time to maturity.
SIPSIP or systematic investment plan works on the principle of making periodic investments of a fixed sum. It works similar to a recurring bank deposit. For instance, an investor may opt for an SIP that invests Rs 500 every 15th of the month in an equity fund for a period of three years.
NAVThe NAV or the net asset value is the total asset value per unit of the mutual fund after deducting all related and permissible expenses. The NAV is calculated at the end of every business day. It is the value at which the investor enters or exits the mutual fund.
BENCHMARKA group of securities, usually a market index, whose performance is used as a standard or benchmark to measure investment performance of mutual funds, among other investments. Some typical benchmarks include the Nifty, Sensex, BSE200, BSE500, 10-Year Gsec.
EXIT LOADExit load is charged at the time an investor redeems the units of a mutual fund. The exit load is deducted from the prevailing NAV at the time of redemption. For instance, if the NAV is Rs. 100 and the exit load is 1 %, the redemption price would be Rs.99 per unit.
MODIFIED DURATIONModified duration is the price sensitivity and the percentage change in price for a unit change in yield.
STANDARD DEVIATIONStandard deviation is a statistical measure of the range of an investment’s performance. When a mutual fund has a high standard deviation, its means its range of performance is wide, implying greater volatility.
SHARPE RATIOThe Sharpe Ratio, named after its founder, the Nobel Laureate William Sharpe, is a measure of risk-adjusted returns. It is calculated using standard deviation and excess return to determine reward per unit of risk.
BETA RATIO (PORTFOLIO BETA)Beta is a measure of an investment’s volatility vis-a-vis the market. Beta of less than 1 means that the security will be less volatile than the market. A beta of greater than 1 implies that the security’s price will be more volatile than the market.
AVERAGE PORTFOLIO PE (AVERAGE P/E)It is price to earnings ratio of the stocks calculated for the entire portfolio on a weighted average basis.
AVERAGE PORTFOLIO PRICE TO BOOK RATIO (AVERAGE P/BV)It is price to book value of the stocks calculated for the entire portfolio on a weighted average basis.
AVERAGE PORTFOLIO IDCW YIELD (AVERAGE IDCW YIELD)It is IDCW yield of the stocks calculated for the entire portfolio on a weighted average basis.
NET EQUITYNet equity level is the net equity exposure percentage adjusted for any derivative positions in stocks or index for hedging or rebalancing purpose.
R SQUAREDIt is a statistical measure of how closely the portfolio returns are correlated with its benchmark.
AUMAUM or assets under management refers to the recent / updated cumulative market value of investments managed by a mutual fund or any investment firm.
HOLDINGSThe holdings or the portfolio is a mutual fund’s latest or updated reported statement of investments/securities. These are usually displayed in terms of percentage to net assets or the rupee value or both. The objective is to give investors an idea of where their money is being invested by the fund manager.
NATURE OF SCHEMEThe investment objective and underlying investments determine the nature of the mutual fund scheme. For instance, a mutual fund that aims at generating capital appreciation by investing in stock markets is an equity fund or growth fund. Likewise, a mutual fund that aims at capital preservation by investing in debt markets is a debt fund or income fund. Each of these categories may have sub-categories.
RATING PROFILEMutual funds invest in securities after evaluating their
IDCWIDCW stands for ‘Income Distribution cum Capital Withdrawal option’. The amounts can be distributed out of investors’ capital (Equalization Reserve), which is part ofthe sale price that represents realized gains, as may be declared by the Trustees at its discretion from time to time(subject to the availability of distributable surplus as calculated in accordance with the Regulations).Refer our notice no. 55 and addendum no. 56 dated March 26, 2021 for details on IDCW.
creditworthiness as disclosed by the ratings. A depiction of the mutual fund in various investments based on their ratings becomes the rating profile of the fund. Typically, this is a feature of debt funds.
10
Data as on December 31, 2021
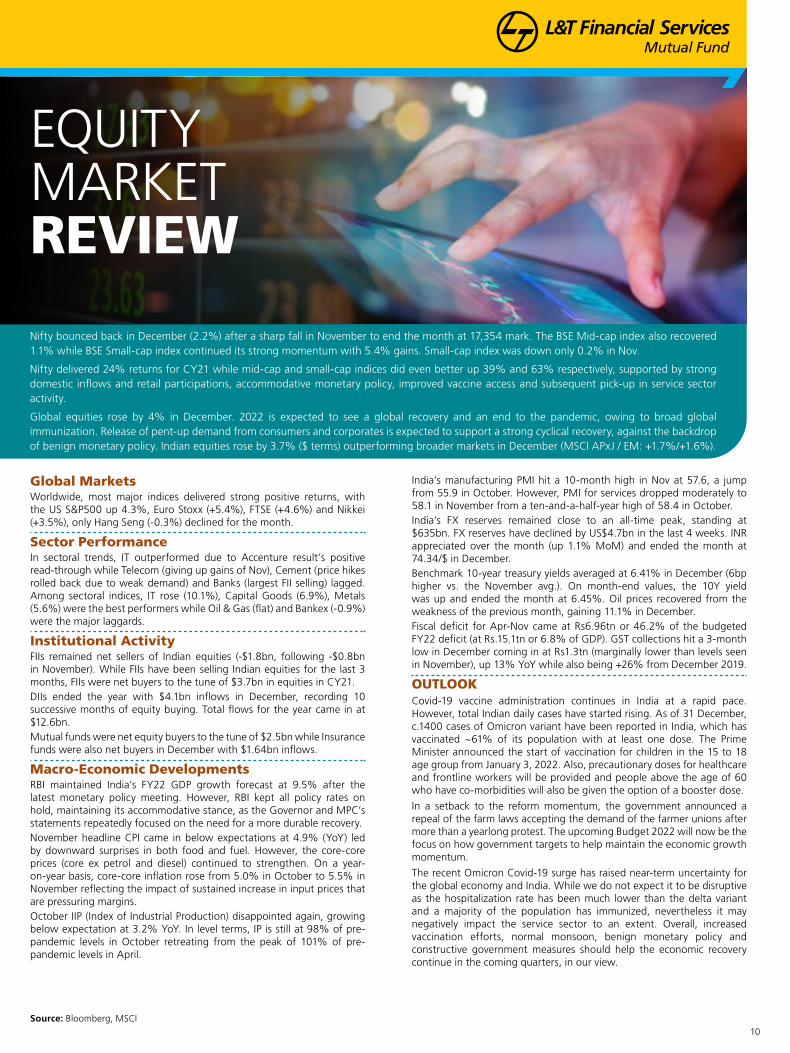
Source: Bloomberg, MSCI
Nifty bounced back in December (2.2%) after a sharp fall in November to end the month at 17,354 mark. The BSE Mid-cap index also recovered 1.1% while BSE Small-cap index continued its strong momentum with 5.4% gains. Small-cap index was down only 0.2% in Nov.
Nifty delivered 24% returns for CY21 while mid-cap and small-cap indices did even better up 39% and 63% respectively, supported by strong domestic inflows and retail participations, accommodative monetary policy, improved vaccine access and subsequent pick-up in service sector activity.
Global equities rose by 4% in December. 2022 is expected to see a global recovery and an end to the pandemic, owing to broad global immunization. Release of pent-up demand from consumers and corporates is expected to support a strong cyclical recovery, against the backdrop of benign monetary policy. Indian equities rose by 3.7% ($ terms) outperforming broader markets in December (MSCI APxJ / EM: +1.7%/+1.6%).
Global MarketsWorldwide, most major indices delivered strong positive returns, with the US S&P500 up 4.3%, Euro Stoxx (+5.4%), FTSE (+4.6%) and Nikkei (+3.5%), only Hang Seng (-0.3%) declined for the month.
Sector PerformanceIn sectoral trends, IT outperformed due to Accenture result’s positive read-through while Telecom (giving up gains of Nov), Cement (price hikes rolled back due to weak demand) and Banks (largest FII selling) lagged. Among sectoral indices, IT rose (10.1%), Capital Goods (6.9%), Metals (5.6%) were the best performers while Oil & Gas (flat) and Bankex (-0.9%) were the major laggards.
Institutional ActivityFIIs remained net sellers of Indian equities (-$1.8bn, following -$0.8bn in November). While FIIs have been selling Indian equities for the last 3 months, FIIs were net buyers to the tune of $3.7bn in equities in CY21. DIIs ended the year with $4.1bn inflows in December, recording 10 successive months of equity buying. Total flows for the year came in at $12.6bn. Mutual funds were net equity buyers to the tune of $2.5bn while Insurance funds were also net buyers in December with $1.64bn inflows.
Macro-Economic DevelopmentsRBI maintained India’s FY22 GDP growth forecast at 9.5% after the latest monetary policy meeting. However, RBI kept all policy rates on hold, maintaining its accommodative stance, as the Governor and MPC’s statements repeatedly focused on the need for a more durable recovery.November headline CPI came in below expectations at 4.9% (YoY) led by downward surprises in both food and fuel. However, the core-core prices (core ex petrol and diesel) continued to strengthen. On a year-on-year basis, core-core inflation rose from 5.0% in October to 5.5% in November reflecting the impact of sustained increase in input prices that are pressuring margins. October IIP (Index of Industrial Production) disappointed again, growing below expectation at 3.2% YoY. In level terms, IP is still at 98% of pre-pandemic levels in October retreating from the peak of 101% of pre-pandemic levels in April.
India’s manufacturing PMI hit a 10-month high in Nov at 57.6, a jump from 55.9 in October. However, PMI for services dropped moderately to 58.1 in November from a ten-and-a-half-year high of 58.4 in October. India’s FX reserves remained close to an all-time peak, standing at $635bn. FX reserves have declined by US$4.7bn in the last 4 weeks. INR appreciated over the month (up 1.1% MoM) and ended the month at 74.34/$ in December. Benchmark 10-year treasury yields averaged at 6.41% in December (6bp higher vs. the November avg.). On month-end values, the 10Y yield was up and ended the month at 6.45%. Oil prices recovered from the weakness of the previous month, gaining 11.1% in December. Fiscal deficit for Apr-Nov came at Rs6.96tn or 46.2% of the budgeted FY22 deficit (at Rs.15.1tn or 6.8% of GDP). GST collections hit a 3-month low in December coming in at Rs1.3tn (marginally lower than levels seen in November), up 13% YoY while also being +26% from December 2019.
OUTLOOKCovid-19 vaccine administration continues in India at a rapid pace. However, total Indian daily cases have started rising. As of 31 December, c.1400 cases of Omicron variant have been reported in India, which has vaccinated ~61% of its population with at least one dose. The Prime Minister announced the start of vaccination for children in the 15 to 18 age group from January 3, 2022. Also, precautionary doses for healthcare and frontline workers will be provided and people above the age of 60 who have co-morbidities will also be given the option of a booster dose.
In a setback to the reform momentum, the government announced a repeal of the farm laws accepting the demand of the farmer unions after more than a yearlong protest. The upcoming Budget 2022 will now be the focus on how government targets to help maintain the economic growth momentum.
The recent Omicron Covid-19 surge has raised near-term uncertainty for the global economy and India. While we do not expect it to be disruptive as the hospitalization rate has been much lower than the delta variant and a majority of the population has immunized, nevertheless it may negatively impact the service sector to an extent. Overall, increased vaccination efforts, normal monsoon, benign monetary policy and constructive government measures should help the economic recovery continue in the coming quarters, in our view.
EQUITYMARKETREVIEW

11
Data as on December 31, 2021
Note: L&T Investment Management Limited and the content providers of this article shall not be liable for any errors in the content or for any actions taken in reliance thereon. The recipient should note that the views expressed above are solely the views of L&T Investment Management Limited and/or its Fund Managers and it should not be construed as a recommendation to buy or sell any securities/stocks in any sectors. The article (including market views expressed herein) is for general information only and does not have regard to specific investment objectives, financial situation and the particular needs of any specific person who may receive this information. Investments in mutual funds and secondary markets inherently involve risks and recipient should consult their legal, tax and financial advisors before investing.
Source: MOSPI, Internal, Bloomberg
RECAP OF THE YEAR GONE BY..
As the world moved into the second year of the pandemic, Governments and Central Banks globally faced the challenge of reviving the dwindling growth on one hand, while keeping inflation in check. Growth took center stage while inflation took a back seat. While Governments provided the quintessential impetus to growth through fiscal stimulus, Central Banks complemented through accommodative policies by providing surplus liquidity and absorbing bond supply through monetary policy tools. Easing of restrictions, progress on vaccination and pick up in spending resulted in a rebound in growth.
However, as the year progressed and economic activity picked up, inflationary pressures which earlier seemed transitory in nature turned out to be more entrenched. Supply side bottlenecks and soaring commodity prices added to concerns. Although resurgence in infections across the world has emerged as a threat to global recovery, various Central Banks are now pushed to act to stem the spiraling inflation. The eventual impact of recent outbreaks might be seen over the next few months
The past year has been fairly volatile across asset classes, both globally and from a domestic perspective. Equity markets scaled new highs across various economies, however, threats around newer variants of the virus denting economic growth resulted in periods of correction. Commodity prices have seen a surge this year. Recovery in manufacturing activity and rising supply bottlenecks pushed metal prices higher before seeing some softening. Crude prices have remained elevated on improving demand conditions and have in turn fed into inflation for major oil-importing nations. Bond yields which had remained benign in the earlier part of the year, edged up higher as inflation pressures prompted various Central Banks to commence exiting from ultra-easy monetary policy stance.
On the domestic front, with a pick-up in external demand, exports have remained buoyant. Imports also rebounded sharply on the back of the revival of domestic demand and higher Crude prices. Recent PMI prints have also been encouraging. Fiscal deficit for Apr-Oct 2021 is at 36.3% of Budget estimates (FY2022) on the back of robust tax collections. However, Government spending is expected to pick up. The recent supplementary demand for grants might put some pressure on the budgeted fiscal deficit. On the other hand, timely progress and completion of bond index inclusion will provide a positive sentiment in an otherwise cautious market environment. The Centre reduced the excise duty on petrol and diesel in November. Although this is marginally negative from a fiscal perspective, buoyant tax collections would most likely render the impact redundant. Excise cut augurs well from an inflation perspective, though an increase in telecom tariffs could possibly offset the positive impact.
RBI has used G-Sec Acquisition Programme (“G-SAP”) as an effective tool to absorb part of the large supply of Government bonds and to anchor yield expectations. Liquidity has remained surplus to facilitate a conducive financial environment for economic recovery. Over the last few months, RBI has deployed Variable Rate Reverse Repo (“VRRR”) auctions as the primary tool for liquidity management. Multiple tenor VRRR auctions have been conducted to push short-term rates higher. This will most likely be followed by a hike in the Reverse Repo rate, followed by a shift of accommodative stance to neutral and eventual hike in the Repo rate. However, RBI has been careful in guiding markets that the overall lift-off process will be gradual and non-disruptive.
EXPECTATIONS FROM 2022
As we head into 2022, the world is dominated by the rapid spread of the Omicron variant. While the numbers are mindboggling, the relatively muted impact of the virus on health gives enough reason for the hope that this too shall pass. If this trend holds up over the coming few months, central banks globally may remain focused on their path of gradual policy normalisation, liquidity absorption and rate hikes, which should keep yields inching higher.
• As markets become comfortable that growth will hold up despite these moves, we expect the longer end of DM yield curves to move up more rapidly than they have done so far.
Closer home - with RBI clearly indicating that they are in no hurry to take away monetary support prematurely, the decision to shift stance from accommodative to neutral may be delayed by a few months.
• The first priority remains to narrow the LAF corridor to 25bps, which should happen by April, instead of February as expected earlier. If by that time, we are past the Omicron hump (hopefully with no other new variants to deal with), the RBI is expected to shift to a more balanced approach between supporting growth and controlling inflation.
• We expect inflation, especially core, to remain in uncomfortable territory, which should push the MPC to shift stance to neutral by the middle of the year and hike repo rates by atleast 50bps in CY22, a scenario already priced in by the short to medium end of the yield curve.
• With a rising current account deficit and volatile global flows environment, maintaining policy credibility with regard to flexible inflation targeting becomes that much more crucial and may force RBI to focus on policy normalisation somewhat faster than currently telegraphed.
The trickier question is about the longer end of the curve, which so far has been controlled closely by RBI actions.
• With liquidity already in huge surplus, the central bank’s ability to do outright OMO purchases would be limited and the demand-supply mismatch would lead to markets pushing yields higher to check the RBI’s resolve on this issue. Timely announcement of India’s inclusion in the global bond index can help prevent some of the damage.
• We expect the 10-year G-Sec benchmark to gravitate towards the 6.75-7% zone through the course of the year.
• Credit spreads remain very low, as supply has underwhelmed the liquidity- driven demand for bonds. Expect this to change, as issuance gradually picks up and spreads widen towards historical ranges.
Accordingly, we would continue to be somewhat cautious in the positioning of our funds and advise investors to do the same. Carry is indeed attractive for going longer on the yield curve – however, it needs to be clearly synchronised with the investment horizon of investors.
While Covid worries are likely to wax and wane over the coming months and quarters, leading to high levels of uncertainty around future projections of growth and inflation, the RBI has clearly communicated that future policy normalisation would be gradual, well-calibrated and telegraphed, which should provide debt investors with much needed comfort against any abrupt sharp movements of interest rates, in our view.
DEBTMARKETREVIEW

12
Data as on December 31, 2021
Flexicap Fund
L&T FLEXICAP FUND
To generate long-term capital growth from a diversified portfolio of predominantly equity and equity-related securities. There is no assurance that the investment objective of the scheme will be realized.
Aims to capitalize on investment opportunities across the market spectrum
Focus on fundamentals: Quality and scalability of business, Management and Valuation
Looking to own companies with relatively strong balance sheets & attractive ratios
Individual stock weight is a function of fundamentals, valuation, market sentiment and conviction
INVESTMENT OBJECTIVE
FUND DETAILS
Date of Inception
Regular Plan Direct Plan
May 16, 2005 January 01, 2013
Portfolio Turnover
0.1740 times
Fund Manager
Mr. Vihang Naik & Mr. Venugopal Manghat (w.e.f. Dec 17, 2019)~
Benchmark
S&P BSE-500 TRI Index
Month end AUM
2,936.09 (` In Crs)
Monthly Average AUM
2,925.27 (` In Crs)
Volatility Measures*
Standard Deviation 21.28%
R-Squared 0.98
Beta 0.96
Sharpe Ratio# 0.54
*Source: ICRA MFIE #Risk free rate assumed to be 3.08% (based on 3-months Mibor NSE rate during last 3 months)
Options
Growth and IDCW. The IDCW Option offers Payout and Reinvestment facilities.
PORTFOLIO ALLOCATION
Name of Instrument % to Net Assets
EQUITY & EQUITY RELATEDListed/Awaiting Listing on the Stock ExchangesBanks
ICICI Bank Limited 5.44%HDFC Bank Limited 4.73%Kotak Mahindra Bank Limited 3.57%
State Bank of India 2.13%Canara Bank 1.20%Indian Bank 0.62%Punjab National Bank 0.26%Software
Infosys Limited 4.95%Tata Consultancy Services Limited 4.74%HCL Technologies Limited 2.84%
MphasiS Limited 2.36%Oracle Financial Services Software Limited 0.60%
PharmaceuticalsDishman Carbogen Amcis Limited 3.12%
Sanofi India Limited 1.82%Pfizer Limited 1.56%Dr. Reddy's Laboratories Limited 1.45%Sun Pharmaceutical Industries Limited 1.40%
Divi's Laboratories Limited 0.46%Finance
Housing Development Finance Corporation Limited 4.13%
Muthoot Finance Limited 2.28%Bajaj Holdings & Investment Limited 1.55%Cholamandalam Investment and Finance Company Limited 1.25%
Can Fin Homes Limited 0.43%IIFL Finance Limited 0.12%Consumer Non DurablesEmami Limited 1.88%Hindustan Unilever Limited 1.81%ITC Limited 1.29%Varun Beverages Limited 0.75%Balrampur Chini Mills Limited 0.64%Petroleum Products
Reliance Industries Limited 5.14%Hindustan Petroleum Corporation Limited 0.91%
AutoTata Motors Limited 2.62%Maruti Suzuki India Limited 1.36%Mahindra & Mahindra Limited 0.49%Cement & Cement ProductsThe Ramco Cements Limited 2.78%
Name of Instrument % to Net Assets
UltraTech Cement Limited 1.18%Retailing
Avenue Supermarts Limited 3.85%ConstructionAshoka Buildcon Limited 1.95%Mahindra Lifespace Developers Limited 1.22%
KNR Constructions Limited 0.50%Industrial ProductsSupreme Industries Limited 1.50%Finolex Cables Limited 1.36%AIA Engineering Limited 0.28%Construction ProjectLarsen & Toubro Limited 2.57%Techno Electric & Engineering Company Limited 0.25%
Ferrous MetalsJSW Steel Limited 1.07%Tata Steel Limited 0.82%Maharashtra Seamless Limited 0.80%Telecom - ServicesBharti Airtel Limited 2.62%Auto AncillariesTube Investment of India Limited 2.28%TransportationContainer Corporation of India Limited 0.81%
Aegis Logistics Limited 0.46%OilOil India Limited 1.11%PaperWest Coast Paper Mills Limited 0.66%Industrial Capital GoodsApar Industries Limited 0.64%GasGAIL India Limited 0.54%Total 99.15%PREFERENCE SHARESListed / Awaiting listing on Stock ExchangesEntertainmentZee Entertainment Enterprises Limited 0.01%Total 0.01%OTHERS(a) Tri Party Repo Dealing System (TREPS) 1.29%
(b) Net Receivables/(Payables) -0.45%Net Assets 100.00%Total number of holdings 58
Indicates top ten instruments
~For investments in foreign securities - Mr. Sonal Gupta (w.e.f July 5, 2021) Exit Load: If the units redeemed or switched out are upto 10% of the units purchased or switched in (“the limit”) within 1 year from the date of allotment – Nil. If units redeemed or switched out are over and above the limit within 1 year from the date of allotment – 1%. If units are redeemed or switched out on or after 1 year from the date of allotment – Nil.-With effect from February 9, 2021, due to change in the fundamental attributes like asset allocation, investment pattern, categorization etc. L&T Equity Fund shall be re-named as L&T Flexicap Fund and shall be categorised as Flexicap Fund.For details of the change please refer Notice dated Jan 5, 2021.
TOP 10 INDUSTRYBanksSoftwarePharmaceuticalsFinanceConsumer Non DurablesPetroleum ProductsAutoCement & Cement ProductsRetailingConstructionOthers
17.95%
15.49%
9.81%
9.76%
6.37%
6.05%
4.47%
3.96%
3.85%
3.67%
17.78%

13
Data as on December 31, 2021
PORTFOLIO ALLOCATION
Name of Instrument % to Net Assets
Consumer Durables Titan Company Limited 2.57%
Voltas Limited 0.75%RetailingAvenue Supermarts Limited 1.16%Zomato Limited 0.77%FSN E-Commerce Ventures Limited (Nykaa) 0.53%
Go Fashion (India) Limited 0.49%AutoTata Motors Limited 1.85%Mahindra & Mahindra Limited 1.03%Consumer Non DurablesAsian Paints Limited 1.55%Tata Consumer Products Limited 0.95%Varun Beverages Limited 0.19%Leisure ServicesIndian Hotels Company Limited 2.30%Jubilant Foodworks Limited 0.04%ConstructionDLF Limited 1.46%Sobha Limited 0.37%Godrej Properties Limited 0.13%InsuranceBajaj Finserv Limited 1.75%EntertainmentZee Entertainment Enterprises Limited 1.53%
PowerTata Power Company Limited 1.36%Industrial ProductsPolycab India Limited 1.23%Capital MarketsComputer Age Management Services Limited 0.74%
UTI Asset Management Company Limited 0.42%
Industrial Capital GoodsHoneywell Automation India Limited 0.71%Total 99.16%PREFERENCE SHARESListed / Awaiting listing on Stock ExchangesEntertainmentZee Entertainment Enterprises Limited 0.01%
Total 0.01%OTHERS(a) Tri Party Repo Dealing System (TREPS) 0.89%
(b) Net Receivables/(Payables) -0.06%Net Assets 100.00%Total number of holdings 61
Name of Instrument % to Net Assets
EQUITY & EQUITY RELATEDListed/Awaiting Listing on the Stock ExchangesSoftware
Infosys Limited 6.66% Persistent Systems Limited 2.68%Wipro Limited 2.48%
Coforge Limited 2.21%Larsen & Toubro Infotech Limited 1.53%Tata Consultancy Services Limited 1.50%KPIT Technologies Limited 1.50%MindTree Limited 0.84%C.E. Info Systems Limited 0.55%Route Mobile Limited 0.40%Tech Mahindra Limited 0.25%Banks
ICICI Bank Limited 6.91%HDFC Bank Limited 2.84%
State Bank of India 2.47%Kotak Mahindra Bank Limited 1.94%Axis Bank Limited 1.00%Petroleum Products
Reliance Industries Limited 6.73%Auto AncillariesMinda Industries Limited 2.34%Sona BLW Precision Forgings Limited 1.96%Motherson Sumi Systems Limited 1.69%ChemicalsSRF Limited 1.90%Clean Science and Technology Limited 1.72%
Navin Fluorine International Limited 1.19%Tata Chemicals Limited 0.87%Cement & Cement Products
UltraTech Cement Limited 3.23%Dalmia Bharat Limited 1.44%Birla Corporation Limited 0.94%Finance
Bajaj Finance Limited 3.13%Housing Development Finance Corporation Limited 1.11%
Cholamandalam Investment and Finance Company Limited 1.03%
PharmaceuticalsGland Pharma Limited 1.53%Divi's Laboratories Limited 1.39%J.B. Chemicals & Pharmaceuticals Limited 0.59%
Healthcare ServicesMax Healthcare Institute Limited 1.81%Apollo Hospitals Enterprise Limited 1.56%Textile Products
K.P.R. Mill Limited 3.00%Page Industries Limited 0.36%
Indicates top ten instruments
ELSS Fund
L&T TAX ADVANTAGE FUND
To generate long-term capital growth from a diversified portfolio of predominantly equity and equity-related securities. There is no assurance that the investment objective of the scheme will be realized.
An open-ended ELSS fund with a flexible, go-anywhere approach
Well-diversified portfolio; Bottom-up investment approach
Focus on fundamentals: quality and scalability of business, management and valuation
3-year lock-in helps the fund manager take positions in stocks with longer term return potential
INVESTMENT OBJECTIVE
FUND DETAILS PORTFOLIO ALLOCATION
Date of Inception
Regular Plan Direct Plan
February 27, 2006 January 01, 2013
Portfolio Turnover
1.1459 times
Fund Manager
Ms. Cheenu Gupta (w.e.f. July 02, 2021) & Mr. Vihang Naik (w.e.f. Dec 17, 2019)
Benchmark
S&P BSE 500 TRI
Month end AUM
3,574.93 (` In Crs)
Monthly Average AUM
3,497.69 (` In Crs)
Volatility Measures*
Standard Deviation 21.99%
R-Squared 0.94
Beta 0.99
Sharpe Ratio# 0.57
*Source: ICRA MFIE #Risk free rate assumed to be 3.08% (based on 3-months Mibor NSE rate during last 3 months)
Options
Growth and IDCW. The IDCW Option offers Payout.
Exit Load: Nil. For details of the performance of the schemes, please refer page nos 48 to 51. For product label please refer Page 3 & 4 of the factsheet.The Fund was co-managed by Mr. Venugopal Manghat till July 1, 2021.
TOP 10 INDUSTRYSoftwareBanksPetroleum ProductsAuto AncillariesChemicalsCement & Cement ProductsFinancePharmaceuticalsHealthcare ServicesTextile ProductsOthers
20.60%
15.16%
6.73%
5.99%5.68%
5.61%
5.27%
3.51%
3.37%
3.36%
23.89%

14
Data as on December 31, 2021
Large and Midcap Fund
L&T LARGE AND MIDCAP FUND
To generate long-term capital growth from a diversified portfolio of predominantly equity and equity-related securities with minimum allocation of at least 35% each to large cap and mid cap companies. There is no assurance that the investment objective of the scheme will be realized.
The fund invests in Midcaps and Large caps as per the mandate of the categorization
The large cap is expected to reduce volatility of the portfolio with exposure to mature and stable companies
Meanwhile exposure to midcap is with the expectation that it will fuel the growth prospects
A fund with exposure to blend of growth and potential stability
INVESTMENT OBJECTIVE
FUND DETAILS PORTFOLIO ALLOCATION
Date of Inception
Regular Plan Direct Plan
May 22, 2006 January 01, 2013
Portfolio Turnover
1.3751 times
Fund Manager
Ms. Cheenu Gupta (w.e.f. July 02, 2021) & Mr. Vihang Naik (w.e.f. Dec 17, 2019)~
Benchmark
NIFTY LargeMidcap 250 TRI
Month end AUM
1,537.86 (` In Crs)
Monthly Average AUM
1,497.48 (` In Crs)
Volatility Measures*
Standard Deviation 20.39%
R-Squared 0.91
Beta 0.85
Sharpe Ratio# 0.67
*Source: ICRA MFIE #Risk free rate assumed to be 3.08% (based on 3-months Mibor NSE rate during last 3 months)
Options
Growth and IDCW. The IDCW Option offers Payout and Reinvestment facilities.
~For investments in foreign securities - Mr. Sonal Gupta (w.e.f July 5, 2021) Exit Load:If the units redeemed or switched out are upto 10% of the units purchased or switched in (“the limit”) within 1 year from the date of allotment – Nil. If units redeemed or switched out are over and above the limit within 1 year from the date of allotment – 1%. If units are redeemed or switched out on or after 1 year from the date of allotment – Nil. For details of the performance of the schemes, please refer page nos 48 to 51.For product label please refer Page 3 & 4 of the factsheet.The Fund was co-managed by Mr. Venugopal Manghat till July 1, 2021.
Name of Instrument % to Net Assets
EQUITY & EQUITY RELATEDListed/Awaiting Listing on the Stock ExchangesSoftware
Infosys Limited 3.96%Persistent Systems Limited 3.32%Coforge Limited 2.80%MphasiS Limited 2.64%
Wipro Limited 2.11%MindTree Limited 1.48%L&T Technology Services Limited 1.23%C.E. Info Systems Limited 0.72%Tata Consultancy Services Limited 0.67%Route Mobile Limited 0.59%Larsen & Toubro Infotech Limited 0.52%Banks
ICICI Bank Limited 5.35%Kotak Mahindra Bank Limited 1.56%HDFC Bank Limited 1.33%State Bank of India 1.22%Axis Bank Limited 0.39%Chemicals
SRF Limited 2.91%Clean Science and Technology Limited 2.02%Tata Chemicals Limited 1.05%Navin Fluorine International Limited 0.91%Neogen Chemicals Limited 0.53%Auto Ancillaries
Minda Industries Limited 3.15%Sona BLW Precision Forgings Limited 2.15%WABCO India Limited 1.38%Motherson Sumi Systems Limited 0.73%Cement & Cement ProductsUltraTech Cement Limited 2.41%Birla Corporation Limited 1.38%Dalmia Bharat Limited 1.26%JK Cement Limited 0.88%Consumer DurablesTitan Company Limited 2.29%Voltas Limited 1.48%Century Plyboards (India) Limited 1.04%Dixon Technologies (India) Limited 0.73%Finance
Bajaj Finance Limited 3.02%Cholamandalam Investment and Finance Company Limited 1.84%
Housing Development Finance Corporation Limited 0.43%
Petroleum ProductsReliance Industries Limited 4.52%
RetailingFSN E-Commerce Ventures Limited (Nykaa) 1.82%
Name of Instrument % to Net Assets
Avenue Supermarts Limited 0.83%Go Fashion (India) Limited 0.70%Zomato Limited 0.49%Healthcare ServicesMax Healthcare Institute Limited 2.14%Apollo Hospitals Enterprise Limited 1.48%PharmaceuticalsGland Pharma Limited 1.71%Divi's Laboratories Limited 1.31%Leisure Services
Indian Hotels Company Limited 2.83%ConstructionSobha Limited 1.52%Phoenix Mills Limited 1.28%AutoTata Motors Limited 1.95%Mahindra & Mahindra Limited 0.77%PowerTata Power Company Limited 1.99%Industrial Capital GoodsHoneywell Automation India Limited 1.78%EntertainmentZee Entertainment Enterprises Limited 1.73%Consumer Non DurablesAsian Paints Limited 1.03%Varun Beverages Limited 0.68%Industrial ProductsPolycab India Limited 1.31%Schaeffler India Limited 0.39%InsuranceBajaj Finserv Limited 1.68%Capital MarketsComputer Age Management Services Limited 0.76%
UTI Asset Management Company Limited 0.36%
Textile ProductsPage Industries Limited 1.04%Ferrous MetalsAPL Apollo Tubes Limited 0.91%TransportationVRL Logistics Limited 0.63%Total 99.12%OTHERS(a) Tri Party Repo Dealing System (TREPS) 0.98%
(b) Net Receivables/(Payables) -0.10%Net Assets 100.00%Total number of holdings 63
Indicates top ten instruments
TOP 10 INDUSTRYSoftwareBanksChemicalsAuto AncillariesCement & Cement ProductsConsumer DurablesFinancePetroleum ProductsRetailingHealthcare ServicesOthers
20.04%
9.85%
7.42%
7.41%
5.93%5.54%
5.29%
4.52%
3.84%
3.62%
25.66%

15
Data as on December 31, 2021
Sectoral Fund
L&T INFRASTRUCTURE FUND
To generate capital appreciation by investing predominantly in equity and equity related instruments of companies in the infrastructure sector. There is no assurance that the investment objective of the scheme will be realized.
Provides opportunity to benefit from participation in India’s structural infrastructure growth
Potential to deliver higher returns, although with relatively higher risk
A product with potential to generate significant alpha, especially during economic recovery
A product with a minimum investment horizon of 5 years
INVESTMENT OBJECTIVE
FUND DETAILS PORTFOLIO ALLOCATION
Date of Inception
Regular Plan Direct Plan
September 27, 2007 January 01, 2013
Portfolio Turnover
0.1369 times
Fund Manager
Mr. Venugopal Manghat (w.e.f. Dec 17, 2019) & Ms. Cheenu Gupta (w.e.f. July 02, 2021)
Benchmark
Nifty Infrastructure TRI Index
Month end AUM
1,382.58 (` In Crs)
Monthly Average AUM
1,362.53 (` In Crs)
Volatility Measures*
Standard Deviation 25.56%
R-Squared 0.84
Beta 1.02
Sharpe Ratio# 0.48
*Source: ICRA MFIE #Risk free rate assumed to be 3.08% (based on 3-months Mibor NSE rate during last 3 months)
Options
Growth and IDCW. The IDCW option offers IDCW Payout and IDCW Reinvestment facilities.
Exit Load: If the units redeemed or switched out are upto 10% of the units purchased or switched in (“the limit”) within 1 year from the date of allotment – Nil. If units redeemed or switched out are over and above the limit within 1 year from the date of allotment – 1%. If units are redeemed or switched out on or after 1 year from the date of allotment – Nil.For details of the performance of the schemes, please refer page nos 48 to 51.For product label please refer Page 3 & 4 of the factsheet.The Fund was co-managed by Mr. Vihang Naik till July 1, 2021.
Name of Instrument % to Net Assets
Oberoi Realty Limited 0.71%KNR Constructions Limited 0.42%Petroleum Products
Reliance Industries Limited 4.60%TransportationVRL Logistics Limited 2.26%Gujarat Pipavav Port Limited 1.28%Aegis Logistics Limited 0.68%PowerTata Power Company Limited 2.51%KEC International Limited 1.50%Aerospace & Defense
Bharat Electronics Limited 3.49%Telecom - Services
Bharti Airtel Limited 3.31%Consumer DurablesVoltas Limited 1.75%Dixon Technologies (India) Limited 0.50%PaperCentury Textiles & Industries Limited 2.07%Non - Ferrous MetalsHindalco Industries Limited 1.44%Ferrous MetalsTata Steel Limited 0.90%GasGAIL India Limited 0.70%OilOil & Natural Gas Corporation Limited 0.43%
Total 99.46%OTHERS(a) Tri Party Repo Dealing System (TREPS) 0.65%
(b) Net Receivables/(Payables) -0.11%Net Assets 100.00%Total number of holdings 48
Indicates top ten instruments
TOP 10 INDUSTRYIndustrial ProductsCement & Cement ProductsIndustrial Capital GoodsConstruction ProjectConstructionPetroleum ProductsTransportationPowerAerospace & DefenseTelecom - ServicesOthers
17.45%
16.88%
16.68%
13.46%
7.57%
4.60%
4.22%
4.01%
3.49%
3.31%
7.79%
Name of Instrument % to Net Assets
EQUITY & EQUITY RELATEDListed/Awaiting Listing on the Stock ExchangesIndustrial Products
Grindwell Norton Limited 5.51%Carborundum Universal Limited 3.44%
Polycab India Limited 2.93%Finolex Cables Limited 2.04%RHI Magnesita India Limited 1.85%Cummins India Limited 0.94%Timken India Limited 0.39%AIA Engineering Limited 0.35%Cement & Cement Products
The Ramco Cements Limited 5.66%UltraTech Cement Limited 4.28%Grasim Industries Limited 2.98%
Birla Corporation Limited 2.78%Shree Cements Limited 0.75%ACC Limited 0.43%Industrial Capital Goods
ABB India Limited 3.81%Honeywell Automation India Limited 2.77%Kennametal India Limited 2.67%Isgec Heavy Engineering Limited 1.95%Apar Industries Limited 1.41%BEML Limited 1.25%Thermax Limited 1.08%Siemens Limited 0.91%Indian Hume Pipe Company Limited 0.81%Mazagon Dock Shipbuilders Limited 0.02%Construction Project
Larsen & Toubro Limited 10.07%H.G Infra Engineering Limited 2.73%Techno Electric & Engineering Company Limited 0.66%
ConstructionBrigade Enterprises Limited 2.49%Godrej Properties Limited 2.30%PNC Infratech Limited 1.65%

16
Data as on December 31, 2021
Large Cap Fund
L&T INDIA LARGE CAP FUND
To generate long-term capital appreciation from a diversified portfolio of predominantly equity and equity related securities, including equity derivatives, in the Indian markets. The Scheme will predominantly invest in large cap stocks. The Scheme could also additionally invest in Foreign Securities. There is no assurance that the investment objective of the scheme will be realized.
Invests predominantly in large cap companies
Focus on fundamentals: Quality and scalability of business, Management and Valuation
Looking to own companies with strong balance sheets and strong cash flows
Individual stock weight is a function of fundamentals, valuation, market sentiment and conviction
INVESTMENT OBJECTIVE
FUND DETAILS PORTFOLIO ALLOCATION
Date of Inception
Regular Plan Direct Plan
October 23, 2007 January 01, 2013
Portfolio Turnover
0.3567 times
Fund Manager
Mr. Venugopal Manghat (w.e.f. Nov 24, 2012) & Ms. Cheenu Gupta (w.e.f. July 02, 2021) ~
Benchmark
S&P BSE 100 TRI Index
Month end AUM
729.73 (` In Crs)
Monthly Average AUM
721.30 (` In Crs)
Volatility Measures*
Standard Deviation 20.60%
R-Squared 0.98
Beta 0.95
Sharpe Ratio# 0.67
*Source: ICRA MFIE #Risk free rate assumed to be 3.08% (based on 3-months Mibor NSE rate during last 3 months)
Options
Growth and IDCW. The IDCW option offers IDCW Payout and IDCW Reinvestment facilities.
~For investments in foreign securities - Mr. Sonal Gupta (w.e.f July 5, 2021) Exit Load: If the units redeemed or switched out are upto 10% of the units purchased or switched in (“the limit”) within 1 year from the date of allotment – Nil. If units redeemed or switched out are over and above the limit within 1 year from the date of allotment – 1%. If units are redeemed or switched out on or after 1 year from the date of allotment – Nil. For details of the performance of the schemes, please refer page nos 48 to 51.For product label please refer Page 3 & 4 of the factsheet.The Fund was co-managed by Mr. Vihang Naik till July 1, 2021.
Name of Instrument Rating % to Net Assets
EQUITY & EQUITY RELATED
Listed/Awaiting Listing on the Stock ExchangesBanks
ICICI Bank Limited 8.68%HDFC Bank Limited 7.25%State Bank of India 4.45%
Axis Bank Limited 1.68%Kotak Mahindra Bank Limited 1.54%Software
Infosys Limited 7.93%Tata Consultancy Services Limited 3.77%HCL Technologies Limited 3.15%
Tech Mahindra Limited 2.56%Wipro Limited 1.51%Petroleum Products
Reliance Industries Limited 7.49%FinanceHousing Development Finance Corporation Limited 2.63%
Bajaj Finance Limited 2.27%SBI Cards and Payment Services Limited 0.71%Cholamandalam Investment and Finance Company Limited 0.69%
Cement & Cement ProductsUltraTech Cement Limited 3.25%
Shree Cements Limited 0.94%Dalmia Bharat Limited 0.89%The Ramco Cements Limited 0.55%Pharmaceuticals
Sun Pharmaceutical Industries Limited 3.37%Divi's Laboratories Limited 1.97%Consumer Non DurablesITC Limited 1.47%Hindustan Unilever Limited 1.39%Asian Paints Limited 0.71%Tata Consumer Products Limited 0.49%Godrej Consumer Products Limited 0.46%Dabur India Limited 0.36%Construction Project
Larsen & Toubro Limited 3.57%AutoMahindra & Mahindra Limited 1.14%Escorts Limited 1.12%Maruti Suzuki India Limited 0.61%Telecom - ServicesBharti Airtel Limited 2.82%InsuranceSBI Life Insurance Company Limited 1.92%
Name of Instrument Rating % to Net Assets
Bajaj Finserv Limited 0.58%ChemicalsSRF Limited 2.24%RetailingAvenue Supermarts Limited 1.34%Trent Limited 0.59%ConstructionGodrej Properties Limited 1.35%Industrial Capital GoodsABB India Limited 1.34%Leisure ServicesJubilant Foodworks Limited 1.25%Consumer DurablesTitan Company Limited 1.18%TransportationContainer Corporation of India Limited 1.10%Aerospace & DefenseBharat Electronics Limited 1.03%Non - Ferrous MetalsHindalco Industries Limited 1.03%Healthcare ServicesApollo Hospitals Enterprise Limited 1.01%Ferrous MetalsTata Steel Limited 0.75%Auto AncillariesJamna Auto Industries Limited 0.59%GasIndraprastha Gas Limited 0.51%EntertainmentZee Entertainment Enterprises Limited 0.46%Total 99.69%PREFERENCE SHARESListed / Awaiting listing on Stock ExchangesEntertainmentZee Entertainment Enterprises Limited 0.02%Total 0.02%BONDS & NCDsListed / awaiting listing on the stock exchanges
Britannia Industries Limited CRISIL AAA ^
Total - OTHERS(a) Tri Party Repo Dealing System (TREPS) 0.75%
(b) Net Receivables/(Payables) -0.46%Net Assets 100.00%Total number of holdings 51
Indicates top ten instruments^ Indicates less than 0.01%
TOP 10 INDUSTRYBanksSoftwarePetroleum ProductsFinanceCement & Cement ProductsPharmaceuticalsConsumer Non DurablesConstruction ProjectAutoTelecom - ServicesOthers
23.60%
18.92%
7.49%
6.30%
5.63%
5.34%
4.88%
3.57%
2.87%
2.82%
18.29%

17
Data as on December 31, 2021
Value Fund
L&T INDIA VALUE FUND
To generate long-term capital appreciation from diversified portfolio of predominantly equity and equity related securities, in the Indian markets with higher focus on undervalued securities. The Scheme could also additionally invest in Foreign Securities in international markets. There is no assurance that the investment objective of the scheme will be realized.
Diversified equity fund with strong value bias that aims to deliver long term superior risk adjusted returns
Focus on identifying valuation anomalies versus the economic potential of a business over the medium term
Aims to minimize portfolio risk by investing in quality companies, monitoring corporate fundamentals closely
No sector/market cap bias
INVESTMENT OBJECTIVE
FUND DETAILS PORTFOLIO ALLOCATION
Date of Inception
Regular Plan Direct Plan
January 08, 2010 January 01, 2013
Portfolio Turnover
0.2728 times
Fund Manager
Mr. Venugopal Manghat (w.e.f. Nov 24, 2012) & Mr. Vihang Naik (w.e.f. Dec 17, 2019)~
Benchmark
S&P BSE 500 TRI
Month end AUM
7,934.64 (` In Crs)
Monthly Average AUM
7,768.46 (` In Crs)
Volatility Measures*
Standard Deviation 24.26%
R-Squared 0.95
Beta 1.09
Sharpe Ratio# 0.65
*Source: ICRA MFIE #Risk free rate assumed to be 3.08% (based on 3-months Mibor NSE rate during last 3 months)
Options
Growth and IDCW. The IDCW option offers IDCW Payout and IDCW Reinvestment facilities.
~For investments in foreign securities - Mr. Sonal Gupta (w.e.f July 5, 2021) Exit Load: If the units redeemed or switched out are upto 10% of the units purchased or switched in (“the limit”) within 1 year from the date of allotment – Nil. If units redeemed or switched out are over and above the limit within 1 year from the date of allotment – 1%. If units are redeemed or switched out on or after 1 year from the date of allotment – Nil. For details of the performance of the schemes, please refer page nos 48 to 51.For product label please refer Page 3 & 4 of the factsheet.
Name of Instrument % to Net Assets
Navin Fluorine International Limited 1.11%Phillips Carbon Black Limited 0.50%PowerKEC International Limited 1.88%Tata Power Company Limited 1.27%Consumer Non DurablesITC Limited 1.43%Emami Limited 1.31%Varun Beverages Limited 0.31%Textile Products
K.P.R. Mill Limited 3.01%FertilisersChambal Fertilizers & Chemicals Limited 1.70%
Coromandel International Limited 1.23%Zuari Agro Chemicals Limited 0.06%Construction Project
Larsen & Toubro Limited 2.92%GasGAIL India Limited 1.46%Telecom - ServicesBharti Airtel Limited 1.41%EntertainmentZee Entertainment Enterprises Limited 0.93%
Leisure ServicesIndian Hotels Company Limited 0.92%Auto AncillariesBalkrishna Industries Limited 0.83%OilOil & Natural Gas Corporation Limited 0.64%
Industrial ProductsCummins India Limited 0.50%Textiles - CottonVardhman Textiles Limited 0.34%Total 99.63%PREFERENCE SHARESListed / Awaiting listing on Stock ExchangesEntertainmentZee Entertainment Enterprises Limited ^
Total - OTHERS(a) Tri Party Repo Dealing System (TREPS) 0.56%
(b) Net Receivables/(Payables) -0.19%Net Assets 100.00%Total number of holdings 58
Name of Instrument % to Net Assets
EQUITY & EQUITY RELATEDListed/Awaiting Listing on the Stock ExchangesBanks
ICICI Bank Limited 8.89% State Bank of India 3.86%HDFC Bank Limited 3.76%
The Federal Bank Limited 1.49%Indian Bank 0.94%Axis Bank Limited 0.84%Software
Infosys Limited 6.98%HCL Technologies Limited 3.26% Persistent Systems Limited 2.93%
Tech Mahindra Limited 2.05%Firstsource Solutions Limited 0.96%Oracle Financial Services Software Limited 0.80%
Cement & Cement ProductsThe Ramco Cements Limited 2.03%Birla Corporation Limited 1.70%Ambuja Cements Limited 1.64%JK Lakshmi Cement Limited 1.59%Pharmaceuticals
Sun Pharmaceutical Industries Limited 4.12%
IPCA Laboratories Limited 1.22%Divi's Laboratories Limited 0.99%ConstructionKNR Constructions Limited 1.80%Oberoi Realty Limited 1.64%Brigade Enterprises Limited 1.51%PNC Infratech Limited 1.25%Petroleum Products
Reliance Industries Limited 3.79%Hindustan Petroleum Corporation Limited 1.58%
AutoMahindra & Mahindra Limited 1.31%Tata Motors Limited 1.24%Escorts Limited 0.94%Maruti Suzuki India Limited 0.83%Ferrous MetalsJindal Stainless Limited 2.01%Jindal Steel & Power Limited 1.23%Ratnamani Metals & Tubes Limited 1.05%FinanceHousing Development Finance Corporation Limited 1.96%
Muthoot Finance Limited 1.22%Can Fin Homes Limited 0.74%ChemicalsDeepak Nitrite Limited 1.72%
Indicates top ten instruments^ Indicates less than 0.01%
TOP 10 INDUSTRYBanksSoftwareCement & Cement ProductsPharmaceuticalsConstructionPetroleum ProductsAutoFerrous MetalsFinanceChemicalsOthers
19.78%
16.98%
6.96%
6.33%6.20%
5.37%
4.32%
4.29%
3.92%
3.33%
22.15%

18
Data as on December 31, 2021
Midcap Fund
L&T MIDCAP FUND
To generate capital appreciation by investing primarily in midcap stocks. There is no assurance that the investment objective of the scheme will be realized.
The fund invests predominantly in midcap stocks
Looks to invest in fundamentally strong companies with good growth prospects
Focus on valuations – aims to own stocks with high margin of safety to reduce overall portfolio risk
Aims at broad diversification of portfolio, with a view to manage liquidity at the aggregate portfolio level
INVESTMENT OBJECTIVE
FUND DETAILS PORTFOLIO ALLOCATION
Date of Inception
Regular Plan Direct Plan
August 09, 2004 January 01, 2013
Portfolio Turnover
0.1694 times
Fund Manager
Mr. Vihang Naik (w.e.f. June 28, 2016) & Mr. Venugopal Manghat (w.e.f. Dec 17, 2019)
Benchmark
S&P BSE Midcap 150 TRI
Month end AUM
6,782.00 (` In Crs)
Monthly Average AUM
6,715.90 (` In Crs)
Volatility Measures*
Standard Deviation 22.73%
R-Squared 0.96
Beta 0.82
Sharpe Ratio# 0.56
*Source: ICRA MFIE #Risk free rate assumed to be 3.08% (based on 3-months Mibor NSE rate during last 3 months)
Options
Growth and IDCW. The IDCW option offers IDCW Payout and IDCW Reinvestment facilities.
Exit Load:If the units redeemed or switched out are upto 10% of the units purchased or switched in (“the limit”) within 1 year from the date of allotment – Nil. If units redeemed or switched out are over and above the limit within 1 year from the date of allotment – 1%. If units are redeemed or switched out on or after 1 year from the date of allotment – Nil.For details of the performance of the schemes, please refer page nos 48 to 51.For product label please refer Page 3 & 4 of the factsheet.
Name of Instrument % to Net Assets
EQUITY & EQUITY RELATEDListed/Awaiting Listing on the Stock ExchangesFinance
Sundaram Finance Limited 2.56%CRISIL Limited 2.16%Cholamandalam Investment and Finance Company Limited
1.94%
Manappuram Finance Limited 1.70%Muthoot Finance Limited 1.07%Indian Railway Finance Corporation Limited 1.05%
Power Finance Corporation Limited 0.93%Pharmaceuticals
IPCA Laboratories Limited 3.00%Abbott India Limited 2.53%
Alkem Laboratories Limited 1.48%Pfizer Limited 1.38%Eris Lifesciences Limited 1.34%Suven Pharmaceuticals Limited 1.26%Consumer Non Durables
Emami Limited 4.53%3M India Limited 2.11%Godfrey Phillips India Limited 1.16%United Spirits Limited 0.80%Berger Paints India Limited 0.78%Software
MphasiS Limited 4.95%BIRLASOFT Limited 1.59%Affle India Limited 1.05%Tech Mahindra Limited 0.88%Industrial Products
Cummins India Limited 2.71%Supreme Industries Limited 1.75%Timken India Limited 1.49%AIA Engineering Limited 0.89%Schaeffler India Limited 0.87%Greaves Cotton Limited 0.27%Ferrous MetalsRatnamani Metals & Tubes Limited 2.31%Jindal Steel & Power Limited 1.27%APL Apollo Tubes Limited 0.83%BanksCanara Bank 1.10%Indian Bank 1.09%Punjab National Bank 0.97%City Union Bank Limited 0.63%Auto Ancillaries
Bosch Limited 2.51%Sundram Fasteners Limited 1.12%ConstructionGodrej Properties Limited 2.10%
Name of Instrument % to Net Assets
Oberoi Realty Limited 1.36%Poddar Housing and Development Limited ^Healthcare ServicesApollo Hospitals Enterprise Limited 1.59%Max Healthcare Institute Limited 1.13%Syngene International Limited 0.74%ChemicalsAarti Industries Limited 1.45%Atul Limited 1.24%Deepak Nitrite Limited 0.71%Capital MarketsICICI Securities Limited 1.79%Multi Commodity Exchange of India Limited 1.37%
Consumer DurablesVoltas Limited 1.80%Johnson Controls - Hitachi Air Conditioning India Limited 1.22%
Transportation Blue Dart Express Limited 2.97%
Aegis Logistics Limited 0.02%Pesticides
Bayer Cropscience Limited 2.82%Cement & Cement Products
The Ramco Cements Limited 2.62%JK Lakshmi Cement Limited 0.12%InsuranceMax Financial Services Limited 2.21%General Insurance Corporation of India 0.35%Leisure ServicesIndian Hotels Company Limited 1.74%FertilisersCoromandel International Limited 1.55%Industrial Capital GoodsThermax Limited 1.48%RetailingTrent Limited 1.32%Textile ProductsPage Industries Limited 1.13%Petroleum ProductsCastrol India Limited 0.54%Construction ProjectH.G Infra Engineering Limited 0.52%Total 95.95%OTHERS(a) Tri Party Repo Dealing System (TREPS) 4.31%
(b) Net Receivables/(Payables) -0.26%Net Assets 100.00%Total number of holdings 64
TOP 10 SECTORSTOP 10 INDUSTRYFinancePharmaceuticalsConsumer Non DurablesSoftwareIndustrial ProductsFerrous MetalsBanksAuto AncillariesHealthcare ServicesConstructionOthers
11.41%
10.99%
9.38%
8.47%
7.98%4.41%
3.79%
3.63%
3.46%
3.46%
28.97%
Indicates top ten instruments^ Indicates less than 0.01%

19
Data as on December 31, 2021
Small Cap Fund
L&T EMERGING BUSINESSES FUND
To generate long-term capital appreciation from a diversified portfolio of predominantly equity and equity related securities, including equity derivatives, in the Indian markets with key theme focus being emerging companies (small cap stocks). The Scheme could also additionally invest in Foreign Securities. There is no assurance that the investment objective of the scheme will be realized.
The scheme will invest at least 65% of its total assets in small cap stocks
The focus is to invest in companies which are in early stage of development and have the potential to grow their revenue and profits at a higher rate as compared to broader market
Small cap stocks will comprise of any equity and equity related instruments of companies that are ranked beyond 250 based on the full market capitalization
Individual stock weight is a function of fundamentals, valuation, market sentiment and conviction
INVESTMENT OBJECTIVE
FUND DETAILS PORTFOLIO ALLOCATION
Date of Inception
Regular Plan Direct Plan
May 12, 2014 May 12, 2014
Portfolio Turnover
0.1563 times
Fund Manager
Mr. Venugopal Manghat & Mr. Vihang Naik (w.e.f. Dec 17, 2019)~
Benchmark
S&P BSE 250 Small Cap Index TRI
Month end AUM
8,189.63 (` In Crs)
Monthly Average AUM
7,863.92 (` In Crs)
Volatility Measures*
Standard Deviation 27.27%
R-Squared 0.97
Beta 0.96
Sharpe Ratio# 0.75
*Source: ICRA MFIE #Risk free rate assumed to be 3.08% (based on 3-months Mibor NSE rate during last 3 months)
Options
Growth and IDCW. (Payout and Reinvestment)
~For investments in foreign securities - Mr. Sonal Gupta (w.e.f July 5, 2021)Exit Load:If the units redeemed or switched out are upto 10% of the units purchased or switched in (“the limit”) within 1 year from the date of allotment – Nil. If units redeemed or switched out are over andabove the limit within 1 year from the date of allotment – 1%. If units are redeemed or switched out on or after 1 year from the date of allotment – Nil.For details of the performance of the schemes, please refer page nos 48 to 51.For product label please refer Page 3 & 4 of the factsheet.
Name of Instrument % to Net Assets
Navin Fluorine International Limited 1.26%Alkyl Amines Chemicals Limited 1.09%Fine Organic Industries Limited 0.78%Oriental Carbon & Chemicals Limited 0.22%Ferrous MetalsAPL Apollo Tubes Limited 1.54%Ratnamani Metals & Tubes Limited 1.39%Maharashtra Seamless Limited 0.89%Shyam Metalics and Energy Limited 0.28%Industrial Capital GoodsLakshmi Machine Works Limited 1.13%Apar Industries Limited 1.10%Isgec Heavy Engineering Limited 1.02%GMM Pfaudler Limited 0.83%Cement & Cement ProductsJK Lakshmi Cement Limited 1.58%The Ramco Cements Limited 1.33%Construction ProjectH.G Infra Engineering Limited 1.06%Techno Electric & Engineering Company Limited 0.76%
NCC Limited 0.24%PharmaceuticalsSuven Pharmaceuticals Limited 1.16%IPCA Laboratories Limited 0.63%TransportationGujarat Pipavav Port Limited 0.95%Aegis Logistics Limited 0.38%RetailingV-Mart Retail Limited 0.69%Trent Limited 0.50%BanksCity Union Bank Limited 1.15%AutoV.S.T Tillers Tractors Limited 1.00%Leisure ServicesEIH Limited 0.95%PesticidesSumitomo Chemical India Limited 0.82%PaperEmami Paper Limited 0.43%Orient Paper & Industries Limited 0.35%FinanceCan Fin Homes Limited 0.58%Healthcare ServicesKrishna Institute of Medical Sciences Limited 0.57%
Textiles - CottonNitin Spinners Limited 0.41%Total 98.96%OTHERS(a) Tri Party Repo Dealing System (TREPS) 1.23%
(b) Net Receivables/(Payables) -0.19%Net Assets 100.00%Total number of holdings 78
Name of Instrument % to Net Assets
EQUITY & EQUITY RELATEDListed/Awaiting Listing on the Stock ExchangesIndustrial Products
Grindwell Norton Limited 4.06%Carborundum Universal Limited 2.65% Finolex Industries Limited 2.22%
KEI Industries Limited 1.59%RHI Magnesita India Limited 1.53%Finolex Cables Limited 1.28%Polycab India Limited 1.13%MM Forgings Limited 0.94%Apollo Pipes Limited 0.78%Supreme Industries Limited 0.58%WIM Plast Limited 0.27%Software
BIRLASOFT Limited 3.04%Sonata Software Limited 2.50%KPIT Technologies Limited 2.38%Persistent Systems Limited 2.31%
Happiest Minds Technologies Limited 0.99%Firstsource Solutions Limited 0.55%Textile Products
K.P.R. Mill Limited 8.41%Welspun India Limited 1.97%Gokaldas Exports Limited 0.63%Dollar Industries Limited 0.42%Consumer DurablesCera Sanitaryware Limited 1.94%Somany Ceramics Limited 1.51%Amber Enterprises Limited 1.48%Greenply Industries Limited 1.38%Dixon Technologies (India) Limited 1.31%Kajaria Ceramics Limited 0.95%Century Plyboards (India) Limited 0.40%Construction
Brigade Enterprises Limited 2.58%Sunteck Realty Limited 1.72%Sobha Limited 1.56%PNC Infratech Limited 0.50%Mahindra Lifespace Developers Limited 0.48%Consumer Non Durables
Balrampur Chini Mills Limited 3.13%EID Parry India Limited 1.91%Emami Limited 0.92%CCL Products (I) Limited 0.65%Auto AncillariesMinda Industries Limited 1.36%Tube Investment of India Limited 1.31%Jamna Auto Industries Limited 1.23%Asahi India Glass Limited 0.96%Sundram Fasteners Limited 0.54%Rolex Rings Limited 0.53%Sterling Tools Limited 0.52%ChemicalsSupreme Petrochem Limited 1.43%Deepak Nitrite Limited 1.36% Indicates top ten instruments
TOP 10 INDUSTRYIndustrial ProductsSoftwareTextile ProductsConsumer DurablesConstructionConsumer Non DurablesAuto AncillariesChemicalsFerrous MetalsIndustrial Capital GoodsOthers
17.03%
11.77%
11.43%
8.97%
6.84%
6.61%
6.45%
6.14%
4.10%
4.08%
15.54%

20
Data as on December 31, 2021
Thematic Fund
L&T BUSINESS CYCLES FUND
To seek to generate long-term capital appreciation from a diversified portfolio of predominantly equity and equity related securities, including equity derivatives, in the Indian market with focus on riding business cycles through dynamic allocation between various sectors and stocks at different stages of business cycles in the economy. There is no assurance that the investment objective of the scheme will be realized.
A product that is suitable for investors looking to benefit from positioning of portfolio on business up-cycle
Potential to deliver higher alpha over long term
Suitable for investors looking to benefit from economic expansion cycle
Adds style diversification to investor’s portfolio
INVESTMENT OBJECTIVE
FUND DETAILS PORTFOLIO ALLOCATION
Date of Inception
Regular Plan Direct Plan
August 20, 2014 August 20, 2014
Portfolio Turnover
0.1357 times
Fund Manager
Mr. Venugopal Manghat (w.e.f. Aug 20, 2014) & Ms. Cheenu Gupta (w.e.f. July 02, 2021)~
Benchmark
S&P BSE 500 TRI
Month end AUM
568.54 (` In Crs)
Monthly Average AUM
562.89 (` In Crs)
Volatility Measures*
Standard Deviation 26.09%
R-Squared 0.88
Beta 1.14
Sharpe Ratio# 0.48
*Source: ICRA MFIE #Risk free rate assumed to be 3.08% (based on 3-months Mibor NSE rate during last 3 months)
Options
Growth and IDCW. The IDCW option offers Payout or Reinvestment facilities.
~For investments in foreign securities - Mr. Sonal Gupta (w.e.f July 5, 2021)Exit Load:If the units redeemed or switched out are upto 10% of the units purchased or switched in (“the limit”) within 1 year from the date of allotment – Nil. If units redeemed or switched out are over and above the limit within 1 year from the date of allotment – 1%. If units are redeemed or switched out on or after 1 year from the date of allotment – Nil.For details of the performance of the schemes, please refer page nos 48 to 51.For product label please refer Page 3 & 4 of the factsheet.The Fund was co-managed by Mr. Vihang Naik till July 1, 2021.
Name of Instrument % to Net Assets
EQUITY & EQUITY RELATEDListed/Awaiting Listing on the Stock ExchangesBanks
ICICI Bank Limited 8.67%HDFC Bank Limited 7.07% State Bank of India 3.67%
Kotak Mahindra Bank Limited 1.51%Industrial Products
Timken India Limited 4.20%Schaeffler India Limited 2.60%Carborundum Universal Limited 2.51%Finolex Cables Limited 1.25%AIA Engineering Limited 0.88%Cement & Cement Products
UltraTech Cement Limited 4.83% The Ramco Cements Limited 2.83%
Birla Corporation Limited 2.46%Shree Cements Limited 1.08%Construction
KNR Constructions Limited 3.50%Godrej Properties Limited 2.30%Ahluwalia Contracts India Limited 1.95%PNC Infratech Limited 0.58%Mahindra Lifespace Developers Limited 0.36%
Consumer DurablesKajaria Ceramics Limited 1.96%Century Plyboards (India) Limited 1.45%Titan Company Limited 1.29%Blue Star Limited 1.16%Whirlpool of India Limited 0.83%Greenpanel Industries Limited 0.61%Industrial Capital GoodsABB India Limited 2.55%Indian Hume Pipe Company Limited 1.22%Thermax Limited 0.89%Honeywell Automation India Limited 0.62%Abb Power Products And Systems India Limited 0.08%
Petroleum ProductsReliance Industries Limited 3.87%
Hindustan Petroleum Corporation Limited 1.01%
Construction Project
Name of Instrument % to Net Assets
Larsen & Toubro Limited 4.14%ChemicalsDeepak Nitrite Limited 2.26%Gujarat Fluorochemicals Limited 1.01%Aarti Industries Limited 0.82%Ferrous Metals
Ratnamani Metals & Tubes Limited 2.69%Jindal Steel & Power Limited 1.36%RetailingTrent Limited 2.00%Avenue Supermarts Limited 1.04%Auto AncillariesSundram Fasteners Limited 1.47%Sona BLW Precision Forgings Limited 1.34%AutoMahindra & Mahindra Limited 1.08%Tata Motors Limited 1.00%Maruti Suzuki India Limited 0.45%TransportationContainer Corporation of India Limited 1.15%
Aegis Logistics Limited 0.86%FinanceHousing Development Finance Corporation Limited 2.01%
Non - Ferrous MetalsHindalco Industries Limited 1.56%PesticidesPI Industries Limited 1.21%Leisure ServicesEIH Limited 1.14%Textile ProductsGokaldas Exports Limited 1.02%FertilisersCoromandel International Limited 0.49%Total 99.89%OTHERS(a) Tri Party Repo Dealing System (TREPS) 0.38%
(b) Net Receivables/(Payables) -0.27%Net Assets 100.00%Total number of holdings 52
Indicates top ten instruments
TOP 10 INDUSTRYBanksIndustrial ProductsCement & Cement ProductsConstructionConsumer DurablesIndustrial Capital GoodsPetroleum ProductsConstruction ProjectChemicalsFerrous MetalsOthers
20.92%
11.44%
11.20%
8.69%7.30%
5.36%
4.88%
4.14%
4.09%
4.05%
17.82%

21
Data as on December 31, 2021
Focused Fund
L&T FOCUSED EQUITY FUND
The investment objective of the scheme is to provide capital appreciation by investing in equity and equity related instruments of maximum 30 stocks. There is no assurance that the investment objective of the scheme will be realized.
An open-ended equity scheme following a concentrated strategy
The fund aims to invest using a concentrated strategy by limiting to 30 stocks in the portfolio
Concentrated risk is mitigated by investing in companies with scalable opportunities, strong corporate governance and robust balance sheet
Ability to harness opportunities across the market spectrum - No market cap, sector or style bias
INVESTMENT OBJECTIVE
FUND DETAILS PORTFOLIO ALLOCATION
Date of Inception
Regular Plan Direct Plan
November 5, 2018 November 5, 2018
Portfolio Turnover
0.3353 times
Fund Manager
Mr. Vihang Naik (w.e.f. Nov 05, 2018) & Mr. Venugopal Manghat (w.e.f. Dec 17, 2019)
Benchmark
Nifty 500 TRI Index
Month end AUM
1,013.74 (` In Crs)
Monthly Average AUM
996.93 (` In Crs)
Options
Growth and IDCW. The IDCW option offers IDCW Payout and IDCW Reinvestment facilities.
Exit Load:If the units redeemed or switched out are upto 10% of the units purchased or switched in (“the limit”) within 1 year from the date of allotment – Nil. If units redeemed or switched out are over and above the limit within 1 year from the date of allotment – 1%. If units are redeemed or switched out on or after 1 year from the date of allotment – Nil.For details of the performance of the schemes, please refer page nos 48 to 51.For product label please refer Page 3 & 4 of the factsheet.
Name of Instrument % to Net Assets
Pesticides
Bayer Cropscience Limited 2.24%
PI Industries Limited 1.45%
Industrial Capital Goods
ABB India Limited 3.60%
Industrial Products
Greaves Cotton Limited 3.52%
Chemicals
Aarti Industries Limited 3.05%
Finance
Sundaram Finance Limited 2.85%
Auto Ancillaries
Bosch Limited 2.55%
Telecom - Services
Bharti Airtel Limited 2.54%
Auto
Maruti Suzuki India Limited 2.14%
Construction
Godrej Properties Limited 1.93%
Ferrous Metals
Tata Steel Limited 1.61%
Total 91.05%
OTHERS(a) Tri Party Repo Dealing System (TREPS) 9.20%
(b) Net Receivables/(Payables) -0.25%Net Assets 100.00%
Total number of holdings 29
Name of Instrument % to Net Assets
EQUITY & EQUITY RELATED
Listed/Awaiting Listing on the Stock Exchanges
Software
Infosys Limited 7.61%
Tata Consultancy Services Limited 6.39%
HCL Technologies Limited 3.90%
eClerx Services Limited 3.61%
Transportation
Blue Dart Express Limited 4.32%Container Corporation of India Limited 2.95%
Pharmaceuticals
Dr. Reddy's Laboratories Limited 3.17%
IPCA Laboratories Limited 2.67%
Procter & Gamble Health Limited 1.23%
Petroleum Products
Reliance Industries Limited 6.31%
Cement & Cement Products
The Ramco Cements Limited 3.05%
JK Lakshmi Cement Limited 3.05%
Retailing
Avenue Supermarts Limited 4.84%
Zomato Limited 0.57%
Consumer Non Durables
Heritage Foods Limited 2.83%
Hindustan Unilever Limited 2.43%
Construction Project
Larsen & Toubro Limited 4.64%
Indicates top ten instruments
TOP 10 INDUSTRYSoftwareTransportationPharmaceuticalsPetroleum ProductsCement & Cement ProductsRetailingConsumer Non DurablesConstruction ProjectPesticidesIndustrial Capital GoodsOthers
21.51%
7.27%
7.07%
6.31%
6.10%
5.41%
5.26%
4.64%
3.69%
3.60%
20.19%

22
Data as on December 31, 2021
Index Fund
L&T NIFTY 50 INDEX FUND
The scheme will adopt a passive investment strategy. The scheme will invest in stocks comprising the Nifty 50 index in the same proportion as in the index with the objective of achieving returns equivalent to the Total Returns Index of Nifty 50 index by minimizing the performance difference between the benchmark index and the scheme. The Total Returns Index is an index that reflects the returns on the index from index gain/ loss plus dividend payments by the constituent stocks. There is no assurance that the investment objective of the scheme will be realized.
INVESTMENT OBJECTIVE
PORTFOLIO ALLOCATION
Date of Inception
Regular Plan Direct Plan
April 15, 2020 April 15, 2020
Portfolio Turnover
0.1846 times
Fund Manager
Mr. Praveen Ayathan (w.e.f. Apr 15, 2020)
Benchmark
Nifty 50 Index TRI
Month end AUM
83.91 (` In Crs)
Monthly Average AUM
81.99 (` In Crs)
Tracking error
0.13%
Annualised Tracking error and computation based on Nifty 50 TRI
Options
Growth and IDCW. The IDCW option offers Payout or Reinvestment facilities.
Exit Load:If the Units redeemed or switched out are upto 10% of the units purchased or switched in (“the limit”) within 1 month from the date of allotment. – Nil. If units redeemed or switched out are over and above the limit within 1 month from the date of allotment – 1%. If units are redeemed or switched out on or after 1 month from the date of allotment – Nil For details of the performance of the schemes, please refer page nos 48 to 51.For product label please refer Page 3 & 4 of the factsheet.
Name of Instrument Rating % to Net Assets
EQUITY & EQUITY RELATEDListed/Awaiting Listing on the Stock ExchangesBanks
HDFC Bank Limited 8.51% ICICI Bank Limited 6.75%Kotak Mahindra Bank Limited 3.46%
State Bank of India 2.32%Axis Bank Limited 2.30%IndusInd Bank Limited 0.76%Software
Infosys Limited 9.20% Tata Consultancy Services Limited 5.09%
HCL Technologies Limited 1.88%Tech Mahindra Limited 1.46%Wipro Limited 1.39%Petroleum Products
Reliance Industries Limited 10.73%Bharat Petroleum Corporation Limited 0.48%Indian Oil Corporation Limited 0.37%Consumer Non Durables
Hindustan Unilever Limited 2.77% ITC Limited 2.51%
Asian Paints Limited 2.00%Nestle India Limited 0.93%Tata Consumer Products Limited 0.59%Britannia Industries Limited 0.56%Finance
Housing Development Finance Corporation Limited 6.15%
Bajaj Finance Limited 2.44%AutoMaruti Suzuki India Limited 1.30%Tata Motors Limited 1.14%Mahindra & Mahindra Limited 1.05%Bajaj Auto Limited 0.56%Eicher Motors Limited 0.48%Hero MotoCorp Limited 0.42%PharmaceuticalsSun Pharmaceutical Industries Limited 1.20%
Dr. Reddy's Laboratories Limited 0.78%Divi's Laboratories Limited 0.78%
Name of Instrument Rating % to Net Assets
Cipla Limited 0.64%Construction Project
Larsen & Toubro Limited 3.01%InsuranceBajaj Finserv Limited 1.30%HDFC Life Insurance Company Limited 0.80%
SBI Life Insurance Company Limited 0.69%Cement & Cement ProductsUltraTech Cement Limited 1.15%Grasim Industries Limited 0.80%Shree Cements Limited 0.48%Telecom - ServicesBharti Airtel Limited 2.12%Ferrous MetalsTata Steel Limited 1.16%JSW Steel Limited 0.85%PowerPower Grid Corporation of India Limited 0.92%
NTPC Limited 0.78%Consumer DurablesTitan Company Limited 1.38%Non - Ferrous MetalsHindalco Industries Limited 0.91%TransportationAdani Ports and Special Economic Zone Limited 0.71%
OilOil & Natural Gas Corporation Limited 0.68%PesticidesUPL Limited 0.54%Minerals/MiningCoal India Limited 0.40%Total 99.68%OTHERS(a) Tri Party Repo Dealing System (TREPS) 0.38%
(b) Net Receivables/(Payables) -0.06%Net Assets 100.00%Total number of holdings 50
Indicates top ten instruments
TOP 10 INDUSTRYBanksSoftwarePetroleum ProductsConsumer Non DurablesFinanceAutoPharmaceuticalsConstruction ProjectInsuranceCement & Cement ProductsOthers
24.10%
19.02%
11.58%
9.36%
8.59%
4.95%
3.40%
3.01%
2.79%
2.43%
10.45%
Low cost: The fund doesn’t require a high level of active management and the stock selection is automatic hence it is cost-effective
No Active Risk: As the fund manager is not taking active calls to generate alpha, the fund doesn’t carry any active risk
Broad Diversification - Exposure to the broader market and get to know where the fund is investing
Low Portfolio Turnover - Portfolio turnover is quite low since portfolio rebalancing happens with Index rebalancing only
FUND DETAILS
`

23
Data as on December 31, 2021
Index Fund
L&T NIFTY NEXT 50 INDEX FUND
The scheme will adopt a passive investment strategy. The scheme will invest in stocks comprising the Nifty Next 50 index in the same proportion as in the index with the objective of achieving returns equivalent to the Total Returns Index of Nifty Next 50 index by minimizing the performance difference between the benchmark index and the scheme. The Total Returns Index is an index that reflects the returns on the index from index gain/ loss plus dividend payments by the constituent stocks. There is no assurance that the investment objective of the scheme will be realized.
INVESTMENT OBJECTIVE
PORTFOLIO ALLOCATION
Date of Inception
Regular Plan Direct Plan
April 15, 2020 April 15, 2020
Portfolio Turnover
0.6259 times
Fund Manager
Mr. Praveen Ayathan (w.e.f. Apr 15, 2020)
Benchmark
Nifty Next 50 Index TRI
Month end AUM
42.18 (` In Crs)
Monthly Average AUM
41.06 (` In Crs)
Tracking error
0.25%
Annualized Tracking error and computation based on Nifty Next 50 TRI
Options
Growth and IDCW. The IDCW option offers IDCW Payout and IDCW Reinvestment facilities.
Exit Load:If the units redeemed or switched out are up to 10% of the units purchased or switched in (“the limit”) within 1 month from the date of allotment – Nil. If units redeemed or switched out are over and above the limit within 1 month from the date of allotment – 1%. If units redeemed or switched out on or after 1 month from the date of allotment – Nil For details of the performance of the schemes, please refer page nos 48 to 51.For product label please refer Page 3 & 4 of the factsheet.
Name of Instrument % to Net Assets
Apollo Hospitals Enterprise Limited 4.01%Cement & Cement ProductsAmbuja Cements Limited 2.20%ACC Limited 1.49%Non - Ferrous Metals
Vedanta Limited 3.53%GasGAIL India Limited 1.87%Indraprastha Gas Limited 1.31%Chemicals
Pidilite Industries Limited 2.98%Consumer DurablesHavells India Limited 2.78%SoftwareLarsen & Toubro Infotech Limited 2.65%Ferrous MetalsSteel Authority of India Limited 1.23%Jindal Steel & Power Limited 1.22%Leisure ServicesJubilant Foodworks Limited 2.18%PesticidesPI Industries Limited 1.94%ConstructionDLF Limited 1.92%Industrial Capital GoodsSiemens Limited 1.67%Telecom - ServicesIndus Towers Limited 1.59%TransportationInterGlobe Aviation Limited 1.54%Petroleum ProductsHindustan Petroleum Corporation Limited 1.48%
Capital MarketsHDFC Asset Management Company Limited 1.28%
Auto AncillariesBosch Limited 1.18%Total 98.74%OTHERS(a) Tri Party Repo Dealing System (TREPS) 0.67%
(b) Net Receivables/(Payables) 0.59%Net Assets 100.00%Total number of holdings 50
Name of Instrument % to Net Assets
EQUITY & EQUITY RELATEDListed/Awaiting Listing on the Stock ExchangesConsumer Non Durables
Godrej Consumer Products Limited 2.91%Dabur India Limited 2.69%United Spirits Limited 2.13%Marico Limited 2.11%Colgate Palmolive (India) Limited 1.57%Berger Paints India Limited 1.49%Procter & Gamble Hygiene and Health Care Limited 0.87%
FinancePiramal Enterprises Limited 2.81%SBI Cards and Payment Services Limited 1.95%Bajaj Holdings & Investment Limited 1.63%Cholamandalam Investment and Finance Company Limited 1.63%
Muthoot Finance Limited 1.29%PharmaceuticalsLupin Limited 1.82%Aurobindo Pharma Limited 1.64%Biocon Limited 1.36%Torrent Pharmaceuticals Limited 1.28%Gland Pharma Limited 1.18%Cadila Healthcare Limited 0.98%Retailing
Avenue Supermarts Limited 4.18% Info Edge (India) Limited 3.42%
PowerAdani Transmission Limited 2.87%Adani Green Energy Limited 2.87%
Minerals/MiningAdani Enterprises Limited 3.73%
NMDC Limited 1.21%Insurance
ICICI Lombard General Insurance Company Limited 2.84%
ICICI Prudential Life Insurance Company Limited 1.73%
BanksBandhan Bank Limited 1.36%Bank of Baroda 1.21%Yes Bank Limited 1.05%Punjab National Bank 0.88%Healthcare Services
Indicates top ten instruments
TOP 10 INDUSTRYConsumer Non DurablesFinancePharmaceuticalsRetailingPowerMinerals/MiningInsuranceBanksHealthcare ServicesCement & Cement ProductsOthers
13.77%
9.31%
8.26%
7.60%
5.74%
4.94%4.57%
4.50%
4.01%
3.69%
32.35%
Low cost: The fund doesn’t require a high level of active management and the stock selection is automatic hence it is cost-effective
No Active Risk: As the fund manager is not taking active calls to generate alpha, the fund doesn’t carry any active risk
Broad Diversification - Exposure to the broader market and get to know where the fund is investing
Low Portfolio Turnover - Portfolio turnover is quite low since portfolio rebalancing happens with Index rebalancing only
FUND DETAILS
`

24
Data as on December 31, 2021
Dynamic Asset Allocation Fund
To seek to generate long-term capital appreciation from a diversified portfolio of equity and equity related securities and to generate reasonable returns by investing in a portfolio of debt and money market instruments and arbitrage opportunities in the cash and derivatives segments of the equity markets. There is no assurance that the investment objective of the scheme will be realized.
A product that follows basic principle of investing - buy low, sell high
A tax efficient product suitable for long-term goal-based investing
Portfolio actively managed to deliver alpha through stock selection
Aims to limit downside by dynamically changing equity allocation based on market valuations
INVESTMENT OBJECTIVE
FUND DETAILS PORTFOLIO ALLOCATION
Date of Inception
Regular Plan Direct Plan
February 07, 2011 January 01, 2013
Portfolio Turnover
5.6819 times
Fund Manager
Mr. Vihang Naik (w.e.f. Dec 17, 2019), Ms. Cheenu Gupta (w.e.f. July 02, 2021) & Mr. Praveen Ayathan (w.e.f. Jan 30, 2016) (for investments in equity and equity related instruments) & Mr. Jalpan Shah (w.e.f. May 30, 2016) (investments in debt and debt related instruments)
Benchmark
NIFTY 50 Composite Hybrid Debt 50-50 Index
Month end AUM
2,124.58 (` In Crs)
Monthly Average AUM
2,112.68 (` In Crs)
Options
Growth and IDCW. The IDCW option offers Payout and Reinvestment facilities.
Exit Load:If the units redeemed or switched out are upto 10% of the units purchased or switched in (“the limit”) within 1 year from the date of allotment – Nil. If units redeemed or switched out are over and above the limit within 1 year from the date of allotment – 1%. If units are redeemed or switched out on or after 1 year from the date of allotment – Nil.For details of the performance of the schemes, please refer page nos 48 to 51.^The name of the Scheme is changed to L&T Balanced Advantage Fund from L&T Dynamic Equity Fund with effect from August 01, 2019 (‘effective date’). Also, note that there has been changes in the fundamentalattributes of the Scheme applicable from the effective date. For further information please refer the Notice cum Addendum dated June 24, 2019.For product label please refer Page 3 & 4 of the factsheet.For investments in equity and equity related instruments in the Fund was co-managed by Mr. Venugopal Manghat till July 1, 2021.
L&T BALANCED ADVANTAGE FUND^
Name of Instrument % to Net Assets
% to Net Assets
(hedged)
% to Net Assets
(unhedged)EQUITY & EQUITY RELATEDListed/Awaiting Listing on the Stock ExchangesBanks
Kotak Mahindra Bank Limited 2.99% 0.39% 2.60% ICICI Bank Limited 3.19% 1.19% 2.00%
HDFC Bank Limited 1.32% 0.24% 1.08%Axis Bank Limited 4.18% 4.18% - State Bank of India 3.15% 3.15% - AU Small Finance Bank Limited 0.32% 0.32% - IndusInd Bank Limited 0.13% 0.13% - Software
Tata Consultancy Services Limited 3.59% 1.21% 2.38% Infosys Limited 1.56% - 1.56%HCL Technologies Limited 1.09% - 1.09%
MphasiS Limited 1.28% 0.22% 1.06%Tech Mahindra Limited 0.18% 0.18% - Pharmaceuticals
Cipla Limited 1.23% - 1.23%Abbott India Limited 0.80% - 0.80%Divi's Laboratories Limited 0.74% 0.06% 0.68%Alkem Laboratories Limited 0.64% - 0.64%Dr. Reddy's Laboratories Limited 0.49% - 0.49%Biocon Limited 0.19% - 0.19%Sun Pharmaceutical Industries Limited 2.52% 2.52% - Cadila Healthcare Limited 0.70% 0.70% - Aurobindo Pharma Limited 0.24% 0.24% - Glenmark Pharmaceuticals Limited 0.04% 0.04% - Consumer Non DurablesZydus Wellness Limited 0.97% - 0.97%Heritage Foods Limited 0.92% - 0.92%Dabur India Limited 0.66% - 0.66%Asian Paints Limited 0.94% 0.44% 0.50%Hindustan Unilever Limited 1.16% 0.73% 0.43%ITC Limited 1.88% 1.56% 0.32%Colgate Palmolive (India) Limited 0.61% 0.61% - United Spirits Limited 0.17% 0.17% - ConstructionSunteck Realty Limited 0.75% - 0.75%Ashoka Buildcon Limited 0.71% - 0.71%DLF Limited 2.77% 2.77% - Auto
Tata Motors Limited 1.09% - 1.09%Maruti Suzuki India Limited 0.43% - 0.43%Hero MotoCorp Limited 1.54% 1.15% 0.39%Mahindra & Mahindra Limited 0.52% 0.28% 0.24%Bajaj Auto Limited 0.17% 0.17% - Ferrous MetalsTata Steel Limited 2.69% 1.83% 0.86%APL Apollo Tubes Limited 0.54% - 0.54%Jindal Steel & Power Limited 0.44% 0.44% - Cement & Cement Products
Shree Cements Limited 1.52% 0.28% 1.24%UltraTech Cement Limited 1.81% 1.81% - Grasim Industries Limited 0.15% 0.15% - Petroleum Products
Reliance Industries Limited 1.77% 0.68% 1.09%Bharat Petroleum Corporation Limited
0.11% 0.11% -
PesticidesUPL Limited 1.61% 1.61% - Auto AncillariesSona BLW Precision Forgings Limited 0.73% 0.00% 0.73%Balkrishna Industries Limited 0.76% 0.76% -
Name of Instrument % to Net Assets
% to Net Assets
(hedged)
% to Net Assets
(unhedged)FinanceCRISIL Limited 1.01% 0.00% 1.01%Manappuram Finance Limited 0.37% 0.00% 0.37%Shriram Transport Finance Company Limited
^ ^ 0.00%
InsuranceHDFC Life Insurance Company Limited
0.84% - 0.84%
ICICI Lombard General Insurance Company Limited
0.53% - 0.53%
EntertainmentZee Entertainment Enterprises Limited 1.14% 1.14% - Telecom - Services
Bharti Airtel Limited 1.12% - 1.12%RetailingAvenue Supermarts Limited 0.97% - 0.97%GasGAIL India Limited 0.70% - 0.70%Gujarat Gas Limited 0.20% 0.20% - Construction ProjectLarsen & Toubro Limited 0.45% - 0.45%H.G Infra Engineering Limited 0.41% - 0.41%Healthcare ServicesTarsons Products Limited 0.51% - 0.51%TransportationBlue Dart Express Limited 0.47% - 0.47%Consumer DurablesTitan Company Limited 0.37% 0.37% - Capital MarketsHDFC Asset Management Company Limited
0.19% - 0.19%
PaperEmami Paper Limited 0.05% - 0.05%Total 67.32% 32.03% 35.29%
Name of Instrument Rating % to Net Assets
DEBT INSTRUMENTSFixed Rates Bonds - CorporateListed / Awaiting listing on Stock ExchangesExport Import Bank of India CRISIL AAA 1.28%Indian Railway Finance Corporation Limited CRISIL AAA 1.25%National Highways Authority of India CRISIL AAA 1.24%National Bank for Agriculture & Rural Development CRISIL AAA 0.73%
Total 4.50%Central Government Securities05.22% GOI 15-JUN-2025 SOVEREIGN 9.34%06.18% GOI 04-NOV-2024 SOVEREIGN 8.51%05.15% GOI 09-NOV-2025 SOVEREIGN 3.50%05.63% GOI 12-APR-2026 SOVEREIGN 2.37%Total 23.72%MONEY MARKET INSTRUMENTCertificate of DepositHDFC Bank Limited CARE A1+ 2.29%Total 2.29%OTHERS(a) Margin as Cash Margin -0.46%(b) Tri Party Repo Dealing System (TREPS) 2.37%(c) Net Receivables/(Payables) 0.26%Net Assets 100.00%Total number of holdings 67
Indicates top ten instrumentsAll corporate ratings are assigned by rating agencies like CRISIL; CARE; ICRA; IND.Total outstanding position (as at Dec, 2021) in Derivative Instruments (Gross Notional) 68,356.80 lakhsTotal percentage of existing assets hedged through futures is 32.03%
TOP 10 INDUSTRY BanksSoftwarePharmaceuticalsConsumer Non DurablesConstructionAutoFerrous MetalsCement & Cement ProductsPetroleum ProductsPesticidesOthers
15.28%
7.70%
7.59%
7.31%
4.23%
3.75%
3.67%
3.48%
1.88%
1.61%
10.82%

25
Data as on December 31, 2021
Aggressive Hybrid Fund
L&T HYBRID EQUITY FUND
To seek to generate long-term capital appreciation from a diversified portfolio of predominantly equity and equity related securities and to generate reasonable returns through a portfolio of debt and money market instruments. There is no assurance that the investment objective of the scheme will be realized.
INVESTMENT OBJECTIVE
PORTFOLIO ALLOCATION
~For investments in foreign securities - Mr. Sonal Gupta (w.e.f July 5, 2021)Exit Load:If the units redeemed or switched out are upto 10% of the units purchased or switched in (“the limit”) within 1 year from the date of allotment – Nil. If units redeemed or switched out are over and above the limit within 1 year from the date of allotment – 1%. If units are redeemed or switched out on or after 1 year from the date of allotment – Nil.For details of the performance of the schemes, please refer page nos 48 to 51.For product label please refer Page 3 & 4 of the factsheet.For investments in equity and equity related instruments in the Fund was co-managed by Mr. Vihang Naik till July 1, 2021.
A Fund that allocates assets across equities and Debt• Invests 65-75% in equity (shares)
and equity related instruments• 25-35% allocation to debt (bonds)
and money market instruments
Equity investments well diversified across sectors and market capitalization segments
Relatively conservative approach in managing debt component to provide stability to the portfolio
FUND DETAILS
Date of Inception
Regular Plan Direct Plan
February 07, 2011 January 01, 2013
Portfolio Turnover
0.5596 times
Fund Manager
Ms. Cheenu Gupta (w.e.f. July 02, 2021) & Mr. Venugopal Manghat (w.e.f. Dec 17, 2019) (for investments in equity and equity related instruments), Mr. Shriram Ramanathan (w.e.f. May 30, 2016) (investments in debt and debt related instruments)~
Benchmark
CRISIL Hybrid 35+65 - Aggressive Index
Month end AUM
5,338.30 (` In Crs)
Monthly Average AUM
5,266.00 (` In Crs)
Volatility Measures*
Standard Deviation 16.08%
R-Squared 0.95
Beta 1.12
Sharpe Ratio# 0.69
*Source: ICRA MFIE #Risk free rate assumed to be 3.08% (based on 3-months Mibor NSE rate during last 3 months)
Options
• Growth• IDCW Option (Reinvestment and Payout)• Annual IDCW Option (Reinvestment and
Payout)
Name of Instrument Rating % to Net Assets
HDFC Asset Management Company Limited 0.31%UTI Asset Management Company Limited 0.25%PowerTata Power Company Limited 0.50%Total 73.53%MONEY MARKET INSTRUMENTCertificate of Deposit/Commercial PaperReliance Industries Limited CRISIL A1+ 0.19%Export Import Bank of India CRISIL AAA 0.18%Total 0.37%DEBT INSTRUMENTSFixed Rates Bonds - CorporateListed / Awaiting listing on Stock ExchangesJamnagar Utilities and Power Pvt Limited CRISIL AAA 1.88%Power Finance Corporation Limited CRISIL AAA 0.97%Housing Development Finance Corporation Limited CRISIL AAA 0.76%National Bank for Agriculture & Rural Development CRISIL AAA 0.52%Housing Development Finance Corporation Limited CRISIL AAA 0.50%Power Finance Corporation Limited CRISIL AAA 0.50%Export Import Bank of India CRISIL AAA 0.49%LIC Housing Finance Limited CRISIL AAA 0.49%Power Finance Corporation Limited CRISIL AAA 0.49%Housing Development Finance Corporation Limited CRISIL AAA 0.30%Rec Limited CRISIL AAA 0.29%National Bank for Agriculture & Rural Development ICRA AAA 0.29%Sikka Ports & Terminals Limited (erstwhile Reliance Ports & Terminals Ltd) CRISIL AAA 0.22%HDFC Bank Limited CRISIL AAA 0.20%National Bank for Agriculture & Rural Development ICRA AAA 0.19%Export Import Bank of India CRISIL AAA 0.11%National Bank for Agriculture & Rural Development CRISIL AAA 0.10%Power Finance Corporation Limited CRISIL AAA 0.07%Small Industries Development Bank of India CARE AAA 0.04%Nuclear Power Corporation Of India Limited CRISIL AAA 0.03%Power Grid Corporation of India Limited CRISIL AAA 0.01%Total 8.45%GOVERNMENT SECURITIESFixed Rates Bonds - Government06.18% GOI 04-NOV-2024 SOVEREIGN 2.51%07.32% GOI 28-JAN-2024 SOVEREIGN 2.22%07.27% GOI 08-APR-2026 SOVEREIGN 2.00%04.26% GOI 17-MAY-2023 SOVEREIGN 1.87%05.22% GOI 15-JUN-2025 SOVEREIGN 1.86%05.15% GOI 09-NOV-2025 SOVEREIGN 1.86%07.17% GOI 08-JAN-2028 SOVEREIGN 0.51%05.79% GOI 11-MAY-2030 SOVEREIGN 0.45%6.70% TAMILNADU SDL - 16-OCT-2024 SOVEREIGN 0.29%07.26% GOI 14-JAN-2029 SOVEREIGN 0.20%06.79% GOI 15-MAY-2027 SOVEREIGN 0.19%5.60% MAHARSHTRA SDL 09-SEP-2024 SOVEREIGN 0.10%07.68% GOI 15-DEC-2023 SOVEREIGN 0.01%Total 14.07%Others(c) Tri Party Repo Dealing System (TREPS) 3.76%(d) Net Receivables/(Payables) -0.18%Net Assets 100.00%Total number of holdings 49
Name of Instrument Rating % to Net Assets
EQUITY & EQUITY RELATEDListed/Awaiting Listing on the Stock ExchangesBanks
ICICI Bank Limited 6.06%HDFC Bank Limited 3.59% State Bank of India 2.76%
Kotak Mahindra Bank Limited 0.83%Software
Infosys Limited 5.61% Tata Consultancy Services Limited 1.81%
Coforge Limited 1.66%Oracle Financial Services Software Limited 1.29%BIRLASOFT Limited 0.92%MindTree Limited 0.86%Persistent Systems Limited 0.59%Route Mobile Limited 0.45%Auto Ancillaries
Sona BLW Precision Forgings Limited 3.04%Minda Industries Limited 2.04%
Motherson Sumi Systems Limited 1.77%Textile Products
K.P.R. Mill Limited 4.16%Page Industries Limited 0.88%PharmaceuticalsDivi's Laboratories Limited 1.74%Gland Pharma Limited 1.72%Sun Pharmaceutical Industries Limited 0.78%Cement & Cement Products
UltraTech Cement Limited 2.33%The Ramco Cements Limited 1.64%Petroleum Products
Reliance Industries Limited 3.63%Consumer Non DurablesVarun Beverages Limited 1.79%Asian Paints Limited 1.05%Tata Consumer Products Limited 0.74%FinanceHousing Development Finance Corporation Limited 1.74%Bajaj Finance Limited 1.72%RetailingAvenue Supermarts Limited 0.82%Zomato Limited 0.52%Go Fashion (India) Limited 0.44%ChemicalsAtul Limited 0.99%SRF Limited 0.51%Chemplast Sanmar Limited 0.19%Industrial Capital GoodsHoneywell Automation India Limited 1.48%Consumer DurablesTitan Company Limited 1.07%Somany Ceramics Limited 0.35%Leisure ServicesIndian Hotels Company Limited 1.42%InsuranceBajaj Finserv Limited 1.04%SBI Life Insurance Company Limited 0.25%PesticidesPI Industries Limited 1.21%Healthcare ServicesMax Healthcare Institute Limited 1.19%Industrial ProductsSupreme Industries Limited 1.12%AutoTata Motors Limited 1.02%ConstructionGodrej Properties Limited 0.84%EntertainmentZee Entertainment Enterprises Limited 0.81%Capital Markets
Indicates top ten instrumentsAll corporate ratings are assigned by rating agencies like CRISIL; CARE; ICRA; IND ,BWR.
TOP 10 INDUSTRY BanksSoftwareAuto AncillariesTextile ProductsPharmaceuticalsCement & Cement ProductsPetroleum ProductsConsumer Non DurablesFinanceRetailingOthers
13.24%
13.19%
6.85%
5.04%4.24%
3.97%
3.63%
3.58%
3.46%
1.78%
14.55%

26
Data as on December 31, 2021
Hybrid Arbitrage Fund
L&T ARBITRAGE OPPORTUNITIES FUND
To seek to generate reasonable returns by predominantly investing in arbitrage opportunities in the cash and derivatives segments of the equity markets and by investing balance in debt and money market instruments. There is no assurance that the investment objective of the scheme will be realized.
Aims to generate returns through fully hedged exposure to equities
Tax efficient, as tax treatment is similar to equity funds
Focus on generating ‘Market-Neutral’ returns
INVESTMENT OBJECTIVE
FUND DETAILS PORTFOLIO ALLOCATION
Date of Inception
Regular Plan Direct Plan
June 30, 2014 June 30, 2014
Portfolio Turnover
13.5362 times
Fund Manager
Mr. Venugopal Manghat (w.e.f June 30, 2014) & Mr. Praveen Ayathan (w.e.f June 30, 2014) for equity portion, Mr. Jalpan Shah (w.e.f January 24, 2019) for Debt Portion~
Benchmark
Nifty 50 Arbitrage TRI Index
Month end AUM
4,506.30 (` In Crs)
Monthly Average AUM
4,730.20 (` In Crs)
Options
•Growth •IDCW Option 1. Monthly IDCW (Payout and Re-investment) 2. Quarterly IDCW (Payout and Re-investment)
~For investments in foreign securities - Mr. Sonal Gupta (w.e.f July 5, 2021)Exit Load:For redemption on or before 1 month from the date of allotment or Purchase applying First in First out basis - 0.50% of Applicable NAV. After 1 month from the date of allotment or Purchase applying First in First out basis NIL.For details of the performance of the schemes, please refer page nos 48 to 51. For product label please refer Page 3 & 4 of the factsheet.
Name of Instrument % to NetAssets
% to NetAssets
(hedged)EQUITY & EQUITY RELATEDListed/Awaiting Listing on the Stock ExchangesBanks
Kotak Mahindra Bank Limited 2.17% 2.17% State Bank of India 1.94% 1.94%
Axis Bank Limited 1.26% 1.26%The Federal Bank Limited 1.10% 1.10%Punjab National Bank 0.75% 0.75%IndusInd Bank Limited 0.68% 0.68%Bank of Baroda 0.55% 0.55%IDFC First Bank Limited 0.52% 0.52%ICICI Bank Limited 0.44% 0.44%AU Small Finance Bank Limited 0.19% 0.19%Canara Bank 0.12% 0.12%Bandhan Bank Limited 0.10% 0.10%City Union Bank Limited 0.05% 0.05%RBL Bank Limited 0.03% 0.03%Ferrous Metals
Tata Steel Limited 3.66% 3.66%Jindal Steel & Power Limited 1.04% 1.04%Steel Authority of India Limited 0.75% 0.75%JSW Steel Limited 0.39% 0.39%Consumer Non Durables
ITC Limited 2.36% 2.36% United Spirits Limited 1.37% 1.37%
Berger Paints India Limited 0.92% 0.92%Hindustan Unilever Limited 0.37% 0.37%Colgate Palmolive (India) Limited 0.22% 0.22%Godrej Consumer Products Limited 0.14% 0.14%Dabur India Limited 0.06% 0.06%Britannia Industries Limited 0.06% 0.06%Tata Consumer Products Limited 0.03% 0.03%Balrampur Chini Mills Limited 0.03% 0.03%Asian Paints Limited 0.03% 0.03%Marico Limited 0.02% 0.02%Nestle India Limited ^ ^ Software
Tata Consultancy Services Limited 1.87% 1.87%HCL Technologies Limited 0.82% 0.82%Oracle Financial Services Software Limited 0.76% 0.76%BIRLASOFT Limited 0.59% 0.59%MphasiS Limited 0.55% 0.55%Firstsource Solutions Limited 0.40% 0.40%MindTree Limited 0.18% 0.18%Larsen & Toubro Infotech Limited 0.10% 0.10%L&T Technology Services Limited 0.07% 0.07%Wipro Limited 0.06% 0.06%Infosys Limited 0.02% 0.02%Persistent Systems Limited 0.02% 0.02%Tech Mahindra Limited ^ ^ Finance
Bajaj Finance Limited 1.40% 1.40%Piramal Enterprises Limited 1.07% 1.07%Muthoot Finance Limited 0.58% 0.58%IDFC Limited 0.53% 0.53%Can Fin Homes Limited 0.50% 0.50%Mahindra & Mahindra Financial Services Limited 0.31% 0.31%Rec Limited 0.25% 0.25%LIC Housing Finance Limited 0.25% 0.25%Shriram Transport Finance Company Limited 0.13% 0.13%Manappuram Finance Limited 0.10% 0.10%Indiabulls Housing Finance Limited 0.09% 0.09%Housing Development Finance Corporation Limited 0.05% 0.05%Cholamandalam Investment and Finance Company Limited
0.03% 0.03%
Aditya Birla Capital Limited 0.03% 0.03%Power Finance Corporation Limited 0.01% 0.01%Transportation
Adani Ports and Special Economic Zone Limited 3.64% 3.64%InterGlobe Aviation Limited 0.49% 0.49%Container Corporation of India Limited 0.42% 0.42%Indian Railway Catering & Tourism Corp Limited 0.02% 0.02%PharmaceuticalsLupin Limited 0.96% 0.96%Aurobindo Pharma Limited 0.71% 0.71%Cadila Healthcare Limited 0.63% 0.63%Granules India Limited 0.48% 0.48%Laurus Labs Limited 0.40% 0.40%IPCA Laboratories Limited 0.34% 0.34%Glenmark Pharmaceuticals Limited 0.28% 0.28%Strides Pharma Science Limited 0.27% 0.27%Abbott India Limited 0.11% 0.11%Sun Pharmaceutical Industries Limited 0.07% 0.07%Divi's Laboratories Limited 0.06% 0.06%Biocon Limited 0.05% 0.05%Alembic Pharmaceuticals Limited 0.02% 0.02%Alkem Laboratories Limited 0.01% 0.01%Pfizer Limited 0.01% 0.01%Torrent Pharmaceuticals Limited 0.01% 0.01%Dr. Reddy's Laboratories Limited 0.01% 0.01%Entertainment
Zee Entertainment Enterprises Limited 2.55% 2.55%PVR Limited 0.30% 0.30%Sun TV Network Limited 0.21% 0.21%Pesticides
UPL Limited 1.62% 1.62%PI Industries Limited 0.86% 0.86%Telecom - ServicesBharti Airtel Limited 1.05% 1.05%Indus Towers Limited 1.00% 1.00%Tata Communications Limited 0.11% 0.11%AutoEscorts Limited 0.92% 0.92%Hero MotoCorp Limited 0.49% 0.49%Bajaj Auto Limited 0.23% 0.23%Mahindra & Mahindra Limited 0.10% 0.10%Tata Motors Limited 0.05% 0.05%Eicher Motors Limited 0.02% 0.02%Ashok Leyland Limited ^ ^ Non - Ferrous MetalsNational Aluminium Company Limited 0.93% 0.93%Vedanta Limited 0.59% 0.59%Hindalco Industries Limited 0.06% 0.06%Hindustan Copper Limited 0.02% 0.02%ChemicalsSRF Limited 0.70% 0.70%Tata Chemicals Limited 0.39% 0.39%Deepak Nitrite Limited 0.32% 0.32%Pidilite Industries Limited 0.04% 0.04%Gujarat Narmada Valley Fertilizers and Chemicals Limited
0.03% 0.03%
Rain Industries Limited 0.02% 0.02%Navin Fluorine International Limited 0.02% 0.02%
Name of Instrument % to NetAssets
% to NetAssets
(hedged)Atul Limited ^ ^ Minerals/MiningNMDC Limited 0.62% 0.62%Coal India Limited 0.47% 0.47%Adani Enterprises Limited 0.28% 0.28%Auto AncillariesExide Industries Limited 0.67% 0.67%Balkrishna Industries Limited 0.40% 0.40%MRF Limited 0.08% 0.08%Amara Raja Batteries Limited 0.02% 0.02%Cement & Cement ProductsUltraTech Cement Limited 0.41% 0.41%Grasim Industries Limited 0.29% 0.29%Ambuja Cements Limited 0.16% 0.16%The Ramco Cements Limited 0.12% 0.12%Shree Cements Limited 0.08% 0.08%Dalmia Bharat Limited 0.06% 0.06%The India Cements Limited 0.05% 0.05%ACC Limited 0.04% 0.04%Petroleum ProductsReliance Industries Limited 0.89% 0.89%Bharat Petroleum Corporation Limited 0.11% 0.11%Hindustan Petroleum Corporation Limited 0.11% 0.11%Indian Oil Corporation Limited 0.10% 0.10%Consumer DurablesTitan Company Limited 0.79% 0.79%Crompton Greaves Consumer Electricals Limited 0.12% 0.12%Havells India Limited 0.10% 0.10%Whirlpool of India Limited 0.05% 0.05%Dixon Technologies (India) Limited 0.04% 0.04%Bata India Limited 0.02% 0.02%Leisure ServicesDelta Corp Limited 0.42% 0.42%Jubilant Foodworks Limited 0.39% 0.39%Indian Hotels Company Limited 0.19% 0.19%RetailingTrent Limited 0.69% 0.69%Info Edge (India) Limited 0.19% 0.19%Indiamart Intermesh Limited 0.05% 0.05%Aditya Birla Fashion and Retail Limited 0.01% 0.01%Industrial Capital GoodsSiemens Limited 0.48% 0.48%Bharat Heavy Electricals Limited 0.32% 0.32%Honeywell Automation India Limited 0.03% 0.03%Capital MarketsHDFC Asset Management Company Limited 0.70% 0.70%Indian Energy Exchange Limited 0.05% 0.05%Nippon Life India Asset Management Limited 0.03% 0.03%Multi Commodity Exchange of India Limited 0.01% 0.01%GasMahanagar Gas Limited 0.62% 0.62%Indraprastha Gas Limited 0.07% 0.07%Gujarat Gas Limited 0.02% 0.02%GAIL India Limited 0.02% 0.02%Petronet LNG Limited ^ ^ ConstructionOberoi Realty Limited 0.47% 0.47%NBCC (India) Limited 0.14% 0.14%Godrej Properties Limited 0.08% 0.08%DLF Limited 0.02% 0.02%Healthcare ServicesApollo Hospitals Enterprise Limited 0.38% 0.38%Dr. Lal Path Labs Limited 0.03% 0.03%Aerospace & DefenseBharat Electronics Limited 0.23% 0.23%Hindustan Aeronautics Limited 0.13% 0.13%InsuranceBajaj Finserv Limited 0.14% 0.14%HDFC Life Insurance Company Limited 0.10% 0.10%ICICI Prudential Life Insurance Company Limited 0.04% 0.04%ICICI Lombard General Insurance Company Limited 0.01% 0.01%Industrial ProductsBharat Forge Limited 0.21% 0.21%Polycab India Limited 0.02% 0.02%Astral Limited 0.01% 0.01%Cummins India Limited 0.01% 0.01%Textile ProductsPage Industries Limited 0.16% 0.16%FertilisersChambal Fertilizers & Chemicals Limited 0.13% 0.13%Coromandel International Limited ^ ^ PowerTata Power Company Limited 0.03% 0.03%Power Grid Corporation of India Limited ^ ^ Construction ProjectLarsen & Toubro Limited 0.01% 0.01%Total 66.53% 66.53%MONEY MARKET INSTRUMENT Certificate of Deposit/Commercial PaperHDFC Bank Limited CARE A1+ 2.16%Housing Development Finance Corporation Limited ICRA A1+ 1.08%Small Industries Development Bank of India CARE A1+ 0.55%Total 3.79%Central Government Securities06.84% GOI 19-DEC-2022 SOVEREIGN 2.73%08.20% GOI 15-FEB-2022 SOVEREIGN 1.73%07.16% GOI 20-MAY-2023 SOVEREIGN 1.15%Total 5.61%Treasury Bill364 DAYS T-BILL 24-MAR-22 SOVEREIGN 3.85%364 DAYS T-BILL 06-JAN-22 SOVEREIGN 3.33%364 DAYS T-BILL 10-FEB-22 SOVEREIGN 2.76%364 DAYS T-BILL 03-FEB-2022 SOVEREIGN 2.21%364 DAYS T-BILL 30-MAR-22 SOVEREIGN 2.20%364 DAY T-BILL 30JUN22 SOVEREIGN 2.18%364 DAY T-BILL 28APR22 SOVEREIGN 1.10%182 DAY T-BILL 12MAY22 SOVEREIGN 1.09%364 DAY T-BILL 13OCT22 SOVEREIGN 1.08%364 DAY T-BILL 20OCT22 SOVEREIGN 1.07%364 DAYS T-BILL 20-JAN-22 SOVEREIGN 0.55%364 DAYS T-BILL 03-MAR-22 SOVEREIGN 0.55%364 DAYS T-BILL 11-MAR-22 SOVEREIGN 0.55%364 DAYS T-BILL 13-JAN-2022 SOVEREIGN 0.44%Total 22.96%OTHERS(a) Margin as Cash Margin -0.91%(b) Tri Party Repo Dealing System (TREPS) 2.65%(c) Net Receivables/(Payables) -0.63%Net Assets 100.00%Total number of holdings 174
Indicates top ten instruments^ Indicates less than 0.01%All corporate ratings are assigned by rating agencies like CRISIL; CARE; ICRA; IND,BWR.Total outstanding position (as at Dec 2021) in Derivative Instruments (Gross Notional) 301,212.64 lakhsTotal percentage of existing assets hedged through futures is 66.53%
TOP 10 INDUSTRY
Banks PharmaceuticalsFerrous Metals EntertainmentConsumer Non Durables PesticidesSoftware Telecom - ServicesFinance OthersTransportation
9.90%
5.84%
5.61%
5.44%
5.33%4.57%
4.42%
3.06%
2.48%
2.16%
17.72%

27
Data as on December 31, 2021
Equity Savings Fund
L&T EQUITY SAVINGS FUND
To generate regular income by predominantly investing in arbitrage opportunities in the cash and derivatives segments of the equity markets and debt and money market instruments and to generate long-term capital appreciation through unhedged exposure to equity and equity related instruments. There is no assurance that the invest-ment objective of the scheme will be realized.
INVESTMENT OBJECTIVE
PORTFOLIO ALLOCATION
Exit Load (w.e.f. October 6, 2021): If the units redeemed or switched out are upto 10% of the units purchased or switched in (“the limit”) within 1 month from the date of allotment – Nil. If units redeemed or switched out are over and above 10% within 1 month from the date of allotment – 0.50%. If units are redeemed or switched out on or after 1 month from the date of allotment – Nil.For details of the performance of the schemes, please refer page nos 48 to 51.For product label please refer Page 3 & 4 of the factsheet.For investments in equity and equity related instruments in the Fund was co-managed by Mr. Vihang Naik till July 1, 2021.
A Fund that allocates assets across equities and debt• Gross investment in equity (shares)
is 65%. Of this net equity levels are maintained between 15-45%
• 10-35% allocation to debt (bonds) and money market instruments
Aims to limit downside while generating returns through arbitrage investments
Aims to minimize portfolio risk by investing in quality companies, monitoring corporate fundamentals closely
A tax efficient product suitable for long-term investing
FUND DETAILS
Date of Inception
Regular Plan Direct Plan
October 18, 2011 January 01, 2013
Portfolio Turnover
6.3790 times
Fund Manager
Ms. Cheenu Gupta (w.e.f. July 02, 2021), Mr. Venugopal Manghat (w.e.f. Nov 24, 2012) & Mr. Praveen Ayathan (w.e.f. Jan 09, 2015) (for investments in equity and equity related instruments) & Mr. Jalpan Shah (w.e.f. May 30, 2016) (for investments in debt and debt related instruments)
Benchmark
NIFTY Equity Savings TRI Index
Month end AUM
203.49 (` In Crs)
Monthly Average AUM
179.36 (` In Crs)
Options
•Growth •IDCW: 1. Monthly IDCW (Reinvestment and Payout) 2. Quarterly IDCW (Reinvestment and Payout)
Name of Instrument % to Net Assets
% to Net Assets
(hedged)
% to Net Assets
(unhedged)EQUITY & EQUITY RELATEDListed/Awaiting Listing on the Stock ExchangesBanks
ICICI Bank Limited 3.55% 1.85% 1.70%Axis Bank Limited 0.67% - 0.67%State Bank of India 0.41% 0.07% 0.34%Kotak Mahindra Bank Limited 6.64% 6.64% - Canara Bank 1.91% 1.91% - IndusInd Bank Limited 1.30% 1.30% - RBL Bank Limited 0.94% 0.94% - Software
Infosys Limited 0.83% - 0.83%Larsen & Toubro Infotech Limited 0.83% 0.11% 0.72%Persistent Systems Limited 4.06% 3.43% 0.63%eClerx Services Limited 0.36% - 0.36%Coforge Limited 0.27% - 0.27%Tata Consultancy Services Limited 2.18% 1.93% 0.25%Oracle Financial Services Software Limited
0.88% 0.88% -
BIRLASOFT Limited 0.80% 0.80% - HCL Technologies Limited 0.23% 0.23% - Non - Ferrous MetalsNational Aluminium Company Limited
4.18% 4.18% -
Vedanta Limited 2.91% 2.91% - Finance
Bajaj Finance Limited 0.94% - 0.94%Cholamandalam Investment and
Finance Company Limited0.90% - 0.90%
Housing Development Finance Corporation Limited
0.25% - 0.25%
Indiabulls Housing Finance Limited 2.66% 2.66% - Piramal Enterprises Limited 1.11% 1.11% - SBI Cards and Payment Services Limited
0.48% 0.48% -
Can Fin Homes Limited 0.40% 0.40% - Power Finance Corporation Limited 0.15% 0.15% - Auto
Tata Motors Limited 1.52% 0.34% 1.18%Mahindra & Mahindra Limited 1.77% 1.44% 0.33%Hero MotoCorp Limited 0.80% 0.80% - Bajaj Auto Limited 0.72% 0.72% - Cement & Cement Products
UltraTech Cement Limited 1.12% - 1.12%Dalmia Bharat Limited 0.27% - 0.27%The India Cements Limited 2.16% 2.16% - Grasim Industries Limited 0.08% 0.08% - Petroleum Products
Reliance Industries Limited 1.75% - 1.75%Indian Oil Corporation Limited 1.57% 1.57% - Hindustan Petroleum Corporation Limited
0.04% 0.04% -
PharmaceuticalsGland Pharma Limited 0.29% - 0.29%Sun Pharmaceutical Industries Limited 0.29% - 0.29%Divi's Laboratories Limited 0.26% - 0.26%Laurus Labs Limited 0.98% 0.98% - Strides Pharma Science Limited 0.53% 0.53% - Biocon Limited 0.12% 0.12% - Abbott India Limited 0.10% 0.10% - Dr. Reddy's Laboratories Limited 0.09% 0.09% - Alkem Laboratories Limited 0.04% 0.04% - Pfizer Limited 0.03% 0.03% - Chemicals
SRF Limited 1.19% - 1.19%Clean Science and Technology Limited
0.38% - 0.38%
Navin Fluorine International Limited 0.31% - 0.31%Deepak Nitrite Limited 0.80% 0.80% - Consumer Non DurablesTata Consumer Products Limited 0.19% - 0.19%Hindustan Unilever Limited 1.88% 1.88% - ITC Limited 0.51% 0.51% - Ferrous Metals
Name of Instrument % to Net Assets
% to Net Assets
(hedged)
% to Net Assets
(unhedged)Tata Steel Limited 0.23% 0.05% 0.18%Steel Authority of India Limited 0.70% 0.70% - JSW Steel Limited 0.48% 0.48% - Jindal Steel & Power Limited 0.05% 0.05% - Leisure Services
Indian Hotels Company Limited 1.10% - 1.10%Delta Corp Limited 0.29% 0.29% - Jubilant Foodworks Limited 0.04% 0.04% - Entertainment
Zee Entertainment Enterprises Limited 1.21% 0.43% 0.78%Auto AncillariesMinda Industries Limited 0.50% - 0.50%Sona BLW Precision Forgings Limited 0.37% - 0.37%Rolex Rings Limited 0.22% - 0.22%GasMahanagar Gas Limited 0.94% 0.94% - Consumer DurablesTitan Company Limited 0.62% - 0.62%Whirlpool of India Limited 0.15% 0.15% - ConstructionSobha Limited 0.31% - 0.31%Phoenix Mills Limited 0.29% - 0.29%RetailingAvenue Supermarts Limited 0.57% - 0.57%Industrial ProductsAstral Limited 0.34% 0.34% - Bharat Forge Limited 0.13% 0.13% - Healthcare ServicesMax Healthcare Institute Limited 0.44% - 0.44%PowerTata Power Company Limited 0.43% - 0.43%Textile ProductsPage Industries Limited 0.35% - 0.35%Capital MarketsUTI Asset Management Company Limited
0.15% - 0.15%
Minerals/MiningNMDC Limited 0.04% 0.04% - Total 69.58% 47.85% 21.73%Name of Instrument Rating % to Net
AssetsPREFERENCE SHARESListed / Awaiting listing on Stock ExchangesEntertainmentZee Entertainment Enterprises Limited 0.01%Total 0.01%BONDS & NCDsListed / awaiting listing on the stock exchangesAmba River Coke Limited (Subsidiary of JSW Steel Ltd)
CARE AA- 1.01%
Total 1.01%Zero Coupon Bonds - CorporateListed / awaiting listing on the stock exchangesAditya Birla Housing Finance Limited ICRA AAA 0.46%Total 0.46%Central Government Securities06.18% GOI 04-NOV-2024 SOVEREIGN 10.15%07.32% GOI 28-JAN-2024 SOVEREIGN 9.74%05.22% GOI 15-JUN-2025 SOVEREIGN 5.29%Total 25.18%OTHERS(a) Margin as Cash Margin -0.66%(b) Tri Party Repo Dealing System (TREPS) 6.10%(c) Net Receivables/(Payables) -1.68%Net Assets 100.00%Total number of holdings 79
Indicates top ten instrumentsAll corporate ratings are assigned by rating agencies like CRISIL; CARE; ICRA; IND, BWR.Total outstanding position (as at Dec, 2021) in Derivative Instruments (Gross Notional) 9,768.83 lakhsTotal percentage of existing assets hedged through futures is 47.85%
TOP 10 INDUSTRY BanksSoftwareNon - Ferrous MetalsFinanceAutoCement & Cement ProductsPetroleum ProductsPharmaceuticalsChemicalsConsumer Non DurablesOthers
15.42%
10.44%
7.09%
6.89%
4.81%
3.63%
3.36%
2.73%
2.68%
2.58%
9.96%

Mutual Fund investments are subject to market risks, read all scheme related documents carefully.
EQUITY FUND SNAPSHOTData as on December 31, 2021
Portfolio at a Glance Portfolio at a Glance
Large Cap
Mid Cap
Small Cap
Hedged
Cash
Name ofthe Fund
Benchmark
Fund Category
Month end AUM(Rs in Crs)
Inception Date(Regular Plan)
Growth of `1 Lacinvested at inception
Top 10 equity holding%
Standard Deviation
R-Squared
Beta
Sharpe Ratio
Total Expense Ratio^
Top 10 Industry
L&T Flexicap L&T India Large L&T Midcap L&T Emerging L&T Large and L&T India Fund Cap Fund Fund Businesses Fund Midcap Fund Value Fund
S&P BSE-500 S&P BSE 100 S&P BSE Midcap S&P BSE 250 Small NIFTY LargeMidcap S&P BSE TRI Index TRI Index 150 TRI Cap Index TRI 250 TRI 500 TRI
Flexi Cap Large Cap Mid Cap Small Cap Large and Midcap Value
2,936.09 729.73 6,782.00 8,189.63 1,537.86 7,934.64
May 16, 2005 Oct 23, 2007 Aug 09, 2004 May 12, 2014 May 22, 2006 Jan 08, 2010
`11,95,260 `4,07,480 `20,63,500 `4,67,310 `7,25,440 `5,81,690
42.51% 52.91% 31.20% 33.28% 30.50% 43.52%
L&T Infrastructure L&T Business L&T Tax L&T Focused L&T Balanced L&T Hybrid L&T EquityFund Cycles Fund Advantage Fund Equity Fund Advantage Fund Equity Fund Savings Fund
Nifty Infrastructure S&P BSE S&P BSE Nifty 500 NIFTY 50 Composite CRISIL Hybrid 35+65 NIFTY Equity Savings TRI Index 500 TRI 500 TRI TRI Index Hybrid Debt - Aggressive Index TRI Index
50-50 Index
Sectoral Thematic ELSS Focused Dynamic Asset Aggressive Hybrid Equity SavingsAllocation Fund
1,382.58 568.54 3,574.93 1,013.74 2,124.58 5,338.30 203.49
Sept 27, 2007 Aug 20, 2014 Feb 27, 2006 Nov 5, 2018 Feb 07, 2011 Feb 07, 2011 Oct 18, 2011
`2,42,400 `2,28,870 `8,17,980 `1,61,630 `3,09,650 `3,79,600 `2,29,750
47.06% 45.47% 40.23% 48.74% 15.36%$ 35.03% 11.49%#
21.28% 20.60% 22.73% 27.27% 20.39% 24.26%
0.98 0.98 0.96 0.97 0.91 0.95
0.96 0.95 0.82 0.96 0.85 1.09
0.54 0.67 0.56 0.75 0.67 0.65
2.08% 2.47% 1.88% 1.85% 2.23% 1.85%
25.56% 26.09% 21.99% - - 16.08% -
0.84 0.88 0.94 - - 0.95 -
1.02 1.14 0.99 - - 1.12 -
0.48 0.48 0.57 - - 0.69 -
2.20% 2.55% 1.97% 2.33% 2.09% 1.90% 1.58%
$Net Equity for Balanced Advantage Fund is 35.29%.#Net Equity for Equity Savings Fund is 21.73%.^Note: Expense ratio is for regular plan as on 31st December 2021.DisclaimersThe document indicates the strategy/ investment approach currently followed by the schemes and the same may change in future depending on market conditions and other factors.Past performance may or may not be sustained in future and should not be used as a basis for comparison with other investments. For performance refer page 42-43 and 46-49 of the factsheet while reading this document.
For product label please refer Page 3 of the factsheet.
Exit LoadIf the units redeemed or switched out are upto 10% of the units purchased or switched in (“the limit”) within 1 year from the date of allotment – Nil. If units redeemed or switched out are over and above the limit within 1 year from the date of allotment – 1%. If units are redeemed or switched out on or after 1 year from the date of allotment – Nil. (L&T Flexicap Fund, L&T Emerging Businesses Fund, L&T Large and Midcap Fund, L&T Focused Equity Fund, L&T India Large Cap Fund, L&T Midcap Fund, L&T India Value Fund, L&T Infrastructure Fund, L&T Business Cycles Fund, L&T Balanced Advantage Fund, L&T Hybrid Equity Fund & L&T Equity Savings Fund).
CL09008
3.91%
5.16%
12.15% 0.84% 0.59% 0.29% 12.17%4.05% 1.04% 10.89% 0.88% 0.26%
38.67%
26.44%
34.35%
0.54%
45.57%
27.28%
27.04%
0.11% 9.00% 0.83% 8.95%
45.62%
21.15%
6.76%
26.47%
6.30%
1.33%
67.40%
19.61%
23.99%
74.97%
54.85%25.12%
19.77%
3.67%
3.85%
3.96%
4.47%
6.05%
6.37%
9.76%
9.81%
15.49%
17.95%
Construction
Retailing
Cement &
Cement Products
Auto
Petroleum
Products
Consumer
Non Durables
Finance
Pharmaceuticals
Software
Banks
2.82%
2.87%
3.57%
4.88%
5.34%
5.63%
6.30%
7.49%
18.92%
23.60%
Telecom -
Services
Auto
Construction Project
Consumer
Non Durables
Pharmaceuticals
Cement &
Cement Products
Finance
Petroleum
Products
Software
Banks
3.46%
3.46%
3.63%
3.79%
4.41%
7.98%
8.47%
9.38%
10.99%
11.41%
Healthcare
Services
Construction
Auto
Ancillaries
Banks
Ferrous
Metals
Industrial
Products
Software
Consumer
Non Durables
Pharmaceuticals
Finance
4.08%
4.10%
6.14%
6.45%
6.61%
6.84%
8.97%
11.43%
11.77%
17.03%
Industrial
Capital Goods
Ferrous
Metals
Chemicals
Auto
Ancillaries
Consumer
Non Durables
Construction
Consumer
Durables
Textile
Products
Software
Industrial
Products
3.62%
3.84%
4.52%
5.29%
5.54%
5.93%
7.41%
7.42%
9.85%
20.04%
Healthcare
Services
Retailing
Petroleum
Products
Finance
Consumer
Durables
Cement &
Cement Products
Auto
Ancillaries
Chemicals
Banks
Software
3.33%
3.92%
4.29%
4.32%
5.37%
6.20%
6.33%
6.96%
16.98%
19.78%
Chemicals
Finance
Ferrous
Metals
Auto
Petroleum
Products
Construction
Pharmaceuticals
Cement &
Cement Products
Software
Banks
3.31%
3.49%
4.01%
4.22%
4.60%
7.57%
13.46%
16.68%
16.88%
17.45%
Telecom -
Services
Aerospace &
Defense
Power
Transportation
Petroleum
Products
Construction
Construction
Project
Industrial
Capital Goods
Cement &
Cement Products
Industrial
Products
4.05%
4.09%
4.14%
4.88%
5.36%
7.30%
8.69%
11.20%
11.44%
20.92%
Ferrous
Metals
Chemicals
Construction
Project
Petroleum
Products
Industrial
Capital Goods
Consumer
Durables
Construction
Cement &
Cement Products
Industrial
Products
Banks
3.36%
3.37%
3.51%
5.27%
5.61%
5.68%
5.99%
6.73%
15.16%
20.60%
Textile
Products
Healthcare
Services
Pharmaceuticals
Finance
Cement &
Cement Products
Chemicals
Auto
Ancillaries
Petroleum
Products
Banks
Software
3.60%
3.69%
4.64%
5.26%
5.41%
6.10%
6.31%
7.07%
7.27%
21.51%
Industrial
Capital Goods
Pesticides
Construction
Project
Consumer
Non Durables
Retailing
Cement &
Cement Products
Petroleum
Products
Pharmaceuticals
Transportation
Software
1.61%
1.88%
3.48%
3.67%
3.75%
4.23%
7.31%
7.59%
7.70%
15.28%
Pesticides
Petroleum
Products
Cement &
Cement Products
Ferrous
Metals
Auto
Construction
Consumer
Non Durables
Pharmaceuticals
Software
Banks
1.78%
3.46%
3.58%
3.63%
3.97%
4.24%
5.04%
6.85%
13.19%
13.24%
Retailing
Finance
Consumer
Non Durables
Petroleum
Products
Cement &
Cement Products
Pharmaceuticals
Textile
Products
Auto
Ancillaries
Software
Banks
2.58%
2.68%
2.73%
3.36%
3.63%
4.81%
6.89%
7.09%
10.44%
15.42%
Consumer
Non Durables
Chemicals
Pharmaceuticals
Petroleum
Products
Cement &
Cement Products
Auto
Finance
Non - Ferrous
Metals
Software
Banks
91.87%
7.25%
64.22%
19.56%
52.60%
35.63%65.85%
24.32%48.08%
24.41%
18.56%26.22%
32.68%
32.03%14.10%
30.42%
47.85%
28

Mutual Fund investments are subject to market risks, read all scheme related documents carefully.
DEBT FUND SNAPSHOTData as on December 31, 2021
Rating Profile Rating Profile
Asset Allocation Profile Asset Allocation Profile
A
A+
A-
AA+
AA
AA-
A1+
AAA
SOV
Cash & Equivalent
NAME OFTHE FUND
Benchmark
Fund Category
Month end AUM(Rs in Crs)
Inception Date(Regular Plan)
Minimum Investment Horizon
Total Expense Ratio+^
L&T Flexi Bond L&T Credit Risk L&T Triple Ace L&T Banking and L&T Gilt Fund L&T ConservativeFund Fund Bond Fund PSU Debt Fund Hybrid Fund
NIFTY Composite NIFTY Credit Risk NIFTY Corporate NIFTY Banking & PSU NIFTY All Duration CRISIL Hybrid 85+15 -Debt Index Bond Index Bond Index Debt Index G-Sec Index Conservative Index
Dynamic Bond Credit Risk Corporate Bond Banking & PSU Gilt Conservative Hybrid
61.24 181.13 9,622.88 3,434.86 255.40 38.73
September 27, 2010 October 08, 2009 March 31, 1997 September 12, 2012 March 29, 2000 July 31, 2003
1 Year + / Tactical 1 Year + 1 Year + 3 Months + 1 Year + / Tactical -
1.62% 1.66% 0.63% 0.61% 1.70% 2.26%
L&T Liquid L&T Ultra L&T Money L&T Low L&T Short Term L&T Resurgent Fund Short Term Fund Market Fund Duration Fund Bond Fund India Bond Fund
NIFTY Liquid Index NIFTY Ultra Short NIFTY Money Market NIFTY Low Duration NIFTY Short Duration NIFTY Medium DurationDuration Debt Index Index Debt Index Debt Index Debt Index
Liquid Ultra Short Term Duration Money Market Low duration Short duration Medium duration
5,304.43 1,892.35 1,007.47 896.75 3,975.33 1,308.64
October 03, 2006 April 10, 2003 August 10, 2005 December 04, 2010 December 27, 2011 February 02, 2015
1 day + 1 Month + 1 Month + 3 Months + 6 Months + 2 Years +
0.20% 0.39% 0.72% 0.92% 0.75% 1.45%
+Effective April 01, 2019 Total Expense Ratio (TER) stands revised. For the actual current expenses charged to the scheme, please refer the website of the Mutual Fund - www.ltfs.com^Note: Expense ratio is for regular plan as on 31st December 2021.
DisclaimersThe document indicates the strategy / investment approach currently followed by the schemes and the same may change in future depending on market conditions and other factors. Refer factsheet while reading this document.
For product label please refer Page 3 of the factsheet.
Exit Load• For redemption within 1 year from the date of allotment or Purchase applying First in First out basis – 0.50% of Applicable NAV. For redemption After 1 year from the date of
allotment or Purchase applying First in First out basis - Nil (L&T Flexi Bond Fund)• If the amount sought to be redeemed or switched out on or before 3 months from the date of allotment: 0.50%. If the amount sought to be redeemed or switched out is invested
for a period of more than 3 months from the date of allotment: Nil (w.e.f. June 09, 2021) (L&T Triple Ace Bond Fund)• If the units redeemed or switched out are upto 10% of the units purchased or switched in (“the limit”) within 1 year from the date of allotment – Nil. If units redeemed or
switched out are over and above the limit within 1 year from the date of allotment – 1%. If units are redeemed or switched out on or after 1 year from the date of allotment – Nil. (L&T Credit Risk Fund & L&T Conservative Hybrid Fund)
• Nil (L&T Ultra Short Term Fund, L&T Money Market Fund, L&T Banking and PSU Debt Fund, L&T Short Term Bond Fund, L&T Gilt Fund, L&T Low Duration Fund & L&T Resurgent India Bond Fund)
• Effective October 20, 2019, exit load will be applicable on all fresh investments in L&T Liquid Fund
CL09008
Treasury Bill
Securitised Debt
Government Bond
NCD
Money Market Instrument
NR/NP
TREPS Reverse Repo
Equity & Equity Related
Units redeemed / switched-out within “X” days from the date of allotment
Day 1 Day 2 Day 3 Day 4 Day 5 Day 6 Day 7 onwards
Exit Load (as a % of redemption proceeds) 0.0070% 0.0065% 0.0060% 0.0055% 0.0050% 0.0045% Nil
28.19%
39.76%
29.79%
2.25%15.11%
43.49%
40.13%
1.27%23.32%
68.47%
8.21%
3.81%
3.42%
46.64%
3.44%
11.16%
31.53%
2.04%
49.69%
45.18%
3.09%
44.44%
6.55%
36.80%
7.21%
5.00%
39.38%
16.94%
43.69%
18.78%
22.31%
36.34%
16.09%
6.48%
68.75%
4.50%
26.75%
2.09%12.98%
84.93%97.89%
2.11%
9.94%
10.75%
24.55%
54.76%
34.29%
39.78%
-6.10%
8.21%2.25%
21.60%
34.35%
40.13%
9.13%
15.12%
4.30%
-3.03%
68.48%
8.18%
4.12%
19.20%
0.03%
4.04%
31.53%
7.52%
3.81%
57.15%
-4.08%
3.22%
2.05%
2.61%
49.68%
42.59%
-0.13%
36.80%
7.27%4.03%
51.96%
-0.06%
0.83%
38.55%
43.68%
16.94%
58.92%
22.30%
0.09%18.69%
-0.07%
68.74%
26.75%
4.57%19.54%
97.89%
-17.43%
10.90%
54.76%
24.56%
9.93%
-0.15%5.86%-3.04%
5.13%
12.98%
79.07%
29

30
Data as on December 31, 2021
Overnight Fund
L&T OVERNIGHT FUND#
The investment objective of the Scheme is to generate regular returns in line with the overnight rates. There is no assurance that the investment objective of the scheme will be realized.
INVESTMENT OBJECTIVE
FUND DETAILS PORTFOLIO ALLOCATION
Date of Inception
Regular Plan November 27, 2006
Direct Plan January 01, 2013
Fund Manager
Mr. Mahesh Chhabria (w.e.f. November 25, 2021) and Mr. Shriram Ramanathan (w.e.f. April 03, 2017)
Benchmark
NIFTY 1D Rate Index
Month end AUM
1,456.98 (` In Crs)
Monthly Average AUM
1,225.11 (` In Crs)
Options
•Growth •IDCW option (Reinvestment and Payout)
Name of Instrument Rating % to Net Assets
DEBT INSTRUMENTS
OthersTri Party Repo Dealing System (TREPS)/Reverse Repo
99.59%
Net Receivable/Payable 0.41%Net Assets 100.00%
Name of Instrument Rating % to Net Assets
Average Maturity: Since the fund invests in overnight securities average maturity is taken as 1 day^.Modified Duration 0.01 yearsMacaulay Duration 0.01 yearsYTM 3.43%
Exit Load: NilFor details of the performance of the schemes, please refer page nos 48 to 51.#The name of the Scheme is changed to L&T Overnight Fund from L&T Cash Fund with effect from February 1, 2020 (‘effective date’).For product label please refer Page 3 & 4 of the factsheet.The Fund was co-managed by Mr. Jalpan Shah till November 24, 2021.
TREPS/Rev Repo/NR/NP
% RATING PROFILE % ASSET ALLOCATION PROFILE
100.00%
0.41%
99.59%
TREPS / Rev Repo/NR/NP
100.00%
0%
20%
40%
60%
80%
100%
120%
% MATURITY PROFILE
^ Since the fund invests in overnight securities average maturity is taken as 1 day
TREPS / Reverse Repo
Net Receivables / (Payables)

31
Data as on December 31, 2021
A1+/ A1+(SO)
AAA/ AAA(SO)/ AAA(CE)
Sovereign
TREPS/Rev Repo/NR/NP
% RATING PROFILE % ASSET ALLOCATION PROFILE
29.79%
28.19%
39.76%
2.25%
34.29%
21.60%
39.78%
8.21%
2.25%
-6.10%
71.81%
28.19%
0%
20%
40%
60%
80%
100%
0 - 3 months TREPS / Rev Repo/NR/NP
% MATURITY PROFILE
L&T LIQUID FUND
The investment objective of the Scheme is to generate regular returns in line with the overnight rates.
INVESTMENT OBJECTIVE
FUND DETAILS PORTFOLIO ALLOCATION
Date of Inception
Regular Plan October 03, 2006
Direct Plan December 31, 2012
Fund Manager
Mr. Mahesh Chhabria (w.e.f. November 25, 2021) and Mr. Shriram Ramanathan (w.e.f. June 30, 2014)
Benchmark
NIFTY Liquid Index
Month end AUM
5,304.43 (` In Crs)
Monthly Average AUM
5,102.10 (` In Crs)
Options
•Growth •IDCW (Reinvestment and Payout) - Weekly IDCW •Daily IDCW Reinvestment Plan
To generate reasonable returns while maintaining safety and providing the investor superior liquidity. To achieve this objective, investments will be predominantly made in a well-diversified and highly liquid portfolio of money market instruments, government securities and corporate debt. There is no assurance that the investment objective of the scheme will be realized.
INVESTMENT OBJECTIVE
FUND DETAILS PORTFOLIO ALLOCATION
Exit Load: Effective October 20, 2019, exit load will be applicable on all fresh investments in L&T Liquid Fund
For details of the performance of the schemes, please refer page nos 48 to 51.For product label please refer Page 3 & 4 of the factsheet.The Fund was co-managed by Mr. Jalpan Shah till November 24, 2021
Units redeemed / switched-out within “X” days from the date of allotment
Day 1 Day 2 Day 3 Day 4 Day 5 Day 6 Day 7 onwards
Exit Load (as a % of redemption proceeds) 0.0070% 0.0065% 0.0060% 0.0055% 0.0050% 0.0045% Nil
Liquid Fund
Name of Instrument Rating % to Net Assets
DEBT INSTRUMENTSMONEY MARKET INSTRUMENTS Commercial Paper (Listed / Awaiting listing on Stock Exchanges) /Certificate of Deposit
Axis Bank Limited CRISIL A1+ 6.57%
ICICI Securities Limited CRISIL A1+ 5.63%
HDFC Securities Limited CRISIL A1+ 5.62%
Reliance Jio Infocomm Limited CRISIL A1+ 5.17%
Export Import Bank of India CRISIL A1+ 3.74%
Reliance Industries Limited CRISIL A1+ 2.82%
Berger Paints India Limited CRISIL A1+ 2.72%
Indian Oil Corporation Limited ICRA A1+ 2.35%National Bank for Agriculture & Rural Development ICRA A1+ 2.35%
NTPC Limited CRISIL A1+ 1.87%
Godrej Agrovet Limited CRISIL A1+ 0.94%
Total 39.78%
GOVERNMENT BONDS
08.20% GOI 15-FEB-2022 SOVEREIGN 8.21%
Total 8.21%
Name of Instrument Rating % to Net Assets
Non Convertible Debentures
Listed/Awaiting Listing on the Exchange
Rec Limited CRISIL AAA 2.25%
Total 2.25%
Treasury Bill
364 DAYS T-BILL 20-JAN-22 SOVEREIGN 5.65%
91 DAY T-BILL 31MAR22 SOVEREIGN 5.61%
91 DAY T-BILL 13JAN22 SOVEREIGN 3.77%
91 DAY T-BILL 02FEB22 SOVEREIGN 3.76%
91 DAY T-BILL 24MAR22 SOVEREIGN 2.81%
Total 21.60%
OthersTri Party Repo Dealing System (TREPS)/Reverse Repo 34.29%
Net Receivable/Payable -6.10%
Net Assets 100.00%
Average Maturity 0.10 years
Modified Duration 0.09 years
Macaulay Duration 0.09 years
YTM 3.55%
Indicates top ten instruments
Money Market Instrument
Government Bonds
Non Convertible Debentures
Treasury Bill
Treps / Reverse Repo
Net Receivables / (Payables)

32
Data as on December 31, 2021
Ultra Short Term Duration Fund
L&T ULTRA SHORT TERM FUND
To generate reasonable and stable income and provide liquidity to the unit holder. To achieve this objective the scheme will invest predominantly in a well diversified and highly liquid portfolio of money market instruments, government securities and corporate debt. The scheme will not invest in equities or equity related instruments. There is no assurance that the investment objective of the scheme will be realized.
INVESTMENT OBJECTIVE
FUND DETAILS PORTFOLIO ALLOCATION
A1+/ A1+(SO)
AAA/ AAA(SO)/ AAA(CE)
Sovereign
TREPS/Rev Repo/NR/NP
Date of Inception
Regular Plan April 10, 2003
Direct Plan January 01, 2013
Fund Manager
Mr. Jalpan Shah (w.e.f June 30, 2014) & Mr. Mahesh Chhabria (w.e.f November 25, 2021)
Benchmark
NIFTY Ultra Short Duration Debt Index
Month end AUM
1,892.35 (` In Crs)
Monthly Average AUM
2,391.19 (` In Crs)
Options
•Growth •IDCW (Reinvestment and Payout) 1. Weekly IDCW 2. Monthly IDCW 3. Semi- annual IDCW •Daily IDCW Reinvestment Plan
Exit Load: NilFor details of the performance of the schemes, please refer page nos 48 to 51.For product label please refer Page 3 & 4 of the factsheet.The Fund was co-managed by Mr. Shriram Ramanathan till November 24, 2021
% RATING PROFILE % ASSET ALLOCATION PROFILE
40.13%
15.11%
1.27%
43.49%
34.35%
40.13%
15.12%
4.30%-3.03%
9.13%
35.96%
57.38%
5.39%1.27%
0%
10%
20%
30%
40%
50%
60%
70%
0- 3 Months 3- 6 Months 2 - 3 Years TREPS / RevRepo/NR/NP
% MATURITY PROFILE
Name of Instrument Rating % to Net Assets
DEBT INSTRUMENTSMONEY MARKET INSTRUMENTS Commercial Paper (Listed / Awaiting listing on Stock Exchanges) /Certificate of Deposit
HDFC Bank Limited CARE A1+/ICRA A1+ 9.15%
Axis Bank Limited CRISIL A1+ 8.72%
Export Import Bank of India CRISIL A1+ 7.86%Small Industries Development
Bank of India CARE A1+ 7.86%Sikka Ports & Terminals Limited
(erstwhile Reliance Ports & Terminals Ltd)
CRISIL A1+ 3.94%
LIC Housing Finance Limited CRISIL A1+ 2.60%
Total 40.13%
GOVERNMENT BONDS
08.15% GOI 11-JUN-2022 SOVEREIGN 27.02%
08.35% GOI 14-MAY-2022 SOVEREIGN 7.33%
Total 34.35%Listed/Awaiting Listing on the ExchangeNon Convertible Debentures
Housing Development Finance Corporation Limited CRISIL AAA 6.40%
National Bank for Agriculture & Rural Development ICRA AAA 5.39%
Name of Instrument Rating % to Net Assets
Rec Limited CRISIL AAA 3.33%
Total 15.12%
Treasury Bill
364 DAYS T-BILL 11-MAR-22 SOVEREIGN 2.62%
364 DAY T-BILL 16JUN22 SOVEREIGN 2.60%
364 DAYS T-BILL 24-MAR-22 SOVEREIGN 1.31%
182 DAY T-BILL 12MAY22 SOVEREIGN 1.30%
364 DAY T-BILL 05MAY22 SOVEREIGN 1.30%
Total 9.13%
OthersTri Party Repo Dealing System (TREPS)/Reverse Repo 4.30%
Net Receivable/Payable -3.03%
Net Assets 100.00%
Average Maturity 0.36 years
Modified Duration 0.34 years
Macaulay Duration 0.35 years
YTM 3.91%
Indicates top ten instruments
Money Market Instrument
Non Convertible Debentures
Government Bonds
Treasury Bill
TREPS / Reverse Repo
Net Receivables / (Payables)

33
Data as on December 31, 2021L&T MONEY MARKET FUND
The investment objective of the Scheme is to generate regular returns in line with the overnight rates.
INVESTMENT OBJECTIVE
FUND DETAILS PORTFOLIO ALLOCATION
A1+/ A1+(SO)
Sovereign
TREPS/Rev Repo/NR/NP
Exit Load: NilFor details of the performance of the schemes, please refer page nos 48 to 51.For product label please refer Page 3 & 4 of the factsheet.The fund was co-managed by Mr. Jalpan Shah till November 24, 2021.
% RATING PROFILE % ASSET ALLOCATION PROFILE
8.21%
68.47%
23.32%
8.18% 0.03%
68.48%
19.20%
4.12%
84.49%
7.30% 8.21%
0%
50%
100%
0- 3 Months 3- 6 Months TREPS / Rev
Repo/NR/NP
To generate regular income through investment in a portfolio comprising substantially of money market instruments. There is no assurance that the investment objective of the scheme will be realized.
INVESTMENT OBJECTIVE
% ASSET ALLOCATION PROFILE
% MATURITY PROFILE
Money Market Fund
Date of Inception
Regular Plan August 10, 2005
Direct Plan January 01, 2013
Fund Manager
Mr. Shriram Ramanathan (w.e.f March 21, 2020) & Mr. Mahesh Chhabria (w.e.f November 25, 2021)
Benchmark
NIFTY Money Market Index
Month end AUM
1,007.47 (` In Crs)
Monthly Average AUM
973.59 (` In Crs)
Options
•Growth •IDCW 1. Daily IDCW (Payout) 2. Weekly IDCW (Payout) 3. Monthly IDCW (Re-investment and Payout)
Name of Instrument Rating % to Net Assets
DEBT INSTRUMENTSMONEY MARKET INSTRUMENTS Commercial Paper (Listed / Awaiting listing on Stock Exchanges) /Certificate of Deposit
Sikka Ports & Terminals Limited (erstwhile Reliance Ports & Terminals Ltd)
CRISIL A1+ 7.40%
HDFC Bank Limited ICRA A1+ 7.39%Reliance Industries Limited CRISIL A1+ 6.41%Bajaj Housing Finance Limited CRISIL A1+ 4.95%LIC Housing Finance Limited CRISIL A1+ 4.95%
Axis Bank Limited CRISIL A1+ 4.94% ICICI Securities Limited CRISIL A1+ 4.93%
UltraTech Cement Limited CRISIL A1+ 4.93%Kotak Mahindra Investment Limited CRISIL A1+ 4.91%
EPL Limited (Erstwhile Essel Propack Limited) IND A1+ 2.96%
Axis Finance Limited CRISIL A1+ 2.47%
Godrej Agrovet Limited CRISIL A1+ 2.46%Small Industries Development Bank of India CARE A1+ 2.46%
Tata Capital Financial Services Limited CRISIL A1+ 2.46%
Bajaj Financial Securities Limited CRISIL A1+ 2.43%Network18 Media & Investments Limited CARE A1+ 2.43%
Total 68.48%
Name of Instrument Rating % to Net Assets
Government Bonds
08.20% GOI 15-FEB-2022 SOVEREIGN 2.57%8.96% PUNJAB SDL 07-Mar-2022 SOVEREIGN 1.55%
Total 4.12%
Treasury Bill364 DAYS T-BILL 11-MAR-22 SOVEREIGN 5.42%364 DAYS T-BILL 30-MAR-22 SOVEREIGN 4.92%91 DAY T-BILL 31MAR22 SOVEREIGN 4.92%
364 DAYS T-BILL 24-MAR-22 SOVEREIGN 3.94%
Total 19.20%
OthersTri Party Repo Dealing System (TREPS)/Reverse Repo 8.18%
Net Receivable/Payable 0.03%
Net Assets 100.00%
Average Maturity 0.19 years
Modified Duration 0.18 years
Macaulay Duration 0.18 years
YTM 3.74%
Indicates top ten instruments
Money Market Instrument
Government Bonds
Treasury Bill
TREPS / Reverse Repo
Net Receivables / (Payables)

34
Data as on December 31, 2021
Banking & PSU Fund
L&T BANKING AND PSU DEBT FUND
To generate reasonable returns by primarily investing in debt and money market securities that are issued by Banks, Public Sector Undertakings (PSUs) and Public Financial Institutions (PFIs) in India. There is no assurance that the investment objective of the scheme will be realized.
INVESTMENT OBJECTIVE
FUND DETAILS PORTFOLIO ALLOCATION
Date of Inception
Regular Plan September 12, 2012
Direct Plan January 01, 2013
Fund Manager
Mr. Jalpan Shah (w.e.f. May 30, 2016) & Mr. Shriram Ramanathan (w.e.f. March 29, 2017)
Benchmark
NIFTY Banking & PSU Debt Index
Month end AUM
3,434.86 (` In Crs)
Monthly Average AUM
3,707.87 (` In Crs)
Options
•Growth •IDCW option (Reinvestment and Payout)
Exit Load: NilFor details of the performance of the schemes, please refer page nos 48 to 51.For product label please refer Page 3 & 4 of the factsheet.
% RATING PROFILE % ASSET ALLOCATION PROFILE
12.98%
84.93%
2.09%
5.86%
79.07%
12.98%
5.13%
-3.04%
4.96%
84.56%
8.40%2.09%
0%
20%
40%
60%
80%
100%
0 -1
Year
1 - 2
Years
2 - 3
Years
TREPS / Rev
Repo/NR/NP
% MATURITY PROFILE
Name of Instrument Rating % to Net Assets
DEBT INSTRUMENTSMoney Market InstrumentCommercial Paper (Listed / Awaiting listing on Stock Exchanges)/Certificate of DepositExport Import Bank of India CRISIL AAA 5.86%
Total 5.86%
GOVERNMENT BONDS07.16% GOI 20-MAY-2023 SOVEREIGN 6.82%06.18% GOI 04-NOV-2024 SOVEREIGN 6.01%
07.35% GOI 22-JUN-2024 SOVEREIGN 0.15%
Total 12.98%Non Convertible Debentures Listed/Awaiting Listing on the Exchange
National Bank for Agriculture & Rural Development
CRISIL AAA/ICRA AAA 9.78%
National Housing Bank CRISIL AAA 9.70%NTPC Limited CRISIL AAA 9.65% Indian Railway Finance
Corporation Limited CRISIL AAA 8.68%
Indian Oil Corporation Limited CRISIL AAA 8.51%Housing Development Finance
Corporation Limited CRISIL AAA 8.34%Power Grid Corporation of India
Limited CRISIL AAA 6.81%Hindustan Petroleum
Corporation Limited CRISIL AAA 6.21%
Power Finance Corporation Limited CRISIL AAA 4.50%
Name of Instrument Rating % to Net Assets
Export Import Bank of India CRISIL AAA 2.58%Rec Limited CRISIL AAA 1.58%Small Industries Development Bank of India ICRA AAA 1.56%
National Highways Authority of India CRISIL AAA 0.75%
NHPC Limited IND AAA 0.16%Housing and Urban Development Corporation Limited
CARE AAA 0.15%
Nuclear Power Corporation Of India Limited CRISIL AAA 0.11%
Total 79.07%OthersTri Party Repo Dealing System (TREPS)/Reverse Repo 5.13%
Net Receivable/Payable -3.04%
Net Assets 100.00%
Average Maturity 1.47 years
Modified Duration 1.34 years
Macaulay Duration 1.40 years
YTM 4.90%
Indicates top ten instruments
AAA/ AAA(SO)/ AAA(CE)
Sovereign
TREPS/Rev Repo/NR/NP
Money Market Instrument
Government Bonds
Non Convertible Debentures
TREPS / Reverse Repo
Net Receivables / (Payables)

35
Data as on December 31, 2021L&T SHORT TERM BOND FUND
The investment objective of the Scheme is to generate regular returns in line with the overnight rates.
INVESTMENT OBJECTIVE
FUND DETAILS PORTFOLIO ALLOCATION
Exit Load: NilFor details of the performance of the schemes, please refer page nos 48 to 51.For product label please refer Page 3 & 4 of the factsheet.
% RATING PROFILE % ASSET ALLOCATION PROFILE
45.18%
49.69%
3.09% 2.04% -0.13%
2.05%
49.68%
42.59%
2.61%3.22%
15.61%
40.14%
11.53%
29.63%
3.09%
0%
5%
10%
15%
20%
25%
30%
35%
40%
45%
0 -1 Year 1 - 2 Years 2 - 3 Years 3 - 5 Years TREPS / Rev
Repo/NR/NP
To generate regular returns and capital appreciation by investing in debt, government and money market securities. There is no assurance that the investment objective of the scheme will be realized.
INVESTMENT OBJECTIVE
% RATING PROFILE % ASSET ALLOCATION PROFILE
% MATURITY PROFILE
Short Duration Fund
Date of Inception
Regular Plan December 27, 2011
Direct Plan January 01, 2013
Fund Manager
Mr. Shriram Ramanathan & Mr. Jalpan Shah (w.e.f. May 30, 2016)
Benchmark
NIFTY Short Duration Debt Index
Month end AUM
3,975.33 (` In Crs)
Monthly Average AUM
4,159.92 (` In Crs)
Options
•Growth •IDCW (Reinvestment and Payout) •Quarterly IDCW (Reinvestment and Payout) •Annual IDCW (Reinvestment and Payout)
Name of Instrument Rating % to Net Assets
DEBT INSTRUMENTSMoney Market Instrument Commercial Paper (Listed / Awaiting listing on Stock Exchanges) / Certificate of DepositHDFC Bank Limited CARE A1+ 1.84%
Axis Bank Limited CRISIL A1+ 0.21%
Total 2.05%
GOVERNMENT BONDS
05.63% GOI 12-APR-2026 SOVEREIGN 10.12%
07.16% GOI 20-MAY-2023 SOVEREIGN 7.85%
07.35% GOI 22-JUN-2024 SOVEREIGN 6.74%
7.89% GUJARAT SDL 15-MAY-2025 SOVEREIGN 5.31%
06.30% GOI 09-APR-2023 SOVEREIGN 5.21%
05.22% GOI 15-JUN-2025 SOVEREIGN 3.74%8.23% MAHARASHTRA SDL 09-SEP-2025 SOVEREIGN 3.60%
04.26% GOI 17-MAY-2023 SOVEREIGN 2.52%8.15% MAHARSHTRA SDL 26-NOV-2025 SOVEREIGN 2.05%8.26% MAHARASHTRA SDL 12-AUG-2025 SOVEREIGN 0.87%
7.96% GUJARAT SDL 14-OCT-2025 SOVEREIGN 0.55%8.14% KARNATAKA SDL 13-NOV-2025 SOVEREIGN 0.55%
8.23% GUJARAT SDL 09-SEP-2025 SOVEREIGN 0.28%
06.17% GOI 12-JUN-2023 SOVEREIGN 0.26%
07.72% GOI 25-MAY-2025 SOVEREIGN 0.03%
Total 49.68%Non Convertible Debentures Listed/Awaiting Listing on the Exchange
National Bank for Agriculture & Rural Development CRISIL AAA 9.00%
Housing Development Finance Corporation Limited CRISIL AAA 7.55%
Indian Railway Finance Corporation Limited CRISIL AAA 6.41%
NTPC Limited CRISIL AAA 4.03%
Name of Instrument Rating % to Net Assets
Indian Oil Corporation Limited CRISIL AAA 3.96%
National Housing Bank CRISIL AAA 3.66%Small Industries Development Bank of India CARE AAA 2.69%Jamnagar Utilities and Power Pvt Limited CRISIL AAA 2.53%
Reliance Industries Limited CRISIL AAA 0.88%
Rec Limited CRISIL AAA 0.68%
Export Import Bank of India CRISIL AAA 0.53%Hindustan Petroleum Corporation Limited CRISIL AAA 0.39%
National Highways Authority of India CRISIL AAA 0.08%
Bajaj Finance Limited CRISIL AAA 0.06%
Sundaram Finance Limited CRISIL AAA 0.05%
Bajaj Housing Finance Limited CRISIL AAA 0.03%Bharat Petroleum Corporation Limited CRISIL AAA 0.03%Housing and Urban Development Corporation Limited CARE AAA 0.03%
Total 42.59%
Securitised Debt AmortFirst Business Receivables Trust(Backed by receivables from Reliance Industries,Reliance Retail,Reliance Jio)
CRISIL AAA(SO) 2.61%
Total 2.61%
Others
Tri Party Repo Dealing System (TREPS)/Reverse Repo 3.22%
Net Receivable/Payable -0.13%
Net Assets 100.00%
Average Maturity 2.12 years
Modified Duration 1.88 years
Macaulay Duration 1.94 years
YTM 5.11%
Indicates top ten instruments
A1+/ A1+(SO)
AAA/ AAA(SO)/ AAA(CE)
Sovereign
TREPS/Rev Repo/NR/NP
Money Market Instrument
Government Bonds
Non Convertible Debentures
Securitised Debt
TREPS / Reverse Repo
Net Receivables / (Payables)

36
Data as on December 31, 2021
Low Duration Fund
L&T LOW DURATION FUND
To generate reasonable returns primarily through investments in fixed income securities and money market instruments. There is no assurance that the objective of the Scheme will be realised and the Scheme does not assure or guarantee any returns.
INVESTMENT OBJECTIVE
FUND DETAILS PORTFOLIO ALLOCATION
Date of Inception
Regular Plan December 04, 2010
Direct Plan January 01, 2013
Fund Manager
Mr. Shriram Ramanathan (w.e.f Nov 24, 2012) & Mr. Jalpan Shah (w.e.f March 21, 2020)
Benchmark
NIFTY Low Duration Debt Index
Month end AUM
896.75 (` In Crs)
Monthly Average AUM
1,111.38 (` In Crs)
Options
•Growth •IDCW option (Reinvestment and Payout) •Annual IDCW option (Reinvestment and Payout)
Exit Load: Nil (w.e.f. July 9, 2020)For details of the performance of the schemes, please refer page nos 48 to 51.For product label please refer Page 3 & 4 of the factsheet.
% RATING PROFILE % ASSET ALLOCATION PROFILE
3.42%3.44%
46.64%
11.16%
3.81%
31.53%
-4.08%
31.53%
3.81%
57.15%
4.04%
7.52%
87.47%
7.95%1.14% 3.44%
0%
20%
40%
60%
80%
100%
0 -1 Year 1 - 2 Years 2 - 3 Years TREPS / Rev
Repo/NR/NP
% MATURITY PROFILE
Name of Instrument Rating % to Net Assets
DEBT INSTRUMENTSMONEY MARKET INSTRUMENTS Commercial Paper (Listed / Awaiting listing on Stock Exchanges) /Certificate of DepositAxis Bank Limited CRISIL A1+ 2.70%ICICI Securities Limited CRISIL A1+ 1.11%
Total 3.81%
Government Bonds08.35% GOI 14-MAY-2022 SOVEREIGN 11.45%06.84% GOI 19-DEC-2022 SOVEREIGN 8.58%07.16% GOI 20-MAY-2023 SOVEREIGN 5.80%08.15% GOI 11-JUN-2022 SOVEREIGN 5.70%
Total 31.53%Listed/Awaiting Listing on the ExchangeNon Convertible Debentures
Housing Development Finance Corporation Limited CRISIL AAA 7.48%
National Bank for Agriculture & Rural Development
CRISIL AAA/ICRA AAA 5.81%
India Grid Trust CRISIL AAA 4.98%ONGC Petro Additions Limited
(Letter of comfort from Oil & Natural Gas Corporation Limited)
ICRA AAA (CE) 4.82%
Power Finance Corporation Limited CRISIL AAA 4.12%Tata Steel Limited BWR AA+ 4.12%
NIIF Infrastructure Finance Limited ICRA AAA 3.74%Aditya Birla Fashion and Retail Limited CRISIL AA 3.42%
Name of Instrument Rating % to Net Assets
Nabha Power Limited (Corporate Guarantee of L&T Limited) ICRA AAA (CE) 2.95%Cholamandalam Investment and Finance Company Limited ICRA AA+ 2.92%
LIC Housing Finance Limited CRISIL AAA 2.92%Indian Oil Corporation Limited CRISIL AAA 2.88%Reliance Industries Limited CRISIL AAA 2.87%Muthoot Finance Limited ICRA AA+ 2.80%Bharti Telecom Limited CRISIL AA+ 1.32%Total 57.15%Securitised DebtFirst Business Receivables Trust(Backed by receivables from Reliance Industries,Reliance Retail,Reliance Jio)
CRISIL AAA(SO) 4.04%
Total 4.04%
OthersTri Party Repo Dealing System (TREPS)/Reverse Repo 7.52%
Net Receivable/Payable -4.08%
Net Assets 100.00%
Average Maturity 0.60 years
Modified Duration 0.56 years
Macaulay Duration 0.58 years
YTM 4.45%
Indicates top ten instruments
AA/ AA(SO)/ AA(CE)
AA+/ AA+(SO)/ AA+(CE)
A1+/ A1+(SO)
AAA/ AAA(SO)/ AAA(CE)
Sovereign
TREPS/Rev Repo/NR/NP
Money Market Instrument
Non Convertible Debentures
Securitised Debt
Government Bonds
Treps / Reverse Repo
Net Receivables / (Payables)

37
Data as on December 31, 2021
To generate regular returns and capital appreciation by investing predominantly in AA and below rated corporate bonds, debt, government securities and money market instruments. There is no assurance that the investment objective of the scheme will be realized.
L&T CREDIT RISK FUND
INVESTMENT OBJECTIVE
FUND DETAILS PORTFOLIO ALLOCATION
Exit Load: If the units redeemed or switched out are upto 10% of the units purchased or switched in (“the limit”) within 1 year from the date of allotment – Nil. If units redeemed or switched out are over and above the limitwithin 1 year from the date of allotment – 1%. If units are redeemed or switched out on or after 1 year from the date of allotment – Nil.For details of the performance of the schemes, please refer page nos 48 to 51.For product label please refer Page 3 & 4 of the factsheet.
% RATING PROFILE % ASSET ALLOCATION PROFILE
18.78%
36.34%
22.31%
6.48%
16.09%
0.09%
58.92%
18.69%
22.30%
FUND DETAILS
% RATING PROFILE
% MATURITY PROFILE
Credit Risk Fund
Date of Inception
Regular Plan October 08, 2009
Direct Plan January 01, 2013
Fund Manager
Mr. Shriram Ramanathan (w.e.f Nov 24, 2012) & Mr. Jalpan Shah (w.e.f March 21, 2020)
Benchmark
NIFTY Credit Risk Bond Index
Month end AUM
181.13 (` In Crs)
Monthly Average AUM
182.07 (` In Crs)
Options
•Growth •IDCW •Annual IDCW
Name of Instrument Rating % to Net Assets
DEBT INSTRUMENTSGovernment Bonds
05.22% GOI 15-JUN-2025 SOVEREIGN 10.95%07.35% GOI 22-JUN-2024 SOVEREIGN 5.80%05.63% GOI 12-APR-2026 SOVEREIGN 5.55%
Total 22.30%Non Convertible Debentures Listed/Awaiting Listing on the Exchange
IIFL Home Finance Limited ICRA AA 8.55%Hinduja Leyland Finance Limited CARE AA- 6.48%Godrej Industries Limited CRISIL AA 5.86%Aadhar Housing Finance Limited CARE AA 5.81%ONGC Petro Additions Limited ICRA AA 5.80%Manappuram Finance Limited CRISIL AA 5.78%Oriental Nagpur Betul Highway
Limited (Nhai Annuity Receivables) CRISIL AAA 4.93%
Coastal Gujarat Power Limited (corporate guarantee of Tata Power Company Ltd)
CARE AA (CE)
4.52%
India Grid Trust CRISIL AAA 4.02%National Bank for Agriculture & Rural Development
ICRA AAA 2.85%
Yarrow Infrastructure Pvt Limited (Vector green energy sponsored co-obligor structure)
CRISIL AAA 2.05%
Name of Instrument Rating % to Net Assets
Vector Green Prayagraj Solar Pvt Limited (Vector green energy sponsored co-obligor structure)
CRISIL AAA 0.76%
Sepset Constructions Pvt Limited (Vector green energy sponsored co-obligor structure)
CRISIL AAA 0.65%
Malwa Solar Power Generation Pvt Limited (Vector green energy sponsored co-obligor structure)
CRISIL AAA 0.64%
Citra Real Estate Limited (Vector green energy sponsored co-obligor structure)
CRISIL AAA 0.11%
Priapus Infrastructure Pvt Limited (Vector green energy sponsored co-obligor structure)
CRISIL AAA 0.11%
Total 58.92%OthersTri Party Repo Dealing System (TREPS)/Reverse Repo 18.69%
Net Receivable/Payable 0.09%
Net Assets 100.00%
Average Maturity 1.99 years
Modified Duration 1.70 years
Macaulay Duration 1.78 years
YTM 5.91%
AA/ AA(SO)/ AA(CE)
AAA/ AAA(SO)/ AAA(CE)
AA-/AA-(SO)
Sovereign
TREPS/Rev Repo/NR/NP
Non Convertible Debentures
GOVERNMENT BONDS
TREPS / Reverse Repo
Net Receivables / (Payables)
Indicates top ten instruments
16.28%
20.17%
17.88%
22.38%
4.52%
18.78%
0%
5%
10%
15%
20%
25%
0 -1
Year
1 - 2
Years
2 - 3
Years
3 - 5
Years
Greater than
5 years
TREPS / Rev
Repo/NR/NP

38
Data as on December 31, 2021
Dynamic Bond Fund
L&T FLEXI BOND FUND
To generate reasonable returns through a diversified portfolio of fixed income securities. There is no assurance that the investment objective of the scheme will be real-ized.
INVESTMENT OBJECTIVE
FUND DETAILS PORTFOLIO ALLOCATION
Date of Inception
Regular Plan September 27, 2010
Direct Plan January 01, 2013
Fund Manager
Mr. Shriram Ramanathan (w.e.f. Feb 02, 2015) & Mr. Jalpan Shah (w.e.f. May 30, 2016)
Benchmark
NIFTY Composite Debt Index
Month end AUM
61.24 (` In Crs)
Monthly Average AUM
61.68 (` In Crs)
Options
•Growth •IDCW option (Reinvestment and Payout) •Annual option (Reinvestment and Payout)
Exit Load: For redemption within 1 year from the date of allotment or Purchase applying First in First out basis – 0.50% of Applicable NAV. For redemption After 1 year from the date of allotment or Purchase applying First inFirst out basis - NilFor details of the performance of the schemes, please refer page nos 48 to 51.For product label please refer Page 3 & 4 of the factsheet.
% RATING PROFILE % ASSET ALLOCATION PROFILE
43.69%
39.38%16.94%
43.68%
16.94%
0.83%
38.55%
0.86%
41.06%
18.70%
39.38%
0%
10%
20%
30%
40%
50%
1 - 2 Years 3 - 5 Years Greater
than 5 years
TREPS / Rev
Repo/NR/NP
% MATURITY PROFILE
Name of Instrument Rating % to Net Assets
DEBT INSTRUMENTS
GOVERNMENT BONDS
05.63% GOI 12-APR-2026 SOVEREIGN 41.06%
07.17% GOI 08-JAN-2028 SOVEREIGN 1.76%
07.68% GOI 15-DEC-2023 SOVEREIGN 0.86%
Total 43.68%
Non Convertible Debentures
Listed/Awaiting Listing on the Exchange
HDFC Bank Limited CRISIL AAA 8.91%National Bank for Agriculture & Rural Development IND AAA 8.03%
Total 16.94%
Name of Instrument Rating % to Net Assets
OthersTri Party Repo Dealing System (TREPS)/Reverse Repo 38.55%
Net Receivable/Payable 0.83%
Net Assets 100.00%
Average Maturity 3.23 years
Modified Duration 2.63 years
Macaulay Duration 2.72 years
YTM 5.04%
AAA/AAA(SO)/AAA(CE)
Sovereign
TREPS/Rev Repo/NR/NP
Government Bonds
Non Convertible Debentures
TREPS / Reverse Repo
Net Receivable/Payable

39
Data as on December 31, 2021
To generate regular return by investing predominantly in AA+ and above rated debt and money market instruments. There is no assurance that the investment objective of the scheme will be realized.
L&T TRIPLE ACE BOND FUND
INVESTMENT OBJECTIVE
FUND DETAILS PORTFOLIO ALLOCATION
Exit Load: If the amount sought to be redeemed or switched out on or before 3 months from the date of allotment: 0.50%. If the amount sought to be redeemed or switched out is invested for a period of more than 3 months from the date of allotment: Nil (w.e.f. June 09, 2021)For details of the performance of the schemes, please refer page nos 48 to 51.For product label please refer Page 3 & 4 of the factsheet.
% RATING PROFILE % ASSET ALLOCATION PROFILE
68.75%4.50%
26.75%
26.75%
68.74%
4.57% -0.07%
95.50%
4.50%
0%
20%
40%
60%
80%
100%
120%
Greater than 5 years TREPS / Rev Repo/NR/NP
% ASSET ALLOCATION PROFILE
% MATURITY PROFILE
Corporate Bond Fund
Date of Inception
Regular Plan March 31, 1997
Direct Plan January 01, 2013
Fund Manager
Mr. Shriram Ramanathan (w.e.f. June 30, 2014) & Mr. Jalpan Shah (w.e.f. April 03, 2017)
Benchmark
NIFTY Corporate Bond Index
Month end AUM
9,622.88 (` In Crs)
Monthly Average AUM
9,781.87 (` In Crs)
Options
•Growth •IDCW (Reinvestment and Payout) 1. Quarterly IDCW 2. Semi-Annual IDCW 3. Annual IDCW
Name of Instrument Rating % to Net Assets
DEBT INSTRUMENTS
GOVERNMENT BONDS07.17% GOI 08-JAN-2028 SOVEREIGN 9.46%06.79% GOI 15-MAY-2027 SOVEREIGN 8.91%07.26% GOI 14-JAN-2029 SOVEREIGN 7.86%
6.47% MAHARSHTRA SDL 21-OCT-2028 SOVEREIGN 0.52%
Total 26.75%Non Convertible Debentures Listed/Awaiting Listing on the Exchange
National Bank for Agriculture & Rural Development
ICRA AAA/CRISIL AAA/IND AAA
9.47%
National Highways Authority of India CRISIL AAA 9.28%
Indian Railway Finance Corporation Limited
CARE AAA/CRISIL AAA 9.11%
Power Grid Corporation of India Limited CRISIL AAA 6.35%
NTPC Limited CRISIL AAA 5.73%
HDFC Bank Limited CRISIL AAA 4.86%
Export Import Bank of India CRISIL AAA 4.66%
Indian Oil Corporation Limited CRISIL AAA 3.91%
Housing and Urban Development Corporation Limited
CARE AAA/ICRA AAA 3.57%
Name of Instrument Rating % to Net Assets
Rec Limited CRISIL AAA 3.39%
ICICI Bank Limited CARE AAA 3.12%
Housing Development Finance Corporation Limited CRISIL AAA 2.88%
Nuclear Power Corporation Of India Limited CRISIL AAA 0.99%
Food Corporation of India Limited
CRISIL AAA (CE) 0.72%
NHPC Limited CARE AAA 0.70%
Total 68.74%
OthersTri Party Repo Dealing System (TREPS)/Reverse Repo 4.57%
Net Receivable/Payable -0.07%
Net Assets 100.00%
Average Maturity 6.66 years
Modified Duration 5.00 years
Macaulay Duration 5.25 years
YTM 6.44%
Indicates top ten instruments
AAA/ AAA(SO)/ AAA(CE)
Sovereign
TREPS/Rev Repo/NR/NP
Government Bonds
Non Convertible Debentures
TREPS / Reverse Repo
Net Receivable/ Payable

40
Data as on December 31, 2021
To generate returns from a portfolio from investments in Government Securities. There is no assurance that the investment objective of the scheme will be realized.
L&T GILT FUND
INVESTMENT OBJECTIVE
FUND DETAILS
Exit Load: Nil.For details of the performance of the schemes, please refer page nos 48 to 51.For product label please refer Page 3 & 4 of the factsheet.
Gilt Fund
Date of Inception
Regular Plan March 29, 2000
Direct Plan January 01, 2013
Fund Manager
Mr. Jalpan Shah (w.e.f. May 30, 2016) & Mr. Shriram Ramanathan (w.e.f. April 03, 2017)
Benchmark
NIFTY All Duration G-Sec Index
Month end AUM
255.40 (` In Crs)
Monthly Average AUM
257.70 (` In Crs)
Options
•Growth •IDCW option (Reinvestment and Payout) Quarterly IDCW
% RATING PROFILE
2.11%
97.89%
% RATING PROFILE
PORTFOLIO ALLOCATION
% ASSET ALLOCATION PROFILE
-17.43%
19.54%
97.89%
20.29%17.73%
59.88%
2.10%
0%
10%
20%
30%
40%
50%
60%
70%
0 -1 Year 3 - 5 Years Greater than 5
years
TREPS/Rev
Repo/NR/NP
% ASSET ALLOCATION PROFILE
% MATURITY PROFILE
Name of Instrument Rating % to Net Assets
DEBT INSTRUMENTS
GOVERNMENT BONDS
06.67% GOI 15-DEC-2035 SOVEREIGN 38.46%
08.20% GOI 15-FEB-2022 SOVEREIGN 20.29%
05.63% GOI 12-APR-2026 SOVEREIGN 17.73%
07.26% GOI 14-JAN-2029 SOVEREIGN 10.58%
07.17% GOI 08-JAN-2028 SOVEREIGN 10.56%
06.19% GOI 16-SEP-2034 SOVEREIGN 0.27%
Total 97.89%
Name of Instrument Rating % to Net Assets
OthersTri Party Repo Dealing System (TREPS)/Reverse Repo 19.54%
Net Receivable/Payable -17.43%
Net Assets 100.00%
Average Maturity 7.58 years
Modified Duration 5.19 years
Macaulay Duration 5.37 years
YTM 5.82%
Sovereign
TREPS/Rev Repo/NR/NP
Government Bonds
TREPS / Reverse Repo
Net Receivables / (Payables)

41
Data as on December 31, 2021
To generate regular income through investments in a range of Debt, Equity and Money Market Instruments. Income will be distributed only if the same is earned by the scheme and there can be no assurance that the objective of the scheme will be realized.
L&T CONSERVATIVE HYBRID FUND
INVESTMENT OBJECTIVE
FUND DETAILSFUND DETAILS
Conservative Hybrid Fund
Date of Inception
Regular Plan July 31, 2003
Direct Plan January 01, 2013
Fund Manager
Ms. Cheenu Gupta (w.e.f. July 02, 2021) & Mr. Venugopal Manghat (w.e.f. Nov 24, 2012) (for investments in equity and equity related instruments) Mr. Jalpan Shah (w.e.f. May 30, 2016) (for investments in debt and debt related instruments)
Benchmark
CRISIL Hybrid 85+15 - Conservative Index
Month end AUM
38.73 (` In Crs)
Monthly Average AUM
38.53 (` In Crs)
Options
•Growth •IDCW (Reinvestment and Payout) 1. Monthly IDCW 2. Quarterly IDCW
Exit Load: If the units redeemed or switched out are upto 10% of the units (the limit) purchased or switched within 1 year from the date of allotment – Nil. If units redeemed or switched out are over and above the limit within1 year from the date of allotment – 1%. If units are redeemed or switched out on or after 1 year from the date of allotment – Nil.For details of the performance of the schemes, please refer page nos 48 to 51.For product label please refer Page 3 & 4 of the factsheet.For investments in equity and equity related instruments the Fund was co-managed by Mr. Vihang Naik till July 1, 2021.
% RATING PROFILE
9.94%
24.55%54.76%
10.75%
PORTFOLIO ALLOCATION
% ASSET ALLOCATION PROFILE % MATURITY PROFILE
4.16%
19.31%
41.23%
24.55%
10.75%
0%
5%
10%
15%
20%
25%
30%
35%
40%
45%
0 -1
Year
1 - 2
Years
3 - 5
Years
Equity &
Equity
Related
TREPS / Rev
Repo/NR/NP
Name of Instrument Rating % to Net Assets
DEBT INSTRUMENTSGovernment Bonds
07.59% GOI 11-JAN-2026 SOVEREIGN 28.41%07.37% GOI 16-APR-2023 SOVEREIGN 13.54%05.22% GOI 15-JUN-2025 SOVEREIGN 12.81%
Total 54.76%EQUITY & EQUITY RELATED Listed / awaiting listing on the stock exchanges
Infosys Limited Software 1.82%K.P.R. Mill Limited Textile Products 1.77% ICICI Bank Limited Banks 1.51%Minda Industries Limited Auto Ancillaries 1.39%Bajaj Finance Limited Finance 1.21%
HDFC Bank Limited Banks 1.04%Sona BLW Precision Forgings Limited Auto Ancillaries 0.98%
State Bank of India Banks 0.95%Brigade Enterprises Limited Construction 0.78%Clean Science and Technology Limited Chemicals 0.75%
Tata Steel Limited Ferrous Metals 0.74%Bajaj Finserv Limited Insurance 0.72%Sobha Limited Construction 0.72%Greenpanel Industries Limited
Consumer Durables 0.70%
Hindalco Industries Limited Non - Ferrous Metals 0.67%
UltraTech Cement LimitedCement & Cement Products
0.63%
APL Apollo Tubes Limited Ferrous Metals 0.62%Tata Consultancy Services Limited Software 0.54%
eClerx Services Limited Software 0.53%Zee Entertainment Enterprises Limited Entertainment 0.53%
Titan Company Limited Consumer Durables 0.52%
Happiest Minds Technologies Limited Software 0.50%
Reliance Industries Limited Petroleum Products 0.47%
Gland Pharma Limited Pharmaceuticals 0.43%Navin Fluorine International Limited Chemicals 0.43%
Name of Instrument Rating % to Net Assets
Computer Age Management Services Limited
Capital Markets 0.41%
Sun Pharmaceutical Industries Limited Pharmaceuticals 0.41%
Rolex Rings Limited Auto Ancillaries 0.40%Godrej Properties Limited Construction 0.39%UTI Asset Management Company Limited Capital Markets 0.38%
VRL Logistics Limited Transportation 0.37%Indian Hotels Company Limited Leisure Services 0.34%
MindTree Limited Software 0.27%Coforge Limited Software 0.26%Cholamandalam Investment and Finance Company Limited
Finance 0.24%
Housing Development Finance Corporation LimitedFinance 0.13%
Total 24.55%PREFERENCE SHARES
Listed/awaiting listing on the stock exchangesZee Entertainment Enterprises Limited Entertainment 0.01%
Total 0.01%Non Convertible Debentures Listed/Awaiting Listing on the Exchange
National Bank for Agriculture & Rural Development
CRISIL AAA 5.77%
Power Finance Corporation Limited CRISIL AAA 4.16%
Total 9.93%OthersTri Party Repo Dealing System (TREPS)/Reverse Repo 10.90%
Net Receivable/Payable -0.15%Net Assets 100.00%Average Maturity 2.29 years
Modified Duration 1.98 years
Macaulay Duration 2.03 yearsYTM 4.97%
Indicates top ten instruments
AAA/ AAA(SO)/ AAA(CE)
Equity & Equity Related
Sovereign
TREPS/Rev Repo/NR/NP
Government Bonds
Equity & Equity Related
Non Convertible Debentures
TREPS / Reverse Repo
Net Receivables / (Payables)
54.76%9.93%
10.90%
24.56%
-0.15%

42
Data as on December 31, 2021
Medium Duration Fund
L&T RESURGENT INDIA BOND FUND
To seek to generate income by investing primarily in debt and money market securities. There is no assurance that the investment objective of the scheme will be realized.
INVESTMENT OBJECTIVE
FUND DETAILS
Exit Load: Nil (w.e.f September 16, 2021)For details of the performance of the schemes, please refer page nos 48 to 51.For product label please refer Page 3 & 4 of the factsheet.
% RATING PROFILE
7.21% 6.55%
44.44%
36.80%
5.00%
PORTFOLIO ALLOCATION
Date of Inception
Regular Plan February 02, 2015
Direct Plan February 02, 2015
Fund Manager
Mr. Shriram Ramanathan (w.e.f Feb 02, 2015) & Mr. Jalpan Shah (w.e.f March 21, 2020)
Benchmark
NIFTY Medium Duration Debt Index
Month end AUM
1,308.64 (` In Crs)
Monthly Average AUM
1,342.13 (` In Crs)
Options
•Growth •IDCW option (Payout and Reinvestment) •Annual IDCW (Payout and Reinvestment)
Name of Instrument Rating % to Net Assets
DEBT INSTRUMENTS
GOVERNMENT BONDS05.22% GOI 15-JUN-2025 SOVEREIGN 13.26%05.63% GOI 12-APR-2026 SOVEREIGN 11.15%06.18% GOI 04-NOV-2024 SOVEREIGN 5.13%8.08% MAHARASHTRA SDL
26-DEC-2028 SOVEREIGN 3.29%
07.16% GOI 20-MAY-2023 SOVEREIGN 1.99%
06.79% GOI 15-MAY-2027 SOVEREIGN 1.98%
Total 36.80%Non Convertible Debentures Listed/Awaiting Listing on the Exchange
National Bank for Agriculture & Rural Development
CRISIL AAA/ICRA AAA 6.94%
Sikka Ports & Terminals Limited (erstwhile Reliance Ports & Terminals Ltd)
CRISIL AAA 4.12%
ONGC Petro Additions Limited (Letter of comfort from Oil & Natural Gas Corporation Limited)
ICRA AAA (CE) 4.01%
Embassy Office Parks REIT CRISIL AAA 3.84%
NIIF Infrastructure Finance Limited ICRA AAA 2.70%Coastal Gujarat Power Limited (corporate guarantee of Tata Power Company Ltd)
CARE AA (CE) 2.50%
Oriental Nagpur Betul Highway Limited (Nhai Annuity Receivables)
CRISIL AAA 2.41%
Patel Knr Heavy Infrastructures Limited (Nhai Annuity Receivables)
CARE AA+ 2.27%
National Highways Authority of India CRISIL AAA 2.18%
Manappuram Finance Limited CARE AA 2.08%
Indian Oil Corporation Limited CRISIL AAA 1.98%
National Housing Bank CRISIL AAA 1.98%
IIFL Home Finance Limited ICRA AA 1.97%
Muthoot Finance Limited ICRA AA+ 1.92%
HDFC Bank Limited CRISIL AAA 1.91%Housing Development Finance Corporation Limited CRISIL AAA 1.91%L&T Metro Rail (Hyderabad) Limited (Put Option On L&T Limited )
IND AAA (CE) 1.38%
Yarrow Infrastructure Pvt Limited (Vector green energy sponsored co-obligor structure)
CRISIL AAA 1.13%
Name of Instrument Rating % to Net Assets
IOT Utkal Energy Services Limited (Long term take or pay agreement with IOCL)
CRISIL AAA 1.00%
Andhra Pradesh Expressway Limited (Nhai Annuity Receivables)
IND AAA 0.99%
State Bank Of India Basel III Compliant AT 1 Bond # CRISIL AA+ 0.81%Indian Railway Finance Corporation Limited CRISIL AAA 0.42%Vector Green Prayagraj Solar Pvt Limited (Vector green energy sponsored co-obligor structure)
CRISIL AAA 0.42%
Malwa Solar Power Generation Pvt Limited (Vector green energy sponsored co-obligor structure)
CRISIL AAA 0.36%
Sepset Constructions Pvt Limited (Vector green energy sponsored co-obligor structure)
CRISIL AAA 0.36%
Power Finance Corporation Limited CRISIL AAA 0.25%Citra Real Estate Limited (Vector green energy sponsored co-obligor structure)
CRISIL AAA 0.06%
Priapus Infrastructure Pvt Limited (Vector green energy sponsored co-obligor structure)
CRISIL AAA 0.06%
Total 51.96%
Securitised DebtFirst Business Receivables
Trust(Backed by receivables from Reliance Industries,Reliance Retail,Reliance Jio)
CRISIL AAA(SO) 4.03%
Total 4.03%
OthersTri Party Repo Dealing System (TREPS)/Reverse Repo 7.27%
Net Receivable/Payable -0.06%
Net Assets 100.00%
Average Maturity 3.00 years
Modified Duration 2.55 years
Macaulay Duration 2.65 years
YTM 5.81%
Indicates top ten instruments
AA/ AA(SO)/ AA(CE)
AA+/ AA+(SO)/ AA+(CE)
AAA/ AAA(SO)/ AAA(CE)
Sovereign
TREPS/Rev Repo/NR/NP
% ASSET ALLOCATION PROFILE % MATURITY PROFILE
-0.06%
36.80%
51.96%
4.03%
7.27%
10.89%13.06%
17.16%
37.58%
14.10%
7.21%
0%
5%
10%
15%
20%
25%
30%
35%
40%
0 -1
Year
1 - 2
Years
2 - 3
Years
3 - 5
Years
Greater than
5 years
TREPS / RevRepo/NR/NP
Government Bonds
Non Convertible Debentures
Securitised Debt
TREPS / Reverse Repo
Net Receivables / (Payables)
Company Name ISIN YTM YTCState Bank Of India **Basel III Compliant AT 1 Bond # INE062A08181 8.44% 5.96%
# The YTC of the security as per guidelines issued by SEBI Circular No SEBI/HO/IMD/DF4/CIR/P/2021/032 dated March 10,2021 read with Clarification issued by SEBI vide circular no SEBI/HO/IMD/DF4/CIR/P/2021/034 dated March 22, 2021 and AMFI Best Practices Guidelines Circular No. 91/ 2020 - 21.

43
Data as on December 31, 2021FUND MANAGER WISE SCHEME DETAILS
*Investments in Foreign Securities was managed by Alok Ranjan till June 22, 2021.
Sr. No. Mr. Shriram Ramanathan Total No. of years of experience: 20
1 L&T Liquid Fund (Co-FM)
2 L&T Low Duration Fund
3 L&T Credit Risk Fund
4 Fixed Maturity Plans (Co-FM)
5 L&T Triple Ace Bond Fund
6 L&T Resurgent India Bond Fund
7 L&T Hybrid Equity Fund (Debt Component)
8 L&T Short Term Bond Fund
9 L&T Flexi Bond Fund
10 L&T Overnight Fund (Co-FM)
11 L&T Banking and PSU Debt Fund (Co-FM)
12 L&T Gilt Fund (Co-FM)
13 L&T Money Market Fund
Sr. No. Mr. Jalpan Shah Total No. of years of experience: 16
1 L&T Ultra Short Term Fund
2 L&T Short Term Bond Fund (Co-FM)
3 L&T Flexi Bond Fund (Co-FM)
4 L&T Gilt Fund
5 L&T Banking and PSU Debt Fund
6 Fixed Maturity Plans
7 L&T Conservative Hybrid Fund (Debt Component)
8 L&T Balanced Advantage Fund (Debt Portion)
9 L&T Equity Savings Fund (Debt Portion)
10 L&T Triple Ace Bond Fund (Co-FM)
11 L&T Arbitrage Opportunities Fund (Debt Portion)
12 L&T Low Duration Fund (Co-FM)
13 L&T Credit Risk Fund (Co-FM)
14 L&T Resurgent India Bond Fund (Co-FM)
Sr. No.Ms. Cheenu Gupta Total No. of years of experience: 11
1 L&T Equity Savings Fund (Equity Component)
2 L&T Conservative Hybrid Fund (Equity Component)
3 L&T Hybrid Equity Fund (Equity Component)
4 L&T Tax Advantage Fund
5 L&T Large and Midcap Fund
6 L&T Balanced Advantage Fund (Co-FM)
7 L&T Infrastructure Fund (Co-FM)
8 L&T Business Cycles Fund (Co-FM)
9 L&T India Large Cap Fund (Co-FM)
Sr. No. Mr. Vihang Naik Total No. of years of experience: 15
1 L&T Flexicap Fund
2 L&T Large and Midcap Fund (Co-FM)
3 L&T Tax Advantage Fund (Co-FM)
4 L&T Balanced Advantage Fund (Equity Component)
5 L&T Midcap Fund
6 L&T Emerging Businesses Fund (Co-FM)
7 L&T Focused Equity Fund
8 L&T India Value Fund (Co-FM)
Sr. No. Mr. Venugopal Manghat Total No. of years of experience: 25
1 L&T India Large Cap Fund
2 L&T India Value Fund
3 L&T Conservative Hybrid Fund (Equity Component) (Co-FM)
4 L&T Equity Savings Fund (Equity Component) (Co-FM)
5 L&T Arbitrage Opportunities Fund
6 L&T Business Cycles Fund
7 L&T Flexicap Fund (Co-FM)
8 L&T Infrastructure Fund
9 L&T Hybrid Equity Fund (Equity Component) (Co-FM)
10 L&T Midcap Fund (Co-FM)
11 L&T Emerging Businesses Fund
12 L&T Focused Equity Fund (Co-FM)
Sr. No. Mr. Sonal Gupta
Total No. of years of experience: 151 L&T Flexicap Fund*
2 L&T India Large Cap Fund*
3 L&T Large and Midcap Fund*
4 L&T India Value Fund*
5 L&T Hybrid Equity Fund
6 L&T Emerging Businesses Fund*
7 L&T Arbitrage Opportunities Fund*
8 L&T Business Cycles Fund*
Sr. No. Mr. Praveen Ayathan Total No. of years of experience: 28
1 L&T Arbitrage Opportunities Fund (Co-FM)
2 L&T Equity Savings Fund (Co-FM)
3 L&T Balanced Advantage Fund (Co-FM)
4 L&T Nifty 50 Index Fund
5 L&T Nifty Next 50 Index Fund
Sr. No. Mr. Mahesh Chhabria Total No. of years of experience: 11
1 L&T Overnight Fund
2 L&T Liquid Fund
3 L&T Ultra Short Term Fund (Co-FM)
4 L&T Money Market Fund (Co-FM)

44
Data as on December 31, 2021
SIP Performance Of Equity Oriented Schemes - Growth Option
L&T Flexicap Fund - Regular Plan 1 Year 3 Year 5 Year 7 Year 10 Year Since Inception
Total Amount Invested (`) 120000 360000 600000 840000 1200000 2000000
Market value of the invested amount (`) 133289 500842 869879 1333878 2448569 6899172
Scheme Returns (%) 21.15 22.65 14.84 12.98 13.66 13.48
Total Value of S&P BSE-500 TRI Index (B*) (`) 136348 541681 974891 1540132 2807482 7228891
S&P BSE-500 TRI Index Returns (B*) (%) 26.19 28.41 19.49 17.01 16.21 13.95
Total Value of S&P BSE SENSEX TRI (AB*) (`) 133576 515296 961802 1519076 2691351 7314593
S&P BSE SENSEX TRI Returns (AB*) (%) 21.62 24.73 18.94 16.62 15.42 14.07
L&T India Large Cap Fund - Regular Plan 1 Year 3 Year 5 Year 7 Year 10 Year Since Inception
Total Amount Invested (`) 120000 360000 600000 840000 1200000 1710000
Market value of the invested amount (`) 133152 502339 897972 1373850 2473536 4754593
Scheme Returns (%) 20.93 22.87 16.13 13.81 13.85 13.28
Total Value of S&P BSE 100 TRI (B*) (`) 134015 521026 948722 1495265 2676355 4944428
S&P BSE 100 TRI Returns (B*) (%) 22.34 25.54 18.38 16.18 15.32 13.77
Total Value of S&P BSE SENSEX TRI (AB*) (`) 133576 515296 961802 1519076 2691351 4958382
S&P BSE SENSEX TRI Returns (AB*) (%) 21.62 24.73 18.94 16.62 15.42 13.80
L&T Tax Advantage Fund - Regular Plan 1 Year 3 Year 5 Year 7 Year 10 Year Since Inception
Total Amount Invested (`) 120000 360000 600000 840000 1200000 1910000
Market value of the invested amount (`) 137318 520708 897307 1410583 2639809 6641412
Scheme Returns (%) 27.80 25.49 16.10 14.55 15.06 14.24
Total Value of S&P BSE 500 TRI (B*) (`) 136348 541681 974891 1540132 2807482 6408511
S&P BSE 500 TRI Returns (B*) (%) 26.19 28.41 19.49 17.01 16.21 13.86
Total Value of S&P BSE SENSEX TRI (AB*) (`) 133576 515296 961802 1519076 2691351 6307004
S&P BSE SENSEX TRI Returns (AB*) (%) 21.62 24.73 18.94 16.62 15.42 13.68
L&T India Value Fund - Regular Plan 1 Year 3 Year 5 Year 7 Year 10 Year Since Inception
Total Amount Invested (`) 120000 360000 600000 840000 1200000 1440000
Market value of the invested amount (`) 140555 556609 955370 1509019 3189252 4495573
Scheme Returns (%) 33.22 30.44 18.66 16.44 18.58 17.68
Total Value of S&P BSE 500 TRI (B*) (`) 136348 541681 974891 1540132 2807482 3744990
S&P BSE 500 TRI (B*) (%) 26.19 28.41 19.49 17.01 16.21 14.95
Total Value of S&P BSE SENSEX TRI (AB*) (`) 133576 515296 961802 1519076 2691351 3594244
S&P BSE SENSEX TRI Returns (AB*) (%) 21.62 24.73 18.94 16.62 15.42 14.33
L&T Large and Midcap Fund - Regular Plan 1 Year 3 Year 5 Year 7 Year 10 Year Since Inception
Total Amount Invested (`) 120000 360000 600000 840000 1200000 1880000
Market value of the invested amount (`) 139819 524097 900149 1391708 2609223 6272118
Scheme Returns (%) 31.98 25.97 16.23 14.17 14.85 14.03
Total Value of NIFTY LargeMidcap 250 TRI (B*) (`) 138552 564453 1009146 1611496 3091140 7137080
NIFTY LargeMidcap 250 (B*) (%) 29.86 31.49 20.92 18.28 18.00 15.44
Total Value of S&P BSE SENSEX TRI (AB*) (`) 133576 515296 961802 1519076 2691351 6076809
S&P BSE SENSEX TRI Returns (AB*) (%) 21.62 24.73 18.94 16.62 15.42 13.68
L&T Midcap Fund - Regular Plan 1 Year 3 Year 5 Year 7 Year 10 Year Since Inception
Total Amount Invested (`) 120000 360000 600000 840000 1200000 2090000
Market value of the invested amount (`) 133545 523469 898748 1450995 3180555 10929438
Scheme Returns (%) 21.57 25.88 16.17 15.34 18.53 16.86
Total Value of S&P BSE Midcap 150 TRI (B*) (`) 141894 615214 1073259 1720825 3489827 NA
S&P BSE Midcap 150 TRI Returns (B*) (%) 35.47 38.08 23.47 20.12 20.24 NA
Total Value of S&P BSE SENSEX TRI (AB*) (`) 133576 515296 961802 1519076 2691351 8626371
S&P BSE SENSEX TRI Returns (AB*) (%) 21.62 24.73 18.94 16.62 15.42 14.60
Past performance may or may not be sustained in the future. SIP Return are calculated on XIRR basis. IDCW are assumed to be reinvested and bonus is adjusted. Load is not taken into consideration. For SIP returns, monthly investment of ` 10000 invested on the 1st day of every month has been considered.*B: Scheme Benchmark, AB: Additional Benchmark
L&T Infrastructure Fund - Regular Plan 1 Year 3 Year 5 Year 7 Year 10 Year Since Inception
Total Amount Invested (`) 120000 360000 600000 840000 1200000 1720000
Market value of the invested amount (`) 147618 563076 925395 1457519 2823653 4650793
Scheme Returns (%) 45.25 31.31 17.36 15.46 16.32 12.86
Total Value of Nifty Infrastructure TRI (B*) (`) 137502 537959 932704 1386199 2200100 3124053
Nifty Infrastructure TRI Returns (B*) (%) 28.11 27.90 17.68 14.06 11.66 7.89
Total Value of S&P BSE SENSEX TRI (AB*) (`) 133576 515296 961802 1519076 2691351 5002174
S&P BSE SENSEX TRI Returns (AB*) (%) 21.62 24.73 18.94 16.62 15.42 13.76
Data as on December 31, 2021

45
Data as on December 31, 2021
SIP Performance Of Equity Oriented Schemes - Growth Option
L&T Focused Equity Fund - Regular Plan 1 Year 3 Year 5 Year 7 Year 10 Year Since Inception
Total Amount Invested (`) 120000 360000 NA NA NA 380000
Market value of the invested amount (`) 131935 493781 NA NA NA 525706
Scheme Returns (%) 18.94 21.63 NA NA NA 20.99
Total Value of Nifty 500 TRI (B*) (`) 136554 540253 NA NA NA 574543
Nifty 500 TRI Returns (B*) (%) 26.53 28.21 NA NA NA 27.11
Total Value of S&P BSE SENSEX TRI (AB*) (`) 133576 515296 NA NA NA 548963
S&P BSE SENSEX TRI Returns (AB*) (%) 21.62 24.73 NA NA NA 23.95
L&T Arbitrage Opportunities Fund - Regular Plan 1 Year 3 Year 5 Year 7 Year 10 Year Since Inception
Total Amount Invested (`) 120000 360000 600000 840000 NA 920000
Market value of the invested amount (`) 122293 383720 677424 1009093 NA 1125323
Scheme Returns (%) 3.55 4.19 4.80 5.16 NA 5.28
Total Value of Nifty 50 Arbitrage TRI (B*) (`) 122531 381026 667144 985537 NA 1097742
Nifty 50 Arbitrage Index Returns (B*) (%) 3.93 3.72 4.19 4.50 NA 4.63
Total Value of CRISIL 1 Year T-Bill Index (AB*) (`) 122184 386068 689011 1034102 NA 1155507
CRISIL 1 Year T-Bill Index Returns (AB*) (%) 3.38 4.59 5.47 5.85 NA 5.96
L&T Emerging Businesses Fund - Regular Plan 1 Year 3 Year 5 Year 7 Year 10 Year Since Inception
Total Amount Invested (`) 120000 360000 600000 840000 NA 920000
Market value of the invested amount (`) 161691 684331 1143107 1877416 NA 2190764
Scheme Returns (%) 70.10 46.49 26.09 22.58 NA 22.05
Total Value of S&P BSE 250 Small Cap Index TRI (B*) (`) 148979 654254 1064588 1631572 NA 1842379
S&P BSE 250 Small Cap Index TRI Returns (B*) (%) 47.61 42.90 23.13 18.63 NA 17.66
Total Value of S&P BSE SENSEX TRI (AB*) (`) 133576 515296 961802 1519076 NA 1715839
S&P BSE SENSEX TRI Returns (AB*) (%) 21.62 24.73 18.94 16.62 NA 15.87
L&T Balanced Advantage Fund - Regular Plan 1 Year 3 Year 5 Year 7 Year 10 Year Since Inception
Total Amount Invested (`) 120000 360000 600000 840000 1200000 1310000
Market value of the invested amount (`) 125073 425076 756793 1127257 2043169 2379926
Scheme Returns (%) 7.93 11.09 9.22 8.27 10.26 10.48
Total Value of NIFTY 50 Composite Hybrid Debt 50-50 Index (B*) (`) 128448 461421 850006 1320956 2268390 2606698
NIFTY 50 Composite Hybrid Debt 50-50 Index (B*) (%) 13.30 16.80 13.90 12.71 12.23 12.03
Total Value of S&P BSE SENSEX TRI (AB*) (`) 133576 515296 961802 1519076 2691351 3103644
S&P BSE SENSEX TRI Returns (AB*) (%) 21.62 24.73 18.94 16.62 15.42 14.97
L&T Equity Savings Fund - Regular Plan 1 Year 3 Year 5 Year 7 Year 10 Year Since Inception
Total Amount Invested (`) 120000 360000 600000 840000 1200000 1240000
Market value of the invested amount (`) 128596 445827 774997 1153188 1889332 1981031
Scheme Returns (%) 13.54 14.39 10.17 8.90 8.78 8.76
Total Value of NIFTY Equity Savings TRI (B^) (`) 126541 433837 785635 1201546 2011991 2118811
NIFTY Equity Savings Index Returns (B^) (%) 10.26 12.49 10.72 10.05 9.97 9.98
Total Value of CRISIL 10 Yr Gilt Index (AB^) (`) 121012 387067 696771 1050477 1702177 1784026
CRISIL 10 Yr Gilt Index Returns (AB^) (%) 1.57 4.76 5.92 6.29 6.80 6.83
L&T Business Cycles Fund - Regular Plan 1 Year 3 Year 5 Year 7 Year 10 Year Since Inception
Total Amount Invested (`) 120000 360000 600000 840000 NA 890000
Market value of the invested amount (`) 136263 522727 878043 1331648 NA 1440861
Scheme Returns (%) 26.05 25.78 15.22 12.93 NA 12.72
Total Value of S&P BSE 500 TRI (B*) (`) 136348 541681 974891 1540132 NA 1666052
S&P BSE 500 TRI Returns (B*) (%) 26.19 28.41 19.49 17.01 NA 16.54
Total Value of S&P BSE SENSEX TRI (AB*) (`) 133576 515296 961802 1519076 NA 1636520
S&P BSE SENSEX TRI Returns (AB*) (%) 21.62 24.73 18.94 16.62 NA 16.07
L&T Hybrid Equity Fund - Regular Plan 1 Year 3 Year 5 Year 7 Year 10 Year Since Inception
Total Amount Invested (`) 120000 360000 600000 840000 1200000 1310000
Market value of the invested amount (`) 133505 487989 851773 1310995 2477015 2900497
Scheme Returns (%) 21.50 20.78 13.98 12.49 13.88 13.83
Total Value of CRISIL Hybrid 35+65 - Aggressive Index (B*) (`) 130746 486052 889245 1394665 2465810 2843144
CRISIL Hybrid 35+65 - Aggressive Index Returns (B*) (%) 17.01 20.49 15.73 14.23 13.79 13.50
Total Value of S&P BSE SENSEX TRI (AB*) (`) 133576 515296 961802 1519076 2691351 3103962
S&P BSE SENSEX TRI Returns (AB*) (%) 21.62 24.73 18.94 16.62 15.42 14.97
Past performance may or may not be sustained in the future. SIP Return are calculated on XIRR basis. IDCW are assumed to be reinvested and bonus is adjusted. Load is not taken into consideration. For SIP returns, monthly investment of ` 10000 invested on the 1st day of every month has been considered.*B: Scheme Benchmark, AB: Additional Benchmark
Data as on December 31, 2021

46
Data as on December 31, 2021
L&T Flexicap FundOption NAV (`)IDCW Option - Regular Plan 37.352Growth Option - Regular Plan 119.526IDCW Option - Direct Plan 43.360Growth Option - Direct Plan 127.211
L&T Business Cycles FundOption NAV (`)IDCW Option - Regular Plan 17.879Growth Option - Regular Plan 22.887IDCW Option - Direct Plan 18.673Growth Option - Direct Plan 24.244
L&T Nifty 50 Index FundOption NAV (`)IDCW Option - Regular Plan 19.499Growth Option - Regular Plan 19.499IDCW Option - Direct Plan 19.646Growth Option - Direct Plan 19.646
L&T Tax Advantage FundOption NAV (`)IDCW Option - Regular Plan 26.463Growth Option - Regular Plan 81.798IDCW Option - Direct Plan 35.088Growth Option - Direct Plan 86.701
L&T Large and Midcap FundOption NAV (`)IDCW Option - Regular Plan 31.991Growth Option - Regular Plan 72.544IDCW Option - Direct Plan 36.691Growth Option - Direct Plan 77.777
L&T India Large Cap FundOption NAV (`)IDCW Option - Regular Plan 20.644Growth Option - Regular Plan 40.748IDCW Option - Direct Plan 22.766Growth Option - Direct Plan 43.668
L&T India Value FundOption NAV (`)IDCW Option - Regular Plan 38.856Growth Option - Regular Plan 58.169IDCW Option - Direct Plan 45.085Growth Option - Direct Plan 62.758
L&T Midcap FundOption NAV (`)IDCW Option - Regular Plan 54.080Growth Option - Regular Plan 206.350IDCW Option - Direct Plan 59.000Growth Option - Direct Plan 224.440
L&T Infrastructure FundOption NAV (`)IDCW Option - Regular Plan 24.240Growth Option - Regular Plan 24.240IDCW Option - Direct Plan 26.250Growth Option - Direct Plan 26.250
L&T Emerging Businesses FundOption NAV (`)IDCW Option - Regular Plan 32.302Growth Option - Regular Plan 46.731IDCW Option - Direct Plan 35.097Growth Option - Direct Plan 50.051
L&T Focused Equity FundOption NAV (`)IDCW Option - Regular Plan 15.652Growth Option - Regular Plan 16.163IDCW Option - Direct Plan 16.245Growth Option - Direct Plan 16.756
L&T Nifty Next 50 Index FundOption NAV (`)IDCW Option - Regular Plan 18.206Growth Option - Regular Plan 18.206IDCW Option - Direct Plan 18.347Growth Option - Direct Plan 18.347
L&T Overnight FundOption NAV (`)Daily IDCW Option - Regular Plan 1023.3000Weekly IDCW Option - Regular Plan 1000.3824Monthly IDCW Option - Regular Plan 1008.5889Growth Option - Regular Plan 1565.0902Daily IDCW Option - Direct Plan 1023.3000Weekly IDCW Option - Direct Plan 1001.7853Monthly IDCW Option - Direct Plan 1064.4770Growth Option - Direct Plan 1644.6329
L&T Liquid FundOption NAV (`)Daily IDCW 1011.7794Weekly IDCW 1003.1373Growth 2875.2106Daily IDCW - Direct Plan 1014.3496Weekly IDCW - Direct Plan 1001.3736Growth - Direct Plan 2889.4413
L&T Ultra Short Term FundOption NAV (`)Daily IDCW 10.3221Weekly IDCW 11.1473Monthly IDCW 12.7050Semi Annual IDCW 26.5350Growth 35.0945Bonus 19.1429Regular Growth 33.7711Daily IDCW - Direct Plan 10.5092Weekly IDCW - Direct Plan 11.3309Monthly IDCW - Direct Plan 13.0268Growth - Direct Plan 36.0237Bonus - Direct Plan 19.6774
L&T Money Market FundOption NAV (`)Daily IDCW Plan - Regular Plan 10.8591Weekly IDCW - Regular Plan 13.0786Monthly IDCW - Regular Plan 11.4976Growth Plan - Regular Plan 21.2353Daily IDCW Plan - Direct Plan 10.8591Weekly IDCW Plan - Direct Plan 13.1560Monthly IDCW - Direct Plan 12.0768Growth Plan - Direct Plan 22.0171
NAV
(Data as on December 31, 2021)Equity Funds
(Data as on December 31, 2021)Debt Funds

47
Data as on December 31, 2021
L&T Banking and PSU Debt FundOption NAV (`)Daily IDCW Option - Regular Plan 11.1160Weekly IDCW Option - Regular Plan 10.8208Monthly IDCW Option - Regular Plan 11.2106Growth Option - Regular Plan 20.0018Daily IDCW Option - Direct Plan 11.1907Weekly IDCW Option - Direct Plan 10.8360Monthly IDCW Option - Direct Plan 11.6694Growth Option - Direct Plan 20.7907
L&T Short Term Bond FundOption NAV (`)Monthly IDCW - Regular Plan 11.2597Quarterly IDCW - Regular Plan 10.8432Annual IDCW - Regular Plan 12.7459Growth - Regular Plan 21.4738Bonus - Regular Plan 21.4739Monthly IDCW - Direct Plan 11.8655Quarterly IDCW - Direct Plan 11.5417Annual IDCW - Direct Plan 13.1877Growth - Direct Plan 22.3894
L&T Low Duration FundOption NAV (`)IDCW Option - Regular Plan 10.4504Annual IDCW Option - Regular Plan 10.8051Growth Option - Regular Plan 22.7625IDCW Option - Direct Plan 11.0761Annual IDCW Option - Direct Plan 11.1110Growth Option - Direct Plan 23.6053
L&T Flexi Bond FundOption NAV (`)IDCW Option - Regular Plan 10.9169Annual IDCW Option - Regular Plan 11.2101Growth Option - Regular Plan 23.8826IDCW Option - Direct Plan 12.9404Annual IDCW Option - Direct Plan 11.6585Growth Option - Direct Plan 25.3447
L&T Gilt FundOption NAV (`)Quarterly IDCW - Regular Plan 11.4387Growth - Regular Plan 54.7959Quarterly IDCW - Direct Plan 12.7090Growth - Direct Plan 60.2288
L&T Credit Risk FundOption NAV (`)IDCW - Regular Plan 10.2550Annual IDCW - Regular Plan 11.6956Growth - Regular Plan 23.4408Bonus - Regular Plan 23.0629IDCW - Direct Plan 10.8743Annual IDCW - Direct Plan 12.2512Growth - Direct Plan 24.7080
L&T Triple Ace Bond FundOption NAV (`)Quarterly IDCW - Regular Plan 11.4964Semi Annual IDCW - Regular Plan 17.4382Annual IDCW - Regular Plan 12.3626Growth Plan - Regular Plan 59.3617Bonus - Regular Plan 22.5488Quarterly IDCW - Direct Plan 11.8252Semi Annual IDCW - Direct Plan 20.4578Annual IDCW - Direct Plan 12.4735Growth Plan - Direct Plan 62.4864
NAV
L&T Balanced Advantage FundOption NAV (`)IDCW Option - Regular Plan 18.166Growth Option - Regular Plan 30.965IDCW Option - Direct Plan 20.416Growth Option - Direct Plan 34.210
L&T Hybrid Equity FundOption NAV (`)IDCW Option - Regular Plan 25.726Annual IDCW - Regular Plan 16.717Growth Option - Regular Plan 37.960IDCW Option - Direct Plan 29.303Annual IDCW - Direct Plan 17.997Growth Option - Direct Plan 41.579
L&T Arbitrage Opportunities FundOption NAV (`)Monthly IDCW - Regular Plan 10.168Quarterly IDCW - Regular Plan 10.956Growth - Regular Plan 15.387Monthly IDCW - Direct Plan 10.448Quarterly IDCW - Direct Plan 11.146Growth - Direct Plan 16.092
L&T Equity Savings FundOption NAV (`)Monthly IDCW - Regular Plan 13.291Quarterly IDCW - Regular Plan 14.089Growth Plan - Regular Plan 22.975Monthly IDCW - Direct Plan 14.671Quarterly IDCW - Direct Plan 15.065Growth Plan - Direct Plan 24.695
L&T Resurgent India Bond FundOption NAV (`)IDCW Option - Regular Plan 10.9602Annual IDCW - Regular Plan 11.8256Growth Option - Regular Plan 16.4140IDCW Option - Direct Plan 11.6414Annual IDCW - Direct Plan 12.5741Growth Option - Direct Plan 17.4470
L&T Conservative Hybrid FundOption NAV (`)Monthly IDCW - Regular Plan 11.6349Quarterly IDCW - Regular Plan 11.3472Growth Plan - Regular Plan 43.7931Monthly IDCW - Direct Plan 12.4741Quarterly IDCW - Direct Plan 12.0119Growth Plan - Direct Plan 46.4848
(Data as on December 31, 2021)Hybrid Funds

48
Data as on December 31, 2021
PERFORMANCE OF SCHEMES
PERFORMANCE OF GROWTH OPTION
1 year 3 year 5 year Since InceptionCAGR
Returns (%)
PTP Returns*
(in `)
CAGR Returns
(%)
PTP Returns*
(in `)
CAGR Returns
(%)
PTP Returns*
(in `)Inception Date
CAGR Returns
(%)
PTP Returns*
(in `)
Name of the Fund Managers : Mr. Vihang Naik & Mr. Venugopal Manghat (Co-FM)
L&T Flexicap Fund - Regular Plan (G)€ 26.34 12,634 14.45 14,998 13.93 19,212 16/May/2005 16.08 1,19,526
S&P BSE-500 TRI 31.63 13,163 19.30 16,987 18.05 22,951 15.15 1,04,602
S&P BSE SENSEX TRI^ 23.23 12,323 18.62 16,698 18.31 23,198 15.42 1,08,781
L&T Flexicap Fund - Direct Plan (G)€ 27.25 12,725 15.27 15,320 14.75 19,915 01/Jan/2013 14.35 33,445
S&P BSE-500 TRI 31.63 13,163 19.30 16,987 18.05 22,951 14.94 35,019
S&P BSE SENSEX TRI^ 23.23 12,323 18.62 16,698 18.31 23,198 14.37 33,484
The respective benchmark performance for the Scheme is calculated using Composite CAGR of: S&P BSE 500 PRI values from 16 May, 2005 to 29 June, 2007 and TRI values from 30 June, 2007 onwards.
L&T Midcap Fund - Regular Plan (G)§ 30.39 13,039 15.71 15,500 15.72 20,770 09/Aug/2004 18.99 2,06,350
S&P BSE Midcap 150 TRI 48.65 14,865 23.70 18,937 20.23 25,151 NA NA
S&P BSE SENSEX TRI^ 23.23 12,323 18.62 16,698 18.31 23,198 16.16 1,35,696
L&T Midcap Fund - Direct Plan (G)§ 31.89 13,189 17.07 16,053 16.95 21,899 01/Jan/2013 20.19 52,354
S&P BSE Midcap 150 TRI 48.65 14,865 23.70 18,937 20.23 25,151 18.73 46,906
S&P BSE SENSEX TRI^ 23.23 12,323 18.62 16,698 18.31 23,198 14.37 33,484
L&T Focused Equity Fund - Regular Plan (G) 23.67 12,367 16.53 15,829 NA NA 05/Nov/2018 16.43 16,163
Nifty 500 TRI 31.60 13,160 19.11 16,906 NA NA 19.34 17,474
S&P BSE SENSEX TRI^ 23.23 12,323 18.62 16,698 NA NA 18.86 17,252
L&T Focused Equity Fund - Direct Plan (G) 25.18 12,518 17.87 16,382 NA NA 05/Nov/2018 17.77 16,756
Nifty 500 TRI 31.60 13,160 19.11 16,906 NA NA 19.34 17,474
S&P BSE SENSEX TRI^ 23.23 12,323 18.62 16,698 NA NA 18.86 17,252€ Fund is co-managed by Mr. Sonal Gupta w.e.f July 05, 2021, for investment in foreign securities.
Name of the Fund Managers : Ms. Cheenu Gupta & Mr. Venugopal Manghat (Co-FM)
L&T Conservative Hybrid Fund - Regular Plan (G)¥ 9.98 10,998 8.97 12,942 7.53 14,381 31/Jul/2003 8.34 43,793
CRISIL Hybrid 85+15 - Conservative Index 7.07 10,707 10.63 13,542 9.18 15,519 8.82 47,494
CRISIL 10 Yr Gilt Index^ 1.35 10,135 6.94 12,232 5.32 12,963 5.88 28,669
L&T Conservative Hybrid Fund - Direct Plan (G)¥ 10.66 11,066 9.61 13,173 8.22 14,852 01/Jan/2013 8.44 20,733
CRISIL Hybrid 85+15 - Conservative Index 7.07 10,707 10.63 13,542 9.18 15,519 9.60 22,823
CRISIL 10 Yr Gilt Index^ 1.35 10,135 6.94 12,232 5.32 12,963 6.80 18,076¥Fund is co-managed by Mr. Jalpan Shah (Debt Portion).
L&T Hybrid Equity Fund - Regular Plan (G)$ 23.15 12,315 14.19 14,893 12.84 18,305 07/Feb/2011 13.01 37,960
CRISIL Hybrid 35+65 - Aggressive Index 19.74 11,974 16.05 15,634 14.71 19,877 12.07 34,639
S&P BSE SENSEX TRI^ 23.23 12,323 18.62 16,698 18.31 23,198 12.88 37,486
L&T Hybrid Equity Fund - Direct Plan (G)$ 24.38 12,438 15.37 15,362 14.02 19,283 01/Jan/2013 15.30 36,040
CRISIL Hybrid 35+65 - Aggressive Index 19.74 11,974 16.05 15,634 14.71 19,877 12.99 30,027
S&P BSE SENSEX TRI^ 23.23 12,323 18.62 16,698 18.31 23,198 14.37 33,484$Fund is co-managed by Mr. Shriram Ramanathan (Debt Portion) & Mr. Sonal Gupta (for investments in Foreign Securities).
L&T Equity Savings Fund - Regular Plan (G)£ 16.11 11,611 10.05 13,331 8.57 15,093 18/Oct/2011 8.49 22,975
NIFTY Equity Savings TRI 11.52 11,152 10.94 13,659 10.37 16,388 10.05 26,588
CRISIL 10 Yr Gilt Index^ 1.35 10,135 6.94 12,232 5.32 12,963 7.25 20,441
L&T Equity Savings Fund - Direct Plan (G)£ 17.11 11,711 11.06 13,703 9.50 15,748 01/Jan/2013 9.31 22,291
NIFTY Equity Savings TRI 11.52 11,152 10.94 13,659 10.37 16,388 9.79 23,191
CRISIL 10 Yr Gilt Index^ 1.35 10,135 6.94 12,232 5.32 12,963 6.80 18,076£Fund is co-managed by Mr. Praveen Ayathan (Equity Portion) & Jalpan Shah (Debt Portion).
Name of the Fund Manager : Mr. Venugopal Manghat
L&T Arbitrage Opportunities Fund - Regular Plan (G)§ 3.67 10,367 4.81 11,516 5.23 12,909 30/Jun/2014 5.91 15,387
Nifty 50 Arbitrage TRI 4.16 10,416 4.37 11,370 4.37 12,387 5.35 14,785
CRISIL 1 Yr T-Bill Index^ 3.49 10,349 5.63 11,788 5.92 13,336 6.59 16,143
L&T Arbitrage Opportunities Fund - Direct Plan (G)§ 4.37 10,437 5.42 11,718 5.86 13,296 30/Jun/2014 6.54 16,092
Nifty 50 Arbitrage TRI 4.16 10,416 4.37 11,370 4.37 12,387 5.35 14,785
CRISIL 1 Yr T-Bill Index^ 3.49 10,349 5.63 11,788 5.92 13,336 6.59 16,143§Fund is co-managed by Mr. Praveen Ayathan, Mr. Sonal Gupta (w.e.f July 05, 2021 for investments in foreign securities) & Jalpan Shah (Debt Portion).
Past performance may or may not be sustained in the future. * Point to Point (PTP) Returns in INR show the value of `10,000/- invested ^Standard Benchmark Dividends are assumed to be reinvested and bonus is adjusted. Load is not taken into consideration.Note: The since inception return is calculated on NAV of `10/- invested at inception. CAGR is Compounded Annualised Growth Rate. Date of inception is deemed to be date of allotment.a. The number of schemes managed or co managed by Mr. Vihang Naik is 9, Venugopal Manghat is 13 & Ms. Cheenu Gupta is 9, effective July 2, 2021.b. Different plans shall have a different expense structure.
As on December 31, 2021

49
Data as on December 31, 2021
Name of the Fund Managers : Ms. Cheenu Gupta & Mr. Vihang Naik (Co-FM) L&T Large and Midcap Fund - Regular Plan (G)€ 30.28 13,028 16.67 15,886 14.91 20,052 22/May/2006 13.52 72,544NIFTY LargeMidcap 250 TRI 37.04 13,704 20.63 17,564 19.11 23,997 NA NAS&P BSE SENSEX TRI^ 23.23 12,323 18.62 16,698 18.31 23,198 13.03 67,748L&T Large and Midcap Fund - Direct Plan (G)€ 31.46 13,146 17.69 16,309 15.88 20,915 01/Jan/2013 15.33 36,117NIFTY LargeMidcap 250 TRI 37.04 13,704 20.63 17,564 19.11 23,997 16.72 40,230S&P BSE SENSEX TRI^ 23.23 12,323 18.62 16,698 18.31 23,198 14.37 33,484€Fund is co-managed by Mr. Sonal Gupta (w.e.f July 05, 2021), for investments in foreign securities.L&T Tax Advantage Fund - Regular Plan (G) 30.27 13,027 15.63 15,467 15.11 20,227 27/Feb/2006 14.18 81,798S&P BSE 500 TRI 31.63 13,163 19.30 16,987 18.05 22,951 13.07 70,136S&P BSE SENSEX TRI^ 23.23 12,323 18.62 16,698 18.31 23,198 12.96 69,064L&T Tax Advantage Fund - Direct Plan (G) 31.22 13,122 16.35 15,756 15.89 20,923 01/Jan/2013 15.52 36,654S&P BSE 500 TRI 31.63 13,163 19.30 16,987 18.05 22,951 14.94 35,019S&P BSE SENSEX TRI^ 23.23 12,323 18.62 16,698 18.31 23,198 14.37 33,484€Fund is co-managed by Mr. Sonal Gupta (w.e.f July 05, 2021), for investments in foreign securities.The respective benchmark performance for the Scheme is calculated using Composite CAGR of: S&P BSE 500 PRI values from 27 Feb, 2006 to 29 June, 2007 and TRI values from 30 June, 2007 onwards.
Name of the Fund Managers : Mr. Vihang Naik & Ms. Cheenu Gupta (Co-FM) L&T Balanced Advantage Fund - Regular Plan (G)§ 8.36 10,836 9.75 13,221 8.78 15,236 07/Feb/2011 10.92 30,965NIFTY 50 Composite Hybrid Debt 50-50 Index 14.53 11,453 14.44 14,991 13.05 18,480 11.01 31,235S&P BSE SENSEX TRI^ 23.23 12,323 18.62 16,698 18.31 23,198 12.88 37,486L&T Balanced Advantage Fund - Direct Plan (G)§ 9.84 10,984 11.17 13,742 10.11 16,193 01/Jan/2013 12.31 28,442NIFTY 50 Composite Hybrid Debt 50-50 Index 14.53 11,453 14.44 14,991 13.05 18,480 11.58 26,813S&P BSE SENSEX TRI^ 23.23 12,323 18.62 16,698 18.31 23,198 14.37 33,484§ Fund is co-managed by Mr. Praveen Ayathan (Equity Portion) & Mr. Jalpan Shah (Debt Portion).
PERFORMANCE OF SCHEMES
PERFORMANCE OF GROWTH OPTION
1 year 3 year 5 year Since InceptionCAGR
Returns (%)
PTP Returns*
(in `)
CAGR Returns
(%)
PTP Returns*
(in `)
CAGR Returns
(%)
PTP Returns*
(in `)Inception Date
CAGR Returns
(%)
PTP Returns*
(in `)Name of the Fund Managers : Mr. Venugopal Manghat & Mr. Vihang Naik (Co-FM)
L&T India Value Fund - Regular Plan (G)€ 40.33 14,033 18.91 16,823 16.03 21,046 08/Jan/2010 15.82 58,169S&P BSE 500 TRI 31.63 13,163 19.30 16,987 18.05 22,951 12.31 40,220S&P BSE SENSEX TRI^ 23.23 12,323 18.62 16,698 18.31 23,198 12.06 39,130L&T India Value Fund - Direct Plan (G)€ 41.68 14,168 20.08 17,325 17.11 22,045 01/Jan/2013 19.87 51,110S&P BSE 500 TRI 31.63 13,163 19.30 16,987 18.05 22,951 14.94 35,019S&P BSE SENSEX TRI^ 23.23 12,323 18.62 16,698 18.31 23,198 14.37 33,484L&T Emerging Businesses Fund - Regular Plan (G)€ 77.41 17,741 23.43 18,814 21.97 27,028 12/May/2014 22.35 46,731S&P BSE 250 Small Cap Index TRI 59.11 15,911 23.03 18,632 17.40 22,320 16.93 33,054S&P BSE SENSEX TRI^ 23.23 12,323 18.62 16,698 18.31 23,198 14.07 27,361L&T Emerging Businesses Fund - Direct Plan (G)€ 79.30 17,930 24.81 19,456 23.20 28,419 12/May/2014 23.45 50,051S&P BSE 250 Small Cap Index TRI 59.11 15,911 23.03 18,632 17.40 22,320 16.93 33,054S&P BSE SENSEX TRI^ 23.23 12,323 18.62 16,698 18.31 23,198 14.07 27,361€Fund is co-managed by Mr. Sonal Gupta (w.e.f July 05, 2021), for investments in foreign securities.
Name of the Fund Managers : Mr. Venugopal Manghat & Ms. Cheenu Gupta (Co-FM) L&T Infrastructure Fund - Regular Plan (G) 56.29 15,629 15.42 15,381 15.47 20,542 27/Sep/2007 6.40 24,240Nifty Infrastructure TRI 37.77 13,777 18.05 16,460 14.77 19,932 1.98 13,227S&P BSE SENSEX TRI^ 23.23 12,323 18.62 16,698 18.31 23,198 12.04 50,685L&T Infrastructure Fund - Direct Plan (G) 57.94 15,794 16.72 15,909 16.69 21,658 01/Jan/2013 16.44 39,355Nifty Infrastructure TRI 37.77 13,777 18.05 16,460 14.77 19,932 9.03 21,781S&P BSE SENSEX TRI^ 23.23 12,323 18.62 16,698 18.31 23,198 14.37 33,484L&T Business Cycles Fund - Regular Plan (G)€ 34.51 13,451 15.67 15,484 13.20 18,598 20/Aug/2014 11.89 22,887S&P BSE 500 TRI 31.63 13,163 19.30 16,987 18.05 22,951 13.82 25,966S&P BSE Sensex TRI^ 23.23 12,323 18.62 16,698 18.31 23,198 12.75 24,210L&T Business Cycles Fund - Direct Plan (G)€ 35.97 13,597 16.80 15,941 14.16 19,401 20/Aug/2014 12.77 24,244S&P BSE 500 TRI 31.63 13,163 19.30 16,987 18.05 22,951 13.82 25,966S&P BSE Sensex TRI^ 23.23 12,323 18.62 16,698 18.31 23,198 12.75 24,210L&T India Large Cap Fund - Regular Plan (G)€ 24.49 12,449 16.80 15,940 15.13 20,241 23/Oct/2007 10.40 40,748S&P BSE-100 TRI 26.53 12,653 17.91 16,398 17.51 22,428 9.95 38,452S&P BSE SENSEX TRI^ 23.23 12,323 18.62 16,698 18.31 23,198 9.88 38,132L&T India Large Cap Fund - Direct Plan (G)€ 25.66 12,566 17.84 16,372 16.11 21,118 01/Jan/2013 14.43 33,661S&P BSE-100 TRI 26.53 12,653 17.91 16,398 17.51 22,428 14.20 33,042S&P BSE SENSEX TRI^ 23.23 12,323 18.62 16,698 18.31 23,198 14.37 33,484€Fund is co-managed by Mr. Sonal Gupta (w.e.f July 05, 2021), for investments in foreign securities.
Past performance may or may not be sustained in the future. * Point to Point (PTP) Returns in INR show the value of `10,000/- invested ^Standard Benchmark Dividends are assumed to be reinvested and bonus is adjusted. Load is not taken into consideration.Note: The since inception return is calculated on NAV of `10/- invested at inception. CAGR is Compounded Annualised Growth Rate. Date of inception is deemed to be date of allotment.a. The number of schemes managed or co managed by Mr. Vihang Naik is 9, Venugopal Manghat is 13 & Ms. Cheenu Gupta is 9, effective July 2, 2021 and Mr. Praveen Ayathan is 5 schemes.
b. Different plans shall have a different expense structure.
As on December 31, 2021

50
Data as on December 31, 2021
PERFORMANCE OF SCHEMES
PERFORMANCE OF GROWTH OPTION
1 year 3 year 5 year Since InceptionCAGR
Returns (%)
PTP Returns*
(in `)
CAGR Returns
(%)
PTP Returns*
(in `)
CAGR Returns
(%)
PTP Returns*
(in `)Inception Date
CAGR Returns
(%)
PTP Returns*
(in `)
Name of the Fund Manager : Mr. Shriram Ramanathan & Mr. Jalpan Shah (Co-FM)L&T Short Term Bond Fund - Regular Plan (G)¥ 2.96 10,296 7.27 12,345 6.82 13,913 27/Dec/2011 7.93 21,474NIFTY Short Duration Debt Index 4.07 10,407 7.75 12,513 7.25 14,195 8.30 22,234CRISIL 10 Yr Gilt Index^ 1.35 10,135 6.94 12,232 5.32 12,963 7.16 19,986L&T Short Term Bond Fund - Direct Plan (G)¥ 3.46 10,346 7.79 12,528 7.35 14,263 01/Jan/2013 8.20 20,336NIFTY Short Duration Debt Index 4.07 10,407 7.75 12,513 7.25 14,195 8.06 20,093CRISIL 10 Yr Gilt Index^ 1.35 10,135 6.94 12,232 5.32 12,963 6.80 18,076L&T Credit Risk Fund - Regular Plan (G)¥ 5.67 10,567 4.29 11,345 5.12 12,840 08/Oct/2009 7.21 23,441NIFTY Credit Risk Bond Index 7.54 10,754 9.39 13,092 8.47 15,025 9.04 28,831CRISIL 10 Yr Gilt Index^ 1.35 10,135 6.94 12,232 5.32 12,963 6.50 21,602L&T Credit Risk Fund - Direct Plan (G)¥ 6.51 10,651 5.15 11,629 5.89 13,318 01/Jan/2013 7.52 19,205NIFTY Credit Risk Bond Index 7.54 10,754 9.39 13,092 8.47 15,025 9.26 22,192CRISIL 10 Yr Gilt Index^ 1.35 10,135 6.94 12,232 5.32 12,963 6.80 18,076L&T Resurgent India Bond Fund - Regular Plan (G)¥ 4.54 10,454 7.16 12,307 6.44 13,666 02/Feb/2015 7.43 16,414NIFTY Medium Duration Debt Index 4.42 10,442 9.16 13,009 7.75 14,527 8.20 17,247CRISIL 10 Yr Gilt Index^ 1.35 10,135 6.94 12,232 5.32 12,963 6.73 15,693L&T Resurgent India Bond Fund - Direct Plan (G)¥ 5.48 10,548 8.13 12,647 7.39 14,292 02/Feb/2015 8.38 17,447NIFTY Medium Duration Debt Index 4.42 10,442 9.16 13,009 7.75 14,527 8.20 17,247CRISIL 10 Yr Gilt Index^ 1.35 10,135 6.94 12,232 5.32 12,963 6.73 15,693L&T Triple Ace Bond Fund - Regular Plan (G)¥ 3.76 10,376 9.50 13,133 7.17 14,144 31/Mar/1997 7.46 59,362NIFTY Corporate Bond Index 4.55 10,455 8.79 12,879 7.75 14,529 NA NACRISIL 10 Yr Gilt Index^ 1.35 10,135 6.94 12,232 5.32 12,963 NA NAL&T Triple Ace Bond Fund - Direct Plan (G)¥ 4.13 10,413 9.87 13,267 7.57 14,411 01/Jan/2013 8.22 20,372NIFTY Corporate Bond Index 4.55 10,455 8.79 12,879 7.75 14,529 8.53 20,894CRISIL 10 Yr Gilt Index^ 1.35 10,135 6.94 12,232 5.32 12,963 6.80 18,076L&T Flexi Bond Fund - Regular Plan (G)¥ 1.05 10,105 7.02 12,260 5.98 13,374 27/Sep/2010 8.03 23,883NIFTY Composite Debt Index 3.93 10,393 9.00 12,953 7.42 14,310 8.18 24,260CRISIL 10 Yr Gilt Index^ 1.35 10,135 6.94 12,232 5.32 12,963 6.72 20,808L&T Flexi Bond Fund - Direct Plan (G)¥ 1.78 10,178 7.77 12,521 6.80 13,897 01/Jan/2013 8.59 21,003NIFTY Composite Debt Index 3.93 10,393 9.00 12,953 7.42 14,310 8.33 20,543CRISIL 10 Yr Gilt Index^ 1.35 10,135 6.94 12,232 5.32 12,963 6.80 18,076¥Fund is co-managed by Mr. Jalpan Shah (Debt Portion).
7 days 15 days 30 days 1 year 3 year 5 year Since Inception
Annualised Returns
(%)
PTP Returns*
(in `)
Annualised Returns
(%)
PTP Returns*
(in `)
Annualised Returns
(%)
PTP Returns*
(in `)
CAGR Returns
(%)
PTP Returns*
(in `)
CAGR Returns
(%)
PTP Returns*
(in `)
CAGR Returns
(%)
PTP Returns* (in `)
Inception Date
CAGR Returns
(%)
PTP Returns*
(in `)
Name of the Fund Manager : Mr. Shriram Ramanathan & Mr. Jalpan Shah (Co-FM)L&T Low Duration Fund - Regular Plan (G)¥ 4.81 10,009 3.16 10,013 2.97 10,024 3.44 10,344 5.13 11,620 6.05 13,417 04/Dec/2010 7.70 22,763
NIFTY Low Duration Debt Index 5.85 10,011 4.00 10,016 3.94 10,032 3.99 10,399 6.27 12,004 6.56 13,743 7.88 23,180
CRISIL 1 Yr T-Bill Index^ 4.06 10,008 2.76 10,011 3.02 10,025 3.49 10,349 5.63 11,788 5.92 13,336 6.71 20,534
L&T Low Duration Fund - Direct Plan (G)¥ 5.48 10,011 3.81 10,016 3.63 10,030 4.11 10,411 5.73 11,822 6.60 13,767 01/Jan/2013 7.84 19,725
NIFTY Low Duration Debt Index 5.85 10,011 4.00 10,016 3.94 10,032 3.99 10,399 6.27 12,004 6.56 13,743 7.55 19,252
CRISIL 1 Yr T-Bill Index^ 4.06 10,008 2.76 10,011 3.02 10,025 3.49 10,349 5.63 11,788 5.92 13,336 6.60 17,784
Name of the Fund Manager : Mr. Jalpan Shah & Mr. Mahesh Chhabria (Co-FM)L&T Ultra Short Term Fund - Regular Plan (G)§ 4.36 10,008 3.61 10,015 3.37 10,028 3.34 10,334 5.46 11,732 6.09 13,446 10/Apr/2003 7.14 36,384
NIFTY Ultra Short Duration Debt Index 4.72 10,009 3.81 10,016 3.79 10,031 3.93 10,393 5.77 11,836 6.43 13,657 7.58 39,348
CRISIL 1 Yr T-Bill Index^ 4.06 10,008 2.76 10,011 3.02 10,025 3.49 10,349 5.63 11,788 5.92 13,336 5.92 29,400
L&T Ultra Short Term Fund - Institutional Plan (G)§ 4.36 10,008 3.62 10,015 3.37 10,028 3.35 10,335 5.46 11,732 6.09 13,446 27/Nov/1997 7.77 60,788
NIFTY Ultra Short Duration Debt Index 4.72 10,009 3.81 10,016 3.79 10,031 3.93 10,393 5.77 11,836 6.43 13,657 NA NA
CRISIL 1 Yr T-Bill Index^ 4.06 10,008 2.76 10,011 3.02 10,025 3.49 10,349 5.63 11,788 5.92 13,336 6.48 45,480
L&T Ultra Short Term Fund - Direct Plan (G)§ 4.53 10,009 3.78 10,016 3.53 10,029 3.51 10,351 5.72 11,817 6.40 13,638 01/Jan/2013 7.63 19,391
NIFTY Ultra Short Duration Debt Index 4.72 10,009 3.81 10,016 3.79 10,031 3.93 10,393 5.77 11,836 6.43 13,657 7.51 19,187
CRISIL 1 Yr T-Bill Index^ 4.06 10,008 2.76 10,011 3.02 10,025 3.49 10,349 5.63 11,788 5.92 13,336 6.60 17,784§Fund is co-managed by Mr. Mahesh Chhabria.
Name of the Fund Manager : Mr. Mahesh Chhabria & Mr. Shriram Ramanathan (Co-FM) L&T Liquid Fund - Regular Plan (G)¢ 3.81 10,007 3.71 10,015 3.45 10,028 3.24 10,324 4.65 11,462 5.60 13,138 03/Oct/2006 7.17 28,752
NIFTY Liquid Index 3.81 10,007 3.89 10,016 3.72 10,031 3.49 10,349 4.73 11,487 5.59 13,127 7.31 29,323
CRISIL 1 Yr T-Bill Index^ 4.06 10,008 2.76 10,011 3.02 10,025 3.49 10,349 5.63 11,788 5.92 13,336 6.22 25,104
L&T Liquid Fund - Direct Plan (G)¢ 3.86 10,007 3.77 10,015 3.51 10,029 3.29 10,329 4.70 11,479 5.66 13,174 31/Dec/2012 6.97 18,339
NIFTY Liquid Index 3.81 10,007 3.89 10,016 3.72 10,031 3.49 10,349 4.73 11,487 5.59 13,127 6.86 18,179
CRISIL 1 Yr T-Bill Index^ 4.06 10,008 2.76 10,011 3.02 10,025 3.49 10,349 5.63 11,788 5.92 13,336 6.61 17,792
L&T Overnight Fund - Regular Plan (G)¢ 3.26 10,006 3.36 10,014 3.27 10,027 3.10 10,310 3.72 11,159 4.41 12,410 27/Nov/2006 6.55 26,085
NIFTY 1D Rate Index 3.44 10,007 3.49 10,014 3.43 10,028 3.28 10,328 4.14 11,296 4.90 12,707 6.06 24,316
CRISIL 1 Yr T-Bill Index^ 4.06 10,008 2.76 10,011 3.02 10,025 3.49 10,349 5.63 11,788 5.92 13,336 6.23 24,916
L&T Overnight Fund - Direct Plan (G)¢ 3.36 10,006 3.46 10,014 3.37 10,028 3.21 10,321 4.10 11,282 4.97 12,748 01/Jan/2013 6.44 17,543
NIFTY 1D Rate Index 3.44 10,007 3.49 10,014 3.43 10,028 3.28 10,328 4.14 11,296 4.90 12,707 6.13 17,091
CRISIL 1 Yr T-Bill Index^ 4.06 10,008 2.76 10,011 3.02 10,025 3.49 10,349 5.63 11,788 5.92 13,336 6.60 17,784¢Fund is co-managed by Mr. Shriram Ramanathan.
Name of the Fund Manager :Mr. Shriram Ramanathan & Mr. Mahesh Chhabria (Co-FM) L&T Money Market Fund - Regular Plan (G)§ 3.81 10,007 3.36 10,014 3.08 10,025 2.89 10,289 5.46 11,732 6.23 13,533 10/Aug/2005 7.32 31,853
NIFTY Money Market Index 4.78 10,009 3.71 10,015 3.59 10,030 3.61 10,361 5.31 11,680 5.97 13,367 7.56 33,059
CRISIL 1 Yr T-Bill Index^ 4.06 10,008 2.76 10,011 3.02 10,025 3.49 10,349 5.63 11,788 5.92 13,336 6.12 26,497
L&T Money Market Fund - Direct Plan (G)§ 4.31 10,008 3.84 10,016 3.56 10,029 3.38 10,338 5.96 11,900 6.75 13,866 01/Jan/2013 7.77 19,608
NIFTY Money Market Index 4.78 10,009 3.71 10,015 3.59 10,030 3.61 10,361 5.31 11,680 5.97 13,367 7.17 18,647
CRISIL 1 Yr T-Bill Index^ 4.06 10,008 2.76 10,011 3.02 10,025 3.49 10,349 5.63 11,788 5.92 13,336 6.60 17,784§Fund is co-managed by Mr. Mahesh Chhabria.Past performance may or may not be sustained in the future. * Point to Point (PTP) Returns in INR show the value of `10,000/- invested ^Standard Benchmark Dividends are assumed to be reinvested and bonus is adjusted. Load is not taken into consideration.Note: The since inception return is calculated considering the NAV of Rs. 1000/- invested in L&T Liquid Fund and L&T Overnight Fund and for Rs.10/- for all other schemes, invested at inception. CAGR is Compounded Annualised Growth Rate. Date of inception is deemed to be date of allotment.a. Mr. Shriram Ramanathan manages or co-manages 13 Schemes, Mr. Jalpan Shah manages or co-manages 14 Schemes and Mahesh Chhabria manages or co-manages 4 schemes.b. Different plans shall have a different expense structure. c. Scheme count for the total schemes managed by the Fund Managers includes all the close ended debt schemes considered as 1 scheme. d. L&T Ultra Short Term Fund is not accepting subscription under Institutional Plan.
As on December 31, 2021

51
Data as on December 31, 2021
PERFORMANCE OF GROWTH OPTION
1 year 3 year 5 year Since InceptionCAGR
Returns (%)
PTP Returns*
(in `)
CAGR Returns
(%)
PTP Returns*
(in `)
CAGR Returns
(%)
PTP Returns*
(in `)Inception Date
CAGR Returns
(%)
PTP Returns*
(in `)Name of the Fund Manager : Mr. Jalpan Shah & Mr. Shriram Ramanathan (Co-FM)
L&T Gilt Fund - Regular Plan (G)¢ 0.54 10,054 6.73 12,160 5.35 12,981 29/Mar/2000 8.13 54,796NIFTY All Duration G-Sec Index 2.68 10,268 8.35 12,722 6.92 13,979 NA NACRISIL 10 Yr Gilt Index^ 1.35 10,135 6.94 12,232 5.32 12,963 NA NAL&T Gilt Fund - Direct Plan (G)¢ 1.76 10,176 8.02 12,608 6.72 13,847 01/Jan/2013 9.50 22,630NIFTY All Duration G-Sec Index 2.68 10,268 8.35 12,722 6.92 13,979 7.70 19,498CRISIL 10 Yr Gilt Index^ 1.35 10,135 6.94 12,232 5.32 12,963 6.80 18,076L&T Banking and PSU Debt Fund - Regular Plan (G)¢ 3.03 10,303 7.61 12,464 6.90 13,967 12/Sep/2012 7.73 20,002NIFTY Banking & PSU Debt Index 4.18 10,418 8.05 12,616 7.07 14,079 8.08 20,615CRISIL 10 Yr Gilt Index^ 1.35 10,135 6.94 12,232 5.32 12,963 7.00 18,769L&T Banking and PSU Debt Fund - Direct Plan (G)¢ 3.43 10,343 8.03 12,612 7.35 14,261 01/Jan/2013 8.17 20,279NIFTY Banking & PSU Debt Index 4.18 10,418 8.05 12,616 7.07 14,079 8.01 20,008CRISIL 10 Yr Gilt Index^ 1.35 10,135 6.94 12,232 5.32 12,963 6.80 18,076L&T FMP - XVII - Plan B - (1452D) - Regular Plan (G)¢ 3.95 10,395 8.18 12,664 NA NA 28/Jun/2018 8.16 13,172CRISIL Composite Bond Fund Index 3.44 10,344 8.74 12,859 NA NA 9.16 13,603CRISIL 10 Yr Gilt Index^ 1.35 10,135 6.94 12,232 NA NA 8.18 13,181L&T FMP - XVII - Plan B - (1452D) - Direct Plan (G)¢ 4.22 10,422 8.47 12,766 NA NA 28/Jun/2018 8.46 13,300CRISIL Composite Bond Fund Index 3.44 10,344 8.74 12,859 NA NA 9.16 13,603CRISIL 10 Yr Gilt Index^ 1.35 10,135 6.94 12,232 NA NA 8.18 13,181L&T FMP - XVIII - Scheme B - (1229D) - Regular Plan (G)¢ 3.81 10,381 8.05 12,617 NA NA 30/Nov/2018 8.20 12,754CRISIL Composite Bond Fund Index 3.44 10,344 8.74 12,859 NA NA 9.05 13,065CRISIL 10 Yr Gilt Index^ 1.35 10,135 6.94 12,232 NA NA 7.48 12,494L&T FMP - XVIII - Scheme B - (1229D) - Direct Plan (G)¢ 4.07 10,407 8.32 12,712 NA NA 30/Nov/2018 8.47 12,853CRISIL Composite Bond Fund Index 3.44 10,344 8.74 12,859 NA NA 9.05 13,065CRISIL 10 Yr Gilt Index^ 1.35 10,135 6.94 12,232 NA NA 7.48 12,494L&T FMP - XVIII - Scheme C - (1178D) - Regular Plan (G)¢ 4.78 10,478 NA NA NA NA 18/Feb/2019 8.34 12,584CRISIL Composite Bond Fund Index 3.44 10,344 NA NA NA NA 9.10 12,837CRISIL 10 Yr Gilt Index^ 1.35 10,135 NA NA NA NA 7.41 12,277L&T FMP - XVIII - Scheme C - (1178D) - Direct Plan (G)¢ 5.03 10,503 NA NA NA NA 18/Feb/2019 8.59 12,667CRISIL Composite Bond Fund Index 3.44 10,344 NA NA NA NA 9.10 12,837CRISIL 10 Yr Gilt Index^ 1.35 10,135 NA NA NA NA 7.41 12,277L&T FMP - XVIII - Scheme D - (1155D) - Regular Plan (G)¢ 3.92 10,392 NA NA NA NA 12/Feb/2019 8.06 12,506CRISIL Composite Bond Fund Index 3.44 10,344 NA NA NA NA 9.05 12,839CRISIL 10 Yr Gilt Index^ 1.35 10,135 NA NA NA NA 7.31 12,256L&T FMP - XVIII - Scheme D - (1155D) - Direct Plan (G)¢ 4.08 10,408 NA NA NA NA 12/Feb/2019 8.22 12,560CRISIL Composite Bond Fund Index 3.44 10,344 NA NA NA NA 9.05 12,839CRISIL 10 Yr Gilt Index^ 1.35 10,135 NA NA NA NA 7.31 12,256¢Fund is co-managed by Mr. Shriram Ramanathan.
Name of the Fund Manager : Mr. Praveen AyathanL&T Nifty 50 Index Fund - Regular Plan (G) 24.72 12,472 NA NA NA NA 15/Apr/2020 47.70 19,499Nifty 50 TRI 25.59 12,559 NA NA NA NA 49.11 19,821L&T Nifty 50 Index Fund - Direct Plan (G) 25.26 12,526 NA NA NA NA 15/Apr/2020 48.34 19,646Nifty 50 TRI 25.59 12,559 NA NA NA NA 49.11 19,821L&T Nifty Next 50 Index Fund - Regular Plan (G) 29.64 12,964 NA NA NA NA 15/Apr/2020 41.89 18,206Nifty Next 50 TRI 30.87 13,087 NA NA NA NA 43.47 18,553Nifty 50 TRI^ 25.59 12,559 NA NA NA NA 49.11 19,821L&T Nifty Next 50 Index Fund - Direct Plan (G) 30.21 13,021 NA NA NA NA 15/Apr/2020 42.54 18,347Nifty Next 50 TRI 30.87 13,087 NA NA NA NA 43.47 18,553Nifty 50 TRI^ 25.59 12,559 NA NA NA NA 49.11 19,821Past performance may or may not be sustained in the future. * Point to Point (PTP) Returns in INR show the value of `10,000/- invested ^Standard Benchmark Dividends are assumed to be reinvested and bonus is adjusted. Load is not taken into consideration.Note: The since inception return is calculated on NAV of `10/- invested at inception. CAGR is Compounded Annualised Growth Rate. Date of inception is deemed to be date of allotment.a. Mr. Shriram Ramanathan manages or co-manages 13 Schemes, Mr. Jalpan Shah manages or co-manages 14 Schemes & Mr. Praveen Ayathan manages or co-manages 5 Schemes.b. Different plans shall have a different expense structure. c. Scheme count for the total schemes managed by the Fund Managers includes all the close ended debt schemes considered as 1 scheme. Common to all Schemes: Performance of the schemes (wherever provided) are calculated basis CAGR for the past 1 year, 3 years, 5 years and for period less than 1 year, returns are calculated on simple annualized basis. In case, the start/end date of the concerned period is a non - business day (NBD), the NAV of the previous date is considered for computation of returns, except for L&T Liquid Fund and L&T Overnight Fund, where last declared NAV is used.
PERFORMANCE OF SCHEMESAs on December 31, 2021

52
Data as on December 31, 2021
- Including Additional Expenses in terms of Reg 52(6A)(c), B30 charges in terms of Reg 52(6A)(b) and GST on Management Fees. - Total Expense Ratio is as on the last business day of the month+Effective April 01, 2019 Total Expense Ratio (TER) stands revised. For the actual current expenses charged to the scheme, please refer the website of the Mutual Fund - www.ltfs.com
Fund Name Regular Direct
L&T Flexicap Fund 2.08% 1.38%
L&T Tax Advantage Fund 1.97% 1.21%
L&T Large and Midcap Fund 2.23% 1.30%
L&T India Large Cap Fund 2.47% 1.51%
L&T India Value Fund 1.85% 0.90%
L&T Midcap Fund 1.88% 0.75%
L&T Infrastructure Fund 2.20% 0.96%
L&T Emerging Businesses Fund 1.85% 0.73%
L&T Business Cycles Fund 2.55% 1.44%
L&T Focused Equity Fund 2.33% 1.07%
L&T Nifty 50 Index Fund 0.70% 0.25%
L&T Nifty Next 50 Index Fund 0.80% 0.35%
L&T Balanced Advantage Fund 2.09% 0.69%
L&T Hybrid Equity Fund 1.90% 0.89%
L&T Arbitrage Opportunities Fund 1.04% 0.37%
L&T Equity Savings Fund 1.58% 0.69%
L&T Overnight Fund 0.20% 0.10%
L&T Liquid Fund 0.20% 0.14%
L&T Ultra Short Term Fund 0.39% 0.23%
L&T Money Market Fund 0.72% 0.24%
L&T Banking and PSU Debt Fund 0.61% 0.23%
L&T Short Term Bond Fund 0.75% 0.27%
L&T Low Duration Fund 0.92% 0.27%
L&T Credit Risk Fund 1.66% 0.86%
L&T Flexi Bond Fund 1.62% 0.90%
L&T Triple Ace Bond Fund 0.63% 0.29%
L&T Gilt Fund 1.70% 0.50%
L&T Conservative Hybrid Fund 2.26% 1.61%
L&T Resurgent India Bond Fund 1.45% 0.55%
Fund NameMinimum Application size
(Initial)Additional Investment Minimum Redemption Size
L&T Flexicap Fund `5,000 per application `1,000 per application `500 or 50 units
L&T Tax Advantage Fund `500 per application and in multiples of `500 thereafter `500 per applicationb and in multiples of `500 thereafter `500 or 50 units
L&T Large and Midcap Fund `5,000 per application `1,000 per application `500 or 50 units
L&T India Large Cap Fund `5,000 per application `1,000 per application `500 or 50 units
L&T India Value Fund `5,000 per application `1,000 per application `500 or 50 units
L&T Midcap Fund `5,000 per application and in multiples of `1 thereafter `1,000 per application and in multiples of `1 thereafter `500 or 50 units
L&T Infrastructure Fund `5,000 per application and in multiples of `1 thereafter `1,000 per application and in multiples of `1 thereafter `500 or 50 units
L&T Emerging Businesses Fund `5,000 per application `1,000 per application `500 or 50 units
L&T Business Cycles Fund `5,000 per application and inmultiples of `1 thereafter `1,000 per application and in multiples of `1 thereafter `500 or 50 units
L&T Focused Equity Fund `5,000 per application and in multiples of `1 thereafter `1,000 per application and in multiples of `1 thereafter `500 or 50 units
L&T Nifty 50 Index Fund `5,000 per application and in multiples of `1 thereafter `1,000 per application and in multiples of `1 thereafter `500 or 50 units
L&T Nifty Next 50 Index Fund `5,000 per application and in multiples of `1 thereafter `1,000 per application and in multiples of `1 thereafter `500 or 50 units
L&T Balanced Advantage Fund `5,000 per application `1,000 per application `500 or 50 units
L&T Hybrid Equity Fund `5,000 per application `1,000 per application `500 or 50 units
L&T Arbitrage Opportunities Fund `5,000 per application and in multiples of `1 thereafter `1,000 per application and in multiples of `1 thereafter `500 or 50 units or account balance, whichever is lower.
L&T Equity Savings Fund `5,000 per application and in multiples of `1 thereafter `1,000 per application and in multiples of `1 thereafter `500 or 50 units
L&T Overnight FundGrowth and IDCW: `10,000 per application and in multiples of `1 thereafter. In case of
Daily IDCW Option, `1,00,000 and in multiples of `1 thereafter.`1,000 per application and thereafter in multiples of `1 `1000 or 1 unit
L&T Liquid FundWeekly IDCW and Growth: `10,000 per application and in
multiples of `1 thereafter Daily IDCW Reinvestment Plan (“DDRIP”): `1,00,000 per application and in multiples of `1 thereafter
`1,000 per application and in multiples of `1 thereafterRegular Plan : `1000/- per application or 1 unit
Weekly IDCW/ Growth/ DDRIP: `1000 per application or 1 unit
L&T Ultra Short Term Fund
Growth/Weekly IDCW/Monthly IDCW/Semi-Annual IDCW:`10,000 per application and in multiples of `1 thereafter; Daily
IDCW Reinvestment Plan: `1,00,000 per application and inmultiples of `1 thereafter.
`1,000 per application and in multiples of `1 thereafter
Regular Plan: `500/- per application or 50 unitsWeekly IDCW/Monthly IDCW/Semi Annual IDCW/ Growth/
Bonus DDRIP: `500 per application or 50 Units
L&T Money Market Fund `10,000 per application and in multiples of `1 thereafter `1,000 per application and in multiples of `1 thereafter `500 or 50 units
L&T Banking and PSU Debt Fund `10,000 per application `1,000 per application and thereafter in multiples of `1 `500 or 50 units
L&T Short Term Bond Fund `10,000 per application and in multiples of `1 thereafter `1,000 per application and in multiples of `1 thereafter `500 or 50 units
L&T Low Duration Fund `10,000 per application `1,000 per application `500 or 50 units
L&T Credit Risk Fund `10,000 per application and in multiples of `1 thereafter. `1,000 per application and in multiples of `1 thereafter.Retail Option : `500/- per application or 50 units
IDCW/ Growth/Bonus: `500 per application or 50 units
L&T Flexi Bond Fund `10,000 per application `1,000 per application and thereafter in multiples of `1 `500 or 50 units
L&T Triple Ace Bond Fund `10,000 per application and in multiples of `1 thereafter `1,000 per application and in multiples of `1 thereafter `500 or 50 units
L&T Gilt Fund `10,000 per application and in multiples of `1 thereafter `1,000 per application and in multiples of `1 thereafter `500 or 50 units
L&T Conservative Hybrid Fund `10,000 per application and in multiples of `1 thereafter `1,000 per application and in multiples of `1 thereafter `500 or 50 units
L&T Resurgent India Bond Fund `5,000 per application and in multiples of `1 thereafter `1,000 per application and in multiples of `1 thereafter `500 or 50 units
MINIMUM INVESTMENT AMOUNT DETAILS
TOTAL EXPENSE RATIO+
Data as on December 31, 2021

53
Data as on December 31, 2021
IDCW HISTORY FOR EQUITY SCHEMES
L&T Flexicap Fund
Record Date NAV as on date of declaration (`) Quantum of IDCW (`) Per Unit
Regular Plan IDCW12-Jan-2017 29.302 2.2500 19-Jan-2018 36.698 2.5000 24-Jan-2019 31.507 2.5000 24-Jan-2020 31.507 2.5000 24-Feb-2021 34.611 2.5000 Direct Plan IDCW24-Jan-2019 35.423 2.500024-Jan-2020 36.035 2.850024-Feb-2021 39.889 2.8500
L&T Midcap FundRecord Date NAV as on date of
declaration (`)Quantum of IDCW
(`) Per UnitRegular Plan IDCW10-Aug-2017 50.380 4.000017-Aug-2018 48.880 4.000023-Aug-2019 38.240 3.250026-Aug-2020 38.480 1.500026-Aug-2021 56.110 3.5000Direct Plan IDCW23-Aug-2019 40.930 3.500026-Aug-2020 41.680 2.000026-Aug-2021 60.910 3.7500
L&T Tax Advantage FundRecord Date NAV as on date of
declaration (`)Quantum of IDCW
(`) Per UnitRegular Plan IDCW26-Nov-2019 21.578 0.750020-Mar-2020 17.780 0.800024-Dec-2020 22.438 0.900026-Mar-2021 23.129 0.900026-Nov-2021 27.119 0.8000Direct Plan IDCW24-Dec-2020 28.929 0.900026-Mar-2021 30.147 0.900026-Nov-2021 35.863 1.0000
L&T Large and Midcap Fund
Record Date NAV as on date of declaration (`)
Quantum of IDCW (`) Per Unit
Regular Plan IDCW 22-Oct-2021 32.882 0.160023-Nov-2021 32.746 0.170023-Dec-2021 31.693 0.1700Direct Plan IDCW22-Oct-2021 37.656 0.190023-Nov-2021 37.525 0.200023-Dec-2021 36.340 0.2000
L&T India Large Cap FundRecord Date NAV as on date of
declaration (`)Quantum of IDCW
(`) Per UnitRegular Plan IDCW23-Dec-2019 17.752 1.3000 24-Dec-2020 18.367 1.100024-Dec-2021 21.406 1.3000Direct Plan IDCW23-Dec-2019 19.214 1.4000 24-Dec-2020 20.071 1.200024-Dec-2021 23.614 1.4500
L&T India Value FundRecord Date NAV as on date of
declaration (`)Quantum of IDCW
(`) Per UnitRegular Plan IDCW15-Jun-2017 27.613 1.750021-Jun-2018 27.372 1.750025-Jun-2021 35.028 1.7500Direct Plan IDCW15-Jun-2017 29.698 1.500021-Jun-2018 30.105 1.400025-Jun-2021 40.413 2.0000
L&T Balanced Advantage FundRecord Date NAV as on date of
declaration (`)Quantum of IDCW
(`) Per UnitRegular Plan IDCW22-Oct-2021 18.808 0.090023-Nov-2021 18.639 0.090023-Dec-2021 18.202 0.0900Direct Plan IDCW22-Oct-2021 21.072 0.100023-Nov-2021 20.910 0.100023-Dec-2021 20.444 0.1000
L&T Hybrid Equity FundRecord Date NAV as on date of
declaration (`)Quantum of IDCW
(`) Per UnitRegular Plan IDCW23-Sep-2021 25.925 0.130022-Oct-2021 26.559 0.130023-Nov-2021 26.185 0.140023-Dec-2021 25.613 0.1400Direct Plan IDCW23-Sep-2021 29.450 0.150022-Oct-2021 30.191 0.150023-Nov-2021 29.790 0.160023-Dec-2021 29.163 0.1600Record Date NAV as on date of
declaration (`)Quantum of IDCW
(`) Per UnitRegular Plan - Annual IDCW22-Mar-2019 12.642 0.619820-Mar-2020 11.080 0.000026-Mar-2021 14.794 0.7000Direct Plan - Annual IDCW22-Mar-2019 13.242 0.664120-Mar-2020 11.710 0.000026-Mar-2021 15.803 0.7500
L&T Arbitrage Opportunities FundRecord Date NAV as on Record
Date (`)Quantum of IDCW
(`) Per UnitRegular Plan - Monthly IDCW28-May-2021 10.190 0.030025-Jun-2021 10.206 0.040030-Jul-2021 10.209 0.040027-Aug-2021 10.197 0.030029-Oct-2021 10.181 0.030026-Nov-2021 10.187 0.030031-Dec-2021 10.168 0.0300Direct Plan - Monthly IDCW30-Apr-2021 10.497 0.050028-May-2021 10.480 0.030025-Jun-2021 10.504 0.050030-Jul-2021 10.506 0.050027-Aug-2021 10.490 0.040029-Oct-2021 10.467 0.040026-Nov-2021 10.448 0.0400Record Date NAV as on date of
declaration (`)Quantum of IDCW
(`) Per Unit
Regular Plan - Quarterly IDCW25-Jun-2021 10.865 0.000024-Sep-2021 10.958 0.000027-Dec-2021 11.045 0.0900Direct Plan - Quarterly IDCW25-Jun-2021 11.141 0.000024-Sep-2021 11.255 0.100027-Dec-2021 11.263 0.1200
L&T Business Cycles FundRecord Date NAV as on date of
declaration (`)Quantum of IDCW
(`) Per UnitRegular Plan IDCW20-Jul-2018 14.520 0.900003-Oct-2019 13.452 0.700023-Jul-2021 17.496 1.0000Direct Plan IDCW20-Jul-2018 14.911 0.900003-Oct-2019 13.974 0.900023-Jul-2021 18.242 1.1000
L&T Emerging Businesses FundRecord Date NAV as on date of
declaration (`)Quantum of IDCW
(`) Per UnitRegular Plan IDCW26-Oct-2018 20.289 1.5000 23-Oct-2019 17.110 1.200022-Oct-2021 33.172 1.5000Direct Plan IDCW26-Oct-2018 21.044 1.600023-Oct-2019 17.912 1.000022-Oct-2021 36.035 1.7000
Pursuant to payment of dividend, NAV per unit of the IDCW options of the aforesaid schemes will fall to the extent of the payment and statutory levy (if applicable). Face value `10/-.Past performance of the aforesaid schemes may or may not be sustained in future. *Please note that the IDCW rates mentioned are post applicable dividend distribution tax deduction.
L&T Equity Savings FundRecord Date NAV as on date of
declaration (`)Quantum of IDCW
(`) Per Unit
Regular Plan - Monthly IDCW29-Oct-2021 13.386 0.060025-Nov-2021 13.358 0.060027-Dec-2021 13.294 0.0600Direct Plan - Monthly IDCW29-Oct-2021 14.763 0.070025-Nov-2021 14.739 0.070027-Dec-2021 14.677 0.0700
Record Date NAV as on date of declaration (`)
Quantum of IDCW (`) Per Unit
Regular Plan - Quarterly IDCW25-Jun-2021 13.718 0.180024-Sep-2021 14.324 0.180027-Dec-2021 14.129 0.1800Direct Plan - Quarterly IDCW25-Jun-2021 14.593 0.190024-Sep-2021 15.273 0.190027-Dec-2021 15.101 0.1900

54
Data as on December 31, 2021
IDCW HISTORY FOR DEBT SCHEMES
L&T Overnight FundRecord Date NAV as on Record
Date (`)Quantum of IDCW
(Corporate) (`) Per Unit
Quantum of IDCW (Non-Corporate)
(`) Per UnitRegular Plan - Monthly IDCW
27-Dec-21 1,010.63 2.4000 2.400025-Nov-21 1,010.16 2.4000 2.400025-Oct-21 1,009.73 2.3000 2.3000Direct Plan - Monthly IDCW27-Dec-21 1,066.59 2.5000 2.500025-Nov-21 1,065.97 2.5000 2.500025-Oct-21 1,065.39 2.4000 2.4000
L&T Money Market FundRecord Date NAV as on Record
Date (`)Quantum of IDCW
(Corporate) (`) Per Unit
Quantum of IDCW (Non-Corporate)
(`) Per UnitRegular - Monthly IDCW
27-Dec-21 11.5225 0.0300 0.030025-Nov-21 11.5222 0.0300 0.030025-Oct-21 11.5207 0.0300 0.0300Direct Plan - Monthly IDCW27-Dec-21 12.1009 0.0300 0.030025-Nov-21 12.0939 0.0300 0.030025-Oct-21 12.0859 0.0300 0.0300
L&T Banking and PSU Debt FundRecord Date NAV as on Record
Date (`)Quantum of IDCW
(Corporate) (`) Per Unit
Quantum of IDCW (Non-Corporate)
(`) Per UnitRegular Plan - Monthly IDCW
27-Dec-21 11.2428 0.0400 0.040025-Nov-21 11.2660 0.0400 0.040025-Oct-21 11.2795 0.0400 0.0400Direct Plan - Monthly IDCW27-Dec-21 11.7007 0.0400 0.040025-Nov-21 11.7193 0.0400 0.040025-Oct-21 11.7280 0.0400 0.0400
L&T Short Term Bond Fund
Record Date NAV as on Record Date (`)
Quantum of IDCW (Corporate) (`) Per Unit
Quantum of IDCW (Non-Corporate)
(`) Per UnitRegular Plan - Monthly IDCW27-Dec-21 11.2897 0.0400 0.040025-Nov-21 11.3201 0.0400 0.040025-Oct-21 11.3336 0.0400 0.0500Direct Plan - Monthly IDCW27-Dec-21 11.8943 0.0400 0.040025-Nov-21 11.9192 0.0400 0.040025-Oct-21 11.9264 0.0400 0.0500Record Date NAV as on date of
declaration (`)Quantum of IDCW
(Corporate) (`) Per Unit
Quantum of IDCW (Non-Corporate) (`)
Per UnitRegular Plan - Quarterly IDCW 27-Dec-21 10.9708 0.1300 0.1300 24-Sep-21 11.0610 0.1400 0.1400 25-Jun-21 11.0854 0.1600 0.1600Direct Plan - Quarterly IDCW 27-Dec-21 11.6775 0.1400 0.1400 24-Sep-21 11.7501 0.1400 0.1400 25-Jun-21 11.7521 0.1600 0.1600Regular Plan - Annual IDCW19-Mar-21 13.0935 0.8000 0.800020-Mar-20 12.9759 0.5336 0.576322-Mar-19 12.7702 0.5336 0.5763Direct Plan - Annual IDCW19-Mar-21 13.5202 0.8500 0.850020-Mar-20 13.3607 0.5670 0.612322-Mar-19 13.1148 0.5670 0.6123
L&T Low Duration FundRecord Date NAV as on Record
Date (`)Quantum of IDCW
(Corporate) (`) Per Unit
Quantum of IDCW (Non-Corporate)
(`) Per UnitRegular Plan - Monthly IDCW27-Dec-21 10.4839 0.0400 0.040025-Nov-21 10.4984 0.0400 0.040025-Oct-21 10.5130 0.0400 0.0400Direct Plan - Monthly IDCW27-Dec-21 11.1084 0.0400 0.040025-Nov-21 11.1151 0.0400 0.040025-Oct-21 11.1221 0.0400 0.0400
Record Date NAV as on date of declaration (`)
Quantum of IDCW (Corporate) (`) Per Unit
Quantum of IDCW (Non-Corporate)
(`) Per UnitRegular Plan - Annual IDCW19-Mar-21 11.1871 0.7000 0.700020-Mar-20 11.2609 0.4669 0.504222-Mar-19 11.4578 0.4669 0.5042Regular Plan - Annual IDCW19-Mar-21 11.4276 0.7000 0.700020-Mar-20 11.4234 0.4669 0.504222-Mar-19 11.5584 0.4669 0.5042
L&T Credit Risk FundRecord Date NAV as on Record
Date (`)Quantum of IDCW
(Corporate) (`) Per Unit
Quantum of IDCW (Non-Corporate)
(`) Per UnitRegular Plan - Monthly IDCW27-Dec-21 10.3045 0.0500 0.050025-Nov-21 10.3332 0.0500 0.050025-Oct-21 10.3370 0.0500 0.0500Direct Plan - Monthly IDCW27-Dec-21 10.9228 0.0500 0.050025-Nov-21 10.9427 0.0500 0.050025-Oct-21 10.9363 0.0500 0.0500
Record Date NAV as on date of declaration (`)
Quantum of IDCW (Corporate) (`) Per Unit
Quantum of IDCW (Non-Corporate)
(`) Per UnitRegular Plan - Annual IDCW19-Mar-21 11.0601 0.0000 0.000020-Mar-20 11.4070 0.4669 0.504222-Mar-19 11.8266 0.4669 0.5042Direct Plan - Annual IDCW19-Mar-21 11.5112 0.0000 0.000020-Mar-20 11.7550 0.4669 0.504222-Mar-19 12.0881 0.4669 0.5042
L&T Gilt FundRecord Date NAV as on date of
declaration (`)Quantum of IDCW
(Corporate) (`) Per Unit
Quantum of IDCW (Non-Corporate)
(`) Per UnitRegular Plan - Quarterly IDCW27-Dec-21 11.6567 0.2000 0.200024-Sep-21 11.8993 0.2500 0.250025-Jun-21 11.9676 0.2500 0.2500Direct Plan - Quarterly IDCW27-Dec-21 12.9444 0.2200 0.220024-Sep-21 13.1662 0.2700 0.2700
25-Jun-21 13.1963 0.2700 0.2700
L&T Ultra Short Term FundRecord Date NAV as on Record
Date (`)Quantum of IDCW
(Corporate) (`) Per Unit
Quantum of IDCW (Non-Corporate)
(`) Per UnitMonthly IDCW27-Dec-21 12.7375 0.0400 0.040025-Nov-21 12.7420 0.0400 0.040025-Oct-21 12.7455 0.0400 0.0400Direct Plan - Monthly IDCW27-Dec-21 13.0589 0.0400 0.040025-Nov-21 13.0606 0.0400 0.040025-Oct-21 13.0615 0.0400 0.0400Semi Annual IDCW24-Sep-21 26.2971 0.0000 0.000019-Mar-21 25.8148 0.0000 0.000024-Sep-20 25.4101 0.0000 0.0000Direct Plan - Semi Annual IDCW16-Mar-16 10.4889 0.1338 0.1445

55
Data as on December 31, 2021
IDCW HISTORY FOR DEBT SCHEMES
L&T Flexi Bond FundRecord Date NAV as on Record
Date (`)
Quantum of IDCW (Corporate) (`) Per Unit
Quantum of IDCW (Non-Corporate)
(`) Per UnitRegular Plan - Monthly IDCW27-Dec-21 10.9592 0.0500 0.050025-Nov-21 11.0230 0.0500 0.050025-Oct-21 11.0556 0.0500 0.0500Direct Plan - Monthly IDCW27-Dec-21 12.9902 0.0600 0.060025-Nov-21 13.0584 0.0600 0.060025-Oct-21 13.0898 0.0600 0.0600
Record Date NAV as on date of declaration (`)
Quantum of IDCW (Corporate) (`) Per Unit
Quantum of IDCW (Non-Corporate)
(`) Per UnitRegular Plan - Annual IDCW19-Mar-21 11.4848 0.7000 0.700020-Mar-20 11.5612 0.4669 0.504222-Mar-19 11.2338 0.4669 0.5042Direct Plan - Annual IDCW19-Mar-21 11.8712 0.7200 0.720020-Mar-20 11.8483 0.4669 0.504222-Mar-19 11.4212 0.4669 0.5042
L&T Triple Ace Bond FundRecord Date NAV as on date of
declaration (`)Quantum of IDCW
(Corporate) (`) Per Unit
Quantum of IDCW (Non-Corporate)
(`) Per UnitRegular Plan - Quarterly IDCW 27-Dec-21 11.6968 0.1800 0.1800 24-Sep-21 11.7975 0.2000 0.2000 25-Jun-21 11.7601 0.2000 0.2000Direct Plan - Quarterly IDCW 27-Dec-21 12.0350 0.1900 0.1900 24-Sep-21 12.1324 0.2100 0.2100 25-Jun-21 12.0882 0.2100 0.2100Regular Plan - Annual IDCW19-Mar-21 12.3257 0.7000 0.700020-Mar-20 11.9928 0.3669 0.396222-Mar-19 11.1585 0.3669 0.3962Direct Plan - Annual IDCW19-Mar-21 12.3978 0.7000 0.700020-Mar-20 12.0195 0.3669 0.3962Regular Plan - Semi Annual IDCW24-Sep-21 17.7201 0.4000 0.400019-Mar-21 17.1803 0.4000 0.400024-Sep-20 17.5205 0.4000 0.4000Direct Plan -Semi Annual IDCW24-Sep-21 20.7494 0.4500 0.450019-Mar-21 20.0642 0.4500 0.450024-Sep-20 20.4104 0.4500 0.4500
L&T Conservative Hybrid Fund
Record Date NAV as on Record Date (`)
Quantum of IDCW (Corporate)
Quantum of IDCW (Non-Corporate)
(`) Per Unit (`) Per Unit
Regular Plan - Monthly IDCW27-Dec-21 11.6363 0.0500 0.050025-Nov-21 11.6416 0.0500 0.050025-Oct-21 11.5768 0.0500 0.0500Direct Plan - Monthly IDCW27-Dec-21 12.4811 0.0600 0.060025-Nov-21 12.4866 0.0600 0.060025-Oct-21 12.4164 0.0600 0.0600Record Date NAV as on date of
declaration (`)Quantum of IDCW
(Corporate)Quantum of IDCW (Non-Corporate)
Regular Plan - Quarterly IDCW27-Dec-21 11.3387 0.1700 0.170024-Sep-21 11.4991 0.2200 0.220025-Jun-21 11.2729 0.2200 0.2200Direct Plan - Quarterly IDCW27-Dec-21 12.0007 0.1800 0.180024-Sep-21 12.1477 0.2300 0.230025-Jun-21 11.8887 0.2300 0.2300
L&T Focused Equity Fund
Record Date NAV as on Record Date (`)
Quantum of IDCW (Corporate)
Quantum of IDCW (Non-Corporate)
(`) Per Unit (`) Per Unit
Regular Plan - Monthly IDCW26-Nov-21 16.418 0.0500 0.0500Direct Plan - Monthly IDCW26-Nov-21 16.996 0.0500 0.0500
L&T Resurgent India Bond FundRecord Date NAV as on date of
declaration (`)Quantum of IDCW
(Corporate) (`) Per Unit
Quantum of IDCW (Non-Corporate)
(`) Per UnitRegular Plan - Monthly IDCW
27-Dec-21 11.0049 0.0500 0.050025-Nov-21 11.0411 0.0500 0.050025-Oct-21 11.0550 0.0500 0.0500Direct Plan - Monthly IDCW27-Dec-21 11.6845 0.0500 0.050025-Nov-21 11.7107 0.0500 0.050025-Oct-21 11.7135 0.0500 0.0500Regular Plan - Annual IDCW19-Mar-21 12.0606 0.7700 0.770020-Mar-20 11.8937 0.4669 0.504222-Mar-19 11.7524 0.4669 0.5042Direct Plan - Annual IDCW19-Mar-21 12.7162 0.8000 0.800020-Mar-20 12.3921 0.4669 0.504222-Mar-19 12.1130 0.4669 0.5042
Pursuant to payment of dividend, NAV per unit of the IDCW options of the aforesaid schemes will fall to the extent of the payout and statutory levy (if applicable). *Face value `1000/-. For the remaining scheme Face value is ̀ 10/-. Past performance of the aforesaid schemes may or may not be sustained in future. Please note that the IDCW rates mentioned are post applicable dividend distribution tax deduction.

56
Data as on December 31, 2021Branches details of the Company
L&T INVESTMENT MANAGEMENT LIMITED - INVESTOR SERVICE CENTRESAhmedabad : 1st Floor, Unit No. 101 & 104, Ratnaraj Spring Nr, Navrangpura Bus stand Navrangpura 380015. Bengaluru : N-111(47-43), Manipal Centre, First Floor, North Block, Dickenson Road, Bengaluru-560042. Bengaluru : Site No. 92, Zed Square, 1st Floor, Industrial Layout, JNC Road, 5th Block, Koramangala, Bangalore–560095. Bhavnagar : L&T Financial Services, Shop No.FF-5,Gopi Arcade, Waghawadi Road, Bhavnagar-364002. Bhopal : Alankar Complex, Mezzanine Floor, Above ICICI Bank, M.P.Nagar Zone-II, Bhopal-462011 Bhubaneshwar : 428/3818, 2nd Floor, Jaydev Nagar, Kalpana Square, Near Pantho Nivas, Bhubaneswar-751002 Borivali (Mumbai) : Office No. 308, 3rd Floor, Jalaram Business Center, Ganjawala Lane, Borivali (West), Mumbai-400092. Chandigarh : Plot No. 174, 3rd Floor, Industrial Area, Phase-2, Chandigarh-160002 Chennai : 6th Floor, K.G.N. Towers,No. 62 Ethiraj Salai (Commander- In- Chief Road), Egmore, Chennai-600105 Kochi: Govardhan Buildings, No. 66/3118-A, 2nd Floor, Chittoor Road, Ernakulam, Kochi-682035. Coimbatore : NO. 2-8, Third Floor, “ATRIA”, Dr. NRN Layout, Papanaickenpalayam, Coimbatore-641037. Dalamal (Mumbai) : 407 Office No.811, 8th Floor, Raheja Center, Free Press Journal Road, Nariman Point, Mumbai 400021. Ghatkopar (Mumbai) : Office No. 504, 5th Floor, Zest Business Spaces, M.G. Road, Ghatkopar (East), Mumbai-400077 Goa : 6th Floor, Bhanav Apartment, Near Mahalaxmi Temple, Dr. Atmaram Borkar Road, Panjim, Goa-403001. Gurgaon (New Delhi) : Office no 221, 2nd Floor, Galleria Market, DLF City Phase 4, Gurgaon-122002. Hyderabad : 2nd Floor, Unit No. 203/2, Block - I, 6-3-1192/1/1, Kundanbagh, White House Begumpet, Hyderabad–500016. Indore : “Dhan Trident” Block No. B-3, PU- 4, Scheme No. 54, Near Vijay Nagar Square, Indore-452010 Jaipur : Shop No. 307, Third Floor, Trimurty VJaycity Point, Ashok Marg, C - Scheme, Jaipur 302001. Jalandhar : SCO-3, 2nd Floor, Puda Complex, Adjoining Andhra Bank, Opp. Suvidha Centre, Jalandhar City-144001 Jamnagar : G-43, Ground Floor, Madhav Plaza,Opp SBI Bank,Near Lal Bunglow Jamnagar-361001 Jamshedpur : 3B, Rear Side,3rd Floor,Fairdeal Complex,H No 7,Main Road Bishtupur,Jamshedpur-831001 Kalina (Mumbai): Ground Floor, Brindavan, Plot No 177, CST Road, Kalina, Santacruz (E), Mumbai-400098 (24-Jul-2018) Kanpur : 4th Floor, Vodafone Tower, Near Leelamani hospital, Civil line Kanpur 208001. Kolhapur : L&T Financial Services,1st Floor,F01&F02,Jaduben Plaza,1108/E,Shahupuri,Kolhapur-416001 Kolkata : 4th Floor, 2/1, Kankaria Centre, Russell Street, Kolkata-700 071 Lucknow : Land No. 12, Shop No. 106, 1st Floor, Saran Chamber, Near Civil Hospital, Lucknow - 226 001. Ludhiana : SBI Building, Second Floor, Plot No. 19, House 223/2, Rani Jhansi Road, Near Khalsa College for Women, Ludhiana, Punjab 141 001. Nagpur : Office No. 501, 5 Floor, Shriram Shyam Tower, Sadar, Nagpur - 440012. Nariman Point (Mumbai) : Office No. 811, 8th Floor, Raheja Center, Free Press Journal Road, Nariman Point, Mumbai- 400021. Nasik : 3rd Floor, Office No. 3&4, Bedmuthas Navkar Heights, Sharanpur Road, New Pandit Colony, Nashik 422 005. New Delhi : 6th Floor,DCM Building,16, Barakhamba Road, Connaught Place, Above Barakhamba Road Metro Station, New Delhi-110001 Panipat : NK Tower, 2nd Floor, GT Road, Panipat-132103 Patna : Office no.201,2nd Floor, Grand Aley Manawar, Ward No. 2, Circle No. 6,Street No.20,Holding No.256,Survey Plot No. 877,Gandhi Maidan Road, Patna-800001 Pune : 3rd Floor, Office No. 301 and 302, Zenith Complex, K B Joshi Path, Shivaji Nagar, Pune 411 055. Rajkot : 2nd Floor, Office No. 212, 214 to 215, Part B, Nath Edifice, Dr. Yagnik, Road, Race Course Road, Rajkot 360001. Surat : 8th Floor, Office No. 800A, International Trade Center, Near Majura Gate, Ring Road, Surat 395002. Thane (Mumbai) : 6 Floor, Unit No. 627 and 628, Lodha Supremus II, Road No. 22, Wagle Estate, Thane West 400 604. Trichy : Sri Krishna Arcade, No.60, First Floor, Thennur High Road, Trichy 621017. Trivandrum : Parmeswara Towers, T C 15/1948(4), Ganapathy Kovil Road, Opp. Canara Bank, Vazhuthacaud, Trivandrum-695014. Vadodara : Office No .202 - 203 , Second Floor , Sahyog Atrium , Old Padra Road , Vadodara-390015 Varanasi : 2ND Floor,Unit D-64/127-CH,Arihant Complex,Sigra,Varanasi-221010 Vijayawada : D 27-23-252, Gopala Reddy Road, 4th Floor, Flat No. 402, Bhaskar Plaza, Governorpet, Vijayawada, Andhra Pradesh-520002.
L&T INVESTMENT MANAGEMENT LIMITED - SALES OFFICESAgra : First Floor, 108, Anand Vrindavan, Sanjay Place, Agra-282002. Allahabad : FF109 & FF110, 1st Floor, Vinayak Complex, Elgin Road, Civil Lines, Allahabad-211 001. Amritsar : G.R Tower, 1st Floor, Mall Road, Amritsar-143001. Anand : Imperial Square, 3rd Floor,Office No. 304 & 305, Amul Dairy Road, Near Ganesh Chowkdi, Anand-388001. Aurangabad : 1st Floor, Ratnaprabha Complex, Jalna Road, Aurangabad-431001. Calicut : 2nd Floor, Trade Link Complex, Challapuram Road,Mankave Junction, Calicut-673007. Cuttack : 1st Floor, OSL Tower-3, Badambadi Square, Cuttack-753009. Dehradun : 2nd Floor, 75-A, Mak Plaza, Rajpur Road, Dehradun-248001. Durgapur : B-27, Biplabi Rasbihari ,Basu Sarani, Bidhan Nagar, Sector 2A, Durgapur-713212. Guwahati : 3rd Floor, Kushan Plaza, Dispur, G.S Road, Guwahati - 781006. Hubli : No. 472, 473 & 474, 3rd floor, V A kalburgi Square, Beside Ganesh Hotel, Vivekananda Hospital road, Deshpande Nagar, Hubli-580 020. Jodhpur : C-44, 2nd Floor, (Rear Portion), 5th Avenue, Pwd Road, Jodhpur-324002. Madurai : Rakesh Towers, No.30C, 3rd Floor, Subramania Pillai Street Bypass Road, S.S Colony, Madurai-625016. Mangalore : 1st Floor, Aadheesh Avenue,Shop No.106,Opposite Besant College, M G Road, Kodiala Bail,Manglore-575003. Mysore : Kiran Mansion, First Floor, No. 646, Chamaraja Double Road, Mysore-570024. Pondicherry : 1st Floor, No:144, 100 feet road, ECR Main Road, Pakkamudayanpet, Lawspet, Pondicherry-605008. Raipur : 1st floor, Simran Tower, Opposite LIC Building, Pandri, Raipur-492004. Ranchi : 1st Floor,45, Garikhana, Near PNB, Harmu Road, Ranchi-834001. Rourkela : Sector 19, L&T House,Ambagan, Rourkela-769005. Siliguri : 3rd Floor, Infinity Square, Sevoke Road, Siliguri-734001. Udaipur : 32/1105, Centre Point, 2nd Floor, Opp. B.N. College, Udaipur-313001. Vapi : 1st floor, Office No - 2, Jayam Complex, Plot No - 32/B, 1st Phase, Near GIDC Char Rasta, Vapi, Gujarat-396195. Vishakapatnam : D.No : 47-14-5/1, Flat No:303, 2rd Floor,Eswara Paradise,Beside State Bank of India, Dwarakanagar Main road,Visakhapatnam-530016.
CL09008

57
Data as on December 31, 2021
THIS FAR?
THIS FAR?
HOW FAR WOULD YOU GOTO FULFIL YOUR PASSION?
THIS FAR?
CL06709
Follow us on
#SIPTakesYouFurther
Plan ahead with SIP and go further on your favourite activity.We all have our own passion, whether it is to scale the tallest peak or drive across many countries. But the one thing that could take you there is a good plan. Start a Systematic Investment Plan (SIP) and invest monthly to help you reach your goal. Each small installment adds up over time and with the power of compounding could grow to a substantial amount. So rather than attempting basecamp, you could set your sights on the tallest peaks!
Investors should deal only with Registered Mutual Funds, to be verified on SEBI website under "Intermediaries/Market Infrastructure Institutions".Refer www.ltfs.com for details on completing one-time KYC (Know Your Customer) process, change of details like address, phone number etc.and change of bank details etc. For complaints redressal, either visit www.ltfs.com or SEBI's website www.scores.gov.in
An investor education & awareness initiative.
Mutual Fund investments are subject to market risks, read all scheme related documents carefully.
visit www.ltfs.com/sipcall 1800 2000 400
THIS FAR?
TOUCHGET IN
Give a missed call on92129 00020 from your registered mobile to receive total valuation on SMS and statements for all your folios and corresponding schemes on your registered email ID.
Get latest NAV ofyour scheme.SMS LNTMF NAV <Scheme Code*> to 56767#
For furtherqueries, email [email protected]
Join us on WhatsApp @ 9326929294 for financial and non-financial transactions, Account statement, etc. or you can connect with us on Chatbot as well by visiting our website (www.ltfs.com/companies/lnt-investment-management/lnt-mutual-fund.html). (For Resident individual investors only with mode of holding as single).
#Visit the Customer Service section on our website for scheme codes.
ooLLoo
rrModerately
LLww
ww
ttooMMooddee aattee
MMooddeerraatteeH gi h
Very High
H gi h
VERYHIGHLOW
Investors understand that their principal will be at moderate risk
Riskometer as on December 31, 2021.
CL09008

58
Data as on December 31, 2021
THIS FAR?
THIS FAR?
HOW FAR WOULD YOU GOTO FULFIL YOUR PASSION?
THIS FAR?
CL06709
Follow us on
#SIPTakesYouFurther
Plan ahead with SIP and go further on your favourite activity.We all have our own passion, whether it is to scale the tallest peak or drive across many countries. But the one thing that could take you there is a good plan. Start a Systematic Investment Plan (SIP) and invest monthly to help you reach your goal. Each small installment adds up over time and with the power of compounding could grow to a substantial amount. So rather than attempting basecamp, you could set your sights on the tallest peaks!
Investors should deal only with Registered Mutual Funds, to be verified on SEBI website under "Intermediaries/Market Infrastructure Institutions".Refer www.ltfs.com for details on completing one-time KYC (Know Your Customer) process, change of details like address, phone number etc.and change of bank details etc. For complaints redressal, either visit www.ltfs.com or SEBI's website www.scores.gov.in
An investor education & awareness initiative.
Mutual Fund investments are subject to market risks, read all scheme related documents carefully.
visit www.ltfs.com/sipcall 1800 2000 400
THIS FAR?
TOUCHGET IN
Give a missed call on92129 00020 from your registered mobile to receive total valuation on SMS and statements for all your folios and corresponding schemes on your registered email ID.
Get latest NAV ofyour scheme.SMS LNTMF NAV <Scheme Code*> to 56767#
For furtherqueries, email [email protected]
Join us on WhatsApp @ 9326929294 for financial and non-financial transactions, Account statement, etc. or you can connect with us on Chatbot as well by visiting our website (www.ltfs.com/companies/lnt-investment-management/lnt-mutual-fund.html). (For Resident individual investors only with mode of holding as single).
#Visit the Customer Service section on our website for scheme codes.
ooLLoo
rrModerately
LLww
ww
ttooMMooddee aattee
MMooddeerraatteeH gi h
Very High
H gi h
VERYHIGHLOW
Investors understand that their principal will be at moderate risk
Riskometer as on December 31, 2021.
CL09008