Pillar 3 Disclosures As at 31st October 2020 - Scotiabank ...
84
Scotiabank (Ireland) Designated Activity Company Pillar 3 Disclosures As at 31 st October 2020
-
Upload
khangminh22 -
Category
Documents
-
view
0 -
download
0
Transcript of Pillar 3 Disclosures As at 31st October 2020 - Scotiabank ...
Scotiabank (Ireland) Designated Activity Company
Pillar 3 Disclosures
As at 31st October 2020

Scotiabank (Ireland) DAC – Pillar 3 Disclosures 2020
2
Table of Contents 1 Introduction ................................................................................................................................................................ 6
1.1 Background ....................................................................................................................................................... 6 1.2 Key Changes in the 2020 Pillar 3 Disclosures .................................................................................................. 6 1.3 COVID-19 Pandemic ......................................................................................................................................... 6 1.4 Policy and Scope of Disclosure ......................................................................................................................... 6 1.5 Principal Activities ............................................................................................................................................. 9 1.6 Key Performance Indicators .............................................................................................................................. 9 1.7 Future Developments ...................................................................................................................................... 10
2 Capital Adequacy .................................................................................................................................................... 11 2.1 Capital Management ....................................................................................................................................... 11 2.2 Minimum Regulatory Capital Requirement (Pillar 1) ....................................................................................... 11 2.3 Internal Capital Adequacy Assessment Process (Pillar 2) .............................................................................. 12 2.4 Leverage Ratio ................................................................................................................................................ 13
3 Risk Management .................................................................................................................................................... 15 3.1 Risk Governance ............................................................................................................................................. 15
3.1.1 The Board of Directors ............................................................................................................................ 16 3.1.2 Nomination and Directorship ................................................................................................................... 16 3.1.3 Board Committees ................................................................................................................................... 19 3.1.4 Senior Management ................................................................................................................................ 19 3.1.5 Governance Structure ............................................................................................................................. 20
3.2 Risk Appetite ................................................................................................................................................... 20 3.3 Risk Management Tools ................................................................................................................................. 22 3.4 Risk Identification and Assessment ................................................................................................................ 22 3.5 Risk Culture ..................................................................................................................................................... 23 3.6 Statement of Internal Controls ........................................................................................................................ 23
4 Credit Risk ............................................................................................................................................................... 24 4.1 Credit Risk Management and Risk Measures ................................................................................................. 24 4.2 Approaches to Credit Risk .............................................................................................................................. 25 4.3 Exposure to Credit Risk .................................................................................................................................. 26 4.4 Credit Risk Mitigation ...................................................................................................................................... 33 4.5 Credit Profile of Exposures ............................................................................................................................. 35 4.6 Counterparty Credit Risk ................................................................................................................................. 42 4.7 Credit Risk Stress Testing ............................................................................................................................... 45 4.8 Wrong-way Risk .............................................................................................................................................. 45
5 Market Risk .............................................................................................................................................................. 45 5.1 Market Risk Management and Risk Measures ............................................................................................... 45
5.1.1 Interest Rate Risk .................................................................................................................................... 45 5.1.2 Foreign Exchange Risk ........................................................................................................................... 46 5.1.3 Credit Spread Risk .................................................................................................................................. 47
5.2 Market Risk Mitigation ..................................................................................................................................... 47 5.2.1 Interest Rate Risk .................................................................................................................................... 47 5.2.2 Foreign Exchange Risk ........................................................................................................................... 47 5.2.3 Credit Spread Risk .................................................................................................................................. 48
5.3 Market Risk Stress Testing ............................................................................................................................. 48 5.3.1 Interest Rate Risk .................................................................................................................................... 48 5.3.2 Foreign Exchange Risk ........................................................................................................................... 48

Scotiabank (Ireland) DAC – Pillar 3 Disclosures 2020
3
5.3.3 Credit Spread Risk .................................................................................................................................. 48
6 Operational Risk ...................................................................................................................................................... 48 6.1 Operational Risk Management and Risk Measures ........................................................................................ 48 6.2 Methodology and Approaches to Operational Risk ......................................................................................... 49 6.3 Operational Risk Mitigation ............................................................................................................................. 49 6.4 Operational Risk Stress Testing ...................................................................................................................... 49
7 Information Technology risk .................................................................................................................................... 49 8 Compliance Risk and Conduct Risk ........................................................................................................................ 50
8.1 Governance and Controls ............................................................................................................................... 50 9 Liquidity Risk ........................................................................................................................................................... 51
9.1 Liquidity Risk Identification and Mitigation ...................................................................................................... 51 9.2 Liquidity Risk Management and Risk Measures ............................................................................................. 52 9.3 Liquidity Stress Testing ................................................................................................................................... 53 9.4 Contingency Funding Planning ....................................................................................................................... 54 9.5 Recovery Plan ................................................................................................................................................. 54 9.6 Liquidity Risk Governance .............................................................................................................................. 54 9.7 Exposure to Liquidity Risk ............................................................................................................................... 55
10 Concentration Risk .................................................................................................................................................. 58 10.1 Concentration Risk Management and Risk Measures .................................................................................... 58 10.2 Concentration Risk Mitigation ......................................................................................................................... 58
11 Securitisations ......................................................................................................................................................... 58 12 Asset Encumbrance ................................................................................................................................................ 60 13 Remuneration .......................................................................................................................................................... 62
13.1 Qualitative Disclosure ..................................................................................................................................... 62 13.1.1 Governance ......................................................................................................................................... 62 13.1.2 Material Risk Taker Criteria ................................................................................................................. 64 13.1.3 Link Between Pay and Performance ................................................................................................... 64 13.1.4 Design and Structure of Remuneration ............................................................................................... 65 13.1.5 Annual Incentives (Upfront Variable Remuneration) ........................................................................... 66 13.1.6 Deferral Incentives (Deferred Variable Remuneration) ....................................................................... 67 13.1.7 Risk Management and Risk Adjustment ............................................................................................. 68
13.2 Quantitative Disclosure ................................................................................................................................... 69 13.2.1 Material Risk Takers ............................................................................................................................ 70 13.2.2 All Employees (who are not MRTs) ..................................................................................................... 72 13.2.3 The Board ............................................................................................................................................ 72
14 Appendix 1 – Countercyclical Capital Buffer ........................................................................................................... 73 15 Appendix 2 – CRR Roadmap .................................................................................................................................. 74 16 Appendix 3 – Geographical Distributions ................................................................................................................ 80 17 Appendix 4 – Own Funds Disclosure ...................................................................................................................... 81 18 Appendix 5 – Reconciliation of equity in the Financial Statements to Regulatory own funds and main features of the Company’s capital instruments ................................................................................................................................. 82

Scotiabank (Ireland) DAC – Pillar 3 Disclosures 2020
4
Index of tables
Table 1 – EU LI1 – Mapping of Financial Statements categories with regulatory risk categories .................................... 7
Table 2 – EU LI2 – Main sources of differences between regulatory exposure amounts and carrying values in Financial Statements ......................................................................................................................................................... 8
Table 3 – Key Performance Indicators ............................................................................................................................ 10
Table 4 – Regulatory Capital Ratios ............................................................................................................................... 12
Table 5 – EU OV1 – Overview of RWAs ......................................................................................................................... 13
Table 6 – LRSum: Summary reconciliation of accounting assets and leverage ratio exposures ................................... 13
Table 7 – LRCom: Leverage ratio common disclosure ................................................................................................... 14
Table 8 – LRSpl: Split-up of on balance sheet exposures (excluding derivatives, SFTs and exempted exposures) .... 14
Table 9 – 2020 Members of the Board of Directors ........................................................................................................ 17
Table 10 – Directors knowledge, skills and expertise ..................................................................................................... 18
Table 11 – Directorships ................................................................................................................................................. 19
Table 12 – Risk Appetite Metrics .................................................................................................................................... 21
Table 13 – Internal Grading Cross Reference ................................................................................................................ 25
Table 14 – EU CRB-B – Total and average net amount of exposures ........................................................................... 26
Table 15 – EU CRB-C – Geographical breakdown of exposures ................................................................................... 27
Table 16 – EU CRB-D – Concentration of exposures by industry or counterparty type ................................................. 29
Table 17 – EU CRB-E – Maturity of Exposures .............................................................................................................. 30
Table 18 – EU CR5 – Standardised approach ................................................................................................................ 31
Table 19 – Exposure by credit quality step (CQS) .......................................................................................................... 32
Table 20 – RWAs and capital requirements by exposure class ..................................................................................... 32
Table 21 – EU CR3 – CRM techniques – Overview ....................................................................................................... 33
Table 22 – CRM Techniques split by exposure class ..................................................................................................... 33
Table 23 – EU CR4 – Standardised approach – Credit risk exposure and CRM effects ............................................... 34
Table 24 – EU CR1-A – Credit quality of exposures by exposure class and instrument ................................................ 36
Table 25 – EU CR1-B – Credit quality of exposures by industry or counterparty types ................................................. 37
Table 26 – EU CR1-C – Credit quality of exposures by geography ............................................................................... 38
Table 27 – Template 1: Credit quality of forborne exposures ......................................................................................... 39
Table 28 – Template 3: Credit quality of performing and non-performing exposures by past due days ........................ 40
Table 29 – Template 4: Performing and non-performing exposures and related provisions .......................................... 41
Table 30 – EU CR2-A – Changes in the stock of general and specific credit risk adjustments ..................................... 42
Table 31 – EU CR2-B – Changes in the stock of defaulted and impaired loans and debt securities ............................. 42
Table 32 – EU CCR5-A – Impact of netting and collateral held on exposure values ..................................................... 43
Table 33 – EU CCR5-B – Composition of collateral for exposures to CCR ................................................................... 43
Table 34 – EU CCR1 – Analysis of CCR exposure by approach ................................................................................... 44
Table 35 – EU CCR2 – CVA capital charge ................................................................................................................... 44
Table 36 – EU CCR3 – CCR exposures by regulatory portfolio and risk weight – Standardised Approach .................. 44
Table 37 – EV and AI ...................................................................................................................................................... 46
Table 38 – DV01 changes in value ................................................................................................................................. 46

Scotiabank (Ireland) DAC – Pillar 3 Disclosures 2020
5
Table 39 – EU MR1 – Market Risk under the Standardised Approach .......................................................................... 47
Table 40 – EU LIQ1 – LCR Disclosure ........................................................................................................................... 56
Table 41 – Total outstanding securitisation exposures ................................................................................................... 59
Table 42 – Encumbered and unencumbered assets ...................................................................................................... 61
Table 43 – Collateral received (encumbered and unencumbered) ................................................................................. 61
Table 44 – Sources of encumbrance .............................................................................................................................. 62
Table 45 – Fixed and Variable Remuneration for 2020 MRTs (pro-rated for part-year MRTs or employees who joined SIDAC or transferred in from or out to the BNS group) .................................................................................................. 70
Table 46 – Variable pay earned during fiscal year 2020 for MRTs, split between cash and share-linked instruments . 70
Table 47 – Deferred remuneration outstanding as at 31 October 2020 and awarded/redeemed in fiscal 2020 ............ 71
Table 48 – Fixed and Variable Remuneration for 2019 MRTs (pro-rated for part-year MRTs or employees who joined SIDAC or transferred in from or out to the BNS group) .................................................................................................. 71
Table 49 – Variable pay earned during fiscal year 2019 for MRTs, split between cash and share-linked instruments . 71
Table 50 – Deferred remuneration outstanding as at 31 October, 2019 and awarded/redeemed in fiscal 2019 ........... 71
Table 51 – All employee remuneration (excluding MRTs) .............................................................................................. 72
Table 52 – Non-Executive Director Remuneration ......................................................................................................... 72
Table 53 – Countercyclical capital buffer – geographical distribution of credit exposures ............................................. 73
Table 54 – Countercyclical capital buffer ........................................................................................................................ 73
Table 55 – CRR Roadmap .............................................................................................................................................. 74
Table 56 – Own funds disclosure template ..................................................................................................................... 81
Table 57 – Reconciliation of equity in Financial Statements to Regulatory own funds .................................................. 82
Table 58 – Capital instruments main features template – Ordinary equity ..................................................................... 82
Table 59 – Capital instruments main features – Preference shares ............................................................................... 83

Scotiabank (Ireland) DAC – Pillar 3 Disclosures 2020
6
1 Introduction
1.1 Background
Scotiabank (Ireland) Designated Activity Company (“SIDAC” or the “Company”), is subject to Irish and European Union legislation which seeks to stabilise and strengthen the EU financial system by ensuring that institutions, including the Company, hold adequate capital to meet the potential impact of the risks to which they are exposed. As part of this capital adequacy regime, institutions are required to publicly disclose specified information (“Pillar 3 disclosures”) to enable market participants to understand how an institution implements the applicable legislation. This report represents the Company’s Pillar 3 disclosures as at 31 October 2020 as required under the Capital Requirements Directive (Directive 2013/36/EU) (“CRD IV”), the Capital Requirements Regulation (Regulation (EU) No. 575/2013) (“CRR”) and associated implementing legislation and guidelines issued by the European Banking Authority (“EBA”). The Central Bank of Ireland (“CBI”) determined that the Company should apply the EBA guidelines on disclosure requirements1 under Part Eight of the CRR in full. The Company is required to disclose this information on an annual basis.
1.2 Key Changes in the 2020 Pillar 3 Disclosures
Enhanced disclosure requirements on non-performing exposures, forbearance and foreclosed assets: In December 2018 the EBA published the final Guidelines in this area including four standardised templates on non-performing exposures, forbearance and foreclosed assets applicable to all banks. The guidelines were effective from 31 December 2019 and so are now reflected in the 2020 disclosures for the Company.
1.3 COVID-19 Pandemic
In March 2020, the World Health Organisation declared the COVID-19 outbreak a pandemic. Absent any medical approaches to slow the spread of the virus, governments implemented a number of measures to slow its progression. The economic impacts of these measures and uncertainty about the path forward led to severe stresses in financial markets in the early days of the pandemic. At the time that financial markets were under severe stress monitoring of funding markets and client activity was heightened and continues to be monitored. Focus has been on continued and constant communication with clients and between business groups, risk management, and head-office teams.
1.4 Policy and Scope of Disclosure
These Pillar 3 disclosures are prepared on an unconsolidated / individual basis. They are disclosed on an annual basis in line with the financial statements and are published on the Company’s website at the following location: https://www.gbm.scotiabank.com/en/legal/ireland-policies-and-disclosures.html. Disclosures required under Pillar 3 are only incorporated if they are deemed relevant and material for the Company and if their omission or misstatement would change or influence the assessment or decision of a user relying on the information. Information regarded as proprietary or confidential has been excluded from this document, as allowed under the CRR.
The information provided in this document is not required to be subject to an external audit. These disclosures do not constitute any form of a Financial Statement and should not be relied upon in making any financial or investment decision. The disclosures have been checked for consistency with existing risk reports and appropriateness against the disclosure requirements and have been reviewed by authorised Senior Management representatives. The disclosures have been deemed adequate, both in terms of frequency and level of detail, to convey SIDAC’s risk profile comprehensively to market participants.
The following table provides a mapping of Financial Statement categories under the regulatory scope of consolidation to regulatory risk categories, as at 31 October 2020. As the Company’s scope of accounting consolidation and its scope of regulatory consolidation are exactly the same, a reconciliation of the Company’s balance sheet on an accounting basis to the Company’s balance sheet under the regulatory scope of consolidation is not required. Column (a) – “Carrying values as reported in published financial statements” is not shown for the same reason.
1 EBA/GL/2016/11 revised June 2017

Scotiabank (Ireland) DAC – Pillar 3 Disclosures 2020
7
Table 1 – EU LI1 – Mapping of Financial Statements categories with regulatory risk categories
31 Oct 2020 31 Oct 2019
a b c d e f
Carrying values under
scope of regulatory
consolidation
Carrying values of items
Carrying values under
scope of regulatory
consolidation
Carrying values of items
US$’000
Subject to the credit
risk framework
Subject to the CCR
framework
Subject to the
securitisation framework
(1) Subject to the market
risk framework
Not subject to capital
requirements or subject to
deduction from capital
Subject to the credit
risk framework
Subject to the CCR
framework
Subject to the
securitisation framework
(1) Subject to the market
risk framework
Not subject to capital
requirements or subject to
deduction from capital
Assets
Cash and balances at central banks 420,479 420,479 - - - - 387,384 387,384 - - - -
Loans and advances to banks 10,102 10,102 - - - - 377,728 24,733 352,995 - - -
Loans and advances to customers 1,647,920 1,356,149 - 291,771 - - 1,812,649 1,521,283 - 291,366 - - Investment securities measured at FVOCI 1,591,017 1,591,017 - - - - 1,665,955 1,665,955 - - - - Investment securities measured at amortised cost 407,901 407,901 - - - - 558,014 558,014 - - - -
Investment securities mandatorily measured at FVTPL 58,225 13,671 - 44,554 - - 52,281 8,450 - 43,831 - -
Derivative financial instruments 13,074 - 13,074 - - - 15,871 - 15,871 - - -
Tangible fixed assets 453 453 - - - - 587 587 - - - -
Intangible assets 279 - - - - 279 462 - - - - 462
Deferred taxation assets 193 193 - - - - 405 405 - - - -
Other assets 2,561 2,561 - - - - 3,987 3,987 - - - -
Prepayments and accrued income 15,194 13,144 - 2,050 - - 18,560 16,493 - 2,067
Right-of-use assets 6,807 6,807 - - - - - - - - - -
Total assets 4,174,205 3,822,477 13,074 338,375 - 279 4,893,883 4,187,291 368,866 337,264 - 462
Liabilities
Deposits by banks 306,583 - - - - 306,583 148,740 - - - - 148,740
Customer accounts 30,616 - - - - 30,616 15,097 - - - - 15,097
Derivative financial instruments 60,751 - 60,751 - - - 46,862 - 46,862 - - -
Debt securities in issue 2,014,615 - - - - 2,014,615 2,977,594 - - - - 2,977,594
Deferred taxation liabilities - - - - - - - - - - - -
Current taxation liabilities 1,349 - - - - 1,349 7,108 - - - - 7,108
Accruals, deferred income & other liabilities 26,058 - 7,363 - - 18,695 22,596 - 11,963 - - 10,633
Net retirement benefit liabilities 8,866 - - - 8,866 11,799 - - - - 11,799
Lease liabilities 6,728 - - - - 6,728
Total liabilities 2,455,566 - 68,114 - - 2,387,452 3,229,796 - 58,825 - - 3,170,971 As the Company does not have an active trading book all remaining market risk relates to FX in the banking book. At 31 October 2020 the FX risk exposure was US$ 65,519,000(2019: US$ 16,693,000) with an associated capital charge of US$ 5,242,000 (2019: US$ 1,335,000).
Table 2 outlines, for items subject to the credit risk and counterparty credit risk (CCR) frameworks, a reconciliation of the carrying value of assets to Exposure at Default (EAD).

Scotiabank (Ireland) DAC – Pillar 3 Disclosures 2020
8
Table 2 – EU LI2 – Main sources of differences between regulatory exposure amounts and carrying values in Financial Statements 31 Oct 2020 31 Oct 2019
a b c d e
Total
Items subject to
Total
Items subject to
US$’000 Credit risk framework
CCR framework
Securitisation framework
Market risk framework (1)
Credit risk framework
CCR framework
Securitisation framework
Market risk framework (1)
1 Assets carrying value amount under the scope of regulatory consolidation (as per template EU LI1) 4,173,926 3,822,477 13,074 338,375 - 4,893,430 4,187,291 368,866 337,273 -
2 Liabilities carrying value amount under the regulatory scope of consolidation (as per template EU LI1) 68,114 - 68,114 - - 58,825 - 58,825 - -
3 Total net amount under the regulatory scope of consolidation 4,173,926 3,822,477 13,074 338,375 - 4,893,430 4,187,291 368,866 337,273 -
4 Off-balance-sheet amounts 1,022,976 1,022,976 - - - 1,073,850 1,073,850 - - -
5 Differences due to different netting rules, other than those already included in row 2 - - - - -
(346,179) - (346,179) - -
6 Differences due to Derivatives (1,321) - (1,321) - - (3,491) - (3,491) - -
7 Differences due to Provisions - - - - - - - - - -
8 Other (1,930) (1,930) - - - (4,437) (4,437) 0 - -
9 Exposure amounts considered for regulatory purposes 5,193,651 4,843,523 11,753 338,375 - 5,613,173 5,256,704 19,196 337,273 -
(1) See note on table 1.
The main differences between carrying amounts reported in the Financial Statements and those for Regulatory purposes are:
• Off balance sheet items included as an exposure value for Regulatory purposes; • The effects of recognition of GMRA netting agreements in the calculation of exposures amounts due to Securities Financing Transactions (SFT) (repurchase
transactions) considered for regulatory purposes (i.e. EAD) according to CRR. • The following effects recognised in the calculation of Derivative exposure amounts:
- inclusion of derivatives with negative fair value which have been recorded in balance sheet liabilities; - recognition of ISDA netting agreements

Scotiabank (Ireland) DAC – Pillar 3 Disclosures 2020
9
1.5 Principal Activities
The Company, which holds a banking licence, is incorporated in Ireland and is a wholly owned subsidiary of BNS International (Bahamas) Limited (“BNSI”) which is incorporated in the Bahamas. BNSI is wholly owned by The Bank of Nova Scotia (“Scotiabank” or “BNS”) which is incorporated in Canada.
The primary activities of the Company are international corporate lending, securities investment and treasury management as outlined below. The Company’s financial objective is to generate a stable source of income within its risk appetite using lending, investment and money market portfolios. Each portfolio is carefully managed and diversified with regard to maturity, credit exposure and currency to achieve this objective, making use of interest rate and currency derivatives to reduce the overall risk profile.
International Corporate Lending
The Company’s Corporate Banking business provides origination and execution for EU27 customers. It is focused on global EU27 clients which operate in a similar core footprint to Scotiabank (the Americas) while leveraging global product and sector expertise to expand European corporate coverage. The three strategic pillars for SIDAC’s Corporate Banking team are:
• Selectively grow the client base in core sectors, and with clients active in the Americas; • Strengthen dialogue at the parent level for European corporates active in priority markets; and, • Grow non-lending revenue.
A significant contributor to the Company’s revenue generation is the extension of credit to corporate clients. Generally, clients are either the parent or a subsidiary of large corporate groups or large infrastructure projects in targeted industry sectors. Opportunities are evaluated by considering the return on a relationship basis which includes lending revenues as well as Scotiabank revenues from other products globally.
The Corporate Banking business offers corporate lending products and Standby Letters of Credit (SBLCs) products and services. Corporate lending is currently the most significant component of SIDAC’s business activities. The corporate loan portfolio comprises revolving and non-revolving credit facilities to primarily investment grade borrowers across a range of industries where Scotiabank is an established lender and where lending is largely in the form of syndicated or bilateral loans. The objective of this portfolio is to generate sustainable lending income accruals, as well as grow ancillary revenue in accordance with Scotiabank’s capabilities across its global footprint, while maintaining a capital preservation ethos.
Treasury Management
The Company’s Treasury team is primarily responsible for managing SIDAC’s liquidity, funding the business lines and ensuring regulatory compliance for liquidity. This involves wholesale market activities such as:
• interbank borrowing and lending; and • funding & liquidity risk management and market risk (interest rate and foreign exchange) management.
It is the policy of the Company to deal only with highly rated counterparties. The Company manages a liquidity portfolio consisting of highly rated bonds issued by sovereigns, supra-nationals, agencies, financial institutions (covered) and high-grade corporations. The focus is on CRD IV/Basel III compliant bonds for liquidity and return purposes. Bond investments are held in floating rate notes, in bonds that have been swapped from fixed to floating interest rates, and fixed interest rate positions assuming outright interest rate risk.
1.6 Key Performance Indicators
The level of business, performance and the year-end financial position were satisfactory. The Company recorded a profit for the year ended 31 October 2020 of US$ 60,856,000 which was a decrease of 44.6% from the previous year. The main reasons for this decrease were an increase in funding costs as a consequence of the dividend paid in 2019, the impact of lower interest rates on income from earning assets and a provision for credit losses charge compared to a credit in 2019. Apart from lower interest rates and the change in the allowance for credit losses, there were no other material impacts caused by COVID-19. Other Key Performance Indicators are:

Scotiabank (Ireland) DAC – Pillar 3 Disclosures 2020
10
Table 3 – Key Performance Indicators
Key performance indicators 2020 2019
Return on Regulatory Capital Employed 7.6% 10.0%
Total Capital Ratio 49.1% 42.6%
Leverage Ratio 32.4% 27.2%
Return on Equity (ROE) 3.6% 4.1%*
Net Interest Margin 2.1% 2.9%
*2019 comparative figure restated.
1.7 Future Developments
Capital Markets in the European Economic Area (“EEA”)
Up to December 2020 SIDAC was one of two Scotiabank units with a European Passport, with a second one held by a United Kingdom (“UK”) affiliate. As part of Scotiabank’s overall European strategy and in light of the UK leaving the European Union (“EU”), SIDAC’s role within Scotiabank will be expanded to become the Scotiabank hub for Capital Markets in the EEA. The Company is well positioned to embrace the potential growth opportunities it currently sees within the EEA and commits to optimise the balance sheet by ensuring that the Company’s business delivers adequate returns on capital. The Company has commenced a licence expansion approval process with the CBI.
Revised Capital Requirements Directive (“CRD V”) and Regulation (“CRR 2”)
The revised Capital Requirements Directive and Regulation, CRD V and CRR 2, refine and continue to implement Basel III in the EU by making important amendments in a number of areas, most of which apply from 28 June 2021. The key changes impacting the Company are:
- Binding Leverage Ratio: CRR 2 broadly reflects the Basel leverage ratio. It sets the Tier 1 capital-based leverage ratio requirement at 3% for all EU banks as per the EBA’s recommendation.
- Net Stable Funding Ratio: CRR 2 requires banks to maintain minimum available stable funding of at least 100% of their required stable funding to ensure that asset exposures are broadly matched with stable funding sources. See section 9.2 for more detail.
- Standardised Approach for Counterparty Credit Risk (SA-CCR): The new approach is a more risk sensitive measure of counterparty risk reflecting netting, hedging and collateral benefits, as well as being better calibrated to observed volatilities.
- Pillar 2 Framework: CRD V revises the Pillar 2 capital regime in EU legislation. The final framework clarifies the rules around the Supervisory Review and Evaluation Process (“SREP”) and introduces some limitations on the national competent authorities’ (“NCA”) discretion when imposing additional reporting and disclosure obligations under Pillar 2.
- Fundamental Review of the Trading Book (FRTB): The Basel Committee on Banking Supervision (‘BCBS’) performed a review of the capital requirements for market risk (the “Fundamental Review of the Trading Book” or FRTB) and published a final regulatory framework in January 2019 - too late for inclusion in CRR2 for the purposes of own funds requirements. Instead, it is introduced initially as a reporting-only requirement (from 30 September 2021) until a full impact assessment can be completed. EU legislators have asked the European Commission to submit a legislative proposal (CRR3) that will require banks to meet their capital requirements under the new FRTB rules starting 2023.
Pillar 3 Disclosures: The new requirements under CRR 2 introduce additional governance requirements and rules around frequency of disclosure and comparison periods over which Pillar 3 disclosures will take effect. CRR 2 also mandates the EBA to introduce uniform disclosure formats via Implementing Technical Standards (“ITS”). These changes will be reflected in the 31 October 2021 disclosures for the Company in line with the effective date of the CRR 2 changes of 28 June 2021.
Scotiabank (Ireland) DAC – Pillar 3 Disclosures 2020
11
2 Capital Adequacy
2.1 Capital Management
The Company has complied with all externally imposed capital requirements throughout the period. No dividends on ordinary shares were either approved or paid out during 2020 to equity holders and there have been no material changes in the Company’s management of capital during the year.
The Company recognises the need to maintain a balance between the higher returns that might be possible with greater gearing and the advantages and security afforded by a sound capital position. This is achieved through the Internal Capital Adequacy Assessment Process (“ICAAP”).
The overarching principle of the ICAAP is the explicit linkage between capital and risk; the adequacy of the Company’s capital is assessed on the basis of the risks to which it is exposed. This requires a clear assessment of the material risk profile of the Company and a consideration of the extent to which identified risks, both individually and in aggregate, require capital to support them. Banking operations are categorised as either trading book or banking book which informs the capital to be held against the products. In addition, the level of capital held by the Company is influenced by minimum regulatory requirements.
The Company uses two measures for determining capital requirements in the decision-making process: Minimum regulatory capital requirements (Pillar 1), and Internal capital requirement (Pillar 2) which is subject to the SREP. In addition, Pillar 2 Guidance (“P2G”) is applied to the Company by the CBI. P2G is a supervisory tool used to set capital expectations at a level above that of overall capital requirements and is based on the SREP process. It is an assessment of the adequacy of an institution’s own funds in stressed conditions. While not an own funds requirement, failure to meet P2G could result in institution-specific supervisory measures.
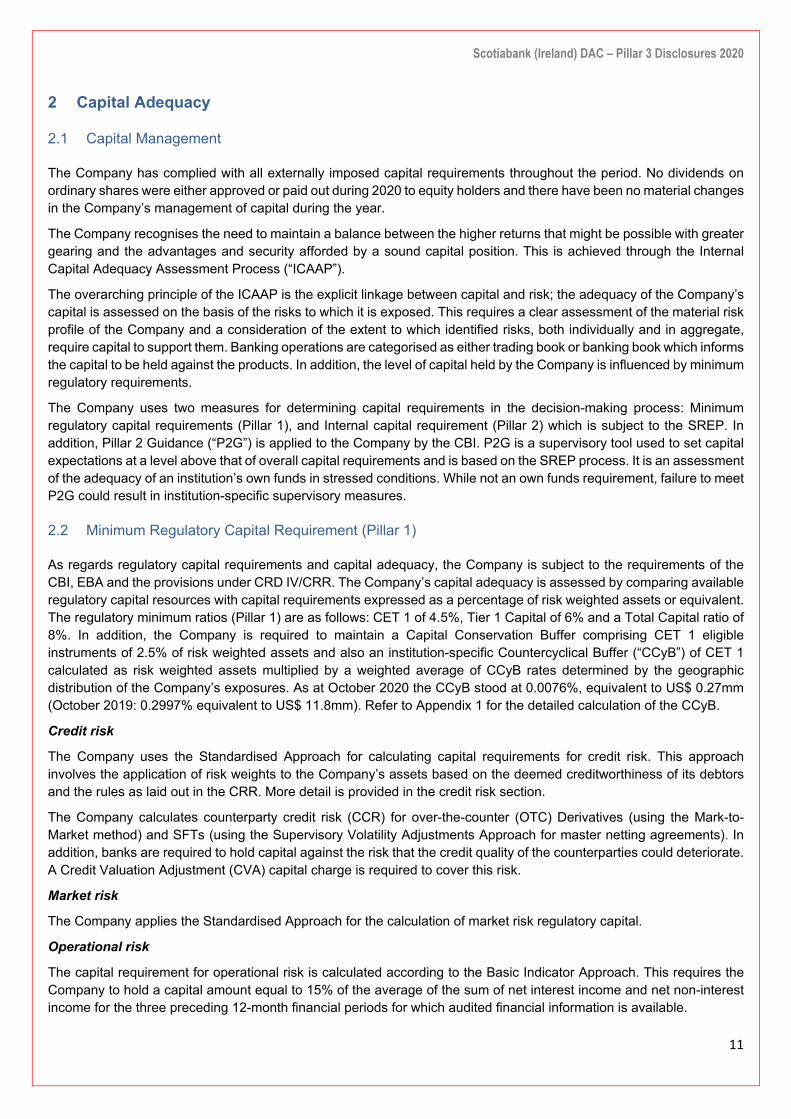
2.2 Minimum Regulatory Capital Requirement (Pillar 1)
As regards regulatory capital requirements and capital adequacy, the Company is subject to the requirements of the CBI, EBA and the provisions under CRD IV/CRR. The Company’s capital adequacy is assessed by comparing available regulatory capital resources with capital requirements expressed as a percentage of risk weighted assets or equivalent. The regulatory minimum ratios (Pillar 1) are as follows: CET 1 of 4.5%, Tier 1 Capital of 6% and a Total Capital ratio of 8%. In addition, the Company is required to maintain a Capital Conservation Buffer comprising CET 1 eligible instruments of 2.5% of risk weighted assets and also an institution-specific Countercyclical Buffer (“CCyB”) of CET 1 calculated as risk weighted assets multiplied by a weighted average of CCyB rates determined by the geographic distribution of the Company’s exposures. As at October 2020 the CCyB stood at 0.0076%, equivalent to US$ 0.27mm (October 2019: 0.2997% equivalent to US$ 11.8mm). Refer to Appendix 1 for the detailed calculation of the CCyB.
Credit risk
The Company uses the Standardised Approach for calculating capital requirements for credit risk. This approach involves the application of risk weights to the Company’s assets based on the deemed creditworthiness of its debtors and the rules as laid out in the CRR. More detail is provided in the credit risk section.
The Company calculates counterparty credit risk (CCR) for over-the-counter (OTC) Derivatives (using the Mark-to-Market method) and SFTs (using the Supervisory Volatility Adjustments Approach for master netting agreements). In addition, banks are required to hold capital against the risk that the credit quality of the counterparties could deteriorate. A Credit Valuation Adjustment (CVA) capital charge is required to cover this risk.
Market risk
The Company applies the Standardised Approach for the calculation of market risk regulatory capital.
Operational risk
The capital requirement for operational risk is calculated according to the Basic Indicator Approach. This requires the Company to hold a capital amount equal to 15% of the average of the sum of net interest income and net non-interest income for the three preceding 12-month financial periods for which audited financial information is available.
Scotiabank (Ireland) DAC – Pillar 3 Disclosures 2020
12
2.3 Internal Capital Adequacy Assessment Process (Pillar 2)
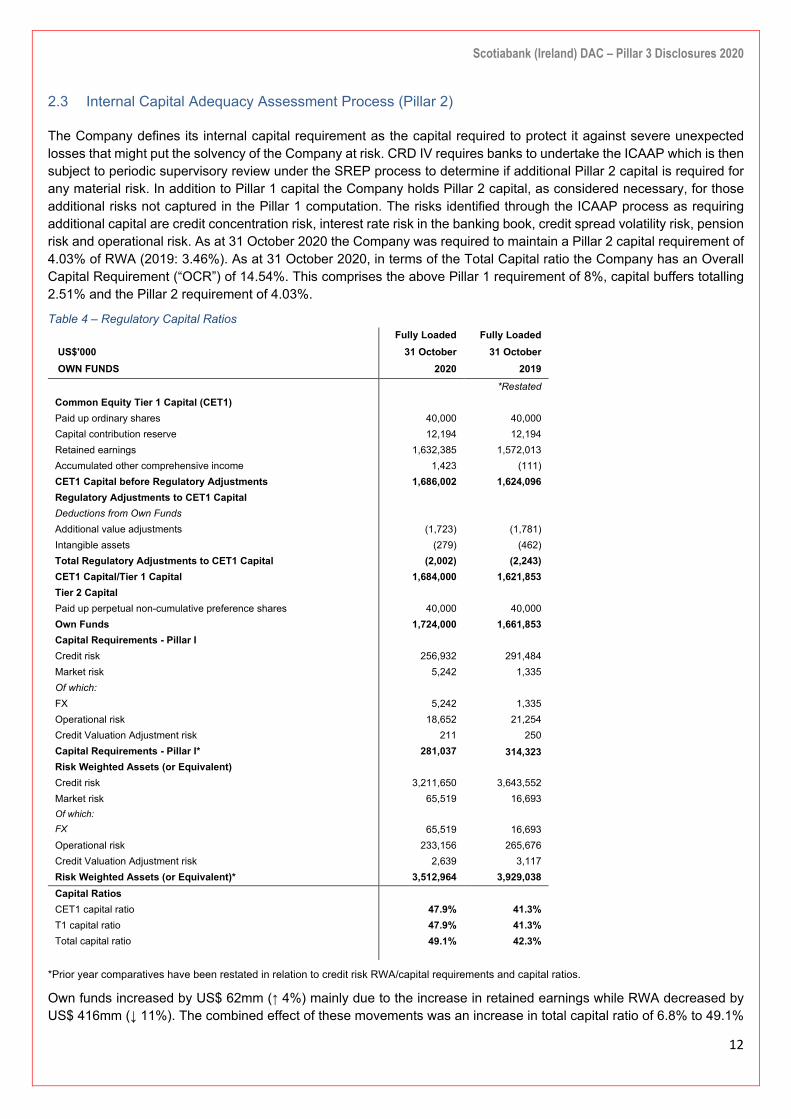
The Company defines its internal capital requirement as the capital required to protect it against severe unexpected losses that might put the solvency of the Company at risk. CRD IV requires banks to undertake the ICAAP which is then subject to periodic supervisory review under the SREP process to determine if additional Pillar 2 capital is required for any material risk. In addition to Pillar 1 capital the Company holds Pillar 2 capital, as considered necessary, for those additional risks not captured in the Pillar 1 computation. The risks identified through the ICAAP process as requiring additional capital are credit concentration risk, interest rate risk in the banking book, credit spread volatility risk, pension risk and operational risk. As at 31 October 2020 the Company was required to maintain a Pillar 2 capital requirement of 4.03% of RWA (2019: 3.46%). As at 31 October 2020, in terms of the Total Capital ratio the Company has an Overall Capital Requirement (“OCR”) of 14.54%. This comprises the above Pillar 1 requirement of 8%, capital buffers totalling 2.51% and the Pillar 2 requirement of 4.03%.
Table 4 – Regulatory Capital Ratios Fully Loaded Fully Loaded US$'000 31 October 31 October OWN FUNDS 2020 2019 *Restated Common Equity Tier 1 Capital (CET1)
Paid up ordinary shares 40,000 40,000 Capital contribution reserve 12,194 12,194 Retained earnings 1,632,385 1,572,013 Accumulated other comprehensive income 1,423 (111) CET1 Capital before Regulatory Adjustments 1,686,002 1,624,096 Regulatory Adjustments to CET1 Capital
Deductions from Own Funds
Additional value adjustments (1,723) (1,781) Intangible assets (279) (462) Total Regulatory Adjustments to CET1 Capital (2,002) (2,243) CET1 Capital/Tier 1 Capital 1,684,000 1,621,853 Tier 2 Capital
Paid up perpetual non-cumulative preference shares 40,000 40,000 Own Funds 1,724,000 1,661,853 Capital Requirements - Pillar I
Credit risk 256,932 291,484 Market risk 5,242 1,335 Of which:
FX 5,242 1,335 Operational risk 18,652 21,254 Credit Valuation Adjustment risk 211 250 Capital Requirements - Pillar I* 281,037 314,323 Risk Weighted Assets (or Equivalent)
Credit risk 3,211,650 3,643,552 Market risk 65,519 16,693 Of which:
FX 65,519 16,693 Operational risk 233,156 265,676 Credit Valuation Adjustment risk 2,639 3,117 Risk Weighted Assets (or Equivalent)* 3,512,964 3,929,038 Capital Ratios
CET1 capital ratio 47.9% 41.3% T1 capital ratio 47.9% 41.3% Total capital ratio 49.1% 42.3%
*Prior year comparatives have been restated in relation to credit risk RWA/capital requirements and capital ratios.
Own funds increased by US$ 62mm (↑ 4%) mainly due to the increase in retained earnings while RWA decreased by US$ 416mm (↓ 11%). The combined effect of these movements was an increase in total capital ratio of 6.8% to 49.1%

Scotiabank (Ireland) DAC – Pillar 3 Disclosures 2020
13
at 31 October 2020. For further information on Transitional Own Funds, see the disclosure in Appendix 4. A reconciliation of equity in the Financial Statements to Regulatory own funds and the main features of the Company’s capital instruments is contained in Appendix 5.
Risk Weighted Asset Calculation
Exposures and Risk Weighted Assets (RWAs) for the Company, with the minimum capital requirements as at 31 October 2020 are outlined in the following table.
Table 5 – EU OV1 – Overview of RWAs US$'000 RWAs Minimum
capital requirements
RWAs Minimum capital
requirements Breakdown by risk type 31 Oct 2020 31 Oct 2020 31 Oct 2019 31 Oct 2019
1 Credit risk (excluding CCR) 2,594,722 207,578 3,004,820 240,386
2 Of which the standardised approach 2,594,722 207,578 3,004,820 240,386
6 CCR 8,458 677 10,670 854
7 Of which mark to market 5,819 465 6,190 495
9 Of which the standardised approach - - 1,363 109
12 Of which CVA 2,639 211 3,117 250
13 Settlement risk - - - -
14 Securitisation exposures in the banking book (after the cap) 611,109 48,889 631,179 50,494
18 Of which standardised approach 611,109 48,889 631,179 50,494
19 Market risk 65,519 5,242 16,693 1,335
20 Of which the standardised approach 65,519 5,242 16,693 1,335
22 Large exposures - - - -
23 Operational risk 233,156 18,652 265,676 21,254
24 Of which basic indicator approach 233,156 18,652 265,676 21,254
27 Amounts below the thresholds for deduction (subject to 250% risk weight) - - - -
28 Floor adjustment - - - -
29 Total 3,512,964 281,037 3,929,038 314,323 The main driver of the reduction in RWA was a reduction in credit risk, due to reduced asset levels across the corporate loan and bond portfolios. Other factors include reductions in operational risk (due to reduced average operational income under the basic indicator approach) partially offset by an increase in market risk (FX risk).
2.4 Leverage Ratio
The leverage ratio is a supplementary non-risk based measure to constrain the build-up of leverage (i.e. create a backstop on the degree to which a banking firm can leverage its capital base). It is calculated as a percentage of Tier 1 capital versus the total on and off balance sheet exposure (not risk weighted).
The following tables analyse the leverage ratio exposures of the Company for the year end 31 October 2020 and comparable.
Table 6 – LRSum: Summary reconciliation of accounting assets and leverage ratio exposures
US$'000 31 Oct 2020 31 Oct
2019 1 Total assets as per published Financial Statements 4,174,205 4,893,892
4 Adjustments for derivative financial instruments (1,321) (3,491)
5 Adjustment for securities financing transactions (SFTs) - 6,816
6 Adjustment for off-balance sheet items (i.e. conversion to credit equivalent amounts of off-balance sheet exposures) 1,022,976 1,073,850
7 Other adjustments (3,935) (6,602)
8 Leverage ratio total exposure measure 5,191,925 5,964,465

Scotiabank (Ireland) DAC – Pillar 3 Disclosures 2020
14
Table 7 – LRCom: Leverage ratio common disclosure
CRR leverage ratio exposures
US$'000 31 Oct 2020 31 Oct 2019 On-balance sheet exposures (excluding derivatives and SFTs)
1 On-balance sheet items (excluding derivatives, SFTs and fiduciary assets, but including collateral) 4,159,198 4,520,595
2 (Asset amounts deducted in determining Tier 1 capital) (2,002) (2,243)
3 Total on-balance sheet exposures (excluding derivatives, SFTs and fiduciary assets) 4,157,196 4,518,352 Derivative exposures
4 Replacement cost associated with all derivatives transactions (i.e. net of eligible cash variation margin) 191 197
5 Add-on amounts for PFE associated with all derivatives transactions (mark-to-market method) 11,562 12,183
7 (Deductions of receivables assets for cash variation margin provided in derivatives transactions) - -
11 Total derivatives exposures 11,753 12,380 SFT exposures
12 Gross SFT assets (with no recognition of netting), after adjusting for sales accounting transactions - 353,067
13 (Netted amounts of cash payables and cash receivables of gross SFT assets) - -
14 Counterparty credit risk exposure for SFT assets - 6,816
16 Total securities financing transaction exposures - 359,883 Other off-balance sheet exposures
17 Off-balance sheet exposures at gross notional amount 2,095,965 2,142,020
18 (Adjustments for conversion to credit equivalent amounts) (1,072,989) (1,068,170)
19 Other off-balance sheet exposures 1,022,976 1,073,850 Capital and total exposure measure
20 Tier 1 capital 1,684,000 1,621,853 21 Leverage ratio total exposure measure 5,191,925 5,964,465
Leverage ratio 22 Leverage ratio 32.4% 27.2%
Choice on transitional arrangements and amount of derecognised fiduciary items
EU-23 Choice on transitional arrangements for the definition of the capital measure Fully phased in EU-24 Amount of derecognised fiduciary items in accordance with Article 429(11) of Regulation (EU) No 575/2013 - -
Table 8 – LRSpl: Split-up of on balance sheet exposures (excluding derivatives, SFTs and exempted exposures) CRR leverage ratio exposures
US$'000 31 Oct 2020 31 Oct 2019
EU-1 Total on-balance sheet exposures (excluding derivatives, SFTs, and exempted exposures), of which: 4,159,201 4,520,595
EU-2 Trading book exposures - -
EU-3 Banking book exposures, of which: 4,159,201 4,520,595
EU-4 Covered Bonds 28,764 30,782
EU-5 Exposures treated as sovereigns 1,629,420 1,588,650
EU-6 Exposures to regional governments, multilateral development banks, international organisations and public sector entities (“PSE”) not treated as sovereigns 302,174 298,991
EU-7 Institutions 148,010 129,685
EU-10 Corporate 1,671,519 2,108,693
EU-11 Exposures in default 18,299 15,425
EU-12 Other exposures (e.g. equity, securitisations, and other non-credit obligation assets) 361,015 348,369
The leverage ratio increased by 5.2% to 32.4% at 31 October 2020 (see table 7). Tier 1 capital increased US$ 62mm (↑ 4%) due to increased retained earnings as noted above while the leverage exposure measure decreased by US$ 773 mm (↓ 13%). The main driver of the decrease in the exposure measure was a reduction in asset levels across corporate loans and bond portfolios as noted above.
The Company manages the risk of excessive leverage through the use of a risk appetite metric which is presented to the Asset & Liability Committee (“ALCO”) on a monthly basis and outlined in table 12 in section 3.2 below.

Scotiabank (Ireland) DAC – Pillar 3 Disclosures 2020
15
3 Risk Management
Introduction
The Company’s financial risk management objective is the prudent management of risk within the parameters of the risk appetite articulated by the Board of Directors (“the Board”), ensuring an appropriate balance between risk and reward in order to maximise shareholder returns in alignment with the Company’s overall business strategy. The Company has implemented a risk management framework, which is modelled significantly on that of Scotiabank and is captured in a Board approved document of that name. The framework includes five components namely Risk Governance, Risk Appetite, Risk Management Tools, Risk Identification and Assessment and Risk Culture. The Framework document is the key source of information for the Board, Senior Management, and all other employees of the Company that:
- Outlines the risk governance, risk management principles, risk culture, risk management tools and other key elements of its risk management framework;
- Describes how SIDAC identifies, measures, manages and controls the key risks to which the entity is exposed; - Serves as an over-arching framework for all elements of risk management activities, and a source document to
which all other risk management frameworks and policies must be aligned.
This Framework is subject to regular evaluation to ensure that it meets the challenges and requirements of the global markets in which SIDAC operates, including regulatory standards and industry best practices as well as standards set by BNS.
The Company has put in place a disciplined and constructive control environment in which all employees understand their roles and obligations. The application of the control environment is through training, management standards and procedures. In the view of the Board the Risk Management Framework is appropriate to the size and scale of operations of the Company and is effective in controlling these operations within the expressed risk appetite.
3.1 Risk Governance
The main elements of the Company’s risk governance model include:
• The Board of Directors • Board Committees • Senior Management
SIDAC’s risk management framework is predicated on the three-lines-of-defence model. Within this model, the First Line of Defence incur and own the risks (1A, supported by 1B/Internal Control) while the Second Line of Defence (comprised of control functions such as Risk Management, Compliance and Finance2) provide independent oversight and objective challenge to the First Line of Defence, as well as monitoring and control of risk. The Internal Audit Department (the 3LOD) provides enterprise-wide independent assurance over the design and operation of SIDAC’s internal control, risk management and governance processes throughout the first and second lines of defence. Employees in every area of the organization are responsible for risk management.
2 Finance conducts both first and second line of defence activities within SIDAC

Scotiabank (Ireland) DAC – Pillar 3 Disclosures 2020
16
3.1.1 The Board of Directors
The Board of Directors, either directly or through its Committees, ensures that decision-making is aligned with the Company’s strategies and risk appetite.
The Board’s membership is composed of highly qualified directors from diverse backgrounds, who have familiarity with the financial industry in the European Union and in Ireland in particular, and who reflect the required expertise and skill sets appropriate for Directors supervising the management of the business and affairs of the Company. They demonstrate sound and independent business judgement, based on the criteria detailed below.
The Board reviews and approves policies designed to help mitigate the risks faced by the business and sets limits to control the level of exposure to these risks. Policies are reviewed regularly to reflect changes in market conditions, regulatory requirements, business activities or product mix.
The Board of Directors has the ultimate responsibility for ensuring that Senior Management establishes and maintains:
- An adequate and effective system of internal control; - A measurement system for assessing the various risks of the Company’s activities; - A system for relating risks to the capital level; and - Appropriate methods for monitoring compliance with laws, regulations and supervisory and internal policies.
3.1.2 Nomination and Directorship
Management Body
The Board has a broad range of expertise across a number of relevant areas including banking and capital markets, accounting, risk management, and taxation. At 31 October 2020, the Board comprised six directors made up of one

Scotiabank (Ireland) DAC – Pillar 3 Disclosures 2020
17
Executive Director, one Non-Group Non-Executive Director, one Group Non–Executive Director and three Independent Non-Executive Directors as shown below. The Corporate Governance structure is documented in a policy paper which is approved by the Board.
Table 9 – 2020 Members of the Board of Directors
Name Roles/Job Titles Board Member Member of Sub-
Committee of the Board
Terry Fryett Former Scotiabank (BNS) Executive Vice President & Chief Credit Officer
Non-Group, Non-Executive Director (Chair of the Board)
Board Risk Committee (“BRC”)
Nicola Vavasour SIDAC CEO Executive Director N/A
Bob Brooks* Risk Management professional in various banks (resigned 18 September 2020) Independent Non-Executive Director
Chair of BRC up to 6 August and member until resignation on 18 September; Audit Committee (“AC”)
Mary Walsh** Chartered Accountant and former International tax partner (resigned 22 January 2021) Independent Non-Executive Director
Chair of AC up to 6 August 2020 and member thereafter; BRC
Peter Heidinger Managing Director & Head, Europe, Scotiabank Group Non-Executive Director BRC and AC
Joseph Dempsey Chartered Accountant and Financial Consultant and Director within various financial services companies and banks Independent Non-Executive Director
Chair of AC with effect from 6th August 2020 (member prior to this period); BRC
Edward Ward Chartered Director and former Senior Executive with Citigroup and AIB Independent Non-Executive Director
Chair of BRC with effect from 6th August 2020 (member prior to this period); AC
*Resigned during 2020
** Resigned during 2021
Recruitment Policy for Board of Directors
Selection Criteria and Policy
The Company’s policies and processes reflect the requirements of the “Joint European Securities and Markets Authority (“ESMA”) and EBA Guidelines on the assessment of the suitability of members of the management body and key function holders”.
The Board as a whole must have relevant financial and risk expertise. When appropriate the Board may engage qualified independent external advisors to conduct a search for candidates who meet the Board’s expertise, skills and diversity criteria.
The Board is responsible for either the appointment of Independent Non-Executive Directors or where appropriate identifying and proposing the appointment of Independent Non-Executive Directors to shareholders. Before appointment to the Board, the proposed director must show that he/she satisfies the selection criteria applicable to the role for which the individual is being proposed for appointment, evidencing items such as their skills, experience, expertise, competencies, professionalism, fitness, probity and integrity to carry out his or her duties, including a knowledge and appreciation of public issues and familiarity with local, national and international affairs.
Diversity
The Company’s Board is composed of highly qualified directors from diverse backgrounds, who have familiarity with the financial industry in the European Union and Ireland in particular.
To support this composition as part of the Board’s commitment to sound and effective corporate governance practices, the Board will, when identifying candidates, and bearing in mind the desire for a diverse Board and diversity criteria, including gender, age, ethnicity and geographic background, recommend for appointment to the Board only those candidates who:

Scotiabank (Ireland) DAC – Pillar 3 Disclosures 2020
18
• have the relevant skills, experience, expertise, knowledge, appropriate qualification for the role and perspectives to provide an independent challenge; and,
• have the necessary personal qualities, professionalism and integrity expected of a Board member.
As part of its commitment to board diversity, the Company is a member of the 30% Club Ireland. The Board’s Diversity Policy states that it aspires to have each gender comprise at least 30% of the Board. For 2020, based on the periods served on the Board, 29% of serving directors were women. This was due to a transitional period as a Board member’s service period came to an end. Board recruitment activities were progressed and by the end of the year the percentage had increased to 33% which is above the 30% target included in the Board’s Diversity Policy. SIDAC is committed to having a diverse board, to achieving the aspirations set in this regard and to ensuring an open and fair recruitment process. As part of the process underpinning the Board’s annual confirmation of compliance with the CBI Corporate Governance Requirements (2015), the Board undertakes an annual review of its Board Diversity Policy’s effectiveness in its review of Board effectiveness.
Table 10 – Directors knowledge, skills and expertise Name Knowledge, skills and expertise
Terry Fryett
Mr. Fryett is Chairman of the Board of Directors. He has over 40 years’ experience at Scotiabank where he has held various senior roles including CEO of Scotiabank Europe plc in the UK and Senior Vice President and CFO, Scotia Capital (now GBM) in Canada. Mr. Fryett was Executive Vice President & Chief Credit Officer at the time of his retirement from Scotiabank in 2019.Currently, Mr. Fryett also acts as Board Chairman of Tangerine Bank which is also part of the Scotiabank Group.
Nicola Vavasour Ms. Vavasour is SIDAC’s CEO. Previously, Ms. Vavasour was Scotiabank’s Chief Risk Officer, Asia Pacific where she was responsible for the overall efficient and effective management, monitoring and reporting of all risks across Scotiabank’s Asia Pacific operations. Prior to this Ms. Vavasour was responsible for developing Scotiabank’s global Liquidity Risk Framework in Toronto.
Bob Brooks* Mr. Brooks has occupied Senior Risk Management roles at a number of major UK banks including NatWest and HBOS and more recently was engaged as a consultant to Daiwa Capital Markets. He has supported the UK Asset and Liability Management Association developing professional banking exam syllabuses. Mr. Brooks stood down from the Board of Directors on 18 September 2020.
Mary Walsh
Ms Walsh, a chartered accountant, is a former international tax partner with over 25 years’ experience at PwC and wide-ranging experience as a Non-Executive Director. Previously, she was a member of the Commission on Taxation and has also held Directorships with the National Treasury Management Agency and Central Bank of Ireland. Mary Walsh stood down from the Board of Directors on 22 January 2021.
Peter Heidinger
Mr. Heidinger is responsible for the regional management of Scotiabank’s wholesale banking operations in Europe and is CEO of Scotiabank’s European subsidiary, Scotiabank Europe plc. These operations include corporate and investment banking and global markets sales and trading. Most recently, he led Scotiabank’s wholesale operations in Asia and Australia. Prior to joining Scotiabank in 2015, he held global and regional coverage, credit and product roles at both U.S. and European banks. Over his career, he has been based in North America, Europe and Asia.
Joseph Dempsey Mr. Dempsey, a chartered accountant and chartered director, is currently a Non-Executive Director of Depfa Bank plc and Guggenheim Partners Europe Limited. He has extensive experience in financial services and previously acted as General Manager of Deutsche Bank Ireland plc and as a financial consultant to a number of entities in the leveraged credit fund management and property sectors.
Edward Ward
Mr. Ward has extensive experience in international and domestic banking. He retired from AIB in 2019 where he held various senior executive positions since 2007, including Divisional Chief Credit Officer. Prior to joining AIB, he held senior executive positions in corporate banking and risk management with Citigroup over a period of 22 years, mainly overseas, having started his banking career with The Investment Bank of Ireland.
He is a Qualified Financial Advisor and Fellow of the Institute of Banking and a Chartered Director of the UK Institute of Directors. He is also a Non-executive Director of Davy Global Fund Management Limited and The Central Remedial Clinic.
*Resigned during 2020
Directorship Appointments must not proceed where possible conflicts of interest may emerge which are significant to the overall work of the Board. The following Directorships are held by current members of the Board including their SIDAC Directorship.
Scotiabank (Ireland) DAC – Pillar 3 Disclosures 2020
19
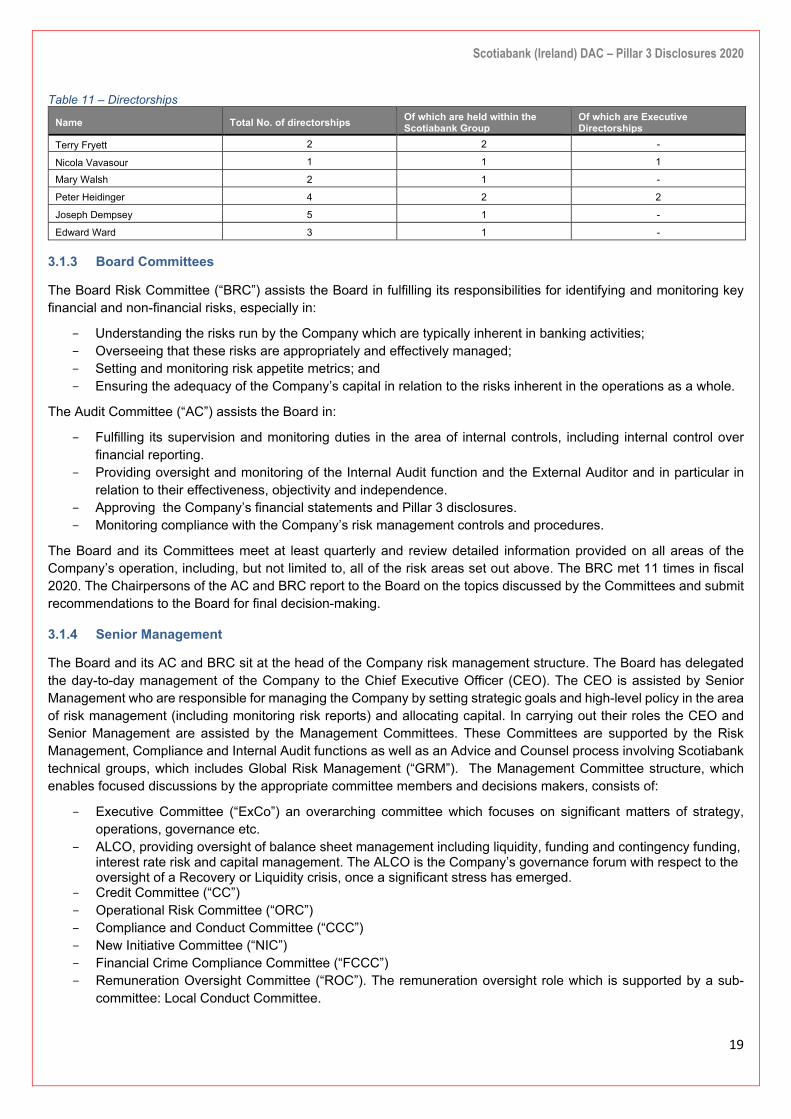
Table 11 – Directorships
Name Total No. of directorships Of which are held within the Scotiabank Group
Of which are Executive Directorships
Terry Fryett 2 2 -
Nicola Vavasour 1 1 1
Mary Walsh 2 1 -
Peter Heidinger 4 2 2
Joseph Dempsey 5 1 -
Edward Ward 3 1 -
3.1.3 Board Committees
The Board Risk Committee (“BRC”) assists the Board in fulfilling its responsibilities for identifying and monitoring key financial and non-financial risks, especially in:
- Understanding the risks run by the Company which are typically inherent in banking activities; - Overseeing that these risks are appropriately and effectively managed; - Setting and monitoring risk appetite metrics; and - Ensuring the adequacy of the Company’s capital in relation to the risks inherent in the operations as a whole.
The Audit Committee (“AC”) assists the Board in:
- Fulfilling its supervision and monitoring duties in the area of internal controls, including internal control over financial reporting.
- Providing oversight and monitoring of the Internal Audit function and the External Auditor and in particular in relation to their effectiveness, objectivity and independence.
- Approving the Company’s financial statements and Pillar 3 disclosures. - Monitoring compliance with the Company’s risk management controls and procedures.
The Board and its Committees meet at least quarterly and review detailed information provided on all areas of the Company’s operation, including, but not limited to, all of the risk areas set out above. The BRC met 11 times in fiscal 2020. The Chairpersons of the AC and BRC report to the Board on the topics discussed by the Committees and submit recommendations to the Board for final decision-making.
3.1.4 Senior Management
The Board and its AC and BRC sit at the head of the Company risk management structure. The Board has delegated the day-to-day management of the Company to the Chief Executive Officer (CEO). The CEO is assisted by Senior Management who are responsible for managing the Company by setting strategic goals and high-level policy in the area of risk management (including monitoring risk reports) and allocating capital. In carrying out their roles the CEO and Senior Management are assisted by the Management Committees. These Committees are supported by the Risk Management, Compliance and Internal Audit functions as well as an Advice and Counsel process involving Scotiabank technical groups, which includes Global Risk Management (“GRM”). The Management Committee structure, which enables focused discussions by the appropriate committee members and decisions makers, consists of:
- Executive Committee (“ExCo”) an overarching committee which focuses on significant matters of strategy, operations, governance etc.
- ALCO, providing oversight of balance sheet management including liquidity, funding and contingency funding, interest rate risk and capital management. The ALCO is the Company’s governance forum with respect to the oversight of a Recovery or Liquidity crisis, once a significant stress has emerged.
- Credit Committee (“CC”) - Operational Risk Committee (“ORC”) - Compliance and Conduct Committee (“CCC”) - New Initiative Committee (“NIC”) - Financial Crime Compliance Committee (“FCCC”) - Remuneration Oversight Committee (“ROC”). The remuneration oversight role which is supported by a sub-
committee: Local Conduct Committee.

Scotiabank (Ireland) DAC – Pillar 3 Disclosures 2020
20
3.1.5 Governance Structure
This diagram3 sets out the governance structure and provides more detail on the roles of each committee. This structure was designed so that ultimate responsibility for implementing and maintaining the structure and for reviewing its effectiveness lies with the Board of Directors.
3.2 Risk Appetite
A clearly articulated risk appetite and how the risk profile of an organisation will be managed within such an appetite is crucial for an effective risk management framework. The Company has a clearly defined Risk Appetite Framework which consists of the identification of:
Risk capacity: The maximum level of risk SIDAC can assume before breaching key constraints;
Risk appetite: The level and types of risk SIDAC is willing to assume within its risk capacity to achieve its strategic objectives, and
Key risk appetite measures: Quantitative metrics that capture SIDAC’s risk appetite, as per table 12 on the following page.
Together, the application of these components helps to ensure SIDAC stays within appropriate risk boundaries.
3 The CEO is supported in the governance of SIDAC by the Management Committees and in particular the ExCo as outlined above and sits on the Board serving as the main link between the Board and the executive.
ExCo focuses on significant matters of culture and conduct, strategy, operations, governance and control in order to provide a key forum for the effective, coordinated management and oversight of SIDAC. ExCo is comprised of the Chief Executive Officer of SIDAC as its Chair and senior management from each business line and support and control functions.
ROC is responsible for providing oversight and guidance to management and the Board on HR remuneration matters and to oversee implementation of compensation policies and procedures. Conduct Committee, a sub- committee of ROC, ensures there is an appropriate linkage between compensation and behaviours.
* The Head of HR, as appropriate, may present directly to the Board of Directors without the CEO present.

Scotiabank (Ireland) DAC – Pillar 3 Disclosures 2020
21
Table 12 – Risk Appetite Metrics
Risk Category Metric Description
Enterprise Risk
Total Capital Ratio
Leverage Ratio
Return on Equity
Strategic Risk YTD % Deviation from Planned Income
Credit Risk – Corporate
Credit Risk Issuer
Credit Risk – All Portfolios
Maximum exposure to Corporate Clients (US$ mm)
Maximum exposure by Borrower/Connection (US$ mm)
Maximum Exposure to Non-Investment Grade credit exposures
Minimum Credit Quality at Extension (Borrower and Facility)
Maximum Securities Exposure (US$ mm)
Minimum Credit Quality of debt investments at Purchase
Maximum Credit Loss (Fiscal Year) (US$ mm)
Credit Spread Volatility Risk CS01 (US$ mm)
Liquidity Risk
Liquidity Coverage Ratio (LCR)
Net Stable Funding Ratio (NSFR)
LSS (0-30 day, Combined Extreme)
Min. Monthly Liquidity Buffer (US$ mm)
% of FX Funding of Balance Sheet
30-day Cumulative EUR Funding Gap (€ mm)
30-day Cumulative GBP Funding Gap (£ mm)
Market Risk Total Annual Income (US$ mm)
Total Economic Value (US$ mm)
Concentration Risk* # of Unauthorised Material Concentrations
Compliance Risk
Qualitative Assessment of Conduct Risk
# of F3 Regulatory Findings/Internal Issues
# of F4 Regulatory Findings/Internal Issues
Reputational Risk # of Negative Impacts to Scotiabank Brand
Operational Risk
Total Annual Loss (US$ mm)
# of High Severity Operational Risk Events
Audit Issue Clearance
# of Material Outsourcing Issues
IT & Cyber Risk # of Hours of Systems Downtime (Hours)
Enterprise Security Risk Index (SRI - Protect)
Enterprise Security Risk Index (SRI – Identify)
Enterprise Security Risk Index (SRI – Respond & Recover)
* The term ‘unauthorised’ distinguishes this concentration from known and accepted concentrations (such as funding from BNS).

Scotiabank (Ireland) DAC – Pillar 3 Disclosures 2020
22
3.3 Risk Management Tools
Effective risk management includes tools that are guided by the Risk Appetite Framework and integrated with the Company’s strategies and business planning processes. The Risk Management Framework is supported by the below risk management tools that are used together to manage risks and are regularly reviewed and updated to ensure consistency with risk-taking activities, and relevance to the business and financial strategies of the Company.
Policies, Frameworks and Limits
Activities are guided by the principles and processes established in various policies which are approved by the Board and/or appropriate management committees. SIDAC develops and implements its key risk policies in consultation with GRM or other BNS departments who provide advice and counsel as applicable. Such policies (which include appetites and frameworks) are designed to reflect the regulatory requirements and guidelines of the CBI and the EBA and other locally applicable legislation or regulations.
Limits govern and control risk-taking activities within the appetite and tolerances established by the Board and Senior Management. They are set to ensure risk taking activities are in line with the strategic objectives, risk culture and risk appetite of SIDAC. Limits also establish accountability for key tasks in the risk-taking process and establish the level or conditions under which transactions may be approved or executed.
Risk Measurement, Monitoring & Reporting
SIDAC measures and monitors its risk exposures to ensure business activities are operating within approved limits or guidelines, strategies and risk appetite. Breaches, if any, of these limits or guidelines are reported to Senior Management and/or the AC depending on the limit or guideline, and for information to BNS GRM.
Risk reports aggregate measures of risk across products and businesses, and are used to ensure compliance with risk policies, limits and guidelines. They also provide a clear statement of the amounts, types, and sensitivities of the various risks in the portfolio. Senior Management and the Board use this information to understand the risk profile and the performance of the portfolios. A comprehensive summary of SIDAC’s risk profile and performance is presented quarterly by the CRO to the BRC.
Stress Testing
Stress testing programs at both the enterprise-wide level and individual risk level allow SIDAC to estimate the potential impact or strain on income and capital as well as other risk factors that may arise as a result of Bank-specific, systemic, and combination stress scenarios. Stress testing is also integrated into both the strategic and financial planning processes (e.g. ICAAP Enterprise Wide Stress Test (“EWST”)) to proactively identify emerging risks and potential vulnerabilities across a number of stress scenarios with differing severities and time horizons. The development, approval and on-going review of stress testing programs are subject to policy, and the oversight of the ALCO. Where appropriate, the Board of Directors or the BRC approves stress testing limits for certain risk factors and receives reports on performance regularly.
3.4 Risk Identification and Assessment
Risk identification and assessment is an integral part of risk management at SIDAC. On an annual basis, SIDAC conducts an entity-wide risk assessment that concludes on the materiality of all risks to the Company and documents them accordingly. This process evaluates each risk and determines the pervasiveness of the risk across multiple business lines, significance of the risk to a specific business line, likelihood and potential impact of the risk and whether the risk may cause unexpected losses in income. The process also reviews other evolving and emerging risks and includes qualitative considerations such as strategic, economic and environmental risk factors. This process is reviewed by ExCo and by the BRC (as part of the ICAAP) who objectively challenge the inclusion and exclusion of risks and is finally recommended by them for approval by the Board.
The Company has identified the following risks as Principal risks via the ARM (assessment of risk materiality):
• Credit risk • Concentration risk • Credit spread volatility risk

Scotiabank (Ireland) DAC – Pillar 3 Disclosures 2020
23
• Market risk • Liquidity risk • Operational risk • Information Technology risk • Compliance risk (including conduct risk) • Reputational risk • Strategic risk
All risks identified in the previous year remain as Principal risks within the Company.
3.5 Risk Culture
Effective risk management requires a strong, robust, and pervasive risk culture where every employee is a risk manager and is responsible for managing risk. Risk culture is influenced by numerous factors including the interdependent relationships amongst risk governance structure, risk appetite, strategy, organisational culture, and the key components of risk management tools.
The Company’s risk culture is supported through four foundational elements:
1. Tone from the Top: Clear and consistent communication from SIDAC’s Board, Senior Management and Scotiabank leaders on risk behaviour expectations and the importance of Scotiabank’s values.
2. Accountability: All employees are accountable for risk management. There is an environment of open communication where employees feel safe to speak-up and raise concerns without fear of retaliation.
3. Risk Management: Risk taking activities are consistent with SIDAC’s strategies and risk appetite. Risk appetite considerations are embedded in key decision-making processes.
4. People Management: Performance and compensation structures encourage desired behaviors and reinforce the risk culture.
Other elements that influence and support the risk culture:
• Code of Conduct: describes the standard of behaviour to which all employees must attest on an annual basis. • Values: Integrity – Act with Honour; Respect – Value Every Voice; Accountability – Make It Happen; Passion – Be
Your Best • Communication: SIDAC actively communicates risk priorities, and how it relates to its staff, to promote a sound risk
culture: Reputation is everything; Information is key; Success depends on you; Know your boundaries. • Compensation: programs are structured to discourage behaviours that are not aligned with the BNS values and
Scotiabank Code of Conduct, and to ensure that such behaviours are not rewarded. • Training: risk culture is continually reinforced by providing effective and informative mandatory and non-mandatory
training modules for all employees on a variety of risk management topics. • Decision-making on risk issues follows a strict governance process: The flow of information and transactions are
challenged by Management Committees and this is subsequently reviewed by the BRC, ensuring that transactions and risks are aligned with SIDAC’s risk appetite.
• Senior Management Roles & Responsibilities: all senior management have risk management responsibilities within their mandates.
3.6 Statement of Internal Controls
Although the Company is not required to make a Corporate Governance Statement as it is not listed, the Board makes a statement on internal control in accordance with best practice.
The Board acknowledges its responsibility to maintain a sound system of internal control, to safeguard the shareholder’s investment and the Company’s assets and to set appropriate policies, controls and limits for the Company’s operations. It further recognises its obligation to seek regular assurance that will enable it to satisfy itself that the system is functioning properly. The Board is assisted in its responsibilities by its BRC and AC. The BRC recommends risk management policies and limits to the Board for approval. It further oversees the management of material risks through

Scotiabank (Ireland) DAC – Pillar 3 Disclosures 2020
24
receipt of reports from management across SIDAC’s universe of material risks. The AC monitors the effectiveness of controls through reviewing and assessing reports presented by the heads of control functions as well as Internal Audit and Scotiabank Group Audit (“GA”).
The Board recognises that sound risk management is essential to the Company’s prudent operation. The Board charges management with developing the required control system and implementing its policies, controls and limits. This includes the process of identifying, evaluating and managing the risks faced by the Company. It receives comfort that these duties have been exercised during the year under review through the regular reporting structure and periodic discussions between Board, AC and BRC members and Senior Management.
Assessment of internal controls by the Board and its committees consists of quarterly reviews of submissions by Senior Management incorporating information on key risks, financial performance, limit usage and details of any unforeseen events. The Board is satisfied that the procedures and processes outlined above have been in operation throughout the year and may request the implementation of revisions or improvements as it deems appropriate.
The internal control system is designed to mitigate risk and cannot be seen as a method by which all risk can be eliminated. Therefore, it provides reasonable rather than absolute assurance against material loss or misstatement. The Company is subject to the CBI “Corporate Governance Requirements for Credit Institutions 2015” (the “Governance Requirements”). The Company does not have to comply with the additional obligations in Appendices 1 and 2 of the Governance Requirements for High Impact designated credit institutions.
4 Credit Risk
Credit risk is the risk of financial loss resulting from the failure of a customer, for any reason, to fully honour its financial or contractual obligations.
4.1 Credit Risk Management and Risk Measures
The Company’s management of credit risk includes the credit risk policies, guidelines, procedures and processes that articulate the Company’s credit risk governance, management and control structures. This framework ensures that credit risk exposures are adequately assessed, properly approved and actively managed in a consistent manner across all business lines. Management of the credit risk portfolios also encompasses in-house credit experience, infrastructure and a due diligence process that is closely embedded within the risk management structure. The Company’s Credit Risk Management Policy sets out the processes and procedures to measure and manage credit risk. The Company has established a Credit Loss and Provisioning Policy that sets out the approach to identifying, assessing and quantifying impairments and resultant credit losses. In 2019, the Company moved to an Origination model for EU 27 business, with an established and resourced local Origination desk. It continues to have access to Scotiabank GRM risk management resources and the UK, US and GRM relationships are managed through a Master Service Level Agreement (“MSLA”).
The Company’s CC has a mandate to oversee the credit risk of the Company, assess potential new credit exposures and monitor the credit profile of the business lines, ensuring that credit risk and portfolio composition are kept within the risk appetite approved at least annually by the Board.
The Company’s Credit Risk Function, (“CRF”) under the direction of the CRO is the primary control function for credit risk. Each new transaction is put through a thorough credit adjudication process, which includes a review of the borrower’s business model, financial performance, key risks and mitigants, including climate risk. With support from GRM, the CRF periodically reviews industry risks, country, economic and credit profiles, and portfolio concentrations. In relation to credit risk and under the Company’s Three Lines-of-Defence structure the CRF is charged with 2nd line of defence responsibility for providing challenge on all transactions under the corporate loans and treasury portfolios, in addition to oversight and monitoring responsibilities. The CRF ensures the risk appetite as set by Board and credit related processes and policies are adhered to and that problem loans are promptly identified, properly assessed and classified, and effectively followed up by the business lines. It tracks the quality of credit portfolios, monitoring for Early Warning Indicators (EWIs) and managing the reporting process, including Heightened Monitoring and Watchlist Reports, Single Name Limits and Board Reports. The CRF also reviews and assesses the appropriateness of recommendations in relation to impairment assessment and provisioning including Expected Credit Losses; ensures that credit risk

Scotiabank (Ireland) DAC – Pillar 3 Disclosures 2020
25
management policies and programs and risk rating systems are documented, reviewed, and updated to reflect material changes; and reviews and implements credit risk measurement and mitigation methodologies.
The primary sources of credit risk arise from direct lending operations and in funding and investment activities where the counterparties have repayments or other obligations to the Company.
The Company’s Corporate Lending business operates as part of a global strategy to serve priority, multi-regional clients, aligned with GBM core markets and industry focus to deliver profitable growth within a robust control environment. The Company’s lending is largely in the form of syndicated or bilateral loans with investment-grade borrowers. The objective of this portfolio is to generate sustainable income accruals while maintaining a capital preservation ethos. The focus of the portfolio is on borrowers which are normally in the top tier of their industry and the Company endeavours to maintain a diversified portfolio through the credit assessment process and controls absolute levels using Board approved industry limits.
The Company’s Treasury function is primarily responsible for managing liquidity, funding the business lines and ensuring regulatory compliance for liquidity. The Company’s liquidity portfolio consists of sovereigns/sub-sovereigns, supranational agencies, high-grade corporates and covered bonds. The main purpose is to maintain an appropriate stock of unencumbered High-Quality Liquid Assets that can be used for contingent funding purposes. The investment focus is on CRD IV/Basel III compliant bonds which are added selectively following the due diligence and assessment process once they meet the risk appetite. The Treasury Investment team also work closely with BNS Group Treasury in executing the global liquidity strategy, purchasing bonds that not only are required for regulatory liquidity management but also to complement that global strategy. Combined with the liquidity strategy the team may make other investments which have a greater emphasis on investment return than liquidity.
Credit risk is primarily controlled by means of credit limits and is monitored through Board-approved single name limits, country and industry limits. These limits are ratified by the Board at least annually. As noted above, the CRF, in consultation with Business Lines, is responsible for reviewing existing limits to ensure that they remain appropriate and consistent with the risk appetite and aligned with Scotiabank’s overall credit risk strategy and approach.
Settlement risk is the risk that the seller of a currency, commodity, security or service delivers its obligation but does not receive payment/delivery, or that the buyer of a currency, commodity, security or service makes payment/delivery, but does not receive value. This risk combines aspects of credit and operational risk and is significantly mitigated by delivery versus payment, netting agreements and the quality of permitted counterparties.
The Company uses Scotiabank’s credit risk rating systems to support the determination of key credit risk parameter estimates which measure credit risk. These risk parameters – probability of default, loss given default and exposure at default are transparent and are used to provide consistency of credit adjudication for each of the risk rating categories. These credit risk rating systems include an internal grading (I.G.) system for evaluating credit risk. The general relationship between the Company’s I.G. codes and external agency ratings is shown below:
Table 13 – Internal Grading Cross Reference I.G. Moody’s S&P
Government/ Supranational 99 Excellent 98 Aaa to Aa1 AAA to AA+ Very Good 95 Aa2 to A1 AA to A+ Good 90 A2 to A3 A to A- Acceptable 87 – 80 Baa1 to Ba1 BBB+ to BB+ Higher Risk 77 – 70 Ba2 to B3 BB to B- Watch list 30 – 65 Default/Credit-Impaired 21 - 27
4.2 Approaches to Credit Risk
While the capital requirements for credit risk depend to a significant degree on the creditworthiness of the obligor, CRD IV permits the use of different approaches to the calculation of RWAs: the Standardised Approach and the Internal Ratings-Based (“IRB”) approaches.
The Company uses the Standardised Approach for calculating capital requirements for credit risk. This approach involves the application of risk weights to the Company’s assets based on the deemed creditworthiness of its debtors

Scotiabank (Ireland) DAC – Pillar 3 Disclosures 2020
26
and the rules as laid out in the CRR. The Company utilises credit ratings attributed by its chosen External Credit Assessment Institutions (“ECAIs”), Standard and Poor’s or Moody’s, whichever is the lower, to all its exposure classes. The Company uses the EBA’s standard association of ECAI ratings and credit quality steps to map ratings to the relevant credit quality step. In the case of unrated exposures, where a credit rating is not available from either Standard and Poor’s or Moody’s, the CRR also provides a risk weight depending on the exposure class.
As per the CRR, the following priorities are used in applying the credit assessments:
For exposures to public sector entities (Article 116), institutions (Articles 119 & 121), or in the form of covered bonds (Articles 129 & 121), the ECAIs are applied in the following priority:
1 - Rating of Issue (exposure); 2 - Rating of Issuer (counterparty); 3 - Rating of Central government of jurisdiction of incorporation
For exposures to central governments or central banks (Article 114), multilateral development banks (Article 117), international organisations (Article 118), corporates (Article 122), the ECAIs are applied in the following priority:
1 - Rating of Issue (exposure); 2 - Rating of Issuer (counterparty);
Exposures to rated securitisations are based solely on the rating of the programme.
4.3 Exposure to Credit Risk
Table 14 outlines the Company’s actual and average4 exposure to credit risk.
Table 14 – EU CRB-B – Total and average net amount of exposures a b
US$’000 Net value of exposures at the end of the period
Average net exposures over
the period
Net value of exposures at the end of the period
Average net exposures over the
period 31 Oct 2020 31 Oct 2020 31 Oct 2019 31 Oct2019
16 Central governments or central banks 786,633 735,702 890,640 1,061,927
17 Regional governments or local authorities 29,641 29,808 29,607 10,901
18 Public sector entities 605,788 554,824 484,297 447,497
19 Multilateral development banks 509,532 495,965 483,097 350,729
21 Institutions 148,010 169,452 129,685 213,555
22 Corporates 3,767,484 3,883,570 4,250,713 4,742,638
28 Exposures in default 18,299 4,042 15,425 19,140
29 Items associated with particularly high risk 13,670 11,226 8,449 18,475
30 Covered bonds 28,764 25,868 30,782 38,115
34 Other exposures 8,691 8,196 2,179 1,609
35 Total standardised approach 5,916,512 5,918,653 6,324,874 6,904,586
36 Total 5,916,512 5,918,653 6,324,874 6,904,586
The overall decrease of US$ 408mm in net exposures over the year can be predominantly attributed to a US$ 483mm decrease in exposures to corporates (loan commitments and investment securities).
4 Net exposures are pre-CRM and CCF; averages are calculated based on monthly datapoints.

Scotiabank (Ireland) DAC – Pillar 3 Disclosures 2020
27
Table 15, presented on the following two pages, provides information on the geographical breakdown of the net value of exposures based on the domicile of the immediate counterparty
Table 15 – EU CRB-C – Geographical breakdown of exposures 31 Oct 2020
Of which; Of which; Of which;
US$’000 Europe United Kingdom France Netherlands Germany Ireland
Other European countries
North America USA Canada
Asia-Pacific Japan Australia
Other Asia Pacific
countries
Other geographical
areas Total
7 Central governments or central banks 537,762 - 58,692 - - 420,483 58,587 153,241 153,241 - 95,630 95,630 - - - 786,633
8 Regional governments or local authorities
29,641 - - - 29,461 180 - - - - - - - - - 29,641
9 Public sector entities 605,788 - - 238,236 303,614 - 63,938 - - - - - - - - 605,788
10 Multilateral development banks - - - - - - - - - - - - - - 509,532 509,532
12 Institutions 19,236 815 - - 486 - 17,935 128,707 343 128,364 67 7 39 21 - 148,010
13 Corporates 2,726,460 503,221 535,957 384,481 503,186 91,055 708,560 739,105 738,161 944 - - - - 301,919 3,767,484
16 Exposures in default - - - - - - - - - - - - - - 18,299 18,299
17 Items associated with particularly high risk - - - - - - - - - - - - - - 13,670 13,670
18 Covered bonds 28,764 - - - - - 28,764 - - - - - - - - 28,764
22 Other exposures 8,691 - - - - 8,691 - - - - - - - - - 8,691
23 Total standardised approach 3,956,342 504,036 594,649 622,717 836,747 520,409 877,784 1,021,053 891,745 129,308 95,697 95,637 39 21 843,420 5,916,512
24 Total 3,956,342 504,036 594,649 622,717 836,747 520,409 877,784 1,021,053 891,745 129,308 95,697 95,637 39 21 843,420 5,916,512

Scotiabank (Ireland) DAC – Pillar 3 Disclosures 2020
28
31 Oct 2019
Of which; Of which;
US$’000 Europe United Kingdom France Netherlands Germany Ireland
Other European countries
North America USA Canada
Asia-Pacific Japan Australia
Other Asia Pacific
countries
Other geographical
areas Total
7 Central governments or central banks 507,796 64,626 - - - 387,377 55,793 151,782 151,782 - 231,062 231,062 - - - 890,640
8 Regional governments or local authorities
29,607 - - - 29,202 405 - - - - - - - - - 29,607
9 Public sector entities 484,297 - - 235,498 185,306 - 63,493 - - - - - - - - 484,297
10 Multilateral development banks - - - - - - - - - - - - - - 483,097 483,097
12 Institutions 17,808 122 - - 80 167 17,439 91,538 3,969 87,569 20,339 136 20,183 20 - 129,685
13 Corporates 3,031,043 1,122,514 624,908 294,181 235,076 107,682 646,682 807,667 794,650 13,017 - - - - 412,003 4,250,713
16 Exposures in default - - - - - - - - - - - - - - 15,425 15,425
17 Items associated with particularly high risk - - - - - - - - - - - - - - 8,449 8,449
18 Covered bonds 30,782 11,684 - - - - 19,098 - - - - - - - - 30,782
22 Other exposures 2,179 - - - - 2,179 - - - - - - - - - 2,179
23 Total standardised approach 4,103,512 1,198,946 624,908 529,679 449,664 497,810 802,505 1,050,987 950,401 100,586 251,401 231,198 20,183 20 918,974 6,324,874
24 Total 4,103,512 1,198,946 624,908 529,679 449,664 497,810 802,505 1,050,987 950,401 100,586 251,401 231,198 20,183 20 918,974 6,324,874
As per table 14, the overall decrease of US$ 408mm in net exposures over the year was driven mainly by a reduction in corporates (mainly in the UK, offset to a degree by increases in exposures to German and Dutch corporates).
Please refer to Appendix 3 for details of the materiality threshold applied and a listing of immaterial countries included in the ‘other’ categories.

Scotiabank (Ireland) DAC – Pillar 3 Disclosures 2020
29
Table 16 provides a breakdown of the net values of exposures by industry classification based on the nature of the immediate counterparty. Please refer to tables 14 and 15 for variance commentary.
Table 16 – EU CRB-D – Concentration of exposures by industry or counterparty type
31 Oct 2020 31 Oct 2019 a b c d e f g
US$’000
Central banks
General governments
Credit institutions
Other financial
corporations
Non-financial corporations
Other Total
Central banks
General governments
Credit institution
s
Other financial
corporations
Non-financial
corporations
Other Total
7 Central governments or central banks 420,483 366,150 - - - - 786,633 387,377 503,263 - - - - 890,640
8 Regional governments or local authorities - 29,641 - - - - 29,641 - 29,607 - - - - 29,607
9 Public sector entities - 38,166 567,622 - - - 605,788 - 484,297 - - - - 484,297
10 Multilateral development banks - - 509,532 - - - 509,532 - - 483,097 - - - 483,097
12 Institutions - - 148,010 - - - 148,010 - - 129,685 - - - 129,685
13 Corporates - - 8,300 339,574 3,419,610 - 3,767,484 - - 20,056 921,857 3,308,800 - 4,250,713
16 Exposures in default - - - - 18,299 - 18,299 - - - - 15,425 - 15,425
17 Items associated with particularly high risk - - - 13,670 - - 13,670 - - - 8,449 - - 8,449
18 Covered bonds - - 28,764 - - - 28,764 - - 30,782 - - - 30,782
22 Other exposures - - - - - 8,691 8,691 - - - - - 2,179 2,179
23 Total standardised approach 420,483 433,957 1,262,228 353,244 3,437,909 8,691 5,916,512 387,377 1,017,167 663,620 930,306 3,324,225 2,179 6,324,874
24 Total 420,483 433,957 1,262,228 353,244 3,437,909 8,691 5,916,512 387,377 1,017,167 663,620 930,306 3,324,225 2,179 6,324,874

Scotiabank (Ireland) DAC – Pillar 3 Disclosures 2020
30
Table 17 provides a breakdown of the net values of exposures by residual maturity
Table 17 – EU CRB-E – Maturity of Exposures 31 Oct 2020 31 Oct 2019 a b c d f
US$’000 On demand <= 1 year > 1 year
<= 5 years > 5 years Total On demand <= 1 year > 1 year
<= 5 years > 5 years Total
7 Central governments or central banks - 633,393 153,240 - 786,633 - 738,858 151,782 - 890,640
8 Regional governments or local authorities - 15,192 14,449 - 29,641 - - 29,607 - 29,607
9 Public sector entities - 280,659 325,129 - 605,788 - - 484,297 - 484,297
10 Multilateral development banks - 125,628 345,359 38,545 509,532 - 97,363 319,164 66,570 483,097
12 Institutions 1,798 41,348 104,864 - 148,010 4,655 48,107 76,923 - 129,685
13 Corporates - 908,558 2,858,926 - 3,767,484 - 787,848 3,378,759 84,106 4,250,713
16 Exposures in default - - 18,299 - 18,299 - - 15,425 - 15,425
17 Items associated with particularly high risk - 13,670 - - 13,670 - 8,449 - - 8,449
18 Covered bonds - - - 28,764 28,764 - 30,782 - - 30,782
19 Claims on institutions and corporates with a short-term credit assessment - - - - - - - - - -
21 Equity exposures - - - - - - - - - -
22 Other exposures - 8,691 - - 8,691 - 2,179 - - 2,179
23 Total standardised approach 1,798 2,027,139 3,820,266 67,309 5,916,512 4,655 1,713,586 4,455,957 150,676 6,324,874
24 Total 1,798 2,027,139 3,820,266 67,309 5,916,512 4,655 1,713,586 4,455,957 150,676 6,324,874
The overall decrease of US$ 408mm in net exposures over the year was concentrated in the 1 to 5 year maturity band (US$ 636mm, of which Corporates: US$ 519mm, PSEs: US$ 159mm). There was an increase in the less than 1 year maturity band of US$ 313mm, which included increases in exposures to Corporates of US$ 120mm and PSEs of US$ 280mm, partially offset by a decrease in exposures to Sovereigns / Central banks of US$ 105mm.

Scotiabank (Ireland) DAC – Pillar 3 Disclosures 2020
31
Table 18 below details exposures under the standardised approach by risk weight and exposure class. All amounts presented are post Credit Risk Mitigation (‘CRM’), post Credit Conversion Factors (‘CCF’) and net of impairment provisions. CCR is excluded. Variance commentary on tables 14, 15 also applies here.
Table 18 – EU CR5 – Standardised approach
31 Oct 2020 US$'000 Risk weight (%) Total
Of which unrated
Exposure classes 0 2 4 10 20 35 50 70 75 100 150 250 370 1250 Others Deducted 1 Central governments or central
banks 632,416 - - - 95,630 - 58,587 - - - - - - - - - 786,633 420,482 2 Regional governments or local
authorities 29,461 - - - - - - - - - - 180 - - - - 29,641 - 3 Public sector entities 303,614 - - - 302,174 - - - - - - - - - - - 605,788 - 4 Multilateral development banks 509,532 - - - - - - - - - - - - - - - 509,532 - 6 Institutions - - - - 148,010 - - - - - - - - - - - 148,010 18 7 Corporates - - - - 161,612 - 424,008 - - 2,022,670 86,205 - - - - - 2,694,495 1,325,697 10 Exposures in default - - - - - - - - - - 18,299 - - - - - 18,299 18,299 11 Exposures associated with
particularly high risk - - - - - - - - - - 13,670 - - - - - 13,670 13,670 12 Covered bonds - - - 28,764 - - - - - - - - - - - - 28,764 - 16 Other items 4 - - - - - - - - 8,687 - - - - - 279 8,970 8,970 17 Total 1,475,027 - - 28,764 707,426 - 482,595 - - 2,031,357 118,174 180 - - - 279 4,843,802 1,787,136 31 Oct 2019 US$'000 Risk weight (%) Total
Of which unrated
Exposure classes 0 2 4 10 20 35 50 70 75 100 150 250 370 1250 Others Deducted 1 Central governments or central
banks 603,785 - - - 231,062 - 55,793 - - - - - - - - - 890,640 - 2 Regional governments or local
authorities 29,201 - - - - - - - - - - 405 - - - - 29,606 -
3 Public sector entities 185,306 - - - 298,991 - - - - - - - - - - - 484,297 - 4 Multilateral development banks 483,098 - - - - - - - - - - - - - - - 483,098 - 6 Institutions - - - - 129,686 - - - - - - - - - - - 129,686 29 7 Corporates - - - - 195,068 - 535,423 - - 2,363,808 88,242 - - - - - 3,182,541 1,722,765 10 Exposures in default - - - - - - - - - - 15,426 - - - - - 15,426 15,425 11 Exposures associated with
particularly high risk - - - - - - - - - - 8,449 - - - - - 8,449 8,449 12 Covered bonds - - - 30,782 - - - - - - - - - - - - 30,782 - 16 Other items 4 - - - - - - - - 2,175 - - - - - 462 2,641 2,641 17 Total 1,301,394 - - 30,782 854,807 - 591,216 - - 2,365,983 112,117 405 - - - 462 5,257,166 1,749,309
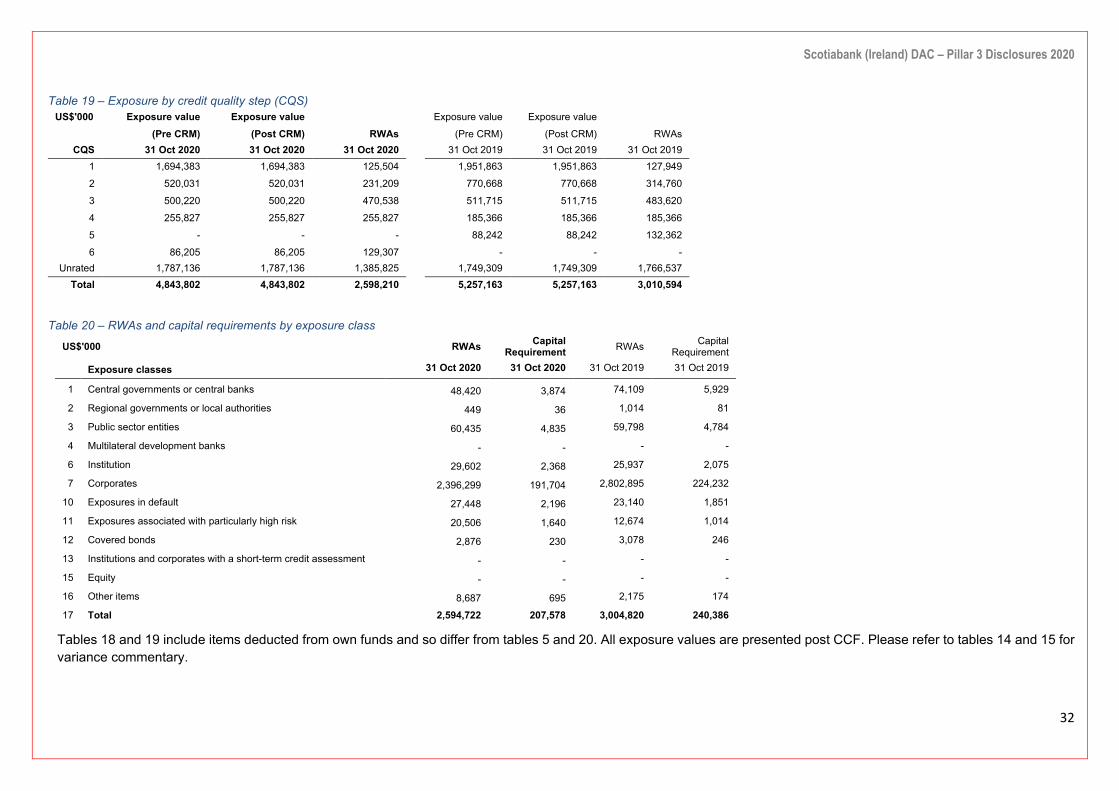
Scotiabank (Ireland) DAC – Pillar 3 Disclosures 2020
32
Table 19 – Exposure by credit quality step (CQS) US$'000 Exposure value Exposure value Exposure value Exposure value
(Pre CRM) (Post CRM) RWAs (Pre CRM) (Post CRM) RWAs CQS 31 Oct 2020 31 Oct 2020 31 Oct 2020 31 Oct 2019 31 Oct 2019 31 Oct 2019
1 1,694,383 1,694,383 125,504 1,951,863 1,951,863 127,949
2 520,031 520,031 231,209 770,668 770,668 314,760
3 500,220 500,220 470,538 511,715 511,715 483,620
4 255,827 255,827 255,827 185,366 185,366 185,366
5 - - - 88,242 88,242 132,362
6 86,205 86,205 129,307 - - - Unrated 1,787,136 1,787,136 1,385,825 1,749,309 1,749,309 1,766,537
Total 4,843,802 4,843,802 2,598,210 5,257,163 5,257,163 3,010,594
Table 20 – RWAs and capital requirements by exposure class
US$'000 RWAs Capital Requirement RWAs Capital
Requirement
Exposure classes 31 Oct 2020 31 Oct 2020 31 Oct 2019 31 Oct 2019
1 Central governments or central banks 48,420 3,874 74,109 5,929
2 Regional governments or local authorities 449 36 1,014 81
3 Public sector entities 60,435 4,835 59,798 4,784
4 Multilateral development banks - - - -
6 Institution 29,602 2,368 25,937 2,075
7 Corporates 2,396,299 191,704 2,802,895 224,232
10 Exposures in default 27,448 2,196 23,140 1,851
11 Exposures associated with particularly high risk 20,506 1,640 12,674 1,014
12 Covered bonds 2,876 230 3,078 246
13 Institutions and corporates with a short-term credit assessment - - - -
15 Equity - - - -
16 Other items 8,687 695 2,175 174
17 Total 2,594,722 207,578 3,004,820 240,386
Tables 18 and 19 include items deducted from own funds and so differ from tables 5 and 20. All exposure values are presented post CCF. Please refer to tables 14 and 15 for variance commentary.

Scotiabank (Ireland) DAC – Pillar 3 Disclosures 2020
33
4.4 Credit Risk Mitigation
The Company uses two methods of credit risk mitigation: direct and indirect. Where CRM is eligible under CRD IV it is used to reduce credit exposures in the regulatory capital calculations.
Direct mitigating methods
The main direct credit risk mitigation is the taking of security or collateral. The Company holds collateral in respect of certain exposures including corporate loans, securities held as part of repurchase agreements and/or OTC derivative activity. Collateral is not usually held against investment securities, and no such collateral was held during the year. The types of collateral that the Company is willing to accept under OTC derivative transactions and repurchase agreements are guided by advice and counsel from Scotiabank GRM and are set out in Limit Documents approved by the Company. The acceptable types of collateral are reviewed on an annual basis as part of the annual limit review process. A variety of types of collateral are accepted against corporate loan advances, including securities, cash, guarantees and insurance, grouped broadly as follows: Financial collateral (lien over deposits, shares, etc.); Physical collateral (mortgage over aircraft, etc.); Other collateral (guarantees, insurance, etc.). The Company is not currently using credit derivatives to mitigate risk.
Parental guarantees are utilised in corporate lending arrangements and guarantees are also in place from corporates or sovereigns in respect of certain securities holdings. Guarantees improve the credit quality of the exposures.
The Company may enter into funded sub-participation agreements with Scotiabank entities on occasion which result in the transfer of a portion of loans and advances by the Company to these entities and the derecognition of the portion transferred in its entirety.
Table 21 – EU CR3 – CRM techniques – Overview
31 Oct 2020 31 Oct 2019 US$’000 a b c d e
Exposures unsecured – Carrying
amount
Exposures secured
- Carrying amount
Exposures secured
by collateral
Exposures secured by
financial guarantees
Exposures secured by
credit derivatives
Exposures unsecured – Carrying
amount
Exposures secured
- Carrying amount
Exposures secured
by collateral
Exposures secured by
financial guarantees
Exposures secured by credit
derivatives 1 Total loans 1,789,590 - - - - 1,937,505 - - - -
2 Total debt securities 2,008,596 - - - - 2,234,721 - - - -
3 Total exposures 3,798,186 - - - - 4,172,226 - - - - 4 Of which
defaulted 18,299 - - - - 15,425 - - - -
Table 22 – CRM Techniques split by exposure class
31 Oct 2020 31 Oct 2019 US$’000 Exposures
unsecured - Carrying
amount
Exposures secured
- Carrying amount
Exposures secured
by collateral
Exposures secured by
financial guarantees
Exposures secured by
credit derivatives
Exposures unsecured – Carrying
amount
Exposures secured
- Carrying amount
Exposures secured by
collateral
Exposures secured by
financial guarantees
Exposures secured by
credit derivatives
Total loans 1,789,590 - - - - 1,937,505 - - - -
Central governments or central banks 420,483 - - - - 387,377 - - - -
Institutions 1,801 - - - - 4,657 - - - -
Corporates 1,349,007 - - - - 1,530,046 - - - -
Exposures in default 18,299 - - - - 15,425 - - - -
Total debt securities 2,008,596 - - - - 2,234,721 - - - - Central governments or central banks 366,150 - - - - 503,263 - - - -
Regional governments or local authorities 29,641 - - - - 29,607 - - - -
Public sector entities 605,788 - - - - 484,297 - - - - Multilateral development banks 509,532 - - - - 483,097 - - - -
Institutions 146,209 - - - - 125,028 - - - -
Corporates 322,512 - - - - 578,647 - - - -
Covered bonds 28,764 - - - - 30,782 - - - -
Total exposures 3,798,186 - - - - 4,172,226 - - - -

Scotiabank (Ireland) DAC – Pillar 3 Disclosures 2020
34
Table 23 – EU CR4 – Standardised approach – Credit risk exposure and CRM effects 31 Oct 2020 31 Oct 2019 US$'000 a b c d e f
Exposures before CCF and CRM
Exposures post CCF and CRM
Exposures before CCF and
CRM Exposures post CCF and
CRM
Exposure classes
On-balance sheet
amount
Off-balance sheet
amount
On-balance sheet
amount
Off-balance sheet
amount
RWAs RWA density
On-balance sheet
amount
Off-balance sheet
amount
On-balance sheet
amount
Off-balance sheet
amount
RWAs RWA density
1 Central governments or central banks 786,633 - 786,633 - 48,420 6% 890,640 - 890,640 - 74,109 8%
2 Regional governments or local authorities 29,641 - 29,641 - 449 2% 29,607 - 29,607 - 1,014 3%
3 Public sector entities 605,788 - 605,788 - 60,435 10% 484,297 - 484,297 - 59,798 12%
4 Multilateral development banks 509,532 - 509,532 - - - 483,097 - 483,097 - - -
6 Institutions 148,010 - 148,010 - 29,602 20% 129,685 - 129,685 - 25,937 20%
7 Corporates 1,671,519 2,095,965 1,671,519 1,022,976 2,396,299 89% 2,108,693 2,142,020 2,108,693 1,073,850 2,802,895 88%
10 Exposures in default 18,299 - 18,299 - 27,448 150% 15,425 - 15,425 - 23,140 150%
11 Exposures associated with particularly high risk 13,670 - 13,670 - 20,506 150% 8,449 - 8,449 - 12,674 150%
12 Covered bonds 28,764 - 28,764 - 2,876 10% 30,782 - 30,782 - 3,078 10%
16 Other items 8,970 - 8,970 - 12,175 136% 2,641 - 2,641 - 7,950 301%
17 Total 3,820,826 2,095,965 3,820,826 1,022,976 2,598,210 54% 4,183,316 2,142,020 4,183,316 1,073,850 3,010,595 57%
Tables 21 and 22 on the previous page provide details on secured and unsecured exposures. Secured exposures are limited to those exposures against which eligible collateral which meets CRR requirements is held and has been used in the calculation of the Company’s capital requirements. These tables are not reflective of the total volume of exposures against which collateral and guarantees are held, nor do they reflect the full range of credit risk mitigation taken. A significant portion of the exposures included in the table (exposures unsecured carrying amount) benefit from security taken to mitigate credit risk, but this security is not eligible for use in the regulatory capital calculations. The total credit exposures where the Company benefits from guarantees from investment graded (or equivalent rating) entities as at 31 October 2020 is US$ 1,024,239,000 (31 October 2019: US$ 1,166,353,000).
Table 23 includes items deducted from own funds and so differs from tables 5, 21 and 22. All exposure values are presented post CCF. Please refer to tables 14 and 15 for variance commentary.

Scotiabank (Ireland) DAC – Pillar 3 Disclosures 2020
35
Indirect mitigating methods
Indirect credit risk mitigants are generally embedded in the structure of the individual transaction to minimise the impact of an external event on the obligor e.g. the requirement for the obligor to hedge interest rates and input material prices or insure assets or receivables.
In addition, credit risk is also mitigated by policy and procedural controls and regular monitoring and reporting of risks to facilitate effective management oversight.
Credit risk concentrations within risk mitigation
As noted in section 3, concentration risk has been recognised as a principal risk. The Company recognises that insufficient diversification of credit risk mitigation techniques increases credit concentration risk. A highly concentrated portfolio has more potential for extreme outcomes and could prevent the effectiveness of the credit risk mitigants used. The Company has a Board approved Concentration Risk Management Policy, which has been subject to advice and counsel from Scotiabank GRM.
The Company seeks to avoid excessive risk concentrations through a diversified mix of businesses, products, geographies, currencies and customers. Appropriate management of concentration risk is also ensured by limits, policies and procedures (refer to risk appetite metrics, table 12 in section 3.2). Oversight of the management of concentration risk includes management committee and Board review and approval of policies and limits relating to credit risk, among other principal risks, as well as quarterly reporting to the BRC on risk concentrations and stress testing on sectors where a material concentration is deemed to arise. No material concentration has arisen as a result of the credit risk mitigation measures which would prevent their effectiveness.
4.5 Credit Profile of Exposures
The Company adheres to regulatory guidelines with respect to the classification of performing versus non-performing loans, in addition to identifying exposures subject to forbearance measures (see tables 27 to 29). Since transition to IFRS 9, all exposures are assessed for significant increase in credit risk and impairment and classified accordingly. The Company employs the BNS Expected Credit Loss (“ECL”) model to estimate credit losses under IFRS 9.
The Company uses the definition of default as set down under Article 178 of the CRR for the purposes of regulatory capital computation relating to all credit exposures and applies this definition for use within any relevant sections of the annual financial statements. In keeping with these requirements, default is considered by the Company to have occurred with regard to a particular obligor when one or more of the following have taken place:
• the Company considers that the obligor is unlikely to pay its credit obligations, without recourse by the Company to actions such as realising security;
• the obligor is past due more than 90 days on any material credit obligation to the Company.
Past due and impaired loans
Based on the above definition, a loan is considered past due and impaired when an obligor has not made a payment for more than 90 days after the contractual due date or there is objective evidence of impairment as a result of one or more events that occurred after the initial recognition of the asset (a ‘loss’ event) and the loss event (or events) has an impact on the estimated future cash flows. Objective evidence of impairment is recognised when, in management’s opinion, there is no longer reasonable assurance that interest and principal payments will be collected based on original contractual terms.
Impairment review and provisions
Impairment assessments necessarily include the use of estimates and expert judgment as management attempts to project the effect of future events on its exposures. Following best practice, the Company regularly reviews and revises key judgements, assumptions and estimates relating to impairment provisioning. The most significant judgements or estimates relate to management’s expectations regarding changes in collateral values, timing of cash flows, value attributed to guarantees and cash flows from trading or other sources. The Company documents all key assumptions including explanations outlining why assumptions have been changed. CRD IV introduced the definition of ‘specific’ and ‘general’ credit risk adjustments and, in line with the relevant Regulatory Technical Standard (“RTS”), the Company has included all ECL amounts as specific credit risk adjustments

Scotiabank (Ireland) DAC – Pillar 3 Disclosures 2020
36
Table 24 summarises the credit quality of on-balance sheet and off-balance sheet exposures by exposure class. The gross carrying value of exposures presented in this table is before the application of: a) credit risk mitigation; b) credit conversion factors; and c) impairment provisions. CCR is excluded.
Table 24 – EU CR1-A – Credit quality of exposures by exposure class and instrument 31 Oct 2020 31 Oct 2019
US$’000 a b c d e f g Gross carrying values of
Specific credit risk
adjust- ment
General credit risk
adjust- ment
Accum-ulated
write-offs
Credit risk adjustment
charges (credit) of the
period
Gross carrying values of
Specific credit risk
adjust- ment
General credit risk
adjust- ment
Accum-ulated
write-offs
Credit risk adjustment
charges (credit) of the
period
Net values
(a+b-c-d)
Exposure class Defaulted exposures
Non- defaulted
exposures
Net values
(a+b-c-d)
Defaulted exposures
Non-defaulted
exposures
16 Central governments or central banks - 786,635 2 - - 1 786,633 - 890,641 1 - - 1 890,640
17 Regional governments or local authorities - 29,643 2 - - 2 29,641 - 29,607 - - - - 29,607
18 Public sector entities - 605,789 1 - - (2) 605,788 - 484,300 3 - - (1) 484,297
19 Multilateral development banks - 509,535 3 - - 1 509,532 - 483,099 2 - - - 483,097
21 Institutions - 148,027 17 - - 15 148,010 - 129,687 2 - - - 129,685
22 Corporates - 3,770,549 3,065 - - 2,049 3,767,484 - 4,251,729 1,016 - - (659) 4,250,713
23 Of which: SMEs - - - - - - - - - - - - - -
28 Exposures in default 18,864 565 - - 87 18,299 15,903 478 - - (10,773) 15,425
29 Items associated with particularly high risk - 13,670 - - - - 13,670 - 8,449 - - - - 8,449
30 Covered bonds - 28,764 - - - - 28,764 - 30,782 - - - (1) 30,782
31 Claims on institutions and corporates with a short-term credit assessment
- - - - - - - - - - - - - -
33 Equity exposures - - - - - - - - - - - - - -
34 Other exposures - 8,691 - - - - 8,691 - 2,179 - - - - 2,179
35 Total standardised approach 18,864 5,901,303 3,655 - - 2,153 5,916,512 15,903 6,310,473 1,502 - - (11,433) 6,324,874
36 Total 18,864 5,901,303 3,655 - - 2,153 5,916,512 15,903 6,310,473 1,502 - - (11,433) 6,324,874
37 Of which: Loans 18,864 1,773,780 3,054 - - 1,680 1,789,590 15,903 1,922,976 1,374 - - (11,390) 1,937,505
38 Of which: Debt securities - 2,008,626 30 - - 9 2,008,596 - 2,234,742 21 - - (43) 2,234,721
39 Of which: Off- balance-sheet exposures - 2,096,536 571 - - 464 2,095,965 - 2,142,127 107 - - - 2,142,020
Specific credit risk adjustments have increased by US$ 2mm, due mainly to increases in stage 2 ECL. Please refer to tables 14 and 15 for other variance commentary relating to net exposure values.
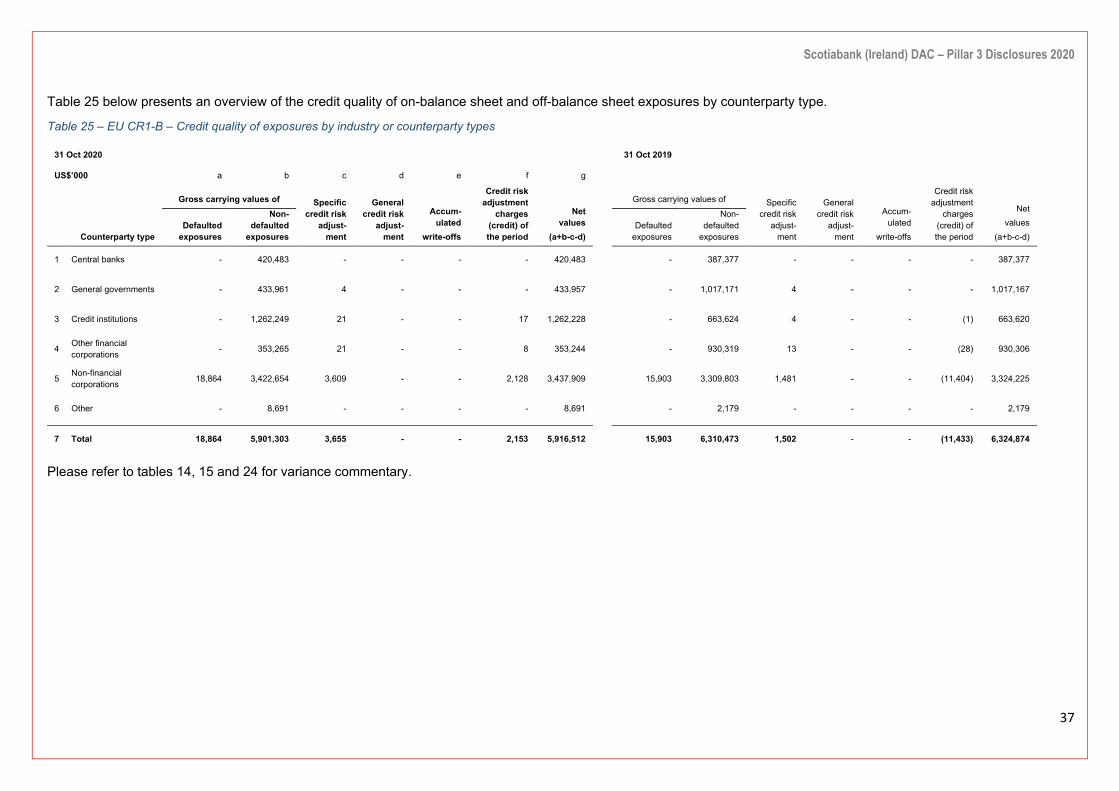
Scotiabank (Ireland) DAC – Pillar 3 Disclosures 2020
37
Table 25 below presents an overview of the credit quality of on-balance sheet and off-balance sheet exposures by counterparty type.
Table 25 – EU CR1-B – Credit quality of exposures by industry or counterparty types
31 Oct 2020 31 Oct 2019
US$’000 a b c d e f g
Gross carrying values of Specific credit risk
adjust- ment
General credit risk
adjust- ment
Accum- ulated
write-offs
Credit risk adjustment
charges (credit) of the period
Net values
(a+b-c-d)
Gross carrying values of Specific
credit risk adjust-
ment
General credit risk
adjust- ment
Accum- ulated
write-offs
Credit risk adjustment
charges (credit) of the period
Net values
(a+b-c-d)
Counterparty type Defaulted
exposures
Non-defaulted
exposures
Defaulted
exposures
Non-defaulted
exposures
1 Central banks - 420,483 - - - - 420,483 - 387,377 - - - - 387,377
2 General governments - 433,961 4 - - - 433,957 - 1,017,171 4 - - - 1,017,167
3 Credit institutions - 1,262,249 21 - - 17 1,262,228 - 663,624 4 - - (1) 663,620
4 Other financial corporations - 353,265 21 - - 8 353,244 - 930,319 13 - - (28) 930,306
5 Non-financial corporations 18,864 3,422,654 3,609 - - 2,128 3,437,909 15,903 3,309,803 1,481 - - (11,404) 3,324,225
6 Other - 8,691 - - - - 8,691 - 2,179 - - - - 2,179
7 Total 18,864 5,901,303 3,655 - - 2,153 5,916,512 15,903 6,310,473 1,502 - - (11,433) 6,324,874
Please refer to tables 14, 15 and 24 for variance commentary.

Scotiabank (Ireland) DAC – Pillar 3 Disclosures 2020
38
Table 26 below presents an overview of the credit quality of on-balance sheet and off-balance sheet exposures by geographical breakdown.
Table 26 – EU CR1-C – Credit quality of exposures by geography 31 Oct 2020 31 Oct 2019
US$’000 a b c d e f g
Gross carrying values of Specific
credit risk adjust-
ment
General credit risk
adjust- ment
Accum- ulated
write-offs
Credit risk adjustment
charges (credit) of the period
Net values
(a+b-c-d)
Gross carrying values of Specific
credit risk adjust-
ment
General credit risk
adjust- ment
Accum- ulated
write-offs
Credit risk adjustment
charges (credit) of the
period Net values
(a+b-c-d)
Geographical area Defaulted exposures
Non-defaulted
exposures
Defaulted exposures
Non-defaulted
exposures
1 Europe - 3,957,559 1,217 - - 959 3,956,342 - 4,103,770 258 - - (59) 4,103,512
of which;
2 - United Kingdom - 504,134 98 - - 26 504,036 - 1,199,018 72 - - 21 1,198,946
3 - France - 594,694 45 - - 34 594,649 - 624,919 11 - - 1 624,908
4 - Netherlands - 622,782 65 - - 42 622,717 - 529,702 23 - - (32) 529,679
5 - Germany - 836,931 184 - - 164 836,747 - 449,684 20 - - 13 449,664
6 - Ireland - 520,458 49 - - 17 520,409 - 497,842 32 - - (31) 497,810
7 - Other European countries - 878,560 776 - - 676 877,784 - 802,605 100 - - (31) 802,505
8 North America - 1,022,855 1,802 - - 1,536 1,021,053 - 1,051,253 266 - - 131 1,050,987
of which;
9 - USA - 893,529 1,784 - - 1,525 891,745 - 950,660 259 - - 125 950,401
10 - Canada - 129,326 18 - - 11 129,308 - 100,593 7 - - 6 100,586
11 Asia-Pacific - 95,697 - - - - 95,697 - 251,401 - - - (1) 251,401
of which;
12 - Japan - 95,637 - - - - 95,637 - 231,198 - - - - 231,198
13 - Australia - 39 - - - - 39 - 20,183 - - - (1) 20,183
14 - Other Asia-Pacific Countries - 21 - - - - 21 - 20 - - - - 20
15 Other geographical areas 18,864 825,192 636 (342) 843,420 15,903 904,049 978 - - (11,504) 918,974
16 Total 18,864 5,901,303 3,655 - - 2,153 5,916,512 15,903 6,310,473 1,502 - - (11,433) 6,324,874
Please refer to Appendix 3 for details of the materiality threshold applied and a listing of immaterial countries included in the ‘other’ categories. Please refer to tables 14,15 and 24 for variance commentary.

Scotiabank (Ireland) DAC – Pillar 3 Disclosures 2020
39
Forbearance
Forbearance occurs when a borrower is granted a temporary or permanent concession or an agreed change to the terms of a loan (‘forbearance measure’) for reasons relating to the actual or apparent financial stress or distress of that borrower. A concession may involve restructuring the contractual terms of a debt or payment in some form other than cash, such as an equity interest in the borrower.
Prior to any decision to grant forbearance the Company performs an assessment of a borrower’s financial circumstances and ability to repay. This assessment includes an individual assessment for impairment of the loan.
The following three tables are now required under the EBA guidelines on disclosures of non-performing and forborne exposures (EBA/GL/2018/10) which apply from 31 December 2019. The Company is required to disclose templates 1, 3 and 4 from the guidelines. Template 9 'Collateral obtained by taking possession and execution processes' is also in scope however is not applicable for this year. The remaining templates are not in scope as they apply to only to significant credit institutions with a gross NPL ratio of 5% or above.
Table 27 presents an overview of the quality of forborne exposures.
Table 27 – Template 1: Credit quality of forborne exposures
31 Oct 2020 US$’000 a b c d e f g h
Gross carrying amount/nominal amount of exposures with forbearance measures
Accumulated impairment, accumulated negative
changes in fair value due to credit risk and provisions
Collateral received and financial guarantees received
on forborne exposures
Performing forborne
Non-performing forborne
On performing forborne
exposures
On non- performing forborne
exposures
Of which collateral and
financial guarantees received on
non- performing exposures with
forbearance measures
Of which defaulted
Of which impaired
1 Loans and advances - 18,864 18,864 18,864 - 565 18,299 18,299
2 Central banks - - - - - - - -
3 General governments - - - - - - - -
4 Credit institutions - - - - - - - -
5 Other financial corporations - - - - - - - -
6 Non-financial corporations - 18,864 18,864 18,864 - 565 18,299 18,299
7 Households - - - - - - - -
8 Debt securities - - - - - - - -
9 Loan commitments given - - - - - - - -
10 Total - 18,864 18,864 18,864 - 565 18,299 18,299
This table is compiled based on definitions as per Annex V of the Commission Implementing Regulation (EU) No 680/2014.

Scotiabank (Ireland) DAC – Pillar 3 Disclosures 2020
40
Table 28 below presents an overview of credit quality of non-performing exposures
Table 28 – Template 3: Credit quality of performing and non-performing exposures by past due days
31 Oct 2020 US$’000 a b c d e f g h i j k l Gross carrying amount/nominal amount Performing exposures Non-performing exposures
Not past due or
past due ≤ 30 days
Past due > 30 days ≤ 90 days
Unlikely to pay that are not
past due or are past due ≤ 90
days
Past due > 90 days
≤ 180 days
Past due > 180 days
≤ 1 year
Past due > 1 year ≤ 2 years
Past due > 2 years ≤ 5 years
Past due > 5 years ≤ 7 years
Past due > 7
years
Of which defaulted
1 Loans and advances 1,773,780 1,773,780 - 18,864 18,864 - - - - - - 18,864
2 Central banks 420,483 420,483 - - - - - - - - - -
3 General governments - - - - - - - - - - - -
4 Credit institutions 10,101 10,101 - - - - - - - - - -
5 Other financial corporations 101,263 101,263 - - - - - - - - - -
6 Non-financial corporations 1,241,933 1,241,933 - 18,864 18,864 - - - - - - 18,864
7 Of which SMEs - - - - - - - - - - - -
8 Households - - - - - - - - - - - -
9 Debt securities 2,008,626 2,008,626 - - - - - - - - - -
10 Central banks - - - - - - - - - - - -
11 General governments 433,961 433,961 - - - - - - - - - -
12 Credit institutions 1,252,148 1,252,148 - - - - - - - - - -
13 Other financial corporations 71,999 71,999 - - - - - - - - - -
14 Non-financial corporations 250,518 250,518 - - - - - - - - - -
15 Off-balance-sheet exposures 2,096,536 - - - - - - - - - - -
16 Central banks - - - - - - - - - - - -
17 General governments - - - - - - - - - - - -
18 Credit institutions - - - - - - - - - - - -
19 Other financial corporations 166,333 - - - - - - - - - - -
20 Non-financial corporations 1,930,203 - - - - - - - - - - -
21 Households - - - - - - - - - - - -
22 Total 5,878,942 3,782,406 - 18,864 18,864 - - - - - - 18,864

Scotiabank (Ireland) DAC – Pillar 3 Disclosures 2020
41
Table 29 below presents an overview of the credit quality of non-performing exposures and related impairments, provisions and valuation adjustments by portfolio and exposure class.
Table 29 – Template 4: Performing and non-performing exposures and related provisions 31 Oct 2020
US$’000 a b c d e f g h i j k l m n o Gross carrying amount/nominal amount Accumulated impairment, accumulated negative changes in fair value
due to credit risk and provisions Collateral and financial
guarantees received
Performing exposures Non-performing exposures Performing exposures –
accumulated impairment and provisions
Non-performing exposures – accumulated impairment,
accumulated negative changes in fair value due to credit risk and
provisions
Accumulated partial write - off
On performing exposures
On non- performing exposures
Of which stage 1
Of which stage 2
Of which
stage 2
Of which
stage 3
Of which
stage 1
Of which
stage 2
Of which stage 2
Of which stage 3
1 Loans and advances 1,773,780 1,686,059 87,721 18,864 - 18,864 2,489 998 1,491 565 - 565 - 1,087,893 18,299
2 Central banks 420,483 420,483 - - - - - - - - - - - - -
3 General governments - - - - - - - - - - - - - - -
4 Credit institutions 10,101 10,101 - - - - - - - - - - - - -
5 Other financial corporations 101,263 101,263 - - - - 18 18 - - - - - - -
6 Non-financial corporations 1,241,933 1,154,212 87,721 18,864 - 18,864 2,471 980 1,491 565 - 565 - 1,087,893 18,299
7 Of which SMEs - - - - - - - - - - - - - - -
8 Households - - - - - - - - - - - - - - -
9 Debt securities 2,008,626 2,008,626 - - - - 30 30 - - - - - 624,178 -
10 Central banks - - - - - - - - - - - - - - -
11 General governments 433,961 433,961 - - - - 4 4 - - - - - 264,304 -
12 Credit institutions 1,252,148 1,252,148 - - - - 21 21 - - - - - 174,990 -
13 Other financial corporations 71,999 71,999 - - - - 1 1 - - - - - 51,996 -
14 Non-financial corporations 250,518 250,518 - - - - 4 4 - - - - - 132,888 -
15 Off-balance-sheet exposures 2,096,536 2,096,536 - - - - 571 571 - - - - - -
16 Central banks - - - - - - - - - - - - - -
17 General governments - - - - - - - - - - - - - -
18 Credit institutions - - - - - - - - - - - - - -
19 Other financial corporations 166,333 166,333 - - - - 2 2 - - - - - -
20 Non-financial corporations 1,930,203 1,930,203 - - - - 569 569 - - - - - -
21 Households - - - - - - - - - - - - - -
22 Total 5,878,942 5,791,221 87,721 18,864 - 18,864 3,090 1,599 1,491 565 - 565 - 1,712,071 18,299
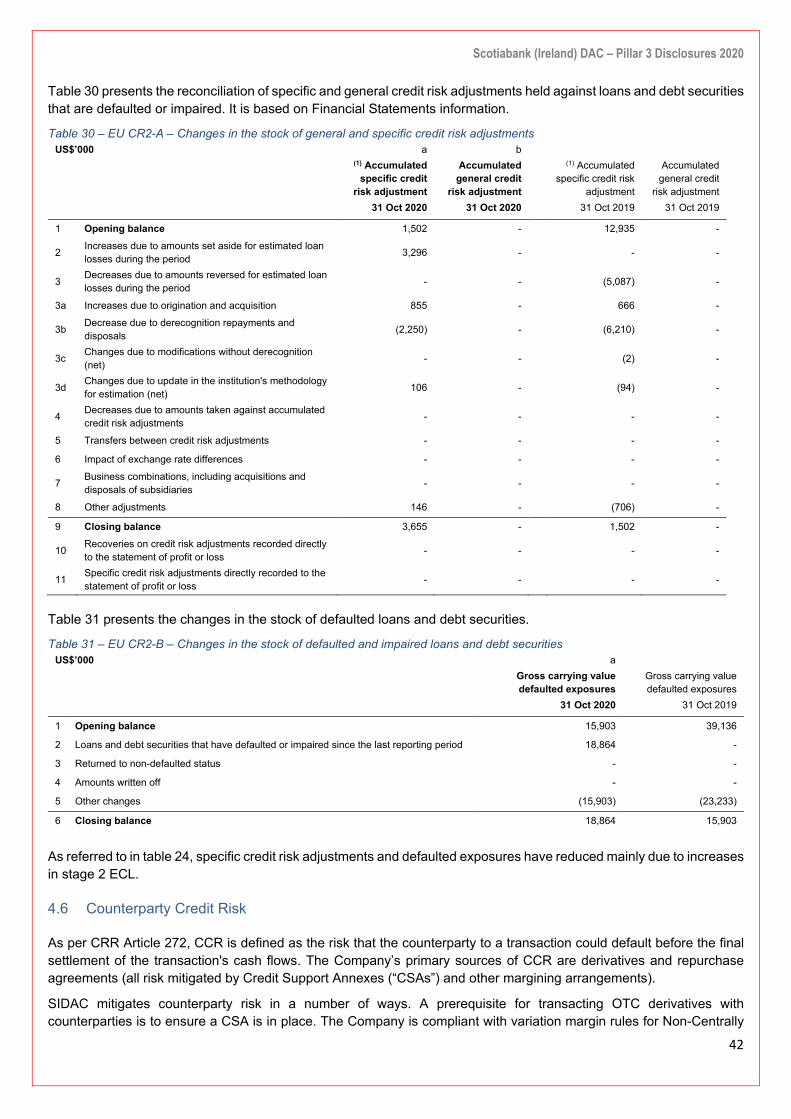
Scotiabank (Ireland) DAC – Pillar 3 Disclosures 2020
42
Table 30 presents the reconciliation of specific and general credit risk adjustments held against loans and debt securities that are defaulted or impaired. It is based on Financial Statements information.
Table 30 – EU CR2-A – Changes in the stock of general and specific credit risk adjustments US$’000 a b
(1) Accumulated
specific credit risk adjustment
Accumulated general credit
risk adjustment
(1) Accumulated specific credit risk
adjustment
Accumulated general credit
risk adjustment
31 Oct 2020 31 Oct 2020 31 Oct 2019 31 Oct 2019
1 Opening balance 1,502 - 12,935 -
2 Increases due to amounts set aside for estimated loan losses during the period 3,296 - - -
3 Decreases due to amounts reversed for estimated loan losses during the period - - (5,087) -
3a Increases due to origination and acquisition 855 - 666 -
3b Decrease due to derecognition repayments and disposals (2,250) - (6,210) -
3c Changes due to modifications without derecognition (net) - - (2) -
3d Changes due to update in the institution's methodology for estimation (net) 106 - (94) -
4 Decreases due to amounts taken against accumulated credit risk adjustments - - - -
5 Transfers between credit risk adjustments - - - -
6 Impact of exchange rate differences - - - -
7 Business combinations, including acquisitions and disposals of subsidiaries - - - -
8 Other adjustments 146 - (706) -
9 Closing balance 3,655 - 1,502 -
10 Recoveries on credit risk adjustments recorded directly to the statement of profit or loss - - - -
11 Specific credit risk adjustments directly recorded to the statement of profit or loss - - - -
Table 31 presents the changes in the stock of defaulted loans and debt securities.
Table 31 – EU CR2-B – Changes in the stock of defaulted and impaired loans and debt securities US$’000 a Gross carrying value
defaulted exposures Gross carrying value defaulted exposures
31 Oct 2020 31 Oct 2019
1 Opening balance 15,903 39,136
2 Loans and debt securities that have defaulted or impaired since the last reporting period 18,864 -
3 Returned to non-defaulted status - -
4 Amounts written off - -
5 Other changes (15,903) (23,233)
6 Closing balance 18,864 15,903
As referred to in table 24, specific credit risk adjustments and defaulted exposures have reduced mainly due to increases in stage 2 ECL.
4.6 Counterparty Credit Risk
As per CRR Article 272, CCR is defined as the risk that the counterparty to a transaction could default before the final settlement of the transaction's cash flows. The Company’s primary sources of CCR are derivatives and repurchase agreements (all risk mitigated by Credit Support Annexes (“CSAs”) and other margining arrangements).
SIDAC mitigates counterparty risk in a number of ways. A prerequisite for transacting OTC derivatives with counterparties is to ensure a CSA is in place. The Company is compliant with variation margin rules for Non-Centrally

Scotiabank (Ireland) DAC – Pillar 3 Disclosures 2020
43
Cleared Derivatives. This in effect reduced variation margin thresholds to zero. The Company now transacts interest rate swaps via Central Counterparty clearing (“CCP”) (facilitated by Scotiabank) which mitigates counterparty credit risk. These techniques are documented in standard trading agreements. Counterparty limits are set by the Company for each individual counterparty, guided by advice and counsel from Scotiabank GRM. Sub-limits can be put in place for each product type. The risk is monitored independently by CRF on a daily basis.
Netting and collaterals held
Legal agreements providing for enforceable master netting arrangements are put in place with counterparties, guided by Scotiabank legal counsel. These include International Swaps and Derivatives Association (“ISDA”) agreements and collateral arrangements (Global Master Repurchase Agreement (“GMRA”) and CSA). Note that these arrangements do not meet the criteria for offsetting in the balance sheet. This is because they create for the parties to the agreement a right of set-off of recognised amounts that is enforceable only following an event of default, insolvency or bankruptcy of the Company or the counterparties or following other predetermined events. In addition, the Company and its counterparties do not intend to settle on a net basis or to realise the assets and settle the liabilities simultaneously.
The Company is unrated by ECAIs and so is not exposed to the effects of a downgrade of its own credit rating. There is also no risk of increased collateral requirements as a result of a downgrade of the Company’s parent as the Company’s credit support agreements do not allow for triggers for the posting of additional collateral due to increased counterparty risk.
Collateral arising in respect of any credit risk exposures is managed through daily monitoring and by comparison of mark-to-market values of applicable positions against collateral calls. With regard to repurchase agreements, when the values exceed collateral thresholds, collateral calls are made. The acceptable types of collateral are reviewed on an annual basis as part of the annual limit review process.
When calculating the CVA capital charge, the Company uses the Standardised Approach, as permitted by the Regulation.
Table 32 – EU CCR5-A – Impact of netting and collateral held on exposure values 31 Oct 2020 31 Oct 2019 US$’000 a b c d e
Gross positive fair value or net
carrying amount
Netting benefits
Netted current
credit exposure
Collateral held
Net credit
exposure
Gross positive fair value or net
carrying amount
Netting benefits
Netted current
credit exposure
Collateral held
Net credit
exposure 1 Derivatives 13,074 12,883 191 - 191 15,752 14,897 855 329 526 2 SFTs - - - - - 353,067 - 353,067 346,251 6,816
3 Cross-product netting
- - - - - - - - - -
4 Total 13,074 12,883 191 - 191 368,819 14,897 353,922 346,580 7,342
Table 33 – EU CCR5-B – Composition of collateral for exposures to CCR 31 Oct 2020 31 Oct 2019
US$’000 a b c d e f a b c d e f Collateral used in derivative transactions Collateral used in derivative transactions
Fair value of collateral received
Fair value of posted collateral
Collateral used in SFTs
Fair value of collateral received
Fair value of posted collateral
Collateral used in SFTs
Segre- gated
Unsegre- gated
Segre- gated
Unsegre- gated
Fair value of collateral received
Fair value of posted collateral
Segre- gated
Unsegre- gated
Segre- gated
Unsegre- gated
Fair value of collateral received
Fair value of collateral received
Cash - - - 1,520 - - 329 - 2,960 - 353,067-
Sovereign debt - - - - - - - - - - 346,251 -
Total - - - 1,520 - - - 329 - 2,960 346,251 353,067
Table 32 shows the impact of netting and collateral held on exposures and table 33 provides a breakdown of all types of collateral posted or received to support or reduce CCR exposures related to derivative transactions and to SFTs. The decrease in net credit exposure in 2020 is due mostly to a reduction in positive market value of forward foreign exchange contracts while the movement in derivative cash collateral received/posted reflects market value movements in
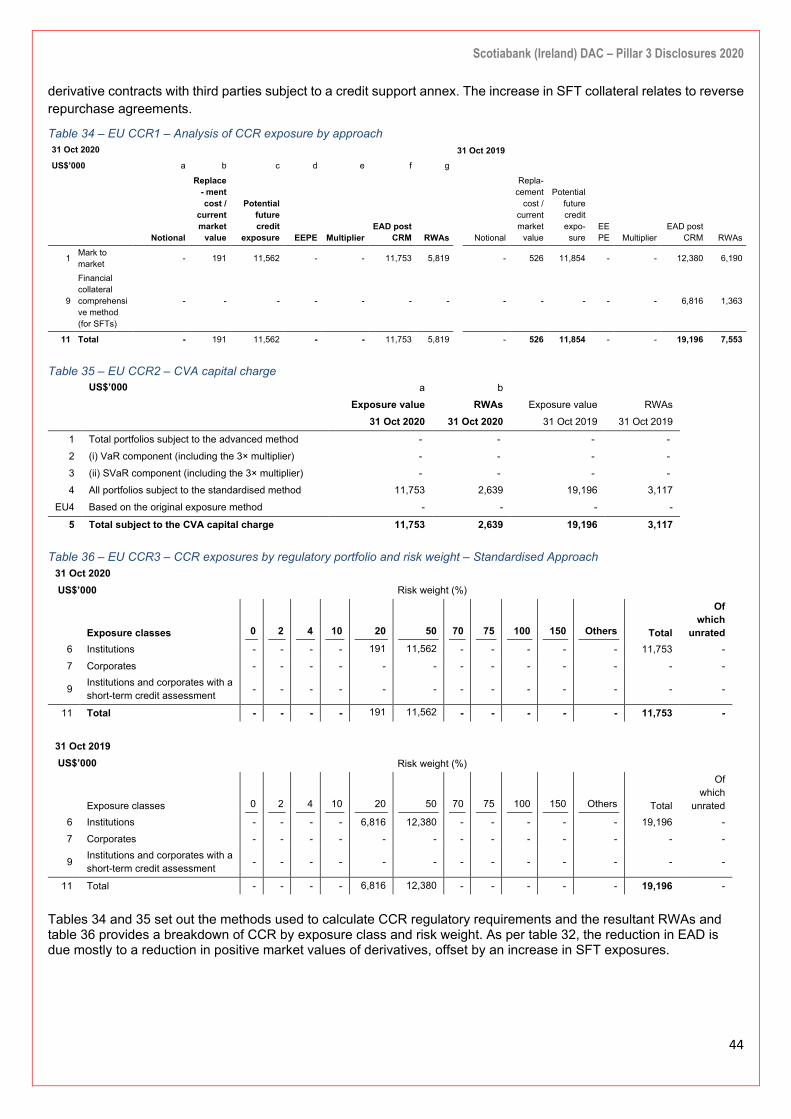
Scotiabank (Ireland) DAC – Pillar 3 Disclosures 2020
44
derivative contracts with third parties subject to a credit support annex. The increase in SFT collateral relates to reverse repurchase agreements.
Table 34 – EU CCR1 – Analysis of CCR exposure by approach 31 Oct 2020 31 Oct 2019
US$’000 a b c d e f g
Notional
Replace- ment cost /
current market
value
Potential future credit
exposure EEPE Multiplier EAD post
CRM RWAs
Notional
Repla-cement
cost / current market
value
Potential future credit expo- sure
EEPE Multiplier
EAD post CRM RWAs
1 Mark to market - 191 11,562 - - 11,753 5,819 - 526 11,854 - - 12,380 6,190
9
Financial collateral comprehensive method (for SFTs)
- - - - - - - - - - - - 6,816 1,363
11 Total - 191 11,562 - - 11,753 5,819 - 526 11,854 - - 19,196 7,553
Table 35 – EU CCR2 – CVA capital charge US$’000 a b
Exposure value RWAs Exposure value RWAs 31 Oct 2020 31 Oct 2020 31 Oct 2019 31 Oct 2019
1 Total portfolios subject to the advanced method - - - - 2 (i) VaR component (including the 3× multiplier) - - - - 3 (ii) SVaR component (including the 3× multiplier) - - - - 4 All portfolios subject to the standardised method 11,753 2,639 19,196 3,117
EU4 Based on the original exposure method - - - -
5 Total subject to the CVA capital charge 11,753 2,639 19,196 3,117
Table 36 – EU CCR3 – CCR exposures by regulatory portfolio and risk weight – Standardised Approach 31 Oct 2020 US$’000 Risk weight (%)
Exposure classes 0 2 4 10 20 50 70 75 100 150 Others Total
Of which
unrated 6 Institutions - - - - 191 11,562 - - - - - 11,753 - 7 Corporates - - - - - - - - - - - - -
9 Institutions and corporates with a short-term credit assessment - - - - - - - - - - - - -
11 Total - - - - 191 11,562 - - - - - 11,753 -
31 Oct 2019 US$’000 Risk weight (%)
Exposure classes 0 2 4 10 20 50 70 75 100 150 Others Total
Of which
unrated 6 Institutions - - - - 6,816 12,380 - - - - - 19,196 - 7 Corporates - - - - - - - - - - - - -
9 Institutions and corporates with a short-term credit assessment - - - - - - - - - - - - -
11 Total - - - - 6,816 12,380 - - - - - 19,196 -
Tables 34 and 35 set out the methods used to calculate CCR regulatory requirements and the resultant RWAs and table 36 provides a breakdown of CCR by exposure class and risk weight. As per table 32, the reduction in EAD is due mostly to a reduction in positive market values of derivatives, offset by an increase in SFT exposures.

Scotiabank (Ireland) DAC – Pillar 3 Disclosures 2020
45
4.7 Credit Risk Stress Testing
SIDAC performs quarterly credit stress tests (industry credit stress test and risk weighted assets stress test) which are presented to CC/ALCO respectively and the BRC. The first represents a general recessionary environment that is not rooted in macroeconomic variables, but rather characterised by a prolonged global economic downturn, which greatly impacts the economic growth in the region. The IG ratings of individual borrowers within their respective industries are generated using the specific risk factors pertinent to each of these industries through BNS internal rating models. These factors include the financial strength of the borrower, expected changes in market conditions, and industry specific factors. Changes in these risk factors as a result of the stress scenario are translated into a migration of the borrower’s credit risk rating and the primary measure of impact is the increase in expected credit losses (ECL). The stress test results in an instantaneous shock to the portfolio assuming the rating migration of the borrowers occurred.
The second estimates the change in regulatory capital requirements that would arise during a mild recession. This is derived by performing a one-notch downgrade of each asset and calculating the resulting capital requirement based on the new risk-weighting of the assets.
In addition, SIDAC performs an annual securitisation stress test which addresses the credit risk of the underlying pool, including default risk and tranche overcollateralization
SIDAC has adopted the Scotiabank model for the computation of expected losses under stressed conditions for inclusion in its ICAAP Enterprise Wide Stress Test (EWST). A stressed credit risk impact is estimated, based on the model, by translating the macro-economic environment projected in each scenario into credit downgrade scenarios.
4.8 Wrong-way Risk
Wrong-way risk is a form of CCR which occurs when the exposure to a counterparty is adversely correlated with the credit quality of that counterparty, causing the default risk and credit exposure to increase together. The Company’s derivative counterparty risks and CVA are potentially sensitive to wrong-way risks. These risks are managed and monitored through limit controls at counterparty level resulting in minimal wrong-way risk exposures.
5 Market Risk
This is the current or prospective risk to earnings and capital arising from adverse movements in asset prices, foreign exchange rates and interest rates. This can arise from dealing in debt and equity securities, currencies or derivatives.
5.1 Market Risk Management and Risk Measures
The Company’s ALCO has a mandate to oversee market risk in accordance with the Board’s risk appetite. The Board charges Senior Management with the implementation of its market risk policies and management of its business activities. The Company’s ALCO meets usually monthly throughout the year and is responsible for monitoring its risk exposures and the activities that give rise to these exposures. The Treasury function is responsible for the execution and controls of market and structural risk management, with 2nd line of defence oversight from Risk Management.
The principal market risk that the Company is exposed to is interest rate risk in the banking book. The Company is also exposed to foreign exchange risk. SIDAC does not currently engage in proprietary trading activity.
5.1.1 Interest Rate Risk
Interest rate risk arises within Treasury activities, principally in relation to the Investment positions held for liquidity management purposes. Part of the Company’s return on financial instruments is obtained from controlled mismatching of the dates on which interest receivable on assets and payable on liabilities is next reset.
All aspects of this risk are closely monitored and controlled. The Board articulates its appetite for Market Risk, in the Risk Appetite Framework (‘RAF’) setting limits and approving the annual Business Plan and policy papers. Risk appetite limits along with early warning indicators are set to control SIDAC’s market and structural risk exposures, and to highlight any potential weaknesses or pressure points. The RAF limits are approved at least annually by the Board. Performance against these metrics is monitored and reported by Risk Management to ALCO and ExCo monthly, and to the BRC on
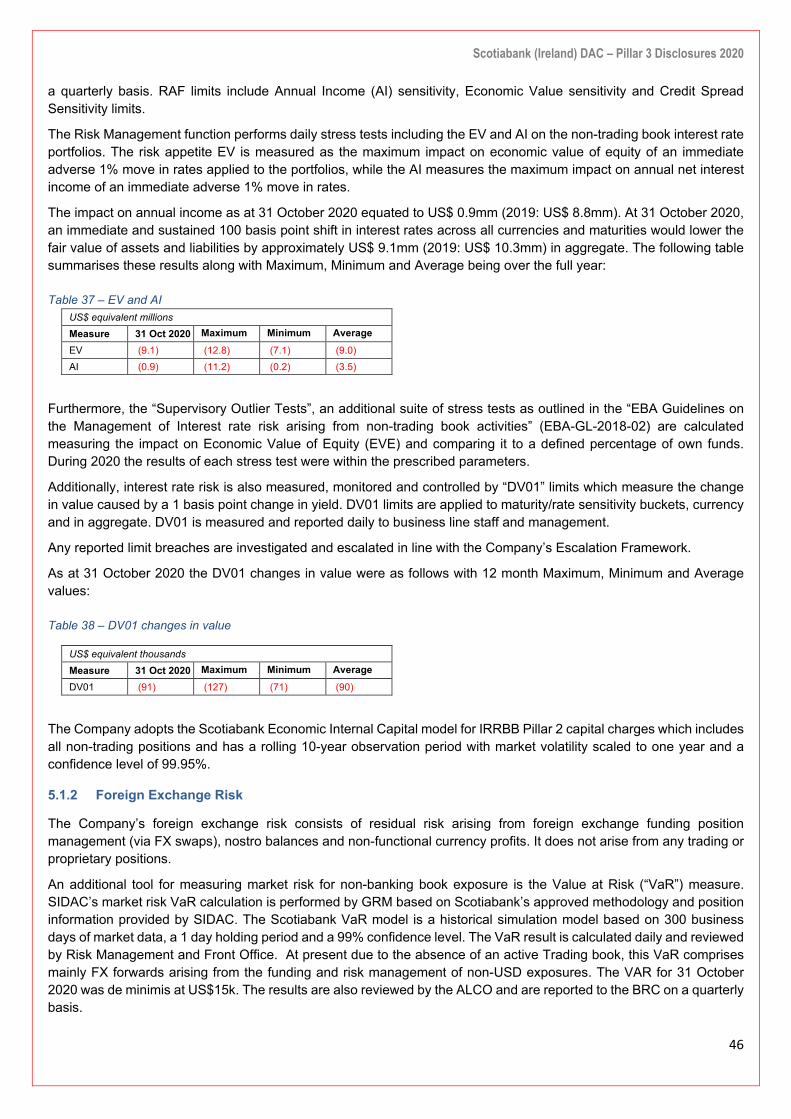
Scotiabank (Ireland) DAC – Pillar 3 Disclosures 2020
46
a quarterly basis. RAF limits include Annual Income (AI) sensitivity, Economic Value sensitivity and Credit Spread Sensitivity limits.
The Risk Management function performs daily stress tests including the EV and AI on the non-trading book interest rate portfolios. The risk appetite EV is measured as the maximum impact on economic value of equity of an immediate adverse 1% move in rates applied to the portfolios, while the AI measures the maximum impact on annual net interest income of an immediate adverse 1% move in rates.
The impact on annual income as at 31 October 2020 equated to US$ 0.9mm (2019: US$ 8.8mm). At 31 October 2020, an immediate and sustained 100 basis point shift in interest rates across all currencies and maturities would lower the fair value of assets and liabilities by approximately US$ 9.1mm (2019: US$ 10.3mm) in aggregate. The following table summarises these results along with Maximum, Minimum and Average being over the full year:
Table 37 – EV and AI US$ equivalent millions
Measure 31 Oct 2020 Maximum Minimum Average EV (9.1) (12.8) (7.1) (9.0) AI (0.9) (11.2) (0.2) (3.5)
Furthermore, the “Supervisory Outlier Tests”, an additional suite of stress tests as outlined in the “EBA Guidelines on the Management of Interest rate risk arising from non-trading book activities” (EBA-GL-2018-02) are calculated measuring the impact on Economic Value of Equity (EVE) and comparing it to a defined percentage of own funds. During 2020 the results of each stress test were within the prescribed parameters.
Additionally, interest rate risk is also measured, monitored and controlled by “DV01” limits which measure the change in value caused by a 1 basis point change in yield. DV01 limits are applied to maturity/rate sensitivity buckets, currency and in aggregate. DV01 is measured and reported daily to business line staff and management.
Any reported limit breaches are investigated and escalated in line with the Company’s Escalation Framework.
As at 31 October 2020 the DV01 changes in value were as follows with 12 month Maximum, Minimum and Average values:
Table 38 – DV01 changes in value
US$ equivalent thousands
Measure 31 Oct 2020 Maximum Minimum Average DV01 (91) (127) (71) (90)
The Company adopts the Scotiabank Economic Internal Capital model for IRRBB Pillar 2 capital charges which includes all non-trading positions and has a rolling 10-year observation period with market volatility scaled to one year and a confidence level of 99.95%.
5.1.2 Foreign Exchange Risk
The Company’s foreign exchange risk consists of residual risk arising from foreign exchange funding position management (via FX swaps), nostro balances and non-functional currency profits. It does not arise from any trading or proprietary positions.
An additional tool for measuring market risk for non-banking book exposure is the Value at Risk (“VaR”) measure. SIDAC’s market risk VaR calculation is performed by GRM based on Scotiabank’s approved methodology and position information provided by SIDAC. The Scotiabank VaR model is a historical simulation model based on 300 business days of market data, a 1 day holding period and a 99% confidence level. The VaR result is calculated daily and reviewed by Risk Management and Front Office. At present due to the absence of an active Trading book, this VaR comprises mainly FX forwards arising from the funding and risk management of non-USD exposures. The VAR for 31 October 2020 was de minimis at US$15k. The results are also reviewed by the ALCO and are reported to the BRC on a quarterly basis.
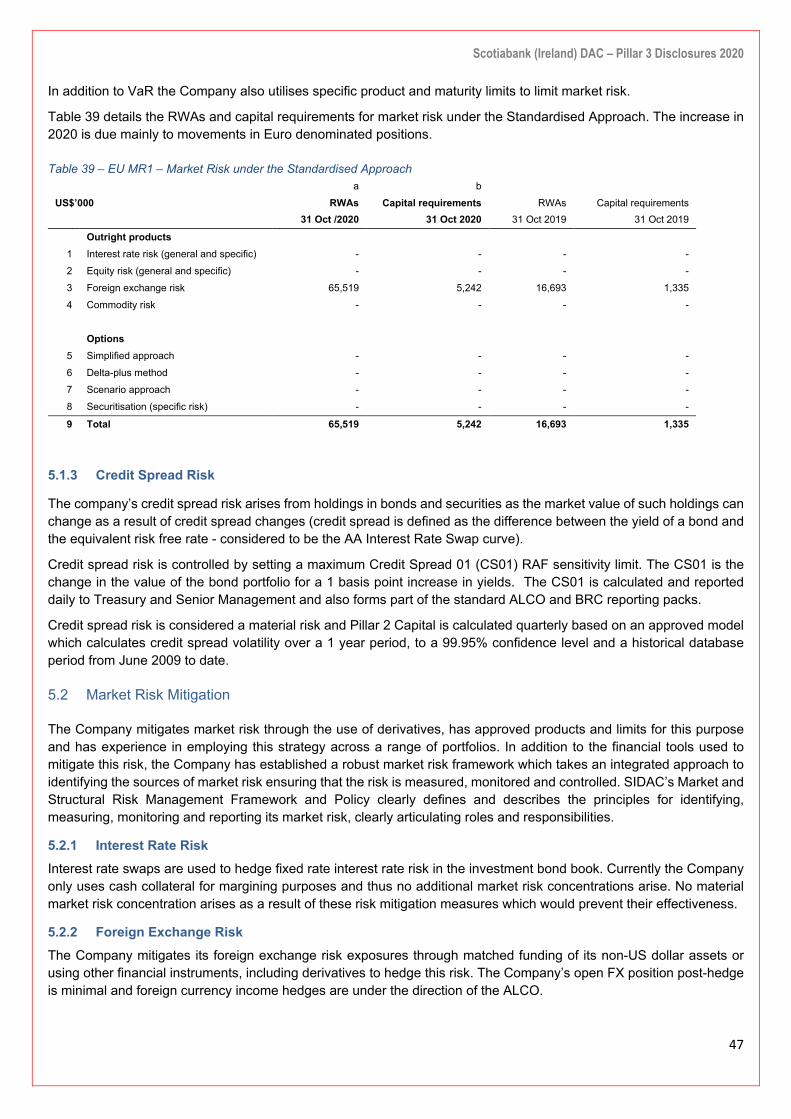
Scotiabank (Ireland) DAC – Pillar 3 Disclosures 2020
47
In addition to VaR the Company also utilises specific product and maturity limits to limit market risk.
Table 39 details the RWAs and capital requirements for market risk under the Standardised Approach. The increase in 2020 is due mainly to movements in Euro denominated positions.
Table 39 – EU MR1 – Market Risk under the Standardised Approach
5.1.3 Credit Spread Risk
The company’s credit spread risk arises from holdings in bonds and securities as the market value of such holdings can change as a result of credit spread changes (credit spread is defined as the difference between the yield of a bond and the equivalent risk free rate - considered to be the AA Interest Rate Swap curve).
Credit spread risk is controlled by setting a maximum Credit Spread 01 (CS01) RAF sensitivity limit. The CS01 is the change in the value of the bond portfolio for a 1 basis point increase in yields. The CS01 is calculated and reported daily to Treasury and Senior Management and also forms part of the standard ALCO and BRC reporting packs.
Credit spread risk is considered a material risk and Pillar 2 Capital is calculated quarterly based on an approved model which calculates credit spread volatility over a 1 year period, to a 99.95% confidence level and a historical database period from June 2009 to date.
5.2 Market Risk Mitigation
The Company mitigates market risk through the use of derivatives, has approved products and limits for this purpose and has experience in employing this strategy across a range of portfolios. In addition to the financial tools used to mitigate this risk, the Company has established a robust market risk framework which takes an integrated approach to identifying the sources of market risk ensuring that the risk is measured, monitored and controlled. SIDAC’s Market and Structural Risk Management Framework and Policy clearly defines and describes the principles for identifying, measuring, monitoring and reporting its market risk, clearly articulating roles and responsibilities.
5.2.1 Interest Rate Risk Interest rate swaps are used to hedge fixed rate interest rate risk in the investment bond book. Currently the Company only uses cash collateral for margining purposes and thus no additional market risk concentrations arise. No material market risk concentration arises as a result of these risk mitigation measures which would prevent their effectiveness.
5.2.2 Foreign Exchange Risk The Company mitigates its foreign exchange risk exposures through matched funding of its non-US dollar assets or using other financial instruments, including derivatives to hedge this risk. The Company’s open FX position post-hedge is minimal and foreign currency income hedges are under the direction of the ALCO.
a b
US$’000 RWAs Capital requirements RWAs Capital requirements 31 Oct /2020 31 Oct 2020 31 Oct 2019 31 Oct 2019 Outright products
1 Interest rate risk (general and specific) - - - - 2 Equity risk (general and specific) - - - - 3 Foreign exchange risk 65,519 5,242 16,693 1,335 4 Commodity risk - - - -
Options
5 Simplified approach - - - - 6 Delta-plus method - - - - 7 Scenario approach - - - - 8 Securitisation (specific risk) - - - -
9 Total 65,519 5,242 16,693 1,335
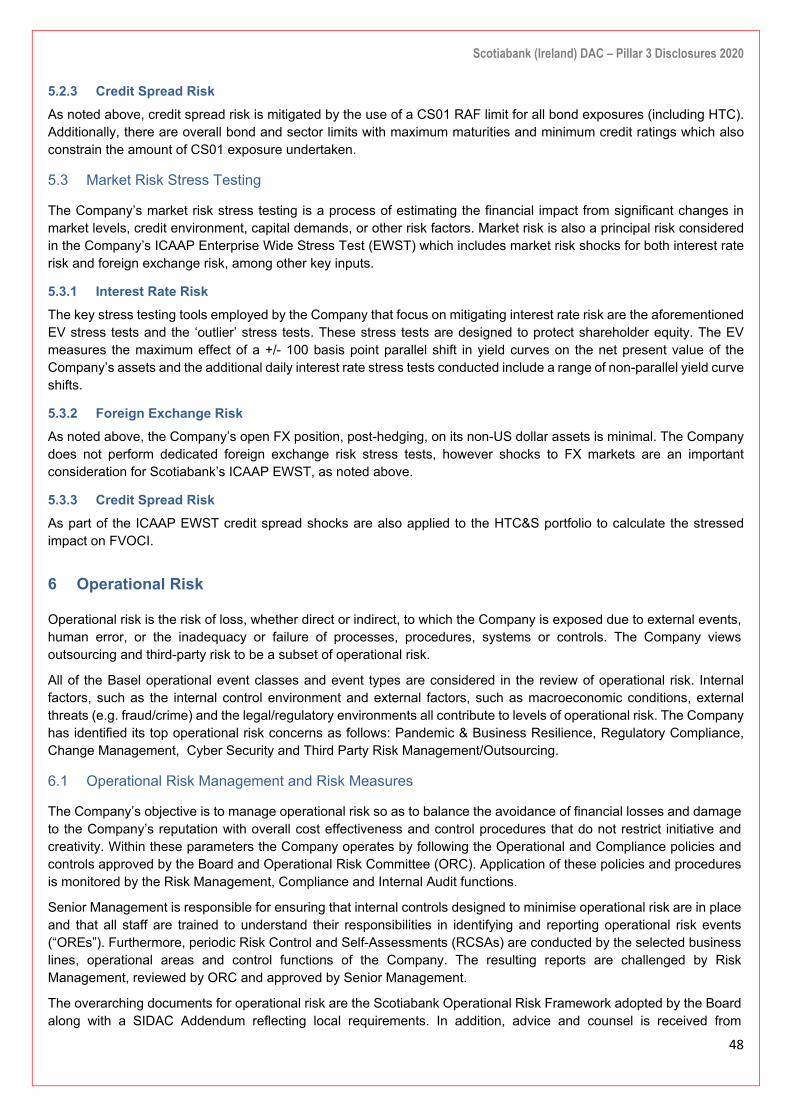
Scotiabank (Ireland) DAC – Pillar 3 Disclosures 2020
48
5.2.3 Credit Spread Risk As noted above, credit spread risk is mitigated by the use of a CS01 RAF limit for all bond exposures (including HTC). Additionally, there are overall bond and sector limits with maximum maturities and minimum credit ratings which also constrain the amount of CS01 exposure undertaken.
5.3 Market Risk Stress Testing
The Company’s market risk stress testing is a process of estimating the financial impact from significant changes in market levels, credit environment, capital demands, or other risk factors. Market risk is also a principal risk considered in the Company’s ICAAP Enterprise Wide Stress Test (EWST) which includes market risk shocks for both interest rate risk and foreign exchange risk, among other key inputs.
5.3.1 Interest Rate Risk The key stress testing tools employed by the Company that focus on mitigating interest rate risk are the aforementioned EV stress tests and the ‘outlier’ stress tests. These stress tests are designed to protect shareholder equity. The EV measures the maximum effect of a +/- 100 basis point parallel shift in yield curves on the net present value of the Company’s assets and the additional daily interest rate stress tests conducted include a range of non-parallel yield curve shifts.
5.3.2 Foreign Exchange Risk As noted above, the Company’s open FX position, post-hedging, on its non-US dollar assets is minimal. The Company does not perform dedicated foreign exchange risk stress tests, however shocks to FX markets are an important consideration for Scotiabank’s ICAAP EWST, as noted above.
5.3.3 Credit Spread Risk As part of the ICAAP EWST credit spread shocks are also applied to the HTC&S portfolio to calculate the stressed impact on FVOCI.
6 Operational Risk
Operational risk is the risk of loss, whether direct or indirect, to which the Company is exposed due to external events, human error, or the inadequacy or failure of processes, procedures, systems or controls. The Company views outsourcing and third-party risk to be a subset of operational risk.
All of the Basel operational event classes and event types are considered in the review of operational risk. Internal factors, such as the internal control environment and external factors, such as macroeconomic conditions, external threats (e.g. fraud/crime) and the legal/regulatory environments all contribute to levels of operational risk. The Company has identified its top operational risk concerns as follows: Pandemic & Business Resilience, Regulatory Compliance, Change Management, Cyber Security and Third Party Risk Management/Outsourcing.
6.1 Operational Risk Management and Risk Measures
The Company’s objective is to manage operational risk so as to balance the avoidance of financial losses and damage to the Company’s reputation with overall cost effectiveness and control procedures that do not restrict initiative and creativity. Within these parameters the Company operates by following the Operational and Compliance policies and controls approved by the Board and Operational Risk Committee (ORC). Application of these policies and procedures is monitored by the Risk Management, Compliance and Internal Audit functions.
Senior Management is responsible for ensuring that internal controls designed to minimise operational risk are in place and that all staff are trained to understand their responsibilities in identifying and reporting operational risk events (“OREs”). Furthermore, periodic Risk Control and Self-Assessments (RCSAs) are conducted by the selected business lines, operational areas and control functions of the Company. The resulting reports are challenged by Risk Management, reviewed by ORC and approved by Senior Management.
The overarching documents for operational risk are the Scotiabank Operational Risk Framework adopted by the Board along with a SIDAC Addendum reflecting local requirements. In addition, advice and counsel is received from

Scotiabank (Ireland) DAC – Pillar 3 Disclosures 2020
49
Scotiabank GRM on the addendum. Additional supporting BNS policies include the BNS New Initiative Risk Management policy, the BNS Model Risk Management Policy, the Business Continuity Policy, the Global Third Party Risk Management Policy and the Internal Control Policy, adopted by the Board each with a local addendum.
The Company recognises the range of operational risks that are inherent in any organisation and uses appropriate Key Risk Indicators (“KRIs”) to monitor each category. KRIs are reviewed by the ORC and presented quarterly to the AC. The AC report also includes qualitative measures of operational risk and a summary and analysis of operational risk events.
Procedures exist for the identification, assessment and reporting of operational risk events, with reports being evaluated and categorised for severity by the owner and reviewed and challenged by the Risk Management function. Reporting of OREs, including analysis of root cause and any trends, is provided to ORC. Remedial action identified as required is tracked by the Risk Management function for completion and progress or delinquency is reported to the ORC. Regulatory reporting for Operational risk is also a requirement as a condition of the Company’s banking licence and this is produced quarterly by the Risk Management function.
6.2 Methodology and Approaches to Operational Risk
The CRR sets out three approaches for calculating exposure values and capital requirements for operational risk: Basic Indicator Approach, Standardised Approach, and the Advanced Measurement Approach. The Company has elected to use the Basic Indicator Approach. This requires the Company to hold a capital amount equal to 15% of the average of the sum of net interest income and net non-interest income for the three preceding 12-month financial periods for which audited financial information is available.
In 2019, the Company introduced a Scenario Analysis (“SA”) process for the management of operational risk. SA is an integral part of operational risk management as it allows the entity to identify potential weaknesses in its control framework, which might lead to an operational risk exposure. Therefore, this exercise enables the business to create appropriate action plans in order to mitigate risk exposures in the future, promptly addressing any weaknesses identified. SA leverages a number of internal and external data sources, looking at both past data and future trends. This process supports the Internal Capital Assessment and the Pillar 2 computation.
6.3 Operational Risk Mitigation
The Company has put in place policies and procedures to mitigate each of the key elements of operational risk as described above. Operational risk is also mitigated through the holding of capital in the form of Pillar 1 regulatory capital and Pillar 2 capital. SIDAC’s Pillar 2 Internal Capital Adequacy Assessment is based on a Scenario Analysis approach. In addition to the scenarios, SIDAC also developed a correlation matrix which assesses the likelihood of two scenarios occurring at the same time. It is based on the assumption that not all scenarios are likely to materialise simultaneously, which is a prudent approach. The correlation matrix therefore allows for the computation of a ‘diversification benefit’. The Pillar 2 charge is computed as the excess of the Internal Capital Adequacy Assessment over the Pillar 1 amount.
6.4 Operational Risk Stress Testing
Within its Enterprise Wide/ICAAP stress testing SIDAC includes stresses for operational risk which are scenario based. SIDAC includes severe yet plausible operational risks events, selecting those for inclusion after considering a suite of operational risk scenarios.
7 Information Technology risk
Information Technology (IT) risk is categorised as a separate risk from operational risk and is deemed to be a principal risk. This is based on the pervasive nature of IT and cyber security risk and the potential for substantial losses and reputational damage that could be caused by an IT failure. The Company’s IT functions are largely outsourced to its ultimate parent, Scotiabank under a Service Level Agreement (SLA) which is monitored against key performance indicators monthly. IT risk is managed by first line staff with oversight by Risk Management locally and via the specialist second line resource shared across GBM Europe. IT risk is monitored by the first line against a range of indicators (e.g. system disruption and downtime) which, along with overall “RAG” status, are assessed and challenged by Risk Management.

Scotiabank (Ireland) DAC – Pillar 3 Disclosures 2020
50
Scotiabank and its subsidiaries are exposed to cyber security risks, which may include theft of assets, unauthorized access to sensitive information, or operational disruption due to breaches of cyber security. Scotiabank has implemented a robust and continuously evolving cyber security program to keep pace with evolving threats in which the Company participates. While computer systems continue to be subject to sophisticated cyber-attack attempts, Scotiabank’s countermeasures in place remain effective. The Company, assisted by Scotiabank IT staff, and in particular supported by a shared Cyber Security resource for GBM Europe located in London, continues to actively monitor this risk, leveraging external threat intelligence, internal monitoring, reviewing best practices and implementing additional controls as required to mitigate these risks, while noting that the Company is a less likely target for cyber-crime, since it has no retail dimension. The Company’s Risk Management function also benefits from second line specialist expertise and support in this area provided under an SLA by a Scotiabank resource located in London. While the risk is considered material to the Company, exposure to this risk is sufficiently mitigated by the capital held for operational risk.
8 Compliance Risk and Conduct Risk
Compliance risk is the risk that the Company’s business activities may not be conducted in conformity with applicable Regulations, internal policies and procedures and ethical standards expected by regulators, customers, investors, employees and other stakeholders. “Regulations” means all Governmental Acts, laws, rules, regulations, regulatory guidelines and industry or self-regulatory organizational codes of conduct, rules and by-laws.
Within Scotiabank Conduct Risk is defined as ‘an aggregation of risks arising from actions or behaviours of the Company’s officers, directors, employees, or the conduct of the Company’s business (directly or indirectly), not in conformity with the Company’s values or principles for ethical conduct and which has, or has the potential to have, an adverse impact on the:
• Company; • Company’s customers or employees; or • Integrity of the financial markets in which the Company operates
Compliance Risk and Conduct Risk are both deemed as principal risks to SIDAC.
Compliance risk arises throughout the Company with respect to on-going compliance with transactions, documentation and a wide range of prudential and conduct of business regulations, including regulatory reporting. This risk is heightened as a result of:
- Increased volume and complexity of new regulations and changes to existing regulatory obligations (such as Markets In Financial Instruments Directive II (MiFID II/MiFIR), European Market Infrastructure Regulation (EMIR), Securities Financing Transactions Regulation (SFTR), EBA/CBI guidance on Remuneration, Volcker Rule, General Data Protection Regulation (GDPR), Anti-Money Laundering, Fitness & Probity , Basel III, Recovery and Resolution Planning, Corporate Governance, Conduct Standards and expectations, etc.) and focus by regulators on non-financial risk such as conduct risk;
- Increased number of regulatory bodies and associations whose rules or guidance have application to the Company’s activities; e.g. CBI, EBA, Basel, ESMA, Financial Action Task Force (FATF), Office of the Superintendent of Financial Institutions (OSFI);
- Extra-territorial scope for international regulation e.g. Volcker, Foreign Account Tax Compliance Act (FATCA), EMIR, GDPR;
- Increased volume and complexity of reporting requirements and impact on existing systems; and
- Increased level of scrutiny, enquiry, inspection and regulatory enforcement by the CBI with an expectation that recommendations will be dealt with promptly.
While the risk is considered material to the Company, exposure to this risk is sufficiently mitigated by the capital held for operational risk.
8.1 Governance and Controls
The Board is ultimately responsible for overseeing the execution of the Company’s Compliance Risk Summary Framework and Culture and Conduct Risk Framework with local addenda. The Board approves a number of policies

Scotiabank (Ireland) DAC – Pillar 3 Disclosures 2020
51
supporting regulatory compliance and conduct. The Director, Head of Compliance has a reporting line directly to the AC and presents a report to that committee quarterly on all compliance or regulatory issues arising. The Compliance & Conduct (CCC) is the management committee responsible for ensuring that the risk of the Company being non-compliant with new or current legal and regulatory requirements is effectively managed and controlled, along with overseeing Conduct Risk. A separate Conduct Risk Committee (a sub-committee of ROC) oversees instances of staff mis-conduct risk where they occur and considers potential variable compensation impact. This Committee is separate to the CCC.
Also, the Financial Crime Committee, which is a management committee, oversees financial crime risk
9 Liquidity Risk
Liquidity Risk is the risk of being unable to meet financial obligations as they fall due without incurring unacceptable losses. Financial obligations include liabilities to depositors, payments due under derivatives contracts, settlement of secured funding transactions, and credit and liquidity contractual and non-contractual commitments.
9.1 Liquidity Risk Identification and Mitigation
Liquidity risk is identified as a principal risk as noted in section 3. Through an analysis of its business lines, operating procedures, EBA guidelines and relevant regulatory requirements, the Company has identified several risk drivers to which the institution is exposed in relation to liquidity risk and funding risk. The Company has adopted policies and measures to mitigate these risks.
Tactical Liquidity Risk
Tactical (short-term or operational) liquidity risk associated with daily funding requirements in the normal course of business applicable to the period from day zero to day thirty (in calendar days) is mitigated through the management of the maturity profile of SIDAC’s funding and by ensuring adequate liquid assets to cover net outflows, facilitated by the application of many liquidity risk tools including but not limited to:
• Liquidity Coverage Ratio (“LCR”) • Cash Gaps • Forecasting
Structural Liquidity Risk
Structural (or long-term) liquidity risk is associated with mismatches in effective maturities between assets and liabilities (more specifically the over-reliance on short-term liabilities to fund longer-term, less liquid assets) as relates to the period beyond 30 calendar days. SIDAC ensures that it acquires appropriate levels of stable / longer dated funding and uses tools such as the Net Stable Funding Ratio (“NSFR”) and forecasting to manage this risk.
Contingent Liquidity Risk
This relates to the impact of and intended responses to sudden stress events.
Liquid Assets Risk
Liquid assets risk relates to a potential situation where there are not enough liquid assets convertible to cash in a timely manner to cover outflows. SIDAC ensures that it maintains a diversified pool of high-quality liquid assets that can be converted to cash in a timely manner in order to cover cash outflows or to cover the additional need for liquidity that may arise over a defined short period of time under stress conditions. This is supported by LCR metrics, Single currency LCR limits and Minimum Liquidity Buffer requirements.
Funding Concentration Risk (intergoup liquidity risk)
SIDAC recognises that is has significant reliance on BNS for funding with the remainder being comprised of a significant portion of capital. SIDAC has identified contingent sources of funding through which it can access alternative funding. Treasury undertake regular testing of repo markets to ensure continued access to repo markets and that bond haircuts can be also tested. It evaluates its ability to withstand crisis situations through the execution of its Liquidity Stress Testing (LST) framework.

Scotiabank (Ireland) DAC – Pillar 3 Disclosures 2020
52
Off-balance Sheet Liquidity Risk
This relates to undrawn lines under committed credit facilities (including SBLCs). Assumptions on the amounts and timings of potential drawings are made under the LST during normal and stressed business conditions. The undrawn committed facilities can be drawn in the Company’s key operational currencies and also its non-material currencies, the potential for which is comparatively low. As noted above, the Company relies on the FX market to fund its non-USD exposures. Assumptions are made within the Liquidity Stress Test (“LST”) framework about the extent and timing of drawings during normal business and under a market disruption.
Cross-Currency Risk
A significant driver of liquidity risk is cross-currency risk as the Company’s business is multi-currency, with the key operational currencies identified as EUR, GBP and USD. The Company’s capital and its liability base are denominated in USD, sourced from Group affiliates. The Company’s business activities require it to fund assets denominated in currencies other than USD. In order for the Treasury function to efficiently fund these non-USD assets, it transacts foreign exchange (FX) swaps to fund its non-USD positions.
FX Swaps are transacted on a frequent and ongoing basis and are currently executed with Scotiabank Group entities. Potential future shortfalls in the funding of non-USD currencies are identified in advance and remedied via FX Swaps
The Company is cognisant that its sources of funding are not diversified, and concentration risk is generated as a result of its dependence on FX swap instruments transacted with Group entities. This risk is mitigated by imposing limits on the percentage amount of funding that can be conducted via FX, by holding a large portfolio of liquid assets and other unencumbered assets in various currencies, as well as by managing the maturity mismatch by ensuring diversification of the funding maturity profile. Risk metrics have been established to ensure the aforementioned mitigants are effective (see table 12).
Intraday Liquidity Risk
Intraday liquidity risk is the risk that a bank fails to manage its intraday liquidity properly, which could leave it unable to meet a payment obligation at the time expected, thereby affecting its own liquidity position and that of other parties. The Company faces intraday liquidity risk through participation indirectly in clearing and payment systems via nostro banks used to access them. Its nostro banks are suitably diversified across major international banks. Funding of intraday payments is monitored continuously. External payments are prioritised over inter-group payments and all internal payments are netted where possible. The Company also uses clearing agents for securities. Intraday liquidity risk is monitored via intraday liquidity reports, real time monitoring of major nostro accounts, and monitoring of payments against expected flows amongst other reports.
To mitigate intraday liquidity risk, the Company has overdrafts in place as appropriate. Close monitoring of payments and receipts intraday occurs with escalation of potential non-receipts on a timely basis.
Capital Repatriation Risk A significant proportion of SIDAC’s assets is funded by capital giving rise to a potential increase in funding in the event of capital repatriation. SIDAC’s liquidity and funding risk management strategy has taken this into consideration identifying alternative sources of funding and noting the potential implications including but not limited to elevated costs and impacts on balance sheet exposures. In order to manage the potential funding and liquidity risk associated with any capital or dividend payment SIDAC must evaluate the risk through forecasting and stress test scenarios in order to assess the amount and more specifically the term of the funding required.
In addition to the measures outlined above to address the various liquidity risk drivers, the Company has a US$1bn committed funding facility from Scotiabank.
9.2 Liquidity Risk Management and Risk Measures
The Company’s Internal Liquidity Adequacy Assessment Process (“ILAAP”) and Liquidity and Funding Risk Management Framework & Policy set out in detail the risk measurement and management approaches employed to address this risk. By approving the ILAAP, the Board has satisfied itself as far as possible, that the Company will always have sufficient liquidity to meet its obligations when due, under both normal and stressed conditions, without incurring unacceptable losses or risking damage to the Company’s reputation.

Scotiabank (Ireland) DAC – Pillar 3 Disclosures 2020
53
The Company adopts a number of tools and methodologies to measure and monitor liquidity risk. These include the monitoring of its LCR, a short-term liquidity measure defined under CRD IV, daily. Banks are required to have sufficient high-quality liquid assets to withstand a 30-calendar day liquidity stress scenario. A regulatory minimum ratio as set out in the CRR and associated implementing legislation and EBA guidelines of 100% applies to the Company. As at 31 October 2020, the Company’s LCR exceeded the regulatory minimum and was 267% (31 October 2019: 330%). The Board has set its risk appetite for LCR at an appropriate level and additionally, the Company has Board approved limits on the minimum liquidity buffer that it must maintain.
The NSFR supports the maintenance of a stable funding profile and requires the Company to have sufficient quantities of funding from stable sources. The EU published the finalized fifth Capital Requirements Directive CRD V (EU Directive 2019/878) and the second Capital Requirements Regulation (EU) 2019/876 which amend the existing CRR/CRD IV and provide additional clarity on the NSFR. It confirms the date of 28 June 2021 for a binding regulatory minimum of 100%. The Company has established a Board risk appetite limit in excess of this level. The NSFR ratio is reported weekly to management, monthly to the ALCO and quarterly to the BRC. This ratio is calculated using the Basel Committee on Banking Supervision’s rules as laid out in the document Basel III: The Net Stable Funding Ratio October 2014. As at 31 October 2020 the NSFR was in excess of the risk appetite metric.
Liquidity risk is measured and controlled through the establishment of quantifiable metrics outlined in the Company’s Risk Appetite Framework, namely LCR, NSFR, Monthly Liquidity Buffer and FX funding metrics. This is supplemented by internal liquidity limits and the performance of daily Liquidity Stress Tests (“LST”) applied to the behavioural characteristics of the Company’s portfolio.
The LSTs are conducted daily, and the output from the LST is used to calibrate the appropriate size of the Minimum Liquidity Buffer on a quarterly basis. The Minimum Liquidity Buffer required to cover net stressed cash-outflows under the Combined Extreme Plus liquidity stress scenario for the defined liquidity horizon, using a 12 month rolling data period and the 97.5th percentile to select the tail event. The Minimum Liquidity Buffer mitigates against liquidity stress events that may occur over a short time horizon of 1 week (Acute Liquidity Buffer) and a longer time horizon of a month (Monthly Liquidity Buffer).
The Company has established limits on the maximum liability cash flow gap (i.e. mismatch between inflows and outflows) it can operate and limits are set by currency. These are monitored through a cumulative 10 day and 30 day cash flow gap position report.
Forecasting of key liquidity metrics play a key role in evaluating the potential future liquidity risk at SIDAC with the view to implementing any remediation action required in order to ensure adherence to limits.
9.3 Liquidity Stress Testing
The Company’s Liquidity Stress Testing Framework (the Framework) governs its Liquidity Stress Testing Program (the LST Program). The LST Program is established to ensure that the Company maintains a sufficient liquidity buffer to mitigate liquidity shortfalls from stress events, such as those defined by the scenarios outlined within the Framework. The LST program defines a range of liquidity stress scenarios that could be encountered and includes idiosyncratic (or Scotiabank specific), market wide and combination scenarios, types of stress tests undertaken, their frequency, methodological details, appropriate assumptions and relevant data infrastructure.
The Framework aligns with the principles outlined in the Committee of European Banking Supervisors (CEBS, now European Banking Authority (EBA)) “Guidelines on Liquidity Buffers & Survival Periods” (December 2009) and the EBA Guidelines on Stress-testing GL2018/04 as well as the BNS Liquidity Stress Testing Operating Framework.
Liquidity stress scenarios are based on varying degrees of severity and plausible events under various time horizons. The scenarios are each divided into two levels of severity: severe and extreme, with the addition of a third level of severity under the combined scenario: extreme plus. Please refer to the following table.
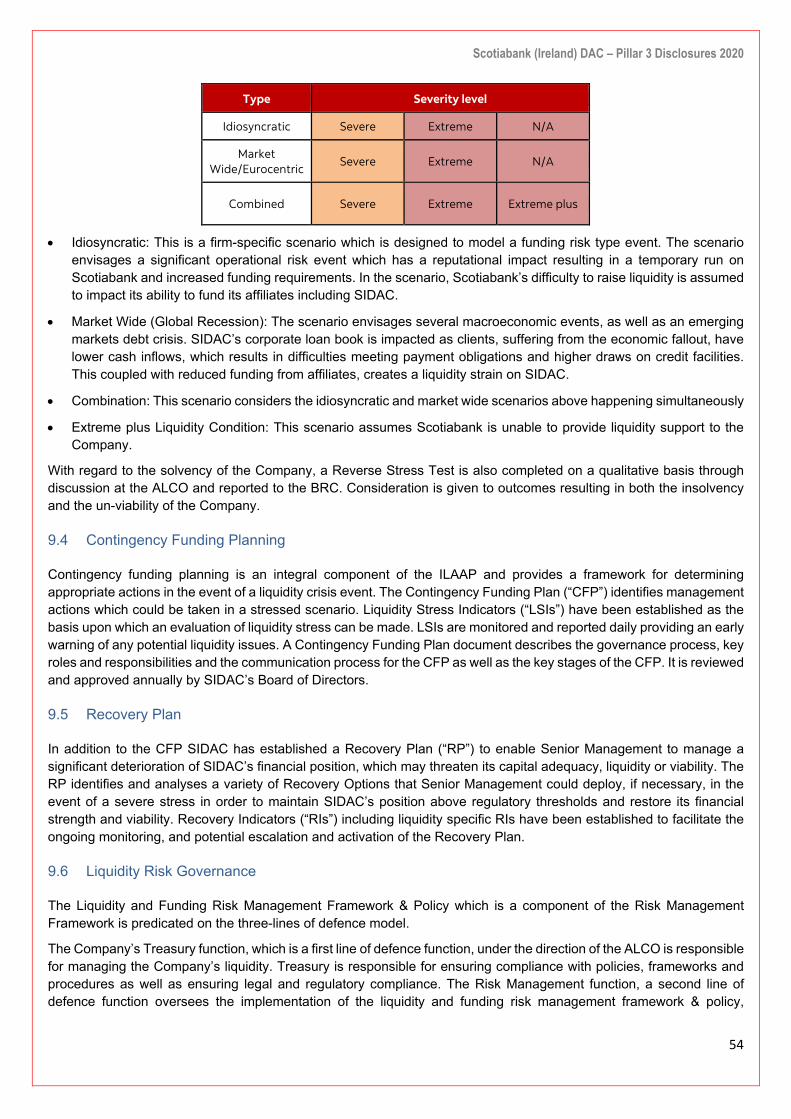
Scotiabank (Ireland) DAC – Pillar 3 Disclosures 2020
54
Type Severity level
Idiosyncratic Severe Extreme N/A
Market Wide/Eurocentric
Severe Extreme N/A
Combined Severe Extreme Extreme plus
• Idiosyncratic: This is a firm-specific scenario which is designed to model a funding risk type event. The scenario envisages a significant operational risk event which has a reputational impact resulting in a temporary run on Scotiabank and increased funding requirements. In the scenario, Scotiabank’s difficulty to raise liquidity is assumed to impact its ability to fund its affiliates including SIDAC.
• Market Wide (Global Recession): The scenario envisages several macroeconomic events, as well as an emerging markets debt crisis. SIDAC’s corporate loan book is impacted as clients, suffering from the economic fallout, have lower cash inflows, which results in difficulties meeting payment obligations and higher draws on credit facilities. This coupled with reduced funding from affiliates, creates a liquidity strain on SIDAC.
• Combination: This scenario considers the idiosyncratic and market wide scenarios above happening simultaneously
• Extreme plus Liquidity Condition: This scenario assumes Scotiabank is unable to provide liquidity support to the Company.
With regard to the solvency of the Company, a Reverse Stress Test is also completed on a qualitative basis through discussion at the ALCO and reported to the BRC. Consideration is given to outcomes resulting in both the insolvency and the un-viability of the Company.
9.4 Contingency Funding Planning
Contingency funding planning is an integral component of the ILAAP and provides a framework for determining appropriate actions in the event of a liquidity crisis event. The Contingency Funding Plan (“CFP”) identifies management actions which could be taken in a stressed scenario. Liquidity Stress Indicators (“LSIs”) have been established as the basis upon which an evaluation of liquidity stress can be made. LSIs are monitored and reported daily providing an early warning of any potential liquidity issues. A Contingency Funding Plan document describes the governance process, key roles and responsibilities and the communication process for the CFP as well as the key stages of the CFP. It is reviewed and approved annually by SIDAC’s Board of Directors.
9.5 Recovery Plan
In addition to the CFP SIDAC has established a Recovery Plan (“RP”) to enable Senior Management to manage a significant deterioration of SIDAC’s financial position, which may threaten its capital adequacy, liquidity or viability. The RP identifies and analyses a variety of Recovery Options that Senior Management could deploy, if necessary, in the event of a severe stress in order to maintain SIDAC’s position above regulatory thresholds and restore its financial strength and viability. Recovery Indicators (“RIs”) including liquidity specific RIs have been established to facilitate the ongoing monitoring, and potential escalation and activation of the Recovery Plan.
9.6 Liquidity Risk Governance
The Liquidity and Funding Risk Management Framework & Policy which is a component of the Risk Management Framework is predicated on the three-lines of defence model.
The Company’s Treasury function, which is a first line of defence function, under the direction of the ALCO is responsible for managing the Company’s liquidity. Treasury is responsible for ensuring compliance with policies, frameworks and procedures as well as ensuring legal and regulatory compliance. The Risk Management function, a second line of defence function oversees the implementation of the liquidity and funding risk management framework & policy,

Scotiabank (Ireland) DAC – Pillar 3 Disclosures 2020
55
providing review and challenge of liquidity and funding risks. Risk Management measures, monitors and reports Liquidity and Funding risk to senior management as well as the BRC.
The ALCO is the committee responsible for the strategic direction for liquidity and funding risk management. It has oversight and monitoring responsibilities with respect to liquidity and funding risk approving ALCO limits and the methodologies used for measuring and managing liquidity risk. It also reviews and challenges the policies, frameworks, strategies and plans with respect to the management of funding and liquidity risk, and consents to their onward submission to the ExCo and/or BRC as appropriate. It also seeks advice and counsel from Scotiabank GRM as appropriate. The Liquidity and Funding Risk Management Framework & Policy receives approval from the Board who also approve liquidity RAFlimits.
9.7 Exposure to Liquidity Risk
Table 40 on the following page has been produced in line with the 2017 EBA Guidelines on LCR disclosure (EBA/GL/2017/01). All figures included in the table represent a 12-month rolling average for each quarter of 2020 and with comparatives for 2019 on the subsequent page.

Scotiabank (Ireland) DAC – Pillar 3 Disclosures 2020
56
Table 40 – EU LIQ1 – LCR Disclosure
2020 Total unweighted value (average) Total weighted value (average) US$’000 31 Oct 31 Jul 30 Apr 31 Jan 31 Oct 31 Jul 30 Apr 31 Jan HIGH QUALITY LIQUID ASSETS 1 Total high-quality liquid assets (HQLA) 1,927,065 2,001,579 2,016,401 1,955,691 CASH OUTFLOWS 2 Retail deposits and deposits from small business customers, of which: - - - - - - - -
3 Stable deposits - - - - - - - -
4 Less stable deposits - - - - - - - - 5 Unsecured wholesale funding 352,562 322,321 358,434 424,671 352,562 322,321 358,434 424,671 6 Operational deposits (all counterparties) and deposits in networks of cooperative banks - - - - - - - -
7 Non-operational deposits (all counterparties) 104,915 65,481 73,820 114,687 104,915 65,481 73,820 114,687 8 Unsecured debt 247,647 256,840 284,614 309,984 247,647 256,840 284,614 309,984 9 Secured wholesale funding 572 572 - - 10 Additional requirements 1,737,656 1,860,531 2,077,275 2,214,736 414,281 414,492 464,602 527,234 11 Outflows related to derivative exposures and other collateral requirements 13,876 8,559 5,909 7,838 13,876 8,559 5,909 7,838 12 Outflows related to loss of funding on debt products - - - - - - - -
13 Credit and liquidity facilities 1,723,780 1,851,972 2,071,366 2,206,897 400,405 405,933 458,693 519,395 14 Other contractual funding obligations 11,864 12,289 12,102 42,121 9,581 10,057 9,931 39,999 15 Other contingent funding obligations - - - - - - - -
16 TOTAL CASH OUTFLOWS 776,996 747,442 832,966 991,903 CASH INFLOWS 17 Secured lending (e.g. reverse repos) 16,675 46,102 46,102 46,102 48 48 48 48 18 Inflows from fully performing exposures 183,604 246,126 340,189 437,398 183,237 245,239 337,919 435,041 19 Other cash inflows 21,231 29,671 38,195 60,122 21,231 29,671 38,195 60,122
EU-19a (Difference between total weighted inflows and total weighted outflows arising from transactions in third countries where there are transfer restrictions or which are denominated in non-convertible currencies) - - - -
EU-19b (Excess inflows from a related specialised credit institution) - - - -
20 TOTAL CASH INFLOWS 221,510 321,898 424,486 543,621 204,516 274,958 376,162 495,211 EU-20a Fully exempt inflows - - - - - - - -
EU-20b Inflows Subject to 90% Cap - - - - - - - -
EU-20c Inflows Subject to 75% Cap 221,510 321,898 424,486 543,621 204,516 274,958 376,162 495,211 21 LIQUIDITY BUFFER 1,942,285 2,012,165 1,996,980 1,921,050 22 TOTAL NET CASH OUTFLOWS 594,701 516,979 496,648 530,986 23 LIQUIDITY COVERAGE RATIO (%) 340% 445% 454% 441%
The quarterly 12 month rolling average LCR ranged from 340% to 454% in 2020. The quarterly average HQLA ranged from US$ 1,927mm to US$ 2,016mm. The quarterly weighted average of outflows ranged from US$ 747mm to US$ 992mm. The quarterly weighted average inflows ranged from US$ 205mm to US$ 495mm. There are no other items in the LCR calculation that are not captured in the LCR disclosure template but that the Company considers relevant for its liquidity profile.
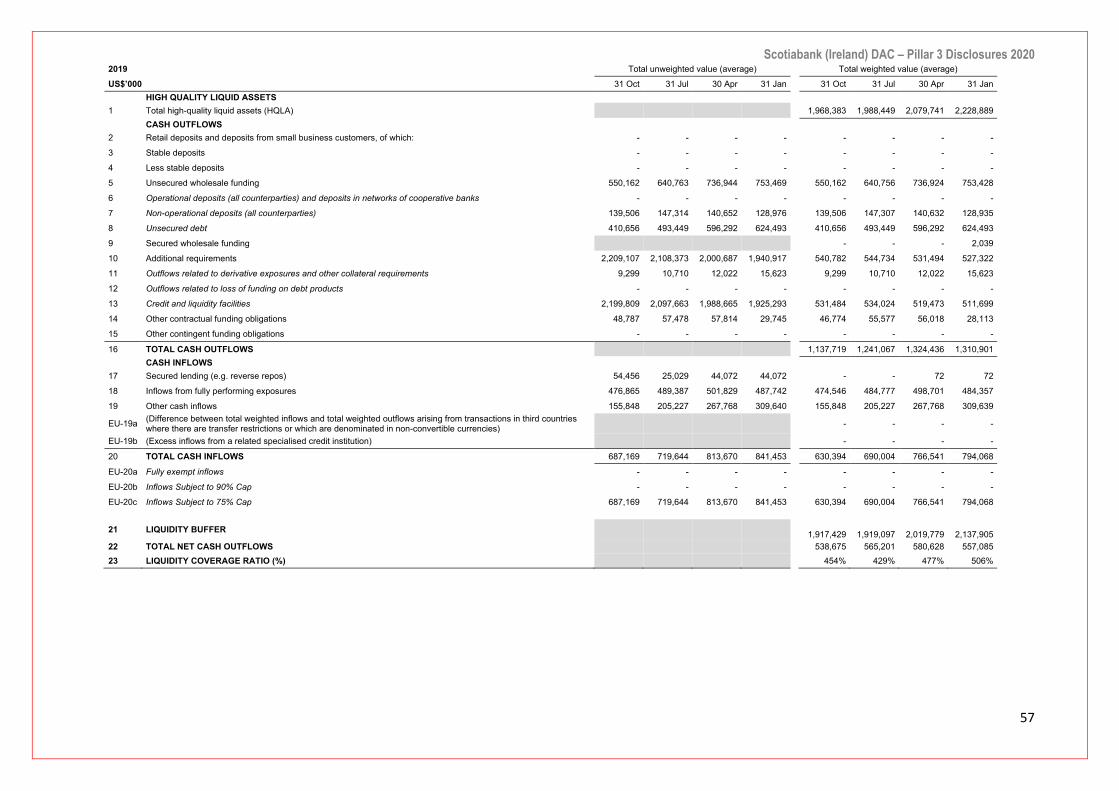
Scotiabank (Ireland) DAC – Pillar 3 Disclosures 2020
57
2019 Total unweighted value (average) Total weighted value (average)
US$’000 31 Oct 31 Jul 30 Apr 31 Jan 31 Oct 31 Jul 30 Apr 31 Jan HIGH QUALITY LIQUID ASSETS 1 Total high-quality liquid assets (HQLA) 1,968,383 1,988,449 2,079,741 2,228,889 CASH OUTFLOWS 2 Retail deposits and deposits from small business customers, of which: - - - - - - - -
3 Stable deposits - - - - - - - -
4 Less stable deposits - - - - - - - -
5 Unsecured wholesale funding 550,162 640,763 736,944 753,469 550,162 640,756 736,924 753,428
6 Operational deposits (all counterparties) and deposits in networks of cooperative banks - - - - - - - -
7 Non-operational deposits (all counterparties) 139,506 147,314 140,652 128,976 139,506 147,307 140,632 128,935
8 Unsecured debt 410,656 493,449 596,292 624,493 410,656 493,449 596,292 624,493
9 Secured wholesale funding - - - 2,039
10 Additional requirements 2,209,107 2,108,373 2,000,687 1,940,917 540,782 544,734 531,494 527,322
11 Outflows related to derivative exposures and other collateral requirements 9,299 10,710 12,022 15,623 9,299 10,710 12,022 15,623
12 Outflows related to loss of funding on debt products - - - - - - - -
13 Credit and liquidity facilities 2,199,809 2,097,663 1,988,665 1,925,293 531,484 534,024 519,473 511,699
14 Other contractual funding obligations 48,787 57,478 57,814 29,745 46,774 55,577 56,018 28,113
15 Other contingent funding obligations - - - - - - - -
16 TOTAL CASH OUTFLOWS 1,137,719 1,241,067 1,324,436 1,310,901 CASH INFLOWS 17 Secured lending (e.g. reverse repos) 54,456 25,029 44,072 44,072 - - 72 72
18 Inflows from fully performing exposures 476,865 489,387 501,829 487,742 474,546 484,777 498,701 484,357
19 Other cash inflows 155,848 205,227 267,768 309,640 155,848 205,227 267,768 309,639
EU-19a (Difference between total weighted inflows and total weighted outflows arising from transactions in third countries where there are transfer restrictions or which are denominated in non-convertible currencies) - - - -
EU-19b (Excess inflows from a related specialised credit institution) - - - -
20 TOTAL CASH INFLOWS 687,169 719,644 813,670 841,453 630,394 690,004 766,541 794,068
EU-20a Fully exempt inflows - - - - - - - -
EU-20b Inflows Subject to 90% Cap - - - - - - - -
EU-20c Inflows Subject to 75% Cap 687,169 719,644 813,670 841,453 630,394 690,004 766,541 794,068
21 LIQUIDITY BUFFER 1,917,429
1,919,097
2,019,779
2,137,905
22 TOTAL NET CASH OUTFLOWS 538,675 565,201 580,628 557,085 23 LIQUIDITY COVERAGE RATIO (%) 454% 429% 477% 506%
Scotiabank (Ireland) DAC – Pillar 3 Disclosures 2020
58
10 Concentration Risk
Concentration risk is the risk associated with any single exposure (or group of exposures that may perform similarly because of a common characteristic or common sensitivity to economic, financial, or business developments) that has the potential to cause considerable risk to earnings and capital. Concentration risk may arise as a result of correlated positions that present exposure to multiple risk factors. Credit concentration risk includes concentrations to the same counterparties or groups of connected counterparties, and counterparties in the same industry sector, geographical region or concentrations from the same activity.
10.1 Concentration Risk Management and Risk Measures
As noted in section 4, the Board has approved a Concentration Risk Management Policy which sets out types of concentration risk and the levels at which concentrations are regarded as material or significant. Oversight of the Company’s management of Concentration risk also includes ALCO, ExCo and Board review and approval of policies and limits relating to credit, market, liquidity, and operational risk as well as quarterly reporting to the BRC on risk concentrations relating to these key risk disciplines and stress testing on sectors where a material concentration is deemed to arise. Specific Board approved limits are set to control the maximum exposure to any counterparty or group of related counterparties. Coupled with this, the regulatory Large Exposure rules must be observed. Industry and country concentration is monitored on a regular basis for internal and regulatory purposes. Overall industry and country exposures are reviewed by the CC on a regular basis.
Credit concentration risk, considered a subset of credit risk, is primarily monitored and controlled by the Company under three categories: exposure to an entity or group of connected entities; exposure by industry; and, exposure by geography. A measure of Credit concentration risk for use in the Company’s internal capital calculation is computed on a quarterly basis using the Moody's RiskFrontier model. Using the model, the deviation of the Company’s credit portfolio from a well-diversified credit portfolio is assessed by approximating the Company’s portion of the consolidated Scotiabank business banking credit portfolio. The difference between the two calculations can be viewed as the diversification benefit that the non-SIDAC exposures in the overall Scotiabank portfolio would provide to reduce the amount of capital otherwise attributable to the SIDAC exposures.
10.2 Concentration Risk Mitigation
As per its Risk Appetite Framework, the Company seeks to avoid excessive risk concentrations through a diversified mix of businesses, products, geographies, currencies and customers. Appropriate management of concentration risk is also ensured by the Company’s limits, policies and procedures. Other credit risk mitigation techniques include reviewing risks associated with large indirect credit exposures.
11 Securitisations
The Company acts purely as investor in securitisations and does not act as originator or sponsor for any securitisation activity. The same overall financial objective applies to any securitisation investments, which is to generate a satisfactory return for the risk being taken.
Since 2019 a new framework for European securitisations has been in place which consolidates legislation governing European securitisations, and introduces rules for issuing simple, transparent and standardised (“STS”) transactions. Since the transitional provisions established under Article 2 of Regulation (EU) No 2017/2401 now expired, the Company’s investments in securitisations are risk weighted under a revised approach as outlined in the securitisation framework. The Company uses the same nominated ECAIs as above for risk weighting securitisations: S&P and Moody’s. At 31 October 2020, the Company held two traditional securitisation positions. One of the positions comprises Class A notes of an asset backed securitisation vehicle which qualify for a reduced risk weight of 10% under the External Ratings Based Approach (SEC-ERBA). Post Brexit, the position no longer qualifies as an STS transaction and so reverts to a RW of 20%. The other is a capital note subordinated to other obligations in a larger Asset Backed Commercial Paper conduit. No new transactions were entered into during the year.

Scotiabank (Ireland) DAC – Pillar 3 Disclosures 2020
59
Table 41 – Total outstanding securitisation exposures 31 Oct 2020
US$’000 Exposure value CQS RWAs Total RWA
Capital Requirement
On Balance Sheet
Off Balance
Sheet 10% 1250%
Loans and receivables 291,821 - 1 29,182 - 29,182 2,335 Investment securities mandatorily measured at FVTPL 46,554 - Unrated - 581,930 581,930 46,554
Total 338,375 29,182 581,930 611,112 48,889 31 Oct 2019
US$’000 Exposure value RWAs Total RWA
Capital Requirement
On Balance Sheet
Off Balance
Sheet CQS 20% 1250%
Loans and receivables 291,442 - 1 58,288 - 58,288 4,663 Investment securities mandatorily measured at FVTPL 45,831 - Unrated - 572,891 572,891 45,831
Total 337,273
- 58,288
572,891
631,179
50,494
The Class A note of ABS is classified as Loans and receivables while the capital note is classified as Investment securities mandatorily measured at FVTPL
Accounting treatment
At inception, exposures to securitisations in the form of debt instruments are classified into one of the following measurement categories: Amortised cost; Fair value through other comprehensive income (FVOCI); or Fair value through profit or loss (FVTPL) for trading related assets and financial instruments mandatorily or optionally designated as such.
Classification of debt instruments is determined based on: the business model under which the assets are held; and the contractual cash flow characteristics of the instrument.
The Class A notes continue to be measured at their amortised cost using the effective interest method, with their impairment calculated using the expected credit loss (ECL) approach.
The capital note is classified within Investment securities mandatorily measured at FVTPL (as its cash flows do not represent payments that are solely payments of principal and interest – “SPPI”) and is measured at fair value in the balance sheet with realised and unrealised gains and losses recognised in the Profit and Loss account as part of net trading income or net gain/loss from other financial instruments carried at fair value. This position is classified as Level 3 as it does not trade in an active market. It is fair valued based on an internally developed model that requires the use of significant unobservable inputs, involving greater management judgment for valuation purposes. The unobservable inputs used in the valuation primarily include assumptions on the level of cash flows and discount rates. These assumptions are reviewed on an ongoing basis by management.
Monitoring of risks
In relation to the capital note position the Company conducts an annual valuation review which incorporates changes in the expected average life, cash flows received and projected, and discount rate to use. The ALCO approve this review. Outside of the formal annual revaluation model review, SIDAC Corporate Banking and Risk Management personnel liaise with the Securitisation Team at Scotiabank USA on a quarterly basis, or more frequently if required. Various factors are considered such as liquidity, pricing, term of the commercial paper issuances, delinquencies, pool amounts, fees and the external economic environment. If any factors are deemed to have a material impact on the pricing assumptions a recommendation to update the valuation can take place outside of the formal annual review process.
In relation to the Class A notes, these are the Senior ranking notes with only net swap payments ranking ahead of principal and interest on the notes. The Company performs monitoring and analysis of the transactions based on the investor report provided by the borrower on a monthly basis. This includes an analysis of delinquency ratios, retention
Scotiabank (Ireland) DAC – Pillar 3 Disclosures 2020
60
and return rates and the level of overcollateralization. A formal stress test in calculated annually by Risk Management to assess if the class A notes held pay out under stressed conditions and results are presented to ALCO for review and approval.
Credit risk
The securitisations are subject to a credit risk capital charge under the Standardised Approach of US$ 48.9mm as at 31 October 2020 (2019: US$ 50.5mm). Using Moody’s ratings, the Class A notes position now attract a risk-weighting of 10% as noted above. As a result of being unrated, the capital note is risk-weighted at 1250%. The Company does not avail of available techniques of hedging or unfunded protection to mitigate the exposures to securitisations.
Other risks
There are a number of possible inherent risks in purchasing certain securitised notes including: the performance of the underlying assets; the explicit support of the Issuer and its financial stability; volatility in the market value of securitised notes; and liquidity risk that the SPV issuing the purchased securitisation notes has insufficient income from the underlying assets to meet its obligations. The Company is not subject to these risks in a material way which would require additional regulatory capital beyond what has been provided under the Standardised Approach.
12 Asset Encumbrance
An asset would be treated as encumbered if it has been pledged or if it is subject to any form of arrangement to secure, collateralise or credit enhance any transaction from which it cannot be freely withdrawn.
The asset encumbrance disclosure templates, shown on the following two pages, have been compiled in accordance with the Commission Delegated Regulation (EU) 2017/2295 on disclosure of encumbered and unencumbered assets under Article 443 of the CRR. The regulation requires that the data is presented as a median calculation. The reported amounts are median values based on quarter end point in time amounts over the year to 31 October 2020.
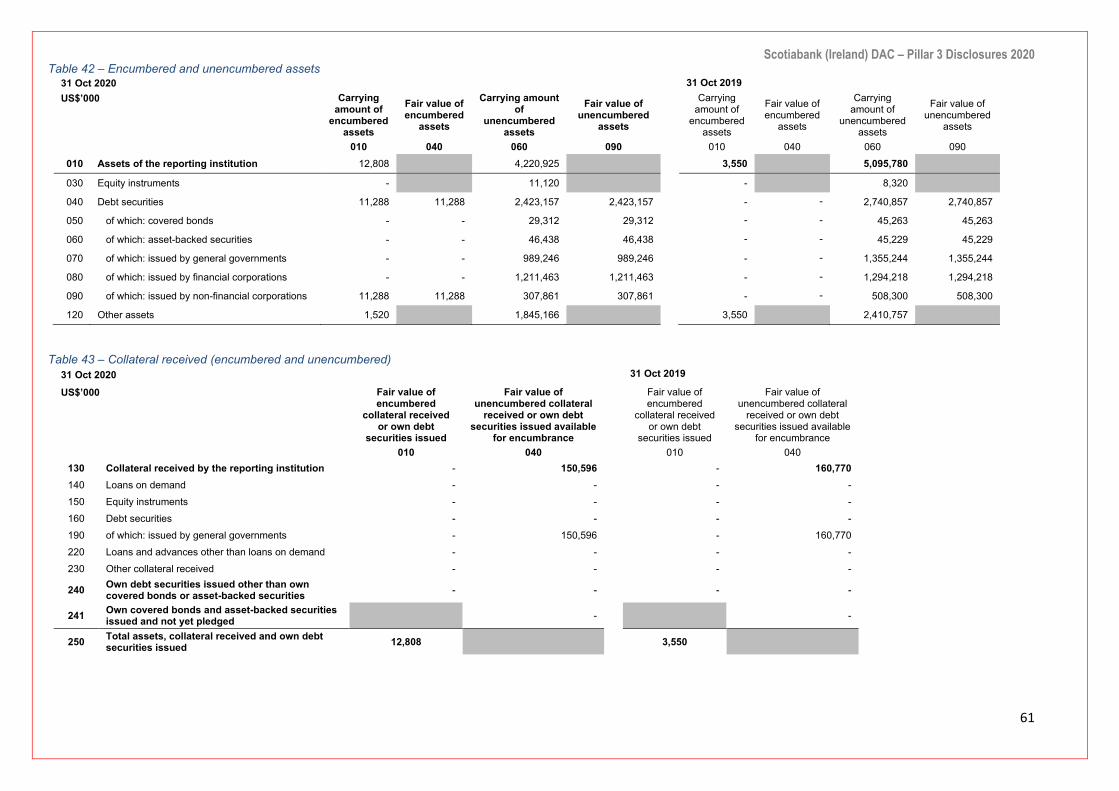
Scotiabank (Ireland) DAC – Pillar 3 Disclosures 2020
61
Table 42 – Encumbered and unencumbered assets 31 Oct 2020 31 Oct 2019 US$’000 Carrying
amount of encumbered
assets
Fair value of encumbered
assets
Carrying amount of
unencumbered assets
Fair value of unencumbered
assets
Carrying amount of
encumbered assets
Fair value of encumbered
assets
Carrying amount of
unencumbered assets
Fair value of unencumbered
assets
010 040 060 090 010 040 060 090 010 Assets of the reporting institution 12,808 4,220,925 3,550 5,095,780
030 Equity instruments - 11,120 - 8,320
040 Debt securities 11,288 11,288 2,423,157 2,423,157 - - 2,740,857 2,740,857
050 of which: covered bonds - - 29,312 29,312 - - 45,263 45,263
060 of which: asset-backed securities - - 46,438 46,438 - - 45,229 45,229
070 of which: issued by general governments - - 989,246 989,246 - - 1,355,244 1,355,244
080 of which: issued by financial corporations - - 1,211,463 1,211,463 - - 1,294,218 1,294,218
090 of which: issued by non-financial corporations 11,288 11,288 307,861 307,861 - - 508,300 508,300
120 Other assets 1,520 1,845,166 3,550 2,410,757
Table 43 – Collateral received (encumbered and unencumbered)
31 Oct 2020 31 Oct 2019 US$’000 Fair value of
encumbered collateral received
or own debt securities issued
Fair value of unencumbered collateral
received or own debt securities issued available
for encumbrance
Fair value of encumbered
collateral received or own debt
securities issued
Fair value of unencumbered collateral
received or own debt securities issued available
for encumbrance
010 040 010 040 130 Collateral received by the reporting institution - 150,596 - 160,770 140 Loans on demand - - - - 150 Equity instruments - - - - 160 Debt securities - - - - 190 of which: issued by general governments - 150,596 - 160,770 220 Loans and advances other than loans on demand - - - - 230 Other collateral received - - - -
240 Own debt securities issued other than own covered bonds or asset-backed securities - - - -
241 Own covered bonds and asset-backed securities issued and not yet pledged
- -
250 Total assets, collateral received and own debt securities issued 12,808 3,550

Scotiabank (Ireland) DAC – Pillar 3 Disclosures 2020
62
Table 44 – Sources of encumbrance 31 Oct 2020 31 Oct 2019
Matching liabilities,
contingent liabilities or
securities lent
Assets, collateral received and own
debt securities issued other than
covered bonds and ABSs encumbered
Matching liabilities,
contingent liabilities or
securities lent
Assets, collateral received and own
debt securities issued other than
covered bonds and ABSs encumbered
US$’000 010 030 010 030 010 Carrying amount of selected financial liabilities 12,580 12,808 3,689 3,550
011 of which: Derivatives 1,528 1,520 3,689 3,550 012 of which: Repurchase agreements 11,052 11,288 - -
As an integral aspect of its business, the Company engages in activities that result in certain assets being encumbered. The majority of encumbrance arises from its repo and reverse repo transactions. Other sources of encumbrance are collateral pledged under CSA agreements with OTC derivative counterparties.
The Company primarily adopts standard collateral agreements and collateralises based on industry standard contractual agreements (mostly CSA, ISDA, and GMRA).
13 Remuneration
All SIDAC employees participate in a compensation structure and programmes that apply to BNS employees globally. The Board and the BNS Human Resources Committee (“BNS HRC”) work together to fulfil the oversight responsibilities contained in their respective mandates outlined below. The Board reviews and adopts the BNS Compensation Policy on an annual basis with any differing local practices reflected in a Board approved Addendum to this policy. The most recent adoption of the BNS Compensation Policy was in August 2020.
This section outlines SIDAC’s approach to remuneration and provides information on the Company’s compliance with remuneration-related regulatory requirements of the CBI and the EBA including the EBA Guidelines on Sound Remuneration Policies, CRD IV, transposed into Irish law as Statutory Instrument No. 158 of 2014, and the EBA’s Regulatory Technical Standards.
13.1 Qualitative Disclosure
13.1.1 Governance
Role of the Board
The Board is responsible for oversight of SIDAC’s remuneration policy and local regulatory processes, within the overarching framework of the BNS Compensation Policy, the BNS Clawback Policy, as well as SIDAC’s Addendum to both policies. SIDAC’s remuneration policy sets out a pay-for-performance philosophy that supports the organization’s strategic focus, encourages strong corporate performance and helps SIDAC and BNS create and sustain shareholder value over the long term. Among other things, the remuneration policy outlines SIDAC’s and BNS’ approach to compensation risk oversight in incentive plan design and funding. It outlines the minimum deferral rates for senior executives and individuals whose roles may have a material impact on the risk profile of the business, including roles in control and support functions.
The Board is ultimately responsible for ensuring that SIDAC has in place remuneration policies and practices that are consistent with sound and effective risk management and do not promote excessive risk-taking. The Board monitors remuneration adequacy, effectiveness and related governance and is responsible for overseeing the implementation of and ensuring compliance with SIDAC's remuneration practices in accordance with remuneration-related regulatory requirements and SIDAC's remuneration policy.
SIDAC does not use variable remuneration vehicles or methods that facilitate avoidance of the EBA Guidelines on Sound Remuneration Policies.
Additionally, the Board is responsible for:

Scotiabank (Ireland) DAC – Pillar 3 Disclosures 2020
63
• Approving the remuneration for executive-level employees5 as well as other identified Material Risk Takers (“MRTs”);
• Approving SIDAC’s remuneration policy and overseeing that policies, practices and processes are in compliance with such policy;
• Assessing the achievement of performance targets and the need for any ex-post risk adjustments;
• Reviewing remuneration decisions in the context of SIDAC’s risk appetite; and
• Overseeing that appropriate compensation frameworks are in place, which may include the adoption of new incentive plans or material changes to existing plans, in accordance with the compensation programmes and policies of the parent company, BNS.
The Board reviews those material matters that are discussed with, or decisions made by, the BNS HRC which are relevant to SIDAC, and provides local oversight, review and input on remuneration matters, where appropriate. The Board interacts with the BNS HRC as required.
The Board met 16 times during fiscal 2020, of which 6 of the meetings included discussion of remuneration matters. Composition of the Board is as referenced in section 3.1.2 of this document.
The Board is supported in executing its remuneration mandate by SIDAC’s Remuneration Oversight Committee (‘ROC’, a management committee of SIDAC). The primary objective of the ROC is to provide oversight and guidance on remuneration-related matters and to implement BNS human resources and compensation policies and procedures as applicable to SIDAC. The ROC has reporting responsibility to the Board and the BNS Compensation Review Committee (‘BNS CRC’, a management committee of BNS) for remuneration-related matters. Specifically, the ROC’s remuneration responsibilities include:
• Ensuring all employee incentive plans approved on behalf of SIDAC are in compliance with applicable legislation and regulations and regulatory guidelines including, but not limited to, the remuneration requirements of the CRD IV and related EBA Guidelines and Regulatory Technical Standards/Regulations;
• Reviewing memos from Heads of Compliance, Risk and Finance, ahead of provision to the Board and BNS HRC prior to their approval of incentive payments, as well as all remuneration-related regulatory disclosures, including the Pillar 3 (remuneration section) and the High Earners Report that are also submitted to the Board;
• Annually approving the MRT Identification Procedures, SIDAC MRTs and the MRT exemptions and waiver recommendations submitted to the Board;
• Annually reviewing and implementing remuneration-related regulatory changes;
• A SIDAC sub-committee of the ROC, referred to as the Local Conduct Committee (‘LCC’), reviews and approves the list of risk and conduct breach incidents quarterly, and recommends ex-ante and/or ex-post adjustments to individual incentive awards for MRTs and other SIDAC employees involved in a material risk or misconduct incident to the BNS CRC for approval by the Board; and
• Reviewing the compensation principles and programmes of BNS as applicable to SIDAC.
Role of The Bank of Nova Scotia Human Resources Committee
BNS has an established Human Resources Committee of its Board of Directors (the “Parent Board”), which is responsible for setting global policies for BNS on compensation, overseeing the compensation governance framework and ensuring that compensation arrangements are consistent with and promote effective risk management. The BNS HRC assumes decision-making responsibilities relating to compensation and annual disclosure and related reviews and recommends to the Parent Board for approval the content and effectiveness of the BNS Compensation Policy, as informed by corporate human resources and independent advisors, and ensures that they align with BNS’ strategic objectives. Additionally, the BNS HRC approves the remuneration for SIDAC MRTs.
At an Enterprise level, the BNS HRC is responsible for:
5 Executive-level employees for the purposes of MRT identification are members of the SIDAC Executive Committee (voting members).

Scotiabank (Ireland) DAC – Pillar 3 Disclosures 2020
64
• Compensation philosophy and human resources policies and practices – oversees alignment with BNS’ pay-for-performance strategy and risk appetite;
• Compensation programmes – oversees material compensation programmes and incentive plans and makes recommendations to the Parent Board with respect to these programmes. Reviews compensation disclosure and recommends approval to the Parent Board prior to publication;
• Compensation governance – reviews evolving governance practices and the alignment of compensation policies with best practices and the remuneration-related requirements of the Financial Stability Board (“FSB”), CBI, EBA and shareholder advisory firms such as Institutional Shareholder Services (“ISS”) and Glass Lewis, and monitors compliance; and
• Managing compensation risk – meets with the BNS Risk Committee to jointly review and recommend all key elements of material incentive plans, including plan design, targets, metrics and potential pay-outs. Seeks independent advice and input from a third-party advisor.
The BNS HRC retains an external, qualified third party to advise on compensation matters including matters that are applicable to SIDAC, for example, regulatory trends and updates in the European Union.
The BNS HRC held eight meetings in 2020 (2019: eight meetings), including a joint session with the BNS Risk Committee. Additional information on BNS HRC composition and compensation decision-making can be found in the Parent’s Management Proxy Circular at http://www.scotiabank.com/ca/en/0,,917,00.html.
13.1.2 Material Risk Taker Criteria
SIDAC follows EBA regulatory technical standards6 and identifies the following groups of employees as MRTs based on qualitative criteria (related to the role and decision-making authority of employees) and quantitative criteria (related to the level of total gross remuneration in absolute or relative terms): a) SIDAC executive-level employees; b) Employees leading business line functions with a significant proportion of revenues, numbers of staff and capital
usage; c) Employees leading control and stewardship functions including risk, compliance, finance, audit and HR; d) Employees responsible for developing and implementing SIDAC’s business line strategy; e) Employees whose activities are deemed to have a material impact on SIDAC’s risk profile; f) Higher earners and employees involved in trading activities who have a material impact on the risk profile of SIDAC;
and g) SIDAC’s non-executive Board members.
13.1.3 Link Between Pay and Performance
In addition to base salary, SIDAC’s remuneration programme includes a mix of annual and deferred incentives – which together are variable pay and known as “pay-at-risk” since they are not guaranteed. In compliance with the requirements as set out within Article 94 (1) CRD IV, and SIDAC shareholder approval on July 18, 2014, SIDAC has capped variable pay at a maximum ratio of 200% of fixed compensation for its MRTs.
Annual incentives reward employees for meeting annual corporate objectives (financial and non-financial) and individual deliverables. The main performance objectives in our Annual Incentive Plan (“AIP”) for non-revenue generating roles, typically in control and support functions, include return on equity, earnings per share, operating leverage and a customer metric, and are used to determine an all-Bank business performance factor that may be further adjusted based on performance relative to peers. Front-office revenue-generating employees receive incentives through the Global Banking and Markets Incentive Plan (“GBMIP”), where a discretionary bonus pool is funded based on Net Income Before Bonus and Tax (“NIBBT”) and Net Income After Tax (“NIAT”) versus Plan, and may be further adjusted based on performance relative to peers. Both AIP and GBMIP bonus pools can be adjusted by the BNS HRC and BNS Risk Committee based on recommendations from the BNS CRO. Additionally, the SIDAC CRO can make recommendations to the Board to adjust the SIDAC bonus spend.
6 Under Article 92(2) of the CRD, the EBA introduced regulatory technical standards to set out the criteria to identify categories of staff whose professional activities have a material impact on the firm’s risk profile (Commission Delegated Regulation (EU) No 604/2014 (the ‘RTS’)).

Scotiabank (Ireland) DAC – Pillar 3 Disclosures 2020
65
Total remuneration of SIDAC employees, including MRTs, may be comprised of fixed remuneration (i.e., base salary, non-discretionary pension, other benefits and all allowances including mobility-related allowances) and variable remuneration (i.e., annual incentives and deferred incentives). SIDAC typically provides severance at or above Irish statutory requirements and in line with market practice in Ireland. In accordance with EU Capital Requirements Directives and related regulation and guidance, any early termination payments reflect performance achieved over time and do not reward for failure or misconduct, and are made consistent with appropriate risk management. Severance payments to MRTs are made in compliance with EU Capital Requirements Directives remuneration requirements and section 9.3 of the EBA Guidelines. Severance pay, if any, is determined on a case-by-case basis and involves legal and human resources. Additionally, SIDAC may seek the advice of external counsel to ensure any severance payments are sound.
In determining the appropriate mix of fixed and variable remuneration, an employee’s ability to affect results over the longer term, the mix for similar positions in the markets in which SIDAC competes, and market practice are all considered.
Guaranteed variable remuneration is not part of SIDAC’s remuneration approach and is discouraged in keeping with SIDAC’s remuneration policy. One-time awards may be selectively provided to new-hire employees to compensate for variable remuneration foregone from a previous employer, and in adherence to EU Capital Requirements Directives remuneration requirements and section 9.1 of the EBA Guidelines.
Additionally, employees at the BNS executive level are required to hold equity in BNS to ensure their interests are aligned with those of BNS shareholders. Common shares, outstanding share units (example: restricted share units) and holdings through the BNS Employee Share Ownership Plan all count towards meeting this requirement.
13.1.4 Design and Structure of Remuneration
Fixed Remuneration
Fixed remuneration includes base salary, non-discretionary pension, and other benefits and allowances, including mobility-related allowances.
Salary
Base salary is paid in non-deferred cash and compensates employees for fulfilling their day-to-day roles and responsibilities, including leadership and management duties. Total remuneration, including base salary and incentives, is reviewed annually and adjusted where appropriate based on each employee’s role and experience, sustained performance, internal job value and local external market practice.
Pension Plan
SIDAC operates two registered pension schemes for its employees, a defined benefit pension (“DB”) scheme which is closed to new members effective November 2005, and a defined contribution scheme (“DC”). The schemes are funded over the employees’ period of service and the assets of the schemes are held in separate trustee-administered funds. In addition, SIDAC makes employer contributions that mirror the DC scheme to Personal Retirement Savings Accounts (“PRSAs”) for temporary or fixed-term employees.
Variable Remuneration
Variable pay is comprised of annual incentives (paid in non-deferred cash or a mix of non-deferred cash and immediately-vested Restricted Share Units (“RSUs”) and deferred incentives (paid in RSUs or a mix of deferred cash and RSUs) for all employees including material risk takers, the management body and control function staff. For all Group Treasury and back- and middle-office employees, including employees in control functions (i.e., risk management, compliance, internal audit and finance) and supporting personnel who are not client-facing, these incentives are delivered through the Annual Incentive Plan (“AIP”) and deferred compensation programmes. For GBM front-office employees, these incentives are delivered through the GBMIP where a portion of the GBMIP award is delivered as upfront incentives and a portion is delivered as deferred incentives. See 13.1.5 and 13.1.6 below.
The separate plans outlined above ensure independence of incentives for control functions from the front-office business they support.

Scotiabank (Ireland) DAC – Pillar 3 Disclosures 2020
66
13.1.5 Annual Incentives (Upfront Variable Remuneration)
Rationale & Eligibility Criteria
All SIDAC employees are eligible to participate in an annual incentive plan. Annual incentives are designed to reward employees for their contribution to the achievement of BNS’ annual financial and non-financial goals.
In 2020, SIDAC had two annual incentive programmes for employees, including MRTs, designed to reward employees for their contribution to the achievement of annual goals.
• AIP, for all back- and middle-office employees, including employees in control function roles and supporting personnel who are not client-facing, as well as Group Treasury employees;
• GBMIP, for GBM front-office employees in designated units and roles that support revenue generation. The GBMIP programme includes an upfront component and a deferred component. That is, a portion of the annual GBMIP award is paid upfront and the remainder is deferred to provide alignment to BNS’ longer-term performance (see 13.1.6 below).
Performance Measurement/Assessment
The AIP rewards employees based on BNS’ performance on financial and customer metrics for the fiscal year and also on individual performance, which has a significant impact on final awards. The AIP includes risk-adjusted measures that reflect the full range of potential risks. The aggregate AIP pool is determined based on BNS’ achievement on a scorecard of all-Bank measures: ROE, earnings per share (“EPS”), operating leverage and customer goals, adjusted for performance relative to peers, as well as a discretionary risk adjustment that is approved by the Parent Board after considering performance against BNS’ Risk Appetite Framework.
The GBMIP rewards eligible employees of GBM for the achievement of GBM’s overall and business line objectives. The aggregate GBMIP pool is determined based on GBM’s net income before bonus and taxes (“NIBBT”) and net income after tax (“NIAT”), adjusted for performance relative to peers and overall BNS performance, as well as a discretionary risk adjustment that is approved by the BNS HRC after considering performance against BNS’ Risk Appetite Framework. Individual awards consider individual and business line performance, as well as market positioning and the pool of funds available.
Risk Adjustment
Prior to the awards being approved, the BNS CRO assesses whether there are any other potential risks that should be reflected in the incentive pool funding and recommends adjustments – where appropriate – to the BNS HRC and BNS Risk Committee. Additionally, SIDAC’s CRO assesses risks undertaken by SIDAC including compensation plan design, conduct considerations, considerations on performance against risk appetite and the use of financial resources within SIDAC in conducting its activities during the fiscal year, and recommends adjustments to the aggregate SIDAC incentive spend – if necessary – to the Board and to the BNS HRC and BNS Risk Committee (in a joint meeting). For further details please refer to section 13.1.7.
Additionally, the Head of Compliance assesses whether SIDAC-adopted remuneration policies are in compliance with EU regulations including EBA Guidelines, and whether the policies impact SIDAC’s ability to comply with other areas of legislation, regulations, internal polices and risk culture, as well as address any conduct or compliance matters related to individual staff members that require ROC and or Board consideration in terms of potential compensation impacts including clawbacks.
Deferral and Vesting7
For participants in the AIP programme: • Non-exempt MRTs8 receive 50% of their AIP award in immediately-vested RSUs pursuant to the BNS Restricted
Share Unit Plan for Participants in the European Economic Area (the “EEA RSU Plan”) and the remainder is paid in non-deferred cash.
7 Note that the EBA deferral rules are not a regulatory requirement for SIDAC as the company is not categorised as a significant institution, but SIDAC has chosen to apply the criteria to non-exempt MRTs. 8 3-year vesting for MRTs occurs on a pro-rata basis at the end of years 1 through 3. Where a SIDAC MRT also meets BNS’ definition of a Material Risk Impact (MRI) employee a 5-year vesting occurs on a pro-rata basis at the end of years 1 through 5. MRI employees are those employees whose role can have a material impact on BNS’ risk profile.
Scotiabank (Ireland) DAC – Pillar 3 Disclosures 2020
67
• Exempt MRTs9 and other SIDAC employees participating in AIP receive their full award in non-deferred cash. There is no regulatory restriction on how the payment of their annual incentive should be made.
For participants in the GBMIP programme:
• The percentage of the upfront portion of the GBMIP award varies depending on GBM job level. • Non-exempt MRTs receive 50% of their GBMIP upfront portion in immediately-vested RSUs pursuant to the
EEA RSU Plan and the remainder is paid in non-deferred cash. • Exempt MRTs and other GBMIP employees receive their full GBMIP upfront portion in cash.
RSUs awarded to all MRTs do not attract reinvested dividend equivalents and are subject to a 12-month retention period prior to payment. Payment of the immediately-vested RSUs is based on the value of the units at the time of payment in cash.
13.1.6 Deferral Incentives (Deferred Variable Remuneration)
Rationale & Eligibility Criteria
A portion of the incentive awards made to MRTs is deferred to reward them for sustained performance over a three- or five-year period. Deferred incentive awards include RSUs and Deferred Cash Awards. The Company does not apply a discount rate for deferred incentives.
For AIP participants, the EEA RSU Plan is intended for key individuals who have the ability to assist in creating future shareholder value. Employees in control function roles and supporting personnel who are not client-facing at the internal director level and above may be eligible to receive grants of deferred compensation. On a case-by-case basis, in order to meet the deferral requirements of the EBA Guidelines, RSUs may be awarded to non-exempt MRTs below director level (employees below director level are typically not eligible for RSU awards) as a carve-out of their annual incentive.
All GBM front-office employees in client-facing roles and roles that support revenue generation are eligible to participate in the GBMIP programme. Participants may receive a portion of their GBMIP award in deferred incentives which includes EEA RSUs, where the portion of the total deferred incentive is dependent on the total variable incentive awarded and may vary between 15% - 40% depending on GBM job level. The EEA RSU Plan is an integral part of the GBMIP designed to align the interests of GBM employees with those of BNS shareholders. On a case-by-case basis and in order to meet the deferral requirements of the EBA Guidelines, non-exempt MRTs in GBM may receive a higher portion of their incentive as deferred incentive than is indicated by their job level.
Deferred Cash Awards are intended for non-exempt MRTs only. All non-exempt MRTs in SIDAC are eligible to receive Deferred Cash Awards, and such awards make up 50% of the total deferred incentive.
Performance Measurement/Assessment
For AIP participants, the EEA RSU Plan is designed to reward nominated employees at the internal director level and certain executives in Ireland for delivering sustained shareholder value.
For GBMIP participants, the EEA RSU Plan allows GBM employees to receive a portion of their incentive award as RSUs tied to BNS common share price.
RSUs gain value with the appreciation in the Parent’s common share price.
Deferral and Vesting
AIP participants at the internal director level and above may be eligible to receive grants of deferred compensation in addition to an AIP award. Deferral and vesting of deferred incentives for MRTs are as follows:
• Non-exempt MRTs receive 50% of their deferred award in RSUs and 50% as Deferred Cash Awards. Both RSUs and Deferred Cash Awards vest pro-rata over a three- or five-year deferral period depending on the MRT’s role9. The portion of the total incentive deferred varies between 40% and 60%, depending on the non-exempt MRT’s remuneration10.
9 Exempt MRTs are those for whom a waiver has been granted by the CBI, exempting them from full application of the MRT remuneration rules. 10 60% deferral applies to High-earner MRTs which are those MRTs whose variable remuneration exceeds €300,000. 40% deferral applies to all other non-exempt MRTs

Scotiabank (Ireland) DAC – Pillar 3 Disclosures 2020
68
• Exempt MRTs and other AIP-eligible employees, depending on seniority, may receive deferred compensation on a discretionary basis based on individual performance and potential, and awards typically range between 0% - 40% of total incentives received. Awards are made entirely in RSUs that vest 100% at the end of three years.
GBMIP participants receive a portion of their award as deferred compensation.
• Non-exempt MRTs who are GBMIP participants have the same vesting and deferral criteria as non-exempt MRT participants of the AIP programme (see above).
• Exempt MRTs and other GBMIP participants receive their entire deferred award in RSUs that vest in equal instalments over three years. The portion of total deferred incentive varies between 15% - 40% depending on GBM job level.
RSUs awarded to all MRTs do not attract reinvested dividend equivalents and are subject to a 12-month retention period prior to payment. Payment of the RSUs is based on the value of the units at the time of payment in cash.
Risk Adjustments
Prior to the awards vesting, the BNS CRO assesses whether there are any other potential risks that should be reflected in the amount vesting and recommends adjustments, where appropriate, to the BNS HRC and BNS Risk Committee. Additionally, SIDAC’s CRO produces a risk assessment on operations and adherence to business risk appetite. For further details please refer to section 13.1.7.
13.1.7 Risk Management and Risk Adjustment
SIDAC’s and BNS’ approach to risk management and compensation is to ensure alignment of compensation with the respective organizations’ risk profile and risk time horizon. The compensation programme takes into account the risks that employees take on behalf of SIDAC and BNS, and ensures compensation takes into consideration prospective risks and outcomes.
In designing employee compensation programmes, SIDAC and BNS strive to ensure that:
1. Risk is carefully managed, so that all business performance targets and individual/department objectives can be accomplished within established risk policies, limits, processes and standards. The key metrics on which incentive compensation plans are based are approved by the Parent Board. Employees are discouraged from taking unreasonable and excessive risks through a strong internal risk culture that is reinforced by compensation programmes. By delivering incentive compensation through a combination of annual, mid-term and long-term incentives that reflect the organization’s risk profile and by deferring a substantial portion of the incentive compensation paid to senior executives and other employees whose actions can have a material impact on risk, employees are discouraged from taking unreasonable and excessive risks. Caps are also placed on annual incentive funding in conjunction with stress-testing potential pay-outs and implementing share ownership and post-retirement share retention requirements to ensure shareholder alignment on a long-term basis.
2. The Board is responsible for ensuring compliance with key CBI and EU remuneration regulatory requirements and overseeing the implementation of policies and procedures to support the requirements, including those of the EBA, CBI, CRD IV and CRR. The Compliance function analyses the impact of SIDAC’s remuneration on compliance with legislation, regulations, internal policies and risk culture and reports any findings.
3. SIDAC has a compensation adjustment process for all employees, the purpose of which is to maintain the alignment between risk and rewards to ensure that variable remuneration is paid / vests only if it is sustainable, taking into account the financial situation of SIDAC, and justified on the basis of the performance of SIDAC, the business area and the individual(s) concerned. Under this framework, SIDAC may take action to adjust variable remuneration either individually or collectively. This process includes SIDAC’s CRO assessing the risks undertaken by SIDAC including compensation plan design, conduct considerations, considerations on performance against risk appetite and the use of financial resources within SIDAC in conducting its activities during the fiscal year, and recommending adjustments to the aggregate Ireland incentive spend – if necessary – to the Board and the BNS HRC and BNS Risk Committee (in a joint meeting). Additionally, the Board assesses the achievement of performance targets and the need for ex-post risk adjustment, including any proposed application of malus and clawback arrangements in SIDAC. Finally, the process includes input from SIDAC Finance on the quality and sustainability of net income and

Scotiabank (Ireland) DAC – Pillar 3 Disclosures 2020
69
profit that feeds into the determination of bonus spend in SIDAC, and evaluations conducted for SIDAC through its ICAAP to ensure SIDAC has been prudent in managing its capital.
4. Measures for incentive programmes are thoroughly reviewed by the BNS senior executive leadership team: A committee has been established of the President and CEO of the Parent and his direct reports, the BNS Human Capital Committee (“BNS HCC”), that provides senior leaders with the opportunity to review and evaluate the key aspects of material incentive programmes from an overall policy and comprehensive risk basis.
5. The BNS Risk Committee participates in reviews of the design and results of incentive programmes: The BNS Risk Committee members and the BNS HRC members jointly review and approve the design, metrics, targets, and payouts of material incentive programmes. In addition, SIDAC’s Chief Risk Officer, produces a risk assessment analysis on operations and adherence to business risk appetite.
6. Control and stewardship functions including risk management, legal, compliance and anti-money laundering, finance, internal audit, and human resources are independent from the business units they oversee and have responsibility independent from the business to provide objective assessment, reporting and / or assurance. Control functions have appropriate authority and are remunerated in accordance with their functional objectives. The remuneration of all MRTs including control function heads is overseen by the Board and the BNS HRC and is predominantly fixed, to reflect the nature of their responsibilities. Compensation for control and stewardship function employees is tied to overall Bank performance only. These employees participate in the Bank’s global programme and are excluded from any incentive programme offered by the business line they support. Control and stewardship function management have day-to-day responsibility and ultimate accountability for control and stewardship function employees including hiring decisions, performance appraisals, and compensation.
7. To ensure appropriate linkage between incentive compensation and risk, possible breaches are reviewed for Material Risk Impact (MRI) employees throughout the Parent organisation by the BNS CRC (whose membership includes the global heads of finance, risk management, legal, compliance, internal audit and human resources) and for MRTs in SIDAC by the local conduct sub-committee of the SIDAC ROC.
8. Clawback and malus provisions: The BNS Clawback Policy and SIDAC’s ‘Schedule B’ of the same policy, applies to covered individuals and employee groups, including SIDAC MRTs. Employees may forfeit outstanding awards, be required to repay previous compensation or have future grants reduced if there is: a) employee misconduct, misbehaviour, fraud or gross negligence; b) material risk management failure of the firm and/or business unit; c) material misstatement of the Parent’s or a business of the Parent’s financial results; d) material downturn in financial performance; e) significant increases in the Parent’s or a business of the Parent’s economic or regulatory capital base; or f) any regulatory sanctions where the conduct of the covered individual contributed to the sanctions.
9. Anti-hedging and non-assignability provisions prohibit employees from utilizing hedging strategies or derivatives to circumvent the risk alignment effects of the Parent’s compensation programmes.
10. Compensation programmes are reviewed independently of management. The Parent’s internal audit group conducts an annual review of compensation programmes and practices, reporting directly to the BNS HRC. The review includes all material compensation plans and programmes, and assessment of the appropriateness of these plans and programmes against organisational goals and risk profile as well as the FSB principles and standards, and an assessment of appropriateness of pay-outs relative to performance and risk.
11. SIDAC’s internal audit and compliance teams conduct reviews of the remuneration programmes applicable to SIDAC employees against remuneration-related regulatory requirements. Internal Audit provides an independent opinion on the design and operating effectiveness of internal controls to ensure that remuneration policies and procedures in SIDAC comply with the applicable regulation of the CBI and EBA. The regulations apply to all SIDAC staff with specific requirements for material risk taker compensation. Compliance conduct tests to provide an opinion on the adequacy of and adherence to the applicable regulation and controls related to remuneration in order to mitigate regulatory and/or other compliance risks.
13.2 Quantitative Disclosure
The following pages show compensation awards and related data for 2020 and prior fiscal year MRTs, all employees (who are not MRTs), and Directors who are not executives of SIDAC. The information is reported by major business
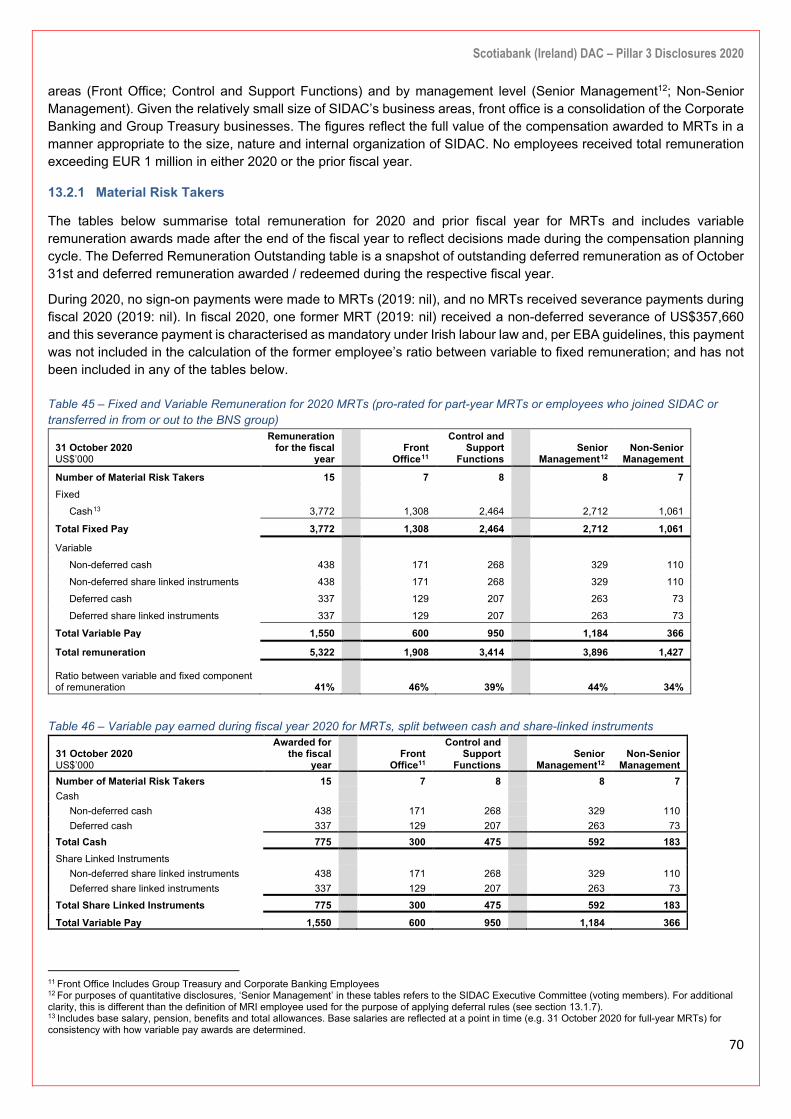
Scotiabank (Ireland) DAC – Pillar 3 Disclosures 2020
70
areas (Front Office; Control and Support Functions) and by management level (Senior Management12; Non-Senior Management). Given the relatively small size of SIDAC’s business areas, front office is a consolidation of the Corporate Banking and Group Treasury businesses. The figures reflect the full value of the compensation awarded to MRTs in a manner appropriate to the size, nature and internal organization of SIDAC. No employees received total remuneration exceeding EUR 1 million in either 2020 or the prior fiscal year.
13.2.1 Material Risk Takers
The tables below summarise total remuneration for 2020 and prior fiscal year for MRTs and includes variable remuneration awards made after the end of the fiscal year to reflect decisions made during the compensation planning cycle. The Deferred Remuneration Outstanding table is a snapshot of outstanding deferred remuneration as of October 31st and deferred remuneration awarded / redeemed during the respective fiscal year.
During 2020, no sign-on payments were made to MRTs (2019: nil), and no MRTs received severance payments during fiscal 2020 (2019: nil). In fiscal 2020, one former MRT (2019: nil) received a non-deferred severance of US$357,660 and this severance payment is characterised as mandatory under Irish labour law and, per EBA guidelines, this payment was not included in the calculation of the former employee’s ratio between variable to fixed remuneration; and has not been included in any of the tables below. Table 45 – Fixed and Variable Remuneration for 2020 MRTs (pro-rated for part-year MRTs or employees who joined SIDAC or transferred in from or out to the BNS group)
31 October 2020 US$’000
Remuneration for the fiscal
year Front
Office11
Control and Support
Functions Senior
Management12 Non-Senior
Management
Number of Material Risk Takers 15 7 8 8 7 Fixed Cash13 3,772 1,308 2,464 2,712 1,061
Total Fixed Pay 3,772 1,308 2,464 2,712 1,061
Variable Non-deferred cash 438 171 268 329 110 Non-deferred share linked instruments 438 171 268 329 110 Deferred cash 337 129 207 263 73 Deferred share linked instruments 337 129 207 263 73
Total Variable Pay 1,550 600 950 1,184 366
Total remuneration 5,322 1,908 3,414 3,896 1,427
Ratio between variable and fixed component of remuneration 41% 46% 39% 44% 34%
Table 46 – Variable pay earned during fiscal year 2020 for MRTs, split between cash and share-linked instruments
31 October 2020 US$’000
Awarded for the fiscal
year Front
Office11
Control and Support
Functions Senior
Management12 Non-Senior
Management Number of Material Risk Takers 15 7 8 8 7 Cash Non-deferred cash 438 171 268 329 110 Deferred cash 337 129 207 263 73 Total Cash 775 300 475 592 183 Share Linked Instruments Non-deferred share linked instruments 438 171 268 329 110 Deferred share linked instruments 337 129 207 263 73 Total Share Linked Instruments 775 300 475 592 183 Total Variable Pay 1,550 600 950 1,184 366
11 Front Office Includes Group Treasury and Corporate Banking Employees 12 For purposes of quantitative disclosures, ‘Senior Management’ in these tables refers to the SIDAC Executive Committee (voting members). For additional clarity, this is different than the definition of MRI employee used for the purpose of applying deferral rules (see section 13.1.7). 13 Includes base salary, pension, benefits and total allowances. Base salaries are reflected at a point in time (e.g. 31 October 2020 for full-year MRTs) for consistency with how variable pay awards are determined.

Scotiabank (Ireland) DAC – Pillar 3 Disclosures 2020
71
Table 47 – Deferred remuneration outstanding as at 31 October 2020 and awarded/redeemed in fiscal 2020
The values of outstanding awards are estimated using the closing share price of BNS common shares on 31 October, 2020 of C$55.35. The table includes former MRTs who remain entitled to deferred compensation (i.e., deferred cash, deferred share-linked instruments), as well as prior awards granted to MRTs including grants when the employees were employed by SIDAC but not in MRT roles. The table does not include deferred remuneration that was awarded in December 2020 for fiscal 2020 – these awards will be included in the 2021 Pillar 3 disclosure table.
31 October 2020 US$’000
Total deferred remuneration
Front Office11
Control and
Support Functions
Senior Management12
Non-Senior Management
Outstanding and Vested14 441 120 321 264 175 Outstanding and Unvested 1,068 235 833 516 551 Awarded during financial year 1,012 321 690 665 347 Paid Out 773 165 606 299 473 Reduced through performance adjustments - - - - -
Table 48 – Fixed and Variable Remuneration for 2019 MRTs (pro-rated for part-year MRTs or employees who joined SIDAC or transferred in from or out to the BNS group)
31 October 2019 US$’000
Remuneration for the fiscal
year Front
Office11
Control and Support
Functions Senior
Management12 Non-Senior
Management Number of Identified Staff 15 7 8 9 6 Fixed Cash13 2,863 880 1,983 2,011 852 Total Fixed Pay 2,863 880 1,983 2,011 852 Variable Non-deferred cash 357 135 222 255 102 Non-deferred share linked instruments 357 135 222 255 102 Deferred cash 283 111 172 215 68 Deferred share linked instruments 283 111 172 215 68 Total Variable Pay 1,280 492 788 940 340 Total remuneration 4,143 1,372 2,771 2,951 1,192
Ratio between variable and fixed component of remuneration 45% 56% 41% 47% 40%
Table 49 – Variable pay earned during fiscal year 2019 for MRTs, split between cash and share-linked instruments
31 October 2019 US$’000
Awarded for the
fiscal year Front
Office11
Control and Support
Functions Senior
Management12 Non-Senior
Management Number of Identified Staff 15 7 8 9 6 Cash Non-deferred cash 357 135 222 255 102 Deferred cash 283 111 172 215 68 Total Cash 640 246 394 470 170 Share Linked Instruments Non-deferred share linked instruments 357 135 222 255 102 Deferred share linked instruments 283 111 172 215 68 Total Share Linked Instruments 640 246 394 470 170 Total Variable Pay 1,280 492 788 940 340
Table 50 – Deferred remuneration outstanding as at 31 October, 2019 and awarded/redeemed in fiscal 2019
The values of outstanding awards are estimated using the closing share price of BNS’ common shares on 31 October 2019 of C$75.54. The table includes former MRTs who remain entitled to deferred compensation (i.e., deferred cash, deferred share-linked instruments), as well as prior awards granted to MRTs including grants when the employees were
14 Vesting Includes the additional 12-month retention period for EEA RSUs prior to payment.

Scotiabank (Ireland) DAC – Pillar 3 Disclosures 2020
72
employed by SIDAC but not in MRT roles. The table does not include deferred remuneration that was awarded in December 2019 for fiscal 2019 – these awards are included in the 2020 table above.
31 October 2019 US$’000
Total deferred
remuneration Front
Office11
Control and
Support Functions
Senior Management12
Non-Senior Management
Outstanding and Vested14 26 - 26 12 14 Outstanding and Unvested 1,543 317 1,226 918 625 Awarded during financial year 1,016 161 855 654 362 Paid Out 428 136 292 202 225 Reduced through performance adjustments - - - - -
13.2.2 All Employees (who are not MRTs)
The table below summarises total remuneration awarded during the 2020 and prior fiscal year for all employees of SIDAC (excluding MRTs) and includes variable remuneration awards made after the end of the fiscal year to reflect decisions made during the compensation planning cycle. This table does not include any mandatory severance payments made to employees who have departed the firm (mandatory severance payments made to departed MRTs are disclosed above).
Table 51 – All employee remuneration (excluding MRTs)
US$’000 Fixed
Remuneration15 Variable
Remuneration Total
Remuneration Number of
Employees16 31 October 2020 Control and Support Functions 6,338 902 7,241 60 Front Office 1,041 245 1,285 9 Total 7,379 1,147 8,526 69 31 October 2019 Control and Support Functions 4,333 741 5,074 49 Front Office 499 93 592 8 Total 4,832 834 5,666 57
13.2.3 The Board
The table below summarises total remuneration earned during the 2020 and prior fiscal year for remunerated Directors who are not executives of SIDAC. For additional clarity, the table includes remuneration for the two Chairmen of the Board in 2019. These Directors received their entire remuneration as fixed compensation (i.e., they received no variable compensation).
Table 52 – Non-Executive Director Remuneration
US$’000 Fixed
Remuneration Variable
Remuneration Total
Remuneration
Number of Non-Executive
Directors 31 October 2020 331 331 5 31 October 2019 261 - 261 7
15 Includes base salary, pension, benefits and total allowances. Base salaries reflect actual earnings for fiscal 2020 16 Number of employees include both temporary and permanent employees on payroll during the fiscal year including partial year employees (i.e. those who either joined or left SIDAC during the year).
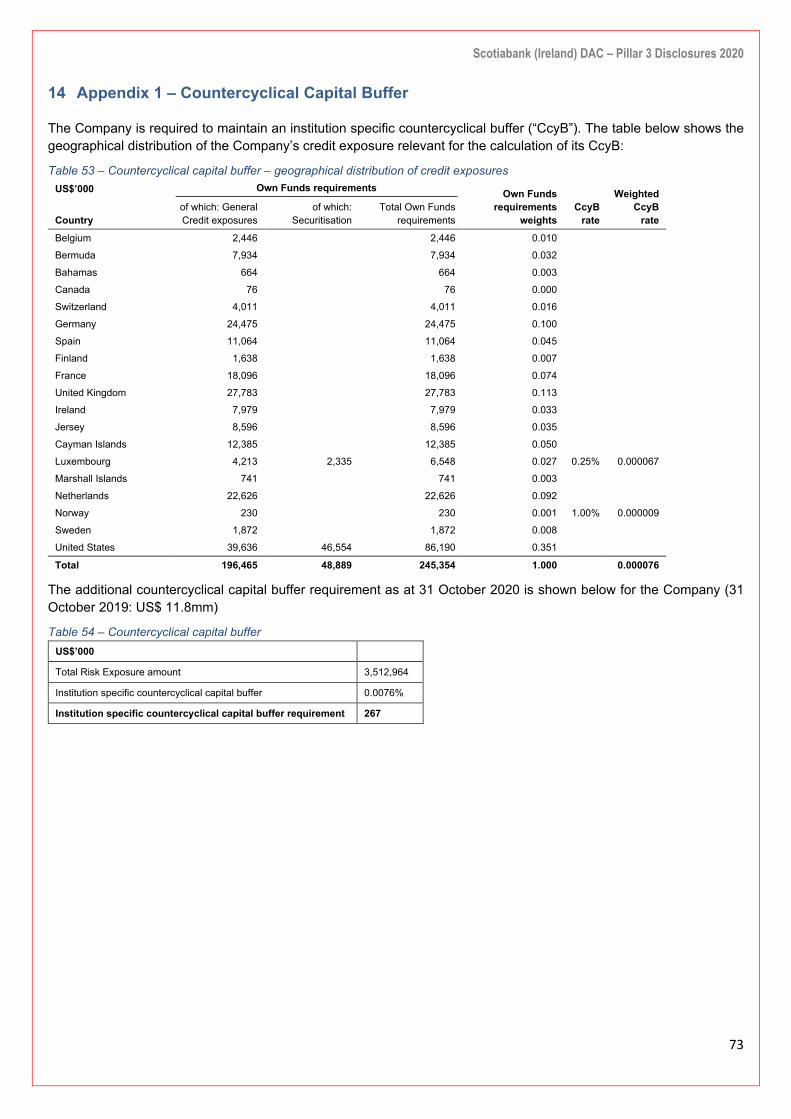
Scotiabank (Ireland) DAC – Pillar 3 Disclosures 2020
73
14 Appendix 1 – Countercyclical Capital Buffer
The Company is required to maintain an institution specific countercyclical buffer (“CcyB”). The table below shows the geographical distribution of the Company’s credit exposure relevant for the calculation of its CcyB:
Table 53 – Countercyclical capital buffer – geographical distribution of credit exposures US$’000 Own Funds requirements Own Funds
requirements weights
CcyB rate
Weighted CcyB
rate Country of which: General Credit exposures
of which: Securitisation
Total Own Funds requirements
Belgium 2,446 2,446 0.010
Bermuda 7,934 7,934 0.032
Bahamas 664 664 0.003
Canada 76 76 0.000
Switzerland 4,011 4,011 0.016
Germany 24,475 24,475 0.100
Spain 11,064 11,064 0.045
Finland 1,638 1,638 0.007
France 18,096 18,096 0.074
United Kingdom 27,783 27,783 0.113
Ireland 7,979 7,979 0.033
Jersey 8,596 8,596 0.035
Cayman Islands 12,385 12,385 0.050
Luxembourg 4,213 2,335 6,548 0.027 0.25% 0.000067
Marshall Islands 741 741 0.003
Netherlands 22,626 22,626 0.092
Norway 230 230 0.001 1.00% 0.000009
Sweden 1,872 1,872 0.008
United States 39,636 46,554 86,190 0.351
Total 196,465 48,889 245,354 1.000 0.000076
The additional countercyclical capital buffer requirement as at 31 October 2020 is shown below for the Company (31 October 2019: US$ 11.8mm)
Table 54 – Countercyclical capital buffer US$’000
Total Risk Exposure amount 3,512,964
Institution specific countercyclical capital buffer 0.0076%
Institution specific countercyclical capital buffer requirement 267

Scotiabank (Ireland) DAC – Pillar 3 Disclosures 2020
74
15 Appendix 2 – CRR Roadmap
Table 55 – CRR Roadmap CRR Ref High Level Summary Company Reference
431 Scope of disclosure requirements
431 (1) Requirement to publish Pillar 3 disclosures. Scotiabank (Ireland) Designated Activity Company Pillar 3 Disclosures as at October 2020
431 (2) Firms with permission to use specific operational risk methodologies must disclose operational risk information. Not applicable
431 (3) Institution must have a policy covering frequency of disclosures, their verification, comprehensiveness and overall appropriateness. Section 1.3
431 (4) Explanation of ratings decision upon request. Not applicable
432 Non-material, proprietary or confidential Information
432 (1) Institutions may omit information that is not material if certain conditions are respected.
SIDAC complies with all relevant disclosure requirements with regards to non-material, proprietary or confidential information.
432 (2) Institutions may omit information that is proprietary or confidential if certain conditions are respected.
432 (3) Where 432 (1) and (2) apply this must be stated in the disclosures, and more general information must be disclosed.
432 (4) Use of 432 (1) or (2) is without prejudice to scope of liability for failure to disclose material information.
433 Frequency of disclosure
433 (1) Disclosures must be published once a year at a minimum, and more frequently if necessary. Section 1.3
433 (2) Disclosures should be published in line with the publication of the Financial Statements Section 1.3
434 Means of disclosures
434 (1) To include of disclosures in one appropriate medium, or provide clear cross-references. Section 1.3
434 (2) Disclosures made under other requirements (e.g. accounting) can be used to satisfy Pillar 3 if appropriate. Not applicable
435 Risk management objectives and policies
435 (1) (a)
Disclose information on strategies and processes; organisational structure, reporting systems and risk mitigation/hedging.
Sections 3 -10 as applicable for each of the risks
435 (1) (b)
435 (1) (c)
435 (1) (d)
435 (1) (e) Inclusion of a declaration approved by the Board on adequacy of risk management arrangements. Section 3
435 (1) (f) Inclusion of a concise risk statement approved by the Board. Section 3
435 (2) Information on governance arrangements, including information on Board composition and recruitment, and risk committees. Section 3.1
435 (2) (a) Number of directorships held by directors. Section 3.1
435 (2) (b) Recruitment policy of Board members, their experience and expertise. Section 3.1
435 (2) (c) Policy on diversity of Board membership and results against targets. Section 3.1
435 (2) (d) Disclosure of whether a dedicated risk committee is in place, and number of meetings in the year. Section 3.1
435 (2) (e) Description of information flow on risk to Board. Section 3.1 Section 3.3
436 Scope of application
436 (a) Name of institution. Section 1.1
436 (b) Difference in basis of consolidation for accounting and prudential purposes, naming entities that are: Section 1.3
436 (b) (i) Fully consolidated; Not applicable
436 (b) (ii) Proportionally consolidated; Not applicable

Scotiabank (Ireland) DAC – Pillar 3 Disclosures 2020
75
CRR Ref High Level Summary Company Reference
436 (b) (iii) Deducted from own funds; Not applicable
436 (b) (iv) Neither consolidated nor deducted. Not applicable
436 (c) Impediments to transfer of funds between parent and subsidiaries. Not applicable
436 (d) Capital shortfalls in any subsidiaries outside of scope of consolidation. Not applicable
436 (e) Making use of articles on derogations from a) prudential requirements or b) liquidity requirements for individual subsidiaries/entities.
Not applicable
437 Own funds
437 (1)
Requirements regarding capital resources table.
Section 2.3 Appendix 1 Appendix 4 Appendix 5
437 (1) (a)
437 (1) (b)
437 (1) (c)
437 (1) (d) (i) 437 (1) (d) (ii) 437 (1) (d) (iii)
437 (1) (e)
437 (1) (f)
437 (2) EBA to publish implementation standards for points above. Not applicable
438 Capital requirements
438 (a) Summary of institution’s approach to assessing adequacy of capital levels. Section 2
438 (b) Result of ICAAP on demand from authorities. Not applicable
438 (c) Capital requirement amounts for credit risk for each Standardised Approach exposure class. Section 4.3
438 (d) (i)
Capital requirements amounts for credit risk for each Internal Ratings Based Approach exposure class. Not applicable
438 (d) (ii)
438 (d) (iii)
438 (d) (iv)
438 (e) Capital requirements amount for market risk or settlement risk, or large exposures where they exceed limits. Section 5.1
438 (f) Capital requirement amounts for operational risk, separately for the basic indicator approach, the standardised approach, and the advanced measurement approaches as applicable.
Section 2.3
438 endnote
Requirement to disclose specialised lending exposures and equity exposures in the banking book falling under the simple risk weight approach. Not applicable
439 Exposure to counterparty credit risk (CCR)
439 (a) Description of process to assign internal capital and credit limits to CCR exposures. Section 4.6
439 (b) Discussion of process to secure collateral and establishing reserves. Section 4.6
439 (c) Discussion of management of wrong-way exposures. Section 4.8
439 (d) Disclosure of collateral to be provided (outflows) in the event of a ratings downgrade. Section 4.6
439 (e) Derivation of net derivative credit exposure. Section 4.6
439 (f) Exposure values for mark-to-market, original exposure, standardised and internal model methods. Section 4.6
439 (g) Notional value of credit derivative hedges and current credit exposure by type of exposure. Not applicable
439 (h) Notional amounts of credit derivative transactions for own credit, intermediation, bought and sold, by product type. Not applicable
439 (i) Estimate of alpha, if applicable. Not applicable
440 Capital buffers

Scotiabank (Ireland) DAC – Pillar 3 Disclosures 2020
76
CRR Ref High Level Summary Company Reference
440 (1) (a) Geographical distribution of relevant credit exposures. Section 4.3 and Appendix 3
440 (1) (b) Amount of the institution specific countercyclical capital buffer. Appendix 1
440 (2) EBA will issue technical implementation standards related to 440 (1). Not applicable
441 Indicators of global systemic importance
441 (1) Disclosure of the indicators of global systemic Importance. Not applicable
441 (2) EBA will issue technical implementation standards related to 441 (1). Not applicable
442 Credit risk adjustments
442 (a) Disclosure of bank‘s definitions of past due and impaired. Section 4.5
442 (b) Approaches for calculating credit risk adjustments. Section 4.5
442 (c) Disclosure of pre-CRM EAD by exposure class. Section 4.3
442 (d) Disclosures of pre-CRM EAD by geography and exposure class. Section 4.3
442 (e) Disclosures of pre-CRM EAD by industry and exposure class. Section 4.3
442 (f) Disclosures of pre-CRM EAD by residual maturity and exposure class. Section 4.3
442 (g)
Breakdown of impaired, past due, specific and general credit adjustments, and impairment charges for the period, by exposure class or counterparty type. Section 4.5
442 (g) (i)
442 (g) (ii)
442 (g) (iii)
442 (h) Impaired, past due exposures, by geographical area, and amounts of specific and general impairment for each geography.
Section 4.5
442 (i)
Reconciliation of changes in specific and general credit risk adjustments. Section 4.5
442 (i) (i)
442 (i) (ii)
442 (i) (iii)
442 (i) (iv)
442 (i) (v)
442 endnote
Specific credit risk adjustments recorded to income statement are disclosed separately. Section 4.5
443 Unencumbered assets
443 EBA shall issue guidelines specifying the disclosure of unencumbered assets Section 12
444 Use of ECAIs
444 (a) Names of the ECAIs used in the calculation of Standardised Approach RWAs, and reasons for any changes.
Section 4.2
444 (b) Exposure classes associated with each ECAI. Section 4.2
444 (c) Explanation of the process for translating external ratings into credit quality steps. Section 4.2
444 (d) Mapping of external rating to credit quality steps. Section 4.2
444 (e) Exposure value pre- and post-credit risk mitigation, by credit quality step. Section 4.3
445 Exposure to market risk
445 Disclosure of position risk, large exposures exceeding limits, FX, settlement and commodities risk. Section 5.1
446 Operational risk
446 Disclosure of the scope of approaches used to calculate operational risk, discussion of advanced methodology and external factors considered. Section 6.2
447 Exposure in equities not included in the trading book
447 (a) Differentiation of exposures based on objectives. Not applicable
447 (b) Recorded and fair value and actual prices of exchange traded equity where it differs from fair value. Not applicable
447 (c) Types, nature and amounts of the relevant classes of equity exposures. Not applicable
447 (d) Realised cumulative gains and losses on sales over the period. Not applicable
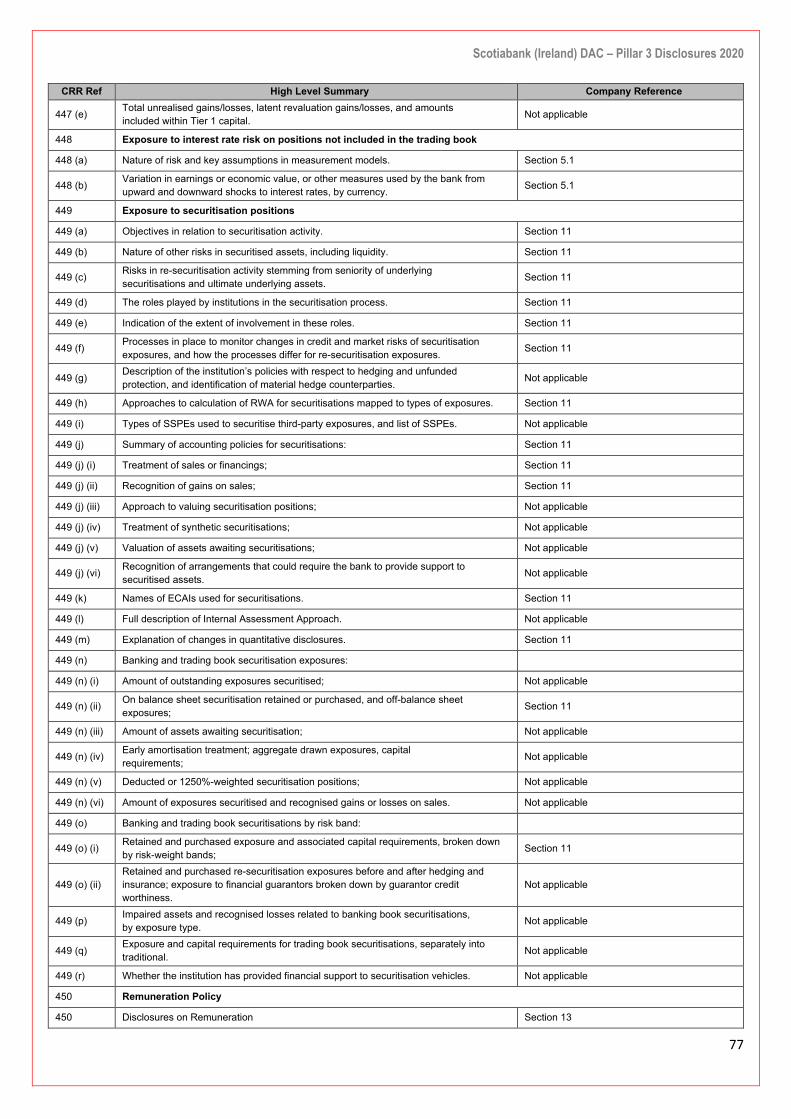
Scotiabank (Ireland) DAC – Pillar 3 Disclosures 2020
77
CRR Ref High Level Summary Company Reference
447 (e) Total unrealised gains/losses, latent revaluation gains/losses, and amounts included within Tier 1 capital. Not applicable
448 Exposure to interest rate risk on positions not included in the trading book
448 (a) Nature of risk and key assumptions in measurement models. Section 5.1
448 (b) Variation in earnings or economic value, or other measures used by the bank from upward and downward shocks to interest rates, by currency. Section 5.1
449 Exposure to securitisation positions
449 (a) Objectives in relation to securitisation activity. Section 11
449 (b) Nature of other risks in securitised assets, including liquidity. Section 11
449 (c) Risks in re-securitisation activity stemming from seniority of underlying securitisations and ultimate underlying assets. Section 11
449 (d) The roles played by institutions in the securitisation process. Section 11
449 (e) Indication of the extent of involvement in these roles. Section 11
449 (f) Processes in place to monitor changes in credit and market risks of securitisation exposures, and how the processes differ for re-securitisation exposures. Section 11
449 (g) Description of the institution’s policies with respect to hedging and unfunded protection, and identification of material hedge counterparties. Not applicable
449 (h) Approaches to calculation of RWA for securitisations mapped to types of exposures. Section 11
449 (i) Types of SSPEs used to securitise third-party exposures, and list of SSPEs. Not applicable
449 (j) Summary of accounting policies for securitisations: Section 11
449 (j) (i) Treatment of sales or financings; Section 11
449 (j) (ii) Recognition of gains on sales; Section 11
449 (j) (iii) Approach to valuing securitisation positions; Not applicable
449 (j) (iv) Treatment of synthetic securitisations; Not applicable
449 (j) (v) Valuation of assets awaiting securitisations; Not applicable
449 (j) (vi) Recognition of arrangements that could require the bank to provide support to securitised assets. Not applicable
449 (k) Names of ECAIs used for securitisations. Section 11
449 (l) Full description of Internal Assessment Approach. Not applicable
449 (m) Explanation of changes in quantitative disclosures. Section 11
449 (n) Banking and trading book securitisation exposures:
449 (n) (i) Amount of outstanding exposures securitised; Not applicable
449 (n) (ii) On balance sheet securitisation retained or purchased, and off-balance sheet exposures; Section 11
449 (n) (iii) Amount of assets awaiting securitisation; Not applicable
449 (n) (iv) Early amortisation treatment; aggregate drawn exposures, capital requirements; Not applicable
449 (n) (v) Deducted or 1250%-weighted securitisation positions; Not applicable
449 (n) (vi) Amount of exposures securitised and recognised gains or losses on sales. Not applicable
449 (o) Banking and trading book securitisations by risk band:
449 (o) (i) Retained and purchased exposure and associated capital requirements, broken down by risk-weight bands; Section 11
449 (o) (ii) Retained and purchased re-securitisation exposures before and after hedging and insurance; exposure to financial guarantors broken down by guarantor credit worthiness.
Not applicable
449 (p) Impaired assets and recognised losses related to banking book securitisations, by exposure type. Not applicable
449 (q) Exposure and capital requirements for trading book securitisations, separately into traditional. Not applicable
449 (r) Whether the institution has provided financial support to securitisation vehicles. Not applicable
450 Remuneration Policy
450 Disclosures on Remuneration Section 13
Scotiabank (Ireland) DAC – Pillar 3 Disclosures 2020
78
CRR Ref High Level Summary Company Reference
451 Leverage
451 (1) (a) Leverage ratio, and breakdown of total exposure measure, including reconciliation to Financial Statements, and derecognised fiduciary items. Section 2.4 451 (1) (b)
451 (1) (c)
451 (1) (d) Description of the risk management approach to mitigate excessive leverage, and factors that impacted the leverage ratio during the year. Section 2.4
451 (1) (e)
451 (2) EBA to publish implementation standards for points above. Not applicable
452 Use of the IRB Approach to credit risk
452 (a) Permission for use of the IRB approach from authority.
Not applicable
452 (b) Explanation of:
452 (b) (i) Internal rating scales mapped to external ratings;
452 (b) (ii) Use of internal ratings for purposes other than capital requirement calculations;
452 (b) (iii) Management and recognition of credit risk mitigation;
452 (b) (iv) Controls around ratings systems.
452 (c)
Description of ratings processes for each IRB asset class, provided separately.
452 (c) (i)
452 (c) (ii)
452 (c) (iii)
452 (c) (iv)
452 (c) (v)
452 (d) Exposure values by IRB exposure class, separately for Advanced and Foundation IRB.
452 (e) For wholesale exposure classes, disclosed separately by obligor grade:
452 (e) (i) Total exposure, separating loans and undrawn exposures where applicable;
452 (e) (ii) Exposure-weighted average risk weight;
452 (e) (iii) Undrawn commitments and average exposure values by asset class.
452 (f) For retail exposure classes, same disclosures as under 452 (e), by risk grade or EL grade.
452 (g) Actual specific risk adjustments for the period and explanation of changes.
452 (h) Commentary on drivers of losses in preceding period.
452 (i) Disclosure of predicted against actual losses for sufficient period, and historical analysis to help assess the performance of the rating system over a sufficient period.
452 (j) For all IRB exposure classes:
452 (j) (i) Where applicable, PD and LGD by each country where the bank operates.
452 (j) (ii)
453 Use of credit risk mitigation techniques
453 (a) Use of on- and off-balance sheet netting. Not applicable
453 (b) How collateral valuation is managed. Section 4.4
453 (c) Description of types of collateral used Section 4.4
453 (d) Types of guarantor and credit derivative counterparty, and their creditworthiness. Section 4.4
453 (e) Disclosure of market or credit risk concentrations within risk mitigation exposures.
Section 4.4 Section 5.2
453 (f) For exposures under either the Standardised or Foundation IRB approach, disclose the exposure value covered by eligible collateral. Section 4.4
453 (g) Exposures covered by guarantees or credit derivatives. Section 4.4
454 Use of the Advanced Measurement Approaches to operational risk
454 Description of the use of insurance or other risk transfer mechanisms to mitigate operational risk. Not applicable
Scotiabank (Ireland) DAC – Pillar 3 Disclosures 2020
79
CRR Ref High Level Summary Company Reference
455 Use of Internal Market Risk Models
455 (a) (i) Disclosure of the characteristics of the market risk models.
Not applicable
455 (a) (ii) Disclosure of the methodology and description of comprehensive risk measure and incremental risk charge.
455 (a) (iii) Descriptions of stress tests applied to the portfolios.
455 (a) (iv) Methodology for back-testing and validating the models.
455 (b) Scope of permission for use of the models.
455 (c) Policies and processes to determine which exposures are to be included in the trading book, and to comply with prudential valuation requirements.
455 (d)
High/Low/Mean values over the year of VaR, sVaR, comprehensive risk measure and incremental risk charge.
455 (d) (i)
455 (d) (ii)
455 (d) (iii)
455 (e) The elements of the own fund calculation.
455 (f) Weighted average liquidity horizons of portfolios covered by models.
455 (g) Comparison of end-of-day VaR measures compared with one-day changes in portfolio’s value.

Scotiabank (Ireland) DAC – Pillar 3 Disclosures 2020
80
16 Appendix 3 – Geographical Distributions
For all tables that require a breakdown by geographical distribution, a threshold of 10% (increased from 5% in 2019) of the net value of exposures by geographical area has been used as the materiality threshold for disclosure of individual jurisdictions.
As such the immaterial jurisdictions are as follows:
1. Other European countries: Belgium, Switzerland, Denmark, Spain, Finland, Guernsey, Jersey, Luxembourg, Norway, Sweden.
2. Other Asia-Pacific countries: Hong Kong, New Zealand, Singapore.
3. Other geographical areas: Bermuda, Bahamas, Cayman Islands, Marshall Islands.
Also included in ‘other geographical areas’ are the following supranational organisations, as per EBA guidance:
Asian Development Bank, European Investment Bank, Inter-American Development Bank, International Bank for Reconstruction and Development, International Finance Corporation, Nordic Investment Bank, European Bank for Reconstruction and Development

Scotiabank (Ireland) DAC – Pillar 3 Disclosures 2020
81
17 Appendix 4 – Own Funds Disclosure
Table 56 – Own funds disclosure template
AMOUNT AT
CRR Article Reference 31 OCTOBER
2020 31 OCTOBER
2019 Common Equity Tier 1 capital: instruments and reserves
*Restated
1 Capital instruments and the related share premium accounts 40,000 40,000 26(1), 27, 28, 29
of which: Ordinary shares 40,000 40,000
2 Retained earnings 1,632,385 1,572,013 26(1)(c)
3 Accumulated other comprehensive income (and any other reserves) 13,617 12,083 26(1)
6 Common Equity Tier 1 (CET1) capital before regulatory adjustments 1,686,002 1,624,096
Common Equity Tier 1 (CET1) capital: regulatory adjustments
7 Additional value adjustments (negative amount) (1,723) (1,781) 34, 105
8 Intangible assets (net of related tax liability) (negative amount) (279) (462) 36(1)(b), 37
27 Qualifying AT1 deductions that exceeds the AT1 capital of the institution (negative amount) - - 36(1)(j)
28 Total regulatory adjustments to Common Equity Tier 1 (CET1) (2,002) (2,243)
29 Common Equity Tier 1 (CET1) capital 1,684,000 1,621,853
44 Additional Tier 1 (AT1) capital - -
45 Tier 1 capital (T1 = CET1 + AT1) 1,684,000 1,621,853
Tier 2 (T2) capital: instruments and provisions
46 Capital instruments and the related share premium accounts 40,000 40,000 62, 63
58 Tier 2 (T2) capital 40,000 40,000
59 Total capital (TC = T1 + T2) 1,724,000 1,661,853
60 Total risk-weighted assets 3,512,964 3,929,038
Capital ratios and buffers
61 Common Equity Tier 1 (as a percentage of total risk exposure amount 47.9% 41.6% 92(2)(a)
62 Tier 1 (as a percentage of total risk exposure amount) 47.9% 41.6% 92(2)(b)
63 Total capital (as a percentage of total risk exposure amount) 49.1% 42.6% 92(2)(c)
64
Institution specific buffer requirement (CET1 requirement in accordance with article 92 (1) (a) plus capital conservation and countercyclical buffer requirements plus a systemic risk buffer, plus systemically important institution buffer expressed as a percentage of total risk exposure amount)
2.51% 2.17% CRD 128, 129, 130, 131,133
65 of which: capital conservation buffer requirement 2.50% 1.88%
66 of which: countercyclical buffer requirement 0.01% 0.30%
68 Common Equity Tier 1 available to meet buffers (as a percentage of risk exposure amount)1 43.4% 37.1% CRD 128
Amounts below the thresholds for deduction (before risk-weighting)
72 Direct and indirect holdings of the capital of financial sector entities where the institution does not have a significant investment in those entities (amount below 10% threshold and net of eligible short positions
- - 36(1)(h), 45, 46, 56(c), 59, 60, 66(c), 69, 70
73 Direct and indirect holdings of the CET1 instruments of financial sector entities where the institution has a significant investment in those entities (amount below 10% threshold and net of eligible short positions
- - 36(1)(i), 45, 48
Applicable caps on the inclusion of provisions in Tier 2
76 Credit risk adjustments included in T2 in respect of exposures subject to standardised approach (prior to the application of the cap) - - 62
77 Cap on inclusion of credit risk adjustments in T2 under standardised approach 43,912 48,764 62
*Prior year comparatives have been restated in relation to credit risk RWA/capital requirements and capital ratios.

Scotiabank (Ireland) DAC – Pillar 3 Disclosures 2020
82
18 Appendix 5 – Reconciliation of equity in the Financial Statements to Regulatory own funds and main features of the Company’s capital instruments
The tables below show the reconciliation between the equity reported in the Financial Statements to Regulatory own funds and the main features of the Company’s capital instruments issued.
Table 57 – Reconciliation of equity in Financial Statements to Regulatory own funds Fully Loaded
US$'000 31 October 2020 31 October 2019 Capital base
Shareholder's funds1 1,726,002 1,664,096 Less Tier 2 instruments2 (40,000) (40,000) Total equity less instruments not qualifying as CET1 1,686,002 1,624,096 Regulatory adjustments3 Value adjustments due to the requirements for prudent valuation (1,723) (1,781) Intangible assets (279) (462) Common equity tier 1 1,684,000 1,621,853 Additional tier 1 - - Total tier 1 capital 1,684,000 1,621,853 Tier 2 Tier 2 instruments 40,000 40,000 Total tier 2 capital 40,000 40,000 Total capital 1,724,000 1,661,853
(1) As per page 13 of the Company’s Financial Statements. (2) See table 59 (preference shares) (3) CRD IV transitional rules that were applicable to SIDAC have expired since 2018 and all measures are fully phased in. In 2018 the Company adopted IFRS
9 and elected not to apply the new transitional arrangements specified in Article 473(a) of the CRR. As such, the Company’s own funds, capital and leverage ratios already reflect the full impact of IFRS 9 ECLs.
Table 58 – Capital instruments main features template – Ordinary equity Capital instruments main features templates
1 Issuer Scotiabank (Ireland) DAC
Scotiabank (Ireland) DAC
Scotiabank (Ireland) DAC
2 Unique identifier (1) N/A N/A N/A
3 Governing laws of the instrument (2) Irish law Irish law Irish law
Regulatory treatment
4 Transitional CRR rules Common Equity Tier 1 Common Equity Tier 1 Common Equity Tier 1
5 Post-transitional CRR rules Common Equity Tier 1 Common Equity Tier 1 Common Equity Tier 1
6 Eligible at: solo; consolidated; solo & consolidated Solo Solo Solo
7 Instrument type Ordinary shares Ordinary shares Ordinary shares
8 Amount recognised in regulatory capital (US$’000) 5,000 15,000 20,000
9 Nominal amount of instrument (US$’000) 5,000 15,000 20,000
9a Issue price US$ 1.00 US$ 1.00 US$ 1.00
9b Redemption price N/A N/A N/A
10 Accounting classification Shareholders' equity Shareholders' equity Shareholders' equity
11 Original date of issuance 31 Aug 1989 06 Jul 1990 07 Jul 1992
12 Perpetual or dated Perpetual Perpetual Perpetual
13 Original maturity date No maturity No maturity No maturity
14 Issuer call subject to prior Supervisory approval N/A N/A N/A
15 Optional call date N/A N/A N/A
Contingent call dates and redemption amount N/A N/A N/A
16 Subsequent call dates, if applicable N/A N/A N/A

Scotiabank (Ireland) DAC – Pillar 3 Disclosures 2020
83
Capital instruments main features templates
Coupon/dividends
17 Fixed or floating dividend/coupon N/A N/A N/A
18 Coupon rate and any related index N/A N/A N/A
19 Existence of a dividend stopper No No No
20a Fully discretionary, partially discretionary or mandatory - in terms of timing
Mandatory Mandatory Mandatory
20b Fully discretionary, partially discretionary or mandatory - in terms of amount
Mandatory Mandatory Mandatory
21 Existence of step up or other incentive to redeem N/A N/A N/A
22 Noncumulative or cumulative N/A N/A N/A
23 Convertible or non-convertible N/A N/A N/A
24 If convertible, conversion trigger(s) N/A N/A N/A
25 If convertible, fully or partially N/A N/A N/A
26 If convertible, conversion rate N/A N/A N/A
27 If convertible, mandatory or optional conversion N/A N/A N/A
28 If convertible, specify instrument type convertible into N/A N/A N/A
29 If convertible, specify issuer of instrument it converts into N/A N/A N/A
30 Write-down features N/A N/A N/A
31 If write-down, write down triggers N/A N/A N/A
32 If write-down, full or partial N/A N/A N/A
33 If write-down, permanent or temporary N/A N/A N/A
34 If temporary write-down, description of write-up mechanism (4) N/A N/A N/A
35 Position in subordination hierarchy in liquidation N/A N/A N/A
36 Non-compliant transitioned features No No No
37 If yes, specify non-compliant features N/A N/A N/A
Table 59 – Capital instruments main features – Preference shares Capital instruments main features templates
1 Issuer Scotiabank (Ireland) DAC
Scotiabank (Ireland) DAC
2 Unique identifier (1) N/A N/A
3 Governing laws of the instrument (2) Irish law Irish law
Regulatory treatment
4 Transitional CRR rules Tier 2 Tier 2
5 Post-transitional CRR rules Tier 2 Tier 2
6 Eligible at: solo; consolidated; solo & consolidated Solo Solo
7 Instrument type Preference Shares Preference Shares
8 Amount recognised in regulatory capital (US$’000) 20,000 20,000
9 Nominal amount of instrument (US$’000) 20,000 20,000
9a Issue price US$ 1.00 US$ 1.00
9b Redemption price US$ 1.00 US$ 1.00
10 Accounting classification Shareholders' equity Shareholders' equity
11 Original date of issuance 06 Jul 1990 07 Jul 1992
12 Perpetual or dated Perpetual Perpetual
13 Original maturity date No maturity No maturity

Scotiabank (Ireland) DAC – Pillar 3 Disclosures 2020
84
Capital instruments main features templates
14 Issuer call subject to prior Supervisory approval Yes Yes
15 Optional call date N/A N/A
16 Subsequent call dates, if applicable N/A N/A
Coupon/dividends
17 Fixed or floating dividend/coupon Floating Floating
18 Coupon rate and any related index 6-month LIBOR 6-month LIBOR
19 Existence of a dividend stopper No No
20a Fully discretionary, partially discretionary or mandatory - in terms of timing Mandatory Mandatory
20b Fully discretionary, partially discretionary or mandatory - in terms of amount Mandatory Mandatory
21 Existence of step up or other incentive to redeem N/A N/A
22 Noncumulative or cumulative Noncumulative Noncumulative
23 Convertible or non-convertible N/A N/A
24 If convertible, conversion trigger(s) N/A N/A
25 If convertible, fully or partially N/A N/A
26 If convertible, conversion rate N/A N/A
27 If convertible, mandatory or optional conversion N/A N/A
28 If convertible, specify instrument type convertible into N/A N/A
29 If convertible, specify issuer of instrument it converts into N/A N/A
30 Write-down features N/A N/A
31 If write-down, write down triggers N/A N/A
32 If write-down, full or partial N/A N/A
33 If write-down, permanent or temporary N/A N/A
34 If temporary write-down, description of write-up mechanism (4) N/A N/A
35 Position in subordination hierarchy in liquidation N/A N/A
36 Non-compliant transitioned features No No
37 If yes, specify non-compliant features N/A N/A