Pillar 3 Disclosures at 31 December 2021 - HSBC Bank Malta ...
43
HSBC Bank Malta p.l.c. Pillar 3 Disclosures at 31 December 2021
-
Upload
khangminh22 -
Category
Documents
-
view
0 -
download
0
Transcript of Pillar 3 Disclosures at 31 December 2021 - HSBC Bank Malta ...

HSBC Bank Malta p.l.c.Pillar 3 Disclosures at 31 December 2021

ContentsPage
Additional regulatory disclosures 2
Introduction 2
Risk management 5
Our risk management framework 5
Basis of Consolidation 8
Capital management 10
Leverage ratio 16
Credit risk 18
Additional disclosures on measures applied in response to the Covid-19 outbreak 24
Risk mitigation 27
Counterparty credit risk 30
Market Risk 32
Non-Financial Risk (‘NFR’) - previously known as Operational Risk 33
Other risks 35
Liquidity and funding 37
Business risk 41
Dilution risk 41
Remuneration policy 41
Pillar 3 Disclosures at 31 December 2021
1 HSBC Bank Malta p.l.c. Pillar 3 2021

Additional regulatory disclosures
Introduction
Regulatory framework for Pillar 3 disclosures
Under the European Central Bank (‘ECB’) Single Supervisory Mechanism (‘SSM’), HSBC Bank Malta p.l.c. falls under the direct supervision of both the ECB, as well as the Malta Financial Services Authority (‘MFSA’) via the Joint Supervisory Team (‘JST’), the latter consisting of representatives of the ECB and MFSA.
The two regulatory bodies receive information on the capital adequacy requirements for HSBC Bank Malta p.l.c. as an entity. At a consolidated level, we calculate capital for prudential regulatory reporting purposes using the Basel III framework of the Basel Committee on Banking Supervision (the ‘Basel Committee’) as implemented by the European Union (‘EU’) in the amended Capital Requirements Regulation and Directive collectively known as CRR/CRD.
The Basel Committee’s framework is structured around three ‘pillars’: the Pillar 1 minimum capital requirements, Pillar 2 in relation to supervisory review process which is complemented by Pillar 3 that concerns market discipline. The aim of Pillar 3 is to produce disclosures that allow market participants to assess the scope of application by banks of the Basel Committee’s framework and the rules in their jurisdiction, their capital condition, risk exposures and risk management processes, hence their capital adequacy. Pillar 3 requires all material risks to be disclosed to provide a comprehensive view of a bank’s risk profile.
These Additional Regulatory Disclosures (‘ARDs’) are aimed at providing the local group’s stakeholders further insight to the local group’s capital structure, adequacy and risk management practices. The disclosures outlined below have been prepared by the local group in accordance with the Pillar 3 quantitative and qualitative disclosure requirements as governed by Banking Rule BR/07: Publication of Annual Report and Audited Financial Statements of Credit Institutions authorised under the Banking Act, 1994, issued by the MFSA. Banking Rule BR/07 follows the disclosure requirements of Directive 2013/36/EU (Capital Requirements Directive — Pillar 1) and EU Regulation No 575/2013 (Capital Requirements Regulation — Pillar 2) of the European Parliament and of the Council of 26 June 2013.
During 2019 the EU published a legislation aimed at reducing risks and enhancing the resilience in the banking sector across the EU. The rules within capital requirements regulation (‘CRR2’) were also revised along with the capital requirements directive (‘CRD V’). The leverage ratio, own funds requirements and eligible liabilities, counterparty credit risk and the net stable funding ratio were subject to the changes implemented by CRR2. The revised regulation gives more clarity on the banks’ obligations to disclose on forborne, performing and non-performing exposures, non-financial guarantees received including collateral, and disclosures on remuneration. In order to promote market discipline and move towards a worldwide standardised approach, during 2021 the EBA adopted new guidelines ‘Final draft implementing technical standards on public disclosures by institutions of the information referred to in Titles II and III of Part Eight of Regulation (EU) No 575/2013. ’The revised standards which are entirely binding became effective as from 28 June 2021 and incorporate the changes introduced under CRR2, aligning the disclosures framework with the standards under Basel Pillar 3.
As outlined in the requirements of banking regulations, these disclosures are not subject to an external audit, except to the extent that any disclosures are equivalent to those made in the Financial Statements, which have been prepared in accordance with the International Financial Reporting Standards (‘IFRS’) as adopted by the EU. The local group, comprising HSBC Bank Malta p.l.c. along with its subsidiary HSBC Global Asset Management (Malta) Ltd., through its internal verification procedures, is satisfied that these ARDs are presented fairly.
Pillar 3 disclosures
Purpose
HSBC Bank Malta p.l.c.’s Pillar 3 disclosures at 31 December 2021 comprise all information required under Pillar 3, both quantitative and qualitative. They are made in accordance with the relevant articles of Part 8 of the CRR and the European Banking Authority’s (‘EBA’) final standards on revised Pillar 3 disclosures.
In light of the fact that the local group is considered a significant subsidiary of HSBC Holdings plc within the local market, and subject to consolidated supervision at the level of HSBC Holdings plc, the local group is exempt from full disclosure requirements laid down in Part Eight of the CRR.
The Pillar 3 disclosures are governed by the Group’s disclosure policy framework. The disclosure policy sets out the governance, control and assurance requirements for publication of the document. While the disclosure statement is not required to be externally audited, the document has been subject to an internal review process in accordance with the banks’ financial reporting and governance processes.
Basis of preparation
The financial information contained in this disclosure has been prepared on a consolidated basis (please refer to note 3a ‘Basis of Consolidation’). In our disclosures, we provide comparative figures for the previous year to facilitate the analysis. Key ratios and figures are reflected throughout the Pillar 3 2021 disclosures. Where disclosures have been enhanced or are new, we do not generally restate or provide prior year comparatives.
The Pillar 3 disclosure for HSBC Bank Malta p.l.c. is available on the HSBC websites, www.hsbc.com or www.hsbc.com.mt, simultaneously. This Pillar 3 disclosure includes regulatory information complementing the financial and risk information presented there and is in line with the requirements of regulatory disclosures.
The information published within this document have been prepared as per the EBAs reporting framework 3.0 issued in March 2021 and effective from June 2021. The new reporting framework aims at facilitating the institutions’ compliance with disclosure requirements and improving the consistency and quality of the information disclosed. The updates are mainly driven by changes during the adoption process of Implementing Technical Standards (‘ITS’) on supervisory reporting and the ITS on public disclosures.
HSBC Bank Malta p.l.c. Pillar 3 2021 2
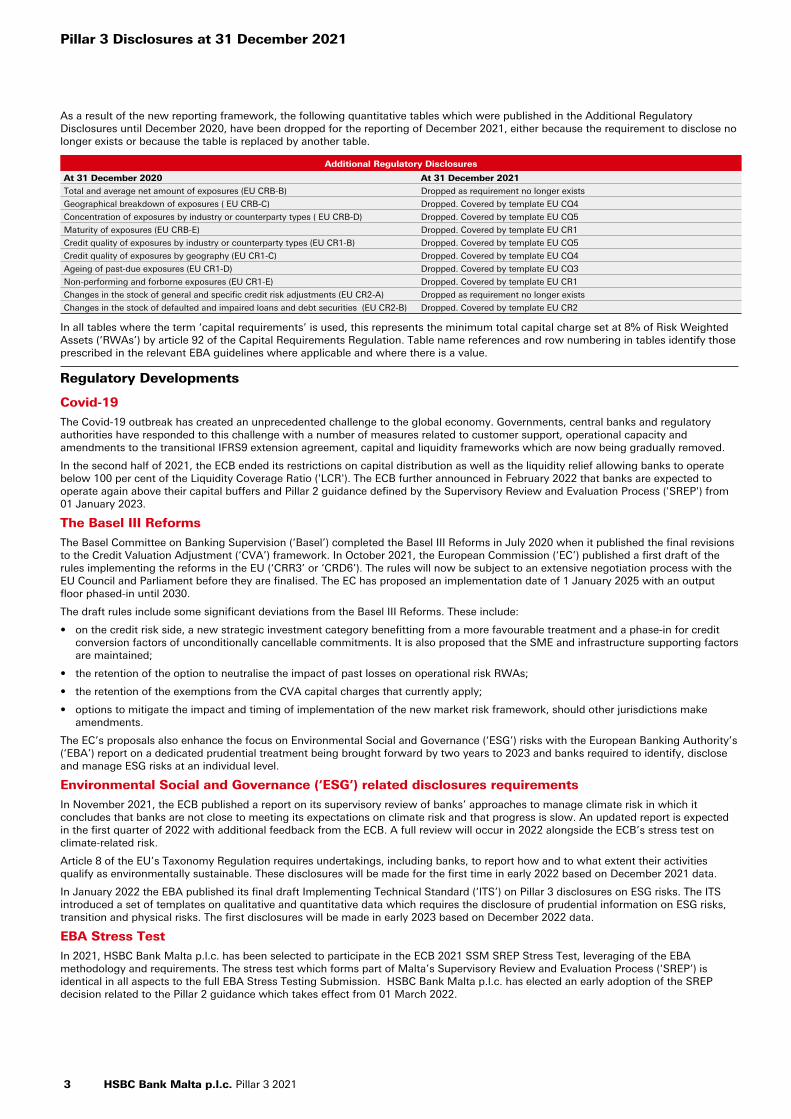
As a result of the new reporting framework, the following quantitative tables which were published in the Additional Regulatory Disclosures until December 2020, have been dropped for the reporting of December 2021, either because the requirement to disclose no longer exists or because the table is replaced by another table.
Additional Regulatory Disclosures
At 31 December 2020 At 31 December 2021
Total and average net amount of exposures (EU CRB-B) Dropped as requirement no longer exists
Geographical breakdown of exposures ( EU CRB-C) Dropped. Covered by template EU CQ4
Concentration of exposures by industry or counterparty types ( EU CRB-D) Dropped. Covered by template EU CQ5
Maturity of exposures (EU CRB-E) Dropped. Covered by template EU CR1
Credit quality of exposures by industry or counterparty types (EU CR1-B) Dropped. Covered by template EU CQ5
Credit quality of exposures by geography (EU CR1-C) Dropped. Covered by template EU CQ4
Ageing of past-due exposures (EU CR1-D) Dropped. Covered by template EU CQ3
Non-performing and forborne exposures (EU CR1-E) Dropped. Covered by template EU CR1
Changes in the stock of general and specific credit risk adjustments (EU CR2-A) Dropped as requirement no longer exists
Changes in the stock of defaulted and impaired loans and debt securities (EU CR2-B) Dropped. Covered by template EU CR2
In all tables where the term ‘capital requirements’ is used, this represents the minimum total capital charge set at 8% of Risk Weighted Assets (‘RWAs’) by article 92 of the Capital Requirements Regulation. Table name references and row numbering in tables identify those prescribed in the relevant EBA guidelines where applicable and where there is a value.
Regulatory Developments
Covid-19
The Covid-19 outbreak has created an unprecedented challenge to the global economy. Governments, central banks and regulatory authorities have responded to this challenge with a number of measures related to customer support, operational capacity and amendments to the transitional IFRS9 extension agreement, capital and liquidity frameworks which are now being gradually removed.
In the second half of 2021, the ECB ended its restrictions on capital distribution as well as the liquidity relief allowing banks to operate below 100 per cent of the Liquidity Coverage Ratio ('LCR'). The ECB further announced in February 2022 that banks are expected to operate again above their capital buffers and Pillar 2 guidance defined by the Supervisory Review and Evaluation Process ('SREP') from 01 January 2023.
The Basel III Reforms
The Basel Committee on Banking Supervision (‘Basel’) completed the Basel III Reforms in July 2020 when it published the final revisions to the Credit Valuation Adjustment (‘CVA’) framework. In October 2021, the European Commission (‘EC’) published a first draft of the rules implementing the reforms in the EU (‘CRR3’ or ‘CRD6’). The rules will now be subject to an extensive negotiation process with the EU Council and Parliament before they are finalised. The EC has proposed an implementation date of 1 January 2025 with an output floor phased-in until 2030.
The draft rules include some significant deviations from the Basel III Reforms. These include:
• on the credit risk side, a new strategic investment category benefitting from a more favourable treatment and a phase-in for credit conversion factors of unconditionally cancellable commitments. It is also proposed that the SME and infrastructure supporting factors are maintained;
• the retention of the option to neutralise the impact of past losses on operational risk RWAs;
• the retention of the exemptions from the CVA capital charges that currently apply;
• options to mitigate the impact and timing of implementation of the new market risk framework, should other jurisdictions make amendments.
The EC’s proposals also enhance the focus on Environmental Social and Governance (‘ESG’) risks with the European Banking Authority’s (‘EBA’) report on a dedicated prudential treatment being brought forward by two years to 2023 and banks required to identify, disclose and manage ESG risks at an individual level.
Environmental Social and Governance (‘ESG’) related disclosures requirements
In November 2021, the ECB published a report on its supervisory review of banks’ approaches to manage climate risk in which it concludes that banks are not close to meeting its expectations on climate risk and that progress is slow. An updated report is expected in the first quarter of 2022 with additional feedback from the ECB. A full review will occur in 2022 alongside the ECB’s stress test on climate-related risk.
Article 8 of the EU’s Taxonomy Regulation requires undertakings, including banks, to report how and to what extent their activities qualify as environmentally sustainable. These disclosures will be made for the first time in early 2022 based on December 2021 data.
In January 2022 the EBA published its final draft Implementing Technical Standard (‘ITS’) on Pillar 3 disclosures on ESG risks. The ITS introduced a set of templates on qualitative and quantitative data which requires the disclosure of prudential information on ESG risks, transition and physical risks. The first disclosures will be made in early 2023 based on December 2022 data.
EBA Stress Test
In 2021, HSBC Bank Malta p.l.c. has been selected to participate in the ECB 2021 SSM SREP Stress Test, leveraging of the EBA methodology and requirements. The stress test which forms part of Malta’s Supervisory Review and Evaluation Process (‘SREP’) is identical in all aspects to the full EBA Stress Testing Submission. HSBC Bank Malta p.l.c. has elected an early adoption of the SREP decision related to the Pillar 2 guidance which takes effect from 01 March 2022.
Pillar 3 Disclosures at 31 December 2021
3 HSBC Bank Malta p.l.c. Pillar 3 2021

Minimum own funds and eligible liability issuance
In December 2021, HSBC Bank Malta p.l.c. entered into an unsecured loan agreement amounting to € 60 million with HSBC Bank plc. This unsecured loan has been recognised as a “borrowing from group undertakings” and was entered into to meet the interim target of the minimum own funds and eligible liabilities (‘MREL’) as set by the Single Resolution Board (‘SRB’). The unsecured loan is considered an eligible liability with a 10-year maturity with an early repayment option on the 9th year in favour of HSBC Bank Malta p.l.c.
Other developments
In August 2021, the EU adopted technical standards on the contractual recognition of stay powers for contracts governed by third-country law. Subsequently, the EU also adopted standards on the impracticability of recognition of bail-in powers for the same type of contracts. Finally, the EU adopted an ITS for banks to notify the above to their supervisory authorities. In September 2021, the EBA published its final guidelines to assess breaches of the Large Exposure limits which applied from 1 January 2022.
In November 2021, the EBA published its final draft Regulatory Technical Standards (‘RTS’) specifying the types of factors and conditions to be considered for the assessment of the appropriateness of risk weights and of minimum loss given default values for real estate exposures. Furthermore, in December 2021, the EBA published its final draft RTS on credit risk adjustment for defaulted exposures under the standardised approach, which now takes into account discounts for banks buying non-performing loans.
Also in November 2021, the EBA published its final draft ITS on the Interest Rate Risk in the Banking Book (‘IRRBB’) Pillar 3 disclosures. Furthermore, in December 2021, it launched three consultations specifying technical aspects of the IRRBB revised framework. The EBA is consulting on its guidelines on IRRBB and credit spread risk arising from non-trading book activities, as well as on technical standards on the IRRBB standardised approach and IRRBB supervisory outlier test.
The EC launched a consultation in December 2021 on the macro-prudential framework for the EU’s banking sector covering notably the overall design and functioning of the buffer framework.
HSBC Bank Malta p.l.c. Pillar 3 2021 4
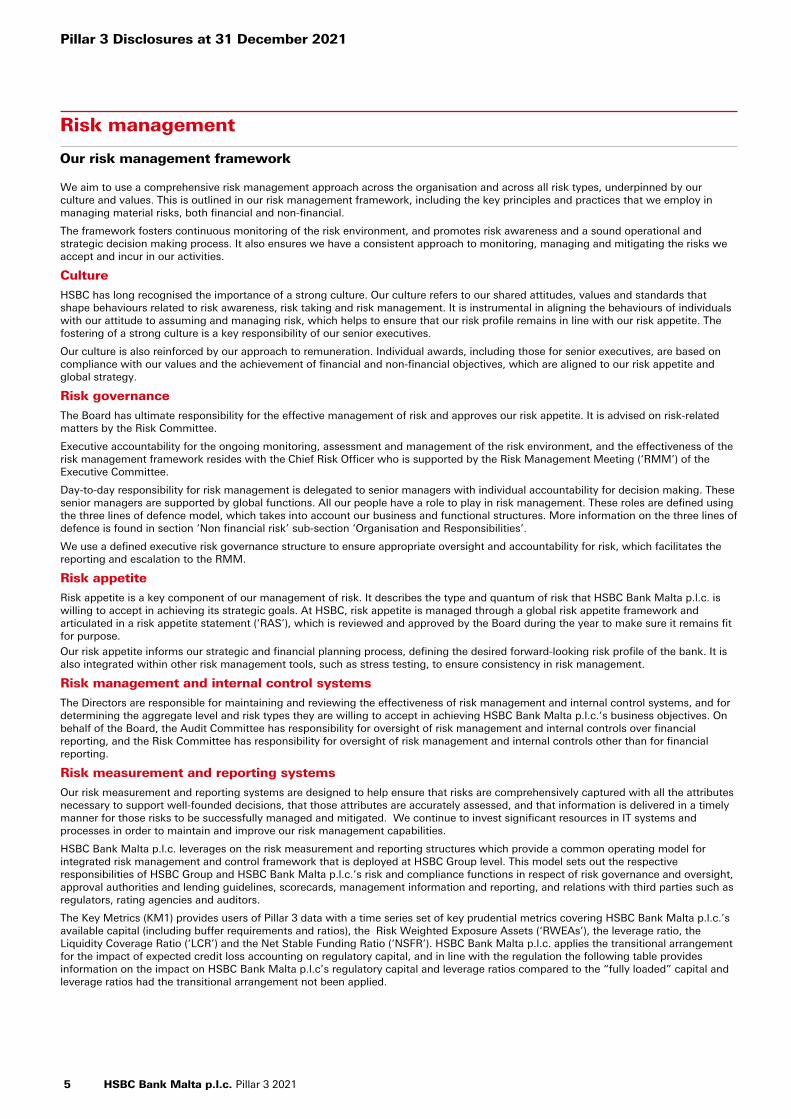
Risk management
Our risk management framework
We aim to use a comprehensive risk management approach across the organisation and across all risk types, underpinned by our culture and values. This is outlined in our risk management framework, including the key principles and practices that we employ in managing material risks, both financial and non-financial.
The framework fosters continuous monitoring of the risk environment, and promotes risk awareness and a sound operational and strategic decision making process. It also ensures we have a consistent approach to monitoring, managing and mitigating the risks we accept and incur in our activities.
Culture
HSBC has long recognised the importance of a strong culture. Our culture refers to our shared attitudes, values and standards that shape behaviours related to risk awareness, risk taking and risk management. It is instrumental in aligning the behaviours of individuals with our attitude to assuming and managing risk, which helps to ensure that our risk profile remains in line with our risk appetite. The fostering of a strong culture is a key responsibility of our senior executives.
Our culture is also reinforced by our approach to remuneration. Individual awards, including those for senior executives, are based on compliance with our values and the achievement of financial and non-financial objectives, which are aligned to our risk appetite and global strategy.
Risk governance
The Board has ultimate responsibility for the effective management of risk and approves our risk appetite. It is advised on risk-related matters by the Risk Committee.
Executive accountability for the ongoing monitoring, assessment and management of the risk environment, and the effectiveness of the risk management framework resides with the Chief Risk Officer who is supported by the Risk Management Meeting (‘RMM’) of the Executive Committee.
Day-to-day responsibility for risk management is delegated to senior managers with individual accountability for decision making. These senior managers are supported by global functions. All our people have a role to play in risk management. These roles are defined using the three lines of defence model, which takes into account our business and functional structures. More information on the three lines of defence is found in section ‘Non financial risk’ sub-section ‘Organisation and Responsibilities’.
We use a defined executive risk governance structure to ensure appropriate oversight and accountability for risk, which facilitates the reporting and escalation to the RMM.
Risk appetite
Risk appetite is a key component of our management of risk. It describes the type and quantum of risk that HSBC Bank Malta p.l.c. is willing to accept in achieving its strategic goals. At HSBC, risk appetite is managed through a global risk appetite framework and articulated in a risk appetite statement (‘RAS’), which is reviewed and approved by the Board during the year to make sure it remains fit for purpose.
Our risk appetite informs our strategic and financial planning process, defining the desired forward-looking risk profile of the bank. It is also integrated within other risk management tools, such as stress testing, to ensure consistency in risk management.
Risk management and internal control systems
The Directors are responsible for maintaining and reviewing the effectiveness of risk management and internal control systems, and for determining the aggregate level and risk types they are willing to accept in achieving HSBC Bank Malta p.l.c.’s business objectives. On behalf of the Board, the Audit Committee has responsibility for oversight of risk management and internal controls over financial reporting, and the Risk Committee has responsibility for oversight of risk management and internal controls other than for financial reporting.
Risk measurement and reporting systems
Our risk measurement and reporting systems are designed to help ensure that risks are comprehensively captured with all the attributes necessary to support well-founded decisions, that those attributes are accurately assessed, and that information is delivered in a timely manner for those risks to be successfully managed and mitigated. We continue to invest significant resources in IT systems and processes in order to maintain and improve our risk management capabilities.
HSBC Bank Malta p.l.c. leverages on the risk measurement and reporting structures which provide a common operating model for integrated risk management and control framework that is deployed at HSBC Group level. This model sets out the respective responsibilities of HSBC Group and HSBC Bank Malta p.l.c.’s risk and compliance functions in respect of risk governance and oversight, approval authorities and lending guidelines, scorecards, management information and reporting, and relations with third parties such as regulators, rating agencies and auditors.
The Key Metrics (KM1) provides users of Pillar 3 data with a time series set of key prudential metrics covering HSBC Bank Malta p.l.c.’s available capital (including buffer requirements and ratios), the Risk Weighted Exposure Assets (‘RWEAs’), the leverage ratio, the Liquidity Coverage Ratio (‘LCR’) and the Net Stable Funding Ratio (‘NSFR’). HSBC Bank Malta p.l.c. applies the transitional arrangement for the impact of expected credit loss accounting on regulatory capital, and in line with the regulation the following table provides information on the impact on HSBC Bank Malta p.l.c’s regulatory capital and leverage ratios compared to the “fully loaded” capital and leverage ratios had the transitional arrangement not been applied.
Pillar 3 Disclosures at 31 December 2021
5 HSBC Bank Malta p.l.c. Pillar 3 2021

Table 1: Key metrics (KM1)
At
31 Dec 31 Dec
Ref* 2021 2020
Available capital (€000)+
1 Common equity tier 1 (‘CET1’) capital^ 412,424 415,426
CET1 capital as if IFRS 9 transitional arrangements had not been applied 397,593 396,744
2 Tier 1 capital^ 412,424 415,426
Tier 1 capital as if IFRS 9 transitional arrangements had not been applied 397,593 396,744
3 Total capital^ 474,424 477,426
Total capital as if IFRS 9 transitional arrangements had not been applied 459,593 458,744
Risk-weighted assets (‘RWAs’) (€000)
4 Total RWAs^ 2,243,665 2,311,411
Total RWAs as if IFRS 9 transitional arrangements had not been applied 2,232,148 2,296,429
Capital ratios (%)
5 Common Equity Tier 1 ratio (%) 18.4 18.0
CET1 as if IFRS 9 transitional arrangements had not been applied 17.8 17.3
6 Tier 1 ratio (%) 18.4 18.0
Tier 1 as if IFRS 9 transitional arrangements had not been applied 17.8 17.3
7 Total capital ratio (%) 21.1 20.7
Total capital as if IFRS 9 transitional arrangements had not been applied 20.6 20.0
Additional own funds requirements based on SREP (as a percentage of risk-weighted exposure amount)
EU 7a Additional own funds requirements to address risks other than the risk of excessive leverage (%) 2.3 2.3
EU 7b of which: to be made up of CET1 capital (percentage points) 1.3 1.3
EU 7c of which: to be made up of Tier 1 capital (percentage points) 1.7 1.7
EU 7d Total SREP own funds requirements (%) 10.3 10.3
Combined buffer and overall capital requirement (as a percentage of risk-weighted exposure amount)
8 Capital conservation buffer requirement 2.5 2.5
9 Institution specific countercyclical capital buffer (%) — —
EU 9a Systemic risk buffer (%) — —
10 Global Systemically Important Institution buffer (%) — —
EU 10a Other Systemically Important Institution buffer (%) 1.5 1.5
11 Combined buffer requirement (%) 4.0 4.0
EU 11a Overall capital requirements (%) 14.3 14.3
12 CET1 available after meeting the total SREP own funds requirements (%)1 8.1 7.7
Leverage ratio2
13 Total exposure measure 6,528,035 6,124,252
14 Leverage ratio (%)^ 6.3 6.8
Leverage ratio as if IFRS 9 transitional arrangements had not been applied 6.1 6.5
EU 14c Total SREP leverage ratio requirements (%) 3 —
Leverage ratio buffer and overall leverage ratio requirement (as a percentage of total exposure measure)
EU 14e Overall leverage ratio requirement (%) 3 —
Liquidity Coverage Ratio (‘LCR’)3
15 Total high-quality liquid assets (HQLA) (Weighted value -average) 2,222,872 1,777,435
EU 16a Cash outflows - Total weighted value 1,034,782 939,030
EU 16b Cash inflows - Total weighted value 448,437 173,361
16 Total net cash outflow (€000) 586,345 765,669
LCR ratio (%) 379.1 232.1
Net Stable Funding Ratio
18 Total available stable funding 5,174,663 4,866,385
19 Total required stable funding 2,601,704 2,926,648
20 NSFR ratio (%) 198.9 166.3
* The references in this, and subsequent tables, identify the lines prescribed in the relevant European Banking Authority (‘EBA’) template where applicable and where there is a value.
+ Capital figures and ratios are reported using the CRR2 transitional basis for capital instruments.^ Figures have been prepared on an IFRS 9 transitional basis.1 Comparative for Row 12 (CET1 after meeting the total SREP own funds requirements) is being restated in accordance with current year
reporting.2 Leverage ratio is calculated using CRR2 for capital instruments.3 The EU’s regulatory transitional arrangements for IFRS 9 in article 473a of the Capital Requirements Regulation do not apply to liquidity coverage
measures. LCR is calculated as at the end of each period rather than using average values.
HSBC Bank Malta p.l.c. Pillar 3 2021 6
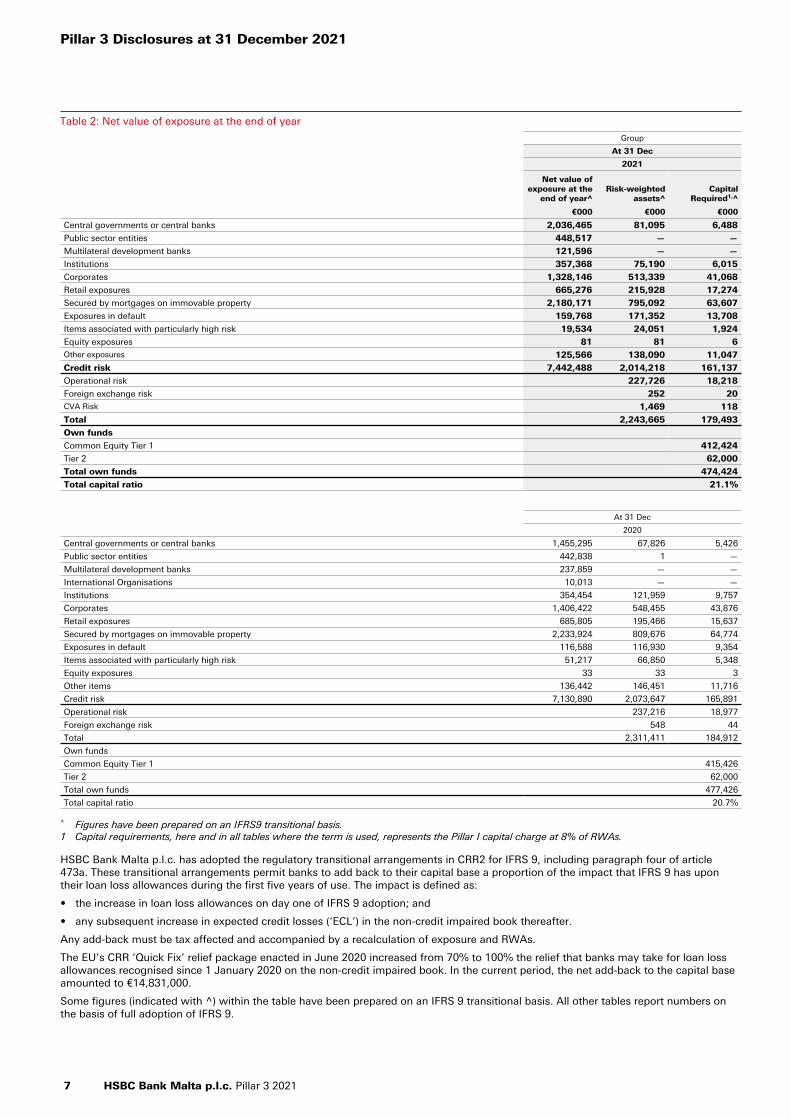
Table 2: Net value of exposure at the end of year
Group
At 31 Dec
2021
Net value of exposure at the
end of year^Risk-weighted
assets^Capital
Required1,^
€000 €000 €000
Central governments or central banks 2,036,465 81,095 6,488
Public sector entities 448,517 — —
Multilateral development banks 121,596 — —
Institutions 357,368 75,190 6,015
Corporates 1,328,146 513,339 41,068
Retail exposures 665,276 215,928 17,274
Secured by mortgages on immovable property 2,180,171 795,092 63,607
Exposures in default 159,768 171,352 13,708
Items associated with particularly high risk 19,534 24,051 1,924
Equity exposures 81 81 6 Other exposures 125,566 138,090 11,047
Credit risk 7,442,488 2,014,218 161,137
Operational risk 227,726 18,218
Foreign exchange risk 252 20 CVA Risk 1,469 118
Total 2,243,665 179,493
Own funds
Common Equity Tier 1 412,424
Tier 2 62,000
Total own funds 474,424
Total capital ratio 21.1%
At 31 Dec
2020
Central governments or central banks 1,455,295 67,826 5,426
Public sector entities 442,838 1 —
Multilateral development banks 237,859 — —
International Organisations 10,013 — —
Institutions 354,454 121,959 9,757
Corporates 1,406,422 548,455 43,876
Retail exposures 685,805 195,466 15,637
Secured by mortgages on immovable property 2,233,924 809,676 64,774
Exposures in default 116,588 116,930 9,354
Items associated with particularly high risk 51,217 66,850 5,348
Equity exposures 33 33 3
Other items 136,442 146,451 11,716
Credit risk 7,130,890 2,073,647 165,891
Operational risk 237,216 18,977
Foreign exchange risk 548 44
Total 2,311,411 184,912
Own funds
Common Equity Tier 1 415,426
Tier 2 62,000
Total own funds 477,426
Total capital ratio 20.7%
^ Figures have been prepared on an IFRS9 transitional basis.1 Capital requirements, here and in all tables where the term is used, represents the Pillar I capital charge at 8% of RWAs.
HSBC Bank Malta p.l.c. has adopted the regulatory transitional arrangements in CRR2 for IFRS 9, including paragraph four of article 473a. These transitional arrangements permit banks to add back to their capital base a proportion of the impact that IFRS 9 has upon their loan loss allowances during the first five years of use. The impact is defined as:
• the increase in loan loss allowances on day one of IFRS 9 adoption; and
• any subsequent increase in expected credit losses (‘ECL’) in the non-credit impaired book thereafter.
Any add-back must be tax affected and accompanied by a recalculation of exposure and RWAs.
The EU’s CRR ‘Quick Fix’ relief package enacted in June 2020 increased from 70% to 100% the relief that banks may take for loan loss allowances recognised since 1 January 2020 on the non-credit impaired book. In the current period, the net add-back to the capital base amounted to €14,831,000.
Some figures (indicated with ^) within the table have been prepared on an IFRS 9 transitional basis. All other tables report numbers on the basis of full adoption of IFRS 9.
Pillar 3 Disclosures at 31 December 2021
7 HSBC Bank Malta p.l.c. Pillar 3 2021

Regulatory Balance Sheet 2021
Basis of consolidation
The basis of consolidation for the purpose of financial accounting under IFRSs, described in Note 2 on the Financial Statements, differs from that used for regulatory purposes, which provides a point in time value of all on balance sheet assets. The regulatory exposure value includes an estimation of risk, and is expressed as the amount expected to be outstanding in and when the counterparty defaults. Moreover the regulatory exposure classes are based on different criteria from accounting asset types and are therefore not comparable on a line by line basis. The following table provides a reconciliation of the financial accounting balance sheet to the regulatory scope of consolidation. Subsidiaries engaged in insurance activities are excluded from the regulatory consolidation by excluding assets, liabilities and post-acquisition reserves, leaving the investment of these insurance subsidiaries to be recorded at cost and deducted from CET1 (subject to thresholds).
Table 3 – EU CC2 – reconciliation of regulatory own funds to balance sheet in the audited financial statements
Balance sheet as in published
financial statements
De-consolidationof insurance
entityRegulatory
balance sheet
€000 €000 €000
Assets
Balances with Central Bank of Malta, Treasury Bills and cash 1,496,407 — 1,496,407
Items in course of collection from other banks 4,453 — 4,453
Financial assets mandatorily measured at fair value through profit or loss 767,808 (767,808) —
Derivatives 4,640 — 4,640
Loans and advances to banks 619,273 (6,211) 613,062
Loans and advances to customers 3,196,725 — 3,196,725
Financial investments 845,735 — 845,735
Prepayments and accrued income 20,558 (2,182) 18,376
Current tax assets 3,669 (1,810) 1,859
Reinsurance assets 77,972 (77,972) —
Other non-current assets held for sale 6,673 — 6,673
Investment in subsidiaries — 28,578 28,578
Investment property 1,600 (1,600) —
Property, plant and equipment 41,923 (2) 41,921
Intangible assets 50,168 (34,146) 16,022
Right-of-use assets 2,569 — 2,569
Deferred tax assets 29,119 — 29,119
Other assets 5,513 (688) 4,825
Total assets at 31 Dec 2021 7,174,805 (863,841) 6,310,964
Liabilities and equity
Deposits by banks 1,397 — 1,397
Customer accounts 5,621,195 34,187 5,655,382
Items in the course of transmission to other banks 21,573 — 21,573
Derivatives 4,592 — 4,592
Accruals and deferred income 21,976 (3,673) 18,303
Current tax liabilities 499 — 499
Liabilities under investment contracts 185,137 (185,137) —
Liabilities under insurance contracts 658,197 (658,197) —
Provisions for liabilities and other charges 21,252 (1,130) 20,122
Deferred tax liabilities 15,005 (11,283) 3,722
Borrowings from group undertaking 60,000 — 60,000
Subordinated liabilities 62,000 — 62,000
Other liabilities 12,245 (3,850) 8,395
Total liabilities at 31 Dec 2021 6,685,068 (829,083) 5,855,985
Equity
Called up share capital 108,092 — 108,092
Revaluation reserve 24,330 — 24,330
Retained earnings1 357,315 (34,758) 322,557
Total equity at 31 Dec 2021 489,737 (34,758) 454,979
Total liabilities and equity at 31 Dec 2021 7,174,805 (863,841) 6,310,964
1 The retained earnings also includes other movements in the equity. The balance sheet components are used in the calculation of the regulatory capital in table 4 (Own funds disclosure EU CC1). This table shows items at their accounting values which might be subject to adjustments in the calculation of regulatory capital.
HSBC Bank Malta p.l.c. Pillar 3 2021 8
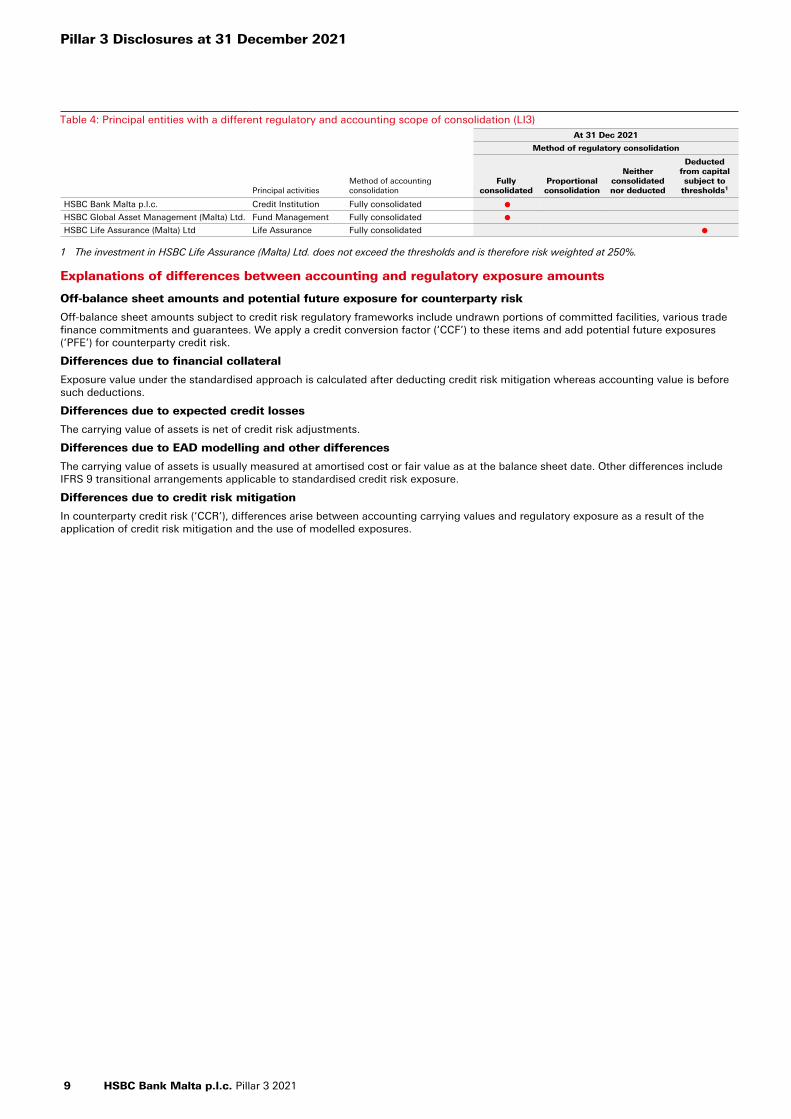
Table 4: Principal entities with a different regulatory and accounting scope of consolidation (LI3)At 31 Dec 2021
Principal activitiesMethod of accounting consolidation
Method of regulatory consolidation
Fully consolidated
Proportional consolidation
Neither consolidated nor deducted
Deducted from capital subject to
thresholds1
HSBC Bank Malta p.l.c. Credit Institution Fully consolidated lHSBC Global Asset Management (Malta) Ltd. Fund Management Fully consolidated lHSBC Life Assurance (Malta) Ltd Life Assurance Fully consolidated l
1 The investment in HSBC Life Assurance (Malta) Ltd. does not exceed the thresholds and is therefore risk weighted at 250%.
Explanations of differences between accounting and regulatory exposure amounts
Off-balance sheet amounts and potential future exposure for counterparty risk
Off-balance sheet amounts subject to credit risk regulatory frameworks include undrawn portions of committed facilities, various trade finance commitments and guarantees. We apply a credit conversion factor (‘CCF’) to these items and add potential future exposures (‘PFE’) for counterparty credit risk.
Differences due to financial collateral
Exposure value under the standardised approach is calculated after deducting credit risk mitigation whereas accounting value is before such deductions.
Differences due to expected credit losses
The carrying value of assets is net of credit risk adjustments.
Differences due to EAD modelling and other differences
The carrying value of assets is usually measured at amortised cost or fair value as at the balance sheet date. Other differences include IFRS 9 transitional arrangements applicable to standardised credit risk exposure.
Differences due to credit risk mitigation
In counterparty credit risk (‘CCR’), differences arise between accounting carrying values and regulatory exposure as a result of the application of credit risk mitigation and the use of modelled exposures.
Pillar 3 Disclosures at 31 December 2021
9 HSBC Bank Malta p.l.c. Pillar 3 2021
Capital management
Approach and policy
HSBC Bank Malta p.l.c. objective in managing the bank's capital is to maintain appropriate levels of capital to support its business strategy and meet regulatory requirements at all times.
HSBC Bank Malta p.l.c. manages its capital to ensure that it exceeds current and expected future requirements. Throughout 2021, HSBC Bank Malta p.l.c. complied with the European Central Bank (‘ECB’) regulatory capital adequacy requirements. To achieve this, the bank manages its capital within the context of an annual capital plan, which is approved by the Board and which determines the appropriate amount and mix of capital.
The policy on capital management is underpinned by the HSBC group capital management framework, which enables a consistent management of the capital.
The Internal Capital Adequacy Assessment Process (‘ICAAP’) which aims at assessing the adequacy of the bank’s capital resources with regards to its risk and requirements, incorporates different assessment methods of the capital needs. These capital measures include economic capital and regulatory capital defined as follows:
• Economic capital is the internally calculated capital requirement which is deemed necessary by HSBC Bank Malta p.l.c. to support the risks to which it is exposed to; and
• Regulatory capital is the level of capital which HSBC Bank Malta p.l.c. is required to hold in accordance with the rules set by the legislation and the ECB.
The following risks managed through the capital management framework have been identified as material:
– Credit risk,
– Operational risk,
– Interest rate risk in the banking book,
– Insurance risk and
– Residual risks.
Stress testing
Stress testing is incorporated in the capital management framework and is an important component of understanding the sensitivities of the core assumptions included in HSBC Bank Malta p.l.c.’s capital plans to the adverse effect of extreme but plausible events. Stress testing allows senior management to formulate its response, including risk mitigating actions, in advance of conditions starting to reflect the stress scenarios identified.
The actual market stresses experienced by the financial system in recent years and more recently through Covid-19 have been used to inform the capital planning process and further develop the stress scenarios employed within HSBC Bank Malta p.l.c.
Regulatory stress tests (carried out at the request of regulators using their prescribed assumptions), internal stress tests (using internally defined scenarios defined to capture the specific risks faced by HSBC Bank Malta p.l.c.) and sensitivity analysis are performed. HSBC Bank Malta p.l.c. takes into account the results of all such regulatory and internal stress testing when assessing internal capital requirements.
Risks to capital
Beyond the stress testing framework, a list of the main risks with associated potential impacts on HSBC Bank Malta p.l.c capital ratios is reviewed regularly. These risks are identified as possibly affecting Risk-Weighted Assets (‘RWAs’) and/or capital position. They can either result from expected regulatory and model changes, or from structural and activity related items. These risks are monitored regularly within the Asset & Liability Committee and the Risk Management Meetings. For the relevant categories of risk, scenario analysis are performed. The downside or upside scenarios are assessed against our capital management objectives and mitigating actions are assigned as necessary.
HSBC Bank Malta p.l.c.’s approach to managing its capital position has been to ensure the bank complies with current regulatory requirements and internal risk appetite, as well as to ensure that future regulatory requirements are considered.
Capital
The Basel III framework also introduces a number of capital buffers, including the Capital Conservation Buffer (‘CCB’), Countercyclical Buffer (‘CCyB’), and other systemic buffers such as the Globally/Other Systematically Important Institutions (‘G-SII’/’O-SII’) buffer. CRR and CRD legislations implemented Basel III in the EU.
The capital management framework defines regulatory capital and economic capital as the two primary measures for the management and control of capital.
Regulatory capital is the capital which HSBC Bank Malta p.l.c. is required to hold in accordance with the rules established by regulators; and Economic capital is the internally calculated capital requirement to support risks to which HSBC Bank Malta p.l.c. is exposed and forms a core part of the internal capital adequacy assessment process.
Overview of regulatory capital framework
Main features of CET1 and T2 instruments issued by HSBC Bank Malta p.l.c.
For regulatory purposes, HSBC Bank Malta p.lc.’s capital base can be divided into three main categories, namely Common Equity Tier 1, Additional Tier 1 and Tier 2, depending on the degree of permanence and loss absorbency exhibited. HSBC Bank Malta p.l.c.’s capital base is divided into two main categories, namely Common Equity Tier 1 and Tier 2, as it holds no instruments under Additional Tier 1. The main features of capital issued by HSBC Bank Malta p.l.c are described below.
HSBC Bank Malta p.l.c. Pillar 3 2021 10
Common Equity Tier 1 (‘CET1’) capital is the highest quality form of capital, comprising shareholders’ equity and related non-controlling interests (subject to limits). Under CRD/CRR, various capital deductions and regulatory adjustments are made against these items – these include deductions for goodwill and intangible assets, deferred tax assets that rely on future profitability as well as prudential recognition for Non-Performing Exposures in line with latest regulations and requirements.
Tier 2 capital comprises eligible subordinated debt and any related share premiums.
T2 capital instruments are either perpetual subordinated instruments or dated instruments on which there is an obligation to pay coupons. These instruments or subordinated loans comprise dated loan capital repayable at par on maturity and must have an original maturity of at least five years. Some subordinated loan capital may be called and redeemed by the issuer to, subject to prior consent from the ECB. For regulatory purposes, it is a requirement that Tier 2 instruments are amortised on a straight line basis in their final five years to maturity, thus reducing the amount of capital that is recognised for regulatory purposes.
Our T2 capital which consists of subordinated debt with HSBC Bank plc is repayable at par on maturity and must have an original maturity of a least five years. It may be called and redeemed by the issuer; subject to prior consent from the ECB.
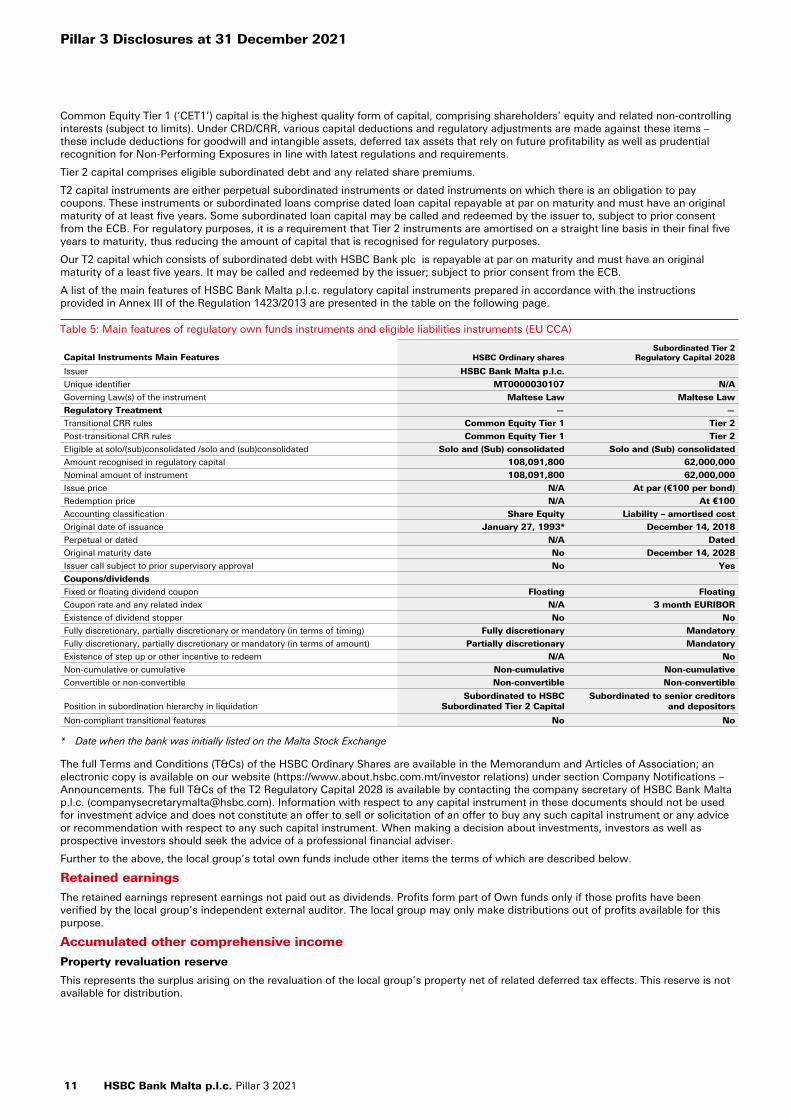
A list of the main features of HSBC Bank Malta p.l.c. regulatory capital instruments prepared in accordance with the instructions provided in Annex III of the Regulation 1423/2013 are presented in the table on the following page.
Table 5: Main features of regulatory own funds instruments and eligible liabilities instruments (EU CCA)
Capital Instruments Main Features HSBC Ordinary sharesSubordinated Tier 2
Regulatory Capital 2028
Issuer HSBC Bank Malta p.l.c.
Unique identifier MT0000030107 N/A
Governing Law(s) of the instrument Maltese Law Maltese Law
Regulatory Treatment — —
Transitional CRR rules Common Equity Tier 1 Tier 2
Post-transitional CRR rules Common Equity Tier 1 Tier 2
Eligible at solo/(sub)consolidated /solo and (sub)consolidated Solo and (Sub) consolidated Solo and (Sub) consolidated
Amount recognised in regulatory capital 108,091,800 62,000,000
Nominal amount of instrument 108,091,800 62,000,000
Issue price N/A At par (€100 per bond)
Redemption price N/A At €100
Accounting classification Share Equity Liability – amortised cost
Original date of issuance January 27, 1993* December 14, 2018
Perpetual or dated N/A Dated
Original maturity date No December 14, 2028
Issuer call subject to prior supervisory approval No Yes
Coupons/dividends
Fixed or floating dividend coupon Floating Floating
Coupon rate and any related index N/A 3 month EURIBOR
Existence of dividend stopper No No
Fully discretionary, partially discretionary or mandatory (in terms of timing) Fully discretionary Mandatory
Fully discretionary, partially discretionary or mandatory (in terms of amount) Partially discretionary Mandatory
Existence of step up or other incentive to redeem N/A No
Non-cumulative or cumulative Non-cumulative Non-cumulative
Convertible or non-convertible Non-convertible Non-convertible
Position in subordination hierarchy in liquidationSubordinated to HSBC
Subordinated Tier 2 CapitalSubordinated to senior creditors
and depositors
Non-compliant transitional features No No
* Date when the bank was initially listed on the Malta Stock Exchange
The full Terms and Conditions (T&Cs) of the HSBC Ordinary Shares are available in the Memorandum and Articles of Association; an electronic copy is available on our website (https://www.about.hsbc.com.mt/investor relations) under section Company Notifications – Announcements. The full T&Cs of the T2 Regulatory Capital 2028 is available by contacting the company secretary of HSBC Bank Malta p.l.c. ([email protected]). Information with respect to any capital instrument in these documents should not be used for investment advice and does not constitute an offer to sell or solicitation of an offer to buy any such capital instrument or any advice or recommendation with respect to any such capital instrument. When making a decision about investments, investors as well as prospective investors should seek the advice of a professional financial adviser.
Further to the above, the local group’s total own funds include other items the terms of which are described below.
Retained earnings
The retained earnings represent earnings not paid out as dividends. Profits form part of Own funds only if those profits have been verified by the local group’s independent external auditor. The local group may only make distributions out of profits available for this purpose.
Accumulated other comprehensive income
Property revaluation reserve
This represents the surplus arising on the revaluation of the local group’s property net of related deferred tax effects. This reserve is not available for distribution.
Pillar 3 Disclosures at 31 December 2021
11 HSBC Bank Malta p.l.c. Pillar 3 2021
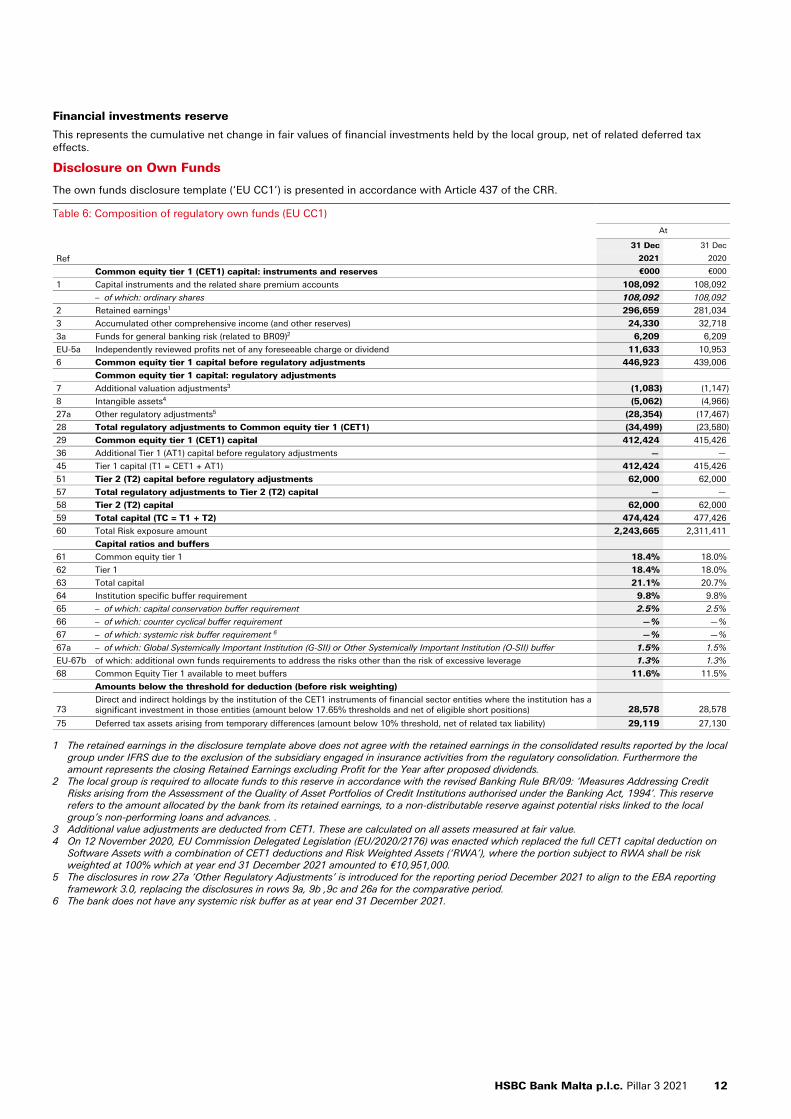
Financial investments reserve
This represents the cumulative net change in fair values of financial investments held by the local group, net of related deferred tax effects.
Disclosure on Own Funds
The own funds disclosure template (‘EU CC1’) is presented in accordance with Article 437 of the CRR.
Table 6: Composition of regulatory own funds (EU CC1)
At
31 Dec 31 Dec
Ref 2021 2020
Common equity tier 1 (CET1) capital: instruments and reserves €000 €000
1 Capital instruments and the related share premium accounts 108,092 108,092
– of which: ordinary shares 108,092 108,092
2 Retained earnings1 296,659 281,034
3 Accumulated other comprehensive income (and other reserves) 24,330 32,718
3a Funds for general banking risk (related to BR09)2 6,209 6,209
EU-5a Independently reviewed profits net of any foreseeable charge or dividend 11,633 10,953
6 Common equity tier 1 capital before regulatory adjustments 446,923 439,006
Common equity tier 1 capital: regulatory adjustments
7 Additional valuation adjustments3 (1,083) (1,147)
8 Intangible assets4 (5,062) (4,966)
27a Other regulatory adjustments5 (28,354) (17,467)
28 Total regulatory adjustments to Common equity tier 1 (CET1) (34,499) (23,580)
29 Common equity tier 1 (CET1) capital 412,424 415,426
36 Additional Tier 1 (AT1) capital before regulatory adjustments — —
45 Tier 1 capital (T1 = CET1 + AT1) 412,424 415,426
51 Tier 2 (T2) capital before regulatory adjustments 62,000 62,000
57 Total regulatory adjustments to Tier 2 (T2) capital — —
58 Tier 2 (T2) capital 62,000 62,000
59 Total capital (TC = T1 + T2) 474,424 477,426
60 Total Risk exposure amount 2,243,665 2,311,411
Capital ratios and buffers
61 Common equity tier 1 18.4% 18.0%
62 Tier 1 18.4% 18.0%
63 Total capital 21.1% 20.7%
64 Institution specific buffer requirement 9.8% 9.8%
65 – of which: capital conservation buffer requirement 2.5% 2.5%
66 – of which: counter cyclical buffer requirement —% —%
67 – of which: systemic risk buffer requirement 6 —% —%
67a – of which: Global Systemically Important Institution (G-SII) or Other Systemically Important Institution (O-SII) buffer 1.5% 1.5%
EU-67b of which: additional own funds requirements to address the risks other than the risk of excessive leverage 1.3% 1.3%
68 Common Equity Tier 1 available to meet buffers 11.6% 11.5%
Amounts below the threshold for deduction (before risk weighting)
73Direct and indirect holdings by the institution of the CET1 instruments of financial sector entities where the institution has a significant investment in those entities (amount below 17.65% thresholds and net of eligible short positions) 28,578 28,578
75 Deferred tax assets arising from temporary differences (amount below 10% threshold, net of related tax liability) 29,119 27,130
1 The retained earnings in the disclosure template above does not agree with the retained earnings in the consolidated results reported by the local group under IFRS due to the exclusion of the subsidiary engaged in insurance activities from the regulatory consolidation. Furthermore the amount represents the closing Retained Earnings excluding Profit for the Year after proposed dividends.
2 The local group is required to allocate funds to this reserve in accordance with the revised Banking Rule BR/09: ‘Measures Addressing Credit Risks arising from the Assessment of the Quality of Asset Portfolios of Credit Institutions authorised under the Banking Act, 1994’. This reserve refers to the amount allocated by the bank from its retained earnings, to a non-distributable reserve against potential risks linked to the local group’s non-performing loans and advances. .
3 Additional value adjustments are deducted from CET1. These are calculated on all assets measured at fair value.4 On 12 November 2020, EU Commission Delegated Legislation (EU/2020/2176) was enacted which replaced the full CET1 capital deduction on
Software Assets with a combination of CET1 deductions and Risk Weighted Assets (‘RWA’), where the portion subject to RWA shall be risk weighted at 100% which at year end 31 December 2021 amounted to €10,951,000.
5 The disclosures in row 27a ‘Other Regulatory Adjustments’ is introduced for the reporting period December 2021 to align to the EBA reporting framework 3.0, replacing the disclosures in rows 9a, 9b ,9c and 26a for the comparative period.
6 The bank does not have any systemic risk buffer as at year end 31 December 2021.
HSBC Bank Malta p.l.c. Pillar 3 2021 12

Table 7: Reconciliation between accounting and regulatory scope of consolidation
At
31 Dec 31 Dec
2021 2020
€000 €000
Common Equity Tier 1 (CET) capital
Called up share capital 108,092 108,092
Retained earnings 357,315 337,604
Revaluation reserve 24,330 32,718
Adjustments
– depositor compensation scheme (20,193) (20,781)
– intangible assets (5,062) (4,966)
– expected final dividend (8,010) (2,717)
– retained earnings - HSBC Life Assurance (Malta) Ltd (34,804) (36,691)
– prudential valuation adjustment (1,083) (1,147)
– IFRS 9 transitional adjustments 14,831 18,682
– single resolution fund (1,272) (1,053)
– Non performing Loans (21,720) (14,315)
412,424 415,426
Tier 2 capital
Subordinated liabilities 62,000 62,000
62,000 62,000
Total own funds 474,424 477,426
Pillar 1
Pillar 1 covers the capital requirements for credit risk, market risk and operational risk. Credit risk includes counterparty and non-counterparty credit risk requirements. These requirements are expressed in terms of RWAs. The table provides information on the scope of permissible approaches and our adopted approach by risk type.
Risk category Scope of permissible approaches Approach adopted by HSBC Bank Malta p.l.c.
Non-counterparty Credit risk
CRR allows three approaches for the calculation of Pillar 1 credit risk capital requirements.
The standardised approach requires banks to use external credit ratings to determine the risk weightings applied to rated counterparties. Other counterparties are classified into broad categories and standardised risk weightings are applied to these categories.
The internal ratings-based (‘IRB’) foundation approach, allows banks to calculate their credit risk capital requirements on the basis of their internal assessment of a counterparty’s probability of default (‘PD’), while their estimates of exposure at default (‘EAD’) and loss given default (‘LGD’) are subject to standard supervisory parameters.
Finally, the IRB Advanced approach allows banks to use their own internal assessment in both determining PD and quantifying EAD and LGD. Expected Losses are assessed by multiplying EAD by PD and LGD. The capital requirement is intended to cover unexpected losses. It is based on a formula foreseen by the regulatory framework which incorporates PD, LGD, EAD and other variables such as maturity and correlation.
For consolidated Group reporting, we have adopted the standardised approach for our business in accordance with Article 317. Under the standardised approach the local group utilises risk weights determined by exposure class, credit risk mitigation and credit ratings as outlined in the CRR.
Counterpartycredit risk
Three approaches to calculating CCR and determining exposure values are defined by the CRR, mark-to-market, standardised and Internal Model Method (‘IMM’). These exposure values are used to determine capital requirements under one of the credit risk approaches: standardised, IRB foundation or IRB advanced.
Two approaches are set out by the Regulatory Authorities for calculating the Credit Valuation Adjustment (‘CVA’) risk capital charge: an advanced methodology that is only available to institutions that have approved internal models, and a standardised approach.
In order to determine exposures at default, HSBC Bank Malta p.l.c. uses the mark-to-market approach to calculate the CCR exposure value as defined in Article 274 of the Capital Requirements Regulation.
Equity For the non-trading book, equity exposures can be assessed under standardised, simplified or IRB approaches.
For HSBC Bank Malta p.l.c. reporting purposes, all non-trading book equity exposures are treated under the standardised approach.
Market risk Market risk capital requirements can be determined under either the standard rules or the Internal Models Approach (‘IMA’). The latter involves the use of internal Value at Risk (‘VaR’) models to measure market risks and determine the appropriate capital requirement. In addition to the VaR models, other internal models include Stressed VaR and Incremental Risk Charge ('IRC').
For HSBC Bank Malta p.l.c. the market risk capital requirement is measured using the standard rules.
Operational risk The CRR includes a capital requirement for operational risk, based on three levels of sophistication. The capital required under the basic indicator approach is a simple percentage of gross revenues. Under the standardised approach; banks apply different percentages to the total operating income to each of eight defined business lines. Thirdly, the advanced measurement approach uses banks’ own statistical analysis and modelling of operational risk data to determine capital requirements.
HSBC Bank Malta p.l.c. has historically adopted and currently uses the standardised approach in determining its operational risk capital requirements.
Pillar 3 Disclosures at 31 December 2021
13 HSBC Bank Malta p.l.c. Pillar 3 2021

Capital buffersThe local group is compliant with the CRD capital requirements. Banking Rule BR/15: ‘Capital Buffers of Credit Institutions authorised under the Banking Act 1994, requires additional buffers, namely the ‘capital conservation buffer’, the ‘countercyclical buffer’, ‘other systemically important institutions (‘O-SII’) buffer’ and the ‘systemic risk buffer’. Automatic restrictions on capital distributions apply if the local group’s CET1 capital falls below the level of its CRD combined buffer.
The local group is required to maintain a capital conservation buffer of 2.5%, O-SII buffer of 1.5% and the institution-specific countercyclical buffer as determined by Article 140 (1) of Directive 2013/36/EU. These capital buffers are to be composed of CET1 capital, as a percentage of the Risk Weighted Assets.
The countercyclical capital buffer is an additional capital buffer introduced by Basel III to achieve the broader macro prudential goal of protecting the banking sector in periods of excess aggregate credit growth.
CRD contemplates a countercyclical buffer in line with Basel III, in the form of an institution-specific countercyclical buffer and the application of increased requirements to address macro-prudential or systemic risk. This is expected to be set in the range of 0-2.5% of relevant credit exposure RWAs, whereby the rate shall consist of the weighted average of the ‘countercyclical buffer’ rates that apply in the jurisdiction where the relevant exposures are located. Given that the local group’s exposures are contained within Malta, this buffer results in a marginal percentage.
The tables below disclose the geographical distribution of the bank’s credit exposure relevant to the calculation of the institution-specific countercyclical buffer rate and the amount of institution-specific countercyclical capital buffer. The disclosures are performed in accordance with Article 440 of Regulation (EU) 575/2013.
Table 8: Geographical distribution of credit exposures relevant for the calculation of the countercyclical capital buffer (EU CCyB1)
Group
General credit exposures Own funds requirement
Own funds requirement
weights
Counter-cyclical
capital buffer rate
Exposure value
for SA^
of which:general credit
exposures Total
Breakdown per country €000 €000 €000 % %
Malta 3,281,352 137,439 137,439 92.47 —
Bulgaria 197 16 16 0.01 1.00
Czech Republic 26 2 2 — 0.50
Hong Kong 6 — — — 1.00
Luxembourg 5 1 1 — 0.50
Norway — — — — 0.50
Others 281,475 11,177 11,177 7.52 —
Total at 31 December 2021 3,563,061 148,635 148,635 100.00
Group
General credit exposures Own funds requirement
Own funds requirement
weights
Counter-cyclical
capital buffer rate
Exposure value
for SA^,1
of which:general credit
exposures1 Total1
Breakdown per country €000 €000 €000 % %
Malta 3,381,127 139,744 139,744 93.00 —
Bulgaria 4 1 1 — 0.50
Czech Republic 32 2 2 — 0.50
Hong Kong 44 3 3 — 1.00
Luxembourg 1 — — — 0.25
Norway 12 1 1 — 1.00
Slovakia — — — — 1.00
Other 262,802 10,511 10,511 7.00 —
Total at 31 December 2020 3,644,022 150,262 150,262 100.00
^ Figures have been prepared on an IFRS 9 transitional basis.1 Column ‘Exposure value for SA’ represents the exposure at default (‘EAD’) amounts and is disclosed as per the EBA guidelines. Comparative
figures are being restated in accordance with current year reporting logic whereby EAD is the value of exposures after deducting provisions and credit risk mitigants. In prior periods the disclosure within this table was presented using the net value of exposures, which is the value of exposures after deducting provisions.
Table 9: Amount of institution-specific countercyclical capital buffer (EU CCyB2)
Group^2021 2020
€000 €000
Total risk amount 2,243,665 2,311,411
Institution specific countercyclical buffer rate (%) — —
Institution specific countercyclical buffer requirement 3 1
^ Figures have been prepared on an IFRS 9 transitional basis.
HSBC Bank Malta p.l.c. Pillar 3 2021 14
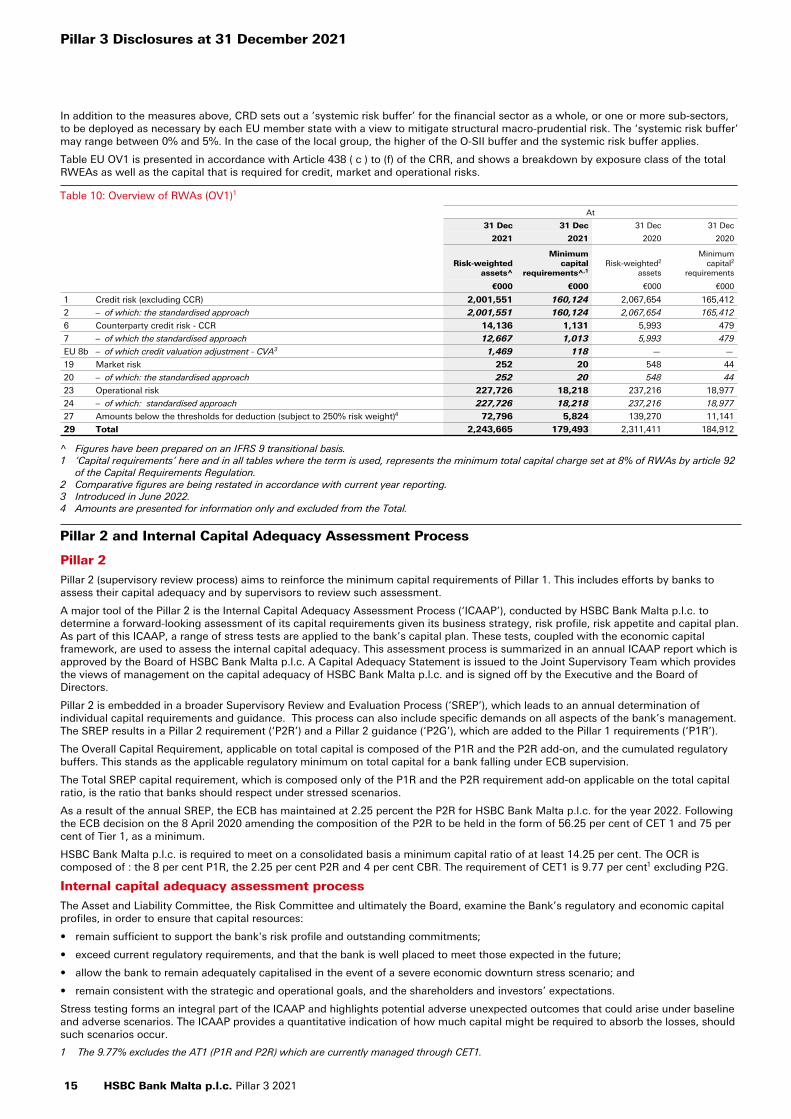
In addition to the measures above, CRD sets out a ‘systemic risk buffer’ for the financial sector as a whole, or one or more sub-sectors, to be deployed as necessary by each EU member state with a view to mitigate structural macro-prudential risk. The ‘systemic risk buffer’ may range between 0% and 5%. In the case of the local group, the higher of the O-SII buffer and the systemic risk buffer applies.
Table EU OV1 is presented in accordance with Article 438 ( c ) to (f) of the CRR, and shows a breakdown by exposure class of the total RWEAs as well as the capital that is required for credit, market and operational risks.
Table 10: Overview of RWAs (OV1)1
At
31 Dec 31 Dec 31 Dec 31 Dec
2021 2021 2020 2020
Risk-weighted assets^
Minimum capital
requirements^,1Risk-weighted2
assets
Minimum capital2
requirements
€000 €000 €000 €000
1 Credit risk (excluding CCR) 2,001,551 160,124 2,067,654 165,412
2 – of which: the standardised approach 2,001,551 160,124 2,067,654 165,412
6 Counterparty credit risk - CCR 14,136 1,131 5,993 479
7 – of which the standardised approach 12,667 1,013 5,993 479
EU 8b – of which credit valuation adjustment - CVA3 1,469 118 — —
19 Market risk 252 20 548 44
20 – of which: the standardised approach 252 20 548 44
23 Operational risk 227,726 18,218 237,216 18,977
24 – of which: standardised approach 227,726 18,218 237,216 18,977
27 Amounts below the thresholds for deduction (subject to 250% risk weight)4 72,796 5,824 139,270 11,141
29 Total 2,243,665 179,493 2,311,411 184,912
^ Figures have been prepared on an IFRS 9 transitional basis.1 ‘Capital requirements’ here and in all tables where the term is used, represents the minimum total capital charge set at 8% of RWAs by article 92
of the Capital Requirements Regulation.2 Comparative figures are being restated in accordance with current year reporting.3 Introduced in June 2022.4 Amounts are presented for information only and excluded from the Total.
Pillar 2 and Internal Capital Adequacy Assessment Process
Pillar 2
Pillar 2 (supervisory review process) aims to reinforce the minimum capital requirements of Pillar 1. This includes efforts by banks to assess their capital adequacy and by supervisors to review such assessment.
A major tool of the Pillar 2 is the Internal Capital Adequacy Assessment Process (‘ICAAP’), conducted by HSBC Bank Malta p.l.c. to determine a forward-looking assessment of its capital requirements given its business strategy, risk profile, risk appetite and capital plan. As part of this ICAAP, a range of stress tests are applied to the bank’s capital plan. These tests, coupled with the economic capital framework, are used to assess the internal capital adequacy. This assessment process is summarized in an annual ICAAP report which is approved by the Board of HSBC Bank Malta p.l.c. A Capital Adequacy Statement is issued to the Joint Supervisory Team which provides the views of management on the capital adequacy of HSBC Bank Malta p.l.c. and is signed off by the Executive and the Board of Directors.
Pillar 2 is embedded in a broader Supervisory Review and Evaluation Process (‘SREP’), which leads to an annual determination of individual capital requirements and guidance. This process can also include specific demands on all aspects of the bank’s management. The SREP results in a Pillar 2 requirement (‘P2R’) and a Pillar 2 guidance (‘P2G’), which are added to the Pillar 1 requirements (‘P1R’).
The Overall Capital Requirement, applicable on total capital is composed of the P1R and the P2R add-on, and the cumulated regulatory buffers. This stands as the applicable regulatory minimum on total capital for a bank falling under ECB supervision.
The Total SREP capital requirement, which is composed only of the P1R and the P2R requirement add-on applicable on the total capital ratio, is the ratio that banks should respect under stressed scenarios.
As a result of the annual SREP, the ECB has maintained at 2.25 percent the P2R for HSBC Bank Malta p.l.c. for the year 2022. Following the ECB decision on the 8 April 2020 amending the composition of the P2R to be held in the form of 56.25 per cent of CET 1 and 75 per cent of Tier 1, as a minimum.
HSBC Bank Malta p.l.c. is required to meet on a consolidated basis a minimum capital ratio of at least 14.25 per cent. The OCR is composed of : the 8 per cent P1R, the 2.25 per cent P2R and 4 per cent CBR. The requirement of CET1 is 9.77 per cent1 excluding P2G.
Internal capital adequacy assessment process
The Asset and Liability Committee, the Risk Committee and ultimately the Board, examine the Bank’s regulatory and economic capital profiles, in order to ensure that capital resources:
• remain sufficient to support the bank's risk profile and outstanding commitments;
• exceed current regulatory requirements, and that the bank is well placed to meet those expected in the future;
• allow the bank to remain adequately capitalised in the event of a severe economic downturn stress scenario; and
• remain consistent with the strategic and operational goals, and the shareholders and investors’ expectations.
Stress testing forms an integral part of the ICAAP and highlights potential adverse unexpected outcomes that could arise under baseline and adverse scenarios. The ICAAP provides a quantitative indication of how much capital might be required to absorb the losses, should such scenarios occur.
1 The 9.77% excludes the AT1 (P1R and P2R) which are currently managed through CET1.
Pillar 3 Disclosures at 31 December 2021
15 HSBC Bank Malta p.l.c. Pillar 3 2021
The minimum regulatory capital that HSBC Bank Malta p.l.c. is required to hold is determined by the rules and guidance established by the Joint Supervisory Team. These capital requirements are a primary influence shaping the business planning process, in which RWA targets are established for global businesses in accordance with the bank’s strategic direction and risk appetite.
The economic capital assessment is a more risk-sensitive measure, as it covers a wider range of risks and takes account of substantial diversification of risk accruing from the bank’s operations. Both the regulatory and the economic capital assessments rely upon the use of models that are integrated into the management of risk. Economic capital models are calibrated to quantify the level of capital that is sufficient to absorb potential losses over a one-year time horizon with a 99.95% confidence level.
The ICAAP and its constituent economic capital calculations are examined by the Joint Supervisory Team as part of its supervisory review and evaluation process. The ICAAP examination coupled with the EBA stress testing exercise inform the regulator’s view of the P2R and P2G.
A strong level of integration between risk and capital management frameworks helps optimising the response to business demand for regulatory and economic capital. Risks that are explicitly assessed through economic capital are credit risk, including counterparty credit risk, market and operational risk, non-trading book interest rate risk, insurance risk and pension risk.
Minimum Requirement for own funds and Eligible Liabilities (‘MREL’)
The minimum requirement for own funds and eligible liabilities (‘MREL’) is set by Single Resolution Board (‘SRB’) to ensure that Banks maintain at all times sufficient eligible instruments to facilitate the implementation of the preferred resolution strategy. HSBC Bank Malta p.l.c. is subject to the MREL requirements as revised in 2019 through amendments to the EU Bank Recovery and Resolution Directive 2014/59/EU (‘BRRD’); Regulation 806/2014/EU establishing a Single Resolution Mechanism (‘SRMR’), the Capital Requirements Regulation (‘CRR’) and Capital Requirements Directive (‘CRD’) (the Banking Package).
This MREL requirement can be met with own funds and eligible liabilities in line with the SRB Policy under the Banking Package. HSBC Bank Malta p.l.c. Interim Targets for internal MREL commencing 01 January 2022 have been communicated at the maximum of 19.87 per cent of RWAs in addition to a combined buffer requirement of 2.5 per cent and 5.91 per cent of leverage exposures. As at 31 December 2021, HSBC Bank Malta p.l.c. has been able to meet the MREL requirements through own funds and other internal eligible liabilities.
Leverage ratio
The leverage ratio was introduced into the Basel III framework as a non-risk-based limit to supplement risk-based capital requirements. It aims at constraining the build-up of excess leverage in the banking sector, introducing additional safeguards against model risk and measurement errors. The Basel III leverage ratio is a volume-based measure calculated as Tier 1 capital divided by total on and weighted off-balance sheet exposures.
The new banking package published in June 2019 (‘CRR2’) introduced a minimum leverage ratio requirement of 3 per cent applicable as of 28 June 2021. The leverage ratio has become a binding Pillar 1 own-funds requirement since that date. The risk of excess leverage is managed as part of HSBC Bank Malta p.l.c.’s risk appetite framework and monitored using a leverage ratio metric within the Risk Appetite Statement (‘RAS’).
The RAS articulates the aggregate level and types of risk that HSBC Bank Malta p.l.c. is willing to accept in its business activities in order to achieve its strategic business objectives.
The RAS is monitored via the risk appetite profile report, which includes comparisons of actual performance against the risk appetite and tolerance thresholds assigned to each metric, to ensure that any excessive risk is highlighted, assessed and mitigated appropriately. The risk appetite profile report is presented monthly to the Risk Management Meeting (‘RMM’).
For HSBC Bank Malta p.l.c. the leverage exposure measure is also calculated and presented to the Asset and Liability Management Committee every month.
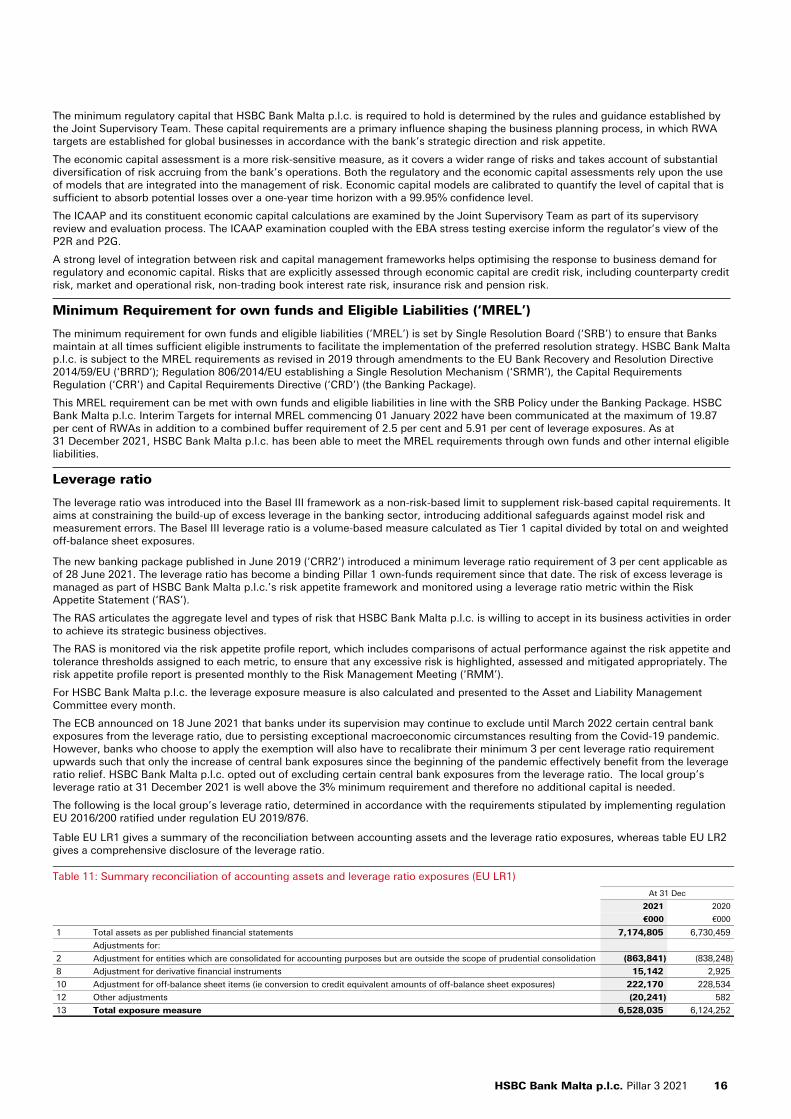
The ECB announced on 18 June 2021 that banks under its supervision may continue to exclude until March 2022 certain central bank exposures from the leverage ratio, due to persisting exceptional macroeconomic circumstances resulting from the Covid-19 pandemic. However, banks who choose to apply the exemption will also have to recalibrate their minimum 3 per cent leverage ratio requirement upwards such that only the increase of central bank exposures since the beginning of the pandemic effectively benefit from the leverage ratio relief. HSBC Bank Malta p.l.c. opted out of excluding certain central bank exposures from the leverage ratio. The local group’s leverage ratio at 31 December 2021 is well above the 3% minimum requirement and therefore no additional capital is needed.
The following is the local group’s leverage ratio, determined in accordance with the requirements stipulated by implementing regulation EU 2016/200 ratified under regulation EU 2019/876.
Table EU LR1 gives a summary of the reconciliation between accounting assets and the leverage ratio exposures, whereas table EU LR2 gives a comprehensive disclosure of the leverage ratio.
Table 11: Summary reconciliation of accounting assets and leverage ratio exposures (EU LR1)
At 31 Dec
2021 2020
€000 €000
1 Total assets as per published financial statements 7,174,805 6,730,459
Adjustments for:
2 Adjustment for entities which are consolidated for accounting purposes but are outside the scope of prudential consolidation (863,841) (838,248)
8 Adjustment for derivative financial instruments 15,142 2,925
10 Adjustment for off-balance sheet items (ie conversion to credit equivalent amounts of off-balance sheet exposures) 222,170 228,534
12 Other adjustments (20,241) 582
13 Total exposure measure 6,528,035 6,124,252
HSBC Bank Malta p.l.c. Pillar 3 2021 16

Table 12: Leverage ratio common disclosure (EU LR2)
At 31 Dec
2021 2020
€000 €000
On-balance sheet exposures (excluding derivatives)
1 On-balance sheet items (excluding derivatives, SFTs, but including collateral) 6,320,582 5,909,798
6 (Asset amounts deducted in determining Tier 1 capital) (34,499) (23,579)
7 Total on-balance sheet exposures (excluding derivatives and SFTs) 6,286,083 5,886,219
Derivative exposures
8 Replacement cost associated with SA-CCR derivatives transactions (ie net of eligible cash variation margin) 7,231 6,574
9 Add-on amounts for potential future exposure associated with SA-CCR derivatives transactions 12,551 2,925
13 Total derivative exposures 19,782 9,499
Other off-balance sheet exposures
19 Off-balance sheet exposures at gross notional amount 1,104,643 1,152,359
20 (Adjustments for conversion to credit equivalent amounts) (882,473) (923,825)
22 Off-balance sheet exposures 222,170 228,534
Capital and total exposure measure
23 Tier 1 capital 412,424 415,426
24 Total exposure measure 6,528,035 6,124,252
Leverage ratios
25 Leverage ratio (%) – transitional 6.3 6.8
26 Regulatory minimum leverage ratio requirement (%) 3.0 N/A
Table EU LR3 provides the split of the on balance sheet exposures; derivatives are excluded from the calculation.
Table 13: Leverage ratio – Split of on-balance sheet exposures (excluding derivatives and exempted exposures) – (EU LR3)
At 31 Dec
2021 2020
€000 €000
EU-1 Total on-balance sheet exposures (excluding derivatives, SFTs and exempted exposures)1 6,320,582 5,909,799
EU-3 Banking book exposures, of which: 6,320,582 5,909,799
EU-5 exposures treated as sovereigns 2,034,590 1,441,731
EU-6 exposures to regional governments, multilateral development banks (‘MDB’), international organisations and public sector entities not treated as sovereigns 464,593 583,342
EU-7 institutions 342,958 323,754
EU-8 secured by mortgages of immovable properties 2,180,171 2,233,925
EU-9 retail exposures 286,784 262,997
EU-10 corporate 726,314 778,079
EU-11 exposures in default 145,851 110,192
EU-12 other exposures (e.g. equity and other non-credit obligation assets)1 139,321 175,779
1 Comparatives are being restated in accordance with current year reporting.
Pillar 3 Disclosures at 31 December 2021
17 HSBC Bank Malta p.l.c. Pillar 3 2021
Credit risk
Overview and Responsibilities
Credit risk is the risk of financial loss if a customer or counterparty fails to meet an obligation under a contract. It arises principally from direct lending, trade finance and treasury business, mainly through the holdings of debt securities, but also from off-balance sheet products such as guarantees. Credit risk represents our largest regulatory capital requirement.
The principal objectives of our credit risk functions are:-
• to maintain across HSBC a strong culture of responsible lending and a robust credit risk policy and control framework;
• to both partner and challenge our businesses in defining, implementing and continually re-evaluating our credit risk appetite under actual and stress scenario conditions; and
• to ensure there is independent, expert scrutiny of credit risks, their costs and their mitigation.
The credit risk functions within Wholesale Credit and Market Risk (‘WMR’) and Wealth and Personal Banking (‘WPB’) are the constituent parts that support the CRO in overseeing credit risks. The major duties comprise undertaking independent reviews of large and high-risk credit proposals, overseeing large exposure policy and reporting on our wholesale and retail credit risk management disciplines. They also own our credit policy and credit systems programmes, oversee portfolio management and report on risk matters to senior executive management and regulators.
These credit risk functions work closely with other parts of Risk, for example with Operational Risk on the internal control framework and with Risk Strategy on the risk appetite process. In addition, they work jointly with Risk Strategy and Finance on stress testing.
The credit risk functions fulfil an essential role as independent risk control units distinct from business line management providing objective scrutiny of risk rating assessments, credit proposals for approval and other risk matters.
Our credit risk procedures operate through a hierarchy of personal credit limit approval authorities. The chief executive acting under authorities delegated by the board and Group standards, is accountable for credit risk and other risks faced by the business. In turn, the chief executive delegates authority to operating chief risk officer and management teams on an individual basis. HSBC Bank Malta p.l.c. is responsible for the quality and performance of its credit portfolios in accordance with the HSBC Bank plc standards. Above these thresholds of delegated personal credit limit approval authorities, approval must be sought from the regional credit risk and / or the global credit risk function as appropriate.
Credit risk management
Credit risk
Our exposure to credit risk arises from a wide range of customer and products, and the risk rating systems in place to measure and monitor these risks are correspondingly diverse. Senior management receives a variety of reports on our credit risk exposures, including expected credit losses, total exposures and RWEAs, as well as updates on specific portfolios that are considered to have heightened credit risk.
Credit risk exposures are generally measured and managed in portfolios of either customer types or product categories. Risk rating systems are designed to assess the default propensity of, and loss severity associated with distinct customers who are typically managed as individual relationships or, in the case of retail business exposures, on a product portfolio basis.
Risk rating systems for retail exposures are generally quantitative in nature, applying techniques such as behavioural analysis across product portfolios comprising large numbers of homogeneous transactions. Rating systems for individually managed relationships typically use customer financial statements and market data analysis, but also qualitative elements and a final subjective overlay to better reflect any idiosyncratic elements of the customer’s risk profile.
A fundamental principle of our policy and approach is that analytical risk rating systems and scorecards are all valuable tools at the disposal of management. The wholesale credit process provides for at least an annual review of facility limits granted. Review may be more frequent, as required by circumstances such as the emergence of adverse risk factors.
We constantly seek to improve the quality of our risk management. HSBC Bank Malta p.l.c.’s IT systems that process credit risk data continue to be enhanced in order to deliver both comprehensive management information in support of business strategy and solutions to evolving regulatory reporting requirements. HSBC Bank Malta p.l.c. adheres to the HSBC Group standards that govern the process through which risk rating systems are initially developed, judged fit for purpose, approved and implemented. They also govern the conditions under which analytical risk model outcomes can be overridden by decision takers and the process of model performance monitoring and reporting. The emphasis is on an effective dialogue between business line and risk management, suitable independence of decision takers, and a good understanding and robust challenge on the part of senior management.
Like other facets of risk management, analytical risk rating systems are not static. They are subject to review and modification in light of the changing environment, the greater availability and quality of data, and any deficiencies identified through internal and external regulatory review. Structured processes and metrics are in place to capture relevant data and feed this into continuous model improvement.
In response to the onset of the Covid-19 pandemic, credit risk appetite was reviewed and adjusted in line with expected impact, as well to support measures aimed at assisting clients through the pandemic.
The tables below set out details of HSBC Bank Malta p.l.c.’s credit risk exposures by exposure class and approach. Further explanation of HSBC Bank Malta p.l.c.’s approach to credit risk, including detail of the past due and impaired exposure, and its approach to credit risk impairment, can be found in the Annual Report and Accounts of HSBC Bank Malta p.l.c.
Credit quality of exposures by exposures class and instruments
We form part of a universal bank with a conservative approach to credit risk. This is reflected in our credit risk profile being diversified across a number of asset classes with a credit quality profile mainly concentrated in the lower risk classes. The following table provides information on the gross carrying amount of exposures and related impairment with further detail on the IFRS 9 stage, accumulated partial write off and collateral.
HSBC Bank Malta p.l.c. Pillar 3 2021 18
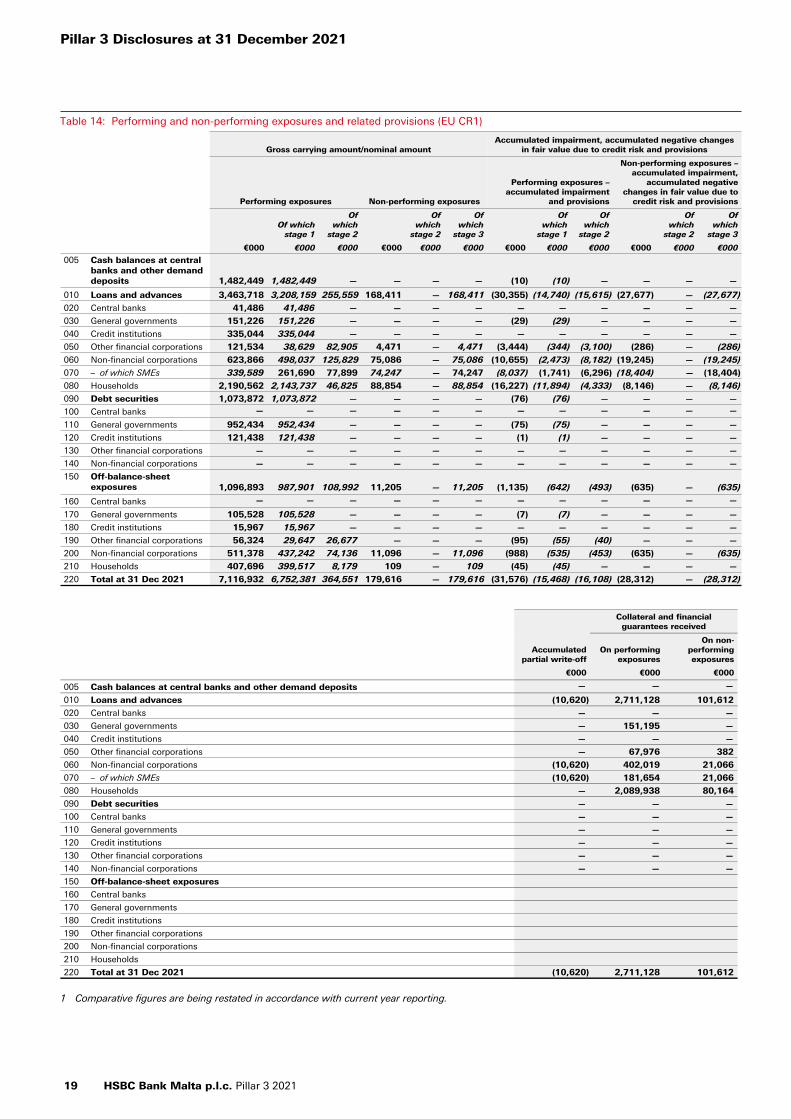
Gross carrying amount/nominal amountAccumulated impairment, accumulated negative changes
in fair value due to credit risk and provisions
Performing exposures Non-performing exposures
Performing exposures – accumulated impairment
and provisions
Non-performing exposures – accumulated impairment,
accumulated negative changes in fair value due to
credit risk and provisions
Of which stage 1
Of which
stage 2
Of which
stage 2
Of which
stage 3
Of which
stage 1
Of which
stage 2
Of which
stage 2
Of which
stage 3
€000 €000 €000 €000 €000 €000 €000 €000 €000 €000 €000 €000
005 Cash balances at central banks and other demand deposits 1,482,449 1,482,449 — — — — (10) (10) — — — —
010 Loans and advances 3,463,718 3,208,159 255,559 168,411 — 168,411 (30,355) (14,740) (15,615) (27,677) — (27,677)
020 Central banks 41,486 41,486 — — — — — — — — — —
030 General governments 151,226 151,226 — — — — (29) (29) — — — —
040 Credit institutions 335,044 335,044 — — — — — — — — — —
050 Other financial corporations 121,534 38,629 82,905 4,471 — 4,471 (3,444) (344) (3,100) (286) — (286)
060 Non-financial corporations 623,866 498,037 125,829 75,086 — 75,086 (10,655) (2,473) (8,182) (19,245) — (19,245)
070 – of which SMEs 339,589 261,690 77,899 74,247 — 74,247 (8,037) (1,741) (6,296) (18,404) — (18,404)
080 Households 2,190,562 2,143,737 46,825 88,854 — 88,854 (16,227) (11,894) (4,333) (8,146) — (8,146)
090 Debt securities 1,073,872 1,073,872 — — — — (76) (76) — — — —
100 Central banks — — — — — — — — — — — —
110 General governments 952,434 952,434 — — — — (75) (75) — — — —
120 Credit institutions 121,438 121,438 — — — — (1) (1) — — — —
130 Other financial corporations — — — — — — — — — — — —
140 Non-financial corporations — — — — — — — — — — — —
150 Off-balance-sheet exposures 1,096,893 987,901 108,992 11,205 — 11,205 (1,135) (642) (493) (635) — (635)
160 Central banks — — — — — — — — — — — —
170 General governments 105,528 105,528 — — — — (7) (7) — — — —
180 Credit institutions 15,967 15,967 — — — — — — — — — —
190 Other financial corporations 56,324 29,647 26,677 — — — (95) (55) (40) — — —
200 Non-financial corporations 511,378 437,242 74,136 11,096 — 11,096 (988) (535) (453) (635) — (635)
210 Households 407,696 399,517 8,179 109 — 109 (45) (45) — — — —
220 Total at 31 Dec 2021 7,116,932 6,752,381 364,551 179,616 — 179,616 (31,576) (15,468) (16,108) (28,312) — (28,312)
Table 14: Performing and non-performing exposures and related provisions (EU CR1)
Accumulated partial write-off
Collateral and financial guarantees received
On performing exposures
On non-performing exposures
€000 €000 €000
005 Cash balances at central banks and other demand deposits — — —
010 Loans and advances (10,620) 2,711,128 101,612
020 Central banks — — —
030 General governments — 151,195 —
040 Credit institutions — — —
050 Other financial corporations — 67,976 382
060 Non-financial corporations (10,620) 402,019 21,066
070 – of which SMEs (10,620) 181,654 21,066
080 Households — 2,089,938 80,164
090 Debt securities — — —
100 Central banks — — —
110 General governments — — —
120 Credit institutions — — —
130 Other financial corporations — — —
140 Non-financial corporations — — —
150 Off-balance-sheet exposures
160 Central banks
170 General governments
180 Credit institutions
190 Other financial corporations
200 Non-financial corporations
210 Households
220 Total at 31 Dec 2021 (10,620) 2,711,128 101,612
1 Comparative figures are being restated in accordance with current year reporting.
Pillar 3 Disclosures at 31 December 2021
19 HSBC Bank Malta p.l.c. Pillar 3 2021
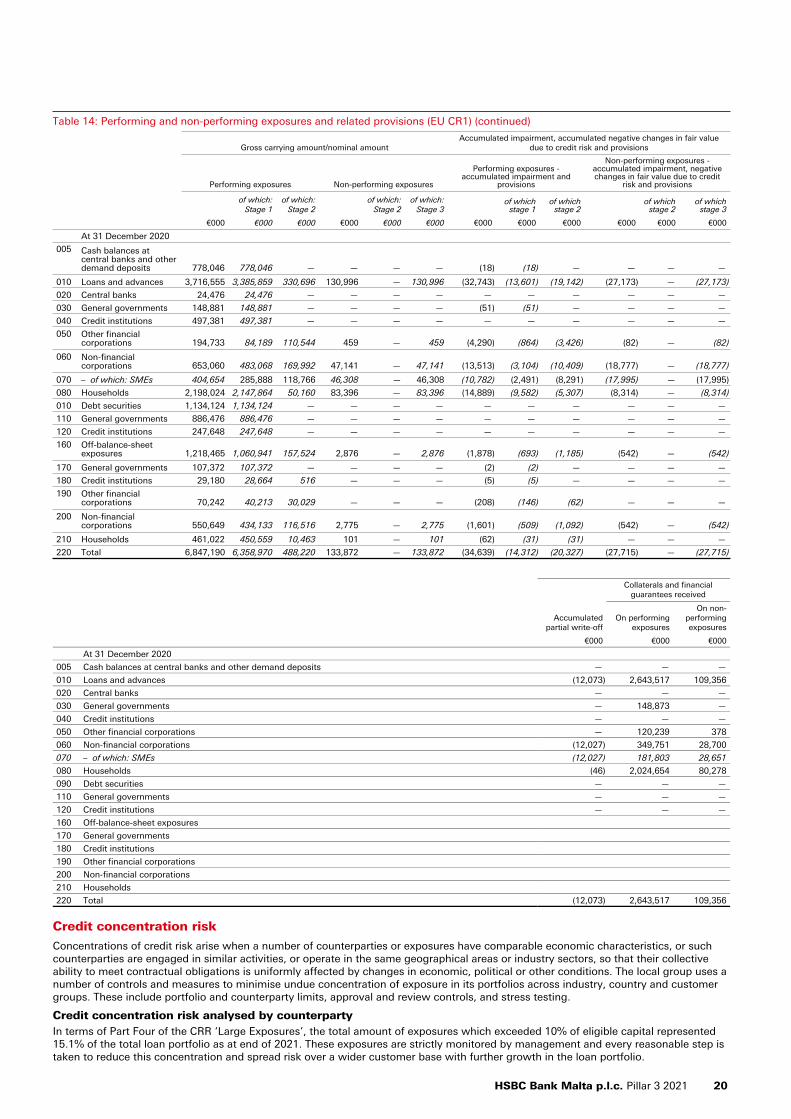
Table 14: Performing and non-performing exposures and related provisions (EU CR1) (continued)
Gross carrying amount/nominal amountAccumulated impairment, accumulated negative changes in fair value
due to credit risk and provisions
Performing exposures Non-performing exposures
Performing exposures - accumulated impairment and
provisions
Non-performing exposures - accumulated impairment, negative changes in fair value due to credit
risk and provisions
of which: Stage 1
of which: Stage 2
of which: Stage 2
of which: Stage 3
of which stage 1
of which stage 2
of which stage 2
of which stage 3
€000 €000 €000 €000 €000 €000 €000 €000 €000 €000 €000 €000
At 31 December 2020
005 Cash balances at central banks and other demand deposits 778,046 778,046 — — — — (18) (18) — — — —
010 Loans and advances 3,716,555 3,385,859 330,696 130,996 — 130,996 (32,743) (13,601) (19,142) (27,173) — (27,173)
020 Central banks 24,476 24,476 — — — — — — — — — —
030 General governments 148,881 148,881 — — — — (51) (51) — — — —
040 Credit institutions 497,381 497,381 — — — — — — — — — —
050 Other financial corporations 194,733 84,189 110,544 459 — 459 (4,290) (864) (3,426) (82) — (82)
060 Non-financial corporations 653,060 483,068 169,992 47,141 — 47,141 (13,513) (3,104) (10,409) (18,777) — (18,777)
070 – of which: SMEs 404,654 285,888 118,766 46,308 — 46,308 (10,782) (2,491) (8,291) (17,995) — (17,995)
080 Households 2,198,024 2,147,864 50,160 83,396 — 83,396 (14,889) (9,582) (5,307) (8,314) — (8,314)
010 Debt securities 1,134,124 1,134,124 — — — — — — — — — —
110 General governments 886,476 886,476 — — — — — — — — — —
120 Credit institutions 247,648 247,648 — — — — — — — — — —
160 Off-balance-sheet exposures 1,218,465 1,060,941 157,524 2,876 — 2,876 (1,878) (693) (1,185) (542) — (542)
170 General governments 107,372 107,372 — — — — (2) (2) — — — —
180 Credit institutions 29,180 28,664 516 — — — (5) (5) — — — —
190 Other financial corporations 70,242 40,213 30,029 — — — (208) (146) (62) — — —
200 Non-financial corporations 550,649 434,133 116,516 2,775 — 2,775 (1,601) (509) (1,092) (542) — (542)
210 Households 461,022 450,559 10,463 101 — 101 (62) (31) (31) — — —
220 Total 6,847,190 6,358,970 488,220 133,872 — 133,872 (34,639) (14,312) (20,327) (27,715) — (27,715)
Accumulated partial write-off
Collaterals and financial guarantees received
On performing exposures
On non-performing exposures
€000 €000 €000
At 31 December 2020
005 Cash balances at central banks and other demand deposits — — —
010 Loans and advances (12,073) 2,643,517 109,356
020 Central banks — — —
030 General governments — 148,873 —
040 Credit institutions — — —
050 Other financial corporations — 120,239 378
060 Non-financial corporations (12,027) 349,751 28,700
070 – of which: SMEs (12,027) 181,803 28,651
080 Households (46) 2,024,654 80,278
090 Debt securities — — —
110 General governments — — —
120 Credit institutions — — —
160 Off-balance-sheet exposures
170 General governments
180 Credit institutions
190 Other financial corporations
200 Non-financial corporations
210 Households
220 Total (12,073) 2,643,517 109,356
Credit concentration risk
Concentrations of credit risk arise when a number of counterparties or exposures have comparable economic characteristics, or such counterparties are engaged in similar activities, or operate in the same geographical areas or industry sectors, so that their collective ability to meet contractual obligations is uniformly affected by changes in economic, political or other conditions. The local group uses a number of controls and measures to minimise undue concentration of exposure in its portfolios across industry, country and customer groups. These include portfolio and counterparty limits, approval and review controls, and stress testing.
Credit concentration risk analysed by counterpartyIn terms of Part Four of the CRR ‘Large Exposures’, the total amount of exposures which exceeded 10% of eligible capital represented 15.1% of the total loan portfolio as at end of 2021. These exposures are strictly monitored by management and every reasonable step is taken to reduce this concentration and spread risk over a wider customer base with further growth in the loan portfolio.
HSBC Bank Malta p.l.c. Pillar 3 2021 20

The maximum on-balance sheet credit exposure to any client, group of connected clients or counterparty as at 31 December 2021 amounted to €183,418,000 before taking account of collateral or other credit enhancements.
Within its daily operations, the local group transacts with counterparty banks and other financial institutions. By conducting these transactions, the local group is running the risk of losing funds due to the possible delays in the repayment of existing and future obligations by counterparty banks. To mitigate this risk, the local group places short-term funds solely with pre-approved counterparties subject to pre-established limits determined on the basis of the respective institution’s credit rating as well as with its parent. The positions are checked against the limits on a daily basis and in real time.
As prescribed in article 400(2)(c), in light of the fact that the local group is subject to prudential supervision on a consolidated basis, the local group’s exposure with its parent is exempt from limits to large exposures outlined in article 395(1) of the CRR. Similarly, the local group invests in debt securities issued by the government of Malta, and given that these exposures attract a 0% risk weight they are exempt from large exposure limits.
Expected Loss (‘EL’) and credit risk adjustments
The local group analyses credit loss experience in order to assess the performance of our risk measurement and control processes, and to inform our understanding of the implications for risk and capital management of dynamic changes occurring in the risk profile of our exposures.
HSBC Bank Malta p.l.c. adopted IFRS9 framework which uses the following three stage model for impairments that looks at the changes in credit quality:
• stage 1: Those financial assets that are unimpaired and without a significant increase in credit risk. A 12-month allowance for ECL is recognised;
• stage 2: A significant increase in credit risk has been experienced on these financial assets since initial recognition. A lifetime ECL is recognised; and
• stage 3: There is objective evidence of impairment and the financial assets are therefore considered to be in default or otherwise credit impaired. A lifetime ECL is recognised.
When comparing regulatory EL with measures of Expected Credit Losses (‘ECL’) under IFRS 9, differences in the definition and scope of each should be considered. These can give rise to material differences in the way economic, business and methodological drivers are reflected quantitatively in the accounting and regulatory measures of loss.
In general, HSBC Bank Malta p.l.c. calculates ECL using three main components namely probability of default, loss given default, and exposure at default.
ECL include impairment allowances (or provisions, against commitments and guarantees) calculated for a 12-month period (’12-month ECL’), for the remaining life of an exposure (‘lifetime ECL’), and on financial assets that are considered to be in default or otherwise credit impaired. ECL resulting from default events that are possible:
• within the next 12 months are recognised for financial instruments in stage 1; and
• beyond 12 months are recognised for financial instruments in stages 2 and 3.
An assessment of whether credit risk has increased significantly since initial recognition is performed at each reporting period by considering the change in the risk of default occurring over the remaining life of the financial instrument.
Unless identified at an earlier stage, all financial assets are deemed to have suffered a significant increase in credit risk when 30 days past due.
Change in ECL and other credit impairment charges represents the movement in the ECL during the year including write-offs, recoveries and foreign exchange losses. EL represents the one-year regulatory expected loss accumulated in the book at the balance sheet date.
Credit risk adjustments (‘CRAs’) encompass the impairment allowances or provisions balances, and changes in ECL and other credit impairment charges.
Further information on the measurement of loans and advances is disclosed in Note 3 of the Significant accounting policies within the Annual Report and Accounts.
Impaired loans and advances
Impaired loans and advances are those that are classified as CRR 9 or CRR 10. These grades are assigned when HSBC Bank Malta p.l.c. considers that either the customer is unlikely to pay its credit obligations in full without recourse to security, or when the customer is more than 90 days past due on any material credit obligation to the bank.
Impaired loans and advances also include renegotiated loans and advances that have been subject to a change in contractual cash flows as a result of a financial concession which the bank would not otherwise consider, and where it is probable that without the concession the borrower would be unable to meet the contractual payment obligations in full, unless the concession is insignificant and there are no other indicators of impairment. Impaired loans and advances can also arise from when a non-financial concession is granted, which may trigger an Unlikely to Pay (‘UTP’) assessment, the outcome of which may result in the exposure being re-classified as CRR9.
The table below analyses the change in stock of specific credit risk adjustment for the financial year ended 31 December 2021.
Table 15: Changes in the stock of non-performing loans and advances (EU CR2)
At 31 Dec 2021
Gross carrying amount
€000
010 Initial stock of non-performing loans and advances 130,996
020 Inflows to non-performing portfolios 67,802
030 Outflows from non-performing portfolios (30,387)
– of which:
040 due to write-offs (1,900)
050 due to other situations (28,487)
060 Final stock of non-performing loans and advances 168,411
Pillar 3 Disclosures at 31 December 2021
21 HSBC Bank Malta p.l.c. Pillar 3 2021
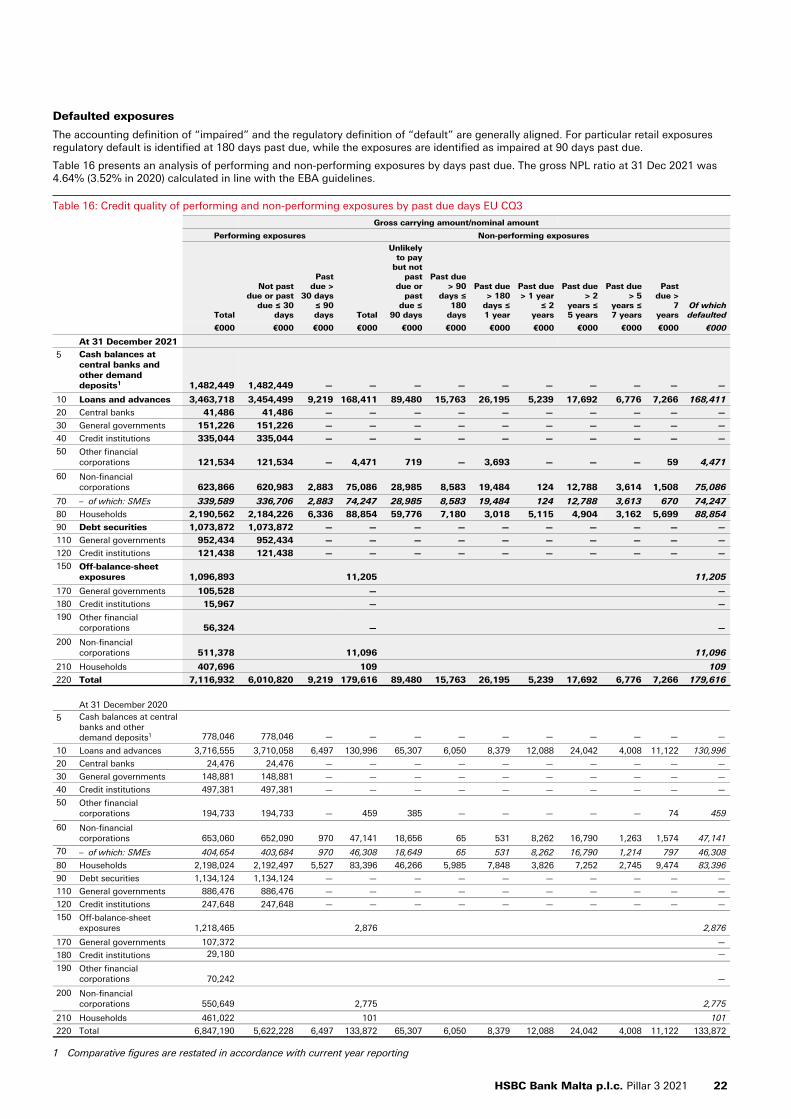
Defaulted exposures
The accounting definition of “impaired” and the regulatory definition of “default” are generally aligned. For particular retail exposures regulatory default is identified at 180 days past due, while the exposures are identified as impaired at 90 days past due.
Table 16 presents an analysis of performing and non-performing exposures by days past due. The gross NPL ratio at 31 Dec 2021 was 4.64% (3.52% in 2020) calculated in line with the EBA guidelines.
Table 16: Credit quality of performing and non-performing exposures by past due days EU CQ3
Gross carrying amount/nominal amount
Performing exposures Non-performing exposures
Total
Not past due or past
due ≤ 30 days
Past due >
30 days ≤ 90 days Total
Unlikely to pay
but not past
due or past
due ≤ 90 days
Past due > 90
days ≤ 180
days
Past due > 180
days ≤ 1 year
Past due > 1 year
≤ 2 years
Past due > 2
years ≤ 5 years
Past due > 5
years ≤ 7 years
Past due >
7 years
Of which defaulted
€000 €000 €000 €000 €000 €000 €000 €000 €000 €000 €000 €000
At 31 December 2021
5 Cash balances at central banks and other demand deposits1 1,482,449 1,482,449 — — — — — — — — — —
10 Loans and advances 3,463,718 3,454,499 9,219 168,411 89,480 15,763 26,195 5,239 17,692 6,776 7,266 168,411
20 Central banks 41,486 41,486 — — — — — — — — — —
30 General governments 151,226 151,226 — — — — — — — — — —
40 Credit institutions 335,044 335,044 — — — — — — — — — —
50 Other financial corporations 121,534 121,534 — 4,471 719 — 3,693 — — — 59 4,471
60 Non-financial corporations 623,866 620,983 2,883 75,086 28,985 8,583 19,484 124 12,788 3,614 1,508 75,086
70 – of which: SMEs 339,589 336,706 2,883 74,247 28,985 8,583 19,484 124 12,788 3,613 670 74,247
80 Households 2,190,562 2,184,226 6,336 88,854 59,776 7,180 3,018 5,115 4,904 3,162 5,699 88,854
90 Debt securities 1,073,872 1,073,872 — — — — — — — — — —
110 General governments 952,434 952,434 — — — — — — — — — —
120 Credit institutions 121,438 121,438 — — — — — — — — — —
150 Off-balance-sheet exposures 1,096,893 11,205 11,205
170 General governments 105,528 — —
180 Credit institutions 15,967 — —
190 Other financial corporations 56,324 — —
200 Non-financial corporations 511,378 11,096 11,096
210 Households 407,696 109 109
220 Total 7,116,932 6,010,820 9,219 179,616 89,480 15,763 26,195 5,239 17,692 6,776 7,266 179,616
At 31 December 2020
5 Cash balances at central banks and other demand deposits1 778,046 778,046 — — — — — — — — — —
10 Loans and advances 3,716,555 3,710,058 6,497 130,996 65,307 6,050 8,379 12,088 24,042 4,008 11,122 130,996
20 Central banks 24,476 24,476 — — — — — — — — — —
30 General governments 148,881 148,881 — — — — — — — — — —
40 Credit institutions 497,381 497,381 — — — — — — — — — —
50 Other financial corporations 194,733 194,733 — 459 385 — — — — — 74 459
60 Non-financial corporations 653,060 652,090 970 47,141 18,656 65 531 8,262 16,790 1,263 1,574 47,141
70 – of which: SMEs 404,654 403,684 970 46,308 18,649 65 531 8,262 16,790 1,214 797 46,308
80 Households 2,198,024 2,192,497 5,527 83,396 46,266 5,985 7,848 3,826 7,252 2,745 9,474 83,396
90 Debt securities 1,134,124 1,134,124 — — — — — — — — — —
110 General governments 886,476 886,476 — — — — — — — — — —
120 Credit institutions 247,648 247,648 — — — — — — — — — —
150 Off-balance-sheet exposures 1,218,465 2,876 2,876
170 General governments 107,372 —
180 Credit institutions 29,180 —
190 Other financial corporations 70,242 —
200 Non-financial corporations 550,649 2,775 2,775
210 Households 461,022 101 101
220 Total 6,847,190 5,622,228 6,497 133,872 65,307 6,050 8,379 12,088 24,042 4,008 11,122 133,872
1 Comparative figures are restated in accordance with current year reporting
HSBC Bank Malta p.l.c. Pillar 3 2021 22
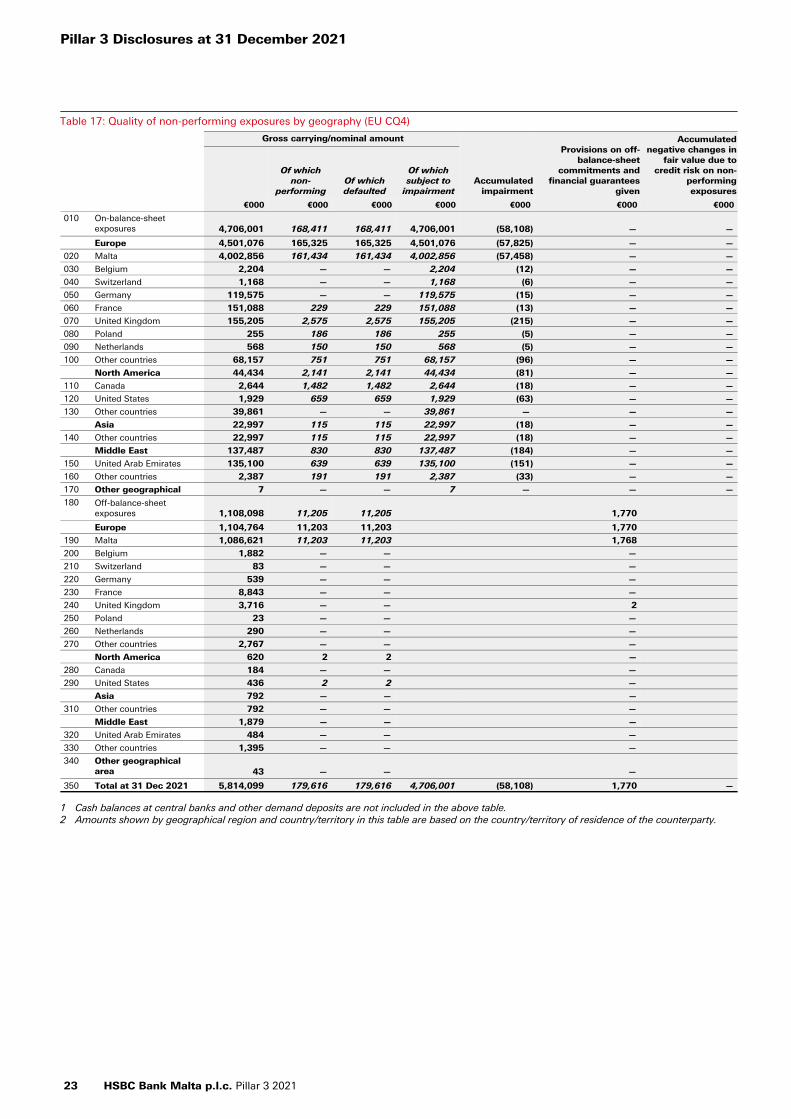
Table 17: Quality of non-performing exposures by geography (EU CQ4)
Gross carrying/nominal amount
Accumulated impairment
Provisions on off-balance-sheet
commitments and financial guarantees
given
Accumulated negative changes in
fair value due to credit risk on non-
performing exposures
Of which non-
performingOf which defaulted
Of which subject to
impairment
€000 €000 €000 €000 €000 €000 €000
010 On-balance-sheet exposures 4,706,001 168,411 168,411 4,706,001 (58,108) — —
Europe 4,501,076 165,325 165,325 4,501,076 (57,825) — —
020 Malta 4,002,856 161,434 161,434 4,002,856 (57,458) — —
030 Belgium 2,204 — — 2,204 (12) — —
040 Switzerland 1,168 — — 1,168 (6) — —
050 Germany 119,575 — — 119,575 (15) — —
060 France 151,088 229 229 151,088 (13) — —
070 United Kingdom 155,205 2,575 2,575 155,205 (215) — —
080 Poland 255 186 186 255 (5) — —
090 Netherlands 568 150 150 568 (5) — —
100 Other countries 68,157 751 751 68,157 (96) — —
North America 44,434 2,141 2,141 44,434 (81) — —
110 Canada 2,644 1,482 1,482 2,644 (18) — —
120 United States 1,929 659 659 1,929 (63) — —
130 Other countries 39,861 — — 39,861 — — —
Asia 22,997 115 115 22,997 (18) — —
140 Other countries 22,997 115 115 22,997 (18) — —
Middle East 137,487 830 830 137,487 (184) — —
150 United Arab Emirates 135,100 639 639 135,100 (151) — —
160 Other countries 2,387 191 191 2,387 (33) — —
170 Other geographical 7 — — 7 — — —
180 Off-balance-sheet exposures 1,108,098 11,205 11,205 1,770
Europe 1,104,764 11,203 11,203 1,770
190 Malta 1,086,621 11,203 11,203 1,768
200 Belgium 1,882 — — —
210 Switzerland 83 — — —
220 Germany 539 — — —
230 France 8,843 — — —
240 United Kingdom 3,716 — — 2
250 Poland 23 — — —
260 Netherlands 290 — — —
270 Other countries 2,767 — — —
North America 620 2 2 —
280 Canada 184 — — —
290 United States 436 2 2 —
Asia 792 — — —
310 Other countries 792 — — —
Middle East 1,879 — — —
320 United Arab Emirates 484 — — —
330 Other countries 1,395 — — —
340 Other geographical area 43 — — —
350 Total at 31 Dec 2021 5,814,099 179,616 179,616 4,706,001 (58,108) 1,770 —
1 Cash balances at central banks and other demand deposits are not included in the above table.2 Amounts shown by geographical region and country/territory in this table are based on the country/territory of residence of the counterparty.
Pillar 3 Disclosures at 31 December 2021
23 HSBC Bank Malta p.l.c. Pillar 3 2021
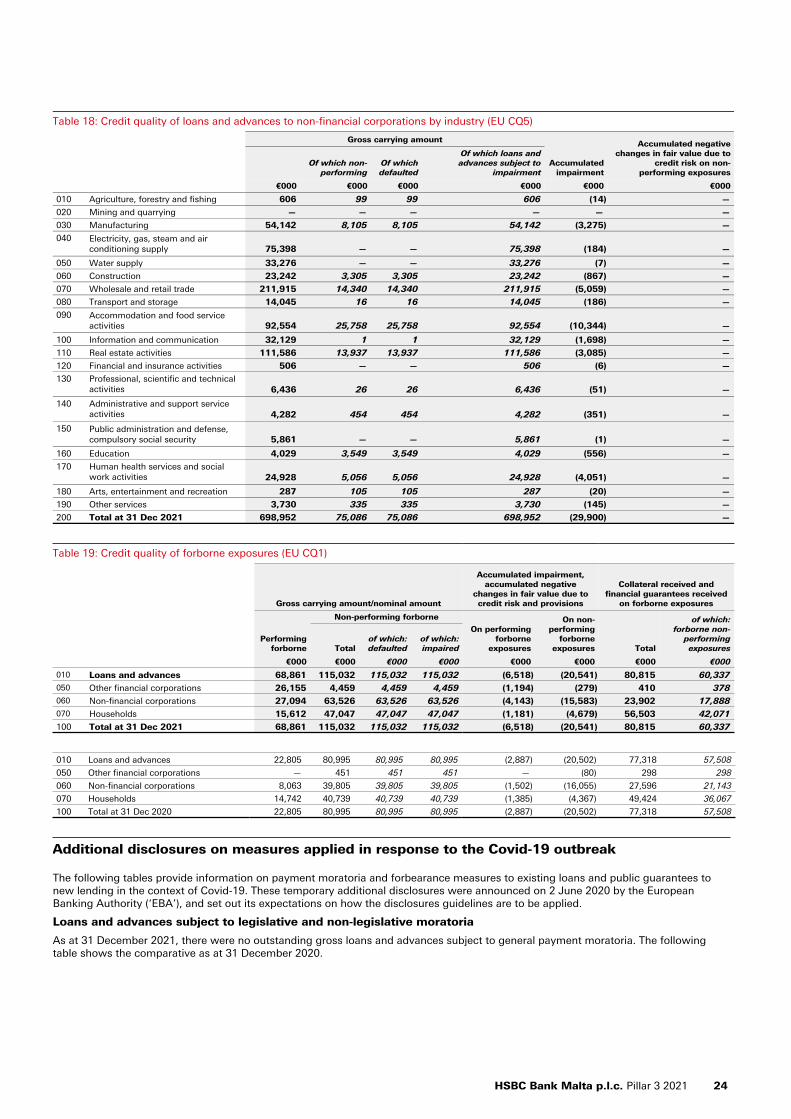
Table 18: Credit quality of loans and advances to non-financial corporations by industry (EU CQ5)
Gross carrying amount
Accumulated impairment
Accumulated negative changes in fair value due to
credit risk on non-performing exposures
Of which non-performing
Of which defaulted
Of which loans and advances subject to
impairment
€000 €000 €000 €000 €000 €000
010 Agriculture, forestry and fishing 606 99 99 606 (14) —
020 Mining and quarrying — — — — — —
030 Manufacturing 54,142 8,105 8,105 54,142 (3,275) —
040 Electricity, gas, steam and air conditioning supply 75,398 — — 75,398 (184) —
050 Water supply 33,276 — — 33,276 (7) —
060 Construction 23,242 3,305 3,305 23,242 (867) —
070 Wholesale and retail trade 211,915 14,340 14,340 211,915 (5,059) —
080 Transport and storage 14,045 16 16 14,045 (186) —
090 Accommodation and food service activities 92,554 25,758 25,758 92,554 (10,344) —
100 Information and communication 32,129 1 1 32,129 (1,698) —
110 Real estate activities 111,586 13,937 13,937 111,586 (3,085) —
120 Financial and insurance activities 506 — — 506 (6) —
130 Professional, scientific and technical activities 6,436 26 26 6,436 (51) —
140 Administrative and support service activities 4,282 454 454 4,282 (351) —
150 Public administration and defense, compulsory social security 5,861 — — 5,861 (1) —
160 Education 4,029 3,549 3,549 4,029 (556) —
170 Human health services and social work activities 24,928 5,056 5,056 24,928 (4,051) —
180 Arts, entertainment and recreation 287 105 105 287 (20) —
190 Other services 3,730 335 335 3,730 (145) —
200 Total at 31 Dec 2021 698,952 75,086 75,086 698,952 (29,900) —
Table 19: Credit quality of forborne exposures (EU CQ1)
Gross carrying amount/nominal amount
Accumulated impairment, accumulated negative
changes in fair value due to credit risk and provisions
Collateral received and financial guarantees received
on forborne exposures
Performing forborne
Non-performing forborne
On performing forborne
exposures
On non-performing
forborne exposures Total
of which: forborne non-
performing exposuresTotal
of which:defaulted
of which: impaired
€000 €000 €000 €000 €000 €000 €000 €000
010 Loans and advances 68,861 115,032 115,032 115,032 (6,518) (20,541) 80,815 60,337 050 Other financial corporations 26,155 4,459 4,459 4,459 (1,194) (279) 410 378 060 Non-financial corporations 27,094 63,526 63,526 63,526 (4,143) (15,583) 23,902 17,888 070 Households 15,612 47,047 47,047 47,047 (1,181) (4,679) 56,503 42,071
100 Total at 31 Dec 2021 68,861 115,032 115,032 115,032 (6,518) (20,541) 80,815 60,337
010 Loans and advances 22,805 80,995 80,995 80,995 (2,887) (20,502) 77,318 57,508
050 Other financial corporations — 451 451 451 — (80) 298 298
060 Non-financial corporations 8,063 39,805 39,805 39,805 (1,502) (16,055) 27,596 21,143
070 Households 14,742 40,739 40,739 40,739 (1,385) (4,367) 49,424 36,067
100 Total at 31 Dec 2020 22,805 80,995 80,995 80,995 (2,887) (20,502) 77,318 57,508
Additional disclosures on measures applied in response to the Covid-19 outbreak
The following tables provide information on payment moratoria and forbearance measures to existing loans and public guarantees to new lending in the context of Covid-19. These temporary additional disclosures were announced on 2 June 2020 by the European Banking Authority (‘EBA’), and set out its expectations on how the disclosures guidelines are to be applied.
Loans and advances subject to legislative and non-legislative moratoria
As at 31 December 2021, there were no outstanding gross loans and advances subject to general payment moratoria. The following table shows the comparative as at 31 December 2020.
HSBC Bank Malta p.l.c. Pillar 3 2021 24
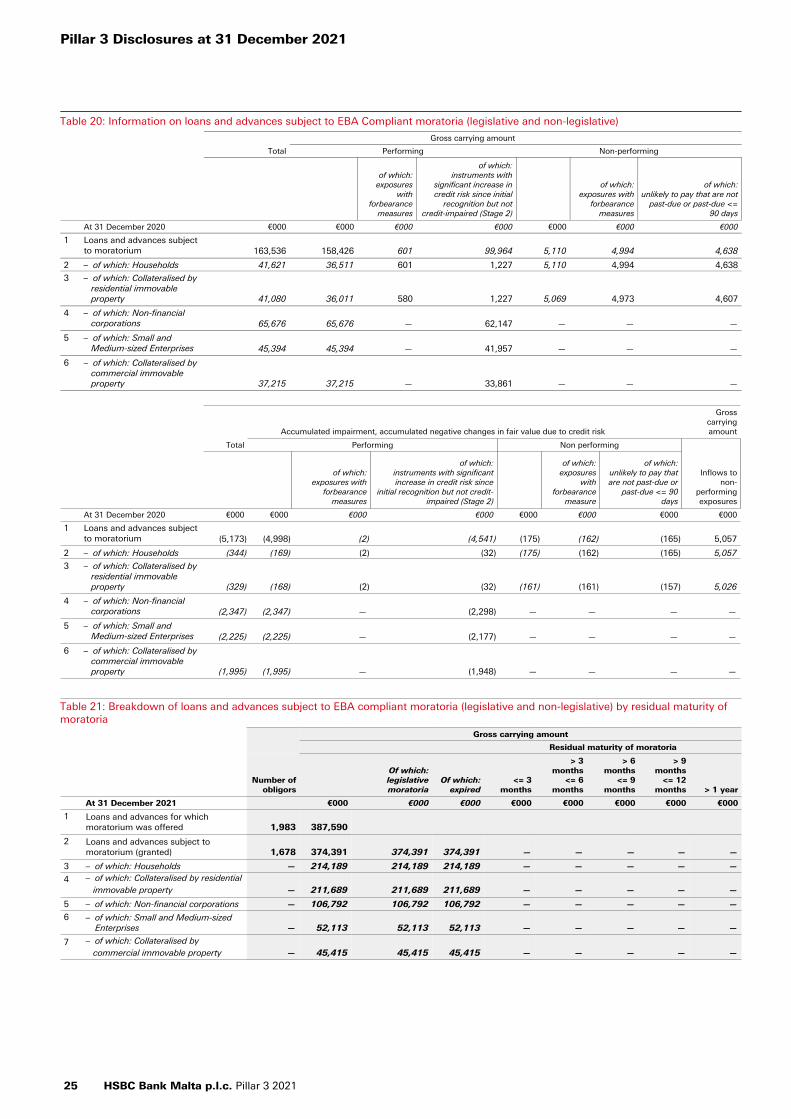
Table 20: Information on loans and advances subject to EBA Compliant moratoria (legislative and non-legislative)
Gross carrying amount
Total Performing Non-performing
of which:exposures
with forbearance
measures
of which:instruments with
significant increase in credit risk since initial
recognition but not credit-impaired (Stage 2)
of which:exposures with
forbearance measures
of which:unlikely to pay that are not
past-due or past-due <= 90 days
At 31 December 2020 €000 €000 €000 €000 €000 €000 €000
1 Loans and advances subject to moratorium 163,536 158,426 601 99,964 5,110 4,994 4,638
2 – of which: Households 41,621 36,511 601 1,227 5,110 4,994 4,638
3 – of which: Collateralised by residential immovable property 41,080 36,011 580 1,227 5,069 4,973 4,607
4 – of which: Non-financial corporations 65,676 65,676 — 62,147 — — —
5 – of which: Small and Medium-sized Enterprises 45,394 45,394 — 41,957 — — —
6 – of which: Collateralised by commercial immovable property 37,215 37,215 — 33,861 — — —
Accumulated impairment, accumulated negative changes in fair value due to credit risk
Gross carrying amount
Total Performing Non performing
Inflows to non-
performing exposures
of which:exposures with
forbearance measures
of which:instruments with significant increase in credit risk since
initial recognition but not credit-impaired (Stage 2)
of which:exposures
with forbearance
measure
of which:unlikely to pay that are not past-due or
past-due <= 90 days
At 31 December 2020 €000 €000 €000 €000 €000 €000 €000 €000
1 Loans and advances subject to moratorium (5,173) (4,998) (2) (4,541) (175) (162) (165) 5,057
2 – of which: Households (344) (169) (2) (32) (175) (162) (165) 5,057
3 – of which: Collateralised by residential immovable property (329) (168) (2) (32) (161) (161) (157) 5,026
4 – of which: Non-financial corporations (2,347) (2,347) — (2,298) — — — —
5 – of which: Small and Medium-sized Enterprises (2,225) (2,225) — (2,177) — — — —
6 – of which: Collateralised by commercial immovable property (1,995) (1,995) — (1,948) — — — —
Table 21: Breakdown of loans and advances subject to EBA compliant moratoria (legislative and non-legislative) by residual maturity of moratoria
Number of obligors
Gross carrying amount
Residual maturity of moratoria
Of which: legislative moratoria
Of which: expired
<= 3 months
> 3 months
<= 6 months
> 6 months
<= 9 months
> 9 months
<= 12 months > 1 year
At 31 December 2021 €000 €000 €000 €000 €000 €000 €000 €000
1 Loans and advances for which moratorium was offered 1,983 387,590
2 Loans and advances subject to moratorium (granted) 1,678 374,391 374,391 374,391 — — — — —
3 – of which: Households — 214,189 214,189 214,189 — — — — —
4 – of which: Collateralised by residential immovable property — 211,689 211,689 211,689 — — — — —
5 – of which: Non-financial corporations — 106,792 106,792 106,792 — — — — —
6 – of which: Small and Medium-sized Enterprises — 52,113 52,113 52,113 — — — — —
7 – of which: Collateralised by commercial immovable property — 45,415 45,415 45,415 — — — — —
Pillar 3 Disclosures at 31 December 2021
25 HSBC Bank Malta p.l.c. Pillar 3 2021

Table 21: Breakdown of loans and advances subject to EBA compliant moratoria (legislative and non-legislative) by residual maturity of moratoria (continued)
Number of obligors
Gross carrying amount
Residual maturity of moratoria
Of which: legislative moratoria
Of which: expired <= 3 months
> 3 months<= 6 months
> 6 months<= 9 months
> 9 months<= 12
months > 1 year
At 31 December 2020 €000 €000 €000 €000 €000 €000 €000 €000
1 Loans and advances for which moratorium was offered 2,224 442,605
2 Loans and advances subject to moratorium (granted) 1,821 430,158 430,158 266,622 42,874 119,377 1,285 — —
3 – of which: Households — 238,718 238,718 197,097 13,205 27,131 1,285 — —
4 – of which: Collateralised by residential immovable property — 233,914 233,914 192,834 13,017 26,778 1,285 — —
5 – of which: Non-financial corporations — 102,727 102,727 37,051 18,923 46,753 — — —
6 – of which: Small and Medium-sized Enterprises — 56,159 56,159 10,765 4,933 40,461 — — —
7 – of which: Collateralised by commercial immovable property — 43,171 43,171 5,956 15,109 22,106 — — —
Information on newly originated loans and advances provided under newly applicable public guarantee schemes introduced in response to Covid-19 crisis
In May 2020, HSBC Bank Malta p.l.c. confirmed its participation in the Malta Development Bank Covid-19 Guarantee Scheme. This government-backed scheme provides banks with credit risk mitigation in respect of loans granted to eligible and viable businesses which may be experiencing cash flow and liquidity pressures resulting from the adverse business conditions following the Covid-19 outbreak.
Table 22: Information on newly originated loans and advances provided under newly applicable public guarantee schemes introduced inresponse to Covid-19 crisis
Gross carrying amount Public guarantees receivedInflows linked to new
lending
of which: forborneMaximum amount of the
guarantee that can be considered Gross carrying amount
At 31 December 2021 €000 €000 €000 €000
1 Newly originated loans and advances subject to public guarantee schemes 37,760 5,659 33,984 15,830
4 – of which: Non-financial corporations 33,974 5,659 30,577 15,830
5 – of which: Small and Medium-sized Enterprises 17,670 —
6 – of which: Collateralised by commercial immovable property 15,076 —
At 31 December 2020
1 Newly originated loans and advances subject to public guarantee schemes 14,284 — 12,676 2,973
4 – of which: Non-financial corporations 14,284 — 12,676 2,973
5 – of which: Small and Medium-sized Enterprises 10,784 —
6 – of which: Collateralised by commercial immovable property 3,255 —
HSBC Bank Malta p.l.c. Pillar 3 2021 26
Risk mitigationOur approach when granting credit facilities is to do so on the basis of capacity to repay, rather than placing primary reliance on credit risk mitigants. Depending on a customer’s standing and the type of product, facilities may be provided on an unsecured basis.
Mitigation of credit risk is a key aspect of effective risk management and takes many forms. Our general policy is to promote the use of credit risk mitigation, justified by commercial prudence and capital efficiency. Detailed policies cover the acceptability, structuring and terms with regards to the availability of credit risk mitigation such as collateral security. These policies together with the setting of suitable valuation parameters are subject to regular review to ensure that they are supported by empirical evidence and continue to fulfil their intended purpose.
Policy and procedures
Policies and procedures govern the protection of our position from the outset of a customer relationship; for instance, in requiring standard terms and conditions or specifically agreed documentation permitting the offset of credit balances against debt obligations, and through controls over the integrity, current valuation and, if necessary, realisation of collateral security.
Collateral
The most common method of mitigating credit risk is to take collateral. In our retail residential and commercial real estate (‘CRE’) businesses, a mortgage over the property is usually taken to secure claims. Physical collateral is also taken in various forms of specialised lending and leasing transactions where income from the physical assets that are financed is also the principal source of facility repayment. In the commercial and industrial sectors, charges are created over business assets such as premises, stock and debtors. Loans to WPB and higher wealth clients may be made against a pledge of eligible marketable securities, cash or real estate. Facilities to small and medium-sized enterprises (‘SME’s’) are commonly granted against guarantees given by their owners and/or directors.
For credit risk mitigants in the form of immovable property, the key determinant of concentration is geographic; use of immovable property mitigants for risk management purposes is entirely property situated in Malta.
Valuing collateral
Valuation strategies are established to monitor collateral mitigants to ensure that they continue to provide the anticipated secure secondary repayment source. Collateral values are determined through a combination of professional appraisals and house price indices. Specifically, HSBC Bank Malta p.l.c. utilises the price index to update its mortgage portfolio value at 6-monthly intervals, or more frequently as the need arises, for example, where market conditions are subject to significant change. Professional valuations are obtained on an annual basis for high value impaired mortgage loans. Valuation of collateral on commercial real estate is obtained on a 3-yearly basis (in line with article 208 of EU regulation 575/2013), with valuation of commercial property securing defaulted exposures being obtained on an annual basis.
In addition, revaluation is also sought where, for example, as part of the regular credit assessment of the obligor, material concerns arise in relation to the performance of the collateral. CRE revaluation also commonly occurs where a decline in the obligor’s credit quality gives cause for concern that the principal payment source may not fully meet the obligation.
Other forms of Credit Risk Mitigation
Guarantees may be taken from third parties where the group extends facilities without the benefit of any alternative form of security, e.g. where it issues a bid or performance bond in favour of a non-customer at the request of another bank. In our corporate lending portfolio, we also take guarantees from corporates as part of a parent/subsidiary or common parent relationships.
Recognition of risk mitigation under the standardised approach
Where credit risk mitigation is available in the form of an eligible guarantee, non-financial collateral or credit derivatives, the exposure is divided into covered and uncovered portions. The covered portion, which is determined after applying an appropriate ‘haircut’ for currency and maturity mismatches (and for omission of restructuring clauses for credit derivatives, where appropriate) to the amount of the protection provided, attracts the risk weight of the protection provider. The uncovered portion attracts the risk weight of the obligor. For exposures fully or partially covered by eligible financial collateral, the value of the exposure is adjusted under the financial collateral comprehensive method using supervisory volatility adjustments, including those arising from currency mismatch, which are determined by the specific type of collateral (and, in the case of eligible debt securities, their credit quality) and its liquidation period. The adjusted exposure value is subject to the risk weight of the obligor.
The table below provides information on the instruments that were cancelled in exchange for collateral obtained by taking possession and on the value of the collateral obtained by taking possession. The value at initial recognition represents the gross carrying amount of the collateral obtained by taking possession at initial recognition on the balance sheet whilst the accumulated negative changes is the accumulated impairment or negative change on the initial recognition value of the collateral obtained by taking possession including amortisation in the case of PP&E and investment properties.
Pillar 3 Disclosures at 31 December 2021
27 HSBC Bank Malta p.l.c. Pillar 3 2021
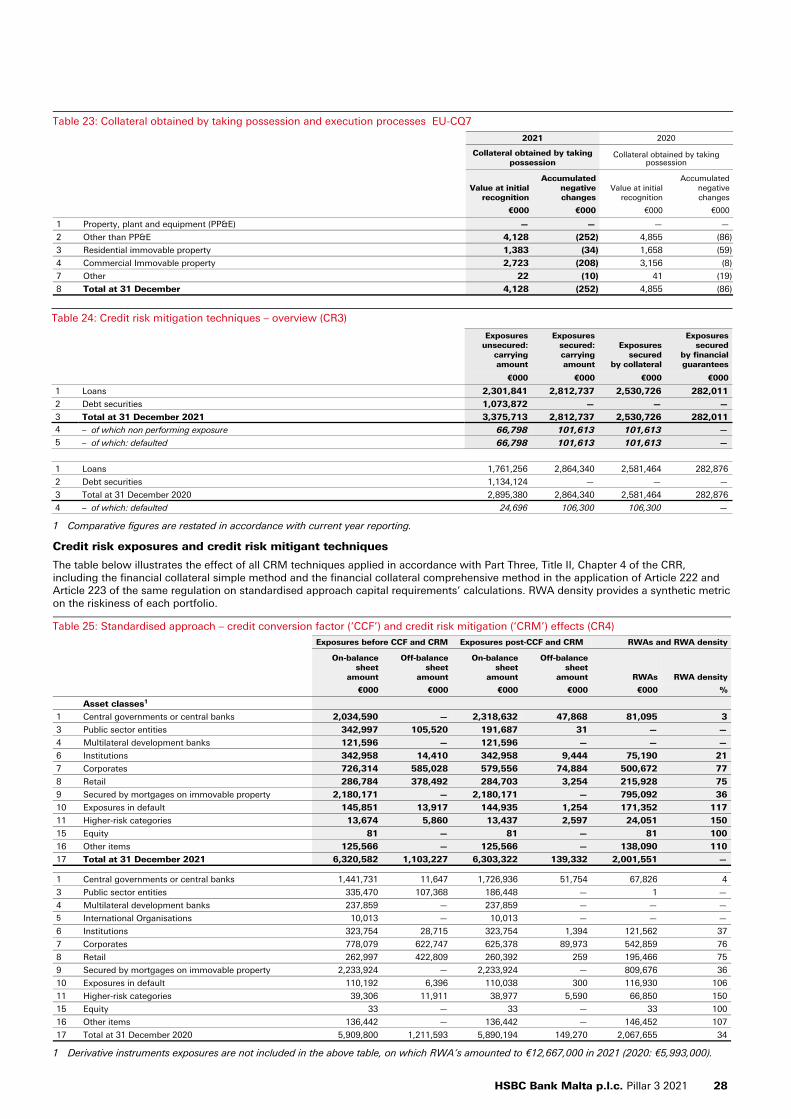
Table 23: Collateral obtained by taking possession and execution processes EU-CQ7
2021 2020
Collateral obtained by taking possession
Collateral obtained by taking possession
Value at initial recognition
Accumulated negative changes
Value at initial recognition
Accumulated negative changes
€000 €000 €000 €000
1 Property, plant and equipment (PP&E) — — — —
2 Other than PP&E 4,128 (252) 4,855 (86)
3 Residential immovable property 1,383 (34) 1,658 (59)
4 Commercial Immovable property 2,723 (208) 3,156 (8)
7 Other 22 (10) 41 (19)
8 Total at 31 December 4,128 (252) 4,855 (86)
Table 24: Credit risk mitigation techniques – overview (CR3)
Exposures unsecured:
carrying amount
Exposures secured:carrying amount
Exposures secured
by collateral
Exposures secured
by financial guarantees
€000 €000 €000 €000
1 Loans 2,301,841 2,812,737 2,530,726 282,011
2 Debt securities 1,073,872 — — —
3 Total at 31 December 2021 3,375,713 2,812,737 2,530,726 282,011 4 – of which non performing exposure 66,798 101,613 101,613 — 5 – of which: defaulted 66,798 101,613 101,613 —
1 Loans 1,761,256 2,864,340 2,581,464 282,876
2 Debt securities 1,134,124 — — —
3 Total at 31 December 2020 2,895,380 2,864,340 2,581,464 282,876
4 – of which: defaulted 24,696 106,300 106,300 —
1 Comparative figures are restated in accordance with current year reporting.
Credit risk exposures and credit risk mitigant techniques
The table below illustrates the effect of all CRM techniques applied in accordance with Part Three, Title II, Chapter 4 of the CRR, including the financial collateral simple method and the financial collateral comprehensive method in the application of Article 222 and Article 223 of the same regulation on standardised approach capital requirements’ calculations. RWA density provides a synthetic metric on the riskiness of each portfolio.
Table 25: Standardised approach – credit conversion factor (‘CCF’) and credit risk mitigation (‘CRM’) effects (CR4)Exposures before CCF and CRM Exposures post-CCF and CRM RWAs and RWA density
On-balance sheet
amount
Off-balance sheet
amount
On-balance sheet
amount
Off-balance sheet
amount RWAs RWA density
€000 €000 €000 €000 €000 %
Asset classes1
1 Central governments or central banks 2,034,590 — 2,318,632 47,868 81,095 3
3 Public sector entities 342,997 105,520 191,687 31 — —
4 Multilateral development banks 121,596 — 121,596 — — —
6 Institutions 342,958 14,410 342,958 9,444 75,190 21
7 Corporates 726,314 585,028 579,556 74,884 500,672 77
8 Retail 286,784 378,492 284,703 3,254 215,928 75
9 Secured by mortgages on immovable property 2,180,171 — 2,180,171 — 795,092 36
10 Exposures in default 145,851 13,917 144,935 1,254 171,352 117
11 Higher-risk categories 13,674 5,860 13,437 2,597 24,051 150
15 Equity 81 — 81 — 81 100
16 Other items 125,566 — 125,566 — 138,090 110
17 Total at 31 December 2021 6,320,582 1,103,227 6,303,322 139,332 2,001,551 —
1 Central governments or central banks 1,441,731 11,647 1,726,936 51,754 67,826 4
3 Public sector entities 335,470 107,368 186,448 — 1 —
4 Multilateral development banks 237,859 — 237,859 — — —
5 International Organisations 10,013 — 10,013 — — —
6 Institutions 323,754 28,715 323,754 1,394 121,562 37
7 Corporates 778,079 622,747 625,378 89,973 542,859 76
8 Retail 262,997 422,809 260,392 259 195,466 75
9 Secured by mortgages on immovable property 2,233,924 — 2,233,924 — 809,676 36
10 Exposures in default 110,192 6,396 110,038 300 116,930 106
11 Higher-risk categories 39,306 11,911 38,977 5,590 66,850 150
15 Equity 33 — 33 — 33 100
16 Other items 136,442 — 136,442 — 146,452 107
17 Total at 31 December 2020 5,909,800 1,211,593 5,890,194 149,270 2,067,655 34
1 Derivative instruments exposures are not included in the above table, on which RWA’s amounted to €12,667,000 in 2021 (2020: €5,993,000).
HSBC Bank Malta p.l.c. Pillar 3 2021 28

Table 26: Standardised approach (EU CR5)
Risk weight
TotalOf which:
unratedExposure classes 0% 20% 35% 50% 70% 75% 100% 150% 250%
1 Central governments or central banks 2,295,887 41,494 — — — — — — 29,119 2,366,500 1,271,931
3 Public sector entities 191,718 — — — — — — — — 191,718 38
4 Multilateral development banks 121,596 — — — — — — — — 121,596 —
6 Institutions — 337,680 — 14,138 — — 584 — — 352,402 584
7 Corporates — 6,859 — 266,798 — — 380,783 — — 654,440 380,783
8 Retail exposures — — — — — 287,957 — — — 287,957 287,957
9 Exposures secured by mortgages on immovable property — — 1,908,975 271,196 — — — — — 2,180,171 2,180,171
10 Exposures in default — — — — — — 95,862 50,327 — 146,189 146,189
11 Exposures associated with particularly high risk — — — — — — — 16,034 — 16,034 16,034
15 Equity exposures — — — — — — 81 — — 81 81
16 Other items 26,781 4,453 — — — — 65,754 — 28,578 125,566 125,566
17 Total at 31 Dec 2021 2,635,982 390,486 1,908,975 552,132 — 287,957 543,064 66,361 57,697 6,442,654 4,409,334
The above table provides a breakdown of exposures by risk weights and asset class post conversion factor and post risk mitigation techniques. Derivatives are excluded.
Pillar 3 Disclosures at 31 December 2021
29 HSBC Bank Malta p.l.c. Pillar 3 2021

Counterparty credit risk
Overview
Counterparty Credit Risk (‘CCR’) is the credit risk associated with contracts to exchange value such as derivatives and securities financing transactions (including repos and reverse repos), and securities lending and borrowing. CCR exposures relating to derivatives and securities financing transactions create a bilateral risk of loss because the market value of the transaction can be positive or negative to either counterparty to the transaction. An economic loss to the Group would occur on derivatives and securities financing transactions if the transactions or portfolio of transactions with the counterparty has a positive economic value at the time of default.
The table below sets out details of the local Group’s counterparty credit risk exposures through its over the counter (‘OTC’) derivative exposures.
Four approaches may be used under CRD to calculate exposure values for CCR: mark-to-market, original exposure, standardised and IMM. Exposure values calculated under these approaches are used to determine RWAs; HSBC Bank Malta p.l.c. applies the mark-to-market approach. Under the mark-to-market approach, the EAD is calculated as current exposure plus regulatory add-ons.
CCR management in HSBC Bank Malta p.l.c. is performed through different levels:
• Credit authority is held by Wholesale Credit Risk (‘WCR’) which is part of the Wholesale Credit and Market Risk (‘WMR’) subfunction within the Risk function, either at local level or at regional level or even at Group level.
• Credit exposure monitoring is performed by the WMR subfunction.
Credit authority for CCR
HSBC Bank Malta p.l.c.’s WCR has a delegated approval authority for Corporates. Depending on the level of the credit limit and customer risk rating (CRR), credit approval might require concurrence from the Group WMR if above HSBC Bank Malta p.l.c.’s delegated approval authority. Sovereigns’, Intra-Group and Banks’ limits require the Group WCR’s concurrence irrespective of the amount of the facility.
All corporate credit limits are reviewed at least once a year. At the request of the local Relationship Manager and potentially the Global Relationship Manager, HSBC Bank Malta p.l.c. WMR may recommend credit limit application to the relevant credit authority, for specific limit requests. WMR’s recommendations highlight the main risk drivers and are based on the in depth analysis of the existing portfolio which includes views on contingent market risk and stress exposure and potentially include proposals to reduce the portfolio risk or mitigate proposed transactions.
Credit limit set up for CCR management
Two groups of limits are used in the management of CCR:
• Counterparty-level limits, and,
• Portfolio-level traded credit risk limits.
Counterparty-level limits
Category A (‘Cat A') limits
Cat A limits are those for which a credit limit is typically recorded at the full notional amount of the facility, the bank being actually or potentially at risk for 100% of the facility. Cat A facilities include on-balance sheet assets such as loans or lines of credit, as well as bond investments and trading lines. They may be either funded (loans, money market advances, bond trading) or unfunded such as guarantees and underwriting limits. Cat A limits are set according to maturity bands.
Category B (‘Cat B') limits
Cat B limits cover key counterparty credit exposures arising from off-balance sheet products and are used for the monitoring of the Potential Future Exposure (‘PFE’). Usage under Cat B represents the cost of replacement of the OTC contracts. In most instances, Cat B limits are set at entity level (known as the parent level) according to maturity bands. Some complex corporates are mainly controlled at entity level but may have shared limits under the total relationship.
Category S (‘Cat S’) limits
Cat S limits cover the risk that counterparties will fail to meet their delivery obligations, either through payment systems ('PSL'), or through settlement processes for treasury and securities transactions (‘TSL').
Portfolio-level limits
WMR has established a number of portfolio-level limits to monitor risk at an aggregate level. These are formalised through a mandate shared with the Head of Global Markets (‘GM’) , subject to annual review and ongoing monitoring routines.
HSBC Bank Malta p.l.c. Pillar 3 2021 30

Table 27: Analysis of counterparty credit risk (‘CCR’) exposure by approach (EU CCR1)
Replacement cost Potential future exposure
Alpha used forcomputing
regulatory exposurevalue
EAD post-CRM RWAs
€000 €000 €000 €000 €000
1 Mark to market 5,165 8,177 1.4 18,679 12,667
11 Total at 31 December 2021 5,165 8,177 1.4 18,679 12,667
1 Mark to Market 6,574 2,925 9,499 5,993
11 Total at 31 December 2020 6,574 2,925 9,499 5,993
Table 28: Transactions subject to own funds requirements for CVA risk - EU CCR2At 31 Dec 2021
Exposure value RWEA
Transactions subject to the Standardised method 8,308 1,469
Total transactions subject to own funds requirements for CVA risk 8,308 1,469
The following table presents information on the risk weighting of CCR exposures under the standardised approach by regulatory portfolio.
Table 29: Standardised approach – CCR exposures by regulatory exposure class and risk weights (EU CCR3)
Risk weight Total exposure
€000 €000
Exposure classes 0% 10% 20% 50% 75% 100% 150% Others
Central governments or central banks 1,875 — — — — — — — 1,875
Corporates — — — 8,274 — 8,530 — — 16,804
Total exposure value 1,875 — — 8,274 — 8,530 — — 18,679
Pillar 3 Disclosures at 31 December 2021
31 HSBC Bank Malta p.l.c. Pillar 3 2021

Market RiskMarket risk is the risk that movements in market risk factors, including foreign exchange rates, interest rates, credit spreads, equity prices and commodity prices, will reduce the bank’s income or portfolio value.
There were no material changes to the policies and practices for the management of market risk during 2021. A summary of our current policies and practices for the management of market risk is set out in Note 4 (e) of the Annual Report and Accounts.
Exposure to Market risk
Exposure to market risk is split into two portfolios:
• Trading portfolios: these comprise positions held for client servicing and market-making, with the intention of short-term resale and / or to hedge risks resulting from such positions.
• Non-trading portfolios: these comprise positions that primarily arise from the interest rate management of our retail and commercial banking assets and liabilities, financial investments measured at fair value through other comprehensive income, debt instruments measured at amortised cost, and exposures arising from our insurance operations.
The local group operates in non-trading portfolios, with the objective of managing and controlling market risk exposures, to optimise return on risk while maintaining a market risk profile consistent with our established risk appetite.
The table below reflects the market risk RWAs under the standardised approach.
Table 30: Market risk under standardised approach (MR1)
At
31 Dec 31 Dec
2021 2020
RWAs RWAs
€000 €000
Outright products
3 Foreign exchange risk 252 548
HSBC Bank Malta p.l.c. Pillar 3 2021 32
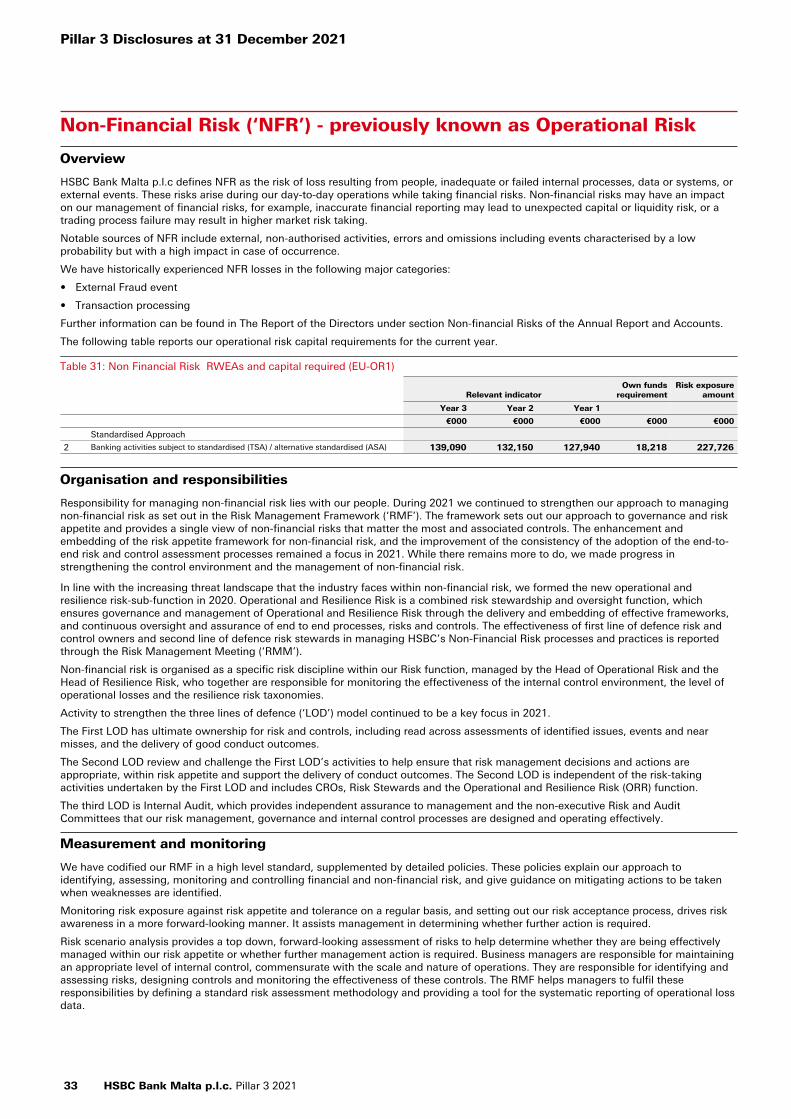
Non-Financial Risk (‘NFR’) - previously known as Operational Risk
Overview
HSBC Bank Malta p.l.c defines NFR as the risk of loss resulting from people, inadequate or failed internal processes, data or systems, or external events. These risks arise during our day-to-day operations while taking financial risks. Non-financial risks may have an impact on our management of financial risks, for example, inaccurate financial reporting may lead to unexpected capital or liquidity risk, or a trading process failure may result in higher market risk taking.
Notable sources of NFR include external, non-authorised activities, errors and omissions including events characterised by a low probability but with a high impact in case of occurrence.
We have historically experienced NFR losses in the following major categories:
• External Fraud event
• Transaction processing
Further information can be found in The Report of the Directors under section Non-financial Risks of the Annual Report and Accounts.
The following table reports our operational risk capital requirements for the current year.
Table 31: Non Financial Risk RWEAs and capital required (EU-OR1)
Relevant indicatorOwn funds
requirementRisk exposure
amount
Year 3 Year 2 Year 1
€000 €000 €000 €000 €000
Standardised Approach
2 Banking activities subject to standardised (TSA) / alternative standardised (ASA) 139,090 132,150 127,940 18,218 227,726
Organisation and responsibilities
Responsibility for managing non-financial risk lies with our people. During 2021 we continued to strengthen our approach to managing non-financial risk as set out in the Risk Management Framework (‘RMF’). The framework sets out our approach to governance and risk appetite and provides a single view of non-financial risks that matter the most and associated controls. The enhancement and embedding of the risk appetite framework for non-financial risk, and the improvement of the consistency of the adoption of the end-to-end risk and control assessment processes remained a focus in 2021. While there remains more to do, we made progress in strengthening the control environment and the management of non-financial risk.
In line with the increasing threat landscape that the industry faces within non-financial risk, we formed the new operational and resilience risk-sub-function in 2020. Operational and Resilience Risk is a combined risk stewardship and oversight function, which ensures governance and management of Operational and Resilience Risk through the delivery and embedding of effective frameworks, and continuous oversight and assurance of end to end processes, risks and controls. The effectiveness of first line of defence risk and control owners and second line of defence risk stewards in managing HSBC’s Non-Financial Risk processes and practices is reported through the Risk Management Meeting (‘RMM’).
Non-financial risk is organised as a specific risk discipline within our Risk function, managed by the Head of Operational Risk and the Head of Resilience Risk, who together are responsible for monitoring the effectiveness of the internal control environment, the level of operational losses and the resilience risk taxonomies.
Activity to strengthen the three lines of defence (‘LOD’) model continued to be a key focus in 2021.
The First LOD has ultimate ownership for risk and controls, including read across assessments of identified issues, events and near misses, and the delivery of good conduct outcomes.
The Second LOD review and challenge the First LOD’s activities to help ensure that risk management decisions and actions are appropriate, within risk appetite and support the delivery of conduct outcomes. The Second LOD is independent of the risk-taking activities undertaken by the First LOD and includes CROs, Risk Stewards and the Operational and Resilience Risk (ORR) function.
The third LOD is Internal Audit, which provides independent assurance to management and the non-executive Risk and Audit Committees that our risk management, governance and internal control processes are designed and operating effectively.
Measurement and monitoring
We have codified our RMF in a high level standard, supplemented by detailed policies. These policies explain our approach to identifying, assessing, monitoring and controlling financial and non-financial risk, and give guidance on mitigating actions to be taken when weaknesses are identified.
Monitoring risk exposure against risk appetite and tolerance on a regular basis, and setting out our risk acceptance process, drives risk awareness in a more forward-looking manner. It assists management in determining whether further action is required.
Risk scenario analysis provides a top down, forward-looking assessment of risks to help determine whether they are being effectively managed within our risk appetite or whether further management action is required. Business managers are responsible for maintaining an appropriate level of internal control, commensurate with the scale and nature of operations. They are responsible for identifying and assessing risks, designing controls and monitoring the effectiveness of these controls. The RMF helps managers to fulfil these responsibilities by defining a standard risk assessment methodology and providing a tool for the systematic reporting of operational loss data.
Pillar 3 Disclosures at 31 December 2021
33 HSBC Bank Malta p.l.c. Pillar 3 2021
Risk and control assessment approach
Non-financial risk and control assessments are performed by individual business units and functions. The risk and control assessment process is designed to provide business areas and functions with a forward-looking view of non-financial risks, an assessment of the effectiveness of controls, and a tracking mechanism for action plans so that they can proactively manage non-financial risks within acceptable levels. Appropriate means of mitigation and controls are considered. These include:
• making specific changes to strengthen the internal control environment; and
• investigating whether cost-effective insurance cover is available to mitigate the risk.
Recording
We use a Group-wide risk management system to record the results of our non-financial risk management process. Non-financial risk and control assessments as described above, are inputted and maintained by business units. Business management monitors and follow up the progress of documented action plans. Operational risk losses are entered into the group-wide risk management system and reported to RMM, the Risk Committee of the Board, and the Board itself, on a regular basis. Loss capture thresholds are in line with industry standards.
Continuity of business operations during Covid-19 pandemic
As a result of the Covid-19 outbreak, business continuity responses have been successfully implemented and the majority of service level agreements have been maintained. We have not experienced any major impacts to the supply chain for our third party service providers due to Covid-19. The risk of damage or theft to our physical assets or criminal injury to our employees remains unchanged and no significant incidents have impacted our buildings or staff.
HSBC Bank Malta p.l.c. Pillar 3 2021 34

Other risks
Reputational risk
Reputational risk is the risk of failing to meet stakeholder expectations as a result of any event, behaviour, action or inaction, either by HSBC, our employees or those with whom we are associated. This might cause stakeholders to form a negative view of the local Group and result in financial or non-financial effects or loss of confidence in HSBC Bank Malta p.l.c. Reputational risk relates to stakeholders’ perceptions, whether fact-based or otherwise. Stakeholders’ expectations change constantly and so reputational risk is dynamic and varies between geographical regions, groups and individuals. We have an unwavering commitment to operating at the high standards we set for ourselves in every jurisdiction. Any lapse in standards of integrity, compliance, customer service or operating efficiency may represent a potential reputational risk. We have taken, and are taking measures to enhance our AML, sanctions and other regulatory compliance frameworks.
Sustainability risk
Sustainability risk arises from the provision of financial services to companies or projects which indirectly result in unacceptable impacts on people or on the environment.
Sustainability risk is:
• measured by assessing the potential sustainability effect of a customer’s activities and assigning a Sustainability Risk Rating to all high-risk transactions; and
• managed using sustainability risk policies covering project finance lending and sector-based sustainability policies for sectors and themes with potentially large environmental or social impacts.
Interest rate risk in the banking book
Interest rate risk in the banking book (IRRBB) is the risk of an adverse impact to earnings or capital due to changes in market interest rates that affect the bank's banking book positions. It is generated by our non-traded assets and liabilities, specifically loans, deposits and financial instruments that are not held for trading intent or held in order to hedge positions held with trading intent. Interest rate risk that can be economically hedged may be transferred to the Markets Treasury to manage within Market Risk limits and in accordance with internal transfer pricing rules. All interest rate risk must be identified, measured, monitored, managed and controlled within metrics and limits. Key metrics to monitor IRRBB are projected net interest income ('NII') and economic value of equity (‘EVE’) sensitivities ('Δ') under varying interest rate scenarios as prescribed by the regulators.
Asset, Liability and Capital Management ('ALCM') monitor and control interest rate risk in the banking book. This includes reviewing and challenging the lines of business prior to the release of new products and proposed behavioural assumptions used. ALCM are also responsible for maintaining and updating the transfer pricing framework, informing the Asset and Liability Committee (‘ALCO’) of the banking book interest rate risk exposure and managing the balance sheet in conjunction with Markets Treasury. EVE and NII sensitivities are monitored against limits and triggers. Group IRRBB as part of Group Treasury, Markets Treasury and ALCO perform oversight over the management of IRRBB. IRRBB is also subject to independent oversight and challenge from Market Risk, Internal Audit and Model governance.
A principal part of the management of non-traded interest rate risk is to monitor the sensitivity of expected net interest income (‘NII’) under varying interest rate scenarios (i.e. simulation modelling), where all other economic variables are held constant. Sensitivity of net interest income reflects the bank’s sensitivity of earnings due to changes in market interest rates. This is assessed over 1 year and 5 years and is calculated on a quarterly basis.
An ΔEVE sensitivity represents the expected movement in EVE due to pre-specified interest rate shocks, where all other economic variables are held constant. EVE represents the present value of the future banking book cash flows that could be distributed to equity providers under a managed run-off scenario. This equates to the current book value of equity plus the present value of future NII in this scenario. EVE can be used to assess the economic capital required to support interest rate risk in the banking book and provides a comprehensive view of the potential long-term effects of changes in interest rates. HSBC Bank Malta p.l.c. monitors EVE sensitivities as a percentage of capital resources on a quarterly basis.
Hold-to-collect-and-sell stressed value at risk (‘VaR’) is a quantification of the potential losses to a 99% confidence level of the portfolio of securities held under a held-to-collect-and-sell business model in the Markets Treasury business. The portfolio is accounted for at fair value through other comprehensive income. This is quantified based on the worst losses over a one-year period going back to the beginning of 2007 with an assumed holding period of 60 days. Hold-to-collect-and-sell stressed VaR uses the same models as those used for trading book capitalisation and covers only the portfolio managed by Markets Treasury under this business model. Markets Treasury sensitivities are measured and monitored daily against risk limits which includes breakdown by currency, tenor basis, curve and asset class whilst HTC Stress VaR is measured weekly.
The results of annual regulatory stress testing and our internal stress tests are used when assessing our internal capital requirements through the ICAAP for credit, market, operational, pension, non-foreign book foreign exchange risk and interest rate risk in the banking book.
The ΔNII are indicative and based on scenarios and assumptions prescribed by the EBA Guidelines on the management of interest rate risk arising from non-trading book activities (EBA/GL/2018/02). This hypothetical base case projection of our NII (excluding insurance) under the following scenarios:
• an immediate shock of +/-25 basis points (‘bps’) to the current market-implied path of interest rates across all currencies (effects over one year and five years)
• an immediate shock of +/-100bps to the current market-implied path of interest rates across all currencies (effects over one year and five years). This scenario includes the effect of flooring the interest rates curve.
Pillar 3 Disclosures at 31 December 2021
35 HSBC Bank Malta p.l.c. Pillar 3 2021
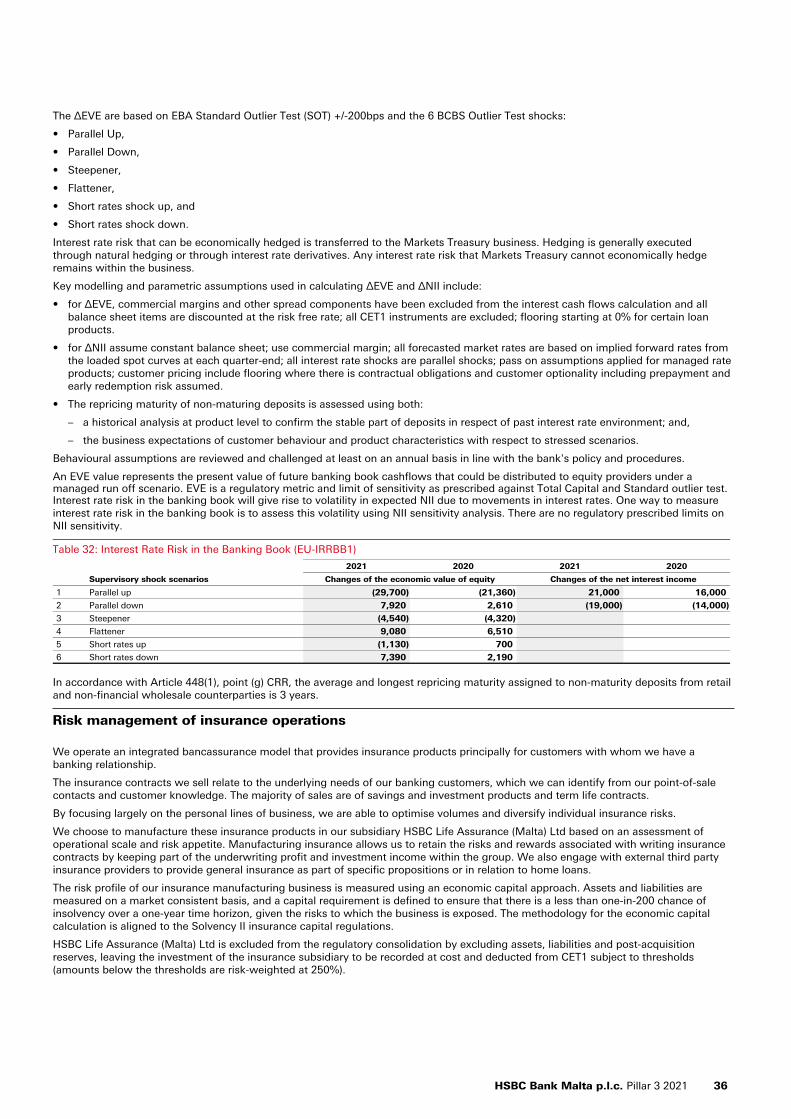
The ΔEVE are based on EBA Standard Outlier Test (SOT) +/-200bps and the 6 BCBS Outlier Test shocks:
• Parallel Up,
• Parallel Down,
• Steepener,
• Flattener,
• Short rates shock up, and
• Short rates shock down.
Interest rate risk that can be economically hedged is transferred to the Markets Treasury business. Hedging is generally executed through natural hedging or through interest rate derivatives. Any interest rate risk that Markets Treasury cannot economically hedge remains within the business.
Key modelling and parametric assumptions used in calculating ΔEVE and ΔNII include:
• for ΔEVE, commercial margins and other spread components have been excluded from the interest cash flows calculation and all balance sheet items are discounted at the risk free rate; all CET1 instruments are excluded; flooring starting at 0% for certain loan products.
• for ΔNII assume constant balance sheet; use commercial margin; all forecasted market rates are based on implied forward rates from the loaded spot curves at each quarter-end; all interest rate shocks are parallel shocks; pass on assumptions applied for managed rate products; customer pricing include flooring where there is contractual obligations and customer optionality including prepayment and early redemption risk assumed.
• The repricing maturity of non-maturing deposits is assessed using both:
– a historical analysis at product level to confirm the stable part of deposits in respect of past interest rate environment; and,
– the business expectations of customer behaviour and product characteristics with respect to stressed scenarios.
Behavioural assumptions are reviewed and challenged at least on an annual basis in line with the bank's policy and procedures.
An EVE value represents the present value of future banking book cashflows that could be distributed to equity providers under a managed run off scenario. EVE is a regulatory metric and limit of sensitivity as prescribed against Total Capital and Standard outlier test.Interest rate risk in the banking book will give rise to volatility in expected NII due to movements in interest rates. One way to measure interest rate risk in the banking book is to assess this volatility using NII sensitivity analysis. There are no regulatory prescribed limits on NII sensitivity.
Table 32: Interest Rate Risk in the Banking Book (EU-IRRBB1)
2021 2020 2021 2020
Supervisory shock scenarios Changes of the economic value of equity Changes of the net interest income
1 Parallel up (29,700) (21,360) 21,000 16,000
2 Parallel down 7,920 2,610 (19,000) (14,000)
3 Steepener (4,540) (4,320)
4 Flattener 9,080 6,510
5 Short rates up (1,130) 700
6 Short rates down 7,390 2,190
In accordance with Article 448(1), point (g) CRR, the average and longest repricing maturity assigned to non-maturity deposits from retail and non-financial wholesale counterparties is 3 years.
Risk management of insurance operations
We operate an integrated bancassurance model that provides insurance products principally for customers with whom we have a banking relationship.
The insurance contracts we sell relate to the underlying needs of our banking customers, which we can identify from our point-of-sale contacts and customer knowledge. The majority of sales are of savings and investment products and term life contracts.
By focusing largely on the personal lines of business, we are able to optimise volumes and diversify individual insurance risks.
We choose to manufacture these insurance products in our subsidiary HSBC Life Assurance (Malta) Ltd based on an assessment of operational scale and risk appetite. Manufacturing insurance allows us to retain the risks and rewards associated with writing insurance contracts by keeping part of the underwriting profit and investment income within the group. We also engage with external third party insurance providers to provide general insurance as part of specific propositions or in relation to home loans.
The risk profile of our insurance manufacturing business is measured using an economic capital approach. Assets and liabilities are measured on a market consistent basis, and a capital requirement is defined to ensure that there is a less than one-in-200 chance of insolvency over a one-year time horizon, given the risks to which the business is exposed. The methodology for the economic capital calculation is aligned to the Solvency II insurance capital regulations.
HSBC Life Assurance (Malta) Ltd is excluded from the regulatory consolidation by excluding assets, liabilities and post-acquisition reserves, leaving the investment of the insurance subsidiary to be recorded at cost and deducted from CET1 subject to thresholds (amounts below the thresholds are risk-weighted at 250%).
HSBC Bank Malta p.l.c. Pillar 3 2021 36
Liquidity and funding
Liquidity management across the group
The HSBC Group’s operating entities are predominantly defined on a country basis to reflect the local management of liquidity and funding. In this context, liquidity and funding risks are managed by HSBC Bank Malta p.l.c. on a standalone basis with no implicit reliance assumed on any other Group entity (unless pre-committed). HSBC Group’s general policy is that each defined operating entity should be self-sufficient in funding its own activities.
HSBC Bank Malta p.l.c. manages its liquidity and funding risks in line with the HSBC Group framework.
Strategies and processes in the management of liquidity risk
HSBC has an internal liquidity and funding risk management framework (‘LFRF’), which aims to allow it to withstand very severe liquidity stresses. It is designed to be adaptable to changing business models, markets and regulations. The management of liquidity and funding is undertaken locally (by country) in compliance with the Group’s LFRF, and with practices and limits set by the Markets Treasury through the RMM and approved by the Board. HSBC Bank Malta p.l.c’s policy is that it should be self-sufficient in funding its own activities.
The key aspects of the internal LFRF which is used to ensure that HSBC maintains an appropriate overall liquidity risk profile are:
• the bank is to manage liquidity and funding risk on a standalone basis without reliance on other members of the group or central banks and other shareholders;
• minimum liquidity coverage ratio (‘LCR’) requirement;
• minimum net stable funding ratio (‘NSFR’) requirement or other appropriate metric;
• annual individual liquidity adequacy assessment;
• liquidity funds transfer pricing; and
• forward looking funding assessments.
Structure and Organisation of the liquidity risk management function
The Asset, Liability & Capital Management (‘ALCM’) team is responsible for the application of the LFRF for HSBC Bank Malta p.l.c. The elements of the LFRF are underpinned by a robust governance framework, the two major elements of which are:
• Asset and Liability Management Committees (‘ALCOs’); and
• Annual individual liquidity adequacy assessment process (‘ILAAP’) used to validate risk tolerance and set risk appetite.
HSBC Bank Malta p.l.c. is required to prepare an internal liquidity adequacy assessment (‘ILAA’) document at an appropriate frequency. The final objective of the ILAA, approved by the Board of Directors, is to verify that HSBC Bank Malta p.l.c. maintains liquidity resources which are adequate in both amount and quality at all times, ensuring that there is no significant risk that its liabilities cannot be met as they fall due, maintaining a prudent funding profile.
Management of liquidity and funding risk
Liquidity coverage ratio
The Liquidity Coverage Ratio (‘LCR’) aims to ensure that a bank has sufficient unencumbered high-quality liquid assets (‘HQLA’) to meet its liquidity needs in a 30 calendar day liquidity stress scenario. HQLA consists of cash or assets that can be converted into cash very quickly with little or no loss of value in markets.
The LCR is calculated as per Commission Delegated Regulation 2015/61 (LCR Delegated Act) supplementing the CRR.
Net stable funding ratio (‘NSFR’)
The NSFR requires institutions to maintain sufficient stable funding relative to required stable funding, and reflects a bank’s long-term funding profile (funding with a term of more than a year). It is designed to complement the LCR.
The NSFR is calculated based on CRR2, which became effective in June 2021.
Liquid Assets
Liquid assets consist in any unencumbered liquid securities and available cash held by Markets Treasury. They are managed at HSBC Bank Malta p.l.c. level. The LFRF gives ultimate control of all unencumbered assets and sources of liquidity to Markets Treasury.
Overall adequacy of liquidity risk management
HSBC Bank Malta p.l.c. is required to manage liquidity risk and funding risk in accordance with the LFRF, which includes the preparation of an Individual Liquidity Adequacy Assessment (‘ILAA’) document, to ensure that:
• liquidity resources are adequate, both as to the amount and quality;
• there is no significant risk that liabilities cannot be met as they fall due;
• a prudent structural funding profile is maintained;
• adequate liquidity resources continue to be maintained; and
• that the liquidity risk framework is adequate and robust.
Pillar 3 Disclosures at 31 December 2021
37 HSBC Bank Malta p.l.c. Pillar 3 2021
The two key objectives of the ILAAP process are to:
• demonstrate that all material liquidity and funding risks are captured within the internal framework; and
• validate the risk tolerance/appetite set by HSBC Bank Malta p.l.c. by demonstrating that reverse stress testing scenarios are acceptably remote; and vulnerabilities have been assessed through the use of severe stress scenarios.
The final conclusion of the ILAA, approved by the Board of Directors, is that HSBC Bank Malta p.l.c.:
• maintains liquidity resources which are adequate in both amount and quality at all times,
• ensures that there is no significant risk that its liabilities cannot be met as they fall due, and
• ensures its liquidity resources contain an adequate amount of high quality liquid assets (‘HQLA’) and maintains a prudent funding profile.
Liquidity stress testing
HSBC Bank Malta p.l.c. undertakes liquidity stress testing to test that its risk appetite is appropriate, to validate that it can continue to operate under various stress scenarios and to test whether the stress assumptions within the LCR scenario are appropriate and conservative enough for the business.
HSBC Bank Malta p.l.c. also conducts reverse stress testing with the specific aim of reviewing the remoteness of the scenarios that would lead Bank Malta p.l.c. to exhaust its liquidity resources. If the scenarios are not deemed remote enough, then corrective action is taken.
Several different stress testing scenarios are run to test the quality of liquidity resources under stresses of varying durations and nature. As part of this exercise, various assumptions are used which are approved by the relevant ALCO and Board and the results of the stress testing are presented through the ILAAP to the Board and on a quarterly basis to the relevant ALCO.
HSBC Bank Malta p.l.c. Pillar 3 2021 38
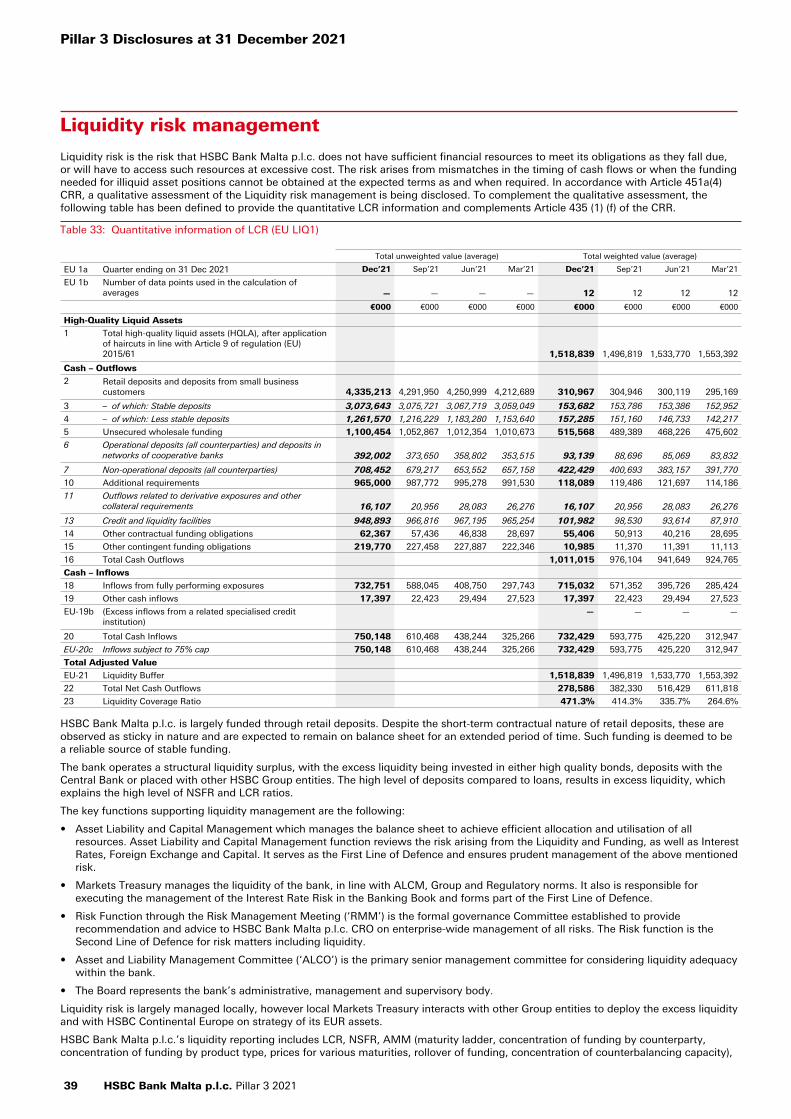
Liquidity risk management
Liquidity risk is the risk that HSBC Bank Malta p.l.c. does not have sufficient financial resources to meet its obligations as they fall due, or will have to access such resources at excessive cost. The risk arises from mismatches in the timing of cash flows or when the funding needed for illiquid asset positions cannot be obtained at the expected terms as and when required. In accordance with Article 451a(4) CRR, a qualitative assessment of the Liquidity risk management is being disclosed. To complement the qualitative assessment, the following table has been defined to provide the quantitative LCR information and complements Article 435 (1) (f) of the CRR.
Table 33: Quantitative information of LCR (EU LIQ1)
Total unweighted value (average) Total weighted value (average)
EU 1a Quarter ending on 31 Dec 2021 Dec’21 Sep’21 Jun’21 Mar’21 Dec’21 Sep’21 Jun’21 Mar’21
EU 1b Number of data points used in the calculation of averages — — — — 12 12 12 12
€000 €000 €000 €000 €000 €000 €000 €000
High-Quality Liquid Assets
1 Total high-quality liquid assets (HQLA), after application of haircuts in line with Article 9 of regulation (EU) 2015/61 1,518,839 1,496,819 1,533,770 1,553,392
Cash – Outflows
2 Retail deposits and deposits from small business customers 4,335,213 4,291,950 4,250,999 4,212,689 310,967 304,946 300,119 295,169
3 – of which: Stable deposits 3,073,643 3,075,721 3,067,719 3,059,049 153,682 153,786 153,386 152,952
4 – of which: Less stable deposits 1,261,570 1,216,229 1,183,280 1,153,640 157,285 151,160 146,733 142,217
5 Unsecured wholesale funding 1,100,454 1,052,867 1,012,354 1,010,673 515,568 489,389 468,226 475,602
6 Operational deposits (all counterparties) and deposits in networks of cooperative banks 392,002 373,650 358,802 353,515 93,139 88,696 85,069 83,832
7 Non-operational deposits (all counterparties) 708,452 679,217 653,552 657,158 422,429 400,693 383,157 391,770
10 Additional requirements 965,000 987,772 995,278 991,530 118,089 119,486 121,697 114,186
11 Outflows related to derivative exposures and other collateral requirements 16,107 20,956 28,083 26,276 16,107 20,956 28,083 26,276
13 Credit and liquidity facilities 948,893 966,816 967,195 965,254 101,982 98,530 93,614 87,910
14 Other contractual funding obligations 62,367 57,436 46,838 28,697 55,406 50,913 40,216 28,695
15 Other contingent funding obligations 219,770 227,458 227,887 222,346 10,985 11,370 11,391 11,113
16 Total Cash Outflows 1,011,015 976,104 941,649 924,765
Cash – Inflows
18 Inflows from fully performing exposures 732,751 588,045 408,750 297,743 715,032 571,352 395,726 285,424
19 Other cash inflows 17,397 22,423 29,494 27,523 17,397 22,423 29,494 27,523
EU-19b (Excess inflows from a related specialised credit institution)
— — — —
20 Total Cash Inflows 750,148 610,468 438,244 325,266 732,429 593,775 425,220 312,947
EU-20c Inflows subject to 75% cap 750,148 610,468 438,244 325,266 732,429 593,775 425,220 312,947
Total Adjusted Value
EU-21 Liquidity Buffer 1,518,839 1,496,819 1,533,770 1,553,392
22 Total Net Cash Outflows 278,586 382,330 516,429 611,818
23 Liquidity Coverage Ratio 471.3% 414.3% 335.7% 264.6%
HSBC Bank Malta p.l.c. is largely funded through retail deposits. Despite the short-term contractual nature of retail deposits, these are observed as sticky in nature and are expected to remain on balance sheet for an extended period of time. Such funding is deemed to be a reliable source of stable funding.
The bank operates a structural liquidity surplus, with the excess liquidity being invested in either high quality bonds, deposits with the Central Bank or placed with other HSBC Group entities. The high level of deposits compared to loans, results in excess liquidity, which explains the high level of NSFR and LCR ratios.
The key functions supporting liquidity management are the following:
• Asset Liability and Capital Management which manages the balance sheet to achieve efficient allocation and utilisation of all resources. Asset Liability and Capital Management function reviews the risk arising from the Liquidity and Funding, as well as Interest Rates, Foreign Exchange and Capital. It serves as the First Line of Defence and ensures prudent management of the above mentioned risk.
• Markets Treasury manages the liquidity of the bank, in line with ALCM, Group and Regulatory norms. It also is responsible for executing the management of the Interest Rate Risk in the Banking Book and forms part of the First Line of Defence.
• Risk Function through the Risk Management Meeting (‘RMM’) is the formal governance Committee established to provide recommendation and advice to HSBC Bank Malta p.l.c. CRO on enterprise-wide management of all risks. The Risk function is the Second Line of Defence for risk matters including liquidity.
• Asset and Liability Management Committee (‘ALCO’) is the primary senior management committee for considering liquidity adequacy within the bank.
• The Board represents the bank’s administrative, management and supervisory body.
Liquidity risk is largely managed locally, however local Markets Treasury interacts with other Group entities to deploy the excess liquidity and with HSBC Continental Europe on strategy of its EUR assets.
HSBC Bank Malta p.l.c.’s liquidity reporting includes LCR, NSFR, AMM (maturity ladder, concentration of funding by counterparty, concentration of funding by product type, prices for various maturities, rollover of funding, concentration of counterbalancing capacity),
Pillar 3 Disclosures at 31 December 2021
39 HSBC Bank Malta p.l.c. Pillar 3 2021

and PRA110. HSBC Bank Malta p.l.c. has also an Internal Liquidity Metric, which is a 90-day dual stress liquidity reporting metric. The Internal Liquidity Metric provides improved analysis of the liquidity of the bank. The metric also includes details of the management actions possible under the baseline scenario and the recovery scenario. HSBC Bank Malta p.l.c. ensures adequacy through HSBC’s liquidity and funding management framework which ensures that all foreseeable funding commitments and deposit withdrawals can be met when due or in case of stress. The HSBC Group framework requires operating entities to maintain strong liquidity positions in line with regulatory and internal requirements. These requirements ensure the maintenance of:
• A diversified and stable funding base comprising core retail and corporate customer deposits and institutional balances, and long-term funding, while discouraging reliance on short-term professional funding; and
• A liquid assets portfolio that enables HSBC Bank Malta p.l.c. to respond to unforeseen liquidity requirements.
HSBC Bank Malta p.l.c. has a strong liquidity surplus, however it also has set-up a Contingency Funding Plan which are expected to document procedures for:
• Identifying when a liquidity stress is starting;
• Managing liquidity during a liquidity stress; and
• Remediating the liquidity position once a liquidity stress has stabilised.
Stress testing serves to identify certain scenarios that could cause liquidity outflows to increase and inflows to slow or cease. The liquidity stress testing for HSBC Bank Malta p.l.c. takes the following forms:
• Calculation of the LCR, which is a thirty-day stress;
• Calculation of the Internal Liquidity Metric which is both a market wide and idiosyncratic ninety-day stress; and
• Internal Liquidity Adequacy Assessment (‘ILAA’) which uses a series of scenarios to assess the suitability of the HSBC Bank Malta p.l.c.’s liquidity position under stress.
On an annual basis the management body provide a declaration on the adequacy of liquidity risk management arrangements of the institution providing assurance that the liquidity risk management systems put in place are adequate with regard to the institution’s profile and strategy. The Liquidity Adequacy Statement as per ILAAP signed by the banks Chairman and CEO states: "HSBC Bank Malta p.l.c. maintains liquidity resources which are adequate in both amount and quality at all times to support the business activity, and ensures there is no significant risk that its liabilities cannot be met as they fall due".
The large, diversified and stable customer base reduces the funding concentration risk for the bank. The top 20 bank’s deposit names only comprised 6% of total customer deposits.
Table 34: Net Stable Funding Ratio (EU LIQ2)
Unweighted value by residual maturity at 31 Dec 2021
Weighted valueNo maturity < 6 months
6 months to < 1yr ≥ 1yr
Available stable funding (‘ASF’) Items €000 €000 €000 €000 €000
1 Capital items and instruments — — — 516,933 516,933
2 Own funds — — 516,933 516,933
4 Retail deposits 4,450,950 — — 4,125,788
5 Stable deposits 3,090,204 — — 2,935,694
6 Less stable deposits 1,360,746 — — 1,190,094
7 Wholesale funding: 1,266,717 5,678 60,501 531,942
8 Operational deposits 427,768 — — 213,884
9 Other wholesale funding 838,949 5,678 60,501 318,058
11 Other liabilities: 25,294 — — —
13 All other liabilities and capital instruments not included in the above categories 25,294 — — —
14 Total available stable funding (‘ASF’) 5,174,663
Required stable funding (‘RSF’) Items
15 Total high-quality liquid assets (‘HQLA’) 20,930
17 Performing loans and securities: 704,160 174,093 2,896,952 2,354,268
19 Performing securities financing transactions with financial customer collateralised by other assets and loans and advances to financial institutions 526,404 35,957 50,001 120,620
20 Performing loans to non- financial corporate clients, loans to retail and small business customers, and loans to sovereigns, and PSEs 108,371 69,460 940,473 2,233,648
21 – of which: With a risk weight of less than or equal to 35% under the Basel II Standardised Approach for credit risk- 11,847 13,793 261,235 1,188,539
22 Performing residential mortgages 69,385 68,676 1,906,478 —
23 – of which: With a risk weight of less than or equal to 35% under the Basel II Standardised Approach for credit risk 57,404 56,703 1,459,790 —
26 Other assets: 43,084 6,109 146,216 172,497
29 NSFR derivative assets 48 48
30 NSFR derivative liabilities before deduction of variation margin posted 4,498 225
31 All other assets not included in the above categories 38,538 6,109 146,216 172,224
32 Off-balance sheet items 1,080,180 — — 54,009
33 Total RSF 2,601,704
34 Net Stable Funding Ratio (%) 198.9%
HSBC Bank Malta p.l.c. Pillar 3 2021 40
Business risk
Business risk is the potential negative effect on profits and capital from the local Group not meeting our strategic objectives, as a result of unforeseen changes in the business and regulatory environment, exposure to economic cycles and technological changes.
We manage and mitigate business risk through our risk appetite, business planning and stress testing processes, so that our business model and planned activities are monitored, resourced and capitalised consistent with the commercial, economic and risk environment in which the local Group operates, and that any potential vulnerabilities of our business plans are identified at an early stage so that mitigating actions can be taken.
Dilution risk
Dilution risk is the risk that an amount receivable is reduced through cash or non-cash credit to the obligor, and arises mainly from factoring and invoice discounting transactions.
Where there is recourse to the seller, we treat these transactions as loans secured by the collateral of the debts purchased and do not report dilution risk for them. For our non-recourse portfolio, we do not report any dilution risk, as we obtain an indemnity from the seller that indemnifies us against this risk. Moreover, factoring transactions involve lending at a discount to the face-value of the receivables which provides protection against dilution risk.
Remuneration policy
Information on the bank’s Remuneration Policy and practices is disclosed in the Remuneration Report section within the Annual Report and Accounts.
Pillar 3 Disclosures at 31 December 2021
41 HSBC Bank Malta p.l.c. Pillar 3 2021

HSBC Bank Malta p.l.c.
116 Archbishop Street Valletta VLT 1444MaltaTelephone: 356 2380 2380 www.hsbc.com.mt