Pillar 3 Disclosures (OCBC Group – As at 30 June 2019)
42
Oversea-Chinese Banking Corporation Limited Pillar 3 Disclosures (OCBC Group – As at 30 June 2019) Incorporated in Singapore Company Registration Number: 193200032W
-
Upload
khangminh22 -
Category
Documents
-
view
0 -
download
0
Transcript of Pillar 3 Disclosures (OCBC Group – As at 30 June 2019)

Oversea-Chinese Banking Corporation Limited
Pillar 3 Disclosures (OCBC Group – As at 30 June 2019)
Incorporated in Singapore
Company Registration Number: 193200032W

Pillar 3 Disclosures June 2019 2
Table of Contents
1. Introduction ..................................................................................................................................................... 3
2. Accounting and Regulatory Consolidation ................................................................................................. 3
3. Key Metrics ...................................................................................................................................................... 4
4. Countercyclical Capital Buffer ...................................................................................................................... 5
5. Composition of Capital .................................................................................................................................. 6
5.1 Reconciliation of Regulatory Capital ............................................................................................................. 6
5.2 Regulatory Capital Position ............................................................................................................................ 7
5.3 Main Features of Capital Instruments ............................................................................................................ 9
6. Leverage Ratio .............................................................................................................................................. 12
6.1 Leverage Ratio Summary Comparison Table .............................................................................................. 12
6.2 Leverage Ratio Common Disclosure Table ................................................................................................ 13
7. Credit Quality ................................................................................................................................................ 14
7.1 Overview of Credit Quality of Assets ........................................................................................................... 14
7.2 Changes in Stock of Defaulted Loans and Bills Receivable, and Debt Securities ...................................... 15
8. Overview of Risk Weighted Assets............................................................................................................. 16
9. RWA Flow Statement for Credit Risk Exposures ...................................................................................... 17
10. Credit Exposures Under Standardised and IRB Approach ...................................................................... 18
10.1 Credit Exposures under Standardised Approach and CRM Effects ........................................................ 18
10.2 Credit Exposures under Standardised Approach by Risk Weight .......................................................... 19
10.3 Credit Exposures under F-IRBA .............................................................................................................. 20
10.4 Credit Exposures under A-IRBA .............................................................................................................. 24
10.5 Overview of Credit Risk Mitigation Techniques ...................................................................................... 28
10.6 Effect on RWA of Credit Derivatives used as CRM ................................................................................. 28
11. Specialised Lending under Supervisory Slotting Criteria ........................................................................ 29
12. Counterparty Credit Risk ............................................................................................................................. 30
12.1 Counterparty Credit Risk Exposures by Approach ................................................................................. 30
12.2 CVA Risk Capital Charge ....................................................................................................................... 31
12.3 Exposures to Central Counterparties ..................................................................................................... 32
12.4 Counterparty Credit Risk Exposures under Standardised Approach by Risk Weight ............................ 33
12.5 Counterparty Credit Risk Exposures under F-IRBA ............................................................................... 34
12.6 Counterparty Credit Risk Exposures under A-IRBA ............................................................................... 38
12.7 Composition of Collateral for Counterparty Credit Risk Exposures ........................................................ 39
12.8 Credit Derivative Exposures ................................................................................................................... 40
13. Securitisation Exposures ............................................................................................................................ 40
14. Market Risk Type under Standardised Approach ..................................................................................... 41
15. Interest Rate Risk in the Banking Book ..................................................................................................... 42

Pillar 3 Disclosures June 2019 3
1. INTRODUCTION
This document presents the information in accordance with Pillar 3 (P3) disclosure requirements under Monetary
Authority of Singapore (MAS) Notice 637 on Risk Based Capital Adequacy Requirements for Banks incorporated
in Singapore. The P3 requirements specify reporting templates for most of the quantitative disclosures to enable
market participants to better compare the capital adequacy and risk profile across banks via improved consistency
in public disclosure.
For purpose of the mid-year disclosure for OCBC Group (Group) as at 30 June 2019, explanations of the drivers
behind significant differences between reporting periods for the respective sections are provided where
appropriate. The disclosure on the RWA flow statements for the following are omitted as there is no exposure
treated under these approaches:
- Counterparty Credit Risk (CCR) under the Internal Models Method (IMM)
- Market Risk exposures under the Internal Models Approach (IMA)
2. ACCOUNTING AND REGULATORY CONSOLIDATION
The consolidation basis used for regulatory capital computation is similar to that used for financial reporting except
for the following:
▪ Great Eastern Holdings Limited and its insurance subsidiaries are excluded from regulatory consolidation
and are treated as investments in unconsolidated major stake companies that are financial institutions in
accordance with MAS Notice 637’s definition of insurance subsidiary. The regulatory adjustments applied
to these investments are in accordance with MAS Notice 637 paragraphs 6.1.3(p), 6.2.3(e) and 6.3.3(e).
▪ As at 30 June 2019, the total equity of these insurance subsidiaries was S$8 billion and total assets
were S$91 billion.
Disclosures on the Group’s reconciliation of regulatory capital and regulatory capital position can be found in Section 5 of this document.

Pillar 3 Disclosures June 2019 4
3. KEY METRICS
The table below provides an overview of the Group’s prudential regulatory metrics, as stipulated by MAS Notice 637.
(a) (b) (c) (d) (e)
Jun-19 Mar-19 Dec-18 Sep-18 Jun-18
Available Capital (S$ million)
1 CET1 Capital 30,176 29,024 28,068 27,377 26,641
2 Tier 1 Capital 31,706 30,585 29,640 28,948 28,714
3 Total Capital 35,341 34,155 32,986 32,300 32,075
Risk Weighted Assets (S$ million)
4 Total RWA 209,203 204,357 200,248 200,322 200,786
Risk-based Capital Ratios as a percentage of RWA (%)
5 CET1 Ratio 14.4 14.2 14.0 13.6 13.2
6 Tier 1 Ratio 15.1 14.9 14.8 14.4 14.3
7 Total Capital Ratio 16.8 16.7 16.4 16.1 15.9
Additional CET1 buffer requirements as a percentage of RWA (%)
8 Capital conservation buffer requirement 2.5 2.5 1.875 1.875 1.875
9 Countercyclical buffer requirement 0.4 0.4 0.3 0.3 0.3
10 Bank G-SIB and/or D-SIB additional requirements - - - - -
11 Total of Bank CET1 specific requirements 1/ 2.9 2.9 2.2 2.1 2.1
12 CET1 available after meeting the Reporting Bank's minimum capital requirements
6.8 6.7 6.4 6.1 5.9
Leverage Ratio (S$ million)
13 Total Leverage Ratio exposure measure 417,885 408,788 409,993 406,022 408,204
14 Leverage Ratio (%) 2/ 7.5 7.4 7.2 7.1 7.0
Liquidity Coverage Ratio (S$ million) 3/
15 Total High Quality Liquid Assets 46,894 48,930 49,751 47,630 50,536
16 Total net cash outflow 31,028 32,942 32,124 36,885 36,956
17 Liquidity Coverage Ratio (%) 151 150 156 130 138
Net Stable Funding Ratio (S$ million)
18 Total available stable funding 239,480 236,498 231,631 228,607 227,516
19 Total required stable funding 219,417 214,338 213,274 211,715 210,220
20 Net Stable Funding Ratio (%) 109 110 109 108 108
1/ Sum of rows 8, 9 and 10
2/ Computed by row 2 / row 13
3/ Reported as simple averages of daily observations for the respective quarter

Pillar 3 Disclosures June 2019 5
4. COUNTERCYCLICAL CAPITAL BUFFER
The following table provides an overview of the Group’s geographical distribution of private sector credit
exposures used in the calculation of countercyclical buffer.
The geographical distribution is based on the country where the physical collateral resides in, residence of the
guarantor, or in the absence of such mitigant, the country of obligor (i.e. the country where the majority of the
obligor’s operating assets is situated) in accordance with MAS Notice 637 requirements.
30 Jun 2019
(a) (b) (c) (d)
Country-Specific
countercyclical buffer requirement
RWA for private sector credit exposures
Bank-Specific countercyclical buffer
requirement 1/ Countercyclical
buffer amount
% S$ million % S$ million
Geographical breakdown
Hong Kong 2.50% 20,544
Sweden 2.00% 236
United Kingdom 1.00% 5,716
Sub-total 26,496
Total 151,588 0.4% 795
31 Dec 2018
(a) (b) (c) (d)
Country-Specific
countercyclical buffer requirement
RWA for private sector credit exposures
Bank-Specific countercyclical buffer
requirement 1/ Countercyclical
buffer amount
% S$ million % S$ million
Geographical breakdown
Hong Kong 1.875% 19,094
Sweden 1.875% 73
United Kingdom 1.00% 5,123
Sub-total 24,290
Total 146,181 0.3% 563
1/ The Bank-Specific countercyclical buffer is the additional capital which needs to be maintained above the Regulatory minimum and Capital Conservation
buffer requirement

Pillar 3 Disclosures June 2019 6
5. COMPOSITION OF CAPITAL
5.1 Reconciliation of Regulatory Capital
The reporting position of the table in this section is as at 30 June 2019.
S$'m
Balance sheet
as per
published
financial
statements
Under
regulatory
scope of
consolidation
Cross
Reference
to Section
5.2
EQUITY
Share capital 16,423 16,423 A
Other equity instruments 1,497 1,497 B
Reserves:
Capital reserves 1,055
Fair value reserves 698
Revenue reserves 25,184
Total reserves 26,936
of which: Retained earnings 19,036 C1
of which: Accumulated other comprehensive income and other disclosed reserves 1,360 C2
of which: Cash flow hedge reserve (3) C3
of which: Unrealised fair value gains/losses on financial liabilities and derivative
liabilities arising from changes in own credit risk
9 C4
Non-controlling interests 1,361
of which: Minority interest that meets criteria for inclusion in CET1 Capital 200 D1
of which: Minority interest that meets criteria for inclusion in AT1 Capital 33 D2
of which: Minority interest that meets criteria for inclusion in Tier 2 Capital 19 D3
Valuation adjustment 41 E
Total equity 46,218
LIABILITIES
Deposits of non-bank customers 296,806
Deposits and balances of banks 11,269
Due to associates 363
Trading portfolio liabilities 317
Derivative payables 7,079
Other liabilities 6,503
Current tax payables 1,034
Deferred tax liabilities 1,752
of which: Associated with intangible assets 47 F
Debt issued 28,406
of which: Tier 2 capital instruments 2,755 G1
Life assurance fund liabilities 80,020
Total liabilities 433,549
Total equity and liabilities 479,767
ASSETS
Cash and placements with central banks 18,705
Singapore government treasury bills and securities 10,427
Other government treasury bills and securities 17,957
Placements with and loans to banks 36,762
Loans and bills receivable 260,099
of which: Eligible provision for inclusion in Tier 2 Capital subject to cap in respect of
exposures under SA and IRBA
861 H
Debt and equity securities 26,490
of which: Investments in unconsolidated major stake financial institutions 343 I1
of which: Investments in unconsolidated non major stake financial institutions 1,520 I2
of which: PE/VC investments held beyond the relevant holding periods set out in
MAS Notice 630
0 I3
Investments in insurance subsidiaries 1,953 J
Derivative and forward securities in unconsolidated non major stake financial
institutions
27 K
Assets pledged 2,943
Assets held for sale 6
Derivative receivables 7,021
Other assets 4,500
Deferred tax assets 46
of which: Deferred tax assets before netting 171 L
Associates 3,330
of which: Investments in unconsolidated major stake financial institutions 3,301 M
Property, plant and equipment 3,556
Investment property 845
Goodwill and intangible assets 5,029
of which: Goodwill 4,010 N1
of which: Intangible assets 317 N2
Life assurance fund investment assets 82,051
Total assets 479,767
Pillar 3 Disclosures June 2019 7
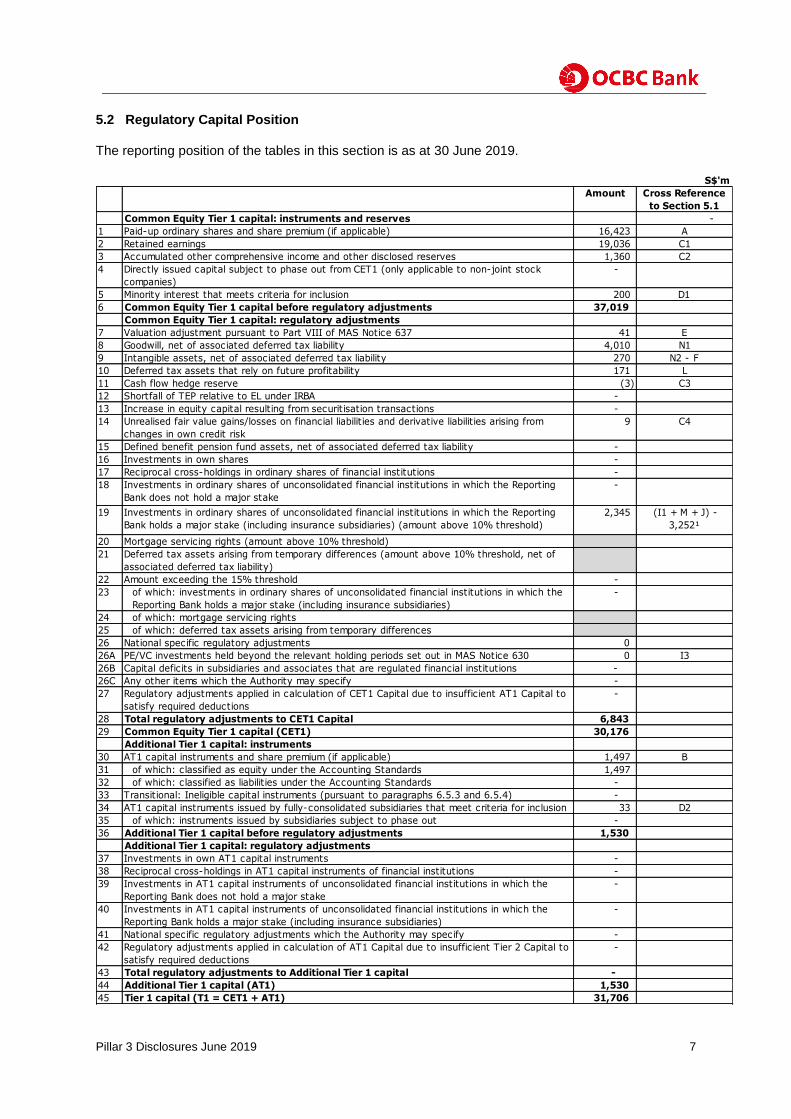
5.2 Regulatory Capital Position
The reporting position of the tables in this section is as at 30 June 2019.
S$'m
Amount Cross Reference
to Section 5.1
Common Equity Tier 1 capital: instruments and reserves -
1 Paid-up ordinary shares and share premium (if applicable) 16,423 A
2 Retained earnings 19,036 C1
3 Accumulated other comprehensive income and other disclosed reserves 1,360 C2
4 Directly issued capital subject to phase out from CET1 (only applicable to non-joint stock
companies)
-
5 Minority interest that meets criteria for inclusion 200 D1
6 Common Equity Tier 1 capital before regulatory adjustments 37,019
Common Equity Tier 1 capital: regulatory adjustments
7 Valuation adjustment pursuant to Part VIII of MAS Notice 637 41 E
8 Goodwill, net of associated deferred tax liability 4,010 N1
9 Intangible assets, net of associated deferred tax liability 270 N2 - F
10 Deferred tax assets that rely on future profitability 171 L
11 Cash flow hedge reserve (3) C3
12 Shortfall of TEP relative to EL under IRBA -
13 Increase in equity capital resulting from securitisation transactions -
14 Unrealised fair value gains/losses on financial liabilities and derivative liabilities arising from
changes in own credit risk
9 C4
15 Defined benefit pension fund assets, net of associated deferred tax liability -
16 Investments in own shares -
17 Reciprocal cross-holdings in ordinary shares of financial institutions -
18 Investments in ordinary shares of unconsolidated financial institutions in which the Reporting
Bank does not hold a major stake
-
19 Investments in ordinary shares of unconsolidated financial institutions in which the Reporting
Bank holds a major stake (including insurance subsidiaries) (amount above 10% threshold)
2,345 (I1 + M + J) -
3,252¹
20 Mortgage servicing rights (amount above 10% threshold)
21 Deferred tax assets arising from temporary differences (amount above 10% threshold, net of
associated deferred tax liability)
22 Amount exceeding the 15% threshold -
23 of which: investments in ordinary shares of unconsolidated financial institutions in which the
Reporting Bank holds a major stake (including insurance subsidiaries)
-
24 of which: mortgage servicing rights
25 of which: deferred tax assets arising from temporary differences
26 National specific regulatory adjustments 0
26A PE/VC investments held beyond the relevant holding periods set out in MAS Notice 630 0 I3
26B Capital deficits in subsidiaries and associates that are regulated financial institutions -
26C Any other items which the Authority may specify -
27 Regulatory adjustments applied in calculation of CET1 Capital due to insufficient AT1 Capital to
satisfy required deductions
-
28 Total regulatory adjustments to CET1 Capital 6,843
29 Common Equity Tier 1 capital (CET1) 30,176
Additional Tier 1 capital: instruments
30 AT1 capital instruments and share premium (if applicable) 1,497 B
31 of which: classified as equity under the Accounting Standards 1,497
32 of which: classified as liabilities under the Accounting Standards -
33 Transitional: Ineligible capital instruments (pursuant to paragraphs 6.5.3 and 6.5.4) -
34 AT1 capital instruments issued by fully-consolidated subsidiaries that meet criteria for inclusion 33 D2
35 of which: instruments issued by subsidiaries subject to phase out -
36 Additional Tier 1 capital before regulatory adjustments 1,530
Additional Tier 1 capital: regulatory adjustments
37 Investments in own AT1 capital instruments -
38 Reciprocal cross-holdings in AT1 capital instruments of financial institutions -
39 Investments in AT1 capital instruments of unconsolidated financial institutions in which the
Reporting Bank does not hold a major stake
-
40 Investments in AT1 capital instruments of unconsolidated financial institutions in which the
Reporting Bank holds a major stake (including insurance subsidiaries)
-
41 National specific regulatory adjustments which the Authority may specify -
42 Regulatory adjustments applied in calculation of AT1 Capital due to insufficient Tier 2 Capital to
satisfy required deductions
-
43 Total regulatory adjustments to Additional Tier 1 capital -
44 Additional Tier 1 capital (AT1) 1,530
45 Tier 1 capital (T1 = CET1 + AT1) 31,706

Pillar 3 Disclosures June 2019 8
5.2 Regulatory Capital Position (continued)
1/ The investments in the ordinary shares of unconsolidated major stake companies that are financial institutions which are within the
prescribed threshold amount in accordance with MAS Notice 637 paragraph 6.1.3 (p)(iii)
Amount Cross Reference
to Section 5.1
Tier 2 capital: instruments and provisions
46 Tier 2 capital instruments and share premium (if applicable) 2,755 G1
47 Transitional: Ineligible capital instruments (pursuant to paragraphs 6.5.3 and 6.5.4) -
48 Tier 2 capital instruments issued by fully-consolidated subsidiaries that meet criteria for
inclusion
19 D3
49 of which: instruments issued by subsidiaries subject to phase out -
50 Provisions 861 H
51 Tier 2 capital before regulatory adjustments 3,635
Tier 2 capital: regulatory adjustments
52 Investments in own Tier 2 instruments -
53 Reciprocal cross-holdings in Tier 2 capital instruments of financial institutions -
54 Investments in Tier 2 capital instruments and other TLAC liabilities of unconsolidated financial
institutions in which the Reporting Bank does not hold a major stake
-
54a Investments in other TLAC liabilities of unconsolidated financial institutions in which the
Reporting Bank does not hold a major stake: amount previously designated for the 5% threshold
but that no longer meets the conditions
-
55 Investments in Tier 2 capital instruments and other TLAC liabilities of unconsolidated financial
institutions in which the Reporting Bank holds a major stake (including insurance subsidiaries)
-
56 National specific regulatory adjustments which the Authority may specify -
57 Total regulatory adjustments to Tier 2 capital -
58 Tier 2 capital (T2) 3,635
59 Total capital (TC = T1 + T2) 35,341
60 Floor-adjusted total risk weighted assets 209,203
Capital ratios (as a percentage of floor-adjusted risk weighted assets)
61 Common Equity Tier 1 CAR 14.4%
62 Tier 1 CAR 15.1%
63 Total CAR 16.8%
64 Bank-specific buffer requirement 9.4%
65 of which: capital conservation buffer requirement 2.500%
66 of which: bank specific countercyclical buffer requirement 0.4%
67 of which: G-SIB and/or D-SIB buffer requirement (if applicable) -
68 Common Equity Tier 1 available after meeting the Reporting Bank's minimum capital requirements 6.8%
National minima
69 Minimum CET1 CAR 6.5%
70 Minimum Tier 1 CAR 8.0%
71 Minimum Total CAR 10.0%
Amounts below the thresholds for deduction (before risk weighting)
72 Investments in ordinary shares, AT1 capital and Tier 2 capital and other TLAC liabilities of
unconsolidated financial institutions in which the Reporting Bank does not hold a major stake
1,547 I2 + K
73 Investments in ordinary shares of unconsolidated financial institutions in which the Reporting
Bank holds a major stake (including insurance subsidiaries)
3,252 Refer to note1
74 Mortgage servicing rights (net of associated deferred tax liability)
75 Deferred tax assets arising from temporary differences (net of associated deferred tax liability)
Applicable caps on the inclusion of provisions in Tier 2
76 Provisions eligible for inclusion in Tier 2 in respect of exposures subject to standardised
approach (prior to application of cap)
488
77 Cap on inclusion of provisions in Tier 2 under standardised approach 600
78 Provisions eligible for inclusion in Tier 2 in respect of exposures subject to internal ratings-
based approach (prior to application of cap)
373
79 Cap for inclusion of provisions in Tier 2 under internal ratings-based approach 681
Capital instruments subject to phase-out arrangements (only applicable between 1 Jan
2013 and 1 Jan 2022)
80 Current cap on CET1 instruments subject to phase out arrangements
81 Amount excluded from CET1 due to cap (excess over cap after redemptions and maturities)
82 Current cap on AT1 instruments subject to phase out arrangements -
83 Amount excluded from AT1 due to cap (excess over cap after redemptions and maturities) -
84 Current cap on T2 instruments subject to phase out arrangements -
85 Amount excluded from T2 due to cap (excess over cap after redemptions and maturities) -

Pillar 3 Disclosures June 2019 9
5.3 Main Features of Capital Instruments
The following disclosures are made pursuant to the requirements of MAS Notice 637 Annex 11D. They are
not a summary of the terms, do not purport to be complete, and should be read in conjunction with, and are
qualified in their entirety by, the relevant Terms and Conditions available on the Bank’s Investor Relations
website (http://www.ocbc.com/group/investors/Cap_and_Reg_Disclosures.html). The reporting position of all tables in this
section is as at 30 June 2019.
OCBC Ordinary Shares OCBC 3.8%
Non-cumulative
Non-convertible
Perpetual Capital Securities
1. Issuer Oversea-Chinese Banking Corporation Limited Oversea-Chinese Banking Corporation Limited
2. Unique identifier (ISIN) SG1S04926220 SG6YJ3000003
3. Governing law(s) of instrument Singapore Singapore
Regulatory treatment
4. Transitional Basel III rules Common Equity Tier 1 Additional Tier 1
5. Post-transitional Basel III rules Common Equity Tier 1 Additional Tier 1
6. Solo and Group Solo and Group
7. Instrument type Ordinary shares Perpetual Capital Securities
8. S$16,423 million S$499 million
9. Par value of instrument NA S$500 million
10. Accounting classification Shareholders' equity Shareholders' equity
11. Original date of issuance NA 25 Aug 2015
12. Perpetual or dated Perpetual Perpetual
13. Original maturity date No maturity No maturity
14. No Yes
15. NA On or after the First Reset Date of 25 Aug 2020 (at par)
Tax call (at par)
Regulatory call (at par)
16. NA Optional call dates - any date after the First Reset Date
Coupons / dividends
17. Fixed or floating dividend / coupon NA Fixed to fixed
18. Coupon rate and any related index NA 3.8% p.a. up to (but excluding) 25 Aug 2020; if not
redeemed, the distribution rate will be reset every 5 years
thereafter to a fixed rate equal to the then prevailing 5-
year SGD SOR plus 1.51% p.a.
19. Existence of a dividend stopper NA Yes
20. NA Fully discretionary
21. NA No
22. Noncumulative or cumulative NA Noncumulative
23. Convertible or non-convertible NA Nonconvertible
24. If convertible, conversion trigger(s) NA NA
25. If convertible, fully or partially NA NA
26. If convertible, conversion rate NA NA
27. NA NA
28. NA NA
29. NA NA
30. Write-down feature No Yes
31. If write-down, write-down trigger(s) NA The earlier of:
i) the MAS notifying the Issuer in writing that it is of the
opinion that a Write-off is necessary, without which the
Issuer would become non-viable; and
ii) a decision by the MAS to make a public sector injection
of capital, or equivalent support, without which the Issuer
would have become non-viable, as determined by the
MAS.
32. If write-down, full or partial NA Fully or partially
33. NA Permanent
34. If temporary write-down,
description of write-up
mechanism
NA NA
35. Additional Tier 1 capital instruments of OCBC Bank Upon the occurrence of any winding-up proceeding (other
than pursuant to a Permitted Reorgnisation), Capital
Securities are expressly subordinated and subject in right
of payment to the prior payment in full of all claims of (i)
Senior Creditors and (ii) holders of Tier II Capital
Securities, and will rank senior to all Junior Obligations.
36. Non-compliant transitioned features No No
37. If yes, specify non-compliant features NA NA
Existence of step up or other
incentive to redeem
If convertible, mandatory or optional
conversion
If convertible, specify instrument
type convertible into
If convertible, specify issuer of instrument it
converts into
If write-down, permanent or
temporary
Position in subordination hierarchy
in liquidation (specify instrument type
immediately senior to instrument in the
insolvency creditor hierarchy of the legal entity
concerned)
Fully discretionary, partially
discretionary or mandatory
Eligible at Solo / Group /
Solo and Group
Amount recognised in regulatory capital
Issuer call subject to prior
supervisory approval
Optional call date, contingent call
dates and redemption amount
Subsequent call dates,
if applicable

Pillar 3 Disclosures June 2019 10
5.3 Main Features of Capital Instruments (continued)
OCBC 4.0% OCBC 4.25%
Non-cumulative Non-convertible Subordinated Notes
Perpetual Capital Securities due 2024
1. Issuer Oversea-Chinese Banking Corporation Limited Oversea-Chinese Banking Corporation Limited
2. Unique identifier (ISIN) SGXF81199428 US69033DAC11 (Reg S)
3. Governing law(s) of instrument Singapore US69033CAC38 (144A)
England
(Save for the subordination provisions)
Singapore
(In respect of the subordination provisions)
Regulatory treatment
4. Transitional Basel III rules Additional Tier 1 Tier 2
5. Post-transitional Basel III rules Additional Tier 1 Tier 2
6. Solo and Group Solo and Group
7. Instrument type Perpetual Capital Securities Subordinated debt
8. S$998 million S$1,404 million
9. Par value of instrument S$1,000 million US$1,000 million
10. Accounting classification Shareholders' equity Liabilities - amortised cost
11. Original date of issuance 24 Aug 2018 19 Jun 2014
12. Perpetual or dated Perpetual Dated
13. Original maturity date No maturity 19 Jun 2024
14. Yes Yes
15. On the First Reset Date of 24 Aug 2023 and each Distribution
Payment Date thereafter (at par)
Tax call (at par) Tax call (at par)
Regulatory call (at par) Regulatory call (at par)
16. Optional call dates - any Distribution Payment Date after the First
Reset Date
NA
Coupons / dividends
17. Fixed or floating dividend / coupon Fixed to fixed Fixed
18. Coupon rate and any related index 4.0% p.a. up to (but excluding) 24 Aug 2023; if not redeemed, the
distribution rate will be reset on the First Reset Date and every 5 years
thereafter to a fixed rate equal to the then prevailing 5-year SGD SOR
plus 1.811% p.a.
4.25% p.a.
19. Existence of a dividend stopper Yes NA
20. Fully discretionary Mandatory
21. No No
22. Noncumulative or cumulative Noncumulative NA
23. Convertible or non-convertible Nonconvertible Nonconvertible
24. If convertible, conversion trigger(s) NA NA
25. If convertible, fully or partially NA NA
26. If convertible, conversion rate NA NA
27. NA NA
28. NA NA
29. NA NA
30. Write-down feature Yes Yes
31. If write-down, write-down trigger(s) Contractual approach
The earlier of:
i) the MAS notifying the Issuer in writing that it is of the opinion that a
Write-off is necessary, without which the Issuer would become non-
viable; and
ii) a decision by the MAS to make a public sector injection of capital, or
equivalent support, without which the Issuer would have become non-
viable, as determined by the MAS.
The earlier of (i) MAS determining that a write-down is
necessary; and (ii) a decision by MAS to make a public
sector injection of capital, or equivalent support, without
which the issuer would become non-viable in both (i) and
(ii)
32. If write-down, full or partial Fully or partially May be written down fully or partially
33. Permanent Permanent
34. If temporary write-down,
description of write-up
mechanism
NA NA
35. Upon the occurrence of any winding-up proceeding (other than
pursuant to a Permitted Reorgnisation), Capital Securities are
expressly subordinated and subject in right of payment to the prior
payment in full of all claims of (i) Senior Creditors which includes
holders of Tier II Capital Securities, and will rank senior to all Junior
Obligations.
Unsubordinated and unsecured obligations of OCBC Bank
36. Non-compliant transitioned features No No
37. If yes, specify non-compliant features NA NA
Existence of step up or other
incentive to redeem
If convertible, mandatory or optional
conversion
If convertible, specify instrument
type convertible into
If convertible, specify issuer of instrument
it converts into
If write-down, permanent or
temporary
Position in subordination hierarchy
in liquidation (specify instrument type
immediately senior to instrument in the
insolvency creditor hierarchy of the legal
entity concerned)
Fully discretionary, partially
discretionary or mandatory
Eligible at Solo / Group /
Solo and Group
Amount recognised in regulatory capital
Issuer call subject to prior
supervisory approval
Optional call date, contingent call
dates and redemption amount
Subsequent call dates,
if applicable
Pillar 3 Disclosures June 2019 11
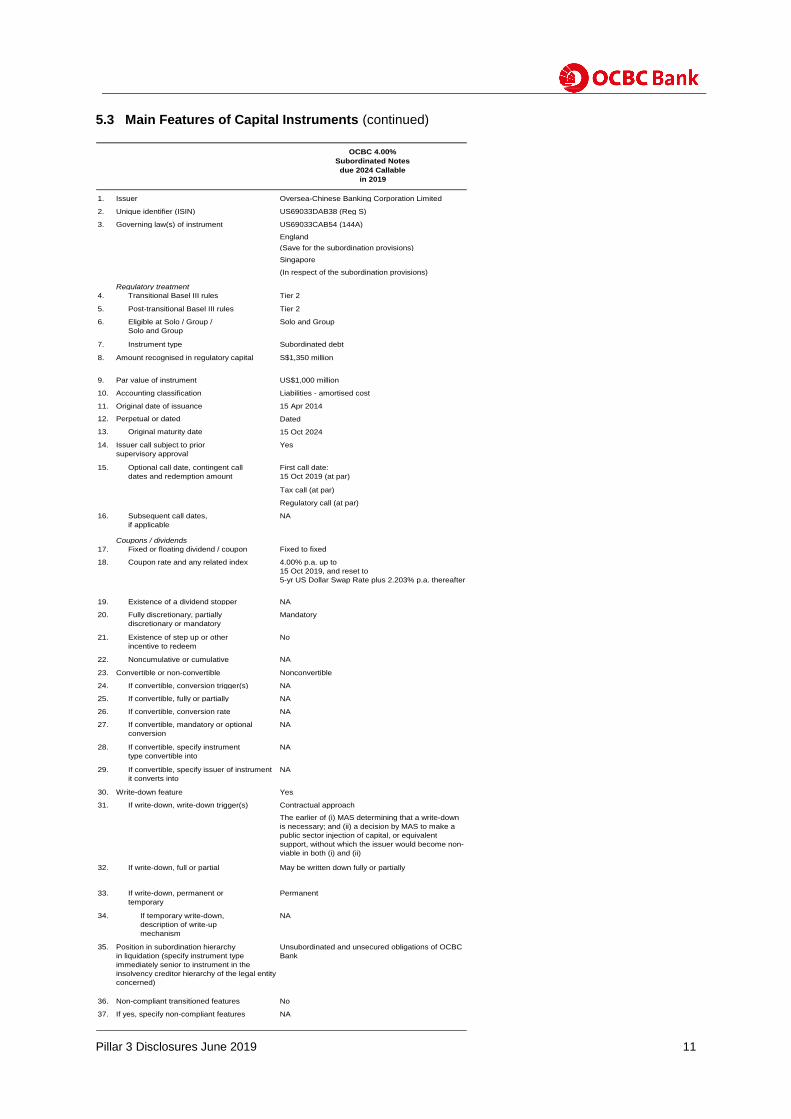
5.3 Main Features of Capital Instruments (continued)
OCBC 4.00%
Subordinated Notes
due 2024 Callable
in 2019
1. Issuer Oversea-Chinese Banking Corporation Limited
2. Unique identifier (ISIN) US69033DAB38 (Reg S)
3. Governing law(s) of instrument US69033CAB54 (144A)
England
(Save for the subordination provisions)
Singapore
(In respect of the subordination provisions)
Regulatory treatment
4. Transitional Basel III rules Tier 2
5. Post-transitional Basel III rules Tier 2
6. Solo and Group
7. Instrument type Subordinated debt
8. S$1,350 million
9. Par value of instrument US$1,000 million
10. Accounting classification Liabilities - amortised cost
11. Original date of issuance 15 Apr 2014
12. Perpetual or dated Dated
13. Original maturity date 15 Oct 2024
14. Yes
15. First call date:
15 Oct 2019 (at par)
Tax call (at par)
Regulatory call (at par)
16. NA
Coupons / dividends
17. Fixed or floating dividend / coupon Fixed to fixed
18. Coupon rate and any related index 4.00% p.a. up to
15 Oct 2019, and reset to
5-yr US Dollar Swap Rate plus 2.203% p.a. thereafter
19. Existence of a dividend stopper NA
20. Mandatory
21. No
22. Noncumulative or cumulative NA
23. Convertible or non-convertible Nonconvertible
24. If convertible, conversion trigger(s) NA
25. If convertible, fully or partially NA
26. If convertible, conversion rate NA
27. NA
28. NA
29. NA
30. Write-down feature Yes
31. If write-down, write-down trigger(s) Contractual approach
The earlier of (i) MAS determining that a write-down
is necessary; and (ii) a decision by MAS to make a
public sector injection of capital, or equivalent
support, without which the issuer would become non-
viable in both (i) and (ii)
32. If write-down, full or partial May be written down fully or partially
33. Permanent
34. If temporary write-down,
description of write-up
mechanism
NA
35. Unsubordinated and unsecured obligations of OCBC
Bank
36. Non-compliant transitioned features No
37. If yes, specify non-compliant features NA
Existence of step up or other
incentive to redeem
If convertible, mandatory or optional
conversion
If convertible, specify instrument
type convertible into
If convertible, specify issuer of instrument
it converts into
If write-down, permanent or
temporary
Position in subordination hierarchy
in liquidation (specify instrument type
immediately senior to instrument in the
insolvency creditor hierarchy of the legal entity
concerned)
Fully discretionary, partially
discretionary or mandatory
Eligible at Solo / Group /
Solo and Group
Amount recognised in regulatory capital
Issuer call subject to prior
supervisory approval
Optional call date, contingent call
dates and redemption amount
Subsequent call dates,
if applicable

Pillar 3 Disclosures June 2019 12
6. LEVERAGE RATIO
6.1 Leverage Ratio Summary Comparison Table
Item Amount (S$’m)
30 Jun 2019 31 Mar 2019
1 Total consolidated assets as per published financial statements
479,767 469,513
2 Adjustment for investments in entities that are consolidated for accounting purposes but are outside the regulatory scope of consolidation
(89,535) (87,395)
3 Adjustment for fiduciary assets recognised on the balance sheet in accordance with the Accounting Standards but excluded from the calculation of exposure measure
- -
4 Adjustment for derivative transactions 4,820 4,733
5 Adjustment for SFTs 4 4
6 Adjustment for off-balance sheet items 29,663 28,946
7 Other adjustments (6,834) (7,013)
8 Exposure measure 417,885 408,788

Pillar 3 Disclosures June 2019 13
6.2 Leverage Ratio Common Disclosure Table
Item Amount (S$’m)
30 Jun 2019 31 Mar 2019
Exposure measures of on-balance sheet items
1 On-balance sheet items (excluding derivative transactions and SFTs, but including on-balance sheet collateral for derivative transactions or SFTs)
380,940 374,091
2 Asset amounts deducted in determining Tier 1 capital (6,834) (7,013)
3 Total exposures measures of on-balance sheet items (excluding derivative transactions and SFTs)
374,106 367,077
Derivative exposure measures
4 Replacement cost associated with all derivative transactions (net of the eligible cash portion of variation margins)
4,910 3,712
5 Potential future exposure associated with all derivative transactions 6,432 6,411
6 Gross-up for derivative collaterals provided where deducted from the balance sheet assets in accordance with the Accounting Standards
- -
7 Deductions of receivables for the cash portion of variation margins provided in derivative transactions
(8) (8)
8 CCP leg of trade exposures excluded - -
9 Adjusted effective notional amount of written credit derivatives 499 431
10 Further adjustments in effective notional amounts and deductions from potential future exposures of written credit derivatives
- -
11 Total derivative exposure measures 11,833 10,546
SFT exposure measures
12 Gross SFT assets (with no recognition of accounting netting), after adjusting for sales accounting
2,279 2,214
13 Eligible netting of cash payables and cash receivables - -
14 SFT counterparty exposures 4 4
15 SFT exposure measures where a Reporting Bank acts as an agent in the SFTs
- -
16 Total SFT exposure measures 2,283 2,218
Exposure measures of off-balance sheet items
17 Off-balance sheet items at notional amount 132,793 133,000
18 Adjustments for calculation of exposure measures of off-balance sheet items
(103,130) (104,054)
19 Total exposure measures of off-balance sheet items 29,663 28,946
Capital and Total exposures
20 Tier 1 capital 31,706 30,585
21 Total exposures 417,885 408,788
Leverage Ratio
22 Leverage ratio 7.5% 7.4%
SFT: Securities Financing Transactions
CCP: Central Counterparty

Pillar 3 Disclosures June 2019 14
7. CREDIT QUALITY
7.1 Overview of Credit Quality of Assets
The table below provides an overview of the credit quality of the on and off-balance sheet assets of the Group. The
breakdown of specific and general allowances for exposures under Standardised and Internal Ratings-Based
Approach is provided effective from 30 June 2019.
A borrower is recognised to be in default when the borrower is unlikely to repay in full its credit obligations to the
Group, or the borrower is past due for more than 90 days on its credit obligations to the Group.
30 Jun 2019
(a) (b) (c) (d) (e) (f) (g)
Gross carrying amount of 1/
of which: Allowances
for Standardised Approach exposures
S$ million
Defaulted exposures
Non-defaulted
exposures
Allowances and Impairments
of which: Specific
Allowances
of which: General
Allowances
of which: Allowances
for IRBA exposures
Net Values 2/
(a + b - c)
1 Loans and bills receivable 3,860 258,848 (2,083) (189) (216) (1,678) 260,625
2 Debt securities 2 24,861 (13) (3) (4) (6) 24,850
3 Off-balance sheet exposures 52 11,477 (262) # (28) (234) 11,267
4 Total 3,914 295,186 (2,358) (192) (248) (1,918) 296,742
31 Dec 2018
(a) (b) (c) (d) (e) (f) (g)
Gross carrying amount of 1/
of which: Allowances
for Standardised Approach exposures
S$ million
Defaulted exposures
Non-defaulted
exposures
Allowances and Impairments
of which: Specific
Allowances
of which: General
Allowances
of which: Allowances
for IRBA exposures
Net Values 2/
(a + b - c)
1 Loans and bills receivable 3,838 253,867 (1,937) 255,768
2 Debt securities 2 22,288 (15) 22,275
3 Off-balance sheet exposures 98 11,866 (266) 11,698
4 Total 3,938 288,021 (2,218) 289,741
1/ Refers to the accounting value of the assets before any allowances and impairments but after write-offs 2/ Refers to total gross carrying amount less allowances and impairments
# Represents amounts of less than $0.5 million

Pillar 3 Disclosures June 2019 15
7.2 Changes in Stock of Defaulted Loans and Bills Receivable, and Debt Securities
The table below identifies the changes in defaulted loans and bills receivable as well as debt securities from the
previous semi-annual reporting period, including the flows between non-defaulted and defaulted categories and
reductions due to write-offs.
Defaulted loans and bills receivable, and debt securities remained relatively unchanged in the first half of 2019.
(a)
S$ million Amount outstanding
1 Defaulted loans and bills receivable, and debt securities as at 31 December 2018 3,840
2 Loans and bills receivable, and debt securities that have defaulted in the first half of 2019 691
3 Return to non-defaulted status (180)
4 Amounts written-off (241)
5 Other changes 1/ (248)
6 Defaulted loans and bills receivable, and debt securities as at 30 June 2019 (1 + 2 - 3 - 4 ± 5)
3,862
1/ Other changes comprise foreign exchange, increase in existing defaulted loans and bills receivable, and recoveries

Pillar 3 Disclosures June 2019 16
8. OVERVIEW OF RISK WEIGHTED ASSETS
The table below provides an overview of the Group’s total RWA, broken down by the approaches with which the
RWA are computed, as stipulated by MAS Notice 637. The increase in RWA between March 2019 and June 2019
was largely attributed to higher Credit Risk RWA led by increased corporate loans.
(a) (b) (c)
RWA
Minimal Capital Requirements 1/
S$ million Jun-19 Mar-19 Jun-19
1 Credit Risk (excluding Counterparty Credit Risk) 165,528 161,471 16,553
2 Of which: Standardised Approach 47,299 46,254 4,730
3 Of which: Foundation Internal Ratings-Based Approach (F-IRBA) 100,631 97,803 10,063
4 Of which: Supervisory Slotting Approach 2,428 1,966 243
5 Of which: Advanced Internal Ratings-Based Approach (A-IRBA) 15,170 15,448 1,517
6 Credit Risk: Counterparty Credit Risk (CCR) 2,696 2,404 270
7 Of which: Current Exposure Method 2,089 1,887 209
8 Of which: Internal Models Method - - -
9 Of which: Other CCR 182 178 18
9a Of which: Central Counterparties (CCP) 425 339 43
10 Credit Valuation Adjustments (CVA) 2,881 2,284 288
11 Equity exposures under Simple Risk Weight Method - - -
11a Equity exposures under Internal Models Method - - -
12 Equity investments in funds - Look Through Approach 121 116 12
13 Equity investments in funds - Mandate-Based Approach 161 155 16
14 Equity investments in funds - Fall Back Approach 15 - 2
14a Equity investments in funds - Partial Use of an Approach 128 122 13
15 Unsettled Transactions 24 12 2
16 Securitisation exposures in banking book - - -
17 Of which: SEC-IRBA - - -
18 Of which: SEC-ERBA, including IAA - - -
19 Of which: SEC-SA - - -
20 Market Risk 14,963 15,627 1,496
21 Of which: Standardised Approach 14,963 15,627 1,496
22 Of which: Internal Models Approach - - -
23 Operational Risk 14,556 14,287 1,455
24 Credit RWA pursuant to paragraph 6.1.3(p)(iii) 2/ 8,130 7,879 813
25 Floor Adjustment - - -
26 Total 209,203 204,357 20,920
1/ Minimum capital requirements are calculated at 10% of RWA
2/ Refers to Credit RWA attributed to investments in the ordinary shares of unconsolidated major stake companies that are financial institutions,
within the prescribed threshold amount in accordance with MAS Notice 637 paragraph 6.1.3 (p)(iii)

Pillar 3 Disclosures June 2019 17
9. RWA FLOW STATEMENT FOR CREDIT RISK EXPOSURES
This table provides an overview of the quarter-on-quarter movement of Credit Risk RWA attributed to the
key drivers from rows 2 to 8.
The increase in RWA during the second quarter of 2019 was primarily due to asset growth particularly in
corporate loans, partially offset by improving asset quality.
(a)
S$ million RWA
1 RWA as at 31 March 2019 1/ 115,217
2 Asset Size 2/ 5,539
3 Asset Quality 3/ (2,084)
4 Model Updates 4/ -
5 Methodology and Policy 5/ -
6 Acquisitions and Disposals 6/ -
7 Foreign exchange movements 7/ (443)
8 Other 8/ -
9 RWA as at 30 June 2019 1/ (1 + 2 + 3 + 4 + 5 + 6 + 7 + 8)
118,229
1/ Refers to RWA of Credit Risk (excluding Counterparty Credit Risk) exposures under IRB Approach and Supervisory Slotting Approach
2/ Refers to organic changes in book size and composition (origination of new businesses and maturing loans), excluding acquisitions and disposal of entities
3/ Refers to changes in the assessed quality of the bank’s assets due to changes in borrower risk, such as rating grade migration or similar effects
4/ Refers to changes due to model implementation, changes in model scope, or any model enhancements
5/ Refers to changes driven by methodological changes such as regulatory policy changes
6/ Refers to changes in book size due to acquisition and disposal of entities or portfolios
7/ Refers to changes driven by market movements such as foreign exchange movements
8/ Refers to changes that cannot be attributed to any other category

Pillar 3 Disclosures June 2019 18
10. CREDIT EXPOSURES UNDER STANDARDISED AND IRB APPROACH
10.1 Credit Exposures under Standardised Approach and CRM effects
The following table illustrates the effects of credit risk mitigation (CRM) on the calculation of capital
requirements for credit and equity exposures under the Standardised Approach.
30 Jun 2019
(a) (b) (c) (d) (e) (f)
Exposures before CCF and CRM Exposures post-CCF and post-CRM
S$ million
On-Balance Sheet Off-Balance Sheet On-Balance Sheet Off-Balance Sheet RWA RWA
Density
Asset Class
1 Cash Items 833 - 833 - 7 1%
2 Sovereign 3,501 - 3,501 - 713 20%
3 PSE 262 41 262 41 151 50%
4 MDB 18 130 18 - - 0%
5 Bank 5,492 163 5,514 146 2,530 45%
6 Corporate 15,005 7,027 14,380 1,488 14,624 92%
7 Regulatory Retail 7,038 1,743 6,681 54 5,051 75%
8 Residential Mortgage 13,524 65 13,279 2 4,711 35%
9 Commercial Real Estate 11,794 1,800 11,707 132 11,839 100%
10 Equity exposures 510 - 510 - 816 160%
11 Past Due exposures 191 # 191 # 237 124%
12 Higher risk exposures - - - - - NA
13 Others 1/ 6,747 792 6,562 58 6,620 100%
14 Total 64,915 11,761 63,438 1,921 47,299 72%
31 Dec 2018
(a) (b) (c) (d) (e) (f)
Exposures before CCF and CRM Exposures post-CCF and post-CRM
S$ million
On-Balance Sheet Off-Balance Sheet On-Balance Sheet Off-Balance Sheet RWA RWA
Density
Asset Class
1 Cash Items 934 - 934 - 6 1%
2 Sovereign 3,724 - 3,724 - 688 18%
3 PSE 193 - 626 - 146 23%
4 MDB 34 126 36 - - 0%
5 Bank 5,067 - 5,113 - 2,273 44%
6 Corporate 14,181 7,462 13,402 1,848 14,255 93%
7 Regulatory Retail 6,802 1,665 6,614 59 5,005 75%
8 Residential Mortgage 14,269 29 14,012 4 5,018 36%
9 Commercial Real Estate 11,593 1,827 11,525 165 11,690 100%
10 Equity exposures 396 - 396 - 633 160%
11 Past Due exposures 187 # 186 # 236 127%
12 Higher risk exposures - - - - - NA
13 Others 1/ 6,706 791 6,485 65 6,550 100%
14 Total 64,086 11,900 63,053 2,141 46,500 71%
1/ Includes other exposures not included in the above asset classes, such as fixed asset
# Represents amounts of less than $0.5 million

Pillar 3 Disclosures June 2019 19
10.2 Credit Exposures under Standardised Approach by Risk Weight
The following table provides a breakdown of credit risk exposures treated under the Standardised approach
by asset class and risk weight. The risk weight assigned corresponds to the level of risk attributed to each
exposure.
30 Jun 2019
(a) (b) (c) (d) (e) (f) (g) (h) (i) (j)
Risk Weight
S$ million 0% 10% 20% 35% 50% 75% 100% 150% Others Total EAD 1/
Asset Class
1 Cash Items 800 - 33 - - - - - - 833
2 Sovereign 2,075 - - - 1,426 - - - - 3,501
3 PSE - - - - 303 - - - - 303
4 MDB 18 - - - - - - - - 18
5 Bank - - 1,015 - 4,639 - 7 - - 5,661
6 Corporate - - 124 - 2,290 - 13,454 - - 15,868
7 Regulatory Retail - - - - - 6,735 - - - 6,735
8 Residential Mortgage - - - 13,143 - 106 32 - - 13,281
9 Commercial Real Estate
- - - - - - 11,839 - - 11,839
10 Equity exposures - - - - - - - - 510 510
11 Past Due exposures - - - - - - 99 92 - 191
12 Higher risk exposures - - - - - - - - - -
13 Others 2/ - - - - - - 6,619 - - 6,619
14 Total 2,893 - 1,172 13,143 8,658 6,841 32,050 92 510 65,359
31 Dec 2018
(a) (b) (c) (d) (e) (f) (g) (h) (i) (j)
Risk Weight
S$ million 0% 10% 20% 35% 50% 75% 100% 150% Others Total EAD 1/
Asset Class
1 Cash Items 904 - 30 - - - - - - 934
2 Sovereign 2,348 - - - 1,376 - - - - 3,724
3 PSE - - 556 - 70 - - - - 626
4 MDB 36 - - - - - - - - 36
5 Bank - - 945 - 4,167 - 1 - - 5,113
6 Corporate - - 96 - 1,836 - 13,318 - - 15,250
7 Regulatory Retail - - - - - 6,673 - - - 6,673
8 Residential Mortgage - - - 13,790 - 135 91 - - 14,016
9 Commercial Real Estate - - - - - - 11,690 - - 11,690
10 Equity exposures - - - - - - - - 396 396
11 Past Due exposures - - - - - - 87 99 - 186
12 Higher risk exposures - - - - - - - - - -
13 Others 2/ - - - - - - 6,550 - - 6,550
14 Total 3,288 - 1,627 13,790 7,449 6,808 31,737 99 396 65,194
1/ Total EAD refers to both on and off-balance sheet amounts that are used for computing capital requirements, net of impairment allowances and write-
offs and after application of CRM and CCF 2/ Includes other exposures not included in the above asset classes, such as fixed assets

Pillar 3 Disclosures June 2019 20
10.3 Credit Exposures under Foundation Internal Ratings-Based Approach (F-IRBA)
The following table provides the main parameters used in the treatment of exposures for the calculation of capital
requirements under the F-IRBA.
30 Jun 2019
(a) (b) (c) (d) (e) (f) (g) (h) (i) (j) (k) (l)
On-
Balance Sheet 1/
Off-Balance Sheet 2/
Average CCF (%)
EAD 3/
(S$ million)
Average PD 4/
(%)
Number of Obligors 5/
Average LGD 4/
(%)
Average Maturity 6/
(In years)
RWA (S$
million)
RWA Density 7/
(%)
Expected Losses
(S$ million)
TEP 8/
(S$ million)
Sovereign (S$ million)
PD Range
0.00 to < 0.15 34,687 944 100% 36,134 0.01% 22 45% 1.6 744 2% 1
0.15 to < 0.25 - - - - - - - - - NA -
0.25 to < 0.50 - - - - - - - - - NA -
0.50 to < 0.75 - - - - - - - - - NA -
0.75 to < 2.50 2 - - 2 1.11% 1 45% 1.0 1 81% #
2.50 to < 10.00 41 - - 41 6.42% 1 48% 1.0 66 164% 1
10.00 to < 100.00 # # - # 11.10% 2 45% 1.0 # 194% #
100.00 (Default) - - - - - - - - - NA -
Sub-total 34,730 944 100% 36,177 0.01% 26 45% 1.6 811 2% 2 8
Bank
PD Range
0.00 to < 0.15 38,615 2,492 13% 39,370 0.05% 260 45% 1.1 5,822 15% 8
0.15 to < 0.25 - - - - - - - - - NA -
0.25 to < 0.50 2,717 128 42% 4,703 0.37% 18 45% 0.9 2,852 61% 8
0.50 to < 0.75 2,711 157 9% 2,746 0.54% 18 45% 0.9 1,999 73% 7
0.75 to < 2.50 1,751 28 5% 1,752 1.89% 26 45% 0.9 2,151 123% 15
2.50 to < 10.00 276 8 40% 279 6.34% 25 45% 0.2 417 150% 8
10.00 to < 100.00 # # 88% # 11.10% 40 2% 1.0 # 7% #
100.00 (Default) # - 0% # 100.00% 1 45% 1.0 - 0% #
Sub-total 46,070 2,813 14% 48,850 0.21% 388 45% 1.1 13,241 27% 46 135
Corporate
PD Range
0.00 to < 0.15 41,248 37,148 21% 49,319 0.09% 894 44% 2.2 13,558 27% 20
0.15 to < 0.25 # 3 1% # 0.19% 5 36% 3.1 # 40% #
0.25 to < 0.50 14,669 15,846 21% 17,925 0.37% 576 43% 2.2 10,652 59% 29
0.50 to < 0.75 8,272 10,527 14% 9,599 0.54% 545 43% 1.7 6,256 65% 23
0.75 to < 2.50 11,255 11,759 13% 10,954 1.42% 771 43% 1.9 10,570 97% 66
2.50 to < 10.00 3,266 2,008 11% 3,107 4.97% 251 43% 2.1 4,526 146% 67
10.00 to < 100.00 920 1,766 1% 914 14.46% 312 40% 3.5 1,965 215% 54
100.00 (Default) 2,182 47 52% 2,206 100.00% 160 44% 2.5 - 0% 970
Sub-total 81,812 79,104 18% 94,024 2.99% 3,514 44% 2.1 47,527 51% 1,229 1,641

Pillar 3 Disclosures June 2019 21
10.3 Credit Exposures under Foundation Internal Ratings-Based Approach (F-IRBA) (continued)
30 Jun 2019
(a) (b) (c) (d) (e) (f) (g) (h) (i) (j) (k) (l)
Corporate (IPRE)
On-Balance Sheet 1/
Off-Balance Sheet 2/
Average CCF (%)
EAD 3/
(S$ million)
Average PD 4/
(%)
Number of
Obligors 5/
Average LGD 4/
(%)
Average Maturity 6/
(In years)
RWA (S$
million)
RWA Density 7/
(%)
Expected Losses
(S$ million)
TEP 8/
(S$ million)
(S$ million)
PD Range
0.00 to < 0.15 2,519 73 66% 2,568 0.14% 15 45% 1.8 831 32% 2
0.15 to < 0.25 - - - - - - - - - NA -
0.25 to < 0.50 4,469 982 60% 5,058 0.37% 41 45% 2.6 3,282 65% 8
0.50 to < 0.75 8,609 1,693 57% 9,577 0.54% 85 45% 3.2 8,107 85% 23
0.75 to < 2.50 13,447 3,049 56% 15,123 1.33% 275 45% 2.6 16,453 109% 90
2.50 to < 10.00 2,403 1,041 49% 2,908 3.74% 138 45% 3.1 4,404 151% 48
10.00 to < 100.00 23 23 58% 36 11.52% 10 45% 3.2 81 223% 2
100.00 (Default) 6 # 50% 6 100.00% 4 45% 4.8 - 0% 3
Sub-total 31,476 6,861 56% 35,276 1.12% 568 45% 2.8 33,158 94% 176 337
Corporate Small Business
PD Range
0.00 to < 0.15 879 706 11% 956 0.12% 457 41% 2.8 296 31% #
0.15 to < 0.25 484 139 11% 499 0.16% 724 38% 4.2 198 40% #
0.25 to < 0.50 621 620 15% 713 0.37% 292 37% 2.6 327 46% 1
0.50 to < 0.75 798 828 8% 866 0.54% 581 38% 1.9 443 51% 2
0.75 to < 2.50 2,269 1,935 11% 2,368 1.43% 1,059 39% 2.3 1,830 77% 13
2.50 to < 10.00 1,890 1,453 10% 2,020 4.33% 617 37% 2.6 2,175 108% 32
10.00 to < 100.00 432 176 20% 466 13.10% 4,866 34% 2.5 625 134% 21
100.00 (Default) 1,102 4 53% 1,104 100.00% 208 43% 1.8 - 0% 479
Sub-total 8,475 5,861 11% 8,992 14.41% 8,804 39% 2.5 5,894 66% 548 589
Total (all portfolios)
202,563 95,583 21% 223,319 2.06% 13,300 44% 1.9 100,631 45% 2,001 2,710

Pillar 3 Disclosures June 2019 22
10.3 Credit Exposures under Foundation Internal Ratings-Based Approach (F-IRBA) (continued)
31 Dec 2018
(a) (b) (c) (d) (e) (f) (g) (h) (i) (j) (k) (l)
On-
Balance Sheet 1/
Off-Balance Sheet 2/
Average CCF (%)
EAD 3/
(S$ million)
Average PD 4/
(%)
Number of Obligors 5/
Average LGD 4/
(%)
Average Maturity 6/
(In years)
RWA (S$
million)
RWA Density 7/
(%)
Expected Losses
(S$ million)
TEP 8/
(S$ million)
Sovereign (S$ million)
PD Range
0.00 to < 0.15 34,516 10 100% 35,161 0.01% 23 45% 1.4 783 2% 1
0.15 to < 0.25 - - - - - - - - - NA -
0.25 to < 0.50 - - - - - - - - - NA -
0.50 to < 0.75 - - - - - - - - - NA -
0.75 to < 2.50 2 - 0% 2 1.90% 1 45% 1.0 2 100% #
2.50 to < 10.00 74 - 0% 74 6.42% 1 45% 1.0 115 155% 2
10.00 to < 100.00 - # - - - 1 - - - NA -
100.00 (Default) - - - - - - - - - NA -
Sub-total 34,592 10 100% 35,237 0.02% 26 45% 1.4 900 3% 3 9
Bank
PD Range
0.00 to < 0.15 40,475 2,840 4% 40,494 0.05% 246 45% 1.1 6,051 15% 9
0.15 to < 0.25 - - - - - - - - - NA -
0.25 to < 0.50 2,068 121 6% 4,266 0.37% 21 45% 0.9 2,562 60% 7
0.50 to < 0.75 2,437 160 1% 2,448 0.54% 19 45% 0.9 1,806 74% 6
0.75 to < 2.50 1,328 35 8% 1,331 1.89% 26 45% 0.9 1,628 122% 11
2.50 to < 10.00 152 27 87% 176 6.29% 29 44% 0.4 287 163% 5
10.00 to < 100.00 8 # 18% 6 11.10% 38 45% 0.0 14 213% #
100.00 (Default) # - 0% # 100.00% 1 45% 1.0 - 0% #
Sub-total 46,468 3,183 5% 48,721 0.18% 380 45% 1.1 12,348 25% 38 117
Corporate
PD Range
0.00 to < 0.15 36,508 38,196 19% 43,877 0.10% 905 44% 2.1 11,934 27% 18
0.15 to < 0.25 1 3 0% 1 0.15% 4 45% 2.9 # 43% #
0.25 to < 0.50 14,513 16,214 22% 18,067 0.37% 584 44% 2.2 10,735 59% 29
0.50 to < 0.75 8,294 9,272 14% 9,580 0.54% 556 43% 1.7 6,147 64% 22
0.75 to < 2.50 11,476 13,435 14% 11,513 1.46% 806 43% 1.8 11,023 96% 72
2.50 to < 10.00 2,806 1,847 13% 2,558 4.97% 250 41% 1.9 3,538 138% 53
10.00 to < 100.00 771 1,374 3% 780 15.01% 325 42% 3.5 1,735 223% 49
100.00 (Default) 2,323 95 39% 2,360 100.00% 158 44% 2.3 - 0% 1,040
Sub-total 76,692 80,436 18% 88,736 3.31% 3,588 43% 2.1 45,112 51% 1,283 1,560

Pillar 3 Disclosures June 2019 23
10.3 Credit Exposures under Foundation Internal Ratings-Based Approach (F-IRBA) (continued)
31 Dec 2018
(a) (b) (c) (d) (e) (f) (g) (h) (i) (j) (k) (l)
Corporate (IPRE)
On-Balance Sheet 1/
Off-Balance Sheet 2/
Average CCF (%)
EAD 3/
(S$ million)
Average PD 4/
(%)
Number of Obligors 5/
Average LGD 4/
(%)
Average Maturity 6/
(In years)
RWA (S$
million)
RWA Density 7/
(%)
Expected Losses
(S$ million)
TEP 8/
(S$ million)
(S$ million)
PD Range
0.00 to < 0.15 2,538 123 43% 2,592 0.14% 15 45% 2.1 905 35% 3
0.15 to < 0.25 - - - - - - - - - NA -
0.25 to < 0.50 4,788 807 61% 5,277 0.37% 44 45% 2.5 3,383 64% 9
0.50 to < 0.75 7,971 1,741 55% 8,928 0.54% 84 45% 3.1 7,503 84% 22
0.75 to < 2.50 10,969 2,810 55% 12,453 1.36% 256 45% 2.5 13,375 107% 76
2.50 to < 10.00 2,636 1,055 50% 3,155 3.68% 150 45% 2.9 4,672 148% 52
10.00 to < 100.00 32 32 41% 45 12.19% 13 45% 3.7 104 231% 2
100.00 (Default) 5 # 50% 5 100.00% 2 45% 2.9 - 0% 2
Sub-total 28,939 6,568 54% 32,455 1.13% 564 45% 2.7 29,942 92% 166 284
Corporate Small Business
PD Range
0.00 to < 0.15 468 744 11% 551 0.13% 447 41% 3.4 203 37% #
0.15 to < 0.25 490 151 15% 513 0.16% 822 38% 4.2 203 39% #
0.25 to < 0.50 937 595 14% 1,020 0.37% 303 39% 3.1 586 57% 1
0.50 to < 0.75 851 850 11% 945 0.54% 572 39% 1.9 498 53% 2
0.75 to < 2.50 2,449 2,171 11% 2,522 1.44% 6,773 39% 2.4 2,047 81% 14
2.50 to < 10.00 1,853 1,101 11% 1,955 4.69% 645 39% 2.2 2,151 110% 35
10.00 to < 100.00 464 156 22% 498 12.63% 382 35% 2.5 703 141% 22
100.00 (Default) 1,236 3 50% 1,237 100.00% 158 44% 2.3 - 0% 547
Sub-total 8,748 5,771 12% 9,241 15.56% 10,102 39% 2.6 6,391 69% 621 648
Total (all portfolios)
195,439 95,968 20% 214,390 2.25% 14,660 44% 1.8 94,693 44% 2,111 2,618
1/ On-balance sheet refers to the amount of the on-balance sheet exposure gross of impairment allowances (before taking into account the effect of CRM) 2/ Off-balance sheet refers to the exposure value without taking into account valuation adjustments and impairment allowances, CCFs and the effect of CRM 3/ EAD refers to the amount relevant for the capital requirements calculation, after taking into account the effect of CCFs and CRM 4/ Refers to the PD and LGD associated with each obligor grade, weighted by EAD 5/ Number of obligors refers to the number of counterparties 6/ Refers to the effective maturity of the exposures to the obligor in years, weighted by EAD 7/ Total RWA divided by the exposures post-CCF and post-CRM 8/ Refers to the total eligible provisions attributed to the respective portfolios # Represents amounts of less than $0.5 million

Pillar 3 Disclosures June 2019 24
10.4 Credit Exposures under Advanced Internal Ratings-Based Approach (A-IRBA)
The following table provides the main parameters used in the treatment of exposures for the calculation of
capital requirements under the A-IRBA.
30 Jun 2019
(a) (b) (c) (d) (e) (f) (g) (h) (i) (j) (k) (l)
On-
Balance Sheet 1/
Off-Balance Sheet 2/ Average
CCF (%)
EAD 3/
(S$ million)
Average PD 4/
(%)
Number of Obligors 5/
Average LGD 4/
(%)
Average Maturity 6/
(In years)
RWA (S$
million)
RWA Density 7/
(%)
Expected Losses
(S$ million)
TEP 8/
(S$ million) Residential
Mortgage (S$ million)
PD Range
0.00 to < 0.15 2,996 667 68% 3,450 0.09% 12,154 10% 81 2% #
0.15 to < 0.25 13,232 712 80% 13,804 0.15% 36,327 10% 486 4% 2
0.25 to < 0.50 11,987 658 70% 12,450 0.25% 44,018 10% 654 5% 3
0.50 to < 0.75 13,540 433 74% 13,861 0.50% 46,732 11% 1,208 9% 7
0.75 to < 2.50 6,590 441 83% 6,955 1.02% 32,454 11% 991 14% 8
2.50 to < 10.00 2,631 125 88% 2,742 3.81% 8,875 11% 844 31% 11
10.00 to < 100.00 963 13 73% 972 23.40% 6,861 12% 629 65% 27
100.00 (Default) 433 8 0% 433 100.00% 2,551 15% 290 67% 67
Sub-total 52,372 3,057 75% 54,667 1.76% 189,972 11% 5,183 9% 125 120
Qualifying Revolving Retail
PD Range
0.00 to < 0.15 725 5,793 43% 3,243 0.06% 544,716 80% 104 3% 1
0.15 to < 0.25 68 1,483 52% 840 0.17% 154,380 81% 66 8% 1
0.25 to < 0.50 204 689 45% 512 0.30% 82,717 81% 64 13% 1
0.50 to < 0.75 310 795 43% 656 0.58% 99,341 78% 135 21% 3
0.75 to < 2.50 285 548 60% 614 1.40% 84,761 83% 263 43% 7
2.50 to < 10.00 308 242 66% 468 5.14% 63,062 83% 498 106% 20
10.00 to < 100.00 120 125 89% 231 24.78% 28,584 86% 534 232% 49
100.00 (Default) 22 - 0% 22 100.00% 3,460 82% - 0% 22
Sub-total 2,042 9,675 47% 6,586 1.82% 1,061,021 81% 1,664 25% 104 38
Retail Small Business
PD Range
0.00 to < 0.15 285 263 57% 436 0.10% 2,501 27% 31 7% #
0.15 to < 0.25 1,250 479 49% 1,483 0.17% 5,906 32% 188 13% 1
0.25 to < 0.50 301 31 53% 317 0.35% 1,148 32% 63 20% #
0.50 to < 0.75 540 45 60% 567 0.50% 3,089 39% 169 30% 1
0.75 to < 2.50 938 92 57% 990 1.15% 5,509 43% 492 50% 5
2.50 to < 10.00 487 26 73% 505 4.45% 5,469 41% 318 63% 9
10.00 to < 100.00 326 23 83% 344 29.78% 6,130 42% 303 88% 43
100.00 (Default) 116 4 0% 116 100.00% 1,249 54% 157 136% 54
Sub-total 4,243 963 54% 4,758 5.44% 31,001 37% 1,721 36% 113 70

Pillar 3 Disclosures June 2019 25
10.4 Credit Exposures under Advanced Internal Ratings-Based Approach (A-IRBA) (continued)
30 Jun 2019
(a) (b) (c) (d) (e) (f) (g) (h) (i) (j) (k) (l)
On-
Balance Sheet 1/
Off-Balance Sheet 2/
Average CCF (%)
EAD 3/
(S$ million)
Average PD 4/
(%)
Number of Obligors 5/
Average LGD 4/
(%)
Average Maturity 6/
(In years)
RWA (S$
million)
RWA Density 7/
(%)
Expected Losses
(S$ million)
TEP 8/
(S$ million)
Other Retail (S$ million)
PD Range
0.00 to < 0.15 442 2,316 99% 2,745 0.05% 2,658 8% 37 1% #
0.15 to < 0.25 2,944 1,310 94% 4,174 0.19% 25,239 11% 183 4% 1
0.25 to < 0.50 271 23 54% 283 0.31% 3,934 15% 23 8% #
0.50 to < 0.75 3,366 632 98% 3,987 0.50% 3,932 10% 314 8% 2
0.75 to < 2.50 7,742 1,325 98% 9,043 1.49% 4,080 10% 1,078 12% 13
2.50 to < 10.00 4,466 869 100% 5,333 5.00% 1,702 10% 829 16% 27
10.00 to < 100.00 8,076 993 100% 9,069 12.96% 1,537 11% 1,893 21% 129
100.00 (Default) 48 1 6% 48 100.00% 163 28% 116 243% 6
Sub-total 27,355 7,469 98% 34,682 4.77% 43,245 10% 4,473 13% 178 52
Corporate
PD Range
0.00 to < 0.15 65 417 100% 482 0.05% 345 7% 1.0 9 2% #
0.15 to < 0.25 517 304 100% 821 0.20% 374 8% 1.0 48 6% #
0.25 to < 0.50 - - - - - - - - - NA -
0.50 to < 0.75 525 148 100% 672 0.50% 164 8% 1.0 65 10% #
0.75 to < 2.50 1,101 228 100% 1,329 1.42% 207 8% 1.0 202 15% 1
2.50 to < 10.00 1,187 369 100% 1,555 5.00% 88 10% 1.0 478 31% 8
10.00 to < 100.00 2,169 353 100% 2,522 11.83% 377 12% 1.0 1,327 53% 36
100.00 (Default) - - - - - - - - - NA -
Sub-total 5,564 1,819 100% 7,381 5.42% 1,555 10% 1.0 2,129 29% 45 22
Total (all portfolios)
91,576 22,983 72% 108,074 3.14% 1,326,794 16% 15,170 14% 565 302

Pillar 3 Disclosures June 2019 26
10.4 Credit Exposures under Advanced Internal Ratings-Based Approach (A-IRBA) (continued)
31 Dec 2018
(a) (b) (c) (d) (e) (f) (g) (h) (i) (j) (k) (l)
On-
Balance Sheet 1/
Off-Balance Sheet 2/
Average CCF (%)
EAD 3/
(S$ million)
Average PD 4/
(%)
Number of Obligors 5/
Average LGD 4/
(%)
Average Maturity 6/
(In years)
RWA (S$
million)
RWA Density 7/
(%)
Expected Losses
(S$ million)
TEP 8/
(S$ million)
Residential Mortgage
(S$ million)
PD Range
0.00 to < 0.15 2,896 653 68% 3,342 0.09% 11,687 10% 78 2% #
0.15 to < 0.25 13,481 835 82% 14,164 0.15% 36,695 10% 499 4% 2
0.25 to < 0.50 12,239 685 73% 12,737 0.25% 43,828 10% 671 5% 3
0.50 to < 0.75 13,861 521 76% 14,255 0.50% 47,632 11% 1,249 9% 8
0.75 to < 2.50 6,500 361 80% 6,790 1.02% 33,802 11% 977 14% 7
2.50 to < 10.00 3,363 123 84% 3,466 3.58% 11,297 11% 1,029 30% 13
10.00 to < 100.00 1,030 11 92% 1,040 22.90% 6,503 12% 670 64% 28
100.00 (Default) 433 5 0% 433 100.00% 2,537 15% 299 69% 65
Sub-total 53,803 3,194 76% 56,227 1.76% 193,981 11% 5,472 10% 126 117
Qualifying Revolving Retail
PD Range
0.00 to < 0.15 709 5,489 44% 3,127 0.06% 525,466 80% 100 3% 1
0.15 to < 0.25 66 1,356 52% 770 0.17% 141,311 81% 61 8% 1
0.25 to < 0.50 227 775 44% 564 0.30% 94,302 81% 71 13% 1
0.50 to < 0.75 316 804 44% 666 0.59% 101,420 78% 138 21% 3
0.75 to < 2.50 293 574 61% 641 1.42% 87,267 83% 278 43% 8
2.50 to < 10.00 318 238 66% 475 5.13% 63,435 83% 505 106% 20
10.00 to < 100.00 123 71 76% 177 22.51% 22,570 84% 386 218% 34
100.00 (Default) 22 - 0% 22 100.00% 3,639 81% - 0% 23
Sub-total 2,074 9,307 47% 6,442 1.62% 1,039,410 81% 1,539 24% 91 37
Retail Small Business
PD Range
0.00 to < 0.15 301 259 56% 447 0.10% 2,613 27% 31 7% #
0.15 to < 0.25 1,322 481 47% 1,549 0.17% 5,947 33% 204 13% 1
0.25 to < 0.50 324 32 55% 341 0.35% 1,118 33% 70 21% #
0.50 to < 0.75 554 44 61% 581 0.50% 3,094 38% 168 29% 1
0.75 to < 2.50 906 91 56% 956 1.14% 7,534 43% 470 49% 5
2.50 to < 10.00 506 36 75% 533 4.45% 5,904 41% 337 63% 10
10.00 to < 100.00 319 14 80% 330 29.07% 2,742 42% 292 89% 39
100.00 (Default) 126 5 0% 126 100.00% 1,365 56% 184 146% 57
Sub-total 4,358 962 53% 4,863 5.42% 30,317 37% 1,756 36% 113 73
Pillar 3 Disclosures June 2019 27
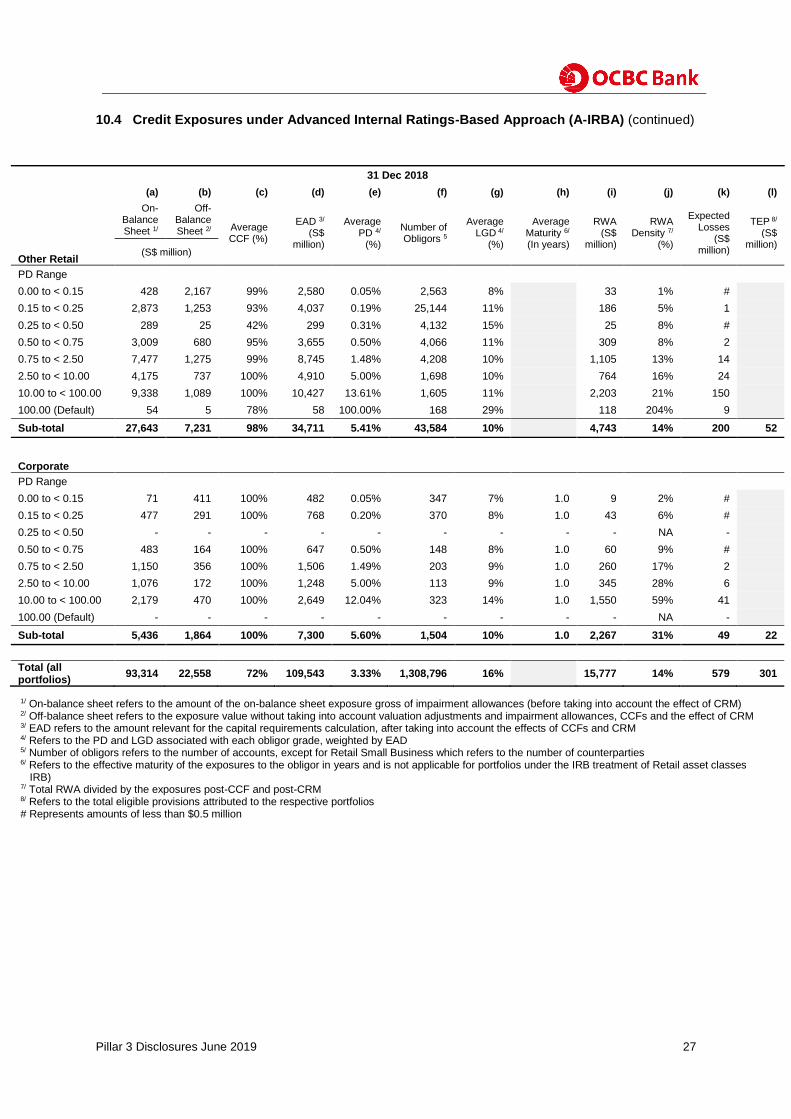
10.4 Credit Exposures under Advanced Internal Ratings-Based Approach (A-IRBA) (continued)
31 Dec 2018
(a) (b) (c) (d) (e) (f) (g) (h) (i) (j) (k) (l)
On-
Balance Sheet 1/
Off-Balance Sheet 2/ Average
CCF (%)
EAD 3/
(S$ million)
Average PD 4/
(%)
Number of Obligors 5
Average LGD 4/
(%)
Average Maturity 6/
(In years)
RWA (S$
million)
RWA Density 7/
(%)
Expected Losses
(S$ million)
TEP 8/
(S$ million)
Other Retail (S$ million)
PD Range
0.00 to < 0.15 428 2,167 99% 2,580 0.05% 2,563 8% 33 1% #
0.15 to < 0.25 2,873 1,253 93% 4,037 0.19% 25,144 11% 186 5% 1
0.25 to < 0.50 289 25 42% 299 0.31% 4,132 15% 25 8% #
0.50 to < 0.75 3,009 680 95% 3,655 0.50% 4,066 11% 309 8% 2
0.75 to < 2.50 7,477 1,275 99% 8,745 1.48% 4,208 10% 1,105 13% 14
2.50 to < 10.00 4,175 737 100% 4,910 5.00% 1,698 10% 764 16% 24
10.00 to < 100.00 9,338 1,089 100% 10,427 13.61% 1,605 11% 2,203 21% 150
100.00 (Default) 54 5 78% 58 100.00% 168 29% 118 204% 9
Sub-total 27,643 7,231 98% 34,711 5.41% 43,584 10% 4,743 14% 200 52
Corporate
PD Range
0.00 to < 0.15 71 411 100% 482 0.05% 347 7% 1.0 9 2% #
0.15 to < 0.25 477 291 100% 768 0.20% 370 8% 1.0 43 6% #
0.25 to < 0.50 - - - - - - - - - NA -
0.50 to < 0.75 483 164 100% 647 0.50% 148 8% 1.0 60 9% #
0.75 to < 2.50 1,150 356 100% 1,506 1.49% 203 9% 1.0 260 17% 2
2.50 to < 10.00 1,076 172 100% 1,248 5.00% 113 9% 1.0 345 28% 6
10.00 to < 100.00 2,179 470 100% 2,649 12.04% 323 14% 1.0 1,550 59% 41
100.00 (Default) - - - - - - - - - NA -
Sub-total 5,436 1,864 100% 7,300 5.60% 1,504 10% 1.0 2,267 31% 49 22
Total (all portfolios)
93,314 22,558 72% 109,543 3.33% 1,308,796 16% 15,777 14% 579 301
1/ On-balance sheet refers to the amount of the on-balance sheet exposure gross of impairment allowances (before taking into account the effect of CRM) 2/ Off-balance sheet refers to the exposure value without taking into account valuation adjustments and impairment allowances, CCFs and the effect of CRM 3/ EAD refers to the amount relevant for the capital requirements calculation, after taking into account the effects of CCFs and CRM 4/ Refers to the PD and LGD associated with each obligor grade, weighted by EAD 5/ Number of obligors refers to the number of accounts, except for Retail Small Business which refers to the number of counterparties 6/ Refers to the effective maturity of the exposures to the obligor in years and is not applicable for portfolios under the IRB treatment of Retail asset classes (A-
IRB) 7/ Total RWA divided by the exposures post-CCF and post-CRM 8/ Refers to the total eligible provisions attributed to the respective portfolios # Represents amounts of less than $0.5 million

Pillar 3 Disclosures June 2019 28
10.5 Overview of Credit Risk Mitigation Techniques
The table below provides an overview of the Group’s usage of Credit Risk Mitigation (CRM) techniques for on-
balance sheet exposures to Loans & Bills Receivable and Debt Securities, categorised by status followed by form
of instrument.
30 Jun 2019
(a) (b) (c) (d) (e)
S$ million Exposures unsecured
Exposures secured 1/
Exposures secured by
Collateral
Exposures secured by
Financial Guarantees
Exposures secured by Credit
Derivatives 2/
1 Loans and Bills Receivable
146,858 113,767 103,309 2,963 -
2 Debt Securities 24,356 494 - 494 -
3 Total 171,214 114,261 103,309 3,457 -
4 Of which: Defaulted 1,741 803 637 - -
31 Dec 2018
(a) (b) (c) (d) (e)
S$ million Exposures unsecured
Exposures secured 1/
Exposures secured by
Collateral
Exposures secured by
Financial Guarantees
Exposures secured by Credit
Derivatives 2/
1 Loans and Bills Receivable
140,826 114,942 104,654 3,111 -
2 Debt Securities 21,698 577 - 577 -
3 Total 162,524 115,519 104,654 3,688 -
4 Of which: Defaulted 1,723 902 700 - -
1/ Refers to carrying amount of exposures (net of impairment allowances) which have at least one credit risk mitigation mechanism, collateral or financial
guarantees associated with them
2/ Not applicable since the Group does not recognise credit derivatives as a form of CRM instrument for exposures
10.6 Effect on RWA of Credit Derivatives used as CRM
The Group does not recognise credit derivatives as a credit risk mitigant for exposures under F-IRBA or
A-IRBA.

Pillar 3 Disclosures June 2019 29
11. SPECIALISED LENDING UNDER SUPERVISORY SLOTTING CRITERIA
Exposures treated under the Supervisory Slotting Criteria include loans to customers for Project Financing (PF),
Object Financing (OF) and Commodity Financing (CF). Income Producing Real Estate (IPRE) exposures are
reported under F-IRBA.
30 Jun 2019
Specialised Lending Portfolio
(S$ million) EAD 3/
Regulatory Categories
Remaining Maturities On-
Balance Sheet 1/
Off-Balance Sheet 2/
Risk Weight
(%) PF OF CF Total RWA
Expected Losses
Strong Less than 2.5 years - - 50% - - - - - -
Equal to or more than 2.5 years - - 70% - - - - - -
Good Less than 2.5 years - - 70% - - - - - -
Equal to or more than 2.5 years - - 90% - - - - - -
Satisfactory 1,287 1,666 115% 1,725 176 91 1,992 2,428 56
Weak - - 250% - - - - - -
Default 129 - - 30 80 89 199 - 99
Total 1,416 1,666 1,755 256 180 2,191 2,428 155
31 Dec 2018
Specialised Lending Portfolio
(S$ million) EAD 3/
Regulatory Categories
Remaining Maturities On-
Balance Sheet 1/
Off-Balance Sheet 2/
Risk Weight
(%) PF OF CF Total RWA
Expected Losses
Strong Less than 2.5 years - - 50% - - - - - -
Equal to or more than 2.5 years - - 70% - - - - - -
Good Less than 2.5 years - - 70% - - - - - -
Equal to or more than 2.5 years - - 90% - - - - - -
Satisfactory 1,153 1,679 115% 1,298 132 159 1,589 1,938 45
Weak - - 250% - - - - - -
Default 121 - - 30 81 66 177 - 88
Total 1,274 1,679 1,328 213 225 1,766 1,938 133
1/ On-balance sheet refers to the amount of the on-balance sheet exposure net of impairment allowances and write-offs (after taking into account
the effect of CRM) 2/ Off-balance sheet refers to the exposure value without taking into account the effects of CCFs and CRM 3/ EAD refers to the amount relevant for capital requirements calculated by taking into account the effects of CCFs and CRM

Pillar 3 Disclosures June 2019 30
12. COUNTERPARTY CREDIT RISK
12.1 Counterparty Credit Risk Exposures by Approach Counterparty credit risk (CCR) is the risk of a counterparty defaulting before the final settlement of the
transaction, which generally represents uncertain exposures that can vary over time with the movement of
underlying market factors such as those in over-the-counter (OTC) derivatives.
The Group currently treats CCR under the Current Exposure Method (CEM), with regulatory prescribed add-
on that represents the potential future exposure in addition to the net replacement cost of the OTC
derivatives.
The table below provides an overview of the CCR for OTC derivatives and Securities Financing Transactions
(SFTs).
30 Jun 2019
(a) (b) (c) (d) (e) (f)
Counterparty Credit Risk Exposure by Approach Replacement
Cost
Potential Future
Exposure
Effective EPE
Alpha factor (α)
EAD 1/ RWA
(S$ million)
1 CEM (For derivatives) 4,138 7,885 6,879 2,089
2 CCR Internal models method (For derivatives and SFTs)
- - -
3 FC(SA) for SFTs - -
4 FC(CA) for SFTs 5,492 182
5 VaR for SFTs - -
6 Total 2,271
31 Dec 2018
(a) (b) (c) (d) (e) (f)
Counterparty Credit Risk Exposure by Approach Replacement
Cost
Potential Future
Exposure
Effective EPE
Alpha factor (α)
EAD 1/ RWA
(S$ million)
1 CEM (For derivatives) 4,768 7,680 7,225 1,828
2 CCR Internal models method (For derivatives and SFTs)
- - -
3 FC(SA) for SFTs - -
4 FC(CA) for SFTs 5,547 451
5 VaR for SFTs - -
6 Total 2,279
1/ EAD refers to the amount relevant for capital requirements calculation, after taking into account the effects of CRM

Pillar 3 Disclosures June 2019 31
12.2 CVA Risk Capital Charge The Credit Valuation Adjustment (CVA) is made to the mark-to-market valuation of OTC derivatives as
calculated under the Standardised approach for the Group.
30 Jun 2019
(a) (b)
S$ million
EAD 1/ RWA
Credit Valuation Adjustments (CVA) Risk Capital Requirements
Total portfolios subject to Advanced CVA capital requirement - -
1 (i) VaR component (including the three-times multiplier) - -
2 (ii) Stressed VaR component (including the three-times multiplier) - -
3 All portfolios subject to Standardised CVA capital requirement 6,348 2,881
4 Total portfolios subject to the CVA risk capital requirement 6,348 2,881
31 Dec 2018
(a) (b)
S$ million
EAD 1/ RWA
Credit Valuation Adjustments (CVA) Risk Capital Requirements
Total portfolios subject to Advanced CVA capital requirement - -
1 (i) VaR component (including the three-times multiplier) - -
2 (ii) Stressed VaR component (including the three-times multiplier) - -
3 All portfolios subject to Standardised CVA capital requirement 6,542 2,010
4 Total portfolios subject to the CVA risk capital requirement 6,542 2,010
1/ EAD refers to the amount relevant for capital requirements calculation, after taking into account the effects of CRM

Pillar 3 Disclosures June 2019 32
12.3 Exposures to Central Counterparties The table below provides an overview of the Group’s exposures to Central Clearing Counterparties (CCPs), including all types of exposures due to operations, margins, contributions to default funds and related capital requirements.
30 Jun 2019
(a) (b)
S$ million EAD RWA
1 Total exposures to qualifying CCPs 415
2 Exposures to qualifying CCPs 4,463 196
3 arising from: OTC derivative transactions; 4,463 196
4 arising from: Exchange-traded derivative transactions; # #
5 arising from: SFTs; and - -
6 arising from: Netting sets 1/ - -
7 Segregated collateral 2/ 67
8 Non-segregated collateral 905 218
9 Pre-funded default fund contributions 12 1
10 Unfunded default fund contributions - -
11 Total exposures to non-qualifying CCPs 10
12 Exposures to non-qualifying CCPs 2 2
13 arising from: OTC derivative transactions; - -
14 arising from: Exchange-traded derivative transactions; 2 2
15 arising from: SFTs; and - -
16 arising from: Netting sets 1/ - -
17 Segregated collateral 2/ -
18 Non-segregated collateral 8 8
19 Pre-funded default fund contributions - -
20 Unfunded default fund contributions - - 1/ Refers to netting assets where cross-product netting has been approved 2/ Refers to collateral which is held in a bankruptcy remote manner
# Represents amounts of less than $0.5 million

Pillar 3 Disclosures June 2019 33
12.4 Counterparty Credit Risk Exposures under Standardised Approach by Risk Weight
The table below represents the risk weights used in the calculation of capital for the Group’s portfolio, which
are subjected to the CCR requirements under the Standardised Approach by asset classes.
30 Jun 2019
(a) (b) (c) (d) (e) (f) (g) (h) (i)
Risk Weight Total EAD 1/
S$ million 0% 10% 20% 50% 75% 100% 150% Others
Asset Class
Sovereign 647 - - - - - - - 647
PSE - - - - - - - - -
MDB - - - - - - - - -
Bank - - 113 3 - # - - 116
Corporate - - # - - 128 - - 128
Regulatory Retail
- - - - - - - - -
Others 2/ - - - - - 72 - - 72
Total 647 - 113 3 - 200 - - 963
31 Dec 2018
(a) (b) (c) (d) (e) (f) (g) (h) (i)
Risk Weight Total EAD 1/
S$ million 0% 10% 20% 50% 75% 100% 150% Others
Asset Class
Sovereign 38 - - - - - - - 38
PSE - - - - - - - - -
MDB - - - - - - - - -
Bank - - 89 15 - - - - 104
Corporate - - # - - 96 - - 96
Regulatory Retail
- - - - - - - - -
Others 2/ - - - - - 53 - - 53
Total 38 - 89 15 - 149 - - 291
1/ EAD refers to the amount relevant for capital requirement calculation, after taking into account the effects of CRM 2/ Includes other exposures not included in the above asset classes
# Represents amounts of less than $0.5 million

Pillar 3 Disclosures June 2019 34
12.5 Counterparty Credit Risk Exposures under Foundation Internal Ratings-Based Approach (F-IRBA) The table below represents the parameters used in the calculation of capital for the Group’s portfolio, which are
subjected to the CCR requirements under the F-IRBA by asset classes.
30 Jun 2019
(a) (b) (c) (d) (e) (f) (g)
EAD 1/
(S$ million)
Average PD 2/
(%)
Number of Obligors 3/
Average LGD 2/
(%)
Average Maturity 4/
(In years)
RWA (S$
million)
RWA Density 5/
(%) Sovereign
PD Range
0.00 to < 0.15 3,207 0.00% 7 27% 0.1 1 0%
0.15 to < 0.25 - - - - - - NA
0.25 to < 0.50 - - - - - - NA
0.50 to < 0.75 - - - - - - NA
0.75 to < 2.50 - - - - - - NA
2.50 to < 10.00 - - - - - - NA
10.00 to < 100.00 - - - - - - NA
100.00 (Default) - - - - - - NA
Sub-total 3,207 0.00% 7 27% 0.1 1 0%
Bank
PD Range
0.00 to < 0.15 3,596 0.05% 128 32% 0.7 357 10%
0.15 to < 0.25 - - - - - - NA
0.25 to < 0.50 132 0.37% 6 44% 0.7 73 55%
0.50 to < 0.75 528 0.54% 9 29% 0.3 221 42%
0.75 to < 2.50 3 1.68% 5 23% 0.3 1 44%
2.50 to < 10.00 # 6.42% 1 45% 0.0 # 142%
10.00 to < 100.00 # 11.10% 3 45% 0.0 # 182%
100.00 (Default) - - - - - - NA
Sub-total 4,259 0.12% 152 32% 0.7 652 15%
Corporate
PD Range
0.00 to < 0.15 1,739 0.07% 196 39% 2.1 426 24%
0.15 to < 0.25 - - - - - - NA
0.25 to < 0.50 517 0.37% 81 22% 1.2 174 34%
0.50 to < 0.75 138 0.54% 71 45% 2.9 113 82%
0.75 to < 2.50 91 1.60% 91 45% 3.0 109 120%
2.50 to < 10.00 34 6.11% 18 45% 2.9 59 175%
10.00 to < 100.00 3 11.10% 37 45% 4.3 6 235%
100.00 (Default) 40 100.00% 2 45% 5.0 - 0%
Sub-total 2,562 1.85% 496 37% 2.0 887 35%

Pillar 3 Disclosures June 2019 35
12.5 Counterparty Credit Risk Exposures under Foundation Internal Ratings-Based Approach (F-IRBA)
(continued)
30 Jun 2019
(a) (b) (c) (d) (e) (f) (g)
EAD 1/
(S$ million)
Average PD 2/
(%)
Number of Obligors 3/
Average LGD 2/
(%)
Average Maturity 4/
(In years)
RWA (S$
million)
RWA Density 5/
(%) Corporate (IPRE)
PD Range
0.00 to < 0.15 27 0.14% 4 45% 3.1 12 44%
0.15 to < 0.25 - - - - - - NA
0.25 to < 0.50 17 0.37% 11 45% 3.0 12 70%
0.50 to < 0.75 45 0.54% 21 45% 3.8 42 93%
0.75 to < 2.50 50 1.33% 34 45% 2.5 53 107%
2.50 to < 10.00 # 3.20% 2 45% 1.0 # 119%
10.00 to < 100.00 - - - - - - NA
100.00 (Default) - - - - - - NA
Sub-total 139 0.72% 72 45% 3.1 119 86%
Corporate Small Business
PD Range
0.00 to < 0.15 15 0.14% 39 45% 4.6 6 45%
0.15 to < 0.25 # 0.17% 5 45% 0.2 # 17%
0.25 to < 0.50 2 0.37% 22 45% 1.4 1 61%
0.50 to < 0.75 89 0.54% 31 45% 0.0 36 40%
0.75 to < 2.50 1 1.29% 55 45% 1.4 1 81%
2.50 to < 10.00 1 3.42% 22 45% 2.4 1 111%
10.00 to < 100.00 # 16.05% 8 45% 0.8 # 156%
100.00 (Default) - - - - - - NA
Sub-total 108 0.55% 182 45% 0.7 45 43%
Total (all portfolios) 10,275 0.53% 909 32% 0.9 1,704 17%

Pillar 3 Disclosures June 2019 36
12.5 Counterparty Credit Risk Exposures under Foundation Internal Ratings-Based Approach (F-IRBA)
(continued)
31 Dec 2018
(a) (b) (c) (d) (e) (f) (g)
EAD 1/
(S$ million)
Average PD 2/
(%)
Number of Obligors 3/
Average LGD 2/
(%)
Average Maturity 4/
(In years)
RWA (S$ million)
RWA Density 5/
(%) Sovereign
PD Range
0.00 to < 0.15 3,112 0.00% 7 40% 0.1 # 0%
0.15 to < 0.25 - - - - - - NA
0.25 to < 0.50 - - - - - - NA
0.50 to < 0.75 - - - - - - NA
0.75 to < 2.50 - - - - - - NA
2.50 to < 10.00 - - - - - - NA
10.00 to < 100.00 - - - - - - NA
100.00 (Default) - - - - - - NA
Sub-total 3,112 0.00% 7 40% 0.1 # 0%
Bank
PD Range
0.00 to < 0.15 3,719 0.06% 123 31% 0.8 401 11%
0.15 to < 0.25 - - - - - - NA
0.25 to < 0.50 112 0.37% 8 44% 0.7 63 56%
0.50 to < 0.75 198 0.54% 8 45% 0.8 143 72%
0.75 to < 2.50 72 1.13% 4 1% 0.2 1 1%
2.50 to < 10.00 # 3.20% 1 45% 0.0 # 106%
10.00 to < 100.00 - 0.00% - 0% - - NA
100.00 (Default) - - - - - - NA
Sub-total 4,101 0.11% 144 32% 0.8 608 15%
Corporate
PD Range
0.00 to < 0.15 2,124 0.08% 180 39% 1.8 461 22%
0.15 to < 0.25 - - - - - - NA
0.25 to < 0.50 806 0.37% 76 16% 0.7 178 22%
0.50 to < 0.75 393 0.54% 78 45% 1.2 272 69%
0.75 to < 2.50 92 1.70% 90 45% 2.6 107 117%
2.50 to < 10.00 4 4.35% 18 45% 3.2 7 160%
10.00 to < 100.00 # 11.10% 30 45% 0.0 # 196%
100.00 (Default) 37 100.00% 2 45% 5.0 - 0%
Sub-total 3,456 1.31% 474 35% 1.5 1,025 30%

Pillar 3 Disclosures June 2019 37
12.5 Counterparty Credit Risk Exposures under Foundation Internal Ratings-Based Approach (F-IRBA)
(continued)
31 Dec 2018
(a) (b) (c) (d) (e) (f) (g)
EAD 1/
(S$ million)
Average PD 2/
(%)
Number of Obligors 3/
Average LGD 2/
(%)
Average Maturity 4/
(In years)
RWA (S$ million)
RWA Density 5/
(%) Corporate (IPRE)
PD Range
0.00 to < 0.15 16 0.14% 5 45% 2.9 6 41%
0.15 to < 0.25 - - - - - - NA
0.25 to < 0.50 8 0.37% 11 45% 1.7 4 55%
0.50 to < 0.75 27 0.54% 20 45% 3.1 23 84%
0.75 to < 2.50 28 1.38% 33 45% 2.8 33 112%
2.50 to < 10.00 # 3.48% 3 45% 1.2 # 125%
10.00 to < 100.00 - - - - - - NA
100.00 (Default) - - - - - - NA
Sub-total 79 0.76% 72 45% 2.8 66 83%
Corporate Small Business
PD Range
0.00 to < 0.15 6 0.14% 31 45% 4.4 3 44%
0.15 to < 0.25 # 0.17% 4 45% 0.2 # 16%
0.25 to < 0.50 3 0.37% 26 45% 1.2 1 46%
0.50 to < 0.75 392 0.54% 38 36% 0.0 185 47%
0.75 to < 2.50 2 1.63% 61 45% 2.2 2 93%
2.50 to < 10.00 1 3.65% 26 45% 1.2 1 104%
10.00 to < 100.00 # 11.10% 4 45% 1.0 # 194%
100.00 (Default) - - - - - - NA
Sub-total 404 0.54% 190 36% 0.1 192 48%
Total (all portfolios) 11,152 0.47% 887 35% 0.8 1,891 17%
1/ EAD refers to the amount relevant for capital requirements calculation, after taking into account the effects of CRM 2/ Refers to the PD and LGD associated with each obligor grade, weighted by EAD 3/ Number of obligors refers to the number of counterparties 4/ Refers to the effective maturity of the exposures to the obligor in years, weighted by EAD 5/ Total RWA divided by the exposures post-CRM
# Represents amounts of less than $0.5 million

Pillar 3 Disclosures June 2019 38
12.6 Counterparty Credit Risk Exposures under Advanced Internal Ratings-Based Approach (A-IRBA)
The table below represents the parameters used in the calculation of capital for the Group’s portfolio, which are
subjected to the CCR requirements under the A-IRBA by asset classes.
There was no CCR exposure within the other prescribed asset classes (Sovereign, Banks and Corporate Small
Business) under A-IRBA as at 30 June 2019.
30 Jun 2019
(a) (b) (c) (d) (e) (f) (g)
EAD 1/
(S$ million)
Average PD 2/
(%)
Number of Obligors 3/
Average LGD 2/
(%)
Average Maturity 4/
(In years)
RWA (S$ million)
RWA Density 5/
(%) Corporate
PD Range
0.00 to < 0.15 8 0.05% 39 7% 1.0 # 2%
0.15 to < 0.25 14 0.20% 72 7% 1.5 1 6%
0.25 to < 0.50 - - - - - - NA
0.50 to < 0.75 6 0.50% 31 7% 1.3 1 9%
0.75 to < 2.50 10 1.29% 47 8% 1.7 2 16%
2.50 to < 10.00 20 5.00% 28 9% 1.2 5 27%
10.00 to < 100.00 49 13.45% 108 15% 2.4 36 75%
100.00 (Default) - - - - - - NA
Sub-total 107 7.31% 325 11% 1.8 45 42%
Total (all portfolios)
107 7.31% 325 11% 1.8 45 42%
31 Dec 2018
(a) (b) (c) (d) (e) (f) (g)
EAD 1/
(S$ million)
Average PD 2/
(%)
Number of Obligors 3/
Average LGD 2/
(%)
Average Maturity 4/
(In years)
RWA (S$
million)
RWA Density 5/
(%) Corporate
PD Range
0.00 to < 0.15 26 0.05% 38 7% 0.7 # 2%
0.15 to < 0.25 20 0.20% 65 8% 1.1 1 5%
0.25 to < 0.50 - - - - - - NA
0.50 to < 0.75 9 0.50% 29 7% 0.5 1 8%
0.75 to < 2.50 19 1.61% 45 7% 0.5 3 14%
2.50 to < 10.00 23 5.00% 42 7% 1.2 5 23%
10.00 to < 100.00 46 14.92% 109 16% 2.0 38 81%
100.00 (Default) - - - - - - NA
Sub-total 143 5.92% 328 10% 1.2 48 33%
Total (all portfolios) 143 5.92% 328 10% 1.2 48 33%
1/ EAD refers to the amount relevant for capital requirements calculation, after taking into account the effects of CRM 2/ Refers to the PD and LGD associated with each obligor grade, weighted by EAD 3/ Number of obligors refers to the number of accounts 4/ Refers to the maturity of the exposures to the obligor in years, weighted by EAD 5/ Total RWA divided by the exposures post-CRM
# Represents amounts of less than $0.5 million

Pillar 3 Disclosures June 2019 39
12.7 Composition of Collateral for Counterparty Credit Risk Exposures
The table below represents all the types of collateral posted or received by the Group to support or reduce its
CCR exposures related to derivatives or securities financing transactions (SFTs), including transactions cleared
through Central Clearing Counterparties (CCP).
30 Jun 2019
(a) (b) (c) (d) (e) (f)
Collateral used in derivative transactions Collateral used in SFTs 1/
Fair value of collateral received Fair value of collateral posted Fair value of collateral received
Fair value of collateral
posted
S$ million Segregated 2/ Unsegregated Segregated 2/ Unsegregated
1 Cash - 1,973 67 2,210 2,722 2,389
2 Debt - 1,176 - 28 1,570 3,396
3 Equity - 1,025 - - - -
4 Others 3/ - 733 - - - -
5 Total - 4,907 67 2,238 4,292 5,785
31 Dec 2018
(a) (b) (c) (d) (e) (f)
Collateral used in derivative transactions Collateral used in SFTs 1/
Fair value of collateral received Fair value of collateral posted Fair value of collateral received
Fair value of collateral
posted
S$ million Segregated 2/ Unsegregated Segregated 2/ Unsegregated
1 Cash - 1,968 81 1,747 1,450 4,697
2 Debt - 1,087 - - 4,079 1,622
3 Equity - 989 - - - -
4 Others 3/ - 594 - - - -
5 Total - 4,638 81 1,747 5,529 6,319
1/ Refers to Securities Financing Transaction (i.e. Repos and Reverse Repos).
2/ Refers to collateral held in a bankruptcy remote manner
3/ Includes collateral not reported in the other categories

Pillar 3 Disclosures June 2019 40
12.8 Credit Derivative Exposures
The table below presents the Group’s exposure to credit derivatives by what had been bought or sold.
The decrease in notional for credit derivatives during the first half of 2019 was mainly driven by lower single-name credit default swaps offset by higher index credit default swaps.
30 Jun 2019 31 Dec 2018
(a) (b) (a) (b)
S$ million Protection Bought Protection Sold Protection Bought Protection Sold
Notional
1 Single-name credit default swaps 1,977 1,683 2,281 1,859
2 Index credit default swaps 1,315 1,330 1,150 1,098
3 Other credit derivatives 362 198 370 205
4 Total notional 3,654 3,211 3,801 3,162
Fair values
5 Positive fair value (asset) 14 50 25 33
6 Negative fair value (liability) 52 14 37 25
13. SECURITISATION EXPOSURES There was no securitisation and re-securitisation exposure in the banking and trading books as at 30 June 2019.

Pillar 3 Disclosures June 2019 41
14. MARKET RISK TYPE UNDER STANDARDISED APPROACH
During the first half of 2019, the increase in Market Risk RWA was driven mainly by higher Foreign
Exchange risk partially offset by lower Interest Rate.
30 Jun 2019
(a)
Market Risk by Standardised Approach RWA
S$ million
Notional
1 Interest rate risk (general and specific) 7,828
2 Equity risk (general and specific) 490
3 Foreign exchange risk 6,097
4 Commodity risk 7
Options
5 Simplified approach -
6 Delta-plus method 466
7 Scenario approach 75
8 Securitisation -
9 Total 14,963
31 Dec 2018
(a)
Market Risk by Standardised Approach RWA
S$ million
Notional
1 Interest rate risk (general and specific) 8,160
2 Equity risk (general and specific) 430
3 Foreign exchange risk 5,583
4 Commodity risk 11
Options
5 Simplified approach -
6 Delta-plus method 331
7 Scenario approach 154
8 Securitisation -
9 Total 14,669
There is no Market Risk exposure under Internal Model Approach as at 30 June 2019.

Pillar 3 Disclosures June 2019 42
15. INTEREST RATE RISK IN THE BANKING BOOK
Qualitative disclosures related to Interest Rate Risk in the Banking Book, including a description of its nature
and key assumptions made by the Group, can be found in the Risk Management chapter and Notes to the
Financial Statements of the Annual Report.
Based on a 100 bp parallel rise in yield curves on the Group's exposure to major currencies i.e. Singapore
Dollar, US Dollar, Hong Kong Dollar and Malaysian Ringgit, net interest income is estimated to increase by
S$820 million, or approximately +13.0% of reported net interest income (on an annualised basis). The
corresponding impact from a 100 bp decrease is an estimated reduction of S$820 million in net interest
income, or approximately -13.0% of reported net interest income (on an annualised basis).