
In this issue - HSBC HK
44
April-June 2012 In this issue Global economy Domestic economy and equity markets Debt markets Union budget 2012-13 Investment and portfolio strategy Funds in focus GLOBAL ECONOMY INVESTMENT AND PORTFOLIO STRATEGY
-
Upload
khangminh22 -
Category
Documents
-
view
3 -
download
0
Transcript of In this issue - HSBC HK

April-June 2012
In this issueGlobal economy
Domestic economy and equity markets
Debt markets
Union budget 2012-13
Investment andportfolio strategy
Funds in focus
�GLOBAL ECONOMY �INVESTMENT AND PORTFOLIO STRATEGY
2 Wealth Strategies - April -June 2012
Disclaimer:
© The Hongkong and Shanghai Banking Corporation Limited, India 2005
52/60 Mahatma Gandhi Road, Mumbai 400 001
For private circulation only. This publication has been issued by The Hongkong and Shanghai Banking Corporation Limited in India (HSBC), incorporated in Hong Kong SAR with limited liability, for the information of its customers who are resident in India. This publication should not be distributed to any other persons and in particular should not be distributed to customers nationals/residents of the United States of America, Canada, Australia and New Zealand. It cannot be reproduced or further disseminated.
This publication does not constitute investment advice or an offer to sell, or a solicitation of an offer to purchase or subscribe for any investment. The information herein is derived from publicly available sources that HSBC considers reliable but which has not been independently verified. Whilst every care has been taken in compiling the information, HSBC makes no guarantee, representation or warranty and accepts no responsibility or liability as to its accuracy or completeness. Some of the information in this document is derived from third party sources as specified at the relevant places where such information is set out. The Bank believes such information to be reliable but it has not independently verified the same. Expressions of opinion are those of HSBC only and are subject to change without notice. Opinions expressed herein do not have regard to specific investment objectives, financial situation and the particular needs of any specific person who may receive this publication. Investors should seek financial advice regarding the appropriateness of investing in any securities or investment strategies that may have been discussed in this publication and should understand that the views regarding future prospects may or may not be realised. This document is for circulation in India. The Bank makes no representations that the products or services mentioned in this document are available to persons of any other country or are necessarily suitable for any particular person or appropriate in accordance with their local law. Among other things, this means that the disclosures set forth in this document may not conform to rules of the regulatory bodies of any other country and investment in the products discussed will not afford the protection offered by the local regulatory regime in any other country. The information contained herein is confidential to the recipients thereof and may not be reproduced or otherwise disseminated. The Bank or its affiliates or their officers, directors and employees may have investments in any of the products mentioned in this publication (or in any related products) and may from time to time, add to or dispose of any such investment.
Investment involves risk, value of investment may increase or decrease and may become valueless. Past performance figures shown are not indicative of future performance. The relevant product offering documents should be read for further details.
3 Wealth Strategies - April -June 2012
GLOBAL ECONOMY 05
DOMESTIC ECONOMY AND EQUITY MARKETS 09
DEBT MARKETS 14
UNION BUDGET 2012-13 17
INVESTMENT AND PORTFOLIO STRATEGY 18
Investment Strategy 19
Investing in domestic consumption growth 19
Portfolio positioning in volatile markets 20
Hedge against agri-based inflation 21
Diversification 22
Tactical investment opportunities 22
FUNDS IN FOCUS 23

4 Wealth Strategies - April -June 2012
5 Wealth Strategies - April -June 2012
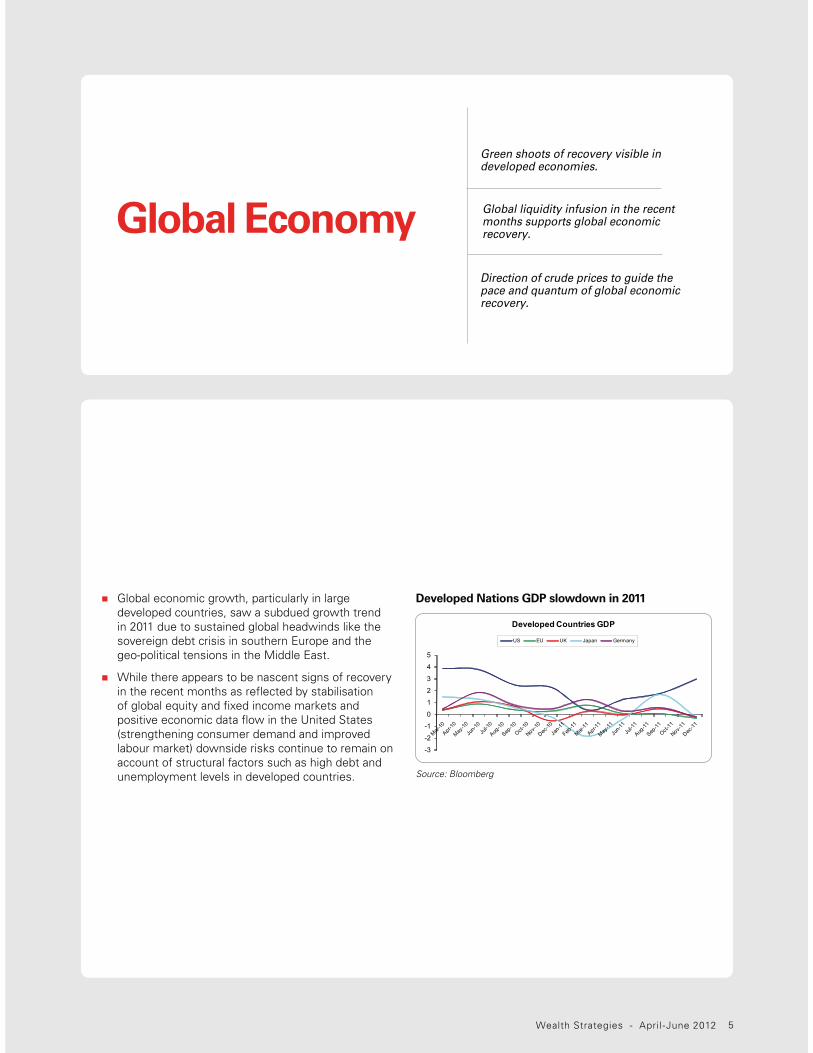
Direction of crude prices to guide the pace and quantum of global economic recovery.
Global liquidity infusion in the recent months supports global economic recovery.
Green shoots of recovery visible in developed economies.
Global Economy
� Global economic growth, particularly in large developed countries, saw a subdued growth trend in 2011 due to sustained global headwinds like the sovereign debt crisis in southern Europe and the geo-political tensions in the Middle East.
� While there appears to be nascent signs of recovery in the recent months as reflected by stabilisation of global equity and fixed income markets and positive economic data flow in the United States (strengthening consumer demand and improved labour market) downside risks continue to remain on account of structural factors such as high debt and unemployment levels in developed countries.
Developed Nations GDP slowdown in 2011
Source: Bloomberg
-3
-2
-1
0
1
2
3
4
5
Developed Countries GDP
US EU UK Japan Germany

6 Wealth Strategies - April -June 2012
� The fast paced growth of the BRIIC economies has been adversely impacted by a slowdown in the developed economies leading to fall in consumer and discretionary spending within the local nations. Key headwinds which may affect the recovery of the economies might be crude prices, geo-political developments and inflation.
BRIIC refers to Brazil, Russia, India, Indonesia and China.
� Global industrial growth moderated at the 50-mark (reading below 50 indicating a contraction). The Purchasing Managers Index (PMI) for developed markets has increased over the past quarters after sustained efforts of monetary infusion by central banks of large developed countries.
Emerging Nations GDP
Source: Bloomberg
5
6
7
8
9
10
11
12
0123456789
10
Mar-10
Apr-10
May-10
Jun-1
0
Jun-1
1Ju
l-10
Jul-1
1
Aug-10
Aug-11
Sep-10
Sep-11
Oct-10
Oct-11
Nov-10
Nov-11
Dec-11
Dec-10
Jan-1
1
Feb-11
Mar-11
Apr-11
May-11
BRIIC GDPBrazil Indonesia Russia China-RHS India-RHS
World PMI
Source: Bloomberg
World PMI
US UK EU GER China
4547495153555759616365
Jan-1
1
Feb-11
Mar-11
Apr-11
May-11
Jun-1
1Ju
l-11
Aug-11
Sep-11
Oct-11
Nov-11
Dec-11
Jan-1
2
Feb-12
� Global economic slowdown and a softening of commodity prices have seen an overall moderation in inflationary pressure across economies. The sustained increase in energy prices however may once again raise inflation concerns across economies over the coming quarters.
� Within the BRIIC nations, inflation has seen a marked downward trajectory mainly due to an economic slowdown, softening of hard commodities and stabilising food prices. This has also prompted most central banks to reduce interest rates, though the main headwind faced by these nations continues to be high energy costs.
Developed Market Inflation
Source: Bloomberg
Developed Market Inflation
US UK EU GERMANY
-0.5
1.5
3.5
5.5
Jan-1
1
Feb-11
Mar-11
Apr-11
May-11
Jun-1
1Ju
l-11
Aug-11
Sep-11
Oct-11
Nov-11
Dec-11
Jan-1
2
Feb-12
Emerging Market Inflation
Source: Bloomberg
BRIIC Inflation
China Indonesia Brazil Russia - RHS India - RHS
3456789
10
012345678
Jan-1
1
Feb-11
Mar-11
Apr-11
May-11
Jun-1
1Ju
l-11
Aug-11
Sep-11
Oct-11
Nov-11
Dec-11
Jan-1
2
Feb-12
7 Wealth Strategies - April -June 2012
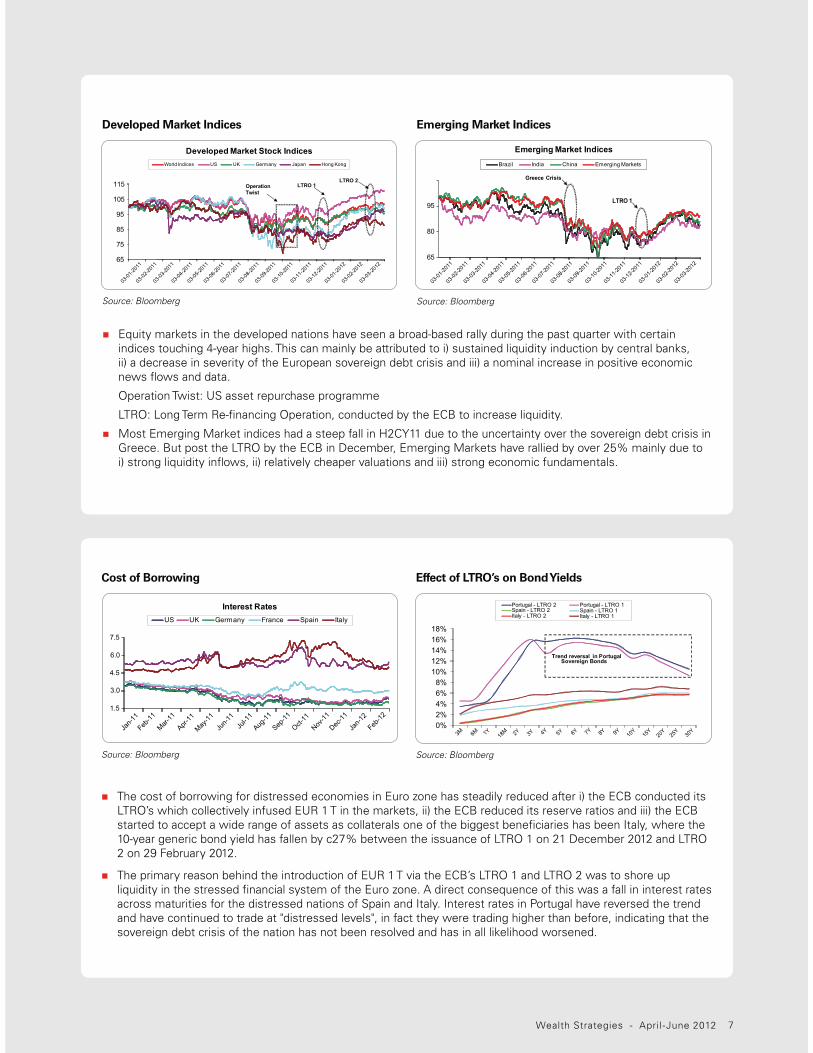
� Equity markets in the developed nations have seen a broad-based rally during the past quarter with certain indices touching 4-year highs. This can mainly be attributed to i) sustained liquidity induction by central banks, ii) a decrease in severity of the European sovereign debt crisis and iii) a nominal increase in positive economic news flows and data.
Operation Twist: US asset repurchase programme
LTRO: Long Term Re-financing Operation, conducted by the ECB to increase liquidity.
� Most Emerging Market indices had a steep fall in H2CY11 due to the uncertainty over the sovereign debt crisis in Greece. But post the LTRO by the ECB in December, Emerging Markets have rallied by over 25% mainly due to i) strong liquidity inflows, ii) relatively cheaper valuations and iii) strong economic fundamentals.
Developed Market Indices
Source: Bloomberg
Developed Market Stock IndicesWorld Indices US UK Germany Japan Hong Kong
65
75
85
95
105
115 LTRO 1 LTRO 2
Operation Twist
03-01
-2011
03-02
-2011
03-03
-2011
03-04
-2011
03-05
-2011
03-06
-2011
03-07
-2011
03-08
-2011
03-09
-2011
03-10
-2011
03-11
-2011
03-12
-2011
03-01
-2012
03-02
-2012
03-03
-2012
Emerging Market Indices
Source: Bloomberg
Emerging Market IndicesBrazil India China Emerging Markets
65
80
95
Greece Crisis
LTRO 1
03-01
-2011
03-02
-2011
03-03
-2011
03-04
-2011
03-05
-2011
03-06
-2011
03-07
-2011
03-08
-2011
03-09
-2011
03-10
-2011
03-11
-2011
03-12
-2011
03-01
-2012
03-02
-2012
03-03
-2012
� The cost of borrowing for distressed economies in Euro zone has steadily reduced after i) the ECB conducted its LTRO’s which collectively infused EUR 1 T in the markets, ii) the ECB reduced its reserve ratios and iii) the ECB started to accept a wide range of assets as collaterals one of the biggest beneficiaries has been Italy, where the 10-year generic bond yield has fallen by c27% between the issuance of LTRO 1 on 21 December 2012 and LTRO 2 on 29 February 2012.
� The primary reason behind the introduction of EUR 1 T via the ECB’s LTRO 1 and LTRO 2 was to shore up liquidity in the stressed financial system of the Euro zone. A direct consequence of this was a fall in interest rates across maturities for the distressed nations of Spain and Italy. Interest rates in Portugal have reversed the trend and have continued to trade at "distressed levels", in fact they were trading higher than before, indicating that the sovereign debt crisis of the nation has not been resolved and has in all likelihood worsened.
Cost of Borrowing
Source: Bloomberg
Interest RatesUS UK Germany France Spain Italy
1.5
4.5
6.0
3.0
7.5
Jan-1
1
Feb-11
Mar-11
Apr-11
May-11
Jun-1
1Ju
l-11
Aug-11
Sep-11
Oct-11
Nov-11
Dec-11
Jan-1
2
Feb-12
Effect of LTRO’s on Bond Yields
Source: Bloomberg
Portugal - LTRO 2 Spain - LTRO 2Italy - LTRO 2
Portugal - LTRO 1 Spain - LTRO 1 Italy - LTRO 1
0%2%4%6%8%
10%12%14%16%18%
Trend reversal in PortugalSovereign Bonds
3M 6M 1Y 18M 2Y 3Y 4Y 5Y 6Y 7Y 8Y 9Y 10
Y15
Y20
Y25
Y30
Y
8 Wealth Strategies - April -June 2012
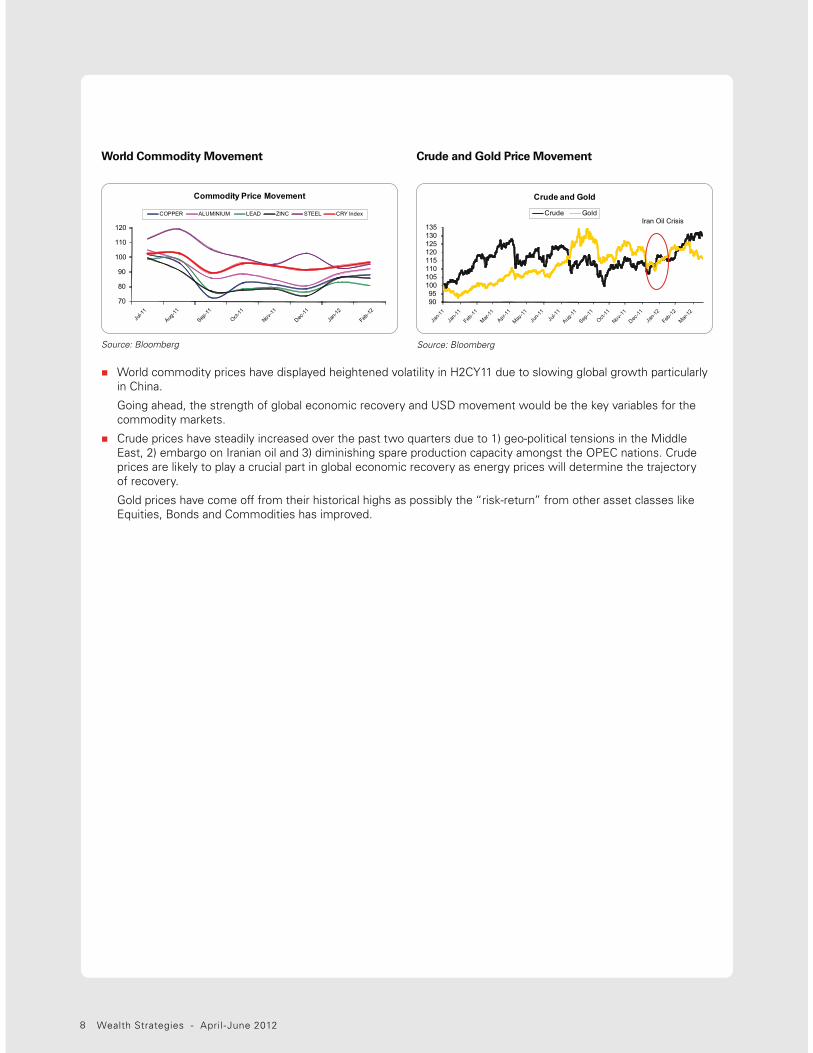
� World commodity prices have displayed heightened volatility in H2CY11 due to slowing global growth particularly in China.
Going ahead, the strength of global economic recovery and USD movement would be the key variables for the commodity markets.
� Crude prices have steadily increased over the past two quarters due to 1) geo-political tensions in the Middle East, 2) embargo on Iranian oil and 3) diminishing spare production capacity amongst the OPEC nations. Crude prices are likely to play a crucial part in global economic recovery as energy prices will determine the trajectory of recovery.
Gold prices have come off from their historical highs as possibly the “risk-return” from other asset classes like Equities, Bonds and Commodities has improved.
World Commodity Movement Crude and Gold Price Movement
Source: Bloomberg Source: Bloomberg
70
80
90
100
110
120
Commodity Price Movement
COPPER ALUMINIUM LEAD ZINC STEEL CRY Index
Crude and Gold
Crude Gold
9095
100105110115120125130135
Iran Oil Crisis

9 Wealth Strategies - April -June 2012
Domestic Economy and Equity Markets
Inflation risks yet to dissipate in the backdrop of high oil prices and volatile INR.
Indian equities regain lost ground backed by strong foreign fund flow in CY12; second best performing market amongst BRIC nation
Union Budget set fiscal deficit target of 5.1% of GDP for FY13; lower on account of expected increase in revenue receipts.
GDP growth moderated during the second half of the year 2011 led by fall in investment growth.
� India’s GDP growth eased further to 6.1% yoy during the Q3FY12 v/s 6.9% yoy in Q2FY12. Services sector registered strong growth of c8% followed by agricultural growth of c2%. Services continue to remain upbeat and shore up the GDP growth rate over the last three quarters while industrial growth was hit by under performance by mining and manufacturing that registered growth of c3% and c0.4% respectively.
� Components of GDP for Q2FY12 saw sharp downward reversion during the quarter. Consumption demand rose from revised growth of 2.92% yoy in Q2FY12 to c6.24% in Q3FY12. Government expenditure and investments too remained muted during the quarter. Going ahead, investment growth is likely to gain momentum as the government rolled out supportive measures such as tax concessions and funding options for infrastructure development in the Union Budget 2012. Government estimates GDP to grow by 6.9% in FY12.
Source: Bloomberg
Growth drops further… Industry growth slumps
14.00
12.00
10.00
8.00
6.00
4.00
2.00
0.00
-2.00
-4.00
Sep-09 Dec-09 Mar-10 Jun-10 Sep-10 Dec-10 Mar-11 Jun-11 Sep-11 Dec-11
Agriculture Industry Services GDP
Consumption recovers but government spending remains timid…
Source: Bloomberg
8.00%
6.00%
4.00%
2.00%
0.00%
-2.00%
-4.00%
-6.00%
Consumption Govt Expenditure Investments
(%yo
y)
Q2-FY12 Q3-FY12

10 Wealth Strategies - April -June 2012
� A slowdown in economy was mirrored in consumption demand coming off over the last few months. Key economic lead indicators like total car sales and cement dispatches showcased a declining trend on monthly basis, as high interest rate and input cost acted as headwinds.
� Industrial growth continued to remain volatile during the quarter. IIP for January 2012 moved up to 6.8% yoy against revised 2.5% in December 2011. Manufacturing production led the overall recovery, though mining continued to feel the heat on the backdrop of prevailing uncertainty in the mining industry. On the contrary, HSBC PMI eased in March 2012 to 54.7 compared to 56.6 in February 2012 on account of likely moderation in sequential output growth. January 2011 PMI reading was the highest in the last 8 months.
Source: Bloomberg
Industrial output continues to remain volatile…
42
44
46
48
50
52
54
56
58
60
-40
-30
-20
-10
0
10
20
30
40
50
60
Jun-11 Jul-11 Aug-11 Sep-11 Oct-11 Nov-11 Dec-11 Jan-12 Feb-12
% g
rowt
h (y
-o-y
)
Basic goods Capital goods Intermediate goodsConsumer goods IIP Manufacturing PMI
Source: Bloomberg
Key indicators remain sluggish…
-20.00%
-15.00%
-10.00%
-5.00%
0.00%
5.00%
10.00%
15.00%
Feb-11 Mar-11 Apr-11 May-11 Jun-11 Jul-11 Aug-11 Sep-11 Oct-11 Nov-11 Dec-11 Jan-12 Feb-12
Cement Dispatches (MOM) Car Sales (MOM)
� After holding above the 9% mark since April, WPI Inflation eased to 7.7% (yoy) in December further easing to 6.95% (yoy) in February responding to RBI’s monetary tightening. The slowdown in the pace of inflation was also supported by a favourable base effect of last year when inflation rose by an average of 9.5% and favourable monsoons during CY11 aided in limiting food inflation.
� Upward risks to inflation have however resurfaced in CY12 on increase in global crude oil prices that have shot up to cUSD 127 per barrel (Brent) on geopolitical concerns. The recent depreciation of the INR against the USD has also increased the risks of imported inflation. Moreover, slowing trend in the primary articles index of inflation is showing signs of reversal indicating risks of spillover into food prices.
� In the near term, risks to inflation have increased following the increase in the indirect taxes (excise and custom duties) announced in the Union Budget but will be supported by the high base of last year. However, with the fiscal deficit expected to reduce in FY13, inflation pressures in the medium to long term are expected to ease although it will take cues from factors such as crude oil prices and currency impact.
Crude Oil and Currency may impact the future inflation trajectory
Source: Bloomberg
40
42
44
46
48
50
52
54
80
85
90
95
100
105
110
115
120
125
130
Jan-10
Feb-10
Mar-10
Apr-10
May-10
Jun-10
Jul-10
Aug-10
Sep-10
Oct-10
Nov-10
Dec-10
Jan-11
Feb-11
Mar-11
Apr-11
May-11
Jun-11
Jul-11
Aug-11
Sep-11
Oct-11
Nov-11
Dec-11
Jan-12
Feb-12
Mar-12
Crude Oil (Brent) INR/ USD (RHS)
Led by favourable base effect, Inflation slowed in recent months
Source: Bloomberg
Repo Rate % WPI Infla�on (yoy %)
4
5
6
7
8
9
10
11
29-01-1019-03-10
20-04-1002-07-10
27-07-1016-09-10
02-11-1003-12-10
16-12-1025-01-11
17-03-1103-05-11
16-06-1126-07-11
16-09-1125-10-11
16-12-1131-12-11
31-01-1229-02-12
Infla�on slowing
pause in monetary �ghtening
11 Wealth Strategies - April -June 2012
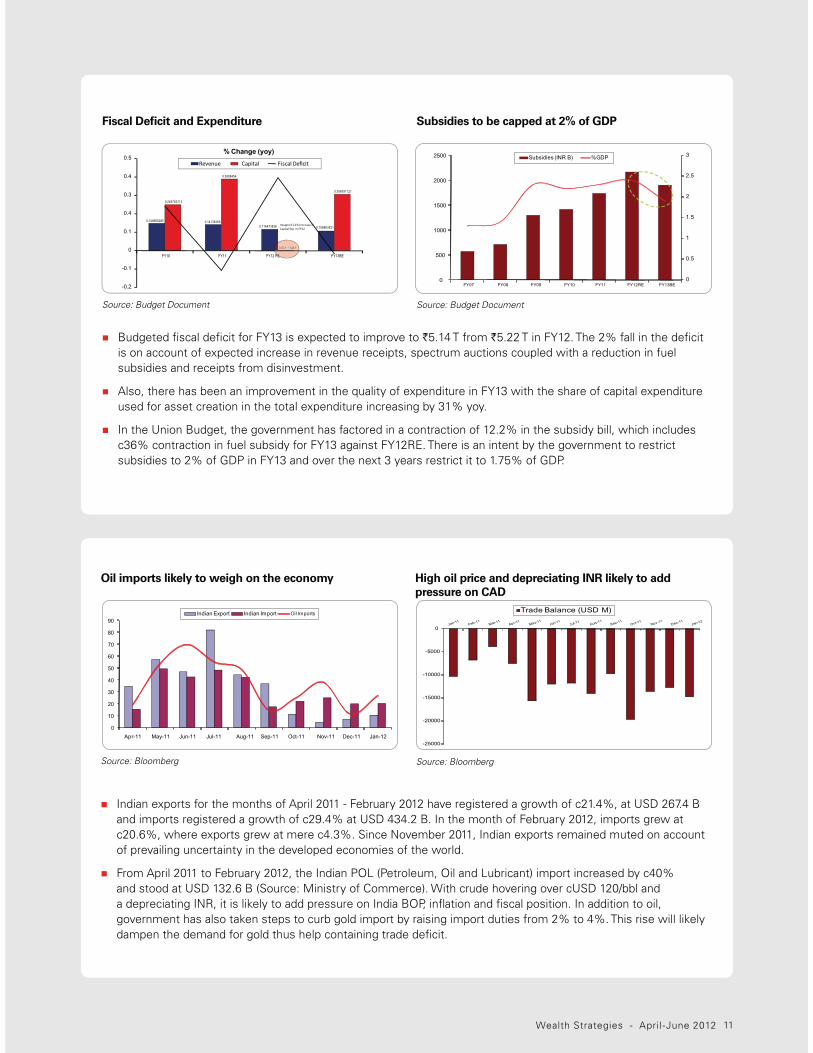
� Budgeted fiscal deficit for FY13 is expected to improve to `5.14 T from `5.22 T in FY12. The 2% fall in the deficit is on account of expected increase in revenue receipts, spectrum auctions coupled with a reduction in fuel subsidies and receipts from disinvestment.
� Also, there has been an improvement in the quality of expenditure in FY13 with the share of capital expenditure used for asset creation in the total expenditure increasing by 31% yoy.
� In the Union Budget, the government has factored in a contraction of 12.2% in the subsidy bill, which includes c36% contraction in fuel subsidy for FY13 against FY12RE. There is an intent by the government to restrict subsidies to 2% of GDP in FY13 and over the next 3 years restrict it to 1.75% of GDP.
Fiscal Deficit and Expenditure
Source: Budget Document
0.148666285 0.141382680.116473836 0.106863521
0.249783713
0.3898454
0.001117461
0.306391121
-0.2
-0.1
0
0.1
0.4
0.3
0.4
0.5
FY10 FY12 RE FY13BEFY11
% Change (yoy) Revenue Capital Fiscal Deficit
0.001117461
RE
meagre 0.11% increase in Capital Exp in FY12
Subsidies to be capped at 2% of GDP
Source: Budget Document
0
0.5
1
1.5
2
2.5
3
0
500
1000
1500
2000
2500
FY07 FY08 FY09 FY10 FY11 FY12RE FY13BE
Subsidies (INR B) %GDP
� Indian exports for the months of April 2011 - February 2012 have registered a growth of c21.4%, at USD 267.4 B and imports registered a growth of c29.4% at USD 434.2 B. In the month of February 2012, imports grew at c20.6%, where exports grew at mere c4.3%. Since November 2011, Indian exports remained muted on account of prevailing uncertainty in the developed economies of the world.
� From April 2011 to February 2012, the Indian POL (Petroleum, Oil and Lubricant) import increased by c40% and stood at USD 132.6 B (Source: Ministry of Commerce). With crude hovering over cUSD 120/bbl and a depreciating INR, it is likely to add pressure on India BOP, inflation and fiscal position. In addition to oil, government has also taken steps to curb gold import by raising import duties from 2% to 4%. This rise will likely dampen the demand for gold thus help containing trade deficit.
Oil imports likely to weigh on the economy
Source: Bloomberg
0
10
20
30
40
50
60
70
80
90
Apr-11 May-11 Jun-11 Jul-11 Aug-11 Sep-11 Oct-11 Nov-11 Dec-11 Jan-12
Indian Export Indian Import Oil Imports
High oil price and depreciating INR likely to add pressure on CAD
Source: Bloomberg
-25000
-20000
-15000
-10000
-5000
0
Trade Balance (USD M)

12 Wealth Strategies - April -June 2012
Primary market activity remains muted
Source: SEBI Bulletin February 2012
� Primary market trends during FY12 remained sluggish compared to FY11 as most corporate houses deferred their capital raising activity on account of unsupportive market conditions that prevailed during most part of FY12. Total amount raised till January 2012 stands at `323 B.
Items
Jan-12 Dec-11 2011-12$ 2010-11$
No. of Issues
Amount (` crore)
No. of Issues
Amount (` crore)
No. of Issues
Amount (` crore)
No. of Issues
Amount (` crore)
Public Issues 1 6,300.0 3 10,759.3 42 32,375.8 56 50,046.9
Public Issue (Equity) of which
0 0.0 0 0.0 30 9,559.0 52 47,801.9
IPOs 0 0.0 0 0.0 29 4,980.8 47 34,706.9
FPOs 0 0.0 0 0.0 1 4,578.2 5 13,095.1
� Indian equities regained momentum in the new year backed by strong foreign fund flow and mean reversion sentiments. Indian markets were the second best performing amongst the BRIC nations, gaining c14% as on 30 March 2012. Markets moved in conjunction with global peers as macro sentiments showed signs of improvement. Key domestic events such as state elections, Union Budget and monetary policy review were watched closely by market participants during the quarter.
� Liquidity induction by global Central Banks probably resulted in strong foreign fund flows into Indian equities during the quarter. FII’s were net buyers of cUSD 9 B worth of equities during the first three months of 2012.
BRIC refers to Brazil, Russia, India and China
Indian Equities Overview
Foreign fund flows remained positive in CY12
Source: Bloomberg
0
5000
10000
15000
20000
25000
-3000
-2000
-1000
0
1000
2000
3000
4000
5000
6000
Apr-11 May-11 Jun-11 Jul-11 Aug-11 Sep-11 Oct-11 Nov-11 Dec-11 Jan-12 Feb-12 Mar-12
Global Liquidity infusion by Central banks supported FII inflows into equi�es
15
FII (USD M) Sensex
Indian equities gained during the quarter; second best among BRIC nations
Source: Bloomberg
30.00%
20.00%
10.00%
0.00%
-10.00%
-20.00%
-30.00%
Russia India EM Brazil World China
YTD 1 year 6 months

13 Wealth Strategies - April -June 2012
Sensex valuation continues to remain in line with historical average
Industrials and consumption sectors outperform…
Source: BloombergSource: Bloomberg
� On the sectoral front, banking was amongst the top two sectors during the quarter. It gained c23% on account of likely rate cut expectation by the Central Bank. Industrial sectors such as capital goods, metals and power too gained momentum on likely mean reversion sentiments.
� Sensex at 17000 continues to trade in line with historical averages making it a fairly priced market. Going ahead, markets are likely to take cues from global developments such as geopolitical tensions over Iran, Euro sovereign debt crisis, slowdown in China and resurgence of US economy. Key domestic events which are likely to keep markets interested in near term include policy action by the Central Bank, inflation and reform actions by the government. Inflation concerns are likely to continue in near term with rising crude price translating in broad based price rise.
-10.00%-5.00%0.00%5.00%
10.00%15.00%20.00%25.00%30.00%35.00%
Rea
lty
Ban
k
Cap
ital G
oods
Met
al
Con
sum
er D
urab
le
Pow
er
Hea
lth C
are
FMC
G
Oil&
Gas IT
3 months 6 months
Jan-01
Sep-01
Jun-02
Mar-03
Dec-03
Sep-04
Jun-05
Mar-06
Dec-06
Sep-07
Jun-08
Mar-09
Dec-09
Sep-10
Jun-11
Mar-12
30
25
20
15
10
5
0
Historic P/E

14 Wealth Strategies - April -June 2012
Money Market instrument 30-Mar-12 30-Dec-11 Change in bps
CP 1M 11.56 10.05 151
CP 3M 11.27 9.83 144
CP 6M 11.20 9.95 125
CP 12M 10.93 10.10 83
CD 1M 11.45 9.60 185
CD 3M 10.70 9.43 127
CD 6M 10.50 9.69 81
CD 12M 10.15 9.75 40
Debt MarketsFiscal deficit lower than last year but largely financed by market borrowings
Pace and quantum of rate cuts to be determined by evolving growth-inflation dynamics
Shorter maturity bonds underperform, corporate bonds lead the fall
� G-sec yield curve, barring few maturities, moved higher during the quarter in the range of 5 to 40 bps. Corporate bond yields too moved up displaying a similar trend in curve movement. G-sec curve outperformed the corporate bond curve at the shorter end but lagged corporate bonds in the medium to longer end. Meanwhile, money market instruments were the worst hit, rising between 40 to 185 bps on tight liquidity conditions.
� Bond yields were mostly impacted by 1) concerns of fiscal deficit slippages, 2) higher crude oil prices triggering fresh concerns of inflation, 3) delay in monetary easing, 4) tight liquidity conditions impacting demand and 5) high market borrowings planned for FY13.
� Markets were however supported by 1) Open Market Operations (OMOs) conducted by RBI, INR 880 B infused during Q1CY12, 2) infusion of liquidity through a 125 bps cut in Cash Reserve Ratio (CRR), INR 800 B added to the banking system, 3) FII inflows into debt markets, USD 4 B received during the quarter, Qualified Foreign Investors (QFIs) permitted to access corporate bond markets in the Union Budget and 4) easing inflation pressures, WPI inflation rose by c7% each in Jan and Feb.
Bond yields rise during the quarter;
shorter end of the curve underperforms
the longer end
Source: Bloomberg
Corporate Bond Yield Curve
Source: Bloomberg
Money Market instrument yields remain elevated on liquidity tightness
Source: Bloomberg
G-sec and Corporate bond yields move higher during the quarter: G-Sec Yield Curve
Change in bps (RHS) 30-Mar-12 30-Dec-11
9.0%
8.8%
8.6%
8.4%
8.2%
8.0%
7.8%
50
40
30
20
10
-
(10)
91 d
ay
182
day
1 yr
2 yr
4 yr
5 yr
6 yr
7 yr
8 yr
9 yr
10 yr
11 yr
15 yr
30 yr
-40
-20
0
20
40
60
80
9.0%
9.2%
9.4%
9.6%
9.8%
10.0%
10.2%
10.4%
3MO 6MO 1YR 2YR 3YR 4YR 5YR 6YR 7YR 8YR 9YR 10YR 15YR
Change in bps (RHS) 30-Mar-12 30-Dec-11
15 Wealth Strategies - April -June 2012
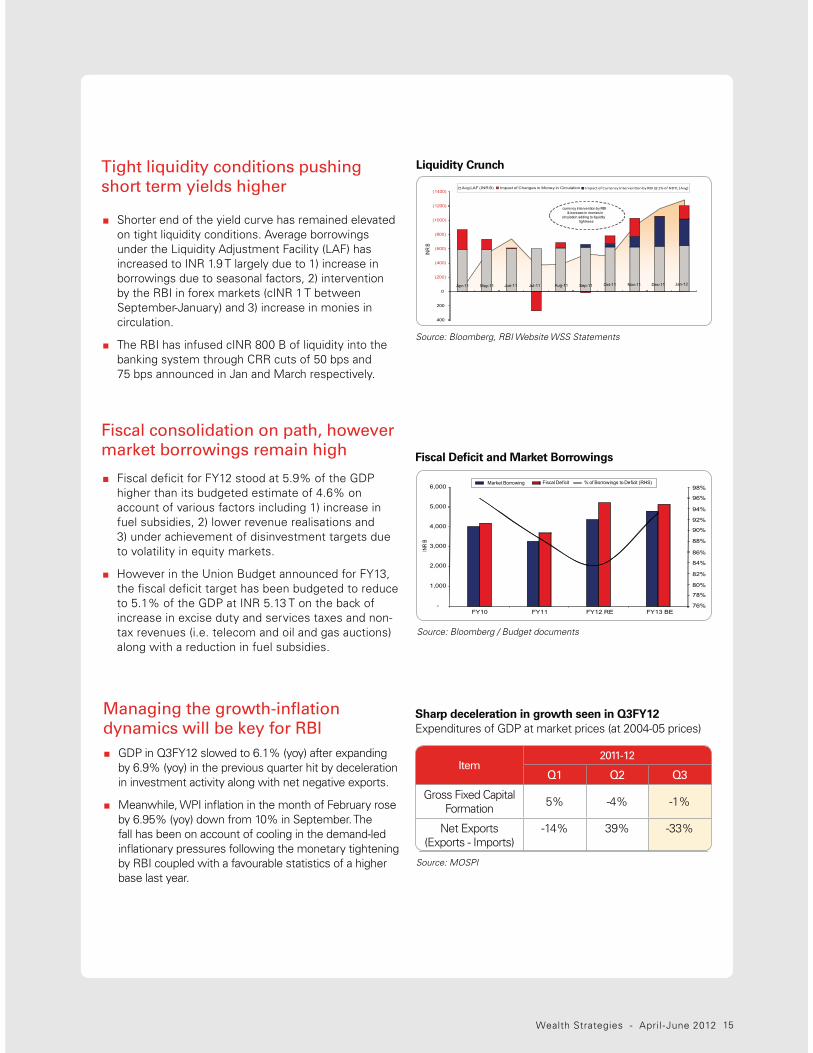
Tight liquidity conditions pushing
short term yields higher
� Shorter end of the yield curve has remained elevated on tight liquidity conditions. Average borrowings under the Liquidity Adjustment Facility (LAF) has increased to INR 1.9 T largely due to 1) increase in borrowings due to seasonal factors, 2) intervention by the RBI in forex markets (cINR 1 T between September-January) and 3) increase in monies in circulation.
� The RBI has infused cINR 800 B of liquidity into the banking system through CRR cuts of 50 bps and 75 bps announced in Jan and March respectively.
Liquidity Crunch
Source: Bloomberg, RBI Website WSS Statements
� Fiscal deficit for FY12 stood at 5.9% of the GDP higher than its budgeted estimate of 4.6% on account of various factors including 1) increase in fuel subsidies, 2) lower revenue realisations and 3) under achievement of disinvestment targets due to volatility in equity markets.
� However in the Union Budget announced for FY13, the fiscal deficit target has been budgeted to reduce to 5.1% of the GDP at INR 5.13 T on the back of increase in excise duty and services taxes and non-tax revenues (i.e. telecom and oil and gas auctions) along with a reduction in fuel subsidies.
Fiscal consolidation on path, however
market borrowings remain high Fiscal Deficit and Market Borrowings
Source: Bloomberg / Budget documents
Managing the growth-inflation
dynamics will be key for RBI
� GDP in Q3FY12 slowed to 6.1% (yoy) after expanding by 6.9% (yoy) in the previous quarter hit by deceleration in investment activity along with net negative exports.
� Meanwhile, WPI inflation in the month of February rose by 6.95% (yoy) down from 10% in September. The fall has been on account of cooling in the demand-led inflationary pressures following the monetary tightening by RBI coupled with a favourable statistics of a higher base last year.
Sharp deceleration in growth seen in Q3FY12Expenditures of GDP at market prices (at 2004-05 prices)
Source: MOSPI
Item2011-12
Q1 Q2 Q3
Gross Fixed Capital Formation 5% -4% -1%
Net Exports (Exports - Imports)
-14% 39% -33%
(1400)
(1200)
(1000)
(800)
(600)
(400)
(200)
0
200
400
Apr-11 May-11 Jun-11 Jul-11 Aug-11 Sep-11 Oct-11 Nov-11 Dec-11 Jan-12
INR
B
Avg LAF (INR B) Impact of Changes in Money in Circulation Impact of Currency Interven�on by RBI 1% of NDTL (Avg)
currency intervention by RBI & increase in monies in
circulation adding to liquidity tightness
Market Borrowing Fiscal Deficit % of Borrowings to Deficit (RHS)
-
4,000
3,000
2,000
1,000
5,000
6,000 98%
96%
94%
92%
90%
88%
86%
84%
82%
80%
78%
76%FY10
INR
B
FY11 FY12 RE FY13 BE

16 Wealth Strategies - April -June 2012
Debt Market Outlook
� Going forward, the bond yield curve will likely take cues from:
i. Sustainability in the pace of growth in the coming months. RBI has projected a growth of 7% for FY12.
ii. The inflation trajectory going forward impacted by developments on global crude oil prices, INR levels against the USD, underlying components of inflation including food and non-food, developments on the onset of normal monsoon. Inflation pressures will impact the pace of monetary easing.
iii. Movement of INR against the USD taking cues from foreign inflows, crude oil prices and global developments.
iv. Liquidity conditions easing from these levels will benefit the bond markets especially the shorter end of the curve.
v. Global developments impacting risk aversion diverting flows into riskier assets.
Increase in upward risks to inflation
Source: Bloomberg
� However, the recent surge in crude oil prices on various geopolitical concerns coupled with strengthening of the USD against the INR have increased upwards risks to inflationary pressures. Also, food prices have been showing an upward trend after declining for the past few months.
�� While the Central Bank has stated that further actions will be towards lowering rate, the timing and quantum of rate cuts will be determined by pace of growth and inflationary pressures.
Crude/Currency Impact (RHS)Oil Prices (USD per bbI) RHSFuel & PowerMfgPrimary Articles
18.0
12.2
8.0 8.18.9
8.2
3.6
7.6
2.3
6.5 6.3 5.8
12.814.0
11.0
14.8 15.5 15.014.2
Sep-11 Oct-11 Nov-11 Dec-11 Jan-12 Feb-12
16.0
14.0
12.0
10.0
8.0
6.0
4.0
2.0
0.0
140
120
100
80
60
40
20
0
nascent fuel
primaryarticles
inflation rising
inflation pressures
4.22

17 Wealth Strategies - April -June 2012
Union Budget 2012-13OverviewThe Budget was presented in the backdrop of moderating growth and deteriorating fiscal balances and private investments. The economy after clocking a yoy growth of above 8% in FY10 and FY11, decelerated in FY12 (expected to grow by 7%) impacted by the global economic slowdown and Euro-region debt concerns, higher crude oil prices and tighter domestic monetary policy. The focus in this Budget has been therefore to strengthen domestic growth drivers including fiscal consolidation, boosting infrastructure expenditure, private investment, develop agriculture sector, improving inclusion and strengthening corporate governance in the backdrop in recovery in macroeconomic environment.
Government FinancesWhile the government’s total budgeted expenditure growth for FY13 has been largely unchanged at c13% yoy, the share of capital expenditure used for asset creation in the total expenditure has increased by 31% yoy (as against a meagre 0.11% growth last year) in FY13, thereby improving the quality of expenditure.
The government has budgeted for a 13% increase in total receipts with the revenue receipts estimated to increase by 22% during FY13, targeting higher revenues to lower its deficit. The jump in revenue receipts is largely expected to come through increases in excise duty and service taxes and spectrum auctions. The increase in indirect taxes could be inflationary in nature in the near term though in the longer term will aid the fiscal consolidation process.
Fiscal ConsolidationThe budgeted fiscal deficit for FY13 therefore stands reduced at 5.1% of the GDP at INR 5.13 T lower by 1.6% over last year’s figure. The government has been able to limit the target fiscal deficit for FY13 on account of expected increase in revenue receipts, spectrum auctions coupled with a reduction in fuel subsidies and receipts from disinvestment. Target for fuel subsidies is estimated at sub-2% of the GDP as against 2.4% of last year. On the flip side though, in FY13, c93% of the fiscal deficit is slated to be financed through market borrowings, raising upward risks to inflation and G-sec supply pressure is therefore expected to remain in FY13.
Revised Estimates
2011 - 2012
Budget Estimates
2012 - 2013
Revenue Deficit 4.4 3.4
Fiscal Deficit 5.9 5.1
(Source: Budget documents)
Infrastructure and investment growth measuresDuring the current year, the growth rate of investment in the economy registered a considerable slowdown as reflected by growth in manufacturing sector. According to Central Statistical Organisation (CSO), the growth in gross capital formulation is estimated to decelerate to 5.8% in the current fiscal year from an average 11% in the previous two years. While the government has announced several measures including external commercial borrowings for various sectors, extending viability gap funding by bringing in more sectors under infrastructure, doubling the amount that can be raised under tax-free bonds, supporting the subsidy payments through the AADHAR platform, there were no announcements on the reforms front (i.e. FDI in the aviation sector, GST). However, the reforms announcement need not be restricted to the Union Budget and may come through in the later part of the year.
SummaryTo summarise, the Budget displays the government’s approach to bring the deficit down to more sustainable levels and at the same time re-orienting expenditure strategy towards priority sectors like health, education, irrigation, infrastructure and investment-related activities. The fiscal policy of 2012-13 has been designed by the government with the assumption that the growth would be bottomed out during 2011-12 at 6.9%. For 2012-13, the government has estimated a real GDP growth of 7.6% with a deviation of 0.25 bps on either side. As with all announcements, the risks to the budgeted projections critically hinge upon policy implementations (including the subsidy reduction) and realisations of the growth forecasts.

18 Wealth Strategies - April -June 2012
Investment and
Portfolio StrategyInvestment Strategy 19
Investing in domestic consumption growth 19
Portfolio positioning in volatile markets 20
Hedge against agri-based inflation 21
Diversification 22
Tactical investment opportunities 22
The above should be read in conjunction with all the disclaimers appearing in the publication.

19 Wealth Strategies - April -June 2012
Global equity markets have recovered from the lows of Q4 2011 primarily led by i) large liquidity infusion by global Central Banks, ii) better than expected growth indicators in the US and Europe and iii) abatement of risk of financial crises. While the recovery in Indian equities have been swift during the quarter, the road ahead for equity markets are likely to be volatile on account of factors such as i) high crude oil prices and its economic impact on currency, interest rates and inflation and ii) recovery in global markets continues to remain subdued due to structural factors such as high unemployment and debt de-leveraging.
On the fixed income space, the current high interest rates will look ahead for policy actions by the Reserve Bank of India (RBI), both on the liquidity front and cost of borrowing, before it heads lower during the course of the year. Besides crude prices, the conduct of large government borrowing by the RBI would be an important variable for longer-term tenure bond yields during the year.
Given the market scenario, investors may consider adopting an asset allocation in line with their risk profile and use a systematic investment and transfer approach to investing. The investor may consider aligning their portfolios towards actively managed products that vary their asset allocation on pre-defined valuation levels, large cap oriented equity funds, and products that invest into high dividend yielding companies. Diversification towards international funds would seek to reduce India-specific risk factors in the portfolio. In the debt space, on a risk-return basis, we remain favourable at the shorter end of the curve.
Investment Strategy
Investing in domestic consumption growth
Product Category
�� Products predominantly maintaining a sizeable exposure to large caps vis-à-vis mid and small cap stocks.
� Products that adopt a bottom-up style of portfolio management focussing on individual stock valuations and not driven by near term market momentum.
� Products that are diversified in nature, avoiding sizeable exposure to a particular sector.
� Products adopting a bottom-up nimble approach to investing capitalising on opportunities presented by sharp market movements.
� Products predominantly investing into dividend yield stocks.
Even as the GDP during Q3FY12 slowed to c6%, India’s economy is expected to grow by 7% in FY12, improving to 7.6% in FY13 led by growth in services and industry sectors. This recovery in growth will also reflect in the broad equity markets. Also while, the recent sell-off in the market has been broad-based, select stocks spread across sectors have displayed strong resilience in the midst of volatility and offer growth opportunities for investors. �� Large Cap oriented funds – Large cap stocks are typically better positioned to tide through market volatility
when compared to mid and small cap stocks on account of deeper and greater participation, comprehensive coverage and higher liquidity.
�� Funds adopting a nimble approach – This style of investing focusses on capitalising on opportunities from steep market movements while being nimble in their approach to investing.
�� Dividend yield funds – These funds invest a considerable part of their portfolio into high dividend yield companies offering stability in returns in the form of dividends.

20 Wealth Strategies - April -June 2012
Markets are expected to remain volatile on developments in the Euro region debt situation, domestic newsflows on inflation, corporate earnings results, pace of economic growth, etc. Also with the increase in global liquidity following stimulus measures adopted by various governments (i.e. Euro and US region) to support their economies, degree of risk aversion will determine the allocations to markets adding to volatility. � Dynamic funds – Adopting an active management style that seeks to play out market trends and developments
across a host of sectors and themes while dynamically changing its asset allocation may help check the portfolio volatility.
�� Asset – Allocation funds – Funds that do not get carried away by market movement and instead focus on disciplined asset allocation aiding in times of market volatility. Asset allocation also enables profit booking during times of optimism while ensuring capital infusion during times of pessimism.
Portfolio positioning in volatile markets
Product Category
�� Products that are dynamically managed generating alpha through adjusting asset allocation based on volatility.
�� Products that adopt a pre-determined approach towards asset allocation regardless of market movement, removing the element of emotion while investing. (e.g. PE-based products)
Risks�� Global developments especially development on the sovereign debt situation in the Euro region and efforts by the
US to revive growth, resulting in change in risk appetite and capital flows in the markets.
�� Domestic factors / developments on corporate result season, policy uncertainties, inflation etc may impact investor sentiment.
�� Products adopting a nimble approach to investing could add to the portfolio turnover adding to the volatility in returns.
�� Products investing into dividend yielding stocks usually defensive in nature and this approach could result in relative underperformance in bullish markets.

21 Wealth Strategies - April -June 2012
� Rising food prices – Rising population globally is putting enormous pressures on the global food supply which is further adversely impacted by environmental pressures and increasing urbanisation leading to inflationary pressures.
Hedge against agri-based inflation
Product Category
�� Products that offer investment opportunity to capture value at various points along the “food chain” investing across the spectrum from agricultural commodities to consumer products.
Risks�� Climatic / environmental changes could lead to volatility in prices.
� Such theme-based funds have higher concentration risks as compared to funds that are well diversified.
� Such products are exposed to region specific risks.
� Products that invest into companies across the world are exposed to currency risks.
Risks�� Global developments especially development on the sovereign debt situation in the Euro region and efforts by
the US to revive growth, resulting in change in risk appetite and capital flows in the markets.
� Domestic factors / developments on corporate result season, policy uncertainties, inflation etc may impact investor sentiment.
� Products adopting a pre-determined asset allocation approach towards investing typically tend to underperform during a surge in an asset class as these products will have limited exposure to it.
� During periods of prolonged volatility, periodic rebalancing would lead to higher expenses.
22 Wealth Strategies - April -June 2012
� Short term opportunities – Yields at shorter end of the yield curve are expected to fall on easing liquidity and expectations of a pause in further interest rates tightening offering opportunities of capital appreciation. Longer term yields while benefiting from a falling yield curve will be volatile on concerns of fiscal consolidations and supply pressure.
Tactical investment opportunities
Product Category
�� Products are positioned to capitalise on opportunities available at the shorter end of the yield curve.
Risks�� Tightness in systemic liquidity.
� Slowdown in the pace of inflation’s downward trajectory.
� Slippages in the fiscal consolidation.
� Regions – Indian equity markets have remained largely range-bound over the past 2 years facing significant resistance primarily on account of valuation concerns, underlying inflation and very recently, high commodity prices. The current investment proposition of investing into companies participating into other growth regions can complement the customers’ portfolio and provide diversification benefits while retaining the high growth orientation.
� Gold – Historically, gold has been considered a hedge against global uncertainties and during times of economic instability, gold acts as an effective hedge against other investments acting as a store of value.
Diversification
Product Category
�� Products investing into companies listed in other growth regions offering opportunities of diversification.
� Products that maintain exposure to gold through ETFs.
Risks�� Many emerging market countries are still in the early stages of modern development and are subject to abrupt and
unexpected changes.
� Product is exposed to region specific risks.
� Such products that invest into companies across the world are exposed to currency risks.
� Financial / speculative interest in gold / related instruments may add to volatility in gold prices.
23 Wealth Strategies - April -June 2012
FT India Dynamic PE Ratio Fund of Funds 24
ICICI Prudential Dynamic Plan 25
Franklin India Bluechip Fund 26
ICICI Prudential Focused Bluechip Equity Fund 27
DSP BlackRock Equity Fund 28
HSBC India Opportunities Fund 29
Birla Sun Life Dividend Yield Plus 30
UTI Dividend Yield Fund 31
DWS Global Agribusiness Offshore Fund 32
HSBC Brazil Fund 33
Reliance Gold Savings Fund 34
FT India Monthly Income Plan 35
HDFC MF Monthly Income Plan - Long Term Plan 36
HSBC MIP - Savings Plan 37
Reliance Monthly Income Plan 38
DSP BlackRock Short Term Fund 39
HSBC Income Fund - Short Term Plan 40
ICICI Prudential Short Term Plan 41
IDFC Super Saver Income Fund - Short Term Plan 42
Funds in Focus
Disclaimer:
The funds mentioned in the following pages have been included after considering various quantitative and qualitative factors, including past performance and observed investment style and is based on data which HSBC believes to be accurate but have not been independently verified. Inclusion in the “Funds in Focus” neither suggests that funds is suitable for you, nor that it will continue to perform as it has in the past. “Funds in Focus” should not be considered as buy or sell recommendations. Investors should carefully consider whether any/all of these funds are appropriate for them in view of their investment experience, objectives, financial resources and relevant circumstances. For further risk disclosures, please refer to the disclaimer on the first page of this publication.
Mutual funds and the underlying investments are subject to market risks and there is no guarantee, implied or otherwise, that the general objectives of the fund or any other specific performance targets will be achieved. In particular, investment returns, repayment of capital and the distribution of dividends or income are not guaranteed and the Sponsor of the fund is not responsible or liable for any loss or shortfall resulting from the operations of the fund. Please read the scheme information document carefully before investing.
24
Funds in Focus
Wealth Strategies - April -June 2012
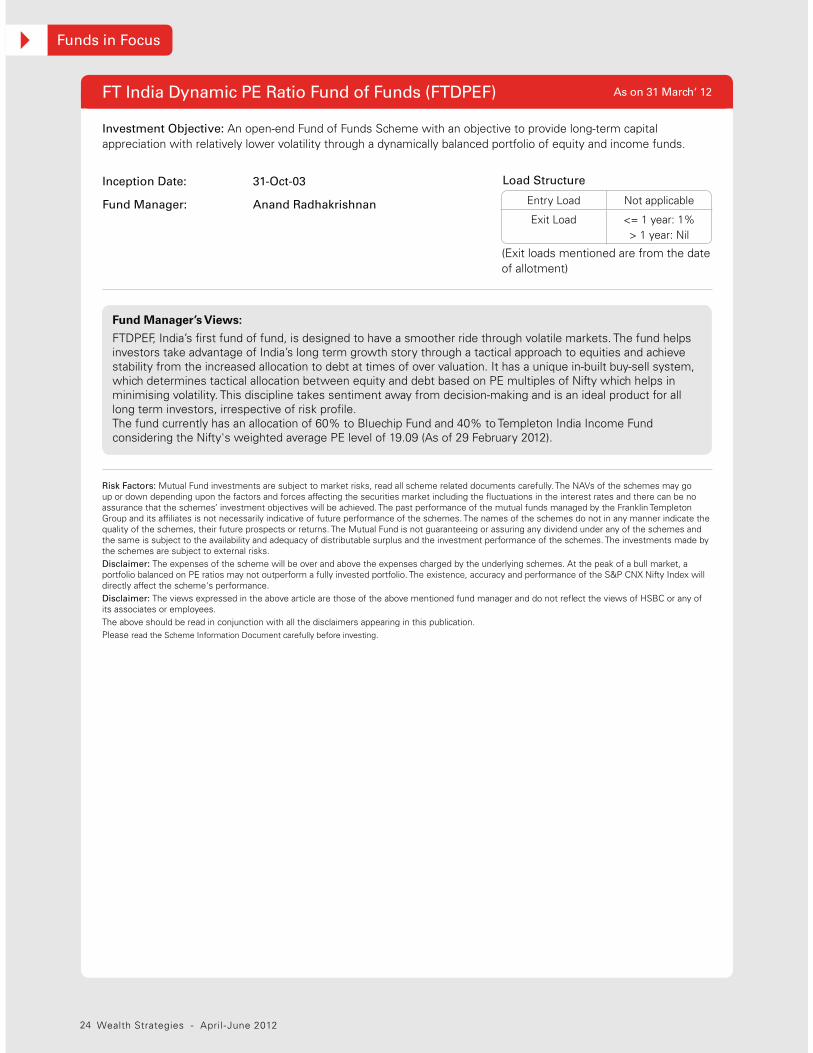
Inception Date: 31-Oct-03
Fund Manager: Anand Radhakrishnan
Investment Objective: An open-end Fund of Funds Scheme with an objective to provide long-term capital appreciation with relatively lower volatility through a dynamically balanced portfolio of equity and income funds.
Load Structure
(Exit loads mentioned are from the date of allotment)
Entry Load Not applicable
Exit Load <= 1 year: 1%> 1 year: Nil
Fund Manager’s Views:
FTDPEF, India’s first fund of fund, is designed to have a smoother ride through volatile markets. The fund helps investors take advantage of India’s long term growth story through a tactical approach to equities and achieve stability from the increased allocation to debt at times of over valuation. It has a unique in-built buy-sell system, which determines tactical allocation between equity and debt based on PE multiples of Nifty which helps in minimising volatility. This discipline takes sentiment away from decision-making and is an ideal product for all long term investors, irrespective of risk profile. The fund currently has an allocation of 60% to Bluechip Fund and 40% to Templeton India Income Fund considering the Nifty's weighted average PE level of 19.09 (As of 29 February 2012).
Risk Factors: Mutual Fund investments are subject to market risks, read all scheme related documents carefully. The NAVs of the schemes may go up or down depending upon the factors and forces affecting the securities market including the fluctuations in the interest rates and there can be no assurance that the schemes’ investment objectives will be achieved. The past performance of the mutual funds managed by the Franklin Templeton Group and its affiliates is not necessarily indicative of future performance of the schemes. The names of the schemes do not in any manner indicate the quality of the schemes, their future prospects or returns. The Mutual Fund is not guaranteeing or assuring any dividend under any of the schemes and the same is subject to the availability and adequacy of distributable surplus and the investment performance of the schemes. The investments made by the schemes are subject to external risks.Disclaimer: The expenses of the scheme will be over and above the expenses charged by the underlying schemes. At the peak of a bull market, a portfolio balanced on PE ratios may not outperform a fully invested portfolio. The existence, accuracy and performance of the S&P CNX Nifty Index will directly affect the scheme's performance.Disclaimer: The views expressed in the above article are those of the above mentioned fund manager and do not reflect the views of HSBC or any of its associates or employees. The above should be read in conjunction with all the disclaimers appearing in this publication.Please read the Scheme Information Document carefully before investing.
FT India Dynamic PE Ratio Fund of Funds (FTDPEF) As on 31 March‘ 12

25
Funds in Focus
Wealth Strategies - April -June 2012
Investment Objective: ICICI Prudential Dynamic Plan is an open-ended equity scheme seeking to generate capital appreciation by actively investing in equity and equity related securities. For defensive considerations, the scheme may invest in debt, money market instruments and derivatives. The investment manager will have the discretion to take aggressive asset calls i.e. by staying 100% invested in equity market/equity related instruments at a given point of time and 0% at another, in which case, the fund may be invested in debt related instruments at its discretion. The AMC may choose to churn the portfolio of the scheme in order to achieve the investment objective. The scheme is suitable for investors seeking high returns and for those who are willing to take commensurate risks. Given the dynamic nature of the investment objective of this scheme and factors such as market volatility and macroeconomic factors, which may at times be unpredictable, there is no assurance that the investment objectives of the scheme will be met.
Risk Factors: Mutual Fund investments are subject to market risks, read all scheme related documents carefully. Nothing contained in this document shall be construed to be an investment advise or an assurance of the benefits of investing in any of the schemes of ICICI Prudential Mutual Fund. Recipient alone shall be fully responsible for any decision taken on the basis of this document.Disclaimer: In the preparation of the material contained in this document, the AMC has used information that is publicly available, including information developed in-house. Some of the material used in the document may have been obtained from members/persons other than the AMC and/or its affiliates and which may have been made available to the AMC and/or to its affiliates. Information gathered and material used in this document is believed to be from reliable sources. The AMC however does not warrant the accuracy, reasonableness and/or completeness of any information. We have included statements / opinions / recommendations in this document, which contain words, or phrases such as “will”, “expect”, “should”, “believe” and similar expressions or variations of such expressions, that are “forward looking statements”. Actual results may differ materially from those suggested by the forward looking statements due to risk or uncertainties associated with our expectations with respect to, but not limited to, exposure to market risks, general economic and political conditions in India and other countries globally, which have an impact on our services and/or investments, the monetary and interest policies of India, inflation, deflation, unanticipated turbulence in interest rates, foreign exchange rates, equity prices or other rates or prices etc. The AMC (including its affiliates), the Mutual Fund, the trust and any of its officers, directors, personnel and employees, shall not be liable for any loss, damage of any nature, including but not limited to direct, indirect, punitive, special, exemplary, consequential, as also any loss of profit in any way arising from the use of this material in any manner. Disclaimer: The views expressed in the above article are those of the above mentioned fund manager and do not reflect the views of HSBC or any of its associates or employees. The above should be read in conjunction with all the disclaimers appearing in this publication.Please read the Scheme Information Document carefully before investing.
Inception Date: 31-Oct-02
Fund Manager: Sankaran Naren and Mittul Kalawadia
Load Structure
(Exit loads mentioned are from the date of allotment)
Entry Load Not applicable
Exit Load <= 1 year: 1%> 1 year: Nil
Fund Manager’s Views:
Directionally markets are expected to remain volatile and thereby provide investment opportunity. We believe that returns can be made due to volatility and there is long term value in the market as there are many stocks with attractive valuations at this point of time. The market will require the government to take the fiscal consolidation roadmap ahead with possible increase in diesel and petrol prices which will be crucial to providing Reserve Bank of India (RBI) headroom for significant rate action. Until then, we continue to look for positive triggers like Brent Crude prices correcting and global growth stabilising to increase allocation to equity. We believe the RBI will continue to watch inflation numbers closely to enable it to take further rate action. RBI is expected to continue the tight-rope walk between short term liquidity management and currency depreciation in the near-term. The portfolio strategy will suit investors who intend to play on volatility theme since this equity-oriented fund aims at generating risk-controlled equity linked returns using a judicious asset allocation approach and help investors to benefit from risk adjusted return potential.
ICICI Prudential Dynamic Plan (Open Ended Diversified Equity Fund) As on 31 March‘ 12

26
Funds in Focus
Wealth Strategies - April -June 2012
Investment Objective: An open-end growth scheme with an objective primarily to provide medium to long-term capital appreciation.
Risk Factors: Mutual Fund investments are subject to market risks, read all scheme related documents carefully. The NAVs of the schemes may go up or down depending upon the factors and forces affecting the securities market including the fluctuations in the interest rates and there can be no assurance that the schemes’ investment objectives will be achieved. The past performance of the mutual funds managed by the Franklin Templeton Group and its affiliates is not necessarily indicative of future performance of the schemes. The names of the schemes do not in any manner indicate the quality of the schemes, their future prospects or returns. The Mutual Fund is not guaranteeing or assuring any dividend under any of the schemes and the same is subject to the availability and adequacy of distributable surplus and the investment performance of the schemes. The investments made by the schemes are subject to external risks.Disclaimer: The views expressed in the above article are those of the above mentioned fund manager and do not reflect the views of HSBC or any of its associates or employees. The above should be read in conjunction with all the disclaimers appearing in this publication.Please read the Scheme Information Document carefully before investing.
Inception Date: 01-Dec-93
Fund Manager: Anand Radhakrishnan and
Anand Vasudevan
Load Structure
(Exit loads mentioned are from the date of allotment)
Entry Load Not applicable
Exit Load <= 1 year: 1%> 1 year: Nil
Fund Manager’s Views:
FIBCF is an open-end diversified equity fund that seeks to achieve capital appreciation through investments in large-cap companies. Launched in 1993, it is one of the oldest equity funds in the country and has consistently out-performed its benchmark BSE SENSEX across time horizons.
The fund follows a bottom-up approach to stock selection with a medium to long term perspective and ignores momentum stocks. The companies that the fund seeks to invest in (a) are well managed; (b) generate high ROCE and (c) demonstrate the ability to deliver sustainable growth in earnings. Our strategy remains focussed on the medium to long term opportunities based on investment and consumption themes.
Franklin India Bluechip Fund (FIBCF) As on 31 March‘ 12

27
Funds in Focus
Wealth Strategies - April -June 2012
Inception Date: 23-May-08
Fund Manager: Manish Gunwani
Investment Objective: ICICI Prudential Focused Bluechip Equity Fund is an open-ended equity scheme that seeks to generate long-term capital appreciation and income distribution to unitholders from a portfolio that is invested in equity and equity related securities of about 20 to 25 companies selected from the Top 200 stocks in terms of market capitalisation on the NSE. If the total assets under management under this scheme goes above `1000 crores, the Fund Manager reserves the right to increase the number of companies to more than 20.
Load Structure
(Exit loads mentioned are from the date of allotment)
Entry Load Not applicable
Exit Load <= 1 year: 1%> 1 year: Nil
Risk Factors: Mutual Fund investments are subject to market risks, read all scheme related documents carefully. Nothing contained in this document shall be construed to be an investment advise or an assurance of the benefits of investing in any of the schemes of ICICI Prudential Mutual Fund. Recipient alone shall be fully responsible for any decision taken on the basis of this document.Disclaimer: In the preparation of the material contained in this document, the AMC has used information that is publicly available, including information developed in-house. Some of the material used in the document may have been obtained from members/persons other than the AMC and/or its affiliates and which may have been made available to the AMC and/or to its affiliates. Information gathered and material used in this document is believed to be from reliable sources. The AMC however does not warrant the accuracy, reasonableness and/or completeness of any information. We have included statements / opinions / recommendations in this document, which contain words, or phrases such as “will”, “expect”, “should”, “believe” and similar expressions or variations of such expressions, that are “forward looking statements”. Actual results may differ materially from those suggested by the forward looking statements due to risk or uncertainties associated with our expectations with respect to, but not limited to, exposure to market risks, general economic and political conditions in India and other countries globally, which have an impact on our services and/or investments, the monetary and interest policies of India, inflation, deflation, unanticipated turbulence in interest rates, foreign exchange rates, equity prices or other rates or prices etc. The AMC (including its affiliates), the Mutual Fund, the trust and any of its officers, directors, personnel and employees, shall not be liable for any loss, damage of any nature, including but not limited to direct, indirect, punitive, special, exemplary, consequential, as also any loss of profit in any way arising from the use of this material in any manner. Disclaimer: The views expressed in the above article are those of the above mentioned fund manager and do not reflect the views of HSBC or any of its associates or employees. The above should be read in conjunction with all the disclaimers appearing in this publication. Please read the Scheme Information Document carefully before investing.
Fund Manager’s Views:
Directionally markets are expected to remain volatile and thereby provide investment opportunity. We believe that returns can be made due to volatility and there is long term value in the market as there are many stocks with attractive valuations at this point of time. The market will require the government to take the fiscal consolidation roadmap ahead with possible increase in diesel and petrol prices which will be crucial to providing Reserve Bank of India (RBI) headroom for significant rate action. Until then, we continue to look for positive triggers like Brent Crude prices correcting and global growth stabilising to increase allocation to equity. We believe the RBI will continue to watch inflation numbers closely to enable it to take further rate action. RBI is expected to continue the tight-rope walk between short term liquidity management and currency depreciation in the near-term. The fund suits investors who seek capital appreciation in the long term though optimal diversification as against excessive diversification. The fund invests in high conviction 20-25 blue-chip stocks of large cap companies having potential to generate alpha over the long term.
ICICI Prudential Focused Bluechip Equity Fund (IPFBF)
(an open-ended equity fund)
As on 31 March‘ 12
28
Funds in Focus
Wealth Strategies - April -June 2012
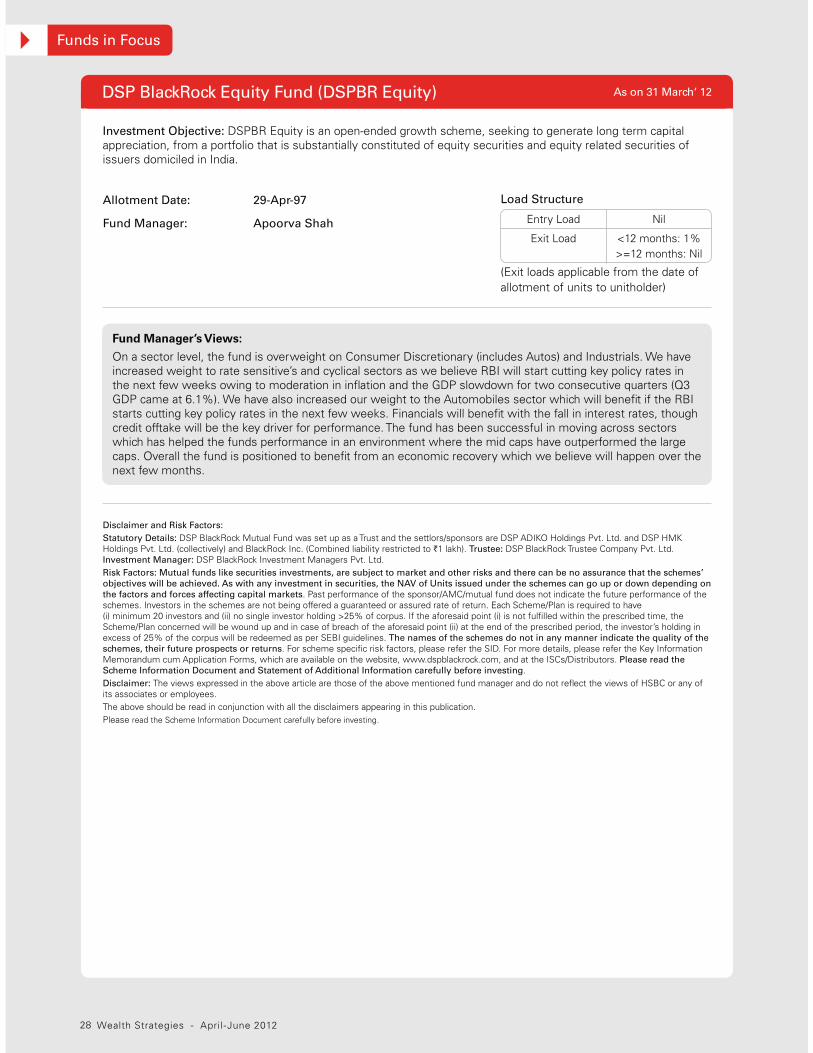
As on 31 March‘ 12
Investment Objective: DSPBR Equity is an open-ended growth scheme, seeking to generate long term capital appreciation, from a portfolio that is substantially constituted of equity securities and equity related securities of issuers domiciled in India.
Disclaimer and Risk Factors:
Statutory Details: DSP BlackRock Mutual Fund was set up as a Trust and the settlors/sponsors are DSP ADIKO Holdings Pvt. Ltd. and DSP HMK Holdings Pvt. Ltd. (collectively) and BlackRock Inc. (Combined liability restricted to `1 lakh). Trustee: DSP BlackRock Trustee Company Pvt. Ltd. Investment Manager: DSP BlackRock Investment Managers Pvt. Ltd.Risk Factors: Mutual funds like securities investments, are subject to market and other risks and there can be no assurance that the schemes’
objectives will be achieved. As with any investment in securities, the NAV of Units issued under the schemes can go up or down depending on
the factors and forces affecting capital markets. Past performance of the sponsor/AMC/mutual fund does not indicate the future performance of the schemes. Investors in the schemes are not being offered a guaranteed or assured rate of return. Each Scheme/Plan is required to have (i) minimum 20 investors and (ii) no single investor holding >25% of corpus. If the aforesaid point (i) is not fulfilled within the prescribed time, the Scheme/Plan concerned will be wound up and in case of breach of the aforesaid point (ii) at the end of the prescribed period, the investor’s holding in excess of 25% of the corpus will be redeemed as per SEBI guidelines. The names of the schemes do not in any manner indicate the quality of the
schemes, their future prospects or returns. For scheme specific risk factors, please refer the SID. For more details, please refer the Key Information Memorandum cum Application Forms, which are available on the website, www.dspblackrock.com, and at the ISCs/Distributors. Please read the
Scheme Information Document and Statement of Additional Information carefully before investing.Disclaimer: The views expressed in the above article are those of the above mentioned fund manager and do not reflect the views of HSBC or any of its associates or employees.The above should be read in conjunction with all the disclaimers appearing in this publication.Please read the Scheme Information Document carefully before investing.
Allotment Date: 29-Apr-97
Fund Manager: Apoorva Shah
Load Structure
(Exit loads applicable from the date of allotment of units to unitholder)
Entry Load Nil
Exit Load <12 months: 1%>=12 months: Nil
Fund Manager’s Views:
On a sector level, the fund is overweight on Consumer Discretionary (includes Autos) and Industrials. We have increased weight to rate sensitive’s and cyclical sectors as we believe RBI will start cutting key policy rates in the next few weeks owing to moderation in inflation and the GDP slowdown for two consecutive quarters (Q3 GDP came at 6.1%). We have also increased our weight to the Automobiles sector which will benefit if the RBI starts cutting key policy rates in the next few weeks. Financials will benefit with the fall in interest rates, though credit offtake will be the key driver for performance. The fund has been successful in moving across sectors which has helped the funds performance in an environment where the mid caps have outperformed the large caps. Overall the fund is positioned to benefit from an economic recovery which we believe will happen over the next few months.
DSP BlackRock Equity Fund (DSPBR Equity)
29
Funds in Focus
Wealth Strategies - April -June 2012
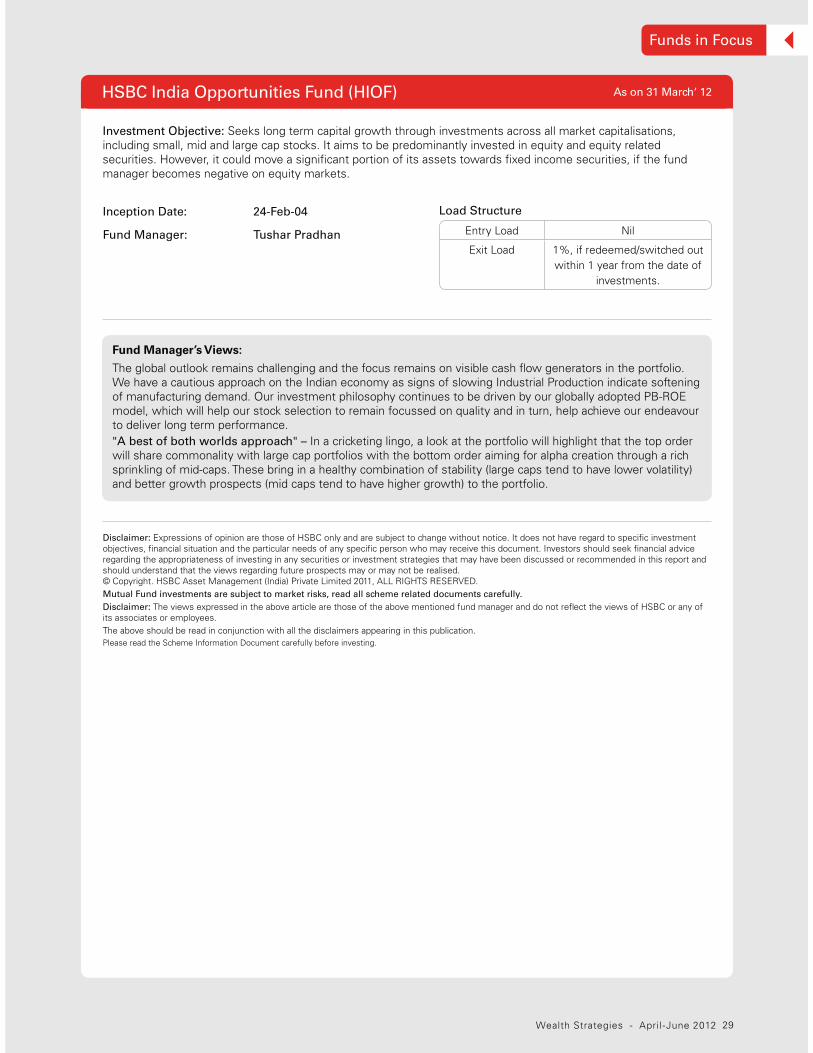
As on 31 March‘ 12
Investment Objective: Seeks long term capital growth through investments across all market capitalisations, including small, mid and large cap stocks. It aims to be predominantly invested in equity and equity related securities. However, it could move a significant portion of its assets towards fixed income securities, if the fund manager becomes negative on equity markets.
Disclaimer: Expressions of opinion are those of HSBC only and are subject to change without notice. It does not have regard to specific investment objectives, financial situation and the particular needs of any specific person who may receive this document. Investors should seek financial advice regarding the appropriateness of investing in any securities or investment strategies that may have been discussed or recommended in this report and should understand that the views regarding future prospects may or may not be realised. © Copyright. HSBC Asset Management (India) Private Limited 2011, ALL RIGHTS RESERVED. Mutual Fund investments are subject to market risks, read all scheme related documents carefully.
Disclaimer: The views expressed in the above article are those of the above mentioned fund manager and do not reflect the views of HSBC or any of its associates or employees.The above should be read in conjunction with all the disclaimers appearing in this publication.Please read the Scheme Information Document carefully before investing.
Inception Date: 24-Feb-04
Fund Manager: Tushar Pradhan
Load Structure
Entry Load Nil
Exit Load 1%, if redeemed/switched out within 1 year from the date of
investments.
Fund Manager’s Views:
The global outlook remains challenging and the focus remains on visible cash flow generators in the portfolio. We have a cautious approach on the Indian economy as signs of slowing Industrial Production indicate softening of manufacturing demand. Our investment philosophy continues to be driven by our globally adopted PB-ROE model, which will help our stock selection to remain focussed on quality and in turn, help achieve our endeavour to deliver long term performance. "A best of both worlds approach" – In a cricketing lingo, a look at the portfolio will highlight that the top order will share commonality with large cap portfolios with the bottom order aiming for alpha creation through a rich sprinkling of mid-caps. These bring in a healthy combination of stability (large caps tend to have lower volatility) and better growth prospects (mid caps tend to have higher growth) to the portfolio.
HSBC India Opportunities Fund (HIOF)
30
Funds in Focus
Wealth Strategies - April -June 2012
Inception Date: 26-Feb-03
Fund Manager: Nishit Dholakia
Investment Objective: The objective of the scheme is to provide capital growth and income by investing primarily in a well-diversified portfolio of dividend paying companies that have a relatively high dividend yield.
Statutory Details: Constitution: Birla Sun Life Mutual Fund has been set up as a Trust under the Indian Trust Act, 1882. Sponsors: Aditya Birla Financial Services Private Limited and Sun Life (India) AMC Investments Inc (liability restricted to seed corpus of `1 lakh). Trustee: Birla Sun Life Trustee Company Pvt. Ltd. Risk Factors: Mutual Funds and securities investments are subject to market risks and there can be no assurance or guarantee that the
objective of the scheme will be achieved. As with any investment in securities, the NAV of the Units issued under the scheme may go up or
down depending on the various factors and forces affecting capital markets and money markets. Past performance of the Sponsor / Investment Manager / Mutual Fund does not indicate the future performance of the scheme and may not necessarily provide a basis of comparison with other investments. The name of the scheme does not, in any manner, indicate either the quality of the scheme or its future prospects or returns.
Unitholders in the scheme are not being offered any guaranteed/assured returns. Investors should read the Scheme Information Document/
Statement of Additional Information/Key Information Memorandum available at Investor Service Centres and with Distributors carefully before
investing.
Disclaimer: The views expressed in the above article are those of the above mentioned fund manager and do not reflect the views of HSBC or any of its associates or employees.The above should be read in conjunction with all the disclaimers appearing in this publication.Please read the Scheme Information Document carefully before investing.
Load Structure
(Exit loads mentioned are from the date of allotment)
Entry Load Not applicable
Exit Load <= 1 year: 1%> 1 year: Nil
Fund Manager’s Views:
Birla Sunlife Dividend Yield Plus invests in stocks having dividend yield twice that of Sensex at the time of making the investment. The objective is to identify business with steady growth prospects and strong management available at reasonable valuation and offering higher risk adjusted returns. After above mentioned filters are met, fund manager identifies and invests in businesses having steady growth in earnings and dividend, strong return ratios on invested capital, strong free cash flow generation, healthy balance sheet and consistency of dividend payments. During market exuberance, the fund may not be able to fully participate in the sharp up move but during extreme market corrections it provides downside cushion to reasonable extent. The scheme typically exhibits lower volatility and over a market cycle would tend to outperform the broader market thereby delivering superior risk adjusted returns. The fund maintains a well diversified equity portfolio. The portfolio dividend yield as of end of March 31, 2012 was 2.7% against 1.5% dividend yield of sensex stocks. The key sectoral exposure in the fund are Banking and Financial Services, Consumer Non Durables and Oil, Gas and Petroleum products and Auto. The fund has around 37% of the portfolio of the fund invested in large cap stocks while balance portfolio is invested in midcap and smallcap stocks. The cash level in the fund is around 5%.
Birla Sun Life Dividend Yield Plus (BDYP) As on 31 March‘ 12
31
Funds in Focus
Wealth Strategies - April -June 2012
As on 31 March‘ 12
Investment Objective: UTI Dividend Yield Fund is an open-ended equity oriented scheme. The investment objective of the scheme is to provide medium to long term capital gains and/or dividend distribution by investing predominantly in equity and equity related instruments, which offer high dividend yield. There can be no assurance that the investment objectives of the scheme will be realised.
Statutory Details: UTI-Dividend Yield Fund: An open-ended equity oriented scheme. Investment Objective: To provide medium to long term capital gains and/or dividend distribution by investing predominantly in equity and equity related instruments, which offer high dividend yield. There can be no assurance that the investment objectives of the scheme will be realised. Load Structure: Entry Load - Nil / Exit Load – 1% for < 1 year and nil for >= 1 year. Asset Allocation: High dividend yield equity and equity related instrument 65% - 100%. Risk profile: High, other equity or equity related instruments 0-35%, Risk profile: High, Debt and money market instruments 0-10%, Risk profile: Low to medium. Dividend Yield is considered as high if it is greater than the Dividend Yield of the Nifty last released / published by NSE. While no fixed allocation will normally be made for investment in money market instruments like Call Deposits, Commercial Papers, Treasury Bills etc. the same may be kept to the minimum generally to meet the liquidity needs of the scheme. UTI-Dividend Yield Fund retains the option to alter the asset allocation for short-term periods on defensive considerations. General Services: Daily NAV, Sale Price/ Redemption Price available for Sale/ Redemption on all business days. Registered Office: UTI Tower, 'Gn' Block, Bandra Kurla Complex, Bandra (E), Mumbai - 400051. Phone: 022 – 66786666.Statutory Details: UTI Mutual Fund has been set up as a Trust under the Indian Trust Act, 1882. Sponsors: State Bank of India, Punjab National Bank, Bank of Baroda and Life Insurance Corporation of India (liability of sponsors limited to `10,000/-). Investment Manager: UTI Asset Management Co. Ltd. (incorporated under the Companies Act, 1956). Trustee: UTI Trustee Co. (P) Ltd. (incorporated under the Companies Act 1956). Risk Factors: All investments in Mutual funds and securities are subject to market risks and the NAV of the units issued under the scheme may go up or down depending upon the factors and forces affecting the securities market. Past performance of the Sponsor / Mutual Fund / Scheme(s) / AMC is not necessarily an indication of future results and may not necessarily provide a basis for comparison with other investments. All Mutual Funds and Securities investments are subject to market risks and there can be no assurance or guarantee that the objectives of the scheme will be achieved. Statements/Observations made are subject to the laws of the land as they exist at any relevant point of time. Growth, appreciation and income, if any, referred are subject to the laws of the land as they exist from time to time. UTI Dividend Yield Fund is only the name of the scheme and does not in any manner indicate either the quality of the scheme, its future prospects or returns. The scheme is subject to risks relating to Credit, Interest Rates, Liquidity, Securities Lending, Reinvestment Risk , Default Risk and Investment in Overseas Markets, Trading in debt and equity derivatives (the specific risk could be Credit, Market, Illiquidity, Judgmental error, Interest rate swaps and Forward rate agreements), investment in securitised papers and scheme specific risk. Please contact the nearest UTI Financial Centre, Business Development Associate (BDA) or AMFI/NISM certified UTI Mutual Fund Independent Financial Advisor (IFA) for a copy of the Key Information Memorandum cum Application Form and Scheme Information Document. Please read the Scheme Information Document carefully before investing. Web site: www.utimf.com Registrar: M/s Karvy Computershare Pvt. Ltd., Narayani Mansion, H. No. 1-90-2/10/E, Vittalrao Nagar, Madhapur, Hyderabad - 500 081. Tel.: 040 – 23421944 to 47, Fax: 040 - 23115503, Email:[email protected] *Value Research Fund Rating (Risk-adjusted Rating) is a convenient composite measure of both returns and risk. It is purely quantitative and there is no subjective component to the Fund Rating. The assessment does not reflect Value Research’s opinion of the future potential of any fund. It only gives a quick summary of how a fund has performed historically relative to its peers. For equity and hybrid funds, the Fund Ratings for the two time periods (3 and 5 years) are combined to give a single assessment of each fund’s risk rating vis-à-vis other funds in each fund category. For debt funds, the Fund Ratings are based on 18-month weekly risk adjusted performance, relative to the other funds in category. Value Research does not rate an equity or hybrid fund with less than 3-year performance and a debt fund with less than 18-month performance track record. Each category must have a minimum of 10 finds for it to be rated. Effective, July 2008, we have put additional qualifying criteria, whereby a fund with less than `5 crore of average AUM in the past six months will not be eligible for rating. (www.valueresearchonline.com) CRISIL CPR Ranking Scale and Definition based on percentile of number of schemes considered in the category: CRISIL CPR~1 - Very Good performance in the category (Top 10 percentile of universe)*. CRISIL CPR~2 – Good performance in the category. CRISIL CPR~3 - Average performance in the category. CRISIL CPR~4 - Below average performance in the category. CRISIL CPR~5 - Relatively weak performance in the category. * - If the top 10 percentile figure is not an integer, the same is rounded off to the next integer. The same approach is adopted for CPR 2 (11th to 30th percentile), CPR 5 (last 91st to 100th percentile) and CPR 4 (71st to 90th percentile) clusters. The residual schemes in the universe are placed in the CPR 3 cluster. Disclaimer: The views expressed in the above article are those of the above mentioned fund manager and do not reflect the views of HSBC or any of its associates or employees.The above should be read in conjunction with all the disclaimers appearing in this publication.Please read the Scheme Information Document carefully before investing.
Inception Date: 03-May-05
Fund Manager: Swati Kulkarni
Load Structure
(Exit loads mentioned are from the date of allotment)
Entry Load Not applicable
Exit Load <= 1 year: 1%> 1 year: Nil
Fund Manager's View:
We are cautiously optimistic on the market in the near term. The monetary policy is expected to focus on growth as inflation concerns may take a back seat on favourable base and stable commodities prices. However, high fiscal deficit and resultant high Government borrowings are likely to limit the extent of cuts in policy rates. We expect a pick-up in investment cycle in 2nd half of 2012 aided by softening monetary policy. We think the macro indicators are bottoming out and are optimistic over a long term.
UTI Dividend Yield Fund (UTI DYF)
32
Funds in Focus
Wealth Strategies - April -June 2012
As on 31 March‘ 12
Investment Objective: To generate long-term capital growth by investing predominantly in units of overseas mutual funds, focussing on agriculture and/or would be direct and indirect beneficiaries of the anticipated growth in the agriculture and/or affiliated/allied sectors.
Disclaimer: The views of the Fund Manager should not be construed as an advice and investors must make their own investment decisions
regarding suitability of the funds based on their specific investment objectives and financial positions and using such independent advisors as
they believe necessary.
Mutual Fund investments are subject to market risks, read all scheme related documents carefully.
Disclaimer: The views expressed in the above article are those of the above mentioned fund manager and do not reflect the views of HSBC or any of its associates or employees.The above should be read in conjunction with all the disclaimers appearing in this publication.Please read the Scheme Information Document carefully before investing.
Inception Date: 14-May-10
Fund Manager: Aniket Inamdar and
Kumaresh Ramakrishnan
Load Structure
(Exit loads mentioned are from the date of allotment)
Entry Load Not applicable
Exit Load <= 1 year: 1%> 1 year: Nil
Fund Manager’s Views:The DWS Global Agribusiness Fund outperformed the MSCI World index, as strong performance from the top ten performers was focussed mainly in upstream agribusiness activity of farm operators, fertiliser and seed with mixed performance from the downstream retailers. Short-term biological lulls are a part of agribusiness, but we remain extremely confident about the medium and long-term future. While biological organisms progress slowly according to nature, the financial markets price daily. One of the issues this presents is working within the volatility of the global equity markets. As a result of outside markets and macroeconomic forces, on any given day a company can see large moves in price that may not reflect the stable nature of the underlying asset. This divergence presents the challenge to evaluate the appropriate risk and reward opportunities of each security. We try to use this volatility to our advantage when the market price of businesses does not reflect changes in their underlying earnings power. The fund managers continually assesses the positioning of each company to see if they can profitably meet the areas of food demand and the need for improved agricultural productivity.
DWS Global Agribusiness Offshore Fund (DWS GABF)
33
Funds in Focus
Wealth Strategies - April -June 2012
Fund Manager’s Views:
Although the global macro-economic environment remains uncertain, our positive outlook on Brazilian equities is driven primarily by strong local factors: 1. Continuation of further monetary easing post the start of rate cuts in Aug 2011, which should be favourable
for equities.2. Comfortable valuations with 12-month forward Price-Earnings multiple and Price-Book multiple remaining
cheaper than other Emerging Markets and some Developed Markets as well.3. Strong support to domestic growth in the coming years from infrastructure development spending towards
the World Cup in 2014 and Olympics in 2016.4. Brazil being one of the most favoured investment destination across the globe – the country ranked fourth in
global FDI with USD 67 billion in 2011.5. Healthy domestic macro parameters – unemployment rate at only 5.5% in Dec 2011; healthy credit growth
of 15-17% expected in 2012.
Disclaimer: Expressions of opinion are those of HSBC only and are subject to change without notice. It does not have regard to specific investment objectives, financial situation and the particular needs of any specific person who may receive this document. Investors should seek financial advice regarding the appropriateness of investing in any securities or investment strategies that may have been discussed or recommended in this report and should understand that the views regarding future prospects may or may not be realised.© Copyright. HSBC Asset Management (India) Private Limited 2011, ALL RIGHTS RESERVED. Mutual Fund investments are subject to market risks, read all scheme related documents carefully.
Disclaimer: The views expressed in the above article are those of the above mentioned fund manager and do not reflect the views of HSBC or any of its associates or employees.The above should be read in conjunction with all the disclaimers appearing in this publication.Please read the Scheme Information Document carefully before investing.
HSBC Brazil Fund (HBF)
Investment Objective: The primary investment objective of the scheme is to provide long term capital appreciation by investing predominantly in units/shares of HSBC Global Investment Funds (HGIF) Brazil Equity Fund. The scheme may, at the discretion of the Investment Manager, also invest in the units of other similar overseas mutual fund schemes, which may constitute a significant part of its corpus. The scheme may also invest a certain proportion of its corpus in money market instruments and/or units of liquid mutual fund schemes, in order to meet liquidity requirements from time to time.
Inception Date: 6-May-11
Fund Manager: Gaurav Mehrotra
(dedicated fund manager
for overseas investments)
Load Structure
Entry Load Nil
Exit Load 1%, if redeemed/switched-out within 1 year from the date of
investments; otherwise Nil
As on 31 March‘ 12

34
Funds in Focus
Wealth Strategies - April -June 2012
Investment Objective: The investment objective is to seek to provide returns that closely correspond to returns provided by price of gold through investment in physical Gold (and Gold related securities as permitted by Regulators from time to time). However, performance of the scheme may differ from that of the domestic prices of Gold due to expenses and or other related factors.
Risk Factors: The views expressed herein constitute only the opinions and do not constitute any guidelines or recommendation on any course of action to be followed by the reader. This information is meant for general reading purposes only and is not meant to serve as a professional guide for the readers. Certain factual and statistical (both historical and projected) industry and market data and other information was obtained by RCAM from independent, third-party sources that it deems to be reliable, some of which have been cited above. However, RCAM has not independently verified any of such data or other information, or the reasonableness of the assumptions upon which such data and other information was based, and there can be no assurance as to the accuracy of such data and other information. Further, many of the statements and assertions contained in these materials reflect the belief of RCAM, which belief may be based in whole or in part on such data and other information. The Sponsor, the Investment Manager, the Trustee or any of their respective directors, employees, affiliates or representatives do not assume any responsibility for, or warrant the accuracy, completeness, adequacy and reliability of such information. Whilst no action has been solicited based upon the information provided herein, due care has been taken to ensure that the facts are accurate and opinions given are fair and reasonable. This information is not intended to be an offer or solicitation for the purchase or sale of any financial product or instrument. Recipients of this information should rely on information/data arising out of their own investigations. Readers are advised to seek independent professional advice, verify the contents and arrive at an informed investment decision before making any investments. None of the Sponsor, the Investment Manager, the Trustee, their respective directors, employees, affiliates or representatives shall be liable for any direct, indirect, special, incidental, consequential, punitive or exemplary damages, including lost profits arising in any way from the information contained in this material. The Sponsor, the Investment Manager, the Trustee, any of their respective directors, employees including the fund managers, affiliates, representatives including persons involved in the preparation or issuance of this material may from time to time, have long or short positions in, and buy or sell the securities thereof, of company(ies) / specific economic sectors mentioned herein. Reliance Gold Savings Fund (An Open Ended Fund of Fund Scheme): The investment objective of the scheme is to seek to provide returns that closely correspond to returns provided by Reliance Gold Exchange Traded Fund (RGETF). Asset Allocation Pattern: Units of RGETF - 95 to 100%, Reverse repo and/or CBLO and/or short-term fixed deposits and/or schemes which invest predominantly in the money market securities or Liquid Schemes * - 0 to 5%. *The Fund Manager may invest in Liquid Schemes of Reliance Mutual Fund. However, the Fund Manager may invest in any other scheme of a mutual fund registered with SEBI, which invest predominantly in the money market securities. Load Structure: Entry Load - Nil. Exit Load - 2% - If redeemed or switched out on or before completion of 1 year from the date of allotment of units, Nil thereafter. Terms of issue: The NAV of the Scheme will be calculated and declared on every working day. The Scheme provides sale / switch-in and repurchase / switch-out facility on all Business Days at NAV based prices. RGETF is an open-ended Gold Exchange Traded Fund that tracks the domestic prices of gold through investments in physical Gold. The investment objective is to seek to provide returns that closely correspond to returns provided by price of gold through investment in physical Gold (and Gold related securities as permitted by Regulators from time to time). However, the performance of the scheme may differ from that of the domestic prices of Gold due to expenses and or other related factors. Asset Allocation Pattern: Physical Gold or Gold Related Instruments as permitted by regulators from time to time - 90 to 100%, Money Market instruments, Bonds, Debentures, Government Securities including T-Bills, Securitised Debt and other debt securities as permitted by regulators from time to time - 0 to 10%. Load Structure - Entry Load and Exit Load - Nil. Terms of Issue - As the units of the scheme are listed on the Exchange, subsequent buying or selling (trading) by Unit holders can be made from the secondary market on all trading days. The minimum number of Units that can be bought or sold on the exchange is 1 (one) unit. Statutory Details: Reliance Mutual Fund has been constituted as a trust in accordance with the provisions of the Indian Trusts Act, 1882. Sponsor: Reliance Capital Limited. Trustee: Reliance Capital Trustee Co. Limited. Investment Manager: Reliance Capital Asset Management Limited (Registered Office of Trustee and Investment Manager: 'H' Block, 1st Floor, Dhirubhai Ambani Knowledge City, Koparkhairne, Navi Mumbai - 400 710, Maharashtra). The Sponsor, the Trustee and the Investment Manager are incorporated under the Companies Act, 1956. The Sponsor is not responsible or liable for any loss resulting from the operation of the scheme beyond their initial contribution of `1 lakh towards the setting up of the Mutual Fund and such other accretions and additions to the corpus.Disclaimer: The views expressed in the above article are those of the above mentioned fund manager and do not reflect the views of HSBC or any of its associates or employees.The above should be read in conjunction with all the disclaimers appearing in this publication.Please read the Scheme Information Document carefully before investing.
Inception Date: 11-Mar-11
Fund Manager: Hiren Chandaria
Load Structure
(Exit loads mentioned are from the date of allotment)
Entry Load Not applicable
Exit Load <= 1 year: 2%> 1 year: Nil
Fund Manager’s Views:Negative real interest rates, longer term inflationary concerns, currency debasement, strong physical demands especially from China, Central Bank's accumulation of Gold and thrust for portfolio diversification are key factors supporting gold prices. Current global economic worries, geopolitical uncertainties have a potential to spike up gold prices. The rise in volatility across all assets makes investors jittery about their investments. Gold tends to benefit during such an environment. Again, factors affecting gold prices may not affect other assets in a similar fashion and gold usually exhibits lower correlation with other asset classes. Hence, gold tends to act as a portfolio diversifier and improves risk adjusted returns. Any correction can be looked at opportunity to accumulate and long term prudent investor may continue investing in gold in a systematic manner as it improves risk adjusted returns for the portfolio.Common Source for Gold View: Bloomberg, Reuters, World Gold Council.
Reliance Gold Savings Fund (RGSF) As on 31 March‘ 12
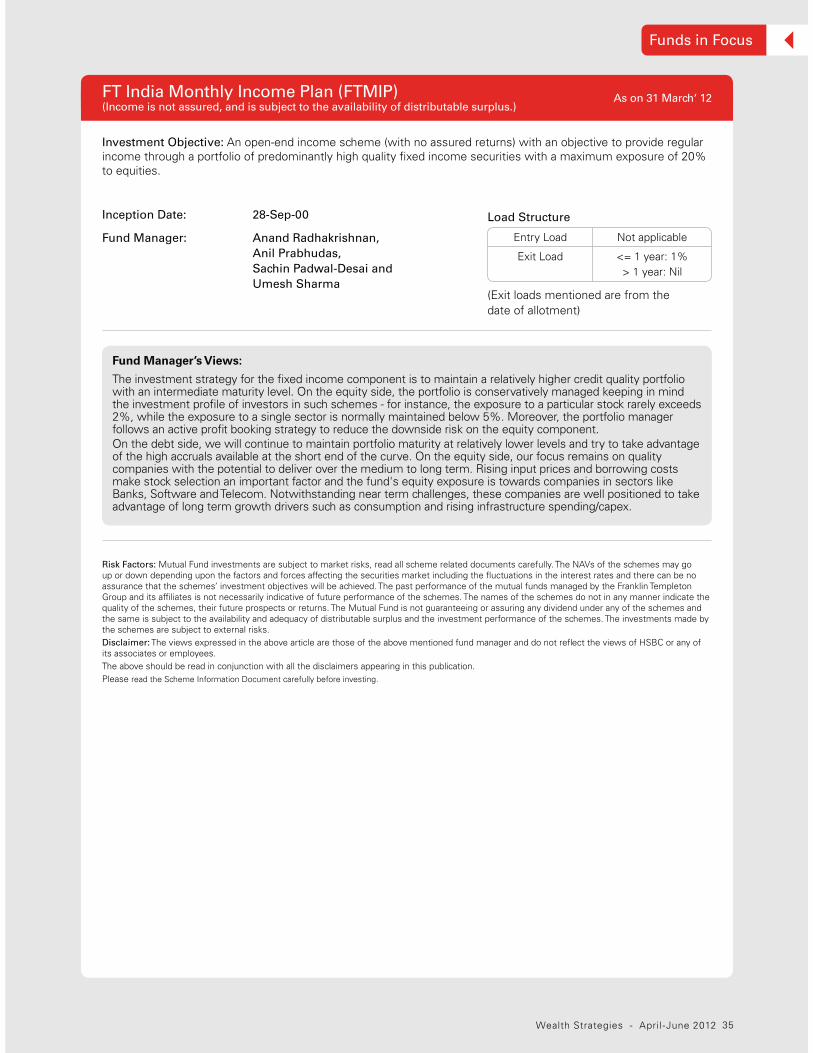
35
Funds in Focus
Wealth Strategies - April -June 2012
Fund Manager’s Views:
The investment strategy for the fixed income component is to maintain a relatively higher credit quality portfolio with an intermediate maturity level. On the equity side, the portfolio is conservatively managed keeping in mind the investment profile of investors in such schemes - for instance, the exposure to a particular stock rarely exceeds 2%, while the exposure to a single sector is normally maintained below 5%. Moreover, the portfolio manager follows an active profit booking strategy to reduce the downside risk on the equity component. On the debt side, we will continue to maintain portfolio maturity at relatively lower levels and try to take advantage of the high accruals available at the short end of the curve. On the equity side, our focus remains on quality companies with the potential to deliver over the medium to long term. Rising input prices and borrowing costs make stock selection an important factor and the fund's equity exposure is towards companies in sectors like Banks, Software and Telecom. Notwithstanding near term challenges, these companies are well positioned to take advantage of long term growth drivers such as consumption and rising infrastructure spending/capex.
Risk Factors: Mutual Fund investments are subject to market risks, read all scheme related documents carefully. The NAVs of the schemes may go up or down depending upon the factors and forces affecting the securities market including the fluctuations in the interest rates and there can be no assurance that the schemes’ investment objectives will be achieved. The past performance of the mutual funds managed by the Franklin Templeton Group and its affiliates is not necessarily indicative of future performance of the schemes. The names of the schemes do not in any manner indicate the quality of the schemes, their future prospects or returns. The Mutual Fund is not guaranteeing or assuring any dividend under any of the schemes and the same is subject to the availability and adequacy of distributable surplus and the investment performance of the schemes. The investments made by the schemes are subject to external risks.Disclaimer: The views expressed in the above article are those of the above mentioned fund manager and do not reflect the views of HSBC or any of its associates or employees. The above should be read in conjunction with all the disclaimers appearing in this publication.Please read the Scheme Information Document carefully before investing.
Investment Objective: An open-end income scheme (with no assured returns) with an objective to provide regular income through a portfolio of predominantly high quality fixed income securities with a maximum exposure of 20% to equities.
Inception Date: 28-Sep-00
Fund Manager: Anand Radhakrishnan,
Anil Prabhudas,
Sachin Padwal-Desai and
Umesh Sharma
Load Structure
Entry Load Not applicable
Exit Load <= 1 year: 1%> 1 year: Nil
(Exit loads mentioned are from the date of allotment)
FT India Monthly Income Plan (FTMIP) (Income is not assured, and is subject to the availability of distributable surplus.)
As on 31 March‘ 12

36
Funds in Focus
Wealth Strategies - April -June 2012
HDFC MF Monthly Income Plan - Long Term Plan (HDFC MIP LT)
Investment Objective: The primary objective of the scheme is to generate regular returns through investment primarily in Debt and Money Market Instruments. The secondary objective of the scheme is to generate long-term capital appreciation by investing a portfolio of the scheme’s assets in equity and equity related instruments. However, there can be no assurance that the investment objective of the scheme will be achieved.
Inception Date: 26-Dec-03
Fund Manager: Prashant Jain (Equity) and
Shobhit Mehrotra (Debt)
Load Structure
(Exit loads mentioned are from the date of allotment)
Entry Load Not applicable
Exit Load <= 1 year: 1%> 1 year: Nil
Fund Manager’s Views:The debt component of HDFC MIP-LTP which constitutes over 75% of the portfolio is positioned to capture the expected easing of interest rates in the first quarter of FY13. With improved liquidity, the fund would stand to benefit from the steepening of the yield curve. The equity component of the Fund is overweight Banking and Financial services, Software, Petroleum Products, etc. With overall interest rates peaking out in the economy and equity valuations being reasonably attractive, MIP-LTP is favourably positioned in the current environment. It is a good asset allocation product for investors seeking controlled exposure to equities.
Risk Factors: All mutual funds and securities investments are subject to market risks and there can be no assurance that the schemes’ objectives will be achieved and the NAV of the schemes may go up or down depending upon the factors and forces affecting the securities market. Past performance of the Sponsors and their affiliates / AMC / Mutual Fund and its scheme(s) do not indicate the future performance of the scheme of the Mutual Fund. There is no assurance or guarantee to unit holders as to the rate of dividend distribution nor that dividends will be paid regularly. Investors in the schemes are not being offered any guaranteed / assured returns. The NAV of the units issued under the schemes may be affected, inter alia by changes in the interest rates, trading volumes, settlement periods, transfer procedures and performance of individual securities. The NAV will inter alia be exposed to Price / Interest Rate Risk and Credit Risk. Long Term Plan of HDFC MF Monthly Income Plan, an open-ended income scheme (Monthly income is not assured and is subject to availability of distributable surplus) is only the name of the Scheme and does not in any manner indicate either the quality of the scheme, its future prospects and returns. Please read the Scheme Information Document and Statement of Additional Information before investing. Investment Objective: To generate regular returns through investment primarily in debt and money market instruments. The secondary objective of the scheme is to generate long term capital appreciation by investing a portion of the scheme’s assets in equity and equity related instruments. Asset Allocation Pattern: Equity and equity related instruments (25%); debt and money market instruments (75%). Load Structure: Entry Load: Not Applicable. Upfront commission shall be paid directly by the investor to the ARN Holder (AMFI registered Distributor) based on the investors’ assessment of various factors including the service rendered by the ARN Holder. Exit Load: In respect of each purchase / switch-in of units, an exit load of 1.00% is payable if units are redeemed / switched-out within 1 year from the date of allotment. No exit load is payable if units are redeemed / switched-out after 1 year from the date of allotment. In view of the individual nature of tax consequences, each investor is advised to consult his/her professional tax advisor. Disclaimer: The views expressed in the above article are those of the above mentioned fund manager and do not reflect the views of HSBC or any of its associates or employees. The above should be read in conjunction with all the disclaimers appearing in this publication.Please read the Scheme Information Document carefully before investing.
As on 31 March‘ 12
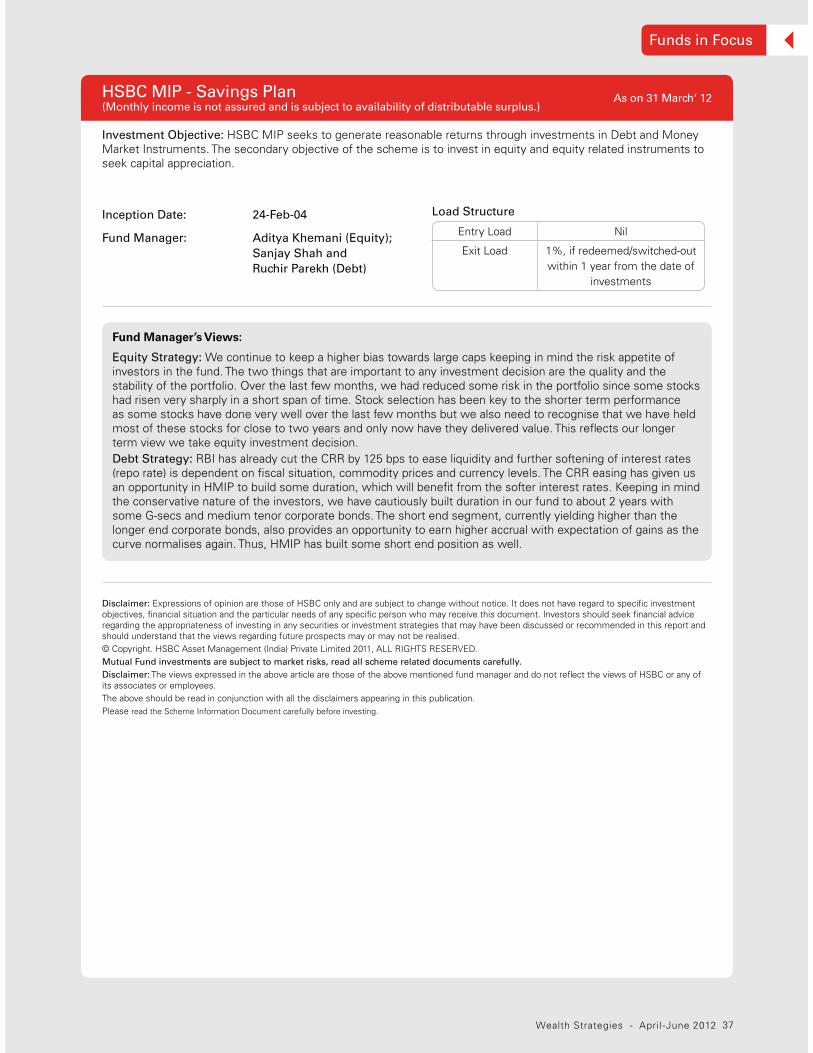
37
Funds in Focus
Wealth Strategies - April -June 2012
Fund Manager’s Views:
Equity Strategy: We continue to keep a higher bias towards large caps keeping in mind the risk appetite of investors in the fund. The two things that are important to any investment decision are the quality and the stability of the portfolio. Over the last few months, we had reduced some risk in the portfolio since some stocks had risen very sharply in a short span of time. Stock selection has been key to the shorter term performance as some stocks have done very well over the last few months but we also need to recognise that we have held most of these stocks for close to two years and only now have they delivered value. This reflects our longer term view we take equity investment decision.Debt Strategy: RBI has already cut the CRR by 125 bps to ease liquidity and further softening of interest rates (repo rate) is dependent on fiscal situation, commodity prices and currency levels. The CRR easing has given us an opportunity in HMIP to build some duration, which will benefit from the softer interest rates. Keeping in mind the conservative nature of the investors, we have cautiously built duration in our fund to about 2 years with some G-secs and medium tenor corporate bonds. The short end segment, currently yielding higher than the longer end corporate bonds, also provides an opportunity to earn higher accrual with expectation of gains as the curve normalises again. Thus, HMIP has built some short end position as well.
Disclaimer: Expressions of opinion are those of HSBC only and are subject to change without notice. It does not have regard to specific investment objectives, financial situation and the particular needs of any specific person who may receive this document. Investors should seek financial advice regarding the appropriateness of investing in any securities or investment strategies that may have been discussed or recommended in this report and should understand that the views regarding future prospects may or may not be realised.© Copyright. HSBC Asset Management (India) Private Limited 2011, ALL RIGHTS RESERVED. Mutual Fund investments are subject to market risks, read all scheme related documents carefully.
Disclaimer: The views expressed in the above article are those of the above mentioned fund manager and do not reflect the views of HSBC or any of its associates or employees. The above should be read in conjunction with all the disclaimers appearing in this publication.Please read the Scheme Information Document carefully before investing.
Investment Objective: HSBC MIP seeks to generate reasonable returns through investments in Debt and Money Market Instruments. The secondary objective of the scheme is to invest in equity and equity related instruments to seek capital appreciation.
Inception Date: 24-Feb-04
Fund Manager: Aditya Khemani (Equity);
Sanjay Shah and
Ruchir Parekh (Debt)
Load Structure
Entry Load Nil
Exit Load 1%, if redeemed/switched-out within 1 year from the date of
investments
HSBC MIP - Savings Plan
(Monthly income is not assured and is subject to availability of distributable surplus.)As on 31 March‘ 12

38
Funds in Focus
Wealth Strategies - April -June 2012
Investment Objective: To generate regular income in order to make regular dividend payments to unit holders and the secondary objective is growth of capital.
Inception Date: 13-Jan-04
Fund Manager: Amit Tripathi and
Ashwani Kumar
Load Structure
(Exit loads mentioned are from the date of allotment)
Entry Load Not applicable
Exit Load <= 1 year: 1%> 1 year: Nil
Fund Manager’s Views:Emphasis is more on accrual based returns than on active trading. MIP portfolio reflects an optimum blend of both fixed and floating rate instruments comprising of Certificate of deposits to take care of liquidity needs and plain vanilla bonds specially to take care of yield enhancement, government securities enhance the credit quality and shall enable in benefiting from the bond market play. In line without expectations of gradual fall in yields as inflation consolidates, moderation in expectations of further rate hikes and improvement in liquidity conditions going forward, we have moderately increased the portfolio duration through allocations to longer dated G-secs and liquid corporate bonds. Though investment into equity and equity linked securities forms a minor part (maximum 20%) of the portfolio, right timing and selection of stocks have been able to generate the alpha returns, thus resulting in the growth of capital.
Risk Factors: The views expressed herein constitute only the opinions and do not constitute any guidelines or recommendation on any course of action to be followed by the reader. This information is meant for general reading purposes only and is not meant to serve as a professional guide for the readers. Certain factual and statistical (both historical and projected) industry and market data and other information was obtained by RCAM from independent, third-party sources that it deems to be reliable, some of which have been cited above. However, RCAM has not independently verified any of such data or other information, or the reasonableness of the assumptions upon which such data and other information was based, and there can be no assurance as to the accuracy of such data and other information. Further, many of the statements and assertions contained in these materials reflect the belief of RCAM, which belief may be based in whole or in part on such data and other information. The Sponsor, the Investment Manager, the Trustee or any of their respective directors, employees, affiliates or representatives do not assume any responsibility for, or warrant the accuracy, completeness, adequacy and reliability of such information. Whilst no action has been solicited based upon the information provided herein, due care has been taken to ensure that the facts are accurate and opinions given are fair and reasonable. This information is not intended to be an offer or solicitation for the purchase or sale of any financial product or instrument. Recipients of this information should rely on information/data arising out of their own investigations. Readers are advised to seek independent professional advice, verify the contents and arrive at an informed investment decision before making any investments. None of the Sponsor, the Investment Manager, the Trustee, their respective directors, employees, affiliates or representatives shall be liable for any direct, indirect, special, incidental, consequential, punitive or exemplary damages, including lost profits arising in any way from the information contained in this material. The Sponsor, the Investment Manager, the Trustee, any of their respective directors, employees including the fund managers, affiliates, representatives including persons involved in the preparation or issuance of this material may from time to time, have long or short positions in, and buy or sell the securities thereof, of company(ies) / specific economic sectors mentioned herein. Reliance Monthly Income Plan (An Open-ended Fund - Monthly Income is not assured and is subject to the availability of distributable surplus): The primary investment objective of the scheme is to generate regular income in order to make regular dividend payments to unit holders and the secondary objective is growth of capital. Asset Allocation: Equities and Equity related Securities - 0 to 20%, Fixed Income Securities (Debt and Money Market) – 80 to 100%. Entry Load – Nil, Exit Load - 1%, if redeemed or switched out on or before completion of 1 year from the date of allotment of units, Nil thereafter. Terms of issue: The NAV of the Scheme will be calculated and declared on every Working Day. The schemes provide sale / switch-in and repurchase / switch-out facility on all Business Days at NAV based prices. Risk Factors: Mutual Funds and securities investments are subject to market risks and there is no assurance or guarantee that the objectives of the scheme will be achieved. As with any investment in securities, the NAV of the Units issued under the scheme can go up or down depending on the factors and forces affecting the capital markets. Reliance Monthly Income Plan is the name of the scheme and does not in any manner indicates either the quality of the scheme; its future prospects or returns. Past performance of the Sponsor/AMC/Mutual Fund is not indicative of the future performance of the scheme. The NAV of the scheme may be affected, inter alia, by changes in the market conditions, interest rates, trading volumes, settlement periods and transfer procedures. The Mutual Fund is not assuring that it will make periodical dividend distributions, though it has every intention of doing so. All dividend distributions are subject to the availability of distributable surplus in the scheme. Please read the Scheme Information Document (SID) and Statement of Additional Information (SAI) carefully before investing. Copies of SID and SAI is available at all the DISC, Distributors and www.reliancemutual.comStatutory Details: Reliance Mutual Fund has been constituted as a trust in accordance with the provisions of the Indian Trusts Act, 1882. Sponsor: Reliance Capital Limited. Trustee: Reliance Capital Trustee Co. Limited. Investment Manager: Reliance Capital Asset Management Limited (Registered Office of Trustee and Investment Manager: 'H' Block, 1st Floor, Dhirubhai Ambani Knowledge City, Koparkhairne, Navi Mumbai - 400 710, Maharashtra). The Sponsor, the Trustee and the Investment Manager are incorporated under the Companies Act, 1956. The Sponsor is not responsible or liable for any loss resulting from the operation of the Scheme beyond their initial contribution of `1 lakh towards the setting up of the Mutual Fund and such other accretions and additions to the corpus. Disclaimer: The views expressed in the above article are those of the above mentioned fund manager and do not reflect the views of HSBC or any of its associates or employees. The above should be read in conjunction with all the disclaimers appearing in this publication.Please read the Scheme Information Document carefully before investing.
Reliance Monthly Income Plan (RMIP) As on 31 March‘ 12

39
Funds in Focus
Wealth Strategies - April -June 2012
As on 31 March‘ 12
Investment Objective: DSPBR STF is an open-ended income scheme, seeking to generate income commensurate with prudent risk, from a portfolio constituted of money market securities, floating rate debt securities and debt securities.
Asset Allocation: 50% - 100%: Money Market Securities, Floating rate debt securities whose coupon(s) are reset at least once a year, fixed rate debt securities having an average or residual maturity of less than or equal to 367 days or having put options within a period not exceeding 367 days. 0% - 50%: Fixed rate debt securities having residual or average maturity of more than 367 days and floating rate debt security where the next reset date is more than 367 days from the date of purchase. (Floating rate debt securities will include fixed rate debt securities swapped for floating rate returns by using derivatives; Debt securities may include securitised debts up to 60% of the net assets).
Disclaimer and Risk Factors:
Statutory Details: DSP BlackRock Mutual Fund was set up as a Trust and the settlors/sponsors are DSP ADIKO Holdings Pvt. Ltd. and DSP HMK Holdings Pvt. Ltd. (collectively) and BlackRock Inc. (Combined liability restricted to `1 lakh). Trustee: DSP BlackRock Trustee Company Pvt. Ltd. Investment Manager: DSP BlackRock Investment Managers Pvt. Ltd.Risk Factors: Mutual funds like securities investments, are subject to market and other risks and there can be no assurance that the schemes’ objectives will be achieved. As with any investment in securities, the NAV of Units issued under the schemes can go up or down depending on the factors and forces affecting capital markets. Past performance of the sponsor/AMC/mutual fund does not indicate the future performance of the schemes. Investors in the schemes are not being offered a guaranteed or assured rate of return. Each Scheme/Plan is required to have (i) minimum 20 investors and (ii) no single investor holding >25% of corpus. If the aforesaid point (i) is not fulfilled within the prescribed time, the Scheme/Plan concerned will be wound up and in case of breach of the aforesaid point, (ii) at the end of the prescribed period, the investor’s holding in excess of 25% of the corpus will be redeemed as per SEBI guidelines. The names of the schemes do not in any manner indicate the quality of the schemes, their future prospects or returns. For scheme specific risk factors, please refer the SID. For more details, please refer the Key Information Memorandum cum Application Forms, which are available on the website, www.dspblackrock.com, and at the ISCs/Distributors. Please read the Scheme Information Document and Statement of Additional Information carefully before investing.Disclaimer: The views expressed in the above article are those of the above mentioned fund manager and do not reflect the views of HSBC or any of its associates or employees.The above should be read in conjunction with all the disclaimers appearing in this publication.Please read the Scheme Information Document carefully before investing.
Allotment Date: 9-Sep-02
Fund Manager: Dhawal Dalal
Load Structure
(Exit loads applicable from the date of allotment of units to unitholder)
Entry Load Nil
Exit Load <=180 days: 0.5%>180 days: Nil
Fund Manager’s Views:
With peaking out in interest rate cycle, Short Term fund category continues to attract investors with preference for low volatility. DSPBR Short Term fund AUM increased to `794 Cr from `776 Cr in the prior month. Systemic liquidity remained extremely tight during the month and that kept the money market yields elevated during the month. This underpins our conviction that adding duration prematurely will not make meaningful contribution to the returns of the fund. We hold the view that credit spreads are likely to widen and hence we are not adding corporate bonds, NCDs or even illiquid CPs. We will cautiously add duration by buying on the dips as and when opportunities emerge. The Fund aims to exhibit flexibility in terms of investing across asset class and maturities. We continue to remain bullish on 1Y CDs due to better risk adjusted returns compared to other asset classes of similar maturity.
DSP BlackRock Short Term Fund (DSPBR STF)
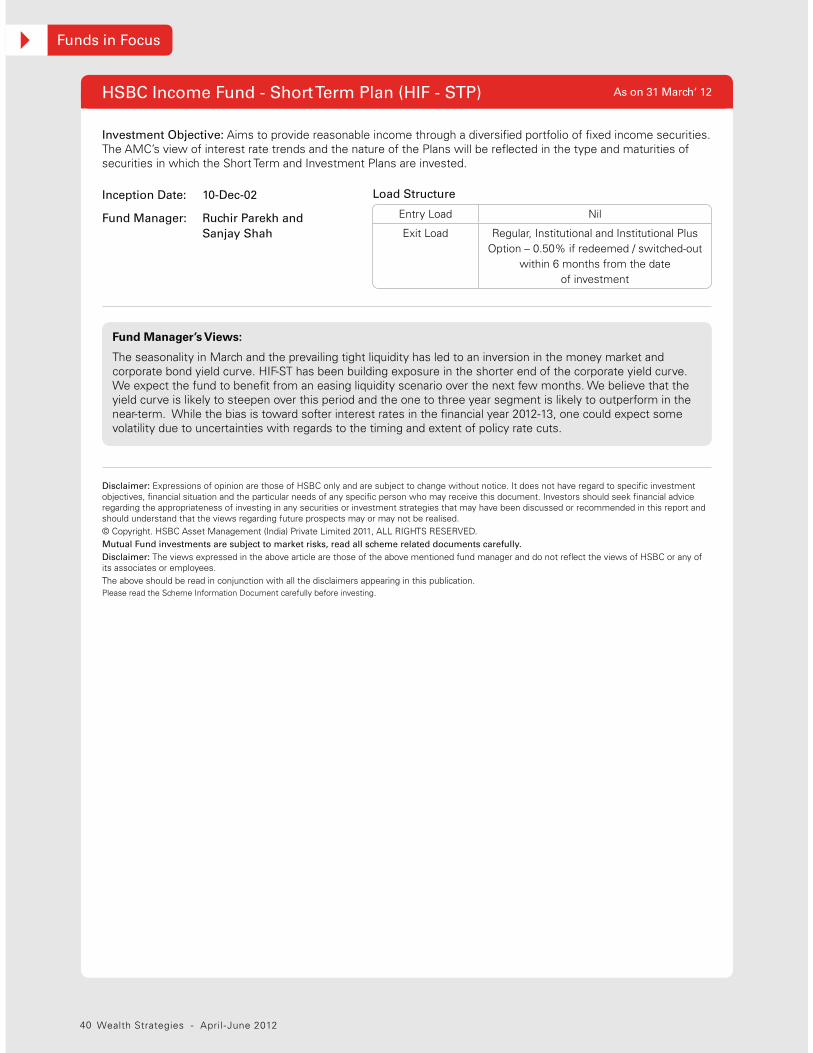
40
Funds in Focus
Wealth Strategies - April -June 2012
Fund Manager’s Views:
The seasonality in March and the prevailing tight liquidity has led to an inversion in the money market and corporate bond yield curve. HIF-ST has been building exposure in the shorter end of the corporate yield curve. We expect the fund to benefit from an easing liquidity scenario over the next few months. We believe that the yield curve is likely to steepen over this period and the one to three year segment is likely to outperform in the near-term. While the bias is toward softer interest rates in the financial year 2012-13, one could expect some volatility due to uncertainties with regards to the timing and extent of policy rate cuts.
Disclaimer: Expressions of opinion are those of HSBC only and are subject to change without notice. It does not have regard to specific investment objectives, financial situation and the particular needs of any specific person who may receive this document. Investors should seek financial advice regarding the appropriateness of investing in any securities or investment strategies that may have been discussed or recommended in this report and should understand that the views regarding future prospects may or may not be realised.© Copyright. HSBC Asset Management (India) Private Limited 2011, ALL RIGHTS RESERVED. Mutual Fund investments are subject to market risks, read all scheme related documents carefully.
Disclaimer: The views expressed in the above article are those of the above mentioned fund manager and do not reflect the views of HSBC or any of its associates or employees.The above should be read in conjunction with all the disclaimers appearing in this publication.Please read the Scheme Information Document carefully before investing.
HSBC Income Fund - Short Term Plan (HIF - STP)
Investment Objective: Aims to provide reasonable income through a diversified portfolio of fixed income securities. The AMC’s view of interest rate trends and the nature of the Plans will be reflected in the type and maturities of securities in which the Short Term and Investment Plans are invested.
Inception Date: 10-Dec-02
Fund Manager: Ruchir Parekh and
Sanjay Shah
Load Structure
Entry Load Nil
Exit Load Regular, Institutional and Institutional Plus Option – 0.50% if redeemed / switched-out
within 6 months from the date of investment
As on 31 March‘ 12
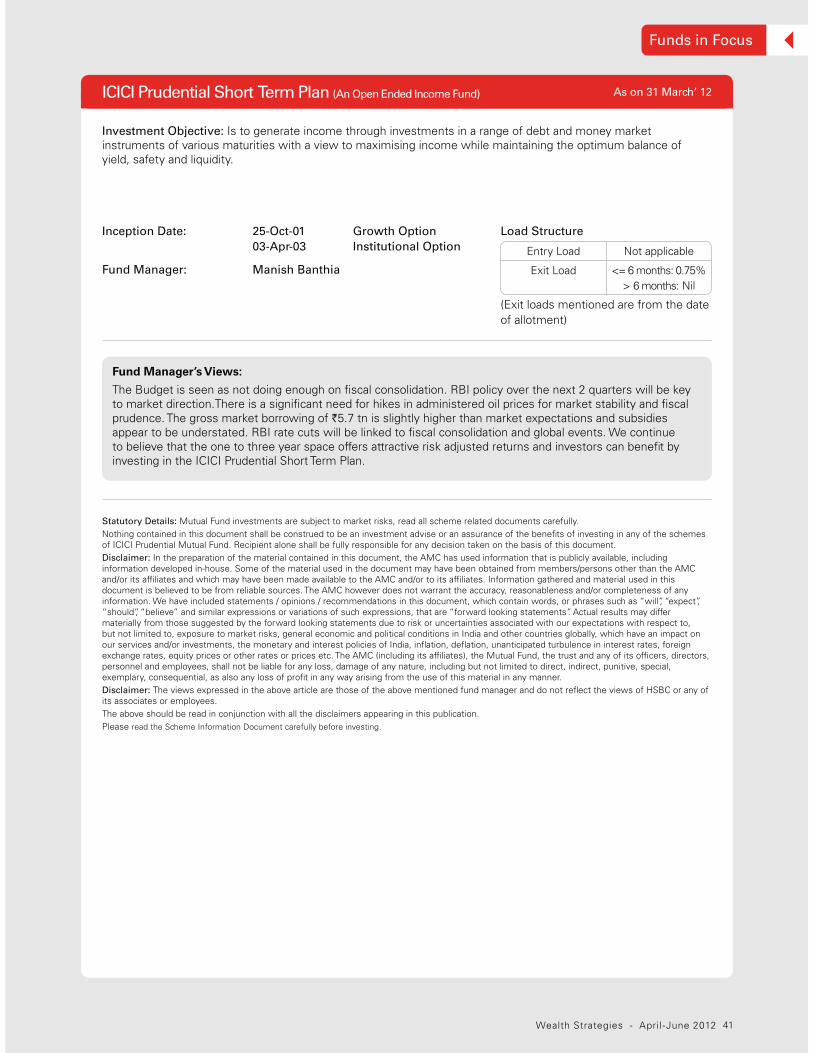
41
Funds in Focus
Wealth Strategies - April -June 2012
Inception Date: 25-Oct-01 Growth Option
03-Apr-03 Institutional Option
Fund Manager: Manish Banthia
Investment Objective: Is to generate income through investments in a range of debt and money market instruments of various maturities with a view to maximising income while maintaining the optimum balance of yield, safety and liquidity.
Load Structure
(Exit loads mentioned are from the date of allotment)
Entry Load Not applicable
Exit Load <= 6 months: 0.75%> 6 months: Nil
Statutory Details: Mutual Fund investments are subject to market risks, read all scheme related documents carefully. Nothing contained in this document shall be construed to be an investment advise or an assurance of the benefits of investing in any of the schemes of ICICI Prudential Mutual Fund. Recipient alone shall be fully responsible for any decision taken on the basis of this document.Disclaimer: In the preparation of the material contained in this document, the AMC has used information that is publicly available, including information developed in-house. Some of the material used in the document may have been obtained from members/persons other than the AMC and/or its affiliates and which may have been made available to the AMC and/or to its affiliates. Information gathered and material used in this document is believed to be from reliable sources. The AMC however does not warrant the accuracy, reasonableness and/or completeness of any information. We have included statements / opinions / recommendations in this document, which contain words, or phrases such as “will”, “expect”, “should”, “believe” and similar expressions or variations of such expressions, that are “forward looking statements”. Actual results may differ materially from those suggested by the forward looking statements due to risk or uncertainties associated with our expectations with respect to, but not limited to, exposure to market risks, general economic and political conditions in India and other countries globally, which have an impact on our services and/or investments, the monetary and interest policies of India, inflation, deflation, unanticipated turbulence in interest rates, foreign exchange rates, equity prices or other rates or prices etc. The AMC (including its affiliates), the Mutual Fund, the trust and any of its officers, directors, personnel and employees, shall not be liable for any loss, damage of any nature, including but not limited to direct, indirect, punitive, special, exemplary, consequential, as also any loss of profit in any way arising from the use of this material in any manner.Disclaimer: The views expressed in the above article are those of the above mentioned fund manager and do not reflect the views of HSBC or any of its associates or employees. The above should be read in conjunction with all the disclaimers appearing in this publication. Please read the Scheme Information Document carefully before investing.
Fund Manager’s Views:
The Budget is seen as not doing enough on fiscal consolidation. RBI policy over the next 2 quarters will be key to market direction.There is a significant need for hikes in administered oil prices for market stability and fiscal prudence. The gross market borrowing of `5.7 tn is slightly higher than market expectations and subsidies appear to be understated. RBI rate cuts will be linked to fiscal consolidation and global events. We continue to believe that the one to three year space offers attractive risk adjusted returns and investors can benefit by investing in the ICICI Prudential Short Term Plan.
ICICI Prudential Short Term Plan (An Open Ended Income Fund) As on 31 March‘ 12
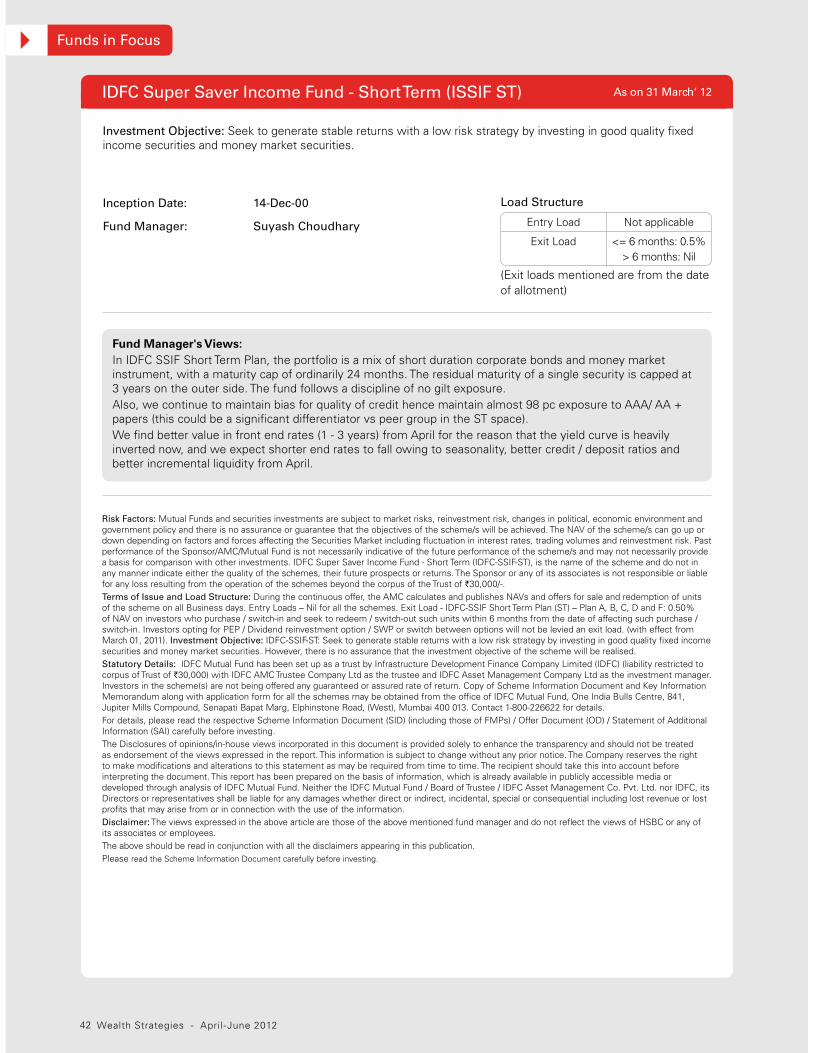
42
Funds in Focus
Wealth Strategies - April -June 2012
Investment Objective: Seek to generate stable returns with a low risk strategy by investing in good quality fixed income securities and money market securities.
Inception Date: 14-Dec-00
Fund Manager: Suyash Choudhary
Load Structure
(Exit loads mentioned are from the date of allotment)
Entry Load Not applicable
Exit Load <= 6 months: 0.5%> 6 months: Nil
Fund Manager's Views:In IDFC SSIF Short Term Plan, the portfolio is a mix of short duration corporate bonds and money market instrument, with a maturity cap of ordinarily 24 months. The residual maturity of a single security is capped at 3 years on the outer side. The fund follows a discipline of no gilt exposure. Also, we continue to maintain bias for quality of credit hence maintain almost 98 pc exposure to AAA/ AA + papers (this could be a significant differentiator vs peer group in the ST space). We find better value in front end rates (1 - 3 years) from April for the reason that the yield curve is heavily inverted now, and we expect shorter end rates to fall owing to seasonality, better credit / deposit ratios and better incremental liquidity from April.
Risk Factors: Mutual Funds and securities investments are subject to market risks, reinvestment risk, changes in political, economic environment and government policy and there is no assurance or guarantee that the objectives of the scheme/s will be achieved. The NAV of the scheme/s can go up or down depending on factors and forces affecting the Securities Market including fluctuation in interest rates, trading volumes and reinvestment risk. Past performance of the Sponsor/AMC/Mutual Fund is not necessarily indicative of the future performance of the scheme/s and may not necessarily provide a basis for comparison with other investments. IDFC Super Saver Income Fund - Short Term (IDFC-SSIF-ST), is the name of the scheme and do not in any manner indicate either the quality of the schemes, their future prospects or returns. The Sponsor or any of its associates is not responsible or liable for any loss resulting from the operation of the schemes beyond the corpus of the Trust of `30,000/-. Terms of Issue and Load Structure: During the continuous offer, the AMC calculates and publishes NAVs and offers for sale and redemption of units of the scheme on all Business days. Entry Loads – Nil for all the schemes. Exit Load - IDFC-SSIF Short Term Plan (ST) – Plan A, B, C, D and F: 0.50% of NAV on investors who purchase / switch-in and seek to redeem / switch-out such units within 6 months from the date of affecting such purchase / switch-in. Investors opting for PEP / Dividend reinvestment option / SWP or switch between options will not be levied an exit load. (with effect from March 01, 2011). Investment Objective: IDFC-SSIF-ST: Seek to generate stable returns with a low risk strategy by investing in good quality fixed income securities and money market securities. However, there is no assurance that the investment objective of the scheme will be realised.Statutory Details: IDFC Mutual Fund has been set up as a trust by Infrastructure Development Finance Company Limited (IDFC) (liability restricted to corpus of Trust of `30,000) with IDFC AMC Trustee Company Ltd as the trustee and IDFC Asset Management Company Ltd as the investment manager. Investors in the scheme(s) are not being offered any guaranteed or assured rate of return. Copy of Scheme Information Document and Key Information Memorandum along with application form for all the schemes may be obtained from the office of IDFC Mutual Fund, One India Bulls Centre, 841, Jupiter Mills Compound, Senapati Bapat Marg, Elphinstone Road, (West), Mumbai 400 013. Contact 1-800-226622 for details.For details, please read the respective Scheme Information Document (SID) (including those of FMPs) / Offer Document (OD) / Statement of Additional Information (SAI) carefully before investing.The Disclosures of opinions/in-house views incorporated in this document is provided solely to enhance the transparency and should not be treated as endorsement of the views expressed in the report. This information is subject to change without any prior notice. The Company reserves the right to make modifications and alterations to this statement as may be required from time to time. The recipient should take this into account before interpreting the document. This report has been prepared on the basis of information, which is already available in publicly accessible media or developed through analysis of IDFC Mutual Fund. Neither the IDFC Mutual Fund / Board of Trustee / IDFC Asset Management Co. Pvt. Ltd. nor IDFC, its Directors or representatives shall be liable for any damages whether direct or indirect, incidental, special or consequential including lost revenue or lost profits that may arise from or in connection with the use of the information.Disclaimer: The views expressed in the above article are those of the above mentioned fund manager and do not reflect the views of HSBC or any of its associates or employees. The above should be read in conjunction with all the disclaimers appearing in this publication.Please read the Scheme Information Document carefully before investing.
IDFC Super Saver Income Fund - Short Term (ISSIF ST) As on 31 March‘ 12


Issued by The Hongkong and Shanghai Banking Corporation Limited, India (HSBC India). Incorporated in Hong Kong SAR with limited liability.