
Risk review - HSBC Group
89
107 Our approach to risk 107 Our risk appetite 107 Risk management 109 Key developments in 2020 110 Top and emerging risks 110 Externally driven 114 Internally driven 116 Areas of special interest 116 Risks related to Covid-19 117 UK withdrawal from the European Union 118 Our material banking risks 119 Credit risk 169 Treasury risk 182 Market risk 186 Resilience risk 186 Regulatory compliance risk 187 Financial crime risk 188 Model risk 189 Insurance manufacturing operations risk Risk review Operational resilience in a pandemic We upheld our operational resilience during the Covid-19 outbreak during a period of increased demand on our teams and systems, with approximately 1.6 million of our WPB customers granted payment relief options across more than 30 markets. We supplemented our existing approach to risk management with additional tools and practices helping to mitigate and manage risks. Initiatives included mortgage assistance, payment holidays, and the waiving of certain fees and charges. As we helped our customers during these challenging times, we continued to prioritise effective and robust credit risk management. We also increased our focus on the quality and timeliness of the data used to inform management decisions, so we were able to manage the varying level of risk actively throughout the year. For further details of our customer relief programmes, see page 142. 106 HSBC Holdings plc Annual Report and Accounts 2020
-
Upload
khangminh22 -
Category
Documents
-
view
0 -
download
0
Transcript of Risk review - HSBC Group

107 Our approach to risk107 Our risk appetite107 Risk management109 Key developments in 2020110 Top and emerging risks110 Externally driven114 Internally driven116 Areas of special interest116 Risks related to Covid-19117 UK withdrawal from the European Union118 Our material banking risks119 Credit risk169 Treasury risk182 Market risk186 Resilience risk186 Regulatory compliance risk187 Financial crime risk188 Model risk189 Insurance manufacturing operations risk
Risk review
Operational resilience in a pandemicWe upheld our operational resilience during the Covid-19 outbreak during a period of increased demand on our teams and systems, with approximately 1.6 million of our WPB customers granted payment relief options across more than 30 markets.
We supplemented our existing approach to risk management with additional tools and practices helping to mitigate and manage risks. Initiatives included mortgage assistance, payment holidays, and the waiving of certain fees and charges.
As we helped our customers during these challenging times, we continued to prioritise effective and robust credit risk management. We also increased our focus on the quality and timeliness of the data used to inform management decisions, so we were able to manage the varying level of risk actively throughout the year.
For further details of our customer relief programmes, see page 142.
106 HSBC Holdings plc Annual Report and Accounts 2020
Our approach to risk
Our risk appetite
We recognise the importance of a strong culture, which refers to our shared attitudes, values and standards that shape behaviours related to risk awareness, risk taking and risk management. All our people are responsible for the management of risk, with the ultimate accountability residing with the Board.
We seek to build our business for the long term by balancing social, environmental and economic considerations in the decisions we make. Our strategic priorities are underpinned by our endeavour to operate in a sustainable way. This helps us to carry out our social responsibility and manage the risk profile of the business. We are committed to managing and mitigating climate-related risks, both physical and transition, and continue to incorporate consideration of these into how we manage and oversee risks internally and with our customers.
The following principles guide the Group’s overarching appetite for risk and determine how our businesses and risks are managed.
Financial position
• We aim to maintain a strong capital position, defined by regulatory and internal capital ratios.
• We carry out liquidity and funding management for each operating entity, on a stand-alone basis.
Operating model
• We seek to generate returns in line with a conservative risk appetite and strong risk management capability.
• We aim to deliver sustainable earnings and consistent returns for shareholders.
Business practice
• We have zero tolerance for any of our people knowingly engaging in any business, activity or association where foreseeable reputational risk or damage has not been considered and/or mitigated.
• We have no appetite for deliberately or knowingly causing detriment to consumers, or incurring a breach of the letter or spirit of regulatory requirements.
• We have no appetite for inappropriate market conduct by any member of staff or by any Group business.
Enterprise-wide application
Our risk appetite encapsulates the consideration of financial and non-financial risks. We define financial risk as the risk of a financial loss as a result of business activities. We actively take these types of risks to maximise shareholder value and profits. Non-financial risk is the risk to achieving our strategy or objectives as the result of failed internal processes, people and systems, or from external events.
Our risk appetite is expressed in both quantitative and qualitative terms and applied at the global business level, at the regional level and to material operating entities. Every three years, the Global Risk function commissions an external independent firm to review the Group’s approach to risk appetite and to help ensure that it remains in line with market best practice and regulatory expectations. The exercise carried out in 2019 confirmed the Group’s risk appetite statement (‘RAS’) remains aligned to best practices, regulatory expectations and strategic goals. Our risk appetite continues to evolve and expand its scope as part of our regular review process.
The Board reviews and approves the Group’s risk appetite twice a year to make sure it remains fit for purpose. The Group’s risk appetite is considered, developed and enhanced through:
• an alignment with our strategy, purpose, values and customer needs;
• trends highlighted in other Group risk reports;
• communication with risk stewards on the developing risk landscape;
• strength of our capital, liquidity and balance sheet;
• compliance with applicable laws and regulations;
• effectiveness of the applicable control environment to mitigate risk, informed by risk ratings from risk control assessments;
• functionality, capacity and resilience of available systems to manage risk; and
• the level of available staff with the required competencies to manage risks.
We formally articulate our risk appetite through our RAS. Setting out our risk appetite ensures that we agree a suitable level of risk for our strategy. In this way, risk appetite informs our financial planning process and helps senior management to allocate capital to business activities, services and products.
The RAS consists of qualitative statements and quantitative metrics, covering financial and non-financial risks. It is applied to the development of business line strategies, strategic and business planning and remuneration. At a Group level, performance against the RAS is reported to the Group Risk Management Meeting (‘RMM’) alongside key risk indicators to support targeted insight and discussion on breaches of risk appetite and associated mitigating actions. This reporting allows risks to be promptly identified and mitigated, and informs risk-adjusted remuneration to drive a strong risk culture.
Each global business, region and strategically important country and territory is required to have its own RAS, which is monitored to help ensure it remains aligned with the Group’s RAS. Each RAS and business activity is guided and underpinned by qualitative principles and/or quantitative metrics.
Risk management
We recognise that the primary role of risk management is to protect our customers, business, colleagues, shareholders and the communities that we serve, while ensuring we are able to support our strategy and provide sustainable growth. This is supported through our three lines of defence model described on page 109.
We are focused on the implementation of our business strategy, as part of which we are carrying out a major change programme. It is critical that we ensure that as we implement changes, we use active risk management to manage the execution risks.
We will also perform periodic risk assessments, including against strategies, to help ensure retention of key personnel for our continued safe operation.
We use a comprehensive risk management framework across the organisation and across all risk types, underpinned by our culture and values. This outlines the key principles, policies and practices that we employ in managing material risks, both financial and non-financial.
The framework fosters continual monitoring, promotes risk awareness and encourages sound operational and strategic decision making. It also ensures a consistent approach to identifying, assessing, managing and reporting the risks we accept and incur in our activities.
Our risk management framework
The following diagram and descriptions summarise key aspects of the risk management framework, including governance and structure, our risk management tools and our culture, which together help align employee behaviour with our risk appetite.
HSBC Holdings plc Annual Report and Accounts 2020 107
Risk review
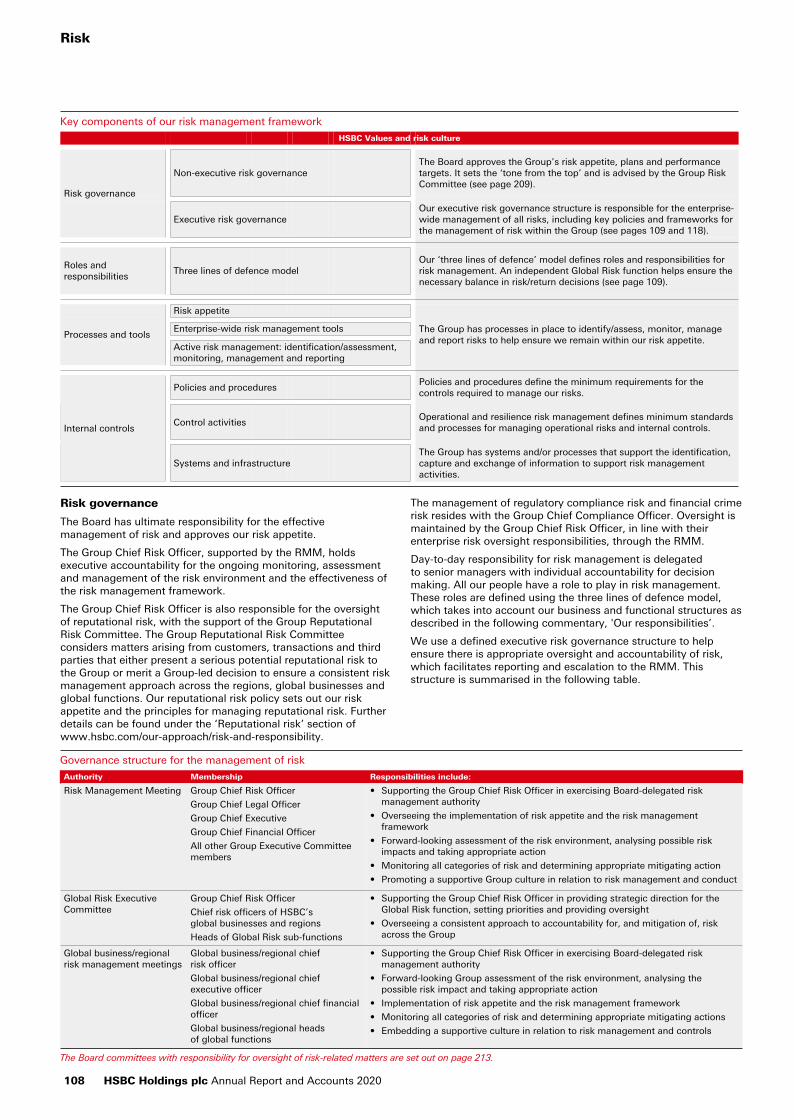
Key components of our risk management framework
HSBC Values and risk culture
Risk governance
Non-executive risk governanceThe Board approves the Group’s risk appetite, plans and performance targets. It sets the ‘tone from the top’ and is advised by the Group Risk Committee (see page 209).
Executive risk governanceOur executive risk governance structure is responsible for the enterprise-wide management of all risks, including key policies and frameworks for the management of risk within the Group (see pages 109 and 118).
Roles and responsibilities
Three lines of defence modelOur ‘three lines of defence’ model defines roles and responsibilities for risk management. An independent Global Risk function helps ensure the necessary balance in risk/return decisions (see page 109).
Processes and tools
Risk appetite
The Group has processes in place to identify/assess, monitor, manage and report risks to help ensure we remain within our risk appetite.
Enterprise-wide risk management tools
Active risk management: identification/assessment, monitoring, management and reporting
Internal controls
Policies and proceduresPolicies and procedures define the minimum requirements for the controls required to manage our risks.
Control activitiesOperational and resilience risk management defines minimum standards and processes for managing operational risks and internal controls.
Systems and infrastructureThe Group has systems and/or processes that support the identification, capture and exchange of information to support risk management activities.
Risk governance
The Board has ultimate responsibility for the effective management of risk and approves our risk appetite.
The Group Chief Risk Officer, supported by the RMM, holds executive accountability for the ongoing monitoring, assessment and management of the risk environment and the effectiveness of the risk management framework.
The Group Chief Risk Officer is also responsible for the oversight of reputational risk, with the support of the Group Reputational Risk Committee. The Group Reputational Risk Committee considers matters arising from customers, transactions and third parties that either present a serious potential reputational risk to the Group or merit a Group-led decision to ensure a consistent risk management approach across the regions, global businesses and global functions. Our reputational risk policy sets out our risk appetite and the principles for managing reputational risk. Further details can be found under the ‘Reputational risk’ section of www.hsbc.com/our-approach/risk-and-responsibility.
The management of regulatory compliance risk and financial crime risk resides with the Group Chief Compliance Officer. Oversight is maintained by the Group Chief Risk Officer, in line with their enterprise risk oversight responsibilities, through the RMM.
Day-to-day responsibility for risk management is delegated to senior managers with individual accountability for decision making. All our people have a role to play in risk management. These roles are defined using the three lines of defence model, which takes into account our business and functional structures as described in the following commentary, 'Our responsibilities’.
We use a defined executive risk governance structure to help ensure there is appropriate oversight and accountability of risk, which facilitates reporting and escalation to the RMM. This structure is summarised in the following table.
Governance structure for the management of risk
Authority Membership Responsibilities include:
Risk Management Meeting Group Chief Risk Officer
Group Chief Legal Officer
Group Chief Executive
Group Chief Financial Officer
All other Group Executive Committee members
• Supporting the Group Chief Risk Officer in exercising Board-delegated risk management authority
• Overseeing the implementation of risk appetite and the risk management framework
• Forward-looking assessment of the risk environment, analysing possible risk impacts and taking appropriate action
• Monitoring all categories of risk and determining appropriate mitigating action
• Promoting a supportive Group culture in relation to risk management and conduct
Global Risk Executive Committee
Group Chief Risk Officer
Chief risk officers of HSBC’s global businesses and regions
Heads of Global Risk sub-functions
• Supporting the Group Chief Risk Officer in providing strategic direction for the Global Risk function, setting priorities and providing oversight
• Overseeing a consistent approach to accountability for, and mitigation of, risk across the Group
Global business/regional risk management meetings
Global business/regional chief risk officer
Global business/regional chief executive officer
Global business/regional chief financial officer
Global business/regional heads of global functions
• Supporting the Group Chief Risk Officer in exercising Board-delegated risk management authority
• Forward-looking Group assessment of the risk environment, analysing the possible risk impact and taking appropriate action
• Implementation of risk appetite and the risk management framework
• Monitoring all categories of risk and determining appropriate mitigating actions
• Embedding a supportive culture in relation to risk management and controls
The Board committees with responsibility for oversight of risk-related matters are set out on page 213.
Risk
108 HSBC Holdings plc Annual Report and Accounts 2020
Our responsibilities
All our people are responsible for identifying and managing risk within the scope of their roles as part of the three lines of defence model.
Three lines of defence
To create a robust control environment to manage risks, we use an activity-based three lines of defence model. This model delineates management accountabilities and responsibilities for risk management and the control environment.
The model underpins our approach to risk management by clarifying responsibility and encouraging collaboration, as well as enabling efficient coordination of risk and control activities. The three lines of defence are summarised below:
• The first line of defence owns the risks and is responsible for identifying, recording, reporting and managing them in line with risk appetite, and ensuring that the right controls and assessments are in place to mitigate them.
• The second line of defence challenges the first line of defence on effective risk management, and provides advice and guidance in relation to the risk.
• The third line of defence is our Global Internal Audit function, which provides independent assurance that our risk management approach and processes are designed and operating effectively.
Global Risk function
Our Global Risk function, headed by the Group Chief Risk Officer, is responsible for the Group’s risk management framework. This responsibility includes establishing global policy, monitoring risk profiles, and identifying and managing forward-looking risk. Global Risk is made up of sub-functions covering all risks to our business. Global Risk forms part of the second line of defence. It is independent from the global businesses, including sales and trading functions, to provide challenge, appropriate oversight and balance in risk/return decisions.
Responsibility for minimising both financial and non-financial risk lies with our people. They are required to manage the risks of the business and operational activities for which they are responsible. We maintain adequate oversight of our risks through our various specialist risk stewards and the collective accountability held by our chief risk officers.
Non-financial risk is the risk to achieving our strategy or objectives as a result of failed internal processes, people and systems, or from external events. Sound non-financial risk management is central to achieving good outcomes for our customers.
During 2020, we continued to strengthen the control environment and our approach to the management of non-financial risk, as broadly set out in our risk management framework. The management of non-financial risk focuses on governance and risk appetite, and provides a single view of the non-financial risks that matter the most and the associated controls. It incorporates a risk management system designed to enable the active management of non-financial risk. Our ongoing focus is on simplifying our approach to non-financial risk management, while driving more effective oversight and better end-to-end identification and management of non-financial risks. This is overseen by the Operational and Resilience Risk function, headed by the Group Head of Operational and Resilience Risk.
Stress testing and recovery planning
We operate a wide-ranging stress testing programme that is a key part of our risk management and capital and liquidity planning. Stress testing provides management with key insights into the impact of severely adverse events on the Group, and provides confidence to regulators on the Group’s financial stability.
Our stress testing programme assesses our capital and liquidity strength through a rigorous examination of our resilience to external shocks. As well as undertaking regulatory-driven stress tests, we conduct our own internal stress tests in order to understand the nature and level of all material risks, quantify the
impact of such risks and develop plausible business-as-usual mitigating actions.
The Bank of England (‘BoE’) annual cyclical scenario stress test in 2020 was cancelled and the publication of the results of the 2019 biennial exploratory scenario on liquidity was postponed due to the Covid-19 outbreak.
Internal stress tests
Our internal capital assessment uses a range of stress scenarios that explore risks identified by management. They include potential adverse macroeconomic, geopolitical and operational risk events, as well as other potential events that are specific to HSBC.
The selection of stress scenarios is based upon the output of our identified top and emerging risks and our risk appetite. Stress testing analysis helps management understand the nature and extent of vulnerabilities to which the Group is exposed. Using this information, management decides whether risks can or should be mitigated through management actions or, if they were to crystallise, be absorbed through capital and liquidity. This in turn informs decisions about preferred capital and liquidity levels and allocations.
In addition to the Group-wide stress testing scenarios, each major subsidiary conducts regular macroeconomic and event-driven scenario analyses specific to its region. They also participate, as required, in the regulatory stress testing programmes of the jurisdictions in which they operate, such as the Comprehensive Capital Analysis and Review and Dodd-Frank Act Stress Testing programmes in the US, and the stress tests of the Hong Kong Monetary Authority (‘HKMA’). Global functions and businesses also perform bespoke stress testing to inform their assessment of risks to potential scenarios.
We also conduct reverse stress tests each year at Group level and, where required, at subsidiary entity level to understand potential extreme conditions that would make our business model non-viable. Reverse stress testing identifies potential stresses and vulnerabilities we might face, and helps inform early warning triggers, management actions and contingency plans designed to mitigate risks.
Recovery and resolution plans
Recovery and resolution plans form part of the integral framework safeguarding the Group’s financial stability. The Group recovery plan together with stress testing help us understand the likely outcomes of adverse business or economic conditions and in the identification of appropriate risk mitigating actions. The Group is committed to further developing its recovery and resolution capabilities in line with the BoE resolvability assessment framework requirements.
Key developments in 2020
We actively managed the risks resulting from the Covid-19 outbreak and its impacts on our customers and operations during 2020, as well as other key risks described in this section.
In addition, we enhanced our risk management in the following areas:
• In January 2020, we simplified our approach and articulation of risk management through the combination of our enterprise risk management framework and our operational risk management framework.
• The global model risk policy and associated standards were revised to improve how we manage model risk and meet enhanced external expectations.
• We continued to focus on simplifying our approach to non-financial risk management. We are implementing more effective oversight and better end-to-end identification and management of non-financial risks.
• We established the Treasury Risk Management function. This function is a dedicated second line of defence, providing independent oversight of treasury activities across capital risk, liquidity and funding risk, structural foreign exchange risk and
HSBC Holdings plc Annual Report and Accounts 2020 109
Risk review

interest rate risk in the banking book, together with pension risk.
• We continued to support the business and our customers throughout the global pandemic, while continuing our focus on managing financial crime risk. We continued to invest in both advanced analytics and artificial intelligence, which remain key components of our next generation of tools to fight financial crime.
• We combined our Operational Risk and Resilience Risk teams to form a new Operational and Resilience Risk sub-function. This sub-function provides robust non-financial risk first line of defence oversight and risk steward oversight of the management of risk by the Group’s businesses, functions, legal entities and critical business services. The sub-function helps to ensure that the first line of defence is focused firmly on priority tasks. By bringing the two teams together, we expect to benefit from improved stewardship, better risk management capabilities and better outcomes for our customers.
• We established a dedicated Climate Risk Oversight Forum to shape and oversee our approach to climate risk. We have also established a climate risk programme to drive the delivery of our enhanced climate risk management approach.
Top and emerging risks
We use a top and emerging risks process to provide a forward-looking view of issues with the potential to threaten the execution of our strategy or operations over the medium to long term.
We proactively assess the internal and external risk environment, as well as review the themes identified across our regions and global businesses, for any risks that may require global escalation, updating our top and emerging risks as necessary.
We define a ‘top risk’ as a thematic issue that may form and crystallise within one year, and which has the potential to materially affect the Group’s financial results, reputation or business model. It may arise across any combination of risk types, regions or global businesses. The impact may be well understood by senior management and some mitigating actions may already be in place.
An ‘emerging risk’ is a thematic issue with large unknown components that may form and crystallise beyond a one-year time horizon. If it were to materialise, it could have a material effect on our long-term strategy, profitability and/or reputation. Existing mitigation plans are likely to be minimal, reflecting the uncertain nature of these risks at this stage. Some high-level analysis and/or stress testing may have been carried out to assess the potential impact.
Our current top and emerging risks are as follows.
Externally driven
Geopolitical and macroeconomic risks
Our operations and portfolios are exposed to risks associated with political instability, civil unrest and military conflict, which could lead to disruption of our operations, physical risk to our staff and/or physical damage to our assets.
Global tensions over trade, technology and ideology can manifest themselves in divergent regulatory standards and compliance regimes, presenting long-term strategic challenges for multinational businesses.
The Covid-19 outbreak dominated the political and economic landscape through much of 2020. The twin shocks of a public health emergency and the resultant economic fallout were felt around the world, hitting both advanced and emerging markets. The closure of borders threatened medical and food supplies for many markets, leading to countries and territories focusing efforts on building resilient supply chains closer to home. The Covid-19 outbreak and corresponding vaccine roll-out will likely dominate the political and economic agenda for most of 2021.
Tensions could increase as countries compete for access to the array of vaccines either under development, approved or pending
approval, while the potential differences of protection offered by vaccines, and the speed and scale with which they can be manufactured and distributed may further add to tensions.
The Covid-19 outbreak also heightened existing US-China tensions. Tensions span a wide range of issues, including trade, finance, military, technology and human rights. The Covid-19 outbreak has accelerated US and Chinese efforts to reduce mutual dependence in strategic industries such as sensitive technology, pharmaceuticals and precursor chemicals.
A range of tensions in US-China relations could have potential ramifications for the Group and its customers. These tensions could include divisions over Hong Kong, US funding of and trading with strategic Chinese industries and claims of human rights violations. Some of these tensions have manifested themselves through actions taken by the governments of the US and China in 2020 and early 2021. These tensions may affect the Group through the impact of sanctions, including the impact of sanctions on customers, and could result in regulatory, reputational and market risks for the Group.
The US has imposed a range of sanctions and trade restrictions on Chinese persons and companies, focusing on entities the US believes are involved in human rights violations, information technology and communications equipment and services, and military activities, among others. In response, China has announced a number of sanctions and trade restrictions that target or provide authority to target foreign officials and companies, including those in the US. Certain measures are of particular relevance.
The US Hong Kong Autonomy Act provides 'secondary sanctions’ authority that allows for the imposition of US sanctions against non-US financial institutions found to be engaged in significant transactions with certain Chinese individuals and entities subject to US sanctions as a result of a US determination that these individuals or entities engaged in activities undermining Hong Kong’s autonomy. The US has also imposed restrictions on US persons’ ability to engage in transactions in or relating to publicly traded securities of a number of prominent Chinese companies. China has subsequently adopted regulations providing a framework for specific prohibitions against compliance with, and private rights of action for damages resulting from, measures that the government determines have an unjustified extraterritorial application that impairs Chinese sovereignty.
No penalties have yet been imposed against financial institutions under any of these measures, and their scope and application remain uncertain. These and any future measures that may be taken by the US and China may affect the Group, its customers, and the markets in which we operate.
It remains unclear the extent to which the new US administration will affect the current geopolitical tensions, following the inauguration of President Biden on 20 January 2021. However, long-term differences between the two nations will likely remain, which could affect sentiment and restrict global economic activity. We continue to monitor the situation.
While UK-China relations have historically been shaped by strong trade and investment, there are also emerging challenges. Following China’s implementation of the Hong Kong national security law, the UK offered residency rights and a path to citizenship to eligible British National (Overseas) passport holders in Hong Kong. In addition, both the UK and Hong Kong governments have suspended their extradition treaties with each other.
As geopolitical tensions rise, the compliance by multinational corporations with their legal or regulatory obligations in one jurisdiction may be seen as supporting the law or policy objectives of that jurisdiction over another, creating additional reputational and political risks for the Group. We maintain an open dialogue with our regulators on the impact of legal and regulatory obligations on HSBC's business and customers.
China’s expanding data privacy and cybersecurity laws could pose potential challenges to intra-group data sharing, especially within the Greater Bay Area. China’s draft Personal Information
Risk
110 HSBC Holdings plc Annual Report and Accounts 2020
Protection Law and Data Security Law, if passed in their current forms, could increase financial institutions’ compliance burdens in respect of cross-border transfers of personal information. In Hong Kong, there is also an increasing focus by regulators on the use of data and artificial intelligence. Use of personal data through digital platforms for initiatives in the Greater Bay Area may need to take into account these evolving data privacy and cybersecurity obligations.
Emerging and frontier markets have suffered particularly heavily from the Covid-19 outbreak, in light of healthcare shortcomings, widespread labour informality, exposure to commodities production and often weak policy frameworks and buffers. Multilateral institutions have mobilised support for the weaker frontier markets, with the World Bank and G-20 marshalling efforts to implement a standstill on debt to public sector institutions. The International Monetary Fund has also, to date, made approximately $106bn in emergency funds available to over 80 countries. However, negotiations on debt to the private sector will likely prove more difficult, and may result in sovereign debt restructuring and defaults for several countries. Most developed markets are expected to recover from the crisis, as macroeconomic policies remain highly accommodative. However, permanent business closures and job losses in some sectors will likely prevent several developed markets from achieving pre-crisis growth rates or activity levels in the near term. These countries and territories should be able to shoulder the higher public deficits and debts necessary to offset private sector weaknesses, given the continuing low cost of servicing public debt. However, some continental European countries entered the Covid-19 crisis on a weak economic and fiscal footing and suffered high healthcare and economic costs. Although substantial joint EU monetary and fiscal measures should help support recoveries and keep debt servicing costs down at least through 2021, there are concerns that permanently higher debt burdens will eventually lead to investors questioning their sustainability. Renewed government restrictions in response to new waves of infections will put further pressure on these economies.
Central banks have reduced interest rates in most financial markets due to the adverse impact on the path for economic recovery from the Covid-19 outbreak, which has in turn increased the likelihood of negative interest rates. This raises a number of risks and concerns, such as the readiness of our systems and processes to accommodate zero or negative rates, the resulting impacts on customers, and the financial implications given the significant impact that prolonged low interest rates have had, and may continue to have, on our net interest income. For some products, we have floored deposit rates at zero or made decisions not to charge negative rates. This, alongside loans repriced at lower rates, will result in our commercial margins being compressed, which is expected to be reflected in our profitability. The pricing of this risk will need to be carefully considered. These factors may challenge the long-term profitability of the banking sector, including HSBC, and will be considered as part of the Group’s transformation programme.
A Trade and Cooperation Agreement between the EU and the UK was agreed on 24 December 2020 and ratified by the UK on 30 December 2020. This avoids the imposition of tariffs and quotas on UK-EU goods trade, and thus a more material setback to the expected gradual recovery of the UK and EU economies from recessions caused by the Covid-19 outbreak. However, the new trading relationship features non-tariff barriers, and leaves several aspects of the broader relationship, including financial services trade, for further negotiation. While it is too early to assess the full economic impact, the UK’s exit from the EU may lead to an increase in market volatility and economic risk, particularly in the UK, which could adversely impact our profitability and prospects for growth in this market. For further details on our approach to the UK’s withdrawal from the EU, see ‘Areas of special interest’ on page 116.
The contraction in the global economy during 2020 has had varying effects on our customers, with many of them experiencing financial difficulties. This has resulted in an increase in expected credit losses (‘ECL’) and risk-weighted assets (‘RWAs’). For further
details on customer relief programmes, see page 142. For further details on RWAs, see page 174.
Mitigating actions
• We closely monitor economic developments in key markets and sectors and undertake scenario analysis. This helps enable us to take portfolio actions where necessary, including enhanced monitoring, amending our risk appetite and/or reducing limits and exposures.
• We stress test portfolios of particular concern to identify sensitivity to loss under a range of scenarios, with management actions being taken to rebalance exposures and manage risk appetite where necessary.
• We undertake regular reviews of key portfolios to help ensure that individual customer or portfolio risks are understood and our ability to manage the level of facilities offered through any downturn is appropriate.
• We continually monitor the geopolitical outlook, in particular in countries where we have material exposures and/or a significant physical presence. We have also established dedicated forums to monitor geopolitical developments.
• We continue to carry out contingency planning following the UK’s withdrawal from the EU and we are assessing the potential impact on our portfolios, operations and staff. This includes the possibility of disputes arising from differing interpretations of the Trade and Cooperation Agreement and other aspects of the bilateral relationship.
• We have taken steps to enhance physical security in those geographical areas deemed to be at high risk from terrorism and military conflicts.
Climate-related risks
Climate change can have an impact across HSBC’s risk taxonomy through both transition and physical channels. Transition risk can arise from the move to a low-carbon economy, such as through policy, regulatory and technological changes. Physical risk can arise through increasing severity and/or frequency of severe weather or other climatic events, such as rising sea levels and flooding.
These have the potential to cause both idiosyncratic and systemic risks, resulting in potential financial and non-financial impacts for HSBC. Financial impacts could materialise if transition and physical risks impact the ability of borrowers to repay their loans. Non-financial impacts could materialise if our own assets or operations are impacted by extreme weather or chronic changes in weather patterns, or as a result of business decisions to achieve our climate ambition.
Climate risks increased over 2020, primarily as a result of the pace and volume of policy and regulatory changes. These impacted the Group both directly and indirectly through our customers.
Mitigating actions
• A dedicated Climate Risk Oversight Forum is responsible for shaping and overseeing our approach to climate risk to provide support in managing the Group climate-related risks that are outside of our risk appetite. We have also established a climate risk programme to drive the delivery of our plans relating to the enhancement of our risk management approach.
• The Group’s risk appetite statement has been enhanced with quantitative metrics to articulate the risks from climate change and embed climate risk into our risk management framework. We established a transition risk framework to gain a better understanding of our exposure to the highest transition risk sectors.
• We implement sustainability risk policies as part of our reputational risk framework. We focus our policies on sensitive sectors that may have a high adverse impact on people or on the environment and in which we have a significant number of customers. These include sectors with potentially high-carbon impacts.
HSBC Holdings plc Annual Report and Accounts 2020 111
Risk review

• We have conducted a climate stress test pilot to inform the development of our approach to climate risk management. This pilot also aims to help us prepare and build the necessary capabilities to execute the Bank of England’s climate biennial exploratory scenario in 2021.
• We continue to engage with our customers, investors and regulators proactively when compiling and disclosing the information needed to manage climate risk. We also engage with initiatives actively, including the Climate Financial Risk Forum, Equator Principles, Taskforce on Climate-related Financial Disclosures and CDP (formerly the Carbon Disclosure Project) to drive best practice for climate risk management.
For further information, see our TCFD report on page 20.
Ibor transition
Interbank offered rates (‘Ibors’) are used to set interest rates on hundreds of trillions of US dollars of different types of financial transactions and are used extensively for valuation purposes, risk measurement and performance benchmarking.
The UK’s Financial Conduct Authority (‘FCA’) announced in July 2017 that it would no longer continue to persuade or require panel banks to submit rates for the London interbank offered rate (‘Libor’) after 2021. In addition, the 2016 EU Benchmark Regulation, which aims to ensure the accuracy, robustness and integrity of interest rate benchmarks, has resulted in other regulatory bodies reassessing their national benchmarks. As a result, industry-led national working groups are actively discussing the mechanisms for an orderly transition of five Libor currencies, four Asia-Pacific benchmarks that reference US dollar Libor, the Euro Overnight Index Average (‘Eonia’), the Singapore interbank offered rate (‘Sibor’), and the Turkish Lira interbank offered rate (‘TRLibor’) to their chosen replacement rates.
The transition process away from Ibors, including the transition of legacy contracts that reference Ibors, exposes HSBC to material execution risks, and increases some financial and non-financial risks.
As our Ibor transition programme progresses into the execution phase, resilience and operational risks are heightened. This is due to an expected increase in the number of new near risk-free rate ('RFR') products being rolled out, compressed timelines for the transition of legacy Ibor contracts and the extensive systems and process changes required to facilitate both new products and the transition. This is being exacerbated by the current interest rate environment where low Libor rates, in comparison with replacement RFRs, could affect decisions to transition contracts early, further compressing transition timelines. Regulatory compliance, legal and conduct risks may also increase as a result of both the continued sale of products referencing Ibors, and the sale of new products referencing RFRs, principally due to the lack of established market conventions across the different RFR products, and the compressed timelines for transition. Financial risks resulting from the discontinuation of Ibors and the development of market liquidity in RFRs will also affect HSBC throughout transition. The differences in Ibor and RFR interest rates will create a basis risk that we need to actively manage through appropriate financial hedging. Basis risk in the trading book and in the banking book may arise out of the asymmetric adoption of RFRs across assets and liabilities and across currencies and products. In addition, this may limit the ability to hedge effectively.
The continued orderly transition from Ibors continues to be the programme’s key objective through 2021 and can be broadly grouped into two workstreams: the development of alternative rate and RFR product capabilities and the transition of legacy Ibor contracts.
Development of alternative rate and RFR product capabilities
All of our global businesses have actively developed and implemented system and operational capabilities for alternative rates, such as base or prime rates and RFR products during 2020. Several key RFR product transactions were undertaken within the wholesale, Wealth and Personal Banking and Markets and
Securities Services business areas. The offering of RFR products is expected to be expanded, with further releases for products referencing the Sterling Overnight Index Average (‘Sonia’) and the Secured Overnight Financing Rate (‘SOFR’) set for the first half of 2021, in addition to products linked to other RFRs set to be released throughout 2021.
These developments and the reduced suitability of Ibor products have enabled HSBC to cease selling certain Ibor-linked products. Notably, the origination of US adjustable rate mortgages linked to Libor has ceased, and Libor-linked loan products have been demised for Business Banking and mid-market enterprise segments in certain countries, where suitable alternatives are available.
While Ibor sales do continue for a number of product lines, Ibor exposures that have post-2021 maturities are reducing, aided by market compression of Ibor trades, and undertaking new transactions in alternative rate and replacement RFR products, as market liquidity builds.
Transition legacy contracts
In addition to offering alternative rate and replacement RFR products, the development of new product capabilities will also help facilitate the transition of legacy Ibor and Eonia products. HSBC has begun to engage clients to determine their ability to transition in line with the readiness of alternative rate and replacement RFR products. The Covid-19 outbreak and the interest-rate environment may have affected clients’ abilities to transition early, and has resulted in compressed timelines for the transition of legacy Ibor contracts. However, for some US dollar Libor legacy contracts, this timing risk may be mitigated in part by the recent announcement by the Libor benchmark administrator, ICE Benchmark Administration Limited (‘IBA’), to consult on extending the publication of overnight and one, three, six and 12 month US dollar Libor settings to 30 June 2023. Despite the proposed extension, regulatory and industry guidance has been clear that market participants should cease writing new US dollar Libor contracts as soon as is practicable, and in any event by the end of 2021 for the majority of products. While the extended deadline will result in additional US dollar Libor transactions maturing before cessation, not all of them will, so it is possible that other proposed solutions, including legislative relief, will still be needed.
The Group continues to have Ibor and Eonia derivatives, loan and bond exposures maturing beyond 2021.
For the derivatives exposures, HSBC’s main trading entities have adhered to the adoption of the International Swaps and Derivatives Association (‘ISDA’) protocol as a fallback provision, which came into effect in January 2021, and the successful changes made by clearing houses to discount derivatives using the euro short-term rate (‘€STR’) and SOFR, to reduce the risk of a disorderly transition of the derivatives market.
For HSBC’s loan book, our global businesses have developed commercial strategies that include active client engagement and communication, providing detailed information on RFR products to determine our clients’ abilities to transition to a suitable alternative rate or replacement RFR product, before Ibor cessation.
With respect to HSBC’s legacy bond issuances referencing Ibors that may be subject to demise, we continue to assess the terms of those bond issuances and a variety of transition options, with a view to implementing, through 2021 and beyond, transition plans that we expect to be value neutral and in line with market practice. The timing of that implementation will depend on a variety of factors, including the expected timing for the demise of the relevant Ibor rate. The success of these transition plans will, to a certain extent, also depend on the participation and engagement of third-party market participants. In addition, bond issuances that reference Ibors by certain issuing entities in the Group also reduced during 2020, with such entities opting to issue bonds that reference RFRs such as Sonia and SOFR. For those bonds where HSBC is the paying agent, there remains dependence on engagement of third-party market participants in the transition process of their issued debt.
Risk
112 HSBC Holdings plc Annual Report and Accounts 2020

Mitigating actions
• Our global Ibor transition programme continues to assist in progressing towards an orderly transition to alternative benchmarks and replacement RFRs for our business and our clients, which is overseen by the Group Chief Risk Officer.
• We have widened the scope of the global Ibor transition programme to include additional interest rate benchmarks, where plans are in place to demise those benchmarks in the near future.
• We have and continue to carry out extensive training, communication and client engagement to facilitate appropriate selection of products.
• We have dedicated teams in place to support the development of and transition to alternative rate and replacement RFR products.
• We are implementing IT and operational changes to enable a longer transition window.
• We met the third quarter of 2020 regulatory endorsed milestones for implementing changes to contractual documentation and the clearing house-led transition to RFR discounting for derivatives.
• We actively compressed derivative contracts and are targeting regulatory endorsed and industry-agreed milestones for the cessation of new issuance of Libor transactions maturing post-2021. These include the first quarter 2021 for sterling Libor and the second quarter 2021 for US dollar Libor. This led to a reduction in the Group’s Ibor portfolio of financial instruments.
• We are undertaking reviews of existing Ibor hedge accounting strategies and have implemented policy and entity tools in respect of regulatory reliefs.
• We assess, monitor and dynamically manage risks, and implement specific mitigating controls when required.
• We continue to engage with regulatory and industry bodies actively to mitigate risks relating to hedge accounting changes, multiple RFR market conventions, and so-called ‘tough legacy’ contracts that have no appropriate replacements or no likelihood of renegotiation to transition. This includes providing feedback and responses on recent IBA and FCA consultations.
Financial instruments impacted by Ibor reform
(Audited)
Interest Rate Benchmark Reform Phase 2, the amendments to IFRSs issued in August 2020, represents the second phase of the IASB’s project on the effects of interest rate benchmark reform. The amendments address issues affecting financial statements when changes are made to contractual cash flows and hedging relationships.
Under these amendments, changes made to a financial instrument measured at other than fair value through profit or loss that are economically equivalent and required by interest rate benchmark reform, do not result in the derecognition or a change in the carrying amount of the financial instrument. Instead they require the effective interest rate to be updated to reflect the change in the interest rate benchmark. In addition, hedge accounting will not be discontinued solely because of the replacement of the interest rate benchmark if the hedge meets other hedge accounting criteria.
These amendments applied from 1 January 2021 with early adoption permitted. HSBC adopted the amendments from 1 January 2020.
Financial instruments yet to transition to alternative benchmarks, by main benchmark
USD Libor GBP Libor JPY Libor Others1
At 31 Dec 2020 $m $m $m $m
Non-derivative financial assets2 94,148 46,587 371 10,763
Non-derivative financial liabilities2 33,602 7,183 1,548 549
Derivative notional contract amount 3,045,337 1,196,865 508,200 514,959
1 Comprises financial instruments referencing other significant benchmark rates yet to transition to alternative benchmarks (Euro Libor, Swiss franc Libor, Eonia, SOR, MIFOR, THBFIX, PHIREF, TRLibor and Sibor).
2 Gross carrying amount excluding allowances for expected credit losses.
The amounts in the above table relate to HSBC’s main operating entities where HSBC has material exposures impacted by Ibor reform, including in the UK, Hong Kong, France, the US, Mexico, Canada, Singapore, the UAE, Bermuda, Australia, Qatar, Germany, Japan and Thailand. The amounts provide an indication of the extent of the Group’s exposure to the Ibor benchmarks that are due to be replaced. Amounts are in respect of financial instruments that:
• contractually reference an interest rate benchmark that is planned to transition to an alternative benchmark;
• have a contractual maturity date after 31 December 2021, the date by which Libor is expected to cease; and
• are recognised on HSBC’s consolidated balance sheet.
The administrator of Libor, IBA, has announced a proposal to extend the publication date of most US dollar Libor tenors until 30 June 2023. Publication of one-week and two-month tenors will cease after 31 December 2021. This proposal, if endorsed, would reduce the amounts presented in the above table as some financial instruments included will reach their contractual maturity date prior to 30 June 2023.
Financial crime risk environment
Financial institutions remain under considerable regulatory scrutiny regarding their ability to prevent and detect financial crime. Financial crime threats continue to evolve, often in tandem with increased geopolitical developments and tensions, posing challenges for financial institutions to keep abreast of developments and manage conflicting laws. In particular, during
2020, the escalating US-China tensions had significant impacts on sanctions and export control legal and regulatory regimes.The global economic slowdown as a result of the Covid-19 outbreak, and the resulting rapid deployment of government relief measures to support individuals and businesses, have increased the risk of fraud. Developments around virtual currencies, stablecoins and central bank digital currencies have continued, with the industry’s financial crime risk assessment and management frameworks in their early stages. The evolving regulatory environment presents an execution challenge. We continue to face increasing challenges presented by national data privacy requirements in a global organisation, which may affect our ability to manage financial crime risks effectively. There has also been an increase in media and public scrutiny on how financial crime is managed within financial institutions.
Mitigating actions
• We continue to enhance our financial crime risk management capabilities. We are investing in next generation capabilities to fight financial crime through the application of advanced analytics and artificial intelligence. We continue to monitor geopolitical developments closely and the impacts on our financial crime controls.
• We are strengthening and investing in our fraud controls, to introduce next generation anti-fraud capabilities to protect both our customers and the Group.
• We have developed procedures and controls to manage the risks associated with direct and indirect exposure to virtual currencies. We continue to monitor external developments. We
HSBC Holdings plc Annual Report and Accounts 2020 113
Risk review
continue to educate our staff on emerging digital products and associated risks.
• We continue to monitor external developments on stablecoins and central bank digital currencies, engaging with central banks and regulators on financial crime risk management.
• We continue to work with jurisdictions and relevant international bodies to address data privacy challenges through international standards, guidance and legislation to help enable effective management of financial crime risk.
• We continue to take steps designed to ensure that the reforms we have put in place are both effective and sustainable over the long term.
• We continue to work closely with our regulators and engage in public-private partnerships, playing an active role in shaping the industry’s financial crime controls for the future.
Regulatory compliance risk environment including conduct
Financial service providers continue to face numerous regulatory and supervisory requirements, particularly in the areas of capital and liquidity management, conduct of business, financial crime, internal control frameworks, the use of models and the integrity of financial services delivery. The competitive landscape in which the Group operates may be significantly altered by future regulatory changes and government intervention. Regulatory changes, including those driven by geopolitical issues, such as US-China tensions and those resulting from the UK’s exit from the EU, may affect the activities of the Group as a whole, or of some or all of its principal subsidiaries. For further details, see page 110.
Mitigating actions
• We engage, wherever possible, with governments and regulators in the countries and territories in which we operate, to help ensure that new requirements are considered properly and can be implemented effectively. In particular, we were proactive with the global policy changes issued in response to the Covid-19 outbreak to help our customers and contribute to an economic recovery.
• We have had regular meetings with all relevant authorities to discuss strategic contingency plans, including those arising from geopolitical issues.
Cyber threat and unauthorised access to systems
Together with other organisations, we continue to operate in an increasingly hostile cyber threat environment, which requires ongoing investment in business and technical controls to defend against these threats.
Key threats include unauthorised access to online customer accounts, advanced malware attacks, attacks on our third-party suppliers and security vulnerabilities being exploited.
Mitigating actions
• We continually evaluate threat levels for the most prevalent attack types and their potential outcomes. To further protect HSBC and our customers and help ensure the safe expansion of our global business lines, we strengthen our controls to reduce the likelihood and impact of advanced malware, data leakage, exposure through third parties and security vulnerabilities.
• We continue to enhance our cybersecurity capabilities, including Cloud security, identity and access management, metrics and data analytics, and third-party security reviews. An important part of our defence strategy is ensuring our colleagues remain aware of cybersecurity issues and know how to report incidents.
• We report and review cyber risk and control effectiveness quarterly at executive and non-executive Board level. We also report across our global businesses, functions and regions to help ensure appropriate visibility and governance of the risk and mitigating actions.
• We participate globally in several industry bodies and working groups to share information about tactics employed by cyber-
crime groups and to collaborate in fighting, detecting and preventing cyber-attacks on financial organisations.
Internally driven
Data management
We use a large number of systems and applications to support key business processes and operations. To manage the risk of error, HSBC employs data controls at the point of capture, transfer and consumption. Along with other organisations, we also need to meet external/regulatory obligations such as the General Data Protection Regulation (‘GDPR’) and Basel III.
Mitigating actions
• We are improving data quality across a large number of systems globally. Our data management, aggregation and oversight continues to strengthen and enhance the effectiveness of internal systems and processes. We are implementing data controls for end-to-end critical processes to improve our data capture at the point of entry and throughout the data lifecycle.
• Through our global data management framework we are expanding and enhancing our data governance processes to help monitor the quality of critical customer, product, reference and transaction data proactively and resolve associated data issues in a timely manner.
• We continue to modernise our data and analytics infrastructure through investments in advanced capabilities in Cloud, visualisation, machine learning and artificial intelligence platforms.
• We help protect customer data via our global data privacy framework programme, which establishes data privacy practices, design principles and guidelines that help enable us to demonstrate compliance with data privacy laws and regulations in the jurisdictions in which we operate.
• To help our employees keep abreast of data privacy laws and regulations we hold data privacy awareness training, highlighting our commitment to protect personal data for our customers, employees and other stakeholders.
Model risk management
Model risk arises whenever business decision making includes reliance on models. We use models in both financial and non-financial contexts, as well as in a range of business applications such as customer selection, product pricing, financial crime transaction monitoring, creditworthiness evaluation and financial reporting. Assessing model performance is a continuous undertaking. Models can need redevelopment as market conditions change. This was required following the outbreak of Covid-19 as some models used for estimating credit losses needed to be redeveloped due to the dramatic change to inputs including GDP, unemployment rates and housing prices.
Prior to the Covid-19 outbreak a key area of focus was improving and enhancing our model risk governance, and this activity continued throughout 2020. We prioritised the redevelopment of internal ratings-based (‘IRB’) and internal models methods (‘IMM’) models, in relation to counterparty credit, as part of the IRB repair and Basel III programmes with a key focus on enhancing the quality of data used as model inputs.
Mitigating actions
• We enhanced the monitoring and review of loss model performance through our Model Risk Management function as part of a broader quarterly process to determine loss levels. The Model Risk Management team aims to provide strong and effective review and challenge of any future redevelopment of these models.
• We appointed model risk stewards for each of the global businesses and functions to support, oversee and guide the global businesses and functions on model risk management. The risk stewards will provide close monitoring of changes in model behaviour, working closely with business and function model owners and sponsors.
Risk
114 HSBC Holdings plc Annual Report and Accounts 2020
• We worked with the model owners of IRB models and traded risk models to increase our engagement on management of model risk with key regulators including the Prudential Regulation Authority (‘PRA’).
• We updated the model risk policy and introduced model risk standards to enable a more risk-based approach to model risk management.
• We refreshed the model risk controls through the risk control assessment process. Employees who work in the first line of defence are expected to complete testing using the new enhanced controls in order to assess and understand model risk across the global businesses and key geographies.
• We upgraded the Group model inventory system to provide more granular measurement and management of model risk for multiple applications of a single model.
• We are redeveloping our IRB and IMM models for counterparty credit and our internal models approach (‘IMA’) for traded risk models. These will be submitted for PRA approval over the next two years.
Risks arising from the receipt of services from third parties
We use third parties for the provision of a range of services, in common with other financial service providers. Risks arising from the use of third-party service providers may be less transparent and therefore more challenging to manage or influence. It is critical that we ensure we have appropriate risk management policies, processes and practices. These should include adequate control over the selection, governance and oversight of third parties, particularly for key processes and controls that could affect operational resilience. Any deficiency in our management of risks arising from the use of third parties could affect our ability to meet strategic, regulatory or customer expectations.
Mitigating actions
• We continue to embed our delivery model in the first line of defence led by a global third-party management team, which works closely with our global businesses, global functions and regions. We have deployed processes, controls and technology to assess third-party service providers against key criteria and associated control monitoring, testing and assurance. This includes requesting third-party service providers to attest to HSBC’s ethical code of conduct during onboarding.
• A dedicated oversight forum in the second line of defence monitors the embedding of policy requirements and performance against risk appetite.
• We delivered a major programme involving our global businesses, global functions and regions to help ensure that we are compliant with our third-party risk policy.
• We reviewed our external supplier engagements to ensure that they meet our third-party risk quality standards including remediation where necessary.
• We implemented a new process for risk assessing our internal group service providers and ensuring that services we provide to other parts of our business also meet defined standards.
Risks associated with workforce capability, capacity and environmental factors with potential impact on growth
Our success in delivering our strategic priorities and managing the regulatory environment proactively depends on the development and retention of our leadership and high-performing employees. The ability to continue to attract, develop and retain competent individuals in an employment market impacted by the Covid-19 outbreak is challenging particularly due to organisational restructuring. Changed working arrangements, local Covid-19 restrictions and health concerns during the pandemic also impact on employee mental health and well-being.
Mitigating actions
• We have put in place measures to help support our people so they are able to work safely during the Covid-19 outbreak. While our approach to workplace recovery around the world is consistent, the measures we take in different locations are specific to their environment.
• We promote a diverse and inclusive workforce and provide active support across a wide range of health and well-being activities. We continue to build our speak-up culture through active campaigns.
• We monitor people risks that could arise due to organisational restructuring, helping to ensure we manage redundancies sensitively and support impacted employees.
• We launched the Future Skills curriculum through HSBC University to help provide critical skills that will enable employees and HSBC to be successful in the future.
• We continue to develop succession plans for key management roles, with actions agreed and reviewed on a regular basis by the Group Executive Committee.
• We have robust plans in place, driven by senior management, to mitigate the effects of external factors that may impact our employment practices. Political and regulatory challenges are closely monitored to minimise the impact on the attraction and retention of talent and key performers.
IT systems infrastructure and resilience
We are committed to investing in the reliability and resilience of our IT systems and critical services. We do so to protect our customers and ensure they are not impacted by disruption to services.
Mitigating actions
• We continue to invest in transforming how software solutions are developed, delivered and maintained, with a particular focus on providing high-quality, stable and secure services. We concentrate on improving system resilience and service continuity testing. We have enhanced the security features of our software development life cycle and improved our testing processes and tools.
• We upgraded many of our IT systems, simplified our service provision and replaced older IT infrastructure and applications. These enhancements led to continued global improvements in service availability during 2020 for both our customers and employees.
Change execution risk
In February 2020, we announced our plans to restructure our business, reallocate freed-up capital into higher-growth and higher-return businesses and markets, and to simplify our organisation and reduce costs. Our success in delivering our strategic priorities and continuing to address regulatory change and other top and emerging risks is dependent on the effective and safe delivery of change across the Group.
Mitigating actions
• We have established a global transformation programme to deliver the commitments made in February 2020. The programme is overseen by members of the Group Executive Committee. Related execution risks across the initiatives, including their sequencing and prioritisation, are being monitored and managed. Many of the initiatives impact our staff and require continued investment in technology.
• We continue to work to strengthen our change management practices to deliver sustainable change. These include increased adoption across the Group of Agile ways of working to deliver change.
HSBC Holdings plc Annual Report and Accounts 2020 115
Risk review
Areas of special interest
During 2020, a number of areas were identified and considered as part of our top and emerging risks because of the effect they may have on the Group. While considered under the themes captured under top and emerging risks, in this section we have placed a particular focus on the Covid-19 outbreak and the UK withdrawal from the EU.
Risks related to Covid-19
The Covid-19 outbreak and its effect on the global economy have impacted our customers and our performance, and the future effects of the outbreak remain uncertain. The outbreak necessitated governments to respond at unprecedented levels to protect public health, local economies and livelihoods. It has affected regions at different times and to varying degrees as it has developed. The varying government support measures and restrictions in response have added challenges, given the rapid pace of change and significant operational demands. The speed at which countries and territories will be able to unwind the government support measures and restrictions and return to pre-Covid-19 economic levels will vary based on the levels of infection, local governmental decisions and access to and ability to roll out vaccines. There remains a risk of subsequent waves of infection, as evidenced by the recently emerged more transmissible variants of the virus. Renewed outbreaks emphasise the ongoing threat of Covid-19 even in countries that have recorded lower than average cases so far.
Government restrictions imposed around the world to limit the spread of Covid-19 resulted in a sharp contraction in global economic activity during 2020. At the same time governments also took steps designed to soften the extent of the damage to investment, trade and labour markets. Our Central scenario used to calculate impairment assumes that economic activity will gradually recover over the course of 2021. In this scenario, recovery will be supported by a successful roll-out of vaccination programmes across our key markets, which, coupled with effective non-pharmacological measures to contain the virus, will lead to a decline in infections over the course of the year. Governments and central banks are expected to continue to work together across many of our key markets to ensure that households and firms receive an appropriate level of financial support until restrictions on economic activity and mobility can be materially eased. Such support is intended to ensure that labour and housing markets do not experience abrupt, negative corrections. It is also intended to limit the extent of long-term structural damage to economies. There is a high degree of uncertainty associated with economic forecasts in the current environment and there are significant risks to our Central scenario. The degree of uncertainty varies by market, driven by country-specific trends in the evolution of the pandemic and associated policy responses. As a result, our Central scenario for impairment has not been assigned an equal likelihood of occurrence across our key markets. For further details of our Central and other scenarios see ‘Measurement uncertainty and sensitivity analysis’ on page 127.
There is a material risk of a renewed drop in economic activity. The economic fallout from the Covid-19 outbreak risks increasing inequality across markets that have already suffered from social unrest. This will leave the burden on governments and central banks to maintain or increase fiscal and monetary stimulus. After financial markets suffered a sharp fall in the early phases of the spread of Covid-19, they rebounded but still remain volatile. Depending on the long-term impact on global economic growth, financial asset prices may suffer a further sharp fall.
Governments and central banks in major economies have deployed extensive measures to support their local populations. Measures implemented by governments have included income support to households and funding support to businesses. Central bank measures have included cuts to policy rates, support to funding markets and asset purchases. These measures are being extended in countries where further waves of the Covid-19 outbreak are prompting renewed government restrictions. Central
banks are expected to maintain record-low interest rates for a considerable period of time and the debt burden of governments is expected to rise significantly.
We initiated market-specific measures to support our personal and business customers through these challenging times. These included mortgage assistance, payment holidays, the waiving of certain fees and charges, and liquidity relief for businesses facing market uncertainty and supply chain disruption. We are also working closely with governments, and supporting national schemes that focus on the parts of the economy most impacted by Covid-19. In the UK, this included providing access to the various government support schemes from the beginning. In Hong Kong, we provided prompt liquidity relief to businesses facing market uncertainty and supply chain pressures. For further details of our customer relief programmes, see page 142.
Central bank and government actions and support measures taken in response to the Covid-19 outbreak, and our responses to those, have created, and may in the future create restrictions in relation to capital. This has limited and may in the future limit management's flexibility in managing the business and taking action in relation to capital distribution and capital allocation. For example, in response to a written request from the PRA, we cancelled the fourth interim dividend for 2019 of $0.21 per ordinary share. We also announced that we would make no quarterly or interim dividend payments or accruals in respect of ordinary shares until the end of 2020. Following this, in December 2020 the PRA announced a temporary approach to shareholder distributions for 2020 in which it set out a framework for board decisions on dividends. After considering the requirements of the temporary approach, the Board announced an interim dividend for 2020 of $0.15 per ordinary share.
The rapid introduction and varying nature of the government support schemes, as well as customer expectations, has led to risks as the Group implements large-scale changes in a short period of time. This has led to increased operational risks, including complex conduct considerations, increased reputational risk and increased risk of fraud. These risks are likely to be heightened further as and when those government support schemes are unwound. Central bank and government actions and support measures, and our responses to those, have also led to increased litigation risk, including lawsuits that have been and may continue to be brought in connection with our cancellation of the fourth interim dividend for 2019.
At 31 December 2020, our CET1 ratio was 15.9%, compared with 14.7% at 31 December 2019, and our liquidity coverage ratio (‘LCR’) was 139%. Our capital, funding and liquidity position is expected to help us to continue supporting our customers throughout the Covid-19 outbreak.
In many of our markets the Covid-19 outbreak has led to a worsening of economic conditions and increased uncertainty, which has been reflected in higher ECL reserves. Furthermore, credit losses may increase due to exposure to vulnerable sectors of the economy such as retail, hospitality and commercial real estate. The impact of the pandemic on the long-term prospects of businesses in these sectors is uncertain and may lead to significant credit losses on specific exposures, which may not be fully captured in ECL estimates. In addition, in times of stress, fraudulent activity is often more prevalent, leading to potentially significant credit or operational losses.
The significant changes in economic and market drivers, customer behaviours and government actions caused by Covid-19 have materially impacted the performance of financial models. ECL model performance has been significantly impacted, which has increased reliance on management judgement in determining the appropriate level of ECL estimates. The reliability of ECL models under these circumstances has also been impacted by the unprecedented response from governments to provide a variety of economic stimulus packages to support livelihoods and businesses. Historical observations on which the models were built do not reflect these unprecedented support measures. We continue to monitor credit performance against the level of government support and customer relief programmes.
Risk
116 HSBC Holdings plc Annual Report and Accounts 2020
In order to address some model limitations and performance issues, we redeveloped some of the key models used to calculate ECL estimates. These models have been independently validated by the Model Risk Management team and assessed as having the ability to deliver reliable credit loss estimates. While this reduced the reliance on management judgement for determining ECL estimates, the current uncertain economic outlook, coupled with the expected end to government support schemes, resulted in judgemental post-model adjustments still being required. The Model Risk Management team is reviewing IFRS 9 model performance at the country and Group level on a quarterly basis to assess whether or not the models in place can deliver reliable outputs.
These assessments provide the credit teams with a view of model reliability. The redevelopment of IFRS 9 models will continue as the economic consequences of the Covid-19 outbreak become clearer over time, economic conditions normalise and actual credit losses occur.
As a result of the Covid-19 outbreak, business continuity responses were implemented and the majority of service level agreements have been maintained. We have not experienced any major impacts to the supply chain from our third-party service providers due to the pandemic. The risk of damage or theft to our physical assets or criminal injury to our employees remains unchanged and no significant incidents have impacted our buildings or staff.
There remain significant uncertainties in assessing the duration of the Covid-19 outbreak and its impact. The actions taken by various governments and central banks, in particular in the UK, mainland China, Hong Kong and the US, provide an indication of the potential severity of the downturn and post-recovery environment, which from a commercial, regulatory and risk perspective could be significantly different to past crises and persist for a prolonged period. A continued prolonged period of significantly reduced economic activity as a result of the impact of the outbreak could have a materially adverse effect on our financial condition, results of operations, prospects, liquidity, capital position and credit ratings. We continue to monitor the situation closely, and given the novel or prolonged nature of the outbreak, additional mitigating actions may be required.
UK withdrawal from the European Union
The UK left the EU on 31 January 2020 and entered a transition period until 31 December 2020. A Trade and Cooperation Agreement between the EU and the UK was agreed on 24 December 2020 and ratified by the UK on 30 December 2020. It includes a joint declaration of cooperation, and in the coming months both parties are expected to enter discussions with the aim of agreeing a Memorandum of Understanding establishing the framework for this cooperation. As expected, the financial passporting arrangement expired at the end of the transition period, and therefore financial institutions in the UK including HSBC Bank plc and HSBC UK lost their EU regulatory permissions to continue servicing clients in the European Economic Area (‘EEA’) from 1 January 2021. The Trade and Cooperation Agreement mainly focused on goods and services but also covered a wide range of other areas, including competition, state aid, tax, fisheries, transport, data and security. However, it included limited elements on financial services, and, as a result, did not change HSBC’s planning in relation to the UK’s withdrawal from the EU.
Our programme to manage the impact of the UK withdrawal from the EU has now been largely completed. It was based on the assumption of a scenario whereby the UK exits the transition period without the financial passporting or regulatory equivalence framework that supports cross-border business.
Equivalence decisions are an established feature of EU law, which allow the authorities in the UK and EU to rely on the other’s regime for specific regulatory purposes only. While the UK and the EU have made a number of equivalence decisions, these decisions do not give UK firms full access to EU clients and counterparties.
Our programme focused on four main components: legal entity restructuring; product offering; customer migrations; and employees. However, there remain risks, many of them linked to the absence of some equivalence decisions between the EU and the UK.
We have carried out detailed reviews of our credit portfolios to determine those sectors and customers most vulnerable to the UK’s exit from the EU and will continue to monitor any implications for our clients in adhering to the new requirements under the Trade and Cooperation Agreement.
Legal entity restructuring
Our branches in seven EEA countries (Belgium, the Netherlands, Luxembourg, Spain, Italy, Ireland and Czech Republic) relied on financial passporting out of the UK. We had worked on the assumption that this passporting would no longer be possible following the UK’s withdrawal from the EU and therefore transferred our branch business to newly established branches of HSBC Continental Europe, our primary banking entity authorised in the EU. This was completed in the first quarter of 2019.
Product offering
To accommodate customer migrations and new business after the UK’s departure from the EU, we expanded our product offering in a wide range of areas such as in our Markets and Securities Services franchise as well as in our Global Trade Business. We also enhanced our cash management solutions in France, the Netherlands and Ireland. We also opened a new branch in Stockholm to service our customers in the Nordic region.
Customer migrations
The UK’s withdrawal from the EU has had an impact on our clients’ operating models, including their working capital requirements, investment decisions and financial markets infrastructure access. Our priority is to provide continuity of service, and while our intention was to minimise the level of change for our customers, we were required to migrate some EEA-incorporated clients from the UK to HSBC Continental Europe or another EEA entity. We have now migrated almost all clients who we expect can no longer be serviced out of the UK. The majority of remaining customers are covered by national regimes that allow continuity of financial services on a temporary or permanent basis between the UK and their respective jurisdictions. We are working in close collaboration with our customers with the aim of managing their transition in 2021, where required.
Employees
The migration of EEA-incorporated clients required us to strengthen our local teams in the EU, and France in particular. We have now completed the transfer of roles from London to Paris to support our post-UK withdrawal from the EU operating model.
Looking beyond the transfer of roles to the EU, we are also providing support to our employees who are UK citizens resident in EEA countries, and employees who are citizens of an EU member state resident in the UK, for example on settlement applications.
HSBC Holdings plc Annual Report and Accounts 2020 117
Risk review
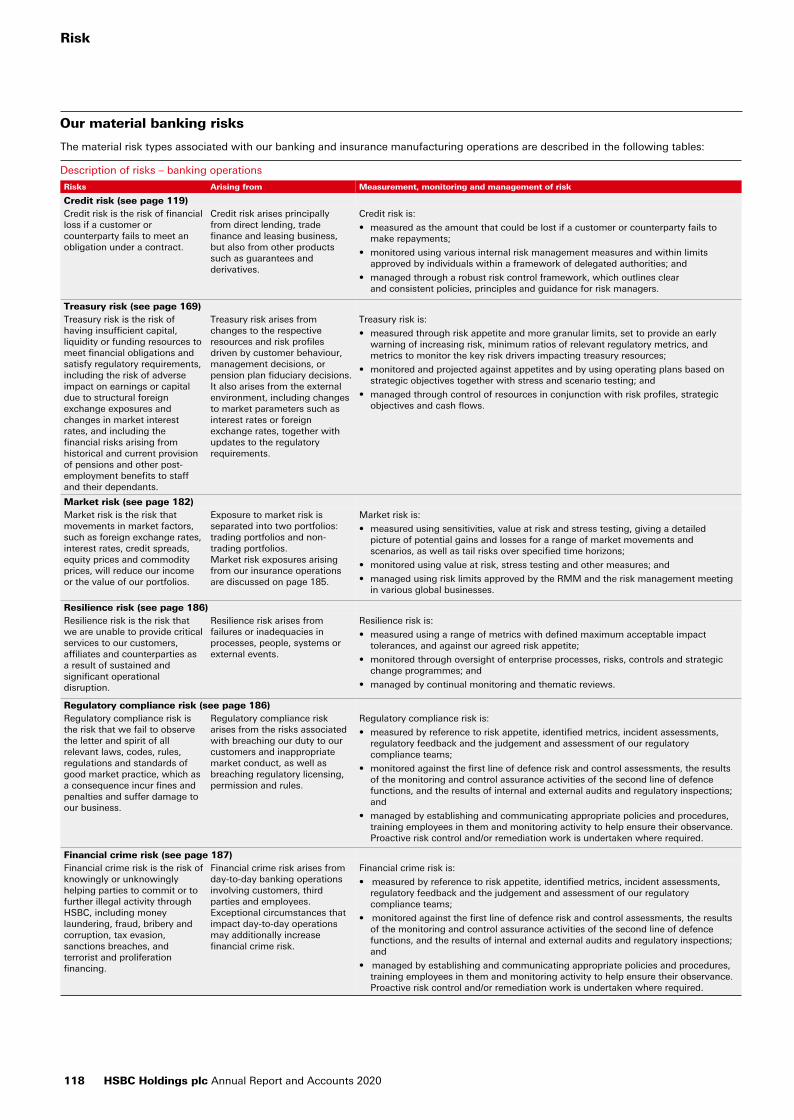
Our material banking risks
The material risk types associated with our banking and insurance manufacturing operations are described in the following tables:
Description of risks – banking operations
Risks Arising from Measurement, monitoring and management of risk
Credit risk (see page 119)Credit risk is the risk of financial loss if a customer or counterparty fails to meet an obligation under a contract.
Credit risk arises principally from direct lending, trade finance and leasing business, but also from other products such as guarantees and derivatives.
Credit risk is:
• measured as the amount that could be lost if a customer or counterparty fails to make repayments;
• monitored using various internal risk management measures and within limits approved by individuals within a framework of delegated authorities; and
• managed through a robust risk control framework, which outlines clear and consistent policies, principles and guidance for risk managers.
Treasury risk (see page 169)Treasury risk is the risk of having insufficient capital, liquidity or funding resources to meet financial obligations and satisfy regulatory requirements, including the risk of adverse impact on earnings or capital due to structural foreign exchange exposures and changes in market interest rates, and including the financial risks arising from historical and current provision of pensions and other post-employment benefits to staff and their dependants.
Treasury risk arises from changes to the respective resources and risk profiles driven by customer behaviour, management decisions, or pension plan fiduciary decisions. It also arises from the external environment, including changes to market parameters such as interest rates or foreign exchange rates, together with updates to the regulatory requirements.
Treasury risk is:
• measured through risk appetite and more granular limits, set to provide an early warning of increasing risk, minimum ratios of relevant regulatory metrics, and metrics to monitor the key risk drivers impacting treasury resources;
• monitored and projected against appetites and by using operating plans based on strategic objectives together with stress and scenario testing; and
• managed through control of resources in conjunction with risk profiles, strategic objectives and cash flows.
Market risk (see page 182)Market risk is the risk that movements in market factors, such as foreign exchange rates, interest rates, credit spreads, equity prices and commodity prices, will reduce our income or the value of our portfolios.
Exposure to market risk is separated into two portfolios: trading portfolios and non-trading portfolios. Market risk exposures arising from our insurance operations are discussed on page 185.
Market risk is:
• measured using sensitivities, value at risk and stress testing, giving a detailed picture of potential gains and losses for a range of market movements and scenarios, as well as tail risks over specified time horizons;
• monitored using value at risk, stress testing and other measures; and
• managed using risk limits approved by the RMM and the risk management meeting in various global businesses.
Resilience risk (see page 186)Resilience risk is the risk that we are unable to provide critical services to our customers, affiliates and counterparties as a result of sustained and significant operational disruption.
Resilience risk arises from failures or inadequacies in processes, people, systems or external events.
Resilience risk is:
• measured using a range of metrics with defined maximum acceptable impact tolerances, and against our agreed risk appetite;
• monitored through oversight of enterprise processes, risks, controls and strategic change programmes; and
• managed by continual monitoring and thematic reviews.
Regulatory compliance risk (see page 186)Regulatory compliance risk is the risk that we fail to observe the letter and spirit of all relevant laws, codes, rules, regulations and standards of good market practice, which as a consequence incur fines and penalties and suffer damage to our business.
Regulatory compliance risk arises from the risks associated with breaching our duty to our customers and inappropriate market conduct, as well as breaching regulatory licensing, permission and rules.
Regulatory compliance risk is:
• measured by reference to risk appetite, identified metrics, incident assessments, regulatory feedback and the judgement and assessment of our regulatory compliance teams;
• monitored against the first line of defence risk and control assessments, the results of the monitoring and control assurance activities of the second line of defence functions, and the results of internal and external audits and regulatory inspections; and
• managed by establishing and communicating appropriate policies and procedures, training employees in them and monitoring activity to help ensure their observance. Proactive risk control and/or remediation work is undertaken where required.
Financial crime risk (see page 187)Financial crime risk is the risk of knowingly or unknowingly helping parties to commit or to further illegal activity through HSBC, including money laundering, fraud, bribery and corruption, tax evasion, sanctions breaches, and terrorist and proliferation financing.
Financial crime risk arises from day-to-day banking operations involving customers, third parties and employees. Exceptional circumstances that impact day-to-day operations may additionally increase financial crime risk.
Financial crime risk is:
• measured by reference to risk appetite, identified metrics, incident assessments, regulatory feedback and the judgement and assessment of our regulatory compliance teams;
• monitored against the first line of defence risk and control assessments, the results of the monitoring and control assurance activities of the second line of defence functions, and the results of internal and external audits and regulatory inspections; and
• managed by establishing and communicating appropriate policies and procedures, training employees in them and monitoring activity to help ensure their observance. Proactive risk control and/or remediation work is undertaken where required.
Risk
118 HSBC Holdings plc Annual Report and Accounts 2020
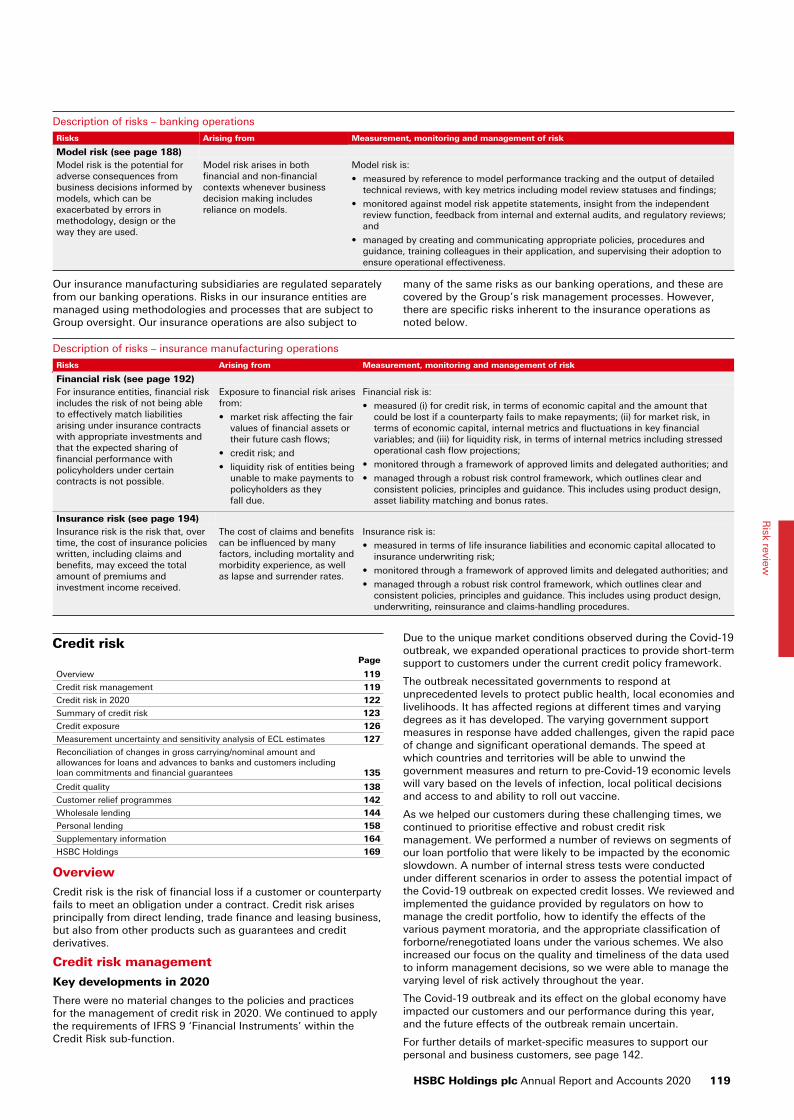
Description of risks – banking operations
Risks Arising from Measurement, monitoring and management of risk
Model risk (see page 188)Model risk is the potential for adverse consequences from business decisions informed by models, which can be exacerbated by errors in methodology, design or the way they are used.
Model risk arises in both financial and non-financial contexts whenever business decision making includes reliance on models.
Model risk is:
• measured by reference to model performance tracking and the output of detailed technical reviews, with key metrics including model review statuses and findings;
• monitored against model risk appetite statements, insight from the independent review function, feedback from internal and external audits, and regulatory reviews; and
• managed by creating and communicating appropriate policies, procedures and guidance, training colleagues in their application, and supervising their adoption to ensure operational effectiveness.
Our insurance manufacturing subsidiaries are regulated separately from our banking operations. Risks in our insurance entities are managed using methodologies and processes that are subject to Group oversight. Our insurance operations are also subject to
many of the same risks as our banking operations, and these are covered by the Group’s risk management processes. However, there are specific risks inherent to the insurance operations as noted below.
Description of risks – insurance manufacturing operations
Risks Arising from Measurement, monitoring and management of risk
Financial risk (see page 192)For insurance entities, financial risk includes the risk of not being able to effectively match liabilities arising under insurance contracts with appropriate investments and that the expected sharing of financial performance with policyholders under certain contracts is not possible.
Exposure to financial risk arises from:
• market risk affecting the fair values of financial assets or their future cash flows;
• credit risk; and
• liquidity risk of entities being unable to make payments to policyholders as they fall due.
Financial risk is:
• measured (i) for credit risk, in terms of economic capital and the amount that could be lost if a counterparty fails to make repayments; (ii) for market risk, in terms of economic capital, internal metrics and fluctuations in key financial variables; and (iii) for liquidity risk, in terms of internal metrics including stressed operational cash flow projections;
• monitored through a framework of approved limits and delegated authorities; and
• managed through a robust risk control framework, which outlines clear and consistent policies, principles and guidance. This includes using product design, asset liability matching and bonus rates.
Insurance risk (see page 194)Insurance risk is the risk that, over time, the cost of insurance policies written, including claims and benefits, may exceed the total amount of premiums and investment income received.
The cost of claims and benefits can be influenced by many factors, including mortality and morbidity experience, as well as lapse and surrender rates.
Insurance risk is:
• measured in terms of life insurance liabilities and economic capital allocated to insurance underwriting risk;
• monitored through a framework of approved limits and delegated authorities; and
• managed through a robust risk control framework, which outlines clear and consistent policies, principles and guidance. This includes using product design, underwriting, reinsurance and claims-handling procedures.
Credit risk Page
Overview 119
Credit risk management 119
Credit risk in 2020 122
Summary of credit risk 123
Credit exposure 126
Measurement uncertainty and sensitivity analysis of ECL estimates 127
Reconciliation of changes in gross carrying/nominal amount and allowances for loans and advances to banks and customers including loan commitments and financial guarantees 135
Credit quality 138
Customer relief programmes 142
Wholesale lending 144
Personal lending 158
Supplementary information 164
HSBC Holdings 169
Overview
Credit risk is the risk of financial loss if a customer or counterparty fails to meet an obligation under a contract. Credit risk arises principally from direct lending, trade finance and leasing business, but also from other products such as guarantees and credit derivatives.
Credit risk management
Key developments in 2020
There were no material changes to the policies and practices for the management of credit risk in 2020. We continued to apply the requirements of IFRS 9 ‘Financial Instruments’ within the Credit Risk sub-function.
Due to the unique market conditions observed during the Covid-19 outbreak, we expanded operational practices to provide short-term support to customers under the current credit policy framework.
The outbreak necessitated governments to respond at unprecedented levels to protect public health, local economies and livelihoods. It has affected regions at different times and varying degrees as it has developed. The varying government support measures in response have added challenges, given the rapid pace of change and significant operational demands. The speed at which countries and territories will be able to unwind the government measures and return to pre-Covid-19 economic levels will vary based on the levels of infection, local political decisions and access to and ability to roll out vaccine.
As we helped our customers during these challenging times, we continued to prioritise effective and robust credit risk management. We performed a number of reviews on segments of our loan portfolio that were likely to be impacted by the economic slowdown. A number of internal stress tests were conducted under different scenarios in order to assess the potential impact of the Covid-19 outbreak on expected credit losses. We reviewed and implemented the guidance provided by regulators on how to manage the credit portfolio, how to identify the effects of the various payment moratoria, and the appropriate classification of forborne/renegotiated loans under the various schemes. We also increased our focus on the quality and timeliness of the data used to inform management decisions, so we were able to manage the varying level of risk actively throughout the year.
The Covid-19 outbreak and its effect on the global economy have impacted our customers and our performance during this year, and the future effects of the outbreak remain uncertain.
For further details of market-specific measures to support our personal and business customers, see page 142.
HSBC Holdings plc Annual Report and Accounts 2020 119
Risk review
Governance and structure
We have established Group-wide credit risk management and related IFRS 9 processes. We continue to assess the impact of economic developments in key markets on specific customers, customer segments or portfolios. As credit conditions change, we take mitigating action, including the revision of risk appetites or limits and tenors, as appropriate. In addition, we continue to evaluate the terms under which we provide credit facilities within the context of individual customer requirements, the quality of the relationship, local regulatory requirements, market practices and our local market position.
Credit Risk sub-function
(Audited)
Credit approval authorities are delegated by the Board to the Group Chief Executive together with the authority to sub-delegate them. The Credit Risk sub-function in Global Risk is responsible for the key policies and processes for managing credit risk, which include formulating Group credit policies and risk rating frameworks, guiding the Group’s appetite for credit risk exposures, undertaking independent reviews and objective assessment of credit risk, and monitoring performance and management of portfolios.
The principal objectives of our credit risk management are:
• to maintain across HSBC a strong culture of responsible lending, and robust risk policies and control frameworks;
• to both partner and challenge our businesses in defining, implementing and continually re-evaluating our risk appetite under actual and scenario conditions; and
• to ensure there is independent, expert scrutiny of credit risks, their costs and their mitigation.
Key risk management processes
IFRS 9 ‘Financial Instruments’ process
The IFRS 9 process comprises three main areas: modelling and data; implementation; and governance.
Modelling and data
We have established IFRS 9 modelling and data processes in various geographies, which are subject to internal model risk governance including independent review of significant model developments.
Implementation
A centralised impairment engine performs the expected credit losses calculation using data, which is subject to a number of validation checks and enhancements, from a variety of client, finance and risk systems. Where possible, these checks and processes are performed in a globally consistent and centralised manner.
Governance
Regional management review forums are established in key sites and regions in order to review and approve the impairment results. Regional management review forums have representatives from Credit Risk and Finance. The key site and regional approvals are reported up to the global business impairment committee for final approval of the Group’s ECL for the period. Required members of the committee are the global heads of Wholesale Credit, Market Risk, and Wealth and Personal Banking Risk, as well as the global business chief financial officers and the Group Chief Accounting Officer.
Concentration of exposure
(Audited)
Concentrations of credit risk arise when a number of counterparties or exposures have comparable economic characteristics, or such counterparties are engaged in similar
activities or operate in the same geographical areas or industry sectors so that their collective ability to meet contractual obligations is uniformly affected by changes in economic, political or other conditions. We use a number of controls and measures to minimise undue concentration of exposure in our portfolios across industries, countries and global businesses. These include portfolio and counterparty limits, approval and review controls, and stress testing.
Credit quality of financial instruments
(Audited)
Our risk rating system facilitates the internal ratings-based approach under the Basel framework adopted by the Group to support the calculation of our minimum credit regulatory capital requirement. The five credit quality classifications encompass a range of granular internal credit rating grades assigned to wholesale and retail lending businesses, and the external ratings attributed by external agencies to debt securities.
For debt securities and certain other financial instruments, external ratings have been aligned to the five quality classifications based upon the mapping of related customer risk rating (‘CRR’) to external credit rating.
Wholesale lending
The CRR 10-grade scale summarises a more granular underlying 23-grade scale of obligor probability of default (‘PD’). All corporate customers are rated using the 10- or 23-grade scale, depending on the degree of sophistication of the Basel approach adopted for the exposure.
Each CRR band is associated with an external rating grade by reference to long-run default rates for that grade, represented by the average of issuer-weighted historical default rates. This mapping between internal and external ratings is indicative and may vary over time.
Retail lending
Retail lending credit quality is based on a 12-month point-in-time probability-weighted PD.
Risk
120 HSBC Holdings plc Annual Report and Accounts 2020
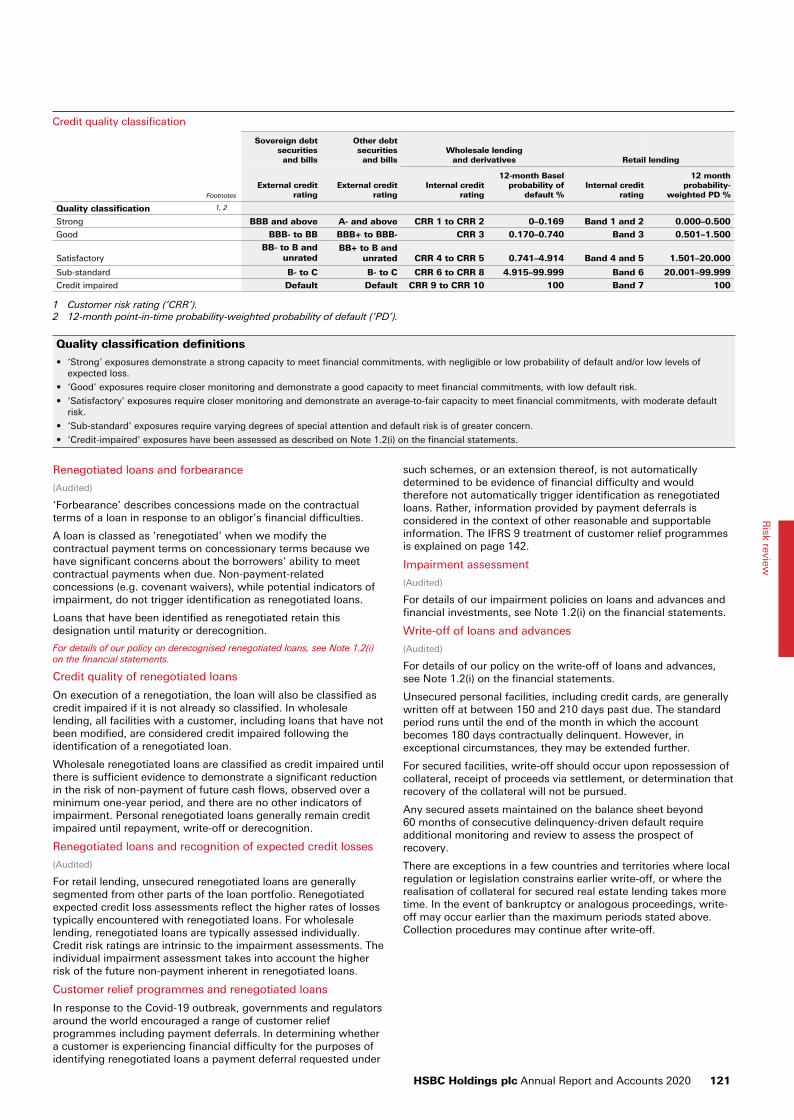
Credit quality classification
Sovereign debt securities
and bills
Other debt securities
and billsWholesale lending
and derivatives Retail lending
Footnotes
External credit rating
External credit rating
Internal credit rating
12-month Basel probability of
default %Internal credit
rating
12 month probability-
weighted PD %
Quality classification 1, 2
Strong BBB and above A- and above CRR 1 to CRR 2 0–0.169 Band 1 and 2 0.000–0.500
Good BBB- to BB BBB+ to BBB- CRR 3 0.170–0.740 Band 3 0.501–1.500
SatisfactoryBB- to B and
unratedBB+ to B and
unrated CRR 4 to CRR 5 0.741–4.914 Band 4 and 5 1.501–20.000
Sub-standard B- to C B- to C CRR 6 to CRR 8 4.915–99.999 Band 6 20.001–99.999
Credit impaired Default Default CRR 9 to CRR 10 100 Band 7 100
1 Customer risk rating (‘CRR’).2 12-month point-in-time probability-weighted probability of default (‘PD’).
Quality classification definitions
• ‘Strong’ exposures demonstrate a strong capacity to meet financial commitments, with negligible or low probability of default and/or low levels of expected loss.
• ‘Good’ exposures require closer monitoring and demonstrate a good capacity to meet financial commitments, with low default risk.
• ‘Satisfactory’ exposures require closer monitoring and demonstrate an average-to-fair capacity to meet financial commitments, with moderate default risk.
• ‘Sub-standard’ exposures require varying degrees of special attention and default risk is of greater concern.
• ‘Credit-impaired’ exposures have been assessed as described on Note 1.2(i) on the financial statements.
Renegotiated loans and forbearance
(Audited)
‘Forbearance’ describes concessions made on the contractual terms of a loan in response to an obligor’s financial difficulties.
A loan is classed as ‘renegotiated’ when we modify the contractual payment terms on concessionary terms because we have significant concerns about the borrowers’ ability to meet contractual payments when due. Non-payment-related concessions (e.g. covenant waivers), while potential indicators of impairment, do not trigger identification as renegotiated loans.
Loans that have been identified as renegotiated retain this designation until maturity or derecognition.
For details of our policy on derecognised renegotiated loans, see Note 1.2(i) on the financial statements.
Credit quality of renegotiated loans
On execution of a renegotiation, the loan will also be classified as credit impaired if it is not already so classified. In wholesale lending, all facilities with a customer, including loans that have not been modified, are considered credit impaired following the identification of a renegotiated loan.
Wholesale renegotiated loans are classified as credit impaired until there is sufficient evidence to demonstrate a significant reduction in the risk of non-payment of future cash flows, observed over a minimum one-year period, and there are no other indicators of impairment. Personal renegotiated loans generally remain credit impaired until repayment, write-off or derecognition.
Renegotiated loans and recognition of expected credit losses
(Audited)
For retail lending, unsecured renegotiated loans are generally segmented from other parts of the loan portfolio. Renegotiated expected credit loss assessments reflect the higher rates of losses typically encountered with renegotiated loans. For wholesale lending, renegotiated loans are typically assessed individually. Credit risk ratings are intrinsic to the impairment assessments. The individual impairment assessment takes into account the higher risk of the future non-payment inherent in renegotiated loans.
Customer relief programmes and renegotiated loans
In response to the Covid-19 outbreak, governments and regulators around the world encouraged a range of customer relief programmes including payment deferrals. In determining whether a customer is experiencing financial difficulty for the purposes of identifying renegotiated loans a payment deferral requested under
such schemes, or an extension thereof, is not automatically determined to be evidence of financial difficulty and would therefore not automatically trigger identification as renegotiated loans. Rather, information provided by payment deferrals is considered in the context of other reasonable and supportable information. The IFRS 9 treatment of customer relief programmes is explained on page 142.
Impairment assessment
(Audited)
For details of our impairment policies on loans and advances and financial investments, see Note 1.2(i) on the financial statements.
Write-off of loans and advances
(Audited)
For details of our policy on the write-off of loans and advances, see Note 1.2(i) on the financial statements.
Unsecured personal facilities, including credit cards, are generally written off at between 150 and 210 days past due. The standard period runs until the end of the month in which the account becomes 180 days contractually delinquent. However, in exceptional circumstances, they may be extended further.
For secured facilities, write-off should occur upon repossession of collateral, receipt of proceeds via settlement, or determination that recovery of the collateral will not be pursued.
Any secured assets maintained on the balance sheet beyond60 months of consecutive delinquency-driven default require additional monitoring and review to assess the prospect of recovery.
There are exceptions in a few countries and territories where local regulation or legislation constrains earlier write-off, or where the realisation of collateral for secured real estate lending takes more time. In the event of bankruptcy or analogous proceedings, write-off may occur earlier than the maximum periods stated above. Collection procedures may continue after write-off.
HSBC Holdings plc Annual Report and Accounts 2020 121
Risk review
Credit risk in 2020
At 31 December 2020, gross loans and advances to customers and banks of $1,134bn increased by $19.4bn, compared with31 December 2019. This included favourable foreign exchange movements of $26.4bn. Excluding foreign exchange movements, the decline was driven by a $33.2bn decrease in wholesale loans and advances to customers. This was partly offset by a $15bn increase in personal loans and advances and a $11.2bn increase in loans and advances to banks.
At 31 December 2020, the allowance for ECL of $15.7bn increased by $6.3bn compared with 31 December 2019, including adverse foreign exchange movements of $0.1bn. It increased by $1.2bn compared with 30 June 2020. The $15.7bn allowance comprised $14.7bn in respect of assets held at amortised cost, $0.9bn in respect of loan commitments and financial guarantees, and $0.1bn in respect of debt instruments measured at fair value through other comprehensive income (‘FVOCI’).
During the first half of 2020, the Group experienced a significant increase in allowances for ECL, which subsequently stabilised during the second half of 2020. Excluding foreign exchange movements, the allowance for ECL in relation to loans and advances to customers increased by $5.7bn from31 December 2019. This was attributable to:
• a $4.1bn increase in wholesale loans and advances to customers, of which $2.0bn was driven by stages 1 and 2; and
• a $1.6bn increase in personal loans and advances to customers, of which $1.3bn was driven by stages 1 and 2.
During the first six months of the year, the Group experienced significant migrations from stage 1 to stage 2, reflecting a worsening of the economic outlook. This trend slowed during the second half of 2020 as forward economic guidance remained broadly stable in comparison with 30 June 2020, with some regions experiencing transfers from stage 2 to stage 1.
At 31 December 2020, stage 3 gross loans and advances to customers and banks of $19.1bn increased by $5.7bn compared with 31 December 2019. This included favourable foreign exchange movements of $0.2bn. Stage 3 gross loans and advances to customers and banks at 31 December 2020 increased from $17.1bn at 30 June 2020, while benefiting from releases from historical default cases. As the Covid-19 pandemic continues, there may be volatility in future stage 3 balances, in particular due to the expiration of the measures implemented by governments, regulators and banks to support customers.
The ECL charge for 2020 was $8.8bn, inclusive of recoveries, which comprised $6.0bn in respect of wholesale lending, of which stage 3 and purchased or originated credit impaired ('POCI') was $3.4bn; $2.7bn in respect of personal lending, of which stage 3 was $0.8bn; and $0.1bn in respect of other financial assets measured at amortised cost and debt instruments measured at FVOCI.
The ECL charge for the six months ended 30 June 2020 was $6.9bn, which comprised $4.6bn in respect of wholesale lending, of which stage 3 and POCI was $2.2bn; $2.0bn in respect of personal lending, of which stage 3 was $0.5bn; and $0.2bn in respect of other financial assets measured at amortised cost and debt instruments measured at FVOCI.
Income statement movements are analysed further on page 79.
While credit risk arises across most of our balance sheet, ECL have typically been recognised on loans and advances to customers and banks, in addition to securitisation exposures and other structured products. As a result, our disclosures focus primarily on these two areas. For further details of:
• maximum exposure to credit risk, see page 126;
• measurement uncertainty and sensitivity analysis of ECL estimates, see page 127;
• reconciliation of changes in gross carrying/ nominal amount and allowances for loans and advances to banks and customers including loan commitments and financial guarantees, see page 135;
• credit quality, see page 138;
• customer relief programmes, see page 142;
• total wholesale lending for loans and advances to banks and customers by stage distribution, see page 145;
• wholesale lending collateral, see page 150;
• total personal lending for loans and advances to customers at amortised cost by stage distribution, see page 159; and
• personal lending collateral, see page 162.
Risk
122 HSBC Holdings plc Annual Report and Accounts 2020

Summary of credit risk
The following disclosure presents the gross carrying/nominal amount of financial instruments to which the impairment requirements in IFRS 9 are applied and the associated allowance for ECL.
Summary of financial instruments to which the impairment requirements in IFRS 9 are applied(Audited)
31 Dec 2020 At 31 Dec 2019
Gross carrying/nominal amount
Allowance forECL1
Gross carrying/nominal amount
Allowance for ECL1
Footnotes $m $m $m $m
Loans and advances to customers at amortised cost 1,052,477 (14,490) 1,045,475 (8,732)
– personal 460,809 (4,731) 434,271 (3,134)
– corporate and commercial 527,088 (9,494) 540,499 (5,438)
– non-bank financial institutions 64,580 (265) 70,705 (160)
Loans and advances to banks at amortised cost 81,658 (42) 69,219 (16)
Other financial assets measured at amortised cost 772,408 (175) 615,179 (118)
– cash and balances at central banks 304,486 (5) 154,101 (2)
– items in the course of collection from other banks 4,094 — 4,956 —
– Hong Kong Government certificates of indebtedness 40,420 — 38,380 —
– reverse repurchase agreements – non-trading 230,628 — 240,862 —
– financial investments 88,719 (80) 85,788 (53)
– prepayments, accrued income and other assets 2 104,061 (90) 91,092 (63)
Total gross carrying amount on-balance sheet 1,906,543 (14,707) 1,729,873 (8,866)
Loans and other credit-related commitments 659,783 (734) 600,029 (329)
– personal 236,170 (40) 223,314 (15)
– corporate and commercial 299,802 (650) 278,524 (307)
– non-bank financial institutions 123,811 (44) 98,191 (7)
Financial guarantees 18,384 (125) 20,214 (48)
– personal 900 (1) 804 (1)
– corporate and commercial 12,946 (114) 14,804 (44)
– non-bank financial institutions 4,538 (10) 4,606 (3)
Total nominal amount off-balance sheet 3 678,167 (859) 620,243 (377)
2,584,710 (15,566) 2,350,116 (9,243)
Fair value
Memorandum allowance for
ECL4 Fair value
Memorandum allowance for
ECL4
$m $m $m $m
Debt instruments measured at fair value through other comprehensive income (‘FVOCI’) 399,717 (141) 355,664 (166)
1 The total ECL is recognised in the loss allowance for the financial asset unless the total ECL exceeds the gross carrying amount of the financial asset, in which case the ECL is recognised as a provision.
2 Includes only those financial instruments that are subject to the impairment requirements of IFRS 9. ‘Prepayments, accrued income and other assets’, as presented within the consolidated balance sheet on page 280, includes both financial and non-financial assets.
3 Represents the maximum amount at risk should the contracts be fully drawn upon and clients default.4 Debt instruments measured at FVOCI continue to be measured at fair value with the allowance for ECL as a memorandum item. Change in ECL is
recognised in ‘Change in expected credit losses and other credit impairment charges’ in the income statement.
The following table provides an overview of the Group’s credit risk by stage and industry, and the associated ECL coverage. The financial assets recorded in each stage have the following characteristics:
• Stage 1: These financial assets are unimpaired and without significant increase in credit risk on which a 12-month allowance for ECL is recognised.
• Stage 2: A significant increase in credit risk has been experienced on these financial assets since initial recognition for which a lifetime ECL is recognised.
• Stage 3: There is objective evidence of impairment and the financial assets are therefore considered to be in default or otherwise credit impaired on which a lifetime ECL is recognised.
• POCI: Financial assets that are purchased or originated at a deep discount are seen to reflect the incurred credit losses on which a lifetime ECL is recognised.
HSBC Holdings plc Annual Report and Accounts 2020 123
Risk review
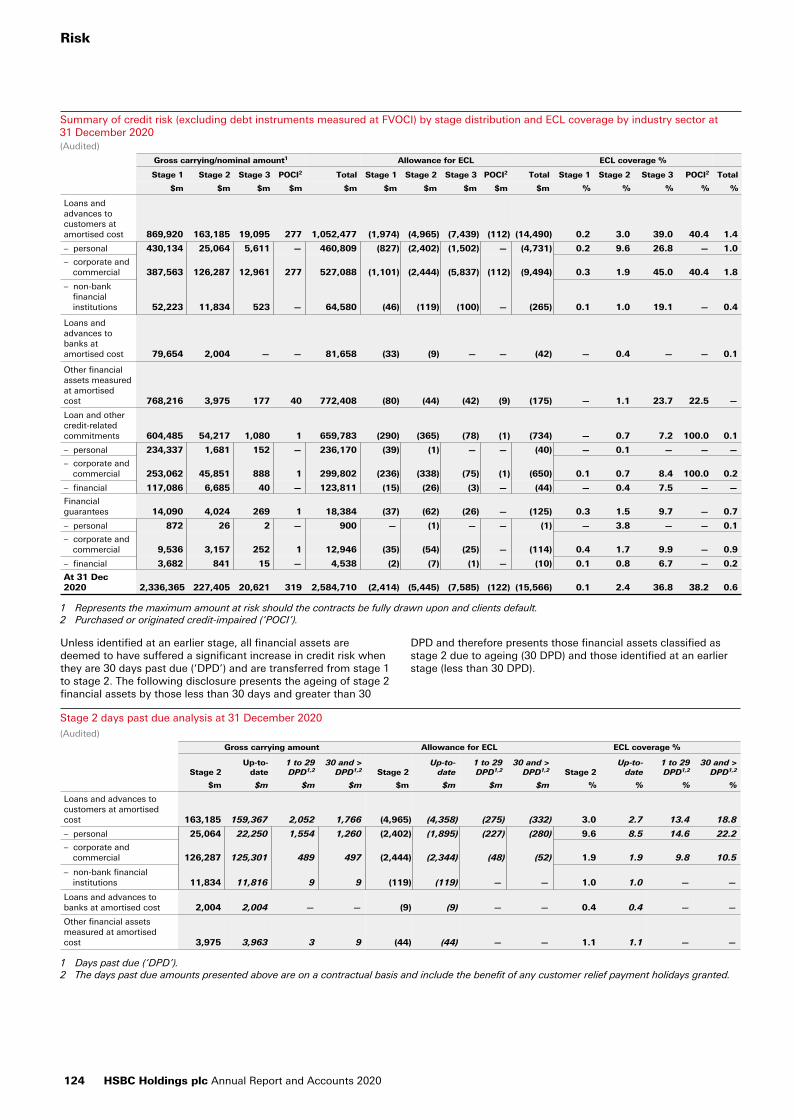
Summary of credit risk (excluding debt instruments measured at FVOCI) by stage distribution and ECL coverage by industry sector at31 December 2020(Audited)
Gross carrying/nominal amount1 Allowance for ECL ECL coverage %
Stage 1 Stage 2 Stage 3 POCI2 Total Stage 1 Stage 2 Stage 3 POCI2 Total Stage 1 Stage 2 Stage 3 POCI2 Total
$m $m $m $m $m $m $m $m $m $m % % % % %
Loans and advances to customers at amortised cost 869,920 163,185 19,095 277 1,052,477 (1,974) (4,965) (7,439) (112) (14,490) 0.2 3.0 39.0 40.4 1.4
– personal 430,134 25,064 5,611 — 460,809 (827) (2,402) (1,502) — (4,731) 0.2 9.6 26.8 — 1.0
– corporate and commercial 387,563 126,287 12,961 277 527,088 (1,101) (2,444) (5,837) (112) (9,494) 0.3 1.9 45.0 40.4 1.8
– non-bank financial institutions 52,223 11,834 523 — 64,580 (46) (119) (100) — (265) 0.1 1.0 19.1 — 0.4
Loans and advances to banks at amortised cost 79,654 2,004 — — 81,658 (33) (9) — — (42) — 0.4 — — 0.1
Other financial assets measured at amortised cost 768,216 3,975 177 40 772,408 (80) (44) (42) (9) (175) — 1.1 23.7 22.5 —
Loan and other credit-related commitments 604,485 54,217 1,080 1 659,783 (290) (365) (78) (1) (734) — 0.7 7.2 100.0 0.1
– personal 234,337 1,681 152 — 236,170 (39) (1) — — (40) — 0.1 — — —
– corporate and commercial 253,062 45,851 888 1 299,802 (236) (338) (75) (1) (650) 0.1 0.7 8.4 100.0 0.2
– financial 117,086 6,685 40 — 123,811 (15) (26) (3) — (44) — 0.4 7.5 — —
Financial guarantees 14,090 4,024 269 1 18,384 (37) (62) (26) — (125) 0.3 1.5 9.7 — 0.7
– personal 872 26 2 — 900 — (1) — — (1) — 3.8 — — 0.1
– corporate and commercial 9,536 3,157 252 1 12,946 (35) (54) (25) — (114) 0.4 1.7 9.9 — 0.9
– financial 3,682 841 15 — 4,538 (2) (7) (1) — (10) 0.1 0.8 6.7 — 0.2
At 31 Dec 2020 2,336,365 227,405 20,621 319 2,584,710 (2,414) (5,445) (7,585) (122) (15,566) 0.1 2.4 36.8 38.2 0.6
1 Represents the maximum amount at risk should the contracts be fully drawn upon and clients default.2 Purchased or originated credit-impaired (‘POCI’).
Unless identified at an earlier stage, all financial assets are deemed to have suffered a significant increase in credit risk when they are 30 days past due (‘DPD’) and are transferred from stage 1 to stage 2. The following disclosure presents the ageing of stage 2 financial assets by those less than 30 days and greater than 30
DPD and therefore presents those financial assets classified as stage 2 due to ageing (30 DPD) and those identified at an earlier stage (less than 30 DPD).
Stage 2 days past due analysis at 31 December 2020(Audited)
Gross carrying amount Allowance for ECL ECL coverage %
Stage 2Up-to-
date1 to 29 DPD1,2
30 and > DPD1,2 Stage 2
Up-to-date
1 to 29 DPD1,2
30 and > DPD1,2 Stage 2
Up-to-date
1 to 29 DPD1,2
30 and > DPD1,2
$m $m $m $m $m $m $m $m % % % %
Loans and advances to customers at amortised cost 163,185 159,367 2,052 1,766 (4,965) (4,358) (275) (332) 3.0 2.7 13.4 18.8
– personal 25,064 22,250 1,554 1,260 (2,402) (1,895) (227) (280) 9.6 8.5 14.6 22.2
– corporate and commercial 126,287 125,301 489 497 (2,444) (2,344) (48) (52) 1.9 1.9 9.8 10.5
– non-bank financial institutions 11,834 11,816 9 9 (119) (119) — — 1.0 1.0 — —
Loans and advances to banks at amortised cost 2,004 2,004 — — (9) (9) — — 0.4 0.4 — —
Other financial assets measured at amortised cost 3,975 3,963 3 9 (44) (44) — — 1.1 1.1 — —
1 Days past due (‘DPD’).2 The days past due amounts presented above are on a contractual basis and include the benefit of any customer relief payment holidays granted.
Risk
124 HSBC Holdings plc Annual Report and Accounts 2020
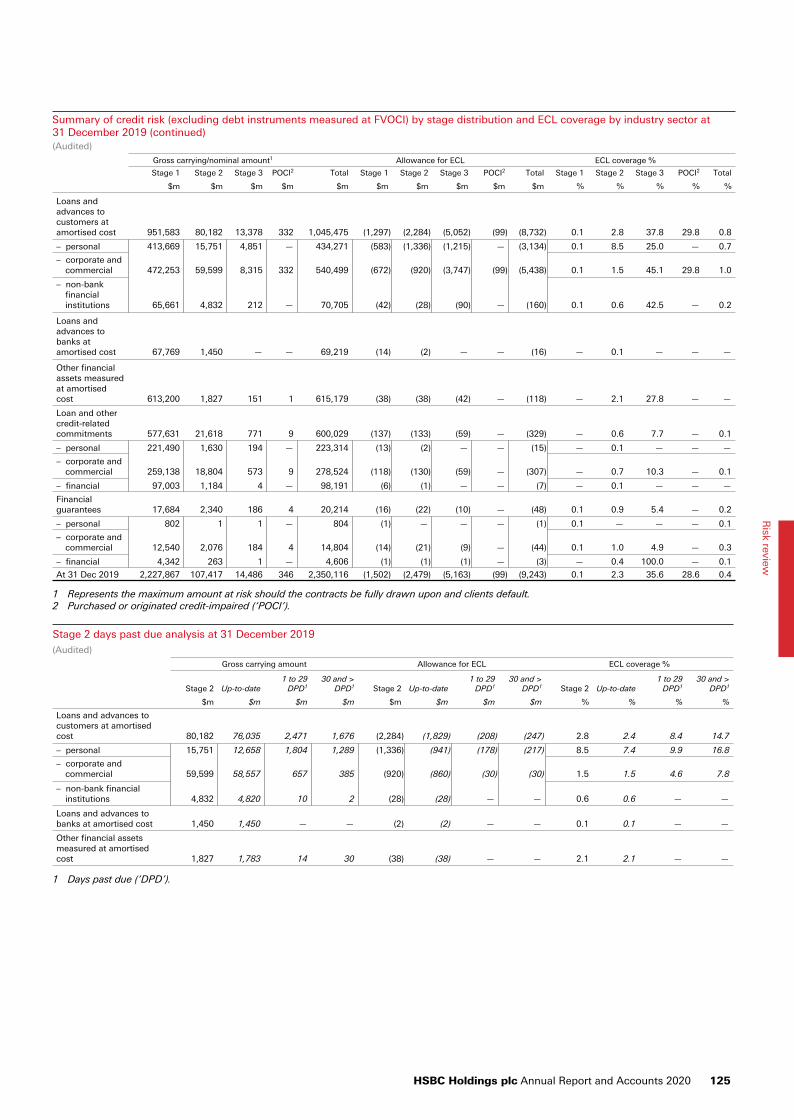
Summary of credit risk (excluding debt instruments measured at FVOCI) by stage distribution and ECL coverage by industry sector at 31 December 2019 (continued)(Audited)
Gross carrying/nominal amount1 Allowance for ECL ECL coverage %
Stage 1 Stage 2 Stage 3 POCI2 Total Stage 1 Stage 2 Stage 3 POCI2 Total Stage 1 Stage 2 Stage 3 POCI2 Total
$m $m $m $m $m $m $m $m $m $m % % % % %
Loans and advances to customers at amortised cost 951,583 80,182 13,378 332 1,045,475 (1,297) (2,284) (5,052) (99) (8,732) 0.1 2.8 37.8 29.8 0.8
– personal 413,669 15,751 4,851 — 434,271 (583) (1,336) (1,215) — (3,134) 0.1 8.5 25.0 — 0.7
– corporate and commercial 472,253 59,599 8,315 332 540,499 (672) (920) (3,747) (99) (5,438) 0.1 1.5 45.1 29.8 1.0
– non-bank financial institutions 65,661 4,832 212 — 70,705 (42) (28) (90) — (160) 0.1 0.6 42.5 — 0.2
Loans and advances to banks at amortised cost 67,769 1,450 — — 69,219 (14) (2) — — (16) — 0.1 — — —
Other financial assets measured at amortised cost 613,200 1,827 151 1 615,179 (38) (38) (42) — (118) — 2.1 27.8 — —
Loan and other credit-related commitments 577,631 21,618 771 9 600,029 (137) (133) (59) — (329) — 0.6 7.7 — 0.1
– personal 221,490 1,630 194 — 223,314 (13) (2) — — (15) — 0.1 — — —
– corporate and commercial 259,138 18,804 573 9 278,524 (118) (130) (59) — (307) — 0.7 10.3 — 0.1
– financial 97,003 1,184 4 — 98,191 (6) (1) — — (7) — 0.1 — — —
Financial guarantees 17,684 2,340 186 4 20,214 (16) (22) (10) — (48) 0.1 0.9 5.4 — 0.2
– personal 802 1 1 — 804 (1) — — — (1) 0.1 — — — 0.1
– corporate and commercial 12,540 2,076 184 4 14,804 (14) (21) (9) — (44) 0.1 1.0 4.9 — 0.3
– financial 4,342 263 1 — 4,606 (1) (1) (1) — (3) — 0.4 100.0 — 0.1
At 31 Dec 2019 2,227,867 107,417 14,486 346 2,350,116 (1,502) (2,479) (5,163) (99) (9,243) 0.1 2.3 35.6 28.6 0.4
1 Represents the maximum amount at risk should the contracts be fully drawn upon and clients default.2 Purchased or originated credit-impaired (‘POCI’).
Stage 2 days past due analysis at 31 December 2019(Audited)
Gross carrying amount Allowance for ECL ECL coverage %
Stage 2 Up-to-date1 to 29
DPD130 and >
DPD1 Stage 2 Up-to-date1 to 29
DPD130 and >
DPD1 Stage 2 Up-to-date1 to 29
DPD130 and >
DPD1
$m $m $m $m $m $m $m $m % % % %
Loans and advances to customers at amortised cost 80,182 76,035 2,471 1,676 (2,284) (1,829) (208) (247) 2.8 2.4 8.4 14.7
– personal 15,751 12,658 1,804 1,289 (1,336) (941) (178) (217) 8.5 7.4 9.9 16.8
– corporate and commercial 59,599 58,557 657 385 (920) (860) (30) (30) 1.5 1.5 4.6 7.8
– non-bank financial institutions 4,832 4,820 10 2 (28) (28) — — 0.6 0.6 — —
Loans and advances to banks at amortised cost 1,450 1,450 — — (2) (2) — — 0.1 0.1 — —
Other financial assets measured at amortised cost 1,827 1,783 14 30 (38) (38) — — 2.1 2.1 — —
1 Days past due (‘DPD’).
HSBC Holdings plc Annual Report and Accounts 2020 125
Risk review
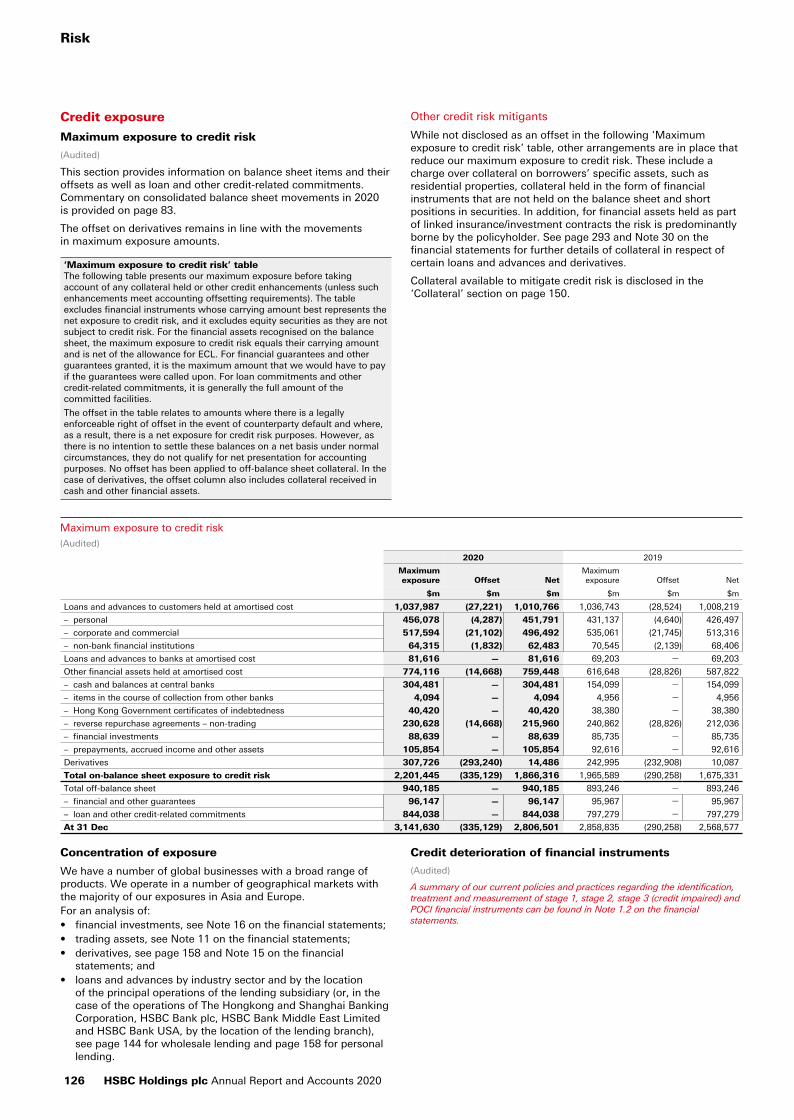
Credit exposure
Maximum exposure to credit risk
(Audited)
This section provides information on balance sheet items and their offsets as well as loan and other credit-related commitments. Commentary on consolidated balance sheet movements in 2020 is provided on page 83.
The offset on derivatives remains in line with the movements in maximum exposure amounts.
‘Maximum exposure to credit risk’ table The following table presents our maximum exposure before taking account of any collateral held or other credit enhancements (unless such enhancements meet accounting offsetting requirements). The table excludes financial instruments whose carrying amount best represents the net exposure to credit risk, and it excludes equity securities as they are not subject to credit risk. For the financial assets recognised on the balance sheet, the maximum exposure to credit risk equals their carrying amount and is net of the allowance for ECL. For financial guarantees and other guarantees granted, it is the maximum amount that we would have to pay if the guarantees were called upon. For loan commitments and other credit-related commitments, it is generally the full amount of the committed facilities.
The offset in the table relates to amounts where there is a legally enforceable right of offset in the event of counterparty default and where, as a result, there is a net exposure for credit risk purposes. However, as there is no intention to settle these balances on a net basis under normal circumstances, they do not qualify for net presentation for accounting purposes. No offset has been applied to off-balance sheet collateral. In the case of derivatives, the offset column also includes collateral received in cash and other financial assets.
Other credit risk mitigants
While not disclosed as an offset in the following ‘Maximum exposure to credit risk’ table, other arrangements are in place that reduce our maximum exposure to credit risk. These include a charge over collateral on borrowers’ specific assets, such as residential properties, collateral held in the form of financial instruments that are not held on the balance sheet and short positions in securities. In addition, for financial assets held as part of linked insurance/investment contracts the risk is predominantly borne by the policyholder. See page 293 and Note 30 on the financial statements for further details of collateral in respect of certain loans and advances and derivatives.
Collateral available to mitigate credit risk is disclosed in the ‘Collateral’ section on page 150.
Maximum exposure to credit risk(Audited)
2020 2019
Maximumexposure Offset Net
Maximumexposure Offset Net
$m $m $m $m $m $m
Loans and advances to customers held at amortised cost 1,037,987 (27,221) 1,010,766 1,036,743 (28,524) 1,008,219
– personal 456,078 (4,287) 451,791 431,137 (4,640) 426,497
– corporate and commercial 517,594 (21,102) 496,492 535,061 (21,745) 513,316
– non-bank financial institutions 64,315 (1,832) 62,483 70,545 (2,139) 68,406
Loans and advances to banks at amortised cost 81,616 — 81,616 69,203 — 69,203
Other financial assets held at amortised cost 774,116 (14,668) 759,448 616,648 (28,826) 587,822
– cash and balances at central banks 304,481 — 304,481 154,099 — 154,099
– items in the course of collection from other banks 4,094 — 4,094 4,956 — 4,956
– Hong Kong Government certificates of indebtedness 40,420 — 40,420 38,380 — 38,380
– reverse repurchase agreements – non-trading 230,628 (14,668) 215,960 240,862 (28,826) 212,036
– financial investments 88,639 — 88,639 85,735 — 85,735
– prepayments, accrued income and other assets 105,854 — 105,854 92,616 — 92,616
Derivatives 307,726 (293,240) 14,486 242,995 (232,908) 10,087
Total on-balance sheet exposure to credit risk 2,201,445 (335,129) 1,866,316 1,965,589 (290,258) 1,675,331
Total off-balance sheet 940,185 — 940,185 893,246 — 893,246
– financial and other guarantees 96,147 — 96,147 95,967 — 95,967
– loan and other credit-related commitments 844,038 — 844,038 797,279 — 797,279
At 31 Dec 3,141,630 (335,129) 2,806,501 2,858,835 (290,258) 2,568,577
Concentration of exposure
We have a number of global businesses with a broad range of products. We operate in a number of geographical markets with the majority of our exposures in Asia and Europe. For an analysis of:• financial investments, see Note 16 on the financial statements;• trading assets, see Note 11 on the financial statements;• derivatives, see page 158 and Note 15 on the financial
statements; and• loans and advances by industry sector and by the location
of the principal operations of the lending subsidiary (or, in the case of the operations of The Hongkong and Shanghai Banking Corporation, HSBC Bank plc, HSBC Bank Middle East Limited and HSBC Bank USA, by the location of the lending branch), see page 144 for wholesale lending and page 158 for personal lending.
Credit deterioration of financial instruments
(Audited)
A summary of our current policies and practices regarding the identification, treatment and measurement of stage 1, stage 2, stage 3 (credit impaired) and POCI financial instruments can be found in Note 1.2 on the financial statements.
Risk
126 HSBC Holdings plc Annual Report and Accounts 2020

Measurement uncertainty and sensitivity analysis of ECL estimates(Audited)
The recognition and measurement of ECL involves the use of significant judgement and estimation. We form multiple economic scenarios based on economic forecasts, apply these assumptions to credit risk models to estimate future credit losses, and probability-weight the results to determine an unbiased ECL estimate. Management judgemental adjustments are used to address late-breaking events, data and model limitations, model deficiencies and expert credit judgements.
Methodology
Four economic scenarios have been used to capture the exceptional nature of the current economic environment and to articulate management’s view of the range of potential outcomes. Scenarios produced to calculate ECL are aligned to HSBC’s top and emerging risks. Three of these scenarios are drawn from consensus forecasts and distributional estimates. The Central scenario is deemed the ‘most likely’ scenario, and usually attracts the largest probability weighting, while the outer scenarios represent the tails of the distribution, which are less likely to occur. The Central scenario is created using the average of a panel of external forecasters, while consensus Upside and Downside scenarios are created with reference to distributions for select markets that capture forecasters’ views of the entire range of outcomes. Management has chosen to use an additional scenario to represent its view of severe downside risks. The use of an additional scenario is in line with HSBC’s forward economic guidance methodology and has been regularly used over the course of 2020. Management may include additional scenarios if it feels that the consensus scenarios do not adequately capture the top and emerging risks. Unlike the consensus scenarios, these additional scenarios are driven by narrative assumptions, could be country-specific and may result in shocks that drive economic activity permanently away from trend.
Description of economic scenarios
The economic assumptions presented in this section have been formed by HSBC with reference to external forecasts specifically for the purpose of calculating ECL.
The world economy experienced a deep economic shock in 2020. As Covid-19 spread globally, governments in many of our markets sought to limit the human impact by imposing significant restrictions on mobility, in turn driving the deep falls in activity that were observed in the first half of the year. Restrictions were eased as cases declined in response to the initial measures, which supported an initial rebound in economic activity by the third quarter of 2020. This increase in mobility unfortunately led to renewed transmission of the virus in several countries, placing healthcare systems under significant burden, leading governments to reimpose restrictions on mobility and causing economic activity to decline once more.
Economic forecasts are subject to a high degree of uncertainty in the current environment. Limitations of forecasts and economic models require a greater reliance on management judgement in addressing both the error inherent in economic forecasts and in assessing associated ECL outcomes. The scenarios used to calculate ECL in the Annual Report and Accounts 2020 are described below.
The consensus Central scenario
HSBC’s Central scenario features an improvement in economic growth in 2021 as activity and employment gradually return to the levels experienced prior to the outbreak of Covid-19.
Despite the sharp contraction in activity, government support in advanced economies played a crucial role in averting significant financial distress. At the same time, central banks in our key markets implemented a variety of measures, which included lowering their main policy interest rates, implementing emergency support measures for funding markets, and either restarting or increasing quantitative easing programmes in order to support
economies and the financial system. Across our key markets, governments and central banks are expected to continue to work together to ensure that households and firms receive an appropriate level of financial support until restrictions on economic activity and mobility can be materially eased. Such support intends to ensure that labour and housing markets do not experience abrupt, negative corrections and also intends to limit the extent of long-term structural damage to economies.
Our Central scenario incorporates expectations that governments and public health authorities in our key markets will implement large vaccination programmes, first by inoculating critical groups and then increasing coverage to include the wider population. The deployment of mass vaccination programmes marks a significant step forward in combating the virus and will ease the burden on healthcare systems. We expect vaccination programmes across our key markets to contribute positively to recovery prospects and our Central scenario assumes a steady increase in the proportion of the population inoculated against Covid-19 over the course of 2021.
Differences across markets in the speed and scale of economic recovery in the Central scenario reflect timing differences in the progression of the Covid-19 outbreak, national level differences in restrictions imposed, the coverage achieved by vaccination programmes and the scale of support measures.
The key features of our Central scenario are:
• Economic activity across our top eight markets will recover in 2021, supported by a successful roll-out of vaccination programmes. We expect vaccination programmes, coupled with effective non-pharmacological measures to contain the virus including ‘track and trace’ systems and restrictions to mobility, to lead to a significant decline in infections across our key markets by the end of 2021.
• Where government support programmes are available, they will continue to provide support to labour markets and households in 2021. We expect a gradual reversion of the unemployment rate to pre-crisis levels over the course of the projection period as a result of economic recovery and due to the orderly withdrawal of government support.
• Inflation will converge towards central bank targets in our key markets.
• In advanced economies, government support in 2020 led to large deficits and a significant increase in public debt. This support is expected to continue as needed and deficits are expected to reduce gradually over the projection period. Sovereign debt levels will remain high and our Central scenario does not assume fiscal austerity.
• Policy interest rates in key markets will remain at current levels for an extended period and will increase very modestly towards the end of our projection period. Central banks will continue to provide assistance through their asset purchase programmes as needed.
• The West Texas Intermediate oil price is forecast to average $43 per barrel over the projection period.
HSBC Holdings plc Annual Report and Accounts 2020 127
Risk review

The following table describes key macroeconomic variables and the probabilities assigned in the consensus Central scenario.
Central scenario 2021–2025
UK US Hong Kong Mainland China Canada France UAE Mexico
% % % % % % % %
GDP growth rate
2020: Annual average growth rate (11.0) (4.1) (6.4) 2.0 (6.1) (9.7) (6.3) (9.7)
2021: Annual average growth rate 4.9 3.8 4.3 7.8 5.0 5.9 3.0 3.7
2022: Annual average growth rate 3.1 2.9 2.9 5.3 3.1 2.9 3.6 2.5
2023: Annual average growth rate 2.4 2.4 2.6 5.2 2.4 2.2 3.9 2.4
5-year average 2.8 2.7 2.9 5.6 2.9 2.9 3.4 2.6
Unemployment rate
2020: Annual average rate 4.6 8.3 5.8 3.9 9.6 7.9 3.1 5.4
2021: Annual average rate 6.9 6.7 5.0 4.1 7.9 10.0 2.7 5.3
2022: Annual average rate 5.8 5.8 3.9 4.2 6.8 9.1 2.6 4.7
2023: Annual average rate 5.4 4.9 3.8 4.1 6.5 8.8 2.7 4.5
5-year average 5.6 5.3 4.0 4.0 6.8 9.0 2.7 4.6
House price growth
2020: Annual average growth rate 2.3 6.0 (0.8) 2.3 5.7 4.4 (11.6) 5.5
2021: Annual average growth rate (2.1) 4.0 (2.2) 4.7 2.1 (0.5) (9.8) 3.4
2022: Annual average growth rate 0.9 4.3 2.4 5.7 2.0 4.1 (1.3) 5.0
2023: Annual average growth rate 3.0 4.0 5.2 5.0 3.1 4.1 2.6 4.6
5-year average 1.9 4.0 2.3 4.7 2.7 2.8 — 4.2
Short-term interest rate
2020: Annual average rate 0.3 0.7 1.2 3.2 0.8 (0.4) 1.0 5.7
2021: Annual average rate 0.1 0.3 1.0 2.9 0.5 (0.5) 0.8 4.5
2022: Annual average rate 0.1 0.3 1.1 3.0 0.6 (0.5) 0.8 4.7
2023: Annual average rate 0.1 0.4 1.2 3.1 0.8 (0.5) 0.9 5.2
5-year average 0.2 0.5 1.3 3.1 0.8 (0.5) 1.0 5.2
Probability 40 65 70 80 70 40 65 65
The graphs comparing the respective Central scenarios in the fourth quarters of 2019 and 2020 reveal the extent of economic dislocation that occurred in 2020 and the impact this has had on central projections made at the end of 2019.
The emergent nature of the Covid-19 outbreak at the end of 2019 meant that, consistent with other banks, HSBC’s Central scenario did not, on a forward-looking basis, consider the impact of the virus. Our Central scenario at the 2019 year-end projected moderate growth over a five-year horizon, with strong prospects for employment and a gradual increase in policy interest rates by central banks in the major economies of Europe and North America. The onset of the virus led to a fundamental reassessment of our Central forecast and the distribution of risks over the course of 2020. Our Central scenario at the end of 2020, as described above, is based on assumptions that are considerably different.
GDP growth: Comparison
UK
Note: Real GDP shown as year-on-year percentage change.
Hong Kong
Note: Real GDP shown as year-on-year percentage change.
US
Note: Real GDP shown as year-on-year percentage change.
Risk
128 HSBC Holdings plc Annual Report and Accounts 2020
0
10
20
30
40
50
60
70
80
90
100
‐25
‐20
‐15
‐10
‐5
0
5
10
15
20
2019 20252021
4Q19 Central
2023
4Q20 Central
4Q19 Central scenario 5Y Average: 1.6%4Q20 Central scenario 5Y Average: 2.8%
0
10
20
30
40
50
60
70
80
90
100
‐10
‐8
‐6
‐4
‐2
0
2
4
6
8
2019 20252021
4Q19 Central
2023
4Q20 Central
4Q19 Central scenario 5Y Average: 1.9%4Q20 Central scenario 5Y Average: 2.9%
0
10
20
30
40
50
60
70
80
90
100
‐10
‐8
‐6
‐4
‐2
0
2
4
6
8
10
2019 20252021
4Q19 Central
2023
4Q20 Central
4Q19 Central scenario 5Y Average: 1.9%4Q20 Central scenario 5Y Average: 2.7%
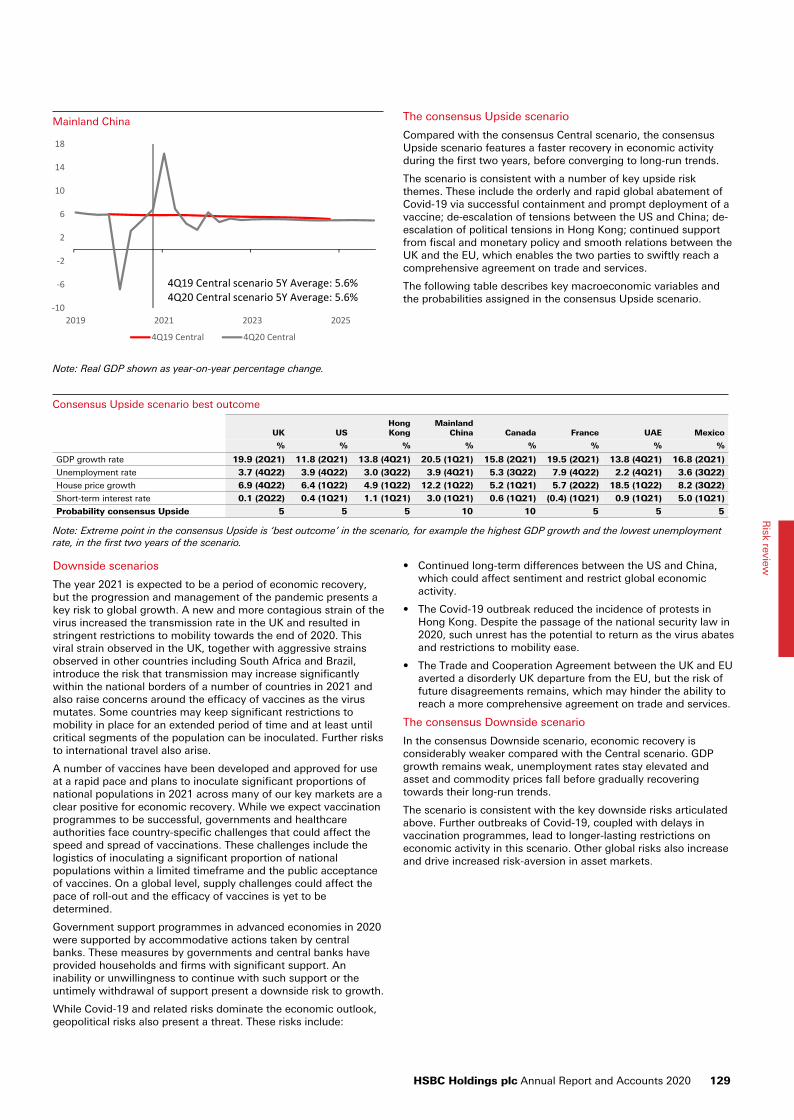
Mainland China
Note: Real GDP shown as year-on-year percentage change.
The consensus Upside scenario
Compared with the consensus Central scenario, the consensus Upside scenario features a faster recovery in economic activity during the first two years, before converging to long-run trends.
The scenario is consistent with a number of key upside risk themes. These include the orderly and rapid global abatement of Covid-19 via successful containment and prompt deployment of a vaccine; de-escalation of tensions between the US and China; de-escalation of political tensions in Hong Kong; continued support from fiscal and monetary policy and smooth relations between the UK and the EU, which enables the two parties to swiftly reach a comprehensive agreement on trade and services.
The following table describes key macroeconomic variables and the probabilities assigned in the consensus Upside scenario.
Consensus Upside scenario best outcome
UK USHongKong
MainlandChina Canada France UAE Mexico
% % % % % % % %
GDP growth rate 19.9 (2Q21) 11.8 (2Q21) 13.8 (4Q21) 20.5 (1Q21) 15.8 (2Q21) 19.5 (2Q21) 13.8 (4Q21) 16.8 (2Q21)
Unemployment rate 3.7 (4Q22) 3.9 (4Q22) 3.0 (3Q22) 3.9 (4Q21) 5.3 (3Q22) 7.9 (4Q22) 2.2 (4Q21) 3.6 (3Q22)
House price growth 6.9 (4Q22) 6.4 (1Q22) 4.9 (1Q22) 12.2 (1Q22) 5.2 (1Q21) 5.7 (2Q22) 18.5 (1Q22) 8.2 (3Q22)
Short-term interest rate 0.1 (2Q22) 0.4 (1Q21) 1.1 (1Q21) 3.0 (1Q21) 0.6 (1Q21) (0.4) (1Q21) 0.9 (1Q21) 5.0 (1Q21)
Probability consensus Upside 5 5 5 10 10 5 5 5
Note: Extreme point in the consensus Upside is ‘best outcome’ in the scenario, for example the highest GDP growth and the lowest unemployment rate, in the first two years of the scenario.
Downside scenarios
The year 2021 is expected to be a period of economic recovery, but the progression and management of the pandemic presents a key risk to global growth. A new and more contagious strain of the virus increased the transmission rate in the UK and resulted in stringent restrictions to mobility towards the end of 2020. This viral strain observed in the UK, together with aggressive strains observed in other countries including South Africa and Brazil, introduce the risk that transmission may increase significantly within the national borders of a number of countries in 2021 and also raise concerns around the efficacy of vaccines as the virus mutates. Some countries may keep significant restrictions to mobility in place for an extended period of time and at least until critical segments of the population can be inoculated. Further risks to international travel also arise.
A number of vaccines have been developed and approved for use at a rapid pace and plans to inoculate significant proportions of national populations in 2021 across many of our key markets are a clear positive for economic recovery. While we expect vaccination programmes to be successful, governments and healthcare authorities face country-specific challenges that could affect the speed and spread of vaccinations. These challenges include the logistics of inoculating a significant proportion of national populations within a limited timeframe and the public acceptance of vaccines. On a global level, supply challenges could affect the pace of roll-out and the efficacy of vaccines is yet to be determined.
Government support programmes in advanced economies in 2020 were supported by accommodative actions taken by central banks. These measures by governments and central banks have provided households and firms with significant support. An inability or unwillingness to continue with such support or the untimely withdrawal of support present a downside risk to growth.
While Covid-19 and related risks dominate the economic outlook, geopolitical risks also present a threat. These risks include:
• Continued long-term differences between the US and China,which could affect sentiment and restrict global economicactivity.
• The Covid-19 outbreak reduced the incidence of protests inHong Kong. Despite the passage of the national security law in2020, such unrest has the potential to return as the virus abatesand restrictions to mobility ease.
• The Trade and Cooperation Agreement between the UK and EUaverted a disorderly UK departure from the EU, but the risk offuture disagreements remains, which may hinder the ability toreach a more comprehensive agreement on trade and services.
The consensus Downside scenario
In the consensus Downside scenario, economic recovery is considerably weaker compared with the Central scenario. GDP growth remains weak, unemployment rates stay elevated and asset and commodity prices fall before gradually recovering towards their long-run trends.
The scenario is consistent with the key downside risks articulated above. Further outbreaks of Covid-19, coupled with delays in vaccination programmes, lead to longer-lasting restrictions on economic activity in this scenario. Other global risks also increase and drive increased risk-aversion in asset markets.
HSBC Holdings plc Annual Report and Accounts 2020 129
Risk review
0
10
20
30
40
50
60
70
80
90
100
‐10
‐6
‐2
2
6
10
14
18
2019 20252021
4Q19 Central
2023
4Q20 Central
4Q19 Central scenario 5Y Average: 5.6%4Q20 Central scenario 5Y Average: 5.6%

The following table describes key macroeconomic variables and the probabilities assigned in the consensus Downside scenario.
Consensus Downside scenario worst outcome
UK USHongKong
MainlandChina Canada France UAE Mexico
% % % % % % % %
GDP growth rate (7.6) (1Q21) (3.4) (1Q21) (2.1) (3Q21) (1.3) (4Q21) (3.6) (1Q21) (3.0) (1Q21) (7.3) (1Q21) (8.0) (1Q21)
Unemployment rate 9.4 (4Q21) 8.2 (2Q21) 6.4 (1Q21) 4.3 (3Q22) 9.2 (1Q21) 11.2 (1Q21) 3.0 (1Q21) 6.2 (3Q21)
House price growth (10.8) (4Q21) 0.1 (3Q21) (6.8) (3Q21) 0.3 (4Q21) (1.3) (1Q22) (3.3) (2Q21) (19.2) (2Q21) 1.0 (4Q21)
Short-term interest rate 0.1 (1Q21) 0.3 (1Q22) 1.1 (4Q22) 2.8 (1Q21) 0.5 (1Q21) (0.5) (1Q21) 0.8 (1Q22) 3.8 (1Q21)
Probability consensus Downside 40 25 20 8 10 40 25 25
Note: Extreme point in the consensus Downside is 'worst outcome' in the scenario, for example lowest GDP growth and the highest unemployment rate, in the first two years of the scenario.
Additional Downside scenario
An additional Downside scenario that features a global recession has been created to reflect management’s view of severe risks. In this scenario, infections rise in 2021 and setbacks to vaccine programmes imply that successful roll-out of vaccines only occurs towards the end of 2021 and it takes until the end of 2022 for the
pandemic to come to an end. The scenario also assumes governments and central banks are unable to significantly increase fiscal and monetary programmes, which results in abrupt corrections in labour and asset markets.
The following table describes key macroeconomic variables and the probabilities assigned in the additional Downside scenario.
Additional Downside scenario worst outcome
UK USHongKong
MainlandChina Canada France UAE Mexico
% % % % % % % %
GDP growth rate (10.1) (1Q21) (4.2) (1Q21) (8.3) (4Q21) (9.5) (4Q21) (5.0) (1Q21) (6.7) (1Q21) (12.2) (1Q21) (10.9) (1Q21)
Unemployment rate 9.8 (3Q21) 11.4 (4Q22) 6.7 (3Q21) 6.1 (3Q22) 11.3 (1Q21) 12.3 (1Q21) 3.9 (1Q21) 6.9 (4Q21)
House price growth (14.5) (4Q21) (9.3) (3Q21) (21.0) (4Q21) (19.4) (4Q21) (10.4) (4Q21) (7.1) (3Q21) (22.9) (2Q21) (2.7) (4Q21)
Short-term interest rate 0.8 (2Q21) 1.1 (1Q21) 1.3 (1Q21) 4.0 (2Q21) 0.4 (1Q21) 0.2 (2Q21) 0.5 (3Q21) 6.7 (2Q21)
Probability additional Downside 15 5 5 2 10 15 5 5
Note: Extreme point in the additional Downside is 'worst outcome' in the scenario, for example lowest GDP growth and the highest unemployment rate, in the first two years of the scenario.
In considering economic uncertainty and assigning probabilities to scenarios, management has considered both global and country-specific factors. This has led management to assigning scenario probabilities that are tailored to its view of uncertainty in individual markets.
To inform its view, management has considered trends in the progression of the virus in individual countries, the expected reach and efficacy of vaccine roll-outs over the course of 2021, the size and effectiveness of future government support schemes and the connectivity with other countries. Management has also been guided by the actual response to the Covid-19 outbreak and by the economic experience across countries in 2020. China’s visible success at containing the virus and its repeated rapid response to localised outbreaks, coupled with government support programmes and clear signs of economic recovery, have led management to conclude that the economic outlook for mainland China is the least volatile out of all our top markets. The Central scenario for mainland China has an 80% probability while a total of 10% has been assigned to the two Downside scenarios. In Hong Kong, the combination of recurrent outbreaks, a lack of details around the roll-out of a vaccination programme and the other risks outlined above, have led management to assign 25% weight to the two Downside scenarios.
The UK and France face the greatest economic uncertainty in our key markets. In the UK, the discovery of a more infectious strain of the virus and subsequent national restrictions on activity imposed before the end of 2020 have resulted in considerable uncertainty in the economic outlook. In France, the increases in cases and hospitalisations towards the end of 2020, the difficulties experienced with the launch of a national vaccination programme and the wide range of measures taken to restrict activity similarly affect the economic outlook. Given these considerations, the Central and the consensus Downside scenario for the UK and France have each been assigned 40% probability. This reflects management’s view that, as a result of elevated uncertainty in these two markets, the Central scenario cannot be viewed as the single most likely outcome. The additional Downside scenario has been assigned 15% probability to reflect the view that the balance of risks is weighted to the downside.
Uncertainty related to the continued impact of the pandemic and the ability of governments to control its spread via restrictions and vaccinations over the course of 2021 also play a prominent role in assigning scenario weights to our other markets. In addition, for the US, Canada and Mexico, connectivity across the three North American economies has been considered. In the UAE, the impact of the oil price on the economy and the ability of non-oil sectors to contribute to economic recovery have influenced the view of uncertainty. The Central scenario has been assigned between 65% and 70% weight for these four markets and, with risks perceived as being weighted to the downside, the two Downside scenarios have been given weights between 20% and 30%.
The following graphs show the historical and forecasted GDP growth rate for the various economic scenarios in our four largest markets.
US
Risk
130 HSBC Holdings plc Annual Report and Accounts 2020
0
10
20
30
40
50
60
70
80
90
100
‐10.0
‐5.0
0.0
5.0
10.0
15.0
2016 2017 2018 2019 2020 2021 2022 2024 2025
Central Upside Downside
2023
Additional Downside

UK
Hong Kong
Mainland China
Critical accounting estimates and judgements
The calculation of ECL under IFRS 9 involves significant judgements, assumptions and estimates. The level of estimation uncertainty and judgement has increased during 2020 as a result of the economic effects of the Covid-19 outbreak, including significant judgements relating to:
• the selection and weighting of economic scenarios, givenrapidly changing economic conditions in an unprecedentedmanner, uncertainty as to the effect of government and centralbank support measures designed to alleviate adverse economicimpacts, and a wider distribution of economic forecasts thanbefore the pandemic. The key judgements are the length oftime over which the economic effects of the pandemic willoccur, the speed and shape of recovery. The main factorsinclude the effectiveness of pandemic containment measures,the pace of roll-out and effectiveness of vaccines, and theemergence of new variants of the virus, plus a range ofgeopolitical uncertainties, which together represent a very highdegree of estimation uncertainty, particularly in assessingDownside scenarios;
• estimating the economic effects of those scenarios on ECL,where there is no observable historical trend that can bereflected in the models that will accurately represent the effectsof the economic changes of the severity and speed broughtabout by the Covid-19 outbreak. Modelled assumptions and
linkages between economic factors and credit losses may underestimate or overestimate ECL in these conditions, and there is significant uncertainty in the estimation of parameters such as collateral values and loss severity; and
• the identification of customers experiencing significantincreases in credit risk and credit impairment, particularlywhere those customers have accepted payment deferrals andother reliefs designed to address short-term liquidity issuesgiven muted default experience to date. The use ofsegmentation techniques for indicators of significant increasesin credit risk involves significant estimation uncertainty.
How economic scenarios are reflected in ECL calculations
Models are used to reflect economic scenarios on ECL estimates. As described above, modelled assumptions and linkages based on historical information could not alone produce relevant information under the unprecedented conditions experienced in 2020, and it was necessary to place greater emphasis on judgemental adjustments to modelled outcomes than in previous years.
We have developed globally consistent methodologies for the application of forward economic guidance into the calculation of ECL for wholesale and retail credit risk. These standard approaches are described below, followed by the management judgemental adjustments made, including those to reflect the circumstances experienced in 2020.
For wholesale, a global methodology is used for the estimation of the term structure of probability of default (‘PD’) and loss given default (‘LGD’). For PDs, we consider the correlation of forward economic guidance to default rates for a particular industry in a country. For LGD calculations, we consider the correlation of forward economic guidance to collateral values and realisation rates for a particular country and industry. PDs and LGDs are estimated for the entire term structure of each instrument.
For impaired loans, LGD estimates take into account independent recovery valuations provided by external consultants where available or internal forecasts corresponding to anticipated economic conditions and individual company conditions. In estimating the ECL on impaired loans that are individually considered not to be significant, we incorporate forward economic guidance proportionate to the probability-weighted outcome and the Central scenario outcome for non-stage 3 populations.
For retail, the impact of economic scenarios on PD is modelled at a portfolio level. Historical relationships between observed default rates and macroeconomic variables are integrated into IFRS 9 ECL estimates by using economic response models. The impact of these scenarios on PD is modelled over a period equal to the remaining maturity of the underlying asset or assets. The impact on LGD is modelled for mortgage portfolios by forecasting future loan-to-value (‘LTV’) profiles for the remaining maturity of the asset by using national level forecasts of the house price index and applying the corresponding LGD expectation.
These models are based largely on historical observations and correlations with default rates. Management judgemental adjustments are described below.
Management judgemental adjustments
In the context of IFRS 9, management judgemental adjustments are short-term increases or decreases to the ECL at either a customer or portfolio level to account for late-breaking events, model and data limitations and deficiencies, and expert credit judgement applied following management review and challenge. In the Annual Report and Accounts 2019, these were ‘Post-model adjustments’.
The most severe projections at 31 December 2020 of macroeconomic variables are outside the historical observations on which IFRS 9 models have been built and calibrated to operate. Moreover, the complexities of country-specific governmental support programmes, the impacts on customer behaviours and the unpredictable pathways of the pandemic have never been modelled. Consequently, HSBC’s IFRS 9 models, in some cases, generate outputs that appear overly sensitive when compared
HSBC Holdings plc Annual Report and Accounts 2020 131
Risk review
0
10
20
30
40
50
60
70
80
90
100
‐25.0
‐20.0
‐15.0
‐10.0
‐5.0
0.0
5.0
10.0
15.0
20.0
25.0
2016 2017 2018 2019 2020 2021 2022 2024 2025
Central Upside Downside
2023
Additional Downside
0
10
20
30
40
50
60
70
80
90
100
‐15.0
‐10.0
‐5.0
0.0
5.0
10.0
15.0
2016 2017 2018 2019 2020 2021 2022 2024 2025
Central Upside Downside
2023
Additional Downside
0
10
20
30
40
50
60
70
80
90
100
‐15.0
‐10.0
‐5.0
0.0
5.0
10.0
15.0
20.0
25.0
2016 2017 2018 2019 2020 2021 2022 2023 2024 2025
Central Upside Downside Additional Downside
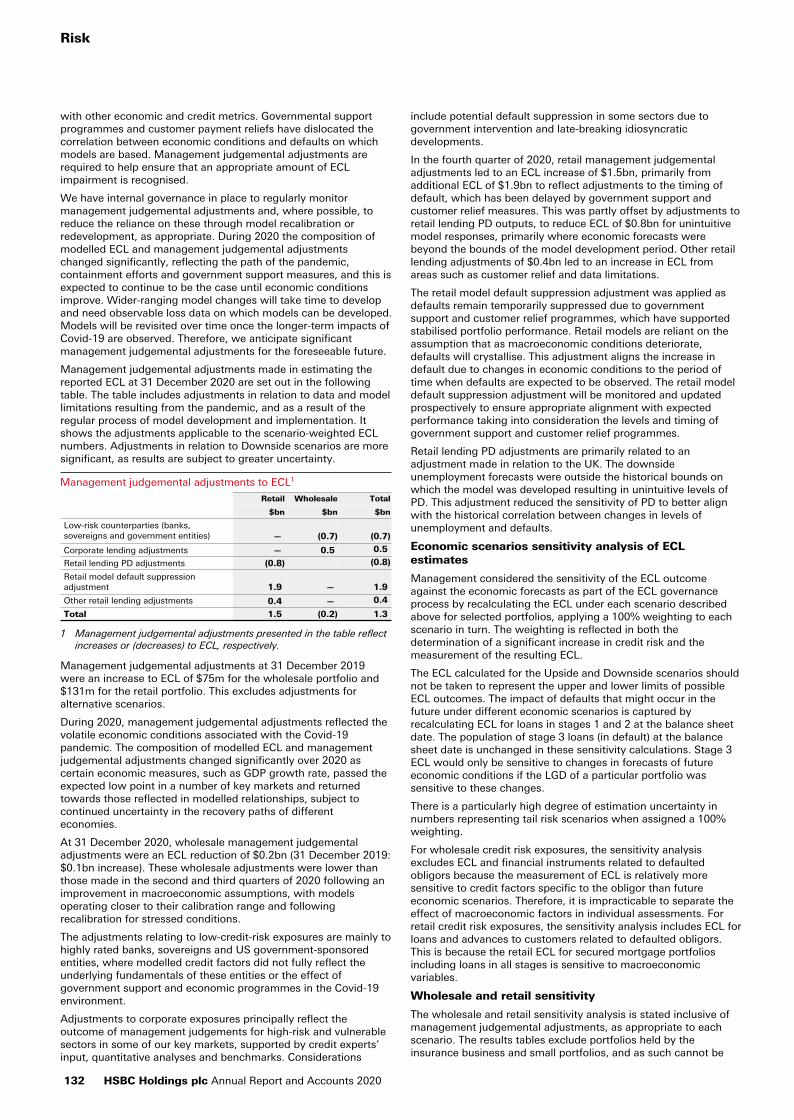
with other economic and credit metrics. Governmental support programmes and customer payment reliefs have dislocated the correlation between economic conditions and defaults on which models are based. Management judgemental adjustments are required to help ensure that an appropriate amount of ECL impairment is recognised.
We have internal governance in place to regularly monitor management judgemental adjustments and, where possible, to reduce the reliance on these through model recalibration or redevelopment, as appropriate. During 2020 the composition of modelled ECL and management judgemental adjustments changed significantly, reflecting the path of the pandemic, containment efforts and government support measures, and this is expected to continue to be the case until economic conditions improve. Wider-ranging model changes will take time to develop and need observable loss data on which models can be developed. Models will be revisited over time once the longer-term impacts of Covid-19 are observed. Therefore, we anticipate significant management judgemental adjustments for the foreseeable future.
Management judgemental adjustments made in estimating the reported ECL at 31 December 2020 are set out in the following table. The table includes adjustments in relation to data and model limitations resulting from the pandemic, and as a result of the regular process of model development and implementation. It shows the adjustments applicable to the scenario-weighted ECL numbers. Adjustments in relation to Downside scenarios are more significant, as results are subject to greater uncertainty.
Management judgemental adjustments to ECL1
Retail Wholesale Total
$bn $bn $bn
Low-risk counterparties (banks, sovereigns and government entities) — (0.7) (0.7)
Corporate lending adjustments — 0.5 0.5
Retail lending PD adjustments (0.8) (0.8)
Retail model default suppression adjustment 1.9 — 1.9
Other retail lending adjustments 0.4 — 0.4
Total 1.5 (0.2) 1.3
1 Management judgemental adjustments presented in the table reflect increases or (decreases) to ECL, respectively.
Management judgemental adjustments at 31 December 2019 were an increase to ECL of $75m for the wholesale portfolio and $131m for the retail portfolio. This excludes adjustments for alternative scenarios.
During 2020, management judgemental adjustments reflected the volatile economic conditions associated with the Covid-19 pandemic. The composition of modelled ECL and management judgemental adjustments changed significantly over 2020 as certain economic measures, such as GDP growth rate, passed the expected low point in a number of key markets and returned towards those reflected in modelled relationships, subject to continued uncertainty in the recovery paths of different economies.
At 31 December 2020, wholesale management judgemental adjustments were an ECL reduction of $0.2bn (31 December 2019: $0.1bn increase). These wholesale adjustments were lower than those made in the second and third quarters of 2020 following an improvement in macroeconomic assumptions, with models operating closer to their calibration range and following recalibration for stressed conditions.
The adjustments relating to low-credit-risk exposures are mainly to highly rated banks, sovereigns and US government-sponsored entities, where modelled credit factors did not fully reflect the underlying fundamentals of these entities or the effect of government support and economic programmes in the Covid-19 environment.
Adjustments to corporate exposures principally reflect the outcome of management judgements for high-risk and vulnerable sectors in some of our key markets, supported by credit experts’ input, quantitative analyses and benchmarks. Considerations
include potential default suppression in some sectors due to government intervention and late-breaking idiosyncratic developments.
In the fourth quarter of 2020, retail management judgemental adjustments led to an ECL increase of $1.5bn, primarily from additional ECL of $1.9bn to reflect adjustments to the timing of default, which has been delayed by government support and customer relief measures. This was partly offset by adjustments to retail lending PD outputs, to reduce ECL of $0.8bn for unintuitive model responses, primarily where economic forecasts were beyond the bounds of the model development period. Other retail lending adjustments of $0.4bn led to an increase in ECL from areas such as customer relief and data limitations.
The retail model default suppression adjustment was applied as defaults remain temporarily suppressed due to government support and customer relief programmes, which have supported stabilised portfolio performance. Retail models are reliant on the assumption that as macroeconomic conditions deteriorate, defaults will crystallise. This adjustment aligns the increase in default due to changes in economic conditions to the period of time when defaults are expected to be observed. The retail model default suppression adjustment will be monitored and updated prospectively to ensure appropriate alignment with expected performance taking into consideration the levels and timing of government support and customer relief programmes.
Retail lending PD adjustments are primarily related to an adjustment made in relation to the UK. The downside unemployment forecasts were outside the historical bounds on which the model was developed resulting in unintuitive levels of PD. This adjustment reduced the sensitivity of PD to better align with the historical correlation between changes in levels of unemployment and defaults.
Economic scenarios sensitivity analysis of ECL estimates
Management considered the sensitivity of the ECL outcome against the economic forecasts as part of the ECL governance process by recalculating the ECL under each scenario described above for selected portfolios, applying a 100% weighting to each scenario in turn. The weighting is reflected in both the determination of a significant increase in credit risk and the measurement of the resulting ECL.
The ECL calculated for the Upside and Downside scenarios should not be taken to represent the upper and lower limits of possible ECL outcomes. The impact of defaults that might occur in the future under different economic scenarios is captured by recalculating ECL for loans in stages 1 and 2 at the balance sheet date. The population of stage 3 loans (in default) at the balance sheet date is unchanged in these sensitivity calculations. Stage 3 ECL would only be sensitive to changes in forecasts of future economic conditions if the LGD of a particular portfolio was sensitive to these changes.
There is a particularly high degree of estimation uncertainty in numbers representing tail risk scenarios when assigned a 100% weighting.
For wholesale credit risk exposures, the sensitivity analysis excludes ECL and financial instruments related to defaulted obligors because the measurement of ECL is relatively more sensitive to credit factors specific to the obligor than future economic scenarios. Therefore, it is impracticable to separate the effect of macroeconomic factors in individual assessments. For retail credit risk exposures, the sensitivity analysis includes ECL for loans and advances to customers related to defaulted obligors. This is because the retail ECL for secured mortgage portfolios including loans in all stages is sensitive to macroeconomic variables.
Wholesale and retail sensitivity
The wholesale and retail sensitivity analysis is stated inclusive of management judgemental adjustments, as appropriate to each scenario. The results tables exclude portfolios held by the insurance business and small portfolios, and as such cannot be
Risk
132 HSBC Holdings plc Annual Report and Accounts 2020
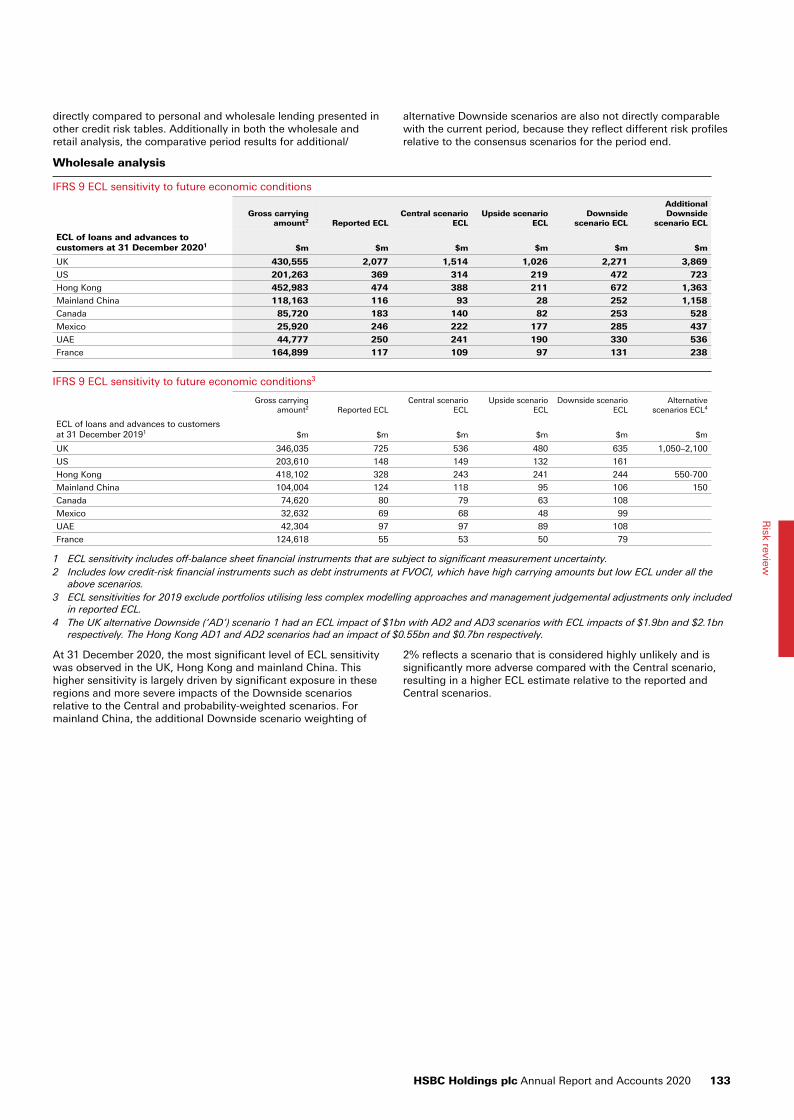
directly compared to personal and wholesale lending presented in other credit risk tables. Additionally in both the wholesale and retail analysis, the comparative period results for additional/
alternative Downside scenarios are also not directly comparable with the current period, because they reflect different risk profiles relative to the consensus scenarios for the period end.
Wholesale analysis
IFRS 9 ECL sensitivity to future economic conditions
Gross carrying amount2 Reported ECL
Central scenario ECL
Upside scenario ECL
Downside scenario ECL
Additional Downside
scenario ECL
ECL of loans and advances to customers at 31 December 20201 $m $m $m $m $m $m
UK 430,555 2,077 1,514 1,026 2,271 3,869
US 201,263 369 314 219 472 723
Hong Kong 452,983 474 388 211 672 1,363
Mainland China 118,163 116 93 28 252 1,158
Canada 85,720 183 140 82 253 528
Mexico 25,920 246 222 177 285 437
UAE 44,777 250 241 190 330 536
France 164,899 117 109 97 131 238
IFRS 9 ECL sensitivity to future economic conditions3
Gross carrying amount2 Reported ECL
Central scenario ECL
Upside scenario ECL
Downside scenario ECL
Alternative scenarios ECL4
ECL of loans and advances to customers at 31 December 20191 $m $m $m $m $m $m
UK 346,035 725 536 480 635 1,050–2,100
US 203,610 148 149 132 161
Hong Kong 418,102 328 243 241 244 550-700
Mainland China 104,004 124 118 95 106 150
Canada 74,620 80 79 63 108
Mexico 32,632 69 68 48 99
UAE 42,304 97 97 89 108
France 124,618 55 53 50 79
1 ECL sensitivity includes off-balance sheet financial instruments that are subject to significant measurement uncertainty.2 Includes low credit-risk financial instruments such as debt instruments at FVOCI, which have high carrying amounts but low ECL under all the
above scenarios. 3 ECL sensitivities for 2019 exclude portfolios utilising less complex modelling approaches and management judgemental adjustments only included
in reported ECL.4 The UK alternative Downside (‘AD’) scenario 1 had an ECL impact of $1bn with AD2 and AD3 scenarios with ECL impacts of $1.9bn and $2.1bn
respectively. The Hong Kong AD1 and AD2 scenarios had an impact of $0.55bn and $0.7bn respectively.
At 31 December 2020, the most significant level of ECL sensitivity was observed in the UK, Hong Kong and mainland China. This higher sensitivity is largely driven by significant exposure in these regions and more severe impacts of the Downside scenarios relative to the Central and probability-weighted scenarios. For mainland China, the additional Downside scenario weighting of
2% reflects a scenario that is considered highly unlikely and is significantly more adverse compared with the Central scenario, resulting in a higher ECL estimate relative to the reported and Central scenarios.
HSBC Holdings plc Annual Report and Accounts 2020 133
Risk review
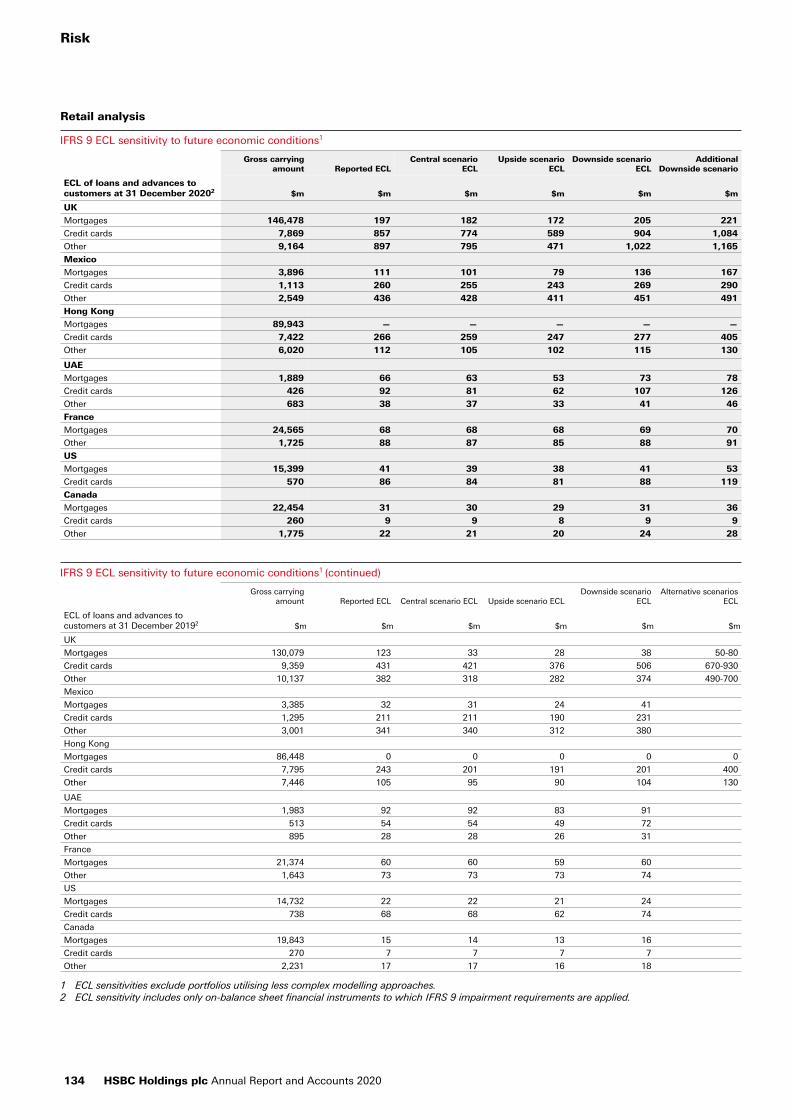
Retail analysis
IFRS 9 ECL sensitivity to future economic conditions1
Gross carrying amount Reported ECL
Central scenario ECL
Upside scenario ECL
Downside scenario ECL
Additional Downside scenario
ECL of loans and advances to customers at 31 December 20202 $m $m $m $m $m $m
UK
Mortgages 146,478 197 182 172 205 221
Credit cards 7,869 857 774 589 904 1,084
Other 9,164 897 795 471 1,022 1,165
Mexico
Mortgages 3,896 111 101 79 136 167
Credit cards 1,113 260 255 243 269 290
Other 2,549 436 428 411 451 491
Hong Kong
Mortgages 89,943 — — — — —
Credit cards 7,422 266 259 247 277 405
Other 6,020 112 105 102 115 130
UAE
Mortgages 1,889 66 63 53 73 78
Credit cards 426 92 81 62 107 126
Other 683 38 37 33 41 46
France
Mortgages 24,565 68 68 68 69 70
Other 1,725 88 87 85 88 91
US
Mortgages 15,399 41 39 38 41 53
Credit cards 570 86 84 81 88 119
Canada
Mortgages 22,454 31 30 29 31 36
Credit cards 260 9 9 8 9 9
Other 1,775 22 21 20 24 28
IFRS 9 ECL sensitivity to future economic conditions1 (continued)
Gross carrying amount Reported ECL Central scenario ECL Upside scenario ECL
Downside scenario ECL
Alternative scenarios ECL
ECL of loans and advances to customers at 31 December 20192 $m $m $m $m $m $m
UK
Mortgages 130,079 123 33 28 38 50-80
Credit cards 9,359 431 421 376 506 670-930
Other 10,137 382 318 282 374 490-700
Mexico
Mortgages 3,385 32 31 24 41
Credit cards 1,295 211 211 190 231
Other 3,001 341 340 312 380
Hong Kong
Mortgages 86,448 0 0 0 0 0
Credit cards 7,795 243 201 191 201 400
Other 7,446 105 95 90 104 130
UAE
Mortgages 1,983 92 92 83 91
Credit cards 513 54 54 49 72
Other 895 28 28 26 31
France
Mortgages 21,374 60 60 59 60
Other 1,643 73 73 73 74
US
Mortgages 14,732 22 22 21 24
Credit cards 738 68 68 62 74
Canada
Mortgages 19,843 15 14 13 16
Credit cards 270 7 7 7 7
Other 2,231 17 17 16 18
1 ECL sensitivities exclude portfolios utilising less complex modelling approaches.2 ECL sensitivity includes only on-balance sheet financial instruments to which IFRS 9 impairment requirements are applied.
Risk
134 HSBC Holdings plc Annual Report and Accounts 2020

At 31 December 2020, the most significant level of ECL sensitivity was observed in the UK, Mexico and Hong Kong.
Mortgages reflected the lowest level of ECL sensitivity across most markets as collateral values remain resilient. Hong Kong mortgages had low levels of reported ECL due to the credit quality of the portfolio, and so presented sensitivity was negligible. Credit cards and other unsecured lending are more sensitive to economic forecasts, which have deteriorated in 2020 due to the Covid-19 pandemic.
Group ECL sensitivity results
The ECL impact of the scenarios and management judgemental adjustments are highly sensitive to movements in economic forecasts, including the efficacy of government support measures. Based upon the sensitivity tables presented above, if the Group ECL balance (excluding wholesale stage 3, which is assessed individually) was estimated solely on the basis of the Central scenario, Downside scenario or the additional Downside scenario at 31 December 2020, it would increase/(decrease) as presented in the below table.
Retail1 Wholesale1
Total Group ECL 2020 $bn $bn
Reported ECL 4.5 4.5
Scenarios
100% consensus Central scenario (0.3) (0.9)
100% consensus Downside scenario 0.3 1.0
100% additional Downside scenario 1.3 5.9
Retail1 Wholesale
Total Group ECL 2019 $bn $bn
Reported ECL 2.9 2.0
Scenarios
100% consensus Central scenario (0.2) (0.3)
100% consensus Downside scenario 0.1 —
100% alternative Downside scenario n/a n/a
1 On the same basis as retail and wholesale sensitivity analysis.
There still remains a significant degree of uncertainty in relation to the UK economic outlook. If a 100% weight were applied to the consensus Downside and additional Downside scenario for the UK, respectively, it would result in an increase in ECL of $0.2bn and $1.8bn in wholesale and $0.2bn and $0.5bn in retail.
Reconciliation of changes in gross carrying/nominal amount and allowances for loans and advances to banks and customers including loan commitments and financial guarantees
The following disclosure provides a reconciliation by stage of the Group’s gross carrying/nominal amount and allowances for loans and advances to banks and customers, including loan commitments and financial guarantees. Movements are calculated on a quarterly basis and therefore fully capture stage movements between quarters. If movements were calculated on a year-to-date basis they would only reflect the opening and closing position of the financial instrument.
The transfers of financial instruments represents the impact of stage transfers upon the gross carrying/nominal amount and associated allowance for ECL.
The net remeasurement of ECL arising from stage transfers represents the increase or decrease due to these transfers, for example, moving from a 12-month (stage 1) to a lifetime (stage 2) ECL measurement basis. Net remeasurement excludes the underlying customer risk rating (‘CRR’)/probability of default (‘PD’) movements of the financial instruments transferring stage. This is captured, along with other credit quality movements in the ‘changes in risk parameters – credit quality’ line item.
Changes in ‘New financial assets originated or purchased’, ‘assets derecognised (including final repayments)’ and ‘changes to risk parameters – further lending/repayment’ represent the impact from volume movements within the Group’s lending portfolio.
HSBC Holdings plc Annual Report and Accounts 2020 135
Risk review
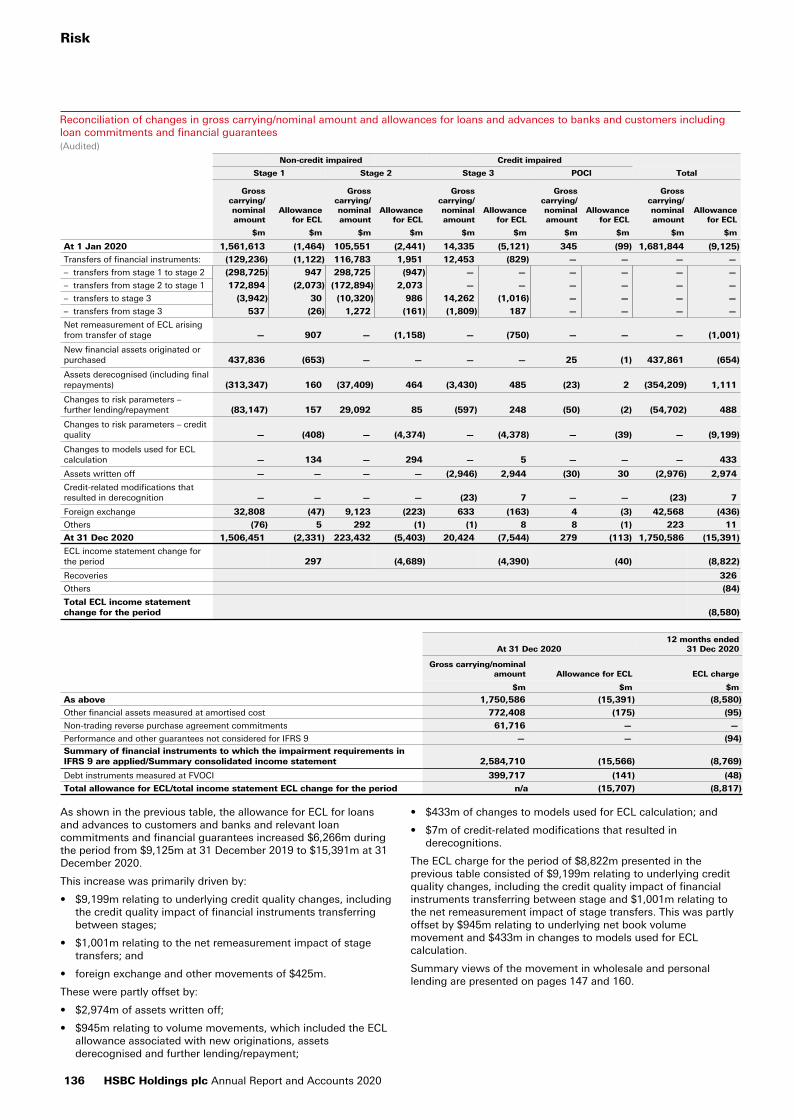
Reconciliation of changes in gross carrying/nominal amount and allowances for loans and advances to banks and customers including loan commitments and financial guarantees(Audited)
Non-credit impaired Credit impaired
Stage 1 Stage 2 Stage 3 POCI Total
Gross carrying/ nominal amount
Allowance for ECL
Gross carrying/ nominal amount
Allowance for ECL
Gross carrying/ nominal amount
Allowance for ECL
Gross carrying/ nominal amount
Allowance for ECL
Gross carrying/ nominal amount
Allowance for ECL
$m $m $m $m $m $m $m $m $m $m
At 1 Jan 2020 1,561,613 (1,464) 105,551 (2,441) 14,335 (5,121) 345 (99) 1,681,844 (9,125)
Transfers of financial instruments: (129,236) (1,122) 116,783 1,951 12,453 (829) — — — —
– transfers from stage 1 to stage 2 (298,725) 947 298,725 (947) — — — — — —
– transfers from stage 2 to stage 1 172,894 (2,073) (172,894) 2,073 — — — — — —
– transfers to stage 3 (3,942) 30 (10,320) 986 14,262 (1,016) — — — —
– transfers from stage 3 537 (26) 1,272 (161) (1,809) 187 — — — —
Net remeasurement of ECL arising from transfer of stage — 907 — (1,158) — (750) — — — (1,001)
New financial assets originated or purchased 437,836 (653) — — — — 25 (1) 437,861 (654)
Assets derecognised (including final repayments) (313,347) 160 (37,409) 464 (3,430) 485 (23) 2 (354,209) 1,111
Changes to risk parameters – further lending/repayment (83,147) 157 29,092 85 (597) 248 (50) (2) (54,702) 488
Changes to risk parameters – credit quality — (408) — (4,374) — (4,378) — (39) — (9,199)
Changes to models used for ECL calculation — 134 — 294 — 5 — — — 433
Assets written off — — — — (2,946) 2,944 (30) 30 (2,976) 2,974
Credit-related modifications that resulted in derecognition — — — — (23) 7 — — (23) 7
Foreign exchange 32,808 (47) 9,123 (223) 633 (163) 4 (3) 42,568 (436)
Others (76) 5 292 (1) (1) 8 8 (1) 223 11
At 31 Dec 2020 1,506,451 (2,331) 223,432 (5,403) 20,424 (7,544) 279 (113) 1,750,586 (15,391)
ECL income statement change for the period 297 (4,689) (4,390) (40) (8,822)
Recoveries 326
Others (84)
Total ECL income statement change for the period (8,580)
At 31 Dec 202012 months ended
31 Dec 2020
Gross carrying/nominal amount Allowance for ECL ECL charge
$m $m $m
As above 1,750,586 (15,391) (8,580)
Other financial assets measured at amortised cost 772,408 (175) (95)
Non-trading reverse purchase agreement commitments 61,716 — —
Performance and other guarantees not considered for IFRS 9 — — (94) Summary of financial instruments to which the impairment requirements in IFRS 9 are applied/Summary consolidated income statement 2,584,710 (15,566) (8,769)
Debt instruments measured at FVOCI 399,717 (141) (48)
Total allowance for ECL/total income statement ECL change for the period n/a (15,707) (8,817)
As shown in the previous table, the allowance for ECL for loans and advances to customers and banks and relevant loan commitments and financial guarantees increased $6,266m during the period from $9,125m at 31 December 2019 to $15,391m at 31 December 2020.
This increase was primarily driven by:
• $9,199m relating to underlying credit quality changes, including the credit quality impact of financial instruments transferring between stages;
• $1,001m relating to the net remeasurement impact of stage transfers; and
• foreign exchange and other movements of $425m.
These were partly offset by:
• $2,974m of assets written off;
• $945m relating to volume movements, which included the ECL allowance associated with new originations, assets derecognised and further lending/repayment;
• $433m of changes to models used for ECL calculation; and
• $7m of credit-related modifications that resulted in derecognitions.
The ECL charge for the period of $8,822m presented in the previous table consisted of $9,199m relating to underlying credit quality changes, including the credit quality impact of financial instruments transferring between stage and $1,001m relating to the net remeasurement impact of stage transfers. This was partly offset by $945m relating to underlying net book volume movement and $433m in changes to models used for ECL calculation.
Summary views of the movement in wholesale and personal lending are presented on pages 147 and 160.
Risk
136 HSBC Holdings plc Annual Report and Accounts 2020
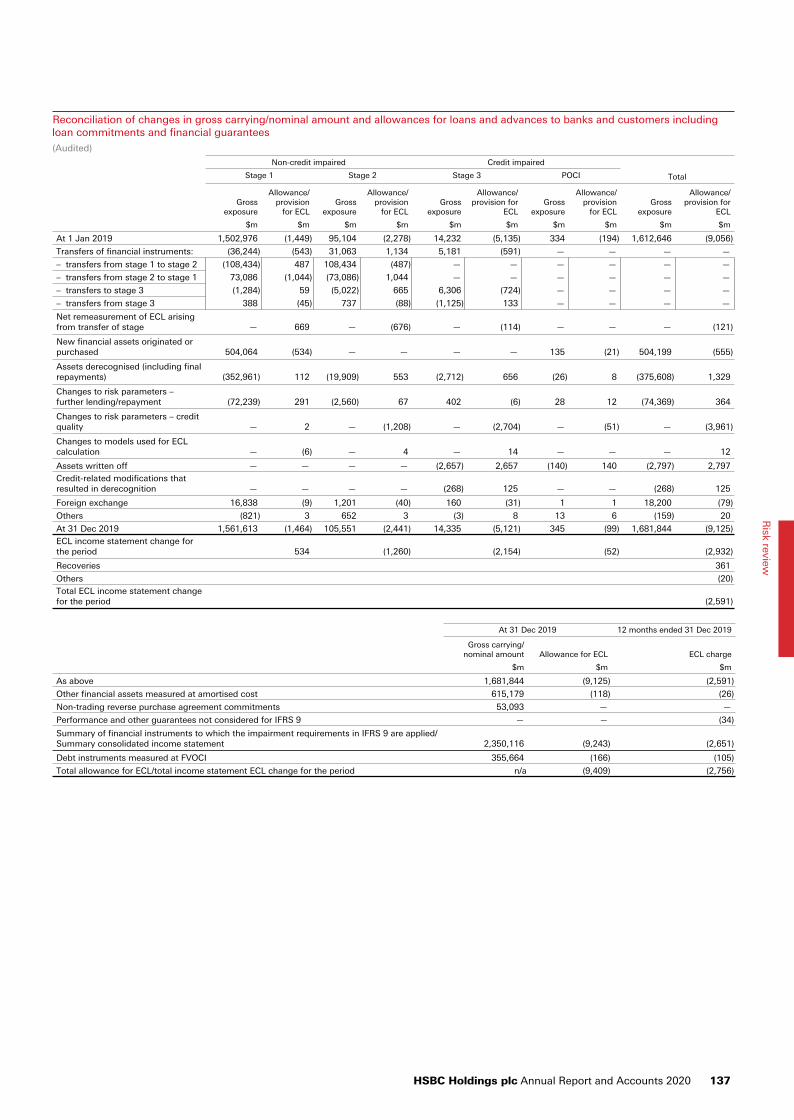
Reconciliation of changes in gross carrying/nominal amount and allowances for loans and advances to banks and customers including loan commitments and financial guarantees
(Audited)
Non-credit impaired Credit impaired
TotalStage 1 Stage 2 Stage 3 POCI
Gross exposure
Allowance/ provision
for ECLGross
exposure
Allowance/ provision
for ECLGross
exposure
Allowance/ provision for
ECLGross
exposure
Allowance/ provision
for ECLGross
exposure
Allowance/ provision for
ECL
$m $m $m $m $m $m $m $m $m $m
At 1 Jan 2019 1,502,976 (1,449) 95,104 (2,278) 14,232 (5,135) 334 (194) 1,612,646 (9,056)
Transfers of financial instruments: (36,244) (543) 31,063 1,134 5,181 (591) — — — —
– transfers from stage 1 to stage 2 (108,434) 487 108,434 (487) — — — — — —
– transfers from stage 2 to stage 1 73,086 (1,044) (73,086) 1,044 — — — — — —
– transfers to stage 3 (1,284) 59 (5,022) 665 6,306 (724) — — — —
– transfers from stage 3 388 (45) 737 (88) (1,125) 133 — — — —
Net remeasurement of ECL arising from transfer of stage — 669 — (676) — (114) — — — (121)
New financial assets originated or purchased 504,064 (534) — — — — 135 (21) 504,199 (555)
Assets derecognised (including final repayments) (352,961) 112 (19,909) 553 (2,712) 656 (26) 8 (375,608) 1,329
Changes to risk parameters – further lending/repayment (72,239) 291 (2,560) 67 402 (6) 28 12 (74,369) 364
Changes to risk parameters – credit quality — 2 — (1,208) — (2,704) — (51) — (3,961)
Changes to models used for ECL calculation — (6) — 4 — 14 — — — 12
Assets written off — — — — (2,657) 2,657 (140) 140 (2,797) 2,797 Credit-related modifications that resulted in derecognition — — — — (268) 125 — — (268) 125
Foreign exchange 16,838 (9) 1,201 (40) 160 (31) 1 1 18,200 (79)
Others (821) 3 652 3 (3) 8 13 6 (159) 20
At 31 Dec 2019 1,561,613 (1,464) 105,551 (2,441) 14,335 (5,121) 345 (99) 1,681,844 (9,125) ECL income statement change for the period 534 (1,260) (2,154) (52) (2,932)
Recoveries 361
Others (20) Total ECL income statement change for the period (2,591)
At 31 Dec 2019 12 months ended 31 Dec 2019
Gross carrying/nominal amount Allowance for ECL ECL charge
$m $m $m
As above 1,681,844 (9,125) (2,591)
Other financial assets measured at amortised cost 615,179 (118) (26)
Non-trading reverse purchase agreement commitments 53,093 — —
Performance and other guarantees not considered for IFRS 9 — — (34)
Summary of financial instruments to which the impairment requirements in IFRS 9 are applied/ Summary consolidated income statement 2,350,116 (9,243) (2,651)
Debt instruments measured at FVOCI 355,664 (166) (105)
Total allowance for ECL/total income statement ECL change for the period n/a (9,409) (2,756)
HSBC Holdings plc Annual Report and Accounts 2020 137
Risk review
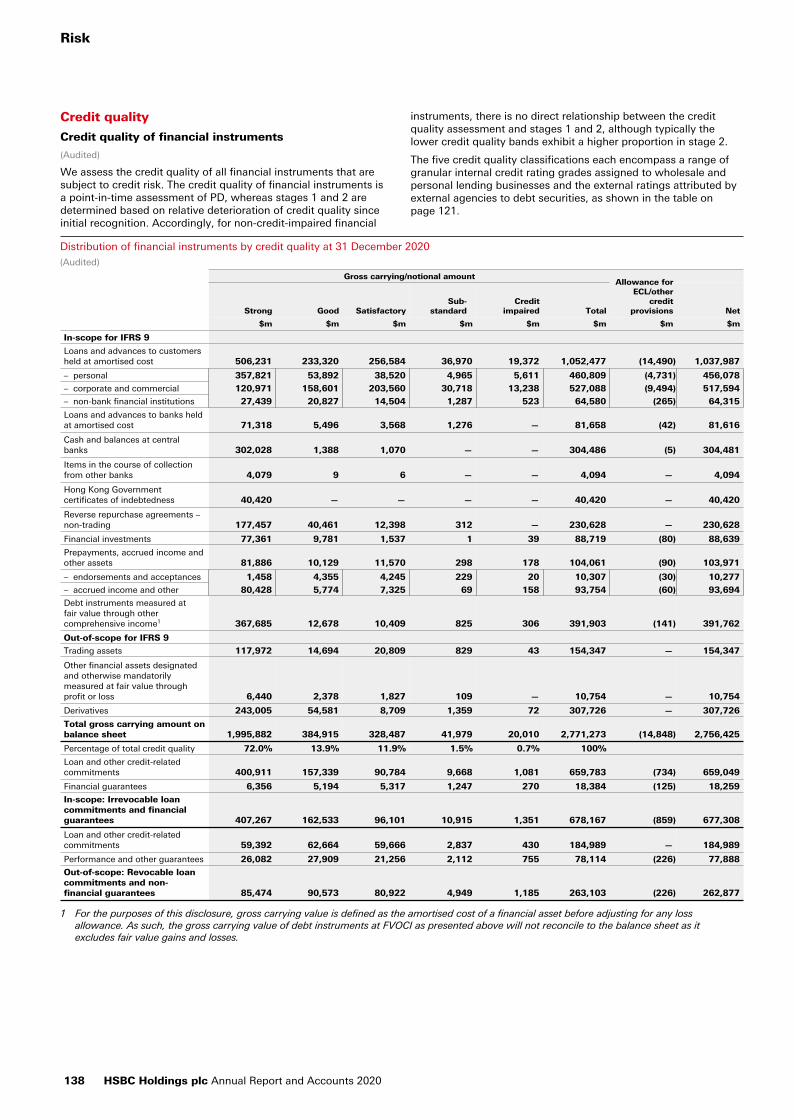
Credit quality
Credit quality of financial instruments
(Audited)
We assess the credit quality of all financial instruments that are subject to credit risk. The credit quality of financial instruments is a point-in-time assessment of PD, whereas stages 1 and 2 are determined based on relative deterioration of credit quality since initial recognition. Accordingly, for non-credit-impaired financial
instruments, there is no direct relationship between the credit quality assessment and stages 1 and 2, although typically the lower credit quality bands exhibit a higher proportion in stage 2.
The five credit quality classifications each encompass a range of granular internal credit rating grades assigned to wholesale and personal lending businesses and the external ratings attributed by external agencies to debt securities, as shown in the table on page 121.
Distribution of financial instruments by credit quality at 31 December 2020(Audited)
Gross carrying/notional amountAllowance for
ECL/other credit
provisions NetStrong Good SatisfactorySub-
standardCredit
impaired Total
$m $m $m $m $m $m $m $m
In-scope for IFRS 9
Loans and advances to customers held at amortised cost 506,231 233,320 256,584 36,970 19,372 1,052,477 (14,490) 1,037,987
– personal 357,821 53,892 38,520 4,965 5,611 460,809 (4,731) 456,078
– corporate and commercial 120,971 158,601 203,560 30,718 13,238 527,088 (9,494) 517,594
– non-bank financial institutions 27,439 20,827 14,504 1,287 523 64,580 (265) 64,315
Loans and advances to banks held at amortised cost 71,318 5,496 3,568 1,276 — 81,658 (42) 81,616
Cash and balances at central banks 302,028 1,388 1,070 — — 304,486 (5) 304,481
Items in the course of collection from other banks 4,079 9 6 — — 4,094 — 4,094
Hong Kong Government certificates of indebtedness 40,420 — — — — 40,420 — 40,420
Reverse repurchase agreements – non-trading 177,457 40,461 12,398 312 — 230,628 — 230,628
Financial investments 77,361 9,781 1,537 1 39 88,719 (80) 88,639
Prepayments, accrued income and other assets 81,886 10,129 11,570 298 178 104,061 (90) 103,971
– endorsements and acceptances 1,458 4,355 4,245 229 20 10,307 (30) 10,277
– accrued income and other 80,428 5,774 7,325 69 158 93,754 (60) 93,694
Debt instruments measured at fair value through other comprehensive income1 367,685 12,678 10,409 825 306 391,903 (141) 391,762
Out-of-scope for IFRS 9
Trading assets 117,972 14,694 20,809 829 43 154,347 — 154,347
Other financial assets designated and otherwise mandatorily measured at fair value through profit or loss 6,440 2,378 1,827 109 — 10,754 — 10,754
Derivatives 243,005 54,581 8,709 1,359 72 307,726 — 307,726
Total gross carrying amount on balance sheet 1,995,882 384,915 328,487 41,979 20,010 2,771,273 (14,848) 2,756,425
Percentage of total credit quality 72.0% 13.9% 11.9% 1.5% 0.7% 100%
Loan and other credit-related commitments 400,911 157,339 90,784 9,668 1,081 659,783 (734) 659,049
Financial guarantees 6,356 5,194 5,317 1,247 270 18,384 (125) 18,259
In-scope: Irrevocable loan commitments and financial guarantees 407,267 162,533 96,101 10,915 1,351 678,167 (859) 677,308
Loan and other credit-related commitments 59,392 62,664 59,666 2,837 430 184,989 — 184,989
Performance and other guarantees 26,082 27,909 21,256 2,112 755 78,114 (226) 77,888
Out-of-scope: Revocable loan commitments and non-financial guarantees 85,474 90,573 80,922 4,949 1,185 263,103 (226) 262,877
1 For the purposes of this disclosure, gross carrying value is defined as the amortised cost of a financial asset before adjusting for any loss allowance. As such, the gross carrying value of debt instruments at FVOCI as presented above will not reconcile to the balance sheet as it excludes fair value gains and losses.
Risk
138 HSBC Holdings plc Annual Report and Accounts 2020

Distribution of financial instruments by credit quality at 31 December 2019 (continued)(Audited)
Gross carrying/notional amountAllowance for
ECL/other credit
provisions NetStrong Good SatisfactorySub-
standard Credit impaired Total
$m $m $m $m $m $m $m $m
In-scope for IFRS 9
Loans and advances to customers held at amortised cost 524,889 258,402 228,485 20,007 13,692 1,045,475 (8,732) 1,036,743
– personal 354,461 45,037 27,636 2,286 4,851 434,271 (3,134) 431,137
– corporate and commercial 138,126 190,470 186,383 16,891 8,629 540,499 (5,438) 535,061
– non-bank financial institutions 32,302 22,895 14,466 830 212 70,705 (160) 70,545
Loans and advances to banks held at amortised cost 60,636 5,329 1,859 1,395 — 69,219 (16) 69,203
Cash and balances at central banks 151,788 1,398 915 — — 154,101 (2) 154,099
Items in the course of collection from other banks 4,935 18 3 — — 4,956 — 4,956
Hong Kong Government certificates of indebtedness 38,380 — — — — 38,380 — 38,380
Reverse repurchase agreements – non-trading 193,157 37,947 9,621 137 — 240,862 — 240,862
Financial investments 78,318 6,503 906 61 — 85,788 (53) 85,735
Prepayments, accrued income and other assets 70,675 8,638 11,321 306 152 91,092 (63) 91,029
– endorsements and acceptances 1,133 4,651 4,196 230 4 10,214 (16) 10,198
– accrued income and other 69,542 3,987 7,125 76 148 80,878 (47) 80,831
Debt instruments measured at fair value through other comprehensive income1 333,158 10,966 7,222 544 1 351,891 (166) 351,725
Out-of-scope for IFRS 9
Trading assets 135,059 15,240 22,964 2,181 — 175,444 — 175,444
Other financial assets designated and otherwise mandatorily measured at fair value through profit or loss 4,655 1,391 5,584 139 — 11,769 — 11,769
Derivatives 187,636 42,642 11,894 821 2 242,995 — 242,995
Total gross carrying amount on balance sheet 1,783,286 388,474 300,774 25,591 13,847 2,511,972 (9,032) 2,502,940
Percentage of total credit quality 70.9% 15.5% 12.0% 1.0% 0.6% 100%
Loan and other credit-related commitments 369,424 146,988 77,499 5,338 780 600,029 (329) 599,700
Financial guarantees 7,441 6,033 5,539 1,011 190 20,214 (48) 20,166
In-scope: Irrevocable loan commitments and financial guarantees 376,865 153,021 83,038 6,349 970 620,243 (377) 619,866
Loan and other credit-related commitments 66,148 69,890 58,754 2,605 182 197,579 — 197,579
Performance and other guarantees 30,099 23,335 20,062 2,057 380 75,933 (132) 75,801
Out-of-scope: Revocable loan commitments and non-financial guarantees 96,247 93,225 78,816 4,662 562 273,512 (132) 273,380
1 For the purposes of this disclosure, gross carrying value is defined as the amortised cost of a financial asset before adjusting for any loss allowance. As such, the gross carrying value of debt instruments at FVOCI as presented above will not reconcile to the balance sheet as it excludes fair value gains and losses.
HSBC Holdings plc Annual Report and Accounts 2020 139
Risk review
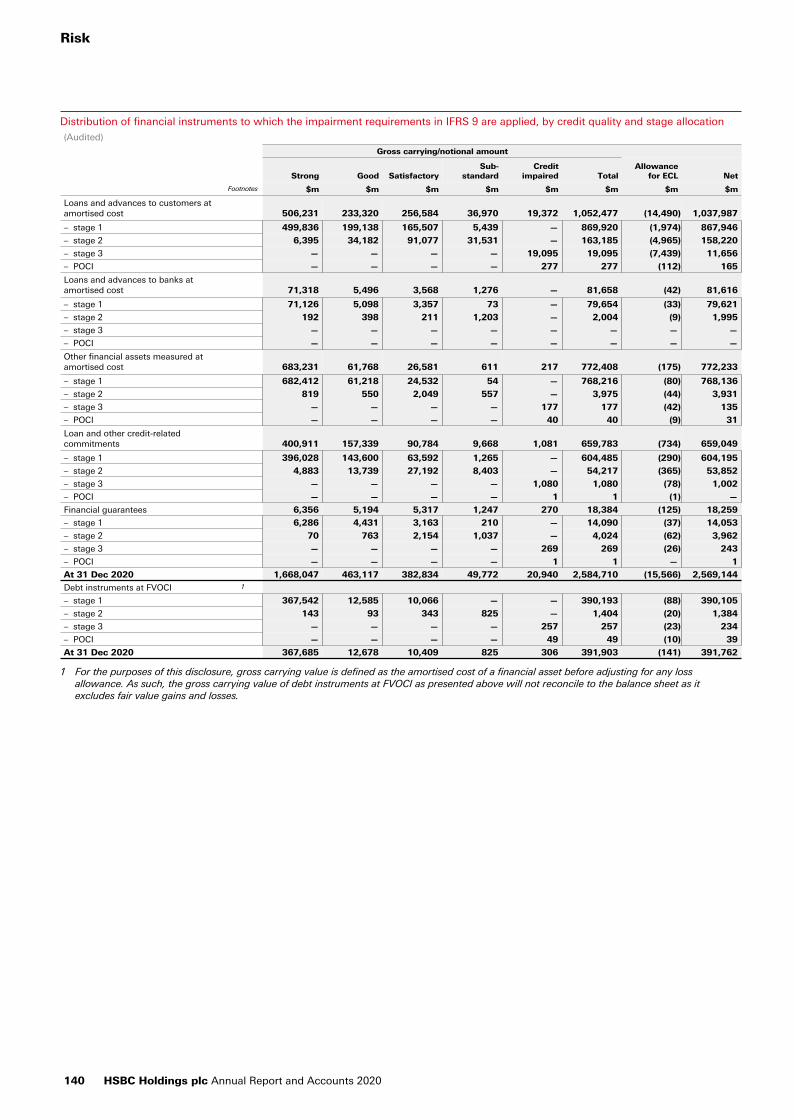
Distribution of financial instruments to which the impairment requirements in IFRS 9 are applied, by credit quality and stage allocation(Audited)
Gross carrying/notional amount
Allowance for ECL NetStrong Good Satisfactory
Sub-standard
Credit impaired Total
Footnotes $m $m $m $m $m $m $m $m
Loans and advances to customers at amortised cost 506,231 233,320 256,584 36,970 19,372 1,052,477 (14,490) 1,037,987
– stage 1 499,836 199,138 165,507 5,439 — 869,920 (1,974) 867,946
– stage 2 6,395 34,182 91,077 31,531 — 163,185 (4,965) 158,220
– stage 3 — — — — 19,095 19,095 (7,439) 11,656
– POCI — — — — 277 277 (112) 165
Loans and advances to banks at amortised cost 71,318 5,496 3,568 1,276 — 81,658 (42) 81,616
– stage 1 71,126 5,098 3,357 73 — 79,654 (33) 79,621
– stage 2 192 398 211 1,203 — 2,004 (9) 1,995
– stage 3 — — — — — — — —
– POCI — — — — — — — —
Other financial assets measured at amortised cost 683,231 61,768 26,581 611 217 772,408 (175) 772,233
– stage 1 682,412 61,218 24,532 54 — 768,216 (80) 768,136
– stage 2 819 550 2,049 557 — 3,975 (44) 3,931
– stage 3 — — — — 177 177 (42) 135
– POCI — — — — 40 40 (9) 31
Loan and other credit-related commitments 400,911 157,339 90,784 9,668 1,081 659,783 (734) 659,049
– stage 1 396,028 143,600 63,592 1,265 — 604,485 (290) 604,195
– stage 2 4,883 13,739 27,192 8,403 — 54,217 (365) 53,852
– stage 3 — — — — 1,080 1,080 (78) 1,002
– POCI — — — — 1 1 (1) —
Financial guarantees 6,356 5,194 5,317 1,247 270 18,384 (125) 18,259
– stage 1 6,286 4,431 3,163 210 — 14,090 (37) 14,053
– stage 2 70 763 2,154 1,037 — 4,024 (62) 3,962
– stage 3 — — — — 269 269 (26) 243
– POCI — — — — 1 1 — 1
At 31 Dec 2020 1,668,047 463,117 382,834 49,772 20,940 2,584,710 (15,566) 2,569,144
Debt instruments at FVOCI 1
– stage 1 367,542 12,585 10,066 — — 390,193 (88) 390,105
– stage 2 143 93 343 825 — 1,404 (20) 1,384
– stage 3 — — — — 257 257 (23) 234
– POCI — — — — 49 49 (10) 39
At 31 Dec 2020 367,685 12,678 10,409 825 306 391,903 (141) 391,762
1 For the purposes of this disclosure, gross carrying value is defined as the amortised cost of a financial asset before adjusting for any loss allowance. As such, the gross carrying value of debt instruments at FVOCI as presented above will not reconcile to the balance sheet as it excludes fair value gains and losses.
Risk
140 HSBC Holdings plc Annual Report and Accounts 2020
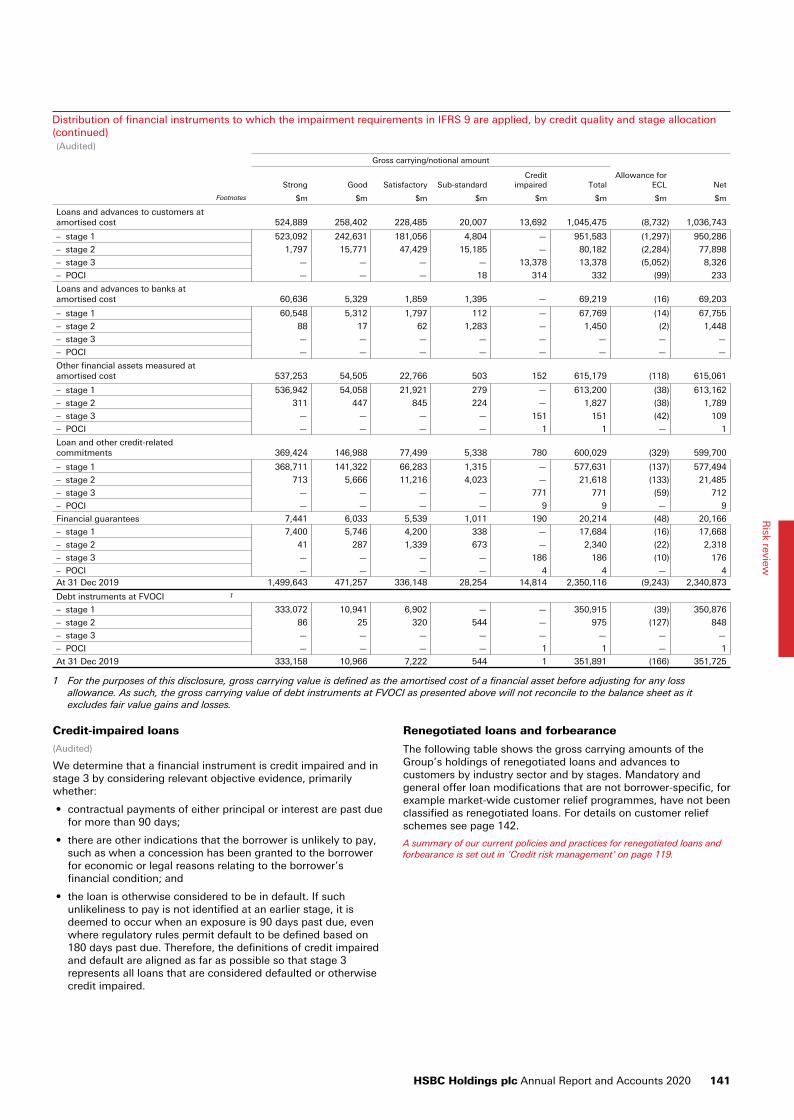
Distribution of financial instruments to which the impairment requirements in IFRS 9 are applied, by credit quality and stage allocation (continued)(Audited)
Gross carrying/notional amount
Strong Good Satisfactory Sub-standardCredit
impaired Total Allowance for
ECL Net
Footnotes $m $m $m $m $m $m $m $m
Loans and advances to customers at amortised cost 524,889 258,402 228,485 20,007 13,692 1,045,475 (8,732) 1,036,743
– stage 1 523,092 242,631 181,056 4,804 — 951,583 (1,297) 950,286
– stage 2 1,797 15,771 47,429 15,185 — 80,182 (2,284) 77,898
– stage 3 — — — — 13,378 13,378 (5,052) 8,326
– POCI — — — 18 314 332 (99) 233
Loans and advances to banks at amortised cost 60,636 5,329 1,859 1,395 — 69,219 (16) 69,203
– stage 1 60,548 5,312 1,797 112 — 67,769 (14) 67,755
– stage 2 88 17 62 1,283 — 1,450 (2) 1,448
– stage 3 — — — — — — — —
– POCI — — — — — — — —
Other financial assets measured at amortised cost 537,253 54,505 22,766 503 152 615,179 (118) 615,061
– stage 1 536,942 54,058 21,921 279 — 613,200 (38) 613,162
– stage 2 311 447 845 224 — 1,827 (38) 1,789
– stage 3 — — — — 151 151 (42) 109
– POCI — — — — 1 1 — 1
Loan and other credit-related commitments 369,424 146,988 77,499 5,338 780 600,029 (329) 599,700
– stage 1 368,711 141,322 66,283 1,315 — 577,631 (137) 577,494
– stage 2 713 5,666 11,216 4,023 — 21,618 (133) 21,485
– stage 3 — — — — 771 771 (59) 712
– POCI — — — — 9 9 — 9
Financial guarantees 7,441 6,033 5,539 1,011 190 20,214 (48) 20,166
– stage 1 7,400 5,746 4,200 338 — 17,684 (16) 17,668
– stage 2 41 287 1,339 673 — 2,340 (22) 2,318
– stage 3 — — — — 186 186 (10) 176
– POCI — — — — 4 4 — 4 At 31 Dec 2019 1,499,643 471,257 336,148 28,254 14,814 2,350,116 (9,243) 2,340,873
Debt instruments at FVOCI 1
– stage 1 333,072 10,941 6,902 — — 350,915 (39) 350,876
– stage 2 86 25 320 544 — 975 (127) 848
– stage 3 — — — — — — — —
– POCI — — — — 1 1 — 1
At 31 Dec 2019 333,158 10,966 7,222 544 1 351,891 (166) 351,725
1 For the purposes of this disclosure, gross carrying value is defined as the amortised cost of a financial asset before adjusting for any loss allowance. As such, the gross carrying value of debt instruments at FVOCI as presented above will not reconcile to the balance sheet as it excludes fair value gains and losses.
Credit-impaired loans
(Audited)
We determine that a financial instrument is credit impaired and in stage 3 by considering relevant objective evidence, primarily whether:
• contractual payments of either principal or interest are past due for more than 90 days;
• there are other indications that the borrower is unlikely to pay, such as when a concession has been granted to the borrower for economic or legal reasons relating to the borrower’s financial condition; and
• the loan is otherwise considered to be in default. If such unlikeliness to pay is not identified at an earlier stage, it is deemed to occur when an exposure is 90 days past due, even where regulatory rules permit default to be defined based on 180 days past due. Therefore, the definitions of credit impaired and default are aligned as far as possible so that stage 3 represents all loans that are considered defaulted or otherwise credit impaired.
Renegotiated loans and forbearance
The following table shows the gross carrying amounts of the Group’s holdings of renegotiated loans and advances to customers by industry sector and by stages. Mandatory and general offer loan modifications that are not borrower-specific, for example market-wide customer relief programmes, have not been classified as renegotiated loans. For details on customer relief schemes see page 142.
A summary of our current policies and practices for renegotiated loans and forbearance is set out in ‘Credit risk management’ on page 119.
HSBC Holdings plc Annual Report and Accounts 2020 141
Risk review
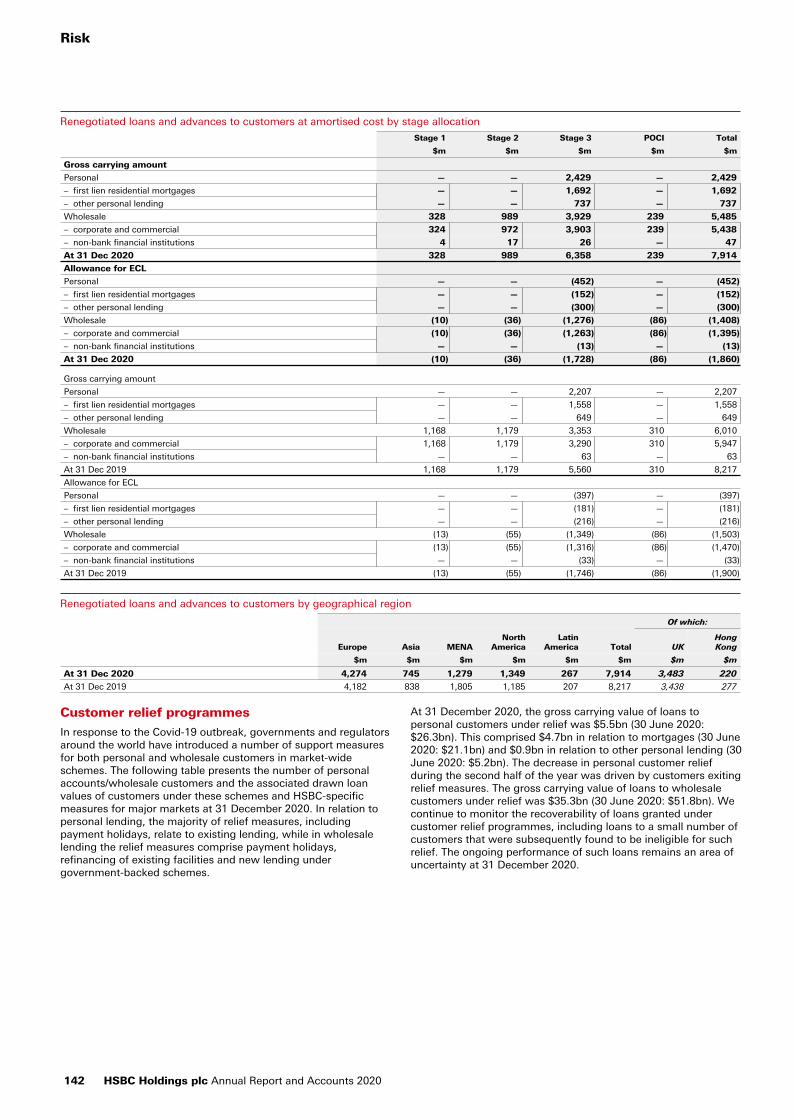
Renegotiated loans and advances to customers at amortised cost by stage allocation
Stage 1 Stage 2 Stage 3 POCI Total
$m $m $m $m $m
Gross carrying amount
Personal — — 2,429 — 2,429
– first lien residential mortgages — — 1,692 — 1,692
– other personal lending — — 737 — 737
Wholesale 328 989 3,929 239 5,485
– corporate and commercial 324 972 3,903 239 5,438
– non-bank financial institutions 4 17 26 — 47
At 31 Dec 2020 328 989 6,358 239 7,914
Allowance for ECL
Personal — — (452) — (452)
– first lien residential mortgages — — (152) — (152)
– other personal lending — — (300) — (300)
Wholesale (10) (36) (1,276) (86) (1,408)
– corporate and commercial (10) (36) (1,263) (86) (1,395)
– non-bank financial institutions — — (13) — (13)
At 31 Dec 2020 (10) (36) (1,728) (86) (1,860)
Gross carrying amount
Personal — — 2,207 — 2,207
– first lien residential mortgages — — 1,558 — 1,558
– other personal lending — — 649 — 649
Wholesale 1,168 1,179 3,353 310 6,010
– corporate and commercial 1,168 1,179 3,290 310 5,947
– non-bank financial institutions — — 63 — 63
At 31 Dec 2019 1,168 1,179 5,560 310 8,217
Allowance for ECL
Personal — — (397) — (397)
– first lien residential mortgages — — (181) — (181)
– other personal lending — — (216) — (216)
Wholesale (13) (55) (1,349) (86) (1,503)
– corporate and commercial (13) (55) (1,316) (86) (1,470)
– non-bank financial institutions — — (33) — (33)
At 31 Dec 2019 (13) (55) (1,746) (86) (1,900)
Renegotiated loans and advances to customers by geographical region
Of which:
Europe Asia MENANorth
AmericaLatin
America Total UKHong Kong
$m $m $m $m $m $m $m $m
At 31 Dec 2020 4,274 745 1,279 1,349 267 7,914 3,483 220
At 31 Dec 2019 4,182 838 1,805 1,185 207 8,217 3,438 277
Customer relief programmes
In response to the Covid-19 outbreak, governments and regulators around the world have introduced a number of support measures for both personal and wholesale customers in market-wide schemes. The following table presents the number of personal accounts/wholesale customers and the associated drawn loan values of customers under these schemes and HSBC-specific measures for major markets at 31 December 2020. In relation to personal lending, the majority of relief measures, including payment holidays, relate to existing lending, while in wholesale lending the relief measures comprise payment holidays, refinancing of existing facilities and new lending under government-backed schemes.
At 31 December 2020, the gross carrying value of loans to personal customers under relief was $5.5bn (30 June 2020: $26.3bn). This comprised $4.7bn in relation to mortgages (30 June 2020: $21.1bn) and $0.9bn in relation to other personal lending (30 June 2020: $5.2bn). The decrease in personal customer relief during the second half of the year was driven by customers exiting relief measures. The gross carrying value of loans to wholesale customers under relief was $35.3bn (30 June 2020: $51.8bn). We continue to monitor the recoverability of loans granted under customer relief programmes, including loans to a small number of customers that were subsequently found to be ineligible for such relief. The ongoing performance of such loans remains an area of uncertainty at 31 December 2020.
Risk
142 HSBC Holdings plc Annual Report and Accounts 2020
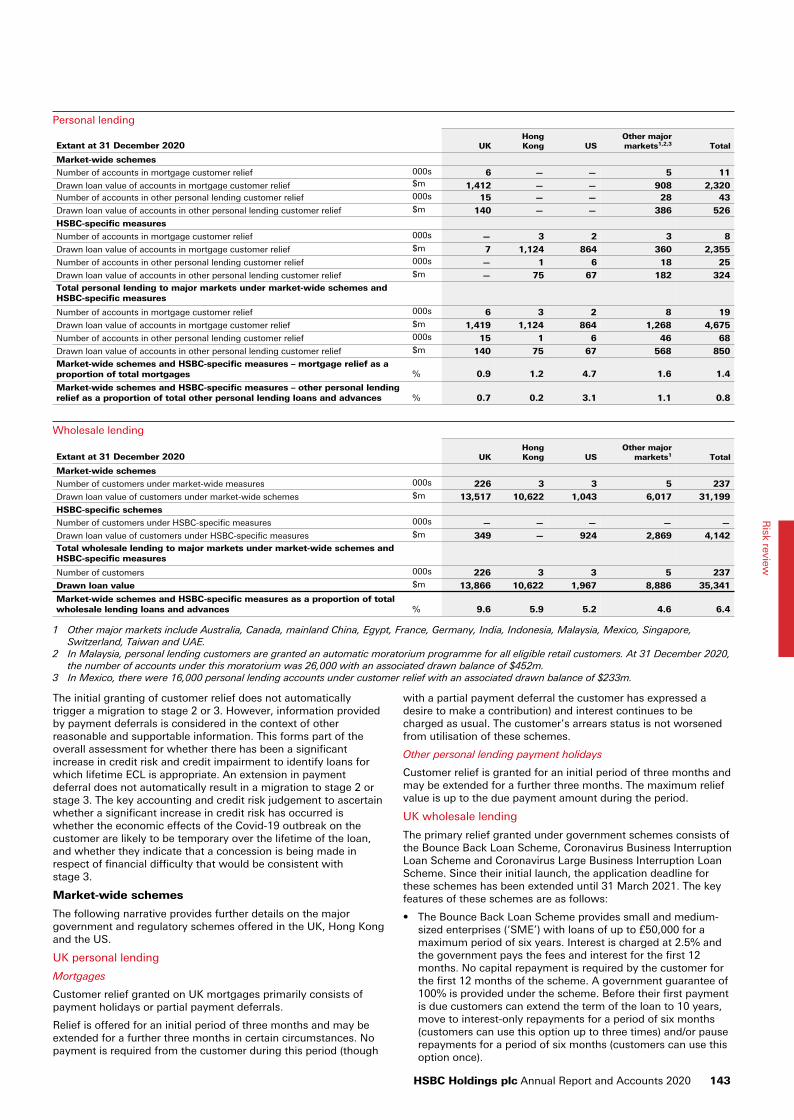
Personal lending
Extant at 31 December 2020 UKHongKong US
Other major markets1,2,3 Total
Market-wide schemes
Number of accounts in mortgage customer relief 000s 6 — — 5 11
Drawn loan value of accounts in mortgage customer relief $m 1,412 — — 908 2,320 Number of accounts in other personal lending customer relief 000s 15 — — 28 43
Drawn loan value of accounts in other personal lending customer relief $m 140 — — 386 526
HSBC-specific measures
Number of accounts in mortgage customer relief 000s — 3 2 3 8
Drawn loan value of accounts in mortgage customer relief $m 7 1,124 864 360 2,355
Number of accounts in other personal lending customer relief 000s — 1 6 18 25
Drawn loan value of accounts in other personal lending customer relief $m — 75 67 182 324 Total personal lending to major markets under market-wide schemes and HSBC-specific measures
Number of accounts in mortgage customer relief 000s 6 3 2 8 19
Drawn loan value of accounts in mortgage customer relief $m 1,419 1,124 864 1,268 4,675
Number of accounts in other personal lending customer relief 000s 15 1 6 46 68
Drawn loan value of accounts in other personal lending customer relief $m 140 75 67 568 850 Market-wide schemes and HSBC-specific measures – mortgage relief as a proportion of total mortgages % 0.9 1.2 4.7 1.6 1.4
Market-wide schemes and HSBC-specific measures – other personal lending relief as a proportion of total other personal lending loans and advances % 0.7 0.2 3.1 1.1 0.8
Wholesale lending
Extant at 31 December 2020 UKHongKong US
Other major markets1 Total
Market-wide schemes
Number of customers under market-wide measures 000s 226 3 3 5 237
Drawn loan value of customers under market-wide schemes $m 13,517 10,622 1,043 6,017 31,199
HSBC-specific schemes
Number of customers under HSBC-specific measures 000s — — — — —
Drawn loan value of customers under HSBC-specific measures $m 349 — 924 2,869 4,142 Total wholesale lending to major markets under market-wide schemes and HSBC-specific measures
Number of customers 000s 226 3 3 5 237
Drawn loan value $m 13,866 10,622 1,967 8,886 35,341
Market-wide schemes and HSBC-specific measures as a proportion of total wholesale lending loans and advances % 9.6 5.9 5.2 4.6 6.4
1 Other major markets include Australia, Canada, mainland China, Egypt, France, Germany, India, Indonesia, Malaysia, Mexico, Singapore, Switzerland, Taiwan and UAE.
2 In Malaysia, personal lending customers are granted an automatic moratorium programme for all eligible retail customers. At 31 December 2020, the number of accounts under this moratorium was 26,000 with an associated drawn balance of $452m.
3 In Mexico, there were 16,000 personal lending accounts under customer relief with an associated drawn balance of $233m.
The initial granting of customer relief does not automatically trigger a migration to stage 2 or 3. However, information provided by payment deferrals is considered in the context of other reasonable and supportable information. This forms part of the overall assessment for whether there has been a significant increase in credit risk and credit impairment to identify loans for which lifetime ECL is appropriate. An extension in payment deferral does not automatically result in a migration to stage 2 or stage 3. The key accounting and credit risk judgement to ascertain whether a significant increase in credit risk has occurred is whether the economic effects of the Covid-19 outbreak on the customer are likely to be temporary over the lifetime of the loan, and whether they indicate that a concession is being made in respect of financial difficulty that would be consistent with stage 3.
Market-wide schemes
The following narrative provides further details on the major government and regulatory schemes offered in the UK, Hong Kong and the US.
UK personal lending
Mortgages
Customer relief granted on UK mortgages primarily consists of payment holidays or partial payment deferrals.
Relief is offered for an initial period of three months and may be extended for a further three months in certain circumstances. No payment is required from the customer during this period (though
with a partial payment deferral the customer has expressed a desire to make a contribution) and interest continues to be charged as usual. The customer’s arrears status is not worsened from utilisation of these schemes.
Other personal lending payment holidays
Customer relief is granted for an initial period of three months and may be extended for a further three months. The maximum relief value is up to the due payment amount during the period.
UK wholesale lending
The primary relief granted under government schemes consists of the Bounce Back Loan Scheme, Coronavirus Business Interruption Loan Scheme and Coronavirus Large Business Interruption Loan Scheme. Since their initial launch, the application deadline for these schemes has been extended until 31 March 2021. The key features of these schemes are as follows:
• The Bounce Back Loan Scheme provides small and medium-sized enterprises (‘SME’) with loans of up to £50,000 for a maximum period of six years. Interest is charged at 2.5% and the government pays the fees and interest for the first 12 months. No capital repayment is required by the customer for the first 12 months of the scheme. A government guarantee of 100% is provided under the scheme. Before their first payment is due customers can extend the term of the loan to 10 years, move to interest-only repayments for a period of six months (customers can use this option up to three times) and/or pause repayments for a period of six months (customers can use this option once).
HSBC Holdings plc Annual Report and Accounts 2020 143
Risk review
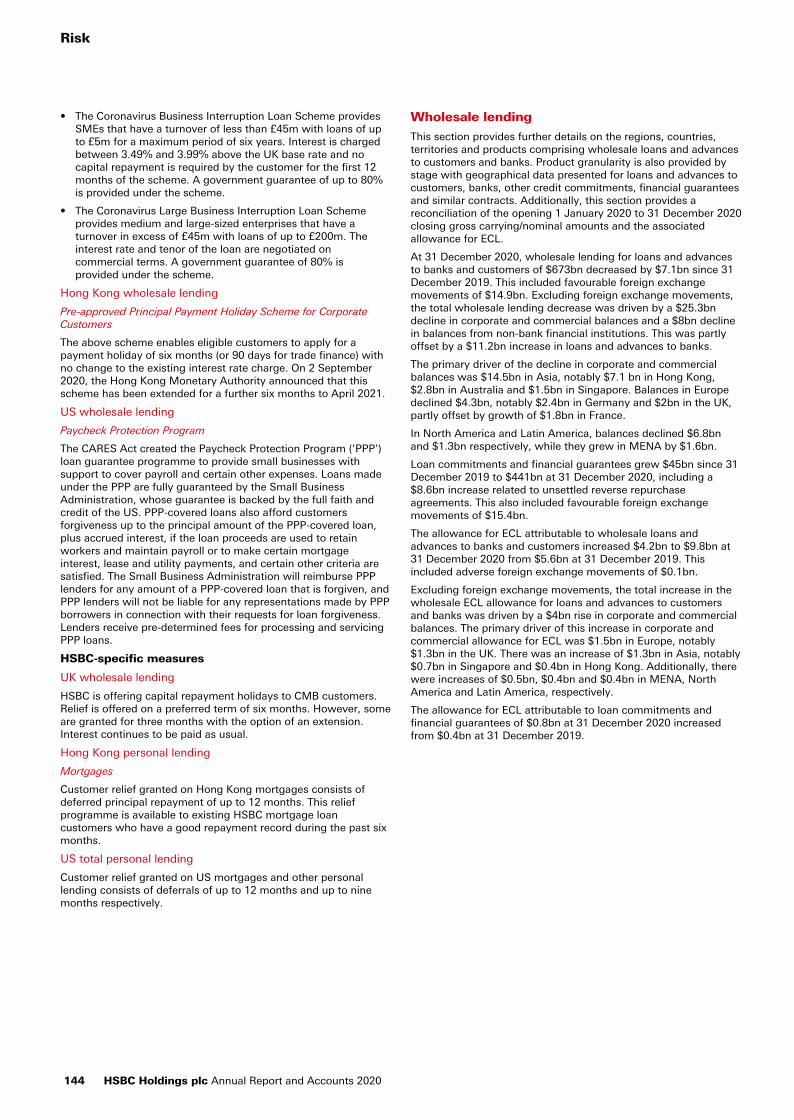
• The Coronavirus Business Interruption Loan Scheme provides SMEs that have a turnover of less than £45m with loans of up to £5m for a maximum period of six years. Interest is charged between 3.49% and 3.99% above the UK base rate and no capital repayment is required by the customer for the first 12 months of the scheme. A government guarantee of up to 80% is provided under the scheme.
• The Coronavirus Large Business Interruption Loan Scheme provides medium and large-sized enterprises that have a turnover in excess of £45m with loans of up to £200m. The interest rate and tenor of the loan are negotiated on commercial terms. A government guarantee of 80% is provided under the scheme.
Hong Kong wholesale lending
Pre-approved Principal Payment Holiday Scheme for Corporate Customers
The above scheme enables eligible customers to apply for a payment holiday of six months (or 90 days for trade finance) with no change to the existing interest rate charge. On 2 September 2020, the Hong Kong Monetary Authority announced that this scheme has been extended for a further six months to April 2021.
US wholesale lending
Paycheck Protection Program
The CARES Act created the Paycheck Protection Program (‘PPP’) loan guarantee programme to provide small businesses with support to cover payroll and certain other expenses. Loans made under the PPP are fully guaranteed by the Small Business Administration, whose guarantee is backed by the full faith and credit of the US. PPP-covered loans also afford customers forgiveness up to the principal amount of the PPP-covered loan, plus accrued interest, if the loan proceeds are used to retain workers and maintain payroll or to make certain mortgage interest, lease and utility payments, and certain other criteria are satisfied. The Small Business Administration will reimburse PPP lenders for any amount of a PPP-covered loan that is forgiven, and PPP lenders will not be liable for any representations made by PPP borrowers in connection with their requests for loan forgiveness. Lenders receive pre-determined fees for processing and servicing PPP loans.
HSBC-specific measures
UK wholesale lending
HSBC is offering capital repayment holidays to CMB customers. Relief is offered on a preferred term of six months. However, some are granted for three months with the option of an extension. Interest continues to be paid as usual.
Hong Kong personal lending
Mortgages
Customer relief granted on Hong Kong mortgages consists of deferred principal repayment of up to 12 months. This relief programme is available to existing HSBC mortgage loan customers who have a good repayment record during the past six months.
US total personal lending
Customer relief granted on US mortgages and other personal lending consists of deferrals of up to 12 months and up to nine months respectively.
Wholesale lending
This section provides further details on the regions, countries, territories and products comprising wholesale loans and advances to customers and banks. Product granularity is also provided by stage with geographical data presented for loans and advances to customers, banks, other credit commitments, financial guarantees and similar contracts. Additionally, this section provides a reconciliation of the opening 1 January 2020 to 31 December 2020 closing gross carrying/nominal amounts and the associated allowance for ECL.
At 31 December 2020, wholesale lending for loans and advances to banks and customers of $673bn decreased by $7.1bn since 31 December 2019. This included favourable foreign exchange movements of $14.9bn. Excluding foreign exchange movements, the total wholesale lending decrease was driven by a $25.3bn decline in corporate and commercial balances and a $8bn decline in balances from non-bank financial institutions. This was partly offset by a $11.2bn increase in loans and advances to banks.
The primary driver of the decline in corporate and commercial balances was $14.5bn in Asia, notably $7.1 bn in Hong Kong, $2.8bn in Australia and $1.5bn in Singapore. Balances in Europe declined $4.3bn, notably $2.4bn in Germany and $2bn in the UK, partly offset by growth of $1.8bn in France.
In North America and Latin America, balances declined $6.8bn and $1.3bn respectively, while they grew in MENA by $1.6bn.
Loan commitments and financial guarantees grew $45bn since 31 December 2019 to $441bn at 31 December 2020, including a $8.6bn increase related to unsettled reverse repurchase agreements. This also included favourable foreign exchange movements of $15.4bn.
The allowance for ECL attributable to wholesale loans and advances to banks and customers increased $4.2bn to $9.8bn at 31 December 2020 from $5.6bn at 31 December 2019. This included adverse foreign exchange movements of $0.1bn.
Excluding foreign exchange movements, the total increase in the wholesale ECL allowance for loans and advances to customers and banks was driven by a $4bn rise in corporate and commercial balances. The primary driver of this increase in corporate and commercial allowance for ECL was $1.5bn in Europe, notably $1.3bn in the UK. There was an increase of $1.3bn in Asia, notably $0.7bn in Singapore and $0.4bn in Hong Kong. Additionally, there were increases of $0.5bn, $0.4bn and $0.4bn in MENA, North America and Latin America, respectively.
The allowance for ECL attributable to loan commitments and financial guarantees of $0.8bn at 31 December 2020 increased from $0.4bn at 31 December 2019.
Risk
144 HSBC Holdings plc Annual Report and Accounts 2020
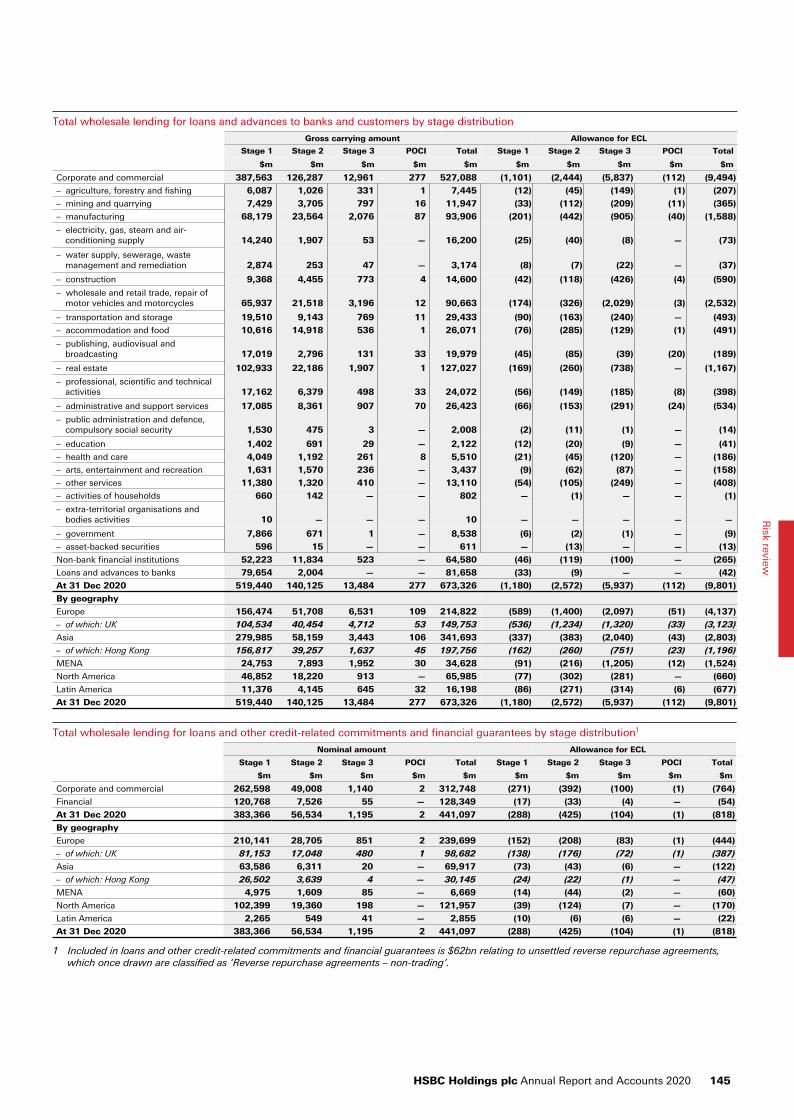
Total wholesale lending for loans and advances to banks and customers by stage distribution
Gross carrying amount Allowance for ECL
Stage 1 Stage 2 Stage 3 POCI Total Stage 1 Stage 2 Stage 3 POCI Total
$m $m $m $m $m $m $m $m $m $m
Corporate and commercial 387,563 126,287 12,961 277 527,088 (1,101) (2,444) (5,837) (112) (9,494)
– agriculture, forestry and fishing 6,087 1,026 331 1 7,445 (12) (45) (149) (1) (207)
– mining and quarrying 7,429 3,705 797 16 11,947 (33) (112) (209) (11) (365)
– manufacturing 68,179 23,564 2,076 87 93,906 (201) (442) (905) (40) (1,588)
– electricity, gas, steam and air-conditioning supply 14,240 1,907 53 — 16,200 (25) (40) (8) — (73)
– water supply, sewerage, waste management and remediation 2,874 253 47 — 3,174 (8) (7) (22) — (37)
– construction 9,368 4,455 773 4 14,600 (42) (118) (426) (4) (590)
– wholesale and retail trade, repair of motor vehicles and motorcycles 65,937 21,518 3,196 12 90,663 (174) (326) (2,029) (3) (2,532)
– transportation and storage 19,510 9,143 769 11 29,433 (90) (163) (240) — (493)
– accommodation and food 10,616 14,918 536 1 26,071 (76) (285) (129) (1) (491)
– publishing, audiovisual and broadcasting 17,019 2,796 131 33 19,979 (45) (85) (39) (20) (189)
– real estate 102,933 22,186 1,907 1 127,027 (169) (260) (738) — (1,167)
– professional, scientific and technical activities 17,162 6,379 498 33 24,072 (56) (149) (185) (8) (398)
– administrative and support services 17,085 8,361 907 70 26,423 (66) (153) (291) (24) (534)
– public administration and defence, compulsory social security 1,530 475 3 — 2,008 (2) (11) (1) — (14)
– education 1,402 691 29 — 2,122 (12) (20) (9) — (41)
– health and care 4,049 1,192 261 8 5,510 (21) (45) (120) — (186)
– arts, entertainment and recreation 1,631 1,570 236 — 3,437 (9) (62) (87) — (158)
– other services 11,380 1,320 410 — 13,110 (54) (105) (249) — (408)
– activities of households 660 142 — — 802 — (1) — — (1)
– extra-territorial organisations and bodies activities 10 — — — 10 — — — — —
– government 7,866 671 1 — 8,538 (6) (2) (1) — (9)
– asset-backed securities 596 15 — — 611 — (13) — — (13)
Non-bank financial institutions 52,223 11,834 523 — 64,580 (46) (119) (100) — (265)
Loans and advances to banks 79,654 2,004 — — 81,658 (33) (9) — — (42)
At 31 Dec 2020 519,440 140,125 13,484 277 673,326 (1,180) (2,572) (5,937) (112) (9,801)
By geography
Europe 156,474 51,708 6,531 109 214,822 (589) (1,400) (2,097) (51) (4,137)
– of which: UK 104,534 40,454 4,712 53 149,753 (536) (1,234) (1,320) (33) (3,123)
Asia 279,985 58,159 3,443 106 341,693 (337) (383) (2,040) (43) (2,803)
– of which: Hong Kong 156,817 39,257 1,637 45 197,756 (162) (260) (751) (23) (1,196)
MENA 24,753 7,893 1,952 30 34,628 (91) (216) (1,205) (12) (1,524)
North America 46,852 18,220 913 — 65,985 (77) (302) (281) — (660)
Latin America 11,376 4,145 645 32 16,198 (86) (271) (314) (6) (677)
At 31 Dec 2020 519,440 140,125 13,484 277 673,326 (1,180) (2,572) (5,937) (112) (9,801)
Total wholesale lending for loans and other credit-related commitments and financial guarantees by stage distribution1
Nominal amount Allowance for ECL
Stage 1 Stage 2 Stage 3 POCI Total Stage 1 Stage 2 Stage 3 POCI Total
$m $m $m $m $m $m $m $m $m $m
Corporate and commercial 262,598 49,008 1,140 2 312,748 (271) (392) (100) (1) (764)
Financial 120,768 7,526 55 — 128,349 (17) (33) (4) — (54)
At 31 Dec 2020 383,366 56,534 1,195 2 441,097 (288) (425) (104) (1) (818)
By geography
Europe 210,141 28,705 851 2 239,699 (152) (208) (83) (1) (444)
– of which: UK 81,153 17,048 480 1 98,682 (138) (176) (72) (1) (387)
Asia 63,586 6,311 20 — 69,917 (73) (43) (6) — (122)
– of which: Hong Kong 26,502 3,639 4 — 30,145 (24) (22) (1) — (47)
MENA 4,975 1,609 85 — 6,669 (14) (44) (2) — (60)
North America 102,399 19,360 198 — 121,957 (39) (124) (7) — (170)
Latin America 2,265 549 41 — 2,855 (10) (6) (6) — (22)
At 31 Dec 2020 383,366 56,534 1,195 2 441,097 (288) (425) (104) (1) (818)
1 Included in loans and other credit-related commitments and financial guarantees is $62bn relating to unsettled reverse repurchase agreements, which once drawn are classified as ‘Reverse repurchase agreements – non-trading’.
HSBC Holdings plc Annual Report and Accounts 2020 145
Risk review
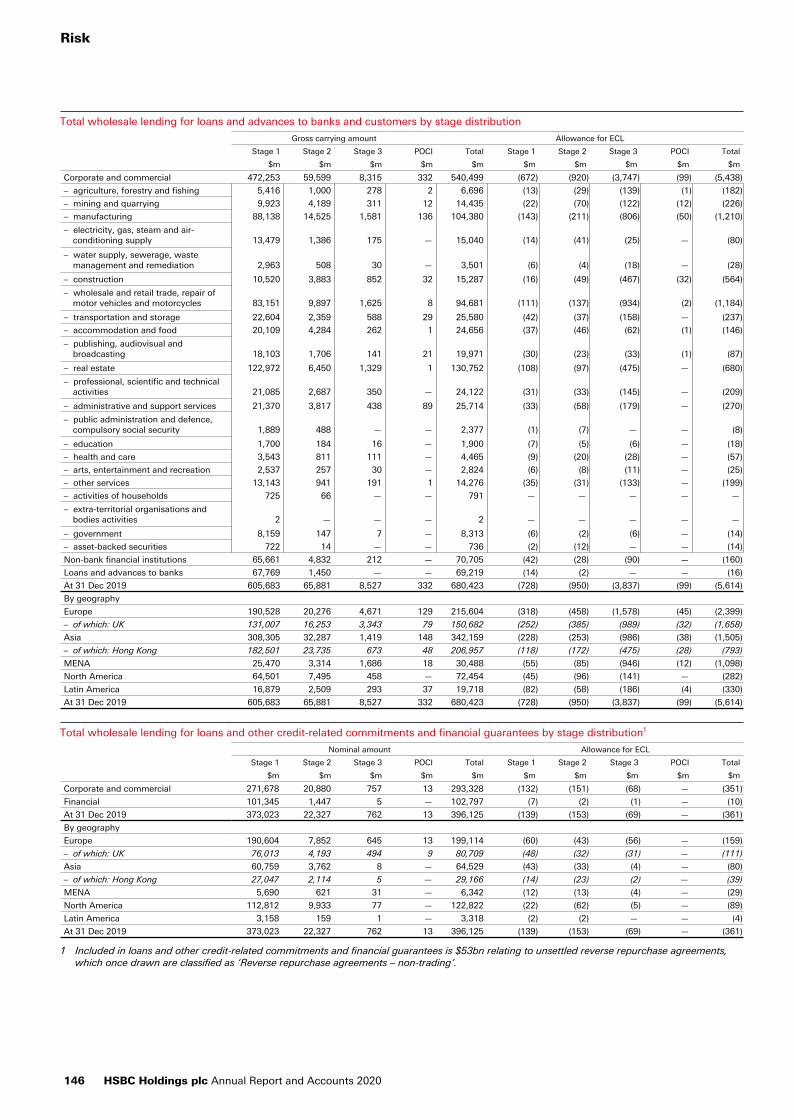
Total wholesale lending for loans and advances to banks and customers by stage distribution
Gross carrying amount Allowance for ECL
Stage 1 Stage 2 Stage 3 POCI Total Stage 1 Stage 2 Stage 3 POCI Total
$m $m $m $m $m $m $m $m $m $m
Corporate and commercial 472,253 59,599 8,315 332 540,499 (672) (920) (3,747) (99) (5,438)
– agriculture, forestry and fishing 5,416 1,000 278 2 6,696 (13) (29) (139) (1) (182)
– mining and quarrying 9,923 4,189 311 12 14,435 (22) (70) (122) (12) (226)
– manufacturing 88,138 14,525 1,581 136 104,380 (143) (211) (806) (50) (1,210)
– electricity, gas, steam and air-conditioning supply 13,479 1,386 175 — 15,040 (14) (41) (25) — (80)
– water supply, sewerage, waste management and remediation 2,963 508 30 — 3,501 (6) (4) (18) — (28)
– construction 10,520 3,883 852 32 15,287 (16) (49) (467) (32) (564)
– wholesale and retail trade, repair of motor vehicles and motorcycles 83,151 9,897 1,625 8 94,681 (111) (137) (934) (2) (1,184)
– transportation and storage 22,604 2,359 588 29 25,580 (42) (37) (158) — (237)
– accommodation and food 20,109 4,284 262 1 24,656 (37) (46) (62) (1) (146)
– publishing, audiovisual and broadcasting 18,103 1,706 141 21 19,971 (30) (23) (33) (1) (87)
– real estate 122,972 6,450 1,329 1 130,752 (108) (97) (475) — (680)
– professional, scientific and technical activities 21,085 2,687 350 — 24,122 (31) (33) (145) — (209)
– administrative and support services 21,370 3,817 438 89 25,714 (33) (58) (179) — (270)
– public administration and defence, compulsory social security 1,889 488 — — 2,377 (1) (7) — — (8)
– education 1,700 184 16 — 1,900 (7) (5) (6) — (18)
– health and care 3,543 811 111 — 4,465 (9) (20) (28) — (57)
– arts, entertainment and recreation 2,537 257 30 — 2,824 (6) (8) (11) — (25)
– other services 13,143 941 191 1 14,276 (35) (31) (133) — (199)
– activities of households 725 66 — — 791 — — — — —
– extra-territorial organisations and bodies activities 2 — — — 2 — — — — —
– government 8,159 147 7 — 8,313 (6) (2) (6) — (14)
– asset-backed securities 722 14 — — 736 (2) (12) — — (14)
Non-bank financial institutions 65,661 4,832 212 — 70,705 (42) (28) (90) — (160)
Loans and advances to banks 67,769 1,450 — — 69,219 (14) (2) — — (16)
At 31 Dec 2019 605,683 65,881 8,527 332 680,423 (728) (950) (3,837) (99) (5,614)
By geography
Europe 190,528 20,276 4,671 129 215,604 (318) (458) (1,578) (45) (2,399)
– of which: UK 131,007 16,253 3,343 79 150,682 (252) (385) (989) (32) (1,658)
Asia 308,305 32,287 1,419 148 342,159 (228) (253) (986) (38) (1,505)
– of which: Hong Kong 182,501 23,735 673 48 206,957 (118) (172) (475) (28) (793)
MENA 25,470 3,314 1,686 18 30,488 (55) (85) (946) (12) (1,098)
North America 64,501 7,495 458 — 72,454 (45) (96) (141) — (282)
Latin America 16,879 2,509 293 37 19,718 (82) (58) (186) (4) (330)
At 31 Dec 2019 605,683 65,881 8,527 332 680,423 (728) (950) (3,837) (99) (5,614)
Total wholesale lending for loans and other credit-related commitments and financial guarantees by stage distribution1
Nominal amount Allowance for ECL
Stage 1 Stage 2 Stage 3 POCI Total Stage 1 Stage 2 Stage 3 POCI Total
$m $m $m $m $m $m $m $m $m $m
Corporate and commercial 271,678 20,880 757 13 293,328 (132) (151) (68) — (351)
Financial 101,345 1,447 5 — 102,797 (7) (2) (1) — (10)
At 31 Dec 2019 373,023 22,327 762 13 396,125 (139) (153) (69) — (361)
By geography
Europe 190,604 7,852 645 13 199,114 (60) (43) (56) — (159)
– of which: UK 76,013 4,193 494 9 80,709 (48) (32) (31) — (111)
Asia 60,759 3,762 8 — 64,529 (43) (33) (4) — (80)
– of which: Hong Kong 27,047 2,114 5 — 29,166 (14) (23) (2) — (39)
MENA 5,690 621 31 — 6,342 (12) (13) (4) — (29)
North America 112,812 9,933 77 — 122,822 (22) (62) (5) — (89)
Latin America 3,158 159 1 — 3,318 (2) (2) — — (4)
At 31 Dec 2019 373,023 22,327 762 13 396,125 (139) (153) (69) — (361)
1 Included in loans and other credit-related commitments and financial guarantees is $53bn relating to unsettled reverse repurchase agreements, which once drawn are classified as ‘Reverse repurchase agreements – non-trading’.
Risk
146 HSBC Holdings plc Annual Report and Accounts 2020
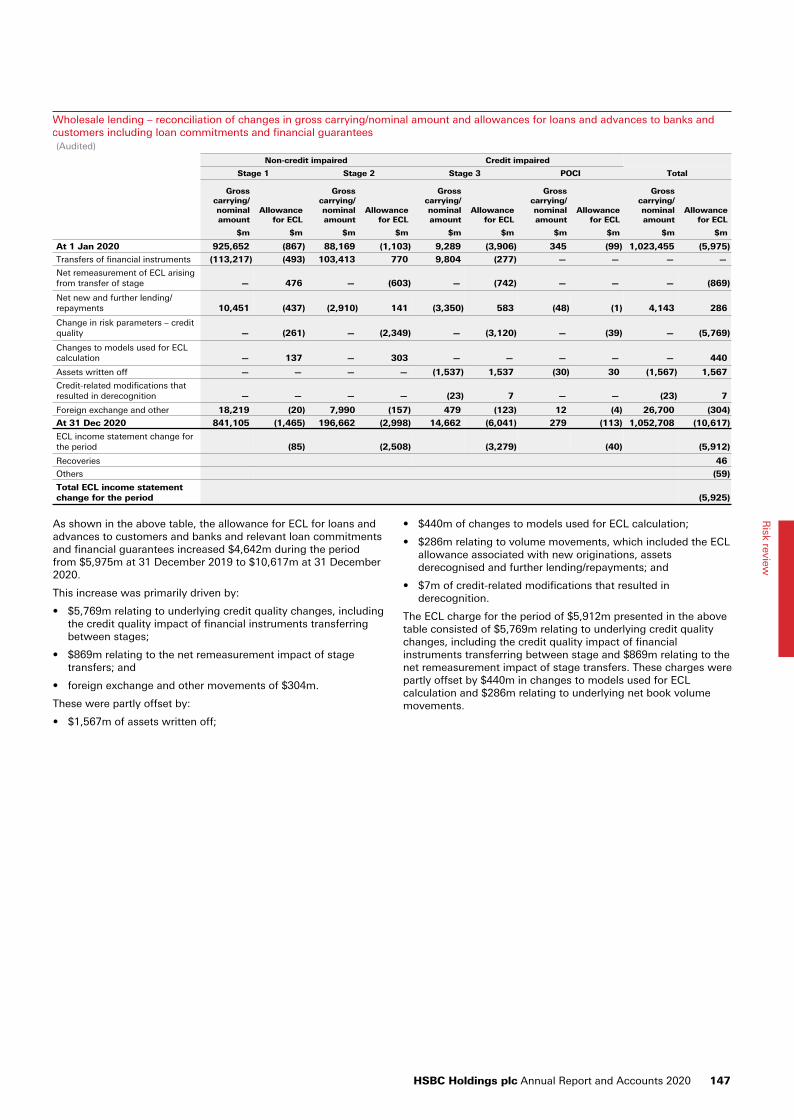
Wholesale lending – reconciliation of changes in gross carrying/nominal amount and allowances for loans and advances to banks and customers including loan commitments and financial guarantees(Audited)
Non-credit impaired Credit impaired
Stage 1 Stage 2 Stage 3 POCI Total
Gross carrying/ nominal amount
Allowance for ECL
Gross carrying/ nominal amount
Allowance for ECL
Gross carrying/ nominal amount
Allowance for ECL
Gross carrying/ nominal amount
Allowance for ECL
Gross carrying/ nominal amount
Allowance for ECL
$m $m $m $m $m $m $m $m $m $m
At 1 Jan 2020 925,652 (867) 88,169 (1,103) 9,289 (3,906) 345 (99) 1,023,455 (5,975)
Transfers of financial instruments (113,217) (493) 103,413 770 9,804 (277) — — — —
Net remeasurement of ECL arising from transfer of stage — 476 — (603) — (742) — — — (869)
Net new and further lending/ repayments 10,451 (437) (2,910) 141 (3,350) 583 (48) (1) 4,143 286
Change in risk parameters – credit quality — (261) — (2,349) — (3,120) — (39) — (5,769)
Changes to models used for ECL calculation — 137 — 303 — — — — — 440
Assets written off — — — — (1,537) 1,537 (30) 30 (1,567) 1,567
Credit-related modifications that resulted in derecognition — — — — (23) 7 — — (23) 7
Foreign exchange and other 18,219 (20) 7,990 (157) 479 (123) 12 (4) 26,700 (304)
At 31 Dec 2020 841,105 (1,465) 196,662 (2,998) 14,662 (6,041) 279 (113) 1,052,708 (10,617)
ECL income statement change for the period (85) (2,508) (3,279) (40) (5,912)
Recoveries 46
Others (59)
Total ECL income statement change for the period (5,925)
As shown in the above table, the allowance for ECL for loans and advances to customers and banks and relevant loan commitments and financial guarantees increased $4,642m during the period from $5,975m at 31 December 2019 to $10,617m at 31 December 2020.
This increase was primarily driven by:
• $5,769m relating to underlying credit quality changes, including the credit quality impact of financial instruments transferring between stages;
• $869m relating to the net remeasurement impact of stage transfers; and
• foreign exchange and other movements of $304m.
These were partly offset by:
• $1,567m of assets written off;
• $440m of changes to models used for ECL calculation;
• $286m relating to volume movements, which included the ECL allowance associated with new originations, assets derecognised and further lending/repayments; and
• $7m of credit-related modifications that resulted in derecognition.
The ECL charge for the period of $5,912m presented in the above table consisted of $5,769m relating to underlying credit quality changes, including the credit quality impact of financial instruments transferring between stage and $869m relating to the net remeasurement impact of stage transfers. These charges were partly offset by $440m in changes to models used for ECL calculation and $286m relating to underlying net book volume movements.
HSBC Holdings plc Annual Report and Accounts 2020 147
Risk review
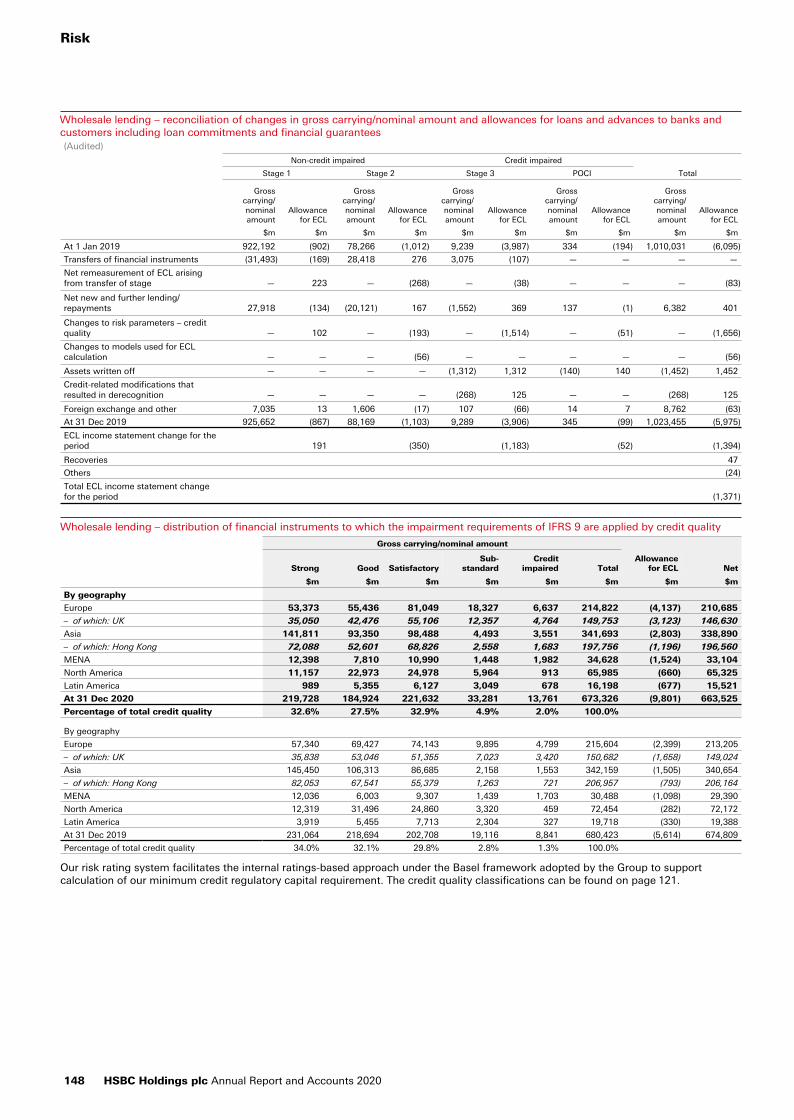
Wholesale lending – reconciliation of changes in gross carrying/nominal amount and allowances for loans and advances to banks andcustomers including loan commitments and financial guarantees(Audited)
Non-credit impaired Credit impaired
Stage 1 Stage 2 Stage 3 POCI Total
Gross carrying/ nominal amount
Allowance for ECL
Gross carrying/ nominal amount
Allowance for ECL
Gross carrying/ nominal amount
Allowance for ECL
Gross carrying/ nominal amount
Allowance for ECL
Gross carrying/ nominal amount
Allowance for ECL
$m $m $m $m $m $m $m $m $m $m
At 1 Jan 2019 922,192 (902) 78,266 (1,012) 9,239 (3,987) 334 (194) 1,010,031 (6,095)
Transfers of financial instruments (31,493) (169) 28,418 276 3,075 (107) — — — —
Net remeasurement of ECL arising from transfer of stage — 223 — (268) — (38) — — — (83)
Net new and further lending/repayments 27,918 (134) (20,121) 167 (1,552) 369 137 (1) 6,382 401
Changes to risk parameters – credit quality — 102 — (193) — (1,514) — (51) — (1,656)
Changes to models used for ECL calculation — — — (56) — — — — — (56)
Assets written off — — — — (1,312) 1,312 (140) 140 (1,452) 1,452
Credit-related modifications that resulted in derecognition — — — — (268) 125 — — (268) 125
Foreign exchange and other 7,035 13 1,606 (17) 107 (66) 14 7 8,762 (63)
At 31 Dec 2019 925,652 (867) 88,169 (1,103) 9,289 (3,906) 345 (99) 1,023,455 (5,975)
ECL income statement change for the period 191 (350) (1,183) (52) (1,394)
Recoveries 47
Others (24)
Total ECL income statement change for the period (1,371)
Wholesale lending – distribution of financial instruments to which the impairment requirements of IFRS 9 are applied by credit quality
Gross carrying/nominal amount
Allowance for ECL NetStrong Good Satisfactory
Sub-standard
Credit impaired Total
$m $m $m $m $m $m $m $m
By geography
Europe 53,373 55,436 81,049 18,327 6,637 214,822 (4,137) 210,685
– of which: UK 35,050 42,476 55,106 12,357 4,764 149,753 (3,123) 146,630
Asia 141,811 93,350 98,488 4,493 3,551 341,693 (2,803) 338,890
– of which: Hong Kong 72,088 52,601 68,826 2,558 1,683 197,756 (1,196) 196,560
MENA 12,398 7,810 10,990 1,448 1,982 34,628 (1,524) 33,104
North America 11,157 22,973 24,978 5,964 913 65,985 (660) 65,325
Latin America 989 5,355 6,127 3,049 678 16,198 (677) 15,521
At 31 Dec 2020 219,728 184,924 221,632 33,281 13,761 673,326 (9,801) 663,525
Percentage of total credit quality 32.6% 27.5% 32.9% 4.9% 2.0% 100.0%
By geography
Europe 57,340 69,427 74,143 9,895 4,799 215,604 (2,399) 213,205
– of which: UK 35,838 53,046 51,355 7,023 3,420 150,682 (1,658) 149,024
Asia 145,450 106,313 86,685 2,158 1,553 342,159 (1,505) 340,654
– of which: Hong Kong 82,053 67,541 55,379 1,263 721 206,957 (793) 206,164
MENA 12,036 6,003 9,307 1,439 1,703 30,488 (1,098) 29,390
North America 12,319 31,496 24,860 3,320 459 72,454 (282) 72,172
Latin America 3,919 5,455 7,713 2,304 327 19,718 (330) 19,388
At 31 Dec 2019 231,064 218,694 202,708 19,116 8,841 680,423 (5,614) 674,809
Percentage of total credit quality 34.0% 32.1% 29.8% 2.8% 1.3% 100.0%
Our risk rating system facilitates the internal ratings-based approach under the Basel framework adopted by the Group to support calculation of our minimum credit regulatory capital requirement. The credit quality classifications can be found on page 121.
Risk
148 HSBC Holdings plc Annual Report and Accounts 2020
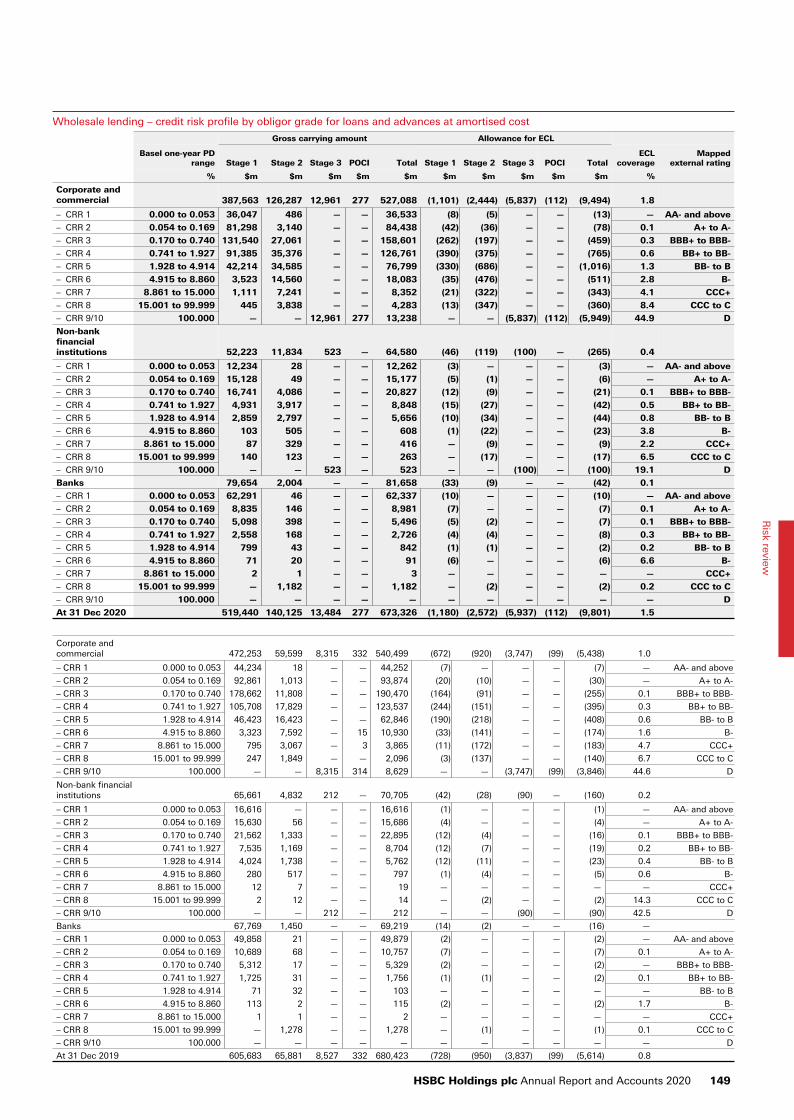
Wholesale lending – credit risk profile by obligor grade for loans and advances at amortised cost
Gross carrying amount Allowance for ECL
Basel one-year PD range Stage 1 Stage 2 Stage 3 POCI Total Stage 1 Stage 2 Stage 3 POCI Total
ECL coverage
Mapped external rating
% $m $m $m $m $m $m $m $m $m $m %
Corporate and commercial 387,563 126,287 12,961 277 527,088 (1,101) (2,444) (5,837) (112) (9,494) 1.8
– CRR 1 0.000 to 0.053 36,047 486 — — 36,533 (8) (5) — — (13) — AA- and above
– CRR 2 0.054 to 0.169 81,298 3,140 — — 84,438 (42) (36) — — (78) 0.1 A+ to A-
– CRR 3 0.170 to 0.740 131,540 27,061 — — 158,601 (262) (197) — — (459) 0.3 BBB+ to BBB-
– CRR 4 0.741 to 1.927 91,385 35,376 — — 126,761 (390) (375) — — (765) 0.6 BB+ to BB-
– CRR 5 1.928 to 4.914 42,214 34,585 — — 76,799 (330) (686) — — (1,016) 1.3 BB- to B
– CRR 6 4.915 to 8.860 3,523 14,560 — — 18,083 (35) (476) — — (511) 2.8 B-
– CRR 7 8.861 to 15.000 1,111 7,241 — — 8,352 (21) (322) — — (343) 4.1 CCC+
– CRR 8 15.001 to 99.999 445 3,838 — — 4,283 (13) (347) — — (360) 8.4 CCC to C
– CRR 9/10 100.000 — — 12,961 277 13,238 — — (5,837) (112) (5,949) 44.9 D
Non-bank financial institutions 52,223 11,834 523 — 64,580 (46) (119) (100) — (265) 0.4
– CRR 1 0.000 to 0.053 12,234 28 — — 12,262 (3) — — — (3) — AA- and above
– CRR 2 0.054 to 0.169 15,128 49 — — 15,177 (5) (1) — — (6) — A+ to A-
– CRR 3 0.170 to 0.740 16,741 4,086 — — 20,827 (12) (9) — — (21) 0.1 BBB+ to BBB-
– CRR 4 0.741 to 1.927 4,931 3,917 — — 8,848 (15) (27) — — (42) 0.5 BB+ to BB-
– CRR 5 1.928 to 4.914 2,859 2,797 — — 5,656 (10) (34) — — (44) 0.8 BB- to B
– CRR 6 4.915 to 8.860 103 505 — — 608 (1) (22) — — (23) 3.8 B-
– CRR 7 8.861 to 15.000 87 329 — — 416 — (9) — — (9) 2.2 CCC+
– CRR 8 15.001 to 99.999 140 123 — — 263 — (17) — — (17) 6.5 CCC to C
– CRR 9/10 100.000 — — 523 — 523 — — (100) — (100) 19.1 D
Banks 79,654 2,004 — — 81,658 (33) (9) — — (42) 0.1
– CRR 1 0.000 to 0.053 62,291 46 — — 62,337 (10) — — — (10) — AA- and above
– CRR 2 0.054 to 0.169 8,835 146 — — 8,981 (7) — — — (7) 0.1 A+ to A-
– CRR 3 0.170 to 0.740 5,098 398 — — 5,496 (5) (2) — — (7) 0.1 BBB+ to BBB-
– CRR 4 0.741 to 1.927 2,558 168 — — 2,726 (4) (4) — — (8) 0.3 BB+ to BB-
– CRR 5 1.928 to 4.914 799 43 — — 842 (1) (1) — — (2) 0.2 BB- to B
– CRR 6 4.915 to 8.860 71 20 — — 91 (6) — — — (6) 6.6 B-
– CRR 7 8.861 to 15.000 2 1 — — 3 — — — — — — CCC+
– CRR 8 15.001 to 99.999 — 1,182 — — 1,182 — (2) — — (2) 0.2 CCC to C
– CRR 9/10 100.000 — — — — — — — — — — — D
At 31 Dec 2020 519,440 140,125 13,484 277 673,326 (1,180) (2,572) (5,937) (112) (9,801) 1.5
Corporate andcommercial 472,253 59,599 8,315 332 540,499 (672) (920) (3,747) (99) (5,438) 1.0
– CRR 1 0.000 to 0.053 44,234 18 — — 44,252 (7) — — — (7) — AA- and above
– CRR 2 0.054 to 0.169 92,861 1,013 — — 93,874 (20) (10) — — (30) — A+ to A-
– CRR 3 0.170 to 0.740 178,662 11,808 — — 190,470 (164) (91) — — (255) 0.1 BBB+ to BBB-
– CRR 4 0.741 to 1.927 105,708 17,829 — — 123,537 (244) (151) — — (395) 0.3 BB+ to BB-
– CRR 5 1.928 to 4.914 46,423 16,423 — — 62,846 (190) (218) — — (408) 0.6 BB- to B
– CRR 6 4.915 to 8.860 3,323 7,592 — 15 10,930 (33) (141) — — (174) 1.6 B-
– CRR 7 8.861 to 15.000 795 3,067 — 3 3,865 (11) (172) — — (183) 4.7 CCC+
– CRR 8 15.001 to 99.999 247 1,849 — — 2,096 (3) (137) — — (140) 6.7 CCC to C
– CRR 9/10 100.000 — — 8,315 314 8,629 — — (3,747) (99) (3,846) 44.6 D
Non-bank financial institutions 65,661 4,832 212 — 70,705 (42) (28) (90) — (160) 0.2
– CRR 1 0.000 to 0.053 16,616 — — — 16,616 (1) — — — (1) — AA- and above
– CRR 2 0.054 to 0.169 15,630 56 — — 15,686 (4) — — — (4) — A+ to A-
– CRR 3 0.170 to 0.740 21,562 1,333 — — 22,895 (12) (4) — — (16) 0.1 BBB+ to BBB-
– CRR 4 0.741 to 1.927 7,535 1,169 — — 8,704 (12) (7) — — (19) 0.2 BB+ to BB-
– CRR 5 1.928 to 4.914 4,024 1,738 — — 5,762 (12) (11) — — (23) 0.4 BB- to B
– CRR 6 4.915 to 8.860 280 517 — — 797 (1) (4) — — (5) 0.6 B-
– CRR 7 8.861 to 15.000 12 7 — — 19 — — — — — — CCC+
– CRR 8 15.001 to 99.999 2 12 — — 14 — (2) — — (2) 14.3 CCC to C
– CRR 9/10 100.000 — — 212 — 212 — — (90) — (90) 42.5 D
Banks 67,769 1,450 — — 69,219 (14) (2) — — (16) —
– CRR 1 0.000 to 0.053 49,858 21 — — 49,879 (2) — — — (2) — AA- and above
– CRR 2 0.054 to 0.169 10,689 68 — — 10,757 (7) — — — (7) 0.1 A+ to A-
– CRR 3 0.170 to 0.740 5,312 17 — — 5,329 (2) — — — (2) — BBB+ to BBB-
– CRR 4 0.741 to 1.927 1,725 31 — — 1,756 (1) (1) — — (2) 0.1 BB+ to BB-
– CRR 5 1.928 to 4.914 71 32 — — 103 — — — — — — BB- to B
– CRR 6 4.915 to 8.860 113 2 — — 115 (2) — — — (2) 1.7 B-
– CRR 7 8.861 to 15.000 1 1 — — 2 — — — — — — CCC+
– CRR 8 15.001 to 99.999 — 1,278 — — 1,278 — (1) — — (1) 0.1 CCC to C
– CRR 9/10 100.000 — — — — — — — — — — — D
At 31 Dec 2019 605,683 65,881 8,527 332 680,423 (728) (950) (3,837) (99) (5,614) 0.8
HSBC Holdings plc Annual Report and Accounts 2020 149
Risk review
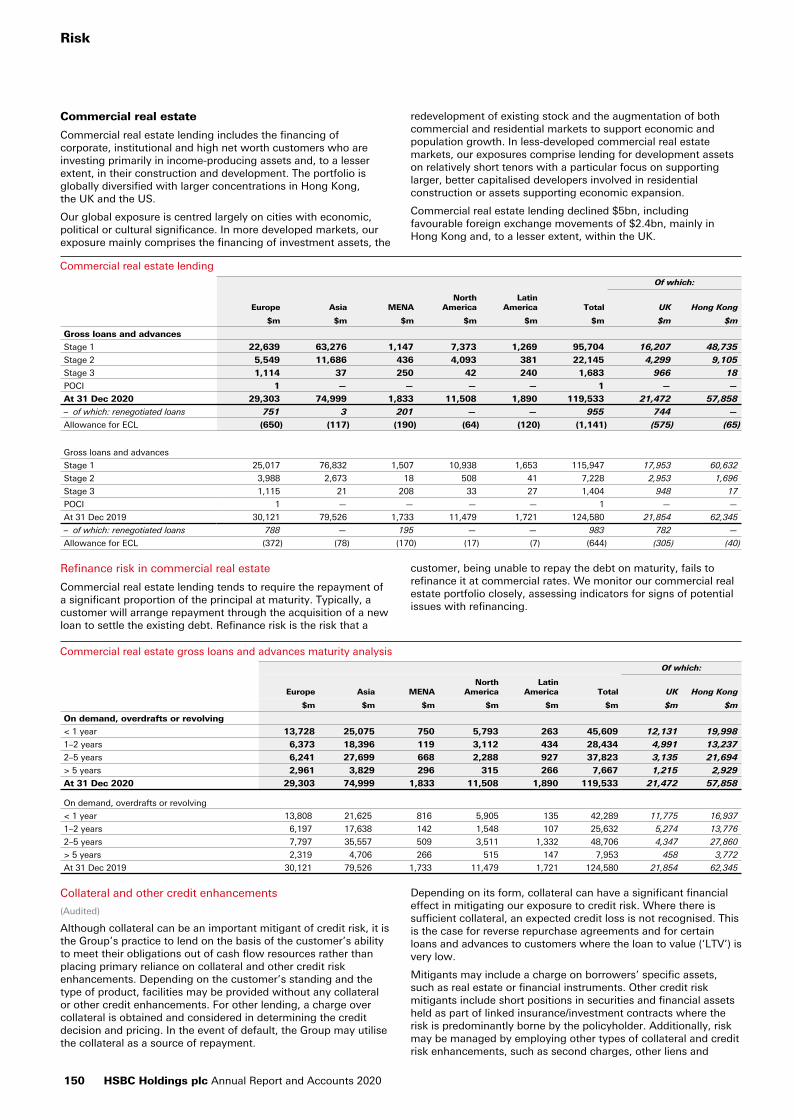
Commercial real estate
Commercial real estate lending includes the financing of corporate, institutional and high net worth customers who are investing primarily in income-producing assets and, to a lesser extent, in their construction and development. The portfolio is globally diversified with larger concentrations in Hong Kong, the UK and the US.
Our global exposure is centred largely on cities with economic, political or cultural significance. In more developed markets, our exposure mainly comprises the financing of investment assets, the
redevelopment of existing stock and the augmentation of both commercial and residential markets to support economic and population growth. In less-developed commercial real estate markets, our exposures comprise lending for development assets on relatively short tenors with a particular focus on supporting larger, better capitalised developers involved in residential construction or assets supporting economic expansion.
Commercial real estate lending declined $5bn, including favourable foreign exchange movements of $2.4bn, mainly in Hong Kong and, to a lesser extent, within the UK.
Commercial real estate lending
Of which:
Europe Asia MENANorth
AmericaLatin
America Total UK Hong Kong
$m $m $m $m $m $m $m $m
Gross loans and advances
Stage 1 22,639 63,276 1,147 7,373 1,269 95,704 16,207 48,735
Stage 2 5,549 11,686 436 4,093 381 22,145 4,299 9,105
Stage 3 1,114 37 250 42 240 1,683 966 18
POCI 1 — — — — 1 — —
At 31 Dec 2020 29,303 74,999 1,833 11,508 1,890 119,533 21,472 57,858
– of which: renegotiated loans 751 3 201 — — 955 744 —
Allowance for ECL (650) (117) (190) (64) (120) (1,141) (575) (65)
Gross loans and advances
Stage 1 25,017 76,832 1,507 10,938 1,653 115,947 17,953 60,632
Stage 2 3,988 2,673 18 508 41 7,228 2,953 1,696
Stage 3 1,115 21 208 33 27 1,404 948 17
POCI 1 — — — — 1 — —
At 31 Dec 2019 30,121 79,526 1,733 11,479 1,721 124,580 21,854 62,345
– of which: renegotiated loans 788 — 195 — — 983 782 —
Allowance for ECL (372) (78) (170) (17) (7) (644) (305) (40)
Refinance risk in commercial real estate
Commercial real estate lending tends to require the repayment of a significant proportion of the principal at maturity. Typically, a customer will arrange repayment through the acquisition of a new loan to settle the existing debt. Refinance risk is the risk that a
customer, being unable to repay the debt on maturity, fails to refinance it at commercial rates. We monitor our commercial real estate portfolio closely, assessing indicators for signs of potential issues with refinancing.
Commercial real estate gross loans and advances maturity analysis
Of which:
Europe Asia MENANorth
AmericaLatin
America Total UK Hong Kong
$m $m $m $m $m $m $m $m
On demand, overdrafts or revolving
< 1 year 13,728 25,075 750 5,793 263 45,609 12,131 19,998
1–2 years 6,373 18,396 119 3,112 434 28,434 4,991 13,237
2–5 years 6,241 27,699 668 2,288 927 37,823 3,135 21,694
> 5 years 2,961 3,829 296 315 266 7,667 1,215 2,929
At 31 Dec 2020 29,303 74,999 1,833 11,508 1,890 119,533 21,472 57,858
On demand, overdrafts or revolving
< 1 year 13,808 21,625 816 5,905 135 42,289 11,775 16,937
1–2 years 6,197 17,638 142 1,548 107 25,632 5,274 13,776
2–5 years 7,797 35,557 509 3,511 1,332 48,706 4,347 27,860
> 5 years 2,319 4,706 266 515 147 7,953 458 3,772
At 31 Dec 2019 30,121 79,526 1,733 11,479 1,721 124,580 21,854 62,345
Collateral and other credit enhancements
(Audited)
Although collateral can be an important mitigant of credit risk, it is the Group’s practice to lend on the basis of the customer’s ability to meet their obligations out of cash flow resources rather than placing primary reliance on collateral and other credit risk enhancements. Depending on the customer’s standing and the type of product, facilities may be provided without any collateral or other credit enhancements. For other lending, a charge over collateral is obtained and considered in determining the credit decision and pricing. In the event of default, the Group may utilise the collateral as a source of repayment.
Depending on its form, collateral can have a significant financial effect in mitigating our exposure to credit risk. Where there is sufficient collateral, an expected credit loss is not recognised. This is the case for reverse repurchase agreements and for certain loans and advances to customers where the loan to value (‘LTV’) is very low.
Mitigants may include a charge on borrowers’ specific assets, such as real estate or financial instruments. Other credit risk mitigants include short positions in securities and financial assets held as part of linked insurance/investment contracts where the risk is predominantly borne by the policyholder. Additionally, risk may be managed by employing other types of collateral and credit risk enhancements, such as second charges, other liens and
Risk
150 HSBC Holdings plc Annual Report and Accounts 2020
unsupported guarantees. Guarantees are normally taken from corporates and export credit agencies. Corporates would normally provide guarantees as part of a parent/subsidiary relationship and span a number of credit grades. The export credit agencies will normally be investment grade.
Certain credit mitigants are used strategically in portfolio management activities. While single name concentrations arise in portfolios managed by Global Banking and Corporate Banking, it is only in Global Banking that their size requires the use of portfolio level credit mitigants. Across Global Banking, risk limits and utilisations, maturity profiles and risk quality are monitored and managed proactively. This process is key to the setting of risk appetite for these larger, more complex, geographically distributed customer groups. While the principal form of risk management continues to be at the point of exposure origination, through the lending decision-making process, Global Banking also utilises loan sales and credit default swap (‘CDS’) hedges to manage concentrations and reduce risk. These transactions are the responsibility of a dedicated Global Banking portfolio management team. Hedging activity is carried out within agreed credit parameters, and is subject to market risk limits and a robust governance structure. Where applicable, CDSs are entered into directly with a central clearing house counterparty. Otherwise, the Group’s exposure to CDS protection providers is diversified among mainly banking counterparties with strong credit ratings.
CDS mitigants are held at portfolio level and are not included in the expected loss calculations. CDS mitigants are not reported in the following tables.
Collateral on loans and advances
Collateral held is analysed separately for commercial real estate and for other corporate, commercial and financial (non-bank) lending. The following tables include off-balance sheet loan commitments, primarily undrawn credit lines.
The collateral measured in the following tables consists of fixed first charges on real estate, and charges over cash and marketable financial instruments. The values in the tables represent the expected market value on an open market basis. No adjustment has been made to the collateral for any expected costs of recovery. Marketable securities are measured at their fair value.
Other types of collateral such as unsupported guarantees and floating charges over the assets of a customer’s business are not measured in the following tables. While such mitigants have value, often providing rights in insolvency, their assignable value is not sufficiently certain and they are therefore assigned no value for disclosure purposes.
The LTV ratios presented are calculated by directly associating loans and advances with the collateral that individually and uniquely supports each facility. When collateral assets are shared by multiple loans and advances, whether specifically or, more generally, by way of an all monies charge, the collateral value is pro-rated across the loans and advances protected by the collateral.
For credit-impaired loans, the collateral values cannot be directly compared with impairment allowances recognised. The LTV figures use open market values with no adjustments. Impairment allowances are calculated on a different basis, by considering other cash flows and adjusting collateral values for costs of realising collateral as explained further on page 294.
Commercial real estate loans and advances
The value of commercial real estate collateral is determined by using a combination of external and internal valuations and physical inspections. For CRR 1–7, local valuation policies determine the frequency of review on the basis of local market conditions because of the complexity of valuing collateral for commercial real estate. For CRR 8–10, almost all collateral would have been revalued within the last three years.
In Hong Kong, market practice is typically for lending to major property companies to be either secured by guarantees or unsecured. In Europe, facilities of a working capital nature are generally not secured by a first fixed charge, and are therefore disclosed as not collateralised.
HSBC Holdings plc Annual Report and Accounts 2020 151
Risk review
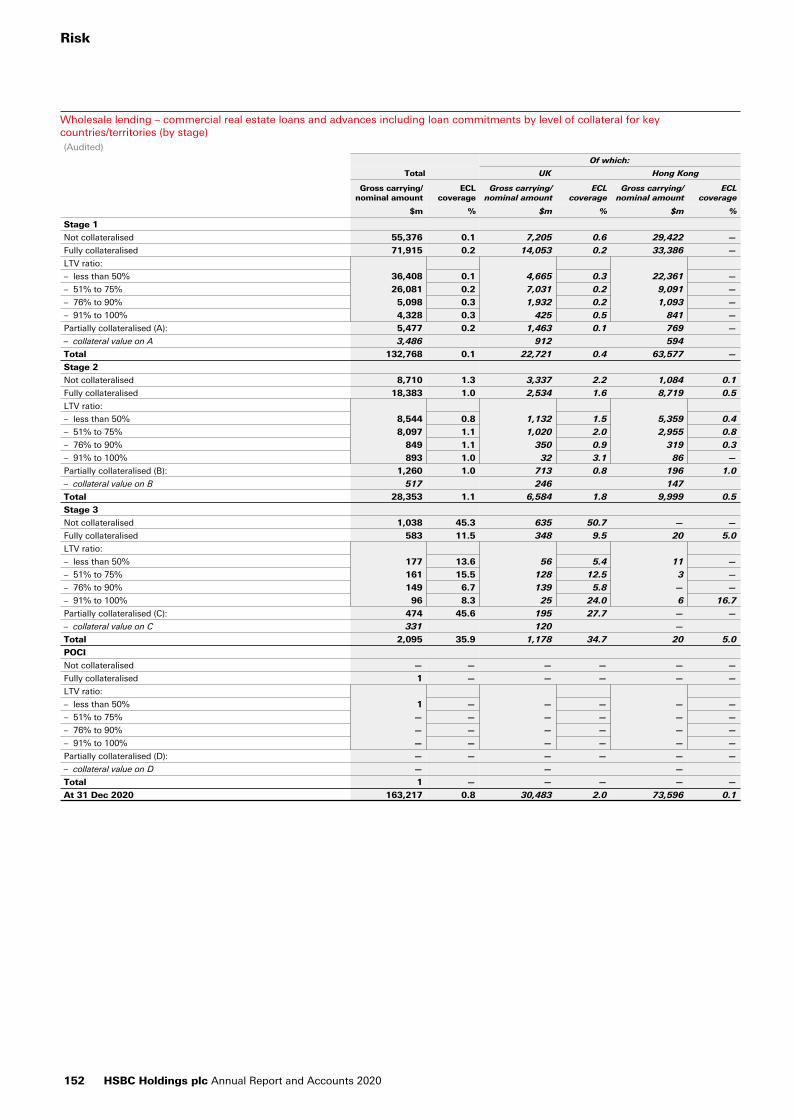
Wholesale lending – commercial real estate loans and advances including loan commitments by level of collateral for key countries/territories (by stage)(Audited)
Of which:
Total UK Hong Kong
Gross carrying/nominal amount
ECL coverage
Gross carrying/nominal amount
ECL coverage
Gross carrying/nominal amount
ECL coverage
$m % $m % $m %
Stage 1
Not collateralised 55,376 0.1 7,205 0.6 29,422 —
Fully collateralised 71,915 0.2 14,053 0.2 33,386 —
LTV ratio:
– less than 50% 36,408 0.1 4,665 0.3 22,361 —
– 51% to 75% 26,081 0.2 7,031 0.2 9,091 —
– 76% to 90% 5,098 0.3 1,932 0.2 1,093 —
– 91% to 100% 4,328 0.3 425 0.5 841 —
Partially collateralised (A): 5,477 0.2 1,463 0.1 769 —
– collateral value on A 3,486 912 594
Total 132,768 0.1 22,721 0.4 63,577 —
Stage 2
Not collateralised 8,710 1.3 3,337 2.2 1,084 0.1
Fully collateralised 18,383 1.0 2,534 1.6 8,719 0.5
LTV ratio:
– less than 50% 8,544 0.8 1,132 1.5 5,359 0.4
– 51% to 75% 8,097 1.1 1,020 2.0 2,955 0.8
– 76% to 90% 849 1.1 350 0.9 319 0.3
– 91% to 100% 893 1.0 32 3.1 86 —
Partially collateralised (B): 1,260 1.0 713 0.8 196 1.0
– collateral value on B 517 246 147
Total 28,353 1.1 6,584 1.8 9,999 0.5
Stage 3
Not collateralised 1,038 45.3 635 50.7 — —
Fully collateralised 583 11.5 348 9.5 20 5.0
LTV ratio:
– less than 50% 177 13.6 56 5.4 11 —
– 51% to 75% 161 15.5 128 12.5 3 —
– 76% to 90% 149 6.7 139 5.8 — —
– 91% to 100% 96 8.3 25 24.0 6 16.7
Partially collateralised (C): 474 45.6 195 27.7 — —
– collateral value on C 331 120 —
Total 2,095 35.9 1,178 34.7 20 5.0
POCI
Not collateralised — — — — — —
Fully collateralised 1 — — — — —
LTV ratio:
– less than 50% 1 — — — — —
– 51% to 75% — — — — — —
– 76% to 90% — — — — — —
– 91% to 100% — — — — — —
Partially collateralised (D): — — — — — —
– collateral value on D — — —
Total 1 — — — — —
At 31 Dec 2020 163,217 0.8 30,483 2.0 73,596 0.1
Risk
152 HSBC Holdings plc Annual Report and Accounts 2020

Wholesale lending – commercial real estate loans and advances including loan commitments by level of collateral for key countries/territories (by stage) (continued)(Audited)
Of which:
Total UK Hong Kong
Gross carrying/nominal amount
ECL coverage
Gross carrying/nominal amount
ECL coverage
Gross carrying/nominal amount
ECL coverage
$m % $m % $m %
Stage 1
Not collateralised 61,820 0.1 7,266 0.1 32,478 —
Fully collateralised 89,319 0.1 18,535 — 41,798 —
LTV ratio:
– less than 50% 46,318 0.1 7,018 0.1 28,776 —
– 51% to 75% 32,583 0.1 9,349 — 10,815 0.1
– 76% to 90% 5,018 0.1 1,649 0.1 1,436 0.1
– 91% to 100% 5,400 0.2 519 — 771 —
Partially collateralised (A): 6,563 0.2 682 — 1,627 0.1
– collateral value on A 3,602 535 1,142
Total 157,702 0.1 26,483 0.1 75,903 —
Stage 2
Not collateralised 3,040 1.2 1,857 1.2 440 0.2
Fully collateralised 5,184 1.1 1,419 1.2 1,501 0.6
LTV ratio:
– less than 50% 2,167 1.1 615 1.8 955 0.3
– 51% to 75% 1,986 0.9 712 0.6 497 1.0
– 76% to 90% 333 2.1 16 6.3 29 —
– 91% to 100% 698 1.1 76 1.3 20 —
Partially collateralised (B): 500 0.6 296 0.3 42 —
– collateral value on B 203 56 25
Total 8,724 1.1 3,572 1.1 1,983 0.5
Stage 3
Not collateralised 315 57.8 66 92.4 — —
Fully collateralised 557 14.9 404 12.9 17 11.8
LTV ratio:
– less than 50% 87 16.1 42 7.1 6 16.7
– 51% to 75% 90 7.8 69 4.3 10 —
– 76% to 90% 89 15.7 72 4.2 — —
– 91% to 100% 291 16.5 221 19.5 1 —
Partially collateralised (C): 773 41.5 507 27.8 — —
– collateral value on C 380 166 —
Total 1,645 35.6 977 26.0 17 11.8
POCI
Not collateralised — — — — — —
Fully collateralised 1 — — — — —
LTV ratio:
– less than 50% 1 — — — — —
– 51% to 75% — — — — — —
– 76% to 90% — — — — — —
– 91% to 100% — — — — — —
Partially collateralised (D): — — — — — —
– collateral value on D — — —
Total 1 — — — — —
At 31 Dec 2019 168,072 0.5 31,032 1.0 77,903 0.1
HSBC Holdings plc Annual Report and Accounts 2020 153
Risk review
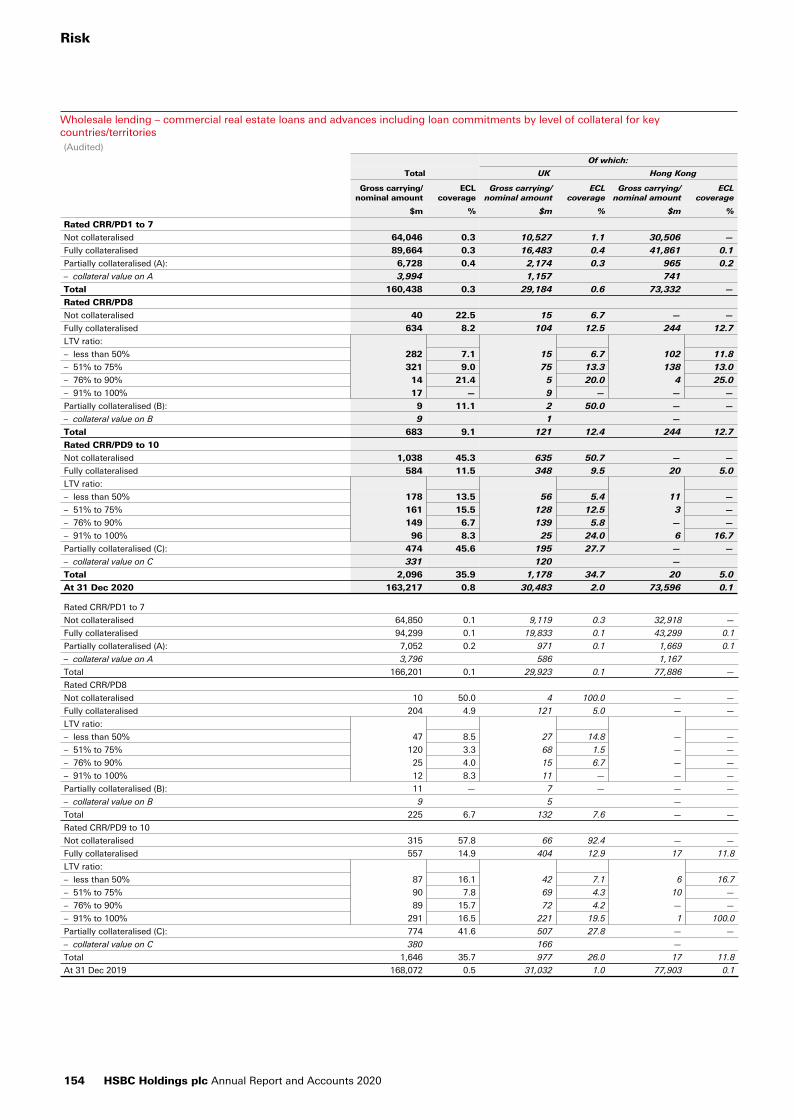
Wholesale lending – commercial real estate loans and advances including loan commitments by level of collateral for key countries/territories(Audited)
Of which:
Total UK Hong Kong
Gross carrying/nominal amount
ECL coverage
Gross carrying/nominal amount
ECL coverage
Gross carrying/nominal amount
ECL coverage
$m % $m % $m %
Rated CRR/PD1 to 7
Not collateralised 64,046 0.3 10,527 1.1 30,506 —
Fully collateralised 89,664 0.3 16,483 0.4 41,861 0.1
Partially collateralised (A): 6,728 0.4 2,174 0.3 965 0.2
– collateral value on A 3,994 1,157 741
Total 160,438 0.3 29,184 0.6 73,332 —
Rated CRR/PD8
Not collateralised 40 22.5 15 6.7 — —
Fully collateralised 634 8.2 104 12.5 244 12.7
LTV ratio:
– less than 50% 282 7.1 15 6.7 102 11.8
– 51% to 75% 321 9.0 75 13.3 138 13.0
– 76% to 90% 14 21.4 5 20.0 4 25.0
– 91% to 100% 17 — 9 — — —
Partially collateralised (B): 9 11.1 2 50.0 — —
– collateral value on B 9 1 —
Total 683 9.1 121 12.4 244 12.7
Rated CRR/PD9 to 10
Not collateralised 1,038 45.3 635 50.7 — —
Fully collateralised 584 11.5 348 9.5 20 5.0
LTV ratio:
– less than 50% 178 13.5 56 5.4 11 —
– 51% to 75% 161 15.5 128 12.5 3 —
– 76% to 90% 149 6.7 139 5.8 — —
– 91% to 100% 96 8.3 25 24.0 6 16.7
Partially collateralised (C): 474 45.6 195 27.7 — —
– collateral value on C 331 120 —
Total 2,096 35.9 1,178 34.7 20 5.0
At 31 Dec 2020 163,217 0.8 30,483 2.0 73,596 0.1
Rated CRR/PD1 to 7
Not collateralised 64,850 0.1 9,119 0.3 32,918 —
Fully collateralised 94,299 0.1 19,833 0.1 43,299 0.1
Partially collateralised (A): 7,052 0.2 971 0.1 1,669 0.1
– collateral value on A 3,796 586 1,167
Total 166,201 0.1 29,923 0.1 77,886 —
Rated CRR/PD8
Not collateralised 10 50.0 4 100.0 — —
Fully collateralised 204 4.9 121 5.0 — —
LTV ratio:
– less than 50% 47 8.5 27 14.8 — —
– 51% to 75% 120 3.3 68 1.5 — —
– 76% to 90% 25 4.0 15 6.7 — —
– 91% to 100% 12 8.3 11 — — —
Partially collateralised (B): 11 — 7 — — —
– collateral value on B 9 5 —
Total 225 6.7 132 7.6 — —
Rated CRR/PD9 to 10
Not collateralised 315 57.8 66 92.4 — —
Fully collateralised 557 14.9 404 12.9 17 11.8
LTV ratio:
– less than 50% 87 16.1 42 7.1 6 16.7
– 51% to 75% 90 7.8 69 4.3 10 —
– 76% to 90% 89 15.7 72 4.2 — —
– 91% to 100% 291 16.5 221 19.5 1 100.0
Partially collateralised (C): 774 41.6 507 27.8 — —
– collateral value on C 380 166 —
Total 1,646 35.7 977 26.0 17 11.8
At 31 Dec 2019 168,072 0.5 31,032 1.0 77,903 0.1
Risk
154 HSBC Holdings plc Annual Report and Accounts 2020
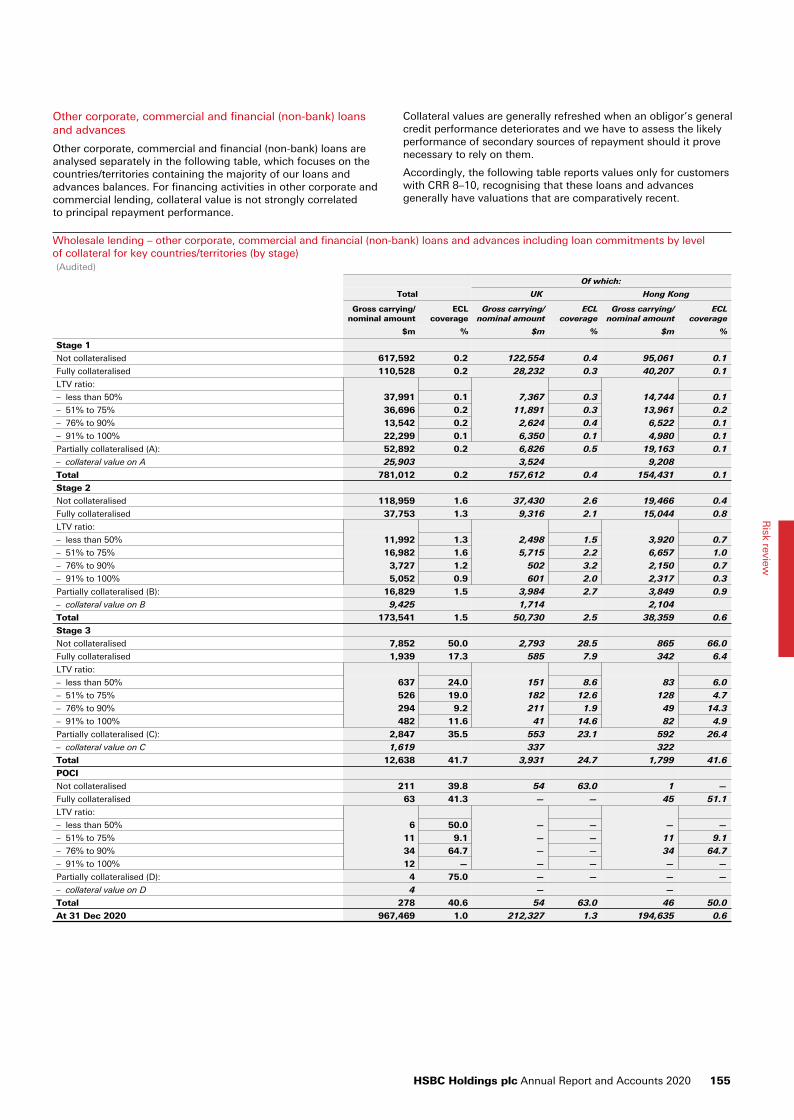
Other corporate, commercial and financial (non-bank) loans and advances
Other corporate, commercial and financial (non-bank) loans are analysed separately in the following table, which focuses on the countries/territories containing the majority of our loans and advances balances. For financing activities in other corporate and commercial lending, collateral value is not strongly correlated to principal repayment performance.
Collateral values are generally refreshed when an obligor’s general credit performance deteriorates and we have to assess the likely performance of secondary sources of repayment should it prove necessary to rely on them.
Accordingly, the following table reports values only for customers with CRR 8–10, recognising that these loans and advances generally have valuations that are comparatively recent.
Wholesale lending – other corporate, commercial and financial (non-bank) loans and advances including loan commitments by level of collateral for key countries/territories (by stage)(Audited)
Of which:
Total UK Hong Kong
Gross carrying/nominal amount
ECL coverage
Gross carrying/nominal amount
ECL coverage
Gross carrying/nominal amount
ECL coverage
$m % $m % $m %
Stage 1
Not collateralised 617,592 0.2 122,554 0.4 95,061 0.1
Fully collateralised 110,528 0.2 28,232 0.3 40,207 0.1
LTV ratio:
– less than 50% 37,991 0.1 7,367 0.3 14,744 0.1
– 51% to 75% 36,696 0.2 11,891 0.3 13,961 0.2
– 76% to 90% 13,542 0.2 2,624 0.4 6,522 0.1
– 91% to 100% 22,299 0.1 6,350 0.1 4,980 0.1
Partially collateralised (A): 52,892 0.2 6,826 0.5 19,163 0.1
– collateral value on A 25,903 3,524 9,208
Total 781,012 0.2 157,612 0.4 154,431 0.1
Stage 2
Not collateralised 118,959 1.6 37,430 2.6 19,466 0.4
Fully collateralised 37,753 1.3 9,316 2.1 15,044 0.8
LTV ratio:
– less than 50% 11,992 1.3 2,498 1.5 3,920 0.7
– 51% to 75% 16,982 1.6 5,715 2.2 6,657 1.0
– 76% to 90% 3,727 1.2 502 3.2 2,150 0.7
– 91% to 100% 5,052 0.9 601 2.0 2,317 0.3
Partially collateralised (B): 16,829 1.5 3,984 2.7 3,849 0.9
– collateral value on B 9,425 1,714 2,104
Total 173,541 1.5 50,730 2.5 38,359 0.6
Stage 3
Not collateralised 7,852 50.0 2,793 28.5 865 66.0
Fully collateralised 1,939 17.3 585 7.9 342 6.4
LTV ratio:
– less than 50% 637 24.0 151 8.6 83 6.0
– 51% to 75% 526 19.0 182 12.6 128 4.7
– 76% to 90% 294 9.2 211 1.9 49 14.3
– 91% to 100% 482 11.6 41 14.6 82 4.9
Partially collateralised (C): 2,847 35.5 553 23.1 592 26.4
– collateral value on C 1,619 337 322
Total 12,638 41.7 3,931 24.7 1,799 41.6
POCI
Not collateralised 211 39.8 54 63.0 1 —
Fully collateralised 63 41.3 — — 45 51.1
LTV ratio:
– less than 50% 6 50.0 — — — —
– 51% to 75% 11 9.1 — — 11 9.1
– 76% to 90% 34 64.7 — — 34 64.7
– 91% to 100% 12 — — — — —
Partially collateralised (D): 4 75.0 — — — —
– collateral value on D 4 — —
Total 278 40.6 54 63.0 46 50.0
At 31 Dec 2020 967,469 1.0 212,327 1.3 194,635 0.6
HSBC Holdings plc Annual Report and Accounts 2020 155
Risk review
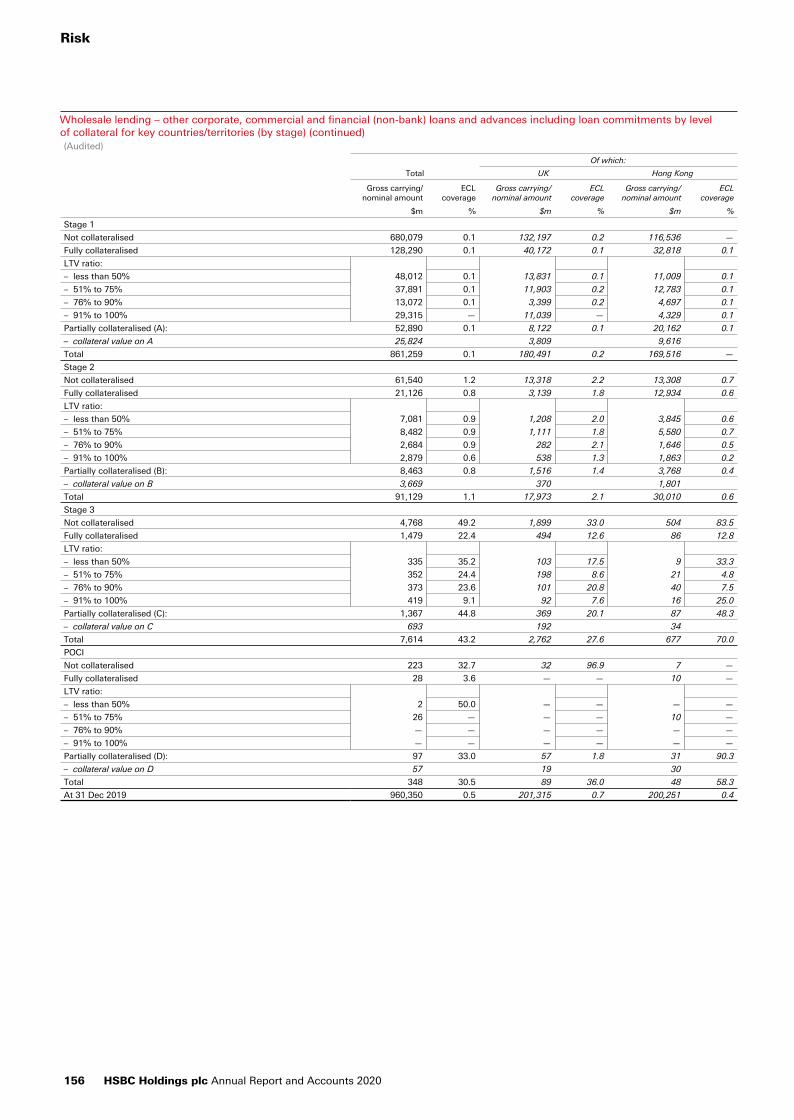
Wholesale lending – other corporate, commercial and financial (non-bank) loans and advances including loan commitments by level of collateral for key countries/territories (by stage) (continued)(Audited)
Of which:
Total UK Hong Kong
Gross carrying/nominal amount
ECL coverage
Gross carrying/nominal amount
ECL coverage
Gross carrying/nominal amount
ECL coverage
$m % $m % $m %
Stage 1
Not collateralised 680,079 0.1 132,197 0.2 116,536 —
Fully collateralised 128,290 0.1 40,172 0.1 32,818 0.1
LTV ratio:
– less than 50% 48,012 0.1 13,831 0.1 11,009 0.1
– 51% to 75% 37,891 0.1 11,903 0.2 12,783 0.1
– 76% to 90% 13,072 0.1 3,399 0.2 4,697 0.1
– 91% to 100% 29,315 — 11,039 — 4,329 0.1
Partially collateralised (A): 52,890 0.1 8,122 0.1 20,162 0.1
– collateral value on A 25,824 3,809 9,616
Total 861,259 0.1 180,491 0.2 169,516 —
Stage 2
Not collateralised 61,540 1.2 13,318 2.2 13,308 0.7
Fully collateralised 21,126 0.8 3,139 1.8 12,934 0.6
LTV ratio:
– less than 50% 7,081 0.9 1,208 2.0 3,845 0.6
– 51% to 75% 8,482 0.9 1,111 1.8 5,580 0.7
– 76% to 90% 2,684 0.9 282 2.1 1,646 0.5
– 91% to 100% 2,879 0.6 538 1.3 1,863 0.2
Partially collateralised (B): 8,463 0.8 1,516 1.4 3,768 0.4
– collateral value on B 3,669 370 1,801
Total 91,129 1.1 17,973 2.1 30,010 0.6
Stage 3
Not collateralised 4,768 49.2 1,899 33.0 504 83.5
Fully collateralised 1,479 22.4 494 12.6 86 12.8
LTV ratio:
– less than 50% 335 35.2 103 17.5 9 33.3
– 51% to 75% 352 24.4 198 8.6 21 4.8
– 76% to 90% 373 23.6 101 20.8 40 7.5
– 91% to 100% 419 9.1 92 7.6 16 25.0
Partially collateralised (C): 1,367 44.8 369 20.1 87 48.3
– collateral value on C 693 192 34
Total 7,614 43.2 2,762 27.6 677 70.0
POCI
Not collateralised 223 32.7 32 96.9 7 —
Fully collateralised 28 3.6 — — 10 —
LTV ratio:
– less than 50% 2 50.0 — — — —
– 51% to 75% 26 — — — 10 —
– 76% to 90% — — — — — —
– 91% to 100% — — — — — —
Partially collateralised (D): 97 33.0 57 1.8 31 90.3
– collateral value on D 57 19 30
Total 348 30.5 89 36.0 48 58.3
At 31 Dec 2019 960,350 0.5 201,315 0.7 200,251 0.4
Risk
156 HSBC Holdings plc Annual Report and Accounts 2020
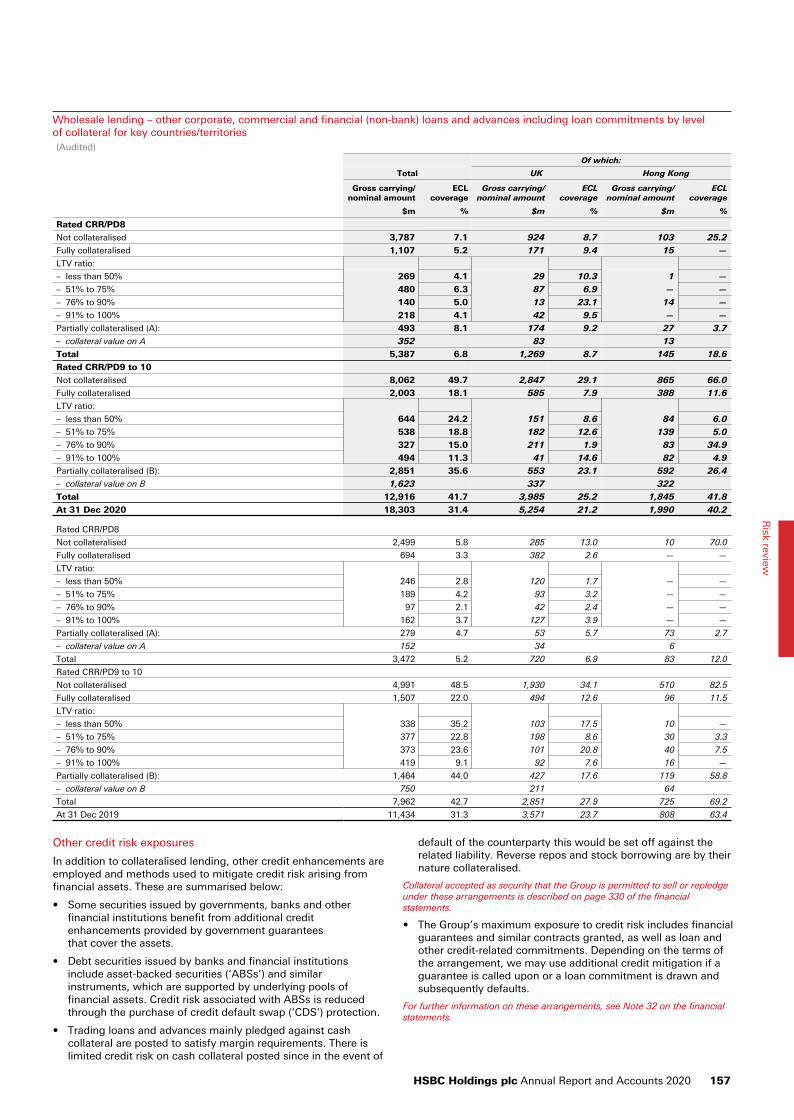
Wholesale lending – other corporate, commercial and financial (non-bank) loans and advances including loan commitments by level of collateral for key countries/territories(Audited)
Of which:
Total UK Hong Kong
Gross carrying/nominal amount
ECL coverage
Gross carrying/nominal amount
ECL coverage
Gross carrying/nominal amount
ECL coverage
$m % $m % $m %
Rated CRR/PD8
Not collateralised 3,787 7.1 924 8.7 103 25.2
Fully collateralised 1,107 5.2 171 9.4 15 —
LTV ratio:
– less than 50% 269 4.1 29 10.3 1 —
– 51% to 75% 480 6.3 87 6.9 — —
– 76% to 90% 140 5.0 13 23.1 14 —
– 91% to 100% 218 4.1 42 9.5 — —
Partially collateralised (A): 493 8.1 174 9.2 27 3.7
– collateral value on A 352 83 13
Total 5,387 6.8 1,269 8.7 145 18.6
Rated CRR/PD9 to 10
Not collateralised 8,062 49.7 2,847 29.1 865 66.0
Fully collateralised 2,003 18.1 585 7.9 388 11.6
LTV ratio:
– less than 50% 644 24.2 151 8.6 84 6.0
– 51% to 75% 538 18.8 182 12.6 139 5.0
– 76% to 90% 327 15.0 211 1.9 83 34.9
– 91% to 100% 494 11.3 41 14.6 82 4.9
Partially collateralised (B): 2,851 35.6 553 23.1 592 26.4
– collateral value on B 1,623 337 322
Total 12,916 41.7 3,985 25.2 1,845 41.8
At 31 Dec 2020 18,303 31.4 5,254 21.2 1,990 40.2
Rated CRR/PD8
Not collateralised 2,499 5.8 285 13.0 10 70.0
Fully collateralised 694 3.3 382 2.6 — —
LTV ratio:
– less than 50% 246 2.8 120 1.7 — —
– 51% to 75% 189 4.2 93 3.2 — —
– 76% to 90% 97 2.1 42 2.4 — —
– 91% to 100% 162 3.7 127 3.9 — —
Partially collateralised (A): 279 4.7 53 5.7 73 2.7
– collateral value on A 152 34 6
Total 3,472 5.2 720 6.9 83 12.0
Rated CRR/PD9 to 10
Not collateralised 4,991 48.5 1,930 34.1 510 82.5
Fully collateralised 1,507 22.0 494 12.6 96 11.5
LTV ratio:
– less than 50% 338 35.2 103 17.5 10 —
– 51% to 75% 377 22.8 198 8.6 30 3.3
– 76% to 90% 373 23.6 101 20.8 40 7.5
– 91% to 100% 419 9.1 92 7.6 16 —
Partially collateralised (B): 1,464 44.0 427 17.6 119 58.8
– collateral value on B 750 211 64
Total 7,962 42.7 2,851 27.9 725 69.2
At 31 Dec 2019 11,434 31.3 3,571 23.7 808 63.4
Other credit risk exposures
In addition to collateralised lending, other credit enhancements are employed and methods used to mitigate credit risk arising from financial assets. These are summarised below:
• Some securities issued by governments, banks and other financial institutions benefit from additional credit enhancements provided by government guarantees that cover the assets.
• Debt securities issued by banks and financial institutions include asset-backed securities (‘ABSs’) and similar instruments, which are supported by underlying pools of financial assets. Credit risk associated with ABSs is reduced through the purchase of credit default swap (‘CDS’) protection.
• Trading loans and advances mainly pledged against cash collateral are posted to satisfy margin requirements. There is limited credit risk on cash collateral posted since in the event of
default of the counterparty this would be set off against the related liability. Reverse repos and stock borrowing are by their nature collateralised.
Collateral accepted as security that the Group is permitted to sell or repledge under these arrangements is described on page 330 of the financial statements.
• The Group’s maximum exposure to credit risk includes financial guarantees and similar contracts granted, as well as loan and other credit-related commitments. Depending on the terms of the arrangement, we may use additional credit mitigation if a guarantee is called upon or a loan commitment is drawn and subsequently defaults.
For further information on these arrangements, see Note 32 on the financial statements.
HSBC Holdings plc Annual Report and Accounts 2020 157
Risk review

Derivatives
We participate in transactions exposing us to counterparty credit risk. Counterparty credit risk is the risk of financial loss if the counterparty to a transaction defaults before satisfactorily settling it. It arises principally from over-the-counter (‘OTC’) derivatives and securities financing transactions and is calculated in both the trading and non-trading books. Transactions vary in value by reference to a market factor such as an interest rate, exchange rate or asset price.
The counterparty risk from derivative transactions is taken into account when reporting the fair value of derivative positions. The adjustment to the fair value is known as the credit valuation adjustment (‘CVA’).
For an analysis of CVAs, see Note 12 on the financial statements.
The following table reflects by risk type the fair values and gross notional contract amounts of derivatives cleared through an exchange, central counterparty or non-central counterparty.
Notional contract amounts and fair values of derivatives
2020 2019
Notional Fair value Notional Fair value
amount Assets Liabilities amount Assets Liabilities
$m $m $m $m $m $m
Total OTC derivatives 22,749,280 372,373 368,010 26,244,531 282,778 279,101
– total OTC derivatives cleared by central counterparties 9,898,260 74,054 75,253 12,563,343 45,140 46,351
– total OTC derivatives not cleared by central counterparties 12,851,020 298,319 292,757 13,681,188 237,638 232,750
Total exchange traded derivatives 1,332,438 4,456 4,094 1,583,590 1,956 2,135
Gross 24,081,718 376,829 372,104 27,828,121 284,734 281,236
Offset (69,103) (69,103) (41,739) (41,739)
At 31 Dec 307,726 303,001 242,995 239,497
The purposes for which HSBC uses derivatives are described in Note 15 on the financial statements.
The International Swaps and Derivatives Association (‘ISDA’) master agreement is our preferred agreement for documenting derivatives activity. It is common, and our preferred practice, for the parties involved in a derivative transaction to execute a credit support annex (‘CSA’) in conjunction with the ISDA master agreement. Under a CSA, collateral is passed between the parties to mitigate the counterparty risk inherent in outstanding positions. The majority of our CSAs are with financial institutional clients.
We manage the counterparty exposure on our OTC derivative contracts by using collateral agreements with counterparties and netting agreements. Currently, we do not actively manage our general OTC derivative counterparty exposure in the credit markets, although we may manage individual exposures in certain circumstances.
We place strict policy restrictions on collateral types and as a consequence the types of collateral received and pledged are, by value, highly liquid and of a strong quality, being predominantly cash.
Where a collateral type is required to be approved outside the collateral policy, approval is required from a committee of senior representatives from Markets, Legal and Risk.
See page 352 and Note 30 on the financial statements for details regarding legally enforceable right of offset in the event of counterparty default and collateral received in respect of derivatives.
Personal lending
This section presents further disclosures related to personal lending. It provides details of the regions, countries and products that are driving the change observed in personal loans and advances to customers, with the impact of foreign exchange separately identified. Additionally, Hong Kong and UK mortgage book LTV data is provided.
This section also provides a reconciliation of the opening 1 January 2020 to 31 December 2020 closing gross carrying/nominal amounts and associated allowance for ECL.
Further product granularity is also provided by stage, with geographical data presented for loans and advances to customers, loan and other credit-related commitments and financial guarantees.
At 31 December 2020, total personal lending for loans and advances to customers of $461bn increased by $26.5bn compared with 31 December 2019. This increase included favourable foreign exchange movements of $11.5bn. Excluding foreign exchange movements, there was growth of $15.1bn, primarily driven by $10.1bn in Europe and $3.4bn in Asia. The allowance for ECL attributable to personal lending, excluding off-balance sheet loan
commitments and guarantees, and foreign exchange movements, increased $1.6bn to $4.7bn at 31 December 2020.
Excluding foreign exchange movements, total personal lending was primarily driven by mortgage growth, which grew by $21.5bn. Mortgages grew $12.3bn in the UK; $6.4bn in Asia, notably $4.7bn in Hong Kong and $1.6bn in Australia; and $1.8bn in Canada. The allowance for ECL, excluding foreign exchange, attributable to mortgages of $0.8bn increased $0.2bn compared with 31 December 2019.
The quality of both our Hong Kong and UK mortgage books remained high, with low levels of impairment allowances. The average LTV ratio on new mortgage lending in Hong Kong was 61%, compared with an estimated 45% for the overall mortgage portfolio. The average LTV ratio on new lending in the UK was 70%, compared with an estimated 51% for the overall mortgage portfolio.
Excluding foreign exchange movements, other personal lending balances at 31 December 2020 declined by $6.5bn compared with 31 December 2019. The decline was attributable to a $3.8bn decline in credit cards and a $2.4bn decline in loans and overdrafts.
The $3.8bn decrease in credit card lending was attributable to declines of $2.1bn in the UK, $0.5bn in Hong Kong and $0.3bn in the US. The $2.4bn decrease in loans and overdrafts was attributable to declines of $1.1bn in Hong Kong, $1.4bn in the UK, $0.5bn in Singapore and $0.3bn in MENA. These declines were partly offset by growth of $1bn in France, primarily in other personal lending guaranteed by Crédit Logement and $0.5bn in Switzerland.
The allowance for ECL, excluding foreign exchange, attributable to other personal lending of $4.0bn increased $1.4bn compared with 31 December 2019. Excluding foreign exchange, the allowance for ECL attributable to credit cards increased by $0.7bn while loans and overdrafts increased by $0.7bn.
Risk
158 HSBC Holdings plc Annual Report and Accounts 2020
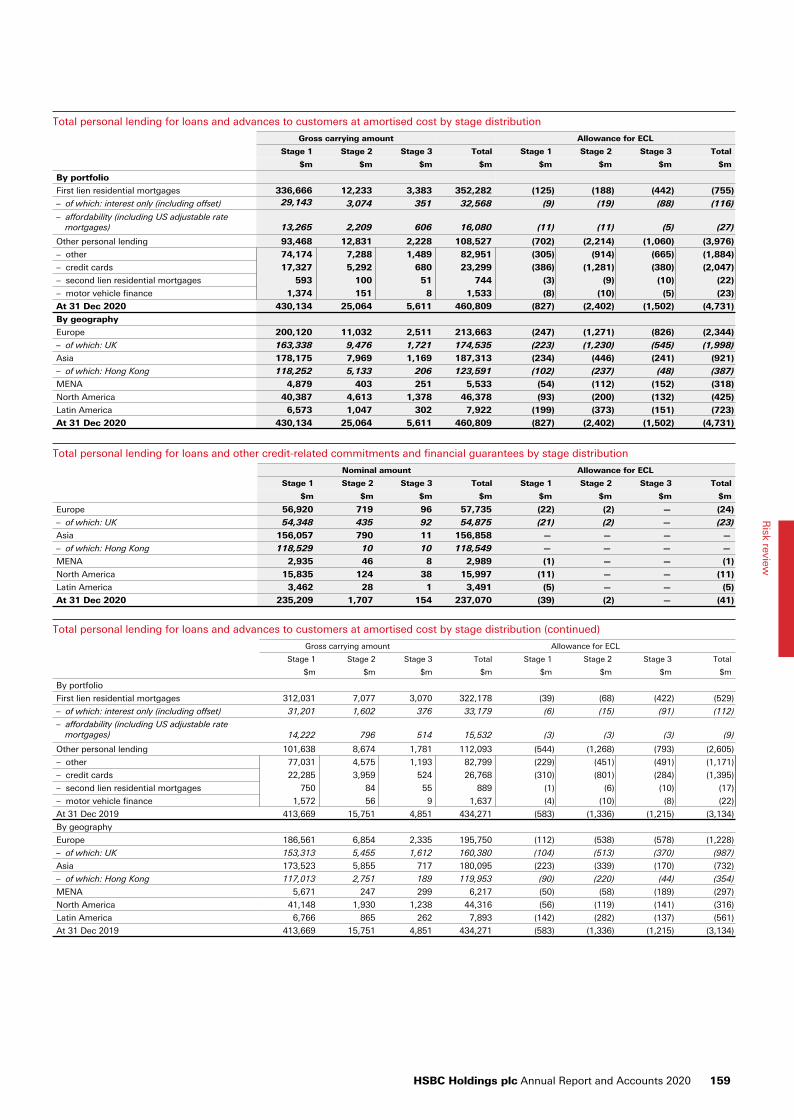
Total personal lending for loans and advances to customers at amortised cost by stage distribution
Gross carrying amount Allowance for ECL
Stage 1 Stage 2 Stage 3 Total Stage 1 Stage 2 Stage 3 Total
$m $m $m $m $m $m $m $m
By portfolio
First lien residential mortgages 336,666 12,233 3,383 352,282 (125) (188) (442) (755)
– of which: interest only (including offset) 29,143 3,074 351 32,568 (9) (19) (88) (116)
– affordability (including US adjustable rate mortgages) 13,265 2,209 606 16,080 (11) (11) (5) (27)
Other personal lending 93,468 12,831 2,228 108,527 (702) (2,214) (1,060) (3,976)
– other 74,174 7,288 1,489 82,951 (305) (914) (665) (1,884)
– credit cards 17,327 5,292 680 23,299 (386) (1,281) (380) (2,047)
– second lien residential mortgages 593 100 51 744 (3) (9) (10) (22)
– motor vehicle finance 1,374 151 8 1,533 (8) (10) (5) (23)
At 31 Dec 2020 430,134 25,064 5,611 460,809 (827) (2,402) (1,502) (4,731)
By geography
Europe 200,120 11,032 2,511 213,663 (247) (1,271) (826) (2,344)
– of which: UK 163,338 9,476 1,721 174,535 (223) (1,230) (545) (1,998)
Asia 178,175 7,969 1,169 187,313 (234) (446) (241) (921)
– of which: Hong Kong 118,252 5,133 206 123,591 (102) (237) (48) (387)
MENA 4,879 403 251 5,533 (54) (112) (152) (318)
North America 40,387 4,613 1,378 46,378 (93) (200) (132) (425)
Latin America 6,573 1,047 302 7,922 (199) (373) (151) (723)
At 31 Dec 2020 430,134 25,064 5,611 460,809 (827) (2,402) (1,502) (4,731)
Total personal lending for loans and other credit-related commitments and financial guarantees by stage distribution
Nominal amount Allowance for ECL
Stage 1 Stage 2 Stage 3 Total Stage 1 Stage 2 Stage 3 Total
$m $m $m $m $m $m $m $m
Europe 56,920 719 96 57,735 (22) (2) — (24)
– of which: UK 54,348 435 92 54,875 (21) (2) — (23)
Asia 156,057 790 11 156,858 — — — —
– of which: Hong Kong 118,529 10 10 118,549 — — — —
MENA 2,935 46 8 2,989 (1) — — (1)
North America 15,835 124 38 15,997 (11) — — (11)
Latin America 3,462 28 1 3,491 (5) — — (5)
At 31 Dec 2020 235,209 1,707 154 237,070 (39) (2) — (41)
Total personal lending for loans and advances to customers at amortised cost by stage distribution (continued)
Gross carrying amount Allowance for ECL
Stage 1 Stage 2 Stage 3 Total Stage 1 Stage 2 Stage 3 Total
$m $m $m $m $m $m $m $m
By portfolio
First lien residential mortgages 312,031 7,077 3,070 322,178 (39) (68) (422) (529)
– of which: interest only (including offset) 31,201 1,602 376 33,179 (6) (15) (91) (112)
– affordability (including US adjustable rate mortgages) 14,222 796 514 15,532 (3) (3) (3) (9)
Other personal lending 101,638 8,674 1,781 112,093 (544) (1,268) (793) (2,605)
– other 77,031 4,575 1,193 82,799 (229) (451) (491) (1,171)
– credit cards 22,285 3,959 524 26,768 (310) (801) (284) (1,395)
– second lien residential mortgages 750 84 55 889 (1) (6) (10) (17)
– motor vehicle finance 1,572 56 9 1,637 (4) (10) (8) (22)
At 31 Dec 2019 413,669 15,751 4,851 434,271 (583) (1,336) (1,215) (3,134)
By geography
Europe 186,561 6,854 2,335 195,750 (112) (538) (578) (1,228)
– of which: UK 153,313 5,455 1,612 160,380 (104) (513) (370) (987)
Asia 173,523 5,855 717 180,095 (223) (339) (170) (732)
– of which: Hong Kong 117,013 2,751 189 119,953 (90) (220) (44) (354)
MENA 5,671 247 299 6,217 (50) (58) (189) (297)
North America 41,148 1,930 1,238 44,316 (56) (119) (141) (316)
Latin America 6,766 865 262 7,893 (142) (282) (137) (561)
At 31 Dec 2019 413,669 15,751 4,851 434,271 (583) (1,336) (1,215) (3,134)
HSBC Holdings plc Annual Report and Accounts 2020 159
Risk review
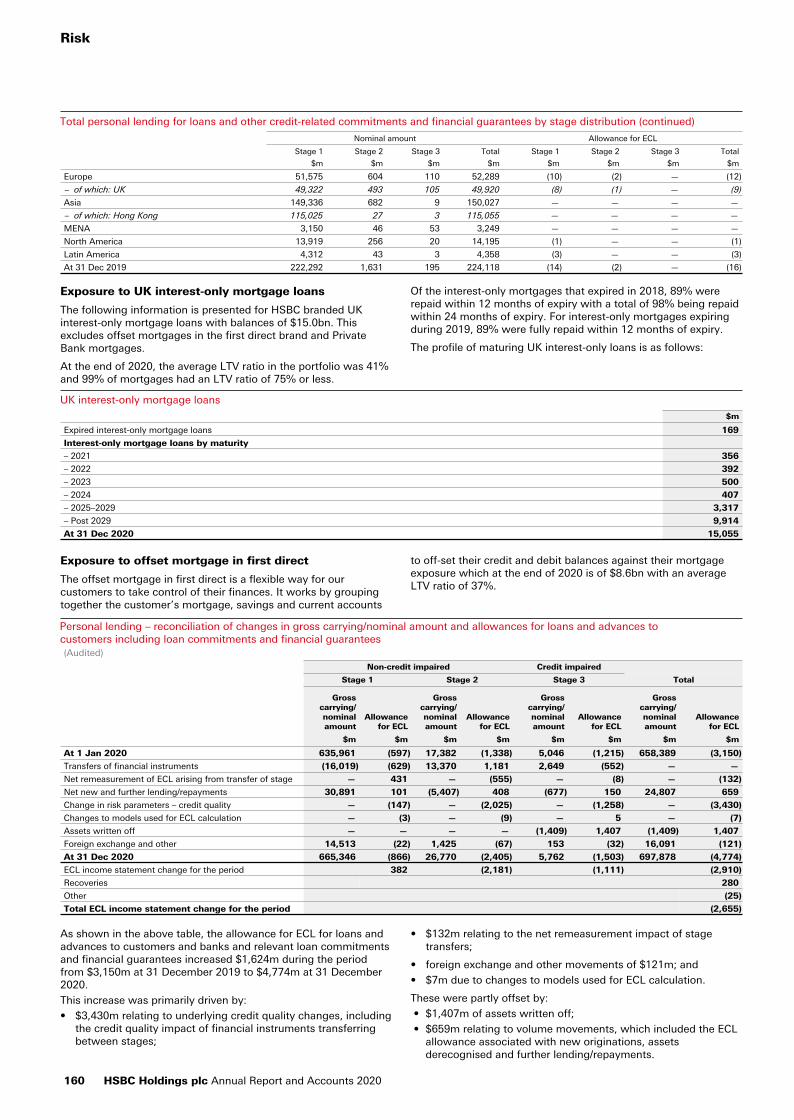
Total personal lending for loans and other credit-related commitments and financial guarantees by stage distribution (continued)
Nominal amount Allowance for ECL
Stage 1 Stage 2 Stage 3 Total Stage 1 Stage 2 Stage 3 Total
$m $m $m $m $m $m $m $m
Europe 51,575 604 110 52,289 (10) (2) — (12)
– of which: UK 49,322 493 105 49,920 (8) (1) — (9)
Asia 149,336 682 9 150,027 — — — —
– of which: Hong Kong 115,025 27 3 115,055 — — — —
MENA 3,150 46 53 3,249 — — — —
North America 13,919 256 20 14,195 (1) — — (1)
Latin America 4,312 43 3 4,358 (3) — — (3)
At 31 Dec 2019 222,292 1,631 195 224,118 (14) (2) — (16)
Exposure to UK interest-only mortgage loans
The following information is presented for HSBC branded UK interest-only mortgage loans with balances of $15.0bn. This excludes offset mortgages in the first direct brand and Private Bank mortgages.
At the end of 2020, the average LTV ratio in the portfolio was 41% and 99% of mortgages had an LTV ratio of 75% or less.
Of the interest-only mortgages that expired in 2018, 89% were repaid within 12 months of expiry with a total of 98% being repaid within 24 months of expiry. For interest-only mortgages expiring during 2019, 89% were fully repaid within 12 months of expiry.
The profile of maturing UK interest-only loans is as follows:
UK interest-only mortgage loans
$m
Expired interest-only mortgage loans 169
Interest-only mortgage loans by maturity
– 2021 356
– 2022 392
– 2023 500
– 2024 407
– 2025–2029 3,317
– Post 2029 9,914
At 31 Dec 2020 15,055
Exposure to offset mortgage in first direct
The offset mortgage in first direct is a flexible way for our customers to take control of their finances. It works by grouping together the customer’s mortgage, savings and current accounts
to off-set their credit and debit balances against their mortgage exposure which at the end of 2020 is of $8.6bn with an average LTV ratio of 37%.
Personal lending – reconciliation of changes in gross carrying/nominal amount and allowances for loans and advances to customers including loan commitments and financial guarantees(Audited)
Non-credit impaired Credit impaired
Stage 1 Stage 2 Stage 3 Total
Gross carrying/ nominal amount
Allowance for ECL
Gross carrying/ nominal amount
Allowance for ECL
Gross carrying/ nominal amount
Allowance for ECL
Gross carrying/ nominal amount
Allowance for ECL
$m $m $m $m $m $m $m $m
At 1 Jan 2020 635,961 (597) 17,382 (1,338) 5,046 (1,215) 658,389 (3,150)
Transfers of financial instruments (16,019) (629) 13,370 1,181 2,649 (552) — —
Net remeasurement of ECL arising from transfer of stage — 431 — (555) — (8) — (132)
Net new and further lending/repayments 30,891 101 (5,407) 408 (677) 150 24,807 659
Change in risk parameters – credit quality — (147) — (2,025) — (1,258) — (3,430)
Changes to models used for ECL calculation — (3) — (9) — 5 — (7)
Assets written off — — — — (1,409) 1,407 (1,409) 1,407
Foreign exchange and other 14,513 (22) 1,425 (67) 153 (32) 16,091 (121)
At 31 Dec 2020 665,346 (866) 26,770 (2,405) 5,762 (1,503) 697,878 (4,774)
ECL income statement change for the period 382 (2,181) (1,111) (2,910)
Recoveries 280
Other (25)
Total ECL income statement change for the period (2,655)
As shown in the above table, the allowance for ECL for loans and advances to customers and banks and relevant loan commitments and financial guarantees increased $1,624m during the period from $3,150m at 31 December 2019 to $4,774m at 31 December 2020.
This increase was primarily driven by:
• $3,430m relating to underlying credit quality changes, including the credit quality impact of financial instruments transferring between stages;
• $132m relating to the net remeasurement impact of stage transfers;
• foreign exchange and other movements of $121m; and
• $7m due to changes to models used for ECL calculation.
These were partly offset by:
• $1,407m of assets written off;
• $659m relating to volume movements, which included the ECL allowance associated with new originations, assets derecognised and further lending/repayments.
Risk
160 HSBC Holdings plc Annual Report and Accounts 2020
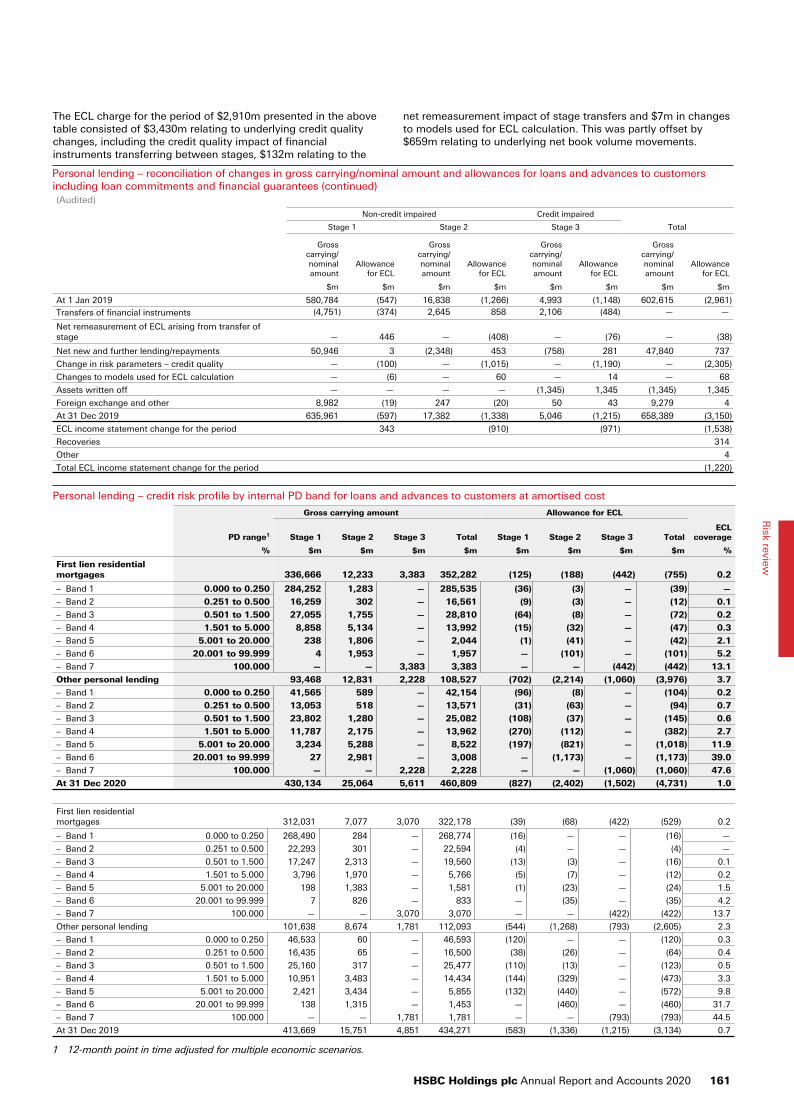
The ECL charge for the period of $2,910m presented in the above table consisted of $3,430m relating to underlying credit quality changes, including the credit quality impact of financial instruments transferring between stages, $132m relating to the
net remeasurement impact of stage transfers and $7m in changes to models used for ECL calculation. This was partly offset by $659m relating to underlying net book volume movements.
Personal lending – reconciliation of changes in gross carrying/nominal amount and allowances for loans and advances to customersincluding loan commitments and financial guarantees (continued)(Audited)
Non-credit impaired Credit impaired
Stage 1 Stage 2 Stage 3 Total
Gross carrying/ nominal amount
Allowance for ECL
Gross carrying/ nominal amount
Allowance for ECL
Gross carrying/ nominal amount
Allowance for ECL
Gross carrying/ nominal amount
Allowance for ECL
$m $m $m $m $m $m $m $m
At 1 Jan 2019 580,784 (547) 16,838 (1,266) 4,993 (1,148) 602,615 (2,961) Transfers of financial instruments (4,751) (374) 2,645 858 2,106 (484) — —
Net remeasurement of ECL arising from transfer of stage — 446 — (408) — (76) — (38)
Net new and further lending/repayments 50,946 3 (2,348) 453 (758) 281 47,840 737
Change in risk parameters – credit quality — (100) — (1,015) — (1,190) — (2,305)
Changes to models used for ECL calculation — (6) — 60 — 14 — 68
Assets written off — — — — (1,345) 1,345 (1,345) 1,345
Foreign exchange and other 8,982 (19) 247 (20) 50 43 9,279 4
At 31 Dec 2019 635,961 (597) 17,382 (1,338) 5,046 (1,215) 658,389 (3,150)
ECL income statement change for the period 343 (910) (971) (1,538)
Recoveries 314
Other 4
Total ECL income statement change for the period (1,220)
Personal lending – credit risk profile by internal PD band for loans and advances to customers at amortised cost
Gross carrying amount Allowance for ECL
PD range1 Stage 1 Stage 2 Stage 3 Total Stage 1 Stage 2 Stage 3 TotalECL
coverage
% $m $m $m $m $m $m $m $m %
First lien residential mortgages 336,666 12,233 3,383 352,282 (125) (188) (442) (755) 0.2
– Band 1 0.000 to 0.250 284,252 1,283 — 285,535 (36) (3) — (39) —
– Band 2 0.251 to 0.500 16,259 302 — 16,561 (9) (3) — (12) 0.1
– Band 3 0.501 to 1.500 27,055 1,755 — 28,810 (64) (8) — (72) 0.2
– Band 4 1.501 to 5.000 8,858 5,134 — 13,992 (15) (32) — (47) 0.3
– Band 5 5.001 to 20.000 238 1,806 — 2,044 (1) (41) — (42) 2.1
– Band 6 20.001 to 99.999 4 1,953 — 1,957 — (101) — (101) 5.2
– Band 7 100.000 — — 3,383 3,383 — — (442) (442) 13.1
Other personal lending 93,468 12,831 2,228 108,527 (702) (2,214) (1,060) (3,976) 3.7
– Band 1 0.000 to 0.250 41,565 589 — 42,154 (96) (8) — (104) 0.2
– Band 2 0.251 to 0.500 13,053 518 — 13,571 (31) (63) — (94) 0.7
– Band 3 0.501 to 1.500 23,802 1,280 — 25,082 (108) (37) — (145) 0.6
– Band 4 1.501 to 5.000 11,787 2,175 — 13,962 (270) (112) — (382) 2.7
– Band 5 5.001 to 20.000 3,234 5,288 — 8,522 (197) (821) — (1,018) 11.9
– Band 6 20.001 to 99.999 27 2,981 — 3,008 — (1,173) — (1,173) 39.0
– Band 7 100.000 — — 2,228 2,228 — — (1,060) (1,060) 47.6
At 31 Dec 2020 430,134 25,064 5,611 460,809 (827) (2,402) (1,502) (4,731) 1.0
First lien residential mortgages 312,031 7,077 3,070 322,178 (39) (68) (422) (529) 0.2
– Band 1 0.000 to 0.250 268,490 284 — 268,774 (16) — — (16) —
– Band 2 0.251 to 0.500 22,293 301 — 22,594 (4) — — (4) —
– Band 3 0.501 to 1.500 17,247 2,313 — 19,560 (13) (3) — (16) 0.1
– Band 4 1.501 to 5.000 3,796 1,970 — 5,766 (5) (7) — (12) 0.2
– Band 5 5.001 to 20.000 198 1,383 — 1,581 (1) (23) — (24) 1.5
– Band 6 20.001 to 99.999 7 826 — 833 — (35) — (35) 4.2
– Band 7 100.000 — — 3,070 3,070 — — (422) (422) 13.7
Other personal lending 101,638 8,674 1,781 112,093 (544) (1,268) (793) (2,605) 2.3
– Band 1 0.000 to 0.250 46,533 60 — 46,593 (120) — — (120) 0.3
– Band 2 0.251 to 0.500 16,435 65 — 16,500 (38) (26) — (64) 0.4
– Band 3 0.501 to 1.500 25,160 317 — 25,477 (110) (13) — (123) 0.5
– Band 4 1.501 to 5.000 10,951 3,483 — 14,434 (144) (329) — (473) 3.3
– Band 5 5.001 to 20.000 2,421 3,434 — 5,855 (132) (440) — (572) 9.8
– Band 6 20.001 to 99.999 138 1,315 — 1,453 — (460) — (460) 31.7
– Band 7 100.000 — — 1,781 1,781 — — (793) (793) 44.5
At 31 Dec 2019 413,669 15,751 4,851 434,271 (583) (1,336) (1,215) (3,134) 0.7
1 12-month point in time adjusted for multiple economic scenarios.
HSBC Holdings plc Annual Report and Accounts 2020 161
Risk review
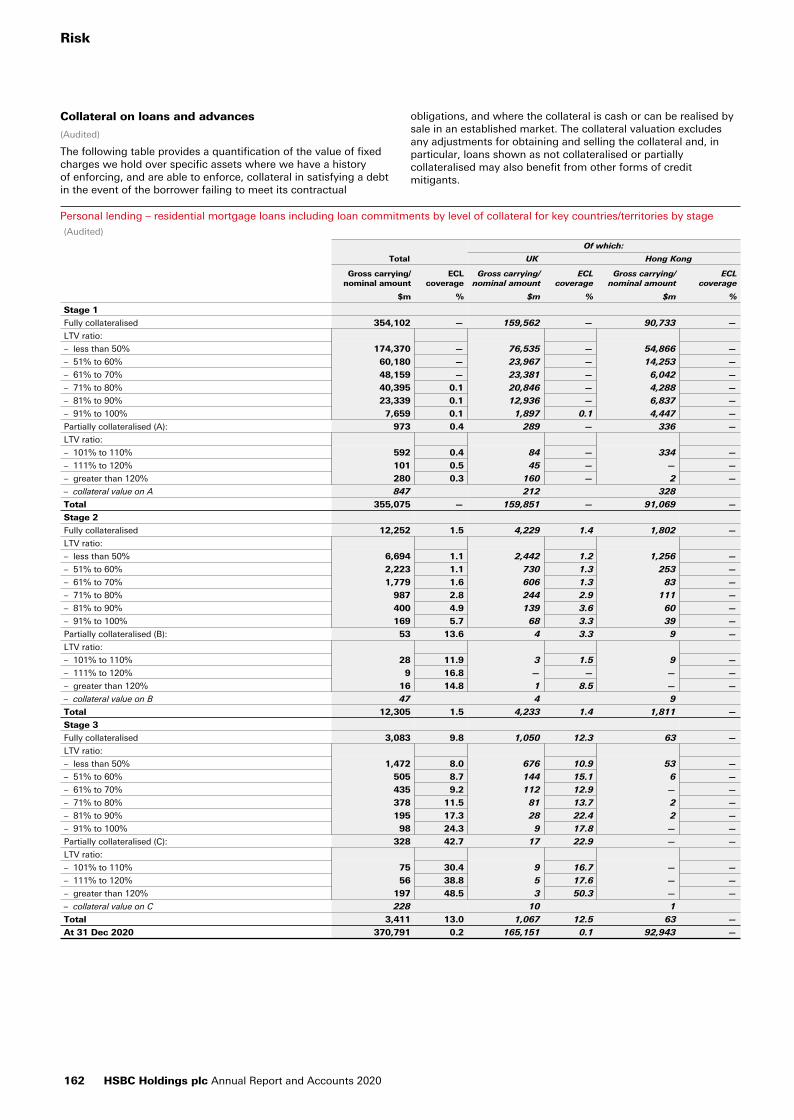
Collateral on loans and advances
(Audited)
The following table provides a quantification of the value of fixed charges we hold over specific assets where we have a history of enforcing, and are able to enforce, collateral in satisfying a debt in the event of the borrower failing to meet its contractual
obligations, and where the collateral is cash or can be realised by sale in an established market. The collateral valuation excludes any adjustments for obtaining and selling the collateral and, in particular, loans shown as not collateralised or partially collateralised may also benefit from other forms of credit mitigants.
Personal lending – residential mortgage loans including loan commitments by level of collateral for key countries/territories by stage(Audited)
Of which:
Total UK Hong Kong
Gross carrying/nominal amount
ECL coverage
Gross carrying/nominal amount
ECL coverage
Gross carrying/nominal amount
ECL coverage
$m % $m % $m %
Stage 1
Fully collateralised 354,102 — 159,562 — 90,733 —
LTV ratio:
– less than 50% 174,370 — 76,535 — 54,866 —
– 51% to 60% 60,180 — 23,967 — 14,253 —
– 61% to 70% 48,159 — 23,381 — 6,042 —
– 71% to 80% 40,395 0.1 20,846 — 4,288 —
– 81% to 90% 23,339 0.1 12,936 — 6,837 —
– 91% to 100% 7,659 0.1 1,897 0.1 4,447 —
Partially collateralised (A): 973 0.4 289 — 336 —
LTV ratio:
– 101% to 110% 592 0.4 84 — 334 —
– 111% to 120% 101 0.5 45 — — —
– greater than 120% 280 0.3 160 — 2 —
– collateral value on A 847 212 328
Total 355,075 — 159,851 — 91,069 —
Stage 2
Fully collateralised 12,252 1.5 4,229 1.4 1,802 —
LTV ratio:
– less than 50% 6,694 1.1 2,442 1.2 1,256 —
– 51% to 60% 2,223 1.1 730 1.3 253 —
– 61% to 70% 1,779 1.6 606 1.3 83 —
– 71% to 80% 987 2.8 244 2.9 111 —
– 81% to 90% 400 4.9 139 3.6 60 —
– 91% to 100% 169 5.7 68 3.3 39 —
Partially collateralised (B): 53 13.6 4 3.3 9 —
LTV ratio:
– 101% to 110% 28 11.9 3 1.5 9 —
– 111% to 120% 9 16.8 — — — —
– greater than 120% 16 14.8 1 8.5 — —
– collateral value on B 47 4 9
Total 12,305 1.5 4,233 1.4 1,811 —
Stage 3
Fully collateralised 3,083 9.8 1,050 12.3 63 —
LTV ratio:
– less than 50% 1,472 8.0 676 10.9 53 —
– 51% to 60% 505 8.7 144 15.1 6 —
– 61% to 70% 435 9.2 112 12.9 — —
– 71% to 80% 378 11.5 81 13.7 2 —
– 81% to 90% 195 17.3 28 22.4 2 —
– 91% to 100% 98 24.3 9 17.8 — —
Partially collateralised (C): 328 42.7 17 22.9 — —
LTV ratio:
– 101% to 110% 75 30.4 9 16.7 — —
– 111% to 120% 56 38.8 5 17.6 — —
– greater than 120% 197 48.5 3 50.3 — —
– collateral value on C 228 10 1
Total 3,411 13.0 1,067 12.5 63 —
At 31 Dec 2020 370,791 0.2 165,151 0.1 92,943 —
Risk
162 HSBC Holdings plc Annual Report and Accounts 2020
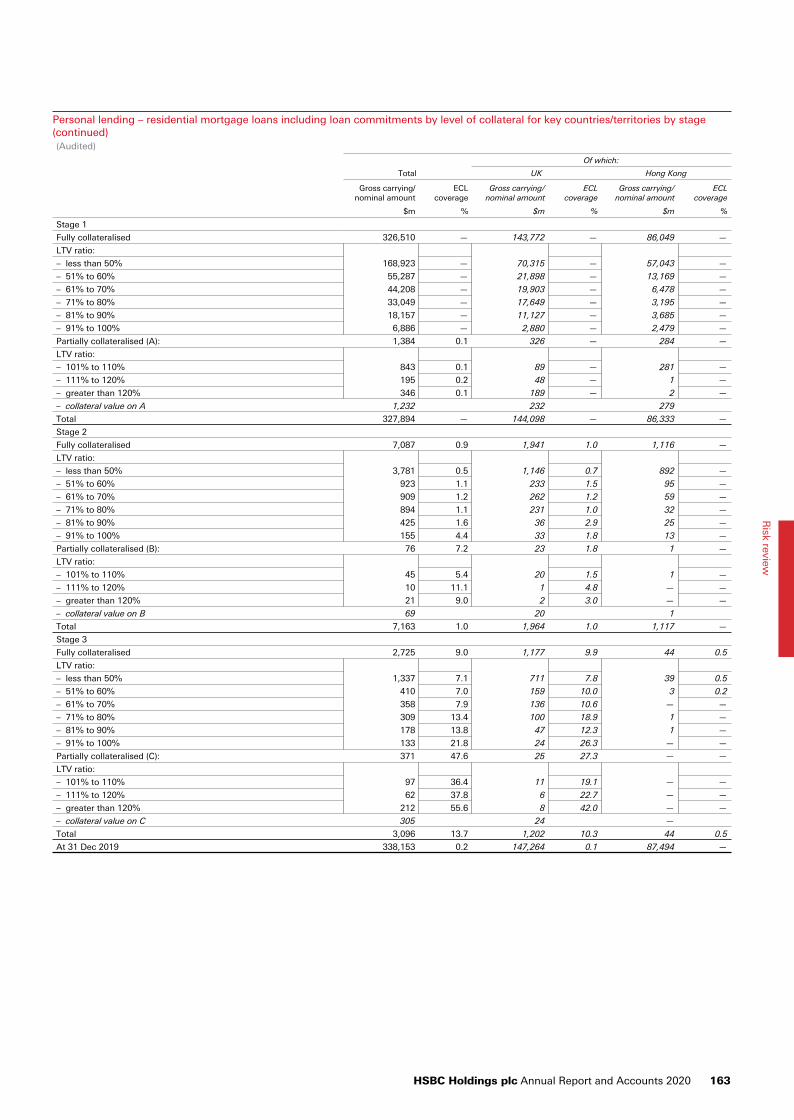
Personal lending – residential mortgage loans including loan commitments by level of collateral for key countries/territories by stage(continued)(Audited)
Of which:
Total UK Hong Kong
Gross carrying/nominal amount
ECL coverage
Gross carrying/nominal amount
ECL coverage
Gross carrying/nominal amount
ECL coverage
$m % $m % $m %
Stage 1
Fully collateralised 326,510 — 143,772 — 86,049 —
LTV ratio:
– less than 50% 168,923 — 70,315 — 57,043 —
– 51% to 60% 55,287 — 21,898 — 13,169 —
– 61% to 70% 44,208 — 19,903 — 6,478 —
– 71% to 80% 33,049 — 17,649 — 3,195 —
– 81% to 90% 18,157 — 11,127 — 3,685 —
– 91% to 100% 6,886 — 2,880 — 2,479 —
Partially collateralised (A): 1,384 0.1 326 — 284 —
LTV ratio:
– 101% to 110% 843 0.1 89 — 281 —
– 111% to 120% 195 0.2 48 — 1 —
– greater than 120% 346 0.1 189 — 2 —
– collateral value on A 1,232 232 279
Total 327,894 — 144,098 — 86,333 —
Stage 2
Fully collateralised 7,087 0.9 1,941 1.0 1,116 —
LTV ratio:
– less than 50% 3,781 0.5 1,146 0.7 892 —
– 51% to 60% 923 1.1 233 1.5 95 —
– 61% to 70% 909 1.2 262 1.2 59 —
– 71% to 80% 894 1.1 231 1.0 32 —
– 81% to 90% 425 1.6 36 2.9 25 —
– 91% to 100% 155 4.4 33 1.8 13 —
Partially collateralised (B): 76 7.2 23 1.8 1 —
LTV ratio:
– 101% to 110% 45 5.4 20 1.5 1 —
– 111% to 120% 10 11.1 1 4.8 — —
– greater than 120% 21 9.0 2 3.0 — —
– collateral value on B 69 20 1
Total 7,163 1.0 1,964 1.0 1,117 —
Stage 3
Fully collateralised 2,725 9.0 1,177 9.9 44 0.5
LTV ratio:
– less than 50% 1,337 7.1 711 7.8 39 0.5
– 51% to 60% 410 7.0 159 10.0 3 0.2
– 61% to 70% 358 7.9 136 10.6 — —
– 71% to 80% 309 13.4 100 18.9 1 —
– 81% to 90% 178 13.8 47 12.3 1 —
– 91% to 100% 133 21.8 24 26.3 — —
Partially collateralised (C): 371 47.6 25 27.3 — —
LTV ratio:
– 101% to 110% 97 36.4 11 19.1 — —
– 111% to 120% 62 37.8 6 22.7 — —
– greater than 120% 212 55.6 8 42.0 — —
– collateral value on C 305 24 —
Total 3,096 13.7 1,202 10.3 44 0.5
At 31 Dec 2019 338,153 0.2 147,264 0.1 87,494 —
HSBC Holdings plc Annual Report and Accounts 2020 163
Risk review

Supplementary information
Wholesale lending – loans and advances to customers at amortised cost by country/territory
Gross carrying amount Allowance for ECL
Corporate and
commercialOf which:
real estate1
Non-bank financial
institutions Total
Corporate and
commercialOf which:
real estate1
Non-bank financial
institutions Total
$m $m $m $m $m $m $m $m
Europe 179,104 26,505 22,176 201,280 (3,918) (632) (185) (4,103)
– UK 128,933 18,890 16,165 145,098 (2,958) (574) (147) (3,105)
– France 32,278 5,740 3,557 35,835 (645) (40) (26) (671)
– Germany 8,309 364 1,156 9,465 (125) — (3) (128)
– Switzerland 1,489 576 513 2,002 (14) — — (14)
– other 8,095 935 785 8,880 (176) (18) (9) (185)
Asia 257,942 82,359 31,637 289,579 (2,766) (162) (38) (2,804)
– Hong Kong 162,039 64,216 18,406 180,445 (1,180) (83) (15) (1,195)
– Australia 9,769 1,813 1,348 11,117 (95) (2) — (95)
– India 7,223 1,951 3,075 10,298 (90) (18) (4) (94)
– Indonesia 3,699 81 246 3,945 (229) (2) 0 (229)
– mainland China 28,443 6,251 7,128 35,571 (187) (23) (18) (205)
– Malaysia 7,228 1,968 123 7,351 (86) (27) — (86)
– Singapore 18,859 4,637 362 19,221 (782) (2) — (782)
– Taiwan 6,115 50 60 6,175 0 — — 0
– other 14,567 1,392 889 15,456 (117) (5) (1) (118)
Middle East and North Africa (excluding Saudi Arabia) 24,625 1,839 379 25,004 (1,512) (187) (9) (1,521)
– Egypt 2,162 37 13 2,175 (157) (7) (3) (160)
– UAE 13,485 1,690 170 13,655 (1,019) (176) (2) (1,021)
– other 8,978 112 196 9,174 (336) (4) (4) (340)
North America 53,386 14,491 9,292 62,678 (637) (73) (23) (660)
– US 30,425 7,722 7,708 38,133 (367) (38) (3) (370)
– Canada 22,361 6,645 1,440 23,801 (243) (27) (9) (252)
– other 600 124 144 744 (27) (8) (11) (38)
Latin America 12,031 1,833 1,096 13,127 (661) (113) (10) (671)
– Mexico 10,244 1,832 1,083 11,327 (589) (113) (10) (599)
– other 1,787 1 13 1,800 (72) — — (72)
At 31 Dec 2020 527,088 127,027 64,580 591,668 (9,494) (1,167) (265) (9,759)
Europe 175,215 26,587 26,497 201,712 (2,304) (354) (81) (2,385)
– UK 126,760 18,941 18,545 145,305 (1,629) (303) (26) (1,655)
– France 27,885 5,643 4,899 32,784 (423) (28) (52) (475)
– Germany 9,771 390 1,743 11,514 (60) — — (60)
– Switzerland 1,535 554 406 1,941 (1) — — (1)
– other 9,264 1,059 904 10,168 (191) (23) (3) (194)
Asia 267,709 85,556 32,157 299,866 (1,449) (94) (52) (1,501)
– Hong Kong 168,380 67,856 19,776 188,156 (750) (51) (40) (790)
– Australia 11,428 1,993 1,743 13,171 (70) (3) — (70)
– India 6,657 1,565 2,622 9,279 (49) (3) (1) (50)
– Indonesia 4,346 63 353 4,699 (222) (1) (2) (224)
– mainland China 26,594 5,304 5,911 32,505 (198) (29) (8) (206)
– Malaysia 6,914 1,597 230 7,144 (40) (2) — (40)
– Singapore 19,986 5,235 618 20,604 (60) (2) — (60)
– Taiwan 6,384 28 82 6,466 (2) — — (2)
– other 17,020 1,915 822 17,842 (58) (3) (1) (59)
Middle East and North Africa (excluding Saudi Arabia) 23,447 1,816 288 23,735 (1,087) (181) (13) (1,100)
– Egypt 1,889 35 16 1,905 (132) — (3) (135)
– UAE 13,697 1,695 122 13,819 (683) (179) (7) (690)
– other 7,861 86 150 8,011 (272) (2) (3) (275)
North America 59,680 15,128 10,078 69,758 (274) (43) (11) (285)
– US 34,477 8,282 8,975 43,452 (116) (14) (2) (118)
– Canada 24,427 6,556 979 25,406 (136) (10) (4) (140)
– other 776 290 124 900 (22) (19) (5) (27)
Latin America 14,448 1,665 1,685 16,133 (324) (8) (3) (327)
– Mexico 12,352 1,664 1,625 13,977 (221) (8) (3) (224)
– other 2,096 1 60 2,156 (103) — — (103)
At 31 Dec 2019 540,499 130,752 70,705 611,204 (5,438) (680) (160) (5,598)
1 Real estate lending within this disclosure corresponds solely to the industry of the borrower. Commercial real estate on page 150 includes borrowers in multiple industries investing in income-producing assets and to a lesser extent, their construction and development.
Risk
164 HSBC Holdings plc Annual Report and Accounts 2020

Personal lending – loans and advances to customers at amortised cost by country/territory
Gross carrying amount Allowance for ECL
First lien residential mortgages
Other personal
Of which: credit cards Total
First lien residential mortgages
Other personal
Of which: credit cards Total
$m $m $m $m $m $m $m $m
Europe 162,630 51,033 8,471 213,663 (364) (1,980) (859) (2,344)
– UK 154,839 19,696 8,064 174,535 (236) (1,762) (852) (1,998)
– France1 3,623 23,982 358 27,605 (43) (120) (5) (163)
– Germany — 368 — 368 — — — —
– Switzerland 1,195 6,641 — 7,836 — (79) — (79)
– other 2,973 346 49 3,319 (85) (19) (2) (104)
Asia 141,581 45,732 11,186 187,313 (80) (841) (563) (921)
– Hong Kong 91,997 31,594 7,573 123,591 — (387) (265) (387)
– Australia 20,320 602 514 20,922 (12) (47) (45) (59)
– India 933 544 215 1,477 (9) (45) (34) (54)
– Indonesia 71 288 167 359 — (37) (26) (37)
– mainland China 9,679 1,155 644 10,834 (6) (81) (73) (87)
– Malaysia 2,797 2,964 841 5,761 (41) (102) (35) (143)
– Singapore 7,394 6,537 375 13,931 — (55) (17) (55)
– Taiwan 5,407 1,069 277 6,476 — (15) (5) (15)
– other 2,983 979 580 3,962 (12) (72) (63) (84)
Middle East and North Africa (excluding Saudi Arabia) 2,192 3,341 863 5,533 (43) (275) (142) (318)
– Egypt — 360 89 360 — (8) (3) (8)
– UAE 1,841 1,158 432 2,999 (37) (163) (92) (200)
– other 351 1,823 342 2,174 (6) (104) (47) (110)
North America 41,826 4,552 1,373 46,378 (159) (266) (193) (425)
– US 18,430 2,141 1,091 20,571 (26) (226) (182) (252)
– Canada 22,241 2,230 244 24,471 (36) (31) (10) (67)
– other 1,155 181 38 1,336 (97) (9) (1) (106)
Latin America 4,053 3,869 1,406 7,922 (109) (614) (290) (723)
– Mexico 3,901 3,351 1,119 7,252 (107) (578) (268) (685)
– other 152 518 287 670 (2) (36) (22) (38)
At 31 Dec 2020 352,282 108,527 23,299 460,809 (755) (3,976) (2,047) (4,731)
Europe 145,382 50,368 10,246 195,750 (266) (962) (438) (1,228)
– UK 137,985 22,395 9,816 160,380 (159) (828) (434) (987)
– France1 3,520 21,120 376 24,640 (39) (101) (3) (140)
– Germany — 325 — 325 — — — —
– Switzerland 1,183 6,165 — 7,348 (6) (17) — (23)
– other 2,694 363 54 3,057 (62) (16) (1) (78)
Asia 131,864 48,231 12,144 180,095 (42) (690) (463) (732)
– Hong Kong 86,892 33,061 8,043 119,953 (1) (353) (242) (354)
– Australia 16,997 693 603 17,690 (5) (34) (33) (39)
– India 1,047 528 219 1,575 (5) (21) (15) (26)
– Indonesia 67 329 204 396 — (24) (18) (24)
– mainland China 8,966 1,190 656 10,156 (2) (74) (68) (76)
– Malaysia 2,840 3,200 980 6,040 (22) (73) (33) (95)
– Singapore 6,687 7,033 452 13,720 (1) (60) (19) (61)
– Taiwan 5,286 1,004 297 6,290 0 (14) (4) (14)
– other 3,082 1,193 690 4,275 (6) (37) (31) (43)
Middle East and North Africa (excluding Saudi Arabia) 2,303 3,914 1,042 6,217 (62) (235) (111) (297)
– Egypt — 346 88 346 — (3) (1) (3)
– UAE 1,920 1,462 517 3,382 (59) (121) (54) (180)
– other 383 2,106 437 2,489 (3) (111) (56) (114)
North America 39,065 5,251 1,742 44,316 (122) (194) (142) (316)
– US 17,870 2,551 1,424 20,421 (8) (160) (134) (168)
– Canada 19,997 2,495 271 22,492 (21) (25) (7) (46)
– other 1,198 205 47 1,403 (93) (9) (1) (102)
Latin America 3,564 4,329 1,594 7,893 (37) (524) (241) (561)
– Mexico 3,419 3,780 1,308 7,199 (31) (488) (224) (519)
– other 145 549 286 694 (6) (36) (17) (42)
At 31 Dec 2019 322,178 112,093 26,768 434,271 (529) (2,605) (1,395) (3,134)
1 Included in other personal lending at 31 December 2020 is $20,625m (31 December 2019: $17,585m) guaranteed by Crédit Lodgement.
HSBC Holdings plc Annual Report and Accounts 2020 165
Risk review
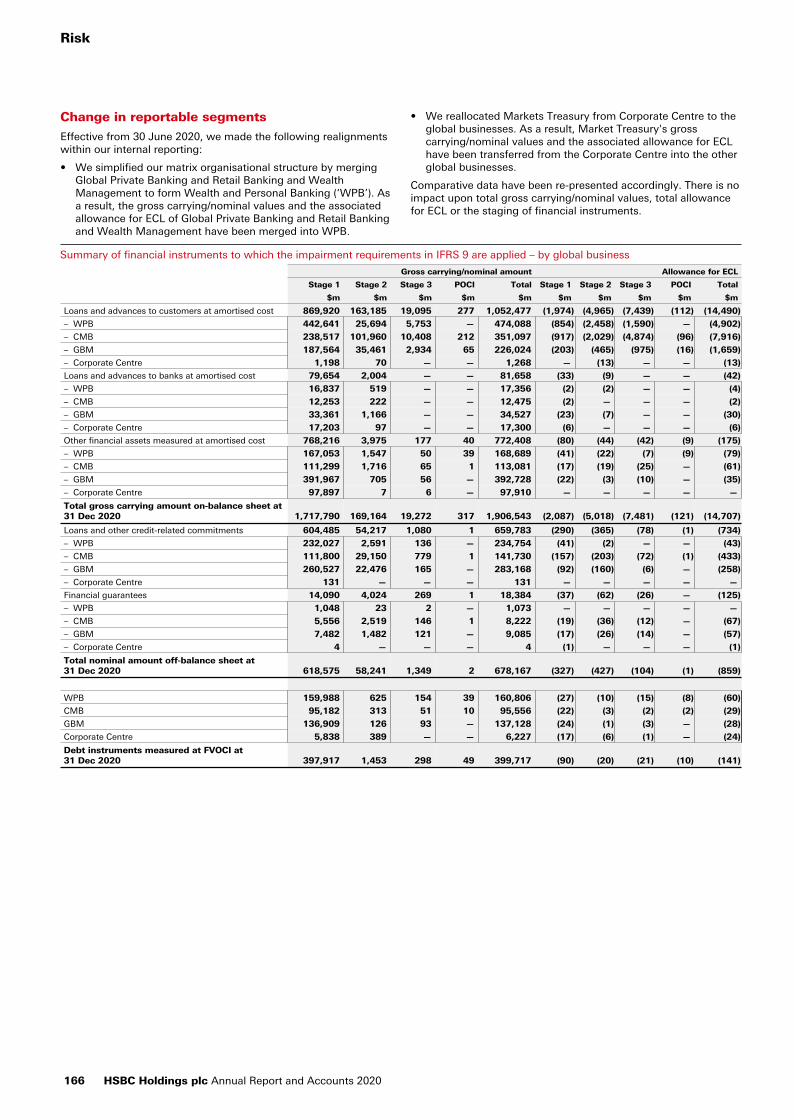
Change in reportable segments
Effective from 30 June 2020, we made the following realignments within our internal reporting:
• We simplified our matrix organisational structure by merging Global Private Banking and Retail Banking and Wealth Management to form Wealth and Personal Banking (‘WPB’). As a result, the gross carrying/nominal values and the associated allowance for ECL of Global Private Banking and Retail Banking and Wealth Management have been merged into WPB.
• We reallocated Markets Treasury from Corporate Centre to the global businesses. As a result, Market Treasury's gross carrying/nominal values and the associated allowance for ECL have been transferred from the Corporate Centre into the other global businesses.
Comparative data have been re-presented accordingly. There is no impact upon total gross carrying/nominal values, total allowance for ECL or the staging of financial instruments.
Summary of financial instruments to which the impairment requirements in IFRS 9 are applied – by global business
Gross carrying/nominal amount Allowance for ECL
Stage 1 Stage 2 Stage 3 POCI Total Stage 1 Stage 2 Stage 3 POCI Total
$m $m $m $m $m $m $m $m $m $m
Loans and advances to customers at amortised cost 869,920 163,185 19,095 277 1,052,477 (1,974) (4,965) (7,439) (112) (14,490)
– WPB 442,641 25,694 5,753 — 474,088 (854) (2,458) (1,590) — (4,902)
– CMB 238,517 101,960 10,408 212 351,097 (917) (2,029) (4,874) (96) (7,916)
– GBM 187,564 35,461 2,934 65 226,024 (203) (465) (975) (16) (1,659)
– Corporate Centre 1,198 70 — — 1,268 — (13) — — (13)
Loans and advances to banks at amortised cost 79,654 2,004 — — 81,658 (33) (9) — — (42)
– WPB 16,837 519 — — 17,356 (2) (2) — — (4)
– CMB 12,253 222 — — 12,475 (2) — — — (2)
– GBM 33,361 1,166 — — 34,527 (23) (7) — — (30)
– Corporate Centre 17,203 97 — — 17,300 (6) — — — (6)
Other financial assets measured at amortised cost 768,216 3,975 177 40 772,408 (80) (44) (42) (9) (175)
– WPB 167,053 1,547 50 39 168,689 (41) (22) (7) (9) (79)
– CMB 111,299 1,716 65 1 113,081 (17) (19) (25) — (61)
– GBM 391,967 705 56 — 392,728 (22) (3) (10) — (35)
– Corporate Centre 97,897 7 6 — 97,910 — — — — —
Total gross carrying amount on-balance sheet at 31 Dec 2020 1,717,790 169,164 19,272 317 1,906,543 (2,087) (5,018) (7,481) (121) (14,707)
Loans and other credit-related commitments 604,485 54,217 1,080 1 659,783 (290) (365) (78) (1) (734)
– WPB 232,027 2,591 136 — 234,754 (41) (2) — — (43)
– CMB 111,800 29,150 779 1 141,730 (157) (203) (72) (1) (433)
– GBM 260,527 22,476 165 — 283,168 (92) (160) (6) — (258)
– Corporate Centre 131 — — — 131 — — — — —
Financial guarantees 14,090 4,024 269 1 18,384 (37) (62) (26) — (125)
– WPB 1,048 23 2 — 1,073 — — — — —
– CMB 5,556 2,519 146 1 8,222 (19) (36) (12) — (67)
– GBM 7,482 1,482 121 — 9,085 (17) (26) (14) — (57)
– Corporate Centre 4 — — — 4 (1) — — — (1)
Total nominal amount off-balance sheet at 31 Dec 2020 618,575 58,241 1,349 2 678,167 (327) (427) (104) (1) (859)
WPB 159,988 625 154 39 160,806 (27) (10) (15) (8) (60)
CMB 95,182 313 51 10 95,556 (22) (3) (2) (2) (29)
GBM 136,909 126 93 — 137,128 (24) (1) (3) — (28)
Corporate Centre 5,838 389 — — 6,227 (17) (6) (1) — (24)
Debt instruments measured at FVOCI at 31 Dec 2020 397,917 1,453 298 49 399,717 (90) (20) (21) (10) (141)
Risk
166 HSBC Holdings plc Annual Report and Accounts 2020
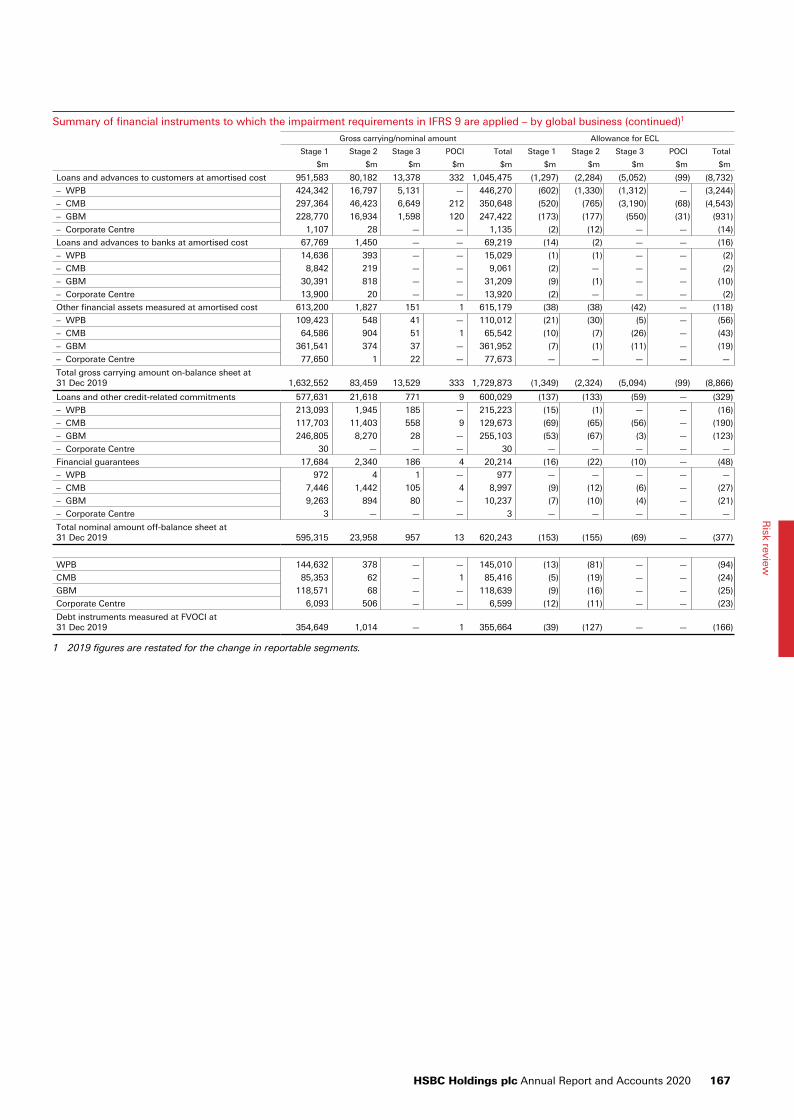
Summary of financial instruments to which the impairment requirements in IFRS 9 are applied – by global business (continued)1
Gross carrying/nominal amount Allowance for ECL
Stage 1 Stage 2 Stage 3 POCI Total Stage 1 Stage 2 Stage 3 POCI Total
$m $m $m $m $m $m $m $m $m $m
Loans and advances to customers at amortised cost 951,583 80,182 13,378 332 1,045,475 (1,297) (2,284) (5,052) (99) (8,732)
– WPB 424,342 16,797 5,131 — 446,270 (602) (1,330) (1,312) — (3,244)
– CMB 297,364 46,423 6,649 212 350,648 (520) (765) (3,190) (68) (4,543)
– GBM 228,770 16,934 1,598 120 247,422 (173) (177) (550) (31) (931)
– Corporate Centre 1,107 28 — — 1,135 (2) (12) — — (14)
Loans and advances to banks at amortised cost 67,769 1,450 — — 69,219 (14) (2) — — (16)
– WPB 14,636 393 — — 15,029 (1) (1) — — (2)
– CMB 8,842 219 — — 9,061 (2) — — — (2)
– GBM 30,391 818 — — 31,209 (9) (1) — — (10)
– Corporate Centre 13,900 20 — — 13,920 (2) — — — (2)
Other financial assets measured at amortised cost 613,200 1,827 151 1 615,179 (38) (38) (42) — (118)
– WPB 109,423 548 41 — 110,012 (21) (30) (5) — (56)
– CMB 64,586 904 51 1 65,542 (10) (7) (26) — (43)
– GBM 361,541 374 37 — 361,952 (7) (1) (11) — (19)
– Corporate Centre 77,650 1 22 — 77,673 — — — — —
Total gross carrying amount on-balance sheet at 31 Dec 2019 1,632,552 83,459 13,529 333 1,729,873 (1,349) (2,324) (5,094) (99) (8,866)
Loans and other credit-related commitments 577,631 21,618 771 9 600,029 (137) (133) (59) — (329)
– WPB 213,093 1,945 185 — 215,223 (15) (1) — — (16)
– CMB 117,703 11,403 558 9 129,673 (69) (65) (56) — (190)
– GBM 246,805 8,270 28 — 255,103 (53) (67) (3) — (123)
– Corporate Centre 30 — — — 30 — — — — —
Financial guarantees 17,684 2,340 186 4 20,214 (16) (22) (10) — (48)
– WPB 972 4 1 — 977 — — — — —
– CMB 7,446 1,442 105 4 8,997 (9) (12) (6) — (27)
– GBM 9,263 894 80 — 10,237 (7) (10) (4) — (21)
– Corporate Centre 3 — — — 3 — — — — —
Total nominal amount off-balance sheet at 31 Dec 2019 595,315 23,958 957 13 620,243 (153) (155) (69) — (377)
WPB 144,632 378 — — 145,010 (13) (81) — — (94)
CMB 85,353 62 — 1 85,416 (5) (19) — — (24)
GBM 118,571 68 — — 118,639 (9) (16) — — (25)
Corporate Centre 6,093 506 — — 6,599 (12) (11) — — (23)
Debt instruments measured at FVOCI at 31 Dec 2019 354,649 1,014 — 1 355,664 (39) (127) — — (166)
1 2019 figures are restated for the change in reportable segments.
HSBC Holdings plc Annual Report and Accounts 2020 167
Risk review
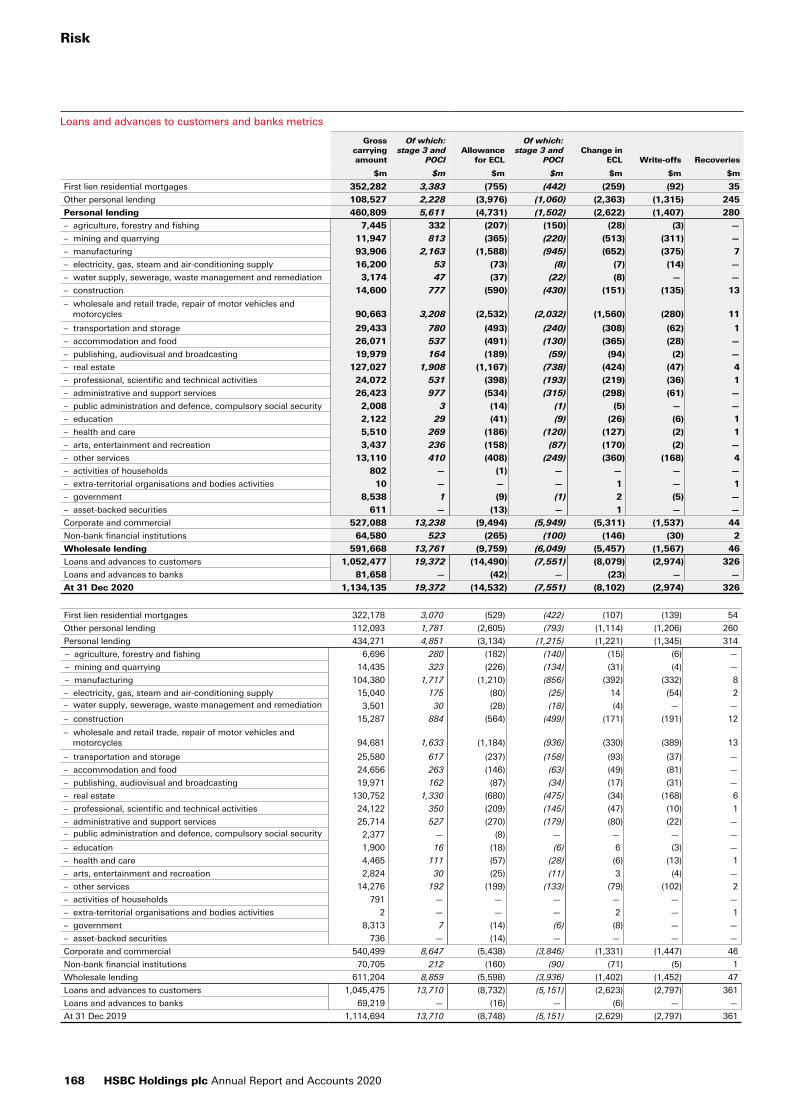
Loans and advances to customers and banks metrics
Gross carrying amount
Of which: stage 3 and
POCIAllowance
for ECL
Of which: stage 3 and
POCIChange in
ECL Write-offs Recoveries
$m $m $m $m $m $m $m
First lien residential mortgages 352,282 3,383 (755) (442) (259) (92) 35
Other personal lending 108,527 2,228 (3,976) (1,060) (2,363) (1,315) 245
Personal lending 460,809 5,611 (4,731) (1,502) (2,622) (1,407) 280
– agriculture, forestry and fishing 7,445 332 (207) (150) (28) (3) —
– mining and quarrying 11,947 813 (365) (220) (513) (311) —
– manufacturing 93,906 2,163 (1,588) (945) (652) (375) 7
– electricity, gas, steam and air-conditioning supply 16,200 53 (73) (8) (7) (14) —
– water supply, sewerage, waste management and remediation 3,174 47 (37) (22) (8) — —
– construction 14,600 777 (590) (430) (151) (135) 13
– wholesale and retail trade, repair of motor vehicles and motorcycles 90,663 3,208 (2,532) (2,032) (1,560) (280) 11
– transportation and storage 29,433 780 (493) (240) (308) (62) 1
– accommodation and food 26,071 537 (491) (130) (365) (28) —
– publishing, audiovisual and broadcasting 19,979 164 (189) (59) (94) (2) —
– real estate 127,027 1,908 (1,167) (738) (424) (47) 4
– professional, scientific and technical activities 24,072 531 (398) (193) (219) (36) 1
– administrative and support services 26,423 977 (534) (315) (298) (61) —
– public administration and defence, compulsory social security 2,008 3 (14) (1) (5) — —
– education 2,122 29 (41) (9) (26) (6) 1
– health and care 5,510 269 (186) (120) (127) (2) 1
– arts, entertainment and recreation 3,437 236 (158) (87) (170) (2) —
– other services 13,110 410 (408) (249) (360) (168) 4
– activities of households 802 — (1) — — — —
– extra-territorial organisations and bodies activities 10 — — — 1 — 1
– government 8,538 1 (9) (1) 2 (5) —
– asset-backed securities 611 — (13) — 1 — —
Corporate and commercial 527,088 13,238 (9,494) (5,949) (5,311) (1,537) 44
Non-bank financial institutions 64,580 523 (265) (100) (146) (30) 2
Wholesale lending 591,668 13,761 (9,759) (6,049) (5,457) (1,567) 46
Loans and advances to customers 1,052,477 19,372 (14,490) (7,551) (8,079) (2,974) 326
Loans and advances to banks 81,658 — (42) — (23) — —
At 31 Dec 2020 1,134,135 19,372 (14,532) (7,551) (8,102) (2,974) 326
First lien residential mortgages 322,178 3,070 (529) (422) (107) (139) 54
Other personal lending 112,093 1,781 (2,605) (793) (1,114) (1,206) 260
Personal lending 434,271 4,851 (3,134) (1,215) (1,221) (1,345) 314
– agriculture, forestry and fishing 6,696 280 (182) (140) (15) (6) —
– mining and quarrying 14,435 323 (226) (134) (31) (4) —
– manufacturing 104,380 1,717 (1,210) (856) (392) (332) 8
– electricity, gas, steam and air-conditioning supply 15,040 175 (80) (25) 14 (54) 2 – water supply, sewerage, waste management and remediation 3,501 30 (28) (18) (4) — —
– construction 15,287 884 (564) (499) (171) (191) 12
– wholesale and retail trade, repair of motor vehicles and motorcycles 94,681 1,633 (1,184) (936) (330) (389) 13
– transportation and storage 25,580 617 (237) (158) (93) (37) —
– accommodation and food 24,656 263 (146) (63) (49) (81) —
– publishing, audiovisual and broadcasting 19,971 162 (87) (34) (17) (31) —
– real estate 130,752 1,330 (680) (475) (34) (168) 6
– professional, scientific and technical activities 24,122 350 (209) (145) (47) (10) 1
– administrative and support services 25,714 527 (270) (179) (80) (22) — – public administration and defence, compulsory social security 2,377 — (8) — — — —
– education 1,900 16 (18) (6) 6 (3) —
– health and care 4,465 111 (57) (28) (6) (13) 1
– arts, entertainment and recreation 2,824 30 (25) (11) 3 (4) —
– other services 14,276 192 (199) (133) (79) (102) 2
– activities of households 791 — — — — — —
– extra-territorial organisations and bodies activities 2 — — — 2 — 1
– government 8,313 7 (14) (6) (8) — —
– asset-backed securities 736 — (14) — — — —
Corporate and commercial 540,499 8,647 (5,438) (3,846) (1,331) (1,447) 46
Non-bank financial institutions 70,705 212 (160) (90) (71) (5) 1
Wholesale lending 611,204 8,859 (5,598) (3,936) (1,402) (1,452) 47
Loans and advances to customers 1,045,475 13,710 (8,732) (5,151) (2,623) (2,797) 361
Loans and advances to banks 69,219 — (16) — (6) — —
At 31 Dec 2019 1,114,694 13,710 (8,748) (5,151) (2,629) (2,797) 361
Risk
168 HSBC Holdings plc Annual Report and Accounts 2020
HSBC Holdings(Audited)
Risk in HSBC Holdings is overseen by the HSBC Holdings Asset and Liability Management Committee (‘Holdings ALCO’). The major risks faced by HSBC Holdings are credit risk, liquidity risk and market risk (in the form of interest rate risk and foreign exchange risk).
Credit risk in HSBC Holdings primarily arises from transactions with Group subsidiaries and its investments in those subsidiaries.
In HSBC Holdings, the maximum exposure to credit risk arises from two components:
• financial instruments on the balance sheet (see page 285); and
• financial guarantees and similar contracts, where the maximum exposure is the maximum that we would have to pay if the guarantees were called upon (see Note 32).
In the case of our derivative balances, we have amounts with a legally enforceable right of offset in the case of counterparty default that are not included in the carrying value. These offsets also include collateral received in cash and other financial assets.
The total offset relating to our derivative balances was $1.7bn at 31 December 2020 (2019: $0.1bn).
The credit quality of loans and advances and financial investments, both of which consist of intra-Group lending and US Treasury bills and bonds, is assessed as ‘strong’, with 100% of the exposure being neither past due nor impaired (2019: 100%). For further details of credit quality classification, see page 121.
Treasury riskPage
Overview 169
Treasury risk management 169
Capital risk in 2020 173
Structural foreign exchange risk in 2020 179
Interest rate risk in the banking book in 2020 179
Overview
Treasury risk is the risk of having insufficient capital, liquidity or funding resources to meet financial obligations and satisfy regulatory requirements, together with the financial risks arising from the provision of pensions and other post-employment benefits to staff and their dependants. Treasury risk also includes the risk to our earnings or capital due to structural foreign exchange exposures and changes in market interest rates.
Treasury risk arises from changes to the respective resources and risk profiles driven by customer behaviour, management decisions or the external environment.
Approach and policy
(Audited)
Our objective in the management of treasury risk is to maintain appropriate levels of capital, liquidity, funding, foreign exchange and market risk to support our business strategy, and meet our regulatory and stress testing-related requirements.
Our approach to treasury management is driven by our strategic and organisational requirements, taking into account the regulatory, economic and commercial environment. We aim to maintain a strong capital and liquidity base to support the risks inherent in our business and invest in accordance with our strategy, meeting both consolidated and local regulatory requirements at all times.
Our policy is underpinned by our risk management framework, our internal capital adequacy assessment process (‘ICAAP’) and our internal liquidity adequacy assessment process (‘ILAAP’). The risk framework incorporates a number of measures aligned to our assessment of risks for both internal and regulatory purposes. These risks include credit, market, operational, pensions, structural foreign exchange, banking book foreign exchange risk and interest rate risk in the banking book.
The ICAAP and ILAAP provide an assessment of the Group’s capital and liquidity adequacy with consideration of HSBC’s risk metrics, business model, strategy, performance and planning, risks to capital, and the implications of stress testing to capital.
For further details, refer to our Pillar 3 Disclosures at 31 December 2020.
Treasury risk management
Key developments in 2020
In 2020, we established the Treasury Risk Management function. This function is a dedicated second line of defence, providing independent oversight of treasury activities across capital risk, liquidity and funding risk, structural foreign exchange risk, banking book foreign exchange risk, and interest rate risk in the banking book, together with pension risk. The approach to treasury risk management is evolving. This will operate across the Group focusing on both adequacy of capital and sufficiency of returns. In 2020, we carried out several initiatives focused on treasury risk:
• We focused on the management of capital and liquidity to ensure we responded to the unprecedented customer and capital demands arising from the Covid-19 outbreak.
• In response to a written request from the PRA, we cancelled the fourth interim dividend for 2019 of $0.21 per ordinary share. Similar requests were also made to other UK incorporated banking groups. We also announced that we would make no quarterly or interim dividend payments or accruals in respect of ordinary shares until the end of 2020. In December 2020, the PRA announced a temporary approach to shareholder distributions for 2020. After considering the requirements of the temporary approach, the Board announced an interim dividend for 2020 of $0.15 per ordinary share.
• In our response to the Covid-19 outbreak, we liaised with governments, central banks and regulatory authorities globally, to ensure there was continued support and provision of financial services to the real economy. The Bank of England’s Financial Policy Committee announced a reduction of the UK countercyclical buffer rate to 0% effective from March 2020. This change was reflected in the Group’s risk appetite statement, and together with other regulatory relief, resulted in a reduction to Group common equity tier 1 (‘CET1’) and leverage ratio requirements.
• We implemented the acceleration of some of the beneficial elements of the amendments to the Capital Requirements Regulation (‘CRR II’) that were originally scheduled for June 2021. The relevant changes impacting the fourth quarter of 2020 positions included a resetting of the transitional provisions in relation to recognising IFRS 9 provisions and the application of the revised small and medium-sized enterprises (‘SME’) supporting factor. It also included changes in the capital treatment of software intangible assets and the netting of the leverage ratio exposure measure of regular-way purchases and sales. Additionally, there were changes that enabled more favourable prudential treatment for investments in infrastructure, beneficial changes to prudent valuation adjustments and exemptions of market risk back-testing exceptions that arose due to the extraordinary market dislocations.
• The Group’s CET1 ratio was 15.9% at 31 December 2020 and the leverage ratio was 5.5%. The Group also continues to maintain the appropriate resources required for the risks to which it is exposed, while continuing to support local economies. This has been further informed by additional internal stress tests carried out in response to the Covid-19 outbreak. Capital risk management practices continued to be enhanced across the Group through the Treasury Risk Management function, focusing on both adequacy of capital and sufficiency of returns.
• The Group’s liquidity levels were impacted by the drawdown of committed facilities and buy-backs of short-term debt. However, this was offset by increases in deposits, use of central bank facilities where appropriate, and the ability to issue in the short-term markets as they stabilised. As a result of these
HSBC Holdings plc Annual Report and Accounts 2020 169
Risk review
liability enhancing actions, the Group and all entities had significant surplus liquidity, resulting in heightened liquidity coverage ratios throughout 2020. At 31 December 2020, all of the Group’s material operating entities were above regulatory minimum levels of liquidity and funding.
• Declines in interest rates and the flattening of interest rate yield curves combined to put downwards pressure on net interest income (‘NII’). Balance sheet composition changed, with a significant build-up of liquidity that was deployed in short-term investments, which were predominantly cash, hold-to-collect-and-sell securities and reverse repos. This factor, together with the lower level of interest rates, increased the sensitivity of NII to future changes in interest rates. In the scenario where interest rates fall significantly from current levels, contractual floors would dampen the effect on the average rate that would be paid on liabilities whereas the asset side of the balance sheet would be more likely to reprice lower, reducing commercial margin.
• During 2020 we worked with the fiduciaries of all our pension plans to ensure robust and timely actions were taken in response to the Covid-19 outbreak, including the smooth transition to remote working for plan providers and dealing appropriately with affected plan members. Our de-risking programmes provided protection against the volatility in financial markets that resulted from the outbreak’s economic impact.
For quantitative disclosures on capital ratios, own funds and RWAs, see pages 173 to 174. For quantitative disclosures on liquidity and funding metrics, see pages 176 to 178. For quantitative disclosures on interest rate risk in the banking book, see pages 179 to 180.
Governance and structure
The Global Head of Treasury Risk Management and Global Risk Analytics is the accountable risk steward for all treasury risks, the Group Head of Performance and Reward is the risk owner for pensions and the Group Treasurer is the risk owner for remaining treasury risks.
Capital and liquidity are the responsibility of the Group Executive Committee and directly addressed by the Group Risk Committee (‘GRC’). Treasury risks are generally managed through the Holdings Asset and Liability Management Committee (‘ALCO’) and local ALCOs and overseen by the Risk Management Meeting (‘RMM’).
The Asset, Liability and Capital Management (‘ALCM’) function is responsible for managing interest rate risk in the banking book. It maintains the transfer pricing framework and informs the Holdings ALCO of the Group’s overall banking book interest rate exposure. Banking book interest rate positions may be transferred to be managed by the Markets Treasury business, previously known as Balance Sheet Management, within the market risk limits approved by the RMM. Effective governance of Markets Treasury is supported by the dual reporting lines it has to the Chief Executive Officer of Global Banking and Markets and to the Group Treasurer, with the Global Risk function acting as a second line of defence.
Pension risk is managed by a network of local and regional pension risk forums. The Global Pensions Oversight Forum provides oversight of all pension plans sponsored by HSBC globally and is co-chaired by the Group Treasurer and the Global Head of Treasury Risk Management and Global Risk Analytics.
Capital, liquidity and funding risk management processes
Assessment and risk appetite
Our capital management policy is underpinned by a capital management framework and our ICAAP. The framework incorporates key capital risk appetites for CET1, total capital, minimum requirements for own funds and eligible liabilities (‘MREL’), and double leverage. The ICAAP is an assessment of the Group’s capital position, outlining both regulatory and internal capital resources and requirements resulting from HSBC’s business model, strategy, risk profile and management,
performance and planning, risks to capital, and the implications of stress testing. Our assessment of capital adequacy is driven by an assessment of risks. These risks include credit, market, operational, pensions, insurance, structural foreign exchange and interest rate risk in the banking book. The Group ICAAP supports the determination of the consolidated capital risk appetite and target ratios as well as enables the assessment and determination of capital requirements by regulators. Subsidiaries prepare ICAAPs based on their local regulatory regimes in order to determine their own risk appetites and ratios.
HSBC Holdings is the provider of equity capital to its subsidiaries and also provides them with non-equity capital where necessary. These investments are substantially funded by HSBC Holdings’ own capital issuance and profit retention.
HSBC Holdings seeks to maintain a prudent balance between the composition of its capital and its investments in subsidiaries, including management of double leverage. Double leverage reflects the extent to which equity investments in operating entities are funded by holding company debt. Where Group capital requirements are less than the aggregate of operating entity capital requirements, double leverage can be used to improve Group capital efficiency provided it is managed appropriately and prudently in accordance with risk appetite. Double leverage is a constraint on managing our capital position, given the complexity of the Group’s subsidiary structure and the multiple regulatory regimes under which we operate. As a matter of long-standing policy, the holding company retains a substantial portfolio of high-quality liquid assets (‘HQLA’), which at 31 December 2020 was in excess of $14bn. The portfolio of HQLA helps to mitigate holding company cash flow risk arising from double leverage, and underpins the strength of support the holding company can offer its subsidiaries in times of stress. Further mitigation is provided by additional tier 1 (‘AT1’) securities issued in excess of the regulatory requirements of our subsidiaries.
We maintain a comprehensive liquidity and funding risk management framework (‘LFRF’), which aims to enable us to withstand very severe liquidity stresses. The LFRF comprises policies, metrics and controls designed to ensure that Group and entity management have oversight of our liquidity and funding risks in order to manage them appropriately. We manage liquidity and funding risk at an operating entity level to ensure that obligations can be met in the jurisdiction where they fall due, generally without reliance on other parts of the Group. Operating entities are required to meet internal minimum requirements and any applicable regulatory requirements at all times. These requirements are assessed through the ILAAP, which ensures that operating entities have robust strategies, policies, processes and systems for the identification, measurement, management and monitoring of liquidity risk over an appropriate set of time horizons, including intra-day. The ILAAP informs the validation of risk tolerance and the setting of risk appetite. It also assesses the capability to manage liquidity and funding effectively in each major entity. These metrics are set and managed locally but are subject to robust global review and challenge to ensure consistency of approach and application of the LFRF across the Group.
Planning and performance
Capital and risk-weighted asset (‘RWA’) plans form part of the annual operating plan that is approved by the Board. Capital and RWA forecasts are submitted to the Group Executive Committee on a monthly basis, and capital and RWAs are monitored and managed against the plan. The responsibility for global capital allocation principles rests with the Group Chief Financial Officer supported by the Group Capital Management Meeting. This is a specialist forum addressing capital management, reporting into Holdings ALCO.
Through our internal governance processes, we seek to strengthen discipline over our investment and capital allocation decisions, and to ensure that returns on investment meet management’s objectives. Our strategy is to allocate capital to businesses and entities to support growth objectives where returns above internal hurdle levels have been identified and in order to meet their
Risk
170 HSBC Holdings plc Annual Report and Accounts 2020
regulatory and economic capital needs. We evaluate and manage business returns by using a return on average tangible equity measure.
Funding and liquidity plans form part of the annual operating plan that is approved by the Board. The critical Board-level appetite measures are the liquidity coverage ratio (‘LCR’) and net stable funding ratio (‘NSFR’). An appropriate funding and liquidity profile is managed through a wider set of measures:
• a minimum LCR requirement;
• a minimum NSFR requirement or other appropriate metric;
• a legal entity depositor concentration limit;
• three-month and 12-month cumulative rolling term contractual maturity limits covering deposits from banks, deposits from non-bank financial institutions and securities issued;
• a minimum LCR requirement by currency;
• intra-day liquidity;
• the application of liquidity funds transfer pricing; and
• forward-looking funding assessments.
The LCR and NSFR metrics are to be supplemented by an internal liquidity metric in 2021.
Risks to capital and liquidity
Outside the stress testing framework, other risks may be identified that have the potential to affect our RWAs and/or capital position. Downside and Upside scenarios are assessed against our capital management objectives and mitigating actions are assigned as necessary. We closely monitor future regulatory changes and continue to evaluate the impact of these upon our capital requirements. This includes the UK’s implementation of amendments to the Capital Requirements Regulation, the Basel III Reforms, and the regulatory impact from the UK’s withdrawal from the EU, as well as other regulatory statements including changes to IRB modelling requirements.
We currently estimate that these regulatory changes could potentially increase RWAs, before any mitigating actions, by approximately 5% over 2022–23. We plan to take action to substantially mitigate a significant proportion of the increase.
The Basel III Reforms introduce an output floor that will be introduced in 2023 with a five-year transitional provision. We estimate that there will be an additional RWA impact as a result of the output floor from 2027.
In parallel with regulatory developments in the EU, the UK’s PRA is reviewing the requirements for the capitalisation of structural foreign exchange risk to align to a Pillar 1 approach.
There remains a significant degree of uncertainty in the impact of the regulatory changes due to the number of national discretions and the need for further supporting technical standards to be developed. Furthermore, the impact does not take into consideration the possibility of offsets against Pillar 2, which may arise as shortcomings within Pillar 1 are addressed.
We have applied the revised regulatory treatment of software assets that became law in the EU following its publication in December 2020. We are aware that the PRA intends to consult on this change with a view to returning to full deduction. In line with the PRA’s guidance, we have therefore excluded the capital benefit of $2.1bn from our decisions about distributions.
Regulatory reporting processes and controls
There is a continued focus on the quality of regulatory reporting by the PRA and other regulators globally. We continue to strengthen our processes and controls, including commissioning independent external reviews of various aspects of regulatory reporting. As a result, there may be impacts on some of our regulatory ratios such as the CET1 and LCR. We continue to keep the PRA and other relevant regulators informed of adverse findings from external reviews and our progress in strengthening the control environment.Further details can be found in the ‘Regulatory developments’ section of the Group’s Pillar 3 Disclosures at 31 December 2020.
Stress testing and recovery planning
The Group uses stress testing to evaluate the robustness of plans and risk portfolios, and to meet the requirements for stress testing set by supervisors. Stress testing also informs the ICAAP and ILAAP and supports recovery planning in many jurisdictions. It is an important output used to evaluate how much capital and liquidity the Group requires in setting risk appetite for capital and liquidity risk. It is also used to re-evaluate business plans where analysis shows capital, liquidity and/or returns do not meet their target.
In addition to a range of internal stress tests, we are subject to supervisory stress testing in many jurisdictions. These include the programmes of the Bank of England, the US Federal Reserve Board, the European Banking Authority, the European Central Bank and the Hong Kong Monetary Authority, as well as stress tests undertaken in other jurisdictions. The results of regulatory stress testing and our internal stress tests are used when assessing our internal capital requirements through the ICAAP. The outcomes of stress testing exercises carried out by the PRA and other regulators feed into the setting of regulatory minimum ratios and buffers.
The Group and subsidiaries have established recovery plans, which set out potential options management could take in a range of stress scenarios that could result in a breach of our internal capital buffers. This is to help ensure that our capital and liquidity position can be recovered even in an extreme stress event.
During 2020, in light of the Covid-19 outbreak, we carried out additional internal testing on baseline and stressed scenarios. The results of these stress tests were considered in determining capital actions to manage the Group’s position.
Additionally, further stress testing was carried out to include scenarios relating to the impact of the UK’s withdrawal from the EU and elevated tensions between the US and China.
All entities monitor internal and external triggers that could threaten their capital, liquidity or funding positions. Entities have established recovery plans providing detailed actions that management would consider taking in a stress scenario should their positions deteriorate and threaten to breach risk appetite and regulatory minimum levels.
Details of HSBC’s liquidity and funding risk management framework (‘LFRF’) can be found in the Group’s Pillar 3 Disclosures at 31 December 2020.
Measurement of interest rate risk in the banking book processes
Assessment and risk appetite
Interest rate risk in the banking book is the risk of an adverse impact to earnings or capital due to changes in market interest rates. It is generated by our non-traded assets and liabilities, specifically loans, deposits and financial instruments that are not held for trading intent or held in order to hedge positions held with trading intent. Interest rate risk that can be economically hedged may be transferred to the Markets Treasury business. Hedging is generally executed through interest rate derivatives or fixed-rate government bonds. Any interest rate risk that Markets Treasury cannot economically hedge is not transferred and will remain within the global business where the risks originate.
The ALCM function uses a number of measures to monitor and control interest rate risk in the banking book, including:
• net interest income sensitivity;
• economic value of equity sensitivity; and
• hold-to-collect-and-sell stressed value at risk.
Net interest income sensitivity
A principal part of our management of non-traded interest rate risk is to monitor the sensitivity of expected net interest income (‘NII’) under varying interest rate scenarios (i.e. simulation modelling), where all other economic variables are held constant. This monitoring is undertaken at an entity level by local ALCOs, where entities forecast both one-year and five-year NII sensitivities across a range of interest rate scenarios.
HSBC Holdings plc Annual Report and Accounts 2020 171
Risk review
Projected NII sensitivity figures represent the effect of pro forma movements in projected yield curves based on a static balance sheet size and structure. The exception to this is where the size of the balances or repricing is deemed interest rate sensitive, for example, non-interest-bearing current account migration and fixed-rate loan early prepayment. These sensitivity calculations do not incorporate actions that would be taken by Markets Treasury or in the business that originates the risk to mitigate the effect of interest rate movements.
The NII sensitivity calculations assume that interest rates of all maturities move by the same amount in the ‘up-shock’ scenario. The sensitivity calculations in the ‘down-shock’ scenarios reflect no floors to the shocked market rates. However, customer product-specific interest rate floors are recognised where applicable. This is a change from the NII sensitivity methodology applied in the Annual Report and Accounts 2019, where market rates were floored to zero, unless the central bank rate was already negative as in the case of the euro, Swiss franc and Japanese yen.
Economic value of equity sensitivity
Economic value of equity (‘EVE’) represents the present value of the future banking book cash flows that could be distributed to equity providers under a managed run-off scenario. This equates to the current book value of equity plus the present value of future NII in this scenario. EVE can be used to assess the economic capital required to support interest rate risk in the banking book. An EVE sensitivity represents the expected movement in EVE due to pre-specified interest rate shocks, where all other economic variables are held constant. Operating entities are required to monitor EVE sensitivities as a percentage of capital resources.
Hold-to-collect-and-sell stressed value at risk
Hold-to-collect-and-sell stressed value at risk (‘VaR’) is a quantification of the potential losses to a 99% confidence level of the portfolio of securities held under a held-to-collect-and-sell business model in the Markets Treasury business. The portfolio is accounted for at fair value through other comprehensive income together with the derivatives held in designated hedging relationships with these securities. This is quantified based on the worst losses over a one-year period going back to the beginning of 2007 and the assumed holding period is 60 days.
Hold-to-collect-and-sell stressed VaR uses the same models as those used for trading book capitalisation and covers only the portfolio managed by Markets Treasury under this business model.
Other Group risks
Structural foreign exchange exposures
Structural foreign exchange exposures represent net investments in subsidiaries, branches and associates, the functional currencies of which are currencies other than the US dollar. An entity’s functional currency is normally that of the primary economic environment in which the entity operates.
Exchange differences on structural exposures are recognised in other comprehensive income (‘OCI’). We use the US dollar as our presentation currency in our consolidated financial statements because the US dollar and currencies linked to it form the major currency bloc in which we transact and fund our business. Therefore, our consolidated balance sheet is affected by exchange differences between the US dollar and all the non-US dollar functional currencies of underlying subsidiaries.
Our structural foreign exchange exposures are managed with the primary objective of ensuring, where practical, that our consolidated capital ratios and the capital ratios of individual banking subsidiaries are largely protected from the effect of changes in exchange rates. We hedge structural foreign exchange exposures only in limited circumstances.
For further details of our structural foreign exchange exposures, see page 179.
Banking book foreign exchange exposures
Banking book foreign exchange exposures arise from transactions in the banking book generating profit and loss or OCI reserves in a currency other than the reporting currency of the operating entity. Transactional foreign exchange exposure is transferred to Markets and Securities Services or Markets Treasury and managed within limits, with the exception of both exposure generating OCI reserves and limited residual foreign exchange exposure arising from timing differences or for other reasons.
HSBC Holdings risk management
As a financial services holding company, HSBC Holdings has limited market risk activities. Its activities predominantly involve maintaining sufficient capital resources to support the Group’s diverse activities; allocating these capital resources across the Group’s businesses; earning dividend and interest income on its investments in the businesses; payment of operating expenses; providing dividend payments to its equity shareholders and interest payments to providers of debt capital; and maintaining a supply of short-term liquid assets for deployment under extraordinary circumstances.
The main market risks to which HSBC Holdings is exposed are banking book interest rate risk and foreign currency risk. Exposure to these risks arises from short-term cash balances, funding positions held, loans to subsidiaries, investments in long-term financial assets and financial liabilities including debt capital issued. The objective of HSBC Holdings’ market risk management strategy is to manage volatility in capital resources, cash flows and distributable reserves that could be caused by movements in market parameters. Market risk for HSBC Holdings is monitored by Holdings ALCO in accordance with its risk appetite statement.
HSBC Holdings uses interest rate swaps and cross-currency interest rate swaps to manage the interest rate risk and foreign currency risk arising from its long-term debt issues.
During 2020, HSBC Holdings undertook a variety of liability management exercises, including the issuance of fixed-rate eligible liabilities. Group Treasury generally hedged out the fixed-rate interest rate risk on these liabilities in previous years, but as major interest rate markets remained at very low levels during 2020, this was assessed on a case-by-case basis and in some cases the decision was made to retain the fixed-rate risk.
For quantitative disclosures on interest rate risk in the banking book, see pages 179 to 180.
Pension risk management processes
Our global pensions strategy is to move from defined benefit to defined contribution plans, where local law allows and it is considered competitive to do so. In 2020 we reviewed our risk appetite metrics and in 2021 we will continue to enhance and expand these to further assist the internal monitoring of our de-risking programmes.
In defined contribution pension plans, the contributions that HSBC is required to make are known, while the ultimate pension benefit will vary, typically with investment returns achieved by investment choices made by the employee. While the market risk to HSBC of defined contribution plans is low, the Group is still exposed to operational and reputational risk.
In defined benefit pension plans, the level of pension benefit is known. Therefore, the level of contributions required by HSBC will vary due to a number of risks, including:
• investments delivering a return below that required to provide the projected plan benefits;
• the prevailing economic environment leading to corporate failures, thus triggering write-downs in asset values (both equity and debt);
• a change in either interest rates or inflation expectations, causing an increase in the value of plan liabilities; and
• plan members living longer than expected (known as longevity risk).
Risk
172 HSBC Holdings plc Annual Report and Accounts 2020
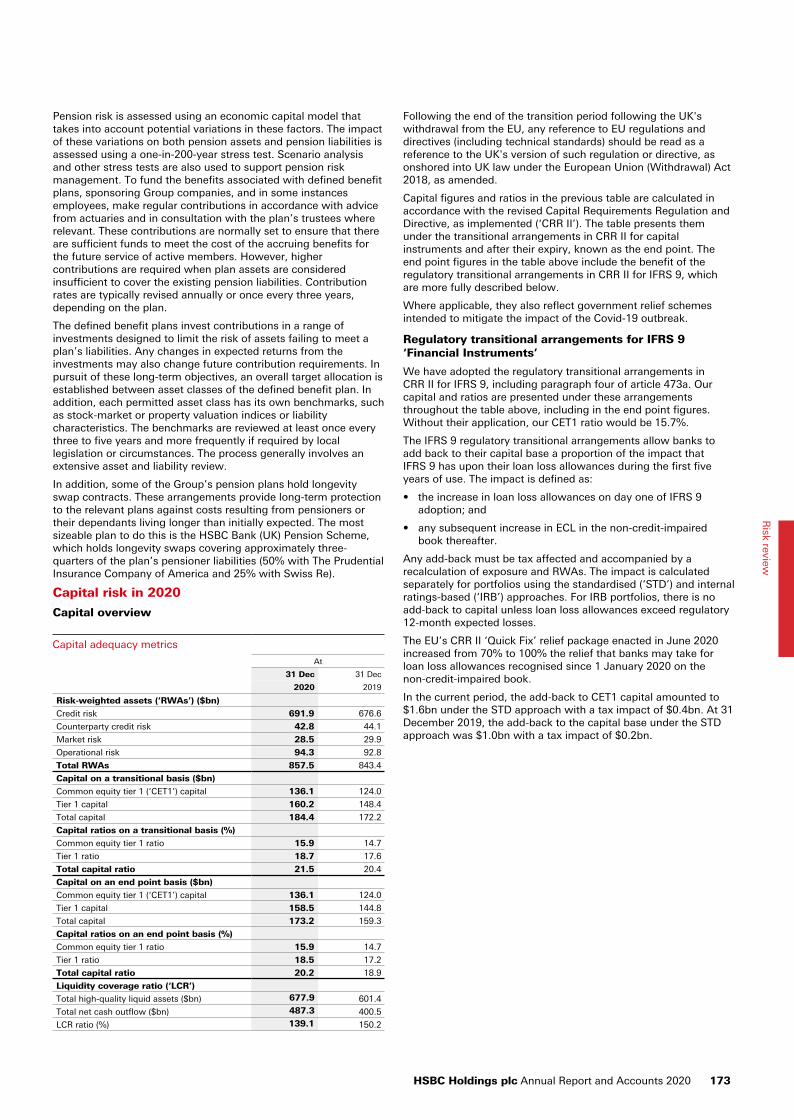
Pension risk is assessed using an economic capital model that takes into account potential variations in these factors. The impact of these variations on both pension assets and pension liabilities is assessed using a one-in-200-year stress test. Scenario analysis and other stress tests are also used to support pension risk management. To fund the benefits associated with defined benefit plans, sponsoring Group companies, and in some instances employees, make regular contributions in accordance with advice from actuaries and in consultation with the plan’s trustees where relevant. These contributions are normally set to ensure that there are sufficient funds to meet the cost of the accruing benefits for the future service of active members. However, higher contributions are required when plan assets are considered insufficient to cover the existing pension liabilities. Contribution rates are typically revised annually or once every three years, depending on the plan.
The defined benefit plans invest contributions in a range of investments designed to limit the risk of assets failing to meet a plan’s liabilities. Any changes in expected returns from the investments may also change future contribution requirements. In pursuit of these long-term objectives, an overall target allocation is established between asset classes of the defined benefit plan. In addition, each permitted asset class has its own benchmarks, such as stock-market or property valuation indices or liability characteristics. The benchmarks are reviewed at least once every three to five years and more frequently if required by local legislation or circumstances. The process generally involves an extensive asset and liability review.
In addition, some of the Group’s pension plans hold longevity swap contracts. These arrangements provide long-term protection to the relevant plans against costs resulting from pensioners or their dependants living longer than initially expected. The most sizeable plan to do this is the HSBC Bank (UK) Pension Scheme, which holds longevity swaps covering approximately three-quarters of the plan’s pensioner liabilities (50% with The Prudential Insurance Company of America and 25% with Swiss Re).
Capital risk in 2020
Capital overview
Capital adequacy metrics
At
31 Dec 31 Dec
2020 2019
Risk-weighted assets (‘RWAs’) ($bn)
Credit risk 691.9 676.6
Counterparty credit risk 42.8 44.1
Market risk 28.5 29.9
Operational risk 94.3 92.8
Total RWAs 857.5 843.4
Capital on a transitional basis ($bn)
Common equity tier 1 (‘CET1’) capital 136.1 124.0
Tier 1 capital 160.2 148.4
Total capital 184.4 172.2
Capital ratios on a transitional basis (%)
Common equity tier 1 ratio 15.9 14.7
Tier 1 ratio 18.7 17.6
Total capital ratio 21.5 20.4
Capital on an end point basis ($bn)
Common equity tier 1 (‘CET1’) capital 136.1 124.0
Tier 1 capital 158.5 144.8
Total capital 173.2 159.3
Capital ratios on an end point basis (%)
Common equity tier 1 ratio 15.9 14.7
Tier 1 ratio 18.5 17.2
Total capital ratio 20.2 18.9
Liquidity coverage ratio (‘LCR’)
Total high-quality liquid assets ($bn) 677.9 601.4
Total net cash outflow ($bn) 487.3 400.5
LCR ratio (%) 139.1 150.2
Following the end of the transition period following the UK's withdrawal from the EU, any reference to EU regulations and directives (including technical standards) should be read as a reference to the UK's version of such regulation or directive, as onshored into UK law under the European Union (Withdrawal) Act 2018, as amended.
Capital figures and ratios in the previous table are calculated in accordance with the revised Capital Requirements Regulation and Directive, as implemented (‘CRR II’). The table presents them under the transitional arrangements in CRR II for capital instruments and after their expiry, known as the end point. The end point figures in the table above include the benefit of the regulatory transitional arrangements in CRR II for IFRS 9, which are more fully described below.
Where applicable, they also reflect government relief schemes intended to mitigate the impact of the Covid-19 outbreak.
Regulatory transitional arrangements for IFRS 9 ‘Financial Instruments’
We have adopted the regulatory transitional arrangements in CRR II for IFRS 9, including paragraph four of article 473a. Our capital and ratios are presented under these arrangements throughout the table above, including in the end point figures. Without their application, our CET1 ratio would be 15.7%.
The IFRS 9 regulatory transitional arrangements allow banks to add back to their capital base a proportion of the impact that IFRS 9 has upon their loan loss allowances during the first five years of use. The impact is defined as:
• the increase in loan loss allowances on day one of IFRS 9 adoption; and
• any subsequent increase in ECL in the non-credit-impaired book thereafter.
Any add-back must be tax affected and accompanied by a recalculation of exposure and RWAs. The impact is calculated separately for portfolios using the standardised (‘STD’) and internal ratings-based (‘IRB’) approaches. For IRB portfolios, there is no add-back to capital unless loan loss allowances exceed regulatory 12-month expected losses.
The EU’s CRR II ‘Quick Fix’ relief package enacted in June 2020 increased from 70% to 100% the relief that banks may take for loan loss allowances recognised since 1 January 2020 on thenon-credit-impaired book.
In the current period, the add-back to CET1 capital amounted to $1.6bn under the STD approach with a tax impact of $0.4bn. At 31 December 2019, the add-back to the capital base under the STD approach was $1.0bn with a tax impact of $0.2bn.
HSBC Holdings plc Annual Report and Accounts 2020 173
Risk review
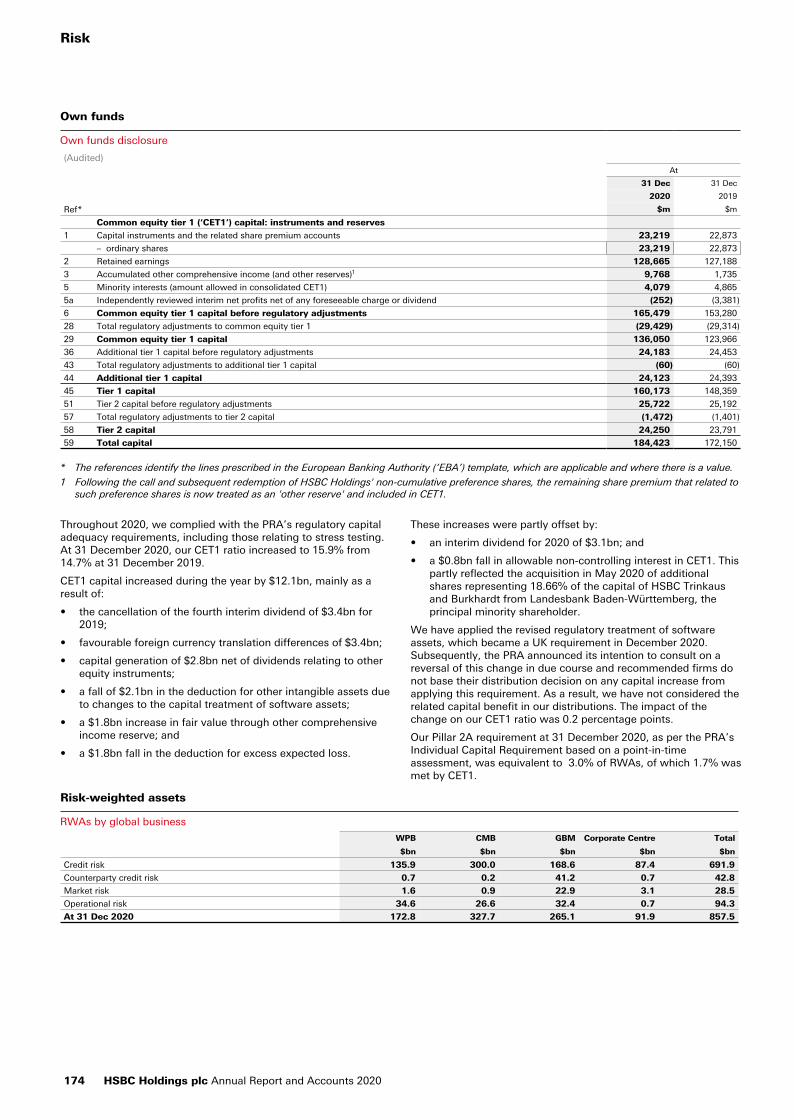
Own funds
Own funds disclosure
(Audited)At
31 Dec 31 Dec
2020 2019
Ref* $m $m
Common equity tier 1 (‘CET1’) capital: instruments and reserves
1 Capital instruments and the related share premium accounts 23,219 22,873
– ordinary shares 23,219 22,873
2 Retained earnings 128,665 127,188
3 Accumulated other comprehensive income (and other reserves)1 9,768 1,735
5 Minority interests (amount allowed in consolidated CET1) 4,079 4,865
5a Independently reviewed interim net profits net of any foreseeable charge or dividend (252) (3,381)
6 Common equity tier 1 capital before regulatory adjustments 165,479 153,280
28 Total regulatory adjustments to common equity tier 1 (29,429) (29,314)
29 Common equity tier 1 capital 136,050 123,966
36 Additional tier 1 capital before regulatory adjustments 24,183 24,453
43 Total regulatory adjustments to additional tier 1 capital (60) (60)
44 Additional tier 1 capital 24,123 24,393
45 Tier 1 capital 160,173 148,359
51 Tier 2 capital before regulatory adjustments 25,722 25,192
57 Total regulatory adjustments to tier 2 capital (1,472) (1,401)
58 Tier 2 capital 24,250 23,791
59 Total capital 184,423 172,150
* The references identify the lines prescribed in the European Banking Authority (‘EBA’) template, which are applicable and where there is a value.
1 Following the call and subsequent redemption of HSBC Holdings' non-cumulative preference shares, the remaining share premium that related to such preference shares is now treated as an 'other reserve' and included in CET1.
Throughout 2020, we complied with the PRA’s regulatory capital adequacy requirements, including those relating to stress testing. At 31 December 2020, our CET1 ratio increased to 15.9% from 14.7% at 31 December 2019.
CET1 capital increased during the year by $12.1bn, mainly as a result of:
• the cancellation of the fourth interim dividend of $3.4bn for 2019;
• favourable foreign currency translation differences of $3.4bn;
• capital generation of $2.8bn net of dividends relating to other equity instruments;
• a fall of $2.1bn in the deduction for other intangible assets due to changes to the capital treatment of software assets;
• a $1.8bn increase in fair value through other comprehensive income reserve; and
• a $1.8bn fall in the deduction for excess expected loss.
These increases were partly offset by:
• an interim dividend for 2020 of $3.1bn; and
• a $0.8bn fall in allowable non-controlling interest in CET1. This partly reflected the acquisition in May 2020 of additional shares representing 18.66% of the capital of HSBC Trinkaus and Burkhardt from Landesbank Baden-Württemberg, the principal minority shareholder.
We have applied the revised regulatory treatment of software assets, which became a UK requirement in December 2020. Subsequently, the PRA announced its intention to consult on a reversal of this change in due course and recommended firms do not base their distribution decision on any capital increase from applying this requirement. As a result, we have not considered the related capital benefit in our distributions. The impact of the change on our CET1 ratio was 0.2 percentage points.
Our Pillar 2A requirement at 31 December 2020, as per the PRA’s Individual Capital Requirement based on a point-in-time assessment, was equivalent to 3.0% of RWAs, of which 1.7% was met by CET1.
Risk-weighted assets
RWAs by global business
WPB CMB GBM Corporate Centre Total
$bn $bn $bn $bn $bn
Credit risk 135.9 300.0 168.6 87.4 691.9
Counterparty credit risk 0.7 0.2 41.2 0.7 42.8
Market risk 1.6 0.9 22.9 3.1 28.5
Operational risk 34.6 26.6 32.4 0.7 94.3
At 31 Dec 2020 172.8 327.7 265.1 91.9 857.5
Risk
174 HSBC Holdings plc Annual Report and Accounts 2020
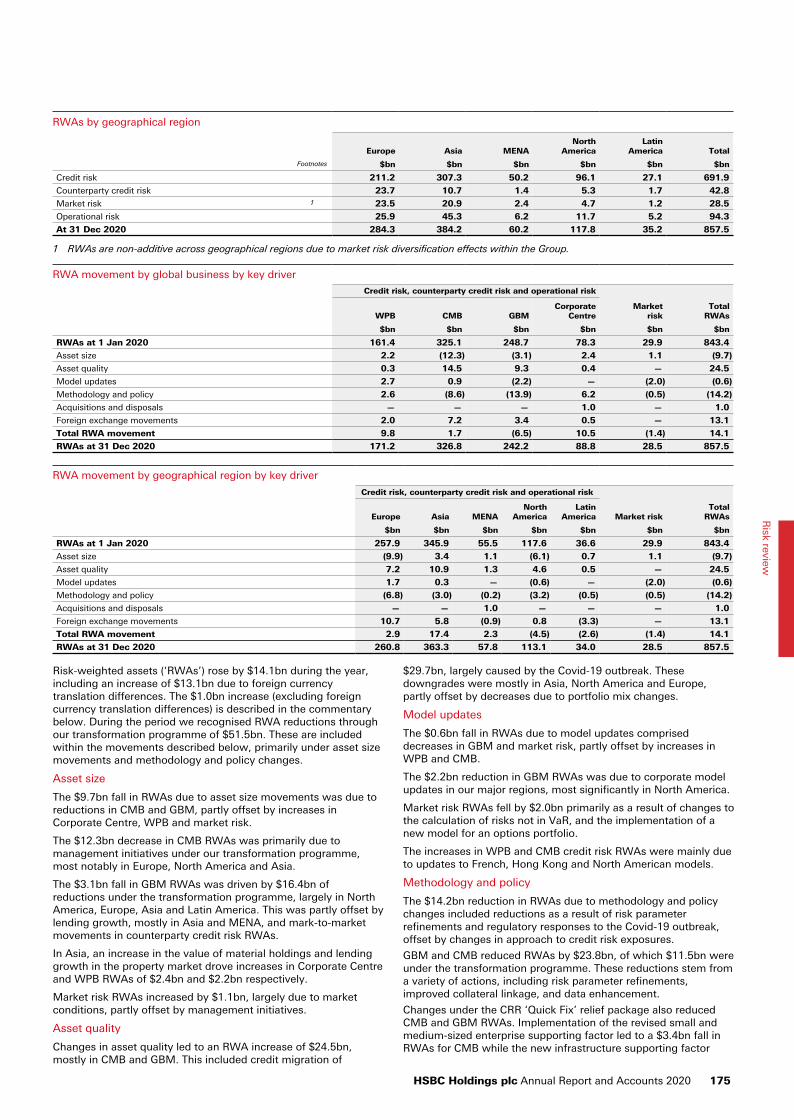
RWAs by geographical region
Europe Asia MENANorth
AmericaLatin
America Total
Footnotes $bn $bn $bn $bn $bn $bn
Credit risk 211.2 307.3 50.2 96.1 27.1 691.9
Counterparty credit risk 23.7 10.7 1.4 5.3 1.7 42.8
Market risk 1 23.5 20.9 2.4 4.7 1.2 28.5
Operational risk 25.9 45.3 6.2 11.7 5.2 94.3
At 31 Dec 2020 284.3 384.2 60.2 117.8 35.2 857.5
1 RWAs are non-additive across geographical regions due to market risk diversification effects within the Group.
RWA movement by global business by key driver
Credit risk, counterparty credit risk and operational risk
WPB CMB GBMCorporate
CentreMarket
riskTotal
RWAs
$bn $bn $bn $bn $bn $bn
RWAs at 1 Jan 2020 161.4 325.1 248.7 78.3 29.9 843.4
Asset size 2.2 (12.3) (3.1) 2.4 1.1 (9.7)
Asset quality 0.3 14.5 9.3 0.4 — 24.5
Model updates 2.7 0.9 (2.2) — (2.0) (0.6)
Methodology and policy 2.6 (8.6) (13.9) 6.2 (0.5) (14.2)
Acquisitions and disposals — — — 1.0 — 1.0
Foreign exchange movements 2.0 7.2 3.4 0.5 — 13.1
Total RWA movement 9.8 1.7 (6.5) 10.5 (1.4) 14.1
RWAs at 31 Dec 2020 171.2 326.8 242.2 88.8 28.5 857.5
RWA movement by geographical region by key driver
Credit risk, counterparty credit risk and operational risk
Europe Asia MENANorth
AmericaLatin
America Market riskTotal
RWAs
$bn $bn $bn $bn $bn $bn $bn
RWAs at 1 Jan 2020 257.9 345.9 55.5 117.6 36.6 29.9 843.4
Asset size (9.9) 3.4 1.1 (6.1) 0.7 1.1 (9.7)
Asset quality 7.2 10.9 1.3 4.6 0.5 — 24.5
Model updates 1.7 0.3 — (0.6) — (2.0) (0.6)
Methodology and policy (6.8) (3.0) (0.2) (3.2) (0.5) (0.5) (14.2)
Acquisitions and disposals — — 1.0 — — — 1.0
Foreign exchange movements 10.7 5.8 (0.9) 0.8 (3.3) — 13.1
Total RWA movement 2.9 17.4 2.3 (4.5) (2.6) (1.4) 14.1
RWAs at 31 Dec 2020 260.8 363.3 57.8 113.1 34.0 28.5 857.5
Risk-weighted assets (‘RWAs’) rose by $14.1bn during the year, including an increase of $13.1bn due to foreign currency translation differences. The $1.0bn increase (excluding foreign currency translation differences) is described in the commentary below. During the period we recognised RWA reductions through our transformation programme of $51.5bn. These are included within the movements described below, primarily under asset size movements and methodology and policy changes.
Asset size
The $9.7bn fall in RWAs due to asset size movements was due to reductions in CMB and GBM, partly offset by increases in Corporate Centre, WPB and market risk.
The $12.3bn decrease in CMB RWAs was primarily due to management initiatives under our transformation programme, most notably in Europe, North America and Asia.
The $3.1bn fall in GBM RWAs was driven by $16.4bn of reductions under the transformation programme, largely in North America, Europe, Asia and Latin America. This was partly offset by lending growth, mostly in Asia and MENA, and mark-to-market movements in counterparty credit risk RWAs.
In Asia, an increase in the value of material holdings and lending growth in the property market drove increases in Corporate Centre and WPB RWAs of $2.4bn and $2.2bn respectively.
Market risk RWAs increased by $1.1bn, largely due to market conditions, partly offset by management initiatives.
Asset quality
Changes in asset quality led to an RWA increase of $24.5bn, mostly in CMB and GBM. This included credit migration of
$29.7bn, largely caused by the Covid-19 outbreak. These downgrades were mostly in Asia, North America and Europe, partly offset by decreases due to portfolio mix changes.
Model updates
The $0.6bn fall in RWAs due to model updates comprised decreases in GBM and market risk, partly offset by increases in WPB and CMB.
The $2.2bn reduction in GBM RWAs was due to corporate model updates in our major regions, most significantly in North America.
Market risk RWAs fell by $2.0bn primarily as a result of changes to the calculation of risks not in VaR, and the implementation of a new model for an options portfolio.
The increases in WPB and CMB credit risk RWAs were mainly due to updates to French, Hong Kong and North American models.
Methodology and policy
The $14.2bn reduction in RWAs due to methodology and policy changes included reductions as a result of risk parameter refinements and regulatory responses to the Covid-19 outbreak, offset by changes in approach to credit risk exposures.
GBM and CMB reduced RWAs by $23.8bn, of which $11.5bn were under the transformation programme. These reductions stem from a variety of actions, including risk parameter refinements, improved collateral linkage, and data enhancement.
Changes under the CRR ‘Quick Fix’ relief package also reduced CMB and GBM RWAs. Implementation of the revised small and medium-sized enterprise supporting factor led to a $3.4bn fall in RWAs for CMB while the new infrastructure supporting factor
HSBC Holdings plc Annual Report and Accounts 2020 175
Risk review
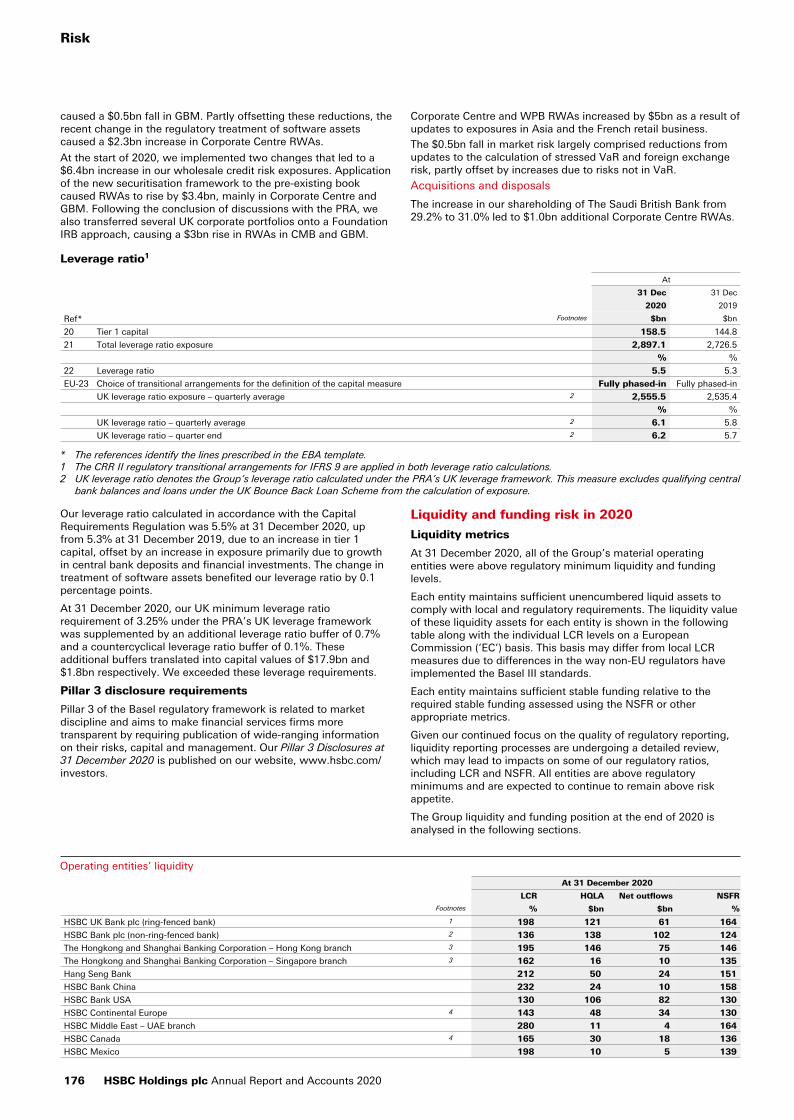
caused a $0.5bn fall in GBM. Partly offsetting these reductions, the recent change in the regulatory treatment of software assets caused a $2.3bn increase in Corporate Centre RWAs.
At the start of 2020, we implemented two changes that led to a $6.4bn increase in our wholesale credit risk exposures. Application of the new securitisation framework to the pre-existing book caused RWAs to rise by $3.4bn, mainly in Corporate Centre and GBM. Following the conclusion of discussions with the PRA, we also transferred several UK corporate portfolios onto a Foundation IRB approach, causing a $3bn rise in RWAs in CMB and GBM.
Corporate Centre and WPB RWAs increased by $5bn as a result of updates to exposures in Asia and the French retail business.
The $0.5bn fall in market risk largely comprised reductions from updates to the calculation of stressed VaR and foreign exchange risk, partly offset by increases due to risks not in VaR.
Acquisitions and disposals
The increase in our shareholding of The Saudi British Bank from 29.2% to 31.0% led to $1.0bn additional Corporate Centre RWAs.
Leverage ratio1
At
31 Dec 31 Dec
2020 2019
Ref* Footnotes $bn $bn
20 Tier 1 capital 158.5 144.8
21 Total leverage ratio exposure 2,897.1 2,726.5
% %
22 Leverage ratio 5.5 5.3
EU-23 Choice of transitional arrangements for the definition of the capital measure Fully phased-in Fully phased-in
UK leverage ratio exposure – quarterly average 2 2,555.5 2,535.4
% %
UK leverage ratio – quarterly average 2 6.1 5.8
UK leverage ratio – quarter end 2 6.2 5.7
* The references identify the lines prescribed in the EBA template.1 The CRR II regulatory transitional arrangements for IFRS 9 are applied in both leverage ratio calculations.2 UK leverage ratio denotes the Group’s leverage ratio calculated under the PRA’s UK leverage framework. This measure excludes qualifying central
bank balances and loans under the UK Bounce Back Loan Scheme from the calculation of exposure.
Our leverage ratio calculated in accordance with the Capital Requirements Regulation was 5.5% at 31 December 2020, up from 5.3% at 31 December 2019, due to an increase in tier 1 capital, offset by an increase in exposure primarily due to growth in central bank deposits and financial investments. The change in treatment of software assets benefited our leverage ratio by 0.1 percentage points.
At 31 December 2020, our UK minimum leverage ratio requirement of 3.25% under the PRA’s UK leverage framework was supplemented by an additional leverage ratio buffer of 0.7% and a countercyclical leverage ratio buffer of 0.1%. These additional buffers translated into capital values of $17.9bn and $1.8bn respectively. We exceeded these leverage requirements.
Pillar 3 disclosure requirements
Pillar 3 of the Basel regulatory framework is related to market discipline and aims to make financial services firms more transparent by requiring publication of wide-ranging information on their risks, capital and management. Our Pillar 3 Disclosures at 31 December 2020 is published on our website, www.hsbc.com/investors.
Liquidity and funding risk in 2020
Liquidity metrics
At 31 December 2020, all of the Group’s material operating entities were above regulatory minimum liquidity and funding levels.
Each entity maintains sufficient unencumbered liquid assets to comply with local and regulatory requirements. The liquidity value of these liquidity assets for each entity is shown in the following table along with the individual LCR levels on a European Commission (‘EC’) basis. This basis may differ from local LCR measures due to differences in the way non-EU regulators have implemented the Basel III standards.
Each entity maintains sufficient stable funding relative to the required stable funding assessed using the NSFR or other appropriate metrics.
Given our continued focus on the quality of regulatory reporting, liquidity reporting processes are undergoing a detailed review, which may lead to impacts on some of our regulatory ratios, including LCR and NSFR. All entities are above regulatory minimums and are expected to continue to remain above risk appetite.
The Group liquidity and funding position at the end of 2020 is analysed in the following sections.
Operating entities’ liquidity
At 31 December 2020
LCR HQLA Net outflows NSFR
Footnotes % $bn $bn %
HSBC UK Bank plc (ring-fenced bank) 1 198 121 61 164
HSBC Bank plc (non-ring-fenced bank) 2 136 138 102 124
The Hongkong and Shanghai Banking Corporation – Hong Kong branch 3 195 146 75 146
The Hongkong and Shanghai Banking Corporation – Singapore branch 3 162 16 10 135
Hang Seng Bank 212 50 24 151
HSBC Bank China 232 24 10 158
HSBC Bank USA 130 106 82 130
HSBC Continental Europe 4 143 48 34 130
HSBC Middle East – UAE branch 280 11 4 164
HSBC Canada 4 165 30 18 136
HSBC Mexico 198 10 5 139
Risk
176 HSBC Holdings plc Annual Report and Accounts 2020
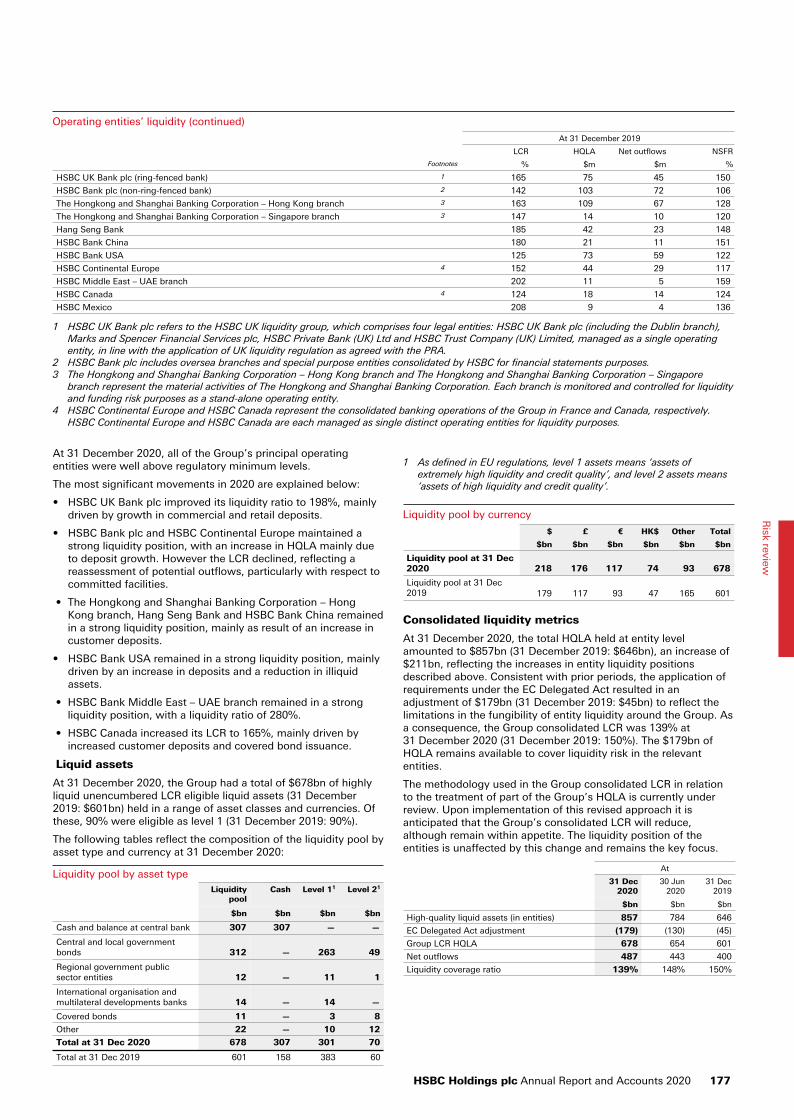
Operating entities’ liquidity (continued)
At 31 December 2019
LCR HQLA Net outflows NSFR
Footnotes % $m $m %
HSBC UK Bank plc (ring-fenced bank) 1 165 75 45 150
HSBC Bank plc (non-ring-fenced bank) 2 142 103 72 106
The Hongkong and Shanghai Banking Corporation – Hong Kong branch 3 163 109 67 128
The Hongkong and Shanghai Banking Corporation – Singapore branch 3 147 14 10 120
Hang Seng Bank 185 42 23 148
HSBC Bank China 180 21 11 151
HSBC Bank USA 125 73 59 122
HSBC Continental Europe 4 152 44 29 117
HSBC Middle East – UAE branch 202 11 5 159
HSBC Canada 4 124 18 14 124
HSBC Mexico 208 9 4 136
1 HSBC UK Bank plc refers to the HSBC UK liquidity group, which comprises four legal entities: HSBC UK Bank plc (including the Dublin branch), Marks and Spencer Financial Services plc, HSBC Private Bank (UK) Ltd and HSBC Trust Company (UK) Limited, managed as a single operating entity, in line with the application of UK liquidity regulation as agreed with the PRA.
2 HSBC Bank plc includes oversea branches and special purpose entities consolidated by HSBC for financial statements purposes.3 The Hongkong and Shanghai Banking Corporation – Hong Kong branch and The Hongkong and Shanghai Banking Corporation – Singapore
branch represent the material activities of The Hongkong and Shanghai Banking Corporation. Each branch is monitored and controlled for liquidity and funding risk purposes as a stand-alone operating entity.
4 HSBC Continental Europe and HSBC Canada represent the consolidated banking operations of the Group in France and Canada, respectively. HSBC Continental Europe and HSBC Canada are each managed as single distinct operating entities for liquidity purposes.
At 31 December 2020, all of the Group’s principal operating entities were well above regulatory minimum levels.
The most significant movements in 2020 are explained below:
• HSBC UK Bank plc improved its liquidity ratio to 198%, mainly driven by growth in commercial and retail deposits.
• HSBC Bank plc and HSBC Continental Europe maintained a strong liquidity position, with an increase in HQLA mainly due to deposit growth. However the LCR declined, reflecting a reassessment of potential outflows, particularly with respect to committed facilities.
• The Hongkong and Shanghai Banking Corporation – Hong Kong branch, Hang Seng Bank and HSBC Bank China remained in a strong liquidity position, mainly as result of an increase in customer deposits.
• HSBC Bank USA remained in a strong liquidity position, mainly driven by an increase in deposits and a reduction in illiquid assets.
• HSBC Bank Middle East – UAE branch remained in a strong liquidity position, with a liquidity ratio of 280%.
• HSBC Canada increased its LCR to 165%, mainly driven by increased customer deposits and covered bond issuance.
Liquid assets
At 31 December 2020, the Group had a total of $678bn of highly liquid unencumbered LCR eligible liquid assets (31 December 2019: $601bn) held in a range of asset classes and currencies. Of these, 90% were eligible as level 1 (31 December 2019: 90%).
The following tables reflect the composition of the liquidity pool by asset type and currency at 31 December 2020:
Liquidity pool by asset typeLiquidity
poolCash Level 11 Level 21
$bn $bn $bn $bn
Cash and balance at central bank 307 307 — —
Central and local government bonds 312 — 263 49
Regional government public sector entities 12 — 11 1
International organisation and multilateral developments banks 14 — 14 —
Covered bonds 11 — 3 8
Other 22 — 10 12
Total at 31 Dec 2020 678 307 301 70
Total at 31 Dec 2019 601 158 383 60
1 As defined in EU regulations, level 1 assets means ‘assets of extremely high liquidity and credit quality’, and level 2 assets means ‘assets of high liquidity and credit quality’.
Liquidity pool by currency
$ £ € HK$ Other Total
$bn $bn $bn $bn $bn $bn
Liquidity pool at 31 Dec 2020 218 176 117 74 93 678
Liquidity pool at 31 Dec 2019 179 117 93 47 165 601
Consolidated liquidity metrics
At 31 December 2020, the total HQLA held at entity level amounted to $857bn (31 December 2019: $646bn), an increase of $211bn, reflecting the increases in entity liquidity positions described above. Consistent with prior periods, the application of requirements under the EC Delegated Act resulted in an adjustment of $179bn (31 December 2019: $45bn) to reflect the limitations in the fungibility of entity liquidity around the Group. As a consequence, the Group consolidated LCR was 139% at 31 December 2020 (31 December 2019: 150%). The $179bn of HQLA remains available to cover liquidity risk in the relevant entities.
The methodology used in the Group consolidated LCR in relation to the treatment of part of the Group’s HQLA is currently under review. Upon implementation of this revised approach it is anticipated that the Group’s consolidated LCR will reduce, although remain within appetite. The liquidity position of the entities is unaffected by this change and remains the key focus.
At
31 Dec2020
30 Jun 2020
31 Dec 2019
$bn $bn $bn
High-quality liquid assets (in entities) 857 784 646
EC Delegated Act adjustment (179) (130) (45)
Group LCR HQLA 678 654 601
Net outflows 487 443 400
Liquidity coverage ratio 139% 148% 150%
HSBC Holdings plc Annual Report and Accounts 2020 177
Risk review

Sources of funding
Our primary sources of funding are customer current accounts and savings deposits payable on demand or at short notice. We issue secured and unsecured wholesale securities to supplement customer deposits, meet regulatory obligations and to change the currency mix, maturity profile or location of our liabilities.
The following ‘Funding sources’ and ‘Funding uses’ tables provide a view of how our consolidated balance sheet is funded. In practice, all the principal operating entities are required to manage liquidity and funding risk on a stand-alone basis.
The tables analyse our consolidated balance sheet according to the assets that primarily arise from operating activities and the sources of funding primarily supporting these activities. Assets and liabilities that do not arise from operating activities are presented at a net balancing source or deployment of funds.
In 2020, the level of customer accounts continued to exceed the level of loans and advances to customers. The positive funding gap was predominantly deployed in liquid assets.
Funding sources (Audited)
2020 2019
$m $m
Customer accounts 1,642,780 1,439,115 Deposits by banks 82,080 59,022 Repurchase agreements – non-trading 111,901 140,344
Debt securities in issue 95,492 104,555
Cash collateral, margin and settlement accounts 78,565 71,002
Subordinated liabilities 21,951 24,600
Financial liabilities designated at fair value 157,439 164,466
Liabilities under insurance contracts 107,191 97,439
Trading liabilities 75,266 83,170 – repos 11,728 558 – stock lending 4,597 9,702
– other trading liabilities 58,941 72,910
Total equity 204,995 192,668
Other balance sheet liabilities 406,504 338,771
At 31 Dec 2,984,164 2,715,152
Funding uses(Audited)
2020 2019Footnotes $m $m
Loans and advances to customers 1,037,987 1,036,743
Loans and advances to banks 81,616 69,203
Reverse repurchase agreements – non-trading 230,628 240,862
Prepayments, accrued income and other assets 1 76,859 63,891
– cash collateral, margin and settlement accounts 76,859 63,891
Assets held for sale 299 123
Trading assets 231,990 254,271 – reverse repos 13,990 13,659 – stock borrowing 8,286 7,691 – other trading assets 209,714 232,921
Financial investments 490,693 443,312 Cash and balances with central banks 304,481 154,099
Other balance sheet assets 529,611 452,648
At 31 Dec 2,984,164 2,715,152
1 Includes only those financial instruments that are subject to the impairment requirements of IFRS 9. ‘Prepayments, accrued income and other assets’, as presented within the consolidated balance sheet on page 280, includes both financial and non-financial assets.
Wholesale term debt maturity profile
The maturity profile of our wholesale term debt obligations is set out in the following table.
The balances in the table are not directly comparable with those in the consolidated balance sheet because the table presents gross cash flows relating to principal payments and not the balance sheet carrying value, which includes debt securities and subordinated liabilities measured at fair value.
Wholesale funding cash flows payable by HSBC under financial liabilities by remaining contractual maturities
Due notmore than
1 month
Due over 1 month but not
more than 3 months
Due over 3 months
but not more than 6 months
Due over 6 months
but not more than 9 months
Due over 9 months
but not morethan
1 year
Due over1 year
but not more than
2 years
Due over 2 yearsbut not
more than 5 years
Due over5 years Total
$m $m $m $m $m $m $m $m $m
Debt securities issued 18,057 16,848 20,314 15,208 7,561 20,768 49,948 59,911 208,615
– unsecured CDs and CP 4,048 8,440 9,977 6,186 2,945 1,474 1,454 1,546 36,070
– unsecured senior MTNs 9,625 3,363 3,915 4,684 2,005 9,295 35,834 49,209 117,930
– unsecured senior structured notes 2,075 1,539 1,451 1,242 1,241 3,702 4,979 6,765 22,994
– secured covered bonds — — 28 — 750 2,514 3,917 — 7,209
– secured asset-backed commercial paper 1,094 — — — — — — — 1,094
– secured ABS 19 119 171 45 41 410 1,865 646 3,316
– others 1,196 3,387 4,772 3,051 579 3,373 1,899 1,745 20,002
Subordinated liabilities 618 — 237 — 12 12 6,081 22,941 29,901
– subordinated debt securities 618 — 237 — 12 12 6,081 21,085 28,045
– preferred securities — — — — — — — 1,856 1,856
At 31 Dec 2020 18,675 16,848 20,551 15,208 7,573 20,780 56,029 82,852 238,516
Debt securities issued 17,728 19,758 15,654 16,284 16,132 35,836 57,387 53,768 232,547
– unsecured CDs and CP 4,913 12,280 11,020 8,745 11,509 1,156 2,095 1,578 53,296
– unsecured senior MTNs 8,198 2,462 695 4,595 1,753 25,121 42,316 38,812 123,952
– unsecured senior structured notes 1,698 1,386 1,711 1,003 923 3,579 6,102 9,596 25,998
– secured covered bonds — — — — 1,139 749 3,661 1,159 6,708
– secured asset-backed commercial paper 1,933 — — — — — — — 1,933
– secured ABS — — 248 161 — 205 911 741 2,266
– others 986 3,630 1,980 1,780 808 5,026 2,302 1,882 18,394
Subordinated liabilities 1,523 — 22 2,000 — 754 2,424 26,809 33,532
– subordinated debt securities 1,500 — 22 2,000 — 754 2,424 24,587 31,287
– preferred securities 23 — — — — — — 2,222 2,245
At 31 Dec 2019 19,251 19,758 15,676 18,284 16,132 36,590 59,811 80,577 266,079
Risk
178 HSBC Holdings plc Annual Report and Accounts 2020
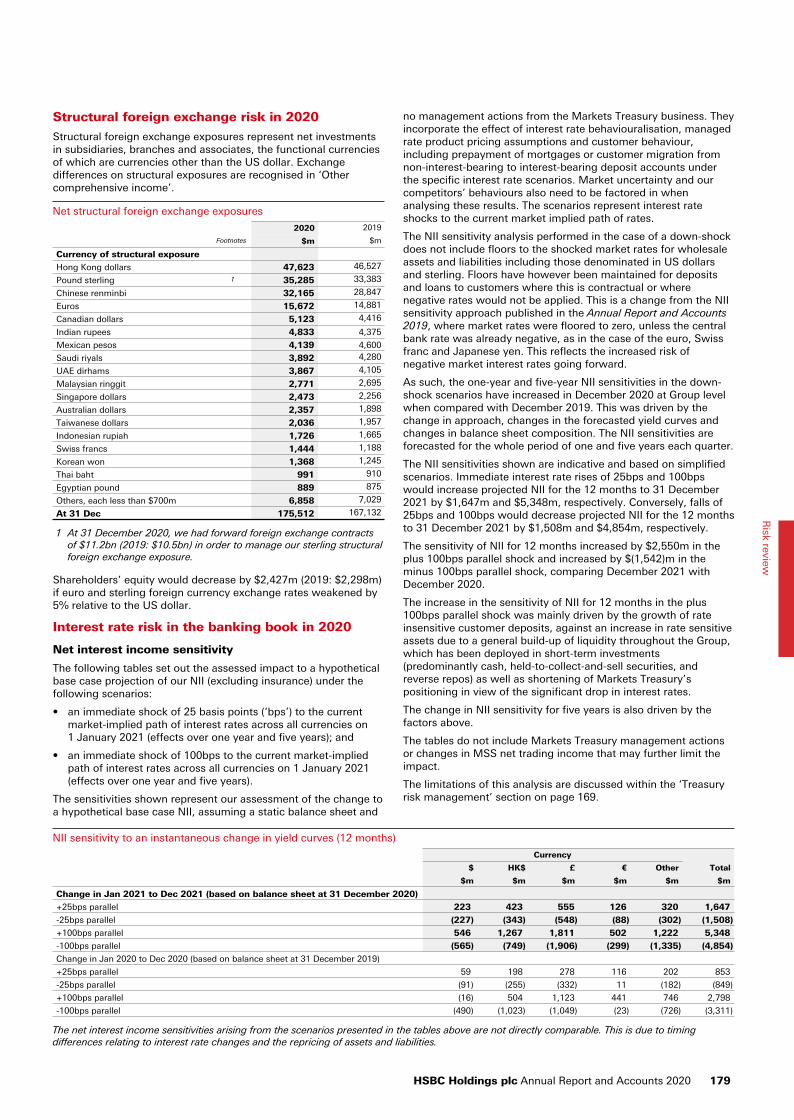
Structural foreign exchange risk in 2020
Structural foreign exchange exposures represent net investments in subsidiaries, branches and associates, the functional currencies of which are currencies other than the US dollar. Exchange differences on structural exposures are recognised in ‘Other comprehensive income’.
Net structural foreign exchange exposures
2020 2019
Footnotes $m $m
Currency of structural exposure
Hong Kong dollars 47,623 46,527
Pound sterling 1 35,285 33,383
Chinese renminbi 32,165 28,847
Euros 15,672 14,881
Canadian dollars 5,123 4,416
Indian rupees 4,833 4,375
Mexican pesos 4,139 4,600
Saudi riyals 3,892 4,280
UAE dirhams 3,867 4,105
Malaysian ringgit 2,771 2,695
Singapore dollars 2,473 2,256
Australian dollars 2,357 1,898
Taiwanese dollars 2,036 1,957
Indonesian rupiah 1,726 1,665
Swiss francs 1,444 1,188
Korean won 1,368 1,245
Thai baht 991 910
Egyptian pound 889 875
Others, each less than $700m 6,858 7,029
At 31 Dec 175,512 167,132
1 At 31 December 2020, we had forward foreign exchange contracts of $11.2bn (2019: $10.5bn) in order to manage our sterling structural foreign exchange exposure.
Shareholders’ equity would decrease by $2,427m (2019: $2,298m) if euro and sterling foreign currency exchange rates weakened by 5% relative to the US dollar.
Interest rate risk in the banking book in 2020
Net interest income sensitivity
The following tables set out the assessed impact to a hypothetical base case projection of our NII (excluding insurance) under the following scenarios:
• an immediate shock of 25 basis points (‘bps’) to the current market-implied path of interest rates across all currencies on 1 January 2021 (effects over one year and five years); and
• an immediate shock of 100bps to the current market-implied path of interest rates across all currencies on 1 January 2021 (effects over one year and five years).
The sensitivities shown represent our assessment of the change to a hypothetical base case NII, assuming a static balance sheet and
no management actions from the Markets Treasury business. They incorporate the effect of interest rate behaviouralisation, managed rate product pricing assumptions and customer behaviour, including prepayment of mortgages or customer migration from non-interest-bearing to interest-bearing deposit accounts under the specific interest rate scenarios. Market uncertainty and our competitors’ behaviours also need to be factored in when analysing these results. The scenarios represent interest rate shocks to the current market implied path of rates.
The NII sensitivity analysis performed in the case of a down-shock does not include floors to the shocked market rates for wholesale assets and liabilities including those denominated in US dollars and sterling. Floors have however been maintained for deposits and loans to customers where this is contractual or where negative rates would not be applied. This is a change from the NII sensitivity approach published in the Annual Report and Accounts 2019, where market rates were floored to zero, unless the central bank rate was already negative, as in the case of the euro, Swiss franc and Japanese yen. This reflects the increased risk of negative market interest rates going forward.
As such, the one-year and five-year NII sensitivities in the down-shock scenarios have increased in December 2020 at Group level when compared with December 2019. This was driven by the change in approach, changes in the forecasted yield curves and changes in balance sheet composition. The NII sensitivities are forecasted for the whole period of one and five years each quarter.
The NII sensitivities shown are indicative and based on simplified scenarios. Immediate interest rate rises of 25bps and 100bps would increase projected NII for the 12 months to 31 December 2021 by $1,647m and $5,348m, respectively. Conversely, falls of 25bps and 100bps would decrease projected NII for the 12 months to 31 December 2021 by $1,508m and $4,854m, respectively.
The sensitivity of NII for 12 months increased by $2,550m in the plus 100bps parallel shock and increased by $(1,542)m in the minus 100bps parallel shock, comparing December 2021 with December 2020.
The increase in the sensitivity of NII for 12 months in the plus 100bps parallel shock was mainly driven by the growth of rate insensitive customer deposits, against an increase in rate sensitive assets due to a general build-up of liquidity throughout the Group, which has been deployed in short-term investments (predominantly cash, held-to-collect-and-sell securities, and reverse repos) as well as shortening of Markets Treasury’s positioning in view of the significant drop in interest rates.
The change in NII sensitivity for five years is also driven by the factors above.
The tables do not include Markets Treasury management actions or changes in MSS net trading income that may further limit the impact.
The limitations of this analysis are discussed within the ‘Treasury risk management’ section on page 169.
NII sensitivity to an instantaneous change in yield curves (12 months)
Currency
$ HK$ £ € Other Total
$m $m $m $m $m $m
Change in Jan 2021 to Dec 2021 (based on balance sheet at 31 December 2020)
+25bps parallel 223 423 555 126 320 1,647
-25bps parallel (227) (343) (548) (88) (302) (1,508)
+100bps parallel 546 1,267 1,811 502 1,222 5,348
-100bps parallel (565) (749) (1,906) (299) (1,335) (4,854)
Change in Jan 2020 to Dec 2020 (based on balance sheet at 31 December 2019)
+25bps parallel 59 198 278 116 202 853
-25bps parallel (91) (255) (332) 11 (182) (849)
+100bps parallel (16) 504 1,123 441 746 2,798
-100bps parallel (490) (1,023) (1,049) (23) (726) (3,311)
The net interest income sensitivities arising from the scenarios presented in the tables above are not directly comparable. This is due to timing differences relating to interest rate changes and the repricing of assets and liabilities.
HSBC Holdings plc Annual Report and Accounts 2020 179
Risk review
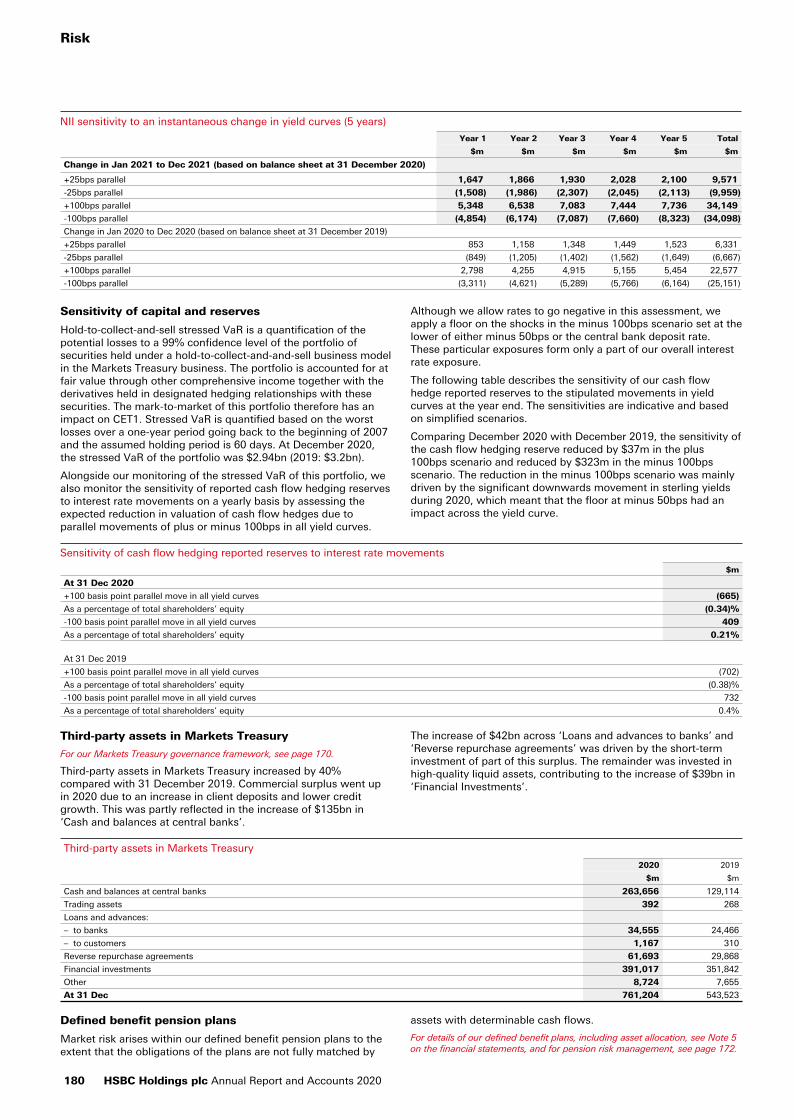
NII sensitivity to an instantaneous change in yield curves (5 years)
Year 1 Year 2 Year 3 Year 4 Year 5 Total
$m $m $m $m $m $m
Change in Jan 2021 to Dec 2021 (based on balance sheet at 31 December 2020)
+25bps parallel 1,647 1,866 1,930 2,028 2,100 9,571
-25bps parallel (1,508) (1,986) (2,307) (2,045) (2,113) (9,959)
+100bps parallel 5,348 6,538 7,083 7,444 7,736 34,149
-100bps parallel (4,854) (6,174) (7,087) (7,660) (8,323) (34,098)
Change in Jan 2020 to Dec 2020 (based on balance sheet at 31 December 2019)
+25bps parallel 853 1,158 1,348 1,449 1,523 6,331
-25bps parallel (849) (1,205) (1,402) (1,562) (1,649) (6,667)
+100bps parallel 2,798 4,255 4,915 5,155 5,454 22,577
-100bps parallel (3,311) (4,621) (5,289) (5,766) (6,164) (25,151)
Sensitivity of capital and reserves
Hold-to-collect-and-sell stressed VaR is a quantification of the potential losses to a 99% confidence level of the portfolio of securities held under a hold-to-collect-and-and-sell business model in the Markets Treasury business. The portfolio is accounted for at fair value through other comprehensive income together with the derivatives held in designated hedging relationships with these securities. The mark-to-market of this portfolio therefore has an impact on CET1. Stressed VaR is quantified based on the worst losses over a one-year period going back to the beginning of 2007 and the assumed holding period is 60 days. At December 2020, the stressed VaR of the portfolio was $2.94bn (2019: $3.2bn).
Alongside our monitoring of the stressed VaR of this portfolio, we also monitor the sensitivity of reported cash flow hedging reserves to interest rate movements on a yearly basis by assessing the expected reduction in valuation of cash flow hedges due to parallel movements of plus or minus 100bps in all yield curves.
Although we allow rates to go negative in this assessment, we apply a floor on the shocks in the minus 100bps scenario set at the lower of either minus 50bps or the central bank deposit rate. These particular exposures form only a part of our overall interest rate exposure.
The following table describes the sensitivity of our cash flow hedge reported reserves to the stipulated movements in yield curves at the year end. The sensitivities are indicative and based on simplified scenarios.
Comparing December 2020 with December 2019, the sensitivity of the cash flow hedging reserve reduced by $37m in the plus 100bps scenario and reduced by $323m in the minus 100bps scenario. The reduction in the minus 100bps scenario was mainly driven by the significant downwards movement in sterling yields during 2020, which meant that the floor at minus 50bps had an impact across the yield curve.
Sensitivity of cash flow hedging reported reserves to interest rate movements
$m
At 31 Dec 2020
+100 basis point parallel move in all yield curves (665)
As a percentage of total shareholders’ equity (0.34)%
-100 basis point parallel move in all yield curves 409
As a percentage of total shareholders’ equity 0.21%
At 31 Dec 2019
+100 basis point parallel move in all yield curves (702)
As a percentage of total shareholders’ equity (0.38)%
-100 basis point parallel move in all yield curves 732
As a percentage of total shareholders’ equity 0.4%
Third-party assets in Markets Treasury
For our Markets Treasury governance framework, see page 170.
Third-party assets in Markets Treasury increased by 40% compared with 31 December 2019. Commercial surplus went up in 2020 due to an increase in client deposits and lower credit growth. This was partly reflected in the increase of $135bn in ‘Cash and balances at central banks’.
The increase of $42bn across ‘Loans and advances to banks’ and ‘Reverse repurchase agreements’ was driven by the short-term investment of part of this surplus. The remainder was invested in high-quality liquid assets, contributing to the increase of $39bn in ‘Financial Investments’.
Third-party assets in Markets Treasury
2020 2019
$m $m
Cash and balances at central banks 263,656 129,114
Trading assets 392 268
Loans and advances:
– to banks 34,555 24,466
– to customers 1,167 310
Reverse repurchase agreements 61,693 29,868
Financial investments 391,017 351,842
Other 8,724 7,655
At 31 Dec 761,204 543,523
Defined benefit pension plans
Market risk arises within our defined benefit pension plans to the extent that the obligations of the plans are not fully matched by
assets with determinable cash flows.
For details of our defined benefit plans, including asset allocation, see Note 5 on the financial statements, and for pension risk management, see page 172.
Risk
180 HSBC Holdings plc Annual Report and Accounts 2020
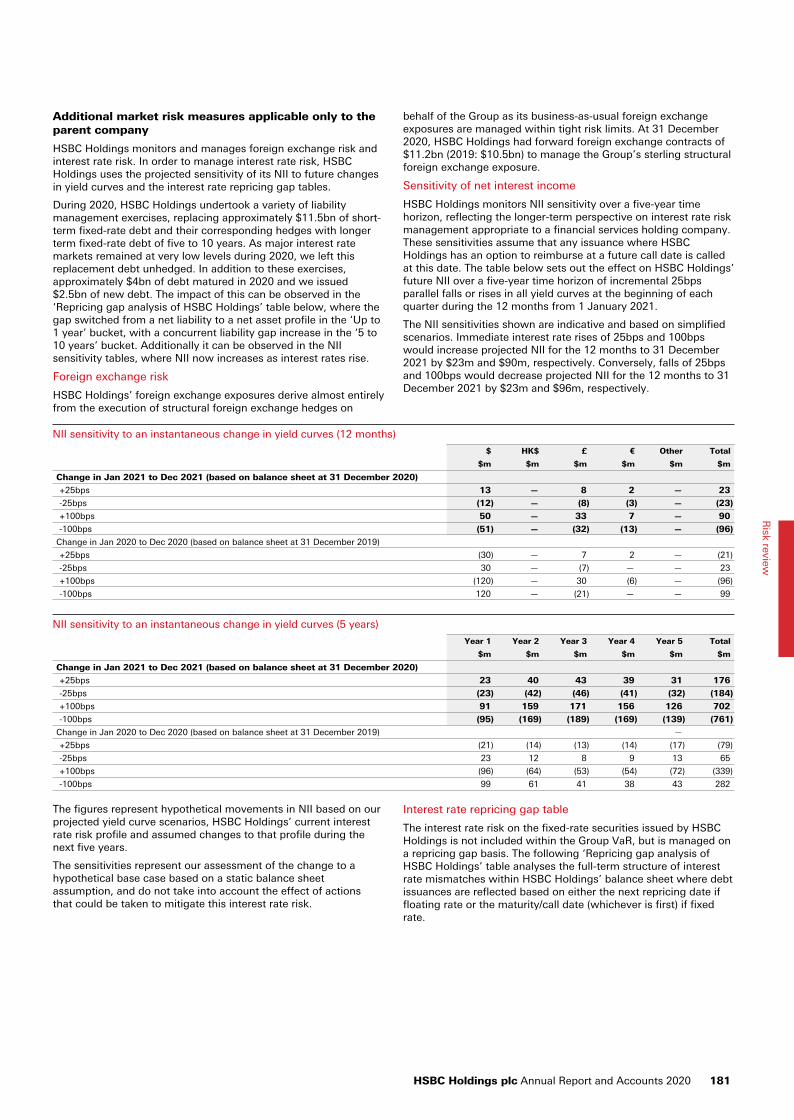
Additional market risk measures applicable only to the parent company
HSBC Holdings monitors and manages foreign exchange risk and interest rate risk. In order to manage interest rate risk, HSBC Holdings uses the projected sensitivity of its NII to future changes in yield curves and the interest rate repricing gap tables.
During 2020, HSBC Holdings undertook a variety of liability management exercises, replacing approximately $11.5bn of short-term fixed-rate debt and their corresponding hedges with longer term fixed-rate debt of five to 10 years. As major interest rate markets remained at very low levels during 2020, we left this replacement debt unhedged. In addition to these exercises, approximately $4bn of debt matured in 2020 and we issued $2.5bn of new debt. The impact of this can be observed in the ‘Repricing gap analysis of HSBC Holdings’ table below, where the gap switched from a net liability to a net asset profile in the ‘Up to 1 year’ bucket, with a concurrent liability gap increase in the ‘5 to 10 years’ bucket. Additionally it can be observed in the NII sensitivity tables, where NII now increases as interest rates rise.
Foreign exchange risk
HSBC Holdings’ foreign exchange exposures derive almost entirely from the execution of structural foreign exchange hedges on
behalf of the Group as its business-as-usual foreign exchange exposures are managed within tight risk limits. At 31 December 2020, HSBC Holdings had forward foreign exchange contracts of $11.2bn (2019: $10.5bn) to manage the Group’s sterling structural foreign exchange exposure.
Sensitivity of net interest income
HSBC Holdings monitors NII sensitivity over a five-year time horizon, reflecting the longer-term perspective on interest rate risk management appropriate to a financial services holding company. These sensitivities assume that any issuance where HSBC Holdings has an option to reimburse at a future call date is called at this date. The table below sets out the effect on HSBC Holdings’ future NII over a five-year time horizon of incremental 25bps parallel falls or rises in all yield curves at the beginning of each quarter during the 12 months from 1 January 2021.
The NII sensitivities shown are indicative and based on simplified scenarios. Immediate interest rate rises of 25bps and 100bps would increase projected NII for the 12 months to 31 December 2021 by $23m and $90m, respectively. Conversely, falls of 25bps and 100bps would decrease projected NII for the 12 months to 31 December 2021 by $23m and $96m, respectively.
NII sensitivity to an instantaneous change in yield curves (12 months)
$ HK$ £ € Other Total
$m $m $m $m $m $m
Change in Jan 2021 to Dec 2021 (based on balance sheet at 31 December 2020)
+25bps 13 — 8 2 — 23
-25bps (12) — (8) (3) — (23)
+100bps 50 — 33 7 — 90
-100bps (51) — (32) (13) — (96)
Change in Jan 2020 to Dec 2020 (based on balance sheet at 31 December 2019)
+25bps (30) — 7 2 — (21)
-25bps 30 — (7) — — 23
+100bps (120) — 30 (6) — (96)
-100bps 120 — (21) — — 99
NII sensitivity to an instantaneous change in yield curves (5 years)
Year 1 Year 2 Year 3 Year 4 Year 5 Total
$m $m $m $m $m $m
Change in Jan 2021 to Dec 2021 (based on balance sheet at 31 December 2020)
+25bps 23 40 43 39 31 176
-25bps (23) (42) (46) (41) (32) (184)
+100bps 91 159 171 156 126 702
-100bps (95) (169) (189) (169) (139) (761)
Change in Jan 2020 to Dec 2020 (based on balance sheet at 31 December 2019) —
+25bps (21) (14) (13) (14) (17) (79)
-25bps 23 12 8 9 13 65
+100bps (96) (64) (53) (54) (72) (339)
-100bps 99 61 41 38 43 282
The figures represent hypothetical movements in NII based on our projected yield curve scenarios, HSBC Holdings’ current interest rate risk profile and assumed changes to that profile during the next five years.
The sensitivities represent our assessment of the change to a hypothetical base case based on a static balance sheet assumption, and do not take into account the effect of actions that could be taken to mitigate this interest rate risk.
Interest rate repricing gap table
The interest rate risk on the fixed-rate securities issued by HSBC Holdings is not included within the Group VaR, but is managed on a repricing gap basis. The following ‘Repricing gap analysis of HSBC Holdings’ table analyses the full-term structure of interest rate mismatches within HSBC Holdings’ balance sheet where debt issuances are reflected based on either the next repricing date if floating rate or the maturity/call date (whichever is first) if fixed rate.
HSBC Holdings plc Annual Report and Accounts 2020 181
Risk review
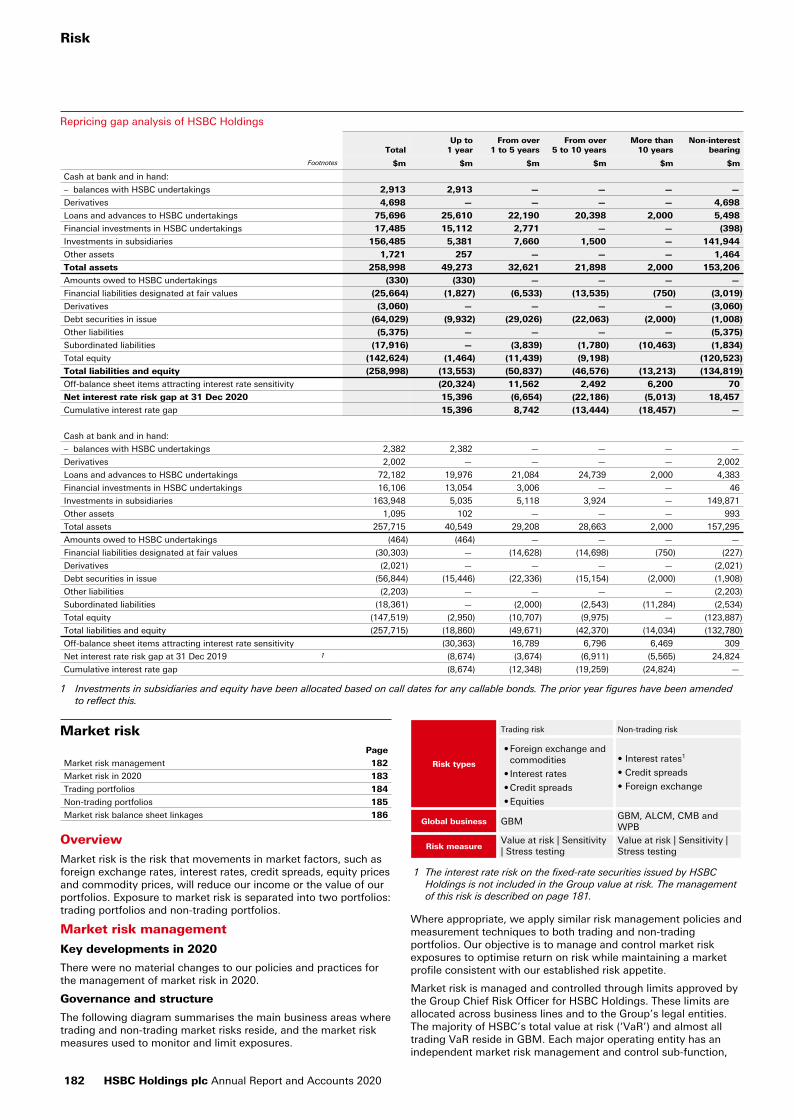
Repricing gap analysis of HSBC Holdings
TotalUp to
1 yearFrom over
1 to 5 yearsFrom over
5 to 10 yearsMore than
10 yearsNon-interest
bearing
Footnotes $m $m $m $m $m $m
Cash at bank and in hand:
– balances with HSBC undertakings 2,913 2,913 — — — —
Derivatives 4,698 — — — — 4,698
Loans and advances to HSBC undertakings 75,696 25,610 22,190 20,398 2,000 5,498
Financial investments in HSBC undertakings 17,485 15,112 2,771 — — (398)
Investments in subsidiaries 156,485 5,381 7,660 1,500 — 141,944
Other assets 1,721 257 — — — 1,464
Total assets 258,998 49,273 32,621 21,898 2,000 153,206
Amounts owed to HSBC undertakings (330) (330) — — — —
Financial liabilities designated at fair values (25,664) (1,827) (6,533) (13,535) (750) (3,019)
Derivatives (3,060) — — — — (3,060)
Debt securities in issue (64,029) (9,932) (29,026) (22,063) (2,000) (1,008)
Other liabilities (5,375) — — — — (5,375)
Subordinated liabilities (17,916) — (3,839) (1,780) (10,463) (1,834)
Total equity (142,624) (1,464) (11,439) (9,198) (120,523)
Total liabilities and equity (258,998) (13,553) (50,837) (46,576) (13,213) (134,819)
Off-balance sheet items attracting interest rate sensitivity (20,324) 11,562 2,492 6,200 70
Net interest rate risk gap at 31 Dec 2020 15,396 (6,654) (22,186) (5,013) 18,457
Cumulative interest rate gap 15,396 8,742 (13,444) (18,457) —
Cash at bank and in hand:
– balances with HSBC undertakings 2,382 2,382 — — — —
Derivatives 2,002 — — — — 2,002
Loans and advances to HSBC undertakings 72,182 19,976 21,084 24,739 2,000 4,383
Financial investments in HSBC undertakings 16,106 13,054 3,006 — — 46
Investments in subsidiaries 163,948 5,035 5,118 3,924 — 149,871
Other assets 1,095 102 — — — 993
Total assets 257,715 40,549 29,208 28,663 2,000 157,295
Amounts owed to HSBC undertakings (464) (464) — — — —
Financial liabilities designated at fair values (30,303) — (14,628) (14,698) (750) (227)
Derivatives (2,021) — — — — (2,021)
Debt securities in issue (56,844) (15,446) (22,336) (15,154) (2,000) (1,908)
Other liabilities (2,203) — — — — (2,203)
Subordinated liabilities (18,361) — (2,000) (2,543) (11,284) (2,534)
Total equity (147,519) (2,950) (10,707) (9,975) — (123,887)
Total liabilities and equity (257,715) (18,860) (49,671) (42,370) (14,034) (132,780)
Off-balance sheet items attracting interest rate sensitivity (30,363) 16,789 6,796 6,469 309
Net interest rate risk gap at 31 Dec 2019 1 (8,674) (3,674) (6,911) (5,565) 24,824
Cumulative interest rate gap (8,674) (12,348) (19,259) (24,824) —
1 Investments in subsidiaries and equity have been allocated based on call dates for any callable bonds. The prior year figures have been amended to reflect this.
Market riskPage
Market risk management 182
Market risk in 2020 183
Trading portfolios 184
Non-trading portfolios 185
Market risk balance sheet linkages 186
Overview
Market risk is the risk that movements in market factors, such as foreign exchange rates, interest rates, credit spreads, equity prices and commodity prices, will reduce our income or the value of our portfolios. Exposure to market risk is separated into two portfolios: trading portfolios and non-trading portfolios.
Market risk management
Key developments in 2020
There were no material changes to our policies and practices for the management of market risk in 2020.
Governance and structure
The following diagram summarises the main business areas where trading and non-trading market risks reside, and the market risk measures used to monitor and limit exposures.
Risk types
Trading risk Non-trading risk
•Foreign exchange and commodities
• Interest rates
•Credit spreads
•Equities
• Interest rates1
• Credit spreads
• Foreign exchange
Global business GBMGBM, ALCM, CMB and WPB
Risk measureValue at risk | Sensitivity | Stress testing
Value at risk | Sensitivity | Stress testing
1 The interest rate risk on the fixed-rate securities issued by HSBC Holdings is not included in the Group value at risk. The management of this risk is described on page 181.
Where appropriate, we apply similar risk management policies and measurement techniques to both trading and non-trading portfolios. Our objective is to manage and control market risk exposures to optimise return on risk while maintaining a market profile consistent with our established risk appetite.
Market risk is managed and controlled through limits approved by the Group Chief Risk Officer for HSBC Holdings. These limits are allocated across business lines and to the Group’s legal entities. The majority of HSBC’s total value at risk (‘VaR’) and almost all trading VaR reside in GBM. Each major operating entity has an independent market risk management and control sub-function,
Risk
182 HSBC Holdings plc Annual Report and Accounts 2020

which is responsible for measuring, monitoring and reporting market risk exposures against limits on a daily basis. Each operating entity is required to assess the market risks arising in its business and to transfer them either to its local Markets and Securities Services or Markets Treasury unit for management, or to separate books managed under the supervision of the local ALCO. The Traded Risk function enforces the controls around trading in permissible instruments approved for each site as well as changes that follow completion of the new product approval process. Traded Risk also restricts trading in the more complex derivative products to offices with appropriate levels of product expertise and robust control systems.
Key risk management processes
Monitoring and limiting market risk exposures
Our objective is to manage and control market risk exposures while maintaining a market profile consistent with our risk appetite.
We use a range of tools to monitor and limit market risk exposures including sensitivity analysis, VaR and stress testing.
Sensitivity analysis
Sensitivity analysis measures the impact of individual market factor movements on specific instruments or portfolios, including interest rates, foreign exchange rates and equity prices. We use sensitivity measures to monitor the market risk positions within each risk type. Granular sensitivity limits are set for trading desks with consideration of market liquidity, customer demand and capital constraints, among other factors.
Value at risk
(Audited)
VaR is a technique for estimating potential losses on risk positions as a result of movements in market rates and prices over a specified time horizon and to a given level of confidence. The use of VaR is integrated into market risk management and calculated for all trading positions regardless of how we capitalise them. In addition, we calculate VaR for non-trading portfolios to have a complete picture of risk. Where we do not calculate VaR explicitly, we use alternative tools as summarised in the ‘Stress testing’ section below.
Our models are predominantly based on historical simulation that incorporates the following features:
• historical market rates and prices, which are calculated with reference to foreign exchange rates, commodity prices, interest rates, equity prices and the associated volatilities;
• potential market movements that are calculated with reference to data from the past two years; and
• calculations to a 99% confidence level and using a one-day holding period.
The models also incorporate the effect of option features on the underlying exposures. The nature of the VaR models means that an increase in observed market volatility will lead to an increase in VaR without any changes in the underlying positions.
VaR model limitations
Although a valuable guide to risk, VaR is used with awareness of its limitations. For example:
• The use of historical data as a proxy for estimating future market moves may not encompass all potential market events, particularly those that are extreme in nature.
• The use of a one-day holding period for risk management purposes of trading and non-trading books assumes that this short period is sufficient to hedge or liquidate all positions.
• The use of a 99% confidence level by definition does not take into account losses that might occur beyond this level of confidence.
• VaR is calculated on the basis of exposures outstanding at the close of business and therefore does not reflect intra-day exposures.
Risk not in VaR framework
The risks not in VaR (‘RNIV’) framework captures and capitalises material market risks that are not adequately covered in the VaR model.
Risk factors are reviewed on a regular basis and are either incorporated directly in the VaR models, where possible, or quantified through either the VaR-based RNIV approach or a stress test approach within the RNIV framework. While VaR-based RNIVs are calculated by using historical scenarios, stress-type RNIVs are estimated on the basis of stress scenarios whose severity is calibrated to be in line with the capital adequacy requirements. The outcome of the VaR-based RNIV approach is included in the overall VaR calculation but excluded from the VaR measure used for regulatory back-testing. In addition, the stressed VaR measure also includes risk factors considered in the VaR-based RNIV approach.
Stress-type RNIVs include a deal contingent derivatives capital charge to capture risk for these transactions and a de-peg risk measure to capture risk to pegged and heavily managed currencies.
Stress testing
Stress testing is an important procedure that is integrated into our market risk management framework to evaluate the potential impact on portfolio values of more extreme, although plausible, events or movements in a set of financial variables. In such scenarios, losses can be much greater than those predicted by VaR modelling.
Stress testing is implemented at legal entity, regional and overall Group levels. A set of scenarios is used consistently across all regions within the Group. The risk appetite around potential stress losses for the Group is set and monitored against a referral limit.
Market risk reverse stress tests are designed to identify vulnerabilities in our portfolios by looking for scenarios that lead to loss levels considered severe for the relevant portfolio. These scenarios may be quite local or idiosyncratic in nature, and complement the systematic top-down stress testing.
Stress testing and reverse stress testing provide senior management with insights regarding the ‘tail risk’ beyond VaR, for which our appetite is limited.
Trading portfolios
Trading portfolios comprise positions held for client servicing and market-making, with the intention of short-term resale and/or to hedge risks resulting from such positions.
Back-testing
We routinely validate the accuracy of our VaR models by back-testing the VaR metric against both actual and hypothetical profit and loss. Hypothetical profit and loss excludes non-modelled items such as fees, commissions and revenue of intra-day transactions.
The number of back-testing exceptions is used to gauge how well the models are performing. We consider enhanced internal monitoring of a VaR model if more than five profit exceptions or more than five loss exceptions occur in a 250-day period.
We back-test our VaR at set levels of our Group entity hierarchy.
Market risk in 2020
Global financial conditions worsened rapidly with the onset of the Covid-19 outbreak from mid-February 2020. Market volatility reached extreme levels across most asset classes and equity prices fell sharply. In credit markets, spreads and yields reached multi-year highs. The gold market experienced Covid-19-related disruption in refining and transportation, affecting the relative pricing of gold futures contracts. Oil prices collapsed due to rising oversupply as demand reduced materially from the economic slowdown. Financial markets stabilised from April onwards, as governments in several developed countries announced economic recovery programmes and key central banks intervened to provide liquidity and support asset prices. Global equity markets substantially recovered from their losses in March and credit
HSBC Holdings plc Annual Report and Accounts 2020 183
Risk review
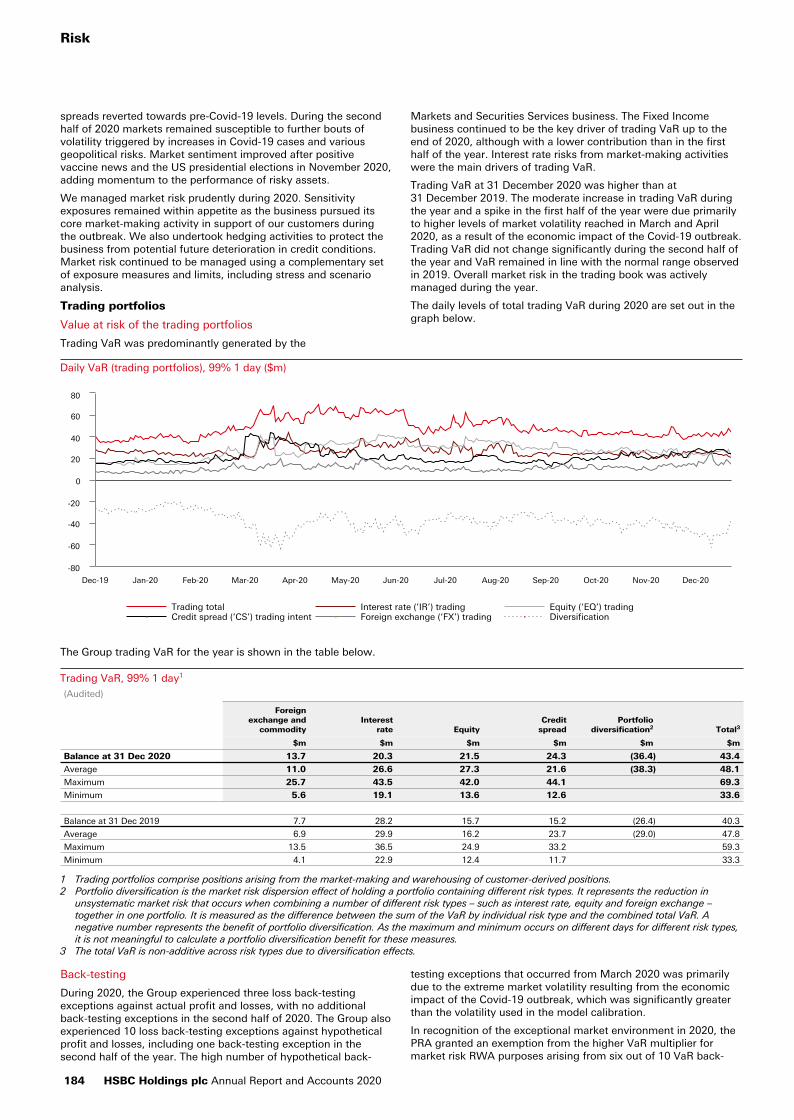
spreads reverted towards pre-Covid-19 levels. During the second half of 2020 markets remained susceptible to further bouts of volatility triggered by increases in Covid-19 cases and various geopolitical risks. Market sentiment improved after positive vaccine news and the US presidential elections in November 2020, adding momentum to the performance of risky assets.
We managed market risk prudently during 2020. Sensitivity exposures remained within appetite as the business pursued its core market-making activity in support of our customers during the outbreak. We also undertook hedging activities to protect the business from potential future deterioration in credit conditions. Market risk continued to be managed using a complementary set of exposure measures and limits, including stress and scenario analysis.
Trading portfolios
Value at risk of the trading portfolios
Trading VaR was predominantly generated by the
Markets and Securities Services business. The Fixed Income business continued to be the key driver of trading VaR up to the end of 2020, although with a lower contribution than in the first half of the year. Interest rate risks from market-making activities were the main drivers of trading VaR.
Trading VaR at 31 December 2020 was higher than at 31 December 2019. The moderate increase in trading VaR during the year and a spike in the first half of the year were due primarily to higher levels of market volatility reached in March and April 2020, as a result of the economic impact of the Covid-19 outbreak. Trading VaR did not change significantly during the second half of the year and VaR remained in line with the normal range observed in 2019. Overall market risk in the trading book was actively managed during the year.
The daily levels of total trading VaR during 2020 are set out in the graph below.
Daily VaR (trading portfolios), 99% 1 day ($m)
Trading total Interest rate (‘IR’) trading Equity (‘EQ’) tradingCredit spread (‘CS’) trading intent Foreign exchange (‘FX’) trading Diversification
Dec-19 Jan-20 Feb-20 Mar-20 Apr-20 May-20 Jun-20 Jul-20 Aug-20 Sep-20 Oct-20 Nov-20 Dec-20
-80
-60
-40
-20
0
20
40
60
80
The Group trading VaR for the year is shown in the table below.
Trading VaR, 99% 1 day1
(Audited)
Foreignexchange and
commodityInterest
rate EquityCredit
spreadPortfolio
diversification2 Total3
$m $m $m $m $m $m
Balance at 31 Dec 2020 13.7 20.3 21.5 24.3 (36.4) 43.4
Average 11.0 26.6 27.3 21.6 (38.3) 48.1
Maximum 25.7 43.5 42.0 44.1 69.3
Minimum 5.6 19.1 13.6 12.6 33.6
Balance at 31 Dec 2019 7.7 28.2 15.7 15.2 (26.4) 40.3
Average 6.9 29.9 16.2 23.7 (29.0) 47.8
Maximum 13.5 36.5 24.9 33.2 59.3
Minimum 4.1 22.9 12.4 11.7 33.3
1 Trading portfolios comprise positions arising from the market-making and warehousing of customer-derived positions.2 Portfolio diversification is the market risk dispersion effect of holding a portfolio containing different risk types. It represents the reduction in
unsystematic market risk that occurs when combining a number of different risk types – such as interest rate, equity and foreign exchange – together in one portfolio. It is measured as the difference between the sum of the VaR by individual risk type and the combined total VaR. A negative number represents the benefit of portfolio diversification. As the maximum and minimum occurs on different days for different risk types, it is not meaningful to calculate a portfolio diversification benefit for these measures.
3 The total VaR is non-additive across risk types due to diversification effects.
Back-testing
During 2020, the Group experienced three loss back-testing exceptions against actual profit and losses, with no additional back-testing exceptions in the second half of 2020. The Group also experienced 10 loss back-testing exceptions against hypothetical profit and losses, including one back-testing exception in the second half of the year. The high number of hypothetical back-
testing exceptions that occurred from March 2020 was primarily due to the extreme market volatility resulting from the economic impact of the Covid-19 outbreak, which was significantly greater than the volatility used in the model calibration.
In recognition of the exceptional market environment in 2020, the PRA granted an exemption from the higher VaR multiplier for market risk RWA purposes arising from six out of 10 VaR back-
Risk
184 HSBC Holdings plc Annual Report and Accounts 2020
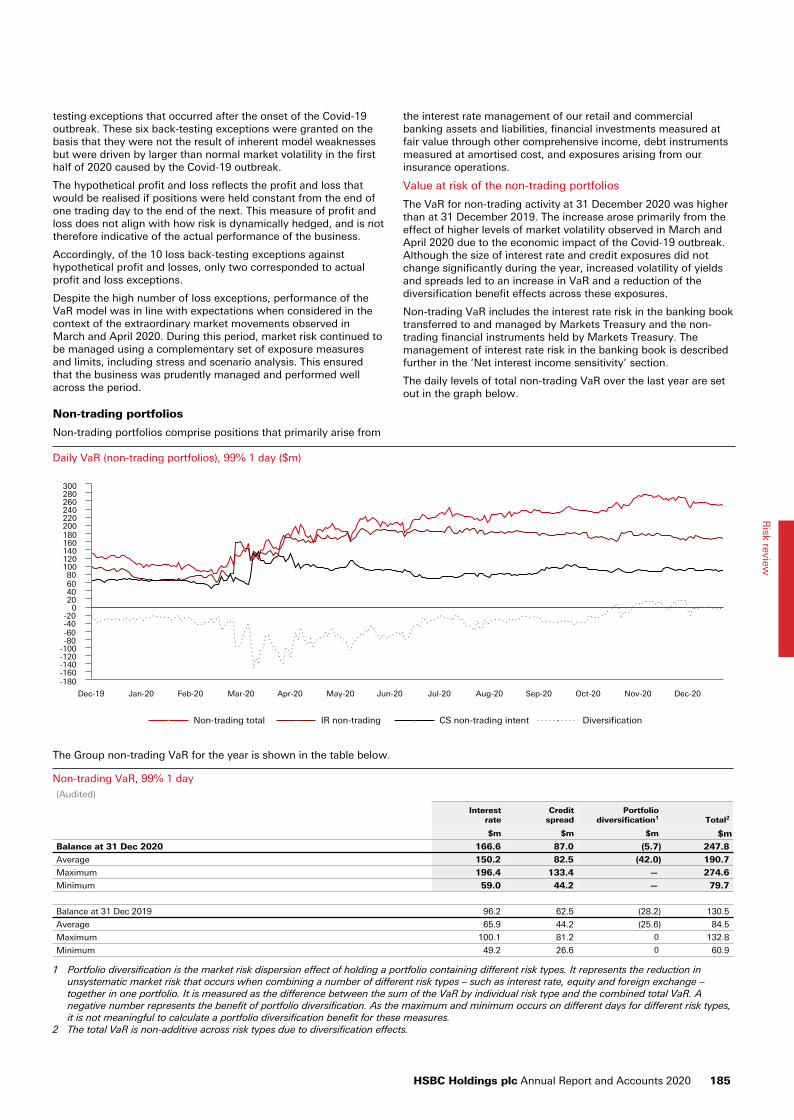
testing exceptions that occurred after the onset of the Covid-19 outbreak. These six back-testing exceptions were granted on the basis that they were not the result of inherent model weaknesses but were driven by larger than normal market volatility in the first half of 2020 caused by the Covid-19 outbreak.
The hypothetical profit and loss reflects the profit and loss that would be realised if positions were held constant from the end of one trading day to the end of the next. This measure of profit and loss does not align with how risk is dynamically hedged, and is not therefore indicative of the actual performance of the business.
Accordingly, of the 10 loss back-testing exceptions against hypothetical profit and losses, only two corresponded to actual profit and loss exceptions.
Despite the high number of loss exceptions, performance of the VaR model was in line with expectations when considered in the context of the extraordinary market movements observed in March and April 2020. During this period, market risk continued to be managed using a complementary set of exposure measures and limits, including stress and scenario analysis. This ensured that the business was prudently managed and performed well across the period.
Non-trading portfolios
Non-trading portfolios comprise positions that primarily arise from
the interest rate management of our retail and commercial banking assets and liabilities, financial investments measured at fair value through other comprehensive income, debt instruments measured at amortised cost, and exposures arising from our insurance operations.
Value at risk of the non-trading portfolios
The VaR for non-trading activity at 31 December 2020 was higher than at 31 December 2019. The increase arose primarily from the effect of higher levels of market volatility observed in March and April 2020 due to the economic impact of the Covid-19 outbreak. Although the size of interest rate and credit exposures did not change significantly during the year, increased volatility of yields and spreads led to an increase in VaR and a reduction of the diversification benefit effects across these exposures.
Non-trading VaR includes the interest rate risk in the banking book transferred to and managed by Markets Treasury and the non-trading financial instruments held by Markets Treasury. The management of interest rate risk in the banking book is described further in the ‘Net interest income sensitivity’ section.
The daily levels of total non-trading VaR over the last year are set out in the graph below.
Daily VaR (non-trading portfolios), 99% 1 day ($m)
Non-trading total IR non-trading CS non-trading intent Diversification
Dec-19 Jan-20 Feb-20 Mar-20 Apr-20 May-20 Jun-20 Jul-20 Aug-20 Sep-20 Oct-20 Nov-20 Dec-20
-180-160-140-120-100-80-60-40-20
020406080
100120140160180200220240260280300
The Group non-trading VaR for the year is shown in the table below.
Non-trading VaR, 99% 1 day(Audited)
Interestrate
Creditspread
Portfoliodiversification1 Total2
$m $m $m $m
Balance at 31 Dec 2020 166.6 87.0 (5.7) 247.8
Average 150.2 82.5 (42.0) 190.7
Maximum 196.4 133.4 — 274.6
Minimum 59.0 44.2 — 79.7
Balance at 31 Dec 2019 96.2 62.5 (28.2) 130.5
Average 65.9 44.2 (25.6) 84.5
Maximum 100.1 81.2 0 132.8
Minimum 49.2 26.6 0 60.9
1 Portfolio diversification is the market risk dispersion effect of holding a portfolio containing different risk types. It represents the reduction in unsystematic market risk that occurs when combining a number of different risk types – such as interest rate, equity and foreign exchange – together in one portfolio. It is measured as the difference between the sum of the VaR by individual risk type and the combined total VaR. A negative number represents the benefit of portfolio diversification. As the maximum and minimum occurs on different days for different risk types, it is not meaningful to calculate a portfolio diversification benefit for these measures.
2 The total VaR is non-additive across risk types due to diversification effects.
HSBC Holdings plc Annual Report and Accounts 2020 185
Risk review
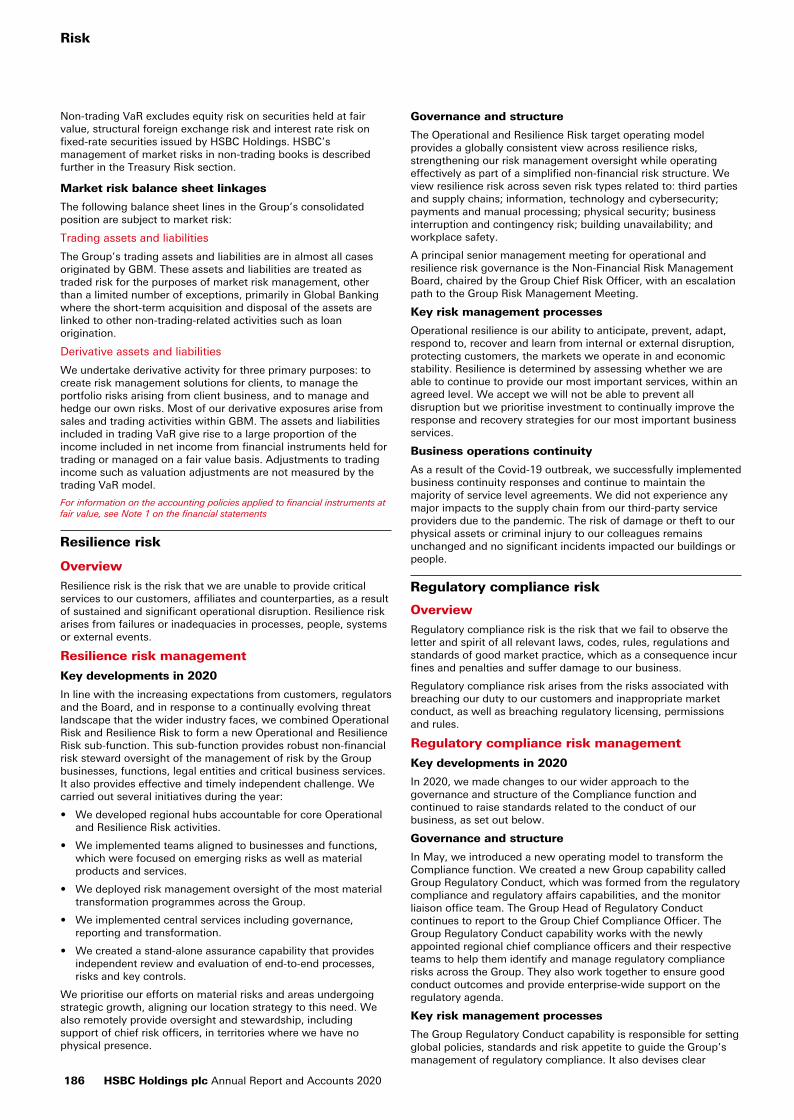
Non-trading VaR excludes equity risk on securities held at fair value, structural foreign exchange risk and interest rate risk on fixed-rate securities issued by HSBC Holdings. HSBC’s management of market risks in non-trading books is described further in the Treasury Risk section.
Market risk balance sheet linkages
The following balance sheet lines in the Group’s consolidated position are subject to market risk:
Trading assets and liabilities
The Group’s trading assets and liabilities are in almost all cases originated by GBM. These assets and liabilities are treated as traded risk for the purposes of market risk management, other than a limited number of exceptions, primarily in Global Banking where the short-term acquisition and disposal of the assets are linked to other non-trading-related activities such as loan origination.
Derivative assets and liabilities
We undertake derivative activity for three primary purposes: to create risk management solutions for clients, to manage the portfolio risks arising from client business, and to manage and hedge our own risks. Most of our derivative exposures arise from sales and trading activities within GBM. The assets and liabilities included in trading VaR give rise to a large proportion of the income included in net income from financial instruments held for trading or managed on a fair value basis. Adjustments to trading income such as valuation adjustments are not measured by the trading VaR model.
For information on the accounting policies applied to financial instruments at fair value, see Note 1 on the financial statements
Resilience risk
Overview
Resilience risk is the risk that we are unable to provide critical services to our customers, affiliates and counterparties, as a result of sustained and significant operational disruption. Resilience risk arises from failures or inadequacies in processes, people, systems or external events.
Resilience risk management
Key developments in 2020
In line with the increasing expectations from customers, regulators and the Board, and in response to a continually evolving threat landscape that the wider industry faces, we combined Operational Risk and Resilience Risk to form a new Operational and Resilience Risk sub-function. This sub-function provides robust non-financial risk steward oversight of the management of risk by the Group businesses, functions, legal entities and critical business services. It also provides effective and timely independent challenge. We carried out several initiatives during the year:
• We developed regional hubs accountable for core Operational and Resilience Risk activities.
• We implemented teams aligned to businesses and functions, which were focused on emerging risks as well as material products and services.
• We deployed risk management oversight of the most material transformation programmes across the Group.
• We implemented central services including governance, reporting and transformation.
• We created a stand-alone assurance capability that provides independent review and evaluation of end-to-end processes, risks and key controls.
We prioritise our efforts on material risks and areas undergoing strategic growth, aligning our location strategy to this need. We also remotely provide oversight and stewardship, including support of chief risk officers, in territories where we have no physical presence.
Governance and structure
The Operational and Resilience Risk target operating model provides a globally consistent view across resilience risks, strengthening our risk management oversight while operating effectively as part of a simplified non-financial risk structure. We view resilience risk across seven risk types related to: third parties and supply chains; information, technology and cybersecurity; payments and manual processing; physical security; business interruption and contingency risk; building unavailability; and workplace safety.
A principal senior management meeting for operational and resilience risk governance is the Non-Financial Risk Management Board, chaired by the Group Chief Risk Officer, with an escalation path to the Group Risk Management Meeting.
Key risk management processes
Operational resilience is our ability to anticipate, prevent, adapt, respond to, recover and learn from internal or external disruption, protecting customers, the markets we operate in and economic stability. Resilience is determined by assessing whether we are able to continue to provide our most important services, within an agreed level. We accept we will not be able to prevent all disruption but we prioritise investment to continually improve the response and recovery strategies for our most important business services.
Business operations continuity
As a result of the Covid-19 outbreak, we successfully implemented business continuity responses and continue to maintain the majority of service level agreements. We did not experience any major impacts to the supply chain from our third-party service providers due to the pandemic. The risk of damage or theft to our physical assets or criminal injury to our colleagues remains unchanged and no significant incidents impacted our buildings or people.
Regulatory compliance risk
Overview
Regulatory compliance risk is the risk that we fail to observe the letter and spirit of all relevant laws, codes, rules, regulations and standards of good market practice, which as a consequence incur fines and penalties and suffer damage to our business.
Regulatory compliance risk arises from the risks associated with breaching our duty to our customers and inappropriate market conduct, as well as breaching regulatory licensing, permissions and rules.
Regulatory compliance risk management
Key developments in 2020
In 2020, we made changes to our wider approach to the governance and structure of the Compliance function and continued to raise standards related to the conduct of our business, as set out below.
Governance and structure
In May, we introduced a new operating model to transform the Compliance function. We created a new Group capability called Group Regulatory Conduct, which was formed from the regulatory compliance and regulatory affairs capabilities, and the monitor liaison office team. The Group Head of Regulatory Conduct continues to report to the Group Chief Compliance Officer. The Group Regulatory Conduct capability works with the newly appointed regional chief compliance officers and their respective teams to help them identify and manage regulatory compliance risks across the Group. They also work together to ensure good conduct outcomes and provide enterprise-wide support on the regulatory agenda.
Key risk management processes
The Group Regulatory Conduct capability is responsible for setting global policies, standards and risk appetite to guide the Group’s management of regulatory compliance. It also devises clear
Risk
186 HSBC Holdings plc Annual Report and Accounts 2020

frameworks and support processes to protect against regulatory compliance risks. The capability provides oversight, review and challenge to the regional chief compliance officers and their teams to help them identify, assess and mitigate regulatory compliance risks, where required. The Group’s regulatory compliance risk policies are regularly reviewed. Global policies and procedures require the prompt identification and escalation of any actual or potential regulatory breach. Relevant reportable events are escalated to the Group RMM and the GRC, as appropriate.
Conduct of business
In 2020, we continued to promote and encourage good conduct through our people’s behaviour and decision making to deliver fair outcomes for our customers, and to maintain financial market integrity. During 2020:
• We continued to champion a strong conduct and customer-focused culture. We implemented a number of measures throughout the Covid-19 outbreak to support our customers in financial difficulties. We also maintained service and supported colleagues in unprecedented conditions.
• We continued our focus on culture and behaviours, adapting our controls and risk management processes to reflect significant levels of remote working throughout the year.
• We continued to invest significant resources to improve our compliance systems and controls relating to our activities in Global Markets and to ensure market integrity. These included enhancements to: pricing and disclosure, order management and trade execution; trade; voice and audio surveillance; front office supervision; and the enforcement and discipline framework for employee misconduct.
• We continued to emphasise – and worked to create – an environment in which employees are encouraged and feel safe to speak up. We placed a particular focus on the importance of well-being during the pandemic through regular top-down communications, virtual town halls, videos and podcasts.
• We continued to embed conduct within our business line processes. We also considered and sought to mitigate the conduct impacts of the Group’s strategic transformation programme and other key business change programmes, including those relating to the UK’s departure from the EU and the Ibor transition.
• We delivered our sixth annual global mandatory training course on conduct to reinforce the importance of conduct for all colleagues.
• We are refreshing our approach to conduct arrangements across the Group with a view to ensuring that the arrangements remain appropriate for the nature of our business.
The Board continues to maintain oversight of conduct matters through the GRC.
Further details can be found under the ‘Our conduct’ section of www.hsbc.com/our-approach/risk-and-responsibility.
Financial crime risk
Overview
Financial crime risk is the risk of knowingly or unknowingly helping parties to commit or to further illegal activity through HSBC, including money laundering, fraud, bribery and corruption, tax evasion, sanctions breaches, and terrorist and proliferation financing. Financial crime risk arises from day-to-day banking operations involving customers, third parties and employees.
Financial crime risk management
Key developments in 2020
In 2020, we continued to strengthen our fight against financial crime and to enhance our financial crime risk management capability. Amid the challenges posed by the Covid-19 outbreak, we introduced a number of financial crime risk management
measures during this period to support the business and our customers. These included:
• We supported the most vulnerable customers and those in financial difficulty, including by increasing the awareness of fraud during this period.
• The Compliance function proactively engaged with other parts of the organisation to ensure financial crime risks were considered as part of Covid-19-related decisions.
• Compliance colleagues were seconded to other parts of the organisation to assist with supporting the establishment of government relief measures.
• We supported customers and the organisation through policy exceptions, including by allowing email instructions instead of face-to-face meetings, and introducing virtual onboarding.
We consistently review the effectiveness of our financial crime risk management framework, which includes consideration of geopolitical and wider economic factors. The sanctions regulatory environment remained changeable and uncertain during the course of 2020 due to the ongoing geopolitical tensions between the US and China, the end of the transition period following the UK’s departure from the EU, and the increasing divergence in sanctions policies between the US and the EU on Iran and Russia. Our policy is to comply with all applicable sanctions regulations in the jurisdictions in which we operate, and we continue to monitor the geopolitical landscape for ongoing developments. We also continued to progress several key financial crime risk management initiatives, including:
• We continued to strengthen our anti-fraud capabilities, focusing on threats posed by new and existing technologies, and have delivered a comprehensive fraud training programme across the Group.
• We continued to invest in the use of artificial intelligence (‘AI’) and advanced analytics techniques to manage financial crime risk, and we published our principles for the ethical use of Big Data and AI.
• We continued to work on strengthening our ability to combat money laundering and terrorist financing. In particular, we focused on the use of technology to enhance our risk management processes while minimising the impact to the customer. We also continued to develop our approach of intelligence-led financial crime risk management, in part, through enhancements to our automated transaction monitoring systems.
Governance and structure
Since establishing a global framework of financial crime risk management committees in 2018, we have continued to strengthen and review the effectiveness of our governance framework to manage financial crime risk. Formal governance committees are held across all countries, territories, regions and global businesses, and are chaired by the respective chief executive officers. They help to enable compliance with the letter and the spirit of all applicable financial crime laws and regulations, as well as our own standards, values and policies relating to financial crime risks. At a Group level, the Financial Crime Risk Management Meeting, chaired by the Group Chief Compliance Officer, has served as the pinnacle of this governance structure, ultimately responsible for the management of financial crime risk. As a reflection of the growing maturity and effectiveness of our financial crime risk management, this meeting was integrated with the Group Risk Management Meeting in January 2021. During the course of 2021, we will review the management of financial crime risk across the Group to identify other areas that could be simplified.
During 2020, we redesigned and delivered an integrated operating model for our Compliance function, with the accompanying restructure providing greater accountability to our regional Compliance teams. These teams, led by regional chief compliance officers, will support the Group Chief Compliance Officer in aligning the way in which we manage all compliance risks, including financial crime risk, to the needs and aims of the wider
HSBC Holdings plc Annual Report and Accounts 2020 187
Risk review
business. They will also support making our compliance risk management processes and procedures more efficient and effective.
Key risk management processes
We continued to deliver a programme to further enhance the policies and controls around identifying and managing the risks of bribery and corruption across our business. Recognising that the fight against financial crime is a constant challenge, we maintained our investment in operational controls and new technology to deter and detect criminal activity in the banking system. We continued to simplify our governance and policy frameworks, and our management information reporting process, which demonstrates the effectiveness of our financial crime controls. We remain committed to enhancing our risk assessment capabilities and to delivering more proactive risk management, including our ongoing investment in the next generation of capabilities to fight financial crime by applying advanced analytics and AI.
We are committed to working in partnership with the wider industry and the public sector in managing financial crime risk, protecting the integrity of the financial system, and helping to protect the communities we serve. We are a strong advocate of public-private partnerships and participate in a number of information-sharing initiatives around the world. We are a constructive partner to national governments and international standard setters, and support reforms being undertaken in key markets such as the UK and the EU where the Group is represented on the joint public-private Economic Crime Strategic Board and the Centre for European Policy Studies taskforce on anti-money laundering, respectively. We also work closely with peer banks in Singapore, and with the Monetary Authority of Singapore. In the US, we are a member of the Bank Secrecy Act Advisory Group, which has put forward recommendations for reform that have been supported by the US Treasury and the Financial Crimes Enforcement Network.
We have been an advocate for a more effective international framework for managing financial crime risk, whether through engaging directly with intergovernmental bodies such as the Financial Action Task Force, or via our key role in industry groups such as the Wolfsberg Group and the Institute of International Finance.
Skilled Person/Independent Consultant
In December 2012, HSBC Holdings entered into a number of agreements, including an undertaking with the UK Financial Services Authority (replaced with a Direction issued by the UK Financial Conduct Authority (‘FCA’) in 2013 and again in 2020), as well as a cease-and-desist order with the US Federal Reserve Board (‘FRB’), both of which contained certain forward-looking anti-money laundering (‘AML’) and sanctions-related obligations. HSBC also agreed to retain an independent compliance monitor (who was, for FCA purposes, a ‘Skilled Person’ under section 166 of the Financial Services and Markets Act and, for FRB purposes, an ‘Independent Consultant’) to produce periodic assessments of the Group’s AML and sanctions compliance programme.
In 2020, HSBC’s engagement with the independent compliance monitor, acting in his roles as both Skilled Person and Independent Consultant, concluded. The role of FCA Skilled Person was assigned to a new individual in the second quarter of 2020. Separately, a new FRB Independent Consultant will be appointed pursuant to the cease-and-desist order.
The new Skilled Person has a narrower mandate to assess the remaining areas that require further work in order for HSBC to transition fully to business-as-usual financial crime risk management. The review is ongoing and is expected to complete later in 2021. The new Independent Consultant is expected to carry out the eighth annual review for the FRB during 2021.
In accordance with the Direction issued by the FCA to HSBC Holdings in 2020, the Group Risk Committee retains oversight of matters relating to anti-money laundering, sanctions, terrorist financing and proliferation financing. Throughout 2020, the Group
Risk Committee received regular updates on the Skilled Person’s and the Independent Consultant’s reviews.
Model risk
Overview
Model risk is the potential for adverse consequences from business decisions informed by models, which can be exacerbated by errors in methodology, design or the way they are used. Model risk arises in both financial and non-financial contexts whenever business decision making includes reliance on models.
Key developments in 2020
In 2020, we carried out a number of initiatives to further develop and embed the Model Risk Management sub-function, including:
• We appointed a Group Chief Model Risk Officer, which is a senior role reporting to the Group Chief Risk Officer.
• We updated the model risk policy and introduced model risk standards to enable a more risk-based approach to model risk management while retaining a consistent approach.
• Working with the businesses and functions, new model risk controls were developed in the risk control library. These controls formed the basis for model risk control assessments that have been implemented for businesses and functions.
• We updated the target operating model for Model Risk Management, referring to internal and industry best practice and added risk stewards for key businesses, functions and legal vehicles. The risk stewards will also provide close monitoring of changes in model behaviour, working closely with business and function model owners and sponsors.
• The independent model validation team began a transformation programme that will use advanced analytics and new workflow tools, with the objective of providing a more risk-based, efficient and effective management of model validation processes.
• The consequences of the Covid-19 outbreak on model performance and reliability resulted in enhanced monitoring of models and related model adjustments. Dramatic changes to model inputs such as GDP and unemployment rates made the model results unreliable. Model performance limitations have been most pronounced for IFRS 9 models, which calculate expected credit losses. As a result, greater reliance has been placed on management underlays and overlays based on business judgement to derive expected credit losses.
• New IFRS 9 models for portfolios that required the largest model overlays during 2020 have been redeveloped, validated and implemented in the fourth quarter of 2020. Limited new data was available for the use in the recalibrations, therefore judgemental post-model adjustments were required to allow for the economic effects of the pandemic not captured by the models.
Governance and structure
We placed greater focus on our model risk activities during 2020, and to reflect this, we elevated Model Risk Management to a function in its own right within the Global Risk structure. Previously, structured as a sub-function within the Global Risk Strategy function, the team now reports directly to the Group Chief Risk Officer. Regional Model Risk Management teams support and advise all areas of the Group.
Key risk management processes
We use a variety of modelling approaches, including regression, simulation, sampling, machine learning and judgemental scorecards for a range of business applications. These activities include customer selection, product pricing, financial crime transaction monitoring, creditworthiness evaluation and financial reporting. Global responsibility for managing model risk is delegated from the RMM to the Group Model Risk Committee, which is chaired by the Group Chief Risk Officer. This committee regularly reviews our model risk management policies and procedures, and requires the first line of defence to demonstrate
Risk
188 HSBC Holdings plc Annual Report and Accounts 2020
comprehensive and effective controls based on a library of model risk controls provided by Model Risk Management.
Model Risk Management also reports on model risk to senior management on a regular basis through the use of the risk map, risk appetite metrics and top and emerging risks.
We regularly review the effectiveness of these processes, including the model oversight committee structure, to help ensure appropriate understanding and ownership of model risk is embedded in the businesses and functions.
Insurance manufacturing operations riskPage
Overview 189
Insurance manufacturing operations risk management 189
Measurement 190
Key risk types 192
– Market risk 192
– Credit risk 193
– Capital and liquidity risk 193
– Insurance risk 194
Overview
The majority of the risk in our insurance business derives from manufacturing activities and can be categorised as financial risk or insurance risk. Financial risks include market risk, credit risk and liquidity risk. Insurance risk is the risk, other than financial risk, of loss transferred from the holder of the insurance contract to HSBC, the issuer.
HSBC’s bancassurance model
We operate an integrated bancassurance model that provides insurance products principally for customers with whom we have a banking relationship.
The insurance contracts we sell relate to the underlying needs of our banking customers, which we can identify from our point-of-sale contacts and customer knowledge. For the products we manufacture, the majority of sales are of savings, universal life and credit and term life contracts.
We choose to manufacture these insurance products in HSBC subsidiaries based on an assessment of operational scale and risk appetite. Manufacturing insurance allows us to retain the risks and rewards associated with writing insurance contracts by keeping part of the underwriting profit and investment income within the Group.
We have life insurance manufacturing subsidiaries in eight countries and territories, which are Hong Kong, France, Singapore, the UK, mainland China, Malta, Mexico and Argentina. We also have a life insurance manufacturing associate in India.
Where we do not have the risk appetite or operational scale to be an effective insurance manufacturer, we engage with a small number of leading external insurance companies in order to provide insurance products to our customers through our banking network and direct channels. These arrangements are generally structured with our exclusive strategic partners and earn the Group a combination of commissions, fees and a share of profits. We distribute insurance products in all of our geographical regions.
Insurance products are sold worldwide through branches, direct channels and third-party distributors.
Insurance manufacturing operations risk management
Key developments in 2020
There were no material changes to the insurance risk management framework in 2020. Policies and practices for the management of risks associated with the selling of insurance contracts outside of bancassurance channels were enhanced in response to this being an increasing area of importance for the insurance business. Also, enhancements were made to the capital risk framework for
insurance operations to better align to the Group’s capital risk framework.
Governance and structure
(Audited)
Insurance risks are managed to a defined risk appetite, which is aligned to the Group’s risk appetite and risk management framework, including its three lines of defence model. For details of the Group’s governance framework, see page 107. The Global Insurance Risk Management Meeting oversees the control framework globally and is accountable to the WPB Risk Management Meeting on risk matters relating to the insurance business.
The monitoring of the risks within our insurance operations is carried out by insurance risk teams. Specific risk functions, including Wholesale Credit and Market Risk, Operational and Resilience Risk, and Compliance, support Insurance Risk teams in their respective areas of expertise.
Stress and scenario testing
(Audited)
Stress testing forms a key part of the risk management framework for the insurance business. We participate in local and Group-wide regulatory stress tests, as well as internally-developed stress and scenario tests, including Group internal stress test exercises.
These have highlighted that a key risk scenario for the insurance business is a prolonged low interest-rate environment. In order to mitigate the impact of this scenario, the insurance operations have taken a number of actions, including repricing some products to reflect lower interest rates, launching less capital intensive products, investing in more capital efficient assets and developing investment strategies to optimise the expected returns against the cost of economic capital.
Key risk management processes
Market risk
(Audited)
All our insurance manufacturing subsidiaries have market risk mandates that specify the investment instruments in which they are permitted to invest and the maximum quantum of market risk that they may retain. They manage market risk by using, among others, some or all of the techniques listed below, depending on the nature of the contracts written:
• We are able to adjust bonus rates to manage the liabilities to policyholders for products with discretionary participating features (‘DPF’). The effect is that a significant portion of the market risk is borne by the policyholder.
• We use asset and liability matching where asset portfolios are structured to support projected liability cash flows. The Group manages its assets using an approach that considers asset quality, diversification, cash flow matching, liquidity, volatility and target investment return. It is not always possible to match asset and liability durations due to uncertainty over the receipt of all future premiums, the timing of claims and because the forecast payment dates of liabilities may exceed the duration of the longest dated investments available. We use models to assess the effect of a range of future scenarios on the values of financial assets and associated liabilities, and ALCOs employ the outcomes in determining how best to structure asset holdings to support liabilities.
• We use derivatives to protect against adverse market movements to better match liability cash flows.
• For new products with investment guarantees, we consider the cost when determining the level of premiums or the price structure.
• We periodically review products identified as higher risk, such as those that contain investment guarantees and embedded optionality features linked to savings and investment products, for active management.
HSBC Holdings plc Annual Report and Accounts 2020 189
Risk review
• We design new products to mitigate market risk, such as changing the investment return sharing portion between policyholders and the shareholder.
• We exit, to the extent possible, investment portfolios whose risk is considered unacceptable.
• We reprice premiums charged on new contracts to policyholders.
Credit risk
(Audited)
Our insurance manufacturing subsidiaries are responsible for the credit risk, quality and performance of their investment portfolios. Our assessment of the creditworthiness of issuers and counterparties is based primarily upon internationally recognised credit ratings and other publicly available information.
Investment credit exposures are monitored against limits by our insurance manufacturing subsidiaries and are aggregated and reported to the Group Insurance Credit Risk and Group Credit Risk functions. Stress testing is performed on investment credit exposures using credit spread sensitivities and default probabilities.
We use a number of tools to manage and monitor credit risk. These include a credit report containing a watch-list of investments with current credit concerns, primarily investments that may be at risk of future impairment or where high concentrations to counterparties are present in the investment portfolio. Sensitivities to credit spread risk are assessed and monitored regularly.
Liquidity risk
(Audited)
Risk is managed by cash flow matching and maintaining sufficient cash resources, investing in high credit-quality investments with deep and liquid markets, monitoring investment concentrations and restricting them where appropriate, and establishing committed contingency borrowing facilities.
Insurance manufacturing subsidiaries complete quarterly liquidity risk reports and an annual review of the liquidity risks to which they are exposed.
Insurance risk
HSBC Insurance primarily uses the following techniques to manage and mitigate insurance risk:
• a formalised product approval process covering product design, pricing and overall proposition management (for example, management of lapses by introducing surrender charges);
• underwriting policy;
• claims management processes; and
• reinsurance which cedes risks above our acceptable thresholds to an external reinsurer thereby limiting our exposure.
Insurance manufacturing operations risk in 2020
Measurement
(Audited)
The risk profile of our insurance manufacturing businesses is measured using an economic capital approach. Assets and liabilities are measured on a market value basis, and a capital requirement is defined to ensure that there is a less than one-in-200 chance of insolvency over a one-year time horizon, given the risks to which the businesses are exposed. The methodology for the economic capital calculation is largely aligned to the pan-European Solvency II insurance capital regulations. The economic capital coverage ratio (economic net asset value divided by the economic capital requirement) is a key risk appetite measure.
The Covid-19 outbreak caused sales of insurance products to be lower than forecast in 2020, although we responded by expanding digital and remote servicing capabilities. To date there has been limited impact on claims or lapse behaviours, although this remains under close monitoring. The largest effect on insurance entities came from volatility in the financial markets and the material fall in interest rates, which impact levels of capital and profitability. Businesses responded by executing de-risking strategies followed by subsequent re-risking of positions as markets recovered. Enhanced monitoring of risks and pricing conditions continues.
Risk
190 HSBC Holdings plc Annual Report and Accounts 2020
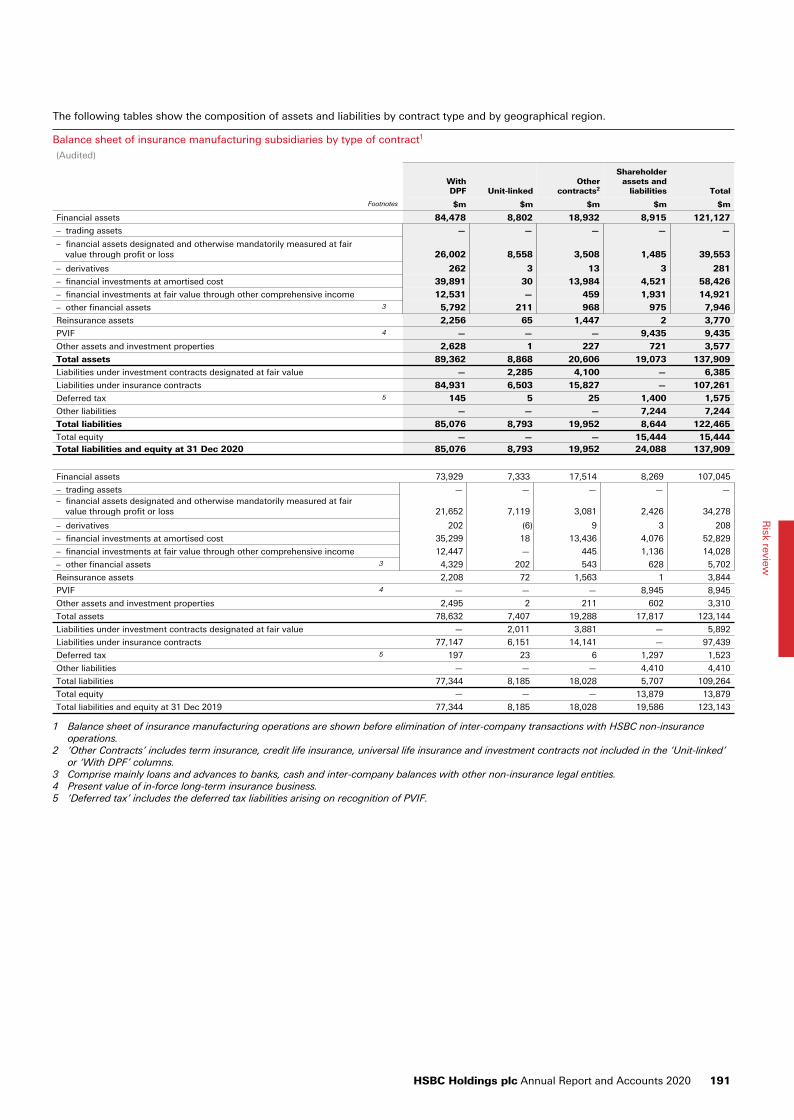
The following tables show the composition of assets and liabilities by contract type and by geographical region.
Balance sheet of insurance manufacturing subsidiaries by type of contract1
(Audited)
WithDPF Unit-linked
Other contracts2
Shareholderassets and
liabilities Total
Footnotes $m $m $m $m $m
Financial assets 84,478 8,802 18,932 8,915 121,127
– trading assets — — — — —
– financial assets designated and otherwise mandatorily measured at fair value through profit or loss 26,002 8,558 3,508 1,485 39,553
– derivatives 262 3 13 3 281
– financial investments at amortised cost 39,891 30 13,984 4,521 58,426
– financial investments at fair value through other comprehensive income 12,531 — 459 1,931 14,921
– other financial assets 3 5,792 211 968 975 7,946
Reinsurance assets 2,256 65 1,447 2 3,770
PVIF 4 — — — 9,435 9,435
Other assets and investment properties 2,628 1 227 721 3,577
Total assets 89,362 8,868 20,606 19,073 137,909
Liabilities under investment contracts designated at fair value — 2,285 4,100 — 6,385
Liabilities under insurance contracts 84,931 6,503 15,827 — 107,261
Deferred tax 5 145 5 25 1,400 1,575
Other liabilities — — — 7,244 7,244
Total liabilities 85,076 8,793 19,952 8,644 122,465
Total equity — — — 15,444 15,444 Total liabilities and equity at 31 Dec 2020 85,076 8,793 19,952 24,088 137,909
Financial assets 73,929 7,333 17,514 8,269 107,045
– trading assets — — — — — – financial assets designated and otherwise mandatorily measured at fair
value through profit or loss 21,652 7,119 3,081 2,426 34,278
– derivatives 202 (6) 9 3 208
– financial investments at amortised cost 35,299 18 13,436 4,076 52,829
– financial investments at fair value through other comprehensive income 12,447 — 445 1,136 14,028
– other financial assets 3 4,329 202 543 628 5,702
Reinsurance assets 2,208 72 1,563 1 3,844
PVIF 4 — — — 8,945 8,945
Other assets and investment properties 2,495 2 211 602 3,310
Total assets 78,632 7,407 19,288 17,817 123,144
Liabilities under investment contracts designated at fair value — 2,011 3,881 — 5,892
Liabilities under insurance contracts 77,147 6,151 14,141 — 97,439
Deferred tax 5 197 23 6 1,297 1,523
Other liabilities — — — 4,410 4,410
Total liabilities 77,344 8,185 18,028 5,707 109,264
Total equity — — — 13,879 13,879
Total liabilities and equity at 31 Dec 2019 77,344 8,185 18,028 19,586 123,143
1 Balance sheet of insurance manufacturing operations are shown before elimination of inter-company transactions with HSBC non-insurance operations.
2 ‘Other Contracts’ includes term insurance, credit life insurance, universal life insurance and investment contracts not included in the ‘Unit-linked’ or ‘With DPF’ columns.
3 Comprise mainly loans and advances to banks, cash and inter-company balances with other non-insurance legal entities.4 Present value of in-force long-term insurance business.5 ‘Deferred tax’ includes the deferred tax liabilities arising on recognition of PVIF.
HSBC Holdings plc Annual Report and Accounts 2020 191
Risk review
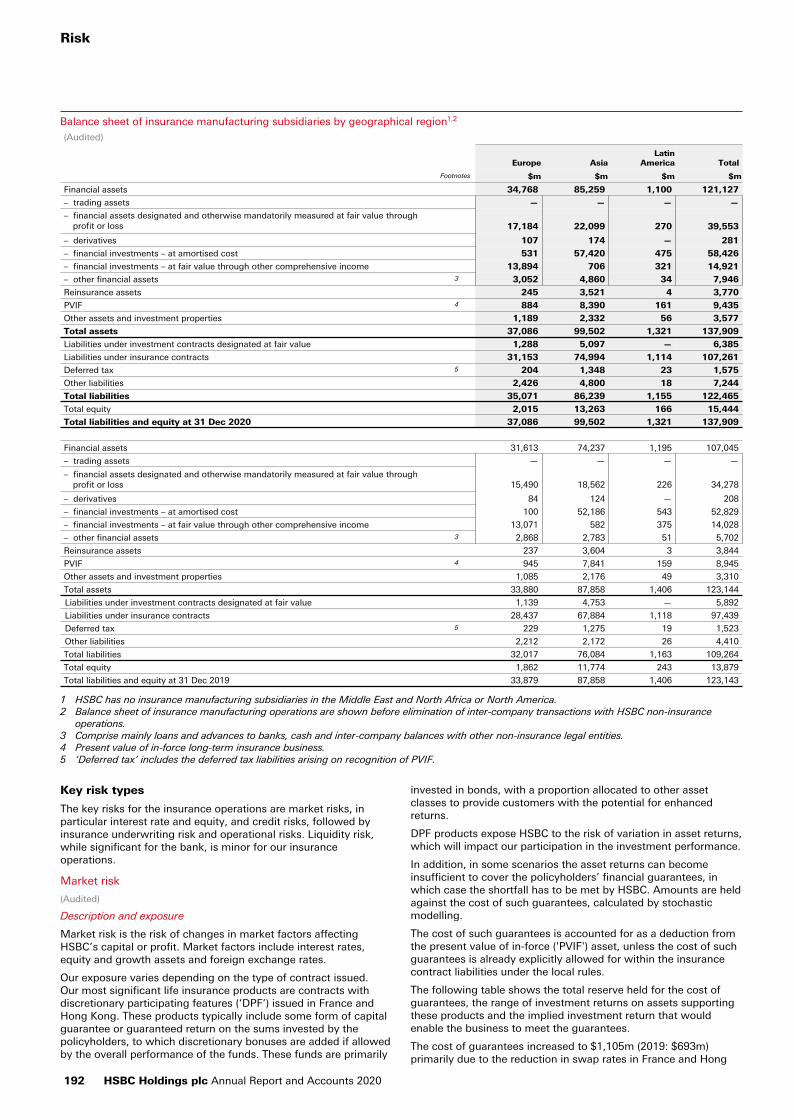
Balance sheet of insurance manufacturing subsidiaries by geographical region1,2
(Audited)
Europe AsiaLatin
America Total
Footnotes $m $m $m $m
Financial assets 34,768 85,259 1,100 121,127
– trading assets — — — —
– financial assets designated and otherwise mandatorily measured at fair value through profit or loss 17,184 22,099 270 39,553
– derivatives 107 174 — 281
– financial investments – at amortised cost 531 57,420 475 58,426
– financial investments – at fair value through other comprehensive income 13,894 706 321 14,921
– other financial assets 3 3,052 4,860 34 7,946
Reinsurance assets 245 3,521 4 3,770
PVIF 4 884 8,390 161 9,435
Other assets and investment properties 1,189 2,332 56 3,577
Total assets 37,086 99,502 1,321 137,909
Liabilities under investment contracts designated at fair value 1,288 5,097 — 6,385
Liabilities under insurance contracts 31,153 74,994 1,114 107,261
Deferred tax 5 204 1,348 23 1,575
Other liabilities 2,426 4,800 18 7,244
Total liabilities 35,071 86,239 1,155 122,465
Total equity 2,015 13,263 166 15,444
Total liabilities and equity at 31 Dec 2020 37,086 99,502 1,321 137,909
Financial assets 31,613 74,237 1,195 107,045
– trading assets — — — —
– financial assets designated and otherwise mandatorily measured at fair value through profit or loss 15,490 18,562 226 34,278
– derivatives 84 124 — 208
– financial investments – at amortised cost 100 52,186 543 52,829
– financial investments – at fair value through other comprehensive income 13,071 582 375 14,028
– other financial assets 3 2,868 2,783 51 5,702
Reinsurance assets 237 3,604 3 3,844
PVIF 4 945 7,841 159 8,945
Other assets and investment properties 1,085 2,176 49 3,310
Total assets 33,880 87,858 1,406 123,144
Liabilities under investment contracts designated at fair value 1,139 4,753 — 5,892
Liabilities under insurance contracts 28,437 67,884 1,118 97,439
Deferred tax 5 229 1,275 19 1,523
Other liabilities 2,212 2,172 26 4,410
Total liabilities 32,017 76,084 1,163 109,264
Total equity 1,862 11,774 243 13,879
Total liabilities and equity at 31 Dec 2019 33,879 87,858 1,406 123,143
1 HSBC has no insurance manufacturing subsidiaries in the Middle East and North Africa or North America.2 Balance sheet of insurance manufacturing operations are shown before elimination of inter-company transactions with HSBC non-insurance
operations.3 Comprise mainly loans and advances to banks, cash and inter-company balances with other non-insurance legal entities.4 Present value of in-force long-term insurance business.5 ‘Deferred tax’ includes the deferred tax liabilities arising on recognition of PVIF.
Key risk types
The key risks for the insurance operations are market risks, in particular interest rate and equity, and credit risks, followed by insurance underwriting risk and operational risks. Liquidity risk, while significant for the bank, is minor for our insurance operations.
Market risk
(Audited)
Description and exposure
Market risk is the risk of changes in market factors affecting HSBC’s capital or profit. Market factors include interest rates, equity and growth assets and foreign exchange rates.
Our exposure varies depending on the type of contract issued. Our most significant life insurance products are contracts with discretionary participating features (‘DPF’) issued in France and Hong Kong. These products typically include some form of capital guarantee or guaranteed return on the sums invested by the policyholders, to which discretionary bonuses are added if allowed by the overall performance of the funds. These funds are primarily
invested in bonds, with a proportion allocated to other asset classes to provide customers with the potential for enhanced returns.
DPF products expose HSBC to the risk of variation in asset returns, which will impact our participation in the investment performance.
In addition, in some scenarios the asset returns can become insufficient to cover the policyholders’ financial guarantees, in which case the shortfall has to be met by HSBC. Amounts are held against the cost of such guarantees, calculated by stochastic modelling.
The cost of such guarantees is accounted for as a deduction from the present value of in-force ('PVIF') asset, unless the cost of such guarantees is already explicitly allowed for within the insurance contract liabilities under the local rules.
The following table shows the total reserve held for the cost of guarantees, the range of investment returns on assets supporting these products and the implied investment return that would enable the business to meet the guarantees.
The cost of guarantees increased to $1,105m (2019: $693m) primarily due to the reduction in swap rates in France and Hong
Risk
192 HSBC Holdings plc Annual Report and Accounts 2020
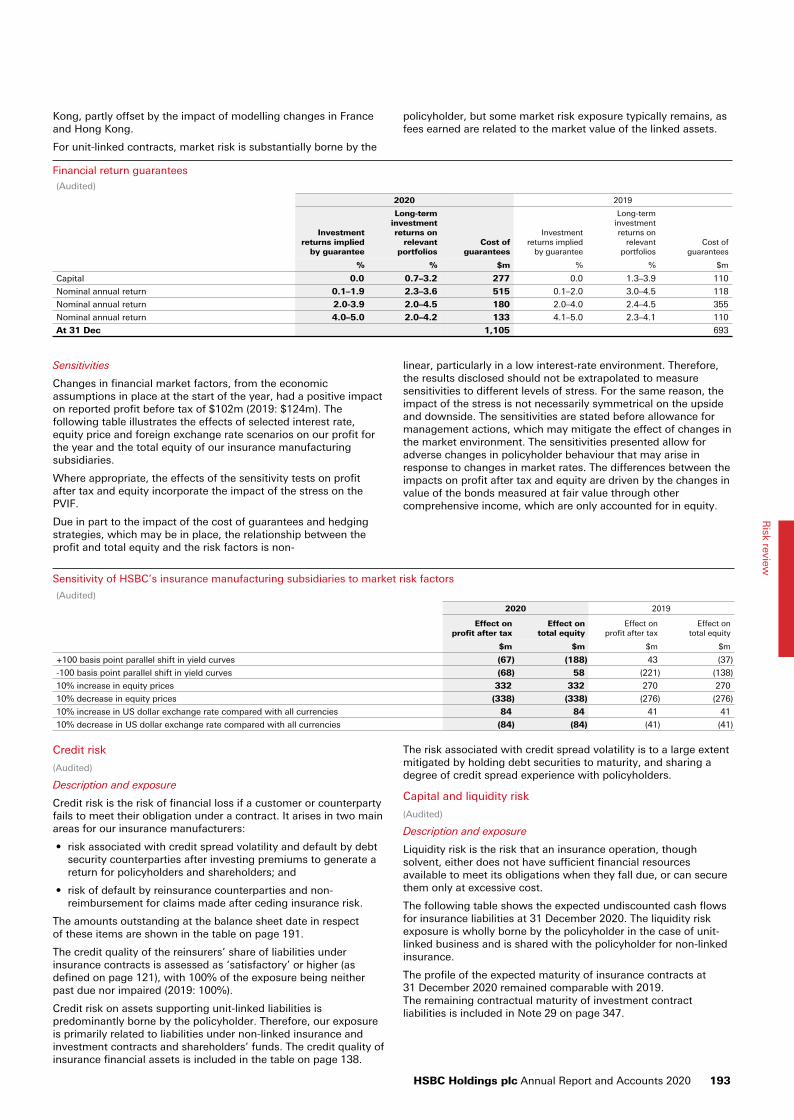
Kong, partly offset by the impact of modelling changes in France and Hong Kong.
For unit-linked contracts, market risk is substantially borne by the
policyholder, but some market risk exposure typically remains, as fees earned are related to the market value of the linked assets.
Financial return guarantees(Audited)
2020 2019
Investment returns implied
by guarantee
Long-term investment returns on
relevant portfolios
Cost of guarantees
Investment returns implied
by guarantee
Long-term investment returns on
relevant portfolios
Cost of guarantees
% % $m % % $m
Capital 0.0 0.7–3.2 277 0.0 1.3–3.9 110
Nominal annual return 0.1–1.9 2.3–3.6 515 0.1–2.0 3.0–4.5 118
Nominal annual return 2.0-3.9 2.0–4.5 180 2.0–4.0 2.4–4.5 355
Nominal annual return 4.0–5.0 2.0–4.2 133 4.1–5.0 2.3–4.1 110
At 31 Dec 1,105 693
Sensitivities
Changes in financial market factors, from the economic assumptions in place at the start of the year, had a positive impact on reported profit before tax of $102m (2019: $124m). The following table illustrates the effects of selected interest rate, equity price and foreign exchange rate scenarios on our profit for the year and the total equity of our insurance manufacturing subsidiaries.
Where appropriate, the effects of the sensitivity tests on profit after tax and equity incorporate the impact of the stress on the PVIF.
Due in part to the impact of the cost of guarantees and hedging strategies, which may be in place, the relationship between the profit and total equity and the risk factors is non-
linear, particularly in a low interest-rate environment. Therefore, the results disclosed should not be extrapolated to measure sensitivities to different levels of stress. For the same reason, the impact of the stress is not necessarily symmetrical on the upside and downside. The sensitivities are stated before allowance for management actions, which may mitigate the effect of changes in the market environment. The sensitivities presented allow for adverse changes in policyholder behaviour that may arise in response to changes in market rates. The differences between the impacts on profit after tax and equity are driven by the changes in value of the bonds measured at fair value through other comprehensive income, which are only accounted for in equity.
Sensitivity of HSBC’s insurance manufacturing subsidiaries to market risk factors
(Audited)2020 2019
Effect onprofit after tax
Effect ontotal equity
Effect on profit after tax
Effect ontotal equity
$m $m $m $m
+100 basis point parallel shift in yield curves (67) (188) 43 (37)
-100 basis point parallel shift in yield curves (68) 58 (221) (138)
10% increase in equity prices 332 332 270 270
10% decrease in equity prices (338) (338) (276) (276)
10% increase in US dollar exchange rate compared with all currencies 84 84 41 41
10% decrease in US dollar exchange rate compared with all currencies (84) (84) (41) (41)
Credit risk
(Audited)
Description and exposure
Credit risk is the risk of financial loss if a customer or counterparty fails to meet their obligation under a contract. It arises in two main areas for our insurance manufacturers:
• risk associated with credit spread volatility and default by debt security counterparties after investing premiums to generate a return for policyholders and shareholders; and
• risk of default by reinsurance counterparties and non-reimbursement for claims made after ceding insurance risk.
The amounts outstanding at the balance sheet date in respect of these items are shown in the table on page 191.
The credit quality of the reinsurers’ share of liabilities under insurance contracts is assessed as ‘satisfactory’ or higher (as defined on page 121), with 100% of the exposure being neither past due nor impaired (2019: 100%).
Credit risk on assets supporting unit-linked liabilities is predominantly borne by the policyholder. Therefore, our exposure is primarily related to liabilities under non-linked insurance and investment contracts and shareholders’ funds. The credit quality of insurance financial assets is included in the table on page 138.
The risk associated with credit spread volatility is to a large extent mitigated by holding debt securities to maturity, and sharing a degree of credit spread experience with policyholders.
Capital and liquidity risk
(Audited)
Description and exposure
Liquidity risk is the risk that an insurance operation, though solvent, either does not have sufficient financial resources available to meet its obligations when they fall due, or can secure them only at excessive cost.
The following table shows the expected undiscounted cash flows for insurance liabilities at 31 December 2020. The liquidity risk exposure is wholly borne by the policyholder in the case of unit-linked business and is shared with the policyholder for non-linked insurance.
The profile of the expected maturity of insurance contracts at 31 December 2020 remained comparable with 2019.The remaining contractual maturity of investment contract liabilities is included in Note 29 on page 347.
HSBC Holdings plc Annual Report and Accounts 2020 193
Risk review
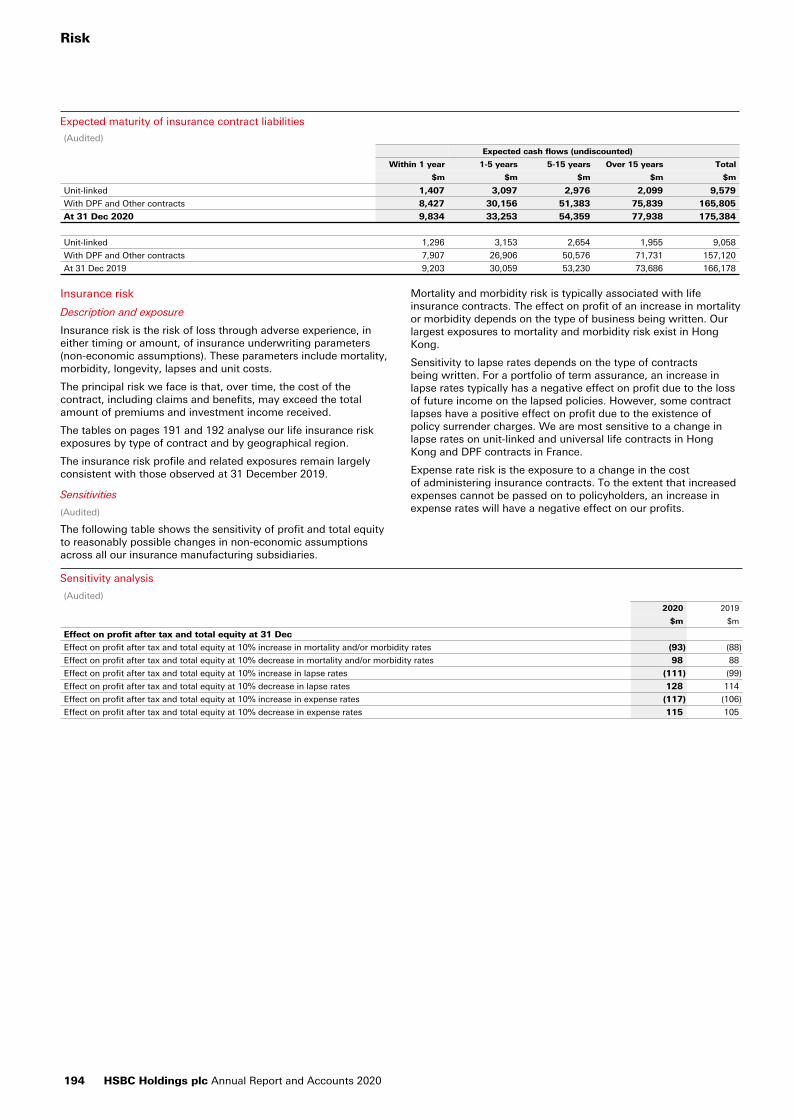
Expected maturity of insurance contract liabilities
(Audited)Expected cash flows (undiscounted)
Within 1 year 1-5 years 5-15 years Over 15 years Total
$m $m $m $m $m
Unit-linked 1,407 3,097 2,976 2,099 9,579
With DPF and Other contracts 8,427 30,156 51,383 75,839 165,805
At 31 Dec 2020 9,834 33,253 54,359 77,938 175,384
Unit-linked 1,296 3,153 2,654 1,955 9,058
With DPF and Other contracts 7,907 26,906 50,576 71,731 157,120
At 31 Dec 2019 9,203 30,059 53,230 73,686 166,178
Insurance risk
Description and exposure
Insurance risk is the risk of loss through adverse experience, in either timing or amount, of insurance underwriting parameters (non-economic assumptions). These parameters include mortality, morbidity, longevity, lapses and unit costs.
The principal risk we face is that, over time, the cost of the contract, including claims and benefits, may exceed the total amount of premiums and investment income received.
The tables on pages 191 and 192 analyse our life insurance risk exposures by type of contract and by geographical region.
The insurance risk profile and related exposures remain largely consistent with those observed at 31 December 2019.
Sensitivities
(Audited)
The following table shows the sensitivity of profit and total equity to reasonably possible changes in non-economic assumptions across all our insurance manufacturing subsidiaries.
Mortality and morbidity risk is typically associated with life insurance contracts. The effect on profit of an increase in mortality or morbidity depends on the type of business being written. Our largest exposures to mortality and morbidity risk exist in Hong Kong.
Sensitivity to lapse rates depends on the type of contracts being written. For a portfolio of term assurance, an increase in lapse rates typically has a negative effect on profit due to the loss of future income on the lapsed policies. However, some contract lapses have a positive effect on profit due to the existence of policy surrender charges. We are most sensitive to a change in lapse rates on unit-linked and universal life contracts in Hong Kong and DPF contracts in France.
Expense rate risk is the exposure to a change in the cost of administering insurance contracts. To the extent that increased expenses cannot be passed on to policyholders, an increase in expense rates will have a negative effect on our profits.
Sensitivity analysis
(Audited)2020 2019
$m $m
Effect on profit after tax and total equity at 31 Dec
Effect on profit after tax and total equity at 10% increase in mortality and/or morbidity rates (93) (88)
Effect on profit after tax and total equity at 10% decrease in mortality and/or morbidity rates 98 88
Effect on profit after tax and total equity at 10% increase in lapse rates (111) (99)
Effect on profit after tax and total equity at 10% decrease in lapse rates 128 114
Effect on profit after tax and total equity at 10% increase in expense rates (117) (106)
Effect on profit after tax and total equity at 10% decrease in expense rates 115 105
Risk
194 HSBC Holdings plc Annual Report and Accounts 2020