Managing Risk at HSBC Holdings plc
46
Managing Risk at HSBC Holdings plc Presentation to Investors and Analysts London, 11 September 2009
-
Upload
khangminh22 -
Category
Documents
-
view
0 -
download
0
Transcript of Managing Risk at HSBC Holdings plc
Managing Risk at HSBC Holdings plcPresentation to Investors and AnalystsLondon, 11 September 2009
2
Forward-looking statements
This presentation and subsequent discussion may contain certain forward-looking statements with respect to the financial condition, results of operations and business of the Group. These forward-looking statements represent the Group’s expectations or beliefs concerning future events and involve known and unknown risks and uncertainty that could cause actual results, performance or events to differ materially from those expressed or implied in such statements. Additional detailed information concerning important factors that could cause actual results to differ materially is available in our Interim Report. Past performance cannot be relied on as a guide to future performance.
Risk Management
4
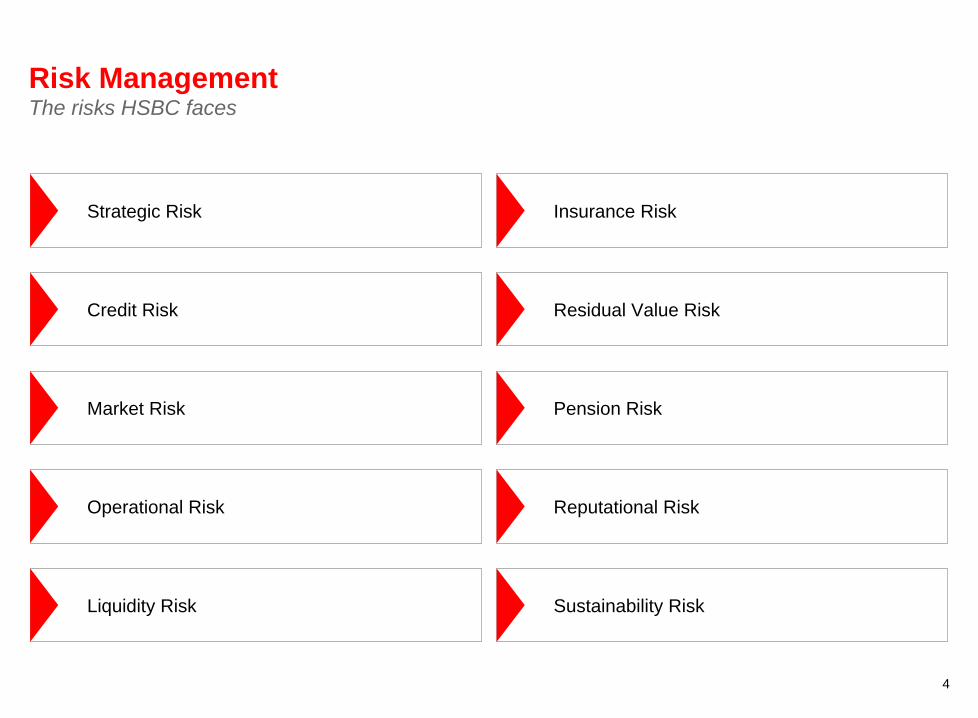
Risk Management The risks HSBC faces
Strategic Risk
Liquidity Risk
Operational Risk
Credit Risk
Market Risk
Insurance Risk
Sustainability Risk
Reputational Risk
Residual Value Risk
Pension Risk
5
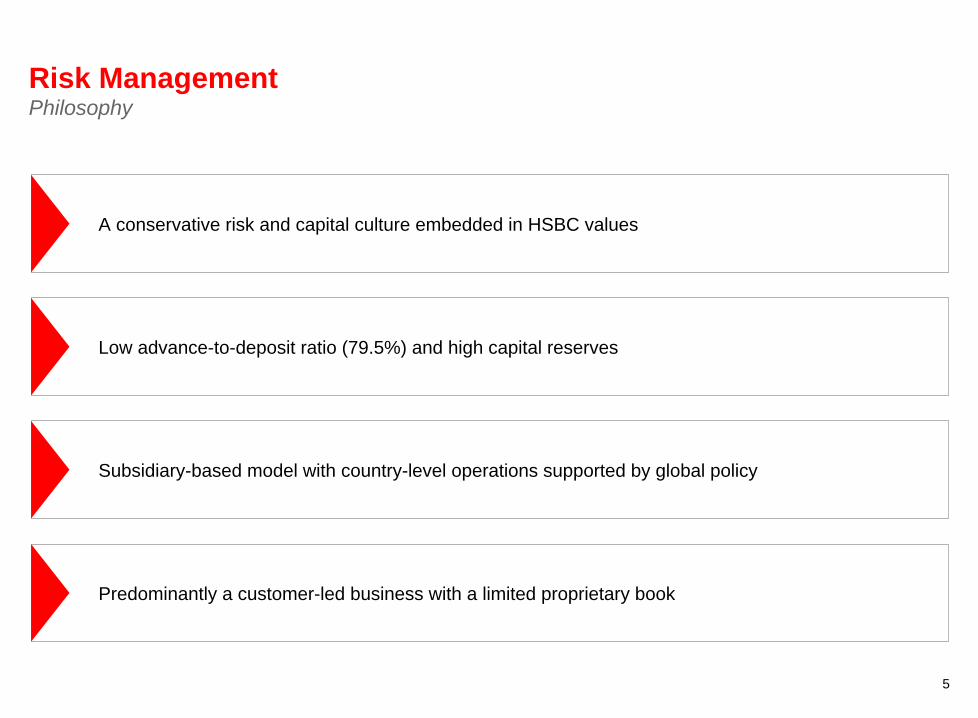
Risk Management Philosophy
A conservative risk and capital culture embedded in HSBC values
Predominantly a customer-led business with a limited proprietary book
Low advance-to-deposit ratio (79.5%) and high capital reserves
Subsidiary-based model with country-level operations supported by global policy
6
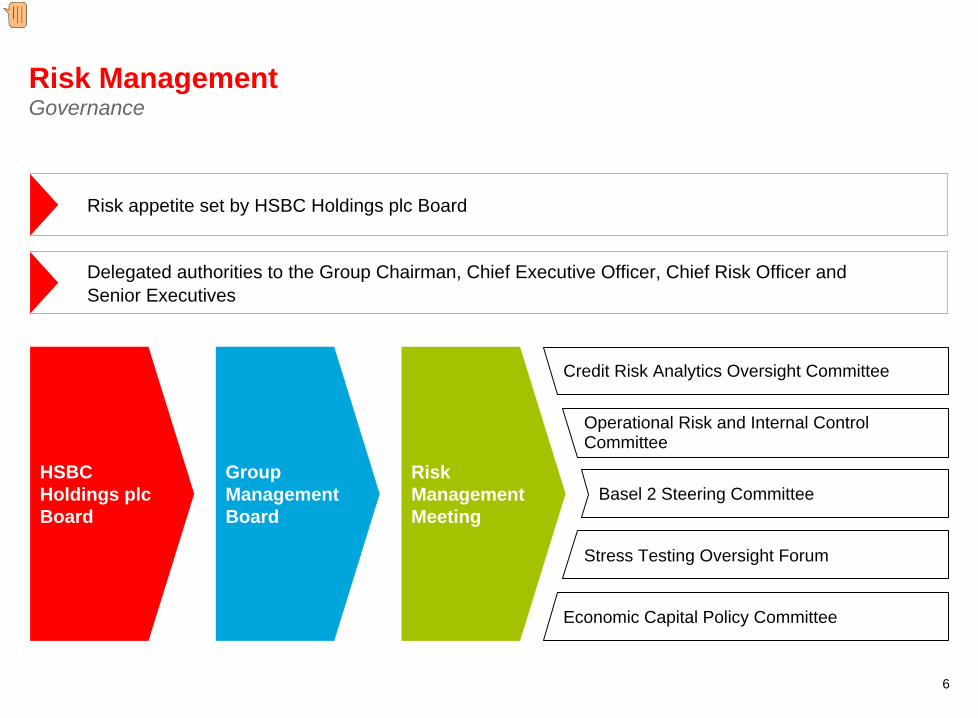
Risk Management Governance
Risk appetite set by HSBC Holdings plc Board
Delegated authorities to the Group Chairman, Chief Executive Officer, Chief Risk Officer and Senior Executives
Risk Management Meeting
Economic Capital Policy Committee
Group Management Board
HSBC Holdings plc Board
Credit Risk Analytics Oversight Committee
Operational Risk and Internal Control Committee
Basel 2 Steering Committee
Stress Testing Oversight Forum
Presenter�
Presentation Notes�
HSBC Holdings plc Board has overall responsibility for the approval of Group risk appetite and top level risk authority delegation It delegates day-to-day risk management to the Group Management Board for practical implementation, whilst receiving high level reports on risk issues and performance Risk Governance is exercised at Group level through the Risk Management Meeting of the Group Management Board and its sub-committees�
7
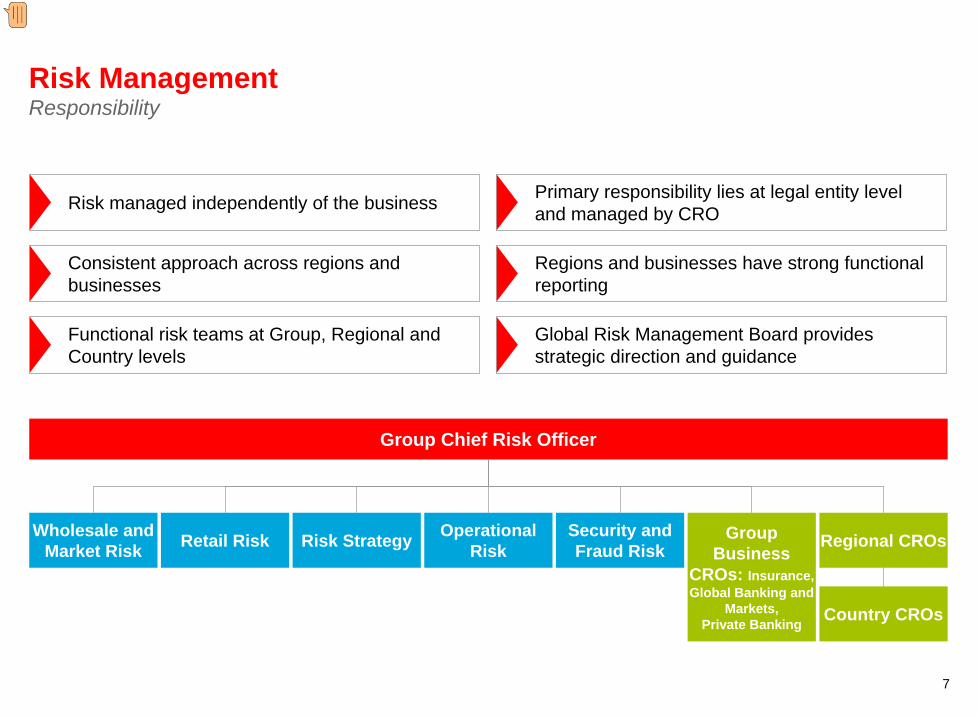
Risk Management Responsibility
Risk managed independently of the business
Consistent approach across regions and businesses
Primary responsibility lies at legal entity level and managed by CRO
Functional risk teams at Group, Regional and Country levels
Regions and businesses have strong functional reporting
Global Risk Management Board provides strategic direction and guidance
Group Chief Risk Officer
Group Business
CROs: Insurance,Global Banking and
Markets,Private Banking
Risk StrategyRetail RiskWholesale and Market Risk Regional CROsOperational
RiskSecurity and Fraud Risk
Country CROs
Presenter�
Presentation Notes�
Risk at HSBC is managed independently of the business, with balance sheet owners (CEOs and Boards at entity level) receiving support from the Risk function Primary responsibility for managing risk lies at the legal entity level and is managed by the respective regional / country / business CRO The Target Operating Model provides for a consistent approach across regions, countries, and businesses, resulting in strong functional reporting and providing a clear line of sight vertically, regionally and between functions and businesses, with Group Risk providing input as required Functional Risk teams exist at the Group, Regional and Country levels Global Risk Management Board brings together regional and business CROs and Risk team heads and provides strategic direction and guidance�
8
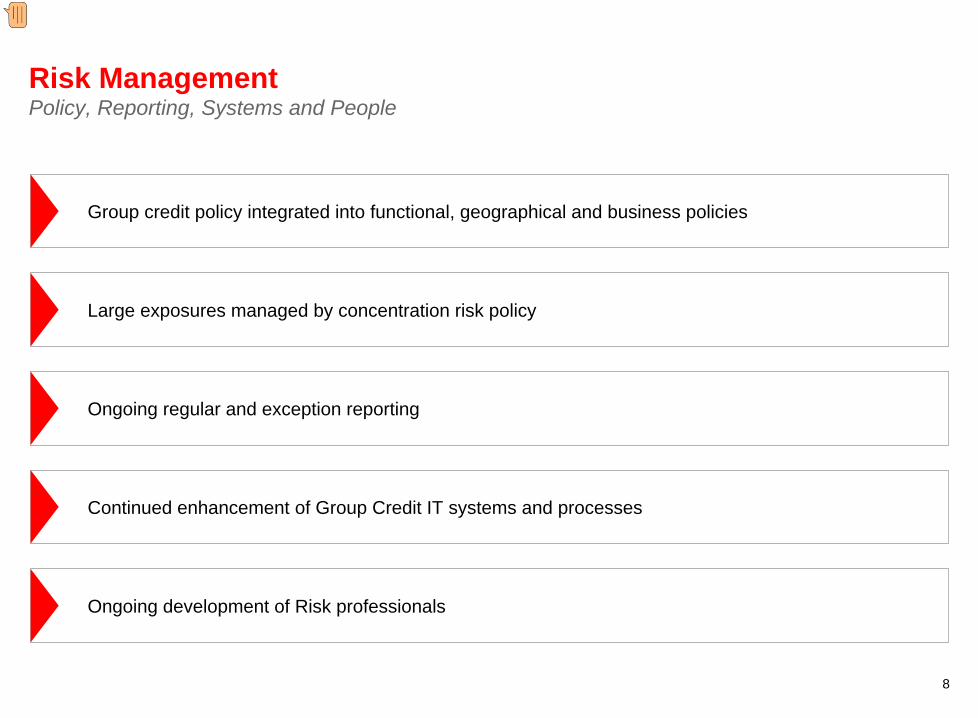
Risk Management Policy, Reporting, Systems and People
Group credit policy integrated into functional, geographical and business policies
Ongoing development of Risk professionals
Continued enhancement of Group Credit IT systems and processes
Large exposures managed by concentration risk policy
Ongoing regular and exception reporting
Presenter�
Presentation Notes�
Credit Policy at HSBC is managed through a hierarchy of policy documents, including the Group Standards Manual (GSM) which embodies core philosophy, principles and standards, the Functional Instruction Manual (FIM) which builds on risk ownership foundations and Business Instructions Manuals (BIMs) Concentration risk policy ensures large exposures are prudent and meet regulatory requirements, including controlling cross border exposures through country limits Ongoing regular and exception reporting is integral to all risk functions, with risk management information including: Regular review of major portfolios, large individual exposures and areas of concern Regional portfolio reviews Sector reports Group / region / entity performance against key risk indicators Risk rating system performance Major impairments and allowances Stress testing at model, portfolio and enterprise levels Escalation on a materiality basis Similar reporting is provided at Country, Regional, and Business Risk Management Committees in addition to Risk Management Meetings. There is continued investment in enhancing HSBC’s credit systems and processes as well as ongoing development of Risk professionals globally �
Risk Appetite
10
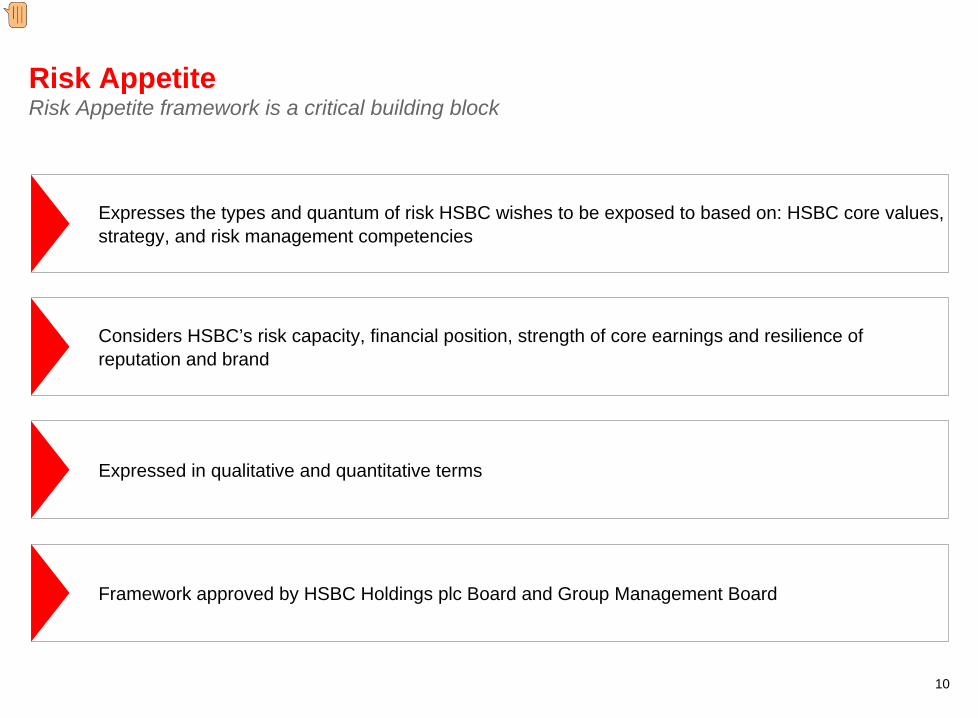
Risk Appetite Risk Appetite framework is a critical building block
Expresses the types and quantum of risk HSBC wishes to be exposed to based on: HSBC core values, strategy, and risk management competencies
Framework approved by HSBC Holdings plc Board and Group Management Board
Considers HSBC’s risk capacity, financial position, strength of core earnings and resilience of reputation and brand
Expressed in qualitative and quantitative terms
Presenter�
Presentation Notes�
The Risk Appetite framework was approved by the HSBC Holdings plc Board and continues to be a key performance measure for our businesses and the way our people are rewarded. Risk appetite is of increasing interest to a range of stakeholders including regulators and the rating agencies.�
11
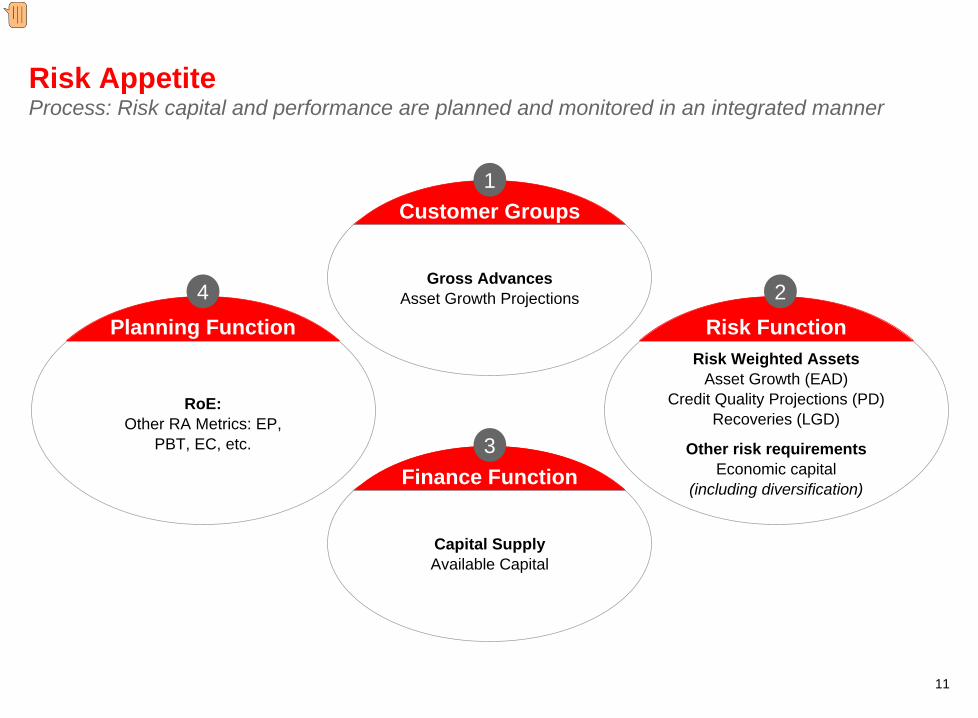
Risk Appetite Process: Risk capital and performance are planned and monitored in an integrated manner
Gross Advances Asset Growth Projections
Customer Groups
RoE: Other RA Metrics: EP,
PBT, EC, etc.
Planning Function
Capital Supply Available Capital
Finance Function
Risk Weighted Assets Asset Growth (EAD)
Credit Quality Projections (PD) Recoveries (LGD)
Other risk requirements Economic capital
(including diversification)
Risk Function
3
1
24
Presenter�
Presentation Notes�
Risk Appetite Metrics seek to ensure that business activity is guided and controlled in line with the risk appetite framework and that business strategy and decisions are proactively shaped in a manner consistent with this. They include: Earnings and Share Price Risk – Maintain a strong balance sheet evidenced by the economic profit spread of the return on invested capital in excess of the Group’s cost of equity Monitor diversification benefit through a lower beta than HSBC peers Capital and Liquidity - Maintain a strong capital position which is defined by a strong Tier 1 ratio and core capital structure which is not overly leveraged Diversification and Expected Loss (EL) - Monitor the diversification benefits driven by the globally diverse nature of HSBC activities as well as (EL – specific provisions) relative to a level of RC Geographic, Customer Group and Business Model - Manage Regions and Customer Group PBT, EP and EC in a manner which provides a stream of non-volatile and predictable earnings, and in line with business maturity, rate of growth, HSBC risk competencies. Strategic Investments - Monitor the value of invested capital against economic capital and regulatory capital in order to assess potential changes in risk profile. HSBC Risk Categories - Risks taken across the Group must be rewarded with the evaluation of this assessed in terms of quantitative measures such as economic capital Capital and Stress Testing - In support of its prudent capital philosophy the Group defines the Tier 1 capital corridor incorporating 1 in 25 year events�
12
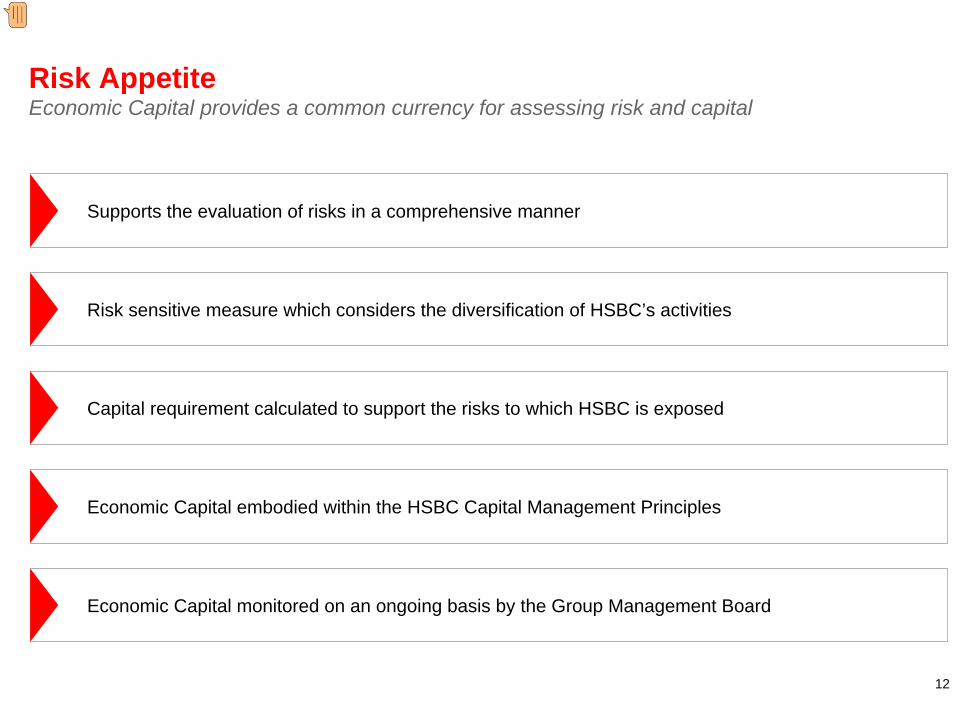
Risk Appetite Economic Capital provides a common currency for assessing risk and capital
Supports the evaluation of risks in a comprehensive manner
Economic Capital monitored on an ongoing basis by the Group Management Board
Economic Capital embodied within the HSBC Capital Management Principles
Risk sensitive measure which considers the diversification of HSBC’s activities
Capital requirement calculated to support the risks to which HSBC is exposed
Presenter�
Presentation Notes�
Economic capital is used as a common measure for assessing most risks we face Having a common measure allows us to effectively evaluate the majority of risks of any given enterprise, and like risk appetite, economic capital is embedded into future strategic and rolling operating plans. The economic capital position is submitted to the Group Management Board quarterly via the Risk Management Meeting, as well as to our regulators as required. �
13
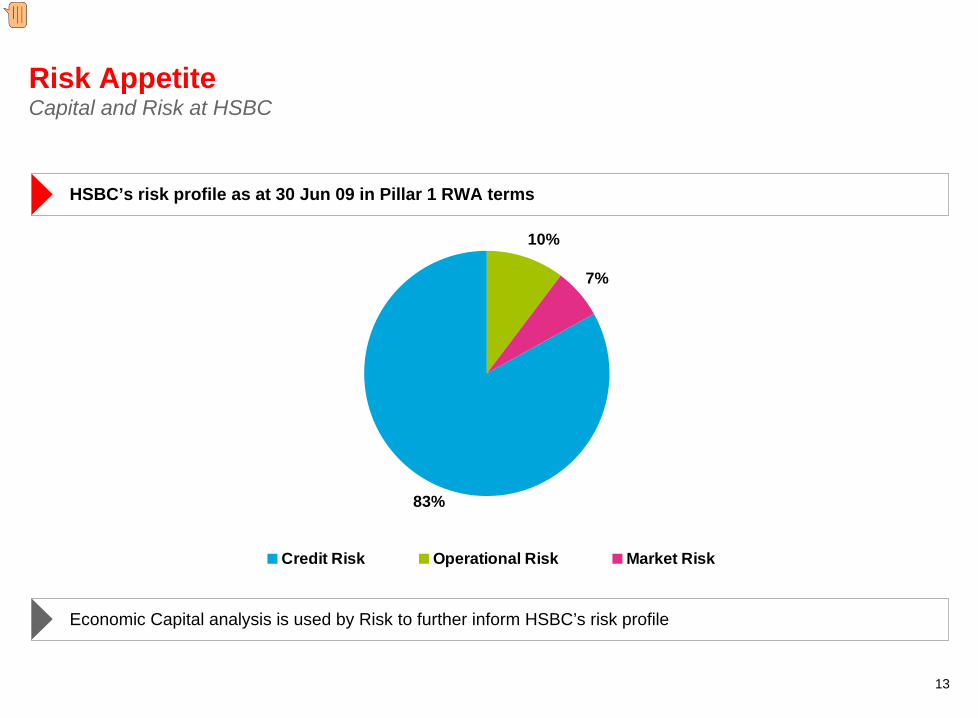
Risk Appetite Capital and Risk at HSBC
HSBC’s risk profile as at 30 Jun 09 in Pillar 1 RWA terms
10%
7%
83%
Credit Risk Operational Risk Market Risk
Economic Capital analysis is used by Risk to further inform HSBC’s risk profile
Presenter�
Presentation Notes�
As at the first quarter of 2009, over half of our economic capital was consumed by credit risk. Having a common measure allows us to effectively evaluate the majority of risks of any given enterprise, and like risk appetite, economic capital is embedded into future strategic and rolling operating plans. The economic capital position is submitted to the Group Management Board quarterly via the Risk Management Meeting, as well as to our regulators as required. �

14
Risk Appetite Stress testing: Risk profile assessed under stress scenarios
Stress testing is important to understand the sensitivities of extreme events to capital and business plans
Stress tests include macroeconomic and event driven scenarios
Analysis reviewed and challenged on an ongoing basis, for instance by Group Audit Committee
Key output: establish management action plans to proactively mitigate risks
Stress Testing Framework overseen by Group Management Board
Presenter�
Presentation Notes�
Scenario Analysis and enterprise-wide risk stress testing are important mechanisms in understanding the sensitivities of capital and business plans to the adverse impacts of extreme but plausible events; A key output is the establishment of management action plans for proactive mitigation of such scenarios should they materialise A few examples of stress scenarios currently under evaluation: Global “Deep U” macroeconomic stress Major counterparty failure– Insurance Major country failure Stagflation “Reverse” stress test�
HSBC Group Credit Risk Profile
16
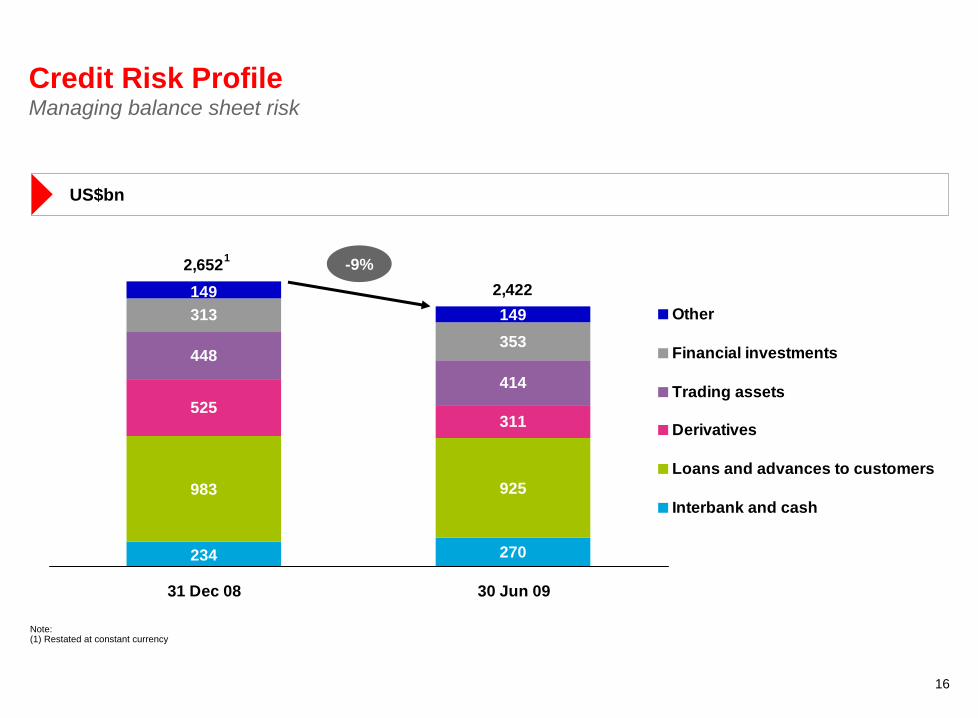
Credit Risk Profile Managing balance sheet risk
Note:(1) Restated at constant currency
270
983 925
525311
448414
313353149
234
149 2,4222,652
31 Dec 08 30 Jun 09
Other
Financial investments
Trading assets
Derivatives
Loans and advances to customers
Interbank and cash
1 -9%
US$bn
17
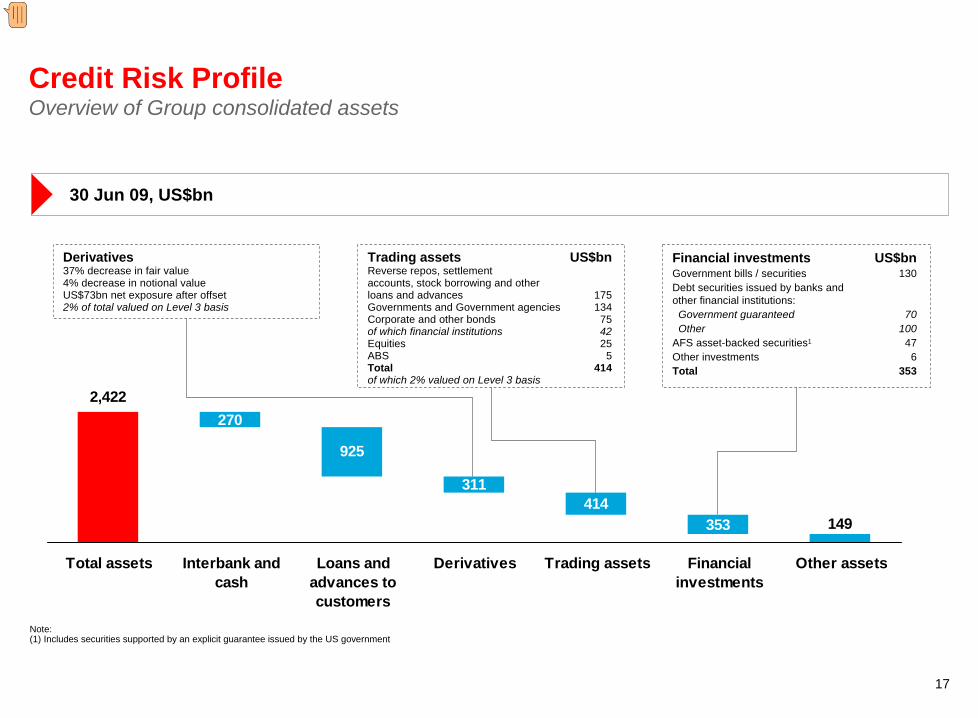
925
311414
2,422
149
270
353
Total assets Interbank andcash
Loans andadvances tocustomers
Derivatives Trading assets Financialinvestments
Other assets
Credit Risk Profile Overview of Group consolidated assets
Note:(1) Includes securities supported by an explicit guarantee issued by the US government
30 Jun 09, US$bn
Derivatives37% decrease in fair value4% decrease in notional valueUS$73bn net exposure after offset2% of total valued on Level 3 basis
Trading assets US$bnReverse repos, settlement accounts, stock borrowing and other loans and advances 175Governments and Government agencies 134Corporate and other bonds 75 of which financial institutions 42Equities 25ABS 5Total 414 of which 2% valued on Level 3 basis
Financial investments US$bnGovernment bills / securities 130Debt securities issued by banks and other financial institutions:
Government guaranteed 70Other 100
AFS asset-backed securities1 47Other investments 6Total 353
Presenter�
Presentation Notes�
Diversification by business line and geography is significant�
Key Elements of Risk at HSBC: Retail Credit Risk

19
Retail Risk HSBC’s Retail Credit portfolio
42%
58%
Residential Mortgages Other Personal
US$437.8bn
Product mix of Retail gross loans and advances to customers at 30 Jun 09
20
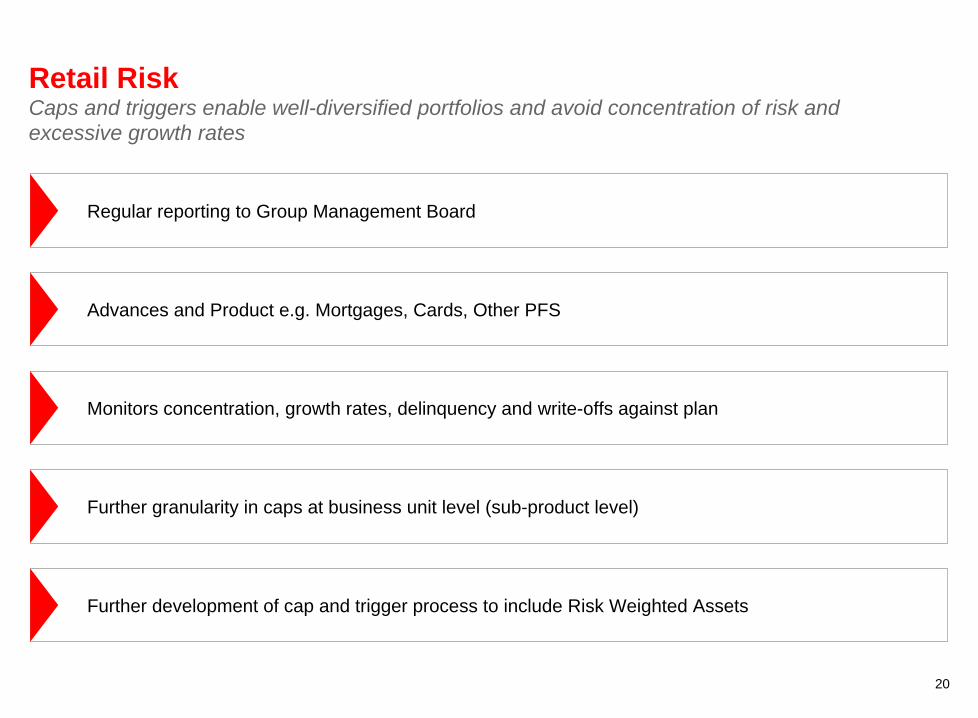
Retail Risk Caps and triggers enable well-diversified portfolios and avoid concentration of risk and excessive growth rates
Regular reporting to Group Management Board
Further development of cap and trigger process to include Risk Weighted Assets
Further granularity in caps at business unit level (sub-product level)
Advances and Product e.g. Mortgages, Cards, Other PFS
Monitors concentration, growth rates, delinquency and write-offs against plan
21
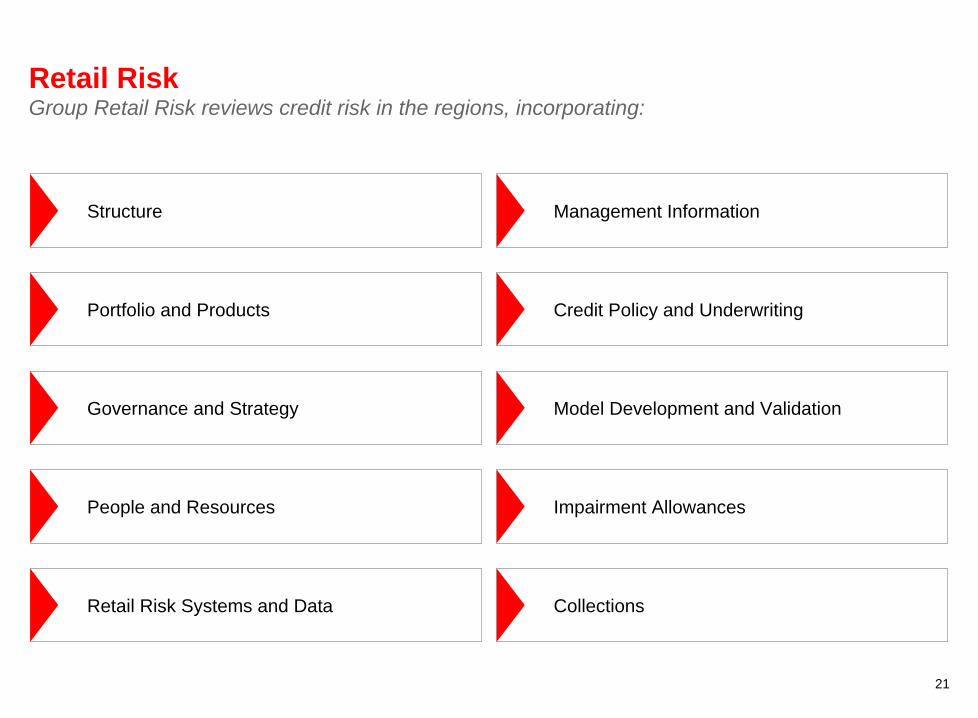
Retail Risk Group Retail Risk reviews credit risk in the regions, incorporating:
Structure
Retail Risk Systems and Data
People and Resources
Portfolio and Products
Governance and Strategy
Management Information
Collections
Impairment Allowances
Credit Policy and Underwriting
Model Development and Validation

22
Retail Risk Centres of Excellence
Global Analytics•
Global organisation and governance
•
Improves model development and achieves consistency
•
Supports developing countries
•
Rationalising systems and processes
•
OneHSBC: greater automation of decisions and reliance on analytics
Collections•
Target Operating Model: achieve best in class
•
Best practice sharing to support developing countries
•
OneHSBC Systems deployment
•
Collections Global Service Centres
•
Consistent dialler strategy and call modelling
23
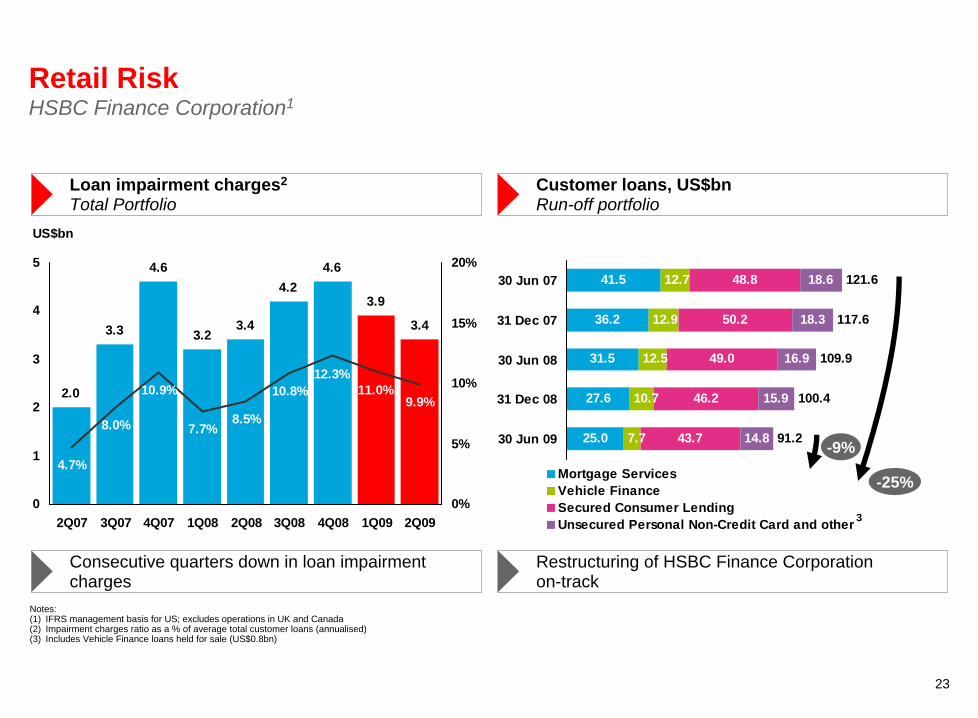
Notes: (1) IFRS management basis for US; excludes operations in UK and Canada(2) Impairment charges ratio as a % of average total customer loans (annualised)(3) Includes Vehicle Finance loans held for sale (US$0.8bn)
Loan impairment charges2
Total PortfolioCustomer loans, US$bnRun-off portfolio
3.3
4.6
3.23.4
4.24.6
3.9
3.4
2.0
4.7%
8.0%
10.9%
7.7%8.5%
10.8%9.9%
12.3%11.0%
0
1
2
3
4
5
2Q07 3Q07 4Q07 1Q08 2Q08 3Q08 4Q08 1Q09 2Q09
US$bn
0%
5%
10%
15%
20%
-9%
-25%3
Consecutive quarters down in loan impairment charges
Restructuring of HSBC Finance Corporation on-track
41.5
36.2
31.5
27.6
25.0
12.7
12.9
12.5
10.7
7.7
48.8
50.2
49.0
46.2
43.7
18.6
18.3
16.9
15.9
14.8
121.6
117.6
109.9
100.4
91.2
30 Jun 07
31 Dec 07
30 Jun 08
31 Dec 08
30 Jun 09
Mortgage ServicesVehicle FinanceSecured Consumer LendingUnsecured Personal Non-Credit Card and other 3
Retail Risk HSBC Finance Corporation1
24
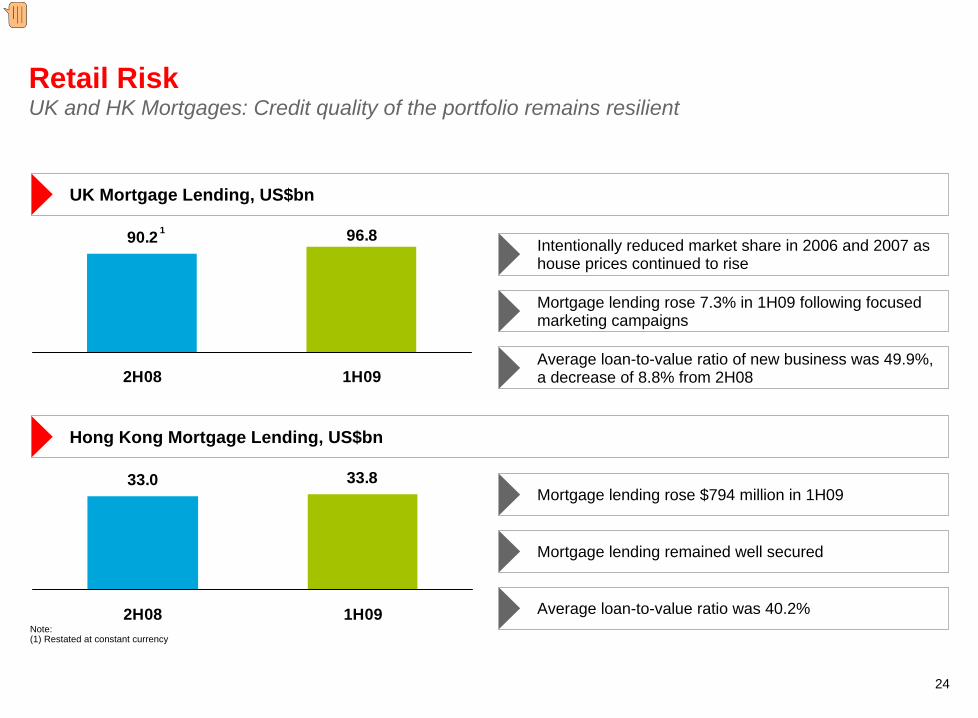
Retail Risk UK and HK Mortgages: Credit quality of the portfolio remains resilient
UK Mortgage Lending, US$bn
Hong Kong Mortgage Lending, US$bn
Intentionally reduced market share in 2006 and 2007 as house prices continued to rise
Mortgage lending rose 7.3% in 1H09 following focused marketing campaigns
Average loan-to-value ratio of new business was 49.9%, a decrease of 8.8% from 2H08
33.0 33.8
2H08 1H09
Mortgage lending rose $794 million in 1H09
Mortgage lending remained well secured
Average loan-to-value ratio was 40.2%Note:(1) Restated at constant currency
90.2 96.8
2H08 1H09
1
Presenter�
Presentation Notes�
The credit quality of the portfolio remain resilient despite further deterioration in the housing and employment markets. Our mortgage lending rose since 2H08 following focused marketing campaigns, with the average loan-to-value ratio for new business in 1H09 amounting to 49.9%, a decrease of 8.8% from 2H08 Loan impairment charges rose from a low base as exposure remained well secured, as HSBC originates almost all new business through its own sales force, lending predominantly to existing customers Mortgage lending rose marginally, while the credit quality of the portfolio remained satisfactory with low delinquency levels In Hong Kong, HSBC reported a recovery of loan impairment charges as the low interest rate environment and high personal incomes supported affordability, with the average loan to value ratio at 38.3% for HSBC and 42.2% for Hang Seng All HK mortgage advances are supported by 1st liens, with all lending through traditional delivery channels �
25
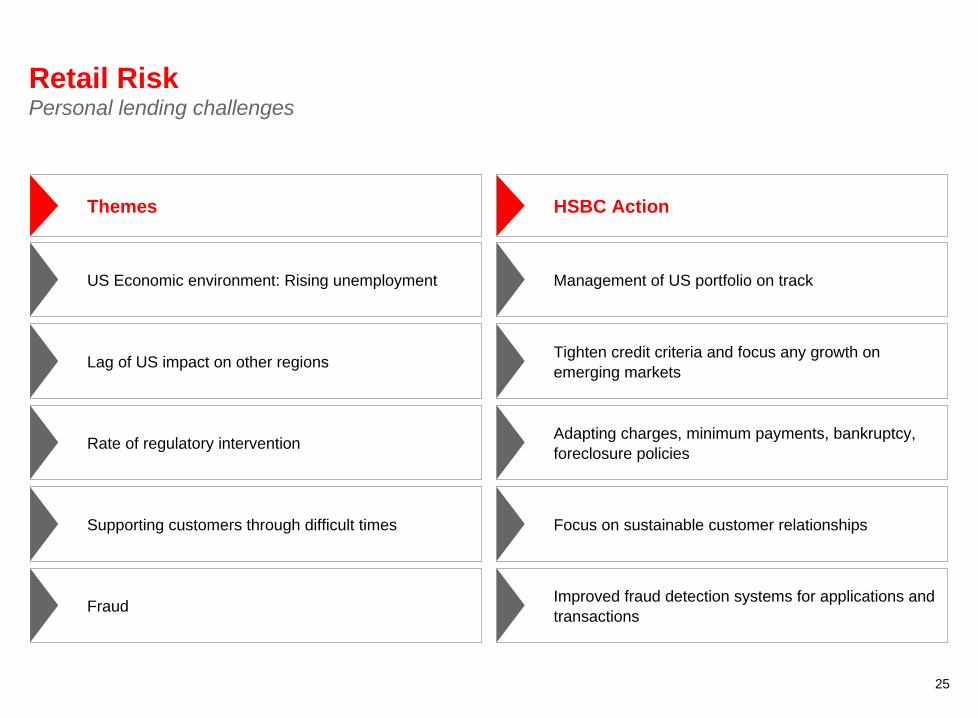
Themes
Retail Risk Personal lending challenges
HSBC Action
Fraud
US Economic environment: Rising unemployment
Rate of regulatory intervention
Supporting customers through difficult times
Lag of US impact on other regions
Improved fraud detection systems for applications and transactions
Management of US portfolio on track
Adapting charges, minimum payments, bankruptcy, foreclosure policies
Focus on sustainable customer relationships
Tighten credit criteria and focus any growth on emerging markets
26
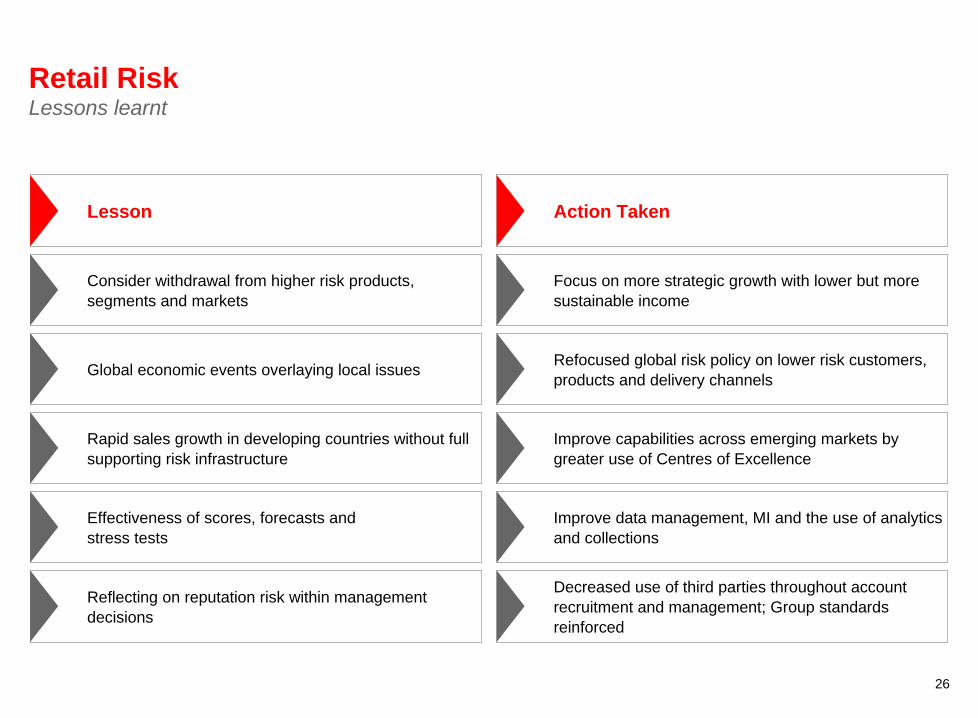
Retail Risk Lessons learnt
Lesson Action Taken
Reflecting on reputation risk within management decisions
Decreased use of third parties throughout account recruitment and management; Group standards reinforced
Rapid sales growth in developing countries without full supporting risk infrastructure
Improve capabilities across emerging markets by greater use of Centres of Excellence
Consider withdrawal from higher risk products, segments and markets
Focus on more strategic growth with lower but more sustainable income
Effectiveness of scores, forecasts and stress tests
Improve data management, MI and the use of analytics and collections
Global economic events overlaying local issues Refocused global risk policy on lower risk customers, products and delivery channels
Key Elements of Risk at HSBC: Wholesale and Market Risk
28
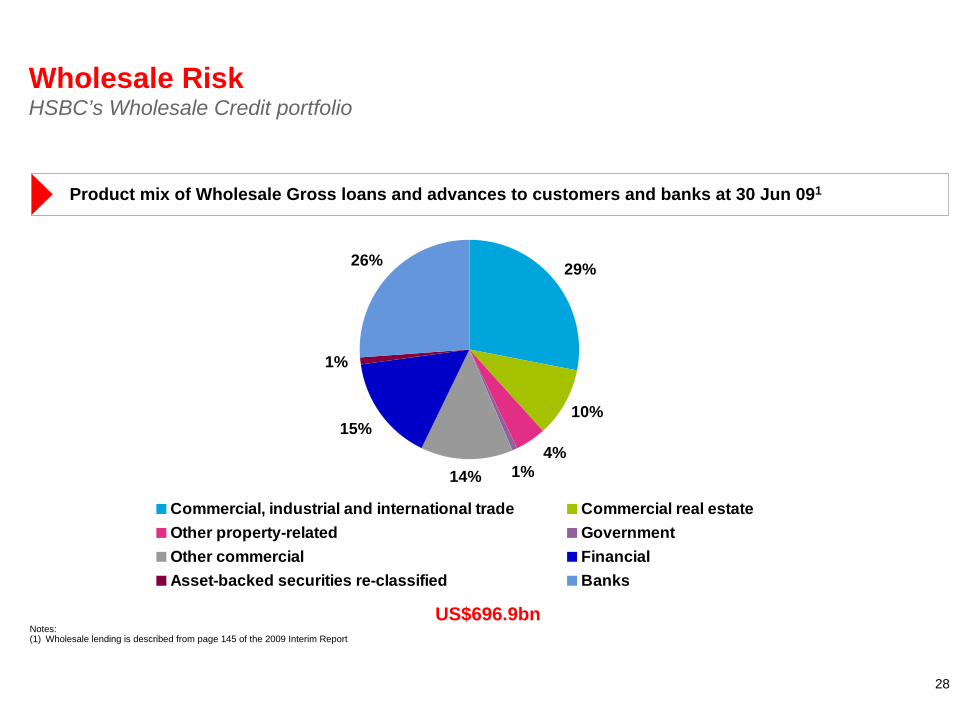
1%4%
10%
14%
15%
1%
26% 29%
Commercial, industrial and international trade Commercial real estateOther property-related GovernmentOther commercial FinancialAsset-backed securities re-classified Banks
Wholesale Risk HSBC’s Wholesale Credit portfolio
US$696.9bn
Product mix of Wholesale Gross loans and advances to customers and banks at 30 Jun 091
Notes: (1) Wholesale lending is described from page 145 of the 2009 Interim Report
29
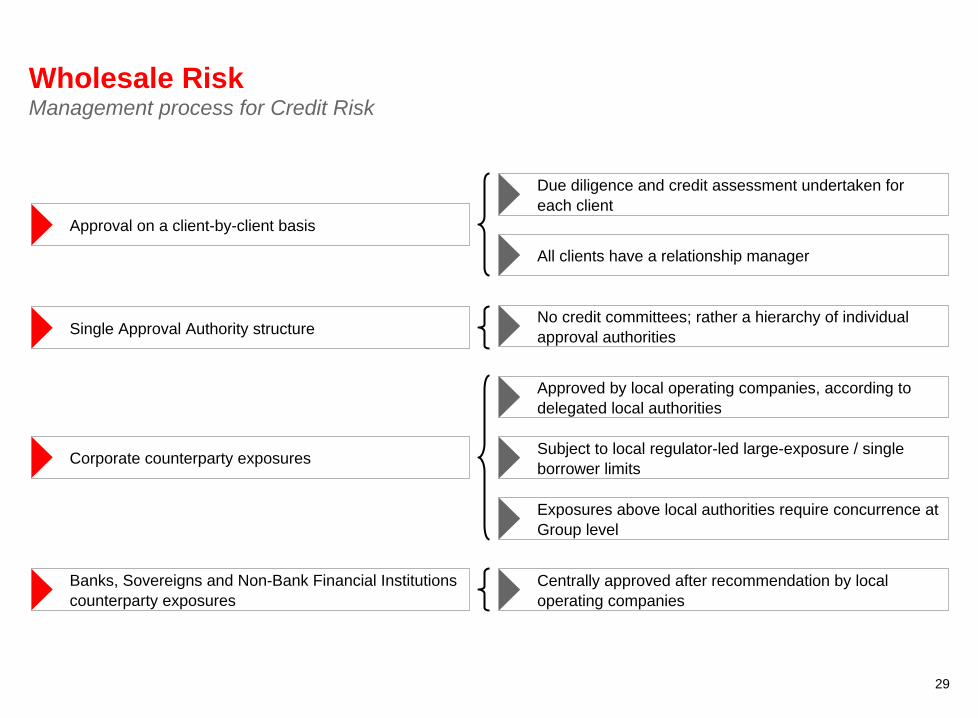
Wholesale Risk Management process for Credit Risk
Due diligence and credit assessment undertaken for each client
All clients have a relationship manager
No credit committees; rather a hierarchy of individual approval authorities
Approved by local operating companies, according to delegated local authorities
Subject to local regulator-led large-exposure / single borrower limits
Exposures above local authorities require concurrence at Group level
Centrally approved after recommendation by local operating companies
Approval on a client-by-client basis
Single Approval Authority structure
Corporate counterparty exposures
Banks, Sovereigns and Non-Bank Financial Institutions counterparty exposures
30
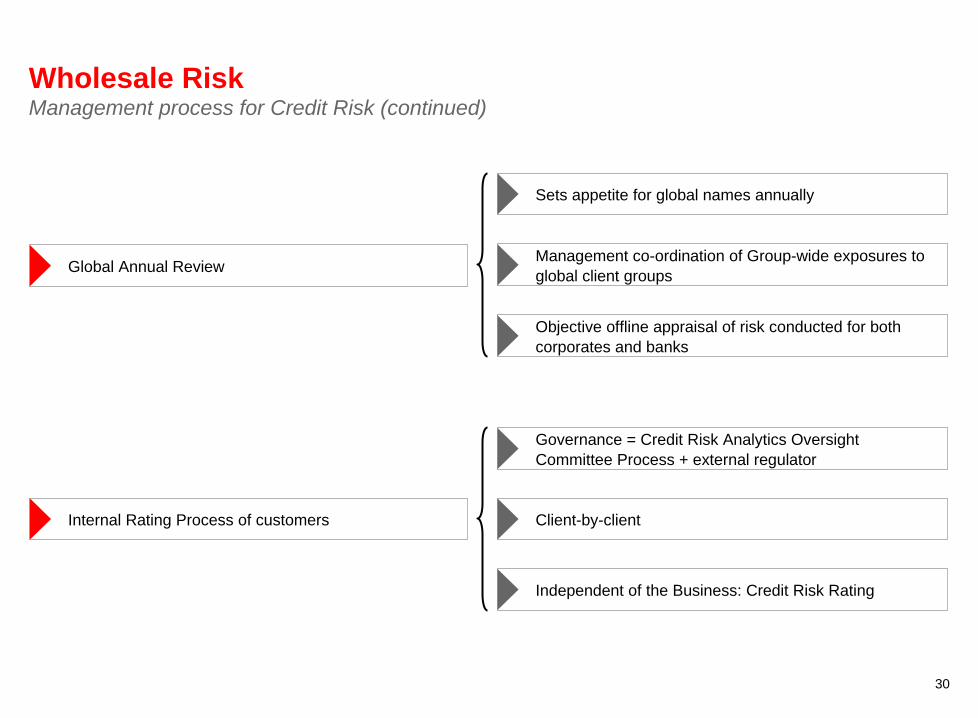
Wholesale Risk Management process for Credit Risk (continued)
Sets appetite for global names annually
Management co-ordination of Group-wide exposures to global client groups
Objective offline appraisal of risk conducted for both corporates and banks
Governance = Credit Risk Analytics Oversight Committee Process + external regulator
Client-by-client
Independent of the Business: Credit Risk Rating
Global Annual Review
Internal Rating Process of customers
31
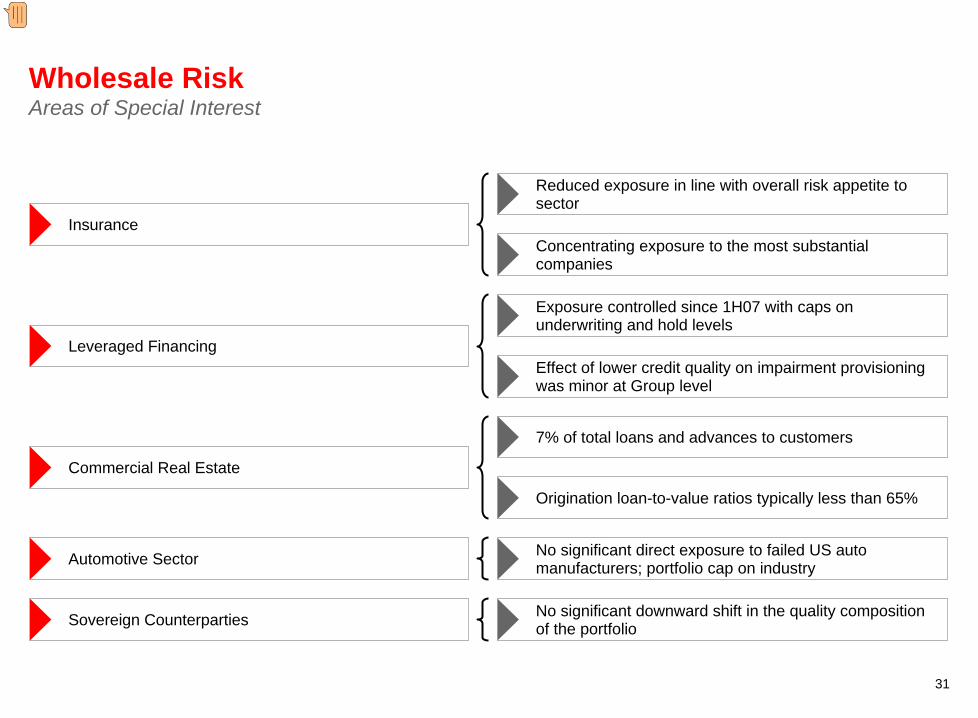
Wholesale Risk Areas of Special Interest
Reduced exposure in line with overall risk appetite to sector
Concentrating exposure to the most substantial companies
Exposure controlled since 1H07 with caps on underwriting and hold levels
Effect of lower credit quality on impairment provisioning was minor at Group level
7% of total loans and advances to customers
Origination loan-to-value ratios typically less than 65%
No significant direct exposure to failed US auto manufacturers; portfolio cap on industry
No significant downward shift in the quality composition of the portfolio
Insurance
Leveraged Financing
Commercial Real Estate
Automotive Sector
Sovereign Counterparties
Presenter�
Presentation Notes�
Autos – almost zero exposure to bankrupt US autos - use figures to tell story �
32
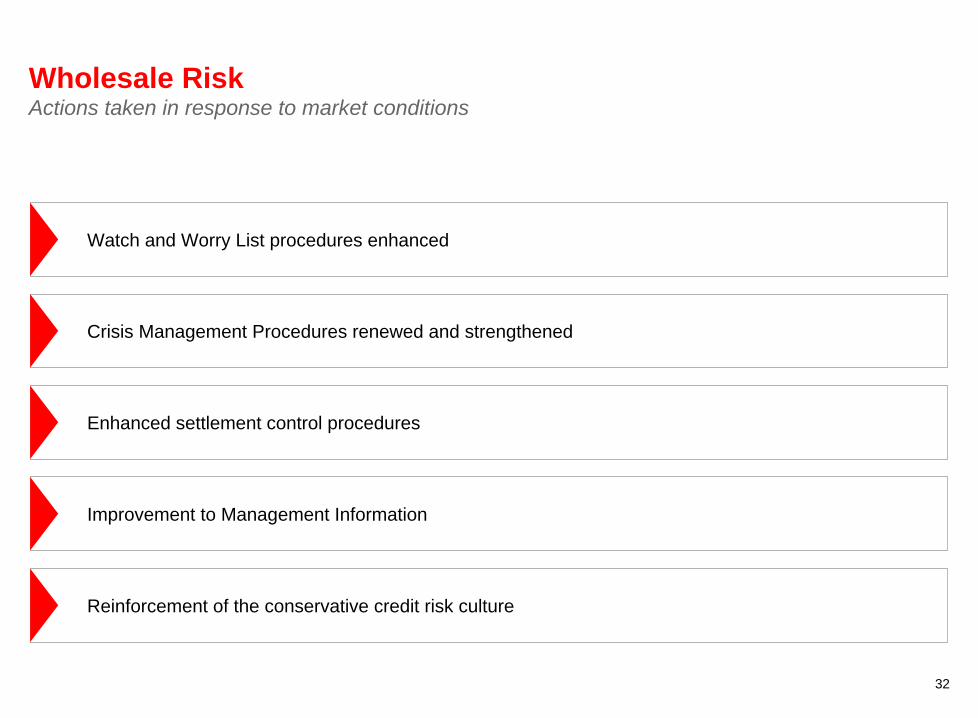
Wholesale Risk Actions taken in response to market conditions
Reinforcement of the conservative credit risk culture
Enhanced settlement control procedures
Crisis Management Procedures renewed and strengthened
Improvement to Management Information
Watch and Worry List procedures enhanced
33
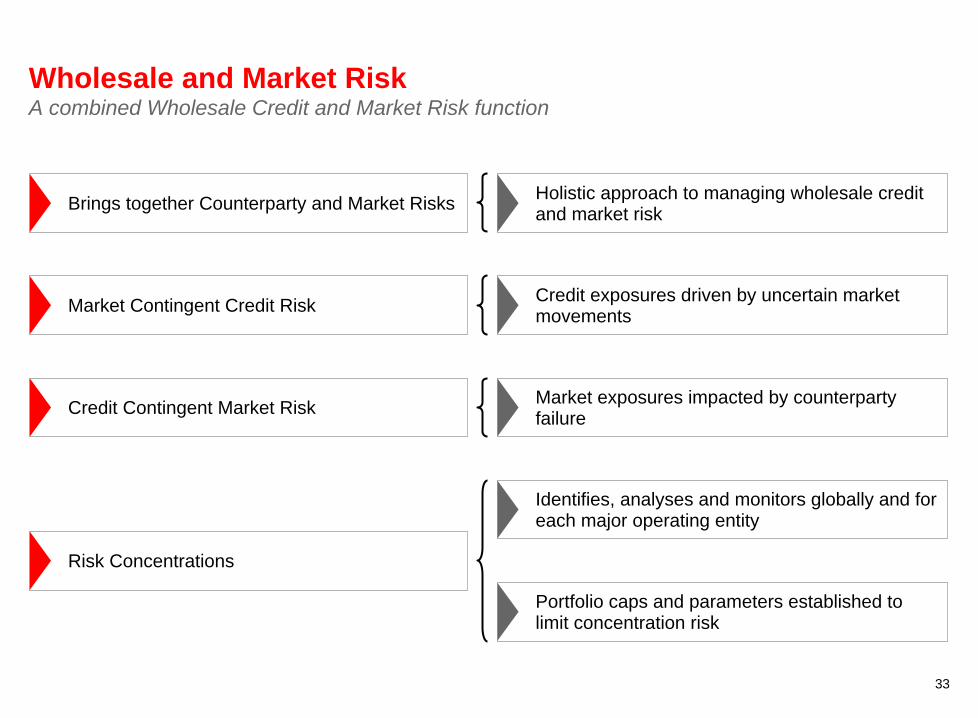
Wholesale and Market Risk A combined Wholesale Credit and Market Risk function
Holistic approach to managing wholesale credit and market riskBrings together Counterparty and Market Risks
Credit exposures driven by uncertain market movements
Market exposures impacted by counterparty failure
Identifies, analyses and monitors globally and for each major operating entity
Portfolio caps and parameters established to limit concentration risk
Market Contingent Credit Risk
Credit Contingent Market Risk
Risk Concentrations
34
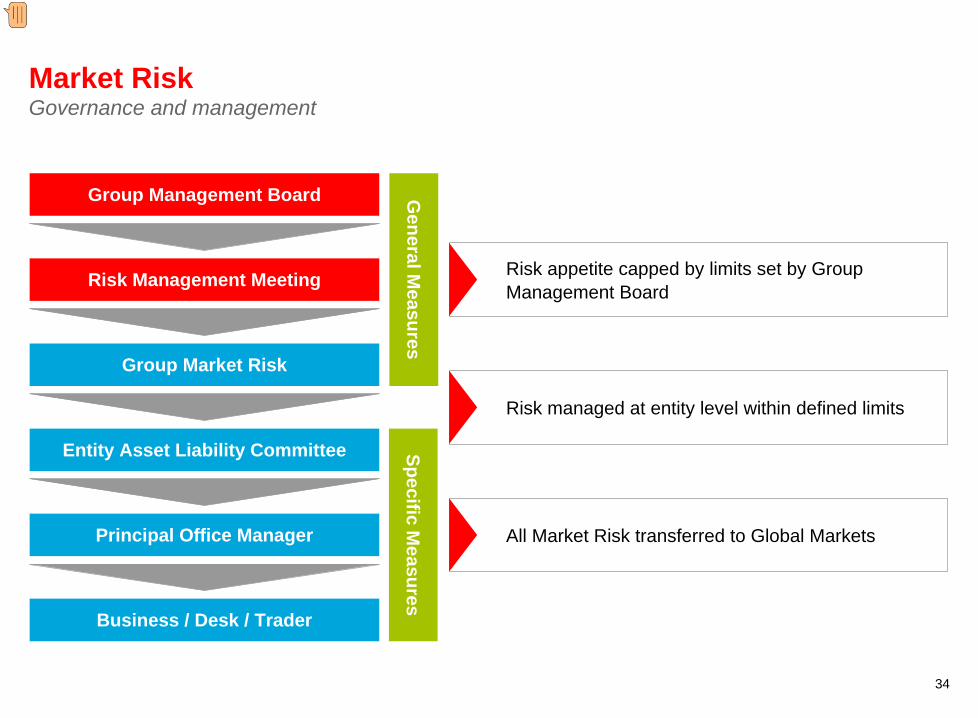
Market Risk Governance and management
General M
easuresSpecific M
easures
Risk Management Meeting
Group Management Board
Group Market Risk
Principal Office Manager
Entity Asset Liability Committee
Business / Desk / Trader
Risk appetite capped by limits set by Group Management Board
Risk managed at entity level within defined limits
All Market Risk transferred to Global Markets
Presenter�
Presentation Notes�
Risk appetite on market risk is capped by limits on primary risk measures set by the Group Management Board The Group Management Board, through its Risk Management Meeting, delegates limits to Group Market Risk Group Market Risk delegates approval limits entity-level Asset Liability Committee, which in turn delegate to the principle office manager and ultimately the trader Senior management is regularly appraised of market risk exposures, amendments and excesses through the Risk Management Meeting of the Group Management Board and the Global Banking and Markets Risk Management Committee Regardless of where in the bank market risk exposure arises, Global Markets is responsible for managing all market risk �
35
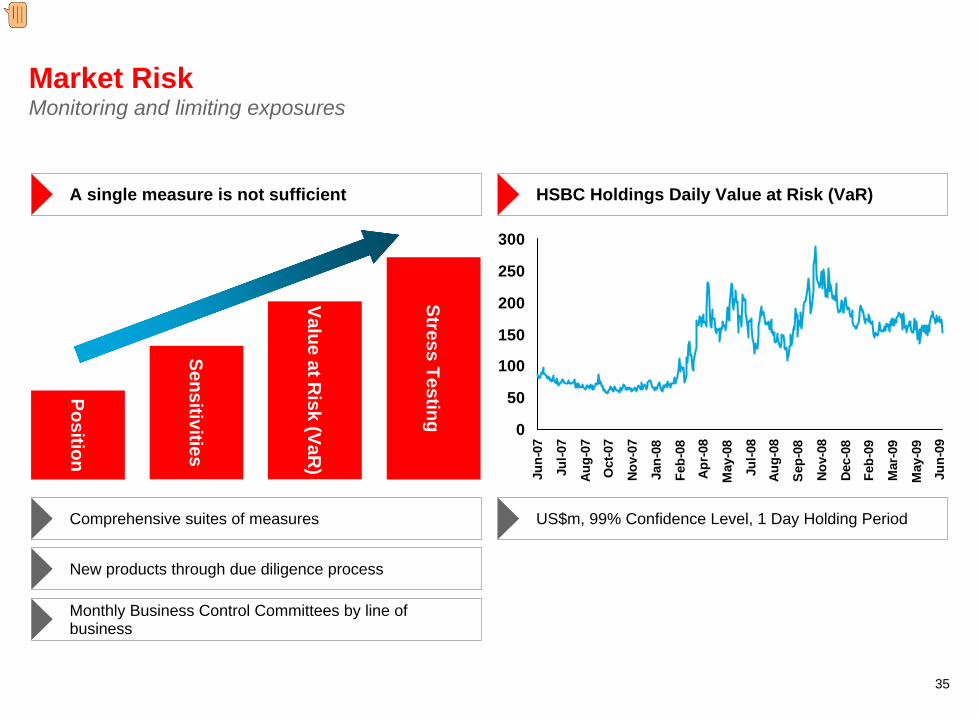
Market Risk Monitoring and limiting exposures
A single measure is not sufficient HSBC Holdings Daily Value at Risk (VaR)
Comprehensive suites of measures US$m, 99% Confidence Level, 1 Day Holding Period
New products through due diligence process
Monthly Business Control Committees by line of business
Position
Sensitivities
Value at Risk (VaR
)
Stress Testing
0
50
100
150
200
250
300
Jun-
07
Jul-0
7
Aug-
07
Oct
-07
Nov
-07
Jan-
08
Feb-
08
Apr
-08
May
-08
Jul-0
8
Aug-
08
Sep-
08
Nov
-08
Dec
-08
Feb-
09
Mar
-09
May
-09
Jun-
09
Presenter�
Presentation Notes�
A single measure is not enough to monitor and limit market risk exposures Sensitivity measures and Value at Risk are complemented by a comprehensive suite of stress tests at an entity, business line and consolidated level, while risk appetites and limits are reviewed and submitted to the Risk Management Meeting for approval All new products / businesses must go through a thorough New Product Due Diligence Process to ensure risks undertaken is fully understood, there will be no system issues, and valuation can be done accurately. Post implementation review is also carried out to ensure Day 2 items are completed in a timely fashion. Structured product lines review are undertaken Continued review of the regulatory model and improvements driven by both internal requirements and external requirements such as stressed value at risk�
36
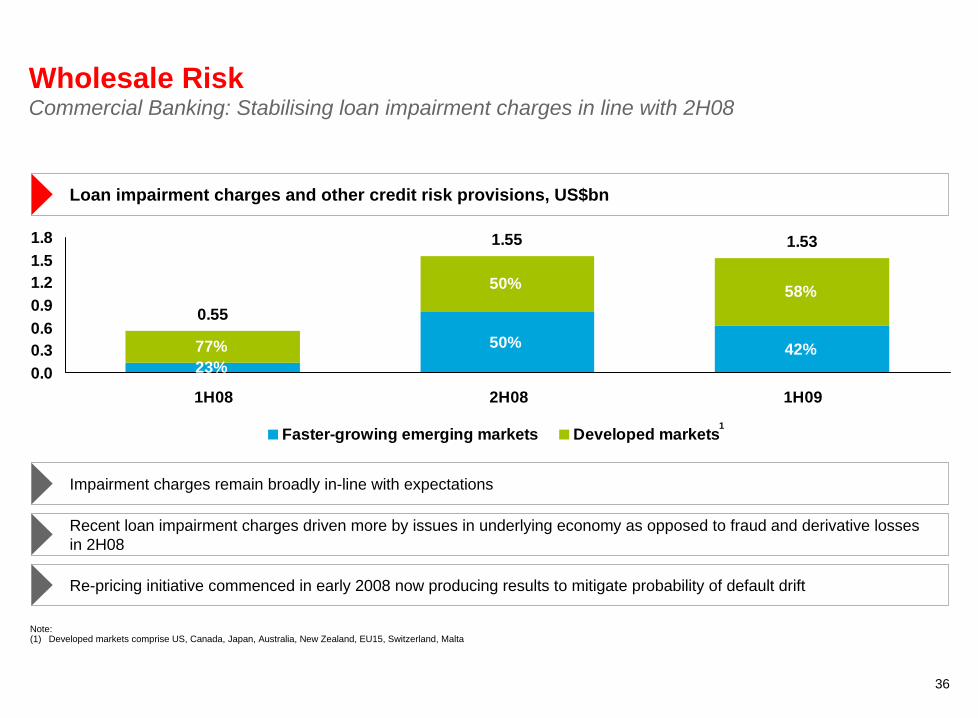
Wholesale Risk Commercial Banking: Stabilising loan impairment charges in line with 2H08
Note:(1) Developed markets comprise US, Canada, Japan, Australia, New Zealand, EU15, Switzerland, Malta
Impairment charges remain broadly in-line with expectations
Recent loan impairment charges driven more by issues in underlying economy as opposed to fraud and derivative losses in 2H08
Re-pricing initiative commenced in early 2008 now producing results to mitigate probability of default drift
Loan impairment charges and other credit risk provisions, US$bn
1.55 1.53
23%50% 42%77%
50% 58%0.55
0.00.30.60.91.21.51.8
1H08 2H08 1H09
Faster-growing emerging markets Developed markets1
37
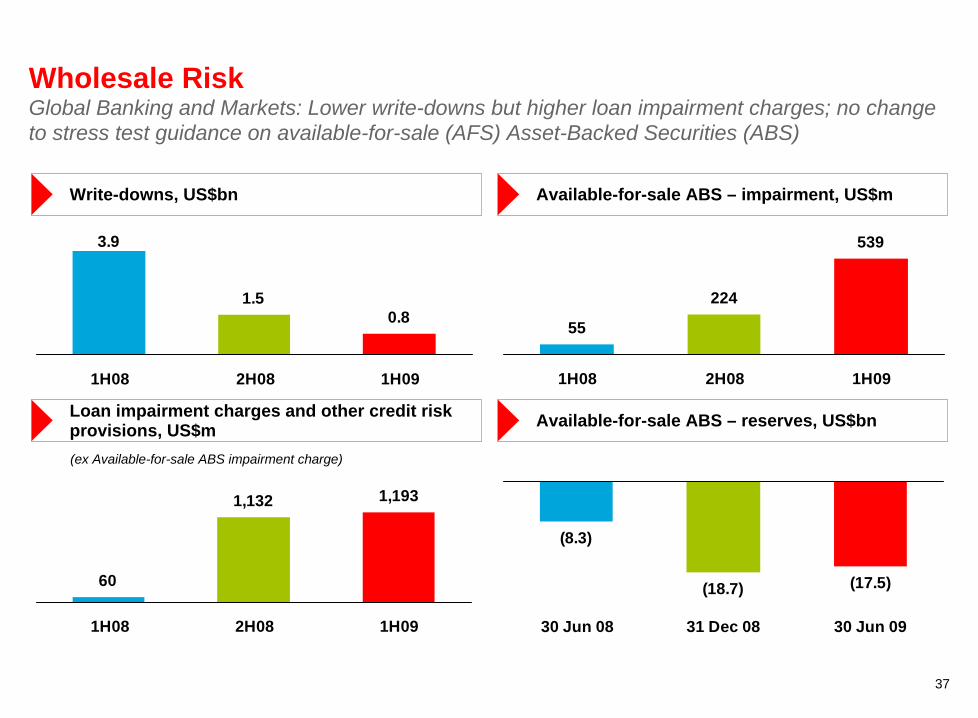
Wholesale Risk Global Banking and Markets: Lower write-downs but higher loan impairment charges; no change to stress test guidance on available-for-sale (AFS) Asset-Backed Securities (ABS)
Write-downs, US$bn Available-for-sale ABS – impairment, US$m
Loan impairment charges and other credit risk provisions, US$m Available-for-sale ABS – reserves, US$bn
3.9
1.50.8
1H08 2H08 1H09
539
224
55
1H08 2H08 1H09
(17.5)
(8.3)
(18.7)
30 Jun 08 31 Dec 08 30 Jun 09
60
1,132 1,193
1H08 2H08 1H09
(ex Available-for-sale ABS impairment charge)

38
Wholesale Risk Global Banking and Markets: Managing balance sheet risk – write-downs and impairments
Note:(1) Includes carrying amount of funded loans plus the net exposure to unfunded leveraged finance commitments
US$mWrite-down/(recovery) Carrying amount at end
1H08 2H08 1H09 Jun 08 Dec 08 Jun 09Sub-prime mortgage related assets
– Loan securitisation 301 292 156 1,565 1,213 943
– Credit trading 665 150 83 1,377 428 302
Other non sub-prime assets
– Credit trading (ABS / MBS / Preferred) 1,327 486 103 8,923 2,201 1,350
– Leveraged loans¹ 278 - (11) 7,375 271 285
Assets reclassified (impairment) – 26 160 – 16,649 16,308
Derivative transactions with monolines
– Investment grade counterparts 598 130 25 1,206 2,089 1,593
– Non-investment grade counterparts 608 370 241 78 352 510
Other credit related items 99 95 5 321 186 116
Total before AFS impairment 3,876 1,549 762
AFS impairment 55 655 564
Total 3,931 2,204 1,326
39
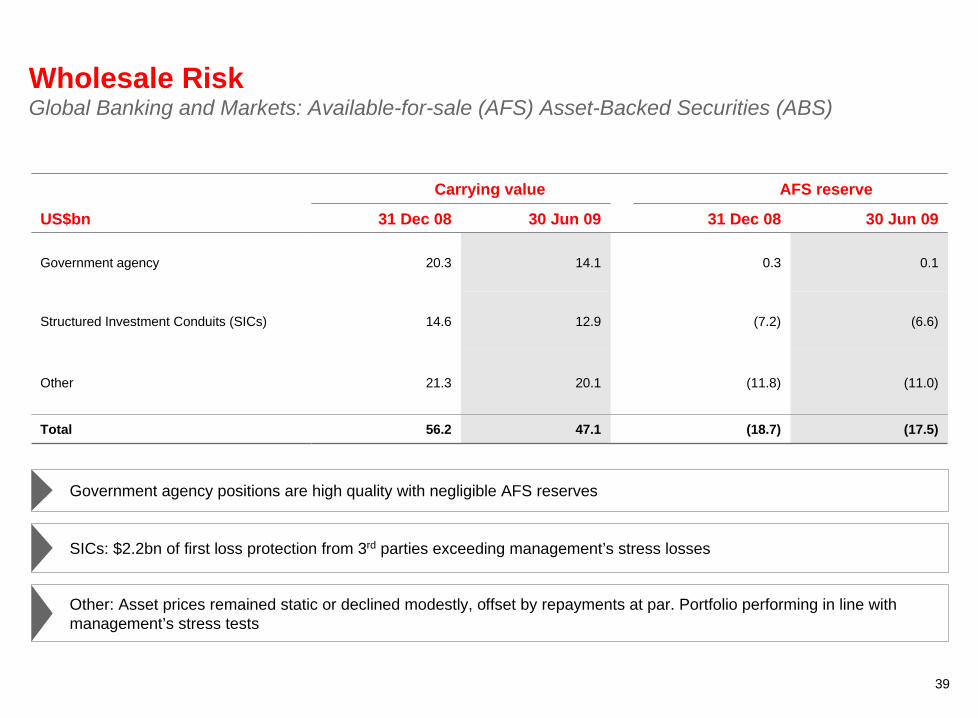
Wholesale Risk Global Banking and Markets: Available-for-sale (AFS) Asset-Backed Securities (ABS)
US$bn
Carrying value AFS reserve
31 Dec 08 30 Jun 09 31 Dec 08 30 Jun 09
Government agency 20.3 14.1 0.3 0.1
Structured Investment Conduits (SICs) 14.6 12.9 (7.2) (6.6)
Other 21.3 20.1 (11.8) (11.0)
Total 56.2 47.1 (18.7) (17.5)
Government agency positions are high quality with negligible AFS reserves
SICs: $2.2bn of first loss protection from 3rd parties exceeding management’s stress losses
Other: Asset prices remained static or declined modestly, offset by repayments at par. Portfolio performing in line with management’s stress tests
Key Elements of Risk at HSBC: Liquidity Risk
41
Fund illiquid assets with core customer deposits
Where core customer deposits are not available as a source of funding, use long term professional funding
In addition we maintain liquidity “buffers” to cater for stress – both firm specific and market wide
Liquidity Risk Managing Liquidity Risk at HSBC
Legal entities and geographies are required to be “stand-alone” with respect to liquidity and funding
42
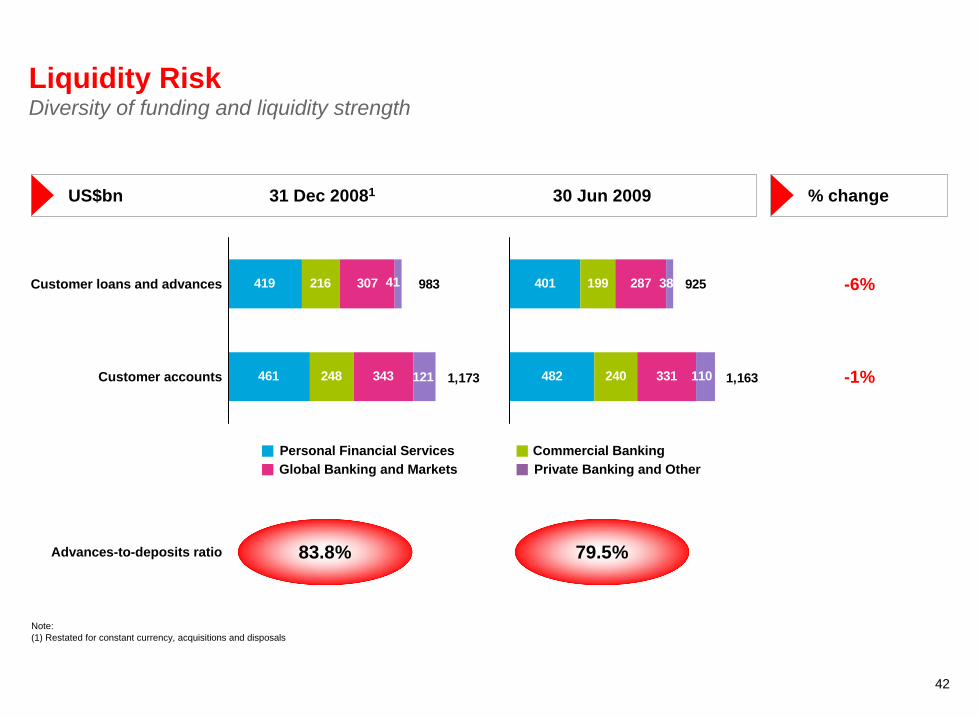
419
461
216
248
307
343 121
41
1,173
983Customer loans and advances -6%
-1%Customer accounts
Advances-to-deposits ratio
US$bn 31 Dec 20081 30 Jun 2009
Personal Financial ServicesGlobal Banking and Markets Private Banking and Other
Commercial Banking
% change
401
482
199
240
287
331 110
38
1,163
925
83.8% 79.5%
Note:(1) Restated for constant currency, acquisitions and disposals
Liquidity Risk Diversity of funding and liquidity strength

43
FSA Regime - 2010
No substantial change to the HSBC approach
Increased competition for customer deposits
Role of Central Bank facilities - unclear
Liquidity Risk The future of Liquidity Risk management

Conclusion
45
Conclusion How we are different
HSBC is predominantly a customer-led business
Subsidiary-based model with country-level operations supported by global policy
Independence between the risk management function and the business
Long term relationship-driven approach provides greater understanding of our customers
Integrated risk culture: strong risk management starts in the business
Well diversified
Presenter�
Presentation Notes�
Our relationship-driven approach results in us having a greater insight into our customer, especially as we are the operating bank for the majority of lending relationships As a bank, HSBC originates to hold, not to distribute Joint responsibility between the business and risk ensures responsible lending, while educating front office staff on the Group’s risk appetite objectives ensures that good risk management starts in the business This has also resulted in alignment at the senior most levels, resulting in an integral risk culture Risk signs-off on compensation plans for areas involved in the provision of credit�
46
Conclusion Positioned for the upturn
An experienced and strong management team
Local businesses can make decisions, based within a global risk framework
A robust capital base and highly liquid
A strong risk culture embedded in the business ensures pursuit of measured growth
HSBC is well positioned for the recovery and ready to capitalise on opportunities
Presenter�
Presentation Notes�
Risk management is an integral part of HSBC’s conservative risk and capital culture and embedded into our values, and we need to ensure it remains so Risk remains independent of the business; but the business has to also take accountability for the risks it enters into, and together we can work towards maximising our risk-adjusted returns The business continues to look at Risk professionals as trusted advisors, and we continue to be such, and seasoned judgement remains an important part of a holistic overview in reviewing analytical output and assessing appropriate responses aligned to strategic goals Maintaining diversification across the Group will continue to be a key mitigant of concentration risk, and an increased focus on emerging risks is imperative Our ability to objectively make decisions is supported by our systems, but equally important is the judgement and experience of our risk professionals As a result of our strong capital position and liquidity and proactive risk management, HSBC is well positioned for any recovery�