Sr. No. Name of the Issuer Sector Type of Instrument Listing ...
Upload
khangminh22Category
view
0download
0
Issuer Filing Information
Santander UK Group Holdings plc

i
ISSUER FILING INFORMATION
Type of Information: Issuer Filing Information
Date of Announcement: 10 March 2020
Issuer Name: Santander UK Group Holdings plc (the "Issuer")
Name and Title of Representative: Tom Ranger
Treasurer
Address of Head Office: 2 Triton Square, Regent’s Place, London, NW1 3AN
United Kingdom
Telephone: +44-(0)207-756-4797
Contact Person: Attorney-in-Fact: Hironori Shibata, Attorney-at-law
Hiroto Ando, Attorney-at-law
Aina Ono, Attorney-at-law
Anderson Mori & Tomotsune
Address: Otemachi Park Building
1-1, Otemachi 1-chome
Chiyoda-ku, Tokyo
Telephone: +81-3-6775-1000
Matters related to Financial Instruments Exchange
Market, etc.:
Not Applicable
Address of Website for Announcement: https://www.jpx.co.jp/english/equities/products/tpbm/ann
ouncement/index.html
Notes to Investors:
1. The TOKYO PRO-BOND Market is a market for professional investors, etc. (Tokutei Toushika tou) as defined
in Article 2, Paragraph 3, Item 2(b)(2) of the Financial Instruments and Exchange Act of Japan (Act No. 25 of
1948, as amended, the "FIEA") (the "Professional Investors, Etc."). Notes listed on the market ("Listed
Notes") may involve high investment risk. Investors should be aware of the listing eligibility and timely
disclosure requirements that apply to issuers of Listed Notes on the TOKYO PRO-BOND Market and
associated risks such as the fluctuation of market prices and shall bear responsibility for their investments.
Prospective investors should make investment decisions after having carefully considered the contents of this
Issuer Filing Information.
2. Where this Issuer Filing Information (a) contains any false statement on important matters, or (b) lacks
information on: (i) important matters that should be announced or (ii) a material fact that is necessary to avoid
misleading content, a person who, at the time of announcement of this Issuer Filing Information, is an officer
(meaning an officer stipulated in Article 21, Paragraph 1 of the FIEA (meaning a director (torishimari-yaku),
accounting advisor (kaikei-sanyo), corporate auditor (kansa-yaku) or executive officer (shikkou-yaku), or a
person equivalent to any of these) (each an "Officer") of the Issuer) that announced this Issuer Filing
Information shall be liable to compensate persons who acquired the securities for any damage or loss arising
from the false statement or lack of information in accordance with the provision of Article 22 of the FIEA
applied mutatis mutandis in Article 27-34 of the FIEA. However, this shall not apply to cases where the
person who acquired the securities was aware of the existence of the false statement or the lack of information
at the time of subscription for acquisition of the securities. Additionally, such Officer shall not be required to
assume the liability prescribed above, where he/she proves that he/she was not aware of, and was unable to
obtain knowledge of, even with due care, the existence of the false statement or the lack of information.
3. The regulatory framework for the TOKYO PRO-BOND Market is different in fundamental aspects from the
general regulatory framework applicable to other exchange markets in Japan. Investors should be aware of the

ii
rules and regulations of the TOKYO PRO-BOND Market, which are available on Japan Exchange Group, Inc.
website.
4. Tokyo Stock Exchange, Inc. does not express opinions or issue guarantees, etc. regarding the content of this
Issuer Filing Information (including but not limited to, whether this Issuer Filing Information (a) contains a
false statement or (b) lacks information on: (i) important matters that should be announced or (ii) a material fact
that is necessary to avoid misleading content) and shall not be liable for any damage or loss.
5. All prospective investors who consider purchasing the notes of the Issuer issued or to be issued under the Program
Information dated 7 August 2019 (as amended and/or supplemented) (the "Notes") should read the relevant
Specified Securities Information before making an investment decision. Among other things, all prospective
investors should be aware that the Notes are subject to certain selling restriction as set forth in the relevant
Specified Securities Information.

Here to help you prosper

Santander UK
We help our customers at the moments that matter most. We champion British businesses and help them to grow sustainably. Our customer focus helps us to develop more loyal and lasting relationships.
Important information for readers Santander UK Group Holdings plc (the Company) and its subsidiaries (collectively Santander UK or the Santander UK group) operate primarily in the UK, and are part of Banco Santander (comprising Banco Santander SA and its subsidiaries). Santander UK plc and Santander Financial Services plc are regulated by the UK Prudential Regulation Authority (PRA) and the Financial Conduct Authority (FCA). Certain other companies within the Santander UK group are regulated by the FCA and the PRA. This Annual Report contains forward-looking statements that involve inherent risks and uncertainties. Actual results may differ materially from those contained in such forward-looking statements. See Forward-looking statements on page 243.
The Company is the immediate parent company of Santander UK plc. The two companies operate on the basis of a unified business strategy, albeit the principal business activities of the Santander UK group are carried on by Santander UK plc and its subsidiaries (the Santander UK plc group). The Board and Committees of the two companies run substantially simultaneously to ensure efficiency and effectiveness, whilst ensuring the independence and autonomy of Santander UK plc, our ring-fenced bank, are appropriately protected.
The Company’s Corporate Governance and Risk Frameworks have been adopted by its subsidiaries to ensure consistency of application. Prior to November 2018, the Corporate Governance and Risk Frameworks were applied from the level of Santander UK plc across the Santander UK plc group and adopted by the Company.
As a result, the review of the business and principal risks and uncertainties facing the Company, and the description of the Company’s Corporate Governance, including the activities of the Board and risk management arrangements, are integrated with those of Santander UK plc and are reported in this document as operating within the Company for all periods presented.
About this report
The Strategic Report outlines the key elements of the Annual Report and provides context for the related financial statements. It is also designed to help members of the company assess how the Directors have performed their duty under section 172 of the Companies Act 2006.
The report highlights key financial and non-financial metrics which help to explain the business’s performance over the past year. It also highlights the external environmental factors affecting the business along with Santander UK’s position in the UK banking market.
At all times we try to treat our stakeholders fairly and meet our environmental responsibilities. Sustainability and our strategic direction are inseparable, and we continue to embed sustainability across our business. We have included information to demonstrate this within our Strategic Report and further information is also available in our ESG Supplement.
By order of the Board.
Shriti VaderaChair 2 March 2020
For more information see aboutsantander.co.uk

1Santander UK Group Holdings plc
Strategic Report Governance Risk review Financial review Financial statements Shareholder information
Highlights 2019
14.4 millionactive customers(2018: 14.7 million)
£981mprofit before tax(2018: £1,567m)
60%mortgage loans refinanced online(2018: 55%)
£22.3bnUK corporate loans(2018: £24.1bn)
£165.4bnUK mortgage loans(2018: £158.0bn)
1,700new active mobile users per day(2018: 1,400 )
14.3%CET1 capital ratio(2018: 13.2%)
5.8 milliondigital customers(2018: 5.5 million)
£155mTransformation investment in 2019
99.6%of waste recycled or diverted from landfill(2018: 99.8%)
100%renewable electricity used(2018: 100%)
1.15%Stage 3 ratio(2018: 1.29%)
Contents
Strategic Report 1
Chair’s statement 2
Santander UK at a glance 4
CEO review 6
Market overview 10
Business model 12
Strategic review 14
Risk management overview 18
Financial overview 24
Sustainability review 26
Throughout the report look out for this symbol to find out more in our case studies
Governance 33
Risk review 70
Financial review 160
Financial statements 172
Shareholder information 252

Santander UK Group Holdings plc2
Annual Report 2019 | Strategic Report
Chair’s statement
2019 marked the first year of delivery of a multi-year transformation to make us simpler, more agile and better able to continually improve our customer service.
Refined strategy In 2019, we began to implement a refined strategy that focuses on core business and customer experience in mortgage provision, trade and SME banking, supported by investment in our technology platform.
We have accelerated the pace at which we are embedding social, ethical and environmental impacts in all aspects of our decision-making, risk analysis and financial transactions, the results of which have included increasing our support for renewable energy. We know that loyalty and trust is increasingly won by companies which make sustainable investments in customers’ own financial resilience, and the environmental and economic resilience of wider society. The focus of our communities programme remains supporting financial inclusion, literacy and education. For example, the Santander Universities programme is the largest private sector contributor to UK universities, donating £88m over the past 12 years. We have a team of Relationship Managers across our 85 university partners to support students and the university community.
A low risk strategy is integral to our business and we have maintained prudent risk management, high credit quality and balance sheet resilience throughout the year. This was reflected in the Bank of England 2019 stress test results, where the impact on Santander UK’s CET1 capital ratio(1) was the lowest of all participating banks.
2019, however, saw a 37% decline in profit before tax as a result of the adverse impact of a combination of factors. These include margin pressures within the mortgage market, the costs of addressing PPI claims and our upfront investment in transformation. In addition, the operational costs of continuing regulatory changes disproportionately affect scale challengers such as Santander UK.
Transformation programme The year saw our CEO, Nathan Bostock, and his leadership team deliver significant progress in this transformation as we reshape the bank to support our customers better. Technology is
changing the way our customers want to engage with us. The volume of transactions carried out through Santander UK branches has fallen by 41% over the past three years, while transactions through digital channels have grown by 93% over the same period. We now have 5.8 million digital customers(2) and 62% of 2019(3) account openings were digital.
In adapting to how our customers are choosing to engage with us, we have restructured and reduced our branch network by 140 to 616 branches as part of our multi-year programme to simplify and digitise the business. We are focused on investing to improve our systems, processes and infrastructure through innovation to increase efficiency and deepen engagement with our customers, while continuing to allow them to choose how they transact with us. We are also leveraging new technology developed within Banco Santander, our shareholder, to increase our ability to deliver exceptional outcomes for our customers.
Shriti VaderaChair
(1) CET1 ratio drawdown is defined as CET1 ratio at 31 Dec 18 less minimum stressed CET1 ratio (before strategic management actions or AT1 conversions) (3) Refers to all new Retail & SME1 products opened
(2) We define a ‘digital customer’ as someone who has logged on to digital banking (either via the mobile app or online bank) in the last month.

3Santander UK Group Holdings plc
Strategic Report Governance Risk review Financial review Financial statements Shareholder information
Continuing to create the right cultureHaving the right culture is essential to our success in transforming the bank, and we have made steady progress so far. However, we need to remain relentless in our commitment to embedding the right values and behaviours across all aspects of our business. Our employee engagement surveys provide the Board with an understanding of the progress we are making in building a diverse and inclusive bank and helps to inform our priorities. Our Board Responsible Banking Committee continues to develop metrics that enable it to monitor cultural change and help ensure that we remain on track.
As we enter a period of significant change, we remain committed to ensuring the well-being of our people through fostering a culture of speaking up and supporting initiatives such as the promotion of mental health.
The flow and volume of regulatory changeThe flow and volume of regulatory change continues to pose significant challenges and operational risks to the sector, not least for scale challengers like Santander UK. We have continued to manage a large volume of over one hundred different regulatory initiatives that are driven by a number of separate regulatory bodies. The co-ordination of this activity remains a concern for the sector given the need to respond to increasing threats of economic and cyber-crime. I am pleased that HM Treasury is undertaking a review of the regulatory framework, as announced last summer. The right recommendations from the review have the potential to strengthen the resilience and competitiveness of the sector and I look forward to its conclusions.
Ring-fencing During the year we developed a revised strategy for Santander Financial Services plc (SFS), formerly Abbey National Treasury Services plc (ANTS), in effect our non-ring-fenced bank, which will be completed in 2020. As a result, in order to comply with regulatory requirements, we are required to make certain changes to our governance arrangements,
including the composition of our holding company and ring-fenced bank Boards.
In December 2019, Susan Allen, Gerry Byrne, Garrett Curran, Annemarie Durbin, Dirk Marzluf and Genevieve Shore stepped down from the Board of Santander UK Group Holdings plc, but remain Directors of the ring-fenced bank, Santander UK plc. In order to ensure efficiency and effectiveness, the Santander UK Group Holdings plc and Santander UK plc Board meetings are run largely simultaneously. Changes to governance and ring-fencing arrangements are described further in my report on corporate governance on page 36.
Board changes in 2019We appointed Susan Allen as Executive Director and Head of Retail and Business Banking with effect from 1 January 2019, replacing Javier San Felix who returned to a Group role at Banco Santander at the end of 2018, as reported last year. On 7 May 2019, we appointed Garrett Curran as an INED replacing Julie Chakraverty and Dirk Marzluf (Banco Santander Group Head of Technology and Operations) as Group nominated Non-Executive Director (GNED) who took the place of Lindsey Argalas. Duke Dayal (Chief Financial Officer) was appointed to the Board on 16 September 2019 as Executive Director, replacing Antonio Roman who moved to a role at Banco Santander. Bruce Carnegie-Brown also re-joined the Board on that date as a GNED replacing Juan Inciarte who had stepped down at the end of 2018. These appointments maintain the Board’s skills and experience in financial services, digital and innovation, strategy and transformation and our connectivity with our shareholder. On behalf of the Board, I would like to thank Lindsey Argalas, Julie Chakraverty and Antonio Roman who stood down in 2019 for their invaluable service to the Board and the Company.
As I will be stepping down as Chair before the end of 2020, I would like to take this opportunity to extend my gratitude to the Board, Nathan Bostock, his leadership team, and all our people for their continued commitment to serving our customers and communities. It has been an enormous privilege to work with all my colleagues and serve the Company. I have every confidence that the dedication of our teams will ensure its future success.
Shriti VaderaChair 2 March 2020
Simple | Personal | FairOur culture is built on doing things The Santander Way
SimpleWe offer our customers products that are easy to understand and a service which is convenient, no matter when or how they want to engage with us. We make our processes better so they are easy and clear for our customers and our people.
PersonalWe treat our customers as valued individuals, providing a professional service they can trust. We support our colleagues to develop their skills and achieve their ambitions.
FairWe are open, honest and treat others as we would like to be treated. We earn our investors a sustainable return and do our part to support our communities.
The commitment of our people is helping to transform the business and make us better able to serve our customers going forward.
Santander UK Group Holdings plc4
Annual Report 2019 | Strategic Report
Santander UK at a glance
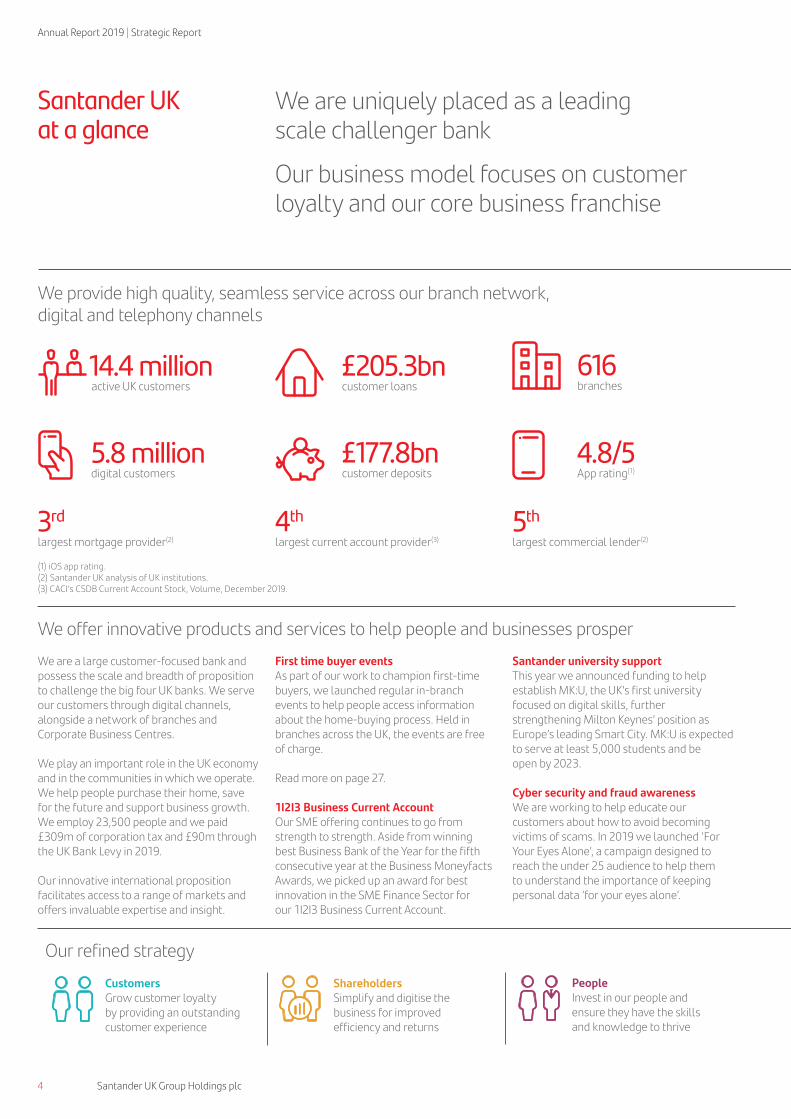
We are uniquely placed as a leading scale challenger bank
Our business model focuses on customer loyalty and our core business franchise
14.4 million active UK customers
616branches
£205.3bncustomer loans
£177.8bncustomer deposits
We provide high quality, seamless service across our branch network, digital and telephony channels
We offer innovative products and services to help people and businesses prosper
We are a large customer-focused bank and possess the scale and breadth of proposition to challenge the big four UK banks. We serve our customers through digital channels, alongside a network of branches and Corporate Business Centres.
We play an important role in the UK economy and in the communities in which we operate. We help people purchase their home, save for the future and support business growth. We employ 23,500 people and we paid £309m of corporation tax and £90m through the UK Bank Levy in 2019.
Our innovative international proposition facilitates access to a range of markets and offers invaluable expertise and insight.
First time buyer eventsAs part of our work to champion first-time buyers, we launched regular in-branch events to help people access information about the home-buying process. Held in branches across the UK, the events are free of charge.
Read more on page 27.
1I2I3 Business Current AccountOur SME offering continues to go from strength to strength. Aside from winning best Business Bank of the Year for the fifth consecutive year at the Business Moneyfacts Awards, we picked up an award for best innovation in the SME Finance Sector for our 1I2I3 Business Current Account.
Santander university supportThis year we announced funding to help establish MK:U, the UK’s first university focused on digital skills, further strengthening Milton Keynes’ position as Europe’s leading Smart City. MK:U is expected to serve at least 5,000 students and be open by 2023.
Cyber security and fraud awarenessWe are working to help educate our customers about how to avoid becoming victims of scams. In 2019 we launched ‘For Your Eyes Alone’, a campaign designed to reach the under 25 audience to help them to understand the importance of keeping personal data ‘for your eyes alone’.
3rd
largest mortgage provider(2)
CustomersGrow customer loyalty by providing an outstanding customer experience
Our refined strategy
ShareholdersSimplify and digitise the business for improved efficiency and returns
PeopleInvest in our people and ensure they have the skills and knowledge to thrive
4.8/5App rating(1)
5.8 milliondigital customers
(1) iOS app rating.(2) Santander UK analysis of UK institutions. (3) CACI’s CSDB Current Account Stock, Volume, December 2019.
4th
largest current account provider(3)
5th
largest commercial lender(2)

5Santander UK Group Holdings plc
Strategic Report Governance Risk review Financial review Financial statements Shareholder information
CommunitiesFurther embed sustainability across our business
Read more in our Sustainability review on pages 26-31
In July we opened our first Work Café in Leeds. The Work Café concept adds a new banking experience, reflecting our commitment to bringing innovation and investment to our branch network. It is an innovative space that brings together a bank, co-working area and café.
The concept was first developed by Santander in Chile in 2016 and the UK opening means there are now over 50 Work Cafés across six countries.
The Work Café offers state-of-the-art banking facilities alongside free co-working spaces and meeting rooms for local businesses and entrepreneurs. Both Santander and non-Santander customers are welcome.
Since opening, over 30,000 visitors have enjoyed using the Work Café facilities whether just for a coffee, to co-work, use the meeting rooms, attend events or discuss banking needs. Feedback has been extremely positive, with the café receiving a five star review in Modern Work Magazine. We have also hosted over 40 Work Café Talks and Events with a focus on supporting small business owners and entrepreneurs with growing their businesses.
More than a café and more than a bank
Our Santander Behaviours outline how we bring to life The Santander Way: Simple, Personal and Fair
Bring Passion and energy and give my best
Speak Up and challenge where necessary
Embrace Change and look for better ways to do things
Show Respect including through the little things
Actively Collaborate with others to get the best outcome for the customer
Truly Listen for different and new opinions and be open to challenge
Give Support to colleagues by taking a genuine interest in them and appreciating their contribution
Talk Straight and think about the impact of my words
Keep Promises and make decisions
Retail Banking
Corporate & Commercial Banking
Corporate & Investment Banking
Ring-fenced bank Non ring-fenced bank
Santander UK plc
Our structure – we manage our bank through three customer business segments supported by the Corporate Centre
Santander UK Group Holdings plc
Santander Financial Services plc
Jersey and Isle of Man businesses
Small number of legacy positions
Banco Santander SA

Santander UK Group Holdings plc6
Annual Report 2019 | Strategic Report
CEO review
We are building on our depth of expertise in key market segments such as residential mortgage and SME banking in order to ensure innovation is truly customer-centric, better integrated across our own and related industries, and supported with first class customer service.
We have a particular focus on helping people across the country achieve their homeownership dream and, in 2019, supported over 37,000 first time buyers; up 47% in three years. We also increased simplicity and ease of online mortgage services, with 60% of customers choosing to retain their mortgage online; up from 41% in 2016. This has all helped reinforce our position as the third largest mortgage lender; achieving £7.4bn net mortgage growth in 2019, which is our strongest for a decade. Meanwhile, customer deposits have increased by £5.7bn; our highest growth in three years, thanks to a successful ISA
Our 2019 results were impacted by the ongoing income pressure on mortgages and legacy PPI charges, but they also include the investment we are making as part of our plan to transform the bank for the future, driven by our focus on delivering great products and service to our customers.
Nathan BostockChief Executive Officer
Today, consumers face greater choice of banking provider than ever before, yet relative uniformity in products and services. This competitive challenge for the banking sector has been compounded by a lack of economic confidence and slower rate of growth; inevitably impacting performance. Our 2019 results, with 37% reduction in profit before tax, further reflect the ongoing income pressure on mortgages and PPI charges, alongside the important investment we are making in transforming our bank for the future. In recent years, we have purposefully operated a low risk strategy; making prudent investments in our core competencies, and embedding sustainable, long-term value across all our business activities. In doing this, we will enhance our standing as a responsible and resilient choice for our retail customers, and also position ourselves well to support the growth and trading strategies of our business customers.
Our cautious approach to risk has been affirmed by the Bank of England’s stress tests, which illustrate our bank’s resilience to a significant economic downturn. We remain focused on restoring our return on tangible equity to our target range over the medium-term, and I’m pleased that our CET1 capital ratio has increased to 14.3% through capital accretion and strong capital discipline. This has been done without compromising dividend payments or our credit quality, while delivering our strategy of selective growth.
In the current environment, taking the time to leverage effectively our competitive points of difference has never been more important in earning and retaining customer loyalty. This is at the heart of our bank’s strategic priorities; providing a comprehensive retail offering, as well as growth-focused support for business and corporate customers, while developing products which make banking simpler, fairer, and far more personalised than ever before.

7Santander UK Group Holdings plc
Strategic Report Governance Risk review Financial review Financial statements Shareholder information
campaign, 1I2I3 Business Current Account inflows and strong performance in our corporate business.
Fundamentally, the products and services which provide financial security and prosperity to retail and business customers, also generate greater resilience and sustainable growth for our bank. All high-performing business activity stems from sustainable goals and, as a responsible business, we know the paramount importance of allocating capital and financing the transition towards a low carbon and more inclusive economy. In recent times, extreme weather events and other consequences of the climate crisis have reinforced a business-critical need to protect our communities and environment. The PRA, FCA and Task Force on Climate-related Financial Disclosures have rightly called for far greater effort and, in advance of the UN Climate Change Conference in the UK this year, we are committed to the UK’s ongoing climate goals, as well as Banco Santander’s target to raise and facilitate €120bn in green finance by 2025.
In 2019, our Corporate and Investment Banking (CIB) and Corporate and Commercial Banking (CCB) units originated business for renewable energy transactions in excess of £1bn; ranking as the third highest financial lender in Europe for the renewables market. Along with Banco Santander, we were also ranked the number one financial adviser in Europe for wind, solar and biofuel projects.
We want to represent the sustainable choice for all customers and colleagues, from macro-financial activity, to the way we run our own business. For example, we are pleased to source 100% of our electricity from green supplies, such as biomass, wind and water. In 2019, we reduced electricity use by 6.6% and aim to do the same again this year, as well as maintaining our green energy certification for using solely renewable electricity.
As you would expect, our sustainability strategy underpins the analysis and evolution of our core business propositions, through a £400m, multi-year transformation programme. To date, we have invested £155m on restructuring the branch network, reshaping our corporate business, and simplifying, digitising and automating the bank. This has already realised over £80m in savings through increased efficiency and, as programme momentum continues to build, we expect efficiency improvements to offset inflationary and other cost pressures.
We know that being fit for the immediate and long-term future means making strides in our sector’s use of new technologies to augment the customer experience in their channel of choice, in order to bring genuine, inclusive benefit to all, and as a driver for efficiency. 2019 saw a strong increase in our ability to fulfil customers’ changing expectations, with a 21% increase in total digital interactions. This encompasses a 5% year-on-year increase in online mortgage
Our Santander behaviours in action
Four years ago, we launched the Santander behaviours to create an environment where our Simple, Personal, Fair values can flourish and be sustained. The culture that they have achieved has never been so relevant today with the opportunities and challenges we face, our behaviours continue to underpin everything we do.
Each day when I talk to our colleagues, I hear and see inspiring stories of how we support our customers alongside our communities and how our behaviours guide those interactions. It’s that sense of purpose that makes me proud to be leading a workforce committed to deliver the very best experience for our customers.
As we transform the organisation, it is more important than ever that we hold firm to the principles that make Santander a great place to work. While transformation brings opportunities, the journey of change is rarely easy. Our set of behaviours are intricately embedded in our approach to both building a bank and workforce of the future. A bank of the future that is driven by outcomes, breaking down silos and delivering an agile working environment. A workforce of the future that has determination, collaboration and resilience that can sustain the pace of change with a relentless focus on our customers.
I want Santander to be a company of choice for people, attracting and retaining key talent and skills, who share our values and passion for helping people and businesses prosper. This is crucial for our future success and the culture we have is key in achieving this. We will continue to embrace our behaviours through transformation and in our everyday interactions in order to maintain and build upon the culture that we have at Santander, one that I am very proud of.
We have made fantastic progress in embedding the right culture within the organisation, and through our Board Responsible Banking Committee we continue to monitor this cultural change to help ensure that we remain on track.
We are confident in our ability to succeed by providing our customers with an experience that is second to none, through a relentless focus on improving our efficiency and competitiveness.

0
3
6
9
12
15
2019201820172016
11.6
4.1
12.2
4.4 4.5
13.2
4.7
14.3
(%)
CET1 capital ratio and UK leverage ratio CET1 capital ratio UK leverage ratio
0
20
40
60
80
100
2019201820172016
(£bn)
Risk Weighted Assets
87.6 87.0
78.873.2
Santander UK Group Holdings plc8
Annual Report 2019 | Strategic Report
CEO review continued
retention, and 8% year-on-year increase in retail current account openings. Our pioneering use of financial technology will support this upward trajectory, including the launch of ‘Mortgage Engine’ in November 2019: a platform we built and financed which, for the first time, enables intermediaries to source simultaneous decisions in principle from multiple lenders. The pilot phase currently connects 22% of the market, and we have ambitious targets for 2020.
Through innovative, intuitive digital products and services such as these, together with targeted support and campaigns, we want to continue improving our customer experience. In 2019, our Net Promoter Score (NPS) places us in the top four for Retail customer satisfaction, and I am delighted that our NPS ranks us first for Business and Corporate customer satisfaction. This reflects the invaluable contribution of programmes
such as ‘Breakthrough’, which provides advice, workshops and growth opportunities to thousands of start-ups and small businesses. Breakthrough’s beneficiaries include those supported in collaboration with the British Library Business and Intellectual Property Centre, with whom we have signed a new three year partnership. We are also helping to meet the ambitions of UK Government’s Investing in Women Code with a new ‘Women in Business’ mentoring programme, supporting female founders and company leaders across the UK.
In recent years, many UK small and medium-sized enterprises have been buffeted by sterling volatility and weakness, whilst a prolonged lack of clarity has made it difficult to make long-term investment and planning decisions. Our international proposition is therefore an important investment in businesses with high-growth
potential which are helping to expand the UK economy, namely trade and export led SMEs. Through our exceptional depth and breadth of market knowledge and connectivity, we aim to get businesses operations-ready within six months of introduction to a new market. We provide a pioneering suite of support for trailblazing businesses through regular trade missions, SME-targeted research in our biannual Trade Barometer, and facilitation of seamless financial and related services through Banco Santander and in-market partners.
In addition, in October 2019, we launched the Trade Club Alliance of fourteen global banks across 60 countries; cooperating via a digital platform to fulfil or signpost the facilitation of trade. Of course, the strength of our international proposition in the UK is reinforced by the global strength of Banco Santander, whose resource and reach benefit our customers. For example, its recent investment in UK FinTech and global transaction banking platform, ‘Ebury’, in order to further simplify the process for all businesses aspiring to enter or expand their operations in global markets.
With rapid industry evolution due to new regulation, technology, innovation and competition, there are a host of new ways to manage everyday banking, but also new areas of vulnerability for the customer. That is why we are rethinking our digital, physical and community infrastructure, and refining our customer offer with bold solutions. This includes making tough decisions, such as closing 140 branches, in order to reinvest in the branch offerings of the future. For example, our first ‘Work Café’ which launched in Leeds in July 2019 and hosted over 30,000 people last year for a combination of branch, business creation and networking services.
We are also tailoring our provision of customer education and support through events such as First Time Buyer Classes and Scam Avoidance Schools. As those aged 18-24 are particularly susceptible to online fraud and scams, we launched a ground-breaking social media campaign for this audience in July 2019. In partnership with characters from the BBC’s ‘Kurupt FM’, well-known by our target audience, we reached millions of young people with educational films focused on personal financial and data security. This followed

9Santander UK Group Holdings plc
Strategic Report Governance Risk review Financial review Financial statements Shareholder information
on from our 2018 campaign for the over 60s, which focused on helping older people who are vulnerable to falling victim to fraudsters and scammers. Meanwhile, in partnership with Age UK and the Alzheimer’s Society, we developed a module to help older customers feel more confident with digital banking. We aim to become the UK’s best digitally dementia-friendly bank; supported by dementia ambassadors in every branch region and contact centre.
Going forward, we are equipping our people with the necessary knowledge and skills to deploy digital capabilities effectively; ensuring artificial intelligence and machine-learning are carefully managed to increase efficiencies, improve quality and reduce risks. To this end, we recently signed a partnership with the renowned digital skills platform ‘Pluralsight’, and are hosting a large and growing number of digital apprenticeships. We also launched the new ‘MIO’ internal training tool in order to provide ongoing learning which is tailored to colleagues’ individual skills needs. Our eight employee networks, with around 40% of all colleagues in membership, are also invaluable forums for support and development. Each is focused on a particular aspect of diversity and inclusion, and sponsored by one of my executive team. This is an important investment in all our people, which is supporting talent across business disciplines.
Meanwhile, Santander Universities UK is continuing to make an invaluable investment in the next generation of talent. In addition to the thousands of student entrepreneurs and ME-internships supported across the UK,
we launched in July 2019 the first STEMships programme to support more female engineering students to enter directly related careers, including the data science required urgently in financial services. I feel strongly that this kind of investment in higher, applied and technical education is business-critical, and we must work more closely with colleges and universities to support development of the skills we need. That is why we are pioneering a new model for partnership between business and academia through our multi-million pound investment in MK:U, the first UK University for digital skills.
As a scale challenger, we want to inject true market competition in fostering a healthy banking culture, supporting small businesses to create jobs, helping more people to access finance easily and safely, and investing in the low carbon economy. This means significant introspection and willingness to do things differently, and it also means taking a stand on matters of the greatest importance for our sector and the people we serve. We are pleased, for example, that our call for greater regulatory coordination has been heard by Government, and we are continuing to spearhead new industry solutions in partnership with peers and regulators.
With this in mind, I would like to take this opportunity to thank our outgoing CFO, Antonio Roman, for his invaluable leadership throughout the ring-fencing process and other structural changes. He returns to Spain as Head of Retail and Commercial Banking for Santander Spain, and I am glad to welcome Duke Dayal, formerly CFO of Santander Holdings USA and President and CEO for Santander Bank NA, as his replacement.
As the regulatory, technological and wider geopolitical world evolves at pace, we have an important role to play in empowering and safeguarding our customers, colleagues and wider stakeholders. I believe that shrewd investments in our core competencies will position us as a trusted point of knowledge and support, and the bank of choice for the broadest spectrum of society. This year, we were proud to be placed in the top 20 organisations in the Social Mobility Employer Index 2019, just one of the ways we have been recognised for our commitment to being an inclusive employer. We have always prided ourselves on doing business in a way that is simple, personal and fair, and our customers can rely on us when they take their next financial steps for the future.
Nathan BostockChief Executive Officer 2 March 2020
We are embedding sustainability across our business and in everything we do and remain well-placed to meet our medium-term goals.

Santander UK Group Holdings plc10
Annual Report 2019 | Strategic Report
Market overview
What we have seenAs customer behaviours change, banks are re-evaluating their service and operating models. The move away from traditional in-branch banking towards online 24-hour service continues. Customers are demanding more customised products and, with more information to hand, are increasingly likely to shop around for products that meet a particular need, rather than relying on their main bank to provide everything. This in turn creates the need for banks to be competitive across all areas of their offering, ensuring they create a range of products that meet a variety of customer needs.
Our response and looking aheadWe aim to serve our customers through the most suitable channel, whether that be through mobile, online, branch or telephone.
The number of transactions carried out via Santander branches has fallen by 41% over the past three years, while transactions via digital channels have grown by 93% over the same period. In response to the changes in how customers are choosing to carry out their banking, this year we have re-shaped our branch network and closed 140 branches. We have also begun to refurbish 100 branches with a focus on personal service, convenience and community engagement.
For our corporate customers we have a network of Corporate Business Centres (CBCs) across the UK and have recently opened our first Work Café, offering an innovative space for clients and non-customers, which brings a bank, co-working area and coffee house together in a single place.
What we have seenThe UK banking sector remains highly competitive with continuing pressure on margins experienced throughout the year. Competition in the mortgage market has continued to be intense with rates for fixed term products decreasing since the start of the year.
There have been new entrants into the banking market, challenging existing providers in areas such as current accounts and savings products. This has put pressure on non-interest generated income along with rates paid on savings accounts.
Our response and looking aheadAs a leading scale challenger we are well-positioned despite a competitive market. We are focusing on our core franchises and in mortgages delivered our best net mortgage lending for a decade. This year we launched an innovative advertising campaign featuring Ant and Dec, initially focused on mortgage lending and raising brand awareness.
We understand the importance of knowing our customers and responding to their changing needs through continuous innovation of products and services.
We have begun a multi-year transformation programme to reduce costs and improve returns. Decisive actions will translate into improved efficiency in the medium-term along with a better customer experience.
3.1 million usersExclusively using mobile app
81bpsAverage net mortgage margin for 2019(1)
Market overview
1 2Changing customer behaviour
Strong market competition
Five major forces continue to shape the UK banking market
As part of Banco Santander, we are helping to establish a key role in the fight against climate change
Protecting ecosystems, promoting financial empowerment and furthering gender equality are among the 17 Sustainable Development Goals defined by the United Nations to protect the planet and foster social well-being. The United Nations Principles for Responsible Banking were developed to engage the financial sector in achieving these objectives. Banco Santander, as a company committed to people, businesses and the planet, is a founding signatory of the initiative.
The signing of the Responsible Banking Principles marked the most significant cooperation between the global banking industry and the United Nations to date. More than 130 banks from all over the world, including Santander, representing US $47tn in capital, have committed to assume a key role in achieving a sustainable and inclusive future.
These principles will influence how the global banking industry behaves and will help to shape the banking market of the future.
(1) Bank of England 2 year fixed 75% LTV less Bloomberg average 2 year swap rate.

11Santander UK Group Holdings plc
Strategic Report Governance Risk review Financial review Financial statements Shareholder information
What we have seenThe UK economy has experienced volatile activity due to pre-Brexit preparations with an average 0.2% quarterly growth in 2019, roughly half the pace seen in the previous two years. In January 2020, the UK left the EU and has entered a period of negotiation on a future trading relationship.
The Bank of England base rate remained flat in 2019 at 0.75%, due to slower global growth and Brexit uncertainties. The rate rose 25bps in both 2017 and 2018.
Our response and looking aheadWe expect UK growth to remain relatively subdued in 2020, with continued Brexit uncertainty and a weaker global economy. UK inflation is expected to remain below the 2% target in the near-term, with lower energy price inflation the main driver.
In early 2020 we announced changes to the 1I2I3 Current Account as a result of a number of factors, including a persistently low interest rate environment.
In our core lending markets we anticipate modest growth, with the mortgage market continuing to grow at c3%, with weaker buyer demand and subdued house price growth likely to continue. The corporate borrowing market is also expected to grow by c4%, as uncertainty continues to dampen investment intentions.
What we have seenTechnology continues to advance rapidly across the financial services sector. Offering digital platforms has become essential, not only for day-to-day banking but for all banking needs, including mortgage applications and investment advice and servicing.
Disruptors are challenging the way banks traditionally serve their customers. They are increasing digital interaction through the use of innovative technology and data from multiple sources such as Open Banking.
Cyber security remains a key priority as customers move towards more digital activity. The ability to adapt to new risks is essential to meet new challenges faced across the industry.
Our response and looking aheadRecognising the changing behaviour of customers, we are focused on digitally transforming the business. By utilising innovative digital solutions allied with our customer-centric approach, we aim to deliver excellence in customer experience.
We collaborate with FinTech companies through open IT architecture to help bring greater personalisation to our services. We benefit from our relationships with a number of innovative technology companies which Banco Santander’s $200m Santander InnoVentures fund invests in.
What we have seenRegulation in the UK remains focused on promoting positive customer outcomes by raising awareness, encouraging the financial education of customers and promoting competition. By removing barriers to exit for customers they can more easily change products and services to suit their needs.
The changes in the UK banking sector bring both risks and opportunities to existing providers. Advances in technology enable both start-ups and established banks to better tailor their offerings to their customers.
In 2019, the FCA announced measures to change the way banks and building societies charge their customers for using overdrafts. They will no longer be able to charge higher fees for unarranged overdrafts than for arranged overdrafts. The new rules will come into force in 2020.
Our response and looking aheadWe expect the regulatory agenda to continue to evolve and encourage more competition in the banking sector, opening it up further to new entrants. We also expect increased regulatory compliance costs as new regulation is implemented.
In 2020 we announced changes to the way we charge our customers for using overdrafts. From 6 April 2020, we will introduce a single interest rate for an arranged overdraft on all adult accounts, making the cost of using an overdraft more proportionate to the amount borrowed.
Over 100Regulatory initiatives in progress
+0.5% to +1.9%Range of HM Treasury consensus for 2020 growth in annual GDP(1)
2/3 UK adults now use contactless payments(1)
3 4 5Demanding regulatory agenda
Uncertain economic environment
Rapid technological change
(1) UK Finance (2019). UK Payment Markets Summary 2019.
(1) HM Treasury Forecasts for the UK economy: a comparison of independent forecasts.
Santander UK Group Holdings plc12
Annual Report 2019 | Strategic Report
Business model
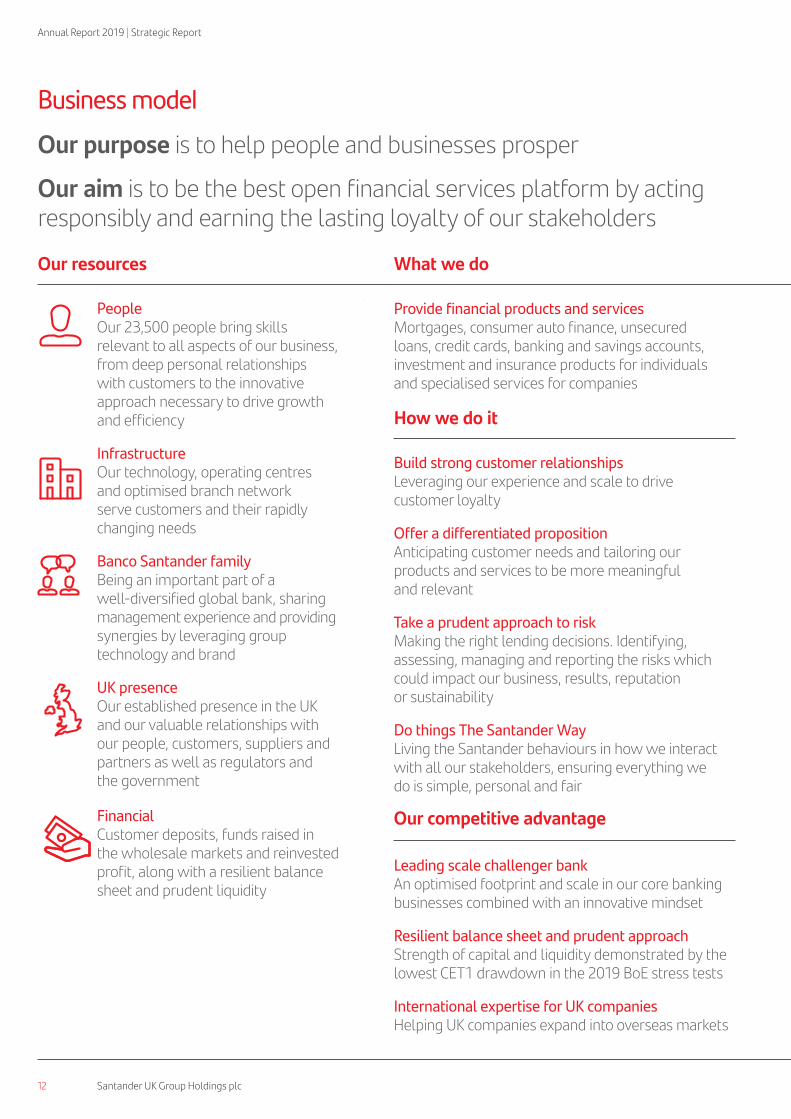
Our purpose is to help people and businesses prosper
Our aim is to be the best open financial services platform by acting responsibly and earning the lasting loyalty of our stakeholders
PeopleOur 23,500 people bring skills relevant to all aspects of our business, from deep personal relationships with customers to the innovative approach necessary to drive growth and efficiency
InfrastructureOur technology, operating centres and optimised branch network serve customers and their rapidly changing needs
Banco Santander familyBeing an important part of a well-diversified global bank, sharing management experience and providing synergies by leveraging group technology and brand
UK presenceOur established presence in the UK and our valuable relationships with our people, customers, suppliers and partners as well as regulators and the government
FinancialCustomer deposits, funds raised in the wholesale markets and reinvested profit, along with a resilient balance sheet and prudent liquidity
Our resources What we do
Provide financial products and servicesMortgages, consumer auto finance, unsecured loans, credit cards, banking and savings accounts, investment and insurance products for individuals and specialised services for companies
Build strong customer relationshipsLeveraging our experience and scale to drive customer loyalty
Offer a differentiated propositionAnticipating customer needs and tailoring our products and services to be more meaningful and relevant
Take a prudent approach to riskMaking the right lending decisions. Identifying, assessing, managing and reporting the risks which could impact our business, results, reputation or sustainability
Do things The Santander WayLiving the Santander behaviours in how we interact with all our stakeholders, ensuring everything we do is simple, personal and fair
How we do it
Leading scale challenger bankAn optimised footprint and scale in our core banking businesses combined with an innovative mindset
Resilient balance sheet and prudent approachStrength of capital and liquidity demonstrated by the lowest CET1 drawdown in the 2019 BoE stress tests
International expertise for UK companiesHelping UK companies expand into overseas markets
Our competitive advantage

13Santander UK Group Holdings plc
Strategic Report Governance Risk review Financial review Financial statements Shareholder information
Value creation
£10.6mEmployee training and development in 2019
144,703 daysEmployee training in 2019
50%Annual dividend payout policy to ordinary shareholders
12 yearsProfitable and dividend paid every year
Shareholders
£7.4bnNet mortgage lending, strongest in over a decade
17Trade corridors to help businesses bolster global trade
Customers
People
£12.7mSupport for communities in 2019
248,100People financially empoweredin 2019
Communities

Santander UK Group Holdings plc14
Annual Report 2019 | Strategic Report
Our refined priorities are aligned to Banco Santander’s European strategy announced in April 2019. We are focused on customer loyalty, simplification, improved efficiency and sustainable growth,
while being the best bank for all our stakeholders. Our four strategic priorities are set out below along with corresponding KPIs on pages 16 and 17.
Our refined strategy
Strategic review
Our strategic priorities
Top risks actively monitored in 2019 include:
– Enable our people to meet their full potential
– Provide training and development opportunities to deliver a workforce for the future
– Ensure all aspects of diversity remain front of mind
– Brexit
– Ring-fencing
– Capital strength
– Pension risk
– Financial crime
– Complex change agenda
– Cyber-attacks
– Conduct risks
– Third party risks
– Continue simplifying, digitising and automating the bank
– Radically improve our technology and operations through innovation and optimisation
– Ensure capital discipline and RWA management
– Maintain prudent approach to risk
Top risks
– Connect our physical and digital channels for seamless customer experience
– Focus on core franchise optimisation
– Profitable growth in retail banking
– Improve returns in corporate banking
– New and evolving revenue sources including global group projects
Grow customer loyalty by providing an outstanding customer experience1
2
3
Simplify and digitise the business for improved efficiency and returns
Invest in our people and ensure they have the skills and knowledge to thrive

15Santander UK Group Holdings plc
Strategic Report Governance Risk review Financial review Financial statements Shareholder information
At Santander UK we understand that the decisions we take have an impact on society, the UK economy, and our environment.
We continue to embed sustainability across our business,
focusing on four pillars, which are explained below with links to the relevant United Nations Sustainable Development Goals.
To find out more, see our 2019 ESG Supplement.
Becoming a more responsible bank
– Act responsibly in everything we do
– Grow our business sustainably
– Create value for all our stakeholders
Further embed sustainability across our business
Create a thriving workplace that attracts, retains and rewards the most talented and committed people
5 10
– Employee development
– Diversity and inclusion
– Compensation and benefits
– Employee engagement and wellbeing
Drive sustainable economic growth, financial inclusion and positive socio-economic impact
1 3 4 5 7 8 10 11 12 13 17
– Climate change and greenhouse gasses
– Financial inclusion
Drive inclusive digitalisation and use technology in a way that creates value for all of our stakeholders
1 9 10
– Privacy and data security
– Digitalisation
Uphold the highest ethical standards and fight financial crime
1 4 5 8 10 12 16
– Financial crime
– Ethics and corporate culture
– Reputation
Key to United Nations Sustainable Development Goals
4

Santander UK Group Holdings plc16
Annual Report 2019 | Strategic Report
Key Performance Indicator(1) 2019 result
Customers Loyal customers
32%
Digital customers
5.8 million
Retail NPS(2)
Top 4
Business and corporate NPS(2)
1st
Shareholders Adjusted RoTE(3) 7.8%
Adjusted cost-to-income ratio(3)
59%
People Top 10 company to work for
Accreditation aim over the medium-term
Communities Financially empowered people
248,100(1) See page 257 for KPI definitions.(2) NPS measure became a KPI during 2019, replacing
customer satisfaction to incorporate a broader measure of advocacy.
(3) See ‘Alternative Performance Measures’ on page 169 for details and reconciliation to the nearest IFRS measure for return on ordinary shareholders’ equity (RoE) and cost-to-income ratio. 2019 RoE was 4.8% and cost-to-income ratio was 61%.
Strategic review
We have taken decisive steps in 2019 to progress our strategic priorities and our focus on cost efficiency is starting to deliver tangible benefits.
We are confident in our ability to succeed through a relentless focus on improving our efficiency and competitiveness.

17Santander UK Group Holdings plc
Strategic Report Governance Risk review Financial review Financial statements Shareholder information
Why it matters and how we performed Results
Loyal customers (as a % of Active customers) measures the proportion of our customers who have a primary banking relationship with us alongside another product. Loyal customers stay with us longer and their current account usage gives us in-depth insight which allows us to tailor our services to their needs. Loyal customers increased in 2019, building on previous years progress and laying a solid foundation for us to achieve our target of 34% in the medium-term.
2018
2019
30%
32%
Digital customers are increasingly important given the benefits that mobile and digital can bring to customer experience alongside more efficient operational delivery of 24/7 service. Customers in the UK are increasingly moving towards mobile and digital banking and we have increased digital customers to 5.8 million in 2019.
5.8
5.52018
2019
Retail net promoter score is a widely-used measure of customer experience and customer advocacy of our retail customers. We ranked in the top four amongst our peers as we focus on building stronger customer relationships and a seamless customer experience.
Top 4 out of 9 competitors
Business and corporate net promoter score is a widely-used measure of customer experience and advocacy for our business and corporate customers. We ranked first amongst our peers, a testament to the comprehensive proposition and our focus on small and medium-sized businesses.
1st out of 6 competitors
Adjusted RoTE is a measure of income generation on shareholder investment. The adjusted RoTE of 7.8% in 2019 was lower than 2018 due to ongoing mortgage income pressure, partially offset by low credit costs which reflect our prudent risk management. We are focused on improving returns through our multi-year transformation programme to achieve a 9-11% adjusted RoTE in the medium-term.
7.8
10.22018
2019
Adjusted cost-to-income ratio is an efficiency measure to capture the amount spent to generate income. Adjusted cost-to-income ratio increased to 59% in 2019 largely due to income pressure. In the low rate environment, we are focused on costs as we invest in our multi-year transformation programme to improve returns going forward.
59
542018
2019
Top 10 company to work for is an important measure of employee satisfaction and our participation forms part of a wider Banco Santander goal. To measure this we will seek to participate in an industry-wide ranking survey for accreditation in 2022 to check our progress towards our over arching global medium-term target. In 2019, Santander UK was accredited in the Top Employers Survey for 2020.
Financially empowered people are those unbanked, underbanked or vulnerable people who we are supporting with access to the financial system, tailored products and financial education. In 2019, we continued to support and invest in communities across the UK to foster sustainable economic growth, contributing to Banco Santander’s target to financially empower 10 million people by 2025.
248,100
875,4002018
2019

Santander UK Group Holdings plc18
Annual Report 2019 | Strategic report
Risk management overview
trafficking and terrorism. Significant investment in ongoing enhancement continues to be made to our financial crime control framework, and to key controls including anti-bribery and corruption measures, customer risk assessment, and screening and transaction monitoring.
Managing a complex change agendaAs part of our business planning strategy we have continued to invest in a project portfolio that supports risk, regulatory and growth requirements. In order to effectively manage our complex change agenda, we have established robust processes and controls that allow us to track any potential issues and mitigate implementation risk. In delivering key projects, we keep pace with developments in the regulatory environment and technological advances, whilst focusing on maintaining our market position and remaining competitive.
Cyber-attacksIn 2019, threats from the external cyber environment continued to evolve, due to heightened geopolitical tension, and active well-established cyber-crime groups. We monitor a range of cyber threats including attacks on payment systems, ATM networks and customer data where insider threat and network intrusion are the most common attack methods; an emerging threat from a new method, aimed at breaching organisations’ on-line customer services, (such as internet banking) and causing denial of service. In addition, Data Security and General Data Protection Regulation (GDPR) compliance continue to be key areas of concern. We have taken mitigating actions against these various threats including deployment of a cyber threat intelligence platform, increased intelligence through chairing the Geopolitical Financial Services working group and robust online service access construction utilising anti Distributed Denial of Service (DDoS) techniques. The mitigants implemented in our Cyber Security Plans are proving effective and we have experienced no significant disruption to date.
Top risks
We regularly review the top risks that could impact our customers and shareholders. Risks actively monitored over 2019 include:
Brexit We continue to monitor Brexit as a top risk, following the UK’s exit from the EU on 31 January 2020. Our Brexit planning is now focused on the potential outcomes of the UK and EU negotiations in respect of a Free Trade Agreement (FTA) and equivalence in financial services, by the end of 2020. We are also maintaining and refining existing plans to address a number of areas requiring cross-divisional communication including financial markets infrastructure, data, payments, third-party services, cyber, and internal and external communications. For more details on our assessment and management of Brexit risks, see page 19.
Ring-fencing implementationWe executed our ring-fencing plans, in order to meet the 1 January 2019 legislative deadline. The majority of customer assets and liabilities remain within the ring-fenced bank, providing longer-term flexibility with minimal disruption for our customers. Corporate and wholesale markets business, which is prohibited from inclusion in the ring-fenced bank, was transferred to Banco Santander London Branch. Ring-fencing resulted in significant change to our structure, people and operations, and we have retained it as a top risk to ensure continued focus on the ongoing embedding of ring-fencing culture throughout our governance and operations. This has included continued emphasis on related controls, procedures, reporting, and additional internal communications and staff training.
Building and maintaining capital strengthRegulatory uncertainty arising from decisions made by regulators on the implementation and interpretation of capital rules and on macro-prudential issues can impact upon our capital management. We continuously review our capital position on a forward looking basis, and it is also subject to the Bank of England’s stress testing regime. Publication
of the 2019 stress test results showed that we passed the stress tests, and were not required to undertake any capital actions.
For the fourth year in a row, we had the lowest stressed CET1 capital ratio impact of all participating firms, demonstrating our resilient balance sheet and prudent approach to risk, in an extremely competitive and uncertain environment. On both IFRS 9 transitional and non-transitional bases, our lowest post-stress end-point CET1 capital ratio, before and after management actions, was in excess of the CET1 hurdle rates established by the Bank of England. On both IFRS 9 bases, but after management actions, our lowest post-stress end-point leverage ratio also exceeded the Bank of England hurdle rates. Given the composition of our balance sheet, the leverage ratio is growing in importance, in terms of the binding capital constraint for our business.
Pension riskOver the course of the past two years a number of de-risking actions have been undertaken including execution of various hedging strategies and strategic asset reallocation which has reduced the fund’s exposure to pro-cyclical assets, and improved the fund’s resilience. Despite falls in long term interest rates, the funding deficit position (2016 valuation basis) was broadly stable over the year as long term inflation also fell and asset values increased. The IAS 19 accounting position did however worsen, as in addition to these factors credit spreads narrowed, increasing the value of the liabilities. During the year we completed and agreed the Triennial Valuation process with the Trustees, which resulted in a lower funding deficit on the updated valuation basis. We have also continued to take actions to improve risk management and control, along with the associated governance procedures.
Financial crimeWe recognise that financial crime activities can have a significant impact on our customers. Criminals are also increasingly using the financial system to launder the profits of illegal activity such as human
Sound risk management is at the centre of our day-to-day activities. It benefits our business and our customers by helping to ensure balanced and responsible growth.

19Santander UK Group Holdings plc
Strategic Report Governance Risk review Financial review Financial statements Shareholder information
Conduct risksLike all UK banks we continue to see a demanding regulatory agenda focused on fair customer outcomes, avoiding customer harm (including from inertia), vulnerability and consumer protection in general. We aim to comply with all applicable regulatory requirements and we have no appetite to operate in a way that leads to unfair outcomes for our customers or that negatively impacts the market or breaches regulatory or legislative requirements. A major conduct issue that has impacted UK banks over the past few years related to Payment Protection Insurance (PPI). A deadline for customer complaints at the end of August 2019 was set by the FCA, and in the run up to this date we saw an uplift in the volume of claims to unprecedented levels, which resulted in us making an additional provision of £70m in Q2 2019 and £99m in Q3 2019 to cover this. When implementing regulatory change we are focused on ensuring that our strategy, leadership, governance arrangements, and approach to managing and rewarding staff does not lead to a detrimental impact on our customers, competition, or to market integrity. We expect all people in our organisation to take responsibility for managing risk through our I AM Risk programme.
Third party risksLike other banks, we rely on a number of major suppliers, in order to continue to deliver products and services to our customers. The complexity and criticality of services provided by third-parties to the industry is a key operational risk that has been recognised by us, our peers, and the regulators. We carefully assess and monitor the degree of risk associated with our suppliers on an ongoing basis, supported by key operational risk indicators and monthly dashboards submitted by our business units. We place emphasis on a carefully controlled and managed Third Party Supplier Risk Framework, and we are enhancing resources in this area in order to manage this risk. This framework ensures that those with whom we intend to conduct business meet our risk and control standards throughout the life of our relationship with them. We monitor and manage our ongoing supplier relationships to ensure our standards and contracted service performance continues to be met.
Brexit
With the general election behind us, there is less uncertainty and more clarity in the political environment. Following the UK’s exit from the EU on 31 January 2020, early indications are that the UK may seek a degree of divergence from the status quo, in its pursuit of a Free Trade Agreement. The UK and the EU will also be assessing their regulatory equivalence, in order to determine the level of access afforded to financial markets. Given the limited time available, and the Government’s stance that it does not want an extension beyond the end of 2020, a ‘no deal’ Brexit remains a risk.
Experience has shown that trading concerns for businesses and investors can have negative consequences for the economic outlook and also impact the market’s perception of future interest rates. There was a bias towards monetary easing by global central banks during the latter half of 2019, and this bias still remains at the beginning of 2020.
However, the Conservative Government’s election pledge to inject stimulus into the UK economy to smooth the UK’s exit from the EU could, if it materialises, temper the market’s expectations for lower interest rates in the future. Should rates remain relatively low for an extended period, it could prove challenging for the banking industry to achieve the longer term targets set out in their business plans.
We have executed interest rate hedging programmes for both our Balance Sheet and Pension Fund to help mitigate exposure to lower rates over the medium-term.
There are additional risks that may arise for our customers as a result of Brexit, in both Northern Ireland and Scotland. The arrangements for Northern Ireland could have impacts on its economy and could lead to a referendum on independence. In the longer term, our business interests in Scotland could also be impacted, should momentum for a second referendum on Scottish independence re-emerge. There have been renewed calls for a second vote, but the UK Prime Minister has since re-iterated his commitment to strengthening the Union.
Our Brexit planning is overseen by the Board, Board Risk Committee and Senior Management Committee. Our Brexit Working Group, comprised of representatives from across the business and support functions, completed our preparations and ensured operational readiness ahead of previous potential ‘no deal’ risk junctures in 2019. These plans will be maintained should they be required again in preparation for a ‘no-deal’ scenario later this year. Further plans will be developed when there is clarity on the future trading arrangements and their potential impacts on the bank and its customers.

Santander UK Group Holdings plc20
Annual Report 2019 | Strategic report
Risk typesAll our activities involve identifying, assessing, managing and reporting risks. Of the Risk Types covered here several also have Top Risks associated with them, including Operational, Capital, Pension, Conduct, and Financial Crime risk.
Risk management overview continued
Credit 1 2 4
Market (Banking market) 1 4
Capital 2 4
Pension 2 4
Stage 3 ratio (%) NIM sensitivity +50bps (£m) Total capital ratio (%) Funded defined benefit pension scheme accounting surplus(£m)
What we have seenCredit quality remained strong, supported by our prudent approach to risk, proactive management actions as well as the ongoing resilience of the UK economy. Low interest rates and falling unemployment have contributed to a benign credit environment resulting in low levels of default in both the mortgage and corporate portfolios. This has also been reflected in a low cost of credit of 11bps compared to the more normalised average of 20bps to 30bps. Whilst the market continues to show resilience, we are cautious on the outlook in light of ongoing market uncertainty.
How we mitigate the riskWe manage our exposures carefully to ensure we stay within our risk appetite and agreed concentration limits. We have thorough credit checking and approval processes to understand the risk we take on when we lend.
We closely monitor the economy and where we see areas of stress we take action to reduce our exposure or to adapt our pricing to adequately reflect the risk.
What we have seen2019 saw yields in the UK begin to fall in the second half of the year. The market started pricing in up to two base rate cuts on renewed fears of global slowdown, trade wars and Brexit. Though the Bank of England has kept BoE rates steady at 0.75%, we saw swap rates significantly lower than the beginning of the year. Market expectations are for future rate cuts over the next year or so, depending on the performance of the UK economy, trade deal with the EU and the wider global economic outlook.
Our balance sheet is positioned to benefit from a rising interest rate environment, while at the same time protecting NII in the case of a low for longer scenario.
How we mitigate the riskWe use a variety of approaches to protect the bank from interest rate risk. These include using financial instruments or by matching fixed rate deposits with fixed rate loans of a similar term.
In addition, stress testing is an essential part of our risk management, helping us to measure and evaluate the potential impact of extreme events or market moves.
What we have seenRegulatory capital requirements, including leverage, have continued to increase. This trend is set to continue across the course of 2020, with the forecast increase in the Countercyclical Capital Buffer.
We have generated capital consistently, whilst undertaking risk management initiatives, including securitisations, to further strengthen our capital position.
How we mitigate the riskWe utilise a capital risk framework that informs and monitors our capital risk appetite. Capital and leverage ratios are monitored to ensure we meet current and future regulatory requirements. We also undertake wide-ranging stress testing analyses to confirm our capital adequacy under various adverse scenarios.
What we have seenIn recent years, UK pension funds have experienced headwinds as a result of falling long-term gilt yields driving an increase in the value of pension liabilities. In many cases these increases in liability values have only been partially offset by increases in the value of hedging assets and return-seeking assets. Where funding positions have deteriorated, additional contributions may be required. The accounting position has been affected by falls in corporate bond yields driving an increase in the value of pension liabilities.
How we mitigate the riskWe monitor pension risk on both the accounting and funding bases monthly against the overall risk appetite set by the Board. A range of investment strategies are used to generate income and capital growth to contribute to the funding of the scheme benefits. Hedging strategies are used to mitigate the impact of inflation and changing interest rates, as well as currency movements and falls in equity values.
1.15
2018
2019
1.29
99
207
212
2402016
2017
2018
2019 21.6
19.1
2016
2017
2018
2019
17.8
17.4
431
766
204
1752016
2017
2018
2019

21Santander UK Group Holdings plc
Strategic Report Governance Risk review Financial review Financial statements Shareholder information
Strategic priority key:1 Grow customer loyalty by
providing an outstanding customer experience
2 Simplify and digitise the business for improved efficiency and returns
3 Invest in our people and ensure they have the skills and knowledge to thrive
4 Further embed sustainability across our business
Conduct 1 2 3 4
Operational 1 2 3 4
Financial crime 2 3 4
Remaining conduct provision (£m)
Operational risk losses trend (excluding PPI and losses below £10,000) (%)
£75mincremental investment in the financial crime transformation programme to enhance systems and controls in 2019
What we have seenIn recent years, a major conduct issue faced by banks related to PPI, with significant provisions set aside by the industry for redress. Following the FCA deadline in August 2019, we are now working through the outstanding stock of enquiries and complaints from unprecedented volumes received around the deadline with a view to completion in 2020.
We made additional PPI provisions of £169m in 2019, with no further provisions made in Q4 2019, after the August deadline for claims.
How we mitigate the risk Our culture of Simple, Personal and Fair, underpinned by our nine behaviours, enables us to embed a conduct strategy within the business where we place the fair treatment of customers at the heart of what we do. We always look to improve our processes and training to ensure this, integrating fair treatment into our product and service design reviews.
What we have seenCyber risk has become an increasingly prominent issue, with various well-known companies targeted by sophisticated cyber-attacks, malware and phishing attacks.
In May 2019, the Contingent Reimbursement Model (CRM) Code for Authorised Push Payments (APP) came into effect, the main change being that where neither bank nor customer is to blame in a case of fraud, the bank will refund the customer.
How we mitigate the risk As one of the top three risks we face, we use separate but complementary approaches to cyber risk. We operate a layered defence, focused on identifying, detecting, preventing, responding to and recovering from cyber-attacks, including simulation tests.
To support the CRM code, we have improved our customers’ online payment journey by adding validation and improved visibility on payment destinations. Across digital channels, branches and by telephone, we have provided more than 55 million warning messages, and many customers have been refunded.
What we have seenUK regulatory change post Brexit may add further complexity to Financial Crime Risk Management. Measures are currently before Parliament for implementation of the UK AML and Sanctions Act and new UK Money Laundering Regulations will be issued in 2020. Material changes to global sanctions regimes are also a key area of focus. Santander UK is engaging with the Government on these issues.
How we mitigate the risk We are committed to the strongest possible response to financial crime risks having made a number of enhancements to our systems and controls in recent years through the implementation of our Financial Crime Transformation Program. We have also undertaken a series of initiatives to enhance training and awareness, underpinned by an anti-financial crime culture agenda. In parallel, we contribute to the wider economic crime strategy, as participants in the public-private sector partnership, working closely with law enforcement and government agencies, as well as NGOs. As part of these activities, we are also strong contributors to the Government’s Economic Crime Plan.
214
2016
2017
2018
2019
276
403
493 2016
2018
2017
2019
(30)
3
5
(63)

Santander UK Group Holdings plc22
Annual Report 2019 | Strategic report
Emerging risks in 2019
We regularly review emerging risks that could impact our business and our customers. We maintain an active dialogue with key Corporate customers to aid our overall understanding of the issues that could arise. As well as those risks identified below, we also consider the potential impacts of various economic scenarios that could arise from other factors, for example a global health emergency (such as the recent coronavirus outbreak), geopolitical conflicts or other significant global events. During the year we reviewed a range of risks associated with LIBOR transition, which are being actively managed at the Asset and Liability Committee (ALCO).
Changing customer behaviourCustomer loyalty is diluting across the Banking industry, as expectations are shifting and population demographics evolve. Increasingly customers require first class digital experiences when interacting with their banking services provider, as their expectations are increasingly defined by experiences outside of banking. This is causing disruption to the banking sector with higher demands for: digital product offerings and solutions to manage customer finances; data security and trustworthiness; immediacy and convenience; tailored value products in return for loyalty; price transparency and comparisons across providers. Santander’s customer-centric transformation is well underway, with further digital enhancements planned for deployment in 2020, truly designed around customer needs.
Rapid technological changeSuccessful financial service providers will be those that invest in platforms that satisfy customer expectations and at the same time deliver substantial cost reduction in order to sustain profitability. Santander UK continues to increase its number of digital customers, develop new digital channels, and improve existing digital services, as well as automating existing physical channels. We also place a high priority on technology risk management, especially cyber security, in order to protect our customers and our reputation.
Strong market competitionThe UK banking market continues to be highly competitive, with an increasing concentration of revenues in mortgages. At present, our main competition comes from incumbent banks who have strengthened and restructured their activity, and also from building societies. Margins across the industry, particularly in mortgages, continue to come under pressure as a result of this
competitive environment, and this trend is expected to continue for several years ahead. Competition for deposits also remains intense and may escalate as many challenger and specialist banks need to replace funding from Government schemes in the near future. In the longer term, there is also potential for new types of competitors, such as scale digital players, to gain market presence by leveraging their large customer bases and digital customer interfaces. Digital banks are emerging globally, with many targeting the UK, as London is seen as Europe’s FinTech hub. We are focused on delivering sustainable, predictable growth in a responsible manner, and achieving consistent profitability through balance sheet strength.
Demanding regulatory agendaWe continue to face a complex regulatory change agenda. The FCA, PRA and other regulatory bodies have been progressing industry reviews across a number of areas during the year. Some key areas of focus include: PPI; High Cost of Credit Review involving the reform of overdraft charges and contingent reimbursement model for authorised push payment fraud. We are focused on managing our regulatory risks, coordinated and prioritised through specific project groups with both risk and regulatory oversight.
Uncertain economic and geopolitical environmentUK economic growth was lower in 2019, compared to 2018, as uncertainty over Brexit continued to subdue business confidence and investment. However, unemployment remains at historical lows and strong real wage growth has continued to support consumption. UK Housing market indicators have generally shown signs of improvement, in the early part of this year, including the level of transactions and price growth. The performance of the broader UK economy during the year, and the government’s housing policies, will likely have an impact upon the full extent and duration of these improvements.
Various global institutions have cited potential emerging risks to the global economic and financial system during the year, including: increasing levels of Corporate Sector Debt; a tightening of financial conditions in repo markets; China’s financial imbalances; and limited capacity of central banks going forward to prevent a fall in economic growth. Many of the risks regularly cited by these institutions may not have a direct impact on Santander UK, however they
could result in an increase in the cost of funding generally in the wholesale markets. We maintain prudent and resilient Funding and Liquidity Policies to protect the bank and our customers.
LIBOR transitionIn Q4 2018, we launched our LIBOR transition programme, which includes identified Senior Managers within the bank who oversee the implementation of our transition plans. The Project has the full support of the Board and Executive Management across the bank. We recognise that there are potential risks to our customers as we transition from LIBOR to risk free rates going forward. Our LIBOR transition programme is in place to ensure a smooth transition, and to anticipate and address any potential customer and conduct related issues that could arise from the change. There are also a number of other thematic risks involved including; legal and compliance; reputational; operational and financial accounting and control. There is also some uncertainty about the likely path of evolution for the set of non-LIBOR benchmarks and markets for non-LIBOR products (including liquidity or illiquidity related issues).
In January 2020, the Working Group on Sterling Risk-Free Reference Rates set targets for 2020, including ceasing the issuance of sterling LIBOR-based cash products maturing beyond 2021 by the end of Q3 2020. The FCA and Bank of England have stated their support for these targets. We have established detailed plan timelines and milestones, including a Project Governance structure, to enable the transition to alternative rates ahead of the end of 2021.
Climate change riskReflecting the significant potential risks posed by Climate Change to the economy and to the financial system, in April 2019, the PRA became the first regulator in the world to publish supervisory expectations setting out how banks need to develop an enhanced approach to managing the financial risks from Climate Change. In 2019, our programme of work focused on enhancing our understanding of the most material climate change related drivers of our business model, and producing an implementation plan to fully deliver the PRA’s expectations under Supervisory Statement (SS) 3/19 ‘Enhancing banks’ and insurers’ approaches to managing the financial risks from climate change’. We are addressing climate change related risk issues through ongoing engagement across our business and support functions, co-ordinated and led by the Risk Division. Our focus will be on implementation of the plan that we delivered to the PRA in October 2019.
Risk management overview continued

23Santander UK Group Holdings plc
Strategic Report Governance Risk review Financial review Financial statements Shareholder information
Task Force on Climate-related Financial Disclosures
IntroductionAs a group, Banco Santander supports the recommendations of the Task Force on Climate-related Financial Disclosures (TCFD), which were published with the aim of improving disclosure of climate financial risk and opportunities. As part of our strategy in the UK we have prioritised embedding sustainability in everything we do and welcome the developments of the PRA and FCA to improve management and disclosure of climate change related risks.
In October 2019, we submitted an initial UK implementation plan to the PRA to address the expectations set out in SS 3/19. Alongside this plan, responsibility for climate related financial risks was added to the Statement of Responsibility of the Chief Risk Officer (CRO) as Senior Management Function (SMF) holder. Delivering on our plan will be a multi-year programme. We are targeting the end of 2022 to achieve full adoption, aligned to the implementation path as set out in the TCFD recommendations. We are working alongside Banco Santander with a shared ambition of being a leading global bank for tackling climate change.
GovernanceThe CRO, as the SMF holder, is responsible for climate-related financial risks. The management of these risks lies in the first line of defence. It is therefore expected that the CRO will be supported by the business division heads to fulfil these responsibilities.
To address TCFD recommendations and PRA expectations, a Climate Change Working Group (CCWG) was launched in 2019 and re-launched in Q1 2020. This CCWG co-ordinates the efforts to deliver the implementation plan and will report on progress to the CRO, Executive Risk Control Committee and Board Risk Committee.
The first half of 2020 will see the documentation of firm-wide climate change risk management governance arrangements. This will articulate the roles and responsibilities and the committees involved across the three lines of defence.
During the second half of 2020, the link between climate change related metrics and remuneration will be defined.
Strategy In 2019, we have developed a high-level analysis of our credit portfolios based on various climate scenarios: a business-as-usual (BAU) scenario (which trends towards 3.7°C of average global warming by 2100) and a low-carbon transition scenario (which trends towards 2°C of warming). This analysis is referred to as the ‘Climate Portfolio Screen’.
The aim of the Climate Portfolio Screen was to identify sectors and segments of the Santander UK lending book where there could be greater potential opportunities and risks associated with both the transition to a lower carbon economy and changes in physical climatic conditions.
According to this analysis, the sectors of most concern based on exposure and or potential risks are mortgages, real estate, consumer finance and automotives. For the mortgage portfolio, we are working on a project that will help us understand the physical and transition risks in our mortgage book under different climate scenarios.
We are committed to strategically aligning our business with the UN Sustainable Development Goals and the Paris Agreement. This means recognising the opportunities for climate financing. In October 2019, Banco Santander issued a €1bn green bond, focused on financing renewable energy projects from wind and solar.
Banco Santander is one of the largest renewable energy financiers, ranking as the 3rd largest lender to the sector by volume (2nd by number) of transactions in 2019 in the UK, and also ranked 1st by volume for advisory services in Europe and the UK(1). Santander UK originated £1.09bn of debt financing to 21 renewable energy projects in 2019.
Risk Management Climate-related risks could eventually manifest in credit, market and operational risks for financial institutions. We are reviewing the appropriate parts of the Risk Framework, Risk Type Frameworks (in particular Credit and Operational risk) and the Risk Appetite Statement to explicitly include climate-related risks.
Our commitment to fight climate change is articulated in the Banco Santander and Santander UK Energy, Mining and Metals and Soft Commodities sector policies. The policies apply strict criteria to transactions related to fossil fuels, for example, prohibiting the financing of any new project for coal power plants or thermal coal mines. In 2020 we will review and update the UK Environmental Policy and Sustainability Policy to reflect climate considerations.
Metrics and targetsIn disclosing metrics and targets we will look to cover both internal environmental footprint as well as the climate-related risks and opportunities of our lending activities. We aim to expand on the latter metrics in 2020 following further analysis and developments with our strategy and risk appetite.
We use 100% renewable electricity and target to maintain this for 2020. We report annually on greenhouse gas emissions, including Scope 3, in our ESG Supplement 2019. Santander in the UK will also contribute to Banco Santander’s global renewable financing target of over €120bn in green finance from 2019 to 2025.
$43tnEstimated present value losses resulting from 6°C of warming, according to: The cost of inaction: Recognising the value at risk from climate change, The Economist.
(1) Inframation league tables 2019, combining both Banco Santander and Santander UK.

Santander UK Group Holdings plc24
Annual Report 2019 | Strategic Report
For the years ended 31 December2019
£m2018
£m
Net interest income 3,295 3,606
Non-interest income(1) 875 937
Total operating income 4,170 4,543
Operating expenses before impairment losses, provisions and charges (2,526) (2,563)
Credit impairment losses (220) (153)
Provisions for other liabilities and charges (443) (260)
Profit before tax 981 1,567
Adjusted profit before tax(2) 1,300 1,707
(1) Comprised of ‘Net fee and commission income’ and ‘Net trading and other income’.(2) The financial results were impacted by a number of specific income, expenses and charges with an aggregate
impact on profit before tax of £319m in 2019 and £140m in 2018. See ‘Alternative Performance Measures’ for details and reconciliation to the nearest IFRS measure.
(3) Transformation programme investment of £155m, of which £50m is operating expenses and £105m is provisions for other liabilities and charges.
Financial overview
Maintaining balance sheet strengthCET1 capital was stable at £10.4bn, with ongoing capital accretion through profits retained after dividend payments, offset by market-driven pension movements. RWAs reduced largely as a result of significant risk transfer (SRT) securitisations and lower corporate lending as we continue to focus on risk-weighted returns. This was partially offset by increased RWAs in Retail Banking in line with mortgage lending growth. The CET1 capital ratio increased 110bps to 14.3%, through active RWA management. The UK leverage ratio increased 20bps to 4.7%. The quality and strength of our balance sheet was again demonstrated by the Bank of England stress test results.
We are improving efficiency while actively managing our funding and liquidity portfolios and capital consumption
Our 2019 financial results reflect competitive and regulatory pressuresProfit before tax was £981m, down 37% from £1,567m in 2018. Profitability was impacted by the ongoing competitive income pressure on mortgages and PPI charges, but also includes the investment we are making as part of our plan to transform the bank for the future. In what was a competitive and uncertain environment, adjusted profit before tax was £1,300m, down 24% from £1,707m in 2018. This was largely due to mortgage income pressure and was reflected in the Banking NIM of 1.64% (2018: 1.80%) and adjusted return on tangible equity(2) of 7.8% (2018: 10.2%).
Net interest income was down 9%, largely impacted by mortgage back book pressure and £3.9bn of SVR attrition (2018: £4.9bn).
Non-interest income was down 7%, largely due to £58m of ring-fencing perimeter changes in 2018, partially offset by £15m additional Vocalink consideration received in Q2 2019.
Operating expenses before credit impairment losses, provisions and charges were down 1%, with the absence of £48m of ring-fencing perimeter changes, £40m of GMP equalisation costs and £38m of Banking Reform costs all
incurred in 2018. This was partially offset by £50m transformation costs(3) in 2019 and £40m higher operating lease depreciation.
Credit impairment losses were up 44% to £220m, largely due to lower mortgage releases as well as a few single name corporate exposures.
Provisions for other liabilities and charges were up £183m to £443m, largely due to additional PPI provisions of £169m and £105m of transformation programme charges(3) (predominantly restructuring costs) as well as an additional £10m other provision charge in 2019 pertaining to our retail credit business operations. Other adjustments to provisions amounted to £80m in 2018.
Supporting our customers while growing our business Customer loans increased £5.4bn, with mortgage lending in Retail Banking up £7.4bn. This was partially offset by a reduction in corporate lending which included managed reductions in Commercial Real Estate (CRE) of £1.1bn. Customer deposits increased £5.7bn, with £3.0bn growth in Retail Banking supported by a successful ISA campaign and 1I2I3 Business Current Account inflows. Corporate deposits also increased as we focused on building strong customer relationships.
Financial highlights
1.64%Banking NIM(2018: 1.80%)
61%Cost-to-income ratio(2018: 56%)
£165.4bnUK mortgage loans(2018: £158.0bn)
£68.7bnRetail Banking current account balances(2018: £68.4bn)
£7.9bnMREL eligible senior unsecured debt(2018: £9.2bn)
£73.2bnRisk-weighted assets (RWAs)(2018: £78.8bn)
Summarised consolidated income statement

25Santander UK Group Holdings plc
Strategic Report Governance Risk review Financial review Financial statements Shareholder information
At 31 December2019£bn
2018£bn
Customer loans
Retail Banking 180.4 172.8
Corporate & Commercial Banking 16.3 17.7
Corporate & Investment Banking 4.1 4.6
Corporate Centre 4.5 4.8
Total customer loans 205.3 199.9
Other assets 83.2 89.5
Total assets 288.5 289.4
Customer deposits
Retail Banking 145.1 142.1
Corporate & Commercial Banking 18.2 17.6
Corporate & Investment Banking 6.1 4.8
Corporate Centre 8.4 7.6
Total customer deposits 177.8 172.1
Total wholesale funding 65.3 70.9
Other liabilities 29.1 30.2
Total liabilities 272.2 273.2
Shareholders’ equity 15.9 15.8
Non-controlling interest(1) 0.4 0.4
Total liabilities and equity 288.5 289.4
(1) Non-controlling interests refers to other equity instruments issued by Santander UK plc and PSA Finance UK Limited (PSA cooperation), a cooperation between Santander Consumer (UK) plc and Banque PSA Finance SA (accounted for as a subsidiary).
Summary of segmental balance sheet assets and liabilities
The Stage 3 ratio of 1.15% (2018: 1.29%) and cost of risk of 11bps (2018: 8bps) demonstrate our prudent approach to risk.
2019 fundingIn late 2018 and early 2019 there was a market expectation that a disorderly Brexit was a likely outcome. As a result we pre-funded our issuance in 2018 and held extra liquidity throughout the year to prepare for potential market disruption. This meant that we had a relatively light funding plan for 2019 with issuance of around £4.0bn, well below normal levels.
We are well placed to meet MREL requirements, with £7.9bn of senior unsecured funding from our holding company issued to date. Total wholesale funding decreased in 2019, reflecting maturities in the period, partially offset by covered bond issuances of £1bn in February 2019, €1bn in May 2019 and £1bn in November 2019, along with a senior unsecured issuance of $1bn in June 2019. In August 2019, we increased our AT1 outstanding by £200m via the issuance of a new £500m 6.3% AT1 to Banco Santander and the repurchase of the £300m 7.6% AT1 from Banco Santander.
2020 outlook We expect our net mortgage lending to be in line with market growth, as we focus on quality customer service, retention and our
Santander UK passes the 2019 Bank of England stress test
The results of the latest Bank of England stress tests were released in December 2019. The parameters of the stress scenario were very similar to the 2018 stress test, with severe downturns in GDP of 4.7% and house prices of 33% along with a sharp increase in unemployment to 9.2%. Additionally, the stress scenario reflects the expected result of such a downturn with bank rate increasing to 4% in response.
With a stressed CET1 ratio of 10.8% after allowed management actions and on an IFRS 9 transitional basis, we were well above the threshold requirement of 8.1%. Additionally, with a stressed leverage ratio of 3.8% after allowed management actions, we were above the threshold requirement of 3.57%.
As a result of the exercise, the Bank of England did not require Santander UK to undertake any actions.
The outcome of the stress test underlines the quality of our UK-based balance sheet as well as our strong risk management practices.
Bank of England 2019 stress tests CET1 drawdown(1) (percentage points)
Santander UK
Barclays
RBS
HSBC
Lloyds
Nationwide
3.7
5.7
6.3
8.6
9.6
19
Source: Bank of England, Stress testing the
UK banking system: 2019 results
comprehensive proposition for first-time buyers. We will continue to actively manage our CRE exposures and focus on supporting our non-CRE trading business customers.
We expect pressures on Banking NIM to continue, although at a slower rate and predicated on a stable rate environment. With the SVR portfolio now 9% of the total mortgage book, we expect SVR attrition to be proportionally lower along with signs of front book margins improving. Recently announced changes to deposit pricing should also begin to offset some of these pressures in the second half of 2020. Lastly, the implementation of regulatory changes regarding the high cost of credit will also increase net interest income, although it is worth noting that this will be more than offset by a reduction in non-interest income.
We expect adjusted operating expenses to be lower in 2020 as the momentum behind our transformation programme builds and improved efficiency begins to outweigh inflationary and other pressures.
Credit impairments are likely to increase from the very low levels seen in recent years, although we do not anticipate a material worsening of credit quality given our prudent approach to risk and the supportive environment.
Since 31 December 2019, trends evident in the business operating results have not changed significantly.
(1) CET1 ratio drawdown is defined as CET1 ratio at 31 Dec 18 less minimum stressed CET1 ratio (before strategic management actions or AT1 conversions)

Santander UK Group Holdings plc26
Annual Report 2019 | Strategic Report
verifications during 2019. Our mobile banking app scores highly with users, ranking 4.8 on iOS and 4.5 on Android, both out of 5.0. In Q4 2019 we completed the work to deliver card controls to our mobile app, including the ability for customers to temporarily block their card when lost or stolen. This was piloted in 2019 and will be fully rolled out in the first quarter of 2020. Customers can also apply blocks to online, contactless, international and gambling transactions.
In 2019, we launched Santander Chat to all Online Banking customers, made up of an automated virtual assistant ‘Bot’ and messaging via a live agent. This provides an authenticated platform for secure conversations and transactions. In 2020, we plan to bring this service to our mobile app, and increase the end-to-end transactions that the Bot can perform on behalf of customers.
Cyber security collaborationWe recognise that, in parallel with the increase in digital banking, we must continually improve our cyber defences and data protection. Our response to the cyber threat is to continue to implement a global, multilayered and agile resilience framework.
Improved awareness is the foundation of cyber defence so we engage with customers, regulators, partners and everyone across the organisation to enhance their understanding of cyber security. We hosted nine Cyber Awareness workshop sessions across our branch network in 2019 to help educate our
Customers
We want to help people and businesses prosper and aim to do so by being Simple, Personal and Fair in everything we do.
Inclusive digitalisationWe continue to innovate to make our digital offerings more customer-friendly, secure and accessible. In 2019, Santander became the first UK high street bank to introduce tailored fraud warnings on our mobile app. We’ve also introduced customer-friendly authentication, including the ability to authorise online shopping transactions using a fingerprint or facial recognition. We have extended these authentication capabilities to customers initiating payment requests via Online Banking.
In 2020, we’ll launch a quicker online banking logon experience. Following the launch of Voice ID in April 2019, 226,490 customers have registered with over 1.4m Voice ID
customers on the threats they face online. We continued to invest in emerging cyber security talent, and the first cohort of our Digital Apprentices will graduate in 2020 with the skills to become the next generation of cyber experts.
Transforming our branch networkThe way customers are choosing to bank with us is changing. With more people choosing to engage through our digital platforms, there’s been an impact on the use of our branch network. We conducted an extensive review of the network to reshape it to meet our customer needs. Our network is evolving, made up of a combination of larger branches offering community facilities to support local businesses and customers as well as smaller branches using the latest technology to offer customers more convenient access to banking services. As part of this, we’ve refurbished 87% of our network.
The introduction of Work Café demonstrates how we’re exploring different ways to use our branches to meet customer needs. Santander opened its first UK Work Café in Leeds in July 2019. Since launch we’ve had 30,000 customer visits to use the co-working and bookable rooms, attend an event, or talk to our specialists.
We’re a signatory to the Access to Banking Standard which ensures open and fair communication where banks close branches. In 2019, we closed 140 branches in line with this standard, following reviews to ensure our
We believe that our business performance should not be considered separately from the prosperity of all our stakeholders and sustainability of the wider environment.
Sustainability review

27Santander UK Group Holdings plc
Strategic Report Governance Risk review Financial review Financial statements Shareholder information
resources are targeted to meet the changing needs of customers. We’ve signed up to the Banking Framework 2, an agreement that allows customers to access 11,000 Post Office outlets to take out or pay in cash and cheques and obtain a balance. We’re also working with UK Finance and other banks to support communities’ access to cash.
Supporting our vulnerable customersBuilding capability across the bank to better support vulnerable customers is a focus of our Vulnerable Customer Strategy. In 2019, we launched an award-winning internal training programme, ‘Perspectives’, featuring real customer stories. This covers dementia, autism, PTSD, financial abuse and confusion and aims to raise awareness, reduce stigma and equip colleagues to better identify and respond to those who need support. Since launch in May 2019 these films were viewed 46,755 times.
We have been working with Alzheimer’s Society to become a more dementia-friendly bank, auditing our branches and improving our products and services for people living with dementia (find out more on page 30).
We’ve also been working with charities and industry forums to respond to challenges such as harmful gambling and financial abuse. Our approach to tackling harmful gambling is informed by a bespoke social insights approach in collaboration with gambling charities, the gambling industry and people with first-hand experience. This allows us to better understand our role in this area and how we can be effective in the detection and prevention of gambling-related financial harm.
Throughout 2020 we will continue our work on the underlying initiatives that support our overall Vulnerable Customer Strategy, providing colleagues the tools and support they need to deliver for all our customers.
Championing ambitious SMEs SMEs are at the heart of our country’s economy, but starting and running a business presents a wide range of challenges. Santander Breakthrough is designed to provide support at every step through events, insights and partnerships. In 2019, we supported over 5,600 businesses from their light bulb moment through to starting up, scaling up and beyond. Our Growth Capital Team provided financial support with £24.3m of growth capital and £90.8m of senior debt to 27 companies.
Supporting first time buyers
Offering unparalleled support to new buyers
First time buyers (FTBs) are a key strategic focus for us, and in 2019 we were proud to win Your Mortgage’s Best First-Time Buyer lender. In 2019, we helped over 37,000 customers into their new home by lending £5.5bn, supporting 37% more customers than the year before. In 2019, Santander was the first lender to launch a free home condition report that helps FTBs identify any potential issues with the home before they buy, avoiding unexpected costs. We also continued to improve our online mortgage servicing hub, including the retention service, with 60% of customers choosing to change their deal online, an increase of 10% from 2018. The convenience of online mortgage services means over 50% of regular overpayments are now made online. Our ambition is for branches to become an integral part of the local community providing unbiased financial education. Since launch in September 2019, we’ve completed over 1,000 FTB events in our branches, providing unbiased advice for those interested in buying their first home.
The launch of our Breakthrough online platform gives business owners better access to support and insights. It also provides the ability to find local Breakthrough business events, of which we ran 188 in 2019. We also launched our Trade Club Alliance, a new digital platform to help businesses boost global trade with market data on over 180 countries. We supported over 650 businesses in 2019 in trade events.
We entered a three year partnership with the British Library’s Business and IP Centre network, aimed at supporting early stage businesses with key skills such as marketing and managing finances.
We are a proud signatory to the Investing in Women Code and support female entrepreneurs with initiatives such as our national mentoring programme.

Santander UK Group Holdings plc28
Annual Report 2019 | Strategic Report
Shareholders
We aim to deliver a long-term, sustainable return for our shareholders while helping people and businesses prosper.
Part of a global bank We are a subsidiary of Banco Santander SA and part of the Banco Santander group, a leading retail and commercial bank headquartered in Spain. Our ordinary shares are all held by Banco Santander group companies and are not listed, although our preference shares are listed on the London Stock Exchange. We also have other equity instruments in the form of AT1 securities issued in 2014, 2015, 2017 and 2019.
Under the subsidiary model operated by Banco Santander, autonomous subsidiaries are responsible for their own liquidity, capital management and funding. This not only mitigates the risk of difficulties in one subsidiary affecting another, it allows local market knowledge and expertise to be utilised and provides considerable operational flexibility.
We benefit from the strong Santander brand along with experience and expertise from a global banking group. Systems development capacity can be shared along with common technology platforms and innovations, creating a significant competitive advantage.
Consistent shareholder returnsOur consistent profitability has enabled us to pay a dividend every year since 2008. Our policy is to declare a dividend of 50% of earnings attributable to ordinary shareholders.
In 2019, we began a multi-year transformation programme to reshape the bank to support our customers better. By focusing on simplification, digitisation and customer experience, we aim to improve returns in the medium-term.
Investor engagementOur UK Investor Relations team actively engages with institutional investors across the globe, working alongside our funding and capital teams for new issuances and building and maintaining relationships with fixed income investors and analysts.
The UK Investor Relations team provides a two-way link between investors and senior management, focusing on both external messaging and communication whilst providing feedback from investors to the Board.
Sustainability review continued
Fair pay
We offer our people a fair and competitive reward package
Our Reward Framework is reviewed annually against the external marketplace. Salary reviews, and changes to reward policies, are assessed for any adverse impacts on a particular group.
Salary ranges and Pay Progression arrangements are visible to all colleagues. We embrace transparent reporting, evidenced by our detailed Gender Pay Gap report, voluntary disclosure of our CEO pay ratio in our Remuneration Implementation Report, input to government consultations on ethnicity pay reporting, and testing of potential reporting methodology.
We work in partnership with recognised trade unions and consult on any changes to our Reward Framework. We are proud to have been an accredited Real Living Wage employer since 2015. Recent pay changes for colleagues include increases to entry level starting salaries, and improvements to our Pay Progression scheme.
£709mprofit after tax(2018: £1,164m)
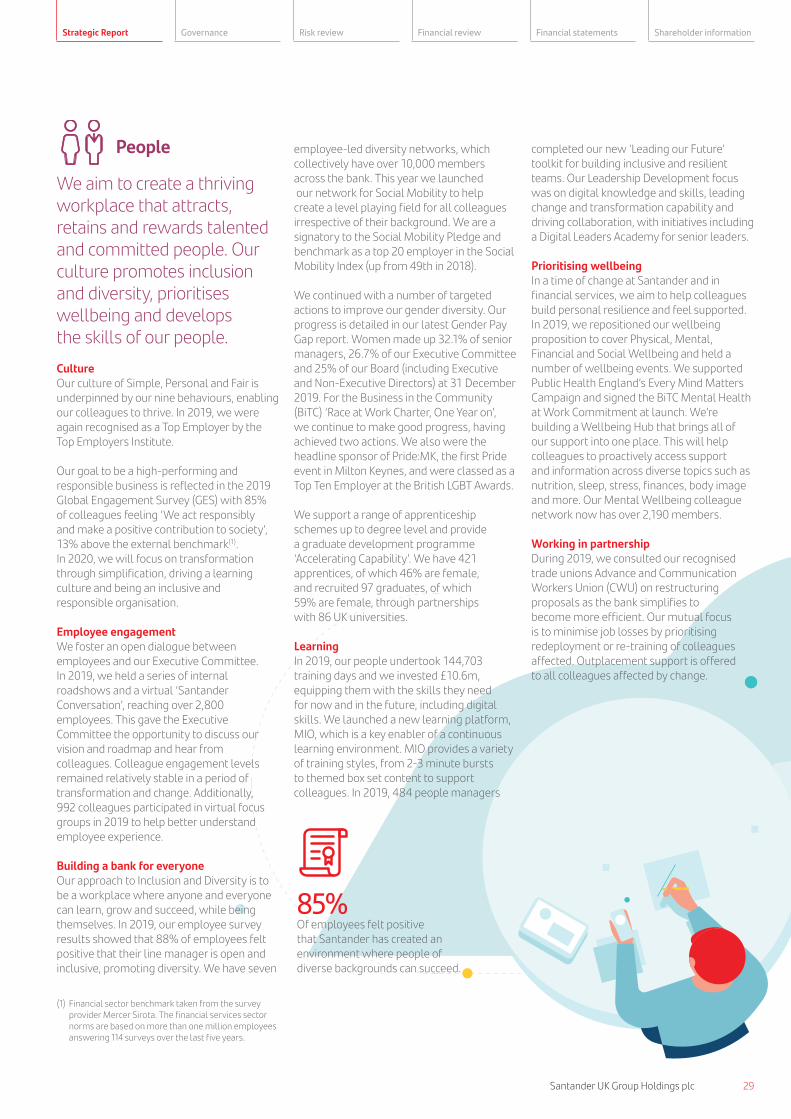
29Santander UK Group Holdings plc
Strategic Report Governance Risk review Financial review Financial statements Shareholder information
People
We aim to create a thriving workplace that attracts, retains and rewards talented and committed people. Our culture promotes inclusion and diversity, prioritises wellbeing and develops the skills of our people.
CultureOur culture of Simple, Personal and Fair is underpinned by our nine behaviours, enabling our colleagues to thrive. In 2019, we were again recognised as a Top Employer by the Top Employers Institute.
Our goal to be a high-performing and responsible business is reflected in the 2019 Global Engagement Survey (GES) with 85% of colleagues feeling ‘We act responsibly and make a positive contribution to society’, 13% above the external benchmark(1). In 2020, we will focus on transformation through simplification, driving a learning culture and being an inclusive and responsible organisation.
Employee engagement We foster an open dialogue between employees and our Executive Committee. In 2019, we held a series of internal roadshows and a virtual ‘Santander Conversation’, reaching over 2,800 employees. This gave the Executive Committee the opportunity to discuss our vision and roadmap and hear from colleagues. Colleague engagement levels remained relatively stable in a period of transformation and change. Additionally, 992 colleagues participated in virtual focus groups in 2019 to help better understand employee experience.
Building a bank for everyoneOur approach to Inclusion and Diversity is to be a workplace where anyone and everyone can learn, grow and succeed, while being themselves. In 2019, our employee survey results showed that 88% of employees felt positive that their line manager is open and inclusive, promoting diversity. We have seven
employee-led diversity networks, which collectively have over 10,000 members across the bank. This year we launched our network for Social Mobility to help create a level playing field for all colleagues irrespective of their background. We are a signatory to the Social Mobility Pledge and benchmark as a top 20 employer in the Social Mobility Index (up from 49th in 2018).
We continued with a number of targeted actions to improve our gender diversity. Our progress is detailed in our latest Gender Pay Gap report. Women made up 32.1% of senior managers, 26.7% of our Executive Committee and 25% of our Board (including Executive and Non-Executive Directors) at 31 December 2019. For the Business in the Community (BiTC) ‘Race at Work Charter, One Year on’, we continue to make good progress, having achieved two actions. We also were the headline sponsor of Pride:MK, the first Pride event in Milton Keynes, and were classed as a Top Ten Employer at the British LGBT Awards.
We support a range of apprenticeship schemes up to degree level and provide a graduate development programme ‘Accelerating Capability’. We have 421 apprentices, of which 46% are female, and recruited 97 graduates, of which 59% are female, through partnerships with 86 UK universities.
LearningIn 2019, our people undertook 144,703 training days and we invested £10.6m, equipping them with the skills they need for now and in the future, including digital skills. We launched a new learning platform, MIO, which is a key enabler of a continuous learning environment. MIO provides a variety of training styles, from 2-3 minute bursts to themed box set content to support colleagues. In 2019, 484 people managers
completed our new ‘Leading our Future’ toolkit for building inclusive and resilient teams. Our Leadership Development focus was on digital knowledge and skills, leading change and transformation capability and driving collaboration, with initiatives including a Digital Leaders Academy for senior leaders.
Prioritising wellbeingIn a time of change at Santander and in financial services, we aim to help colleagues build personal resilience and feel supported. In 2019, we repositioned our wellbeing proposition to cover Physical, Mental, Financial and Social Wellbeing and held a number of wellbeing events. We supported Public Health England’s Every Mind Matters Campaign and signed the BiTC Mental Health at Work Commitment at launch. We’re building a Wellbeing Hub that brings all of our support into one place. This will help colleagues to proactively access support and information across diverse topics such as nutrition, sleep, stress, finances, body image and more. Our Mental Wellbeing colleague network now has over 2,190 members.
Working in partnership During 2019, we consulted our recognised trade unions Advance and Communication Workers Union (CWU) on restructuring proposals as the bank simplifies to become more efficient. Our mutual focus is to minimise job losses by prioritising redeployment or re-training of colleagues affected. Outplacement support is offered to all colleagues affected by change.
85%Of employees felt positive that Santander has created an environment where people of diverse backgrounds can succeed.
(1) Financial sector benchmark taken from the survey provider Mercer Sirota. The financial services sector norms are based on more than one million employees answering 114 surveys over the last five years.

Santander UK Group Holdings plc30
Annual Report 2019 | Strategic Report
Communities
We support and invest in communities across the UK to foster sustainable economic growth.
Helping our communities prosperWe’re changing the way we partner with charities to ensure strategic collaborations which help us to become a more responsible bank. On top of employee fundraising and volunteering, we have developed joint strategic initiatives to address pressing challenges. For instance, in January 2019 we appointed Alzheimer’s Society as our new charity partner for 2019-2021. Our aim is to leverage the charity’s expertise to help us become a digitally dementia-friendly bank.
Financial inclusion and literacyFinancial inclusion and literacy are critical elements of our strategy. Santander colleagues supported over 25,000 students through our in-school mentoring programme focused on money management, digital skills and careers. We also reached almost 200,000 young people during My Money Week, helping 4 – 19 year olds to gain confidence in money matters.
We used our UEFA Champions League flagship sponsorship and partnered with National Numeracy to bring the power of football and education together and tackle the fact that 40% of people in the UK don’t feel ‘fully confident’ with everyday budgeting and money management. We created The Numbers Game: 13 UK-wide roadshows through which we engaged over 20,000 children, families and young adults, resulting in over 11,900 people completing the experience.
Use of National Numeracy online learning materials increased 31% since we started our tour, doubling their engagement rate. Our on-site research showed that 85% of people gained a better understanding of the importance of numbers in everyday life, while 87% believed that being confident with numbers helped them to manage their money better.
Innovative fraud and scams education In June 2019, Santander teamed up with Kurupt FM from BAFTA-winning BBC TV show People Just Do Nothing to create its latest fraud awareness campaign, ‘MC Grindah’s Deadliest Dupes’. Statistics show
that Generation Z are among the most likely to fall victim to scams, and their behaviours online can make them vulnerable to fraudsters. In the last year, identity theft among people under 21 has risen by 26% while 50% of money mules are aged 26 or under and 27% are aged 21 or under.
We partnered with Barnardo’s to deliver the content we created with Kurupt FM to some of the most vulnerable young people, reaching approximately 220,000 in their network. We ran seven workshops with Barnardo’s, resulting in 83% of attendees saying they now felt more confident on how to avoid these scams.
In 2019, the Santander Foundation, a separate legal entity that operates independently from Santander UK, reviewed its strategy and explored how to deliver a greater positive impact within our communities. Following this, the Foundation will launch a new Grants Giving programme in 2020 to support digital and financial skills. During 2019, the Foundation continued to support local charities via the Matched Donations programme, approving 1,694 in employee-submitted requests.
Santander Universities Santander Universities is our global programme supporting education, employability and entrepreneurship across students in higher education. Since 2002 Banco Santander has donated over €1.7bn to universities, making us one of the largest global corporate contributors to higher education. In the UK, we donated over £88m to 86 partner universities in the last 12 years.
Our Vision 2020 goal is to provide life-changing opportunities, ensuring by the end of 2020 that 80% of individual recipients are from widening participation backgrounds and aspiring to an equal gender balance. In 2019, we directly supported more than 15,000 students. Over 1,400 SMEs have benefited from the Santander Universities Internship scheme with 1,700 student interns, of which over 50% went on to employment, exceeding our target.
In 2019, we launched the Santander Universities two year Women in Engineering Programme. This initiative focuses on dedicated support for women undertaking an engineering degree, addressing the gender gap in engineering studies. Of the 81 female students supported, 30 were selected for a scholarship, an internship and a trip to the USA to an engineering company.
Becoming the best dementia-friendly bank in the UK
850,000 people are estimated to be living with dementia in the UK, a figure set to increase. In 2019, we launched a three year partnership with leading dementia charity Alzheimer’s Society and Alzheimer Scotland, aiming to fundraise £1.5m and leverage their expertise to become the most dementia-friendly bank in the UK. In 2019, Alzheimer’s Society audited a cross-section of our branches and contact centres to help us better support customers affected by dementia. In 2020 we’ll implement their recommendations, including training three Dementia Ambassadors in each branch region and contact centre. We’re also using Alzheimer’s Society expertise to improve our products, services and digital access. In 2019, we created Santander’s dementia steering group made up of people living with and caring for people with dementia. This permanent group will continue to advise us on how to become a more dementia friendly bank, including a review of our ATM journey.
£745,000Raised for Alzheimer’s Society in the first year of partnership, exceeding our target with record employee engagement.
Sustainability review continued
31Santander UK Group Holdings plc
Strategic Report Governance Risk review Financial review Financial statements Shareholder information
Ethics and Environment
We are committed to upholding the highest ethical standards.
Responsible lendingAs part of the Banco Santander group, we comply with the Equator Principles, factoring social, ethical and environmental impacts into our risk analysis and decision making process for financial transactions. These principles address climate change, prevention of pollution and toxic waste emissions, biodiversity, indigenous peoples and human rights.
Our policy on Aerospace and Defence, Energy, Mining & Metals and Soft Commodities and our Sensitive Social and Ethical Sectors policy continue to define our approach towards creating long-term value while managing reputational, social and environmental risks.
In 2019, we further improved these policies by introducing prohibitions and strengthening restrictions on a range of activities. Prohibited activities now include the provision of products or services for new Coal Fired Power Plant (CFPP) projects and taking on new clients with existing CFPPs. Restricted activities include transactions specific to CFPPs for existing clients which do not significantly improve environmental impacts, such as a significant reduction of CO2. Our Reputational Risk Forum reviews and approves all restricted activities to ensure that they fall within our risk appetite. This forum reviews, monitors and escalates key decisions around financial and non-financial reputational risks to the Board.
Renewable financingIn 2019, Santander was the 3rd largest lender among renewable energy financiers in the sector by volume (2nd by number of transactions) in the UK, and also ranked first by volume for advisory services in Europe and the UK(1). As part of this, Santander UK originated £1.09bn of debt financing to 21 renewable energy projects in 2019. We provide advisory and financing solutions for renewable and alternative energy clients across a range of renewable schemes, including onshore and offshore wind, solar and biofuel projects. In 2019, we further
enhanced our services by increasing the range of technologies we support and at the same time introduced a number of innovative funding structures. In particular, Santander advised in the refinancing and acquisition of 2 offshore wind farms in the UK and 2 onshore wind portfolio financings across the whole of Europe, which will afford clients flexibility to fund their future growth in this sector.
Environmental performanceWe strive to reduce our operational impact on the environment. In 2019, our offices and data centres successfully recertified for ISO 14001 and transitioned to the new ISO 50001 standard.
Our energy data platforms allow us to accurately manage each of our properties that have a smart meter installed, and we reduced electricity use by 6.6% and gas usage by 10.7% in 2019. We also use lifecycle assessment to maximise energy saving opportunities when upgrading facilities. Our water use also reduced by 8.3% in 2019 with installation of efficient water fittings in three offices. We have a network of over 2,800 Green Champions to embed sustainability and green behaviour into site culture. These Champions ran 12 roadshows across our offices in 2019.
Ethical supply chainWe want to do business with companies who share our values. Our standard supplier contracts include specific requirements to respect human rights and ethical labour practice based on the principles of the UN Global Compact.
In 2019 we improved our Third-Party Risk Management (TPRM) framework, processes and policies, including enhancements to meet new European Banking Authority outsourcing requirements. Our third-party policy reflects our Board-approved Risk Appetite Statements, including specific provisions on forced labour. Our Third-Party Code of Conduct was launched this year, with reference to Banco Santander group Human Rights Policy and International Labor Organization (ILO) standards.
We completed a full review and update of our third-party supplier control assessment approach as part of improvements to third-party due diligence. The new framework was effective in August 2019 and with an
external partner we completed 15 on-site suppliers assessments in 2019, with further assessments scheduled for 2020.
Anti-Financial Crime, Anti-Bribery and CorruptionOur Anti-Financial Crime (AFC) strategy is set around the three principles of ‘Deter, Detect and Disrupt’. In 2019, we continued to drive a culture of AFC across the business and with partners. We ran 10 events for the UK’s Regional Organised Crime Units to better work with law enforcement to protect customers. We also held 8 AFC Culture roadshows with 510 colleagues attending, of which 96% better understood the AFC Vision and 69% said they will change behaviour.
We enhanced our governance of AFC by launching a Strategy & Policy forum in September covering strategy, anti-money laundering, counter-terrorism financing and sanctions. We also engaged with government and law enforcement stakeholders to shape the reforms that are part of the government’s Economic Crime Plan, which aims to improve the resilience of the UK’s overall defences against financial crime.
(1) Inframation league tables 2019, combining both Banco Santander and Santander UK.
The Directors, in preparing this Strategic Report, have complied with s414C of the Companies Act 2006. Under the UK Companies Act 2006, a safe harbour limits the liability of Directors in respect of statements in and omissions from the Strategic Report. Under English law the Directors would be liable to the Company, but not to any third party, if this report contained errors as a result of recklessness or knowing misstatement or dishonest concealment of a material fact, but would otherwise not be liable. The Strategic Report has been drawn up and presented in accordance with and in reliance upon English company law and the liabilities of the Directors in connection with these reports shall be subject to the limitations and restrictions provided by such law.
Tackling modern slavery and human trafficking
This year we worked with non-profit ‘Stop the Traffik’ to raise awareness and expertise in Santander on modern slavery and human trafficking (MSHT). As a financial institution, we are uniquely placed to deter, detect and disrupt those profiting from this criminal industry. We ran a targeted campaign with Stop the Traffik to raise awareness and capability in branch staff in a location at high risk for MSHT. Stop the Traffik also held masterclasses at our AFC roadshows. We work closely with law enforcement and the Joint Money Laundering Intelligence Taskforce (JMLIT). In 2019 our Financial Crime team were actively involved in cases, including one which resulted in the arrest of suspects after migrants were found in the back of a lorry. Our Modern Slavery Statement is published online and subject to approval from the Board and Responsible Banking Committee.

Santander UK Group Holdings plc32
Annual Report 2019 | Strategic Report
Section 172 statement
The Directors consider the views of all impacted stakeholders whilst acting in the best interests of the Company and its members as a whole. The table below includes ways in which they believe they have done so in accordance with their duties under s172:
Section 172 requirement Examples of how the Board’s discussions and decision-making have taken this into account Where in the 2019 Annual Report
(a) likely consequences of any decision in the long term
– Investing in a substantial transformation programme including digitising and streamlining our branch network.
– Repurposing of certain branches and development of the Work Café concept to adapt to changes in working practices and the growth in the SME economy.
– Funding decisions based on sustainable economic entities with due consideration for the impact of funding decisions on the environment.
Sustainability review p. 26Task Force on Climate-related Financial Disclosures p. 23
(b) interests of the company’s employees
– Emphasis on employee engagement. – Emphasis on employee personal development/training. – Determination to ensure fair remuneration, at least the Living Wage. – A positive working environment by embedding the Santander Behaviours.
Employees:Fair pay p. 28People p. 29Remuneration Committee report p. 56
(c) need to foster the company’s business relationships with suppliers, customers and others
– The focus of the Company’s activities is on its customers, and the Board actively monitors changing needs and customer feedback, to adjust its offering.
– Provision of services to customers is dependent on dedicated, suitably qualified employees but also the value added by suppliers, both contractors working in-house and those providing discrete services.
– The Company works closely with the regulatory authorities to ensure the integrity of its services.
– The Company is a significant member of the Banco Santander group and contributes to multi-national and global banking initiatives.
Suppliers: Ethical Supply Chain p. 31Third Party p. 153Customers: Supporting our vulnerable customers p. 27Supporting first time buyers p. 27Customers with Dementia p. 30Transforming our branch network p. 26Inclusive digitalisation p. 26Financial Inclusion and Literacy p. 30
(d) impact of the company’s operations on the community and the environment
– The Company is conscious of its importance in the communities it serves and has carefully considered the impact of certain business decisions on affected communities.
– It has also carefully considered the needs of our society as a whole and endeavoured to identify sectors with additional needs, such as the increasing number struggling with Alzheimer’s and similar illnesses, that can be helped by measures identified through co-operation with related parties.
Communities: Cyber security collaboration p. 26Responsible lending p. 31Environmental performance p. 31Anti-Financial crime p. 31Innovative Fraud and scams education p. 30
(e) desirability of the company maintaining a reputation for high standards of business conduct
– The integrity of the banking system is of paramount importance. The Board is committed to complying with applicable regulation, support law enforcement agencies and pro-actively identify wrong-doing to maintain its trustworthy reputation.
Cyber security collaboration p. 26Anti-financial crime p. 31Combatting modern slavery p. 31Successful Public Private Partnerships p. 157
(f) need to act fairly as between members of the company
– The Company is ultimately owned by Banco Santander SA. Shareholders p. 28
Non-financial information statement This section is produced to comply with s414CA and s414CB of the Companies Act 2006. The information listed is incorporated by cross-reference. Additional non-financial information can be found in our 2019 ESG Supplement.
Reporting requirement Policies and standards Information necessary to understand our business and its impact
Environmental matters
Environmental Policy Market overview, page 10. Risk management overview: TCFD, page 23. Sustainability Review: Ethics and environment, page 31. Directors’ report: CO2 emissions, page 66.
Employees People PoliciesWhistleblowing Policy Ethical Code of Conduct
Chair’s statement: Continuing to create the right culture, page 3; Simple I Personal I Fair, page 3. Sustainability review: Fair pay, page 28; People, page 29. Board Audit Committee Chair’s report: Whistleblowing, page 53. Board Responsible Banking Committee Chair’s report, page 54.Directors’ report: Ethical Code of Conduct, page 66.
Human rights Human Rights Policy Ethics and environment, page 31.
Social matters Social Ethical Policy Sustainability review: Communities, page 30; Ethics and environment, page 31. Board Responsible Banking Committee Chair’s report, page 54.
Anti-corruption and anti-bribery
Anti-Bribery & Corruption PolicyEthical Code of Conduct
Ethics and environment page 31. Board Responsible Banking Committee Chair’s report, page 54. Directors’ report: Ethical Code of Conduct, page 66.
Principal risks and impact of business activity Risk management overview pages 18-23.
Description of business model Business model pages 12-13.
Non-financial key performance indicators Strategic review pages 14-17.

33Santander UK Group Holdings plc
Strategic Report Governance Risk review Financial review Financial statements Shareholder information
Governance
Our governanceThe UK Corporate Governance Code 2018 (the Code) sets out the framework for premium listed companies in the UK. The Code is the corporate governance code applied by the Company, with appropriate amendments as a fully owned subsidiary, and the standard against which we measure ourselves.
This Governance section (including the Chair’s report on Corporate Governance, the Committee Chair Reports and the Remuneration Policy and Remuneration Implementation reports) detail how the Company has applied and complied with the principles and provisions of the Code.
Any principles and provisions of the Code that are not precisely followed are detailed in the Directors’ Report on page 68.
How our governance supports the delivery of our strategyAll Directors are collectively responsible for the success of the Company. The Non-Executive Directors exercise objective judgement in respect of Board decisions, and scrutinise and challenge management. They also have various responsibilities concerning the integrity of financial information, internal controls and risk management.
The Board is responsible for setting our strategy and policies, overseeing risk and corporate governance, and monitoring progress towards meeting our objectives and annual plans. It is accountable to our shareholder for the proper conduct of the business and our long-term success, and seeks to represent the interests of all stakeholders.
Contents
Governance 33
Board of Directors 34
Corporate Governance report 36
Chair’s report on corporate governance 36
Board Nomination Committee Chair’s report 40
Board Risk Committee Chair’s report 42
Board Audit Committee Chair’s report 48
Board Responsible Banking Committee Chair’s report 54
Directors’ Remuneration report 56
Board Remuneration Committee Chair’s report 56
Remuneration policy report 57
Remuneration implementation report 60
Board and Committee membership and attendance 64
Directors’ report 65

Santander UK Group Holdings plc34
Annual Report 2019 | Governance
1 Shriti VaderaChair Appointed as Chair in March 2015, previously Independent Non-Executive Director and Deputy Chair from 1 January 2015
Skills and experienceShriti was an investment banker with SG Warburg/UBS from 1984 to 1999, on the Council of Economic Advisers, HM Treasury from 1999 to 2007, Minister in the UK Government from 2007 to 2009 (Cabinet Office, Business Department and International Development Department), G20 Adviser from 2009 to 2010, and advised governments, banks and investors on the Eurozone crisis, banking sector, debt restructuring and markets from 2010 to 2014. She was a Non-Executive Director of AstraZeneca plc between 2011 and 2018.
Other principal appointmentsChair of Santander UK plc*. Senior Independent Director of BHP.
Board Committee membershipsBoard Nomination Committee
2 Ed GieraIndependent Non-Executive Director Appointed 19 August 2015
Skills and experienceEd is currently Principal of EJ Giera LLC, providing corporate finance advisory and fiduciary services, and the Manager of Boscobel Place Capital LLC, a private investment partnership focused on the global financial services sector. Formerly, his executive career was with JP Morgan Securities, the investment banking affiliate of JP Morgan Chase & Co.
Ed also previously served as a Non-Executive Director at Pension Corporation Group Limited, ICBC Standard Bank plc, the Renshaw Bay Structured Finance Opportunity Fund, NovaTech LLC and the Life and Longevity Markets Association.
Other principal appointmentsIndependent Non-Executive Director of Santander UK plc*. Non-Executive Director of the Renshaw Bay Real Estate Finance Fund.
Board Committee membershipsBoard Audit Committee Board Responsible Banking Committee Board Risk Committee
3 Chris JonesIndependent Non-Executive Director Santander UK’s Whistleblower’s ChampionAppointed 30 March 2015
Skills and experienceChris was a partner at PwC from 1989 to 2014 and was a Senior Audit Partner specialising in the audit of banks and other financial services companies. He also led PwC’s EMEA Financial Services practice. He is a past president of the Association of Corporate Treasurers and a former Chairman of the Advisory Board of the Association of Corporate Treasurers.
Other principal appointmentsIndependent Non-Executive Director of Santander UK plc*. Audit and Risk Committee member of the Wellcome Trust. Non-Executive Director of Redburn (Europe) Limited. Board member of the Audit Committee Chairs’ Independent Forum.
Board Committee membershipsBoard Audit Committee Board Remuneration Committee Board Risk Committee
4 Scott WhewayIndependent Non-Executive Director Senior Independent Director Appointed 10 January 2014
Skills and experienceScott brings extensive retail and consumer knowledge to the Board, having formerly held senior roles at Tesco plc, including Operations Director and CEO, Tesco Japan. He was then CEO of Best Buy Europe and Managing Director and Retail Director of The Boots Company plc and Managing Director of Boots the Chemist at Alliance Boots plc. Scott is also a former Non-Executive Director of Aviva plc and Chairman of Aviva Insurance Limited.
Other principal appointmentsIndependent Non-Executive Director of Santander UK plc*. Interim Chairman of Centrica plc. Chairman of AXA UK plc.
Board Committee membershipsBoard Nomination Committee Board Remuneration Committee Board Responsible Banking Committee Board Risk Committee
Board of Directors
1
3
2
4

35Santander UK Group Holdings plc
Strategic Report Governance Risk review Financial review Financial statements Shareholder information
5 Ana BotínBanco Santander Nominated Non-Executive DirectorAppointed 10 January 2014, NED from 29 September 2014
Skills and experienceAna joined the Banco Santander group in 1988 and was appointed Executive Chair of Banco Santander SA in September 2014. She has been a member of Banco Santander SA’s Board and Executive Committee since 1989 and previously served as CEO of Santander UK plc between 2010 and 2014. Ana directed Banco Santander’s Latin American expansion in the 1990s.
Other principal appointmentsNon-Executive Director of Santander UK plc*. Executive Chair of Banco Santander SA* and Director. Non-Executive Director of The Coca-Cola Company. Vice-Chair of the Empresa y Crecimiento Foundation. Vice-Chair of the World Business Council for Sustainable Development. Member of the MIT’s CEO Advisory Board.
Board Committee membershipsBoard Nomination Committee
6 Bruce Carnegie-BrownBanco Santander Nominated Non-Executive DirectorAppointed 16 September 2019
Skills and experienceBruce is a Vice Chairman and Lead Independent Director of Banco Santander SA* and Chairman of Lloyd’s of London.
Bruce has served as Non-Executive Chairman of Moneysupermarket.com Group plc and a Non-Executive Director of JLT Group plc. He was also Non-Executive Chairman of Aon UK Ltd, and was Senior Independent Director at Close Brothers Group plc and Catlin Group Ltd. As an executive, he was co-founder and managing partner of the listed private equity division of 3i Group plc, President and CEO of Marsh Europe and a managing director of JP Morgan.
He was previously a Non-Executive Director of Santander UK plc* between 2012 and 2017, and a Non-Executive Director of Santander UK Group Holdings plc* between 2014 and 2017.
Other principal appointmentsNon-Executive Director of Santander UK plc* since September 2019. Vice Chairman and Lead Independent Director of Banco Santander SA*. Chairman of Lloyd’s of London.
7 Nathan BostockExecutive Director Chief Executive OfficerAppointed 19 August 2014
Skills and experienceNathan joined Santander UK from RBS, where he was an Executive Director and Group Finance Director. He joined RBS in 2009 as Head of Restructuring and Risk, and Group Chief Risk Officer. He previously spent eight years with Abbey National plc (now Santander UK plc*) and served on the Board as an Executive Director from 2005. During his time with Abbey National plc, he held other senior positions including Chief Financial Officer.
He was also at RBS from 1991 to 2001 in a number of senior positions and spent seven years before that with Chase Manhattan Bank, having previously qualified as a Chartered Accountant at Coopers & Lybrand (now PwC).
Other principal appointmentsChief Executive Officer of Santander UK plc*. Member of the Financial Services Trade Investment Board.
8 Madhukar (Duke) DayalExecutive Director Chief Financial OfficerAppointed 16 September 2019
Skills and experienceDuke has extensive financial services experience in a wide range of areas. Before joining Santander UK*, he worked for Santander US* in Boston as CFO of Santander Holdings* (April 2016 – July 2019) and President and CEO of Santander Bank NA* (September 2017 – July 2019).
Prior to joining Santander, Duke was with BNP Paribas for six years, where he served as Chief Financial Officer for BNP Paribas USA Holdings, BancWest and Bank of the West. Before that he helped lead a private equity start-up for JP Morgan Chase & Co, Brysam Global Partners. Prior to that, he spent eight years with Citi.
Duke also served as a member of the Executive Committee on the Board of Trustees for the Institute of International Banking in New York as a Board member of the Federal Home Loan Bank of Pittsburgh.
Other principal appointmentsChief Financial Officer of Santander UK plc*. * Part of the Banco Santander group.
For full bios visit www.santander.co.uk/uk/about-santander-uk/about-us/non-executive-directors
5
7
6
8

Santander UK Group Holdings plc36
Annual Report 2019 | Governance
Our governance Maintaining high standards of corporate governance is an essential element underpinning the long-term sustainable success of the Company.
In addition to the UK Corporate Governance Code 2018 (the standard against which we measure ourselves), our governance practices and rules are set out in a number of our key documents, principally:
– The UK Group Framework, which defines clearly our responsibilities and relationship with Banco Santander SA, our shareholder, taking account of our fiduciary and regulatory responsibilities. This provides us with the autonomy to discharge our responsibilities in the UK in line with best practice as an independent board while providing Banco Santander SA with the oversight and controls it needs. Clarity of roles and responsibilities is key to ensuring proper accountability for decisions and outcomes; and
– The Corporate Governance Framework, which is designed to assist the Board of Directors in discharging their responsibilities and ensuring an appropriate scheme of delegation throughout the Santander UK group.
The Board’s schedule and activities are planned to ensure that directors have regard to the matters necessary to promote the success of the Company, including the broader implications of their decisions for all the Company’s stakeholders including its shareholder. Details of how the Board has achieved this are set out in the Section 172 statement in the Strategic report.
Ring-fencing implementationFollowing ring-fencing requirements which came into force on 1 January 2019, the Boards and Committees of Santander UK Group Holdings plc and Santander UK plc operated simultaneously with 100% common director membership because the substantive business of the Santander UK group was conducted by Santander UK plc, our ring-fenced bank. The Boards consisted of 7 Independent Non-Executive Directors (INEDs) including the Chair, 3 Executive Directors (EDs) and 4 Group-appointed Non-Executive Directors (GNEDs). These arrangements were agreed by our regulators, and ensured the
efficient management of Board activities, promoting the effective oversight of the business, and were enabled by means of compliance with various ring-fencing rule modifications granted by the PRA. Under the UK Group Framework, in light of the fact that Santander UK Group Holdings plc is fully owned by Banco Santander and that the Chair is independent of the shareholder, the Chair is counted as an INED. This does not comply with Code provisions.
During the year, we developed a revised strategy to optimise the business of Santander Financial Services plc (formerly Abbey National Treasury Services plc), in effect our non-ring-fenced bank, which will be completed in 2020. In order to comply with regulatory requirements to ensure the integrity of ring-fencing in Santander UK plc, our ring-fenced bank, we are required to make changes to the Santander UK Group Holdings plc Board, such that it will no longer have complete membership in common with Santander UK plc. Three INEDs stepped down from the Santander UK Group Holdings plc Board with effect from 31 December 2019 and will therefore be Directors of the ring-fenced bank only (Double INEDs). At the same time, in order to ensure that its Board continues to comprise 50:50 INEDs and non-independent directors, in accordance with the UK Group Framework, one ED and two GNEDs also stood down and serve only the ring-fenced bank. The Board of Santander UK Group Holdings plc therefore has 4 INEDs, including the Chair, 2 EDs and 2 GNEDs. These changes are summarised opposite.
The Board and Committees of the two companies continue to be run substantially simultaneously to ensure efficiency and effectiveness whilst ensuring the independence and autonomy of our ring-fenced bank are appropriately protected. The Company will therefore continue to benefit from the knowledge, skills and experience of the 6 Directors that have stepped down from the Board through their contribution, where appropriate, in the simultaneous Board and Committee meetings of both companies. We shadow ran these arrangements in December 2019 to ensure efficient parallel running upon implementation in January 2020.
Chair’s report on corporate governance
My report describes the roles, responsibilities and activities of the Board and its Committees.
(1) In addition, ad hoc Board Committee meetings were held to consider the Company’s application for the RBS Alternative Remedies Incentivised Switching Scheme and conduct matters.
How we spent our time (%)
Business and Customer
People
Risk and Control
Regulation and Capital
Governance
2019 2018
57 47
12 18
13 17
11 11
7 7
2019
2018
The Board focuses on supporting and challenging management to achieve our strategy and transformation programme.
Shriti VaderaChair 2 March 2020
Board activitiesRead more on p39
Board and Committee membership and attendanceRead more on p64

37Santander UK Group Holdings plc
Strategic Report Governance Risk review Financial review Financial statements Shareholder information
positions is supported by continuous and proactive processes. We take into account our strategic priorities and the main trends and factors affecting the sustainability and success of the business. We oversee and regularly review the development of a diverse pipeline for succession.
Changes to Board membership are set out on page 65. These appointments maintain valuable skill and experience of financial services, digital and innovation, strategy development and execution and transformation. On behalf of the Board, I would like to thank Lindsey Argalas, Julie Chakraverty and Antonio Roman who stepped down during 2019 for their invaluable service to the Board and the Company.
As was announced on 30 January 2020, I will be stepping down before the end of the year as Chair after five years. A search has been initiated by Scott Wheway, as the Senior Independent Director, allowing for an orderly transition with my successor.
All aspects of diversity form part of our Board succession planning process, which is explained in the Board Nomination Committee Chair’s report. In 2016 we set an aspirational target of having 33% women on the Board by 2020. As anticipated in last year’s report, the level we achieved at that time (54%) reduced during 2019 as a result of Julie Chakraverty and Lindsey Argalas stepping down from the Board, and we ended the year at 36%. As a result of changes to the membership of the Santander UK Group Holdings plc Board (see page 65),
this reduced further to 25% with effect from 1 January 2020, while the Board of Santander UK plc remained at 36%. Despite this reduction, we remain committed to our aspirational target. The Boards of the two companies are run largely simultaneously.
Board CommitteesThe Board delegates certain responsibilities to Board Committees to help discharge its duties, as set out later in this section. The Committees play an essential role in supporting the Board in these duties, providing focused oversight of key areas and aspects of the business. The role and responsibilities of the Board and Board Committees are set out in formal Terms of Reference. These are reviewed at least annually as part of the review of the Corporate Governance Framework. Except for the Board Nomination Committee which has one GNED, all Committees are composed of INEDs only.
Board activitiesThe Board considered a range of options for implementing the Code requirement that boards must engage with employees to ensure that the views of the workforce are appropriately represented in discussions and decision-making. In view of the designation of Annemarie Durbin as Santander UK plc Double INED with this responsibility, and as the overwhelming majority of colleagues within the Santander UK group are employed in the UK by Santander UK plc, the Board concluded that it did not need to implement separate arrangements to ensure appropriate representation. During 2019, in addition to
We appointed Annemarie Durbin (Double INED) as Senior Ring-fencing Director (SRD) of Santander UK plc in order to comply with additional ring-fencing requirements set by the PRA. These relate primarily to ensuring that processes to identify and manage any conflicts of interest between the ring-fenced bank group and other members of the Santander UK group are operating effectively.
The reduction in Board membership arising from implementation of ring-fencing requirements has resulted in the Board Audit Committee and Board Remuneration Committee comprising 2 INEDs each. Having assessed this in the light of Code recommendations, and as the substantive business of the Santander UK group is conducted by Santander UK plc, we are satisfied that the Committees will continue to be able to discharge their duties professionally, effectively and efficiently particularly as the Chairs of the Santander UK Group Holdings plc Board Audit Committee and Board Risk Committee are also chairs of the Santander UK plc Committees. As the Santander UK Group Holdings plc and Santander UK plc Committees will run substantively simultaneously, they will also continue to have the opportunity to benefit from the broader INED group’s skills and experience.
Board membershipThrough the Board Nomination Committee, we ensure we have the right composition of individuals on the Board, providing an appropriate balance of knowledge, skills, experience and perspectives. Our aim of ensuring orderly succession for Board
Santander UK Group Holdings plc Board
Shriti Vadera (Chair and Chair of NomCo)
Ed Giera (Chair of BRC)
Chris Jones (Chair of BAC)
Scott Wheway (SID and Chair of RBC and RemCo)
Ana Botín (Group Executive Chair)
Bruce Carnegie-Brown (Group NED)
Nathan Bostock (CEO)
Duke Dayal (CFO)
Santander UK plc Board
Shriti Vadera (Chair and Chair of NomCo)
Ed Giera (Chair of BRC)
Chris Jones (Chair of BAC)
Scott Wheway (SID and Chair of RBC)
Garrett Curran* Annemarie Durbin* (SRD and Chair of RemCo)
Genevieve Shore*
Ana Botín (Group Executive Chair)
Gerry Byrne* (Group Head of Europe)
Bruce Carnegie-Brown (Group NED)
Dirk Marzluf* (Group Head of Technology & Operations)
Nathan Bostock (CEO)
Susan Allen* (Head of Retail)
Duke Dayal (CFO)
* Santander UK Group Holdings plc Directors stepped down on 31 December 2019.
Key
HoldCo/RFB INED Group NED RFB only INED ED

Santander UK Group Holdings plc38
Annual Report 2019 | Governance
Chair’s report on corporate governance continued
extensive reporting on people issues to the Board, Annemarie Durbin participated in focus groups, management fora and development workshops covering simplification, employee engagement and leadership.
The Chair, with the CEO and Company Secretary, supported by the Directors and senior management, ensure that the Board has an appropriate schedule, which is focused on the opportunities and risks to the future success of the business, business performance and risk mitigation, and ensuring that the Company’s culture is aligned with its purpose, values and
strategy. The Board regularly monitors progress against the strategic priorities and performance targets of the business. In June we held an offsite meeting that focused on future retail business models in the context of the medium-term strategy, our longer-term plans and aspirations, recognising the internal and external challenges faced in light of our competitive and uncertain external operating environment.
To ensure the most effective use of the time at Board meetings, in addition to the delegation of certain responsibilities to the Board Committees, the Board holds Board dinners, lunches and external speaker
workshops to consider important topics in depth and engage with key stakeholders. The Board ensures regular contact with management and colleagues through a number of means. These include inviting relevant business and function heads to present to the Board or its Committees on current developments; permitting observers as part of individual senior managers’ development plans; scheduling regular meetings for Committee Chairs to meet with relevant senior managers; site visits by one or more NEDs; and topical or technical workshops. In addition, senior leaders are available to the NEDs throughout the year.
Board Committee responsibilities
Key responsibilities
Board Nomination Committee
– Review the Board’s structure, size and composition, including skills, knowledge, experience
and diversity.
– Consider succession planning for Directors and Senior Executives.
– Identify and nominate candidates to fill Board vacancies as and when they arise.
– Assess the performance of the Board.
– Review each year whether NEDs have dedicated enough time to their duties to have been effective.
– Oversee governance arrangements.
Board Risk Committee
– Advise the Board on the enterprise wide risk profile, Risk Appetite and strategy.
– Review the enterprise wide risk profile through business updates from the First Line of Defence and
regular reports and updates on each key risk type from the Second Line of Defence.
– Provide advice, oversight and challenge to embed and maintain a supportive risk culture.
– Review the Risk Framework and recommend it to the Board for approval.
– Review and approve the key risk type and risk activity frameworks identified in the Risk Framework.
– Review the capability to identify and manage new risks and risk types.
– Oversee and challenge the day-to-day risk management actions and oversight arrangements and
adherence to risk frameworks and policies.
Board Audit Committee
– Monitor and review the integrity of the financial reporting.
– Keep under review the adequacy and effectiveness of the internal financial controls.
– Review the adequacy of Whistleblowing arrangements.
– Monitor and review the effectiveness of the Internal Audit function.
– Assess the performance of the External Auditors and oversight of their independence.
Board Responsible Banking Committee
– Oversee culture and operational risks relating to conduct, compliance, competition, financial crime
and legal matters set within the Risk Appetites and Risk Framework.
– Ensure adequate and effective control processes and policies for conduct and compliance risk,
fair customer treatment and customer outcomes.
– Monitor, challenge and support management in its efforts to evolve conduct, culture and ethical
standards through sustained effectiveness of Santander UK’s values and nine behaviours.
– Oversee the reputation of Santander UK and how it impacts its brand and market positioning, and the
Corporate and Social Responsibility Programme.
Board Remuneration Committee
– Approve and oversee the remuneration governance framework.
– Oversee implementation of remuneration policies, ensuring they promote sound, effective
risk management.
– Consider and approve specific remuneration packages for EDs and other senior management.
– Review and approve regulatory submissions in relation to remuneration.
– Approve the variable pay pools for EDs and other senior management, including the application of risk
adjustment as appropriate.
BoardNominationCommitteeChair’s reportRead more on p40
Board RiskCommitteeChair’s reportRead more on p42
Board AuditCommitteeChair’s reportRead more on p48
BoardResponsibleBankingCommitteeChair’s reportRead more on p54
BoardRemunerationCommitteeChair’s reportRead more on p56

39Santander UK Group Holdings plc
Strategic Report Governance Risk review Financial review Financial statements Shareholder information
Director inductions and trainingThe Company Secretary supports the Chair in designing individual inductions for NEDs, which include site visits and cover topics such as strategy, key risks and current issues including the legal and regulatory landscape. The delivery of our tailored NED induction programmes for our new appointments continued through 2019. Garrett Curran and Dirk Marzluf benefited from tailored induction programmes phased over an initial period of 12 months, which includes meeting
with senior management and a number of site visits. All other NEDs have ongoing development plans.
Throughout 2019, we continued to deliver workshops for all NEDs to further develop their knowledge and understanding of key business issues including model risks, regulatory challenges and stress testing; technological transformation opportunities and intervention; cyber risks; and recovery planning, strategies and tools.
Following a discussion arising from the publication of Slaughter and May’s report into TSB’s April 2018 new IT platform migration, the Board will receive a detailed briefing on lessons that can be learned from TSB Board’s handling of that situation. These activities were supplemented with visits to corporate sites (including Banco Santander group headquarters) and branches. A summary of the Board’s activities in 2019 is set out above.
Summary of Board activities in 2019The Board endeavoured to consider the views of all impacted stakeholders, whilst acting in the best interests of the Company and its members as a whole, and as described in the Section 172 statement on page 32. The Board’s activities in 2019 included the following themes:
Theme Actions taken by the Board and outcomes
Business andcustomer
– Reviewed, challenged and remained apprised of the performance of the business divisions and functions, strategic business
opportunities and developments with customer experience.
– Reviewed, challenged and remained apprised of all aspects of the Company’s transformation programme.
– Reviewed, challenged and approved the 3-year business plan (2020-2022) and the annual Budget, including cost efficiencies and
associated risk assessments.
– Conducted strategic reviews of loyalty products and digital developments, including approval of new strategies and monitoring
of progress.
Strategy – Reviewed, challenged and approved a refined business strategy focusing on mortgages and core products.
– Considered options and approved a refined strategy to develop the business of Santander Financial Services plc.
– Received regular updates on the competitive landscape, the UK economy and banking sector including changes resulting from
regulatory change requirements and digital developments.
– Following an off site strategy meeting in June, considered an overview of the UK banking market including banking trends,
competition and Santander UK’s position in the current banking market, the future of Banking in the UK market (including
technological developments and simplification), an in depth review of Mortgages; and M&A market opportunities.
– Regularly reviewed progress in delivering the strategic priorities of Santander UK including the future Retail business model and
technological journey and associated investments required (for example, people skills required to achieve the technological journey).
– Regularly reviewed organic and inorganic growth opportunities.
Regulation,Balance Sheetand capital
– Reviewed, challenged and approved the ICAAP, ILAAP, and the Recovery Plan; adequacy and effectiveness of stress-testing and capital
management; Dividends and AT1 Payments.
– Provided an attestion to the PRA on effective implementation of ring-fencing.
– Received regular updates on capital planning.
– Considered asset and liability management activities and was appraised of regulatory developments.
– Approved policies including the Volcker Policy, Modern Slavery Statement, Money Laundering, climate change and ring-fencing
related policies.
– Agreed key assumptions and capabilities and approved the final 2019 BoE Concurrent Stress Test submission.
– Approved the Annual Report and Accounts and other year-end related matters.
– Received and discussed regular updates on ring-fencing implementation.
– Approved the Surplus Capital Allocation Framework and Dividend Policy.
Risk andcontrol
– Received regular enterprise wide risk updates from the CRO, together with updates on specific risks, such as pensions, cyber
security, financial crime, climate change and Brexit.
People and Culture
– Received updates on issues including talent management and succession planning, gender pay, and diversity and inclusion.
– Received updates on culture, considering our long-term strategic direction and assessment findings from the Banking Standards Board.
– Considered Succession Planning across all key control and support functions.
Governance – Considered the impact of ring-fencing legislation on governance arrangements, and made consequential changes to Board and
Board Committee composition.
– Considered and approved revisions to the Corporate Governance Framework and UK Group Framework arising from implementation
of ring-fencing.
– Approved the appointment of new directors and the Company Secretary.
– Reviewed, challenged and approved Santander UK’s Annual Report.
– Received regular updates from Board Committees, via the Chairs.
– Approved revised Board strategic priorities and terms of reference for the Board and its committees.

Santander UK Group Holdings plc40
Annual Report 2019 | Governance
Overview of the yearDuring 2019, the Committee’s work included: leading the process for several appointments to the Board and for orderly Board succession planning; continuing to develop our long-term Board and management succession planning; reviewing the collective skills and experience of the Board; Board Committee membership and the Board’s Diversity & Inclusion Policy and reviewing various governance arrangements as set out on page 36, including for ring-fencing rule modifications granted by the PRA resulting from changes to the business strategy. In addition, the Committee has ensured arrangements relating to Directors, such as Directors’ interests, terms of appointment and fee and time commitments remain appropriate and take account of good governance standards.
The Committee met on eight occasions in 2019. Detail’s of the Committee’s members and meeting attendance are set out on page 64.
Board changes and Succession planning The Committee leads the process for Board appointments and ensures plans are in place for orderly succession to both the Board and senior management positions. Board appointments follow a structured, rigorous and transparent procedure designed to ensure they are based on merit and objective criteria and they promote broad diversity to complement and strengthen the Board’s and its Committees’ combination of skills, experience and knowledge. The Committee takes account of views of all the Company’s stakeholders in the recommendations it makes to the Board. The Board retains responsibility for and approves final decisions on these matters.
The Committee instructed Russell Reynolds(1) to lead a search for Julie Chakraverty’s replacement, resulting in its recommendation to the Board to appoint Garrett Curran as an INED.
As I will have completed five years as Chair in 2020, the Senior Independent Director commenced a planned search for my successor, assisted by Spencer Stuart(1), in order to ensure an orderly transition.
To support orderly succession planning for Board and senior management positions, the Committee assesses the challenges and opportunities facing the Company and evaluates the skills and expertise that will be needed in the future alongside internal capabilities, including board evaluation feedback. Increasing diversity in all respects in the boardroom and executive pipeline is a key factor we consider. Board appointments and succession planning during 2019 were conducted consistently with this approach, tailored as appropriate in each case.
The Committee reviewed executive succession planning, including a thorough assessment of the skill sets that would be required in light of the strategic direction of the business, together with development planning for identified talent, to ensure a strong and diverse leadership pipeline.
As a result of our revised strategy to develop the business of Santander Financial Services plc, (see page 36), and in order to ensure Santander UK plc’s continued compliance with ring-fencing requirements, the Committee reviewed and recommended changes to the Board and Committee memberships of Santander UK Group Holdings plc which took effect from 1 January 2020.
The Committee has focused on succession planning and governance throughout the year
Board Nomination Committee Chair’s report
We continue to ensure that diversity of thinking and skills remain front of mind in our succession planning.
Shriti VaderaChair 2 March 2020
Responsibilities of the CommitteeRead more on p38
Committee membership and attendanceRead more on p64
(1) Russell Reynolds and Spencer Stuart do not have any
connection with Santander UK.

41Santander UK Group Holdings plc
Strategic Report Governance Risk review Financial review Financial statements Shareholder information
It also considered and recommended designation of specific roles to Santander UK plc INEDs as required by the regulator. Full details are set out on page 36 of my report on corporate governance.
There were no changes to the Committee’s membership during the year. With effect from 1 January 2020, and following changes described on page 36, 3 Double INEDs stepped off the Board and Committees. As a result, Scott Wheway will now chair the Board Remuneration Committee, while Annemarie Durbin will remain as Chair of the Santander UK plc Board Remuneration Committee. This Committee will continue to handle all substantive remuneration business, as Santander UK plc, together with its subsidiaries, employs the majority of our people.
Board EffectivenessDuring 2019, the Committee considered feedback gained from the 2018 performance evaluations, which concluded that the performance of the Board, its Committees, the Chair and each of the Directors continues to be effective. The Committee reviewed with the Board the areas identified for greater focus in 2019 (monitoring business performance, efficiency, in-depth strategic consideration of digital and technological disruption on business strategy, customers, people and wider engagement with management) and recommended a series of actions which were then led by the Board and its Committees in meeting agendas and activities arranged accordingly. Individual Directors’ assessments were also conducted, and the Senior Independent Director undertook his twice-yearly assessment of my performance as Chair.
Having just implemented the changes in Board membership, as described on page 36 in order to continue to comply with ring-fencing requirements, the Committee determined that an external evaluation of the operation of the Board and Board Committees towards the end of 2020, following the implementation of new governance arrangements in January 2020, would provide more meaningful observations for the ongoing operational effectiveness of the Board. As a consequence, an internal Board Effectiveness review during the first quarter of 2020 will provide the feedback mechanism for continuous improvement and to keep areas for development in focus.
Diversity, inclusion and engagement with stakeholdersIn 2016, we set an aspirational target of having 33% women on the Board by 2020. As anticipated in last year’s report, the level we achieved at that time (54%) reduced during 2019 as a result of Julie Chakraverty and Lindsey Argalas stepping down from the Board, and we ended the year at 36%. As a result of changes to the membership of the Board (see page 37), this reduced further to 25% with effect from 1 January 2020, while the Board of Santander UK plc remained at 36%. Despite this reduction we remain committed to our aspirational target. The Boards of the two companies are run largely simultaneously for efficiency. Our Senior Manager female population (Executive Committee) is 26.7%. 30.1% of the Executive Committee’s direct reports are female as at 31 December 2019. We are a signatory to the Women in Finance Charter, setting a target of 50% (+\-10%) by 2021 for our wider senior manager female population of which this forms a part.
We will also continue to ensure that gender and all aspects of diversity remain front of mind in our succession planning. The Board has signed the Business in the Community ‘Race at Work’ Charter and made good progress, having achieved two of our five actions with good progress on the other three. In February 2019, the Board confirmed our ambition to increase senior manager representation of Black, Asian and Minority Ethnic (BAME) employees to 14% (+/-2%) across mid to senior manager roles by 2025.
GovernanceDuring the year, the Committee focused on changes to ring-fencing arrangements described on page 36 and on ensuring that governance arrangements continued to be efficient and effective.
We also conducted our annual review of our Corporate Governance Framework and of the terms of reference for the Board and its Committees. On the Committee’s recommendation, the Board endorsed changes to these documents and to the UK Group Framework described in my report on Corporate Governance to ensure continued compliance with ring-fencing rules.
Annual review of director interests, fees and conflicts of interestDuring the year, the Committee continued to review Directors’ interests and to ensure any conflicts are managed appropriately and in compliance with CRD IV and ring-fencing requirements. The Company’s Articles of Association contain provisions that allow the Board to consider and, if it sees fit, to authorise situational conflicts. The Board confirms that such powers have operated effectively and that a formal system for Directors to declare their interests and for the non-conflicted Directors to authorise situational conflicts continues to be in place. Any authorisations given are recorded by the Company Secretary.
The Chair, CEO and Group NED (who does not get paid a Board fee) reviewed the level of fees paid to INEDs for Board and Board Committee chairmanship and membership, together with the role of the SID. In doing so, they considered whether NED fees were at an appropriate level, having regard to a number of factors including the challenge of recruiting INEDs into the sector and the increasing regulatory and ring-fencing-related expectations and the associated time commitments for INEDs. In light of this, increases to the INED base fee, the Board Risk Committee Chair and member fee and an increase to the SID fee were approved. Further details are contained in the Remuneration Implementation Report on page 63.
Priorities for 2020Over the next year we will continue to work on talent and succession planning, in particular on executive and senior management succession and NEDs’ continuing development and embedding revised governance arrangements in compliance with ring-fencing requirements. We will also undertake an external evaluation of the Board and Board Committees’ effectiveness.

Santander UK Group Holdings plc42
Annual Report 2019 | Governance
How we spent our time (%)
Operational risk
Risk appetite and
internal controls
Credit risk
Reporting*
Regulatory risk
Other risks
Specific risks
2019 2018
15 19
18 14
9 13
19 7
12 17
16 11
11 19
2019
2018
Overview of the yearThe Committee considered a wide range of risks to our customers and our business in 2019, including:
– Operational risks, resilience of systems to fraud and cyber risks, data integrity and security, and third party risks
– Capital and liquidity – Credit, both retail and commercial – Embedding ring-fencing – Contingency planning in respect of Brexit.
We reviewed the top risks at each meeting and also received regular updates on specific matters such as stress testing, market risk, pension risk and business risk reviews.
The Board Risk Committee maintains a holistic view of Enterprise-Wide risks and, to help achieve this, there is appropriate cross-membership between this Committee and both the Board Responsible Banking Committee and the Board Audit Committee.
Whilst the Board Responsible Banking Committee has oversight of financial crime risk, the Board Risk Committee retains ultimate oversight of risk appetite with respect to conduct and regulatory, reputational and financial crime risks.
MembershipThere have been two changes to the membership of the Committee during the year: Garrett Curran became a member in May and Julie Chakraverty left the Committee on her retirement from the Board in May. Julie had been a member of the Committee since June 2018. I would like to take this opportunity to thank Julie, on behalf of the Committee, for her contributions to our discussions. I would also like to welcome Garrett.
I believe that the Committee retains an appropriate balance of skills and expertise to carry out its role effectively. The Terms of Reference require the majority of the members to be Independent Non-Executive Directors. This criterion was met throughout the year.
The Committee supports the Board in ensuring that the business operates within agreed Risk Appetite while reviewing the capability to identify and manage new and emerging risks.
Board Risk Committee Chair’s report
We challenged management as to whether the investment, prioritisation and pace of change relating to digitisation and systems improvement was appropriate.
Ed GieraBoard Risk Committee Chair 2 March 2020
Responsibilities of the CommitteeRead more on p38
Committee membership and attendanceRead more on p64 * Reporting includes Enterprise-Wide Risk
Management, Top Risks and Risk Disclosures.

43Santander UK Group Holdings plc
Strategic Report Governance Risk review Financial review Financial statements Shareholder information
Meeting our key responsibilities in 2019The Committee addressed our key responsibilities relating to Risk Appetite and the Risk Framework, our oversight of stress testing and liquidity, as well as a selection of challenges raised relating to certain risk categories. For more on our responsibilities relating to risk management and internal controls see page 47.
Significant areas of focus
Area of focus Action taken by the Board Risk Committee Outcome
Risk Appetite – Considered a number of changes proposed to the Board’s Risk Appetite Statement as part of the Annual Risk Appetite Review.
– Noted changes to certain concentration limits either as a consequence of asset migrations to the Banco Santander London Branch, as part of ring-fencing, or as a result of continued portfolio rebalancing.
– Challenged management in relation to making changes in single name management framework.
– Requested the introduction of metrics to improve the Committee’s oversight and monitoring of the capital planning risk associated with significant risk transfer (SRT) securitisations.
– Queried proposed revisions to operational risk appetite and asked for a clearer, more consistent recommendation for monitoring utilisation of risk appetite.
– Received management’s proposal for additional controls and limitations intended to mitigate financial crime risk relative to risk appetite and continued to monitor progress on addressing financial crime risk exposure relative to risk appetite.
– Discussed the PRA expectations for implementing the recommendations of the Task Force on Climate-related Financial Disclosures relating to managing financial and strategic risks from climate change.
– Noted and were satisfied that a more detailed single name exposure framework had been implemented.
– Management developed a metric to monitor the maximum potential fall in the CET1 capital ratio if regulatory or execution risks arose with current or planned SRTs.
– Following challenge, recommended management’s proposed changes to Risk Appetite to the Board for approval.
– Monitored and provided ongoing challenge to management in relation to financial crime risk exceeding tolerance, and received updates on management actions to return to within Risk Appetite.
– Received a recalibration of Operational and Financial Crime risk appetite after challenge to management.
– Continued to assess management’s progress relative to Risk Appetite in the context of the Financial Crime Transformation Programme.
For more, see ‘Risk Appetite’ in the ‘Risk governance’ section of the Risk review.
Risk Framework – Received an update following the annual certification process, and assessed the extent to which the Risk Framework had been effectively implemented and embedded across the business.
– Further to updates made to the Risk Framework in H2 2018, to reflect the implementation of ring-fencing, received management’s proposals for the introduction of new minimum standards intended to strengthen the controls around independence of decision making and management of conflicts of interest.
– Received management’s proposal for changes to the suite of Risk Type and Risk Activity Frameworks and their delineation between Santander UK Group Holdings plc and Santander UK plc.
– Received the Risk function’s confirmation that the Risk Framework had embedded the ring-fencing changes
– Noted there was transparency and ownership of areas for improved compliance.
– Recommended the proposed changes to the Board for approval.
For more, see ‘Risk Framework’ in the ‘Risk governance’ section of the Risk review.
Stress testing – Monitored the 2019 Bank of England Concurrent Stress Test exercise, and received updates throughout the process. We questioned the ability of our systems to process data seamlessly and discussed the additional complexity created by the IFRS 9 model implementation.
– Considered the results of the stress test both on an IFRS 9 transitional basis and on an IFRS 9 basis without transitional arrangements.
– Received a specific paper, produced by the Risk team, with details of risk management in stress testing.
– Noted that risks associated with Santander UK’s suite of stress testing models had generally improved across the last year.
– Questioned whether sufficient resource was planned and available for the ongoing multi-year effort to improve stress testing models.
– Recommended the governance, process, controls and stress test results to the Board for approval and onward submission to the PRA.
– Committee members were provided with greater insight to review the most significant models.
– Supported management on the allocation of resources for planned stress testing model enhancements and requested a holistic view of the resource requirements as part of the next update.
For more, see ‘Stress testing’ in the ‘Risk governance’ section of the Risk review.
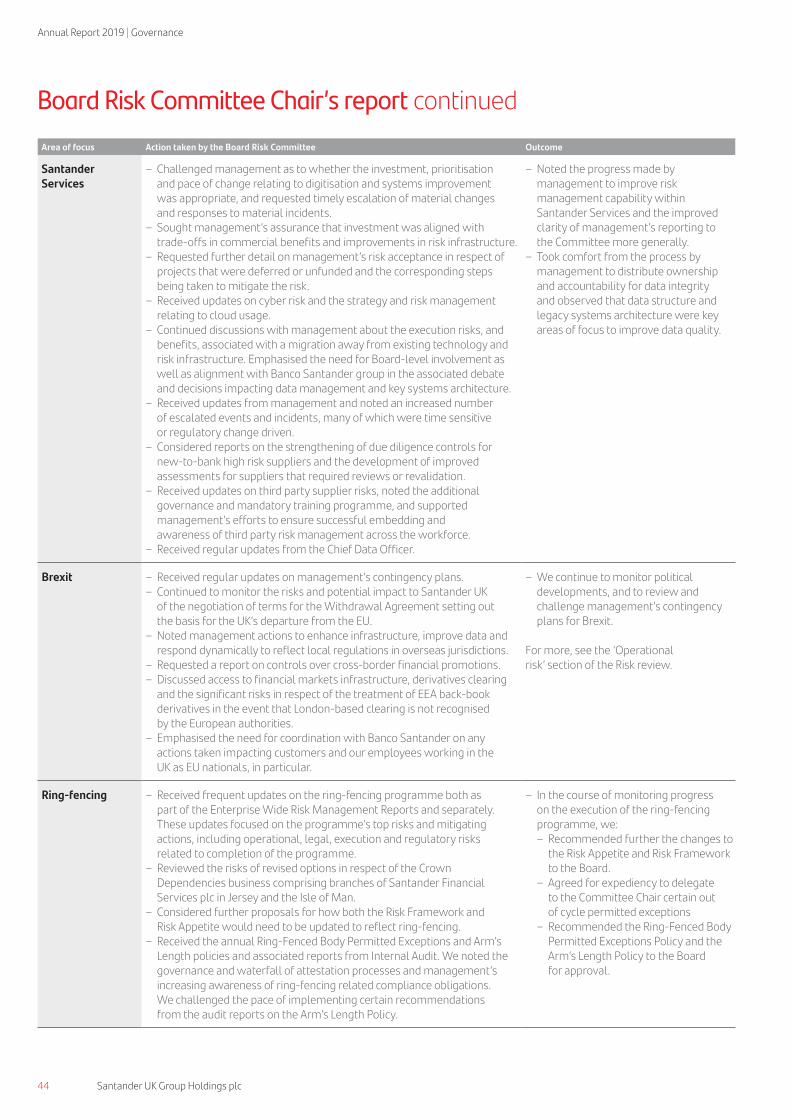
Santander UK Group Holdings plc44
Annual Report 2019 | Governance
Area of focus Action taken by the Board Risk Committee Outcome
SantanderServices
– Challenged management as to whether the investment, prioritisation and pace of change relating to digitisation and systems improvement was appropriate, and requested timely escalation of material changes and responses to material incidents.
– Sought management’s assurance that investment was aligned with trade-offs in commercial benefits and improvements in risk infrastructure.
– Requested further detail on management’s risk acceptance in respect of projects that were deferred or unfunded and the corresponding steps being taken to mitigate the risk.
– Received updates on cyber risk and the strategy and risk management relating to cloud usage.
– Continued discussions with management about the execution risks, and benefits, associated with a migration away from existing technology and risk infrastructure. Emphasised the need for Board-level involvement as well as alignment with Banco Santander group in the associated debate and decisions impacting data management and key systems architecture.
– Received updates from management and noted an increased number of escalated events and incidents, many of which were time sensitive or regulatory change driven.
– Considered reports on the strengthening of due diligence controls for new-to-bank high risk suppliers and the development of improved assessments for suppliers that required reviews or revalidation.
– Received updates on third party supplier risks, noted the additional governance and mandatory training programme, and supported management’s efforts to ensure successful embedding and awareness of third party risk management across the workforce.
– Received regular updates from the Chief Data Officer.
– Noted the progress made by management to improve risk management capability within Santander Services and the improved clarity of management’s reporting to the Committee more generally.
– Took comfort from the process by management to distribute ownership and accountability for data integrity and observed that data structure and legacy systems architecture were key areas of focus to improve data quality.
Brexit – Received regular updates on management’s contingency plans. – Continued to monitor the risks and potential impact to Santander UK of the negotiation of terms for the Withdrawal Agreement setting out the basis for the UK’s departure from the EU.
– Noted management actions to enhance infrastructure, improve data and respond dynamically to reflect local regulations in overseas jurisdictions.
– Requested a report on controls over cross-border financial promotions. – Discussed access to financial markets infrastructure, derivatives clearing and the significant risks in respect of the treatment of EEA back-book derivatives in the event that London-based clearing is not recognised by the European authorities.
– Emphasised the need for coordination with Banco Santander on any actions taken impacting customers and our employees working in the UK as EU nationals, in particular.
– We continue to monitor political developments, and to review and challenge management’s contingency plans for Brexit.
For more, see the ‘Operational risk’ section of the Risk review.
Ring-fencing – Received frequent updates on the ring-fencing programme both as part of the Enterprise Wide Risk Management Reports and separately. These updates focused on the programme’s top risks and mitigating actions, including operational, legal, execution and regulatory risks related to completion of the programme.
– Reviewed the risks of revised options in respect of the Crown Dependencies business comprising branches of Santander Financial Services plc in Jersey and the Isle of Man.
– Considered further proposals for how both the Risk Framework and Risk Appetite would need to be updated to reflect ring-fencing.
– Received the annual Ring-Fenced Body Permitted Exceptions and Arm’s Length policies and associated reports from Internal Audit. We noted the governance and waterfall of attestation processes and management’s increasing awareness of ring-fencing related compliance obligations. We challenged the pace of implementing certain recommendations from the audit reports on the Arm’s Length Policy.
– In the course of monitoring progress on the execution of the ring-fencing programme, we:
– Recommended further the changes to the Risk Appetite and Risk Framework to the Board.
– Agreed for expediency to delegate to the Committee Chair certain out of cycle permitted exceptions
– Recommended the Ring-Fenced Body Permitted Exceptions Policy and the Arm’s Length Policy to the Board for approval.
Board Risk Committee Chair’s report continued

45Santander UK Group Holdings plc
Strategic Report Governance Risk review Financial review Financial statements Shareholder information
Oversight and advice to the Board on Santander UK’s current risk exposure and future risk strategyIn 2019, we reviewed Santander UK’s exposure to the risks outlined below and analysed emerging themes, including regulatory, macroeconomic and global risks, which could affect Santander UK’s ability to achieve its strategic goals.
Risk Action taken by the Board Risk Committee Outcome
Credit risk – Received regular credit risk updates across Retail Banking, Corporate & Commercial Banking and Corporate Investment Banking businesses.
– Received updates on the retail mortgage book, including interest-only and buy-to-let mortgages.
– Monitored concentration risks, reviewed growth strategies and challenged management in relation to the Consumer Finance business.
– In relation to the construction and associated support sectors, we noted the progress made by management to implement risk management, including control enhancements, adjustments to limits and exposures, corporate credit monitoring and approval processes, and operational procedures for delivering supply chain financing and receivables purchase products.
– Continued to monitor utilisation of existing risk appetite and requested that the Committee has early and comprehensive assessments from Line 2 of any material adjustments to credit policy or risk limits recommended by management in connection with the update of the three year plan.
– Counselled management on the need for a comprehensive approach with the Banco Santander Risk function, and to recognise the broader credit risks, including concentrations, which might evolve from industry or market responses to emerging risks, including climate change.
For more, see the ‘Credit risk’ section of the Risk review.
Strategic risk – Considered strategic risk as part of risk reports on M&A opportunities, Data, Change and Operational Risk.
– Noted the critical importance of data and systems to ensuring the long term success of the Company and encouraged management to ensure appropriate prioritisation.
– Discussed the strategic threats to Santander UK’s capacity to defend and build further franchise value.
– Requested a substantive update on Strategic risk in Q1 2020.
For more, see the ‘Strategic risk’ section of the Risk review.
Pension risk – Considered papers on pension investment strategy and governance. – Sought assurance around the continued effectiveness of the pension governance arrangements.
– Noted the company and the pension trustees had reached agreement on the triennial valuation, the approach to which was consistent with continuing to de-risk and appropriately fund the pension schemes.
– Received updates on the transition to new investment managers and improvements in the transparency of manager reporting for risk management purposes.
– Confirmed and supported the outcome of the triennial valuation, the continued development of the pension investment portfolio transition and risk management strategies, and ongoing enhancements of the governance arrangements with the trustees.
For more, see the ‘Pension risk’ section of the Risk review.
Liquidity risk – Reviewed the Internal Liquidity Adequacy Assessment Process (ILAAP) and noted material enhancements to the previous process made by management.
– Questioned management about material liquidity stress test assumptions, and the flexibility and timeliness of our liquidity reporting.
– Received half yearly updates on asset and liability management activities and confirmed the liquid asset buffer portfolio remained within risk appetite, and appropriately hedged against duration risks and LIBOR decommissioning risks, respectively.
– Agreed to recommend the 2019 ILAAP to the Board for approval following review and challenge.
For more, see the ‘Liquidity risk’ section of the Risk review.

Santander UK Group Holdings plc46
Annual Report 2019 | Governance
Risk Action taken by the Board Risk Committee Outcome
Capital risk – Considered, from a capital risk perspective, dividends payable on AT1 securities, and the ordinary dividends proposed to be paid by Santander UK Group Holdings plc and Santander UK plc for the mid-year and year-end respectively.
– Requested management develop a framework to address and provide additional rigour to the consideration of and allocation of surplus available capital.
– Approved this Surplus Capital Allocation Framework. – Reviewed the Internal Capital Adequacy Assessment Process (ICAAP) and noted material enhancements to the previous process made by management.
– Sought clarity on the key drivers to the CET1 capital and leverage ratios and considered management’s proposals for various risk and capital management initiatives.
– Received updates on model risk including the evolution of the approach to a new internal ratings based (IRB) regulatory capital model for the mortgage book, as well as the securitisation of certain assets.
– Received updates on progress in respect of the capital management initiatives proposed in the year, and challenged management on execution, operating, and regulatory risks.
– Recommended the payment of dividends to the Board for approval. Comments and challenges received from Committee members were considered by management and incorporated into the final draft ICAAP.
– Agreed to recommend the ICAAP to the Board for approval following review and challenge.
– Agreed to recommend the plans for potential risk and capital management actions to the Board for approval.
– Arranged a workshop on SRTs and sought clarity from management on the future SRT strategy.
For more, see the ‘Capital risk’ section of the Risk review.
Operational risk – Noted the design and implementation of the Operational Risk Framework, the downward trend of operational losses excluding PPI and management’s shift in focus toward business continuity as opposed to appetite for financial loss in respect of operational resiliency.
– Received Operational Risk updates within Enterprise-wide Risk Management as well as Operational Resiliency, Data Centre Resilience and Change Risk.
– Received regular updates on management’s strategies for mitigating cyber risk and third party risk.
– Considered crystallised operational risk incidents impacting other companies, and how these had impacted our own customers, as well as any lessons that could be learned.
– Noted the enhancements to programme management disciplines around change and considered third party risk and dependance on key suppliers.
– Highlighted the elevated risk presented by the confluence of regulatory change requirements, change risk more generally and organisational capacity and capability programme.
– Considered and noted good progress on the LIBOR transition.
– Monitored the impacts on operational risk and key controls associated with management’s execution of the high volume of significant transformation and remediation programmes.
For more, see the ‘Operational risk’ section of the Risk review.
For more on our LIBOR transition, see the ‘Managing LIBOR transition’ case study in the ‘Market risk’ section of the Risk review.
Model risk – Considered an update on the regular monitoring of capital adequacy models.
– Received an update on the regulatory review of key mortgage and corporate IRB models.
– Considered the implications of differing regulatory perspectives on through-the-cycle capital requirements of the Bank of England and the ECB, respectively.
– The Committee will continue to monitor progress in respect of regulatory initiatives for IRB models, and request evidence of appropriate model types, assumptions and calibration.
For more, see the ‘Model risk’ section of the Risk review.
Board Risk Committee Chair’s report continued

47Santander UK Group Holdings plc
Strategic Report Governance Risk review Financial review Financial statements Shareholder information
Effectiveness of risk management system and internal controlsThe Committee considered, as part of the Operational Risk Profile & Analysis update, the results of the 2018 year end Risk and Control Self Assessment (RCSA). This highlighted the risk and exposure issues reported through the RCSA processes. Based on our assessments of the risk and exposure issues reported, we considered that there had been an increase in critical and high risks versus the prior year’s assessment, however, overall critical and high risks were well managed via risk mitigation and reassessment process, respectively. The remaining high risks related mainly to IT risks, relating to legacy systems and data management, and new operational risks resulting from ring-fencing requirements. Whilst the self-assessment acknowledged a number of control weaknesses, in particular for Financial Crime, we were satisfied that appropriate actions were planned and being progressed by management to address these. We continue to monitor the position, including with respect to overall risk appetite. Notwithstanding these considerations, the Committee subsequently requested, and management implemented, additional controls and limitations on certain activities intended to further mitigate exposure to Financial Crime risk relative to risk appetite.
We noted an increase in reported risks, partly due to the result of a dynamic transformation and change risk profile, increased reporting across the business as a result of improved systems, and noted further the need for additional classification improvements. Management also advised the Committee that overall operational controls improved following system enhancements, however, the Committee highlighted the need to make further progress.
The Committee reaffirmed its view and concurred with the regulator’s expectation of a comprehensive approach reflecting appropriate prioritisation of investment in management’s strategic plan, particularly with reference to the plan for bank-wide risk infrastructure. The Committee will continue to review management’s reports on the execution of the overall bank-wide risk infrastructure investment programme, as well as the status of management’s regulatory dialogue, and will continue to request management to evidence the effectiveness of controls and improvements driven by the programme over the investment period.
Change ProgrammeThe Committee maintained its oversight of the changing scale, scope and critical nature of the various change initiatives undertaken by Santander UK to meet regulatory and other requirements that continued to pose significant risk in 2019.
Reports from the Transformation Office and Operational Risk identified similar themes with respect to root cause issues underpinning the execution of change programmes. The Committee expressed concern at management’s capacity to effectively resource and execute the number of strategic transformation programmes in progress concurrently with the execution of regulatory change requirements including customer alerts and the high cost of credit review.
The Committee considered that improved management information would assist management to better plan and sequence the implementation of complex and often time critical and interdependent deliverables.
Effectiveness of the CommitteeAs noted above, the Committee membership saw one member leave and one member join during the year. I believe that the Committee has an appropriate mix of skills to enable it to operate effectively and to offer appropriate challenge and support to management.
In December 2019, we reviewed the Committee’s responsibilities as set out in the Terms of Reference and confirmed that the Committee had discharged its responsibilities in full in 2019.
An internal review of the Committee’s effectiveness during 2019 will take place during the first quarter of 2020 to provide the feedback mechanism for continuous improvement and to keep areas for development in focus.
Full terms of reference can be found on our website at www.aboutsantander.co.uk and a summary is given on page 38.
We continued to receive regular reports on enterprise wide risk and to call risk owners to our meetings to account for their progress.
We have benefited from the perspectives of each of the three lines of defence to gain assurance and confirm progress in respect of material initiatives intended to mitigate key risk exposures.
These actions are examples of how we have looked to inform our debate and decision making in the year and contribute to our effectiveness as a Committee.
Priorities for 2020In 2020, we will monitor Santander UK’s capital and liquidity adequacy and assess credit risk in changing economic conditions and extremely competitive operating environment including the risks and uncertainties surrounding Brexit and the UK regulatory landscape.
Data, cyber, third party, operational resilience and other IT-related operational risks will continue to be a priority, including the adoption of cloud services.
We expect to review continuing developments in areas such as model risk, pension risk, enhancements to Santander UK’s risk infrastructure and management of transformation risks.
In accordance with the additional responsibilities of the CRO, we also will monitor and review Santander UK’s climate-related financial and strategy risks.

Santander UK Group Holdings plc48
Annual Report 2019 | Governance
Board Audit Committee Chair’s report
How we spent our time (%)
Financial reporting
Internal audit and
internal controls
External audit
Legal, Regulatory and
compliance including
whistleblowing
Other
2019 2018
36 43
29 26
16 16
8 7
11 8
2019
2018
Overview of the yearIn 2019, the main activities of the Committee included:
– Assessing the appropriateness of key management judgements and related reporting each quarter.
– Considering our exposure to, provisioning for and disclosure of PPI related matters given a number of factors including claims volumes and the expiration of the PPI deadline.
– Monitoring the embedding of IFRS 9, including operation of, and key changes to, models and methodologies, impacts and related controls with a particular focus on the weights applied to the economic scenarios given political and economic uncertainties, including Brexit, as well as Year 2 disclosure enhancements.
– Reviewing our contingent liability disclosures, including those relating to conduct.
– Considering the adequacy of comfort on our risk-weighted assets reporting.
– Reviewing the actuarial assumptions of the pension scheme accounting valuation as well as the triennial valuation.
– Monitoring management’s responses to various industry reviews of the UK statutory audit market and Financial Reporting Council.
– Providing oversight on the adequacy and effectiveness of internal controls over financial reporting.
– Overseeing the performance of the Internal Audit function.
– Continuing oversight of interaction with our External Auditors.
– Overseeing Santander UK’s whistleblowing arrangements, including further enhancements in line with FCA guidance and rules on whistleblowing.
– Reviewing Santander UK’s Recovery Plan and management’s plans in respect of the incoming Resolvability Assessment Framework.
– Monitoring the transition for the incoming CFO as well as changes to key management in the Finance function.
We also addressed other responsibilities delegated to the Committee by the Board.
Committee MembershipJulie Chakraverty retired on 7 May 2019 and I would like to thank her for her service on behalf of the Committee. We welcomed Garrett Curran, who joined the Committee in May 2019. Garrett brings extensive financial services experience and strong risk management credentials.
At 31 December 2019, all four members of the Committee were Independent Non-Executive Directors. The Committee also met the necessary requirements of independence throughout the year, in accordance with the requirements of Rule 10A-3 under the US Securities Exchange Act 1934.
Our responsibilities include oversight of the integrity of financial reporting and controls, the effectiveness of our internal audit function, the relationship with the external auditors and the adequacy of our whistleblowing arrangements.
In 2019, we monitored our exposure to PPI in the context of the time bar, reviewed the provisions and disclosures for other conduct and operational matters, performed oversight of management’s responses to Internal Audit reviews and reviewed the weights of economic scenarios in respect of IFRS 9 ECL calculations given political and economic uncertainties, including Brexit.
Chris JonesBoard Audit Committee Chair 2 March 2020
Responsibilities of the CommitteeRead more on p38
Committee membership and attendanceRead more on p64

49Santander UK Group Holdings plc
Strategic Report Governance Risk review Financial review Financial statements Shareholder information
Significant financial reporting issues and judgementsThe use of assumptions or estimates and the application of management judgement is an essential part of financial reporting. In 2019, we focused on the following significant reporting matters in relation to financial accounting and disclosures:
Financial reporting issue or judgement Action taken by the Board Audit Committee Outcome
Conduct provisions The provision for conduct remediation activities for PPI and other products continued to be highly judgemental and requires significant assumptions including claim volumes and Plevin in scope rates.
– Continued to scrutinise the level and adequacy of conduct provisions and challenged the reasonableness of management’s assumptions throughout the year.
– In respect of PPI including Plevin, the Committee: – Reviewed the judgements and estimates in respect
of the provision considering management’s assumptions around changes in claim volumes, uphold rates and average cost of redress. This was in the context of key developments in the year, taking into account the implementation of the FCA’s consumer deadline ‘time bar’ on PPI complaints of 29 August 2019, our specific approach to auto conversion and the appointment of Deloitte to assist the Official Receiver for certain individuals subject to bankruptcy court orders.
– Noted the very significant increase in the levels of customer information requests and complaints in the time leading up to the implementation of the time bar, and its impact on the provision.
– Inquired as to the methodology management had adopted in determining the top end of the range of their estimates of the additional charge that should be made for PPI as a result of the increase in complaints.
– Noted that the PPI model is an expert judgement model and therefore had not gone through the standard model governance process. Requested that management explain the governance and controls in place around the model to ensure the accuracy of its financial outputs, and invited the Head of Internal Audit to comment.
– In respect of other products, the Committee reviewed management’s judgements and estimates in respect of the provision.
– Endorsed management’s recommendation that additional charges of £70m in Q2 2019 and £99m in Q3 2019 should be made for PPI.
– Considered the classification and disclosure of provisions related to a specific PPI related portfolio which is the subject of litigation, together with an associated contingent liability.
– Received a report from management on the governance and controls in place around the PPI model, including controls that are tested as part of the Sarbanes-Oxley compliance process. Noted that Internal Audit had reviewed the PPI model but had not identified any significant concerns.
– Agreed with management’s judgement on the level of conduct provisions and disclosures, including PPI and other products.
– We continued to monitor the provisioning levels in light of any changes to claims volumes, inflows and average redress costs.
See ‘Critical judgements and accounting estimates’ in Note 1 to the Consolidated Financial Statements.
See Note 27 to the Consolidated Financial Statements.
Credit provisions Ensuring appropriate application and embedding of IFRS 9 is a significant area of judgement given its technical complexity, the number of judgements needed, and their potential impact. Determining the appropriateness of credit provisions is also highly judgemental, requiring management to make a number of assumptions.
Embedding of IFRS 9 – Monitored the embedding of IFRS 9, includingchanges
to the controls environment, throughout the year. – Reviewed management decisions and challenged key assumptions.
– Reviewed the operation of, and key changes to, models and methodologies and their impacts. We placed particular focus on the weights applied to the economic scenarios given political and economic risks, including Brexit.
– Reviewed the proposed approach to year-end disclosures, including the Year 2 recommendations of the PRA’s Taskforce on Disclosures about ECL.
– Satisfied ourselves that management continued to have a robust methodology for evaluating the results of the models given their complexity and a clear trail of their workings, particularly due to the models’ key outputs.
– Obtained comfort on the adequacy of data in the context of the evolving control environment.
– Noted that model and methodology changes had been approved by the Model Risk Management Forum.
– Endorsed the proposed year-end disclosures.
See the ‘Credit risk’ section in the Risk review.
See ‘Critical judgements and accounting estimates’ in Note 1 to the Consolidated Financial Statements.

Santander UK Group Holdings plc50
Annual Report 2019 | Governance
Financial reporting issue or judgement Action taken by the Board Audit Committee Outcome
Credit provisionscontinued
Retail credit provisions – Reviewed detailed reports from management throughout the year analysing the proposed provisions by key product.
– Considered management’s proposals to apply Post Model Adjustments (PMAs) to the mortgage model to address interest-only maturity default risk, buy-to-let and long-term indeterminate arrears.
– Agreed with management’s judgement on the level of retail credit provisions, concluding that provisions remain robust and assumptions were appropriate.
– Agreed with management’s recommendations for the continued application of PMAs in relation to the mortgage model, including changes and updates to the PMA population.
– We will continue to monitor retail credit provisions.
See ‘Critical judgements and accounting estimates’ in Note 1 to the Consolidated Financial Statements.
See Note 13 to the Consolidated Financial Statements.
Corporate credit provisions – Reviewed reports from management throughout the year, including consideration of individually assessed impairments and PMAs, to satisfy ourselves as to the completeness of the provision requirements.
– Noted that corporate credit provisions can be more volatile than retail credit provisions, and may be supported by more limited data.
– Considered reports on specific cases, as well as a review of the rest of the portfolio, to identify other cases or industry sectors that could potentially be at risk, including the retail sector.
– Discussed other exposures and satisfied ourselves that no material adjustments to provision levels were required.
– Agreed with management’s judgement on the level of corporate credit provisions, concluding that provisions remain robust and assumptions were appropriate.
– We will continue to monitor corporate credit provisions.
See ‘Critical judgements and accounting estimates’ in Note 1 to the Consolidated Financial Statements.
See Note 13 to the Consolidated Financial Statements.
Pension obligations Significant judgement is required on the key assumptions underlying defined benefit pension obligation calculations. Outcomes remain inherently uncertain.
– Reviewed detailed reports throughout the year on key assumptions underlying the defined benefit pension obligation calculations. We recognised that, although some assumptions are based on observable data, others continue to require significant judgement.
– Considered the best estimate of our pension liabilities under IAS 19, recognising the inputs of external actuaries who generate financial assumptions and propose liabilities.
– Reviewed the results of the triennial funding valuation agreed in August 2019.
– Reviewed changes proposed as the result of a review of experience analysis by the Trustee, which informed the choice of demographic assumptions.
– Reviewed the regulatory capital impact of the changes. – Monitored the continued appropriateness of the methodology and reviewed the inflation, discount and mortality rates applied at the year-end.
– Noted that the proposed changes to demographic assumptions had been reviewed at the Pension Risk Forum and reviewed by Independent Model Risk Review.
– Agreed with management’s approach to the assumptions applied, including changes made in 2019.
– Endorsed the proposed quantitative and qualitative year-end disclosures in respect of pension obligations.
See ‘Critical judgements and accounting estimates’ in Note 1 to the Consolidated Financial Statements.
See ‘Pension risk management’ in the Risk Review.
See Note 28 to the Consolidated Financial Statements.
Other areas – Reviewed the appropriateness of the provision, and considered the disclosures required, in relation to i) a specific PPI portfolio of complaints and ii) our consumer credit business operations.
– Considered disclosures relating to the Cologne CPO and German FTO ongoing investigations of our historical involvement in German dividend tax arbitrage transactions.
– Reviewed the appropriateness of the accounting, and considered the disclosures required, relating to certain leases that are currently under review by HMRC in connection with claims for tax allowances.
– Endorsed management’s recommended provision and level of disclosure in these regards, including an additional provision of £10m for our consumer credit business operations.
– Endorsed the proposed year-end disclosures relating to German dividend tax arbitrage transactions.
– Endorsed management’s recommended accounting and level of disclosure relating to the leases under review by HMRC.
See Notes 27 and 29 to the Consolidated Financial Statements.
Board Audit Committee Chair’s report continued

51Santander UK Group Holdings plc
Strategic Report Governance Risk review Financial review Financial statements Shareholder information
The Committee’s focus continues to be on areas of significant judgement which pose the greatest risk of a material financial statement misstatement. In addition to the areas set out in the preceding table, the Committee also considers other higher risk items. During the 2019 year-end process, these included the identification and assessment of risks of material misstatement due to fraud or error and the controls over calculation of risk-weighted assets. We also received regular reports on any material litigation cases and their progress, as part of our consideration of provisions and contingent liabilities.
External AuditorWe continued to develop and oversee the interaction with PwC and with Mr Holloway in his fourth year as the audit partner, following PwC’s appointment in 2016. The independence and objectivity of PwC was considered and monitored throughout the year.
Oversight of the relationship with our External AuditorsAs part of our review of our relationship with PwC, our activities included:
– Consideration of their work and opinion relating to management judgements.
– Review of the summary of misstatements not corrected by management. The Committee was satisfied that they were not quantitatively or qualitatively material, either individually or in the aggregate.
– Discussion on the level of disclosure in the Annual Report and Half Yearly Financial Report to satisfy ourselves that it is appropriate.
– Discussion of developments in financial reporting including changes to accounting standards, statute and best practice.
– A review of PwC’s reports on findings and recommendations on internal control and financial reporting matters identified during their audit and their view of management’s progress in resolving them.
– Interactions, including meetings in private session during each Committee meeting, and at other times throughout the year.
– Reviewed the latest results of the FRC’s quality inspections and our auditors’ response to the FRC’s challenge on the general quality of banking audits as well as enquired into the results of any audit quality reviews of Santander UK.
Based on the above inputs, which were captured in a formalised assessment, the Committee satisfied itself as to the rigour and quality of PwC’s audit process.
Non-audit feesWe have a robust policy on non-audit services provided by our External Auditors, which was updated in 2016 in the context of the Revised Ethical Standard issued by the FRC on auditor independence requirements resulting from the European Audit Regulation and Directive.
Non-audit services were under continuous review throughout 2019 to determine that they were permitted by reference to their nature, assessing potential threats and safeguards to auditor independence as well as the overall ratio of audit to non-audit fees.
All assignments require advance approval, either by the Chair (or in his absence his alternate), under delegated authority for amounts under £250,000 plus VAT or, if larger, by the full Committee. This process is in addition to the requirement for all non-audit fees to be approved by the Banco Santander Audit Committee.
The fees for non-audit work performed by PwC in the year, which are disclosed in Note 7 to the Consolidated Financial Statements, mainly comprised audit-related assurance services relating to the review of interim financial information of Santander UK, reporting in connection with the group’s regulators and support of various debt issuance programmes. We ensured that these met the external and internal tests for maintaining their independence.
In 2019, PwC’s non-audit related fees were 22% of their total audit fees, well within the internal cap of 70% approved by the Committee.
Fees for non-audit work performed by PwC in the year, other than those in relation to audit related assurance services, were approximately 2% of the average of the fees approved for Deloitte, EY and KPMG.
The Committee considered the findings of the Competition and Markets Authority (CMA) market study into the UK Statutory Audit market and subsequent Business Energy & Industrial Strategy (BEIS) consultation as well as the Kingman independent review of the Financial Reporting Council and noted management’s responses to the CMA and BEIS consultations.
Internal controlsThe Board Risk Committee has overall responsibility for the effectiveness of the internal control systems. However, due to the nature of internal control matters, there is a degree of overlap in responsibilities with those of this Committee, particularly regarding financial reporting controls.
Section 404 of the Sarbanes-Oxley Act requires management to report on the design and effectiveness of its internal controls over financial reporting (ICFR) framework. During 2019, further enhancements have been introduced to the framework.
We considered the financial control environment in the year. Finance and our External and Internal Auditors provided regular reports to the Committee on ICFR, including key systems, and provided feedback on remediation and overall improvements required to ensure that the relevant controls were appropriately designed and operating effectively. This included access management, end user computing, controls over IFRS 9 and the Client Assets control environment.

Santander UK Group Holdings plc52
Annual Report 2019 | Governance
Disclosure in the Annual ReportWe received regular reports from the Disclosure Committee, a senior executive committee chaired by the CFO. Its remit is to advise the Committee on the completeness and accuracy of disclosures in Santander UK’s external reporting. This, together with other reports received in the year, and a review of best practice and the approach of our peers, enabled us to conclude that we were satisfied with the disclosures in this Annual Report.
Management also engaged the Board and Committee early on concerning the approach to the report which enabled them to provide input into the overall tone and messaging in a timely manner.
Fair, balanced and understandable The Disclosure Committee also reports on whether the Annual Report is fair, balanced, and understandable, aligns with the quarterly results and whether it provides the information necessary for readers to assess Santander UK’s position and performance, business model and strategy:
– Key messages remained consistent throughout the document, relating both to financial performance and progress against strategic priorities.
– All key judgements, significant risks and issues are reported and explained clearly and adequately.
– There is a clear framework to the document with good signposting and a complete picture of performance and events.
In addition to the above review process, the Committee’s assessment of fair, balanced and understandable is underpinned by the understanding it gains through the reporting made to it throughout the year of management judgements, internal control matters, Internal Audit activities and the reports of the External Auditors.
The Committee’s assessment also considers the robustness and outcomes of the assurance, review and verification processes conducted by management and considers whether the key risks reflected those that were of a concern to the Committee and were consistent with those reported by management.
Following our assessment we concluded that the 2019 Annual Report is fair, balanced and understandable.
Financial Reporting Council (FRC) Annual Review of Corporate Reporting 2019/20 In October 2019, the FRC issued a report which sets out its perspective on key developments for 2019/20 annual reports. As part of our oversight of this area, we received and reviewed a report from management on its work in respect of the areas of interest to the FRC. We are satisfied that management addressed the areas identified by the FRC in the preparation of this Annual Report to the extent appropriate to our ownership structure, including the requirement to incorporate a section 172 statement in the Strategic Report, which describes how the Board has had regard to a number of factors when working to promote the success of the business.
Alternative Performance Measures (APMs)This Annual Report includes a number of financial measures which are not accounting measures within the scope of IFRS.
Such non-IFRS measures are APMs and include financial measures of historical or future financial performance, financial position or cash flows that exclude or include amounts that would not be adjusted in the most comparable IFRS measures.
Management reviews these APMs in order to measure Santander UK’s overall performance, position and profitability, as well as to show business growth excluding ring-fence transfers, and believes that their presentation provides useful information to investors on the Santander UK group.
Definition of these APMs and, where such APMs are adjusted, reconciliations to the nearest comparable IFRS measures are presented in ‘Selected financial data’ in the ‘Financial review’ section.
We are satisfied that the APMs provide useful information to investors, and that management has clearly identified the APMs presented in this Annual Report and, where such APMs are adjusted, reconciled them to the nearest comparable IFRS measures.
Going Concern and ViabilityWe satisfied ourselves that it is appropriate to use the going concern basis of accounting in preparing the financial statements, supported by a detailed analysis provided to the Committee by senior finance management.
As part of the assessment, we considered whether there are sufficient financial resources, including liquidity and capital, available to continue the operations of Santander UK. We considered Santander UK’s resilience in the face of potential stress and prominent events. In making our assessment, we took into account all information of which we were aware about the future, which was at least, but not limited to, 12 months from the date that the balance sheet was signed.
The going concern assessment is further enhanced by the Viability Statement, in line with the UK 2018 Corporate Governance Code. This statement requires Directors to explain how they have assessed Santander UK’s prospects, over what period they have done so and why they consider that period appropriate.
The full disclosures are included in the Directors’ report and we have satisfied ourselves that a three-year time period for the viability statement remains appropriate. Although the determination of longer-term viability for banks is of greater inherent uncertainty, banks are already subject to extensive regulatory measures including having to meet minimum capital and liquidity requirements as well as having to carry out stress tests. A time period of three years remains consistent with our planning horizon and that covered by regulatory monitoring.
Board Audit Committee Chair’s report continued

53Santander UK Group Holdings plc
Strategic Report Governance Risk review Financial review Financial statements Shareholder information
Internal AuditThe Internal Audit plan, based on a comprehensive risk assessment, was presented in draft and then final form for challenge and approval by the Committee. The plan has been updated at regular intervals throughout the year in response to changes in the business and the regulatory environment and at the request of the Committee.
All unsatisfactory audit reports issued were subject to additional scrutiny by the Committee with the relevant business areas being required to present their action plans to the Committee.
We chose to invite management to present on progress with the implementation of Internal Audit’s recommendations, issues encountered, key milestones and key dependencies.
We received regular reports on audit recommendations from our Chief Internal Auditor (the Head of Internal Audit), quarterly Internal Audit reports and monitored findings as part of our oversight. We considered the total number of recommendations, the rationale for any of them becoming overdue, and broader root cause analyses. The Committee also requested that the Chief Internal Auditor highlight recommendations becoming due and any that were past due.
We noted a strong engagement between Internal Audit and the business in 2019.
We also oversaw the objective setting and performance evaluation of the Chief Internal Auditor.
Internal Audit External Quality AssessmentThroughout 2019, the Committee reviewed progress implementing the improvement opportunities identified in the External Quality Assessment of the Internal Audit function that was conducted in 2018. This review is conducted every five years and evaluates the Internal Audit function in respect of its conformance with the standards of the Chartered Institute of Internal Auditors (CIIA), as well as its performance and effectiveness in comparison to industry peers and good practice. The outcome of the review had been favourable with the function being compliant with the CIIA’s Guidance on Effective Internal Audit in Financial Services – Second Edition and also benchmarked well against peers.
WhistleblowingSantander UK recognises the importance of a culture where colleagues feel able to speak up.
In 2019, management continued to make improvements to its whistleblowing framework and arrangements under our oversight. This included management changes within the whistleblowing teams as well as a change of management reporting line from legal to conduct and compliance within the Legal & Regulatory function, further embedding of operating procedures, expanded data analytics capability, targeted training and a reporting line more closely aligned to that used by the Banco Santander group in its whistleblowing programme. There has been significant senior management engagement and expanded staff whistleblowing communications and awareness events.
The Committee is responsible for reviewing and monitoring the effectiveness of Santander UK’s whistleblowing procedures. It received and considered bi-annual reports on Santander UK’s whistleblowing arrangements. The reporting included oversight and progress of concerns, outcomes, identifiable trends, observable risks, the regulatory environment, changes to proposed legislation and activities to promote and enhance the arrangements to support the culture of speaking up. The Committee also reviewed the annual Whistleblowing Report prepared for the Board to consider. The Committee is satisfied that Santander UK has complied with the FCA and PRA regulations on whistleblowing in the year.
I continued to act as the Whistleblowers’ Champion to oversee the integrity, independence, and effectiveness of the whistleblowing arrangements. I remained focused on procedures and governance to prevent victimisation of those employees raising a whistleblowing concern. I meet regularly with management and I have been involved in overseeing the implementation of suggested enhancements to continuously improve the arrangements.
Effectiveness of the CommitteeThe Board has determined that I have the necessary qualifications and skills to qualify as a Board Audit Committee financial expert as defined in Item 16A of Form 20-F and by reference to the NYSE listing standards.
In respect of the Revised Statutory Audit Directive, the Board satisfied itself that at least one member of the Committee had competence in accounting and auditing, and the members of the Committee as a whole had competence in the banking sector, in which we are operating.
In my capacity as Committee Chair, I meet with key members of the management team and the External Auditors in advance of each Committee meeting. I ensure that the Committee meets with management, the Internal Auditors and the External Auditors in private sessions. I also attend meetings with the PRA, the FCA and the FRC.
In line with an assessment of the Committee’s forward-looking agenda and the Board programme, it has been agreed that the number of scheduled meetings of the Committee will be ten in 2020.
Terms of ReferenceThe Committee reviews its Terms of Reference annually. Following the 2019 review, they were revised primarily to reflect the requirements of ring-fencing. The Committee’s Terms of Reference are available at www.aboutsantander.co.uk
Priorities for 2020Areas of focus for the Committee for 2020 will include:
– Monitoring any likely financial impact and disclosure consequences of conduct and litigation related issues.
– The ongoing monitoring and reviewing of the operation of IFRS 9, including reviewing our enhanced disclosures in response to the recommendations of the PRA’s Taskforce on Disclosure about ECL.
– The financial control and reporting implications of any change in the economy, including any arising from economic or political risks including Brexit.
– Monitoring changes to the Resolvability Assessment Framework.
– Assessing the impact of the Financial Reporting Council’s Revised Ethical Standard (due to take effect from March 2020) on the work that can be undertaken by PwC.
– Monitoring the rotation of audit partners who have completed their term of service on the audit engagement team.
– Succession planning in respect of the Chief Internal Auditor role.

Santander UK Group Holdings plc54
Annual Report 2019 | Governance
Board Responsible Banking Committee Chair’s report
2019
2018
How we spent our time (%)
People
Regulation
Culture
Risk and control
Governance
Conduct and customer outcomes
2019 2018
10 15
25 15
15 20
15 15
10 10
25 25
Role and responsibilitiesThe purpose of the Committee is to strengthen focus on culture, conduct and customer outcomes. It monitors, challenges and supports actions taken by management to ensure that the business is run in a responsible way, in the interests of all of our stakeholders including customers, our people and communities in order to promote Santander UK’s long-term success.
The Committee supports the Board with shaping Santander UK’s culture, reputation and customer propositions through oversight of matters related to conduct, compliance, culture, diversity and inclusion, sustainability, corporate social responsibility, reputation, brand and financial crime. The oversight of financial crime includes anti-money laundering, sanctions, terrorist financing, anti-bribery and corruption and a key transformation programme of our controls and systems. In December, the Committee’s Terms of Reference were updated to include oversight of reputational aspects of climate change.
The Committee Chairs collaborate to prevent any gaps in coverage and to ensure that any areas of overlap are addressed in the appropriate forum. Committee Chairs are members of other Board Committees to ensure breadth of visibility and open channels of communication.
Overview of the yearIn 2019, the Committee considered, monitored and challenged a range of matters, including:
Customers and Customer OutcomesThe Committee focused on:
– Vulnerable customers; – Fair customer treatment and outcomes; – Fraud prevention and detection; – Themes arising from customer complaints, whistleblowing and satisfaction metrics, including referrals to the FOS;
– Changes to overdraft charges; – GDPR requirements; – Open Banking implementation; – Resourcing; and – Enhancing technology to support our customer contact colleagues.
Reputational riskThe Committee ensured that adequate and effective control processes were in place to identify and manage reputational risks.
It received and considered reports detailing ongoing and possible reputational, brand and franchise risks, including media and public policy issues. The reports also included any key decisions or key risk events that may give rise to reputational risk issues.
Financial crimeThe Committee:
– Received regular updates on Financial Crime from the Money Laundering Reporting Officer, including his annual report, and endorsed the proposed recommendations;
– Monitored progress of Santander UK in developing and implementing effective systems, processes and controls to combat financial crime;
The Committee supports the Board with oversight of culture, diversity and inclusion, reputation, customer outcomes and the wellbeing of our employees
We have challenged management on delivering appropriate financial crime controls, managing regulatory change and maintaining focus on continuously improving our customers’ experiences.
Scott WhewayResponsible Banking Committee Chair 2 March 2020
Responsibilities of the CommitteeRead more on p38
Committee membership and attendanceRead more on p64

55Santander UK Group Holdings plc
Strategic Report Governance Risk review Financial review Financial statements Shareholder information
– Received regular updates on financial crime from the retail and corporate businesses; and
– Reviewed potential financial crime risks and any actions required in response, including in respect of international sanctions compliance.
Conduct and ComplianceThe Committee:
– Ensured that adequate and effective control processes and policies were in place to manage and measure Conduct and Compliance risk;
– Considered key emerging Conduct and Compliance risk issues, lessons learned and anticipated risks via horizon scanning and investigations;
– Received first and second line reporting against Conduct and Compliance risk metrics and reports on conduct-related regulatory interaction matters;
– Considered the FCA Firm-Wide Evaluation and appropriate response plans;
– Considered the 2019 Compliance Programme, including resourcing in the 2019 Compliance Monitoring Plan; and
– Considered any actions in response to regulatory developments, including individual and market developments, on Conduct and Compliance risk matters which may have a material impact on the business.
People and CultureThe Committee:
– Received regular updates on culture, including risk culture, as part of an holistic culture update;
– Considered thematic culture and conduct trends, including management-identified cultural drivers, changes in policy and working practices;
– Monitored the culture strategy and management efforts to embed and maintain the desired culture throughout the business in line with the Company’s purpose, vision, values and the nine Santander behaviours;
– Reviewed programmes relating to the responsible treatment of employees, including diversity and inclusion and wellbeing;
– Monitored the approach to diversity and inclusion, including progress against gender targets to support reducing the gender pay gap; and approved the approach to increasing senior level BAME representation; and
– Reviewed key themes arising from employee surveys, focus groups and people metrics in order to evaluate the impact on conduct, brand and culture, including the external Banking Standards Board Assessment and the internal Global Engagement Survey results.
Brand, Sustainability and Corporate Social ResponsibilityThe Committee:
– Considered and guided on brand purpose; – Considered the reputation of Santander UK and how reputational risk impacts its brand and market positioning;
– Received updates on reputation tracker metrics; and
– Monitors the embedding of Sustainability and Corporate Social Responsibility in our business strategy and helps the bank deliver value to all stakeholders, protecting its reputation and brand. It also oversees alignment to international frameworks, such as the Sustainable Development Goals and the UN Principles for Responsible Banking.
Committee membershipAll five members of the Committee, including the Chair, are Independent Non-Executive Directors. A list of members, details of their experience, qualifications and attendance at Committee meetings during the year are shown in the Board of Directors section.
In addition to the Committee members, during 2019, regular attendees at Committee meetings included the Board Chair, Chief Executive Officer, Chief Legal and Regulatory Officer, Chief Risk Officer, Head of Retail and Business Banking, Chief HR Officer, Director of Corporate Communications and the Director of Conduct and Compliance.
Committee’s Effectiveness ReviewAn internal review of the Committee’s effectiveness during 2019 will take place during the first quarter of 2020 to provide the feedback mechanism for continuous improvement and to keep areas for development in focus.
Terms of ReferenceIn December 2019, the Committee adopted updated Terms of Reference following the annual review of its role and responsibilities. The Committee’s Terms of Reference are available at www.aboutsantander.co.uk.
Priorities for 2020In 2020, the Committee will continue to take an holistic approach to gain greater understanding and oversight of all of the key areas that contribute to the experiences of our customers, our people and wider stakeholders.
Key priorities will be: – Enforcement of Financial Crime and Fraud prevention;
– Monitoring the delivery of the Financial Crime Transformation Programme;
– Oversight of the wide ranging programme of Regulatory change, including timelines, complexity, customer impact and outcomes;
– Enhancement of fraud prevention; – Monitoring reputational risks; – Ensuring the highest standards of conduct and fair outcomes for our customers;
– Oversight of the impact of digital transformation of the UK banking landscape on our people, customers and wider stakeholders;
– Monitoring Sustainability initiatives, embedding, measurement and reporting progress; and
– Oversight of management efforts to embed and maintain the desired culture through the cultural priorities of supporting transformation through simplification, driving a learning culture and being an inclusive and responsible organisation.
Santander UK’sResponsible
BankingCommittee
Franchise &
Reputation
Co
nd
uct
CustomerBrand
Pro
po
siti
on
People
Culture

Santander UK Group Holdings plc56
Annual Report 2019 | Governance
Board Remuneration Committee Chair’s Report
I am pleased to present the Directors’ Remuneration Report for 2019. Santander UK continues to undergo significant transformational change, following ring-fencing and other strategic priorities. Against this backdrop, the role of the Committee evolved in 2019.
Role and responsibilityThe purpose of the Committee is to maintain oversight of the over-arching remuneration policies and frameworks for the Santander UK group. The Committee is also responsible for the remuneration arrangements of employing entities outside the Ring-Fenced Bank (Santander UK plc) perimeter.
The remuneration activities of the Ring-Fenced Bank are now governed by the Santander UK plc Board Remuneration Committee. More information is set out in the Santander UK plc Annual Report, which does not form part of this Annual Report.
Overview of the year Through its monitoring and challenging of remuneration matters, the Committee delivered the following outcomes:
– Strengthened and continued to embed the regulated remuneration governance framework across the Santander UK group.
– Taking account of financial and non-financial performance achieved during the year, in conjunction with the assessment of future risks, the Committee also approved the overall bonus pool for Santander Financial Services plc.
Committee membershipDuring 2019, there was no change to the Committee’s membership. From 1 January 2020, due to refinements in our ring-fence governance model, Scott Wheway took over as Chair of the Committee, and Genevieve Shore and Annemarie Durbin left the Committee to remain on the Board Remuneration Committee of the Ring-Fenced
Bank, of which Annemarie remains Chair. The Committee is satisfied that its composition and operation complies with our ring-fencing obligations.
Effectiveness of the CommitteeThe Committee has a process to solicit feedback at the end of each meeting in the spirit of continuous improvement. An internal review of the Committee’s effectiveness during 2019 will take place during the first quarter of 2020, to provide the feedback mechanism for continuous improvement and to keep areas for development in focus.
Terms of referenceThe terms of reference were reviewed and revised during the year to reflect the scope of the Committee’s role with respect to colleagues within and outside the Ring-Fenced Bank. Full terms of reference are available at www.aboutsantander.co.uk.
Priorities for 2020 – Continue to review and monitor remuneration policies and frameworks across the Santander UK group.
– Continue to comply with ring-fencing obligations, ensuring adherence to the operational parameters in the terms of reference of the Committee and Santander UK plc’s Board Remuneration Committee.
The objective is to ensure that remuneration practices are aligned to Santander UK’s strategic priorities and reinforce the right culture and behaviours by our colleagues.
Following ring-fencing, the Committee remains dynamic in its approach, as we continue to enhance remuneration governance to reflect our evolving strategy, control environment and the latest governance developments in the UK.
Scott WhewayBoard Remuneration Committee Chair 2 March 2020
Responsibilities of the CommitteeRead more on p38
Committee membership and attendanceRead more on p64
How we spent our time (%)
People
Regulation
Culture
Risk and control
Governance
Conduct
2019 2018
28 30
29 30
– –
12 10
22 20
9 10
2019
2018

57Santander UK Group Holdings plc
Strategic Report Governance Risk review Financial review Financial statements Shareholder information
Basis of preparationThis report has been prepared on behalf of the Board by the Board Remuneration Committee. We comply with the statutory reporting obligations for large private companies. In addition, we follow the UK Corporate Governance Code 2018 (the Code) and other listed disclosure requirements to the extent considered appropriate given our
ownership structure, save for some factors. These relate to remuneration policy (see below with regard to post-employment shareholdings) and certain descriptions of the Committee’s work as provided under provision 41. Accordingly, several voluntary disclosures relating to remuneration have been presented in this report.
Forward-looking remuneration policy for Executive DirectorsOur forward-looking remuneration policy is outlined below. Remuneration is structured into two main elements: fixed pay and variable pay. Fixed pay is set at market competitive levels appropriate for the role so that inappropriate risk taking is not encouraged. Variable pay rewards the delivery of financial targets, key strategic priorities and individual performance.
Remuneration policy report
Executive Directors’ remuneration structure
Fixed Pay Principle and description Policy
Base salary – To attract and retain Executive Directors of sufficient calibre and with the requisite skills to deliver the strategy taking into account the demands and complexity of the role.
– Base salaries are normally reviewed annually. In reviewing base salaries the Committee considers a number of factors, including:
– The skills and responsibilities of the role alongside the market value of these attributes;
– Set at a level to avoid inappropriate risk taking; – Base salary increases awarded across the wider employee population; and
– Prevailing market and economic conditions.
Pension arrangements
– To provide a discrete element of the package to contribute towards retirement.
– All Executive Directors receive a cash allowance in lieu of pension. – Unless determined otherwise, pension arrangements for new appointments to the Board will be in line with the average level of pension provision available to the broader workforce, currently 9% of salary.
– Our approach to current Executive Director pension allowances is set out on page 58.
Other benefits – Benefits are offered to Executive Directors as part of a competitive remuneration package and to support the wellbeing of employees.
– Including but not limited to: private medical insurance for Executive Directors and their dependants, life assurance, health screening, relocation allowances and expatriate allowances where relevant.
– Access to Santander UK’s all-employee share schemes on the same terms as all UK employees.
Variable Pay Principle and description Policy
Variable pay plan – To motivate Executive Directors to achieve and exceed annual financial and strategic targets within Santander UK’s Risk Appetite and in alignment with our business strategy and values.
– Multi-year deferral, further performance testing and delivery in Banco Santander SA shares aligns Executive Directors’ interests to the long-term interests of Santander UK.
– Deferral of part of the award is applied in accordance with the requirements of the PRA Remuneration Code.
– Awards are discretionary and determined by reference to performance against a scorecard of financial and strategic goals based on Company and individual performance.
– 40% of the bonus awarded is paid upfront after the performance year ends (year one), delivered half in cash and half in shares.
– 60% of the bonus awarded is deferred and delivered in equal tranches over years three to seven, with each tranche delivered half in cash and half in shares.
– For Executives, the first three of five deferred award tranches are subject to further performance testing, which may reduce the level of payout, but not increase the deferred award.
– Share based awards are subject to a minimum twelve-month retention period following the relevant vesting date.
– Malus and clawback provisions apply to variable pay for up to ten years following the grant of an award.
– The structure of variable pay awards ensures that Executives acquire a meaningful shareholding in Banco Santander SA which may extend for a significant period post-employment. As such, a formal post-employment shareholding requirement is not in place at this time.

Santander UK Group Holdings plc58
Annual Report 2019 | Governance
Remuneration policy report continued
Our remuneration policy continues to meet regulatory requirements. Santander UK applies a 2:1 variable to fixed pay cap in line with approvals granted to Banco Santander SA. For control function colleagues, a lower operational ratio of 1:1 is applied, save for in exceptional circumstances.
Executive remuneration policies and principlesOur core values of Simple, Personal and Fair drive our remuneration policy. We focus on delivering a reward framework that is simple to understand, tailored to individual roles and competitive yet fair.
The key drivers of our Remuneration PolicyAlignment to culture
– To design policies aligned to the long-term success of the business which support the delivery of our strategy and reinforce our values.
– To base variable pay on a balanced scorecard of quantitative and qualitative metrics which reflect our KPIs across Customers, Shareholders and People. For 2020, Communities has been re-introduced into the bonus scorecard (previously considered as part of risk adjustment). This ensures that our day-to-day activities align with Santander UK’s over-arching strategy and our aim of being the best bank.
Simplicity – To ensure our approach to remuneration is transparent and easily understood.
– To operate simple and clear structures for all Santander UK colleagues.
Risk – To apply a consistent approach to reward for all our employees which upholds our prudent approach to Risk Appetite set as part of a Santander UK-wide Risk Framework. Risk adjustment occurs at both an individual and bonus pool level.
– To provide a balanced package between fixed and variable pay, and short-term and long-term pay horizons to align with our strategic goals whilst promoting prudent risk management.
– To ensure remuneration is compliant with applicable regulations and legislation.
Fairness – To take into account an assessment of the Executive Director’s performance against a performance management framework set at the start of the year covering a range of financial, non-financial, quantitative and qualitative criteria.
– To set robust and stretching targets which reward exceptional performance.
– To attract, retain and motivate employees of the highest calibre by providing total remuneration which reflects individual and Company performance, is competitive, reflects the responsibilities of the role and drives the organisation’s growth.
– To consider wider employee pay when determining pay of our Executives.
ClarityThe Committee reviews remuneration reporting on an annual basis against principles of best practice and developments in corporate governance, including the Code. Our reporting is designed to be transparent to promote effective stakeholder engagement but reflective of our subsidiary structure.
PredictabilityThe Committee reviews the variable pay opportunity for individuals annually and the basis of the pool calculation. However, due to commercial sensitivity, these are not disclosed as per the requirements of the Code. Directors’ remuneration is within the variable pay cap as approved by Banco Santander SA shareholders and set out above on this page.
Executive Director pension alignmentIn 2018, following developments in corporate governance and best practice, the Committee took the decision to reduce pension allowances for new Executive Directors to 9% of salary, in line with the wider workforce average. This pension level applied on the appointment to the Board of Susan Allen, Head of Retail and Business Banking, on 1 January 2019 and Duke Dayal, Chief Financial Officer, on 16 September 2019.
In 2019, the Committee decided to extend this approach to existing Executive Directors, namely the Chief Executive Officer. This reduction shall be phased with the Chief Executive Officer’s allowance reducing from 35% to 22% of salary, effective 1 January 2020. From 1 January 2021, the Chief
Executive Officer’s pension will be reduced further to the employee average of 9% of salary p.a.. No other changes to the Chief Executive Officer’s remuneration are proposed for 2020.
On recruitmentWhen appointing a new Executive Director, base salary is set at a market competitive level appropriate for the role, taking into consideration a range of factors including scope and responsibilities of the role, internal relativities, the individual’s previous remuneration, relevant experience, and an assessment against relevant comparator groups and cost.
Unless determined otherwise, any new Executive Director will receive a pension allowance in line with the wider workforce average, being 9% of salary. Benefits available will typically be aligned to the wider employee population.
Other elements of remuneration will be established in line with the Remuneration Policy, set out in the Executive Directors’ remuneration structure table on page 57.
Relocation support and international mobility benefits may also be provided. Where provided, relocation assistance will normally be for a capped amount and/or limited time. For an overseas appointment, the Committee will have discretion to offer cost effective benefits and pension provisions which reflect local market practice and relevant legislation.
Buy-out awardsCompensation may be provided to Executive Directors recruited externally for the forfeiture of any award on leaving their previous employer. The Committee retains discretion to make such compensation as deemed appropriate to secure the relevant Executive Director’s employment and ensure any such payments align with the long-term interests of Santander UK and the prevailing regulatory framework.
Such payments will be in line with the benefits foregone from leaving the previous employer taking into account value, vesting dates and the extent to which performance conditions applied to the original awards.

59Santander UK Group Holdings plc
Strategic Report Governance Risk review Financial review Financial statements Shareholder information
Service agreementsTerms and conditions of employment are set out in individual service agreements which include a notice period of six months from both the Executive Director and the Company.
The agreements may be terminated immediately with payment of fixed pay in lieu of notice. In the event of termination for gross misconduct, neither notice nor payment in lieu of notice is required, and any deferred awards are forfeited.
Termination paymentsThe impact on remuneration of an Executive Director leaving the Company under various scenarios reflects the service agreements, the relevant scheme rules, and the Committee’s policy in this area.
With respect to outstanding variable pay awards, these generally lapse on termination, other than where an individual is considered a ‘good leaver’. The Committee determines whether an Executive Director is a good leaver under certain circumstances including but not limited to: injury, ill-health, disability, redundancy, retirement, death, or any other reason at the Committee’s discretion.
There is a framework in place which is intended to guide the Committee to determine the discretionary circumstances when good leaver status is appropriate. Other than a payment in the event of redundancy, there are generally no other payments upon termination of employment for Executive Directors.
In the event of a change in control, variable pay awards may continue to be paid in respect of the full financial year (pre and post change of control), or an award may be made in respect of the portion of the year that has elapsed at the point of change in control. Exceptionally the Committee may exercise its discretion to waive pro-rating. In the event of a change in control, outstanding share awards may lapse and be replaced with equivalent awards over shares in a new company, subject to Committee discretion. Alternatively, outstanding awards may vest on a change in control, subject to the assessment of performance and pro-rating of awards where appropriate.
Risk and Performance adjustmentWe continue to ensure that the requirements of the Remuneration Code on risk and performance adjustment are met for our employees. All variable remuneration is subject to adjustment for current and future risks through our Additional Risk Adjustment Standard which is linked to our Board approved Risk Appetite.
Our Additional Risk Adjustment Standard (the Standard) provides both a formula-based assessment against Santander UK’s Risk Appetite and an additional qualitative risk event assessment overlay that can reduce the bonus pool or individual awards to nil at the Committee’s discretion. The Standard also considers a range of factors deemed relevant by the Committee such as evolution of complaints, progress on remediation projects, ring-fencing compliance and people, culture and communities metrics. Given commercial sensitivity, the Committee does not provide annual detail on the application of discretion as required by the Code.
Our Individual Remuneration Adjustment Standard provides a framework for the process, governance and standards relevant for decisions in relation to individual performance adjustments following an incident, including the application of malus and clawback.
Performance adjustments may include, but are not limited to:
– Reducing a bonus for the current year; – Reducing the amount of any unvested deferred variable remuneration;
– Requiring a bonus which has been awarded (but not yet paid) to be forfeited; and
– Requiring repayment on demand (on a net basis) of any cash and share awards received at any time for a period of up to ten years following the date of award.
The Committee has full discretion to prevent vesting of all or part of an amount of deferred remuneration and/or to freeze an award during an ongoing investigation in a number of circumstances, including:
– Employee misbehaviour or material error; – Material downturn in the performance of Santander UK or a relevant business
unit’s performance; – Santander UK or a relevant business unit suffers a material failure of risk management;
– Significant changes in Santander UK’s economic or regulatory capital base and the qualitative assessment of risk; and
– Material restatement of the Santander UK’s financial statements (except when required due to modification of the accounting rules).
When determining variable pay awards for individuals performing roles across Santander UK plc and Santander UK Group Holdings, the Holdings Remuneration Committee will apply any necessary discretion based on factors related to UK Group entities outside of Santander UK plc. This discretion is subject to validation by the Santander UK plc Remuneration Committee.
The Committee seeks input from the Chair of the Board Risk Committee, Chief Risk Officer, Chief Legal and Regulatory Officer, Chair of the Board Audit Committee, Chief HR Officer, Chair of the Board and Chief Internal Auditor when determining whether any performance or risk adjustments are required.
Policy for all employees Our performance, reward and benefits approach across the Company supports and drives our business strategy, rewards strong performance and reinforces our values within the approved risk management framework. The general principles of the Remuneration Policy broadly apply across all colleagues where appropriate and are designed to facilitate recruitment, motivation and retention whilst driving performance.
The composition of remuneration packages for the Executive Directors is aligned with the broader colleague population, comprising salary, pensions and benefits and eligibility for discretionary variable pay dependent on role and responsibility. The level of pension allowance for newly appointed Executives is aligned with the average employer contribution for the wider workforce.
The Committee annually approve the operation of all of our variable reward schemes for our customer-facing colleagues to ensure that all our plans reward appropriate behaviour and do not incentivise unnecessary risk taking.

Santander UK Group Holdings plc60
Annual Report 2019 | Governance
Remuneration implementation report
IntroductionThis section of the report outlines how our Remuneration Policy was implemented for 2019.
Variable Pay PlanTo incentivise and reward Executive Directors for achieving superior and sustained performance, our Directors participate in a single variable incentive plan. A balance of financial and non-financial performance metrics are selected annually by the Committee and are aligned with our strategy as measured over the financial year. Multi-year deferral, further performance testing and delivery in Banco Santander SA shares ensures that Executive Directors’ interests are aligned to the long-term interests of the business. Both upfront and deferred awards are made half in cash and half in shares. The deferred element is delivered over seven years, with the first three deferred tranches of awards subject to further performance testing against long-term metrics which can reduce but not increase the level of awards. Awards delivered in shares are subject to an additional one-year retention period from the point of delivery.
The structure of the plan is illustrated below. The 2019 Variable Pay Plan pool was determined based on a range of metrics using a balanced scorecard approach as follows:
Quantitative assessmentA quantitative assessment is undertaken against a balanced scorecard of financial and non-financial metrics that are key to Santander UK’s 2019 strategy:
– Customers (Net Promotor Score and loyal customers)
– Shareholders – Risk (Cost of credit ratio and Stage 3 ratio) – Capital (Contribution to Banco Santander group capital)
– Profitability (Net profit and RoTE) – Employees (Employee Engagement).
Performance metrics are reviewed annually to ensure continued alignment with KPIs and strategy.
Qualitative assessment A qualitative assessment adds context to the quantitative assessment and ensures a balanced view of performance has been made.
Banco Santander Group Multiplier The Committee has the discretion to adjust the pool upwards or downwards to reflect overall Banco Santander performance if appropriate.
Exceptional AdjustmentIntended to cover unexpected factors or additional targets not covered by the quantitative or qualitative assessments. This may also include adjustments not covered in the qualitative assessments, including major risk events. No exceptional metrics were applied to the 2019 variable pay awards.
UK-focused risk adjustment Linked to Santander UK’s Risk Appetite, this provides both a formula-based assessment against Risk Appetite and an additional qualitative risk event assessment overlay (including consideration of people, culture, contribution to communities, conduct and other relevant factors) that can result in a downward risk adjustment of up to 100% of the bonus pool or individual awards at the discretion of the Committee.
The Committee has considered, reviewed and approved changes required to remuneration governance and frameworks in order to comply with the relevant regulatory rules, including for ring-fencing and these have applied from the 2019 performance year.
Deferred long-term awardsThe payment of the first three deferred tranches of the 2019 awards (36% of the total award), payable in 2023, 2024 and 2025, is conditional on the achievement of long-term objectives measured over the three-year period 2020 to 2022. The performance measures for 2019 awards are EPS, relative TSR and compliance with the fully-loaded Common Equity Tier 1 (CET1) capital. Following performance assessment, the level of awards will be adjusted accordingly. The measures can reduce but not increase the value of the deferred awards. The payment of the final two deferred tranches (24% of the total award), payable in 2026 and 2027 are subject to continued employment only.
Ye
ars
2019 2020 2021 2022 2023 2024 2025 2026 2027
100%variable
rem.
40%
12% 12% 12% 12% 12%
Upfront award
Deferral subject to long-term performance (2020-2022) (recovery provisions apply)
Deferral (recovery provisions apply)
Shares (subject to retention period)
Cash
Deferral profile

61Santander UK Group Holdings plc
Strategic Report Governance Risk review Financial review Financial statements Shareholder information
Executive Directors’ remuneration Total remuneration of each Executive Director for the years ended 31 December 2019 and 2018.
Executive rewards Nathan Bostock(3) Susan Allen(4) Antonio Roman(5) Duke Dayal(6) Total
2019£000
2018£000
2019£000
2018£000
2019£000
2018£000
2019£000
2018£000
2019£000
2018£000
Salary and fees 1,680 1,680 800 – 378 629 277 – 3,135 2,309
Taxable benefits (1) 56 50 3 – 22 5 504 – 585 55
Pension 588 588 72 – 95 157 25 – 780 745
Total fixed pay 2,324 2,318 875 – 495 791 806 – 4,500 3,109
Bonus (paid and deferred) (2) 1,990 2,317 859 – 693 1,077 354 – 3,896 3,394
Total remuneration 4,314 4,635 1,734 – 1,188 1,868 1,160 – 8,396 6,503
(1) Taxable Benefits for the Executive Directors comprises a range of benefits including private health care, life and critical illness cover, health insurance, car allowance and relocation allowances where applicable. Included in the benefits figure for Duke Dayal is a relocation allowance of £500,000.
(2) The bonus value shown is the total variable pay award made in respect of 2019. As set out in this report, a portion of this award (36% of the value shown) is subject to further performance testing which may reduce, but not increase, the value delivered.
(3) As detailed in the Remuneration Policy report, the pension contribution received by Nathan Bostock will be reduced from 35% to 22% of salary, effective 1 January 2020 and to 9% of salary effective 1 January 2021.
(4) Susan Allen was appointed as an Executive Director on 1 January 2019 and resigned on 31 December 2019 from the Board of Santander UK Group Holdings plc. She remains an executive director of Santander UK plc.
(5) Antonio Roman left the Board on 15 September 2019 and returned to a Group role with Banco Santander. His remuneration is shown in respect of his service in the UK. (6) Duke Dayal was appointed as an Executive Director on 16 September 2019 and his remuneration is shown from this date.
Relative importance of spend on pay
2019£m
2018£m
Change%
Profit before tax 981 1,567 -37%
Total employee costs 1,288 1,376 -6%
2019 Business Performance and Impact on RemunerationSantander UK delivered a strong balance sheet in 2019 despite results being impacted by a challenging banking environment. Whilst competitive pressures on mortgages and PPI charges coupled with continued investment in our transformation programme impacted on profit, we are continuing to support customers whilst growing and operating a sustainable business. Santander UK achieved its strongest net mortgage growth in a decade, reinforcing its position as the UK’s third largest mortgage lender. Our drive to deliver tailored products and customer service with an enhanced digital offering was reflected in the growth of customer deposits.
The Committee approved payments to Executive Directors under the Santander UK Variable Pay Plan in the context of this performance.
In addition the Committee confirmed that the remuneration policy operated as intended, demonstrating pay for performance alignment.
Context for decision making The Committee ensures that broader remuneration policies and practices for employees across the Santander UK group are taken into account when setting the policy for Executive Director remuneration. The Committee annually reviews remuneration trends across the Santander UK group including the relationship between Executive remuneration and the remuneration of other Santander UK group employees as well as remuneration in the wider UK market when making decisions on Executive pay.
The Committee oversees the broader workforce remuneration policies and practices, the implementation of remuneration and related employment policies across the Santander UK group and the salary and variable pay awards for all MRTs. It also approves the design of any material performance-related pay plans.
As part of the monitoring of pay, the following is considered:
– Santander UK’s engagement with its recognised trade unions on matters relating to pay and benefits for all employees;
– Annual pay reviews for the general employee population;
– Santander UK group-wide pension and other benefit provisions;
– The design of and overall spend on variable incentive arrangements; and
– An assessment of conduct across the business.
The Committee is focused on ensuring that employees are not unduly stretched or inappropriately incentivised. This is monitored using existing employee engagement indicators via the Global Engagement Survey, and The Santander Way survey which provides an indication of our progress in performance against the nine Santander behaviours.
Stakeholder views During 2019, Santander UK continued to engage with key stakeholders on remuneration related matters including its main regulators the PRA and FCA.
Employee opinion surveys are undertaken annually on employee engagement, and discussion on remuneration matters generally takes place with union representatives during the annual pay review cycle and on relevant employee reward matters. The Committee receives updates on these discussions during the year.

Santander UK Group Holdings plc62
Annual Report 2019 | Governance
CEO pay ratio
CEOPay
25thPercentile Median
75thPercentile
2019 pay ratio 183.1 132.1 77.3
Total salary £ 1,680,000 20,030 26,368 42,708
Total pay £ 4,313,993 23,562 32,662 55,786
(1) Employee pay is calculated based on ‘Methodology A,’ calculating a comparable single figure for each employee, as set out in the reporting requirements. (2) Employee pay data is based on full time equivalent pay for Santander UK plc employees at 31 December 2019. This excludes a small number of employees in the rest of the
Santander UK Group. Including those employees’ results in a ratio consistent with the above. For each employee, total pay is calculated based on fixed pay accrued during the financial year whilst variable pay is based on the previous financial year (i.e. paid in 2019 in respect of 2018 performance).
(3) The CEO’s total remuneration is aligned to that disclosed in the Executive Directors’ remuneration table on the previous page.
CEO pay ratio Santander UK is committed to delivering fair pay which attracts, retains and motivates employees of the highest calibre across all grades. In line with this commitment, the Remuneration Committee has oversight of compensation across the organisation, including pay ratios, and considers fair pay when determining reward outcomes. For the first time this year, Santander UK is voluntarily disclosing the pay ratio of the CEO’s total remuneration to the remuneration of UK employees.
In assessing the pay ratio, the Committee is confident that the Company’s policy on remuneration is fair and that improvements to pay progression will continue to ensure that lower paid colleagues receive a greater share of pay awards. A summary of our approach to Fair Pay is included on page 28.
Advice and support provided to the Committee As permitted by its Terms of Reference, the Committee has engaged the advice and support of Deloitte LLP (Deloitte) as independent remuneration consultants at the expense of the Company. Total fees (excluding VAT) for advice and support provided to the Committee during 2019 were £157,500 (2018: £192,600). Deloitte is a founding member of the Remuneration Consultants Group and voluntarily operates under the Code of Conduct in relation to Executive remuneration consulting in the UK.
The Committee is comfortable that the Deloitte engagement partner and team that provides remuneration advice to the Committee do not have connections with Santander UK that may impair their independence.
regulatory expectation of Non-Executive Directors and the associated time commitment, targeted increases to Non-Executives’ fees were awarded. The Non-Executive Directors base fee was increased from £90,000 to £95,000 and the fee for the Senior Independent Director fee increased from £30,000 to £35,000. Targeted increases were made to the Board Risk Committee Chair fee and membership fee, each increased by £5,000 to £65,000 and £30,000 respectively. No other changes to fees were made during the year.
All Non-Executive Directors and the Chair serve under letters of appointment and either party can terminate on three months’ written notice, except in the case of the Chair where twelve months’ written notice is required.
Neither the Chair nor the Non-Executive Directors have the right to compensation on the early termination of their appointment beyond payments in lieu of notice at the option of Santander UK. In addition, neither the Chair nor the Non-Executive Directors are eligible for pension scheme membership, bonus or other incentive arrangements.
In 2019, Deloitte also provided unrelated tax, financial and advisory, risk, assurance and consulting services to Santander UK.
The Chair, Chief Executive Officer, Chief HR Officer, Performance & Reward Director, Company Secretary, Chair of the Board, Chair of the Board Audit Committee, Chief Legal and Regulatory Officer and Chief Risk Officer attended Committee meetings by invitation in order to support the discussion of the agenda items as appropriate. The Committee Chair also engages with the Chair of the Board Risk Committee when required. No individual participates in discussions regarding their own remuneration.
Chair and Non-Executive Director remunerationThe Chair’s fee is reviewed and approved by the Committee. The fees paid to Non-Executive Directors are reviewed and approved by the Chief Executive Officer and the Chair. Fees are reviewed annually taking into account the market rate and time commitment for the role. The Chair is paid an all-inclusive base fee. Non-Executive Directors are paid a base fee, with a supplement for serving on or chairing a Board Committee. Group Non-Executive Directors do not receive fees in respect of their Santander UK duties.
An increase to the Board Chair’s fees of 3.8% was approved in 2019. This reflects the increased complexity of the role, particularly in the context of Banking Reform, greater time commitment and that no increase has been awarded since her appointment in 2015. Additionally, in recognition of the increasing
Remuneration implementation report continued

63Santander UK Group Holdings plc
Strategic Report Governance Risk review Financial review Financial statements Shareholder information
Chair and Board Committee member fees
Fees effective from 1 May 2019
Non-Executive DirectorsBoard£000
BoardNomination Committee
£000
BoardRisk
Committee£000
BoardAudit
Committee£000
BoardResponsible
Banking Committee
£000
BoardRemuneration
Committee£000
Chair (inclusive of membership fee) 675 – 65 60 60 60
Senior Independent Director 35 – – – – –
Member 95 – 30 25 25 25
2019 Fees£000
2018 Fees
£000
2019Expenses
£000(6)
2018Expenses
£000
2019Benefits
£000
2018Benefits
£000
2019 Total£000
2018 Total£000
Chair
Shriti Vadera (1) 667 650 – – 22 17 689 667
Independent Non-Executive Directors
Garett Curran (2) 114 – 2 – – – 116 –
Annemarie Durbin (7) 222 200 – – – 222 200
Ed Giera 207 200 29 – – 236 200
Chris Jones 207 200 – 3 – – 207 203
Genevieve Shore (7) 197 198 3 1 – – 200 199
Scott Wheway 240 230 8 2 – – 248 232
Julie Chakraverty(3) 58 92 – 1 – – 58 93
Banco Santander nominated Non-Executive Directors(4)
Ana Botin – – – – – – – –
Lindsey Argalas – – – – – – – –
Bruce Carnegie-Brown (5) – – – – – – – –
Dirk Marzluf (2) – – – – – – – –
Gerry Byrne (7) – – – – – – – –
Total 1,912 1,770 42 7 22 17 1,976 1,794
(1) As detailed above, 2019 full year fees for the Board Chair reflect the increase on 1 May 2019 from £650,000 to £675,000. Shriti Vadera was entitled to taxable benefits as follows: private medical cover of £626 (2018: £733) and transportation of £20,752 (2018: £15,931).
(2) Garrett Curran and Dirk Marzluf were appointed on 7 May 2019 and resigned on 31 December 2019 from the Board of Santander UK Group Holdings plc. Fees received are in respect of services from this date.
(3) Julie Chakraverty and Lindsey Argalas resigned on 7 May 2019. Fees received are in respect of services to this date. (4) None of the Banco Santander nominated Non-Executive Directors received any fees or expenses, except as shown.(5) Bruce Carnegie-Brown was appointed on 16 September 2019. (6) Directors’ expenses are disclosed above in relation to the period in which they were accrued. 2018 expenses have been restated to reflect this approach. Expenses for Ed Giera
include international travel as he does not reside in the UK.(7) Annemarie Durbin, Genevieve Shore and Gerry Byrne resigned on 31 December 2019 from the Board of Santander UK Group Holdings plc. Annemarie Durbin’s fees include
£15,000 in relation to her services as Chair of Cater Allen Ltd.(8) The 2018 total shown above has been restated to reflect the fees received by those directors who served in 2019.

Santander UK Group Holdings plc64
Annual Report 2019 | Governance
Board and Committee membership and attendance
BoardNomination Committee
Risk Committee
Audit Committee
Responsible Banking Committee
Remuneration Committee
Scheduled meetings attended
Ad hoc meetings attended
Scheduled meetings attended
Ad hoc meetings attended
Scheduled meetings attended
Ad hoc meetings attended
Scheduled meetings attended
Ad hoc meetings attended
Scheduled meetings attended
Ad hoc meetings attended
Scheduled meetings attended
Ad hoc meetings attended
Chair Shriti Vadera 8/8 3/3 6/6 2/2 – – – – – – – –
Independent Non-Executive Directors
Julie Chakraverty(1) 3/3 0/0 – – 3/3 0/0 3/3 0/0 2/2 0/0 – –
Garrett Curran(2) 5/5 3/3 – – 6/6 0/0 6/6 0/0 3/3 0/0 – –
Annemarie Durbin(3) 8/8 3/3 – – 7/9 0/0 – – 5/5 0/0 6/6 2/2
Ed Giera 8/8 3/3 – – 9/9 0/0 9/9 0/0 5/5 0/0 – –
Chris Jones(4) 8/8 3/3 – – 9/9 0/0 9/9 0/0 – – 6/6 2/2
Genevieve Shore(5) 7/8 3/3 – – 8/9 0/0 8/9 0/0 5/5 0/0 5/6 2/2
Scott Wheway(6) 8/8 2/3 6/6 2/2 8/9 0/0 – – 5/5 0/0 5/6 2/2
Banco Santander nominatedNon-Executive Directors
Lindsey Argalas(7) 2/3 0/0 – – – – – – – – – –
Ana Botín 5/8 1/3 2/6 0/2 – – – – – – – –
Gerry Byrne(8) 7/8 1/3 – – – – – – – – – –
Bruce Carnegie-Brown(9) 3/3 0/0 – – – – – – – – – –
Dirk Marzluf(10) 5/5 3/3 – – – – – – – – – –
Executive Directors
Nathan Bostock 8/8 3/3 – – – – – – – – – –
Susan Allen(11) 8/8 3/3 – – – – – – – – – –
Duke Dayal(12) 3/3 0/0 – – – – – – – – – –
Antonio Roman(13) 5/5 2/3 – – – – – – – – – –
(1) Resigned as a director on 7 May 2019(2) Appointed as a director on 7 May 2019, resigned on 31 December 2019(3) Resigned as a director on 31 December 2019(4) Deemed financial expert(5) Resigned as a director on 31 December 2019(6) Senior Independent Director (7) Resigned as a director on 7 May 2019(8) Resigned as a director on 31 December 2019(9) Appointed as a director on 16 September 2019(10) Appointed as a director on 7 May 2019, resigned on 31 December 2019(11) Appointed as a director on 1 January 2019, resigned on 31 December 2019(12) Appointed as a director on 16 September 2019(13) Resigned as a director on 15 September 2019

65Santander UK Group Holdings plc
Strategic report Governance Risk Review Financial review Financial statements Shareholder information
IntroductionThe Directors submit their report together with the financial statements for the year ended 31 December 2019. The information in the Directors’ Report is unaudited, except where marked.
History and corporate structureSantander UK Group Holdings plc (incorporated on 23 September 2013) is a subsidiary of Banco Santander SA, a Spanish retail and commercial bank with a meaningful market share in ten core countries in Europe and the Americas. Santander UK was formed from the acquisition of two former building societies, Abbey National and Alliance & Leicester together with the branch network of Bradford & Bingley, and has operated under a single brand since 2010. The ordinary shares of the Company are not traded.
In 2018, certain subsidiaries and portfolios were transferred as part of the implementation of the ring-fence arrangements required under the Financial Services (Banking Reform) Act 2013. Following these transfers, Santander UK plc and its subsidiaries comprise only entities whose business is permitted under the Act as a ring-fenced bank. Other entities including Santander Financial Services plc (previously named Abbey National Treasury Services plc) are now directly or indirectly owned by the Company.
Result and dividendsThe audited consolidated profit after tax for the year was £709m (2018: £1,164m). The Directors do not recommend the payment of a final dividend for 2019 (2018: £nil). Two interim dividends were declared on the Company’s ordinary shares in issue in the year. The first dividend of £138m was declared on 18 June 2019 and the second dividend of £124m was declared on 5 December 2019. Both interim dividends were paid in 2019.
Details of Santander UK’s activities and business performance in 2019, together with an indication of future outlook, are set out in the Strategic report and the Financial review.
Events after the balance sheet dateThere have been no material post balance sheet events, except as set out in Note 40.
DirectorsThe names and biographical details of the current Directors are shown in the Board of Directors section. Details of their emoluments and interests in shares are set out in the Directors’ Remuneration implementation report. Changes to the composition of the Board can be found in the Board of Directors section with more details in the Chair’s report on Corporate Governance, and the relevant Committee Chairs’ reports.
Appointment and retirement of Directors All Directors are appointed and retired in accordance with the Company’s Articles of Association, the UK Companies Act 2006 and the UK Group Framework. The following appointments took place in 2019: Bruce Carnegie-Brown, Garrett Curran, Dirk Marzluf, Susan Allen and Duke Dayal. The following resignations took place in 2019: Julie Chakraverty, Lindsey Argalas and Antonio Roman. In addition, as part of a Board restructure, Annemarie Durbin, Genevieve Shore, Garrett Curran, Dirk Marzluf, Gerry Byrne and Susan Allen resigned from the Santander UK Group Holdings plc Board. All of these six Directors remained on the Board of Santander UK plc. Further details are outlined on page 64.
A resolution was passed at the last Annual General Meeting, on 2 May 2019 to amend the Articles of Association to require Directors to retire every year, with those wishing to serve again submitting themselves for election or re-election.
Directors’ indemnitiesIn addition to Directors’ and Officers’ liability insurance cover in place throughout 2019, individual deeds of indemnity were also in place to provide cover to the Directors for liabilities to the maximum extent permitted by law. These remain in force for the duration of the Directors’ period of office from the date of appointment until such time as any limitation periods for bringing claims against
the Directors have expired. The Directors including former Directors who resigned in the year, benefit from these deeds of indemnity.
They constitute as qualifying third party indemnity provisions for the purposes of the Companies Act 2006. Deeds for existing Directors are available for inspection at the Company’s registered office.
The Company has also granted an indemnity which constitutes ‘qualifying third party indemnity provisions’ to the Directors of its subsidiary and affiliated companies, including former Directors who resigned in the year and since the year-end. Qualifying pension scheme indemnities were also granted to the Trustees of Santander UK’s pension schemes.
Executive Management Day-to-day management of the Company’s business is delegated by the Directors to certain executives, principally the Chief Executive Officer. In support of the discharge of the Chief Executive Officer’s responsibilities to the Directors and the Company’s external regulators, executive management decisions are informed and taken by the Senior Management Committee (SMC). The SMC is made up of the Chief Executive Officer (as Chair) and those members of Santander UK plc executive management who also hold Senior Management Functions (SMF) under the Senior Managers & Certification Regime. The Executive Committee comprises members of the SMC plus additional management executives who do not hold SMF accountabilities.
EmployeesWe continue to ensure that Santander UK’s remuneration policies are consistent with its strategic objectives and are designed with its long-term success in mind. In doing so, we aim to attract and retain the most talented and committed people.
CommunicationSantander UK wants to involve and inform employees on matters that affect them. The intranet is a focal point for communications and the ‘We are Santander’ website connects staff to all the information they need about working for Santander UK. We also use face-to-face communication, such as team meetings, regional roadshows and annual staff conventions for strategic updates.
Directors’ report

Santander UK Group Holdings plc66
Annual Report 2019 | Governance
Directors’ report continued
Santander UK considers employees’ opinions and asks for their views on a range of issues through regular Santander UK-wide surveys.
ConsultationSantander UK has a successful history of working in partnership with its recognised trade unions, Advance and the Communication Workers Union (CWU). Both trade unions are affiliated to the Trades Union Congress. We consult Advance and the CWU on significant proposals and change initiatives in the business at national and local levels.
Employee share ownershipSantander UK continues to operate two all-employee, HMRC-approved share schemes: a Save-As-You-Earn (Sharesave) Scheme and a Share Incentive Plan (SIP), the latter of which allows employees to purchase Banco Santander SA shares from gross salary. Eligible senior management participated in a Banco Santander long-term incentive plan. See Note 35 for a description of the plans and the related costs and obligations.
DisabilitySantander UK is committed to equality of access and quality of service for disabled people and embraces the spirit of the UK Equality Act 2010 throughout its business operations. Santander UK has processes in place to help train, develop, retain and promote employees with disabilities. We are committed to giving full and fair consideration to employment applications by disabled people, having regard to their particular aptitudes and abilities, and for continuing the employment of employees who have become disabled by arranging appropriate training and making reasonable adjustment within the workplace.
CO2 emissions In 2019 CO2 emissions, measured in CO2 equivalent tonnes, decreased by 15% to 8,643 tonnes. CO2 from fuel decreased by 11% to 4,688 tonnes, CO2 from business travel decreased by 18 % to 3,955 tonnes and output per employee reduced by 10% to 0.37 tonnes.
Ethical Code of ConductSantander UK is committed to maintaining high ethical standards – adhering to laws and regulations, conducting business in a responsible way, and treating all stakeholders with honesty and integrity. These principles are further reflected in Santander UK’s Ethical Code of Conduct, which sets out the standard expected of all employees. Under their terms and conditions of employment, staff are required to act at all times with the highest standards of business conduct in order to protect Santander UK’s reputation and ensure a Company culture which is free from any risk of corruption, compromise or conflicts of interest.
Staff are also required to comply with all Company policies, which require them to:
– Abide by all relevant laws and regulations – Act with integrity in all their business actions on behalf of Santander UK
– Not use their authority or office for personal gain
– Conduct business relationships in a transparent manner
– Reject all improper practices or dealings to which they may be exposed.
The SEC requires companies to disclose whether they have a code of ethics that applies to the Chief Executive Officer and senior financial officers which promotes honest and ethical conduct, full, fair, accurate, timely and understandable disclosures, compliance with applicable governmental laws, rules and regulations, prompt internal reporting of violations, and accountability for adherence to such a code of ethics.
The Santander UK group meets these requirements through its Ethical Code of Conduct, the Anti-Bribery and Corruption Policy, the Whistleblowing Policy, the FCA’s Principles for Businesses, and the FCA’s Statements of Principle and Code of Practice for Approved Persons, with which the CEO and senior financial officers must comply.
These include requirements to manage conflicts of interest appropriately and to disclose any information the FCA may want to know about. Copies of these documents are available to anyone, free of charge, on application to Santander UK Group Holdings plc, 2 Triton Square, Regent’s Place, London NW1 3AN.
Political contributionsIn 2019 and 2018, no contributions were made by the Company for political purposes and no political expenditure was incurred.
Share capitalDetails about the structure of the Company’s capital can be found in Note 30.
For details of employee share schemes and how rights are exercisable, see Note 35.
The powers of the Directors in relation to share capital are set out in the Company’s Articles of Association as determined by the Companies Act 2006.
Subsidiaries and branchesThe Santander UK group consists of a parent company, Santander UK Group Holdings plc, incorporated in England and Wales, and a number of directly and indirectly held subsidiaries and associates. The Company directly or indirectly holds 100% of the issued ordinary share capital of its principal subsidiaries. All companies operate principally in their country of incorporation or registration. Santander Financial Services plc, a subsidiary of the Company, has branch offices in the Isle of Man and in Jersey. For more information, see Note 19.
Financial instrumentsThe financial risk management objectives and policies of Santander UK, the policy for hedging, and the exposure of Santander UK to credit risk, market risk and liquidity risk are outlined in the Risk review.
Research and developmentSantander UK has a comprehensive product approval process and policy. New products, campaigns and business initiatives are reviewed by Santander UK’s Proposition Approval Forum.
Supervision and regulationSome of the Company’s subsidiaries and associates are authorised by the PRA or the FCA, and regulated by the FCA or both the FCA and the PRA.
As a financial services group, Santander UK is subject to extensive financial services laws, regulations, administrative actions and policies in the UK, the EU and in each other location In which Santander UK operates. This intensive approach to supervision is maintained in the United Kingdom by the PRA and the FCA. Santander UK complies with the FCA Conduct rules and the Senior Managers Certification Regime.

67Santander UK Group Holdings plc
Strategic report Governance Risk Review Financial review Financial statements Shareholder information
As well as being subject to UK regulation, as part of the Banco Santander group, Santander UK is also affected by other regulators, such as Banco de Espana and the ECB, as well as various legal and regulatory regimes (including the US) that have extra-territorial effect. Extensive legislation and implementing regulations affecting the financial services industry have recently been adopted in regions that directly or indirectly affect Santander UK’s business, including Spain, the US, the EU and other jurisdictions.
Internal controlsRisk management and internal controls The Board and its Committees are responsible for reviewing and ensuring the effectiveness of management’s system of risk management and internal controls.
We have carried out a robust assessment of the principal and emerging risks facing Santander UK including those that would threaten its business model, future performance, solvency or liquidity. Details of our principal risks, our procedures to identify emerging risks, and an explanation of how these are being managed or mitigated are set out in the Risk review. A summary of our Top and Emerging Risks is also set out in the Strategic report. For more details, see the Strategic report and the Risk review.
Management’s report on internal control over financial reportingAs a registrant under the US Securities Exchange Act of 1934, Santander UK Group Holdings Plc’s management is responsible for establishing and maintaining an adequate system of internal control over financial reporting in order to ensure the accuracy and reliability of Santander UK Group Holdings plc’s Financial Statements and the Form 20-F submitted to the US Securities and Exchange Commission.
Management is responsible for establishing and maintaining adequate internal control over the financial reporting of Santander UK. Management assessed the effectiveness of Santander UK’s internal control over financial reporting at 31 December 2019 based on the criteria established in the Internal Control - Integrated Framework issued by the Committee of Sponsoring Organizations of the Treadway Commission (COSO) in May 2013.
Internal control over financial reporting is a component of an overall system of internal control. Santander UK’s internal control over financial reporting is designed to provide
reasonable assurance regarding the reliability of financial reporting, and the preparation and fair presentation of financial statements for external purposes in accordance with International Financial Reporting Standards (IFRS) as issued by the International Accounting Standards Board (IASB) and endorsed by the EU and in order to comply with its obligations under the Sarbanes-Oxley Act of 2002.
Santander UK’s internal control over financial reporting includes:
– Policies and procedures that relate to the maintenance of records that fairly and accurately reflect transactions and dispositions of assets
– Controls providing reasonable assurance that transactions are recorded as necessary to permit the preparation of financial statements in accordance with IFRS, and that receipts and expenditures are being made only as authorised by management
– Controls providing reasonable assurance regarding prevention or timely detection of unauthorised acquisition, use or disposition of assets that could have a material effect on the financial statements.
Because of its inherent limitations, internal control over financial reporting may not prevent or detect misstatements. In addition, projections of any evaluation of effectiveness to future periods are subject to the risk that controls may become inadequate because of changes in conditions, or because the degree of compliance with policies or procedures may deteriorate.
In line with COSO and SEC requirements, those controls recognised as S-Ox applicable are subject to annual testing and certification by management including an attestation by the Chief Executive Officer (CEO) and the Chief Financial Officer (CFO) that the controls are operating effectively and that the internal control over financial reporting can be relied on.
Any Sarbanes-Oxley control weaknesses identified are captured, assessed and included within the year end assessment of the reliability of the Internal Control environment. These weaknesses are reported on an ongoing basis to the Audit Committee to ensure continuous improvements to the control environment are achieved.
Based on this assessment, Management concluded, at 31 December 2019, that Santander UK’s internal control over financial reporting was effective.
Disclosure controls and procedures over financial reportingSantander UK’s management has evaluated, with the participation of its CEO and CFO, the effectiveness of its disclosure controls at 31 December 2019. There are inherent limitations to the effectiveness of any system of disclosure controls and procedures, including the possibility of human error, and the circumvention or overriding of the controls and procedures. Accordingly, even effective disclosure controls and procedures can only provide reasonable assurance of achieving their control objectives.
Based upon this evaluation, the CEO and the CFO have concluded that, at 31 December 2019, Santander UK’s disclosure controls and procedures were effective to provide reasonable assurance that information required to be disclosed by Santander UK in the reports that it files and submits under the US Securities Exchange Act of 1934 is recorded, processed, summarised and reported within the time periods specified in the applicable rules and forms, and that it is accumulated and communicated to Santander UK’s management, including the CEO and CFO, as appropriate, to allow timely decisions regarding disclosure.
Changes in internal control over financial reportingThere were no changes to our internal control over financial reporting during the period covered by this report that have materially affected, or are reasonably likely to materially affect, our internal control over financial reporting.
Going concern and viabilityThe going concern and viability of Santander UK are reliant on preserving a sufficient level of capital and adequately funding the balance sheet. Santander UK’s business activities and financial position, together with the factors likely to affect its future development and performance, are set out in the Financial review. Santander UK’s objectives, policies and processes for managing the financial risks to which it is exposed, including capital, funding and liquidity, are described in the Risk review.

Santander UK Group Holdings plc68
Annual Report 2019 | Governance
Directors’ report continued
While a five-year plan is prepared for regulatory purposes and our stress testing encompasses scenarios some of which also extend out to that time period, increasing the time horizon increases uncertainty. After taking account of Santander UK’s current position and principal risks, the Directors consider that a period of three years from the balance sheet date is the most appropriate timeframe from which a reasonable assessment of viability can be made. This period is consistent with the period covered by Santander UK’s three-year plan and is representative of the time horizon to consider the impact of anticipated regulatory change within the financial services industry.
In making their going concern and viability assessments, the Directors consider a wide range of information that including Santander UK’s long-term business and strategic plans, forecasts and projections, estimated capital, funding and liquidity requirements, contingent liabilities and the reasonably possible changes in trading performance arising from potential economic, market and product developments.
For capital, funding and liquidity purposes, Santander UK operates on a standalone basis and is subject to regular and rigorous monitoring by external parties. For capital purposes, from 1 January 2019 the Company operates as part of the Non ring-fenced bank Capital Support Deed with Santander Financial Services plc and Santander Equity Investments Limited. The Directors review the outputs of stress testing as part of the approval processes for the ICAAP, the ILAAP, our Risk Appetite and regulatory stress tests. We exceeded the Bank of England’s 2019 stress test threshold requirement, as described in the Capital risk section of the Risk review.
The Directors are satisfied that the Santander UK group has adequate resources to continue operations for a period of at least twelve months from that date of this report and therefore consider it appropriate to adopt the going concern basis of accounting in preparing the financial statements.
Based on their assessment of longer-term viability, the Directors have a reasonable expectation that Santander UK will be able to continue in operation and meet its liabilities as they fall due over the next three years.
Statements of ComplianceThe UK Corporate Governance CodeThe Board confirms that, for the year ended 31 December 2019, Santander UK has applied those principles and provisions of the UK Corporate Governance Code 2018 (the Code), as appropriate, and has provided an explanation where there has been an omission in compliance with the Code. Further information on how the Code was complied with can be found in the Chair’s report on Corporate Governance on page 36.
Santander UK has applied those principles and complied with those provisions of the Code as appropriate, with the exception of:
– Provision 5: The Company has not appointed a Non-Executive Director to represent the views of the workforce (for details see page 37);
– Provision 11: The Company does not comply with the requirement for at least half the Board, excluding the Chair, to be Non-executive Directors whom the Board considers to be independent. For details see page 57;
– Provision 24: With effect from 1 January 2020, the BAC does not meet the membership requirements of the Code (for details see page 37);
– Provision 36: The development of a formal policy for post-employment shareholding requirements - whilst Directors have a meaningful interest in Banco Santander SA Shares, we do not intend to introduce a formal policy (for details see page 59);
– Provision 40: When determining remuneration policy, a range of factors are considered although not all are publicly disclosed (for details see page 58); and
– Provision 41: The Remuneration Committee’s activities are set out in the Remuneration report although not all Committee decisions are disclosed (see Remuneration Policy Report).
UK Finance Code for Financial Reporting DisclosureSantander UK’s financial statements for the year ended 31 December 2019 have been prepared in compliance with the principles of the UK Finance Code for Financial Reporting Disclosure.
Engagement with stakeholders and employeesSantander UK recognises the importance of fostering relationships with their principal stakeholders and how this is key to the long term success of our business. The Directors understand the importance to act fairly and responsibly between members of the company. Further information on employee and stakeholder engagement can be found under the S172 table in the Strategic report.
Statement of Directors’ responsibilitiesThe Directors are responsible for preparing the Annual Report and the financial statements in accordance with applicable law and regulations. Company law requires the Directors to prepare financial statements for each financial year. Under that law, the Directors have prepared the Santander UK group and Company financial statements in accordance with IFRS as adopted by the EU.
In preparing the financial statements, the Directors have also elected to comply with IFRS as issued by the IASB. Under company law, the Directors must not approve the financial statements unless they are satisfied that they give a true and fair view of the state of affairs of the Santander UK group and the Company and of the profit or loss of the Santander UK group and the Company for that period.
In preparing the financial statements, the Directors are required to:
– Select suitable accounting policies and then apply them consistently
– State whether applicable IFRS as adopted by the EU and IFRS issued by the IASB have been followed for the Santander UK group and Company financial statements, subject to any material departures disclosed and explained in the financial statements
– Make judgements and accounting estimates that are reasonable and prudent
– Prepare the financial statements on the going concern basis unless it is inappropriate to presume that the Santander UK group and company will continue in business.

69Santander UK Group Holdings plc
Strategic report Governance Risk Review Financial review Financial statements Shareholder information
The Directors are also responsible for safeguarding the assets of the Santander UK group and the Company, and hence for taking reasonable steps for the prevention and detection of fraud and other irregularities.
The Directors are responsible for keeping adequate accounting records that are sufficient to show and explain the Santander UK group’s and the Company’s transactions and disclose with reasonable accuracy at any time the financial position of the Santander UK group and the Company, and enable them to ensure that the financial statements comply with the UK Companies Act 2006 and, as regards the Santander UK group financial statements, Article 4 of the IAS Regulation.
The Directors are responsible for the integrity and maintenance of Santander UK’s website.
Legislation in the UK governing the preparation and dissemination of financial statements may differ from legislation in other jurisdictions.
Having taken into account all the matters considered by the Board and brought to its attention during the year, the Directors are satisfied that the Annual Report taken as a whole is fair, balanced and understandable, and provides the information necessary to assess Santander UK’s position and performance, business model and strategy.
Each of the Directors at the date of approval of this report confirms, to the best of their knowledge, that:
– The financial statements, prepared in accordance with IFRS, as adopted by the EU, give a true and fair view of the assets, liabilities, financial position and profit or loss of the Company and the Santander UK group
– The management report, which is incorporated into the Directors’ report, includes a fair review of the development and performance of the business and the position of the Company and the Santander UK group, together with a description of the principal risks and uncertainties they face.
Disclosure of information to AuditorsEach of the Directors at the date of approval of this report confirms that:
– So far as the Director is aware, there is no relevant audit information of which Santander UK’s auditor is unaware
– The Director has taken all steps that they ought to have taken as a Director to make himself or herself aware of any relevant audit information and to establish that Santander UK’s auditor is aware of that information.
This confirmation is given and should be interpreted in accordance with the provisions of Section 418 of the UK Companies Act 2006.
AuditorPricewaterhouseCoopers LLP have expressed their willingness to continue in the office of auditor and a resolution to reappoint them will be proposed at the Company’s forthcoming Annual General Meeting.
By Order of the Board
Katie Jackson-TurnerCompany Secretary 2 March 2020 2 Triton Square, Regent’s Place, London NW1 3AN

Risk review
This Risk review consists of audited financial information except where it is marked as unaudited. The audited financial information is an integral part of our Consolidated Financial Statements.
We aim to continually enhance our disclosures and their usefulness to readers in the light of developing market practice and areas of focus. As a result, our disclosures go beyond the minimum required by accounting standards and other regulatory requirements.
We support the recommendations and guidance made by the Taskforce on Disclosures about ECL (DECL Taskforce) and have adopted its recommendations where it is practical to do so. The DECL Taskforce was formed in 2017 by the FCA, FRC and PRA with a remit to help encourage high-quality ECL-related disclosures following adoption of IFRS 9.
Contents
Risk governance 71
Introduction (unaudited) 71
Risk Framework 71
Risk Appetite (unaudited) 75
Stress Testing (unaudited) 76
How risk is distributed across our business (unaudited)
76
Credit risk 77
Santander UK group level 77
Retail Banking 98
Other business segments 111
Market risk 124
Banking market risk 124
Trading market risk 128
Liquidity risk 130
Capital risk 139
Pension risk (unaudited) 145
Conduct and regulatory risk (unaudited)
148
Operational risk (unaudited) 151
Other key risks (unaudited) 156
Financial crime risk 156
Legal risk 158
Strategic and business risk 158
Reputational risk 159
Model risk 159
Santander UK Group Holdings plc70
Annual Report 2019 | Risk review

Santander UK Group Holdings plc 71
Strategic report Governance Risk review Financial review Financial statements Shareholder information
Risk governance
Risk governance
INTRODUCTION (UNAUDITED)
Santander UK Group Holdings plc is the immediate parent company of Santander UK plc. The two companies operate on the basis of a unified business strategy with some overlap in membership, albeit the principal business activities of the Santander UK group are carried on by Santander UK plc and its subsidiaries (the Santander UK plc group). The Company’s Risk Frameworks have been adopted by its subsidiaries to ensure consistency of application.
As a financial services provider, managing risk is a core part of our day-to-day activities. To be able to manage our business effectively, it is critical that we understand and control risk in everything we do. We aim to use a prudent approach and advanced risk management techniques to help us deliver robust financial performance and build sustainable value for our stakeholders. We aim to keep a predictable medium-low risk profile, consistent with our business model. This is key to achieving our strategic priorities.
RISK FRAMEWORK
How we define risk (unaudited) Risk is any uncertainty about us being able to achieve our business objectives. It can be split into a set of key risk types, each of which could affect our results and our financial resources. Enterprise wide risk is the aggregate view of all the key risk types described below:
Key risk types Description
Credit The risk of loss due to the default or credit quality deterioration of a customer or counterparty to which we have provided credit, or for which we have assumed a financial obligation.
Market Banking market risk – the risk of loss of income or economic value due to changes to interest rates in the banking book or to changes in exchange rates, where such changes would affect our net worth through an adjustment to revenues, assets, liabilities and off-balance sheet exposures in the banking book.
Trading market risk – the risk of changes in market factors that affect the value of positions in the trading book.
Liquidity The risk that we do not have sufficient liquid financial resources available to meet our obligations as they fall due, or we can only secure such resources at excessive cost.
Capital The risk that we do not have an adequate amount or quality of capital to meet our internal business objectives, regulatory requirements, market expectations and dividend payments, including AT1 coupons.
Pension The risk caused by our contractual or other liabilities with respect to a pension scheme (whether set up for our employees or those of a related company or otherwise). It also refers to the risk that we will need to make payments or other contributions with respect to a pension scheme due to a moral obligation or for some other reason.
Conduct and regulatory Conduct risk – the risk that our decisions and behaviours lead to a detriment or poor outcome for our customers. It also refers to the risk that we fail to maintain high standards of market behaviour and integrity.
Regulatory risk – the risk of financial or reputational loss, or imposition or conditions on regulatory permission, as a result of failing to comply with applicable codes, regulator’s rules, guidance and regulatory expectations.
Operational risk The risk of loss due to inadequate or failed internal processes, people and systems, or external events. We give a particular focus to the following risks which we mitigate through our management of operational risk:
Process and change management risk – A key part of our business strategy is to develop and deliver new banking channels and products. We are also implementing a large number of regulatory and legal changes, impacting all areas of our business.
Third party risk – We rely extensively on third parties, both within the Banco Santander group and outside of it, for a range of services and goods.
Cyber risk – We rely extensively on the use of technology across our business. It is critically important that we give our customers a secure environment in which to deal with us, especially when the threat from cyber criminals is so prevalent and more sophisticated than ever. Failure to protect the data assets of Santander UK and its customers against theft, damage or destruction from cyber-attacks could result in damage to our reputation and direct financial losses.
Other key risk types Financial crime risk – the risk that we are used to further financial crime, including money laundering, sanctions evasion, terrorist financing, bribery and corruption. Failure to meet our legal and regulatory obligations could result in criminal or civil penalties against Santander UK or individuals, as well as affecting our customers and the communities we serve.
Legal risk – the risk of an impact arising from legal deficiencies in contracts; failure to protect assets; failure to manage legal disputes appropriately; failure to assess or implement the requirements of a change of law; or failure to comply with law or regulation or to discharge duties or responsibilities created by law or regulation.
Strategic and business risk – the risk of significant loss or damage arising from strategic decisions that impact the long-term interests of our key stakeholders or from an inability to adapt to external developments.
Reputational risk – the risk of damage to the way our reputation and brand are perceived by the public, clients, government, colleagues, investors or any other interested party.
Model risk – the risk that the results of our models may be inaccurate, causing us to make sub-optimal decisions, or that a model may be used inappropriately.
Top and emerging risks
Several of our risk types also have top risks associated with them. We regularly review the top risks that could impact our business, customers and shareholders. Top risks actively monitored over 2019 are set out in the relevant section of this Risk review and summarised in the ‘Top Risks’ section in the Strategic report. We also regularly review emerging risks that could impact our business, customers and shareholders. The identification of Emerging Risks is co-ordinated by the Risk Division. A key part of the process is continual scanning of the external environment, focusing on emerging risk drivers such as regulation, markets, technology, competition, customers, geo-politics, climate change and the economy. Emerging risks actively monitored over 2019 are set out in the relevant section of this Risk review and summarised in the ‘Emerging Risks’ section in the Strategic report.
Santander UK Group Holdings plc 71
Strategic Report Governance Risk review Financial review Financial statements Shareholder information
Risk governance
71Santander UK Group Holdings plc

Annual Report 2019 | Risk review
72 Santander UK Group Holdings plc
Key elements (unaudited) Our Risk Framework sets out how we manage and control risk. In 2019, we updated our Risk Framework with the introduction of new minimum standards to strengthen controls around independence of decision-making following the introduction of ring-fencing on 1 January 2019.
As a group, Banco Santander supports the recommendations of the TCFD, which were published with the aim of improving disclosure of climate financial risk and opportunities. We also welcome the UK developments of the PRA and FCA to improve management and disclosure of climate change related risks. In October 2019, we submitted an initial implementation plan to the PRA to address the expectations set out Supervisory Statement 3/19 ‘Enhancing banks’ and insurers’ approaches to managing the financial risks from climate change’. Alongside this plan, responsibility for climate related financial risks was added to the Statement of Responsibility of the CRO as SMF holder. Delivering on our plan will be a multi-year programme. We are targeting the end of 2022 to achieve full adoption, aligned to the implementation path as set out in the TCFD recommendations. For more, see the case study ‘Addressing climate risk’ in the Risk appetite section that follows.
In addition, in 2020, we introduced a new standard to consider the impact of risks related to climate change.
How we approach risk – our culture and principles (unaudited) The complexity and importance of the financial services industry demands a strong risk culture. We have extensive systems, controls and safeguards in place to manage and control the risks we face, but it is also crucial that everyone takes personal responsibility for managing risk. Our risk culture plays a key role in our aim to be the best bank for our customers, shareholders, people and communities by acting responsibly. It is vital that everyone in our business understands this. To achieve this, our people have a strong, shared understanding of what risk is, and what their role is in helping to control it. We express this in our Risk Culture Statement:
Risk Culture Statement
Santander UK will only take risks that it understands and will always remain prudent in identifying, assessing, managing and reporting all risks. We proactively encourage our people to take personal responsibility for doing the right thing and to challenge without fear. We ensure decisions and actions take account of the best interests of all our stakeholders and are in line with The Santander Way.
The Board reviews and approves our Risk Culture Statement every year. Senior executives are responsible for promoting our risk culture from the top. They drive cultural change and increased accountability across the business. We reinforce our Risk Culture Statement and embed our risk culture in all our business units through our Risk Framework, Risk Certifications and other initiatives. This includes highlighting that:
− It is everyone’s personal responsibility to play their part in managing risk − We must Identify, Assess, Manage and Report risk quickly and accurately − We make risk part of how we assess our people’s performance and how we recruit, develop and reward them − Our internal control system is essential to ensure we manage and control risk in line with our principles, standards, Risk Appetite and policies.
We use Risk Certifications to confirm how we manage and control risks in line with our Risk Framework and within our Risk Appetite. As an example, every year, each member of our Executive Committee confirms that they have managed risk in line with the Risk Framework in the part of the business for which they are responsible. Their certification lists any exceptions and the agreed actions to be taken to correct them. This is a tangible sign of the personal responsibility that is such a key part of our risk culture.
Our risk culture programme – I AM Risk
I AM Risk continues to play a key part in our aim to be the best bank for our people, customers, shareholders and communities. Our I AM Risk approach aims to make sure our people:
I AM Risk is how we make risk management part of everyone’s life as a Santander UK employee from how we recruit them and manage their performance to how we develop and reward them. It is also how we encourage people to take personal responsibility for risk to speak up and to come up with ideas. We use I AM Risk in our risk certifications, policies, frameworks and governance, and risk-related communications. We also include it in reward arrangements and in mandatory training and induction courses for our staff. To support this, our learning website includes e-learning videos and factsheets.
As part of I AM Risk, we include mandatory risk objectives for all our people in our performance management processes – from our Executive Committee to branch staff. The Executive Committee leads our culture initiatives under the CEO’s sponsorship. In our most recent employment engagement survey, over 90% of employees recognised their personal responsibility for the risks they face in their day-to-day work. This demonstrates how we have embedded risk management in our culture.
I AM Risk Month
In November 2019, we once again joined colleagues from across the Banco Santander group to celebrate our risk culture, with an emphasis on what I AM Risk means to each of us. As a business, we are going through a significant period of transformation, whilst dealing with a highly competitive financial services sector and a challenging political and regulatory environment. At times of change, it is natural for people to feel under more pressure; to act quickly, to deliver and to succeed. We know that we need to deliver, but how we make the decisions that help us achieve our goals is also critical, and considering the risks involved is a key part of that process. We also recognise that managing our risks can result in broader benefits for the business.
Simplifying our processes, reducing the number of systems we use, improving the quality of our data or automating controls; these are all examples of ways we can reduce the risks we face, whilst also making things more efficient and simpler, for both our customers and our colleagues. We recognise that we need to remain vigilant in identifying, assessing, managing and reporting all risks. We need to speak up when we see a risk, so we can work together to do the right thing for our colleagues, customers and shareholders. It is by working together across the business that we can get the best from each other, be confident in the decisions we make and help the business achieve its goals.
Over the four weeks of I AM Risk Month, we encouraged our colleagues to use our I AM Risk resources to:
− Join our new I AM Risk Hub to help each other become more risk aware − Recognise a colleague for good risk behaviour − Share a story of how an individual or team have taken personal accountability for risk − Use our Speak Up Matrix to help find the right channels to raise any concerns.
− Identify risks and opportunities − Assess their probability and impact − Manage the risks and suggest alternatives − Report, challenge, review, learn and ‘speak up’.
Santander UK Group Holdings plc72
Annual Report 2019 | SectionAnnual Report 2019 | Risk review
Santander UK Group Holdings plc72

Santander UK Group Holdings plc 73
Strategic report Governance Risk review Financial review Financial statements Shareholder information
Risk governance
Our risk governance structure We are committed to the highest standards of corporate governance in every part of our business. This includes risk management. For details of our governance, including the Board and its Committees, see the ‘Governance’ section of this Annual Report. The Board delegates certain responsibilities to Board Level Committees as needed and where appropriate. Our risk governance structure strengthens our ability to identify, assess, manage and report risks, as follows:
− Committees: A number of Board and Executive committees are responsible for specific parts of our Risk Framework − Key senior management roles: A number of senior roles have specific responsibilities for risk management − Risk organisational structure: We have the ‘three lines of defence’ model built into the way we run our business.
Committees The Board Level Committee responsibilities for risk are:
Board Level Committee Main risk responsibilities
The Board (including the Santander UK plc Board)
−Has overall responsibility for business execution and for managing risk
−Reviews and approves the Risk Framework and Risk Appetite.
Board Risk Committee −Assesses the Risk Framework and recommends it to the Board for approval
−Advises the Board on our overall Risk Appetite, tolerance and strategy
−Oversees our exposure to risk and our strategy and advises the Board on both
−Reviews the effectiveness of our risk management systems and internal controls.
Board Responsible Banking Committee
−Responsible for culture and operational risk from conduct, compliance, competition, financial crime & legal matters
−Reviews reports from the CLRO on the adequacy and effectiveness of the compliance function
−Ensures that adequate and effective control processes are in place to identify and manage reputational risks
−Oversees our Corporate Social Responsibility programme and how it impacts on employees, communities, the environment including sustainability and climate change, reputation, brand and market positioning.
Board Audit Committee –Monitors and reviews the financial statements integrity, and any formal announcements on financial performance
–Reviews the adequacy and effectiveness of the internal financial controls and whistleblowing arrangements
–Monitors and reviews the effectiveness of the internal audit function.
Board Remuneration Committee –Oversees implementation of remuneration policies, ensuring they promote sound, effective risk management.
The Executive Level Committee responsibilities for risk are:
Executive Level Committee Main risk responsibilities
Executive Committee −Reviews business plans in line with our Risk Framework and Risk Appetite before they are recommended to the Board to approve.
−Receives updates on key risk issues managed by CEO-level committees and monitors the actions taken.
Senior Management Committee −Focuses on the responsibilities of the Executive Committee Senior Management Function holders and how they are discharged
−Reviews updates on key risk issues, customer, reputational and conduct matters.
Executive Risk Control Committee (ERCC)
−Reviews Risk Appetite proposals before they are sent to the Board Risk Committee and the Board to approve
−Ensures that we comply with our Risk Framework, Risk Appetite and risk policies
−Reviews and monitors our risk exposures and approves any corrective steps we need to take.
Asset and Liability Committee (ALCO)
−Reviews liquidity risk appetite (LRA) proposals
−Ensures we measure and control structural balance sheet risks, including capital, funding and liquidity, in line with the policies, strategies and plans set by the Board
−Reviews and monitors our key asset and liability management activities to ensure we keep our exposure in line with our Risk Appetite.
Pensions Committee −Reviews pension risk appetite proposals
−Approves actuarial valuations and reviews the impact they may have on our contributions, capital and funding
−Consults with the pension scheme trustees on the scheme’s investment strategy.
Capital Committee −Puts in place reporting systems and risk control processes to make sure capital risks are managed within our Risk Framework
−Reviews capital adequacy and capital plans, including the ICAAP, before they are sent to the Board to approve.
Incident Accountability Committee
−Considers, calibrates, challenges and agrees any appropriate individual remuneration adjustments
−Presents recommendations to the Board Remuneration Committee.
Credit Approval Committee −Approves corporate and wholesale credit transactions which exceed levels delegated to lower level approval forums or individuals.
Investment Approval Committee −Approves equity type investment transactions which exceed levels delegated to lower level approval forums or individuals.
Key senior management roles
Senior roles with specific responsibilities for risk management are:
Role Main risk responsibilities
Chief Executive Officer The Board delegates responsibility for our business activities and managing risk on a day-to-day basis to the CEO. The CEO proposes our strategy and business plan, puts them into practice and manages the risks involved. The CEO must also ensure we have a suitable system of controls to manage risks and report to the Board on it.
Chief Risk Officer (CRO) As the Risk Division leader, oversees and challenges risk activities, and ensures new lending decisions are made within our Risk Appetite. Accountable for the control and oversight of credit, market, liquidity, capital, pension, strategic and business, operational and model risks.
Chief Legal and Regulatory Officer (CLRO)
Accountable for the control and oversight of legal, conduct and regulatory, reputational and financial crime risk, and is responsible for reporting on these risks to the CRO to provide them with a holistic enterprise wide view of all risks.
Chief Financial Officer Responsible for developing strategy, leadership and management of the CFO and Financial Accounting & Control Divisions. In supporting our corporate goals within our risk appetite, the CFO is responsible for managing interest rate, liquidity, pension and capital risks.
Chief Internal Auditor (CIA) Designs and uses an audit system that identifies key risks and evaluates controls. The CIA also develops an audit plan to assess existing risks that involve producing audit, assurance and monitoring reports.
Money Laundering Reporting Officer (MLRO)
Responsible to the CLRO for control and oversight of financial crime risk but has regulatory responsibility to report on this risk type to Executive and Board Committees and the FCA.
Santander UK Group Holdings plc 73
Strategic Report Governance Risk review Financial review Financial statements Shareholder information
Risk governance
73Santander UK Group Holdings plc
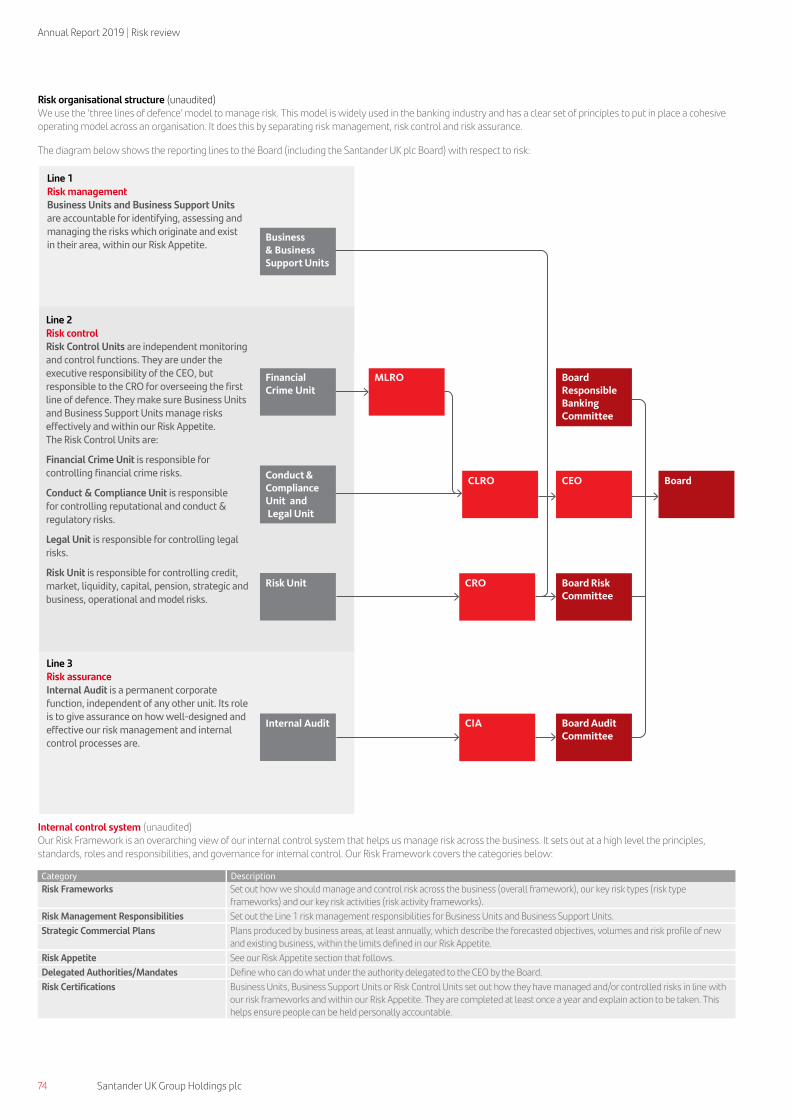
CLRO CEO
Board Risk
Committee
Board Audit
Committee
CIA
Board
Business
& Business
Support Units
Financial
Crime Unit
Conduct &
Compliance
Unit and
Legal Unit
Risk Unit
Internal Audit
MLRO Board
Responsible
Banking
Committee
CRO
Annual Report 2019 | Risk review
74 Santander UK Group Holdings plc
Risk organisational structure (unaudited) We use the ‘three lines of defence’ model to manage risk. This model is widely used in the banking industry and has a clear set of principles to put in place a cohesive operating model across an organisation. It does this by separating risk management, risk control and risk assurance.
The diagram below shows the reporting lines to the Board (including the Santander UK plc Board) with respect to risk:
Internal control system (unaudited) Our Risk Framework is an overarching view of our internal control system that helps us manage risk across the business. It sets out at a high level the principles, standards, roles and responsibilities, and governance for internal control. Our Risk Framework covers the categories below:
Category Description
Risk Frameworks Set out how we should manage and control risk across the business (overall framework), our key risk types (risk type frameworks) and our key risk activities (risk activity frameworks).
Risk Management Responsibilities Set out the Line 1 risk management responsibilities for Business Units and Business Support Units.
Strategic Commercial Plans Plans produced by business areas, at least annually, which describe the forecasted objectives, volumes and risk profile of new and existing business, within the limits defined in our Risk Appetite.
Risk Appetite See our Risk Appetite section that follows.
Delegated Authorities/Mandates Define who can do what under the authority delegated to the CEO by the Board.
Risk Certifications Business Units, Business Support Units or Risk Control Units set out how they have managed and/or controlled risks in line with our risk frameworks and within our Risk Appetite. They are completed at least once a year and explain action to be taken. This helps ensure people can be held personally accountable.
Line 1 Risk management Business Units and Business Support Units are accountable for identifying, assessing and managing the risks which originate and exist in their area, within our Risk Appetite.
Line 2 Risk control Risk Control Units are independent monitoring and control functions. They are under the executive responsibility of the CEO, but responsible to the CRO for overseeing the first line of defence. They make sure Business Units and Business Support Units manage risks effectively and within our Risk Appetite. The Risk Control Units are:
Financial Crime Unit is responsible for controlling financial crime risks.
Conduct & Compliance Unit is responsible for controlling reputational and conduct & regulatory risks.
Legal Unit is responsible for controlling legal risks.
Risk Unit is responsible for controlling credit, market, liquidity, capital, pension, strategic and business, operational and model risks.
Line 3 Risk assurance Internal Audit is a permanent corporate function, independent of any other unit. Its role is to give assurance on how well-designed and effective our risk management and internal control processes are.
Santander UK Group Holdings plc74
Annual Report 2019 | SectionAnnual Report 2019 | Risk review
Santander UK Group Holdings plc74

Santander UK Group Holdings plc 75
Strategic report Governance Risk review Financial review Financial statements Shareholder information
Risk governance
RISK APPETITE (UNAUDITED)
How we control the risks we are prepared to take
When our Board sets our strategic objectives, it is important that we are clear about the risks we are prepared to take to achieve them. We express this through our Risk Appetite Statement, which defines the amount and kind of risk we are willing to take. Our Risk Appetite and strategy are closely linked, and our strategy must be achievable within the limits set out in our Risk Appetite. The principles of our Risk Appetite
Our Risk Appetite Statement lists ten principles that we use to set our Risk Appetite.
− We always aim to have enough financial resources to continue to do business in adverse but plausible stressed economic and business conditions, as well as to survive a very severe stress that would deplete our capital reserves
− We should be able to predict how our income and losses might vary – that is, how volatile they are. That applies to all our risks and lines of business − Our earnings and dividend payments should be stable, and in line with the return we aim to achieve − We are an autonomous business, so we always aim to have strong capital and liquidity resources − The way we fund our business should be based on diverse funding sources and duration. This helps us avoid relying too much on wholesale markets − We set controls on large concentrations of risk, like single customers or specific industries − There are some key risks we take, but for which we do not actively seek any reward, like operational, conduct and regulatory, financial crime, legal and reputational
risk. We take a risk-averse approach to these risks − We comply with all regulations – and aim to exceed the standards they set − Our pay and bonus schemes should support these principles and our risk culture − We always aim to earn the trust of our people, customers, shareholders and communities.
How we describe the limits in our Risk Appetite
Our Risk Appetite sets out detailed limits for different types of risk, using metrics and qualitative statements.
Metrics
We use metrics to set limits on losses, capital, liquidity and concentration. We set:
− Limits for losses for our most important risks, including credit, market, operational and conduct risk − Capital limits, reflecting both the capital that regulators expect us to hold (regulatory capital) and our own internal measure economic capital (EC) − Liquidity limits according to a range of plausible stress scenarios for our business − Concentration limits, to determine the maximum concentration level that we are willing to accept.
These limits apply in normal business conditions, but also when we might be experiencing a far more difficult economic environment. A good example of this might be when the UK economy is performing much worse than we expected. We refer to conditions like this as being under stress. There is more on EC and stress scenarios later in this section.
Qualitative statements
For some types of risk we also use qualitative statements that describe in words the appetite we want to set. For example, in operational risk, we use them to describe our risk-averse appetite for cyber risk. We also use them to prohibit or restrict exposure to certain sectors, types of customer and activities.
How we set our Risk Appetite, and stay within it
We control our Risk Appetite through our Risk Appetite Framework. Our Board approves and oversees our Risk Appetite Statement every year. This ensures it is consistent with our strategy and reflects the markets in which we operate. Our ERCC is responsible for ensuring that our risk profile (the level of risk we are prepared to accept) is consistent with our Risk Appetite Statement. To do this they monitor our performance against our Risk Appetite, business plans and budgets each month.
We also use stress testing to review how our business plan performs against our Risk Appetite Statement. This shows us if we would stay within our Risk Appetite under stress conditions. It also helps us to identify any adverse trends or inconsistencies.
We embed our Risk Appetite by setting more detailed risk limits for each business unit and key portfolio. These are set in a way so that if we stay within each detailed limit, we will stay within our overall Risk Appetite. When we use qualitative statements to describe our appetite for a risk, we link them to lower-level key risk indicators, so that we can monitor and report our performance against them.
We provide a programme of communication and training for our staff, including new joiners, which helps ensure that our Risk Appetite is well understood.
Addressing climate risk
The CRO, as the SMF holder, is responsible for climate-related financial risks. The management of these risks lies in the first line of defence. It is therefore expected that the CRO will be supported by the business division heads to fulfil these responsibilities. To address TCFD recommendations and PRA expectations a Climate Change Working Group (CCWG) was launched in 2019 and re-launched in Q1 2020. This CCWG co-ordinates the efforts to deliver the implementation plan and will report on progress to the CRO, ERCC and Board Risk Committee.
The first half of 2020 will see the documentation of firm-wide climate change risk management governance arrangements. This will articulate the roles and responsibilities and the committees involved across the three lines of defence. During the second half of 2020, the link between climate change related metrics and remuneration will be defined.
Climate-related risks could eventually manifest in credit, market and operational risks for financial institutions. We are reviewing the appropriate parts of the Risk Framework, Risk Type Frameworks (in particular Credit and Operational risk) and the Risk Appetite Statement to explicitly include climate-related risks.
Santander UK Group Holdings plc 75
Strategic Report Governance Risk review Financial review Financial statements Shareholder information
Risk governance
75Santander UK Group Holdings plc

Annual Report 2019 | Risk review
76 Santander UK Group Holdings plc
STRESS TESTING (UNAUDITED) Stress testing helps us understand how different events and economic conditions could affect our business plan, earnings and risk profile. This helps us plan and manage our business.
Scenarios for stress testing
To see how we might cope with difficult conditions, we regularly develop challenging scenarios that we might face. We consult a broad range of internal stakeholders, including Board members, when we design and choose our most important scenarios. The scenarios cover a wide range of outcomes, risk factors, time horizons and market conditions. They are designed to test:
− The impact of shocks affecting the economy as a whole or the markets we operate in − Key potential vulnerabilities of our business model, and the processes and systems which support it − Potential impacts on specific risk types.
We describe each scenario using a narrative setting out how events might unfold, as well as a market and/or economic context. For example, the key economic factors we reflect in our ICAAP scenarios include house prices, interest rates, unemployment levels and the size of the UK economy. One scenario looks at what might happen in a recession where the output of the economy shrinks by around 5%, unemployment reaches over 9%, and house prices fall by around 30% in a context of high inflation and interest rates rising rapidly. We use a comprehensive suite of stress scenarios to explore sensitivities to market risk, including those based on historical market events.
How we use stress testing
We use stress testing to estimate the effect of these scenarios on our business and financial performance, including:
− Our business plan, and its assessment against our Risk Appetite − Our capital strength, through our ICAAP − Our liquidity position, through our ILAAP − Impacts on other risk types.
We use a wide range of models, approaches and assumptions. These help us interpret the links between factors in markets and the economy, and our financial performance. For example, one model looks at how changes to key macroeconomic variables like unemployment rates might affect the number of customers who might fall into arrears on their mortgage.
Our stress testing models are subject to a formal review, independent validation and approval process. We highlight the key weaknesses and related model assumptions in the approval process for each stress test. In some cases, we overlay expert judgement onto the results of our models. Where this is material to the outcome of the stress test, the approving governance committee reviews it. We take a multi-layered approach to stress testing to capture risks at various levels. This ranges from sensitivity analysis of a single factor to a portfolio, to wider exercises that cover all risks across our entire business. We use stress test outputs to design plans that aim to mitigate damaging effects.
We also conduct reverse stress tests. These are tests in which we identify and assess scenarios that are most likely to cause our business model to fail.
Board oversight of stress testing
The ERCC approves the design of the scenarios in our ICAAP and ILAAP. The Board Risk Committee approves the stress testing framework. The Board reviews stress test outputs as part of the approval processes for the ICAAP, ILAAP, Recovery and Resolution, our Risk Appetite and regulatory stress tests.
Regulatory stress tests
We take part in a number of external stress testing exercises. These can include stress tests of the UK banking system conducted by the PRA. We also contribute to stress tests of Banco Santander conducted by the European Banking Authority (EBA).
For more on capital and liquidity stress testing, see the ‘Capital risk’ and ‘Liquidity risk’ sections.
HOW RISK IS DISTRIBUTED ACROSS OUR BUSINESS (UNAUDITED)
Economic capital
As well as assessing how much regulatory capital we need to hold, we use an internal EC model to measure our risk. We use EC to get a consistent measure across different risk types. EC also takes account of how concentrated our portfolios are, and how much diversification there is between our various businesses and risk types. As a consequence, we can use EC for a range of risk management activities. For example, we can use it to help us compare requirements in our ICAAP or to get a risk-adjusted comparison of income from different activities.
Regulatory capital – risk-weighted assets
We hold regulatory capital against our credit, market and operational risks. In 2019, the largest category continued to be credit risk in Retail Banking, which accounted for more than half of our risk-weighted assets. This reflects our business strategy and balance sheet.
For more on this, see ‘Risk-weighted assets’ in the ‘Capital risk’ section.
Santander UK Group Holdings plc76
Annual Report 2019 | SectionAnnual Report 2019 | Risk review
Santander UK Group Holdings plc76

Santander UK Group Holdings plc 77
Strategic report Governance Risk review Financial review Financial statements Shareholder information
Credit risk
Credit risk
Overview (unaudited)
Credit risk is the risk of loss due to the default or credit quality deterioration of a customer or counterparty to which we provided credit, or for which we assumed a financial obligation.
Santander UK group level We start by discussing credit risk at a Santander UK group level. We set out how our exposures arise, our types of customer and how we manage them, and our approach to credit risk across the credit risk lifecycle. We provide an introduction into how climate change could impact credit risk. We also discuss our ECL approach and the key inputs to our ECL model. We then analyse our key metrics, credit performance and forbearance.
Business segments Then we cover Retail Banking separately from our other business segments – Corporate & Commercial Banking, Corporate & Investment Banking and Corporate Centre – in more detail.
Key metrics (unaudited)
Stage 3 ratio improved to 1.15% (2018: 1.29%).
Loss allowances increased to £863m (2018: £807m).
Average LTV of 65% (2018: 63%) on new mortgage lending.
Credit risk – Santander UK group level
SANTANDER UK GROUP LEVEL – CREDIT RISK MANAGEMENT
Exposures
Exposures to credit risk arise in our business segments from:
Retail Banking Corporate & Commercial Banking Corporate & Investment Banking Corporate Centre
− Residential mortgages, business banking, consumer (auto) finance and other unsecured lending (credit cards, personal loans and overdrafts).
− Loans, bank accounts, treasury services, invoice discounting, cash transmission, trade finance and asset finance.
− Loans, bank accounts, treasury services, treasury markets activities, trade finance, receivables discounting and cash transmission.
− Asset and liability management of our balance sheet, as well as our non-core and Legacy Portfolios being run down.
− We provide these to individuals and small businesses.
− We provide these to SMEs and mid corporates, Commercial Real Estate and Social Housing associations.
− We provide these to large corporates and financial institutions.
− Exposures include sovereign and other international organisation assets that we hold for liquidity.
The segmental basis of presentation in this Annual Report has been changed, and the prior periods restated, to report our short term markets business in Corporate Centre rather than in Corporate & Investment Banking. See Note 2 for more information.
Our types of customers and how we manage them
We manage credit risk across all our business segments in line with the credit risk lifecycle that we show in the next section. We tailor the way we manage risk to the type of customer. We classify our customers as standardised or non-standardised:
Standardised Non-standardised
− Mainly individuals and small businesses. Their transactions are for relatively small amounts of money and share similar credit characteristics.
− Mainly medium and large corporate customers. Their transactions are for larger values and have more diverse credit characteristics.
− In Retail Banking, Corporate & Commercial Banking (for some small, non-complex corporate clients) and Corporate Centre (for our non-core portfolios).
− In Retail Banking (for some business banking transactions), Corporate & Commercial Banking, Corporate & Investment Banking and Corporate Centre.
− We manage risk using automated decision-making tools. These are backed by teams of expert analysts.
− We manage risk through expert analysis. We support this with decision-making tools based on internal risk assessment models.
Climate-related impact on credit risk
In 2019, we developed a high-level analysis of our credit portfolios based on various climate scenarios: a business-as usual (BAU) scenario (which trends towards 3.7°C of average global warming by 2100) and a low-carbon transition scenario (which trends towards 2°C of warming). This analysis is referred to as the ‘Climate Portfolio Screen’.
The aim of the Climate Portfolio Screen was to identify sectors and segments of the Santander UK lending book where there could be greater potential opportunities and risks associated with both the transition to a lower carbon economy and changes in physical climatic conditions.
According to this analysis, the sectors of most concern based on exposure and or potential risks are mortgages, real estate, consumer finance and automotives. For the mortgage portfolio, we are working on a project that will help us understand the physical and transition risks in our mortgage book under different climate scenarios.
Santander UK Group Holdings plc 77
Strategic Report Governance Risk review Financial review Financial statements Shareholder information
Credit risk
77Santander UK Group Holdings plc

Annual Report 2019 | Risk review
78 Santander UK Group Holdings plc
Our approach to credit risk
We manage our portfolios across the credit risk lifecycle (above), from drawing up our risk strategy, plans, budgets and limits to making sure the actual risk profile of our exposures stays in line with our business plans and within our Risk Appetite. We further tailor the way we manage risk across the lifecycle to the type of product. We say more on this in the Credit risk – Retail Banking and the Credit risk – Other business segments sections.
1. Risk strategy and planning
All relevant areas of the business work together to create our business plans. We aim to balance our strategy, goals, and financial and technical resources with our Risk Appetite. To do this, we focus on economic and market conditions and forecasts, regulations, conduct matters, profitability, returns and market share. The result is an agreed set of targets and limits that help us direct our business.
2. Assessment and origination
Managing credit risk begins with lending responsibly. That means only lending to customers who can afford to pay us back, even if things get tighter for them, and are committed to paying us back. We perform a thorough risk assessment to make sure customers can meet their obligations before we approve a credit application. We make these decisions with authority from the Board and we consider:
− The credit quality of the customer − The underlying risk – and how we can mitigate it, such as through netting or collateral − Our risk policy, limits and appetite − Whether we can balance the amount of risk we face with the returns we expect, and − Assessment of customer affordability.
We also use stress testing, for example to estimate how a customer might be able to cope if interest rates rise.
3. Monitoring
We measure and monitor changes in our credit risk profile on a regular and systematic basis against our budgets, limits and benchmarks. We monitor credit performance by portfolio, segment, customer or transaction. If our portfolios do not perform as we expect, we investigate to understand the reasons. Then we take action to mitigate it as far as possible and bring performance back on track. We monitor and review our risk profile through formal governance forums and committees across our business. These agree and track any steps we need to take to manage our portfolios, to make sure the impact is prompt and effective. This structure is a vital feedback tool to coordinate issues, trends and developments across each part of the credit risk lifecycle.
Credit concentrations
A core part of our monitoring and management is a focus on credit concentrations, such as the proportion of our lending that goes to specific borrowers, groups or industries. We set concentration limits in line with our Risk Appetite and review them on a regular basis. We track how concentrated our portfolios are using a range of criteria. These include geographies, economic sectors, products and groups of customers.
Geographical concentrations We set exposure limits to countries and geographies, with reference to the country limits set by Banco Santander. These are determined according to how the country is classified (whether it is a developed OECD country or not), its credit rating, its gross domestic product, and the products and services we or Banco Santander want to offer in that country. For more geographical information, see ‘Country risk exposures’.
Industry concentrations We also set exposure limits by industry sector. We set these limits based on the industry outlook, our strategic aims and desired level of concentration, and relevant limits set by Banco Santander. We analyse committed exposures in the ‘Credit risk review’.
4. Arrears management
Sometimes our customers face financial difficulty and may fall into payment arrears or breach the conditions of their credit facility. If this happens, we work with them to get their account back on track. We aim to support our customers and keep our relationship with them. To do this, we:
− Find affordable and sustainable ways of repaying to fit their circumstances − Monitor their finances and use models to predict how they will cope. This helps us put in place the right strategy to manage their debt − Work with them to get their account back on track as soon as possible in a way that works for them and us − Monitor agreements we make to manage their debt, so we know they are working.
For more, see the Forbearance section on the next page.
5. Debt recovery
Sometimes, even when we have taken all reasonable and responsible steps we can to manage arrears, they are not effective. If this happens, we have to end our agreement with the customer and try to recover the whole debt, or as much of it as we can.
Pre-transaction Transaction Post-transaction
Forbearance
Control
1. Risk strategyand planning
2. Assessment and origination
3. Monitoring4.5.
Credit risk lifecycle (unaudited)
Arrears management Debt recovery
Santander UK Group Holdings plc78
Annual Report 2019 | SectionAnnual Report 2019 | Risk review
Santander UK Group Holdings plc78

Santander UK Group Holdings plc 79
Strategic report Governance Risk review Financial review Financial statements Shareholder information
Credit risk
Loan modifications We sometimes change the terms of a loan when a customer gets into financial difficulty (this is known as forbearance), or for other commercial reasons.
Forbearance When a customer gets into financial difficulties, we can change the terms of their loan, either temporarily or permanently. We do this to help customers through temporary periods of difficulty so they can get back on to sustainable terms and fully pay off the loan over its lifetime, with support if needed. We try to do this before the customer defaults. Whatever we offer, we assess it to make sure the customer can afford the repayments. Forbearance improves our customer relationships and our credit risk profile. We review our approach regularly to make sure it is still effective. In a few cases, we can help a customer in this way more than once. This can happen if the plan to repay their debt doesn’t work and we have to draw up another one. When this happens more than once in a year, or more than three times in five years, we call it multiple forbearance. We only use foreclosure or repossession as a last resort.
When we agree to forbearance, we consider that the account has suffered a Significant Increase in Credit Risk (SICR), as we explain later on. We review our loss allowance for it and report the account as forborne. For retail accounts, if an account is in Stage 1 (a 12-month ECL) when we agree forbearance, we transfer it to Stage 2 (a lifetime ECL). For all accounts, if an account is already in Stage 2 when we agree forbearance, we keep it in Stage 2 unless the forbearance arrangement involves the forgiveness of fees and interest which would put the case into Stage 3 (a lifetime ECL). If an account is already in Stage 3 when we agree forbearance, we keep it in Stage 3. We monitor the performance of all forborne loans. A loan moves from a lifetime ECL to a 12-month ECL once the criteria to exit forbearance have been met, as set out below.
Exit from forbearance or cure
For a loan to exit forbearance, all the following conditions must be met:
− The loan has been forborne for at least two years or, if forbearance was temporary, must have returned to performing under normal terms for at least two years − The loan has been performing under the forborne terms for at least two years − The account is no longer in arrears, and the customer has no other material debts with us which are more than 30 days in arrears.
Other modifications When a customer is not showing any signs of financial difficulties, we can also change the terms of their loan. We do this to keep a good relationship with them.
Risk measurement and control We measure and control credit risk at all stages across the credit risk lifecycle. We have a range of tools, processes and approaches, but we rely mainly on:
− Credit control: as a core part of risk management we generate, extract and store accurate, comprehensive and timely data to track credit limits. We use internal data and data from third parties like credit bureaux.
− Models: we use models widely to measure credit risk and capital needs. They range from statistical and expert models to benchmarks. − Review: we use formal and informal forums to approve, validate, review and challenge our risk management. We do this to help predict if our credit risk will
worsen.
Key metrics We use a number of key metrics to measure and control credit risk, as follows:
Metric Description
Expected Credit Loss (ECL)
ECL tells us what credit risk is likely to cost us either over the next 12 months on qualifying exposures, or defaults over the lifetime of the exposure where there is evidence of a SICR since origination. We explain how we calculate ECL below.
Stages 1, 2 and 3 We assess each facility’s credit risk profile to determine which stage to allocate them to, and we monitor where there is a SICR and transfers between the Stages including monitoring of coverage ratios for each stage. We explain how we allocate a facility to Stage 1, 2 or 3 below.
Stage 3 ratio The Stage 3 ratio is total Stage 3 exposure as a percentage of customer loans plus undrawn Stage 3 exposures. We changed our definition of the Stage 3 ratio in 2019 and restated 2018 for consistency. The Stage 3 ratio was previously calculated as Stage 3 exposures as a percentage of customer loans. The Stage 3 ratio at 31 December 2018 using the new definition was 1.29%, compared to 1.20% using the previous definition.
Following the introduction of IFRS 9 in 2018, the Stage 3 ratio became the main indicator of credit quality performance and replaces the NPL ratio which is no longer reported.
Expected Loss (EL) EL is based on the regulatory capital rules of CRD IV and gives us another view of credit risk. It is the product of the probability of default, exposure at default and loss given default. We calculate each factor in accordance with CRD IV and include direct and indirect costs. We base them on our risk models and our assessment of each customer’s credit quality. There are differences between regulatory EL and IFRS 9 ECL, which we set out below. For the rest of our Risk review, impairments, losses and loss allowances refer to calculations in accordance with IFRS, unless we specifically say they relate to CRD IV. For our IFRS accounting policy on impairment, see Note 1 to the Consolidated Financial Statements.
We also assess risks from other perspectives, such as geography, business area, product and process to identify areas we need to focus on. We also use stress testing to establish vulnerabilities to economic deterioration. Our business segments tailor their approach to credit risk to their own customers, as we explain later on.
Key differences between regulatory EL and IFRS 9 ECL models (unaudited) There are differences between the regulatory EL and the IFRS 9 ECL approaches. Although our IFRS 9 models use the existing Basel advanced IRB risk components, we need to make several adjustments to ensure the outcome is in line with the IFRS 9 requirements, as follows.
Basel advanced IRB EL IFRS 9 ECL
Rating philosophy Mix of point-in-time, through-the-cycle or hybrid Point-in-time, forward-looking. Considers a range of economic scenarios
Parameters calibration Contains regulatory floors and downturn calibration Unbiased estimate, based on conditions known at the balance sheet date
Calculation timing Considers aggregation of possible default events in the next 12 months
Considers monthly calculation of parameters, for all possible future default dates. First 12 months are used for Stage 1, full lifetime for Stages 2 and 3.
Probability of Default (PD) PD in the next 12 months Includes forward-looking economic data and removes conservatism and bias. Adjusted to convert from 12 months to lifetime for Stages 2 and 3
Loss Given Default (LGD) Lifetime LGD for defaults in the next 12 months Modelled without regulatory floors and exclusion of indirect costs
Exposure at Default (EAD) Exposure at the point of default if the customer defaults in the next 12 months
Floored at amount owed, except on some revolving facilities. Recognises ability for exposure to reduce from the balance sheet date to default date
SICR Does not include SICR concept Includes SICR concept
Discounting applied At the weighted average cost of capital to the default date At the effective interest rate (EIR) to the balance sheet date
Strategic Report Governance Risk review Financial review Financial statements Shareholder information
Credit risk
79Santander UK Group Holdings plcSantander UK Group Holdings plc 7979Santander UK plc

Annual Report 2019 | Risk review
80 Santander UK Group Holdings plc
Recognising ECL The ECL approach estimates the credit losses arising from defaults in the next 12 months on qualifying exposures, or defaults over the lifetime of the exposure where there is evidence of a SICR since the origination date. The ECL approach takes into account forward-looking data, including a range of possible outcomes, which should be unbiased and probability-weighted in order to reflect the risk of a loss being incurred even when it is considered unlikely.
Multiple economic scenarios and probability weights For all our portfolios, except CIB (which we cover in more depth below), we use five forward-looking economic scenarios. They consist of a central base case, two upside scenarios and two downside scenarios. We use five scenarios to reflect a wide range of possible outcomes in the performance of the UK economy.
Base case Our base case assumes that the UK will negotiate a trade deal with the EU and that there will be an orderly exit.
Base case key macroeconomic assumptions for 2019
– House price growth: House price growth is forecast to remain at 1% for 2020 with growth pushing up over the subsequent years to 2%. This reflects the subdued nature of the housing market over the last few years, which has led, on average, to low levels of house price growth.
– GDP: GDP is forecast to follow a similar growth path to last year over 2020 as uncertainty over the UK’s future trading relationship with the EU continues. However, moving forward growth is expected by 2021 to follow a stronger growth path as the uncertainties from Brexit start to fall away and the economy adjusts to its new position outside the EU, but with a free trade agreement between the UK and EU in place.
– Unemployment rate: Unemployment is expected to continue its current trend at approximately 4% over the forecast period, in line with the consensus view.
– Bank of England Base Rate (Base Rate): For Bank of England base rate forecast, the base case currently assumes a flat profile of 75bps for our planning horizon. This is based on the view that we have a deal and a smooth transition, providing some stability to the economy. With inflation expected to remain near target, the Monetary Policy Committee will wait to understand how the economy responds to the new economic environment before changing the Bank Rate.
In the medium-term, the projections assume that current demographic and productivity trends will continue, causing a reduction in the UK’s growth potential. This is reflected in an average growth expectation of less than 1.6% pa, the OBR’s latest estimate of the UK’s long run average growth rate.
We expect the low value of sterling to continue into 2020. However, we would expect some improvement if the economic data continues to recover and there is constructive dialogue between the UK and the EU on agreeing the terms of a future trade deal. Even though the continuing Brexit negotiations on a future trade deal are likely to result in some increased trade costs between the EU and UK, these are not expected to significantly impact the downwards trend in the share of UK exports going to the EU.
CPI inflation is forecast to remain around the 2% target rate and nominal earnings growth of approximately 3% is expected to continue over the forecast horizon. This implies positive real earnings growth, which in turn will support household spending power. However, the effect of limited business investment on growth will continue until the final outcome of Brexit is known. Furthermore, with the household savings ratio stabilising and consumer credit growth slowing, consumer demand will be driven increasingly by the fundamentals of household income growth.
In summary, the base case assumes that activity will continue to run at a relatively slow pace as we move through 2020 but will pick up further in subsequent years.
Key changes to our base case in 2019 The key changes to our base case assumptions in 2019 were that we lowered our GDP forecasts for 2019, 2020 and 2021 to reflect the slower growth we have been seeing given the continuing Brexit uncertainty and the decline in global growth. We also reduced house price growth slightly for 2020 and 2021 and the unsecured lending path was amended to reflect Bank of England revisions to historic estimates.
(i) For all our portfolios, except CIB
Our forecasting approach We derive our scenarios in part by using a set of parameters in GDP fan charts published by the Office for Budget Responsibility (OBR) twice a year. To avoid major changes to the scenarios due to changes in the OBR fan charts, we place more weight on what the long-run outlook of the fan charts are rather than relying solely on each individual release as this can create large swings in the scenarios which may not be appropriate. We use the OBR fan charts to calculate our GDP paths for each scenario. These fan charts reflect the probability distribution of a deviation from the OBR’s central forecast to illustrate the uncertainty regarding the outcome of a variable, in this case GDP.
We use the 0.6 and 0.7 fan chart paths for our Upside scenarios, and the 0.3 path for Downside 1. However, for Downside 2 we use a blend of the Downside 1 scenario and the recession of the early 1980s. We believe that a recession of that order of magnitude is more likely than a repeat of the 2008/09 recession. This means that in the longer run the GDP levels in our Downside 1 and 2 scenarios converge. To ensure that Downside 2 is kept consistent with any changes to the OBR fan charts, we calculate the Downside 2 GDP by taking the percentage difference between Downside 2 and Downside 1 GDP in the original forecast and applying this difference to the new Downside 1.
Our use of five scenarios is designed to reflect different possible outcomes to the base case forecast highlighting the upside and downside risks associated with the central scenario. The downside risks include unfavourable developments for Brexit, a further and sharper downturn in global growth, continuation of the very low productivity growth seen in the UK, and a move to a more protectionist agenda for trade. The upside risks are more muted at present and include the quick implementation of a new free trade agreement with the EU and an upturn in global growth, coupled with a move to more open trade.
The two upside scenarios are based on a faster global recovery and the UK quickly concluding trade agreements with a number of countries after leaving the EU, along with minimum effective tariffs. It is also based on productivity growth recovering. If this is combined with a strong supply side response, interest rate normalisation can occur in a gradual and well managed fashion. The difference between the two scenarios is how quickly the recovery happens and the strength of global recovery.
Santander UK Group Holdings plc80
Annual Report 2019 | SectionAnnual Report 2019 | Risk review
Santander UK Group Holdings plc80

Santander UK Group Holdings plc 81
Strategic report Governance Risk review Financial review Financial statements Shareholder information
Credit risk
Regarding the two downside scenarios, Downside 1 reflects slower growth for longer, representing a period of continued uncertainty as the Brexit process continues to mute expectations. It also assumes ‘lower for longer’ global growth. With sterling under continuing pressure, this causes the Monetary Policy Committee (the MPC) to raise rates to quell further inflation even though a looser stance would be more beneficial to growth. Business and household confidence continue to be negative and business investment struggles. In terms of trade, the UK defaults to WTO rules with the EU but maintains an open trade policy pursuing bilateral trade agreements with countries rather than pure free trade agreements. Downside 2 assumes the UK economy goes into outright recession. Here global growth is undermined by further weakness among the advanced economies and the emerging markets slowing more markedly than expected. This scenario also assumes that the UK leaves the EU without a trade deal and that business investment contracts further given the continued uncertainty over future trading arrangements. There is also widespread and substantial capital flight as overseas investors sell UK assets, which in turn leads to a tightening in domestic financial conditions. As overseas investors’ appetite for UK assets diminishes, this causes a sell-off in sterling and pushes up inflation, with the MPC forced to raise rates to mitigate this. Rising interest rates trigger an increase in debt-servicing costs for households with variable rate mortgages. This combined with the additional negative shock of higher unemployment leads to rising impairments, with some borrowers forced to sell their properties which leads to a fall in property values. The UK continues to negotiate trade deals with other countries, including the EU, and the successful implementation of these goes some way to restoring stability and business confidence with the UK returning to trend growth in the outer years.
Given the above, our scenarios and weights reflect the range of possible outcomes that the UK may face in 2020 and beyond.
Once we have established the GDP paths for each scenario, we run them through the Oxford Global Economic Model (OGEM) to derive the other macroeconomic variables, such as unemployment and house prices. These variables are the product of the GDP growth paths we have forecast and the output of the OGEM for these particular growth paths. We then impose a Bank Rate profile for each scenario using expert judgement. We determine the Bank Rate by using the base case Bank Rate profile and adjusting this for each of the four scenarios. To do this, we firstly consider what each of the scenarios is trying to achieve.
For the upside scenarios which have a higher growth path and rising productivity growth, a strengthening of sterling keeps CPI inflation low and allows for a managed tightening of the monetary stance. In contrast, the downside scenarios show monetary policy forced into a reactive stance to contain CPI inflation at a time of weakening output growth, so we assume the Bank of England would raise rates in this scenario in order to bring the inflation rate back to its target rate. The rising Bank Rate profiles are based on forward guidance from the Bank of England where increases are assumed to be gradual and incremental.
We update the baseline in our economic scenarios at least twice a year in line with our annual budgeting and three-year planning processes, or sooner if there is a material change in current or expected economic conditions. We refresh all our economic scenarios each quarter to reflect the latest data and OBR fan charts if these have changed, which are then reviewed and approved by ALCO. ALCO also assess the probability weights at least once a quarter. We avoid embedding new economic scenarios into our models on a quarter-end month. Instead, we aim to run the model with the new scenarios for two months before the quarter-end to ensure that we can fully validate the output.
We do not use consensus forecasts as inputs to our models, but we do compare the outputs of our models against consensus views for the base case, to make sure that we understand any significant differences and address them, where needed. In 2019, there were no significant differences between our base case forecasts and the consensus views.
Key changes to our forecasting approach in 2019
In 2019, there were no significant changes in our forecasting approach, except that for the two upside scenarios we have changed the Bank Rate profiles. Initially, we had a falling Bank Rate profile for the upside scenarios to maintain symmetry with the downside scenarios, which showed a rising Bank Rate. However, it was later decided that symmetrical outcomes were no longer required for the upside and downside scenarios; rather it was more logical to have Bank Rate rising when the economy is growing strongly, and inflation is picking up.
Scenario weights
To determine our initial scenario weights, we give the highest weight to the base case, whilst the outer scenarios typically attract lower weights than the more moderate ones. We also consider how the GDP five-year average growth rates for each scenario fits with the average growth rates over the last 10 years in helping to determine the weights to apply. We use a 10-year period as we consider this more reflective of the current UK economic environment. For example, our recent analysis shows that the likelihood that growth is positive occurs 90% of the time, so there could be negative growth 10% of the time. Therefore, using this approach would suggest we apply a 10% weight to the scenario with negative growth, in this case Downside 2. We also consider changes in the economic and political environment and whether such forces suggest further small changes to the weights would be appropriate. For example, due to the current economic position both in the UK and globally and policy concerns around securing a trade deal with the EU by the end of 2020, we have applied a higher weight to the downside scenarios than focusing on historical experience as a guide would suggest. We consider this appropriate in light of the consensus view of the future performance of the UK economy and the balance of risks, which are currently more heavily weighted to the downside.
As part of our review of the scenarios and weights that we use, we perform statistical analysis to assess whether their use ensures that we capture the non-linearity of losses implied by the results. The outcome of this analysis, which modelled several additional scenarios, showed that there is a non-linear relationship between the ECLs based on the GDP growth paths for the individual scenarios for mortgages. In addition, the trend line modelled showed that our Base case, Downside 1 and Downside 2 scenarios provided a good fit for the loss distribution profile. For example, the base case scenario provides a good fit for losses in distribution for GDP between 1-2%; that Downside 1 does this for 0-1% and Downside 2 does this for less than 0%.
In terms of applying scenario weights to this for, say, Downside 1 we consider how much weight should be attached to an outcome where GDP is between 0-1%. To determine this, we run the GDP five-year average growth rates, as discussed above. Taking this approach and applying it to Downside 1, where GDP is between 0-1%, would be considered to happen between 20-40% of the time. Then using the actual GDP five-year average growth rate for the Downside 1 scenario (0.70%) this fits with a 30% likelihood which aligns with the current weight. However, as discussed above, we then review the outcome of the analysis against the global and domestic economic back drop which may mean making small changes to the weights profile to encompass the upside or downside risks associated with these events.
The scenario weights we applied for 2019 and 2018 were:
Scenario weights Upside 2
% Upside 1
% Base case
% Downside 1
% Downside 2
%
2019 5 10 40 30 15
2018 5 15 40 30 10
Key changes to our scenario weights in 2019
The key changes to our scenario weights were made in Q3 2019 to reduce the Upside 1 weight by 5% to reflect the lower upside risk to the base case forecast from global economic conditions and increase the Downside 2 weight by 5% to reflect the higher downside risks relating to Brexit and the risk of global recession.
Santander UK Group Holdings plc 81
Strategic Report Governance Risk review Financial review Financial statements Shareholder information
Credit risk
81Santander UK Group Holdings plc

Annual Report 2019 | Risk review
82 Santander UK Group Holdings plc
Our macroeconomic assumptions and their evolution throughout the forecast period Our macroeconomic assumptions and their evolution throughout the forecast period for 2019 and 2018 were:
2019 Upside 2
% Upside 1
% Base case
% Downside 1
% Downside 2
%
House price growth 5-year average increase/decrease 4.90 3.70 1.60 (1.20) (9.30)
Peak/(trough) (1) at 8.10 5.80 2.00 (2.80) (13.50)
GDP 5-year average increase/decrease 2.40 2.00 1.60 0.70 0.20
Cumulative growth/(fall) to peak/(trough) (2) 1.50 1.00 0.70 (1.10) (5.60)
Unemployment rate 5-year end period 1.90 2.70 4.00 5.60 7.40
Peak/(trough) at 1.88 2.73 4.10 5.64 7.84
Bank of England base rate 5-year end period 2.00 2.00 0.75 2.00 2.25
Peak/(trough) at 2.00 2.00 0.75 2.00 3.00
2018 House price growth 5-year average increase/decrease 3.40 2.30 2.00 (2.00) (9.50)
Peak/(trough) at 7.40 4.60 2.00 (5.80) (15.60)
GDP 5-year average increase/decrease 2.50 2.10 1.60 0.70 0.30
Cumulative growth/(fall) to peak/(trough) 1.60 1.10 0.60 (0.60) (6.10)
Unemployment rate 5-year end period 2.80 3.80 4.30 6.90 8.60
Peak/(trough) at 2.58 3.71 4.39 7.30 8.65
Bank of England base rate 5-year end period 1.00 1.25 1.50 2.50 2.25
Peak/(trough) at 2.00 2.00 1.50 2.50 3.00
(1) Peak/(trough) refers to the peak that the variable will reach in the upside scenario and the trough that the variable will reach in the downside scenario. (2) Cumulative growth/(fall) refers to the cumulative change from the last historical data point for GDP growth to the peak (for Upside scenarios) or to the trough (for Downside scenarios).
The historical and forecast growth rates for the GDP assumptions we use for scenario modelling The evolution of the historical and forecast growth rates for the GDP assumptions we used for scenario modelling at 31 December 2019 was:
Our forecasting period for GDP is five years and then we revert to the average trend growth over three years based on the OBR’s long-run GDP forecast.
In the Upside 1 and Upside 2 scenarios, the economy is assumed to peak by the end of Q4 2022, after which GDP declines. In the Downside 1 the trough occurs in Q4 2020 and in Downside 2 a trough is assumed to occur in Q2 2020. In all scenarios, we assume that GDP will have reverted to the OBR’s long-run forecast rate after Q4 2027. The reversion to mean for all macroeconomic variables is expected to take three years after the initial five-year forecast period.
Key changes to our alternative scenarios in 2019 In terms of key changes to our alternative scenarios in 2019, these only related to changes to the base case, historic data for each variable, OBR fan charts and the OGEM. We did not make any methodological changes to the scenarios. The combination of these different inputs will mean differences across the variables for each of the alternative scenarios when we update them each quarter. As such it is not possible to pin-point a specific reason for each change as we do not run the inputs in isolation. However, we compare the variables between each quarter and review any large changes to ensure they are not erroneous.
GD
P G
row
th r
ate
(%)
2017 2018 2019
Reporting date End of the forecast period used for scenario modelling
2020 2021 2022 2023 2024 2025 2026 2027 2028 2029
-5
-4
-3
-2
-1
0
1
2
3
Historical and forecasted GDP growth rate for each economic scenario Downside 1
Downside 2
Baseline
Upside 1
Upside 2
Santander UK Group Holdings plc82
Annual Report 2019 | SectionAnnual Report 2019 | Risk review
Santander UK Group Holdings plc82

Santander UK Group Holdings plc 83
Strategic report Governance Risk review Financial review Financial statements Shareholder information
Credit risk
(ii) For our CIB portfolios
Our forecasting approach For our CIB portfolios, we adopted the approach developed centrally by Banco Santander to ensure consistent treatment of these large and/or international counterparties across the Banco Santander group. For CIB, we use three scenarios (Base case, Upside and Downside). Like the UK scenarios, the base case uses the base scenario that has been developed and is used in other work that Banco Santander performs for planning and stress testing purposes. To develop the Downside scenario, the path of GDP for each country is calculated using the distribution probability of GDP estimated using a Monte Carlo simulation. The path used is the one that falls into a percentile that sits halfway between the baseline and global stress we use for our ICAAP. For the Upside, the distribution probability of GDP is again used, for each country the GDP path is consistent with the symmetric percentile selected on the Downside. This means that the scenarios maintain the asymmetry that comes with the probabilities of distribution.
Key changes to our forecasting approach in 2019
In 2019, there were no significant changes in our forecasting approach.
Scenario weights For our CIB portfolios, to determine our initial scenario weights, we give the highest weight to the base case. As set out above, we base the GDP path associated with the Upside scenario on the distribution probability of GDP consistent with the symmetric percentile selected on the Downside. This allows us to maintain the asymmetry of the scenarios that has been introduced in the probabilities of distribution. It also enables us to assign centred weights.
The scenario weights we applied to the scenarios for our CIB portfolio for 2019 and 2018 were:
Scenario weights Upside
% Base case
% Downside
%
2019 30 40 30
2018 20 60 20
Our macroeconomic assumptions and their evolution throughout the forecast period Our macroeconomic assumptions and their evolution throughout the forecast period for our CIB portfolio for 2019 and 2018 were:
GDP assumption Upside
% Base case
% Downside
%
2019 5 year average increase/decrease 3.7 3.5 3.0
Cumulative growth/(fall) to peak/(trough) (1) 0.3 0.5 (1.2)
2018 5 year average increase/decrease 4.2 3.6 2.7
Cumulative growth/(fall) to peak/(trough) 0.4 0.3 (0.8)
(1) Cumulative growth/(fall) refers to the cumulative change from the last historical data point for GDP growth to the peak (for upside scenarios) or to the trough (for downside scenarios).
Key changes to our alternative scenarios in 2019
There were no key changes to our alternative scenarios in 2019.
Significant Increase in Credit Risk (SICR) Loans which have suffered a SICR since origination are subject to a lifetime ECL assessment which extends to a maximum of the contractual term of the loan, or the behavioural term for a revolving facility. Loans which have not experienced a SICR are subject to 12 month ECL. We assess the credit risk profile of each facility to determine which of three stages to allocate them to:
– Stage 1: when there has been no SICR since initial recognition. We apply a loss allowance equal to a 12 month ECL i.e. the proportion of lifetime expected losses that relate to that default event expected in the next 12 months
– Stage 2: when there has been a SICR since initial recognition, but no credit impairment has materialised. We apply a loss allowance equal to the lifetime ECL i.e. lifetime expected loss resulting from all possible defaults throughout the residual life of a facility
– Stage 3: when the exposure is considered credit impaired. We apply a loss allowance equal to the lifetime ECL. Objective evidence of credit impairment is required. For more, see the section ‘Definition of default (Credit impaired)’ that follows.
We use a range of quantitative, qualitative and backstop criteria to identify exposures that have experienced a SICR. The Credit Risk Provisions Forum (CRPF) reviews and approves our SICR thresholds periodically. The Board Audit Committee reviews and challenges the appropriateness of them each year, or more often if we change them.
Quantitative criteria We use quantitative criteria to identify where an exposure has increased in credit risk. The criteria we apply are based on whether any increase in the lifetime PD since the recognition date exceeds a set threshold both in relative and absolute terms. We base the value anticipated from the initial recognition on a similar set of assumptions and data to the ones we used at the reporting date, adjusted to reflect the account surviving to that date. The comparison uses either an annualised lifetime PD, where the lifetime PD is divided by the forecast period, or the absolute change in lifetime PD since initial recognition. For each portfolio, the quantitative criteria we used for 2019 were:
Retail Banking(1)
Mortgages Consumer (auto)
finance(2) Other unsecured Corporate &
Commercial Banking Corporate &
Investment Banking Personal loans Credit cards Overdrafts
30bps 300bps 30bps 340bps 260bps 30bps Internal rating method
(1) In Business banking, for larger customers we apply the same criteria that we use for Corporate & Commercial Banking. (2) Consumer (auto) finance use the comparison of lifetime PDs to determine Stage allocation, unlike other products which first turn the lifetime PD into an average yearly PD (annualised) and then do the comparison.
The criteria above are absolute (rather than relative) increases in lifetime PD since initial recognition. These are all absolute values.
We also applied a relative threshold of 100% (doubling the PD) across all portfolios except CIB.
In 2019, there were no changes to the way that we measure SICR, except that we changed the absolute thresholds for unsecured personal loans and Corporate & Commercial Banking exposures to be calculated on an annualised basis to bring them into line with our other portfolios with no material impact on Stage allocation or ECL.
Strategic Report Governance Risk review Financial review Financial statements Shareholder information
Credit risk
83Santander UK Group Holdings plc

Annual Report 2019 | Risk review
84 Santander UK Group Holdings plc
Qualitative criteria We also use qualitative criteria to identify where an exposure has increased in credit risk, independent of any changes in PD. For each portfolio, the criteria we used for 2019 and 2018 were:
Retail Banking(1)
Mortgages Consumer (auto)
finance Other unsecured Corporate &
Commercial Banking Corporate &
Investment Banking Personal loans Credit cards Overdrafts
In forbearance In forbearance In Collections In forbearance Fees suspended In forbearance
Default in last 24m Deceased or Insolvent Default in last 12m Default in last 12m Default in last 12m Default in last 12m
>30 Days past due (DPD) in last 12m
Court ‘Return of goods’ order or Police
watchlist
In Collections Debit dormant >35 days
Watchlist – proactive management
Watchlist – proactive management
Bankrupt Agreement terminated Default at proxy origination
£100+ arrears Payment holiday £50+ arrears £100+ arrears Any excess in month
Cash Collection
(1) In Business Banking, for larger customers we apply the same criteria that we use for Corporate & Commercial Banking.
Backstop criteria As a backstop, we classify all exposures more than 30 or 90 DPD in at least Stage 2 or in Stage 3, respectively. This means that we do not rebut the backstop presumptions in IFRS 9 (i.e. credit risk has significantly increased if contractual payments are more than 30 DPD) relating to either a SICR or default.
Improvement in credit risk or cure In some cases, instruments with a lifetime ECL (in Stage 2 or 3) may be transferred back to 12 month ECL (Stage 1). Financial assets in Stage 3 can only be transferred to Stage 2 or Stage 1 when they are no longer considered to be credit impaired, as defined below. Financial assets in Stage 2 can only be transferred to Stage 1 when they are no longer considered to have experienced a SICR. Where we identified a SICR using quantitative criteria, the instruments automatically transfer back to Stage 1 when the original PD-based transfer criteria are no longer met. Where we identified a SICR using qualitative criteria, the issues that led to the transfer must be cured before the instruments can be reclassified to Stage 1. For a loan in forbearance to cure, it must meet the exit conditions set out in the earlier section ‘Forbearance’.
Definition of default (Credit impaired) We define a financial instrument as in default (i.e. credit impaired) for purposes of calculating ECL if it is more than three months past due, or if we have data to make us doubt the customer can keep up with their payments i.e. they are unlikely to pay. The data we have on customers varies across our business segments. It typically includes where:
Retail Banking
− They have been reported bankrupt or insolvent. This excludes accounts which are up to date and are not defaulted.
− Their loan term has ended, but they still owe us money more than three months later
− They have had forbearance while in default, but have not caught up with the payments they had missed before that, or they have had multiple forbearance
− We have suspended their fees and interest because they are in financial difficulties
− We have repossessed the property.
Other business segments: Corporate & Commercial Banking, Corporate & Investment Banking and Corporate Centre
− They have had a winding up notice issued, or something happens that is likely to trigger insolvency – such as another lender calls in a loan
− Something happens that makes them less likely to be able to pay us – such as they lose an important client or contract
− They have regularly missed or delayed payments, even though they have not gone over the three-month limit for default
− Their loan is unlikely to be refinanced or repaid in full on maturity
− Their loan has an excessive LTV that is unlikely to be resolved, such as by a change in planning policy, pay-downs, or increase in market value.
Where we use the advanced internal ratings-based basis for a portfolio in our capital calculations, we use the same default definitions for ECL purposes. The CRPF reviews and approves the definition of default at least annually. The Board Audit Committee reviews and challenges the appropriateness of the definition each year, or more often if we change it.
Measuring ECL For accounts not in default at the reporting date, we estimate a monthly ECL for each exposure and for each month over the forecast period. The lifetime ECL is the sum of the monthly ECLs over the forecast period, while the 12-month ECL is limited to the first 12 months. We calculate each monthly ECL as the discounted value for the relevant forecast month of the product of the following factors:
Factor Description
Survival rate (SR) The probability that the exposure has not closed or defaulted since the reporting date.
PD The likelihood of a borrower defaulting in the following month, assuming it has not closed or defaulted since the reporting date. For each month in the forecast period, we estimate the monthly PD from a range of factors. These include the current risk grade for the exposure, which becomes less relevant further into the forecast period, as well as the expected evolution of the account risk with maturity and factors for changing economics. We support this with historical data analysis.
EAD The amount we expect to be owed if a default event was to occur. We determine EAD for each month of the forecast period by the expected payment profile, which varies by product type. For amortising products, we base it on the borrower’s contractual repayments over the forecast period. We adjust this for any expected overpayments on Stage 1 accounts that the borrower may make and for any arrears we expect if the account was to default. For revolving products, or amortising products with an off-balance sheet element, we determine EAD using the balance at default and the contractual exposure limit. We vary these assumptions by product type and base them on analysis of recent default data.
LGD Our expected loss if a default event were to occur. We express it as a percentage and calculate it as the expected loss divided by EAD for each month of the forecast period. We base LGD on factors that impact the likelihood and value of any subsequent write-offs, which vary according to whether the product is secured or unsecured. If the product is secured, we take into account collateral values as well as the historical discounts to market/book values due to forced sales type.
We use the original effective interest rate as the discount rate. For accounts in default, we use the EAD as the reporting date balance. We also calculate an LGD to reflect the default status of the account, considering the current DPD and loan to value. PD and SR are not required for accounts in default.
Santander UK Group Holdings plc84
Annual Report 2019 | SectionAnnual Report 2019 | Risk review
Santander UK Group Holdings plc84

Santander UK Group Holdings plc 85
Strategic report Governance Risk review Financial review Financial statements Shareholder information
Credit risk
Forecast period We base the forecast period for amortising facilities on the remaining contract term. For revolving facilities, we use an analytical approach based on the behavioural, rather than contractual, characteristics of the facility type. In some cases, we shorten the period to simplify the calculation. If we do this, we apply a post model adjustment to reflect our view of the full lifetime ECL.
Forward-looking information Our assessments of a SICR and the calculation of ECL both incorporate forward-looking data. We perform historical analysis and identify the key economic variables that impact credit risk and ECL for each portfolio. These can include the house price growth, GDP, unemployment rate and Bank of England base rate. Where applicable, we incorporate these economic variables and their associated impacts into our models.
Economic forecasts have the most impact on the measurement of ECL for residential mortgages and, to a lesser extent, corporate loans. This is due to the long behavioural lives and large sizes of these portfolios. Economic forecasts have less impact on the measurement of ECL for our other portfolios. This is due to the shorter behavioural lives and smaller sizes of these portfolios.
Grouping of instruments for losses measured on a collective basis We measure ECL at the individual financial instrument level. However, where we have used internal capital or similar models as the basis for our ECL models, this typically results in a large number of relatively small homogenous groups. We typically group instruments where they share risk characteristics using one or more statistical models and assess them for impairment collectively.
We use this approach for:
– all our Retail Banking portfolios (as described in Retail Banking – credit risk management) – SME customers in Corporate & Commercial Banking – Legacy Portfolios in run-off and the Crown Dependencies mortgage portfolio in Corporate Centre.
We calculate separate collective provisions for instruments in Stages 1, 2 and 3 where the instrument is not individually assessed.
As described above, for our CIB portfolios (whether we assess them for impairment individually or collectively) we use three forward-looking economic scenarios for forecasting. For all our other portfolios (whether we assess them for impairment individually or collectively) we use five forward-looking economic scenarios.
Management judgement applied in calculating ECL IFRS 9 recognises that expert management judgement is an essential part of calculating ECL. Specifically, where the historical data that we use in our models does not reflect current or future expected conditions, or the data we have does not cover a sufficient period or is not robust enough. We consider the significant management judgements in calculating ECL to be:
– Definition of default: We define a financial instrument as in default (i.e. credit impaired) for purposes of calculating ECL if it is more than three months past due, or if we have data to make us doubt they can keep up with their payments. The data we have on customers varies across our business segments.
– Forward-looking multiple economic scenarios: We use five scenarios, consisting of a central base case, two upside scenarios and two downside scenarios except for our CIB portfolio, where we use three scenarios – a central and a single upside and downside scenario. This symmetry meets the ‘unbiased’ requirement and we consider these scenarios sufficient to account for any non-linear relationships.
– Probability weights: In determining the initial scenario probability weights, we assign the highest probability to the base case, whilst the outer scenarios typically attract lower probabilities than the more moderate ones.
– SICR thresholds: We use a combination of quantitative (both absolute and relative), qualitative and backstop criteria to identify exposures that we consider have shown a SICR since initial recognition.
– Post Model Adjustments: These relate to adjustments which we need to account for identified model limitations – such as those that have arisen due to challenges in obtaining historical data. We expect these to gradually be incorporated into the underlying models as we build up more comparative data over future reporting periods.
Post Model Adjustments (PMAs) We use a range of methods to identify whether we need a PMA. These include regular review of model monitoring tools, period-to-period movement and trend analysis, comparison against forecasts, and input from expert teams who monitor and manage key portfolio risks. We only recognise a PMA if the ECL is over £1m. We keep PMAs in place until we no longer need them. This will typically be when they are built into our core credit model or the conditions that impacted the historical data no longer exist.
The Risk Provisions & Forecasting team calculates PMAs to ensure they are incremental to the core credit model and to ensure the calculation is performed in a consistent and controlled manner. We apply standard end-user computing controls to material and long-standing PMAs i.e. those expected to be in place for more than six months. Our Independent Validations Team may also review significant PMAs at their discretion. The CRPF approves all new PMAs. It delegates authority to approve temporary PMAs not expected to last beyond a quarter-end to the CFO. The Consolidated Reporting team reviews all new PMAs to ensure they comply with IFRS 9. We record all PMAs on a central log maintained by the Consolidated Reporting team which documents the justification, IFRS 9 compliance assessment, expected life, recalibration frequency, calculation methodology and value of each PMA. The CRPF reviews and approves the log each quarter.
The CRPF reviews and approves changes in all key management judgements at least each quarter. The Board Audit Committee reviews and challenges the appropriateness of changes in all key management judgements at least each quarter. The creation of new PMAs is a joint responsibility between the Risk Provisions & Forecasting team, as model owners who may identify issues with the historical data, and the Consolidated Reporting team who may identify changes in portfolio or credit quality performance.
Santander UK Group Holdings plc 85
Strategic Report Governance Risk review Financial review Financial statements Shareholder information
Credit risk
85Santander UK Group Holdings plc

Annual Report 2019 | Risk review
86 Santander UK Group Holdings plc
The most significant PMAs that we applied at 31 December 2019 and 2018 were:
PMAs 2019
£m 2018
£m
Interest-only maturity default risk 51 69
Buy-to-Let 21 20
Long-term indeterminate arrears 19 23
12+ months in arrears 23 11
– Interest-only maturity default risk: When an interest-only mortgage reaches contractual maturity and the capital payment becomes due, there is a risk that the customer won’t be able to repay the full capital balance. Our model estimates the likelihood of a customer missing a monthly payment, rather than the capital repayment. We hold an incremental provision to address the risk of default on capital repayments on maturity ultimately leading to write-off. We calculate it using a Judgement Model which uses historically observed experience and expert judgement to determine the proportion of customers who won’t be able to repay. Over time, as we continue to enhance our model, we expect the need for this PMA will diminish. This PMA increases our ECL.
– Buy-to-Let (BTL): Historical data shows that the risk of default on a BTL mortgage is higher than on a residential mortgage particularly in a downturn. However, our IFRS 9 models have been calibrated over a period of favourable and relatively benign economic conditions during which our BTL mortgage portfolio has continued to grow with limited loss events. To avoid underestimating ECL in an economic downturn, we adjust the loss allowance for our BTL accounts to increase the ECL. We use market data from the last economic crisis to estimate the adjustment. Over time, as our historical data grows and covers a wider range of economic conditions, we expect the need for this PMA will diminish. This PMA increases our ECL.
– Long-term indeterminate arrears: To mitigate the risk of model underestimation, we fully provide for accounts in arrears which have neither repaid (cured) or been written-off after a period of 180 days for unsecured portfolios or 5 years for secured portfolios. For our secured portfolios, we use expected security valuations at the point of repossession to estimate the adjustment. At 31 December 2019 and 2018, we only needed to make an adjustment for mortgages. Over the medium term, as we continue to address long term arrears in the portfolio, we expect the need for this PMA will diminish. This PMA increases our ECL.
– 12+ months in arrears: To mitigate the risk of underestimating ECL, mortgage accounts which are more than 12 months past due are fully provided for after deducting a historically observed self-cure rate. Over the medium term, as we continue to address long term arrears in the portfolio, we expect the need for this PMA will diminish. This PMA increases our ECL.
Governance around ECL impairment allowances Our Risk Methodology team developed our ECL impairment models (except for the external models we use, such as OGEM which we described earlier in ‘Our forecasting approach’), and our Independent Validations Team independently reviews all material models. As model owners, our Risk Provisioning & Forecasting team run the models to calculate our ECL impairment allowances each month. The models are sensitive to changes in credit conditions and reflect various management judgements that give rise to measurement uncertainty in our reportable ECL as set out above. The following committees and forums review the provision drivers and ensure that the management judgements we apply remain appropriate:
– Model Risk Control Forum (MRCF) reviews and approves new models and required model changes. It also reviews the use of OGEM as a reliable model on which to base our other forecast macroeconomic variables. It is used across all stress testing and planning so it is subject to model risk criteria. MRCF will delegate responsibility of approvals to Model Risk Management Forum (MRMF) for changes of low risk materiality or less complex changes.
– ALCO reviews and approves the economic scenarios and probability weights we use to calculate forward-looking scenarios. – CRPF reviews management judgements and approves ECL impairment allowances. – Board Audit Committee reviews and challenges the appropriateness of the estimates and judgements made by management.
For more on the governance around specific elements of the ECL impairment allowances, including the frequency of, and thresholds for, reviews, including by these committees and forums, see the detailed sections above.
How we assess the performance of our ECL estimation process We assess the reasonableness of our ECL provisions and the results of our Staging analysis using a range of methods. These include:
– Benchmarking: we compare our coverage levels with our peers. – Stand-back testing: we monitor the level of our coverage against actual write-offs. – Back-testing: we compare key drivers periodically as part of model monitoring practices. – Monitoring trends: we track ECL and Staged assets over time and against our internal budgets and forecasts, with triggers set accordingly.
Santander UK Group Holdings plc86
Annual Report 2019 | SectionAnnual Report 2019 | Risk review
Santander UK Group Holdings plc86

Santander UK Group Holdings plc 87
Strategic report Governance Risk review Financial review Financial statements Shareholder information
Credit risk
SANTANDER UK GROUP LEVEL – CREDIT RISK REVIEW Our maximum and net exposure to credit risk The tables below show the main differences between our maximum and net exposure to credit risk. They show the effects of collateral, netting, and risk transfer to mitigate our exposure. The tables only show the financial assets that credit risk affects and to which the impairment requirements in IFRS 9 are applied.
For balance sheet assets, the maximum exposure to credit risk is the carrying value after impairment loss allowances. Off-balance sheet exposures are mortgage offers, guarantees, formal standby facilities, credit lines and other commitments. For off-balance sheet guarantees, the maximum exposure is the maximum amount that we would have to pay if the guarantees were called on. For formal standby facilities, credit lines and other commitments that are irrevocable over the life of the facility, the maximum exposure is the total amount of the commitment.
Maximum exposure Balance sheet asset Off-balance sheet Collateral(1)
2019
Gross amounts
£bn
Loss allowance
£bn
Net amounts
£bn
Gross amounts
£bn
Loss allowance
£bn
Net amounts
£bn Cash £bn
Non-cash £bn
Netting(2) £bn
Net exposure
£bn
Cash and balances at central banks 26.4 – 26.4 – – – – – – 26.4
Financial assets at amortised cost:
– Loans and advances to customers:(3)
– Loans secured on residential properties(4) 165.6 (0.2) 165.4 13.4 – 13.4 – (168.9) – 9.9
– Corporate loans 27.0 (0.2) 26.8 14.3 (0.1)(5) 14.2 (0.1) (19.4) – 21.5
– Finance leases 6.3 (0.2) 6.1 0.3 – 0.3 (0.1) (6.3) – –
– Other unsecured loans 7.2 (0.2) 7.0 12.4 – 12.4 – – – 19.4
– Amounts due from fellow Banco Santander group subsidiaries and joint ventures 2.2 – 2.2 – – – – – – 2.2
Total loans and advances to customers 208.3 (0.8) 207.5 40.4 (0.1) 40.3 (0.2) (194.6) – 53.0
– Loans and advances to banks 2.5 – 2.5 1.2 – 1.2 – – – 3.7
– Reverse repurchase agreements – non trading 23.6 – 23.6 – – – – (23.1) (0.5) –
– Other financial assets at amortised cost 7.1 – 7.1 – – – – – – 7.1
Total financial assets at amortised cost 241.5 (0.8) 240.7 41.6 (0.1) 41.5 (0.2) (217.7) (0.5) 63.8
Financial assets at fair value at FVOCI:
– Loans and advances to customers 0.1 – 0.1 – – – – – – 0.1
– Debt securities 9.6 – 9.6 – – – – – – 9.6
Total financial assets at FVOCI 9.7 – 9.7 – – – – – – 9.7
Total 277.6 (0.8) 276.8 41.6 (0.1) 41.5 (0.2) (217.7) (0.5) 99.9
2018
Cash and balances at central banks 24.2 – 24.2 – – – – – – 24.2
Financial assets at amortised cost:
– Loans and advances to customers:(3)
– Loans secured on residential properties(4) 158.2 (0.2) 158.0 11.2 – 11.2 – (164.1) – 5.1
– Corporate loans 27.8 (0.2) 27.6 17.0 – 17.0 – (20.2) – 24.4
– Finance leases 6.8 (0.1) 6.7 0.2 – 0.2 (0.1) (6.1) – 0.7
– Other unsecured loans 7.6 (0.2) 7.4 11.6 (0.1) 11.5 – – – 18.9
– Amounts due from fellow Banco Santander group subsidiaries and joint ventures 2.0 – 2.0 – – – – (0.6) – 1.4
Total loans and advances to customers 202.4 (0.7) 201.7 40.0 (0.1) 39.9 (0.1) (191.0) – 50.5
– Loans and advances to banks 3.5 – 3.5 1.6 – 1.6 – – – 5.1
– Reverse repurchase agreements – non trading 21.1 – 21.1 – – – – (18.4) (2.7) –
– Other financial assets at amortised cost 7.2 – 7.2 – – – – – – 7.2
Total financial assets at amortised cost 234.2 (0.7) 233.5 41.6 (0.1) 41.5 (0.1) (209.4) (2.7) 62.8
Financial assets at FVOCI:
– Loans and advances to customers 0.1 – 0.1 0.1 – 0.1 – – – 0.2
– Debt securities 13.2 – 13.2 – – – – – – 13.2
Total financial assets at FVOCI 13.3 – 13.3 0.1 – 0.1 – – – 13.4
Total 271.7 (0.7) 271.0 41.7 (0.1) 41.6 (0.1) (209.4) (2.7) 100.4
(1) The forms of collateral we take to reduce credit risk include: residential and commercial property; other physical assets, including motor vehicles; liquid securities, including those transferred under reverse repurchase agreements; cash, including cash used as collateral for derivative transactions; and receivables. Charges on residential property are most of the collateral we take.
(2) We can reduce credit risk exposures by applying netting. We do this mainly for derivative and repurchase transactions with financial institutions. For derivatives, we use standard master netting agreements. They allow us to set off our credit risk exposure to a counterparty from a derivative against our obligations to the counterparty in the event of default. This gives us a lower net credit exposure. They may also reduce settlement exposure. For more on this, see ‘Credit risk mitigation’ in the ‘Other business segments – credit risk management’ section.
(3) Balances include interest we have charged to the customer’s account and accrued interest that we have not charged to the account yet. (4) The collateral value we have shown against advances secured on residential property is limited to the balance of each associated individual loan. It does not include the impact of over–collateralisation (where the collateral has a higher value
than the loan balance) and includes collateral we would receive on draw down of certain off–balance sheet commitments. (5) The total rounds to £0.1bn and is split across all portfolios. In this table, it has been allocated in full to Corporate loans for presentational purposes. For the full detail, see the ‘Credit Quality’ section.
Santander UK Group Holdings plc 87
Strategic Report Governance Risk review Financial review Financial statements Shareholder information
Credit risk
87Santander UK Group Holdings plc

Annual Report 2019 | Risk review
88 Santander UK Group Holdings plc
The tables below show the main differences between our maximum and net exposure to credit risk on the financial assets that credit risk affects and to which the impairment requirements in IFRS 9 are not applied.
Balance
sheet asset gross
amount £bn
Collateral(1)
Netting(2) £bn
Net exposure
£bn 2019 Cash £bn
Non–cash £bn
Financial assets at FVTPL:
– Derivative financial instruments 3.4 – (1.9) (0.8) 0.7
– Other financial assets at FVTPL 1.0 – – – 1.0
Total 4.4 – (1.9) (0.8) 1.7
2018
Financial assets at FVTPL:
– Derivative financial instruments 5.3 – (2.1) (0.9) 2.3
– Other financial assets at FVTPL 6.1 – (2.3) – 3.8
Total 11.4 – (4.4) (0.9) 6.1
(1) The forms of collateral we take to reduce credit risk include: liquid securities, including those transferred under reverse repurchase agreements; cash, including cash used as collateral for derivative transactions; and receivables. (2) We can reduce credit risk exposures by applying netting. We do this mainly for derivative and repurchase transactions with financial institutions. For derivatives, we use standard master netting agreements. They allow us to set off our credit risk
exposure to a counterparty from a derivative against our obligations to the counterparty in the event of default. This gives us a lower net credit exposure. They may also reduce settlement exposure. For more on this, see ‘Credit risk mitigation’ in the ‘Other business segments – credit risk management’ section.
Single credit rating scale (unaudited) In the table below, we have used a single rating scale to ensure we are consistent across all our credit risk portfolios in how we report the risk of default. It has eight grades for non–defaulted exposures, from 9 (lowest risk) to 2 (highest risk). We define each grade by an upper and lower PD value and we scale the grades so that the default risk increases by a factor of ten every time the grade number drops by two steps. For example, grade 9 has an average PD of 0.010%, and grade 7 has an average PD of 0.100%. We give defaulted exposures a grade 1 and a PD value of 100%. In the final column of the table we show the approximate equivalent credit rating grade used by Standard & Poor’s Ratings Services (S&P).
PD range
Santander UK risk grade Mid
% Lower
% Upper
% S&P equivalent
9 0.010 0.000 0.021 AAA to AA+
8 0.032 0.021 0.066 AA to AA–
7 0.100 0.066 0.208 A+ to BBB
6 0.316 0.208 0.658 BBB– to BB
5 1.000 0.658 2.081 BB–
4 3.162 2.081 6.581 B+ to B
3 10.000 6.581 20.811 B–
2 31.623 20.811 99.999 CCC to C
1 (Default) 100.000 100.000 100.000 D
The PDs in the table above are based on Economic Capital (EC) PD mappings which are calculated based on the average probability of default over an economic cycle. This is different to the IFRS 9 PDs which are calculated at a point in time using forward looking economic scenarios. Where possible, the EC PD values are largely aligned to the regulatory capital models however any regulatory floors are removed and PDs are defined at every possible rating rather than categorised into rating buckets.
Santander UK Group Holdings plc88
Annual Report 2019 | SectionAnnual Report 2019 | Risk review
Santander UK Group Holdings plc88
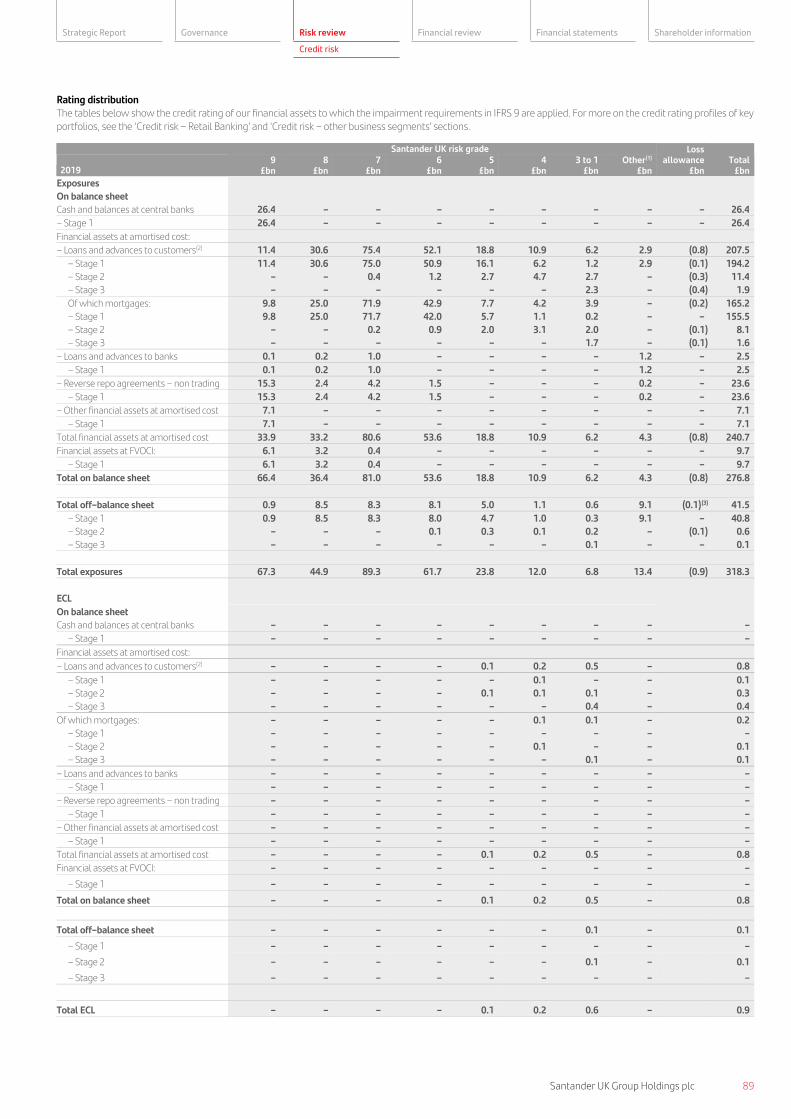
Santander UK Group Holdings plc 89
Strategic report Governance Risk review Financial review Financial statements Shareholder information
Credit risk
Rating distribution The tables below show the credit rating of our financial assets to which the impairment requirements in IFRS 9 are applied. For more on the credit rating profiles of key portfolios, see the ‘Credit risk – Retail Banking’ and ‘Credit risk – other business segments’ sections.
Santander UK risk grade Loss allowance
£bn Total
£bn 2019 9
£bn 8
£bn 7
£bn 6
£bn 5
£bn 4
£bn 3 to 1
£bn Other(1)
£bn
Exposures
On balance sheet
Cash and balances at central banks 26.4 – – – – – – – – 26.4
– Stage 1 26.4 – – – – – – – – 26.4
Financial assets at amortised cost:
– Loans and advances to customers(2) 11.4 30.6 75.4 52.1 18.8 10.9 6.2 2.9 (0.8) 207.5
– Stage 1 11.4 30.6 75.0 50.9 16.1 6.2 1.2 2.9 (0.1) 194.2
– Stage 2 – – 0.4 1.2 2.7 4.7 2.7 – (0.3) 11.4
– Stage 3 – – – – – – 2.3 – (0.4) 1.9
Of which mortgages: 9.8 25.0 71.9 42.9 7.7 4.2 3.9 – (0.2) 165.2
– Stage 1 9.8 25.0 71.7 42.0 5.7 1.1 0.2 – – 155.5
– Stage 2 – – 0.2 0.9 2.0 3.1 2.0 – (0.1) 8.1
– Stage 3 – – – – – – 1.7 – (0.1) 1.6
– Loans and advances to banks 0.1 0.2 1.0 – – – – 1.2 – 2.5
– Stage 1 0.1 0.2 1.0 – – – – 1.2 – 2.5
– Reverse repo agreements – non trading 15.3 2.4 4.2 1.5 – – – 0.2 – 23.6
– Stage 1 15.3 2.4 4.2 1.5 – – – 0.2 – 23.6
– Other financial assets at amortised cost 7.1 – – – – – – – – 7.1
– Stage 1 7.1 – – – – – – – – 7.1
Total financial assets at amortised cost 33.9 33.2 80.6 53.6 18.8 10.9 6.2 4.3 (0.8) 240.7
Financial assets at FVOCI: 6.1 3.2 0.4 – – – – – – 9.7
– Stage 1 6.1 3.2 0.4 – – – – – – 9.7
Total on balance sheet 66.4 36.4 81.0 53.6 18.8 10.9 6.2 4.3 (0.8) 276.8
Total off–balance sheet 0.9 8.5 8.3 8.1 5.0 1.1 0.6 9.1 (0.1)(3) 41.5
– Stage 1 0.9 8.5 8.3 8.0 4.7 1.0 0.3 9.1 – 40.8
– Stage 2 – – – 0.1 0.3 0.1 0.2 – (0.1) 0.6
– Stage 3 – – – – – – 0.1 – – 0.1
Total exposures 67.3 44.9 89.3 61.7 23.8 12.0 6.8 13.4 (0.9) 318.3
ECL
On balance sheet
Cash and balances at central banks – – – – – – – – –
– Stage 1 – – – – – – – – –
Financial assets at amortised cost:
– Loans and advances to customers(2) – – – – 0.1 0.2 0.5 – 0.8
– Stage 1 – – – – – 0.1 – – 0.1
– Stage 2 – – – – 0.1 0.1 0.1 – 0.3
– Stage 3 – – – – – – 0.4 – 0.4
Of which mortgages: – – – – – 0.1 0.1 – 0.2
– Stage 1 – – – – – – – – –
– Stage 2 – – – – – 0.1 – – 0.1
– Stage 3 – – – – – – 0.1 – 0.1
– Loans and advances to banks – – – – – – – – –
– Stage 1 – – – – – – – – –
– Reverse repo agreements – non trading – – – – – – – – –
– Stage 1 – – – – – – – – –
– Other financial assets at amortised cost – – – – – – – – –
– Stage 1 – – – – – – – – –
Total financial assets at amortised cost – – – – 0.1 0.2 0.5 – 0.8
Financial assets at FVOCI: – – – – – – – – –
– Stage 1 – – – – – – – – –
Total on balance sheet – – – – 0.1 0.2 0.5 – 0.8
Total off–balance sheet – – – – – – 0.1 – 0.1
– Stage 1 – – – – – – – – –
– Stage 2 – – – – – – 0.1 – 0.1
– Stage 3 – – – – – – – – –
Total ECL – – – – 0.1 0.2 0.6 – 0.9
Santander UK Group Holdings plc 89
Strategic Report Governance Risk review Financial review Financial statements Shareholder information
Credit risk
89Santander UK Group Holdings plc

Annual Report 2019 | Risk review
90 Santander UK Group Holdings plc
Santander UK risk grade
Total
% 2019 9
% 8
% 7
% 6
% 5
% 4
% 3 to 1
% Other(1)
%
Coverage ratio
On balance sheet
Cash and balances at central banks – – – – – – – – –
– Stage 1 – – – – – – – – –
Financial assets at amortised cost:
– Loans and advances to customers(2) – – – – 0.5 1.8 8.1 – 0.4
– Stage 1 – – – – – 1.6 – – 0.1
– Stage 2 – – – – 3.7 2.1 3.7 – 2.6
– Stage 3 – – – – – – 17.4 – 21.1
Of which mortgages: – – – – – 2.4 2.6 – 0.1
– Stage 1 – – – – – – – – –
– Stage 2 – – – – – 3.2 – – 1.2
– Stage 3 – – – – – – 5.9 – 6.3
– Loans and advances to banks – – – – – – – – –
– Stage 1 – – – – – – – – –
– Reverse repo agreements – non trading – – – – – – – – –
– Stage 1 – – – – – – – – –
– Other financial assets at amortised cost – – – – – – – – –
– Stage 1 – – – – – – – – –
Total financial assets at amortised cost – – – – 0.5 1.8 8.1 – 0.3
Financial assets at FVOCI: – – – – – – – – –
– Stage 1 – – – – – – – – –
Total on balance sheet – – – – 0.5 1.8 8.1 – 0.3
Total off–balance sheet – – – – – – 16.7 – 0.2
– Stage 1 – – – – – – – – –
– Stage 2 – – – – – – 50.0 – 16.7
– Stage 3 – – – – – – – – –
Total coverage ratio – – – – 0.4 1.7 8.8 – 0.3
(1) Includes cash at hand and smaller cases mainly in the consumer (auto) finance and commercial mortgages portfolios. We use scorecards for these items, rather than rating models. (2) Includes interest we have charged to the customer’s account and accrued interest we have not charged to the account yet.
Santander UK risk grade Loss
allowance £bn
Total £bn 2018
9 £bn
8 £bn
7 £bn
6 £bn
5 £bn
4 £bn
3 to 1 £bn
Other(1) £bn
Exposures
On balance sheet
Cash and balances at central banks 24.2 – – – – – – – – 24.2
– Stage 1 24.2 – – – – – – – – 24.2
Financial assets at amortised cost:
– Loans and advances to customers(2) 10.0 27.5 72.4 51.6 20.3 11.4 6.3 2.9 (0.7) 201.7
– Stage 1 10.0 27.5 72.2 50.3 17.6 6.9 1.1 2.8 (0.1) 188.3
– Stage 2 – – 0.2 1.3 2.7 4.5 2.8 0.1 (0.3) 11.3
– Stage 3 – – – – – – 2.4 – (0.3) 2.1
Of which mortgages: 7.7 21.8 69.0 42.8 7.8 4.7 4.2 – (0.2) 157.8
– Stage 1 7.7 21.8 68.8 41.6 5.5 1.2 0.2 – – 146.8
– Stage 2 – – 0.2 1.2 2.3 3.5 2.1 – (0.1) 9.2
– Stage 3 – – – – – – 1.9 – (0.1) 1.8
– Loans and advances to banks 0.9 0.2 1.4 – – – – 1.0 – 3.5
– Stage 1 0.9 0.2 1.4 – – – – 1.0 – 3.5
– Reverse repo agreements – non trading 15.2 3.8 1.3 0.4 – – – 0.4 – 21.1
– Stage 1 15.2 3.8 1.3 0.4 – – – 0.4 – 21.1
– Other financial assets at amortised cost 7.2 – – – – – – – – 7.2
– Stage 1 7.2 – – – – – – – – 7.2
Total financial assets at amortised cost 33.3 31.5 75.1 52.0 20.3 11.4 6.3 4.3 (0.7) 233.5
Financial assets at FVOCI: 6.6 5.8 0.7 – – – – 0.2 – 13.3
– Stage 1 6.6 5.8 0.7 – – – – 0.2 – 13.3
Total on balance sheet 64.1 37.3 75.8 52.0 20.3 11.4 6.3 4.5 (0.7) 271.0
Total off–balance sheet 0.7 8.0 8.9 9.0 5.4 1.3 0.5 7.9 (0.1)(4) 41.6
– Stage 1 0.7 8.0 8.9 8.9 5.3 1.2 0.3 7.9 (0.1) 41.1
– Stage 2 – – – 0.1 0.1 0.1 0.1 – – 0.4
– Stage 3 – – – – – – 0.1 – – 0.1
Total exposures 64.8 45.3 84.7 61.0 25.7 12.7 6.8 12.4 (0.8) 312.6
Santander UK Group Holdings plc90
Annual Report 2019 | SectionAnnual Report 2019 | Risk review
Santander UK Group Holdings plc90

Santander UK Group Holdings plc 91
Strategic report Governance Risk review Financial review Financial statements Shareholder information
Credit risk
Santander UK risk grade
Total
£bn 2018 9
£bn 8
£bn 7
£bn 6
£bn 5
£bn 4
£bn 3 to 1
£bn Other(1)
£bn
ECL
On balance sheet
Cash and balances at central banks – – – – – – – – –
– Stage 1 – – – – – – – – –
Financial assets at amortised cost:
– Loans and advances to customers(2) – – – – 0.1 0.2 0.4 – 0.7
– Stage 1 – – – – – 0.1 – – 0.1
– Stage 2 – – – – 0.1 0.1 0.1 – 0.3
– Stage 3 – – – – – – 0.3 – 0.3
Of which mortgages: – – – – – 0.1 0.1 – 0.2
– Stage 1 – – – – – – – – –
– Stage 2 – – – – – 0.1 – – 0.1
– Stage 3 – – – – – – 0.1 – 0.1
– Loans and advances to banks – – – – – – – – –
– Stage 1 – – – – – – – – –
– Reverse repo agreements – non trading – – – – – – – – –
– Stage 1 – – – – – – – – –
– Other financial assets at amortised cost – – – – – – – – –
– Stage 1 – – – – – – – – –
Total financial assets at amortised cost – – – – 0.1 0.2 0.4 – 0.7
Financial assets at FVOCI: – – – – – – – – –
– Stage 1 – – – – – – – – –
Total on balance sheet – – – – 0.1 0.2 0.4 – 0.7
Total off–balance sheet – – – – – – 0.1 – 0.1
– Stage 1 – – – – – – 0.1 – 0.1
– Stage 2 – – – – – – – – –
– Stage 3 – – – – – – – – –
– – – – – – – –
Total ECL – – – – 0.1 0.2 0.5 – 0.8
% % % % % % % % %
Coverage ratio
On balance sheet
Cash and balances at central banks – – – – – – – – –
– Stage 1 – – – – – – – – –
Financial assets at amortised cost:
– Loans and advances to customers(2) – – – – 0.5 1.8 6.3 – 0.3
– Stage 1 – – – – – 1.4 – – 0.1
– Stage 2 – – – – 3.7 2.2 3.6 – 2.7
– Stage 3 – – – – – – 12.5 – 14.3
Of which mortgages: – – – – – 2.1 2.4 – 0.1
– Stage 1 – – – – – – – – –
– Stage 2 – – – – – 2.9 – – 1.1
– Stage 3 – – – – – – 5.3 – 5.6
– Loans and advances to banks – – – – – – – – –
– Stage 1 – – – – – – – – –
– Reverse repo agreements – non trading – – – – – – – – –
– Stage 1 – – – – – – – – –
– Other financial assets at amortised cost – – – – – – – – –
– Stage 1 – – – – – – – – –
Total financial assets at amortised cost – – – – 0.5 1.8 6.3 – 0.3
Financial assets at FVOCI: – – – – – – – – –
– Stage 1 – – – – – – – – –
Total on balance sheet – – – – 0.5 1.8 6.3 – 0.3
Total off–balance sheet – – – – – – 20.0 – – 0.2
– Stage 1 – – – – – – 33.3 – – 0.2
– Stage 2 – – – – – – – – – –
– Stage 3 – – – – – – – – – –
Total coverage ratio – – – – 0.4 1.6 7.4 – 0.3
(1) Includes cash at hand and smaller cases mainly in the consumer (auto) finance and commercial mortgages portfolios. We use scorecards for these items, rather than rating models. (2) Includes interest we have charged to the customer’s account and accrued interest we have not charged to the account yet. (3) The total rounds to £0.1bn and is split across all three Stages. In this table, it has been allocated in full to Stage 2 for presentational purposes. For the full detail, see the ‘Credit Quality’ section. (4) The total rounds to £0.1bn and is split across all three Stages. In this table, it has been allocated in full to Stage 1 for presentational purposes. For the full detail, see the ‘Credit Quality’ section.
Santander UK Group Holdings plc 91
Strategic Report Governance Risk review Financial review Financial statements Shareholder information
Credit risk
91Santander UK Group Holdings plc

Annual Report 2019 | Risk review
92 Santander UK Group Holdings plc
Credit performance The customer loans in the tables below and in the rest of the ‘Credit risk’ section are presented differently from the balances in the Consolidated Balance Sheet. The main difference is that customer loans exclude interest we have accrued but not charged to customers’ accounts yet.
2019
Customer loans
£bn
Stage 3 drawn
exposure(1)(2) £m
Stage 3 undrawn exposure
£m
Stage 3 ratio(3)
%
Gross write–offs
£m
Total loss
allowances £m
Retail Banking: 180.4 1,936 38 1.09 206 591
− of which mortgages 165.4 1,722 12 1.05 14 218
− of which business banking 1.8 78 1 4.28 24 52
− of which consumer (auto) finance 7.7 42 – 0.55 34 88
− of which other unsecured lending 5.5 94 25 2.15 134 233
Corporate & Commercial Banking 16.3 335 27 2.22 41 210
Corporate & Investment Banking 4.1 – 15 0.36 – 50
Corporate Centre 4.5 18 – 0.40 2 12
205.3 2,289 80 1.15 249 863
2018
Retail Banking: 172.8 2,211 43 1.30 182 594
– of which mortgages 158.0 1,982 17 1.27 18 237
– of which business banking 1.8 89 – 4.99 15 53
– of which consumer (auto) finance 7.3 43 – 0.58 24 85
– of which other unsecured lending 5.7 97 26 2.17 125 219
Corporate & Commercial Banking 17.7 264 12 1.56 97 182
Corporate & Investment Banking 4.6 – 26 0.56 252(4) 18
Corporate Centre 4.8 16 – 0.33 3 13
199.9 2,491 81 1.29 534 807
Of which: Corporate lending
2019 22.3 413 43 2.04 65 311
2018 24.1 353 38 1.62 364 253
(1) We define Stage 3 in the ‘Credit risk – Santander UK group level’ section.
(2) Interest on Stage 3 exposures is derecognised in line with the requirements of IFRS 9.
(3) Total Stage 3 exposure as a percentage of customer loans plus undrawn Stage 3 exposures. The way we calculate the Stage 3 ratio was changed from 1 January 2019, and 2018 restated for consistency. See ‘Key metrics’ in the ‘Credit risk – Santander UK group level’ section.
(4) Related to Carillion plc write-off in Q1 2018.
Corporate lending comprises the business banking portfolio in our Retail Banking segment, and our Corporate & Commercial Banking and Corporate & Investment Banking segments.
Santander UK Group Holdings plc92
Annual Report 2019 | SectionAnnual Report 2019 | Risk review
Santander UK Group Holdings plc92

Santander UK Group Holdings plc 93
Strategic report Governance Risk review Financial review Financial statements Shareholder information
Credit risk
Credit quality Total on-balance sheet exposures at 31 December 2019 comprised £205.3bn of customer loans, L&A to banks of £2.6bn, £30.7bn of sovereign assets measured at amortised cost, £9.7bn of assets measured at FVOCI, and £26.4bn of cash and balances at central banks.
Stage 1 Stage 2 Stage 3 Total 2019 £m £m £m £m
Exposures
On-balance sheet
Retail Banking 169,003 9,459 1,936 180,398
– of which mortgages 155,477 8,157 1,722 165,356
Corporate & Commercial Banking 14,068 1,894 335 16,297
Corporate & Investment Banking 3,916 198 – 4,114
Corporate Centre 73,759 129 18 73,906
Total on-balance sheet 260,746 11,680 2,289 274,715
Off–balance sheet
Retail Banking(1) 25,849 194 38 26,081
– of which mortgages(1) 13,353 67 12 13,432
Corporate & Commercial Banking 5,249 282 27 5,558
Corporate & Investment Banking 9,129 198 15 9,342
Corporate Centre 626 – – 626
Total off–balance sheet(2) 40,853 674 80 41,607
Total exposures
301,599 12,354 2,369 316,322
ECL
On-balance sheet
Retail Banking 85 255 224 564
– of which mortgages 11 100 103 214
Corporate & Commercial Banking 34 35 126 195
Corporate & Investment Banking 2 12 – 14
Corporate Centre 3 3 6 12
Total on-balance sheet 124 305 356 785
Off–balance sheet
Retail Banking 13 13 1 27
– of which mortgages 3 1 – 4
Corporate & Commercial Banking 7 6 2 15
Corporate & Investment Banking 3 24 9 36
Total off–balance sheet 23 43 12 78
Total ECL 147 348 368 863
% % % %
Coverage ratio(3) On-balance sheet
Retail Banking 0.1 2.7 11.6 0.3
– of which mortgages – 1.2 6.0 0.1
Corporate & Commercial Banking 0.2 1.8 37.6 1.2
Corporate & Investment Banking 0.1 6.1 – 0.3
Corporate Centre – 2.3 33.3 –
Total on-balance sheet – 2.6 15.6 0.3
Off–balance sheet
Retail Banking 0.1 6.7 2.6 0.1
– of which mortgages – 1.5 – –
Corporate & Commercial Banking 0.1 2.1 7.4 0.3
Corporate & Investment Banking – 12.1 60.0 0.4
Total off-balance sheet 0.1 6.4 15.0 0.2
Total coverage – 2.8 15.5 0.3
(1) Off-balance sheet exposures include £7.6bn of retail mortgage offers in the pipeline. (2) Off-balance sheet amounts consist of contingent liabilities and commitments. For more, see Note 29 to the Consolidated Financial Statements. (3) ECL as a percentage of the related exposure.
Santander UK Group Holdings plc 93
Strategic Report Governance Risk review Financial review Financial statements Shareholder information
Credit risk
93Santander UK Group Holdings plc

Annual Report 2019 | Risk review
94 Santander UK Group Holdings plc
Total on-balance sheet exposures at 31 December 2018 comprised £199.9bn of customer loans, L&A to banks of £3.5bn, £28.4bn of sovereign assets measured at amortised cost, £13.3bn of assets measured at FVOCI, and £24.2bn cash and balances at central banks.
Stage 1 Stage 2 Stage 3 Total 2018 £m £m £m £m
Exposures
On-balance sheet
Retail Banking 160,212 10,324 2,211 172,747
– of which mortgages 146,619 9,356 1,982 157,957
Corporate & Commercial Banking 16,394 1,044 264 17,702
Corporate & Investment Banking 4,535 78 – 4,613
Corporate Centre 74,010 133 16 74,159
Total on-balance sheet 255,151 11,579 2,491 269,221
Off–balance sheet
Retail Banking(1) 22,819 196 43 23,058
– of which mortgages(1) 11,120 76 17 11,213
Corporate & Commercial Banking 4,939 182 12 5,133
Corporate & Investment Banking 12,923 56 26 13,005
Corporate Centre 531 – – 531
Total off–balance sheet(2) 41,212 434 81 41,727
Total exposures 296,363 12,013 2,572 310,948
ECL
On-balance sheet
Retail Banking 84 256 228 568
– of which mortgages 10 118 106 234
Corporate & Commercial Banking 31 26 111 168
Corporate & Investment Banking 1 1 – 2
Corporate Centre 5 3 5 13
Total on-balance sheet 121 286 344 751
Off–balance sheet
Retail Banking 12 13 1 26
– of which mortgages 2 1 – 3
Corporate & Commercial Banking 6 6 2 14
Corporate & Investment Banking 4 2 10 16
Total off–balance sheet 22 21 13 56
Total ECL 143 307 357 807
% % % %
Coverage ratio(3)
On-balance sheet
Retail Banking 0.1 2.5 10.3 0.3
– of which mortgages – 1.3 5.3 0.1
Corporate & Commercial Banking 0.2 2.5 42.0 0.9
Corporate & Investment Banking – 1.3 – –
Corporate Centre – 2.3 31.3 –
Total on-balance sheet – 2.5 13.8 0.3
Off–balance sheet
Retail Banking 0.1 6.6 2.3 0.1
– of which mortgages – 1.3 – –
Corporate & Commercial Banking 0.1 3.3 16.7 0.3
Corporate & Investment Banking – 3.6 38.5 0.1
Total off–balance sheet 0.1 4.8 16.0 0.1
Total coverage – 2.6 13.9 0.3
(1) Off-balance sheet exposures include £6.2bn of retail mortgage offers in the pipeline. (2) Off-balance sheet amounts consist of contingent liabilities and commitments. For more, see Note 29 to the Consolidated Financial Statements. (3) ECL as a percentage of the related exposure.
2019 compared to 2018 (unaudited) Key movements in exposures and ECL in the year by Stage were:
− The increase in Stage 1 exposures was largely driven by lending growth in the mortgage portfolio, with further growth coming from the reverse repos, and cash and balances at central banks held in Corporate Centre. Stage 1 ECLs increased to reflect this lending growth.
− Stage 2 exposures marginally increased due to a single name CIB case moving onto our Watchlist and an update to our economics scenarios to reflect lower Commercial Property Index impacting corporate accounts, offset by a reduction in mortgages due to improved HPI economic scenarios. Stage 2 ECLs increased reflecting the increase in Stage 2 exposures.
− Stage 3 exposures reduced due to cures in the mortgage portfolio mainly due to Term Extension Forbearance activity. Stage 3 ECLs increased as the reduction in mortgage ECLs was more than offset by an increase in ECLs mainly from single name cases in Corporate and Commercial Banking.
Santander UK Group Holdings plc94
Annual Report 2019 | SectionAnnual Report 2019 | Risk review
Santander UK Group Holdings plc94

Santander UK Group Holdings plc 95
Strategic report Governance Risk review Financial review Financial statements Shareholder information
Credit risk
Stage 2 analysis
The following table analyses our Stage 2 exposures and ECL by the reason the exposure is classified as Stage 2.
Retail Banking Other business segments Total
2019 Exposure
£m ECL £m
Coverage %
Exposure £m
ECL £m
Coverage %
Exposure £m
ECL £m
Coverage %
PD deterioration 6,844 194 2.8 1,998 25 1.3 8,842 219 2.5
Forbearance 516 4 0.8 45 1 2.2 561 5 0.9
Other 1,239 24 1.9 498 52 10.4 1,737 76 4.4
30 DPD 1,054 46 4.4 160 2 1.3 1,214 48 4.0
9,653 268 2.8 2,701 80 3.0 12,354 348 2.8
2018
PD deterioration 7,854 196 2.5 655 15 2.3 8,509 211 2.5
Forbearance 450 3 0.7 12 1 8.3 462 4 0.9
Other 1,267 31 2.4 815 22 2.7 2,082 53 2.5
30 DPD 949 39 4.1 11 – – 960 39 4.1
10,520 269 2.6 1,493 38 2.5 12,013 307 2.6
Where balances satisfy more than one of the criteria above for determining a significant increase in credit risk, we have assigned the corresponding gross carrying amount and ECL in order of the categories presented.
The following table analyses our Stage 2 exposures and the related ECL by whether or not they are in a cure period at the balance sheet date.
2019 2018
Exposure
£m ECL £m
Coverage %
Exposure £m
ECL £m
Coverage %
Stage 2 not in cure period 12,020 342 2.8 11,839 301 2.5
Stage 2 in cure period (for transfer to Stage 1) 334 6 1.8 174 6 3.4
12,354 348 2.8 12,013 307 2.6
2019 compared to 2018 (unaudited) In 2019, total Stage2 accounts triggered by PD deterioration increased slightly. This was due to an increase in ‘Other business segments’ mainly driven by single name cases entering Stage 2, which was partly offset by an improvement in Retail Banking led by Stage 2 mortgages.
We do not have any cure period criteria for exiting Stage 3.
Reconciliation of exposures, loss allowance and net carrying amounts
The table below shows the relationships between disclosures in this Credit risk review section which refer to drawn exposures and the associated ECL, and the total assets as presented in the Consolidated Balance Sheet.
On-balance sheet Off-balance sheet
2019 Exposures
£m
Loss allowance
£m
Net carrying amount
£m Exposures
£m
Loss allowance
£m
Retail Banking 180,398 564 179,834 26,081 27
– of which mortgages 165,356 214 165,142 13,432 4
Corporate & Commercial Banking 16,297 195 16,102 5,558 15
Corporate & Investment Banking 4,114 14 4,100 9,342 36
Corporate Centre 73,906 12 73,894 626 –
Total exposures presented in Credit Quality tables 274,715 785 273,930 41,607 78
Other items(1) 2,985
Adjusted net carrying amount 276,915
Assets classified at FVTPL 4,336
Non–financial assets 7,237
Total assets per the Consolidated Balance Sheet 288,488
2018
Retail Banking 172,747 568 172,179 23,058 26
– of which mortgages 157,957 234 157,723 11,213 3
Corporate & Commercial Banking 17,702 168 17,534 5,133 14
Corporate & Investment Banking 4,613 2 4,611 13,005 16
Corporate Centre 74,159 13 74,146 531 –
Total exposures presented in Credit Quality tables 269,221 751 268,470 41,727 56
Other items(1) 2,501
Adjusted net carrying amount 270,971
Assets classified at FVTPL 11,458
Non–financial assets 6,952
Total assets per the Consolidated Balance Sheet 289,381
(1) These assets mainly relate to loans as part of a JV agreement and the accrued interest on them. They carry low credit risk and therefore have an immaterial ECL.
Santander UK Group Holdings plc 95
Strategic Report Governance Risk review Financial review Financial statements Shareholder information
Credit risk
95Santander UK Group Holdings plc

Annual Report 2019 | Risk review
96 Santander UK Group Holdings plc
Movement in total exposures and the corresponding ECL The following table shows changes in total on and off-balance sheet exposures, subject to ECL assessment, and the corresponding ECL, in the year. The table presents total gross carrying amounts and ECLs at a Santander UK group level. We present segmental views in the sections below.
Stage 1 Stage 2 Stage 3 Total
Exposures(1) ECL Exposures(1) ECL Exposures(1) ECL Exposures(1) ECL £m £m £m £m £m £m £m £m
At 1 January 2019 296,363 143 12,013 307 2,572 357 310,948 807
Transfers from Stage 1 to Stage 2(3) (4,101) (11) 4,101 11 – – – –
Transfers from Stage 2 to Stage 1(3) 3,458 74 (3,458) (74) – – – –
Transfers to Stage 3(3) (361) (2) (595) (24) 956 26 – –
Transfers from Stage 3(3) 10 1 516 23 (526) (24) – –
Transfers of financial instruments (994) 62 564 (64) 430 2 – –
Net ECL remeasurement on stage transfer(4) – (66) – 130 – 96 – 160
Change in economic scenarios(2) – 5 – (15) – (9) – (19)
Changes to model – – – – – 13 – 13
New lending and assets purchased (5) (8) 42,415 29 827 32 15 9 43,257 70
Other(6) 4,195 6 295 (14) 171 191 4,661 183
Redemptions and repayments (7) (40,379) (32) (1,344) (28) (458) (42) (42,181) (102)
Assets written off(7) (1) – (1) – (361) (249) (363) (249)
At 31 December 2019 301,599 147 12,354 348 2,369 368 316,322 863
Net movement in the year 5,236 4 341 41 (203) 11 5,374 56
ECL charge/(release) to the Income Statement 4 41 260 305
Less: ECL relating to derecognised income – – (14) (14)
Less: Recoveries net of collection costs (10) (15) (46) (71)
Total ECL charge/(release) to the Income Statement (6) 26 200 220
2018
At 1 January 2018 285,133 176 12,110 284 3,043 691 300,286 1,151
Transfers from Stage 1 to Stage 2(3) (4,190) (11) 4,190 11 – – – –
Transfers from Stage 2 to Stage 1(3) 3,325 68 (3,325) (68) – – – –
Transfers to Stage 3(3) (445) (8) (603) (23) 1,048 31 – –
Transfers from Stage 3(3) 17 6 443 27 (460) (33) – –
Transfers of financial instruments (1,293) 55 705 (53) 588 (2) – –
Net remeasurement of ECL on stage transfer(4) – (63) – 83 – 79 – 99
Change in economic scenarios(2) – 4 – (12) – (8) – (16)
Changes to model – (1) – 2 – (8) – (7)
New lending and assets purchased(5) (8) 57,280 43 1,084 34 17 12 58,381 89
Other(6) 11,021 (27) (173) (16) 268 208 11,116 165
Redemptions and repayments (7) (55,778) (44) (1,713) (15) (688) (81) (58,179) (140)
Assets written off(7) – – – – (656) (534) (656) (534)
At 31 December 2018 296,363 143 12,013 307 2,572 357 310,948 807
Net movement in the year 11,230 (33) (97) 23 (471) (334) 10,662 (344)
ECL charge/(release) to the Income Statement (33) 23 200 190
Less: Recoveries net of collection costs – – (36) (36)
Total credit impairment charge/(release) (33) 23 164 154
(1) Exposures that have attracted an ECL, and as reported in the Credit Quality table above. (2) Changes to assumptions in the year. Isolates the impact on ECL from changes to the economic variables for each scenario, changes to the scenarios themselves as well as changes in the probability weights from all other movements. The
impact of changes in economics on exposure Stage allocations are shown within Transfers of financial instruments. (3) Total impact of facilities that moved Stage(s) in the year. This means, for example, that where risk parameter changes (model inputs) or model changes (methodology) result in a facility moving Stage, the full impact is reflected here (rather
than in Other). Stage flow analysis only applies to facilities that existed at both the start and end of the year. Transfers between Stages are based on opening balances and ECL at the start of the period. (4) Relates to the revaluation of ECL following the transfer of an exposure from one Stage to another. (5) Exposures and ECL of facilities that did not exist at the start of the year but did at the end. Amounts in Stage 2 and 3 represent assets which deteriorated in the year after origination in Stage 1. (6) Residual movements on facilities that did not change Stage in the year, and which were neither acquired nor purchased in the year. Includes the impact of changes in risk parameters in the year, unwind of discount rates and increases in ECL
requirements of accounts which ultimately were written off in the period. (7) Exposures and ECL for facilities that existed at the start of the year, but not at the end. (8) Basis of preparation for this line item is changed to report new lending for corporate loans at the opening balance rather than the year-end closing balance and non-customer assets in Corporate Centre on a net basis rather than a gross basis.
Santander UK Group Holdings plc96
Annual Report 2019 | SectionAnnual Report 2019 | Risk review
Santander UK Group Holdings plc96

Santander UK Group Holdings plc 97
Strategic report Governance Risk review Financial review Financial statements Shareholder information
Credit risk
COUNTRY RISK EXPOSURES We manage our country risk exposure under our global limits framework. Within this framework, we set our Risk Appetite for each country, taking into account factors that may affect its risk profile. These can include political events, macroeconomics and the nature of the risk. We actively manage exposures if we think we need to. We consider Banco Santander related risk separately.
The tables below show our total exposures, which are the total of balance sheet and off–balance sheet values. We calculate balance sheet values in accordance with IFRS (i.e. after netting allowed under IAS 32) except for credit provisions which we add back. Off–balance sheet values are undrawn facilities and letters of credit. We classify location by country of risk – the country where each client has its main business or assets. That is unless there is a full risk transfer guarantee in place, in which case we use the guarantor’s country of domicile. If a client has operations in many countries, we use their country of incorporation. The tables below exclude balances with other Banco Santander companies. We show them separately in the ‘Balances with other Banco Santander companies’ section.
2019 2018
Government Financial institutions Government
Financial institutions
Governments
£bn guaranteed
£bn Banks(1)
£bn Other
£bn Retail
£bn Corporate
£bn Total(2)
£bn Governments
£bn guaranteed
£bn Banks(1)
£bn Other
£bn Retail
£bn Corporate
£bn Total(2)
£bn
Eurozone
Ireland – – – 7.5 – 0.1 7.6 – – – 12.3 – 0.4 12.7
Italy – – – 0.1 – – 0.1 – – – 0.1 – 0.2 0.3
Spain – – – – – – – – – – 0.2 – – 0.2
France 0.1 – 0.6 0.5 – – 1.2 – – 1.0 – – – 1.0
Germany – – 1.2 0.1 – 0.1 1.4 – – 1.6 – – – 1.6
Luxembourg – – 0.1 2.7 – 0.1 2.9 – – – 0.9 – 0.2 1.1
Other(3) 0.3 – 1.1 – – – 1.4 0.3 – 1.2 0.2 – 1.1 2.8
0.4 – 3.0 10.9 – 0.3 14.6 0.3 – 3.8 13.7 – 1.9 19.7
Other countries
UK 33.5 – 3.6 15.6 204.6 38.2 295.5 32.1 – 4.3 16.3 194.2 37.5 284.4
US 1.0 – 1.1 0.1 – 0.1 2.3 1.1 – 1.5 1.5 – 0.3 4.4
Japan 2.3 – 1.6 – – – 3.9 3.8 – 2.6 – – – 6.4
Switzerland – – – – – – – – – – – – 0.1 0.1
Denmark – – – – – 0.5 0.5 – – 0.2 – – 0.5 0.7
Other 0.1 – 0.5 0.1 0.3 0.8 1.8 0.1 – 1.9 0.4 0.3 1.0 3.7
36.9 – 6.8 15.8 204.9 39.6 304.0 37.1 – 10.5 18.2 194.5 39.4 299.7
Total 37.3 – 9.8 26.7 204.9 39.9 318.6 37.4 – 14.3 31.9 194.5 41.3 319.4
(1) Excludes balances with central banks. (2) Excludes cash at hand, interests in other entities, intangible assets, property, plant and equipment, tax assets, retirement benefit assets and other assets. Loans are included gross of credit provisions. (3) Includes The Netherlands of £0.2bn (2018: £1.2bn), Belgium of £0.6bn (2018: £0.9bn), Greece of £nil (2018: £nil).
Balances with other Banco Santander companies We deal with other Banco Santander companies in the ordinary course of business. We do this where we have a particular business advantage or expertise and where they can offer us commercial opportunities. These transactions also arise where we support the activities of, or with, larger multinational corporate clients and financial institutions which may deal with other Banco Santander companies. We also dealt with Banco Santander SA as part of implementing our ring–fencing plans. We conduct these activities on the same terms as for similar transactions with third parties, and in a way that manages the credit risk within limits acceptable to the PRA.
At 31 December 2019 and 2018, we had gross balances with other Banco Santander companies as follows:
2019 2018 Financial institutions Financial institutions
Banks
£bn Other
£bn Corporate
£bn Total
£bn Banks
£bn Other
£bn Corporate
£bn Total
£bn
Assets
Spain 1.8 – – 1.8 2.7 – – 2.7
UK – 2.2 – 2.2 – 2.0 – 2.0
1.8 2.2 – 4.0 2.7 2.0 – 4.7
Liabilities
Spain 2.4 0.1 – 2.5 3.9 0.1 – 4.0
UK – 1.2 – 1.2 – 1.0 – 1.0
Uruguay 0.2 – – 0.2 0.2 – – 0.2
2.6 1.3 – 3.9 4.1 1.1 – 5.2
Santander UK Group Holdings plc 97
Strategic Report Governance Risk review Financial review Financial statements Shareholder information
Credit risk
97Santander UK Group Holdings plc

Annual Report 2019 | Risk review
98 Santander UK Group Holdings plc
Credit risk – Retail Banking
Overview
We offer a full range of retail products and services through our branches, the internet, digital devices and over the phone, as well as through intermediaries.
Retail Banking – credit risk management In this section, we explain how we manage and mitigate credit risk.
Retail Banking – credit risk review In this section, we analyse our credit risk exposures and how they are performing. We also focus on forbearance and portfolios of particular interest. Our main portfolios are:
Residential mortgages – This is our largest portfolio. We lend to customers of good credit quality (prime lending). Most of our mortgages are for owner-occupied homes. We also have buy-to-let mortgages where we focus on non-professional landlords with small portfolios.
Consumer (auto) finance and other unsecured lending – Consumer (auto) finance includes financing for cars, vans, motorbikes and caravans – so long as they are privately bought. Other unsecured lending includes personal loans, credit cards and bank account overdrafts.
Business banking – This portfolio consists of small businesses with an annual turnover of up to £6.5m.
The segmental basis of presentation in this Annual Report has been changed, and the prior periods restated, to report our short term markets business in Corporate Centre rather than in Corporate & Investment Banking. See Note 2 for more information.
RETAIL BANKING – CREDIT RISK MANAGEMENT
In Retail Banking, our customers are individuals and small businesses. We have a high volume of customers and transactions and they share similar credit characteristics, such as their credit score or LTV. As a result, we manage our overall credit risk by looking at portfolios or groups of customers who share similar credit characteristics. Where we take this approach, we call them ‘standardised’ customers. Exactly how we group customers into segments depends on the portfolio and the stage of the credit risk lifecycle. For example, we may segment customers at origination by their credit score. For accounts in arrears, we may segment them by how fast they improve or worsen. We regularly review each segment compared with our expectations for its performance, budget or limit.
1. Risk strategy and planning For more on how we set our risk strategy and plans for Retail Banking, see the ‘Santander UK group level – credit risk management’ section.
2. Assessment and origination We undertake a thorough risk assessment to make sure a customer can meet their obligations before we approve a credit application. We do this mainly by looking at affordability and the customer’s credit profile:
Affordability We take proportionate steps to make sure that the customer will be able to make all the repayments on the loan over its full term. As part of this, we assess the risk that they will not pay us back. We do this by a series of initial affordability and credit risk assessments. If the loan is secured, we assess affordability by reviewing the customer’s income and spending, their other credit commitments, and what would happen if interest rates went up. For unsecured personal loans and credit cards, we stress accommodation costs on a proportionate basis as part of the affordability assessment. We regularly review the way we calculate affordability and refine it when we need to. This can be due to changes in regulations, the economy or our risk profile.
Credit profile We look at each customer’s credit profile and signs of how reliable they are at repaying credit. When they apply, we use the data they give us, and:
− Credit policy: these are our rules and guidelines. We review them regularly to make sure our decisions are consistent and fair and align to the risk profile we want. For secured lending, we look at the property and the LTV as well as the borrower
− Credit scores: based on statistics about the reasons people fail to pay off debt. We use them to build models of what is likely to happen in the future. These models give a credit score to the customer for the loan they want, to show how likely it is to be repaid. We regularly review them
− Credit reference agencies: data from credit reference agencies about how the borrower has handled credit in the past − Other Santander accounts: we look at how the customer is using their other accounts with us.
For more on our approach to credit risk at a Santander UK group level See pages 78 to 86
Pre-transaction Transaction Post-transaction
Forbearance
Control
1. Risk strategyand planning
2. Assessment and origination
3. Monitoring4.5.
Credit risk lifecycle (unaudited)
Arrears management Debt recovery
Santander UK Group Holdings plc98
Annual Report 2019 | SectionAnnual Report 2019 | Risk review
Santander UK Group Holdings plc98

Santander UK Group Holdings plc 99
Strategic report Governance Risk review Financial review Financial statements Shareholder information
Credit risk
How we make the decision Many of our decisions are automated as our risk systems contain data about affordability and credit history. We tailor the process and how we assess the application based on the type of product being taken. More complex transactions often need greater manual assessment. This means we have to rely more on our credit underwriters’ skill and experience in making the decision. This is particularly true for secured lending, where we might need to do more checks on the customer’s income, or get a property valuation from an approved surveyor, for example.
Credit risk mitigation The types of credit risk mitigation, including collateral, across each of our portfolios is:
Portfolio Description
Residential mortgages Collateral is in the form of a first legal charge over the property. Before we grant a mortgage, we have the property valued. We have our own guidelines for surveyor valuations, which build on guidance from the Royal Institution of Chartered Surveyors (RICS). But we also make use of automated valuation methodologies where our confidence in the accuracy of this method is high.
Unsecured lending Unsecured lending means there is no collateral or security tied to the loan that can be used to mitigate any potential loss if the customer does not pay us back.
Consumer (auto) finance Collateral is in the form of legal ownership of the vehicle for most consumer (auto) finance loans, with the customer being the registered keeper. Only a very small proportion of the consumer (auto) finance business is underwritten as a personal loan. In these cases, there is no collateral or security tied to the loan. We use a leading vehicle valuation company to assess the LTV at the proposal stage.
In addition, from time to time at a portfolio level we execute significant risk transfer transactions, which typically reduce RWAs.
Business banking Includes secured and unsecured lending. We can take mortgage debentures as collateral if the business is incorporated. These are charges over a company’s assets. We can also take guarantees, but we do not treat them as collateral and we do not put a cash value on them unless they are supported by a tangible asset which is charged to us. If a customer defaults, we work with them to consider debt restructuring options. We generally do not enforce our security over their assets except as a last resort. In which case we might appoint an administrator or receiver.
3. Monitoring Our risk assessment does not end once we have made the decision to lend. We monitor credit risk across the credit risk lifecycle, mainly using IT systems. There are three main parts:
− Behaviour scoring: we use statistical models that help to predict whether the customer will have problems repaying, based on data about how they use their accounts
− Credit reference agencies: we often use data from agencies on how the borrower is handling credit from other lenders in our behaviour scoring models. We also buy services like proprietary scorecards or account alerts, which tell us as soon as the customer does something that concerns us, such as missing a payment to another lender
− Other Santander accounts: each month, we also look at how the customer uses their other accounts with us, so we can identify problems early.
For secured lending, our monitoring also takes account of changes in property prices. We estimate the property’s current value every three months. In most cases, we use statistical models based on recent sales prices and valuations in that local area. Use of this model is subject to Model Risk Governance. Where a lack of data means the model’s valuation is not available, we use the original surveyor valuation with a House Price Index (HPI) adjustment as appropriate.
The way we use our monitoring to manage risk varies by product. For revolving credit facilities like credit cards and overdrafts, it might lead us to raise or lower credit limits. Our monitoring can also mean we change our minds about whether a product is still right for a customer. This can influence whether we approve a refinancing application. In these ways we can balance a customer’s needs and their ability to manage credit. If we find evidence that a customer is in financial difficulties, we contact them about arrears management including forbearance, which we explain in more detail below.
Our day-to-day retail credit risk monitoring relies on a mix of product, customer and portfolio performance measures as described above. However, changes in the wider UK macro-economy also have an impact on our retail portfolios. To reflect this, since 2017 we have used a Retail Risk Playbook tolerance framework to enhance our day-to-day risk monitoring. This is a formal, structured framework that sets out the macroeconomic variables that are most relevant to retail portfolio performance. We monitor these variables against the related forecasts that we have used in our business plans. If the economy deviates materially from our forecasts, we will formally review and reconsider our retail risk management policy and strategy. This framework remains in place and will continue to do so for as long as we consider it necessary.
4. Arrears management We have several strategies for managing arrears and these can be used before the customer has formally defaulted, or as early as the day after a missed payment. We assess the problems a customer is having, so we can offer them the right help to bring their account up to date as soon as possible. The most common way to bring an account up to date is to agree an affordable repayment plan with the customer. The strategy we use depends on the risk and the customer’s circumstances. We have a range of tools to help customers to reach an affordable and acceptable solution. This could mean visiting the customer or offering debt counselling by a third party.
5. Debt recovery When a customer cannot or will not keep to an agreement for paying off their arrears, we consider recovery options. We only do this once we have tried to get the account back in order. To recover what we are owed, we may use a debt collection agency, sell the debt, or take the customer to court. For retail mortgage loans, we can delay legal action. That can happen if the customer shows that they will be able to pay off the loan or the arrears. We aim to repossess only as a last resort or, if necessary, to protect the property from damage or third-party claims. We make sure our estimated losses from repossessed properties are realistic by getting two independent valuations on each property, as well as the estimated cost of selling it. These form the basis of our loss allowances calculations. Where we do enforce the possession of properties held as collateral, we use external agents to realise the value and settle the debt. During this process we do not own the property, but we do administer the sale process. Any surplus funds are returned to the borrower or are otherwise dealt with in accordance with insolvency regulations.
Santander UK Group Holdings plc 99
Strategic Report Governance Risk review Financial review Financial statements Shareholder information
Credit risk
99Santander UK Group Holdings plc

Annual Report 2019 | Risk review
100 Santander UK Group Holdings plc
Loan modifications
Forbearance
If a customer lets us know they are having financial difficulty, we aim to come to an arrangement with them before they actually default. Their problems can be the result of losing their job, falling ill, a relationship breaking down, or the death of someone close to them.
Forbearance is mainly for mortgages and unsecured loans. We offer forbearance in line with our risk policies, and on a case-by-case basis to ensure we continue to lend responsibly and help customers be able to continue to afford their payments.
We may offer the following types of forbearance, but only if our assessments show the customer can meet the revised payments:
Action Description
Capitalisation We offer two main types, which are often combined with term extensions and, in the past, interest-only concessions:
− If the customer cannot afford to increase their monthly payment enough to pay off their arrears in a reasonable time but has been making their monthly payments (usually for at least six months), then we can add the arrears to the mortgage balance.
− We can also add to the mortgage balance at the time of forbearance unpaid property charges which are due to a landlord and which we pay on behalf of the customer to avoid the lease being forfeited.
Term extension We can extend the term of the loan, making each monthly payment smaller. At a minimum, we expect the customer to pay the interest in the short-term and have a realistic chance of repaying the full balance in the long-term. We may offer this option if the customer is up to date with their payments but showing signs of financial difficulties. For mortgages, the customer must also meet our policies for maximum loan term and age when they finish repaying (usually no more than 75).
Customers with interest-only mortgages have to make arrangements to repay the principal at the end of the mortgage. If customers know they will not be able to repay their mortgage in full when it ends, or if their mortgage has already passed the date when it should have ended, we talk to them, and if we think it is in the customer’s interests (and they can afford it) we look at other ways of managing it, such as term extensions.
Interest-only In the past, if it was not possible or affordable for a customer to have a term extension, we may have agreed to let them pay only the interest on the loan for a short time – usually less than a year. We only agreed to this where we believed their financial problems were temporary and they were likely to recover. Since March 2015 we no longer provide this option. Instead, interest-only is only offered as a short-term standard collections arrangement. We now record any related shortfall in monthly payments as arrears and report them to the credit reference agencies. As a result, we no longer classify new interest-only arrangements agreed since March 2015 as forbearance. We continue to manage and report all interest-only arrangements offered before this date as forbearance.
Other modifications
Apart from forbearance, we have sometimes changed the contract terms to keep a good relationship with a customer. These customers showed no signs of financial difficulties at the time, so we do not classify the contract changes as forbearance, and most of the loans were repaid without any problems. We do not classify insolvency solutions for any unsecured retail customers as forbearance. This is in line with industry guidelines on the treatment of customers in insolvency or bankruptcy.
Risk measurement and control
Retail Banking involves managing large numbers of accounts, so it produces a huge amount of data. This allows us to take a more analytical and data intense approach to measuring risk. This is reflected in the wide range of statistical models we use across the credit risk lifecycle. We use:
− Risk strategy and planning: econometric models − Assessment and origination: application scorecards, and attrition, pricing, loss allowance and capital models − Monitoring: behavioural scorecards and profitability models − Arrears management: models to estimate the proportion of cases that will result in possession (known as roll rates) − Debt recovery: recovery models.
We assess and review our loss allowances regularly and have them independently reviewed. We look at a number of factors, including the cash flow available to service debt. We also use an agency to value any collateral – mainly mortgages.
Santander UK Group Holdings plc100
Annual Report 2019 | SectionAnnual Report 2019 | Risk review
Santander UK Group Holdings plc100

Santander UK Group Holdings plc 101
Strategic report Governance Risk review Financial review Financial statements Shareholder information
Credit risk
RETAIL BANKING – CREDIT RISK REVIEW
Movement in total exposures and the corresponding ECL The following table shows changes in total on and off-balance sheet exposures subject to ECL assessment, and the corresponding ECL in the year. The footnotes to the Santander UK group level table on page 96 also apply to this table.
Stage 1 Stage 2 Stage 3 Total
Exposures(1) £m
ECL £m
Exposures(1) £m
ECL £m
Exposures(1) £m
ECL £m
Exposures(1) £m
ECL £m
At 1 January 2019 183,031 96 10,520 269 2,254 229 195,805 594
Transfers from Stage 1 to Stage 2 (3) (3,132) (8) 3,132 8 – – – –
Transfers from Stage 2 to Stage 1(3) 3,289 69 (3,289) (69) – – – –
Transfers to Stage 3(3) (322) (2) (500) (20) 822 22 – –
Transfers from Stage 3(3) 11 1 509 23 (520) (24) – –
Transfers of financial instruments (154) 60 (148) (58) 302 (2) – –
Net ECL remeasurement on stage transfer(4) – (61) – 76 – 63 – 78
Change in economic scenarios(2) – (3) – (24) – (9) – (36)
Changes to model – – – – – 13 – 13
New lending and assets purchased (5) 37,230 23 479 27 14 9 37,723 59
Other(6) 2,670 6 68 (2) 128 162 2,866 166
Redemptions and repayments(7) (27,924) (23) (1,265) (20) (449) (34) (29,638) (77)
Assets written off(7) (1) – (1) – (275) (206) (277) (206)
At 31 December 2019 194,852 98 9,653 268 1,974 225 206,479 591
Net movement in the year 11,821 2 (867) (1) (280) (4) 10,674 (3)
ECL charge/(release) to the Income Statement 2 (1) 202 203
Less: ECL relating to derecognised income – – (9) (9)
Less: Recoveries net of collection costs (2) – (32) (34)
Income statement charge/(release) for the year – (1) 161 160
2018
At 1 January 2018 178,978 110 10,885 247 2,263 268 192,126 625
Transfers from Stage 1 to Stage 2 (3) (3,407) (7) 3,407 7 – – – –
Transfers from Stage 2 to Stage 1(3) 2,992 58 (2,992) (58) – – – –
Transfers to Stage 3(3) (403) (7) (569) (22) 972 29 – –
Transfers from Stage 3(3) 15 5 438 26 (453) (31) – –
Transfers of financial instruments (803) 49 284 (47) 519 (2) – –
Net ECL remeasurement on stage transfer(4) – (54) – 73 – 60 – 79
Change in economic scenarios(2) – (1) – (9) – (8) – (18)
Changes to model – (1) – 2 – 1 – 2
New lending and assets purchased (5) 33,366 26 670 26 15 11 34,051 63
Other(6) (27) (19) (125) (14) 143 100 (9) 67
Redemptions and repayments(7) (28,483) (14) (1,194) (9) (436) (19) (30,113) (42)
Assets written off(7) – – – – (250) (182) (250) (182)
At 31 December 2018 183,031 96 10,520 269 2,254 229 195,805 594
Net movement in the year 4,053 (14) (365) 22 (9) (39) 3,679 (31)
ECL charge/(release) to the Income Statement (14) 22 143 151
Less: Recoveries net of collection costs – – (27) (27)
Income statement charge/(release) for the year (14) 22 116 124
(1) Exposures that have attracted an ECL, and as reported in the Credit Quality table above. (2) Changes to assumptions from the start of the year to the end of the year. Includes changes to the economic variables for each scenario, changes to the scenarios themselves as well as changes in the probability weightings. Also includes
changes in risk parameters and model changes. (3) Total impact of facilities that moved stage(s) in the year. This means, for example, that where risk parameter changes (model inputs) or model changes (methodology) result in a facility moving stage, the full impact is reflected here (rather than
in Other). Stage flow analysis only applies to facilities that existed at both the start and end of the year. Transfers from each stage are based on opening balances, and transfers in are based on closing balances, giving rise to a net movement on transfer.
(4) Relates to the revaluation of ECL following the transfer of an exposure from one stage to another. (5) Exposures and ECL at reporting date of facilities that did not exist at the start of the year, but did at the end. Amounts in Stage 2 and 3 represent assets which have deteriorated during the year subsequent to origination in Stage 1. (6) Residual movements on facilities that did not change stage in the year, and which were neither acquired nor purchased in the year. (7) Exposures and ECL for facilities that existed at the start of the year, but not at the end.
Santander UK Group Holdings plc 101
Strategic Report Governance Risk review Financial review Financial statements Shareholder information
Credit risk
101Santander UK Group Holdings plc

Annual Report 2019 | Risk review
102 Santander UK Group Holdings plc
RESIDENTIAL MORTGAGES We offer mortgages to people who want to buy a property and offer additional borrowing (known as further advances) to existing mortgage customers. The property must be in the UK, except for a small number of loans in the Isle of Man and Jersey.
2019 compared to 2018 (unaudited) Credit risk is at very low levels historically. The benign credit environment has supported our customers and helped to reduce credit risk. From our experience we know that unemployment is one of the most important factors in defaults on mortgages, our biggest loan book. Whilst the UK market continues to show resilience, we are cautious on the outlook in light of recent economic uncertainty. £7.4bn net mortgage growth in 2019 (2018: £3.3bn) was our strongest for a decade, with a focus on pricing, customer retention and service.
Borrower profile
In this table, ‘home movers’ include both existing customers moving house and taking out a new mortgage with us, and customers who switch their mortgage to us when they move house. ‘Remortgagers’ are new customers who are taking a new mortgage with us.
Stock New business
2019 2018 2019 2018 £m % £m % £m % £m %
Home movers 70,860 43 69,198 44 11,192 38 10,854 39
Remortgagers 52,480 32 51,272 32 9,197 31 9,237 34
First-time buyers 32,112 19 29,235 19 6,952 23 4,848 18
Buy-to-let 9,904 6 8,252 5 2,473 8 2,335 9
165,356 100 157,957 100 29,814 100 27,274 100
As well as the new business in the table above, there were £31.6bn (2018: £27.2bn) of remortgages where we moved existing customers with maturing products onto new mortgages. We also provided £1.3bn (2018: £1.5bn) of further advances and flexible mortgage drawdowns.
2019 compared to 2018 (unaudited) The borrower profile of stock remained broadly unchanged. The change in borrower profile of new business reflected product initiatives designed to help first-time buyers and changes to credit policy in 2019 to increase the maximum loan term from 35 to 40 years. In 2019, we helped first-time buyers purchase their new home with £7.0bn of gross lending (2018: £4.8bn).
Interest rate profile
The interest rate profile of our mortgage asset stock was:
2019 2018 £m % £m %
Fixed rate 128,798 78 115,178 73
Variable rate 22,116 13 24,396 15
Standard Variable Rate (SVR) 14,442 9 18,383 12
165,356 100 157,957 100
2019 compared to 2018 (unaudited) In 2019, we continued to see customer refinancing from SVR products into fixed rate products influenced by low mortgage rates and the competitive mortgage market.
Geographical distribution
The geographical distribution of our mortgage asset stock was:
Stock New business
Region 2019
£bn 2018
£bn 2019
£bn 2018
£bn
London 41.4 39.0 7.5 7.1
Midlands and East Anglia 22.1 21.1 4.3 3.8
North 22.7 22.2 3.8 3.4
Northern Ireland 3.3 3.4 0.3 0.2
Scotland 6.8 6.7 1.2 1.0
South East excluding London 51.7 48.7 9.7 9.0
South West, Wales and other 17.4 16.9 3.0 2.8
165.4 158.0 29.8 27.3
Average loan size for new business £’000 £’000
South East including London 277 270
Rest of the UK 154 150
UK as a whole 207 203
2019 compared to 2018 (unaudited) The geographical distribution of the portfolio continued to represent a broad footprint across the UK, whilst maintaining a concentration around London and the South East. The loan-to-income multiple of mortgage lending during the year, representing average earnings of new business at inception, was 3.27 (2018: 3.24).
Santander UK Group Holdings plc102
Annual Report 2019 | SectionAnnual Report 2019 | Risk review
Santander UK Group Holdings plc102

Santander UK Group Holdings plc 103
Strategic report Governance Risk review Financial review Financial statements Shareholder information
Credit risk
Larger loans
The mortgage asset stock of larger loans was:
South East including London UK
Individual mortgage loan size 2019
£m 2018
£m 2019
£m 2018
£m
<£0.25m 45,828 45,851 105,855 105,181
£0.25m to £0.50m 34,027 30,488 44,549 39,841
£0.50m to £1.0m 11,471 10,103 13,114 11,551
£1.0m to £2.0m 1,538 1,168 1,644 1,236
>£2.0m 186 146 194 148
93,050 87,756 165,356 157,957
At 31 December 2019, there were 76 (2018: 57) individual mortgages over £2.0m. In 2019, there were 32 (2018: 9) new mortgages over £2.0m.
Loan-to-value analysis
This table shows the LTV distribution for the gross carrying amount and the related ECL of our total mortgage portfolio and Stage 3 mortgages, as well as the LTV distribution for new business. We also show the collateral value and simple average LTV for our mortgage stock, Stage 3 stock and new business. We use our estimate of the property value at the balance sheet date. We include fees that have been added to the loan in the LTV calculation. For flexible products, we only include the drawn amount, not undrawn limits.
2019 2018
Stock Stage 3 New Stock Stage 3 New
LTV Total
£m ECL £m
Total £m
ECL £m
business £m
Total £m
ECL £m
Total £m
ECL £m
business £m
Up to 50% 70,714 24 743 11 5,113 72,613 25 872 11 5,124
>50-75% 67,311 65 626 24 11,876 63,505 67 698 24 11,512
>75- 85% 17,436 31 136 13 6,130 14,191 32 156 13 5,955
>85-100% 9,011 34 110 17 6,650 6,508 36 125 16 4,648
>100% 884 64 107 38 45 1,140 77 131 42 35
165,356 218 1,722 103 29,814 157,957 237 1,982 106 27,274
Collateral value of residential properties(1) 165,229 1,702 29,813 157,787 1,850 27,274
% % % % % %
Simple average(2) LTV (indexed) 43 42 65 42 43 63
(1) Collateral value shown is limited to the balance of each related loan. Excludes the impact of over-collateralisation (where the collateral is higher than the loan). Includes collateral against loans in negative equity of £757m (2018: £969m). (2) Total of all LTV% divided by the total of all accounts.
At 31 December 2019, the parts of loans in negative equity which were effectively uncollateralised before deducting loss allowances reduced to £127m (2018: £170m).
In 2019, the simple average LTV of mortgage total new lending in London was 61% (2018: 58%).
Santander UK Group Holdings plc 103
Strategic Report Governance Risk review Financial review Financial statements Shareholder information
Credit risk
103Santander UK Group Holdings plc

Annual Report 2019 | Risk review
104 Santander UK Group Holdings plc
Credit performance
2019
£m 2018
£m
Mortgage loans and advances to customers of which: 165,356 157,957
– Stage 1 155,477 146,619
– Stage 2 8,157 9,356
– Stage 3 1,722 1,982
Loss allowances(3) 218 234
% %
Stage 1 ratio(1) 94.03 92.82
Stage 2 ratio(1) 4.93 5.92
Stage 3 ratio(2) 1.05 1.27
(1) Stage 1/Stage 2 exposures as a percentage of customer loans. (2) Total Stage 3 exposure as a percentage of customer loans plus undrawn Stage 3 exposures. The way we calculate the Stage 3 ratio was changed from 1 January 2019, and 2018 restated for consistency. See ‘Key metrics’ in the ‘Credit risk –
Santander UK group level’ section. (3) The ECL allowance is for both on and off–balance sheet exposures.
Movement in total exposures and the corresponding ECL The following table shows changes in total on and off-balance sheet exposures subject to ECL assessment, and the corresponding ECL, for residential mortgages in the year. The footnotes to the Santander UK group level analysis on page 96 are also applicable to this table.
Stage 1 Stage 2 Stage 3
Mortgages Exposures(1)
£m ECL £m
Exposures(1) £m
ECL £m
Exposures(1)
£m ECL £m
Exposures(1) £m
ECL £m
At 1 January 2019 157,739 12 9,432 119 1,999 106 169,170 237
Transfers from Stage 1 to Stage 2 (3) (2,345) (1) 2,345 1 – – – –
Transfers from Stage 2 to Stage 1((3) 2,921 24 (2,921) (24) – – – –
Transfers to Stage 3(3) (231) – (429) (8) 660 8 – –
Transfers from Stage 3(3) 5 (1) 485 16 (490) (15) – –
Transfers of financial instruments 350 22 (520) (15) 170 (7) – –
Net ECL remeasurement on stage transfer(4) – (23) – 16 – 12 – 5
Change in economic scenarios(2) – (5) – (22) – (9) – (36)
Changes to model – – – – – 13 – 13
New lending and assets purchased (5) 31,090 5 198 3 2 – 31,290 8
Other(6) 2,090 4 153 6 31 14 2,274 24
Redemptions and repayments(7) (22,439) (1) (1,039) (6) (396) (12) (23,874) (19)
Assets written off(7) – – – – (72) (14) (72) (14)
At 31 December 2019 168,830 14 8,224 101 1,734 103 178,788 218
Net movement in the year 11,091 2 (1,208) (18) (265) (3) 9,618 (19)
Charge/(release) to the Income Statement 2 (17) 11 (4)
Less: ECL relating to derecognised income – – (2) (2)
Less: Recoveries net of collection costs – – (2) (2)
Income statement charge/(release) for the year 2 (17) 7 (8)
2018
At 1 January 2018 155,155 20 9,884 131 2,004 121 167,043 272
Transfers from Stage 1 to Stage 2 (3) (2,941) (1) 2,941 1 – – – –
Transfers from Stage 2 to Stage 1((3) (329) (6) (512) (12) 841 18 – –
Transfers to Stage 3(3) 2,628 21 (2,628) (21) – – – –
Transfers from Stage 3(3) 4 – 405 14 (409) (14) – –
Transfers of financial instruments (638) 14 206 (18) 432 4 – –
Net ECL remeasurement on stage transfer(4) – (20) – 20 – 14 – 14
Change in economic scenarios(2) – (6) – (7) – (8) – (21)
Changes to model – – – 2 – 2 – 4
New lending and assets purchased (5) 28,330 2 446 5 3 1 28,779 8
Other(6) (249) 6 (81) (5) (5) 1 (335) 2
Redemptions and repayments(7) (24,859) (4) (1,023) (9) (358) (11) (26,240) (24)
Assets written off(7) – – – – (77) (18) (77) (18)
At 31 December 2018 157,739 12 9,432 119 1,999 106 169,170 237
Net movement in the year 2,584 (8) (452) (12) (5) (15) 2,127 (35)
Charge/(release) to the Income Statement (8) (12) 3 (17)
Less: Recoveries net of collection costs – – (4) (4)
Income statement charge/(release) for the year (8) (12) (1) (21)
Santander UK Group Holdings plc104
Annual Report 2019 | SectionAnnual Report 2019 | Risk review
Santander UK Group Holdings plc104
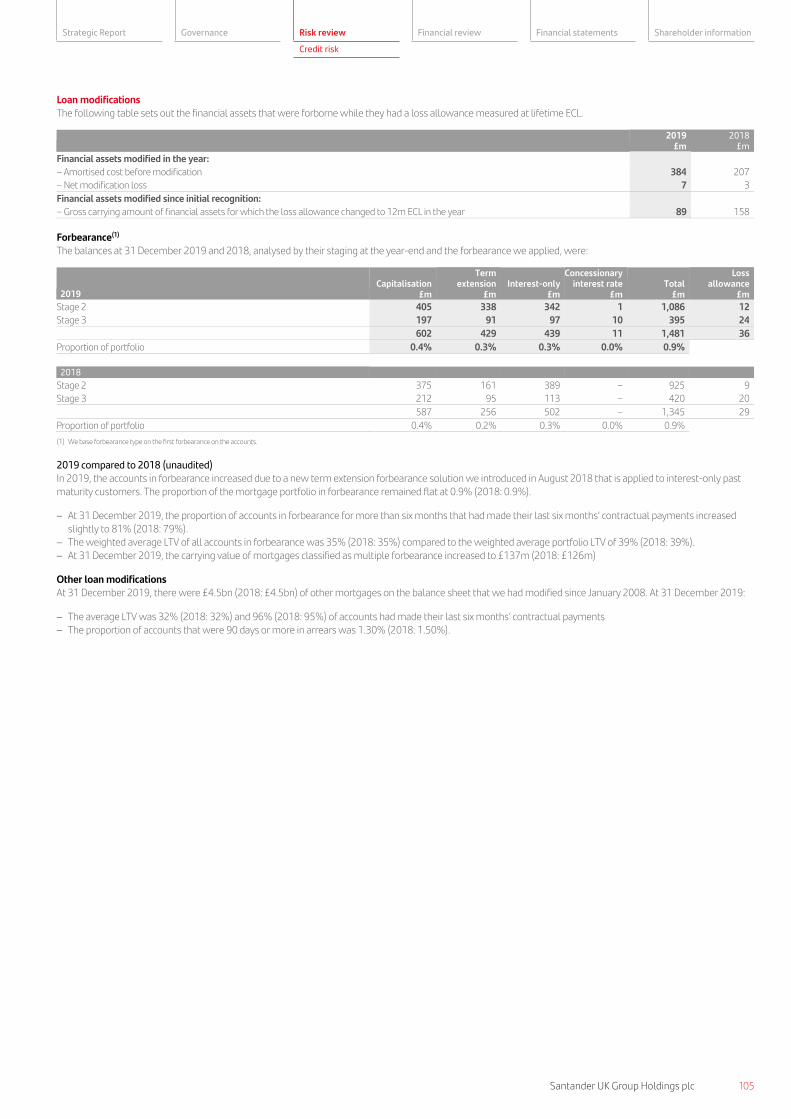
Santander UK Group Holdings plc 105
Strategic report Governance Risk review Financial review Financial statements Shareholder information
Credit risk
Loan modifications The following table sets out the financial assets that were forborne while they had a loss allowance measured at lifetime ECL.
2019
£m 2018
£m
Financial assets modified in the year:
– Amortised cost before modification 384 207
– Net modification loss 7 3
Financial assets modified since initial recognition:
– Gross carrying amount of financial assets for which the loss allowance changed to 12m ECL in the year 89 158
Forbearance(1) The balances at 31 December 2019 and 2018, analysed by their staging at the year-end and the forbearance we applied, were:
2019 Capitalisation
£m
Term extension
£m Interest-only
£m
Concessionary interest rate
£m Total
£m
Loss allowance
£m
Stage 2 405 338 342 1 1,086 12
Stage 3 197 91 97 10 395 24
602 429 439 11 1,481 36
Proportion of portfolio 0.4% 0.3% 0.3% 0.0% 0.9%
2018
Stage 2 375 161 389 – 925 9
Stage 3 212 95 113 – 420 20
587 256 502 – 1,345 29
Proportion of portfolio 0.4% 0.2% 0.3% 0.0% 0.9%
(1) We base forbearance type on the first forbearance on the accounts.
2019 compared to 2018 (unaudited) In 2019, the accounts in forbearance increased due to a new term extension forbearance solution we introduced in August 2018 that is applied to interest-only past maturity customers. The proportion of the mortgage portfolio in forbearance remained flat at 0.9% (2018: 0.9%).
− At 31 December 2019, the proportion of accounts in forbearance for more than six months that had made their last six months’ contractual payments increased slightly to 81% (2018: 79%).
− The weighted average LTV of all accounts in forbearance was 35% (2018: 35%) compared to the weighted average portfolio LTV of 39% (2018: 39%). − At 31 December 2019, the carrying value of mortgages classified as multiple forbearance increased to £137m (2018: £126m)
Other loan modifications At 31 December 2019, there were £4.5bn (2018: £4.5bn) of other mortgages on the balance sheet that we had modified since January 2008. At 31 December 2019:
− The average LTV was 32% (2018: 32%) and 96% (2018: 95%) of accounts had made their last six months’ contractual payments − The proportion of accounts that were 90 days or more in arrears was 1.30% (2018: 1.50%).
Santander UK Group Holdings plc 105
Strategic Report Governance Risk review Financial review Financial statements Shareholder information
Credit risk
105Santander UK Group Holdings plc

Annual Report 2019 | Risk review
106 Santander UK Group Holdings plc
RESIDENTIAL MORTGAGES – PORTFOLIOS OF PARTICULAR INTEREST
Introduction (unaudited) We are mainly a residential prime lender and we do not originate sub-prime or second charge mortgages. Despite that, some types of mortgages have higher risks and others stand out for different reasons. These are:
Product Description
Interest-only loans and part interest-only, part repayment loans
With an interest-only mortgage, the customer pays interest every month but the principal until the end of the mortgage. Some mortgages have a part that is interest-only, with the rest being a normal repayment mortgage. Customers with part interest-only, part repayment mortgages still have to pay back a lump sum at the end of their mortgage for the interest-only part. This means there is a higher credit risk on these loans as we depend on the customers to pay back a lump sum. We design new account LTV maximums to mitigate this credit risk. We also make sure the customer has a plausible repayment plan before we lend to them and remains on track for the life of the loan.
Since 2009, we have reduced the risk from new interest-only mortgages by lowering the maximum LTV. It has been 50% since 2012. When a customer plans to repay their mortgage by selling the property, we now only allow that if they own more than a set proportion of the equity.
Customers with interest-only mortgages have to make arrangements to repay the principal at the end of the mortgage. We have a strategy to make sure that we tell these customers that they have to do this. We send them messages with their annual mortgage statements, and we run contact campaigns to encourage them to tell us how they plan to repay.
In 2013, we contacted all our customers whose mortgages were due to mature before 2020. Since 2016, we have extended these campaigns to periodically contact all interest-only customers. We increase our contact frequency as customers approach term maturity. Outside of sending out annual mortgage statements, we contact more than 100,000 interest-only customers per year.
If customers know they will not be able to repay their mortgage in full when it ends, or if their mortgage has already passed the date when it should have ended, we talk to them. If we think it is in the customer’s interests and they can afford it, we look at other ways of managing it. That can mean turning the mortgage into a standard repayment one and extending it. Or, if the customer is waiting for their means of repaying it, such as an investment plan or bonds, to mature, it can just mean extending it.
Flexible loans Flexible mortgages allow customers to pay more or less than their usual amount each month, or even to take ‘payment holidays’ when they pay nothing at all. Customers do not have to take or draw down the whole loan all at once – so if they took out a mortgage big enough to allow them to build a home extension after three years, they do not have to start paying interest on that extra money until they are ready to spend it. There are conditions on when and how much customers can draw down:
– There are often limits on how much can be drawn down in any month
– The customer cannot be in payment arrears
– The customer cannot have insolvency problems, such as a county court judgement, bankruptcy, an individual voluntary arrangement, an administration order or a debt relief order.
A customer can ask us to increase their credit limit, but that means we will go through our full standard credit approval process. We can also lower the customer’s credit limit at any time, so it never goes above 90% of the property’s current market value.
We no longer offer flexible loan products for new mortgages.
This is an area of interest in order to identify customers who might be using these facilities to self-forbear, such as regularly drawing down small amounts. If there is any sign that the credit risk has significantly increased, we reflect this in our provision calculations.
Loans with an LTV >100% Where the mortgage balance is more than the property is now worth, we cannot recover the full value of the loan by repossessing and selling the property. This means there is a higher credit risk on these loans. In some cases, property prices have fallen, so mortgages we gave in the past with lower LTVs now have LTVs greater than 100%. Before 2009, we sometimes allowed customers to borrow more than the price of the property.
We monitor existing accounts with LTVs >100% as part of our assessment of ongoing portfolio performance. We design new account LTV maximums to mitigate an increase in the volume of accounts with an LTV >100%.
Buy-to-Let (BTL) loans In recent years, we have refined our BTL proposition to appeal to a wider catchment, and we have improved our systems to cater for this segment with a focus on non-professional landlords. We have prudent lending criteria, and specific policies for BTL. We only lend to a maximum 75% LTV. The first applicant must earn a minimum income of £25,000 per year, and we require evidence of income in all cases. We also use a BTL affordability rate as part of our assessment about whether to lend. This means that the rental income must cover the monthly mortgage interest payments by a prescribed amount when calculated using a stressed interest rate. We regularly review the prescribed amount and adjust it as needed.
Santander UK Group Holdings plc106
Annual Report 2019 | SectionAnnual Report 2019 | Risk review
Santander UK Group Holdings plc106

Santander UK Group Holdings plc 107
Strategic report Governance Risk review Financial review Financial statements Shareholder information
Credit risk
Credit performance
Portfolio of particular interest(1)
2019 Total
£m Interest-only
£m
Part interest-only, part
repayment(2) (3) £m
Flexible(3) £m
LTV >100% £m
Buy-to-let £m
Other portfolio
£m
Mortgage portfolio 165,356 38,062 13,247 11,273 884 9,904 109,234
– Stage 1 155,477 33,739 12,112 10,183 594 9,593 105,114
– Stage 2 8,157 3,502 888 873 183 285 3,526
– Stage 3 1,722 821 247 217 107 26 594
Stage 3 ratio(4) 1.05% 2.17% 1.87% 2.03% 12.11% 0.26% 0.54%
PIPs 32 14 9 2 13 1 8
Simple average LTV (indexed) 43% 45% 45% 28% 117% 60% 44%
2018
Mortgage portfolio 157,957 38,035 13,201 12,926 1,140 8,252 101,158
– Stage 1 146,619 33,001 11,824 11,558 740 7,906 96,767
– Stage 2 9,356 4,029 1,115 1,082 273 317 3,802
– Stage 3 1,982 1,005 262 286 127 29 589
Stage 3 ratio(4) 1.27% 2.67% 1.99% 2.34% 11.18% 0.35% 0.58%
PIPs 25 12 5 3 8 – 7
Simple average LTV (indexed) 42% 44% 44% 29% 118% 58% 43%
(1) Where a loan falls into more than one category, we include it in all the categories that apply. As a result, the sum of the mortgages in the segments of particular interest and the other portfolio does not agree to the total mortgage portfolio. (2) Mortgage balance includes both the interest-only part of £9,823m (2018: £9,756m) and the non-interest-only part of the loan. (3) Includes legacy Alliance & Leicester flexible loans that work in a more limited way than our current Flexi loan product. (4) Total Stage 3 exposure as a percentage of customer loans plus undrawn Stage 3 exposures. The way we calculate the Stage 3 ratio was changed from 1 January 2019, and 2018 restated for consistency. See ‘Key metrics’ in the ‘Credit risk –
Santander UK group level’ section.
2019 compared to 2018 (unaudited) – In 2019, the proportion of interest-only loans together with part interest-only, part repayment and flexible loans reduced, reflecting our strategy to manage down
the overall exposure to these lending profiles. − BTL mortgage balances increased £1.6bn to £9.9bn (2018: £8.3bn) driven by continued focus in growing this portfolio. In 2019, the simple average LTV of
mortgage total new lending in the form of BTL was 64% (2018: 62%).
Interest-only sub analysis (unaudited) Full interest-only new business in the year
2019
£m 2018
£m
Full interest-only loans 4,000 3,810
Full interest-only maturity profile
2019
Term expired
£m
Within 2 years
£m
Between 2-5 years
£m
Between 5-15 years
£m
Greater than 15 years
£m Total
£m
Full interest-only portfolio 338 1,541 3,706 20,984 11,493 38,062
– of which value weighted average LTV (indexed) is >75% 11 111 219 1,793 1,051 3,185
2018
Full interest-only portfolio 541 1,346 3,761 21,711 10,676 38,035
– of which value weighted average LTV (indexed) is >75% 43 110 265 2,029 642 3,089
2019 compared to 2018 (unaudited) For full interest-only mortgages, of the total £338m that was term expired at 31 December 2019, 84% continued to pay the interest due under the expired contract terms. Interest-only mortgages that matured in 2019 totalled £731m, of which: £314m was subsequently repaid, £5m was refinanced under normal credit terms, £213m was refinanced under forbearance arrangements and £199m remained unpaid and was classified as term expired at 31 December 2019.
At 31 December 2019, there were 76,767 (2018: 84,773) flexible mortgage customers, with undrawn facilities of £5,841m (2018: £6,000m). The portfolio’s value weighted LTV (indexed) was 27% (2018: 28%).
Forbearance(1) The balances at 31 December 2019 and 2018 were:
2019 Interest-only(2)
£m Flexible
£m LTV >100%
£m Buy-to-Let
£m
Total 392 73 17 10
– Stage 2 285 56 8 8
– Stage 3 107 17 9 2
2018
Total 229 32 10 9
– Stage 2 136 18 3 6
– Stage 3 93 14 7 3
(1) Where a loan falls into more than one category, we have included it in all the categories that apply. (2) Comprises full interest-only loans and part interest-only, part repayment loans.
Santander UK Group Holdings plc 107
Strategic Report Governance Risk review Financial review Financial statements Shareholder information
Credit risk
107Santander UK Group Holdings plc

Annual Report 2019 | Risk review
108 Santander UK Group Holdings plc
CONSUMER (AUTO) FINANCE AND OTHER UNSECURED LENDING
Consumer (auto) finance Retail Banking provides auto finance through Santander Consumer (UK) plc (SCUK). SCUK provides a range of wholesale finance facilities (stock finance) and retail products designed for the purchase of new and used personal, business and commercial vehicles, motorcycles, bicycles and caravans through an extensive network of motor dealers and manufacturer partners. SCUK’s products are mainly distributed through intermediary introducers at the point of sale, and through partnerships with selected car and motorcycle manufacturers. At 31 December 2019, the business operated with 14 Original Equipment Manufacturer partners which includes two joint venture arrangements.
Through SCUK’s Hyundai Capital UK Ltd (HCUK) and PSA Finance UK Ltd (PSAF) joint ventures, we provide retail point of sale customer finance as well as wholesale finance facilities (stock finance) for Hyundai and Kia, managed by HCUK, as well as Peugeot, Citroën and DS, managed by PSAF. SCUK holds a 50% share in each of these joint ventures. However, due to the varying structures of the joint ventures, we equity account for HCUK and consolidate PSAF.
Residual Value (RV) risk remains the top risk for SCUK. We monitor the RV portfolio on a monthly basis, and we use key risk triggers to identify any material change in trends. We have a conservative approach to setting RV amounts and maintain a prudent provisioning policy to mitigate potential losses on disposal of the asset. We use a leading independent vehicle valuation company to assess the estimated future value of the asset, prior to inception and periodically throughout the life of the agreement.
Other unsecured lending Retail Banking also provides other unsecured lending, which includes:
− Personal loans: we offer personal loans for most purposes, such as debt consolidation, home improvement, and to support significant life events such as weddings − Credit cards: we offer a wide range of credit cards designed to suit a variety of customers, including balance transfer cards and cards that offer rewards − Overdrafts: we also offer arranged overdrafts for customers who have a bank account with us. We evaluate our customers’ circumstances to decide how much they
can borrow. In other cases, a customer may have overdrawn their bank account without arranging it with us first.
For both Consumer (auto) finance and Other unsecured lending, we maintain rigorous credit scoring and affordability assessment criteria that we monitor and report regularly. There were no significant changes to our risk policy or appetite in these portfolios. This approach continued to result in stable, good credit quality consumer credit portfolios.
We use a combination of internal, credit reference agency and application data in our credit assessments. Scorecards supported by policy rules give us confidence that customers are creditworthy and can afford their repayments. We closely monitor and manage the performance of our consumer credit portfolios using a range of data that includes portfolio and key segments performance, macroeconomic indicators and customer risk data. Nonetheless, we are not complacent about the prospect for future risk events and always look at ways to strengthen our approach.
Credit performance
Consumer (auto) finance
£m
Other unsecured
2019
Personal loans
£m
Credit cards
£m Overdrafts
£m
Total other unsecured
£m Total
£m
Loans and advances to customers of which: 7,684 2,135 2,788 590 5,513 13,197
– Stage 1 7,038 2,020 2,473 404 4,897 11,935
– Stage 2 604 95 267 160 522 1,126
– Stage 3 42 20 48 26 94 136
Loss allowances(2) 88 51 120 62 233 321
Stage 3 undrawn exposures – 25
Stage 3 ratio(1) 0.55% 2.15% 1.21%
Gross write-offs 34 134 168
2018
Loans and advances to customers of which: 7,347 2,182 2,865 593 5,640 12,987
– Stage 1 6,950 2,113 2,560 422 5,095 12,045
– Stage 2 354 48 256 144 448 802
– Stage 3 43 21 49 27 97 140
Loss allowances(2) 85 47 112 61 220 305
Stage 3 undrawn exposures – 26
Stage 3 ratio(1) 0.58% 2.17% 1.28%
Gross write-offs 24 125 149
(1) Total Stage 3 exposure as a percentage of loans and advances to customers plus undrawn Stage 3 exposures. The way we calculate the Stage 3 ratio was changed from 1 January 2019, and 2018 restated for consistency. See ‘Key metrics’ in the ‘Credit risk – Santander UK group level’ section.
(2) The ECL allowance is for both on and off–balance sheet exposures.
Santander UK Group Holdings plc108
Annual Report 2019 | SectionAnnual Report 2019 | Risk review
Santander UK Group Holdings plc108

Santander UK Group Holdings plc 109
Strategic report Governance Risk review Financial review Financial statements Shareholder information
Credit risk
Loan modifications The following table sets out the financial assets that were forborne while they had a loss allowance measured at lifetime ECL.
2019
Credit cards
£m Overdrafts
£m
Total other unsecured
£m
Financial assets modified in the year:
– Amortised cost before modification 23 15 38
– Net modification loss 12 8 20
Financial assets modified since initial recognition:
– Gross carrying amount of financial assets for which the loss allowance changed to 12m ECL in the year 3 2 5
2018
Financial assets modified in the year:
– Amortised cost before modification 26 17 43
– Net modification loss 12 8 20
Financial assets modified since initial recognition:
– Gross carrying amount of financial assets for which the loss allowance changed to 12m ECL in the year 2 3 5
Forbearance The balances at 31 December 2019 and 2018 were:
Other unsecured
2019
Consumer (auto) finance
£m
Personal loans
£m
Credit cards
£m Overdrafts
£m
Total other unsecured
£m Total
£m
Total 7 – 51 25 76 83
– Stage 2 5 – 10 7 17 22
– Stage 3 2 – 41 18 59 61
2018
Total 6 – 53 26 79 85
– Stage 2 4 – 10 7 17 21
– Stage 3 2 – 43 19 62 64
2019 compared to 2018 (unaudited) We maintained our prudent Consumer (auto) finance underwriting criteria through the year. In 2019, the product mix was broadly unchanged. This reflected underlying stability in target market segments, product pricing and distribution strategy. The car finance market saw challenges in 2019 mainly due to Brexit and changing emission standards, and there was a fall in the supply of new vehicles.
At 31 December 2019, Consumer (auto) finance balances represented 4% (2018: 4%) of our total Retail Banking loans and 4% (2018: 4%) of total customer loans. In 2019, Consumer (auto) finance balances increased by £337m (5%). In 2019, Consumer (auto) finance gross lending (new business) was £3,308m (2018: £3,444m). Wholesale loans (Stock finance) to car dealerships at 31 December 2019 were approximately 16.8% of the Consumer loan book, a decrease of £33m on 2018. The portfolio continues to perform satisfactorily with the overall risk profile remaining broadly stable.
At 31 December 2019, the average Consumer (auto) finance loan size was £13,900 (2018: £11,400).
Forbearance levels were broadly stable in 2019. Santander UK Group Holdings plc 109
Strategic Report Governance Risk review Financial review Financial statements Shareholder information
Credit risk
109Santander UK Group Holdings plc
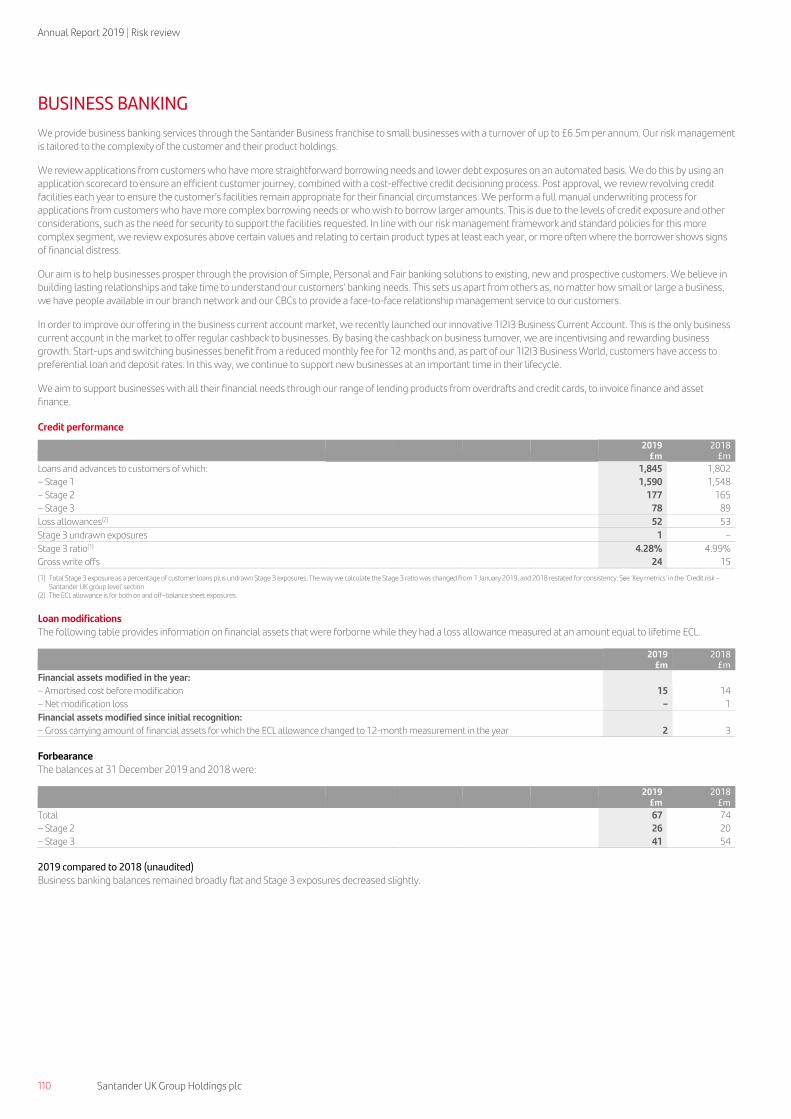
Annual Report 2019 | Risk review
110 Santander UK Group Holdings plc
BUSINESS BANKING
We provide business banking services through the Santander Business franchise to small businesses with a turnover of up to £6.5m per annum. Our risk management is tailored to the complexity of the customer and their product holdings.
We review applications from customers who have more straightforward borrowing needs and lower debt exposures on an automated basis. We do this by using an application scorecard to ensure an efficient customer journey, combined with a cost-effective credit decisioning process. Post approval, we review revolving credit facilities each year to ensure the customer’s facilities remain appropriate for their financial circumstances. We perform a full manual underwriting process for applications from customers who have more complex borrowing needs or who wish to borrow larger amounts. This is due to the levels of credit exposure and other considerations, such as the need for security to support the facilities requested. In line with our risk management framework and standard policies for this more complex segment, we review exposures above certain values and relating to certain product types at least each year, or more often where the borrower shows signs of financial distress.
Our aim is to help businesses prosper through the provision of Simple, Personal and Fair banking solutions to existing, new and prospective customers. We believe in building lasting relationships and take time to understand our customers’ banking needs. This sets us apart from others as, no matter how small or large a business, we have people available in our branch network and our CBCs to provide a face-to-face relationship management service to our customers.
In order to improve our offering in the business current account market, we recently launched our innovative 1I2I3 Business Current Account. This is the only business current account in the market to offer regular cashback to businesses. By basing the cashback on business turnover, we are incentivising and rewarding business growth. Start-ups and switching businesses benefit from a reduced monthly fee for 12 months and, as part of our 1I2I3 Business World, customers have access to preferential loan and deposit rates. In this way, we continue to support new businesses at an important time in their lifecycle.
We aim to support businesses with all their financial needs through our range of lending products from overdrafts and credit cards, to invoice finance and asset finance.
Credit performance
2019
£m 2018
£m
Loans and advances to customers of which: 1,845 1,802
– Stage 1 1,590 1,548
– Stage 2 177 165
– Stage 3 78 89
Loss allowances(2) 52 53
Stage 3 undrawn exposures 1 –
Stage 3 ratio(1) 4.28% 4.99%
Gross write offs 24 15
(1) Total Stage 3 exposure as a percentage of customer loans plus undrawn Stage 3 exposures. The way we calculate the Stage 3 ratio was changed from 1 January 2019, and 2018 restated for consistency. See ‘Key metrics’ in the ‘Credit risk – Santander UK group level’ section
(2) The ECL allowance is for both on and off–balance sheet exposures.
Loan modifications
The following table provides information on financial assets that were forborne while they had a loss allowance measured at an amount equal to lifetime ECL.
2019
£m 2018
£m
Financial assets modified in the year:
– Amortised cost before modification 15 14
– Net modification loss – 1
Financial assets modified since initial recognition:
– Gross carrying amount of financial assets for which the ECL allowance changed to 12-month measurement in the year 2 3
Forbearance
The balances at 31 December 2019 and 2018 were:
2019
£m 2018
£m
Total 67 74
– Stage 2 26 20
– Stage 3 41 54
2019 compared to 2018 (unaudited) Business banking balances remained broadly flat and Stage 3 exposures decreased slightly.
Santander UK Group Holdings plc110
Annual Report 2019 | SectionAnnual Report 2019 | Risk review
Santander UK Group Holdings plc110

Santander UK Group Holdings plc 111
Strategic report Governance Risk review Financial review Financial statements Shareholder information
Credit risk
Credit risk – other business segments
Overview
In Corporate & Commercial Banking, we are exposed to credit risk through providing overdraft, loan, invoice discounting, trade finance, asset finance and treasury products. We offer bank accounts and cash transmission services to further support clients.
In Corporate & Investment Banking, we are mainly exposed to credit risk through lending and selling treasury products to large corporates.
In Corporate Centre, our exposures come from asset and liability management of our balance sheet and our non-core and Legacy Portfolios in run-off.
Credit risk management
In this section, we explain how we manage and mitigate credit risk.
Credit risk review
In this section, we analyse our credit risk exposures and how they are performing. We also focus on forbearance and portfolios of particular interest.
Our main portfolios are:
Corporate & Commercial Banking Corporate & Investment Banking Corporate Centre
− −
−
SME and mid corporate – banking, lending and treasury services mainly to enterprises with an annual turnover of up to £500m. Commercial Real Estate – lending to experienced, professional landlords mainly secured by tenanted UK property in the office, retail, industrial and residential sub-sectors.
Social Housing – lending and treasury services for UK housing association groups secured by tenanted UK residential property. Borrowers are mainly charitable entities and registered with the appropriate regulator for the part of the UK in which they operate.
− −
Large Corporate – loans and treasury products for large corporates to support their working capital and liquidity needs. Financial Institutions – mainly derivatives, under approved ring-fenced bank exceptions policy to facilitate hedging, and trade finance instruments.
−
−
–
–
–
–
–
Sovereign and Supranational – securities issued by local and central governments, and government guaranteed counterparties. We hold some of them to help meet our liquidity needs.
Structured Products – we have two portfolios. The High Quality Liquid Assets (HQLA) portfolio is high quality assets, chosen for diversification and liquidity. The Legacy Treasury asset portfolio is mainly asset-backed securities.
Social Housing – legacy social housing loans that do not fit with our strategy.
Financial Institutions – mainly derivatives, repurchase and reverse repurchase transactions (known as repos and reverse repos), and stock borrowing/lending, under approved ring-fenced bank exceptions policy to facilitate hedging or liquidity management.
Legacy Portfolios in run-off – assets from acquisitions that do not fit with our strategy. These include some commercial mortgages.
Derivatives – older total return swaps we held for liquidity, that we are running down.
Crown Dependencies – mainly residential mortgages to individuals in Jersey and the Isle of Man.
The segmental basis of presentation in this Annual Report has been changed, and the prior periods restated, to report our short term markets business in Corporate Centre rather than in Corporate & Investment Banking. See Note 2 for more information.
OTHER BUSINESS SEGMENTS – CREDIT RISK MANAGEMENT
In Corporate & Commercial Banking, we classify most of our customers as non-standardised. We also have some SME customers, which we mainly classify as standardised as it is a high-volume portfolio with smaller exposures. In CIB and Corporate Centre, we classify all our customers as non-standardised, except for the commercial mortgages in our Legacy Portfolios in run-off, and the Crown Dependencies mortgage portfolio.
We set out how we manage the credit risk on our standardised customers in the previous section ‘Credit risk – Retail Banking’. We manage the credit risk on our standardised customers in Corporate & Commercial Banking and Corporate Centre in the same way, except that we do not use scorecards or credit reference agencies. In the rest of this section, we explain how we manage the credit risk on our non-standardised customers.
For more on our approach to
credit risk at a Santander UK
group level
See pages 78 to 86
Pre-transaction Transaction Post-transaction
Forbearance
Control
1. Risk strategyand planning
2. Assessment and origination
3. Monitoring4.5.
Credit risk lifecycle (unaudited)
Arrears management Debt recovery
Santander UK Group Holdings plc 111
Strategic Report Governance Risk review Financial review Financial statements Shareholder information
Credit risk
111Santander UK Group Holdings plc

Annual Report 2019 | Risk review
112 Santander UK Group Holdings plc
1. Risk strategy and planning
For details of how we set risk strategy and plans, see the ‘Santander UK group level – credit risk management’ section. For treasury products, we take credit risk up to limits for each client. We control, manage and report risks on a counterparty basis, regardless of which part of our business takes the risk.
2. Assessment and origination
We do a thorough risk assessment to make sure customers can meet their obligations before we approve a credit application. We do this mainly by assigning each customer a credit rating, using our internal rating scale (see ‘Credit quality’ in ‘Santander UK group level – credit risk review’ section). To do this, we look at the customer’s financial history and trends in the economy – backed up by the expert judgement of a risk analyst. We review our internal ratings at least every year. We also assess the underlying risk of the transaction, taking into account any mitigating factors (see the tables below) and how it fits with our risk policies, limits and Risk Appetite, as set by the Board and lower level committees and fora. We consider transactions in line with credit limits approved by the relevant credit authority. In CIB and Corporate Centre, a specialist analyst usually reviews a transaction at the start and over its life. They base their review on the financial strength of the client, its position in its industry, and its management strengths.
We lend to a wide range of sectors and industries, including those that are intrinsic or of strategic importance to the economy of the UK or another country or territory. As part of lending responsibly, we comply with the Equator Principles, factoring social, ethical and environmental impacts into our risk analysis and decision-making process for financial transactions. These principles address climate change, prevention of pollution and toxic waste emissions, biodiversity, indigenous peoples and human rights. Our policy on Aerospace and Defence, Energy, Mining & Metals and Soft Commodities and our Sensitive Social and Ethical Sectors policy continue to define our approach towards creating long-term value while managing reputational, social and environmental risks. In 2019, we further improved these policies by introducing prohibitions and strengthening restrictions on a range of activities. Prohibited activities now include the provision of products or services for new Coal Fired Power Plant (CFPP) projects and taking on new clients with existing CFPPs. Restricted activities include transactions specific to CFPPs for existing clients which do not significantly improve environmental impacts, such as a significant reduction of CO2. Our Reputational Risk Forum reviews and approves all restricted activities to ensure that they fall within our risk appetite. This forum reviews, monitors and escalates key decisions around financial and non-financial reputational risks to the Board
Credit risk mitigation
The types of credit risk mitigation, including collateral, across each of our portfolios are as follows. In addition, from time to time at a portfolio level we execute significant risk transfer transactions, which typically reduce RWAs.
Corporate & Commercial Banking:
Portfolio Description
SME and mid
corporate
Includes secured and unsecured lending. We can use covenants (financial or non-financial) to support a customer’s credit rating. For example, we can set limits on how much they can spend or borrow, or how they operate as a business. We can take mortgage debentures as collateral. These are charges over a company’s assets, almost always first charges. We can also take a first legal charge on commercial property as collateral. Before agreeing the loan, we get an independent professional valuation which assesses the property. We can also take guarantees, but we do not treat them as collateral and we do not put a cash value on them unless they are supported by a tangible asset which is charged to us. If a customer defaults, we work with them to consider debt restructuring options. We generally do not enforce our security over their assets except when restructuring options have been exhausted or to protect our position in relation to third party claims. In this case, we might appoint an administrator.
We also lend against assets (like vehicles and equipment) and invoices for some customers. For assets, we value them before we lend. For invoices, we review the customer’s ledgers regularly and lend against debtors that meet agreed criteria. If the customer defaults, we repossess and sell their assets or collect on their invoices.
Commercial
Real Estate
We take a first legal charge on commercial property as collateral. The loan is subject to strict criteria, including the property condition, age and location, tenant quality, lease terms and length, and the sponsor’s experience and creditworthiness. Before agreeing the loan, we visit the property and get an independent professional valuation which assesses the property, the tenant and future demand (such as comparing market rent to current rent). Loan agreements typically allow us to view the property each year and get revaluations every two to three years, or more often if it is likely covenants may be breached.
Social Housing We take a first legal charge on portfolios of residential real estate owned and let by UK Housing Associations as collateral, in most cases. We revalue this every three to five years (in line with industry practice), using the standard methods for property used for Social Housing. The value would be considerably higher if we based it on normal residential use. On average, the loan balance is 25% to 50% of the implied market value, using our LGD methodology. We have not had a default, loss or repossession on Social Housing. We manage older Social Housing loans that do not fit our current business strategy in Corporate Centre.
Corporate & Investment Banking:
Portfolio Description
Large Corporate Most of these corporate loans and products are unsecured. We also have a structured finance portfolio, where we typically hold legal charges over the assets we finance. For all customer segments, the bank monitors borrowers are in line with expected performance and (where applicable) documented covenants so we detect any financial distress early.
Financial Institutions We manage the risk on derivatives in this portfolio in the same way as for the derivatives in the Financial Institutions in Corporate Centre.
Santander UK Group Holdings plc112
Annual Report 2019 | SectionAnnual Report 2019 | Risk review
Santander UK Group Holdings plc112

Santander UK Group Holdings plc 113
Strategic report Governance Risk review Financial review Financial statements Shareholder information
Credit risk
Corporate Centre:
Portfolio Description
Sovereign and
Supranational
In line with market practice, there is no collateral against these assets.
Structured Products These are our HQLA and Legacy Treasury asset portfolios. These assets are primarily ABS and covered bonds, which benefit from senior positions in the creditor hierarchy. Their credit rating reflects the over-collateralisation in the structure, and the assets that underpin their cash flows and repayment schedules. We use a detailed expected cash flow analysis to assess the portfolios and we consider the structure and assets backing each individual security.
Social Housing We manage the risk on this portfolio in the same way as for the Social Housing portfolio in Corporate & Commercial Banking.
Financial Institutions We use standard legal agreements to reduce credit risk on derivatives, repos and reverse repos, and stock borrowing/lending. We also hold collateral and trade through central counterparties (CCPs) to reduce risk.
Netting – We use netting agreements where they have legal force, mainly in the UK, the rest of Europe and the US. This means that if a counterparty defaults, we can legally offset what we owe them and what they owe us and settle the net amount. However, netting arrangements often do not mean we can offset assets and liabilities for accounting purposes, as transactions are usually settled on a gross basis. In line with market practice, we use standard legal agreements. For derivatives, we use ISDA Master Agreements; for repos and reverse repos, we use Global Master Repurchase Agreements; and for stock borrowing/lending and other securities financing, we use Global Master Securities Lending Agreements.
Collateral – We use the Credit Support Annex with the ISDA Master Agreement. This gives us collateral for our net exposures. The collateral can be cash, securities or equities. For stock borrowing/lending and repos and reverse repos, it includes high quality liquid debt securities and highly liquid equities listed on major developed markets. We revalue our exposures and collateral daily, adjusting the collateral to reflect deficits or surpluses. We have processes to control how we value and manage collateral, including documentation reviews and reporting. Collateral has to meet our ‘Liquid Assets and Eligible Collateral’ policy, which controls the quality and how much of any one kind of collateral we can hold. That gives us confidence we will be able to cash in the collateral if a client defaults. We have these controls for equities and debt securities. The collateral held for reverse repos is worth at least 100% of our exposure.
CCPs – These are intermediaries between a buyer and a seller – generally a clearing house. We use CCPs to reduce counterparty credit risk in derivatives.
Legacy Portfolios
in run-off
We often hold collateral through a first legal charge over the underlying asset or cash. We get independent third-party valuations on fixed charge security in line with industry guidelines. We then review our impairment loss allowance. To do that, we bear in mind:
− The borrower’s ability to generate cash flow
− The age of the assets
− Whether the loan is still performing satisfactorily
− Whether or not the reduction in value is likely to be temporary
− Whether there are other ways to solve the problem.
Where a borrower gets into difficulty we look to dispose of the collateral, either with agreement or through the insolvency process. We do this as early as possible, to minimise any loss. We rarely take ownership of collateral.
Derivatives We manage the risk on this portfolio in the same way as for the derivatives in Financial Institutions in Corporate Centre.
Crown Dependencies We manage the risk on this portfolio in the same way as for mortgages in Retail Banking.
3. Monitoring
We regularly monitor and report our credit risk by portfolio, segment, industry, location and customer. We give our ERCC a detailed analysis of our credit exposures and risk trends every month. We also report our larger exposures and risks to the Board Risk Committee every month.
Our Watchlist
We also use a Watchlist to help us identify potential problem debt early. Just because a customer is on our Watchlist does not mean they have defaulted. It just means that something has happened that has increased the probability of default. There are several reasons we might put customers on this list. For example, if they suffer a downturn in trade, breach a covenant, lose a major contract, slip into early arrears, or their key management resign. Whatever the trigger, we review the case to assess the potential financial impact.
We classify Watchlist cases as:
− Enhanced monitoring: for less urgent cases. If they are significant, we monitor them more often − Proactive management: for more urgent or serious cases. We may take steps to restructure debt including extending the term, taking more collateral, agreeing a
lower credit limit or seeking repayment of the loan through refinancing or other means.
We assess cases on the Watchlist for impairment in accordance with IFRS 9 as explained in ‘Significant Increase in Credit Risk (SICR)’ in the ‘Santander UK group level – Credit risk management’ section.
When a customer is included in enhanced monitoring, we do not consider that it has suffered a SICR for ECL purposes, so it remains in Stage 1 for purposes of our loss allowance calculations. When a customer is included in proactive management, we consider that it has suffered a SICR. This means we transfer it to Stage 2 and subject it to a lifetime ECL assessment to calculate the new loss allowance. We take into account any forbearance we offer. This includes whether any extra security or guarantees are available, the likelihood of more equity and the potential to enhance value through asset management.
In Corporate & Commercial Banking, as part of our client review process, for loans approaching maturity, we look at the prospects of refinancing the loan on current market terms and applicable credit policy. Where this seems unlikely, we put the case on our Watchlist.
In CIB and Corporate Centre, we monitor the credit quality of our exposures daily. We use both internal and third-party data to detect any potential credit deterioration. In Corporate Centre, we manage the credit quality of our Crown Dependencies mortgages in the same way as for mortgages in Retail Banking.
Santander UK Group Holdings plc 113
Strategic Report Governance Risk review Financial review Financial statements Shareholder information
Credit risk
113Santander UK Group Holdings plc
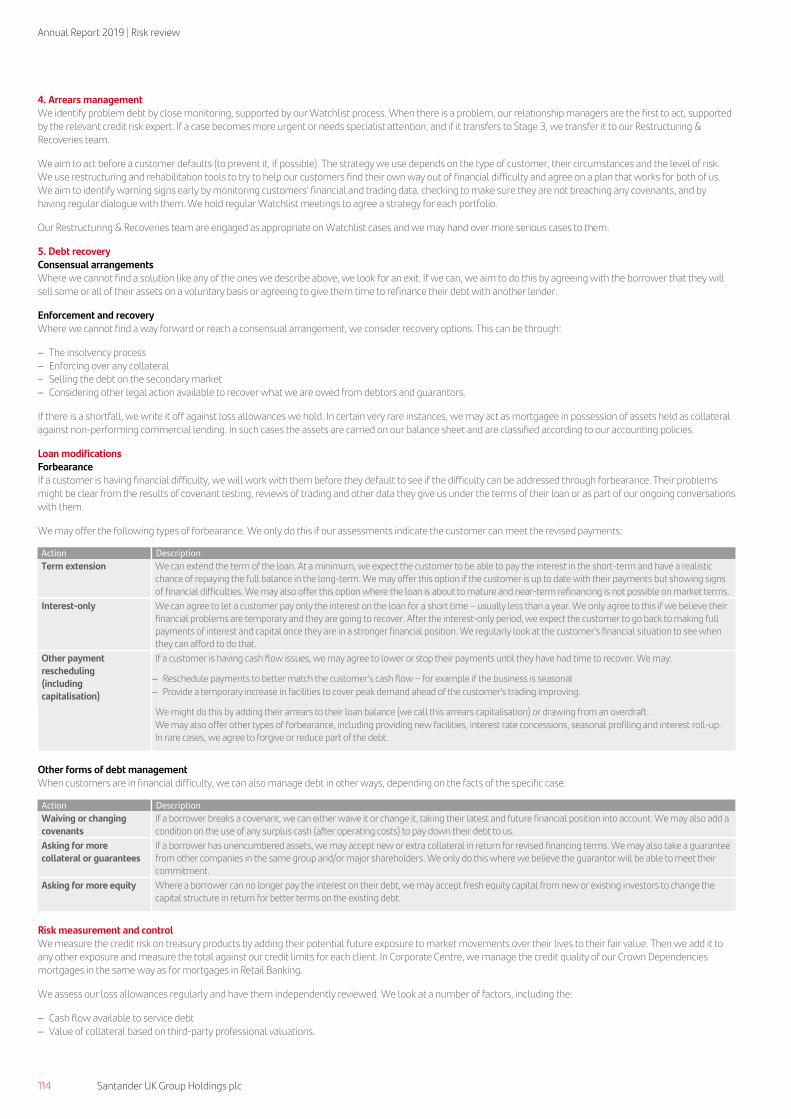
Annual Report 2019 | Risk review
114 Santander UK Group Holdings plc
4. Arrears management We identify problem debt by close monitoring, supported by our Watchlist process. When there is a problem, our relationship managers are the first to act, supported by the relevant credit risk expert. If a case becomes more urgent or needs specialist attention, and if it transfers to Stage 3, we transfer it to our Restructuring & Recoveries team.
We aim to act before a customer defaults (to prevent it, if possible). The strategy we use depends on the type of customer, their circumstances and the level of risk. We use restructuring and rehabilitation tools to try to help our customers find their own way out of financial difficulty and agree on a plan that works for both of us. We aim to identify warning signs early by monitoring customers’ financial and trading data, checking to make sure they are not breaching any covenants, and by having regular dialogue with them. We hold regular Watchlist meetings to agree a strategy for each portfolio.
Our Restructuring & Recoveries team are engaged as appropriate on Watchlist cases and we may hand over more serious cases to them.
5. Debt recovery Consensual arrangements Where we cannot find a solution like any of the ones we describe above, we look for an exit. If we can, we aim to do this by agreeing with the borrower that they will sell some or all of their assets on a voluntary basis or agreeing to give them time to refinance their debt with another lender.
Enforcement and recovery Where we cannot find a way forward or reach a consensual arrangement, we consider recovery options. This can be through:
− The insolvency process − Enforcing over any collateral − Selling the debt on the secondary market − Considering other legal action available to recover what we are owed from debtors and guarantors.
If there is a shortfall, we write it off against loss allowances we hold. In certain very rare instances, we may act as mortgagee in possession of assets held as collateral against non-performing commercial lending. In such cases the assets are carried on our balance sheet and are classified according to our accounting policies.
Loan modifications Forbearance If a customer is having financial difficulty, we will work with them before they default to see if the difficulty can be addressed through forbearance. Their problems might be clear from the results of covenant testing, reviews of trading and other data they give us under the terms of their loan or as part of our ongoing conversations with them.
We may offer the following types of forbearance. We only do this if our assessments indicate the customer can meet the revised payments:
Action Description
Term extension We can extend the term of the loan. At a minimum, we expect the customer to be able to pay the interest in the short-term and have a realistic chance of repaying the full balance in the long-term. We may offer this option if the customer is up to date with their payments but showing signs of financial difficulties. We may also offer this option where the loan is about to mature and near-term refinancing is not possible on market terms.
Interest-only We can agree to let a customer pay only the interest on the loan for a short time – usually less than a year. We only agree to this if we believe their financial problems are temporary and they are going to recover. After the interest-only period, we expect the customer to go back to making full payments of interest and capital once they are in a stronger financial position. We regularly look at the customer’s financial situation to see when they can afford to do that.
Other payment rescheduling (including capitalisation)
If a customer is having cash flow issues, we may agree to lower or stop their payments until they have had time to recover. We may:
− Reschedule payments to better match the customer’s cash flow – for example if the business is seasonal
− Provide a temporary increase in facilities to cover peak demand ahead of the customer’s trading improving.
We might do this by adding their arrears to their loan balance (we call this arrears capitalisation) or drawing from an overdraft.
We may also offer other types of forbearance, including providing new facilities, interest rate concessions, seasonal profiling and interest roll-up. In rare cases, we agree to forgive or reduce part of the debt.
Other forms of debt management When customers are in financial difficulty, we can also manage debt in other ways, depending on the facts of the specific case:
Action Description
Waiving or changing covenants
If a borrower breaks a covenant, we can either waive it or change it, taking their latest and future financial position into account. We may also add a condition on the use of any surplus cash (after operating costs) to pay down their debt to us.
Asking for more collateral or guarantees
If a borrower has unencumbered assets, we may accept new or extra collateral in return for revised financing terms. We may also take a guarantee from other companies in the same group and/or major shareholders. We only do this where we believe the guarantor will be able to meet their commitment.
Asking for more equity Where a borrower can no longer pay the interest on their debt, we may accept fresh equity capital from new or existing investors to change the capital structure in return for better terms on the existing debt.
Risk measurement and control We measure the credit risk on treasury products by adding their potential future exposure to market movements over their lives to their fair value. Then we add it to any other exposure and measure the total against our credit limits for each client. In Corporate Centre, we manage the credit quality of our Crown Dependencies mortgages in the same way as for mortgages in Retail Banking.
We assess our loss allowances regularly and have them independently reviewed. We look at a number of factors, including the:
− Cash flow available to service debt − Value of collateral based on third-party professional valuations.
Santander UK Group Holdings plc114
Annual Report 2019 | SectionAnnual Report 2019 | Risk review
Santander UK Group Holdings plc114

Santander UK Group Holdings plc 115
Strategic report Governance Risk review Financial review Financial statements Shareholder information
Credit risk
OTHER BUSINESS SEGMENTS – CREDIT RISK REVIEW
Movement in total exposures and the corresponding ECL The following tables show changes in total on and off-balance sheet exposures and ECL in the year. The footnotes to the Santander UK group level table on page 96 also apply to these tables.
Corporate & Commercial Banking
Stage 1 Stage 2 Stage 3 Total Exposures(1)
£m ECL £m
Exposures(1) £m
ECL £m
Exposures(1) £m
ECL £m
Exposures(1) £m
ECL £m
At 1 January 2019 21,333 37 1,226 32 276 113 22,835 182
Transfers from Stage 1 to Stage 2(3) (747) (3) 747 3 – – – –
Transfers from Stage 2 to Stage 1(3) 120 5 (120) (5) – – – –
Transfers to Stage 3(3) (33) – (92) (3) 125 3 – –
Transfers from Stage 3(3) – – 6 – (6) – – –
Transfers of financial instruments (660) 2 541 (5) 119 3 – –
Net ECL remeasurement on stage transfer(4) – (4) – 17 – 32 – 45
Change in economic scenarios(2) – 7 – 9 – – – 16
New lending and assets purchased(5) 5,129 4 350 6 2 1 5,481 11
Other(6) 1,293 4 63 (11) 49 29 1,405 22
Redemptions and repayments(7) (7,778) (9) (4) (7) (3) (9) (7,785) (25)
Assets written off(7) – – – – (81) (41) (81) (41)
At 31 December 2019 19,317 41 2,176 41 362 128 21,855 210
Net movement in the year (2,016) 4 950 9 86 15 (980) 28
ECL charge/(release) to the Income Statement 4 9 56 69
Less: ECL relating to derecognised income – – (4) (4)
Less: Recoveries net of collection costs (8) (8) (12) (28)
Income statement charge/(release) for the year (4) 1 40 37
Corporate & Investment Banking £m £m £m £m £m £m £m £m
At 1 January 2019 17,458 5 134 3 26 10 17,618 18
Transfers from Stage 1 to Stage 2 (3) (208) – 208 – – – – –
Transfers from Stage 2 to Stage 1((3) 41 – (41) – – – – –
Transfers to Stage 3(3) – – – – – – – –
Transfers from Stage 3(3) – – – – – – – –
Transfers of financial instruments (167) – 167 – – – – –
Net ECL remeasurement on stage transfer(4) – – – 37 – – – 37
Changes to model – – – – – – – –
New lending and assets purchased (5) 54 – – – – – 54 –
Other(6) 376 – 171 (1) (6) (1) 541 (2)
Redemptions and repayments(7) (4,676) – (76) (3) (5) – (4,757) (3)
Assets written off(7) – – – – – – – –
At 31 December 2019 13,045 5 396 36 15 9 13,456 50
Net movement in the year (4,413) – 262 33 (11) (1) (4,162) 32
ECL charge/(release) to the Income Statement – 33 (1) 32
Less: ECL relating to derecognised income – – – –
Less: Recoveries net of collection costs – (8) (2) (10)
Income statement charge/(release) for the year – 25 (3) 22
Corporate Centre £m £m £m £m £m £m £m £m
At 1 January 2019 74,541 5 133 3 16 5 74,690 13
Transfers from Stage 1 to Stage 2(3) (15) – 15 – – – – –
Transfers from Stage 2 to Stage 1(3) 7 – (7) – – – – –
Transfers to Stage 3(3) (3) – (4) – 7 – – –
Transfers from Stage 3(3) – – – – – – – –
Transfers of financial instruments (11) – 4 – 7 – – –
Net ECL remeasurement on stage transfer(4) – – – – – 2 – 2
Change in economic scenarios(2) – 1 – – – – – 1
Changes to model – – – – – – – –
New lending and assets purchased(5) (8) – – – – – – – –
Other(6) (145) (3) (8) – (1) 1 (154) (2)
Redemptions and repayments(7) – – – – – – – –
Assets written off(7) – – – – (4) (2) (4) (2)
At 31 December 2019 74,385 3 129 3 18 6 74,532 12
Net movement in the year (156) (2) (4) – 2 1 (158) (1)
ECL charge/(release) to the Income Statement (2) – 3 1
Less: ECL relating to derecognised income – – – –
Less: Recoveries net of collection costs – – – –
Income statement charge/(release) for the year (2) – 3 1
Strategic Report Governance Risk review Financial review Financial statements Shareholder information
Credit risk
Santander UK Group Holdings plc 115Santander UK Group Holdings plc 115

Annual Report 2019 | Risk review
116 Santander UK Group Holdings plc
Corporate & Commercial Banking
Stage 1 Stage 2 Stage 3 Total Exposures(1)
£m ECL £m
Exposures(1)
£m ECL £m
Exposures(1) £m
ECL £m
Exposures(1)
£m ECL £m
At 1 January 2018 22,417 43 866 33 388 173 23,671 249
Transfers from Stage 1 to Stage 2(3) (670) (3) 670 3 – – – –
Transfers from Stage 2 to Stage 1(3) 200 8 (200) (8) – – – –
Transfers to Stage 3(3) (41) – (31) (1) 72 1 – –
Transfers from Stage 3(3) 2 1 2 1 (4) (2) – –
Transfers of financial instruments (509) 6 441 (5) 68 (1) – –
Net ECL remeasurement on stage transfer(4) – (7) – 10 – 18 – 21
Change in economic scenarios(2) – 5 – (3) – – – 2
New lending and assets purchased(5) 9,115 12 281 5 3 1 9,399 18
Other(6) 1,642 (5) (37) (4) 23 33 1,628 24
Redemptions and repayments(7) (11,332) (17) (325) (4) (101) (14) (11,758) (35)
Assets written off(7) – – – – (105) (97) (105) (97)
At 31 December 2018 21,333 37 1,226 32 276 113 22,835 182
Net movement in the year (1,084) (6) 360 (1) (112) (60) (836) (67)
ECL charge/(release) to the Income Statement (6) (1) 37 30
Less: Recoveries net of collection costs – – (7) (7)
Income statement charge/(release) for the year (6) (1) 30 23
Corporate & Investment Banking £m £m £m £m £m £m £m £m
At 1 January 2018 20,503 16 109 – 372 242 20,984 258
Transfers from Stage 1 to Stage 2(3) (2) – 2 – – – – –
Changes to model – – – – – (10) – (10)
New lending and assets purchased(5) 14,799 4 133 3 – – 14,932 7
Other(6) (1,876) (1) 83 1 103 76 (1,690) 76
Redemptions and repayments(7) (15,966) (14) (193) (1) (150) (46) (16,309) (61)
Assets written off(7) – – – – (299) (252) (299) (252)
At 31 December 2018 17,458 5 134 3 26 10 17,618 18
Net movement in the year (3,045) (11) 25 3 (346) (232) (3,366) (240)
ECL charge/(release) to the Income Statement (11) 3 20 12
Less: Recoveries net of collection costs – – 2 2
Income statement charge/(release) for the year (11) 3 22 14
Corporate Centre £m £m £m £m £m £m £m £m
At 1 January 2018 63,236 7 250 4 20 8 63,506 19
Transfers from Stage 1 to Stage 2(3) (111) (1) 111 1 – – – –
Transfers from Stage 2 to Stage 1(3) 133 3 (133) (3) – – – –
Transfers to Stage 3(3) – – (4) – 4 – – –
Transfers from Stage 3(3) – – 3 1 (3) (1) – –
Transfers of financial instruments 22 2 (23) (1) 1 (1) – –
Net ECL remeasurement on stage transfer(4) – (2) – – – 1 – (1)
Change in economic scenarios(2) – 1 – – – – – 1
Changes to model – – – – – – – –
New lending and assets purchased(5) (8) – – – – – – – –
Other(6) 11,283 (3) (94) – (2) – 11,187 (3)
Redemptions and repayments(7) – – – – – – – –
Assets written off(7) – – – – (3) (3) (3) (3)
At 31 December 2018 74,541 5 133 3 16 5 74,690 13
Net movement in the year 11,305 (2) (117) (1) (4) (3) 11,184 (6)
ECL charge/(release) to the Income Statement (2) (1) – (3)
Less: Recoveries net of collection costs – – (4) (4)
Income statement charge/(release) for the year (2) (1) (4) (7)
Santander UK Group Holdings plc116
Annual Report 2019 | SectionAnnual Report 2019 | Risk review
Santander UK Group Holdings plc116

Santander UK Group Holdings plc 117
Strategic report Governance Risk review Financial review Financial statements Shareholder information
Credit risk
Committed exposures Credit risk arises on both asset balances and off–balance sheet transactions such as guarantees. As a result, committed exposures are typically higher than asset balances. However, committed exposures can be smaller than the asset balances on the balance sheet due to netting. We show Sovereigns and Supranationals net of short positions and Large Corporate reverse repurchase agreement exposures are shown net of repurchase agreement liabilities and include OTC derivatives. The derivative and other treasury product exposures (which are classified as ‘Financial Institutions’) shown are also typically lower than the asset balances. This is because we show our overall risk exposure which takes into account our procedures to mitigate credit risk. The balances on our balance sheet only reflect the more restrictive netting permitted by IAS 32.
Rating distribution These tables show our credit risk exposure according to our internal rating scale (see ‘Credit quality’ in the ‘Santander UK group level – credit risk review’ section) for each portfolio. On this scale, the higher the rating, the better the quality of the counterparty.
Santander UK risk grade
2019 9
£m 8
£m 7
£m 6
£m 5
£m 4
£m 3 to 1
£m Other(1)
£m Total
£m
Corporate & Commercial Banking
SME and mid corporate – 25 790 1,914 4,414 3,348 946 32 11,469
Commercial Real Estate – – – 426 3,708 1,363 94 – 5,591
Social Housing 1,231 3,655 26 – – 2 4 – 4,918
1,231 3,680 816 2,340 8,122 4,713 1,044 32 21,978
Corporate & Investment Banking
Large Corporate 281 2,356 4,419 4,558 842 75 115 – 12,646
Financial Institutions 383 822 718 11 – – – – 1,934
664 3,178 5,137 4,569 842 75 115 – 14,580
Corporate Centre
Sovereign and Supranational 37,359 2,255 – – – – – – 39,614
Structured Products 1,166 981 396 29 – – – – 2,572
Social Housing 934 3,036 90 – – – – – 4,060
Financial Institutions 542 246 43 25 1 – – – 857
Legacy Portfolios in run-off(2) – – – 130 27 98 140 303 698
Crown Dependencies – – – – – – 1 288 289
40,001 6,518 529 184 28 98 141 591 48,090
Total 41,896 13,376 6,482 7,093 8,992 4,886 1,300 623 84,648
Of which:
Stage 1 41,896 13,376 6,456 6,901 8,263 3,586 466 608 81,552
Stage 2 – – 26 192 729 1,300 439 15 2,701
Stage 3 – – – – – – 395 – 395
2018
Corporate & Commercial Banking
SME and mid corporate – – 66 1,745 5,749 3,426 886 36 11,908
Commercial Real Estate – – – 302 4,564 1,846 31 – 6,743
Social Housing 680 3,899 138 – – 2 24 – 4,743
680 3,899 204 2,047 10,313 5,274 941 36 23,394
Corporate & Investment Banking
Large Corporate 12 3,187 5,535 6,361 888 3 78 – 16,064
Financial Institutions 500 1,047 1,443 55 – – – – 3,045
512 4,234 6,978 6,416 888 3 78 – 19,109
Corporate Centre
Sovereign and Supranational 34,905 3,898 – 1 – – – – 38,804
Structured Products 2,436 2,062 318 24 – – – – 4,840
Social Housing 1,377 2,847 76 43 – – – – 4,343
Financial Institutions 356 345 47 21 – – – – 769
Legacy Portfolios in run-off(2) – – – 203 35 137 126 357 858
Derivatives – 147 – – – – – – 147
Crown Dependencies 14 39 124 77 14 8 7 – 283
39,088 9,338 565 369 49 145 133 357 50,044
Total 40,280 17,471 7,747 8,832 11,250 5,422 1,152 393 92,547
Of which:
Stage 1 40,280 17,471 7,747 8,759 10,802 4,780 527 377 90,743
Stage 2 – – – 73 448 635 318 16 1,490
Stage 3 – – – – – 7 307 – 314
(1) Smaller exposures mainly in the commercial mortgage portfolio. We use scorecards for them, instead of a rating model. (2) Commercial mortgages and residual structured and asset finance loans (shipping, aviation, and structured finance).
Santander UK Group Holdings plc 117
Strategic Report Governance Risk review Financial review Financial statements Shareholder information
Credit risk
117Santander UK Group Holdings plc

Annual Report 2019 | Risk review
118 Santander UK Group Holdings plc
Geographical distribution
We typically classify geographical location according to the counterparty’s country of domicile unless a full risk transfer guarantee is in place, in which case we use the guarantor’s country of domicile instead.
2019 2018
UK £m
Europe £m
US £m
Rest of World
£m Total
£m
UK £m
Europe £m
US £m
Rest of World
£m Total
£m
Corporate & Commercial Banking
SME and mid corporate 11,384 84 – 1 11,469 11,833 74 – 1 11,908
Commercial Real Estate 5,591 – – – 5,591 6,743 – – – 6,743
Social Housing 4,918 – – – 4,918 4,743 – – – 4,743
21,893 84 – 1 21,978 23,319 74 – 1 23,394
Corporate & Investment Banking
Large Corporate 10,665 1,922 2 57 12,646 13,080 2,752 124 108 16,064
Financial Institutions 611 849 169 305 1,934 891 1,528 187 439 3,045
11,276 2,771 171 362 14,580 19,971 4,280 311 547 19,109
Corporate Centre
Sovereign and Supranational 33,202 1,549 855 4,008 39,614 30,587 1,802 965 5,450 38,804
Structured Products 1,710 811 – 51 2,572 2,576 1,142 – 1,122 4,840
Social Housing 4,060 – – – 4,060 4,343 – – – 4,343
Financial Institutions 329 335 157 36 857 346 358 11 54 769
Legacy Portfolios in run–off 587 – – 111 698 744 – – 114 858
Derivatives – – – – – – – 147 – 147
Crown Dependencies – – – 289 289 – – – 283 283
39,888 2,695 1,012 4,495 48,090 38,596 3,302 1,123 7,023 50,044
2019 compared to 2018 (unaudited) In Corporate & Commercial Banking, we saw a 6% reduction in committed exposure, mainly driven by active management of our Commercial Real Estate (CRE) portfolio. Our CRE portfolio decreased by 17% as we continue to manage our exposure in line with proactive risk management policies.
In CIB, committed exposures decreased by 24% mainly due to reductions in our Large Corporate portfolio, driven by facilities that were re-booked in Banco Santander London Branch. Credit quality was stable.
In Corporate Centre, committed exposures decreased by 4% mainly driven by our Structured Products portfolio due to sale of assets following an ALCO strategy change in H219. Sovereign and Supranational exposures decreased by 2% as part of normal liquid asset portfolio management. The portfolio profile remained short-term, reflecting the purpose of the holdings. Legacy Portfolios in run–off reduced by 19%. Social Housing exposures also reduced.
Santander UK Group Holdings plc118
Annual Report 2019 | SectionAnnual Report 2019 | Risk review
Santander UK Group Holdings plc118

Santander UK Group Holdings plc 119
Strategic report Governance Risk review Financial review Financial statements Shareholder information
Credit risk
Credit risk mitigation
2019
Gross Exposure
Stage 3 £m
Collateral
Stage 3 £m
Net Exposure
Stage 3 £m
Corporate & Commercial Banking
SME and mid corporate 279 51 228
Commercial Real Estate 83 56 27
362 107 255
Corporate & Investment Banking
Large Corporate 15 – 15
15 – 15
Corporate Centre
Legacy Portfolios in run–off 17 11 6
Crown Dependencies 1 – 1
18 11 7
2018
Corporate & Commercial Banking
SME and mid corporate 253 55 198
Commercial Real Estate 23 14 9
276 69 207
Corporate & Investment Banking
Large Corporate 26 – 26
26 – 26
Corporate Centre
Legacy Portfolios in run–off 16 9 6
Crown Dependencies – – –
16 9 6
In CIB, the top 20 clients with derivative exposure made up 90% (2018: 85%) of our total derivative exposure. The weighted–average credit rating of these top 20 clients was 6.1 (2018: 7.1).
Santander UK Group Holdings plc 119
Strategic Report Governance Risk review Financial review Financial statements Shareholder information
Credit risk
119Santander UK Group Holdings plc

Annual Report 2019 | Risk review
120 Santander UK Group Holdings plc
Credit performance We monitor exposures that show potentially higher risk characteristics using our Watchlist process (described in ‘Monitoring’ in the ‘Credit risk management’ section). The table below shows the exposures we monitor, and those we classify as Stage 3 by portfolio at 31 December 2019 and 2018.
2019
Committed exposure
Loss allowances
£m
Watchlist
Fully performing
£m
Enhanced monitoring
£m
Proactive management
£m Stage 3
£m Total(1)
£m
Corporate & Commercial Banking
SME and mid corporate 9,864 1,056 270 279 11,469 164
Commercial Real Estate 5,338 89 81 83 5,591 46
Social Housing 4,828 90 – – 4,918 –
20,030 1,235 351 362 21,978 210
Corporate & Investment Banking
Large Corporate 11,834 252 545 15 12,646 50
Financial Institutions 1,924 – 10 – 1,934 –
13,758 252 555 15 14,580 50
Corporate Centre
Sovereign and Supranational 39,614 – – – 39,614 –
Structured Products 2,572 – – – 2,572 –
Social Housing 4,047 13 – – 4,060 –
Financial Institutions 854 – 3 – 857 –
Legacy Portfolios in run–off 656 17 8 17 698 12
Derivatives – – – – – –
Crown Dependencies 288 – – 1 289 –
48,031 30 11 18 48,090 12
Total loss allowances 272
2018
Corporate & Commercial Banking
SME and mid corporate 10,350 972 333 253 11,908 160
Commercial Real Estate 6,426 247 47 23 6,743 22
Social Housing 4,626 117 – – 4,743 –
21,402 1,336 380 276 23,394 182
Corporate & Investment Banking
Large Corporate 15,304 548 186 26 16,064 18
Financial Institutions 3,045 – – – 3,045 –
18,349 548 186 26 19,109 18
Corporate Centre
Sovereign and Supranational 38,804 – – – 38,804 –
Structured Products 4,840 – – – 4,840 –
Social Housing 4,321 22 – – 4,343 –
Financial Institutions 769 – – – 769 –
Legacy Portfolios in run–off 809 26 7 16 858 12
Derivatives 147 – – – 147 –
Crown Dependencies 283 – – – 283 1
49,973 48 7 16 50,044 13
Total loss allowances 213
(1) Includes committed facilities and derivatives. We define ‘Enhanced Monitoring’ and ‘Proactive Management’ in the ‘Monitoring‘ section.
2019 compared to 2018 (unaudited) In Corporate & Commercial Banking, Stage 3 exposures increased in the 'SME and mid Corporate' portfolio and our 'CRE' portfolio, largely due to underlying structural changes impacting some sectors. Exposures subject to enhanced monitoring were broadly unchanged, with increases in the SME and mid Corporate portfolio offset by reductions in the CRE and Social Housing portfolios.
In CIB, Large Corporate exposures subject to enhanced monitoring reduced. Exposures subject to proactive management increased, due to the downgrade of a number of cases that were experiencing performance issues. Stage 3 exposure decreased following a reduction in exposure of a single deal. Financial Institutions exposures subject to enhanced monitoring were unchanged. Exposures subject to proactive management increased due to the downgrade of a single case.
In Corporate Centre, exposures subject to enhanced monitoring and proactive management reduced slightly as the related portfolios continued to be managed for value.
Santander UK Group Holdings plc120
Annual Report 2019 | SectionAnnual Report 2019 | Risk review
Santander UK Group Holdings plc120

Santander UK Group Holdings plc 121
Strategic report Governance Risk review Financial review Financial statements Shareholder information
Credit risk
Loan modifications
The following table sets out the financial assets that were forborne while they had a loss allowance measured at lifetime ECL.
2019 2018
Corporate & Commercial
Banking £m
Corporate & Investment
Banking £m
Corporate Centre
£m
Corporate & Commercial
Banking £m
Corporate & Investment
Banking £m
Corporate Centre
£m
Financial assets modified in the year:
– Amortised cost before modification 135 – 10 104 – 2
– Net modification loss 8 – 1 10 – –
Financial assets modified since initial recognition:
– Gross carrying amount of financial assets for which the loss allowance changed to 12m ECL in the year
34 – 2 8 7 4
Forbearance
We only make forbearance arrangements for lending to customers. The balances at 31 December 2019 and 2018, analysed by their staging at the year–end and the forbearance we applied, were:
2019 2018
Corporate & Commercial
Banking £m
Corporate & Investment
Banking £m
Corporate Centre
£m
Corporate & Commercial
Banking £m
Corporate & Investment
Banking £m
Corporate Centre
£m
Stock:(1)
– Term extension 60 42 – 67 42 –
– Interest–only 110 – 13 112 – 8
– Other payment rescheduling 192 15 9 163 26 10
362 57 22 342 68 18
Of which:
– Stage 1 57 42 1 43 – 3
– Stage 2 75 – 11 78 42 8
– Stage 3 230 15 10 221 26 7
362 57 22 342 68 18
Proportion of portfolio 1.6% 0.4% 3.2% 1.5% 0.4% 2.1%
(1) We base forbearance type on the first forbearance we applied. Tables only show accounts open at the year-end. Amounts are drawn balances and include off balance sheet balances.
2019 compared to 2018 (unaudited) In Corporate & Commercial Banking, the cumulative forbearance stock increased slightly. Forbearance stock reduced in CIB, following a reduction in exposure for the one forborne customer in Stage 3. At 31 December 2019, there were only two forborne cases (2018: two cases) in CIB.
Santander UK Group Holdings plc 121
Strategic Report Governance Risk review Financial review Financial statements Shareholder information
Credit risk
121Santander UK Group Holdings plc

Annual Report 2019 | Risk review
122 Santander UK Group Holdings plc
PORTFOLIOS OF PARTICULAR INTEREST (UNAUDITED)
Introduction Some types of lending have higher risk and others stand out for other reasons. We give more detail below on two areas of particular interest.
Portfolio Description
Commercial Real Estate The CRE market experienced a challenging environment in the immediate years after the last financial crisis and has previously seen regular cyclical downturns. For those reasons, this is a portfolio of particular interest. We manage and report our Commercial Real Estate portfolio in Corporate & Commercial Banking and Retail Banking.
Social Housing The Social Housing sector in the UK is critical in ensuring the supply of affordable housing across the country. Housing associations play a prominent role in addressing the UK’s shortage of housing across all tenures. The sector benefits from a zero–loss default history aided by its regulated nature. This is a portfolio of particular interest as we hold a significant position in the market.
We see continued investment in this sector as a direct way to support the UK and, indirectly, the wider community initiatives undertaken by our customers. We manage and report our Social Housing portfolio in Corporate & Commercial Banking, except for older loans that do not fit our current business strategy, which we manage and report in Corporate Centre. We provide detailed disclosures of our Social Housing portfolios in in the sections above. We provide a summary of our total Social Housing portfolio below, to give a Santander UK–wide view.
Commercial Real Estate Credit performance The table below shows the main CRE credit performance metrics at 31 December 2019 and 2018.
Customer loans(1)
£m Stage 3(2)
£m
Stage 3 Ratio(3)
%
Gross write–offs
£m
Total loss allowance
£m
2019 5,350 89 1.55 8 49
2018 6,459 29 0.41 23 26
(1) CRE drawn loans in the business banking portfolio of our Retail Banking segment of £241m (2018: £257m) and in the CRE portfolio of our Corporate & Commercial Banking segment of £5,109m (2018: £6,202m). (2) We define Stage 3 in the ‘Credit risk management’ section. (3) Total Stage 3 exposure as a percentage of customer loans plus undrawn Stage 3 exposures. The way we calculate the Stage 3 ratio was changed from 1 January 2019, and 2018 restated for consistency. See ‘Key metrics’ in the ‘Credit risk –
Santander UK group level’ section.
LTV analysis The table below shows the LTV distribution for our CRE total stock and Stage 3 stock (based on the drawn balance and our latest estimate of the property’s current value) of the portfolio at 31 December 2019 and 2018.
2019 2018
Stock Stage 3 Stock Stage 3
LTV Total
£m ECL £m
Total £m
ECL £m
Total £m
ECL £m
Total £m
ECL £m
Up to 50% 3,133 17 15 8 3,663 5 3 –
>50–70% 1,557 24 63 17 2,039 4 4 –
>70–100% 29 1 1 – 47 2 1 1
>100% 9 1 3 1 18 7 16 7
Standardised portfolio(1) 617 6 7 3 631 7 5 2
Total with collateral 5,345 49 89 29 6,398 25 29 10
Development loans 5 – – – 61 1 – –
5,350 49 89 29 6,459 26 29 10
(1) Smaller value transactions, mainly commercial mortgages.
Santander UK Group Holdings plc122
Annual Report 2019 | SectionAnnual Report 2019 | Risk review
Santander UK Group Holdings plc122

Santander UK Group Holdings plc 123
Strategic report Governance Risk review Financial review Financial statements Shareholder information
Credit risk
Sector analysis
Sector
2019 2018
£m % £m %
Office 1,262 24 1,556 24
Retail 850 16 1,004 16
Industrial 699 13 888 14
Residential 757 14 927 14
Mixed use 759 14 932 14
Student accommodation 85 2 123 2
Hotels and leisure 268 5 309 5
Other 53 1 89 1
Standardised portfolio(1) 617 11 631 10
5,350 100 6,459 100
(1) Smaller value transactions, mainly commercial mortgages.
The CRE portfolio is well diversified across sectors, with no significant regional or single name concentration, representing 24% (2018: 27%) of our total lending to corporates and 3% (2018: 3%) of total customer loans. At 31 December 2019, the LTV profile of the portfolio remained conservative with £4,690m (2018: £5,702m) of the non–standardised portfolio at or below 70% LTV.
Refinancing risk
At 31 December 2019, CRE loans of £1,157m (2018: £1,144m) were due to mature within 12 months. Of these, £2m or 0.2% (2018: £30m or 3%) had an LTV ratio higher than is acceptable under our current credit policy, all of which was reported as Stage 3 (2018: £5m).
2019 compared to 2018
In our CRE portfolio, customer loans decreased by £1.1bn, as we focus on risk-weighted returns to manage our exposure in line with proactive risk management policies. In 2019, we maintained a prudent lending approach, with all new business (2018: 70%) written at or below 60% LTV. The weighted average LTV on the CRE portfolio was 45% (2018: 47%).
Exposures subject to enhanced monitoring decreased to £100m (2018: £247m). Exposures subject to proactive management increased by 70% to £80m (2018: £47m) largely driven by our exposure to the retail sector. Stage 3 exposures increased to £89m (2018: £23m) as a result of deterioration in the retail sub-sector.
Social Housing
We manage and report our Social Housing portfolio in Corporate & Commercial Banking, except for older Social Housing loans that do not fit our current business strategy, which we manage and report in Corporate Centre. We provide detailed disclosures of our Social Housing portfolios in the sections above. At 31 December 2019 and 2018, our total Social Housing exposure was:
2019 2018
On-balance sheet
£m
Total exposure
£m
Total loss allowances
£m
On-balance sheet
£m
Total exposure
£m
Total loss allowances
£m
Corporate & Commercial Banking 2,794 4,918 – 2,844 4,743 –
Corporate Centre 3,585 4,060 – 3,780 4,343 –
6,379 8,978 – 6,624 9,086 –
Santander UK Group Holdings plc 123
Strategic Report Governance Risk review Financial review Financial statements Shareholder information
Credit risk
123Santander UK Group Holdings plc

Annual Report 2019 | Risk review
124 Santander UK Group Holdings plc
Market risk
Overview (unaudited) Market risk comprises banking market risk and trading market risk.
Banking market risk is the risk of loss of income or economic value due to changes to interest rates in the banking book or to changes in exchange rates, where such changes would affect our net worth through an adjustment to revenues, assets, liabilities and off-balance sheet exposures in the banking book.
Trading market risk is the risk of losses in trading positions, both on and off-balance sheet, due to movements in market prices or other external factors.
In this section, we set out which of our assets and liabilities are exposed to banking and trading market risk. Then we explain how we manage these risks and discuss our key market risk metrics. We also provide some insight into the process of replacing LIBOR and other Interbank Offered Rates.
Key metrics (unaudited) Santander UK plc group Net Interest Margin (NIM) sensitivity to +50bps was £99m and to -50bps was £56m (2018: £207m and £(23)m)
SFS NIM sensitivity to +50bps was £19m and to -50bps was £(14)m
Santander UK plc group Economic Value of Equity (EVE) sensitivity to +50bps was £10m and to -50bps was £(88)m (2018: £162m and £(124)m)
SFS EVE sensitivity to +50bps was £23m and to -50bps was £(22)m
BALANCE SHEET ALLOCATION BY MARKET RISK CLASSIFICATION
We manage our assets and liabilities exposed to market risk as either banking or trading market risk. We classify all our assets and liabilities exposed to market risk as banking market risk, except for certain derivatives that we manage on a trading intent basis. For accounting purposes, we classify all derivatives as held for trading unless they are designated as being in a hedging relationship. The derivatives that we manage on a trading intent basis are a small proportion of the derivatives that we classify as held for trading for accounting purposes. For more, see Note 12 to the Consolidated Financial Statements.
BANKING MARKET RISK
OUR KEY BANKING MARKET RISKS (UNAUDITED)
Banking market risk mainly comes from providing banking products and services to our customers, as well as our structural balance sheet exposures. It arises in all our business segments.
In Retail Banking and Corporate & Commercial Banking, it is a by-product of us writing customer business and we transfer most of these risks to Corporate Centre to manage. The only types of banking market risk that we keep in Retail Banking and Corporate & Commercial Banking are short-term mismatches due to forecasting variances in prepayment and launch risk. This is where customers repay their loans earlier than their expected maturity date or do not take the expected volume of new products.
In Corporate & Investment Banking, it arises from short-term markets and lending to corporates, which we also transfer to Corporate Centre to manage. Corporate Centre also manages our structural balance sheet exposures, such as foreign exchange and Income Statement volatility risk.
Our key banking market risks are:
Key risks Description
Interest rate risk Yield curve risk: comes from timing mismatches in repricing fixed and variable rate assets, liabilities and off-balance sheet instruments. It also comes from investing non-rate sensitive liabilities in interest-earning assets. We mainly measure yield curve risk with NIM and EVE sensitivities, which are measures that are commonly used in the financial services industry. We also use other risk measures, like Value at Risk (VaR) which is a statistical measure based on a historical simulation of events, and stress testing. Our NIM and EVE sensitivities cover all the material yield curve risk in our banking book balance sheet.
Basis risk: comes from pricing assets using a different rate index to the liabilities that fund them. We are exposed to basis risks associated with Base Rate, reserve rate linked assets we deposit with central banks, the Sterling Overnight Index Average (SONIA) rate, and LIBOR rates of different terms. As LIBOR and other Interbank Offered Rates are in the process of being replaced, we continue to engage with stakeholders across the business to ensure we capture and understand new risks as they emerge.
Spread risks Spread risk arises when the value of assets or liabilities which are accounted for at fair value (either through Other Comprehensive Income or though Profit and Loss) are affected by changes in the spread. We measure these spreads as the difference between the discount rate we use to value the asset or liability, and an underlying interest rate curve.
Spread risks can be split into Swap Spread (where the instrument has been issued by a Sovereign counterparty) and Credit Spread (where the instrument has been issued by for example a corporate or bank counterparty). It principally arises in the bond portfolios we hold for liquidity purposes. We measure spread risk with sensitivities, stress tests and VaR measures.
Foreign exchange risk Our non-trading businesses operate mainly in sterling markets, so we do not create significant foreign exchange exposures. The only exception to this is money we raise in foreign currencies. For more on this, see ‘Wholesale funding’ in the ‘Liquidity risk’ section.
Income statement
volatility risk
We measure most of the assets and liabilities in our banking book balance sheet at amortised cost. We sometimes manage their risk profile by using derivatives. As all derivatives are accounted for at fair value, the mismatch in their accounting treatment can lead to volatility in our Income Statement. This happens even if the derivative is an economic hedge of the asset or liability.
Santander UK Group Holdings plc124
Annual Report 2019 | SectionAnnual Report 2019 | Risk review
Santander UK Group Holdings plc124

Santander UK Group Holdings plc 125
Strategic report Governance Risk review Financial review Financial statements Shareholder information
Market risk
BANKING MARKET RISK MANAGEMENT
Risk appetite
Our framework for dealing with market risk is part of our overall Risk Framework. The banking market risk framework sets out our high-level arrangements and standards to manage, control and oversee banking market risk. Our Risk Appetite sets the controls, risk limits and key risk metrics for banking market risk. We articulate risk appetite by the income and value sensitivity limits we set in our Risk Appetite, at both Santander UK and Banco Santander group levels.
Risk measurement (unaudited) For banking market risk, we mainly measure our exposures with NIM and EVE sensitivity analysis. We support this with VaR risk measures and stress testing. We also monitor our interest rate repricing gap.
NIM and EVE sensitivities
The calculations for NIM and EVE sensitivities involve many assumptions, including expected customer behaviour (such as early repayment of loans) and how interest rates may move. These assumptions are a key part of our overall control framework, so we update and review them regularly.
Our NIM and EVE sensitivities include the interest rate risk from all our banking book positions. Our banking book positions generate almost all our reported net interest income.
NIM sensitivity
− NIM sensitivity is an income-based measure we use to forecast the changes to interest income and interest expense in different scenarios. It gives us a combined impact on net interest income over a given period – usually 12 or 36 months.
− We calculate NIM sensitivity by simulating the NIM using two yield curves. The difference between the two NIM totals is the NIM sensitivity.
− Our main model assumptions are that:
− The balance sheet is dynamic. This means that it includes the run-off of current assets and liabilities as well as retained and new business
− We use a behavioural balance sheet rather than contractual one. This means that we adjust balances for behavioural or assumed profile. We do this with most retail products whose behavioural maturity is different to the contractual maturity. This is usually because customers are exercising the option to withdraw or prepay early, or there is no contractual maturity.
EVE sensitivity
− We calculate EVE as the change in the net present value of all the interest rate sensitive items in the banking book balance sheet for a defined set of instantaneous parallel and non-parallel shifts in the yield curve.
− We use a static balance sheet. This means that all balance sheet items run-off according to their contractual, behavioural or assumed run-off behaviour (whichever is appropriate), and there is no retained or new business.
The limitations of sensitivities
We use sensitivities to measure the impact of standard, instantaneous, parallel shifts in relevant yield curves. The advantage of using standard parallel shifts is they generally give us a constant measure of the size of our market risk exposure, with a simple and consistent stress. This compares to specific scenarios like ‘flat rates’. The magnitude of flat rates depends on the shape of the current curve and the shift required to reach the flat rate scenario.
There is one exception to the relative simplicity of parallel shifts. In order to limit negative interest rates, the yield curve may be ‘floored’. Using material parallel shocks does not always seem realistic, or it might not necessarily test the scenarios that have the most impact on us. So we run non-parallel stress tests too, to calculate the impact of some plausible non-parallel scenarios, and over various time periods for income stresses (usually one or three years).
VaR
VaR
− VaR indicates the losses that we might suffer because of unfavourable changes in the markets under normal (non-stressed) market conditions.
− We run a historical simulation using the past two years of daily price moves, at a 99% confidence level, to find how much we might lose – the Value at Risk.
− For any given day’s position, we expect to suffer losses greater than the VaR estimate 1% of the time – once every 100 trading days, or two to three times a year.
− This gives us a consistent way of assessing risk for all relevant market risk factors in our portfolios.
The limitations of VaR
Whilst VaR is a useful and important market standard measure of risk, it does have some limitations. These include:
− VaR assumes what happened in the past is a reliable way to predict what will happen in the future. This may not always be the case − VaR is based on positions at the end of the business day so it doesn’t include intra-day positions − VaR does not predict how big the loss could be on the 1% of trading days that it is greater than the VaR – Using a time horizon of one day means VaR does not tell us everything about exposures that we cannot liquidate or hedge within a day, or products with infrequent
pricing.
Back-testing – comparing VaR estimates with reality
To check that the way we estimate VaR is reasonable, we back-test our VaR by comparing it against both actual and hypothetical profits and losses, using a one-day time horizon. Back-testing allows us to identify exceptions – times when the predictions were out of line with what happened. We can then look for trends in these exceptions, which can help us decide whether we need to recalibrate our VaR model.
Other ways of measuring risk
As well as using sensitivities and stress tests, we can measure banking market risk using net notional positions. This can give us a simple expression of our exposure, although we generally need to combine it with other risk measures to cover all aspects of a risk profile, such as projected changes over time.
Other metrics we can use include Earnings at Risk (EaR). Although VaR can be useful as it captures changes in economic values, as we describe above, VaR will not reflect the actual Income Statement impact of most of our banking book positions. This is because we account for them at amortised cost rather than fair value. EaR is like VaR but captures changes in income rather than value. We use this approach mainly to generate a one-year EaR measure to assess Basis risk.
Santander UK Group Holdings plc 125
Strategic Report Governance Risk review Financial review Financial statements Shareholder information
Market risk
125Santander UK Group Holdings plc
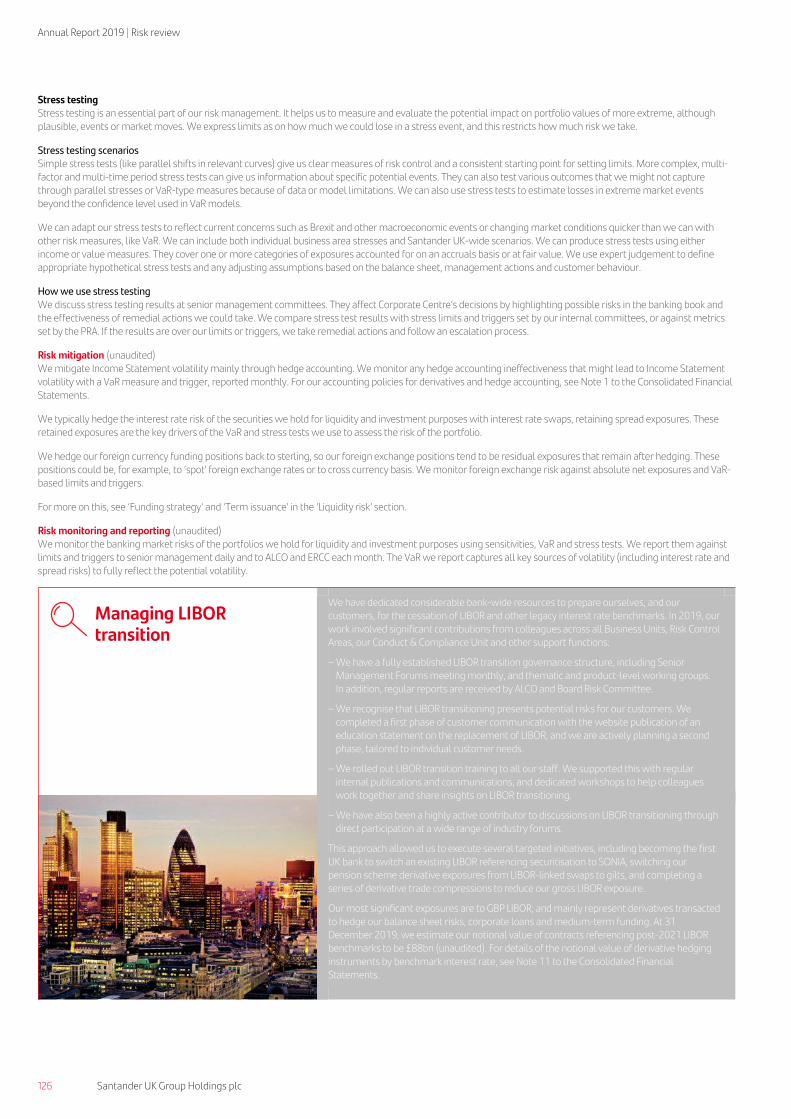
Annual Report 2019 | Risk review
126 Santander UK Group Holdings plc
Stress testing
Stress testing is an essential part of our risk management. It helps us to measure and evaluate the potential impact on portfolio values of more extreme, although plausible, events or market moves. We express limits as on how much we could lose in a stress event, and this restricts how much risk we take.
Stress testing scenarios Simple stress tests (like parallel shifts in relevant curves) give us clear measures of risk control and a consistent starting point for setting limits. More complex, multi-factor and multi-time period stress tests can give us information about specific potential events. They can also test various outcomes that we might not capture through parallel stresses or VaR-type measures because of data or model limitations. We can also use stress tests to estimate losses in extreme market events beyond the confidence level used in VaR models.
We can adapt our stress tests to reflect current concerns such as Brexit and other macroeconomic events or changing market conditions quicker than we can with other risk measures, like VaR. We can include both individual business area stresses and Santander UK-wide scenarios. We can produce stress tests using either income or value measures. They cover one or more categories of exposures accounted for on an accruals basis or at fair value. We use expert judgement to define appropriate hypothetical stress tests and any adjusting assumptions based on the balance sheet, management actions and customer behaviour.
How we use stress testing We discuss stress testing results at senior management committees. They affect Corporate Centre’s decisions by highlighting possible risks in the banking book and the effectiveness of remedial actions we could take. We compare stress test results with stress limits and triggers set by our internal committees, or against metrics set by the PRA. If the results are over our limits or triggers, we take remedial actions and follow an escalation process.
Risk mitigation (unaudited) We mitigate Income Statement volatility mainly through hedge accounting. We monitor any hedge accounting ineffectiveness that might lead to Income Statement volatility with a VaR measure and trigger, reported monthly. For our accounting policies for derivatives and hedge accounting, see Note 1 to the Consolidated Financial Statements.
We typically hedge the interest rate risk of the securities we hold for liquidity and investment purposes with interest rate swaps, retaining spread exposures. These retained exposures are the key drivers of the VaR and stress tests we use to assess the risk of the portfolio.
We hedge our foreign currency funding positions back to sterling, so our foreign exchange positions tend to be residual exposures that remain after hedging. These positions could be, for example, to ‘spot’ foreign exchange rates or to cross currency basis. We monitor foreign exchange risk against absolute net exposures and VaR-based limits and triggers.
For more on this, see ‘Funding strategy‘ and ‘Term issuance’ in the ‘Liquidity risk’ section.
Risk monitoring and reporting (unaudited) We monitor the banking market risks of the portfolios we hold for liquidity and investment purposes using sensitivities, VaR and stress tests. We report them against limits and triggers to senior management daily and to ALCO and ERCC each month. The VaR we report captures all key sources of volatility (including interest rate and spread risks) to fully reflect the potential volatility.
Managing LIBOR transition
We have dedicated considerable bank-wide resources to prepare ourselves, and our customers, for the cessation of LIBOR and other legacy interest rate benchmarks. In 2019, our work involved significant contributions from colleagues across all Business Units, Risk Control Areas, our Conduct & Compliance Unit and other support functions:
– We have a fully established LIBOR transition governance structure, including Senior Management Forums meeting monthly, and thematic and product-level working groups. In addition, regular reports are received by ALCO and Board Risk Committee.
– We recognise that LIBOR transitioning presents potential risks for our customers. We completed a first phase of customer communication with the website publication of an education statement on the replacement of LIBOR, and we are actively planning a second phase, tailored to individual customer needs.
– We rolled out LIBOR transition training to all our staff. We supported this with regular internal publications and communications, and dedicated workshops to help colleagues work together and share insights on LIBOR transitioning.
– We have also been a highly active contributor to discussions on LIBOR transitioning through direct participation at a wide range of industry forums.
This approach allowed us to execute several targeted initiatives, including becoming the first UK bank to switch an existing LIBOR referencing securitisation to SONIA, switching our pension scheme derivative exposures from LIBOR-linked swaps to gilts, and completing a series of derivative trade compressions to reduce our gross LIBOR exposure.
Our most significant exposures are to GBP LIBOR, and mainly represent derivatives transacted to hedge our balance sheet risks, corporate loans and medium-term funding. At 31 December 2019, we estimate our notional value of contracts referencing post-2021 LIBOR benchmarks to be £88bn (unaudited). For details of the notional value of derivative hedging instruments by benchmark interest rate, see Note 11 to the Consolidated Financial Statements.
Santander UK Group Holdings plc126
Annual Report 2019 | SectionAnnual Report 2019 | Risk review
Santander UK Group Holdings plc126

Santander UK Group Holdings plc 127
Strategic report Governance Risk review Financial review Financial statements Shareholder information
Market risk
BANKING MARKET RISK REVIEW
Interest rate risk Yield curve risk The table below shows how our base case income and valuation would be affected by a 50 basis point parallel shift (both up and down) applied instantaneously to the yield curve at 31 December 2019 and 2018 for the Santander UK plc group and SFS. Sensitivity to parallel shifts represents the amount of risk in a way that we think is both simple and scalable. 50 basis points is the stress we typically focus on for banking market risk controls, although we also monitor sensitivities to other parallel and non-parallel shifts as well as scenarios.
Santander UK plc group
2019
2018 +50bps -50bps +50bps -50bps
£m £m £m £m
NIM sensitivity 99 56 207 (23)
EVE sensitivity (unaudited) 10 (88) 162 (124)
SFS(1)
NIM sensitivity 19 (14) n/a n/a
EVE sensitivity (unaudited) 23 (22) n/a n/a
Basis risk (unaudited) We report basis risk using the EaR approach.
2019 2018
£m £m
Basis risk EaR 18 25
Interest rate repricing gap (unaudited) The table below shows the interest rate repricing gap of our balance sheet by repricing buckets.
3 months 1 year 3 years 5 years >5years Not sensitive Total 2019 £m £m £m £m £m £m £m
Assets 107,155 50,284 67,439 32,918 12,561 16,539 286,896
Liabilities 188,773 17,513 22,774 12,892 21,900 24,064 287,916
Off-balance sheet 14,945 (18,495) 4,481 (1,516) 1,605 – 1,020
Net gap (66,673) 14,276 49,146 18,510 (7,734) (7,525) –
2018
Assets 128,173 46,354 61,946 26,048 13,705 16,607 292,833
Liabilities 194,362 16,762 23,987 13,508 23,345 23,845 295,809
Off-balance sheet 11,096 (12,204) (2,731) 6,870 (55) – 2,976
Net gap (55,093) 17,388 35,228 19,410 (9,695) (7,238) –
Spread risks (unaudited) The table below shows the risk metrics covering the portfolios of securities we hold for liquidity and investment purposes.
2019 2018 £m £m
VaR 3 4
Worst three month stressed loss 123 190
2019 compared to 2018 (unaudited) The reduction in Santander UK plc group NIM and EVE sensitivities in 2019 was largely driven by balance sheet management activities. These included leaving fixed rate assets unhedged, increasing the net structural position over the latter end of the year primarily to mitigate further margin compression risk as a result of lower levels of the yield curve. The movement in Santander UK plc group sensitivities over the year also reflected the separation of SFS exposures from the ring-fenced bank group sensitivities following the implementation of our ring-fencing plans.
In 2019, the worst three month stressed loss decreased more compared to the decrease in VaR in the year due to the sale of £2bn of liquidity assets in Q4 2019. The assets that were sold had a greater impact on the stress results than the VaR. This was due to the conservative nature of the stress scenarios that we use.
The basis risk EaR in 2019 decreased due to the natural evolution of the balance sheet leading to a reduced underlying net basis position, as well as methodology updates to ensure we fully capture LIBOR transition risks.
We continue to periodically review our risk models and metrics including underlying modelling assumptions to ensure they continue to reflect the risks inherent in the current rate environment and incorporate regulatory expectations.
In addition, as discussed earlier, climate-related risks could eventually manifest in risks for financial institutions. During 2020, we will review the appropriate parts of the Risk Framework, Risk Type Frameworks (in particular Credit and Operational risk, but also market risk) and the Risk Appetite Statement to explicitly include climate-related risks.
(1) NIM and EVE sensitivities for SFS were not monitored separately in 2018 i.e. before the implementation of our ring-fencing plans.
Santander UK Group Holdings plc 127
Strategic Report Governance Risk review Financial review Financial statements Shareholder information
Market risk
127Santander UK Group Holdings plc

Annual Report 2019 | Risk review
128 Santander UK Group Holdings plc
TRADING MARKET RISK
OUR KEY TRADING MARKET RISKS (UNAUDITED)
Our main exposure to trading market risk is in Corporate & Investment Banking and it is an inherent part of providing financial services for our customers. Our exposures are mainly affected by market movements in interest rates, credit spreads, and foreign exchange. We have no exposures in Retail Banking, Corporate & Commercial Banking or Corporate Centre. Trading market risk can reduce our net income. Its effect can be seen in our Consolidated Income Statement, where it appears in the ‘Net trading and other income’ line, under ‘Net trading and funding of other items by the trading book’.
Following the implementation of our ring-fencing plans in 2018, only a small amount of trading market risk from permitted products and permitted customers remains in the Santander UK ring-fenced bank. This arises from hedging activity and back-to-back trading, with client trading and negligible position-taking. In all cases, market risk is hedged with Banco Santander SA or CCPs, in accordance with ring-fencing legislation.
Our ring-fenced bank Santander UK plc has two trading desks. The Link Desk sells ring-fenced bank permissible products to clients. The Retail Structured Products desk (RSP) sells investments (Santander UK plc issued notes) to retail investors, through our UK branches and elsewhere. The Link Desk has risk exposure to the credit quality of our clients. The adjustment for this is known as the Credit Valuation Adjustment (CVA) and feeds our valuations and hence income and expense. The low level of direct market risk in our trading business means that this is the main driver of income statement movements, along with similar factors – principally Debt Valuation Adjustment (DVA) driven by our own credit, and Liquidity Valuation Adjustment (LVA) driven by the market price of liquidity. These valuation adjustments are collectively referred to as XVAs.
Our reduced level of trading market risk after ring-fencing led us to decommission our Internal Model. As a result, from 1 January 2019, we calculate market risk capital using standardised rules.
TRADING MARKET RISK MANAGEMENT
Risk appetite
Our framework for dealing with market risk is part of our overall Risk Framework. The market risk framework sets out our high-level arrangements and minimum standards for managing, controlling and overseeing trading market risk. Our Risk Appetite for trading market risk is low, so we only report a qualitative measure to the Board. We monitor trading market risk using stress measures which we report to the ERCC each month.
Risk measurement (unaudited) For trading market risk, we have a range of ways of measuring trading market risk, including VaR (which we explain in the Banking market risk management section above) and detailed sensitivity measures.
Stress testing
Stress testing is an essential part of our risk management. It helps us to measure and evaluate the potential impact on portfolio values of more extreme, although plausible, events or market moves. We express limits to how much we could lose in a stress event, and this restricts how much risk we take.
Stress testing scenarios We calculate the impact of over 100 scenarios on our trading books, each month. The scenarios we create may be inspired by past events, like the global financial crisis. They may also include plausible ways that unusual market conditions could occur in the future that impact interest rates, equity prices and exchange rates. Most are reported against limits, and so could lead to our front office being asked to reduce risk. Our scenarios are not all calibrated to the same severity – some may be for a much longer holding period or a completely artificial and unrealistic scenario. We therefore do not limit all of them in the same way.
How we use stress testing We use limits to manage how much risk we take, expressed as how much we could lose in a stress event. We need to make sure the effects of possible events do not exceed the Risk Appetite set by the Board. We regularly inform senior managers, including ERCC and BRC of the results.
Risk mitigation (unaudited) We manage and control trading market risk within clear parameters. We measure and monitor our risk exposures against these limits. There are specific levels that trigger relevant teams to act or alert people in other functions. This means we can limit the impact of any negative market movements, while also improving our earnings. We keep the business units that originate trading market risk separate from the functions responsible for managing, controlling and overseeing risk.
Risk monitoring and reporting (unaudited) We maintain a complete set of written policies, procedures and processes to help identify, assess, manage and report trading market risk.
Santander UK Group Holdings plc128
Annual Report 2019 | SectionAnnual Report 2019 | Risk review
Santander UK Group Holdings plc128

Santander UK Group Holdings plc 129
Strategic report Governance Risk review Financial review Financial statements Shareholder information
Market risk
TRADING MARKET RISK REVIEW
VaR This table and graph show our Internal VaR for exposure to each of the main classes of risk for 2019 and 2018. The VaR figures show how much the fair values of all our tradeable instruments could have changed. Since trading instruments are recorded at fair value, these are also the amounts by which they could have increased or reduced our net income.
Year-end exposure Average exposure Highest exposure Lowest exposure
2019 2018 2019 2018 2019 2018 2019 2018 Trading instruments £m £m £m £m £m £m £m £m
Interest rate risks 0.2 0.5 0.4 1.4 0.6 3.9 0.1 0.2
Equity risks 0.0 – 0.0 0.2 0.1 0.6 0.0 –
Foreign exchange risks 0.4 0.1 0.2 0.3 0.4 0.9 0.1 –
Diversification offsets(1) (0.3) (0.2) (0.3) (0.5) (0.5) – (0.0) –
Total correlated one-day VaR 0.3 0.4 0.3 1.4 0.6 3.8 0.2 0.3
2019 compared to 2018 (unaudited) In 2019, only a small amount of trading market risk from permitted products and permitted customers remained, in the Santander UK ring-fenced bank. There were no breaches of the total VaR limit in 2019. Following the completion of ring-fencing in 2018, we saw an increase in the number of back-testing exceptions. This was due to the profit and loss on the residual activity in the trading book being driven by non-market risk factors, such as fee income and value adjustments. These are not captured in VaR and outweigh the effect of market risk factors such as interest rates, which do affect VaR. These back-testing exceptions have no impact as we no longer calculate capital under an Internal Model Approach.
(1) The highest and lowest exposures for each risk type did not necessarily happen on the same day as the highest and lowest total correlated one-day VaR. It is impossible to calculate a corresponding correlation offset effect, so we have not included it.
Santander UK Group Holdings plc 129
Strategic Report Governance Risk review Financial review Financial statements Shareholder information
Market risk
129Santander UK Group Holdings plc

Annual Report 2019 | Risk review
130 Santander UK Group Holdings plc
Liquidity risk
Overview (unaudited) Liquidity risk is the risk that, while still being solvent, we do not have the liquid financial resources to meet our obligations when they fall due, or we can only obtain them at high cost.
In this section, we describe our sources and uses of liquidity and how we manage liquidity risk. We also analyse our key liquidity metrics, including our LCRs and our eligible liquidity pools.
We then explain our funding strategy and structure and we analyse our wholesale funding. Finally, we analyse how we have encumbered some of our assets to support our funding activities.
Key metrics (unaudited) RFB DoLSub LCR of 142% (2018: DoLSub LCR of 164%)
SFS LCR of 471% (2018: n/a)
Wholesale funding and AT1 with maturity <1 year £22.5bn (2018: £16.8bn)
RFB DoLSub LCR eligible liquidity pool of £42.0bn (2018: DoLSub £54.1bn)
SFS LCR eligible liquidity pool of £5.7bn (2018: n/a)
OUR KEY LIQUIDITY RISKS (UNAUDITED)
Through our LRA framework, we manage our funding or structural contingent and market liquidity risks wherever they arise. This can be in retail and corporate deposit outflows, wholesale secured and unsecured liquidity outflows and off-balance sheet activities. Other risks our framework covers include funding concentrations, intra-day cash flows, intra-group commitments and support, and franchise retention.
Our main sources of liquidity
Customer deposits finance most of our customer lending. Although these funds are mostly callable, in practice they give us a stable and predictable core of funding. This is due to the nature of retail accounts and the breadth of our retail customer relationships.
We have a strong wholesale funding investor base, diversified across product types and geographies. Through the wholesale markets, we have active relationships in many sectors including banks, other financial institutions, corporates and investment funds. We access the wholesale funding markets through the issuance of capital, senior unsecured debt, covered bonds, structured notes and short-term funding. We also access these markets through securitisations of certain assets of Santander UK plc and our operating subsidiaries. For more on our programmes, see Notes 14, 21 and 25 in the Consolidated Financial Statements.
We generate funding on the strength of our own balance sheet, our own profitability and our own network of investors. We comply with rules set by the PRA, other regulators, and Banco Santander standards. While we manage, consolidate and monitor liquidity risk centrally, we also manage and monitor it in the business area it comes from. For more on our structural relationship with Banco Santander and how that impacts our liquidity management, see the Directors’ report.
In addition, we have access to UK Government funding schemes.
Our main uses of liquidity
Our main uses of liquidity are to fund our lending in Retail Banking and Corporate & Commercial Banking, to pay interest and dividends, and to repay debt. Our ability to pay dividends depends on various factors. These include our regulatory capital needs, the level of our distributable reserves, and our financial performance. We also use liquidity to pay for business combinations.
LIQUIDITY RISK MANAGEMENT
Introduction (unaudited) We manage liquidity risk on a consolidated basis in our CFO division, which is our centralised function for managing funding, liquidity and capital. We created our governance, oversight and control frameworks, and our LRA, on the same consolidated basis.
From 1 January 2019, following the implementation of ring-fencing, we monitor and manage liquidity risk for the Santander UK plc group and its former subsidiary SFS separately. Under this model, and the PRA’s liquidity rules, Santander UK plc and its subsidiary Cater Allen Limited form the RFB Domestic Liquidity Sub-group (the RFB DoLSub), which allows the entities to collectively meet regulatory requirements for the purpose of managing liquidity risk. Each member of the RFB DoLSub will support the other by transferring surplus liquidity in times of stress.
Prior to 1 January 2019, Santander UK plc, SFS and Cater Allen Limited formed the Domestic Liquidity Sub-group (the DoLSub), which allowed those entities to collectively meet regulatory liquidity requirements. The RFB DoLSub permission granted with effect from 1 January 2019 withdrew SFS from the previous DoLSub.
We continue to transfer liquidity risks from the products Santander UK Group Holdings plc issues, or the contracts it executes, into our subsidiaries largely through back-to-back transactions. We fund any mismatches, if needed, by ordinary share dividends from subsidiaries.
Annual Report 2019 | SectionAnnual Report 2019 | Risk review
Santander UK Group Holdings plc130

Santander UK Group Holdings plc 131
Strategic report Governance Risk review Financial review Financial statements Shareholder information
Liquidity risk
Risk appetite
Following the implementation of ring-fencing from 1 January 2019, separate LRAs for Santander UK plc and for SFS have been approved. These are appropriate to their individual business models and consistent with the strategy of Santander UK Group Holdings plc.
Our LRA statement is based on the principles of liquidity management we use to manage our balance sheet. It also supports our need to meet or exceed the rules of our regulators. In line with our liquidity management principles, we avoid an over-reliance on funding from a single product, customer or counterparty. We also maintain enough unencumbered customer assets to support current and future funding and collateral requirements and maintain enough capacity to monetise liquid assets and other counterbalancing capacity within an appropriate timeframe.
Our LRA is proposed to the Risk division and the Board, which is then approved under advice from the Board Risk Committee. Our LRA, in the context of our overall Risk Appetite, is reviewed and approved by the Board each year, or more often if needed.
Risk measurement (unaudited) We use a number of metrics to manage liquidity risk. These include metrics that show the difference between cash and collateral inflows and outflows in different periods. They also include structural metrics, such as our level of encumbered assets.
Ongoing business management
Within our framework of prudent funding and liquidity management, we manage our activities to minimise our liquidity risk. We have clear responsibilities for short-term funding, medium-term funding, encumbrance, collateral and liquid asset management. This ensures we manage liquidity risks as part of our daily operations, strategy and planning.
Our liquidity management framework is split between short-term and strategic activities. Our short-term activities focus on intra-day collateral; management and maintaining liquid assets to cover unexpected demands on cash in a stress scenario (such as large and unexpected deposit withdrawals by customers and loss of wholesale funding). Our strategic activities focus on ensuring we are not over reliant on any one source for funding and that we avoid excessive concentrations in the maturity of our funding.
We regularly test the liquidity of our eligible liquidity pool, in line with PRA and Basel rules. We do this by realising some of the assets through repurchase or outright sale to the market. We make sure that over any 12-month period we realise a significant part of our eligible liquidity pool. As well as our eligible liquidity pool, we always hold a portfolio of unencumbered liquid assets. Our LRA and PRA requirements determine the size and composition of this portfolio. These assets give us a source of contingent liquidity, as we can realise some of them in a time of stress to create liquidity through repurchase or outright sale to the market.
Stress testing
We have a liquidity stress test framework in place which is central to our LRA measurement and monitoring. It includes three severe but plausible stress test scenarios. To fit with our risk appetite, the liquidity outflows that come from these stress tests must be fully covered with high-quality liquid assets, other liquid assets and management actions sanctioned at the right level of governance. Additionally, a funding plan disruption stress scenario forms part of our LRA monitoring.
Our Risk division runs a range of stress tests. Our LRA stress test is a combination of three tests that cover idiosyncratic, market-wide and combined scenarios. Our other tests consider scenarios such as a global economic slowdown that results in reduced confidence in the banking industry, a slowdown in one of the major economies or a deterioration in the availability of liquidity. These are considered on both an acute and protracted basis. We also run severe combined stress tests which look at both a deep and prolonged UK recession that results in a reduction in wholesale funding availability and a simultaneous idiosyncratic shock that would lead to retail and commercial outflows.
We also conduct sensitivity analysis and reverse stress testing for instant liquidity shocks by each key liquidity risk. We do this to understand the impacts they would have on our LRA and our regulatory liquidity metrics.
We monitor our LCR to ensure we continue to meet the requirements. Although the Basel Committee published its final Net Stable Funding Ratio (NSFR) standards in October 2014, the NSFR has not yet been implemented within the EU (unlike the LCR). As such, there is no formal NSFR requirement applicable to UK or other EU banks until such time as the European Commission adopts appropriate regulatory and technical standards. Nonetheless, we monitor our NSFR on an ongoing basis and will be ready to comply with the standards once agreed.
Risk mitigation (unaudited) The Board aims to make our balance sheet resilient at all times and for it to be perceived as such by stakeholders. This preserves our short and long-term viability. The Board recognises that as we are involved in maturity transformation, we cannot hold enough liquidity to cover all possible stress scenarios. The Board requires us to hold enough liquidity to make sure we will survive three plausible but severe stress scenarios (our LRA stress). We do this by maintaining a prudent balance sheet structure and approved liquid resources.
Recovery framework
In the event of a liquidity or capital stress, we have developed a series of actions outlined in our Recovery Plan. This enables us to respond to a wide variety of stresses, from mild to severe, in a coordinated and efficient manner. Our Recovery Plan addresses how we would manage a capital or liquidity stress. We would invoke it in response to triggers across a range of metrics falling outside threshold levels, or a qualitative assessment of potential serious risks to our financial position and balance sheet strength. All of these metrics are part of our existing risk management processes. The Recovery Plan would be invoked as early and proactively as possible in order to mitigate a stress with suitable actions.
Our Recovery Plan is approved by the Board under advice from the Board Audit Committee and is subject to ongoing review and enhancement. The CFO division manages the recovery and resolution plans and the operational continuity process.
Risk monitoring and reporting (unaudited) We monitor liquidity risk daily, weekly and monthly. We do this through different committees and levels of management, including ALCO and the Board Risk Committee.
Strategic Report Governance Risk review Financial review Financial statements Shareholder information
Liquidity risk
131Santander UK Group Holdings plc

Annual Report 2019 | Risk review
132 Santander UK Group Holdings plc
LIQUIDITY RISK REVIEW (UNAUDITED)
Liquidity Coverage Ratio This table shows our LCR and LRA at 31 December 2019 and 2018. The LCR at 31 December 2019 reflects the RFB DoLSub, and at 31 December 2018 reflects the previous DoLSub. We also show the SFS LCR and LRA at 31 December 2019, reflecting the fact that we monitor and manage liquidity risk for SFS separately from 1 January 2019. The LRA data reflect the stress testing methodology in place at that time.
LCR RFB DoLSub(1) LRA RFB(2) 2019 2018 2019 2018 £bn £bn £bn £bn
Eligible liquidity pool (liquidity value) 41.6 53.0 40.6 52.2
Net stress outflows (29.3) (32.4) (31.7) (32.1)
Surplus 12.3 20.6 8.9 20.1
Eligible liquidity pool as a percentage of anticipated net cash flows 142% 164% 128% 163%
LCR SFS
LRA SFS
Eligible liquidity pool (liquidity value) 5.7 n/a 5.7 n/a
Net stress outflows (1.2) n/a (1.1) n/a
Surplus 4.5 n/a 4.6 n/a
Eligible liquidity pool as a percentage of anticipated net cash flows 471% n/a 518% n/a (1) For 2019, in accordance with our ring-fence structure, data is for the RFB DoLSub. For 2018, i.e. before the implementation of ring-fencing, data is for the previous DoLSub. The RFB LCR was 146%. (2) The LRA is calculated for the Santander UK plc group (the RFB Group) and is a three-month Santander UK specific requirement.
LCR eligible liquidity pool This table shows the carrying value and liquidity value of our eligible liquidity pool assets at 31 December 2019 for the RFB DoLSub and 31 December 2018 for the previous DoLSub. It also shows the weighted average carrying value in the year. We also show SFS at 31 December 2019, reflecting the fact that we monitor and manage liquidity risk for SFS separately from 1 January 2019.
RFB DoLSub
Carrying value Liquidity value(1) Weighted average carrying
value in the year 2019 2018 2019 2018 2019 2018 £bn £bn £bn £bn £bn £bn
Cash and balances at central banks 19.3 22.4 19.3 22.4 19.1 24.4
Government bonds 17.9 26.1 17.7 25.7 20.8 16.8
Supranational bonds and multilateral development banks 2.9 1.1 2.9 1.1 2.9 1.1
Covered bonds 1.5 2.7 1.4 2.5 2.4 2.6
Asset-backed securities 0.4 1.7 0.3 1.3 1.4 1.4
Equities – 0.1 – – – 2.1
42.0 54.1 41.6 53.0 46.6 48.4
SFS
Cash and balances at central banks 5.2 n/a 5.2 n/a 4.4 n/a
Government bonds 0.5 n/a 0.5 n/a 0.5 n/a
5.7 n/a 5.7 n/a 4.9 n/a (1) Liquidity value is the carrying value with the applicable LCR haircut applied.
Currency analysis This table shows the carrying value of our eligible liquidity pool by major currencies at 31 December 2019 for the RFB DoLSub and 31 December 2018 for the previous DoLSub. The composition of the pool is consistent with the currency profile of our net liquidity outflows. We also show SFS at 31 December 2019, reflecting the fact that we monitor and manage liquidity risk for SFS separately from 1 January 2019.
RFB DoLSub US Dollar Euro Sterling Other Total £bn £bn £bn £bn £bn
2019 3.6 1.2 36.1 1.1 42.0
2018 5.3 3.9 42.2 2.7 54.1
SFS
2019 – – 5.7 – 5.7
2018 n/a n/a n/a n/a n/a
Annual Report 2019 | SectionAnnual Report 2019 | Risk review
Santander UK Group Holdings plc132

Santander UK Group Holdings plc 133
Strategic report Governance Risk review Financial review Financial statements Shareholder information
Liquidity risk
Composition of the eligible liquidity pool
This table shows the allocation of the carrying value of the assets in our eligible liquidity pool for LRA and LCR purposes at 31 December 2019 for the RFB DoLSub and 31 December 2018 for the previous DoLSub. We also show SFS at 31 December 2019, reflecting the fact that we monitor and manage liquidity risk for SFS separately from 1 January 2019.
RFB DoLSub
2019 2018
LCR eligible liquidity pool LCR eligible liquidity pool
Level 1 Level 2A Level 2B Total Of which
LRA eligible Level 1 Level 2A Level 2B Total Of which
LRA eligible
£bn £bn £bn £bn £bn £bn £bn £bn £bn £bn
Cash and balances at central banks 19.3 – – 19.3 19.3 22.4 – – 22.4 21.8
Government bonds:
– AAA to AA- 16.7 – – 16.7 16.7 23.6 – – 23.6 23.3
– A+ to A – 1.2 – 1.2 1.2 – 2.5 – 2.5 2.5
Supranational bonds and multilateral development banks:
– AAA to AA- 2.9 – – 2.9 2.5 1.1 – – 1.1 1.1
Covered bonds:
– AAA to AA- 1.4 0.1 – 1.5 1.5 1.6 1.1 – 2.7 2.7
Asset-backed securities:
– AAA to AA- – – 0.4 0.4 0.4 – – 1.7 1.7 1.7
Equities – – – – – – 0.1 0.1 0.1
40.3 1.3 0.4 42.0 41.6 48.7 3.6 1.8 54.1 53.2
SFS
Cash and balances at central banks 5.2 – – 5.2 5.2 n/a n/a n/a n/a n/a
Government bonds: – AAA to AA- 0.5 – – 0.5 0.5 n/a n/a n/a n/a n/a
5.7 – – 5.7 5.7 n/a n/a n/a n/a n/a
2019 compared to 2018
While RFB DoLSub LCR remains high at 142%, it is lower than 2018 reflecting reduced uncertainty.
The RFB DoLSub LCR and LCR eligible liquidity pool both decreased following the transfer of our Isle of Man and Jersey businesses (Crown Dependencies) into SFS in 2018 as part of ring-fencing implementation.
SFS liquidity benefited from £6.1bn of deposits in our Crown Dependencies business, which increased £1.3bn in 2019 in preparation for the planned transfer of some RFB assets to SFS in 2020.
Strategic Report Governance Risk review Financial review Financial statements Shareholder information
Liquidity risk
133Santander UK Group Holdings plc

Annual Report 2019 | Risk review
134 Santander UK Group Holdings plc
FUNDING RISK MANAGEMENT
Funding strategy (unaudited) Our funding strategy continues to be based on maintaining a conservatively structured balance sheet and diverse sources of funding to meet the needs of our business strategy and plans. The CFO Division maintains a funding plan and ensures it is compliant with the LRA and regulatory liquidity and capital requirements.
Most of our funding comes from customer deposits. We source the rest from a mix of secured and unsecured funding in the wholesale markets. Overall, this means that we do not rely too heavily on wholesale funds. We manage funding requirements by targeting a specific Liquidity Coverage Ratio, we ensure maturities are prefunded and capital/TLAC requirements are prioritised. We also have checks and controls to limit our asset encumbrance from our secured funding operations. As part of maintaining a diverse funding base, we raise funding in a number of currencies, including euro and USD, and convert it into sterling through currency swaps to fund our commercial assets which are largely sterling denominated.
Our base of stable retail and corporate deposits is a key funding source for us. We leverage our large and diverse customer base to offer products that give us a long-term sustainable source of funding. We do this by focusing on building long-term relationships. Over 85% of our total core retail customer liabilities are covered by the Financial Services Compensation Scheme (the FSCS).
Behavioural maturities
The contractual maturity of our balance sheet assets and liabilities highlights the maturity transformation that underpins the role of banks to lend long term, but to fund themselves mainly with shorter-term liabilities, like customer deposits. We do this by diversifying our funding operations across a wide customer base, both in numbers and by type of depositor. In practice, the behavioural profiles of many liabilities show more stability and longer maturity than their contractual maturity. This is especially true of many types of retail and corporate deposits that, while they may be repayable on demand or at short notice, have shown good stability even in times of stress. We model behaviour profiles using our experience of customer behaviour. We use this data to determine the funds transfer pricing interest rates at which we reward and charge our business units for sources and uses of funds. We apply this rate until a customer changes to a different product or service offered by us or by one of our competitors.
We continue to improve the quality of our retail, commercial and wholesale deposits. We aim to deepen our customer relationships across all customer segments. We do this to lengthen the contractual and behavioural profile of our liability base.
Deposit funding
We mainly fund our Retail Banking and Corporate & Commercial Banking activities by customer deposits. We fund the rest through wholesale markets.
Wholesale funding
Wholesale funding and issuance model (unaudited) Banco Santander is a multiple point of entry resolution group. This means that should it fail; it would be split up into parts. Healthy parts might be sold or be kept as a residual group without their distressed sister companies. The resolution or recapitalisation of the distressed parts might be effected via ‘bail in’ of bonds that had been issued to the market by a regional intermediate holding company.
Santander UK is a single point of entry resolution group. This means that resolution would work downwards from the group’s holding company (i.e. Santander UK Group Holdings plc). Losses in subsidiaries would first be transferred up to Santander UK Group Holdings plc. If the holding company is bankrupt as a result, the group is deemed to be failing or likely to fail, it will be put into resolution. The ‘bail in’ tool is applied to the holding company, with the equity being written off and bonds written off or converted into equity as needed to recapitalise the group. Those bondholders would become the new owners, and the group would stay together.
Santander UK Group Holdings plc is the immediate holding company of Santander UK plc but does not guarantee its debts or other obligations. This structure is a Bank of England recommended configuration which aims to ensure the activities of the operating company are not disrupted as the group goes through resolution, thereby maintaining continuity of services for customers.
Composition of wholesale funding (unaudited) We are active in the wholesale markets and we have direct access to both money market and long-term investors through our funding programmes. This makes our wholesale funding well diversified by product, maturity, geography and currency. This includes currencies available across a range of channels from money markets, repo markets, senior unsecured, secured, medium-term and capital. For details of our main programmes, see the Funding Information section of our website www.santander.co.uk/uk/about-santander-uk/investor-relations/funding-information.
Following the implementation of our ring-fencing plan, Santander UK plc is now our main operating company issuer of senior unsecured debt, structured notes, short-term funding and covered bonds.
Santander UK Group Holdings plc is the issuer of capital and MREL/Total Loss Absorbing Capacity (TLAC) eligible senior unsecured debt. The Financial Stability Board established the TLAC standard in 2015 and it is applied from 1 January 2019. The standard is designed to enhance the resilience of the global financial system by ensuring that failing Global Systemically Important Banks (G-SIBs) have sufficient capital to absorb losses and recapitalise under resolution, whilst continuing to provide critical banking services. In the EU, the Bank Recovery and Resolution Directive (BRRD) sets out a framework for all European banks and investment firms, not just G-SIBs, to satisfy a Minimum Requirement for own funds and Eligible Liabilities (MREL). The Banking Act 2009 was amended in 2014 as part of the UK implementation of the BRRD and HM Treasury will remediate deficiencies caused by the UK’s withdrawal from the EU in the Bank Recovery and Resolution (Amendment) (EU Exit) Regulations 2018. MREL is designed to ensure that banks have sufficient liabilities to prevent broader financial disruption or use of public funds in resolution. Since the implementation of CRR II in June 2019, G-SIBs have been subject to the MREL standard. Since 1 January 2019, UK resolution entities that are G-SIBs or are part of a G-SIB , including Santander UK Group Holdings plc, have been required to meet the TLAC minimum requirements, implemented through the Bank of England Statement of Policy on MREL in the UK. The TLAC requirement is the higher of 16% of RWAs on a consolidated basis or 6% of leverage exposures on a consolidated basis. Our operating company Santander UK plc is subject to internal MREL as it meets the requirements of a material subsidiary of our ultimate parent Banco Santander SA. We also access the wholesale markets through securitisations of certain assets of our operating subsidiaries. In addition, we have access to UK Government funding schemes. Eligible collateral for these schemes includes all collateral that is eligible in the Bank of England’s Discount Window Facility. We ensure that enough collateral is placed and available at the Discount Window.
Annual Report 2019 | SectionAnnual Report 2019 | Risk review
Santander UK Group Holdings plc134

Santander UK Group Holdings plc 135
Strategic report Governance Risk review Financial review Financial statements Shareholder information
Liquidity risk
FUNDING RISK REVIEW
2019 compared to 2018 (unaudited) − Our overall funding strategy remains to develop and sustain a diversified funding base. We also need to fulfil regulatory requirements as well as support our credit
ratings. − 2019 had a much lower funding requirement than average. We pre-funded 2019 and managed our maturity profile to increase LCR at the end of 2018, ensuring
we did not have large requirements when the UK was expected to leave the EU. − In 2019, our total term funding was £4.5bn (2018: £17.1bn), of which £4.1bn (2018: £14.8bn) was medium-term issuance and none (2018: £2.3bn) was from the
closed UK Government’s Term Funding Scheme (TFS). − The £4.1bn medium-term funding included £0.9bn of senior unsecured notes, £2.9bn of covered bonds and £0.1bn of securitisations. − Maturities in 2019 were £8.1bn (2018: £6.9bn). At 31 December 2019, 67% (2018: 77%) of wholesale funding had a maturity of greater than one year, with an
overall residual duration of 33 months (2018: 37 months). The total drawdown outstanding from the TFS was unchanged at £10.8bn (2018: £10.8bn) and the total drawdowns of UK Treasury Bills under the FLS were £1.0bn (2018: £1.0bn).
− Total wholesale funding decreased, reflecting maturities in the period, partially offset by covered bond issuances of £1bn in February 2019, €1bn in May 2019 and £1bn in November 2019, along with senior unsecured issuance of $1bn in June 2019. In August 2019, we increased our AT1 outstanding by £200m via the issuance of a new £500m 6.3% AT1 to Banco Santander SA and the repurchase of the £300m 7.6% AT1 from Banco Santander SA.
− In 2019, c£7bn of medium-term funding was left in US Dollars and a further £1bn in Euro. These balances were used to fund customer assets and our HQLA portfolio.
− Our level of encumbrance from external and internal issuance of securitisations and covered bonds remained broadly static in 2019, as planned.
Reconciliation of wholesale funding to the balance sheet This table reconciles our wholesale funding to our balance sheet at 31 December 2019 and 2018.
Balance sheet line item
Funding analysis
Deposits by banks
Deposits by customers(1)
Repurchase agreements –
non trading
Financial liabilities
designated at fair value
Debt securities
in issue Subordinated
liabilities
Other equity instruments
and non- controlling interests(2)
2019 £bn £bn £bn £bn £bn £bn £bn £bn
Deposits 0.3 0.3 – – – – – –
Certificates of deposit and commercial paper 5.8 – – – – 5.8 – –
Senior unsecured – public benchmark 18.9 – – – – 18.9 – –
– privately placed 2.7 – – – 1.0 1.7 – –
Covered bonds 18.2 – – – – 18.2 – –
Securitisation and structured issuance 5.6 – – 1.4 0.5 3.7 – –
Term Funding Scheme 10.8 10.8 – – – – – –
Subordinated liabilities and equity 5.5 – – – – – 2.9 2.6
Total wholesale funding 67.8 11.1 – 1.4 1.5 48.3 2.9 2.6
Repos 16.9 – – 16.9 – – – –
Foreign exchange and hedge accounting 2.5 – – – – 1.9 0.6 –
Other 3.5 3.3(3) – – 0.2 – – –
Balance sheet total 90.7 14.4 – 18.3 1.7 50.2 3.5 2.6
2018
Deposits by banks 1.0 1.0 – – – – – –
Certificates of deposit and commercial paper 6.4 – – – – 6.4 – –
Senior unsecured – public benchmark 21.3 – – – – 21.3 – –
– privately placed 4.0 – – – 1.0 3.0 – –
Covered bonds 16.6 – – – – 16.6 – –
Securitisation and structured issuance 7.8 – 0.5 2.2 – 5.1 – –
Term Funding Scheme 10.8 10.8 – – – – – –
Subordinated liabilities and equity 5.3 – – – – – 3.0 2.4
Total wholesale funding 73.2 11.8 0.5 2.2 1.0 52.4 3.0 2.4
Repos 10.8 – – 8.7 2.1 – – –
Foreign exchange and hedge accounting 4.1 – – – – 3.5 0.6 –
Other 9.2 6.0(3) – – 3.2 – – –
Balance sheet total 97.3 17.8 0.5 10.9 6.3 55.9 3.6 2.4
(1) This is included in our balance sheet total of £ £179,006m (2018: £ 173,692m). (2) Consists of £nil (2018: £14m) fixed/floating rate non-cumulative callable preference shares, £235m (2018: £235m) Step-up Callable Perpetual Reserve Capital Instruments and £2,241m (2018: £2,041m) Perpetual Capital Securities (net of
issuance costs). See Notes 32 and 31 to the Consolidated Financial Statements. (3) Other consists of items in the course of transmission and other deposits, excluding the TFS. See Note 23 to the Consolidated Financial Statements.
Strategic Report Governance Risk review Financial review Financial statements Shareholder information
Liquidity risk
135Santander UK Group Holdings plc

Annual Report 2019 | Risk review
136 Santander UK Group Holdings plc
Maturity profile of wholesale funding This table shows our main sources of wholesale funding. It does not include securities finance agreements. The table is based on exchange rates at issue and scheduled repayments and call dates. It does not reflect the final contractual maturity of the funding.
≤ 1
month >1 and ≤ 3
months >3 and ≤ 6
months >6 and ≤ 9
months >9 and ≤ 12
months Sub-total
≤ 1 year >1 and
≤ 2 years >2 and
≤ 5 years >5 years Total 2019 £bn £bn £bn £bn £bn £bn £bn £bn £bn £bn
Santander UK Group Holdings plc(1)
Senior unsecured – public benchmark – – – – 0.8 0.8 1.8 4.2 1.8 8.6
– privately placed – – – – – – – – 0.1 0.1
Subordinated liabilities and equity (incl. AT1) – – – – – – – 1.3 2.0 3.3
– – – – 0.8 0.8 1.8 5.5 3.9 12.0
Santander UK plc
Deposits by banks 0.1 – – 0.2 – 0.3 – – – 0.3
Certificates of deposit and commercial paper 0.6 3.1 2.0 0.1 – 5.8 – – – 5.8
Senior unsecured – public benchmark 0.8 1.4 – 0.6 1.9 4.7 2.9 1.9 0.8 10.3
– privately placed – 0.9 – 0.9 – 1.8 0.4 0.1 0.3 2.6
Covered bonds – – 1.8 – 1.0 2.8 5.6 6.2 3.6 18.2
Securitisation and structured issuance(2) 0.2 – 0.8 0.2 0.2 1.4 1.3 1.3 – 4.0
Term Funding Scheme – – – – 4.5 4.5 4.0 2.3 – 10.8
Subordinated liabilities – – – – – – – 0.9 1.3 2.2
1.7 5.4 4.6 2.0 7.6 21.3 14.2 12.7 6.0 54.2
Other group entities
Securitisation & structured issuance(3) – 0.1 0.1 0.1 0.1 0.4 0.6 0.6 – 1.6
Total at 31 December 2019 1.7 5.5 4.7 2.1 8.5 22.5 16.6 18.8 9.9 67.8
Of which: – Secured 0.2 0.1 2.7 0.3 5.8 9.1 11.5 10.4 3.6 34.6
– Unsecured 1.5 5.4 2.0 1.8 2.7 13.4 5.1 8.4 6.3 33.2
1.7 5.5 4.7 2.1 8.5 22.5 16.6 18.8 9.9 67.8
2018
Total at 31 December 2018 3.1 6.8 3.3 2.7 0.9 16.8 15.9 30.1 10.4 73.2
Of which:
– Secured 0.8 0.7 0.7 1.7 0.5 4.4 8.5 18.3 4.0 35.2
– Unsecured 2.3 6.1 2.6 1.0 0.4 12.4 7.4 11.8 6.4 38.0
(1) 94% of Senior Unsecured debt issued from Santander UK Group Holdings plc has been downstreamed to Santander UK plc as ‘secondary non-preferential debt’ in line with the guidelines from the Bank of England for Internal MREL. (2) Includes funding from mortgage-backed securitisation vehicles where Santander UK plc is the asset originator. (3) Includes funding from asset-backed securitisation vehicles where entities other than Santander UK plc are the asset originator.
Currency composition of wholesale funds This table shows our wholesale funding by major currency at 31 December 2019 and 2018.
2019 2018 Sterling US Dollar Euro Other Sterling US Dollar Euro Other % % % % % % % %
Santander UK Group Holdings plc Senior unsecured – public benchmark 12 64 22 2 11 65 22 2
– privately placed – – – 100 – – – 100
Subordinated liabilities and equity (incl. AT1) 70 30 – – 68 32 – –
27 54 16 3 26 56 16 2
Santander UK plc Deposits by banks 3 97 – – 3 97 – –
Certificates of deposit and commercial paper 45 54 1 – 48 52 – –
Senior unsecured – public benchmark 14 54 32 – 11 56 33 –
– privately placed 21 15 59 5 13 12 72 3
Covered bonds 54 – 45 1 50 – 49 1
Securitisation & structured issuance 72 28 – – 61 35 4 –
Term Funding Scheme 100 – – – 100 – – –
Subordinated liabilities 49 51 – – 49 51 – –
54 22 24 – 48 25 26 1
Other group entities Securitisation & structured issuance 95 5 – – 89 11 – –
Total 50 27 22 1 46 30 24 –
Annual Report 2019 | SectionAnnual Report 2019 | Risk review
Santander UK Group Holdings plc136

Santander UK Group Holdings plc 137
Strategic report Governance Risk review Financial review Financial statements Shareholder information
Liquidity risk
Term issuance
In 2019, our external term issuance (sterling equivalent) was:
Sterling US Dollar Euro Other Total 2019 Total 2018
£bn £bn £bn £bn £bn £bn
Santander UK Group Holdings plc Senior unsecured – public benchmark – – – – – 2.7
Subordinated debt and equity (inc. AT1) 0.5 – – – 0.5 –
0.5 – – – 0.5 2.7
Santander UK plc Securitisations and other secured funding – – – – – 2.9
Covered bonds 2.0 – 0.9 – 2.9 4.3
Senior unsecured – public benchmark 0.1 0.8 – – 0.9 2.9
– privately placed – – – – – 1.6
Term Funding Scheme – – – – – 2.3
2.1 0.8 0.9 – 3.8 14.0
Other group entities Securitisations 0.2 – – – 0.2 0.4
Total gross issuances 2.8 0.8 0.9 – 4.5 17.1
Encumbrance (unaudited) We have encumbered an asset if we have pledged or transferred it as collateral against an existing liability. This means it is no longer available to secure funding, meet our collateral needs or be sold to reduce future funding needs. Being able to pledge or transfer assets as collateral is an integral part of a financial institution’s operations. We do various things that lead to asset encumbrance. These include where we:
− Enter into securitisation, covered bonds, and repurchase agreements (including central bank programmes) to access medium and long-term funding − Enter into short-term funding transactions. These include repurchase agreements and stock borrowing transactions as part of our operational liquidity
management − Pledge collateral as part of participating in payment and settlement systems − Post collateral as part of derivatives activity.
We monitor our mix of secured and unsecured funding sources in our funding plan. We aim to use our available collateral efficiently to raise secured funding and to meet our other collateralised obligations.
Our biggest source of encumbrance is where we use our mortgage portfolio to raise funds through securitisation, covered bonds or other structured borrowing. We control our levels of encumbrance from these by setting a minimum level of unencumbered assets that must be available after we factor in our future funding plans, whether we can use our assets for our future collateral needs, the impact of a possible stress and our current level of encumbrance.
Assets classified as readily available for encumbrance include cash and securities we hold in our eligible liquidity pool. They also include other unencumbered assets that give us a source of contingent liquidity. We do not rely on these extra unencumbered assets in our LRA, but we might use some of them in a time of stress. We can create liquidity by using them as collateral for secured funding or through outright sale.
Loans and advances to customers are only classified as readily available for encumbrance if they are already in a form we can use to raise funding without any other actions on our part. This includes excess collateral that is already in a secured funding structure. It also includes collateral that is pre-positioned at central banks and is available for use in secured funding.
All other loans and advances are classified as not readily available for encumbrance, however, may still be suitable for use in secured funding structures.
Strategic Report Governance Risk review Financial review Financial statements Shareholder information
Liquidity risk
137Santander UK Group Holdings plc

Annual Report 2019 | Risk review
138 Santander UK Group Holdings plc
Encumbrance of customer loans and advances We have issued prime retail mortgage-backed and other asset-backed securitised products to a diverse investor base through our mortgage-backed and other asset-backed funding programmes.
We have raised funding with mortgage-backed notes, both issued to third parties and retained – the latter being central bank eligible collateral for funding purposes in other Bank of England facilities. We also have a covered bond programme, under which we issue securities to investors secured by a pool of residential mortgages.
For more on how we have issued notes from our secured programmes externally and also retained them, and what we have used them for, see Notes 14 and 25 to the Consolidated Financial Statements.
On-balance sheet encumbered and unencumbered assets
Encumbered with counterparties other than
central banks Unencumbered assets not pre-positioned
with central banks
Covered
bonds Securitis-
ations Other Total
Assets positioned at central
banks(3) Readily
available
Other available
assets Cannot be
encumbered Total Total
assets 2019 £m £m £m £m £m £m £m £m £m £m
Cash and balances at central banks(1)(2) – – 1,080 1,080 707 24,608 – – 25,315 26,395
Financial assets at FVTPL:
– Derivative financial instruments – – – – – – – 3,363 3,363 3,363
– Other financial assets at FVTPL – – – – – – – 973 973 973
Financial assets at amortised cost:
– Loans and advances to customers 23,310 12,915 366 36,591 55,272 76,568 22,875 16,192 170,907 207,498
– Loans and advances to banks – – 615 615 – – – 1,968 1,968 2,583
– Repurchase agreements – non trading – – – – – – – 23,636 23,636 23,636
– Other financial assets at amortised cost – – 3,026 3,026 – 4,030 – – 4,030 7,056
Financial assets at FVOCI – – 6,020 6,020 – 3,727 – – 3,727 9,747
Interests in other entities – – – – – – – 117 117 117
Intangible assets – – – – – – – 1,776 1,776 1,776
Property, plant and equipment – – – – – – 1,971 – 1,971 1,971
Current tax assets – – – – – – – 186 186 186
Retirement benefit assets – – – – – – – 670 670 670
Other assets – – – – – – – 2,517 2,517 2,517
Total assets 23,310 12,915 11,107 47,332 55,979 108,933 24,846 51,398 241,156 288,488
2018
Cash and balances at central banks(1)(2) – – 1,080 1,080 636 22,464 – – 23,100 24,180
Financial assets at FVTPL:
– Derivative financial instruments – – – – – – – 5,321 5,321 5,321
– Other financial assets at FVTPL – – – – – – – 6,137 6,137 6,137
Financial assets at amortised cost:
– Loans and advances to customers 21,240 14,454 256 35,950 52,497 71,942 20,943 20,287 165,669 201,619
– Loans and advances to banks – – 402 402 – – – 3,113 3,113 3,515
– Repurchase agreements– non trading – – – – – – – 21,127 21,127 21,127
– Other financial assets at amortised cost – – 3,763 3,763 – 3,465 – – 3,465 7,228
Financial assets at FVOCI – – 5,825 5,825 – 7,477 – – 7,477 13,302
Interests in other entities – – – – – – – 88 88 88
Intangible assets – – – – – – – 1,814 1,814 1,814
Property, plant and equipment – – – – – – 1,835 – 1,835 1,835
Current tax assets – – – – – – – 106 106 106
Retirement benefit assets – – – – – – – 842 842 842
Other assets – – – – – – – 2,267 2,267 2,267
Total assets 21,240 14,454 11,326 47,020 53,133 105,348 22, 778 61,102 242,361 289,381
(1) Encumbered cash and balances at central banks include minimum cash balances we have to hold at central banks for regulatory purposes. (2) Readily realisable cash and balances at central banks are amounts held at central banks as part of our liquidity management activities. (3) Comprises pre-positioned assets and encumbered assets.
Annual Report 2019 | SectionAnnual Report 2019 | Risk review
Santander UK Group Holdings plc138

Santander UK Group Holdings plc 139
Strategic report Governance Risk review Financial review Financial statements Shareholder information
Capital risk
Capital risk
Overview (unaudited)
Capital risk is the risk that we do not have an adequate amount or quality of capital to meet our internal business needs, regulatory requirements and market expectations, including dividend and AT1 distributions.
In this section, we set out how we are regulated. We also give details of the results of the Bank of England’s 2019 stress testing exercise. We explain how we manage capital on a standalone basis as a subsidiary in the Banco Santander group. We then analyse our capital resources and key capital ratios including our leverage and RWAs.
Key metrics (unaudited)
CET1 capital ratio of 14.3% (2018: 13.2%)
Total qualifying regulatory capital increased to £15.8bn (2018: £15.0 bn)
UK leverage ratio of 4.7% (2018: 4.5%)
THE SCOPE OF OUR CAPITAL ADEQUACY
Regulatory supervision
For capital purposes, we are subject to prudential supervision by the PRA, as a UK banking group, and by the European Central Bank (ECB) as part of the Banco Santander group. The ECB supervises Banco Santander as part of the Single Supervisory Mechanism (SSM). Although we are part of the Banco Santander group, we do not have a guarantee from our immediate and ultimate parent Banco Santander SA and we operate as a standalone subsidiary. As we are part of the UK sub-group that is regulated by the PRA, we have to meet the PRA capital requirements on a standalone basis. We also have to show the PRA that we can withstand capital stress tests without the support of our parent. Reinforcing our corporate governance framework, the PRA exercises oversight through its rules and regulations on the Board and senior management appointments. Santander UK Group Holdings plc is the holding company of Santander UK plc and is the head of the Santander UK group for regulatory capital and leverage purposes.
Our basis of consolidation for our capital disclosures is substantially the same as for our Consolidated Financial Statements. Following the implementation of ring-fencing, with effect from 1 January 2019, Santander UK plc is now the head of the ring-fenced bank sub-group and is subject to regulatory capital and leverage rules in relation to that sub-group.
CAPITAL RISK MANAGEMENT
The Board is responsible for capital management strategy and policy and ensuring that we monitor and control our capital resources within regulatory and internal limits. We manage our funding and maintain capital adequacy on a standalone basis. We operate within the capital risk framework and appetite approved by our Board. This reflects the business environment we operate in, our strategy for each material risk and the potential impact of any adverse scenarios or stresses on our capital position.
Management of capital requirements
Our capital risk appetite aims to maintain capital levels appropriate to the level of stress applied, and the expected regulatory response. In:
− An adverse economic stress, which we might expect to occur once in 20 years, the firm should remain profitable and exceed all regulatory capital minimums at all times.
− A very severe economic stress, which we might expect to occur once in 100 years, and which has been designed to test any specific weaknesses of a firm’s business model, the firm should meet all regulatory capital minimums at all times. This is subject to the use of regulatory buffers designed to absorb losses in such a stress.
Management of capital resources
We use a mix of regulatory and EC ratios and limits, internal buffers and restrictions to manage our capital resources. We also take account of the costs of differing capital instruments and capital management techniques. We also use these to shape the best structure for our capital needs. We decide how to allocate our capital resources as part of our strategic planning process. We base this in part on the relative returns on capital using both EC and regulatory capital measures. We plan for severe stresses and we set out what action we would take if an extremely severe stress threatened our viability and solvency. This could include not paying dividends, selling assets, reducing our business and issuing more capital.
Risk measurement (unaudited) We apply Banco Santander’s approach to capital measurement and risk management for CRD IV. Santander UK Group Holdings plc is classified as a significant subsidiary of Banco Santander SA. For more on the CRD IV risk measurement of our exposures, see Banco Santander’s Pillar 3 report. For more on our capital, see our Additional Capital and Risk Management Disclosures on www.aboutsantander.co.uk.
Key metrics (unaudited) The main metrics we use to measure capital risk are:
Key risk metrics Description
CET1 capital ratio CET1 capital divided by RWAs.
Total capital ratio Total capital divided by RWAs.
UK leverage ratio CRD IV end-point Tier 1 capital divided by leverage exposure.
Stress testing (unaudited) Each year we create a capital plan, as part of our ICAAP. We share our ICAAP with the PRA. The PRA then tells us how much capital (Pillar 2A), and of what quality, it thinks we should hold on top of our Pillar 1 requirements. We also develop a series of economic scenarios to stress test our capital needs and confirm that we have enough regulatory capital to meet our projected and stressed capital needs and to meet our obligations as they fall due. We augment our regulatory minimum capital with internal buffers. We hold buffers to ensure we have enough time to take action against unexpected movements.
Strategic Report Governance Risk review Financial review Financial statements Shareholder information
Capital risk
139Santander UK Group Holdings plc

Annual Report 2019 | Risk review
140 Santander UK Group Holdings plc
Risk mitigation (unaudited) We have designed our capital risk framework, policies and procedures to ensure that we operate within our Risk Appetite. We manage capital transferability between our subsidiaries in line with our business strategy, our risk and capital management policies, and UK laws and regulations. There are no legal restrictions on us moving capital resources promptly, or repaying liabilities, between the Company and its subsidiaries except for distributions between Santander UK entities in the ring-fenced bank sub-group and Santander UK entities that are not members of the ring-fenced bank sub-group, where the PRA is required to assess the impact of proposed distribution prior to payment. For details on our Recovery framework in the event of a capital stress, see the risk mitigation section in the ‘Liquidity risk’ section.
From 1 January 2019, following the implementation of ring-fencing, Santander UK plc, Cater Allen Limited and certain other non-regulated subsidiaries within the ring-fenced bank entered into a capital support deed dated 13 November 2018 (the RFB Sub-Group Capital Support Deed). The parties to the RFB Sub-Group Capital Support Deed are permitted by the PRA to form a core UK group, as defined in the PRA Rulebook, a permission which will expire on 31 December 2021. Exposures of each of the regulated entities to other members of the core UK group are exempt from large exposure limits that would otherwise apply. The purpose of the RFB Sub-Group Capital Support Deed is to facilitate the prompt transfer of available capital resources from, or repayment of liabilities by, the non-regulated parties to any of the regulated parties in the event that one of the regulated parties breaches or is at risk of breaching its capital resources requirements or risk concentrations requirements.
From 1 January 2019, as a result of ring-fencing, Santander UK Group Holdings plc, SFS and Santander Equity Investments Limited entered into a capital support deed dated 13 November 2018 (the NRFB Capital Support Deed) which expires on 31 December 2021. The purpose of the NRFB Capital Support Deed is to facilitate the prompt transfer of available capital resources from, or repayment of liabilities by, the non-regulated parties to any of the regulated parties in the event that one of the regulated parties breached or was at risk of breaching its capital resources requirements or risk concentrations requirements.
Prior to 1 January 2019, Santander UK plc, SFS and Cater Allen Limited, which are the PRA-regulated entities within the Santander UK group, were party to a capital support deed dated 23 December 2015 (the Capital Support Deed 2015) with Santander UK Group Holdings plc and certain other non-regulated subsidiaries of Santander UK plc. The core UK group permission as supported by the Capital Support Deed 2015 expired on 31 December 2018.
Other than the change of the entities in scope, the purpose of the RFB Sub-Group Capital Support Deed and the NRFB Capital Support Deed is the same as the previous Capital Support Deed 2015.
Risk monitoring and reporting (unaudited) We monitor and report regularly against our capital plan. We do this to identify any change in our business performance that might affect our capital. Each month, we also review the economic assumptions we use to create and stress test our capital plan. We do this to identify any potential reduction in our capital.
CAPITAL RISK REVIEW
2019 compared to 2018 (unaudited) Our CET1 capital ratio increased 110bps to 14.3% at 31 December 2019 (2018: 13.2%), through active RWA management.
CET1 capital was stable at £10.4bn, with ongoing capital accretion through profits retained after dividend payment, offset by market-driven pension movements.
Our total capital ratio increased to 21.6% at 31 December 2019 (2018: 19.1%).
RWAs reduced largely as a result of significant risk transfer (SRT) securitisations and lower lending in our corporate business as we continue to focus on risk-weighted returns. This was partially offset by increased RWAs in Retail Banking with lending growth in mortgages and consumer (auto) finance.
Impact of IFRS 9 on regulatory capital
Although the adoption of IFRS 9 in 2018 did not have a material impact on our capital position, we expect our ECL-based provisions to be more volatile than our IAS 39 incurred loss-based provision as our ECL methodology takes account of forward-looking data and covers a range of possible economic outcomes. This is likely to impact our CET1 capital levels, and result in increased pro-cyclicality of risk-based capital and leverage ratios. However, the impact is currently mitigated by our surplus of ECL over provisions for exposures using the IRB approach. For such exposures (which include residential mortgages) the adverse impact on CET1 capital of provision increases from reserve movements is offset by the related reduction of the negative CET1 capital adjustment for regulatory expected loss amounts. Furthermore, the EU transition arrangements for the capital impact of IFRS 9 mean that adverse CET1 effects from increases in ECL-based provisions from the level of such provisions at 1 January 2018 are partly reduced until the end of 2022.
We reflect projections of ECL provisions in our capital position forecasting under base case and stress scenarios for ICAAP and capital management purposes. We also consider the dynamics of ECL in how we assess, monitor and manage capital risk. The greater volatility from IFRS 9 ECL could result in material favourable and unfavourable swings to our Income Statement. Whilst the initial impacts of IFRS 9 were based on estimates prepared in a supportive economic environment, a period of economic instability could significantly impact our results and our financial assets. It could also impact the amount of capital we have to hold. We take into account the volatility of ECL in our capital planning strategy.
Bank of England stress testing (unaudited) The results of the latest round of PRA stress tests were released in December 2019. As a result of the exercise, the Bank of England did not require Santander UK to undertake any actions. We had the lowest stressed CET1 capital ratio impact of all participating firms, reflecting our prudent risk management, high credit quality and balance sheet resilience.
With a stressed CET1 capital ratio of 10.8% after allowed management actions and on an IFRS 9 transitional basis, we were well above the PRA threshold requirement of 8.1%. Additionally, with a stressed leverage ratio of 3.8% after allowed management actions, we were above the PRA threshold requirement of 3.57%.
Since the introduction of IFRS 9 on 1 January 2018, the stress test results are published on an IFRS 9 transitional and non-transitional basis, over a five-year stress period to the end of 2023. On an IFRS 9 transitional basis, our lowest post-stress CRD IV end-point CET1 capital ratio was modelled to be 9.5% before management actions and 10.8% after allowed management actions. On an IFRS 9 non-transitional basis, our lowest post-stress CRD IV end-point CET1 capital ratio was modelled to be 9.9% before management actions and 10.4% after allowed management actions.
These results are significantly in excess of the CET1 hurdle rate established by the Bank of England of 8.1% on an IFRS 9 transitional basis, and 7.3% on an IFRS 9 non-transitional basis.
Annual Report 2019 | SectionAnnual Report 2019 | Risk review
Santander UK Group Holdings plc140

Santander UK Group Holdings plc 141
Strategic report Governance Risk review Financial review Financial statements Shareholder information
Capital risk
The Bank of England’s CET1 hurdle rate comprises the CRR Pillar 1 minimum of 4.5% together with a Pillar 2A CET1 requirement, an estimate of the applicable Systemic Risk Buffer and an adjustment to offset the pro-cyclical impacts of IFRS 9. We have been subject to a Pillar 2A requirement of 2.7% for CET1 capital from the start of 2020.
On an IFRS 9 transitional basis, our lowest post-stress end-point leverage ratio, over a five-year stress period to the end of 2023, was modelled to be 3.2% before management actions and 3.8% after allowed management actions. On an IFRS 9 non-transitional basis, our lowest post-stress end-point leverage ratio, over a five-year stress period to the end of 2023, was modelled to be 3.3% before management actions and 3.7% after allowed management actions. After allowed management actions, we exceeded the leverage threshold established by the Bank of England of 3.57% on an IFRS 9 transitional and 3.25% on an IFRS 9 non-transitional basis.
Meeting evolving capital requirements (unaudited) We target a CET1 management buffer of sufficient size to absorb volatility in CET1 deductions, capital supply and capital demand whilst remaining above the regulatory CET1 requirement. Distribution restrictions would be expected to be applied if we were unable to meet both our minimum requirement, which consists of the Pillar 1 minimum plus Pillar 2A, and the CRD IV buffers consisting of the Capital Conservation Buffer (CCB), and the Countercyclical Capital Buffer (CCyB) and the Systemic Risk Buffer (SRB) at the level of the RFB Group.
Distance of our CET1 capital ratio to our current MDA trigger level at 31 December 2019 (unaudited) At 31 December 2019, the distance of our CET1 capital ratio of 14.3% to our 7% AT1 permanent write down (PWD) securities trigger was 7.3% of total RWAs or £5.3bn (2018: 6.2% of total RWAs or £4.9bn).
The distance of our CET1 capital ratio to our current maximum distributable amount (MDA) trigger level at 31 December 2019 was:
Current MDA %
Pillar 1 4.5
Pillar 2A(1) 3.2
CCB 2.5
CCyB(2) 1.0
Current MDA trigger 11.2
Distance to current MDA 3.1
Total CET1 capital ratio 14.3
(1) Santander UK’s Pillar 2 CET1 requirement was 3.15% at 31 December 2019. Pillar 2A guidance is a point in time assessment.
(2) The current applicable UK CCyB rate is 1%. Santander UK’s current geographical allocation of the CCyB is 0.98%.
At 1 January 2020, Santander UK Group Holdings plc’s total Pillar 2A requirements reduced to 4.9% and CET1 Pillar 2A requirements reduced to 2.7%.
MREL recapitalisation
We have made major progress to meet MREL requirements. To date, we have issued £7.9bn of MREL compliant senior unsecured bonds. Our forward-looking MREL recapitalisation glide path assumes the Pillar 2A requirement remains at 5.6% and is calculated using RWA, leverage exposures and exchange rates at 31 December 2019. Based on this set of assumptions, our MREL requirements are driven by leverage until 2022. Santander UK’s indicative MREL requirements excluding CRD IV buffer is currently circa. £20bn from 1 January 2022. Assuming the current glide path by 2022, we expect to issue a further £2-3bn of senior unsecured bonds per year to cover the maturities and meet our total 2022 MREL recapitalisation requirement of £10.0bn.
In addition to meeting our minimum requirement, we intend to have an MREL recapitalisation management buffer in excess of the value of Santander UK Group Holdings plc senior unsecured securities that are due to become MREL ineligible over the following six months.
Key capital ratios (unaudited)
Santander UK Group Holdings plc Santander UK plc
2019 2018 2019 2018 % % % %
CET1 capital ratio 14.3 13.2 14.3 13.2
AT1 3.1 2.6 2.7 2.2
Grandfathered Tier 1 0.5 0.4 0.7 0.8
Tier 2 3.7 2.9 4.0 4.1
Total capital ratio 21.6 19.1 21.7 20.3
The total capital difference between Santander UK Group Holdings plc and Santander UK plc was due to the recognition of minority interests. The total subordination available to Santander UK plc bondholders was 21.7% (2018: 20.3%) of RWAs.
Strategic Report Governance Risk review Financial review Financial statements Shareholder information
Capital risk
141Santander UK Group Holdings plc

Annual Report 2019 | Risk review
142 Santander UK Group Holdings plc
Regulatory capital resources This table shows our qualifying regulatory capital.
2019 2018 £m £m
CET1 capital instruments and reserves: – Capital instruments 7,060 7,060
– Retained earnings 6,251 6,439
– Accumulated other reserves and non-controlling interests 554 431
CET1 capital before regulatory adjustments 13,865 13,930
CET1 regulatory adjustments: – Additional value adjustments (35) (42)
– Goodwill (net of tax) (1,155) (1,161)
– Other intangibles (573) (610)
– Fair value reserves related to gains or losses on cash flow hedges (368) (251)
– Negative amounts resulting from the calculation of regulatory expected loss amounts (619) (599)
– Gains or losses on liabilities valued at fair value resulting from changes in own credit standing (5) (67)
– Deferred tax assets that rely on future profitability excluding timing differences (8) (20)
– Defined benefit pension fund assets (502) (631)
– Dividend accrual (18) (18)
– IFRS 9 Transitional Adjustment 16 21
– Deductions for non-controlling interests (160) (151)
CET1 capital 10,438 10,401
AT1 capital instruments: – Capital instruments 2,241 2,041
– Amount of qualifying items subject to phase out from AT1 487 593
– Regulatory deductions for instruments issued by subsidiary undertakings (83) (268)
AT1 capital 2,645 2,366
Tier 1 capital 13,083 12,767
Tier 2 capital instruments: – Capital instruments 2,901 2,888
– Amount of qualifying items subject to phase out from Tier 2 377 369
– Regulatory deductions for instruments issued by subsidiary undertakings or subject to CRDIV amortisation (583) (986)
Tier 2 capital 2,695 2,271
Total regulatory capital(1) 15,778 15,038
(1) Capital resources include a transitional IFRS 9 benefit at 31 December 2019 of £16m (2018: £21m).
2019 compared to 2018 (unaudited) CET1 capital was stable at £10.4bn, with ongoing capital accretion through profits retained after dividend payment, offset by market-driven pension movements.
Movements in regulatory capital (unaudited):
CET1 Capital AT1 Capital Tier 2 capital Total £m £m £m £m
At 1 January 2019 10,401 2,366 2,271 15,038
– Retained earnings (188) – – (188)
– Other reserves and non-controlling interests 123 – – 123
– Additional value adjustments 7 – – 7
– Goodwill (net of tax) 6 – – 6
– Other intangibles 37 – – 37
– Fair value reserves related to gains and losses on cash flow hedges (117) – – (117)
– Negative amounts resulting from the calculation of regulatory expected loss amounts (20) – – (20)
– Gains or losses on liabilities valued at fair value resulting from changes in own credit standing 62 – – 62
– Deferred tax assets that rely on future profitability excluding timing differences 12 – – 12
– Defined benefit pension fund assets 129 – – 129
– Dividend accrual – – – –
– Deductions for non-controlling interests (9) – – (9)
– Capital instruments – 200 13 213
– IFRS 9 Transitional Adjustment (5) – – (5)
– Amount of qualifying items subject to phase out from AT1 – (106) – (106)
– Amount of qualifying items subject to phase out from Tier 2 – – 8 8
– Deductions for instruments issued by subsidiary undertakings or subject to CRD IV amortisation – 185 403 588
At 31 December 2019 10,438 2,645 2,695 15,778
Annual Report 2019 | SectionAnnual Report 2019 | Risk review
Santander UK Group Holdings plc142

Santander UK Group Holdings plc 143
Strategic report Governance Risk review Financial review Financial statements Shareholder information
Capital risk
CET1, AT1 and Tier 2 regulatory adjustments These are adjustments required by CRD IV.
AT1 capital These are preference shares and innovative/hybrid Tier 1 securities. None of the instruments we issued before 1 January 2014 fully meet the CRD IV AT1 capital rules, which apply from that date. These instruments will be phased out by CRD IV rules which restrict their recognition as capital. The £750m Fixed Rate Reset Perpetual AT1 Capital Securities (net of issuance costs), the £800m Perpetual Capital Securities and the £500m Perpetual Capital Securities we issued since then fully meet the CRD IV AT1 capital rules.
In August 2019, as part of a capital management exercise, the Company purchased and redeemed the £300m Fixed Rate Reset Perpetual AT1 Capital Securities, and issued a further £500m Fixed Rate Reset Perpetual AT1 Capital Securities to Banco Santander SA.
Tier 2 capital These are fully CRD IV eligible Tier 2 instruments and grandfathered Tier 2 instruments whose recognition as capital is being phased out under CRD IV.
Risk-weighted assets (unaudited) The tables below are consistent with our regulatory filings for 2019 and 2018. For more on our RWAs, see our Additional Capital and Risk Management Disclosures on www.aboutsantander.co.uk.
2019 2018 RWAs by risk £bn £bn
Credit risk 64.1 67.7
Counterparty risk 1.5 2.5
Market risk 0.3 1.0
Operational risk 7.3 7.6
73.2 78.8
2019 2018
RWAs by segment £bn £bn
Retail Banking 49.0 46.2
Corporate & Commercial Banking 12.5 17.0
Corporate & Investment Banking 4.9 7.2
Corporate Centre 6.8 8.4
73.2 78.8
Movements in RWAs by risk:
Credit/ counterparty
risk Market risk Operational
risk Total £bn £bn £bn £bn
At 1 January 2019 70.2 1.0 7.6 78.8
Asset size (2.1) (1.0) – (3.1)
Asset quality 0.7 0.9 – 1.6
Model updates (1.8) – – (1.8)
Methodology and policy (1.4) – – (1.4)
Acquisitions and disposals – – – –
Foreign exchange movements – – – –
Other – (0.6) (0.3) (0.9)
At 31 December 2019 65.6 0.3 7.3 73.2
2019 compared to 2018 (unaudited) RWAs reduced largely as a result of significant risk transfer (SRT) securitisations and lower corporate lending as we continue to focus on risk-weighted returns. This was partially offset by increased RWAs in Retail Banking in line with mortgage lending growth.
We use SRT securitisation transactions to manage and diversify credit and other risks, and to manage capital requirements. Currently, we have SRT securitisation transactions which cover portfolios of corporate facilities and Consumer Finance loans.
Strategic Report Governance Risk review Financial review Financial statements Shareholder information
Capital risk
143Santander UK Group Holdings plc

Annual Report 2019 | Risk review
144 Santander UK Group Holdings plc
Regulatory leverage (unaudited) The CRD IV rules include the requirements to use a leverage ratio to complement risk-based capital ratios. The UK leverage ratio is consistent with the leverage ratio applied to large UK banks under the framework defined by the Financial Policy Committee. This framework also specifies the minimum leverage ratio requirement.
The table below shows our leverage ratio, which we calculated using the PRA rules. Our ratio was greater than the minimum of 3.25% at 31 December 2019 and 2018.
2019 2018
£m £m
Regulatory exposure 269,162 275,551
End-point Tier 1 capital(1) 12,625 12,442
UK leverage ratio 4.7% 4.5%
(1) Includes deductions and AT1 adjustment permitted under the recommendation from the Financial Policy Committee on 25 July 2016.
Under the PRA rules, we adjust our total assets per the Consolidated Balance Sheet to calculate our regulatory exposure for leverage purposes. We do this as follows:
2019 2018 £m £m
Total assets per the Consolidated Balance Sheet 288,488 289,381
Derivatives netting and potential future exposure (1,671) (2,349)
Securities financing current exposure add-on 1,006 812
Removal of IFRS netting 1,191 1,337
Removal of qualifying central bank claims (26,400) (24,776)
Commitments calculated in accordance with Basel Committee Leverage Framework 8,393 13,414
CET1 regulatory adjustments (1,845) (2,268)
269,162 275,551
The adjustments are:
− Derivatives netting and potential future exposure: where a qualifying netting agreement is in place netting is allowed for leverage purposes. This is partially offset by including the PEE we use to calculate EADs
− Securities financing current exposure add-on: we include an add-on for securities financing transactions to show current exposure for leverage purposes − Removal of IFRS netting: where netting of assets and liabilities is allowed under IFRS, but not under the Basel rules, we remove it for leverage purposes − Removal of qualifying central banks claims: permitted under the recommendation of the FPC on 25 July 2016, under CRD IV rules the exposure measure does not
allow the removal of qualifying central bank deposits or claims − Commitments calculated in accordance with Basel Committee Leverage Framework: we add the gross value of off-balance sheet commitments for leverage
purposes after we apply regulatory credit conversion factors − CET1 regulatory adjustments: where we have deducted assets from CET1, they can be deducted for leverage purposes.
Distributable items (unaudited) Distributable items are equivalent to distributable profits under the UK Companies Act 2006. The distributable items of Santander UK Group Holdings plc under CRD IV at 31 December 2019 and 2018, and movements in the year, were as follows:
2019 2018 £m £m
At 1 January 4,221 4,209
Dividends approved:
– AT1 Capital Securities (142) (145)
– Tax on above item 38 27
– Ordinary shares (262) (1,123)
Dividends receivable:
– Investment in AT1 Capital Securities 125 139
– Tax on above item (34) (28)
– Investment in ordinary shares of subsidiary 323 1,139
Other income statement items (Company) (7) 3
At 31 December 4,262 4,221
Annual Report 2019 | SectionAnnual Report 2019 | Risk review
Santander UK Group Holdings plc144

Santander UK Group Holdings plc 145
Strategic report Governance Risk review Financial review Financial statements Shareholder information
Pension risk
Pension risk (UNAUDITED)
Overview
Pension risk is the risk caused by our contractual or other liabilities with respect to a pension scheme (whether set up for our employees or those of a related company or otherwise). It also refers to the risk that we will need to make payments or other contributions with respect to a pension scheme due to some other reason.
In this section, we explain how we manage and mitigate pension risk, including our investment and hedging strategies. We also provide some insight on how we are monitoring different Brexit scenarios and their potential impact on pension risk.
Key metrics
Funding Deficit at Risk was £1,520m (2018: £1,410m)
Funded defined benefit pension scheme accounting surplus was £431m (2018: £766m)
OUR KEY PENSION RISKS
Sources of risk
Pension risk is one of our key financial risks. Santander UK plc is the sponsor of the Santander (UK) Group Pension Scheme (the Scheme), a defined benefit scheme. Our risk is that over the long-term the Scheme’s assets are not enough to meet its liabilities as they fall due. When this happens, we could have to (or choose to) make extra contributions. We might also need to hold more capital to reflect this risk.
The key pension risk factors the Scheme is exposed to are:
Key risks Description
Interest rate risk The risk that a decrease in (long-term) interest rates causes an increase in the value of the Scheme’s liabilities that are not matched by an increase in the value of its assets.
Inflation risk Annual pension increases are directly linked to RPI or CPI. The risk is that an increase in inflation causes an increase in the value of the Scheme’s liabilities that are not matched by an increase in the value of its assets.
Longevity risk The Scheme’s liabilities are in respect of current and past employees and are expected to stretch beyond 2080 due to the long-term nature of the obligation. Therefore, the value of the Scheme’s liabilities is also impacted by changes to the life expectancy of Scheme members over time.
Investment risk The risk that the return on the Scheme’s assets is insufficient to meet the liabilities.
The accounting and regulatory capital can be sensitive to changes in the assumptions of these key risk factors.
For more on our defined benefit schemes, see Note 28 to the Consolidated Financial Statements. This includes a sensitivity analysis of our key actuarial assumptions.
Defined contribution schemes
We also have defined contribution schemes for some of our employees. The benefits received at retirement will mainly depend on the contributions made (by both the employees and us) and the performance of the investments which are typically chosen by employees. These schemes carry far less market risk for us, although we are still exposed to operational and reputational risks. To manage these risks, we monitor the administration performance of the provider and the performance of the investment funds and the costs met by members. We ensure our employees are given enough information about their investment choices.
For more on our defined contribution schemes, see Note 28 to the Consolidated Financial Statements.
The impact of our defined benefit schemes on capital
We take account of the impact of pension risk on our capital as part of our stress testing process. This includes our ICAAPs, PRA stress tests and our quarterly assessment of capital requirements. We also consider the impact of any changes proposed to the Scheme or its investment strategy.
Our defined benefit pension schemes affect capital in two ways:
− We treat an IAS 19 deficit as a liability on our balance sheet. We recognise movements in a deficit through Other Comprehensive Income and so this reduces our shareholders’ equity and CET1 capital. Deficit movements on the balance sheet are mainly due to re-measurements, including actuarial losses. We treat an IAS 19 surplus as an asset on our balance sheet. This increases shareholders’ equity. However, it is deducted for the purposes of determining CET1 capital. An IAS 19 surplus or deficit on our balance sheet is partially offset by a deferred tax liability or asset, respectively. These may be recognised for calculating CET1 capital depending on our overall deferred tax position at that time.
− The PRA takes pension risk into account in the Pillar 2A capital assessment through the annual ICAAP exercise. The Pillar 2A requirement forms part of our overall regulatory minimum requirement for CET1 capital, Tier 1 capital and total capital. We perform a quarterly assessment internally. For more on our minimum regulatory requirements, see the ‘Capital risk’ section.
Strategic Report Governance Risk review Financial review Financial statements Shareholder information
Conduct and
regulatory risk
Strategic Report Governance Risk review Financial review Financial statements Shareholder information
Pension risk
145Santander UK Group Holdings plc

Annual Report 2019 | Risk review
146 Santander UK Group Holdings plc
PENSION RISK MANAGEMENT
Scheme governance
The Scheme operates under a trust deed. Santander (UK) Group Pension Scheme Trustees Limited (the Trustee), is a wholly owned subsidiary of the Santander UK group. The Trustee ensures that the Scheme is run properly, and that members' benefits are secure. It delegates investment decisions within ranges determined in the Statement of Investment Principles to the board of Santander (CF Trustee) Limited (the CF Trustee). The CF Trustee is responsible for reviewing, agreeing and implementing investment strategies, with our input as and when needed. Every month, we discuss pension-related matters at our Pensions Committee and Pension Risk Forum. For example, our Pensions Committee reviews the Scheme’s investment strategies and approves actuarial valuations. The Pension Risk Forum is a Risk division management forum that monitors our pension risk within approved risk appetite and policies. We work with the Trustee to ensure that the Scheme is adequately funded but our responsibilities are clearly segregated from the Trustee’s.
Risk appetite
Our risk appetite is a key consideration in all decisions and risk management activities related to the Scheme. Our pension risk appetite is reviewed by our Pensions Committee at least once a year. It is then sent to the Board for approval. We measure pension risk on both a technical provisions (funding) basis and an accounting basis (in line with IAS 19 ‘Employee Benefits’). We manage pension risk on both the accounting and the funding basis. Both bases are inputs into our capital calculations.
Risk measurement
Our key risk metrics include:
Key risk metrics Description
Funding Deficit at Risk We use a VaR and a forward-looking stress testing framework to model the Scheme’s assets and liabilities to show the potential deterioration in the current funding position. This ensures we adequately capture the risks, diversification benefits and liability matching characteristics of the obligations and investments of the Scheme. We use a time period of 1 year and a 95% confidence interval in our VaR model.
Required Return This estimates the return required from the Scheme’s assets each year to reach a pre-defined funding target by a fixed date in the future.
Pensions CET1 Volatility We use a VaR and a forward-looking stress testing framework to model the volatility in the pension-related capital deduction. We use a time period of 1 year and a 95% confidence interval in our VaR model.
We perform stress tests for regulators, including for ICAAPs and PRA stress tests. The stress testing framework allows us to also consider how macroeconomic events could impact the Scheme’s assets and liabilities. For more on our stress testing, see the Risk Governance section.
Risk mitigation
The key tools we use to maintain the above key risk metrics within appetite are:
Key tools Description
Investment strategies The Trustee developed the following investment objectives to reflect their principal duty to act in the best interests of the Scheme beneficiaries:
− To maintain a diversified portfolio of assets of appropriate suitability, quality, security, liquidity and profitability which will generate income and capital growth to meet, together with new contributions from members and the employers, the cost of current and future benefits which the Scheme provides, as set out in the Rules of the Scheme
− To limit the risk that the assets fail to meet the liabilities
− To invest in a manner appropriate to the nature and duration of the expected future retirement benefit payments under the Scheme
− To minimise the long-term costs of the Scheme by maximising asset returns net of fees and expenses whilst reflecting the objectives above.
The investment strategy is regularly reviewed. The impact of the investment strategy on Funding Deficit at Risk is considered. This assessment includes the changing impact of different forward-looking stress tests as the asset allocation evolves over time, as the profile of the Scheme evolves on the journey to lower dependence on Santander UK. Fund managers are also reviewed annually to ensure the investments remain appropriate for the Scheme.
Hedging strategies The Trustee has a hedging strategy to reduce key market risks, mainly interest rate and inflation risk. This includes investing in suitable fixed income and inflation-linked assets and entering into interest rate and inflation hedges.
The CF Trustee also hedges some of its equity and currency risk. This is achieved by using equity put options, equity collars and other derivatives that provide downside protection. Currency hedging is used to reduce risks from investing in assets denominated in currencies other than sterling. The hedging of interest rate and inflation risk in particular reduce Funding Deficit at Risk.
We look at the impact on our risk metrics when determining the appropriateness of the investment and hedging strategies. We also use the impact on our risk metrics to propose changes to optimise these strategies.
Risk monitoring and reporting
We monitor pension risk each month and report on it at Pension Risk Forum, ERCC, Pensions Committee and, where thresholds are exceeded (or likely to be), to the Board Risk Committee and the Board in line with our pension risk appetite. We discuss any remedial action with the Trustee. For all key risk metrics, we determine tolerance levels for deterioration based on our risk appetite. We use red, amber, green triggers to indicate our position relative to those risks. Green means the risk level is acceptable, amber means that close monitoring is required and red means action is needed. We report all key risk metrics against these triggers to Pensions Committee and Pension Risk Forum each month. We take actions to reduce risk to an acceptable level where the position looks likely to exceed the red trigger level.
In addition, we monitor the performance of third parties who support the valuation of the Scheme’s assets and liabilities. The models they use are reviewed and validated by our internal model validation team and approved by the model risk committee. Every year, we carry out a full analysis of the assumptions we use which is considered by the Board Audit Committee and Pensions Committee. We ensure that we carry out consistency checks for all liability calculations supplied by third parties. We obtain audited figures of the asset values from the appointed investment manager. Independent audits are then carried out on behalf of the custodian. We also apply our own checks to make sure that the asset values provided are consistent with expectations.
Annual Report 2019 | SectionAnnual Report 2019 | Risk reviewAnnual Report 2019 | Risk review
Santander UK Group Holdings plc146

Santander UK Group Holdings plc 147
Strategic report Governance Risk review Financial review Financial statements Shareholder information
Pension risk
PENSION RISK REVIEW
2019 compared to 2018
Following significant interest rate hedging in 2018, the underlying level of risk in the Scheme remained broadly stable in 2019. No further interest rate or inflation hedging took place, and asset allocation changes were relatively small. The focus was mainly on agreeing the 31 March 2019 actuarial valuation and the future plans for further hedging and asset allocation in light of the results of that valuation. However, the reported risk figures increased marginally as falling gilt and corporate bond yields increased the overall size of the Scheme.
Risk monitoring and measurement
Our main focus is to ensure the Scheme achieves the right balance between risk and reward whilst minimising the impact on our capital and financial position. In 2019, overall asset returns were positive with positive performance from all major asset classes. The Funding Deficit at Risk increased to £1,520m (2018: £1,410m). Our long-term objective is to reduce the risk of the Scheme and eliminate the deficit on the funding basis.
On the funding basis, the interest rate hedging ratio was 64% (2018: 68%) and the inflation hedging ratio was 63% (2018: 67%) at 31 December 2019.
We also monitor the potential impact from variations in the IAS 19 position on CET1 capital. This metric was broadly stable over 2019. For more on the impact of our defined benefit schemes on capital in 2019, see the ‘Capital risk’ section.
Accounting position
In 2019, the accounting surplus of the Scheme and other funded schemes decreased. Some sections in the Scheme had a surplus of £670m at 31 December 2019 (2018: £842m) whilst other sections had a deficit of £239m (2018: £76m). The overall position was £431m surplus (2018: £766m surplus). There were also unfunded scheme liabilities of £41m at 31 December 2019 (2018: £39m). The deterioration in the overall position was mainly driven by a decrease in the discount rate in the year. This was due to falling corporate bond yields which increased the value of liabilities. However, this was partially offset by a rise in overall asset values. For more on our pension schemes, including the current asset allocation and our accounting assumptions, see Note 28 to the Consolidated Financial Statements.
Maturity profile of undiscounted benefit payments
The Scheme’s obligation to make benefit payments extends over the long-term. This is expected to stretch beyond 2080. The graph below shows the maturity profile of the undiscounted benefit payments expected to be paid from the Scheme over its life at 31 December 2019 was:
Brexit risk monitoring
In 2019, as part of our pension risk monitoring process we considered different scenarios and how they might impact the funding level in the Scheme. This allowed us to identify a risk of deterioration in the funding level which was beyond our risk tolerance.
The potential deterioration in the funding level was due to a number of factors, one of which was the risk of falls in equity values. The downside protection that the Scheme employs on its equity portfolio reduced the equity volatility in this scenario. This protection includes the use of equity put options, equity collars and other derivatives.
Another factor we identified from our analysis was that some exposure to overseas currencies brings diversification benefits in some stress scenarios because this analysis is then input into the CF Trustees foreign exchange hedging strategy.
Both these actions reduced our Funding Deficit at Risk in our scenarios.
Pensioners (including dependants)
Un
dis
cou
nte
d b
enefi
t p
aym
ents
(£m
)
Deferred members Active members
0
100
200
300
400
500
600
2020 2050 2105
Strategic Report Governance Risk review Financial review Financial statements Shareholder information
Conduct and
regulatory risk
Strategic Report Governance Risk review Financial review Financial statements Shareholder information
Pension risk
147Santander UK Group Holdings plc

Annual Report 2019 | Risk review
148 Santander UK Group Holdings plc
Conduct and regulatory risk (UNAUDITED)
Overview We manage the conduct and non-financial regulatory risk types in one framework. We do this to reflect their similarities.
Conduct risk is the risk that our decisions and behaviours lead to a detriment or poor outcome for our customers. It also refers to the risk that we fail to hold and maintain high standards of market integrity.
Regulatory risk is the risk of financial or reputational loss, imposition of or conditions on regulatory permission, as a result of failing to comply with applicable codes, regulator’s rules, guidance and regulatory expectations.
We are committed to ensuring conduct strategy is embedded in our business and that the fair treatment of our customers is at the heart of what we do.
In this section, we explain how we manage conduct and regulatory risk. We also describe our main conduct provisions, with a focus on PPI, and give some insight into our work to protect younger consumers from fraud and scams, by raising awareness through a social media campaign with Kurupt FM.
Key metrics PPI provision was £189m (2018: £246m)
Other conduct provision was £25m (2018: £30m)
Regulatory provisions principally comprised £68m (2018: £58m)
OUR KEY CONDUCT AND REGULATORY RISKS
We believe that delivering a Simple, Personal and Fair bank starts with meeting the needs and expectations of our customers. To achieve this, we are committed to making sure that our strategy, proposition and initiative approval process, and systems, operations and controls are well designed and delivered.
We see our key exposure to conduct and regulatory risk through:
– the risk of errors in our product design, sales practices, post-sale servicing, operational processes, complaint handling, and – failure to supervise, monitor and control the activities of our employees.
All of these may result in the risk that we do not meet our customers’ needs, align to the expectations of our regulators or deliver the expected outcomes or observe required standards of market behaviour.
Our Conduct and Regulatory Framework is built on the following underlying types of risk:
Key risks Description
Regulatory The risk that we fail to adhere to relevant laws, regulations and codes which could have serious financial, reputational and customer impacts. This includes the risk that we may be adversely impacted by changes and related uncertainty around UK and international regulations. We categorise regulatory risk into financial and non-financial risk. This is aligned to our main regulators who are the PRA and FCA but also includes other regulators and authorities such as the CMA, Payment Systems Regulator, Lending Standards Board, Financial Ombudsman Service and Information Commissioner’s Office.
As well as being subject to UK regulation, as part of the Banco Santander group, we are impacted indirectly through regulation by the Banco de España (the Bank of Spain) and, at a corporate level, by the ECB through the SSM. We also fall within the scope of US regulation, including the Dodd-Frank Wall Street Reform and Consumer Protection Act. This restricts our activities both in the UK and the US. We must also adhere to the rules and guidance of other regulators and voluntary codes in the UK.
Product The risk that we offer products and services that do not result in the right outcomes for our customers.
Sales The risk that we sell products and services to our customers without giving them enough information to make an informed decision or we do not provide correct advice.
After-sale and servicing The risk that failures of our operations, processes, servicing activity, IT or controls result in poor outcomes for our customers. This includes the risks that:
− We do not give appropriate after-sale communications to customers, making it difficult for them to contact us, or we fail to take account of a customer’s vulnerability
− We do not have robust systems and controls to detect and prevent fraud or errors in the customer experience.
Culture The risk that we do not maintain a culture that encourages the right behaviour and puts the customer at the heart of what we do.
Competition The risk of financial harm, criminal liability, customer harm or reputational damage that we may incur because we fail to comply with relevant competition law or being involved in any competition law investigation or proceedings.
Controls The risk that we do not supervise and monitor our employees effectively or do not have robust systems and controls in place to prevent and detect misconduct.
Annual Report 2019 | SectionAnnual Report 2019 | Risk review
Santander UK Group Holdings plc148

Santander UK Group Holdings plc 149
Strategic report Governance Risk review Financial review Financial statements Shareholder information
Conduct and regulatory risk
CONDUCT AND REGULATORY RISK MANAGEMENT
Risk appetite
We aim to comply with all regulatory requirements, and we have no appetite to make decisions or operate in a way that leads to unfair outcomes for our customers or negatively impacts the market. Our Board approves our risk appetite on an annual basis, or more often if needed, and we cascade it to our business units through our risk framework and policies. We also have lower level risk tolerance thresholds that are agreed at least annually. Our material conduct and regulatory risk exposures are subject to, and reported against, our conduct and regulatory risk appetite statements, as well as lower level triggers and thresholds for action.
Risk measurement
Due to the close links between our conduct, regulatory and operational risk frameworks, our tools to identify, assess, manage and report operational risks also apply where such exposures and risks have a conduct and/or regulatory risk impact. We support our conduct and regulatory risk framework and policies with tools that aim to identify and assess new and emerging conduct risks. These include:
Key tools Description
Strategy and business
planning
Our Strategy and Corporate Development team help align our overall corporate strategy, financial plans, risk appetite and operational capabilities through our annual process to set our strategy. We derive our business unit plans from our overall corporate strategy and they contain a view of conduct and regulatory risk with our other key risk types.
Sales quality assurance We subject our retail sales to internal quality assurance and, as needed, external monitoring to ensure the quality of our sales and practices.
Operational risk and
control assessments
Our business and business support units assess our operational risks, systems and controls to give us a consolidated risk view across all our business areas. We complete the assessments through a central tool to evaluate and manage our residual risk exposures.
Scenario testing and
horizon scanning
We consider conduct and regulatory risk in our scenario testing. This reviews possible root causes and assumptions to determine the likelihood and size of the impact, and actions to enhance our controls where required.
Conduct risk reporting We use dashboards to give us an end-to-end view of our conduct risks across our business. This allows us to apply a lens to manage conduct risk and understand if it is in line with our risk appetite.
Compliance monitoring We carry out an annual conduct and regulatory risk assurance programme which is approved by the Board and tracked through the year.
Risk mitigation
Our conduct and regulatory risk framework and policies set out the principles, standards, roles and responsibilities and governance for conduct and regulatory risk, such as:
Policies Description
Product approval Our product approval process aims to minimise our conduct, legal, regulatory or reputational risks in the design, marketing, sales and service of new products and services. We assess all our products and services within a formal framework to make sure they are within our risk appetite and agreed metrics, and to ensure that processes and controls are in place.
Suitable advice for customers We give guidance to advisers and staff on the key principles, requirements and ethical behaviours they must follow. This ensures our customers are sufficiently informed when they make a buying decision. In our Retail Banking division, the main products we cover are mortgages, investments, savings and protection.
Training and competence In line with the expectations of our regulators, we train our staff and require them to maintain an appropriate level of competence (in line with their role and responsibilities) to ensure customers achieve fair outcomes. We invest in all our people to ensure that we achieve our mandatory risk objectives and that everyone acknowledges their personal responsibility for risk management through our I AM Risk approach.
We place a specific focus on:
– Vulnerability: Ensuring that our colleagues are trained to help customers who may be vulnerable (see below).
– Financial abuse: We work closely with other members of UK Finance, as part of the Financial Abuse Working Party, with a shared vision to help victims regain control of their finances. Through this collaboration we have adopted a Financial Abuse Code of Practice as part of our overall vulnerable customer strategy. We have specific training material for colleagues to raise awareness and improve understanding around the devastating impacts of financial abuse and how we can help. Due to the very complex nature of situations involving financial abuse, we also have a dedicated Specialist Support Team that offers guidance to colleagues dealing with customers who are victims and need tailored solutions to help them regain control of their finances.
Treating vulnerable
customers fairly
Some customers may be impacted financially or personally as a result of their circumstances. Our Vulnerable Customer Policy gives business areas a clear and consistent understanding of what vulnerability can mean and the types of situations when customers may need more support. Our guidelines focus on identifying vulnerable customers, and the support we can give to help them avoid financial difficulty. We work with key charities, authorities, trade associations and other specialists to develop our understanding of vulnerability.
In addition to mandatory training, we train our customer-facing colleagues using real customer scenarios to highlight different vulnerable situations. This enables our colleagues to deal with a wide range of sensitive issues. We also have an online Vulnerable Customer Support Tool for our colleagues to give them more guidance and support. Our colleagues have access to our Specialist Support Team who can give specific help and guidance for the most complex vulnerable customer situations.
We consider vulnerability in every initiative. Adapting our technology to the needs of customers with physical disabilities is a key part of our design and testing stages and we work closely with the Digital Accessibility Centre. We have also developed our training approach through a series of real-life customer stories available to colleagues to access anytime to develop their skills.
Risk monitoring and reporting
We consider conduct and regulatory risk as part of the governance around all our business decisions. We have specific fora and committees such as the Conduct and Compliance Forum, and business specific risk management fora to make decisions on conduct and regulatory risk matters and we ultimately report to the ERCC and Board Responsible Banking Committee. The data we report to senior management and Committees gives them a clear understanding of current and potential emerging conduct and regulatory risks and issues. Our risk and control fora support management to control risks in their business units. Reporting includes conduct risk dashboards, which set out a range of metrics across common areas. These include policy breaches logged, mystery shopping, quality assurance and complaints, as well as commentary on trends and root causes. This approach enables us to take effective action. As well as the reports issued by the business, our Legal and Regulatory Division reports directly to the Board to give a view on legal, conduct and regulatory, reputational and financial crime risks, and to escalate issues or any breach of our risk appetite.
Strategic Report Governance Risk review Financial review Financial statements Shareholder information
Conduct and
regulatory risk
149Santander UK Group Holdings plc

Annual Report 2019 | Risk review
150 Santander UK Group Holdings plc
CONDUCT AND REGULATORY RISK REVIEW
2019 compared to 2018 In 2019, to ensure we fully considered customer and conduct impacts across our business, we continued to maintain a strong focus on robust oversight and control of the full customer journey. We maintain Compliance teams across all our key business divisions and on key cross functional areas such as fraud and data protection. Conduct and regulatory risk frameworks are in place across all business divisions that operate alongside our wider Risk Framework to identify, assess, manage and report conduct and regulatory risk.
In 2019, we continued to build on our progress in 2018 and remained vigilant in taking a customer-focused approach in developing strategy, products and policies that support fair customer outcomes and market integrity. As part of this, we:
– Assessed the views and new policy areas in the FCA’s 2019/20 Business Plan and built them into our three-year business planning activities, in addition to considering regulatory developments that arose during the course of the year
– Continued to manage technological change and increased digitalisation in line with regulatory initiatives – Delivered change to meet the evolving regulatory landscape, including changes brought about by Second Payment Services Directive (PSD2) and Open Banking;
General Data Protection Regulation; Banking Reform and implementing the Banking Reform compliance model; and the FCA Consumer Protection Agenda – Continued to prepare for the transition from LIBOR to risk-free rates at the end of 2021, including planning for customer communications and recognition of
potential conduct risks, and – Developed specific conduct risk training to strengthen the business wide I AM Risk training.
Following the launch of the Contingent Reimbursement Model, a voluntary code of good practice for dealing with authorised push payment fraud, we agreed along with seven other banks to a funding loan for no-blame cases. We continue to engage with the industry and authorities in developing the code.
Like all UK banks we continue to see a demanding regulatory agenda focused on addressing customer detriment, price regulation and vulnerability. A major conduct issue that has impacted UK banks over the past few years related to PPI. A deadline for customer complaints of 29 August 2019 was set by the FCA, and in the run up to this date we saw an uplift in the volume of claims to unprecedented levels, which resulted in us making additional provisions to cover this. When implementing regulatory change, we are focused on ensuring that our strategy, leadership, governance arrangements, and approach to managing and rewarding staff does not lead to a detrimental impact on our customers, competition, or to market integrity. We expect all people in our organisation to take responsibility for managing risk through our I AM Risk programme.
Accounting position The remaining provision for PPI redress and related costs was £189m (2018: £246m). In 2019, we charged an additional £169m in respect of PPI. We made an additional provision of £70m in Q2 2019 reflecting an increase of claims volumes and additional industry activities and having considered guidance provided by the FCA and our specific approach to PPI claims, in advance of the PPI claims deadline on 29 August 2019. In Q3 2019, and in line with industry experience, we received unprecedented volumes of information requests in August 2019 and saw a significant spike in both these requests and complaints in the final days prior to the complaint deadline. Our best estimate of the additional provision required was £99m.
The remaining provision for other conduct issues was £25m (2018: £30m), which primarily relates to the sale of interest rate derivatives.
Regulatory and other provisions included an amount of £68m (2018: £58m) that arose from a systems related historical issue identified by Santander UK, relating to compliance with certain requirements, of the Consumer Credit Act. This provision is based on detailed reviews of relevant systems related to customer credit business operations, supported by external legal and regulatory advice, and reflects our best estimate at 31 December 2019 of potential costs in respect to the identified issue.
For more on our provisions, including sensitivities, see Note 27 to the Consolidated Financial Statements.
For more on our contingent liabilities, see Note 29 to the Consolidated Financial Statements.
Protecting our customers
We continue to focus on protecting customers against fraud and scams. In 2019, we launched a social media campaign MC Grindah’s Deadliest Dupes. We partnered with Kurupt FM – the stars of the British Academy of Film and Television Awards (BAFTA)-winning BBC mockumentary programme ‘People Just Do Nothing’ .
Statistics show that Generation Z are among the most likely to fall victim to scams, and their behaviours online can make them vulnerable to fraudsters.
The campaign aimed to reach and educate younger people about fraud and scams and to help them spot the early signs. Deadliest Dupes is now live on social media. We have reached more than four million people on Instagram at least 19 times. This represents 99% of our target – up to 76% of 18 to 24 year-olds on Instagram, Snapchat and YouTube in the UK.
We have also partnered with the charity Barnardo’s to deliver the content we created with Kurupt FM to vulnerable young people.
Annual Report 2019 | SectionAnnual Report 2019 | Risk review
Santander UK Group Holdings plc150

Santander UK Group Holdings plc 151
Strategic report Governance Risk review Financial review Financial statements Shareholder information
Operational risk
Operational risk (UNAUDITED)
Overview
Operational risk is the risk of direct, or indirect, loss due to inadequate or failed internal processes, people and systems, or external events.
In this section, we explain how we manage operational risk, with a focus on our top three key operational risks. We also describe our operational risk event losses and developments in the year, and give some insight into how we are protecting our customers.
Key metrics
Operational risk losses (over £10,000, and excluding PPI) decreased by 63%
OUR KEY OPERATIONAL RISKS
Operational risk is inherent in our business. As a result, we aim to manage it down to as low a level as possible, rather than eliminate it entirely. Operational risk events can have a financial impact and can also affect our business objectives, customer service and regulatory obligations. These events can include product misselling, fraud, process failures, system downtime and damage to assets.
Our top three key operational risks are:
Key risks Description
Process and change
management
We have to constantly change to keep up with the latest regulatory requirements, and with an increasing rate of change in technological innovation, evolving business models and the competitive landscape. A key part of our business strategy is to develop and deliver new banking products and services, while making our processes and systems more efficient and resilient. Third party involvement is increasing as part of this strategy.
We are also implementing a large number of regulatory and legal changes, impacting all areas of our business. There is more on this in the ‘Regulatory risk’ section.
The scale and pace of our plans, and the potential compound effect of various changes happening at the same time increases our operational risk. These changes could have financial, customer, reputational and regulatory impacts if we do not manage them properly.
Outsourced and third-party
supplier management
We rely extensively on third parties, both within the Banco Santander group and outside of it, for a range of goods, services and activities. These include outsourced services, such as IT infrastructure and public cloud, software development, and banking operations. In line with regulatory requirements, we classify other legal entities in the Banco Santander group as external suppliers and manage them as third parties and on an arms-length basis.
Third party risk is a key operational risk for us due to the number, complexity and criticality of the services provided by our third parties, as well as reflecting our increasing use of the public cloud. The failure of a supplier may cause operational disruption, breach of data security or regulations, negative customer impact, financial loss or reputational damage. In addition, regulatory requirements around how we manage our outsourced services increased significantly in 2019, with the European Banking Authority (EBA) Outsourcing Guidelines that became effective on 30 September 2019. These affirm the need for strong internal governance and oversight arrangements, including sound risk management, whenever we outsource functions.
Cyber risk We rely extensively on the use of technology across our business. This includes internal platforms, such as our core banking systems, mortgage platforms, telecommunications and finance systems, and customer-facing platforms such as our mobile app and online banking websites. The use of technology and the internet have changed the way we live and work. They have allowed us to develop and improve the way we deal with our customers. It is critically important that we protect our customers’ data and give our customers a secure environment in which to deal with us, especially when the threat from cyber criminals is so prevalent and more sophisticated than ever.
Failure to protect the data assets of Santander UK and its customers against theft, damage or destruction from cyber-attacks could cause operational disruption, breach of data security or regulations, negative customer impact, financial loss or reputational damage. Even small periods of disruption that deny access to our digital services can erode our customers’ trust in us. This applies not only to our own systems but also to those of our third-party providers and counterparties in the market. The value of data itself, especially the personal details of customers and staff, has increased considerably and is a core focus of cyber criminals along with systems, such as payments and ATM networks, that enable the monetisation of cyber system breaches. It is therefore critical that we are resilient to cyber-attacks and can withstand and quickly recover from those events should they occur.
Following the UK’s exit from the EU on 31 January 2020, our Brexit planning is now focused on the potential outcomes of the UK and EU negotiations in respect of a Free Trade Agreement (FTA) and equivalence in financial services, by the end of 2020. We are also maintaining and refining existing plans to address a number of areas requiring cross-divisional communication including financial markets infrastructure, data, payments, third-party services, cyber, and internal and external communications.
Our Brexit planning is overseen by the Board and Senior Management Committee. Our Brexit Working Group, comprised of representatives from across the business and support functions, completed our preparations and ensured operational readiness ahead of previous potential ‘no deal’ risk junctures in 2019. These plans will be maintained should they be required again in preparation for a ‘no-deal’ scenario later this year. Further plans will be developed when there is clarity on the future trading arrangements and their potential impacts on the bank and its customers.
We are also exposed to tax risk which, even though it is a lower risk for us, is still a high-profile risk and may include legacy items. We define tax risk as the risk that we fail to comply with domestic and international tax regulations because we misinterpret legislation, regulations or guidance, or we report to the tax authorities inaccurately or late. This could lead to financial penalties, additional tax charges or reputational damage. Santander UK adopted the Code of Practice on Taxation for Banks in 2010. For more on this, see our Tax Strategy at www.santander.co.uk/about-santander/sustainability/taxation-strategy.
Strategic Report Governance Risk review Financial review Financial statements Shareholder information
Other key risks
Strategic Report Governance Risk review Financial review Financial statements Shareholder information
Operational risk
151Santander UK Group Holdings plc

Annual Report 2019 | Risk review
152 Santander UK Group Holdings plc
OPERATIONAL RISK MANAGEMENT
Risk appetite
We set our operational risk appetite at a Santander UK level and we express it through measures approved by the Board. These include risk statements and metrics set against the seven CRD IV loss event types. We cascade our appetite across our business areas by setting out clear lower level triggers, qualitative parameters and quantitative thresholds, and processes by which risks and events must be managed and escalated, and by which they may be formally accepted.
Coverage across the seven CRD IV loss event types is comprehensive and aligns to Principal Risk Areas approved by ERCC. As a result, we have specific embedded monitoring and measurement of our operational risks, including our top three key operational risks as follows:
− Process and change management: We monitor our risk profile and performance against risk appetite under several Principal Risk Areas, which reflects the different ways that this risk can manifest. Change is one of our core risk appetite areas of focus, ensuring we can specifically monitor risk appetite in relation to Change via a clearly defined suite of statements and metrics. In addition, we monitor this risk via statements, metrics and limits within our Compliance consideration, as this incorporates a view of regulatory change. We also consider key elements within our IT & Cyber Risk appetite, specifically in relation to ensuring that we address obsolescence considerations as part of our change agenda, and as part of our third party risk appetite consideration, in line with their increasing involvement in process and change management related activities.
− Outsourced and third-party supplier management: We have a directly aligned suite of defined Risk Appetite statements and metrics which have been agreed by the Board, and which allow ongoing measurement of our risk profile in this area. These statements and metrics reflect core principles which are set out in our Third-Party Risk Framework, as well as reflecting regulatory standards and developments.
− Cyber risk: We have a comprehensive set of Risk Appetite statements and metrics which have been agreed by the Board, and which allow us to measure our cyber risk. We have defined statements and metrics with key subject matter experts in our Cyber and IT teams, and we incorporate Banco Santander group principles and standards, regulatory requirements and industry best practice, where applicable.
We report against all the Principal Risk Areas defined in our risk appetite each month to ERCC, and formal actions are required to address and mitigate any measures which are reported out of tolerance. We communicate, action, and escalate as needed, any material issues identified to the Board.
Risk measurement and mitigation
The key components of the operational risk toolset we use to measure and mitigate risk are:
Operational risk toolset Description
Operational risk and
control assessments
Our business units identify and assess their operational risks to ensure they manage and control them within our operational risk appetite. They also ensure that we prioritise any actions needed. Every area has to identify their risks, assess their controls for adequacy and then accept the risk or formulate a plan to address any deficiencies.
Risk scenario analysis We perform this across business units. It involves a top down assessment of our most significant operational risks. We have a set of scenarios that we review and update each year. The analysis gives us insight into rare but high impact events. It also allows us to better understand the potential impacts and to address any issues.
Key indicators Key indicators and their tolerance levels give us an objective view of the degree of risk exposure or the strength of a control at any point in time. They also show trends over time and give us early warning of potential increasing risk exposures. Of primary importance are business-wide risk appetite indicators which measure our adherence to our defined risk appetite statements.
Operational risk losses Our operational risk loss appetite sets the level of total operational risk loss (expected and unexpected) in any given year (on a 12-month rolling basis) that we consider to be acceptable. We track actual losses against our appetite, and we escalate as needed.
Operational risk event
management
Operational risk events occur when our controls do not operate as we planned and this leads to customer impact, financial loss, regulatory impacts and/or damage to our reputation. We have processes to capture and analyse loss events. We use data from these processes to identify and correct any control weaknesses. We also use root cause analysis to identify emerging themes, to prevent or reduce the impacts of recurrence and to support risk and control assessments, scenario analysis and risk reporting.
Risk based insurance Where appropriate, we use insurance to complement other risk mitigation measures.
For process and change management risk, we track and monitor the number of regulatory projects with a red risk status (under our Transformation Office’s Execution Risk Management Framework). We give priority to our regulatory change projects for funding and delivery. All our change initiatives must have an operational risk assessment in place. We track these using a coverage metric.
For third-party risks, we identify and assess the inherent risk profile of each third-party arrangement prior to onboarding. We continue to measure this throughout the relationship. The inherent risk level drives the required governance and oversight of the third-party arrangement – the higher the inherent risk profile, the greater the governance we put in place. In addition, we identify and measure key third-party risks and the related control environment as part of our operational risk and control assessments. We do this both as part of business as usual activities and within related change initiatives. We have processes to capture and assess related events, as well as operational risk indicators in place which measure the ongoing third-party risk profile of the business.
For cyber risk, our Security and Information Technology teams continually identify and assess technological risks. They are guided by standardised, industry-leading control frameworks to ensure that we remain within our operational risk appetite. We measure the maturity of our controls in terms of their design and effectiveness and when combined with our cyber threat intelligence, we use it to define and prioritise our programmes of mitigation. We have processes to capture and analyse events from our security systems with tolerances derived from our risk appetite that drives escalation processes as needed. We operate a layered defence approach to cyber risk which we test and assess continually to ensure that it addresses the prevailing threats. Our comprehensive approach to validating our controls includes tests designed to replicate real-world cyber-attacks with test findings driving our ongoing improvement plans. As part of this, we participate in industry wide cyber security stress tests, such as CBEST, through to weekly cyber testing of our internet facing digital services that enables us to compare against our peers.
Annual Report 2019 | SectionAnnual Report 2019 | Risk reviewAnnual Report 2019 | Risk review
Santander UK Group Holdings plc152

Santander UK Group Holdings plc 153
Strategic report Governance Risk review Financial review Financial statements Shareholder information
Operational risk
We also mitigate our key operational risks in the following ways:
Key risks Risk mitigation
Process and change
management
We have to constantly change to keep up with the latest regulatory requirements, and an increasing rate of technological innovation, evolving business models and the competitive landscape. Changes can arise from a number of factors. These include the introduction of new third-party suppliers, the adoption of new technologies and business models, organisational changes, and dealing with legacy systems and processes. Our operational risk exposure increases when we make changes, and the risks can compound when several changes happen at the same time.
In order to support the constant need for change whilst minimising the operational risk, we review: – The risk management of individual projects
– The risk management of the aggregate change from our portfolio of projects
– Our capacity and capability to deliver the overall change agenda.
For individual projects, we assess the operational risk for all material changes in each new project, product and supplier, before they are allowed to go ahead. At the portfolio level, we monitor our portfolio for concentrations of change which can compound a risk or place high demands for our teams to deliver several changes at once. In terms of our overall capacity and capability, we constantly recruit, train and upskill more dedicated project managers to support the delivery of our overall change agenda.
Our Risk and Control Self-Assessment (RCSA) captures the risks related to process and change management that are identified by the business, alongside an assessment of the effectiveness of the controls, and the residual risk exposure. We log any operational risk events that occur and escalate them through our operational risk Santander Early Escalation Notification (SEEN) process.
Outsourced and third-party
supplier management
We place emphasis on a carefully controlled and managed Third Party Supplier Risk Framework and are enhancing our resources in this area in order to manage this risk.
We aim to ensure that those with whom we do business meet our risk and control standards across the life of our relationship with them:
On-boarding: We ensure that all third-party suppliers meet our needs before we enter into any agreement with them to mitigate the risks inherent to the process, function or activity they may provide. As part of this, we: – Verify that the third-party supplier has enough capacity to perform and/or supply the goods, services or activities we need
– Make sure that each third-party provider meets minimum conditions we require in legal, compliance, financial crime and technical terms
– Analyse the economic viability of the third-party provider in the short and medium term.
In-service management: We assign all third-party services an accountable Service Director and appoint a Service Manager to manage the service and key risks on a day-to-day basis. We provide training to these colleagues to ensure they understand their responsibilities. Through these roles we also monitor and manage our ongoing supplier relationships to ensure our standards and contracted service performance continue to be met. As part of this we: – Follow up and analyse third-party provider performance. This includes periodic service review meetings to monitor performance against
contractual service level agreements and other key risk indicators – Follow up and analyse broader risks associated with the third-party arrangement, by establishing key risk and control indicators. These can
relate to areas such as data protection, information security, anti-bribery & corruption, conduct, operational resiliency and reputational risks – Monitor how third-party providers comply with their obligations and commitments under the contract
– Monitor and manage any third-party incidents that arise. Where incidents impact our business, we report and manage them in line with our Operational Risk Event Escalation, Management & Reporting Policy
– Set and review mitigation actions with the third-party provider to improve performance, manage incidents, or mitigate key risks.
Off-boarding and exit management: When we decide to exit a third-party arrangement, we aim to do so without undue disruption or adverse impact on their compliance with the regulatory framework and without detriment to the continuity and quality of services provided to customers. We aim to mitigate the related risks through: – Comprehensive and documented Exit Strategies and Exit Plans for our most critical services
– Review and testing of these Exit Plans to ensure they are adequate. This includes an analysis of the potential costs, impact, resource and timing implications of moving to a different provider, and
– Completing Operational Risk Assessments to ensure that we identify, assess, manage, and report the risks of exit.
Cyber risk Protecting our customers, systems and data remains a top priority for us. Online security and data breach stories, along with many reports of scams and online fraud, continue to feature strongly in headlines. All organisations, including banks, are in an ongoing race to keep ahead of criminals who are becoming ever more sophisticated and destructive in their approach. Criminals persist in attempts to deny our customers access to our digital channels, target online services and data, or steal online credentials by various methods, including social engineering.
We continue to enhance our resilience to cyber disruption. Keeping our systems secure is everybody’s responsibility and we continue to enhance our training programmes for staff to support this. We have Board-level expertise and supervision in cyber security matters to ensure robust monitoring and challenge, with at least one Director who has significant experience in this area. We also have targeted training for Board members and senior management as well as those staff who may be singled out by criminals, such as those facilitating payments. New cyber security training ensures that all our staff understand the threats we face, and that we all have the expertise to spot emails from criminals and attacks on our systems. We continue to work with other banks as members of the Cyber Defence Alliance, where we share intelligence on cyber threats and effective strategies to counter them.
We campaign to raise awareness and give customers the knowledge they need to avoid becoming victims of fraud. We use robust technology to protect our customers, in particular to look for anomalous behaviour or malicious software on customer devices, and we continually invest in the fight to counter scams. As part of this, we run customer education campaigns, and we offer advice on our online security centre. We prevent the vast majority of fraud and protect our customers’ money.
We continually improve and test our cyber security risk management and ensure we focus on priority areas and drive action. This includes the security due diligence of existing systems as well as new products, services and our third parties. We regularly perform independent and internal security testing and are subject to rigorous cyber simulation exercises by our regulator. We take these exercises very seriously and use the lessons learnt to continually adapt and improve our cyber defences. There have been no material security breaches to date, although we are highly vigilant at all times. We have a Cyber insurance policy to provide us with immediate response to assess and control the impact of a breach.
Analysis of our security posture drives an ongoing discussion about cyber risks across the business. This includes individual business areas who must include cyber risk when they make business continuity decisions. We also use maturity assessments and both internal and external threat analyses. Our cyber security experts assess our overall security posture and make recommendations to both management and Risk fora on a monthly basis, with onward reporting to the Executive Committee, ERCC, BRC and Board at least four times a year.
Strategic Report Governance Risk review Financial review Financial statements Shareholder information
Other key risks
Strategic Report Governance Risk review Financial review Financial statements Shareholder information
Operational risk
153Santander UK Group Holdings plc

Annual Report 2019 | Risk review
154 Santander UK Group Holdings plc
Risk monitoring and reporting
Reporting is a key part of how we manage risk. It ensures we identify, escalate and manage issues on a timely basis. We can identify exposures through our operational risk and control assessments, risk scenario analysis, key indicators and incidents. We report exposures for each business unit through regular risk and control reports. These include details on risk exposures and how we plan to mitigate them. We prioritise and highlight events that have a material impact on our finances, reputation or customers by reporting them to key executives and committees. These include changes in our cyber risk profile.
We have a crisis management framework that covers all levels of the business. This includes the Board, Executive Committee, senior management and business and support functions. Our framework identifies possible trigger events and sets out how we will manage a crisis or major incident and we test it at least annually. If an event occurs, we have business continuity plans in place to recover as quickly as possible. These are aligned with our key customer journeys and delivery of critical IT services. We use The Standardised Approach (TSA) for Pillar 1 operational risk capital needs. We use an internal model aligned to the CRD IV advanced measurement approach to assess our Pillar 2 capital needs.
Process and change management risk We monitor and report process and change management risk in the relevant governance stream for the type of change. For example, changes from products and services and technological changes have specific governance which have their own operational risk reporting requirements. We report an aggregated view of change risk by every business division, at least each quarter, using our Principal Operational Risk Dashboard. We capture risks related to process and change management identified by the business in our RCSAs, and we report operational risk events related to change using the SEEN process
Outsourced and third-party supplier management We set up a Third-Party Risk Management Team in 2018 to more effectively manage this risk. It operates as a Line 1 Control Function responsible for the identification, assessment, management, and reporting of third-party risks across Santander UK. Part of this remit includes developing and maintaining an effective Third-Party Risk Management Framework.
Our Third-Party Outsourcing & Risk Management Policy, supported by a series of Standards, sets out detailed requirements and guidance to support our colleagues through the end-to-end third-party lifecycle. We have specific Standards for On-Boarding Management, Risk Provider Certification, In-Service Management, Off-Boarding & Exit Management and Outsourcing of Critical Services.
We formally track our third-party risk profile against our risk appetite through a monthly risk and control forum. This includes monitoring compliance with our policy and standards. We use key risk indicators to support our monitoring activity and we report them to this forum. We escalate any significant risks, or changes in the risk profile, to the relevant senior risk committees such as ERCC, BRC and the Board.
We also updated our Third-Party Risk Management System to improve the completeness and quality of data that we capture and use for the Operational Risk Indicators we report to senior management. This also supports central oversight of our supplier portfolio.
Cyber risk We base our monitoring and reporting on the metrics and operational dashboards in our cyber security and IT functions. Our Cyber Threat Unit and experts carry out analysis within the worldwide Santander Security Operations Centre in Madrid. We use a wide range of key risk indicators, threat intelligence reports and results from security testing to identify improvements to our cyber defences. Our operational teams, with input from Risk, review these trends and steer management activity where required.
We also formally track our cyber and technological risks against our risk appetite through a monthly risk control forum. Part of the forum’s remit is to identify changes in risk posture and to inform senior risk committees of any significant changes. Issues such as technological obsolescence and the challenges in keeping our technologies free from known vulnerabilities, are examples of where a metric driven approach to reporting through our risk management frameworks has led to proactive mitigation of risk.
Protecting our customers
To raise awareness of fraud and educate younger adults about how to avoid becoming victims of scams, we launched ‘For Your Eyes Alone’, a campaign designed to reach the under 25 (Generation Z) audience via the outlets and channels they use the most.
This age group love to share: 40% have shared their online banking passwords, and 85% have shared personal data on social media that could leave them vulnerable to scammers.
To underline the importance of keeping personal data ‘for your eyes alone’ we launched the world’s first invisible cinema – only visible through special polarised glasses – and toured it around UK universities.
We teamed up with Love Islander, Wes Nelson to create a scam awareness film to be screened at cinema events and used on his social media channels. Alongside the social reach that Wes achieved, the campaign attracted wide media coverage and we were able to provide detail directly, either via the film or supporting materials, to over 560,000 students through our university activity.
Annual Report 2019 | SectionAnnual Report 2019 | Risk reviewAnnual Report 2019 | Risk review
Santander UK Group Holdings plc154

Santander UK Group Holdings plc 155
Strategic report Governance Risk review Financial review Financial statements Shareholder information
Operational risk
OPERATIONAL RISK REVIEW
Operational risk event losses
The table below shows our operational losses in 2019 and 2018 for reportable events with an impact over £10,000, excluding conduct risk events (which we discuss separately in the ‘Conduct and regulatory risk’ section), by CRD IV loss event types. We manage some of these risks using frameworks for other risk types, including regulatory and financial crime risk even though we report them here.
2019 2018
Value
%
Volume
%
Value %
Volume %
Internal fraud – – 1 2
External fraud 30 80 4 48
Employment practices and workplace safety – – – 2
Clients, products, and business practices 39 6 3 18
Business disruption and systems failures 2 1 1 1
Execution, delivery, and process management 29 13 91 29
100 100 100 100
2019 compared to 2018
In 2019, we did not experience material losses similar to those in 2018, such as the FCA fine of £32m and the Consumer Credit Act breach of £58m. As a result, the value of our operational risk losses (Events over £10,000 but excluding PPI) fell by 63% year-on-year. However, we saw a significant increase of 103% in the overall volume of losses due to external fraud. This reflects trends and industry direction in relation to scams and we continue to enhance our anti-fraud measures to help protect our customers. We also saw a rise in the number of events and losses prompted by the increasing level of change, due to enhanced regulation, industry developments and the need to digitalise the business. We discuss developments on PPI in the conduct and regulatory risk section of this Risk review.
In addition, as discussed earlier, climate-related risks could eventually manifest in risks for financial institutions. During 2020, we will review the appropriate parts of the Risk Framework, Risk Type Frameworks (in particular Credit and Operational risk) and the Risk Appetite Statement to explicitly include climate-related risks.
Process and change management risk
Business, regulatory and legal change continues to gather pace and 2019 saw a substantial review of our portfolio of change initiatives to re-focus, concentrate and re-prioritise scarce capital resources at the most pressing initiatives. The Open Banking Initiative and PSD2, both of which introduced further requirements in 2019, together bring significant opportunity for us to develop new products and services to enhance the ways customers use their data and pay for services. However, they also introduce a new layer of risk to both customers and us. We continued to carry out detailed operational risk assessments in relation to these initiatives, in order to identify, assess, manage and report the key risks involved. These regulatory requirements were enhanced by significant new initiatives such as the high cost of credit review and the migration of a certain segment of customers across to a new banking platform. As we must deliver new and innovative solutions to market faster than ever before, we recognise the need to manage the risks associated with change as a priority in our design processes. We have concentrated effort on further refining our Operational Risk Management identification and assessment methodologies to streamline, remove inefficiency, and focus on risk.
Third party risk
Third Party Risk Management remains a key factor when we engage with our key outsourcing partners (Third Party Service Providers). The demand for innovative solutions and digital services brings additional risks, new technologies, widening spans of control across the supply chain, and cyber threats. To enable us to manage these challenges we continue to review our governance processes and introduce new systems solutions which provide data and focus on our supplier relationships and performance. This work will continue, develop and strengthen in 2020, aligned with the requirements of the EBA Outsourcing Guidelines that became effective on 30 September 2019. In 2019, we enhanced our Third Party Risk Management Framework and our resources in this area in order to manage this increased risk. We also updated our Third-Party Risk Management system to improve the completeness and quality of data that we capture and use for the Operational Risk Indicators we report to senior management. This also supports central oversight of our supplier portfolio.
Cyber risk
Cyber and information security also remains a top priority for us. We invest to ensure we have the right skills and resources to manage cyber and information security risk effectively across all our lines of defence. Our cyber transformation programme enhances our capabilities and ensure we deliver secure products and solutions for our customers and the communities that we serve. Whilst we continue to be subject to cyber-attack, we did not suffer any material cyber or information security events in 2019 and we actively participate in the Cyber Defence Alliance with industry peers to share cyber threat intelligence, expertise and experience to help identify common features of cyber-attacks and effective mitigation strategies.
In 2019, threats from the external cyber environment continued to evolve, due to heightened geo-political tension, and active well-established cyber-crime groups. We monitor a range of cyber threats including; attacks on payment systems, ATM networks and customer data where insider threat and network intrusion are the most common attack methods; an emerging threat from a new method, aimed at breaching organisations’ on-line customer services, (such as internet banking) and causing denial of service; and in addition Data Security and GDPR compliance continue to be key areas of concern. We have taken mitigating actions against these various threats including deploying a Cyber threat intelligence platform; increased intelligence through chairing the Geopolitical Financial Services working group; robust online service access construction utilising anti Distributed Denial of Service techniques. The mitigants implemented in our Cyber Security Plans are proving effective and we have experienced no significant disruption to date.
Data Management continues to be an increasingly important risk factor for us. We are progressing with our strategy to develop our core data management systems and capabilities and improve our level of Data Management risk by investing in the capabilities identified to support the maturity of Data Management Strategy programme. We have implemented a data governance model including a Senior Data Forum which reports to the Senior Management Committee, Board Audit Committee and Board Risk Committee. The programme is designed to support our Digital Transformation and meet the objectives of our data maturity capabilities, including a business owned data domain view, a common data architecture and enhanced and consistent data quality.
The Bank of England, PRA and FCA recently published a consultation paper, following their 2018 joint discussion paper to help financial firms evolve their approach to operational resilience. They expect firms to assume disruptive operational incidents will occur, and be able to show that they can withstand, absorb, recover and manage these in a way which considers the needs of all affected parties. We are improving our operational resilience by enhancing our operational risk framework and implementing a Board-approved strategy. This will focus on defining our key business services, providing enriched management data, and mapping our dependencies end-to-end. It will also set, approve and test the impact tolerances of our ability to provide those services to the limit. In addition to regulatory compliance, this will achieve business and operational benefits through a programme of work in 2020 designed to embed operational resilience in our Digital Transformation programme as well as business-as-usual activities.
Strategic Report Governance Risk review Financial review Financial statements Shareholder information
Other key risks
Strategic Report Governance Risk review Financial review Financial statements Shareholder information
Operational risk
Santander UK Group Holdings plc 155

Annual Report 2019 | Risk review
156 Santander UK Group Holdings plc
Other key risks (UNAUDITED)
Overview In this section, we describe how we manage our other key risks and discuss developments in the year. Our other key risks are:
– Strategic and business risk: the risk of loss or damage due to decisions
that impact the long-term interests of our key stakeholders, or from an inability to adapt to external developments.
– Reputational risk: the risk of damage to the way our reputation and brand are perceived by the public, clients, government, colleagues, investors, or any other interested party.
– Model risk: the risk of loss from decisions mainly based on results of models due to errors in their design, application or use.
– Financial crime risk: the risk that we are used to further financial crime, including money laundering, sanctions evasion, terrorist financing, bribery and corruption.
– Legal risk: the risk of loss due to legal deficiencies in contracts; failure to take appropriate measures to protect assets; failure to manage legal disputes appropriately; failure to assess or implement the requirements of a change of law; or failure to comply with law or regulation or to discharge duties or responsibilities created by law or regulation.
FINANCIAL CRIME RISK
OUR KEY FINANCIAL CRIME RISKS
Financial crime is a high priority risk for us. We recognise that financial crime activities can have a significant impact on our customers. Criminals are also increasingly using the financial system to launder the profits of illegal activity such as human trafficking and terrorism. We may be adversely affected if we fail to effectively mitigate the risk that third parties or our employees facilitate, or that our products and services are used to facilitate financial crime. This includes money laundering, terrorist financing and proliferation financing, breaches of economic and financial sanctions, bribery and corruption, and the facilitation of tax evasion. Therefore, we are committed to ‘Deter, Detect and Disrupt’ criminality as a core pillar of our anti-financial crime (AFC) strategy. Our AFC strategy is a vehicle for change, initiating new ways of working to deliver this vision. We adopt a risk-based approach in line with UK and international laws and standards, and we target our resources in a proportionate and effective manner at the highest priority risks. We work with government, law enforcement and the private sector to help meet our commitments.
Our key financial crime risks are:
Key risks Description
Money laundering We are used by criminals to transform the proceeds of crime into seemingly legitimate money or other assets.
Terrorist financing We are used by terrorists to deposit, distribute or collect funds that are used to fund their activity.
Sanctions We do not identify payments, customers or entities that are subject to economic or financial sanctions.
Bribery and corruption We fail to put in place effective controls to prevent or detect bribery and corruption.
FINANCIAL CRIME RISK MANAGEMENT
Risk appetite
Financial Crime risk appetite is the level of risk which we are prepared to accept in carrying out our activities in respect to financial crime risk. This is approved and disseminated across legal entities and businesses, with limits specified to control exposures and activities that have material concentration risk implications for us and the communities we are part of. Our customers and shareholders will be impacted if we do not mitigate the risks of Santander UK being used to facilitate financial crime. We comply with applicable UK law, international sanctions and other regulations and make sure our risk appetite adapts to external events. We have minimal tolerance for residual financial crime risk and zero tolerance for sanctions, and bribery and corruption risk. We also have no appetite for risks associated with employees who do not act with integrity, due diligence or care, or those who breach our policy and regulatory requirements.
Risk measurement
We measure our exposure to financial crime risk regularly. Our anti-financial crime strategy along with frameworks sets the strategic direction for risk management by defining standards, objectives and responsibilities for all areas of the business. It supports senior management in effective risk management and developing a strong risk culture. We screen and risk rate all our customers and monitor activity to identify potential suspicious behaviour. We complete ad-hoc reviews based on key trigger events. Our Financial Intelligence Unit assesses specific types of threat, drawing on data from law enforcement and public authorities.
Risk mitigation
We take a proactive approach to mitigating financial crime risk. Our financial crime risk frameworks are supported by policies and standards which explain the requirements for mitigating money laundering, terrorist financing, sanctions, facilitation of tax evasion and bribery & corruption risks. We update these regularly to ensure they reflect new requirements and industry best practice. We support our colleagues to make sure they can make the right decisions at the right time. We raise awareness and provide role-specific training to build knowledge of emerging risks.
Key elements of our financial crime risk mitigation approach are that we:
− Complete due diligence of new customers, where we seek to understand their activities and banking needs − Complete risk assessments of customers, products, businesses, sectors and geographic risks to tailor our mitigation efforts – Ensure all our staff complete mandatory Financial Crime training, supporting specialist training and learning − Deploy new systems to better capture, analyse and act on data to mitigate bribery and corruption risks – Partner with public authorities, the Home Office and the wider financial services industry to pool expertise and data. We are also involved in partnerships such as
the Joint Money Laundering Intelligence Taskforce (JMLIT) which supports public-private collaboration to tackle financial crime.
Annual Report 2019 | SectionAnnual Report 2019 | Risk review
Santander UK Group Holdings plc156

Santander UK Group Holdings plc 157
Strategic report Governance Risk review Financial review Financial statements Shareholder information
Other key risks
Risk monitoring and reporting
We use key risk indicators to monitor our exposure to financial crime risks, and we report all issues in a timely manner. We work closely with subject matter experts across the business on all risk management and monitoring activities alongside more effective communication of policy changes. Regulators around the world continue to emphasise the importance of effective risk culture, personal accountability and the adoption and enforcement of risk-based requirements and adequate internal reporting processes and procedures. We remained focused to enhance our financial crime operating and governance model, to ensure that our control environment evolves at pace, keeping up with new or amended laws, regulations or industry guidance.
We adhere to a strong governance and reporting schedule to our ERCC and Senior Management Committee, including analysis of the risks on the horizon, key risk indicators and a directional indication of the risk profile. Throughout the year, management continued to update the risk committees on management and mitigation of financial crime risks. We have introduced an enhanced set of financial crime risk indicators for effective risk reporting to senior management. We also regularly report to the Board Responsible Banking Committee on financial crime risk, the impact on the business and the actions we are taking to mitigate the risk.
FINANCIAL CRIME RISK REVIEW
2019 compared to 2018
The financial crime landscape continues to be difficult and complex, with geo-political factors and continually evolving criminal methods influencing the risks we face. We continued embedding our anti-financial crime strategy, policies and training across the business in 2019, endorsed by our senior leaders. Our Board has been supporting investment in our anti-financial crime capabilities that deliver key elements of the strategy, from improved systems and controls to increased efficiency through automation, as well as promoting an anti-financial crime culture across the business. We made a £75m investment in financial crime enhancements in 2019 through our ongoing Financial Crime Transformation Programme.
In 2019, we placed a significant focus on driving an anti-financial crime culture across the business. We increased awareness of financial crime through culture focus programmes and encouraged our staff to use their judgement to do the right thing and make responsible decisions. We aim to redefine the way we all think and behave in our day-to-day activities by combating financial crime risk. Our vision is that Deterring, Detecting and Disrupting financial crime is part of our DNA. Throughout the year, we continued to raise awareness and provide role-specific training to colleagues to build knowledge of emerging risks to support their effective mitigation.
There are four underlying key messages driving our anti-financial crime culture:
− Collaboration: We must work together across business lines. Tackling financial crime is a common goal − Integrity: Act with bravery, integrity and without fear of recrimination – Responsibility: We are all liable at both an individual and organisational level − Instinct: Trust your instinct. If it feels wrong, it probably is.
Our financial crime control environment is evolving but still needs significant enhancement and investment. Our Financial Crime Transformation Programme delivered improvements across the control environment in 2019 and the foundations of key strategic controls are now in place. Enhancements continue to be made to our Financial Crime control framework, and to key controls including anti-bribery and corruption measures, customer risk assessment, and screening and transaction monitoring.
In 2019, we continued to drive a culture of AFC across the business and with partners. We ran ten events for the UK police’s regional organised crime units to better work with law enforcement to protect customers. We worked closely with law enforcement to develop an education programme to all financial investigators, explaining the way banks identify, investigate and respond to financial crime. These events were facilitated by SME’s from across Financial Crime and Fraud and led to senior managers presenting at the UK’s National Police Chiefs’ conference. This was a first for a bank to deliver such training to a wide audience and has been significantly welcomed. We also held a series of eight AFC Culture roadshows for colleagues across the UK to drive with 510 colleagues attending, of which 96% better understood the AFC Vision and 69% said they would change behavioural change. We enhanced our governance of AFC by launching a Strategy & Policy forum in September covering AFC strategy and policy challenges and developments, anti-money laundering, counter-terrorism financing and sanctions. We also engaged with government and law enforcement stakeholders to shape the reforms that are part of the government’s Economic Crime Plan, which aims to improve the resilience of the UK’s overall defences against financial crime.We continued to work with the with industry and the UK Government to combat financial crime which also helps us further develop our own capabilities. For example, we increased our work with the industry and law enforcement. We ran a targeted campaign with non-profit ‘Stop the Traffik’ to raise branch colleagues’ awareness and capability to identify trafficking in branch staff in a location area at high risk for modern slavery and human trafficking (MSHT). Stop the Traffik also held masterclasses at our anti-financial crime roadshows.
We worked closely with law enforcement to develop an education programme to all financial investigators, explaining the way banks identify, investigate and respond to financial crime. This resulted in SME’s from across Financial Crime and Fraud conducting ten events for across the UK’s Regional Organised Crime Units and then senior managers presenting at the UK’s National Police Chiefs’ conference. This was a first for a bank to deliver such training to a wide audience and has been significantly welcomed.
Successful Public Private Partnerships
Our Financial Intelligence Unit (FIU) continues to work closely with the JMLIT. This is a government initiative for public and private partnership between law enforcement and the financial industry to combat high end money laundering and share intelligence.
The FIU received intelligence from the Child Sexual Exploitation Unit via the JMLIT that an organised crime group were facilitating child sexual exploitation in the UK and globally. Financial investigations corroborated the intelligence and showed significant sums of money being transferred via money service bureaus, to enable large scale live-streaming of child sexual abuse.
The FIU worked closely with law enforcement to provide intelligence and analysis of value, enabling a thorough and complete view of members of the organised crime group, which ultimately allowed for timely arrests to be made of the offenders, both in the UK and overseas. Through the intelligence development of the FIU a number of additional suspects were identified and disclosed.
Strategic Report Governance Risk review Financial review Financial statements Shareholder information
Other key risks
157Santander UK Group Holdings plc

Annual Report 2019 | Risk review
158 Santander UK Group Holdings plc
LEGAL RISK
Legal risk includes the legal consequences of operational risk (such as breach of contract) and operational risk with legal origins (such as a legally defective contract). We manage legal risk as a standalone risk-type to reflect the continued pace and breadth of regulatory change across financial services.
We define legal risk as losses or impacts arising from legal deficiencies in contracts or failure to:
− Take appropriate measures to protect assets − Manage legal disputes appropriately − Assess, implement or comply with law or regulation − Discharge duties or responsibilities created by law or regulation.
Legal risk management Description
Risk appetite We have no appetite to make decisions or operate in a way that leads to legal risk, we apply robust controls to manage these risks. We have a low tolerance for residual legal risk.
Risk measurement Due to the close links between our legal and operational risk frameworks, our tools to identify, assess, manage and report operational risks also apply where such exposures have a legal risk impact.
Risk mitigation The Legal team provides specialist advice and support to all business units to ensure we effectively manage legal risk. They help to implement a strong legal risk culture throughout our business using guidelines, policies and procedures and specific support on a product, service, transaction or arrangement basis and decide whether legal advice should be sourced internally or externally.
Risk monitoring and
reporting
We have developed our internal legal risk reporting framework to improve the visibility of the Santander UK-wide legal risk profile. We provide regular updates of our key legal risks, issues or breaches, to senior management and the Board through our Legal & Regulatory function. This is in addition to reports issued by the business.
2019 compared to 2018 Our legal risk profile remained broadly stable in 2019, with continued uncertainty relating to Brexit, LIBOR transition risks, the quantum of regulation change applicable to our Retail Banking business and an upward trajectory of PPI-related litigation and ongoing customer remediation issues balancing out the mitigation of existing legal risks we reported in 2018.
We took significant steps throughout 2019 to evolve and embed the legal risk framework across the business. As part of this, we improved our quantitative and qualitative legal risk reporting, legal risk management and accountability.
We also renewed the approved law firm panel in mid-2019, renewing existing contracts and entering into contracts with new specialist firms and legal suppliers in order to diligently manage legal risks. We introduced improved processes to ensure that instructions outside of these panel relationships are on an exceptional basis only and always approved by senior management.
Further, we created a small specialist mortgage panel of law firms and other legal suppliers for secured collections and recoveries work, together with other mortgage related issues such as forfeiture, un-registered charges and professional negligence. The concentration of such issues under a specialist panel mitigates legal risk and increases control and visibility over our processes. This work forms part of a wider collections and recoveries transformation programme which began in 2019 and will continue into 2020.
We also introduced further rigour into the court orders and requests unit, embedding tighter controls, processes and accountability.
STRATEGIC AND BUSINESS RISK
Strategic and business risk could impact our long-term success if it caused our business model to become out of date, ineffective, or inconsistent with our goals. This could arise if we:
− Have an incomplete picture of our environment, such as the economy, regulation, competitor activity and changes in technology and customer expectations − Misjudge our capabilities, or ability to implement our strategy − Pursue initiatives like acquisitions that do not fit with our business model or miss opportunities that we could benefit from.
Strategic and business risk management Description
Risk appetite We have a low to moderate appetite for strategic and business risk. This limits the risks we are prepared to take to achieve our strategic objectives and is aligned to our balanced, customer-centric business model.
Risk measurement Our Board and senior management regularly review potential risks with our operations and plans to ensure we stay within our risk appetite.
Risk mitigation We manage strategic and business risk by having a clear and consistent strategy that takes account of external factors and our own capabilities. We have an effective planning process which ensures we refine, strengthen, and adapt our strategy to reflect changes in the environment and other key risks and opportunities.
Risk monitoring and
reporting
We closely track our business environment, including long-term trends that might affect us in the future. As part of this, we report a range of indicators. These include our KPIs as set out in the ‘Strategic report’.
2019 compared to 2018 Our business environment is always changing, and this affects how we do business.
− Throughout 2019 we experienced persistent uncertainty regarding the outcome of Brexit with a range of possible scenarios, including some which could have an adverse impact on the economy. As the UK’s leading scale challenger, with a resilient balance sheet and a record of consistent profitability, we believe we are well-placed to continue to deliver our strategy during these uncertain times.
− Competitive pressure remained high in 2019. This was mainly from established players, but new technology-led entrants also made progress and could disrupt the market in the longer term. We expect these trends to continue in 2020, but we believe our customer-focused business model and strategy, and our adaptable and innovative approach, will support our continued success.
− Our refined priorities are an integral part of Banco Santander’s European strategy announced in April 2019. focusing on customer outcomes, simplify and digitise the business, invest in our people and deliver sustainable returns. For more on this, see the ‘Strategic report’.
Annual Report 2019 | SectionAnnual Report 2019 | Risk review
Santander UK Group Holdings plc158

Santander UK Group Holdings plc 159
Strategic report Governance Risk review Financial review Financial statements Shareholder information
Other key risks
REPUTATIONAL RISK
Our key reputational risks arise from failures in corporate governance or management, failing to treat our customers fairly, the actual or perceived way we do
business, and the sectors and countries we deal with. They also result from how our clients and those who act for us conduct themselves, and how business is
conducted in our industry. External factors may also present a risk to us. These can include the macro environment and the performance of the sector. Sustained
damage to our reputation could have a material impact on our ability to operate fully. In turn, this could affect our financial performance and prospects. Reputational
risk is not static; today’s decisions may be judged by different standards tomorrow. We build this into our risk culture, evaluation and sanction procedures.
Reputational risk management Description
Risk appetite We have a low appetite for reputational risk, which is agreed by the Board at least each year. We express it in terms of the risk measures set
out below.
Risk measurement We assess our exposure to reputational risk daily. We base this on expert judgement and analysis of social, print, and broadcast media, and the
views of political and market commentators. We also commission independent third parties to analyse our activities and those of our UK peers
to identify significant reputational events, or a prolonged decline in our reputation and any sector level or thematic issues that may impact our
wider business. We also measure the perception of Santander UK amongst key stakeholder groups through regular interactions and perform
annual reviews of staff sentiment. We review our reputation daily through media and political interactions and updates, and through weekly
reputation reports from an external supplier.
Risk mitigation Our business units consider reputational risk as part of their operational risk and control assessments. We also consider it as part of our new
product assessments. Our Corporate Communications, Legal and Marketing team helps our business units to mitigate the risk and agree
action plans as needed. They do this as part of their role to monitor, build and protect our reputation and brand.
Risk monitoring and reporting We monitor and report reputational risks and issues on a timely basis. Our Reputational Risk Forum reviews, monitors and escalates to Board
level key decisions on reputational risks. It also has regular and ad-hoc meetings to discuss the risks we face. We escalate them to the ERCC
and Board Responsible Banking Committee, as needed. Our Corporate Communications, Legal and Marketing team also reports regularly to
our Executive Committee on Corporate Social Responsibility, Sustainability and Public Affairs policies. They do this from an environment,
community and sector point of view.
2019 compared to 2018
In 2019 we worked with the business to manage the impact of the UK’s departure from the EU. We developed communications for our customers to advise them how
we think Brexit will impact the products and services they enjoy, but also to reassure them of our ongoing commitment to serving the UK.
We also handled the communications issues around the deadline for customers to make PPI claims. The volume of customer interaction slowed down our website
and resulted in extended call-waiting times for customers using our contact centre, but we advised media of the steps we were taking to resolve the problem.
In January 2019, we worked with the business to deliver the communication for the restructuring of our branch network. Following a wide-ranging review into how
our customers were choosing to do business with us, we announced in March 2019 that we would be closing 140 branches. We handled the communications with
affected MPs, Members of the Scottish Parliament and Welsh Assembly members as well as national and local media. We highlighted our commitment to investing
in the network, including refurbishing branches and opening a new Work Café in Leeds, as well as the services that customers can access through the Post Office.
Our Reputational Risk Forum continued to meet regularly to discuss our emerging and material risks, bringing together senior representatives from across the
business, alongside the use of our formal Reputational Risk Register. This has ensured that reputational risk is a leading consideration with both the ERCC and the
Board Responsible Banking Committee. This maintains the visibility and discussion of reputational risk issues at Board level.
MODEL RISK
Our key model risks arise from weaknesses and limitations in our models, or the incorrect use of a model. They include risks stemming from model data, systems,
development, performance and governance. The most material models we use help us calculate our regulatory capital and credit losses, and perform stress tests.
Increased regulatory standards influence how we manage model risk. We continue to enhance our governance documentation, align our resources to new, demands
and improve our systems to manage and control our activities.
Model risk management Description
Risk appetite We express our model risk appetite through risk assessments of our key risk models. The Board is asked to agree this at least each year.
Risk measurement We consider both the percentage of models that have been independently assessed, and the outcome of those reviews, in how we measure
model risk. All models have several assumptions and in general the more limitations we have for those assumptions, the higher the levels of
model risk.
Risk mitigation We mitigate model risk through controls over how we use models throughout their life. We maintain a central model inventory that includes
data on owners, uses and model limitations. We assess how important each model is to our business, and we track and resolve actions from
independent reviews. We also maintain a clear approval path for new models and updates.
Risk monitoring and
reporting
We report model risks and issues using management and control forums. We escalate issues to the ERCC when needed, or if our risk appetite is
breached or showing adverse trends that could lead to future issues.
2019 compared to 2018
In addition to our focus on developing new models for IFRS 9 purposes, we performed a self-assessment against the new PRA regulatory policy and supervisory
statement on stress test models. The principles are closely aligned to our model risk framework, so we did not need to make any significant changes. We further
clarified the roles of Model Owners and Model Users and enhanced our Model Risk Appetite with more performance indicators. We maintain a risk-based approach to
management and control. For example, we focus independent model reviews on our more material models, such as those for credit losses, or those with specific
regulatory standards defined.
The redevelopment of the suite of regulatory capital models to account for new regulations is a key model project for the Bank. This focuses on several different
regulations across both the PRA and ECB including the Hybrid Philosophy for Secured Residential Real Estate and the new Definition of Default requirements. The
majority of work for this is expected to complete in 2020 and will then be subject to regulatory review
Strategic Report Governance Risk review Financial review Financial statements Shareholder information
Other key risks
159Santander UK Group Holdings plc

Annual Report 2019 | Risk review
Financial review
Critical factors affecting results
The preparation of the Consolidated Financial Statements requires management to make
judgements and accounting estimates that affect the reported amount of assets and liabilities
at the date of the Consolidated Financial Statements and the reported amount of income and
expenses during the reporting period. Management evaluates its judgements and accounting
estimates, which are based on historical experience and on various other factors that are
believed to be reasonable under the circumstances, on an ongoing basis. Actual results may
differ from these accounting estimates under different assumptions or conditions.
Estimates and judgements that are considered important to the portrayal of our financial
condition including, where applicable, quantification of the effects of reasonably possible
ranges of such estimates are set out in ‘Critical Judgements and Accounting Estimates’ in Note
1 to the Consolidated Financial Statements.
Contents
Income statement review 161
Summarised Consolidated Income Statement 161
Profit before tax by segment 162
Balance sheet review 163
Summarised Consolidated Balance Sheet 163
Customer balances 165
Cash flows 166
Summarised Consolidated Cash Flow Statement 166
Capital and funding 167
Liquidity 167
Selected financial data 168
Santander UK Group Holdings plc160
Annual Report 2019 | Financial review

Santander UK Group Holdings plc 161
Secret Strategic report Governance Risk review Financial review Financial statements Shareholder information
Income statement review
SUMMARISED CONSOLIDATED INCOME STATEMENT
Adjusted(3)
2019 2018(2) 2019 2018
£m £m £m £m
Net interest income 3,295 3,606 3,295 3,598
Non-interest income(1) 875 937 757 816
Total operating income 4,170 4,543 4,052 4,414
Operating expenses before credit impairment losses, provisions and charges (2,526) (2,563) (2,373) (2,374)
Credit impairment losses (220) (153) (220) (153)
Provisions for other liabilities and charges (443) (260) (159) (180)
Total operating credit impairment losses, provisions and charges (663) (413) (379) (333)
Profit before tax 981 1,567 1,300 1,707
Tax on profit (272) (403)
Profit after tax 709 1,164
Attributable to:
Equity holders of the parent 672 1,125
Non-controlling interests 37 39
Profit after tax 709 1,164
(1) Comprised of Net fee and commission income and Net trading and other income. (2) Adjusted to reflect the amendment to IAS 12, as described in Note 1. (3) The financial results were impacted by a number of specific income, expenses and charges with an aggregate impact on profit before tax of £319m in 2019 and £140m in 2018. See ‘Alternative Performance Measures’ for details and
reconciliation to the nearest IFRS measure.
A more detailed Consolidated Income Statement is contained in the Consolidated Financial Statements.
2019 compared to 2018 Profit before tax was down 37% to £981m and adjusted profit(3) before tax was down 24% to £1,300m due to the factors outlined below. By income statement line item, the movements were: – Net interest income was down 9%, largely impacted by mortgage back book pressure and £3.9bn of SVR attrition (2018: £4.9bn). – Non-interest income was down 7%, largely due to £58m of ring-fencing perimeter changes in 2018, partially offset by £15m additional Vocalink consideration
received in Q2 2019. When adjusted for these items and £103m (2018: £63m) of operating lease depreciation(4), non-interest income(3) was down 7%, largely due to the closure of trading businesses following ring-fencing implementation.
– Operating expenses before credit impairment losses, provisions and charges were down 1%, with the absence of £48m of ring-fencing perimeter changes, £40m of GMP equalisation costs and £38m of Banking Reform costs all incurred in 2018. This was partially offset by £50m(5) transformation costs in 2019 and £40m higher operating lease depreciation. When adjusted for these items, operating expenses were flat as higher depreciation costs and inflationary pressures were offset by lower staff costs and efficiency savings.
– Credit impairment losses were up 44% to £220m, largely due to lower mortgage releases as well as a few single name corporate exposures. – Provisions for other liabilities and charges were up £183m to £443m, largely due to additional PPI provisions of £169m and £105m of transformation programme
charges(5) (predominantly restructuring costs) as well as an additional £10m other provision charge in 2019 pertaining to our retail credit business operations. Other adjustments to provisions amounted to £80m in 2018. When adjusted for these items, provisions(3) were down £21m, which was the net effect of a number of items, most notably the release of property provisions. The £169m charged in respect of PPI comprised:
– In Q219 we reported an additional provision of £70m reflecting an increase in PPI claim volumes, additional industry activities and having considered guidance provided by the FCA and our specific approach to PPI claims, in advance of the PPI claims deadline on 29 August 2019.
– In Q3 2019, and in line with industry experience, we received unprecedented volumes of information requests in August 2019 and saw a significant spike in both these requests and complaints in the final days prior to the complaint deadline. Our best estimate of the additional provision required was £99m.
– Tax on profit decreased £131m to £272m, as a result of lower taxable profits in 2019, partially offset by the tax effect of additional PPI remediation charges which are not tax deductible.
(4) In Q4 2019 we made a new adjustment for operating lease depreciation relating to our consumer (auto) finance business which is included in adjusted non-interest income and excluded from adjusted operating expenses (2019: £103m, 2018: £63m). See ‘Alternative Performance Measures’ for details.
(5) Transformation programme investment of £155m, of which £50m is operating expenses and £105m is provisions for other liabilities and charges.
161Santander UK Group Holdings plc
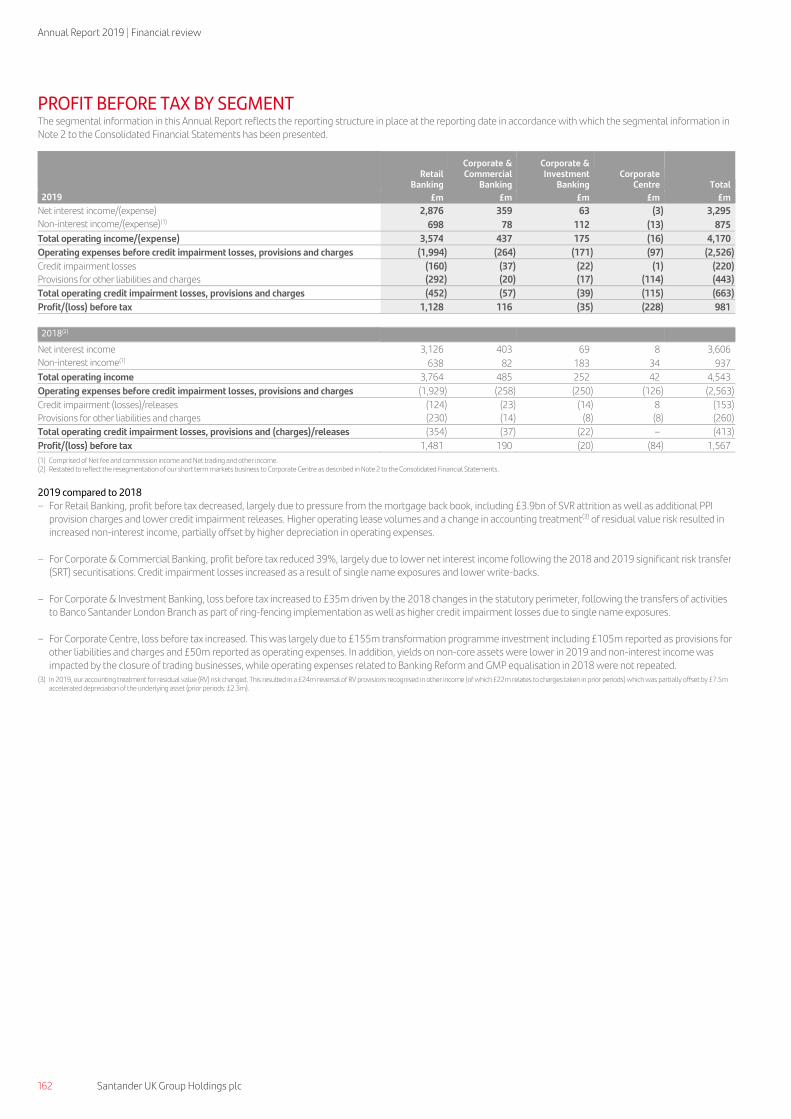
Annual Report 2019 | Financial review
162 Santander UK Group Holdings plc
Secret
PROFIT BEFORE TAX BY SEGMENT The segmental information in this Annual Report reflects the reporting structure in place at the reporting date in accordance with which the segmental information in Note 2 to the Consolidated Financial Statements has been presented.
Retail Banking
Corporate & Commercial
Banking
Corporate & Investment
Banking Corporate
Centre Total
2019 £m £m £m £m £m
Net interest income/(expense) 2,876 359 63 (3) 3,295
Non-interest income/(expense)(1) 698 78 112 (13) 875
Total operating income/(expense) 3,574 437 175 (16) 4,170
Operating expenses before credit impairment losses, provisions and charges (1,994) (264) (171) (97) (2,526)
Credit impairment losses (160) (37) (22) (1) (220)
Provisions for other liabilities and charges (292) (20) (17) (114) (443)
Total operating credit impairment losses, provisions and charges (452) (57) (39) (115) (663)
Profit/(loss) before tax 1,128 116 (35) (228) 981
2018(2)
Net interest income 3,126 403 69 8 3,606
Non-interest income(1) 638 82 183 34 937
Total operating income 3,764 485 252 42 4,543
Operating expenses before credit impairment losses, provisions and charges (1,929) (258) (250) (126) (2,563)
Credit impairment (losses)/releases (124) (23) (14) 8 (153)
Provisions for other liabilities and charges (230) (14) (8) (8) (260)
Total operating credit impairment losses, provisions and (charges)/releases (354) (37) (22) – (413)
Profit/(loss) before tax 1,481 190 (20) (84) 1,567
(1) Comprised of Net fee and commission income and Net trading and other income. (2) Restated to reflect the resegmentation of our short term markets business to Corporate Centre as described in Note 2 to the Consolidated Financial Statements.
2019 compared to 2018 – For Retail Banking, profit before tax decreased, largely due to pressure from the mortgage back book, including £3.9bn of SVR attrition as well as additional PPI
provision charges and lower credit impairment releases. Higher operating lease volumes and a change in accounting treatment(3) of residual value risk resulted in increased non-interest income, partially offset by higher depreciation in operating expenses.
– For Corporate & Commercial Banking, profit before tax reduced 39%, largely due to lower net interest income following the 2018 and 2019 significant risk transfer (SRT) securitisations. Credit impairment losses increased as a result of single name exposures and lower write-backs.
– For Corporate & Investment Banking, loss before tax increased to £35m driven by the 2018 changes in the statutory perimeter, following the transfers of activities to Banco Santander London Branch as part of ring-fencing implementation as well as higher credit impairment losses due to single name exposures.
– For Corporate Centre, loss before tax increased. This was largely due to £155m transformation programme investment including £105m reported as provisions for other liabilities and charges and £50m reported as operating expenses. In addition, yields on non-core assets were lower in 2019 and non-interest income was impacted by the closure of trading businesses, while operating expenses related to Banking Reform and GMP equalisation in 2018 were not repeated.
(3) In 2019, our accounting treatment for residual value (RV) risk changed. This resulted in a £24m reversal of RV provisions recognised in other income (of which £22m relates to charges taken in prior periods) which was partially offset by £7.5m accelerated depreciation of the underlying asset (prior periods: £2.3m).
Santander UK Group Holdings plc162
Annual Report 2019 | Financial review

Santander UK Group Holdings plc 163
Strategic report Governance Risk review Financial review Financial statements Shareholder information
Balance sheet review
SUMMARISED CONSOLIDATED BALANCE SHEET
2019 2018
£m £m
Assets
Cash and balances at central banks 26,395 24,180
Financial assets at fair value through profit or loss 4,336 11,458
Financial assets at amortised cost 240,773 233,489
Financial assets at fair value through other comprehensive income 9,747 13,302
Interest in other entities 117 88
Property, plant and equipment 1,971 1,835
Retirement benefit assets 670 842
Tax, intangibles and other assets 4,479 4,187
Total assets 288,488 289,381
Liabilities
Financial liabilities at fair value through profit or loss 3,422 7,880
Financial liabilities at amortised cost 265,350 261,933
Retirement benefit obligations 280 115
Tax, other liabilities and provisions 3,095 3,233
Total liabilities 272,147 273,161
Equity
Total shareholders’ equity 15,946 15,820
Non-controlling interests 395 400
Total equity 16,341 16,220
Total liabilities and equity 288,488 289,381
A more detailed Consolidated Balance Sheet is contained in the Consolidated Financial Statements.
2019 compared to 2018
Assets
Cash and balances at central banks
Cash and balances at central banks increased by 9% to £26,395m at 31 December 2019 (2018: £24,180m). This was driven by cash inflows generated from profits in the year, higher customer deposits and the net disposal of certain asset backed securities, offset by additional retail lending and net cash outflows relating to debt securities in issue.
Financial assets at fair value through profit or loss:
Financial assets at fair value through profit or loss decreased by 62% to £4,336m at 31 December 2019 (2018: £11,458m), mainly due to:
– £2.1bn of senior tranches of credit linked notes, which were previously classified as other financial assets at fair value through profit or loss, are now presented on a net basis as a result of changes to legal agreements. For more information see Note 12 to the Consolidated Financial Statements.
– The maturity of non-trading reverse repurchase agreements held at FVTPL, which totalled £2.3bn at 31 December 2018.
Financial assets at amortised cost:
Financial assets at amortised cost increased by 3% to £240,773m at 31 December 2019 (2018: £233,489m), mainly due to:
– An increase in customer loans, with mortgage lending in Retail Banking up £7.4bn. This was partially offset by a reduction in corporate lending which included managed reductions in Commercial Real Estate of £1.1bn.
– Reverse repurchase agreements – non trading increasing by £2.5bn, reflecting the classification of all new non-trading reverse repurchase agreements at amortised cost in line with our ring-fenced model and as part of normal liquidity risk management.
Financial assets at fair value through other comprehensive income
Financial assets at fair value through other comprehensive income decreased by 27% to £9,747m at 31 December 2019 (2018: £13,302m) mainly due to the disposal of certain asset backed securities as part of normal liquid asset portfolio management.
Property, plant and equipment
Property, plant and equipment increased by 7% to £1,971m at 31 December 2019 (2018: £1,835m) mainly due to an increase in operating lease assets and the recognition of right-of-use assets following the adoption of IFRS 16 on 1 January 2019.
Retirement benefit assets
Retirement benefit assets decreased by 20% to £670m at 31 December 2019 (2018: £842m), reflecting a decrease in the overall accounting surplus of the Santander (UK) Group Pension Scheme (the Scheme). This was mainly due to a decrease in corporate bond yields, resulting in a higher value being placed on the liabilities in the Scheme. This was partially offset by asset growth, mainly driven by the decrease in corporate bond yields.
Tax, intangibles and other assets
Tax, intangibles and other assets increased by 7% to £4,479m at 31 December 2019 (2018: £4,187m), mainly due to an increase in the carrying value of the macro hedge of interest rate risk.
163Santander UK Group Holdings plc

Annual Report 2019 | Financial review
164 Santander UK Group Holdings plc
Secret
Liabilities
Financial liabilities at fair value through profit or loss:
Financial liabilities at fair value through profit or loss decreased by 57% to £3,422m at 31 December 2019 (2018: £7,880m), mainly due to:
– £2.1bn of cash deposits, which were previously classified as other financial liabilities at fair value through profit or loss, are now presented on a net basis as a result of changes to legal agreements. For more information see Note 21 to the Consolidated Financial Statements.
– The maturity of non-trading repurchase agreements held at FVTPL, which totalled £2.1bn at 31 December 2018.
Financial liabilities at amortised cost
Financial liabilities at amortised cost increased by 1% to £265,350m at 31 December 2019 (2018: £261,933m). This was mainly due to:
– Repurchase agreements – non trading increasing by £7.4bn reflecting the classification of all new non-trading repurchase agreements at amortised cost in line with our ring-fenced model and as part of normal liquidity risk management.
– An increase in customer deposits, with £3.0bn growth in Retail Banking supported by a successful ISA campaign and 1I2I3 Business Current Account inflows. Corporate deposits also increased as we focused on building strong customer relationships.
– Deposits by banks decreasing by £3.5bn due to a reduction in time deposits with other banks, including deposits placed with Banco Santander, and lower balances held as cash collateral.
– Debt securities in issue decreasing by £5.7bn, reflecting maturities in the period, partially offset by covered bond issuances of £1bn in February 2019, €1bn in May 2019 and £1bn in November 2019, along with a senior unsecured issuance of $1bn in June 2019.
Retirement benefit obligations
Retirement benefit obligations increased by 143% to £280m at 31 December 2019 (2018: £115m), reflecting a decrease in the overall accounting surplus of the Scheme. This was mainly due to a decrease in corporate bond yields, resulting in a higher value being placed on the liabilities in the Scheme. This was partially offset by asset growth, mainly driven by the decrease in corporate bond yields.
Tax, other liabilities and provisions
Tax, other liabilities and provisions decreased by 4% to £3,095m at 31 December 2019 (2018: £3,233m) mainly due to changes in unsettled financial transactions as well as tax balances.
Equity
Total shareholders’ equity
Total shareholders’ equity increased by 1% to £15,946m at 31 December 2019 (2018: £15,820m). This was principally due to the profit after tax for the year and a net increase in other equity instruments being offset by downward defined benefit pension remeasurements and dividend payments.
Santander UK Group Holdings plc164
Annual Report 2019 | Financial review

Santander UK Group Holdings plc 165
Strategic report Governance Risk review Financial review Financial statements Shareholder information
CUSTOMER BALANCES
Consolidated
2019 2018
£bn £bn
Customer loans 205.3 199.9
Other assets 83.2 89.5
Total assets 288.5 289.4
Customer deposits 177.8 172.1
Total wholesale funding 65.3 70.9
Other liabilities 29.1 30.2
Total liabilities 272.2 273.2
Shareholders' equity 15.9 15.8
Non-controlling interest 0.4 0.4
Total liabilities and equity 288.5 289.4
Further analyses of credit risk on customer loans, and on our funding strategy, are included in the Credit risk and Liquidity risk sections of the Risk review.
2019 compared to 2018
– Customer loans increased £5.4bn, with mortgage lending in Retail Banking up £7.4bn. This was partially offset by a reduction in corporate lending which included
managed reductions in CRE of £1.1bn. – Customer deposits increased £5.7bn, with £3.0bn growth in Retail Banking supported by a successful ISA campaign and 1I2I3 Business Current Account inflows.
Corporate deposits also increased as we focused on building strong customer relationships. Retail Banking
2019 2018
£bn £bn
Mortgages 165.4 158.0
Business banking 1.8 1.8
Consumer (auto) finance 7.7 7.3
Other unsecured lending 5.5 5.7
Customer loans 180.4 172.8
Current accounts 68.7 68.4
Savings 57.2 56.0
Business banking accounts 12.9 11.9
Other retail products 6.3 5.8
Customer deposits 145.1 142.1
Corporate & Commercial Banking
2019 2018
£bn £bn
Non-Commercial Real Estate trading businesses 11.2 11.5
Commercial Real Estate 5.1 6.2
Customer loans 16.3 17.7
Customer deposits 18.2 17.6
Corporate & Investment Banking
2019 2018
£bn £bn
Customer loans 4.1 4.6
Customer deposits 6.1 4.8
Corporate Centre
2019 2018
£bn £bn
Social Housing 3.6 3.8
Crown Dependencies (Isle of Man and Jersey) 0.3 0.3
Non-core 0.6 0.7
Customer loans 4.5 4.8
Customer deposits 8.4 7.6
– of which Crown Dependencies 6.1 4.8
165Santander UK Group Holdings plc

Annual Report 2019 | Financial review
166 Santander UK Group Holdings plc
Secret
Cash flows
SUMMARISED CONSOLIDATED CASH FLOW STATEMENT
2019 2018 £m £m
Net cash flows from operating activities 3,523 (13,182)
Net cash flows from investing activities 2,885 (3,925)
Net cash flows from financing activities (4,091) 5,687
Change in cash and cash equivalents 2,317 (11,420)
A more detailed Consolidated Cash Flow Statement is contained in the Consolidated Financial Statements.
The major activities and transactions that affected cash flows during 2019 and 2018 were as follows:
In 2019, the net cash inflows from operating activities of £3,523m resulted from net cash inflows generated from profits in the year and higher customer deposits, offset by additional retail lending. The net cash inflows from investing activities of £2,885m mainly reflected the net disposal of certain asset backed securities as part of normal liquid asset portfolio management. The net cash outflows from financing activities mainly reflected net cash outflows relating to debt securities in issue. These resulted in cash and cash equivalents increasing by £2,317m in the year.
In 2018, the net cash outflows from operating activities of £13,182m resulted from net cash outflows relating to trading and derivative assets and liabilities. The net cash outflows from investing activities of £3,925m mainly reflected purchases of financial investments in the year as part of normal liquidity management. The net cash inflows from financing activities of £5,687m reflected the net inflows from debt securities following the pre-funding of our 2019 requirements. This was offset by payments of dividends on ordinary shares, preference shares, other equity instruments and non-controlling interests. Cash and cash equivalents decreased by £11,420m principally from the decrease in cash held at central banks.
Santander UK Group Holdings plc166
Annual Report 2019 | Financial review

Santander UK Group Holdings plc 167
Strategic report Governance Risk review Financial review Financial statements Shareholder information
Capital and funding 2019 2018
£bn £bn
Capital and leverage
CET1 capital 10.4 10.4
Total qualifying regulatory capital 15.8 15.0
CET1 capital ratio 14.3% 13.2%
Total capital ratio 21.6% 19.1%
UK leverage ratio 4.7% 4.5%
RWAs 73.2 78.8
– of which Retail Banking(1) 49.0 47.9
– of which Corporate & Commercial Banking 12.5 17.0
– of which Corporate & Investment Banking(1) 4.9 6.9
– of which Corporate Centre(1) 6.8 7.0
Funding
Total wholesale funding 67.8 73.2
– of which with a residual maturity of less than one year 22.5 16.8 (1) Segmental RWAs for 2018 have been restated to reflect the transfer of our short term markets activity from CIB to Corporate Centre and the reallocation of an equity stake in a joint venture from Corporate Centre to Retail Banking.
Further analysis of capital and funding is included in the Capital risk and Liquidity risk sections of the Risk review.
2019 compared to 2018
– CET1 capital was stable at £10.4bn, with ongoing capital accretion through profits retained after dividend payment, offset by market-driven pension movements.
– RWAs reduced largely as a result of SRT securitisations and lower corporate lending as we continue to focus on risk-weighted returns. This was partially offset by increased RWAs in Retail Banking in line with mortgage lending growth.
– CET1 capital ratio increased 110bps to 14.3%, through active RWA management. UK leverage ratio increased 20bps to 4.7%. – Total wholesale funding decreased, reflecting maturities in the period, partially offset by covered bond issuances of £1bn in February 2019, €1bn in May
2019 and £1bn in November 2019, along with senior unsecured issuance of $1bn in June 2019. In August 2019, we increased our AT1 outstanding by £200m via the issuance of a new £500m 6.3% AT1 to Banco Santander and the repurchase of the £300m 7.6% AT1 from Banco Santander.
Liquidity 2019 2018
£bn £bn
Santander UK Domestic Liquidity Sub Group (RFB DoLSub)
Liquidity Coverage Ratio (LCR) 142% 164%
LCR eligible liquidity pool 42.0 54.1
Santander Financial Services (SFS)
LCR 471% –
LCR eligible liquidity pool 5.7 –
Further analysis of liquidity is included in the Liquidity risk section of the Risk review.
2019 compared to 2018
– While LCR remains high at 142%, it is lower than 2018 reflecting reduced uncertainty.
– The RFB DoLSub LCR and LCR eligible liquidity pool both decreased following the transfer of our Isle of Man and Jersey businesses (Crown Dependencies) into SFS in 2018 as part of ring-fencing implementation.
– SFS liquidity benefited from £6.1bn of deposits in our Crown Dependencies business, which increased £1.3bn in 2019 in preparation for the planned transfer of some RFB assets to SFS in 2020.
167Santander UK Group Holdings plc

Annual Report 2019 | Financial review
168 Santander UK Group Holdings plc
Secret
Selected financial data The financial information set forth below for the years ended 31 December 2019, 2018 and 2017 and at 31 December 2019 and 2018 has been derived from the audited Consolidated Financial Statements of Santander UK Group Holdings plc (the Company) and its subsidiaries (together, the Santander UK group) prepared in accordance with IFRS included elsewhere in this Annual Report. The information should be read in connection with, and is qualified in its entirety by reference to, the Santander UK group’s Consolidated Financial Statements and the Notes thereto.
The financial information in this selected financial data does not constitute statutory accounts within the meaning of the Companies Act 2006. The auditor’s report on the Consolidated Financial Statements for each of the five years ended 31 December 2019 was unmodified and did not include a statement under sections 237(2) and 237(3) of the Companies Act 1985 or sections 498(2) and 498(3) of the Companies Act 2006, as applicable. The Consolidated Financial Statements of the Santander UK group at 31 December 2019, 2018, 2017 and 2016 were audited by PwC LLP; 2015 was audited by Deloitte LLP.
BALANCE SHEETS
2019(1) 2018(2,3) 2017 2016 2015
£m £m £m £m £m
Assets
Cash and balances at central banks 26,395 24,180 32,771 17,107 16,842
Financial assets at fair value through profit or loss 4,336 11,458 52,593 57,646 47,270
Financial assets at amortised cost 240,773 233,489 205,412 204,085 201,594
Financial assets at fair value through other comprehensive income 9,747 13,302
Financial investments 17,611 17,466 9,064
Interests in other entities 117 88 73 61 48
Intangible assets 1,776 1,814 1,742 1,685 1,600
Property, plant and equipment 1,971 1,835 1,598 1,491 1,597
Current tax assets 186 106 – – 51
Retirement benefit assets 670 842 449 398 556
Other assets 2,517 2,267 2,511 2,571 2,156
Total assets 288,488 289,381 314,760 302,510 280,778
Liabilities
Financial liabilities at fair value through profit or loss 3,422 7,880 51,037 41,103 36,246
Financial liabilities at amortised cost 265,350 261,933 243,858 241,590 225,852
Other liabilities 2,373 2,507 2,728 3,221 2,445
Provisions 577 515 558 700 870
Current tax liabilities – – 3 53 1
Deferred tax liabilities 145 211 88 128 223
Retirement benefit obligations 280 115 286 262 110
Total liabilities 272,147 273,161 298,558 287,057 265,747
Equity
Total shareholders’ equity 15,946 15,820 15,801 15,054 14,640
Non-controlling interests 395 400 401 399 391
Total equity 16,341 16,220 16,202 15,453 15,031
Total liabilities and equity 288,488 289,381 314,760 302,510 280,778
(1) On 1 January 2019, the Santander UK group adopted IFRS 16 (2015-2018: IAS 17). (2) On 1 January 2018, the Santander UK group adopted IFRS 9 (2015-2017: IAS 39). (3) In 2018, the Santander UK group completed the implementation of its ring-fencing plans.
INCOME STATEMENTS
2019(1) 2018(2,3,4) 2017(2) 2016 2015
£m £m £m £m £m
Net interest income 3,295 3,606 3,803 3,582 3,575
Net fee and commission income 689 749 807 770 715
Net trading and other income 186 188 302 443 283
Total operating income 4,170 4,543 4,912 4,795 4,573
Operating expenses before credit impairment losses, provisions and charges (2,526) (2,563) (2,502) (2,417) (2,403)
Credit impairment losses (220) (153) (203) (67) (66)
Provisions for other liabilities and charges (443) (260) (393) (397) (762)
Total operating credit impairment losses, provisions and charges (663) (413) (596) (464) (828)
Profit before tax 981 1,567 1,814 1,914 1,342
Tax on profit (272) (403) (514) (597) (380)
Profit after tax 709 1,164 1,300 1,317 962
(1) On 1 January 2019, the Santander UK group adopted IFRS 16 (2015-2018: IAS 17). (2) Adjusted to reflect amendment to IAS 12, as described in Note 1 to the Consolidated Financial Statements. (3) On 1 January 2018, the Santander UK group adopted IFRS 9 (2015-2017: IAS 39). (4) In 2018, the Santander UK group completed the implementation of its ring-fencing plans.
Santander UK Group Holdings plc168
Annual Report 2019 | Financial review
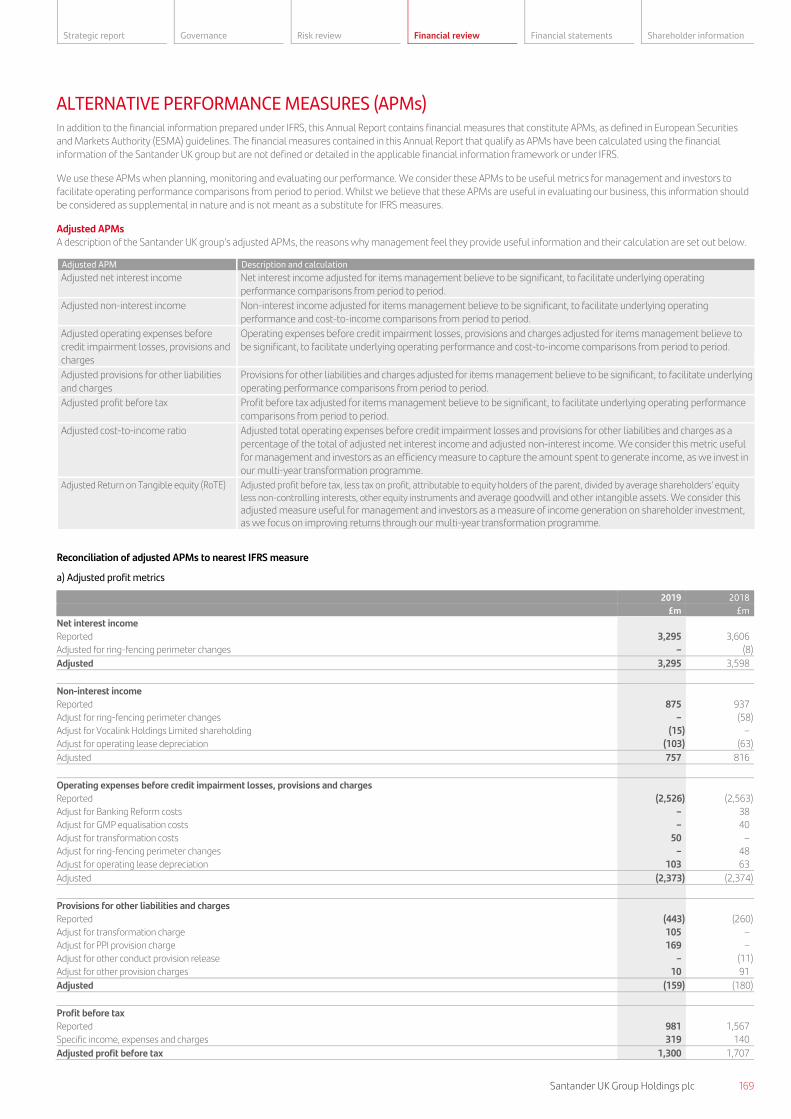
Santander UK Group Holdings plc 169
Strategic report Governance Risk review Financial review Financial statements Shareholder information
Secret
ALTERNATIVE PERFORMANCE MEASURES (APMs) In addition to the financial information prepared under IFRS, this Annual Report contains financial measures that constitute APMs, as defined in European Securities and Markets Authority (ESMA) guidelines. The financial measures contained in this Annual Report that qualify as APMs have been calculated using the financial information of the Santander UK group but are not defined or detailed in the applicable financial information framework or under IFRS.
We use these APMs when planning, monitoring and evaluating our performance. We consider these APMs to be useful metrics for management and investors to facilitate operating performance comparisons from period to period. Whilst we believe that these APMs are useful in evaluating our business, this information should be considered as supplemental in nature and is not meant as a substitute for IFRS measures.
Adjusted APMs A description of the Santander UK group’s adjusted APMs, the reasons why management feel they provide useful information and their calculation are set out below.
Adjusted APM Description and calculation
Adjusted net interest income Net interest income adjusted for items management believe to be significant, to facilitate underlying operating performance comparisons from period to period.
Adjusted non-interest income Non-interest income adjusted for items management believe to be significant, to facilitate underlying operating performance and cost-to-income comparisons from period to period.
Adjusted operating expenses before credit impairment losses, provisions and charges
Operating expenses before credit impairment losses, provisions and charges adjusted for items management believe to be significant, to facilitate underlying operating performance and cost-to-income comparisons from period to period.
Adjusted provisions for other liabilities and charges
Provisions for other liabilities and charges adjusted for items management believe to be significant, to facilitate underlying operating performance comparisons from period to period.
Adjusted profit before tax Profit before tax adjusted for items management believe to be significant, to facilitate underlying operating performance comparisons from period to period.
Adjusted cost-to-income ratio Adjusted total operating expenses before credit impairment losses and provisions for other liabilities and charges as a percentage of the total of adjusted net interest income and adjusted non-interest income. We consider this metric useful for management and investors as an efficiency measure to capture the amount spent to generate income, as we invest in our multi-year transformation programme.
Adjusted Return on Tangible equity (RoTE) Adjusted profit before tax, less tax on profit, attributable to equity holders of the parent, divided by average shareholders’ equity less non-controlling interests, other equity instruments and average goodwill and other intangible assets. We consider this adjusted measure useful for management and investors as a measure of income generation on shareholder investment, as we focus on improving returns through our multi-year transformation programme.
Reconciliation of adjusted APMs to nearest IFRS measure
a) Adjusted profit metrics
2019 2018
£m £m
Net interest income Reported 3,295 3,606
Adjusted for ring-fencing perimeter changes – (8)
Adjusted 3,295 3,598
Non-interest income Reported 875 937
Adjust for ring-fencing perimeter changes – (58)
Adjust for Vocalink Holdings Limited shareholding (15) –
Adjust for operating lease depreciation (103) (63)
Adjusted 757 816
Operating expenses before credit impairment losses, provisions and charges Reported (2,526) (2,563)
Adjust for Banking Reform costs – 38
Adjust for GMP equalisation costs – 40
Adjust for transformation costs 50 –
Adjust for ring-fencing perimeter changes – 48
Adjust for operating lease depreciation 103 63
Adjusted (2,373) (2,374)
Provisions for other liabilities and charges Reported (443) (260)
Adjust for transformation charge 105 –
Adjust for PPI provision charge 169 –
Adjust for other conduct provision release – (11)
Adjust for other provision charges 10 91
Adjusted (159) (180)
Profit before tax Reported 981 1,567
Specific income, expenses and charges 319 140
Adjusted profit before tax 1,300 1,707
169Santander UK Group Holdings plc

Annual Report 2019 | Financial review
170 Santander UK Group Holdings plc
Secret
The financial results for 2019 and 2018 were impacted by a number of specific income, expenses and charges with an aggregate impact on profit before tax of £319m in 2019 and £140m in 2018. The specific income, expenses and charges are outlined below:
– Ring-fencing perimeter changes As part of our ring-fencing implementation programme, in July 2018 we transferred £1.4bn of customer loans, £21.5bn of other assets and £20.7bn of liabilities from Santander UK to Banco Santander London Branch. The associated income and costs related to the businesses transferred amounted to a net profit before tax of £18m in 2018.
– Vocalink Holdings Limited shareholding Santander UK was part of the consortium of banks that sold a majority of the shares in Vocalink Holdings Limited to Mastercard in 2017. Under the terms of the sale agreement, we retained a shareholding of 0.775%. In respect of the shares we sold in 2017, we were entitled to receive additional consideration where Vocalink’s 2018 earnings performance exceeded an agreed amount and in June 2019 we received additional consideration of £15m.
– Operating lease depreciation In Q4 2019 we began to adjust operating expenses and non-interest income for operating lease depreciation. We believe this provides a clearer explanation of expenses and income as operating lease depreciation is a direct cost associated with growing business volumes largely in consumer (auto) finance.
– Banking Reform costs These 2018 costs of £38m related to a multi-year investment needed to comply with the Banking Reform Act implemented on 1 January 2019.
– GMP equalisation costs On 26 October 2018, the High Court handed down a judgement concluding that defined benefit schemes should equalise pension benefits for men and women in relation to guaranteed minimum pension (GMP) and concluded on the methods that were appropriate. The estimated increase in liabilities at the date of the judgement was £40m and is based on a number of assumptions and the actual impact may be different.
– Transformation costs and charges Transformation costs and charges relate to a multi-year project to deliver on our strategic priorities and enhance efficiency in order for us to better serve our customers and meet our medium-term targets. Q1 2019 charges largely related to restructuring of our branch network. Further charges in Q2 2019 were largely associated with the announced plans to reshape our Corporate & Commercial Banking business.
– PPI We have been closely involved in the additional industry activities to support the regulatory time-bar for claims and orderly closure of the FCA remediation campaign. We made an additional provision of £70m in Q2 2019 reflecting an increase of claims volumes and additional industry activities and having considered guidance provided by the FCA and our specific approach to PPI claims, in advance of the PPI claims deadline on 29 August 2019. In Q3 2019, and in line with industry experience, we received unprecedented volumes of information requests in August 2019 and saw a significant spike in both these requests and complaints in the final days prior to the complaint deadline. Our best estimate of the additional provision required was £99m.
– Other conduct provision release Provisions for other liabilities and charges in 2018 included a release of £11m in the second quarter or 2018 relating to provisions for the sale of interest rate derivatives, following ongoing reviews regarding the regulatory classification of certain customers eligible for redress.
– Other provision charges In Q4 2019 we made a £10m provision in relation to our consumer credit business operations. This follows a £58m charge in Q4 2018 (included in the total adjustment of £91m).
b) Adjusted cost-to-income ratio
Adjusted cost-to-income ratio is a new KPI in 2019 and an adjusted APM. We consider this useful for management and investors as an efficiency measure to capture the amount spent to generate income. In the low rate environment, we are focused on costs as we invest in our multi-year transformation programme to improve returns going forward.
2019 2018
£m £m
Adjusted net interest income 3,295 3,598
Adjusted non-interest income 757 816
Adjusted total operating income 4,052 4,414
Adjusted operating expenses before credit impairment losses, provisions and charges (2,373) (2,374)
Adjusted cost-to-income ratio 59% 54%
Cost-to-income ratio 61% 56%
Santander UK Group Holdings plc170
Annual Report 2019 | Financial review
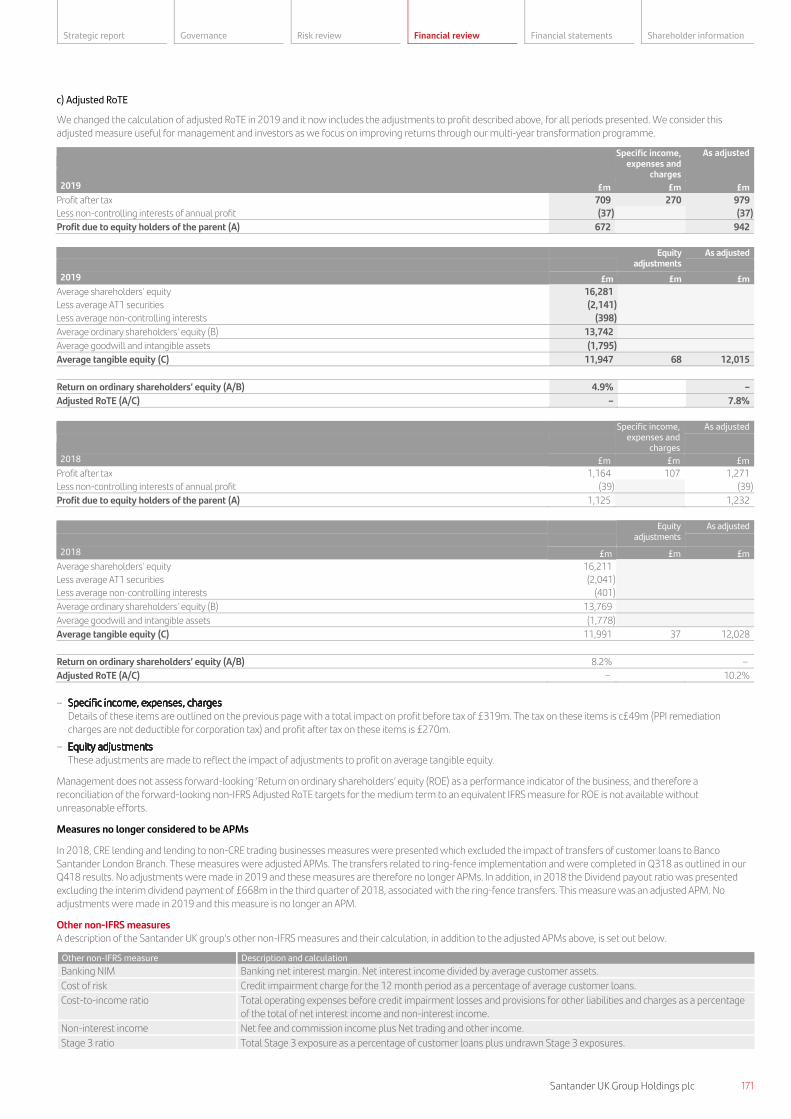
Santander UK Group Holdings plc 171
Strategic report Governance Risk review Financial review Financial statements Shareholder information
Secret
c) Adjusted RoTE
We changed the calculation of adjusted RoTE in 2019 and it now includes the adjustments to profit described above, for all periods presented. We consider this adjusted measure useful for management and investors as we focus on improving returns through our multi-year transformation programme.
Specific income,
expenses and charges
As adjusted
2019 £m £m £m
Profit after tax 709 270 979
Less non-controlling interests of annual profit (37) (37)
Profit due to equity holders of the parent (A) 672 942
Equity
adjustments As adjusted
2019 £m £m £m
Average shareholders' equity 16,281
Less average AT1 securities (2,141)
Less average non-controlling interests (398)
Average ordinary shareholders' equity (B) 13,742
Average goodwill and intangible assets (1,795)
Average tangible equity (C) 11,947 68 12,015
Return on ordinary shareholders’ equity (A/B) 4.9% –
Adjusted RoTE (A/C) – 7.8%
Specific income,
expenses and charges
As adjusted
2018 £m £m £m
Profit after tax 1,164 107 1,271
Less non-controlling interests of annual profit (39) (39)
Profit due to equity holders of the parent (A) 1,125 1,232
Equity
adjustments As adjusted
2018 £m £m £m
Average shareholders' equity 16,211
Less average AT1 securities (2,041)
Less average non-controlling interests (401)
Average ordinary shareholders' equity (B) 13,769
Average goodwill and intangible assets (1,778)
Average tangible equity (C) 11,991 37 12,028
Return on ordinary shareholders’ equity (A/B) 8.2% –
Adjusted RoTE (A/C) – 10.2%
– Specific income, expenses, charges
Details of these items are outlined on the previous page with a total impact on profit before tax of £319m. The tax on these items is c£49m (PPI remediation charges are not deductible for corporation tax) and profit after tax on these items is £270m.
– Equity adjustments These adjustments are made to reflect the impact of adjustments to profit on average tangible equity.
Management does not assess forward-looking ‘Return on ordinary shareholders’ equity (ROE) as a performance indicator of the business, and therefore a reconciliation of the forward-looking non-IFRS Adjusted RoTE targets for the medium term to an equivalent IFRS measure for ROE is not available without unreasonable efforts.
Measures no longer considered to be APMs
In 2018, CRE lending and lending to non-CRE trading businesses measures were presented which excluded the impact of transfers of customer loans to Banco Santander London Branch. These measures were adjusted APMs. The transfers related to ring-fence implementation and were completed in Q318 as outlined in our Q418 results. No adjustments were made in 2019 and these measures are therefore no longer APMs. In addition, in 2018 the Dividend payout ratio was presented excluding the interim dividend payment of £668m in the third quarter of 2018, associated with the ring-fence transfers. This measure was an adjusted APM. No adjustments were made in 2019 and this measure is no longer an APM.
Other non-IFRS measures A description of the Santander UK group’s other non-IFRS measures and their calculation, in addition to the adjusted APMs above, is set out below.
Other non-IFRS measure Description and calculation
Banking NIM Banking net interest margin. Net interest income divided by average customer assets.
Cost of risk Credit impairment charge for the 12 month period as a percentage of average customer loans.
Cost-to-income ratio Total operating expenses before credit impairment losses and provisions for other liabilities and charges as a percentage of the total of net interest income and non-interest income.
Non-interest income Net fee and commission income plus Net trading and other income.
Stage 3 ratio Total Stage 3 exposure as a percentage of customer loans plus undrawn Stage 3 exposures.
171Santander UK Group Holdings plc

Financial statements
Contents
Audit report 173
Primary financial statements 180
Consolidated Income Statement 180
Consolidated Statement of Comprehensive Income
181
Consolidated Balance Sheet 182
Consolidated Cash Flow Statement 183
Consolidated Statement of Changes in Equity
184
Notes to the financial statements 185
Primary company financial statements
247
Company Balance Sheet 247
Company Cash Flow Statement 248
Company Statement of Changes in Equity
248
Notes to the company financial statements
249
Santander UK Group Holdings plc172
Annual Report 2019 | Financial statements

Strategic report Governance Risk review Financial review Financial statements Shareholder information
Audit report
Independent auditors’ report to the members of Santander UK Group Holdings plc
Report on the audit of the financial statements
Opinion
In our opinion, Santander UK Group Holdings plc’s group financial statements and company financial statements (the “financial statements”):
– give a true and fair view of the state of the group’s and of the company’s affairs as at 31 December 2019 and of the group’s profit and the group’s and the company’s cash flows for the year then ended;
– have been properly prepared in accordance with International Financial Reporting Standards (IFRSs) as adopted by the European Union and, as regards the company’s financial statements, as applied in accordance with the provisions of the Companies Act 2006; and
– have been prepared in accordance with the requirements of the Companies Act 2006 and, as regards the group financial statements, Article 4 of the IAS Regulation.
We have audited the financial statements, included within the Annual Report, which comprise the:
– Consolidated and Company Balance Sheets as at 31 December 2019; – Consolidated Income Statement and Statement of Comprehensive Income for the year then ended; – Consolidated and Company Cash Flow Statements for the year then ended; – Consolidated and Company Statements of Changes in Equity for the year then ended; and – Notes to the financial statements, which include a description of the significant accounting policies.
Certain required disclosures have been presented elsewhere in the Annual Report, rather than in the notes to the financial statements. These are cross-referenced from the financial statements.
Our opinion is consistent with our reporting to the Board Audit Committee.
Separate opinion in relation to IFRSs as issued by the IASB
As explained in note 1 to the financial statements, the group, in addition to applying IFRSs as adopted by the European Union, has also applied IFRSs as issued by the International Accounting Standards Board (IASB).
In our opinion, the group financial statements have been properly prepared in accordance with IFRSs as issued by the IASB.
Basis for opinion
We conducted our audit in accordance with International Standards on Auditing (UK) (“ISAs (UK)”) and applicable law. Our responsibilities under ISAs (UK) are further described in the Auditors’ responsibilities for the audit of the financial statements section of our report. We believe that the audit evidence we have obtained is sufficient and appropriate to provide a basis for our opinion.
Independence
We remained independent of the group in accordance with the ethical requirements that are relevant to our audit of the financial statements in the UK, which includes the FRC’s Ethical Standard, as applicable to listed public interest entities, and we have fulfilled our other ethical responsibilities in accordance with these requirements.
To the best of our knowledge and belief, we declare that non-audit services prohibited by the FRC’s Ethical Standard were not provided to the group or the company.
Other than those disclosed in note 7 to the financial statements, we have provided no non-audit services to the group or the company in the period from 1 January 2019 to 31 December 2019.
Our audit approach
Overview
– Overall group materiality: £67 million (2018: £77 million), based on 5% of adjusted profit before tax. – Overall company materiality: £18million (2018: £31million), based on 5% of profit before tax. – The scope of our audit and the nature, timing and extent of audit procedures performed were determined by our risk assessment, the financial significance of
components and other qualitative factors (including history of misstatement through fraud or error). – We performed audit procedures over components considered to be financially significant in the context of the group (full scope audit) or in the context of individual
primary statement account balances (audit of specific account balances). – The key audit matters which were of most significance in the audit of the financial statements were: – Impairment of loans and advances to customers (group only) – Legal, conduct and regulatory matters (group only) – Valuation of defined benefit pension obligations (group only) – These items were discussed with the Board Audit Committee as part of our audit plan communicated in June 2019 and updated in October 2019 and January 2020.
These areas were the key audit matters for discussion at the conclusion of the audit.
The scope of our audit
As part of designing our audit, we determined materiality and assessed the risks of material misstatement in the financial statements. In particular, we looked at where the directors made subjective judgements, for example in respect of significant accounting estimates that involved making assumptions and considering future events that are inherently uncertain.
173Santander UK Group Holdings plc

Annual Report 2019 | Financial statements
174 Santander UK Group Holdings plc
Capability of the audit in detecting irregularities, including fraud
Based on our understanding of the group and the banking industry, we identified that the principal risks of non-compliance with laws and regulations related to breaches of banking laws and regulations such as, but not limited to, regulations relating to consumer credit and unethical and prohibited business practices, and we considered the extent to which non-compliance might have a material effect on the financial statements. We also considered those laws and regulations that have a direct impact on the preparation of the financial statements such as the Companies Act 2006.
We evaluated management’s incentives and opportunities for fraudulent manipulation of the financial statements (including the risk of override of controls), and determined that the principal risks were related to management bias through judgements and assumptions in significant accounting estimates. The group engagement team shared this risk assessment with the component auditors referred to in the scoping section of our report below, so that they could include appropriate audit procedures in response to such risks in their work. Audit procedures performed by the group engagement team and/or component auditors included:
– Discussions with management and those charged with governance in relation to known or suspected instances of non-compliance with laws and regulation and fraud;
– Evaluation and testing of the operating effectiveness of management’s entity level controls designed to prevent and detect irregularities, in particular their code of conduct and whistleblowing helpline;
– Assessment of matters reported on the group’s whistleblowing helpline and the results of management’s investigation of such matters; – Observing the effectiveness of key governance forums and reviewing management information presented at these meetings; – Reviewing key correspondence with the Financial Conduct Authority and Prudential Regulation Authority; – Challenging assumptions and judgements made by management in their significant accounting estimates, in particular in relation to the impairment of loans and
advances, conduct and regulatory related provisions and the valuation of defined benefit obligations (see related key audit matters below); – Identifying and testing journal entries, in particular any journal entries posted by senior management and unusual account combinations to enable key metrics to be
met and testing period end adjustments; and – Incorporated unpredictability into the nature, timing and/or extent of our testing.
There are inherent limitations in the audit procedures described above and the further removed non-compliance with laws and regulations is from the events and transactions reflected in the financial statements, the less likely we would become aware of it. Also, the risk of not detecting a material misstatement due to fraud is higher than the risk of not detecting one resulting from error, as fraud may involve deliberate concealment by, for example, forgery or intentional misrepresentations, or through collusion.
Santander UK Group Holdings plc174
Annual Report 2019 | Financial statements

Strategic report Governance Risk review Financial review Financial statements Shareholder information
Audit report
Key audit matters Key audit matters are those matters that, in the auditors’ professional judgement, were of most significance in the audit of the financial statements of the current period and include the most significant assessed risks of material misstatement (whether or not due to fraud) identified by the auditors, including those which had the greatest effect on: the overall audit strategy; the allocation of resources in the audit; and directing the efforts of the engagement team. These matters, and any comments we make on the results of our procedures thereon, were addressed in the context of our audit of the financial statements as a whole, and in forming our opinion thereon, and we do not provide a separate opinion on these matters. This is not a complete list of all risks identified by our audit.
The key audit matters below only relate to the group.
Key audit matter How our audit addressed the key audit matter
Expected credit loss allowance for loans and advances to customers
Refer to page 48 (Board Audit Committee Chair’s report), page 185 (Accounting Policies), page 196 (Critical Accounting Estimates), and page 211 (note 13: Loans and Advances to customers).
Impairment allowances represent management’s best estimate of expected credit loss (‘ECL’) within each portfolio at the balance sheet date. The identification and the determination of allowances is inherently judgemental.
The key allowance risks relate to residential mortgage loans within Retail Banking and the corporate loans within Corporate & Commercial Banking and Corporate & Investment Banking.
Under IFRS 9 management is required to determine ECLs that may occur over either a 12 month period or the remaining life of an asset, depending on the categorisation of the individual asset. This categorisation is determined by an assessment of whether there has been a significant increase in credit risk (‘SICR’) of the borrower since loan origination. It is also necessary to consider the impact of different future macroeconomic conditions in the determination of ECLs.
Management uses a number of models and post model adjustments (‘PMAs’) to achieve compliance with the requirements of IFRS 9. The determination of ECLs is complex and a number of significant judgements are involved in the estimation process. As a result, we consider that the following elements of our work to be a key audit matter.
We consider the appropriateness of the model methodologies and the following judgements used in the determination of the modelled ECL for the residential mortgage and corporate loan portfolios to be significant:
− Setting of appropriate thresholds for what represents an SICR; − The determination of forward looking macroeconomic scenarios and the
probability weights applied to ECLs associated with each scenario; and − The completeness and ongoing appropriateness of PMAs to address data
and model limitations.
In the corporate loan portfolios, individual impairment assessments are performed for credit impaired loans and advances which are categorised as Stage 3. Judgement is required to estimate the level of any allowance. Our focus was on the principal judgements applied by management in estimating impairment allowances such as the valuation of collateral, forecast cash flows and the reasonableness of the probability weighting of expected likely outcomes.
We understood and evaluated the design of the key controls over the determination of ECLs and tested their operating effectiveness. These controls included:
− Model performance monitoring controls, including testing model estimates against actual outcomes;
− The Credit Risk Provisions Forum's review and approval of significant judgements, estimates and the assessment of ECL modelled outputs; and
− Review and approval of the key judgements used to calculate ECLs on individually assessed loans including the valuation of collateral and probability weighting of likely outcomes.
We noted no significant exceptions in the design or operating effectiveness of the above controls. In addition, we performed the substantive procedures described below.
We assessed whether the IFRS 9 ECL model methodologies used by management were appropriate, making use of our credit risk modelling experts and our industry knowledge. This included an evaluation of the criteria set by management for determining whether there had been a significant increase in credit risk.
We independently recalculated critical model components and re-performed the calculation of ECL for Corporate & Commercial Banking loans and for a sample of mortgages.
We ensured that the ECL calculations were consistent with the approved model methodologies.
We independently re-performed key aspects of model monitoring performed by management relating to model performance, segmentation and stability; and critically assessed the monitoring results. We found no exceptions in this work.
We used our economics and credit risk modelling experts to critically assess the reasonableness of the multiple economic scenarios and weights adopted by management. We considered external economic data and consensus forecasts and whether management’s forecasts appropriately reflected the possible economic consequences of Brexit and different possible future trading relationships with the EU and the rest of the world. We concluded that management’s scenarios and associated weights were reasonable.
We considered whether PMAs were required to address relevant risks that were not captured in the modelled loss allowances, and whether appropriate methodologies were applied in their calculation. We were satisfied with the PMAs included in the estimate of ECL.
For a sample of impaired loans, we evaluated the specific circumstances of the borrower, including the latest developments, scenarios and weightings assigned for measuring the impairment provision, and whether key judgements were appropriate. We re-performed management’s impairment calculations and tested key inputs. We tested the valuation of collateral held on a sample basis and challenged management on subjective estimates and assumptions. We also compared gains and losses realised when a loan is sold or exited to the existing provision.
Based on the procedures performed and the evidence obtained, we found management’s judgements used in the determination of the ECLs to be reasonable.
175Santander UK Group Holdings plc

Annual Report 2019 | Financial statements
176 Santander UK Group Holdings plc
Key audit matter How our audit addressed the key audit matter
Legal, Conduct and Regulatory matters
Refer to page 48 (Board Audit Committee Chair’s report), page 185 (Accounting Policies), page 196 (Critical Accounting Estimates), page 220 (note 27: Provisions) and page 226 (note 29: Contingent Liabilities and Commitments).
Included within Provisions is the group’s best estimate of present obligations related to forecast customer redress payments as a result of past events arising from conduct or operational issues. These provisions are significant, involve management judgement and as a result represent a key audit matter.
The most significant provision is held in respect of Payment Protection Insurance (‘PPI’) policies historically sold, reflecting forecast payments associated with customer redress. The deadline for customers to submit complaints was 29 August 2019. The group received a significant volume of claims and information requests leading up to the deadline. The remaining provision includes an estimate of the cost of dealing with these final claims and for Plevin related redress costs. There is also a provision relating to a specific portfolio which is the subject of a legal dispute with a third party.
Provisions include an estimate for customer redress relating to compliance with the Consumer Credit Act 1974 (‘CCA’).
In determining the provisions, management judgement is required to determine the amounts that will be reimbursed to customers, or paid to regulatory and other authorities or counterparties in the future. Management has estimated the cost of future redress and evaluated the legal and regulatory obligations of the group. In some cases, it is not practicable to determine a reliable estimate of the future cost, if any.
There are uncertainties that exist which mean that the cost to the group may be different to the current estimates.
Disclosures are also required in relation to contingent liabilities arising from regulatory and legal matters where it is not necessary, based on probability of loss, or practicable to determine the extent, if any, of provisions.
We understood and tested the operating effectiveness of key controls over the calculation and approval of material conduct and regulatory provisions. We determined we could rely on these controls for the purposes of our audit.
Given the judgements involved, we also examined the most significant provisions and contingent liabilities in detail and sought additional evidence.
We understood and challenged the provisioning methodologies and underlying assumptions used by management. For those assumptions based on historic information, we considered whether this continued to be appropriate for future experience.
In relation to provisions for PPI, CCA and the specific portfolio subject to a legal dispute, we considered regulatory developments, market practice, advice received from management's external legal and regulatory experts and management’s interactions with regulators. We held discussions with the group's external experts to confirm our understanding of their views on certain judgements applied by management in determining the estimate of the provisions. We also held discussions with an external regulator.
We evaluated management’s judgements in respect of matters where it is not yet practicable to make a reliable estimate of any liability. In this regard, we understood the risks facing the group, the status of the investigations, reviewed reports provided to governance fora and discussed matters with management’s external experts.
Based on the procedures performed and evidence obtained, we found management’s conclusions to be appropriate.
Given the estimation uncertainty associated with the calculation of the provisions, we evaluated the disclosures made in the financial statements. In particular, we focused on challenging management around whether the disclosures were sufficiently clear in highlighting the uncertainties that exist and the risks associated with the estimates made and remaining exposures. We evaluated the disclosures against the requirements of IAS 37 Provisions, Contingent Liabilities and Contingent Assets and IAS 1 Presentation of Financial Statements. We found the disclosures to be appropriate.
Valuation of defined benefit pension obligations
Refer to page 48 (Board Audit Committee Chair’s report), page 185 (Accounting Policies), page 196 (Critical Accounting Estimates) and page 222 (note 28: Retirement Benefit Plans).
The valuation of the defined benefit obligations of the Santander (UK) Group Pension Scheme (the ‘Scheme’) is dependent on a number of assumptions, including the discount rate, inflation rate and mortality rates. Small changes in these assumptions can have a material impact on the valuation due to size and the duration of the pension obligations.
Management performs a review of the valuation methodology and assumptions each year using external experts. There were no changes to the methodologies used to derive the financial assumptions during the year. Mortality rates and future improvement assumptions were updated to reflect the latest data for life expectancy.
The valuation of the defined benefit obligations is complex and judgemental and therefore represents a key audit matter.
We understood and tested the controls for determining the actuarial assumptions used in calculating the valuation of future pension obligations and the approval of those assumptions by senior management. We determined we could rely on these controls for the purposes of our audit.
We engaged our actuarial specialists to understand the judgements made by management in determining the key financial and demographic assumptions used in the calculation of the liability. We assessed the reasonableness of the methodologies and assumptions adopted using our knowledge of market practice and industry developments, PwC developed benchmarks and external market data. We concluded that the assumptions, in aggregate, used by management were appropriate.
We considered the objectivity and competence of management’s actuarial expert. We reviewed the expert’s IAS 19 report and discussed with the expert the methods adopted to determine the valuation of the obligations. We also performed calculations of pension liabilities and compared these with the expert’s calculations.
Based on the evidence obtained, we found the valuation of the Scheme’s defined benefit obligations to be reasonable.
We read and assessed the disclosures made in the financial statements, including the disclosures of the assumptions, and found them to be appropriate.
Santander UK Group Holdings plc176
Annual Report 2019 | Financial statements

Strategic report Governance Risk review Financial review Financial statements Shareholder information
Audit report
How we tailored the audit scope
We tailored the scope of our audit to ensure that we performed enough work to be able to give an opinion on the financial statements as a whole, taking into account the structure of the group, the accounting processes and controls, and the industry sectors in which it operates.
The group comprises the company and a number of subsidiaries. Santander UK plc is the principal operating entity in the group.
We considered which entities (“components”) required a full scope audit either due to being individually financially significant (defined as 15% of adjusted profit before tax) or due to their risk characteristics, including a consideration of the history of misstatements due to fraud or error, in the context of the group’s consolidated financial statements. We identified the significant audit risks and key audit matters and these all relate to Santander UK plc. We concluded that we should perform a full scope audit of the company and Santander UK plc.
We then considered whether the other components in the group had either financially significant or unusual account balances which were required to be brought into scope. Where this was the case, we performed specific audit procedures over these account balances.
The group conducts business in four segments; Retail Banking, Corporate & Commercial Banking, Corporate & Investment Banking and Corporate Centre. Each segment is made up of a number of components. We therefore requested component audit teams to audit the in scope components by business segment. Certain balances and processes of the group, including pension assets and liabilities, PPI and certain other provisions, the consolidation process, goodwill and taxation were audited centrally by the group engagement team.
Almost all of the audit work is undertaken by PwC UK component auditors. Processes and controls supporting the group’s operations are also undertaken by Banco Santander S.A. in Spain, including the hosting and monitoring of certain IT systems, and therefore we place reliance on the work of other auditors. As part of the planning and execution of the audit, we worked closely with the component auditors throughout the year to ensure that the procedures performed on our behalf were sufficient for our purposes and we reviewed the results of their work.
The procedures which we performed over the reporting units accounted for 95.7% of total operating income and 99.5% of total assets of the group.
Materiality
The scope of our audit was influenced by our application of materiality. We set certain quantitative thresholds for materiality. These, together with qualitative considerations, helped us to determine the scope of our audit and the nature, timing and extent of our audit procedures on the individual financial statement line items and disclosures and in evaluating the effect of misstatements, both individually and in aggregate on the financial statements as a whole.
Based on our professional judgement, we determined materiality for the financial statements as a whole as follows:
Group financial statements Company financial statements
Overall materiality £67 million (2018: £77 million). £18 million (2018: £31 million).
How we determined it 5% of adjusted profit before tax. 5% of profit before tax.
Rationale for benchmark applied We chose 5% of profit before tax, adjusted for the effect of the PPI charge and restructuring charges incurred during the year. As these items do not reflect the underlying business performance and are not expected to recur, adjusted profit before tax is considered an appropriate benchmark upon which to determine our audit materiality.
We chose 5% of profit before tax because it is a key performance indicator for the group’s stakeholders and a generally accepted auditing benchmark for determining audit materiality.
For each component in the scope of our group audit, we allocated a materiality that is less than our overall group materiality. The range of materiality allocated across components was between £5 million and £44 million, based on the relative size of each in scope component and assessment of our audit risk. Certain components were audited to a local statutory audit materiality that was also less than our overall group materiality.
We agreed with the Board Audit Committee that we would report to them misstatements identified during our audit above £4 million (group audit) (2018: £4 million) and £4 million (company audit) (2018: £4 million) as well as misstatements below those amounts that, in our view, warranted reporting for qualitative reasons.
Going concern
In accordance with ISAs (UK) we report as follows:
Reporting obligation Outcome
We are required to report if we have anything material to add or draw attention to in respect of the directors’ statement in the financial statements about whether the directors considered it appropriate to adopt the going concern basis of accounting in preparing the financial statements and the directors’ identification of any material uncertainties to the group’s and the company’s ability to continue as a going concern over a period of at least twelve months from the date of approval of the financial statements.
We have nothing material to add or to draw attention to.
However, because not all future events or conditions can be predicted, this statement is not a guarantee as to the group’s and company’s ability to continue as a going concern. For example, the terms of the United Kingdom’s withdrawal from the European Union are not clear, and it is difficult to evaluate all of the potential implications on the group’s business, customers, suppliers and the wider economy.
177Santander UK Group Holdings plc

Annual Report 2019 | Financial statements
178 Santander UK Group Holdings plc
Reporting on other information
The other information comprises all of the information in the Annual Report other than the financial statements and our auditors’ report thereon. The directors are responsible for the other information. Our opinion on the financial statements does not cover the other information and, accordingly, we do not express an audit opinion or, except to the extent otherwise explicitly stated in this report, any form of assurance thereon.
In connection with our audit of the financial statements, our responsibility is to read the other information and, in doing so, consider whether the other information is materially inconsistent with the financial statements or our knowledge obtained in the audit, or otherwise appears to be materially misstated. If we identify an apparent material inconsistency or material misstatement, we are required to perform procedures to conclude whether there is a material misstatement of the financial statements or a material misstatement of the other information. If, based on the work we have performed, we conclude that there is a material misstatement of this other information, we are required to report that fact. We have nothing to report based on these responsibilities.
With respect to the Strategic Report and Directors’ Report, we also considered whether the disclosures required by the UK Companies Act 2006 have been included.
Based on the responsibilities described above and our work undertaken in the course of the audit, the Companies Act 2006 (CA06) and ISAs (UK) require us also to report certain opinions and matters as described below (required by ISAs (UK) unless otherwise stated).
Strategic Report and Directors’ Report In our opinion, based on the work undertaken in the course of the audit, the information given in the Strategic Report and Directors’ Report for the year ended 31 December 2019 is consistent with the financial statements and has been prepared in accordance with applicable legal requirements. (CA06)
In light of the knowledge and understanding of the group and company and their environment obtained in the course of the audit, we did not identify any material misstatements in the Strategic Report and Directors’ Report. (CA06)
The directors’ assessment of the prospects of the group and of the principal risks that would threaten the solvency or liquidity of the group As a result of the directors’ reporting on how they have applied the UK Corporate Governance Code (the “Code”), we are required to report to you if we have anything material to add or draw attention to regarding:
– The directors’ confirmation on page 67 of the Annual Report that they have carried out a robust assessment of the principal risks facing the group, including those that would threaten its business model, future performance, solvency or liquidity.
– The disclosures in the Annual Report that describe those risks and explain how they are being managed or mitigated.
– The directors’ explanation on page 68 of the Annual Report as to how they have assessed the prospects of the group, over what period they have done so and why they consider that period to be appropriate, and their statement as to whether they have a reasonable expectation that the group will be able to continue in operation and meet its liabilities as they fall due over the period of their assessment, including any related disclosures drawing attention to any necessary qualifications or assumptions.
We have nothing to report in respect of this responsibility.
Other Code Provisions As a result of the directors’ reporting on how they have applied the Code, we are required to report to you if, in our opinion:
– The statement given by the directors, on page 69, that they consider the Annual Report taken as a whole to be fair, balanced and understandable, and provides the information necessary for the members to assess the group’s and company’s position and performance, business model and strategy is materially inconsistent with our knowledge of the group and company obtained in the course of performing our audit.
– The section of the Annual Report on page 48 describing the work of the Board Audit Committee does not appropriately address matters communicated by us to the Board Audit Committee.
We have nothing to report in respect of this responsibility.
Responsibilities for the financial statements and the audit
Responsibilities of the directors for the financial statements
As explained more fully in the Statement of Directors’ Responsibilities set out on page 68, the directors are responsible for the preparation of the financial statements in accordance with the applicable framework and for being satisfied that they give a true and fair view. The directors are also responsible for such internal control as they determine is necessary to enable the preparation of financial statements that are free from material misstatement, whether due to fraud or error.
In preparing the financial statements, the directors are responsible for assessing the group’s and the company’s ability to continue as a going concern, disclosing, as applicable, matters related to going concern and using the going concern basis of accounting unless the directors either intend to liquidate the group or the company or to cease operations, or have no realistic alternative but to do so.
Auditors’ responsibilities for the audit of the financial statements
Our objectives are to obtain reasonable assurance about whether the financial statements as a whole are free from material misstatement, whether due to fraud or error, and to issue an auditors’ report that includes our opinion. Reasonable assurance is a high level of assurance, but is not a guarantee that an audit conducted in accordance with ISAs (UK) will always detect a material misstatement when it exists. Misstatements can arise from fraud or error and are considered material if, individually or in the aggregate, they could reasonably be expected to influence the economic decisions of users taken on the basis of these financial statements.
A further description of our responsibilities for the audit of the financial statements is located on the FRC’s website at: www.frc.org.uk/auditorsresponsibilities. This description forms part of our auditors’ report.
Use of this report
This report, including the opinions, has been prepared for and only for the company’s members as a body in accordance with Chapter 3 of Part 16 of the Companies Act 2006 and for no other purpose. We do not, in giving these opinions, accept or assume responsibility for any other purpose or to any other person to whom this report is shown or into whose hands it may come save where expressly agreed by our prior consent in writing.
Santander UK Group Holdings plc178
Annual Report 2019 | Financial statements

Strategic report Governance Risk review Financial review Financial statements Shareholder information
Audit report
Other required reporting
Companies Act 2006 exception reporting
Under the Companies Act 2006 we are required to report to you if, in our opinion:
– we have not received all the information and explanations we require for our audit; or – adequate accounting records have not been kept by the company, or returns adequate for our audit have not been received from branches not visited by us; or – certain disclosures of directors’ remuneration specified by law are not made; or – the company financial statements are not in agreement with the accounting records and returns.
We have no exceptions to report arising from this responsibility.
Appointment
Following the recommendation of the audit committee, we were appointed by the members on 31 March 2016 to audit the financial statements for the year ended 31 December 2016 and subsequent financial periods. The period of total uninterrupted engagement is 4 years, covering the years ended 31 December 2016 to 31 December 2019.
Other voluntary reporting
Going concern
The directors have requested that we review the statement on page 68 in relation to going concern as if the company were a premium listed company. We have nothing to report having performed our review.
The directors’ assessment of the prospects of the group and of the principal risks that would threaten the solvency or liquidity of the group
The directors have requested that we perform a review of the directors’ statements on pages 67 and 68 that they have carried out a robust assessment of the principal risks facing the group and in relation to the longer-term viability of the group, as if the company were a premium listed company. Our review was substantially less in scope than an audit and only consisted of making inquiries and considering the directors’ process supporting their statements; checking that the statements are in alignment with the relevant provisions of the Code; and considering whether the statements are consistent with the knowledge and understanding of the group and company and their environment obtained in the course of the audit. We have nothing to report having performed this review.
Other Code provisions
The directors have prepared a corporate governance statement and requested that we review it as though the company were a premium listed company. We have nothing to report in respect of the requirement for the auditors of premium listed companies to report when the directors’ statement relating to the company’s compliance with the Code does not properly disclose a departure from a relevant provision of the Code specified, under the Listing Rules, for review by the auditors.
Jonathan Holloway (Senior Statutory Auditor) for and on behalf of PricewaterhouseCoopers LLP Chartered Accountants and Statutory Auditors London 2 March 2020
179Santander UK Group Holdings plc
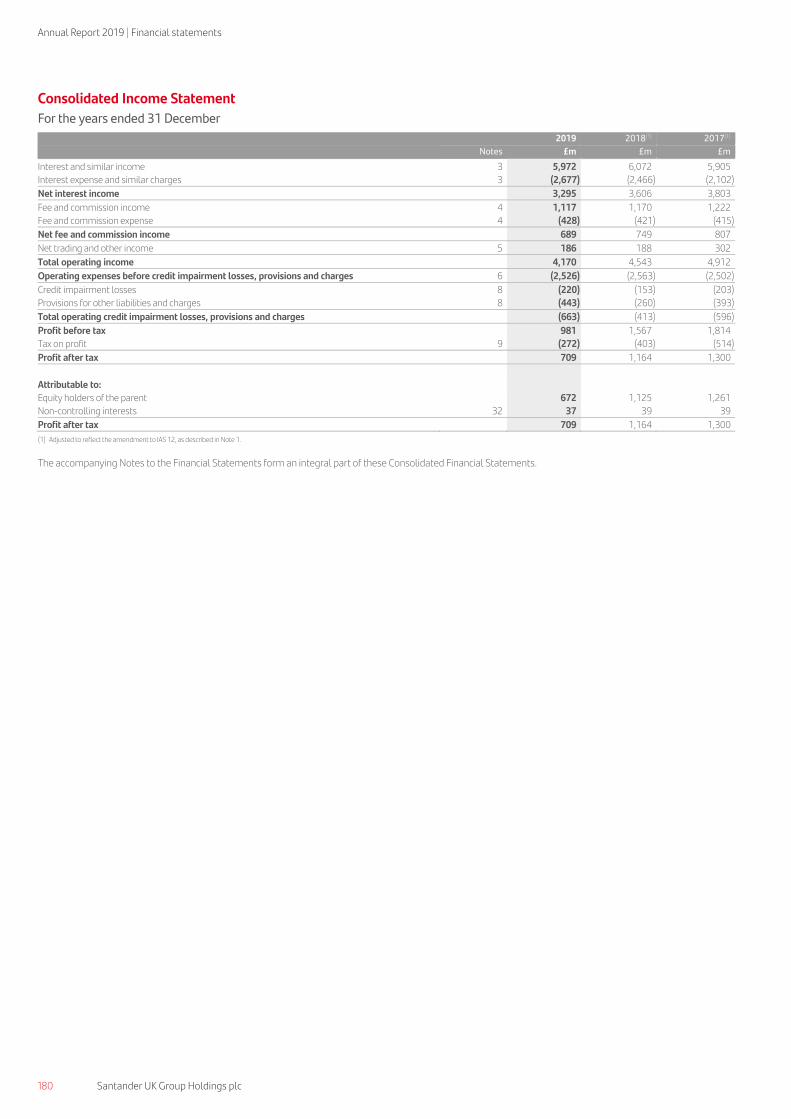
Annual Report 2019 | Financial statements
Consolidated Income Statement
For the years ended 31 December
2019 2018(1) 2017(1)
Notes £m £m £m
Interest and similar income 3 5,972 6,072 5,905
Interest expense and similar charges 3 (2,677) (2,466) (2,102)
Net interest income 3,295 3,606 3,803
Fee and commission income 4 1,117 1,170 1,222
Fee and commission expense 4 (428) (421) (415)
Net fee and commission income 689 749 807
Net trading and other income 5 186 188 302
Total operating income 4,170 4,543 4,912
Operating expenses before credit impairment losses, provisions and charges 6 (2,526) (2,563) (2,502)
Credit impairment losses 8 (220) (153) (203)
Provisions for other liabilities and charges 8 (443) (260) (393)
Total operating credit impairment losses, provisions and charges (663) (413) (596)
Profit before tax 981 1,567 1,814
Tax on profit 9 (272) (403) (514)
Profit after tax 709 1,164 1,300
Attributable to:
Equity holders of the parent 672 1,125 1,261
Non-controlling interests 32 37 39 39
Profit after tax 709 1,164 1,300 (1) Adjusted to reflect the amendment to IAS 12, as described in Note 1.
The accompanying Notes to the Financial Statements form an integral part of these Consolidated Financial Statements.
Santander UK Group Holdings plc180
Annual Report 2019 | Financial statements

Strategic report Governance Risk review Financial review Financial statements Shareholder information
Primary financial statements
Consolidated Statement of Comprehensive Income
For the years ended 31 December
2019 2018(2) 2017(2)
£m £m £m
Profit after tax 709 1,164 1,300
Other comprehensive income:
Other comprehensive income/(expense) that may be reclassified to profit or loss subsequently:
Available-for-sale securities(1)
– Change in fair value 80
– Income statement transfers (54)
– Taxation (6)
20
Movement in fair value reserve (debt instruments):(1)
– Change in fair value 147 (74)
– Income statement transfers (147) 21
– Taxation – 14
– (39)
Cash flow hedges:
– Effective portion of changes in fair value (864) 788 (238)
– Income statement transfers 1,021 (751) (94)
– Taxation (40) (14) 89
117 23 (243)
Currency translation on foreign operations (3) – –
Net other comprehensive income/(expense) that may be reclassified to profit or loss subsequently 114 (16) (223)
Other comprehensive income/(expense) that will not be reclassified to profit or loss subsequently:
Pension remeasurement:
– Change in fair value (523) 469 (103)
– Taxation 131 (117) 26
(392) 352 (77)
Own credit adjustment:
– Change in fair value (77) 84 (29)
– Taxation 19 (21) 7
(58) 63 (22)
Net other comprehensive (expense)/income that will not be reclassified to profit or loss subsequently (450) 415 (99)
Total other comprehensive (expense)/income net of tax (336) 399 (322)
Total comprehensive income 373 1,563 978
Attributable to:
Equity holders of the parent 334 1,524 939
Non-controlling interests 39 39 39
Total comprehensive income 373 1,563 978 (1) Following the adoption of IFRS 9, a fair value reserve was introduced to replace the available-for-sale reserve. (2) Adjusted to reflect the amendment to IAS 12, as described in Note 1.
The accompanying Notes to the Financial Statements form an integral part of these Consolidated Financial Statements.
181Santander UK Group Holdings plc

Annual Report 2019 | Financial statements
182 Santander UK Group Holdings plc
Consolidated Balance Sheet
At 31 December
2019 2018
Notes £m £m
Assets
Cash and balances at central banks 26,395 24,180
Financial assets at fair value through profit or loss:
– Derivative financial instruments 11 3,363 5,321
– Other financial assets at fair value through profit or loss 12 973 6,137
Financial assets at amortised cost:
– Loans and advances to customers 13 207,498 201,619
– Loans and advances to banks 2,583 3,515
– Reverse repurchase agreements – non trading 16 23,636 21,127
– Other financial assets at amortised cost 17 7,056 7,228
Financial assets at fair value through other comprehensive income 18 9,747 13,302
Interests in other entities 19 117 88
Intangible assets 20 1,776 1,814
Property, plant and equipment 1,971 1,835
Current tax assets 9 186 106
Retirement benefit assets 28 670 842
Other assets 2,517 2,267
Total assets 288,488 289,381
Liabilities
Financial liabilities at fair value through profit or loss:
– Derivative financial instruments 11 1,709 1,594
– Other financial liabilities at fair value through profit or loss 21 1,713 6,286
Financial liabilities at amortised cost:
– Deposits by customers 22 179,006 173,692
– Deposits by banks 23 14,359 17,824
– Repurchase agreements – non trading 24 18,286 10,910
– Debt securities in issue 25 50,171 55,906
– Subordinated liabilities 26 3,528 3,601
Other liabilities 2,373 2,507
Provisions 27 577 515
Deferred tax liabilities 9 145 211
Retirement benefit obligations 28 280 115
Total liabilities 272,147 273,161
Equity
Share capital 30 7,060 7,060
Other equity instruments 31 2,241 2,041
Retained earnings 6,251 6,439
Other reserves 394 280
Total shareholders’ equity 15,946 15,820
Non-controlling interests 32 395 400
Total equity 16,341 16,220
Total liabilities and equity 288,488 289,381
The accompanying Notes to the Financial Statements form an integral part of these Consolidated Financial Statements.
The Financial Statements were approved and authorised for issue by the Board on 2 March 2020 and signed on its behalf by:
Nathan Bostock Madhukar Dayal
Chief Executive Officer Chief Financial Officer
Company Registered Number: 08700698
Santander UK Group Holdings plc182
Annual Report 2019 | Financial statements

Santander UK Group Holdings plc 183
Strategic report Governance Risk review Financial review Financial statements Shareholder information
Primary financial
statements
Consolidated Cash Flow Statement
For the years ended 31 December
2019 2018(1) 2017(1)
£m £m £m
Cash flows from operating activities
Profit after tax
709 1,164 1,300
Adjustments for:
Non-cash items included in profit:
– Depreciation and amortisation
545 378 354
– Provisions for other liabilities and charges
443 260 393
– Impairment losses
238 189 257
– Corporation tax charge
272 403 514
– Other non-cash items
(345) (68) (218)
– Pension charge for defined benefit pension schemes 35 81 32 1,188 1,243 1,332
Net change in operating assets and liabilities:
– Cash and balances at central banks
(84) (161) (25)
– Trading assets
– 24,528 (941)
– Derivative assets
1,959 14,621 5,529
– Other financial assets at fair value through profit or loss
1,637 (3,467) 25
– Loans and advances to banks and customers
(605) (8,221) (1,829)
– Other assets
240 203 (246)
– Deposits by banks and customers
2,225 1,845 8,805
– Derivative liabilities
115 (16,018) (5,490)
– Trading liabilities
– (31,101) 15,017
– Other financial liabilities at fair value through profit or loss
(959) 4,480 717
– Debt securities in issue
(548) (2,760) 132
– Other liabilities (600) (824) (1,388) 3,380 (16,875) 20,306
Corporation taxes paid
(309) (445) (484)
Effects of exchange rate differences
(1,445) 1,731 (574)
Net cash flows from operating activities 3,523 (13,182) 21,880
Cash flows from investing activities
Investments in other entities
– (66) –
Purchase of property, plant and equipment and intangible assets
(510) (699) (542)
Proceeds from sale of property, plant and equipment and intangible assets
108 26 52
Purchase of financial assets at amortised cost and financial assets at fair value through other comprehensive income(2)
(5,013) (7,002) (726)
Proceeds from sale and redemption of financial assets at amortised cost and financial assets at fair value through other comprehensive income(2)
8,300 3,816 2,032
Net cash flows from investing activities 2,885 (3,925) 816
Cash flows from financing activities
Issue of other equity instruments
500 – 500
Issuance costs of other equity instruments
– – (4)
Issue of debt securities and subordinated notes
4,145 13,329 8,748
Issuance costs of debt securities and subordinated notes
(15) (31) (23)
Repayment of debt securities and subordinated notes
(7,969) (6,303) (13,763)
Repurchase of non-controlling interests and other equity instruments
(318) – –
Dividends paid on ordinary shares
(262) (1,123) (829)
Dividends paid on other equity instruments
(142) (145) (135)
Dividends paid on non-controlling interests
(30) (40) (37)
Net cash flows from financing activities (4,091) 5,687 (5,543)
Change in cash and cash equivalents 2,317 (11,420) 17,153
Cash and cash equivalents at beginning of the year
30,969 42,228 25,709
Effects of exchange rate changes on cash and cash equivalents
(53) 161 (634)
Cash and cash equivalents at the end of the year 33,233 30,969 42,228
Cash and cash equivalents consist of:
Cash and balances at central banks
26,395 24,180 32,771
Less: regulatory minimum cash balances
(720) (636) (395)
25,675 23,544 32,376
Net trading other cash equivalents
– – 5,953
Net non-trading other cash equivalents
7,558 7,425 3,899
Cash and cash equivalents at the end of the year 33,233 30,969 42,228 (1) Adjusted to reflect the amendment to IAS 12, as described in Note 1. (2) Amounts in 2017, prior to the adoption of IFRS 9, are in respect of financial investments.
The accompanying Notes to the Financial Statements form an integral part of these Consolidated Financial Statements.
183Santander UK Group Holdings plc

Annual Report 2019 | Financial statements
184 Santander UK Group Holdings plc
Consolidated Statement of Changes in Equity
For the years ended 31 December
Other reserves Non-
controlling interests
Share capital
Other equity instruments
Available- for-sale(1)
Fair Value(1)
Cash flow hedging
Currency translation
Retained earnings(2)
Total Total £m £m £m £m £m £m £m £m £m £m
1 January 2019 7,060 2,041 24 251 5 6,439 15,820 400 16,220
Profit after tax – – – – – 672 672 37 709
Other comprehensive income, net of tax:
– Cash flow hedges – – – 117 – – 117 – 117
– Pension remeasurement – – – – – (394) (394) 2 (392)
– Own credit adjustment – – – – – (58) (58) – (58)
– Currency translation on foreign operations – – – – (3) – (3) – (3)
Total comprehensive income – – – 117 (3) 220 334 39 373
Issue of other equity instruments – 500 – – – – 500 – 500
Repurchase of non-controlling interests and other equity instruments – (300) – – – (4) (304) (14) (318)
Dividends on ordinary shares – – – – – (262) (262) – (262)
Dividends on other equity instruments – – – – – (142) (142) – (142)
Dividends on non-controlling interests – – – – – – – (30) (30)
At 31 December 2019 7,060 2,241 24 368 2 6,251 15,946 395 16,341
At 31 December 2017 7,060 2,041 68 228 5 6,399 15,801 401 16,202
Adoption of IFRS 9(3) – – (68) 63 – – (187) (192) – (192)
At 1 January 2018 7,060 2,041 – 63 228 5 6,212 15,609 401 16,010
Profit after tax – – – – – 1,125 1,125 39 1,164
Other comprehensive income, net of tax: – Fair value reserve (debt instruments) – – (39) – – – (39) – (39)
– Cash flow hedges – – – 23 – – 23 – 23
– Pension remeasurement – – – – – 352 352 – 352
– Own credit adjustment – – – – – 63 63 – 63
Total comprehensive income – – (39) 23 – 1,540 1,524 39 1,563
Other – – – – – (45) (45) – (45)
Dividends on ordinary shares – – – – – (1,123) (1,123) – (1,123)
Dividends on other equity instruments – – – – – (145) (145) – (145)
Dividends on non-controlling interests – – – – – – – (40) (40)
At 31 December 2018 7,060 2,041 24 251 5 6,439 15,820 400 16,220
At 1 January 2017 7,060 1,545 48 471 5 5,925 15,054 399 15,453
Profit after tax – – – – – 1,261 1,261 39 1,300
Other comprehensive income, net of tax:
– Available-for-sale securities – – 20 – – – 20 – 20
– Cash flow hedges – – – (243) – – (243) – (243)
– Pension remeasurement – – – – – (77) (77) – (77)
– Own credit adjustment – – – – – (22) (22) – (22)
Total comprehensive income – – 20 (243) – 1,162 939 39 978
Issue of other equity instruments – 496 – – – – 496 – 496
Dividends on ordinary shares – – – – – (553) (553) – (553)
Dividends on other equity instruments – – – – – (135) (135) – (135)
Dividends on non-controlling interests – – – – – – – (37) (37)
At 31 December 2017 7,060 2,041 68 228 5 6,399 15,801 401 16,202 (1) Following the adoption of IFRS 9, a fair value reserve was introduced to replace the available-for-sale reserve. (2) Adjusted to reflect the amendment to IAS 12, as described in Note 1. (3) The adoption of IFRS 9 decreased shareholders’ equity at 1 January 2018 by £192m (net of tax), comprised of a £49m decrease arising from the application of the new classification and measurement requirements for financial assets, and a
£211m decrease arising from the application of the new ECL impairment methodology, these amounts being partially offset by the recognition of a deferred tax asset of £68m.
The accompanying Notes to the Financial Statements form an integral part of these Consolidated Financial Statements.
Santander UK Group Holdings plc184
Annual Report 2019 | Financial statements

Santander UK Group Holdings plc 185
Strategic report Governance Risk review Financial review Financial statements Shareholder information
Notes to the financial statements
1. ACCOUNTING POLICIES
These financial statements are prepared for Santander UK Group Holdings plc (the Company) and the Santander UK Group Holdings plc group (the Santander UK group) under the UK Companies Act 2006. The principal activity of the Santander UK group is the provision of a wide range of banking and financial services to personal, business and corporate customers. Santander UK Group Holdings plc is a public company, limited by shares and incorporated in England and Wales having a registered office at 2 Triton Square, Regent’s Place, London, NW1 3AN, phone number 0870-607-6000. It is a financial services holding company.
Basis of preparation These financial statements incorporate the financial statements of the Company and entities controlled by the Company (its subsidiaries) made up to 31 December each year. The Consolidated Financial Statements have been prepared on the going concern basis using the historical cost convention, except for financial assets and liabilities that have been measured at fair value. An assessment of the appropriateness of the adoption of the going concern basis of accounting is disclosed in the statement of going concern in the Directors’ Report.
Compliance with International Financial Reporting Standards The Santander UK group Consolidated Financial Statements have been prepared in accordance with IFRSs as issued by the IASB, including interpretations issued by the IFRS Interpretations Committee (IFRS IC) of the IASB (together IFRS). The Santander UK group has also complied with its legal obligation to comply with IFRSs as adopted by the European Union as there are no applicable differences between the two frameworks for the periods presented.
The Company financial statements have been prepared in accordance with IFRSs as adopted by the European Union and as applied in accordance with the provision of the UK Companies Act 2006. Disclosures required by IFRS 7 ‘Financial Instruments: Disclosure’ relating to the nature and extent of risks arising from financial instruments, and IAS 1 ‘Presentation of Financial Statements’ relating to objectives, policies and processes for managing capital, can be found in the Risk review. Those disclosures form an integral part of these financial statements.
Recent accounting developments
IFRS 16 ‘Leases’ (IFRS 16) On 1 January 2019 the Santander UK group adopted IFRS 16 and the revised accounting policies as lessee which have been applied from 1 January 2019 are set out below. Comparatives have not been restated. The impact of applying IFRS 16 is disclosed in section (ii). As described below, IFRS 16 impacted property and equipment leases where the Santander UK group is the lessee. IFRS 16 had no impact for leases where the Santander UK group is the lessor.
i) Accounting policy change The Santander UK group as lessee The Santander UK group assesses whether a contract is or contains a lease at the inception of the contract and recognises a right-of-use (ROU) asset representing its right to use the underlying leased asset and a lease liability representing its obligation to make lease payments for all leases, except for short-term leases, being those with a term of 12 months or less, or leases for which the underlying asset is of low value which are expensed in the income statement on a straight-line basis over the lease terms. Lease payments exclude irrecoverable VAT which is expensed in the income statement as lease payments are made.
The lease liability, which is included within Other liabilities on the balance sheet, is initially measured at the present value of the lease payments that are not paid at the commencement date, discounted using the incremental borrowing rate appropriate to the lease term. The lease liability is subsequently measured at amortised cost using the effective interest rate method. Remeasurement of the lease liability occurs if there is a change in the lease payments (when a corresponding adjustment is made to the ROU asset), the lease term or in the assessment of an option to purchase the underlying asset.
At inception, the ROU asset, which is included within Property, plant and equipment on the balance sheet, comprises the lease liability, initial direct costs and the obligations to restore the asset, less any incentives granted by the lessor. The ROU asset is depreciated over the shorter of the lease term or the useful life of the underlying asset and is reviewed for indications of impairment as for owned assets. The obligation to restore the asset is included within Provisions on the balance sheet.
ii) Impact of adoption The Santander UK group elected to apply the modified retrospective approach whereby the ROU asset at the date of initial application was measured at an amount equal to the lease liability. The ROU asset was adjusted for any prepaid lease payments and incentives relating to the relevant leases that were recognised on the balance sheet at 31 December 2018 and included an estimate of the costs of restoring the underlying assets to the condition required by the terms of the lease. In addition, the following practical expedients permitted by the standard were applied:
– a single discount rate being the incremental borrowing rate was applied to a portfolio of leases with reasonably similar characteristics; and – operating leases with a remaining lease term of less than 12 months as at 1 January 2019 were treated as short term leases.
For the Santander UK group, the application of IFRS 16 at 1 January 2019 increased property, plant and equipment by £211m (being the net increase in ROU assets referred to above), reduced other assets by £12m and increased other liabilities by £182m from recognising lease liabilities. In addition, we also increased provisions by £17m (see Note 27). There was no impact on shareholders’ equity. The amount of the lease liabilities above differed from the amount of operating lease commitments at 31 December 2018 and is reconciled as follows:
Group
£m
Rental commitments under non-cancellable operating leases under IAS 17 at 31 December 2018 (see Note 29) 247
Recognition exemption for short-term leases (73)
Effect from discounting at the incremental borrowing rate at 1 January 2019 8
Additional liabilities recognised based on the initial application of IFRS 16 at 1 January 2019 182
185Santander UK Group Holdings plc

Annual Report 2019 | Financial statements
186 Santander UK Group Holdings plc
In addition to the choice of transition approach, the determination of the discount rate is the most significant area of judgement. The Santander UK group applies an incremental borrowing rate (based on 3-month GBP LIBOR plus a credit spread to reflect the cost of raising unsecured funding in the wholesale markets) appropriate to the relevant remaining lease term.
IAS 12 The Santander UK group has also applied the amendment to IAS 12 ‘Income Taxes’ (part of ‘Annual Improvements to IFRS Standards 2015-2017 Cycle’) in these Condensed Consolidated Interim Financial Statements. The amendment clarifies that the income tax consequences of dividends on financial instruments classified as equity should be recognised according to where the past transactions or events that generated distributable profits were recognised. This means that, to the extent that profits from which dividends on equity instruments were recognised in the income statement, the income tax consequences would be similarly recognised in the same statement. The amendment, which has been applied retrospectively, reduces the effective tax rate where the tax relief on dividends in respect of other equity instruments is recognised in the income statement rather than as a separate line item within the statement of changes in equity. Overall, there was no impact on shareholders’ equity for the Santander UK group from applying the amendment to IAS 12 at 1 January 2019. For the Santander UK group, the impact of the amendment to IAS 12 on the income statement for the year ended 31 December 2019 was to reduce tax on profit by £39m (2018: £43m, 2017: £46m), increasing profit after tax by the same amount.
London Inter-Bank Offered Rate (LIBOR) reform In September 2019, the IASB issued Interest Rate Benchmark Reform: Amendments to IFRS 9 ‘Financial Instruments’, IAS 39 ‘Financial Instruments: Recognition and Measurement’ and IFRS 7 ‘Financial Instruments: Disclosure’. Santander UK applies IAS 39 hedge accounting so the amendments to IFRS 9 do not apply. The IAS 39 amendments provide temporary exceptions from applying specific hedge accounting requirements to hedging relationships that are directly affected by the reform to LIBOR and other Interbank Offered Rates, hereinafter referred to as LIBOR reform. The exceptions have the effect that LIBOR reform should not generally cause hedge accounting to terminate, however any hedge ineffectiveness continues to be recognised in the income statement. The exceptions end at the earlier of:
– when the uncertainty regarding the timing and the amount of interest rate benchmark based cash flows is no longer present, and – discontinuance of the hedge relationship (or reclassification of all amounts from the cash flow hedge reserve).
The IAS 39 amendments apply to all hedging relationships directly affected by uncertainties related to LIBOR reform and must be applied for annual periods beginning on or after 1 January 2020. However, following their endorsement for use in the European Union, Santander UK has elected to apply the IAS 39 and IFRS 7 amendments in the preparation of the financial statements for the year ended 31 December 2019. The exceptions given by the IAS 39 amendments mean that LIBOR reform had no impact on hedge relationships for affected hedges at and for the year ended 31 December 2019. The main assumptions or judgements made by Santander UK in applying the IAS 39 amendments are outlined below.
– For cash flow hedges affected by LIBOR reform, Santander UK management has assumed that the interest rate benchmark on which hedged cash flows are based is not altered as a result of LIBOR reform when assessing whether the future cash flows are highly probable. For discontinued hedging relationships, the same assumption has been applied for determining whether the hedged future cash flows are expected to occur.
– In making its prospective hedge effectiveness assessments, Santander UK assumes that the interest rate benchmark on which the hedged item and the hedging instrument are based is not altered as a result of LIBOR reform.
– Santander UK will not discontinue hedge accounting during the period of LIBOR-related uncertainty solely because the retrospective effectiveness falls outside the required 80-125% range.
– For hedges of a non-contractually specified benchmark portion of an interest rate, Santander UK only considers at inception of such a hedging relationship whether the separately identifiable requirement is met.
Details of the significant interest rate benchmarks to which hedging relationships are exposed, the extent of risk exposure that is affected by LIBOR reform, and how Santander UK’s transition to alternative benchmark interest rates is being managed, are disclosed in the Banking market risk section of the Risk review. The nominal amount of the hedging instruments in hedging relationships directly affected by uncertainties related to LIBOR reform is disclosed in Note 11.
Future accounting developments At 31 December 2019, for the Santander UK group, there were no significant new or revised standards and interpretations, and amendments thereto, which have been issued but which are not yet effective or which have otherwise not been early adopted where permitted.
Comparative information As required by US public company reporting requirements, these financial statements include two years of comparative information for the consolidated income statement, consolidated statement of comprehensive income, consolidated statement of changes in equity, consolidated statement of cash flows and related Notes.
Consolidation a) Subsidiaries The Consolidated Financial Statements incorporate the financial statements of the Company and entities (including structured entities) controlled by it and its subsidiaries. Control is achieved where the Company (i) has power over the investee; (ii) is exposed, or has rights, to variable returns from its involvement with the investee; and (iii) has the ability to use its power to affect its returns. The Company reassesses whether or not it controls an investee if facts and circumstances indicate that there are changes to one or more of the three elements of control listed above. When the Company has less than a majority of the voting rights of an investee, it has power over the investee when the voting rights are sufficient to give it the practical ability to direct the relevant activities of the investee unilaterally. The Company considers all relevant facts and circumstances in assessing whether or not the Company's voting rights in an investee are sufficient to give it power, including:
– The size of the Company's holding of voting rights relative to the size and dispersion of holdings of the other vote holders – Potential voting rights held by the Company, other vote holders or other parties – Rights arising from other contractual arrangements – Any additional facts and circumstances that indicate that the Company has, or does not have, the current ability to direct the relevant activities at the time that
decisions need to be made, including voting patterns at previous shareholders' meetings.
Consolidation of a subsidiary begins when the Company obtains control over the subsidiary and ceases when the Company loses control of the subsidiary. Specifically, the results of a subsidiary acquired or disposed of during the year are included in the consolidated income statement and the consolidated statement of comprehensive income from the date the Company gains control until the date when the Company ceases to control the subsidiary. Inter-company transactions, balances and unrealised gains on transactions between Santander UK group companies are eliminated; unrealised losses are also eliminated unless the cost cannot be recovered.
Santander UK Group Holdings plc186
Annual Report 2019 | Financial statements

Santander UK Group Holdings plc 187
Strategic report Governance Risk review Financial review Financial statements Shareholder information
Notes to the
financial statements
The acquisition method of accounting is used to account for the acquisition of subsidiaries which meet the definition of a business. The cost of an acquisition is measured at the fair value of the assets given up, shares issued or liabilities undertaken at the date of acquisition. Acquisition-related costs are expensed as incurred. The excess of the cost of acquisition, as well as the fair value of any interest previously held, over the fair value of the Santander UK group’s share of the identifiable net assets of the subsidiary at the date of acquisition is recorded as goodwill. When the Santander UK group loses control of a subsidiary, the profit or loss on disposal is calculated as the difference between (i) the aggregate of the fair value of the consideration received and the fair value of any retained interest and (ii) the previous carrying amount of the assets (including goodwill), less liabilities of the subsidiary and any non-controlling interests. Amounts previously recognised in other comprehensive income in relation to the subsidiary are accounted for (i.e. reclassified to profit or loss or transferred directly to retained earnings) in the same manner as would be required if the relevant assets or liabilities are disposed of. The fair value of any investment retained in a former subsidiary at the date when control is lost is regarded as the fair value on initial recognition for subsequent accounting under IFRS 9 or, when applicable, the costs on initial recognition of an investment in an associate or joint venture.
Business combinations between entities under common control (i.e. fellow subsidiaries of Banco Santander SA, the ultimate parent) are outside the scope of IFRS 3 – ‘Business Combinations’, and there is no other guidance for such transactions under IFRS. The Santander UK group elects to account for business combinations between entities under common control at their book values in the acquired entity by including the acquired entity’s results from the date of the business combination and not restating comparatives. Reorganisations of entities within the Santander UK group are also accounted for at their book values.
Interests in subsidiaries are eliminated during the preparation of the Consolidated Financial Statements. Interests in subsidiaries in the Company unconsolidated financial statements are held at cost subject to impairment.
b) Joint ventures Joint ventures are joint arrangements whereby the parties that have joint control of the arrangement have rights to its net assets. Joint control is the contractually agreed sharing of control of an arrangement, which exists only when decisions about the relevant activities require unanimous consent of the parties sharing control. Accounting policies of joint ventures have been aligned to the extent there are differences from the Santander UK group’s policies. Investments in joint ventures are accounted for by the equity method of accounting and are initially recorded at cost and adjusted each year to reflect the Santander UK group’s share of their post-acquisition results. When the Santander UK group's share of losses of a joint venture exceed its interest in that joint venture, the Santander UK group discontinues recognising its share of further losses. Further losses are recognised only to the extent that the Santander UK group has incurred legal or constructive obligations or made payments on behalf of the joint venture.
Foreign currency translation Items included in the financial statements of each entity (including foreign branch operations) in the Santander UK group are measured using the currency that best reflects the economic substance of the underlying events and circumstances relevant to that entity (the functional currency). The Consolidated Financial Statements are presented in sterling, which is the functional currency of the Company.
Income statements and cash flows of foreign entities are translated into the Santander UK group’s presentation currency at average exchange rates for the year and their balance sheets are translated at the exchange rates ruling on 31 December. Exchange differences on the translation of the net investment in foreign entities are recognised in other comprehensive income. When a foreign entity is sold, such exchange differences are recognised in the income statement as part of the gain or loss on sale.
Foreign currency transactions are translated into the functional currency of the entity involved at the exchange rates prevailing at the dates of the transactions. Foreign exchange gains and losses resulting from the settlement of such transactions and from the translation of monetary assets and liabilities denominated in foreign currencies are recognised in the income statement unless recognised in other comprehensive income in connection with a cash flow hedge. Non-monetary items denominated in a foreign currency measured at historical cost are not retranslated. Exchange rate differences arising on non-monetary items measured at fair value are recognised in the consolidated income statement except for differences arising on equity securities measured at fair value through other comprehensive income (FVOCI) (2017: available-for-sale asset measured at fair value), which are recognised in other comprehensive income.
Revenue recognition a) Interest income and expense Interest and similar income comprises interest income on financial assets measured at amortised cost, investments in debt instruments measured at FVOCI (2017: available-for-sale measured at fair value) and interest income on hedging derivatives. Interest expense and similar charges comprises interest expense on financial liabilities measured at amortised cost, and interest expense on hedging derivatives. Interest income on financial assets measured at amortised cost, investments in debt instruments measured at FVOCI (2017: available-for-sale measured at fair value) and interest expense on financial liabilities other than those at fair value through profit or loss (FVTPL) is determined using the effective interest rate method.
The effective interest rate is the rate that discounts the estimated future cash payments or receipts over the expected life of the instrument or, when appropriate, a shorter period, to the gross carrying amount of the financial asset (i.e. its amortised cost before any impairment allowance) or to the amortised cost of a financial liability. When calculating the effective interest rate, the future cash flows are estimated after considering all the contractual terms of the instrument excluding expected credit losses. The calculation includes all amounts paid or received by the Santander UK group that are an integral part of the overall return, direct incremental transaction costs related to the acquisition, issue or disposal of the financial instrument and all other premiums or discounts.
Interest income is calculated by applying the effective interest rate to the gross carrying amount of financial assets, except for financial assets that have subsequently become credit-impaired (or ‘Stage 3’), for which interest revenue is calculated by applying the effective interest rate to their amortised cost (i.e. net of the ECL provision). For more information on stage allocations of credit risk exposures, see ‘Significant increase in credit risk’ in the ‘Santander UK group level – credit risk management’ section of the Risk Review.
b) Fee and commission income and expense Fees and commissions that are not an integral part of the effective interest rate are recognised when the service is performed. Most fee and commission income is recognised at a point in time. Certain commitment, upfront and management fees are recognised over time but are not material. For retail and corporate products, fee and commission income consists principally of collection services fees, commission on foreign currencies, commission and other fees received from retailers for processing credit card transactions, fees received from other credit card issuers for providing cash advances for their customers through the Santander UK group’s branch and ATM networks, annual fees payable by credit card holders and fees for non-banking financial products.
For insurance products, fee and commission income consists principally of commissions and profit share arising from the sale of building and contents insurance and life protection insurance. Commissions arising from the sale of buildings and contents insurance are recognised over the period of insurance cover, adjusted to take account of cancelled policies. Profit share income from the sale of buildings and contents insurance which is not subject to any adjustment is recognised when the
187Santander UK Group Holdings plc

Annual Report 2019 | Financial statements
188 Santander UK Group Holdings plc
profit share income is earned. Commissions and profit share arising from the sale of life protection insurance is subject to adjustment for cancellations of policies within 3 years from inception.
Fee and commission income which forms an integral part of the effective interest rate of a financial instrument (for example certain loan commitment fees) is recognised as an adjustment to the effective interest rate and recorded in ‘Interest income’.
c) Dividend income Except for equity securities classified as trading assets or financial assets held at fair value through profit or loss, described below, dividend income is recognised when the right to receive payment is established. This is the ex-dividend date for equity securities.
d) Net trading and other income Net trading and other income includes all gains and losses from changes in the fair value of financial assets and liabilities held at fair value through profit or loss (comprising financial assets and liabilities held for trading, trading derivatives and other financial assets and liabilities at fair value through profit or loss), together with related interest income, expense, dividends and changes in fair value of any derivatives managed in conjunction with these assets and liabilities. Changes in fair value of derivatives in a fair value hedging relationship are also recognised in net trading and other income. Net trading and other income also includes income from operating lease assets, and profits and losses arising on the sales of property, plant and equipment and subsidiary undertakings.
Borrowing costs Borrowing costs directly attributable to the acquisition, construction or production of qualifying assets, including computer software, which are assets that necessarily take a substantial period of time to develop for their intended use, are added to the cost of those assets, until the assets are substantially ready for their intended use. All other borrowing costs are recognised in profit or loss in the period in which they occur.
Pensions and other post-retirement benefits a) Defined benefit schemes A defined benefit scheme is a pension scheme that guarantees an amount of pension benefit to be provided, usually as a function of one or more factors such as age, years of service or compensation. Pension costs are charged to ‘Administration expenses’, within the line item ‘Operating expenses before impairment losses, provisions and charges’ with the net interest on the defined benefit asset or liability included within ‘Net interest income’ in the income statement. The asset or liability recognised in respect of defined benefit pension schemes is the present value of the defined benefit obligation at the balance sheet date, less the fair value of scheme assets. The defined benefit obligation is calculated annually by independent actuaries using the projected unit credit method. The assets of the schemes are measured at their fair values at the balance sheet date.
The present value of the defined benefit obligation is estimated by projecting forward the growth in current accrued pension benefits to reflect inflation and salary growth to the date of pension payment, then discounted to present value using the yield applicable to high-quality AA rated corporate bonds of the same currency and which have terms to maturity closest to the terms of the scheme liabilities, adjusted where necessary to match those terms. In determining the value of scheme liabilities, demographic and financial assumptions are made by management about life expectancy, inflation, discount rates, pension increases and earnings growth, based on past experience and future expectations. Financial assumptions are based on market conditions at the balance sheet date and can generally be derived objectively.
Demographic assumptions require a greater degree of estimation and judgement to be applied to externally derived data. Any surplus or deficit of scheme assets over liabilities is recognised in the balance sheet as an asset (surplus) or liability (deficit). An asset is only recognised to the extent that the surplus can be recovered through reduced contributions in the future or through refunds from the scheme. The income statement includes the net interest income/expense on the net defined benefit liability/asset, current service cost and any past service cost and gain or loss on settlement. Remeasurement of defined benefit pension schemes, including return on scheme assets (excludes amounts included in net interest), actuarial gains and losses (arising from changes in demographic assumptions, the impact of scheme experience and changes in financial assumptions) and the effect of the changes to the asset ceiling (if applicable), are recognised in other comprehensive income. Remeasurement recognised in other comprehensive income will not be reclassified to the income statement. Past-service costs are recognised as an expense in the income statement at the earlier of when the scheme amendment or curtailment occurs and when the related restructuring costs or termination benefits are recognised. Curtailments include the impact of significant reductions in the number of employees covered by a scheme, or amendments to the terms of the scheme so that a significant element of future service will no longer qualify for benefits or will qualify only for reduced benefits. Curtailment gains and losses on businesses that meet the definition of discontinued operations are included in profit or loss for the year from discontinued operations. Gains and losses on settlements are recognised when the settlement occurs.
b) Defined contribution plans A defined contribution plan is a pension scheme under which the Santander UK group pays fixed contributions as they fall due into a separate entity (a fund). The pension paid to the member at retirement is based on the amount in the separate fund for each member. The Santander UK group has no legal or constructive obligations to pay further contributions into the fund to ‘top up’ benefits to a certain guaranteed level. The regular contributions constitute net periodic costs for the year in which they are due and are included in staff costs within Operating expenses in the income statement.
c) Post-retirement medical benefit plans Post-retirement medical benefit liabilities are determined using the projected unit credit method, with actuarial valuations updated at each year-end. The expected benefit costs are accrued over the period of employment using an accounting methodology similar to that for the defined benefit pension scheme.
Share-based payments The Santander UK group engages in cash-settled and equity-settled share-based payment transactions in respect of services received from certain of its employees. Shares of the Santander UK group’s parent, Banco Santander SA are purchased in the open market by the Santander UK group (for the Employee Sharesave scheme) or are purchased by Banco Santander SA or another Banco Santander subsidiary (including awards granted under the Long-Term Incentive Plan and the Deferred Shares Bonus Plan) to satisfy share options or awards as they vest.
Options granted under the Employee Sharesave scheme are accounted for as cash-settled share-based payment transactions. Awards granted under the Long-Term Incentive Plan and Deferred Shares Bonus Plan are accounted for as equity-settled share-based payment transactions.
The fair value of the services received is measured by reference to the fair value of the shares or share options initially on the date of the grant for both the cash and equity settled share-based payments and then subsequently at each reporting date for the cash-settled share-based payments. The cost of the employee services received in respect of the shares or share options granted is recognised in the income statement in administration expenses over the period that the services are received i.e. the vesting period.
Santander UK Group Holdings plc188
Annual Report 2019 | Financial statements

Santander UK Group Holdings plc 189
Strategic report Governance Risk review Financial review Financial statements Shareholder information
Notes to the financial statements
A liability equal to the portion of the services received is recognised at the fair value determined at each balance sheet date for cash-settled share-based payments. A liability equal to the amount to be reimbursed to Banco Santander SA is recognised at the fair value determined at the grant date for equity-settled share-based payments.
The fair value of the options granted under the Employee Sharesave scheme is determined using an option pricing model, which takes into account the exercise price of the option, the current share price, the risk free interest rate, the expected volatility of the Banco Santander SA share price over the life of the option and the dividend growth rate. The fair value of the awards granted for the Long-Term Incentive Plan was determined at the grant date using an option pricing model, which takes into account the share price at grant date, the risk free interest rate, the expected volatility of the Banco Santander SA share price over the life of the award and the dividend growth rate. Vesting conditions included in the terms of the grant are not taken into account in estimating fair value, except for those that include terms related to market conditions. Non-market vesting conditions are taken into account by adjusting the number of shares or share options included in the measurement of the cost of employee service so that, ultimately, the amount recognised in the income statement reflects the number of vested shares or share options. Where vesting conditions are related to market conditions, the charges for the services received are recognised regardless of whether or not the market–related vesting conditions are met, provided that the non-market vesting conditions are met.
Where an award has been modified, as a minimum, the expense of the original award continues to be recognised as if it had not been modified. Where the effect of a modification is to increase the fair value of an award or increase the number of equity instruments, the incremental fair value of the award or incremental fair value of the modification of the award is recognised in addition to the expense of the original grant, measured at the date of modification, over the modified vesting period.
Cancellations in the vesting period are treated as an acceleration of vesting, and recognised immediately for the amount that would otherwise have been recognised for services over the vesting period.
Goodwill and other intangible assets Goodwill represents the excess of the cost of an acquisition, as well as the fair value of any interest previously held, over the fair value of the share of the identifiable net assets of the acquired subsidiary, associate, or business at the date of acquisition. Goodwill on the acquisition of subsidiaries and businesses is included in intangible assets. Goodwill on acquisitions of associates is included as part of investment in associates. Goodwill is tested for impairment annually, or more frequently when events or changes in circumstances dictate, and carried at cost less accumulated impairment losses. Gains and losses on the disposal of an entity or business include the carrying amount of goodwill relating to the entity or business sold.
Other intangible assets are recognised if they arise from contractual or other legal rights or if they are capable of being separated or divided from the Santander UK group and sold, transferred, licensed, rented or exchanged. The value of such intangible assets is amortised on a straight-line basis over their useful economic life of three to seven years. Other intangible assets are reviewed annually for impairment indicators and tested for impairment where indicators are present.
Software development costs are capitalised when they are direct costs associated with identifiable and unique software products that are expected to provide future economic benefits and the cost of those products can be measured reliably. These costs include payroll, materials, services and directly attributable overheads. Internally developed software meeting these criteria and externally purchased software are classified in intangible assets on the balance sheet and amortised on a straight-line basis over their useful life of three to seven years, unless the software is an integral part of the related computer hardware, in which case it is treated as property, plant and equipment as described below. Capitalisation of costs ceases when the software is capable of operating as intended. Costs of maintaining software are expensed as incurred.
Property, plant and equipment Property, plant and equipment include owner-occupied properties (including leasehold properties), office fixtures and equipment and computer software. Property, plant and equipment also includes operating leases where the Santander UK group is the lessor and right-of-use assets where the Santander UK group is the lessee, as described further in ‘Leases’ below. Property, plant and equipment are carried at cost less accumulated depreciation and accumulated impairment losses. A review for indications of impairment is carried out at each reporting date. Gains and losses on disposal are determined by reference to the carrying amount and are reported in net trading and other income. Repairs and renewals are charged to the income statement when the expenditure is incurred. Internally developed software meeting the criteria set out in ‘Goodwill and other intangible assets’ above and externally purchased software are classified in property, plant and equipment where the software is an integral part of the related computer hardware (for example operating system of a computer). Classes of property, plant and equipment are depreciated on a straight-line basis over their useful life, as follows:
Owner-occupied properties Not exceeding 50 years Office fixtures and equipment 3 to 15 years Computer software 3 to 7 years
Right-of-use assets (see ‘Leases – The Santander UK group as lessee’ below) Shorter of the lease term or the useful life of the underlying asset
Depreciation is not charged on freehold land and assets under construction. Depreciation on operating lease assets where the Santander UK group is the lessor is described in 'Leases' below.
Financial instruments a) Initial recognition and measurement Financial assets and liabilities are initially recognised when the Santander UK group becomes a party to the contractual terms of the instrument. The Santander UK group determines the classification of its financial assets and liabilities at initial recognition and measures a financial asset or financial liability at its fair value plus or minus, in the case of a financial asset or financial liability not at FVTPL, transaction costs that are incremental and directly attributable to the acquisition or issue of the financial asset or financial liability. Transaction costs of financial assets and financial liabilities carried at FVTPL are expensed in profit or loss. Immediately after initial recognition, an expected credit loss (ECL) allowance is recognised for financial assets measured at amortised cost and investments in debt instruments measured at FVOCI.
A regular way purchase is a purchase of a financial asset under a contract whose terms require delivery of the asset within the timeframe established generally by regulation or convention in the market place concerned. Regular way purchases of financial assets classified as loans and receivables, issues of equity or financial liabilities measured at amortised cost are recognised on settlement date; all other regular way purchases and issues are recognised on trade date.
b) Financial assets and liabilities i) Classification and subsequent measurement The Santander UK group classifies its financial assets in the measurement categories of amortised cost, FVOCI and FVTPL.
189Santander UK Group Holdings plc
Annual Report 2019 | Financial statements
190 Santander UK Group Holdings plc
Financial assets and financial liabilities are classified as FVTPL where there is a requirement to do so or where they are otherwise designated at FVTPL on initial recognition. Financial assets and financial liabilities which are required to be held at FVTPL include:
– Financial assets and financial liabilities held for trading – Debt instruments that do not have solely payments of principal and interest (SPPI) characteristics. Otherwise, such instruments are measured at amortised cost or
FVOCI, and – Equity instruments that have not been designated as held at FVOCI.
Financial assets and financial liabilities are classified as held for trading if they are derivatives or if they are acquired or incurred principally for the purpose of selling or repurchasing in the near-term, or form part of a portfolio of financial instruments that are managed together and for which there is evidence of short-term profit taking.
In certain circumstances, other financial assets and financial liabilities are designated at FVTPL where this results in more relevant information. This may arise because it significantly reduces a measurement inconsistency that would otherwise arise from measuring assets or liabilities or recognising the gains or losses on them on a different basis, where the assets and liabilities are managed and their performance evaluated on a fair value basis or, in the case of financial liabilities, where it contains one or more embedded derivatives which are not closely related to the host contract.
The classification and measurement requirements for financial asset debt and equity instruments and financial liabilities are set out below.
a) Financial assets: debt instruments Debt instruments are those instruments that meet the definition of a financial liability from the issuer’s perspective, such as loans and government and corporate bonds. Classification and subsequent measurement of debt instruments depend on the Santander UK group’s business model for managing the asset, and the cash flow characteristics of the asset.
Business model The business model reflects how the Santander UK group manages the assets in order to generate cash flows and, specifically, whether the Santander UK group’s objective is solely to collect the contractual cash flows from the assets or is to collect both the contractual cash flows and cash flows arising from the sale of the assets. If neither of these is applicable, such as where the financial assets are held for trading purposes, then the financial assets are classified as part of an ‘other’ business model and measured at FVTPL. Factors considered in determining the business model for a group of assets include past experience on how the cash flows for these assets were collected, how the assets’ performance is evaluated and reported to key management personnel, and how risks are assessed and managed.
SPPI Where the business model is to hold assets to collect contractual cash flows or to collect contractual cash flows and sell, the Santander UK group assesses whether the assets’ cash flows represent SPPI. In making this assessment, the Santander UK group considers whether the contractual cash flows are consistent with a basic lending arrangement (i.e. interest includes only consideration for the time value of money, credit risk, other basic lending risks and a profit margin that is consistent with a basic lending arrangement). Where the contractual terms introduce exposure to risk or volatility that is inconsistent with a basic lending arrangement, the related asset is classified and measured at FVTPL.
Financial assets with embedded derivatives are considered in their entirety when determining whether their cash flows are SPPI.
Based on these factors, the Santander UK group classifies its debt instruments into one of the following measurement categories:
– Amortised cost – Financial assets that are held for collection of contractual cash flows where those cash flows represent SPPI, and that are not designated at FVTPL, are measured at amortised cost. The carrying amount of these assets is adjusted by any ECL recognised and measured as presented in Note 13. Interest income from these financial assets is included in ‘Interest and similar income’ using the effective interest rate method. When estimates of future cash flows are revised, the carrying amount of the respective financial assets or financial liabilities is adjusted to reflect the new estimate discounted using the original effective interest rate. Any changes are recognised in the income statement.
– FVOCI – Financial assets that are held for collection of contractual cash flows and for selling the assets, where the assets’ cash flows represent SPPI, and that are not designated at FVTPL, are measured at FVOCI. Movements in the carrying amount are recognised in OCI, except for the recognition of impairment gains or losses, interest revenue and foreign exchange gains and losses on the instrument’s amortised cost which are recognised in profit or loss. When the financial asset is derecognised, the cumulative gain or loss previously recognised in OCI is reclassified from equity to profit or loss and recognised in ‘Net trading and other income’. Interest income from these financial assets is included in ‘Interest and similar income’ using the effective interest rate method.
– FVTPL – Financial assets that do not meet the criteria for amortised cost or FVOCI are measured at FVTPL. A gain or loss on a debt instrument that is subsequently measured at FVTPL, including any debt instruments designated at fair value, is recognised in profit or loss and presented in the income statement in ‘Net trading and other income’ in the period in which it arises.
The Santander UK group reclassifies financial assets when and only when its business model for managing those assets changes. The reclassification takes place from the start of the first reporting period following the change. Such changes are expected to be very infrequent.
b) Financial assets: equity instruments Equity instruments are instruments that meet the definition of equity from the issuer’s perspective, being instruments that do not contain a contractual obligation to pay cash and that evidence a residual interest in the issuer’s net assets. All equity investments are subsequently measured at FVTPL, except where management has elected, at initial recognition, to irrevocably designate an equity investment at FVOCI. When this election is used, fair value gains and losses are recognised in OCI and are not subsequently reclassified to profit or loss, including on disposal. ECLs (and reversal of ECLs) are not reported separately from other changes in fair value. Dividends, when representing a return on such investments, continue to be recognised in profit or loss as other income when the right to receive payments is established. Gains and losses on equity investments at FVTPL are included in the ‘Net trading and other income’ line in the income statement.
Santander UK Group Holdings plc190
Annual Report 2019 | Financial statements

Santander UK Group Holdings plc 191
Strategic report Governance Risk review Financial review Financial statements Shareholder information
Notes to the financial statements
c) Financial liabilities Financial liabilities are classified as subsequently measured at amortised cost, except for:
– Financial liabilities at fair value through profit or loss: this classification is applied to derivatives and other financial liabilities designated as such at initial recognition. Gains or losses on financial liabilities designated at fair value through profit or loss are presented partially in other comprehensive income (the amount of change in the fair value of the financial liability that is attributable to changes in the credit risk of that liability) and partially in profit or loss (the remaining amount of change in the fair value of the liability)
– Financial liabilities arising from the transfer of financial assets which did not qualify for derecognition, whereby a financial liability is recognised for the consideration received for the transfer. In subsequent periods, the Santander UK group recognises any expense incurred on the financial liability, and
– Financial guarantee contracts and loan commitments.
Contracts involving the receipt of cash on which customers receive an index-linked return are accounted for as equity index-linked deposits. The principal products are Capital Guaranteed/Protected Products which give the customers a limited participation in the upside growth of an equity index. In the event the index falls in price, a cash principal element is guaranteed/protected. The equity index-linked deposits contain embedded derivatives. These embedded derivatives, in combination with the principal cash deposit element, are designed to replicate the investment performance profile tailored to the return agreed in the contracts with customers. The cash principal element is accounted for as deposits by customers at amortised cost. The embedded derivatives are separated from the host instrument and are separately accounted for as derivatives.
d) Sale and repurchase agreements (including stock borrowing and lending) Securities sold subject to a commitment to repurchase them at a predetermined price (repos) under which substantially all the risks and rewards of ownership are retained by the Santander UK group remain on the balance sheet and a liability is recorded in respect of the consideration received. Securities purchased under commitments to resell (reverse repos) are not recognised on the balance sheet and the consideration paid is recorded as an asset. The difference between the sale and repurchase price is treated as trading income in the income statement, except where the repo is not treated as part of the trading book, in which case the difference is recorded in interest income or expense.
Securities lending and borrowing transactions are generally secured, with collateral in the form of securities or cash advanced or received. Securities lent or borrowed are not reflected on the balance sheet. Collateral in the form of cash received or advanced is recorded as a deposit or a loan. Collateral in the form of securities is not recognised.
e) Day One profit adjustments The fair value of a financial instrument on initial recognition is generally its transaction price (that is, the fair value of the consideration given or received). However, sometimes the fair value will be based on other observable current market transactions in the same instrument, without modification or repackaging, or on a valuation technique whose variables include only data from observable markets, such as interest rate yield curves, option volatilities and currency rates. When such evidence exists, the Santander UK group recognises a trading gain or loss at inception (Day One gain or loss), being the difference between the transaction price and the fair value. When significant unobservable parameters are used, the entire Day One gain or loss is deferred and is recognised in the income statement over the life of the transaction until the transaction matures, is closed out, the valuation inputs become observable or an offsetting transaction is entered into.
ii) Impairment of debt instrument financial assets The Santander UK group assesses on a forward-looking basis the ECL associated with its debt instrument assets carried at amortised cost and FVOCI and with the exposure arising from financial guarantee contracts and loan commitments. The Santander UK group recognises a loss allowance for such losses at each reporting date. The measurement of ECL reflects:
– An unbiased and probability-weighted amount that is determined by evaluating a range of possible outcomes – The time value of money, and – Reasonable and supportable information that is available without undue cost or effort at the reporting date about past events, current conditions and forecasts of
future economic conditions.
Grouping of instruments for losses measured on a collective basis We typically group instruments and assess them for impairment collectively where they share risk characteristics (as described in Retail Banking – credit risk management in the Risk review) using one or more statistical models. Where we have used internal capital or similar models as the basis for our IFRS 9 models, this typically results in a large number of relatively small homogenous groups which are determined by the permutations of the underlying characteristics in the statistical models. We calculate separate collective provisions for instruments in Stages 1, 2 and 3 where the instrument is not individually assessed, as described below.
Individually assessed impairments (IAIs) We assess significant Stage 3 cases individually. We do this for CIB and Corporate & Commercial Banking cases, but not for Business Banking cases in Retail Banking which we assess collectively. To calculate the estimated loss, we estimate the future cash flows under several scenarios each of which uses case-specific factors and circumstances. We then probability-weight the net present value of the cash flows under each scenario to arrive at a weighted average provision requirement. We update our assessment process every quarter and more frequently if there are changes in circumstances that might affect the scenarios, cash flows or probabilities we apply.
For more on how ECL is calculated, see the Credit risk section of the Risk review.
a) Write-off For secured loans, a write-off is only made when all collection procedures have been exhausted and the security has been sold and/or a claim made on any mortgage indemnity guarantee or other insurance. In the corporate portfolio, there may be occasions where a write-off occurs for other reasons, such as following a consensual restructure or refinancing of the debt or where the debt is sold for strategic reasons into the secondary market at a value lower than its face value.
There is no threshold based on past due status beyond which all secured loans are written off as there can be significant variations in the time needed to enforce possession and sale of the security, especially due to the different legal frameworks that apply in different regions of the UK. For unsecured loans, a write-off is only made when all internal avenues of collecting the debt have been exhausted. Where appropriate the debt is passed over to external collection agencies. A past due threshold is applied to unsecured debt where accounts that are 180 days past due are written off unless there is a dispute awaiting resolution. Contact is made with customers with the aim to achieve a realistic and sustainable repayment arrangement. Litigation and/or enforcement of security is usually carried out only when the steps described above have been undertaken without success.
191Santander UK Group Holdings plc

Annual Report 2019 | Financial statements
192 Santander UK Group Holdings plc
All write-offs are assessed / made on a case-by-case basis, taking account of the exposure at the date of write-off, after accounting for the value from any collateral or insurance held against the loan. The exception to this is in cases where fraud has occurred, where the exposure is written off once investigations have been completed and the probability of recovery is minimal. The time span between discovery and write-off will be short and may not result in an impairment loss allowance being raised. The write-off policy is regularly reviewed. Write-offs are charged against previously established loss allowances.
b) Recoveries Recoveries of credit impairment losses are not included in the impairment loss allowance, but are taken to income and offset against credit impairment losses. Recoveries of credit impairment losses are classified in the income statement as ‘Credit impairment losses’.
iii) Modifications of financial assets The treatment of a renegotiation or modification of the contractual cash flows of a financial asset normally depends upon whether the renegotiation or modification is due to financial difficulties of the borrower or for other commercial reasons.
– Contractual modifications due to financial difficulties of the borrower: where Santander UK modifies the contractual conditions to enable the borrower to fulfil their payment obligations, the asset is not derecognised. The gross carrying amount of the financial asset is recalculated as the present value of the renegotiated/modified contractual cash flows that are discounted at the financial asset’s original EIR and any gain or loss arising from the modification is recognised in the income statement.
– Contractual modifications for other commercial reasons: such modifications are treated as a new transaction resulting in derecognition of the original financial asset, and the recognition of a ‘new’ financial asset. Any difference between the carrying amount of the derecognised asset and the fair value of the new asset is recognised in the income statement as a gain or loss on derecognition.
Any other contractual modifications, such as where a regulatory authority imposes a change in certain contractual terms or due to legal reasons, are assessed on a case-by-case basis to establish whether or not the financial asset should be derecognised.
iv) Derecognition other than on a modification Financial assets are derecognised when the rights to receive cash flows have expired or the Santander UK group has transferred its contractual right to receive the cash flows from the assets and either: (1) substantially all the risks and rewards of ownership have been transferred; or (2) the Santander UK group has neither retained nor transferred substantially all of the risks and rewards, but has transferred control.
Financial liabilities are derecognised when extinguished, cancelled or expired.
c) Financial guarantee contracts and loan commitments Financial guarantee contracts are contracts that require the issuer to make specified payments to reimburse the holder for a loss it incurs because a specified debtor fails to make payments when due, in accordance with the terms of a debt instrument. Such financial guarantees are given to banks, financial institutions and others on behalf of customers to secure loans, overdrafts and other banking facilities.
Financial guarantee contracts are initially measured at fair value and subsequently measured at the higher of the amount of the loss allowance, and the premium received on initial recognition less income recognised in accordance with the principles of IFRS 15. Loan commitments are measured as the amount of the loss allowance (determined in accordance with IFRS 9 as described in Credit risk section of the Risk review). The Santander UK group has not provided any commitment to provide loans at a below-market interest rate, or that can be settled net in cash or by delivering or issuing another financial instrument.
For financial guarantee contracts and loan commitments, the loss allowance is recognised as a provision and charged to credit impairment losses in the income statement. The loss allowance in respect of revolving facilities is classified in loans and advances to customers to the extent of any drawn balances. The loss allowance in respect of undrawn amounts is classified in provisions. When amounts are drawn, any related loss allowance is transferred from provisions to loans and advances to customers.
Derivative financial instruments (derivatives) Derivatives are contracts or agreements whose value is derived from one or more underlying indices or asset values inherent in the contract or agreement, which require no or little initial net investment and are settled at a future date. Transactions are undertaken in interest rate, cross currency, equity, residential property and other index-related swaps, forwards, caps, floors, swaptions, as well as credit default and total return swaps, equity index contracts and exchange traded interest rate futures, and equity index options.
Derivatives are held for risk management purposes. Derivatives are classified as held for trading unless they are designated as being in a hedge accounting relationship. The Santander UK group chooses to designate certain derivatives as in a hedging relationship if they meet specific criteria, as further described in ‘Hedge accounting’ below.
Derivatives are recognised initially (on the date on which a derivative contract is entered into), and are subsequently remeasured, at their fair value. Fair values of exchange-traded derivatives are obtained from quoted market prices. Fair values of over-the-counter derivatives are estimated using valuation techniques, including discounted cash flow and option pricing models.
Certain derivatives may be embedded in hybrid contracts, such as the conversion option in a convertible bond. If the hybrid contract contains a host that is a financial asset, then the Santander UK group assesses the entire contract as described in the financial asset section above for classification and measurement purposes. Otherwise, embedded derivatives are treated as separate derivatives when their economic characteristics and risks are not closely related to those of the host contract; the terms of the embedded derivative would meet the definition of a stand-alone derivative if they were contained in a separate contract; and the combined contract is not held for trading or designated at fair value. These embedded derivatives are measured at fair value with changes in fair value recognised in the income statement.
Contracts containing embedded derivatives are not subsequently reassessed for separation unless either there has been a change in the terms of the contract which significantly modifies the cash flows (in which case the contract is reassessed at the time of modification) or the contract has been reclassified (in which case the contract is reassessed at the time of reclassification).
All derivatives are carried as assets when their fair value is positive and as liabilities when their fair value is negative, except where netting is permitted. The method of recognising fair value gains and losses depends on whether derivatives are held for trading or are designated as hedging instruments and, if the latter, the nature of the risks being hedged. Gains and losses from changes in the fair value of derivatives held for trading are recognised in the income statement, and included within net trading and other income.
Santander UK Group Holdings plc192
Annual Report 2019 | Financial statements

Santander UK Group Holdings plc 193
Strategic report Governance Risk review Financial review Financial statements Shareholder information
Notes to the
financial statements
Offsetting financial assets and liabilities Financial assets and liabilities including derivatives are offset and the net amount reported in the balance sheet when there is a legally enforceable right to set off the recognised amounts and there is an intention to settle on a net basis, or realise the asset and settle the liability simultaneously. The Santander UK group is party to a number of arrangements, including master netting arrangements under industry standard agreements which facilitate netting of transactions in jurisdictions where netting agreements are recognised and have legal force. The netting arrangements do not generally result in an offset of balance sheet assets and liabilities for accounting purposes, as transactions are usually settled on a gross basis.
Hedge accounting The Santander UK group applies hedge accounting to represent, to the maximum possible extent permitted under accounting standards, the economic effects of its risk management strategies. Derivatives are used to hedge exposures to interest rates, exchange rates and certain indices such as retail price indices.
At the time a financial instrument is designated as a hedge (i.e. at the inception of the hedge), the Santander UK group formally documents the relationship between the hedging instrument(s) and hedged item(s), its risk management objective and strategy for undertaking the hedge. The documentation includes the identification of each hedging instrument and respective hedged item, the nature of the risk being hedged (including the benchmark interest rate being hedged in a hedge of interest rate risk) and how the hedging instrument’s effectiveness in offsetting the exposure to changes in the hedged item’s fair value attributable to the hedged risk is to be assessed. Accordingly, the Santander UK group formally assesses, both at the inception of the hedge and on an ongoing basis, whether the hedging derivatives have been and will be highly effective in offsetting changes in the fair value attributable to the hedged risk during the period that the hedge is designated. A hedge is normally regarded as highly effective if, at inception and throughout its life, the Santander UK group can expect, and actual results indicate, that changes in the fair value or cash flow of the hedged items are effectively offset by changes in the fair value or cash flow of the hedging instrument. If at any point it is concluded that it is no longer highly effective in achieving its documented objective, hedge accounting is discontinued.
Where derivatives are held for risk management purposes, and when transactions meet the required criteria for documentation and hedge effectiveness, the derivatives may be designated as either: (i) hedges of the change in fair value of recognised assets or liabilities or firm commitments (fair value hedges); (ii) hedges of the variability in highly probable future cash flows attributable to a recognised asset or liability, or a forecast transaction (cash flow hedges); or (iii) a hedge of a net investment in a foreign operation (net investment hedges). The Santander UK group applies fair value and cash flow hedge accounting, but not hedging of a net investment in a foreign operation.
a) Fair value hedge accounting Changes in the fair value of derivatives that are designated and qualify as fair value hedges are recorded in the income statement, together with the changes in the fair value of the hedged asset or liability that are attributable to the hedged risk. Where the hedged item is measured at amortised cost, the fair value changes due to the hedged risk adjust the carrying amount of the hedged asset or liability. Changes in the fair value of portfolio hedged items are presented separately in the consolidated balance sheet in macro hedge of interest rate risk and recognised in the income statement within net trading and other income. If the hedge no longer meets the criteria for hedge accounting, changes in the fair value of the hedged item attributable to the hedged risk are no longer recognised in the income statement. For fair value hedges of interest rate risk, the cumulative adjustment that has been made to the carrying amount of the hedged item is amortised to the income statement using the effective interest method over the period to maturity. For portfolio hedged items, the cumulative adjustment is amortised to the income statement using the straight line method over the period to maturity.
b) Cash flow hedge accounting The effective portion of changes in the fair value of qualifying cash flow hedges is recognised in other comprehensive income in the cash flow hedging reserve. The gain or loss relating to the ineffective portion is recognised immediately in the income statement. Amounts accumulated in equity are reclassified to the income statement in the periods in which the hedged item affects profit or loss. When a hedging instrument expires or is sold, or when a hedge no longer meets the criteria for hedge accounting, any cumulative gain or loss existing in equity at that time remains in equity and is recognised in the income statement when the forecast transaction is ultimately recognised in the income statement. When a forecast transaction is no longer expected to occur, the cumulative gain or loss that was reported in equity is immediately transferred to the income statement. The Santander UK group is exposed to cash flow interest rate risk on its floating rate assets, foreign currency risk on its fixed rate debt issuances denominated in foreign currency and equity price risk arises from the Santander UK group operating the Employee Sharesave scheme. Cash flow hedging is used to hedge the variability in cash flows arising from these risks.
Securitisation transactions The Santander UK group has entered into arrangements where undertakings have issued mortgage-backed and other asset-backed securities or have entered into funding arrangements with lenders in order to finance specific loans and advances to customers. As the Santander UK group has retained substantially all the risks and rewards of the underlying assets, such financial instruments continue to be recognised on the balance sheet, and a liability recognised for the proceeds of the funding transaction.
Impairment of non-financial assets At each balance sheet date, or more frequently when events or changes in circumstances dictate, property plant and equipment (including operating lease assets) and intangible assets (including goodwill) are assessed for indicators of impairment. If indications are present, these assets are subject to an impairment review. The impairment review comprises a comparison of the carrying amount of the asset or cash generating unit with its recoverable amount: the higher of the asset’s or cash-generating unit’s fair value less costs to sell and its value in use. The cash-generating unit represents the lowest level at which non-financial assets, including goodwill, are monitored for internal management purposes and is not larger than an operating segment.
The fair value is the price that would be received to sell an asset or paid to transfer a liability in an orderly transaction between market participants at the measurement date. Value in use is calculated by discounting management’s expected future cash flows obtainable as a result of the asset’s continued use, including those resulting from its ultimate disposal, at a market-based discount rate on a pre-tax basis. The recoverable amounts of goodwill have been based on value in use calculations.
The carrying values of property, plant and equipment, goodwill and other intangible assets are written down by the amount of any impairment and the loss is recognised in the income statement in the period in which it occurs. A previously recognised impairment loss relating to property, plant and equipment may be reversed in part or in full when a change in circumstances leads to a change in the estimates used to determine the property, plant and equipment’s recoverable amount. The carrying amount of the property, plant and equipment will only be increased up to the amount that would have been had the original impairment not been recognised. Impairment losses on goodwill are not reversed. For conducting goodwill impairment reviews, cash generating units are the lowest level at which management monitors the return on investment on assets.
193Santander UK Group Holdings plc

Annual Report 2019 | Financial statements
194 Santander UK Group Holdings plc
Leases a) The Santander UK group as lessor Operating lease assets are recorded at cost and depreciated over the life of the asset after taking into account anticipated residual value (RV). Operating lease rental income and depreciation is recognised on a straight-line basis over the life of the asset. After initial recognition, residual values are reviewed regularly, and any changes are recognised prospectively through remaining depreciation charges.
Amounts due from lessees under finance leases and hire purchase contracts are recorded as receivables at the amount of the Santander UK group’s net investment in the leases. Finance lease income is allocated to accounting periods to reflect a constant periodic rate of return on the Santander UK group’s net investment outstanding in respect of the leases and hire purchase contracts. A provision is recognised to reflect a reduction in any anticipated unguaranteed RV. A provision is also recognised for voluntary termination of the contract by the customer, where appropriate.
b) The Santander UK group as lessee The Santander UK group assesses whether a contract is or contains a lease at the inception of the contract and recognises a right-of-use (ROU) asset representing its right to use the underlying leased asset and a lease liability representing its obligation to make lease payments for all leases, except for leases with a term of 12 months or less which are expensed in the income statement on a straight-line basis over the lease terms. Lease payments exclude irrecoverable VAT which is expensed in the income statement as lease payments are made.
The lease liability, which is included within Other liabilities on the balance sheet, is initially measured at the present value of the lease payments that are not paid at the commencement date, discounted using the incremental borrowing rate appropriate to the lease term. The lease liability is subsequently measured at amortised cost using the effective interest rate method. Remeasurement of the lease liability occurs if there is a change in the lease payments (when a corresponding adjustment is made to the ROU asset), the lease term or in the assessment of an option to purchase the underlying asset.
At inception, the ROU asset, which is included within Property, plant and equipment on the balance sheet, comprises the lease liability, initial direct costs and the obligations to restore the asset, less any incentives granted by the lessor. The ROU asset is depreciated over the shorter of the lease term or the useful life of the underlying asset and is reviewed for indications of impairment as for owned assets. The obligation to restore the asset is included within Provisions on the balance sheet.
Income taxes, including deferred taxes The tax expense represents the sum of the income tax currently payable and deferred income tax.
Income tax payable on profits, based on the applicable tax law in each jurisdiction, is recognised as an expense in the period in which profits arise. Taxable profit differs from net profit as reported in the income statement because it excludes items of income or expense that are taxable or deductible in other years and it further excludes items that are never taxable or deductible. The liability for current tax is calculated using tax rates that have been enacted or substantively enacted by the balance sheet date. Current taxes associated with the repurchase of equity instruments are reported directly in equity.
A current tax liability for the current or prior period is measured at the amount expected to be paid to the tax authorities. Where the amount of the final tax liability is uncertain or where a position is challenged by a taxation authority, the liability recognised is the most likely outcome. Where a most likely outcome cannot be determined, a weighted average basis is applied.
Deferred income tax is the tax expected to be payable or recoverable on income tax losses available to carry forward and on temporary differences arising between the tax bases of assets and liabilities and their carrying amounts in the Consolidated Financial Statements and is accounted for using the balance sheet liability method. Deferred tax liabilities are generally recognised for all taxable temporary differences and deferred tax assets are recognised to the extent that it is probable that taxable profits will be available against which the assets may be utilised as they reverse. Such deferred tax liabilities are not recognised if the temporary difference arises from the initial recognition of goodwill. Deferred tax assets and liabilities are not recognised from the initial recognition of other assets (other than in a business combination) and liabilities in a transaction that affects neither the taxable profit nor the accounting profit.
Deferred tax is calculated at the tax rates that are expected to apply in the period when the liability is settled or the asset is realised based on rates enacted or substantively enacted at the balance sheet date. Deferred tax is charged or credited in the income statement, except when it relates to items recognised in other comprehensive income or directly in equity, in which case the deferred tax is also recognised in other comprehensive income or directly in equity. Deferred tax liabilities are recognised for taxable temporary differences arising on investments in subsidiaries except where the Santander UK group is able to control reversal of the temporary difference and it is probable that it will not reverse in the foreseeable future. The Santander UK group reviews the carrying amount of deferred tax assets at each balance sheet date and reduces it to the extent that it is no longer probable that sufficient taxable profits will be available to allow all or part of the asset to be recovered.
Deferred tax relating to actuarial gains and losses on defined benefits is recognised in other comprehensive income. Deferred tax relating to fair value re-measurements of financial instruments accounted for at FVOCI and cash flow hedging instruments is charged or credited directly to other comprehensive income and is subsequently recognised in the income statement when the deferred fair value gain or loss is recognised in the income statement.
Deferred and current tax assets and liabilities are only offset when they arise in the same tax reporting group and where there is both the legal right and the intention to settle on a net basis or to realise the asset and settle the liability simultaneously.
Cash and cash equivalents For the purposes of the cash flow statement, cash and cash equivalents comprise balances with less than three months maturity from the date of acquisition, including cash and non-restricted balances with central banks, treasury bills and other eligible bills, loans and advances to banks and short-term investments in securities.
Balances with central banks represent amounts held at the Bank of England as part of the Santander UK group’s liquidity management activities. In addition, it includes certain minimum cash balances held for regulatory purposes required to be maintained with the Bank of England.
Provisions Provisions are recognised for present obligations arising as consequences of past events where it is more likely than not that a transfer of economic benefits will be necessary to settle the obligation, and it can be reliably estimated.
Conduct provisions are made for the estimated cost of making redress payments with respect to the past sales of products, using conclusions such as the number of claims the number of those that will be upheld, the estimated average settlement per case and other related costs. Provision is made for the anticipated cost of
Santander UK Group Holdings plc194
Annual Report 2019 | Financial statements

Santander UK Group Holdings plc 195
Strategic report Governance Risk review Financial review Financial statements Shareholder information
Notes to the
financial statements
restructuring, including redundancy costs, when an obligation exists. An obligation exists when the Santander UK group has a detailed formal plan for restructuring a business, has raised valid expectations in those affected by the restructuring, and has started to implement the plan or announce its main features.
When a leasehold property ceases to be used in the business, provision is made where the unavoidable costs of the future obligations relating to the lease are expected to exceed anticipated rental income. The net costs are discounted using market rates of interest to reflect the long-term nature of the cash flows.
Loan commitments are measured as the amount of the loss allowance (determined in accordance with IFRS 9 as described in Credit risk section of the Risk review).
Contingent liabilities are possible obligations whose existence will be confirmed only by certain future events or present obligations where the transfer of economic benefit is uncertain or cannot be reliably measured. Contingent liabilities are not recognised but are disclosed unless they are remote.
Share capital a) Share issue costs Incremental external costs directly attributable to the issue of new shares are deducted from equity net of related income taxes.
b) Dividends Dividends on ordinary shares are recognised in equity in the period in which the right to receive payment is established.
Accounting policies relating to comparatives – IAS 39 On 1 January 2018, the Santander UK group adopted IFRS 9, which replaced IAS 39. In accordance with the transition requirements of IFRS 9, comparatives were not restated. The principal accounting policies applied in accordance with IAS 39 for periods before the adoption of IFRS 9 are set out below:
Classification and measurement of financial assets and liabilities – IAS 39 Financial assets and liabilities are initially recognised when the Santander UK group becomes a party to the contractual terms of the instrument. The Santander UK group determines the classification of its financial assets and liabilities at initial recognition. Financial assets are classified as financial assets at fair value through profit or loss, loans and receivables and available-for-sale financial assets. Financial liabilities are classified as fair value through profit or loss if they are either held for trading or otherwise designated at fair value through profit or loss on initial recognition.
Financial assets and financial liabilities classified as FVTPL are initially recognised at fair value and transaction costs are taken directly to the income statement. Gains and losses arising from changes in fair value are included directly in the income statement except for gains and losses on financial liabilities designated at FVTPL relating to own credit which are presented in other comprehensive income. Derivative financial instruments, trading assets and liabilities and financial assets and liabilities designated at fair value are classified as FVTPL.
Loans and receivables are initially recognised at fair value including direct and incremental transaction costs. They are subsequently valued at amortised cost, using the effective interest method. Loans and receivables consist of loans and advances to banks, loans and advances to customers, and loans and receivables securities.
Available-for-sale financial assets are initially recognised at fair value including direct and incremental transaction costs, and subsequently held at fair value. Gains and losses arising from changes in fair value are recognised in other comprehensive income until sale or until determined to be impaired when the cumulative gain or loss or impairment losses are transferred to the income statement. Impairment losses and foreign exchange translation differences on monetary items are recognised in the income statement.
Impairment of financial assets – IAS 39 At each balance sheet date, the Santander UK group assesses whether there is objective evidence that a financial asset or group of financial assets is impaired. A financial asset or a group of financial assets is impaired and impairment losses are incurred only if there is objective evidence of impairment as a result of one or more events that occurred after the initial recognition of the asset (a loss event) and that loss event (or events) has an impact on the estimated future cash flows of the financial asset or group of financial assets that can be reliably estimated. In the case of equity investments classified as available-for-sale, a significant or prolonged decline in the fair value of the security below its cost is considered an indicator that the assets are impaired.
For assets carried at amortised cost, including loans and advances and loans and receivables securities, the amount of the loss is measured as the difference between the asset’s carrying amount and the present value of estimated future cash flows (excluding future credit losses that have not been incurred) discounted at the financial asset’s original effective interest rate. The carrying amount of the asset is reduced and the amount of the loss is recognised in profit or loss.
For available-for-sale financial assets, the Santander UK group assesses impairment at each balance sheet date, which involves reviewing the financial circumstances (including creditworthiness) and future prospects of the issuer, assessing the future cash flows expected to be realised and, in the case of equity shares, considering whether there has been a significant or prolonged decline in the fair value of the security below its cost. The cumulative loss is measured as the difference between the acquisition cost and the current fair value, less any impairment loss previously reported in the income statement and is removed from other comprehensive income and recognised in the income statement.
IAS 17 On 1 January 2019, Santander UK group adopted IFRS 16, which replaced IAS 17. Having chosen to apply the modified retrospective approach, in accordance with the transition requirements of IFRS 16, comparatives were not restated. The accounting policies for the Santander UK group as lessee applied in accordance with IAS 17 for periods before the adoption of IFRS 16 are set out below:
The Santander UK group as lessee – IAS 17 The Santander UK group enters into operating leases for the rental of equipment or real estate. Payments made under such leases are charged to the income statement on a straight-line basis over the period of the lease. When an operating lease is terminated before the lease period has expired, any payment to be made to the lessor by way of penalty is recognised as an expense in the period in which termination takes place. If the lease agreement transfers the risk and rewards of the asset, the lease is recorded as a finance lease and the related asset is capitalised. At inception, the asset is recorded at the lower of the present value of the minimum lease payments or fair value and depreciated over the lower of the estimated useful life and the life of the lease. The corresponding rental obligations are recorded as borrowings. The aggregate benefit of incentives, if any, is recognised as a reduction of rental expense over the lease term on a straight-line basis.
195Santander UK Group Holdings plc
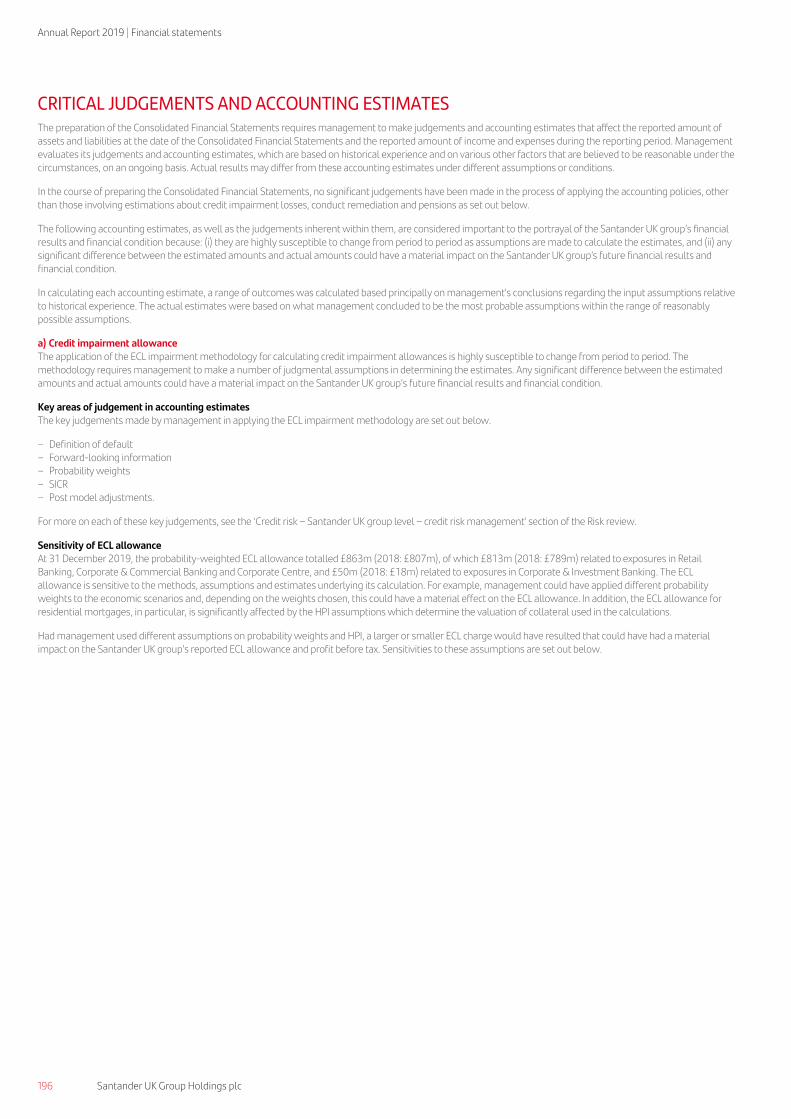
Annual Report 2019 | Financial statements
196 Santander UK Group Holdings plc
CRITICAL JUDGEMENTS AND ACCOUNTING ESTIMATES
The preparation of the Consolidated Financial Statements requires management to make judgements and accounting estimates that affect the reported amount of assets and liabilities at the date of the Consolidated Financial Statements and the reported amount of income and expenses during the reporting period. Management evaluates its judgements and accounting estimates, which are based on historical experience and on various other factors that are believed to be reasonable under the circumstances, on an ongoing basis. Actual results may differ from these accounting estimates under different assumptions or conditions.
In the course of preparing the Consolidated Financial Statements, no significant judgements have been made in the process of applying the accounting policies, other than those involving estimations about credit impairment losses, conduct remediation and pensions as set out below.
The following accounting estimates, as well as the judgements inherent within them, are considered important to the portrayal of the Santander UK group’s financial results and financial condition because: (i) they are highly susceptible to change from period to period as assumptions are made to calculate the estimates, and (ii) any significant difference between the estimated amounts and actual amounts could have a material impact on the Santander UK group’s future financial results and financial condition.
In calculating each accounting estimate, a range of outcomes was calculated based principally on management’s conclusions regarding the input assumptions relative to historical experience. The actual estimates were based on what management concluded to be the most probable assumptions within the range of reasonably possible assumptions.
a) Credit impairment allowance The application of the ECL impairment methodology for calculating credit impairment allowances is highly susceptible to change from period to period. The methodology requires management to make a number of judgmental assumptions in determining the estimates. Any significant difference between the estimated amounts and actual amounts could have a material impact on the Santander UK group’s future financial results and financial condition.
Key areas of judgement in accounting estimates The key judgements made by management in applying the ECL impairment methodology are set out below.
– Definition of default – Forward-looking information – Probability weights – SICR – Post model adjustments.
For more on each of these key judgements, see the ‘Credit risk – Santander UK group level – credit risk management’ section of the Risk review.
Sensitivity of ECL allowance At 31 December 2019, the probability-weighted ECL allowance totalled £863m (2018: £807m), of which £813m (2018: £789m) related to exposures in Retail Banking, Corporate & Commercial Banking and Corporate Centre, and £50m (2018: £18m) related to exposures in Corporate & Investment Banking. The ECL allowance is sensitive to the methods, assumptions and estimates underlying its calculation. For example, management could have applied different probability weights to the economic scenarios and, depending on the weights chosen, this could have a material effect on the ECL allowance. In addition, the ECL allowance for residential mortgages, in particular, is significantly affected by the HPI assumptions which determine the valuation of collateral used in the calculations.
Had management used different assumptions on probability weights and HPI, a larger or smaller ECL charge would have resulted that could have had a material impact on the Santander UK group’s reported ECL allowance and profit before tax. Sensitivities to these assumptions are set out below.
Santander UK Group Holdings plc196
Annual Report 2019 | Financial statements

Santander UK Group Holdings plc 197
Strategic report Governance Risk review Financial review Financial statements Shareholder information
Notes to the
financial statements
Probability weights
The amounts shown in the tables below illustrate the ECL allowances that would have arisen had management applied a 100% weighting to each economic scenario.
The allowances were calculated using a stage allocation appropriate to each economic scenario presented and differs from the probability-weighted stage allocation
used to determine the ECL allowance shown above. For exposures subject to individual assessment, the distribution of ECL which could reasonably be expected has
also been considered, assuming no change in the number of cases subject to individual assessment, and within the context of a potential best to worst case outcome.
As described in more detail in the ‘Santander UK group level – Credit risk management’ section in the Risk review, our CIB segment uses three forward-looking
economic scenarios, whereas our other segments use five scenarios. In order to present a consolidated view in a single table, the data for CIB in the table below
presents the CIB Upside scenario in the Upside 2 column, the CIB downside scenario in the Downside 2 column, and interpolated data for CIB in the Upside 1 and
Downside 1 columns. 2019
Weighted £m
Upside 2 £m
Upside 1 £m
Base case £m
Downside 1 £m
Downside 2 £m
Exposure
Retail Banking 206,479 206,479 206,479 206,479 206,479 206,479
– of which: mortgages 178,788 178,788 178,788 178,788 178,788 178,788
CCB 21,855 21,855 21,855 21,855 21,855 21,855
CIB 13,456 13,456 13,456 13,456 13,456 13,456
Corporate Centre 74,532 74,532 74,532 74,532 74,532 74,532
ECL
Retail Banking 591 456 467 485 570 1,148
– of which: mortgages 218 122 127 137 196 660
CCB 210 156 169 183 219 317
CIB 50 19 34 48 53 58
Corporate Centre 12 9 10 10 13 18
% % % % % %
Proportion of assets in Stage 2
Retail Banking 4.7 3.2 3.3 3.3 3.7 8.3
– of which: mortgages 4.6 3.1 3.1 3.1 3.6 8.7
CCB 10.0 7.4 7.4 7.4 8.5 16.3
CIB 2.9 1.5 1.5 1.5 1.5 1.5
Corporate Centre 0.2 0.1 0.1 0.1 0.2 0.3
2018 £m £m £m £m £m £m
Exposure
Retail Banking 195,805 195,805 195,805 195,805 195,805 195,805
– of which: mortgages 169,170 169,170 169,170 169,170 169,170 169,170
CCB 22,835 22,835 22,835 22,835 22,835 22,835
CIB 17,618 17,618 17,618 17,618 17,618 17,618
Corporate Centre 74,690 74,690 74,690 74,690 74,690 74,690
ECL
Retail Banking 594 431 452 480 637 1,607
– of which: mortgages 237 121 131 137 273 1,105
CCB 182 115 135 157 192 302
CIB 18 8 12 17 22 27
Corporate Centre 13 8 9 11 13 21
% % % % % %
Proportion of assets in Stage 2
Retail Banking 5.4 3.4 3.5 3.7 4.7 15.1
– of which: mortgages 5.6 3.4 3.6 3.7 4.9 16.5
CCB 5.4 3.0 3.0 3.1 4.3 10.7
CIB 0.8 0.4 0.4 0.4 0.4 0.4
Corporate Centre 0.2 0.1 0.1 0.1 0.2 0.4
Changes to Stage 3 instruments are excluded from the disclosure because they are not specifically sensitive to changes in macroeconomic assumptions.
We have incorporated our post model adjustments into the sensitivity analysis.
197Santander UK Group Holdings plc

Annual Report 2019 | Financial statements
198 Santander UK Group Holdings plc
HPI Given the relative size of our residential mortgage portfolio, management considers that changes in HPI assumptions underpinning the calculation of the ECL allowance for residential mortgages of £218m at 31 December 2019 (2018: £237m) would have the most significant impact on the ECL allowance. The table below shows the impact on profit before tax of applying an immediate and permanent house price increase / decrease to our base case economic scenario, and assumes no changes to the staging allocation of exposures:
Increase/decrease in house prices
Increase/(decrease) in profit before tax +20%
£m +10%
£m -10%
£m -20%
£m
31 December 2019 16 10 (16) (43)
31 December 2018 20 12 (20) (52)
b) Provisions and contingent liabilities
Significant judgment may be required when accounting for provisions, including in determining whether a present obligation exists and in estimating the probability and amount of any outflows. These judgments are based on the specific facts available and often require specialist professional advice. There can be a wide range of possible outcomes and uncertainties, particularly in relation to legal actions, and regulatory and consumer credit matters. As a result it is often not possible to make reliable estimates of the likelihood and amount of any potential outflows.
The main areas of judgement relating to provisions and contingent liabilities are set out below. For more details, see Notes 27 and 29.
(i) PPI conduct remediation The most critical factor in determining the level of PPI provision is the volume of claims that fall in scope for Santander UK. The uphold rate is informed by historical experience and the average cost of redress can be predicted reasonably accurately given that management is dealing with a high volume and reasonably homogeneous population.
Key areas of judgement in accounting estimates The provision mainly represents management’s best estimate of Santander UK’s future liability in respect of misselling of PPI policies and Plevin complaints. It requires significant judgement by management in determining appropriate assumptions, although the level of judgement has reduced with the passing of the FCA deadline of 29 August 2019 for PPI complaints. The key assumption in calculating the provision was the estimated number of complaints that would be received in respect of customers with successful information requests that were still eligible to make a complaint.
Sensitivity of PPI conduct remediation provision Had management used different assumptions, a larger or smaller provision charge would have resulted that could have had a material impact on the Santander UK group’s reported profit before tax.
More details can be found in the PPI section of Note 27.
(ii) Other Included in Regulatory and other provisions in Note 27 is an amount in respect of management’s best estimate of liability relating to compliance with certain requirements of the Consumer Credit Act. It also includes an amount in respect of management’s best estimate of liability relating to a legal dispute regarding allocation of responsibility for a specific PPI portfolio of complaints. For both items, Note 29 provides disclosure relating to ongoing factual issues and reviews that could impact the timing and amount of any outflows.
In addition, Note 29 includes disclosure relating to an investigation in relation to the historical involvement of Santander UK plc, Santander Financial Services plc and Cater Allen International Limited in German dividend tax arbitrage transactions. It also includes disclosure relating to certain leases in which current and former Santander UK group members were the lessor that are currently under review by HMRC in connection with claims for tax allowances.
c) Pensions The Santander UK group operates a number of defined benefit pension schemes as described in Note 28 and estimates their position as described in the accounting policy ‘Pensions and other post retirement benefits’.
Key areas of judgement in accounting estimates Accounting for defined benefit pension schemes requires management to make assumptions principally about the discount rate adopted, but also about price inflation, pension increases, life expectancy and earnings growth. Management’s assumptions are based on past experience and current economic trends, which are not necessarily an indication of future experience. These are described in more detail in the ‘Actuarial assumptions’ section in Note 28.
Sensitivity of defined benefit pension scheme estimates Had management used different assumptions, a larger or smaller pension remeasurement gain or loss would have resulted that could have had a material impact on the Santander UK group’s reported financial position. Detailed disclosures on the actuarial assumption sensitivities of the schemes can be found in the ‘Actuarial assumption sensitivities’ section in Note 28.
Santander UK Group Holdings plc198
Annual Report 2019 | Financial statements

Santander UK Group Holdings plc 199
Secret
Strategic report Governance Risk review Financial review Financial statements Shareholder information
Notes to the
financial statements
2. SEGMENTS Santander UK’s principal activity is financial services, mainly in the UK. The business is managed and reported on the basis of the following segments, which are strategic business units that offer different products and services, have different customers and require different technology and marketing strategies:
– Retail Banking offers a wide range of products and financial services to individuals and small businesses through a network of branches and ATMs, as well as through telephony, digital and intermediary channels. Retail Banking includes business banking customers, small businesses with an annual turnover up to £6.5m, and Santander Consumer Finance, predominantly a vehicle finance business.
– Corporate & Commercial Banking covers multi-sector businesses with an annual turnover typically between £6.5m and £500m. It offers a wide range of financial services and solutions provided by relationship teams and product specialists based across the UK and through digital and telephony channels.
– Corporate & Investment Banking services corporate clients with an annual turnover of £500m and above. CIB clients require specially tailored solutions and value-added services due to their size, complexity and sophistication. We provide these clients with products to manage currency fluctuations, protect against interest rate risk, and arrange capital markets finance and specialist trade finance solutions, as well as providing support to the rest of Santander UK’s business segments.
– Corporate Centre mainly includes the treasury, non-core corporate and legacy portfolios, as well as the Crown Dependencies. Corporate Centre is also responsible for managing capital and funding, balance sheet composition, structure, pension and strategic liquidity risk. To enable a more targeted and strategically aligned apportionment of capital and other resources, revenues and costs incurred in Corporate Centre are allocated to the three business segments. The non-core corporate and legacy portfolios are being run-down and/or managed for value.
The segmental data below is presented in a manner consistent with the internal reporting to the committee which is responsible for allocating resources and assessing performance of the segments and has been identified as the chief operating decision maker. The segmental data is prepared on a statutory basis of accounting, in line with the accounting policies set out in Note 1. Transactions between segments are on normal commercial terms and conditions. Internal charges and internal UK transfer pricing adjustments are reflected in the results of each segment. Revenue sharing agreements are used to allocate external customer revenues to a segment on a reasonable basis. Funds are ordinarily reallocated between segments, resulting in funding cost transfers disclosed in operating income. Interest charged for these funds is based on Santander UK’s cost of wholesale funding. Interest income and interest expense have not been reported separately. The majority of segment revenues are interest income in nature and net interest income is relied on primarily to assess segment performance and to make decisions on the allocation of segment resources.
The segmental basis of presentation was changed, and the prior periods restated, to report our short term markets business in Corporate Centre rather than in Corporate & Investment Banking. This reflects the run down or transfer to Banco Santander London Branch of the prohibited part of the business in 2018, as part of the transition to our ring-fenced model, with the remaining permitted business forming part of our liquidity risk management function.
Results by segment
Retail Banking
Corporate & Commercial
Banking
Corporate & Investment
Banking Corporate
Centre Total 2019 £m £m £m £m £m
Net interest income/(expense) 2,876 359 63 (3) 3,295
Non-interest income/(expense) 698 78 112 (13) 875
Total operating income/(expense) 3,574 437 175 (16) 4,170
Operating expenses before credit impairment losses, provisions and charges (1,994) (264) (171) (97) (2,526)
Credit impairment losses (160) (37) (22) (1) (220)
Provisions for other liabilities and charges (292) (20) (17) (114) (443)
Total operating credit impairment losses, provisions and charges(1) (452) (57) (39) (115) (663)
Profit/(loss) before tax 1,128 116 (35) (228) 981
Revenue from external customers 4,311 530 181 (852) 4,170
Inter-segment revenue (737) (93) (6) 836 –
Total operating income/(expense) 3,574 437 175 (16) 4,170
Revenue from external customers includes the following fee and commission income disaggregated by income type:(2)
– Current account and debit card fees 702 27 29 – 758
– Insurance, protection and investments 76 – – 1 77
– Credit cards 86 – – – 86
– Non-banking and other fees(3) 61 56 71 8 196
Total fee and commission income 925 83 100 9 1,117
Fee and commission expense (373) (23) (17) (15) (428)
Net fee and commission income/(expense) 552 60 83 (6) 689
Customer loans 180,398 16,297 4,114 4,489 205,298
Total assets(4) 187,556 16,297 4,727 79,908 288,488
Customer deposits 145,050 18,234 6,101 8,437 177,822
Total liabilities 145,917 18,260 6,500 101,470 272,147
Average number of staff 20,832 1,796 901 177 23,706
(1) Credit impairment losses for 2018 and later are calculated on an IFRS 9 basis and for 2017 on an IAS 39 basis. (2) The disaggregation of fees and commission income as shown above is not included in reports provided to the chief operating decision maker but is provided to show the split by reportable segments. (3) Non-banking and other fees include mortgages, consumer finance, commitment commission, asset finance, invoice finance and trade finance. (4) Includes customer loans, net of credit impairment loss allowances.
199Santander UK Group Holdings plc
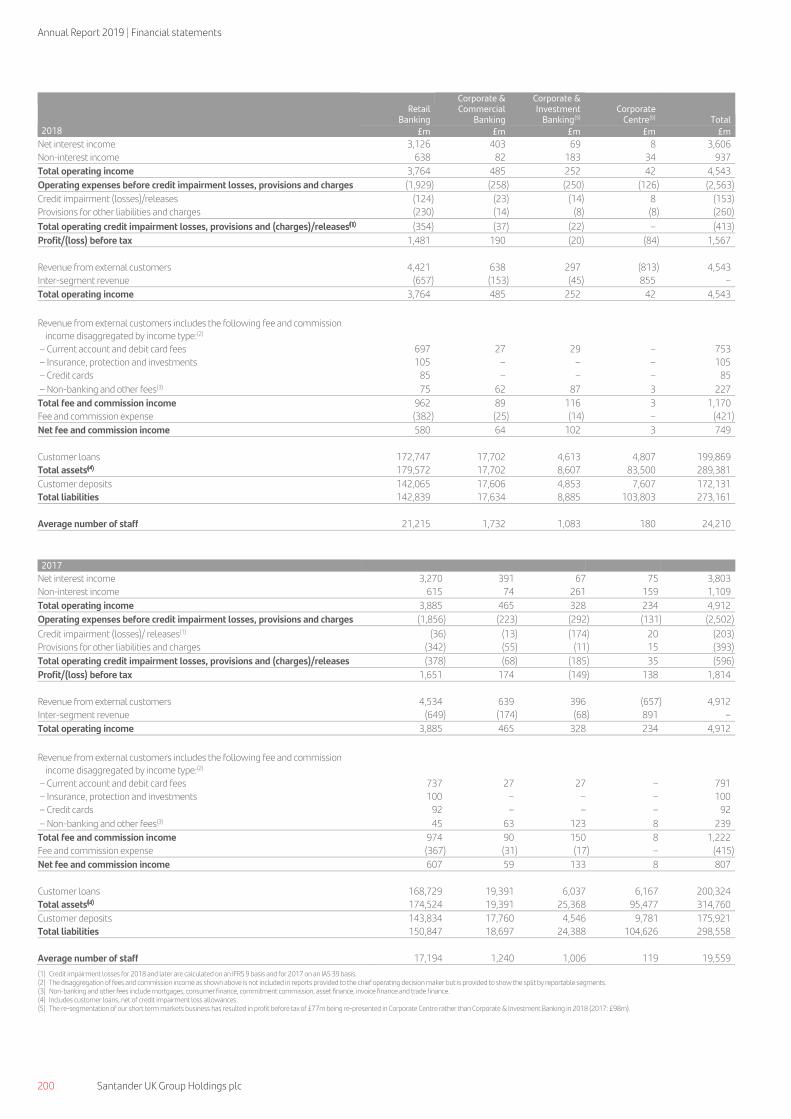
Annual Report 2019 | Financial statements
200 Santander UK Group Holdings plc
Secret
2017
Retail
Banking
Corporate & Commercial
Banking
Corporate & Investment
Banking(5) Corporate
Centre(5) Total 2018 £m £m £m £m £m
Net interest income 3,126 403 69 8 3,606
Non-interest income 638 82 183 34 937
Total operating income 3,764 485 252 42 4,543
Operating expenses before credit impairment losses, provisions and charges (1,929) (258) (250) (126) (2,563)
Credit impairment (losses)/releases (124) (23) (14) 8 (153)
Provisions for other liabilities and charges (230) (14) (8) (8) (260)
Total operating credit impairment losses, provisions and (charges)/releases(1) (354) (37) (22) – (413)
Profit/(loss) before tax 1,481 190 (20) (84) 1,567
Revenue from external customers 4,421 638 297 (813) 4,543
Inter-segment revenue (657) (153) (45) 855 –
Total operating income 3,764 485 252 42 4,543
Revenue from external customers includes the following fee and commission
income disaggregated by income type:(2) – Current account and debit card fees 697 27 29 – 753
– Insurance, protection and investments 105 – – – 105
– Credit cards 85 – – – 85
– Non-banking and other fees(3) 75 62 87 3 227
Total fee and commission income 962 89 116 3 1,170
Fee and commission expense (382) (25) (14) – (421)
Net fee and commission income 580 64 102 3 749
Customer loans 172,747 17,702 4,613 4,807 199,869
Total assets(4) 179,572 17,702 8,607 83,500 289,381
Customer deposits 142,065 17,606 4,853 7,607 172,131
Total liabilities 142,839 17,634 8,885 103,803 273,161
Average number of staff 21,215 1,732 1,083 180 24,210
Net interest income 3,270 391 67 75 3,803
Non-interest income 615 74 261 159 1,109
Total operating income 3,885 465 328 234 4,912
Operating expenses before credit impairment losses, provisions and charges (1,856) (223) (292) (131) (2,502)
Credit impairment (losses)/ releases(1) (36) (13) (174) 20 (203)
Provisions for other liabilities and charges (342) (55) (11) 15 (393)
Total operating credit impairment losses, provisions and (charges)/releases (378) (68) (185) 35 (596)
Profit/(loss) before tax 1,651 174 (149) 138 1,814
Revenue from external customers 4,534 639 396 (657) 4,912
Inter-segment revenue (649) (174) (68) 891 –
Total operating income 3,885 465 328 234 4,912
Revenue from external customers includes the following fee and commission
income disaggregated by income type:(2) – Current account and debit card fees 737 27 27 – 791
– Insurance, protection and investments 100 – – – 100
– Credit cards 92 – – – 92
– Non-banking and other fees(3) 45 63 123 8 239
Total fee and commission income 974 90 150 8 1,222
Fee and commission expense (367) (31) (17) – (415)
Net fee and commission income 607 59 133 8 807
Customer loans 168,729 19,391 6,037 6,167 200,324
Total assets(4) 174,524 19,391 25,368 95,477 314,760
Customer deposits 143,834 17,760 4,546 9,781 175,921
Total liabilities 150,847 18,697 24,388 104,626 298,558
Average number of staff 17,194 1,240 1,006 119 19,559
(1) Credit impairment losses for 2018 and later are calculated on an IFRS 9 basis and for 2017 on an IAS 39 basis. (2) The disaggregation of fees and commission income as shown above is not included in reports provided to the chief operating decision maker but is provided to show the split by reportable segments. (3) Non-banking and other fees include mortgages, consumer finance, commitment commission, asset finance, invoice finance and trade finance. (4) Includes customer loans, net of credit impairment loss allowances. (5) The re-segmentation of our short term markets business has resulted in profit before tax of £77m being re-presented in Corporate Centre rather than Corporate & Investment Banking in 2018 (2017: £98m).
Santander UK Group Holdings plc200
Annual Report 2019 | Financial statements
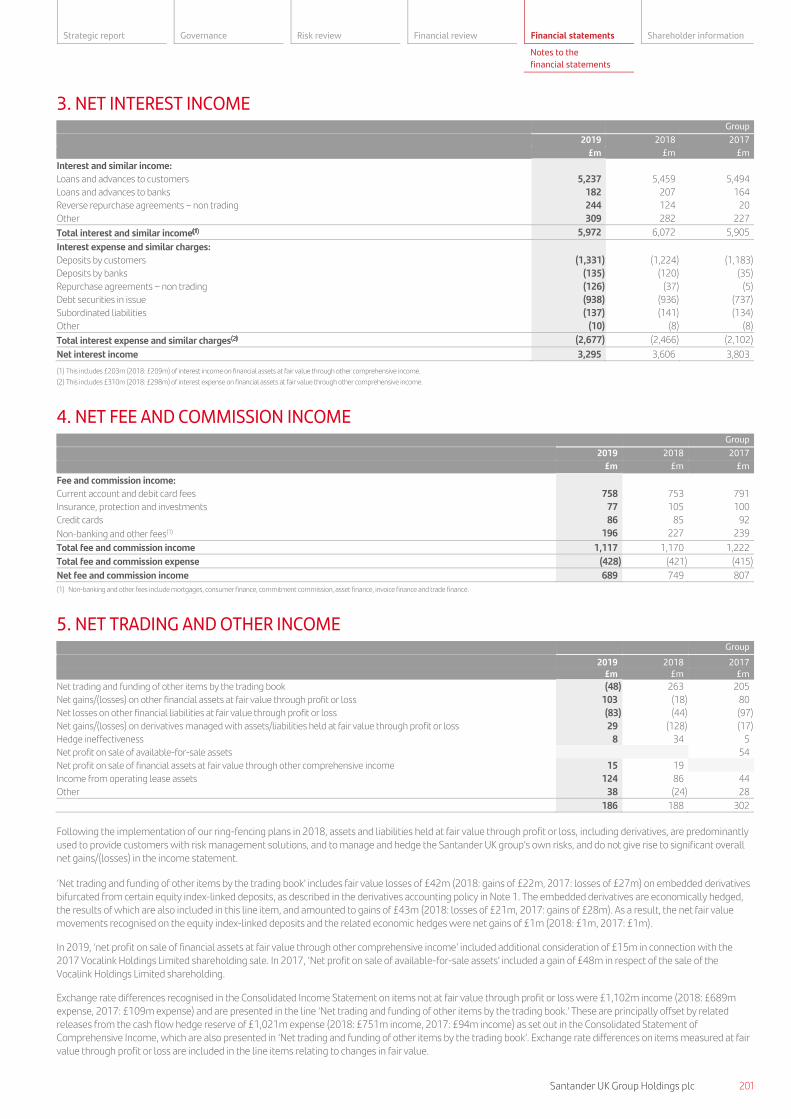
Santander UK Group Holdings plc 201
Secret
Strategic report Governance Risk review Financial review Financial statements Shareholder information
Notes to the
financial statements
3. NET INTEREST INCOME
Group
2019 2018 2017
£m £m £m
Interest and similar income:
Loans and advances to customers 5,237 5,459 5,494
Loans and advances to banks 182 207 164
Reverse repurchase agreements – non trading 244 124 20
Other 309 282 227
Total interest and similar income(1) 5,972 6,072 5,905
Interest expense and similar charges:
Deposits by customers (1,331) (1,224) (1,183)
Deposits by banks (135) (120) (35)
Repurchase agreements – non trading (126) (37) (5)
Debt securities in issue (938) (936) (737)
Subordinated liabilities (137) (141) (134)
Other (10) (8) (8)
Total interest expense and similar charges(2) (2,677) (2,466) (2,102)
Net interest income 3,295 3,606 3,803
(1) This includes £203m (2018: £209m) of interest income on financial assets at fair value through other comprehensive income.
(2) This includes £310m (2018: £298m) of interest expense on financial assets at fair value through other comprehensive income.
4. NET FEE AND COMMISSION INCOME
Group
2019 2018 2017
£m £m £m
Fee and commission income:
Current account and debit card fees 758 753 791
Insurance, protection and investments 77 105 100
Credit cards 86 85 92
Non-banking and other fees(1) 196 227 239
Total fee and commission income 1,117 1,170 1,222
Total fee and commission expense (428) (421) (415)
Net fee and commission income 689 749 807
(1) Non-banking and other fees include mortgages, consumer finance, commitment commission, asset finance, invoice finance and trade finance.
5. NET TRADING AND OTHER INCOME
Group
2019 2018 2017
£m £m £m
Net trading and funding of other items by the trading book (48) 263 205
Net gains/(losses) on other financial assets at fair value through profit or loss 103 (18) 80
Net losses on other financial liabilities at fair value through profit or loss (83) (44) (97)
Net gains/(losses) on derivatives managed with assets/liabilities held at fair value through profit or loss 29 (128) (17)
Hedge ineffectiveness 8 34 5
Net profit on sale of available-for-sale assets 54
Net profit on sale of financial assets at fair value through other comprehensive income 15 19
Income from operating lease assets 124 86 44
Other 38 (24) 28
186 188 302
Following the implementation of our ring-fencing plans in 2018, assets and liabilities held at fair value through profit or loss, including derivatives, are predominantly used to provide customers with risk management solutions, and to manage and hedge the Santander UK group’s own risks, and do not give rise to significant overall net gains/(losses) in the income statement.
‘Net trading and funding of other items by the trading book’ includes fair value losses of £42m (2018: gains of £22m, 2017: losses of £27m) on embedded derivatives bifurcated from certain equity index-linked deposits, as described in the derivatives accounting policy in Note 1. The embedded derivatives are economically hedged, the results of which are also included in this line item, and amounted to gains of £43m (2018: losses of £21m, 2017: gains of £28m). As a result, the net fair value movements recognised on the equity index-linked deposits and the related economic hedges were net gains of £1m (2018: £1m, 2017: £1m).
In 2019, ‘net profit on sale of financial assets at fair value through other comprehensive income’ included additional consideration of £15m in connection with the 2017 Vocalink Holdings Limited shareholding sale. In 2017, ‘Net profit on sale of available-for-sale assets’ included a gain of £48m in respect of the sale of the Vocalink Holdings Limited shareholding.
Exchange rate differences recognised in the Consolidated Income Statement on items not at fair value through profit or loss were £1,102m income (2018: £689m expense, 2017: £109m expense) and are presented in the line ‘Net trading and funding of other items by the trading book.’ These are principally offset by related releases from the cash flow hedge reserve of £1,021m expense (2018: £751m income, 2017: £94m income) as set out in the Consolidated Statement of Comprehensive Income, which are also presented in ‘Net trading and funding of other items by the trading book’. Exchange rate differences on items measured at fair value through profit or loss are included in the line items relating to changes in fair value.
201Santander UK Group Holdings plc

Annual Report 2019 | Financial statements
202 Santander UK Group Holdings plc
Secret
In 2019, our accounting treatment for residual value risk changed. This resulted in a £24m reversal of RV provisions recognised in other income (of which £22m relates to charges taken in prior periods) which was partially offset by £7.5m accelerated depreciation of the underlying asset (prior periods: £2.3m). The net adjustment is not considered material and therefore the 2018 accounts were not restated.
6. OPERATING EXPENSES BEFORE CREDIT IMPAIRMENT LOSSES, PROVISIONS AND CHARGES Group 2019 2018 2017 £m £m £m
Staff costs: Wages and salaries 866 905 746
Performance-related payments 160 160 157
Social security costs 112 111 93
Pensions costs – defined contribution plans 67 66 54
– defined benefit plans 35 81 32
Other share-based payments 7 3 10
Other personnel costs 41 50 45 1,288 1,376 1,137
Other administration expenses 693 809 1,011
Depreciation, amortisation and impairment 545 378 354
2,526 2,563 2,502
Staff costs
’Performance-related payments’ include bonuses paid in cash and share awards granted under the Long-Term Incentive Plan and the Deferred shares bonus plan, as described in Note 35. Included in this are equity-settled share-based payments, none of which related to option-based schemes. These are disclosed in the table below as ‘Share awards’. Performance-related payments above include amounts related to deferred performance awards as follows:
Costs recognised in 2019 Costs expected to be recognised in 2020 or later Arising from
awards in current year
Arising from awards in prior year Total
Arising from awards in
current year
Arising from awards in prior year Total
£m £m £m £m £m £m
Cash 3 7 10 7 10 17
Shares 3 6 9 7 10 17
6 13 19 14 20 34
The following table shows the amount of bonus awarded to employees for the performance year 2019. In the case of deferred cash and share awards, the final amount paid to an employee is influenced by forfeiture provisions and any performance conditions to which these awards are subject. The deferred share award amount is based on the fair value of these awards at the date of grant.
Expenses charged in the year Expenses deferred to future periods Total 2019 2018 2019 2018 2019 2018 £m £m £m £m £m £m
Cash award – not deferred 131 123 – – 131 123
– deferred 10 13 17 20 27 33
Shares award – not deferred 10 11 – – 10 11
– deferred 9 13 17 17 26 30
Total discretionary bonus 160 160 34 37 194 197
On 26 October 2018, the High Court handed down a judgement concluding that defined benefit schemes should equalise pension benefits for men and women in relation to GMP and concluded on the methods that were appropriate. The estimated increase in liabilities at the date of the judgement was £40m and was based on a number of assumptions and the actual impact may be different. This was reflected in the income statement and in the closing net accounting surplus of the Scheme in 2018. The allowance included in the Scheme liabilities at 31 December 2019 increased by £5m to £45m (2018: £40m) to reflect the latest assumptions. This change was recognised in other comprehensive income. We continue to await implementation guidance on the judgement from the UK Government and HMRC.
‘Other share-based payments’ consist of options granted under the Employee Sharesave scheme which comprise the Santander UK group’s cash-settled share-based payments. For more, see Note 35.
The average number of full-time equivalent staff was 23,706 (2018: 24,210, 2017: 19,559). The increase in staff numbers in 2018 reflected Santander UK plc’s acquisition of Santander UK Operations Ltd (formerly Geoban UK Ltd, a subsidiary of Geoban SA) and Santander UK Technology Ltd (formerly Isban UK Ltd, a subsidiary of Ingenieria de Software Bancario SL).
Depreciation, amortisation and impairment
In 2019, depreciation, amortisation and impairment was impacted by operating lease depreciation of £103m (2018: £63m) on operating lease assets (where the Santander UK group is the lessor) with a net book value of £574m at 31 December 2019 (2018: £470m). It was also impacted by depreciation of £61m on right-of-use assets with a net book value of £153m at 31 December 2019, following the adoption of IFRS 16 on 1 January 2019.
Santander UK Group Holdings plc202
Annual Report 2019 | Financial statements

Santander UK Group Holdings plc 203
Secret
Strategic report Governance Risk review Financial review Financial statements Shareholder information
Notes to the
financial statements
7. AUDIT AND OTHER SERVICES
Group
2019 2018 2017
£m £m £m
Audit fees: Fees payable to the Company’s auditor and its associates for the audit of the Santander UK group’s annual accounts 8.5 7.7 7.8
Fees payable to the Company’s auditor and its associates for other services to the Santander UK group: – Audit of the Santander UK group’s subsidiaries 1.9 1.6 1.4
Total audit fees(1) 10.4 9.3 9.2
Non-audit fees: Audit-related assurance services(2) 1.7 2.2 1.6
Other assurance services 0.4 0.1 0.1
Other non-audit services 0.2 1.0 0.4
Total non-audit fees 2.3 3.3 2.1
(1) 2019 audit fees included £0.3m (2018: £nil) which related to the prior year.
(2) 2019 audit-related assurance services included £nil (2018: £0.1m) which related to the prior year.
Audit fees payable for the statutory audit of Santander UK Group Holdings plc were £0.5m (2018: £0.5m, 2017: £0.4m).
Audit-related assurance services mainly comprises services performed in connection with review of the interim financial information of the Company and reporting to the Company's UK regulators.
Of the total non-audit fees, £1.6m (2018: £1.1m, 2017: £0.8m) accords with the definition of "Audit Fees" per US Securities and Exchange Commission (SEC) guidance, £0.5m (2018: £1.1m, 2017: £0.8m) accords with the definition of "Audit related fees" per that guidance and £0.2m (2018: £1.1m, 2017: £0.5m) accords with the definition of "All other fees" per that guidance.
In 2019, the Company’s auditors earned no fees (2018: £150,000, 2017: £45,000) payable by entities outside the Santander UK group for the review of the financial position of corporate and other borrowers.
8. CREDIT IMPAIRMENT LOSSES AND PROVISIONS Group
2019 2018 2017
£m £m £m
Credit impairment losses:(1)
Loans and advances to customers 238 189 257
Recoveries of loans and advances, net of collection costs (40) (42) (54)
Off-balance sheet exposures (See Note 27) 22 6
220 153 203
Provisions for other liabilities and charges (excluding off-balance sheet credit exposures) (See Note 27) 437 260 385
Provisions for RV and voluntary termination 6 – 8
443 260 393
663 413 596
(1) Credit impairment losses for 2018 and later are calculated on an IFRS 9 basis and for 2017 and earlier on an IAS 39 basis.
In 2019 and 2018 there were no material credit impairment losses on loans and advances to banks, non-trading reverse repurchase agreements, other financial assets at amortised cost and financial assets at fair value through other comprehensive income.
203Santander UK Group Holdings plc

Annual Report 2019 | Financial statements
204 Santander UK Group Holdings plc
Secret
9. TAXATION
Group
2019 2018(1) 2017(1) £m £m £m
Current tax: UK corporation tax on profit for the year 255 413 509
Adjustments in respect of prior years (30) (22) (27)
Total current tax 225 391 482
Deferred tax: Charge for the year 51 11 23
Adjustments in respect of prior years (4) 1 9
Total deferred tax 47 12 32
Tax on profit 272 403 514
(1) Adjusted to reflect the amendment to IAS 12, as described in Note 1.
The standard rate of UK corporation tax was 27% for banking entities and 19% for non-banking entities (2018: 27% for banking entities and 19% for non-banking entities; 2017: 27.25% for banking entities and 19.25% for non-banking entities) following the introduction of an 8% surcharge to be applied to banking companies from 1 January 2016. Taxation for other jurisdictions is calculated at the rates prevailing in the relevant jurisdictions. Finance Act 2016 introduced a reduction in the standard rate of corporation tax rate to 17% from 2020. The effects of the changes in tax rates are included in the deferred tax balances at both 31 December 2019 and 2018.
The Santander UK group’s effective tax rate for 2019, based on profit before tax, was 27.7% (2018: 25.7%, 2017: 28.3%). The tax on profit before tax differs from the theoretical amount that would arise using the basic corporation tax rate of the Company as follows:
Group
2019 2018(1) 2017(1) £m £m £m
Profit before tax 981 1,567 1,814
Tax calculated at a tax rate of 19% (2018: 19%, 2017: 19.25%) 186 298 349
Bank surcharge on profits 64 111 132
Non-deductible preference dividends paid 8 8 9
Non-deductible UK Bank Levy 24 20 25
Non-deductible conduct remediation, fines and penalties 44 6 35
Other non-deductible costs and non-taxable income 29 26 30
Effect of change in tax rate on deferred tax provision (10) (2) (2)
Tax relief on dividends in respect of other equity instruments (39) (43) (46)
Adjustment to prior year provisions (34) (21) (18)
Tax charge 272 403 514
(1) Adjusted to reflect the amendment to IAS 12, as described in Note 1.
The increase in effective tax rate from 2018 to 2019 was largely due to the increased impact of non-deductible conduct remediation, fines and penalties net of releases in accruals for prior periods. It is anticipated that the Santander UK group’s effective tax rate in future periods will continue to be impacted by the 8% surcharge, the level of any non-deductible conduct remediation, fines and penalties, changes to the cost of the Bank Levy and reductions in the statutory rate as noted above. The adjustment to prior year provisions in 2019 and 2018 principally related to the reassessment of prior year tax provision estimates following the filing of relevant tax returns and the resolution of certain legacy matters with tax authorities.
Current tax assets and liabilities Movements in current tax assets and liabilities during the year were as follows:
Group 2019 2018(1) £m £m
Assets 106 –
Liabilities – (3)
At 1 January 106 (3)
Income statement charge (225) (391)
Other comprehensive income (charge)/credit (3) 32
Corporate income tax paid 309 445
Other movements (1) 23
186 106
Assets 186 106
Liabilities – –
At 31 December 186 106
(1) Adjusted to reflect the amendment to IAS 12, as described in Note 1.
The amount of corporation income tax paid differs from the tax charge for the period as a result of the timing of payments due to the tax authorities together with the effects of movements in deferred tax, adjustments to prior period current tax provisions and current tax recognised directly in other comprehensive income.
Santander UK proactively engages with HM Revenue & Customs to resolve tax matters relating to prior years. The accounting policy for recognising provisions for such matters are described in Note 1. It is not expected that there will be any material movement in such provisions within the next 12 months. Santander UK adopted the Code of Practice on Taxation for Banks in 2010.
Santander UK Group Holdings plc204
Annual Report 2019 | Financial statements

Santander UK Group Holdings plc 205
Secret
Strategic report Governance Risk review Financial review Financial statements Shareholder information
Notes to the
financial statements
Deferred tax The table below shows the deferred tax assets and liabilities including the movement in the deferred tax account during the year. Deferred tax balances are presented in the balance sheet after offsetting assets and liabilities where the Santander UK group has the legal right to offset and intends to settle on a net basis.
Group
Fair value of financial
instruments Pension
remeasurement Cash flow
hedges Available-
for-sale Fair value
reserve
Tax losses carried
forward Accelerated tax
depreciation
Other temporary
differences Total
£m £m £m £m £m £m £m £m £m
At 1 January 2019 (51) (182) (43) (12) 20 (4) 61 (211)
Income statement (charge)/credit (1) (47) – – (7) 22 (14) (47)
Transfers/reclassifications – – 22 4 – – (26) –
Credited/(charged) to other comprehensive income – 131 (37) – – – 19 113
At 31 December 2019 (52) (98) (58) (8) 13 18 40 (145)
At 31 December 2017 (41) (41) 3 (26) 25 (4) (4) (88)
Adoption of IFRS 9 – – – 26 (26) – – 68 68
At 1 January 2018 (41) (41) 3 (26) 25 (4) 64 (20)
Income statement (charge)/credit (10) (24) – – (5) – 27 (12)
Transfers/reclassifications – – – – – – (9) (9)
Credited/(charged) to other comprehensive income – (117) (46) 14 – – (21) (170)
At 31 December 2018 (51) (182) (43) (12) 20 (4) 61 (211)
The deferred tax assets and liabilities above have been recognised in the Santander UK group on the basis that sufficient future taxable profits are forecast within the foreseeable future, in excess of the profits arising from the reversal of existing taxable temporary differences, to allow for the utilisation of the assets as they reverse. Based on the conditions at the balance sheet date, management determined that a reasonably possible change in any of the key assumptions underlying the estimated future taxable profits in the Santander UK group’s five-year plan (described in Note 20) would not cause a reduction in the deferred tax assets recognised. At 31 December 2019, the Santander UK group had a recognised deferred tax asset in respect of UK capital losses carried forward of £11m (2018: £17m) included within tax losses carried forward. There are no unrecognised deferred tax assets on capital losses carried forward (2018: £nil).
As part of the election campaign, the UK government indicated that it would look to reverse or defer the future tax rate reduction due to apply from 1 April 2020. The next UK Budget scheduled for 11 March 2020 is likely to clarify the position and give an indication of the possible impact on the deferred tax position. It is estimated that the effect could increase the Santander UK Group's deferred tax liability by up to £12m.
10. DIVIDENDS ON ORDINARY SHARES Dividends on ordinary shares declared and paid in the year were as follows:
Group Group
2019 Pence per
share
2018 Pence per
share
2017 Pence per
share
2019 £m
2018 £m
2017 £m
In respect of current year – first interim 1.95 3.54 4.58 138 250 323
– second interim 1.76 9.46 3.26 124 668 230
– third interim - 2.90 – – 205 –
3.71 15.90 7.84 262 1,123 553
In 2018, in addition to the dividends of £250m and £205m that were made as part of our policy to pay 50% of recurring earnings, we also paid a dividend of £668m that related to the ring-fencing transfers to Banco Santander, London Branch.
205Santander UK Group Holdings plc
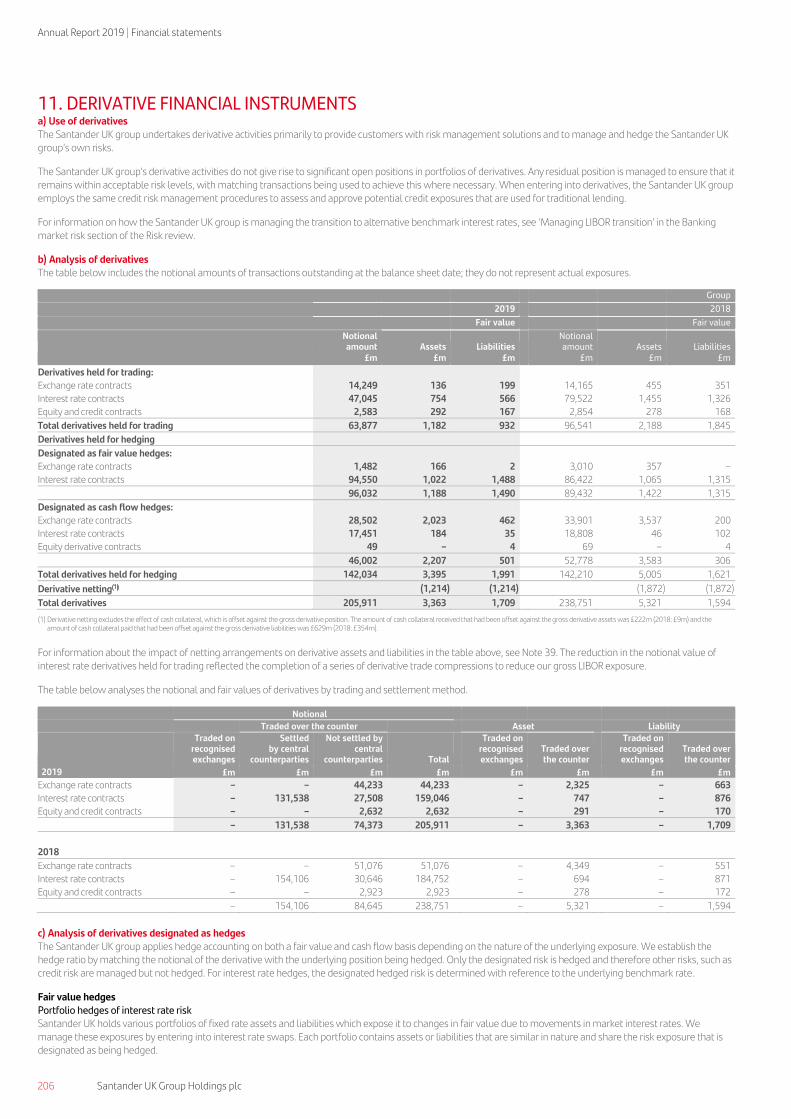
Annual Report 2019 | Financial statements
206 Santander UK Group Holdings plc
Secret
11. DERIVATIVE FINANCIAL INSTRUMENTS a) Use of derivatives The Santander UK group undertakes derivative activities primarily to provide customers with risk management solutions and to manage and hedge the Santander UK group’s own risks.
The Santander UK group’s derivative activities do not give rise to significant open positions in portfolios of derivatives. Any residual position is managed to ensure that it remains within acceptable risk levels, with matching transactions being used to achieve this where necessary. When entering into derivatives, the Santander UK group employs the same credit risk management procedures to assess and approve potential credit exposures that are used for traditional lending.
For information on how the Santander UK group is managing the transition to alternative benchmark interest rates, see ‘Managing LIBOR transition’ in the Banking market risk section of the Risk review.
b) Analysis of derivatives The table below includes the notional amounts of transactions outstanding at the balance sheet date; they do not represent actual exposures.
Group
2019 2018
Fair value Fair value
Notional amount Assets Liabilities
Notional amount Assets Liabilities
£m £m £m £m £m £m
Derivatives held for trading:
Exchange rate contracts 14,249 136 199 14,165 455 351
Interest rate contracts 47,045 754 566 79,522 1,455 1,326
Equity and credit contracts 2,583 292 167 2,854 278 168
Total derivatives held for trading 63,877 1,182 932 96,541 2,188 1,845
Derivatives held for hedging
Designated as fair value hedges:
Exchange rate contracts 1,482 166 2 3,010 357 –
Interest rate contracts 94,550 1,022 1,488 86,422 1,065 1,315
96,032 1,188 1,490 89,432 1,422 1,315
Designated as cash flow hedges:
Exchange rate contracts 28,502 2,023 462 33,901 3,537 200
Interest rate contracts 17,451 184 35 18,808 46 102
Equity derivative contracts 49 – 4 69 – 4
46,002 2,207 501 52,778 3,583 306
Total derivatives held for hedging 142,034 3,395 1,991 142,210 5,005 1,621
Derivative netting(1) (1,214) (1,214) (1,872) (1,872)
Total derivatives 205,911 3,363 1,709 238,751 5,321 1,594
(1) Derivative netting excludes the effect of cash collateral, which is offset against the gross derivative position. The amount of cash collateral received that had been offset against the gross derivative assets was £222m (2018: £9m) and the amount of cash collateral paid that had been offset against the gross derivative liabilities was £629m (2018: £354m).
For information about the impact of netting arrangements on derivative assets and liabilities in the table above, see Note 39. The reduction in the notional value of interest rate derivatives held for trading reflected the completion of a series of derivative trade compressions to reduce our gross LIBOR exposure.
The table below analyses the notional and fair values of derivatives by trading and settlement method.
Notional Traded over the counter Asset Liability
Traded on recognised exchanges
Settled by central
counterparties
Not settled by central
counterparties Total
Traded on recognised exchanges
Traded over the counter
Traded on recognised exchanges
Traded over the counter
2019 £m £m £m £m £m £m £m £m
Exchange rate contracts – – 44,233 44,233 – 2,325 – 663
Interest rate contracts – 131,538 27,508 159,046 – 747 – 876
Equity and credit contracts – – 2,632 2,632 – 291 – 170
– 131,538 74,373 205,911 – 3,363 – 1,709
2018
Exchange rate contracts – – 51,076 51,076
– 4,349
– 551
Interest rate contracts – 154,106 30,646 184,752
– 694
– 871
Equity and credit contracts – – 2,923 2,923 – 278 – 172
– 154,106 84,645 238,751 – 5,321 – 1,594
c) Analysis of derivatives designated as hedges The Santander UK group applies hedge accounting on both a fair value and cash flow basis depending on the nature of the underlying exposure. We establish the hedge ratio by matching the notional of the derivative with the underlying position being hedged. Only the designated risk is hedged and therefore other risks, such as credit risk are managed but not hedged. For interest rate hedges, the designated hedged risk is determined with reference to the underlying benchmark rate.
Fair value hedges Portfolio hedges of interest rate risk Santander UK holds various portfolios of fixed rate assets and liabilities which expose it to changes in fair value due to movements in market interest rates. We manage these exposures by entering into interest rate swaps. Each portfolio contains assets or liabilities that are similar in nature and share the risk exposure that is designated as being hedged.
Santander UK Group Holdings plc206
Annual Report 2019 | Financial statements
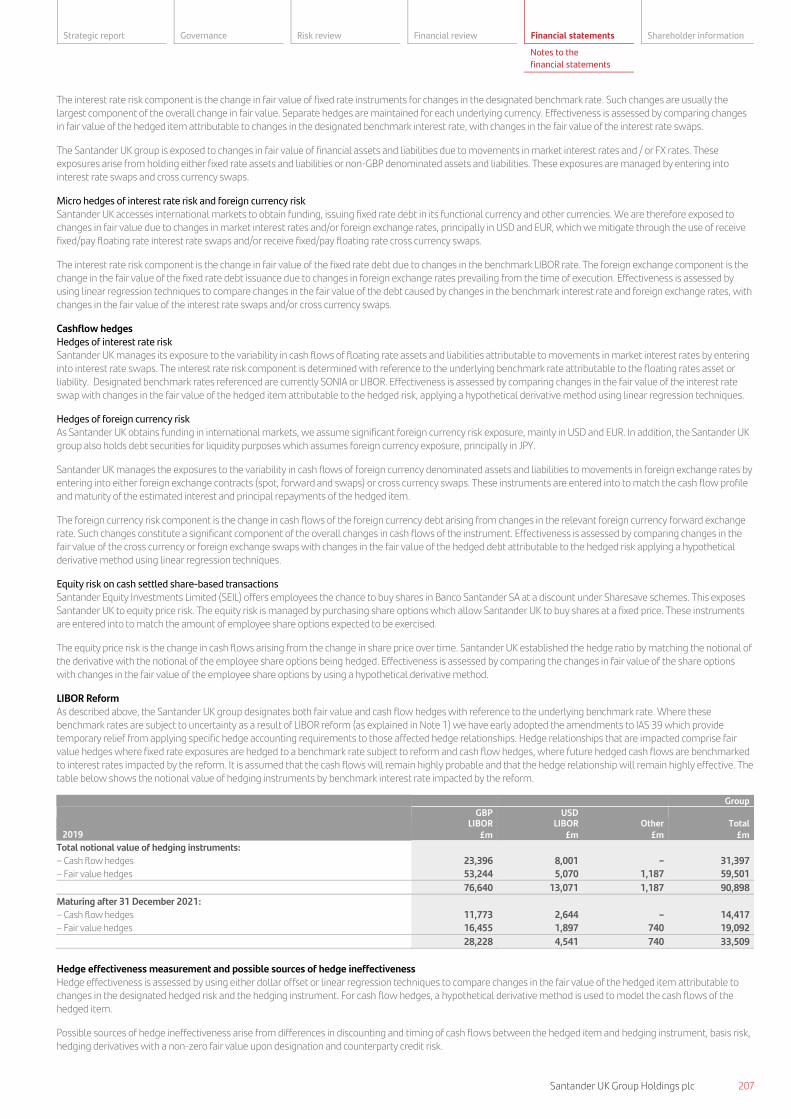
Santander UK Group Holdings plc 207
Secret
Strategic report Governance Risk review Financial review Financial statements Shareholder information
Notes to the
financial statements
The interest rate risk component is the change in fair value of fixed rate instruments for changes in the designated benchmark rate. Such changes are usually the largest component of the overall change in fair value. Separate hedges are maintained for each underlying currency. Effectiveness is assessed by comparing changes in fair value of the hedged item attributable to changes in the designated benchmark interest rate, with changes in the fair value of the interest rate swaps.
The Santander UK group is exposed to changes in fair value of financial assets and liabilities due to movements in market interest rates and / or FX rates. These exposures arise from holding either fixed rate assets and liabilities or non-GBP denominated assets and liabilities. These exposures are managed by entering into interest rate swaps and cross currency swaps.
Micro hedges of interest rate risk and foreign currency risk
Santander UK accesses international markets to obtain funding, issuing fixed rate debt in its functional currency and other currencies. We are therefore exposed to changes in fair value due to changes in market interest rates and/or foreign exchange rates, principally in USD and EUR, which we mitigate through the use of receive fixed/pay floating rate interest rate swaps and/or receive fixed/pay floating rate cross currency swaps.
The interest rate risk component is the change in fair value of the fixed rate debt due to changes in the benchmark LIBOR rate. The foreign exchange component is the change in the fair value of the fixed rate debt issuance due to changes in foreign exchange rates prevailing from the time of execution. Effectiveness is assessed by using linear regression techniques to compare changes in the fair value of the debt caused by changes in the benchmark interest rate and foreign exchange rates, with changes in the fair value of the interest rate swaps and/or cross currency swaps.
Cashflow hedges
Hedges of interest rate risk
Santander UK manages its exposure to the variability in cash flows of floating rate assets and liabilities attributable to movements in market interest rates by entering into interest rate swaps. The interest rate risk component is determined with reference to the underlying benchmark rate attributable to the floating rates asset or liability. Designated benchmark rates referenced are currently SONIA or LIBOR. Effectiveness is assessed by comparing changes in the fair value of the interest rate swap with changes in the fair value of the hedged item attributable to the hedged risk, applying a hypothetical derivative method using linear regression techniques.
Hedges of foreign currency risk
As Santander UK obtains funding in international markets, we assume significant foreign currency risk exposure, mainly in USD and EUR. In addition, the Santander UK group also holds debt securities for liquidity purposes which assumes foreign currency exposure, principally in JPY.
Santander UK manages the exposures to the variability in cash flows of foreign currency denominated assets and liabilities to movements in foreign exchange rates by entering into either foreign exchange contracts (spot, forward and swaps) or cross currency swaps. These instruments are entered into to match the cash flow profile and maturity of the estimated interest and principal repayments of the hedged item.
The foreign currency risk component is the change in cash flows of the foreign currency debt arising from changes in the relevant foreign currency forward exchange rate. Such changes constitute a significant component of the overall changes in cash flows of the instrument. Effectiveness is assessed by comparing changes in the fair value of the cross currency or foreign exchange swaps with changes in the fair value of the hedged debt attributable to the hedged risk applying a hypothetical derivative method using linear regression techniques.
Equity risk on cash settled share-based transactions
Santander Equity Investments Limited (SEIL) offers employees the chance to buy shares in Banco Santander SA at a discount under Sharesave schemes. This exposes Santander UK to equity price risk. The equity risk is managed by purchasing share options which allow Santander UK to buy shares at a fixed price. These instruments are entered into to match the amount of employee share options expected to be exercised.
The equity price risk is the change in cash flows arising from the change in share price over time. Santander UK established the hedge ratio by matching the notional of the derivative with the notional of the employee share options being hedged. Effectiveness is assessed by comparing the changes in fair value of the share options with changes in the fair value of the employee share options by using a hypothetical derivative method.
LIBOR Reform
As described above, the Santander UK group designates both fair value and cash flow hedges with reference to the underlying benchmark rate. Where these benchmark rates are subject to uncertainty as a result of LIBOR reform (as explained in Note 1) we have early adopted the amendments to IAS 39 which provide temporary relief from applying specific hedge accounting requirements to those affected hedge relationships. Hedge relationships that are impacted comprise fair value hedges where fixed rate exposures are hedged to a benchmark rate subject to reform and cash flow hedges, where future hedged cash flows are benchmarked to interest rates impacted by the reform. It is assumed that the cash flows will remain highly probable and that the hedge relationship will remain highly effective. The table below shows the notional value of hedging instruments by benchmark interest rate impacted by the reform.
Group
GBP
LIBOR USD
LIBOR Other Total
2019 £m £m £m £m
Total notional value of hedging instruments:
– Cash flow hedges 23,396 8,001 – 31,397
– Fair value hedges 53,244 5,070 1,187 59,501
76,640 13,071 1,187 90,898
Maturing after 31 December 2021:
– Cash flow hedges 11,773 2,644 – 14,417
– Fair value hedges 16,455 1,897 740 19,092
28,228 4,541 740 33,509
Hedge effectiveness measurement and possible sources of hedge ineffectiveness
Hedge effectiveness is assessed by using either dollar offset or linear regression techniques to compare changes in the fair value of the hedged item attributable to changes in the designated hedged risk and the hedging instrument. For cash flow hedges, a hypothetical derivative method is used to model the cash flows of the hedged item.
Possible sources of hedge ineffectiveness arise from differences in discounting and timing of cash flows between the hedged item and hedging instrument, basis risk, hedging derivatives with a non-zero fair value upon designation and counterparty credit risk.
207Santander UK Group Holdings plc

Annual Report 2019 | Financial statements
208 Santander UK Group Holdings plc
Secret
Maturity profile and average price/rate of hedging instruments The following table sets out the maturity profile and average price/rate of the hedging instruments used in the Santander UK group’s hedging strategies:
Group
2019 Hedging Instruments ≤1 month >1 and ≤3
months >3 and ≤12
months >1 and ≤5
years >5 years Total
Fair value hedges:
Interest rate risk Interest rate contracts – Notional amount (£m) 4,354 5,804 27,405 43,652 13,099 94,314
Average fixed interest rate – GBP 0.77% 0.90% 0.88% 1.33% 3.00%
Average fixed interest rate – EUR (0.41)% 0.29% 2.21% 1.36% 2.36%
Average fixed interest rate – USD – 1.54% 1.99% 2.69% 4.56%
Interest rate/FX risk Exchange rate contracts – Notional amount (£m) – 755 – 317 410 1,482
Interest rate contracts – Notional amount (£m) – – – 18 218 236
Average GBP – EUR exchange rate – – – 1.1781 1.1603
Average GBP – USD exchange rate – 1.5110 – – –
Average fixed interest rate – EUR – – – 3.52% 2.12%
Average fixed interest rate – USD – 2.38% – – –
Cash flow hedges:
Interest rate risk Interest rate contracts – Notional amount (£m) – 339 1,066 4,671 500 6,576
Average fixed interest rate – GBP – 0.76% 0.82% 1.46% 0.40%
FX risk Exchange rate contracts – Notional amount (£m) 1,187 2,119 3,758 5,217 – 12,281
Interest rate contracts – Notional amount (£m) – – – 755 – 755
Average GBP – JPY exchange rate – 145.9275 143.0857 140.8152 –
Average GBP – EUR exchange rate – 1.1444 1.1167 1.1526 –
Average GBP – USD exchange rate 1.2856 1.2624 1.2925 1.2991 –
Equity risk Equity derivative contracts – Notional amount (£m) – – 7 41 1 49
Interest rate/FX risk Exchange rate contracts – Notional amount (£m) 812 – 3,367 8,009 4,033 16,221
Interest rate contracts – Notional amount (£m) – – 3,121 4,829 2,170 10,120
Average GBP – EUR exchange rate 1.2742 – 1.1689 1.3114 1.2090
Average GBP – USD exchange rate – – 1.5357 1.5811 1.4499
Average fixed interest rate – GBP 2.49% – 2.16% 2.87% 2.96%
2018
Fair value hedges:
Interest rate risk Interest rate contracts – Notional amount (£m) 6,162 8,411 14,611 39,508 15,652 84,344
Average fixed interest rate – GBP 0.63% 0.79% 1.06% 1.59% 2.85%
Average fixed interest rate – EUR (0.22)% 0.67% 0.91% 1.09% 1.26% Average fixed interest rate – USD 1.51% 1.31% 1.34% 2.68% 2.18%
Interest rate/FX risk Exchange rate contracts – Notional amount (£m) 392 1,295 – 1,101 222 3,010
Interest rate contracts – Notional amount (£m) 392 1,295 – 90 301 2,078
Average GBP – EUR exchange rate – – – 1.1827 1.1682
Average GBP – USD exchange rate 1.5800 1.3325 – 1.5110 –
Average fixed interest rate – EUR – – – 3.89% 3.92% Average fixed interest rate – USD 3.62% 2.50% – 2.38% 7.95%
Cash flow hedges: Interest rate risk Interest rate contracts – Notional amount (£m) – 1,715 1,991 3,100 – 6,806
Average fixed interest rate – GBP – 0.73% 0.73% 1.33% –
FX risk Exchange rate contracts – Notional amount (£m) 3,916 2,552 2,961 5,596 – 15,025
Interest rate contracts – Notional amount (£m) – – – 785 – 785
Average GBP – JPY exchange rate – 147.2149 146.3718 145.3191 –
Average GBP – EUR exchange rate – – 1.2803 1.1349 – Average GBP – USD exchange rate 1.3035 1.3067 1.3099 1.3049 –
Equity risk Equity derivative contracts – Notional amount (£m) – – 37 32 – 69
Interest rate/FX risk Exchange rate contracts – Notional amount (£m) – – 1,773 11,481 5,622 18,876
Interest rate contracts – Notional amount (£m) – – 784 7,562 2,871 11,217
Average GBP – EUR exchange rate – – 1.2523 1.2707 1.2167
Average GBP – USD exchange rate – – 1.6333 1.5447 1.5109
Average fixed interest rate – GBP – – 2.34% 2.66% 2.90%
Santander UK Group Holdings plc208
Annual Report 2019 | Financial statements

Santander UK Group Holdings plc 209
Secret
Strategic report Governance Risk review Financial review Financial statements Shareholder information
Notes to the
financial statements
Net gains or losses arising from fair value and cash flow hedges included in net trading and other income
Group
2019 2018 2017
£m £m £m
Fair value hedging:
(Losses)/gains on hedging instruments (360) 4 56
Gains/(losses) on hedged items attributable to hedged risks 414 75 (2)
Fair value hedging ineffectiveness 54 79 54
Cash flow hedging ineffectiveness (46) (45) (49)
8 34 5
Hedge ineffectiveness can be analysed by risk category as follows:
Group
2019 2018
Change in FV of hedging instruments
Change in FV of hedged items
Recognised in income statement
Change in FV of hedging instruments
Change in FV of hedged items
Recognised in income statement
£m £m £m £m £m £m
Fair value hedges:
Interest rate risk (264) 284 20
26 15 41
Interest rate/FX risk (96) 130 34 (22) 60 38
(360) 414 54 4 75 79
Group
2019 2018
Hedging Instruments Hedging Instruments
Income statement line item affected by reclassification
Change in FV Recognised
in OCI
Recognised in income
statement
Reclassified from reserves
to income Change
in FV Recognised
in OCI
Recognised in income
statement
Reclassified from
reserves to income
£m £m £m £m £m £m £m £m
Cash flow hedges:
Interest rate risk Net interest income 34 (33) 1 13 20 (14) 6 26
FX risk Net interest income/net trading and other income (333) 329 (4) (316) 17 (19) (2) 9
Equity risk Operating expenses (7) 7 – (9) (16) 16 – (10)
Interest rate/FX risk Net interest income/net trading and other income (604) 561 (43) (709) 722 (771) (49) 726
(910) 864 (46) (1,021) 743 (788) (45) 751
In 2019, cash flow hedge accounting of £4m (2018: £12m) had to cease due to foreign currency denominated cash flows relating to IT project expenditure no longer being expected to occur.
The following table provides a reconciliation by risk category of components of equity and analysis of OCI items (before tax) resulting from hedge accounting.
Group
2019 2018
£m £m
Balance at 1 January 322 285
Effective portion of changes in fair value:
– Interest rate risk 33 14
– Foreign currency risk (329) 19
– Equity risk (7) (16)
– Interest rate/foreign currency risk (561) 771
(864) 788
Income statement transfers:
– Interest rate risk (13) (26)
– Foreign currency risk 316 (9)
– Equity risk 9 10
– Interest rate/foreign currency risk 709 (726)
1,021 (751)
Balance at 31 December 479 322
209Santander UK Group Holdings plc

Annual Report 2019 | Financial statements
210 Santander UK Group Holdings plc
Secret
Hedged exposures Santander UK hedges its exposures to various risks, including interest rate risk and foreign currency risk, as set out in the following table.
Group
2019 2018
Accumulated amount of FV hedge adjustments
Change in value to
calculate hedge
ineffective-ness
Accumulated amount of FV hedge adjustments
Change in value to
calculate hedge
ineffective-ness Carrying value
Hedged item
Portfolio hedge of interest
rate risks
Of which Discontinued
hedges Carrying
value Hedged
item
Portfolio hedge of
interest rate risks
Of which Discontinued
hedges
£m £m £m £m £m £m £m £m £m £m
Fair value hedges Interest rate risk: Loans and advances to customers 43,098 – 870 630 258 42,075 – 638 729 (149)
Other financial assets at amortised cost 6,627
– 142 121 83 6,640
– 59
– 59
Reverse repos – non trading 17,121 – (2) – (2) 10,954 – – – –
Other financial assets at FVOCI 5,944 102 – 82 125 7,429 10 – 123 (46)
Deposits by customers (6,261) – 4 – 3 (702) – 1 – –
Deposits by banks (517) (16) – (17) (1) (516) (15) – (23) 9
Debt securities in issue (11,782) (388) (166) (311) (163) (11,920) (199) (191) (369) 121
Subordinated liabilities (707) (181) (48) (204) (19) (694) (161) (52) (223) 21
Interest rate/FX risk: Other financial assets at FVOCI 241 3 – – (4) 18 – – – –
Debt securities in issue (1,396) (135) – (122) 136 (3,192) (170) – (179) 37
Subordinated liabilities 7 7 – 7 (2) 9 9 – 9 23
52,375 (608) 800 186 414 50,101 (526) 455 67 75
Group
2019 2018
Change in value to calculate hedge ineffectiveness
Cash flow hedge
reserve
Balances on cash flow hedge reserve for
discontinued hedges
Change in value to calculate hedge ineffectiveness
Cash flow hedge
reserve
Balances on cash flow hedge reserve for
discontinued hedges
Hedged item balance sheet line item £m £m £m £m £m £m
Cash flow hedges:
Interest rate risk: Loans and advances to customers (34) 21 (11) (19) (4) (2) Loans and advances to banks (2) – – – (2) – Deposits by banks 3 (2) – 6 (1) – Debt securities in issue – – – (1) – –
FX risk: Other financial assets at FVOCI (122) 3 – 199 (1) – Not applicable – highly probable
forecast transactions 267 2 –
(1) – – Deposits by customers 3 – – – – – Deposits by banks 4 – – – – – Debt securities in issue 177 (3) – (217) 21 3
Equity risk: Other liabilities 7 (2) (1) 16 (3) (2)
Interest rate/FX risk: Debt securities in issue/loans and advances to customers 630 280 20 (564) 233 50
Subordinated liabilities/loans and
advances to customers (69) 180 – (207) 79 –
864 479 8 (788) 322 49 Santander UK Group Holdings plc210
Annual Report 2019 | Financial statements

Santander UK Group Holdings plc 211
Secret
Strategic report Governance Risk review Financial review Financial statements Shareholder information
Notes to the
financial statements
12. OTHER FINANCIAL ASSETS AT FAIR VALUE THROUGH PROFIT OR LOSS
Group
2019 2018
£m £m
Loans and advances to customers: Loans to housing associations 12 13
Other loans 528 496
540 509
Debt securities 298 3,263
Equity securities 135 93
Reverse repurchase agreements – non trading – 2,272
973 6,137
For the Santander UK group, other financial assets at FVTPL comprised £465m (2018: £1,521m) of financial assets designated at FVTPL and £509m (2018: £4,616m) of financial assets mandatorily held at FVTPL.
Loans and advances to customers principally represented other loans, being a portfolio of roll-up mortgages and deferred consideration following the partial sale of the portfolio. These are managed, and have their performance evaluated, on a fair value basis in accordance with a documented investment strategy, and information about them is provided on that basis to management. Since 2009, the Santander UK group’s policy has been not to designate similar new loans at fair value through profit or loss.
In 2019 £2.1bn of senior tranches of credit linked notes related to an SRT securitisation, which were previously classified as debt securities in the table above, were presented on a net basis. This followed a deed of amendment, including a legal right of set-off between the principal amounts of the senior tranches of credit linked notes and the related cash deposits included as collateral in Note 21. At 31 December 2019 the amount of this netting was £1.5bn.
The net (loss)/gain in the year attributable to changes in credit risk for loans and advances at fair value through profit or loss was £nil (2018: £(1)m, 2017: £49m). The cumulative net loss attributable to changes in credit risk for loans and advances at fair value through profit or loss at 31 December 2019 was £2m (2018: £2m).
13. LOANS AND ADVANCES TO CUSTOMERS
Group
2019 2018
£m £m
Loans secured on residential properties 165,645 158,248
Corporate loans 27,043 27,819
Finance leases 6,264 6,821
Secured advances – –
Other unsecured loans 7,188 7,554
Amounts due from fellow Banco Santander subsidiaries and joint ventures 2,204 1,997
Loans and advances to customers 208,344 202,439
Credit impairment loss allowances on loans and advances to customers (785) (751)
RV and voluntary termination provisions on finance leases (61) (69)
Net loans and advances to customers 207,498 201,619
For movements in expected credit losses, see the Credit risk section of the Risk review. The contractual amount outstanding on financial assets that were written off in the year and are still subject to enforcement activity was £72m (2018: £76m).
Finance lease and hire purchase contract receivables may be analysed as follows: Group
2019 2018
Gross investment
£m
Unearned finance income
£m
Net investment
£m
Gross investment
£m
Unearned finance income
£m
Net investment
£m
No later than one year 2,650 (371) 2,279 3,730 (210) 3,520
Later than one year and not later than two years 1,829 (207) 1,622 1,839 (148) 1,691
Later than two years and not later than three years 1,047 (119) 928 1,056 (87) 969
Later than three years and not later than four years 473 (54) 419 488 (39) 449
Later than four years and not later than five years 41 (4) 37 32 (4) 28
Later than five years 1,116 (137) 979 210 (46) 164
7,156 (892) 6,264 7,355 (534) 6,821
The Santander UK group enters into finance leasing arrangements primarily for the financing of motor vehicles and a range of assets for its corporate customers. Included in the carrying value of net investment in finance leases and hire purchase contracts is £1,219m (2018: £1,034m) of unguaranteed RV at the end of the current lease terms, which is expected to be recovered through re-payment, re-financing or sale. Contingent rent income of £nil (2018: £nil, 2017: £5m) was earned during the year, which was classified in ‘Interest and similar income’. Finance income on the net investment in finance leases was £299m (2018: £346m, 2017: £201m).
Finance lease receivable balances are secured over the asset leased. The Santander UK group is not permitted to sell or repledge the asset in the absence of default by the lessee. The Directors consider that the carrying amount of the finance lease receivables approximates to their fair value.
Included within loans and advances to customers are advances assigned to bankruptcy remote structured entities and Abbey Covered Bonds LLP. These loans provide security to issues of covered bonds and mortgage-backed or other asset-backed securities issued by the Santander UK group. For more, see Note 14.
211Santander UK Group Holdings plc
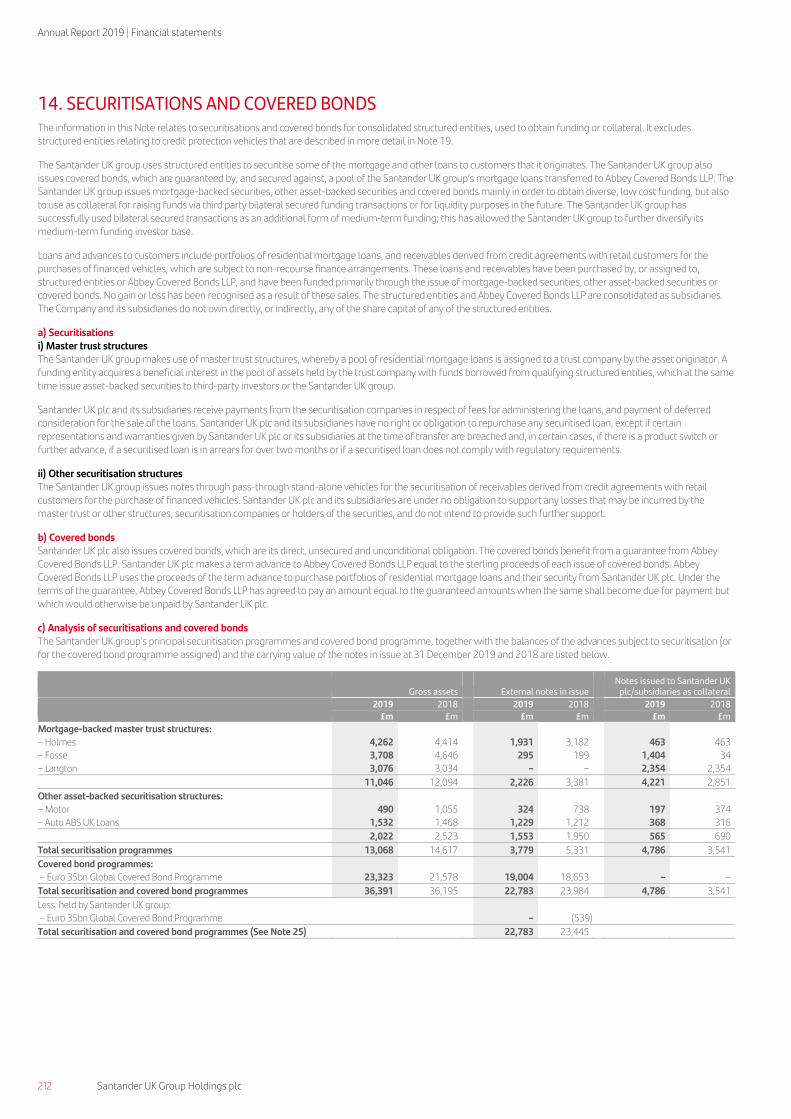
Annual Report 2019 | Financial statements
212 Santander UK Group Holdings plc
Secret
14. SECURITISATIONS AND COVERED BONDS
The information in this Note relates to securitisations and covered bonds for consolidated structured entities, used to obtain funding or collateral. It excludes structured entities relating to credit protection vehicles that are described in more detail in Note 19.
The Santander UK group uses structured entities to securitise some of the mortgage and other loans to customers that it originates. The Santander UK group also issues covered bonds, which are guaranteed by, and secured against, a pool of the Santander UK group’s mortgage loans transferred to Abbey Covered Bonds LLP. The Santander UK group issues mortgage-backed securities, other asset-backed securities and covered bonds mainly in order to obtain diverse, low cost funding, but also to use as collateral for raising funds via third party bilateral secured funding transactions or for liquidity purposes in the future. The Santander UK group has successfully used bilateral secured transactions as an additional form of medium-term funding; this has allowed the Santander UK group to further diversify its medium-term funding investor base.
Loans and advances to customers include portfolios of residential mortgage loans, and receivables derived from credit agreements with retail customers for the purchases of financed vehicles, which are subject to non-recourse finance arrangements. These loans and receivables have been purchased by, or assigned to, structured entities or Abbey Covered Bonds LLP, and have been funded primarily through the issue of mortgage-backed securities, other asset-backed securities or covered bonds. No gain or loss has been recognised as a result of these sales. The structured entities and Abbey Covered Bonds LLP are consolidated as subsidiaries. The Company and its subsidiaries do not own directly, or indirectly, any of the share capital of any of the structured entities.
a) Securitisations i) Master trust structures The Santander UK group makes use of master trust structures, whereby a pool of residential mortgage loans is assigned to a trust company by the asset originator. A funding entity acquires a beneficial interest in the pool of assets held by the trust company with funds borrowed from qualifying structured entities, which at the same time issue asset-backed securities to third-party investors or the Santander UK group.
Santander UK plc and its subsidiaries receive payments from the securitisation companies in respect of fees for administering the loans, and payment of deferred consideration for the sale of the loans. Santander UK plc and its subsidiaries have no right or obligation to repurchase any securitised loan, except if certain representations and warranties given by Santander UK plc or its subsidiaries at the time of transfer are breached and, in certain cases, if there is a product switch or further advance, if a securitised loan is in arrears for over two months or if a securitised loan does not comply with regulatory requirements.
ii) Other securitisation structures The Santander UK group issues notes through pass-through stand-alone vehicles for the securitisation of receivables derived from credit agreements with retail customers for the purchase of financed vehicles. Santander UK plc and its subsidiaries are under no obligation to support any losses that may be incurred by the master trust or other structures, securitisation companies or holders of the securities, and do not intend to provide such further support.
b) Covered bonds Santander UK plc also issues covered bonds, which are its direct, unsecured and unconditional obligation. The covered bonds benefit from a guarantee from Abbey Covered Bonds LLP. Santander UK plc makes a term advance to Abbey Covered Bonds LLP equal to the sterling proceeds of each issue of covered bonds. Abbey Covered Bonds LLP uses the proceeds of the term advance to purchase portfolios of residential mortgage loans and their security from Santander UK plc. Under the terms of the guarantee, Abbey Covered Bonds LLP has agreed to pay an amount equal to the guaranteed amounts when the same shall become due for payment but which would otherwise be unpaid by Santander UK plc.
c) Analysis of securitisations and covered bonds The Santander UK group’s principal securitisation programmes and covered bond programme, together with the balances of the advances subject to securitisation (or for the covered bond programme assigned) and the carrying value of the notes in issue at 31 December 2019 and 2018 are listed below.
Gross assets External notes in issue
Notes issued to Santander UK plc/subsidiaries as collateral
2019 2018
2019 2018
2019 2018
£m £m £m £m £m £m
Mortgage-backed master trust structures: – Holmes 4,262 4,414 1,931 3,182 463 463
– Fosse 3,708 4,646 295 199 1,404 34
– Langton 3,076 3,034 – – 2,354 2,354
11,046 12,094 2,226 3,381 4,221 2,851
Other asset-backed securitisation structures: – Motor 490 1,055 324 738 197 374
– Auto ABS UK Loans 1,532 1,468 1,229 1,212 368 316
2,022 2,523 1,553 1,950 565 690
Total securitisation programmes 13,068 14,617 3,779 5,331 4,786 3,541
Covered bond programmes: – Euro 35bn Global Covered Bond Programme 23,323 21,578 19,004 18,653 – –
Total securitisation and covered bond programmes 36,391 36,195 22,783 23,984 4,786 3,541
Less: held by Santander UK group: – Euro 35bn Global Covered Bond Programme – (539) Total securitisation and covered bond programmes (See Note 25) 22,783 23,445
Santander UK Group Holdings plc212
Annual Report 2019 | Financial statements

Santander UK Group Holdings plc 213
Secret
Strategic report Governance Risk review Financial review Financial statements Shareholder information
Notes to the
financial statements
The following table sets out the internal and external issuances and redemptions in 2019 and 2018 for each securitisation and covered bond programme.
Internal issuances External issuances Internal redemptions External redemptions
2019 2018 2019 2018 2019 2018 2019 2018
£bn £bn £bn £bn £bn £bn £bn £bn
Mortgage-backed master trust structures: – Holmes – 0.1 – 1.8 – – 1.1 0.1
– Fosse 1.4 – 0.1 – – – – 0.4
Other asset-backed securitisation structures: – Motor – – – – 0.2 0.1 0.4 0.1
– Auto ABS UK Loans 0.1 – 0.2 0.4 0.1 – 0.2 0.4
Covered bond programme – – 2.9 4.3 0.5 0.5 1.5 1.9
1.5 0.1 3.2 6.5 0.8 0.6 3.2 2.9
Holmes Funding Ltd has a beneficial interest of £2.1bn (2018: £3.2bn) in the residential mortgage loans held by Holmes Trustees Ltd. The remaining share of the beneficial interest in residential mortgage loans held by Holmes Trustees Ltd belongs to Santander UK plc.
Fosse Funding (No.1) Ltd has a beneficial interest of £1.7bn (2018: £0.2bn) in the residential mortgage loans held by Fosse Trustee (UK) Ltd. The remaining share of the beneficial interest in residential mortgage loans held by Fosse Trustee (UK) Ltd belongs to Santander UK plc.
Langton Funding (No.1) Ltd has a beneficial interest of £2.4bn (2018: £2.3bn) in the residential mortgage loans held by Langton Mortgage Trustee (UK) Ltd. The remaining share of the beneficial interest in residential mortgage loans held by Langton Mortgage Trustee (UK) Ltd belongs to Santander UK plc.
The Holmes securitisation companies have cash deposits of £283m (2018: £218m), which have been accumulated to finance the redemption of a number of securities issued by the Holmes securitisation companies. The share of Holmes Funding Ltd in the trust assets is therefore reduced by this amount.
Fosse Master Issuer plc has cash deposits of £nil (2018: £nil), which have been accumulated to finance the redemption of a number of securities issued by Fosse Master Issuer plc. Fosse Funding (No.1) Ltd’s beneficial interest in the assets held by Fosse Trustee (UK) Ltd is therefore reduced by this amount.
15. TRANSFERS OF FINANCIAL ASSETS NOT QUALIFYING FOR DERECOGNITION
The Santander UK group enters into transactions in the normal course of business by which it transfers recognised financial assets directly to third parties or to structured entities. These transfers may give rise to the full or partial derecognition of those financial assets. Transferred financial assets that do not qualify for derecognition consist of (i) securities held by counterparties as collateral under repurchase agreements, (ii) securities lent under securities lending agreements, and (iii) loans that have been securitised under arrangements by which the Santander UK group retains a continuing involvement in such transferred assets. As the substance of the sale and repurchase and securities lending transactions is secured borrowings, the asset collateral continues to be recognised in full and the related liability reflecting the Santander UK group’s obligation to repurchase the transferred assets for a fixed price at a future date is recognised in deposits from banks or customers, as appropriate. As a result of these transactions, the Santander UK group is unable to use, sell or pledge the transferred assets for the duration of the transaction. The Santander UK group remains exposed to interest rate risk and credit risk on these pledged instruments. The counterparty’s recourse is not limited to the transferred assets.
The Santander UK group securitisation transfers do not qualify for derecognition. The Santander UK group remains exposed to credit risks arising from the mortgage loans or credit agreements and has retained control of the transferred assets. Circumstances in which the Santander UK group has continuing involvement in the transferred assets may include retention of servicing rights over the transferred assets, entering into a derivative transaction with the securitisation vehicle, retaining an interest in the securitisation vehicle or providing a cash reserve fund. Where the Santander UK group has continuing involvement it continues to recognise the transferred assets to the extent of its continuing involvement and recognises an associated liability. The net carrying amount of the transferred assets and associated liabilities reflects the rights and obligations that the Santander UK group has retained.
The following table analyses the carrying amount of financial assets that did not qualify for derecognition and their associated financial liabilities:
Group
2019 2018
Assets Liabilities
Assets Liabilities
Nature of transaction £m £m £m £m
Sale and repurchase agreements 7,592 (6,739) 7,642 (7,188)
Securities lending agreements 195 (143) 144 (120)
Securitisations (See Notes 14 and 25) 9,992 (3,779) 11,583 (5,331)
17,779 (10,661) 19,369 (12,639)
213Santander UK Group Holdings plc

Annual Report 2019 | Financial statements
214 Santander UK Group Holdings plc
Secret
16. REVERSE REPURCHASE AGREEMENTS – NON TRADING
Group
2019 2018
£m £m
Agreements with banks 2,161 3,254
Agreements with customers 21,475 17,873
23,636 21,127
17. OTHER FINANCIAL ASSETS AT AMORTISED COST
Group
2019 2018
£m £m
Asset backed securities 532 719
Debt securities 6,524 6,509
7,056 7,228
A significant portion of the debt securities are held in our eligible liquidity pool and consist mainly of government bonds and covered bonds. Detailed disclosures can
be found in the ‘Liquidity risk’ section of the Risk review.
18. FINANCIAL ASSETS AT FAIR VALUE THROUGH OTHER COMPREHENSIVE INCOME
Group
2019 2018
£m £m
Debt securities 9,691 13,229
Loans and advances to customers 56 73
9,747 13,302
A significant portion of the debt securities are held in our eligible liquidity pool and consist mainly of government bonds and covered bonds. Detailed disclosures can
be found in the ‘Liquidity risk’ section of the Risk review.
Santander UK Group Holdings plc214
Annual Report 2019 | Financial statements

Santander UK Group Holdings plc 215
Secret
Strategic report Governance Risk review Financial review Financial statements Shareholder information
Notes to the
financial statements
19. INTERESTS IN OTHER ENTITIES
Group
2019 2018
£m £m
Joint ventures 117 88
117 88
The Santander UK group consists of a parent company, Santander UK Group Holdings plc, incorporated and domiciled in the UK and a number of subsidiaries and joint
ventures held directly and indirectly by the Company. The Company has no individually significant associates. Details of subsidiaries, joint ventures and associates are
set out in the Shareholder Information section and form an integral part of these financial statements.
a) Interests in subsidiaries The Company holds directly or indirectly 100% of the issued ordinary share capital of its principal subsidiaries. All companies operate principally in their country of
incorporation or registration. SFS has branch offices in Jersey and the Isle of Man.
Subsidiaries with significant non-controlling interests The only subsidiary with significant non-controlling interests is PSA Finance UK Limited, which operates in the UK. In 2019 and 2018, the proportion of ownership
interests and voting rights held by non-controlling interests was 50%.
2019 2018
£m £m
Profit attributable to non-controlling interests 19 22
Accumulated non-controlling interests of the subsidiary 160 151
Dividends paid to non-controlling interests 12 22
Summarised financial information:
– Total assets 3,228 3,289
– Total liabilities 2,905 2,987
– Profit for the year 40 43
– Total comprehensive income for the year 40 43
215Santander UK Group Holdings plc

Annual Report 2019 | Financial statements
216 Santander UK Group Holdings plc
Secret
Interests in consolidated structured entities Structured entities are formed by Santander UK to accomplish specific and well-defined objectives. Santander UK consolidates these structured entities when the substance of the relationship indicates control, as described in Note 1. In addition to the structured entities disclosed in Note 14 which are used for securitisation and covered bond programmes, the only other structured entities consolidated by Santander UK are described below. All the external assets and liabilities in these entities are included in the financial statements and in relevant Notes. Other than as set out below, no significant judgements were required with respect to control or significant influence.
i) Guaranteed Investment Products 1 PCC Limited (GIP) GIP is a Guernsey-incorporated, closed-ended, protected cell company. The objective of each cell is to achieve capital growth for retail investors. In order to achieve the investment objective, GIP, on behalf of the respective cells, has entered into transactions with Santander UK plc. Santander Guarantee Company, a Santander UK group company, also guarantees the shareholders of cells a fixed return on their investment and/or the investment amount. GIP has no third party assets. Although the share capital is owned by the retail investors, Santander UK continues to have exposure to variable risks and returns through Santander Guarantee Company’s guarantee and has therefore consolidated this entity.
ii) Motor Securities 2018-1 Designated Activity Company (Motor 2018) Motor 2018 is a credit protection entity, and a Designated Activity Company limited by shares, incorporated in Ireland. It has issued a series of credit linked notes varying in seniority which reference portfolios of Santander UK group loans. Concurrently, these entities sell credit protection to Santander UK in respect of the referenced loans and, in return for a fee, are liable to make protection payments to Santander UK upon the occurrence of a credit event in relation to any of the referenced loans. The entity has been consolidated as Santander UK holds a variable interest by retaining the junior tranche of notes issued by the entity.
b) Interests in joint ventures Santander UK does not have any individually material interests in joint ventures. As set out in the accounting policies in Note 1, interests in joint ventures are accounted for using the equity method. In 2019, Santander UK’s share in the profit after tax of its joint ventures was £30m (2018: £15m) before elimination of transactions between Santander UK and the joint ventures. At 31 December 2019, the carrying amount of Santander UK’s interest was £117m (2018: £88m). At 31 December 2019 and 2018, the joint ventures had no commitments and contingent liabilities.
c) Interests in unconsolidated structured entities Structured entities sponsored by the Santander UK group Santander UK has interests in structured entities which it sponsors but does not control. Santander UK considers itself a sponsor of a structured entity when it facilitates the establishment of the structured entity. Other than as set out below, no significant judgements were required with respect to control or significant influence. The structured entities sponsored but not consolidated by Santander UK are as follows.
i) Santander (UK) Common Investment Fund The Santander (UK) Common Investment Fund (the Fund) is a common investment fund that was established to hold the assets of the Santander (UK) Group Pension Scheme. The Fund is not consolidated by Santander UK, but its assets of £12,446m (2018: £11,433m) are accounted for as part of the defined benefit assets and obligations recognised on Santander UK’s balance sheet. For more on the Fund, see Note 28. As the Fund holds the assets of the pension scheme, it is outside the scope of IFRS 10. Santander UK’s maximum exposure to loss is the carrying amount of the assets held.
ii) Credit protection entities Santander UK has established four (2018: three) unconsolidated credit protection entities, which are Designated Activity Companies limited by shares, incorporated in Ireland. Each entity has issued a series of credit linked notes varying in seniority which reference portfolios of Santander UK group loans. Concurrently, these entities sell credit protection to Santander UK in respect of the referenced loans and, in return for a fee, are liable to make protection payments to Santander UK upon the occurrence of a credit event in relation to any of the referenced loans.
Senior credit linked notes, which amounted to £3,766m (2018: £3,053m), are issued to, and held by, Santander UK. Junior credit linked notes, which amounted to £825m (2018: £408m), are all held by third party investors and suffer the first losses incurred in the referenced portfolios. Funds raised by the sale of the credit linked notes are deposited with Santander UK as collateral for the credit protection.
£110m (2018: £3,053m) of the senior credit linked notes are presented on a gross basis and included within ‘Other financial assets at fair value through profit or loss’ on the balance sheet (see Note 12). Deposits and associated guarantees relating to the senior notes are included within ‘Other financial liabilities at fair value through profit or loss’ (see Note 21). The remainder of the senior credit linked notes, along with the deposits and associated guarantees, are presented on a net basis, to reflect a legal right of set-off between the principal amounts of senior notes and the cash deposits. Deposits and associated guarantees in respect of the junior credit linked notes are included within ‘Deposits by customers’ (see Note 22).
The entities are not consolidated by Santander UK because the third party investors have the exposure, or rights, to all of the variability of returns from the performance of the entities. No assets are transferred to, or income received from, these vehicles. Since the credit linked notes (including those held by Santander UK) are fully cash collateralised, Santander UK’s maximum exposure to loss is equal to any unamortised fees paid to the credit protection entities in connection with the credit protection outlined above.
Structured entities not sponsored by the Santander UK group Santander UK also has interests in structured entities which it does not sponsor or control. These consist of holdings of mortgage and other asset backed securities issued by entities that were established and/or sponsored by other unrelated financial institutions. These securities comprise the asset backed securities included in Note 17. Management has concluded that the Santander UK group has no control or significant influence over these entities and that the carrying value of the interests held in these entities represents the maximum exposure to loss.
Santander UK Group Holdings plc216
Annual Report 2019 | Financial statements

Santander UK Group Holdings plc 217
Secret
Strategic report Governance Risk review Financial review Financial statements Shareholder information
Notes to the
financial statements
20. INTANGIBLE ASSETS
a) Goodwill
Group
Cost
£m
Accumulated impairment
£m Net book value
£m
At 31 December 2018, 1 January 2019 and 31 December 2019 1,285 (82) 1,203
Impairment of goodwill In 2019 and 2018, no impairment of goodwill was recognised. Impairment testing in respect of goodwill allocated to each cash-generating unit (CGU) is performed annually or more frequently if there are impairment indicators present. For the purpose of impairment testing, the CGUs are based on customer groups within the relevant business divisions.
The cash flow projections for each CGU are based on the five-year plan prepared for regulatory purposes, based on Santander UK’s 3-Year Plan and approved by the Santander UK plc Board. The assumptions included in the expected future cash flows for each CGU take into consideration the UK economic environment and financial outlook within which the CGU operates. The base case economic scenario used in the 3-Year Plan includes key assumptions such as projected house price and GDP growth rates, the level and change in unemployment rates in the UK and the forecast Bank of England base rates. For more on Santander UK’s base case economic scenario, including information on our forecasting approach and the assumptions in place at 31 December 2019, see the Credit risk – Santander UK group level section of the Risk review.
The rate used to discount the cash flows is based on a pre-tax rate that reflects the weighted average cost of capital allocated by Santander UK to investments in the business division in which the CGU operates. The growth rate used reflects management’s five-year forecasts, with a terminal growth rate for each year applied thereafter, in line with the estimated long-term average UK GDP growth rate.
Based on the conditions at the balance sheet date, management determined that a reasonably possible change in any of the key assumptions described above would not cause an impairment of goodwill to be recognised.
The following CGUs include in their carrying values goodwill that comprises the goodwill reported by Santander UK. The CGUs do not carry on their balance sheets any other intangible assets with indefinite useful lives. The calculations have been based on value in use using cash flows based on the five-year plan.
Goodwill Discount rate Growth rate(1)
2019 2018 2019 2018 2019 2018 CGU £m £m % % % %
Personal financial services 1,169 1,169 9.8 10.5 3 2
Private banking 30 30 9.8 10.5 4 2
Other 4 4 9.8 10.5 3 2
1,203 1,203 (1) Average growth rate based on the five-year plan for the first five years and a growth rate of 1.6% (2018: 1.6%) applied thereafter.
In 2019, the discount rate decreased by 0.7 percentage points to 9.8% (2018: 10.5%). The decrease reflected changes in current market and economic conditions. In 2019, the change in growth rates reflected Santander UK’s updated strategic priorities in the context of forecast economic conditions.
b) Other intangibles
Group
Cost £m
Accumulated amortisation/
impairment £m
Net book value £m
At January 2019 1,099 (488) 611
Additions 178 – 178
Disposals (14) – (14)
Charge – (192) (192)
Impairment – (10) (10)
At 31 December 2019 1,263 (690) 573
At 1 January 2018 962 (423) 539
Additions 213 – 213
Write offs (76) 76 –
Charge – (141) (141)
At 31 December 2018 1,099 (488) 611
Other intangibles consist of computer software.
217Santander UK Group Holdings plc

Annual Report 2019 | Financial statements
218 Santander UK Group Holdings plc
Secret
21. OTHER FINANCIAL LIABILITIES AT FAIR VALUE THROUGH PROFIT OR LOSS
Group
2019 2018
£m £m
US$30bn Euro Medium Term Note Programme 159 165
Structured Notes Programmes 809 696
Eurobonds 137 129
Structured deposits 435 133
Collateral and associated financial guarantees 173 3,053
Repurchase agreements – non trading – 2,110
1,713 6,286
For the Santander UK group, all (2018: all) of the other financial liabilities at fair value through profit or loss were designated as such.
Collateral and associated financial guarantees in the table above represent collateral received, together with associated credit protection guarantees, in respect of the proceeds of the retained senior tranches of credit linked notes described in Note 12. The financial guarantees are valued using the same parameters as the related credit linked notes, such that changes in the respective valuations are offset exactly, and there is no charge or credit to the income statement. In 2019 £2.1bn of cash deposits, which were previously included within collateral and associated financial guarantees in the table above, were presented on a net basis. This followed a deed of amendment, including a legal right of set-off between the principal amounts of senior tranches of credit linked notes, classified as debt securities in Note 12, and the cash deposits. At 31 December 2019 the amount of this netting was £1.5bn. For more, see ‘Credit protection entities’ in Note 19.
Gains and losses arising from changes in the credit spread of securities issued by the Santander UK group reverse over the contractual life of the debt, provided that the debt is not repaid at a premium or a discount. The net loss during the year attributable to changes in the Santander UK group’s own credit risk on the above securities was £77m (2018: £84m gain, 2017: £29m loss). The cumulative net gain attributable to changes in the Santander UK group’s own credit risk on the above securities at 31 December 2019 was £nil (2018: £77m).
At 31 December 2019, the amount that would be required to be contractually paid at maturity of the securities above was £4m lower (2018: £128m lower) than the carrying value.
22. DEPOSITS BY CUSTOMERS
Group
2019 2018
£m £m
Current and demand accounts 90,332 87,316
Savings accounts(1) 69,319 69,102
Time deposits 18,121 16,204
Amounts due to fellow Banco Santander subsidiaries and joint ventures 1,234 1,070
179,006 173,692 (1) Includes equity index-linked deposits of £1,139m (2018: £1,176m). The capital amount guaranteed/protected and the amount of return guaranteed in respect of the equity index-linked deposits were £1,139m and £18m (2018: £1,176m and
£28m) respectively.
23. DEPOSITS BY BANKS
Group
2019 2018 £m £m
Items in the course of transmission 337 262
Deposits held as collateral 2,175 4,058
Other deposits(1) 11,847 13,504
14,359 17,824 (1) Includes drawdown from the TFS of £10.8bn (2018: £10.8bn).
24. REPURCHASE AGREEMENTS – NON TRADING
Group
2019 2018
£m £m
Agreements with banks 10,227 5,865
Agreements with customers 8,059 5,045
18,286 10,910
Santander UK Group Holdings plc218
Annual Report 2019 | Financial statements

Santander UK Group Holdings plc 219
Secret
Strategic report Governance Risk review Financial review Financial statements Shareholder information
Notes to the
financial statements
25. DEBT SECURITIES IN ISSUE
Group
2019 2018
£m £m
Medium-term notes: – US$30bn Euro Medium Term Note Programme 4,679 7,229
– Euro 30bn Euro Medium Term Note Programme 5,175 5,348
– US SEC-registered – Santander UK Group Holdings plc 5,763 5,841
– US SEC-registered – Santander UK plc 5,891 7,649
– US$20bn Commercial Paper Programmes 3,014 3,131
24,522 29,198
Euro 35bn Global Covered Bond Programme (See Note 14) 19,004 18,114
Certificates of deposit 2,806 3,221
Credit linked notes 60 42
Securitisation programmes (See Note 14) 3,779 5,331
50,171 55,906
The funding from the Euro 30bn Euro Medium Term Note Programme and the US SEC-registered Debt Programme in the name of Santander UK Group Holdings plc has been downstreamed to our operating company Santander UK plc.
26. SUBORDINATED LIABILITIES
Group
2019 2018
£m £m
£325m Sterling Preference Shares 344 344
Undated subordinated liabilities 581 574
Dated subordinated liabilities 2,603 2,683
3,528 3,601
The above securities will, in the event of the winding up of the issuer, be subordinated to the claims of depositors and all other creditors of the issuer, other than creditors whose claims rank equally with, or are junior to, the claims of the holders of the subordinated liabilities. The subordination amongst each of the subordinated liabilities upon a winding up of the issuer is specified in their respective terms and conditions.
In 2019 and 2018, the Santander UK group had no defaults of principal, interest or other breaches with respect to its subordinated liabilities. No repayment or purchase by the issuer of the subordinated liabilities may be made prior to their stated maturity without the consent of the PRA.
Undated subordinated liabilities
Group
2019 2018
First call date £m £m
10.0625% Exchangeable capital securities n/a 205 205
7.375% 20 Year Step-up perpetual callable subordinated notes 2020 15 16
7.125% 30 Year Step-up perpetual callable subordinated notes 2030 361 353
581 574
In common with other debt securities issued by Santander UK group companies and notwithstanding the issuer’s first call dates in the table above, in the event of certain tax changes affecting the treatment of payments of interest on subordinated liabilities in the UK, the 7.375% 20 Year Step-up perpetual callable subordinated notes and the 7.125% 30 Year Step-up perpetual callable subordinated notes are redeemable at any time, and the 10.0625% Exchangeable capital securities are redeemable on any interest payment date – each in whole at the option of Santander UK plc, at their principal amount together with any accrued interest.
The 10.0625% Exchangeable capital securities are exchangeable into fully paid 10.375% non-cumulative non-redeemable sterling preference shares of £1 each, at the option of Santander UK plc, on the business day immediately following any interest payment date.
Dated subordinated liabilities
Group
2019 2018
Maturity £m £m
5% Subordinated notes (US$1,500m) 2023 1,132 1,173
4.75% Subordinated notes (US$1,000m) 2025 763 791
7.95% Subordinated notes (US$1,000m) 2029 280 278
6.50% Subordinated notes 2030 40 38
5.875% Subordinated notes 2031 9 9
5.625% Subordinated notes (US$500m) 2045 379 394
2,603 2,683
The dated subordinated liabilities are redeemable in whole at the option of Santander UK plc in the event of certain tax changes affecting the treatment of payments of interest on the subordinated liabilities in the UK, at their principal amount together with any accrued interest.
Each of the subordinated liabilities issued by Santander UK Group Holdings plc has been downstreamed to Santander UK plc by means of Santander UK plc issuing equivalent subordinated liabilities to Santander UK Group Holdings plc.
219Santander UK Group Holdings plc

Annual Report 2019 | Financial statements
220 Santander UK Group Holdings plc
27. PROVISIONS
Group
Conduct remediation
PPI Other products FSCS and
Bank Levy Property Off–balance
sheet ECL Regulatory and other Total
£m £m £m £m £m £m £m
At 31 December 2018 246 30 44 40 56 99 515
Adoption of IFRS 16 (see Note 1) – – – 17 – – 17
At 1 January 2019 246 30 44 57 56 99 532
Additional provisions (see Note 8) 169 – 87 44 22 166 488
Provisions released (see Note 8) – – (5) (21) – (3) (29)
Utilisation and other(1) (226) (5) (90) (19) – (86) (426)
Recharge(2) – – 12 – – – 12
At 31 December 2019 189 25 48 61 78 176 577
To be settled:
– Within 12 months 189 18 48 45 78 172 550
– In more than 12 months – 7 – 16 – 4 27
189 25 48 61 78 176 577 (1) Utilisation and other included a transfer from ‘PPI’ to ‘Regulatory and other’ in respect of an ongoing legal dispute. No further information has been provided on the basis it would be seriously prejudicial. (2) This relates to a recharge in respect of the UK Bank Levy paid on behalf of other UK entities of Banco Santander SA.
a) Conduct remediation The amounts in respect of conduct remediation comprise the estimated cost of making redress payments, including related costs, with respect to the past sales or administration of products. The provision for conduct remediation represents management’s best estimate of the anticipated costs of related customer contact and/or redress, including related costs.
(i) Payment Protection Insurance (PPI) The FCA set a deadline of 29 August 2019 for PPI complaints and delivered a nationwide communications campaign to raise awareness of this deadline among consumers. In line with industry experience, we received unprecedented volumes of information requests in August 2019 and saw a significant spike in both these requests and complaints in the final days prior to the complaint deadline, with the processing of these claims ongoing.
PPI assumptions A provision for conduct remediation has been recognised to represent management’s best estimate of Santander UK’s liability in respect of misselling of PPI policies.
Given the passing of the FCA’s August 2019 time bar, the level of judgment required by management in determining appropriate assumptions has reduced. At 31 December 2019, the key assumption in calculating the provision was around the estimated number of customer complaints that would be received in respect of customers with successful information requests that were still eligible to submit a complaint.
The uphold rates are informed by historical experience and the average cost of redress can be predicted reasonably accurately given that management is dealing with a high volume and reasonably homogenous population.
Cumulative complaints from the inception of the PPI complaints process to 31 December 2019, regardless of the likelihood of Santander UK incurring a liability and including the specific PPI portfolio of complaints referred to below, were 3.5m. This includes c.327,000 that were still being reviewed. Future expected claims were c.49,000. For every additional 10,000 inbound PPI complaints, we would expect an additional charge in the order of £4m.
2019 compared to 2018 In 2019, we charged an additional £169m in respect of PPI: – In Q2 2019 we reported an additional provision of £70m reflecting an increase in PPI claim volumes, additional industry activities and having considered guidance
provided by the FCA and our specific approach to PPI claims, in advance of the PPI claims deadline on 29 August 2019. – In Q3 2019, and in line with industry experience, we received unprecedented volumes of information requests in August 2019 and saw a significant spike in both
these requests and complaints in the final days prior to the complaint deadline. Our best estimate of the additional provision required was £99m.
(ii) Other products A provision for conduct remediation has also been recognised in respect of sales of other products. A number of uncertainties remain as to the eventual costs with respect to conduct remediation in respect of these products given the inherent difficulties in determining the number of customers involved and the amount of any redress to be provided to them.
The remaining provision for other conduct was £25m (2018: £30m), which primarily related to the sale of interest rate derivatives.
Santander UK Group Holdings plc220
Annual Report 2019 | Financial statements

Santander UK Group Holdings plc 221
Strategic report Governance Risk review Financial review Financial statements Shareholder information
Notes to the
financial statements
b) Financial Services Compensation Scheme (FSCS) and Bank Levy (i) FSCS The FSCS is the UK’s independent statutory compensation fund for customers of authorised financial services firms and pays compensation if a firm is unable to pay claims against it. The FSCS is funded by levies on the industry (and recoveries and borrowings where appropriate).
Following the default of a number of deposit takers since 2008, the FSCS borrowed funds from HM Treasury to meet the compensation costs for customers of those firms. The remaining debt due to the FSCS, that related to the failure of Bradford & Bingley plc, has now been repaid. This has enabled the FSCS to make a corresponding repayment of the balance of its loan to HM Treasury. As a result, the opening provision of £4m was released in 2019 (2018: £4m release, 2017: £1m charge), to bring the balance to £nil (2018: £4m).
(ii) UK Bank Levy In addition to changes in UK corporation tax rates, Finance (No.2) Act 2015 reduced the UK Bank Levy rate from 0.21% via subsequent annual reductions to 0.10% from 1 January 2021. As a result, a rate of 0.15% applies for 2019 (2018: 0.16%). The cost of the UK Bank Levy for 2019 was £87m (2018: £69m, 2017: £92m). The Santander UK group paid £90m in 2019 (2018: £86m) and provided for a liability of £48m at 31 December 2019 (2018: £40m).
c) Property Property provisions include vacant property provisions and property dilapidation provisions for leased properties within the scope of IFRS 16. Vacant property provisions are made by reference to an estimate of any expected sub-let income, compared to the head rent, and the possibility of disposing of Santander UK’s interest in the lease, taking into account conditions in the property market. These provisions are reassessed on a semi-annual basis and will normally run off over the period of the leases concerned. Where a property is disposed of earlier than anticipated, any remaining provision relating to that property is released.
Property provisions were impacted by £40m of transformation charges in 2019. These relate to a multi-year project to deliver on our strategic priorities and enhance efficiency in order for us to better serve our customers and meet our medium-term targets. These charges largely related to restructuring of our branch network associated with the announcement made in 2019.
d) Off-balance sheet ECL Provisions include expected credit losses relating to guarantees given to third parties and undrawn loan commitments.
e) Regulatory and other Regulatory and other provisions principally comprised amounts in respect of regulatory charges (including fines), operational loss and operational risk provisions, restructuring charges and litigation and related expenses. A number of uncertainties exist with respect to these provisions given the uncertainties inherent in operational, restructuring and litigation matters that affect the amount and timing of any potential outflows with respect to which provisions have been established. These provisions are reviewed at least quarterly.
At 31 December 2019 the balance included an amount of £68m (2018: £58m) that arose from a systems related historical issue identified by Santander UK, relating to compliance with certain requirements of the Consumer Credit Act. This provision is based on detailed reviews of relevant systems related to consumer credit business operations, supported by external legal and regulatory advice, and reflects our best estimate at 31 December 2019 of potential costs in respect of the identified issue. As detailed in Note 29, there are aspects of the issue which remain under review.
The balance also included an amount in respect of our best estimate of liability relating to a legal dispute regarding allocation of responsibility for a specific PPI portfolio of complaints, further described in Note 29. No further information regarding the best estimate is provided on the basis that it would be seriously prejudicial to Santander UK’s interests in connection with the dispute.
Regulatory and other provisions charged in 2019 included £65m of transformation charges in 2019, relating to the multi-year project described above in ‘c) Property’. In addition to charges largely related to the restructuring of our branch network, further charges were largely associated with the announced plans to reshape our Corporate & Commercial Banking business. Regulatory and other provisions charged in 2019 also included £68m of operational loss and operational risk provisions.
221Santander UK Group Holdings plc

Annual Report 2019 | Financial statements
222 Santander UK Group Holdings plc
28. RETIREMENT BENEFIT PLANS
The amounts recognised in the balance sheet were as follows:
Group
2019 2018
£m £m
Assets/(liabilities)
Funded defined benefit pension scheme – surplus 670 842
Funded defined benefit pension scheme – deficit (239) (76)
Unfunded pension and post retirement medical benefits (41) (39)
Total net assets 390 727
Remeasurement losses/(gains) recognised in other comprehensive income during the year were as follows:
Group
2019 2018 2017 £m £m £m
Pension remeasurement 523 (469) 103
a) Defined contribution pension plans The Santander UK group operates a number of defined contribution pension plans. The assets of the defined contribution pension plans are held and administered separately from those of the Santander UK group. The majority of employees are members of a defined contribution Master Trust, LifeSight. This Master Trust is the plan into which eligible employees are enrolled automatically. The assets of the LifeSight Master Trust are held in separate trustee-administered funds.
An expense of £67m (2018: £66m, 2017: £54m) was recognised for defined contribution plans in the year and is included in staff costs classified within operating expenses (see Note 6). None of this amount was recognised in respect of key management personnel for the years ended 31 December 2019, 2018 and 2017.
b) Defined benefit pension schemes The Santander UK group operates a number of defined benefit pension schemes. The main scheme is the Santander (UK) Group Pension Scheme (the Scheme). It comprises seven legally segregated sections. The Scheme covers 11% (2018: 13%) of the Santander UK group’s current employees and is a funded defined benefit scheme which is closed to new members.
The corporate trustee of the Scheme is Santander (UK) Group Pension Scheme Trustees Limited (the Trustee), a private limited company incorporated in 1996 and a wholly-owned subsidiary of Santander UK Group Holdings plc. The principal duty of the Trustee is to act in the best interests of the members of the Scheme. The Trustee board comprises five (2018: six) Directors selected by Santander UK Group Holdings plc, plus five (2018: six) member-nominated Directors selected from eligible members who apply for the role.
The assets of the funded schemes including the Scheme are held independently of the Santander UK group’s assets in separate trustee administered funds. Investment strategy across the sections of the Scheme remains under regular review. Investment decisions are delegated by the Trustee to a common investment fund, managed by Santander (CF Trustee) Limited, a private limited company owned by five Trustee directors, three appointed by Santander UK plc and two by the Trustee. The Santander (CF Trustee) Limited directors’ principal duty, within the investment powers delegated to them, is to act in the best interest of the members of the Scheme. Ultimate responsibility for investment policy and strategy rests with the Trustee of the Scheme who is required under the Pensions Act 2004 to prepare a statement of investment principles. The defined benefit pension schemes expose the Santander UK group to risks such as investment risk, interest rate risk, longevity risk and inflation risk. The Santander UK group does not hold material insurance policies over the defined benefit pension schemes and has not entered into any significant transactions with them.
Formal actuarial valuations of the assets and liabilities of the defined benefit schemes are carried out on at least a triennial basis by independent professionally-qualified actuaries and valued for accounting purposes at each balance sheet date. Each scheme’s trustee is responsible for the actuarial valuations and in doing so considers, or relies in part on, a report of a third-party expert. The latest formal actuarial valuation for the Scheme at 31 March 2019 was finalised in August 2019, with a deficit to be funded of £1,136m. The next triennial funding valuation will be at 31 March 2022. Any funding surpluses can be recovered by Santander UK plc from the Scheme through refunds as the Scheme is run off over time or could be used to pay for the cost of benefits which are accruing.
The total amount charged to the income statement was as follows:
Group
2019 2018 2017
£m £m £m
Net interest income (24) (7) (5)
Current service cost 34 41 31
Past service and GMP costs 1 41 1
Administration costs 8 8 8
19 83 35
On 26 October 2018, the High Court handed down a judgement concluding that defined benefit schemes should equalise pension benefits for men and women in relation to GMP and concluded on the methods that were appropriate. The estimated increase in liabilities at the date of the judgement was £40m and was based on a number of assumptions and the actual impact may be different. This was reflected in the income statement and in the closing net accounting surplus of the Scheme in 2018. The allowance included in the Scheme liabilities at 31 December 2019 increased by £5m to £45m (2018: £40m) to reflect the latest assumptions. This change was recognised in other comprehensive income. We continue to await implementation guidance on the judgement from the UK Government and HMRC.
Santander UK Group Holdings plc222
Annual Report 2019 | Financial statements

Santander UK Group Holdings plc 223
Strategic report Governance Risk review Financial review Financial statements Shareholder information
Notes to the
financial statements
The amounts recognised in other comprehensive income were as follows:
Group
2019 2018 2017
£m £m £m
Return on plan assets (excluding amounts included in net interest expense) (873) 246 (435)
Actuarial losses/(gains) arising from changes in demographic assumptions 42 (56) (151)
Actuarial (gains)/losses arising from experience adjustments (40) 15 (11)
Actuarial losses/(gains) arising from changes in financial assumptions 1,394 (674) 700
Pension remeasurement 523 (469) 103
Movements in the present value of defined benefit scheme obligations were as follows:
Group
2019 2018
£m £m
At 1 January (10,805) (11,583)
Current service cost paid by Santander UK plc (22) (27)
Current service cost paid by other subsidiaries (12) (14)
Current service cost paid by fellow Banco Santander subsidiaries – –
Interest cost (308) (282)
Employer salary sacrifice contributions (8) (6)
Past service cost (1) (1)
GMP equalisation cost – (40)
Remeasurement due to actuarial movements arising from:
– Changes in demographic assumptions (42) 56
– Experience adjustments 40 (15)
– Changes in financial assumptions (1,394) 674
Benefits paid 387 433
At 31 December (12,165) (10,805)
Movements in the fair value of the schemes’ assets were as follows:
Group
2019 2018
£m £m
At 1 January 11,532 11,746
Interest income 332 289
Contributions paid by employer and scheme members 213 184
Contributions paid by fellow Banco Santander subsidiaries – –
Administration costs paid (8) (8)
Return on plan assets (excluding amounts included in net interest expense) 873 (246)
Benefits paid (387) (433)
At 31 December 12,555 11,532
223Santander UK Group Holdings plc

Annual Report 2019 | Financial statements
224 Santander UK Group Holdings plc
The composition and fair value of the schemes’ assets by category was:
Group
Quoted prices in active markets
Prices not quoted in active markets
Total
2019 £m % £m % £m %
UK equities 128 1 – – 128 1
Overseas equities 1,742 14 933 7 2,675 21
Corporate bonds 1,333 11 444 4 1,777 15
Government fixed interest bonds 2,710 22 – – 2,710 22
Government index–linked bonds 4,543 35 – – 4,543 35
Property – – 1,332 11 1,332 11
Derivatives – – 94 1 94 1
Cash – – 984 8 984 8
Repurchase agreements(1) – – (3,263) (26) (3,263) (26)
Other – – 1,575 12 1,575 12
10,456 83 2,099 17 12,555 100
2018
UK equities 159 1
– –
159 1
Overseas equities 1,854 16
878 8
2,732 24
Corporate bonds 1,536 13
311 3
1,847 16
Government fixed interest bonds 2,636 23
– –
2,636 23
Government index–linked bonds 4,248 37
– –
4,248 37
Property – –
1,143 10
1,143 10
Derivatives – –
65 –
65 –
Cash – –
662 6
662 6
Repurchase agreements(1) – –
(2,981) (26)
(2,981) (26)
Other – –
1,021 9
1,021 9
10,433 90 1,099 10 11,532 100 (1) Sale and repurchase agreements net of purchase and resale agreements.
Scheme assets are stated at fair value based upon quoted prices in active markets except for property, property funds, derivatives, private equity and those classified under ‘Other’. The ‘Other’ category includes of asset-backed securities, annuities and hedge funds. The property funds were valued using market valuations prepared by an independent expert. Investments in absolute return funds that are included in the ‘Other’ category, and investments in foreign exchange, inflation, equity and interest rate derivatives that are included in the ‘Derivatives’ category, were valued by investment managers by reference to market observable data. Private equity funds were valued by reference to their latest published accounts whilst the insured annuities were valued by actuaries based on the liabilities insured.
A strategy is in place to manage interest rate and inflation risk relating to the liabilities. The Scheme also has in place an equity collar to manage equity risk and hedges a proportion of its foreign exchange exposure to manage currency risk. At 31 December 2019, the equity collar had a notional value of £1,560m (2018: £1,795m) and the currency futures had a notional value of £2,079m (2018: £2,112m). In 2018, the level of interest rate hedging in the Scheme was increased, and the Scheme moved from using LIBOR-based instruments to gilt-backed instruments, including through the use of total return swaps and repurchase agreements. In addition, repurchase agreements were entered into by the Scheme over an equivalent value of Government fixed interest and index-linked bonds and are therefore included in the table above.
The Santander UK group’s pension schemes did not directly hold any equity securities of the Company or any of its related parties at 31 December 2019 and 2018. The Santander UK group’s pension scheme assets do not include any property or other assets that are occupied or used by the Santander UK group.
Funding In August 2019, in compliance with the Pensions Act 2004, the Trustee and the Santander UK group agreed to a new recovery plan in respect of the Scheme and schedule of contributions following the finalisation of the 31 March 2019 actuarial valuation. The funding target for this actuarial valuation is for the Scheme to have sufficient assets to make payments to members in respect of the accrued benefits as and when they fall due. In accordance with the terms of the Trustee agreement in place at the time, the Santander UK group contributed £203m in 2019 (2018: £176m) to the Scheme, of which £153m (2018: £123m) was in respect of agreed deficit repair contributions. The agreed schedule of the Santander UK group’s remaining contributions to the Scheme broadly comprises contributions of £187m each year from 30 September 2019 to 31 March 2026. In addition, the Santander UK group has agreed to pay further contingent contributions should the funding position have fallen behind plan.
Santander UK Group Holdings plc224
Annual Report 2019 | Financial statements

Santander UK Group Holdings plc 225
Strategic report Governance Risk review Financial review Financial statements Shareholder information
Notes to the financial statements
Actuarial assumptions The principal actuarial assumptions used for the defined benefit schemes were:
Group
2019 2018 2017
% % %
To determine benefit obligations:
– Discount rate for scheme liabilities 2.1 2.9 2.5
– General price inflation 3.0 3.2 3.2
– General salary increase 1.0 1.0 1.0
– Expected rate of pension increase 2.9 2.9 2.9
Years Years Years
Longevity at 60 for current pensioners, on the valuation date:
– Males 27.3 27.3 27.4
– Females 29.8 30.1 30.1
Longevity at 60 for future pensioners currently aged 40, on the valuation date:
– Males 28.9 28.7 28.9
– Females 31.3 31.6 31.7
Discount rate for scheme liabilities The rate used to discount the retirement benefit obligation for accounting purposes is based on the annual yield at the balance sheet date of high-quality corporate bonds on that date. There are only a limited number of higher quality Sterling-denominated corporate bonds, particularly those that are longer-dated. Therefore, in order to set a suitable discount rate, we need to construct a corporate bond yield curve. The model which we use for constructing the curve uses corporate bond data but excludes most convertible and asset-backed bonds. The curve is then constructed from this data by extrapolating the horizontal forward curve from 30 years, with the level of this forward rate being the average of the fitted forward rates over the 15 to 30 year range. When considering an appropriate assumption, we project forward the expected cash flows of the Scheme and adopt a single equivalent cash flow weighted discount rate, subject to management judgement.
General price inflation Consistent with our discount rate methodology, we set the inflation assumption using the expected cash flows of the Scheme, fitting them to an inflation curve to give a weighted average inflation assumption. We then deduct an inflation risk premium to reflect the compensation holders of fixed rate instruments expect to receive for taking on the inflation risk. This premium is subject to a cap, to better reflect management’s view of inflation expectations.
General salary increase From 1 March 2015, a cap on pensionable pay increases of 1% each year was applied to staff in the Scheme.
Expected rate of pension increase The pension increase assumption methodology uses a stochastic model, which is calibrated to consider both the observed historical volatility term structure and derivative pricing. The model allows for the likelihood that high or low inflation in one-year feeds into inflation remaining high or low in the next year.
Mortality assumptions The mortality assumptions are based on an independent analysis of the Scheme’s actual mortality experience, carried out as part of the triennial actuarial valuation, together with recent evidence from the Continuous Mortality Investigation. An allowance is then made for expected future improvements to life expectancy based on the Continuous Mortality Investigation Tables. Following this review the S3 Medium all pensioner mortality table was adopted with appropriate adjustments to reflect the actual mortality experience. For future improvements, the CMI 2018 projection model was adopted, with model parameters selected having had regard to the Scheme’s membership profile with an initial addition to improvements of 0.15% per annum, together with a long-term rate of future improvements to life expectancy of 1.25% for male and female members. Both of these are published by the Continuous Mortality Investigation.
In 2019, the methodology for setting the demographic assumptions was changed to better represent current expectations, following a review carried out by the Trustee as part of the 2019 triennial valuation and a separate review conducted on early retirement experience. These reviews resulted in changes in the assumptions for commutation, family statistics and early retirement, in addition to the changes described above for mortality. At 31 December 2019, these changes combined had a negative impact of £44m on the accounting surplus.
Actuarial assumption sensitivities The sensitivity analyses below have been determined based on reasonably possible changes of the respective assumptions occurring at the end of the reporting period, while holding all other assumptions constant.
(Decrease)/increase
Change in pension obligation at year-end from 2019 2018
Assumption £m £m
Discount rate 25 bps increase (564) (483)
General price inflation 25 bps increase 407 350
Mortality Each additional year of longevity assumed 419 335
The sensitivity analysis presented above may not be representative of the actual change in the defined benefit obligation as it is unlikely that the changes in assumptions would occur in isolation of one another as some of the assumptions may be correlated. Furthermore, in presenting the sensitivity analysis, the present value of the defined benefit obligation has been calculated using the projected unit credit method at the end of the reporting period, which is the same method used to calculate the defined benefit obligation recognised in the balance sheet. There were no changes in the methods and assumptions used in preparing the sensitivity analyses from prior years.
225Santander UK Group Holdings plc

Annual Report 2019 | Financial statements
226 Santander UK Group Holdings plc
The benefits expected to be paid in each of the next five years, and in the aggregate for the five years thereafter are:
Year ending 31 December £m
2020 332
2021 308
2022 330
2023 343
2024 364
Five years ending 2029 2,083
The average duration of the defined benefit obligation at 31 December 2019 was 18.8 years (2018: 19.1 years).
29. CONTINGENT LIABILITIES AND COMMITMENTS
Group
2019 2018
£m £m
Guarantees given to third parties 1,198 1,611
Formal standby facilities, credit lines and other commitments with original term to maturity of:
– One year or less 18,256 8,560
– Later than one year 22,154 31,566
41,608 41,737 For segmental and credit risk staging analysis relating to off-balance sheet exposures, see the credit quality table in the ‘Santander UK group level – credit risk review’ section.
At 31 December 2019, the Santander UK group had credit impairment loss provisions relating to guarantees given to third parties and undrawn loan commitments. See Note 27 for further details. For segmental and credit risk staging analysis relating to off-balance sheet exposures, see the credit quality table in the ‘Santander UK group level – credit risk review’ section.
Where the items set out below can be reliably estimated, they are disclosed in the table above.
Capital support arrangements
From 1 January 2019, following the implementation of ring-fencing, Santander UK plc, Cater Allen Limited and certain other non-regulated subsidiaries within the ring-fenced bank entered into a capital support deed dated 13 November 2018 (the RFB Sub-Group Capital Support Deed). The parties to the RFB Sub-Group Capital Support Deed are permitted by the PRA to form a core UK group as defined in the PRA Rulebook, a permission which will expire on 31 December 2021. Exposures of each of the regulated entities to other members of the core UK group are exempt from large exposure limits that would otherwise apply. The purpose of the RFB Sub-Group Capital Support Deed is to facilitate the prompt transfer of available capital resources from, or repayment of liabilities by, the non-regulated parties to any of the regulated parties in the event that one of the regulated parties breaches or is at risk of breaching its capital resources requirements or risk concentrations requirements.
Prior to 1 January 2019, Santander UK plc, SFS and Cater Allen Limited, which are the PRA-regulated entities within the Santander UK Group Holdings plc group, were party to a capital support deed dated 23 December 2015 (the Capital Support Deed 2015) with Santander UK Group Holdings plc and certain other non-regulated subsidiaries of Santander UK plc. The core UK group permission as supported by the Capital Support Deed 2015 expired on 31 December 2018.
From 1 January 2019 as a result of ring-fencing, Santander UK Group Holdings plc, SFS and Santander Equity Investments Limited entered into a Capital Support Deed dated 13 November 2018 (the NRFB Capital Support Deed) which expires on 31 December 2021. The purpose of the Capital Support Deed is to facilitate the prompt transfer of available capital resources from, or repayment of liabilities by, the non-regulated parties to any of the regulated parties in the event that one of the regulated parties breached or was at risk of breaching its capital resources requirements or risk concentrations requirements.
Other than the change of the entities in scope, the purpose of the RFB Sub-Group Capital Support Deed and the NRFB Capital Support Deed is the same as the previous Capital Support Deed 2015.
Liquidity support arrangements
From 1 January 2019, following the implementation of ring-fencing, we monitor and manage liquidity risk for the Santander UK plc group and its former subsidiary SFS separately. Under this model, and the PRA’s liquidity rules, Santander UK plc and its subsidiary Cater Allen Limited form the RFB Domestic Liquidity Sub-group (the RFB DoLSub), which allows the entities to collectively meet regulatory requirements for the purpose of managing liquidity risk. Each member of the RFB DoLSub will support the other by transferring surplus liquidity in times of stress.
Prior to 1 January 2019, Santander UK plc, SFS and Cater Allen Limited formed the Domestic Liquidity Sub-group (the DoLSub), which allowed those entities to collectively meet regulatory liquidity requirements. The RFB DoLSub permission granted with effect from 1 January 2019 withdrew SFS from the previous DoLSub.
Guarantees given to third parties
Guarantees given to third parties consist primarily of letters of credit, bonds and guarantees granted as part of normal product facilities which are offered to customers.
Santander UK Group Holdings plc226
Annual Report 2019 | Financial statements

Santander UK Group Holdings plc 227
Strategic report Governance Risk review Financial review Financial statements Shareholder information
Notes to the
financial statements
Formal standby facilities, credit lines and other commitments
Standby facilities, credit lines and other commitments are also granted as part of normal product facilities which are offered to customers. Retail facilities comprise undrawn facilities granted on flexible mortgages, bank overdrafts and credit cards. On flexible mortgages, the credit limit is set at the point of granting the loan through property value and affordability assessments. Ongoing assessments are made to ensure that credit limits remain appropriate considering any change in the security value or the customer’s financial circumstances. For unsecured overdraft facilities and credit cards, the facilities are granted based on new business risk assessment and are reviewed more frequently based on internal, as well as external data. The delinquency status of the account would result in the withdrawal of the facility. Corporate facilities can comprise standby and revolving facilities which are subject to ongoing compliance with covenants and may require the provision of agreed security. Failure to comply with these terms can result in the withdrawal of the unutilised facility headroom.
FSCS
As described in Note 27, the Santander UK group participates in the UK’s national resolution scheme, the FSCS, and is thus subject to levies to fund the FSCS. If the FSCS significantly increase the levies to be paid by firms, the associated costs to the Santander UK group would rise.
Loan representations and warranties
In connection with the securitisations and covered bond transactions described in Note 14, the Santander UK group entities selling the relevant loans into the applicable securitisation or covered bond portfolios make representations and warranties with respect to such loans, in each case as of the date of the sale of the loans into the applicable portfolio. These representations and warranties cover, among other things, the ownership of the loan by the relevant Santander UK group entity, absence of a material breach or default by the relevant borrower under the loan, the loan’s compliance with applicable laws and absence of material disputes with respect to the relevant borrower, asset and loan. The specific representations and warranties made by Santander UK group companies which act as sellers of loans in these securitisations and covered bond transactions depend in each case on the nature of the transaction and the requirements of the transaction structure. In addition, market conditions and credit rating agency requirements may affect the representations and warranties required of the relevant Santander UK group companies in these transactions.
In the event that there is a material breach of the representations and warranties given by Santander UK plc as seller of loans under the residential mortgage-backed securitisations or the covered bond programmes included in Note 14, or if such representations and warranties prove to be materially untrue as at the date when they were given (being the sale date of the relevant mortgage loans), Santander UK plc may be required to repurchase the affected mortgage loans (generally at their outstanding principal balance plus accrued interest). These securitisations and covered bond programmes are collateralised by prime residential mortgage loans. Santander UK plc is principally a retail prime lender and has no appetite or product offering for any type of sub-prime business. In addition, Santander UK plc’s credit policy explicitly prohibits such lending.
Similarly, under the auto loan securitisations in Note 14, in the event that there is a breach or inaccuracy in respect of a representation or warranty relating to the loans, the relevant Santander UK group entity who sold the auto loans into the securitisation portfolio will be required to repurchase such loans from the structure (also at their outstanding principal balance plus accrued interest). In addition to breaches of representation and warranties, under the auto loan securitisations, the seller may also have a repurchase obligation if certain portfolio limits are breached (which include, amongst other things, limits as to the size of a loan given to an individual customer, LTV ratio, average term to maturity and average seasoning).
In the case of a repurchase of a loan from the relevant securitisation or covered bond programmes, the Santander UK group may bear any subsequent credit loss on such loan. The Santander UK group manages and monitors its securitisation and covered bond activities closely to minimise potential claims.
Other legal actions and regulatory matters
Santander UK engages in discussion, and co-operates, with the FCA, PRA, CMA and other regulators and government agencies in various jurisdictions in their supervision and review of Santander UK including reviews exercised under statutory powers, regarding its interaction with past and present customers, both as part of general thematic work and in relation to specific products, services and activities. During the ordinary course of business, Santander UK is also subject to complaints and threatened legal proceedings brought by or on behalf of current or former employees, customers, investors or other third parties, in addition to legal and regulatory reviews, challenges and tax or enforcement investigations or proceedings in various jurisdictions. All such matters are assessed periodically to determine the likelihood of Santander UK incurring a liability.
In those instances where it is concluded that it is not yet probable that a quantifiable payment will be made, for example because the facts are unclear or further time is required to fully assess the merits of the case or to reasonably quantify the expected payment, no provision is made. In addition, where it is not currently practicable to estimate the possible financial effect of these matters, no provision is made.
Payment Protection Insurance
In relation to a specific PPI portfolio of complaints, a legal dispute regarding allocation of liability is ongoing and remains in its early stages. The dispute relates to the liability for PPI mis-selling complaints relating to pre-2005 PPI policies underwritten by Financial Insurance Company Ltd (FICL) and Financial Assurance Company Ltd (FACL) and involves two Santander UK plc subsidiaries, Santander Cards UK Limited and Santander Insurance Services Limited (the Santander Entities). During the relevant period, FICL and FACL were owned by Genworth Financial International Holdings, Inc. In July 2015 AXA S.A. (AXA) acquired FICL and FACL from Genworth. In July 2017, Santander UK plc notified AXA that the Santander Entities did not accept liability for losses on PPI policies relating to this period. Santander UK plc entered into a Complaints Handling Agreement (CHA) with FICL and FACL pursuant to which it agreed to handle complaints on their behalf, and FICL and FACL agreed to pay redress assessed to be due to relevant policyholders on a without prejudice basis.
A related dispute between AXA and (1) Genworth Financial International Holdings, Inc. and (2) Genworth Financial, Inc. (Genworth) concerning, inter alia, the proper construction of an alleged obligation to make payment on demand of a sum equal to 90% of all applicable PPI mis-selling losses (the Construction Issue) in a sale and purchase agreement dated 17 September 2015 (SPA) was determined by the High Court (Court) in December 2019. The Santander Entities were joined as third parties in connection with an application for declaratory relief by Genworth. This application related to Genworth’s assertion that upon any payment to AXA under the SPA, Genworth would have rights of subrogation against the Santander Entities (the Subrogation Issue). The Court found against Genworth and in favour of AXA on the Construction Issue, and against Genworth and in favour of the Santander Entities in relation to the Subrogation Issue. In documents before the Court, AXA’s claim was stated to be £265 million as at the end of 2018, noting further significantly larger sums would be demanded. During the Court hearing in November 2019, AXA noted that it had sought further sums, bringing the outstanding sum of its claim against Genworth to around £350 million at that time, with such figure likely to increase significantly.
Genworth’s application for permission to appeal was refused by the Court. Genworth made an application for permission to appeal to the Court of Appeal on 10 January 2020. The application for permission to appeal has not yet been determined. Most recently in its US SEC filing of 27 February 2020, Genworth noted that AXA had at that date submitted invoices claiming aggregate losses of approximately US$560 million.
More generally, there are ongoing factual issues to be resolved which may have legal consequences including in relation to liability. These issues create uncertainties which mean that it is not currently practicable to reliably predict the resolution of the matter including timing or the significance of the possible impact.
227Santander UK Group Holdings plc

Annual Report 2019 | Financial statements
228 Santander UK Group Holdings plc
The Regulatory and other provision in Note 27 includes our best estimate of Santander UK’s liability to the specific portfolio. Further information has not been provided on the basis that it would be seriously prejudicial to Santander UK’s interests in connection with the dispute.
In addition, and in relation to PPI more generally, there are legal claims being made by Claims Management Companies challenging the FCA’s industry guidance on the treatment of Plevin /recurring non-disclosure assessments. No provision has been made as it is not possible to make a reliable estimate of the possible outflow of economic resource relating to this risk.
German dividend tax arbitrage transactions In June 2018 the Cologne Criminal Prosecution Office and the German Federal Tax Office commenced an investigation in relation to the historical involvement of Santander UK plc, Santander Financial Services plc and Cater Allen International Limited (all subsidiaries of Santander UK Group Holdings plc) in German dividend tax arbitrage transactions (known as cum/ex transactions). These transactions allegedly exploited a feature of a specific German settlement mechanism through short-selling and complex derivative structuring which resulted in the German government either refunding withholding tax where such tax had not been paid or refunding it more than once. The German authorities are investigating numerous institutions and individuals in connection with alleged transactions and practices which may be found to be illegal under German law.
During 2019 we have continued to cooperate with the German authorities and, with the assistance of external experts, to progress an internal investigation into the matters in question. From Santander UK plc’s perspective the investigation is focused principally on the period 2009-2011 and remains on-going. There remain factual issues to be resolved which may have legal consequences including potentially material financial penalties. These issues create uncertainties which mean that it is difficult to predict the resolution of the matter including timing or the significance of the possible impact.
Consumer credit
The Santander UK group’s unsecured lending and other consumer credit business is governed by consumer credit law and related regulations, including the CCA. Claims brought by customers in relation to these requirements, including potential breaches, could result in costs to the Santander UK group where such potential breaches are not found to be de minimis. The CCA includes very detailed and prescriptive requirements for lenders, including in relation to post contractual information.
As described in Note 27, other provisions include an amount of £68m arising from a systems-related historical issue identified by Santander UK, relating to compliance with certain requirements of the CCA. This provision has been based on detailed reviews of relevant systems related to consumer credit business operations, supported by external legal and regulatory advice. Reviews of systems, commercial agreements and the legal and regulatory position are ongoing, such that the potential for additional remedial action is still being determined. The Regulatory and other provision in Note 27 includes our best estimate of Santander UK’s liability for the specific issue. The actual cost of customer compensation could differ from the amount provided. It is not currently practicable to provide an estimate of the risk and amount of any further financial impact.
Taxation
The Santander UK group engages in discussion, and co-operates, with HM Revenue & Customs (HMRC) in their oversight of the Santander UK group’s tax matters. The Santander UK group adopted the UK’s Code of Practice on Taxation for Banks in 2010.
Certain leases in which the Santander UK group is or was the lessor are currently under review by HMRC in connection with claims for tax allowances. Under the terms of the lease agreements, the Santander UK group is fully indemnified in all material respects by the respective lessees for any liability arising from the disallowance of tax allowances plus accrued interest, which could be up to £146m. Whilst legal opinions have been obtained to support the Santander UK group’s position, the matter remains uncertain pending formal resolution with HMRC and any subsequent litigation. It is anticipated that the matters will move to formal litigation in 2020 as required under the terms of the leases.
Other
On 2 November 2015, Visa Europe Ltd agreed to sell 100% of its share capital to Visa Inc. The deal closed on 21 June 2016. As a member and shareholder of Visa Europe Ltd, Santander UK received upfront consideration made up of cash and convertible preferred stock. Conversion of the preferred stock into Class A Common Stock of Visa Inc. depends on the outcome of litigation against Visa involving UK & Ireland (UK&I) multilateral interchange fees (MIFs). Santander UK and certain other UK&I banks have agreed to indemnify Visa Inc. in the event that the preferred stock is insufficient to meet the costs of this litigation. Visa Inc. has recourse to this indemnity once more than €1bn of losses relating to UK&I MIFs have arisen or once the total value of the preferred stock issued to UK&I banks on closing has been reduced to nil. In valuing the preferred stock, Santander UK makes adjustments for illiquidity and the potential for changes in conversion. Visa Inc. may have recourse to a general indemnity in place under Visa Europe Operating Regulations for damages not satisfied through the above mechanism.
As part of the sale of subsidiaries, businesses and other entities, and as is normal in such circumstances, Santander UK has given warranties and indemnities to the purchasers.
Obligations under stock borrowing and lending agreements
Obligations under stock borrowing and lending agreements represent contractual commitments to return stock borrowed. These obligations are offset by a contractual right to receive stock under other contractual agreements. See Note 34.
Other off-balance sheet commitments
The Santander UK group has commitments to lend at fixed interest rates which expose us to interest rate risk. For more, see the Risk review.
Santander UK Group Holdings plc228
Annual Report 2019 | Financial statements

Santander UK Group Holdings plc 229
Strategic report Governance Risk review Financial review Financial statements Shareholder information
Notes to the
financial statements
Operating lease commitments
The table below shows the rental commitments under non-cancellable operating leases at 31 December 2018. Following the application of IFRS 16 at 1 January 2019, Santander UK now recognises a lease liability on the balance sheet to represent its obligation to make lease payments. For more information, including a reconciliation of operating lease commitments at 31 December 2018 to lease liabilities recognised at 1 January 2019, see Note 1.
Group
Rental commitments under non-cancellable operating leases
2018
£m
Not later than one year 73
Later than one year and not later than five years 114
Later than five years 60
247
The majority of leases are subject to a third party outsourcing contract which expires in December 2020 and the remainder are held directly by the Santander UK group with third party landlords. Where leases subject to the outsourcing contract expire on or after the expiry of the outsourcing contract in December 2020 and occupation is still required, negotiations will be held directly with the landlords of these properties, to agree renewal terms. Negotiations will be in accordance with a conventional landlord and tenant negotiation on lease expiry, subject to a lease renewal being available from the external landlords. Where a freehold interest in the property is held by the outsourcing company, a notice has been served under the contract confirming the properties where a new lease is required post-2020. The terms for the leases of these properties will also be negotiated during 2020. In 2018, rental expense amounted to £61m (2017: £61m), including minimum rentals of £63m (2017: £61m), offset by sub-lease rental income of £2m (2017: £nil). There was no contingent rent expense included in this amount.
30. SHARE CAPITAL
Group
Ordinary shares
of £1 each
Issued and fully paid share capital No. £m
At 31 December 2018, 1 January 2019 and 31 December 2019 7,060,000,000 7,060
31. OTHER EQUITY INSTRUMENTS
Group
Interest rate 2019 2018
% Next call date £m £m
AT1 securities:
– £500m Fixed Rate Reset Perpetual AT1 Capital Securities 6.75 June 2024 496 496
– £750m Fixed Rate Reset Perpetual AT1 Capital Securities 7.375 June 2022 745 745
– £300m Fixed Rate Reset Perpetual AT1 Capital Securities 7.60 n/a – 300
– £500m Fixed Rate Reset Perpetual AT1 Capital Securities 5.33 March 2020 500 500
– £500m Fixed Rate Reset Perpetual AT1 Capital Securities 6.30 March 2025 500 –
2,241 2,041
229Santander UK Group Holdings plc

Annual Report 2019 | Financial statements
230 Santander UK Group Holdings plc
AT1 securities The securities are perpetual and pay a distribution on 24 March, June, September and December. At each distribution payment date, the Company can decide whether to pay the distribution, which is non-cumulative, in whole or in part. The distribution rate resets every five years. The securities will be automatically written down and the investors will lose their entire investment in the securities should the CET1 capital ratio of the Santander UK prudential consolidation group fall below 7%. They are redeemable at the option of the Company on their first call date or on any reset date thereafter in the cases of the 6.75% and 7.375% Fixed Rate Reset Perpetual AT1 Capital Securities, and on any distribution payment date thereafter in the cases of the 5.33% and 6.30% Fixed Rate Reset Perpetual AT1 Capital Securities. No such redemption may be made without the consent of the PRA.
The £500m 5.33% Fixed Rate Reset Perpetual AT1 Capital Securities and the £500m 6.30% Fixed Rate Reset Perpetual AT1 Capital Securities were fully subscribed by the Company’s immediate parent company, Banco Santander SA. £100m of the £750m 7.375% Fixed Rate Reset Perpetual AT1 Capital Securities were subscribed by Banco Santander SA.
In August 2019, as part of a capital management exercise, the Company purchased and redeemed the £300m 7.60% Fixed Rate Reset Perpetual AT1 Capital Securities, and issued a further £500m 6.30% Fixed Rate Reset Perpetual AT1 Capital Securities to Banco Santander SA.
32. NON-CONTROLLING INTERESTS
Initial interest rate 2019 2018 % First call date £m £m
Santander UK plc issued:
– £300m Fixed/Floating Rate Non-Cumulative Callable Preference Shares 6.222 May 2019 – 14
– £300m Step-up Callable Perpetual Reserve Capital Instruments 7.037 February 2026 235 235
PSA Finance UK Limited 160 151
395 400
Fixed/Floating Rate Non-Cumulative Callable Preference Shares These shares entitled the holders to a fixed non-cumulative dividend, at the discretion of Santander UK plc, of 6.222% per annum payable annually from 24 May 2010 until 24 May 2019 and quarterly thereafter at a rate of 1.13% per annum above three month sterling LIBOR. The remaining preference shares were redeemed at the option of Santander UK plc on 24 May 2019.
Step-up Callable Perpetual Reserve Capital Instruments These instruments are redeemable by Santander UK plc on 14 February 2026 or on any coupon payment date thereafter, subject to the prior approval of the PRA. They are perpetual and pay interest annually. The coupon rate resets every five years, based on the UK five-year benchmark gilt rate. Interest payments may be deferred by Santander UK plc. The instruments are not redeemable at the option of the holders and the holders do not have any rights against other Santander UK group companies.
PSA Finance UK Limited PSA Finance UK Limited is the only subsidiary in the Santander UK group that gives rise to significant non-controlling interests. See Note 19 for summarised financial information of PSA Finance UK Limited.
Santander UK Group Holdings plc230
Annual Report 2019 | Financial statements

Santander UK Group Holdings plc 231
Strategic report Governance Risk review Financial review Financial statements Shareholder information
Notes to the
financial statements
33. CHANGES IN LIABILITIES ARISING FROM FINANCING ACTIVITIES
The table below shows the changes in liabilities arising from financing activities.
Group
2019 2018
Balance sheet line item Balance sheet line item
Debt securities
in issue Subordinated
liabilities Other equity
instruments Dividends
paid Total
Debt securities
in issue Subordinated
liabilities
Other equity
instruments Dividends
paid Total
£m £m £m £m £m £m £m £m £m £m
At 1 January 55,906 3,601 2,041 – 61,548 48,860 3,793 2,041 – 54,694
Cash flows from financing activities (3,839) – 196 (434) (4,077) 7,272 (277) – (1,308) 5,687
Cash flows from operating activities (548) – – – (548) (2,760) (2) – – (2,762)
Non–cash changes: – Unrealised foreign exchange (1,647) (94) – – (1,741) (2,085) 149 – – (1,936)
– Other changes 299 21 4 434 758 4,619 (62) – 1,308 5,865
At 31 December 50,171 3,528 2,241 – 55,940 55,906 3,601 2,041 – 61,548 34. ASSETS CHARGED AS SECURITY FOR LIABILITIES AND COLLATERAL ACCEPTED
AS SECURITY FOR ASSETS
The following transactions are conducted under terms that are usual and customary to collateralised transactions including, where relevant, standard securities lending and repurchase agreements.
a) Assets charged as security for liabilities The financial assets below are analysed between those assets accounted for on-balance sheet and off-balance sheet.
Group
2019 2018
£m £m
On-balance sheet:
Cash and balances at central banks 1,080 1,080
Loans and advances to banks 615 402
Loans and advances to customers – securitisations and covered bonds (See Note 14) 36,225 35,694
Loans and advances to customers – other 16,315 16,402
Other financial assets at amortised cost 3,026 3,763
Financial assets at fair value through other comprehensive income 6,020 5,825
Total on–balance sheet 63,281 63,166
Total off-balance sheet 15,111 15,221
The Santander UK group provides assets as collateral in the following areas of the business.
Sale and repurchase agreements The Santander UK group enters into sale and repurchase agreements and similar transactions of debt securities, which are accounted for as secured borrowings. Upon entering into such transactions, the Santander UK group provides collateral in excess of the borrowed amount. The carrying amount of assets that were so provided at 31 December 2019 was £20,634m (2018: £17,485m), of which £2,067m (2018: £2,383m) was classified within ‘Loans and advances to customers – securitisations and covered bonds’ in the table above.
Securitisations and covered bonds As described in Note 14, Santander UK plc and certain of its subsidiaries issue securitisations and covered bonds. At 31 December 2019, there were £36,391m (2018: £36,195m) of gross assets in these secured programmes and £166m (2018: £501m) of these related to internally retained issuances that were available for use as collateral for liquidity purposes in the future.
At 31 December 2019, a total of £4,728m (2018: £4,039m) of notes issued under securitisation and covered bond programmes had been retained internally, a proportion of which had been used as collateral for raising funds via third party bilateral secured funding transactions, which totalled £1,581m at 31 December 2019 (2018: £1,834m), or for use as collateral for liquidity purposes in the future.
Stock borrowing and lending agreements Asset balances under stock borrowing and lending agreements represent stock lent by the Santander UK group. These balances amounted to £21,639m at 31 December 2019 (2018: £25,910m) and are offset by contractual commitments to return stock borrowed or cash received.
Derivatives business In addition to the arrangements described, collateral is also provided in the normal course of derivative business to counterparties. At 31 December 2019 £1,961m (2018: £1,681m) of such collateral in the form of cash had been provided by the Santander UK group and is included in the table.
231Santander UK Group Holdings plc

Annual Report 2019 | Financial statements
232 Santander UK Group Holdings plc
b) Collateral accepted as security for assets The collateral held as security for assets, analysed between those liabilities accounted for on balance sheet and off-balance sheet, was:
Group
2019 2018 £m £m
On-balance sheet:
Deposits by banks 2,175 4,058
Total on-balance sheet 2,175 4,058
Total off-balance sheet 25,461 23,473
Purchase and resale agreements The Santander UK group also enters into purchase and resale agreements and similar transactions of debt securities, which are accounted for as collateralised loans. Upon entering into such transactions, the Santander UK group receives collateral in excess of the loan amount. The level of collateral held is monitored daily and if required, further calls are made to ensure the market values of collateral remains at least equal to the loan balance. The subsidiaries are permitted to sell or repledge the collateral held in the absence of default. At 31 December 2019, the fair value of such collateral received was £20,444m (2018: £15,728m). Of the collateral received, almost all was sold or repledged. The subsidiaries have an obligation to return collateral that they have sold or pledged.
Stock borrowing and lending agreements Obligations representing contractual commitments to return stock borrowed by the Santander UK group amounted to £5,017m at 31 December 2019 (2018: £7,745m) and are offset by a contractual right to receive stock lent.
Derivatives business In addition to the arrangements described, collateral is also received from counterparties in the normal course of derivative business. At 31 December 2019, £2,175m (2018: £4,058m) of such collateral in the form of cash had been received by the Santander UK group and is included in the table.
Lending activities In addition to the collateral held as security for assets, the Santander UK group may obtain a charge over a customer’s property in connection with its lending activities. Details of these arrangements are set out in the ‘Credit risk’ section of the Risk review.
35. SHARE-BASED COMPENSATION
The Santander UK group operates share schemes and arrangements for eligible employees. The main current schemes are the Sharesave Schemes, the Long-Term Incentive Plan (the LTIP), the Deferred Shares Bonus Plan and the Partnership Shares scheme. All the share options and awards relate to shares in Banco Santander SA.
The amount charged to the income statement in respect of share-based payment transactions is set out in Note 6.
a) Sharesave Schemes The Santander UK group launched its twelfth HM Revenue & Customs approved Sharesave Scheme under Banco Santander SA ownership in September 2019. The first eleven Sharesave Schemes were launched each year from 2008 to 2018 under broadly similar terms. Under the Sharesave Scheme’s HMRC-approved savings limits, eligible employees may enter into contracts to save between £5 and £500 per month. For all schemes, at the end of a fixed term of three or five years after the grant date, the employees can use these savings to buy shares in Banco Santander SA at a discount, calculated in accordance with the rules of the scheme. The discount is currently 10% of the average middle market quoted price of Banco Santander SA shares over the first three dealing days prior to invitation. The vesting of awards under the scheme depends on continued employment with the Banco Santander SA group. Participants in the scheme have six months from the date of vest to exercise the option.
The table below summarises movements in the number of options, and changes in weighted average exercise price over the same period.
2019 2018
Number of options
Weighted average exercise price Number of options
Weighted average exercise price
‘000 £ ‘000 £
Outstanding at 1 January 26,838 3.12
27,201 3.12
Granted 9,594 2.83
6,210 3.46
Exercised (7,978) 2.83
(3,340) 3.16
Forfeited/expired (5,081) 3.42
(3,233) 3.76
Outstanding at 31 December 23,373 3.03 26,838 3.12
Exercisable at 31 December 2,519 3.62 10,370 2.81
The weighted average share price at the date the options were exercised was £3.18 (2018: £3.79).
Santander UK Group Holdings plc232
Annual Report 2019 | Financial statements

Santander UK Group Holdings plc 233
Strategic report Governance Risk review Financial review Financial statements Shareholder information
Notes to the
financial statements
The following table summarises the range of exercise prices and weighted average remaining contractual life of the options at 31 December 2019 and 2018.
2019 2018
Range of exercise prices
Weighted average remaining
contractual life
Weighted average
exercise price
Weighted average remaining
contractual life
Weighted average
exercise price
Years £ Years £
£2 to £3 3 2.80
2 2.75
£3 to £4 2 3.38
3 3.36
£4 to £5 2 4.13 3 4.11
The fair value of each option at the date of grant is estimated using a partial differentiation equation model. This model uses assumptions on the share price, the EUR/GBP FX rate, the risk free interest rate, dividend yields, the expected volatility of the underlying shares and the expected lives of options granted. The weighted average grant-date fair value of options granted during the year was £0.49 (2018: £0.53).
At 31 December 2019, the carrying amount of liabilities arising from share-based payment transactions in the Santander UK Group Holdings plc group was £2.4m (2018: £7.7m), of which £1.4m had vested at 31 December 2019 (2018: £0.7m).
b) LTIP In 2014 and 2015, conditional cash awards were made to certain Executive Directors, Key Management Personnel (as defined in Note 36) and other nominated individuals which are converted into shares in Banco Santander SA at the time of vesting and deferred for three years. There have been no LTIP awards granted since 2015 due to the introduction of a single variable remuneration framework across the Banco Santander group in 2016.
The LTIP plans granted in 2014 and 2015 involved a one-year performance cycle for vesting, deferred for a further three-year period dependent upon performance conditions applied. Beneficiaries were granted an initial award determined in GBP which was converted into shares in Banco Santander SA in January 2015 and January 2016 respectively based on performance over the performance cycle. The 2014 LTIP awards lapsed during 2018 due to the performance conditions not being satisfied. The 2015 LTIP vested in January 2016, was deferred over three years and was subject to performance conditions based on Banco Santander SA’s Earnings Per Share (EPS) and Return on Tangible Equity (RoTE) performance against budget. The conditions of the 2015 LTIP were met and payment was made to the remaining eligible population in March 2019 at 65.78% of the original award.
The following table summarises the movement in the value of conditional awards in the LTIPs in 2019 and 2018:
2015 LTIP 2014 LTIP
2019 2018 2019 2018
£000 £000 £000 £000
Outstanding at 1 January 6,374 6,503 – 1,910
Payments made (4,578) – – –
Forfeited/cancelled (1,796) (129) – (1,910)
Outstanding at 31 December – 6,374 – –
c) Deferred shares bonus plan Deferred bonus awards are designed to align employee performance with shareholder value and encourage increased retention of senior employees. During 2018 and 2019, conditional share awards were made to employees (designated as Material Risk Takers). Such employees receive part of their annual bonus as a deferred award comprising 50% in shares, and 50% in cash. Any deferred awards are dependent on continued employment or subject to Santander’s discretion for leavers. For 2018 and 2019 bonus awards, deferral of the award is over a three, five or seven-year period from the anniversary of the initial award. Deferred bonus awards in shares are subject to an additional one-year retention period from the point of delivery.
Material Risk Takers are required to defer either 40% or 60% of any annual bonus (40% for variable pay of less than £500,000, 60% for variable pay at or above this amount). Vesting of both deferred bonus awards and long-term bonus awards is subject to risk and performance adjustment in the event of deficient performance and prudent financial control provisions.
d) Partnership Shares scheme A Partnership Shares scheme is operated for eligible employees under the Share Incentive Plan (SIP) umbrella. Participants can choose to invest up to £1,800 per tax year (or no more than 10% of an employee’s salary for the tax year) from pre-tax salary to buy Banco Santander SA shares. Shares are held in trust for the participants. There are no vesting conditions attached to these shares, and no restrictions as to when the shares can be removed from the trust. However, if a participant chooses to sell the shares before the end of five years, they will be liable for the taxable benefit received when the shares are taken out of the trust. The shares can be released from trust after five years free of income tax and national insurance contributions. 2,396,909 shares were outstanding at 31 December 2019 (2018: 2,346,108 shares).
233Santander UK Group Holdings plc

Annual Report 2019 | Financial statements
234 Santander UK Group Holdings plc
36. TRANSACTIONS WITH DIRECTORS AND OTHER KEY MANAGEMENT PERSONNEL
The Directors of Santander UK Group Holdings plc did not receive any remuneration in respect of their services to the Company. The remuneration disclosures in these financial statements reflect their remuneration in respect of the Santander UK plc group.
a) Remuneration of Directors and Other Key Management Personnel The remuneration of the Directors and Other Key Management Personnel of the Santander UK group is set out in aggregate below.
2019 2018 2017 Directors’ remuneration £ £ £
Salaries and fees 5,045,302 5,028,434 4,406,908
Performance-related payments(1) 3,896,382 5,194,317 3,685,464
Other fixed remuneration (pension and other allowances & non-cash benefits) 1,386,439 1,467,011 1,580,321
Expenses 42,526 25,198 96,358
Total remuneration 10,370,649 11,714,960 9,769,051
2019 2018 2017 Directors' and Other Key Management Personnel compensation £ £ £
Short-term employee benefits(2) 23,238,187 24,445,189 24,642,085
Post-employment benefits(3) 3,674,772 2,399,261 2,292,857
Total Compensation 26,912,959 26,844,450 26,934,942 (1) In line with the Code, a proportion of the performance-related payment was deferred. Further details can be found in Note 35. (2) There were no buy-outs of deferred performance-related payments in 2019. 2018 and 2017 exclude grants of shares in Banco Santander SA made as buy-outs of deferred performance-related payments of shares in connection with previous
employment for five individuals (2018: 189,381; 2017: 603,614). 2018 and 2017 exclude payments made as buy-outs of deferred performance-related payments in connection with previous employment for one individual (2018: £266,667 for one individual; 2017: £52,100 for one individual).
(3) Termination payments of £1,076,435 were paid in 2019 to one key management persons (2018: £847,388 for two individuals; 2017: £nil).
In 2019, the remuneration, excluding pension contributions, of the highest paid Director, was £3,725,993 (2018: £4,635,497) of which £1,989,900 (2018: £2,317,000) was performance related. In 2019, there was no pension benefit accrued for the highest paid Director but in respect of the qualifying past services to Santander UK to 31 May 2009 he has a deferred pension benefit accruing under a defined benefit scheme of £20,973 p.a. (2018: £20,402 p.a.).
b) Retirement benefits Defined benefit pension schemes are provided to certain employees. See Note 28 for details of the schemes and the related costs and obligations. As described above, one director, being the highest paid director, has a deferred pension benefit accruing under a defined benefit scheme. Ex gratia pensions paid to former Directors of Santander UK plc in 2019, which have been provided for previously, amounted to £ 335,202 (2018: £87,300; 2017: £2,482). In 1992, the Board decided not to award any new such ex gratia pensions.
c) Transactions with Directors, Other Key Management Personnel and each of their connected persons Directors, Other Key Management Personnel (Defined as the Executive Committee of Santander UK plc who served during the year) and their connected persons have undertaken the following transactions with the Santander UK group in the ordinary course of business. 2019 2018
No. £000 No. £000
Secured loans, unsecured loans and overdrafts
At 1 January 16 3,035
7 1,216
Net movements 2 1,885
9 1,819
At 31 December 18 4,920 16 3,035
Deposit, bank and instant access accounts and investments
At 1 January 30 10,963
25 13,184
Net movements 2 1,012
5 (2,221)
At 31 December 32 11,975 30 10,963
In 2019 and 2018, no Director held any interest in the shares of any company in the Santander UK group and no Director exercised or was granted any rights to subscribe for shares in any company in the Santander UK group. In addition, in 2019 and 2018, no Directors exercised share options over shares in Banco Santander SA, the ultimate parent company of the Company.
Secured loans, unsecured loans and overdrafts are made to Directors, Other Key Management Personnel and their connected persons, in the ordinary course of business, with terms prevailing for comparable transactions and on the same terms and conditions as applicable to other employees in the Santander UK group. Such loans do not involve more than the normal risk of collectability or present any unfavourable features. Amounts deposited by Directors, Other Key Management Personnel and their connected persons earn interest at the same rates as those offered to the market or on the same terms and conditions applicable to other employees in the Santander UK group. Deposits, bank and instant access accounts and investments are entered into by Directors, Other Key Management Personnel and their connected persons on normal market terms and conditions, or on the same terms and conditions as applicable to other employees in Santander UK group.
In 2019, loans were made to nine Directors (2018: eight Directors), with a principal amount of £1,767,066 outstanding at 31 December 2019 (2018: £65,232). In 2019, loans were made to nine Other Key Management Personnel (2018: eight), with a principal amount of £3,153,343 outstanding at 31 December 2019 (2018: £2,969,462).
In 2019 and 2018, there were no other transactions, arrangements or agreements with Santander UK in which Directors, Other Key Management Personnel or their connected persons had a material interest. In addition, in 2019 and 2018, no Director had a material interest in any contract of significance with Santander UK other than a service contract.
Santander UK Group Holdings plc234
Annual Report 2019 | Financial statements

Santander UK Group Holdings plc 235
Strategic report Governance Risk review Financial review Financial statements Shareholder information
Notes to the
financial statements
37. RELATED PARTY DISCLOSURES
a) Parent undertaking and controlling party The Company’s immediate and ultimate parent and controlling party is Banco Santander SA, a company incorporated in Spain. The smallest and largest groups into which the Santander UK group’s results are included are the group accounts of Banco Santander SA, copies of which may be obtained from Shareholder Relations, 2 Triton Square, Regent’s Place, London NW1 3AN, or on the Banco Santander corporate website (www.santander.com).
b) Transactions with related parties Transactions with related parties during the year and balances outstanding at the year-end:
Group
Interest, fees and
other income received
Interest, fees and other expenses paid
Amounts owed by related parties
Amounts owed to related parties
2019 2018 2017 2019 2018 2017 2019 2018 2019 2018
£m £m £m £m £m £m £m £m £m £m
Ultimate parent (150) (73) (60)
334 231 321
1,817 2,737
(2,409) (3,854)
Fellow subsidiaries (58) (81) (76)
158 169 491
34 39
(500) (591)
Associates & joint ventures (29) (28) (20)
– – –
2,194 1,986
(930) (718)
(237) (182) (156) 492 400 812 4,045 4,762 (3,839) (5,163)
For more on this, see ‘Balances with other Banco Santander companies’ in the Risk review. In addition, transactions with pension schemes operated by the Santander UK group are described in Note 28.
The above transactions were made in the ordinary course of business, except those carried out with Banco Santander SA as part of our ring-fencing implementation in 2018, on substantially the same terms as for comparable transactions with third party counterparties, and within limits acceptable to the PRA. Such transactions do not involve more than the normal risk of collectability or present any unfavourable features.
In addition, in July 2018 we transferred £1.4bn of customer loans, £21.5bn of other assets and £20.7bn of liabilities from Santander UK to Banco Santander London Branch. Of these transfers, £19.7bn of assets and £18.8bn of liabilities related to derivatives business. These transfers reduced RWAs by £5.5bn and we paid an associated dividend of £668m.
235Santander UK Group Holdings plc

Annual Report 2019 | Financial statements
236 Santander UK Group Holdings plc
Secret
38. FINANCIAL INSTRUMENTS
a) Measurement basis of financial assets and liabilities Financial assets and financial liabilities are measured on an ongoing basis either at fair value or at amortised cost. Note 1 describes how the classes of financial instruments are measured, and how income and expenses, including fair value gains and losses, are recognised.
b) Fair value measurement and hierarchy (i) Fair value measurement The fair value of financial instruments is the price that would be received to sell an asset or paid to transfer a liability in an orderly transaction between market participants at the measurement date in the principal, or in its absence, the most advantageous market to which Santander UK has access at that date. The fair value of a liability reflects its non-performance risk.
Financial instruments valued using observable market prices If a quoted market price in an active market is available for an instrument, the fair value is calculated as the current bid price multiplied by the number of units of the instrument held.
Financial instruments valued using a valuation technique In the absence of a quoted market price in an active market, management uses internal models to make its best estimate of the price that the market would set for that financial instrument. In order to make these estimations, various techniques are employed, including extrapolation from observable market data and observation of similar financial instruments with similar characteristics. Wherever possible, valuation parameters for each product are based on prices directly observable in active markets or that can be derived from directly observable market prices. Chosen valuation techniques incorporate all the factors that market participants would take into account in pricing transactions.
Santander UK manages certain groups of financial assets and liabilities on the basis of its net exposure to either market risks or credit risk. As a result it has elected to use the exception under IFRS 13 which permits the fair value measurement of a group of financial assets and financial liabilities on the basis of the price that would be received to sell a net long position for a particular risk exposure or paid to transfer a net short position for a particular risk exposure in an orderly transaction between market participants at the measurement date under current market conditions.
(ii) Fair value hierarchy Santander UK applies the following fair value hierarchy that prioritises the inputs to valuation techniques used in measuring fair value. The hierarchy establishes three categories for valuing financial instruments, giving the highest priority to unadjusted quoted prices in active markets for identical assets or liabilities and the lowest priority to unobservable inputs. The three categories are: quoted prices in active markets (Level 1), internal models based on observable market data (Level 2) and internal models based on other than observable market data (Level 3). If the inputs used to measure an asset or a liability fall to different levels within the hierarchy, the classification of the entire asset or liability will be based on the lowest level input that is significant to the overall fair value measurement of the asset or liability.
Santander UK categorises assets and liabilities measured at fair value within the fair value hierarchy based on the inputs to the valuation techniques as follows:
Level 1 Unadjusted quoted prices for identical assets or liabilities in an active market that Santander UK can access at the measurement date. Active markets are assessed by reference to average daily trading volumes in absolute terms and, where applicable, by reference to market capitalisation for the instrument.
Level 2 Quoted prices in inactive markets, quoted prices for similar assets or liabilities, recent market transactions, inputs other than quoted market prices for the asset or liability that are observable either directly or indirectly for substantially the full term, and inputs to valuation techniques that are derived principally from or corroborated by observable market data through correlation or other statistical means for substantially the full term of the asset or liability.
Level 3 Significant inputs to the pricing or valuation techniques are unobservable. These unobservable inputs reflect the assumptions that market participants would use when pricing assets or liabilities and are considered significant to the overall valuation.
Changes in the observability of significant valuation inputs during the reporting period may result in a transfer of assets and liabilities within the fair value hierarchy. The Santander UK group recognises transfers between levels of the fair value hierarchy when there is a significant change in either its principal market or the level of observability of the inputs to the valuation techniques as at the end of the reporting period.
Santander UK Group Holdings plc236
Annual Report 2019 | Financial statements

Santander UK Group Holdings plc 237
Secret
Strategic report Governance Risk review Financial review Financial statements Shareholder information
Notes to the
financial statements
c) Valuation techniques The main valuation techniques employed in internal models to measure the fair value of the financial instruments at 31 December 2019 and 2018 are set out below. In substantially all cases, the principal inputs into these models are derived from observable market data. Santander UK did not make any material changes to the valuation techniques and internal models it used in 2019, 2018 and 2017.
A In the valuation of financial instruments requiring static hedging (for example interest rate, currency derivatives and property derivatives) and in the valuation of loans and advances and deposits, the ‘present value’ method is used. Expected future cash flows are discounted using the interest rate curves of the applicable currencies or forward house price index levels, as well as credit spreads. The interest rate curves are generally observable market data and reference yield curves derived from quoted interest rates in appropriate time bandings, which match the timings of the cash flows and maturities of the instruments. The forward commodity house price index levels are generally observable market data.
B In the valuation of equity financial instruments requiring dynamic hedging (principally equity securities, options and other structured instruments), proprietary local volatility and stochastic volatility models are used. These types of models are widely accepted in the financial services industry. Observable market inputs used in these models include the bid-offer spread, foreign currency exchange rates, volatility and correlation between indices. In limited circumstances, other inputs may be used in these models that are based on unobservable market data, such as the Halifax’s UK HPI volatility, HPI forward growth, HPI spot rate, mortality, mean reversion and contingent litigation risk.
C In the valuation of financial instruments exposed to interest rate risk that require either static or dynamic hedging (such as interest rate futures, caps and floors, and options), the present value method (futures), Black’s model (caps/floors) and the Hull/White and Markov functional models (Bermudan options) are used. These types of models are widely accepted in the financial services industry. The significant inputs used in these models are observable market data, including appropriate interest rate curves, volatilities, correlations and exchange rates. In limited circumstances, other inputs may be used in these models that are based on unobservable market data, such as HPI volatility, HPI forward growth, HPI spot rate and mortality.
D In the valuation of linear instruments such as credit risk and fixed-income derivatives, credit risk is measured using dynamic models similar to those used in the measurement of interest rate risk. In the case of non-linear instruments, if the portfolio is exposed to credit risk such as credit derivatives, the probability of default is determined using the credit default spread market. The main inputs used to determine the underlying cost of credit of credit derivatives are quoted credit risk premiums and the correlation between the quoted credit derivatives of various issuers.
The fair values of the financial instruments arising from Santander UK’s internal models take into account, among other things, contract terms and observable market data, which include such factors as bid-offer spread, interest rates, credit risk, exchange rates, the quoted market price of equity securities, volatility and prepayments. In all cases, when it is not possible to derive a valuation for a particular feature of an instrument, management uses judgement to determine the fair value of the particular feature. In exercising this judgement, a variety of tools are used including proxy observable data, historical data and extrapolation techniques. Extrapolation techniques take into account behavioural characteristics of equity markets that have been observed over time, and for which there is a strong case to support an expectation of a continuing trend in the future. Estimates are calibrated to observable market prices when they become available.
Santander UK believes its valuation methods are appropriate and consistent with other market participants. Nevertheless, the use of different valuation methods or assumptions, including imprecision in estimating unobservable market inputs, to determine the fair value of certain financial instruments could result in different estimates of fair value at the reporting date and the amount of gain or loss recorded for a particular instrument. Most of the valuation models are not significantly subjective, because they can be tested and, if necessary, recalibrated by the internal calculation of and subsequent comparison to market prices of actively traded securities, where available.
237Santander UK Group Holdings plc

Annual Report 2019 | Financial statements
238 Santander UK Group Holdings plc
d) Control framework Fair values are subject to a control framework designed to ensure that they are either determined or validated by a function independent of the risk-taker. To this end, ultimate responsibility for the determination of fair values lies with the Risk Department. For all financial instruments where fair values are determined by reference to externally quoted prices or observable pricing inputs to models, independent price determination or validation is utilised. In inactive markets, direct observation of a traded price may not be possible. In these circumstances, Santander UK will source alternative market information to validate the financial instrument’s fair value, with greater weight given to information that is considered to be more relevant and reliable.
The factors that are considered in this regard include:
– The extent to which prices may be expected to represent genuine traded or tradeable prices – The degree of similarity between financial instruments – The degree of consistency between different sources – The process followed by the pricing provider to derive the data – The elapsed time between the date to which the market data relates and the balance sheet date – The manner in which the data was sourced.
The source of pricing data is considered as part of the process that determines the classification of the level of a financial instrument. Consideration is given to the quality of the information available that provides the current mark-to-model valuation and estimates of how different these valuations could be on an actual trade, taking into consideration how active the market is. For spot assets that cannot be sold due to illiquidity, forward estimates are discounted to estimate a realisable value over time. Adjustments for illiquid positions are regularly reviewed to reflect changing market conditions.
For fair values determined using a valuation model, the control framework may include, as applicable, independent development and / or validation of: (i) the logic within the models; (ii) the inputs to those models; and (iii) any adjustments required outside the models. Internal valuation models are validated independently within the Risk Department. A validation report is produced for each model-derived valuation that assesses the mathematical assumptions behind the model, the implementation of the model and its integration within the trading system.
e) Fair values of financial instruments carried at amortised cost The following tables analyse the fair value of the financial instruments carried at amortised cost at 31 December 2019 and 2018, including their levels in the fair value hierarchy – Level 1, Level 2 and Level 3. It does not include fair value information for financial assets and financial liabilities carried at amortised cost if the carrying amount is a reasonable approximation of fair value. Cash and balances at central banks, which consist of demand deposits with the Bank of England, together with cash in tills and ATMs, have been excluded from the table as the carrying amount is deemed an appropriate approximation of fair value. The fair value of the portfolio of UK Government debt securities, included in other financial assets at amortised cost, is the only material financial instrument categorised in Level 1 of the fair value hierarchy.
Group
2019 2018
Fair value Carrying Fair value Carrying
Level 1 Level 2 Level 3 Total value Level 1 Level 2 Level 3 Total value
£m £m £m £m £m £m £m £m £m £m
Assets
Loans and advances to customers – – 212,007 212,007 207,498
– – 204,391 204,391 201,619
Loans and advances to banks – 2,039 539 2,578 2,583
– 3,028 448 3,476 3,515
Reverse repurchase agreements – non trading – 23,634 – 23,634 23,636
– 21,130 – 21,130 21,127
Other financial assets at amortised cost 6,575 535 – 7,110 7,056
6,390 720 – 7,110 7,228
6,575 26,208 212,546 245,329 240,773 6,390 24,878 204,839 236,107 233,489
Liabilities
Deposits by customers – 96 179,040 179,136 179,006
– 21 173,762 173,783 173,692
Deposits by banks – 13,962 407 14,369 14,359
– 16,859 977 17,836 17,824
Repurchase agreements – non trading – 18,292 – 18,292 18,286
– 10,923 – 10,923 10,910
Debt securities in issue – 51,736 – 51,736 50,171
– 56,695 – 56,695 55,906
Subordinated liabilities – 4,220 – 4,220 3,528
– 3,825 – 3,825 3,601
– 88,306 179,447 267,753 265,350 – 88,323 174,739 263,062 261,933
The carrying value above of any financial assets and liabilities that are designated as hedged items in a portfolio (or macro) fair value hedge relationship excludes gains and losses attributable to the hedged risk, as this is included in other assets on the balance sheet.
Santander UK Group Holdings plc238
Annual Report 2019 | Financial statements

Santander UK Group Holdings plc 239
Secret
Strategic report Governance Risk review Financial review Financial statements Shareholder information
Notes to the financial statements
Valuation methodology for financial instruments carried at amortised cost
The valuation approach to specific categories of financial instruments is described below.
Assets:
Loans and advances to customers
The approach to estimating the fair value of loans and advances to customers has been determined by discounting expected cash flows to reflect either current market rates or credit spreads relevant to the specific industry of the borrower. The determination of their fair values is an area of considerable estimation and uncertainty as there is no observable market and values are significantly affected by customer behaviour.
i) Advances secured on residential property The fair value of the mortgage portfolio is calculated by discounting contractual cash flows by different spreads for each LTV Band, after taking account of expected customer prepayment rates. The spread is based on new business interest rates derived from competitor market information.
ii) Corporate loans The determination of the fair values of performing loans takes account of the differential between existing margins and estimated new business rates for similar loans in terms of segment and maturity. Provisions are considered appropriate for the book that is not impaired. A discount has been applied to impaired loans. Although exits have generally been achieved at carrying value, this does not reflect the discount a purchaser would require. A discount has therefore been applied based on the target return sought by distressed bond funds, who are the typical purchaser of the assets.
iii) Other loans These consist of unsecured personal loans, credit cards, overdrafts and consumer (auto) finance. The weighted average lives of these portfolios are short and relate to relatively new business. As a result, contractual interest rates approximate new business interest rates, and therefore no mark-to-market surplus or deficit has been recorded with respect to the performing book, with the exception of unsecured personal loans and consumer (auto) finance loans, where a small surplus or deficit has been recognised based on the differential between existing portfolio margins and the current contractual interest rates.
Loans and advances to banks
These comprise secured loans, short-term placements with banks including collateral and unsettled financial transactions. The secured loans have been valued based on a discounted spread for the term of the loans using valuation technique A as described above. The carrying amount of the other items is deemed a reasonable approximation of their fair value, as the transactions are very short-term in duration.
Reverse repurchase agreements – non trading
The fair value of the reverse repurchase agreements – non trading has been estimated using valuation technique A as described above, using a spread appropriate to the underlying collateral.
Other financial assets at amortised cost
These consist of asset backed securities and debt securities. The asset backed securities can be complex products and in some instances are valued with the assistance of an independent, specialist valuation firm. These fair values are determined using industry-standard valuation techniques, including discounted cash flow models. The inputs to these models used in these valuation techniques include quotes from market makers, prices of similar assets, adjustments for differences in credit spreads, and additional quantitative and qualitative research.
The debt security investments consist of a portfolio of government debt securities. The fair value of this portfolio has been determined using quoted market prices.
Liabilities:
Deposits by customers
The majority of deposit liabilities are payable on demand and therefore can be deemed short-term in nature with the fair value equal to the carrying value. Certain of the deposit liabilities are at a fixed rate until maturity. The deficit/surplus of fair value over carrying value of these liabilities has been estimated by reference to the market rates available at the balance sheet date for similar deposit liabilities of similar maturities. The fair value of such deposit liabilities has been estimated using valuation technique A as described above.
Deposits by banks
The fair value of deposits by banks, including repos, has been estimated using valuation technique A as described above, discounted at the appropriate credit spread.
Repurchase agreements – non trading
The fair value of the repurchase agreements – non trading has been estimated using valuation technique A as described above, discounted at a spread appropriate to the underlying collateral.
Debt securities in issue and subordinated liabilities
Where reliable prices are available, the fair value of debt securities in issue and subordinated liabilities has been calculated using quoted market prices.
239Santander UK Group Holdings plc

Annual Report 2019 | Financial statements
240 Santander UK Group Holdings plc
f) Fair values of financial instruments measured at fair value The following tables summarise the fair values of the financial assets and liabilities accounted for at fair value at 31 December 2019 and 2018, analysed by their levels in the fair value hierarchy – Level 1, Level 2 and Level 3.
Group
2019 2018
Level 1 Level 2 Level 3 Total Level 1 Level 2 Level 3 Total Valuation £m £m £m £m £m £m £m £m technique
Assets
Derivative financial instruments Exchange rate contracts – 2,319 6 2,325 – 4,324 25 4,349 A
Interest rate contracts – 1,951 9 1,960 – 2,560 6 2,566 A & C Equity and credit contracts – 223 69 292 – 194 84 278 B & D Netting – (1,214) – (1,214) – (1,872) – (1,872)
– 3,279 84 3,363 – 5,206 115 5,321
Other financial assets at FVTPL Loans and advances to customers – 448 92 540 – 427 82 509 A Debt securities 2 2 294 298 26 2,343 894 3,263 A, B & D Equity securities 16 – 119 135 14 – 79 93 B Reverse repurchase agreements –
non trading – – – – – 2,272 – 2,272 A
18 450 505 973 40 5,042 1,055 6,137
Financial assets at FVOCI Debt securities 9,209 482 – 9,691 12,487 742 – 13,229 D Loans and advances to customers – – 56 56 – – 73 73 D
9,209 482 56 9,747 12,487 742 73 13,302
Total assets at fair value 9,227 4,211 645 14,083 12,527 10,990 1,243 24,760
Liabilities
Derivative financial instruments Exchange rate contracts – 659 4 663 – 528 23 551 A
Interest rate contracts – 2,087 2 2,089 – 2,736 7 2,743 A & C Equity and credit contracts – 142 29 171 – 132 40 172 B & D Netting – (1,214) – (1,214) – (1,872) – (1,872)
– 1,674 35 1,709 – 1,524 70 1,594
Other financial liabilities at FVTPL Debt securities in issue – 1,099 6 1,105 – 983 7 990 A Structured deposits – 406 29 435 – 104 29 133 A Repurchase agreements – non
trading – – – – – 2,110 – 2,110 A Collateral and associated financial
guarantees – 147 26 173 – 3,040 13 3,053 D
– 1,652 61 1,713 – 6,237 49 6,286
Total liabilities at fair value – 3,326 96 3,422 – 7,761 119 7,880 Transfers between levels of the fair value hierarchy Transfers between levels of the fair value hierarchy are reported regularly throughout the year. In 2019, there were no significant transfers of financial instruments between Levels 1 and 2 or between Levels 2 and 3. In 2018, the main transfers of financial instruments between Levels 2 and 3 were Derivative assets of £56m and Derivative liabilities of £35m which were transferred from Level 2 to Level 3 following enhancements to the fair value hierarchy classification process.
Santander UK Group Holdings plc240
Annual Report 2019 | Financial statements

Santander UK Group Holdings plc 241
Secret
Strategic report Governance Risk review Financial review Financial statements Shareholder information
Notes to the financial statements
g) Fair value adjustments The internal models incorporate assumptions that Santander UK believes would be made by a market participant to establish fair value. Fair value adjustments are adopted when Santander UK considers that there are additional factors that would be considered by a market participant that are not incorporated in the valuation model.
Santander UK classifies fair value adjustments as either ‘risk-related’ or ‘model-related’. The fair value adjustments form part of the portfolio fair value and are included in the balance sheet values of the product types to which they have been applied. The magnitude and types of fair value adjustment are listed in the following table:
2019 2018 £m £m
Risk-related:
– Bid-offer and trade specific adjustments (12) 13
– Uncertainty 37 36
– Credit risk adjustment 6 9
– Funding fair value adjustment 6 4
37 62
Model-related – 5
37 67
Risk-related adjustments Risk-related adjustments are driven, in part, by the magnitude of Santander UK’s market or credit risk exposure, and by external market factors, such as the size of market spreads.
(i) Bid-offer and trade specific adjustments Portfolios are marked at bid or offer, as appropriate. Valuation models will typically generate mid-market values. The bid-offer adjustment reflects the cost that would be incurred if substantially all residual net portfolio market risks were closed using available hedging instruments or by disposing of or unwinding the position. For debt securities, the bid-offer spread is based on a market price at an individual security level. For other products, the major risk types are identified. For each risk type, the net portfolio risks are first classified into buckets, and then a bid-offer spread is applied to each risk bucket based upon the market bid-offer spread for the relevant hedging instrument.
(ii) Uncertainty Certain model inputs may be less readily determinable from market data, and/or the choice of model itself may be more subjective. In these circumstances, a range of possible values exists that the financial instrument or market parameter may assume, and an adjustment may be needed to reflect the likelihood that in estimating the fair value of the financial instrument, market participants would adopt more conservative values for uncertain parameters and/or model assumptions than those used in the valuation model.
(iii) Credit risk adjustment Credit risk adjustments comprise credit and debit valuation adjustments. The credit valuation adjustment (CVA) is an adjustment to the valuation of OTC derivative contracts to reflect within fair value the possibility that the counterparty may default, and Santander UK may not receive the full market value of the transactions. The debit valuation adjustment (DVA) is an adjustment to the valuation of the OTC derivative contracts to reflect within the fair value the possibility that Santander UK may default, and that Santander UK may not pay full market value of the transactions.
Santander UK calculates a separate CVA and DVA for each Santander UK legal entity, and within each entity for each counterparty to which the entity has exposure. Santander UK calculates the CVA by applying the probability of default of the counterparty to the expected positive exposure to the counterparty, and multiplying the result by the loss expected in the event of default i.e. LGD. Conversely, Santander UK calculates the DVA by applying the PD of the Santander UK group, conditional on the non-default of the counterparty, to the expected positive exposure of the counterparty to Santander UK and multiplying the result by the LGD. Both calculations are performed over the life of the potential exposure.
For most products Santander UK uses a simulation methodology to calculate the expected positive exposure to a counterparty. This incorporates a range of potential exposures across the portfolio of transactions with the counterparty over the life of the portfolio. The simulation methodology includes credit mitigants such as counterparty netting agreements and collateral agreements with the counterparty.
The methodologies do not, in general, account for wrong-way risk. Wrong-way risk arises where the underlying value of the derivative prior to any credit risk adjustment is positively correlated to the probability of default of the counterparty. When there is significant wrong-way risk, a trade-specific approach is applied to reflect the wrong-way risk within the valuation. Exposure to wrong-way risk is limited via internal governance processes and deal pricing. Santander UK considers that an appropriate adjustment to reflect wrong-way risk is £nil (2018: £nil).
(iv) Funding fair value adjustment (FFVA) The FFVA is an adjustment to the valuation of OTC derivative positions to include the net cost of funding uncollateralised derivative positions. This is calculated by applying a suitable funding cost to the expected future funding exposure of any uncollateralised component of the OTC derivative portfolio.
Model-related adjustments Models used for portfolio valuation purposes may be based upon a simplifying set of assumptions that do not capture all material market characteristics. Additionally, markets evolve, and models that were adequate in the past may require development to capture all material market characteristics in current market conditions. In these circumstances, model limitation adjustments are adopted. As model development progresses, model limitations are addressed within the core revaluation models and a model limitation adjustment is no longer needed.
241Santander UK Group Holdings plc
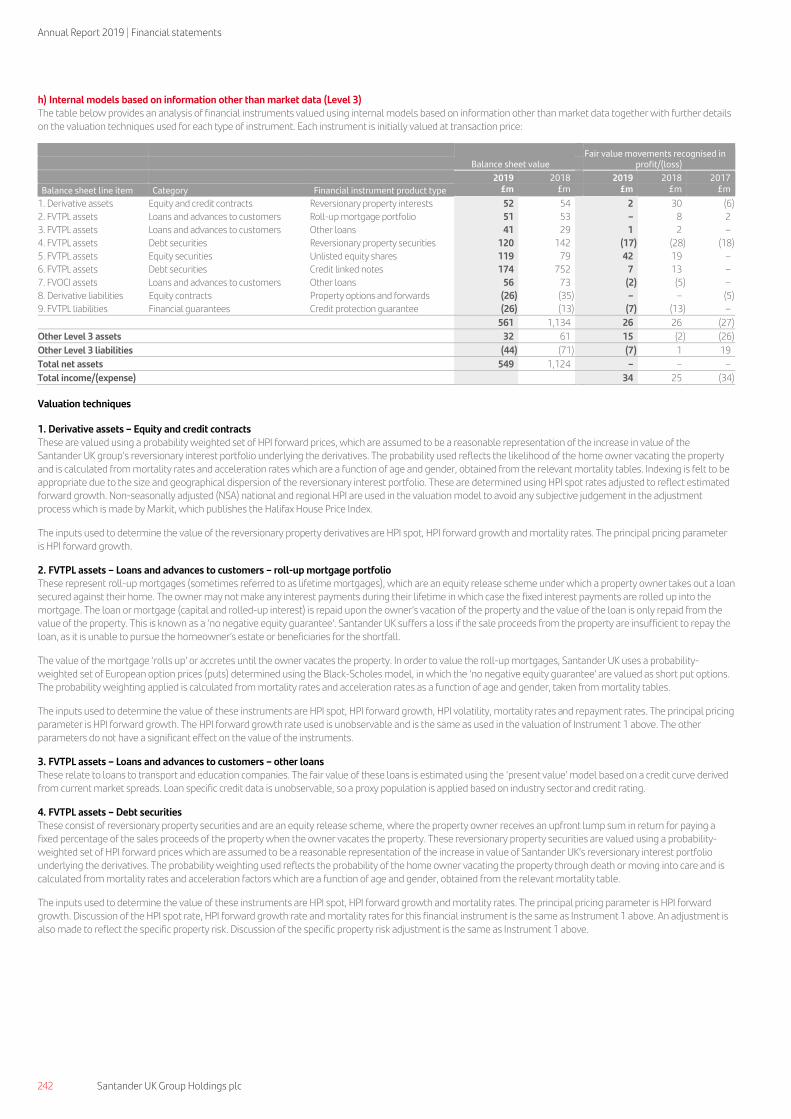
Annual Report 2019 | Financial statements
242 Santander UK Group Holdings plc
Secret
h) Internal models based on information other than market data (Level 3) The table below provides an analysis of financial instruments valued using internal models based on information other than market data together with further details on the valuation techniques used for each type of instrument. Each instrument is initially valued at transaction price:
Balance sheet value
Fair value movements recognised in profit/(loss)
2019 2018 2019 2018 2017
Balance sheet line item Category Financial instrument product type £m £m £m £m £m
1. Derivative assets Equity and credit contracts Reversionary property interests 52 54 2 30 (6)
2. FVTPL assets Loans and advances to customers Roll-up mortgage portfolio 51 53 – 8 2
3. FVTPL assets Loans and advances to customers Other loans 41 29 1 2 –
4. FVTPL assets Debt securities Reversionary property securities 120 142 (17) (28) (18)
5. FVTPL assets Equity securities Unlisted equity shares 119 79 42 19 –
6. FVTPL assets Debt securities Credit linked notes 174 752 7 13 –
7. FVOCI assets Loans and advances to customers Other loans 56 73 (2) (5) –
8. Derivative liabilities Equity contracts Property options and forwards (26) (35) – – (5)
9. FVTPL liabilities Financial guarantees Credit protection guarantee (26) (13) (7) (13) –
561 1,134 26 26 (27)
Other Level 3 assets 32 61 15 (2) (26)
Other Level 3 liabilities (44) (71) (7) 1 19
Total net assets 549 1,124 – – –
Total income/(expense)
34 25 (34)
Valuation techniques
1. Derivative assets – Equity and credit contracts These are valued using a probability weighted set of HPI forward prices, which are assumed to be a reasonable representation of the increase in value of the Santander UK group’s reversionary interest portfolio underlying the derivatives. The probability used reflects the likelihood of the home owner vacating the property and is calculated from mortality rates and acceleration rates which are a function of age and gender, obtained from the relevant mortality tables. Indexing is felt to be appropriate due to the size and geographical dispersion of the reversionary interest portfolio. These are determined using HPI spot rates adjusted to reflect estimated forward growth. Non-seasonally adjusted (NSA) national and regional HPI are used in the valuation model to avoid any subjective judgement in the adjustment process which is made by Markit, which publishes the Halifax House Price Index.
The inputs used to determine the value of the reversionary property derivatives are HPI spot, HPI forward growth and mortality rates. The principal pricing parameter is HPI forward growth.
2. FVTPL assets – Loans and advances to customers – roll-up mortgage portfolio These represent roll-up mortgages (sometimes referred to as lifetime mortgages), which are an equity release scheme under which a property owner takes out a loan secured against their home. The owner may not make any interest payments during their lifetime in which case the fixed interest payments are rolled up into the mortgage. The loan or mortgage (capital and rolled-up interest) is repaid upon the owner’s vacation of the property and the value of the loan is only repaid from the value of the property. This is known as a ‘no negative equity guarantee’. Santander UK suffers a loss if the sale proceeds from the property are insufficient to repay the loan, as it is unable to pursue the homeowner’s estate or beneficiaries for the shortfall.
The value of the mortgage ‘rolls up’ or accretes until the owner vacates the property. In order to value the roll-up mortgages, Santander UK uses a probability-weighted set of European option prices (puts) determined using the Black-Scholes model, in which the ‘no negative equity guarantee’ are valued as short put options. The probability weighting applied is calculated from mortality rates and acceleration rates as a function of age and gender, taken from mortality tables.
The inputs used to determine the value of these instruments are HPI spot, HPI forward growth, HPI volatility, mortality rates and repayment rates. The principal pricing parameter is HPI forward growth. The HPI forward growth rate used is unobservable and is the same as used in the valuation of Instrument 1 above. The other parameters do not have a significant effect on the value of the instruments.
3. FVTPL assets – Loans and advances to customers – other loans These relate to loans to transport and education companies. The fair value of these loans is estimated using the ‘present value’ model based on a credit curve derived from current market spreads. Loan specific credit data is unobservable, so a proxy population is applied based on industry sector and credit rating.
4. FVTPL assets – Debt securities These consist of reversionary property securities and are an equity release scheme, where the property owner receives an upfront lump sum in return for paying a fixed percentage of the sales proceeds of the property when the owner vacates the property. These reversionary property securities are valued using a probability-weighted set of HPI forward prices which are assumed to be a reasonable representation of the increase in value of Santander UK’s reversionary interest portfolio underlying the derivatives. The probability weighting used reflects the probability of the home owner vacating the property through death or moving into care and is calculated from mortality rates and acceleration factors which are a function of age and gender, obtained from the relevant mortality table.
The inputs used to determine the value of these instruments are HPI spot, HPI forward growth and mortality rates. The principal pricing parameter is HPI forward growth. Discussion of the HPI spot rate, HPI forward growth rate and mortality rates for this financial instrument is the same as Instrument 1 above. An adjustment is also made to reflect the specific property risk. Discussion of the specific property risk adjustment is the same as Instrument 1 above.
Santander UK Group Holdings plc242
Annual Report 2019 | Financial statements

Santander UK Group Holdings plc 243
Secret
Strategic report Governance Risk review Financial review Financial statements Shareholder information
Notes to the financial statements
5. FVTPL assets – Equity securities These consist of unquoted equity investments in companies providing infrastructure services to the financial services industry. In the valuation of equity financial instruments requiring dynamic hedging, proprietary local volatility and stochastic volatility models are used. These types of models are widely accepted in the financial services industry. Observable market inputs used in these models include equity prices, bid-offer spread, foreign currency exchange rates. The significant unobservable input is contingent litigation costs and related expenses in respect of convertible preferred stock in Visa Inc, as described in Note 29. This is estimated by reference to best estimates received from third party legal counsel.
6. FVTPL assets – Debt securities (Credit linked notes) These consist of the retained senior tranches of credit linked notes in respect of credit protection vehicles sponsored by Santander UK, and are mandatorily held at fair value through profit or loss. These vehicles provide credit protection on reference portfolios of Santander UK group loans with junior notes sold to external investors. The notes retained by Santander UK are classified as level 3 financial instruments as their valuation depends upon unobservable parameters relating to the underlying reference portfolios of loans, including credit spreads, correlations and prepayment speed, which have a significant effect on the overall valuation. For more information, see ‘Credit protection entities’ in Note 19.
7. FVOCI assets – Loans and advances to customers – other loans These relate to shipping and construction loans. The fair value of these loans is estimated using the ‘present value’ model based on a credit curve derived from current market spreads. Loan specific credit data is unobservable, so a proxy population is applied based on industry sector and credit rating.
8. Derivative liabilities – Equity contracts There are three types of derivatives in this category:
European options – These are valued using a modified Black-Scholes model where the HPI is log-normally distributed with the forward rates determined from the HPI forward growth. Asian options – Asian (or average value) options are valued using a modified Black-Scholes model, with an amended strike price and volatility assumption to account for the average exercise period, through a closed form adjustment that reflects the strike price relative to the distribution of stock prices at each relevant date. This is also known as the Curran model. Forward contracts – Forward contracts are valued using a standard forward pricing model.
The inputs used to determine the value of the above instruments are HPI spot rate, HPI forward growth rate and HPI volatility. The principal pricing parameter is HPI forward growth rate.
9. FVTPL liabilities –Financial guarantees These relate to credit protection guarantees in respect of the proceeds of the retained senior tranches of credit linked notes described in Instrument 6 above, and have been designated at fair value through profit or loss. These instruments are valued using the same unobservable parameters described in Instrument 6 above, such that changes in the valuation of the senior tranches of the credit linked notes are offset by changes in the value of these credit protection guarantees. For more information, see ‘Credit protection entities’ in Note 19.
Reconciliation of fair value measurement in Level 3 of the fair value hierarchy The following table sets out the movements in Level 3 financial instruments in 2019 and 2018:
Assets Liabilities
Derivatives Other financial
assets at FVTPL
Financial assets at
FVOCI Total Derivatives
Other financial liabilities at
FVTPL Total £m £m £m £m £m £m £m
At 1 January 2019 115 1,055 73 1,243 (70) (49) (119)
Total gains/(losses) recognised in profit or loss:
– Fair value movements 17 33 (2) 48 (8) (6) (14)
– Foreign exchange and other movements – 4 – 4 – (6) (6)
Transfers in – 11 – 11 – – –
Netting(1) – (430) – (430) – – –
Additions 2 188 – 190 – (3) (3)
Sales – – – – – – –
Settlements (50) (356) (15) (421) 43 3 46
At 31 December 2019 84 505 56 645 (35) (61) (96)
Gains/(losses) recognised in profit or loss relating to assets and liabilities held at the end of the year 17 37 (2) 52 (8) (12) (20)
At 1 January 2018 64 838 199 1,101 (63) (6) (69)
Total gains/(losses) recognised in profit or loss: – Fair value movements 28 14 (5) 37 1 (13) (12)
– Foreign exchange and other movements (5) – – (5) 5 (1) 4
Transfers in 56 18 – 74 (35) (29) (64)
Additions – 280 17 297 – – –
Sales – (95) – (95) – – –
Settlements (28) – (138) (166) 22 – 22
At 31 December 2018 115 1,055 73 1,243 (70) (49) (119)
Gains/(losses) recognised in profit or loss relating to assets and liabilities held at the end of the year 23 14 (5) 32 6 (14) (8)
(1) This relates to the effect of netting on the fair value of the credit linked notes due to a legal right of set-off between the principal amounts of the senior notes and the associated cash deposits. For more, see ‘ii) Credit protection entities’ in Note 19.
243Santander UK Group Holdings plc
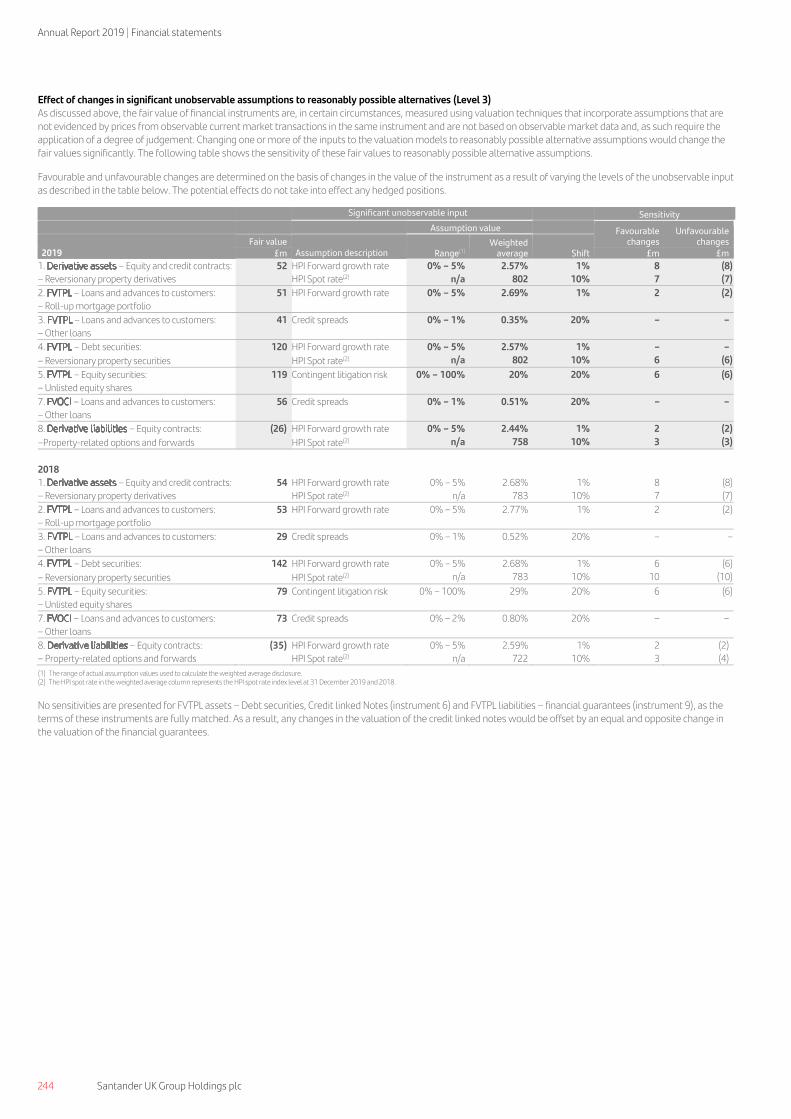
Annual Report 2019 | Financial statements
244 Santander UK Group Holdings plc
Secret
Effect of changes in significant unobservable assumptions to reasonably possible alternatives (Level 3) As discussed above, the fair value of financial instruments are, in certain circumstances, measured using valuation techniques that incorporate assumptions that are not evidenced by prices from observable current market transactions in the same instrument and are not based on observable market data and, as such require the application of a degree of judgement. Changing one or more of the inputs to the valuation models to reasonably possible alternative assumptions would change the fair values significantly. The following table shows the sensitivity of these fair values to reasonably possible alternative assumptions.
Favourable and unfavourable changes are determined on the basis of changes in the value of the instrument as a result of varying the levels of the unobservable input as described in the table below. The potential effects do not take into effect any hedged positions.
Significant unobservable input Sensitivity
Assumption value Favourable changes
Unfavourable changes Fair value
Range(1) Weighted
average Shift 2019 £m Assumption description £m £m
1. Derivative assets – Equity and credit contracts: 52 HPI Forward growth rate 0% – 5% 2.57% 1% 8 (8)
– Reversionary property derivatives HPI Spot rate(2) n/a 802 10% 7 (7)
2. FVTPL – Loans and advances to customers: 51 HPI Forward growth rate 0% – 5% 2.69% 1% 2 (2)
– Roll-up mortgage portfolio
3. FVTPL – Loans and advances to customers: 41 Credit spreads 0% – 1% 0.35% 20% – –
– Other loans
4. FVTPL – Debt securities: 120 HPI Forward growth rate 0% – 5% 2.57% 1% – –
– Reversionary property securities HPI Spot rate(2) n/a 802 10% 6 (6)
5. FVTPL – Equity securities: 119 Contingent litigation risk 0% – 100% 20% 20% 6 (6)
– Unlisted equity shares
7. FVOCI – Loans and advances to customers: 56 Credit spreads 0% – 1% 0.51% 20% – –
– Other loans
8. Derivative liabilities – Equity contracts: (26) HPI Forward growth rate 0% – 5% 2.44% 1% 2 (2)
–Property-related options and forwards HPI Spot rate(2) n/a 758 10% 3 (3)
2018
1. Derivative assets – Equity and credit contracts: 54 HPI Forward growth rate 0% – 5% 2.68% 1% 8 (8)
– Reversionary property derivatives HPI Spot rate(2) n/a 783 10% 7 (7)
2. FVTPL – Loans and advances to customers: 53 HPI Forward growth rate 0% – 5% 2.77% 1% 2 (2)
– Roll-up mortgage portfolio
3. FVTPL – Loans and advances to customers: 29 Credit spreads 0% – 1% 0.52% 20% – –
– Other loans
4. FVTPL – Debt securities: 142 HPI Forward growth rate 0% – 5% 2.68% 1% 6 (6)
– Reversionary property securities HPI Spot rate(2) n/a 783 10% 10 (10)
5. FVTPL – Equity securities: 79 Contingent litigation risk 0% – 100% 29% 20% 6 (6)
– Unlisted equity shares
7. FVOCI – Loans and advances to customers: 73 Credit spreads 0% – 2% 0.80% 20% – –
– Other loans
8. Derivative liabilities – Equity contracts: (35) HPI Forward growth rate 0% – 5% 2.59% 1% 2 (2)
– Property-related options and forwards HPI Spot rate(2) n/a 722 10% 3 (4)
(1) The range of actual assumption values used to calculate the weighted average disclosure. (2) The HPI spot rate in the weighted average column represents the HPI spot rate index level at 31 December 2019 and 2018.
No sensitivities are presented for FVTPL assets – Debt securities, Credit linked Notes (instrument 6) and FVTPL liabilities – financial guarantees (instrument 9), as the terms of these instruments are fully matched. As a result, any changes in the valuation of the credit linked notes would be offset by an equal and opposite change in the valuation of the financial guarantees.
Santander UK Group Holdings plc244
Annual Report 2019 | Financial statements

Santander UK Group Holdings plc 245
Secret
Strategic report Governance Risk review Financial review Financial statements Shareholder information
Notes to the
financial statements
i) Maturities of financial liabilities and off-balance sheet commitments The table below analyses the maturities of the undiscounted cash flows relating to financial liabilities and off-balance sheet commitments of Santander UK based on
the remaining period to the contractual maturity date at the balance sheet date. Deposits by customers largely consist of retail deposits. This table is not intended to
show the liquidity of Santander UK.
Group
On demand Not later than 3
months
Later than 3 months and
not later than 1 year
Later than 1 year and not later than 5
years Later than 5
years Total
2019 £m £m £m £m £m £m
Financial liabilities
Derivative financial instruments 9 250 294 424 796 1,773
Other financial liabilities at fair value through profit or loss 1 6 203 617 969 1,796
Deposits by customers 162,774 3,851 7,931 3,563 1,101 179,220
Deposits by banks 2,717 487 4,765 6,339 220 14,528
Repurchase agreements – non trading 6 15,878 1,578 846 – 18,308
Debt securities in issue – 7,211 9,815 24,676 10,989 52,691
Subordinated liabilities – 239 131 1,539 3,961 5,870
Total financial liabilities 165,507 27,922 24,717 38,004 18,036 274,186
Off-balance sheet commitments given 18,907 7,829 840 11,490 4,993 44,059
2018
Financial liabilities Derivative financial instruments – 431 61 104 1,170 1,766
Other financial liabilities at fair value through profit or loss 11 2,146 76 408 3,855 6,496
Deposits by customers 151,284 4,640 11,350 5,328 1,373 173,975
Deposits by banks 5,692 1,108 93 11,106 52 18,051
Repurchase agreements – non trading 2 9,101 972 849 517 11,441
Debt securities in issue – 9,194 5,677 28,553 15,384 58,808
Subordinated liabilities – 255 134 709 5,279 6,377
Total financial liabilities 156,989 26,875 18,363 47,057 27,630 276,914
Off-balance sheet commitments given 18,667 5,843 670 13,418 1,426 40,024
As the above table is based on contractual maturities, no account is taken of call features related to subordinated liabilities. In addition, the repayment terms of debt
securities may be accelerated in line with relevant covenants. Further, no account is taken of the possible early repayment of Santander UK’s mortgage-backed non-
recourse finance which is redeemed by Santander UK as funds become available from redemptions of the residential mortgages. Santander UK has no control over
the timing and amount of redemptions of residential mortgages.
245Santander UK Group Holdings plc

Annual Report 2019 | Financial statements
246 Santander UK Group Holdings plc
Secret
39. OFFSETTING FINANCIAL ASSETS AND LIABILITIES
Financial assets and financial liabilities are reported on a net basis on the balance sheet only if there is a legally enforceable right to set off the recognised amounts and there is an intention to settle on a net basis, or to realise the asset and settle the liability simultaneously. The following table shows the impact of netting arrangements on:
– All financial assets and liabilities that are reported net on the balance sheet – All derivative financial instruments and repurchase agreements and other similar secured lending and borrowing agreements that are subject to enforceable
master netting arrangements or similar agreements, but do not qualify for balance sheet netting.
The table identifies the amounts that have been offset in the balance sheet and also those amounts that are covered by enforceable netting arrangements (offsetting arrangements and financial collateral) but do not qualify for netting under the requirements described above.
For derivative contracts, the ‘Financial instruments’ column identifies financial assets and liabilities that are subject to set off under netting agreements, such as the ISDA Master Agreement or derivative exchange or clearing counterparty agreements, whereby all outstanding transactions with the same counterparty can be offset and close-out netting applied across all outstanding transactions covered by the agreements if an event of default or other predetermined events occur. Financial collateral refers to cash and non-cash collateral obtained, typically daily or weekly, to cover the net exposure between counterparties by enabling the collateral to be realised in an event of default or if other predetermined events occur. For repurchase and reverse repurchase agreements and other similar secured lending and borrowing, the ‘Financial instruments’ column identifies financial assets and liabilities that are subject to set off under netting agreements, such as global master repurchase agreements and global master securities lending agreements, whereby all outstanding transactions with the same counterparty can be offset and close-out netting applied across all outstanding transactions covered by the agreements if an event of default or other predetermined events occur. Financial collateral typically comprises highly liquid securities which are legally transferred and can be liquidated if a counterparty defaults.
Santander UK engages in a variety of counterparty credit mitigation strategies in addition to netting and collateral arrangements. Therefore, the net amounts presented in the tables below do not purport to represent Santander UK’s actual credit exposure.
Group
Amounts subject to enforceable netting arrangements
Assets not subject
Effects of offsetting on balance sheet Related amounts not offset
Gross amounts
Amounts offset
Net amounts on balance
sheet
Financial instruments
Financial collateral(1)
Net amount
to enforceable netting
arrangements(2)
Balance sheet
total(3) 2019 £m £m £m £m £m £m £m £m
Assets
Derivative financial assets 4,493 (1,214) 3,279 (768) (1,915) 596 84 3,363
Reverse repurchase, securities borrowing & similar agreements:
– Amortised cost 25,312 (1,676) 23,636 (537) (23,099) – – 23,636
– Fair value – – – – – – – –
Loans and advances to customers and banks(4) 6,036 (1,248) 4,788 – – 4,788 205,294 210,082
35,841 (4,138) 31,703 (1,305) (25,014) 5,384 205,378 237,081
Liabilities
Derivative financial liabilities 2,877 (1,214) 1,663 (768) (572) 323 46 1,709
Repurchase, securities lending & similar agreements:
– Amortised cost 19,962 (1,676) 18,286 (537) (17,749) – – 18,286
– Fair value – – – – – – – –
Deposits by customers and banks(4) 2,482 (1,248) 1,234 – (502) 732 192,131 193,365
25,321 (4,138) 21,183 (1,305) (18,823) 1,055 192,177 213,360
2018 Assets Derivative financial assets 7,088 (1,872) 5,216 (933) (2,133) 2,150 105 5,321
Reverse repurchase, securities borrowing & similar agreements:
– Amortised cost 24,733 (3,606) 21,127 (2,721) (18,406) – – 21,127
– Fair value 2,272 – 2,272 – (2,272) – – 2,272
Loans and advances to customers and banks(4) 6,820 (1,308) 5,512 – – 5,512 199,622 205,134
40,913 (6,786) 34,127 (3,654) (22,811) 7,662 199,727 233,854
Liabilities Derivative financial liabilities 3,412 (1,872) 1,540 (933) (303) 304 54 1,594
Repurchase, securities lending & similar agreements: – Amortised cost 14,516 (3,606) 10,910 (2,721) (8,189) – – 10,910
– Fair value 2,110 – 2,110 – (2,110) – – 2,110
Deposits by customers and banks(4) 2,879 (1,308) 1,571 – (502) 1,069 189,945 191,516
22,917 (6,786) 16,131 (3,654) (11,104) 1,373 189,999 206,130
(1) Financial collateral is reflected at its fair value, but has been limited to the net balance sheet exposure so as not to include any over-collateralisation. (2) This column includes contractual rights of set-off that are subject to uncertainty under the laws of the relevant jurisdiction. (3) The balance sheet total is the sum of ‘Net amounts reported on the balance sheet’ that are subject to enforceable netting arrangements and ‘Amounts not subject to enforceable netting arrangements’. (4) The amounts offset within loans and advances to customers/banks or deposits by customers/banks relate to offset mortgages which are classified as either and that are subject to netting.
40. EVENTS AFTER THE BALANCE SHEET DATE
There have been no significant events between 31 December 2019 and the date of approval of these financial statements which would require a change to or additional disclosure in the financial statements.
Santander UK Group Holdings plc246
Annual Report 2019 | Financial statements

Santander UK Group Holdings plc 247
Strategic report Governance Risk review Financial review Financial statements Shareholder information
Primary Company
financial statements
Company Balance Sheet
At 31 December
2019 2018
Notes £m £m
Assets Financial assets at amortised cost – Loans and advances to banks 4 8,920 9,214
– Other financial assets at amortised cost 5 1,142 1,185
Interests in other entities 6 13,600 13,400
Current tax assets 6 1
Other assets 2 2
Total assets 23,670 23,802
Liabilities Financial liabilities at amortised cost: – Deposits by banks 7 8 –
– Debt securities in issue 8 8,957 9,295
– Subordinated liabilities 9 1,142 1,185
Total liabilities 10,107 10,480
Equity Share capital 12 7,060 7,060
Other equity instruments 13 2,241 2,041
Retained earnings 4,262 4,221
Total shareholders’ equity 13,563 13,322
Total liabilities and equity 23,670 23,802
The accompanying Notes form an integral part of these Financial Statements.
The profit after tax of the Company attributable to shareholders was £449m (2018: £1,280m). The profit after tax of the Company attributable to shareholders in 2018 included a dividend receipt of £668m associated with ring-fencing transfers to Banco Santander London Branch. As permitted by Section 408 of the UK Companies Act 2006, the Company’s income statement has not been presented.
The Financial Statements were approved and authorised for issue by the Board on 2 March 2020 and signed on its behalf by:
Nathan Bostock Madhukar Dayal
Chief Executive Officer Chief Financial Officer
Company Registered Number: 08700698
247Santander UK Group Holdings plc

Annual Report 2019 | Financial statements
248 Santander UK Group Holdings plc
Company Cash Flow Statement
At 31 December
2019 2018(1) £m £m
Cash flows from operating activities Profit after tax 449 1,280
Adjustments for: Non-cash items included in profit 3 (75)
Net change in operating assets and liabilities 370 (2,604)
Corporation tax paid – (28)
Effects of exchange rate differences (371) 419
Net cash flows from operating activities 451 (1,008)
Cash flows from investing activities Investments in other entities (200) (377)
Net cash flows from investing activities (200) (377)
Cash flows from financing activities Issue of other equity instruments 500 –
Issuance costs of other equity instruments – –
Issue of debt securities and subordinated notes – 2,679
Repayment of debt securities – (21)
Repurchase of other equity instruments (304) –
Issuance costs of debt securities and subordinated notes – –
Dividends paid on ordinary shares (262) (1,123)
Dividends paid on other equity instruments (142) (145)
Net cash flows from financing activities (208) 1,390
Change in cash and cash equivalents 43 5
Cash and cash equivalents at beginning of the year 8 3
Cash and cash equivalents at the end of the year 51 8 (1) Adjusted to reflect the amendment to IAS 12, as described in Note 1.
Company Statement of Changes in Equity
For the years ended 31 December
Share capital Other equity instruments
Retained earnings(2) Total
£m £m £m £m
At 1 January 2019 7,060 2,041 4,221 13,322
Total comprehensive income:(1)
– Profit after tax – – 449 449
Issue of other equity instruments – 500 – 500
Repurchase of other equity instruments – (300) (4) (304)
Dividends on ordinary shares – – (262) (262)
Dividends on other equity instruments – – (142) (142)
At 31 December 2019 7,060 2,241 4,262 13,563
At 1 January 2018 7,060 2,041 4,209 13,310
Total comprehensive income:(1)
– Profit after tax – – 1,280 1,280
Dividends on ordinary shares – – (1,123) (1,123)
Dividends on other equity instruments – – (145) (145)
At 31 December 2018 7,060 2,041 4,221 13,322 (1) Total comprehensive income comprises only the profit for the year; no statement of comprehensive income has been shown for the Company, as permitted by Section 408 of the UK Companies Act 2006. (2) Adjusted to reflect the amendment to IAS 12, as described in Note 1.
The accompanying Notes form an integral part of these Financial Statements.
Santander UK Group Holdings plc248
Annual Report 2019 | Financial statements

Santander UK Group Holdings plc 249
Strategic report Governance Risk review Financial review Financial statements Shareholder information
Notes to the Company
financial statements
1. ACCOUNTING POLICIES
These financial statements are prepared for Santander UK Group Holdings plc (the Company) under the Companies Act 2006. The principal activity of the Company is a financial services holding company. Santander UK Group Holdings plc is a public limited company incorporated in England and Wales having a registered office in England.
Basis of preparation
The accounting policies of the Company are the same as those of the Santander UK Group Holdings plc group which are set out in Note 1 to the Consolidated Financial Statements, to the extent that the Company has similar transactions to the Santander UK Group Holdings plc group. The financial statements have been prepared on the going concern basis using the historical cost convention. An assessment of the appropriateness of the adoption of the going concern basis of accounting is disclosed in the Directors’ statement of going concern set out in the Directors’ Report.
Compliance with International Financial Reporting Standards
The Company’s financial statements have been prepared in accordance with IFRSs as issued by the IASB, including interpretations issued by IFRIC. The Company has also complied with IFRS as adopted by the European Union as there are no applicable differences between the two frameworks for the periods presented.
Recent accounting developments
See Note 1 to Consolidated Financial Statements.
There was no impact on shareholders’ equity from applying the amendment to IAS 12 at 1 January 2019. The impact of the amendment to IAS 12 on the income statement for the year ended 31 December 2019 was to reduce tax on profit by £28m (2018: £27m, 2017: £26m), increasing profit after tax by the same amount.
The adoption of IFRS 16 did not have any significant impact on the Company.
2. OPERATING EXPENSES BEFORE CREDIT IMPAIRMENT LOSSES, PROVISIONS AND CHARGES
These comprise wages and salaries of £7m (2018: £3m) recharged by the operating company, Santander UK plc. In 2019 and 2018, the Company had no full-time staff as they are all employed by Santander UK plc.
3. DIVIDENDS ON ORDINARY SHARES
Dividends on ordinary shares declared and paid during the year are set out in Note 10 to the Consolidated Financial Statements.
4. LOANS AND ADVANCES TO BANKS
Loans and advances to banks principally comprise amounts due from Santander UK group undertakings. The fair values of loans and advances to banks are equal to their carrying amounts. In 2019 and 2018, no impairment losses were incurred. All of our senior debt issued out of Santander UK Group Holdings plc is downstreamed to our operating company Santander UK plc.
5. OTHER FINANCIAL ASSETS AT AMORTISED COST
These consisted of investments in subordinated notes and have a maturity greater than 10 years.
6. INTERESTS IN OTHER ENTITIES 2019 2018
£m £m
Interests in ordinary shares of subsidiaries 11,645 11,645
£500m Fixed Rate Reset Perpetual AT1 Capital Securities 495 495
£750m Fixed Rate Reset Perpetual AT1 Capital Securities 750 750
£300m Fixed Rate Reset Perpetual AT1 Capital Securities – 300
£500m Fixed Rate Reset Perpetual AT1 Capital Securities 210 210
£500m Fixed Rate Reset Perpetual AT1 Capital Securities 500 –
13,600 13,400
Interests in subsidiaries are held at cost subject to impairment. During 2019 and 2018, no impairment was recognised. The Company has no associates.
249Santander UK Group Holdings plc

Annual Report 2019 | Financial statements
250 Santander UK Group Holdings plc
The movement in the Company’s interests in subsidiaries was as follows:
Cost Impairment Net book value £m £m £m
At 1 January 2019 and 31 December 2019 11,645 – 11,645
At 1 January 2018 11,268 – 11,268
Additions 377 – 377
At 31 December 2018 11,645 – 11,645
Interests in ordinary shares of subsidiaries include the Company’s investment in 100% of the ordinary share capital of Santander UK plc, SFS and SEIL.
During 2018, the following restructures were carried out as part of the Santander UK group’s ring-fencing plans:
– Santander UK Group Holdings plc acquired 100% of the share capital of SEIL from SFS, for a consideration of £40m, which was equivalent to the book value of the associated assets and liabilities.
– Santander UK Group Holdings plc acquired 100% of the share capital of SFS from Santander UK plc, for a consideration of £337m, which was equivalent to the book value of the associated assets and liabilities.
Details of subsidiary undertakings and joint ventures are set out in the Shareholder information section. For information on AT1 Capital Securities, see Note 31 to the Consolidated Financial Statements.
7. DEPOSITS BY BANKS
These consist of amounts due to subsidiaries and are repayable on demand.
8. DEBT SECURITIES IN ISSUE
The Company issues notes in the US from time to time pursuant to a shelf registration statement on Form F-3 filed with the SEC in 2018.
9. SUBORDINATED LIABILITIES
2019 2018 Dated subordinated liabilities Maturity £m £m
4.75% Subordinated notes (US$1,000m) 2025 763 791
5.625% Subordinated notes (US$500m) 2045 379 394
1,142 1,185 10. CHANGES IN LIABILITIES ARISING FROM FINANCING ACTIVITIES
The table below shows the changes in liabilities arising from financing activities.
2019 2018
Balance sheet line item Balance sheet line item
Debt securities
in issue Subordinated
liabilities Other equity
instruments Dividends
paid Total
Debt
securities in issue
Subordinated liabilities
Other equity instruments
Dividends paid Total
£m £m £m £m £m £m £m £m £m £m
At 1 January 9,295 1,185 2,041 – 12,521
6,256 1,116 2,041 – 9,413
Cash flows from financing activities – – 196 (404) (208)
2,658 – – (1,268) 1,390
Cash flows from operating activities – – – – –
(7) – – – (7)
Non-cash changes: – – – – –
– – – – –
– Unrealised foreign exchange (327) (44) – – (371)
418 – – – 418
– Other changes (11) 1 4 404 398 (30) 69 – 1,268 1,307
At 31 December 8,957 1,142 2,241 – 12,340 9,295 1,185 2,041 – 12,521
Santander UK Group Holdings plc250
Annual Report 2019 | Financial statements

Santander UK Group Holdings plc 251
Strategic report Governance Risk review Financial review Financial statements Shareholder information
Notes to the Company
financial statements
11. CONTINGENT LIABILITIES AND COMMITMENTS
Details of the capital support arrangements entered into by the Company are set out in Note 29 to the Consolidated Financial Statements.
12. SHARE CAPITAL
Details of the Company’s share capital are set out in Note 30 to the Consolidated Financial Statements.
13. OTHER EQUITY INSTRUMENTS
Details of the Company’s other equity instruments are set out in Note 31 to the Consolidated Financial Statements.
14. TRANSACTIONS WITH DIRECTORS AND OTHER KEY MANAGEMENT PERSONNEL
The Directors of Santander UK Group Holdings plc did not receive any remuneration in respect of their services to the Company. The remuneration disclosures in
respect of the Santander UK group are set out in Note 36 to the Consolidated Financial Statements.
15. RELATED PARTY TRANSACTIONS
The Company’s only transactions with related parties arise in connection with the receipt of dividends declared by its subsidiaries, payment of dividends on its own
ordinary shares and Perpetual Capital Securities, interest payments to its subsidiary on intercompany loans and interest received from its subsidiaries relating to
downstreamed funding of senior debt, as well as any transactions entered into as part of the implementation of Santander UK’s ring-fencing plans in 2018.
16. EVENTS AFTER THE BALANCE SHEET DATE
See Note 40 to the Consolidated Financial Statements.
251Santander UK Group Holdings plc

Shareholder information
Contents
Subsidiaries, joint ventures 253 and associates
Forward-looking statements 256 Glossary 257
Santander UK Group Holdings plc252
Annual Report 2019 | Shareholder information

In accordance with Section 409 of the Companies Act 2006, details of Santander UK Group Holdings plc’s subsidiaries, joint ventures and associates at 31 December 2019 are set out below. This section forms an integral part of the financial statements.
SubsidiariesAll subsidiaries are consolidated by the Santander UK group.
Incorporated and registered in England and Wales:
Name of subsidiaryRegistered office(1)
Direct/indirect ownership
Share class through which ownership is held
Proportion of ownership
interest %
Ultimate proportion of
ownership %
2 & 3 Triton Limited A Indirect Ordinary £1 – 100
A & L CF June (2) Limited A Indirect Ordinary £1 – 100
A & L CF June (3) Limited A Indirect Ordinary £1 – 100
A & L CF March (5) Limited A Indirect Ordinary £1 – 100
A & L CF September (4) Limited A Indirect Ordinary £1 – 100
Abbey National Beta Investments Limited A Indirect Ordinary £1 – 100
Abbey National Business Office Equipment Leasing Limited A Indirect Ordinary £1 – 100
Abbey National Nominees Limited A Indirect Ordinary £1 – 100
Abbey National PLP (UK) Limited A Indirect Ordinary £1 – 100
Abbey National Property Investments A Indirect Ordinary £1 – 100
Abbey National Treasury Services Investments Limited A Indirect Ordinary £1 – 100
Abbey National Treasury Services Overseas Holdings A Indirect Ordinary £1 – 100
Abbey National UK Investments A Indirect Ordinary €0.20
Ordinary £1– 100
Abbey Stockbrokers (Nominees) Limited A Indirect Ordinary £1 – 100
Abbey Stockbrokers Limited A Indirect Ordinary £1A Preference £1B Preference £1
– 100
Alliance & Leicester Cash Solutions Limited A Indirect Ordinary £1 – 100
Alliance & Leicester Commercial Bank Limited A Indirect Ordinary £1 – 100
Alliance & Leicester Investments (Derivatives) Limited A Indirect Ordinary £1 – 100
Alliance & Leicester Investments (No.2) Limited A Indirect Ordinary £1 – 100
Alliance & Leicester Investments Limited A Indirect Ordinary £1 – 100
Alliance & Leicester Limited G Indirect Ordinary £0.50 – 100
Alliance & Leicester Personal Finance Limited G Indirect Ordinary £1 – 100
AN (123) Limited A Indirect Ordinary £0.10 – 100
ANITCO Limited A Indirect Ordinary £1 – 100
Athena Corporation Limited A Indirect Ordinary £1 – 100
Cater Allen Holdings Limited A Indirect Ordinary £1 – 100
Cater Allen International Limited A Indirect Ordinary £1 – 100
Cater Allen Limited A Indirect Ordinary £1 – 100
Cater Allen Lloyd's Holdings Limited A Indirect Ordinary £1 – 100
Cater Allen Syndicate Management Limited A Indirect Ordinary £1 – 100
First National Motor Business Limited A Indirect Ordinary £1 – 100
First National Motor Contracts Limited A Indirect Ordinary £1 – 100
First National Motor Facilities Limited A Indirect Ordinary £1 – 100
First National Motor Finance Limited A Indirect Ordinary £1 – 100
First National Motor Leasing Limited A Indirect Ordinary £1 – 100
First National Motor plc B Indirect Ordinary £1 – 100
First National Tricity Finance Limited A Indirect Ordinary £1 – 100
Insurance Funding Solutions Limited A Indirect Ordinary £1 – 100
Liquidity Limited A Indirect Ordinary A £0.10Ordinary B1 £0.10Ordinary B2 £0.10Preference £1
– 100
Mortgage Engine Limited A Indirect Ordinary £1 – 100
PSA Finance UK Limited H Indirect Ordinary £1 – 50
Subsidiaries, joint ventures and associates
253Santander UK Group Holdings plc
Strategic Report Governance Risk review Financial review Financial statements Shareholder information

Name of subsidiaryRegistered office(1)
Direct/indirect ownership
Share class through which ownership is held
Proportion of ownership
interest %
Ultimate proportion of
ownership %
Santander (CF Trustee Property Nominee) Limited M Trust relationship Ordinary £1 – –
Santander (CF Trustee) Limited M Trust relationship Ordinary £1 – –
Santander (UK) Group Pension Scheme Trustees Limited M Direct Ordinary £1 100 100
Santander Asset Finance (December) Limited G Indirect Ordinary £1 – 100
Santander Asset Finance plc A Indirect Ordinary £0.10 – 100
Santander Cards Limited A Indirect Ordinary £1 – 100
Santander Cards UK Limited A Indirect Ordinary £1 – 100
Santander Consumer (UK) plc B Indirect Ordinary £1 – 100
Santander Consumer Credit Services Limited A Indirect Ordinary £1 – 100
Santander Equity Investments Limited A Direct Ordinary £1 100 100
Santander Estates Limited G Indirect Ordinary £1 – 100
Santander Financial Services plc A Direct Ordinary £1 100 100
Santander Global Consumer Finance Limited A Indirect Ordinary £0.0001 – 100
Santander Guarantee Company A Indirect Ordinary £1 – 100
Santander Lending Limited A Indirect Ordinary £1 – 100
Santander Mortgage Holdings Limited A Indirect Ordinary £1 – 100
Santander Private Banking UK Limited A Indirect Ordinary £1 – 100
Santander Secretariat Services Limited A Direct A Ordinary US$0.01 100 100
Santander UK Operations Limited A Indirect Ordinary A £1Ordinary B £1
––
100100
Santander UK (Structured Solutions) Limited A Indirect Ordinary £0.01 – 100
Santander UK Technology Limited A Indirect Ordinary £1 – 100
Santander UK plc A Direct Ordinary £0.10 100 100
Sheppards Moneybrokers Limited A Indirect Ordinary £1 – 100
Solarlaser Limited A Indirect Ordinary £1 – 100
SCF Eastside Locks GP Limited M Trust relationship Ordinary £1 – –
The Alliance & Leicester Corporation Limited A Indirect Ordinary £1 – 100
Time Retail Finance Limited (In liquidation) F Indirect Ordinary £1Ordinary £0.0001
––
100100
Tuttle and Son Limited A Indirect Ordinary £1 – 100
(1) Refer to the key at the end of this section for the registered office address.
Incorporated and registered outside England and Wales:
Name of subsidiaryRegistered office(1)
Direct/indirect ownership
Share class through which ownership is held
Proportion of ownership
interest %
Ultimate proportion of
ownership %
A & L CF (Guernsey) Limited N Indirect Ordinary £1 – 100
Abbey Business Services (India) Private Limited Q Indirect Ordinary INR 10 – 100
Abbey National International Limited O Indirect Ordinary £1 – 100
ALIL Services Limited R Indirect Ordinary £1 – 100
Carfax (Guernsey) Limited N Indirect Ordinary £1 – 100
Santander Cards Ireland Limited J Indirect Ordinary €1 Ordinary €1.27
– 100
Santander ISA Managers Limited I Indirect Ordinary £1 – 100
Sovereign Spirit Limited P Indirect Ordinary BMD 1 – 100
Whitewick Limited (In liquidation) O Indirect Ordinary £1 – 100
(1) Refer to the key at the end of this section for the registered office address, including the country.
Subsidiaries, joint ventures and associates continued
Santander UK Group Holdings plc254
Annual Report 2019 | Shareholder information

Other subsidiary undertakingsAll entities are registered in England and Wales except for Guaranteed Investment Products 1 PCC Limited which is registered in Guernsey and Motor Securities 2018-1 Designated Activity Company which is registered in Ireland.
The Company and its subsidiaries do not own directly, or indirectly, any of the share capital of any of the entities, however they are consolidated by the Santander UK group because the substance of the relationship indicates control, as described in Note 1 to the Consolidated Financial Statements.
Name of entityRegistered office(1) Name of entity
Registered office(1)
Abbey Covered Bonds (Holdings) Limited E Holmes Trustees Limited A
Abbey Covered Bonds (LM) Limited E Langton Funding (No.1) Limited C
Abbey Covered Bonds LLP A Langton Mortgages Trustee (UK) Limited A
Auto ABS UK Loans 2017 Holdings Limited C Langton PECOH Limited C
Auto ABS UK Loans 2017 plc C Langton Securities (2008-1) plc C
Auto ABS UK Loans 2019 Holdings Limited L Langton Securities (2010-1) plc C
Auto ABS UK Loans 2019 plc L Langton Securities (2010-2) plc C
Auto ABS UK Loans Holdings Limited C Langton Securities Holdings Limited C
Auto ABS UK Loans plc C MAC No. 1 Limited A
Fosse (Master Issuer) Holdings Limited C Motor 2015-1 Holdings Limited C
Fosse Funding (No.1) Limited C Motor 2015-1 plc (In liquidation) D
Fosse Master Issuer plc C Motor 2016-1 Holdings Limited C
Fosse PECOH Limited C Motor 2016-1 plc C
Fosse Trustee (UK) Limited A Motor 2017-1 Holdings Limited C
Guaranteed Investment Products 1 PCC Limited S Motor 2017-1 plc C
Holmes Funding Limited A Motor Securities 2018-1 Designated Activity Company T
Holmes Holdings Limited A PECOH Limited A
Holmes Master Issuer plc A
(1) Refer to the key at the end of this section for the registered office address.
Joint ventures and associates All these entities are registered in England and Wales and are accounted for by the equity method of accounting.
Name of joint ventureRegistered office(1)
Direct/indirect ownership
Share class through which ownership is held
Proportion of ownership
interest %
Ultimate proportion of
ownership %
Hyundai Capital UK Limited K Indirect Ordinary £1 – 50
PSA UK Number 1 plc H Indirect B Ordinary £1C Ordinary £1
– 50
Syntheo Limited (In liquidation) F Indirect Ordinary £1 – 50
(1) Refer to the key at the end of this section for the registered office address.
All entities are joint ventures, except for PSA UK Number 1 plc which is an associate.
Overseas branchesThe Company has no overseas branches. Santander Financial Services plc, a subsidiary, has branch offices in Jersey and the Isle of Man.
Key of registered office addressesA 2 Triton Square, Regent’s Place, London NW1 3AN B Santander House, 86 Station Road, Redhill RH1 1SR C 35 Great St. Helen’s, London EC3A 6APD 40a Station Road, Upminster, Essex RM14 2TRE Wilmington Trust SP Services (London) Limited, 1 Kings Arms Yard,
London EC2R 7AFF Griffins, Tavistock House South, Tavistock Square, London WC1H 9LGG Building 3, Floor 2, Carlton Park, Narborough, Leicester LE19 0ALH 61 London Road, Redhill RH1 1QAI 287 St. Vincent Street, Glasgow, Scotland G2 5NBJ 25/28 North Wall Quay, Dublin 1, IrelandK London Court, 39 London Road, Reigate RH2 9AQ
L Level 37, 25 Canada Square, London E14 5LQ M Santander House, 201 Grafton Gate East, Milton Keynes MK9 1AN N Fourth Floor, The Albany, South Esplanade, St. Peter Port,
Guernsey GY1 4NFO 19-21 Commercial Street, St. Helier, Jersey JE2 3RU P Clarendon House, 2 Church Street, Hamilton HM11, BermudaQ The Residency, 7th Floor, 133/1 Residency Road, Bangalore, KA
560 025, IndiaR 19/21 Prospect Hill, Douglas, Isle of Man IM99 1RYS Ground Floor, Dorey Court, Admiral Park, St Peter Port, Guernsey
GY1 2HTT 3rd Floor, Flemming Court, Flemming’s Place, Dublin 4
255Santander UK Group Holdings plc
Strategic Report Governance Risk review Financial review Financial statements Shareholder information

The Company and its subsidiaries (together Santander UK) may from time to time make written or oral forward-looking statements. The Company makes written forward-looking statements in this Annual Report and may also make forward-looking statements in its periodic reports to the SEC on Forms 20-F and 6-K, in its offering circulars and prospectuses, in press releases and in other written materials and in oral statements made by its officers, directors or employees to third parties. Examples of such forward-looking statements include, but are not limited to:
– projections or expectations of revenues, costs, profit (or loss), earnings (or loss) per share, dividends, capital structure or other financial items or ratios – statements of plans, objectives or goals of Santander UK or its management, including those related to products or services – statements of future economic performance, and – statements of assumptions underlying such statements
Words such as ‘believes’, ‘anticipates’, ‘expects’, ‘intends’, ‘aims’, ‘plans’, ‘targets’ and similar expressions are intended to identify forward-looking statements, but are not the exclusive means of identifying such statements.
By their very nature, forward-looking statements are not statements of historical or current facts; they cannot be objectively verified, are speculative and involve inherent risks and uncertainties, both general and specific, and risks exist that the predictions, forecasts, projections and other forward-looking statements will not be achieved. Santander UK cautions readers that a number of important factors could cause actual results to differ materially from the plans, objectives, expectations, estimates and intentions expressed in such forward-looking statements made by Santander UK or on its behalf. Some of these factors, which could affect Santander UK’s business, financial condition and/or results of operation, are considered in detail in the Risk review, and they include:
– the effects of disruptions and volatility in the global economy and global financial markets – the effects of UK economic conditions – the effects of UK’s withdrawal from the European Union – the effects of competition with other financial institutions, including new entrants into the financial services sector – the risk that Santander UK’s new or existing products and services may not become (or may not continue to be) successful – the risk that Santander UK may be unable to continue offering products and services from third parties – the extent to which Santander UK’s loan portfolio is subject to prepayment risk – the risk that Santander UK may be unable to manage the growth of its operations – the effects of any changes to the reputation of Santander UK or its affiliates – the extent to which regulatory capital, liquidity and leverage requirements, and any changes to these requirements may limit Santander UK’s operations – Santander UK’s ability to access liquidity and funding on acceptable financial terms – the effects of an adverse movement in external credit rating assigned to Santander UK, any Santander UK member or any of their respective debt securities – the effects of any changes in the pension liabilities and obligations of Santander UK – the effects of fluctuations in interest rates and other market risks – risks arising from the integrity and continued existence of reference rates – the extent to which Santander UK may be required to record negative fair value adjustments for its financial assets due to changes in market conditions – Santander UK’s ability to control the level of non-performing or poor credit quality loans and whether Santander UK’s loan loss reserves are sufficient to cover loan losses – the risk that the value of the collateral, including real estate, securing Santander UK’s loans may not be sufficient and that Santander UK may be unable to realise the
full value of the collateral securing its loan portfolio – the effects of the financial services laws, regulations, government oversight, administrative actions and policies and any changes thereto in each location or market
in which Santander UK operates – the risk that Santander UK may become subject to the provisions of the Banking Act 2009, including the bail-in and write down powers thereunder – the effects of any failure to comply with anti-money laundering, anti-terrorism, anti-corruption, anti-tax evasion or sanctions laws or regulations, or the risk of any
failure to prevent or detect any illegal or improper activities fully or timeously – the effects of taxation (and any changes to tax), in each location in which Santander UK operates – Santander UK’s exposure to any risk of loss from civil litigation and/or criminal legal or regulatory proceedings – the risk of failing to successfully apply or to improve Santander UK’s credit risk management systems – the risk that Santander UK’s data management policies and processes may not be sufficiently robust – the effect of cyber-crime on Santander UK’s business – the risks arising from any non-compliance with Santander UK’s policies, from any employee misconduct or human error, or from any negligence or fraud – the risk of failing to effectively manage changes in Santander UK’s information technology infrastructure and management information systems in a timely manner – Santander UK’s exposure to unidentified or unanticipated risks despite its risk management policies, procedures and methods – the risks arising from Santander UK’s reliance on third parties and affiliates for key infrastructure support, products and services – the ability of Santander UK to recruit retain and develop appropriate senior management and skilled personnel – the effects of any inaccuracy within the judgements and accounting estimates which underpin aspects of the financial statements, and the consequent risk of any
material misstatement of Santander UK’s financial results – the effect of any change in accounting standards
Please refer to our latest filings with the SEC (including, without limitation, our Annual Report on Form 20-F for the year ended 31 December 2019) for a discussion of certain risk factors and forward-looking statements. Undue reliance should not be placed on forward-looking statements when making decisions with respect to any Santander UK member and/or its securities. Investors and others should take into account the inherent risks and uncertainties of forward-looking statements and should carefully consider the foregoing non-exhaustive list of important factors. Forward-looking statements speak only as of the date on which they are made and are based on the knowledge, information available and views taken on the date on which they are made; such knowledge, information and views may change at any time. Santander UK does not undertake any obligation to update or revise any forward-looking statement, whether as a result of new information, future events or otherwise.
Forward-looking statements
Santander UK Group Holdings plc256
Annual Report 2019 | Shareholder information

Our glossary of industry and other main terms is available on our website: www.santander.co.uk/about-santander/investor-relations/glossary.
The definitions of our KPIs are included in the table below. KPIs are presented at 31 December in the periods indicated and are based on spot balances at these dates, except for:
– The adjusted CIR, adjusted RoTE, retail NPS and business and corporate NPS, which are based on performance in the relevant period – Top 10 company to work for, which we aim to gain accreditation for over the medium-term – Financially empowered people, which is a cumulative figure from the start of 2019.
KPI Definition
Loyal customers Loyal customers are defined as primary banking current account customers who hold an additional product.
Net Promoter Score
– Business and corporate
Measured by the MarketVue Business Banking from Savanta. This is an ongoing telephone based survey designed to monitor usage and attitude of UK businesses towards banks. Structured telephone interviews are conducted each year among businesses of all sizes from new start-ups to large corporates and are weighted by region and turnover to be representative of businesses in Great Britain. NPS – recommendation score is based on an 11 point scale (%Top 2 – %Bottom 7).
Net Promoter Score
– Retail
The Financial Research Survey (FRS) is a monthly personal finance survey of around 5,000 consumers prepared by the independent market research agency, IPSOS MORI. The NPS is based on a 11-point scale (%Top2 – %Bottom 7) across mortgages, savings, main current accounts, home insurance, UPLs and credit cards, based on a weighting of those products calculated to reflect the average product distribution across Santander UK and competitor brands.
Digital customers Digital customers reflect the number of customers who have logged onto Retail or Business online banking or mobile app(s) (Retail Mobile includes SanWallet & OnePayFX) at least once in the month.
Adjusted RoTE The adjusted profit after tax attributable to equity holders of the parent divided by average shareholders’ equity less non-controlling interests, other equity instruments and average goodwill and intangible assets.
Adjusted cost to income ratio Adjusted total operating expenses before credit impairment losses and provisions for other liabilities and charges as a percentage of adjusted total operating income.
Top 10 company to work for In line with Banco Santander’s aspiration, we will aim to achieve the accreditation of a Top 10 company to work for, as measured by an industry-wide benchmarking survey, over the medium-term.
Financially empowered people The number of people we are supporting who are unbanked, underbanked or in a situation of vulnerability to get access to the financial system, receive tailored finance and increase their knowledge and resilience through financial education. In 2019 we started to contribute to Banco Santander’s target to financially empower 10m people by 2025.
Glossary
257Santander UK Group Holdings plc
Strategic Report Governance Risk review Financial review Financial statements Shareholder information

Further Information
Customer servicesFor more information on our products and services, please visit our website:
santander.co.uk [email protected]
+44 (0)800 389 7000
ShareholdersInformation for UK shareholders of Banco Santander can be found at our website:
santandershareview.com [email protected]
By post, please write to:
Santander Nominee Service Aspect House Spencer Road Lancing BN99 6DA
+44 (0)371 384 2000 +44 (0)121 415 7188 (From outside the UK)
Community involvementTo find out more about applying for donations and the Santander UK Foundation, please visit our website:
santanderfoundation.org.uk
Media centreContacts for the media relations team are available at our website via the media section:
aboutsantander.co.uk [email protected]
Investor relationsFor financial results and presentations, stock exchange announcements, credit ratings and information for debt investors, please visit the investor relations section of our website:
santander.co.uk/about-santander/investor-relations [email protected]
Registered addressSantander UK 2 Triton Square Regent’s Place London NW1 3AN
28 April 2020 29 July 2020 28 October 2020
For a glossary of terms used in this report:
www.santander.co.uk/about-santander/investor-relations/glossary
Q1 2020 results Q2 2020 results Q3 2020 results
Contact us
Key dates
Glossary
Designed and produced by
Santander UK Group Holdings plc258
Annual Report 2019


Santander UK 2 Triton Square Regent’s Place London NW1 3AN
santander.co.uk
Copyright © 2022 FDOKUMEN