Stanbic IBTC Holdings PLC Annual report - The Vault
124
Stanbic IBTC Holdings PLC Annual report 2013
-
Upload
khangminh22 -
Category
Documents
-
view
6 -
download
0
Transcript of Stanbic IBTC Holdings PLC Annual report - The Vault
Stanbic IBTC Holdings PLC
Annual report
2013

1
Overview Business review
Otherinformation
Annual report and financial statements
All results in this booklet are presented on an IFRS (International Financial Reporting Standards) basis.
Contents
OverviewOur vision and values
Corporate profile
Our network
Recognition
Business reviewChairman’s statement
Chief executive’s statement
Economic review
Financial review
Executive committee
Personal and Business Banking
Case study – NBC Case study – Erisco Foods Limited
Corporate and Investment Banking Case study – Danone and Abraaj story Case study – Power and infrastructure story
Wealth Abridged sustainability report Enterprise risk review
Annual report and financial statements Board of directors
Directors’ report
Statement of directors’ responsibility
Corporate governance report
Report of the audit committee
Independent auditor’s report
Statement of financial position
Statement of profit or loss
Statement of cash flows
Notes to the annual financial statements
Annexure A
Annexure B
Other informationManagement team
Branch network
Contact information
4
6
8
10
16
20
24
28
54
58
60
62
66
70
72
76
82
86
118
120
125
126
140
141
142
143
150
151
228
229
234
238
243
Stanbic IBTC Annual group financial statements for the year ended 31 December 2013

32
Balance sheet analysis
Capital management
Market and Shareholderinformation
Otherinformation
Balance sheetanalysis
Stanbic IBTC Annual group financial statements for the year ended 31 December 2013
OverviewOur vision and values
Corporate profile
Our network
Recognition
4
6
8
10
Overview

5
Balance sheet analysis
Business review
Annual report and financial statements
Otherinformation
Overview
4 Stanbic IBTC Annual group financial statements for the year ended 31 December 2013
Overview
Our vision and values
Upholding the highest levels of integrity
Our entire business model is based on trust and integrity as perceived by our stakeholders, especially our clients.
Growing our people
We encourage and help our people to develop to their full potential and measure our leaders on how well they grow and challenge the people they lead.
Serving our customers
We do everything in our power to ensure that we provide our clients with the products, services and solutions to suit their needs, provided that everything we do for them is based on sound business principles.
Respecting each other
We have the highest regard for the dignity of all people. We respect each other and what Stanbic IBTC stands for. We recognise that there are corresponding obligations associated with our individual rights.
Delivering to our shareholders
We understand that we earn the right to exist by providing appropriate long-term returns to our shareholders. We try extremely hard to meet our various targets and deliver on our commitments.
Being proactive
We strive to stay ahead by anticipating rather than reacting, but our actions are always carefully considered.
Guarding againstarrogance
We have confidence in our ability to achieve ambitious goals and we celebrate success, but we never allow ourselves to become arrogant.
Working in teams
We, and all aspects of our work, are interdependent. We appreciate that, as teams, we can achieve much greater things than as individuals. We value teams within and across business units, divisions and countries.
The values that underpin our strategy
To be the leading end-to-end financial solutions provider in Nigeria through innovative and customer-focused people.

7
Balance sheet analysis
Business review
Annual report and financial statements
Otherinformation
Overview
6 Stanbic IBTC Annual group financial statements for the year ended 31 December 2013
Overview
Corporate profile
Stanbic IBTC was incorporated as Investment Banking and Trust Company Limited, a private limited liability company on 2 February 1989. IBTC was granted a merchant banking license in February 1989 and commenced operations on 1 March 1989. IBTC’s merchant banking license was converted to a universal banking license in January 2002, pursuant to the universal banking guidelines of the CBN. In 2005, IBTC became a public company and its shares were listed on The Nigerian Stock Exchange.
In December 2005, IBTC merged with Chartered Bank PLC and Regent Bank Plc and changed its name to IBTC Chartered Bank Plc (“IBTC Chartered”) on 25 January 2006. On 24 September 2007, IBTC Chartered merged with Stanbic Bank Nigeria Limited (“Stanbic Bank”), a wholly owned subsidiary of Stanbic Africa Holdings Limited (“SAHL”), which in turn is a subsidiary of Standard Bank Group Limited of South Africa. As part of the transaction that resulted in the combination of IBTC Chartered and Stanbic Bank, SAHL acquired a majority shareholding (52.8%) in the enlarged bank, which was named Stanbic IBTC Bank PLC.
Stanbic IBTC Holdings is a full service financial institution which offers a wide range of products to a variety of segments. Stanbic IBTC provides end-to-end financial solutions which include corporate and investment banking, personal and business banking, stockbroking and wealth management.
Standard Bank Group, to which Stanbic IBTC Bank belongs, is rooted in Africa with strategic representation in 20 key sub-Saharan countries and other emerging markets. Standard Bank has been in operation for over 150 years and prides itself on being a global bank with African roots. The largest African bank by assets and earnings, it operates in 20 countries on the African continent, including South Africa, as well as in other selected emerging markets.
We uphold high standards of corporate governance and are committed to advancing the principles and practice of sustainable development. Our success and growth over the long term is built on making a difference in the communities in which we operate.
Gross revenue
Total deposit
Total income
Gross loans and advances
Corporate andInvestment Banking52%
Wealth 17%
Personal and business banking
31%
Gross revenue
N58.5 billionCorporate and investment banking services to government, parastatals, larger corporates, financial institutions and international counter-parties in Nigeria.
Gross revenue
N34.0 billionBanking and other financial services to individual customers and small to medium sized enterprises.
Gross revenue
N18.7 billionInvestment management in form of asset management, pension fund administration and trusteeship.
Corporate and
Investment Banking
(CIB)
Personal and
Business Banking
(PBB)
Wealth
99.9%
99.9%
99.9%
99.9%
99.9%
99.9%
70.6%
99.9%
99.9%
99.9%
Stanbic IBTC Holdings PLC
Stanbic IBTCBank PLC
Stanbic IBTCBureau de
Change Limited
Stanbic IBTCAsset
Management Limited
Stanbic Nominees
Nigeria Limited
Stanbic IBTCCapital Limited
Stanbic IBTCStockbrokers
Limited
Stanbic IBTCPension
Managers Limited
Stanbic IBTCTrustees Limited
Stanbic IBTCInvestments
Limited
Stanbic IBTCVenturesLimited
Corporate andInvestment Banking48%
Wealth 22%
Personal and business banking
30%
Corporate andInvestment Banking52%
Corporate andInvestment Banking56%
Personal and Business Banking
48%
Personal and Business Banking
44%

9
Balance sheet analysis
Business review
Annual report and financial statements
Otherinformation
Overview
8 Stanbic IBTC Annual group financial statements for the year ended 31 December 2013
Overview
Our network
1 Angola
2 Botswana
3 Cote d’ivoire
4 DRC
5 Ethiopia
6 Ghana
7 Kenya
8 Lesotho
9 Malawi
10 Mauritius
11 Mozambique
12 Namibia
13 Nigeria
14 South Africa
15 South Sudan
16 Swaziland
17 Tanzania
18 Uganda
19 Zambia
20 Zimbabwe
Market capitalisation
R209 billion (USD20 billion)Total assets
R1,694 billion (USD162 billion)Operating in
20 African countriesand 13 countries outside Africa
Branches
12 FCT Abuja region
15 Lagos Island region
48 Lagos Mainland region
8 North Central region
9 North East region
22 North West region
21 South East region
12 South South region
33 South West region
ATMs
21 FCT Abuja region
41 Lagos Island region
98 Lagos Mainland region
16 North Central region
13 North East region
38 North West region
31 South East region
35 South South region
66 South West region
48,808 employees (2,077 in Nigeria)
1,283 branches (180 in Nigeria)
9,300 ATMs (359 in Nigeria)
Group overview
Nigeria overview
10
1120
19
9
174
18
7
5
151363
1
2
12
16
8
14

11
Balance sheet analysis
Business review
Annual report and financial statements
Otherinformation
Overview
10 Stanbic IBTC Annual group financial statements for the year ended 31 December 2013
Overview
Recognition
Awards – 2013
1. Best Foreign Exchange Provider in Africa and Nigeria Global Finance Awards 2013
2. M & A Deal of the Year The Banker’s awards (2013) for the Tiger Brand’s acquisition of a 63 percent stake in Nigeria’s Dangote Flour Mills
3. Structured Finance Deal of the Year (The Banker’s awards (2013) for the USD150-million Skye Bank Remittances Future Flow Securitisation in Nigeria
4. Best sub-custodian bank in Nigeria 2013 Global Finance magazine awards
5. Bank of the Year The Nigerian Auto Awards 2013 (On Wheels Auto Awards 2013)
6. Most innovative banking product Stanbic IBTC Bank consumer loan (Businessday Annual Awards 2013)
7. Best Investment Management Company in Nigeria World Finance (awarded to Stanbic IBTC Asset Management)
8. Best Investment Bank in Nigeria EMEA Awards
9. Best Broker in Nigeria EMEA Awards
10. Best Sub-Custodian in Nigeria Global Finance Magazine at SIBOS
11. Best FX Provider in Nigeria Global Finance Magazine at SIBOS
12. 2013 Best Bank in Nigeria Award Euromoney Real Estate Survey
13. The Most active Dealing Member Firm (Stockbroking) The Nigerian Stock Exchange CEO Award 2013

13
Overview Capital management
Otherinformation
Business review
12 Stanbic IBTC Annual group financial statements for the year ended 31 December 2013
Business review Annual report and financial statements
Business review
Business reviewChairman’s statement
Chief executive’s statement
Economic review
Financial review
Executive committee
Personal and Business Banking
Case study – NBC Case study – Erisco Foods Limited
Corporate and Investment Banking Case study – Danone and Abraaj story Case study – Power and infrastructure story
Wealth Abridged sustainability report Enterprise risk review
16
20
24
28
54
58
60
62
66
70
72
76
82
86

15
Overview Capital management
Otherinformation
Business review
14 Stanbic IBTC Annual group financial statements for the year ended 31 December 2013
Business review Annual report and financial statements
Chairman’s statement

17
Overview Capital management
Otherinformation
Business review
16 Stanbic IBTC Annual group financial statements for the year ended 31 December 2013
Business review Annual report and financial statements
Dear Shareholders,
On behalf of the board of Stanbic IBTC Holdings PLC, I am delighted to welcome you to the second annual general meeting of our company since its restructure into a holding company.
On the global economic landscape, the year 2013 was dominated by widespread uncertainty on the back of recurring concerns about growth in some areas of the Eurozone, political instability in the Middle East and mixed signals about quantitative easing/tapering in the United States.
By contrast, the Nigerian economy recorded GDP growth in line with historical trends on the back of improved output from non-oil sectors. In addition, the stability of the Naira against international currencies led to increased confidence by investors and the sustained flow of foreign portfolio investments into the country. These positive indicators were partially moderated by unrest in some parts of northern Nigeria which dampened economic activities in those areas.
On the domestic capital markets scene, the All Share Index of The Nigerian Stock Exchange appreciated by 47% in 2013 on the back of strengthening company fundamentals, positive investor outlook and rising business confidence arising from the successful privatisation of the unbundled electricity distribution and generation companies which previously belonged to the Federal Government of Nigeria via its monopoly Power Holding Company.
Within the banking industry, the main drivers during the year were regulatory changes with the most significant being the increase in cash reserve ratio to 50% imposed on public sector deposits held by banks and the increase in the statutory AMCON levy.
Against this backdrop, our company achieved many milestones during the course of the year. Our banking customer base crossed the one million customer mark, in line with our growth ambitions. We will continue to leverage on economies of scale to optimize costs, and to continue to provide best-in-class service to our customers.
In addition, we were awarded with several accolades across our group including the most active dealing member firm at The Nigerian Stock Exchange CEO award 2013 and the best Investment Management Company in Nigeria by World Finance. These accolades were in recognition of our leadership across asset classes within Nigerian financial markets.
Balance sheet
The group’s total assets increased by N86 billion or 13% from N677 billion to N763 billion at the end of 2013. This growth was in line with our continued focus on growing our balance sheet.
The bank’s deposits from customers increased by N61 billion or 17% from N355 billion to N416 billion at the end of 2013. This growth was largely driven by a focus on driving appropriately priced deposits and reducing the average cost of funds of the existing balance sheet.
The Bank’s loans to customers also increased by N23 billion or 9% from N280 billion to N303 billion at the end of 2013. The growth rate was muted due to the persistently high interest rate regime.
In line with the group’s robust risk management framework, provisions were made for the loans and advances portfolio. The total provision made was 4.4% of the loans and advances book compared to 5.1% as the end of 2013.
Income statement
Stanbic IBTC Holdings PLC achieved gross earnings of N111 billion for the financial period ended 31st December 2013, which represented an increase of 21% over the N92 billion achieved in 2012. This was largely due to an exceptional performance from increased transactional fee income and growing investor flows.
The group’s net interest income increased by 10% from N34 billion in 2012 to N37 billion in 2013. This growth is largely
as a result of our focus on reducing our overall cost of funds.Non-interest revenue grew by an impressive 42% from N34 billion in 2012 to N48 billion in 2013. This performance was on the back of a strong showing from our Wealth division as well as trading revenue earned by leveraging off opportunities recorded in the market during the year.
Overall, the group’s profit after tax increased by 105% from N10 billion earned in 2012 to N21 billion in 2013.
Following the interim dividend of 70 kobo per share already paid to shareholders on 22 August 2013, your Directors are pleased to recommend a final dividend of 10 kobo per share.
General
This annual general meeting is coming at the end of our first full financial year since our reorganization into a holding company structure.
We have focused our corporate social responsibility initiatives around impactful sectors that align with our core beliefs and support development in a Nigerian context; health, education and economic empowerment.
We continue to demonstrate our commitment to excellence in corporate governance with entrenched practices that ensure that we run a profitable business in an ethical and environmentally sustainable manner.
I would like to use this opportunity to express our gratitude to our shareholders, regulators, host communities, customers and staff for the hard work and support that has enabled us to achieve these results.
In the coming year, we will continue to leverage on our core strengths to ensure that we are able to provide even better solutions to all of our customers’ financial needs.
Atedo N A Peterside conChairman
05 February 2014
2013 statistics
Atedo N Peterside CON Chairman
“Our banking customer base crossed the one million mark, in line with our growth ambitions.”
13% up
17% up
Total assets
N763billion
Customer deposits
N416billion
Chairman’s statement

19
Overview Capital management
Otherinformation
Business review
18 Stanbic IBTC Annual group financial statements for the year ended 31 December 2013
Business review Annual report and financial statements
Chief executive’s statement

21
Overview Capital management
Otherinformation
Business review
20 Stanbic IBTC Annual group financial statements for the year ended 31 December 2013
Business review Annual report and financial statements
Dear Shareholders,
The Nigerian economy experienced growth and macroeconomic stability in 2013, in contrast with a slowing global economy; however this growth was partly constrained by insecurity in some parts of the North which hindered economic activities in those areas.
During the year, the domestic banking industry was largely impacted by regulatory headwinds with an attendant constraining effect on revenue streams for banks in the medium term.
Against this backdrop, our group delivered a solid performance, outperforming market expectations and further reinforcing our commitment to building a profitable platform from which we will create value for our shareholders.
Our group posted respective increases of 26% and 105% over the prior year’s performance in operating income and profit after tax. You will find included herein detailed financial reports.
The conclusion of our first full financial year since our reorganization into a holding company structure in November 2012 resulted in operational efficiencies that have validated our decision to restructure ourselves in this manner.
As an indication of our leadership in our focus sectors, we were awarded with several accolades during the year as listed below:
Bank of the Year – The Nigerian Auto Awards 2013 (On Wheels Auto Awards 2013).
Best Bank in Nigeria (2013) – Euromoney Real Estate Survey.
Best sub-custodian bank in Nigeria (2013) – Global Finance Awards.
Best Investment Management Company in Nigeria (awarded to Stanbic IBTC Asset Management) – World Finance Awards.
Best Broker in Nigeria (awarded to Stanbic IBTC Stockbrokers) - EMEA Awards.
The Most active Dealing Member Firm (awarded to Stanbic IBTC Stockbrokers) – The Nigerian Stock Exchange CEO Awards 2013.
Best Foreign Exchange Provider in Africa and Nigeria (2013) – Global Finance Awards.
Best merger and acquisition (M and A) deal in Africa – EMEA Finance 2013.
Best follow-on funding in Africa – EMEA Finance 2013.
M and A Deal of the Year – The Banker’s Awards (2013).
Structured Finance Deal of the Year – The Banker’s Awards (2013).
Most innovative banking product – Businessday Annual Awards 2013.
We have continued to expand our customer touch points across the nation, evidenced by the increase in the number of branches to 180 and the deployment of 110 ATMs during the course of the year taking our ATM footprint to 359. This is in line with our strategy to provide our over one million customers with easy and convenient access to our services across the nation.
During the year, our MobileMoney platform was upgraded resulting in a more robust solution with the capability to support a larger number of concurrent users and fulfilling our objective of improving our customers’ experience. In addition, we deployed MobileMoney applications for smartphones in order to further improve ease of access to MobileMoney services.
Our custody business retained its market leadership and reinforced its role as the leading non-pension custodial service
provider in Nigeria. This feat was underscored by a significant growth in assets under custody by Stanbic IBTC Nominees Limited (“SINL”) to N2.8 trillion. In addition, SINL continued to set the pace within the custody industry; successfully running a pilot of an industry first securities lending product.
Our asset management subsidiary, Stanbic IBTC Asset Management Limited (“SIAML”) successfully integrated its mutual fund offering onto the Quickteller payment platform during the year, providing its customers with the ability to purchase unit holdings conveniently. In addition, SIAML launched an online redemption service for its mutual funds to enable customers’ process redemptions promptly.
Our stockbroking subsidiary, Stanbic IBTC Stockbrokers Limited (“SISL”) reaffirmed its market leadership by remaining the top ranked broker on the floor of The Nigerian Stock Exchange in 2013 by volume traded and value. In addition, SISL’s appointment as stockbroker to the Federal Government was renewed whilst they were also appointed as a broker-dealer on the NASD OTC platform.
Our non-interest banking product continues to record progress, ending the year with c.N2 billion in deposits. We are continually developing innovative solutions to meet the unique needs of customers in this segment. The achievement of these milestones was due to the hard work and dedication of our staff as well as the loyalty of our esteemed customers.
In 2013, we recorded successes through an unrelenting focus on cost control, deposit mobilization and responsible asset growth; we plan to leverage on these efficiencies in 2014 to ensure that we continue to grow our capacity to provide financial solutions to our customers in a sustainable manner.
Our outlook for the year is positive as we leverage on our competencies to provide best-in-class service to our customers while concurrently creating value for our shareholders.
Sola David-BorhaChief Executive
05 February 2014
Chief executive’s statement
2013 statistics
Sola David-BorhaChief Executive
“Our custody business retained its market leadership and reinforced its role as the leading non-pension custodial service provider in Nigeria.”
Profit after tax
105% increaseon 2012

23
Overview Capital management
Otherinformation
Business review
22 Stanbic IBTC Annual group financial statements for the year ended 31 December 2013
Business review Annual report and financial statements
Economic review

25
Overview Capital management
Otherinformation
Business review
24 Stanbic IBTC Annual group financial statements for the year ended 31 December 2013
Business review Annual report and financial statements
Economic review
Global economic environment
Economic growth in emerging and developing countries continued to drive global growth in 2013 which reached an estimated 2.9% (2012: 3.2%). Latest International Monetary Fund (IMF) figures suggest that growth in advanced economies slowed modestly to 1.2% in 2013, from 1.5% in 2012, as a result of sluggish economic activity in the Eurozone, despite the U.S economy appearing to have ended the year on a stronger note, especially when considering the decline in unemployment levels (7% in late 2013).
The moderately improving macroeconomic environment in the U.S prompted the Federal Reserve Bank (FED) at its December Federal Open Market Commitee (FOMC) meeting to modestly reduce the pace of its asset purchases by USD10bn, starting from January 2014. The committee signaled that it will monitor information on economic and financial developments in subsequent months, while employing its other policy tools as appropriate, until the outlook for the labour market has improved substantially. If incoming economic data broadly supports the Committee’s expectation of ongoing improvement in labour market conditions, with inflation moving back toward its longer-run objective, “the Committee will likely reduce the pace of asset purchases in further measured steps at future FOMC meetings”. Having said this, the committee reaffirmed its expectation that the current exceptionally low target range for the federal funds rate of 0% to 0.25% will be appropriate at least as long as the unemployment rate remains above 6.5%.
Meanwhile, deflationary risks continued in the Eurozone with the European Central Bank (ECB) having to cut the refinancing rate to a record low of 0.25% in November in order to prevent the economic recovery from stalling. In fact, ECB President Mario Draghi stressed that the central bank still had an “easing bias” with room to act if needed.
Growth in emerging markets and developing economies also eased to 4.5% in 2013, from 4.9% in 2012, because of poorer economic performances in India and China, at 3.8% and 7.6%, respectively. Meanwhile, Sub-Sahara Africa’s growth remained broadly flat over the period,and is estimated at 5.0% from 4.9% in 2012.
Global markets in 2013 were occupied by the outlook for monetary policy in the US, as attention shifted away from the Eurozone debt crisis, and focused more on FED taper talk. Emerging market asset prices displayed increased volatility following FED Chairman Ben Bernanke’s speech in May which announced a possible turn in the pace of quantitative easing, but recovered somewhat later in the year.
Commodity prices in 2013 trended moderately downwards due to a combination of somewhat lacklustre demand from China, a switch out of commodities as an investment class in favour of equities as well as the prospect of reduced global liquidity conditions going forward. Indeed, gold bullion was down 28% in 2013, but Brent actually proved resilient and closed the year at USD110.8 pbl.
Political landscape
2013 was dominated by heightening political/election engineering as the merger between the Action Congress of Nigeria (ACN), Congress for Progressive Change (CPC) and All Nigerian People’s Party (ANPP) finally came to fruition to form the All Progressive Congress (APC). Additionally, further infighting broke out within the ruling PDP, with the formation of a New PDP faction (mainly along north-south lines) and the resignation of a number of governors and lawmakers who joined the opposition APC party.
Economic growth
Nigeria’s economic growth remained robust – albeit flat – in 2013, with GDP estimated to grow by 6.5% YoY, from 6.6% YoY in 2012 (and much lower than the 7.3% YoY recorded in 2011). Economic activity remained driven by the non-oil sector which expanded 7.9% in Q3:13 (vs 7.6% in Q3:12), with non-tradable sectors still performing decently. Agricultural growth actually quickened in the third quarter, reaching 5.1%, from 4.3% in H1:13 and 4.0% YoY in 2012. However, oil growth has been consistently negative in recent years (-0.5% in Q3:13), which mirrors a decline in output and limited new investment in the sector. The passing of the Petroleum Industry Bill (PIB) was held off and looks set to remain so at least till after the 2015 elections.
The finance and insurance sector underperformed overall non-oil growth again in 2013, expanding 4.3% YoY, from 4.0% YoY in 2012. This is probably as a result of various reforms which banks had to contend with such as the gradual removal of COT and total removal of ATM fees. Banks’ private sector lending remained constrained in 2013 as various structural bottlenecks had not yet been resolved.
Other sectors still recorded robust growth rates such as building and construction (Q3:13: 14.3%), hotel and restaurants (13.7%), solid minerals (12.7%) as well as telecoms (24.4%). Progress made in terms of structural reforms in the power sector, as illustrated by the privatization of PHCN successor companies, should have a greater impact on economic growth in the manufacturing sector in coming years.
Fiscal position
The freeze in recurrent expenditure in the 2012 and 2013 budgets is likely to be reversed in the 2014 budget, as recurrent expenditure of NGN2.43 trillion in 2014 represents a proportional increase from a 68% to a 72% share of spending. This is as a result of increased allocation to pensions as well as a high wage bill. In addition, provision for debt servicing is up to NGN712 billion from NGN591.8 billion in 2013. The fiscal deficit is set to stabilise at 1.9%/GDP, from 1.8%/GDP in 2013.
This is as the oil price is expected to be marginally lower, with government struggling with revenue leakages throughout 2013. Unlike the case during the approval process for the 2013 budget, the controversy over the oil price benchmark seems not to be repeated for the 2014. Appropriation Bill, as the National Assembly has agreed on a price of USD77.5 pbl, which is still lower than the USD79 pbl in 2013.
The lack of fiscal savings accretion in 2013 is worrying as the Excess Crude Account (ECA) was depleted to USD3.2 billion by December, after opening the year at USD9 billion. This suggests that the fiscal breakeven point of the economy was actually higher than the oil price benchmark. As such, Nigeria remains vulnerable to oil boom and bust cycles in the long-run.
Exchange rate and interest rate dynamics
The Central Bank of Nigeria (CBN) pursued policies to ensure exchange rate stability, as it sees USD/NGN as its nominal monetary policy anchor. The apex bank maintained the view that any meaningful devaluation in the currency would add little to external competitiveness as oil exports still account for c.95% of total exports. Besides, this would weigh negatively on imported inflation and investment as well as business confidence as experienced in the aftermath of the global economic crisis in 2008/2009.
The CBN’s decision to reintroduce the Retail Dutch Auction System (RDAS) and suspend the Wholesale Dutch Auction System (WDAS), impose a cap on the amount of USD sales by banks to the Bureau de Change (BDCs), as well as place further regulations surrounding FX cash importation by banks, contributed to the stability of the USD/NGN from Q4:13. Despite capital inflows basically drying up after FED taper headwinds, outflows were indeed limited. However, the improved FX picture has been at the expense of a wider spread between the official (155.7)/interbank and parallel (173) rates over the period. The CBN’s steps to introduce a restriction on the selling rate of FX by banks to BDCs to a max of 1% above
the interbank rate and place a cap on BDC sales at an extra 2% above their buying rate have done little to enable the FX rates to converge.
Given the limited new portfolio inflows since Q2: 13, foreign reserves trended moderately downwards after reaching highs of USD48.7Bn earlier in 2013 and eventually closed the year at USD43.6bn.
The Monetary Policy Rate (MPR) was held steady at 12% in 2013 while the cash reserve requirement ratio (CRR) was left at 12%. Of note was the introduction of a 50% special CRR on public sector deposits held by banks at the 22/23 July MPC meeting. This was aimed to address systemic inefficiencies in liquidity management and reduce the banks’ ability to tap cheap government deposits to purchase higher yielding T-bills and OMOs. Interestingly, this tightening in effective monetary conditions resulted in an initial back-up in T-bill yields; however, this was not disorderly and subsequently dissipated as the pace of new OMO operations reduced.
Having said that, fixed income rates were responsive to global market headwinds in 2013, especially from May when FED Chairman Ben Bernanke suggested that the institution could start tapering its asset purchases. This caused a sell-off across emerging markets asset classes with FGN T-bill rates drifting higher as a result of foreign portfolio investors lightening up on their holdings. For instance, the secondary market 91 day T-bill yield was at 9.9% in February, but shut up to 13.8% by the end of July. Market rates remained elevated in the remainder of the year, albeit at slightly lower levels. For example, the 91 day T-bill closed 2013 at 12.5%. Bonds also reacted to the FED taper talk coming out of the U.S, as yields on FGN bonds backed up about 200bps as a result. FGN bonds closed the year around the 13% level.
Inflation remained in single-digit territory throughout 2013, starting the year at 9.0% YoY and moving steadily downwards towards the end of the year, around the 8% YoY. Month-on-month inflation remained extremely benign, reaching as low as 0.3% in August.

27
Overview Capital management
Otherinformation
Business review
26 Stanbic IBTC Annual group financial statements for the year ended 31 December 2013
Business review Annual report and financial statements
Financialreview

29
Overview Capital management
Otherinformation
Business review
28 Stanbic IBTC Annual group financial statements for the year ended 31 December 2013
Business review Annual report and financial statements
Financial review
The group’s diversified business and deep market knowledge allowed us to weather the testing operating environment in 2013.
This report provides: An overview of the operating environment.
A general description of how the group generates its revenue and the risks it faces doing so.
A description of the impact of the economic environment on key financial ratios.
An overview of key features of 2013 financial results.
An analysis of the group’s financial performance.
An analysis of the results of the banking activities.
An overview of the financial performance of wealth and investment banking businesses.
Commentary on the capital and liquidity position of the group.
An overview of finance function’s priorities for 2014.
Overview of operating environment
Global operating environment
The world economy recorded a 2.9% growth in 2013 (2012: 3.2%), driven principally by growth in the emerging and developing economies. Advanced economies achieved a 1.3% growth, down from 1.5% recorded in 2012, despite the strong showing of the US economy in the latter part of the year. The quantitative easing measures by the US Federal Reserve (FED) helped to restore momentum to the US economy and contributed to the improvement of the Eurozone economy in 2013. The US economy grew by 1.9%, while the Eurozone recorded a negative growth of 0.3% in 2013.
The emerging and developing economies growth decelerated marginally to 4.5% from 4.9% in 2012 on the back of reduced economic performances in India and China. Sub-Sahara Africa’s growth remained broadly flat at 5.0% from 4.9% in 2012. It is expected that the emerging markets that were major beneficiaries of cheap funding from the FED stimulus could experience financial market instability in 2014 as tapering begins, although the US authorities have made it clear that they remain sensitive to the impact of their domestic policies on global markets and will therefore aim to minimise disruptions.
Most central banks maintained a cautious posture in 2013, retaining or varying policy rates only slightly. Global inflation was 2.3% in 2013 and it is estimated to rise to 2.7% in 2014 driven by the upward pressure on prices of major commodities. Commodity prices declined slightly during the year as a result of the switch out of commodities as an investment class in favour of equities as well as the prospect of reduced global liquidity conditions.
Domestic operating environment
Macroeconomic indicators in 2013 remained mostly consistent with that of 2012. Key indicators such as gross domestic product (GDP), inflation and exports, as well as capital market indicators all moved in the positive direction.
The country’s average gross domestic product (GDP) increased slightly to 6.8% in 2013 from 6.6% in 2012. Growth rate of 7.7% was achieved in 4Q 2013, which was higher than the 6.8%, 6.2% and 6.6% recorded in 3Q 2013, 2Q 2013 and 1Q 2013 respectively. The GDP was driven primarily by growth in the non-oil sectors, with agriculture; wholesale and retail trade; and services being major contributors.
Contribution to GDP by sector
Oil prices, though marginally volatile, remained largely favorable, staying above the 2013 federal government budgeted benchmark of USD79 per barrel. However, during the year, the nation’s oil sector suffered some disruption due to oil bunkering and pipeline vandalism, which adversely affected oil production output. The daily oil production declined from 2.52 million barrel per day (mbpd) at the beginning of the year to 2.26mbpd at the end of 2013.
The reform in power sector culminated in the privatisation of the sector in 2013. With the privitisation concluded, it is expected that the sector will contribute significantly to the economy in the medium to long term. Also, the agricultural transformation initiative embarked upon by the government and the proposed reform of the oil sector would positively drive the country’s growth.
The nation’s foreign reserves stood at USD43.6 billion at the end of 2013. This represents a 1.4% decline over the USD44.2 billion recorded in 2012. The decline is attributable to the central bank (CBN) stance to protect the Naira to ensure foreign exchange stability. The foreign reserves reached the peak of USD48.9 billion in April 2013.
Relative stability was achieved in the exchange rate as it traded largely within the CBN target of N155-160/USD1. The pressure on the Naira, as a result of capital outflows in 2Q 2013, necessitated the CBN selling foreign exchange (FX) directly to banks, while increasing supply to the Wholesale Dutch Auction System (WDAS) to defend the Naira. The CBN reintroduced the Retail Dutch Auction System (w/rDAS) and suspended the WDAS, placed additional regulation on FX cash importation by banks and imposed a limit on the amount of foreign exchange sales to the Bureau de change (BDC) operators in the second half of 2013. Consequently, the end-period exchange rate remained stable at the w/rDAS and interbank segments but depreciated significantly at the BDC segment. The exchange rate at the w/rDAS opened at N157.33/USD at the start of 2013 and closed at N157.26/USD, while the inter-bank selling rate opened at N156.25/USD and closed at N159.90/USD, representing a depreciation of 2.4% in 2013. However, at the BDC, the selling rate opened at N159.50/USD and closed at N172.00/USD, representing a depreciation of 7.8%.
The moderation in inflationary pressure, which began in the 4Q 2012, continued in 2013. The year-on-year headline inflation fell consistently from 9.0% at the beginning of the year to 8.0% at the end of 2013. Similarly, core inflation declined from 11.3% in January to 7.9% in December 2013. The moderation in domestic price level was largely due to the tight monetary policy stance coupled with the relatively stable exchange rate regime, which resulted in single digit inflation in the year. This is the first time the country has achieved a single digit inflation rate since 2007.
Interest rates in all segments of the money market reflected the liquidity conditions in the banking system. The Monetary Policy Rate (MPR) was retained at 12% throughout the year as it was in 2012, with a symmetric corridor of +/- 200 basis points, thus effectively maintaining the Standing Lending Facility (SLF) and Standing Deposit Facility (SDF) rates at 14% and 10% respectively. Alongside the existing Cash Reserve
Requirement (CRR) of 12.0%, the CBN introduced a 50% special CRR on public sector funds in July 2013. This was aimed to address systemic inefficiencies in liquidity management and reduce banks’ ability to tap cheap government deposits to purchase higher yielding Treasury-bills and Open Market Operations. Consequently, both the weighted average inter-bank call and Open-Buy Back rates opened at 11.7% in December 2012 but closed at 10.9% and 10.5% respectively in December 2013.
In the capital market, the bullish run that started in the second half of 2012, continued with greater impetus in 2013. Total market capitalization increased by 29% from N14.8 trillion at the beginning of the year, to N19.1 trillion on the last trading day of 2013. Overall, the Nigerian Stock Exchange All share index (NSE ASI) grew by 47% from 28,078.8 at the beginning of the year to 41,329.2 at the end of December. The equities market performance could be attributed to factors such as the rub-off effect of the 2012 year end results; impressive valuation of blue chip companies; growing investors’ confidence; and significant increase in capital inflow and portfolio investment as well as the tight regulatory oversight by the Securities and Exchange Commission (SEC) and the NSE.
The on-going reform of the banking sector continued in 2013 with measure such as financial inclusion, cashless banking, implementation of International Financial Reporting Standards (IFRS), risk-based supervision, release of exposure draft for Basle II/III and other sustainable banking practices introduced and/or reinforced during the year.
How the group generates its revenue and key risks that it faces in doing so
The group generates its revenue from three broad sources: net interest income;
fee and commission revenue;
trading revenue; and
income from wealth business.
Net interest income represents the difference between interest received by the group on money lent to customers and other banks as well as funds otherwise invested in government securities, and the interest paid by the group to depositors and other providers of finance. Funds lent to individual customers include mortgage loans, instalment sale and finance lease on vehicles and other assets, as well as credit card facilities. Corporate loans include corporate lending facilities, structured finance, project finance and trade finance.
Agriculture41.9%
Crude petroleumand natural gas12.5%
Manufacturing3.6%
Others8.5%
Telecommunication7.8%
Real estate and
construction3.6%
Finance andinsurance
2.8%
Wholesaleand retail
19.2%
Arthur Oginga – Group, CFO

31
Overview Capital management
Otherinformation
Business review
30 Stanbic IBTC Annual group financial statements for the year ended 31 December 2013
Business review Annual report and financial statements
Impact of the economic environment on key financial ratios
The table below sets out the key financial ratios that drive the earnings and ultimately the value of the group. The table also sets out the external economic factors influencing these value drivers assuming no management action, an indication of how these economic factors influenced the performance of the group in 2013, and the expected impact of these economic factors in 2014.
Key financial ratio Economic factor impacting key financial ratioImpact
on 2013
Expected impact
on 2014
Growth in loans and advances Debt-to-disposable income level
GDP growth
Interest rates
Net interest margin Interest rates
Credit loss ratio Number of insolvencies and liquidations
Collateral values
Debt-to-disposable income level
Growth in non-interest revenue
Growth in fee and commission revenue GDP growth
Growth in trading revenue Market trading volumes
Market price volatility
Growth in operating expenses GDP growth
Inflation rate
Effective tax rate Corporate tax rates
Growth in long-term wealth business revenue Equity market performance
Growth in assets under management
Debt-to-disposable income level
Increase in economic factor/positive impact on group’s performance
Decrease in economic factor/negative impact on group’s performance
Neutral
Growth in loans and advances
Loans and advances represent the largest asset class on the group’s balance sheet. This asset class provides the group with its largest source of revenue in the form of interest income and creates cross-selling opportunities in the form of transactional fees and other related revenues. Growth in loans and advances within the risk levels accepted by the group is therefore essential to increasing revenue.
Growth in loans and advances in the personal market in particular is dependent on customers’ ability to repay debt. The debt-to-disposable income ratio provides a measure of the ability of households to service existing loans and also assume further debt.
Debt-to-disposable income levels are not expected to reduce significantly over the short to medium term. It is, however, expected that a slow improvement in disposable income levels coupled with a moderate improvement in economic growth will be positive for loan growth in 2014.
Financial review (continued)
Interest rates charged are determined by considering the factors that influence the risk that the customer will not repay the funds advanced. Deterioration in this risk, otherwise known as credit risk, is reflected in credit impairment charges in the group’s income statement.
The group requires funding for its lending and investment activities. Funding is obtained in the form of deposits placed by customers on which interest is payable. The interest rates on deposits are dependent on the term and size of the deposits and macroeconomic variables. Interest rates on assets (loans) and liabilities (deposits) do not necessarily reprice at the same time and assets and liabilities consist of both fixed rate and floating rate instruments, resulting in interest rate risk to the group.
In addition to supporting tier I capital adequacy, the group uses its shareholders’ funds to finance both equity-related investments and a small portion of the loan book. Shareholders require a return in the form of dividends and growth in share price. No interest is paid on shareholders’ funds. The benefit of this ‘free funding’ is a significant contributor to the “endowment effect” and reduces during times of declining or persistently low interest rates.
Deposits placed on demand (current accounts) can be withdrawn at any stage and banks therefore manage the liquidity risk that could materialise if a significant portion of total deposits is withdrawn without cash being available to settle these withdrawals, or if deposits being redeemed cannot be replaced with new deposits.
The group is required to hold minimum reserve balances with the central bank and minimum amounts of liquid assets. Banks are typically able to access liquidity from the central bank. This is normally priced at a central bank repurchase rate which is an important central bank-determined pricing trigger for managing monetary policy.
Non-interest revenue consists of fee and commission revenue and trading revenue, as well as a combination of diverse other non-interest revenue sources.
Fee and commission revenue is generated through transactional banking activities of corporates, small and medium businesses and individual customers. These fees and commissions are earned on banking transactions through various channels, which include branches, ATMs, telephone banking, point-of-sale devices and internet-based transactions such as online business banking, internet banking and trading products. The group also earns knowledge-based fees from corporate advisory and loan structuring activities as well as financial planning and equity broking services.
Trading revenue is generated from trading activities on products such as foreign exchange, commodity, credit, interest rate and equity products. These trading activities are predominantly related to client flows and are managed within the group’s risk tolerance levels. Through these activities the group is exposed to market risk as market prices on these asset classes may increase or decrease due to external factors. This risk can be reduced through offsetting trades with counterparties and other clients. The group generates revenue through the margins earned on accepting trading positions with clients and managing the net market risk trading exposure within its trading operations. To earn trading revenue, the group takes on and manages market risk, counterparty credit risk included in credit risk and operational risk arising from large and complex trading operations.
Other revenue sources include gains on property and dividend income from private equity and strategic investment activities.
The wealth business focuses primarily on pension administration and management, private non- pension asset management as well trusteeship and estate planning. The pension business managed through Stanbic IBTC Pension Managers Limited is 70.6% owned by Stanbic IBTC Group, while the asset management and trustee businesses, managed through Stanbic IBTC Asset Management Limited and Stanbic IBTC Trustees Limited respectively, are 100% owned. The wealth business contributed 22% to the group’s 2013 total income. Fees and commissions are derived from assets and funds under management and other investment outlets including the capital market related activities. The group’s wealth business is the largest institutional investment business and number one wealth manager in Nigeria in terms of assets under management, number of clients and revenue.
Returns to shareholders
The group’s shareholders are the primary providers of capital. They carry the ultimate business risk should the group’s operations not be sufficiently profitable or through the erosion of value as a result of a decline in the group’s share price. Shareholders are rewarded for accepting this risk through biannual distributions from the earnings of the group and the possibility of growth in share price. Share price growth is dependent on the group’s ability to grow shareholders’ equity on an annual basis at a rate that exceeds the rate that shareholders would expect for an investment with the risk profile of the group and expected future growth in returns.
33
Overview Capital management
Otherinformation
Business review
32 Stanbic IBTC Annual group financial statements for the year ended 31 December 2013
Business review Annual report and financial statements
Net interest margin
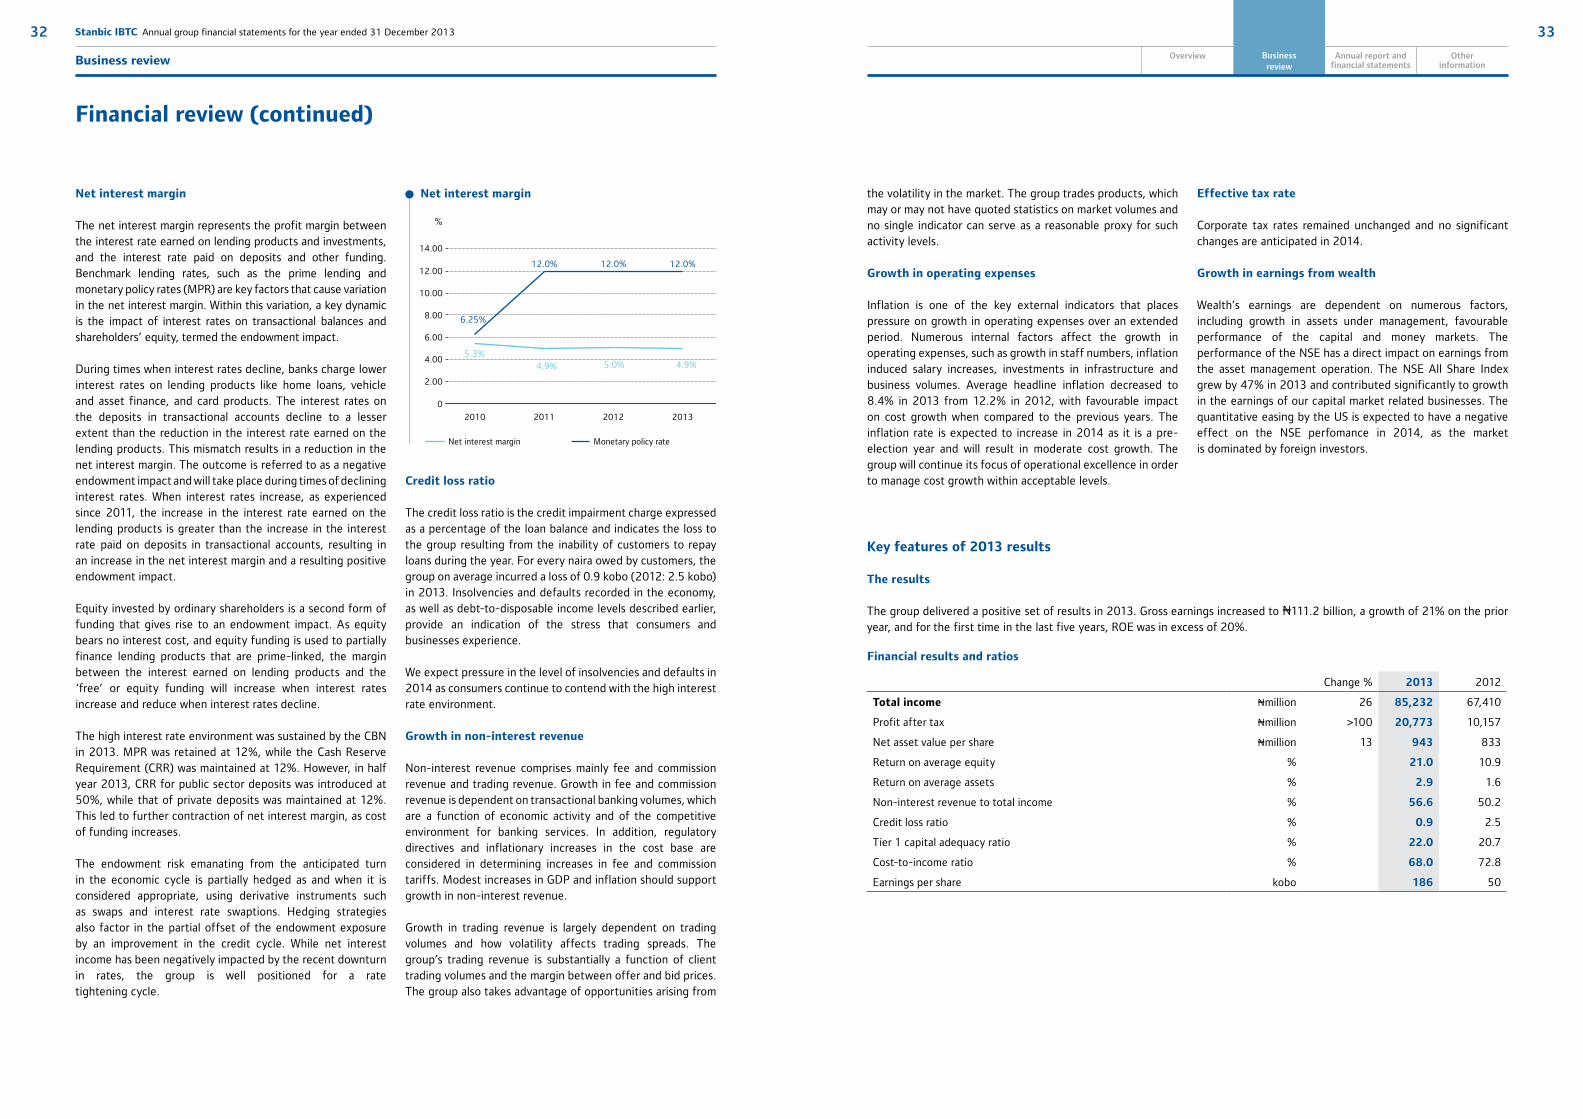
The net interest margin represents the profit margin between the interest rate earned on lending products and investments, and the interest rate paid on deposits and other funding. Benchmark lending rates, such as the prime lending and monetary policy rates (MPR) are key factors that cause variation in the net interest margin. Within this variation, a key dynamic is the impact of interest rates on transactional balances and shareholders’ equity, termed the endowment impact.
During times when interest rates decline, banks charge lower interest rates on lending products like home loans, vehicle and asset finance, and card products. The interest rates on the deposits in transactional accounts decline to a lesser extent than the reduction in the interest rate earned on the lending products. This mismatch results in a reduction in the net interest margin. The outcome is referred to as a negative endowment impact and will take place during times of declining interest rates. When interest rates increase, as experienced since 2011, the increase in the interest rate earned on the lending products is greater than the increase in the interest rate paid on deposits in transactional accounts, resulting in an increase in the net interest margin and a resulting positive endowment impact.
Equity invested by ordinary shareholders is a second form of funding that gives rise to an endowment impact. As equity bears no interest cost, and equity funding is used to partially finance lending products that are prime-linked, the margin between the interest earned on lending products and the ‘free’ or equity funding will increase when interest rates increase and reduce when interest rates decline.
The high interest rate environment was sustained by the CBN in 2013. MPR was retained at 12%, while the Cash Reserve Requirement (CRR) was maintained at 12%. However, in half year 2013, CRR for public sector deposits was introduced at 50%, while that of private deposits was maintained at 12%. This led to further contraction of net interest margin, as cost of funding increases.
The endowment risk emanating from the anticipated turn in the economic cycle is partially hedged as and when it is considered appropriate, using derivative instruments such as swaps and interest rate swaptions. Hedging strategies also factor in the partial offset of the endowment exposure by an improvement in the credit cycle. While net interest income has been negatively impacted by the recent downturn in rates, the group is well positioned for a rate tightening cycle.
the volatility in the market. The group trades products, which may or may not have quoted statistics on market volumes and no single indicator can serve as a reasonable proxy for such activity levels.
Growth in operating expenses
Inflation is one of the key external indicators that places pressure on growth in operating expenses over an extended period. Numerous internal factors affect the growth in operating expenses, such as growth in staff numbers, inflation induced salary increases, investments in infrastructure and business volumes. Average headline inflation decreased to 8.4% in 2013 from 12.2% in 2012, with favourable impact on cost growth when compared to the previous years. The inflation rate is expected to increase in 2014 as it is a pre-election year and will result in moderate cost growth. The group will continue its focus of operational excellence in order to manage cost growth within acceptable levels.
Effective tax rate
Corporate tax rates remained unchanged and no significant changes are anticipated in 2014.
Growth in earnings from wealth
Wealth’s earnings are dependent on numerous factors, including growth in assets under management, favourable performance of the capital and money markets. The performance of the NSE has a direct impact on earnings from the asset management operation. The NSE All Share Index grew by 47% in 2013 and contributed significantly to growth in the earnings of our capital market related businesses. The quantitative easing by the US is expected to have a negative effect on the NSE perfomance in 2014, as the market is dominated by foreign investors.
Key features of 2013 results
The results
The group delivered a positive set of results in 2013. Gross earnings increased to N111.2 billion, a growth of 21% on the prior year, and for the first time in the last five years, ROE was in excess of 20%.
Credit loss ratio
The credit loss ratio is the credit impairment charge expressed as a percentage of the loan balance and indicates the loss to the group resulting from the inability of customers to repay loans during the year. For every naira owed by customers, the group on average incurred a loss of 0.9 kobo (2012: 2.5 kobo) in 2013. Insolvencies and defaults recorded in the economy, as well as debt-to-disposable income levels described earlier, provide an indication of the stress that consumers and businesses experience.
We expect pressure in the level of insolvencies and defaults in 2014 as consumers continue to contend with the high interest rate environment.
Growth in non-interest revenue
Non-interest revenue comprises mainly fee and commission revenue and trading revenue. Growth in fee and commission revenue is dependent on transactional banking volumes, which are a function of economic activity and of the competitive environment for banking services. In addition, regulatory directives and inflationary increases in the cost base are considered in determining increases in fee and commission tariffs. Modest increases in GDP and inflation should support growth in non-interest revenue.
Growth in trading revenue is largely dependent on trading volumes and how volatility affects trading spreads. The group’s trading revenue is substantially a function of client trading volumes and the margin between offer and bid prices. The group also takes advantage of opportunities arising from
Change % 2013 2012
Total income Nmillion 26 85,232 67,410
Profit after tax Nmillion >100 20,773 10,157
Net asset value per share Nmillion 13 943 833
Return on average equity % 21.0 10.9
Return on average assets % 2.9 1.6
Non-interest revenue to total income % 56.6 50.2
Credit loss ratio % 0.9 2.5
Tier 1 capital adequacy ratio % 22.0 20.7
Cost-to-income ratio % 68.0 72.8
Earnings per share kobo 186 50
Financial review (continued)
Net interest margin
0
2.00
6.00
4.00
10.00
8.00
14.00
12.00
%
2010 2011 2012 2013
5.3%
6.25%
12.0% 12.0% 12.0%
4.9% 5.0% 4.9%
Net interest margin Monetary policy rate
Financial results and ratios

35
Overview Capital management
Otherinformation
Business review
34 Stanbic IBTC Annual group financial statements for the year ended 31 December 2013
Business review Annual report and financial statements
Key features of the 2013 results that influenced the financial results and ratios were:
Slow lending growth in corporate banking Loans and advances grew by 9% despite the challeng-
ing operating condition exacerbated by the high interest rate environment and strong competition for top quality corporate credits. This resulted in a 3% decline in Cor-porate and Investment Banking’s loan book. Personal and Business Banking’s loan book however grew by 27%.
Increased liquid assets requirement also had a negative impact on lending activities. CRR for public sector deposits was raised from 12% to 50% during the year, although the increase had a little impact on the group’s cost of funding as public sector deposits accounted for less than 10% of total deposits at the end of 2013.
Continued pressure on margin The MPR rate was maintained at 12% throughout 2013 by
the CBN, with resultant pressure on margin. Loan growth was constrained by the high lending rates, while funding continued to be influenced by the upward rate pressure. Despite the headwind, our margin benefitted from im-provement in deposit mix as considerable low cost depos-its were gathered in 2013.
Growth in transaction volumes Significant growth in transactional banking volumes and
activities were recorded in 2013. Increased transaction volumes were also recorded in our non-banking business in wealth, custody, investment banking and stockbroking, with positive impact on the revenues.
Well positioned trading book Trading revenue benefitted from increased transaction
volumes and correct reading of market movements in interest rates, coupled with volatility in the foreign exchange market.
Improvement in credit impairment Credit impairment benefitted from enhanced rehabilitation
and recovery capability as well as releases of specific credit impairments held against a number of exposures in the business banking and corporate market.
Improvement in asset quality Non-performing loans declined by N0.9 billion
notwithstanding the N24 billion increase in loan book. It benefitted from improved recoveries and loan collections.
Analysis of the Group’s financial performance
Balance sheet analysis
The group’s total assets stood at N763.0 billion at the end of 2013. This represents a 13% growth over N676.8 billion recorded in 2012. The growth is driven by loans and advances and liquid assets. The total assets were funded primarily from deposits from customers, which accounted for 55% of total assets.
Loans and advances
Loans and advances to customers grew by 9% to N303.3 billion and resulted mainly from 27% growth in Personal and Business Banking (PBB) loans to customers. Corporate and Investment Banking loan book decreased by 3%.
Breakdown of loans and advances by business unit
Personal and
Banking BusinessNmillion
Corporate and
Investment BankingNmillion
Total Nmillion
Overdrafts 18,577 14,949 33,526
Term loans 88,223 145,504 233,727
Instalment sales and finance leases 18,084 9,303 27,387
Mortgage lending 8,667 - 8,667
Total loans and advances 133,550 169,756 303,307
The ratio of non-performing loans to total loans improved to 4.4% from 5.1% in 2012 supported by the reduction in non-performing loans from N14.3 billion in 2012 to N13.4 billion. Cumulative provision on non-performing loans improved from 91.6% to 101.1%.
Deposits
Total deposits from customers grew by 17% on the back of 21% growth in PBB deposit book and 14% growth in that of CIB. The group’s most stable and low cost funding source – demand and savings deposits from PBB business was 28% higher than the prior year, while that of CIB grew by 62%.
Change%
2013Nmillion
2012Nmillion
Personal and Business Banking 21 197,898 164,031
Current deposits 28 98,550 76,793
Savings deposits 26 19,097 15,116
Call deposits >100 8,863 1,799
Term deposits 2 71,388 70,323
Corporate and Investment Banking 14 218,454 191,388
Current deposits 62 99,770 61,731
Call deposits >100 44,064 20,377
Term deposits (32) 74,620 109,280
Total deposits and current accounts 17 416,352 355,419
The group is focused on generating low cost deposits to improve funding cost.
Income statement analysis
The group delivered a 21% growth in gross revenue to cross the N100 billion mark to N111.2 billion from N91.9 billion in 2012. Total income also grew by a respectable 26% during the year. The growth in total income is supported by a 42% growth in non-interest revenue and a 10% growth in net interest income. Profit after tax was buoyed by the reduction in credit impairment charges and a moderate growth in operating expenses.
Net interest income
The group’s net interest income was up 10% and was supported by continued growth in lending activities, increased income from investment securities, albeit at a lower yield than prior year and moderate growth in interest expense. The interest expense benefitted from improved deposit mix as the ratio of low cost deposits to total deposits grew significantly to 52% (2012: 43%) during the year.
Corporate and Investment Banking’s net interest income increased by 23% to N16.6 billion on the back of a 9%
Change%
2013Nmillion
2012Nmillion
Personal and Business Banking - 18,443 18,374
Corporate and Investment Banking 23 16,622 13,496
Wealth 16 1,948 1,684
Net interest income 10 37,013 33,554
Change%
2013Nmillion
2012Nmillion
Corporate and Investment Banking 51 24,599 16,334
Personal and Business Banking 34 6,909 5,154
Wealth 35 16,712 12,368
Non-interest revenue 42 48,219 33,856
Financial review (continued)
reduction in interest expense, while Personal and Business Banking’s net interest income was flat at N18.4 billion. Wealth net interest income grew by 16% to N1.9 billion.
PBB’s net interest income was adversely impacted by a 53% growth in interest expenses driven largely by growth in deposit book and customer’s preference for call deposits. Call deposits, although at lower rate, grew significantly to N8.9 billion from N1.8 billion recorded in 2012.
Non-interest revenue
Non-interest revenue increased significantly by 42% to N48.2 billion on the back of significant growth in fee and commission revenue and trading revenue. Net fee and commission revenue grew by 29% to N32.9 billion, while trading revenue was up 84%. The growth in net fee and commission revenue is supported by increased transaction volume, steady growth in assets under management within the wealth business, considerable growth in assets under custody, improved performance of the capital markets and closure of good advisory mandates in the investment banking business. Trading revenue on the other hand benefitted from increased customer transactional volumes, good reading of interest rate movements and relative volatility in the foreign exchange market.
Corporate and Investment Banking’s non-interest revenue grew by 51%, and accounted for 51% of total group’s non-interest revenue, while Personal and Business banking’s non-interest revenue was up 34% and accounted for 14% of total non-interest revenue. Wealth contributed 35% to total non-interest revenue, with non-interest revenue growing by 35%.
Non-interest income by business unit
NPL ratio and provision adequacy
02010 2011 2012 2013
10
NPL/Total loas Provision adequacy
7.0%6.2%
5.1%4.4%
46.0%
56.6%
91.6%
101.1%
NPL/total loan Provision adequacy

37
Overview Capital management
Otherinformation
Business review
36 Stanbic IBTC Annual group financial statements for the year ended 31 December 2013
Business review Annual report and financial statements
Change%
2013Nmillion
2012Nmillion
Specific credit impairment charges (64) 2,474 6,816
Provision for performing loans 48 745 504
Total impairment charges (56) 3,219 7,320
Recoveries 30 (552) (425)
Credit impairment charges (61) 2,667 6,895
Operating expenses
Operating expenses grew by 18% to N57.9 billion. The growth is driven by the increase in staff costs and other operating expenses. Staff costs grew by 20%, while other operating cost grew by 17%. Cost-to-income ratio improved from 72.4% to 68.0% as revenue continue to grow faster than cost.
Operating cost and cost-to-income
CIB’s operating expenses grew 21%, with cost-to-income ratio improving to 50.6% from 57.9% in 2012. The major driver of CIB’s cost growth is staff cost, attributable to the continued investment in people and skills. PBB witnessed a 22% growth and recorded a cost-to-income ratio of 121.1% (2012: 107.1%). Marketing and brand expenses, premises maintenance cost as well as NDIC insurance expenses were major drivers of operating costs in PBB.
Wealth on the other hand, recorded a 3% reduction in operating expenses and an improvement in cost-to income ratio from 46.8% in 2012 to 34.3%. Wealth operating cost benefitted from the absence of regulatory induced technology expenses incurred in 2012.
Operating expenses by business unit
Taxation
The group effective tax rate benefited from tax exempt sources during the year. The effective tax rate was 15.6% in 2013 (2012: 11.0%). CIB’s effective tax rate improved to 8.6% from 20.0% in 2012, while PBB’s tax credit declined by 39%. Wealth effective tax rate deteriorated from 25.4% in 2012 to 31.6%.
Overall, the group’s profit after tax improved by N10.5 billion to N20.7 billion, thus, representing a 105% growth. CIB’s profit after tax grew by 140% to N18.4 billion, while that of Wealth grew by 50% to N8.4 billion. PBB’s loss after tax grew from N3.0 billion in 2012 to N6.0 billion.
Change%
2013Nmillion
2012Nmillion
Corporate and Investment Banking
21 20,844 17,264
Personal and Business Banking
22 30,703 25,258
Wealth (3) 6,401 6,581
Operating expenses 18 57,948 49,103
Credit impairment charges
Credit impairment charges decreased by 61% to N2.7billion, benefitting from resolution of delinquent assets and improvement in debt collection capabilities. Corporate and Investment Banking and Personal and Business Banking recorded a 90% and 34% reduction in credit impairment charges respectively during the year.
Movement in credit impairment charges
The high lending rates resulted in a decrease of 18% and 9% in mortgage loans and instalment sale and finance leases respectively. However, overdrafts grew by 13%, while term loans were up 12% and benefitted from growing customer relationships.
Asset quality continued to improve as the ratio of non-performing loans to total loans declined further from 5.1% in 2012 to 4.4%. Non-performing loans reduced by 7%, despite growth in loan book. The reduction in non-performing loans is supported by the decline in non-performing loans of products such as home loans and term loans. CTB’s non-performing loans decreased by 40%, while the ratio of non-performing loans (NPL) to total loans (TL), improved from 3.3% in 2012 to 2.0% in 2013. PBB’s non-performing loans increased 15% as a result of newly classified loans in the business banking. However, the improvement in PBB’s ratio of NPL/TL to 7.5% from 8.2% in 2013 is occasioned by the increase in loan book.
Asset quality
Deposits and current accounts, increased by N59.5 billion to N419.0 billion, thus representing a 17% growth. The increase in deposits is attributable to the significant growth in number of customers, a function of our ability to leverage on our expanded network. The number of customers crossed
Financial review (continued)
Analysis of the banking business results
Balance sheet analysis
The banking business is structured along two business units; namely Corporate and Transactional Banking (CTB) and Personal and Business Banking (PBB). The investment banking business is carried out under a separate business entity Stanbic IBTC Capital Limited.
Total assets in the banking activities of the Group increased by 11% to N725.1 billion. The main drivers of the growth were loans to customers and banks, financial investments and cash and cash equivalents. These accounted for 85% of total assets.
Gross loans and advances, were up 9%, with Corporate and Transactional Banking (CTB) reporting a 3% decline, while Personal and Business Banking (PBB) grew by 27%. The bank grew its loan book responsibly in the light of the prevailing high interest rate operating environment and competition for good quality credit.
Loans and advances CAGR (2010-2013): 18%
2010 2011 2012 20130 0.0
50,000
90.0
100.0
80.0
70.0
60.0
50.0
40.0
30.0
20.0
10.0
40,000
30,000
20,000
10,000
60,000
34,476
68.6%75.6%
49,103
72.8%
57,948Nmillion %
10
68.0%41,792
Operating expenses Cost-to-income ratio
2010 2011 2012 20130
300.0
250.0
200.0
150.0
100.0
50.0
350.0
185.0
266.1279.5
303.3
Nbillion
10
Overdrafts11% (2012: 10%)
Term loans77% (2012: 75%)
Mortgage3% (2012: 4%)
Instalment salesand finance leases9% (2012: 11%)
1.0
2.0
3.0
4.0
5.0
6.0
7.0
8.0
2010 2011 2012 20130 0.0
15.0
10.0
5.0
20.0
12.8
7.0%16.6
14.3
13.4
Nbillion %
10
6.2%
5.1%
4.4%
Non-performing loans NPL/total loans
Composition of gross loans and advances
39
Overview Capital management
Otherinformation
Business review
38 Stanbic IBTC Annual group financial statements for the year ended 31 December 2013
Business review Annual report and financial statements
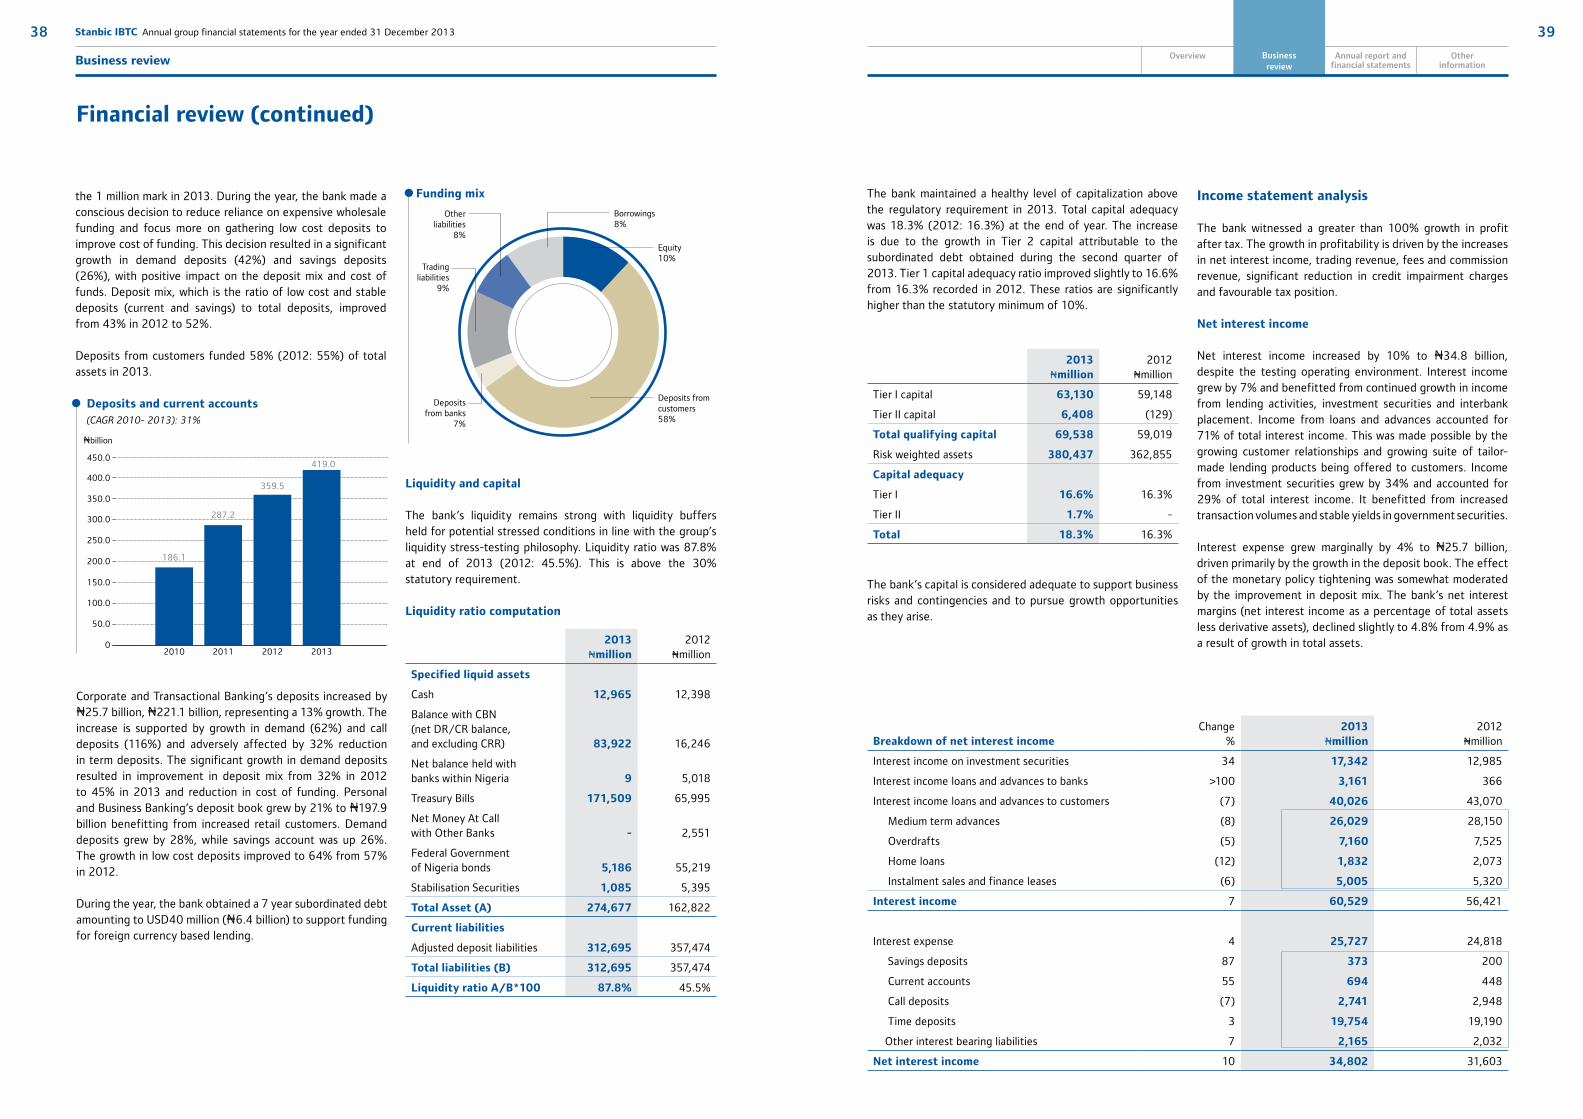
Liquidity and capital
The bank’s liquidity remains strong with liquidity buffers held for potential stressed conditions in line with the group’s liquidity stress-testing philosophy. Liquidity ratio was 87.8% at end of 2013 (2012: 45.5%). This is above the 30% statutory requirement.
Liquidity ratio computation
2013Nmillion
2012Nmillion
Specified liquid assets
Cash 12,965 12,398
Balance with CBN (net DR/CR balance, and excluding CRR) 83,922 16,246
Net balance held with banks within Nigeria 9 5,018
Treasury Bills 171,509 65,995
Net Money At Call with Other Banks - 2,551
Federal Government of Nigeria bonds 5,186 55,219
Stabilisation Securities 1,085 5,395
Total Asset (A) 274,677 162,822
Current liabilities
Adjusted deposit liabilities 312,695 357,474
Total liabilities (B) 312,695 357,474
Liquidity ratio A/B*100 87.8% 45.5%
The bank maintained a healthy level of capitalization above the regulatory requirement in 2013. Total capital adequacy was 18.3% (2012: 16.3%) at the end of year. The increase is due to the growth in Tier 2 capital attributable to the subordinated debt obtained during the second quarter of 2013. Tier 1 capital adequacy ratio improved slightly to 16.6% from 16.3% recorded in 2012. These ratios are significantly higher than the statutory minimum of 10%.
Income statement analysis
The bank witnessed a greater than 100% growth in profit after tax. The growth in profitability is driven by the increases in net interest income, trading revenue, fees and commission revenue, significant reduction in credit impairment charges and favourable tax position.
Net interest income
Net interest income increased by 10% to N34.8 billion, despite the testing operating environment. Interest income grew by 7% and benefitted from continued growth in income from lending activities, investment securities and interbank placement. Income from loans and advances accounted for 71% of total interest income. This was made possible by the growing customer relationships and growing suite of tailor-made lending products being offered to customers. Income from investment securities grew by 34% and accounted for 29% of total interest income. It benefitted from increased transaction volumes and stable yields in government securities.
Interest expense grew marginally by 4% to N25.7 billion, driven primarily by the growth in the deposit book. The effect of the monetary policy tightening was somewhat moderated by the improvement in deposit mix. The bank’s net interest margins (net interest income as a percentage of total assets less derivative assets), declined slightly to 4.8% from 4.9% as a result of growth in total assets.
2013Nmillion
2012Nmillion
Tier I capital 63,130 59,148
Tier II capital 6,408 (129)
Total qualifying capital 69,538 59,019
Risk weighted assets 380,437 362,855
Capital adequacy
Tier I 16.6% 16.3%
Tier II 1.7% -
Total 18.3% 16.3%
Financial review (continued)
the 1 million mark in 2013. During the year, the bank made a conscious decision to reduce reliance on expensive wholesale funding and focus more on gathering low cost deposits to improve cost of funding. This decision resulted in a significant growth in demand deposits (42%) and savings deposits (26%), with positive impact on the deposit mix and cost of funds. Deposit mix, which is the ratio of low cost and stable deposits (current and savings) to total deposits, improved from 43% in 2012 to 52%.
Deposits from customers funded 58% (2012: 55%) of total assets in 2013.
Deposits and current accounts(CAGR 2010- 2013): 31%
Corporate and Transactional Banking’s deposits increased by N25.7 billion, N221.1 billion, representing a 13% growth. The increase is supported by growth in demand (62%) and call deposits (116%) and adversely affected by 32% reduction in term deposits. The significant growth in demand deposits resulted in improvement in deposit mix from 32% in 2012 to 45% in 2013 and reduction in cost of funding. Personal and Business Banking’s deposit book grew by 21% to N197.9 billion benefitting from increased retail customers. Demand deposits grew by 28%, while savings account was up 26%. The growth in low cost deposits improved to 64% from 57% in 2012.
During the year, the bank obtained a 7 year subordinated debt amounting to USD40 million (N6.4 billion) to support funding for foreign currency based lending.
The bank’s capital is considered adequate to support business risks and contingencies and to pursue growth opportunities as they arise.
Breakdown of net interest incomeChange
%2013
Nmillion2012
Nmillion
Interest income on investment securities 34 17,342 12,985
Interest income loans and advances to banks >100 3,161 366
Interest income loans and advances to customers (7) 40,026 43,070
Medium term advances (8) 26,029 28,150
Overdrafts (5) 7,160 7,525
Home loans (12) 1,832 2,073
Instalment sales and finance leases (6) 5,005 5,320
Interest income 7 60,529 56,421
Interest expense 4 25,727 24,818
Savings deposits 87 373 200
Current accounts 55 694 448
Call deposits (7) 2,741 2,948
Time deposits 3 19,754 19,190
Other interest bearing liabilities 7 2,165 2,032
Net interest income 10 34,802 31,603
2010 2011 2012 20130
350.0
400.0
300.0
250.0
200.0
150.0
100.0
50.0
450.0
186.1
287.2
359.5
419.0
Nbillion
10
Equity10%
Deposits fromcustomers58%
Borrowings8%
Other liabilities
8%
Deposits from banks
7%
Tradingliabilities
9%
Funding mix

41
Overview Capital management
Otherinformation
Business review
40 Stanbic IBTC Annual group financial statements for the year ended 31 December 2013
Business review Annual report and financial statements
Corporate and Transactional Banking’s net interest income grew by 24% to N16.4 billion, owing chiefly to the growth in income from investment securities and reduction in interest expense. Personal and Business Banking’s net interest income was flat at N18.4 billion due to the growth in interest expense, a function of the increase in the deposit book. CTB’s net interest margin expanded to 3.7% from 3.4%, while that of PBB contracted from 7.1% in 2012 to 6.5% mainly due to reduction in total assets
Non-interest revenue
Non-interest revenue increased by 25% during the year with net fee and commission revenue and trading revenue up 6% and 82% respectively. The limited growth in fee and commission revenue is attributable to investment banking revenues moved to Stanbic IBTC Capital (‘Capital’), which were reported under the Bank in 2012. Other revenue was down by 94% as a result of the absence of dividend income received from the erstwhile subsidiaries of the Bank, which are now the Holding company’s subsidiaries with effect from November 2012.
Breakdown of non-interest revenue
Change%
2013Nmillion
2012Nmillion
Net fee and commission revenue 6 11,688 10,978
Account transaction fees 1 3,543 3,495
Card based commission >100 1,460 518
Knowledge based fees and commission (16) 2,910 3,469
Foreign currency service fees 10 1,299 1,185
Documentation and administration fees (27) 1,005 1,376
Electronic banking 50 241 161
Others 59 1,625 960
Fees and Commission expenses (395) (186)
Trading revenue 82 14,603 8,013
Foreign exchange 57 6,644 4,230
Interest rates (14) 1,329 1,541
Credit >100 6,630 2,242
Other revenue (94) 135 2,134
Dividend income (98) 34 2,114
Other non-bank revenue >100 101 20
Total non-interest revenue 25 26,426 21,125
Net fee and commission revenue increased by 6%. The following are the factors that impacted net fee and commission revenue in 2013:
Growth in the customer base resulting in increased income from account transaction fees although the income was somewhat affected by the regulatory reduction in transaction fees such as commission on turnover, SMS, ATM etc. during the year.
Card based commission grew in excess of 100% as a result of increased turnover volumes, a larger account base and higher merchant penetration.
Foreign currency service fees increased by 10% on the back of improved client flows during the year.
Electronic banking revenue increased by 50% due to higher utilization of Stanbic IBTC devices and growth in the number of transactions, especially internet transactions.
Documentation and administration fees reduced by 27% as a result of regulatory induced reduction in fees relating to lending activities.
The 16% reduction in knowledge based fees is attributable to the significant reduction in revenue from financial advisory services in 2013. Revenue generated by investment banking business, such as structuring, origination and advisory fees were reported under the Stanbic IBTCBank in 2012 but are now reflected under Stanbic IBTC Capital in line with new Group structure.
The growth in Other fee and commission revenue by 59% is supported by commission received on government bonds with the bank acting as agent.
Trading revenue grew 82% mainly due to the following reasons:
Forex trading benefitted from favourable trading environment and grew by 57%.
Credit trading revenue grew in excess of 100% on the back of large hedging transactions for clients.
Reduced liquidity in the interest rate market resulted in the 14% decline in credit trading revenue.
Credit impairment charges
Credit impairment charges decreased by 61% and the credit loss ratio improved to 0.9% from 2.5% recorded in 2012.
Credit impairment and credit loss ratio
Corporate and Transactional Banking’s credit impairment charges reduced by 90%, while credit loss ratio improved to 0.2% from 1.9% in 2012. Corporate loan impairments benefitted from the non-recurrence of specific provisions raised on 3 corporate clients in the prior year and improvement in rehabilitation and recovery capabilities. Personal and Business Banking’s credit impairment charges also witnessed a decline by 34%, resulting in improvement in credit loss ratio from 3.4% in 2012 to 1.8%. The resolution of some assets in business banking aided the reduction.
Operating expenses in banking business
The bank’s cost-to-income ratio increased marginally to 80.2% from 79.4% in 2012. Personal and Business Banking as well as Corporate and Transactional Banking reported increases of 22% and 13% in operating expenses and cost-to-income ratios of 121.1% and 52.1% respectively.
Financial review (continued)
0.5
1.5
2.5
(5,000)
5,000
0
10,000
0.0
2.0
1.0
3.0
Nmillion %
(2,167)
2,358
0.9%
2.5%
0.1%
2,381
968504
1,922
745
5
1.3%
6,391
2010 2011 2012 2013
Credit impairment charge on non-performing loans
Credit impairment charge on performing loans
Credit loss ratio

43
Overview Capital management
Otherinformation
Business review
42 Stanbic IBTC Annual group financial statements for the year ended 31 December 2013
Business review Annual report and financial statements
Breakdown of the bank’s operating expenses Change%
2013Nmillion
2012Nmillion
Staff costs 12 19,218 17,164
Salaries and allowances 11 18,395 16,632
Staff cost: below market loan adjustment (25) 245 327
Equity linked transactions >100 578 205
Other operating expenses: 19 29,869 24,905
Communication 8 615 571
Depreciation 20 3,863 3,231
Information technology 24 3,161 2,554
Marketing and advertising 73 2,152 1,243
Premises and maintenance (20) 3,010 3,767
Security 29 1,140 885
Administration and membership fees >100 644 196
Training expenses 30 328 253
Stationery and printing (9) 655 717
Insurance: AMCON, NDIC and others 64 5,430 3,321
Travel and transportation 3 1,015 985
Professional fees (14) 4,153 4,848
Provision on contingent and other known losses >100 2,411 1,137
Others 13 1,292 1,197
Total operating expenses 17 49,087 42,069
Staff cost and headcount
Staff cost increased by 12% driven by inflation adjusted salary increase for staff, market driven fixed remuneration increase for non-managerial staff and recruitment of non-full time staff to drive sales and customer acquisition.
Full time staff headcount decreased by 6%, while the headcount for non- full time staff grew by 20% to 2,147.
Change%
2013 2012
Personal and Business Banking (11) 998 1,125
Corporate and Transactional Banking (16) 152 181
Enabling functions (36) 305 473
Total (8) 1,355 1,475
Other operating expenses
The bank’s other operating expenses increased by 18%. The growth is attributable to: higher depreciation cost due to impairments on leasehold;
higher information technology cost for securing competitive advantage in business efficiency;
higher marketing cost due to new product and brand awareness initiatives;
higher communication cost due to increase in business volume;
Increased regulatory and compliance related insurance cost – AMCON sinking fund and NDIC deposit insurance;
Increased training cost to improve staff technical skills; and
Increased security cost due to network expansion and increased focus on protection of bank’s resources.
Change%
2013Nmillion
2012Nmillion
Direct taxation (57) (655) (1,536)
Normal taxation 80 1,617 899
Deferred tax (7) (2,272) (2,435)
Total tax credit (57) (655) (1,536)
Overall, the bank’s profitability as evidenced by profit before tax and profit after tax grew significantly in 2013. Profit before tax was up by 152%, while profit after tax grew by 9%.
Overview of the financial performance of wealth and investment banking business
Wealth business
The Wealth group comprises three companies namely:
Stanbic IBTC Asset Management Limited (SIAML) for the management of non-pension assets;
Stanbic IBTC Pension Managers Limited (SIPML) for the administration and management of pension assets, and
Stanbic IBTC Trustees Limited (SITL) for trusteeship and estate management functions.
SIPML is the largest company within the Wealth Group as it contributes more than 80% of the group’s revenue, total assets and assets under management.
The Wealth group closed the year as the largest wealth manager in Nigeria in terms of revenue, assets under management and number of clients. Two (SIPML and SIAML) of the three companies under the wealth group maintained their market leadership in 2013. The third company (SITL), established in 2011, continued to make good inroad into the trusteeship business and estate management.
Income statement analysis
The wealth group recorded a profit after tax of N8.4 billion, representing a 50% increase over the N5.6 billion recorded in 2012. The group’s profit after tax represented 40% of the total Stanbic IBTC Group’s profit after tax. Wealth’s profitability benefitted from continued growth in assets under management, impressive performance of the Nigerian capital market as well as thought through investment decisions.
Net interest income grew by 16% to N1.9 billion, on the back of positive yields on investment securities, which was strong enough to support positive return on the portfolios.
Non-interest revenue
Non-interest revenue, consisting only net fee and commission, grew strongly by 35% to N16.7 billion. The growth is buoyed by the increase in assets under managements, a function of growth in number of clients and size of contributions as well as the good performance of the stock market during the year.
As a consequent of the good performance in net interest income and non-interest revenue, total income increased by 33% to N18.7 billion.
Total income by business units
Financial review (continued)
Pensionmanagement84%
Asset management15%
Trustees 1%
Taxation
The bank’s tax credit reduced by 57% to N655 million. The bank has been benefitting from tax exempt sources including Federal Government of Nigeria bonds and treasury bills in the last two years.
Full time banking staff headcount by business unit

45
Overview Capital management
Otherinformation
Business review
44 Stanbic IBTC Annual group financial statements for the year ended 31 December 2013
Business review Annual report and financial statements
Operating expenses
Operating expenses, which is inclusive of staff and other operating cost, was down 3%. Staff cost grew by 17% as a result of inflation adjusted salary increase. Other operating costs declined by 15%, benefiting from non-occurrence of one-off regulatory induced technology improvement that existed in the prior year. Consequently, cost to income ratio improved significantly from 46.8% in 2012 to 34.3%.
Breakdown of profitability by entity
Pension management
Nmillion
Assetmanagement
NmillionTrusteesNmillion
Total Wealth group
Nmillion
Total income 15,739 2,777 144 18,660
Profit before tax 10,775 1,414 43 12,232
Profit after tax 7,357 1,001 28 8,386
Balance sheet analysis
Total assets stood at N22.6 billion at the end of 2013, representing a 33% growth over 2012. Liquid assets accounted for over 70% of total assets.
The wealth group achieved a record asset under management (AuM) of N1.32 trillion to maintain its position as the largest institutional investment business in Nigeria. This represents a 33% increase over the N990.9 billion achieved in 2012. A breakdown of the group’s AuM shows that SIPML crossed the N1trillion mark to N1.16 trillion, thus achieving a 37% growth, while SIAML recorded a 27% growth in AuM to N158.8 billion. The wealth business also witnessed considerable growth in number of clients and products. The pension business achieved a 16% growth in the number of retirement savings accounts (RSA), ending the year with 1.22 million clients. The non-pension asset management maintained a client base of about 35,000 in its mutual funds during the year. Many new products were also launched during the year by the two businesses.
Assets under management and retirement savings account
Overall, the wealth group achieved a return on average equity of 65.2% in 2013, an improvement over the 52.6% recorded in 2012.
Investment banking business
The Group’s investment banking functions and transactions are managed through Stanbic IBTC Capital Limited, which was incorporated in second quarter of 2012. These functions were previously performed by and reported in the Bank. Stanbic IBTC Capital is a leading investment bank in Nigeria and well respected in the industry. It has participated in major deals ranging from oil and gas, infrastructure and project financing to debt and equity raising. Financial Performance
The investment banking revenue is made up of non-interest revenue only as no lending activities are undertaken by the entity. Fee and commission revenue is generated through structuring, originating and provision of advisory services on various transactions for clients.. Revenue growth was particularly strong in the advisory, property group, debt capital markets, and mining energy and infrastructure in 2013.
Net fee and commission revenue grew by 70%, while a more than 250% growth was achieved in trading revenue. The prior period comparison is for 8 month (May-December 2012), starting from when the date of the company’s incorporation. When the prior period is annualized, net fee and commission revenue and trading revenue grew by 15% and 145% respectively.
Breakdown of non-interest revenue
Overview of the group’s liquidity and capital management
Liquidity management
Liquidity market overview The group’s liquidity risk management framework is
designed to measure and manage the liquidity position at various levels of consolidation so that payment obligations could be met at all times, under both normal and considerably stressed conditions. Under the delegated authority of the board, the Asset and Liability Committee (ALCO) sets liquidity risk policies in accordance with regulatory requirements and international best practice.
The group’s overall liquidity risk has remained unchanged over 2013 with continued active management of financial resources within the group’s stated risk tolerance.
New term lending and investment activity are monitored and priced to take into account liquidity costs of anticipated regulatory changes that will impact the group.
CBN maintained its monetary policy tightening stance throughout 2013. It retained the monetary policy rate, liquidity ratio and cash reserve requirement at 12%, 30% and 12% respectively. During the second half of the year, a new cash reserve requirement of 50% was introduced for public sector deposits, while the 12% was retained for private sector deposits.
The average cost of wholesale funding continued to be high as a result of the monetary policy tightening, with adverse effect on margin.
Repricing of risk assets continued to be challenging in CIB due to competitive pressures. However, this was effectively done in PBB business segment.
Liquidity buffer Portfolios of highly liquid marketable securities, over and
above prudential requirements, are maintained as protection against unexpected disruptions in cash flows. These holdings are considered in the context of internal stress tests and discounts assumed on certain securities in a possible sale.
The amount of contingent liquidity required the group’s liquidity risk standard is influenced by the nature of the depositor, and the contractual terms of the deposit as well as the prevailing and anticipated regulation.
The surplus liquidity holdings are managed taking into account liquidity stress testing results and CBN regulation. The unencumbered surplus liquidity amounted to N265.2 billion as at 31 December 2013.
Change%
12 monthNmillion
8 monthNmillion
Net fee and commission revenue 70 2,725 1,599
Corporate advisory services >100 2,418 914
Structuring fees (50) 307 616
Others (100) - 69
Trading revenue >100 281 76
Total non-interest revenue 79 3,006 1,675
Total income grew by 79% (annualized: 20%) to N3.0 billion. The growth in total income was however muted by the significant growth in operating expenses, as the prior year cost allocation was done only in latter part of 2012. Cost-to- income ratio in 2013 was 50.2%
Financial review (continued)
2010 2011 2012 20130
1200.0
1000.0
800.0
600.0
400.0
200.0
1400.0
Nbillion
91.4
488.8
834.3
939.21,054.5
1,221.0
93.6
606.2
125.0
865.9
158.5
1,157.9
Nbillion
0
1,200
1,000
800
600
400
200
1,400
Nbillion
5
Asset management Pension management Retirement saving accounts
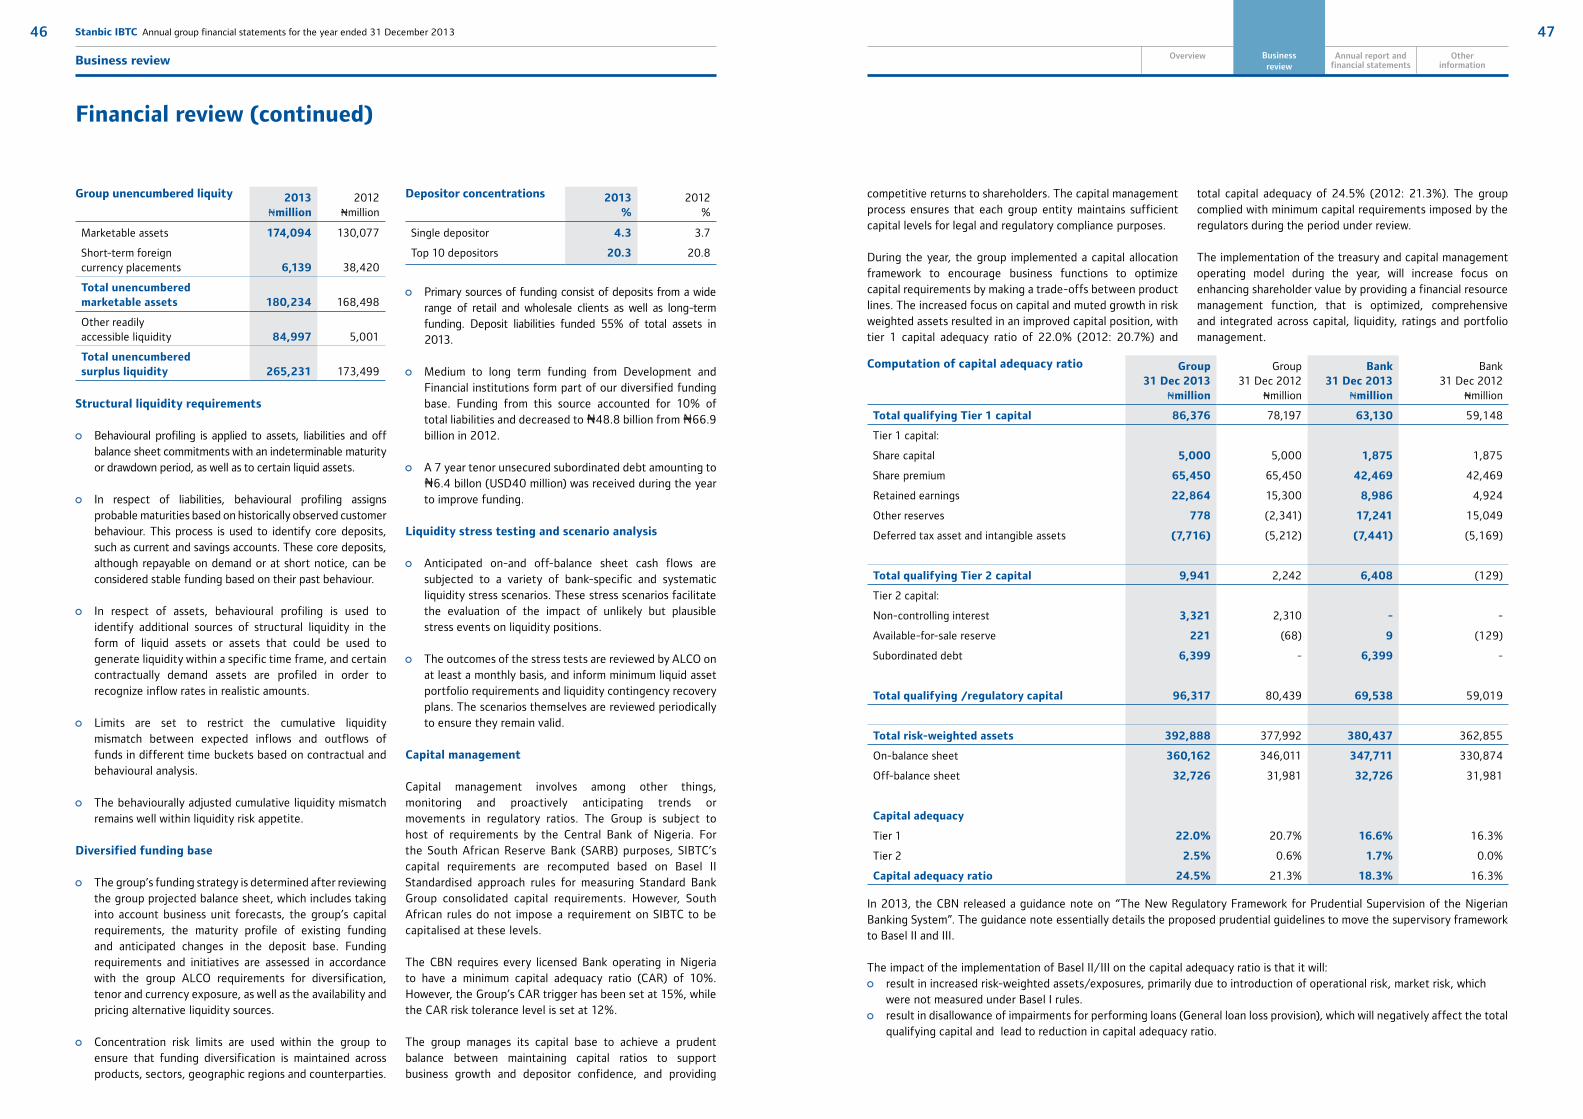
47
Overview Capital management
Otherinformation
Business review
46 Stanbic IBTC Annual group financial statements for the year ended 31 December 2013
Business review Annual report and financial statements
Structural liquidity requirements
Behavioural profiling is applied to assets, liabilities and off balance sheet commitments with an indeterminable maturity or drawdown period, as well as to certain liquid assets.
In respect of liabilities, behavioural profiling assigns probable maturities based on historically observed customer behaviour. This process is used to identify core deposits, such as current and savings accounts. These core deposits, although repayable on demand or at short notice, can be considered stable funding based on their past behaviour.
In respect of assets, behavioural profiling is used to identify additional sources of structural liquidity in the form of liquid assets or assets that could be used to generate liquidity within a specific time frame, and certain contractually demand assets are profiled in order to recognize inflow rates in realistic amounts.
Limits are set to restrict the cumulative liquidity mismatch between expected inflows and outflows of funds in different time buckets based on contractual and behavioural analysis.
The behaviourally adjusted cumulative liquidity mismatch remains well within liquidity risk appetite.
Diversified funding base
The group’s funding strategy is determined after reviewing the group projected balance sheet, which includes taking into account business unit forecasts, the group’s capital requirements, the maturity profile of existing funding and anticipated changes in the deposit base. Funding requirements and initiatives are assessed in accordance with the group ALCO requirements for diversification, tenor and currency exposure, as well as the availability and pricing alternative liquidity sources.
Concentration risk limits are used within the group to ensure that funding diversification is maintained across products, sectors, geographic regions and counterparties.
Primary sources of funding consist of deposits from a wide range of retail and wholesale clients as well as long-term funding. Deposit liabilities funded 55% of total assets in 2013.
Medium to long term funding from Development and Financial institutions form part of our diversified funding base. Funding from this source accounted for 10% of total liabilities and decreased to N48.8 billion from N66.9 billion in 2012.
A 7 year tenor unsecured subordinated debt amounting to N6.4 billon (USD40 million) was received during the year to improve funding.
Liquidity stress testing and scenario analysis
Anticipated on-and off-balance sheet cash flows are subjected to a variety of bank-specific and systematic liquidity stress scenarios. These stress scenarios facilitate the evaluation of the impact of unlikely but plausible stress events on liquidity positions.
The outcomes of the stress tests are reviewed by ALCO on at least a monthly basis, and inform minimum liquid asset portfolio requirements and liquidity contingency recovery plans. The scenarios themselves are reviewed periodically to ensure they remain valid.
Capital management
Capital management involves among other things, monitoring and proactively anticipating trends or movements in regulatory ratios. The Group is subject to host of requirements by the Central Bank of Nigeria. For the South African Reserve Bank (SARB) purposes, SIBTC’s capital requirements are recomputed based on Basel II Standardised approach rules for measuring Standard Bank Group consolidated capital requirements. However, South African rules do not impose a requirement on SIBTC to be capitalised at these levels.
The CBN requires every licensed Bank operating in Nigeria to have a minimum capital adequacy ratio (CAR) of 10%. However, the Group’s CAR trigger has been set at 15%, while the CAR risk tolerance level is set at 12%.
The group manages its capital base to achieve a prudent balance between maintaining capital ratios to support business growth and depositor confidence, and providing
2013Nmillion
2012Nmillion
Marketable assets 174,094 130,077
Short-term foreign currency placements 6,139 38,420
Total unencumbered marketable assets 180,234 168,498
Other readily accessible liquidity 84,997 5,001
Total unencumbered surplus liquidity 265,231 173,499
2013%
2012%
Single depositor 4.3 3.7
Top 10 depositors 20.3 20.8
competitive returns to shareholders. The capital management process ensures that each group entity maintains sufficient capital levels for legal and regulatory compliance purposes.
During the year, the group implemented a capital allocation framework to encourage business functions to optimize capital requirements by making a trade-offs between product lines. The increased focus on capital and muted growth in risk weighted assets resulted in an improved capital position, with tier 1 capital adequacy ratio of 22.0% (2012: 20.7%) and
Financial review (continued)
Group unencumbered liquity Depositor concentrations total capital adequacy of 24.5% (2012: 21.3%). The group complied with minimum capital requirements imposed by the regulators during the period under review.
The implementation of the treasury and capital management operating model during the year, will increase focus on enhancing shareholder value by providing a financial resource management function, that is optimized, comprehensive and integrated across capital, liquidity, ratings and portfolio management.
In 2013, the CBN released a guidance note on “The New Regulatory Framework for Prudential Supervision of the Nigerian Banking System”. The guidance note essentially details the proposed prudential guidelines to move the supervisory framework to Basel II and III.
The impact of the implementation of Basel II/III on the capital adequacy ratio is that it will: result in increased risk-weighted assets/exposures, primarily due to introduction of operational risk, market risk, which
were not measured under Basel I rules. result in disallowance of impairments for performing loans (General loan loss provision), which will negatively affect the total
qualifying capital and lead to reduction in capital adequacy ratio.
Group 31 Dec 2013
Nmillion
Group31 Dec 2012
Nmillion
Bank 31 Dec 2013
Nmillion
Bank31 Dec 2012
Nmillion
Total qualifying Tier 1 capital 86,376 78,197 63,130 59,148
Tier 1 capital:
Share capital 5,000 5,000 1,875 1,875
Share premium 65,450 65,450 42,469 42,469
Retained earnings 22,864 15,300 8,986 4,924
Other reserves 778 (2,341) 17,241 15,049
Deferred tax asset and intangible assets (7,716) (5,212) (7,441) (5,169)
Total qualifying Tier 2 capital 9,941 2,242 6,408 (129)
Tier 2 capital:
Non-controlling interest 3,321 2,310 - -
Available-for-sale reserve 221 (68) 9 (129)
Subordinated debt 6,399 - 6,399 -
Total qualifying /regulatory capital 96,317 80,439 69,538 59,019
Total risk-weighted assets 392,888 377,992 380,437 362,855
On-balance sheet 360,162 346,011 347,711 330,874
Off-balance sheet 32,726 31,981 32,726 31,981
Capital adequacy
Tier 1 22.0% 20.7% 16.6% 16.3%
Tier 2 2.5% 0.6% 1.7% 0.0%
Capital adequacy ratio 24.5% 21.3% 18.3% 16.3%
Computation of capital adequacy ratio

49
Overview Capital management
Otherinformation
Business review
48 Stanbic IBTC Annual group financial statements for the year ended 31 December 2013
Business review Annual report and financial statements
The group’s act of compliance with the capital adequacy requirement in terms of South African banking regulations measured on Basel II principles coupled with the risk governance structure and implementation of Enterprise Risk Management framework as well as collation of loss data and stress testing, amongst others, have continued to reinforce the group’s readiness for a regulatory regime that is anchored on Basel II principles from 2014.
Priorities in 2014
The group finance function’s priorities in 2014 are to:
facilitate strict control over costs to improve the group’s overall profitability and enhance returns to shareholders.
evaluate and respond appropriately to the implementation of Basel II/III.
ensure that the highest standards of execution are applied to the group’s corporate activity.
optimize the allocation of the key financial resources of capital and liquidity in order to improve the group’s return on equity.
analyse the impact of and prepare for changes in accounting standards.
evaluate opportunities for further standardization, alignment of processes and efficiencies within the group.
ensure a seamless implementation of financial reporting systems.
continue to provide relevant and reliable financial information to the group’s stakeholders, including regulators, tax authorities and shareholders.
Three-year reviewConsolidated statement of financial position
CAGR%
2013Nmillion
2012Nmillion
2011Nmillion
2013USDmillion
2012USDmillion
2011USDmillion
Assets – Banking activities
Cash and balances with central banks 91 109,385 99,840 30,072 686 638 189
Trading assets (22) 38,049 113,401 63,324 239 725 397
Pledged assets 13 24,733 24,440 19,501 155 156 122
Derivative assets (30) 1,526 1,709 3,081 10 11 19
Financial investments 24 123,457 71,629 80,762 774 458 507
Loans and advances 13 383,927 290,915 302,771 2,408 1,860 1,899
Loans and advances to banks 44 94,180 24,571 45,132 591 157 283
Loans and advances to customers 6 289,747 266,344 256,720 1,817 1,703 1,610
Other assets 23 14,634 19,378 9,750 92 124 61
Current and deferred tax assets 67 7,441 5,169 2,668 47 33 17
Intangible assets (100) - - 5,033 - - 32
Property and equipment (5) 21,948 23,989 24,161 138 153 152
Investment banking 15,373 8,745 - 96 56 -
Wealth 30 22,573 17,604 13,384 142 113 84
Total assets 17 763,046 676,819 554,507 4,786 4,327 3,478
Liabilities – Banking activities
Trading liabilities 3 66,960 88,371 63,173 420 565 396
Derivative liabilities 20 1,085 772 749 7 5 5
Deposit and current accounts 25 470,718 386,135 299,787 2,952 2,469 1,880
Deposits from banks >100 51,686 26,632 12,545 324 170 79
Deposits from customers 21 419,032 359,503 287,242 2,628 2,299 1,802
Other borrowings 1 48,764 66,873 47,618 306 428 299
Subordinated debt 2,723 1,577 - 17 10 -
Current and deferred tax liabilities (5) 2,723 1,577 3,028 17 10 19
Other liabilities 3 57,871 42,554 54,183 363 272 340
Investment banking 6,642 (3,217) - 42 (21) -
Wealth 38 7,926 6,526 4,191 50 42 26
Total liabilities 19 665,412 591,168 472,729 4,173 3,780 2,965
Equity
Equity attributable to ordinary shareholders 9 94,313 83,341 79,867 592 533 501
Banking activities 0 70,580 64,188 70,674 443 410 443
Investment banking 9,086 8,075 - 57 52 -
Wealth 26 14,647 11,078 9,193 92 71 58
Attributable to minority interest 32 3,321 2,310 1,911 21 15 12
Equity 9 97,634 85,651 81,778 612 548 513
Total equity and liabilities 17 763,046 676,819 554,507 4,786 4,327 3,478
Financial review (continued)

51
Overview Capital management
Otherinformation
Business review
50 Stanbic IBTC Annual group financial statements for the year ended 31 December 2013
Business review Annual report and financial statements
Change % 2013 2012
Business unit contribution to profit before tax
Profit before tax Nmillion >100 24,617 11,412
Banking business >100 9,474 3,764
Personal & Business Banking Nmillion 45 (7,696) (5,296)
Corporate & Transactional Banking Nmillion 90 17,170 9,060
Investment Banking Nmillion >100 2,884 177
Wealth Nmillion 64 12,259 7,471
Balance sheet
Total assets Nmillion 13 763,046 676,819
Loans and advances (net of credit impairments) Nmillion 9 289,747 266,344
Deposits from customers Nmillion 17 416,352 355,419
Key performance indicators
Net interest margin % 4.9 5.0
Non-interest revenue to total income % 56.6 50.2
Cost-to-income ratio % 68.0 72.8
Return on average equity (pre-tax) % 27.7 14.4
Return on average equity (after-tax) % 21.0 10.9
Return on average assets (pre-tax) % 3.4 1.9
Return on average assets (after-tax) % 2.9 1.6
Basic earnings per share kobo >100 186 50
Net asset value per share kobo 13 943 833
Shareholders' equity Nmillion 13 94,313 83,341
Other indicators
Price-to-book (P/B ratio) times 74 2.3 1.3
Effective tax rate % 15.6 11.0
Average number of employees % (5) 2,077 2,184
Financial review (continued)
^ Figures included in the three year review have been restated where necessary to provide meaningful comparison of performance over the yearsExchange rates utilized to convert the statement of financial position are: 2013: N159.08/USD1; 2012: N158.40/USD1 ; 2011: N155.69/USD1
Three-year reviewConsolidated income statement
Financial results, ratios and statistics
%2013
Nmillion2012
Nmillion2011
Nmillion2013
USDmillion2012
Nmillion2011
Nmillion
Banking activities
Net interest income 14 34,802 31,603 26,836 219 200 172
Non-interest revenue 20 26,426 21,125 18,385 166 133 118
Net fees and commission revenue 13 11,688 10,978 9,208 73 69 59
Trading revenue 28 14,603 8,013 8,845 92 51 57
Other revenue (36) 135 2,134 332 1 13 2
Total income 16 61,228 52,728 45,221 385 333 290
Credit impairment charges (11) (2,667) (6,895) (3,349) (17) (43) (21)
Net specific credit impairment charges (10) (1,922) (6,391) (2,381) (12) (40) (15)
Portfolio credit impairment charges (12) (745) (504) (968) (5) (3) (6)
Income after credit impairment charges 18 58,561 45,833 41,872 368 290 269
Operating expenses 14 (49,087) (42,069) (37,446) (309) (266) (241)
Staff costs 9 (19,218) (17,164) (16,129) (121) (108) (104)
Other operating expenses 18 (29,869) (24,905) (21,317) (188) (157) (137)
Profit before taxation 46 9,474 3,764 4,426 60 24 28
Taxation 655 1,536 (1,747) 4 10 (11)
Banking activities profit attributable to ordinary shareholders 94
10,129
5,300
2,679
64
34
17
Wealth
Profit for the year 45 8,386 5,576 3,964 53 35 25
Attributable to non-controlling interest 49 (2,163) (1,289) (976) (14) (8) (6)
Wealth profit attributable to ordinary shareholders 44 6,223 4,287 2,988 39 27 19
Investment banking
Profit for the year 2,258 (719) - 14 (5) -
Attributable to group ordinary shareholders 81
18,610 8,868 5,667 119 56 36

53
Overview Capital management
Otherinformation
Business review
52 Stanbic IBTC Annual group financial statements for the year ended 31 December 2013
Business review Annual report and financial statements
Financial review (continued)
Change % 2013 2012
Banking activities
Balance sheet
Total assets Nmillion 11 725,100 650,470
Loans and advances (net of credit impairments) Nmillion 9 289,747 266,344
Deposits from customers Nmillion 17 419,032 359,503
Selected returns and ratios
Return on average equity (pre-tax) % 14.1 5.6
Return on average equity (after-tax) % 15.0 7.9
Return on average assets (pre-tax) % 1.4 0.6
Return on average assets (after-tax) % 1.5 0.9
Loan to deposit ratio % 72.4 77.7
Net interest margin % 4.8 4.9
Non-interest revenue to total income % 43.2 40.1
Credit impairment charges Nmillion >100 2,667 6,895
Credit loss ratio % 0.9 2.5
Cost-to-income ratio % 80.2 79.8
Tier 1 capital adequacy % 16.6 16.3
Total capital adequacy % 18.3 17.4
Non-performing loan to total loan % 4.4 5.1
Effective tax credit % 6.9 34.1

55
Overview Capital management
Otherinformation
Business review
54 Stanbic IBTC Annual group financial statements for the year ended 31 December 2013
Business review Annual report and financial statements
Executive committee
Sola David-BorhaChief Executive:Stanbic IBTC Holdings
William le RouxHead: CIB Credit
Angela Omo-Dare Head: Legal Services
Yinka SanniChief Executive:Stanbic IBTC Bank
Obinnia Abajue Executive Director PBB Stanbic IBTC Bank
Victor WilliamsExecutive Director CTB Stanbic IBTC Bank
Funke AmobiHead: Human Resources
Chidi OkezieCompany Secretary
Babatunde MacaulyHead: Transactional Products and Services
Demola SogunleCEO Stanbic IBTC Pension Managers
Nkiru Olumide-OjoHead: Marketing and Communication
Steve IdehHead: Internal Audit
Wole AdeniyiED Business Support StanbicIBTC Bank
Yewande Sadiku CEO, Stanbic IBTC Capital Ltd
Arthur Oginga Chief Financial Officer
M’fon AkpanHead: Group Risk

57
Overview Capital management
Otherinformation
Business review
56 Stanbic IBTC Annual group financial statements for the year ended 31 December 2013
Business review Annual report and financial statements
Personal and Business Banking

59
Overview Capital management
Otherinformation
Business review
58 Stanbic IBTC Annual group financial statements for the year ended 31 December 2013
Business review Annual report and financial statements
Personal and Business Banking
Overview
In line with our earlier articulated strategic plan, the focus of the business in 2013 was to scale up by growing our client base across all lines of business with particular attention to Personal Banking and SME. We were able to surpass the one million customer mark within the year after acquiring >360,000 new customers in the period. We will continue to grow our active customer base to achieve desirable scale.
We continued to pay particular attention to our relationship management capability and service delivery, ensuring that every target customer is served by a relationship manager and that customer experience within our branches and other touch points continue to be consistent and reliable.
It has been an impressive year in our retail banking business, having successfully assisted individuals and small businesses to smoothen their cash flows with the provision of consumer and small business loans to support their needs, our unsecured lending position has reflected overall good credit behaviour of benefitting customers. Our focus on providing consumer finance was recognized in the course of the year when our Bank won best Vehicle and Asset Finance Bank at the On Wheels Motor Industry awards for the third time in a row and the Most Innovative Bank by Business Day newspaper for our focus on those market segments.
Our transactional banking offering continues to be popular with our growing customer base. This has also been spurred by the CBN’s cash lite initiative and the proliferation of many electronic alternatives that support client convenience. Channel expansion and efficiency was therefore in focus in 2013 as we grew our ATM complement by 42% to close at 359 deployed machines at the end of the year. Our machines continue to be known for reliability in the market, having maintained a 95% minimum uptime across our infrastructure, with higher availability during peak periods. Our Point of Sale terminals were also more efficient as we focused on improving utilization, growing from about 13% active ratio to about 28% compared to industry ratio of 10%. Although for strategic and operational reasons, we were not very aggressive in growing our Mobile Money client base, we still achieved a client base of c800,000 with transactions valued at N7 billion during the year.
With the progressive rollout of cash lite Nigeria and understanding that the way customers interact with financial services is changing, we have added an all-inclusive digital solution to enhance customer convenience. Our Group app was developed to provide end-to-end financial service
to individual customers of Stanbic IBTC Group. Available services on the platform include Mobile Money, Banking services, Pension and Mutual Fund services with airtime and other value added services, provided in a safe environment.
The Bank commenced the development of an Agent network and has already grown its agency network to >2,000 within the period. Agency banking allows us to further extend our distribution network and offer banking and other value added services to both banked and unbanked customers across the country. We believe that this network will prove particularly useful in the new world of privatized electricity operations. We must now focus on driving awareness in the marketplace to derive the benefits of efficiency expected from the channel. This is also consistent with the CBN’s goal of financial inclusion and serves well as a part of the MobileMoney ecosystem.
Business Performance
We continue to gather momentum in the business focusing on the growth and efficiency of our balance sheet. Given our existing investments and cost base, our focus is on achieving a stronger top line while managing our expenses appropriately.
Outlook for 2014
We plan to continue to grow our business with focus on acquiring more customers across our chosen client segments as the importance of scale cannot be over emphasized in the growth phase that we are in. In addition, we will maintain our focus on Customer Relationship Management and improving operational efficiency through effective channel management.
Financial Performance2013
Nmillion2012
NmillionGrowth
%
Total income 25,351 23,528 8
Staff costs (13,366) (12,685) 5
Other operating expenses (17,377) (12,573) 38
Provision for risk assets (2,344) (3,566) (34)
Tax provision 1,689 2,286 (26)
Loss after tax 6,007 3,010 100
Deposits 197,898 164,031 21
Gross loans and advances 133,550 105,055 27

61
Overview Capital management
Otherinformation
Business review
60 Stanbic IBTC Annual group financial statements for the year ended 31 December 2013
Business review Annual report and financial statements
A very happy work place banking relationship
It was a great opportunity gone bad. We had a series of complaints and very unhappy customers.
In a show of increasing confidence in our work place banking proposition, Stanbic IBTC re-launched the work place banking offering in Nigerian Bottling Company. We went in to meet with the top executives; we listened to the issues and gave a commitment to resolve all the issues within a timeframe. We kept our promise and we wowed them.
This re-launch of the group scheme involved the regularization of existing accounts and the acquisition of new employees of Nigerian Bottling Company through our salary domiciliation and loan offering agreement platform. We got their attention and they came on-board.
To date, Nigerian Bottling Company has grown to become one of the key and strategic customers of the bank in the Personal Banking space. The bank has been able to acquire about 60% of the senior staff workforce and we have recently gotten the go ahead to bank their entire junior staff workforce – over 3,000 staff and we have started the acquisition of these customers on to our books.
Our relationship with the organisation and its employees has grown tremendously as exemplified in the recent transfer of their junior staff loan scheme to us outrightly from a competitor.
“A very happy work place banking relationship”Nigeria Bottling Company (NBC)
Case Study
The benefits of a well-managed work place banking proposition impacted positively on our CIB business. During the year under review, our share of the client’s Corporate banking business doubled from 8% in the 2012 FY to 16%.
Our pension business also continued to witness immense patronage from Nigerian Bottling Company, with 60% of the entire workforce of NBC using Stanbic IBTC Pension Managers as their Pension Fund administrator as new employees continue to join.
“Your bank, Stanbic IBTC, is a brand that has come to stay in the Nigerian Bottling Company because of its responsiveness, transparency and integrity”These are the words of a senior Human resource personnel as also echoed by other employees.

63
Overview Capital management
Otherinformation
Business review
62 Stanbic IBTC Annual group financial statements for the year ended 31 December 2013
Business review Annual report and financial statements
Description of Business
Our long term commitment to support Nigerian entrepreneurs to grow and succeed can be described with Erisco Foods Limited, an indigenous food processing company. Erisco has been banking with Stanbic IBTC since August 2008 when they first opened an account with us and experienced our quality service with our Toyin street branch in Lagos.
Erisco Foods Limited was incorporated in 2004 as an indigenous manufacturer of food products in Nigeria. The company began operations in 2009, producing one brand of Tomato Paste in sachet called Nagiko. Soon after they introduced another brand of tomato paste called Ric-Giko. They currently have over 10 SKU’s including two brands of tomato paste in sachet, along with other products like Nagiko Sugar, Nagiko Monosodium glutamate, Nagiko Basmati Rice in the market. Erisco Foods Ltd is currently expanding their product lines by introducing new products to the market.
Company Office and outlets
The company’s corporate head office as well as factory and warehouse are all located at Oregun, Alausa Lagos.
The target market zones of its products include Lagos, Ondo, Oyo, Kwara, Kano, Sokoto, Kaduna, Ogun and Enugu State. The Company’s intention is to establish warehouse and offices in all the states of the federation in order to meet up with the market demand for their products which is growing astronomically. The Company’s distribution channels involve the use of major distributors that buy directly from its factory. These major distributors resell to smaller distributors who then sell to the retailers that sell directly to the consumers.
Relationship with Stanbic IBTC
In May 2010, the company requested for working capital finance which the bank evaluated and approved. The company utilized the facility to stabilize its operations, and enhance its liquidity requirements. The Bank was repaid within the tenor of the loan.
In March 2013, the company approached the bank for growth finance and working capital due to the heavy capital outlay involved in acquiring their warehouse, equipment and machinery, and also to enable them increase their production lines and introduce the canned tomato products to meet the latent demand in the market. This was granted by the bank and ensured the company met up with its 2013 objectives.
The management team of the company led by Chief Eric Umeofia, has a strong passion for manufacturing and is focused on steadily growing the business and increasing the company’s market share of Tomato paste in Nigeria. Accordingly to Chief Eric Umeofia’s comments about the bank published in Daily Sun Thursday, October 10, 2013 “Stanbic IBTC Bank saw our vision and keyed into it’’, “Even when some advised us to import finished tomato paste from china for them to grant us funds for trading rather than for manufacturing, we stuck to our dream, due to our good intentions for our country”.
Business Development and Future Prospects
The company plans to have completed the installation of its tin tomato production line before the end of the first quarter in 2014. This is expected to add a production capacity of 240,000 tins per day to its existing capacity of 230,000 sachets per day. The expansion will also require the services of new technicians, engineers, supervisors as well as sales staff in addition to the 50 staff already employed by the company and ultimately result in additional employment of at least 65 staff.
The client is present in other African countries, which presents additional opportunity to assist its expansion with Standard Bank’s presence in Africa. In essence the Bank has been able to support Erisco’s operations through liquidity management, growth finance and international trade facilitation, three key pillars of our strategy in supporting local entrepreneurs who are able to create sustainable value for all stakeholders.
This story inspires us and demonstrates how the right type of support from a bank can create the platform for sustainable business growth, and improve society through job creation and value addition.
Erisco Foods Limited
Case Study

65
Overview Capital management
Otherinformation
Business review
64 Stanbic IBTC Annual group financial statements for the year ended 31 December 2013
Business review Annual report and financial statements
Corporateand Investment Banking

67
Overview Capital management
Otherinformation
Business review
66 Stanbic IBTC Annual group financial statements for the year ended 31 December 2013
Business review Annual report and financial statements
Corporate and Investment Banking
The Corporate and Investment Banking (CIB) business continues to make great strides in Nigeria’s challenging and complex economic, capital markets and regulatory environment in pursuit of its goal of being the clear leader in corporate and investment banking in, and for, Nigeria. The diversified skills and expertise of the various units in CIB – Client Coverage, Global Markets, Transactional Products and Services and Investment Banking – and our linkages to the international capabilities of Standard Bank Group, enables us to deliver to our clients a broad array of services at market-leading levels of quality.
In 2013, greater collaboration across units in CIB and with the Wealth and PBB businesses within Stanbic IBTC Group has helped to make the CIB client proposition more robust. Our CIB client revenue achieved record levels, up nearly 100% from the year before. Increasingly, we are utilizing our breadth of capabilities more effectively to capitalize on the opportunities we see in the market. An example of the collaboration across functions is our retail foreign exchange business, which drew on capabilities in Global Markets, the branch network, Business Banking and the public sector, to achieve year-on-year growth of 211%.
The significant growth in our total client revenue reflects in part our linkages to Standard Bank’s franchise. Standard Bank Group’s sustainable competitive advantages are based on our presence, knowledge and experience across Africa, our capabilities in key strategic international capital markets, and the heritage and extent of our expertise in natural resources. Our strategy is to be the full-service corporate and investment bank in Nigeria that offers clients the best of local capabilities and execution, on-the-ground presence in key African markets, and access to international capital markets to support African transactions.
CIB’s success in executing its strategy and our strong market position is exemplified by the industry awards received for our services and the transactions in which we have been involved:
Best Investment Bank in Nigeria, EMEA Finance Banking Award, 2013 (for the second year running)
Best Bank in Africa, Euromoney Real Estate Award, 2013 (for the second year running)
The Most Active Dealing Member Firm (Stockbroking) - The Nigerian Stock Exchange CEO Award 2013
Best Custodian in Nigeria 2013 by Global Investor for the seventh year running
Best Sub-Custodian in Nigeria, 2013 - Global Finance Magazine at SIBOS
Best Foreign Exchange Provider in Nigeria, 2013 - Global Finance Magazine at SIBOS
M&A Deal of the Year, The Banker awards (2013): for Tiger Brand’s acquisition of a 63 percent stake in Nigeria’s Dangote Flour Mills
Structured Finance Deal of the Year, The Banker awards (2013) for the USD150 million Skye Bank Remittances Future Flow Securitisation in Nigeria.
Overview of 2013
Transactional Product and Services (TPS)
Transactional Product and Services (TPS) client offerings include domestic and cross border payments, trade finance, cash management and custodial services.
In 2013, revenues from both cash management and trade rose significantly compared to the prior year, driven in particular by the market share gain in trade and favorable market conditions with lower interest rates.
With an improved payment platform, TPS offered clients customized solutions which provided added value in the area of working capital liquidity and payment terms. Overall, transactional value and volumes increased notably compared to 2012. Deposits grew by 8%.
Departmental highlight
Stanbic IBTC Nominees Nigeria Limited
Stanbic IBTC Bank PLC pioneered the custody business in Nigeria in 1994 to serve foreign investors that are in need of safekeeping and administration capabilities. Stanbic IBTC Bank PLC has since emerged as and remained the biggest custodian in the Nigerian market.
We provide custodial services to both local and international clients and investors, namely fund managers, asset managers, global custodians, international broker dealers, stockbrokers, retirement benefit schemes and other institutional investors wishing to invest in the Nigerian market.
Stanbic IBTC Bank PLC is one of the six appointed custodians of money market and fixed income instruments by the CBN. In August 2012, Stanbic IBTC Bank PLC was also appointed as one of the two agents to pioneer securities lending in Nigeria, a significant testament to our thought-leadership initiatives that are aimed at improving market processes and the investing climate.

69
Overview Capital management
Otherinformation
Business review
68 Stanbic IBTC Annual group financial statements for the year ended 31 December 2013
Business review Annual report and financial statements
2013Nmillion
2012 Nmillion
Growth %
Total income 41,222 29,830 38
Staff costs (7,586) (4,791) 58
Other operating expenses (13,258) (12,473) 6
Provision for risk assets (323) (90) (84)
Tax provision (1,660) (1,646) (9)
Profit after tax 18,394 7,951 >100
Deposits 218,454 191,388 14
Gross loans and advances 169,756 174,148 (3)
Financial Performance
The key performance indicators are highlighted below:
Corporate and Investment Banking (continued)
In interfacing with clients, we strive to develop a clear understanding of their service requirements in order to deliver a total client experience. Our well trained and experienced operations and relationship teams are supported with robust infrastructure, which enables us to provide excellent and best-in-class value proposition.
Our strong expertise, market leadership and excellent client services have resulted in the growth of assets under custody (AUC) and transaction volumes which have been trending upward since early 2012.
Global Markets (GM)
The Global Markets unit comprises sales and trading teams with varying specializations in equities, fixed income, foreign exchange, money markets and structuring of a wide range of financial hedging solutions. The research team provides analysis of markets, products and client activities.
Global Markets performed well in 2013, despite the volatile market environment seen over the course of the year. In our Foreign exchange business, trading volumes reached a record level in 2013, and retail FX revenue increased significantly with a wider reach to our retail customers. Our FX desk was ranked best Foreign Exchange Provider in Nigeria by Global Finance.
In 2013, we continued to be a market leader in structured products by providing innovative solutions that delivered cost savings to a wider scope of customers.
Departmental highlight
Stanbic IBTC Stockbrokers Limited
Stanbic IBTC Stockbrokers Limited (SISL) is the wholly-owned subsidiary of Stanbic IBTC Holdings PLC. It is registered by the Securities and Exchange Commission as a broker-dealer and was licensed on 24 June 1987.
We have consistently been Nigeria’s largest stockbroking firm in terms of transaction value (2006 to 2013) with a market share of approximately 19% as at 2013 year end.
SISL has continually demonstrated its expertise in executing primary market transactions by acting as stockbrokers to various capital raisings. We also won the Nigerian Stock Exchange CEO Award for the most active dealing member firm and InterContinental Finance Magazine’s award for the Stockbroker of the Year 2013 in Nigeria.
The Debt Management Office re-appointed SISL for another year (2014) as the only stockbroker to Federal Government
bonds. SISL was also the most active stockbroking firm trading retail bonds on the floor of The Nigerian Stock Exchange (NSE) in 2013 and we will continue to promote retail bond trading on the NSE.
As stockbrokers, we are always willing to place our experience and expertise in dealing securities of public companies and bonds quoted on the NSE. We do not only execute transactions, we build relationships.
Investment banking (IB)
Investment banking (IB) continues to receive market–wide acknowledgement of its leading position in Nigeria, as exemplified by the awards we have received. Our investment banking team turned in strong performance in growing fee income. Year-on-year revenue growth was particularly strong in advisory, real estate, debt capital markets, and mining, energy and infrastructure.
Some notable transactions during the year included:
Sole Issuing house for La Casera’s N3 billion Corporate Bond Issue
Joint financial advisor to AMCON’s NGN5.6trn debt restructuring in 2013
Sole advisor for Danone’s acquisition of a 49% stake in Fan Milk.
Sole advisor on the merger of Consolidated Breweries, DIL Maltex, & BBL
Advisor on the merger of Intercontinental Properties Limited and WAPIC Insurance Plc
Buy side advisor to Southern Sun Africa on the acquisition of a 75% equity stake in Ikoyi Hotels Limited
Advisory on UAC of Nigeria PLC’s acquisition of Portland Paints & Products Nigeria PLC
Initial Public Offering for the UPDC REIT
Client Coverage (CC)
Coverage of corporate clients is provided by the Client Coverage (CC) team which is organized into the following sectors: Conglomerates and Diversified Industries, Fast Moving Consumer Goods; Telecom and Commodities; Oil & Gas, Power & Infrastructure; and Financial Institutions. Client Revenue grew significantly across all sectors reflecting greater relevance of our offerings to our clients’ needs.
Strategic Direction
Generating value for our clients underpins our strategy and differentiates our franchise. We will continue to develop our client management capabilities and deliver a consistent CIB client offering and experience which will enable us to maximise cross-selling opportunities and deliver optimal financial resource utilisation.
Cost efficiency and improving our operational performance are the cornerstones of improvements in our cost structure, margins and capital ratios.
We will continue to help our clients grow through increased lending to the resource, manufacturing, agriculture and service sectors, and by raising debt and equity for our clients in the local and international capital markets.

71
Overview Capital management
Otherinformation
Business review
70 Stanbic IBTC Annual group financial statements for the year ended 31 December 2013
Business review Annual report and financial statements
Fan Milk is the leading manufacturer and distributor of frozen dairy products and juices in West Africa. Since its establishment over 50 years ago, Fan Milk has grown rapidly through a unique distribution network and currently operates in Nigeria, Ghana, Togo, Burkina Faso, Benin and Ivory Coast. The Company generated sales of c. EUR120 million in 2012 and owns strong and deeply entrenched brands in the countries in which it operates.
In 2013, Stanbic IBTC Capital Limited advised Danone, one of the largest food product manufacturers in the world, producing fresh dairy, water and nutritional products globally, on the acquisition of Fan Milk in partnership with Abraaj, a leading emerging market focused private equity group. The partnership with Abraaj combined Danone’s deep global resources across various functions, including route-to-market, marketing functions and research and development capabilities with Abraaj’s understanding of the domestic environments in which Fan Milk operates.
In 2012, the shareholders of Fan Milk, assisted by advisers, commenced a process to divest of their interest in the Company via a competitive auction process that entailed several financial and trade buyers. Potential bidders were attracted by Fan Milk’s strong brands, historical financial performance, geographic diversification, unique distribution model and strong governance.
Stanbic IBTC assisted Danone in deepening its understanding of the markets in which Fan Milk operates, conducting due diligence on the company and outlining a compelling proposal to Fan Milk’s shareholders. The competitive auction process culminated with Danone and Abraaj partnering to acquire Fan Milk.
Advising Danone on the acquisition of Fan Milk represents Stanbic IBTC’s commitment to assisting global players on making strategic investments aimed at benefiting from the significant growth potential in Africa.
“Bringing the world to Africa” Danone and Abraaj’s Acquisition of Fan Milk
Case Study

73
Overview Capital management
Otherinformation
Business review
72 Stanbic IBTC Annual group financial statements for the year ended 31 December 2013
Business review Annual report and financial statements
Our Aspiration, Our Commitment… “Power and Infrastructure Story”
Stanbic IBTC’s commitment to the power sector reform which will boost the economic and social development of Nigeria is demonstrated by its focus on financing and advisory solutions offered during the privatisation of the PHCN successor generating companies (“Gencos”) and distribution companies (“Discos”) in 2013.
Stanbic IBTC and Standard Bank Group (SBG) supported Vigeo Holdings in its acquisition of Benin Disco and Copperbelt Energy Corporation PLC (CEC) in the acquisition of Abuja Disco and Shiroro Hydro Genco.
The first stage of the bidding process commenced with each consortium submitting a bid bond with its complete technical and commercial bid documents. The technical bid was then evaluated upon which successful consortiums proceeded to the commercial bid stage and were required to post a Post Qualification Security before their commercial bids were opened. The successful consortium at the commercial bid stage was declared the preferred bidder and required to post a Preferred Bidders’ Guarantee equivalent to 15% of the bid price. The preferred bidder proceeded to negotiate industry and transaction documents with BPE and was required to pay 25% of the bid price upon execution of agreements, while the balance 75% was paid within 6 months thereafter.
In August 2013, 15 consortia paid the required 75% final payments for their respective assets to complete the acquisition process with USD3 billion accruing to the federal government from the divestment. Subsequently on November 01, 2013, the 15 PHCN successor companies were handed over to new owners declaring the emergence of the new privatized electricity market and making the Nigeria the first country on the African continent to achieve this milestone.
Vigeo Holdings Ltd
Vigeo Holdings evolved into a conglomerate holding company with subsidiaries operating in various sectors including financial services, marketing and distribution, real estate management since its inception in 1985. Vigeo Holdings’ business activities in the power sector are carried out via Vigeo Power Limited (“VPL”) and Global Utilities Management Company Limited (“GUMCO”). GUMCO had gained experience of the Nigerian power sector since 2002, when it participated in the Federal Government’s metering billing and revenue management program.
Copperbelt Energy Corporation PLC (CEC)
CEC is a market leader in providing power to the mining industries on the Copperbelt and distributes around 50% of Zambia’s power. CEC is a 52% subsidiary of Zambia Energy Corporation Limited. CEC submitted its bid via Kann Utility Limited (Nigerian incorporated vehicle, in which CEC owns a majority stake) for the acquisition of Abuja Electricity Distribution Plc.
Stanbic IBTC and SBG provided all the bonds and guarantees towards the acquisition bid culminating in the preferred bidders guarantee upon Kann Utility being named winner of the bid process for Abuja Disco, and part financed payments for the assets.
We are committed to the power sector reforms and are excited about the prospects for the sector going forward. To that end, Stanbic IBTC and SBG sponsored two investor forums in the United States in September 2013, which enabled ministers of the Federal Government to present the power strategy to groups of US and international investors.
The bank will continue to support the market as the new owners commence investments into rehabilitation and expansion of the sector towards the achievement of the goal of 40,000MWs by the year 2020. We will also work with other parties to support off-grid and clean energy solutions to expand the range and capacity of power solutions in Nigeria.
Case Study

75
Overview Capital management
Otherinformation
Business review
74 Stanbic IBTC Annual group financial statements for the year ended 31 December 2013
Business review Annual report and financial statements
Wealth

77
Overview Capital management
Otherinformation
Business review
76 Stanbic IBTC Annual group financial statements for the year ended 31 December 2013
Business review Annual report and financial statements
Wealth
What we offer
The Wealth division focuses primarily on pension administration and management, private non-pension asset management as well as trusteeship and estate planning business.
2013 highlights
Achieved record assets under management of N1.32 trillion (USD8.18 billion) to maintain position as the largest institutional investment business and number one wealth manager in Nigeria with Stanbic IBTC Pension Managers crossing the N1 trillion mark in assets under management.
Recorded year on year net profit growth of 64%.
Improved cost efficiency by attaining a cost to income ratio of 35%, a 12% improvement over last year’s ratio of 47%.
Recorded an impressive return on equity of 57.3%.
Launched the first mobile office in the pension industry – “Pension on Wheels”.
Conducted successfully the first pre-retirement seminar to educate our “soon-to-be” retirees.
Won our first State Bond mandate as Lead Trustee.
Secured approval from the Securities and Exchange Commission on the Stanbic IBTC Iman Fund bringing the total number of Collective Investment Schemes to seven (7).
Awarded the Best Investment Manager Company in Nigeria in 2013 by World Finance.
Introduced the online self-service channels for subscription, redemption and password auto-reset processes for existing mutual fund unit-holders.
Investment in the Stanbic IBTC Nigerian Equity Fund by the Securities and Exchange Commission on behalf of winners of the 2013 SEC Integrity Award.
Enhanced visibility and awareness of Stanbic IBTC Trustees Limited within the industry.
2014 priorities
Active collaboration with Banks that do not have associated Trustee Companies.
Launching of the Stanbic IBTC Trustees Limited website to create more awareness/visibility.
Introduction of an online application process for pension payments via secure web.
Extension of the pre-retirement seminar for “soon-to-be” retirees to other regions within the country.
Focus on service quality and greater accessibility to clients by building a culture of service and being customer centric.
Exploration of online registration as an alternative to capture the internet savvy subset of prospective Retirement Savings Account (RSA) holders.
Creation of an alternative investment desk and the launching of our first Exchange Traded Fund.
Overview
The Wealth division is one of the arms of Stanbic IBTC Holdings Plc. This division comprises three companies:
Stanbic IBTC Pension Managers Limited (SIPML) for the administration and management of pension assets,
Stanbic IBTC Asset Management Limited (SIAML) for the management of non-pension assets and
Stanbic IBTC Trustees Limited (SITL) for trusteeship and estate management functions.
The Wealth group as at 31 Dec 2013 had circa N1.32 trillion as assets under management (AUM) and has remained the leading wealth manager in Nigeria with SIPML consolidating its pre-eminent position as the largest PFA in terms of AUM and number of RSAs, SIAML also maintained its position as the largest independent non-pension assets manager measured by value of AUM, number and size of mutual funds and number of customers with SITL broadening our product offering by catering to the needs of different strata of our clientele with respect to estate management and trusteeship.

79
Overview Capital management
Otherinformation
Business review
78 Stanbic IBTC Annual group financial statements for the year ended 31 December 2013
Business review Annual report and financial statements
Looking forward
2014 has the potential to be another positive year for global equities, though not on the level witnessed in 2013. After a year in which multiple expansion has been the dominant factor, we expect that financial markets will gradually pay more attention to the underlying profitability of the companies, given the gradual phasing out of the US Fed’s generous monetary policy. On the fixed income side, 2014 is a pre-election year in Nigeria and is usually characterized by higher spending; Federal government spending increased by nearly 50% YoY before the last election in 2011, enhanced by supplementary budgets. We expect that there will be supplementary budgets to support political spending in 2014.
A couple of regulatory changes are expected to take-off in 2014, including the appointment of a new Director-General of the National Pension Commission, as well as other Commissioners. The much awaited multi-fund structure on the RSA Funds and opening of the transfer window in the Pension industry are also expected to take off during the year. While we still expect to face challenges in investment returns and fee generation, we intend to remain steadfast to our core values and policies which will guide our decisions throughout the course of the New Year.
The RSA number and size will be driven by continually exploring new markets and aiming for a larger share of existing markets by taking advantage of the transfer window which we expect will go live in 2014. We also intend to launch additional mobile offices making our services more accessible and convenient for our customers. In addition, to capture the internet savvy subset of the market, we intend to explore online applications for pension payments as well as online registration for prospective RSA customers.
To further make our services available and convenient to our customers, we will enable new subscriptions to the mutual funds online thereby eliminating the need for physical human interaction and/or document submission. We will also be expanding our asset management business by introducing our first Exchange Traded Fund to enable investors obtain a broad exposure to the Nigerian Equities Market in a cost efficient manner.
We intend to collaborate with key Trust companies in the industry to get on board state government bonds and other related transactions. In addition, we will go on an aggressive mandate acquisition drive by partnering with Banks that do not have associated Trust Companies.
Wealth (continued)
Strategy
The wealth business model is primarily focused on assisting our clients in investing in a variety of eligible asset classes including fixed income and equities markets to effectively deploy, accumulate and preserve wealth. However, in doing this, we are committed to ensuring security, liquidity and reasonable returns over a medium-long term investment horizon.
Across the Wealth division in 2013, we maintained our leadership position in the industry by further increasing our client base and assets under management as well as introducing new product offerings. For the pension business, we added over 160,000 clients closing the year with 1.22 million RSA clients. Assets under management grew by 34% to close at N1.16 trillion (USD7.19 billion). The first ever mobile pension office “Pension on Wheels” was launched during the year. This initiative is in line with our commitment to ensuring that all our clients experience excellent and convenient service at all times.
The non-pension asset management business closed its assets under management at N159 billion (USD987 million) recording a 27% increase over the 2012 closing figures. During the year, SIAML maintained a subscriber base of about 35,000 in its mutual funds despite investors’ apathy and other macro-economic challenges. The Stanbic IBTC Iman Fund was also launched in the course of the year creating an additional avenue for investors to diversify their portfolios.
The trusteeship and estate management business continued to thrive in the year and maintained its profitable position. We focused on entering into the bond market by acquiring State Bond mandates in 2013. We were appointed as Lead Trustees to the Nasarawa State Bond Offering which was a first for us.
Financial performance
In 2013, the Wealth Group continued to benefit from the positive performance of the Nigerian capital market. The impressive equities market performance could be attributed to factors such as the rub-off effect of the largely impressive 2012 year end results; impressive valuation of blue chip consumer names; growing investors’ confidence; and significant increase in foreign inflow into the market. Yields on fixed income instruments were lower than last year on average due to a significant drop in headline inflation levels and relative price stability; they were however still strong enough to support positive return on our portfolios.
Despite the negative impact of the policy changes by the CBN during the year and increased competition from peers, the Wealth Group was able to surpass its set budgetary
Revenue by business unit
2013 Nmillion
2012 Nmillion
Change(%)
Net interest income 1,948 1,684 16
Non-interest revenue 16,712 12,368 35
Total income 18,660 14,052 33
Staff cost (2,899) (2,477) 17
Other operating cost (3,502) (4,104) (15)
Tax provision (3,837) (1,895) >100
Profit after tax 8,386 5,576 50
Assets under management
N1.32 trillion
N991 billion 33
Retirement savings accounts 1,220,777 1,054,525 16
Cost-to-income ratio 34% 47%
SIPML84.34%
SITL0.77%
SIAML14.89%
target, benefitting from favourable market indices and well-researched investment decisions. Revenue grew by 33% and net profit rose by an impressive 64% over the 2012 figures, while total assets under management increased by 33% to close at N1.32 trillion (USD8.18 billion). We were able to leverage on the strength of our businesses and our premier positioning in the industries to sustain improvement in income levels, while keeping operational expenses in check by improving internal efficiencies.

81
Overview Capital management
Otherinformation
Business review
80 Stanbic IBTC Annual group financial statements for the year ended 31 December 2013
Business review Annual report and financial statements
Abridged sustainabilityreport

83
Overview Capital management
Otherinformation
Business review
82 Stanbic IBTC Annual group financial statements for the year ended 31 December 2013
Business review Annual report and financial statements
Abridged sustainability report
Sustainability remains a fundamental part of our business strategy
At Stanbic IBTC, we understand that sustainable practices within a business can create value for customers, investors, and all other key stakeholders. We believe that a sustainable business must meet customer needs while, at the same time, take care of the social needs of its host community. And because our main objective as a business is to create value for our stakeholders, Sustainability will always remain a fundamental part of our business strategy.
We proactively embed sustainability thinking and sustainable business practices at every level of our business. We believe that our most important contribution to sustainable development is to operate an effective and profitable bank. By providing access to credit, savings and other financial products, we enable individuals to improve their quality of life and enhance their financial security. By providing finance to large and small businesses we facilitate economic growth and job creation, and by financing infrastructure and the development of key sectors, we assist in resolving global challenges such as energy and food scarcity, resource depletion and climate change.
The very nature of our business positions us to help our customers and stakeholders manage social and environmental challenges and invest for the future, which in turn contributes to the viability and sustainable growth of local markets and national economies. The success of our customers, clients and stakeholders guarantees future business, which underpins our sustainability.
A journey to sustainable social impact
What does Social Impact mean to our stakeholders? How do we deliver sustainable social value that will resonate with the yearnings of our key stakeholders? How can we make contribution that will satisfy the needs of today and those of generations to come? These are questions that we ask ourselves constantly as we strive to create a sustainable business. Our strategies are constantly evolving and improving to ensure that the answers to these questions remain fresh and relevant. Our journey to creating a sustainable business is deliberately never ending because we are more interested in the lessons that we pick along the way than the actual destination.
Corporate social investment: Business Needs and Societal Needs
As with any strategic endeavour, Our Corporate Social Investment activities are hinged on three thematic areas (Health, Education and Economic Empowerment). Socio economic research has identified these thematic areas as part of the current most pressing needs of our business environment. Focus helps us align our investments so that we can make considerable impact in any of these thematic areas. It has also helped us define frameworks for engagement. We try to balance CSI investments between business interests and the needs of our host community.
We work in partnership with the communities in which we operate and prioritize communities in which we want to do business. We employ a research-based approach to understand the deeper socio-economic needs of these communities by engaging with government, other businesses and community organisations. Through merging business and CSI goals, we aim to create meaningful and lasting mutual benefit.
Creating thriving partnerships
At Stanbic IBTC, monitoring and evaluation of projects is a routine business practice. We ensure that every step in the project lifecycle is completed and proper evaluation of project is carried out at the end of each project. This is part of the data that feeds the engine that drives our “continuous improvement journey”.
We have a pre-defined framework for engagement. The framework differs from project to project and is reviewed periodically. Our major CSI objectives are; supporting strategic and credible projects that are aligned with business objectives, deploying solutions that can be scaled, reaching a large pool of beneficiaries and being able to leverage business opportunities as they arise.
Category Major social partners
Education Federal University of Technology, Ado Ekiti IFRS
Ekiti State Government (SUBEB) Sickle Cell Foundation
Depot Nigerian Army Ministry of Education (Kaduna)
Yaba College of Technology Ministry of Education (Maiduguri)
Lagos Progressive School Music Society of Nigeria
Junior Achievement Ministry of Education (Yobe)
Federal Ministry of Finance (YOUWIN) Zuru Community
UNIBEN
Enterprise Development Nigerian Bar Association
South African Consulate
Health and Wellness Free optometry services with the Ogun State Government (Oriade LGA)
Modupe Cole
Sickle Cell Foundation
International Womens Organisation for Charity
Hyssop Foundation
Employee Community Involvement School Library Project by the Finance department
Breakdown of CSI Spend 2013
Social partners in Nigeria 2013
Education85%
Health9%
Economic empowerment
7%

85
Overview Capital management
Otherinformation
Business review
84 Stanbic IBTC Annual group financial statements for the year ended 31 December 2013
Business review Annual report and financial statements
Enterpriseriskreview

87
Overview Capital management
Otherinformation
Business review
86 Stanbic IBTC Annual group financial statements for the year ended 31 December 2013
Business review Annual report and financial statements
Enterprise risk review
Overview
The group’s strong enterprise risk management practice is the bedrock of its commitment to continually enhance shareholders’ value in strict adherence to the risk appetite as set by the board whilst considering the wider interest of other stakeholders amongst who are depositors and regulators.
The tone for a responsive and accountable risk management culture is set at the board level and this flows down through the organisation to each business manager and independent risk officer. Risks are managed according to set risk governance standards, which are implemented across the group and are supported by appropriate risk policies and procedures. The bank and other subsidiaries within the group have each adopted the Enterprise Risk Management (ERM) framework with an independent control process that provides an objective view of risk taking activities across all business and risk types at both an individual and aggregated portfolio level. The group seeks to achieve the right balance between risk and reward in its businesses, and limits adverse variations in earnings by appropriately managing its capital within specified risk appetite levels.
Key achievements in 2013
Amidst randomly unfolding new regulatory guidelines and frameworks, the group was able to distinguish itself in the industry by the quality and robustness of its risk management practices and tools. Some specific achievements include:
Operational Risk
Business continuity management simulation for crisis management and emergency evacuation teams; and
Consolidation of New Product Approval process across the group.
Market Risk
Diversified Normal and Stress VaR reporting across all trading desks with the implementation of Historical 10 day Stress VaR;
Partial introduction of automated Market Risk Report (MRR);
Upgrade of Trading/Risk system from Calypso version 9 to version 13;
Introduction of point of weakness scenarios;
Implementation of a market-oriented FTP methodology which has resulted in attracting the right amount of liability;
Creation of an endowment hedge portfolio for managing the Interest Rate Risk of Banking Book (IRRBB); and
Quantitative Risk Management (QRM) software implementation to replace IPS Sendero for ALM monitoring.
Compliance
Roll out of the Anti Money Laundering (AML) / Countering Financing of Terrorism (CFT) computer based training for all employees of the group;
Focus areas for 2014
Against a backdrop of an expected increase in the level of financial transactions on the electronic payment platform with the attendant rise in cyber fraud, the roll-out of Basel II and III by the CBN, and other macroeconomic factors like the expected increase in Direct Foreign Investments, a few of the risk focus areas for 2014 are:
Deployment of an Enterprise-wide fraud management solution;
Deployment of a new AML solution that would be used for the detection, identification and reporting of suspicious transactions;
Enhancement of the group’s IT disaster recovery infrastructure;
Implementation of a local Basel II/III framework in line with the CBN guidelines;
Full implementation of MRR for automated reporting and limit monitoring across all market risk metrics;
Development of a methodology to deal with stale trading inventory;
Set-up of a Middle Office that will oversee the operations of non-standard lending transaction; and
Set-up of the Risk Oversight Committee (ROC) that would be responsible for the oversight in respect of all risk types and facilitate risk independence from the business.
Risk management framework
Approach and structure
The group’s approach to risk management is based on well established governance processes that rely on both individual responsibility and collective oversight that is supported by a robust MIS. This approach balances strong corporate oversight at senior management level with independent risk management structures in the business. Business unit heads are known as the first line of defense and are specifically responsible for the management of risk within their business using appropriate risk management frameworks that are adequate in design, effective in operation and that meet the required group minimum standards.
An important element that underpins the group’s approach to the management of all risk is independence and appropriate segregation of responsibilities between business and risk. Risk officers report separately to the head of group risk who reports to the chief executive officer of Stanbic IBTC and also through a matrix reporting line to the Standard Bank Group (SBG).
All key risks are supported by the risk department.
Governance structure
Stanbic IBTC Holdings PLC Board Shareholders
Audit Committee
Risk Management Committee
Executive Committee
Career Management Committee
New Products Committee
Wealth EXCO
Shared ServiceOperations EXCO
IT Steering Committee(Programme of Works)
Operational Risk and Compliance Committee
Renumeration Committee (REMCO)
Nominations Committee
Board Committees
Statutory Committee
Management Committee
Governance structure
The risk governance structure provides the board and executive/senior management through the various committees, with the platforms to evaluate and debate key risks faced by the group and assess the effectiveness of risk responses through the risk profiles received from the chief risk officers across the group (please refer to the pictorial representation of the group risk governance structure below).
The board committees comprise the statutory audit committee, board credit committee and board risk management committee, while executive management oversight at the subsidiary and group levels are achieved through management committees that focus on specific risks. Each of the board and management committees is governed by mandates that set out the expected committee terms of reference.

89
Overview Capital management
Otherinformation
Business review
88 Stanbic IBTC Annual group financial statements for the year ended 31 December 2013
Business review Annual report and financial statements
Risk governance standards, policies and procedures
The group has developed a set of risk governance standards for each major risk type i.e. credit, market and operational risks. The standards define the acceptable conditions for the assumption of the major risks and ensure alignment and consistency in the manner in which these risks are identified, measured, managed, controlled and reported, across the group.
All standards are applied consistently across the group and are approved by the board. It is the responsibility of the business unit executive management to ensure that the requirements of the risk governance standards, policies and procedures are implemented within the business units.
Each standard is supported by policies and procedural documents.
Risk appetite
Risk appetite is an expression of the maximum level of residual risk that the group is prepared to accept in order to deliver its business objectives. It is the balance of return and risk as the group implements business plans, whilst recognising a range of possible outcomes.
Risk appetite is expressed by balancing:
budgetary provisions for expected losses that are consistent with the risk appetite implied by the business plans;
an agreed tolerance for profit and loss volatility;
the risk adjusted returns generated from risk-taking activities; and
the absolute constraints on financial resources under stressed conditions.
The board establishes the group’s parameters for risk appetite by:
providing strategic leadership and guidance;
reviewing and approving annual budgets and forecasts for the group and each subsidiary; and
regularly reviewing and monitoring the group’s performance in relation to set risk appetite.
Stress testing
Stress testing serves as a diagnostic and forward looking tool to improve the group’s understanding of its credit; market and operational risks profile under event based scenarios.
Management reviews the outcome of stress tests and selects appropriate mitigating actions to minimise and manage the impact of the risks to the group.
Residual risk is then evaluated against the risk appetite.
Risk categories
The group’s enterprise risk management framework is designed to govern, identify, measure, manage, control and report on the principal risks to which the group is exposed. The principal risks are defined as follows:
Credit risk
Credit risk arises primarily in the group operations where an obligor/counterparty fails to perform in accordance with agreed terms or where the counterparty’s ability to meet such contractual obligation is impaired.
Credit risk comprises counterparty risk, settlement risk, country risk and concentration risk.
Counterparty risk
Counterparty risk is the risk of loss to the group as a result of failure by a counterparty to meet its financial and/or contractual obligations to the group. It has three components:
i. primary credit risk which is the exposure at default (EAD) arising from lending and related banking product activities, including their underwriting;
ii. pre-settlement credit risk which is the EAD arising from unsettled forward and derivative transactions, arising from the default of the counterparty to the transaction and measured as the cost of replacing the transaction at current market rates; and
iii. issuer risk which is the EAD arising from traded credit and equity products, and including their underwriting.
Settlement risk
Settlement risk is the risk of loss to the group from a transaction settlement, where value is exchanged, failing such that the counter value is not received in whole or part.
Country and cross border risk
Country and cross border risk is the risk of loss arising from political or economical conditions or events in a particular country which reduce the ability of counterparties in that particular country to fulfill their obligations to the group.
Enterprise risk review (continued)
Cross border risks is the risk of restriction on the transfer and convertibility of local currency funds, into foreign currency funds thereby limiting payment by offshore counterparties to the group.
Concentration risk
Concentration risk refers to any single exposure or group of exposures large enough to cause credit losses which threaten the group’s capital adequacy or ability to maintain its core operations. It is the risk that common factors within a risk type or across risk types cause credit losses or an event occurs within a risk type which results to credit losses.
Market risk
Market risk is defined as the risk of a change in the actual or effective market value or earnings of a portfolio of financial instruments caused by adverse moves in market variables such as equity, bond and commodity prices, foreign exchange rates, interest rates, credit spreads, recovery rates, correlations and implied volatilities in the market variables. Market risk covers both the impact of these risk factors on the market value of traded instruments as well as the impact on the group’s net interest margin as a consequence of interest rate risk on banking book assets and liabilities.
Liquidity risk
Liquidity risk is defined as the risk that the group, although balance-sheet solvent, cannot maintain or generate sufficient cash resources to meet its payment obligations in full as they fall due (as a result of funding liquidity risk), or can only do so at materially disadvantageous terms (as a result of market liquidity risk).
Funding liquidity risk refers to the risk that the counterparties, who provide the group with funding, will withdraw or not roll-over that funding.
Market liquidity risk refers to the risk of a generalised disruption in asset markets that makes normal liquid assets illiquid and the potential loss through the forced-sale of assets resulting in proceeds being below their fair market value.
Operational risk
Operational risk is defined as the risk of loss resulting from inadequate or failed processes, people and systems (including information technology and infrastructure) or from external events.
The definition of operational risk also includes:
information risk – the risk of unauthorised use, modification or disclosure of information resources;
fraud risk – the risk of losses resulting from fraudulent activities;
environmental risk – the risk of inadvertently participating in the destruction of the environment;
legal risk – the risk that the group will be exposed to litigation;
taxation risk – the risk that the group will incur a financial loss due to incorrect interpretation and application of taxation legislation or due to the impact of new taxation legislation on existing business;
compliance risk – the risk that the group does not comply with applicable laws and regulations or supervisory requirements.
Business risk
Business risk is the risk of loss due to adverse local and global operating conditions such as decrease in demand, increased competition, increased cost, or by entity specific causes such as inefficient cost structures, poor choice of strategy, reputation damage or the decision to absorb costs or losses to preserve reputation.
Credit risk Principal credit standard and policies
The Standard Bank Group’s Credit Risk Governance Standard, as reviewed regularly, sets out the broad overall principles to be applied in credit risk decisions and sets out the overall framework for the consistent and unified governance, identification, measurement, management and reporting of credit risk in the group.
The Corporate and Investment Banking (CIB) and the Personal and Business Banking (PBB) Global Credit Policies have been designed to expand the Group Credit Risk Governance Standard requirements by embodying the core principles for identifying, measuring, approving, and managing credit risk. These policies provide a comprehensive framework within which all credit risk emanating from the operations of the bank are legally executed, properly monitored and controlled in order to minimize the risk of financial loss; and assure consistency of approach in the treatment of regulatory compliance requirements.
91
Overview Capital management
Otherinformation
Business review
90 Stanbic IBTC Annual group financial statements for the year ended 31 December 2013
Business review Annual report and financial statements
In addition to the Credit Risk Governance Standard, CIB and PBB Global Credit Policies, a number of related credit policies and documents have been developed, with contents that are relevant to the full implementation and understanding of the credit policies.
Methodology for risk rating
Internal counterparty ratings and default estimates that are updated and enhanced from time-to-time play an essential role in the credit risk management and decision-making process, credit approvals, internal capital allocation, and corporate governance functions. Ratings are used for the following purposes:
Credit assessment and evaluation
Credit monitoring
Credit approval and delegated authority
Economic capital calculation, portfolio and management reporting
Regulatory capital calculation
RARORC (Risk-Adjusted Return on Regulatory Capital) calculation
Pricing: PDs, EADs, and LGDs may be used to assess and compare relative pricing of assets/facilities, in conjunction with strategic, relationship, market practice and competitive factors
The starting point of all credit risk assessment and evaluation lies in the counterparty risk grading, which is quantified and calculated in compliance with the group’s credit rating policy and using such Basel-2 compliant models as are in current use and which are updated or enhanced from time to time.
Credit risk quantification for any exposure or portfolio is summarised by the calculation of the expected loss (EL), which is arrived at in the following way:
based on the risk grading foundation which yields the counterparty’s probability of default (PD), the nature and quantum of the credit facilities are considered;
a forward-looking quantification of the exposure at default (EAD) is determined in accordance with group standard guidelines;
risk mitigants such as security and asset recovery propensities are then quantified to moderate exposure at default to yield the loss given default (LGD); and
finally, the EL is a function of the PD, the LGD and the EAD.
These parameters are in turn used in quantifying the required regulatory capital reserving, using the Regulatory Capital Calculator developed, maintained and updated in terms of Basel 2, and the economic capital implications through the use of Credit Portfolio Management’s (CPM’s) Economic Capital tools. Furthermore, bearing in mind the quantum of the facility and the risk/reward thereof, an appropriate consideration of Basel 2 capital requirements (where applicable) and the revenue and return implications of the credit proposal.
Framework and governance
Credit risk remains a key component of financial risks faced by any bank given the very nature of its business. The importance of credit risk management cannot be over emphasised as consequences can be severe when neglected. The bank has established sound governance principles to ensure that credit risk is managed effectively within a comprehensive risk management and control framework.
In reaching credit decisions and taking credit risk, both the credit and business functions must consistently and responsibly balance risk and return, as return is not the sole prerogative of business neither is credit risk the sole prerogative of credit. Credit (and the other risk functions, as applicable) and business must work in partnership to understand the risk and apply appropriate risk pricing, with the overall aim of optimising the bank’s risk adjusted performance.
The reporting lines, responsibilities and authority for managing credit risk in the bank are very clear and independent. However, ultimate responsibility for credit risk rests with the board and which has delegated this to the following organs:
Board credit committee
The purpose of the board credit committee is to ensure that effective credit governance is in place in order to provide for the adequate management, measurement, monitoring and control of credit risk including country risk. In addition to its pre-existing role, the committee has also been vested with the following responsibilities as may be set by the board:
setting overall risk appetite;
reviewing and approving credit facilities that are within monetary amounts as approved by the board;
ensuring committees within the structure operate according to defined mandates and delegated authorities;
maintaining overall accountability and authority for the adequacy and appropriateness of all aspects of the group credit risk management process;
utilising appropriate tools to measure, monitor and control credit risk in line with the SBG policies whilst taking into account local circumstances;
recommending the group’s credit policies and guidelines for board approval; and
any other matters relating to credit as may be delegated to the committee by the board.
Credit committee
The credit committee (CC) is the senior management credit decision-making function of the bank with a defined delegated authority (DA) as determined by the board through the board credit committee from time to time.
The credit committee exercises responsibility for the independent assessment, approval, review and monitoring of all credit risk assets relating to the bank’s business, while ensuring that the origination and management of the assets comply with the principles documented in the credit risk governance standard.
In addition to the above, the CC ensures that the credit portfolio is maintained within the risk appetite set by the board credit committee.
Credit risk management committee
The credit risk management committee (CRMC) is the senior management credit oversight function with a defined oversight role as determined by the board through the board credit committee from time to time.
The CRMC effectively enhances credit discipline within the bank and is responsible for controlling, inter alia, delegated authorities, concentration risk, distressed debt and regulatory issues pertaining to credit, credit audits, policy and governance.
In addition to the above, the CRMC provides oversight of governance; recommends to the board credit committee the level of the bank’s risk appetite; monitors model performance, development and validation; determine counterparty and portfolio risk limits and approval, country, industry, market, product, customer segment and maturity concentration risk, risk mitigation; ,mpairments and risk usage.
Heads of CIB and PBB credit
The heads of CIB credit and PBB credit ensure granularity and function-specific details at the business unit levels. They have functional responsibility for credit risk management across the group and are positioned at sufficiently senior levels in order to ensure the necessary experience and independence of judgment.
They are responsible for providing an independent and objective check on credit risk taking activities to safeguard the integrity of the entire credit risk process.
Credit risk mitigation
Credit risk mitigation is defined as all methods of reducing credit expected loss whether by means of reduction of EAD (e.g. netting), risk transfer (e.g. guarantees) or risk transformation.
Guarantees, collateral and the transaction structures are used by the group to mitigate credit risks both identified and inherent though the amount and type of credit risk is determined on a case by case basis. The group’s credit policy and guidelines are used in a consistent manner while security is valued appropriately and reviewed regularly for enforceability and to meet changing business needs.
The credit risk mitigation policy establishes and defines the principles of risk transfer, transformation and reduction. Processes and procedures for accepting, verifying, maintaining, and releasing collateral are well documented in order to ensure appropriate application of the collateral management techniques.
Credit delegated authority
In terms of specific delegated authority (DA) levels approved (and updated from time to time) by the board upon advise, authority for approval of any credit facilities accorded to counterparties is vested in individuals, and/or groups of individuals acting in concert, and/or credit committees.
Such DA levels are quantified according to counterparty risk grade. Individuals may be accorded DA levels on the authority of the parties specifically mandated to do so in terms of the credit governance framework.
Enterprise risk review (continued)

93
Overview Capital management
Otherinformation
Business review
92 Stanbic IBTC Annual group financial statements for the year ended 31 December 2013
Business review Annual report and financial statements
Enterprise risk review (continued)
Group’s rating Global and Africa Credit Committee / Board Credit
Committee
Management Credit
Committee
Country Credit Head /
Head of CIB Credit
Maximum approval limit (N’m)
Corporate and investment banking
SB01 – SB10 Up to legal lending limit Up to Legal Lending Limit Up to Legal Lending Limit
SB11 – SB12 Up to legal lending limit Up to Legal Lending Limit 11,200
SB13 Up to legal lending limit Up to Legal Lending Limit 8,000
SB14 – SB15 Up to legal lending limit Up to Legal Lending Limit 4,800
SB16 – SB18 Up to legal lending limit 12,800 4,000
SB19 – SB20 Up to legal lending limit 6,400 1,600
SB21 Up to legal lending limit 4,800 1,600
SB22 – SB23 Up to legal lending limit 4,800 800
SB24 – SB25 Up to legal lending limit 4,800 600
Personal and business banking
SB01 – SB25 Up to legal lending limit 2,400 1,200
The global credit committee approves based on the mandate given to them by the board credit committee. All approvals are sanctioned by the board credit committee. The board credit committee approves all insider-related credit irrespective of the amount. Credit risk measurement
A key element in the measurement of credit risk is the assignment of credit ratings, which are used to determine expected defaults across asset portfolios and risk bands. The risk ratings attributed to counterparties are based on a combination of factors which cover business and financial risks: The group uses the PD Master Scale rating concept with a single scale to measure the credit riskiness of all counterparty types. The grading system is a 25-point scale, with three additional default grades.
Group’s rating Grade description
External rating
SB01 – SB12/SB13 Investment grades AAA to BBB-
SB13 – SB25 Speculative grades BB- to CCC
IFRS 7
The tables that follow analyse the credit quality of loans and advances measured in terms of IFRS. Maximum exposure to credit risk Loans and advances are analysed and categorised based on credit quality using the following definitions. Performing loans
Neither past due nor specifically impaired loans are loans that are current and fully compliant with all contractual terms and conditions. Early arrears but not specifically impaired loans include those loans where the counterparty has failed to make contractual payments and payments are less than 90 days past due, but it is expected that the full carrying value will be recovered when considering future cash flows, including collateral. Ultimate loss is not expected but could occur if the adverse conditions persist.
Non-performing loans
Non-performing loans are those loans for which: the group has identified objective evidence of default,
such as a breach of a material loan covenant or condition; or instalments are due and unpaid for 90 days or more.
Non-performing but not specifically impaired loans are not specifically impaired due to the expected recoverability of the full carrying value when considering future cash flows, including collateral.
Loans
Performing loans Non-performing loans
SubstandardCurrent DoubtfulClose monitoring
Loss
Neither past due nor
specifically impaired loans
Non-performing but not
specifically impaired loans
Early arrears but not
specifically impaired loans
Specifically impaired
loans
Loans structure
Portfolio credit impairments
Specific credit impairments
Non-performing specifically impaired loans are those loans that are regarded as non-performing and for which there has been a measurable decrease in estimated future cash flows. Specifically impaired loans are further analysed into the following categories: Substandard items that show underlying well-defined
weaknesses and are considered to be specifically impaired;
Doubtful items that are not yet considered final losses due to some pending factors that may strengthen the quality of the items; and Loss items that are considered to be uncollectible in whole
or in part. The group provides fully for its anticipated loss, after taking collateral into account.
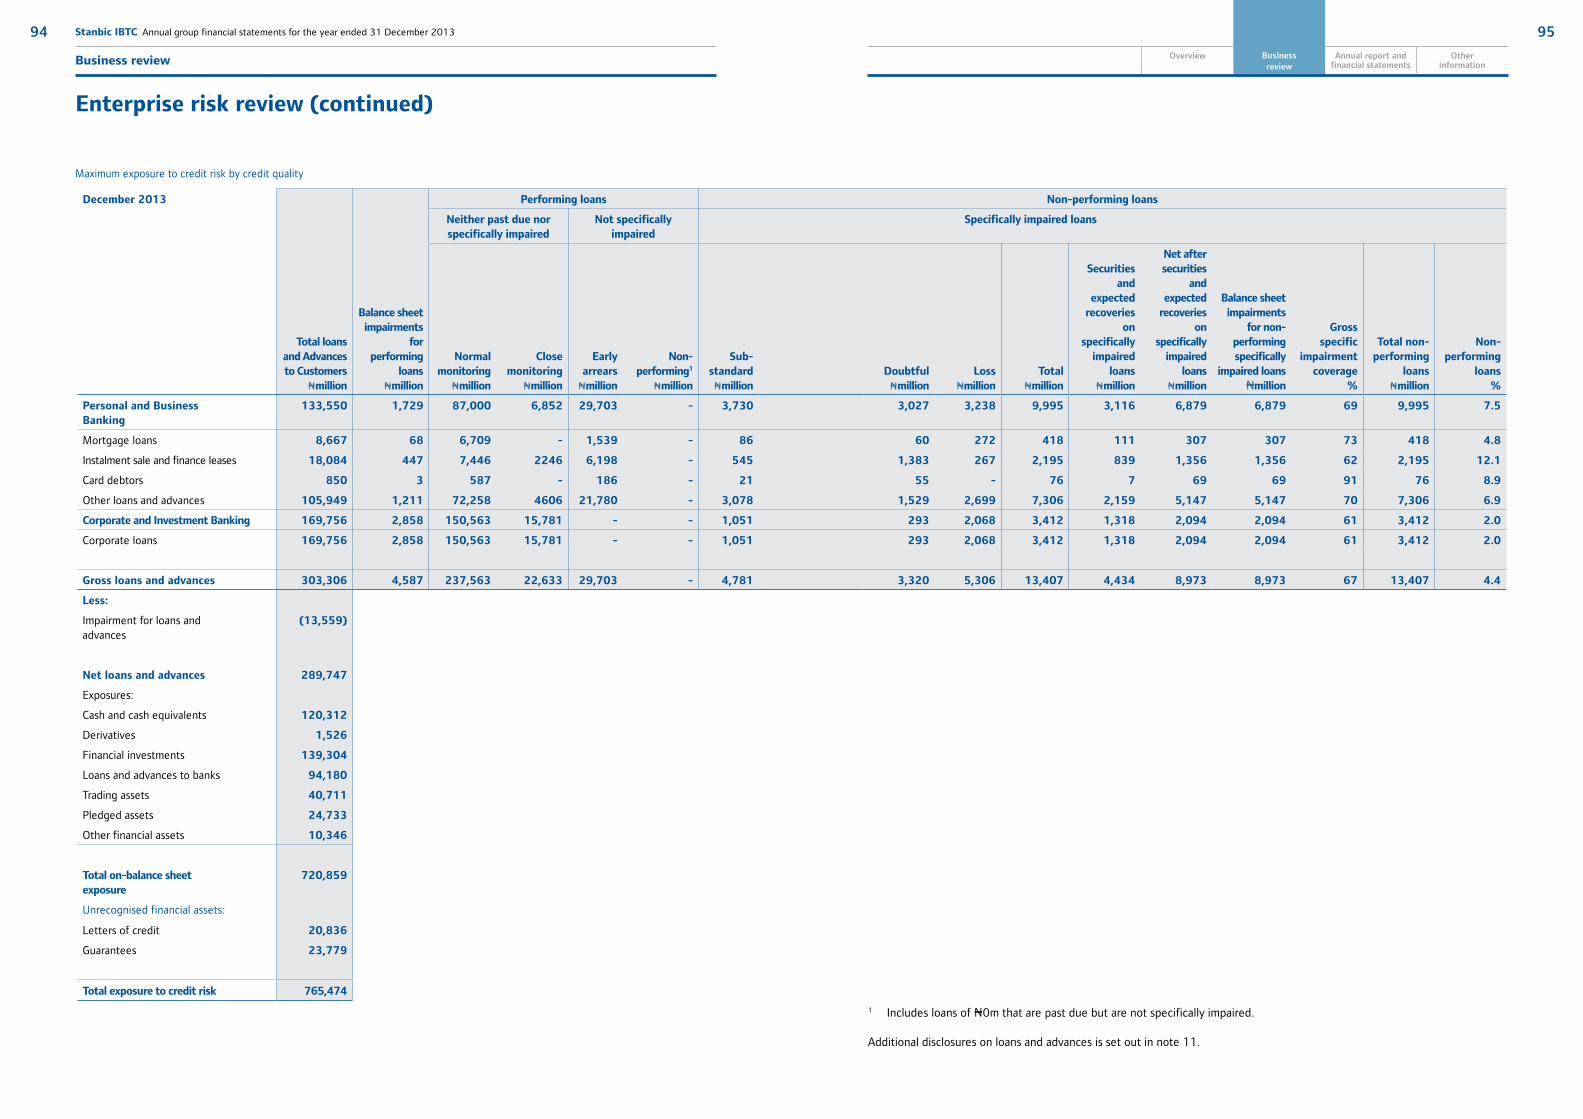
95
Overview Capital management
Otherinformation
Business review
94 Stanbic IBTC Annual group financial statements for the year ended 31 December 2013
Business review Annual report and financial statements
Enterprise risk review (continued)
December 2013 Performing loans Non-performing loans
Neither past due nor specifically impaired
Not specifically impaired
Specifically impaired loans
Total loans and Advances to Customers
Nmillion
Balance sheet impairments
for performing
loans Nmillion
Normal monitoring
Nmillion
Close monitoring
Nmillion
Early arrears
Nmillion
Non-performing1
Nmillion
Sub-standardNmillion
DoubtfulNmillion
LossNmillion
Total Nmillion
Securities and
expected recoveries
on specifically
impaired loans
Nmillion
Net after securities
and expected
recoveries on
specifically impaired
loans Nmillion
Balance sheet impairments
for non-performing specifically
impaired loans Nmillion
Gross specific
impairment coverage
%
Total non-performing
loansNmillion
Non-performing
loans%
Personal and Business Banking
133,550 1,729 87,000 6,852 29,703 - 3,730 3,027 3,238 9,995 3,116 6,879 6,879 69 9,995 7.5
Mortgage loans 8,667 68 6,709 - 1,539 - 86 60 272 418 111 307 307 73 418 4.8
Instalment sale and finance leases 18,084 447 7,446 2246 6,198 - 545 1,383 267 2,195 839 1,356 1,356 62 2,195 12.1
Card debtors 850 3 587 - 186 - 21 55 - 76 7 69 69 91 76 8.9
Other loans and advances 105,949 1,211 72,258 4606 21,780 - 3,078 1,529 2,699 7,306 2,159 5,147 5,147 70 7,306 6.9
Corporate and Investment Banking 169,756 2,858 150,563 15,781 - - 1,051 293 2,068 3,412 1,318 2,094 2,094 61 3,412 2.0
Corporate loans 169,756 2,858 150,563 15,781 - - 1,051 293 2,068 3,412 1,318 2,094 2,094 61 3,412 2.0
Gross loans and advances 303,306 4,587 237,563 22,633 29,703 - 4,781 3,320 5,306 13,407 4,434 8,973 8,973 67 13,407 4.4
Less:
Impairment for loans and advances
(13,559)
Net loans and advances 289,747
Exposures:
Cash and cash equivalents 120,312
Derivatives 1,526
Financial investments 139,304
Loans and advances to banks 94,180
Trading assets 40,711
Pledged assets 24,733
Other financial assets 10,346
Total on-balance sheet exposure
720,859
Unrecognised financial assets:
Letters of credit 20,836
Guarantees 23,779
Total exposure to credit risk 765,474
Maximum exposure to credit risk by credit quality
1 Includes loans of N0m that are past due but are not specifically impaired.
Additional disclosures on loans and advances is set out in note 11.
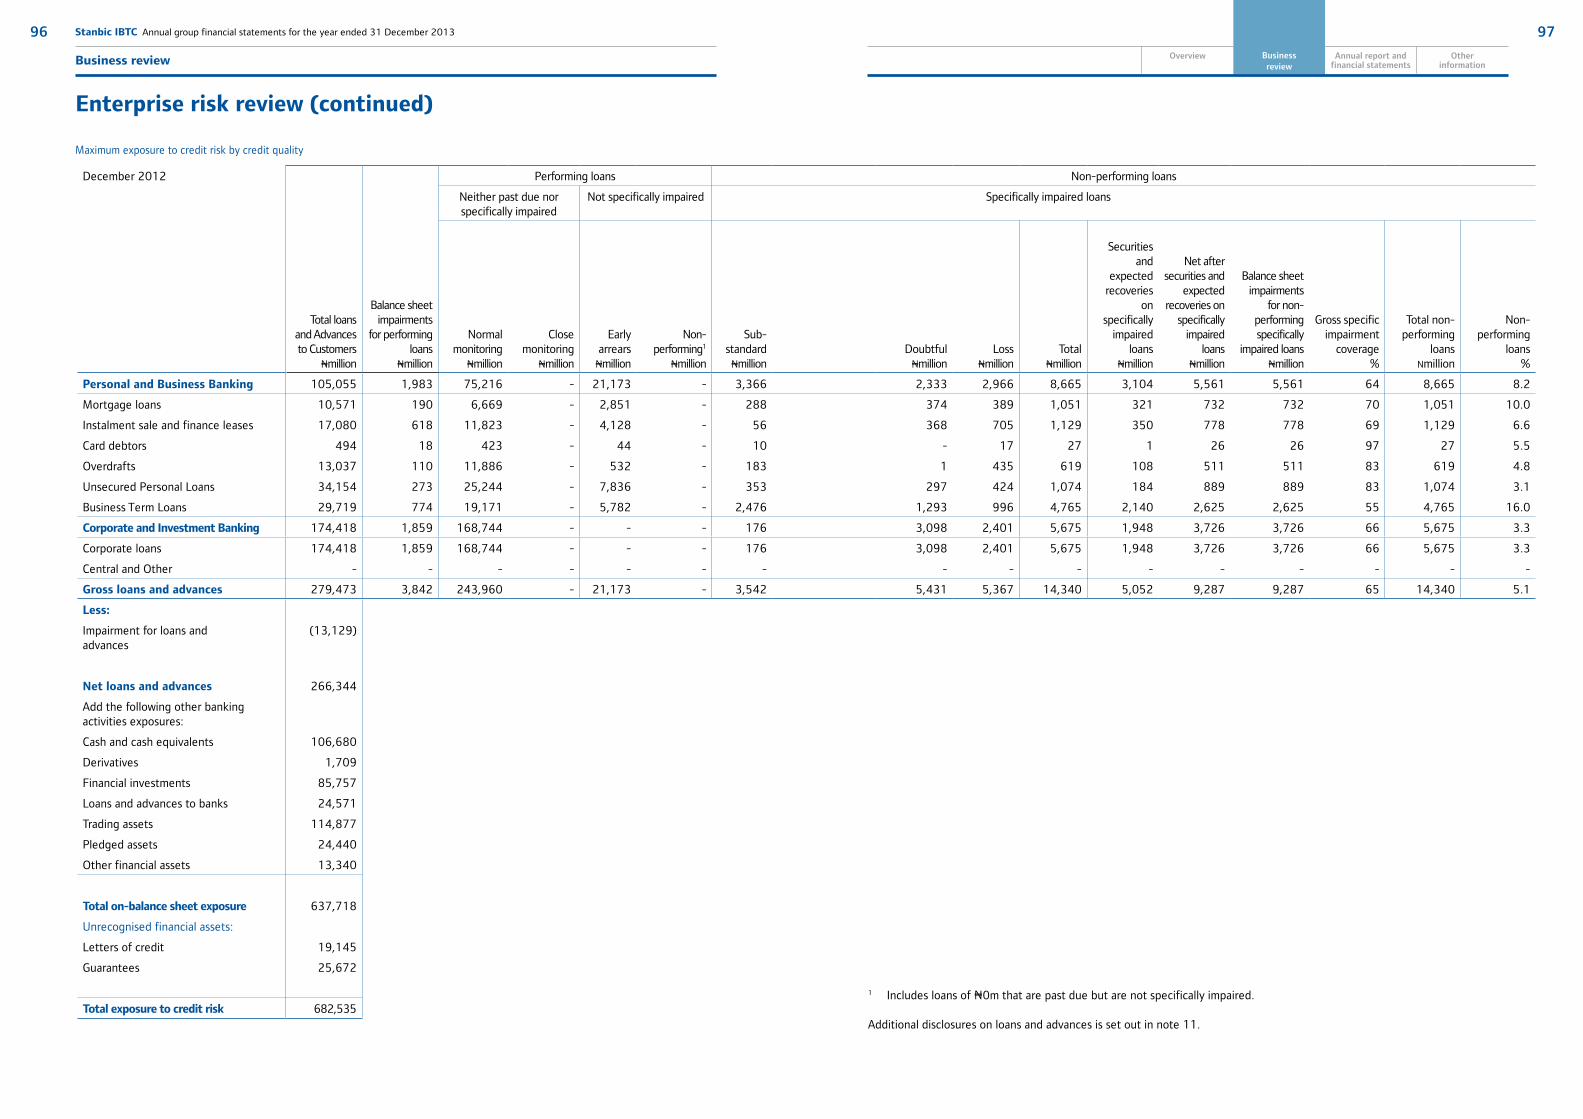
97
Overview Capital management
Otherinformation
Business review
96 Stanbic IBTC Annual group financial statements for the year ended 31 December 2013
Business review Annual report and financial statements
Enterprise risk review (continued)
December 2012 Performing loans Non-performing loans
Neither past due nor specifically impaired
Not specifically impaired Specifically impaired loans
Total loans and Advances to Customers
Nmillion
Balance sheet impairments
for performing loans
Nmillion
Normal monitoring
Nmillion
Close monitoring
Nmillion
Early arrears
Nmillion
Non-performing1
Nmillion
Sub-standardNmillion
DoubtfulNmillion
LossNmillion
Total Nmillion
Securities and
expected recoveries
on specifically
impaired loans
Nmillion
Net after securities and
expected recoveries on
specifically impaired
loans Nmillion
Balance sheet impairments
for non-performing specifically
impaired loans Nmillion
Gross specific impairment
coverage %
Total non-performing
loansNmillion
Non-performing
loans%
Personal and Business Banking 105,055 1,983 75,216 - 21,173 - 3,366 2,333 2,966 8,665 3,104 5,561 5,561 64 8,665 8.2
Mortgage loans 10,571 190 6,669 - 2,851 - 288 374 389 1,051 321 732 732 70 1,051 10.0
Instalment sale and finance leases 17,080 618 11,823 - 4,128 - 56 368 705 1,129 350 778 778 69 1,129 6.6
Card debtors 494 18 423 - 44 - 10 - 17 27 1 26 26 97 27 5.5
Overdrafts 13,037 110 11,886 - 532 - 183 1 435 619 108 511 511 83 619 4.8
Unsecured Personal Loans 34,154 273 25,244 - 7,836 - 353 297 424 1,074 184 889 889 83 1,074 3.1
Business Term Loans 29,719 774 19,171 - 5,782 - 2,476 1,293 996 4,765 2,140 2,625 2,625 55 4,765 16.0
Corporate and Investment Banking 174,418 1,859 168,744 - - - 176 3,098 2,401 5,675 1,948 3,726 3,726 66 5,675 3.3
Corporate loans 174,418 1,859 168,744 - - - 176 3,098 2,401 5,675 1,948 3,726 3,726 66 5,675 3.3
Central and Other - - - - - - - - - - - - - - - -
Gross loans and advances 279,473 3,842 243,960 - 21,173 - 3,542 5,431 5,367 14,340 5,052 9,287 9,287 65 14,340 5.1
Less:
Impairment for loans and advances
(13,129)
Net loans and advances 266,344
Add the following other banking activities exposures:
Cash and cash equivalents 106,680
Derivatives 1,709
Financial investments 85,757
Loans and advances to banks 24,571
Trading assets 114,877
Pledged assets 24,440
Other financial assets 13,340
Total on-balance sheet exposure 637,718
Unrecognised financial assets:
Letters of credit 19,145
Guarantees 25,672
Total exposure to credit risk 682,535
Maximum exposure to credit risk by credit quality
1 Includes loans of N0m that are past due but are not specifically impaired.
Additional disclosures on loans and advances is set out in note 11.

99
Overview Capital management
Otherinformation
Business review
98 Stanbic IBTC Annual group financial statements for the year ended 31 December 2013
Business review Annual report and financial statements
Enterprise risk review (continued)
Renegotiated loans and advances
Renegotiated loans and advances are exposures which have been refinanced, rescheduled, rolled over or otherwise modified due to weaknesses in the counterparty’s financial position, and where it has been judged that normal repayment will likely continue after the restructure. Renegotiated loans that would otherwise be past due or impaired comprised N1.871 billion as at 31 December 2013 (Dec 2012: N2.869 billion). Collateral
The table that follows shows the financial effect that collateral has on the group’s maximum exposure to credit risk. The table is presented according to Basel II asset categories and includes collateral that may not be eligible for recognition under Basel II but that management takes into consideration in the management of the group’s exposures to credit risk. All on- and off-balance sheet exposures which are exposed to credit risk, including non-performing assets, have been included.
Collateral includes: financial securities that have a tradable market, such as
shares and other securities;
physical items, such as property, plant and equipment; and
financial guarantees, suretyships and intangible assets.
All exposures are presented before the effect of any impairment provisions.
In the retail portfolio, 58% (Dec 2012: 39%) is fully collateralised. Of the group’s total exposure, 69% (Dec 2012: 74%) is unsecured and mainly reflects exposures to well-rated corporate counterparties, bank counterparties and sovereign entities.
Less than31 daysNmillion
31-60days
Nmillion
61-90days
Nmillion
91-180days
Nmillion
More than180 daysNmillion
TotalNmillion
December 2013
Personal and Business Banking 25,256 3,164 1,283 - - 29,703
Mortgage loans 1,109 285 146 - - 1,540
Instalment sales and finance lease 4,654 1,267 276 - - 6,197
Card debtors 128 36 22 - - 186
Other loans and advances 19,365 1,576 839 - - 21,780
Corporate and Investment Banking - - - - - -
Corporate loans - - - - - -
Total 25,256 3,164 1,283 - - 29,703
December 2012
Personal and Business Banking 14,823 4,857 1,493 - - 21,173
Mortgage loans 1,864 743 243 - - 2,850
Instalment sales and finance lease 2,410 1,485 233 - - 4,128
Card debtors - 31 13 - - 44
Other loans and advances 10,549 2,598 1,004 - - 14,151
Corporate and Investment Banking - - - - - -
Corporate loans - - - - - -
Total 14,823 4,857 1,493 - - 21,173
Ageing of loans and advances past due but not specifically impaired Total collateral coverage
Note
TotalexposureNmillion
UnsecuredNmillion
SecuredNmillion
Nettingagreements
Nmillion
Securedexposure
afternettingNmillion
1%-50%Nmillion
50%-100%
Nmillion
Greaterthan
100%Nmillion
December 2013
Corporate 218,902 65,139 153,763 - - 83,124 36,451 34,188
Sovereign 200,868 200,868 - - - - - -
Bank 204,442 204,442 - - - - - -
Retail 138,348 58,246 80,102 - - 13,465 21,245 45,392
Retail mortgage 8,667 - 8,667 - - 124 993 7,549
Other retail 129,681 58,246 71,435 - - 13,341 20,252 37,843
Total 762,560 528,695 233,865 - - 96,589 57,696 79,580
Add: Financial assets not exposed to credit risk
16,480
Less: Impairments for loans and advances
(13,559)
Less: Unrecognised off balance sheet items
(44,615)
Total exposure 720,866
Reconciliation to balance sheet:
Cash and cash equivalents
7 120,312
Derivatives 10 1,526
Financial investments 11 139,304
Loans and advances 12 383,927
Trading assets 9 40,711
Pledged assets 8 24,733
Other financial assets 10,346
Total 720,859
Collateral

101
Overview Capital management
Otherinformation
Business review
100 Stanbic IBTC Annual group financial statements for the year ended 31 December 2013
Business review Annual report and financial statements
Enterprise risk review (continued)
Total collateral coverage
Note
TotalexposureNmillion
UnsecuredNmillion
SecuredNmillion
Nettingagreements
Nmillion
Securedexposure
afternetting
Nmillion1%-50%Nmillion
50%-100%
Nmillion
Greaterthan
100%Nmillion
December 2012
Corporate 226,711 97,354 129,357 - - 55,475 73,426 456
Sovereign 191,033 191,033 - - - - - -
Bank 152,513 152,513 - - - - - -
Retail 109,871 66,742 43,129 - - 6,756 34,150 2,223
Retail mortgage 11,400 - 11,400 - - - 11,400 -
Other retail 98,471 66,742 31,729 - - 6,756 22,750 2,223
Total 680,128 507,642 172,486 - - 62,231 107,576 2,679
Add: Financial assets not exposed to credit risk 15,536
Less: Impairments for loans and advances
(13,129)
Less: Unrecognised off balance sheet items
(44,817)
Total exposure 637,718
Reconciliation to balance sheet:
Cash and cash equivalents
7 106,680
Derivatives 10 1,709
Financial investments 11 85,757
Loans and advances 12 290,915
Trading assets 9 114,877
Pledged assets 8 24,440
Other financial assets 13,340
Total 637,718
Collateral Credit provisioning based on prudential guidelines
In accordance with the Prudential Guidelines issued by the Central Bank of Nigeria, provision against credit risk is as follows;
Non performing accounts
Interest and/or principal outstanding for over: Classification Minimum provision
90 days but less than 180 days Substandard 10%
180 days but less than 360 days Doubtful 50%
Over 360 days Lost 100%
When a loan is deemed uncollectible, it is written off against the related provision for impairments. Subsequent recoveries are credited to the provision for loan losses in the profit and loss account. If the amount of the impairment subsequently decreases due to an event occurring after the write-down, the release of the provision is credited as a reduction of the provision for impairment in the profit and loss account.
Performing accounts
A minimum of 1% general provision on performing loans is made in accordance with the prudential guidelines.
Prudential guidelines disclosures
Had the Prudential Guidelines been employed in the preparation of these financial statements, the impairments for loans and advances to customers as well as related disclosures, would have been made as follows:
Group
31 Dec 2013Nmillion
31 Dec 2012Nmillion
Prudential disclosure of loan and advances to customer
Gross loans and advances to customers 306,306 281,080
Accrued interest on impaired loans - 1,607
Customer exposure for loans and advances 303,306 279,473
Mortgage loans 8,667 10,571
Instalment sale and finance leases 27,012 29,972
Card debtors 850 494
Overdrafts and other demand loans 32,676 29,193
Other term loans 234,101 209,243
Credit impairments for loans and advances (14,329) (13,949)
Specific credit impairments (11,420) (9,691)
Interest in suspense - (1,607)
Portfolio credit impairments (2,909) (2,651)
Net loans and advances 288,977 267,131

103
Overview Capital management
Otherinformation
Business review
102 Stanbic IBTC Annual group financial statements for the year ended 31 December 2013
Business review Annual report and financial statements
Enterprise risk review (continued)
Liquidity risk
Framework and governance
The nature of banking and trading activities results in a continuous exposure to liquidity risk. Liquidity problems can have an adverse impact on a group’s earnings and capital and, in extreme circumstances, may even lead to the collapse of a group which is otherwise solvent. The group's liquidity risk management framework is designed to measure and manage the liquidity position at various levels of consolidation such that payment obligations can be met at all times, under both normal and considerably stressed conditions. Under the delegated authority of the board of directors, ALCO sets liquidity risk policies in accordance with regulatory requirements and international best practice. Limits and guidelines are prudently set and reflect the group's conservative appetite for liquidity risk. ALCO is charged with ensuring compliance with liquidity risk standards and policies.
Liquidity and funding management
A sound and robust liquidity process is required to measure, monitor and manage liquidity exposures. The group has incorporated the following liquidity principles as part of a cohesive liquidity management process:
structural liquidity mismatch management;
long-term funding ratio;
back-testing;
maintaining minimum levels of liquid and marketable securities;
depositor concentration;
local currency loan to deposit limit;
foreign currency loan to deposit limit;
intra-day liquidity management;
daily cash flow management;
liquidity stress and scenario testing; and
liquidity contingency planning.
The cumulative impact of the above principle is monitored, at least monthly by ALCO and the process is underpinned by a system of extensive controls. The latter includes the application of purpose-built technology, documented
processes and procedures, independent oversight and regular independent reviews and evaluations of the effectiveness of the system.
Structural liquidity mismatch management
The mismatch approach measures a group’s liquidity by assessing the mismatch between its inflow and outflow of funds within different time bands on a maturity ladder. The structural liquidity mismatch is based on behaviourally-adjusted cash flows which factors a probability of maturity into the various time bands. Detailed assumptions and reasoning applied in compiling the structural liquidity mismatch are well documented.
In the main, readily available liquidity is profiled based on realistic liquidation periods (including appropriate forced-sale discounts), while other cash flows with a predetermined runoff are profiled according to their remaining contractual maturity;
Ambiguous maturity loan and advance products are profiled using an attrition analysis;
Ambiguous maturity deposit and borrowing products are profiled using a volatility analysis, except where such products do not exhibit term behaviour, in which case they are profiled in the sight-to-7 day maturity bucket;
Where material, off-balance sheet facilities granted by the group must be profiled on the basis of probable drawdown; all other cash flow items or positions in respect of which no right or obligation in respect of maturity exists must be profiled in the >12-months maturity bucket.
All other cash flow items or positions in respect of which no right or obligation in respect of maturity exists must be profiled in the >12-months maturity bucket.
A net mismatch figure is obtained by subtracting liabilities and net off-balance sheet positions from assets in each time band. The group’s liquidity position is assessed by means of the net cumulative mismatch position (aggregation of net position in each successive time band), expressed as a percentage of total funding related liabilities to the public.
The maturity analysis for financial liabilities represents the basis for effective management of exposure to structural liquidity risk. Behavioural profiling is applied to assets, liabilities and off-balance sheet commitments with an indeterminable maturity or draw-down period, as well as to certain liquid assets. The monitoring of liquidity risk using the behavioural adjusted basis is facilitated by the adoption of maximum mismatch limits and guidelines to restrict the mismatch between the expected inflows and outflows of funds in different time buckets.
Based on forecast business growth and the structural dynamics of the balance sheet, ALCO projects long-term funding requirements, thereby setting targets for long-term funding ratios. The projected long-term ratio is a transparent and practical measure for the funding desk to target and monitor the pace of raising long-term deposits. There are no limits for mismatches due to contractually based inflows and outflows.
The group’s ability to withstand huge outflow was very strong as shown in the tables below where the net cumulative mismatch positions as a percentage of total funding related liabilities were in excess of the limits in all the time bands.
Anticipated liquidity gap (local currency) (lcy) - All figures in millions
LCY (Nmillion) Overnight
1 month
2 months
3 months
4-6 months
7-12 months
13-24 months
> 24 months
Period gap 73,940 (8,962) (34,136) (30,186) 1,395 2,380 46,993 56,560
Cumulative gap 73,940 64,978 30,842 657 2,051 4,431 51,424 107,984
Anticipated liquidity gap (foreign currency) (fcy) - All figures in millions
Period (USDmillion) Overnight
1 month
2 months
3 months
4-6 months
7-12 months
13-24 months
> 24 months
Period gap 4 55 (34) (33) (74) (202) (163) 507
Cumulative gap 4 59 25 (8) (82) (284) (447) 60
Cumulative gap as a % of TFLRP* - Local currency
Cumulative gap as a % of TFLRP* Overnight
1 month
2 months
3 months
4 - 6 months
7 - 12 months
December 2013 20.46% 17.98% 8.53% 0.18% 0.57% 1.23%
December 2012 33.82% 22.11% (6.21%) (12.30%) (15.52%) (20.83%)
Limit 0% (5%) (10%) (10%) (15%) (20%)
Cumulative gap as a % of TFLRP* - Foreign currency
Cumulative gap as a % of TFLRP* Overnight
1 month
2 months
3 months
4 - 6 months
7 - 12 months
December 2013 0.28% 4.61% 1.93% (0.65%) (6.45%) (22.31%)
December 2012 9.10% 21.20% 14.80% 5.80% (4.90%) (19.80%)
Limit 0% (5%) (10%) (10%) (15%) (20%)
* TFLRP - Total funding liability related to public.

105
Overview Capital management
Otherinformation
Business review
104 Stanbic IBTC Annual group financial statements for the year ended 31 December 2013
Business review Annual report and financial statements
Enterprise risk review (continued)
Maintaining minimum levels of liquid and marketable assets
Minimum levels of prudential liquid assets are held in accordance with all prudential requirements as specified by the regulatory authorities. The group needs to hold additional unencumbered marketable assets, in excess of any minimum prudential liquid asset requirement, to cater for volatile depositor withdrawals, draw-downs under committed facilities, collateral calls, etc.
The following criteria apply to readily marketable securities:
prices must be quoted by a range of counterparties;
the asset class must be regularly traded;
the asset may be sold or repurchased in a liquid market, for payment in cash; and
settlement must be according to a prescribed, rather than a negotiated, timetable.
Depositor concentration
To ensure that the group does not place undue reliance on any single entity as a funding source, restrictions are imposed on the short dated (0-3 months term) deposits accepted from any entity. These include:
the sum of 0-3 month deposits and standby facilities provided by any single deposit counterparty must not, at any time, exceed 10% of total funding related liabilities to the public; and
the aggregate of 0-3 month deposits and standby facilities from the 10 largest single deposit counterparties must not, at any time, exceed 20% of total funding related liabilities to the public.
Concentration risk limits are used to ensure that funding diversification is maintained across products, sectors, and counterparties. Primary sources of funding are in the form of deposits across a spectrum of retail and wholesale clients. As mitigants, the group maintains marketable securities in excess of regulatory requirement in order to condone occasional breaches of concentration limits.
Loan to deposit limit
A limit is put in place, restricting the local currency loan to deposit ratio to a maximum specified level, which is reviewed periodically. Similarly, in order to restrict the extent of foreign currency lending from the foreign currency deposit base, a foreign currency loan to deposit limit, which is also referred to
as own resource lending, is observed. As mitigants, the group maintains high levels of unencumbered marketable and liquid assets in excess of regulatory benchmark.
Intra-day liquidity management
The group manages its exposures in respect of payment and settlement systems. Counterparties may view the failure to settle payments when expected as a sign of financial weakness and in turn delay payments to the group. This can also disrupt the functioning of payment and settlement systems. At a minimum, the following operational elements are included in the group’s intra-day liquidity management:
capacity to measure expected daily gross liquidity inflows and outflows, including anticipated timing where possible;
capacity to monitor its intraday liquidity positions, including available credit and collateral;
sufficient intraday funding to meet its objectives;
ability to manage and mobilise collateral as required;
robust capacity to manage the timing of its intraday outflows; and
readiness to deal with unexpected disruptions to its intraday liquidity flows.
Daily cash flow management
The group generates a daily report to monitor significant cash flows. Maturities and withdrawals are forecast at least 3-months in advance and management is alerted to large outflows. The report, which is made available to the funding team, ALM and market risk also summarises material daily new deposit as well as the interbank and top depositor reliance (by value and product).
The daily cash flow management report forms an integral part of the ongoing liquidity management process and is a crucial tool to proactively anticipate and plan for large cash outflows.
Liquidity stress testing and scenario testing
Anticipated on-and-off balance sheet cash flows are subjected to a variety of the group specific and systemic stress scenarios in order to evaluate the impact of unlikely but plausible events on liquidity positions. Scenarios are based on both historical events, such as past emerging markets crises, past local financial markets crisis and hypothetical events, such as a entity specific crisis. The results obtained from stress testing provide meaningful input when defining target liquidity risk positions.
Maturity analysis of financial liabilities by contractual maturity
The tables below analyses cash flows on a contractual, undiscounted basis based on the earliest date on which the group can be required to pay (except for trading liabilities and trading derivatives) and may therefore not agree directly to the balances disclosed in the consolidated statement of financial position.
Derivative liabilities are included in the maturity analysis on a contractual, undiscounted basis when contractual maturities are essential for an understanding of the derivatives’ future cash flows. Management considers only contractual maturities to be essential for understanding the future cash flows of derivative liabilities that are designated as hedging instruments in effective hedge accounting relationships. All other derivative liabilities are treated as trading and are included at fair value in the redeemable on demand bucket since these positions are typically held for short periods of time.
The following tables also include contractual cash flows with respect to off-balance sheet items which have not yet been recorded on-balance sheet. Where cash flows are exchanged simultaneously, the net amounts have been reflected.
Maturity analysis of financial liabilities by contractual maturity
Redeemable on demand
Nmillion
Maturingwithin
1 monthNmillion
Maturingbetween
1-6 monthsNmillion
Maturingbetween
6-12 months
Nmillion
Maturingafter
12 monthsNmillion
TotalNmillion
December 2013
Financial liabilities
Derivative financial instruments - 634 139 15 297 1,085
Trading liabilities - 20,664 34,988 9,594 1,714 66,960
Deposits and current accounts 310,915 87,923 56,952 12,209 39 468,038
Subordinated debt - - - - 6,399 6,399
Other borrowings - 1,196 308 1,422 45,838 48,764
Total 310,915 110,417 92,387 23,240 54,287 591,246
Unrecognised financial instruments
Letters of credit 607 877 19,308 44 - 20,836
Guarantees - 2,197 5,426 5,229 10,927 23,779
Total 607 3,074 24,734 5,273 10,927 44,615
December 2012
Financial liabilities
Derivative financial instruments - 313 459 - - 772
Trading liabilities 11,437 16,939 14,788 8,091 37,116 88,371
Deposits and current accounts 205,271 109,639 50,320 16,789 32 382,051
Other borrowings - 3,173 389 1,463 61,848 66,873
Total 216,708 130,064 65,956 26,343 98,996 538,067
Unrecognised financial instruments
Letters of credit 1,508 602 17,030 5 - 19,145
Guarantees 86 2,102 12,713 9,439 1,333 25,673
Total 1,594 2,704 29,743 9,444 1,333 44,818

107
Overview Capital management
Otherinformation
Business review
106 Stanbic IBTC Annual group financial statements for the year ended 31 December 2013
Business review Annual report and financial statements
Enterprise risk review (continued)
Liquidity contingency plans
The group recognises that it is not possible to hold sufficiently large enough quantity of readily available liquidity to cover the least likely liquidity events. However, as such event can have devastating consequences, it is imperative to bridge the gap between the liquidity the group chooses to hold and the maximum liquidity the group might need.
The group’s liquidity contingency plan is designed to, as far as possible, protect stakeholder interests and maintain market confidence in order to ensure a positive outcome in the event of a liquidity crisis. The plan incorporates an extensive early warning indicator methodology supported by a clear and decisive crisis response strategy. Early warning indicators span group specific crises, systemic crises, contingency planning, and liquidity risk management governance and are monitored based on assigned frequencies and tolerance levels. The crisis response strategy is formulated around the relevant crisis management structures and addresses internal and external communications, liquidity generation, operations, as well as heightened and supplementary information requirements.
Foreign currency liquidity management
A number of indicators are observed to monitor changes in either market liquidity or exchange rates. Foreign currency loans and advances are restricted to the availability of foreign currency deposits.
Funding strategy
Funding markets are evaluated on an ongoing basis to ensure appropriate group funding strategies are executed depending on the market, competitive and regulatory environment. The group employs a diversified funding strategy, sourcing liquidity in both domestic and offshore markets, and incorporates a coordinated approach to accessing capital and loan markets across the group.
Concentration risk limits are used within the group to ensure that funding diversification is maintained across products, sectors, geographic regions and counterparties.
Primary funding sources are in the form of deposits across a spectrum of retail and wholesale clients, as well as long-term capital and loan markets. The group remains committed to increasing its core deposits and accessing domestic and foreign capital markets when appropriate to meet its anticipated funding requirements.
2013%
2012%
Single depositor 5 4
Top 10 depositors 25 21
Depositor concentrations
Market risk
The identification, management, control, measurement and reporting of market risk is categorised as follows:
Trading market risk
These risks arise in trading activities where the bank acts as a principal with clients in the market. The group policy is that all trading activities are contained within the bank's Corporate and Investment Banking (CIB) trading operations.
Banking book interest rate risk
These risks arise from the structural interest rate risk caused by the differing re-pricing characteristics of banking assets and liabilities.
Foreign currency risk
These risks arise as a result of changes in the fair value or future cash flows of financial exposures due to changes in foreign exchange rates.
Equity investment risk
These risks arise from equity price changes in listed and unlisted investments, and managed through the equity investment committee, which is a sub-committee of the executive committee.
Framework and governance
The board approves the market risk appetite and standards for all types of market risk. The board grants general authority to take on market risk exposure to the asset and liability committee (ALCO). ALCO sets market risk policies to ensure that the measurement, reporting, monitoring and management of market risk associated with operations of the bank follow a common governance framework. The bank’s ALCO reports to EXCO and also to the board risk management committee.
The in-country risk management is subject to SBG oversight for compliance with group standards and minimum requirements.
The market risk management unit which is independent of trading operations and accountable to ALCO, monitors market risk exposures due to trading and banking activities. This unit
monitors exposures and respective excesses daily, report monthly to ALCO and quarterly to the board risk management committee.
Market risk measurement
The techniques used to measure and control market risk include:
daily net open position;
daily VaR;
back-testing;
PV01;
other market risk measures; and
annual net interest income at risk.
Daily net open position
The board on the input of ALCO sets limits on the level of exposure by currency and in aggregate for overnight positions. The latter is also aligned to the net open position limit as specified by the regulators, which is usually a proportion of the groups’ capital.
Daily value-at-risk (VaR)
VaR is a technique that estimates the potential losses that may occur as a result of market movements over a specified time period at a predetermined probability.
VaR limits and exposure measurements are in place for all market risks the trading desk is exposed to. The bank generally uses the historical VaR approach to derive quantitative measures, specifically for market risk under normal market conditions. Normal VaR is based on a holding period of one day and a confidence level of 95%. Daily losses exceeding the VaR are likely to occur, on average, 13 times in every 250 days.
The use of historic VaR has limitations as it is based on historical correlations and volatilities in market prices and assumes that future prices will follow the observed historical distribution. Hence, there is a need to back-test the VaR model regularly.
VaR back-testing
The group and the banking business back-test its foreign currency, interest rate and credit trading exposure VaR model to verify the predictive ability of the VaR calculations thereby
ensuring the appropriateness of the model. Back-testing exercise is an ex-post comparison of the daily hypothetical profit and loss under the one-day buy and hold assumption to the prior day VaR. Profit or loss for back-testing is based on the theoretical profits or losses derived purely from market moves both interest rate and foreign currency spot moves and it is calculated over 250 cumulative trading-days at 95% confidence level.
Stress tests
Stress testing provides an indication of the potential losses that could occur in extreme market conditions.
The stress tests carried out include individual market risk factor testing and combinations of market factors on individual asset classes and across different asset classes. Stress tests include a combination of historical and hypothetical simulations.
PV01
PV01 is a risk measure used to assess the effect of a change of rate of one basis point on the price of an asset. This limit is set for the fixed income, money market trading, credit trading, derivatives and foreign exchange trading portfolios.
Other market risk measures
Other market risk measures specific to individual business units include permissible instruments, concentration of exposures, gap limits, maximum tenor and stop loss triggers. In addition, only approved products that can be independently priced and properly processed are permitted to be traded.
Pricing models and risk metrics used in production systems, whether these systems are off-the-shelf or in-house developed, are independently validated by the market risk unit before their use and periodically thereafter to confirm the continued applicability of the models. In addition, the market risk unit assesses the daily liquid closing price inputs used to value instruments and performs a review of less liquid prices from a reasonableness perspective at least fortnightly. Where differences are significant, mark-to-market adjustments are made.
Annual net interest income at risk
A dynamic forward-looking annual net interest income forecast is used to quantify the banks’ anticipated interest rate exposure. This approach involves the forecasting of both changing balance sheet structures and interest rate scenarios, to determine the effect these changes may have on future earnings. The analysis is completed under both normal market conditions as well as stressed market conditions.

109
Overview Capital management
Otherinformation
Business review
108 Stanbic IBTC Annual group financial statements for the year ended 31 December 2013
Business review Annual report and financial statements
Enterprise risk review (continued)
Distribution of trading income in 2013
The histogram below shows the distribution of daily income and losses during 2013. It captures trading income volatility and shows the number of days in which the bank’s trading related revenues fell within particular ranges. The distribution is skewed to the profit side. Overall, it shows that trading income was realised on 180 days out of a total of 240 days with 22 positive outliers.
Analysis of Value-at-Risk (VaR) and actual income
The graph below shows the normal VaR analysis and the actual income of the trading unit in 2013. It reflects a relative stability in VaR amount despite the fluctuation in trading income.
Trading income - 2013 Trading income and diversified normal VaR - 2013
The table below highlights the historical diversified normal VaR across the various trading desks. The minimum and maximum trading diversified normal VaR stood at USD130k and USD3.8m respectively with an annual average of USD1.3m which translates to a very conservative VaR base limit utilisation of 23% on average
Desk Maximum Minimum Average 31 Dec 2013 31 Dec 2012 Limit
Bankwide 3,807 130 1,314 224 841 5,610
FX Trading 361 1 19 33 10 88
Money Markets Trading
3,850 108 1,230 209 143 2,300
Fixed Income Trading
826 2 189 95 320 1,856
Credit Trading 536 9 59 16 512 2,000
Derivatives 549 9 28 15 13 63
Diversified normal VaR exposures (USD’000)
Analysis of average trading revenue by income stream
The table below shows the breakout of trading revenue by asset class between the year ending 2013 and 2012.
Analysis of PV01
The table below shows the PV01 of the money market banking and the individual trading books. The money market trading book PV01 exposure was N365k, the money market banking book PV01 exposure stood at N2.4 million while the fixed income trading book PV01 exposure was N767k thus reflecting a very conservative exposure utilisation. Overall, limit discipline was very good across the banking and trading books.
Trading revenue in streams
2013Nmillion
2012Nmillion
Change %
Foreign exchange 6,644 4,230 57
Credit 1,329 1,617 (18)
Interest rates 6,911 2,241 208
Equities 11 3 267
Total 14,895 8,091 84
PVO1 31 Dec2013
Nmillion
31 Dec2012
Nmillion Limit
Money market trading book
36.97 595.37 3,700.00
Fixed income trading book
766.82 2,703.50 3,400.00
Credit trading book
145.47 4,447.43 3,200.00
Derivatives trading book
10.08 88.92 500.00
Total 1,287.35 7,835.22 10,800.00
Money marketbanking book
2,419.33 7,179.65 10,000.00
Measure Stress conditionUtilisation (%)
31 Dec 2013Utilisation (%)31 Dec 2012 Limit
LCY parallel rate shock 450 19.69 8.04 10.0%
(450) (19.67) (7.37) 10.0%
FCY parallel rate shock 75 2.08 (3.02) 10.0%
(75) (6.25) 1.77 10.0%
Analysis of banking book market risk exposures
Banking-related market risk exposure principally involves the management of the potential adverse effect of interest movements on net interest income.
The risk is transferred to and managed within the bank’s treasury operations under supervision of ALCO. A dynamic, forward-looking net interest income forecast is used to quantify the bank’s anticipated interest rate exposure. This approach involves the forecasting of both changing balance sheet structures and interest rate scenarios, to determine the effect these changes may have on future earnings. Balance sheet projections and the impact on net interest income due to rate changes normally cover a minimum of 12 months forecasting. The analysis allows for the dynamic interaction of payments, new business and interest rates, and also captures the effects of embedded or explicit options.
The analyses are done under normal market conditions i.e. under a bullish, expected and bearish interest rate scenario and, under stressed market conditions in which the banking book is subjected to an upward and downward 450 basis points parallel rate shock for local currency and 75 basis points for foreign currency.
The table below shows the sensitivity of the bank’s net interest income in response to standardised parallel rate shocks. The impacts of the rate shocks on the bank’s net interest income are well within the 10% limit.
* Dec 2013 LCY stress was +/- 450
02
/0
1/
20
13
02
/0
2/
20
13
02
/0
3/
20
13
02
/0
4/
20
13
02
/0
5/
20
13
02
/0
6/
20
13
02
/0
7/
20
13
02
/0
8/
20
13
02
/0
9/
20
13
02
/1
0/
20
13
02
/1
1/
20
13
02
/1
2/
20
13
USD
mill
ion
10
(5)
(4)
(3)
(2)
(1)
0
1
2
3
4
5
Trading P and L Lower tail VaR Upper tail VaR
Loss
Freq
uenc
y of
Tra
ding
Day
s
Nmillions
< (
50
0)
> (
50
0)
< (
45
0)
> (
45
0)
< (
40
0)
> (
40
0)
< (
35
0)
> (
35
0)
< (
30
0)
> (
30
0)
< (
25
0)
> (
25
0)
< (
20
0)
> (
20
0)
< (
15
0)
> (
15
0)
< (
10
0)
> (
10
0)
< (
50
)>
(5
0)
< 0
> 0
< 5
0>
50
< 1
00
> 1
00
< 1
50
> 1
50
< 2
00
> 2
00
< 2
50
> 2
50
< 3
00
> 3
00
< 3
50
> 3
50
< 4
00
> 4
00
< 4
50
> 4
50
< 5
00
> 5
00
Profit
10
0
10
20
30
40
50
60
70
80
90
100
110

111
Overview Capital management
Otherinformation
Business review
110 Stanbic IBTC Annual group financial statements for the year ended 31 December 2013
Business review Annual report and financial statements
Enterprise risk review (continued)
Concentrations of currency risk – on- and off-balance sheet financial instruments
At 31 December 2013 NairaNmillion
US DollarNmillion
GBPNmillion
EuroNmillion
OthersNmillion
TotalNmillion
Asset
Cash and cash equivalents 91,365 22,386 3,428 2,544 589 120,312
Trading assets 40,711 - - - - 40,711
Pledged assets 24,733 - - - - 24,733
Derivative assets 1,492 34 - - - 1,526
Financial investments 139,304 - - - - 139,304
Loans and advances to banks 85,023 6,135 - - 3,022 94,180
Loans and advances to customers 180,329 108,648 153 617 - 289,747
Other assets (67,851) 85,749 (333) (627) 2,891 19,829
Current and deferred tax assets 7,716 - - - - 7,716
Property and equipment 24,988 - - - - 24,988
Total assets 527,810 222,952 3,248 2,534 6,502 763,046
Liabilities
Trading liabilities 6,488 60,472 - - - 66,960
Derivative liabilities 1,075 10 - - - 1,085
Deposits and current accounts from banks 37,701 13,984 - - 1 51,686
Deposits and current accounts from customers 323,973 88,192 2,950 1,090 147 416,352
Other borrowings 19,132 29,632 - - - 48,764
Subordinated debt - 6,399 - - - 6,399
Current and deferred tax liabilities 7,788 - - - - 7,788
Other liabilitiies 39,612 21,498 332 1,445 3,491 66,378
Total liabilities 435,769 220,187 3,282 2,535 3,639 665,412
Net on-balance sheet financial position 92,041 2,765 (34) (1) 2,863 97,634
Off balance sheet 18,281 25,234 65 940 95 44,615
At 31 December 2012 NairaNmillion
US DollarNmillion
GBPNmillion
EuroNmillion
OthersNmillion
TotalNmillion
Total assets 519,681 150,200 2,032 1,850 3,056 676,819
Total liabilities 459,352 125,330 2,038 1,858 2,590 591,168
Net on-balance sheet financial position 60,329 24,870 (6) (8) 466 85,651
Off balance sheet 12,311 27,723 1,006 1,924 1,852 44,817
Market risk on equity investment
The equity committee has governance and oversight of all investment decisions. The committee is tasked with the formulation of risk appetite and oversight of investment performance. In this regard, a loss trigger is in place for the non-strategic portion.
Foreign exchange risk
The group takes on exposure to the effects of fluctuations in the prevailing foreign currency exchange rates on its financial position and cash flows. The board sets limits on the level of exposure by currency and in aggregate for both overnight and intra day positions, which are monitored daily. The table below summarises the group’s exposure to foreign currency exchange risk as at 31 December 2013.

113
Overview Capital management
Otherinformation
Business review
112 Stanbic IBTC Annual group financial statements for the year ended 31 December 2013
Business review Annual report and financial statements
Enterprise risk review (continued)
Operational risk
The operational risk and compliance committee (ORCC) serves as the oversight body in the application of the group’s risk management framework. This is achieved through enforcing standards for identification, assessing, controlling, monitoring and reporting. ORCC reviews and recommends operational risk appetite and tolerance to the executive committee and board risk management committee (BRMC).
Approach to managing operational risk
The group’s approach to managing operational risk is to adopt practices that are fit for purpose, to increase the efficiency and effectiveness of the group’s resources, minimise losses and utilise opportunities.
This approach is aligned to the group’s enterprise risk management framework, policies, procedures and tools to identify, assess, monitor, control and report such risks as well as adopt sound practices recommended by various sources, including the Basel II Accord’s Sound Practices for the Management and Supervision of Operational Risk and the regulators. The group continues to embed operational risk management practices into its day-to-day business activities.
Governance
The BRMC as the delegated risk oversight body on behalf of the board has the ultimate responsibility for operational risk management. It ensures quality, integrity and reliability of operational risk management across the group.
Management and measurement of operational risk
The operational risk management framework serves to ensure that risk owners are clearly accountable for the risk inherent within the business activities of the group. The key element in the framework includes methodologies and tools to identify, measure, and manage operational risks, a governance model, and processes to ensure internal training and awareness, communication, and change management.
Risk and control self assessments (RCSA) are designed to be forward-looking. Management is required to identify risks that could threaten the achievement of business objectives and together with the required set of controls and actions, to mitigate the risks.
The loss data collection process ensures that all operational risk loss events and near misses are captured into a centralized database. The flow of information into the loss event database is a bottom-up approach. The capture process identifies and classifies all incidents in terms of an incident classification list.
This information is used to monitor the state of operational efficiency, address trends, implement corrective action and manage recovery, where possible.
The group uses key risk indicators (KRIs) to monitor the risks highlighted in the RCSA process. The implementation of the KRIs is an integral element of the framework and is therefore compulsory throughout the group. Business units are required to report on a regular and event-driven basis. The reports include a profile of the key risk to the achievement of their business objectives, control issues of group-level significance, and operational risks events.
The group maintains adequate insurance to cover key operational and other risks. Insurance is considered an effective tool for mitigating operational risks by reducing the economic impact of operational losses.
Business continuity management (BCM)
The core focus in 2013 was to carry out business impact analysis (BIA) and conduct Disaster Recovery simulations to test the ability of the information technology team to recover and restore the bank’s applications in the event of unexpected disruptions or disasters as well as testing the recovery site infrastructure to determine its suitability for meeting its recovery objectives.
Information risk management
Information risk is defined as the risk of accidental or intentional unauthorised use, modification, disclosure or destruction of information resources, which compromises their confidentiality, integrity or availability.
From a strategic perspective, information risk management is treated as a particular discipline within the operational risk framework. In essence, information risk management not only protects the group’s information resources from a wide range of threats, but also enhances business operations, ensures business continuity, maximises return on investments and supports the implementation of various services. The approach to the management of information risk in the group is in accordance with global best practice, applicable laws and regulations.
The group has embarked on an enterprise-wide comprehensive awareness/education campaign to ensure that the culture of information protection is entrenched and the risks associated with improper handling information are mitigated.
Fraud risk management
The group has a set of values that embraces honesty, integrity and ethics and, in this regard, has a “zero tolerance” approach
to fraud and corruption. Where necessary, disciplinary, civil and criminal actions are taken against staff and third parties who perpetrate fraud; staff found guilty of dishonesty through the group’s disciplinary processes is listed on appropriate industry and regulatory databases of dismissed staff.
The group’s financial crime control unit (FCC), which is responsible for fraud risk management practices, in conjunction with law enforcement agencies, investigates all losses incurred as a result of misconduct of staff and criminal intent of third parties, and proceeds with criminal prosecutions and recovery of the crime proceeds.
There are anti-fraud mechanisms and regular campaigns in place to mitigate fraud risk. These measures include; fraud awareness, prevention, detection and reporting workshops organized for all members of staff; dissemination of fraud circulars highlighting new fraud trends; anti bribery and corruption as well as the whistle blowing policies; distribution of “Stop Fraud Campaign Letter” to all the registered vendors of the bank introducing the bank’s whistle blowing hotline and soliciting for their collaborated efforts in reporting any corrupt staff; constant review and re-engineering of the group’s internal processes, engagement of law enforcement agencies, industry forums and collaborative workshops to discuss best practices to combat fraud.
Whistle blowing
The group actively encourages its employees to embrace its values, especially in respect of the upholding of the highest levels of integrity. Consequently, the obligation exists for employees to report any unlawful, irregular or unethical conduct that they observe through the requisite whistle blowing channels.
A whistle-blower may choose to reveal his or her identity when a report or disclosure is made, and the group will respect and protect the confidentiality and identity of the whistle-blower.
The only exception to this assurance relates to an overriding legal obligation to breach confidentiality, where the group is obligated to reveal confidential information relating to a whistle-blowing report if ordered to do so by a court of law.
Alternative to confidential reporting, a whistle-blower may also choose not to reveal his or her identity when reporting or disclosing any unlawful, irregular or unethical conduct and such report could be made through the group’s whistle-blowing hotline which is managed by an independent third party firm. The systems of the firm managing the whistle-blowing line is set up in such a way that electronic reporting is non-traceable through devices such as caller ID and contractually the firm is not permitted to divulge the identity of the caller to the group
(in the event that it becomes aware of the caller’s identity).
Environmental risk management
The group acknowledges that the development of a corporate culture whereby environmental protection and the sound management of natural resources in both its own operating environment and with all the parties with which it has a business association is crucial to sustainable development. The group adopts a precautionary approach to environmental management, striving to anticipate and prevent environmental degradation in line with the guidelines set out in the Equator Principles and the provisions of the environmental laws of Nigeria.
The group has also adopted the sustainability principle that was recently introduced by the bankers’ committee.
Legal risk management
The group is aware of the potential losses that can arise where a financial institution faces a negative court judgment or where a contract does not provide the required legal protection or where it incurs liability for damages to third parties. It has therefore established a legal risk function that operates within the legal services unit and which focuses on managing and mitigating legal risk.
The legal risk function, as part of the legal risk management process:
ensures that service agreements are executed between the group and its services providers;
reviews and monitors legal claims made against the entities in the group; and
obtains independent legal opinions on all litigation instituted against the entities within the group.
As a general rule, provisions are made in all instances where, in the group’s opinion, there is a likelihood that a legal claim instituted against it may succeed. The amount of such provisions represents the bank’s estimate of the amount that could be awarded against it or which it could become liable to pay.
The group also encourages the use of alternative dispute resolution mechanisms. Such mechanisms, where appropriate, amicably resolve otherwise difficult litigation and avoid the lengthy and time consuming processes inherent in litigation.

115
Overview Capital management
Otherinformation
Business review
114 Stanbic IBTC Annual group financial statements for the year ended 31 December 2013
Business review Annual report and financial statements
Compliance risk management
Compliance risk management is an independent core risk management activity by the group’s compliance unit, which is overseen by the chief compliance officer. The unit provides independent reports to the Operational Risk and Compliance Committee (ORCC), Executive Committee (EXCO) and Board Risk Management Committee (BRMC). The group’s approach to managing compliance risk is proactive and premised on globally accepted compliance management principles. The group fosters a culture of compliance which is seen not only as a requirement of law but also good business practice.
The compliance unit is well positioned to guard against the risk of failure to comply with applicable laws, regulators, codes of conduct and standards of good practice, which may result in regulatory sanctions, financial or reputation loss. It focuses on ensuring that the group complies with laid down legislations and regulations that are applicable to its business and operations.
The unit serves as the interface between the group and the group’s primary regulators during spot checks and routine examinations with the aim of ensuring that issues raised during the spot checks and routine examinations are properly addressed.
Conflict of interest and personal account trading
The group is highly committed to conducting business professionally, ethically, with integrity and in accordance with international best practice at all times. In line with its established framework and policy, conflict of interest situations are constantly identified and managed.
In the course of the year, 48 deals were cleared through the standard bank group’s global Compliance Control Room (CCR).
In line with its personal account trading policy, personal trades carried out by members of staff on their individual stock holding through the group’s stockbroking subsidiary are reviewed regularly to ensure that staff have not traded on the shares of companies that they have material non-public price-sensitive information on by virtue of their jobs. Members of staff who trade through external stockbroking firms are required to notify the compliance unit whenever a trading instruction is issued. The disclosure is also applicable to trades executed by connected persons.
Furthermore, all the senior management staff members including 235 embargoed and nominated employees were prohibited from trading on the group’s shares with effect from 1st December 2013 until the group’s annual financial results are formally announced to the public.
Anti Money laundering
The group attaches utmost importance to ensuring that the “know your customer” (KYC), anti-money laundering (AML) and combating financing of terrorism (CFT) regulations and legislations are strictly adhered to.
Key legislations and regulations that govern anti-money laundering are the Money Laundering (Prohibition) Act 2011 (as amended); Central Bank of Nigeria (CBN) AML /CFT Regulation of 2013; Terrorism Prevention Amendment Act 2013; Terrorism Prevention Regulation 2013; Securities and Exchange Commission (SEC) AML/CFT Regulation 2013; Economic and Financial Crimes Commission (EFCC) Act 2004 and various CBN circulars.
In accordance with the relevant provisions of the Money Laundering (Prohibition) Act 2011 (as amended) and the CBN AML/CFT Regulation of 2013, up to date training programmes are organised. The group’s employees were trained on KYC/AML/CFT issues through the e-learning platform in the course of the year, where all employees were required to take an on line assessment to determine their level of understanding with the topics covered.
All active accounts are categorised into categories A, B, and C for high, medium and low risk accounts respectively to allow for a risk-based approach to accounts’ monitoring.
As part of the commitment and resolve to combat the scourge of money laundering and terrorist financing, the group is on the verge of rolling out a new anti-money laundering (AML) solution that would make the process of identifying, investigating and reporting suspicious transactions more effective.
Nigeria as a country also recorded a major milestone in the area of AML/CFT in 2013 as the country was removed during the plenary meeting of the Financial Action Task Force (FATF) held in Paris, France in October, 2013 from the “Grey list” which is a list of countries that were identified to have significant deficiencies in their AML/CFT regime. The removal of Nigeria from the list was a fall-out of the visit by the International Co-operation Review Group (ICRG) of the FATF to ascertain the progress made in the area of AML/CFT.
Capital management
Capital adequacy
The group manages its capital base to achieve a prudent balance between maintaining capital ratios to support business growth and depositor confidence, and providing competitive
returns to shareholders. The capital management process ensures that each group entity maintains sufficient capital levels for legal and regulatory compliance purposes. The group ensures that its actions do not compromise sound governance and appropriate business practices and it eliminates any negative effect on payment capacity, liquidity and profitability.
Capital adequacy ratio, which reflects the capital strength of an entity compared to the minimum regulatory requirements, is monitored daily by the management, essentially employing approaches based on the guidelines developed by the regulators for supervisory purposes. It is calculated by dividing the capital held by the bank by its risk-weighted assets. Risk weighted assets are determined by applying prescribed risk weighting to on and off balance sheet exposures according to the relative credit risk of the counterparty.
The regulators require the banking business to hold a minimum regulatory capital of N25 billion and maintain a minimum of 10% capital adequacy ratio. The required information is filed monthly with the Central Bank of Nigeria (CBN).
In line with regulatory specification, the group’s regulatory capital is divided into two tiers:
Tier 1 capital: share capital, retained earnings and reserves created by appropriations of retained earnings.
Tier 2 capital: minority interest arising from consolidation, fixed asset revaluation reserves, foreign currency revaluation reserves and general provision subject to a maximum of 1.25% of risk assets.
Investment in unconsolidated subsidiaries and associations are deducted from Tier 1 and 2 capital to arrive at the regulatory capital.
The risk-weighted assets are measured by means of a hierarchy of five risk weights classified according to the nature of asset and reflecting an estimate of credit, market and other risks associated with – each asset and counterparty, taking into account any eligible collateral or guarantees. A similar treatment is adopted for off balance sheet exposures, with some adjustments to reflect the more contingent nature of the potential losses.
Capital management
The table below summarises the composition of regulatory capital and the ratios of the group for the period ended 31 December 2013. During the year, the individual entities within the group and the group complied with all of the externally imposed capital requirements to which they are subject.
2013Nmillion
2012Nmillion
Tier 1 capital:
Share capital 5,000 5,000
Share premium 65,450 65,450
Retained earnings 22,864 15,300
Other reserves 778 (2,341)
Deferred tax asset and intangible assets
(7,716) (5,212)
Total qualifying Tier 1 capital 86,376 78,197
Tier 2 capital:
Non-controlling interest 3,321 2,310
Available-for-sale reserve 221 (68)
Subordinated debt 6,399 -
Total qualifying Tier 2 capital 9,941 2,242
Total regulatory capital 96,317 80,439
Risk-weighted assets:
On-balance sheet 360,162 346,011
Off-balance sheet 32,726 31,981
Total risk-weighted assets 392,888 377,992
Capital adequacy ratio 24.5% 21.3%
Regulatory capital compliance
The group complied with minimum capital requirements imposed by the regulators during the period under review. Apart from the local requirements, the group is also required to comply with the capital adequacy requirement in terms of South African banking regulations measured on Basel II principles. This act of compliance coupled with the risk governance structure and implementation of ERM framework as well as collation of loss data, amongst others, have continued to reinforce the group’s readiness for a regulatory regime that is anchored on Basel II principles in the near future.
Enterprise risk review (continued)
117
Market & Shareholderinformation
Otherinformation
116 Stanbic IBTC Annual group financial statements for the year ended 31 December 2013
Annual report and financial statements Overview Business review
Annual reports and financial statements
Annual report and financial statements
Annual report and financial statements Board of directors
Directors’ report
Statement of directors’ responsibility
Corporate governance report
Report of the audit committee
Independent auditor’s report
Statement of financial position
Statement of profit or less
Statement of cash flows
Notes to the annual financial statements
Annexure A
Annexure B
118
120
125
126
140
141
142
143
150
151
228
229

119
Market & Shareholderinformation
Otherinformation
118 Stanbic IBTC Annual group financial statements for the year ended 31 December 2013
Annual report and financial statements Overview Business review
Annual reports and financial statements
Board of directors
Sola David-Borha Chief executive Officer
B.Sc (Econs), MBA Appointed: 2012
Directorships: Stanbic IBTC Bank PLC, Stanbic Nominees Nigeria Ltd, Stanbic IBTC Stockbrokers Ltd, Stanbic IBTC Asset Management Ltd, Stanbic IBTC Pension Managers Ltd, Stanbic IBTC Ventures Ltd, Financial Institutions Training Centre (FITC), First Securities Discount House, Credit Reference Company, Frezone Plant Fabrication Int Ltd, First SMI Investment Company, Fate Foundation, Redeemers International School
Committee member: board nominations committee, board risk management committee.
Sam Cookey Non-executive
B.A. Hons A and E D, B.Arch Hons Appointed: 2012
Directorships: Stanbic IBTC Bank PLC, Space Concepts Limited, Context Matrix Ltd, Mentor Trinity Ltd
Committee member: board risk management committee, audit committee
Atedo N.A. Peterside con Chairman
B.Sc, MBA Appointed: 2012
Directorships: Stanbic IBTC Bank PLC, Stanbic IBTC Pension Managers Ltd, Cadbury Nigeria PLC, Nigerian Breweries PLC, Presco PLC, Unilever Nigeria PLC, Flour Mills of Nigeria PLC
Moses Adedoyin Non-executive
FCIB Appointed: 2012
Directorships: Stanbic IBTC Bank PLC, Remofal Ltd, Allegiance Technologies Ltd, Bank Directors Association of Nigeria
Committee member: board remuneration commitee, audit committee
Dominic Bruynseels Non-executive
BA Hons, MBA, Associate of Institute of Bankers, UK, Diploma in Financial Studies Appointed: 2012
Directorships: Stanbic IBTC Bank PLC, Standard Bank de Angola, S.A, Stanbic Bank Ghana Limited, Standard Bank RDC SARL, Stanbic IBTC Pension Managers Limited
Committee member: board remunerations committee, board risk management committee, board nominations committee
Lilian. I. Esiri Non-executive
LLB, BL, LLM Appointed: 2012
Directorships: Stanbic IBTC Bank PLC, Stanbic IBTC Asset Management Limited, Podini International Limited, Veritas Geophysical Nigeria Limited, Ashburt Leisures Limited, Ashburt Beverages Limited, Ashburt Oil and Gas Limited
Committee member: board risk management committee, board nominations committee
Arnold Gain Non-executive
B.Com, FA, BDP Appointed 2012
Directorships: Stanbic IBTC Bank PLC
Committee member: board risk management committee
Sim Tshabalala Non-executive
BA; LLB; LLM Appointed: August 2013
Directorships: Stanbic IBTC Bank PLC; Standard Bank of South Africa; Standard Bank Group; Banking Association of South Africa.
Committee: Board Remunerations Committee; Board Nominations Committee
Ratan Mahtani Non-executive
Appointed: 2012
Directorships: Stanbic IBTC Bank PLC, Aegean Investments Limited, Churchgate Nigeria Limited, First Century International Limited, Foco International Investments Limited, T F Kuboye and Co, International Seafoods Limited
Committee member: audit committee
Maryam Uwais MFR Non-executive
LLB, LLM Appointed: 2012
Directorships: Stanbic IBTC Bank PLC, Wali Uwais and Co
Committee member: board remuneration committee
Christopher Newson Non-executive
B.Com, CA(SA), CSEP Appointed: 2012
Directorships: Stanbic IBTC Holdings PLC
Committee member: board remunerations committee, board risk management committee, board nominations committee

121
Market & Shareholderinformation
Otherinformation
120 Stanbic IBTC Annual group financial statements for the year ended 31 December 2013
Annual report and financial statements Overview Business review
Annual reports and financial statements
Directors’ reportFor the year ended 31 December 2013
The directors present their report on the affairs of Stanbic IBTC Holdings PLC (“the company”) and its subsidiaries (“the group”), together with the consolidated financial statements and auditor’s report for the year ended 31 December 2013.
a. Legal form
The company was incorporated in Nigeria under the Companies and Allied Matters Act (CAMA) as a public limited liability company on 14 March 2012. The company’s shares were listed on 23 November 2012 on the floor of The Nigerian Stock Exchange.
b. Principal activity and business review
The principal activity of the company is to carry on business as a financial holding company, to invest in and hold controlling shares in as well as manage equity in its subsidiary companies.
The company has eight subsidiaries, namely: Stanbic IBTC Bank PLC, Stanbic IBTC Pension Managers Limited, Stanbic IBTC Asset Management Limited, Stanbic IBTC Capital Limited, Stanbic IBTC Investments Limited, Stanbic IBTC Stockbrokers Limited, Stanbic IBTC Ventures Limited and Stanbic IBTC Trustees Limited.
The company prepares consolidated financial statements, which includes separate financial statements of the company. Stanbic IBTC Investments Limited was non operating as at 31 December 2013 and did not have assets, liabilities or operating results at reporting date.
c. Operating results and dividends
The group’s gross earnings increased by 21%, while profit before tax increased by 116% for the year ended 31 December 2013. The board recommended the approval of dividend of 80 kobo per share (2012: 10 kobo) for the year ended ended 31 December 2013.
Highlights of the group’s operating results for the year under review are as follows:
31 Dec 2013Group
N'million
31 Dec 2012Group
N'million
31 Dec 2013CompanyN'million
31 Dec 2012CompanyN'million
Gross earnings 111,226 91,860 9,137 1,250
Profit before tax 24,617 11,412 8,216 1,053
Taxation (3,844) (1,225) 116 -
Profit after tax 20,773 10,157 8,332 1,053
Non controlling interest (2,163) (1,289) - -
Profit attributable to the group 18,610 8,868 8,332 1,053
Appropriations:
Transfer to statutory reserve 2,439 1,343 - -
Transfer to retained earnings reserve 16,171 7,525 8,332 1,053
18,610 8,868 8,332 1,053
Dividend proposed 8,000 1,000 8,000 1,000
Total non-performing loans and advances (N'million) 13,407 14,340 - -
Total non-performing loans to gross loans and advances (%) 4.4% 5.1% - -
d. Directors’ shareholding
The direct interest of directors in the issued share capital of the company as recorded in the register of directors shareholding and/or as notified by the directors for the purposes of section 275 and 276 of CAMA and the listing requirements of The Nigerian Stock Exchang as follows:
Number of Ordinary shares of Stanbic IBTC Holdings PLC held as at
December 2013
Number of Ordinary shares of Stanbic IBTC Holdings PLC held as at
December 2012
Atedo N. A. Peterside CON 120,000,000 118,660,925
Sola David-Borha 527,839 1,664,839
Dominic Bruynseels - -
Moses Adedoyin 22,400,554 22,400,554
Sam Cookey 1,066,668 1,066,668
Maryam Uwais MFR 251,735 251,735
Ifeoma Esiri 42,776,676 52,776,676
Arnold Gain - -
Ratan Mahtani * 28,465,803 28,465,803
Simpiwe Tshabalala - -
Christopher Newson - -
* Mr Ratan Mahtani has indirect shareholdings amounting to 1,067,555,439 ordinary shares (Dec 2012: 1,068,346,259) respectively through First Century International Limited, Churchgate Nigeria Limited, International Seafoods Limited, Foco International Limited, and R B Properties Limited.
In terms of section 259 (1) of the Companies and Allied Matters Act 2004, the company shall hold its second annual general meeting in 2014, and Messrs. Moses Adedoyin; Sam Cookey and Ifeoma Esiri shall retire by rotation and being eligible shall offer themselves for re–election.
e. Directors interest in contracts
There were no director related contracts with the company disclosed to the board during 2013, in compliance with the requirements of Section 277 of CAMA.
f. Property and equipment
Information relating to changes in property and equipment is given in note 17 to the financial statements. In the directors’ opinion the disclosures regarding the group’s properties are in line with the related statement of accounting policy of the group.

123
Market & Shareholderinformation
Otherinformation
122 Stanbic IBTC Annual group financial statements for the year ended 31 December 2013
Annual report and financial statements Overview Business review
Annual reports and financial statements
Directors’ report (continued)
Share rangeNo. of
shareholdersPercentage of shareholders No. of holding
Percentage holdings
1 - 1,000 39,092 39.1 21,347,568 0.2
1,001 - 5,000 38,649 38.7 80,445,549 0.8
5,001 - 10,000 10,535 10.5 65,466,095 0.7
10,001 - 50,000 8,965 9.0 170,084,878 1.7
50,001 - 100,000 1,348 1.4 84,696,422 0.9
100,001 - 500,000 1,015 1.0 185,938,301 1.9
500,001 - 1,000,000 136 0.1 86,785,521 0.9
1,000,001 - 5,000,000 91 0.1 187,051,640 1.9
5,000,001 - 10,000,000 23 0.0 169,709,213 1.7
10,000,001 - 50,000,000 40 0.0 857,026,475 8.6
50,000,001 - 100,000,000 13 0.0 812,730,135 8.1
100,000,001 - 500,000,000 9 0.0 1,429,633,646 14.3
500,000,001 - 1,000,000,000 1 0.0 747,089,076 7.5
1,000,000,001 - 10,000,000,000 1 0.0 5,101,995,481 51.0
Grand Total 99,918 100.0 10,000,000,000 100.0
Foreign shareholders 156 5,444,066,030 54.4
N
Federal University of Technology, FUTA 10,000,000
Ekiti State SUBEB office 25,000,000
Nigeria Army Training School Zaria 3,876,850
Yaba College of Technology 4,557,060
Lagos Progressive School, Surulere 1,073,500
Junior Achievement Nigeria 1,950,000
Youwin Business Finance clinic (Federal Ministry of Finance) 5,000,000
Education Trade Mission to Canada - University of Benin 1,000,000
Federal Inland Revenue Service (FIRS) training sponsorship 3,022,815
Sickle Cell Foundation - Library renovation 2,000,000
2013 Muson Festival – Music Society of Nigeria 1,660,600
G.R.A Primary School Ikeja - School Library Project 1,318,350
Water Project in two public secondary schools – Maiduguri 2,336,000
Inaboki Secondary School Kaduna 10,000,000
Fika Secondary School Yobe State 5,000,000
Zuru Community – acquisition centre building 20,000,000
Oriade local government, Osun state 5,150,000
International Women Organization for charity - Small world 2014 300,000
Modupe Cole Child Care 42,000
Nelson Mandela day celebration 1,855,000
Total 105,142,175
g. Shareholding analysis
The shareholding pattern of the company as at 31 December 2013 is as stated below:
h. Substantial interest in shares
According to the register of members as at 31 December 2013, no shareholder held more than 5% of the issued share capital of the company except the following:
Shareholder No. of shares held Percentage shareholding
Stanbic Africa Holdings Limited (SAHL) 5,316,268,150 53.2
First Century International Limited 747,089,076 7.5
Authorised (N000) Issued and fully paid up
Year Increase Cummulative Increase Cummulative
2012 10,000,000 10,000,000 10,000,000 10,000,000
i. Share capital history
j. Donations and Charitable Gifts
The group made contributions to charitable and non – political organizations amounting to N105,142,175 (Dec 2012: N154,363,863) during the year.
k. Events after the reporting date
There were no events after the reporting date which could have a material effect on the financial position of the group as at 31 December 2013 which have not been recognised or disclosed.
l. Human resources
Employment of disabled persons The company continues to maintain a policy of giving fair consideration to applications for employment made by disabled persons with due regard to their abilities and aptitude. The company’s policy prohibits discrimination of disabled persons or persons with HIV in the recruitment, training and career development of its employees. In the event of members of staff becoming disabled, efforts will be made to ensure that, as far as possible, their employment with company continues and appropriate training is arranged to ensure that they fit into the company’s working environment.
125
Market & Shareholderinformation
Otherinformation
124 Stanbic IBTC Annual group financial statements for the year ended 31 December 2013
Annual report and financial statements Overview Business review
Annual reports and financial statements
Health safety and welfare at work
The company enforces strict health and safety rules and practices at the work environment which are reviewed and tested regularly. The company’s staff are covered under a comprehensive health insurance scheme pursuant to which the medical expenses of staff and their immediate family are covered up to a defined limit.
Fire prevention and firefighting equipment are installed in strategic locations within the company’s premises.
The company has both Group Personal Accident and Workmen’s Compensation Insurance cover for the benefit of its employees. It also operates a contributory pension plan in line with the Pension Reform Act 2004.
m. Employee involvement and training
The company ensures, through various fora, that employees are kept informed on matters concerning them. Formal and informal channels are employed for communication with employees with an appropriate two – way feedback mechanism. In accordance with the company’s policy of continuous staff development, training facilities are provided in the group’s well equipped Training School (the Blue Academy). Employees of the Company attend training programmes organized by the Standard Bank Group (SBG) in South Africa and elsewhere and participate in programmes at the Standard Bank Global Leadership centre in South Africa. The company also provides its employees with on the job training in the company and at various Standard Bank locations.
n. Auditors
In accordance with Section 357(1) of CAMA, Messrs KPMG Professional Services (“KPMG”) were appointed to act as the company’s auditors during 2012 financial year. KPMG have indicated their willingness to continue in office as auditors. In accordance with Section 361 of CAMA, a resolution will be proposed, and if considered appropriate, passed by Shareholders at the next Annual General Meeting, to authorize the directors to fix their remuneration.
By order of the Board
Chidi OkezieCompany Secretary FRC/2013/NBA/0000000108205 February 2014
Statement of directors’ responsibilities in relation to the financial statementsFor the year ended 31 December 2013
The directors accept responsibility for the preparation of the annual financial statements set out on pages 1 to 99 that give a true and fair view in accordance with International Financial Reporting Standards (IFRS) and in the manner required by the Companies and Allied Matters Act of Nigeria.
The directors further accept responsibility for maintaining adequate accounting records as required by the Companies and Allied Matters Act of Nigeria and for such internal control as the directors determine is necessary to enable the preparation of financial statements that are free from material misstatement whether due to fraud or error.
The directors have made assessment of the company’s ability to continue as a going concern and have no reason to believe that the company will not remain a going concern in the year ahead.
Signed on behalf of the directors by:
Sola David-BorhaChief Executive OfficerFRC/2013/CIBN/0000000107005 February 2014
Atedo N.A. Peterside conChairmanFRC/2013/CIBN/0000000106905 February 2014
Directors’ report (continued)

127
Market & Shareholderinformation
Otherinformation
126 Stanbic IBTC Annual group financial statements for the year ended 31 December 2013
Annual report and financial statements Overview Business review
Annual reports and financial statements
Corporate governance report
Introduction
The company is a member of the Standard Bank Group, which holds a 53.16% equity holding in the company.
Standard Bank Group (“SBG”) is committed to implementing initiatives that improve corporate governance for the benefit of all stakeholders. SBG’s board of directors remains steadfast in implementing governance practices that comply with international best practice, where substance prevails over form.
Subsidiary entities within SBG are guided by these principles in establishing their respective governance frameworks, which are aligned to SBG’s standards in addition to meeting the relevant jurisdictional requirements in their areas of operation.
Stanbic IBTC Holdings PLC (“the company”), and its subsidiaries (“the group”), as a member of SBG, operate under a governance framework which enables the board to balance its role of providing oversight and strategic counsel with its responsibility to ensure conformance with regulatory requirements, group standards and acceptable risk tolerance parameters.
The major subsidiaries of the company; Stanbic IBTC Bank PLC, Stanbic IBTC Asset Management Limited; Stanbic IBTC Pension Managers Limited, Stanbic IBTC Trustees Limited; Stanbic IBTC Stockbrokers, Stanbic IBTC Ventures Limited, Stanbic IBTC Investments Limited and Stanbic IBTC Capital Limited and their respective subisidiaries have their own distinct boards and take account of the particular statutory and regulatory requirements of the businesses they operate. These subsidiaries operate under a governance framework that enables their boards to balance their roles in providing oversight and strategic counsel with their responsibility for ensuring compliance with the regulatory requirements that apply in their areas of operation and the standards and acceptable risk tolerance parameters adopted by the company. In this regard they have aligned their respective governance frameworks to that of the company. As Stanbic IBTC Holdings PLC is the holding company for the subsidiaries in the group, the company’s board also acts as the group board, with oversight of the full activities of the group.
A number of committees have been established by the company’s board that assists the board in fulfilling its stated objectives. The committees’ roles and responsibilities are set out in their mandates, which are reviewed periodically to ensure they remain relevant. The mandates set out their roles, responsibilities, scope of authority, composition and procedures for reporting to the board.
Codes and regulations
The company operates in highly regulated markets and compliance with applicable legislation, regulations, standards
and codes, including transparency and accountability, remain an essential characteristic of its culture. The board monitors compliance with these by means of management reports, which include information on the outcome of any significant interaction with key stakeholders such as regulators.
The group complies with all applicable legislation, regulations, standards and codes.
Shareholders’ responsibilities
The shareholders’ role is to approve appointments to the board of directors and the external auditors as well as to grant approval for certain corporate actions that are by legislation or the company’s articles of association specifically reserved for shareholders. Their role is extended to holding the board accountable and responsible for efficient and effective corporate governance.
Developments during 2013
During 2013, the following developments in the company’s corporate governance practices occurred:
There was a continued focus on directors training, particularly in the areas of islamic finance; corporate governance; and improving board effectiveness.
The provision of an enhanced level of information in the financial statements provided to shareholders and investors on an annual and quarterly basis continued.
Full implementation of the compliance plan with respect to the Central Bank of Nigeria’s regulation on the Scope of Banking Activities and Ancillary Matters No 3, 2010 (CBN Regulation No.3).
Stanbic IBTC Bureau De Change Limited received its final license from the CBN to commence business as a Bureau De Change on 20 September 2013.
Focus areas for 2014
The group intends during 2014 to:
continue the focus on directors’ training via formal training sessions and information bulletins on issues that are relevant; and
continue to enhance the level of information provided to and interaction with shareholders, investors and stakeholders generally.
Board and directors
Board structure and composition
Ultimate responsibility for governance rests with the board of directors of the company, who ensure that appropriate controls, systems and practices are in place. The company has a unitary board structure and the roles of chairman and chief executive are separate and distinct. The company’s chairman is a non-executive director. The number and stature of non-executive directors ensure that sufficient consideration and debate are brought to bear on decision making thereby contributing to the efficient running of the board.
One of the features of the manner in which the board operates is the role played by board committees, which facilitate the discharge of board responsibilities. The committees each have a board approved mandate that is regularly reviewed.
Strategy
The board considers and approves the company’s strategy. Once the financial and governance objectives for the following year have been agreed, the board monitors performance against financial objectives and detailed budgets on an on-going basis, through quarterly reporting.
Regular interaction between the board and the executive is encouraged. Management is invited, as required, to make presentations to the board on material issues under consideration.
Directors are provided with unrestricted access to the company’s management and company information, as well as the resources required to carry out their responsibilities, including external legal advice, at the company’s expense.
It is the board’s responsibility to ensure that effective management is in place to implement the agreed strategy, and to consider issues relating to succession planning. The board is satisfied that the current pool of talent available within the company, and the ongoing work to deepen the talent pool, provides adequate succession depth in both the short and long term.
Skills, knowledge, experience and attributes of directors
The board ensures that directors possess the skills, knowledge and experience necessary to fulfill their obligations. The directors bring a balanced mix of attributes to the board, including:
international and domestic experience;
operational experience;
knowledge and understanding of both the macroeconomic and the microeconomic factors affecting the group;
local knowledge and networks; and
financial, legal, entrepreneurial and banking skills.
The credentials and demographic profile of the board are regularly reviewed, to ensure the board’s composition remains both operationally and strategically appropriate.
Appointment philosophy
The appointment philosophy ensures alignment with all necessary legislation and regulations which include, but are not limited to the requirements of the Central Bank of Nigeria; SEC Code of Corporate Governance; the Companies and Allied Matters Act as well as the legislations of SBG’s home country.
Consideration for the appointment of directors and key executives take into account compliance with legal and regulatory requirements and appointments to external boards to monitor potential for conflicts of interest and ensure directors can dedicate sufficient focus to the company’s business. The board takes cognisance of the skills, knowledge and experience of the candidate, as well as other attributes considered necessary to the prospective role.
During the 2013 financial year, Messrs. Barend Kruger and John H. Maree resigned from the Board, while Mr. Simpiwe Tshabalala was appointed as a non-executive director on the Board. In terms of Section 259 (1) of the Companies and Allied Matters Act 2004, the company shall hold its second Annual General Meeting in 2014, and Messrs. Moses Adedoyin; Sam Cookey and Ifeoma Esiri shall retire by rotation and being eligible shall offer themselves for re–election.
With these appointment and resignations, the board’s size as at 31 December 2013 has reduced to eleven, one (1) executive director and ten (10) non-executive directors. It is important to note that two non-executive directors, namely, Mr. Sam Cookey and Mrs. Maryam Uwais (MFR) are designated as Independent non-executive directors. The board has the right mix of competencies and experience.
Board responsibilities
The key terms of reference in the board’s mandate, which forms the basis for its responsibilities, are to:
agree the group’s objectives, strategies and plans for achieving those objectives;
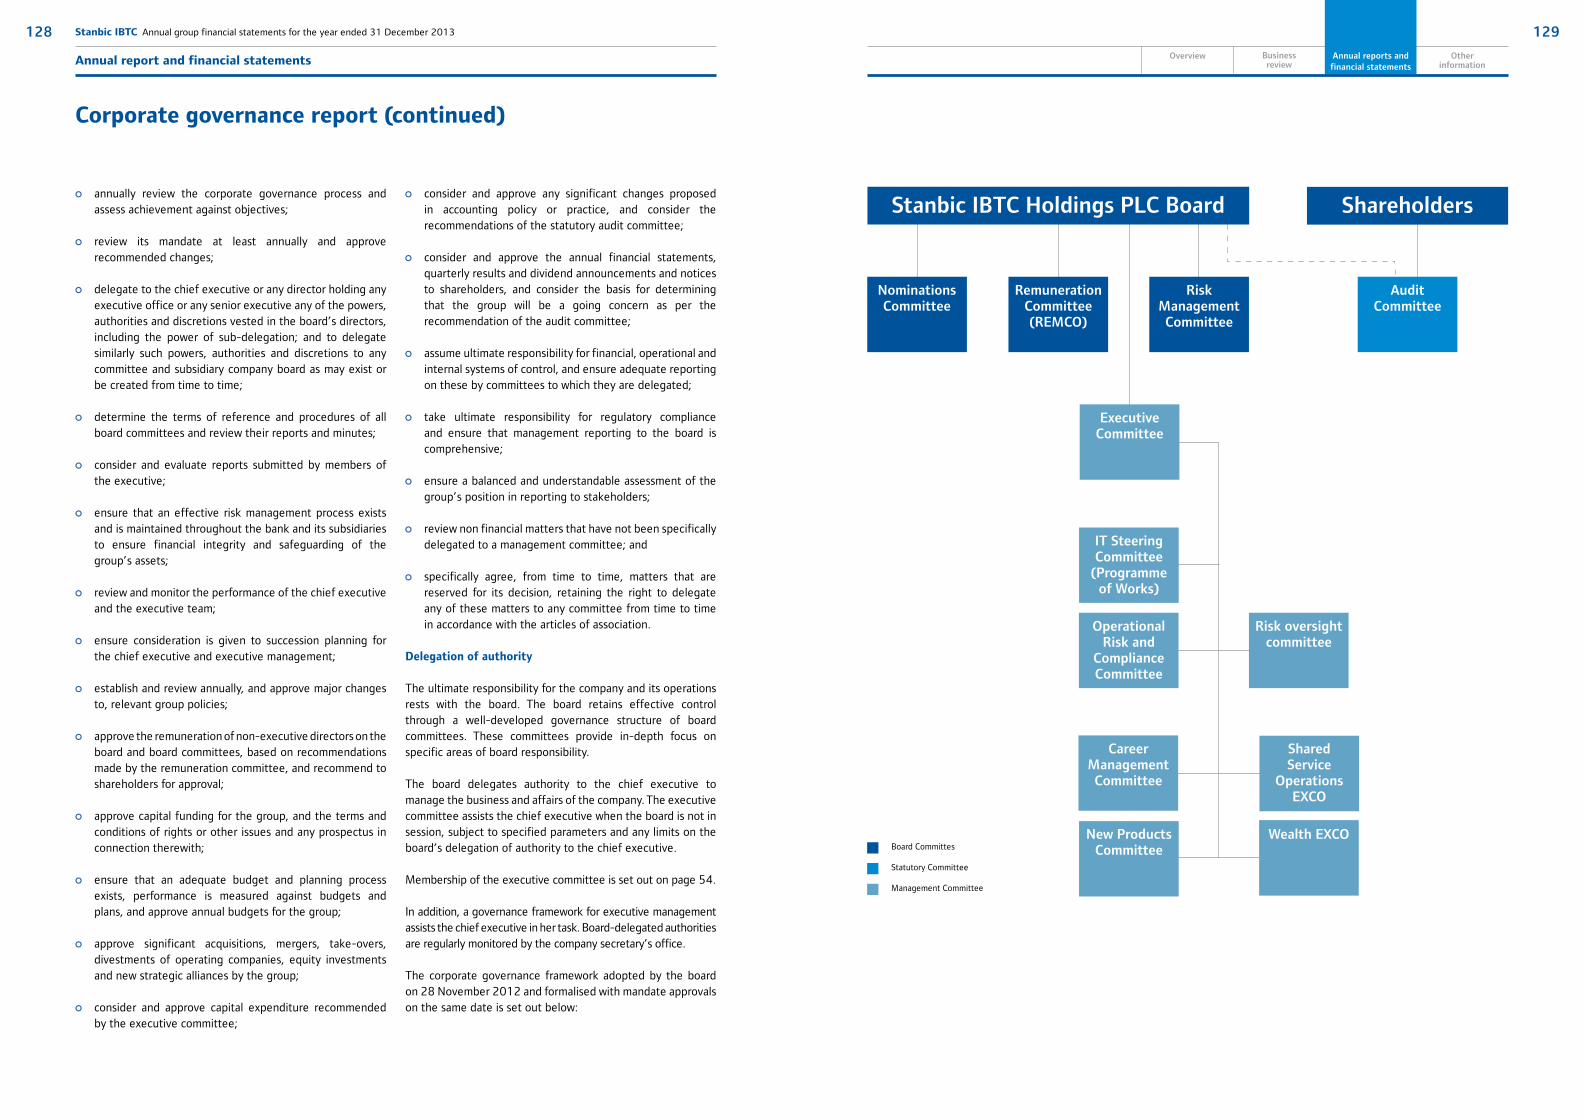
129
Market & Shareholderinformation
Otherinformation
128 Stanbic IBTC Annual group financial statements for the year ended 31 December 2013
Annual report and financial statements Overview Business review
Annual reports and financial statements
Corporate governance report (continued)
annually review the corporate governance process and assess achievement against objectives;
review its mandate at least annually and approve recommended changes;
delegate to the chief executive or any director holding any executive office or any senior executive any of the powers, authorities and discretions vested in the board’s directors, including the power of sub-delegation; and to delegate similarly such powers, authorities and discretions to any committee and subsidiary company board as may exist or be created from time to time;
determine the terms of reference and procedures of all board committees and review their reports and minutes;
consider and evaluate reports submitted by members of the executive;
ensure that an effective risk management process exists and is maintained throughout the bank and its subsidiaries to ensure financial integrity and safeguarding of the group’s assets;
review and monitor the performance of the chief executive and the executive team;
ensure consideration is given to succession planning for the chief executive and executive management;
establish and review annually, and approve major changes to, relevant group policies;
approve the remuneration of non-executive directors on the board and board committees, based on recommendations made by the remuneration committee, and recommend to shareholders for approval;
approve capital funding for the group, and the terms and conditions of rights or other issues and any prospectus in connection therewith;
ensure that an adequate budget and planning process exists, performance is measured against budgets and plans, and approve annual budgets for the group;
approve significant acquisitions, mergers, take-overs, divestments of operating companies, equity investments and new strategic alliances by the group;
consider and approve capital expenditure recommended by the executive committee;
consider and approve any significant changes proposed in accounting policy or practice, and consider the recommendations of the statutory audit committee;
consider and approve the annual financial statements, quarterly results and dividend announcements and notices to shareholders, and consider the basis for determining that the group will be a going concern as per the recommendation of the audit committee;
assume ultimate responsibility for financial, operational and internal systems of control, and ensure adequate reporting on these by committees to which they are delegated;
take ultimate responsibility for regulatory compliance and ensure that management reporting to the board is comprehensive;
ensure a balanced and understandable assessment of the group’s position in reporting to stakeholders;
review non financial matters that have not been specifically delegated to a management committee; and
specifically agree, from time to time, matters that are reserved for its decision, retaining the right to delegate any of these matters to any committee from time to time in accordance with the articles of association.
Delegation of authority
The ultimate responsibility for the company and its operations rests with the board. The board retains effective control through a well-developed governance structure of board committees. These committees provide in-depth focus on specific areas of board responsibility.
The board delegates authority to the chief executive to manage the business and affairs of the company. The executive committee assists the chief executive when the board is not in session, subject to specified parameters and any limits on the board’s delegation of authority to the chief executive.
Membership of the executive committee is set out on page 54.
In addition, a governance framework for executive management assists the chief executive in her task. Board-delegated authorities are regularly monitored by the company secretary’s office.
The corporate governance framework adopted by the board on 28 November 2012 and formalised with mandate approvals on the same date is set out below:
Stanbic IBTC Holdings PLC Board Shareholders
Nominations Committee
Remuneration Committee (REMCO)
Risk Management Committee
Executive Committee
IT Steering Committee
(Programme of Works)
Operational Risk and
Compliance Committee
Risk oversight committee
Career Management Committee
New Products Committee
Shared Service
Operations EXCO
Wealth EXCO
Audit Committee
Board Committes
Statutory Committee
Management Committee

131
Market & Shareholderinformation
Otherinformation
130 Stanbic IBTC Annual group financial statements for the year ended 31 December 2013
Annual report and financial statements Overview Business review
Annual reports and financial statements
Board effectiveness and evaluation
The board is focused on continued improvements in its corporate governance performance and effectiveness.
During the year the directors underwent an evaluation conducted by an independent consultant. The aim of this evaluation was to assist individual directors, the board and committees to constantly improve their effectiveness. The assessment conducted in 2013 focused on structure, process and effectiveness.
The report on this evaluation was discussed at a board meeting and relevant action points have been noted for implementation to further improve board functioning.
The performance of the chairman and chief executive are assessed annually, providing a basis to set their remuneration.
Induction and training
An induction programme designed to meet the needs of each new director is being implemented. One-on-one meetings are scheduled with management to introduce new directors to the company and its operations. The company secretary manages the induction programme. The Securities and Exchange Commission’s code of conduct is provided to new directors on their appointment.
Directors are kept abreast of all relevant legislation and regulations as well as sector developments leading to changing risks to the organisation on an on - going basis. This is achieved by way of management reporting and quarterly board meetings, which are structured to form part of ongoing training.
Directors attended various trainings at different periods during 2013 that included Islamic Finance, corporate governance, credit as well as board effectiveness. These trainings were aimed at enhancing the understanding of key issues, and skills of directors.
Executive committee members
As at 31 December 2013, the executive committee comprised of 17 members each with individual responsibilities.
Corporate governance report (continued)
S/n. Name Responsibility
i Sola David – Borha Chief executive - Stanbic IBTC Holdings PLC
ii Yinka Sanni Chief executive - Stanbic IBTC Bank PLC
iii Victor Williams Executive Director, Corporate and Transactional Banking
iv Obinnia Abajue Executive Director, Personal and Business Banking
v Wole Adeniyi Executive Director, Business Support
vi Angela Omo - Dare Head, Legal Services
vii Olufunke Amobi Head, Human Resources
viii William le Roux Head, CIB Credit
ix Chidi Okezie Company Secretary
x M'fon Akpan Head, Risk
xi Nkiru Olumide-Ojo Head, Marketing and Communications
xii Demola Sogunle Head, Wealth
xiii Babatunde Macaulay Head, Transactional Products and Services
xiv Arthur Oginga Chief Financial Officer
xv Steve Ideh Head, Group Internal Audit
xvi Yewande Sadiku Chief executive - Stanbic IBTC Capital Limited
xvii Rotimi Adojutelegan Acting Chief Compliance Officer
Board meetings
The board meets, at a minimum, once every quarter with ad-hoc meetings being held whenever it was deemed necessary. The board held a strategy session in August 2013. Directors, in accordance with the articles of association of the company, attend meetings either in person or via tele/video conferencing.
Directors are provided with comprehensive board documentation at least four days prior to each of the scheduled meetings.
Attendance at board meetings from 1 January – 31 December 2013 is set out in the following table:
Name February April August October
Atedo Peterside CON Chairman / / / /
Chris Newson / / / /
Sola David-Borha / / / /
Dominic Bruynseels / / / /
Moses Adedoyin / / / /
Sam Cookey / / / /
Ifeoma Esiri / / / /
Arnold Gain / / / /
Ben Kruger* / / / -
Ratan Mahtani / / / /
John H. Maree** / - - -
Maryam Uwais MFR / A / /
Sim Tshabalala*** - - - /
/ = Attendance A = Apology - = Not applicable
*Mr Kruger resigned with effect from 19 September 2013**Mr. Maree resigned with effect from 7 March 2013***Mr. Tshabalala’s appointment became effective from 20 August 2013
Board committees
Some of the functions of the board have been delegated to board committees, consisting of board members appointed by the board, which operates under mandates approved at the board meeting of 28 November 2012.
Risk management committee
The board is ultimately responsible for risk management. The main purpose of the risk management committee, as specified in its mandate is the provision of independent and objective oversight of risk management within the company. The committee is assisted in fulfilling its mandate by a number of management.
To achieve effective oversight, the committee reviews and assesses the integrity of risk control systems and ensures that risk policies and strategies are effectively managed and contribute to a culture of discipline and control that reduces the opportunity for fraud.

133
Market & Shareholderinformation
Otherinformation
132 Stanbic IBTC Annual group financial statements for the year ended 31 December 2013
Annual report and financial statements Overview Business review
Annual reports and financial statements
The risk management committee during the period under review was vested, among others, with the following responsibilities:
to oversee management’s activities in managing credit, market, liquidity, operational, legal and other risks of the group;
to periodically review the group’s risk management systems and report thereon to the board;
to ensure that the group’s material business risks are being effectively identified, quantified, monitored and controlled and that the systems in place to achieve this are operating effectively at all times; and
such other matters relating to the group’s risk assets as may be specifically delegated to the committee by the board.
The committee’s mandate is in line with SBG’s standards, while taking account of local circumstances.
A more in-depth risk management section which provides details of the overall framework for risk management in the group commences on page 71 of the consolidated financial statements.
As at 31 December 2013, the committee consisted of six directors, five of whom, including the chairman were non–executives.
Members’ attendance at risk management committee meetings during the financial year ended 31 December 2013 is stated below:
Name February April Aug Oct
Ifeoma Esiri (Chairman) / / / /
Sola David-Borha / / / /
Sam Cookey / / / /
Arnold Gain / / / /
Ben Kruger* / / / -
Chris Newson / / / /
Dominic Bruynseels / / / /
Name Feb April Aug Nov
Dominic Bruynseels (Chairman) / / / /
Ben Kruger* / / / -
Maryam Uwais / A / /
Moses Adedoyin / / / /
John H. Maree** / - - -
Chris Newson / / / /
Sim Tshabalala*** - - - /
/ = Attendance A = Apology - = Not applicable
/ = Attendance A = Apology - = Not applicable
* Mr. Kruger resigned with effect from 19 September 2013
*Mr Kruger resigned with effect from 19 September 2013 **Mr. Maree resigned with effect from 7 March 2013 ***Mr. Tshabalala’s appointment became effective from 20 August 2013
Corporate governance report (continued)
Remuneration committee
The remuneration committee (REMCO) was vested with responsibilities during the year under review that included:
reviewing the remuneration philosophy and policy;
considering the guaranteed remuneration, annual performance bonus and pension incentives of the group’s executive directors and managers;
reviewing the performance measures and criteria to be used for annual incentive payments for all employees;
determining the remuneration of the chairman and non-executive directors, which are subject to board and shareholder approval;
considering the average percentage increases of the guaranteed remuneration of executive management across the group, as well as long-term and short-term incentives; and
agreeing incentive schemes across the group.
The chief executive attends meetings by invitation. Other members of executive management are invited to attend when appropriate. No individual, irrespective of position, is expected to be present when his or her remuneration is discussed.
When determining the remuneration of executive and non-executive directors as well as senior executives, REMCO is expected to review market and competitive data, taking into account the company’s performance using indicators such as earnings.
REMCO utilises the services of a number of suppliers and advisors to assist it in tracking market trends relating to all levels of staff, including fees for non-executive directors.
The board reviews REMCO’s proposals and, where relevant, will submit them to shareholders for approval at the annual general meeting (AGM.). The board remains ultimately responsible for the remuneration policy.
As at 31 December 2013, the committee consisted of five directors, all of whom are non–executives.
Members’ attendance at REMCO meetings during the financial year ended 31 December 2013 is stated below:

135
Market & Shareholderinformation
Otherinformation
134 Stanbic IBTC Annual group financial statements for the year ended 31 December 2013
Annual report and financial statements Overview Business review
Annual reports and financial statements
Remuneration
Introduction
The purpose of this section is to provide stakeholders with an understanding of the remuneration philosophy and policy applied across the group for executive management, employees, and directors (executive and non-executive).
Remuneration philosophy
The group’s board and remuneration committee set a remuneration philosophy which is guided by SBG’s philosophy and policy as well as the specific social, regulatory, legal and economic context of Nigeria.
In this regard, the group employs a cost to company structure, where all benefits are included in the listed salary and appropriately taxed.
The following key factors have informed the implementation of reward policies and procedures that support the achievement of business goals:
the provision of rewards that enable the attraction, retention and motivation of employees and the development of a high performance culture;
maintaining competitive remuneration in line with the market, trends and required statutory obligations;
rewarding people according to their contribution;
allowing a reasonable degree of flexibility in remuneration processes and choice of benefits by employees;
utilising a cost-to-company remuneration structure; and
educating employees on the full employee value proposition;
The group’s remuneration philosophy aligns with its core values, including growing our people, appropriately remunerating high performers and delivering value to our shareholders. The philosophy emphasises the fundamental value of our people and their role in ensuring sustainable growth. This approach is crucial in an environment where skills remain scarce.
The board sets the principles for the group‘s remuneration philosophy in line with the approved business strategy and objectives. The philosophy aims to maintain an appropriate balance between employee and shareholder interests. The deliberations of REMCO inform the philosophy, taking into account reviews of performance at a number of absolute and relative levels – from a business, an individual and a competitive point of view.
A key success factor for the group is its ability to attract, retain and motivate the talent it requires to achieve its strategic and operational objectives. The group’s remuneration philosophy includes short-term and long-term incentives to support this ability.
Short-term incentives, which are delivery specific, are viewed as strong drivers of competitiveness and performance. A significant portion of top management’s reward is therefore variable, being determined by financial performance and personal contribution against specific criteria set in advance. This incites the commitment and focus required to achieve targets.
Long-term incentives seek to ensure that the objectives of management and shareholders are broadly aligned over longer time periods.
Remuneration policy
The group has always had a clear policy on the remuneration of staff, executive and non-executive directors which set such remuneration at levels that are fair and reasonable in a competitive market for the skills, knowledge, experience required and which complies with all relevant tax laws.
REMCO assists the group’s board in monitoring the implementation of the group remuneration policy, which ensures that:
salary structures and policies, as well as cash and long term incentives, motivate sustained high performance and are linked to corporate performance objectives;
stakeholders are able to make a reasonable assessment of reward practices and the governance process; and
the group complies with all applicable laws and codes.
Remuneration structure
Non-executive directors
Terms of serviceDirectors are appointed by the shareholders at the AGM, although board appointments may be made between AGMs. These appointments are made in terms of the company’s policy. Shareholder approvals for such interim appointments are however sought at the annual general meeting that holds immediately after such appointments are made.
Non-executive directors are required to retire after three years and may offer themselves for re-election. If recommended by the board, their re-election is proposed to shareholders at the AGM.
In terms of CAMA, if a director over the age of 70 is seeking re-election to the board his age must be disclosed to shareholders at the meeting at which such reelection is to occur.
Fees
Non-executive directors’ receive fixed annual fees and sitting allowances for service on the board and board committees. There are no contractual arrangements for compensation for loss of office. Non-executive directors do not receive short-term incentives, nor do they participate in any long-term incentive schemes.
REMCO reviews the non-executive directors’ fees annually and makes recommendations on same to the board for consideration. Based on these recommendations, the board in turn recommends a gross fee to shareholders for approval at the Annual General Meeting (AGM).
Fees that are payable for the reporting period 1 January to 31 December of each year.
Category 2014(i) 2013
Chairman 50,287,360 46,220,000
Non-Executive Directors 13,977,536 12,847,000
Sitting Allowances for Board Meetings (ii)
Chairman 300,000 239,000
Non-Executive Directors 200,000 151,000
(i) Proposed for approval by shareholders at the AGM taking place in 2014.(ii) Fees quoted as sitting allowance represent per meeting sitting allowance paid for board, board committee and ad hoc meetings. No annual fees are payable to committee members with respect to their roles on such committees.
Retirement benefits
Non-executive directors do not participate in the pension scheme.
Executive directors
The company had one executive director as at 31 December 2013.Executive directors receive a remuneration package and qualify for long-term incentives on the same basis as other employees.
Executive director’s bonus and pension incentives are subject to an assessment by REMCO of performance against various criteria. The criteria include the financial performance of the company, based on key financial measures and qualitative aspects of performance, such as effective implementation of group strategy and human resource leadership.
Management and general staff
Total remuneration packages for employees comprises the following:
guaranteed remuneration – based on market value and the role played;
annual bonus – used to stimulate the achievement of group objectives;
long term incentives – rewards the sustainable creation of shareholder value and aligns behaviour to this goal;
pension – provides a competitive post-retirement benefit in line with other employees.
Corporate governance report (continued)
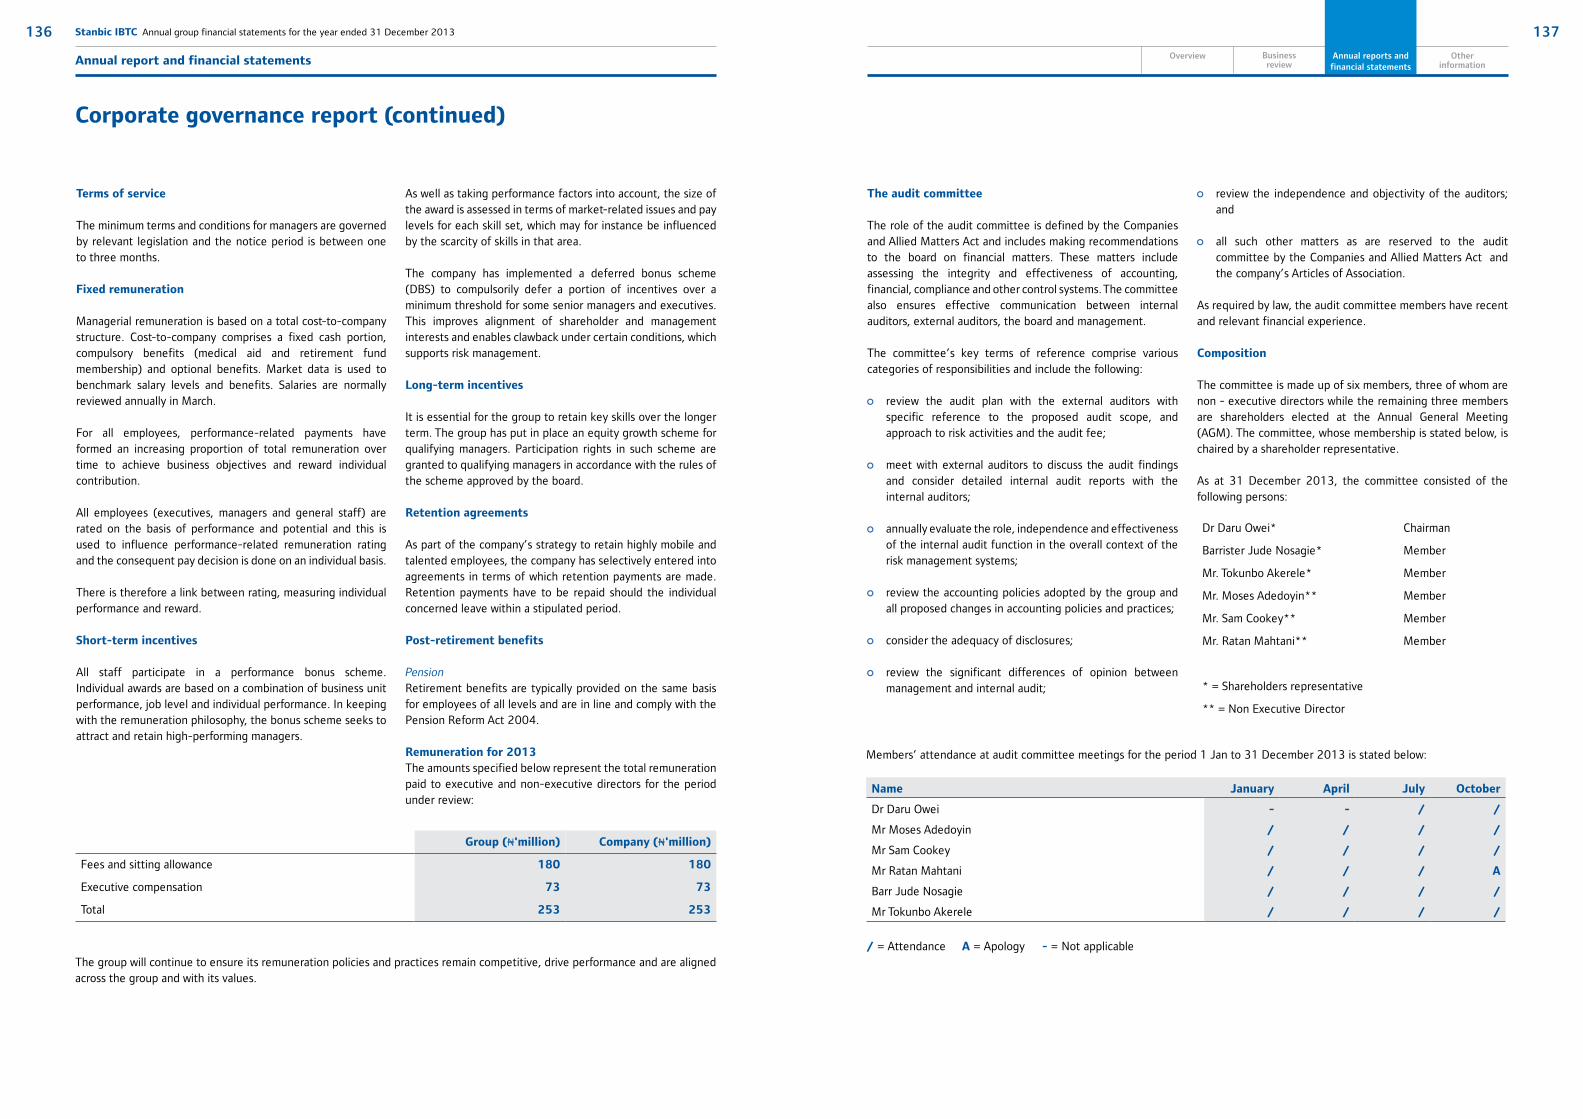
137
Market & Shareholderinformation
Otherinformation
136 Stanbic IBTC Annual group financial statements for the year ended 31 December 2013
Annual report and financial statements Overview Business review
Annual reports and financial statements
Terms of service
The minimum terms and conditions for managers are governed by relevant legislation and the notice period is between one to three months.
Fixed remuneration
Managerial remuneration is based on a total cost-to-company structure. Cost-to-company comprises a fixed cash portion, compulsory benefits (medical aid and retirement fund membership) and optional benefits. Market data is used to benchmark salary levels and benefits. Salaries are normally reviewed annually in March.
For all employees, performance-related payments have formed an increasing proportion of total remuneration over time to achieve business objectives and reward individual contribution.
All employees (executives, managers and general staff) are rated on the basis of performance and potential and this is used to influence performance-related remuneration rating and the consequent pay decision is done on an individual basis.
There is therefore a link between rating, measuring individual performance and reward.
Short-term incentives
All staff participate in a performance bonus scheme. Individual awards are based on a combination of business unit performance, job level and individual performance. In keeping with the remuneration philosophy, the bonus scheme seeks to attract and retain high-performing managers.
Corporate governance report (continued)
As well as taking performance factors into account, the size of the award is assessed in terms of market-related issues and pay levels for each skill set, which may for instance be influenced by the scarcity of skills in that area.
The company has implemented a deferred bonus scheme (DBS) to compulsorily defer a portion of incentives over a minimum threshold for some senior managers and executives. This improves alignment of shareholder and management interests and enables clawback under certain conditions, which supports risk management.
Long-term incentives
It is essential for the group to retain key skills over the longer term. The group has put in place an equity growth scheme for qualifying managers. Participation rights in such scheme are granted to qualifying managers in accordance with the rules of the scheme approved by the board.
Retention agreements
As part of the company’s strategy to retain highly mobile and talented employees, the company has selectively entered into agreements in terms of which retention payments are made. Retention payments have to be repaid should the individual concerned leave within a stipulated period.
Post-retirement benefits
PensionRetirement benefits are typically provided on the same basis for employees of all levels and are in line and comply with the Pension Reform Act 2004.
Remuneration for 2013The amounts specified below represent the total remuneration paid to executive and non-executive directors for the period under review:
Group (N'million) Company (N'million)
Fees and sitting allowance 180 180
Executive compensation 73 73
Total 253 253
Dr Daru Owei* Chairman
Barrister Jude Nosagie* Member
Mr. Tokunbo Akerele* Member
Mr. Moses Adedoyin** Member
Mr. Sam Cookey** Member
Mr. Ratan Mahtani** Member
* = Shareholders representative
** = Non Executive Director
The group will continue to ensure its remuneration policies and practices remain competitive, drive performance and are aligned across the group and with its values.
The audit committee
The role of the audit committee is defined by the Companies and Allied Matters Act and includes making recommendations to the board on financial matters. These matters include assessing the integrity and effectiveness of accounting, financial, compliance and other control systems. The committee also ensures effective communication between internal auditors, external auditors, the board and management.
The committee’s key terms of reference comprise various categories of responsibilities and include the following:
review the audit plan with the external auditors with specific reference to the proposed audit scope, and approach to risk activities and the audit fee;
meet with external auditors to discuss the audit findings and consider detailed internal audit reports with the internal auditors;
annually evaluate the role, independence and effectiveness of the internal audit function in the overall context of the risk management systems;
review the accounting policies adopted by the group and all proposed changes in accounting policies and practices;
consider the adequacy of disclosures;
review the significant differences of opinion between management and internal audit;
review the independence and objectivity of the auditors; and
all such other matters as are reserved to the audit committee by the Companies and Allied Matters Act and the company’s Articles of Association.
As required by law, the audit committee members have recent and relevant financial experience.
Composition
The committee is made up of six members, three of whom are non - executive directors while the remaining three members are shareholders elected at the Annual General Meeting (AGM). The committee, whose membership is stated below, is chaired by a shareholder representative.
As at 31 December 2013, the committee consisted of the following persons:
Members’ attendance at audit committee meetings for the period 1 Jan to 31 December 2013 is stated below:
Name January April July October
Dr Daru Owei - - / /
Mr Moses Adedoyin / / / /
Mr Sam Cookey / / / /
Mr Ratan Mahtani / / / A
Barr Jude Nosagie / / / /
Mr Tokunbo Akerele / / / /
/ = Attendance A = Apology - = Not applicable

139
Market & Shareholderinformation
Otherinformation
138 Stanbic IBTC Annual group financial statements for the year ended 31 December 2013
Annual report and financial statements Overview Business review
Annual reports and financial statements
Company secretary
It is the role of the company secretary to ensure the board remains cognisant of its duties and responsibilities. In addition to providing the board with guidance on its responsibilities, the company secretary keeps the board abreast of relevant changes in legislation and governance best practices. The company secretary oversees the induction of new directors, including subsidiary directors, as well as the ongoing training of directors. All directors have access to the services of the company secretary.
Going concern
On the recommendation of the audit committee, the board annually considers and assesses the going concern basis for the preparation of the financial statements at the year end.
The board continues to view the company as a going concern for the foreseeable future.
Management committees
The group has the following management committees:
Executive committee (Exco)
Wealth Exco
Shared services operations Exco
IT steering committee (“program of works”)
Operational risk and compliance committee
New products committee
Career management committee
Risk oversight committee
Relationship with shareholders
As an indication of its fundamental responsibility to create shareholder value, effective and ongoing communication with shareholders is seen as essential. In addition to the ongoing engagement facilitated by the company secretary and the head of investor relations, the company encourages shareholders to attend the annual general meeting and other shareholder meetings where interaction is welcomed. The chairman of the company’s audit committee is available at the meeting to respond to questions from shareholders.
Voting at general meetings is conducted either on a show of hands or a poll depending on the subject matter of the resolution on which a vote is being cast and separate resolutions are proposed on each significant issue.
Dealing in securities
In line with its commitment to conduct business professionally and ethically, the company has introduced policies to restrict the dealing in securities by directors, shareholder representatives on the audit committee and embargoed employees. A personal account trading policy is in place to prohibit employees and directors from trading in securities during close periods. Compliance with this policy is monitored on an ongoing basis.
Sustainability
The company as a member of the Standard Bank Group (SBG) is committed to conducting business professionally, ethically, with integrity and in accordance with international best practice. To this end, the company subscribes to and adopts risk management standards, policies and procedures that have been adopted by the SBG. The company is also bound by the Nigerian Sustainable Banking Principles (“the Principles”) and the provisions of the Principles are incorporated into policies approved by the Board.
SBG’s risk management standards, policies and procedures have been amended to be more reflective of the Nigerian business and regulatory environment. All such amendments to the risk management standards, policies and procedures have been agreed to by Standard Bank Africa (SBAF) Risk Management.
The group is committed to contributing to sustainable development through ethical, responsible financing and business practices which unlocks value for our stakeholders. We manage the environmental and social aspects that impact our activities, products and services whilst ensuring sustainable value creation for our customers. We are passionately committed to encouraging financial inclusion through the provision of banking and other financial services to all cadres of the society and a promoter of gender equality.
Social responsibility
As an African business, the group understands the challenges and benefits of doing business in Africa, and owes its existence to the people and societies within which it operates.
The group is therefore committed not only to the promotion of economic development but also to the strengthening of civil society and human well being.
The group is concentrating its social investment expenditure in defined focus area which currently include education in order to make the greatest impact. These areas of focus will be subject to annual revision as the country socio-economic needs change.
Ethics and organisational integrity
The board aims to provide effective and ethical leadership and ensures that its conduct and that of management is aligned to the organization’s values and code of ethics. The board subscribes to the SBG group’s values and enables decision making at all levels of the business according to defined ethical principles and values.
Compliance with the Securities and Exchange Commission’s code of corporate governance
As a public company, Stanbic IBTC Holdings PLC confirms that throughout the year ended 31 December 2013 the company has complied with the principles set out in the Securities and Exchange Commission’s Code of Corporate Governance.
The company applies the Code’s principles of transparency, integrity and accountability through its own behaviour, corporate governance best practice and by adopting, as appropriate and proportionate for a company of its size and nature. The policies and procedures adopted by the Board and applicable to the company’s businesses are documented in mandates, which also set out the roles and delegated authorities applying to the Board, Board Committees, and the Executive Committee.
Corporate governance report (continued)

141
Market & Shareholderinformation
Otherinformation
140 Stanbic IBTC Annual group financial statements for the year ended 31 December 2013
Annual report and financial statements Overview Business review
Annual reports and financial statements
Report of the audit committee Independent auditor’s report
To the members of Stanbic IBTC Holdings PLC
In compliance with the provisions of Section 359(3) to (6) of the Companies and Allied Matters Act Cap C20 Laws of the Federation of Nigeria 2004, the audit committee considered the audited financial statements for the year ended 31 December 2013 together with the management controls report from the auditors and the company’s response to this report at its meeting held on 05 February 2014.
In our opinion, the scope and planning of the audit for the year ended 31 December 2013 were adequate.
We have exercised our statutory functions under Section 359 (6) of the Companies and Allied Matters Act of Nigeria and acknowledge the co-operation of management and staff in the conduct of these responsibilities.
We are of the opinion that the accounting and reporting policies of the company and the group are in accordance with legal requirements and agreed ethical practices, and that the scope and planning of both the external and internal audits for the period ended 31 December 2013 were satisfactory and reinforce the group’s internal control systems.
To the Members of Stanbic IBTC Holdings PLC
Report on the Financial Statements
We have audited the accompanying financial statements of Stanbic IBTC Holdings PLC (‘’the Company”) and its subsidiary companies (together “the Group”), which comprise the statements of financial position as at December 31, 2013, and the statements of profit or loss and other comprehensive income, statements of changes in equity, and statements of cash flows for the year then ended, and a summary of significant accounting policies and other explanatory information, as set out on pages 142 to 229.
Directors’ Responsibility for the Financial Statements
The directors are responsible for the preparation of financial statements that give a true and fair view in accordance with International Financial Reporting Standards and in the manner required by the Companies and Allied Matters Act of Nigeria, the Financial Reporting Council of Nigeria Act, 2011, and the Banks and Other Financial Institutions Act of Nigeria and relevant Central Bank of Nigeria circulars, and for such internal control as the directors determine is necessary to enable the preparation of financial statements that are free from material misstatement, whether due to fraud or error.
Auditor’s Responsibility
Our responsibility is to express an opinion on these financial statements based on our audit. We conducted our audit in accordance with International Standards on Auditing. Those standards require that we comply with ethical requirements and plan and perform the audit to obtain reasonable assurance about whether the financial statements are free from material misstatement.
An audit involves performing procedures to obtain audit evidence about the amounts and disclosures in the financial statements. The procedures selected depend on the auditor’s judgment, including the assessment of the risks of material misstatement of the financial statements, whether due to fraud or error. In making those risk assessments, the auditor considers internal control relevant to the entity’s preparation and fair presentation of the financial statements that give a true and fair view in order to design audit procedures that are appropriate in the circumstances, but not for the purpose of expressing an opinion on the effectiveness of the entity’s internal control. An audit also includes evaluating the appropriateness of accounting policies used and the reasonableness of accounting estimates made by the directors, as well as evaluating the overall presentation of the financial statements.
Dr Daru OweiChairman, audit committee05 February 2014FRC/2014/NIM/00000006666
Members of the audit committee are:1. Dr Daru Owei 2. Mr Moses Adedoyin3. Mr Sam Cookey4. Mr Ratan Mahtani 5. Barr Jude Nosagie6. Mr Tokunbo Akerele
After due consideration, the audit committee accepted the report of the auditors that the financial statements were in accordance with ethical practice and International Financial Reporting Standards and give a true and fair view of the state of the company’s financial affairs.
The committee reviewed management’s response to the auditors findings in respect of management matters and we and the auditors are satisfied with management’s response thereto.
We are satisfied that the company has complied with the provisions of Central Bank of Nigeria circular BSD/1/2004 dated 18 February 2004 on “Disclosure of insider related credits in the financial statements of banks”, and hereby confirm that an aggregate amount of N27,851,980,227 (31 December 2012: N28,004,048,212) was outstanding as at 31 December 2013. The perfomance status of insider related credits is as disclosed in note 34.
The committee therefore recommended that the audited consolidated financial statements of the company for the year ended 31 December 2013 and the auditor’s report thereon be approved by the board.
The committee also approved the provision made in the consolidated financial statements in relation to the remuneration of the auditors.
We believe that the audit evidence we have obtained is sufficient and appropriate to provide a basis for our audit opinion.
Opinion
In our opinion, these financial statements give a true and fair view of the financial position of Stanbic IBTC Holdings PLC (“the Company”) and its subsidiaries (together “the Group”) as at December 31, 2013, and of the Group and Company’s financial performance and cash flows for the year then ended in accordance with International Financial Reporting Standards and in the manner required by the Companies and Allied Matters Act of Nigeria and the Financial Reporting Council of Nigeria Act, 2011, the Banks and Other Financial Institutions Act of Nigeria, and relevant Central Bank of Nigeria circulars.
Report on Other Legal and Regulatory Requirements
Compliance with the requirements of Schedule 6 of the Companies and Allied Matters Act of Nigeria
In our opinion, proper books of account have been kept by the Company, so far as appears from our examination of those books and the Company’s statement of financial position and the statement of comprehensive income are in agreement with the books of account.
Compliance with Section 27 (2) of the Banks and Other Financial Institutions Act of Nigeria and Central Bank of Nigeria circular BSD/1/2004
i. There were no penalties paid by the Company in respect of contraventions of the Banks and Other Financial Institutions Act during the year ended 31 December 2013. However, the Group paid penalties as disclosed in note 37 to the financial statements.
ii. Related party transactions and balances are disclosed in note 33 to the financial statements in compliance with the Central Bank of Nigeria circular BSD/1/2004.
Signed:
Ayodele H. Othihiwa, FCA
FRC/2012/ICAN/00000000425For: KPMG Professional Services Chartered Accountants11 March 2014Lagos Nigeria

143
Market & Shareholderinformation
Otherinformation
142 Stanbic IBTC Annual group financial statements for the year ended 31 December 2013
Annual report and financial statements Overview Business review
Annual reports and financial statements
Statement of profit or loss
Group Company
Note31 Dec 2013
Nmillion31 Dec 2012
Nmillion31 Dec 2013
Nmillion31 Dec 2012
Nmillion
Gross earnings 111,226 91,860 9,137 1,250
Net interest income 37,013 33,554 - -
Interest income 28.1 62,585 57,818 - -
Interest expense 28.2 (25,572) (24,264) - -
Non-interest revenue 48,219 33,856 9,137 1,250
Net fee and commission revenue 28.3 32,900 25,568 728 -
Fee and commission revenue 28.3 33,322 25,754 728 -
Fee and commission expense 28.3 (422) (186) - -
Trading revenue 28.4 14,895 8,091 - -
Other revenue 28.5 424 197 8,409 1,250
Total income 85,232 67,410 9,137 1,250
Credit impairment charges 28.6 (2,667) (6,895) - -
Income after credit impairment charges 82,565 60,515 9,137 1,250
Operating expenses (57,725) (48,789) (883) (72)
Staff costs 28.7 (23,851) (19,953) (456) (21)
Other operating expenses 28.8 (33,874) (28,836) (427) (51)
Net income before indirect taxation 24,840 11,726 8,254 1,178
Indirect taxation 30.1 (223) (314) (38) (125)
Profit before direct taxation 24,617 11,412 8,216 1,053
Direct taxation 30.2 (3,844) (1,255) 116 -
Profit for the year 20,773 10,157 8,332 1,053
Profit attributable to:
Non-controlling interests 2,163 1,289 - -
Equity holders of the parent 18,610 8,868 8,332 1,053
Profit for the year 20,773 10,157 8,332 1,053
Earnings per share
Basic earnings per ordinary share (kobo) 31 186 50 83 -
The accompanying notes from page 151 to 227 form an integral part of these financial statements.
Group Company
Note31 Dec 2013
Nmillion31 Dec 2012
Nmillion31 Dec 2013
Nmillion31 Dec 2012
Nmillion
Assets
Cash and cash equivalents 7 120,312 106,680 2,722 2,625
Trading assets 9 40,711 114,877 - -
Pledged assets 8 24,733 24,440 - -
Derivative assets 10 1,526 1,709 - -
Financial investments 11 139,304 85,757 - -
Loans and advances 12 383,927 290,915 - -
Loans and advances to banks 12 94,180 24,571 - -
Loans and advances to customers 12 289,747 266,344 - -
Equity Investment in group companies 13 - - 68,951 68,951
Other assets 15 19,829 22,771 1,038 916
Current tax and deferred tax assets 16 7,716 5,212 118 -
Property and equipment 17 24,988 24,458 2,572 16
Total assets 763,046 676,819 75,401 72,508
Equity and liabilities
Equity 97,634 85,651 71,846 71,503
Equity attributable to ordinary shareholders 94,313 83,341 71,846 71,503
Ordinary share capital 18 5,000 5,000 5,000 5,000
Share premium 18 65,450 65,450 65,450 65,450
Reserves 23,863 12,891 1,396 1,053
Non-controlling interest 3,321 2,310
Liabilities 665,412 591,168 3,555 1,005
Trading liabilities 9 66,960 88,371 - -
Derivative liabilities 10 1,085 772 - -
Deposit and current accounts 19 468,038 382,051 - -
Deposits from banks 19 51,686 26,632 - -
Deposits from customers 19 416,352 355,419 - -
Other borrowings 20 48,764 66,873 - -
Current and deferred tax liabilities 22 7,788 4,844 2 -
Subordinated debt 21 6,399 - - -
Provisions and other liabilities 23 66,378 48,257 3,553 1,005
Total equity and liabilities 763,046 676,819 75,401 72,508
Statement of financial position
Sola David-BorhaChief Executive OfficerFRC/2013/CIBN/0000000107005 February 2014
Atedo N.A. Peterside CONChairmanFRC/2013/CIBN/0000000106905 February 2014
Arthur Oginga Chief Financial Officer FRC/2013/IODN/00000003181 05 February 2014

145
Market & Shareholderinformation
Otherinformation
144 Stanbic IBTC Annual group financial statements for the year ended 31 December 2013
Annual report and financial statements Overview Business review
Annual reports and financial statements
The accompanying notes from page 151 to 227 form an integral part of these financial statements.
Statement of profit or loss and other comprehensive income
Group Company
31 Dec 2013Nmillion
31 Dec 2012Nmillion
31 Dec 2013Nmillion
31 Dec 2012Nmillion
Profit for the year 20,773 10,157 8,332 1,053
Other comprehensive income
Items that will never be reclassified to profit or loss - - - -
Items that are or may be reclassified subsequently to profit or loss:
Net change in fair value of available-for-sale financial assets
408 3,645 - -
Realised fair value adjustments on available-for-sale financial assets reclassified to income statement
(153) 269 - -
Income tax on other comprehensive income 255 3,914 - -
Other comprehensive income for the year net of tax 255 3,914 - -
Total comprehensive income for the year 21,028 14,071 8,332 1,053
Total comprehensive income attributable to:
Non-controlling interests 2,129 1,255 - -
Equity holders of the parent 18,899 12,816 8,332 1,053
21,028 14,071 8,332 1,053

147
Market & Shareholderinformation
Otherinformation
146 Stanbic IBTC Annual group financial statements for the year ended 31 December 2013
Annual report and financial statements Overview Business review
Annual reports and financial statements
Statement of changes in equity
Refer to note 18.3 for an explanation of the components of reserve The accompanying notes from page 151 to 227 form an integral part of these financial statements
Group
Ordinary share
capital Nmillion
Share premiumNmillion
Merger reserveNmillion
Statutory credit risk
reserveNmillion
Available- for-sale
revaluation reserveNmillion
Share-based payment
reserveNmillion
Other regulatory
reservesNmillion
Retained earnings Nmillion
Ordinary shareholders’
equityNmillion
Non-controlling
interest Nmillion
Totalequity
Nmillion
Balance at 1 January 2012 9,375 65,450 (19,123) - (3,982) 295 15,077 12,775 79,867 1,911 81,778
Total comprehensive (loss)/income for the year - - - - 3,914 - 1,343 7,525 12,782 1,255 14,037
Profit for the year - - - - - - 1,343 7,525 8,868 1,289 10,157
Other comprehensive (loss)/income after tax for the year - - - - 3,914 - - - 3,914 (34) 3,880
Net change in fair value on available-for-sale financial assets - - - - 3,645 - - - 3,645 (34) 3,611
Realised fair value adjustments on available-for-sale financial assets - - - - 269 - - - 269 - 269
Income tax on other comprehensive income - - - - - - - - - - -
Transactions with shareholders, recorded directly in equity (4,375) - - - - 67 - (5,000) (9,308) (856) (10,164)
Equity-settled share-based payment transactions - - - - - 67 - - 67 - 67
Shares cancelled on holding company restructuring (7,500) - - - - - - - (7,500) - (7,500)
Issue of shares on holding company restructuring 3,125 - - - - - - (3,125) - - -
Dividends paid to equity holders - - - - - - - (1,875) (1,875) (856) (2,731)
Balance at 31 December 2012 5,000 65,450 (19,123) - (68) 362 16,420 15,300 83,341 2,310 85,651
Balance at 1 January 2013 5,000 65,450 (19,123) - (68) 362 16,420 15,300 83,341 2,310 85,651
Total comprehensive income/(loss) for the year - - - - 289 - 2,439 16,171 18,899 2,129 21,028
Profit for the year - - - - - - 2,439 16,171 18,610 2,163 20,773
Other comprehensive income/(loss) after tax for the year - - - - 289 - - - 289 (34) 255
Net change in fair value on available-for-sale financial assets - - - - 442 - - - 442 (34) 408
Realised fair value adjustments on available-for-sale financial assets - - - - (153) - - - (153) - (153)
Income tax on other comprehensive income - - - - - - - - - - -
Statutory credit risk reserve - - - 769 - - - (769) - - -
Transactions with shareholders, recorded directly in equity - - - - - (89) - (7,838) (7,927) (1,118) (9,045)
Equity-settled share-based payment transactions - - - - - 73 - - 73 - 73
Transfer of vested portion of equity settled share based payment to retained earnings
- - - - - (162) - 162 - - -
Dividends paid to equity holders - - - - - - - (8,000) (8,000) (1,118) (9,118)
Balance at 31 December 2013 5,000 65,450 (19,123) 769 221 273 18,859 22,864 94,313 3,321 97,634

149
Market & Shareholderinformation
Otherinformation
148 Stanbic IBTC Annual group financial statements for the year ended 31 December 2013
Annual report and financial statements Overview Business review
Annual reports and financial statements
Statement of changes in equity
The accompanying notes from page 151 to 227 form an integral part of these financial statements
Company
Ordinary share capital
Nmillion
Share premiumNmillion
Available-for-sale revaluation reserve
Nmillion
Share-based payment reserve
Nmillion
Other regulatory reservesNmillion
Retained earnings Nmillion
Ordinary shareholders’ equity
Nmillion
Balance at 1 January 2012 - - - - - - -
Total comprehensive income/(loss) for the year - - - - - 1,053 1,053
Profit for the year - - - - - 1,053 1,053
Other comprehensive income/(loss) after tax for the year - - - - - - -
Net change in fair-value on available-for-sale financial assets - - - - - - -
Realised fair-value adjustments on available-for-sale financial assets - - - - - - -
Other - - - - - - -
Transactions with shareholders, recorded directly in equity 5,000 65,450 - - - - 70,450
Issue of shares 5,000 65,450 - - - - 70,450
Dividends paid to equity holders - - - - - - -
Balance at 31 December 2012 5,000 65,450 - - - 1,053 71,503
Balance at 1 January 2013 5,000 65,450 - - - 1,053 71,503
Total comprehensive income/(loss) for the year - - - 8,332 8,332
Profit for the period - - - - - 8,332 8,332
Other comprehensive income/(loss) after tax for the period - - - - - - -
Net change in fair value on available-for-sale financial assets - - - - - - -
Realised fair-value adjustments on available-for-sale financial assets - - - - - - -
Other - - - - - - -
Transactions with shareholders, recorded directly in equity - - - - 8 (7,997) (7,989)
Equity-settled share-based payment transactions - - - - 11 - 11
Transfer of vested portion of equity settled share based payment to retained earnings
- - - - (3) 3 -
Dividends paid to equity holders - - - - - (8,000) (8,000)
Balance at 31 December 2013 5,000 65,450 - - 8 1,388 71,846

151
Market & Shareholderinformation
Otherinformation
150 Stanbic IBTC Annual group financial statements for the year ended 31 December 2013
Annual report and financial statements Overview Business review
Annual reports and financial statements
Group Company
Note
31 Dec2013
Nmillion
31 Dec2012
Nmillion
31 Dec2013
Nmillion
31 Dec2012
Nmillion
Net cash flows from operating activities 91,682 15,476 10,678 1,141
Cash flows used in operations 58,110 (13,691) 10,678 1,141
Net income before indirect taxes 24,617 11,412 8,216 1,053
Adjusted for: (30,285) (23,657) 36 -
Credit impairment charges on loans and advances 2,667 6,895 - -
Depreciation of property and equipment 4,053 3,410 25 -
Dividends included in trading revenue and investment income (98) (112) - -
Equity-settled share-based payments 73 67 11 -
Interest expense 25,572 24,264 - -
Interest income (62,585) (57,818) - -
Loss/(profit) on sale of property and equipment 33 (49) - -
Increase in income-earning assets 32.1 (18,368) (102,005) (122) (916)
Increase in deposits and other liabilities
32.2 82,146 100,245 2,548 1,004
Dividends received 98 112 - -
Interest paid (25,572) (24,264) - -
Interest received 62,585 57,818 - -
Direct taxation paid (3,539) (4,499) - -
Net cash flows used in investing activities (57,908) 8,941 (2,581) (3,516)
Capital expenditure on:
- Property (27) (89) - -
- Equipment, furniture and vehicles (4,715) (2,091) (2,581) (16)
- Intangible assets - (30) - -
Proceeds from sale of property, equipment, furniture and vehicles
126 657 - -
Proceeds from sale of intangible assets - 3,494 - -
(Purchase)/Sale of financial investment securities (53,292) 7,000 -
Investment in new subsdiary – Stanbic IBTC Capital Limited - - - (3,500)
Net cash flows used in financing activities (20,828) 9,024 (8,000) 5,000
Net increase/(decrease) in other borrowings (18,109) 19,255 - -
Inflow received from Stanbic IBTC Bank PLC - - - 5,000
Proceed from issue subordinated debt 6,399 - - -
Special dividend paid on share cancellation - (7,500) - -
Net dividends paid (9,118) (2,731) (8,000) -
Effect of exchange rate changes on cash and cash equivalents 686 (384) - -
Net increase in cash and cash equivalents 13,632 33,057 97 2,625
Cash and cash equivalents at beginning of the year 106,680 73,623 2,625 -
Cash and cash equivalents at end of the year 32.3 120,312 106,680 2,722 2,625
Statement of cash flows
The accompanying notes from page 151 to 227 form an integral part of these financial statements
Notes to the annual financial statements
1. Reporting entity
Stanbic IBTC Holdings PLC (the ‘company’) is a company domiciled in Nigeria. The company registered office is at I.B.T.C. Place Walter Carrington Crescent Victoria Island, Lagos, Nigeria. These consolidated financial statements comprise the company and its subsidiaries (together referred to as the ‘group’). The group is primarily involved in the provision of banking and other financial services to corporate and individual customers.
2. Basis of preparation
(a) Statement of complianceThese consolidated financial statements have been prepared in accordance with International Financial Reporting Standards (IFRS) as issued by the International Accounting Standards Board (IASB). The financial statements comply with the Company and Allied Matters Act of Nigeria, Bank and Other Financial Institution Act, Financial Reporting Council of Nigeria Act, and relevant Central Bank of Nigeria circulars.
The consolidated financial statements were authorised for issue by the Board of Directors on 05 February 2014.
(b) Basis of measurementThe consolidated financial statements have been prepared on the historical cost basis except for the following material items in the statement of financial position:
derivative financial instruments are measured at fair value.
financial instruments at fair value through profit or loss are measured at fair value.
available-for-sale financial assets are measured at fair value.
liabilities for cash-settled share-based payment arrangements are measured at fair value.
trading liabilities are measured at fair value.
(c) Functional and presentation currencyThe consolidated financial statements are presented in Nigerian Naira, which is the company’s functional and presentation currency. All financial information presented in Naira has been rounded to the nearest million, except when otherwise stated.
(d) Use of estimates and judgementThe preparation of the consolidated financial statements in conformity with IFRS requires management to make judgements, estimates and assumptions that affect the application of accounting policies and the reported amount
of assets, liabilities, income and expenses. Actual results may differ from these estimates.
Estimates and underlying assumptions are reviewed on an on-going basis. Revisions to accounting estimates are recognised in the period in which estimates are revised and in any future period affected. Information about significant area of estimation uncertainty and critical judgement in applying accounting policies that have most significant effect on the amount recognised in the consolidated financial statements are included in note 6.
3. Changes in accounting policies
Except as noted below, the group has consistently applied the accounting policies as set out in Note 4 to all periods presented in these financial statements.
The group adopted the following new standards and amendments to standards, including any consequential amendments to other standards, with a date of initial application of 1 January 2013.
IFRS 10 Consolidated financial statements (2011)
IFRS 12 Disclosure of interests in other entities
IFRS 13 Fair value measurement
Disclosures – offsetting financial assets and financial liabilities (Amendments to IFRS 7)
Presentation of items of other comprehensive income (amendments to IAS 1)
The nature and effect of the changes are explained below.
(a) Subsidiaries including structure entitiesAs a result of IFRS 10, the group has changed its accounting policy for determining whether it has control over and consequently whether it consolidates other entities. IFRS 10 introduces a new control model that focuses on whether the group has power over an investee, exposure or rights to variable returns from its involvement with the investee and the ability to use its power to affect those returns.
The change did not have a material impact on the group financial statements. No additional entity is consolidated as a result of the adoption of IFRS 10.
(b) Interest in other entitiesAs a result of IFRS 12, the group has expanded disclosures about its interests in subsidiaries (see Note 13) and involvement with unconsolidated strutured entities (see Note 14).

153
Market & Shareholderinformation
Otherinformation
152 Stanbic IBTC Annual group financial statements for the year ended 31 December 2013
Annual report and financial statements Overview Business review
Annual reports and financial statements
The disclosure requirements related to its involvement in unconsolidated structured entities are not included in the comparative information.
(c) Fair value measurementIn accordance with the transitional provisions of IFRS 13, the group has applied the new definition of fair value, as set out in Note 4.16, prospectively. The change had no significant impact on the measurements of the group’s assets and liabilities, but the group has included new disclosures in the financial statements, which are required in the comparative information.
(d) Offsetting financial assets and financial liabilitiesAs a result of the amendments to IFRS 7, the group has expanded disclosures about offsetting financial assets and financial liabilities (see Note 26).
(e) Presentation of items of other comprehensive income (OCI)As a result of the amendments to IAS 1, the group has modified the presentation of items of OCI in its statements of profit or loss and OCI, to present items that would be reclassified to profit or loss in the future separately from those that would never be. Comparative information has been represented on the same basis.
4. Statement of significant accounting policies
Except for the changes explained in note 3, the group has consistently applied the following accounting policies to all periods presented in these consolidated financial statements.
4.1 Basis of consolidation
SubsidiariesThe group consolidates the annual financial statements of investees which it controls. The group controls an investee when:
it has power over the investee;
has exposure or rights to variable returns from its involvement with the investee; and
has the ability to use its power to affect the returns from its involvement with the investee.
The annual financial statements of the investee are consolidated from the date on which the group acquires control up to the date that control ceases. Control is assessed on a continuous basis.
Intragroup transactions, balances and unrealised gains and losses are eliminated on consolidation. Unrealised losses are eliminated in the same manner as unrealised gains, but only to the extent that there is no evidence of impairment.
The proportion of comprehensive income and changes in equity allocated to the group and non-controlling interests are determined on the basis of the group’s present ownership interest in the subsidiary.
The accounting policies of subsidiaries that are consolidated by the group conform to these policies.
Investments in subsidiaries are accounted for at cost less accumulated impairment losses (where applicable) in the separate financial statements. The carrying amounts of these investments are reviewed annually and impaired (limited to initial cost) when necessary.
Business combinationsThe acquisition method of accounting is used to account for the acquisition of subsidiaries by the group. The consideration transferred is measured as the sum of the fair value of the assets given, equity instruments issued and liabilities incurred or assumed at the acquisition date. The consideration includes any asset, liability or equity resulting from a contingent consideration arrangement.
The obligation to pay contingent consideration is classified as either a liability or equity based on the terms of the arrangement. The right to a return of previously transferred consideration is classified as an asset. Transaction costs for business combinations prior to 1 January 2010 were capitalised as part of the consideration transferred. Transaction costs for business combinations on or after 1 January 2010 are recognised within profit or loss as and when they are incurred.
Where the initial accounting for a business combination is incomplete by the end of the reporting period in which the business combination occurs, the group reports provisional amounts. Where applicable, the group adjusts retrospectively the provisional amounts to reflect new information obtained about facts and circumstances that existed at the acquisition date and affected the measurement of the provisional amounts.
The group elects on each acquisition to initially measure non-controlling interests on the acquisition date at either fair value or at the non-controlling interest’s proportionate share of the subsidiary’s identifiable net assets.
Identifiable assets acquired, liabilities and contingent liabilities assumed in a business combination are measured initially at their fair values at the acquisition date, irrespective of the extent of any non-controlling interest. The excess of the sum of the consideration transferred (including contingent consideration), the value of non-controlling interest recognised and the acquisition date fair value of any previously held equity interest in the subsidiary over the
Notes to the annual financial statements (continued)
fair value of identifiable net assets acquired is recorded as goodwill and accounted for in terms of accounting policy 4.6 – Intangible assets.
If the sum of the consideration transferred including contingent consideration, the value of non-controlling interest recognised and the acquisition date fair value of any previously held equity interest in the subsidiary is less than the fair value of the identifiable net assets acquired, the difference, referred to as a gain from a bargain purchase, is recognised directly in profit or loss.
When a business combination occurs in stages, the previously held equity interest is remeasured to fair value at the acquisition date and any resulting gain or loss is recognised in profit or loss.
Transactions with non-controlling interestsTransactions with non-controlling interests that do not result in the gain or loss of control, are accounted for as transactions with equity holders of the group. For purchases of additional interests from non-controlling interests, the difference between the purchase consideration and the group’s proportionate share of the subsidiary’s additional net asset value acquired is accounted for directly in equity. Gains or losses on the partial disposal (where control is not lost) of the group’s interest in a subsidiary to non-controlling interests are also accounted for directly in equity.
Common control transactionsCommon control transactions, in which the company is the ultimate parent entity both before and after the transaction, are accounted for at book value.
4.2 Foreign currency translationsItems included in the annual financial statements of each of the group’s entities are measured using the currency of the primary economic environment in which the entity operates (functional currency).
The annual financial statements are presented in Nigerian Naira, which is the functional and presentation currency of Stanbic IBTC Holdings PLC.
Transactions and balancesForeign currency transactions are translated into the respective functional currencies of group entities at exchange rates prevailing at the date of the transactions. Foreign exchange gains and losses resulting from the settlement of such transactions and from the translation of monetary assets and liabilities denominated in foreign currencies at year end exchange rates, are recognised in profit or loss (except when recognised in OCI as part of qualifying cash flow hedges and net investment hedges).
Non-monetary assets and liabilities denominated in foreign currencies that are measured at historical cost are translated using the exchange rate at the transaction date, and those measured at fair value are translated at the exchange rate at the date that the fair value was determined.
Exchange rate differences on non-monetary items are accounted for based on the classification of the underlying items. Foreign exchange gains and losses on equities (debt) classified as available-for-sale financial assets are recognised in the available-for-sale reserve in OCI (profit or loss) whereas the exchange differences on equities and debt that are classified as held at fair value through profit or loss are reported as part of the fair value gain or loss in profit or loss.
4.3 Cash and cash equivalents
Cash and balances with central banks comprise coins and bank notes, and balances with central banks. Cash and cash equivalents presented in the statement of cash flows consist of cash and balances with central banks, and current account balances with other banks.
4.4 Financial instruments
Initial recognition and measurementFinancial instruments include all financial assets and liabilities. These instruments are typically held for liquidity, investment, trading or hedging purposes. All financial instruments are initially recognised at fair value plus directly attributable transaction costs, except those carried at fair value through profit or loss where transaction costs are recognised immediately in profit or loss.
Financial instruments are recognised (derecognised) on the date the group commits to purchase (sell) the instruments (trade date accounting).
Subsequent measurementSubsequent to initial measurement, financial instruments are measured either at fair value or amortised cost, depending on their classifications as follows:
Held-to-maturity financial assets and liabilitiesHeld-to-maturity investments are non-derivative financial assets with fixed or determinable payments and fixed maturities that management has both the positive intent and ability to hold to maturity. Where the group is to sell more than an insignificant amount of held-to-maturity investments, the entire category would be tainted and reclassified as available-for-sale assets with the difference between amortised cost and fair value being accounted for in OCI.

155
Market & Shareholderinformation
Otherinformation
154 Stanbic IBTC Annual group financial statements for the year ended 31 December 2013
Annual report and financial statements Overview Business review
Annual reports and financial statements
Notes to the annual financial statements (continued)
Held-to-maturity investments are carried at amortised cost, using the effective interest method, less any impairment losses.
Held-for-trading financial assets and liabilitiesHeld-for-trading assets and liabilities include those financial assets and liabilities acquired or incurred principally for the purpose of selling or repurchasing in the near term, those forming part of a portfolio of identified financial instruments that are managed together and for which there is evidence of a recent actual pattern of short-term profit-taking, and commodities that are acquired principally by the group for the purpose of selling in the near future and generating a profit from fluctuations in price or broker-traders’ margin. Derivatives are always categorised as held-for-trading.
Subsequent to initial recognition, the financial instruments’ fair values are remeasured at each reporting date. All gains and losses, including interest and dividends arising from changes in fair value are recognised in profit or loss as trading revenue within non-interest revenue.
Financial assets and liabilities designated at fair value through profit or lossThe group designates certain financial assets and liabilities, other than those classified as held-for-trading, as at fair value through profit or loss when
this designation eliminates or significantly reduces an accounting mismatch that would otherwise arise. Under this criterion, the main classes of financial instruments designated by the group are loans and advances to banks and customers and financial investments. The designation significantly reduces measurement inconsistencies that would have otherwise arisen. For example, where the related derivatives were treated as held-for-trading and the underlying financial instruments were carried at amortised cost;
groups of financial assets, financial liabilities or both are managed, and their performance evaluated, on a fair value basis in accordance with a documented risk management or investment strategy, and reported to the group’s key management personnel on a fair-value basis. Under this criterion, certain private equity, short-term insurance and other investment portfolios have been designated at fair value through profit or loss; or
financial instruments containing one or more embedded derivatives that significantly modify the instruments’ cash flows.
The fair value designation is made on initial recognition and is irrevocable. Subsequent to initial recognition, the fair values are remeasured at each reporting date. Gains and losses arising from changes in fair value are recognised in
interest income (interest expense) for all debt financial assets (financial liabilities) and in other revenue within non-interest revenue for all equity instruments.
Loans and receivablesLoans and receivables are non-derivative financial assets with fixed or determinable payments that are not quoted in an active market, other than those classified by the group as at fair value through profit or loss or available-for-sale.
Loans and receivables are measured at amortised cost using the effective interest method, less any impairment losses. Origination transaction costs and origination fees received that are integral to the effective rate are capitalised to the value of the loan and amortised through interest income as part of the effective interest rate. The majority of the group’s loans and advances are included in the loans and receivables category.
Available-for-saleFinancial assets classified by the group as available-for-sale are generally strategic capital investments held for an indefinite period of time, which may be sold in response to needs for liquidity or changes in interest rates, exchange rates or equity prices, or non-derivative financial assets that are not classified within another category of financial assets.
Available-for-sale financial assets are subsequently measured at fair value. Unrealised gains or losses are recognised directly in the available-for-sale reserve until the financial asset is derecognised or impaired. When debt (equity) available-for-sale financial assets are disposed of, the cumulative fair value adjustments in OCI are reclassified to interest income (other revenue).
Available-for-sale financial assets are impaired when there has been a significant or prolonged decline in the fair value of the financial asset below its cost. The cumulative fair value adjustments previously recognised in OCI on the impaired financial assets are reclassified to profit or loss. Reversal of impairments on equity available-for-sale financial assets are recognised in OCI.
Interest income, calculated using the effective interest method, is recognised in profit or loss. Dividends received on debt (equity) available-for-sale instruments are recognised in interest income (other revenue) within profit or loss when the group’s right to receive payment has been established.
Financial liabilities at amortised costFinancial liabilities that are neither held for trading nor designated at fair value are measured at amortised cost.
Reclassification of financial assetsThe group may choose to reclassify non-derivative trading assets out of the held-for-trading category if the financial
asset is no longer held for the purpose of selling it in the near term. Financial assets that would not otherwise have met the definition of loans and receivables are permitted to be reclassified out of the held-for-trading category only in rare circumstances. In addition, the group may choose to reclassify financial assets that would meet the definition of loans and receivables out of the held-for-trading or available-for-sale categories if the group, at the date of reclassification, has the intention and ability to hold these financial assets for the foreseeable future or until maturity.
Derivatives or any financial instrument designated at fair value through profit or loss shall not be reclassified out of their respective categories.
Reclassifications are made at fair value as of the reclassification date. Effective interest rates for financial assets reclassified to loans and receivables, held-to-maturity and available-for-sale categories are determined at the reclassification date. Subsequent increases in estimates of cash flows adjust the financial asset’s effective interest rates prospectively.
On reclassification of a trading asset, all embedded derivatives are reassessed and, if necessary, accounted for separately.
Impairment of financial assets
Assets carried at amortised cost
The group assesses at each reporting date whether there is objective evidence that a loan or group of loans is impaired. A loan or group of loans is impaired if objective evidence indicates that a loss event has occurred after initial recognition which has a negative effect on the estimated future cash flows of the loan or group of loans that can be estimated reliably.
Criteria that are used by the group in determining whether there is objective evidence of impairment include:
known cash flow difficulties experienced by the borrower;
a breach of contract, such as default or delinquency in interest and/or principal payments;
breaches of loan covenants or conditions
where the group, for economic or legal reasons relating to the borrower’s financial difficulty, grants the borrower a concession that the group would not otherwise consider.
The group first assesses whether there is objective evidence of impairment individually for loans that are individually significant, and individually or collectively for loans that are not individually significant. Non-performing loans include those
loans for which the group has identified objective evidence of default, such as a breach of a material loan covenant or condition as well as those loans for which instalments are due and unpaid for 90 days or more.
The impairment of non-performing loans takes into account past loss experience adjusted for changes in economic conditions and the nature and level of risk exposure since the recording of the historic losses.
When a loan carried at amortised cost has been identified as specifically impaired, the carrying amount of the loan is reduced to an amount equal to the present value of its estimated future cash flows, including the recoverable amount of any collateral, discounted at the financial asset’s original effective interest rate. The carrying amount of the loan is reduced through the use of a specific credit impairment account and the loss is recognised as a credit impairment charge in profit or loss.
The calculation of the present value of the estimated future cash flows of collateralised financial assets recognised on an amortised cost basis includes cash flows that may result from foreclosure less costs of obtaining and selling the collateral, whether or not foreclosure is probable.
If the group determines that no objective evidence of impairment exists for an individually assessed loan, whether significant or not, it includes the loan in a group of financial loans with similar credit risk characteristics and collectively assesses for impairment. Loans that are individually assessed for impairment and for which an impairment loss is recognised are not included in a collective assessment for impairment.
Impairment of groups of loans that are assessed collectively is recognised where there is objective evidence that a loss event has occurred after the initial recognition of the group of loans but before the reporting date. In order to provide for latent losses in a group of loans that have not yet been identified as specifically impaired, a credit impairment for incurred but not reported losses is recognised based on historic loss patterns and estimated emergence periods (time period between the loss trigger events and the date on which the group identifies the losses). Groups of loans are also impaired when adverse economic conditions develop after initial recognition, which may impact future cash flows. The carrying amount of groups of loans is reduced through the use of a portfolio credit impairment account and the loss is recognised as a credit impairment charge in profit or loss.
Increases in loan impairments and any subsequent reversals thereof, or recoveries of amounts previously impaired (including loans that have been written off), are reflected within credit impairment charges in profit or loss. Previously

157
Market & Shareholderinformation
Otherinformation
156 Stanbic IBTC Annual group financial statements for the year ended 31 December 2013
Annual report and financial statements Overview Business review
Annual reports and financial statements
Notes to the annual financial statements (continued)
impaired loans are written off once all reasonable attempts at collection have been made and there is no realistic prospect of recovering outstanding amounts. Any subsequent reductions in amounts previously impaired are reversed by adjusting the allowance account with the amount of the reversal recognised as a reduction in impairment for credit losses in profit or loss.
Subsequent to impairment, the effects of discounting unwind over time as interest income.
Renegotiated loans
Loans that would otherwise be past due or impaired and whose terms have been renegotiated and exhibit the characteristics of a performing loan are reset to performing loan status. Loans whose terms have been renegotiated are subject to ongoing review to determine whether they are considered to be impaired or past due.
The effective interest rate of renegotiated loans that have not been derecognised (described under the heading Derecognition of financial instruments), is redetermined based on the loan’s renegotiated terms.
Available-for-sale financial assets
Available-for-sale financial assets are impaired if there is objective evidence of impairment, resulting from one or more loss events that occurred after initial recognition but before the reporting date, that have a negative impact on the future cash flows of the asset. In addition, an available-for-sale equity instrument is considered to be impaired if a significant or prolonged decline in the fair value of the instrument below its cost has occurred. In that instance, the cumulative loss, measured as the difference between the acquisition price and the current fair value, less any previously recognised impairment losses on that financial asset, is reclassified from OCI to profit or loss.
If, in a subsequent period, the amount relating to an impairment loss decreases and the decrease can be linked objectively to an event occurring after the impairment loss was recognised in profit or loss, the impairment loss is reversed through profit or loss for available-for-sale debt instruments. Any reversal of an impairment loss in respect of an available-for-sale equity instrument is recognised directly in OCI.
Offsetting financial instrumentsFinancial assets and liabilities are offset and the net amount reported in the statement of financial position when there is a legally enforceable right to set-off the recognised amounts and there is an intention to settle the asset and the liability on a net basis, or to realise the asset and settle the liability simultaneously.
Income and expenses are presented on a net basis only when permitted by the accounting standards, or for gains and losses arising from a group of similar transactions.
Derivative financial instruments A derivative is a financial instrument whose fair value changes in response to an underlying variable, requires no initial net investment or an initial net investment that is smaller than would be required for other types of contracts that would be expected to have a similar response to changes in market factors and is settled at a future date. Derivatives are initially recognised at fair value on the date on which the derivatives are entered into and subsequently remeasured at fair value as described under the fair value policy under note 4.16.
All derivative instruments are carried as financial assets when the fair value is positive and as financial liabilities when the fair value is negative, subject to offsetting principles as described under the heading “Offsetting financial instruments” above.
Embedded derivatives included in hybrid instruments are treated and disclosed as separate derivatives when their economic characteristics and risks are not closely related to those of the host contract, the terms of the embedded derivative are the same as those of a stand-alone derivative and the combined contract is not measured at fair value through profit or loss. The financial host contracts are accounted for and measured applying the rules of the relevant financial instrument category.
All gains and losses from changes in the fair values of derivatives are recognised immediately in profit or loss as trading revenue.
BorrowingsBorrowings are recognised initially at fair value, generally being their issue proceeds, net of directly attributable transaction costs incurred. Borrowings are subsequently measured at amortised cost and interest is recognised using the effective interest method.
Financial guarantee contractsA financial guarantee contract is a contract that requires the group (issuer) to make specified payments to reimburse the holder for a loss it incurs because a specified debtor fails to make payment when due in accordance with the original or modified terms of a debt instrument.
Financial guarantee contracts are initially recognised at fair value, which is generally equal to the premium received, and then amortised over the life of the financial guarantee. Subsequent to initial recognition, the financial guarantee liability is measured at the higher of the present value of any
expected payment, when a payment under the guarantee has become probable, and the unamortised premium.
De-recognition of financial instrumentsFinancial assets are derecognised when the contractual rights to receive cash flows from the financial assets have expired, or where the group has transferred its contractual rights to receive cash flows on the financial asset such that it has transferred substantially all the risks and rewards of ownership of the financial asset. Any interest in transferred financial assets that is created or retained by the group is recognised as a separate asset or liability.
The group enters into transactions whereby it transfers assets recognised in its statement of financial position, but retains either all or a portion of the risks or rewards of the transferred assets. If all or substantially all risks and rewards are retained, then the transferred assets are not derecognised. Transfers of assets with the retention of all or substantially all risks and rewards include securities lending and repurchase agreements.
When assets are sold to a third party with a concurrent total rate of return swap on the transferred assets, the transaction is accounted for as a secured financing transaction, similar to repurchase transactions. In transactions where the group neither retains nor transfers substantially all the risks and rewards of ownership of a financial asset, the asset is derecognised if control over the asset is lost. The rights and obligations retained in the transfer are recognised separately as assets and liabilities as appropriate.
In transfers where control over the asset is retained, the group continues to recognise the asset to the extent of its continuing involvement, determined by the extent to which it is exposed to changes in the value of the transferred asset.
Financial liabilities are derecognised when they are extinguished, that is, when the obligation is discharged, cancelled or expires.
Where an existing financial asset or liability is replaced by another with the same counterparty on substantially different terms, or the terms of an existing financial asset or liability are substantially modified, such an exchange or modification is treated as a derecognition of the original asset or liability and the recognition of a new asset or liability, with the difference in the respective carrying amounts being recognised in profit or loss.
Sale and repurchase agreements and lending of securitiesSecurities sold subject to linked repurchase agreements (repurchase agreements) are reclassified in the statement of financial position as pledged assets when the transferee has the right by contract or custom to sell or repledge the collateral. The liability to the counterparty is included under deposit and
current accounts or trading liabilities, as appropriate.
Securities purchased under agreements to resell (reverse repurchase agreements), at either a fixed price or the purchase price plus a lender’s rate of return, are recorded as loans and included under trading assets or loans and advances, as appropriate.
For repurchase and reverse repurchase agreements measured at amortised cost, the difference between the purchase and sales price is treated as interest and amortised over the life using the effective interest method.
Securities lent to counterparties are retained in the annual financial statements and are classified and measured in accordance with the measurement policy of the group. Securities borrowed are not recognised in the annual financial statements unless sold to third parties. In these cases, the obligation to return the securities borrowed is recorded at fair value as a trading liability.
Income and expenses arising from the securities borrowing and lending business are recognised over the period of the transactions.
4.5 Interest in associates and joint ventures
Associates and joint venturesThose entities in which the group has significant influence, but not control, over the financial and operating policies are classified as associates.
A joint venture is a joint arrangement whereby the parties that have joint control of the arrangement have rights to the net assets of the arrangement. Joint control is the contractually agreed sharing of control of an arrangement which only exists when decisions about the relevant activities require unanimous consent of the parties sharing control.
Interests in associates and joint ventures are accounted for using the equity method and are measured in the consolidated statement of financial position at an amount that reflects the group’s share of the net assets of the associate or joint venture (including goodwill).
Equity accounting involves recognising the investment initially at fair value, including goodwill, and subsequently adjusting the carrying value for the group’s share of the associates’ and joint ventures income and expenses and OCI. Equity accounting of losses in associates and joint ventures is restricted to the interests in these entities, including unsecured receivables or other commitments, unless the group has an obligation or has made payments on behalf of the associate or joint ventures. Unrealised intragroup profits are eliminated in determining
159
Market & Shareholderinformation
Otherinformation
158 Stanbic IBTC Annual group financial statements for the year ended 31 December 2013
Annual report and financial statements Overview Business review
Annual reports and financial statements
Notes to the annual financial statements (continued)
the group’s share of equity accounted profits. Unrealised losses are eliminated in the same way as unrealised gains, but only to the extent that there is no evidence of impairment.
Equity accounting is applied from the date on which the entity becomes an associate or joint venture up to the date on which it ceases to be an associate or joint venture. The accounting policies of associates and joint venture have been changed where necessary to ensure consistency with the policies of the group.
Investments in associates and joint ventures are accounted for at cost less impairment losses in the company’s annual financial statements.
Jointly controlled operations A joint operation is a joint arrangement whereby the joint operators who have joint control have rights to the assets and obligations for the liabilities relating to the arrangement. The joint operator recognises:
assets it controls, including the assets jointly controlled;
liabilities including its share of liabilities incurred jointly;
revenue from the sale of its share of output and from the sale of the output by a joint operation; and
expenses including the share of expenses incurred jointly.
4.6 Intangible assets
Computer softwareCosts associated with developing or maintaining computer software programmes and the acquisition of software licences are generally recognised as an expense as incurred. However, direct computer software development costs that are clearly associated with an identifiable and unique system, which will be controlled by the group and have a probable future economic benefit beyond one year, are recognised as intangible assets.
Capitalisation is further limited to development costs where the group is able to demonstrate its intention and ability to complete and use the software, the technical feasibility of the development, the availability of resources to complete the development, how the development will generate probable future economic benefits and the ability to reliably measure costs relating to the development. Direct costs include software development employee costs and an appropriate portion of relevant overheads.
Expenditure subsequently incurred on computer software is capitalised only when it increases the future economic benefits embodied in the specific asset to which it relates.
Direct computer software development costs recognised as intangible assets are amortised on the straight-line basis at rates appropriate to the expected useful lives of the assets (two to 10 years) from the date that the assets are available for use, and are carried at cost less accumulated amortisation and accumulated impairment losses. The carrying amount of capitalised computer software is reviewed annually and is written down when impaired.
Amortisation methods, useful lives and residual values are reviewed at each financial year end and adjusted, if necessary.
There have been no changes in the estimated useful lives from those applied in the previous financial year.
Other intangible assetsThe group recognises the costs incurred on internally generated intangible assets such as brands, customer lists, customer contracts and similar rights and assets, in profit or loss as incurred.
The group capitalises brands, customer lists, customer contracts, distribution forces and similar rights acquired in business combinations.
Capitalised intangible assets are measured at cost less accumulated amortisation and accumulated impairment losses. Amortisation is recognised in profit or loss on a straight-line basis over the estimated useful lives of intangible assets, not exceeding 20 years, from the date that they are available for use.
Amortisation methods, useful lives and residual values are reviewed at each financial yearend and adjusted, if necessary. There have been no changes in the estimated useful lives from those applied in the previous financial year.
4.7 Property and equipment
Equipment and owner-occupied properties Equipment, furniture, vehicles and other tangible assets are measured at cost less accumulated depreciation and accumulated impairment losses
Costs that are subsequently incurred are included in the asset’s related carrying amount or are recognised as a separate asset, as appropriate, only when it is probable that future economic benefits will flow to the group and the cost of the item can be measured reliably. Expenditure, which does not meet these criteria, is recognised in profit or loss as incurred. Depreciation, impairment losses and gains and losses on disposal of assets are included in profit or loss.
Owner-occupied properties are held for use in the supply of services or for administrative purposes. Property and
equipment are depreciated on the straight-line basis over the estimated useful lives of the assets to their residual values. Land is not depreciated. Leasehold buildings are depreciated over the period of the lease or over a lesser period, as is considered appropriate.
The assets’ residual values, useful lives and the depreciation method applied are reviewed, and adjusted if appropriate, at each financial year end.
The estimated useful lives of tangible assets are typically as follows:
Buildings – 25 years
Computer equipment – 3 to 5 years
Motor vehicles – 4 years
Office equipment – 6 years
Furniture and fittings – 4 years
Capitalised leased assets/branch refurbishment cost premises – over the shorter of the lease term or useful life of underlying asset.
There has been no change to the estimated useful lives from those applied in the previous financial year.
Items of property and equipment are derecognised on disposal or when no future economic benefits are expected from their use or disposal. The gain or loss on derecognition is recognised in profit or loss and is determined as the difference between the net disposal proceeds and the carrying amount of the item.
4.8 Property developments and properties in possession
Property developments are stated at the lower of cost or net realisable value. Cost is assigned by specific identification and includes the cost of acquisition and where applicable, development and borrowing costs during development. When development is completed borrowing costs and other charges are expensed as incurred.
Properties in possession are properties acquired by the group which were previously held as collateral for underlying lending arrangements that, subsequent to origination, have defaulted.
The property is recognised at the time at which the risks and rewards of the properties are transferred to the group. The properties are initially recognised at cost and are subsequently measured at the lower of cost and its net realisable value.
Any subsequent write-down in the value of the acquired properties is recognised as an operating expense. Any subsequent increases in the net realisable value, to the extent that it does not exceed its original cost, are also recognised within operating expenses.
4.9 Capitalisation of borrowing costs
Borrowing costs that relate to qualifying assets, that is, assets that necessarily take a substantial period of time to get ready for their intended use or sale and which are not measured at fair value, are capitalised. All other borrowing costs are recognised in profit or loss.
4.10 Impairment of non-financial assets
Intangible assets that have an indefinite useful life and goodwill are tested annually for impairment and additionally when an indicator of impairment exists. Intangible assets that are subject to amortisation and other non-financial assets are reviewed for impairment at each reporting date and tested for impairment whenever events or changes in circumstances indicate that the carrying amount may not be recoverable.
An impairment loss is recognised in profit or loss for the amount by which the asset’s carrying amount exceeds its recoverable amount. The recoverable amount is the higher of an asset’s fair value less costs to sell and value in use. Fair value less costs to sell is determined by ascertaining the current market value of an asset and deducting any costs related to the realisation of the asset. In assessing value in use, the estimated future cash flows are discounted to their present value using a pre-tax discount rate that reflects current market assessments of the time value of money and the risks specific to the asset. For the purposes of assessing impairment, assets that cannot be tested individually are grouped at the lowest levels for which there are separately identifiable cash inflows from continuing use (cash-generating units). Impairment losses recognised in respect of cash-generating units are allocated first to reduce the carrying amount of any goodwill allocated to the units, and then to reduce the carrying amounts of the other assets in the unit on a pro rata basis.
An impairment loss in respect of goodwill is not reversed. In respect of other non-financial assets, impairment losses recognised in prior periods are assessed at each reporting date for any indications that the loss has decreased or no longer exists. An impairment loss is reversed if there has been a change in the estimates used to determine the recoverable amount. An impairment loss is reversed through profit or loss only to the extent that the asset’s carrying amount does not exceed the carrying amount that would have been determined, net of depreciation or amortisation, if no impairment loss had been recognised.

161
Market & Shareholderinformation
Otherinformation
160 Stanbic IBTC Annual group financial statements for the year ended 31 December 2013
Annual report and financial statements Overview Business review
Annual reports and financial statements
Notes to the annual financial statements (continued)
4.11 Leases
A lease is an agreement whereby the lessor conveys to the lessee in return for a payment or series of payments the right to use an asset for an agreed period of time. A lease of assets is either classified as a finance lease or operating lease. Lease of assets under which the group transfers substantially all the risks and rewards incidental to ownership of the assets are classified as finance leases. Similarly leases of assets under which the group retains a significant portion of the risks and rewards of ownership are classified as operating leases.
Group as lesseeLeases, where the group assumes substantially all the risks and rewards incidental to ownership, are classified as finance leases. All other leases are classified as operating leases.
Finance leases are capitalised at the inception of the lease at the lower of the fair value of the leased asset and the present value of the minimum lease payments. Lease payments are calculated using the interest rate implicit in the lease to identify the finance cost, which is recognised in profit or loss over the lease period, and the capital repayment, which reduces the liability to the lessor.
Payments made under operating leases, net of any incentives received from the lessor, are recognised in profit or loss on a straight-line basis over the term of the lease. Contingent rentals are expensed as they are incurred. When an operating lease is terminated before the lease period has expired, any payment required to be made to the lessor by way of penalty is recognised as an expense in the period in which termination takes place.
Group as lessorLease and instalment sale contracts are primarily financing transactions in banking activities, with rentals and instalments receivable, less unearned finance charges, being included in loans and advances in the statement of financial position.
Finance charges earned are computed using the effective interest method, which reflects a constant periodic rate of return on the investment in the finance lease. Initial direct costs and fees are capitalised to the value of the lease receivable and accounted for over the lease term as an adjustment to the effective rate of return. The tax benefits arising from investment allowances on assets leased to clients are accounted for in the direct taxation line.
Operating lease income from properties held as investment properties, net of any incentives given to lessees, is recognised on the straight-line basis or a more representative basis where applicable over the lease term. When an operating lease is terminated before the lease period has expired, any payment
required by the group by way of a penalty is recognised as income in the period in which termination takes place.
4.12 Provisions, contingent assets and contingent liabilities
Provisions are recognised when the group has a present legal or constructive obligation as a result of past events, it is probable that an outflow of resources embodying economic benefits will be required to settle the obligation and a reliable estimate of the amount of the obligation can be made. Provisions are determined by discounting the expected future cash flows using a pre-tax discount rate that reflects current market assessments of the time value of money and the risks specific to the liability.
A provision for restructuring is recognised when the group has approved a detailed formal plan, and the restructuring either has commenced or has been announced publicly. Future operating costs or losses are not provided for.
A provision for onerous contracts is recognised when the expected benefits to be derived by the group from a contract are lower than the unavoidable cost of meeting its obligations under the contract. The provision is measured at the present value of the lower of the expected cost of terminating the contract and the expected net cost of continuing with the contract. Before a provision is established, the group recognises any impairment loss on the assets associated with that contract.
Contingent assets are not recognised in the annual financial statements but are disclosed when, as a result of past events, it is probable that economic benefits will flow to the group, but this will only be confirmed by the occurrence or non-occurrence of one or more uncertain future events which are not wholly within the group’s control.
Contingent liabilities include certain guarantees, other than financial guarantees, and letters of credit. Contingent liabilities are not recognised in the annual financial statements but are disclosed in the notes to the annual financial statements unless they are remote.
4.13 Employee benefits
Post-employment benefitsDefined contribution plansThe group operates a defined contribution plan, based on a percentage of pensionable earnings funded by both employer companies and employees, the assets of which are generally held in separate trustee-administered funds.
Contributions to these plans are recognised as an expense in profit or loss in the periods during which services are rendered by employees.
Termination benefitsTermination benefits are recognised as an expense when the group is committed, without realistic possibility of withdrawal, to a formal detailed plan to terminate employment before the normal retirement date, or to provide termination benefits as a result of an offer made to encourage voluntary redundancy. Termination benefits for voluntary redundancies are recognised as an expense if the group has made an offer encouraging voluntary redundancy, it is probable that the offer will be accepted, and the number of acceptances can be estimated reliably
Short-term benefitsShort-term benefits consist of salaries, accumulated leave payments, profit share, bonuses and any non-monetary benefits such as medical aid contributions.
Short-term employee benefit obligations are measured on an undiscounted basis and are expensed as the related service is provided.
A liability is recognised for the amount expected to be paid under short-term cash bonus plans or accumulated leave if the group has a present legal or constructive obligation to pay this amount as a result of past service provided by the employee and the obligation can be estimated reliably.
4.14 Tax
Direct taxDirect taxation includes all domestic and foreign taxes based on taxable profits and capital gains tax. Current tax is determined for current period transactions and events and deferred tax is determined for future tax consequences. Current tax and deferred tax are recognised in profit or loss except to the extent that it relates to a business combination (relating to a measurement period adjustment where the carrying amount of the goodwill is greater than zero), or items recognised directly in equity or in OCI.
Current tax represents the expected tax payable on taxable income for the year, using tax rates enacted or substantively enacted at the reporting date, and any adjustments to tax payable in respect of previous years.
Deferred tax is recognised in respect of temporary differences arising between the tax bases of assets and liabilities and their carrying values for financial reporting purposes. Deferred tax is measured at the tax rates that are expected to be applied to the temporary differences when they reverse, based on the laws that have been enacted or substantively enacted at the reporting date. Deferred tax is not recognised for the following temporary differences:
the initial recognition of goodwill
the initial recognition of assets and liabilities in a transaction that is not a business combination, which affects neither accounting nor taxable profits or losses
investments in subsidiaries and jointly controlled entities (excluding mutual funds) where the group controls the timing of the reversal of temporary differences and it is probable that these differences will not reverse in the foreseeable future.
The amount of deferred tax provided is based on the expected manner of realisation or settlement of the carrying amount of the asset or liability and is not discounted.
Deferred tax assets are recognised to the extent that it is probable that future taxable income will be available against which the unused tax losses can be utilised. Deferred tax assets are reviewed at each reporting date and are reduced to the extent that it is no longer probable that the related tax benefit will be realised.
Current and deferred tax assets and liabilities are offset if there is a legally enforceable right to offset current tax liabilities and assets, and they relate to income taxes levied by the same tax authority on the same taxable entity, or on different tax entities, but they intend to settle current tax liabilities and assets on a net basis or their tax assets and liabilities will be realised simultaneously.
Indirect taxIndirect taxes, including non-recoverable VAT, skills development levies and other duties for banking activities, are recognised in profit or loss and disclosed separately in the income statement.
4.15 Non-current assets held for sale and disposal groups
Non-current assets, or disposal groups comprising assets and liabilities that are expected to be recovered primarily through sale rather than continuing use, are classified as held for sale
Non-current assets held as investments for the benefit of policyholders as part of the group’s investment management and life insurance activities are not classified as held for sale as ongoing investment management implies regular purchases and sales in the ordinary course of business.
Immediately before classification as held for sale, the assets (or components of a disposal group) are remeasured in accordance with the group’s accounting policies and tested for impairment (refer accounting policy 4.10 – Impairment of

163
Market & Shareholderinformation
Otherinformation
162 Stanbic IBTC Annual group financial statements for the year ended 31 December 2013
Annual report and financial statements Overview Business review
Annual reports and financial statements
Notes to the annual financial statements (continued)
non-financial assets). Thereafter, the assets are measured at the lower of their carrying amount and fair value less costs to sell. Impairment losses on initial classification as held for sale and subsequent gains and losses on remeasurement are recognised in profit or loss.
Assets (or components of a disposal group) are presented separately in the statement of financial position.
Property and equipment and intangible assets once classified as held for sale, are not depreciated or amortised.
Once an interest in an associate or joint venture is classified as held for sale, equity accounting is suspended.
The group classifies a component of the business as a discontinued operation when that component has been disposed of, or is classified as held for sale, and:
represents a separate major line of business or geographical area of operations;
is part of a single coordinated plan to dispose of a separate major line of business or geographical area of operations; or
is a subsidiary acquired exclusively with a view to resale.
Discontinued operations are presented separately within the income statement and the cash flow statement.
4.16 Fair value
Fair value is the price that would be received to sell an asset or paid to transfer a liability in an orderly transaction in the principal (or most advantageous) market between market participants at the measurement date under current market conditions.
When a price for an identical asset or liability is not observable, fair value is measured using another valuation technique that maximises the use of relevant observable inputs and minimises the use of unobservable inputs.
In estimating the fair value of an asset or a liability, the group takes into account the characteristics of the asset or liability that market participants would take into account when pricing the asset or liability at measurement date.
For financial instruments, where the fair value of the financial instrument differs to the transaction price, the difference is commonly referred to as day one profit or loss. Day one profit or loss is recognised in profit or loss immediately where the fair value of the financial instrument is either evidenced by
comparison with other observable current market transactions in the same instrument, or is determined using valuation models with only observable market data as inputs.
Day one profit or loss is deferred where the fair value of the financial instrument is not able to be evidenced by comparison with other observable current market transactions in the same instrument, or determined using valuation models that utilise non-observable market data as inputs.
Subsequent to initial recognition, fair value is measured based on quoted market prices or dealer price quotations for the assets and liabilities that are traded in active markets and where those quoted prices represent fair value at the measurement date. If the market for an asset or liability is not active or the instrument is unlisted, the fair value is determined using other applicable valuation techniques. These include the use of recent arm’s length transactions, discounted cash flow analyses, pricing models and other valuation techniques commonly used by market participants.
Where discounted cash flow analyses are used, estimated future cash flows are based on management’s best estimates and a market related discount rate at the reporting date for an asset or liability with similar terms and conditions.
If an asset or a liability measured at fair value has both a bid and an ask price, the price within the bid-ask spread that is most representative of fair value is used to measure fair value.
The group has elected the portfolio exception to measure the fair value of certain groups of financial assets and financial liabilities. This exception permits the group of financial assets and financial liabilities to be measured at fair value on a net basis. This election is applied where the group:
manages the group of financial assets and financial liabilities on the basis of the group’s net exposure to a particular market risk (or risks) or to the credit risk of a particular counterparty in accordance with the group’s documented risk management or investment strategy;
provides information on that basis about the group of financial assets and financial liabilities to the group’s key management personnel; and
is required to or has elected to measure those financial assets and financial liabilities at fair value at the end of each reporting period.
Where the fair value of investments in equity instruments or identical instruments do not have a quoted price in an active market, and derivatives that are linked to and must be settled by delivery of such equity instruments, are unable to be
reliably determined, those instruments are measured at cost less impairment losses. Impairment losses on these financial assets are not reversed.
Fair value measurements are categorised into level 1, 2 or 3 based on the degree to which the inputs to the fair value measurements are observable and the significance of the inputs to the fair value measurement.
4.17 Equity
Share issue costsIncremental external costs directly attributable to a transaction that increases or decreases equity are deducted from equity, net of related tax. All other share issue costs are expensed.
Distributions on ordinary sharesDistributions are recognised in equity in the period in which they are declared. Distributions declared after the reporting date are disclosed in the notes to the financial statements.
Reacquired equity instrumentsWhere subsidiaries purchase/(short) the holding entity’s equity instruments, the consideration paid/(received) is deducted/(added) from/(to) equity attributable to ordinary shareholders as treasury shares on consolidation.
Fair value changes recognised by subsidiaries on these instruments are reversed on consolidation and dividends received are eliminated against dividends paid. Where such shares are subsequently sold or reissued/(reacquired) outside the group, any consideration received/(paid) is included in equity attributable to ordinary shareholders.
4.18 Equity-linked transactions
Equity compensation plansThe group operates cash and equity share-based compensation plans.
The fair value of equity-settled share options is determined on the grant date and accounted for as staff costs over the vesting period of the share options, with a corresponding increase in the share-based payment reserve. Non-market vesting conditions, such as the resignation of employees and retrenchment of staff, are not considered in the valuation but are included in the estimate of the number of options expected to vest. At each reporting date, the estimate of the number of options expected to vest is reassessed and adjusted against profit or loss and equity over the remaining vesting period.
On vesting of share options, amounts previously credited to the share-based payment reserve are transferred to retained
earnings through an equity transfer. On exercise of equity- settled share options, proceeds received are credited to share capital and premium.
Share-based payments settled in cash are accounted for as liabilities at fair value until settled. The liability is recognised over the vesting period and is revalued at every reporting date and on settlement. Any changes in the liability are recognised in profit or loss.
4.19 Revenue and expenditure
Banking activitiesRevenue is derived substantially from the business of banking and related activities and comprises interest income, fee and commission revenue, trading revenue and other non-interest revenue.
Net interest incomeInterest income and expense (with the exception of those borrowing costs that are capitalised – refer to accounting policy 4.7 – Capitalisation of borrowing costs) are recognised in profit or loss on an accrual basis using the effective interest method for all interest-bearing financial instruments, except for those classified at fair value through profit or loss. In terms of the effective interest method, interest is recognised at a rate that exactly discounts estimated future cash payments or receipts through the expected life of the financial instrument or, where appropriate, a shorter period, to the net carrying amount of the financial asset or financial liability.
Direct incremental transaction costs incurred and origination fees received, including loan commitment fees, as a result of bringing margin-yielding assets or liabilities into the statement of financial position, are capitalised to the carrying amount of financial instruments that are not at fair value through profit or loss and amortised as interest income or expense over the life of the asset or liability as part of the effective interest rate.
Where the estimates of payments or receipts on financial assets (except those that have been reclassified – refer to accounting policy 3.4 – Financial instruments) or financial liabilities are subsequently revised, the carrying amount of the financial asset or financial liability is adjusted to reflect actual and revised estimated cash flows.
The carrying amount is calculated by computing the present value of the estimated cash flows at the financial asset or financial liability’s original effective interest rate. Any adjustment to the carrying value is recognised in net interest income.
Where financial assets have been impaired, interest income continues to be recognised on the carrying value of the

165
Market & Shareholderinformation
Otherinformation
164 Stanbic IBTC Annual group financial statements for the year ended 31 December 2013
Annual report and financial statements Overview Business review
Annual reports and financial statements
Notes to the annual financial statements (continued)
impaired financial asset, based on the original effective interest rate.
Fair value gains and losses on realised debt financial instruments, including amounts removed from OCI in respect of available-for-sale debt financial assets, and excluding those classified as held-for-trading, are included in net interest income.
Dividends received on redeemable preference share investments form part of the group’s lending activities and are included in interest income.
Non-interest revenue
Net fee and commission revenueFee and commission revenue, including transactional fees, account servicing fees, investment management fees, sales commissions and placement fees are recognised as the related services are performed. Loan commitment fees for loans that are not expected to be drawn down are recognised on a straight-line basis over the commitment period. Loan syndication fees, where the group does not participate in the syndication or participates at the same effective interest rate for comparable risk as other participants, are recognised as revenue when the syndication has been completed. Syndication fees that do not meet these criteria are capitalised as origination fees and amortised as interest income.
The fair value of issued financial guarantee contracts on initial recognition is amortised as income over the term of the contract.
Fee and commission expense included in net fee and commission revenue are mainly transaction and service fees relating to financial instruments, which are expensed as the services are received.
Expenditure is recognised as fee and commission expenses where the expenditure is linked to the production of fee and commission revenue.
Trading revenueTrading revenue comprises all gains and losses from changes in the fair value of trading assets and liabilities, together with related interest income, expense and dividends.
Other revenueOther revenue includes gains and losses on equity instruments designated at fair value through profit or loss, dividends relating to those financial instruments, underwriting profit from the group’s short-term insurance operations and related insurance activities and remeasurement gains and losses from contingent consideration on disposal and purchases.
Gains and losses on equity available-for-sale financial assets are reclassified from OCI to profit or loss on derecognition or impairment of the investments. Dividends on these instruments are recognised in profit or loss.
Dividend incomeDividends are recognised in profit or loss when the right to receipt is established. Scrip dividends are recognised as dividends received where the dividend declaration allows for a cash alternative.
Management fees on assets under managementFee income includes management fees on assets under management and administration fees. Management fees on assets under management are recognised over the period for which the services are rendered, in accordance with the substance of the relevant agreements.
4.20 Segment reporting
An operating segment is a component of the group engaged in business activities, whose operating results are reviewed regularly by management in order to make decisions about resources to be allocated to segments and assessing segment performance. The group’s identification of segments and the measurement of segment results is based on the group’s internal reporting to management.
Transactions between segments are priced at market-related rates.
4.21 Earnings per share
The group presents basic and diluted earnings per share (EPS) data for its ordinary shares. Basic EPS is calculated by dividing the profit or loss that is attributable to ordinary shareholders of the company by the weighted average number of ordinary shares outstanding during the period.
Diluted EPS is determined by adjusting the profit or loss that is attributable to ordinary shareholders and the weighted average number of ordinary shares outstanding for the effects of all dilutive potential ordinary shares, which comprise share options granted to employees.
4.22 Fiduciary activities
The group commonly engages in trust or other fiduciary activities that result in the holding or placing of assets on behalf of individuals, trusts, post-employment benefit plans and other institutions.
These assets and the income arising directly thereon are excluded from these financial statements as they are not assets of the group. However, fee income earned and fee expenses incurred by the group relating to the group’s responsibilities from fiduciary activities are recognised in profit or loss.
4.23 Comparative figuresWhere necessary, comparative figures within notes have been restated to conform to changes in presentation in the current year.
4.24 New standards and interpretations not yet adopted The following new or revised standards and amendments which have a potential impact on the group are not yet effective for the year ended 31 December 2013 and have not been applied in preparing these financial statements. The group is currently assessing the impact of the new or revised standards and amendments.
Pronouncement Title Effective date
IFRS 9 (amended) Financial Instruments
IFRS 9 will replace the existing standard on the recognition and measurement of financial instruments and requires all financial assets to be classified and measured on the basis of the entity’s business model for managing the financial assets and the contractual cash flow characteristics of the financial assets.
The accounting for financial assets differs in various other areas to existing requirements such as embedded derivatives and the recognition of fair value adjustments in other comprehensive income.
All changes in the fair value of financial liabilities that are designated at fair value through profit or loss due to changes in own credit risk will be required to be recognised within other comprehensive income.
Annual periods beginning on or after 1 January 2018
IAS 32 (amendments) Offsetting Financial Assets and Financial Liabilities
The amendments to IAS 32 clarify the requirements for offsetting of financial assets and liabilities.
Annual periods beginning on or after 1 January 2014

167
Market & Shareholderinformation
Otherinformation
166 Stanbic IBTC Annual group financial statements for the year ended 31 December 2013
Annual report and financial statements Overview Business review
Annual reports and financial statements
Pronouncement Title Effective date
Amendments toIFRS 10, IFRS 12 and IAS 27 – Investment entities
IFRS 10 Consolidated Financial StatementsIFRS 12 Disclosure of Interests in Other EntitiesIAS 27 Separate Financial Statements
The amendments provide ‘investment entities’ (as defined) an exemption from the consolidation of particular subsidiaries and instead require that an investment entity measure the investment in each eligible subsidiary at fair value through profit or loss in accordance with IFRS 9 Financial Instruments or IAS 39 Financial Instruments: Recognition and Measurement.
The amendments also require additional disclosure about why the entity is considered an investment entity, details of the entity’s unconsolidated subsidiaries, and the nature of relationship and certain transactions between the investment entity and its subsidiaries.
Further, an investment entity will be required to account for its investment in a relevant subsidiary in the same way in its consolidated and separate financial statements (or to only provide separate financial statements if all subsidiaries are unconsolidated).
Annual periods beginning on or after 1 January 2014
IAS 36 (amendments) Impairment of Assets
Amendments reduce the circumstances in which the recoverable amount of assets or cash-generating units is required to be disclosed, clarify the disclosures required, and introduce an explicit requirement to disclose the discount rate used in determining impairment (or reversals) where recoverable amount (based on fair value less costs of disposal) is determined using a present value technique.
Annual periods beginning on or after 1 January 2014
IAS 39 (amendments) Financial Instruments: Recognition and Measurement
These amendments make it clear that there is no need to discontinue hedge accounting if a hedging derivative is novated, provided certain criteria are met.
A novation indicates an event where the original parties to a derivative agree that one or more clearing counterparties replace their original counterparty to become the new counterparty to each of the parties. In order to apply the amendments and continue hedge accounting, novation to a central counterparty (CCP) must happen as a consequence of laws or regulations or the introduction of laws or regulations.
Annual periods beginning on or after 1 January 2014
Notes to the annual financial statements (continued)
IFRIC 21 Levies
IFRIC 21 provides guidance on when to recognise a liability for a levy imposed by a government, both for levies that are accounted for in accordance with IAS 37 Provisions, Contingent Liabilities and Contingent Assets and those where the timing and amount of the levy is certain.
The Interpretation identifies the obligating event for the recognition of a liability as the activity that triggers the payment of the levy in accordance with the relevant legislation. It provides the following guidance on recognition of a liability to pay levies:
The liability is recognised progressively if the obligating event occurs over a period of time
If an obligation is triggered on reaching a minimum threshold, the liability is recognised when that minimum threshold is reached.
Annual periods beginning on or after 1 January 2014

169
Market & Shareholderinformation
Otherinformation
168 Stanbic IBTC Annual group financial statements for the year ended 31 December 2013
Annual report and financial statements Overview Business review
Annual reports and financial statements
Notes to the annual financial statements (continued)
5. Segment reporting
The group is organised on the basis of products and services, and the segments have been identified on this basis. The principal business units in the group are as follows:
Business unit
Personal and Business Banking Banking and other financial services to individual customers and small-to-medium-sized enterprises.
Mortgage lending – Provides residential accommodation loans to mainly personal market customers.
Instalment sale and finance leases – Provides instalments finance to personal market customers and finance of vehicles and equipment in the business market.Card products – Provides credit and debit card facilities for individuals and businesses.
Transactional and lending products – Transactions in products associated with the various points of contact channels such as ATMs, internet, telephone banking and branches. This includes deposit taking activities, electronic banking, cheque accounts and other lending products coupled with debit card facilities to both personal and business market customers.
Corporate and Investment Banking Corporate and investment banking services to larger corporates, financial institutions and international counterparties.
Global markets – Includes foreign exchange, fixed income, interest rates, and equity trading. Transaction process and services - includes transactional banking and investors services.
Transactional and lending products – Includes corporate lending and transactional banking businesses, custodial services, trade finance business and property-related lending.
Investment banking – Include project finance, structured finance, equity investments, advisory, corporate lending, primary market acquisition, leverage finance and structured trade finance.
Wealth The wealth group is made up of the company's subsidiaries, whose activities involve investment management, portfolio management, unit trust/funds management, and trusteeship.

171
Market & Shareholderinformation
Otherinformation
170 Stanbic IBTC Annual group financial statements for the year ended 31 December 2013
Annual report and financial statements Overview Business review
Annual reports and financial statements
Notes to the annual financial statements (continued)
5. Segment reporting (continued) Personal and Business Banking
Corporate and Investment Banking Wealth Eliminations Group
Operating segments31 Dec 2013
Nmillion31 Dec 2012
Nmillion31 Dec 2013
Nmillion31 Dec 2012
Nmillion31 Dec 2013
Nmillion31 Dec 2012
Nmillion31 Dec 2013
Nmillion31 Dec 2012
Nmillion31 Dec 2013
Nmillion31 Dec 2012
Nmillion
Gross earnings 34,391 29,257 59,058 49,836 18,660 14,052 (883) (1,285) 111,226 91,860
Net interest income 18,442 18,374 16,623 13,496 1,948 1,684 - - 37,013 33,554
Interest income 27,124 24,030 33,668 32,659 1,948 1,684 (155) (555) 62,585 57,818
Interest expense (8,682) (5,656) (17,045) (19,163) - - 155 555 (25,572) (24,264)
Non-interest revenue 6,909 5,154 25,326 17,064 16,712 12,368 (728) (730) 48,219 33,856
Net fee and commission revenue 6,769 5,141 10,147 8,813 16,712 12,344 (728) (730) 32,900 25,568
Fee and commission revenue 7,127 5,214 10,211 8,926 16,712 12,344 (728) (730) 33,322 25,754
Fee and commission expense (358) (73) (64) (113) - - - - (422) (186)
Trading revenue - - 14,895 8,091 - - - - 14,895 8,091
Other revenue 140 13 284 160 - 24 - - 424 197
Total income 25,351 23,528 41,949 30,560 18,660 14,052 (728) (730) 85,232 67,410
Credit impairment charges (2,344) (3,566) (323) (3,329) - - - - (2,667) (6,895)
Income after credit impairment charges 23,007 19,962 41,626 27,231 18,660 14,052 (728) (730) 82,565 60,515
Operating expenses (30,703) (25,258) (21,572) (17,994) (6,401) (6,581) 728 730 (57,948) (49,103)
Staff costs (13,366) (12,685) (7,586) (4,791) (2,899) (2,477) - - (23,851) (19,953)
Other operating expenses (17,337) (12,573) (13,986) (13,203) (3,502) (4,104) 728 730 (34,097) (29,150)
Net income before indirect taxation (7,531) (5,232) 20,112 9,487 12,259 7,471 - - 24,840 11,726
Indirect taxation (165) (64) (58) (250) - - - - (223) (314)
Profit before direct taxation (7,696) (5,296) 20,054 9,237 12,259 7,471 - - 24,617 11,412
Direct taxation 1,689 2,286 (1,660) (1,646) (3,873) (1,895) - - (3,844) (1,255)
Profit/ (loss) for the year (6,007) (3,010) 18,394 7,591 8,386 5,576 - - 20,773 10,157
Total assets 284,810 257,191 459,605 408,024 22,572 17,031 (3,941) (5,427) 763,046 676,819
Total liabilities 272,001 230,536 389,426 360,105 7,926 5,954 (3,941) (5,427) 665,412 591,168
Depreciation and amortisation 3,259 2,858 635 380 159 172 - - 4,053 3,410
Number of employees 1,346 1,433 395 384 336 336 - - 2,077 2,153

173
Market & Shareholderinformation
Otherinformation
172 Stanbic IBTC Annual group financial statements for the year ended 31 December 2013
Annual report and financial statements Overview Business review
Annual reports and financial statements
Notes to the annual financial statements (continued)
6. Key management assumptions
In preparing the financial statements, estimates and assumptions are made that could materially affect the reported amounts of assets and liabilities within the next financial year. Estimates and judgements are continually evaluated and are based on factors such as historical experience and current best estimates of uncertain future events that are believed to be reasonable under the circumstances. No material changes to assumptions have occurred during the period
6.1 Credit impairment losses on loans and advances
Portfolio loan impairmentsThe group assesses its loan portfolios for impairment at each reporting date. In determining whether an impairment loss should be recorded in profit or loss, the group makes judgements as to whether there is observable data indicating a measurable decrease in the estimated future cash flows from a portfolio of loans before the decrease can be allocated to an individual loan in that portfolio. For corporate and investment banking, estimates are made of the duration between the occurrence of a loss event and the identification of a loss on an individual basis. This is calculated on a portfolio basis, based on historical loss ratios, adjusted for national and industry-specific economic conditions and other indicators present at the reporting date that correlate with defaults on the portfolio. These include early arrears and other indicators of potential default, such as changes in macroeconomic conditions and legislation affecting credit recovery. These annual loss ratios are applied to loan balances in the portfolio and scaled to the estimated loss emergence period. At the period end, the group applied the following loss emergence periods:
For Personal and Business Banking, the estimates for the duration between the occurrence of a loss event and the identification of a loss impairment for performing loans is calculated using portfolio loss given default and the probablility of default for the arrears bucket and linked to the relevant emergence period.
1 Sensitivity is based on the effect of a change of one month in the emergence period on the value of the impairment.
Average loss emergence period Sensitivity1
Dec 2013Months
Dec 2012Months
Dec 2013Nmillion
Dec 2012Nmillion
Personal and Business Banking - - (15) 355
Mortgage lending 3 3 (2) 43
Instalment sale and finance leases 3 3 (1) -
Card debtors 3 3 (1) 3
Other lending 3 3 (11) 309
Corporate and Investment Banking (total loan portfolio) 12 12 238 155
Specific loan impairmentsNon-performing loans include those loans for which the group has identified objective evidence of default, such as a breach of a material loan covenant or condition as well as those loans for which instalments are due and unpaid for 90 days or more. Management’s estimates of future cash flows on individually impaired loans are based on historical loss experience for assets with similar credit risk characteristics. The methodology and assumptions used for estimating both the amount and timing of future cash flows are reviewed regularly to reduce any differences between loss estimates and actual loss experience. Recoveries of individual loans as a percentage of the outstanding balances are estimated as follows:
Expected time to recovery
Expected recoveries as a percentage of
impaired loansImpairment loss
sensitivity1
Dec 2013Months
Dec 2012Months
Dec 2013%
Dec 2012%
Dec 2013Nmillion
Dec 2012Nmillion
Personal and Business Banking 43 48
Mortgage lending 12 12 33 40 3 8
Instalment sale and finance leases 6 6 29 50 7 7
Card debtors 8 8 9 9 1 -
Other lending 8 8 33 17 32 33
Corporate and Investment Banking The estimated recoveries for Corporate and Investment Banking non-performing loans are calculated on a customer by customer basis.
1 Sensitivity is based on the effect of a change of one percentage point in the value of the estimated recovery on the value of the impairment.
Determination of regulatory risk reservesProvisions under prudential guidelines are determined using the time based provisioning regime prescribed by the Revised Central Bank of Nigeria (CBN) Prudential Guidelines. This is at variance with the incurred loss model required by IFRS under IAS 39. As a result of the differences in the methodology/provision regime, there will be variances in the impairments allowances required under the two methodologies.
Paragraph 12.4 of the revised Prudential Guidelines for Deposit Money Banks in Nigeria stipulates that Banks would be required to make provisions for loans as prescribed in the relevant IFRS Standards when IFRS is adopted. However, Banks would be required to comply with the following:
Provisions for loans recognised in the profit and loss account should be determined based on the requirements of IFRS. However, the IFRS provision should be compared with provisions determined under prudential guidelines and the expected impact/changes in general reserves should be treated as follows:
Prudential Provisions is greater than IFRS provisions; the excess provision resulting should be transferred from the general reserve account to a “regulatory risk reserve”.
Prudential Provisions is less than IFRS provisions; IFRS determined provision is charged to the statement of comprehensive income. The cumulative balance in the regulatory risk reserve is thereafter reversed to the general reserve account.

175
Market & Shareholderinformation
Otherinformation
174 Stanbic IBTC Annual group financial statements for the year ended 31 December 2013
Annual report and financial statements Overview Business review
Annual reports and financial statements
Notes to the annual financial statements (continued)
The non-distributable reserve should be classified under Tier 1 as part of the core capital.
The company’s subsidiary Stanbic IBTC Bank, has complied with the requirements of the guidelines as follows:
Statement of prudential adjustments Note31 Dec 2013
Nmillion 31 Dec 2012
Nmillion
Prudential provision
Specific provision on loans and advances 11,420 9,691
General provision on loans and advances 2,909 2,651
Provision for other credit losses - 1,607
Provision on other losses 3,653 4,472
17,982 18,421
IFRS provision
Specific impairment on loans and advances 12.3 8,972 9,287
Portfolio Impairment on loans and advances 12.3 4,587 3,842
Impairment and other losses 3,654 5,292
17,213 18,421
Closing regulatory reserve 769 -
Opening regulatory reserve - -
Appropriation: Transfer (to)/from retained earnings 769 -
6.2 Fair value of financial instruments
The fair value of financial instruments, such as unlisted equity investments, that are not quoted in active markets is determined using valuation techniques. Wherever possible, models use only observable market data. Where required, these models incorporate assumptions that are not supported by prices from observable current market transactions in the same instrument and are not based on available observable market data. Such assumptions include risk premiums, liquidity discount rates, credit risk, volatilities and correlations. Changes in these assumptions could affect the reported fair values of financial instruments.
Additional disclosures on fair value measurements of financial instruments are set out in notes 25.
6.3 Impairment of available-for-sale equity investments
The group determines that available-for-sale equity investments are impaired and recognised as such in profit or loss when there has been a significant or prolonged decline in the fair value below its cost. The determination of what is significant or prolonged requires judgement. In making this judgement, the group evaluates, among other factors, the normal volatility in the fair value. In addition, impairment may be appropriate when there is evidence of a deterioration in the financial health of the investee, industry or sector, or operational and financing cash flows or significant changes in technology.
Had the declines of financial instruments with fair values below cost been considered significant or prolonged, the group would have suffered an additional loss attributable to ordinary shareholders of N98 million (2012: N38 million) in its financial statements, being the transfer of the negative revaluations within the available-for-sale reserve to profit or loss.
6.4 Securitisations and special purpose entities (SPEs)
The group sponsors the formation of SPEs primarily for the purpose of allowing clients to hold investments, for asset securitisation transactions, asset financing and for buying or selling credit protection. The group consolidates SPEs that it controls in terms of IFRS. As it can sometimes be difficult to determine whether the group controls an SPE, it makes judgements about its exposure to the risks and rewards, as well as about its ability to make operational decisions for the SPE in question. In arriving at judgements, these factors are considered both jointly and separately.
6.5 Intangible assets
Direct computer software development costs that are clearly associated with an identifiable and unique system, which will be controlled by the group and have a probable future economic benefit beyond one year, are capitalised and disclosed as computer software intangible assets.
Computer software intangible assets are carried at cost
less accumulated amortisation and accumulated impairment losses. The assets are tested for impairment whenever events or changes in circumstances indicate that the carrying amount may not be recoverable. The determination of the recoverable amount of each asset requires judgement. The recoverable amount is based on the value in use and calculated by estimating future cash benefits that will result from each asset and discounting these cash benefits at an appropriate pre-tax discount rate.
6.6 Investment funds
The group acts as fund manager to a number of investment funds. Determination of whether the group controls such an investment fund usually focuses on the assessment of the
aggregate economic interest of the group in the fund and the investors’ rights to remove the fund manager. For all funds managed by the group, the investors are able to vote by simple majority to remove the group as fund manager without cause, and the group’s aggregate economic interest is in each case less than 15%. As a result, the group has concluded that it acts as agent for the investors in all cases, and therefore has not consolidated these funds.
Further disclosure in respect of investment funds in which the group has an interest is contained in note 14.
6.7 OtherThe nature of the assumptions or other estimation uncertainty for group share incentive schemes are disclosed in note 28.9.
Group Company
31 Dec 2013Nmillion
31 Dec 2012Nmillion
31 Dec 2013Nmillion
31 Dec 2012Nmillion
Coins and bank notes 16,481 15,536 - -
Balances with central bank 66,018 61,397 - -
Current balances with banks within Nigeria 10,866 7,861 2,722 2,625
Current balances with banks outside Nigeria 26,947 21,886 - -
120,312 106,680 2,722 2,625
7. Cash and cash equivalents
8. Pledged assets and assets not derecognised
Cash and balances with central bank include N51,603 million (2012: N40,520 million) that is not available for use by the group on a day to day basis. These restricted balances comprise primarily reserving requirements held with Central Bank of Nigeria (CBN).
Included in current balances with banks outside Nigeria is N5.45 billion (2012: N8.99billion) which represents Naira value of foreign currency bank balances held on behalf of customers in respect of letters of credit transactions. The corresponding liability is included in other liabilities.
All pledged assets of the group are classified as available-for-sale financial instruments.
Group Company
31 Dec 2013Nmillion
31 Dec 2012Nmillion
31 Dec 2013Nmillion
31 Dec 2012Nmillion
8.1 Pledged assets
Financial assets that may be repledged or resold by counterparties
Government bonds - 8,493 - -
Treasury bills 24,733 15,947 - -
24,733 24,440 - -
Maturity analysisThe maturities represent periods to contractual redemption of the pledged assets recorded.
Redeemable on demand
Maturing within 1 month 24,341 5,971 - -
Maturing after 1 month but within 6 months 392 15,947 - -
Maturing after 6 months but within 12 months - 2,522 - -
Maturing after 12 months - - - -
24,733 24,440 - -

177
Market & Shareholderinformation
Otherinformation
176 Stanbic IBTC Annual group financial statements for the year ended 31 December 2013
Annual report and financial statements Overview Business review
Annual reports and financial statements
Notes to the annual financial statements (continued)
8.2 Total assets pledged
The assets pledged by the group are strictly for the purpose of providing collateral to the counterparty for various transactions. These transactions include assets pledged in connection with clearing/settlement activities of the group.
To the extent that the counterparty is permitted to sell and/or repledge the assets in the absence of default, the assets are classified in the statement of financial position as pledged assets.
The carrying amount of total financial assets that have been pledged as collateral for liabilities (included in amounts reflected in 8.1 above) at 31 December 2013 was N2,955 million (2012: N2,905 million). The liability in respect of which the collateral has been pledged relates to on-lending facility obtained from Bank of Industry as disclosed under note 20.
9. Trading assets and trading liabilities
Trading assets and trading liabilities mainly relates to client-facilitating activities carried out by the Global Markets business. These instruments are managed on a combined basis and should therefore be assessed on a total portfolio basis and not as stand-alone assets and liability classes.
9.1 Trading assetsGroup Company
Classification31 Dec 2013
Nmillion31 Dec 2012
Nmillion31 Dec 2013
Nmillion31 Dec 2012
Nmillion
Listed 40,711 114,877 - -
Unlisted - - - -
40 711 114,877 - -
Comprising:
Government bonds 2,634 37,037 - -
Treasury bills 38,026 56,407 - -
Listed equities 51 11 - -
Placements - 21,422 - -
40,711 114,877 - -
Dated assets
40,660
114,866
-
-
Undated assets 51 11 - -
40,711 114,877 - -
Maturity analysisThe maturities represent periods to contractual redemption of the trading assets recorded.
Redeemable on demand - 11,172 - -
Maturing within 1 month 35,069 41,043 - -
Maturing after 1 month but within 6 months 3,030 10,917 - -
Maturing after 6 months but within 12 months 863 14,418 - -
Maturing after 12 months 1,697 37,316 - -
Undated assets 51 11 - -
40,710 114,877 - -
Redemption valueDated trading assets had a redemption value at 31 December 2013 of N41,398 million (2012: N118,709 million).
Group Company
Classification31 Dec 2013
Nmillion31 Dec 2012
Nmillion31 Dec 2013
Nmillion31 Dec 2012
Nmillion
Listed 6,438 51,664 - -
Unlisted 60,522 36,707 - -
66,960 88,371 - -
Comprising:
Government bonds (short positions) 1,714 15,687 - -
Deposits 60,522 36,707
Treasury bills (short positions) 4,724 35,977 - -
66,960 88,371 - -
Maturity analysisThe maturity analysis is based on the remaining periods to contractual maturity from period end.
Repayable on demand - 11,437 - -
Maturing within 1 month 20,664 16,939 - -
Maturing after 1 month but within 6 months 34,988 14,787 - -
Maturing after 6 months but within 12 months 9,594 8,092 - -
Maturing after 12 months 1,714 37,116 - -
66,960 88,371 - -
10. Derivative instruments
All derivatives are classified as either derivatives held for risk management or hedging purposes.
10.1 Use and measurement of derivative instruments
In the normal course of business, the group enters into a variety of derivative transactions for both trading and risk management purposes. Derivative financial instruments are entered into for trading purposes and for hedging foreign exchange and interest rate exposures. Derivative instruments used by the group in both trading and hedging activities include swaps, forwards and other similar types of instruments based on foreign exchange rates and interest rates.
The risks associated with derivative instruments are monitored in the same manner as for the underlying instruments. Risks are also measured across the product range in order to take into account possible correlations.
The fair value of all derivatives is recognised on the statement of financial position and is only netted to the extent that there is both a legal right of set-off and an intention to settle on a net basis.
Swaps are transactions in which two parties exchange cash flows on a specified notional amount for a predetermined period.
The major types of swap transactions undertaken by the group are as follows:
(i) Foreign exchange swaps are contractual obligations between two parties to swap a pair of currencies. Foreign exchange swaps are tailor-made agreements that are transacted between counterparties in the Over-the-counter (OTC) market.
(ii) Forwards are contractual obligations to buy or sell financial instruments or commodities on a future date at a specified price. Forward contracts are tailor-made agreements that are transacted between counterparties in the OTC market.
9.1 Trading liabilities

179
Market & Shareholderinformation
Otherinformation
178 Stanbic IBTC Annual group financial statements for the year ended 31 December 2013
Annual report and financial statements Overview Business review
Annual reports and financial statements
Maturity analysis of net fair value
31 December 2012
Within 1 year
Nmillion
After 1 year but
within 5 years
Nmillion
After 5 years
Nmillion
Net fair value
Nmillion
Fair
value of assets
Nmillion
Fair
value of liabilitiesNmillion
Contract /
notional amountNmillion
Derivatives held-for-trading
Foreign exchange derivatives (348) - - (348) 424 (772) 61,269
Forwards (348) - - (348) 424 (772) 61,269
Options - - - - - - -
Interest rate derivatives 5 1,279 - 1,285 1,285 - 25,541
Forwards - - - - - - -
Swaps 5 1,279 - 1,285 1,285 - 25,541
Total derivative assets/(liabilities) (343) 1,279 - 937 1,709 (772) 86,810
10.2 Derivatives held-for-trading
The group trades derivative instruments on behalf of customers and for its own positions. The group transacts derivative contracts to address customer demand by structuring tailored derivatives for customers. The group also takes proprietary positions for its own account. Trading derivative products include the following derivative instruments:
10.2.1 Foreign exchange derivatives
Foreign exchange derivatives are primarily used to hedge foreign currency risks on behalf of customers and for the group’s own positions. Foreign exchange derivatives primarily consist of foreign exchange forwards.
10.2.2 Interest rate derivatives
Interest rate derivatives are primarily used to modify the volatility and interest rate characteristics of interest-earning assets and interest-bearing liabilities on behalf of customers and for the group’s own positions. Interest rate derivatives primarily consist of swaps.
10.3 Unobservable valuation differences on initial recognition
Any difference between the fair value at initial recognition and the amount that would be determined at that date using a valuation technique in a situation in which the valuation is dependent on unobservable parameters is not recognised in profit or loss immediately but is recognised over the life of the instrument on an appropriate basis or when the instrument is redeemed.
10.4 Fair values
The fair value of a derivative financial instrument represents for quoted instruments the quoted market price and for unquoted instruments the present value of the positive or negative cash flows, which would have occurred if the rights and obligations arising from that instrument were closed out in an orderly market place transaction at period end.
10.5 Notional amount
The gross notional amount is the sum of the absolute value of all bought and sold contracts. The notional amounts have been translated at the closing rate at the reporting date where cash flows are receivable in foreign currency. The amount cannot be used to assess the market risk associated with the positions held and should be used only as a means of assessing the group’s participation in derivative contracts.
Maturity analysis of net fair value
31 December 2013
Within 1 year
Nmillion
After 1 year but within 5
yearsNmillion
After 5 years
Nmillion
Net fair value
Nmillion
Fair value of
assets Nmillion
Fair value of
liabilitiesNmillion
Contract /notional
amountNmillion
Derivatives held-for-trading
Foreign exchange derivatives (161) (18) - (179) 422 (601) 10,691
Forwards (161) (18) - (179) 422 (601) 10,691
Interest rate derivatives (116) 736 - 620 1,104 (484) 102,093
Swaps (116) 736 - 620 1,104 (484) 102,093
Total derivative assets/(liabilities) (277) 718 - 441 1,526 (1,085) 112,784
Notes to the annual financial statements (continued)
10.7 Unobservable valuation differences on initial recognition
The table below sets out the aggregate difference yet to be recognised in profit or loss at the beginning and end of the year with a reconciliation of the changes of the balance during the year for trading assets and liabilities.
2013Nmillion
2012Nmillion
Unrecognised profit at beginning of the year 277 780
Additional profit on new transactions - -
Recognised in profit or loss during the year (274) (503)
Unrecognised profit at end of the year 3 277

181
Market & Shareholderinformation
Otherinformation
180 Stanbic IBTC Annual group financial statements for the year ended 31 December 2013
Annual report and financial statements Overview Business review
Annual reports and financial statements
Notes to the annual financial statements (continued)
11. Financial investments
All financial investments of the group are classified as available for sale investments.
Aggregate unrealised loss of N0 million (2012: N68 million) was recognised in the available for sale reserve.
1 Undated investments include unutilised equities and mutual funds and linked investments.
Group Company
31 Dec 2013
Nmillion
31 Dec 2012
Nmillion
31 Dec 2013
Nmillion
31 Dec 2012
Nmillion
Short - term negotiable securities 125,695 32,062 - -
Listed 125,695 32,062 - -
Unlisted - - - -
Other financial investments 13,609 53,695 - -
Listed 11,001 42,805 - -
Unlisted 2,608 10,890 - -
139,304 85,757 - -
Comprising:
Government bonds 9,781 41,087 - -
Treasury Bills 125,695 32,062 - -
Corporate bonds 1,867 2,453 - -
Unlisted equities 741 706 - -
Mutual funds and unit-linked investments 1,220 1,717 - -
Placements - 7,732 - -
139,304 85,757 - -
Maturity analysis The maturities represent periods to contractual redemption of the financial investments recorded.
Redeemable on demand - - - -
Maturing within 1 month 57,439 2,598 - -
Maturing after 1 month but within 6 months 67,972 46,933 - -
Maturing after 6 months but within 12 months 6,709 5,343 - -
Maturing after 12 months 5,223 28,427 - -
Undated investments 1 1,961 2,456 - -
139,304 85,757 - -
Group Company
31 Dec 2013
Nmillion
31 Dec 2012
Nmillion
31 Dec 2013
Nmillion
31 Dec 2012
Nmillion
Loans and advances to banks 94,180 24,571 - -
Placements with banks 94,180 24,571 - -
Loans and advances to customers 289,747 266,344 - -
Gross loans and advances to customers 303,306 279,473 - -
Mortgage loans 8,667 10,571 - -
Instalment sale and finance leases (note 12.2) 27,012 29,972 - -
Card debtors 850 494 - -
Overdrafts and other demand loans 32,676 29,193 - -
Medium term loans 232,635 206,668 - -
Other term loans 1,466 2,575 - -
Credit impairments for loans and advances (note 12.3) (13,559) (13,129) - -
Specific credit impairments (8,972) (9,287) - -
Portfolio credit impairments (4,587) (3,842) - -
Net loans and advances 383,927 290,915 - -
Comprising:
Gross loans and advances 397,486 304,044 - -
Less: Credit impairments (13,559) (13,129) - -
Net loans and advances 383,927 290,915 - -
Loans to banks represent current account balances and placements with other banks mainly held for liquidity purposes and for facilitating trade finance activities.
Included in current balances with banks outside Nigeria is N5.45 billion (2012: N8.99 billion) which represents Naira value of foreign currency bank balances held on behalf of customers in respect of letters of credit transactions. The corresponding liability is included in other liabities.
Regulatory prudential disclosures on loans and advances have been disclosed under note 6 and credit risk management– prudential guidelines disclosures.
Maturity analysis
The maturity analysis is based on the remaining periods to contractual maturity from the period end.
Redeemable on demand 23,132 44,741 - -
Maturing within 1 month 123,297 46,703 - -
Maturing after 1 month but within 6 months 39,433 48,840 - -
Maturing after 6 months but within 12 months 19,935 27,139 - -
Maturing after 12 months 191,689 166,368 - -
Gross loans and advances 397,486 333,791 - -
12. Loans and advances
12.1 Loans and advances net of impairments

183
Market & Shareholderinformation
Otherinformation
182 Stanbic IBTC Annual group financial statements for the year ended 31 December 2013
Annual report and financial statements Overview Business review
Annual reports and financial statements
Notes to the annual financial statements (continued)
Group Company
Segmental analysis - industry
31 Dec 2013
Nmillion
31 Dec 2012
Nmillion
31 Dec 2013
Nmillion
31 Dec 2012
Nmillion
Agriculture 12,703 10,361 - -
Construction and real estate 15,294 5,921 - -
Electricity 10,671 7,223 - -
Finance and other business services 107,197 71,223 - -
Individuals 55,853 46,026 - -
Manufacturing 55,741 67,629 - -
Mining 55,568 32,136 - -
Other services 48,016 48,591 - -
Transport 11,318 10,992 - -
Wholesale 25,125 33,689 - -
Gross loans and advances 397,486 333,791 - -
Segmental analysis – geographic area
The following table sets out the distribution of the group’s loans and advances by geographic area where the loans are recorded.
South South 17,157 12,163 - -
South West 329,525 247,721 - -
South East 4,682 3,147 - -
North West 19,709 14,772 - -
North Central 15,332 11,279 - -
North East 1,924 824 - -
Outside Nigeria 9,157 43,885 - -
Gross loans and advances 397,486 333,791 - -
Group Company
31 Dec 2013
Nmillion
31 Dec 2012
Nmillion
31 Dec 2013
Nmillion
31 Dec 2012
Nmillion
Gross investment in instalment sale and finance leases 33,632 39,145 - -
Receivable within 1 year 2,728 3,043 - -
Receivable after 1 year but within 5 years 30,898 35,790 - -
Receivable after 5 years 6 312 - -
Unearned finance charges deducted (6,620) (9,173) - -
Net investment in instalment sale and finance leases 27,012 29,972 - -
Receivable within 1 year 2,582 2,462 - -
Receivable after 1 year but within 5 years 24,427 27,328 - -
Receivable after 5 years 3 182 - -
All loans and advances to customers are held at amortised cost.
12.1 Loans and advances net of impairments (continued)
12.2 Installment sale and finance leases
Included in gross loans and advances to customers are finance lease as analysed below
12.3 Credit impairments for loans and advances
A reconciliation of the allowance for impairment losses for loans and advances, by class:
Group
Mortgage lending
Nmillion
Instalment sales and
finance leases
Nmillion
Card debtorsNmillion
Other loans and advancesNmillion
Commercial property
financeNmillion
TotalNmillion
31 December 2013
Specific impairments
Balance at beginning of the year 730 778 27 4,026 3,726 9,287
Net impairments raised/(released) (105) 1,062 43 2,049 (575) 2,474
Impaired accounts written off (342) (499) - (892) (1,056) (2,789)
Balance at end of the year 283 1,341 70 5,183 2,095 8,972
Portfolio impairments
Balance at beginning of the year 190 617 18 1,157 1,860 3,842
Net impairments raised/(released) (107) (172) (15) 41 998 745
Balance at end of the year 83 445 3 1,198 2,858 4,587
Total 366 1,786 73 6,381 4,953 13,559
Group
Mortgage lendingNmillion
Instalment sales and
finance leasesNmillion
Card debtorsNmillion
Other loans and advancesNmillion
Commercial property
financeNmillion
TotalNmillion
31 December 2012
Specific impairments
Balance at beginning of the year 452 180 28 1,867 3,497 6,024
Net impairments raised/(released) 278 626 (1) 2,562 3,351 6,816
Impaired accounts written off - (28) - (403) (3,122) (3,553)
Balance at end of the year 730 778 27 4,026 3,726 9,287
Portfolio impairments
Balance at beginning of the year 184 80 17 1,176 1,881 3,338
Net impairments raised/(released) 6 537 1 (19) (21) 504
Balance at end of the year 190 617 18 1,157 1,860 3,842
Total 920 1,395 45 5,183 5,586 13,129

185
Market & Shareholderinformation
Otherinformation
184 Stanbic IBTC Annual group financial statements for the year ended 31 December 2013
Annual report and financial statements Overview Business review
Annual reports and financial statements
Notes to the annual financial statements (continued)
Segmental analysis of specific impairments - industry
The following table sets out the segment analysis of the group impairment by industry.
Segmental analysis of specific impairments – geographic area
The following table sets out the distribution of the group’s impairments by geographic area where the loans are recorded.
Group
Group
31 Dec 2013
Nmillion
31 Dec 2012
Nmillion
Agriculture 994 243
Construction and real estate 1,102 1,101
Electricity - 31
Finance and other business services 825 61
Individuals 1,811 1,756
Manufacturing 970 2,187
Mining 302 234
Other services 995 806
Transport 330 976
Wholesale 1,643 1,892
8,972 9,287
Group
Group
31 Dec 2013
Nmillion
31 Dec 2012
Nmillion
South South 927 256
South West 7,289 8,250
South East 161 163
North West 197 117
North Central 366 483
North East 32 18
8,972 9,287
Group Company
%
31 Dec 2013
Nmillion
31 Dec 2012
Nmillion
31 Dec 2013
Nmillion
31 Dec 2012
Nmillion
Stanbic IBTC Ventures Limited ("SIVL") 100% - - 500 500
Stanbic IBTC Bank PLC 100% - - 63,467 63,467
Stanbic IBTC Capital Limited 100% - - 3,500 3,500
Stanbic IBTC Asset Management Limited ("SIAML") 100% - - 710 710
Stanbic IBTC Pension Managers Limited ("SIPML") 70.59% - - 565 565
Stanbic IBTC Trustees Limited ("SITL") 100% - - 100 100
Stanbic IBTC Stockbrokers Limited ("SISL") 100% - - 109 109
- - 68,951 68,951
13. Equity investment in group companies
SubsidiariesCountry of
incorporationNature of business
Percentage of capital held
Financial year end
Stanbic IBTC Ventures Limited ("SIVL")
Nigeria Undertakes venture capital projects
99.99% 31 December
Stanbic IBTC Bank PLC Nigeria Provision of banking and related financial
services
99.99% 31 December
Stanbic IBTC Capital Limited Nigeria Provision of general corporate finance and debt advisory services
99.99% 31 December
Stanbic IBTC Asset Management Limited ("SIAML")
Nigeria Acting as investment manager, portfolio manager and as a
promoter and manager of unit trusts and funds
99.99% 31 December
Stanbic IBTC Pension Managers Limited ("SIPML")
Nigeria Administration and management of
pension fund assets
70.59% 31 December
Stanbic IBTC Trustees Limited ("SITL")
Nigeria Acting as executors and trustees of
wills and trusts and provision of agency
services
99.99% 31 December
Stanbic IBTC Stockbrokers Limited ("SISL")
Nigeria Provision of stockbroking services
99.99% 31 December
13.2 Significant restrictions
The group does not have significant restrictions on its ability to access or use its assets and settle its liabilities other than those resulting from the regulatory frameworks within which the subsidiaries operate.
The regulatory frameworks require all the subsidiaries (except SIVL and SITL) to maintain certain level of regulatory capital. In addition, the banking subsidiary (Stanbic IBTC Bank PLC) is required to keep certain levels of liquid assets, limit exposures to other parts of the group and comply with other ratios.
For information on assets, liabilities and earnings of the subsidiaries, see Note 13.4.
13.1 List of significant subsidiaries
The table below provides details of the significant subsidiaries of the group.

187
Market & Shareholderinformation
Otherinformation
186 Stanbic IBTC Annual group financial statements for the year ended 31 December 2013
Annual report and financial statements Overview Business review
Annual reports and financial statements
Notes to the annual financial statements (continued)
13.3 Non-controlling interests (NCI) in subsidiariesThe following table summarises the information relating to the group subsidiary that has material NCI.
Group
Stanbic IBTC Pension Managers Limited
31 Dec 2013
Nmillion
31 Dec 2012
Nmillion
NCI percentage 29.41% 29.41%
Total assets 18,060 13,335
Total liabilities (6,648) (5,474)
Net assets 11,412 7,861
Carrying amount of NCI 3,356 2,310
Revenue 15,739 11,747
Profit 7,356 4,630
Total comprehensive income 7,356 4,628
Profit allocated to NCI 2,163 1,289
Cash flows from operating activities 8,210 6,267
Cash flows from investing activities (3,435) (2,925)
Cash flow from financing activities, before dividends to NCI (2,682) (2,054)
Cash flow from financing activities - cash dividends to NCI (1,118) (856)
Net increase in cash and cash equivalents 975 432
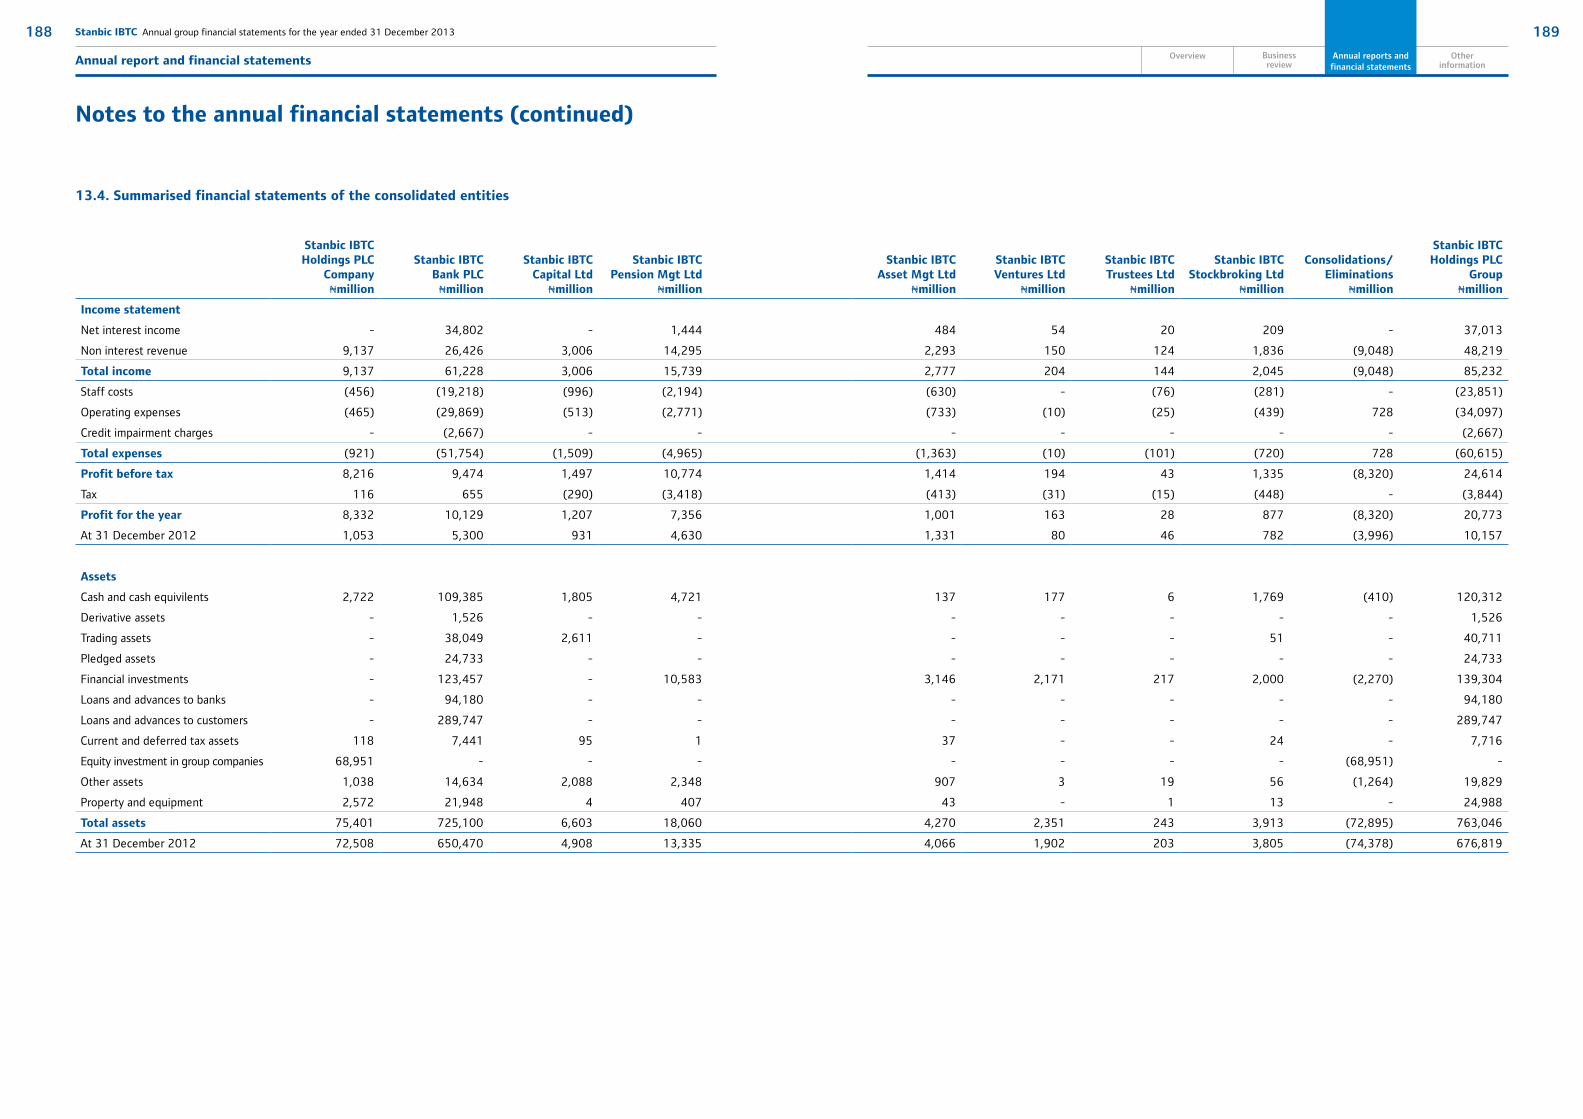
189
Market & Shareholderinformation
Otherinformation
188 Stanbic IBTC Annual group financial statements for the year ended 31 December 2013
Annual report and financial statements Overview Business review
Annual reports and financial statements
Notes to the annual financial statements (continued)
13.4. Summarised financial statements of the consolidated entities
Stanbic IBTC Holdings PLC
CompanyNmillion
Stanbic IBTC Bank PLC
Nmillion
Stanbic IBTC Capital Ltd
Nmillion
Stanbic IBTC Pension Mgt Ltd
Nmillion
Stanbic IBTC Asset Mgt Ltd
Nmillion
Stanbic IBTC Ventures Ltd
Nmillion
Stanbic IBTC Trustees Ltd
Nmillion
Stanbic IBTC Stockbroking Ltd
Nmillion
Consolidations/Eliminations
Nmillion
Stanbic IBTC Holdings PLC
GroupNmillion
Income statement
Net interest income - 34,802 - 1,444 484 54 20 209 - 37,013
Non interest revenue 9,137 26,426 3,006 14,295 2,293 150 124 1,836 (9,048) 48,219
Total income 9,137 61,228 3,006 15,739 2,777 204 144 2,045 (9,048) 85,232
Staff costs (456) (19,218) (996) (2,194) (630) - (76) (281) - (23,851)
Operating expenses (465) (29,869) (513) (2,771) (733) (10) (25) (439) 728 (34,097)
Credit impairment charges - (2,667) - - - - - - - (2,667)
Total expenses (921) (51,754) (1,509) (4,965) (1,363) (10) (101) (720) 728 (60,615)
Profit before tax 8,216 9,474 1,497 10,774 1,414 194 43 1,335 (8,320) 24,614
Tax 116 655 (290) (3,418) (413) (31) (15) (448) - (3,844)
Profit for the year 8,332 10,129 1,207 7,356 1,001 163 28 877 (8,320) 20,773
At 31 December 2012 1,053 5,300 931 4,630 1,331 80 46 782 (3,996) 10,157
Assets
Cash and cash equivilents 2,722 109,385 1,805 4,721 137 177 6 1,769 (410) 120,312
Derivative assets - 1,526 - - - - - - - 1,526
Trading assets - 38,049 2,611 - - - - 51 - 40,711
Pledged assets - 24,733 - - - - - - - 24,733
Financial investments - 123,457 - 10,583 3,146 2,171 217 2,000 (2,270) 139,304
Loans and advances to banks - 94,180 - - - - - - - 94,180
Loans and advances to customers - 289,747 - - - - - - - 289,747
Current and deferred tax assets 118 7,441 95 1 37 - - 24 - 7,716
Equity investment in group companies 68,951 - - - - - - - (68,951) -
Other assets 1,038 14,634 2,088 2,348 907 3 19 56 (1,264) 19,829
Property and equipment 2,572 21,948 4 407 43 - 1 13 - 24,988
Total assets 75,401 725,100 6,603 18,060 4,270 2,351 243 3,913 (72,895) 763,046
At 31 December 2012 72,508 650,470 4,908 13,335 4,066 1,902 203 3,805 (74,378) 676,819
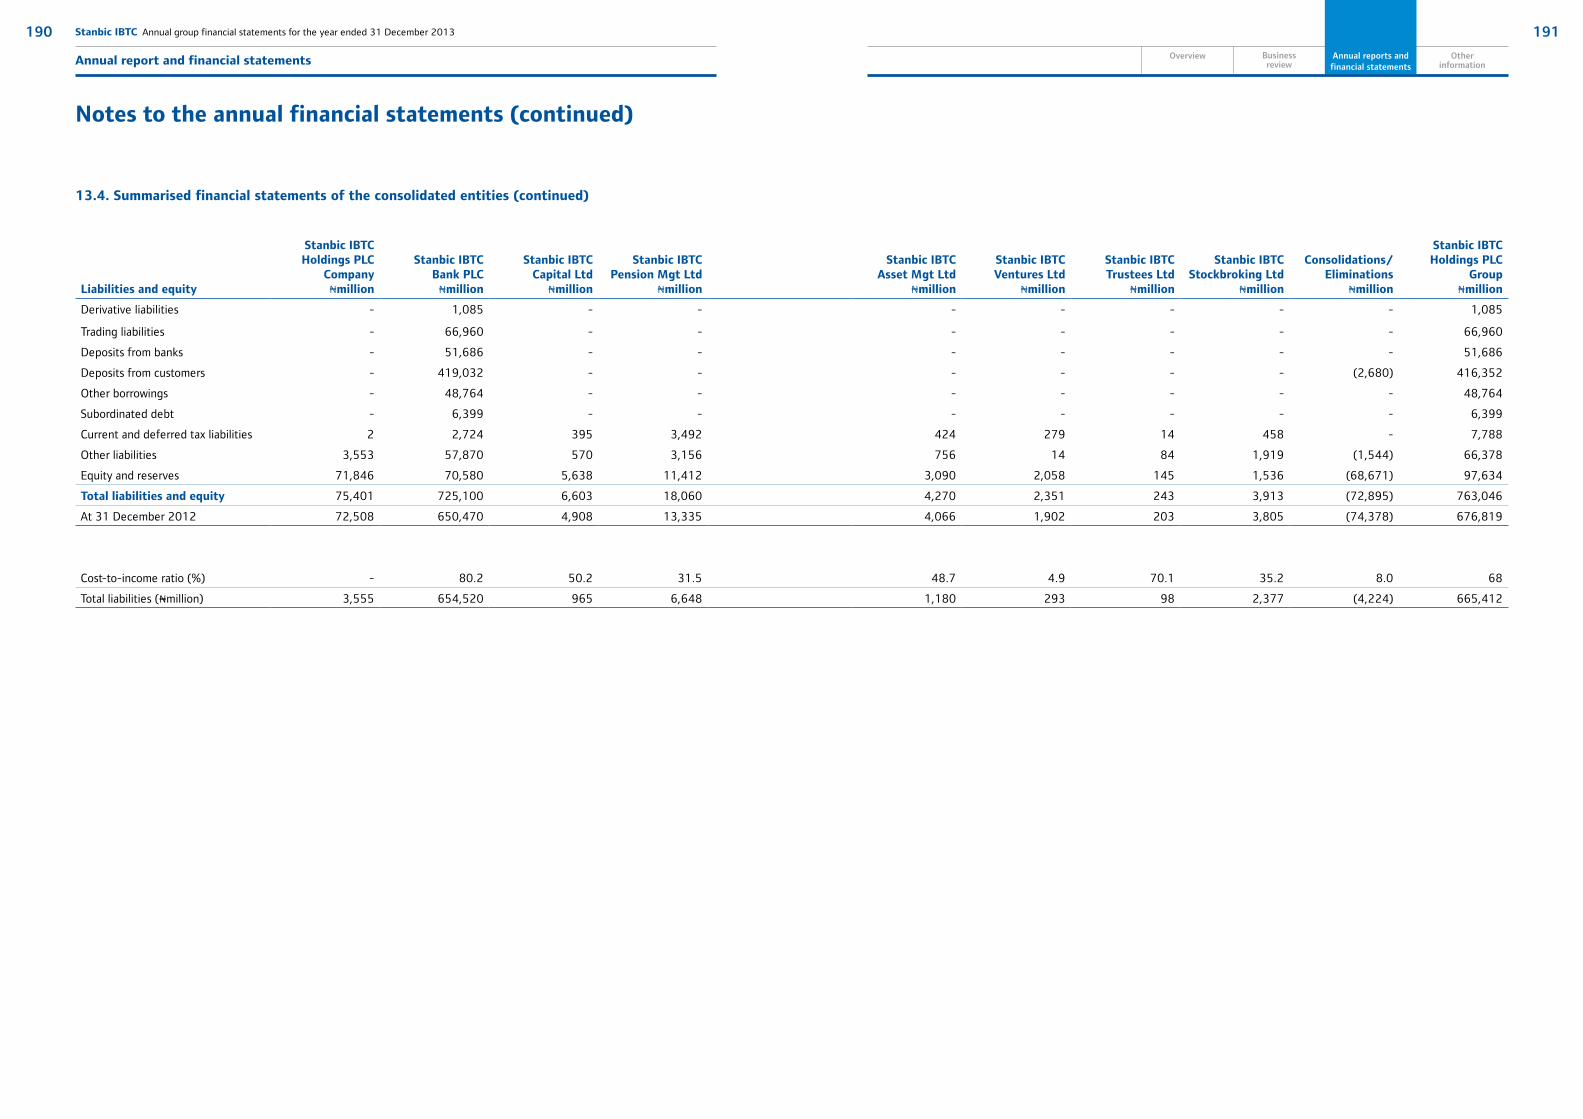
191
Market & Shareholderinformation
Otherinformation
190 Stanbic IBTC Annual group financial statements for the year ended 31 December 2013
Annual report and financial statements Overview Business review
Annual reports and financial statements
Notes to the annual financial statements (continued)
13.4. Summarised financial statements of the consolidated entities (continued)
Liabilities and equity
Stanbic IBTC Holdings PLC
CompanyNmillion
Stanbic IBTC Bank PLC
Nmillion
Stanbic IBTC Capital Ltd
Nmillion
Stanbic IBTC Pension Mgt Ltd
Nmillion
Stanbic IBTC Asset Mgt Ltd
Nmillion
Stanbic IBTC Ventures Ltd
Nmillion
Stanbic IBTC Trustees Ltd
Nmillion
Stanbic IBTC Stockbroking Ltd
Nmillion
Consolidations/Eliminations
Nmillion
Stanbic IBTC Holdings PLC
GroupNmillion
Derivative liabilities - 1,085 - - - - - - - 1,085
Trading liabilities - 66,960 - - - - - - - 66,960
Deposits from banks - 51,686 - - - - - - - 51,686
Deposits from customers - 419,032 - - - - - - (2,680) 416,352
Other borrowings - 48,764 - - - - - - - 48,764
Subordinated debt - 6,399 - - - - - - - 6,399
Current and deferred tax liabilities 2 2,724 395 3,492 424 279 14 458 - 7,788
Other liabilities 3,553 57,870 570 3,156 756 14 84 1,919 (1,544) 66,378
Equity and reserves 71,846 70,580 5,638 11,412 3,090 2,058 145 1,536 (68,671) 97,634
Total liabilities and equity 75,401 725,100 6,603 18,060 4,270 2,351 243 3,913 (72,895) 763,046
At 31 December 2012 72,508 650,470 4,908 13,335 4,066 1,902 203 3,805 (74,378) 676,819
Cost-to-income ratio (%) - 80.2 50.2 31.5 48.7 4.9 70.1 35.2 8.0 68
Total liabilities (Nmillion) 3,555 654,520 965 6,648 1,180 293 98 2,377 (4,224) 665,412

193
Market & Shareholderinformation
Otherinformation
192 Stanbic IBTC Annual group financial statements for the year ended 31 December 2013
Annual report and financial statements Overview Business review
Annual reports and financial statements
Notes to the annual financial statements (continued)
14. Involvement with unconsolidated structured entities
The table below describes the types of structured entities that the group does not consolidate but in which it holds an interest.
Type of structured entity Nature and purpose Interest held by the group
Investment funds To generate fees from managing assets on behalf of third party investors.
Investments in units issued by the funds
These vehicles are financed through the issue of units to investors.
Management fees
The table below sets out an analysis of the investment funds managed by the group, their assets under management, and the carrying amounts of interests held by the group in the investment funds. The maximum exposure to loss is the carrying amount of the interest held by the group.
Asset under management Interest held by the group
S/N Group2013
Nmillion2012
Nmillion 2013
Nmillion2012
Nmillion
i Stanbic IBTC Nigerian Equity Fund 14,908 14,111 294 456
ii Stanbic IBTC Ethical Fund 3,561 3,258 334 332
iii Stanbic IBTC Iman Fund 127 66 - -
iv Stanbic IBTC Guaranteed Investment Fund 2,386 2,371 - -
v Stanbic IBTC Money Market Fund 19,787 12,414 471 814
vi Stanbic IBTC Bond Fund 1,060 1,916 122 115
vii Stanbic IBTC Balanced Fund 1,073 822 - -
viii Stanbic IBTC Aggressive Fund 614 324 - -
ix Stanbic IBTC Conservative Fund 680 546 - -
x Stanbic IBTC Absolute Fund 1,205 1,353 - -
Total 45,401 37,181 1,221 1,717
The interest held by the group is presented under financial investments in the statement of financial position.
Group Company
31 Dec 2013
Nmillion
31 Dec 2012
Nmillion
31 Dec 2013
Nmillion
31 Dec 2012
Nmillion
Trading settlement assets 1,196 1,103 - -
Receivable from AMCON in respect of loans sold - 8,613 - -
Accrued income 2,407 3,398 - -
Indirect/withholding tax receivables 609 593 - -
Accounts receivable 10,071 4,786 657 843
Prepayments 6,467 5,440 396 73
Other debtors 475 738 - -
21,225 24,671 1,053 916
Impairment provision on doubtful receivable (1,396) (1,900) (15) -
19,829 22,771 1,038 916
Movement in provision for doubtful receivables
At start of year 1,900 1,067 - -
Additions/(write back) 1,120 833 15 -
Amount written off (1,624) - - -
At end of year 1,396 1,900 15 -
15. Other assets
Group Company
31 Dec 2013
Nmillion
31 Dec 2012
Nmillion
31 Dec 2013
Nmillion
31 Dec 2012
Nmillion
Current tax assets 62 43 - -
Deferred tax assets (note 22.1) 7,654 5,169 118 -
7,716 5,212 118 -
16. Current and deferred tax assets
The directors have determined that based on company’s profit forecast, it is probable that there will be future taxable profits against which the tax losses, from which a deferred tax asset has been recognised, can be utilised.

195
Market & Shareholderinformation
Otherinformation
194 Stanbic IBTC Annual group financial statements for the year ended 31 December 2013
Annual report and financial statements Overview Business review
Annual reports and financial statements
Notes to the annual financial statements (continued)
Group
Leasehold land and
buildingsNmillion
Motor vehiclesNmillion
Furniture, fittings and equipment
Nmillion
Computer equipment
Nmillion
Work in progressNmillion
TotalNmillion
17.1 Cost
Balance at 1 January 2013 19,186 481 8,318 7,792 2,401 38,178
Additions 27 60 226 689 3,740 4,742
Disposals (105) (120) (99) (70) (27) (421)
Transfers/reclassifications 811 - 166 850 (1,827) -
Balance at 31 December 2013 19,919 421 8,611 9,261 4,287 42,499
Balance at 1 January 2012 18,867 643 8,083 5,472 2,337 35,402
Additions 89 26 172 706 1,187 2,180
Disposals - (198) (191) (287) (95) (771)
Transfers/reclassifications 230 10 254 1,901 (1,028) 1,367
Balance at 31 December 2012 19,186 481 8,318 7,792 2,401 38,178
17.2 Accumulated depreciation
Balance at 1 January 2013 3,978 302 5,119 4,321 - 13,720
Charge for the year 1,167 73 1,456 1,357 - 4,053
Disposals (46) (90) (94) (32) - (262)
Transfers/reclassifications - - - - - -
Balance at 31 December 2013 5,099 285 6,481 5,646 - 17,511
Balance at 1 January 2012 3,304 289 3,776 3,309 - 10,678
Charge for the year 654 105 1,507 1,144 - 3,410
Disposals - (97) (152) (119) - (368)
Transfers/reclassifications 20 5 (12) (13) - -
Balance at 31 December 2012 3,978 302 5,119 4,321 - 13,720
Net book value:
31 December 2013 14,820 136 2,130 3,615 4,287 24,988
31 December 2012 15,208 179 3,199 3,471 2,401 24,458
17. Property and equipment
There were no capitalised borrowing costs related to the acquisition of property and equipment during the year (2012: Nil).
Company
Leasehold land and
buildingsNmillion
Motor vehiclesNmillion
Furniture, fittings and equipment
Nmillion
Computer equipment
Nmillion
Work in progressNmillion
TotalNmillion
17.1 Cost
Balance at 1 January 2013 - - - - 16 16
Additions - - 27 520 2,034 2,581
Disposals - - - - - -
Transfers/reclassifications - - 5 1 (6) -
Balance at 31 December 2013 - - 32 521 2,044 2,597
Balance at 1 January 2012 - - - - - -
Additions - - - - 16 16
Disposals - - - - - -
Impairments - - - - - -
Transfers/reclassifications - - - - - -
Balance at 31 December 2012 - - - - 16 16
17.2 Accumulated depreciation
Balance at 1 January 2013 - - - - - -
Charge for the year - - 3 22 - 25
Disposals - - - - - -
Transfers/reclassifications - - - - - -
Balance at 31 December 2013 - - 3 22 - 25
Balance at 1 January 2012
Charge for the year - - - - - -
Disposals - - - - - -
Impairments - - - - - -
Transfers/reclassifications - - - - - -
Balance at 31 December 2012 - - - - - -
Net book value:
31 December 2013 - - 29 499 2,044 2,572
31 December 2012 - - - - 16 16

197
Market & Shareholderinformation
Otherinformation
196 Stanbic IBTC Annual group financial statements for the year ended 31 December 2013
Annual report and financial statements Overview Business review
Annual reports and financial statements
Notes to the annual financial statements (continued)
Group Company
31 Dec 2013
Nmillion
31 Dec 2012
Nmillion
31 Dec 2013
Nmillion
31 Dec 2012
Nmillion
18.1 Authorised
20,000,000,000 Ordinary shares of 50k each(Dec 2012: 20,000,000,000 Ordinary shares of 50k each) 10,000 10,000 10,000 10,000
18.2 Issued and fully paid-up
20,000,000,000 Ordinary shares of 50k each(Dec 2012: 20,000,000,000 Ordinary shares of 50k each) 5,000 5,000 5,000 5,000
Ordinary share premium 65,450 65,450 65,450 65,450
18. Share capital and reserves
All issued shares are fully paid up. Details of directors’ interest in shares, the shareholder spread and major shareholders are given in the directors’ report on page ii of these financial statements.
18.3 Reserves
a) Merger reserve Merger reserve arose as a result of the implementation of the holding company restructuring. It represents the difference
between pre-restructuring share premium/share capital and the post-restructuring share premium/share capital.
b) Other regulatory reserves The other regulatory reserves includes statutory reserve and the small and medium scale industries reserve (SMEEIS) as
described below.
(i) Statutory reserves Nigerian banking and pension industry regulations require Stanbic IBTC Bank PLC (“the bank”) and Stanbic IBTC Pension
Managers Ltd (“SIPML) that are subsidiary entities, to make an annual appropriation to a statutory reserve.
As stipulated by S.16(1) of the Banks and Other Financial Institution Act of 1991 (amended), an appropriation of 30% of profit after tax is made if the statutory reserve is less than paid-up share capital and 15% of profit after tax if the statutory reserve is greater than the paid up share capital. The bank (a subsidiary) transferred 15% of its profit after tax to statutory reserves as at period end.
Section 69 of Pension Reform Act, 2004 requires SIPML to transfer 12.5% of its profit after tax to a statutory reserve.
(ii) Small and medium scale industries reserve (SMEEIS) The SMEEIS reserve is maintained to comply with the Central Bank of Nigeria (CBN) requirement that all licensed banks
set aside a portion of the profit after tax in a fund to be used to finance equity investment in qualifying small and medium scale enterprises. Under the terms of the guideline (amended by CBN letter dated 11 July 2006), the contributions will be 10% of profit after tax and shall continue after the first 5 years but banks’ contributions shall thereafter reduce to 5% of profit after tax. However, this is no longer mandatory. The small and medium scale industries equity investment scheme reserves are non-distributable.
c) Available for sale reserve This represents unrealised gains or losses arising from changes in the fair value of available-for-sale financial assets which are
recognised directly in the available-for-sale reserve until the financial asset is derecognised or impaired.
d) Statutory credit risk reserve Should credit impairment on loans and advances as accounted for under IFRS using the incurred loss model differ from the
Prudential Guidelines set by the Central Bank of Nigeria the following adjustment is required.
(i) If the Prudential Provision is greater than IFRS provisions; transfer the difference from the general reserve to a non-distributable regulatory reserve (statutory credit reserve).
(ii) If the Prudential Provision is less than IFRS provisions; the excess charges resulting should be transferred from the regulatory reserve account to the general reserve to the extent of the non-distributable reserve previously recognised.
e) Share based payment reserve This represents obligations under the equity settled portion of the group’s share incentive scheme which enables key
management personnel and senior employees to benefit from the performance of Stanbic IBTC Holdings Plc and its subsidiaries.
Group Company
31 Dec 2013
Nmillion
31 Dec 2012
Nmillion
31 Dec 2013
Nmillion
31 Dec 2012
Nmillion
Deposits from banks 51,686 26,632 - -
Deposits from banks 51,686 26,632 - -
Deposits from customers 416,352 355,419 - -
Current accounts 198,320 138,524 - -
Call deposits 52,927 22,176 - -
Savings accounts 19,097 15,116 - -
Term deposits 130,940 167,101 - -
Negotiable certificate of deposits 15,068 12,502 - -
Total deposits and current accounts 468,038 382,051 - -
Maturity analysis
The maturity analysis is based on the remaining periods to contractual maturity from year end.
Repayable on demand 310,915 203,215 - -
Maturing within 1 month 87,923 111,695 - -
Maturing after 1 month but within 6 months 56,952 50,320 - -
Maturing after 6 months but within 12 months 12,209 16,789 - -
Maturing after 12 months 39 32 - -
Total deposits and current accounts 468,038 382,051 - -
19. Deposit and current accounts
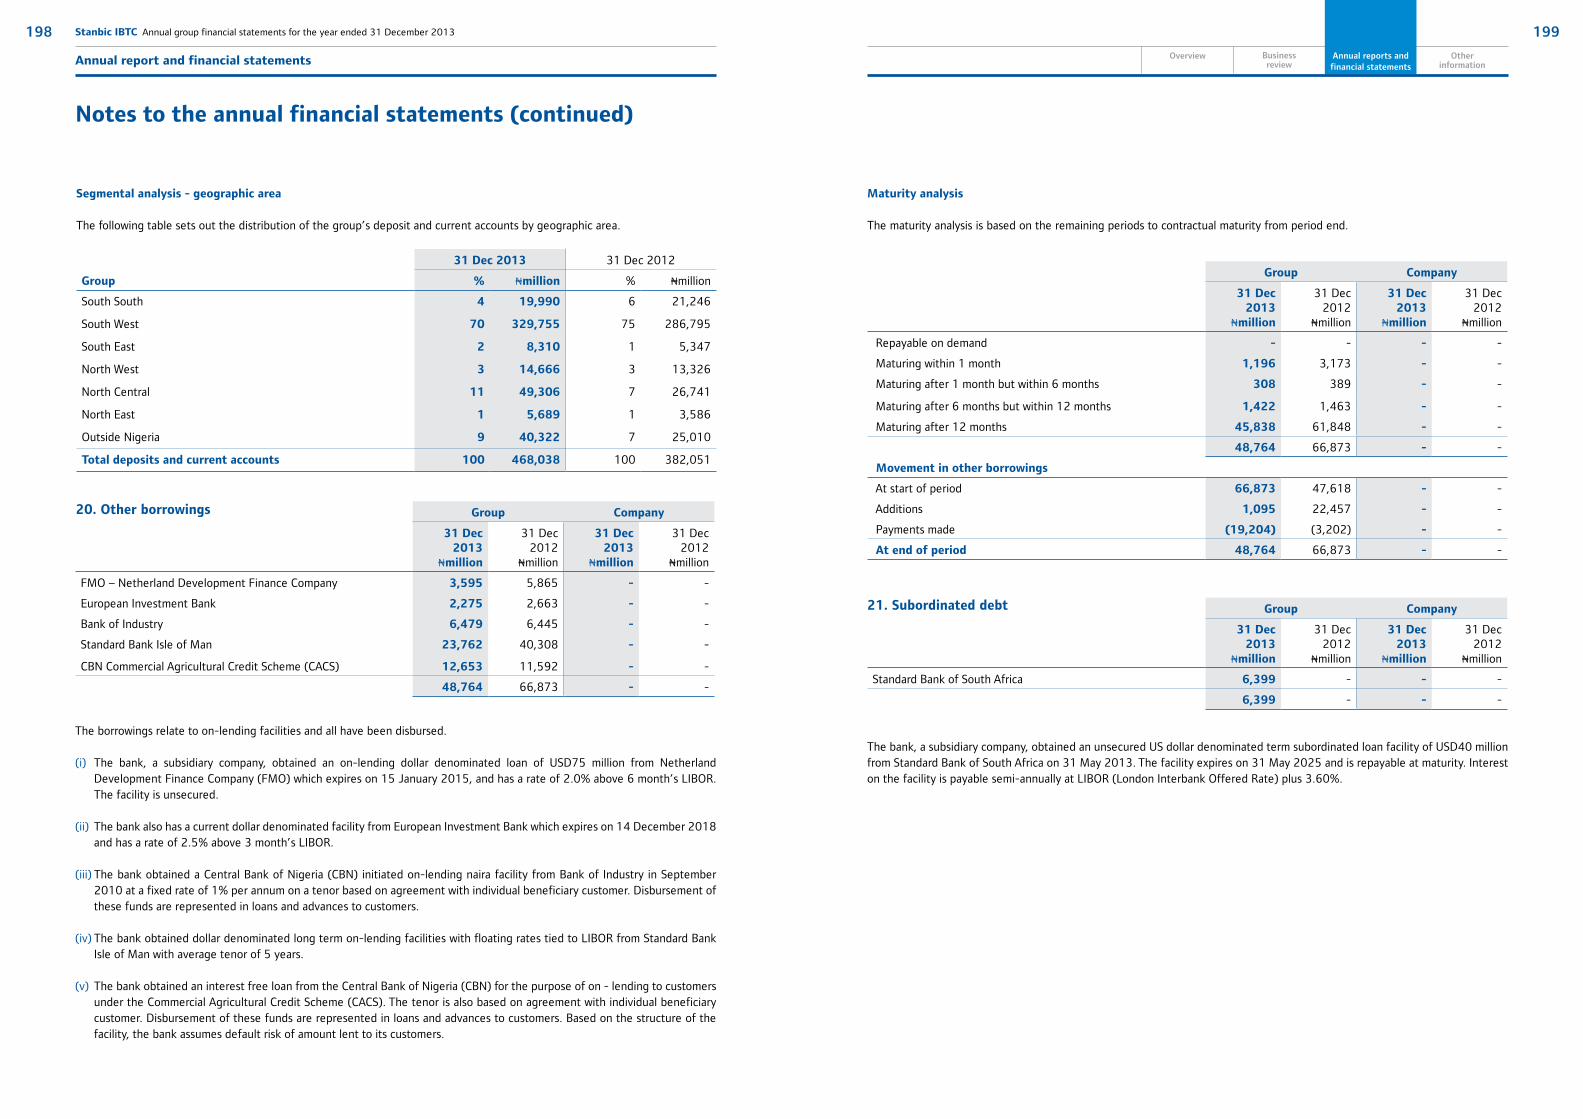
199
Market & Shareholderinformation
Otherinformation
198 Stanbic IBTC Annual group financial statements for the year ended 31 December 2013
Annual report and financial statements Overview Business review
Annual reports and financial statements
Notes to the annual financial statements (continued)
Segmental analysis - geographic area
The following table sets out the distribution of the group’s deposit and current accounts by geographic area.
31 Dec 2013 31 Dec 2012
Group % Nmillion % Nmillion
South South 4 19,990 6 21,246
South West 70 329,755 75 286,795
South East 2 8,310 1 5,347
North West 3 14,666 3 13,326
North Central 11 49,306 7 26,741
North East 1 5,689 1 3,586
Outside Nigeria 9 40,322 7 25,010
Total deposits and current accounts 100 468,038 100 382,051
Group Company
31 Dec 2013
Nmillion
31 Dec 2012
Nmillion
31 Dec 2013
Nmillion
31 Dec 2012
Nmillion
FMO – Netherland Development Finance Company 3,595 5,865 - -
European Investment Bank 2,275 2,663 - -
Bank of Industry 6,479 6,445 - -
Standard Bank Isle of Man 23,762 40,308 - -
CBN Commercial Agricultural Credit Scheme (CACS) 12,653 11,592 - -
48,764 66,873 - -
20. Other borrowings
The borrowings relate to on-lending facilities and all have been disbursed.
(i) The bank, a subsidiary company, obtained an on-lending dollar denominated loan of USD75 million from Netherland Development Finance Company (FMO) which expires on 15 January 2015, and has a rate of 2.0% above 6 month’s LIBOR. The facility is unsecured.
(ii) The bank also has a current dollar denominated facility from European Investment Bank which expires on 14 December 2018 and has a rate of 2.5% above 3 month’s LIBOR.
(iii) The bank obtained a Central Bank of Nigeria (CBN) initiated on-lending naira facility from Bank of Industry in September 2010 at a fixed rate of 1% per annum on a tenor based on agreement with individual beneficiary customer. Disbursement of these funds are represented in loans and advances to customers.
(iv) The bank obtained dollar denominated long term on-lending facilities with floating rates tied to LIBOR from Standard Bank Isle of Man with average tenor of 5 years.
(v) The bank obtained an interest free loan from the Central Bank of Nigeria (CBN) for the purpose of on - lending to customers under the Commercial Agricultural Credit Scheme (CACS). The tenor is also based on agreement with individual beneficiary customer. Disbursement of these funds are represented in loans and advances to customers. Based on the structure of the facility, the bank assumes default risk of amount lent to its customers.
Group Company
31 Dec 2013
Nmillion
31 Dec 2012
Nmillion
31 Dec 2013
Nmillion
31 Dec 2012
Nmillion
Repayable on demand - - - -
Maturing within 1 month 1,196 3,173 - -
Maturing after 1 month but within 6 months 308 389 - -
Maturing after 6 months but within 12 months 1,422 1,463 - -
Maturing after 12 months 45,838 61,848 - -
48,764 66,873 - -
Movement in other borrowings
At start of period 66,873 47,618 - -
Additions 1,095 22,457 - -
Payments made (19,204) (3,202) - -
At end of period 48,764 66,873 - -
Group Company
31 Dec 2013
Nmillion
31 Dec 2012
Nmillion
31 Dec 2013
Nmillion
31 Dec 2012
Nmillion
Standard Bank of South Africa 6,399 - - -
6,399 - - -
Maturity analysis
The maturity analysis is based on the remaining periods to contractual maturity from period end.
21. Subordinated debt
The bank, a subsidiary company, obtained an unsecured US dollar denominated term subordinated loan facility of USD40 million from Standard Bank of South Africa on 31 May 2013. The facility expires on 31 May 2025 and is repayable at maturity. Interest on the facility is payable semi-annually at LIBOR (London Interbank Offered Rate) plus 3.60%.
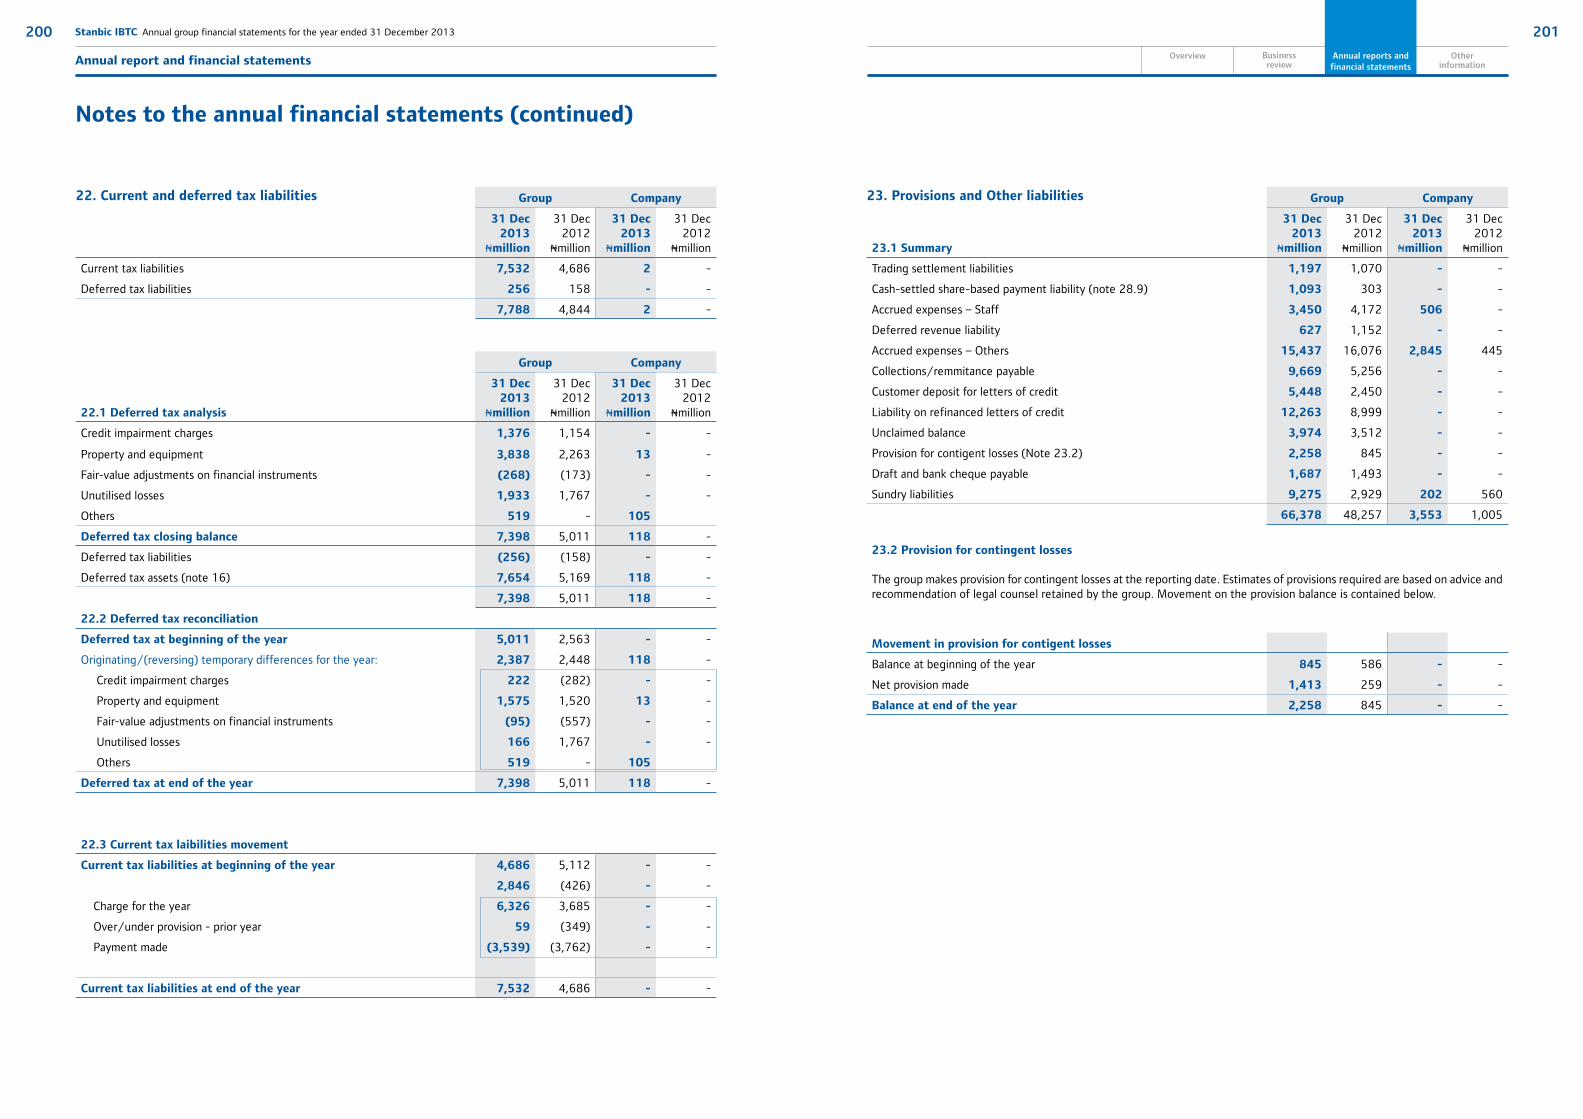
201
Market & Shareholderinformation
Otherinformation
200 Stanbic IBTC Annual group financial statements for the year ended 31 December 2013
Annual report and financial statements Overview Business review
Annual reports and financial statements
Notes to the annual financial statements (continued)
Group Company
31 Dec 2013
Nmillion
31 Dec 2012
Nmillion
31 Dec 2013
Nmillion
31 Dec 2012
Nmillion
Current tax liabilities 7,532 4,686 2 -
Deferred tax liabilities 256 158 - -
7,788 4,844 2 -
Group Company
22.1 Deferred tax analysis
31 Dec 2013
Nmillion
31 Dec 2012
Nmillion
31 Dec 2013
Nmillion
31 Dec 2012
Nmillion
Credit impairment charges 1,376 1,154 - -
Property and equipment 3,838 2,263 13 -
Fair-value adjustments on financial instruments (268) (173) - -
Unutilised losses 1,933 1,767 - -
Others 519 - 105
Deferred tax closing balance 7,398 5,011 118 -
Deferred tax liabilities (256) (158) - -
Deferred tax assets (note 16) 7,654 5,169 118 -
7,398 5,011 118 -
22.2 Deferred tax reconciliation
Deferred tax at beginning of the year 5,011 2,563 - -
Originating/(reversing) temporary differences for the year: 2,387 2,448 118 -
Credit impairment charges 222 (282) - -
Property and equipment 1,575 1,520 13 -
Fair-value adjustments on financial instruments (95) (557) - -
Unutilised losses 166 1,767 - -
Others 519 - 105
Deferred tax at end of the year 7,398 5,011 118 -
22.3 Current tax laibilities movement
Current tax liabilities at beginning of the year 4,686 5,112 - -
2,846 (426) - -
Charge for the year 6,326 3,685 - -
Over/under provision - prior year 59 (349) - -
Payment made (3,539) (3,762) - -
Current tax liabilities at end of the year 7,532 4,686 - -
22. Current and deferred tax liabilities Group Company
23.1 Summary
31 Dec 2013
Nmillion
31 Dec 2012
Nmillion
31 Dec 2013
Nmillion
31 Dec 2012
Nmillion
Trading settlement liabilities 1,197 1,070 - -
Cash-settled share-based payment liability (note 28.9) 1,093 303 - -
Accrued expenses – Staff 3,450 4,172 506 -
Deferred revenue liability 627 1,152 - -
Accrued expenses – Others 15,437 16,076 2,845 445
Collections/remmitance payable 9,669 5,256 - -
Customer deposit for letters of credit 5,448 2,450 - -
Liability on refinanced letters of credit 12,263 8,999 - -
Unclaimed balance 3,974 3,512 - -
Provision for contigent losses (Note 23.2) 2,258 845 - -
Draft and bank cheque payable 1,687 1,493 - -
Sundry liabilities 9,275 2,929 202 560
66,378 48,257 3,553 1,005
23.2 Provision for contingent losses
The group makes provision for contingent losses at the reporting date. Estimates of provisions required are based on advice and recommendation of legal counsel retained by the group. Movement on the provision balance is contained below.
Movement in provision for contigent losses
Balance at beginning of the year 845 586 - -
Net provision made 1,413 259 - -
Balance at end of the year 2,258 845 - -
23. Provisions and Other liabilities

203
Market & Shareholderinformation
Otherinformation
202 Stanbic IBTC Annual group financial statements for the year ended 31 December 2013
Annual report and financial statements Overview Business review
Annual reports and financial statements
Notes to the annual financial statements (continued)
24. Classification of financial instruments
Accounting classifications and fair values
The table below sets out the group’s classification of assets and liabilities, and their fair values.
31 December 2013
Note Held-for-trading
Nmillion
Designated at
fair value Nmillion
Loans and
receivables Nmillion
Available-for-saleNmillion
Other amortised cost
Nmillion
Total carrying amount Nmillion
Fair value1
Nmillion
Assets
Cash and cash equivalents 7 - - 120,312 - - 120,312 120,312
Derivative assets 10 1,526 - - - - 1,526 1,526
Trading assets 9 40,711 - - - - 40,711 40,711
Pledged assets 8 - - - 24,733 - 24,733 24,733
Financial investments 11 - - - 139,304 - 139,304 139,304
Loans and advances to banks 12 - - 94,180 - - 94,180 94,164
Loans and advances to customers 12 - - 289,747 - - 289,747 259,076
Other financial assets - - 10,346 - - 10,346 10,346
42,237 - 514,585 164,037 - 720,859 690,172
Liabilities
Derivative liabilities 10 1,085 - - - - 1,085 1,085
Trading liabilities 9 66,960 - - - - 66,960 66,960
Deposits from banks 19 - - - - 51,686 51,686 51,692
Deposits from customers 19 - - - - 416,352 416,352 415,625
Subordinated debt 21 - - - - 6,399 6,399 5,721
Other financial liabilities - - - - 112,257 112,257 112,358
68,045 - - - 580,295 648,340 647,720

205
Market & Shareholderinformation
Otherinformation
204 Stanbic IBTC Annual group financial statements for the year ended 31 December 2013
Annual report and financial statements Overview Business review
Annual reports and financial statements
Notes to the annual financial statements (continued)
1 Carrying value has been used where it closely approximates fair values. Fair value estimates are generally subjective in nature, and are made as of a specific point in time based on the characteristics of the financial instruments and relevant market information. Where available, the most suitable measure for fair value is the quoted market price. In the absence of organised secondary markets for financial instruments, such as loans, deposits and unlisted derivatives, direct market prices are not always available. The fair value of such instruments was therefore calculated on the basis of well-established valuation techniques using current market parameters. The fair value is a theoretical value applicable at a given reporting date, and hence can only be used as an indicator of the value realisable in a future sale.
Wherever possible, the group compares valuations derived from models with quoted prices of similar financial instruments, and with actual values when realised, in order to further validate and calibrate the models. These techniques involve uncertainties and are significantly affected by the assumptions used and judgements made regarding risk characteristics of various financial instruments, discount rates, estimates of future cash flows,future expected loss experiences and other factors. Changes in assumptions could affect these estimates and the resulting fair values.
Derived fair value estimates cannot necessarily be substantiated by comparison to independent markets and may not be realised in an immediate sale of the instruments.
24. Classification of financial instruments (continued)
31 December 2012
Note Held-for-trading
Nmillion
Designated at
fair value Nmillion
Loans and
receivables Nmillion
Available-for-saleNmillion
Other amortised cost
Nmillion
Total carrying amount Nmillion
Fair value1
Nmillion
Assets
Cash and cash equivalents 7 - - 106,680 - - 106,680 106,680
Derivative assets 10 1,709 - - - - 1,709 1,709
Trading assets 9 114,877 - - - - 114,877 114,877
Pledged assets 8 - - - 24,440 - 24,440 24,440
Financial investments 11 - - - 85,757 - 85,757 85,757
Loans and advances to banks 12 - - 24,571 - - 24,571 24,598
Loans and advances to customers 12 - - 266,344 - - 266,344 232,828
Other financial assets - - 13,340 - - 13,340 13,340
116,586 - 410,935 110,197 - 637,718 604,229
Liabilities
Derivative liabilities 10 772 - - - - 772 772
Trading liabilities 9 88,371 - - - - 88,371 88,371
Deposits from banks 19 - - - - 26,632 26,632 26,632
Deposits from customers 19 - - - - 355,419 355,419 355,565
Other non-financial liabilities - - - - 115,130 115,130 109,493
89,143 - - - 497,181 586,324 580,833

207
Market & Shareholderinformation
Otherinformation
206 Stanbic IBTC Annual group financial statements for the year ended 31 December 2013
Annual report and financial statements Overview Business review
Annual reports and financial statements
Notes to the annual financial statements (continued)
25 Financial instruments measured at fair value
The tables below analyse financial instruments carried at fair value at the end of the reporting period, by level of fair value hierarchy as required by IFRS 7. The different levels are based on the extent that quoted prices are used in the calculation of the fair value of the financial instruments and the levels have been defined as follows:
Level 1 fair values are based on quoted market prices (unadjusted) in active markets for an identical instrument.
Level 2 fair values are calculated using valuation techniques based on observable inputs, either directly (i.e. as quoted prices) or indirectly (i.e. derived from quoted prices). This category includes instruments valued using quoted market prices in active markets for similar instruments, quoted prices for identical or similar instruments in markets that are considered less than active or other valuation techniques where all significant inputs are directly or indirectly observable from market data.
Level 3 fair values are based on valuation techniques using significant unobservable inputs. This category includes all instruments where the valuation technique includes inputs not based on observable data and the unobservable inputs have a significant effect on the instrument’s valuation. This category includes instruments that are valued based on quoted prices for similar instruments where significant unobservable adjustments or assumptions are required to reflect differences between the instruments.
GroupLevel 1
NmillionLevel 2
NmillionLevel 3
NmillionTotal
Nmillion
31 December 2013
Assets
Derivative assets - 1,526 - 1,526
Trading assets 51 40,660 - 40,711
Pledged assets - 24,733 - 24,733
Financial investments - 139,091 213 139,304
51 206,010 213 206,274
Comprising:
Held-for-trading 51 42,186 - 42,237
Designated at fair value - - - -
Available-for-sale - 163,824 213 164,037
51 206,010 213 206,274
Liabilities
Derivative liabilities - 1,085 - 1,085
Trading liabilities - 66,960 - 66,960
- 68,045 - 68,045
Comprising:
Held-for-trading - 68,045 - 68,045
Designated at fair value - - - -
- 68,045 - 68,045
There have been no transfers between Level 1 and Level 2 during the period.
GroupLevel 1Nmillion
Level 2Nmillion
Level 3Nmillion
TotalNmillion
31 December 2012
Assets
Derivative assets - 1,709 - 1,709
Trading assets - 114,877 - 114,877
Pledged assets - 24,440 - 24,440
Financial investments - 85,476 281 85,757
- 226,502 281 226,783
Comprising:
Held-for-trading - 116,586 - 116,586
Designated at fair value - - - -
Available-for-sale - 109,916 281 110,197
- 226,502 281 226,783
Liabilities
Derivative liabilities - 772 - 772
Trading liabilities - 88,371 - 88,371
Other financial liabilities - - - -
- 89,143 - 89,143
Comprising:
Held-for-trading - 89,143 - 89,143
Designated at fair value - - - -
- 89,143 - 89,143
There have been no transfers between Level 1 and Level 2 during the period.

209
Market & Shareholderinformation
Otherinformation
208 Stanbic IBTC Annual group financial statements for the year ended 31 December 2013
Annual report and financial statements Overview Business review
Annual reports and financial statements
Notes to the annual financial statements (continued)
26 Offsetting of financial assets and financial liabilities
26.1 Financial assets subject to offsetting, enforceable master netting arrangements and similar agreements
The disclosures set out in the tables below include financial assets and financial liabilities that:
are offset in the group’s statement of financial position; or
are subject to an enforceable master netting agreement or similar agreement that covers similar financial instruments, irrespective of whether they are offset in the statement of financial position.
The group had no offsetting financial assets and liabilities as at year end.
Group Company
27.1 Contingent liabilities
31 Dec 2013
Nmillion
31 Dec 2012
Nmillion
31 Dec 2013
Nmillion
31 Dec 2012
Nmillion
Letters of credit 20,836 19,145 - -
Guarantees 23,779 25,672 - -
44,615 44,817 - -
Performance bonds and guarantees are generally short term commitments to third parties which are not directly dependent on the customer’s credit worthiness.
Letters of credit are agreements to lend to a customer in the future, subject to certain conditions. They are secured by different types of collaterals similar to those accepted for actual credit facilities.
27.2 Capital commitments
Contracted capital expenditure 445 201 - -
Capital expenditure authorised but not yet contracted - - - -
445 201 - -
27. Contingent liabilities and commitments
The expenditure will be funded from the group’s internal resources.
27.3 Legal proceedings
In the conduct of its ordinary course of business, the group is exposed to various actual and potential claims, lawsuits and other proceedings relating to alleged errors and omissions, or non-compliance with laws and regulations. The directors are satisfied, based on present information and the assessed probability of claims crystallising, that the group has adequate insurance programmes and provisions in place to meet such claims.
There were a total of 147 legal proceedings outstanding as at 31 December 2013. 88 of these were against the group with claims amounting to N168.63 billion (31 December 2012: N80.61 billion), while 59 other cases were instituted by the group with claims amounting to N4.23 billion (31 December 2012: N4.9 billion).
The claims against the group are being vigorously defended. It is not expected that the ultimate resolution of any of the proceedings will have a significant adverse effect on the financial position of the group.
Group Company
28.1 Interest income
31 Dec 2013
Nmillion
31 Dec 2012
Nmillion
31 Dec 2013
Nmillion
31 Dec 2012
Nmillion
Interest on loans and advances to banks 3,152 352 - -
Interest on loans and advances to customers 40,234 43,497 - -
Interest on investments 19,199 13,969 - -
62,585 57,818 - -
All interest income reported above relates to financial assets not carried at fair value through profit or loss.
28.2 Interest expense
Savings accounts 373 200 - -
Current accounts 694 580 - -
Call deposits 2,741 2,816 - -
Term deposits 19,599 18,636 - -
Interbank deposits 1,105 1,293 - -
Borrowed funds 1,060 739 - -
25,572 24,264 - -
All interest expense reported above relates to financial assets not carried at fair value through profit or loss.
28.3 Net fee and commission revenue
Fee and commission revenue 33,322 25,754 728 -
Account transaction fees 3,543 3,495 - -
Card based commission 1,460 518 - -
Brokerage and financial advisory fees 5,028 3,215 728 -
Asset management fees 16,613 12,330 - -
Custody transaction fees 2,508 1,525 - -
Electronic banking 241 161 - -
Foreign currency service fees 1,299 1,185 - -
Documentation and administration fees 1,005 2,364 - -
Other 1,625 961 - -
Fee and commission expense (422) (186) - -
32,900 25,568 728 -
26.4 Trading revenue
Foreign exchange 6,644 4,230 - -
Credit 1,329 1,617 - -
Interest rates 6,911 2,241 - -
Equities 11 3 - -
14,895 8,091 - -
28. Supplementary income statement information

211
Market & Shareholderinformation
Otherinformation
210 Stanbic IBTC Annual group financial statements for the year ended 31 December 2013
Annual report and financial statements Overview Business review
Annual reports and financial statements
Notes to the annual financial statements (continued)
Supplementary income statement information (continued) Group Company
28.5 Other revenue
31 Dec 2013
Nmillion
31 Dec 2012
Nmillion
31 Dec 2013
Nmillion
31 Dec 2012
Nmillion
Dividend income 98 112 8,320 1,250
Other 326 85 89 -
424 197 8,409 1,250
28.6 Credit impairment charges
Net credit impairments raised and released for loans and advances 3,219 7,320 - -
Recoveries on loans and advances previously written off (552) (425) - -
2,667 6,895 - -
Comprising:
Net specific credit impairment charges 1,922 6,391 - -
Specific credit impairment charges (note 12.3) 2,474 6,816 - -
Recoveries on loans and advances previously written off (552) (425) - -
Portfolio credit impairment charges/(reversal) (note 12.3) 745 504 - -
2,667 6,895 - -
28.7 Staff costs – banking activities
Salaries and allowances 22,393 19,421 456 21
Staff cost: below-market loan adjustment 245 327 - -
Equity-linked transactions (note 28.9) 1,213 205 - -
23,851 19,953 456 21
28.8 Other operating expenses
Information technology 3,517 3,143 - -
Communication 755 709 - -
Premises and maintenance 3,428 4,192 - -
Marketing and advertising 2,658 1,765 - -
Insurance 5,543 3,366 42 -
Professional fees 4,467 6,057 107 -
Depreciation 4,053 3,410 25 -
Stationery and printing 774 797 10 -
Security 1,169 903 - -
Travel and entertainment 1,382 1,112 30 -
Provision on contingent and other known losses 2,533 1,092 - -
Administration and membership fees 661 196 - -
Training 680 462 - -
Other 2,477 1,946 251 176
34,097 29,150 465 176
Group Company
31 Dec 2013
Nmillion
31 Dec 2012
Nmillion
31 Dec 2013
Nmillion
31 Dec 2012
Nmillion
Auditors' remuneration 200 189 15 12
Audit fees 200 152 15 12
Current year 200 152 15 12
Fees for other services - 37 - -
Depreciation 4,053 3,410 25 -
Property 1,167 654 - -
- Freehold 28 28 - -
- Leasehold 1,139 626 - -
Equipment 2,886 2,756 25 -
- Computer equipment 1,357 1,144 22 -
- Motor vehicles 73 105 - -
- Office equipment 103 109 3 -
- Furniture and fittings 1,353 1,398 - -
Operating lease charges 949 1,153 3 -
Properties 949 1,153 3 -
Equipment - - - -
Loss (profit) on sale of property and equipment 33 (49) - -
The following disclosable items are included in other operating expenses:

213
Market & Shareholderinformation
Otherinformation
212 Stanbic IBTC Annual group financial statements for the year ended 31 December 2013
Annual report and financial statements Overview Business review
Annual reports and financial statements
Notes to the annual financial statements (continued)
Expenses recognised in staff costs31 Dec 2013
Nmillion31 Dec 2012
Nmillion
Stanbic IBTC Equity Growth Scheme 908 -
Parent company share incentive schemes 73 67
Deferred bonus scheme (DBS) 232 138
1,213 205
Liabilities recognised in other liabilities
Stanbic IBTC Equity Growth Scheme 1,159 303
Deferred bonus scheme 380 156
1,539 459
28.9 Share-based payment transactions
The group operates a number of share- based payment arrangements under which the entity receives services from employees as a consideraion for equity instrument of the group or cash settlement based on equity instrument of the group.
At 31 December 2013, the group had the following share-based arrangements.
(a) Share appreciation rights based on equity instrument of Stanbic IBTC Holdings PLC (Stanbic IBTC Equity Growth Scheme) - cash settled
(b) Share options and appreciation rights based on equity instrument of Standard Bank Group (Parent company share incentive schemes) - equity settled.
(c) Deferred bonus scheme.
The expenses and liabilities recognised in respect of the share based arrangements are as follows:
**The Parent company share incentive scheme is equity settled. As such, a corresponding increase in equity has been recognised. See Statement of changes in equity for further details.
(a) Stanbic IBTC Equity Growth Scheme On 1 March 2010 and 1 March 2011, the group granted share appreciation rights to key management personnel that entitles the employees to cash value determined based on the increase in share price of Stanbic IBTC Holdings PLC between grant date and exercise date.
The object and purpose of the scheme is to promote an identity of interest between the group and its senior employees, to attract, retain and motivate skilled and competent personnel with high potential to influence the direction, growth and profitability of the group by enhancing leadership commitment and drive to grow the group market value and position in support of shareholder interests.
The provision in respect of liabilities under the scheme amounts to NGN1,159 million at 31 December 2013.
The terms and conditions of the grants are as follows.
Vesting category Year % vesting Expiry
Type A 3, 4, 5 50, 75, 100 10 Years
A reconciliation of the movement of the share appreciation rights is detailed below:
Units
Reconciliation 31 Dec 2013 31 Dec 2012
Units outstanding at beginning of the year 219,110,923 410,832,980
Granted - -
Transferred out - (191,722,057)
Forfeited (42,829,525) -
Exercised (18,011,971) -
Lapsed - -
Units outstanding at end of the year 158,269,427 219,110,923
31 Dec 2013 31 Dec 2012
Weighted average fair value at grant date (Naira) - Rights granted 1 March 2010***
15.30 15.30
Weighted average fair value at grant date (Naira) - Rights granted 1 March 2011***
20.06 20.06
Expected life (years) 5.07 5.07
Expected volatility (%) 37.34 47.00
Risk-free interest rate (%) 13.09 16.00
Dividend yield (%) 3.75 4.00
The fair value of share appreciation rights is determined using Black-Scholes formula. The inputs used in the measurement of their fair value were as follows:
*During 2012, the underlying shares on which the Scheme is based was changed to that of Stanbic IBTC Holdings PLC following the holding company restructuring executed in 2012.

215
Market & Shareholderinformation
Otherinformation
214 Stanbic IBTC Annual group financial statements for the year ended 31 December 2013
Annual report and financial statements Overview Business review
Annual reports and financial statements
Option price range Number of options
(ZAR) (Naira)31 Dec 2013
31 Dec 2013
31 Dec 2012
Options outstanding at beginning of the period 469,000 1,100,000
Transfers 40,65-111,94 615.44-1,694.77 219,900 (580,950)
Exercised 40,65-111,94 615.44-1,694.77 (161,400) (39,100)
Lapsed 62,39-111,94 944.58-1,694.77 (90,950) (10,950)
Options outstanding at the end of the period 436,550 469,000
Notes to the annual financial statements (continued)
(b) Parent company share incentive schemes
Share options and appreciation rightsA number of employees of the group participate in the Standard Bank Group’s share schemes. There are two equity-settled schemes, namely the Group Share Incentive Scheme and the Equity Growth Scheme. The Group Share Incentive Scheme confers rights to employees to acquire ordinary shares at the value of the Standard Bank Group share price at the date the option is granted. The Equity Growth Scheme was implemented in 2005 and allocates appreciation rights to employees. The eventual value of the right is settled by receipt of value of shares equivalent to the full value of the rights.
The two schemes have five different sub-types of vesting categories as illustrated by the table below:
Year % vesting Expiry
Type A 3, 4, 5 50, 75, 100 10 Years
Type B 5, 6, 7 50, 75, 100 10 Years
Type C 2, 3, 4 50, 75, 100 10 Years
Type D 2, 3, 4 33, 67, 100 10 Years
Type E 3, 4, 5 33, 67, 100 10 Years
The weighted average SBG share price for the period to 31 December 2013 was ZAR115,39 (NGN1,747) (December 2012: ZAR110.19 (NGN2,034.11)).
The following options granted to employees had not been exercised at 31 December 2013:
Option price range Weighted average price Option expiry period
No. of ordinary shares (ZAR) (Naira) (ZAR) (Naira)
4,600 79,50 1,203.63 79,50 1,203.63 Year to 31 Dec 2016
7,800 98,00 1,483.72 98,00 1,483.72 Year to 31 Dec 2017
131,500 92,00 1,392.88 92,00 1,392.88 Year to 31 Dec 2018
55,100 62,39 944.58 62,39 944.58 Year to 31 Dec 2019
122,550 104,53 - 111,94 1,582.58-1,694.77 106,24 1,608.47 Year to 31 Dec 2020
115,000 98,80 - 103.03 1,495.83-1,559.87 99,72 1,509.76 Year to 31 Dec 2021
436,550
(b)(i) Group Share Incentive Scheme - Share options
Option price range Weighted average price Option expiry period
No. of ordinary shares (ZAR) (Naira) (ZAR) (Naira)
4,500 79,50 1463,6 79,50 1463,60 Year to 31 Dec 2016
13,200 98,00 1804,18 98,00 1804,18 Year to 31 Dec 2017
122,300 92,00 1693,72 92,00 1693,72 Year to 31 Dec 2018
64,000 62,39 - 97,15 1148,60 -1788,53 67,46 1241,94 Year to 31 Dec 2019
192,500 104,53 - 111,94 1924,40 - 2060,82 108,44 1996,38 Year to 31 Dec 2020
72,500 98,80 1818,91 99,80 1837,32 Year to 31 Dec 2021
469,000
The following options granted to employees had not been exercised at 31 December 2012:
(b)(ii) Equity Growth Scheme - Appreciation rights
Appreciation right price range Number of rights
31 Dec 2013(ZAR)
31 Dec 2013(Naira)
31 Dec 2013 31 Dec 2012
Rights outstanding at beginning of the year 134,725 492,875
Transfers 62,39 - 111,94 944.58 - 1,694.77 111,025 (308,900)
Exercised1 62,39 - 111,94 944.58 - 1,694.77 (47,062) (12,000)
Lapsed 62,39 944.58 (1,250) 37,250
Rights outstanding at end of the year2 197,438 134,725
1 During the period SBG 12 225 (December 2012: 2 131) shares were issued to settle the appreciated rights value.
2 At 31 December 2013 the group would need to issue 68 217 (December 2012: 40 397) SBG shares to settle the outstanding appreciated rights value.
The following rights granted to employees had not been exercised at 31 December 2013:
Price range Weighted average price
Number of rights (ZAR) (Naira) (ZAR) (Naira) Expiry period
11,000 65,60 - 65,60 993.18 Year to 31 December 2015
22,500 79,50 - 79,50 1,203.63 Year to 31 December 2016
19,563 98,00 - 98,00 1,483.72 Year to 31 December 2017
34,500 92,00 - 92,00 1,392.88 Year to 31 December 2018
64,250 62,39 -82,50 - 65,05 991.67 Year to 31 December 2019
33,125 111,94 - 111,94 1,694.77 Year to 31 December 2020
12,500 98,80 - 98,80 1,495.83 Year to 31 December 2021
197,438

217
Market & Shareholderinformation
Otherinformation
216 Stanbic IBTC Annual group financial statements for the year ended 31 December 2013
Annual report and financial statements Overview Business review
Annual reports and financial statements
Notes to the annual financial statements (continued)
(c) Deferred bonus scheme (DBS)
It is essential for the group to retain key skills over the longer term. This is done particularly through share-based incentive plans. The purpose of these plans is to align the interests of the group, its subsidiaries and employees, as well as to attract and retain skilled, competent people.
The group has implemented a scheme to defer a portion of incentive bonuses over a minimum threshold for key management and executives. This improves the alignment of shareholder and management interests by creating a closer linkage between risk and reward, and also facilitates retention of key employees.
All employees, who are awarded short-term incentives over a certain threshold, are subject to a mandatory deferral of a percentage of their cash incentive into the DBS. Vesting of the deferred bonus occurs after three years, conditional on continued employment at that time. The final payment of the deferred bonus is calculated with reference to the Standard Bank Group share price at payment date. To enhance the retention component of the scheme, additional increments on the deferred bonus become payable at vesting and one year thereafter. Variables on thresholds and additional increments in the DBS are subject to annual review by the remuneration committee, and may differ from one performance year to the next.
The provision in respect of liabilities under the scheme amounts to N91 million (31 December 2012: N45 million) and the amount charged for the year was NGN46 million (December 2012: NGN27 Million).
Units
Reconciliation 31 Dec 2013 31 Dec 2012
Units outstanding at beginning of the year 34,494 35,612
Granted - -
Exercised - -
Lapsed (1,012) (1,118)
Units outstanding at end of the year 33,482 34,494
Weighted average fair value at grant date (R) 87.93 87.93
Expected life (years) 3.00 3.00
Risk-free interest rate (%) 5.54 4.92
Price range Weighted average price Option expiry period
Number of rights (ZAR) (Naira) (ZAR) (Naira)
7,000 65,60 1,207.70 65,60 1,207.70 Year to 31 December 2015
10,625 79,50 1,463.60 79,50 1,463.60 Year to 31 December 2016
16,400 98,00 1,804.18 98,00 1,804.18 Year to 31 December 2017
22,200 92,00 1,693.72 92,00 1,693.72 Year to 31 December 2018
51,000 62,39 1,148.60 62,39 1,148.60 Year to 31 December 2019
27,500 111,94 2,060.82 111,94 2,060.82 Year to 31 December 2020
134,725
The following rights granted to employees had not been exercised at 31 December 2012:
Units
Reconciliation 31 Dec 2013 31 Dec 2012
Units outstanding at beginning of the year 147,807 -
Granted 132,481 157,768
Exercised (48,807) -
Lapsed (1,368) (9,961)
Units outstanding at end of the year 230,113 147,807
Weighted average fair value at grant date (R) 115.51 108.90
Expected life (years) 2.51 2.51
Risk-free interest rate (%) 5.54 4.84
Deferred bonus scheme 2012 (DBS 2012)
In 2012, changes were made to the DBS to provide for a single global incentive deferral scheme accross the Standard Bank Group (SBG). The purpose of the Deferred Bonus Scheme 2012 is to encourage a longer-term outlook in business decision-making and closer alignment of performance with long-term value creation.
All employees granted an annual performance award over a threshold have part of their award deferred. The award is indexed to the SBG’s share price and accrues notional dividends during the vesting period, which are payable on vesting. The awards vest in three equal amounts at 18 months, 30 months and 42 months from the date of award. The final payout is determined with reference to the SBG’s share price on vesting date.
The provision in respect of liabilities under the scheme amounts to NGN 289 million (December 2012: NGN111 million) and the amount charged for the period was NGN 141 million (December 2012: NGN111 million).
31 Dec 2013
Nmillion
31 Dec 2012
Nmillion
Executive directors
Emoluments of directors in respect of services rendered1:
While directors of Stanbic IBTC Holdings PLC
- as directors of the company and/or subsidiary companies 73 265
- otherwise in connection with the affairs of Stanbic IBTC Holdings PLC or its subsidiaries - -
Non-executive directors
Emoluments of directors in respect of services rendered:
While directors of Stanbic IBTC Holdings PLC
- as directors of the company and/or subsidiary companies 178 74
- otherwise in connection with the affairs of Stanbic IBTC Holdings PLC or its subsidiaries - -
Pensions of directors and past directors 2 4
253 343
1 In order to align emoluments with the performance to which they relate, emoluments reflect the amounts accrued in respect of each period and not the amounts paid.
29. Emoluments of Stanbic IBTC Holdings PLC directors

219
Market & Shareholderinformation
Otherinformation
218 Stanbic IBTC Annual group financial statements for the year ended 31 December 2013
Annual report and financial statements Overview Business review
Annual reports and financial statements
Group Company
31 Dec2013
Nmillion
31 Dec2012
Nmillion
31 Dec2013
Nmillion
31 Dec2012
Nmillion
Indirect taxation (note 30.1) 223 314 38 125
Direct taxation (note 30.2) 3,844 1,255 (116) -
4,067 1,569 (78) 125
30.1 Indirect taxation
Value added tax 223 101 38 -
Witholding tax - 213 - 125
223 314 38 125
30.2 Direct taxation
Current year 3,844 1,255 (116) -
Current tax 6,326 3,685 2 -
Deferred tax (2,482) (2,430) (118) -
3,844 1,255 (116) -
Income tax recognised in other comprehensive income - - - -
Deferred tax - - - -
Current tax - - - -
Direct taxation per the income statement 3,844 1,255 (116) -
30.3 Rate reconciliation Group Company
31 Dec 2013
%
31 Dec2012
%
31 Dec2013
%
31 Dec2012
%
Rate reconciliation including indirect and direct tax
The total tax charge for the year as a percentage of profit before taxation 16 11 (1) 11
Information technology levy (1) (1) - -
Education tax (1) (1) - -
The corporate tax charge for the year as a percentage of profit before tax
14 9 (1) 11
Tax relating to prior years 1 5 - -
Net tax charge 15 14 (1) 11
The charge for the year has been reduced/(increased) as a consequence of:
Dividend received - - 31 19
Income from government securities 16 16 - -
Other non-taxable income - - - -
Other permanent differences (1) - - -
Standard rate of tax 30 30 30 30
Notes to the annual financial statements (continued)
30. Taxation 30.4 Income tax recognised in other comprehensive income
The table below sets out the amount of income tax relating to each component within other comprehensive income:
Group Company
31 Dec2013
Nmillion
31 Dec2012
Nmillion
31 Dec2013
Nmillion
31 Dec2012
Nmillion
Earnings based on weighted average shares in issue
Earnings attributable to ordinary shareholders (Nmillion) 18,610 8,868 8,332 -
Weighted average number of ordinary shares in issue (number of shares)
Weighted average number of ordinary shares in issue 10,000 17,626 10,000 -
Basic earnings per ordinary share (kobo) 186 50 83 -
Diluted earnings per ordinary shareBasic earnings per ordinary share equals diluted earnings per share as there are no potential dilutive ordinary shares in issue.
Group
Before tax
Nmillion
Tax (expense)/benefit Nmillion
Net of tax
Nmillion
31 December 2013
Net change in fair value of available-for-sale financial assets 408 - 408
Realised fair value adjustments on available-for-sale financial assets transferred to profit or loss
(153) - (153)
255 - 255
31 December 2012
Net change in fair value of available-for-sale financial assets 3,645 - 3,645
Realised fair value adjustments on available-for-sale financial assets transferred to profit or loss
269 - 269
3,914 - 3,914
31. Earnings per ordinary share
The calculation of basic earnings per ordinary share and diluted earnings per ordinary share are as follows:

221
Market & Shareholderinformation
Otherinformation
220 Stanbic IBTC Annual group financial statements for the year ended 31 December 2013
Annual report and financial statements Overview Business review
Annual reports and financial statements
Group Company
31 Dec2013
Nmillion
31 Dec2012
Nmillion
31 Dec2013
Nmillion
31 Dec2012
Nmillion
32.1 Decrease/(increase) in income-earning assets
Net derivative assets 496 1,395 - -
Trading assets 74,166 (48,401) - -
Pledged assets (293) (4,939) - -
Loans and advances (95,679) (38,588) - -
Other assets 2,942 (11,472) (122) (916)
(18,368) (102,005) (122) (916)
32.2 Increase/(decrease) in deposits and other liabilities
Deposit and current accounts 85,987 82,264 - -
Trading liabilities (21,411) 25,198 - -
Other liabilities and provisions 17,570 (7,217) 2,548 1,004
82,146 100,245 2,548 1,004
32.3 Cash and cash equivalents
Cash and cash equivalents (note 7) 120,312 106,680 2,722 2,625
Cash and cash equivalents at end of the year 120,312 106,680 2,722 2,625
33. Related party transactions
33.1 Parent and ultimate controlling party
Standard Bank Group (“SBG”) of South Africa is the ultimate holding company of Stanbic IBTC Holdings PLC.
33.2 Subsidiaries
Details of effective interest in subsidiaries are disclosed in Note 13.
33.3 Key management personnel
Key management personnel includes: members of the Stanbic IBTC Holdings PLC board of directors and Stanbic IBTC Holdings PLC executive committee. The definition of key management includes close members of key management personnel and any entity over which key management exercise control, joint control or significant influence. Close family members are those family members who may influence, or be influenced by that person in their dealings with Stanbic IBTC Holdings PLC. They include the person’s domestic partner and children, the children of the person’s domestic partner, and dependents of the person or the person’s domestic partner.
Notes to the annual financial statements (continued)
32. Statement of cash flows notes 31 Dec2013
Nmillion
31 Dec2012
Nmillion
Key management compensation
Salaries and other short-term benefits 699 613
Post-employment benefits 43 49
Value of share options and rights expensed 310 67
1,052 729
The transactions below are entered into in the normal course of business.
Loans and advances
Loans outstanding at the beginning of the year 422 207
Net movement during the year (207) 215
Loans outstanding at the end of the year 215 422
Deposit and current accounts
31 Dec2013
Nmillion
31 Dec2012
Nmillion
Deposits outstanding at beginning of the year 574 1,161
Net movement during the year 143 (587)
Deposits outstanding at end of the year 717 574
Investment products
31 Dec2013
Nmillion
31 Dec2012
Nmillion
Balance at the beginning of the year 46 62
Net movement during the year (22) (16)
Balance at the end of the year 24 46
Net investment return 13.36% 18.95%
Shares and share options held
Aggregate number of share options issued to Stanbic IBTC key management personnel:
Share options held (Stanbic IBTC Holdings PLC scheme) 158,269,427 219,110,923
Share options held (ultimate parent company schemes) 436,550 469,000
Loans include mortgage loans, instalment sale and finance leases and credit cards. No specific impairments have been recognised in respect of loans granted to key management (2012: nil). The mortgage loans and instalment sale and finance leases are secured by the underlying assets. All other loans are unsecured.
Deposits include cheque, current and savings accounts.
Investments
Details of key management personnel’s investment transactions and balances with Stanbic IBTC Holdings PLC are set out below.

223
Market & Shareholderinformation
Otherinformation
222 Stanbic IBTC Annual group financial statements for the year ended 31 December 2013
Annual report and financial statements Overview Business review
Annual reports and financial statements
33.4 Transactions with Ultimate Holding company (Standard Bank Group)
31 Dec2013
Nmillion
31 Dec2012
Nmillion
Revenue
Trading revenue 592 11
Net interest income 580 (759)
Total revenue earned 1,172 (748)
Loans
Loans outstanding at the beginning of the year 25,647 11,021
Net loans received during the year (4,255) 14,626
Loans outstanding at the end of the year 21,392 25,647
Deposits
Deposits outstanding at the beginning of the year 49,248 79,755
Net deposits received/(repaid) during the year 50,008 (30,507)
Deposits outstanding at the end of the year 99,256 49,248
Notes to the annual financial statements (continued)

225
Market & Shareholderinformation
Otherinformation
224 Stanbic IBTC Annual group financial statements for the year ended 31 December 2013
Annual report and financial statements Overview Business review
Annual reports and financial statements
34. Director and staff related exposures
The group has some exposures in terms of loans and advances to customers that are related to its directors and employees. These facilities were granted at rates and terms comparable to other facilities. There were no non-performing director related exposures as at balance sheet date.
Below is a list of directors and staff related lending as at balance sheet date.
Notes to the annual financial statements (continued)
Schedule of directors and staff related credits Perfected security
Name of Company/Individual Relationship
Name of related
interest Facility type Date granted Expiry date
Approved credit limit
N000
Outstanding plus accrued
interest StatusInterest
rate Security nature
Security value
N000
Nigeria Breweries Plc Chairman Atedo Peterside Term loan 23 Aug 2013 19 Feb 2014 2,000,000 2,083,258 Performing 11.02% Negative Pledge -
Nigeria Breweries Plc Chairman Atedo Peterside Term loan 6 Sep 2013 5 Mar 2014 2,000,000 2,076,932 Performing 11.02% Negative Pledge -
Golden Sugar Company Limited Chairman Atedo Peterside Advance 23 Dec 2013 22 Jan 2014 51,804 51,853 Performing 3.76% Debenture on Fixed and Floating Asset 2,150,000
Golden Sugar Company Limited Chairman Atedo Peterside Advance 16 Dec 2013 14 Feb 2014 88,080 86,227 Performing 7.00% Debenture on Fixed and Floating Asset 2,150,000
Golden Sugar Company Limited Chairman Atedo Peterside Overdraft 21 Nov 2013 9 Jan 2014 901,592 426,067 Performing 5.80% Debenture on Fixed and Floating Asset 2,150,000
Golden Sugar Company Limited Chairman Atedo Peterside Term Loan 24 Oct 2013 22 Jan 2014 38,903 39,182 Performing 15.00% Debenture on Fixed and Floating Asset 2,150,000
Golden Sugar Company Limited Chairman Atedo Peterside Term Loan 17 Dec 2012 23 May 2016 1,594,400 1,424,511 Performing 15.00% Debenture on Fixed and Floating Asset 2,152
Golden Sugar Company Limited Chairman Atedo Peterside Term Loan 13 Jul 2012 13 Jul 2022 1,854,000 1,859,689 Performing 15.00% Debenture on Fixed and Floating Asset 2,152
Golden Sugar Company Limited Chairman Atedo Peterside Term Loan 1 Dec 2013 31 Dec 2013 5,081,218 4,086,967 Performing 15.00% Debenture on Fixed and Floating Asset 2,152
Apapa Bulk Terminal Limited Chairman Atedo Peterside Overdraft 13 Mar 2013 12 Mar 2014 480,000 318,162 Performing 15.00% Negative Pledge -
Flour Mills of Nigeria Plc Chairman Atedo Peterside Advance 24 Sep 2013 22 Jan 2014 174,059 175,854 Performing 3.75% Negative Pledge -
Chartered Institute of Stock Brokers Director Yinka Sanni VAF 6 Jan 2011 31 Dec 2014 3,080 1,379 Performing 26.00% Asset Financed 3,080
Chartered Institute of Stock Brokers Director Yinka Sanni VAF 6 Jan 2011 31 Dec 2014 3,080 1,379 Performing 26.00% Asset Financed 3,080
Chartered Institute of Stock Brokers Director Yinka Sanni VAF 6 Jan 2011 31 Dec 2014 3,080 1,379 Performing 26.00% Asset Financed 3,080
Chartered Institute of Stock Brokers Director Yinka Sanni VAF 6 Jan 2011 31 Dec 2014 5,856 2,617 Performing 26.00% Asset Financed 5,856
MTN Nigeria Communication Ltd Ex-Non Executive Director Ahmed I Dasuki Term Loan 30 Mar 2012 31 Dec 2015 15,000,000 7,478,491 Performing 14.34% Negative Pledge -
MTN Nigeria Communication Ltd Ex-Non Executive Director Ahmed I Dasuki Term Loan 22 May 2013 30 Nov 2019 2,500,000 1,669,339 Performing 14.04% Negative Pledge -
PPC Limited Ex-Non Executive Director Sam U Unuigbe/Ahmed I Dasuki VAF 20 Jan 2012 29 Jan 2015 3,488 1,554 Performing 24.00% Asset Financed 3,488
PPC Limited Ex-Non Executive Director Sam U Unuigbe/Ahmed I Dasuki VAF 20 Jan 2012 29 Jan 2015 3,488 1,554 Performing 24.00% Asset Financed 3,488
PPC Limited Ex-Non Executive Director Sam U Unuigbe/Ahmed I Dasuki VAF 20 Jan 2012 29 Jan 2015 3,488 1,554 Performing 24.00% Asset Financed 3,488
PPC Limited Ex-Non Executive Director Sam U Unuigbe/Ahmed I Dasuki VAF 20 Jan 2012 29 Jan 2015 3,638 1,621 Performing 24.00% Asset Financed 3,638
PPC Limited Ex-Non Executive Director Sam U Unuigbe/Ahmed I Dasuki VAF 20 Jan 2012 29 Jan 2015 3,638 1,621 Performing 24.00% Asset Financed 3,638
PPC Limited Ex-Non Executive Director Sam U Unuigbe/Ahmed I Dasuki VAF 20 Jan 2012 29 Jan 2015 3,638 1,621 Performing 24.00% Asset Financed 3,638
Lilian Ifeoma Esiri Ex-Non Executive Director Ifeoma Esiri Credit Card 15 Apr 2013 15 Apr 2016 7,178 72 Performing 30.00% -
Atedo Peterside Chairman Atedo Peterside Credit Card 15 Apr 2013 15 Apr 2016 7,178 139 Performing 30.00% -
Various Staff Staff Various Staff Staff Loan 8,441,925 6,056,957 Performing
Total 40,256,811 27,851,979 8,642,930

227
Market & Shareholderinformation
Otherinformation
226 Stanbic IBTC Annual group financial statements for the year ended 31 December 2013
Annual report and financial statements Overview Business review
Annual reports and financial statements
Off balance sheet engagements
Name of CompanyRelationship Name of related
interest Facility type Outstanding
N000 Status
Golden Sugar Company Limited Chairman Atedo Peterside Bond and Guarantee 268,000 Performing
Flour Mills of Nigeria Chairman Atedo Peterside Letters of credit 12,124 Performing
Golden Sugar Company Limited Chairman Atedo Peterside Letters of credit 15,711 Performing
Cadbury Nigeria PLC Chairman Atedo Peterside Letters of credit 836 Performing
Cadbury Nigeria PLC Chairman Atedo Peterside Letters of credit 168 Performing
Cadbury Nigeria PLC Chairman Atedo Peterside Letters of credit 854 Performing
Total 297,695
35. Retirement benefit obligations
The group operates a defined contribution pension scheme in line with the provisions of the Pension Reform Act 2004, with contributions based on the sum of employees’ basic salary, housing and transport allowances in the ratio 7.5% by the employee and 7.5% by the employer. The amount contributed by the group and remitted to the Pension Fund Administrators during the period was N1,397 million (2012: N1,444 million).
The group’s contribution to this scheme is charged to the income statement in the period to which it relates. Contributions to the scheme are managed by Stanbic IBTC Pension Managers Limited, and other appointed pension managers on behalf of the beneficiary staff in line with the provisions of the Pension Reform Act. Consequently, the group has no legal or constructive obligations to pay further contributions if the funds do not hold sufficient assets to meet the related obligations to employees.
36. Employees and Directors
a) Employees Group
31 Dec 2013 Number
31 Dec 2012 Number
The average number of persons employed by the group during the year by category:
Executive directors 5 5
Management 429 454
Non-management 1,643 1,694
2,077 2,153
Below N1,000,001 - 5
N1,000,001– N2,000,000 13 61
N2,000,001– N3,000,000 345 574
N3,000,001– N4,000,000 91 358
N4,000,001– N5,000,000 545 359
N5,000,001– N6,000,000 341 182
N6,000,001 and above 742 614
2,077 2,153
Notes to the annual financial statements (continued)
c) Disclosure on diversity in employment
The group is an equal opportunity employer that is committed to maintaining a positive work environment that facilitates high level of professional efficiency at all times. The group’s policy prohibits discrimination of gender, disabled persons or persons with HIV in the recruitment, training and career development of its employees.
i) Persons with disability:The group continues to maintain a policy of giving fair consideration to applications for employment made by disabled persons with due regard to their abilities and aptitude.
ii) Gender diversity within the group
31 December 2013 31 December 2012
Workforce% of gender composition Workforce
% of gender composition
Total workforce:
Women 830 40% 884 41%
Men 1,247 60% 1,269 59%
2,077 100% 2,153 100%
Recruitments made during the year:
Women 94 32% 44 41%
Men 200 68% 64 59%
294 100% 108 100%
Diversity of members of board of directors – Number of Board members
Women 3 23% 3 21%
Men 10 77% 11 79%
13 100% 14 100%
Diversity of board executives – Number of Executive directors to Chief executive officer
Women 1 20% 1 20%
Men 4 80% 4 80%
5 100% 5 100%
Diversity of senior management team – Number of Assistant General Manager to General Manager
Women 23 28% 21 27%
Men 60 72% 56 73%
83 100% 77 100%

229
Market & Shareholderinformation
Otherinformation
228 Stanbic IBTC Annual group financial statements for the year ended 31 December 2013
Annual report and financial statements Overview Business review
Annual reports and financial statements
Annexure A: Statement of value added
Group Company
31 Dec 2013 31 Dec 2012 31 Dec 2013 31 Dec 2012
Nmillion % Nmillion % Nmillion % Nmillion %
Gross earnings 111,226 91,860 9,137 1,250
Interest paid:
local (24,393) (22,971) - -
foreign (1,179) (1,293) - -
(25,572) (24,264) - -
Administrative overhead:
local (27,238) (21,051) (440) (3)
foreign (3,228) (4,875) - (48)
(30,466) (25,926) (440) (51)
Provision for losses (2,667) (6,895) - -
Value added 52,521 100 34,775 100 8,697 100 1,199
Distribution
Employees and Directors
Salaries and benefits 23,851 45 19,953 57 456 5 21 2
Government
Taxation 3,844 7 1,255 4 (116) (1) 125 10
The Future
Asset replacement (depreciation) 4,053 3,410 25 - -
Expansion (retained in the business) 20,773 10,157 8,332 1,053 -
Total 24,826 47 13,567 39 8,357 96 1,053 88
52,521 99 34,775 100 8,697 100 1,199 100
Group Company
31 Dec 2013
Nmillion
31 Dec 2012
Nmillion
31 Dec 2011
Nmillion
31 Dec 2010
Nmillion
31 Dec 2013
Nmillion
31 Dec 2012
Nmillion
31 Dec 2011
Nmillion
Assets
Cash and cash equivalents 120,312 106,680 30,074 10,048 2,722 2,625 -
Derivative assets 1,526 1,709 3,081 263 - - -
Trading assets 40,711 114,877 66,476 70,886 - - -
Pledged assets 24,733 24,440 19,501 18,573 - - -
Financial investments 139,304 85,757 88,877 29,203 - - -
Loans and advances to banks
94,180 24,571 46,051 33,291 - - -
Loans and advances to customers
289,747 266,344 256,720 176,679 - - -
Current and deferred tax assets
7,716 5,212 2,668 1,696 118 - -
Deferred tax assets - - - - - - -
Equity Investment in group companies
- - - - 68,951 68,951 -
Other assets 19,829 22,771 11,299 16,375 1,038 916 -
Intangible assets - - 5,036 4,559 - - -
Property and equipment 24,988 24,458 24,724 25,645 2,572 16 -
763,046 676,819 554,507 387,218 75,401 72,508 -
Equity and liabilities
Share capital 5,000 5,000 9,375 9,375 5,000 5,000 -
Reserves 90,562 78,341 70,492 76,227 66,846 66,503 -
Non-controlling interest 2,072 2,310 1,911 1,376 - -
Derivative liabilities 1,085 772 749 - - - -
Trading liabilities 66,960 88,371 63,173 50,116 - - -
Deposits from banks 51,686 26,632 12,545 6,232 - - -
Deposits from customers 416,352 355,419 287,242 186,118 - - -
Other borrowings 48,764 66,873 47,618 18,272 - - -
Subordinated debt 6,399 - - - - - -
Current and deferred tax liabilities
7,788 4,844 5,187 4,703 2 - -
Other liabilities 66,378 48,257 56,215 34,799 3,553 1,005 -
763,046 676,819 554,507 387,218 75,401 72,508 -
Acceptances and guarantees
44,615 44,817 37,752 14,861 - - -
Annexure B: Financial summary

231
Market & Shareholderinformation
Otherinformation
230 Stanbic IBTC Annual group financial statements for the year ended 31 December 2013
Annual report and financial statements Overview Business review
Annual reports and financial statements
Group Company
31 Dec 2013
Nmillion
31 Dec 2012
Nmillion
31 Dec 2011
Nmillion
31 Dec 2010
Nmillion
31 Dec 2013
Nmillion
31 Dec 2012
Nmillion
31 Dec 2011
Nmillion
Income Statement
Net operating income 85,232 67,410 55,247 9,137 1,250 -
Operating expenses and provisions
(60,392) (55,998) (45,141) (921) (72) -
Profit before tax 24,617 11,412 10,106 8,216 1,178 -
Taxation (4,067) (1,255) (3,463) - (125) -
Profit after taxation 20,773 10,157 6,643 8,216 1,053 -
Profit attributable to :
Non-controlling interests 2,163 1,289 976 - - -
Equity holders of the parent
18,610 8,868 5,667 8,216 1,053 -
Profit for the period 20,773 10,157 6,643 8,216 1,053 -
Statistical Information
Earnings per share (EPS) - basic/diluted
186k 50k 30k 83k 11k -

233
Annual report and financial statements
Otherinformation
Otherinformation
232 Stanbic IBTC Annual group financial statements for the year ended 31 December 2013
Other information Overview Business review
Other information
Other informationManagement team
Branch network
Contact information
234
238
243

235
Annual report and financial statements
Otherinformation
Otherinformation
234 Stanbic IBTC Annual group financial statements for the year ended 31 December 2013
Other information Overview Business review
Olaronke AgunbiadeHead: Group real estate services
Aderenle AdesinaResearch
Ayo AdioPersonal markets
Adesola AdegbesanHead: Global Markets
Jumoke AdejumobiFinancial Institutions
Management team
Shuaibu Audu Chief executive: Stanbic IBTC Investments Ltd
Adeleke AdekoyaE-Business
Aishah AhmadHNIs
Folasope AiyesimojuStanbic IBTC Capital Ltd
Oyinda AkinyemiStanbic IBTC Capital Ltd
Kobby Bentsi-EnchilStanbic IBTC Capital Ltd
Bunmi Dayo-Olagunju Stanbic IBTC Pension Managers Ltd
Olu DelanoCorporate Banking
Steve ElusopeExecutive director: Stanbic IBTC Pension Managers Ltd
Eric FajemisinExecutive director: Stanbic IBTC Pension Managers Ltd
Samir GadioResearch
Abiodun GbadamosiPBB Channels
Olufunke IsicheiCustomer Experience

237
Annual report and financial statements
Otherinformation
Otherinformation
236 Stanbic IBTC Annual group financial statements for the year ended 31 December 2013
Other information Overview Business review
Management team
Charles MoltenoPBB Credit
Dele KutiOil , Gas and Renewables
Busola JejelowoExecutive director: Stanbic IBTC Stockbrokers Ltd
Anton MariasCorporate Banking
Soji OmisoreMining, Energy and Infrastructure
Yusufu ModibboPublic Sector
Binta Max-GbinijeChief executive: Stanbic IBTC Trustees Ltd
Samuel OchehoGlobal Markets
Bunmi OdunowoCountry operations
Joyce UrediPersonal Market
Akeem OyewaleExecutive director: Stanbic IBTC Nominees Ltd
Dele SotuboChief executive: Stanbic IBTC Stockbrokers Ltd
Segun SanniChief executive: Stanbic IBTC Nominees Ltd
Ruby OnwudiweInformation Technology
Babayo SaiduNon-interest Banking
Lloyd OnaghinonBusiness Banking
Olumide OyetanChief executive: Stanbic IBTC Asset management Ltd
Adeola SoyoyeProcurement

239
Annual report and financial statements
Otherinformation
Otherinformation
238 Stanbic IBTC Annual group financial statements for the year ended 31 December 2013
Other information Overview Business review
FCT Abuja region
1. Ahmadu Bello Way branch Plot 1049, Ahmadu Bello Way Area 11, Garki, Abuja
2. Deidei branch Deidei-Gwaga road Deidei Abuja
3. Edo House branch No. 75, Ralph Sodeinde street Central Business District Garki, Abuja
4. Garki Area 3 branch 11 Kaura Namoda street off Faskari crescent Garki Area 3, Abuja
5. Garki Model Market branch Plot CBN 2 Ladoke Akintola bvld Garki 11, Abuja
6. Grand Tower Mall Branch Shop 10, Grand Tower Mall Apo, Abuja
7. Gwagwalada branch Plot 415, Specialist Hospital road Gwagwalada, Abuja
8. Kubwa branch Plot No. CM71/72 Gado Nasko road Kubwa, Abuja
9. Maitama branch Plot 2777, Cadastral Zone A6 Maitama District, Abuja
10. NNPC Complex branch Herbert Macaulay way Abuja
11. Utako branch Plot 37, Ekunkinam street (Opposite ABC Transport) Utako, Abuja
12. Wuse 11 branch Plot 1387, Aminu Kano crescent Wuse 11, Abuja
Lagos Island region
1. Adetokunbo Ademola branch No. 76, Adetokunbo Ademola street Victoria Island, Lagos
2. Afribank Street branch Churchgate Towers Plot 30, Afribank street Victoria Island, Lagos
3. Ajah branch Mega Wave Plaza 4A Addo roundabout Off Badore road, Ajah Lagos
4. Ajose Adeogun branch Plot 290E Ajose Adeogun street Victoria Island, Lagos
5. Awolowo Road branch No. 85, Awolowo road, Ikoyi Lagos
6. Federal Palace Hotel branch Ahmadu Bello way Victoria Island, Lagos
7. Idejo branch Plot 1712, Idejo street Victoria Island, Lagos
8. Idumagbo branch No. 16, Idumagbo Avenue Lagos
9. Ikota branch Shop 167-194, Block 1 Ikota Shopping Complex Ajah, Lagos
10. Karimu Kotun branch Plot 1321B, Karimu Kotun street Victoria Island, Lagos
11. Lekki Admiralty branch Plot A Block 12E, Admiralty way Lekki Phase 1 Lekki ,Lagos
12. Lekki-Ajah Expressway branch Km 18, Lekki-Epe Expressway Agungi, Lekki Lagos
13. Lekki Phase 1 branch The Palms Shopping Complex Lekki, Lagos
14. Martins Street branch No. 19, Martins Street Lagos
15. Oke Arin branch 120, Alakoro Street, Oke Arin Lagos Island, Lagos
16. Walter Carrington branch IBTC Place Walter Carrington Crescent Victoria Island, Lagos
Lagos Mainland region
1. Abule Egba Branch 633, Lagos Abeokuta Expressway Abule Egba, Lagos
2. Agege branch 173, Old Abeokuta motor road Agege, Lagos
3. Aguda Branch 1/3 Enitan Street, Aguda Surulere, Lagos
4. Ajegunle branch No. 11, Orodu street Ajegunle, Lagos
5. Akoka branch No. 100, St. Finbarr’s road Akoka, Lagos state
6. Alaba branch H48/H49 Alaba international market Ojo, Lagos
7. Alausa branch WAPCO Building, Alausa Ikeja, Lagos
8. Allen Avenue branch No. 80, Allen Avenue Ikeja, Lagos
9. Balogun Business Association branch Executive plaza, No.12, BBA market Trade fair complex Badagry, Lagos
10. Daleko branch Bank road, Daleko market off Isolo road Mushin, Lagos
11. Egbeda branch 38, Shasha road Egbeda, Lagos
12. Ejigbo branch Isolo ikotun road Ejigbo, Lagos
13. Festac branch Gacoun shopping plaza 23 road, off 2nd avenue Festac town, Lagos
14. Gbagada Branch Plot 15, Diya Street Gbagada Kosofe, Lagos
15. Gbaja market branch No. 12, Gbaja market Surulere, Lagos
16. Herbert Macaulay branch No. 220, Herbert Macaulay way Yaba, Lagos
17. Igando branch No. 51, Lasu-Iba road Igando, Lagos
Branch network
18. Ikeja City Mall branch Shop L55, Ikeja City Mall (Opposite Elephant House) Alausa, Ikeja, Lagos
19. Ikorodu branch No. 108, Lagos road Ikorodu, Lagos
20. Ikotun branch 45 Idimu road Ikotun, Lagos
21. Ipaja branch 142, Ipaja road Baruwa-Ipaja Lagos
22. Ketu branch 463, Ikorodu road Ketu, Lagos
23. Lawanson branch 35, Lawanson road Lawanson, Lagos
24. Maryland branch 10, Mobolaji Bank Anthony way Maryland, Lagos
25. NAHCO Complex NAHCO Complex, MMIA Ikeja, Lagos
26. Nigeria Ports Authority branch Account block, NPA Wharf road, Apapa, Lagos
27. Oba Akran branch No. 20, Oba Akran Avenue Ikeja, Lagos
28. Ogba branch No. 32, Ijaiye road Ogba, Lagos
29. Ogudu branch 54 Ogudu-Ojota road Ogudu, Lagos
30. Ojodu branch 102 Isheri road Ojodu Berger, Lagos 31. Ojuwoye branch No. 214, Agege motor road Ojuwoye, Mushin, Lagos
32. Oko-Oba branch Abattoire Market, New Oko Oba Agege, Lagos
33. Okota branch Adenekan Mega Plaza Okota, Isolo Lagos
34. Opebi branch No. 43, Opebi road Ikeja, Lagos
35. Oshodi branch Plot 14A – Oshodi Apapa Express way Lagos
36. Osolo Way branch Ajao Estate (Beside ASCON Filling station) Isolo, Lagos
37. Oyingbo branch 7, Coates street, Ebute metta Oyingbo, Lagos
38. Palms Avenue branch 103, Ladipo street Mushin, Lagos
39. Shomolu branch 22 Market street Shomolu, Lagos
40. Surulere branch 39, Adeniran Ogunsanya street Surulere, Lagos
41. Tejuosho branch 77, Ojuelegba road Yaba, Lagos
42. Tin can branch Suite 7 and 27, container complex Lagos
43. Toyin street branch No. 36A, Toyin street Ikeja, Lagos
44. Trade fair branch International trade fair complex ASPAMDA plaza Alaba, Lagos
45. Warehouse road branch No. 10/12, Warehouse road Apapa, Lagos
46. Yinka folawiyo branch No. 38, warehouse road Folawiyo plaza Apapa, Lagos
North Central region
1. Bauchi Branch 16, Yandoka Road, Bauchi Bauchi State
2. Jos branch No.34, Ahmadu Bello way Jos, Plateau state
3. Kontagora branch Lagos-Kaduna road Kontagora Niger State
4. Lokoja branch IBB Way, Opposite new Specialist Hospital Lokoja, Kogi State
5. Mararaba Branch Shop No 1A Kwad Shopping Complex at Mararaba Gurku along Keffi Abuja
6. Minna branch Paiko road, Minna Niger State
7. Nyanyan branch Bomma Plaza Abuja-Keffi expressway, Nyanyan Nassarawa State
8. Suleja branch Minna road Opposite Forec A Division, Suleja Niger State

241
Annual report and financial statements
Otherinformation
Otherinformation
240 Stanbic IBTC Annual group financial statements for the year ended 31 December 2013
Other information Overview Business review
North East region 1. Bauchi branch No. 16, Yandoka road Bauchi state
2. Damaturu branch Plot 591A, Njiwaji layout Damaturu, Yobe state
3. Gombe branch No. 1, Biu road Gombe state
4. Jalingo branch 22 Hammaruwa way, Jalingo Taraba State
5. Lafia Branch Plot 1, Jos road, Lafia Nassarawa State
6. Maiduguri branch No. 38, Baga road Maiduguri, Borno State
7. Markurdi Branch No 12, Ali Akilu road Makurdi,Benue state
8. Otukpo Branch Enugu-Markurdi road,Otukpo Benue State
9. Yola branch No. 1, Muhammad Mustapha way Jimeta, Yola, Adamawa State
North West region 1. Bello road branch No. 13, Bello road, Kano Kano state
2. Birnin-Kebbi branch No. 68, Ahmadu Bello Way Birnin-Kebbi, Kebbi state
3. Dutse branch Plot 14/15, Sanni Abacha Way Dutse, Jigawa state
4. Gusua branch No. 10 Sanni Abacha road Gusua, Zamfara state
5. Hotoro market branch No. 4 Maiduguri road, Kano Kano state
7. Kachia road branch No. 7A, Kachia road, Kaduna south Kaduna state
8. Kaduna branch No. 14, Ahmadu Bello Way Kaduna, Kaduna state
9. Kaduna Central Market branch No. 001 Bayajida road Central Market, Kaduna North Kaduna state
10. Kasuwa Barci branch AH6 Kasuwa Barci, Tundun Wada Kaduna, Kaduna state
11. Katin Kwari branch 71A, Fagge ta Kudu (Opposite Kanti Kwari Market) Kano, Kano State
13. Katsina branch No. 175, Kurfi House, IBB Way Katsina, Katsina state
12. Kawo Mando branch Kawo-Zaria road Kawo Market, Kaduna Kaduna State
14. KSC Bank road branch No. 4 Bank Road Kano, Kano state
15. PPMC/NNPC branch Kaduna Refining and Petrochemical complex Sabon Tasha road, Kaduna South Kaduna state
16. Sabon Gari branch 7A, Amino road Sabongari, Zaria Kaduna State
17. Sabon Gari branch No. 4A Galadima Road Sabon Gari, Kano
18. Sabon Tasha branch No. 32, Kachia road, Sabon Tasha Kaduna, Kaduna state
19. Samaru branch 2 Sokoto road, Samaru Zaria, Kaduna state
20. Shauchi branch 1, Rimi Quarters, Umma Bayero road Kano, Kano state
21. Sokoto branch No. 8, Maiduguri road Sokoto, Sokoto state
22. Zaria branch No. 9, Kaduna road Zaria, Kaduna state
23. Zaria City branch No. 90 Anguwan Mallam Sule Kasuwa Zaria, Kaduns State
Branch network (continued)
South East region 1. Aba Main branch No. 7, Aba-Owerri road Abia state
2. Aba Market branch No. 7, Duru Street, off Cemetry road Aba, Abia state
3. Abakaliki branch 10 Ogoja road,Abakaliki Ebonyi State
4 Airport road branch 23, Ogunu – Airport Road, Warri Delta State
5. Ariaria Market branch 189 Faulks road, Ariaria market Aba, Abia state
6. Asaba branch 206, Nnebisi Road Asaba
7. Awka branch No. 49, Zik avenue Awka, Anambra state
8. Benin City branch 71, Apkakpava Street, Benin City Edo State
9. Calabar branch 71, Ndidem Isong Road, Calabar Cross River State
10. Enugu branch No. 252, Ogui Road Enugu, Enugu state
11. Enugu Polo Mall branch Shop 54, Polo Park Mall Abakaliki road, Enugu Enugu State
12. Head-bridge branch No. 56, Port Harcourt road Onitsha, Anambra state
13. Ikom branch 28 Calabar Road, Ikom Cross River State
14. New Benin branch 136, Upper Mission Road New Benin Market, Benin
15. Onitsha branch No. 13, Bright street Onitsha, Anambra state
16. Owerri branch No. 8, Wetheral road Owerri, Imo state
17 Sapele road branch No. 131A Sapele Road, Benin Edo State
18. Umuahia branch 2 Market road, Umuahia Abia State
19 Uniben – Ugbowo branch Bank Road, University of Benin Edo state
20. WATT Market branch CITA House Complex, 54 Bedwell Street Calabar
21. Warri branch 84, Warri/Sapele Road, Warri Delta State
South South region 1. Aba Road PH branch 171, Aba Road Port Harcourt
2. Artillery branch 234, Aba road Artillery, Port Harcourt Rivers State
3. Eleme Petrochemical branch EPCL Complex Port Harcourt, Rivers state
4. Olu Obasanjo branch No. 133A, Olu Obasanjo road Port Harcourt, Rivers state
5. Olu Obasanjo road branch No. 58, Olu Obasanjo Road Port Harcourt, Rivers state
6. Onne branch Oil and Gas Free Zone Authority Federal Ocean Terminal road, Onne Rivers State
7. Oyigbo branch Aba – Port Harcourt road, Oyigbo Rivers State
8. Port Harcourt Airport branch International Airport, Port Harcourt Rivers state
9. Trans Amadi branch No. 7, Trans Amadi road Port Harcourt, Rivers state
10. Trans Amadi 2 branch 87 Trans Amadi road Port Harcourt Rivers State
11. Uyo Branch No. 5B, Nwaniba road Uyo, Akwa Ibom state
12. Yenagoa branch No. 623, Mbiama-Yenagoa road Yenagoa, Bayelsa state

243
Annual report and financial statements
Otherinformation
Otherinformation
242 Stanbic IBTC Annual group financial statements for the year ended 31 December 2013
Other information Overview Business review
South West region 1. Abeokuta branch No. 2A , Lantoro road, Isale-Ake Abeokuta, Ogun state
2. Ado –Ekiti branch Ado/Iyin express (old secretariat) rd Ado- Ekiti, Ekiti state
3. Agbara branch Agbara Estate Shopping Mall Agbara, Ogun state
4. Agodi Gate branch Inaolaji Business Complex Agodi Gate, Ibadan Oyo state
5. Akure branch Great Nigerian Insurance House Owo/Ado Ekiti road Akure, Ondo State
6. Aleshinloye branch Shop 37-39, Nigerian Army Post Service Housing Scheme, Phase 2 Eleyele road, Ibadan Oyo state
7. Apata branch Abeokuta-Ibadan road Apata, Ibadan Oyo state
8. Bodija market branch Trans Wonderland Opposite Bodija market Secretariat road, Bodija Ibadan, Oyo state
9. Gbagi branch No. 15, Jimoh Odutola street Ogunpa/Dugbe Ibadan, Oyo state
10. Ibadan Main branch UCH/Secretariat road Total Garden, Ibadan Oyo state
11. Ife branch No. 5 Obalofun Lagere road Lagere junction, Ile–Ife Osun state
12. Ijebu-Ode branch 58 Ibadan road, Ijebu-Ode, Ogun state
13. Ilesha branch A198 Oshogbo road Ishokun, Ilesha Osun state
14. Ilorin Branch N011, Unity Road (Amosan House) Ilorin, Kwara State
15. Iwo Town branch 147, Ejigbo Road, Araromi – Sabo Iwo Town, Osun State
16. Iwo road branch 32 Iwo road, (beside Tantalizers) Ibadan, Oyo state
17. Iyana Church branch Ibitola Plaza, Iyana Church Ibadan, Oyo state
18. Kwara Mall branch Kwara Mall, Ilorin
19. Mokola branch No. 18B, Oyo road, Mokola, Ibadan Oyo state
20. New Gbagi Market branch Bashmur and Ayimur Plaza Old Ife road, Gbagi Ibadan, Oyo state
21. Ogbomosho branch Ogbomosho Ilorin road, Ogbomosho Oyo State
22. Ojatuntun branch A171 Abdulazeez Attah Road, Surulere Ilorin, Kwara State
23. Ondo branch 62, Yaba road, Ondo Ondo State
24. Orita Challenge branch No 127 Orita challenge Ibadan, Oyo state
25. Oshogbo branch No. 201, Gbogan/Ibadan road Oshogbo, Osun state
26. Oyo Town branch Oyo- Ogbomosho road, beside Oyo East Local Government Secretariat Oyo Town, Oyo state
27. Ring road branch 18, Moshood Abiola Way Ring road, Ibadan Oyo state
28. Sagamu branch 167, Akarigbo street Sagamu, Ogun state
29. Saki branch Sango-Ajegunle road (beside Saki West Local Government secretariat) Saki, Oyo state
30. Sango-Otta branch No. 101, Idi-iroko/Otta road Sango –Otta, Ogun state
31. Sango Otta 2 branch KM 38 Abeokuta Expressway Sango Otta, Ogun state
31. Sapon branch House 42a, Isale Igbehin Sapon Abeokuta Ogun state
32. University of Ibadan road branch Sayora Building University of Ibadan road Ibadan, Oyo State
Branch network (continued) Contact information
Registered address:
I.B.T.C PlaceWalter Carrington CrescentP. O. Box 71707Victoria IslandLagosNigeria
Henry AnahHead, Investor Relations
T: +234 1 4228742 E: [email protected]
Olufunke IsicheiCustomer Experience
T: +234 1 4228559E: [email protected]
Arthur Oginga Chief Financial Officer
T: +234 1 4228695E: [email protected]
Chidi OkezieCompany secretary
T: +234 1 4228695E: [email protected]

Stanbic IBTC Holdings PLC RC1018051
www.stanbicibtc.comDesigned and produced by Creative Interpartners, LondonEmail: [email protected]
Photography: Centaur Photographers