
Barclays PLC Interim Pillar 3 Report
69
Barclays PLC Interim Pillar 3 Report 30 June 2022
-
Upload
khangminh22 -
Category
Documents
-
view
4 -
download
0
Transcript of Barclays PLC Interim Pillar 3 Report

Barclays PLC Interim Pillar 3 Report30 June 2022

Barclays PLC Pillar 3 PageIntroduction 04
KM1 - Key Metrics 07
CapitalCC1 - Composition of regulatory own funds 09CC2 - Reconciliation of regulatory own funds to balance sheet in the audited financial statements 11
IFRS 9IFRS 9-FL - Comparison of institution’s own funds and capital and leverage ratios with and without the IFRS9 transitional arrangements 12
Risk weighted assets (RWA)RWAs by risk type and business 13OV1 - Overview of risk weighted exposure amounts 14CR8 - RWEA flow statement of credit risk exposures under the advanced IRB approach 15CCR7 - RWEA flow statement of counterparty credit risk exposures under the IMM 16MR2-B - RWA flow statement of market risk exposures under the IMA 17
LeverageLR1 - Summary of reconciliation of accounting assets and leverage ratio exposures 18LR2 - Leverage ratio common disclosure 19LR3 - Split-up of on balance sheet exposures (excluding derivatives, SFTs and exempted exposures) 20
Minimum Requirements for own funds and Eligible Liabilities (MREL)KM2 - Key Metrics - TLAC Requirements 21TLAC 1 - TLAC composition for G-SIBs 22TLAC 3 - Resolution entity - creditor ranking at legal entity level 23TLAC 2 - Material subgroup entity - creditor ranking at legal entity level 24
LiquidityLIQ1 - Liquidity Coverage ratio 25
Interest Rate Risk in the Banking BookIRRBB1 - Quantitative information on IRRBB 26
Analysis of Credit RiskCR4 - Standardised Credit risk exposure and CRM effects 27CR5 - Standardised approach 28CR7 - IRB approach – Effect on the RWEAs of credit derivatives used as CRM techniques 30CR7 - A IRB approach – Disclosure of the extent of the use of CRM techniques 31CR6 - IRB approach – Total Portfolios 32CR6 - IRB approach – Credit risk exposures by exposure class and PD range for central governments and central banks 33CR6 - IRB approach – Credit risk exposures by exposure class and PD range for institutions 34CR6 - IRB approach – Credit risk exposures by exposure class and PD range for corporates - other 35CR6 - IRB approach – Credit risk exposures by exposure class and PD range for corporates - SME 36CR6 - IRB approach – Credit risk exposures by exposure class and PD range for retail - SME 37CR6 - IRB approach – Credit risk exposures by exposure class and PD range for secured retail - non SME 38CR6 - IRB approach – Credit risk exposures by exposure class and PD range for revolving retail 39CR6 - IRB approach – Credit risk exposures by exposure class and PD range for other retail - non SME 40CR10 - Specialised lending and equity exposures under the simple risk weighted approach 41CR1- A Maturity of exposures 42CR2 - Changes in the stock of non-performing loans and advances 42CR3 - CRM techniques overview: Disclosure of the use of credit risk mitigation techniques 42CQ4 - Quality of non-performing exposures by geography 43CQ5 - Credit quality of loans and advances to non-financial corporations by industry 44CQ1 - Credit quality of forborne exposures 45CR1 - Performing and non-performing exposures and related provisions 46CQ7 - Collateral obtained by taking possession and execution processes 48
Table of contents
Barclays PLC 1

Analysis of counterparty credit riskCCR1 - Analysis of CCR exposure by approach 49CCR3 - Standardised approach – CCR exposures by regulatory exposure class and risk weights 50CCR4 - IRB approach – CCR exposures by portfolio and PD range for central governments and central banks 51CCR4 - IRB approach – CCR exposures by portfolio and PD range for institutions 52CCR4 - IRB approach – CCR exposures by portfolio and PD range for corporates 53CCR5 - Composition of collateral for CCR exposures 54CCR6 - Credit derivatives exposures 54CCR8 - Exposures to CCPs 55CCR2 - Transactions subject to own funds requirements for CVA risk 56
Analysis of market riskMR3 - IMA values for trading portfolios 57Breakdown of the major regulatory risk measures by portfolio 58MR1 - Market risk under the standardised approach 59MR2-A - Market risk under the internal Model Approach (IMA) 59MR4 - Comparison of VaR estimates with gains/losses 61
Analysis of SecuritisationSEC1 - Securitisation exposures in the non-trading book 63SEC2 - Securitisation exposures in the trading book 63SEC3 - Securitisation exposures in the non-trading book and associated regulatory capital requirements - institution acting as originator or as sponsor
64
SEC4 - Securitisation exposures in the non-trading book and associated regulatory capital requirements - institution acting as investor 65SEC5 - Exposures securitised by the institution - Exposures in default and specific credit risk adjustments 66
Countercyclical capital bufferCCyB1 - Geographical distribution of credit exposures relevant for the calculation of the countercyclical buffer 67CCyB2 - Amount of institution-specific countercyclical capital buffer 68
Table of contents
Barclays PLC 2

The terms Barclays or Group refer to Barclays PLC together with its subsidiaries. The abbreviations ‘£m’ and ‘£bn’ represents millions and thousands of millions of Pounds Sterling respectively.
There are a number of key judgement areas, for example impairment calculations, which are based on models and which are subject to ongoing adjustment and modifications. Reported numbers reflect best estimates and judgements at the given point in time.
Relevant terms that are used in this document but are not defined under applicable regulatory guidance or International Financial Reporting Standards (IFRS) are explained in the results glossary that can be accessed at home.barclays/investor-relations/reports-and-events/latest-financial-results.
Forward-looking statements
This document contains certain forward-looking statements within the meaning of Section 21E of the US Securities Exchange Act of 1934, as amended, and Section 27A of the US Securities Act of 1933, as amended, with respect to the Group. Barclays cautions readers that no forward-looking statement is a guarantee of future performance and that actual results or other financial condition or performance measures could differ materially from those contained in the forward-looking statements. Forward-looking statements can be identified by the fact that they do not relate only to historical or current facts. Forward-looking statements sometimes use words such as ‘may’, ‘will’, ‘seek’, ‘continue’, ‘aim’, ‘anticipate’, ‘target’, ‘projected’, ‘expect’, ‘estimate’, ‘intend’, ‘plan’, ‘goal’, ‘believe’, ‘achieve’ or other words of similar meaning. Forward-looking statements can be made in writing but also may be made verbally by members of the management of the Group (including, without limitation, during management presentations to financial analysts) in connection with this document. Examples of forward-looking statements include, among others, statements or guidance regarding or relating to the Group’s future financial position, income levels, assets and liabilities, impairment charges, provisions, capital, leverage and other regulatory ratios, capital distributions (including dividend pay-out ratios and expected payment strategies), projected levels of growth in banking and financial markets, projected expenditures, costs or savings, any commitments and targets (including, without limitation, environmental, social and governance (ESG) commitments and targets), business strategy, plans and objectives for future operations, group structure, IFRS impacts and other statements that are not historical or current facts. By their nature, forward-looking statements involve risk and uncertainty because they relate to future events and circumstances. Forward-looking statements speak only as at the date on which they are made. Forward-looking statements may be affected by a number of factors, including, without limitation: changes in legislation, regulation and the interpretation thereof, the development of IFRS and other accounting standards, evolving practices with regard to the interpretation and application of accounting standards, emerging and developing ESG reporting standards, the outcome of current and future legal proceedings and regulatory investigations and any related impact on provisions, the policies and actions of governmental and regulatory authorities, the Group’s ability along with governments and other stakeholders to measure, manage and mitigate the impacts of climate change effectively, environmental, social and geopolitical risks and incidents or similar events beyond the Group’s control, and the impact of competition. In addition, factors including (but not limited to) the following may have an effect: capital, leverage and other regulatory rules applicable to past, current and future periods; UK, US, Eurozone and global macroeconomic and business conditions; volatility in credit and capital markets; market related risks such as changes in interest rates and foreign exchange rates; changes in valuation of credit market exposures; changes in valuation of issued securities; changes in credit ratings of any entity within the Group or any securities issued by such entities; changes in counterparty risk; changes in consumer behaviour; the direct and indirect consequences of the Russia-Ukraine War on European and global macroeconomic conditions, political stability and financial markets; direct and indirect impacts of the coronavirus (COVID-19) pandemic; instability as a result of the UK’s exit from the European Union (EU), the effects of the EU-UK Trade and Cooperation Agreement and the disruption that may subsequently result in the UK and globally; the risk of cyber-attacks, information or security breaches or technology failures on the Group’s reputation, business or operations; the Group’s ability to access funding; and the success of acquisitions, disposals and other strategic transactions. A number of these influences and factors are beyond the Group’s control. As a result, the Group’s actual financial position, future results, capital distributions, capital, leverage or other regulatory ratios or other financial and nonfinancial metrics or performance measures or ability to meet commitments and targets may differ materially from the statements or guidance set forth in the Group’s forward-looking statements. Additional risks and factors which may impact the Group’s future financial condition and performance are identified in Barclays PLC’s filings with the SEC (including, without limitation, Barclays PLC’s Annual Report on Form 20-F for the financial year ended 31 December 2021, as amended, and Interim Results Announcement for the six months ended 30 June 2022 filed on Form 6-K), which are available on the SEC’s website at www.sec.gov.
Subject to Barclays’ obligations under the applicable laws and regulations of any relevant jurisdiction (including, without limitation, the UK and the US), in relation to disclosure and ongoing information, we undertake no obligation to update publicly or revise any forward-looking statements, whether as a result of new information, future events or otherwise.
Notes
Barclays PLC 3

Disclosure Background
Barclays’ Pillar 3 disclosures complement the Barclays 2022 Interim Results Announcement and provide additional information about Barclays’ risk profile, including its regulatory capital, minimum requirements for own funds and eligible liabilities (MREL), RWAs, liquidity and leverage exposures for Barclays Group.
The Pillar 3 report is prepared in accordance with the Capital Requirements Regulation and Capital Requirements Directive (‘CRR’ and ‘CRD V’). In particular articles 431 to 455 of CRR specify the requirements of the Pillar 3 framework. The regulations came into force on 1 January 2022, and were implemented by the PRA via the PRA Rulebook. The Pillar 3 disclosures have also been prepared in accordance with the updated PRA Rulebook.
References to CRR, as amended by CRR II mean, unless otherwise specified, CRR as amended by CRR II, as it forms part of UK law pursuant to the European Union (Withdrawal) Act 2018. On 31 March 2022, the temporary transitional powers (TTP) available to UK regulators to delay or phase in on-shoring of European Union legislation into UK law ended with full compliance of the on-shored regulations required from 1 April 2022.
The disclosures included in this report reflect the Bank’s interpretation of the current rules and guidance.
Regulatory changes in the period
Capital and RWAs
The EBA published a report on the implementation of Internal Ratings-Based approach (IRB) roadmap changes. These have subsequently been implemented by the PRA via several Policy Statements, from 1 January 2022. Key changes include revisions to the criteria for definition of default, PD and LGD estimation to ensure supervisory consistency and increase transparency of IRB models.
The PRA finalised their implementation of Basel standards through Policy Statement 22/21, and were implemented from 1 January 2022. The finalised requirements included the introduction of the Standardised Approach for Counterparty Credit Risk (SA-CCR) which replaces the Current Exposure Method (CEM) for Standardised derivative exposures as a more risk sensitive approach. The PRA also confirmed the intention to revert to the previous treatment of 100% CET1 capital deduction for qualifying software assets.
UK Leverage Ratio Framework
Following the PRA publication of Policy Statement 21/21 on the UK leverage ratio framework (UKLRF), from 1 January 2022, UK banks have been subject to a single UK leverage ratio requirement meaning that the CRR leverage ratio no longer applies. The Policy Statement also implemented changes to the qualifying claims on central banks exemption whereby central bank claims can be excluded from the UK leverage ratio measure as long as they are matched by qualifying liabilities (rather than deposits). Minimum requirements for the Group remain the same with minimum requirements also expected to be applied at the individual level from 1 January 2023. Individual requirements may be replaced with a sub-consolidated measure, subject to permission from the PRA.
MREL requirements
On 3 December 2021 the Bank of England (BoE) set new MREL requirements via an updated Statement of Policy removing the requirements under CRR, meaning that from 1 January 2022 the Group is required to meet the higher of i) 2 times 8% Pillar 1 and 4.2% Pillar 2A requirement; and ii) 6.75% of UK leverage exposure. The Statement of Policy also confirmed that own funds instruments issued by subsidiaries cannot count towards the Group's MREL from 1 January 2022.
Pillar 3 disclosures
As part of the introduction of PS 22/21 changes from 1 January 2022, a number of new Pillar 3 disclosures have been introduced in line with the updated PRA rulebook (Disclosure (CRR) - Pillar 3 Templates and Instructions). New disclosures will be noted and any new data points will have no comparatives. Comparatives are not provided where there has been a change in the guidelines for disclosures that were reportable for 31 December 2021. The terms RWA and RWEA are used interchangeably throughout the document. Leverage related tables do not have comparatives due to prior period being disclosed on a CRR basis which no longer applies to UK banks.
Large subsidiary
The Group's disclosable large subsidiaries as at 30 June 2022 are Barclays Bank PLC, Barclays Bank UK Group and Barclays Bank PLC Ireland (BBI). These entities are published in standalone documents “Barclays Bank PLC’s Pillar 3 Report”, “Barclays Bank UK PLC Pillar 3 Report” and “Barclays Bank Ireland PLC Pillar 3 report” respectively. Group relates to Barclays PLC and all its subsidiaries.
Introduction
Barclays PLC 4

Regulatory minimum requirements
Capital
The Group’s Overall Capital Requirement for CET1 is 10.9% comprising a 4.5% Pillar 1 minimum, a 2.5% Capital Conservation Buffer (CCB), a 1.5% Global Systemically Important Institution (G-SII) buffer, a 2.4% Pillar 2A requirement and a 0% Countercyclical Capital Buffer (CCyB).
The Group’s CCyB is based on the buffer rate applicable for each jurisdiction in which the Group has exposures. On 11 March 2020, the Financial Policy Committee (FPC) set the CCyB rate for UK exposures at 0% with immediate effect. The buffer rates set by other national authorities for non-UK exposures are not currently material. Overall, this results in a 0.0% CCyB for the Group. On 13 December 2021, the FPC announced that a CCyB rate of 1% for UK exposures has been re-introduced and will be applicable from 13 December 2022. On 5 July 2022, the FPC announced that the UK CCyB rate will be increased from 1% to 2% and will be applicable from 5 July 2023.
The Group’s Pillar 2A requirement as per the PRA’s Individual Capital Requirement was set as a nominal amount. When expressed as a percentage of RWAs this was 4.2% of which at least 56.25% needed to be met with CET1 capital, equating to approximately 2.4% of RWAs. The Pillar 2A requirement is subject to at least annual review and is based on a point in time assessment.
The Group’s CET1 target ratio of 13-14% takes into account headroom above requirements which includes a confidential institution-specific PRA buffer. The Group remains above its minimum capital regulatory requirements including the PRA buffer.
Leverage
The Group is subject to a UK leverage ratio requirement of 3.8%. This comprises the 3.25% minimum requirement, a G-SII additional leverage ratio buffer (G-SII ALRB) of 0.53% and a countercyclical leverage ratio buffer of 0.0%. Although the leverage ratio is expressed in terms of Tier 1 (T1) capital, 75% of the minimum requirement, equating to 2.4375%, needs to be met with CET1 capital. In addition, the G-SII ALRB must be covered solely with CET1 capital. The CET1 capital held against the 0.53% G-SII ALRB was £6.0bn.
The Group is also required to disclose an average UK leverage ratio which is based on capital on the last day of each month in the quarter and an exposure measure for each day in the quarter.
MREL
The Group is required to meet the higher of: (i) two times the sum of 8% Pillar 1 and 4.2% Pillar 2A; and (ii) 6.75% of leverage exposures plus capital buffers, including the above mentioned confidential institution-specific PRA buffer. CET1 capital cannot be counted towards both MREL and the capital buffers, meaning that the buffers will effectively be applied above MREL requirements.
Introduction
Barclays PLC 5

Basis of preparation relating to the over-issuance of securities in the US
In March 2022, the Group became aware that Barclays Bank PLC had issued securities in excess of the amount it had registered with the SEC under the Barclays Bank PLC’s 2019 F-31 and subsequently became aware that securities had also been issued in excess of the amount it had registered with the SEC under the Predecessor Shelf2 (the Over-issuance of Securities). The securities issued in excess of the registered amount comprised structured products and exchange traded notes. As these securities were not issued in compliance with the US Securities Act of 1933, as amended, a right of rescission has arisen for certain purchasers of the securities. A proportion of the expected costs associated with the right of rescission3 are attributable to the financial statements for the year ended 31 December 2021 and the interim financial statements for the six month period ended 30 June 2021, resulting in restatements in the following disclosures:
31 December 2021
Prior to the restatement, litigation and conduct charges in the income statement in relation to the year ended on 31 December 2021 were under reported by £220m (pre-tax). As previously reported in the Barclays PLC Pillar 3 Report as at 31 March 2022, due to the restatement, total transitional CET1 decreased by £170m from £47,947m to £47,327m. Both the transitional and fully loaded CET1 ratios remained unchanged at 15.1% and 14.7% respectively. The T1 ratio moved from 19.2% to 19.1% and the total capital ratio moved from 22.3% to 22.2%.
The leverage exposure increased £1.9bn to recognise on a regulatory basis, the potential commitment relating to the rescission offer (see 'Other matters' on page 6 of Barclays PLC Q2'22 results announcement). This resulted in the UK leverage ratio moving from 5.3% to 5.2% whilst the average UK leverage ratio remained unchanged at 4.9%.
30 June 2021
Prior to the restatement, litigation and conduct charges in the income statement in relation to the six month period ended on 30 June 2021 were under reported by £60m (post-tax). Due to the restatement, total transitional CET1 decreased by £60m from £46,225m to £46,165m. Transitional RWAs increased by £941m to £307,365m to recognise, on a regulatory basis, the potential commitment relating to the rescission offer. This resulted in reductions in the transitional CET1 ratio (15.1% to 15.0%), transitional tier 1 ratio (18.9% to 18.8%) and transitional total capital ratio (22.3% to 22.2%).
The leverage exposure increased £1.3bn to recognise on a regulatory basis, the potential commitment relating to the rescission offer (see 'Other matters' on page 6 of Barclays PLC Q2'22 results announcement). Both UK leverage and average UK leverage ratio remained unchanged for June 2021
1. Barclays Bank PLC’s shelf registration statement on Form F-3, as declared effective by the SEC in August 2019.2. Barclays Bank PLC’s predecessor shelf registration statement on Form F-3 filed in 2018.3. Refer to Restatement of financial statements on page 73 of the Barclays H1’22 Results Announcement for more information.
Introduction
Barclays PLC 6

Table 1: KM1 - Key metrics - Part 1This table shows key regulatory metrics and ratios as well as related components like own funds, RWAs, capital ratios, additional requirements based on Supervisory Review and Evaluation Process (SREP), capital buffer requirements, leverage ratio and liquidity coverage ratio.
Restated1 Restated1 Restated1
As at As at As at As at As at30.06.22 31.03.22 31.12.21 30.09.21 30.06.21
KM1 ref £m £m £m £m £mAvailable own funds (amounts)
1 Common Equity Tier 1 (CET1) capital2 46,691 45,269 47,327 47,170 46,165
1a Fully loaded common Equity Tier 1 (CET1) capital3 46,049 44,668 46,098 45,838 44,834
2 Tier 1 capital2 58,988 56,328 60,143 59,978 57,900
2a Fully loaded tier 1 capital3 58,346 55,727 58,277 58,010 55,921
3 Total capital2 68,620 66,140 69,882 70,149 68,189
3a Fully loaded total capital3 67,142 64,672 67,909 68,044 66,108
Risk-weighted exposure amounts
4 Total risk-weighted exposure amount2 344,516 328,830 314,136 307,717 307,365
4a Fully loaded total risk-weighted exposure amount3 344,284 328,646 313,876 307,467 307,118
Capital ratios (as a percentage of risk-weighted exposure amount)
5 Common Equity Tier 1 ratio (%)2 13.6% 13.8% 15.1% 15.3% 15.0%
5a Fully loaded common Equity Tier 1 ratio (%)3 13.4% 13.6% 14.7% 14.9% 14.6%
6 Tier 1 ratio (%)2,4 17.1% 17.1% 19.1% 19.5% 18.8%
6a Fully loaded tier 1 ratio (%)3,5 16.9% 17.0% 18.6% 18.9% 18.2%
7 Total capital ratio (%)2,4 19.9% 20.1% 22.2% 22.8% 22.2%
7a Fully loaded total capital ratio (%)3,5 19.5% 19.7% 21.6% 22.1% 21.5%
Additional own funds requirements based on SREP (as a percentage of risk-weighted exposure amount)
UK 7a Additional CET1 SREP requirements (%) 2.4% 2.5%
UK 7b Additional AT1 SREP requirements (%) 0.8% 0.8%
UK 7c Additional T2 SREP requirements (%) 1.1% 1.1%
UK 7d Total SREP own funds requirements (%) 12.2% 12.4%
Combined buffer requirement (as a percentage of risk-weighted exposure amount)
8 Capital conservation buffer (%) 2.5% 2.5% 2.5% 2.5% 2.5%
9 Institution specific countercyclical capital buffer (%) 0.0% 0.0% 0.0% 0.0% 0.0%
10 Global Systemically Important Institution buffer (%) 1.5% 1.5% 1.5% 1.5% 1.5% 11 Combined buffer requirement (%) 4.0% 4.0% 4.0% 4.0% 4.0%
UK 11a Overall capital requirements (%) 16.2% 16.4%
12 CET1 available after meeting the total SREP own funds requirements (%)
6.7% 6.8%
1. Capital metrics as at 31 December 2021, 30 September 2021 and 30 June 2021 have been restated. More details are available on page 6.2. CET1 capital and RWAs are calculated applying the IFRS 9 transitional arrangements of the CRR as amended by CRR II.3. Fully loaded CET1 capital and RWAs are calculated without applying the IFRS 9 transitional arrangements of the CRR as amended by CRR II.4. Transitional Tier 1 and Total capital are calculated applying the grandfathering of CRR II non-compliant capital instruments. Prior year comparatives include the
grandfathering of CRR non-compliant capital instruments.5. Fully loaded Tier 1 and Total capital are calculated without applying the grandfathering of CRR II non-compliant capital instruments.
The CET1 ratio decreased by c.150bps to 13.6% (December 2021: 15.1%) as capital decreased by £0.6bn to £46.7bn and RWAs increased by £30.4bn to £344.5bn
• c.80bps reduction to the CET1 ratio due to the expected impact of regulatory change on 1 January 2022 as CET1 capital decreased £1.7bn and RWAs increased £6.6bn
• c.30bps reduction due to the £1bn buyback announced with FY21 results, which is well progressed• c.40bps reduction due to the impact of the Over-issuance of Securities. c.20bps due to the £0.6bn net of tax impact reducing CET1 capital and
c.20bps due to a £4.5bn temporary increase in RWAs reflecting the hedging arrangements designed to manage the risk of the rescission offer relating to the Over-issuance of Securities. The hedging related RWAs are expected to reverse after the rescission offer is completed in Q322
• Excluding the impacts above, an increase in CET1 capital of £2.7bn was offset by a £19.3bn increase in RWAs:• The £2.7bn increase in CET1 capital reflects profits and an increase in the currency translation reserve, offset by an accrual toward a FY22
dividend, equity coupons paid, and a decrease in the fair value through other comprehensive income reserve• The £19.3bn increase in RWAs was primarily due to the appreciation of USD against GBP, increased client activity within CIB and higher
CC&P balances mainly driven by the GAP portfolio acquisition. This was marginally offset by the partial disposal of Barclays' equity stake in Absa Group Limited (Absa) in April 2022
Introduction
Barclays PLC 7

Table 1: KM1 - Key metrics - Part 2Restated1 Restated1 Restated1
As at As at As at As at As at30.06.22 31.03.22 31.12.21 30.09.21 30.06.21
KM1 ref
LR2 Ref
£m £m £m £m £m
Leverage ratio13 UK 24b Total exposure measure excluding claims on central banks1,2 1,151,214 1,123,531 1,137,904 1,162,668 1,154,87814 25 Leverage ratio excluding claims on central banks (%)1,2 5.1% 5.0% 5.2% 5.1% 5.0%
Additional leverage ratio disclosure requirements
UK 14a UK 25a Fully loaded ECL accounting model leverage ratio excluding claims on central banks (%)3
5.1% 5.0%
UK 14b UK 25c Leverage ratio including claims on central banks (%)2 4.1% 4.1% UK 14c UK 33 Average leverage ratio excluding claims on central banks
(%)1,2,4 4.7% 4.8% 4.9% 4.9% 4.8%
UK 14d UK 34 Average leverage ratio including claims on central banks 3.9% 4.0% UK 14e UK 27b Countercyclical leverage ratio buffer (%) 0.0% 0.0% UK 14f UK 27 Leverage ratio buffer (%) 0.5% 0.5%
Liquidity Coverage Ratio15 Total high-quality liquid assets (HQLA) (Weighted value)5 308,489 300,538 293,556 291,764 298,380UK 16a Cash outflows - Total weighted value 269,331 260,731 256,986 257,080 256,557UK 16b Cash inflows - Total weighted value 72,972 72,251 73,330 75,217 76,84016 Total net cash outflows (adjusted value)5 196,359 188,480 183,656 181,863 179,71717 Liquidity coverage ratio (%) 156% 159% 168% 161% 162%
1. Capital and leverage metrics as at 31 December 2021, 30 September 2021and 30 June 2021 have been restated. More details are available on page 6.2. Transitional UK leverage ratios are calculated applying the IFRS 9 transitional arrangements of the CRR as amended by CRR II.3. Fully loaded UK leverage ratio is calculated without applying the IFRS9 transitional arrangements of the CRR as amended by CRR II.4. Average UK leverage ratio uses capital based on the last day of each month in the quarter and an exposure measure for each day in the quarter.5. Prior period comparatives have been updated to reflect the average measures as amended by CRR II.
The UK leverage ratio decreased to 5.1% (December 2021: 5.2%) primarily due to an increase in the leverage exposure of £13.3bn, due to increases of £36.8bn in derivative financial instruments post additional regulatory netting and adjustments for cash collateral, £34.4bn in loans and advances at amortised cost, £28.1bn in securities financing transactions, £12.6bn in net written credit protection, partially offset by decreases of £51.8bn in potential future exposures on derivatives, £39.8bn decrease due to an £84.3bn increase in the qualifying central bank claims exemption, partially offset by a £44.6bn increase in cash and a £20.0bn decrease in trading portfolio assets.
Introduction
Barclays PLC 8

Table 2: CC1 – Composition of regulatory own funds This table shows the components of regulatory capital presented on both a transitional and fully loaded basis as at 30 June 2022.
As at 30.06.22
As at 30.06.22
Transitional position
Fully loaded position
Ref† £m £mCommon Equity Tier 1 (CET1) capital: instruments and reserves1 Capital instruments and the related share premium accounts a 4,508 4,508 of which called up share capital and share premium 4,508 4,508 2 Retained earnings b 50,717 50,717 3 Accumulated other comprehensive income (and other reserves) c (198) (198) UK-5a Independently reviewed interim profits net of any foreseeable charge or dividend b 1,271 1,271 6 Common Equity Tier 1 (CET1) capital before regulatory adjustments 56,298 56,298
Common Equity Tier 1 (CET1) capital: regulatory adjustments7 Additional value adjustments (1,810) (1,810) 8 Intangible assets (net of related tax liability)
d,e,f,g1 (8,232) (8,232) 10 Deferred tax assets that rely on future profitability excluding those arising from temporary
differences (net of related tax liability where the conditions in Article 38 (3) CRR are met) h (1,010) (1,010) 11 Fair value reserves related to gains or losses on cash flow hedges of financial instruments that
are not valued at fair value i 4,673 4,673 14 Gains or losses on liabilities valued at fair value resulting from changes in own credit standing j (62) (62) 15 Defined-benefit pension fund assets k, g1 (3,785) (3,785) 16 Direct, indirect and synthetic holdings by an institution of own CET1 instruments (20) (20) 27a Other regulatory adjustments to CET1 capital (including IFRS 9 transitional adjustments when
relevant)2 639 (3) 28 Total regulatory adjustments to Common Equity Tier 1 (CET1) (9,607) (10,249) 29 Common Equity Tier 1 (CET1) capital 46,691 46,049
Additional Tier 1 (AT1) capital: instruments30 Capital instruments and the related share premium accounts l 12,357 12,357 31 of which: classified as equity under applicable accounting standards l 12,357 12,357 36 Additional Tier 1 (AT1) capital before regulatory adjustments 12,357 12,357
Additional Tier 1 (AT1) capital: regulatory adjustments
37 Direct, indirect and synthetic holdings by an institution of own AT1 instruments (60) (60) 43 Total regulatory adjustments to Additional Tier 1 (AT1) capital (60) (60) 44 Additional Tier 1 (AT1) capital 12,297 12,297
45 Tier 1 capital (T1 = CET1 + AT1) 58,988 58,346
Tier 2 (T2) capital: instruments
46 Capital instruments and the related share premium accounts m 8,442 8,442 UK-47b Amount of qualifying items referred to in Article 494b (2) CRR subject to phase out from T2 — — 48 Qualifying own funds instruments included in consolidated T2 capital (including minority
interests and AT1 instruments not included in rows 5 or 34) issued by subsidiaries and held by third parties3
m, n 1,277 408 50 Credit risk adjustments 73 106 51 Tier 2 (T2) capital before regulatory adjustments 9,792 8,956
† The references (a) – (n) identify balance sheet components in Table 3: CC2 – Reconciliation of regulatory capital to balance sheet on page 11 which are used in the calculation of regulatory capital.
1 Deferred tax liabilities on intangible assets and pension fund assets are included as either a negative component of the deferred tax asset or a deferred tax liability on the balance sheet depending on the net deferred tax position of the bank at the time of reporting.
2 Other regulatory adjustments to CET1 capital includes IFRS 9 transitional adjustments of which static £319m, of which modified £323m.3 Row 48 includes £1,006m of T2 instruments issued by subsidiaries and subject to phase out from T2 under Article 494b(2). They are not reported in row UK-47b to avoid
double counting with row 48.
Capital
Barclays PLC 9

Table 2: CC1 – Composition of regulatory own funds – continuedAs at
30.06.22As at
30.06.22Transitional
positionFully loaded
positionRef† £m £m
Tier 2 (T2) capital: regulatory adjustments
52 Direct, indirect and synthetic holdings by an institution of own T2 instruments and subordinated loans (negative amount) (160) (160)
57 Total regulatory adjustments to Tier 2 (T2) capital (160) (160)58 Tier 2 (T2) capital 9,632 8,79659 Total capital (TC = T1 + T2) 68,620 67,14260 Total Risk exposure amount 344,516 344,284
Capital ratios and buffers61 Common Equity Tier 1 (as a percentage of total risk exposure amount) 13.6% 13.4% 62 Tier 1 (as a percentage of total risk exposure amount) 17.1% 16.9% 63 Total capital (as a percentage of total risk exposure amount) 19.9% 19.5% 64 Institution CET1 overall capital requirement (CET1 requirement in accordance with Article 92
(1) CRR, plus additional CET1 requirement which the institution is required to hold in accordance with point (a) of Article 104(1) CRD, plus combined buffer requirement in accordance with Article 128(6) CRD) expressed as a percentage of risk exposure amount) 10.9% 10.9%
65 of which: capital conservation buffer requirement 2.5% 2.5% 66 of which: countercyclical buffer requirement 0.0% 0.0% UK-67a of which: Global Systemically Important Institution (G-SII) or Other Systemically Important
Institution (O-SII) buffer 1.5% 1.5% 68 Common Equity Tier 1 available to meet buffers (as a percentage of risk exposure amount) 6.7% 6.5%
Amounts below the thresholds for deduction (before risk weighting)
72 Direct and indirect holdings of own funds and eligible liabilities of financial sector entities where the institution does not have a significant investment in those entities (amount below 10% threshold and net of eligible short positions) 3,959 3,959
73 Direct and indirect holdings by the institution of the CET1 instruments of financial sector entities where the institution has a significant investment in those entities (amount below 17.65% thresholds and net of eligible short positions) 131 131
75 Deferred tax assets arising from temporary differences (amount below 17,65% threshold, net of related tax liability where the conditions in Article 38 (3) CRR are met) 3,330 3,484
Applicable caps on the inclusions of provisions in Tier 2
78 Credit risk adjustments included in T2 in respect of exposures subject to internal ratings-based approach (prior to the application of the cap) 73 106
79 Cap for inclusion of credit risk adjustments in T2 under internal ratings-based approach 883 886
Capital
Barclays PLC 10

Table 3: CC2 – Reconciliation of regulatory own funds to balance sheet in the audited financial statementsThese tables show the reconciliation between the balance sheet prepared for statutory and regulatory scope of consolidation. The amount shown under the regulatory scope of consolidation is not a RWA measure; it is based on an accounting measure and cannot be directly reconciled to other tables in this report.
Balance sheet as in published financial
statementsUnder regulatory scope
of consolidation Ref†As at 30 June 2022 £m £mAssets1 Cash and balances at central banks 283,136 283,067 2 Cash collateral and settlement balances 132,623 132,005 3 Loans and advances at amortised cost 395,824 389,011 4 Reverse repurchase agreements and other similar secured lending 1,639 1,639 5 Trading portfolio assets 127,004 133,052 6 Financial assets at fair value through the income statement 212,723 211,287 7 Derivative financial instruments 344,855 344,437 8 Financial assets at fair value through other comprehensive income 63,194 63,300 9 Investments in subsidiaries, associates and joint ventures 911 36 e10 Goodwill and intangible assets 8,245 8,273 11 - Of which: goodwill 3,912 3,939 d12 - Of which: other intangibles (excluding MSRs) 4,333 4,334 f13 Property, plant and equipment 3,582 3,584 14 Current tax assets 551 551 15 Deferred tax assets 5,044 5,044 g,h16 Retirement benefit assets 5,233 5,233 k17 Other assets 4,666 5,165 18 Total assets 1,589,230 1,585,684 Liabilities 1 Deposits at amortised cost 568,670 568,671 2 Cash collateral and settlement balances 124,724 123,531 3 Repurchase agreements and other similar secured borrowing 28,566 28,566 4 Debt securities in issue 115,906 107,356 5 Subordinated liabilities 11,871 11,871 m6 Trading portfolio liabilities 76,638 81,913 7 Financial liabilities designated at fair value 255,136 254,338 8 Derivative financial instruments 321,396 321,120 9 Current tax liabilities 449 447 10 Deferred tax liabilities 5 5 g11 Retirement benefit liabilities 309 309 12 Other liabilities 11,538 13,576 13 Provisions 3,426 3,460 14 Total liabilities 1,518,634 1,515,163 Equity1 Called up share capital and share premium 4,508 4,508 2 - Of which: amount eligible for CET1 4,508 4,508 a3 Other equity instruments 12,357 12,357 l4 Other reserves (218) (192) c,i,j5 Retained earnings 52,980 52,879 b6 Total equity excluding non-controlling interests 69,627 69,552 7 Non-controlling interests 969 969 n8 Total equity 70,596 70,521 9 Total liabilities and equity 1,589,230 1,585,684
† The references (a) – (n) identify balance sheet components that are used in the calculation of regulatory capital in Table 2: Composition of regulatory capital on page 8.
Capital
Barclays PLC 11

Table 4: IFRS 91/Article 468-FL – Comparison of institution’s own funds and capital and leverage ratios with and without the application of transitional arrangements for IFRS 9 or analogous ECLs, and with and without the application of the temporary treatment in accordance with Article 468 of the CRR2
Restated3 Restated3 Restated3As at
30.06.22As at
31.03.22As at
31.12.21As at
30.09.21As at
30.06.21Barclays Group £m £m £m £m £m
Available capital (amounts)1 CET1 capital4 46,691 45,269 47,327 47,170 46,1652 CET1 capital as if IFRS 9 or analogous ECLs transitional
arrangements had not been applied 46,049 44,668 46,098 45,838 44,8343 Tier 1 capital5 58,988 56,328 60,143 59,978 57,9004 Tier 1 capital as if IFRS 9 or analogous ECLs transitional
arrangements had not been applied 58,346 55,727 58,914 58,646 56,5695 Total capital5 68,620 66,140 69,882 70,149 68,1896 Total capital as if IFRS 9 or analogous ECLs transitional
arrangements had not been applied 68,011 65,578 68,982 69,241 67,350
Risk-weighted assets (amounts)7 Total risk-weighted assets4 344,516 328,830 314,136 307,717 307,3658 Total risk-weighted assets as if IFRS 9 or analogous ECLs
transitional arrangements had not been applied 344,284 328,646 313,876 307,467 307,118
Capital ratios9 CET1 (as a percentage of risk exposure amount)4 13.6% 13.8% 15.1% 15.3% 15.0% 10 CET1 (as a percentage of risk exposure amount) as if IFRS 9 or
analogous ECLs transitional arrangements had not been applied 13.4% 13.6% 14.7% 14.9% 14.6%
11 Tier 1 (as a percentage of risk exposure amount)4,5 17.1% 17.1% 19.1% 19.5% 18.8% 12 Tier 1 (as a percentage of risk exposure amount) as if IFRS 9 or
analogous ECLs transitional arrangements had not been applied 16.9% 17.0% 18.8% 19.1% 18.4%
13 Total capital (as a percentage of risk exposure amount)4,5 19.9% 20.1% 22.2% 22.8% 22.2% 14 Total capital (as a percentage of risk exposure amount) as if
IFRS 9 or analogous ECLs transitional arrangements had not been applied 19.8% 20.0% 22.0% 22.5% 21.9%
Leverage ratio15 Leverage ratio total exposure measure 1,151,214 1,123,53116 Leverage ratio4 5.1% 5.0% 17 Leverage ratio as if IFRS 9 or analogous ECLs transitional
arrangements had not been applied 5.1% 5.0%
1. From 1 January 2018, Barclays Group elected to apply the IFRS 9 transitional arrangements of the CRR. The transitional relief on the “day 1” impact on adoption of IFRS 9 and on increases in non-defaulted provisions between “day 1” and 31 December 2019 is phased out over a 5 year period with 25% applicable for 2022 and with no transitional relief from 2023. On 27 June 2020, CRR was amended to extend the transitional period by two years and to introduce a new modified calculation. The transitional relief for increases in non-defaulted provisions between 1 January 2020 and the reporting date is also phased out over a 5 year period with 75% applicable for 2022; 50% for 2023; 25% for 2024 and with no transitional relief from 2025.
2. As at 30 June 2022, the Group had not elected to apply the temporary treatment specified in Article 468 of the CRR, amended by Regulation EU 2020/873, resulting in the Group’s capital and leverage ratios reflecting the full impact of unrealised gains and losses measured at fair value through other comprehensive income.
3. Capital and leverage metrics as at 31 December 2021, 30 September 2021and 30 June 2021 have been restated. More details are available on page 64. Transitional CET1 capital, RWAs and leverage ratio are calculated applying the IFRS 9 transitional arrangements of the CRR as amended by CRR II.5. Transitional Tier 1 and Total capital are calculated applying the transitional arrangements of the CRR as amended by CRR II. Prior year comparatives include the
grandfathering of CRR non-compliant capital instruments.
Capital
Barclays PLC 12

Table 5: RWAs by risk type and businessThis table shows RWAs by business and risk type.
Credit risk Counterparty credit risk Market risk
Std AIRB Std AIRBSettlement risk CVA Std IMA
Operational risk
Total RWAs
As at 30 June 2022 £m £m £m £m £m £m £m £m £m £mBarclays UK 6,613 53,958 253 — — 76 236 — 11,047 72,183
Corporate and Investment Bank 40,055 71,737 18,739 22,099 440 3,357 17,466 28,423 25,296 227,612 Consumer, Cards and Payments 25,516 3,643 256 34 — 64 28 195 6,424 36,160
Barclays International 65,571 75,380 18,995 22,133 440 3,421 17,494 28,618 31,720 263,772 Head Office 3,488 6,069 — — — — — — (996) 8,561 Barclays Group 75,672 135,407 19,248 22,133 440 3,497 17,730 28,618 41,771 344,516
As at 31 December 2021Barclays UK 7,195 53,408 426 — — 138 100 — 11,022 72,289
Corporate and Investment Bank 29,420 64,416 15,223 19,238 105 2,289 17,306 27,308 25,359 200,664 Consumer, Cards and Payments 20,770 2,749 215 18 — 21 — 57 6,391 30,221
Barclays International 50,190 67,165 15,438 19,256 105 2,310 17,306 27,365 31,750 230,885 Head Office 4,733 7,254 — — — — — — (1,025) 10,962 Barclays Group 62,118 127,827 15,864 19,256 105 2,448 17,406 27,365 41,747 314,136
Risk weighted assets
Barclays PLC 13

Table 6: OV1 – Overview of risk weighted exposure amountsThe table shows RWAs and minimum capital requirement by risk type and approach.
Risk weighted exposure amounts (RWEAs) Total own funds requirements
As at 30 June
As at 31 March
As at 31 December
As at 30 June
As at 31 March
As at 31 December
2022 2022 2021 2022 2022 2021£m £m £m £m £m £m
1 Credit risk (excluding CCR) 194,932 190,343 177,898 15,595 15,227 14,232
2 Of which the standardised approach 69,826 64,420 58,008 5,586 5,154 4,641
4 Of which: slotting approach 5,101 5,629 4,168 408 450 333
5 Of which the advanced IRB (AIRB) approach 120,005 120,294 115,722 9,600 9,624 9,258
6 Counterparty credit risk - CCR 44,793 41,645 37,491 3,583 3,332 2,999
7 Of which the standardised approach 4,948 4,034 2,674 396 323 214
8 Of which internal model method (IMM) 27,281 25,411 24,196 2,183 2,033 1,936
UK 8a Of which exposures to a CCP 1,360 1,307 1,601 109 105 128
UK 8b Of which credit valuation adjustment - CVA 3,497 3,769 2,448 280 302 196
9 Of which other CCR 7,708 7,123 6,572 617 570 526
15 Settlement risk 440 268 105 35 21 8
16 Securitisation exposures in the non-trading book (after the cap) 16,232 13,885 12,124 1,299 1,111 970
17 Of which SEC-IRBA approach 10,302 9,094 7,937 824 728 635
18 Of which SEC-ERBA (including IAA) 1,809 1,549 1,424 145 124 114
19 Of which SEC-SA approach 4,119 3,240 2,755 330 259 220
UK 19a Of which 1250%/ deduction 2 2 9 0 0 1
20 Position, foreign exchange and commodities risks (Market risk) 46,348 40,918 44,771 3,708 3,273 3,582
21 Of which the standardised approach 17,730 17,333 17,406 1,418 1,387 1,392
22 Of which IMA 28,618 23,585 27,365 2,289 1,887 2,189
UK 22a Large exposures — — — — — —
23 Operational risk 41,771 41,771 41,747 3,342 3,342 3,340
UK 23b Of which standardised approach 41,771 41,771 41,747 3,342 3,342 3,340
24 Amounts below the thresholds for deduction (subject to 250% risk weight) (For information) 8,654 12,595 11,276 692 1,008 902
29 Total 344,516 328,830 314,136 27,562 26,306 25,131
Overall RWAs increased £15.7bn to £344.5bn (March 2022: £328.8bn) primarily due to:
• Credit risk RWAs increased £4.6bn to £194.9bn primarily due to appreciation of period end USD against GBP, the acquisition of GAP portfolio and a temporary increase in RWAs reflecting the hedging arrangements designed to manage the risk of the rescission offer relating to the Over-issuance of Securities, which are expected to reverse after the rescission offer has been completed in Q3 22. This was partially offset by the benefit in mortgages from an increase in the House Price Index (HPI) and partial disposal of Barclays' equity stake in Absa
▪ Counterparty Credit risk RWAs increased £3.1bn to £44.8bn primarily due to an increase in trading activities within SFTs and derivatives as well as an increase due to appreciation of period end USD against GBP
▪ Securitisation RWAs increased £2.3bn to £16.2bn primarily driven by increase in business activities
▪ Market risk RWAs increased £5.4bn to £46.3bn primarily due to increased client and trading activities as well as an increase due to appreciation of period end USD against GBP
Risk weighted assets
Barclays PLC 14

Table 7: CR8 – RWEA flow statements of credit risk exposures under the IRB approachThe total in this table shows the contribution of credit risk RWAs under the AIRB approach and will not directly reconcile to the CR AIRB RWAs in table 5.
Three months ended 30 June 2022
Six months ended 30 June 20221
£m £m1 Risk weighted exposure amount as at the end of the previous reporting period 110,699 104,413 2 Asset size (312) 2,346 3 Asset quality (2,173) (3,780) 4 Model updates — — 5 Methodology and policy 179 4,710 6 Acquisitions and disposals (89) (156) 7 Foreign exchange movements 2,507 3,278 8 Other — — 9 Risk weighted exposure amount as at the end of the reporting period 110,811 110,811
1. Opening balance has been updated to exclude Securitisation and non-credit obligation assets as per CRR II guidelines.
Three months ended advanced credit risk RWAs increased £0.1bn to £110.8bn primarily driven by:• A £2.2bn decrease in asset quality primarily driven by the benefit in mortgages from an increase in the HPI and improved credit quality within
CIB• A £2.5bn increase in FX primarily due to appreciation of period end USD against GBP
Six months ended advanced credit risk RWAs increased £6.4bn to £110.8bn primarily driven by:• A £2.3bn increase in asset size mainly driven by lending activities within CIB• A £3.8bn decrease in asset quality primarily driven by the benefit in mortgages from an increase in the HPI and improved credit quality
within CIB• A £4.7bn increase in methodology and policy as a result of regulatory changes that took effect from 1 January 2022, relating to
implementation of IRB roadmap changes• A £3.3bn increase in FX primarily due to appreciation of period end USD against GBP
Risk weighted assets
Barclays PLC 15
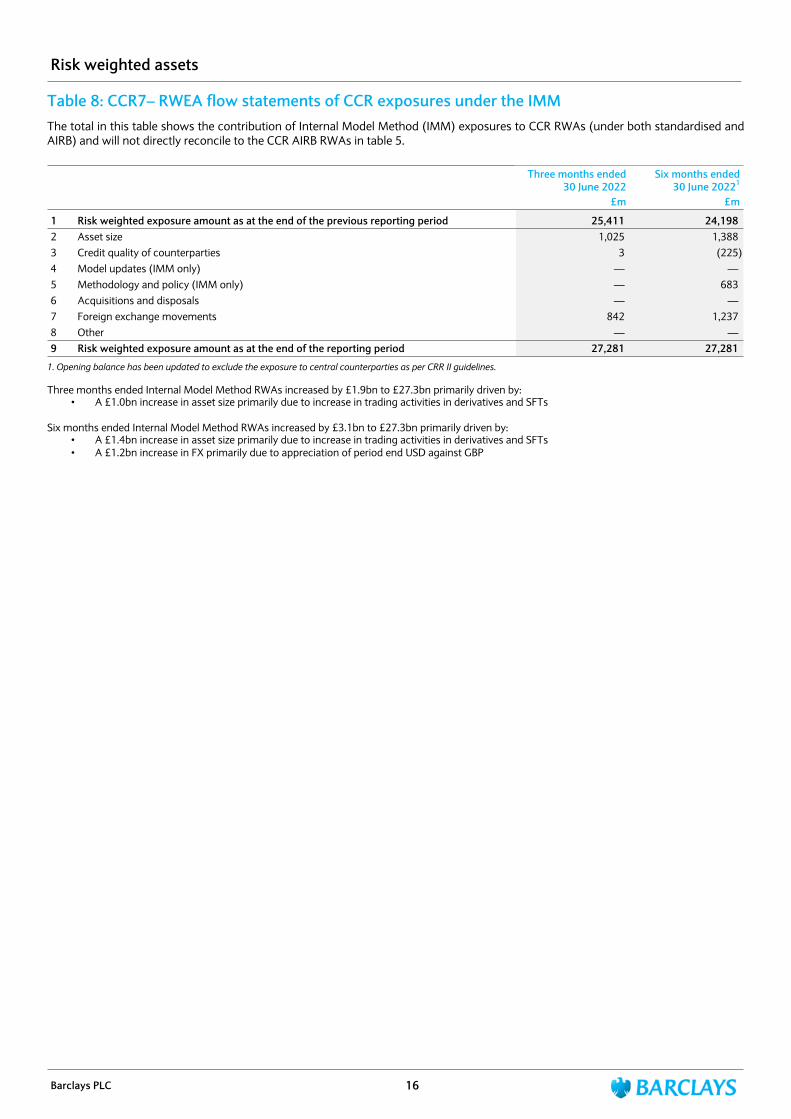
Table 8: CCR7– RWEA flow statements of CCR exposures under the IMMThe total in this table shows the contribution of Internal Model Method (IMM) exposures to CCR RWAs (under both standardised and AIRB) and will not directly reconcile to the CCR AIRB RWAs in table 5.
Three months ended 30 June 2022
Six months ended30 June 20221
£m £m
1 Risk weighted exposure amount as at the end of the previous reporting period 25,411 24,198 2 Asset size 1,025 1,388 3 Credit quality of counterparties 3 (225) 4 Model updates (IMM only) — — 5 Methodology and policy (IMM only) — 683 6 Acquisitions and disposals — — 7 Foreign exchange movements 842 1,237 8 Other — — 9 Risk weighted exposure amount as at the end of the reporting period 27,281 27,281
1. Opening balance has been updated to exclude the exposure to central counterparties as per CRR II guidelines.
Three months ended Internal Model Method RWAs increased by £1.9bn to £27.3bn primarily driven by:• A £1.0bn increase in asset size primarily due to increase in trading activities in derivatives and SFTs
Six months ended Internal Model Method RWAs increased by £3.1bn to £27.3bn primarily driven by:• A £1.4bn increase in asset size primarily due to increase in trading activities in derivatives and SFTs• A £1.2bn increase in FX primarily due to appreciation of period end USD against GBP
Risk weighted assets
Barclays PLC 16

Table 9: MR2-B – RWA flow statements of market risk exposures under the IMAThis table shows the contribution of market risk RWA covered by internal models (i.e. value at risk, stressed value at risk and incremental risk charge).
Three months ended 30 June 2022
VaR SVaR IRC OtherTotal
RWEAs
Total own funds
requirements£m £m £m £m £m £m
1 RWAs at previous period end 6,404 8,204 3,821 5,156 23,585 1,887 1a Regulatory adjustment1 (3,349) (4,507) (818) — (8,674) (694) 1b RWAs at the previous quarter-end (end of the day) 3,055 3,697 3,003 5,156 14,911 1,193 2 Movement in risk levels 1,691 2,998 190 240 5,119 409 3 Model updates/changes — — — — — — 4 Methodology and policy — — — — — — 5 Acquisitions and disposals — — — — — — 6 Foreign exchange movements — — — — — — 7 Other — — — — — — 8a RWAs at the end of the reporting period (end of the day) 4,746 6,695 3,193 5,396 20,030 1,602
8b Regulatory adjustment2 4,103 4,485 — — 8,588 687
8 RWAs at the end of the disclosure period 8,849 11,180 3,193 5,396 28,618 2,289
1. Row 1a reflects the difference between reported RWA (row 1) and the relevant spot measure (row 1b) for the previous period.2. Row 8b reflects the difference between the relevant spot measure (row 8a) and reported RWA (row 8) for the current period.
Modelled market risk RWAs increased £5.0bn to £28.6bn primarily driven by client and trading activity.
Six months ended 30 June 2022
VaR SVaR IRC OtherTotal
RWEAs
Total own funds
requirements£m £m £m £m £m £m
1 RWAs at previous period end 4,476 13,751 4,112 5,026 27,365 2,189 1a Regulatory adjustment1 (2,372) (3,135) — — (5,507) (440) 1b RWAs at the previous quarter-end (end of the day) 2,104 10,616 4,112 5,026 21,858 1,749 2 Movement in risk levels 2,642 (3,921) (919) 370 (1,828) (147) 3 Model updates/changes — — — — — — 4 Methodology and policy — — — — — — 5 Acquisitions and disposals — — — — — — 6 Foreign exchange movements — — — — — — 7 Other — — — — — — 8a RWAs at the end of the reporting period (end of the day) 4,746 6,695 3,193 5,396 20,030 1,602 8b Regulatory adjustment2 4,103 4,485 — — 8,588 687
8 RWAs at the end of the disclosure period 8,849 11,180 3,193 5,396 28,618 2,289
1. Row 1a reflects the difference between reported RWA (row 1) and the relevant spot measure (row 1b) for the previous period.2. Row 8b reflects the difference between the relevant spot measure (row 8a) and reported RWA (row 8) for the current period.
Modelled market risk RWAs increased £1.3bn to £28.6bn primarily driven by client and trading activity partially offset by a reduction in SVaR model adjustment as a result of changes in the portfolio composition.
Risk weighted assets
Barclays PLC 17

Leverage ratio and exposures
The following leverage tables show the components of the leverage ratio using the UKLRF definition for leverage exposure and Tier 1 capital as at 30 June 2022.1
Table 10: LR1 - Summary reconciliation of accounting assets and leverage ratio exposures
This table is a summary of the total leverage exposures and comprises total IFRS assets used for statutory purposes, regulatory consolidation and other leverage adjustments.
As at 30 June 2022£m
1 Total assets as per published financial statements 1,589,2302 Adjustment for entities which are consolidated for accounting purposes but are outside the scope of prudential
consolidation (3,546)3 Adjustment for securitised exposures that meet the operational requirements for the recognition of risk transference (468)4 Adjustment for exemption of exposures to central banks (294,477)6 Adjustment for regular-way purchases and sales of financial assets subject to trade date accounting (45,935)8 Adjustments for derivative financial instruments (175,156)9 Adjustment for securities financing transactions (SFTs) 29,78410 Adjustment for off-balance sheet items (i.e. conversion to credit equivalent amounts of off-balance sheet exposures) 129,67011 Adjustment for prudent valuation adjustments and specific and general provisions which have reduced Tier 1 capital (4,081)12 Other adjustments (73,807)13 Total exposure measure 1,151,214
1. Capital and leverage measures are calculated applying the transitional arrangements of the CRR as amended by CRR II.
Leverage
Barclays PLC 18

Table 11: LR2 - Leverage ratio common disclosureThis table shows the leverage ratio calculation and includes additional breakdowns for the leverage exposure measure.
As at 30 June 2022£m
On-balance sheet exposures (excluding derivatives and SFTs)1 On-balance sheet items (excluding derivatives, SFTs, but including collateral) 992,7333 Deductions of receivables assets for cash variation margin provided in derivatives transactions (26,464)6 Asset amounts deducted in determining tier 1 capital (leverage) (14,278)7 Total on-balance sheet exposures (excluding derivatives and SFTs) 951,991Derivative exposures8 Replacement cost associated with SA-CCR derivatives transactions (i.e. net of eligible cash variation margin) 65,2259 Add-on amounts for potential future exposure associated with SA-CCR derivatives transactions 101,00810 Exempted CCP leg of client-cleared trade exposures (SA-CCR) (51,501)11 Adjusted effective notional amount of written credit derivatives 737,32112 Adjusted effective notional offsets and add-on deductions for written credit derivatives (709,219)13 Total derivatives exposures 142,834Securities financing transaction (SFT) exposures14 Gross SFT assets (with no recognition of netting), after adjustment for sales accounting transactions 582,19815 Netted amounts of cash payables and cash receivables of gross SFT assets (388,631)16 Counterparty credit risk exposure for SFT assets 29,89918 Total securities financing transaction exposures 223,466Other off-balance sheet exposures 19 Off-balance sheet exposures at gross notional amount 415,10720 Adjustments for conversion to credit equivalent amounts (285,436)21 General provisions deducted in determining tier 1 capital (leverage) and specific provisions associated with off-
balance sheet exposures (2,271)22 Off-balance sheet exposures 127,400Capital and total exposure measure23 Tier 1 capital (leverage) 58,98824 Total exposure measure including claims on central banks 1,445,691UK-24a (-) Claims on central banks excluded (294,477)UK-24b Total exposure measure excluding claims on central banks 1,151,214Leverage ratio25 Leverage ratio excluding claims on central banks (%) 5.1% UK-25a Fully loaded ECL accounting model leverage ratio excluding claims on central banks (%) 5.1% UK-25b Leverage ratio excluding central bank reserves as if the temporary treatment of unrealised gains and losses
measured at fair value through other comprehensive income had not been applied (%) 5.1% UK-25c Leverage ratio including claims on central banks (%) 4.1% 26 Regulatory minimum leverage ratio requirement (%) 3.3% Additional leverage ratio disclosure requirements - leverage ratio buffers27 Leverage ratio buffer (%) 0.5% UK-27a Of which: G-SII or O-SII additional leverage ratio buffer (%) 0.5% UK-27b Of which: countercyclical leverage ratio buffer (%) 0.0%
Leverage
Barclays PLC 19
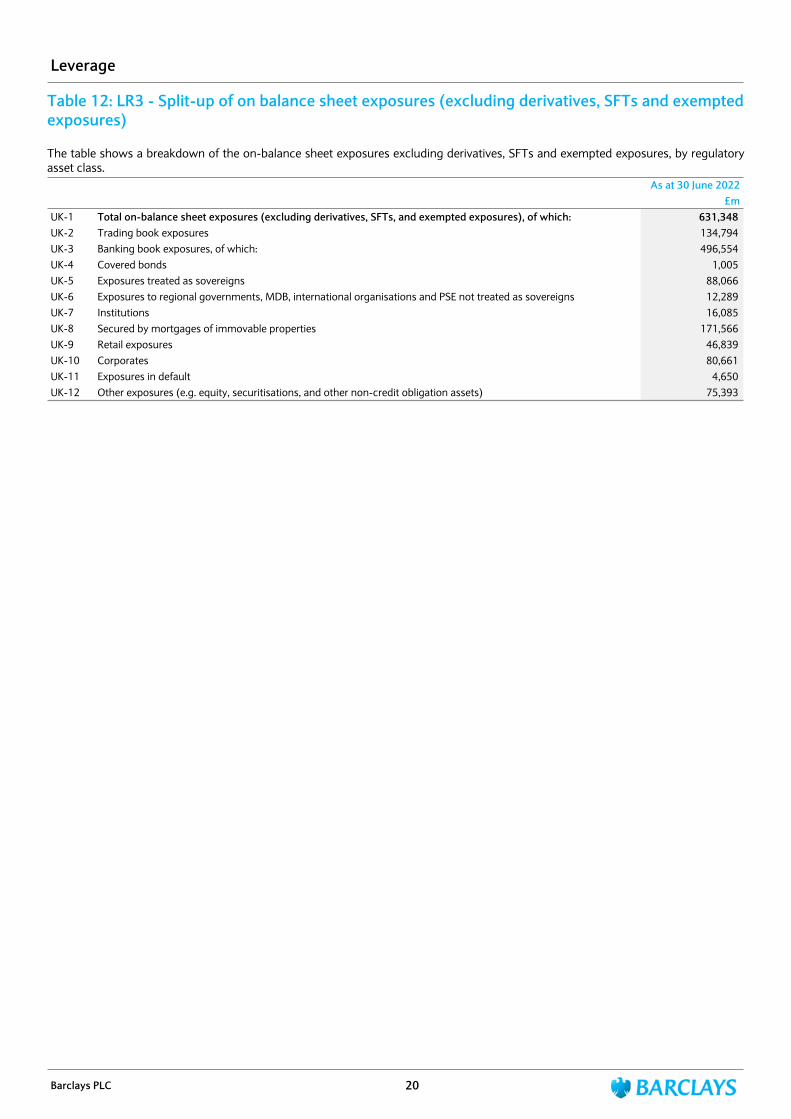
Table 12: LR3 - Split-up of on balance sheet exposures (excluding derivatives, SFTs and exempted exposures)
The table shows a breakdown of the on-balance sheet exposures excluding derivatives, SFTs and exempted exposures, by regulatory asset class.
As at 30 June 2022£m
UK-1 Total on-balance sheet exposures (excluding derivatives, SFTs, and exempted exposures), of which: 631,348 UK-2 Trading book exposures 134,794 UK-3 Banking book exposures, of which: 496,554 UK-4 Covered bonds 1,005 UK-5 Exposures treated as sovereigns 88,066 UK-6 Exposures to regional governments, MDB, international organisations and PSE not treated as sovereigns 12,289 UK-7 Institutions 16,085 UK-8 Secured by mortgages of immovable properties 171,566 UK-9 Retail exposures 46,839 UK-10 Corporates 80,661 UK-11 Exposures in default 4,650 UK-12 Other exposures (e.g. equity, securitisations, and other non-credit obligation assets) 75,393
Leverage
Barclays PLC 20

Table KM2 has been prepared in accordance with CRR as amended by CRR II, using the uniform format set out in the Basel Committee for Banking Supervision (BCBS) Standard on Pillar 3 disclosure requirements.
Table 13: KM2 - Key metrics - TLAC requirements (at resolution group level)1
This table shows the key metrics for the Group’s own funds and eligible liabilities.Restated3 Restated3 Restated3
As at 30.06.22
As at 31.03.22
As at 31.12.21
As at 30.09.21
As at 30.06.21
£m £m £m £m £m1 Total Loss Absorbing Capacity (TLAC) available1,2 106,480 102,486 109,771 108,936 108,9361a Fully loaded ECL accounting model TLAC available 105,871 101,923 108,871 108,028 108,0282 Total RWA at the level of the resolution group1 344,516 328,830 314,136 307,717 307,3653 TLAC as a percentage of RWA (row 1 / row 2) (%)1,2 30.9% 31.2% 34.9% 35.4% 35.4% 3a Fully loaded ECL accounting model TLAC as a percentage of fully loaded ECL
accounting model RWA (%) 30.8% 31.0% 34.7% 35.1% 35.2% 4 Leverage ratio exposure measure at the level of the resolution group4 1,151,214 1,123,531 1,356,191 1,368,259 1,368,2595 TLAC as a percentage of leverage ratio exposure measure (row 1 / row 4) (%)2,4 9.2% 9.1% 8.1% 8.0% 8.0% 5a Fully loaded ECL accounting model TLAC as a percentage of fully loaded ECL
accounting model Leverage exposure measure (%) 9.2% 9.1% 8.0% 7.9% 7.9% 6a Does the subordination exemption in the antepenultimate paragraph of Section 11
of the FSB TLAC Term Sheet apply? No No No No No6b Does the subordination exemption in the penultimate paragraph of Section 11 of
the FSB TLAC Term Sheet apply? No No No No No6c If the capped subordination exemption applies, the amount of funding issued that
ranks pari passu with Excluded Liabilities and that is recognised as external TLAC, divided by funding issued that ranks pari passu with Excluded Liabilities and that would be recognised as external TLAC if no cap was applied (%)
N/A N/A N/A N/A N/A
1. Own funds included in TLAC, and RWAs are calculated applying the IFRS9 transitional arrangements of the CRR as amended by CRR II. 2. Prior year comparatives include subsidiary issuances, which were no longer eligible from 1 January 2022.3. Capital and leverage metrics as at 31 December 2021, 30 September 2021and 30 June 2021 have been restated. More details are available on page 64. Prior year comparatives are based on fully loaded CRR leverage exposure which was no longer applicable to UK banks from 1January 2022.
As at 30 June 2022, Barclays PLC (the Parent company) held £106.5bn of own funds and eligible liabilities equating to 30.9% of RWAs. This was in excess of the Group's MREL requirement, excluding the confidential institution-specific PRA buffer, to hold £98.1bn of own funds and eligible liabilities equating to 28.5% of RWAs. The Group remains above its MREL regulatory requirements including the PRA buffer.
Minimum requirement for own funds and eligible liabilities (MREL)
Barclays PLC 21

Table 14: TLAC 1 - TLAC composition for G-SIBs (at resolution group level)This table shows the composition of the Group’s own funds and eligible liabilities and ratios.
As at 30.06.22Barclays Group £m
Regulatory capital elements of TLAC and adjustments1
1 Common Equity Tier 1 capital (CET1) 46,6912 Additional Tier 1 capital (AT1) before TLAC adjustment 12,2975 AT1 instruments eligible under the TLAC framework 12,2976 Tier 2 capital (T2) before TLAC adjustments 9,6327 Amortised portion of T2 instruments where remaining maturity > 1 year 9288 T2 capital ineligible as TLAC as issued out of subsidiaries to third parties (1,277)10 T2 instruments eligible under the TLAC framework 9,28311 TLAC arising from regulatory capital 68,271
Non-regulatory capital elements of TLAC 12 External TLAC instruments issued directly by the bank and subordinated to excluded liabilities 38,26717 TLAC arising from non-regulatory capital instruments before adjustments 38,267
Non-regulatory capital elements of TLAC: adjustments18 TLAC before deductions 106,53820 Deduction of investments in own other TLAC liabilities (58)22 TLAC after deductions 106,480
Risk-weighted assets and leverage exposure measure for TLAC purposes23 Total risk-weighted assets adjusted as permitted under the TLAC regime1 344,51624 Leverage exposure measure2 1,151,214
TLAC ratios and buffers25 TLAC (as a percentage of risk-weighted assets adjusted as permitted under the TLAC regime) 30.9% 26 TLAC (as a percentage of leverage exposure)2 9.2%
27CET1 (as a percentage of risk-weighted assets) available after meeting the resolution group’s minimumcapital and TLAC requirements 9.1%
28Institution-specific buffer requirement (capital conservation buffer plus countercyclical buffer requirements plus higher loss absorbency requirement, expressed as a percentage of risk-weighted assets) 4.0%
29 Of which: capital conservation buffer requirement 2.5% 30 Of which: bank specific countercyclical buffer requirement 0.0% 31 Of which: higher loss absorbency requirement 1.5%
1. Own funds included in TLAC, and RWAs are calculated applying the transitional arrangements of the CRR as amended by CRR II. This includes IFRS 9 transitional arrangements and the grandfathering of CRR II non-compliant capital instruments.
2. Fully loaded CRR leverage exposure is calculated without applying the transitional arrangements of the CRR as amended by CRR II.
Minimum requirement for own funds and eligible liabilities (MREL)
Barclays PLC 22

Table 15: TLAC 3 - Resolution entity - creditor ranking at legal entity levelThis table shows the nominal values of Barclays PLC’s (the parent company) capital and liabilities and the position in the creditor hierarchy.
Barclays PLC (the Parent company)Creditor ranking
1 2 3 4Most junior Most senior Total
As at 30.06.2022 £m £m £m £m £m1 Description of creditor ranking Ordinary
SharesPerpetual
Deeply Subordinated
Contingent Convertible
Debt
Dated Subordinated
Debt
Unsecured and Unsub-ordinated Debt, and other pari
passu liabilities
2 Total capital and liabilities net of credit risk mitigation 4,133 12,425 10,010 42,184 68,752 3 Subset of row 2 that are excluded liabilities — — — 1,152 1,152 4 Total capital and liabilities less excluded liabilities 4,133 12,425 10,010 41,032 67,600 5 Subset of row 4 that are potentially eligible as TLAC 4,133 12,425 10,010 40,792 67,360 6 Subset of row 5 with 1 year ≤ residual maturity < 2 years — — — 7,092 7,092 7 Subset of row 5 with 2 years ≤ residual maturity < 5 years — — 2,716 16,936 19,652 8 Subset of row 5 with 5 years ≤ residual maturity < 10
years — — 5,648 9,757 15,404 9 Subset of row 5 with residual maturity ≥ 10 years, but
excluding perpetual securities — — 1,646 7,007 8,653 10 Subset of row 5 that is perpetual
securities 4,133 12,425 — — 16,558
Minimum requirement for own funds and eligible liabilities (MREL)
Barclays PLC 23

Table 16: TLAC2 - Material subgroup entity - creditor ranking at legal entity levelThis table shows the nominal values of Barclays Bank PLC’s capital and liabilities and the position in the creditor hierarchy.Barclays Bank PLC
Creditor ranking1 2 3 4
Most junior Most senior TotalAs at 30.06.2022 £m £m £m £m £m1 Is the resolution entity the creditor/investor? Yes Yes Yes Yes2 Description of creditor ranking
Ordinary Shares
Perpetual Deeply
Subordinated Contingent Convertible
Debt
Dated Subordinated
Debt
Dated secondary
non-preferential
debt3 Total capital and liabilities net of credit risk mitigation 2,343 9,850 8,357 23,709 44,259 4 Subset of row 3 that are excluded liabilities — — — — — 5 Total capital and liabilities less excluded liabilities 2,343 9,850 8,357 23,709 44,259 6 Subset of row 5 that are eligible as TLAC 2,343 9,850 8,357 23,468 44,018 7 Subset of row 6 with 1 year ≤ residual maturity < 2 years — — — 5,445 5,445 8 Subset of row 6 with 2 years ≤ residual maturity < 5 years — — 1,125 8,878 10,003 9 Subset of row 6 with 5 years ≤ residual maturity < 10 years — — 4,325 5,418 9,743 10 Subset of row 6 with residual maturity ≥ 10 years, but
excluding perpetual securities — — 2,907 3,827 6,634 11 Subset of row 6 that is perpetual securities 2,343 9,850 — — 12,193
Table 17: TLAC2 - Material subgroup entity - creditor ranking at legal entity levelThis table shows the nominal values of Barclays Bank UK PLC Group’s capital and liabilities and the position in the creditor hierarchy.Barclays Bank UK PLC Group
Creditor ranking1 2 3 4
Most junior Most senior TotalAs at 30.06.2022 £m £m £m £m £m1 Is the resolution entity the creditor/investor? Yes Yes Yes Yes 2 Description of creditor ranking
Ordinary Shares
Perpetual Deeply
Subordinated Contingent Convertible
Debt
Dated Subordinated
Debt
Dated secondary
non-preferential
debt 3 Total capital and liabilities net of credit risk mitigation 5 2,575 3,737 4,867 11,185 4 Subset of row 3 that are excluded liabilities — — — — — 5 Total capital and liabilities less excluded liabilities 5 2,575 3,737 4,867 11,185 6 Subset of row 5 that are eligible as TLAC 5 2,575 3,737 4,867 11,185 7 Subset of row 6 with 1 year ≤ residual maturity < 2 years — — — 430 430 8 Subset of row 6 with 2 years ≤ residual maturity < 5 years — — 1,591 3,293 4,885 9 Subset of row 6 with 5 years ≤ residual maturity < 10 years — — 1,323 823 2,146 10 Subset of row 6 with residual maturity ≥ 10 years, but
excluding perpetual securities — — 823 321 1,144 11 Subset of row 6 that is perpetual securities 5 2,575 — — 2,580
Minimum requirement for own funds and eligible liabilities (MREL)
Barclays PLC 24

Table 18: LIQ1 - Liquidity coverage ratioThis table shows the level and components of the Liquidity Coverage Ratio.Liquidity coverage ratio (period end) Total period end value
30.06.22 31.03.22 31.12.21 30.09.21Barclays Group £m £m £m £mLiquidity buffer 331,096 310,291 285,272 283,628Total net cash outflows 211,911 194,920 169,342 176,308Liquidity coverage ratio (%) (period end) 156% 159% 168% 161%
Liquidity coverage ratio (average)Total unweighted value (average) Total weighted value (average)
UK1a 30.06.22 31.03.22 31.12.21 30.09.21 30.06.22 31.03.22 31.12.21 30.09.21
UK1b Number of data points used in calculation of averages1 12 12 12 12 12 12 12 12
High-quality liquid assets £m £m £m £m £m £m £m £m
1 Total high-quality liquid assets (HQLA) 308,489 300,538 293,556 291,764Cash outflows2 Retail deposits and deposits from small business
customers, of which: 264,959 262,267 258,737 254,402 23,085 22,569 22,047 21,5223 Stable deposits 140,387 140,312 139,457 137,608 7,019 7,016 6,973 6,8804 Less stable deposits 118,259 114,334 110,798 108,014 16,026 15,519 15,048 14,6355 Unsecured wholesale funding, of which: 249,032 238,591 230,221 225,365 127,466 119,836 114,848 113,9036 Operational deposits (all counterparties) and deposits in
networks of cooperative banks 63,328 61,133 58,777 56,278 15,507 14,956 14,373 13,7587 Non-operational deposits (all counterparties)2 174,668 167,796 162,363 160,393 100,923 95,217 91,685 91,4518 Unsecured debt 11,036 9,662 9,081 8,694 11,036 9,662 8,790 8,6949 Secured wholesale funding 57,555 57,348 56,779 57,56110 Additional requirements, of which: 182,422 183,697 185,531 185,859 50,313 51,619 54,548 55,30411 Outflows related to derivative exposures and other
collateral requirements 18,968 19,623 21,030 21,326 16,414 17,144 18,604 18,95912 Outflows related to loss of funding on debt products 6,316 7,883 10,105 10,670 6,316 7,883 10,105 10,67013 Credit and liquidity facilities 157,137 156,191 154,396 153,863 27,582 26,591 25,839 25,67514 Other contractual funding obligations 5,226 3,839 3,010 3,018 4,669 3,403 2,628 2,55715 Other contingent funding obligations 154,562 147,039 151,612 152,326 6,243 5,957 6,136 6,23316 Total cash outflows 269,331 260,731 256,986 257,080Cash inflows17 Secured lending (e.g. reverse repos) 568,552 548,009 531,068 523,471 56,564 55,097 55,088 55,43418 Inflows from fully performing exposures 12,070 11,872 12,179 13,562 7,622 7,367 7,694 9,32619 Other cash inflows3 13,100 13,687 14,184 14,097 8,786 9,788 10,548 10,457UK-19a (Difference between total weighted inflows and total
weighted outflows arising from transactions in third countries where there are transfer restrictions or which are denominated in non-convertible currencies) — — — —
UK-19b (Excess inflows from a related specialised credit institution) — — — —
20 Total cash inflows 593,722 573,567 557,431 551,130 72,972 72,251 73,330 75,217UK-20a Fully exempt inflows — — — — — — — —UK-20b Inflows subject to 90% cap — — — — — — — —UK-20c Inflows subject to 75% cap 479,472 461,221 448,286 443,670 72,972 72,251 73,330 75,217UK-21 Liquidity buffer 308,489 300,538 293,556 291,76422 Total net cash outflows 196,359 188,480 183,656 181,86323 Liquidity coverage ratio (%) (average) 157% 159% 160% 160%
1. Trailing average of 12 month-end observations to the reporting date.2. Non-operational deposits in row 7 also includes excess operational deposits as defined in the PRA Rulebook (Liquidity Coverage Ratio - CRR) Article 27(4)3. Difference between total weighted inflows and total weighted outflows arising from transactions in third countries where there is transfer restrictions or which are
denominated in non-convertible currencies.
As at 30 June 2022, the LCR was 156% (December 2021: 168%), equivalent to a surplus of £119bn (December 2021: £116bn) above the 100% regulatory requirement. The trailing 12 month-end average LCR to 30 June 2022 was 157% (December 2021: 160%).
Liquidity
Barclays PLC 25

Net interest income sensitivity
The table below shows the impact on the Bank’s economic value of equity (EVE) and net interest income (NII) from the six standardised interest rate shock scenarios defined by the Bank of England, in the PRA Rulebook: CRR Firms: Interest rate risk arising from non trading activities instrument 2020. These sensitivities are calculated in line with the PRA Rulebook, in particular with the exclusion of equity from EVE cash flows.
Table 19: Quantitative information on IRRBB1
In reporting currency ∆EVE ∆NII Tier 1 capital Period 30.06.22 30.06.22 30.06.22
£m £m £m10 Parallel shock up (3,953) 579 20 Parallel shock down 1,233 (1,633) 30 Steepener shock (853) 40 Flattener shock (682) 50 Short rates shock up (1,975) 60 Short rates shock down 473 70 Maximum (3,953) (1,633) 80 Tier 1 capital 58,988
1. No comparatives are provided as this reflects revised disclosure requirements from 1 January 2022.
The maximum EVE loss under the six scenarios was £3,953m under the parallel up scenario as of June 2022.
The material driver of the parallel up scenario is the sensitivity of the Bank’s structural hedging of its equity position and the fixed rate positions in the liquidity pool to rates rising.
The maximum one-year loss in NII was £1,633m as of June 2022. The material driver of the parallel down scenario is the Bank’s exposure to margin compression risk through deposits across the Retail, Corporate and Private Bank.
Interest rate risk in the banking book
Barclays PLC 26

Table 20: CR4 Standardised – Credit risk exposure and CRM effectsThis table shows the impact of CRM and credit conversion factors (CCF) on exposure values, broken down by regulatory exposure class. This table includes exposures subject to the standardised approach only.
The term ‘before CCF and CRM’ means the original gross exposures before the application of credit conversion factor and before the application of risk mitigation techniques.
As at 30 June 2022
Exposures before CCF and CRM
Exposures post CCF and CRM
RWA and RWA density
On-balance
sheet amount
Off-balance
sheet amount
On-balance
sheet amount
Off-balance
sheet amount RWA
RWA density
£m £m £m £m £m £m1 Central governments or central banks 293,319 39,883 303,242 50,359 77 0% 2 Regional governments or local authorities 7,226 242 7,045 25 1,115 16% 3 Public sector entities 7,267 505 7,293 210 179 2% 4 Multilateral development banks 4,821 — 4,821 — — 0% 5 International organisations 417 — 417 — — 0% 6 Institutions 5,693 1,951 5,498 882 1,837 29% 7 Corporates 32,076 39,443 21,785 10,310 29,509 92% 8 Retail 34,347 107,600 27,738 19 20,719 75% 9 Secured by mortgages on immovable property 10,347 361 10,277 125 3,915 38% 10 Exposures in default 2,866 941 1,397 394 2,199 123% 11 Exposures associated with particularly high risk 4,614 13,312 4,614 2 8,109 176% 12 Covered bonds 384 — 384 — 38 10% 13 Institutions and corporates with a short-term credit assessment — — — — — — 14 Collective investment undertakings — — — — — — 15 Equity 132 — 132 — 330 250% 16 Other items 3,809 — 3,809 — 1,799 47% 17 Total 407,318 204,238 398,452 62,326 69,826 15%
As at 31 December 20211 Central governments or central banks 217,964 33,971 229,353 42,332 61 0% 2 Regional governments or local authorities 9,151 266 9,006 26 1,501 17% 3 Public sector entities 5,617 257 5,619 130 190 3% 4 Multilateral development banks 5,314 — 5,314 — — 0% 5 International organisations 558 — 558 — — 0% 6 Institutions 4,505 1,582 4,280 825 1,526 30% 7 Corporates 27,029 38,927 17,440 10,346 25,446 92% 8 Retail 30,645 76,369 22,545 35 16,855 75% 9 Secured by mortgages on immovable property 9,430 102 9,382 51 3,548 38% 10 Exposures in default 2,329 516 1,104 201 1,515 116% 11 Exposures associated with particularly high risk1 1,957 10,170 1,957 2 2,938 150% 12 Covered bonds 1,110 — 1,110 — 115 10% 13 Institutions and corporates with a short-term credit assessment — — — — — — 14 Collective investment undertakings — — — — — — 15 Equity 851 — 851 — 2,127 250% 16 Other items 4,217 — 4,217 — 2,186 51% 17 Total 320,677 162,160 312,736 53,948 58,008 16%
1. Prior period number has been updated to reflect the impact of Over-issuance of securities. More details are available on page 6.
Standardised RWAs increased by £11.8bn to £69.8bn primarily driven by:• Corporate RWAs increased by £4.1bn to £29.5bn primarily due to lending activities within CIB and an increase in FX primarily due to
appreciation of period end USD against GBP• Retail RWAs increased by £3.9bn to £20.7bn driven by the higher CC&P balances mainly due to GAP acquisition and an increase in FX
primarily due to appreciation of period end USD against GBP• Exposures associated with particularly high risk RWAs increased by £5.2bn to £8.1bn due to temporary increase in RWAs reflecting the
hedging arrangements designed to manage the risk of the rescission offer relating to the Over-issuance of securities, which are expected to reverse after the rescission offer has been completed in Q322
• Equity RWAs decreased by £1.8bn to £0.3bn primarily driven by partial disposal of Barclays' equity stake in Absa in April 2022
Analysis of credit risk
Barclays PLC 27

Table 21: CR5 – Standardised approachThis table shows exposure at default post-CCF and CRM, broken down by Credit Exposure Class and risk weight. This table includes exposures subject to the standardised approach only.
Risk weightTotal
Of which unratedAs at 30 June 2022 0% 2% 4% 10% 20% 35% 50% 70% 75% 100% 150% 250% 370% 1250% Others
1 Central governments or central banks
353,525 — — — — — — — — 76 — — — — — 353,601 502
2 Regional government or local authorities
1,494 — — — 5,576 — — — — — — — — — — 7,070 5,217
3 Public sector entities 6,609 — — — 893 — 1 — — — — — — — — 7,503 8594 Multilateral development
banks4,821 — — — — — — — — — — — — — — 4,821 —
5 International organisations 417 — — — — — — — — — — — — — — 417 —6 Institutions — — — — 5,283 — 637 — — 460 — — — — — 6,380 7817 Corporates — — — — 2,150 — 1,797 — — 27,618 525 — — 5 — 32,095 26,1308 Retail — — — — — — — — 27,757 — — — — — — 27,757 27,7579 Secured by mortgages on
immovable property— — — — — 9,946 — — 18 438 — — — — — 10,402 10,402
10 Exposures in default — — — — — — — — — 975 816 — — — — 1,791 1,79111 Exposures associated with
particularly high risk— — — — — — — — — — 4,508 — — 108 — 4,616 4,616
12 Covered bonds — — — 384 — — — — — — — — — — — 384 —13 Institutions and corporates
with a short-term credit assessment
— — — — — — — — — — — — — — — — —
14 Unit or shares in collective investment undertakings
— — — — — — — — — — — — — — — — —
15 Equity — — — — — — — — — — — 132 — — — 132 13216 Other items 1,198 — — — 1,013 — — — — 1,598 — — — — — 3,809 3,80917 TOTAL 368,064 — — 384 14,915 9,946 2,435 — 27,775 31,165 5,849 132 — 113 — 460,778 81,996
Analysis of credit risk
Barclays PLC 28

Table 22: CR5 – Standardised approach - continuedRisk weight
TotalOf which unratedAs at 31 December 2021 0 % 2 % 4 % 10 % 20 % 35 % 50 % 70 % 75 % 100 % 150 % 250 % 370 % 1250 % Others
1 Central governments or central banks 271,623 — — — — — — — — 62 — — — — — 271,685 484
2 Regional government or local authorities 1,526 — — — 7,506 — — — — — — — — — — 9,032 7,200
3 Public sector entities 4,804 — — — 944 — — — — 1 — — — — — 5,749 9204 Multilateral development
banks 5,314 — — — — — — — — — — — — — — 5,314 —5 International organisations 558 — — — — — — — — — — — — — — 558 —6 Institutions — — — — 4,116 — 611 — — 376 — — — 2 — 5,105 8167 Corporates — — — — 1,767 — 1,819 — — 23,782 415 — — 3 — 27,786 22,6398 Retail — — — — — — — — 22,580 — — — — — — 22,580 22,5809 Secured by mortgages on
immovable property — — — — — 9,020 — — 20 393 — — — — — 9,433 9,43310 Exposures in default — — — — — — — — — 884 421 — — — — 1,305 1,30511 Exposures associated with
particularly high risk — — — — — — — — — — 1,959 — — — — 1,959 1,95912 Covered bonds — — — 1,071 39 — — — — — — — — — — 1,110 —13 Institutions and corporates
with a short-term credit assessment — — — — — — — — — — — — — — — — —
14 Unit or shares in collective investment undertakings — — — — — — — — — — — — — — — — —
15 Equity — — — — — — — — — — — 851 — — — 851 85116 Other items 1,388 — — — 824 — — — — 2,005 — — — — — 4,217 4,21717 TOTAL 285,213 — — 1,071 15,196 9,020 2,430 — 22,600 27,503 2,795 851 — 5 — 366,684 72,404
Standardised RWAs increased £94.1bn to £460.8bn primarily driven by:• Central Government and Central Bank primarily due to an increase in the Group liquidity pool within the 0% risk weight category• Retail increase in IEL balances within the 75% risk weight category driven by GAP acquisition and an increase in FX primarily due to appreciation of period end USD against GBP• Corporate increase due to lending activities within CIB and an increase in FX primarily due to appreciation of period end USD against GBP
Analysis of credit risk
Barclays PLC 29

Table 23: CR7 – IRB approach – Effect on the RWEAs of credit derivatives used as CRM techniquesThis table shows the effect of credit derivatives on the AIRB credit risk approach and will not directly reconcile to the CR AIRB RWAs in table 5.
Pre-credit derivatives risk weighted exposure amount Actual risk weighted exposure amount
As at 30 June As at 31 December As at 30 June As at 31 December2022 2021 2022 2021
£m £m £m £m5 Exposures under AIRB 105,724 100,268 105,710 100,244 6 Central governments and central banks 3,958 4,569 3,958 4,569 7 Institutions 5,700 3,941 5,700 3,941 8 Corporates1 48,988 45,867 48,974 45,843 8.1 of Corporates - which SMEs 8,662 8,310 8,662 8,310 9 Retail 47,078 45,891 47,078 45,891
9.1of which Retail – SMEs - Secured by immovable property collateral — — — —
9.2of which Retail – non-SMEs - Secured by immovable property collateral 25,931 26,725 25,931 26,725
9.3 of which Retail – Qualifying revolving 14,164 12,353 14,164 12,353 9.4 of which Retail – SMEs - Other 3,220 3,176 3,220 3,176 9.5 of which Retail – Non-SMEs - Other 3,763 3,637 3,763 3,637 10 TOTAL 105,724 100,268 105,710 100,244
1. Corporate specialised lending exposures under the slotting approach is excluded from this table and disclosed separately in CR10.
Advanced credit risk RWAs increased by £5.5bn to £105.7bn primarily driven by the regulatory changes that took effect from 1 January 2022 relating to implementation of IRB roadmap changes, CIB lending activity and an increase in FX primarily due to appreciation of period end USD against GBP. This was partially offset by a benefit in mortgages from an increase in the HPI.
Analysis of credit risk
Barclays PLC 30

Table 24: CR7-A – IRB approach – Disclosure of the extent of the use of CRM techniques1
This table shows the extent of the use of CRM techniques broken down by exposure classes under the IRB approach. The exposure classes capture both secured and unsecured balances, resulting in the CRM coverage percentages being calculated on an aggregate basis.
AIRB Total exposures
Credit risk Mitigation techniquesCredit risk Mitigation
methods in the calculation of RWEAs
Funded credit Protection (FCP) Unfunded credit Protection (UFCP)
RWEA post all CRM
assigned to the obligor exposure
class
RWEA with substitution
effects
Part of exposures covered by
Other eligible
collaterals
Part of exposures covered by
Other funded credit
protection
Part of exposures covered by Guarantees
Part of exposures covered by
Credit Derivatives
Part of exposures covered by Financial
Collaterals
Part of exposures covered by Immovable
property Collaterals
Part of exposures covered by Receivables
Part of exposures covered by
Other physical collateral
Part of exposures covered by
Cash on deposit
Part of exposures covered by
Life insurance
policies
Part of exposures covered by
Instruments held by a
third party
As at 30 June 2022 £m % % % % % % % % % % % £m £m1 Central governments and central banks 76,550 0.19% — — — — — — — — — — 3,958 3,9582 Institutions 21,623 0.70% 0.98% 0.41% — 0.57% — — — — 4.06% — 5,700 5,7003 Corporates 89,679 6.61% 18.84% 15.34% 0.56% 2.94% — — — — 4.20% 0.13% 48,974 48,9743.1 Of which Corporates – SMEs 12,878 9.13% 64.05% 61.84% 1.86% 0.35% — — — — 1.01% — 8,662 8,662
3.2 Of which Corporates – Specialised lending — — — — — — — — — — — — — —
3.3 Of which Corporates – Other 76,801 6.19% 11.26% 7.54% 0.35% 3.37% — — — — 4.74% 0.15% 40,312 40,3124 Retail 216,386 — 218.34% 218.34% — — — — — — 1.23% — 47,078 47,078
4.1 Of which Retail – Immovable property SMEs — — — — — — — — — — — — — —
4.2 Of which Retail – Immovable property non-SMEs 171,670 — 272.96% 272.96% — — — — — — 1.54% — 25,931 25,931
4.3 Of which Retail – Qualifying revolving 32,882 — — — — — — — — — — — 14,164 14,1644.4 Of which Retail – Other SMEs 7,673 0.02% 50.50% 50.37% — 0.13% — — — — 0.43% — 3,220 3,2204.5 Of which Retail – Other non-SMEs 4,161 — — — — — — — — — — — 3,763 3,7635 Total 404,238 1.54 % 121.11 % 120.30 % 0.13 % 0.68 % — — — — 1.81 % 0.03 % 105,710 105,710
1. No comparatives are provided as this is a new disclosure requirement from 1 January 2022.
Analysis of credit risk
Barclays PLC 31

AIRB obligor grade disclosure
The following tables show credit risk exposure at default post-CRM for the advanced IRB approach for portfolios within the banking book. Separate tables are provided for the following credit exposure classes: central governments and central banks (table 27), institutions (table 28), corporates - Other (table 29), corporates SMEs (table 30), retail SME (table 31), secured retail (table 32), revolving retail (table 33) and other retail (table 34).
Barclays’ Model Risk Management group reviews and approves the application of post model adjustments to models that do not fully reflect the risk of the underlying exposures.
Table 25: CR6 – IRB approach - Total Portfolios
On-balance
sheet exposur
es
Off-balance-
sheet exposur
es pre-CCF
Exposure
weighted
average CCF1
Exposure post
CCF and post CRM
Exposure
weighted
average PD
Number of obligors
Exposure
weighted
average LGD
Exposure
weighted
average maturity
(years)
Risk weighte
d exposur
e amount
after supporti
ng factors
Density of risk
weighted
exposure
amount
Expected loss
amount
Value adjust-ments
and provisio
nsAs at 30 June 2022 £m £m % £m % % £m % £m £m
Total (all exposure classes)
320,518 160,106 51.7% 397,837 24,903,867 2 105,710 26.6% 2,866 (3,143)
As at 31 December 2021
Total (all exposure classes)
335,379 150,754 45.8% 408,256 24,812,706 2 100,244 24.6% 2,732 (3,278)
1. Current period average CCF is calculated on a weighted average basis in line with revised disclosure requirements that took effect from 1 January 2022 and also reflects where the modelled EAD is higher than the on and off balance sheet exposures pre CCF. For prior period, the average CCF was calculated on an aggregate level.
Further information on the key drivers for the RWA density are provided in table 27 - table 34
Analysis of credit risk
Barclays PLC 32

Table 26: CR6 – IRB approach – Credit risk exposures by exposure class and PD range for central governments and central banks
PD rangeOn-
balance sheet
exposures
Off-balance-
sheet exposures pre-CCF
Exposure
weighted
average CCF1
Exposure post
CCF and post CRM
Exposure
weighted
average PD
Number of
obligors
Exposure
weighted
average LGD
Exposure
weighted
average maturity
(years)
Risk weighte
d exposur
e amount
after supporti
ng factors
Density of risk
weighted
exposure
amount
Expected loss
amount
Value adjustme
nts and provision
sAs at 30 June 2022 £m £m % £m % % £m % £m £m
0.00 to <0.15 75,662 97 60.0% 75,534 0.0% 31 45.0% 2 3,390 4.5% 2 0
0.00 to <0.10 75,662 97 60.0% 75,534 0.0% 31 45.0% 2 3,390 4.5% 2 0
0.10 to <0.15 — — — — — — — — — — — —
0.15 to <0.25 39 — — 39 0.2% 3 47.0% 1 15 37.6% 0 —
0.25 to <0.50 823 — — 823 0.3% 2 45.0% 3 544 66.1% 1 (2)
0.50 to <0.75 9 — — 9 0.6% 1 45.0% 3 9 95.9% 0 0
0.75 to <2.50 — — — — — — — — — — — —
0.75 to <1.75 — — — — — — — — — — — —
1.75 to <2.5 — — — — — — — — — — — —
2.50 to <10.00 — — — — — — — — — — — —
2.5 to <5 — — — — — — — — — — — —
5 to <10 — — — — — — — — — — — —
10.00 to <100.00 0 — — 0 15.0% 1 63.0% 1 0 335.8% 0 —
10 to <20 0 — — 0 15.0% 1 63.0% 1 0 335.8% 0 —
20 to <30 — — — — — — — — — — — —
30.00 to <100.00 — — — — — — — — — — — —
100.00 (Default) — — — — — — — — — — — —
Subtotal (exposure class)
76,533 97 60.0% 76,405 0.0% 38 45.0% 2 3,958 5.2% 3 (2)
As at 31 December 2021
0.00 to < 0.15 94,463 97 18.5% 94,391 0.0% 33 45.0% 2 4,172 4.4% 4 0.15 to < 0.25 4 — — 4 0.2% 4 48.1% 1 1 35.2% 0 0.25 to < 0.50 592 — — 592 0.4% 3 45.0% 2 396 66.8% 1 0.50 to < 0.75 — — — — — — — — — — — 0.75 to < 2.50 — — — — — — — — — — — 2.50 to < 10.00 — — — — — — — — — — — 10.00 to < 100.00 — — — — 12.1% 1 63.0% 1 — 300.8% 0 100.00 (Default) — — — — — — — — — — — Subtotal (exposure class) 95,059 97 18.5% 94,987 0.0% 41 45.0% 2 4,569 4.8% 5 (0)
1. Current period average CCF is calculated on a weighted average basis in line with revised disclosure requirements that took effect from 1 January 2022 and also reflects where the modelled EAD is higher than the on and off balance sheet exposures pre CCF. For prior period, the average CCF was calculated on an aggregate level.
The RWA density associated with central governments and central banks remained broadly stable at 5.2% (December 2021: 4.8%).
Analysis of credit risk
Barclays PLC 33

Table 27: CR6 – IRB approach – Credit risk exposures by exposure class and PD range for institutions
PD rangeOn-
balance sheet
exposures
Off-balance-
sheet exposur
es pre-CCF
Exposure
weighted
average CCF1
Exposure post
CCF and post CRM
Exposure
weighted
average PD
Number of
obligors
Exposure
weighted
average LGD
Exposure
weighted
average maturity
(years)
Risk weighte
d exposur
e amount
after supporti
ng factors
Density of risk
weighted
exposure
amount
Expected loss
amount
Value adjust-ments
and provisio
nsAs at 30 June 2022 £m £m % £m % % £m % £m £m0.00 to <0.15 12,993 9,403 50.0% 17,633 0.0% 459 42.4% 2 3,381 19.2% 3 0
0.00 to <0.10 12,914 9,392 49.9% 17,544 0.0% 426 42.4% 2 3,346 19.1% 3 00.10 to <0.15 79 11 92.3% 89 0.1% 33 53.7% 1 35 39.0% 0 0
0.15 to <0.25 2,621 305 46.1% 2,762 0.2% 39 32.6% 2 993 36.0% 2 00.25 to <0.50 54 76 53.0% 94 0.3% 46 49.9% 2 73 77.4% 0 00.50 to <0.75 31 91 77.8% 102 0.6% 48 37.7% 1 78 76.2% 0 00.75 to <2.50 77 148 48.0% 148 1.5% 273 50.4% 3 158 107.0% 1 0
0.75 to <1.75 64 91 48.9% 108 1.1% 201 34.2% 2 86 79.3% 0 01.75 to <2.5 13 57 46.6% 40 2.5% 72 94.7% 5 72 182.5% 1 0
2.50 to <10.00 476 330 60.6% 676 4.6% 146 40.6% 2 952 140.9% 10 -32.5 to <5 386 72 56.6% 427 3.0% 101 51.5% 2 723 169.4% 7 -15 to <10 90 258 61.8% 249 7.2% 45 22.0% 2 229 92.0% 3 -2
10.00 to <100.00 14 72 70.5% 65 20.8% 21 13.5% 2 53 80.7% 2 -110 to <20 1 23 45.5% 12 13.9% 13 32.7% 2 21 179.8% 1 020 to <30 13 49 82.3% 53 22.3% 3 9.2% 1 30 56.1% 1 -130.00 to <100.00 — — 47.3% 0 35.2% 5 40.9% 2 2 970.5% 0 0
100.00 (Default) 9 2 18.4% 10 100.0% 10 11.6% 2 12 125.9% 0 0Subtotal (exposure class)
16,275 10,427 51.1% 21,490 0.3% 1,042 41.1% 2 5,700 26.5% 18 (4)
As at 31 December 20210.00 to < 0.15 11,669 7,431 49.6% 15,312 0.0% 484 38.5% 3 2,854 18.6% 3 0.15 to < 0.25 1,141 62 70.1% 1,184 0.2% 54 15.5% 2 208 17.6% 0 0.25 to < 0.50 79 161 55.6% 169 0.3% 62 56.4% 2 149 88.2% 0 0.50 to < 0.75 32 62 83.3% 83 0.6% 63 34.1% 1 50 60.0% 0 0.75 to < 2.50 76 83 51.6% 118 1.7% 275 40.7% 3 131 111.2% 1 2.50 to < 10.00 184 188 52.5% 282 4.0% 139 48.2% 2 469 166.2% 5 10.00 to < 100.00 18 63 71.1% 63 20.2% 15 19.1% 2 70 110.5% 2 100.00 (Default) 8 14 0.3% 8 100.0% 12 11.3% 2 10 121.8% 0 Subtotal (exposure class) 13,207 8,064 50.3% 17,219 0.3% 1,104 37.2% 3 3,941 22.9% 11 (4)
1. Current period average CCF is calculated on a weighted average basis in line with revised disclosure requirements that took effect from 1 January 2022 and also reflects where the modelled EAD is higher than the on and off balance sheet exposures pre CCF. For prior period, the average CCF was calculated on an aggregate level.
The RWA density associated with institutions increased 3.6% to 26.5% primarily due to an increase in lending within lower PD bands.
Analysis of credit risk
Barclays PLC 34

Table 28: CR6 – IRB approach – Credit risk exposures by exposure class and PD range for corporates - other
PD rangeOn-
balance sheet
exposures
Off-balance-
sheet exposur
es pre-CCF
Exposure
weighted
average CCF1
Exposure post
CCF and post CRM
Exposure
weighted
average PD
Number of
obligors
Exposure
weighted
average LGD
Exposure
weighted
average maturity
(years)
Risk weighte
d exposur
e amount
after supporti
ng factors
Density of risk
weighted
exposure
amount
Expected loss
amount
Value adjust-ments
and provisio
nsAs at 30 June 2022 £m £m % £m % % £m % £m £m0.00 to <0.15 13,528 50,468 48.8% 37,006 0.1% 1,864 39.6% 3 9,674 26.1% 11 (7)
0.00 to <0.10 11,495 43,009 48.7% 31,506 0.1% 1,449 39.7% 3 7,637 24.2% 7 (5) 0.10 to <0.15 2,033 7,459 49.6% 5,500 0.1% 415 39.5% 3 2,037 37.0% 4 (2)
0.15 to <0.25 3,111 7,081 54.6% 6,411 0.2% 519 38.4% 3 2,822 44.0% 5 (5) 0.25 to <0.50 5,640 8,017 57.4% 9,503 0.4% 823 39.6% 3 6,017 63.3% 14 (23) 0.50 to <0.75 971 1,791 53.4% 1,795 0.6% 845 34.4% 2 1,262 70.3% 4 (7) 0.75 to <2.50 3,012 7,427 44.9% 5,942 1.5% 3,242 30.8% 3 5,081 85.5% 27 (47)
0.75 to <1.75 2,038 5,282 42.7% 4,019 1.2% 2,328 31.8% 3 3,298 82.1% 15 (26) 1.75 to <2.5 974 2,145 50.5% 1,923 2.0% 914 28.9% 3 1,783 92.7% 12 (21)
2.50 to <10.00 4,233 7,493 52.5% 7,268 5.2% 3,384 29.3% 3 8,775 120.7% 106 (158) 2.5 to <5 1,767 3,790 55.6% 3,722 3.6% 2,510 30.4% 3 4,189 112.6% 40 (56) 5 to <10 2,466 3,703 49.2% 3,546 6.8% 874 28.1% 3 4,586 129.3% 66 (102)
10.00 to <100.00 1,156 4,664 52.4% 3,580 16.6% 735 28.4% 3 6,064 169.4% 172 (306) 10 to <20 927 4,393 52.4% 3,216 15.3% 494 27.2% 3 5,102 158.6% 129 (219) 20 to <30 119 186 53.1% 218 23.6% 163 27.8% 2 406 186.7% 14 (63) 30.00 to <100.00 110 85 51.7% 146 35.9% 78 55.3% 3 556 380.4% 29 (24)
100.00 (Default) 342 193 59.2% 434 100.0% 276 39.7% 2 616 142.1% 127 (146)
Subtotal (exposure class)
31,993 87,134 50.4% 71,939 2.2% 11,688 37.1% 3 40,311 56.0% 466 (699)
As at 31 December 20210.00 to < 0.15 15,977 48,121 49.7% 39,187 0.1% 1,825 38.0% 3 10,333 26.4% 13 0.15 to < 0.25 2,825 5,844 46.8% 5,218 0.2% 600 39.0% 3 2,326 44.6% 4 0.25 to < 0.50 4,086 5,872 54.9% 6,942 0.4% 1,158 39.7% 3 4,410 63.5% 10 0.50 to < 0.75 1,681 2,175 51.4% 2,706 0.6% 1,530 40.3% 2 2,052 75.8% 7 0.75 to < 2.50 2,244 5,927 43.7% 4,653 1.4% 4,188 29.2% 3 3,664 78.8% 19 2.50 to < 10.00 4,330 7,703 50.7% 7,901 5.4% 4,404 30.9% 3 9,702 122.8% 130 10.00 to < 100.00 954 3,425 51.5% 2,478 17.1% 612 25.7% 3 3,660 147.7% 108 100.00 (Default) 451 1,424 54.6% 1,221 100.0% 332 31.7% 2 1,386 113.5% 175 Subtotal (exposure class) 32,549 80,492 49.7% 70,307 3.1% 14,649 36.4% 3 37,533 53.4% 465 (664)
1. Current period average CCF is calculated on a weighted average basis in line with revised disclosure requirements that took effect from 1 January 2022 and also reflects where the modelled EAD is higher than the on and off balance sheet exposures pre CCF. For prior period, the average CCF was calculated on an aggregate level.
The RWA density associated with corporates other increased 2.7% to 56.0% primarily due to regulatory changes that took effect from 1 January 2022, relating to implementation of IRB roadmap changes and business activity within higher PD bands.
Analysis of credit risk
Barclays PLC 35

Table 29: CR6 – IRB approach – Credit risk exposures by exposure class and PD range for corporates - SME
PD rangeOn-
balance sheet
exposures
Off-balance-
sheet exposur
es pre-CCF
Exposure
weighted
average CCF
Exposure post
CCF and post CRM
Exposure
weighted
average PD
Number of
obligors
Exposure
weighted
average LGD
Exposure
weighted
average maturity
(years)
Risk weighte
d exposur
e amount
after supporti
ng factors
Density of risk
weighted
exposure
amount
Expected loss
amount
Value adjust-ments
and provisio
nsAs at 30 June 2022 £m £m % £m % % £m % £m £m0.00 to <0.15 1,634 917 66.1% 2,039 0.1% 885 24.9% 4 522 25.6% 1 (3)
0.00 to <0.10 1,142 870 66.4% 1,678 0.1% 651 23.0% 4 347 20.7% 1 (1) 0.10 to <0.15 492 47 60.9% 361 0.1% 234 33.3% 5 175 48.4% 0 (2)
0.15 to <0.25 207 79 68.5% 260 0.2% 230 31.8% 4 115 44.3% 0 (1) 0.25 to <0.50 1,076 454 48.5% 1,222 0.4% 1,282 35.8% 3 519 42.5% 2 (3) 0.50 to <0.75 1,227 343 34.6% 1,239 0.6% 2,090 24.9% 3 442 35.7% 3 (2) 0.75 to <2.50 3,857 759 44.8% 3,887 1.4% 15,907 27.7% 3 2,378 61.2% 31 (34)
0.75 to <1.75 2,776 573 44.1% 2,824 1.2% 11,691 26.9% 3 1,592 56.4% 18 (20) 1.75 to <2.5 1,081 186 47.0% 1,063 2.0% 4,216 29.8% 3 786 73.9% 13 (14)
2.50 to <10.00 1,903 517 61.7% 1,952 4.5% 6,783 34.1% 3 2,250 115.2% 86 (85) 2.5 to <5 1,211 344 53.7% 1,238 3.3% 4,884 32.7% 3 1,287 103.9% 38 (42) 5 to <10 692 173 77.5% 714 6.6% 1,899 36.6% 3 963 134.7% 48 (43)
10.00 to <100.00 525 54 47.2% 334 18.7% 893 36.2% 3 575 171.7% 57 (79) 10 to <20 418 37 49.8% 249 13.8% 573 35.0% 3 367 147.0% 24 (33) 20 to <30 22 1 50.9% 21 24.5% 76 35.0% 3 28 131.9% 2 (44) 30.00 to <100.00 85 16 40.7% 64 36.0% 244 41.2% 3 180 281.1% 31 (2)
100.00 (Default) 1,122 188 66.9% 1,180 100.0% 617 15.5% 3 1,861 157.7% 141 (63)
Subtotal (exposure class)
11,551 3,311 54.7% 12,113 11.6% 28,687 27.9% 3 8,662 71.5% 321 (270)
As at 31 December 20210.00 to < 0.15 1,614 934 63.9% 2,185 0.1% 1104 25.5% 4 582 26.7% 1 0.15 to < 0.25 316 84 62.6% 349 0.2% 330 40.2% 4 135 38.6% 0 0.25 to < 0.50 873 389 58.9% 1,023 0.4% 2027 34.5% 3 441 43.1% 2 0.50 to < 0.75 971 288 49.0% 997 0.6% 3113 29.3% 3 403 40.5% 2 0.75 to < 2.50 3,908 886 41.1% 3,855 1.4% 15208 28.4% 3 2,112 54.8% 19 2.50 to < 10.00 2,564 536 55.8% 2,480 4.5% 7136 32.8% 3 2,161 87.1% 44 10.00 to < 100.00 514 63 53.3% 489 19.5% 1098 31.0% 3 589 120.2% 35 100.00 (Default) 1,302 207 54.9% 1,343 100.0% 676 16.2% 3 1,887 140.5% 91 Subtotal (exposure class) 12,062 3,387 53.9% 12,721 12.7% 30692 28.5% 3 8,310 65.3% 194 (338)
1. Current period average CCF is calculated on a weighted average basis in line with revised disclosure requirements that took effect from 1 January 2022 and also reflects where the modelled EAD is higher than the on and off balance sheet exposures pre CCF. For prior period, the average CCF was calculated on an aggregate level.
The RWA density associated with corporates SME increased 6.2% to 71.5% primarily due to regulatory changes that took effect from 1 January 2022, relating to implementation of IRB roadmap changes.
Analysis of credit risk
Barclays PLC 36

Table 30: CR6 – IRB approach – Credit risk exposures by exposure class and PD range for retail -SME
PD range On-balance
sheet exposure
s
Off-balance-
sheet exposure
s pre-CCF
Exposure weighted
average CCF1
Exposure post CCF and post
CRM
Exposure weighted
average PD
Number of
obligors
Exposure weighted
average LGD
Risk weighted exposure
amount after
supporting
factors
Density of risk
weighted exposure
amount
Expected loss
amount
Value adjust-ments
and provision
sAs at 30 June 2022 £m £m % £m % % £m % £m £m0.00 to <0.15 23 5 5133.5% 261 0.1% 154,130 44.3% 24 9.2% 0 0
0.00 to <0.10 8 1 17908.8% 181 0.1% 116,792 43.5% 14 7.8% 0 0 0.10 to <0.15 15 4 1780.0% 80 0.1% 37,338 46.2% 10 12.3% 0 0
0.15 to <0.25 43 19 265.4% 91 0.2% 25,333 37.7% 12 13.2% 0 0 0.25 to <0.50 241 144 45.7% 284 0.4% 25,789 24.5% 36 12.6% 0 0 0.50 to <0.75 327 188 108.0% 494 0.6% 78,332 33.9% 121 24.6% 1 0 0.75 to <2.50 2,027 778 125.5% 2,749 1.5% 490,882 37.4% 1,013 36.8% 16 (8)
0.75 to <1.75 1,299 577 128.7% 1,878 1.2% 361,622 37.6% 663 35.3% 9 (4) 1.75 to <2.5 728 201 116.2% 871 2.1% 129,260 37.0% 350 40.1% 7 (4)
2.50 to <10.00 1,934 276 178.9% 2,304 4.6% 260,842 38.0% 1,078 46.8% 40 (17) 2.5 to <5 1,349 215 154.8% 1,586 3.5% 174,623 37.3% 709 44.7% 21 (10) 5 to <10 585 61 264.4% 718 6.9% 86,219 39.5% 369 51.4% 19 (7)
10.00 to <100.00 367 27 268.3% 426 21.3% 49,712 36.4% 271 63.5% 32 (8) 10 to <20 215 15 369.7% 262 13.6% 33,794 39.1% 162 61.9% 14 (4) 20 to <30 51 3 220.2% 57 24.1% 6,212 34.2% 39 68.1% 5 (1) 30.00 to <100.00 101 9 124.5% 107 38.6% 9,706 30.9% 70 65.0% 13 (3)
100.00 (Default) 584 36 39.1% 567 100.0% 41,174 20.5% 665 117.3% 63 (212) Subtotal (exposure class)
5,546 1,473 143.6% 7,176 11.3% 1,126,194 35.7% 3,220 44.9% 152 (245)
As at 31 December 20210.00 to < 0.15 16 2 14526.7% 286 0.1% 166,585 46.2% 25 8.8% 00.15 to < 0.25 40 14 256.1% 74 0.2% 17,454 33.1% 9 11.9% 00.25 to < 0.50 248 88 153.3% 366 0.4% 63,189 30.3% 63 17.2% 00.50 to < 0.75 413 137 190.7% 623 0.6% 109,566 34.9% 158 25.3% 10.75 to < 2.50 2,289 767 112.8% 2,846 1.5% 441,668 37.9% 1,048 36.8% 162.50 to < 10.00 1,649 500 99.8% 2,015 4.7% 249,277 37.5% 942 46.7% 3610.00 to < 100.00 388 46 199.3% 467 23.1% 60,987 37.3% 303 65.0% 39100.00 (Default) 558 39 36.8% 552 100.0% 34,320 21.1% 628 113.8% 66Subtotal (exposure class) 5,601 1,593 136.8% 7,229 11.1% 1,143,046 36.1% 3,176 43.9% 158 (148)
1. Current period average CCF is calculated on a weighted average basis in line with revised disclosure requirements that took effect from 1 January 2022 and also reflects where the modelled EAD is higher than the on and off balance sheet exposures pre CCF. For prior period, the average CCF was calculated on an aggregate level.
The RWA density associated with retail SMEs remained broadly stable at 44.9% (December 2021: 43.9%).
Analysis of credit risk
Barclays PLC 37

Table 31: CR6 – IRB approach – Credit risk exposures by exposure class and PD range for secured retail - non SME
PD range On-balance
sheet exposure
s
Off-balance-
sheet exposure
s pre-CCF
Exposure weighted
average CCF1
Exposure post CCF and post
CRM
Exposure weighted
average PD
Number of
obligors
Exposure weighted
average LGD
Risk weighted exposure
amount after
supporting
factors
Density of risk
weighted exposure
amount
Expected loss
amount
Value adjust-ments
and provision
sAs at 30 June 2022 £m £m % £m % % £m % £m £m0.00 to <0.15 24,785 2,285 70.9% 26,466 0.1% 114,657 11.9% 1,555 5.9% 6 (3)
0.00 to <0.10 17,563 1,586 70.9% 18,721 0.1% 61,444 10.2% 507 2.7% 2 (1) 0.10 to <0.15 7,222 699 71.0% 7,745 0.1% 53,213 15.9% 1,048 13.5% 4 (2)
0.15 to <0.25 10,384 1,502 61.9% 11,337 0.2% 78,937 13.5% 935 8.2% 5 (2) 0.25 to <0.50 34,843 2,975 58.5% 36,706 0.4% 215,044 10.8% 2,760 7.5% 18 (4) 0.50 to <0.75 40,108 2,237 54.1% 41,446 0.6% 253,319 10.1% 4,058 9.8% 27 (3) 0.75 to <2.50 37,863 3,088 71.2% 40,187 1.3% 239,542 14.0% 8,749 21.8% 76 (9)
0.75 to <1.75 31,612 2,696 71.1% 33,628 1.1% 197,375 13.6% 6,570 19.5% 54 (7) 1.75 to <2.5 6,251 392 71.6% 6,559 2.0% 42,167 15.8% 2,179 33.2% 22 (2)
2.50 to <10.00 8,525 558 74.4% 8,976 4.4% 52,221 15.0% 4,210 46.9% 59 (9) 2.5 to <5 6,123 483 74.4% 6,507 3.4% 37,831 16.4% 3,043 46.8% 38 (5) 5 to <10 2,402 75 74.9% 2,469 7.1% 14,390 11.5% 1,167 47.2% 21 (4)
10.00 to <100.00 4,763 143 74.4% 4,892 29.5% 29,283 9.1% 2,381 48.7% 128 (22) 10 to <20 2,520 77 66.4% 2,580 14.7% 14,314 9.0% 1,273 49.4% 35 (5) 20 to <30 669 34 69.5% 696 24.8% 4,706 10.0% 426 61.1% 18 (5) 30.00 to <100.00 1,574 32 98.6% 1,616 55.3% 10,263 8.8% 682 42.2% 75 (12)
100.00 (Default) 1,653 2 0.0% 1,659 100.0% 16,179 17.9% 1,283 77.4% 372 (353) Subtotal (exposure class)
162,924 12,790 64.3% 171,669 2.6% 999,182 12.0% 25,931 15.1% 691 (405)
As at 31 December 20210.00 to < 0.15 19,877 1,662 97.9% 21,081 0.1% 99,459 12.0% 1,510 7.2% 100.15 to < 0.25 10,738 1,282 95.9% 11,528 0.2% 77,376 12.8% 881 7.6% 70.25 to < 0.50 28,813 2,452 96.8% 30,276 0.4% 171,350 10.3% 2,075 6.9% 130.50 to < 0.75 39,942 2,274 97.6% 41,222 0.6% 259,486 10.1% 4,010 9.7% 270.75 to < 2.50 46,326 2,905 98.5% 48,509 1.2% 288,025 13.8% 10,269 21.2% 882.50 to < 10.00 9,736 591 98.8% 10,206 4.4% 59,264 14.9% 4,688 45.9% 6610.00 to < 100.00 4,296 145 99.5% 4,420 28.4% 27,756 9.3% 2,135 48.3% 134100.00 (Default) 1,737 3 100.0% 1,743 100.0% 16,748 17.5% 1,157 66.4% 368Subtotal (exposure class) 161,465 11,314 97.8% 168,985 2.6% 999,464 12.0% 26,725 15.8% 713 (424)
1. Current period average CCF is calculated on a weighted average basis in line with revised disclosure requirements that took effect from 1 January 2022 and also reflects where the modelled EAD is higher than the on and off balance sheet exposures pre CCF. For prior period, the average CCF was calculated on an aggregate level.
The RWA density associated with secured retail non SMEs remained broadly stable at 15.1% primarily due to a reduction following HPI refresh, partially offset by growth in mortgages.
Analysis of credit risk
Barclays PLC 38

Table 32: CR6 – IRB approach – Credit risk exposures by exposure class and PD range for revolving retail
PD range
On-balance
sheet exposure
s
Off-balance-
sheet exposure
s pre-CCF
Exposure weighted
average CCF1
Exposure post CCF and post
CRM
Exposure weighted
average PD
Number of obligors
Exposure weighted
average LGD
Risk weighted exposure
amount after
supporting
Density of risk
weighted exposure
amount
Expected loss
amount
Value adjust-ments
and provision
sAs at 30 June 2022 £m £m % £m % % £m % £m £m0.00 to <0.15 1,180 21,382 53.7% 12,661 0.1% 13,028,207 74.3% 529 4.2% 11 (8)
0.00 to <0.10 735 16,199 57.4% 10,038 0.1% 10,896,981 73.8% 358 3.6% 8 (6) 0.10 to <0.15 445 5,183 42.0% 2,623 0.1% 2,131,226 76.3% 171 6.5% 3 (2)
0.15 to <0.25 795 6,137 41.3% 3,332 0.2% 2,488,750 76.8% 339 10.2% 8 (6) 0.25 to <0.50 1,537 6,837 38.2% 4,147 0.4% 1,995,593 78.4% 754 18.2% 20 (23) 0.50 to <0.75 943 3,031 35.6% 2,023 0.6% 869,971 79.2% 502 24.8% 13 (19) 0.75 to <2.50 3,441 5,798 43.9% 5,988 1.4% 2,139,720 81.0% 3,165 52.8% 106 (190)
0.75 to <1.75 2,535 4,522 39.6% 4,328 1.1% 1,520,774 81.0% 2,042 47.2% 68 (112) 1.75 to <2.5 906 1,276 59.1% 1,660 2.2% 618,946 81.1% 1,123 67.7% 38 (78)
2.50 to <10.00 2,453 1,384 66.6% 3,376 4.8% 1,092,748 82.9% 4,253 126.0% 181 (410) 2.5 to <5 1,494 1,094 56.6% 2,114 3.5% 708,793 82.7% 2,172 102.8% 85 (218) 5 to <10 959 290 104.4% 1,262 6.9% 383,955 83.3% 2,081 164.9% 96 (192)
10.00 to <100.00 597 98 173.3% 768 22.6% 290,648 82.9% 2,225 289.9% 191 (228) 10 to <20 378 66 177.2% 495 13.5% 178,277 83.1% 1,146 231.7% 68 (113) 20 to <30 92 15 173.1% 119 24.0% 49,717 82.7% 302 253.9% 26 (37) 30.00 to <100.00 127 17 158.1% 154 50.9% 62,654 82.6% 777 505.4% 97 (78)
100.00 (Default) 588 206 0.0% 588 100.0% 278,597 78.1% 2,397 407.8% 455 (432) Subtotal (exposure class)
11,534 44,873 47.6% 32,883 3.2% 22,184,234 77.7% 14,164 43.1% 985 (1,316)
As at 31 December 20210.00 to < 0.15 1,114 22,987 48.0% 13,140 0.1% 13,574,052 73.9% 497 3.8% 100.15 to < 0.25 753 6,305 12.8% 3,179 0.2% 2,121,186 76.9% 306 9.6% 70.25 to < 0.50 1,507 6,833 11.8% 4,048 0.4% 1,897,689 78.4% 699 17.3% 190.50 to < 0.75 958 2,938 8.9% 1,981 0.6% 836,643 79.6% 480 24.2% 130.75 to < 2.50 3,458 5,296 5.9% 5,831 1.4% 2,076,654 81.0% 2,961 50.8% 992.50 to < 10.00 2,454 1,148 5.0% 3,292 4.8% 1,005,917 82.0% 3,923 119.2% 17810.00 to < 100.00 538 87 22.1% 683 22.8% 257,374 80.6% 1,797 262.9% 166100.00 (Default) 667 212 2.7% 667 100.0% 295,870 78.6% 1,690 253.3% 433Subtotal (exposure class) 11,449 45,806 26.9% 32,821 3.4% 22,065,385 77.4% 12,353 37.6% 925 (1,463)
1. Current period average CCF is calculated on a weighted average basis in line with revised disclosure requirements that took effect from 1 January 2022 and also reflects where the modelled EAD is higher than the on and off balance sheet exposures pre CCF. For prior period, the average CCF was calculated on an aggregate level.
The RWA density associated with revolving retail increased 5.4% to 43.1% primarily due to regulatory changes that took effect from 1 January 2022, relating to implementation of IRB roadmap changes.
Analysis of credit risk
Barclays PLC 39

Table 33: CR6 – IRB approach – Credit risk exposures by exposure class and PD range for other retail - non SME
PD range On-balance
sheet exposure
s
Off-balance-
sheet exposure
s pre-CCF
Exposure weighted
average CCF1
Exposure post CCF and post
CRM
Exposure weighted
average PD
Number of
obligors
Exposure weighted
average LGD
Risk weighted exposure
amount after
supporting
factors
Density of risk
weighted exposure
amount
Expected loss
amount
Value adjust-ments
and provision
sAs at 30 June 2022 £m £m % £m % % £m % £m £m0.00 to <0.15 396 1 2.2% 396 0.1% 64,358 74.6% 78 19.8% 0 0
0.00 to <0.10 194 1 2.2% 194 0.1% 35,346 74.3% 30 15.6% 0 0 0.10 to <0.15 202 — — 202 0.1% 29,012 74.9% 48 23.8% 0 0
0.15 to <0.25 320 0 5.5% 320 0.2% 51,655 74.4% 105 32.9% 1 0 0.25 to <0.50 697 0 67.7% 697 0.4% 91,540 75.5% 339 48.7% 2 (2) 0.50 to <0.75 464 0 0.0% 464 0.6% 58,553 75.9% 334 72.0% 3 (2) 0.75 to <2.50 1,193 0 0.0% 1,193 1.4% 144,267 76.5% 1,152 96.6% 14 (12)
0.75 to <1.75 915 0 0.0% 915 1.2% 110,871 76.4% 831 90.8% 9 (8) 1.75 to <2.5 278 — — 278 2.1% 33,396 76.9% 321 115.5% 5 (4)
2.50 to <10.00 686 0 0.0% 686 4.6% 84,530 77.4% 955 139.1% 27 (23) 2.5 to <5 465 0 0.0% 465 3.5% 56,553 77.2% 614 131.9% 14 (12) 5 to <10 221 — — 221 7.0% 27,977 77.7% 341 154.4% 13 (11)
10.00 to <100.00 246 — — 246 27.3% 34,446 77.6% 660 268.0% 57 (37) 10 to <20 151 — — 151 13.5% 20,562 77.7% 500 331.1% 21 (14) 20 to <30 34 — — 34 24.0% 4,760 77.5% 67 195.6% 6 (5) 30.00 to <100.00 61 — — 61 63.1% 9,124 77.2% 93 152.4% 30 (18)
100.00 (Default) 160 — — 160 100.0% 23,774 76.7% 140 87.6% 126 (126)
Subtotal (exposure class)
4,162 1 4.7% 4,162 6.8% 553,123 76.1% 3,763 90.4% 230 (202)
As at 31 December 20210.00 to < 0.15 374 1 99.7% 375 0.1% 66,911 74.2% 73 19.6% 0 0.15 to < 0.25 317 — — 317 0.2% 52,575 74.4% 104 32.9% 1 0.25 to < 0.50 652 — — 652 0.4% 91,002 75.3% 319 48.9% 3 0.50 to < 0.75 425 — — 425 0.6% 57,279 75.7% 305 71.8% 4 0.75 to < 2.50 1,111 — — 1,111 1.4% 142,440 76.4% 1,068 96.1% 15 2.50 to < 10.00 669 — — 669 4.6% 85,845 77.1% 918 137.2% 33 10.00 to < 100.00 249 — — 249 26.4% 35,318 77.3% 648 260.4% 70 100.00 (Default) 190 — — 190 100.0% 27,895 77.0% 202 106.3% 136 Subtotal (exposure class) 3,987 1 97.9% 3,988 7.7% 559,265 76.0% 3,637 91.2% 262 (236)
1. Current period average CCF is calculated on a weighted average basis in line with revised disclosure requirements that took effect from 1 January 2022 and also reflects where the modelled EAD is higher than the on and off balance sheet exposures pre CCF. For prior period, the average CCF was calculated on an aggregate level.
The RWA density associated with other retail non SME remained broadly stable at 90.4% (December 2021: 91.2%).
Analysis of credit risk
Barclays PLC 40

Table 34: CR10 – Specialised lending and equity exposures under the simple risk weighted approach1,2
Slotting, also known as specialised lending, is an approach that is applied to financing of individual projects where the repayment is highly dependent on the performance of the underlying pool or collateral. It uses a standard set of rules for the calculation of RWAs, based upon an assessment of factors such as the financial strength of the counterparty. The requirements for the application of the Slotting approach are detailed in CRR article 153.
Specialised lending : Income-producing real estate and high volatility commercial real estate (Slotting approach)
Regulatory categories Remaining maturity
On-balance sheet
exposure
Off-balance sheet
exposureRisk weight
Exposure value
Risk weighted exposure
Expected loss amount
As at 30 June 2022 £m £m £m £m £m
Category 1Less than 2.5 years 2,627 622 50 % 2,879 1,245 0
Equal to or more than 2.5 years 1,654 316 70 % 1,828 1,149 7
Category 2Less than 2.5 years 1,244 90 70 % 1,272 821 5
Equal to or more than 2.5 years 445 5 90 % 447 348 4
Category 3Less than 2.5 years 936 203 115 % 980 1,110 27
Equal to or more than 2.5 years 378 34 115 % 393 446 11
Category 4Less than 2.5 years 46 14 250 % 52 130 4
Equal to or more than 2.5 years 12 — 250 % 12 25 1
Category 5Less than 2.5 years 58 2 — 58 — 29
Equal to or more than 2.5 years 45 2 — 47 — 23
TotalLess than 2.5 years 4,911 931 5,241 3,306 65
Equal to or more than 2.5 years 2,534 357 2,727 1,968 46
1. No comparatives are provided as this reflects revised disclosure requirements from 1 January 2022.2. The table includes counterparty credit risk exposures.
Analysis of credit risk
Barclays PLC 41

Table 35: CR1-A Maturity of exposures1
This table has replaced table CRB-E, representing the on and off balance sheet net credit risk exposures by residual contractual maturity, split by either loans and advances or debt securities. The amounts shown are based on IFRS accounting values according to the regulatory scope of consolidation.
Net Exposure ValueAs at 30 June 2022 On demand <= 1 year > 1 year <= 5 > 5 years No stated Total
£m £m £m £m £m £m1 Loans and advances 487,582 318,262 99,698 207,127 — 1,112,669 2 Debt securities — 24,154 50,193 36,869 — 111,216 3 Total 487,582 342,416 149,891 243,996 — 1,223,885
1. No comparatives are provided as this reflects revised disclosure requirements from 1 January 2022.
Table 36: CR2 – Changes in the stock of non-performing loans and advances
This table shows information on changes in the institutions stock of on balance sheet non-performing loans and advances. The amounts shown are based on IFRS accounting values according to the regulatory scope of consolidation.
As at 30 June 2022 Gross carrying amount£m
010 Initial stock of non-performing loans and advances 7,569 020 Inflows to non-performing portfolios 2,601 030 Outflows from non-performing portfolios (545) 040 Outflows due to write-offs (775) 050 Outflow due to other situations1 (1,253) 060 Final stock of non-performing loans and advances 7,597
1. Other changes include repayments and disposals and other adjustments, partly offset by a net increase in the exposure in default on existing loans and debt securities.
Table 37: CR3 – CRM techniques overview: Disclosure of the use of credit risk mitigation techniques1
This table shows a breakdown of on balance sheet unsecured and secured credit risk exposures secured by various methods of collateral for both loans and advances and debt securities. The amounts shown are based on IFRS accounting values according to the regulatory scope of consolidation.
Unsecured carrying amount
Secured carrying amount
Of which secured by
collateral
Of which secured by
financial guarantees
Of which secured by
credit derivatives
As at 30 June 2022 £m £m £m £m £m1 Loans and advances 538,760 432,653 416,491 16,162 — 2 Debt securities 108,985 2,265 1,133 1,132 3 Total 647,745 434,918 417,624 17,294 — 4 Of which non-performing exposures 3,623 3,974 3,006 968 — 5 Of which defaulted 3,607 3,959
1. No comparatives are provided as this reflects revised disclosure requirements from 1 January 2022.
Analysis of credit risk
Barclays PLC 42

Table 38: CQ4 - Quality of non-performing exposures by geography1
This table shows the credit quality of on balance sheet and off balance sheet exposure for loans and advances, debt securities, derivatives and equity instruments by geography. The amounts shown are based on IFRS accounting values according to the regulatory scope of consolidation.
Gross carrying/Nominal amount
Accumulated impairment
Provisions on off-balance
sheet commitments and financial
guarantee given
Accumulated negative
changes in fair value due to credit risk
on non-performing exposures
of which: non-performing of which: subject to
impairmentof which: defaulted
As at 30 June 2022 £m £m £m £m £m £m £m
On balance sheet exposures 1,086,200 7,597 7,567 873,607 (5,650) —
UNITED KINGDOM 509,829 4,432 4,432 476,863 (2,368) —
UNITED STATES 264,131 947 947 168,053 (2,166) —
FRANCE 85,542 129 129 71,482 (42) —
GERMANY 47,939 186 171 41,576 (248) —
JAPAN 31,131 0 0 20,376 0 —
CANADA 13,314 0 0 9,165 (3) —
ITALY 11,315 723 708 10,318 (374) —
SINGAPORE 10,930 2 2 6,592 (2) —
IRELAND 10,883 9 9 8,514 (14) —
Other Countries 101,187 1,169 1,169 60,667 (431) —
Off balance sheet exposures 429,899 1,146 1,146 (525)
UNITED STATES 252,695 419 419 (277)
UNITED KINGDOM 109,475 436 436 (194)
GERMANY 11,189 99 99 (4)
FRANCE 7,244 5 5 (5)
IRELAND 4,496 15 15 (7)
LUXEMBOURG 4,011 7 7 (5)
NETHERLANDS 3,989 139 139 (2)
Other Countries 36,800 26 26 (31)
Total 1,516,099 8,743 8,713 873,607 (5,650) (525) —
1. No comparatives are provided as this reflects revised disclosure requirements from 1 January 2022.2. Countries that have more than 1% of the total gross exposure are disclosed in the table and countries with <1% gross exposure are aggregated within “other countries”.
Analysis of credit risk
Barclays PLC 43

Table 39: CQ5 - Credit quality of loans and advances to non-financial corporations by industry1
This table shows the credit quality of loans and advances on balance sheet exposure to non-financial corporation by industry types. The amounts shown are based on IFRS accounting values according to the regulatory scope of consolidation.
Gross carrying amount
Accumulated impairment
Accumulated negative changes in fair value due to credit risk on non-performing exposures
of which: non-performing
of which: loans and advances subject to impairment
of which: defaulted
As at 30 June 2022 £m £m £m £m £m £m010 Agriculture, forestry and fishing 4,130 391 391 4,126 (133) — 020 Mining and quarrying 1,736 39 39 1,736 (11) — 030 Manufacturing 8,912 102 102 8,357 (134) — 040 Electricity, gas, steam and air conditioning supply 2,905 1 1 2,857 (7) — 050 Water supply 964 5 5 949 (3) — 060 Construction 3,844 216 216 3,790 (56) — 070 Wholesale and retail trade 8,930 273 273 8,633 (123) — 080 Transport and storage 3,278 158 158 3,106 (54) — 090 Accommodation and food service activities 3,621 223 223 3,480 (69) — 100 Information and communication 5,649 127 127 5,344 (73) — 110 Financial and insurance actvities — — — — — — 120 Real estate activities 26,142 390 390 19,842 (198) — 130 Professional, scientific and technical activities 4,165 128 128 4,165 (43) — 140 Administrative and support service activities 8,227 179 179 6,649 (89) —
150Public administration and defense, compulsory social security 229 0 0 186 (2) —
160 Education 3,654 37 37 2,217 (17) — 170 Human health services and social work activities 3,848 188 188 3,651 (84) — 180 Arts, entertainment and recreation 1,285 95 95 1,285 (22) — 190 Other services 1,080 88 88 1,037 (37) — 200 Total 92,599 2,640 2,640 81,410 (1,155) —
1. No comparatives are provided as this is a new disclosure requirement from 1 January 2022.
Analysis of credit risk
Barclays PLC 44

Table 40: CQ1 Credit quality of forborne exposures1
This table provides an overview of the quality of on and off balance sheet forborne exposures. The amounts shown are based on IFRS accounting values according to the regulatory scope of consolidation.
Gross carrying amount/nominal amount of exposures with forbearance measures
Accumulated impairment, accumulated negative
changes in fair value due to credit risk and
provisions
Collateral received and financial guarantees received on forborne
exposures
Performing forborne
Non-performing forborne
On performing
forborne exposures
Onnon-
performing forborne
exposures
Of which collateral
and financial
guarantees received on
non-performingexposures
with forbearance
measures
Of which defaulted
Of which impaired
As at 30 June 2022 £m £m £m £m £m £m £m £m
005Cash balances at central banks and other demand deposits — — — — — — — —
010 Loans and Advances 1,882 1,873 1,735 1,705 (160) (460) 1,487 642 020 Central banks — — — — — — — — 030 General governments — — — — — — — — 040 Credit institutions — — — — — — — — 050 Other financial corporations 3 39 39 39 — (1) — — 060 Non-financial corporations 1,368 723 675 653 (49) (129) 820 168 070 Households 511 1,111 1,021 1,013 (111) (330) 667 474 080 Debt securities — — — — — — — — 090 Loan commitments given 1,027 256 187 185 (4) — 28 12 100 Total 2,909 2,129 1,922 1,890 (164) (460) 1,515 654
As at 31 December 2021010 Loans and Advances 1,901 2,136 2,002 1,999 (204) (696) 1,495 655 020 Central banks — — — — — — — — 030 General governments — — — — — — — — 040 Credit institutions — — — — — — — — 050 Other financial corporations 4 18 18 18 — (9) 1 — 060 Non-financial corporations 1,396 914 891 873 (52) (320) 854 170 070 Households 501 1,204 1,093 1,108 (152) (367) 640 485 080 Debt securities — — — — — — — — 090 Loan commitments given 1,148 198 176 175 (7) — 23 10 100 Total 3,049 2,334 2,178 2,174 (211) (696) 1,518 665
1. Cash balances at central banks and other demand deposits included in the current period as this reflects revised disclosure requirements from 1 January 2022.
Analysis of credit risk
Barclays PLC 45

Table 41: CR1 - Performing and non-performing exposures and related provisions1
This table provides an overview of the credit quality of on and off balance sheet non-performing exposures and related impairments, provisions and valuation adjustments by portfolio and exposure class.
Gross carrying amount/nominalAccumulated impairment, accumulated negative changes in fair
value due to credit risk and provisions
Accumulated partial write-off
Collateral and financial guarantees received
Performing exposures Non-performing exposuresPerforming exposures –
accumulated impairment and provisions
Non-performing exposures – accumulated impairment,
accumulated negative changes in fair value due to credit risk and
provisions
On performin
g exposures
On non- performin
g exposures
Of which Stage 1
Of which Stage 2
Of which Stage 2
Of which Stage 3
Of which Stage 1
Of which Stage 2
Of which Stage 2
Of which Stage 3
As at 30 June 2022 £m £m £m £m £m £m £m £m £m £m £m £m £m £m £m
005
Cash balances at central banks and other demand deposits 282,501 282,501 — — — — — — — — — — — — —
010 Loans and advances 681,315 640,478 40,837 7,597 118 7,475 (3,150) (1,295) (1,855) (2,465) (9) (2,456) (77) 428,679 3,974 020 Central banks 30,286 30,286 — — — — — — — — — — 0 13,493 — 030 General governments 8,123 8,103 20 — — — (2) (1) (1) — — — 0 5,748 — 040 Credit institutions 58,867 58,848 19 23 — 23 (2) (1) (1) (19) — (19) 0 25,737 — 050 Other financial corporations 270,982 268,406 2,576 89 — 89 (41) (26) (15) (27) — (27) 0 161,222 19 060 Non-financial corporations 89,958 76,895 13,063 2,640 — 2,640 (647) (384) (263) (507) — (507) (77) 45,149 1,625 070 Of which SMEs 18,981 14,635 4,346 1,977 — 1,977 (262) (171) (91) (271) — (271) 0 15,074 589 080 Households 223,099 197,940 25,159 4,845 118 4,723 (2,458) (883) (1,575) (1,912) (9) (1,903) — 177,330 2,330 090 Debt securities 111,249 108,516 2,733 1 — 1 (33) (11) (22) (1) — (1) — 2,265 — 100 Central banks 1,357 1,357 — — — — — — — — — — — 0 — 110 General governments 71,812 71,098 714 — — — (8) (4) (4) — — — — 0 — 120 Credit institutions 15,688 14,122 1,566 — — — (2) (1) (1) — — — — 1,131 — 130 Other financial corporations 15,335 15,027 308 — — — (6) (2) (4) — — — — 943 — 140 Non-financial corporations 7,057 6,912 145 1 — 1 (17) (4) (13) (1) — (1) — 191 — 150 Off-balance-sheet exposures 428,753 404,360 24,393 1,146 — 1,146 (508) (275) (233) (18) — (18) 43,026 47 160 Central banks 525 525 — — — — — — — — — — 0 — 170 General governments 2,452 2,452 — — — — — — — — — — 0 — 180 Credit institutions 3,083 3,030 53 — — — (3) (2) (1) — — — 16 — 190 Other financial corporations 75,101 73,183 1,918 237 — 237 (15) (8) (7) 0 — 0 18,592 — 200 Non-financial corporations 180,302 162,988 17,314 689 — 689 (371) (202) (169) (18) — (18) 19,391 38 210 Households 167,290 162,182 5,108 220 — 220 (119) (63) (56) — — — 5,027 9 220 Total 1,503,818 1,435,855 67,963 8,744 118 8,622 (3,691) (1,581) (2,110) (2,484) (9) (2,475) (77) 473,970 4,021
Analysis of credit risk
Barclays PLC 46

Table 41: CR1 - Performing and non-performing exposures and related provisions – continued
Gross carrying amount/nominalAccumulated impairment, accumulated negative changes in fair
value due to credit risk and provisions
Accumulated partial write-off
Collateral and financial guarantees received
Performing exposures Non-performing exposuresPerforming exposures –
accumulated impairment and provisions
Non-performing exposures – accumulated impairment,
accumulated negative changes in fair value due to credit risk and
provisionsOn
performing exposures
On non- performing exposures
Of which Stage 1
Of which Stage 2
Of which Stage 2
Of which Stage 3
Of which Stage 1
Of which Stage 2
Of which Stage 2
Of which Stage 3
As at 31 December 2021 £m £m £m £m £m £m £m £m £m £m £m £m £m £m £m010 Loans and advances 836,706 796,338 40,368 7,568 163 7,382 (3,238) (1,223) (2,015) (2,613) (9) (2,604) (248) 403,128 3,648 020 Central banks 266,931 266,931 — — — — — — — — — — — 13,344 — 030 General governments 9,967 9,941 26 — — — (4) (3) (1) — — — — 7,686 — 040 Credit institutions 49,517 49,509 8 — — — (2) (2) — — — — — 24,591 — 050 Other financial corporations 208,608 207,661 947 71 — 71 (25) (20) (5) (33) — (33) — 135,254 21 060 Non-financial corporations 87,513 73,278 14,235 2,771 — 2,771 (615) (353) (262) (615) — (615) (248) 47,717 1,486 070 Of which SMEs 20,446 17,977 2,469 1,872 — 1,872 (270) (196) (74) (202) — (202) — 16,808 635 080 Households 214,170 189,018 25,152 4,726 163 4,540 (2,592) (845) (1,747) (1,965) (9) (1,956) — 174,536 2,141 090 Debt securities 95,336 94,743 593 1 — 1 (15) (9) (6) (1) — (1) — 2,123 — 100 Central banks 1,336 1,336 — — — — — — — — — — — — — 110 General governments 60,459 60,400 59 — — — (3) (3) — — — — — — — 120 Credit institutions 15,149 15,073 76 — — — (1) (1) — — — — — 1,485 — 130 Other financial corporations 12,771 12,514 257 — — — (3) (1) (2) — — — — 371 — 140 Non-financial corporations 5,621 5,420 201 1 — 1 (8) (4) (4) (1) — (1) — 267 — 150 Off-balance-sheet exposures 371,683 337,232 34,451 1,298 — 1,298 (519) (217) (302) (23) — (23) — 36,690 37 160 Central banks 595 595 — — — — — — — — — — — 150 — 170 General governments 2,450 2,374 76 — — — — — — — — — — — — 180 Credit institutions 2,401 2,382 19 — — — (1) (1) — — — — — 18 — 190 Other financial corporations 64,515 62,607 1,908 98 — 98 (10) (7) (3) — — — — 15,961 — 200 Non-financial corporations 166,752 140,022 26,730 1,002 — 1,002 (414) (173) (241) (23) — (23) — 15,572 34 210 Households 134,970 129,252 5,718 198 — 198 (94) (36) (58) — — — — 4,989 3 220 Total 1,303,725 1,228,313 75,412 8,867 163 8,681 (3,772) (1,449) (2,323) (2,637) (9) (2,628) (248) 441,941 3,685
1. Cash balances at central banks and other demand deposits included in the current period as this reflects revised disclosure requirements from 1 January 2022.
Increase in Cash balances with Central bank due to increase in liquidity pool driven by increased deposits. Increase in Loans balances is primarily due to new loans and increase in existing facilities within CIB, Increase in Home Finance due to strong demand, acquisition of GAP portfolio within Barclaycard US along with increase in settlement balances, cash collateral and reverse repos.Increase in Debt securities due to acquisition of UK GILTS, Italian, Japanese and Australian government bonds on the back of attractive returns.
Analysis of credit risk
Barclays PLC 47

Table 42: CQ7 - Collateral obtained by taking possession and execution processesThis table provides an overview of foreclosed assets obtained from non-performing exposures. The amounts shown are based on IFRS accounting values according to the regulatory scope of consolidation.
Collateral obtained by taking possessionValue at initial recognition Accumulated negative changes
As at 30 June 2022 £m £m010 Property, plant and equipment (PP&E) — — 020 Other than PP&E — — 030 Residential immovable property 29 14 040 Commercial Immovable property — — 050 Movable property (auto, shipping, etc.) — — 060 Equity and debt instruments — — 070 Other collateral 17 1 080 Total 46 15
As at 31 December 2021010 Property, plant and equipment (PP&E) — — 020 Other than PP&E — — 030 Residential immovable property 19 12 040 Commercial Immovable property — — 050 Movable property (auto, shipping, etc.) — — 060 Equity and debt instruments — — 070 Other collateral 16 1 080 Total 35 13
Analysis of credit risk
Barclays PLC 48

Table 43: CCR1 – Analysis of CCR exposure by approach1
This table provides a comprehensive view of the methods used to calculate CCR regulatory requirements and the main parameters used within each method.
Replacement cost
(RC)
Potential future
exposure (PFE) EEPE
Alpha used for
computing regulatory
exposure value
Exposure value pre-
CRM
Exposure value post-
CRMExposure
value RWEAAs at 30 June 2022 £m £m £m £m £m £m £m1 SA-CCR (for derivatives) 3,133 3,237 1.4 16,456 8,909 8,909 4,948 2 IMM (for derivatives and SFTs) 67,865 1.4 141,275 95,012 95,012 27,281 2a Of which securities financing
transactions netting sets 29,969 41,957 41,957 7,007
2b Of which derivatives and long settlement transactions netting sets
37,896 141,275 53,055 53,055 20,274
4 Financial collateral comprehensive method (for SFTs)
68,960 18,394 18,394 7,708
6 Total 226,691 122,315 122,315 39,937
1. No comparatives are provided as this reflects revised disclosure requirements from 1 January 2022.
Analysis of counterparty credit risk
Barclays PLC 49

Table 44: CCR3 – Standardised approach – CCR exposures by regulatory exposure class and risk weightsThis table shows exposure at default, broken down by exposure class and risk weight. This table includes exposures subject to the standardised approach only.
Exposure classes Risk weight
0% 2% 4% 10% 20% 50% 70% 75% 100% 150% others
Total exposure
valueAs at 30 June 2022 £m £m £m £m £m £m £m £m £m £m £m £m1 Central governments or central banks 2,226 — — — 48 5 — — 18 — — 2,297 2 Regional government or local authorities 399 — — — — — — — 1 — — 400 3 Public sector entities 506 — — — 93 2 — — 145 — — 746 4 Multilateral development banks 699 — — — 6 — — — — — — 705 5 International organisations 162 — — — — — — — — — — 162 6 Institutions — 30,732 — — 1,009 573 — — 96 — — 32,410 7 Corporates — — — — 103 257 — — 16,836 2 — 17,198 8 Retail — — — — — — — — — — — — 9 Institutions and corporates with a short-
term credit assessment — — — — — — — — — — — — 10 Other items — — — — — — — — — 23 — 23 11 Total exposure value 3,992 30,732 — — 1,259 837 — — 17,096 25 — 53,941
0% 2% 4% 10% 20% 50% 70% 75% 100% 150% Others
Total exposure
valueAs at 31 December 2021 £m £m £m £m £m £m £m £m £m £m £m £m
1 Central governments or central banks 3,491 — — — 32 4 — — 5 — — 3,532
2 Regional governments or local authorities 1,410 — — — 1 — — — — — — 1,411
3 Public sector entities 526 — — — 522 1 — — — — — 1,049
4 Multilateral development banks 243 — — — 6 — — — — — — 249
5 International Organisations 110 — — — — — — — — — — 110
6 Institutions — 23,487 — — 390 688 — — 11 — — 24,576
7 Corporates — — — — 48 234 — — 13,503 — — 13,785
8 Retail — — — — — — — — — — — —
9 Institutions and corporates with a short-term credit assessment
— — — — — — — — — — — —
10 Other items — — — — — — — — — 1 — 1
17 Total 5,780 23,487 — — 999 927 — — 13,519 1 — 44,713
Counterparty Credit Risk (CCR) EAD increased by £9.4bn to £53.9bn primarily driven by an increase in trading activities with central clearing counterparties.
Analysis of counterparty credit risk
Barclays PLC 50

IRB obligor grade disclosure
The following tables show counterparty credit risk exposure at default post-CRM for the IRB approach for portfolios within both the trading and banking books. Separate tables are provided for the following exposure classes: central governments and central banks (table 44), institutions (table 45), corporates (table 46) and corporates subject to slotting (table 47).
Table 45: CCR4 – IRB approach – CCR exposures by portfolio and PD range for central governments and central banks
PD scaleExposure
value
Exposure weighted
average PDNumber of
obligors
Exposure weighted
average LGD
Exposure weighted
average maturity
(years) RWEA
Density of risk weighted exposure
amountAs at 30 June 2022 £m % % £m %1 0.00 to <0.15 5,918 0.0% 54 60.6% 1 559 9.4% 2 0.15 to <0.25 289 0.2% 9 50.1% 1 83 28.7% 3 0.25 to <0.50 35 0.3% 2 45.0% 1 12 35.5% 4 0.50 to <0.75 1 0.6% 3 75.8% 1 1 108.3% 5 0.75 to <2.50 1 1.8% 3 46.5% 1 1 110.7% 6 2.50 to <10.00 1 5.6% 2 47.4% 1 1 167.1% 7 10.00 to <100.00 3 12.4% 2 59.5% 1 8 293.6% 8 100.00 (Default) — — — — — — —
Total 6,248 0.1% 75 60.0% 1 665 10.6%
As at 31 December 20211 0.00 to <0.15 7,197 0.0 % 49 59.5 % 0 709 9.8% 2 0.15 to <0.25 164 0.2 % 11 51.8 % 1 53 32.2% 3 0.25 to <0.50 154 0.4 % 5 45.2 % 1 70 45.4% 4 0.50 to <0.75 — — — — — — — 5 0.75 to <2.50 299 2.0 % 4 45.1 % 0 289 96.6% 6 2.50 to <10.00 3 7.6 % 3 55.2 % 1 5 217.3% 7 10.00 to <100.00 19 12.1 % 1 63.0 % 1 58 300.8% 8 100.00 (Default) — — — — — — —
Total 7,836 0.2 % 73 58.5 % 0 1,184 15.1%
The RWA density associated with central governments and central banks decreased 4.5% to 10.6% primarily driven by a decrease in trading activities within lower PD bands.
Analysis of counterparty credit risk
Barclays PLC 51

Table 46: CCR4 – IRB approach – CCR exposures by portfolio and PD range for institutions
PD scale Exposure value
Exposure weighted
average PDNumber of
obligors
Exposure weighted
average LGD
Exposure weighted
average maturity
(years) RWEA
Density of risk weighted exposure
amountAs at 30 June 2022 £m % % £m %1 0.00 to <0.15 21,425 0.0% 566 46.4% 2 4,132 19.3% 2 0.15 to <0.25 2,078 0.2% 76 45.0% 1 732 35.2% 3 0.25 to <0.50 615 0.3% 84 43.0% 1 285 46.4% 4 0.50 to <0.75 71 0.6% 23 50.8% 1 52 72.5% 5 0.75 to <2.50 337 1.7% 62 45.0% 1 385 114.1% 6 2.50 to <10.00 133 4.3% 60 49.1% 2 184 138.3% 7 10.00 to <100.00 10 14.6% 18 34.3% 1 14 146.5% 8 100.00 (Default) — — — — — — —
Total 24,669 0.1% 889 46.2% 2 5,784 23.4%
As at 31 December 20211 0.00 to <0.15 17,824 0.0% 551 47.2% 2 3,652 20.5% 2 0.15 to <0.25 2,102 0.2% 90 45.2% 1 693 33.0% 3 0.25 to <0.50 194 0.4% 75 51.0% 1 109 56.3% 4 0.50 to <0.75 169 0.7% 26 45.5% 1 111 66.3% 5 0.75 to <2.50 132 1.6% 64 45.3% 1 127 95.9% 6 2.50 to <10.00 204 4.5% 61 49.5% 1 288 141.1% 7 10.00 to <100.00 12 14.3% 14 27.5% 1 12 100.7% 8 100.00 (Default) — — — — — — —
Total 20,637 0.1% 881 47.0% 2 4,992 24.2%
The RWA density associated with institutions remained broadly stable at 23.4% (December 2021: 24.2%).
Analysis of counterparty credit risk
Barclays PLC 52

Table 47: CCR4 – IRB approach – CCR exposures by portfolio and PD range for corporates
PD scaleExposure
value
Exposure weighted
average PDNumber of
obligors
Exposure weighted
average LGD
Exposure weighted
average maturity
(years) RWEA
Density of risk weighted exposure
amountAs at 30 June 2022 £m % % £m %1 0.00 to <0.15 53,539 0.1% 6,074 45.7% 1 7,693 14.4% 2 0.15 to <0.25 4,452 0.2% 664 42.5% 2 1,737 39.0% 3 0.25 to <0.50 4,279 0.3% 282 23.4% 2 1,595 37.3% 4 0.50 to <0.75 1,889 0.6% 253 39.4% 1 1,024 54.2% 5 0.75 to <2.50 2,572 1.2% 278 43.2% 1 2,035 79.1% 6 2.50 to <10.00 924 4.7% 231 42.7% 2 1,047 113.3% 7 10.00 to <100.00 318 15.5% 85 22.3% 2 371 116.5% 8 100.00 (Default) 6 100.0% 9 41.8% 1 9 141.0%
Total 67,979 0.3% 7,876 43.7% 1 15,511 22.8%
As at 31 December 20211 0.00 to <0.15 43,984 0.0% 5,886 44.9% 1 6,440 14.6% 2 0.15 to <0.25 4,112 0.2% 632 37.8% 2 1,537 37.4% 3 0.25 to <0.50 2,346 0.3% 315 19.8% 3 688 29.3% 4 0.50 to <0.75 663 0.6% 260 27.0% 3 328 49.5% 5 0.75 to <2.50 3,850 1.1% 286 21.0% 1 1,691 43.9% 6 2.50 to <10.00 1,573 4.7% 238 40.5% 2 1,785 113.5% 7 10.00 to <100.00 516 18.0% 66 22.3% 2 486 94.1% 8 100.00 (Default) 38 100.0% 16 8.4% 4 31 81.5%
Total 57,082 0.5% 7,699 41.2% 1 12,986 22.7%
The RWA density associated with corporates remained broadly stable at 22.8% (December 2021: 22.7%).
Analysis of counterparty credit risk
Barclays PLC 53

Table 48: CCR5 – Composition of collateral for CCR exposures1
This table shows the types of collateral posted or received to support or reduce CCR exposures relating to derivative transactions or SFTs, including transactions cleared through a CCP.
Collateral used in derivative transactions Collateral used in SFTsFair value of collateral
received Fair value of posted collateralFair value of
collateral received
Fair value of posted
collateralSegregated Unsegregated Segregated UnsegregatedAs at 30 June 2022 £m £m £m £m £m £m1 Cash — 90,472 — 84,634 — 3,278 2 Debt 9,460 15,927 2,614 3,144 667,004 665,090 3 Equity 3,002 82 6 — 206,564 158,791 4 Others 322 880 — 524 19,573 10,865 5 Total 12,784 107,361 2,620 88,302 893,141 838,024
1. No comparatives are provided as this reflects revised disclosure requirements from 1 January 2022.
Table 49: CCR6 - Credit derivatives exposures1
This table provides a breakdown of the Barclays’ exposures to credit derivatives products.
Protection bought Protection soldAs at 30 June 2022 £m £mNotionals1 Single-name credit default swaps 176,804 195,857 2 Index credit default swaps 347,352 329,487 3 Total return swaps 3,862 4,607 4 Credit options 110,706 97,244 5 Other credit derivatives — — 6 Total notionals 638,724 627,195 Fair value7 Positive fair value (asset) 7,666 3,490 8 Negative fair value (liability) (2,906) (7,780)
1. No comparatives are provided as this reflects revised disclosure requirements from 1 January 2022.
Analysis of counterparty credit risk
Barclays PLC 54

Table 50: CCR8 - Exposures to CCPs
This table provides a breakdown of Barclays’ exposures and RWAs to CCPs.As at 30 June 2022 As at 31 December 2021
Exposure value RWEA Exposure value RWEA
£m £m £m £m
1 Exposures to QCCPs (total) 1,360 1,601
2Exposures for trades at QCCPs (excluding initial margin and default fund contributions); of which 13,967 279 11,584 232
3 (i) OTC derivatives 5,095 101 3,667 73
4 (ii) Exchange-traded derivatives 4,794 96 2,954 59
5 (iii) SFTs 4,078 82 4,963 100
6 (iv) Netting sets where cross-product netting has been approved — — — —
7 Segregated initial margin 991 1,514
8 Non-segregated initial margin 16,765 335 11,903 238
9 Prefunded default fund contributions 4,077 746 2,416 1,131
10 Unfunded default fund contributions 9,483 —
The EAD for trades at QCCPs increased by £2.4bn to £14.0bn driven by increased client and trading activities.
Analysis of counterparty credit risk
Barclays PLC 55

Credit valuation adjustments (CVA)CVA measures the risk from MTM losses due to deterioration in the credit quality of a counterparty to over-the-counter derivative transactions with Barclays. It is a complement to the counterparty credit risk charge, that accounts for the risk of outright default of a counterparty.
Table 51: CCR2 Transactions subject to own funds requirements for CVA riskTwo approaches can be used to calculate the adjustment:
▪ Standardised approach: this approach takes account of the external credit rating of each counterparty, EAD from the calculation of the CCR and the effective maturity
▪ Advanced approach: this approach requires the calculation of the charge as (a) a 10-day 99% Value at Risk (VaR) measure for the most recent one-year period and (b) the same measure for a one-year stressed period. The sum of the 60 day averages for the two VaR measures is multiplied with the relevant multiplication factor, based on the number of market risk back-testing exceptions for the most recent 250 business days, to yield the capital charge.
Credit valuation adjustment (CVA) capital charge Exposure Value RWEAAs at 30 June 2022 £m £m
1 Total transactions subject to the Advanced method 23,291 2,674 2 (i) VaR component (including the 3× multiplier) — 694 3 (ii) stressed VaR component (including the 3× multiplier) — 1,980 4 Transactions subject to the Standardised method 1,949 823 5 Total transactions subject to own funds requirements for CVA risk 25,240 3,497
As at 31 December 20211 Total transactions subject to the Advanced method 15,895 2,128 2 (i) VaR component (including the 3× multiplier) — 398 3 (ii) stressed VaR component (including the 3× multiplier) — 1,730 4 Transactions subject to the Standardised method 890 320 5 Total transactions subject to own funds requirements for CVA risk 16,785 2,448
The CVA RWA increased to £3.5bn (December 2021: £2.4bn) primarily as a result of regulatory changes which took effect from 1 January 2022, relating to the introduction of SA-CCR.
Analysis of counterparty credit risk
Barclays PLC 56

Review of market risk regulatory measures
The following disclosures provide details of regulatory measures of market risk. Refer to pages 183 and 184 of Barclays PLC Pillar 3 Report 2021 for more detail on regulatory measures and the differences when compared to management measures.
Barclays Group’s market risk capital requirement comprises two elements:▪ the market risk of trading book positions booked to legal entities are measured under a PRA approved internal models approach,
including Regulatory VaR, SVaR and IRC as required▪ the trading book positions that do not meet the conditions for inclusion within the approved internal models approach are
calculated using standardised rules.
The table below summarises the regulatory market risk measures, under the internal models approach. Refer to Table 54 and Table 55 on page 62 for a breakdown of RWAs by approach.
Table 52: MR3 - IMA values for trading portfolios
Period-end Avg. Max MinAs at 30 June 2022 £m £m £m £mRegulatory VaR- 1 day 67 62 107 32Regulatory VaR- 10 daya 211 195 337 101SVaR - 1 day 114 93 158 49SVaR - 10 daya 361 295 499 156IRC 220 197 312 92
As at 31 December 2021Regulatory VaR- 1 day 34 35 64 18Regulatory VaR- 10 daya 108 111 204 58SVaR - 1 day 58 63 116 47SVaR - 10 daya 184 200 365 149IRC 278 329 544 217
a 10-day VaR results reported above are based on 1-day VaR multiplied by the square root of 10.
Average VaR and SVaR increased and IRC decreased in H12022:▪ Regulatory VaR and SVaR: The increase in Regulatory VaR for H122 was driven by elevated market volatility and defensive risk
positioning.▪ IRC: The reduction in IRC is due to lower default exposure in the FI Credit and Rates business during the period.
Analysis of market risk
Barclays PLC 57

Table 53: Breakdown of the major regulatory risk measures by portfolio
Macro Equities CreditSecuritized
ProductsCross
Markets
Fixed Income
Financing Banking
Barclays Group
Treasury
As at 30 June 2022 £m £m £m £m £m £m £m £mRegulatory VaR- 1 day 41 19 32 6 13 5 30 9 Regulatory VaR - 10 daya 130 61 101 17 41 16 95 27 SVaR- 1 day 101 38 26 8 25 6 26 25 SVaR- 10 day 318 122 83 26 81 20 81 78 IRC 79 10 290 11 123 1 19 6
As at 31 December 2021 £m £m £m £m £m £m £m £mRegulatory VaR- 1 day 17 19 14 2 14 1 5 2 Regulatory VaR - 10 daya 53 61 44 6 44 3 15 6 SVaR- 1 day 35 40 40 7 30 6 5 3 SVaR- 10 day 111 126 126 23 94 18 16 9 IRC 224 72 505 10 17 1 — —
a 10-day VaR results reported above are based on 1-day VaR multiplied by the square root of 10.
The table above shows the primary portfolios which are driving the trading businesses’ modelled capital requirement as at 2021 year-end. The standalone portfolio results diversify at the total level and are not additive. Regulatory VaR, SVaR and IRC in the prior table show the diversified results at a Group level.
Analysis of market risk
Barclays PLC 58

Table 54: MR1 – Market risk under the standardised approachThis table shows the RWAs and capital requirements for standardised market risk split between outright products, options and securitisation. This table includes exposures subject to the standardised approach only.
As at 30 June 2022 As at 31 December 2021RWEAs RWEAs
£m £mOutright products — —
1 Interest rate risk (general and specific) 7,489 6,068 2 Equity risk (general and specific) 4,257 3,750 3 Foreign exchange risk 1,266 2,710 4 Commodity risk — —
Options — — 5 Simplified approach — — 6 Delta-plus approach 1,420 1,166 7 Scenario approach 147 194 8 Securitisation (specific risk) 3,151 3,518 9 Total 17,730 17,406
Standardised market risk RWAs increased £0.3bn to £17.7bn primarily due to increased trading activity partially offset by a reduction in the Pillar 1 Structural FX charge.
Table 55: MR2-A – Market risk under the internal Model Approach (IMA)
This table shows RWAs and capital requirements under the internal models approach. The table shows the calculation of capital requirements as a function of latest and average values for each component.
As at 30 June 2022 As at 31 December 2021
RWEAsOwn funds
requirements RWEAsOwn funds
requirements£m £m £m £m
1 VaR (higher of values a and b) 8,849 708 4,476 358 (a) Previous day’s VaR (VaRt-1) — 380 — 168 (b) Multiplication factor (mc) x average of previous 60 working days (VaRavg) — 708 — 358 2 SVaR (higher of values a and b) 11,180 894 13,750 1,100 (a) Latest available SVaR (SVaRt-1)) — 536 — 849 (b) Multiplication factor (ms) x average of previous 60 working days (sVaRavg) — 894 — 1,100 3 IRC (higher of values a and b) 3,193 255 4,113 329 (a) Most recent IRC measure — 255 — 329 (b) 12 weeks average IRC measure — 205 — 314 5 Other 5,396 432 5,026 402 6 Total 28,618 2,289 27,365 2,189
Modelled market risk RWAs increased £1.3bn to £28.6bn primarily driven by:• VaR increased £4.4bn primarily due to client and trading activity• SVaR decreased £2.6bn primarily driven by a reduction in SVaR model adjustment as a result of changes in portfolio composition
partially offset by increased client and trading activity
Analysis of market risk
Barclays PLC 59

Regulatory backtesting
Backtesting is the method by which Group checks and affirms that its procedures for estimating VaR are reasonable and serve its purpose of estimating the potential loss arising from unfavourable market movements. The backtesting process is a regulatory requirement and seeks to estimate the performance of the regulatory VaR model. Performance is measured by the number of exceptions to the model, i.e. actual or hypothetical P&L loss in one trading day is greater than the estimated VaR for the same trading day. Barclays Group’s procedures could be underestimating VaR if exceptions occur more frequently than expected (a 99% confidence interval indicates that one exception will occur in 100 days).
Backtesting is performed at a legal entity level, sub-portfolio levels and business-aligned portfolios (shown in the table below and in the charts on the next page) using Barclays Group’s regulatory VaR model. Regulatory backtesting compares Regulatory VaR at 99% confidence level (one-day holding period equivalent) to actual and hypothetical changes in portfolio value as defined in CRR Article 366. The consolidated Barclays Bank PLC, Barclays Capital Securities Ltd and Barclays Bank Ireland PLC is the highest level of consolidation for the VaR model that is used in the calculation of regulatory capital. The Intermediate Holding Company (IHC) backtesting process compares IHC 99% Regulatory VaR against Hypothetical P&L. The definition of Hypothetical P&L and the scope of Regulatory VaR for the IHC are consistent with the Federal Reserve’s Market Risk Rule.
A backtesting exception is generated when a loss is greater than the daily VaR for any given day.
As defined by the PRA, a green status is consistent with a good working VaR model and is achieved for models that have four or fewer backtesting exceptions in a 250-day period. Backtesting counts the number of days when a loss exceeds the corresponding VaR estimate, measured at the 99% regulatory confidence level.
Backtesting is also performed on management VaR to validate it remains reasonable and fit for purpose.
The table below shows the VaR backtesting exceptions on legal entities aligned to Group’s business as at 30 June 2022. Model performance at a legal entity level determines regulatory capital within those entities. Legal entity disclosure is also relevant from a management perspective as Barclays’ VaR and model performance of VaR for a legal entity across asset class are key metrics in addition to asset class metrics across legal entity.
Barclays’ regulatory DVaR model at the consolidated legal entity level maintained green model status throughout the half year to 30 June 2022.
Actual P&L Hypo P&LPortfolios Total Exceptions Status Total Exceptions StatusBBPlc solo - consolidated + BCSL + BBI 0 G 2 GBBPlc solo - consolidated 0 G 3 GBCSL 1 G 0 GBBI 1 G 2 GIHC N/A N/A 0 G
Analysis of market risk
Barclays PLC 60

The charts below show VaR for the Group’s regulatory portfolios aligned by legal entity. The black and grey points on the charts indicate losses on those days on which actual and hypothetical P&L respectively exceeded the VaR amount.
In addition to being driven by market moves in excess of the 99% confidence level, backtesting exceptions can be caused by risks that impact P&L not captured directly in the VaR itself but separately captured as non VaR-type, namely Risks Not in VaR (RNIVs).
Exceptions are reported to internal management and regulators according to a CRR prescribed schedule as and when they occur, and are investigated to ensure the model performs as expected. In the half year to 30 June 2022, Group experienced two back testing exceptions against hypothetical P&L: one exception was driven by volatility in foreign exchange rates while the other was a broad-based exception with drivers from multiple asset classes.
Table 56: MR4 - Comparison of VaR estimates with gains/losses
BBPLC solo-consolidated, Barclays Capital Securities Limited (BCSL) and BBI
Note: Data reported between the period 1st July 2021 and 30th June 2022 is at BBPLC solo-consolidated, BCSL and BBI entity.
BBPLC solo-consolidated
Analysis of market risk
Barclays PLC 61

BCSL
BBI
IHC
Analysis of market risk
Barclays PLC 62

Table 57: SEC1 - Securitisation exposures in the non-trading book1
This table shows the non-trading book securitisation exposure split by exposure type and associated regulatory capital requirements
Institution acts as originator Institution acts as sponsor Institution acts as investorTraditional Synthetic
Sub-total
Traditional
Synthetic
Sub-total Traditional
Synthetic Sub-totalSTS Non-STS
of which SRT STS Non-STS STS Non-STSof which
SRTof which SRT
As at 30 June 2022 £m £m £m £m £m £m £m £m £m £m £m £m £m £m £m1 Total exposures — — 41,514 5,343 44,283 44,283 85,797 60 7,026 — 7,086 1,144 22,292 — 23,436 2 Retail (total) — — 17,167 4,924 — — 17,167 60 4,878 — 4,938 1,144 6,629 — 7,773 3 Residential mortgage — — 8,056 4,518 — — 8,056 — 1,124 — 1,124 944 4,162 — 5,106 4 Credit card — — — — — — — — 603 — 603 — — — — 5 Other retail exposures — — 9,111 406 — — 9,111 60 3,151 — 3,211 200 2,467 — 2,667 6 Re-securitisation — — — — — — — — — — — — — — — 7 Wholesale (total) — — 24,347 419 44,283 44,283 68,630 — 2,148 — 2,148 — 15,663 — 15,663 8 Loans to corporates — — 23,928 — 40,354 40,354 64,282 — 94 — 94 — 12,158 — 12,158 9 Commercial mortgage — — 407 407 — — 407 — — — — — 350 — 350 10 Lease and receivables — — — — — — — — 1,203 — 1,203 — 1,824 — 1,824 11 Other wholesale — — 12 12 3,929 3,929 3,941 — 851 — 851 — 1,332 — 1,332 12 Re-securitisation — — — — — — — — — — — — 0 — 0
1. No comparatives are provided as this reflects revised disclosure requirements from 1 January 2022.
Table 58: SEC2 - Securitisation exposures in the trading book1
This table shows the trading book securitisation exposure split by exposure type and associated regulatory capital requirementsInstitution acts as originator Institution acts as sponsor Institution acts as investor
TraditionalSynthetic Sub-total
TraditionalSynthetic Sub-total
TraditionalSynthetic Sub-total
STS Non-STS STS Non-STS STS Non-STSAs at 30 June 2022 £m £m £m £m £m £m £m £m £m £m £m £m1 Total exposures — 0 — 0 — — — — — 81 — 81 2 Retail (total) — 0 — 0 — — — — — 69 — 69 3 Residential mortgage — 0 — 0 — — — — — 21 — 21 4 Credit card — — — — — — — — — — — — 5 Other retail exposures — — — — — — — — — 48 — 48 6 Re-securitisation — — — — — — — — — — — — 7 Wholesale (total) — — — — — — — — — 12 — 12 8 Loans to corporates — — — — — — — — — — — — 9 Commercial mortgage — — — — — — — — — 3 — 3 10 Lease and receivables — — — — — — — — — 0 — 011 Other wholesale — — — — — — — — — 9 — 9 12 Re-securitisation — — — — — — — — — 0 — 0
1. No comparatives are provided as this reflects revised disclosure requirements from 1 January 2022.
Analysis of securitisation
Barclays PLC 63

Table 59: SEC3 - Securitisation exposures in the non-trading book and associated regulatory capital requirements - institution acting as originator or as sponsor1
This table shows the non-trading book securitisation exposures, where the institution acts as originator or as sponsorExposure values (by RW bands/deductions) Exposure values (by regulatory RWEA (by regulatory approach) Capital charge after cap
≤20% RW
>20% to 50% RW
>50% to 100%
RW
>100% to
<1250%
1250% RW/
deductioSEC-IRBA
SEC-ERBA
(includin SEC-SA
1250%/ deductio
nsSEC-IRBA
SEC-ERBA
(includin SEC-SA
1250%/deducti
onsSEC-IRBA
SEC-ERBA
(includi SEC-SA
1250%/deducti
onsAs at 30 June 2022 £m £m £m £m £m £m £m £m £m £m £m £m £m £m £m £m £m1 Total exposures 33,916 20,586 688 85 0 44,174 6,980 4,121 — 8,893 1,640 654 — 711 131 52 — 2 Traditional transactions 9,356 917 688 85 0 — 6,980 4,066 — — 1,640 629 — — 131 50 — 3 Securitisation 9,356 917 688 85 0 — 6,980 4,066 — — 1,640 629 — — 131 50 — 4 Retail underlying 8,005 646 161 85 — — 4,984 3,913 — — 1,062 606 — — 85 48 — 5 Of which STS 60 — — — — — 60 — — — 6 — — — 0 — — 6 Wholesale 1,351 271 527 0 0 — 1,996 153 — — 578 23 — — 46 2 — 7 Of which STS — — — — — — — — — — — — — — — — — 8 Re-securitisation — — — — — — — — — — — — — — — — — 9 Synthetic transactions 24,560 19,669 — 0 0 44,174 — 55 — 8,893 — 25 — 711 — 2 — 10 Securitisation 24,560 19,669 — 0 — 44,174 — 55 — 8,893 — 25 — 711 — 2 — 11 Retail underlying — — — — — — — — — — — — — — — — — 12 Wholesale 24,560 19,669 — 0 0 44,174 — 55 — 8,893 — 25 — 711 — 2 — 13 Re-securitisation — — — — — — — — — — — — — — — — —
1. No comparatives are provided as this reflects revised disclosure requirements from 1 January 2022.
Analysis of securitisation
Barclays PLC 64

Table 60: SEC4 - Securitisation exposures in the non-trading book and associated regulatory capital requirements - institution acting as investor1
This table shows the non-trading book securitisation exposures, where the institution acts as investorExposure values (by RW bands/deductions) Exposure values (by regulatory RWEA (by regulatory approach) Capital charge after cap
≤20% RW
>20% to 50%
RW
>50% to 100%
RW
>100% to
<1250% RW
1250% RW/
deductions
SEC-IRBA
SEC-ERBA
(including IAA) SEC-SA
1250%/ deducti
onsSEC-IRBA
SEC-ERBA
(including IAA) SEC-SA
1250%/deducti
onsSEC-IRBA
SEC-ERBA
(including IAA) SEC-SA
1250%/deducti
onsAs at 30 June 2022 £m £m £m £m £m £m £m £m £m £m £m £m £m £m £m £m £m1 Total exposures 18,145 4,085 1,205 79 3 2,478 364 20,675 0 1,409 169 3,465 2 113 13 277 02 Traditional transactions 18,145 4,085 1,205 79 3 2,478 364 20,675 0 1,409 169 3,465 2 113 13 277 03 Securitisation 18,145 4,085 1,205 79 3 2,478 364 20,675 0 1,409 169 3,465 1 113 13 277 04 Retail underlying 7,627 151 4 58 0 — 270 7,571 0 — 111 1,105 1 — 9 88 05 Of which STS 1,144 — — — — — 200 944 — — 20 94 — — 2 8 — 6 Wholesale 10,518 3,934 1,201 21 3 2,478 94 13,104 0 1,409 58 2,360 0 113 4 189 07 Of which STS — — — — — — — — — — — — — — — — — 8 Re-securitisation — — — — 0 — — — 0 — — — 1 — — — 09 Synthetic transactions — — — — — — — — — — — — — — — — — 10 Securitisation — — — — — — — — — — — — — — — — — 11 Retail underlying — — — — — — — — — — — — — — — — — 12 Wholesale — — — — — — — — — — — — — — — — — 13 Re-securitisation — — — — — — — — — — — — — — — — —
1. No comparatives are provided as this reflects revised disclosure requirements from 1 January 2022.
Analysis of securitisation
Barclays PLC 65
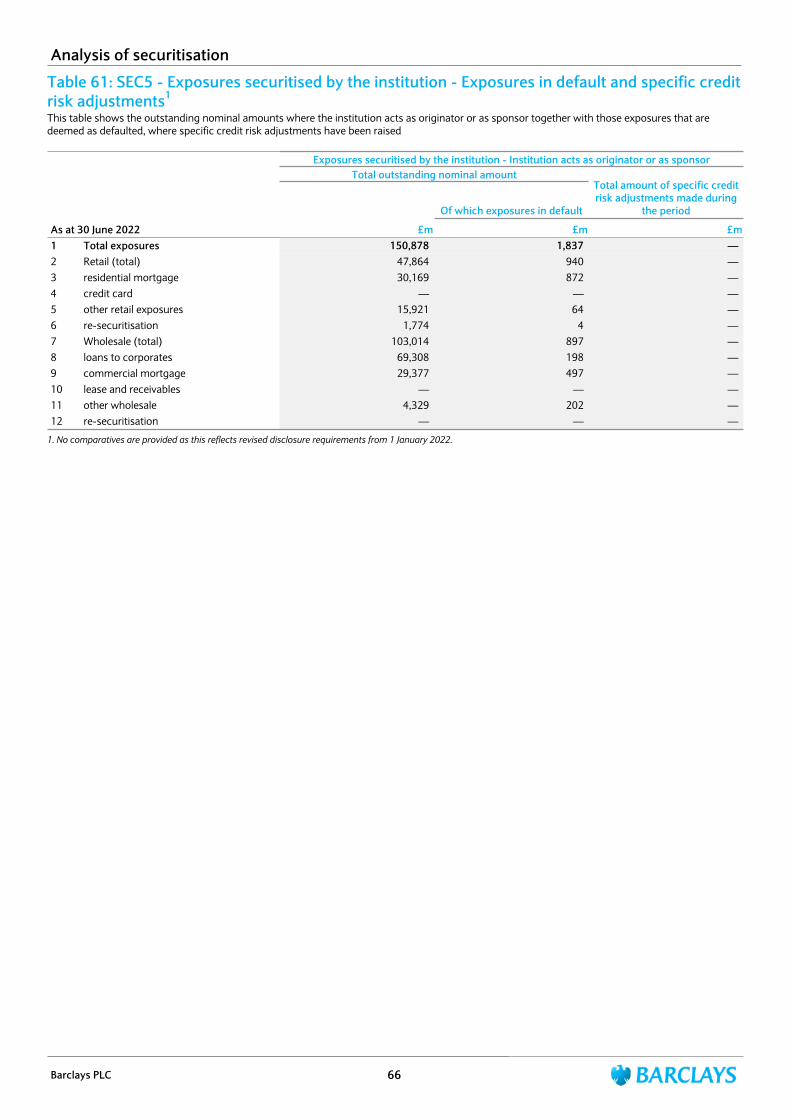
Table 61: SEC5 - Exposures securitised by the institution - Exposures in default and specific credit risk adjustments1
This table shows the outstanding nominal amounts where the institution acts as originator or as sponsor together with those exposures that are deemed as defaulted, where specific credit risk adjustments have been raised
Exposures securitised by the institution - Institution acts as originator or as sponsorTotal outstanding nominal amount
Total amount of specific credit risk adjustments made during
the periodOf which exposures in default
As at 30 June 2022 £m £m £m1 Total exposures 150,878 1,837 — 2 Retail (total) 47,864 940 — 3 residential mortgage 30,169 872 — 4 credit card — — — 5 other retail exposures 15,921 64 — 6 re-securitisation 1,774 4 — 7 Wholesale (total) 103,014 897 — 8 loans to corporates 69,308 198 — 9 commercial mortgage 29,377 497 — 10 lease and receivables — — — 11 other wholesale 4,329 202 — 12 re-securitisation — — —
1. No comparatives are provided as this reflects revised disclosure requirements from 1 January 2022.
Analysis of securitisation
Barclays PLC 66

Table 62: CCyB1 - Geographical distribution of credit exposures relevant for the calculation of the countercyclical bufferThe below table shows the geographical distribution of credit exposures relevant to the calculation of the countercyclical buffer in line with CRR Article 440. Note that exposures in the below table are prepared in accordance with CRD, Article 140. Hence exclude exposures to central governments/banks, regional governments, local authorities, public sector entities, multilateral development banks, international organisations and institutions and as such the exposure values differ to those found in the Analysis of credit risk section.
General credit exposures Relevant credit exposures – Market risk
Securiti-sation
exposures Exposure value for
non-trading book
Total exposure
value
Own fund requirements
Risk-weighted exposure amounts
Own fund requirements weights
Counter-cyclical
buffer rate (%)
Exposure value under
the standardised approach
Exposure value under
the IRB approach
Sum of long and short
positions of trading book
exposures for SA
Value of trading book
exposures for internal
models
Relevant credit risk
exposures - Credit risk
Relevant credit
exposures – Market risk
Relevant credit
exposures – Securiti-
sation positions in
the non-trading book
Total
Breakdown by country £m £m £m £m £m £m £m £m £m £m £m % %Norway 355 388 33 13 — 789 27 3 — 30 378 0.16% 1.50% Hong Kong 449 465 31 128 — 1,073 50 9 — 59 735 0.31% 1.00% Slovakia — — — 5 — 5 — — — — 5 —% 1.00% Luxembourg 2,199 3,678 180 1 426 6,485 228 29 7 264 3,301 1.41% 0.50% Czech Republic 12 141 — 13 — 166 7 1 — 8 105 0.04% 0.50% Bulgaria — — — — — — — — — — — —% 0.50%
Total (countries with existing CCyB rate) 3,015 4,672 244 160 426 8,518 312 42 7 361 4,524 1.92% United Kingdom 25,993 261,098 806 131 27,020 315,048 7,128 78 384 7,590 94,875 40.65% n/aUnited States 45,191 63,691 11,451 1,039 46,313 167,685 5,530 774 806 7,111 88,883 38.08% n/aGermany 2,682 7,919 469 364 431 11,865 392 52 8 451 5,635 2.41% n/aItaly 681 5,566 67 688 — 7,002 257 31 — 288 3,595 1.54% n/aIndia 2,818 176 86 20 185 3,285 248 16 3 267 3,338 1.43% n/aIreland 946 3,305 111 22 1,370 5,754 168 17 25 210 2,630 1.13% n/aCanada 949 3,284 114 51 10 4,409 196 12 — 208 2,606 1.12% n/aFrance 1,992 3,524 280 332 183 6,312 166 36 2 205 2,556 1.10% n/a
Total (countries with own funds requirements weights 1% or above 81,252 348,563 13,384 2,647 75,512 521,360 14,085 1,016 1,228 16,330 204,118 87.46%
Total (rest of the world less than 1% requirement) 13,940 22,655 1,874 2,285 2,852 43,606 1,641 278 63 1,982 24,773 10.60% n/a
Total 98,207 375,890 15,502 5,092 78,790 573,484 16,038 1,336 1,298 18,673 233,415 100.00%
Countercyclical Capital Buffer
Barclays PLC 67

Table 63: UK CCyB2 - Amount of institution-specific countercyclical capital bufferThis table shows an overview of institution specific countercyclical exposure and buffer requirements
As at 30 June 20221 Total risk exposure amount £344,516m2 Institution specific countercyclical capital buffer rate 0.01% 3 Institution specific countercyclical capital buffer requirement £45m
Countercyclical Capital Buffer
Barclays PLC 68