INTERIM RESULT DATAPACK - GPT
82
2014 INTERIM RESULT DATAPACK GPT >
-
Upload
khangminh22 -
Category
Documents
-
view
3 -
download
0
Transcript of INTERIM RESULT DATAPACK - GPT

1PB
ARTWORK TO COME2014INTERIM RESULTDATAPACKGPT>

42
CONTENTS
GPT Overview 46
Financial Performance 56
Retail Portfolio 72
Office Portfolio 86
Logistics Portfolio 98
Development 110
Funds Management 124
Note: All information included in this pack includes GPT owned assets and GPT’s interest in the Wholesale Funds (GWOF and GWSCF), unless otherwise stated.
750 Collins Street, Melbourne, VIC

2014GPT>
GPT
O
verv
iew
INTERIM RESULTGPT OVERVIEW

46
GPT’s core portfolio consists of high quality properties in the retail, office and logistics sectors. The portfolio includes some of the most iconic buildings in Australia and award winning developments. GPT’s Investment Management team is focused on maximising returns across the portfolio.
Highpoint Shopping Centre, VIC
Liberty Place, Sydney
Connect@Erskine Park, NSW
Retail Portfolio Office Portfolio Logistics Portfolio
16 shopping centres 1,040,000 sqm GLA3,600+ tenants $4.5bn portfolio$8.1bn AUM
23 assets 1,120,000 sqm NLA360+ tenants$3.0bn portfolio $7.1bn AUM
30 assets 760,000 sqm GLA80+ tenants$1.3bn portfolio $1.5bn AUM
Retail 51% Office 34%
Logistics 15%
GPT Portfolio Diversity As at 30 June 2014
GPT OVERVIEW

4847
GPT PORTFOLIO OVERVIEW
6.4%
1.6% 8.1%
6.6%
0.9% 7.6%
6.7%
1.2% 8.0%8.4% 0.2% 8.6%
Income Return Capital Return Total Return
Note: Total Return figures include equity interests in wholesale funds and exclude logistics development land. Variance in total is due to rounding.
IPD Total Return for the 12 months to 30 June 2014
Retail(Inc GWSCF Stake)
Office(Inc GWOF Stake)
LogisticsInvestment Portfolio
TotalPortfolio
Total Portfolio Return for the rolling 12 months to 30 June 2014.

4847
Across the three sectors, GPT has maintained high occupancy and a long WALE.
Portfolio Size1Comparable
Income Growth2 WALE Occupancy WACR
Retail $4.53bn 2.6% 4.0 years 99.5% 5.96%
Office $2.96bn (3.1%) 6.3 years 91.7% 6.56%
Logistics $1.31bn 0.6% 5.5 years 95.3% 8.17%
Total $8.80bn 0.3% 4.9 years 95.6% 6.43%
Structured Rental Increases³
1. Assets as at 30 June 2014.2. Income for the six months to 30 June 2014 compared to the previous corresponding period.3. For the six months to 31 December 2014.
GPT PORTFOLIO METRICS
RetailFixed 86%Other 14%
4.5% Average Increase
OfficeFixed 85%Other 15% 3.9%
Average Increase
LogisticsFixed 88% Other 12%3.4%
Average Increase

5049
GPT Securityholders by Geography As at 30 June 2014
GPT Securityholders by Type As at 30 June 2014
GPT Registry by Geography
Australia 61%North America 21%
UK 5%Europe (ex UK) 7%
Asia 6%
Domestic Institutions 50%
Foreign Institutions 39%
Retail Investors 11%
GPT SECURITYHOLDER OVERVIEW

5049
DRIVERS OF EARNINGS AND VALUE
Total Return8.4%
Distribution6.8%
NTA Change1.6%
Asset Scrub
Valuation
Development
Bonds 40%
Gearing 24.8%
Banks 60%
Acquisitions$1.1bn
Divestments
New ProfitSources
Development Fees2H 2014 Expiries
Retail: 12%Office: 3%
Logistics: 3%
Retail: 99.5%Office: 91.7%
Logistics: 95.3%
Fixed Rental Increases
86% at 4.2%
Retail: 86%at 4.5% increase3
Office: 85%at 3.9% increase3
Logistics: 88% at 3.4% increase3
Existing Funds
Buy-back
Interest Expense
76% HedgedFixed
100% HedgedAUD
WACD4
4.81%
Average Term 6.0 years
Refinancing 12 months: Nil
Cap RatesRetail: 5.96%Office: 6.56%
Logistics: 8.17%
Portfolio MixRetail: 51%Office: 34%
Logistics: 15%
EPS Yield 7.0%
Less Exchangeable
Less Capex
Maintenance Incentives
Income
Jaws
Expenses Capital
MER < 45 bps
FM Fees
Occupancy95.6%
Innogen
Others
LiquidSpace
New Funds
WANOS2
Derivatives
Other Fees
1. For the six months to 30 June 2014.2. Weighted average number of securities.3. Structured rental increases for the six months to 31 December 2014. 4. Weighted average cost of debt.
For the rolling 12 months to 30 June 2014.

5251
STRATEGY ON A PAGE
OUR ACHIEVEMENT CULTURE
OUR PURPOSE
Property to ProsperityWe maximise the financial potential of Australian property with solutions that fulfil the aspirations of our investors, tenants and communities.
Measured over 1, 3 and 5 years:• Total return > 9% • Leading relative total shareholder return
OUR GOALS
FOR OUR INVESTORS
We provide investors with access to value in property to meet their investment needs.
FOR OUR TENANTS
We provide property solutions, enabling businesses to prosper and connect.
FOR OUR COMMUNITIES
We are committed to being a highly trusted partner, creating value in our communities.
FOR OUR SECURITYHOLDERS
We are a secure, reliable investment, targeting superior risk adjusted returns over time.
FOR OUR PEOPLE
We equip our people for high performance, creating a unified team with a culture of achievement.
ACCOUNTABLE UNIFIEDCOURAGEOUSFUTURE SHAPING CAN DOAUTHENTICEFFECTIVE
5251
A Grade...........................As per the Property Council of Australia’s ‘A Guide to Office Building Quality’AFFO ............................... Adjusted Funds From OperationsAREIT ..............................Australian Real Estate Investment TrustASX .................................Australian Securities ExchangeAUM ................................ Assets under management
Assets under management includes interests in joint ventures.Bps .................................Basis PointsCapex..............................Capital expenditureCBD ...............................Central Business DistrictCO2 .................................Carbon DioxideCPI ..................................Consumer Price Indexcps ..................................Cents per securityDPS.................................Distribution per securityEBIT ................................Earnings Before Interest and TaxEPS ................................. Earnings per security
Earnings per security is defined as Funds From Operations per ordinary security.FFO ................................. Funds From Operations
Funds From Operations is defined as the underlying earnings calculated in accordance with the PCA ‘Voluntary Best Practice Guidelines for Disclosing FFO and AFFO’.
FUM ................................Funds under managementGearing ...........................The level of borrowings relative to tangible assets.GFA .................................Gross Floor AreaGLA .................................Gross Lettable AreaGWOF..............................GPT Wholesale Office FundGWSCF ...........................GPT Wholesale Shopping Centre FundHoA .................................Heads of AgreementIFRS ................................ International Financial Reporting StandardsIPD .................................. Investment Property DatabankIRR .................................. Internal Rate of ReturnJaws ...............................Jaws is defined as the combined benefit derived from the increase in income and the reduction in expenses.Major Tenants ................ Retail tenancies including Supermarkets, Discount Department Stores, Department Stores and Cinemas.MAT ................................Moving Annual TurnoverMER ................................ Management Expense Ratio
Management Expense Ratio is defined as management expenses divided by assets under management.Mini-Major Tenants ........Retail tenancies with a GLA above 400 sqm not classified as a Major Tenant.
GLOSSARY

5453
MTN ................................Medium Term NotesN/A .................................Not ApplicableNABERS .........................National Australian Built Environment Rating SystemNAV .................................Net Asset ValueNLA ................................Net Lettable AreaNPAT ...............................Net Profit After TaxNTA .................................Net Tangible Assets per security.Ordinary Securities ........ Ordinary securities are those that are most commonly traded on the ASX.
The ASX defines ordinary securities as those securities that carry no special or preferred rights. Holders of ordinary securities will usually have the right to vote at a general meeting of the company, and to participate in any dividends or any distribution of assets on winding up of the company on the same basis as other ordinary securityholders.
PCA .................................Property Council of AustraliaPremium Grade..............As per the Property Council of Australia’s ‘A Guide to Office Building Quality’Prime Grade ...................Prime Grade includes assets of Premium and A Grade quality.psm ................................Per square metrePV ...................................Present ValueRetail Sales ....................100% of GPT and GWSCF assets. GPT reports retail sales in accordance with the Shopping Centre Council of Australia (SCCA) guidelines.ROCE ..............................Return on capital expenditureSpecialty Tenants ...........Retail tenancies with a GLA below 400 sqm.Sqm ................................Square metreTR ................................... Total Return
Total Return is defined as the sum of the change in Net Tangible Assets, plus the distribution per security over the period, divided by the NTA at the beginning of the period.
TSR ................................. Total Securityholder Return Total Securityholder Return is defined as the distribution per security plus change in security price.
Total Tangible Assets .....Total Tangible Assets is defined as per the Constitution of the Trust and equals Total Assets less Intangible Assets reported in the Statement of Financial Position.USPP ..............................United States Private PlacementVWAP ..............................Volume weighted average priceWACD .............................Weighted average cost of debtWACR .............................Weighted average capitalisation rateWALE ..............................Weighted average lease expiryWANOS ...........................Weighted average number of securities
2014INTERIM RESULTFINANCIAL PERFORMANCEGPT>
2014GPT>
Fina
ncia
l Pe
rfor
man
ce
INTERIM RESULTFINANCIAL PERFORMANCE

5655
FINANCIAL SUMMARY
Financial Performance6 months to 30 June 2014 2013 ChangeFunds From Operations (FFO) ($m) 223.6 223.6 -
Net profit after tax ($m) 240.6 257.0 Down 6.4%
Earnings per ordinary security (cents) 13.3 12.7 Up 4.5%
Earnings yield (based on period end price) 7.0% 6.7% Up 30 bps
Distribution per security (cents) 10.5 10.1 Up 4.0%
Distribution yield (based on period end price) 5.5% 5.3% Up 20 bps
Net interest expense ($m) (47.4) (49.8) Down 4.8%
Interest capitalised ($m) 4.4 0.6 Up 633.3%
Weighted average cost of debt 4.81% 5.10% Down 29 bps
Interest cover (x) 5.6 times 5.4 times Up 3.7%
The weighted average number of ordinary stapled securities was 1,687.2 million at 30 June 2014 and 1,766.4 million at 30 June 2013.
As at 30 Jun 14 As at 31 Dec 13 ChangeTotal assets ($m) 9,559.0 9,421.8 Up 1.5%
Total borrowings ($m) 2,415.5 2,310.4 Up 4.5%
NTA per security ($) 3.82 3.79 Up 0.7%
Net gearing 24.8% 22.3% Up 250 bps
Net look through gearing 27.3% 23.2% Up 410 bps
Weighted average term to maturity 6.0 years 5.5 years Up 0.5 years
Credit ratings A- (positive) / A3 (stable) A- (stable) / A3 (stable)
Weighted average term of interest rate hedging 5.2 years 5.9 years Down 0.7 years

5857
RESULTS SUMMARY
Segment performance 6 months to 30 June ($m) 2014 2013 CommentRetail NOI 123.6 139.6 Comparable income growth of 2.6%
Office NOI 67.8 73.1 Comparable income decline of 3.1%
Logistics NOI 43.1 37.1 Comparable income growth of 0.6%
Income from Funds 38.7 35.8 Increased distribution from higher interest in GWOF and GWSCF plus Fund asset acquisitions
Investment Management Expenses (2.3) (3.0)
Investment Management 270.9 282.6
Asset Management 2.5 2.6
Development - Retail & Major Projects 1.8 1.2
Development - Logistics 2.0 (1.3)
Funds Management 15.5 10.1
Net financing costs (47.4) (49.8) Lower cost of debt and increase in capitalised interest offset by higher amount of debt
Corporate Management & Administrative Expenses (12.6) (14.4)
Tax Expenses (2.2) (0.6)
Non-Core 5.5 5.6
Less: distribution to exchangeable securities (12.4) (12.4)
Total Funds From Operations (FFO) 223.6 223.6
Valuation increase - core operations 30.8 20.0
Financial instruments mark to market value movements and net foreign exchange movements (27.4) 8.3
Other items 1.2 (7.3)
Exclude distributions on exchangeable securities in Funds From Operations 12.4 12.4
Net profit after tax 240.6 257.0
5857
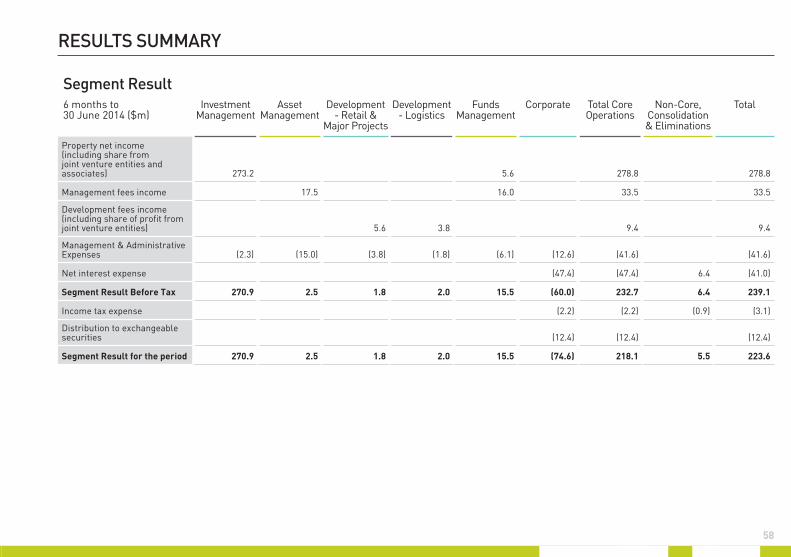
RESULTS SUMMARY
Segment Result6 months to 30 June 2014 ($m)
Investment Management
Asset Management
Development - Retail &
Major Projects
Development - Logistics
Funds Management
Corporate Total Core Operations
Non-Core, Consolidation & Eliminations
Total
Property net income (including share from joint venture entities and associates) 273.2 5.6 278.8 278.8
Management fees income 17.5 16.0 33.5 33.5
Development fees income (including share of profit from joint venture entities) 5.6 3.8 9.4 9.4
Management & Administrative Expenses (2.3) (15.0) (3.8) (1.8) (6.1) (12.6) (41.6) (41.6)
Net interest expense (47.4) (47.4) 6.4 (41.0)
Segment Result Before Tax 270.9 2.5 1.8 2.0 15.5 (60.0) 232.7 6.4 239.1
Income tax expense (2.2) (2.2) (0.9) (3.1)
Distribution to exchangeable securities (12.4) (12.4) (12.4)
Segment Result for the period 270.9 2.5 1.8 2.0 15.5 (74.6) 218.1 5.5 223.6

6059
FUNDS FROM OPERATIONS TO ADJUSTED FUNDS FROM OPERATIONS
CAPITAL EXPENDITURE OVERVIEW
6 months to 30 June ($m) 2014 2013
Core business 292.7 295.2
Non-core operations 5.5 5.6
Financing and corporate overheads (62.2) (64.8)
Less: distribution to exchangeable securities (12.4) (12.4)
Funds From Operations 223.6 223.6
Maintenance capital expenditure (19.8) (14.7)
Lease incentives (including rent free) (20.5) (31.4)
Adjusted Funds From Operations 183.3 177.5
Capital Expenditure ($m) 1H 2014 FY 2013 1H 2013
Maintenance capital expenditure 19.8 40.4 14.7
Lease incentives (including rent free) 20.5 50.8 31.4
Total operating capital expenditure 40.3 91.2 46.1
Development capital expenditure 138.4 80.4 17.7
Interest capitalised 4.4 3.0 0.6
Total property capital expenditure 183.1 174.6 64.4

6059
INVESTMENTS AND INCOME
Proportion of IncomeProportion of Real Estate Investments
As at 30 June 2014 6 months to 30 June 2014
As at 31 December 2013 6 months to 30 June 2013
Retail 44%Office 24%
Logistics 17% GWOF 8%GWSCF 6%
Non-Core 1%
Retail 45%Office 25%
Logistics 15% GWOF 8%GWSCF 6%
Non-Core 1%
Retail 43%Office 23%
Logistics 17% Funds Management 16%
Non-Core 1%
Retail 48%Office 24%
Logistics 12% Funds Management 14%
Non-Core 2%

6261
NTA MOVEMENT
NTA Movement Net Assets($m)
No. of Securities(million)
NTA perSecurity ($)
NTA position as at 31 December 2013 6,423.5 1,694.9 3.79
FFO 223.6 0.13
Core revaluation (includes development profit) 30.8 0.02
Mark to market of Treasury (30.2) (0.02)
Distribution (177.0) (0.10)
Buy back (41.0) (11.4) (0.00)
Issue of securities 5.7 2.0 0.00
Other (8.3) (0.00)
Movement in net assets 3.6 0.03
Less intangibles - movement 3.2 0.00
NTA position as at 30 June 2014 6,430.3 1,685.5 3.82
Securities on Issue Number of Securities(million)
Opening balance 1 January 2014 1,694.9
Issue of securities 2.0
Buy back of securities (11.4)
30 June 2014 Balance¹ 1,685.5
1. Excludes exchangeable securities.
On-market Security Buy Back at 30 June
2014
Securities acquired 174.0m
% of securities on issue 9.4%
Cost $585.5m
Average price paid $3.365
Average discount to NTA 11.8%2
Value created $62.5m
2. Discount to 30 June 2014 NTA.

6261
NTA Movement Net Assets($m)
No. of Securities(million)
NTA perSecurity ($)
NTA position as at 31 December 2013 6,423.5 1,694.9 3.79
FFO 223.6 0.13
Core revaluation (includes development profit) 30.8 0.02
Mark to market of Treasury (30.2) (0.02)
Distribution (177.0) (0.10)
Buy back (41.0) (11.4) (0.00)
Issue of securities 5.7 2.0 0.00
Other (8.3) (0.00)
Movement in net assets 3.6 0.03
Less intangibles - movement 3.2 0.00
NTA position as at 30 June 2014 6,430.3 1,685.5 3.82
CAPITAL MANAGEMENT SUMMARY
Gearing ($m) As at 30 June 2014
Total assets 9,559.0
Less: intangible assets (47.5)
Total tangible assets 9,511.5
Current borrowings 0.0
Non-current borrowings 2,415.5
Total borrowings1 2,415.5
Headline gearing 25.4%
Net gearing 24.8%
Interest Cover ($m) 30 June 2014
Funds From Operations 223.6
Plus: taxes deducted 3.1
Add: distribution to exchangeable securities 12.4
Add: Gross Finance Costs for the period (post capitalised interest) 52.0
Earnings before Interest & Tax 291.1
Gross Finance Costs 52.0
Interest Cover 5.6 times
1. Includes fair value adjustment. As at 30 June 2014, drawn debt is $2,405 million.

6463
LOOK THROUGH GEARING
Look Through Gearing as at 30 June 2014 ($m) GPT Group GWOF GWSCF Other² Total
Share of assets of non-consolidated entities
Group total tangible assets 9,511.5 9,511.5
(i) Plus: GPT share of assets of non-consolidated entities 993.8 704.7 817.7 2,516.1
(ii) Less: total equity investment in non-consolidated entities (761.0) (512.3) (742.5) (2,015.8)
(iii) Less: GPT loans to non-consolidated entities (8.3) (8.3)
Total look through assets 9,511.5 232.8 192.4 66.9 10,003.5
Group total borrowings 2,415.5 2,415.5
(iv) Plus: GPT share of external debt of non-consolidated entities 209.7 172.9 1.9 384.5
Total look through borrowings 2,415.5 209.7 172.9 1.9 2,800.0
Look through gearing 28.0%
Based on net debt1 27.3%
1. Net debt equals debt less cash/total tangible assets less cash. 2. Retail, office and other assets (held in associates).

6463
DEBT
Debt Cost as at 30 June 2014
Debt($m)
% of Total Debt(%)
Interest Rate (%)
Hedged debt 1,825 76% 3.64%
Floating debt 580 24% 2.74%
Total debt 2,405 3.43%
Margin 0.98%
Fees 0.43%
All-in cost of funds 4.84%
Debt Funded Capacity as at 30 June 2014
Current Gearing(%)
Investment Capacity($m)
Balance Sheet 25.4% 700
Wholesale Funds
- Office 21.1% 635
- Retail 24.5% 280
Total 1,615
SOURCES OF DRAWN DEBT
Domestic bank debt 42%
Foreign bank debt 14% Secured bank debt 4%Domestic MTNs 14%
Foreign MTNs 4%USPP 18%
CPI bonds 4%
Sources of Drawn DebtAs at 30 June 2014

6665
DEBT FACILITIES
Current Forward Start Debt Facilities
Start Date Maturity Date
Limit ($m) (equiv)
30 Sep 14 30 Mar 19 100
8 Jul 14 8 Jul 29 121
Total 221
Current Debt Facilities as at 30 June 2014
Outstanding ($m) (equiv)
Maturity Date Limit ($m) (equiv)
Available ($m) (equiv)
Bank Bilateral 200 11 Jul 15 200 0
Bank Bilateral 150 10 Sep 15 150 0
Bank Bilateral 150 11 Sep 15 150 0
Bank Facility - Metroplex 6 21 Nov 15 10 4
Bank Facility - Somerton 80 31 Mar 16 83 2
Bank Bilateral 140 1 Apr 16 140 0
Bank Bilateral 100 1 Apr 16 100 0
Bank Bilateral 100 1 Apr 16 100 0
Bank Bilateral 0 30 Nov 16 75 75
Bank Facility - Metroplex 12 21 May 17 12 0
Bank Bilateral 300 30 Sep 17 300 0
Bank Bilateral 17 26 Oct 17 75 58
Medium Term Notes 30 19 Nov 17 30 0
Bank Bilateral 325 26 Oct 18 325 0
Medium Term Notes 250 24 Jan 19 250 0
Medium Term Notes 50 16 Aug 22 50 0
US Private Placement 146 19 Jun 25 146 0
Medium Term Notes 99 5 Feb 28 99 0
US Private Placement 97 19 Jun 28 97 0
US Private Placement 67 8 Jul 29 67 0
CPI Indexed Bonds 85 10 Dec 29 85 0
Total Borrowings 2,405 2,543 139

6665
DEBT MATURITY PROFILE
1H 2H
2014
1H 2H
2015
1H 2H
2016
1H 2H
2017
1H 2H
2018
1H 2H
2019
1H 2H
2020
1H 2H
2021
1H 2H
2022
1H 2H
2023
1H 2H
2024
1H 2H
2025
1H 2H
2026
1H 2H
2027
1H 2H
2028
1H 2H
2029
1H 2H
2030
289
423
405
325 35
0
50
146
196
273
75
12Facility A$ millions
As at 30 June 2014

6867
LIQUIDITY PROFILE
Excess liquidity at
31 Dec 2014
Cash balance 30 June 2014
Undrawn existing facilities
Current liquidity
Forward Start Facilities
Retained earnings
Sale of assets
Participation in Funds’
equity raise & DRP
Capex0.0
0.2
0.4
0.6
1.0
0.8
($bn)
Liquidity Profile As at 30 June 2014

6867
HEDGING PROFILE
3,000 3.64% 3.63% 3.71% 3.74% 3.71% 3.70% 3.70% 3.69%4.03% 3.97%
2,500
2,000
($m)1,500
1,000
500
Jun
14
Dec
14
Jun
15
Dec
15
Jun
16
Dec
16
Jun
17
Dec
17
Jun
18
Dec
18
0 0.00%
1.00%
2.00%
3.00%
4.00%
Forecast DebtShort Term “interest cost management” swaps
Long term “interest rate risk management” swapsFixed rate debt
Weighted average fixed rate
Hedging Profile as at 30 June 2014
Hedging Position Average Rate on Hedged Balance excl Margins
Principal Amount of Derivative Financial Instruments ($m)
Principal Amount of Fixed Rate Borrowings ($m)
30 June 2014 3.64% 1,265 560
30 June 2015 3.71% 965 710
30 June 2016 3.71% 1,040 710
30 June 2017 3.70% 1,040 710
30 June 2018 4.03% 1,240 710
30 June 2019 4.02% 440 135

2014GPT>
Ret
ail
Port
folio
INTERIM RESULTRETAIL PORTFOLIO

7271
RETAIL PORTFOLIO OVERVIEW
GPT is a leading owner, manager and developer of Australian retail property. GPT’s retail investments of $4.5 billion include a portfolio of assets held on the Group’s balance sheet and an investment in the GPT Wholesale Shopping Centre Fund (GWSCF).
Northern Territory GPT OWNEDCasuarina Square (50%)
GWSCF OWNEDCasuarina Square (50%)
Queensland GPT OWNEDSunshine Plaza (50%)*
Australian Capital Territory GWSCF OWNEDWestfield Woden (50%)*
New South Wales GPT OWNEDCharlestown Square (Hunter Region)Rouse Hill Town CentreWestfield Penrith (50%)*
GWSCF OWNEDForestway Shopping CentreMacarthur Square (50%)*Norton PlazaWollongong Central (Illawarra Region)
VictoriaGPT OWNEDDandenong PlazaMelbourne CentralHighpoint Shopping Centre (16.67%)
GWSCF OWNEDChirnside ParkHighpoint Shopping Centre (50%)Northland Shopping Centre (50%)*Parkmore Shopping Centre
* Not managed by GPT Retail Portfolio Definitions Specialty Tenants - includes tenancies with a GLA below 400 sqm Mini-Major Tenants - includes tenancies with a GLA above 400 sqm not classified as a Major TenantMajor Tenants - includes Supermarkets, Discount Department Stores, Department Stores and CinemasRetail Sales - 100% of GPT and GWSCF assets. GPT reports retail sales in accordance with the Shopping Centre Council of Australia (SCCA) guidelines.GLA and number of tenancies is updated on an annual basis, as at 31 December 2013 (excludes Northland, updated as at 30 June 2014).
Number of assets in each state
QLD
NSW
SA
NT
WA
VIC
TAS
1
1
1
6
7
Darwin
Brisbane
Sydney
Canberra
Melbourne

7473
Wesfarmers Woolworths Myer
5.2%
2.1% 1.6% 1.3% 1.2% 1.2% 1.2%
4.4% 2.9% 2.7%
Cotton onClothing Hoyts BB Retail Westpac
James Pascoe Group
CountryRoadGroup
Premier Retail
(Just Group)
RETAIL PORTFOLIO SUMMARY
The GPT retail portfolio is well positioned with a high level of occupancy at 99.5%. The retail portfolio achieved comparable income growth of 2.6% over the first half of 2014.
Top Ten Tenants1 As at 30 June 2014
Asset Quality As at 30 June 2014
Geographic WeightingAs at 30 June 2014
Peer1
Peer2
Peer3
Peer4
GPT
Reg
iona
l
Su
b R
egio
nal
Oth
er
100
80
60
40
20
0
(%)
PORTFOLIO BY GEOGRAPHY
NSW 44%VIC 39%QLD 9%ACT 1%NT 7%
1. Based on gross rent (including turnover rent).

7473
RETAIL PORTFOLIO SUMMARY
The high quality retail portfolio has been created over approximately 40 years and currently consists of interests in 16 shopping centres.
Location Owner- ship
GLA(100%
Interest)(sqm)
30 Jun 14Fair Value
($m)
30 Jun 14Cap Rate
(%)
31 Dec 13Cap Rate
(%)
External orDirectorsValuation
Occupancy Annual Centre
Turnover($m)
OccupancyCost
Specialty
SpecialtySales
($psm)
GPT PortfolioCasuarina Square NT 50% 53,500 256.0 6.00% 6.00% Directors 99.8% 396.6 15.5% 10,967Charlestown Square NSW 100% 89,300 838.7 5.88% 6.00% External 98.7% 508.1 16.9% 9,277Dandenong Plaza VIC 100% 61,400 173.5 8.00% 8.00% Directors N/A 206.2 18.4% 6,321Highpoint Shopping Centre¹ VIC 16.67% 153,900 307.7 5.50% 5.50% Directors 99.5% 881.5 20.9% 9,530Melbourne Central2 VIC 100% 52,700 1,003.7 5.75% 5.75% Directors 99.6% 393.0 21.4% 9,596Rouse Hill Town Centre NSW 100% 68,900 472.7 6.00% 6.00% Directors 99.8% 400.2 15.0% 7,425Sunshine Plaza QLD 50% 72,700 407.5 5.75% 5.75% External 99.6% 517.1 18.5% 11,312Westfield Penrith NSW 50% 91,700 562.5 5.75% 5.75% External 99.9% 590.5 19.5% 10,759GWSCF PortfolioCasuarina Square NT 50% 53,500 255.8 6.00% 6.00% Directors 99.8% 396.6 15.5% 10,967Chirnside Park VIC 100% 37,900 233.7 6.75% 7.00% External 99.9% 251.9 16.1% 9,803Forestway Shopping Centre NSW 100% 9,600 87.0 7.50% 7.50% Directors 100.0% 99.9 15.4% 10,763Highpoint Shopping Centre¹ VIC 50% 153,900 922.7 5.50% 5.50% Directors 99.5% 881.5 20.9% 9,530Macarthur Square NSW 50% 94,100 406.6 6.25% 6.25% Directors 99.9% 545.8 17.7% 9,207Northland Shopping Centre VIC 50% 94,600 499.2 5.75% N/A Directors 99.7% 497.8 22.1% 8,205Norton Plaza NSW 100% 11,900 114.0 6.75% 7.00% External 100.0% 118.0 13.6% 11,224Parkmore Shopping Centre VIC 100% 36,800 224.0 7.00% 7.00% External 99.3% 241.9 15.5% 8,382Westfield Woden ACT 50% 72,300 313.5 6.25% 6.25% External 99.5% 367.4 20.2% 8,639Wollongong Central NSW 100% 37,900 432.4 6.25% 6.50% External N/A 151.5 19.3% 8,636Total 1,039,200 5.96%3 5.99%3 99.5%4 6,167.4 18.0%5 9,6135
1. Fair value includes Homemaker City Maribyrnong. Cap rate of 9.00%.2. Fair value includes retail and 100% interest of car park. Car park cap rate of 7.25%.3. Includes GPT shopping centres and GPT interest in GWSCF. 4. Excludes development impacted centres: Dandenong Plaza and Wollongong Central.5. Includes 100% interest in GPT and GWSCF assets. Excludes Northland Shopping Centre and development impacted centres: Dandenong Plaza, Highpoint Shopping Centre and Wollongong Central.
PORTFOLIO BY GEOGRAPHY
NSW 44%VIC 39%QLD 9%ACT 1%NT 7%

7675
RETAIL SALES SUMMARY
OwnershipMoving Annual Turnover (MAT) Occupancy Costs
Centre MAT($psm)
Comparable CentreMAT Growth
Specialty MAT($psm)
Comparable SpecialtyMAT Growth
Centre Specialty
Casuarina Square GPT/GWSCF 8,475 0.7% 10,967 3.1% 9.8% 15.5%
Charlestown Square GPT 6,351 2.8% 9,277 2.6% 11.3% 16.9%
Chirnside Park GWSCF 7,514 (9.3%) 9,803 (4.5%) 8.0% 16.1%
Forestway Shopping Centre GWSCF 16,854 2.1% 10,763 (2.3%) 6.3% 15.4%
Melbourne Central Retail GPT 7,907 5.5% 9,596 3.6% 17.7% 21.4%
Macarthur Square GWSCF/APPF 6,195 0.0% 9,207 3.4% 11.1% 17.7%
Norton Plaza GWSCF 13,825 0.4% 11,224 1.7% 6.2% 13.6%
Parkmore Shopping Centre GWSCF 7,021 (0.7%) 8,382 0.5% 8.1% 15.5%
Rouse Hill Town Centre GPT 6,649 4.3% 7,425 8.3% 9.1% 15.0%
Sunshine Plaza GPT/APPF 8,385 1.2% 11,312 3.0% 11.2% 18.5%
Westfield Penrith1 GPT/Westfield 7,244 (1.2%) 10,759 3.2% 12.5% 19.5%
Westfield Woden1 GWSCF/Westfield 6,103 (1.8%) 8,639 (1.0%) 12.0% 20.2%
Total 7,255 0.5% 9,613 2.7% 11.1% 18.0%
Centres Under DevelopmentDandenong Plaza GPT 4,473 (8.9%) 6,321 (7.4%) 11.2% 18.4%
Highpoint Shopping Centre GPT/GWSCF/HPG 6,246 26.1% 9,530 20.8% 14.2% 20.9%
Wollongong Central GWSCF 5,038 (6.1%) 8,636 (4.0%) 14.6% 19.3%
Assets Acquired
Northland Shopping Centre2 GWSCF/CFS 5,803 (0.4%) 8,205 (0.5%) 14.0% 22.1%1. Analysis provided by Westfield.2. Analysis provided by CFS.

7675
COMPARABLE CHANGE IN RETAIL SALES BY CATEGORY
Structured Rent Increases
Fixed 86% Other1 14%
GPT’s retail portfolio occupancy levelsremain high at 99.5%, with a relativelyhigh proportion of structured rentalincreases. This positions GPT well tocontinue to deliver income growth.
Retail sales showed positive growth over the 12 months to 30 June 2014 with total centre sales up 0.5% and specialties up 2.7%.
Comparable Change in Retail Sales by Categoryas at 30 June 2014
MAT ($m) 12 Months Growth
Department Store $197 (1.0%)
Discount Department Store $485 (5.8%)
Supermarket $934 (0.7%)
Mini Majors $477 (2.5%)
Other Retail¹ $394 5.9%
Total Specialties $1,944 2.7%
Total Centre $4,430 0.5%
Specialty Sales Split
Retail Services $160 10.6%
General Retail $196 4.9%
Food Catering $359 4.0%
Leisure $119 4.0%
Food Retail $149 3.1%
Apparel $673 0.9%
Jewellery $133 0.7%
Homewares $89 (2.4%)
Mobile Phones $66 (2.4%)Excludes Northland Shopping Centre and development impacted centres: Highpoint Shopping Centre, Dandenong Plaza and Wollongong Central. Based on 100% of GPT and GWSCF assets.1. Other Retail includes travel agents, lotto, automotive accessories, cinemas, and other entertainment and other reporting tenants.
Structured specialty rent increases for the six months to 31 December 2014. Based on specialty base rent.1. Other includes expiries in 2014.
4.5% Average Increase

7877
Weighted Average Capitalisation Rate
RETAIL SALES
Retail specialty sales have increased by 2.7% over the 12 months to 30 June 2014.
Jun 04 Dec 04 Jun 05 Dec 05 Jun 06 Dec 06 Jun 07 Dec 07 Jun 08 Dec 08 Jun 09 Dec 09 Jun 10 Dec 10 Jun 11 Dec 11 Jun 12 Dec 12 Jun 13 Dec 13
4.8%
5.8%6.0%
3.3%
1.4%
2.3%
3.9% 4.0%4.4%
2.8%
3.6%3.2%
0.2%0.5%
2.1%
1.2%
0.4%
1.5%1.1%
1.8%
2.7%
Jun 140.0%
1.0%
2.0%
3.0%
4.0%
5.0%
6.0%
7.0%
Specialty MAT Growth
100% of GPT & GWSCF assets. Excludes development impacted centres and Northland Shopping Centre.

7877
WEIGHTED AVERAGE CAPITALISATION RATE
The weighted average capitalisation rate of the retail portfolio firmed by 3 basis points over the past six months to 5.96% at 30 June 2014.
5.84% 6.04%6.26% 6.26% 6.25% 6.21% 6.19% 6.21% 6.10% 6.07% 6.03% 5.99%
5.63%
Dec 08Jun 08Dec 07 Jun 09 Dec 09 Jun 10 Dec 10 Jun 11 Dec 11 Jun 12 Dec 12 Jun 13 Dec 13 Jun 14
5.96%
Weighted Average Capitalisation Rate

8079
LEASE EXPIRY PROFILE
Weighted Average Lease Expiry (by base rent) as at 30 June 2014
Major Tenants 11.6 years
Mini-Major Tenants 4.2 years
Specialty Tenants 2.5 years
Weighted Total 4.0 years
11.7%
19.2%
16.6%
12.9% 13.1%
7.3%
5.8%
1.7% 1.4% 1.5%
8.9%
2H 2014 2015 2016 2017 2018 2019 2020 2021 2022 2023 2024+
14.4%
22.6%
20.3%
15.5%
13.8%
7.5%
3.4%
1.0% 0.4% 0.7% 0.3%
2H 2014 2015 2016 2017 2018 2019 2020 2021 2022 2023 2024+
Total Centres Total Specialty Tenants

8079
RETAIL PORTFOLIO EXTERNAL VALUATION SUMMARY
48% of the GPT retail portfolio was valued externally in the six months to 30 June 2014.
State Date Valuer Valuation($m)
Interest(%)
CapitalisationRate (%)
TerminalCapitalisation
Rate (%)
DiscountRate (%)
GPT PortfolioCasuarina Square NT 31 Dec 13 JLL 247.0 50% 6.00% 6.25% 8.75%Charlestown Square NSW 30 Jun 14 Savills 838.7 100% 5.88% 6.13% 8.75%Dandenong Plaza VIC 30 Jun 13 Colliers 155.0 100% 8.00% 8.25% 9.50%Highpoint Shopping Centre¹ VIC 30 Sep 13 Savills 306.4 16.67% 5.50% 5.75% 8.50%Melbourne Central2 VIC 31 Dec 13 Savills 998.2 100% 5.75% 6.00% 8.75%Rouse Hill Town Centre NSW 31 Dec 13 JLL 470.0 100% 6.00% 6.25% 8.75%Sunshine Plaza QLD 30 Jun 14 CBRE 407.5 50% 5.75% 6.00% 8.75%Westfield Penrith NSW 30 Jun 14 JLL 562.5 50% 5.75% 6.00% 8.50%GWSCF PortfolioCasuarina Square NT 31 Dec 13 JLL 247.0 50% 6.00% 6.25% 8.75%Chirnside Park VIC 30 Jun 14 CBRE 233.7 100% 6.75% 7.00% 8.75%Forestway Shopping Centre NSW 31 Mar 14 CBRE 86.9 100% 7.50% 7.75% 9.00%Highpoint Shopping Centre¹ VIC 30 Sep 13 Savills 919.3 50% 5.50% 5.75% 8.50%Macarthur Square NSW 31 Mar 14 CBRE 404.5 50% 6.25% 6.50% 8.75%Northland Shopping Centre VIC 31 Mar 14 CBRE 497.0 50% 5.75% 5.88% 8.50%Norton Plaza NSW 30 Jun 14 Colliers 114.0 100% 6.75% 7.00% 8.75%Parkmore Shopping Centre VIC 30 Jun 14 Colliers 224.0 100% 7.00% 7.25% 8.75%Westfield Woden ACT 30 Jun 14 Savills 313.5 50% 6.25% 6.50% 8.75%Wollongong Central NSW 30 Jun 14 CBRE 432.4 100% 6.25% 6.50% 8.50%Note: Valuations include ancillary assets. 1. Valuation includes Homemaker City Maribyrnong. 2. Valuation includes Melbourne Central Retail and car park.

8281
RETAIL PORTFOLIO INCOME AND FAIR VALUE SCHEDULE
Income 6 months to
30 June ($m)
Fair Value
Fair Value31 Dec 13
($m)
Capex($m)
LeaseIncentives
($m)
Acquisitions($m)
Sales($m)
NetRevaluations
($m)
OtherAdjustments
($m)
Fair Value30 Jun 14
($m)
% of Portfolio
(%)2013 2014 Variance
GPT Portfolio
Casuarina Square 7.7 7.9 0.2 247.0 9.0 0.1 0.0 0.0 0.0 0.0 256.0 5.6
Charlestown Square 24.4 24.6 0.3 829.9 0.6 0.5 0.0 0.0 7.6 0.0 838.7 18.5
Dandenong Plaza 9.5 8.1 (1.4) 158.8 14.6 0.1 0.0 0.0 0.0 0.0 173.5 3.8
Highpoint Shopping Centre 7.5 8.7 1.2 307.2 0.3 0.2 0.0 0.0 0.0 0.0 307.7 6.8
Melbourne Central 30.4 31.4 1.1 998.2 0.7 0.3 4.8 0.0 (0.3) 0.0 1,003.7 22.1
Rouse Hill Town Centre 14.4 14.5 0.1 470.0 1.7 1.0 0.0 0.0 0.0 0.0 472.7 10.4
Sunshine Plaza 11.4 11.9 0.5 399.2 0.6 0.4 0.0 0.0 7.4 0.0 407.5 9.0
Westfield Penrith 16.2 16.4 0.2 553.9 1.0 0.7 0.0 0.0 6.9 0.0 562.5 12.4
Equity Interests
GPT Equity Interest in GWSCF (20.1%)¹ 14.7 15.0 0.3 523.8 - - - - (11.5) - 512.3 11.3
Total Retail Portfolio 136.1 138.6 2.5 4,488.0 28.5 3.2 4.8 0.0 10.2 0.0 4,534.7
1. GPT Equity Interest in GWSCF represents GPT’s equity accounted interest in the net assets of the Fund, including net revaluations during the period resulting from mark to market movements of financial instruments and investment property revaluations. Net income for the six months to 30 June 2014 represents distributions declared from the Fund for the March 2014 and June 2014 quarterly distribution periods.

8281
RETAIL SUSTAINABILITY
AreaGLA
Water (Total) Litres/m2
Emissionskg CO2-e/m2
Waste % Recycled/Reused
GPT Portfolio
Casuarina Square 53,500 2,201 112 24%
Charlestown Square 89,300 806 49 85%
Dandenong Plaza 61,400 896 120 18%
Highpoint Shopping Centre 153,900 874 103 24%
Melbourne Central 52,700 1,974 193 25%
Rouse Hill Town Centre 68,900 712 48 67%
Sunshine Plaza 72,700 905 93 46%
Westfield Penrith 91,700 1,484 110 40%
GWSCF Portfolio
Casuarina Square 53,500 2,201 112 24%
Chirnside Park 37,900 1,031 62 31%
Forestway Shopping Centre 9,600 1,781 61 24%
Highpoint Shopping Centre 153,900 874 103 24%
Macarthur Square 94,100 1,161 68 41%
Norton Plaza 11,900 1,311 104 25%
Parkmore Shopping Centre 36,800 844 90 34%
Westfield Woden 72,300 1,198 83 28%
Wollongong Central 37,900 745 79 49%
Total 1,121 92 38%
Note: Sustainability data as at 31 December 2013.

PB83
GPT WHOLESALE SHOPPING CENTRE FUND
The GPT Wholesale Shopping Centre Fund (GWSCF) provides GPT with an important source of income through funds management, property management and development management fees in addition to the distribution received from the Fund.
GWSCF - Top Ten Tenants1
As at 30 June 2014
Regional 94%Other 6%
GWSCF - Portfolio by Sub-SectorAs at 30 June 2014
1. Based on gross rent (including turnover rent).
Wesfarmers Woolworths Myer
5.7%
2.1% 1.8% 1.5% 1.5% 1.4% 1.3%
4.9% 2.9% 2.1%
David Jones Hoyts Westpac
James Pascoe Group
SpecialityFashion Group
Cotton On Clothing
Premier Retail
(Just Group)

2014GPT> Offi
ce
Port
folioINTERIM RESULT
OFFICE PORTFOLIO
8685
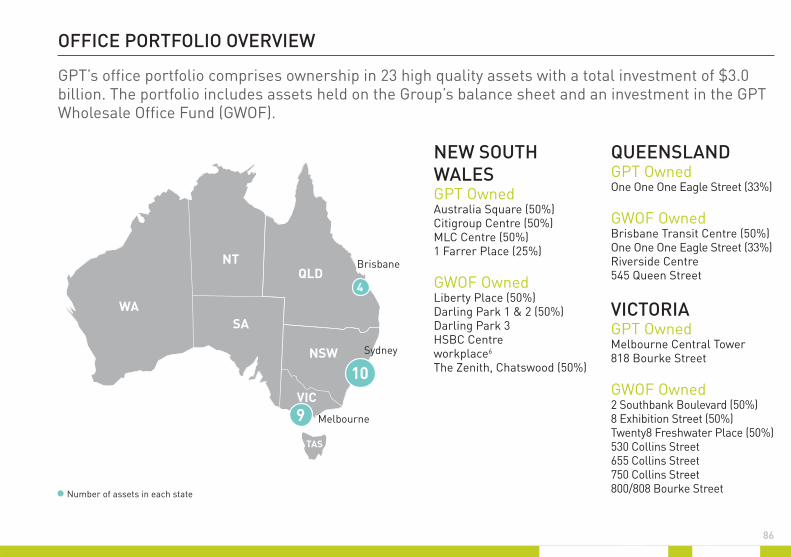
OFFICE PORTFOLIO OVERVIEW
NEW SOUTH WALESGPT OwnedAustralia Square (50%)Citigroup Centre (50%)MLC Centre (50%)1 Farrer Place (25%)
GWOF OwnedLiberty Place (50%)Darling Park 1 & 2 (50%)Darling Park 3HSBC Centreworkplace6
The Zenith, Chatswood (50%)
QUEENSLANDGPT OwnedOne One One Eagle Street (33%)
GWOF OwnedBrisbane Transit Centre (50%)One One One Eagle Street (33%)Riverside Centre545 Queen Street
VICTORIAGPT OwnedMelbourne Central Tower818 Bourke Street
GWOF Owned2 Southbank Boulevard (50%)8 Exhibition Street (50%)Twenty8 Freshwater Place (50%)530 Collins Street655 Collins Street750 Collins Street800/808 Bourke Street
GPT’s office portfolio comprises ownership in 23 high quality assets with a total investment of $3.0 billion. The portfolio includes assets held on the Group’s balance sheet and an investment in the GPT Wholesale Office Fund (GWOF).
l Number of assets in each state
QLD
NSW
SA
NT
WA
VIC
TAS
4
9
10
Brisbane
Sydney
Melbourne

8887
GPT has the highest exposure to Prime Grade office assets out of the listed AREIT sector. The GPT office portfolio is underpinned by a strong weighted average lease term of 6.3 years.
Peer2
Peer1
Peer3
Peer4
Peer5
GPT
Prem
ium
A
Gra
de
Oth
er
100
80
60
40
20
0
(%)Sydney 58%
Melbourne 28% Brisbane 14%
Members EquityGovernment
Ericsson Australia
ArrowEnergy ANZ Citibank CBA
King & WoodMallesons
NAB PwC
11.0% 2.4%2.4%2.6%3.3%
2.2% 2.1%2.2%2.2%2.2%
Top Ten Tenants1
As at 30 June 2014Asset Quality
As at 30 June 2014Geographic Weighting
As at 30 June 2014
1. Based on gross rent.
OFFICE PORTFOLIO SUMMARY

8887
Sydney 58% Melbourne 28% Brisbane 14%
Geographic WeightingAs at 30 June 2014
OFFICE PORTFOLIO SUMMARY
Location Owner-ship
Office NLA
(100% Interest)
(sqm)
30 Jun 14 Fair
Value($m)
30 Jun 14 Cap Rate
(%)
31 Dec 13 Cap Rate
(%)
External or Directors
Valuation
Office Occupancy WALEBy
Income(Years)Actual
Inc. SignedLeases
Inc. Heads of
Agreement
GPT PortfolioAustralia Square, Sydney NSW 50% 51,400 320.0 6.50% 6.75% External 93.6% 97.7% 97.7% 5.2Citigroup Centre, Sydney NSW 50% 73,400 399.5 6.50% 6.50% Directors 79.2% 92.4% 92.7% 6.5MLC Centre, Sydney NSW 50% 68,500 365.0 6.75% 7.00% External 64.0% 65.8% 68.4% 6.31 Farrer Place, Sydney NSW 25% 86,400 336.3 6.00% 6.25% External 83.3% 85.1% 89.5% 6.8Melbourne Central Tower, Melbourne VIC 100% 65,700 399.7 6.75% 6.75% Directors 88.5% 88.5% 88.5% 5.0818 Bourke Street, Melbourne VIC 100% 21,900 150.0 7.00% 7.25% External 100.0% 100.0% 100.0% 4.3One One One Eagle Street, Brisbane QLD 33% 63,800 229.7 6.50% 6.50% Directors 83.7% 93.6% 93.6% 9.4GWOF PortfolioLiberty Place, Sydney NSW 50% 56,400 452.5 6.00% 6.25% External 100.0% 100.0% 100.0% 10.9Darling Park 1 & 2, Sydney NSW 50% 101,800 620.1 6.38% - 6.75% 6.50% - 6.75% Directors 100.0% 100.0% 100.0% 5.0
Darling Park 3, Sydney NSW 100% 29,800 292.5 6.25% 7.00% External 100.0% 100.0% 100.0% 5.4
HSBC Centre, Sydney NSW 100% 37,300 341.6 7.00% 7.00% Directors 94.5% 94.5% 94.5% 3.5workplace6, Sydney NSW 100% 16,300 173.1 7.00% 7.00% Directors 100.0% 100.0% 100.0% 5.4The Zenith, Chatswood NSW 50% 43,400 128.5 8.00% 8.50% External 94.5% 94.5% 94.5% 3.72 Southbank Boulevard, Melbourne VIC 50% 53,500 198.0 6.25% - External 100.0% 100.0% 100.0% 3.78 Exhibition Street, Melbourne VIC 50% 44,600 175.1 6.25% 6.50% Directors 100.0% 100.0% 100.0% 6.4Twenty8 Freshwater Place, Melbourne VIC 50% 33,900 123.5 6.75% 7.00% External 100.0% 100.0% 100.0% 4.7530 Collins Street, Melbourne VIC 100% 65,700 444.2 6.50% 6.63% Directors 96.3% 96.3% 97.0% 6.4655 Collins Street, Melbourne VIC 100% 16,600 112.0 6.25% - External 100.0% 100.0% 100.0% 15.4750 Collins Street, Melbourne VIC 100% 37,300 263.0 7.13% - External 100.0% 100.0% 100.0% 5.4800/808 Bourke Street, Melbourne VIC 100% 59,600 402.0 6.25% 6.50% External 100.0% 100.0% 100.0% 13.1Brisbane Transit Centre, Brisbane QLD 50% 29,500 62.5 9.00% 9.00% Directors 69.2% 69.2% 69.2% 1.8One One One Eagle Street, Brisbane QLD 33% 63,800 229.1 6.50% 6.50% Directors 83.7% 93.6% 93.6% 9.4Riverside Centre, Brisbane QLD 100% 51,700 590.0 6.75% 7.00% External 96.4% 96.4% 96.4% 4.7545 Queen Street, Brisbane QLD 100% 13,100 86.5 7.75% 7.75% Directors 100.0% 100.0% 100.0% 2.9Total 1,121,500 6.56% 6.72% 88.3% 91.1% 91.7% 6.3

9089
WEIGHTED AVERAGE CAPITALISATION RATEThe weighted average capitalisation rate of the office portfolio firmed by 16 basis points to 6.56% over the 6 months to 30 June 2014.
Dec 08 Jun 09 Dec 09 Jun 10 Dec 10 Jun 11 Dec 11 Jun 12 Dec 12 Jun 13 Dec 13 Jun 14
6.60%7.10% 7.27% 7.20% 7.14% 7.11% 7.07% 7.01% 6.86% 6.78% 6.72% 6.56%
Jun 08
6.10%
Weighted Average Capitalisation Rate
9089
Weighted Average Capitalisation Rate
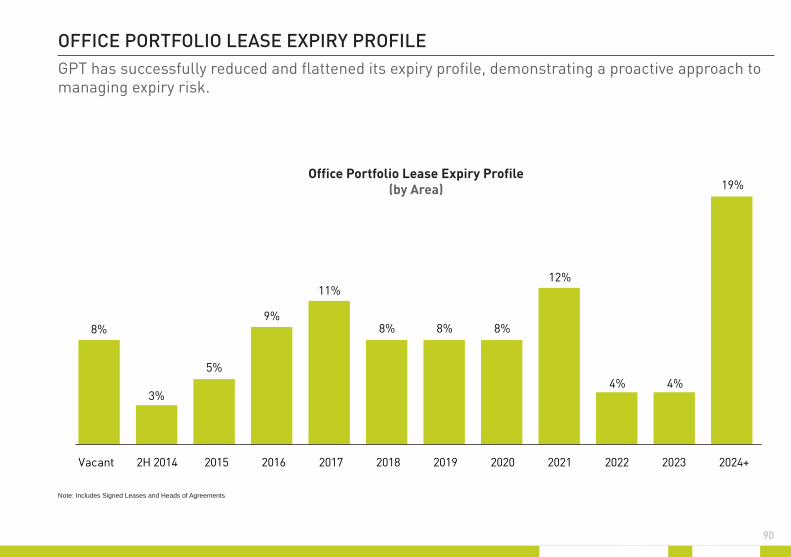
OFFICE PORTFOLIO LEASE EXPIRY PROFILEGPT has successfully reduced and flattened its expiry profile, demonstrating a proactive approach to managing expiry risk.
Vacant 2H 2014 2015 2016 2017 2018 2019 2020 2021 2022 2023 2024+
8%
3%
5%
9%
11%
8% 8% 8%
12%
4% 4%
19%Office Portfolio Lease Expiry Profile
(by Area)
Note: Includes Signed Leases and Heads of Agreements

9291
OFFICE MARKET OUTLOOK
GPT’s office portfolio has adiverse tenant mix across a widerange of sectors. Income growthis underpinned by 85% of reviewedleases being subject to a fixed rental review with an average increase of 3.9%. The weighted office portfolio is over-rented by 1.5%1.
Sydney and Melbourne CBD office markets are showing signs of stabilisation, whilst Brisbane continues to experience a soft market environment.
2002 2003 2004 2005 2006 2007 2008 2009 2010 2011 2012 2013
30.3%32.8%
30.0%
Sydney CBD Melbourne CBD Brisbane CBD
2H 20140%5%
10%15%20%25%30%35%
2002 2003 2004 2005 2006 2007 2008 2009 2010 2011 2012 2013
10.3%
15.1%
10.4%
Sydney CBD Melbourne CBD Brisbane CBD
2H 20140%2%4%6%8%
10%12%14%16%18%
Total Vacancy
Prime Incentives
Rent ReviewsFixed 85%Other2 15%
Structured rent reviews for the six months to 31 December 2014.1. Passing rents struck on effective deals “faced up”
at current incentive levels.2. Other includes market reviews, CPI reviews and
expiries in 2014.
3.9% Average Increase
Forecast 2014-2016
Average Vacancy
Forecast 2014-2016
Average Prime Incentives
Source: JLL Research, Q2 2014
Source: JLL Research, Q2 2014. Note: Incentives in Sydney and Brisbane are based on gross face rents, whilst Melbourne is based on net face rents.

9291
OFFICE PORTFOLIO EXTERNAL VALUATION SUMMARY68% of the GPT office portfolio was valued externally in the six months to 30 June 2014.
State Date Valuer Valuation ($m)
Interest(%)
Capitalisation Rate (%)
Terminal Capitalisation
Rate (%)Discount Rate
(%)
GPT Portfolio Australia Square, Sydney NSW 30 Jun 14 Knight Frank 320.0 50% 6.50% 6.63% 8.50%Citigroup Centre, Sydney NSW 31 Dec 13 CBRE 395.0 50% 6.50% 6.50% 8.75%MLC Centre, Sydney NSW 30 Jun 14 CBRE 365.0 50% 6.75% 6.88% 8.50%1 Farrer Place, Sydney NSW 30 Jun 14 Knight Frank 336.3 25% 6.00% 6.13% 8.25%Melbourne Central Tower, Melbourne VIC 31 Dec 13 Knight Frank 394.0 100% 6.75% 7.00% 8.65%818 Bourke Street, Melbourne VIC 30 Jun 14 CBRE 150.0 100% 7.00% 7.25% 8.50%One One One Eagle Street, Brisbane QLD 31 Mar 14 JLL 228.3 33% 6.50% 6.50% 8.50%GWOF Portfolio Liberty Place, Sydney NSW 30 Jun 14 JLL 452.5 50% 6.00% 6.25% 8.00%
Darling Park 1 & 2, Sydney NSW 31 Mar 14 Knight Frank 620.0 50% Office: 6.38% - 6.63% Retail: 6.75%
Office: 6.75% Retail: 7.00%
Office: 8.50% Retail: 8.75%
Darling Park 3, Sydney NSW 30 Jun 14 JLL 292.5 100% 6.25% 6.57% 8.25%HSBC Centre, Sydney NSW 31 Dec 13 JLL 340.0 100% 7.00% 7.00% 8.75%workplace6, Sydney NSW 31 Dec 13 CBRE 173.0 100% 7.00% 7.25% 8.75%The Zenith, Chatswood NSW 30 Jun 14 JLL 128.5 50% 8.00% 8.25% 8.75%2 Southbank Boulevard, Melbourne VIC 30 Jun 14 JLL 198.0 50% 6.25% 6.50% 8.25%8 Exhibition Street, Melbourne VIC 31 Mar 14 m3 172.8 50% 6.50% 6.50% 8.50%Twenty8 Freshwater Place, Melbourne VIC 30 Jun 14 JLL 123.5 50% 6.75% 6.75% 8.25%530 Collins Street, Melbourne VIC 31 Dec 13 Knight Frank 445.0 100% 6.63% 6.75% 8.50%655 Collins Street, Melbourne VIC 30 Jun 14 Knight Frank 112.0 100% 6.25% 7.00% 8.50%750 Collins Street, Melbourne VIC 30 Jun 14 JLL 263.0 100% 7.13% 7.50% 8.50%800/808 Bourke Street, Melbourne VIC 30 Jun 14 JLL 402.0 100% 6.25% 7.00% 8.25%Brisbane Transit Centre, Brisbane QLD 31 Dec 13 Colliers 62.3 50% 9.00% 9.25% 9.25%One One One Eagle Street, Brisbane QLD 31 Mar 14 JLL 228.3 33% 6.50% 6.50% 8.50%Riverside Centre, Brisbane QLD 30 Jun 14 Knight Frank 590.0 100% 6.75% 6.75% 8.25%545 Queen Street, Brisbane QLD 31 Dec 13 Colliers 86.5 100% 7.75% 8.00% 9.00%

9493
OFFICE PORTFOLIO INCOME AND FAIR VALUE SCHEDULE
Income6 months to
30 June ($m)
Fair Value
Fair Value31 Dec 13
($m)Capex($m)
Lease Incentives
($m)Acquisitions
($m)Sales($m)
NetRevaluations
($m)
Other Adjustments
($m)
Fair Value30 Jun 14
($m)
% of Portfolio
(%)2013 2014 Variance
GPT Portfolio
Australia Square, Sydney 9.2 10.0 0.8 311.1 4.1 2.0 0.0 0.0 3.0 (0.1) 320.0 10.8
Citigroup Centre, Sydney 13.2 14.2 1.1 395.0 0.9 3.5 0.0 0.0 0.0 0.1 399.5 13.5
MLC Centre, Sydney 13.7 9.5 (4.2) 384.4 11.1 4.8 0.0 0.0 (35.3) 0.0 365.0 12.3
1 Farrer Place, Sydney 10.7 10.2 (0.5) 335.6 (1.0) 0.3 0.0 0.0 0.9 0.5 336.3 11.4
Melbourne Central Tower, Melbourne 15.9 12.3 (3.6) 394.0 2.5 3.3 0.0 0.0 0.0 (0.1) 399.7 13.5
818 Bourke Street, Melbourne 5.0 5.3 0.2 138.4 0.1 0.0 0.0 0.0 11.5 0.0 150.0 5.1
One One One Eagle Street, Brisbane 5.4 6.4 1.0 224.9 (0.1) 2.6 0.0 0.0 2.4 0.0 229.7 7.8
Equity InterestsGPT Equity Interest in GWOF1 (20.5%) 21.1 23.7 2.6 714.9 - - 24.3 - 21.8 0.0 761.0 25.7
Total 94.2 91.6 (2.6) 2,898.3 17.5 16.5 24.3 0.0 4.3 0.3 2,961.2
1. GPT Equity Interest in GWOF represents GPT’s equity accounted interest in the net assets of the Fund, including net revaluations during the period resulting from mark to market movements of financial instruments and investment property revaluations. Net income for the six months to 30 June 2014 represents distributions declared from the Fund for the March 2014 and June 2014 quarterly distribution periods.
Cap rate compression underpinning capital values.

9493
Cap rate compression underpinning capital values.
OFFICE SUSTAINABILITYA number of GPT office assets are recognised for exceptional performance with the extension of their NABERS rating1 to 5.5 star.
NABERS Energy Rating (including Green Power) NABERS Water Rating
2008 2009 2010 2011 2012 2013 2014 2008 2009 2010 2011 2012 2013 2014
GPT PortfolioAustralia Square, Sydney (Tower) 4.0 4.5 4.5 4.0 4.5 4.0 4.0 3.5 3.5 3.5 4.0 4.0 4.0 3.0Australia Square, Sydney (Plaza) 5.0 5.0 5.0 5.0 5.0 5.0 5.5 3.5 4.0 4.0 3.5 4.0 4.0 4.0Citigroup Centre, Sydney 4.5 5.0 5.0 5.0 5.0 5.0 5.0 4.0 4.0 4.0 3.5 3.5 3.5 3.5MLC Centre, Sydney 4.5 5.0 5.0 5.0 5.5 5.0 5.0 2.5 3.0 3.0 3.5 3.0 3.5 4.01 Farrer Place, Sydney, (GMT) 3.0 3.0 4.5 4.5 4.5 4.5 4.5 - 4.0 4.0 4.0 4.0 3.5 N/A1 Farrer Place, Sydney (GPT) 3.0 3.0 4.0 4.0 3.5 4.5 4.5 - 3.0 3.0 3.0 3.0 3.5 N/AMelbourne Central, Melbourne 4.5 4.5 4.5 5.0 5.0 5.0 4.5 2.0 3.5 3.5 2.5 3.0 3.0 3.0818 Bourke Street, Melbourne 5.0 5.0 5.0 5.0 5.5 5.0 5.0 - 5.0 5.0 5.0 5.5 5.0 5.5One One One Eagle Street, Brisbane - - - - - - 5.5 - - - - - - 4.5GWOF PortfolioLiberty Place, Sydney2 - - - - - - - - - - - -Darling Park 1, Sydney 4.5 4.0 5.0 5.5 5.5 5.0 5.0 2.0 2.5 2.5 3.5 3.5 3.5 3.0Darling Park 2, Sydney 5.0 5.0 5.0 5.0 5.0 5.0 5.5 3.0 3.0 3.0 3.5 3.5 3.0 3.5Darling Park 3, Sydney 5.0 5.0 5.0 5.5 5.5 5.0 5.0 3.5 3.0 3.0 3.5 3.5 3.5 3.5HSBC Centre, Sydney 3.5 3.5 4.0 4.0 4.5 5.0 5.0 3.0 3.0 3.0 2.5 3.0 3.5 3.0workplace6, Sydney - - 5.0 5.5 5.5 5.0 5.0 - - 5.0 5.0 5.0 5.0 5.0The Zenith, Chatswood 3.0 3.0 3.5 3.5 3.5 5.0 5.5 1.5 2.0 2.0 2.0 2.0 4.0 4.08 Exhibition Street, Melbourne - - - - - 4.5 4.5 - - - - - 4.0 3.5530 Collins Street, Melbourne 4.0 4.5 5.0 5.0 5.5 5.5 5.0 3.0 3.0 3.0 3.5 3.5 3.0 2.0655 Collins Street, Melbourne - - - - - - 4.5 - - - - - - 5.5750 Collins Street, Melbourne - - - - - - 4.5 - - - - - - 4.5800/808 Bourke Street, Melbourne 4.5 5.0 5.0 5.0 4.5 5.0 5.0 3.0 3.0 3.0 2.5 2.5 2.5 3.02 Southbank Boulevard, Melbourne - - - - - - 4.5 - - - - - - 3.5Twenty8 Freshwater Place, Melbourne - - 5.0 5.0 5.0 5.0 5.0 - - 3.5 4.5 4.5 4.5 4.5One One One Eagle Street, Brisbane - - - - - - 5.5 - - - - - - 4.5Riverside Centre, Brisbane 5.0 5.0 5.0 5.0 5.0 5.0 5.0 3.5 3.5 3.5 3.5 3.0 3.5 3.5Brisbane Transit Centre, Brisbane - - - - - 5.0/5.5 5.0/5.0 - - - - - 2.5/3.5 3.0/3.5545 Queen Street, Brisbane - 5.0 5.0 5.0 5.0 5.5 5.0 - - 4.5 4.5 4.5 4.0 N/APortfolio Average 4.4 4.6 4.8 5.0 5.0 5.0 4.9 2.8 3.2 3.3 3.7 3.7 3.7 3.6
1. NABERS rating: 1 to 6 stars, 1=poor performance, 6=exceptional performance.2. Asset in the process of being rated, requiring 12 months post commissioning and occupancy data to be assessed.

95
OFFICE SUSTAINABILITYGPT is committed to carbon neutrality in areas within its control. GPT is also committed to supporting and encouraging its stakeholders to reduce greenhouse gas emissions and energy use in areas within its influence.
AreaNLA
Water (total) Litres/m2
Emissionskg CO2-e/m2
Waste % Reused/Recycled
GPT PortfolioAustralia Square, Sydney 51,600 958 97 56%
Citigroup Centre, Sydney 73,400 650 85 81%
MLC Centre, Sydney 68,500 744 116 58%
1 Farrer Place, Sydney 86,500 783 102 67%
Melbourne Central Tower, Melbourne 65,800 602 44 72%
818 Bourke Street, Melbourne 21,900 119 47 51%
GWOF PortfolioDarling Park 1 & 2, Sydney 102,000 811 42 63%
Darling Park 3, Sydney 29,800 831 62 66%
HSBC Centre, Sydney 37,300 955 108 55%
workplace6, Sydney 16,300 194 59 48%
The Zenith, Chatswood 44,000 621 71 63%
Twenty8 Freshwater Place, Melbourne 33,900 412 52 70%
530 Collins Street, Melbourne 66,000 473 75 58%
800/808 Bourke Street, Melbourne 59,600 584 0 44%
Brisbane Transit Centre, Brisbane 29,500 871 100 35%
Riverside Centre, Brisbane 51,600 794 86 59%
545 Queen Street, Brisbane 13,100 626 59 51%
Portfolio Average 682 69 61%
Note: Only recycled waste reported. Sustainability data as at 31 December 2013.
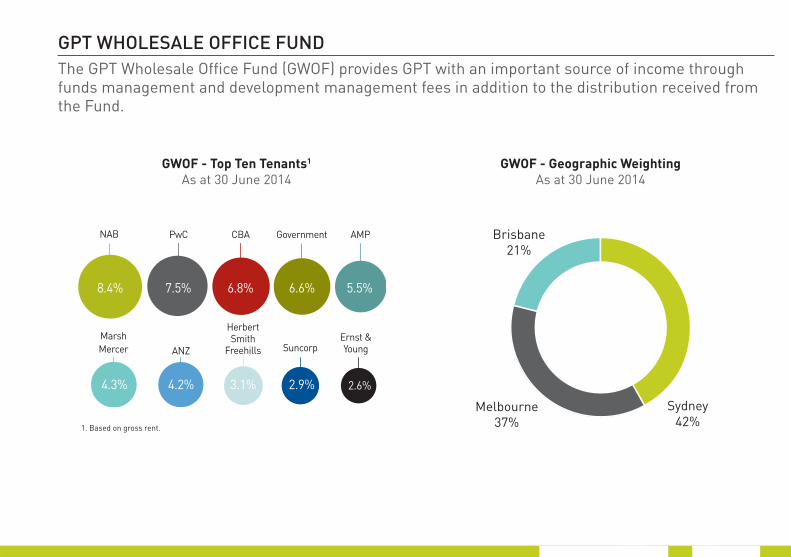
GPT WHOLESALE OFFICE FUND
NAB
MarshMercer
Herbert Smith
Freehills Suncorp
PwC
Ernst & Young
CBA AMPGovernment
8.4% 5.5%6.6%6.8%7.5%
4.3% 2.6%2.9%3.1%4.2%
ANZ
GWOF - Top Ten Tenants1
As at 30 June 2014
Brisbane21%
Sydney42%
Melbourne37%
GWOF - Geographic WeightingAs at 30 June 2014
1. Based on gross rent.
The GPT Wholesale Office Fund (GWOF) provides GPT with an important source of income through funds management and development management fees in addition to the distribution received from the Fund.

2014GPT>
Logi
stic
s Po
rtfo
lio
INTERIM RESULTLOGISTICS PORTFOLIO

9897
LOGISTICS PORTFOLIO OVERVIEWGPT’s logistics portfolio consists of ownership in 30 high quality traditional logistics and business park assets located in Australia’s major industrial and business park areas.
New South Wales Rosehill Business Park, Camellia10 Interchange Drive, Eastern CreekConnect@Erskine Park Stage 1Connect@Erskine Park Stage 215 & 19 Berry Street, Granville2-4 Harvey Road, Kings Park407 Pembroke Road, Minto (50%)4 Holker Street, Newington18-24 Abbott Road, Seven Hills83 Derby Street, Silverwater3 Figtree Drive, Sydney Olympic Park5 Figtree Drive, Sydney Olympic Park7 Figtree Drive, Sydney Olympic Park6 Herb Elliott Avenue, Sydney Olympic Park8 Herb Elliott Avenue, Sydney Olympic Park5 Murray Rose Avenue, Sydney Olympic ParkQuads 1, 2, 3 and 4, Sydney Olympic Park372-374 Victoria Street, Wetherill Park 38 Pine Road, Yennora
Victoria Citiwest Industrial Estate, Altona NorthCitiport Business Park, Port MelbourneAustrak Business Park, Somerton (50%)134-140 Fairbairn Road, Sunshine West
Queensland 92-116 Holt Street, Pinkenba16-28 Quarry Road, Yatala59 Forest Way, Karawatha
Warehoused Assets Optus Centre, 15 Green Square Close, Fortitude Valley, QLDVantage, 109 Burwood Road, Hawthorn, VIC
Number of assets in each state
QLD
NSW
SA
NT
WA
VIC
TAS
3
4
23
Brisbane
Sydney
Melbourne

10099
LOGISTICS PORTFOLIO SUMMARYThe logistics portfolio delivered comparable income growth of 0.6%, maintaining a high occupancy level of 95.3% and a long weighted average lease expiry of 5.5 years.
Top Ten Tenants1 As at 30 June 2014
Geographic Weighting4
As at 30 June 2014Key Operating Metrics2
As at 30 June 2014
TollFreedomFurnitureWesfarmers
SchenkerAustralia
LionGroup
AustralianPharmaceutical
IndustriesGoodman
Fielder BluescopeVodafone
4.0%4.4%
4.5%10.3% 8.0% 5.6% 4.6%
3.9% 3.3% 3.1%
Super Cheap Auto
NSW 60%VIC 26%QLD 14%
1H 2014 1H 2013
Number of Assets2 30 29
Portfolio Value3 $1,307.7m $1,024.8m
Comparable Net Income Growth
0.6% 3.2%
Occupancy 95.3% 98.5%
Weighted Average Lease Expiry
5.5 years 5.4 years
2. Consolidated properties are counted individually. Excludes warehoused assets.
3. Includes land and development.
1. Based on net rent. Excludes warehoused assets. 4. Excludes assets under development and warehoused assets.
10099
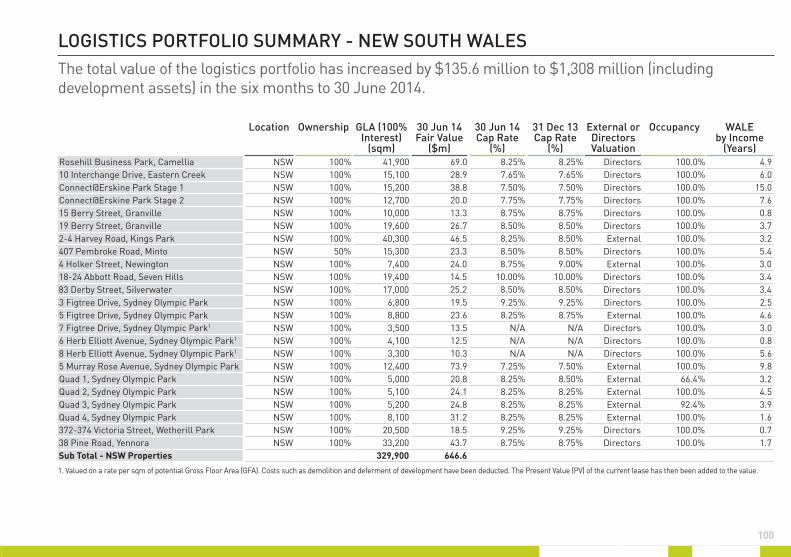
LOGISTICS PORTFOLIO SUMMARY - NEW SOUTH WALESThe total value of the logistics portfolio has increased by $135.6 million to $1,308 million (including development assets) in the six months to 30 June 2014.
Location Ownership GLA (100% Interest)
(sqm)
30 Jun 14 Fair Value
($m)
30 Jun 14 Cap Rate
(%)
31 Dec 13Cap Rate
(%)
External or Directors Valuation
Occupancy WALE by Income
(Years)Rosehill Business Park, Camellia NSW 100% 41,900 69.0 8.25% 8.25% Directors 100.0% 4.910 Interchange Drive, Eastern Creek NSW 100% 15,100 28.9 7.65% 7.65% Directors 100.0% 6.0Connect@Erskine Park Stage 1 NSW 100% 15,200 38.8 7.50% 7.50% Directors 100.0% 15.0Connect@Erskine Park Stage 2 NSW 100% 12,700 20.0 7.75% 7.75% Directors 100.0% 7.615 Berry Street, Granville NSW 100% 10,000 13.3 8.75% 8.75% Directors 100.0% 0.819 Berry Street, Granville NSW 100% 19,600 26.7 8.50% 8.50% Directors 100.0% 3.72-4 Harvey Road, Kings Park NSW 100% 40,300 46.5 8.25% 8.50% External 100.0% 3.2407 Pembroke Road, Minto NSW 50% 15,300 23.3 8.50% 8.50% Directors 100.0% 5.44 Holker Street, Newington NSW 100% 7,400 24.0 8.75% 9.00% External 100.0% 3.018-24 Abbott Road, Seven Hills NSW 100% 19,400 14.5 10.00% 10.00% Directors 100.0% 3.483 Derby Street, Silverwater NSW 100% 17,000 25.2 8.50% 8.50% Directors 100.0% 3.43 Figtree Drive, Sydney Olympic Park NSW 100% 6,800 19.5 9.25% 9.25% Directors 100.0% 2.55 Figtree Drive, Sydney Olympic Park NSW 100% 8,800 23.6 8.25% 8.75% External 100.0% 4.67 Figtree Drive, Sydney Olympic Park1 NSW 100% 3,500 13.5 N/A N/A Directors 100.0% 3.06 Herb Elliott Avenue, Sydney Olympic Park1 NSW 100% 4,100 12.5 N/A N/A Directors 100.0% 0.88 Herb Elliott Avenue, Sydney Olympic Park1 NSW 100% 3,300 10.3 N/A N/A Directors 100.0% 5.65 Murray Rose Avenue, Sydney Olympic Park NSW 100% 12,400 73.9 7.25% 7.50% External 100.0% 9.8Quad 1, Sydney Olympic Park NSW 100% 5,000 20.8 8.25% 8.50% External 66.4% 3.2Quad 2, Sydney Olympic Park NSW 100% 5,100 24.1 8.25% 8.25% External 100.0% 4.5Quad 3, Sydney Olympic Park NSW 100% 5,200 24.8 8.25% 8.25% External 92.4% 3.9Quad 4, Sydney Olympic Park NSW 100% 8,100 31.2 8.25% 8.25% External 100.0% 1.6372-374 Victoria Street, Wetherill Park NSW 100% 20,500 18.5 9.25% 9.25% Directors 100.0% 0.738 Pine Road, Yennora NSW 100% 33,200 43.7 8.75% 8.75% Directors 100.0% 1.7Sub Total - NSW Properties 329,900 646.6
1. Valued on a rate per sqm of potential Gross Floor Area (GFA). Costs such as demolition and deferment of development have been deducted. The Present Value (PV) of the current lease has then been added to the value.

102101
LOGISTICS PORTFOLIO SUMMARYThe total value of the logistics portfolio has increased by $135.6 million to $1,308 million (including development assets) in the six months to 30 June 2014.
Location Ownership GLA (100% Interest)
(sqm)
30 Jun 14 Fair Value
($m)
30 Jun 14 Cap Rate
(%)
31 Dec 13Cap Rate
(%)
External or Directors Valuation
Occupancy WALE by Income
(Years)Sub Total - NSW Properties 329,900 646.6Citiwest Industrial Estate, Altona North VIC 100% 90,000 66.9 8.50%-8.75% 8.50%-8.75% Directors 93.2% 2.2Citiport Business Park, Port Melbourne VIC 100% 27,100 60.4 8.25% 8.25% Directors 67.0% 2.3Austrak Business Park, Somerton VIC 50% 193,600 140.7 7.75% 7.75% External 80.5% 8.6134-140 Fairbairn Road, Sunshine West VIC 100% 16,800 13.2 9.25% 9.25% Directors 100.0% 3.692-116 Holt Street, Pinkenba QLD 100% 14,500 14.1 9.00% 9.25% External 100.0% 3.616-28 Quarry Road, Yatala QLD 100% 41,600 44.5 9.50% 9.50% Directors 100.0% 1.759 Forest Way, Karawatha QLD 100% 44,000 89.5 7.13% 7.55% External 100.0% 14.7Sub Total 757,500 1,076.0 8.17% 8.33% 95.3% 5.5Assets Under Development Erskine Park - Developments and Land NSW 100% 151.3 Directors17 Berry Street, Granville - Land NSW 100% 2.9 Directors407 Pembroke Road, Minto - Land NSW 50% 4.7 Directors7 Parkview Drive, Sydney Olympic Park NSW 100% 45.3 DirectorsAustrak Business Park, Somerton - Land VIC 50% 27.6 DirectorsTotal Logistics Portfolio 1,307.7
Warehoused Assets
Optus Centre, 15 Green Square Close, Fortitude Valley QLD 100% 16,600 110.0 7.75% 7.75% External 100.0% 8.1
Vantage, 109 Burwood Road, Hawthorn VIC 100% 13,000 63.0 8.25% N/A External 100.0% 3.2
102101
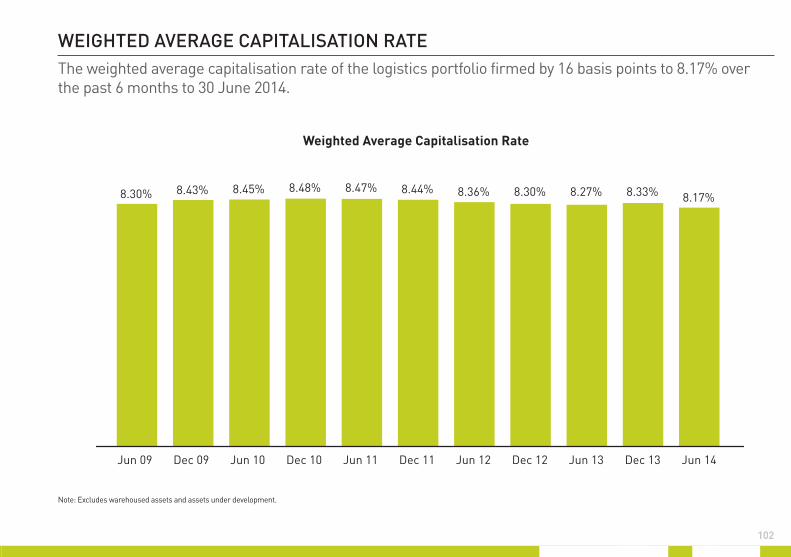
WEIGHTED AVERAGE CAPITALISATION RATEThe weighted average capitalisation rate of the logistics portfolio firmed by 16 basis points to 8.17% over the past 6 months to 30 June 2014.
8.17%8.43%8.30% 8.45% 8.48% 8.47% 8.44% 8.36% 8.30% 8.27% 8.33%
Dec 09 Jun 10Jun 09 Dec 10 Jun 11 Dec 11 Jun 12 Jun 13Dec 12 Dec 13 Jun 14
Weighted Average Capitalisation Rate
Note: Excludes warehoused assets and assets under development.

104103
LEASE EXPIRY PROFILEThe portfolio has an attractive lease expiry profile with a weighted average lease expiry of 5.5 years.
Vacant
6%
3%
14%
7%
29%
15%
1%
3%
0% 0%
3%
18%
2H 2014 2015 2016 2017 2018 2019 2020 2021 20232022 2024+
Lease Expiry Profile(by Area)
Note: Excludes warehoused assets, assets under development and land leases.

104103
INDUSTRIAL MARKET OUTLOOK
88% of the portfolio is subject to fixed rental increases with an average increase of 3.4% over the 2014 period with the balance subject to market and CPI reviews.The logistics portfolio is well positioned with occupancy levels at 95.3% and a long WALE of 5.5 years. The logistics portfolio is over-rented by 7.4%.
Ongoing improvement in lead indicators such as trade volumes, housing construction and retail trade growth are yet to translate into industrial demand.
20142005 2006 2007 2008 2009 2010 2011 2012 2013
Take
-Up
(m2 )
10 Year Average
Under ConstructionCompleted
0
1,500,000
500,000
1,000,000
2,000,000
2,500,000
3,000,000
1H 20142005 2006 2007 2008 2009 2010 2011 2012 2013
Take
-Up
(m2 ) 10 Year Average
0
1,500,000
500,000
1,000,000
2,000,000
2,500,000
3,000,000
National Take-Up (m2)
National Supply (m2)
Rent ReviewsFixed 88% Other1 12%
Structured rent reviews for the six months to 31 December 2014. Excludes warehoused assets. 1. Other includes market reviews, CPI reviews and expiries
in 2014.
3.4% Average Increase
Source: JLL Research, Q2 2014
Source: JLL Research, Q2 2014

106105
LOGISTICS PORTFOLIO EXTERNAL VALUATION SUMMARY48% of the portfolio was valued externally in the 6 months to 30 June 2014.
Location Date Valuer Valuation ($m)
Interest (%)
Capitalisation Rate (%)
Terminal Capitalisation
Rate (%)
Discount Rate (%)
Rosehill Business Park, Camellia NSW 31 Dec 13 JLL 68.5 100% 8.25% 8.25% 9.50%10 Interchange Drive, Eastern Creek NSW 31 Jul 12 CBRE 28.6 100% 7.65% 7.90% 9.50%Connect@Erskine Park Stage 1 NSW 30 Jun 12 Knight Frank 38.8 100% 7.50% 8.00% 9.50%Connect@Erskine Park Stage 2 NSW 30 Jun 13 CBRE 20.0 100% 7.75% 8.25% 9.50%15 Berry Street, Granville NSW 30 Jun 12 Savills 13.3 100% 8.75% 9.00% 9.50%19 Berry Street, Granville NSW 30 Jun 12 Savills 26.7 100% 8.50% 8.75% 9.50%2-4 Harvey Road, Kings Park NSW 30 Jun 14 Savills 46.5 100% 8.25% 8.50% 9.25%407 Pembroke Road, Minto NSW 30 Jun 13 Knight Frank 23.3 50% 8.50% 8.50% 9.50%4 Holker Street, Newington NSW 30 Jun 14 Colliers 24.0 100% 8.75% 9.75% 10.00%18-24 Abbott Road, Seven Hills1 NSW 31 Dec 11 CBRE 13.6 100% 10.00% N/A N/A83 Derby Street, Silverwater NSW 30 Jun 12 Knight Frank 25.0 100% 8.62% 8.75% 10.00%3 Figtree Drive, Sydney Olympic Park NSW 01 Mar 13 CBRE 19.4 100% 9.25% 9.50% 10.00%5 Figtree Drive, Sydney Olympic Park NSW 30 Jun 14 CBRE 23.6 100% 8.25% 8.75% 9.00%7 Figtree Drive, Sydney Olympic Park2 NSW 30 Jun 13 Knight Frank 13.5 100% N/A N/A N/A6 Herb Elliott Avenue, Sydney Olympic Park2 NSW 30 Jun 13 JLL 12.5 100% N/A N/A N/A8 Herb Elliott Avenue, Sydney Olympic Park2 NSW 30 Jun 13 Knight Frank 10.2 100% N/A N/A N/A5 Murray Rose Avenue, Sydney Olympic Park NSW 30 Apr 14 JLL 73.9 100% 7.25% 7.50% 9.00%Quad 1, Sydney Olympic Park NSW 30 Jun 14 JLL 20.8 100% 8.25% 8.75% 9.50%Quad 2, Sydney Olympic Park NSW 30 Jun 14 JLL 24.1 100% 8.25% 8.50% 9.50%Quad 3, Sydney Olympic Park NSW 30 Jun 14 JLL 24.8 100% 8.25% 8.25% 9.50%Quad 4, Sydney Olympic Park NSW 30 Jun 14 JLL 31.2 100% 8.25% 8.75% 9.75%372-374 Victoria Street, Wetherill Park NSW 30 Jun 12 Knight Frank 18.3 100% 9.25% 9.75% 10.50%38 Pine Road, Yennora NSW 05 Sep 13 JLL 43.6 100% 8.75% 8.75% 9.25%Citiwest Industrial Estate, Altona North VIC 31 Dec 13 Savills 66.6 100% 8.50%-8.75% 8.75%-9.50% 9.50%-9.75%Citiport Business Park, Port Melbourne VIC 31 Dec 13 JLL 60.0 100% 8.25% 8.50% 9.50%Austrak Business Park, Somerton VIC 30 Jun 14 JLL 140.7 50% 7.75% 8.25% 9.00%134-140 Fairbairn Road, Sunshine West VIC 31 Dec 11 CBRE 13.2 100% 9.25% 10.50% 10.00%92-116 Holt Street, Pinkenba QLD 30 Jun 14 m3 14.1 100% 9.00% 9.50% 10.50%16-28 Quarry Road, Yatala QLD 15 Oct 13 Knight Frank 44.5 100% 9.50% 9.50% 10.50%59 Forest Way, Karawatha QLD 30 Jun 14 JLL 89.5 100% 7.13% 7.88% 9.13% 1. Valued using the capitalisation and direct comparison (rate per sqm of GLA) approaches. 2. Valued on a rate per sqm of potential GFA. Costs such as demolition and deferment of development have been deducted. The PV of the current lease has then been added to the value.

106105
LOGISTICS PORTFOLIO INCOME AND FAIR VALUE SCHEDULE
Location Date Valuer Valuation ($m)
Interest (%)
Capitalisation Rate (%)
Terminal Capitalisation
Rate (%)
Discount Rate (%)
Rosehill Business Park, Camellia NSW 31 Dec 13 JLL 68.5 100% 8.25% 8.25% 9.50%10 Interchange Drive, Eastern Creek NSW 31 Jul 12 CBRE 28.6 100% 7.65% 7.90% 9.50%Connect@Erskine Park Stage 1 NSW 30 Jun 12 Knight Frank 38.8 100% 7.50% 8.00% 9.50%Connect@Erskine Park Stage 2 NSW 30 Jun 13 CBRE 20.0 100% 7.75% 8.25% 9.50%15 Berry Street, Granville NSW 30 Jun 12 Savills 13.3 100% 8.75% 9.00% 9.50%19 Berry Street, Granville NSW 30 Jun 12 Savills 26.7 100% 8.50% 8.75% 9.50%2-4 Harvey Road, Kings Park NSW 30 Jun 14 Savills 46.5 100% 8.25% 8.50% 9.25%407 Pembroke Road, Minto NSW 30 Jun 13 Knight Frank 23.3 50% 8.50% 8.50% 9.50%4 Holker Street, Newington NSW 30 Jun 14 Colliers 24.0 100% 8.75% 9.75% 10.00%18-24 Abbott Road, Seven Hills1 NSW 31 Dec 11 CBRE 13.6 100% 10.00% N/A N/A83 Derby Street, Silverwater NSW 30 Jun 12 Knight Frank 25.0 100% 8.62% 8.75% 10.00%3 Figtree Drive, Sydney Olympic Park NSW 01 Mar 13 CBRE 19.4 100% 9.25% 9.50% 10.00%5 Figtree Drive, Sydney Olympic Park NSW 30 Jun 14 CBRE 23.6 100% 8.25% 8.75% 9.00%7 Figtree Drive, Sydney Olympic Park2 NSW 30 Jun 13 Knight Frank 13.5 100% N/A N/A N/A6 Herb Elliott Avenue, Sydney Olympic Park2 NSW 30 Jun 13 JLL 12.5 100% N/A N/A N/A8 Herb Elliott Avenue, Sydney Olympic Park2 NSW 30 Jun 13 Knight Frank 10.2 100% N/A N/A N/A5 Murray Rose Avenue, Sydney Olympic Park NSW 30 Apr 14 JLL 73.9 100% 7.25% 7.50% 9.00%Quad 1, Sydney Olympic Park NSW 30 Jun 14 JLL 20.8 100% 8.25% 8.75% 9.50%Quad 2, Sydney Olympic Park NSW 30 Jun 14 JLL 24.1 100% 8.25% 8.50% 9.50%Quad 3, Sydney Olympic Park NSW 30 Jun 14 JLL 24.8 100% 8.25% 8.25% 9.50%Quad 4, Sydney Olympic Park NSW 30 Jun 14 JLL 31.2 100% 8.25% 8.75% 9.75%372-374 Victoria Street, Wetherill Park NSW 30 Jun 12 Knight Frank 18.3 100% 9.25% 9.75% 10.50%38 Pine Road, Yennora NSW 05 Sep 13 JLL 43.6 100% 8.75% 8.75% 9.25%Citiwest Industrial Estate, Altona North VIC 31 Dec 13 Savills 66.6 100% 8.50%-8.75% 8.75%-9.50% 9.50%-9.75%Citiport Business Park, Port Melbourne VIC 31 Dec 13 JLL 60.0 100% 8.25% 8.50% 9.50%Austrak Business Park, Somerton VIC 30 Jun 14 JLL 140.7 50% 7.75% 8.25% 9.00%134-140 Fairbairn Road, Sunshine West VIC 31 Dec 11 CBRE 13.2 100% 9.25% 10.50% 10.00%92-116 Holt Street, Pinkenba QLD 30 Jun 14 m3 14.1 100% 9.00% 9.50% 10.50%16-28 Quarry Road, Yatala QLD 15 Oct 13 Knight Frank 44.5 100% 9.50% 9.50% 10.50%59 Forest Way, Karawatha QLD 30 Jun 14 JLL 89.5 100% 7.13% 7.88% 9.13% 1. Valued using the capitalisation and direct comparison (rate per sqm of GLA) approaches. 2. Valued on a rate per sqm of potential GFA. Costs such as demolition and deferment of development have been deducted. The PV of the current lease has then been added to the value.
Income6 months to
30 June ($m)
Fair Value
Fair Value 31 Dec 13
($m)
Capex ($m)
Lease Incentives
($m)
Acquisitions ($m)
Sales ($m)
Net Revaluations
($m)
Other Adjust-
ments ($m)
Fair Value 30 Jun 14
($m)
% of Portfolio
(%)2013 2014 Variance Rosehill Business Park, Camellia 2.6 2.8 0.2 68.5 0.1 0.3 0.0 0.0 0.0 0.1 69.0 5.310 Interchange Drive, Eastern Creek 0.9 1.1 0.2 28.9 0.0 0.0 0.0 0.0 0.0 0.0 28.9 2.2Connect@Erskine Park Stage 1 1.6 1.7 0.1 38.8 0.0 0.0 0.0 0.0 0.0 0.0 38.8 3.0Connect@Erskine Park Stage 2 0.8 0.8 0.0 20.0 0.0 0.0 0.0 0.0 0.0 0.0 20.0 1.515 Berry Street, Granville 0.6 0.6 0.0 13.3 0.0 0.0 0.0 0.0 0.0 0.0 13.3 1.019 Berry Street, Granville 1.2 1.2 0.1 26.6 0.1 0.0 0.0 0.0 0.0 0.0 26.7 2.02-4 Harvey Road, Kings Park 2.0 2.1 0.0 44.1 0.1 0.0 0.0 0.0 2.3 0.0 46.5 3.6407 Pembroke Road, Minto 1.1 1.2 0.1 23.3 0.0 0.0 0.0 0.0 0.0 0.0 23.3 1.84 Holker Street, Newington 1.6 1.6 0.0 26.0 0.5 0.0 0.0 0.0 (2.5) 0.0 24.0 1.818-24 Abbott Road, Seven Hills 0.8 0.8 (0.1) 14.5 0.0 0.0 0.0 0.0 0.0 0.0 14.5 1.183 Derby Street, Silverwater 1.1 1.2 0.0 25.2 0.0 0.0 0.0 0.0 0.0 0.0 25.2 1.93 Figtree Drive, Sydney Olympic Park 0.4 0.9 0.5 19.4 0.1 0.0 0.0 0.0 0.0 0.0 19.5 1.55 Figtree Drive, Sydney Olympic Park 0.9 1.0 0.0 21.0 (0.1) 0.0 0.0 0.0 2.5 0.1 23.6 1.87 Figtree Drive, Sydney Olympic Park 0.5 0.5 0.0 13.5 0.0 0.0 0.0 0.0 0.0 0.0 13.5 1.06 Herb Elliott Avenue, Sydney Olympic Park 0.4 0.4 0.0 12.5 0.0 0.0 0.0 0.0 0.0 0.0 12.5 1.08 Herb Elliott Avenue, Sydney Olympic Park 0.4 0.4 0.0 10.2 0.1 0.0 0.0 0.0 0.0 0.0 10.3 0.85 Murray Rose Avenue, Sydney Olympic Park 2.6 2.7 0.1 70.4 0.0 0.0 0.0 0.0 3.5 0.0 73.9 5.7Quad 1, Sydney Olympic Park 0.2 0.3 0.1 20.3 0.0 0.1 0.0 0.0 0.2 0.1 20.8 1.6Quad 2, Sydney Olympic Park 1.2 1.0 (0.2) 24.4 0.0 0.0 0.0 0.0 (0.3) 0.0 24.1 1.8Quad 3, Sydney Olympic Park 0.9 1.0 0.1 24.0 0.0 0.1 0.0 0.0 0.7 0.0 24.8 1.9Quad 4, Sydney Olympic Park 1.4 1.6 0.1 33.9 0.0 0.0 0.0 0.0 (2.7) 0.0 31.2 2.4372-374 Victoria Street, Wetherill Park 0.9 0.9 0.0 18.4 0.1 0.0 0.0 0.0 0.0 0.0 18.5 1.438 Pine Road, Yennora 0.0 2.0 2.0 43.6 0.1 0.0 0.0 0.0 0.0 0.0 43.7 3.3Citiwest Industrial Estate, Altona North 2.9 3.1 0.1 66.6 0.3 0.0 0.0 0.0 0.0 0.0 66.9 5.1Citiport Business Park, Port Melbourne 2.6 2.1 (0.5) 60.0 0.3 0.1 0.0 0.0 0.0 0.0 60.4 4.6Austrak Business Park, Somerton 5.9 4.8 (1.1) 140.1 0.1 0.0 0.0 0.0 0.5 0.0 140.7 10.8134-140 Fairbairn Road, Sunshine West 0.6 0.6 0.0 13.2 0.0 0.0 0.0 0.0 0.0 0.0 13.2 1.092-116 Holt Street, Pinkenba 0.6 0.6 0.0 13.5 0.0 0.0 0.0 0.0 0.6 0.0 14.1 1.116-28 Quarry Road, Yatala 0.0 2.2 2.2 44.5 0.0 0.0 0.0 0.0 0.0 0.0 44.5 3.459 Forest Way, Karawatha 0.0 1.9 1.9 62.1 23.1 0.0 0.0 0.0 4.4 0.0 89.5 6.8Assets Under DevelopmentErskine Park - Development & Land 0.0 0.0 0.0 75.1 67.2 0.0 0.0 0.0 9.0 0.0 151.3 11.617 Berry Street, Granville - Land 0.0 0.0 0.0 2.9 0.0 0.0 0.0 0.0 0.0 0.0 2.9 0.2407 Pembroke Road, Minto - Land 0.0 0.0 0.0 4.7 0.0 0.0 0.0 0.0 0.0 0.0 4.7 0.47 Parkview Drive, Sydney Olympic Park 0.4 0.0 (0.4) 24.4 18.9 0.0 0.0 0.0 2.0 0.0 45.3 3.5Austrak Business Park, Somerton - Land 0.0 0.0 0.0 24.3 3.6 0.0 0.0 0.0 (0.2) 0.0 27.6 2.1Total Logistics Portfolio 37.1 43.1 6.0 1,172.2 114.6 0.8 0.1 0.0 20.0 0.3 1,307.7
Warehoused AssetsOptus Centre, 15 Green Square Close, Fortitude Valley 0.0 4.3 4.3 110.0 0.0 0.0 0.1 0.0 (0.1) 0.0 110.0
Vantage, 109 Burwood Road, Hawthorn 0.0 1.3 1.3 0.0 0.0 0.0 66.6 0.0 (3.6) 0.0 63.0
2014Artist’s Impression
GPT>
Dev
elop
men
t
INTERIM RESULTDEVELOPMENT

110
GPT’S DEVELOPMENT APPROACH
Development is a core part of GPT’s business, adding value through improved income and increased fund management fees.
GPT’s Retail & Major Projects Development business is focused on enhancing and preserving existing assets with the flexibility to respond to demand for growth, the aim being to incrementally develop and create new assets, when the time is right.Objectives include:
• Respond to demand for growth and outperformance
• Sourcing and creating assets
• Confidence around delivery of pipeline
• Flexible resourcing approach
• Capacity to enhance M&A opportunities
GPT’s Logistics Development business is focused on activating GPT’s existing land bank and acquiring additional land to develop assets.
Objectives for the business include:
• Deliver committed pipeline
• Increase asset production for balance sheet and funds
• Broaden market share through ‘fund through’ and ‘development management’ activities
• Deliver above target risk adjusted returns and enhance growth opportunities
Flexible Development Model

111
DEVELOPMENT OVERVIEW
GPT has $0.7 billion in development projects currently underway across the retail, office and logistics sectors, with an additional $2.5 billion pipeline of future development opportunities on behalf of assets owned on balance sheet and in GPT’s wholesale funds.
Developments Underway
Retail & Major ProjectsGPT OwnedCasuarina Square, NT
GWSCF OwnedWollongong Central - West Keira, NSWCasuarina Square, NT
GWOF Owned150 Collins Street, Melbourne, VIC
Logistics GPT OwnedTNT Express, Erskine Park, NSWRand, Erskine Park, NSWRRM, Erskine Park, NSWSamsung, 3 Murray Rose, Sydney Olympic Park, NSWIMCD and Lot B, Austrak Business Park, Somerton, VIC
QLD
NSW
SA
NT
WA
VIC
TAS
Number of assets in each state
1
2
5
Sydney
Darwin
Melbourne

112
RETAIL & MAJOR PROJECTS DEVELOPMENT OVERVIEW
Return Targets1 Development IRR2
Retail 10% - 13%
Office 11% - 14%1. Excluding fund-through developments. 2. Development IRR is the Internal Rate of Return calculated from the
commencement of a development project through to practical completion.
Development
GLA/NLA100% Interest
(sqm)
OwnershipInterest
(%)
ForecastTotal Cost
($m)
Forecast Cost to Complete GPT Share
($m) Fund’s Share
($m)
RetailWollongong Central - West Keira, NSW 18,000 100% GWSCF 210 0 55
Casuarina Square - Student Accommodation, NT 303 beds 50% GPT /
50% GWSCF 33 9 9
Office150 Collins Street, Melbourne, VIC 20,500 100% GWOF 181 0 37
Total Underway 424 9 101
Planned 270
Future Pipeline 1,603
Total Pipeline 2,297
GPT’s Retail & Major Projects Development business has $424 million of developments underway ($110 million cost to complete) on behalf of assets owned on balance sheet and in GPT’s wholesale funds.
150 Collins Street, Melbourne
Wollongong Central - West Keira, NSW
Casuarina Square - Student Accommodation, NT
150 Collins Street, Melbourne, VIC
Q3 Q4 Q1 Q2
2014 2015
Development Timeline - Projects Underway

113
RETAIL & MAJOR PROJECTS DEVELOPMENT PIPELINE
Planned DevelopmentOwnership
Interest(%)
Forecast Total Cost
($m)
GPT Owned
Casuarina Square, NT 50% 135
GWSCF Owned
Casuarina Square, NT 50% 135
Total Planned Developments 270
Future Pipeline
GPT Owned
Rouse Hill Town Centre, NSW 100% 250
Sunshine Plaza, QLD 50% 170
Highpoint Shopping Centre, VIC 16.67% 13
MLC Centre, NSW 50% 75
GWSCF Owned
Westfield Woden, ACT 50% 100
Macarthur Square, NSW 50% 85
Parkmore Shopping Centre, VIC 100% 125
Highpoint Shopping Centre, VIC 50% 40
Chirnside Park, VIC 100% 65
Other 680
Total Future Pipeline 1,603
Total Planned and Future Pipeline 1,873
GPT’s Retail & Major Projects Development business has a $1.9 billion planned and future development pipeline.

114
Key Metrics as at 30 June 2014Ownership Interest 100% GWSCFAcquired March 2007Additional GLA 18,000 sqmDevelopment Cost $210mTarget Yield 6%Target IRR¹ 8.5%Completion 2H 2014
1. IRR is 10 years from project completion.
The Wollongong - West Keira development will deliver a unique retail experience with an extension of 18,000 sqm. This responds directly to the needs of the Wollongong community by addressing a significant undersupply of food retail in Wollongong’s city centre. Anchor tenants have been secured (Coles, Target and the relocation of JB HiFi) and leasing of the 75 additional specialty shops is well progressed.
WOLLONGONG CENTRAL - WEST KEIRANEW SOUTH WALES
Construction has commenced on a 303 bed student accommodation facility at Casuarina Square. The development has the full support of Charles Darwin University and will meet the strong demand for student lodging in the region. UniLodge will operate the facility.
Key Metrics as at 30 June 2014Ownership Interest 50% GPT / 50% GWSCFAdditional GLA 303 bedsDevelopment Cost $33mTarget Yield 10%Target IRR1 13%Completion 1H 2015
1. IRR is 10 years from project completion.
CASUARINA SQUARE - STUDENT ACCOMODATIONNORTHERN TERRITORY

115
150 Collins Street is a new A Grade development with Premium Grade services featuring 20,500 sqm of accommodation over 13 floors. The development is being undertaken by Grocon/APN and is scheduled for completion in the second half of 2014. The asset is located in the exclusive “Paris” end of Collins Street and is 64% precommitted to Westpac Group for 12 years. There is a 24 month rent guarantee from Grocon/APN on the vacant space.
Key Metrics as at 30 June 2014Ownership Interest 100% GWOFAcquired July 2012NLA 20,500 sqm% Area Committed 64%Development Cost $181mTarget Yield 6.7%Completion 2H 2014
150 COLLINS STREETMELBOURNE

116
LOGISTICS DEVELOPMENT OVERVIEW
GPT’s Logistics Development business has $300 million of developments underway ($139 million cost to complete) on behalf of assets owned on balance sheet and for potential funds.
Development
GLA/NLAPost Development
100% Interest (sqm)
OwnershipInterest
(%)
LeasingPre-commitment
(%)
AverageWALE(years)
ForecastTotal Cost
($m)
Forecast Cost to CompleteGPT’s Share
($m)
Underway
TNT Express, Erskine Park, NSW 31,900 100% GPT 100% 15.0 60 16
Rand, Erskine Park, NSW 23,760 100% GPT 100% 20.0 60 23
RRM, Erskine Park, NSW 20,520 100% GPT 100% 20.0 100 54
Samsung, 3 Murray Rose Avenue, Sydney Olympic Park, NSW 12,950 100% GPT 100% 7.0 72 45
IMCD and Lot B, Austrak Business Park, Somerton, VIC 12,500 50% GPT 49% 12.0 8 1
Total Developments - Underway 101,630 14.8 300 139
Planned
4 Murray Rose Avenue, Sydney Olympic Park, NSW 15,000 100% GPT 85 85
Erskine Park, NSW 10,500 100% GPT 16 16
Austrak Business Park, Somerton, VIC 167,140 50% GPT 162 81
Austrak Business Park, Minto, NSW 27,600 50% GPT 18 9
17 Berry Street, Granville, NSW 9,660 100% GPT 8 8
Metroplex, Wacol, QLD 325,000 50% GPT 300 150
Total Developments - Planned 554,900 589 349
Total Developments - Underway or Planned 656,530 889 488
Return Targets1 Development IRR2
Logistics 12% - 15%1. Excluding fund-through developments. 2. Development IRR is the Internal Rate of Return calculated from the
commencement of a development project through to practical completion.
Key Metrics as at 30 June 2014Ownership Interest 100% GWOFAcquired July 2012NLA 20,500 sqm% Area Committed 64%Development Cost $181mTarget Yield 6.7%Completion 2H 2014

117
LOGISTICS DEVELOPMENT
TNT Express, Erskine Park, NSW
Rand, Erskine Park, NSW
RRM, Erskine Park, NSW
Samsung, 3 Murray Rose Avenue, Sydney Olympic Park, NSW
IMCD and Lot B, Austrak Business Park, Somerton, VIC
Q3 Q4 Q1 Q2 Q3 Q4
2014 2015
Development Timeline - Projects Underway
The development on Site D at Connect@Erskine Park is a 31,900 sqm warehouse, distribution facility and transport terminal for TNT Australia.
TNT EXPRESS, ERSKINE PARKNEW SOUTH WALES
Key Metrics as at 30 June 2014Ownership Interest 100% GPTAcquired May 2008GLA 31,900 sqm% Area Committed 100%WALE 15.0 yearsDevelopment Cost $60mTarget Yield 7.7%Completion 1H 2015

118
Q3 Q4 Q1 Q2 Q3 Q4
2014 2015
The development on Site F at Connect@Erskine Park is a 23,760 sqm temperature controlled and ambient storage and distribution facility for Rand Transport (a division of ASX listed Automotive Holdings).
The development on Site G at Connect@Erskine park is a 20,520 sqm Retail Ready Meats (RRM) chilled food processing and manufacturing facility.
Key Metrics as at 30 June 2014Ownership Interest 100% GPTAcquired May 2008GLA 23,760 sqm% Area Committed 100%WALE 20.0 yearsDevelopment Cost $60mTarget Yield 8.7%Completion 1H 2015
Key Metrics as at 30 June 2014Ownership Interest 100% GPTAcquired May 2008GLA 20,520 sqm% Area Committed 100%WALE 20.0 yearsDevelopment Cost $100mTarget Yield 8.5%Completion 1H 2015
RAND, ERSKINE PARK
RRM, ERSKINE PARK NEW SOUTH WALES
NEW SOUTH WALES

119
SAMSUNG, 3 MURRAY ROSE AVENUE, SYDNEY OLYMPIC PARKNEW SOUTH WALES
Key Metrics as at 30 June 2014Ownership Interest 100% GPTAcquired May 2002GLA 12,950 sqm% Area Committed 100%WALE 7.0 yearsDevelopment Cost $72mTarget Yield 8.0%Completion 1H 2015
3 Murray Rose is a 12,950 sqm office development which completes the second stage of the masterplanned Murray Rose development at Sydney Olympic Park. This premium office will house Samsung’s Australian head office.

120
Hoppers Crossing
Maribyrnong
Werribee
East Melbourne
Altona
Altona Meadows
Avondale Heights
Caroline Springs
Deer Park
Essendon
Fitzroy
Flemington
Footscray
Keilor Downs
Moonee Ponds
Point Cook
Seddon
St Albans
St Kilda
Sunshine
West Melbourne
Williamstown
Yarraville
Highpoint
Secondary
Tertiary
Tertiary
Tertiary
Secondary
Secondary
Secondary
Melbourne
Primary
North East
North
MelbourneAirport
South West
Tertiary Melton
Inner West
East
South
West
Sunbury
Sunshine North
Docklands
F
Parkville
CBD
8KM
Secondary
EastTertiary
Boral
QUBE
IMCD AND LOT B, AUSTRAK BUSINESS PARK, SOMERTONVICTORIA
Key Metrics as at 30 June 2014Ownership Interest 50% GPTCo-Owner Austrak (50%)Acquired October 2003GLA 12,500 sqm% Area Committed 49%WALE 12.0 yearsDevelopment Cost $8mTarget Yield 7.0%Completion 2H 2014
A 12,500 sqm logistics facility with a 49% pre-lease commitment to IMCD, currently under construction.
Hume Highw
ay
Somerton Road
Nation Link Drive
Uni
on R
oad
Aust
rak
Driv
e
Regi
onal
Dri
ve
Terminal
Leased
Available
Retarding Basin
Development underway
Linfox
P&O Somerton IntermodalTerminal
Coles Myer Limited Labelmakers

121
2014INTERIM RESULTFUNDS MANAGEMENTGPT>
METROPLEX, BOUNDARY ROAD, WACOLQUEENSLAND
Key Metrics as at 30 June 2014Ownership Interest 50% GPTCo-Owner Cidneo (50%)Acquired May 2014GLA 325,000 sqmDevelopment Cost $150mTarget Yield 9.0%Staged Completion 2015 - 2019
Metroplex is Queensland’s premier logistics and business park development, located in the south west of Brisbane. GPT has a 50 per cent share in this 92 hectare estate in which it can develop up to 58 hectares of industrial, commercial and bulky goods retail.

2014GPT>
Fund
s
Man
agem
ent
INTERIM RESULTFUNDS MANAGEMENT

124
GPT FUNDS MANAGEMENT OVERVIEW
One of GPT’s key strategic focal points is the growth in the contribution the Funds Management business makes to the Group’s overall earnings. Over the six months to 30 June 2014, Funds under Management (FUM) increased 18%. This growth in FUM will contribute to GPT’s goal to increase active earnings from 3% to 10%, driving Total Returns whilst maintaining a low cost of capital.
Dec 2010 Dec 2011 Dec 2012 Dec 2013 Jun 2014
$5.3b $5.6b
$6.6b$7.1b
$8.4b
0100020003000400050006000700080009000
10000
Dec 13FUM
Jun 14FUM
Developments & Asset Growth
Acquisitions Divestments
$7.1b $0.3b
$1.0b $8.4b
0
2
4
6
8
10
12
GWOF Mercer / IPDAll Office Index
1 Year 3 Years 5 Years
Tota
l ret
urn
(%)
11.311.0
9.1 9.48.7
7.48.2
6.77.4
6.6 6.35.1
8.78.1
6.8
Peer 1 Peer 2 Peer 3 GWSCF Mercer / IPDAll Retail Index
Peer 1 Peer 2 Peer 3
1 Year 3 Years 5 Years
Tota
l ret
urn
(%)
5.7
7.2 7.58.2 8.3
7.7 8.1 8.1 7.99.0 8.5
7.48.4
8.8 8.7
10
8
6
4
2
0
Historical Growth in Funds under Management Growth in FUM for the six months to 30 June 2014
GWOF performance versus benchmark GWSCF performance versus benchmark
Source: Mercer / IPD

125
Strong Corporate GovernanceThe Fund has a number of policies and procedures in place such as the Operational Policies Deed and the Relationship Deed to govern, among other issues, the relationship between The GPT Group and the Funds.
A Majority Independent BoardGPT Funds Management Limited (GPTFM) is the Responsible Entity of the two Funds. The Board of GPTFM currently consists of a majority Independent Directors (three) appointed by the investors (excluding GPT) and two Executive Directors appointed by GPT.
The GPTFM Board consists of:Independent Directors• Ernest Bennett• Dennis Broit• Gary Symons
Executive Directors• Michael Cameron, GPT CEO and Managing Director• Carmel Hourigan, GPT Chief Investment Officer
Acquisition and Divestment RightsPre-emptive rights to acquire property - The two Funds have a right of first refusal to acquire certain office and retail assets which The GPT Group wishes to sell. Where GPT sources an asset of this kind from a third party, the Funds will be offered the opportunity to acquire that asset. These rights are subject to some limitations such as the pre-emptive rights of co-owners, the right of GPT to develop vacant land before it sells that land, the right of GPT to do an asset swap and the exclusion of assets which are a part of a portfolio acquired as a result of a takeover, merger or similar transaction.
Pre-emptive obligation when selling property - Similar to the two Funds’ rights to acquire properties from The GPT Group, GPT has a first right of refusal to acquire certain assets from the Funds. These rights are subject to some limitations. In GWOF, GPT has a first right of refusal to acquire certain assets in the event of a disposal by GWOF or on the winding up or termination of GWOF (including the original seed assets and assets developed on vacant land by GPT and subsequently acquired by the Fund). In GWSCF, in the event of a disposal by GWSCF or on the removal of GPTFM as the Responsible Entity or the winding up or termination of the Fund, GPT has a first right of refusal to acquire the original seed assets and any properties subsequently acquired by the Fund from GPT.
Management FeesFees payable to the Manager include a base management fee of 0.1125% per quarter of the Asset Value (payable quarterly in arrears) and a performance fee which is paid semi-annually in arrears and is calculated as 15% of outperformance above the benchmark. The benchmark is the 10 year Government bond yield on the first day of the half year plus 3% per annum (post base management fee). For GWOF and GWSCF, the total funds management fee is capped at 0.45% of the Fund’s Asset Value per half year. Excess outperformance and underperformance is carried forward to future periods.
GPT FUNDS MANAGEMENT OVERVIEW

126
GPT WHOLESALE OFFICE FUND
GWOF provides wholesale investors with exposure to high quality office assets, located in Australia’s major office markets. At 30 June 2014 , the Fund consisted of 18 office assets located across Australia’s key CBD office markets with a value of $4.8 billion.
Fund Details as at 30 June 2014
GPT's Ownership Interest (%) 20.5%
GPT's Ownership Interest ($m) $761.0m
Established July 2006
Weighted Average Capitalisation Rate 6.60%
Portfolio Occupancy (%) 97.5%
Distributions Received ($m) $23.7m
GPT Base Management Fee ($m) $9.3m
GPT Performance Fee ($m) $0.0m
Equity IRR 1 July 2013
to 30 June 2014Inception to Date
(Annualised) 21 July 2006 to 30 June 2014
Post fees 11.1% 8.1%
June 2014 December 2013
Number of Assets 18 15
Property Investments $4,834m $4,107m
Gearing 21.1% 11.7%
One Year Equity IRR (post-fees) 11.1% 9.9%
Domestic Super Funds 50%
Domestic Other 8%Offshore Pension Funds 13%
Offshore Other 1%Sovereign Wealth Funds 8%
GPT 20%
GWOF Ownership Composition As at 30 June 2014

127
GWOF CAPITAL MANAGEMENT
Total borrowings for the Fund at 30 June 2014 were $1,027 million resulting in gearing of 21.1%.
GWOF Capital Management Summary as at 30 June 2014
Gearing 21.1%
Weighted Average Cost of Debt 4.3%
Fees and Margins (included in above) 1.3%
Weighted Average Debt Term 2.4 years
Drawn Debt Hedging 56%
Weighted Average Hedge Term 3.1 years
750 Collins Street, Melbourne
GWOF Loan Facilities Facility Limit ($m)
Facility Expiry Amount Currently Drawn ($m)
Bank Bilateral Facility 250.0 1 July 2015¹ 250.0
Bank Bilateral Facility 150.0 29 July 2015¹ 150.0
Bank Bilateral Facility 100.0 30 July 2015¹ 100.0
Bank Bilateral Facility 50.0 2 July 2016 50.0
Bank Bilateral Facility 160.0 31 January 2017 160.0
Bank Bilateral Facility 50.0 1 February 2017 47.0
Bank Bilateral Facility 150.0 30 September 2017 70.0
Bank Bilateral Facility 200.0 2 October 2018 200.0
Total 1,110.0 1,027.0
1. Quarterly extension facility.

128
GWOF Loan Facilities Facility Limit ($m)
Facility Expiry Amount Currently Drawn ($m)
Bank Bilateral Facility 250.0 1 July 2015¹ 250.0
Bank Bilateral Facility 150.0 29 July 2015¹ 150.0
Bank Bilateral Facility 100.0 30 July 2015¹ 100.0
Bank Bilateral Facility 50.0 2 July 2016 50.0
Bank Bilateral Facility 160.0 31 January 2017 160.0
Bank Bilateral Facility 50.0 1 February 2017 47.0
Bank Bilateral Facility 150.0 30 September 2017 70.0
Bank Bilateral Facility 200.0 2 October 2018 200.0
Total 1,110.0 1,027.0
1. Quarterly extension facility.
GWOF CAPITAL MANAGEMENT
GWOF has $370 million of derivative instruments and $200 million of fixed rate loans (being 56% hedged) and these have a weighted average term of 3.1 years.
($m)
3.31% 3.40% 3.40% 3.47% 3.60% 3.63% 3.63% 3.63% 3.51%3.31%
Jun
19
Jun
14
Dec
14
Jun
15
Dec
15
Jun
16
Dec
16
Jun
17
Dec
17
Jun
18
Dec
18
0
200
400
600
800
1,000
1,200 5%
4%
3%
2%
1%
0%
Forecast debt Hedges Fixed Rate Debt Weighted average fixed rate
GWOF Hedging ProfileAs at 30 June 2014

129
GPT WHOLESALE SHOPPING CENTRE FUND
GWSCF provides wholesale investors with exposure to high quality retail assets. At 30 June 2014, the Fund consisted of 10 shopping centres with a value of $3.5 billion.
Fund Details as at 30 June 2014
GPT's Ownership Interest (%) 20.1%
GPT's Ownership Interest ($m) $512.3m
Established March 2007
Weighted Average Capitalisation Rate 6.11%
Portfolio Occupancy (%) 99.7%
Distributions Received ($m) $15.0m
GPT Base Management Fee ($m) $6.7m
GPT Performance Fee ($m) $0.0m
Equity IRR 1 July 2013 to 30 June 2014
Inception to Date (Annualised) 31 March 2007
to 30 June 2014
Post fees 5.7% 4.8%
June 2014 December 2013
Number of Assets 10 9
Property Investments $3,489m $2,959m
Gearing 24.5% 10.7%
One Year Equity IRR (post-fees) 5.7% 9.5%
GWSCF Ownership Composition As at 30 June 2014
Domestic Super Funds 39%
Domestic Other 15%Offshore Pension Funds 15%
Offshore Other 1%Sovereign Wealth Funds 10%
GPT 20%

130
GWSCF CAPITAL MANAGEMENT
Total borrowings for the Fund at 30 June 2014 were $864 million resulting in gearing of 24.5%.
GWSCF Capital Management Summary as at 30 June 2014
Gearing 24.5%
Weighted Average Cost of Debt 4.5%
Fees and Margins (included in above) 1.5%
Weighted Average Debt Term 3.1 years
Drawn Debt Hedging 53%
Weighted Average Hedge Term 4.2 years
GWSCF Loan Facilities Facility Limit ($m) Facility Expiry Amount Currently Drawn ($m)
Bank Bilateral Facility 100.0 1 July 2015¹ 100.0
Bank Bilateral Facility 100.0 1 July 2015¹ 100.0
Bank Bilateral Facility 50.0 30 July 2015¹ 50.0
Bank Bilateral Facility 50.0 1 October 2016 50.0
Bank Bilateral Facility 100.0 31 March 2017 100.0
Bank Bilateral Facility 75.0 30 September 2017 75.0
Bank Bilateral Facility 100.0 30 September 2017 100.0
Bank Bilateral Facility 70.0 1 October 2017 70.0
Bank Bilateral Facility 150.0 30 April 2019 19.0
Medium Term Notes 200.0 13 November 2017 200.0
Total 995.0 864.0
GWSCF Forward Start Debt Facilities Facility Limit ($m) Start Date Facility Expiry
Bank Bilateral Facility 180.0 August 20 14 1 July 20151
Total 180.0
1. Quarterly extension facilities.
Northland Shopping Centre, VIC

131
GWSCF CAPITAL MANAGEMENT
GWSCF has $260 million of derivative instruments and $200 million of fixed rate Medium Term Notes (being 53% hedged) and these have a weighted average term of 4.2 years.
4%
3%
2%
1%
0%
3.21%3.25% 3.21% 3.23%3.44% 3.61%3.44%3.44% 3.61%3.61%
Forecast debt Hedges Fixed Rate Debt Weighted average fixed rate
Jun
19
Jun
14
Dec
14
Jun
15
Dec
15
Jun
16
Dec
16
Jun
17
Dec
17
Dec
18
Jun
18
200
0
400
600
800
1,000
($m)
GWSCF Hedging ProfileAs at 30 June 2014