31st MARCH 1943 BASLE Autumn 1943 - Bank for ...
332
BANK FOR INTERNATIONAL SETTLEMENTS THIRTEENTH ANNUAL REPORT 1st APRIL 1942 —31st MARCH 1943 BASLE Autumn 1943
-
Upload
khangminh22 -
Category
Documents
-
view
0 -
download
0
Transcript of 31st MARCH 1943 BASLE Autumn 1943 - Bank for ...

B A N K F O R
I N T E R N A T I O N A L S E T T L E M E N T S
T H I R T E E N T H A N N U A L R E P O R T
1st APRIL 1942 —31st MARCH 1943
BASLE
Autumn 1943

T A B L E O F C O N T E N T S
PageI. Introduction 5
II. Exchange Rates, Foreign Trade and Commodity Prices:
(1) Exchange Rates 39
(2) Foreign Trade 60
(3) Price Movements . 83
III. Production and Movements of Gold:
(1) Supply of Gold 113
(2) Movements of Gold 118
IV. Lend-Lease, British Disinvestment and European Clearings 132
V. Government Finance, Money and Capital Markets and the Stock Exchanges:
(1) Government Finance, Money and Capital Markets 170
(2) Share Markets 280
VI. Central Banking and Currency Developments 291
VII. Current Activities of the Bank 321
VIII. Conclusion 328
A N N E X E S
I. Balance sheet as at March 31, 1943.
II. Profit and Loss Account and Appropriation Account for the financial year endedMarch 31, 1943.

T H I R T E E N T H A N N U A L R E P O R T
OF THE PRESIDENT OF THE
BANK FOR INTERNATIONAL SETTLEMENTS
announced at the
ANNUAL GENERAL MEETING
held at
Basle, 16th June 1943.
The President has the honour to submit herewith the Annual Report ofthe Bank for International Settlements for the thirteenth financial year, beginning1st April 1942 and ending 31st March 1943. The results of the year's businessoperations are set out in detail in Chapter VII. Net profits, after provision forcontingencies, amount to 4,508,953.89 Swiss gold francs. After the allocationto the Legal Reserve that is required by Article 53 of the Statutes, to an amountequal to 5 per cent, of the net profits, i. e. 225,447.69 Swiss gold francs, thereremain 4,283,506.20 Swiss gold francs available towards the payment of adividend. This sum together with the balance in the Dividend Reserve Fundamounting to 1,626,940.33 Swiss gold francs — in all 5,910,446.53 Swiss goldfrancs — permits the distribution of a dividend of 29.55 Swiss gold francs pershare. At the end of the financial year the balance-sheet total was 483.4 millionSwiss gold francs, as compared with 476.6 million Swiss gold francs on31st March 1942.
Although the total of the Bank's balance sheet has thus risen slightly,there has again been some curtailment in current business after the substantialreductions which occurred in the first two years of the war. Such operationsas are still possible, including the management of the Bank's investments onvarious markets and certain transactions for the Red Cross, now usually callfor much more detailed work than in the past, on account of the great massof new regulations to which international payments have been subjected andother difficulties which have to be overcome. In its activities, the Bank hascontinued to adhere to the principles of scrupulous neutrality which it laid downfor itself in the autumn of 1939, avoiding all transactions whereby any questioncould possibly arise of conferring economic or financial advantages on abelligerent nation to the detriment of another.
From the very outbreak of hostilities it was generally realised that warin modern conditions demands the utmost effort, both civilian and military,from belligerent nations and that state direction of economic life was involvedon a scale surpassing anything known in the past. It would even be anunderstatement to say that in matters of government control the present warstarted where the last one left off, since in many fields lacunae which were

still embarrassing the administrations of 1918 were this time dealt withimmediately the war began, one notable example being the early impositionof exchange control. While the present struggle was thus a total war fromits very beginning, with each year that it has been prolonged and with eachextension of its compass there has been a further intensification of effort,through which, so to speak, higher and higher degrees of totality have beenattained.*
In the field of fore ign commerce government direction is everywheresupreme, trade being subject to priorities, import and export permits, rationingof foreign exchange and allocation of transport facilities, while premiums andspecial charges have been introduced to "equalise" prices at home andabroad and thus assist the movement of goods in directions where otherwisethe price differential would be prohibitive or would exert an undesirableinfluence on the price structure. The methods of control are many but theresult is one: private business, tied by governmental restrictions, is made tofunction more and more for official account. Through economic warfare — theblockade, the counter-blockade and all the measures supplementary thereto —the world has become divided into quasi-watertight compartments, with onlya few trickles of trade being allowed to pass through the barriers, as, forinstance, imports and exports to and from Sweden via Gothenburg and toand from Switzerland via Portuguese, Spanish and Italian ports, these ship-ments requiring permits from the belligerents on both sides.
In the winter of 1941-42 the pattern of world trade was suddenly changedin a large measure by the extension of Japanese domination in the southand south-western Pacific. This made it necessary for many countries eitherto seek alternative sources of supply, for instance in Latin America, or toembark upon the production of substitutes at home; an outstanding exampleof such production is the manufacture of artificial rubber in the United Statesat a rate estimated at 250,000 to 275,000 long tons in 1943, compared withpeacetime requirements of natural rubber amounting to 410,000 long tons in1938. Another important change in the international movement of goods hasbeen the increase in lend-lease deliveries, not less than 60 per cent, of thetotal exports of the United States in 1942 being on lend-lease account. On theother hand, foreign trade inside the continent of Europe showed little changein 1942, credits through the clearing mechanism being on about the samescale as in the previous year.
In its economic policy each belligerent country must aim at a maximumut i l isa t ion of i ts human and material resources. Under the influenceof cost and price changes in markets still comparatively competitive, the man-power of a nation could in peacetime be left more or less free to distribute
* The war has brought the suppression of a number of statistical series, in particular those relating tocommodity stocks and other matters on which information might be considered of value to the enemy;and, for much the same reasons, the greater part of the new material collected for official purposes connectedwith the war effort has not been published. But a considerable volume of reliable statistical material hasremained, although not always easily available: especially as regards monetary and financial developmentsis much of the information normally received in peacetime still to hand; indeed, in a number of cases,regular publication has been resumed after an initial suspension, e. g. of certain central-bank returns.

y
itself among the various occupations open to i t ; but, in time of war, thegovernment itself must necessarily determine what groups have to be draftedfor service in the armed forces and it must further try to prevent, or atleast to limit, the rise in prices which would normally be the result of itsown increased demand for goods and services. In some countries higherprices and pay have no doubt been helpful factors in the transformationof production, including the regrouping of labour; but, with the intensifi-cation of the war effort, the driving force has increasingly been supplied bygovernment direction, exerting its influence through a whole series of economicmeasures: •
(i) The mobi l isat ion of the last reserves of manpower includes (inaddition to the use of foreign workers, which has been important inGermany), the reabsorption of the unemployed, the lengthening of hoursof work, the postponement of retirement, the earlier active employmentof young people and — as not the least important measure — thegreater empjoyment of women in all kinds of occupations. Experience inmore than one industry has shown that women often equal men inefficiency and sometimes even surpass them. In Germany, where 50 percent, more women were working in trade and industry in 1939 than in1932, the war at first brought a decline in the employment of women(mainly as a result of the many marriages) ; but the figure began to riseagain in 1940, so that by 1942 1.3 million more women were employedthan at the outbreak of war (and early in 1943 there was a furtherenlistment in order to set more men free for active service or armamentproduction). By the end of 1942 foreign workers (including prisoners ofwar) represented 17 per cent, of those employed in industry in Germany,it being estimated that the effective yield of foreign labour was on anaverage about 80 per cent, of that of German workers.
That in times of heavy rearmament and war there is an urgent needfor manpower is but another way of stating the fact that at such timesunemployment has ceased to be a problem. In the United States, forinstance, there were about 7 million more people employed in the autumnof 1942 than in the summer of 1939 and during the same interval theactual working week in manufacturing establishments had been lengthenedby about one-seventh. In this as in other countries heavy new ordersby the state, financed to the extent of one-half or more by additions tothe public debt, provide a definite outlet for productive capacity; commodityprices — whether strictly controlled or not — are fixed so as to allowfull remuneration of costs ; and the redundant purchasing power in thehands of the public makes it possible to sell almost anything, while thestandard of living in civilian life is necessarily pressed down. The fewremaining neutral countries, with a smaller proportion of their manpowerdrafted for service in the armed forces, have from time to time fearedthat lack of raw materials and curtailment of export facilities would causeextensive unemployment; but they too have found, not without some

— 8 —
surprise, that, thanks to the production of substitute articles and materialsand to the general hunger for goods, the number of unemployed hasbeen kept at well-nigh the lowest figure ever recorded. It is one of thetragic aspects of life that some problems — and notably the problemof employment — can be more easily solved in periods of increasingscarcity and international conflict than in periods of peace and abundance.But, although in times of plenty a mounting production of a variety ofgoods certainly brings with it the risk of many maladjustments, it is,none the less, at such times that man's material welfare is increased.It makes all the difference whether the work done produces goods andservices actually wanted by the people (what they are willing to buythemselves with their earnings) or whether full employment is attainedonly by virtue of government purchases and at a reduced standard ofliving, ending in scarcities all round.
(ii) Hand in hand with the better utilisation of existing manpower there havebeen great ef forts to rat ional ise product ion —.not least in thecivilian sector — the aim being to simplify output, in accordance withwartime principles, by a standardisation of models, concentration ofproduction and curtailment of the apparatus of distribution. In the UnitedKingdom a vast and far-reaching scheme for the purpose of concentratingproduction was put into effect in the spring of 1941, with the result that,from May of that year up to March 1943, 235,000 workers were releasedfor service in the armed forces or for war work and 61 million squarefeet of factory space was given over to war production or made availablefor storage purposes; this involved the closing of 2,800 establishments,while 5,800 were designated "nucleus firms" (and, as such, usuallycarried on manufacture, on a commission basis or against direct payment,for the firms which had been closed). In each country the character ofthe measures taken depends, of course, upon local conditions. In Germanythe existing cartel system has been modified in several respects, newforms of association being introduced to carry out tasks allotted to thevarious branches of industry and trade; and in the autumn of 1943 theMinister of Armaments and Munitions was given the direction of thewhole of German production (including, from then onwards, the civiliansector). In Japan also the government has taken drastic measures,concentration of industrial production being followed in the autumn of1943 by the suppression of a great number of enterprises not essentialfor the war effort.
All this economic transformation has, of course, been primarily plannedin the interests of the all-out war effort, but some of the resulting changeswill no doubt have a lasting effect on industrial life. Such countries as havenot taken the same stern measures of industrial concentration have begun toask themselves whether those who have done so will not benefit greatly froman enduring improvement in efficiency, thanks to the increased interchangeof technical knowledge and the many new inventions which have formed part

— 9 —
of the almost irresistible impulse towards rationalisation caused by an acutelabour shortage. It is naturally in the armament industries that the advancehas been most pronounced and the results thereof should be felt particularlyin the production of durable goods. Peace will presumably bring back —though probably not at once — the right of the consumer to determine whathe will buy, and much of the present manufacture according to standardisedpatterns will then no doubt go by the board ; but, within many fields and fora large number of articles, production according to more standardised speci-fications provides such great advantages that it will certainly be continued evenwhen the war is over, and this will make it possible to charge much lessthan would otherwise be the case. On the other hand, there is a certaindanger that the strong industrial and commercial associations formed duringthe war may seek to retain monopoly positions conferred upon them underwholly exceptional circumstances, endeavouring to limit competition and resistchange and thus failing to adapt themselves to peacetime conditions, therebymaking it exceedingly difficult to ensure work for those returning from activeservice or no longer occupied in armament industries.
The l imi tat ion of output for c iv i l ian purposes has been appliedmost drastically to the production of durable consumer goods (dwelling-houses,automobiles, refrigerators, radios, etc.), since the industries and trades engagedin their production are those which can most easily be switched over tothe manufacture of war materials, the bulk of which consist of guns andmunitions, tanks and lorries, aeroplanes and ships. In the United States thefirst curtailment in the supply of finished civilian goods came in the autumnof 1941 ; the following table shows that from the middle of that year tothe middle of 1942 the entire rise in the aggregate industrial productionwas caused by the rapid expansion in the output of durable manufacturesand that very much the same held good for the following twelve monthsup to the middle of 1943.
In the spring of 1943it was estimated that nearlytwo-thirds of the current in-dustrial output in the UnitedStates was for war purposes;for the first half of 1943 theindex of industrial productionshowed little change in thetotal, thus apparently indicat-ing that a more or less finalstage of economic mobilisationhad been reached, marked,inter alia, by an acute short-age of manpower.
Index of Industr ia l Product ionin the United States.
Base 1935-39 = 100
Durable manufactures . . .Non-durable manufactures.Minerals (except gold) . . .
Total index
June 1941
198138131
160
June 1942
246136132
177
June 1943
303147121
203
The increase between June 1942 and June 1943 in the indexfigures for non-durable manufactures reflects mainly higheroutput In the chemical industry, the products of which consistmore largely of munitions than those of any other Industry inthe non-durable group. The decline in minerals in June 1943would seem to have been largely temporary (a result of labourconflicts In the coal industry).
Industrial production in Canada has increased even more rapidly thanin the United States, Canada having become, after the great powers, by farthe largest armaments producer in the world. This spectacular increase is

— 10 —
partly due to improvements in technical efficiency; but the main reason is ashift in employment from occupations with a low rate of productivity to otherswith very high productivity (the value of a man's output will rise fast if hemoves from a "marginal" farm to an aeroplane factory equipped with all thelatest machinery). War demand would seem to be in the main for goodswhich can be produced on a conveyer belt or with the aid of other appli-ances of modern mass production, while the peacetime requirements of theordinary consumer are largely of a different character, including an in-creasingly high proportion of services (restaurants, holiday resorts, medicalattendance, beauty treatment, etc.) which cannot benefit to the same extent from
the use of labour-saving devicesor large-scale production. This —be it said in passing — wouldseem to be one of the reasonswhy for the satisfaction of peace-time needs there cannot be thesame spectacular rise in the natio-nal output as has been achievedduring the war.
Indexes of Industrial Productionon base 1936 = 1ÖO.
(*) New index, with a new method of weighting.
Apart from Finland, none ofthe belligerent countries in Europeregularly publishes an index ofindustrial production, and indi-cations of the general trend aregiven but rarely. It is likely thatfor most of them the proportionof war production to the totalindustrial output is very much thesame as in the United States.The rate of total output varies,however, considerably from countryto country. For France in 1942 itis estimated to have been abouttwo-thirds of the 1938 volume.The sharp decline in Finland'sindustrial production, as shown inthe graph, is due partly to lackof raw materials and partly to thehigh percentage of the populationon active service — for longperiods, up to 18 per cent. ' Fromthe spring of 1940 lack of normallyimported raw materials affectedthe volume of industrial pro-duction in Sweden and Denmarkalso, the loss of markets being

- 11 -
another factor. If, in spite of the falling-away of the important Anglo-Saxonoutlets for the Swedish pulp, paper and timber industries, the total industrialproduction in that country has kept up relatively well (at about the 1936 level),this has been due partly to armament work and partly to substantial invest-ments for the production of substitutes.
The yield of industrial production is usually the most important, but stillonly one, of the component parts of the national income. In a number ofcountries current estimates are compiled (but not always published) not merelyof the net but also of the gross national income, the latter including thewhole flow of goods and services produced during a year and thus alsothe cost of maintenance and replacement of the nation's capital.* Onceestimates are available covering the maintenance and replacement charges,the total private consumption and the amounts of domestic and foreigninvestments (or disinvestments), it is possible to set out more or lessfully the yield of the rea l s o u r c e s f r o m w h i c h c o n t r i b u t i o n s tot h e c o s t s of t h e war a re d e r i v e d . These costs may be met,firstly, by an increase in production ; secondly, by a reduction in one ormore of the following items: private consumption, government expenditureother than for war purposes, maintenance and replacement charges, provisionfor new domestic capital ; and, thirdly, by a draft on foreign resources(foreign disinvestment).
For four countries, fairly complete estimates of the national income in 1942have become available and some of the main figures are reproduced on thefollowing pages, it being understood, however, that full comparability between thedata for different countries cannot be expected, considering the rather widemargin of error to which such estimates are subject and the possible employmentof varying methods of computation. Even within one and the same countrya true comparison between the figures for different years cannot be ensuredwithout a reduction of these figures to a unit representing stable prices (say, 1939dollars for the United States, for instance). Such a reduction is, of course,a somewhat hazardous undertaking, since it is most difficult to take intoaccount the price changes of the many heterogeneous elements which makeup the earnings of a nation or on which the government and the publicat large spend their money. It is, however, hoped that the results may givesome idea of the proportions involved.
The first two columns in the table regarding the United States give theactual figures for 1939 and 1942 respectively and the third column the figuresfor 1942 recalculated in terms of "1939 dollars" on the basis of a price indexregistering a rise of 14 per cent, from 1939 to 1942. The difference betweenthe figures for 1942 in "1939 dollars" and those for the year 1939 shows thereal sources contributing to the cost of the war. Thus, war expenditure rose by$41.8 milliard (in 1939 dollars) but the increase in the gross national product was
• The net as well as the gross national income is often calculated both at prices including and at pricesexcluding the increase due to indirect taxation.

- 12
Real Sources of Cont r ibut ionsto War Expenditure in the United States
in 1942 in compar ison with 1939.
Sources ofcontribution
Gross national productDeduct :
Private consumption . . .Private gross capitalformation
Non-war governmentexpenditure*
Total deductionsLeaving for :
War expenditure*
1939
88.6
61.7
10.9
14.687.2
1.4
1942
in milliards151.6
81.9
8.0
12.5102.4
49.2
1942in 1939dollars
of dollars133.2
72.0
7.0
11.090.0
43.2
Differencebetween
1942(in 1939dollars)
and1939
+ 44.6
+ 10.3
— 3.9
— 3.6+ 2.8
+ 41.8
This table has been prepared on the basis of data given in an articleon the "National Income and National Product in 1942" by Milton Gilbertand George Jazzi, appearing in the "Survey of Current Business" forMarch 1943, issued by the U. S. Department of Commerce.* For goods and services, i.e. without such transfer expenditure as interest
on the public debt, pensions, etc.
Real Sources of Cont r ibu t ionsto War Expenditure in the United Kingdom
in 1942 in compar ison with 1938.
Sources ofcontribution
Gross national incomeAdd:
Overseas disinvestment .Total available . .
Deduct:Private consumption . . .Maintenance and increase
of private domestic ca-pital
Total deductionsLeaving for:Government expenditure*
1938
5,587
555,642
4,035
7624,797
845
1942
in millions <9,078
6329,710
4,800
3025,102
4,608
1942in 1938pounds
}f £ sterling6,700
4857,185
3,408
2323,640
3,545
Differencebetween
1942(in 1933pounds)
and1938
+ 1,113
+ 430+ 1,543
— 627
— 530— 1,157
+ 2,700In a British Government White Paper, presented to Parliament in April
1943, an analysis was given of the sources of war finance and for thatpurpose an estimate was made of the national income and expenditure In1938, 1940, 1941 and 1942. On the basis of the figures thus presented, "TheEconomist" In an article of 27th April 1943 made a recalculation of the1942 figures in terms of "1938 pounds", assuming a rise of 30 per cent, inprices from 1938 to 1942. In the above table account has been taken of thefigures in the White Paper and in "The Economist".* For goods and services, i.e. without transfer expenditure.
0) Footnote see opposite page.
even greater — $44.6milliard — and, with adecrease of $3.9 mil-liard in the privategross capital forma-tion and of $3.6 mil-liard in non-war ex-penditure, was suffi-cient to enable privateconsumption to attainin 1942 a figure of$10.3 milliard over andabove the 1939 level(i. e. allowance beingmade for the rise inprices).
In terms of "1938pounds" governmentexpenditure in theU n i t e d K i n g d o mincreased by £2,700million between 1938and 1942 and thisincrease was coveredby a rise of £1,113million in the grossnational income, by areduction of £627 mil-lion in private con-sumption, by a com-pression of £530 mil-lion in the sumsdevoted to mainten-ance and increase ofdomestic capital and,finally, by a draft of£430 million on for-eign assets. (Over-seas disinvestment of£55 million in 1938 pro-bably represented thereinvestment in GreatBritain of amountsreceived from abroadas amortisation onlong-term loans pre-viously granted(1).)

- 13 -
Because of the increase in Hungarian territory since 1938, per-capitafigures are the best basis of comparison, but even they need some fur-
ther adjustment owingNat ional Income in Hungary 1938-39 and 1942-43. to the relative poverty
of the newly-incor-porated areas. TheInstitute for EconomicResearch estimatedthat, of the declineamounting to 17 percent, in the nationalincome per head ofpopulation, 12 per cent,was due to this cir-cumstance and onlythe remaining 5 percent, represented areal decline, which inits turn was largely aresult of the bad har-vest in 1942 as com-pared with the excellent
harvest in 1938. But heavier government expenditure and a higher export surplusabsorbed more of the national income in 1942^43 than in 1938-39 and privateconsumption (measured in stable prices) fell, therefore, within the Trianonfrontiers, by 11 per cent, per head of population, a percentage which maybe taken as a measure of the reduction in the standard of living as com-pared with pre-war conditions.
0) In order to find a mode of comparison which is not obstructed by the difference in the size of the United Statesand the United Kingdom and In the value of their currencies, "The Economist" has expressed the (partiallyregrouped) figures for the two countries as percentages of their pre-war gross Income, i.e. the Britishfigures are calculated as percentages of £5,587 million (the British gross national income In 1938) and theAmerican figures as percentages of $88.6 milliard (the gross national product of the United States in 1939).The percentages thus obtained give a real indication of the magnitude of the changes brought about bythe war: thus for 1942 the cost of the war to the United Kingdom, as measured by the increase in govern-ment expenditure, comes to 48.4 per cent, of the gross national income, and this means that in that yearthe British Government devoted to the war a quantum of goods and services equal to nearly one-half ofthe total output of the British community before the war.
Costs of the War and Sources of Contributions to Costsin the United Kingdom and the United States
as Percentages of the Pre-war Gross National Income.
Groups
Total national incomeDeduct:
Private consumption . .Leaving for other pur-
poses, i.e. for govern mentexpenditure on goods andservices, and for the ex-port surplus
National income per headof population
1938-39within theTrianonfrontiers
The wider territory1942-43
incurrentvalues
in1938-39prices
DifferencebetweenColumn 3
andColumn 1
in millions of pengöCD
5,192
4,450
742
(2)-12,461
9,917
2,544
(3)7,029
5,594
1,435
in pengö
572 840 474
W+ 1,837
+ 1,144
+ 693
% change
-17%
The above table has been constructed on the basis of estimates of thecurrent national income, in comparison with pre-war figures, published inJuly 1943 by the Institute for Economic Research in Budapest. In Itscalculations the Institute has assumed a price rise of 77 per cent, between1938-39 and 1942-43.
Pre-war Gross National Income = 100
Costs of the war(increase in government expenditure)
Derived from:Increased production (increase in gross national income) . . . .Reduced consumptionReduced provision for private capital and disinvestment, if any .
United Kingdom
48.4
20.011.217.2
United States
46.5
51.2— 8.7
4.0
In the two countries the increase in government expenditure has thus been in very much the sameproportion to the pre-war output : but in the United States the higher costs have been met wholly by a riseIn production — 50 per cent, in three years — while in the United Kingdom the increase in productionamounted to 20 per cent, in four years, the difference being explained (at least to some extent) by theexistence of large unused resources in the United States before the war.
For 1943 it has been estimated that about one-half of the national product in the United States is absorbedby the war effort. In 1918 the proportion so absorbed was about one-fourth.

— 14 —
In terms of "1939 prices" the central-government expenditure on goodsand services in Sweden was in 1942 twice as high as before the war. Nocontribution to the increased costs of the government was, however, receivedfrom an expansion in total production, which on the contrary fell by about
7 per cent, betweenExpenditure on Goods and Services in Sweden 1939 and 1942 (pari
in 1939 and 1942. passu with the "totalgross expenditure", asshown in the table).That being the case,the increased outlayof the central govern-ment and the fall inproduction led to adecline of 14 to 15per cent, in privateconsumption, a re-duction of nearly one-third in private in-vestment and a cer-tain contraction inthe effective volumeof local governmentexpenditure.
Groups
Total gross expenditure(public and private) . . .
Deduct :Private consumption . . .Private investments . . .Local government expen-
Total deductions .Leaving for:
Central-governmentexpenditu re . . . .
1939 1942 1942In "1939prices"
Differencebetween
1942(in 1939prices)
and 1939in millions of S.Kr.
10,891
7,5881,481
9279,996
895
13,930
9,0871,354
1,02311,464
2,466
10,200
6,5001,050
8508,400
1,800
— 700
— 1,100— 400
— 100— 1,600
+ 900
The figures given in the first two columns of the above table are takenas they stand from an analysis of "Income Developments and the Excessof Purchasing Power during the War Years", published in May 1943 by the"Koniunkturlnstitut" In Stockholm. The figures in the last two columns haveon the other hand, been calculated on the basis of certain percentages andother indications given by the Institute. For the reduction of private consump-tion to "1939 prices", the Institute has assumed a rise of about 40 per cent,in prices between 1939 and 1942.
Taking into account other information than that given in the above tables,developments during the war up to 1942 in the four countries under reviewmay be summarised as follows: in "constant prices" the total (central andlocal) government expenditure on goods and services rose in Hungary andSweden by about one-half*, while in the United Kingdom and the UnitedStates it more than trebled ; total production increased by 50 per cent, inthe United States and by 20 per cent, in the United Kingdom, but is esti-mated to have fallen by 5 to 7 per cent, in Hungary and Sweden ; total privateconsumption in the United States was 16 per cent, higher in 1942 than in1939 (thanks mainly to the steep rise in American production), while in theUnited Kingdom and Sweden there was a reduction by 15 per cent, and inHungary by 10 per cent, below the pre-war level.
For Germany no similar data are available, but it has been estimated thattotal government (central and local) expenditure on goods and services rosefrom RM 36 milliard in 1938 to RM 70 milliard in 1941, and that during the sameperiod the amount available for civilian expenditure (private consumption andinvestments) increased from RM 59 to 71 milliard, a rise which reflects, on
* If account were taken not only of expenditure on goods and services but also of transfer expenditure, I. e.of interest on the public debt, pensions, and subsidies granted to keep down prices, the increase in thetotal (central and local) government expenditure in Sweden and Hungary would, It seems, be higher thanthe proportion given in the text.

— 15 —
the one hand, the incorporation of new provinces in the east and west and,on the other, higher remuneration and higher prices in certain sectors. Theavailable statistics do not make it possible to establish the share ascribableto each of the main sources contributory to the war effort: increased work,curtailed consumption and drafts on capital; but it may be regarded as certainthat all three have helped to make possible the redirection of resources forthe prosecution of the war.
It is the shortages in men, machines and materials which set the finallimits to the war effort in its economic aspects; but, in order to exercisecommand over real resources, the governments as a rule need to make paymentsin money at home and abroad, and this raises the question of the f inancia lsources of the war effort.* When able to apply modern methods of fiscaland credit policy, governments seem to master financial limitations with com-parative ease — at least on their domestic markets ; and in relation to othercountries various means (lend-lease, reciprocal agreements, clearing arrangementsand payment of occupation costs) have been employed to prevent a lack offunds from hampering the flow of goods. The methods of financing whichwere worked out during the first two or three years of the war haveremained essentially unchanged, such modifications as have been made beingdesigned to ensure that the economic and financial structure would stand thestrain of heavier war liabilities and the piling-up of buying power in thehands of the public. While the figures of national income and consumptionindicate a considerable amount of diversity between different countries, a highdegree of parallelism is found in fiscal developments; in matters of taxationand borrowing, governments show no hesitation in availing themselves of theexperience gained in other countries — whether friends or enemies"; in anycase, the choice open to the governments is not very wide, an element ofcompulsion entering into the picture.
In last year's Annual Report (pages 13-15) the var ious methods ofrais ing money to meet government expendi ture were considered fromthe point of view of their eff icacy in res is t ing in f la t ion , and a" h i e r a r c h y " was formulated, which may be summarised as follows:
(a) taxation (and other current receipts),(b) borrowing of genuine current savings,(c) expansion of commercial-bank credit, and(d) expansion of central-bank credit.
The first two methods — taxation and the borrowing of genuine currentsavings — were shown to be the "soundest" from a monetary point of viewand it is in many respects the total of the two together that is really important.
' Government financing In wartime exerts a dominant influence on the monetary system and in the differentchapters of the present Report more space has, therefore, been devoted to this subject, including thepresentation of statistics of government revenue and expenditure, of public borrowing and of such mattersas lend-lease, clearing balances and the payment of occupation costs. To facilitate comparison with earlieryears, and to provide a background against which the wide and rapid changes of the war years may be set,the statistical tables include a number of figures relating to the immediate past — a feature which is partlyresponsible for the exceptional length of the Report.

- 16 -
While for most countries lack of statistical data makes it impossible todraw up exact figures grouped according to the "hierarchy", an approximationcan be made in some cases. In Germany and the United Kingdom privatecredit operations unconnected with the war have practically come to an end, andthe total of government borrowing on the internal market has thus becomeapproximately equal to the so-called "money-capital formation". For thesetwo countries tables in Chapter V (page 269) set out in some detail themeans whereby government expenditure was financed in the years 1940-42,the sources being arranged roughly in conformity with the "hierarchy"; andan analysis on somewhat similar lines is made for the United States also. Some
of the principal facts and conclusionsAna lys is of government f inanc ing,
averages f o r p e r i o d 1940-42:Germany and the United K ingdom.
are given here in an abbreviated form.
The construction of these tableshas necessitated certain estimatesand adjustments which are mentionedin the notes on page 269. By andlarge, the differences and errors donot appear great enough to vitiate abroad comparison of the figures, andthe main points brought out by thetables are these:
(i) In both countries the propor-tion of government expenditure(internally financed) raised bytaxation and other current internalrevenue averaged just under50 per cent, in the years 1940-42(the highest level being in thethird year, 1942);
(ii) similarly, borrowing from other sources than the commercial and centralbanking system, at 34-35 per cent., was approximately equal for the twocountries. The proportion covered by taxation and other internal revenue, plusborrowing outside the banking system, was thus 84 per cent, in both countries;
(iii) the proportion covered by borrowing from the commercial banks was10-12^2 per cent, for the whole period (with a marked tendency to decl inefrom year to year) ; from the banking system as a whole (central andcommercial banks) 16 per cent, was borrowed, also with a declining trend.
Judged on these lines the similarity of war finance in the two countriesis truly remarkable; after three full years of war the relative importance of thesources of internal financing was so nearly the same in Germany and theUnited Kingdom that the differences in the percentage figures are well withinthe margin of error due to the unavoidable inaccuracies of the data.*
Sources of fundscovering government
expenditure1940-42
Taxation and other currentrevenue
Borrowing other than fromthe central and commer-cial banks
Total . . .Borrowing from thecommer-
cial banksBorrowing from the central
bankTotal . . .
Total expenditureinternally financed .
Germany UnitedKingdom
As percentagesof total expenditureinternally financed
48.9
35.184.0
10.2
5.816.0
100.0
49.9
34.284.1
12.5
. 3.415.9
100.0
* It should be remembered that the comparison given in the text is based on tables covering the situationup to the end of 1942, while the intensification of the war in 1943 has led to many changes in the scope ofthe government's command of goods and services in the different countries — changes which are likelyto be reflected in the financial accounts.

— 17 —
Analys is of government f inanc ing
the United States, 1940-42.in
Besides similarities, however, the sources of financing show somedifferences. One of these — brought out by the tables — is that the pro-portion borrowed from the central bank was somewhat larger in Germanythan in the United Kingdom, reflecting the greater importance of the com-mercial banks in the latter country. On the other hand, in the United Statesthe proportion borrowed from the commercial banks was considerably largerthan in either of the two European countries, as may be seen from thefollowing table.
The proportion of expenditure covered by taxation and other currentinternal revenue fell in the United States from over 60 per cent, in 1940 to under30 per cent, in 1942, and, conversely, total borrowing and movements of official
balances rose from 40 to70 per cent, of expenditure.Actual new governmentborrowing from the FederalReserve Banks was compa-ratively small but from thecommercial banks it wasvery considerable, notwith-standing the fairly success-ful efforts made in 1942to sell securities to pur-chasers other than banks.One reason for the high pro-portion of borrowing fromthe banks was the rapiditywith which government ex-penditure increased after theUnited States had becomeinvolved in the war ~ arapidity which also helps toexplain why a smaller pro-portion of government ex-penditure has been coveredby taxation in the UnitedStates than in the UnitedKingdom or Germany.
Sources of funds coveringgovernment expenditure
Taxation and other currentrevenue
Government securitiestaken by:
Investors other than banksTotal . . .
Government securitiestaken by :
Federal Reserve Banks . .Total . . .
Movements of officialbalances
Total exp e nditure . .
1940 1941 1942 Total1940-42
In percentages of total expenditure
60.4
22.182.5
15.1(— 3.1)
12.0
5.5
100
46.4
48.995.3
21.20.3
21.5
(—16.8)
100
29.3
43.472.7
34.97.0
41.9
(- 14.6)
100
36.7
42.278.9
29.54.4
33.9
(-12.8)
100
There are two main reasons why it has not been possible tocompile for the United States a table in the same form as for Germanyand the United Kingdom. Firstly the formation of money capital couldnot in the United States be taken as equal to government borrowing,since private credit operations were still very important, especially in1940 and 1941 before the entry of the country into the war; and,secondly, large purchases of government securities by the Federal ReserveBanks in earlier years had led to an accumulation of latent central-bankcredit by the way of excess reserves of the member banks. The abovetable has been based on the budget figures and on the statisticsregularly published regarding the principal holders of governmentsecurities.
Averaging 34 per cent, for the years 1940-42, the proportion of governmentexpenditure financed by the banks of the United States is twice that of suchfinancing in Germany and the United Kingdom. But the danger of governmentfinancing by an extension of bank credit cannot be measured primarily by itsratio to the total of government expenditure; it depends essentially on the rateof expansion in the volume of credit and currency and must thus be relatedto the size of the commercial banking system, which, in terms ofthe budget and the national income, varies from country to country.

Years 1938 and 1942
1938Credit volume
CurrencyCommercial-bank deposits.Total credit volume . . . .
Net national income . .1942
Budget expen ditureinternally financed
The credit volume in 1938as percentage ofthe net national income in1938the budget expenditure in-ternally financed in 1942 .
Germany UnitedKingdom
in millions ofRM | £ stg
10,50019,50030,00080,000
90,000
6002,8003,4004,500
4,500
UnitedStates
dollars
6,80043,70050,50064,500
56,000Percentage proportions
37%
33
75
75
78
90
- 18 -
The importance These percentagesof the banking system in Germany, show that, in relation to
the United Kingdom and the United States, national income and war-time budgets, the bankingand currency structurewas on a smaller scalein Germany than in thetwo Anglo-Saxon coun-tries, the ratio beingabout 1:2 in relationto the United Kingdomand somewhat higher inrelation to the UnitedStates ; this would seemto reflect a profounddifference of habit withregard to the main-tenance of amounts inthe liquid form of cashand bank deposits.
A system with a more restricted mass of liquid claims outstanding may in somerespects have its advantages; but, with regard to the problem of war financing,it is obvious that recourse to the credit system covering, say, 15 per cent, ofbudget expenditure (internally financed) must provoke a greater relativeexpansion of bank credit in a country with a smaller initial volume than inother countries.* The expansive movement is, by its nature, cumulative, thedanger of government financing by an extension of bank credit lying in thefact that annual war expenditure is of a very large order compared with theoutstanding volume of bank-notes and bank credit dictated by the usualrequirements of a peace economy. Thus, if a certain proportion of governmentwar expenditure is financed by borrowing from the banking system, the expan-sion of bank credit will be relatively much greater.
Developments in the United Kingdom during the last war maybe taken as an example. If not only the actual war years but the whole periodfrom August 1914 to March 1921 be considered, 44 per cent, of the internallyfinanced expenditure amounting to £11,050 million was covered by taxation,5 per cent, by other current receipts and 51 per cent, by borrowing. Of theamounts borrowed internally, some £350 million appears to have been in theform of "central-bank credit" (including issues of Treasury notes) while theexpansion of commercial-bank deposits amounted to £1,350 million. The totalincrease in currency and credit — equivalent to the government's financingby the banking system as a whole — was thus £1,700 million, representing15 per cent, of government expenditure internally financed — a proportion veryclose to that of 1940-42. Although this does not seem a high percentage, its
* In actual practice, of course, account has also to be taken of changes In the area in which the bankingsystem operates and thus, as regards Germany, of the widening of that area In recent years.

- 19 -
uninterrupted influence on the volume of notes and bank deposits for nearlyseven years was very considerable. Owing to the circulation of gold coinsbefore 1914 and to other factors, it is not possible to state exactly the amountof currency in circulation on the outbreak of war, but it appears to have beenabout £120 million ; with a volume of commercial-bank deposits amounting tosome £1,100 million, the total of circulating media was, say, £1,220 million.Thus, an expansion of £1,700 million, although covering only 15 per cent, ofgovernment expenditure, represented 140 per cent, of the total of currency andbank credit outstanding before the war; as a matter of fact, commercial-bankdeposits more than doubled and the currency in circulation rose to four timesits pre-war level.*
In this as in the last war no government has been able wholly to avoidborrowing from the banking system. Indeed, apart from the necessity ofresorting to the banks when the flow of funds from other sources has becomeinsufficient, it is fair to say that some expansion of the currency and creditvolume has been helpful-— perhaps indispensable — as a means of facilitatingthe collection of taxes and the placing of government securities. But theconsequence has been an increase in the buying power of thepubl ic at a time when such an increase was being stimulated in other waysalso (good employment all round, etc.). Rising note circulations and bankdeposits are outward signs of growing money surpluses; and estimates ofnational income point the same way. Thus, the U. S. Department of Commercehas calculated that the national income for the second quarter of 1943 was19 per cent, above the level in the third quarter of 1942, that is, just beforethe inception in the United States of the anti-inflation programme. At the rateattained in the second quarter of 1943, the annual national income would be$146 milliard, i. e. $37 milliard more than the sum of (i) the total value of goodsand services available for consumption and (ii) the amount of taxes paid byprivate individuals and corporations. In September 1942 the difference inquestion — the so-called "inflationary gap" — was just short of $29 milliard;it has thus been growing at a relatively more rapid rate than the nationalincome itself.
For Sweden, also, an attempt has been made to calculate the excess ofbuying power in the hands of the public, the term being given, in this case,a somewhat different meaning in that an amount corresponding to the normalrate of savings is also deducted from the gross income. In the Swedish senseof the term, the excess of buying power was found to represent, in 1942,about 10 per cent, of the total income in the hands of the public.
Could the principles of a war economy be carried to their logical con-clusion, there would presumably be no "free sector" of goods and services
The more rapid increase in the note circulation during the war caused a permanent change in the ratioof currency and bank deposits; while in 1913 the value of commercial-bank deposits was eight to nine timesthat of notes and gold coins in circulation, the proportion had fallen to five and a half times by 1919. Thisexpansion of currency and credit in the United Kingdom was illustrated by a graph on page 214 of thetwelfth Annual Report; the graph also showed that the volume attained during the war remained outstandingwhen the war was over, a phenomenon found also in the United States, although In that country a fairlylarge part of the war debt was repaid by 1931. See also page 279 of this Report.

- 20 -
left, but all purchases would have to be authorised either by the possessionof coupons or by some special permit. Money would then have no purchasingpower in itself but only within the framework of these authorisations; and whatcould not be spent would have to be saved (the supposition being that, withfully effective control, no black market could emerge). Total consumption beinglimited to the supplies officially available, any amounts paid out by thegovernment in excess of what was required to purchase the authorised volumeof consumption goods would take the form of taxes and savings ; and, ifhoarding of bank-notes could be prevented, the amounts saved, when notinvested in government securities, would lead specifically to an increase inbank deposits, which would in its turn be lent to the government. This processis often described as a "money circuit", but it would work adequately, i.e.without inflation, only in so far as the newly-created moneys paid out by thegovernment (that is to say the amounts borrowed from the banking system)were effectively brought back by taxation or genuine savings. The author i t ieshave, as it were, to pursue and capture the new purchasing powerwherever it makes its appearance. In dealing with this problem, threedirect methods have been employed to check inflationary developments:
(i) taxation ;(ii) forced and semi-forced saving, and
(iii) stimulation of direct investment in government securities.
Since these steps, however, have proved inadequate, a series of furthermeasures, designed to limit the expansive effect of government outlay and thusto curb indirectly the pressure of unbalanced demand, has been necessary:
(iv) restricting the resort to loanable funds of commercial and central banksand preventing their use for other than war purposes;
(v) measures to avoid credit creation in financing surplus exports;(vi) price control as a means of combating the inflationary spiral ;
(vii) checking an increase in prices of capital assets.
These various steps are considered in the following paragraphs:
(i) Taxation has been described by the German Finance Minister to be"the most important means of combating inflationary dangers, while, at atime of deflationary stagnation in business, credit policy would take the primaryplace."* During the present war, steep increases in income and profit taxes,coupled with the effects of such measures as restrictions on the payment ofdividends, have, in a number of countries, amounted to even more than thewhole additional money income of the better-situated classes. The increase inbuying power, as revealed, for instance, by the rise in the figures of nationalincome, seems to have been spread for the most part over the broad mass of thepopulation as a result of increased employment, longer working hours, higherrates of pay per hour and a transfer of labour to better-paid occupations —not forgetting a substantial increase almost everywhere in the income of theagricultural population. Of the growth in the national income in the United States
In an article in "Europa-Kabel" of 17th September 1943 on "Volkswirtschaftliche Aufgaben der Finanzpolitik" .

— 21 —
from the third quarter of 1942 to the second quarter of 1943 the farmers wereproportionately the main beneficiaries, with a rise in net income (on an annualbasis) by $3.7 milliard to $13.6 milliard. Wage and salary earners had anincrease by $17 milliard to $103.2 milliard, while profits on business enterprisesrose by $0.9 milliard to $8.7 milliard and interest yields and pensions etc. by$1 milliard to $9.5 milliard (these figures representing income before paymentof direct taxes). According to data given in the White Paper submitted withthe budget in April 1943, the private income of British individuals with £1,000or more a year amounted to a total of £930 million in 1941-42. At the taxrates in force in 1938-39 the amount retained after payment of income taxand surtax would have been £668 million, but at the 1941-42 rates it cameonly to £450 million ; thus, direct taxes in wartime absorbed well over one-halfof the original income.
While the application of increased rates to the higher income groupshas presented few technical difficulties, the absorption of a substantial pro-portion of the new buying power from the mass of consumers has everywheregiven rise to many difficult problems. The solutions found have generallyincluded sharp increases of indirect taxation, most typically, perhaps, by theintroduction or augmentation of turnover taxes, the yield of which rises alongwith an increase in commodity prices — an excellent attribute from a fiscalpoint of view. In judging the burden of these taxes on the poorer classesand particularly on larger families, account has to be taken of other govern-ment measures including subsidies granted to hold down the prices of neces-sities such as bread and milk; amounts thus utilised may fairly be regardedas a set-off to mitigate the effects of increased indirect taxation. Steps havealso been taken to extend income tax to brackets formerly exempt, and toapply the principle of "pay-as-you-go", together with deduction at the source(called in the United States "withholding") by the employer of a part ofsalaries, wages and other earnings. Such extensions of the incidence ofincome tax have, in particular, been characteristic of the fiscal policies of theAnglo-Saxon countries, where before this war the free limit was relatively high,especially as compared with countries on the continent of Europe. Thenumber of actual taxpayers with gross incomes below £500 a year rose, forinstance, in the United Kingdom from 3 million in 1938-39 to 9% millionin 1941-42. The "pay-as-you-go" principle, whereby the tax is collected onthe basis of current earnings, was adopted in 1943 both in the UnitedKingdom and in the United States; it ensures that the amounts due arepaid promptly instead of at a later period, and it also helps taxpayers(particularly the new ones, many of whom are likely to have only smallreserves) to discharge their tax liability in a not too burdensome way.
(ii) In addition to and in conjunction with ordinary taxation, some countries(notably the United Kingdom and the United States) have adopted measuresof forced saving with repayments when the war is over (or, in certainspecial cases, at an earlier date), while other countries (notably Germany)have made arrangements for organised voluntary savings, underwhich certain percentages are deducted from current wages, the amounts

- 22 -
being credited to savings-bank accounts or invested in government securitiesfor the benefit of the income-earners. The proceeds obtained from suchschemes and arrangements may not as a rule be very important comparedwith the great needs of wartime financing, but these measures help to someextent to absorb purchasing power from the mass of income-earners and theyalso "tie up" savings in a form which will render them less dangerous whenthe war is over.
A further form of savings containing a certain element of compulsion isrepresented by the reservation for the state of the periodic payment of insurancepremiums and the regular contractual amortisation of mortgage and similarloans. In most belligerent and some other countries the granting of newprivate credit, unconnected with the war effort, has generally been forbidden,so that mortgage banks, building societies and similar institutions have hadtheir normal lending business severely curtailed. In these circumstances, debtrepayments have become an important element in current savings; insti-tutions which regularly receive repayments on loans outstanding have — oftenas part of a concerted scheme — devoted such incoming funds to the purchaseof government securities, which thus come to constitute a growing item amongtheir assets. In neutral countries also similar measures have often been taken :in Switzerland the granting of new mortgage loans to agriculture has beensubjected to a strict control, amounting in practice to a prohibition, a measureprimarily designed, however, to prevent a repetition of the speculative borrowingcharacteristic of the last war and ending in disastrous consequences for land-owners. On the other hand, a measure more directly aiming at the reservationof available funds for the government has been the curtailment of instalmentlending in the United States, the outstanding volume of which was reducedby two-thirds between the end of 1941 and the summer of 1943.
(iii) In general, success in financing may be judged by the degree towhich investments in government secur i t ies are " t i ed up" — acriterion the value of which may not be fully evident until after the war; inthis respect long-term borrowing is better than short-term; non-marketablesecurities are better than marketable; and direct purchases of governmentsecurities by the public are better than commercial-bank deposits.
In the issuing of loans the technique differs from country to country butthe tendency is to provide a wide range of long and shor t -term secur i t ies suited to the most varied kinds of funds. Marketable loans,both at long and short term, are favoured by the banks and other large marketinvestors in all countries. Non-marketable long-term securities are issued tosavings banks, insurance companies and social funds, which are often of anofficial nature — the so-called "Liquidity loans" in Germany and "specialissues" in the United States are typical examples. Non-marketable short-termissues in the form of tax certificates, which are designed to absorb liquidfunds held in readiness for taxation payments, have recently proved popularin several places where they have been introduced.
In some countries the governments have organised intensive propagandacampaigns to stimulate personal savings and the direct purchase of government

- 23 -
securities by others than banks. For many reasons particular attention has beenpaid to "small" savers (who become "large" in the aggregate) and specialtypes of non-marketable securities have been created to meet their needs.It is characteristic of German war financing, however, that no such specialsavings issues have been made, reliance being placed on the attractiveness ofsavings deposits; of the RM 44 milliard accumulated on savings deposits inthe three years 1940-1942, RM 1 milliard was in the form of "iron savings",which are tied up until after the war. This is in contrast to England and theUnited States, where savings deposits have been of considerably less im-portance than special savings issues in the financing of the war, as is shownin Chapter V, which also gives indications of the various proportions frnancedby market and non-market issues, long and short-term borrowing etc.
(iv) In so far as governments have been unable to borrow from the publicand from such financial institutions as insurance companies and savingsbanks, they have turned to the commercia l banks and, as a lastresort , to the central bank; by keeping strictly to this order they havehoped to lessen the inflationary effects. This is true particularly of the largercountries with a highly developed banking system ; and in certain of the smallercountries also this principle has been followed, e.g. in Hungary. But it mustbe expected that part of the amounts borrowed from the commercial banksand paid out by the government will be withdrawn in cash by the public. Tomeet the public's demand for currency, the commercial banks may alreadyhave ample cash reserves at their disposal (that was the case, for instance,in the United States when the rearmament period began) or cash reservesmay accrue to the banks from an influx of funds from abroad (as happenedin Switzerland during 1940 and 1941). Often, however, the commercial bankswill have to borrow from the central bank, or sell to it (directly or indirectly)part of their government paper; or the central bank may by its own opera-tions (including direct lending to the government) furnish the banks withsufficient funds. Thus, credit is extended by the central and the commercialbanks concurrently, in proportions dependent upon the ratio of the notecirculation to bank deposits ; and, generally, attempts are made to provide fora harmonious parallel expansion.
The pursuance of a well-balanced policy requires, on the one hand,skilful maintenance of a high degree of liquidity on the money and capitalmarkets (as a condition, inter alia, of continued low interest rates) and, onthe other hand, reaction against a superabundance of liquid funds liable toproduce inflationary lending for speculative and other purposes. The questionhas sometimes arisen as to the steps which could and should be taken bythe authorities to regain control over the money and capital markets; in theUnited States the minimum cash requirements of the commercial banks wereincreased before the entry of that country into the war, but later somewhatrelaxed for banks in New York and Chicago, which were exposed to an out-flow of funds to other districts; in Denmark minimum cash requirements wereintroduced in 1942 for the first time and funds received from special governmentissues were not used to meet current expenditure but were sterilised by being

— 24 —
left on deposit at the central bank; and in Sweden the Riksbank was authorisedto obtain, at its request, government securities from the Public Debt Officewith a view to absorbing excess funds from the market when it thought fit.
Monetary action to cope with the liquidity problem has thus taken theform of open-market operations and of changes in minimum cash requirements,while interest rates have been kept down in continuation of the cheap-moneypolicy pursued before the war. So long as the war lasts, the Treasuries havepractically been given a monopoly position to enable them to borrow the hugeamounts they need at favourable rates. Indeed, it has been found that creditcontrol is not difficult to apply when war needs must be given preference overeverything else; in peacetime, the task is different, it being then a case ofselecting, among a vast number of possibilities, those which best provide forthe variety of civilian needs. The earning power of different businesses willthen regain its importance as a test of usefulness and a guide to production ;and, presumably, credit conditions will again be related to the profit marginsof those actually using the credit facilities which can be made available.
(v) A problem of particular importance in the present war has beenthe f inanc ing of surplus exports and other excess balances inrelat ion to fore ign countr ies. The financing of lend-lease exports in theUnited States has been put on a par with that of other war expenditure andthe same is true with regard to the "reverse lend-lease" of countries withinthe British Empire. In a similar way the Swiss Government has provided fromits own funds the amounts advanced to meet clearing "Spitzen", thus reducingthe risk of a creation of new buying power and also carrying the credit riskof the clearing arrangements (which were of course concluded by the governmentitself). In other European countries the task of financing clearing surpluses hasgenerally devolved upon the central bank, with the result that the note circula-tion and commercial-bank reserves have together increased by an amountcorresponding to the clearing advances. In some Latin American countriesproblems of a similar nature have arisen under the influence of substantialexport surpluses. It may be added that the intervention practised by exchangeequalisation accounts before the present war was mostly in respect of fundswhich the owners intended to maintain as capital assets (e. g. short-term moneymoving from one market to another). It is a more difficult matter to insulatea credit structure from the impact of advances in the clearing, since the greaterpart of the balances then to be offset represents sums which are employedfor wage payments, purchases of materials etc., and thus effectively utilisedin payment of goods and services.
(vi) Whatever efforts have been made to raise taxation and to borrowgenuine savings, no country has been able to avoid the emergence of excessbuying power, side by side with shrinking supplies of consumption goods. Inthe last war also there was an overflow of buying power, but commodi typrices Were then mostly determined by the interplay of supply and demand,with the result that prices rose far above the pre-war level. The rise didnot lead, however, to the attainment of a new equilibrium but tended tocontinue as long as the financial needs of the government brought further

— 25 —
additions to the volume of buying power already in the hands of the public.There was a disposition to regard continued price increases as well-nighinevitable and in such a situation higher discount rates or other purely monetarymeasures could but be ineffective as a check on the price rise. This timethe governments of the most important countries have adopted a completelydifferent line of action, instituting a comprehensive price con t ro l , whichhas gradually been extended to wages and other forms of income.
In Germany, price control, which had been in operation since 1936, wasvery much reinforced in the autumn of 1939, particularly by the addition of aformal wage stop. Most other countries proceeded step by step to build upa comprehensive control. At first, price increases emanating from abroad weregenerally allowed to exert their full influence on the domestic price structures;the reduction in the exchange value of sterling by 14 per cent, in the autumnof 1939 thus brought about an advance in British prices; and adjustment tothe higher German price level (as calculated at the official exchange rates)was one of the most characteristic features of price developments on thecontinent of Europe up to the spring of 1942, while increased transport andinsurance charges had a considerable influence on the cost of imported goods.By arrangements between different governments, however, steps were taken tofix the prices of goods exchanged between their respective countries and thesearrangements soon became fairly effective (thanks, in some measure, to stricterprice control internally). But in relations with countries subject to clearlyinflationary tendencies more far-reaching measures proved necessary to preventundesirable price influences and, indeed, to keep trade going at all. Examplesof such measures are the special organisations established to carry on tradebetween Germany and Greece, and, in the Far East, between Japan andNanking China. By these and other measures it became possible, if notwholly to eliminate, at least greatly to reduce price-raising influences fromabroad — an essential condition for a successful handling of price problemsat home.
In their internal affairs, governments have carefully controlled the pricespaid by them for their own requirements. Considering the importance of thearmaments sector, this control has as a rule covered the major part of theindustry of a belligerent power and has thus gone a long way towards preventingthe enormous demand by the state from immediately becoming a price-raisingfactor. With the continuance of the war, improved methods of price-fixinghave been elaborated (e. g. in Germany, by the adoption of uniform or groupprices, which have given an incentive to individual firms to rationalise theirproduction in order to be able to increase — or, in some cases, merely tomaintain — their profits).
By this and other forms of price control, profit margins were alreadylimited, but increased gross profits have often still been realised as a result oflarger turnovers, reductions in costs etc. A considerable part of theseincreased profits has no doubt been absorbed by higher taxation and theremainder usually finds its way back to the state as a result of a limitation ofdividends (observed de facto even in countries where there has been no legal

- 26 -
Obligation) and a control imposed upon investments, either directly or byrestricting the supply of essential materials (iron and steel, timber etc.).Individual firms have thus been given no choice but to keep their remainingundistributed profits chiefly in the form of money savings, which in one wayor another must be lent to the government.
The introduction of a wage and salary stop has served a double purpose:besides bringing the most important cost element for the economy as a wholeunder control, it has helped to keep down the effective demand for goodsand services emanating from wage and salary earners. In order to makesuch a measure acceptable, however, some guarantee was required as tothe stability of living costs; the introduction of a wage and salary stop wasin fact bound up with the question of agricultural prices, so important forthe level of the cost of living. But in dealing with these problems the govern-ments usually found themselves in a dilemma: on the one hand, it wasnecessary to stimulate agricultural production by the granting of remunerativeprices (as politically strong groups were prone to insist) ; on the other hand,the cost of living could not be permitted to rise too much.
Government subsid iesannounced in 1942-43 to keepdown prices of commodi t ies.
Countries
Argentina . . . .CanadaCroatiaEireFinlandFranceGermany . . . .Great Britain . .ItalyJapanSlovakiaSweden
In millionsof national
currency units
Pesos 240Can.$ 70Kunas 2,000£ 3.6FM 1,600Fr.fcs 3,000RM 1,000£ 180Lit. 12,000Yen 400Ks. 300S.Kr. 220
In millions ofSwiss francs
23026017060
140300
1,7303,1002,700
40050
230
A solution has been found in morethan one country by the granting of sub-sidies designed to reduce prices for theconsumer; but here again the govern-ments were faced with a dilemma: sub-sidies add to the budget deficit andnaturally the last addition is the mostdifficult to meet without resorting toinflationary financing. In his report tothe general meeting on 31st March 1943the Governor of the Banca d'Italia ob-served that subsidies, together with otherindirect costs of the war, were thensuch a substantial item in the Italianbudget that any further increase would
defeat its own end, since recourse by the Treasury to the bank of issuewould in the long run frustrate the attempt to keep down the general levelof prices.
(vii) Finally, mention should be made of the measures taken to preventundesirable increases in the pr ices of capi tal assets, liable to exerta dangerous influence as a symptom of, and a further incitement to, aninflationary orientation of economic life. The pursuance of a cheap-moneypolicy is to some extent a handicap in dealing with these problems, but theoverwhelming influences are no doubt the hopes and fears entertained withregard to the intrinsic value of each individual currency when the war isover. The different measures taken to counteract a strong upward movementin share quotations are mentioned in Chapter V, 2. of this Report; wherefixed prices have been prescribed, the result has usually been that thevolume of transactions has shrunk to a minimum.

- 27 -
Indexes of Wholesale Prices.January-June 1939 = 100
240
220
200
180
160
140
120
100220
200
180
160
140
120
100
-
-
-
Den
t'
: t£Z.....- \ f \ ^
-JffA
i ^Finland/^
mark,.—•-, - - - J ^
-
/
Norwav
'"'Sweden
---Japan-
Germany
-
J I
1939 1940 1941 19« 1943-
-
-
-
-
"niir m. ry
/
Bulgaria/
/rlungar
/ ;
y-
-
-
1942 1943
240
220
200
180
160
140
120
100220
200
180
160
140
120
100
1940 1941 1942 1943
This l is t of possib le re-act ions against a redundantpurchasing power is by nomeans complete but it showswhat a variety of of f ic ia lagencies have to cooperatein the task of res is t ing in-f la t ion . The central bank is oneof these agencies, being speci-ally concerned with maintaining aproper degree of liquidity in thecredit system and collaboratingwith official and other institutionsin regard to all questions havingâ monetary significance. In war-time, of course, the requirementsof the government must pre-dominate. Aid must be given to
. make borrowing at cheap ratespossible even if the central banksare thereby debarred from curtail-ing the amount of cash furnishedby them to the markets (howevermuch such action would have beennatural and requisite in times ofpeace). In this, as in other fields,the needs of the war must beallowed to take first place. Theprice control, so to say, takesover the task of maintaining "theintegrity of the currency" (theexpression used in the Act estab-lishing the Central Bank of Irelandin 1943); for that purpose a vastnew administrative machinery hasto be instituted. After four yearsof war the general principles whichshould govern the price controlare well known ; but principles arenot enough ; their application isof equal importance ; and it is noteverywhere that a sufficiency ofcapable and trustworthy personscan suddenly be found for adminis-trative purposes, especially sincemany suitable candidates are likelyto be called to the armed forces.
— 28 —
Another problem is that of coordinating the work of the different agencies; thegovernments themselves will, for instance, have to decide questions which forone reason or another have assumed important political aspects. Thus govern-ments (with or without the assent of parliaments) seem to have invariablyreserved for themselves the fixing of prices of agricultural products, partlybecause of the importance of these prices for the cost of living, and thusfor the general wage level, and partly because the farmers' organisationspractically everywhere exert considerable political influence.
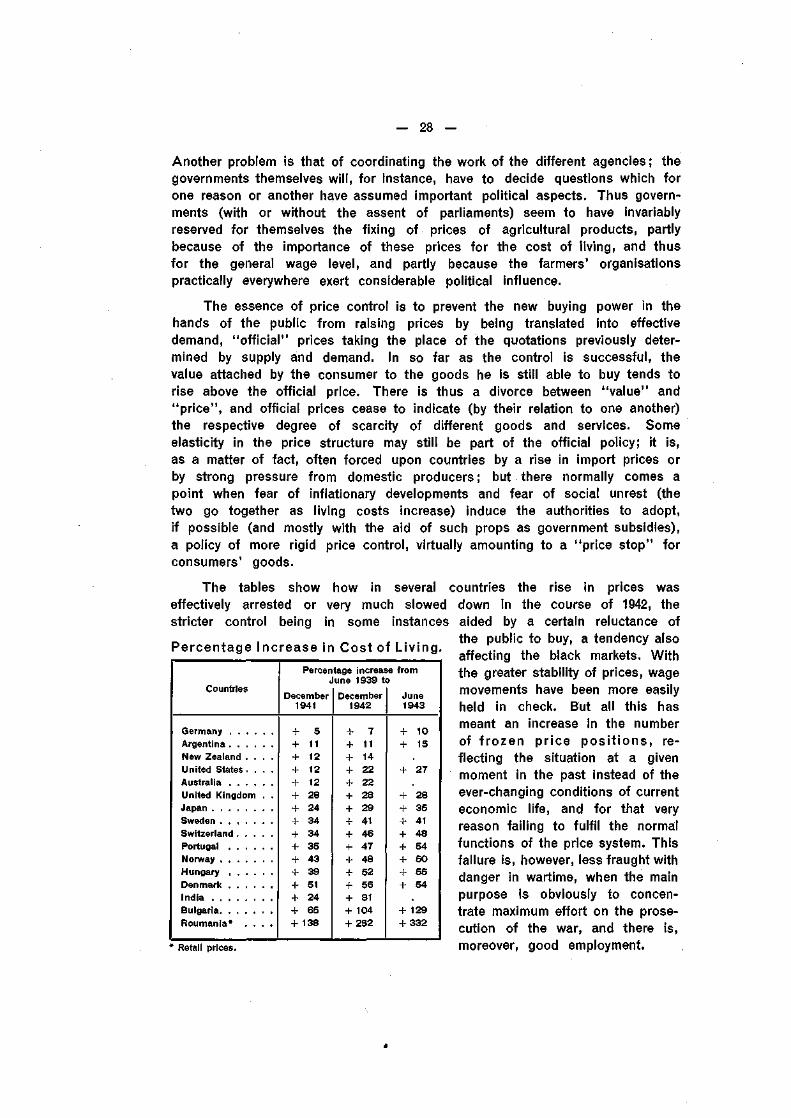
The essence of price control is to prevent the new buying power in thehands of the public from raising prices by being translated into effectivedemand, "official" prices taking the place of the quotations previously deter-mined by supply and demand. In so far as the control is successful, thevalue attached by the consumer to the goods he is still able to buy tends torise above the official price. There is thus a divorce between "value" and"price", and official prices cease to indicate (by their relation to one another)the respective degree of scarcity of different goods and services. Someelasticity in the price structure may still be part of the official policy; it is,as a matter of fact, often forced upon countries by a rise in import prices orby strong pressure from domestic producers ; but there normally comes apoint when fear of inflationary developments and fear of social unrest (thetwo go together as living costs increase) induce the authorities to adopt,if possible (and mostly with the aid of such props as government subsidies),a policy of more rigid price control, virtually amounting to a "price stop" forconsumers' goods.
The tables showeffectively arrested orstricter control being
Percentage Increase in Cost of L iv ing.
Countries
Germany . . . .Argentina . . . .New Zealand . .United States . .Australia . . . .United KingdomJapanSwedenSwitzerland . . .Portugal . . . .NorwayHungary . . . .Denmark . . . .IndiaBulgariaRoumania* . .
Percentage increase fromJune 1939 to
December1941
December1942
June1943
51112121228
+ 24+ 34+ 34+ 35+ 43+ 39+ 51+ 24+ 65+ 138
* Retail prices.
h o w in several coun t r ies the r ise in pr ices was
very much s lowed d o w n in the course of 1942, t he
in some ins tances a ided by a cer ta in re luc tance of
the pub l ic to buy, a tendency a lso
af fec t ing the black markets . W i t h
the greater s tabi l i ty of p r i ces , wage
movemen ts have been more easi ly
held in check. But all t h i s has
meant an increase in the number
of f r o z e n p r i c e p o s i t i o n s , re -
f lec t ing the s i tua t ion at a given
m o m e n t in t he past ins tead of the
ever -chang ing cond i t i ons of cur rent
e c o n o m i c l i fe , and fo r tha t very
reason fa i l ing to fu l f i l t he norma l
f u n c t i o n s of t he pr ice sys tem. T h i s
fa i lu re is , however , less f r augh t w i th
danger in war t ime , w h e n the main
pu rpose is obv ious ly to c o n c e n -
t ra te max imum ef for t on the p rose-
cu t ion of t he war , and there is ,
moreover , good emp loymen t .
+ 7+ 11+ 14+ 22+ 22+ 28+ 29+ 41+ 46+ 47+ 48+ 52+ 56+ 81+ 104+ 252
+ 10+ 15
+ 27
+ 28+ 35+ 41+ 48+ 54+ 50+ 55+ 54
+ 129+ 332

- 29 -
Relating control to positions in the past seems, indeed, to be a matter ofintrinsic necessity; the practice extends to many fields, including the distributionof scarce raw materials, allocation of export and import quotas, the grantingof compensation when businesses are closed, etc. In all these cases themeasuring rod is usually the peacetime turnover of the individual trader orproducer, which means that preferential treatment is given to firms alreadyestablished. And very soon, as part of the wartime regulations, workers aredebarred from changing their place of employment without permission froman official agency subordinate to a national manpower commission or similarcontrol organ.
The freezing of positions is also found in the f ie ld of fore ignexchange: there the outstanding feature of the war has been the maintenance— with few exceptions — of practically stable exchange rates, thanks to theintervention of central banks, stabilisation funds or exchange institutionsoperating in highly-controlled markets. During the war of 1914-18 a nucleusof stability was established through the pegging of sterling in relation to thedollar and of the French franc in relation to sterling (effective from the springof 1916 until the end of the war) ; but other exchange rates showed consider-able movements despite an increased application of exchange control. Thecurrencies of neutral countries appreciated in relation to other currencies, onereason being that these countries refused at times to accept gold uncondition-ally in payment from abroad. Outside the range of the pegged exchanges,to which the lira was added in the summer of 1918, the currencies of mostof the belligerent countries became increasingly depreciated as the war wenton, being subject from time to time to sudden declines.
In the present war, pegging of exchange rates being universally adopted,the authorities have obtained the resources required partly from existingmonetary reserves, partly through the mobilisation of privately-owned foreignassets and, finally, from foreign credits or other forms of foreign assistance.In the " l e n d - l e a s e " and " rec ip roca l a i d " arrangements the main emphasishas been laid on the actual supply of goods and services, less importancebeing attached to the credit or money aspect of the transactions (whichshows, incidentally, the exceptional wartime character of these new forms of"lending").
In Europe, c lear ings have largely ceased to serve their original purposeof equalising incoming and outgoing foreign payments and have become a creditdevice by which a government advances the funds necessary to enableits country's export trade to continue even when no adequate countervalue isobtained from the importing country. In the various countries on the continentof Europe involved in the war, virtually the whole foreign trade is settled viaclearings; in addition to the "trade" transactions, there are, however, certaindeliveries of a military nature not entered in the clearing accounts. Nearly75 per cent, of the foreign trade of Switzerland and over 80 per cent, of thatof Sweden are paid for via clearings. This means that' these two neutralcountries, like the belligerents, settle an overwhelming part of their foreignpayments outside the ordinary exchange markets. Among the belligerent
- 30 -
countries all the world over, most of the trade being handled by the stateitself, the ordinary exchange market tends to disappear altogether. In theend, the foreign exchange control not only excludes all forms of arbitrageoperations but increasingly differentiates between the payments for which eachparticular kind of money may be used. (The regulations may prescribe, forinstance, that goods exported must be paid for by the foreign purchaserthrough the delivery of foreign exchange or that certain kinds of depositsmay only be used for investment in government bonds; the examples couldeasily be multiplied.) Under these circumstances money no longer constitutesgeneral purchasing power; the stock of circulating media becomes dividedinto different categories, each with its particular use.
These restrictions on the use of money apply especially to balances andcash of foreign holders and thus affect, in particular, international monetaryrelations. In actual practice, mul t i la teral c lear ing so far has had little moreto show than permits, given in isolated cases, to employ certain limited amountsfor payments in third countries. And the reason is obvious: a real multilateralclearing, in which balances in one currency could, without serious restrictions,be used for settlements in other countries, presupposes an approach to equili-brium in the balances of payments and in the exchange structure — a state ofaffairs very different from the growing disequilibria which characterise inter-national relations under a war economy. It has been said that the conditionsunder which a multilateral clearing would work satisfactorily are very much thesame as those under which the whole system of clearings could be dispensedwith. This may be too sweeping a statement* but it at least draws attentionto the need of fundamental equilibrium in any currency system if it is to becapable of rendering adequate service as a vehicle for multilateral trade andthe settlement of current financial obligations. The essence of the system ofclearings is, indeed, to be found in the fact that it permits a measure ofdiscrimination in regard to certain countries (purchases or sales by one partnerbeing related to the purchases or sales by the other partner) and in regardto groups of commodities ("useful" or "essential" purchases being given apreference over purchases of other commodities). If a system were reallymultilateral, there would be little possibility of maintaining discrimination ofthe kind indicated.
The universal pegging of exchange rates in the present war has remainedthe policy of the authorities even when it has become clear that the existingrates no longer correspond to the underlying realities of the relative cost andprice structures. When the war is over, governments will have to cope withthe two closely connected problems of excessive buying powerin the hands of the publ ic and adjustment of the exchangesto the in t r ins ic values of the var ious currencies. Much thought
* A particular danger may arise from the fact that the huge public debts contracted during the war havegreatly increased the proportion of assets of a liquid nature held by the public. In discussions regarding theproblems created by these debts, such questions as the internal "burden" of the debt, its annual servicein the budget etc. have often been given primary importance. But it must not be overlooked that the massof outstanding public obligations, an artificial kind of wealth, is liable to exert a disturbing effect on thewhole capital structure ; while shares and other forms of real wealth may be allowed to fall in price if offeredto an increasing extent on the market, such a fall in the quotations of government securities would at leastimperil the uninterrupted maintenance of a cheap-money policy.

- 31 -
has already been given to these problems, past experience being ransackedwith a view to avoiding a repetition of old mistakes, especially those committedafter the last war. Much will depend upon the success with which eachparticular government is able to master its own internal problems, and inparticular to prevent uncovered budget deficits from producing a "gallopinginflation" (such as occurred in several countries after the last war). In thedifferent sections of Chapter II of this Report dealing with exchanges, foreigntrade and prices, some aspects, chiefly international, of the post-war problemsare discussed ; here a few general observations are briefly set down :
(i) It is sometimes taken for granted that at the end of thepresent war prices wi l l tend to fo l low the same courseas after the last war, i.e. that after a brief period of hesitation abrisk demand will set in to make up for shortages suffered during thewar, and that a slump in prices will come only after a few years, whenimmediate post-war needs have already been satisfied. Ups and downsof this kind being undesirable, it has been suggested that the wartimesystem of control, rationing and subsidies should be maintained forsome time after the end of hostilities, in order to check the impulsetowards an immediate post-war boom and, by doing so, to assist inpreventing a subsequent severe slump. Thus the British Chancellor of theExchequer in his budget speech on 12th April 1943 declared that it was theintention of his government to control supplies and restrict private con-sumption for some time after the war; two months earlier (in February1943) he had explained that it was the policy of the government to main-tain commodity prices at the level which had been reached during the war.
When forecasts are made of post-war fluctuations, account shouldbe taken of the probability that business men and others, remembering
300
200
150
100
50 i ilnliihi
Movement of Wholesales Prices 1914 to 1925.Indexes 1913 or 1914 = 100.
ir
CssaafSf
I iJ nil ill I
Swirzer
/
/ js *
• il'ihih i
land..../
1
iilniiili
United
1915 1916 1917 1918 1919
A
H
Sfahes "
Illllllllll1920
jrear Br
\
I llllllllll1921
tain
iiliilnhi
^ ^ :
iiiiiiiiin1922 1923
|jlllllllll1924
. • r i • 11 • 1111925
300
250
200
150
100
•ifl

— 32 —
how the profit boom of 1919-20 was followed by heavy losses in 1921-22,may be much more careful in their purchases this time and may, inparticular, decide to keep stocks down to a minimum until, in theiropinion, a more settled price situation has been reached. Should sucha cautious attitude be adopted, there would be much less risk of aviolent rise of prices in the first phase of the post-war cycle and alsoless need for the maintenance of the whole apparatus of wartimecontrol. After the last war lack of shipping facilities (aggravated bydelays in ports) was among the factors contributing to the highprices in 1919-20; and it remains to be seen whether in this respectsimilar scarcities and delays will occur again. In general it may be hopedthat present planning will not be based too slavishly on the assumptionthat the after-effects of the last war must necessarily recur, but willremain sufficiently flexible to enable measures, in practice, to be adaptedto varying circumstances. Nor should planning be made an end initself; in exaggerated zeal to avoid upheavals, governments must notregard it as their paramount duty to perpetuate controls, the maintenanceof which may delay necessary adaptation and hamper more dynamic forceswhose contribution is vital for the employment of the millions returningto civilian work. Care should be taken lest, in too much concern aboutthe transition period, the world loses the benefit of an upward swingsuch as that which, after the last war and in spite of all vicissitudes,had by 1924-25 brought production back to the 1913 level and, in a greatnumber of countries, lifted the average of real wages to well above thepre-war standard.
(ii) While it is often assumed that exchange rates are determined byrelative costs and prices (according to the theory of purchasing-powerparities) it is frequently found in practice that some general idea asto the fu ture exchange re lat ionship plays a predominant rôle.After the last war, for instance, actual exchange movements were greatlyinfluenced by the belief that it was the settled policy of many countriesto re-establish the gold standard at the old pre-war parity; andthis belief also affected the trend of commodity prices, both directly andindirectly through the movements in the exchange rates. For some timeafter this war exchange rates will presumably remain subject to officialcontrol and current beliefs will accordingly have less influence, officialaction being decisive, especially when government finances are in order.If that is the case, the most important single factor in determining theprice level, particularly of smaller countries, will undoubtedly be the moreor less deliberately chosen foreign exchange rates; and it is to behoped that the larger countries will soon succeed in establishing andmaintaining relatively stable prices, to which the others could link theireconomies.
The importance of the exchange problem is, of course, fully realised,and currency plans under discussion in the summer of 1943 envisaged asituation in which, by consultation and, if need be, financial assistance,

- 33 -
countries will be in a position to maintain orderly exchange conditions.It will certainly not be an easy task to find the right levels for stabilisa-tion, considering the profound changes to which different economies andtheir currencies and credit structures have been exposed. When in thenineteenth century one country after another linked on to the goldstandard they did so at rates of exchange which had already establishedthemselves in the market and could fairly be regarded as equilibriumrates. The different countries then had a good chance of maintainingthose rates, provided that in other respects they applied the principlesof the gold standard, which at that time were accepted as almost self-evident precepts of monetary policy. As it functioned before 1914, thegold standard meant, of course, much more than the maintenance ofstable exchanges and the settlement of international balances by ship-ments of gold. It provided a number of semi-automatic correctivesdesigned to remedy the causes of monetary disequilibrium at their veryinception, and it presupposed a code of behaviour, with regard tobudgets, borrowing, credits, interest rates and readjustments of costs,which had slowly become the common doctrine of well-nigh the wholeworld. A later generation may have found some of the "acceptedprinciples" too restrictive, involving too many financial " taboos"; but,while the old system lasted, a comparatively uniform financial policy waspursued in the different countries and, in commercial matters thegovernments refrained from imposing too cramping restrictions. Withoutidealising the past, it may be said that the gold standard up to the lastwar gave the world a uniform monetary system, with its internationalcredit centre in London, while since 1914 it has proved impossible tore-establish a monetary community equally comprehensive and smoothlyworking.
When a country contemplates measures with a view to influencing themovement of domestic prices, it will have to take into account the probablepsychological react ions on the part of the general publ ic. After thelast war the cost of living in certain countries remained permanently at alevel fully 50 per cent, above that of 1914, yet the public did not attributethis increase to unwise monetary management but simply to the effects of thewar; holders of money claims such as government bonds and insurancepolicies did not feel that they had been unjustly treated as compared with thosewho had invested their money in shares and other real assets ("Sachwerte").Nor had they any grievance when currencies depreciated in the 'thirtiessince prices and living costs did not mount above the level attained in theyears 1926-29. In the countries in question the public continued to take outinsurances and to practise other forms of saving in terms of money. (InSweden and Switzerland — countries in which the cost of living had risen totwice the figure for 1914 — the amount of subscriptions to new life assurancein 1942 was an all-time record — a sign of unshaken confidence in thecurrency.)

— 34 —
In some other countries, however, a point was reached beyond the limitwithin which a unit of the currency was still regarded as retaining the samevalue, notwithstanding the rise in prices. In France the franc of 1926-28 became"le franc à quatre sous" while a Swiss franc remained unquestionably aSwiss franc. When people begin to feel that money claims may be subjectto special risks, their attitude towards savings in money form necessarilychanges and it may then prove difficult indeed to re-establish a sufficiencyof real monetary confidence. These distinctions — vague though they maybe — are not without their importance and the governments will probably bewell advised to take them into account when they proceed to rebuild thecurrency system after this war.
This does not mean, however, that a country must subordinate its wholeeconomic and monetary policy to the attainment of some former parity orsome definite price level. Both foreign exchange rates and commodity pricesmay alter within a fairly wide margin before a reduction in the purchasingpower of the currency unit is felt as a positive grievance; within that margina government may seek a level conducive to a high degree of production witha satisfactory volume of employment. But, if it should thus be possible toavoid a deflationary fall in prices, there must, even so, be some sectors inwhich costs will have to be reduced from high wartime levels; and then itwill be well to remember that a sharp cut is often preferable to a long-drawn-out adaptation, since the former is more likely to establish a proper basisfor recovery and will thus hasten the advent of a more satisfactory level ofemployment.
In the l ight of past experience, the restorat ion of a truebalance in the cost and price s t ructure appears to providethe only rel iable basis for an economic recovery characterised bya high degree of activity in the investment industries, and with profit and lossas a guide to production and a gauge of efficiency. Such a balance canhardly be attained without some adjustment of costs ; but reductions in wagerates and other cost elements are generally not by themselves sufficient as abasis for recovery since they may simply result in successive contractions indemand, with a tendency to cumulative deflation — a tendency which, however,may be counteracted by a financial expansion designed to restore and evento augment the volume of demand. In the years 1929 to 1932 hourly wage ratesin the manufacturing industries in the United States were reduced by about20 per cent.; but this adjustment, being accompanied by a contraction ofdemand and an even more rapid fall in commodity prices, failed to bring abouta recovery and the result was a feeling of frustration and useless suffering.In a number of other countries (including Australia, the United Kingdom,Sweden and also Germany) cost adjustments were, however, supplemented bya policy of financial expansion, costs and prices being balanced within eachnational economy and vis-à-vis other countries, after which signal success wasachieved in reviving industrial activity. In this process a cheap-money policyplayed a part, both by reducing the cost of capital and by providing a stimulusto new borrowing. Depreciation of currencies was likewise a factor, helping

- 35 -
especially the smaller countries to restore a balance with other markets andalso to bring about a better relation between costs and prices in the domesticstructure, making it easier, besides, to pursue a cheap-money policy. As regardspublic works, the attitude in different countries was not uniform and the partthey played in the recovery was less decisive until wholesale governmentspending for rearmament, and later on for war, brought industrial activity ofa special kind to a high pitch.
The methods of the 'thirties will not, of course, be applicable againin every respect. Other and better means of expansion must be employedthan depreciation of currencies and heavy spending on armaments; but thèmain conclusion certainly holds good : a combination of financial expansion andcost adjustment brings about a revival of economic activity with less realcost and with much greater certainty than would be possible without one orother of these factors. It is one of the great advantages of insistence on costadjustment that it brings home to every single firm the importance of takingthe steps needed to put its business into proper order, while exclusive relianceon such general measures as cheap money and public works is apt to givethe impression that individual firms can simply wait for the beneficial effects ofsome outside action. None of the forces which can help in overcoming adepression must be neglected ; and the sum total of a great number of indi-vidual efforts may represent an important — even indispensable — contributionto this difficult task. In framing an anti-depression policy one should not betoo orthodox and exclude all resort to credit expansion, nor too expansionistand rule out every measure of cost adjustment.
Possible d i f f i cu l t ies of f ind ing employment in the f i r s t yearsafter the war w i l l , however, be di f ferent f rom those of an ordinarybusiness depress ion, in which an abundance of productive capacity seemsto curtail the opportunities of useful investment as an outlet for current savings.Indeed, just the opposite may happen, in that the desire of people to purchasewhat they have been forced to do without for years may reduce the volumeof voluntary savings to less than the amounts needed for repairs and recon-struction, the réadaptation of industry and, maybe, credits to other countries.Such maladjustments as may be foreseen will probably be wholly due to causesother than a flow of savings in excess of the available investment possibilities,and the primary task will then be to sweep away those other frictions aridhindrances to recovery, e.g. by finding proper parities between the differentcurrencies, by correcting such costs and prices as are obviously out of line,and by arranging for raw-material credits and other financial assistancedesigned to revivify international trade. There will not be one patent solutionfor the troubles arising but many different measures will have to be taken,the main task of the governments being to secure political order, nationallyand internationally.
In three part icular f ie lds — development of expor ts , thebui ld ing trade and publ ic works — a number of special ques-t ions arise. For countries with insufficient monetary reserves and largerequirements of raw materials the development of the export t rade

- 36 -
will be of primary importance. But those more fortunate countries which arein possession of adequate monetary reserves will also be greatly concernedabout the future trend of world trade, since each one of them will have todecide how far it should integrate its own economic life with that of the restof the world. The end of the war will find almost all countries applyingintricate systems of exchange control which, as much as any tariff policy,may stand in the way of a recovery in international trade. Such measuresas can be taken to replenish monetary reserves or provide foreign creditsfor a resumption of the flow of merchandise may be particularly helpful inwidening one of the obvious bottlenecks in the post-war situation, not leastbecause they will facilitate a relaxation of exchange restrictions.
Demands for protection will, no doubt, be put forward by both mastersand men in industries expanded during the war beyond the scope of ordinaryrequirements (the shipbuilding industry is, for instance, reported to haveattained in the Anglo-Saxon countries a capacity ten times as great as islikely to be needed in times of peace). As it will be difficult to find employmentat once for those no longer occupied in the typical war industries, there maybe a strong temptation to try to relieve the situation by measures representedas detrimental "only to the foreigner". Much will then depend upon the leadgiven by the larger countries. After all the obstacles to world trade which werebuilt up during the great depression — the tariff increases in the United Statesin 1930, the introduction of exchange control in Germany in 1931 and, in thefollowing year, the adoption of a tariff in Great Britain, together with the con-clusion of the Ottawa agreements — some equally important and strikingmoves, but in the opposite direction, would seem to be needed to convincethe world that a turning-point in the realm of commercial policy had indeedbeen reached.
It has been feared that industrialisation, especially of extra-Europeancountries, will seriously curtail the future volume of international trade; but theexperience already gained in the older industrial countries themselves seemsto indicate that this is by no means a necessary consequence: as long as thetrade policies adopted by individual countries are followed by an increase intheir standard of living, with new wants and new activities, there will in allprobability be an expanding market for the products of other countries also.The composition of foreign trade will, however, tend to change somewhat, inthat the countries which are in process of industrialisation will come to import,instead of mass-produced goods, a larger quantity of highly finished articles,including those they need for their capital equipment, namely, tools andmachines of all kinds. Such a change in character may be entirely compatiblewith an increase in the aggregate volume of world trade, though it raises foreach exporting country the problem of attaining the highest efficiency, especiallyin those industries which stand to profit from the change in the pattern ofworld trade.
Turning to activities on the domestic market, the outstanding importanceof the bui ld ing trade is, perhaps, best shown by the fact that in times ofgood business this trade is normally responsible for fully 50 per cent, of all

- 37 -
current capital investments, a proportion found even in the nineteenth centuryat a time when railway construction in the United States was at its peak.In the present emergency the private building trade has been greatly con-tracted since special permits are needed for new constructions and areusually granted only for purposes connected with the war effort. Accordingto the official index figures, building costs have risen by 20 per cent, inGermany, and even more in other countries, though the exceptional characterof wartime building makes it difficult to calculate reliable index numbers ofthese costs. Rents, on the other hand, have not been allowed to go up; inmany countries they have not risen at all, and everywhere the increase has beenless than in other items on which the cost-of-living indexes are based (com-pare the table in Chapter II, page 107). Here are the elements of a seriousmaladjustment which, no doubt, will have to be corrected before privatebuilding activity can again expand. Experience after the last war provedconclusively that those countries which were the first to abolish their rentrestrictions were also the first to benefit from a recovery in building activity,followed by a general revival. As there is little prospect of bringing buildingcosts back to the pre-war level, an increase in rents would seem to berequired. Socially and politically, however, it will be anything but easy toallow rents to rise and thus to establish in practice the balance in the costand price structure which is more and more recognised as a necessary con-dition for a sound recovery.
In order to be .prepared for such difficult situations as may arise whenthe war is over, many governments have had lists drawn up of suitable pro-jects for publ ic works. One of the main tasks of the transition period afterthe war will obviously be to shift workers from industries having undergonea great wartime expansion to those which cater for ordinary peacetime needs.The problem will then be essentially one of industrial flexibility and, as such,it will be affected not only by the existence of powerful economic organisationsbut also by a number of other circumstances, including the readiness ofindividual workers to change their occupations and, maybe, to find new homes,despite the wrench of such an uprooting. Sometimes one is almost des-pairingly driven to the opinion that the more modern communicationsdevelop the less can reliance be placed upon the voluntary migration ofworkers in response to economic demands. Hence the need for well-organisedlabour exchanges.
Unfortunately, public works are apt to reduce still further the mobility oflabour and the capacity for adjustment in industry generally. The financingof such works might easily absorb a good part of current savings and itwould thus reduce the amount of capital in search of new investments(ordinarily one of the mainsprings of industrial expansion). By the relief whichpublic works would provide, they would tend to diminish the inducement —weak as it already is — to seek new employment. In these different ways theexecution of a vast programme of public works might impede and delay thecorrection of maladjustments which had arisen in the course of the war.These dangers are all well known and, in order to eliminate them as far as

- 38 -
is humanly possible, such programmes as are adopted should at leastprovide for a high degree of flexibility and also ensure that the works inquestion, primarily concerned as they must be with the home market, shallnot prejudice the production and trade of the export industries.
In countries having suffered much war damage, extensive reconstructionworks will be needed and these will, at least in part, be financed by thegovernment; elsewhere, also, a large demand for labour and materials willarise in connection with delayed repairs, the restocking of factories and ware-houses, etc. Being additional to direct purchases by consumers, this demandis likely to ensure an initial phase of good business with great industrialactivity; but much of the work thus undertaken may be of a non-continuousnature and the post-war boom may therefore be followed after some years bya second phase with fewer openings for current savings. If these are theprospects for the post-war period, it would seem advisable not to set aboutpublic works of a less urgent nature too early in the programme but to keepthem in reserve for a subsequent downward turn of business.
It is, however, most difficult to forecast what will happen in theeconomic field when the war is over and it is therefore imperative that p lansfo r t h i s pe r i od s h o u l d be a d j u s t a b l e to the c i r c u m s t a n c e s pre-v a i l i n g at the t ime of t h e i r execu t i on . If countries feel that they cancount upon good prospects for their export trade (as a result, maybe, ofmonetary or other arrangements) they will be less disposed to embark upona vast programme of public works at home. It is obvious that the soonereconomic enterprise can start producing what private consumers themselvesare anxious and willing to buy, the quicker and greater will be the improvementin the standard of living. Not every mode of employment is equally valuablefor the satisfaction of peacetime needs ; for the betterment of social conditionsit is necessary not only that the available human and material resources shouldbe employed but that they should produce what is actually wanted — this beingobviously in the interests of the great mass of consumers. In the presentemergency, representatives of employers and employed have participated, asnever before, in the working-out of the general principles governing the wareconomy, and they have been largely responsible for many arrangements whichcould hardly have been realised so smoothly or so efficiently in any other way.Would it be too much to hope that the same spirit of cooperation may stillbe alive and remain a vital force to ensure industrial flexibility and to dealwith the many other difficult post-war problems, the solution of which canform the only adequate and reliable basis for a progressive policy of socialsecurity?
- 39 -
II. EXCHANGE RATES, FOREIGN TRADE AND COMMODITY PRICES.
1. EXCHANGE RATES.
The maintenance of stable official rates has continued to characterise theexchange position in most parts of the world. Considering the unequal risein prices in the different countries, the consequence has been that, in a numberof instances, rates continue to be quoted which are out of touch withunderlying conditions; and this state of affairs undoubtedly acts as a brakeon the exchange of goods and services despite all efforts made to removethe obstacles by a combination of export charges and import premiums (orvice versa). The competent authorities have feared that by an alteration inthe rates they might release psychological and other forces, bringing intheir train consequences which could not be foreseen. It has, moreover,proved difficult in practice to modify rates agreed upon in commercial andpayments arrangements, since often more than two countries have beeninvolved, which has made it hard, if not impossible, to arrive at a positiveresult. The maintenance of the stable rates by countries obtaining a largeimport surplus usually involves some sort of credit arrangements, e.g. ad-vances and other payments by occupied countries, aid between belligerentcountries on the same side and special credit arrangements with the fewremaining! neutrals^ ! ,
There have, however, been some except ions to exchange stabi l i ty .In January 1942 (as mentioned in the twelfth Annual Report) the Danish crownwas appreciated by 8.2 per cent., after negotiations with Germany, the mainpurpiose being that of counteracting a further rise in the Danish price level.More directly in response to market developments, the currencies of someSouth American countries have risen in exchange value. In these countriescurrent supplies of dollars have exceeded the demand, exports being mostlywell maintained, while difficulties are experienced in obtaining deliveries frombelligerent countries,^ including the United States. In Iran the improvementin the value of the rial, which set in after the occupation of the country byBritish and Soviet" troops in the autumn of 1941, has continued, the effectivequotation of the pound sterling having been reduced by stages from Rials 174before the occupation to Rials 129 in May 1942. But the most spectacularcurrency changes have takeri place in the Far East, involving, inter alia, amonetary unification in relation to the yen. Thus the currency units of thePhilippines, Hong Kong, Thailand, the Straits Settlements, Burma and Javahave all been made equal to the yen, which has entailed varying degrees ofdepreciation for the local currencies.
By these measures the division of the world into separate currencyareas has been further accentuated; other moves in the same direction arethe attachment of the territories of North Africa to the sterling and the dollarareas. The official dollar-sterling rate itself has been maintained practically

- 40 -
unchanged at $4.03 = £1 since the autumn of 1939; measures taken in 1942to simplify the sterling accounts held by residents in the United States maybe regarded as one of the signs of an increasingly close connectionbetween the two Anglo-Saxon currency blocs.
The remaining neutral countries on the continent of Europe cannot besaid to belong exclusively to any of the different currency areas. They main-tain monetary relations with countries on both sides in the war and theycombine fixed official quotations for the pound and the dollar with the main-tenance of stable rates for the Reichsmark, which, in the various clearingagreements, retains its full gold value.
Apart from the appreciation of the Danish crown mentioned above, nochange has been made during the year under review in the rates betweenthe Reichsmark and other European currencies. The process of bringingthe exchange valuation of the Reichsmark in the Danubian and Balkan areainto line with the quotations of the dollar, the Swiss franc and other "freecurrencies" came to an end in 1941, the only exception to the uniformitybeing Roumania, where a 90 per cent, premium is applied to the Swedishcrown and the Swiss franc; for the Reichsmark the rate quoted correspondsto a premium of 50 per cent., while for a number of other currencies thepremium is only 38 per cent.
In this connection it may be mentioned that for the French franc alsothere is a difference in the valuation. In the Franco-Swiss clearing the agreedrate of Fr.fcs 100 = Sw.Fcs 10 practically conforms to the official rate for thedollar at Fr.fcs 43.80 = $1, which has been maintained by the Bank of Francesince the autumn of 1939. On the other hand, the clearing with Germany isbased on the rate of Fr.fcs 20 = RM 1, which represents for the French franca depreciation of 12.4 per cent, compared with the official rate of the dollar.In addition, there is an exchange market in Switzerland for "free" Frenchfrancs, with regular transactions in French francs held in the so-called"Swiss foreign accounts" by persons resident in Switzerland. Up toNovember 1942 the rate in this market was kept in the proximity of theofficial clearing rate, but after the events in November 1942 it fell sharply —for a time to less than Sw.fcs 3 for Fr.fcs 100. Steps were taken to rendersupport to the market, however, and the rate recovered at the beginningof 1943 to Sw.fcs 4 and later on exceeded Sw.fcs 5. The market is in anycase very narrow, since it comprises only transfers outside the clearing, thelatter including in particular all commercial transactions. The "free" marketseems to be used mainly for certain financial transfers such as payments ofinsurance and reinsurance premiums etc. But, in spite of this limitation,the quotations for "free" French francs in Switzerland have attracted muchattention, although, of course, similar markets exist for a number of othercurrencies whenever particular quotations are allowed for special purposes.(As regards the quotations of the French franc in the territories outside thehome country, see page 44.)

— 41 —
On the Swedish exchange market the rate of the "Reisemark" was in-creased in March 1943 from S.Kr. 90 to S.Kr. 95 = RM 100. This increase wasallowed in connection with a reintroduction of the special fee of S.Kr. 18.50per RM 100 first levied under the Standstill Agreement of 1937 (at a rate ofSw.fcs 10, later increased to Sw.fcs 20) but suppressed from 1938 onwardsas regards the most important source of "Reisemarks" for the Swedish market.The official rate of the Reichsmark has remained unchanged in the clearingat S.Kr. 167.50-168.50 = RM 100.
Among the innovations during the year, mention should be made of anew currency: the carbovanez issued by the Ukraine Central Bankestablished in March 1942. Another new bank of issue, the Ost land CentralBank, was opened with head office in Riga in April 1943. Some detailsregarding the operations of these two banks will be found in Chapter VI.
The external relations of the new banks of issue and of the Reichs-kreditkassen are practically limited to their connection with the monetaryauthorities in Berlin. For payments to other countries and areas they may,however, be allowed to use their holdings of Reichsmarks. The annual reportof the Reichsbank for 1942 mentions that nineteen countries and areas areattached to the mul t i la tera l c lear ing via Ber l in. It is understood thatas a rule special arrangements are required to determine the nature of thetransactions which are eligible for the multilateral clearing and the amountsinvolved. Under the one-sided developments caused by wartime conditionsthe effects of bilateralism have not been overcome and it must thereforebe the endeavour of each country to secure equilibrium in relation to othercountries both collectively and individually, surplus balances in one marketbeing but rarely utilisable for settlement of liabilities in other markets.
For the remaining neutral countries "on the continent of Europe there wasthe further complication that they had to handle in even more strictly separatecompartments their commercial and monetary affairs with each of the belli-gerent groups. In doing so they have gradually been drawn nearer to eachother. As an example of this closer contact may be mentioned that, since5th August 1942, the Portuguese escudo and, since 7th October of the same year,the Argentine peso have been included in the list of official quotations on theSwedish exchange market. Notwithstanding a surplus in the current accountof its balance of payments in both 1941 and 1942 (see page 122), Sweden hasmaintained the exchange restrictions which were imposed at a critical timein February 1940; the restrictions are kept in force mainly as a precautionarymeasure and to facilitate wartime control of commercial and financial payments.They are, however, applied in a liberal spirit and in several foreign exchangemarkets the Swedish crown is still regarded as a "free" currency in the sameway as the Swiss franc and the dollar.
One of the main exchange problems with which the Swiss authoritieshave had to deal is still that of absorbing large offers of dollars which aresubject to the freezing provisions imposed in the United States in the summer

42
of 1941. Under the regulations in force Swiss assets in the United States canpractically only be used for payments within the dollar area, the Swiss NationalBank mentioning in its last annual report that the difficulties rather increasedduring 1942. As in the previous year, the National Bank has in the mainlimited its purchases to dollars originating from exports of merchandise, traveland payments in connection with insurance, or concerned with payments tothe Diplomatic Corps, the International Red Cross and persons domiciled inSwitzerland whose sole income consists of their dollar receipts. On the otherhand, the bank has, in principle, refused to accept dollars resulting fromtransfers of or income from capital, being anxious to safeguard, above all,the country's foreign trade. In view of the limited possibilities of utilisingdollar assets, the National Bank has been obliged to accept — but only withgreat reluctance — blocked dollars and gold in the United States, since thedemand for dollars from importers of goods has been insufficient to absorbthe exporters' offers of dollars and it has been practically impossible to utilisedollars in third countries. Consequently the bank's monetary reserves have greatlyincreased. The agreement concluded with the commercial banks in September1941 regarding purchases and sales of dollars has remained in force; each weeka balance is struck between the banks' purchases and sales of dollars for therecognised purposes, and the surplus which then generally arises is takenover by the National Bank at agreed rates of exchange. Over an extensivefield, including all commercial uses, a stable dollar rate is thus ensured; but,outside that field, Swiss francs are dealt in on the New York market atrates differing widely from those officially applied in Switzerland. While theofficial rate for the dollar in Switzerland is Sw.fcs 4.30 = $ 1 , rates as IowasSw.fcs. 3 = $1 have occasionally been quoted in New York.
In 1938 about one-third of Swiss foreigntrade was carried throughclearing accounts; in 1942the proportion had risen toabout three-quarters, thereasons for this develop-ment being that, apart fromsettlements with Portugaland Sweden, paymentswithin Europe could nolonger be freely madeand that the share of thecontinent of Europe inSwitzerland's foreign tradehad risen as a result ofthe increased difficultiesin the way of commercialrelations with overseascountries. Transactionswhich pass through the
Quotationsas
of Foreign Bank-Notes in Switzerlandpercentage of clearing or official rate.
1939 1941 1942 1943

— 43 —
clearing are settled at the official rates agreed upon by the clearing partners,and these rates are of great practical importance for the currents of trade andthe trend of prices, being certainly more significant in these respects than, forinstance, the rates quoted for bank-notes or for currency balances availableonly for special purposes. Quotations for bank-notes may be said to havelittle or no relation to the volume of trade and are as a rule unaffected byofficial support, the repatriation of notes being, on the contrary, forbidden inalmost all countries, as part of the standard exchange regulations. The graphon the opposite page shows the quotations on the Swiss market for thenotes of five countries as a percentage of the clearing or official rates forthe currencies in question.
The Portuguese exchange market continued to be of considerableimportance in 1942, being free from restrictions but feeling to some extentthe effects of the more incisive regulations to which the country's foreigntrade had been subjected. The sterling rate remained unchanged atEsc. 99.80—100.20, while certain slight adjustments were made in the ratesfor the dollar, the Swedish crown and the Swiss franc. The stability thusattained has been ensured through continued purchases of gold and foreigncurrencies by the Banco de Portugal, which increased its holdings of theseassets in 1942 by no less than Esc. 4,530 million.
Spain also would seem to have strengthened its foreign exchangeposition during 1942. From 26th July of that year the so-called "voluntary"rates, which had been quoted in addition to the official exchange rates, wereabolished. For sterling the "voluntary" rate had been Pesetas 46.55, the officialrate, which still remains, being Pesetas 40.50. For the dollar the reductionwas from the "voluntary" rate of Pesetas 12.56 to 10.95 and for the Swiss francfrom Pesetas 2.91 to 2.53. Dealings in U.S. bank-notes have been forbidden.Towards the end of the year there was some increase in the demand forpesetas in foreign markets. This development would seem to reflect the reduc-tion in the budget deficit and also the relative improvement in the "purchasingpower parity", caused mainly by a more rapid rise in foreign costs and prices.
The Turk ish pound has been subject to varying influences in recentyears. There has been a good demand for certain Turkish export products,such as iron ore and chromium, while difficulties have been experienced insecuring imports, and this has contributed to the maintenance of a relativelyfirm exchange position vis-à-vis other countries; on the other hand, commodityprices have risen rapidly on the domestic market, affecting the internalpurchasing power of the currency. In order to counteract the persistentadvance of prices, the government decided in May 1942 to suppress the 40 percent, premiums on exports paid for in "free" currencies (the Swiss franc, theSwedish crown and the dollar) and in August reduced from 48 to 35 per cent,certain exchange premiums burdening imports paid for in dollars and otherfree currencies (a measure which would seem to be equivalent to an appre-ciation of the Turkish pound). Rates fixed in clearing agreements, however,remained unaltered. Notwithstanding the favourable export position, measureswere introduced in the autumn affecting the conversion of Turkish pounds

- 44 -
into other currencies. A decree issued in September 1942 blocked allbalances belonging to persons or firms, whether Turkish or foreign, domiciledoutside Turkey, including all sums from the sale of commodities, rents fromreal estate and dividends from Turkish and foreign stocks and shares. Nocredit may in future be opened in Turkish pounds for any person or concerndomiciled abroad. The Minister of Finance may in some cases grant exemptions.The blocked amounts can be used only for buying and exporting certainTurkish goods specified in the decree or enumerated in the various com-mercial agreements.
The European neutral countries are gaining what would normally beregarded as a strong exchange position by the additions to their monetaryreserves; but the surplus exports (visible and invisible) which give rise tothese additions involve payments which have to be financed on their domesticmarkets; in arranging this financing care has to be taken not to provoke adangerous monetary expansion. For the neutrals such problems of financinghave arisen in relation to countries on both sides in the war. AlthoughSweden and Switzerland are debarred from merchandise traffic with theUnited Kingdom and the United States to a greater extent than are Portugal,Spain and Turkey, the current accounts of their balances of payments stillcontinue to show a substantial turnover with the monetary centres in thesterling and dollar areas.
The Br i t ish foreign exchange control, which had gradually been perfectedduring the first two years of the war, underwent no important amendmentsduring 1942. Perhaps the most significant new move was a simplification inrelation to the dollar, by which three different types of sterling accounts heldby residents in the United States were merged into "registered accounts",the balances of which could, if desired, be converted into dollars at the officialrate. This put an end to the market for free sterling in New York. A similarmeasure Of unification was not applied in relation to Switzerland — the onlyother country for which the system of "registered accounts" had been inforce. Since the beginning of 1943, however, it has been permissible to open"registered accounts" in favour of private persons and firms domiciled inSwitzerland, whereas previously such accounts had only been allowed betweenbanks (with the authorisation of the Bank of England).
Foreign exchange quotations in London showed hardly any variation during1942, official rates being applied vis-à-vis practically all countries whosecurrencies were quoted. New rates, applicable to the territories in North Africa,were, however, fixed for the Italian and French currencies. For Cyrenaica andTripolitania the rate was fixed at Lit. 480 to the pound sterling, in line withthat which had previously been adopted for Eritrea and Abyssinia, while forSicily a rate of Lit. 400 to the pound sterling was announced in July 1943together with a rate of Lit. 100 = $1. For French North Africa the first ratesto be applied were Fr.fcs 300 to the pound and Fr.fcs 75 to the dollar but,in response to representations from various quarters, these rates were changed

- 45 -
in February 1943 to Fr.fcs 200 and Fr.fcs 50 respectively. These new ratesrepresent a depreciation of the French franc by about 12 per cent, in relationto the official rates of Fr.fcs 176.625 to the pound and Fr.fcs 43.80 tothe dollar, established in the autumn of 1939. Since, however, the rate ofFr.fcs 176.625 has been maintained in the territories of "Free France" underagreements with the British authorities, the result is that two rates are nowquoted in the French overseas territories: one rate, based on Fr.fcs 200 tothe pound, applicable mainly to North Africa and to French West Africa,and the other rate, based on Fr.fcs 176.625 to the pound, applicable toFrench Equatorial Africa, Syria, Lebanon, Madagascar, French Cameroons,New Caledonia and other South Sea possessions as well as to French India.
In September 1942 the Brazilian milreis and the Uruguayan peso wereadded to the list of "specified" currencies which must be surrendered to theTreasury if held by any resident in the United Kingdom — indicating a sharpreversal in the position of these two currencies, which had previously beenconspicuous by their weak tendency.
(n relation to the United States the maintenance of a stable sterling-dollar rate has been much facilitated by the lend-lease arrangements, underwhich war deliveries are precluded from exerting an influence on the exchanges.Although the American foreign exchange market as such is not subject tocontrol, this market is affected, on the one hand, by the exchange regulationsin force in other countries and, on the other hand, by the Foreign FundsControl applicable to more than $7 milliard of foreign-owned assets held in theUnited States and to the transactions of more than 35 countries, including thewhole of Continental Europe (except Turkey), China, Japan and the countriesoccupied by Japan. The "frozen" assets consist not only of bank deposits,gold and securities but also of a great number of business enterprises, aswell as merchandise, patents and other forms of property; and the controlcovers all financial and commercial transactions in which the countries affectedor their nationals have an interest, whether such transactions are purelydomestic or come under the heading of foreign exchange or foreign trade.After the United States became involved in the war, the Control was madean agency of economic warfare and its objectives and powers were definedaccordingly. The control is carried out by an organisation created withinthe Treasury Department, major policy decisions being frequently consideredby inter-departmental groups. Much of the field work concerned with licencesto effect transactions subject to the control has been delegated to theFederal Reserve Banks, which in this respect act as agents of the TreasuryDepartment.
To provide the information necessary for the administration of the control,a census of all foreign property subject to the jurisdiction of the UnitedStates was taken by the Treasury Department. The total value of the propertyreported in the census was in excess of $13 milliard, and more than $7 milliardof this total was reported as the property of blocked countries or their nationals.

— 46 —
Property reported as owned or held for Latin American Republics or theirnationals amounted to more than $1.2 milliard. The following table showsproperty holdings classified according to the principal types of property.
Pr inc ipal Foreign-owned Assets in the United Statesin the middle of 19410).
Groups of countries
Enemy countriesEnemy-occupied countries (2) . . . .Other blocked countries (3)Other American republicsAll other countries
Total . . . .
Goldear-
marked
Depositsand otherbankingassets
Stocks ofregistered
bondsDirectinvest-ments
Otherinvest-ments
Total
in millions of dollars24
1,269848322
4
2,467
1601,225
975605
1,115
4,080
50625540225
1,690
3,160
10536512020
1,340
1,950
12550020050
650
1,525
4643,9842,6831,2224,799
13,152
(') Table reproduced from a memorandum published by theTreasury Department, Foreign Funds Control, In June 1942.(2) Including Finland and the part of France not occupied at that time. (3) Including China.
Apart from the "war debts" of 1917-19, the foreign assets owned bythe United States at the end of 1940 were estimated by the Departmentof Commerce to be slightly over $11 milliard. If only those countries arecounted which are subject to the Foreign Funds Control, the claims of theUnited States at the end of 1940 would be as follows*:
Direct business investments $1,051 millionDollar bonds 613 „Short-term banking funds 80 ,,
Total . . . . 1,744 million
In the course of 1942 a number of stabilisation agreements were concludedby the United States, with the granting of credits through the ExchangeStabilization Fund. Under an agreement concluded in July 1942 the creditline of $60 million which the Brazilian Government had already obtained in1937 was increased to $100 million, for the purpose of stabilising the value ofthe milreis. In the same month an agreement was concluded with the CubanGovernment, under which the latter became entitled to acquire gold on creditin the United States, the credits to be repaid within twenty days and in nocase to exceed $5 million. By the use of this facility the Cuban monetaryauthorities would be able, if they so wished, to acquire gold in advance ofactual payments in dollars due to them. Earlier in the year the EcuadorGovernment received a credit up to $5 million from the U.S. Stabilization Fund,to enable it to stabilise the rate between the sucre and the dollar; and, underan agreement with Iceland, the Stabilization Fund was authorised to provideup to $2 million to ensure a stable relationship between the Icelandic crownand the dollar. Arrangements were also made to prolong, to the end ofJune 1943, the agreement concluded with the Chungking Government in April1941, under which the Stabilization Fund extended credits up to an amountof $50 million in order to secure the value of the yuan.
* From an article by Judd Polk on the "Future of Frozen Funds" in the American Economic Review for June 1942.

— 47 —
Loans to several Latin American countries were -< g ranted in the courseof the year by the Export-Import Bank and some countries were also recipientsof lend-lease assistance. The expenditure of large sums by the United Statesand other governments, in payment for materials and .services required inconnection with the war, also helped to provide Latin American countrieswith substantial dollar balances, only a part of which was, as a rule, usedto pay for imported goods. Some of the countries received, in addition, anInflux of private refugee capital, which likewise added to the foreign resourcesin the hands of their central banks and Treasuries.
In the course of 1942 the gold reserves of Brazi l increased from theequivalent of U.S. $70 to 115 million (as compared with $34 million in July1939). The quotations of the Brazilian currency in New York showed increasingfirmness up to the end of the year, the average free rate being 5.1427 centsin 1942 as against 5.0705 cents in the previous year. During the early partof 1943, however, the strong tendency was not maintained; in February theBank of Brazil was vested with fresh powers of monetary control and tooksteps to prohibit imports and exports of Brazilian currency as well as un-authorised sales and holdings of foreign exchange. On 1st November 1942 theofficial designation of the unit of the Brazilian currency was changed from milreis(divided into 1,000 reis) to cruzeiro (divided into 100 centavos). In September1942 the exchange rate in the "Special Account" with the United Kingdom wasaltered from Milreis 78.570-79.570 to 83.648 = £1. For transactions other thanthose falling under this account, the existing regulations provide that 30 per cent,of the value of sight export bills must be sold by the exporters at the officialrates of Cr. 16.50 for the dollar and Cr. 66.49% for the pound, the remaining70 per cent, being sold at the free market rates of Cr. 19.47 for the dollar andCr. 78.46 7/i6 for the pound. The buying rates for importers in the free marketare slightly higher, viz. Cr. 19.63 for the dollar and Cr. 79.599/i6 for the pound.In addition, there is a special free market for cheques and mail transfers inU.S. currency with rates of Cr. 19.70-20.50 for the dollar, the purchase ofdollars from the banks being subject to a 5 per cent, exchange tax.
In Venezuela the different selling rates of dollars to importers wereunified in May 1942. Before this unification there were two different rates:the official rate at Bs. 3.35 = $1, applicable to payments for essential importsduly authorised in advance, and the free rate, varying between Bs. 3.42 and4.00 for the dollar, applicable to payments for other imports. The new uniformrate was fixed at Bs. 3.35, involving a substantial appreciation of the bolivarfor a great number of transactions. Different rates, involving, in some cases,considerable subsidies, are still applied to the sales of foreign exchange byexporters; in view of the rise in the foreign price for coffee and cocoa, thepurchase rates for export bills for these commodities were, however, some-what reduced in 1942. While the current budget is usually balanced witha surplus, the government arranged in 1942 for loans amounting to $20 millionfrom the Export-Import Bank to be used for development works. Bol iv ia alsoobtained loans from the Export-Import Bank and, as a result of the great

- 48 -
foreign demand for some of its export products, especially tin, the foreignreserves increased substantially and the official rate of exchange was loweredin February 1943 from Bs. 46 to Bs. 42 for $1. Thanks to an improvement intheir exchange positions, Mexico and Paraguay were able to resume a partialservice of their foreign debts. In Nicaragua the Exchange Commission as anautonomous institution was abolished in the summer of 1942 and its functionsentrusted to the central bank. Similarly in Chile the powers of the ExchangeControl Commission were transferred to the central bank from the end of 1942.
The exchange position of the Argent ine has been influenced by anexport surplus of Pesos 702 million in 1942 as compared with 363 million inthe preceding year, and also by a continued inflow of capital from abroad.No change has been made in the official buying rate of Pesos 335.82 = $100(Pesos 13.50 = £1), applicable to about 90 per cent, of the country's exports,or in the preferential selling rate of Pesos 373.13, applicable to governmentpayments and imports of certain essential commodities. But in April 1943 thebuying rate applicable to other exports than those classified as "regular" wasreduced from Pesos 421.82 to 397.02, corresponding to a decline in the freemarket rate from Pesos 424.75 to 398 (with a corresponding reduction fromPesos 16.96 to 15.96 = £1). Financial payments continued to be effected at theold rates, a claim by British holders of Argentine railway shares for remittancesat a better rate than Pesos 16 = £1 being refused.
In consequence of decisions reached at the Pan-American Conferencein Rio de Janeiro in 1942, steps had been taken by the Argentine Governmentto control capital movements in relation to other than American countries.In April 1943 the control thus introduced was extended to all countries inorder to protect the Argentine market from the harmful repercussions of anexcessive inflow of funds from abroad. Any import of capital would in futurerequire a permit, which would be granted only if the import in questionserved productive purposes, it being held that the capacity of the Argentinemarket to absorb unproductive refugee funds had already reached its limit.
The main purpose of the monetary policy of Japan since the beginningof 1942 has been the establishment of a yen area comprising the whole ofthe Far East. Different aspects of this policy have been (i) the monetaryunification of the occupied parts of China, involving a gradual elimination ofthe military yen and a strengthening of the position held by the Nanking yuanand the Peiping yuan; (ii) the establishment of the South Seas DevelopmentBank, provided with the privilege of note issue (of which it began to makeuse on 1st April 1943); (iii) the confirmation of the yen as the basic currencyfor all the other currencies in the area.
The main instrument for the extension of the monetary power of Japanhas been the gumpyo, i. e. the military currency issued by the Japaneseoccupying authorities. While in China the military yen had from the beginningthe same value as the yen of the mother country, elsewhere the gumpyo was,in each area, given the same value as the local currency, with which it was

- 49 -
thus made interchangeable; only later was it to be brought into a fixed relationwith the yen. An exception was made, however, in Hong Kong where, onaccount of the close economic relations with China, the military yen was alreadyintroduced as a new currency on 5th January 1942, but the Hong Kong dollar wasallowed for the time being to continue in circulation. The rate of exchange betweenthe military yen and the Hong Kong dollar was originally fixed at Hong Kong$2 = Military Yen 1, but was soon altered to Hong Kong $4 = Military Yen 1.By the adoption of the latter rate the Hong Kong dollar was subjected to adepreciation of more than 75 per cent, (the value of the military yen beingtaken as fully equal to that of the Japanese yen itself). In the spring of 1942all holders of Hong Kong dollars were told to exchange them for military yenbefore 31st May 1943; all liabilities in Hong Kong dollars would be repayablein military yen, including bank deposits, which were to be converted intomilitary yen; and from 1st June the Hong Kong dollar ceased to be legaltender. To give support to these measures the Nanking Government prohibitedwithin its jurisdiction the holding and use of Hong Kong dollars, English poundsand U.S. dollars (the Japanese military authorities in China had already inJuly 1942 prohibited all transactions in these currencies).
In the other occupied areas the gumpyo was, as mentioned above, atfirst made equivalent to the respective local currency. But, in settlementswith Japan, the gumpyo was, without exception, put on a par with theJapanese yen, which involved an indirect attachment of all the local currenciesto the yen at a rate of 1:1. Apart from the adoption of the decimal system forthe subdivision of the Burmese monetary unit, there have so far been no formalcurrency changes in the different areas, but the de facto introduction of a newparity with the yen has amounted to a depreciation of the local currencies:
The rupee in Burma was depreciated by 22 per cent.The baht in Thailand by 37 „ ,,The Straits dollar in British Malaya, North Borneo and Sarawak . . . by 50 „ „The peso in the Philippines by 53 „ „The guilder in the Dutch East Indies by 56 „ ,,
The Thai land baht was defined in February 1942 as equal to 0.32639 grammesof fine gold (instead of being linked to sterling at the rate of Bahts 11 aspreviously). By this definition Bahts 100 were equal to Yen 155.70, but alreadyin April 1942 the link with gold was broken and the baht was given the samevalue as the Japanese yen. In January 1943 it was agreed that, in relationto Japan, French Indo- China would accept "special yen" instead of, aspreviously, gold or certain foreign currencies, in settlement of balances arisingfrom commercial payments, expenses for stationing Japanese forces and allpayments on service account (the new mode of settlement being applied alsoto the various areas under Japanese domination). Simultaneously the relationshipof the piastre to the yen was slightly altered from Yen 98.12% to Yen 97.60 =Piastres 100. The new rate, calculated via the last yen-sterling quotation of1s.2d. = Yen 1, corresponds to a rate of Fr.fcs 175.64 = £1. The piastre beingthus equal to Yen 0.976, the currency unit has become practically the same forall the southern Pacific areas dominated by Japan; the new relationship hasbeen so fixed as to give a high purchasing power to the Japanese yen.

- 50 -
Of the four currencies circulating in China proper, three — themilitary yen, the Nanking yuan and the Peiping yuan — are attached to theJapanese yen, and the fourth — the Chungking yuan — is the currency of theChungking Government. In these circumstances of great diversity the monetarydevelopments present a double aspect: within each area the authorities haveto cope with the problem of maintaining some measure of currency order inspite of the strain and stress of a prolonged war; at the same time, betweenthe currencies attached to the yen, on the one hand, and the Chungking yuan,on the other, they are pursuing a kind of monetary warfare parallel with thearmed struggle.
A slight lowering of the official exchange rates for sterling and theU.S. dollar was announced from Chungking in July 1942. In place of therates of 36/32d. for Yuan 1 and $59/s2 for Yuan 100 the central bank quotednew selling rates of 3d. and $5 respectively; the fixing of these quotationswould seem to be a sign that the Chinese Currency Stabilisation Fund,backed by the British and United States Governments, is continuing to function.According to information given by the Finance Minister, the circulation of notesexpressed in Chungking yuan, which in June 1937, i. e. at the beginning ofthe so-called China incident, stood at Yuan 1.6 milliard, had attained an amountof Yuan 22% milliard by the autumn of 1942, or about 8% milliard more thana year earlier. At the rate of $5 for 100 Chungking yuan, the latter currencyretains only 17 per cent, of the value it had in the summer of 1937.
Among the Japanese-sponsored currencies, a determined effort has beenmade to bring support to the Nanking yuan — the currency issued by theCentral Reserve Bank in Nanking, opened on 6th January 1941. The notecirculation of this bank, which by the end of its first business year hadreached about Yuan 300 million, stood at about Yuan 1,000 million in the earlysummer of 1942 and reached Yuan 1,700 million in the autumn of the sameyear. This increase is at least partially connected with the measures takento oust the Chungking yuan from the areas under the Nanking Government.
Originally, the Nanking yuan was given the same value as the Chungkingyuan but on 31st March 1942 a rate of Chungking Yuan 100 = Nanking Yuan 77was fixed, the Nanking Government announcing at the same time that thelink between the two currencies was officially broken. Two months afterwardssteps were taken in specified provinces (including Shanghai) for the withdrawalof Chungking yuan and their conversion into Nanking yuan at a rate of twoto one. To avoid a large expansion in the note circulation of the CentralReserve Bank in Nanking it was decided to issue so-called "stabilisationbonds" in exchange for the large amounts of Chungking notes held by thebanks, while the public were to receive Nanking notes in exchange for suchnotes. Gradually, the area in which the Nanking yuan was to be the solecurrency was extended: after the first stage, comprising the important districtsof Nanking and Shanghai, the Nanking yuan was introduced in the provincesof Kiangsu, Chekiang and Anhwei; a further move aimed at its introductionin the province of Hupeh, with Hankow as the leading city. The Finance

- 51 -
Minister of the Nanking Government announced in the autumn of 1942 thatall Chungking notes still in private hands on 1st December 1942 in the provincesof Kiangsu, Chekiang and Anhwei would not only be banned and debarredfrom circulation but the carrying or hoarding of such notes would be severelypunished. This order also applied to the cities of Nanking and Shanghai. Thepopulation in these various districts were at the same time offered a lastopportunity to exchange Chungking for Nanking notes. Continuing the samepolicy, the Nanking Government in January 1943 announced similar measuresapplicable to the Hankow area and such districts in Kwangtung as werecontrolled by the said government (in particular the city of Canton). The timelimit for the exchange of Chungking notes for Nanking notes was 14th February1943 in the case of Hankow, but as early as 25th January for the Cantondistricts.
The Central Reserve Bank in Nanking has received support from theJapanese authorities in several ways. In July 1942 the Japanese Governmentgranted the Nanking Government, through the Bank of Japan, a five-yearbook credit of Yen 100 million, carrying interest at 3% per cent., for thepurpose of forming a reserve in yen as cover for the notes issued by theCentral Reserve Bank. At the same time it was reported that credits grantedby the Japanese to the Nanking Government in June 1941 amounted toYen 300 million. In this connection it may be mentioned that the CentralReserve Bank in Nanking has transferred the execution of ordinary bankingbusiness to the Bank of China and the Bank of Communications, these twoinstitutions having dissociated themselves from the Chungking Governmentand become private banks under the control of the Nanking Government.The Central Reserve Bank in Nanking has announced that from the begin-ning of 1943 it will confine its own operations to those of a government bankof issue.
On 9th March 1942 the rate of the Nanking yuan in relation to the militaryyen was fixed at 5 : 1 , but on 22nd June of the same year the rate was alteredto 5.55 : 1 (or Military Yen 18 = Nanking Yuan 100), involving a further depre-ciation of the Nanking yuan by 10 per cent. Since commodity prices, however,were much higher in Nanking China at the official rate of exchange than inJapan, it was rumoured that the relation between the yen and the Nankingyuan would be radically revised. To allay the fears which had thus arisen, theJapanese Economic Adviser to the Nanking Government explained, on a visitto Tokio in March 1943, that, on the one hand, measures would be taken tocounteract the price rise in Nanking China but, on the other hand, the presentrelation between the military yen and the Nanking yuan would be maintained.The price discrepancy, however, seems to be considerable: in January 1943the wholesale price index in Tokio stood at 249, while in Shanghai theindex had attained 3,518 (on the basis of the level obtaining before the out-break of the Sino-Japanese conflict). A price equalisation system which hadbeen introduced before 1939 for imports and exports, in order to bridge overthe difference between Japanese and Chinese commodity prices, was super-seded in September 1941 by a system providing for "special yen" rates for
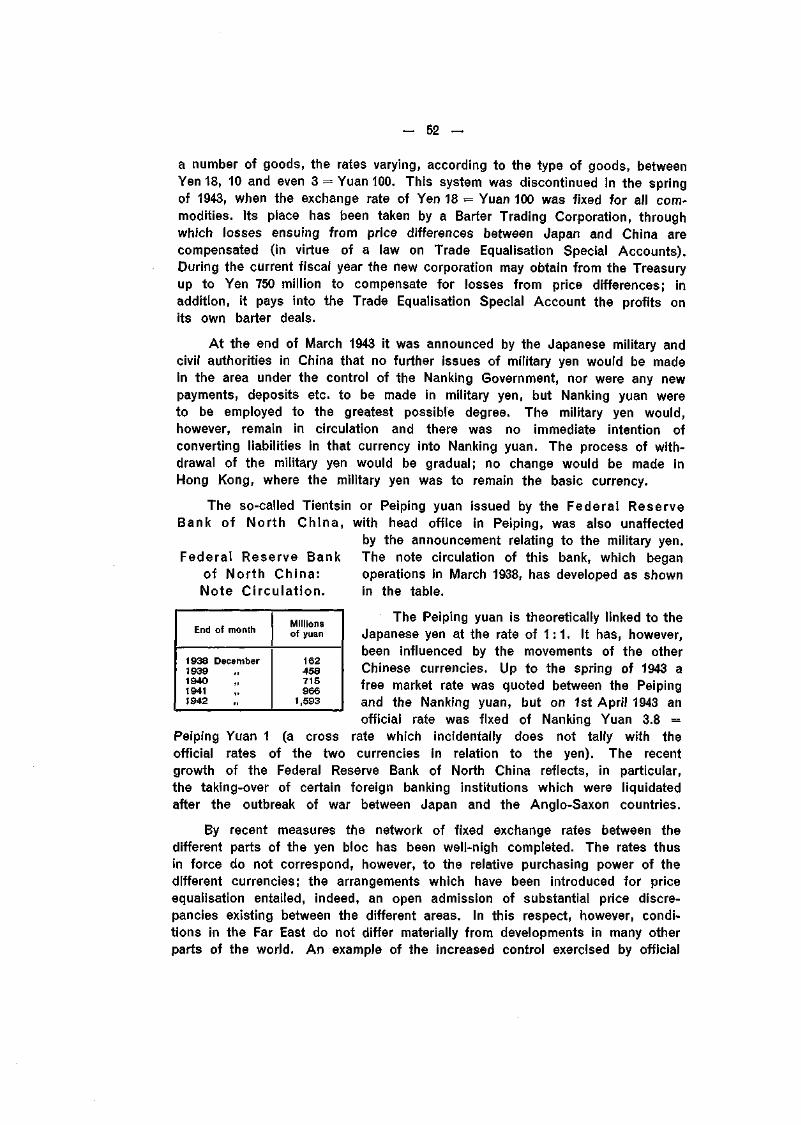
- 52 -
a number of goods, the rates varying, according to the type of goods, betweenYen 18, 10 and even 3 = Yuan 100. This system was discontinued in the springof 1943, when the exchange rate of Yen 18 = Yuan 100 was fixed for all com-modities. Its place has been taken by a Barter Trading Corporation, throughwhich losses ensuing from price differences between Japan and China arecompensated (in virtue of a law on Trade Equalisation Special Accounts).During the current fiscal year the new corporation may obtain from the Treasuryup to Yen 750 million to compensate for losses from price differences; inaddition, it pays into the Trade Equalisation Special Account the profits onits own barter deals.
At the end of March 1943 it was announced by the Japanese military andcivil authorities in China that no further issues of military yen would be madein the area under the control of the Nanking Government, nor were any newpayments, deposits etc. to be made in military yen, but Nanking yuan wereto be employed to the greatest possible degree. The military yen would,however, remain in circulation and there was no immediate intention ofconverting liabilities in that currency into Nanking yuan. The process of with-drawal of the military yen would be gradual; no change would be made inHong Kong, where the military yen was to remain the basic currency.
The so-called Tientsin or Peiping yuan issued by the Federal ReserveBank of North China, with head office in Peiping, was also unaffected
by the announcement relating to the military yen.Federal Reserve Bank The note circulation of this bank, which began
of North China: operations in March 1938, has developed as shownNote Ci rcu lat ion. in the table.
The Peiping yuan is theoretically linked to theJapanese yen at the rate of 1 :1 . It has, however,been influenced by the movements of the otherChinese currencies. Up to the spring of 1943 afree market rate was quoted between the Peipingand the Nanking yuan, but on 1st April 1943 anofficial rate was fixed of Nanking Yuan 3.8 =
Peiping Yuan 1 (a cross rate which incidentally does not tally with theofficial rates of the two currencies in relation to the yen). The recentgrowth of the Federal Reserve Bank of North China reflects, in particular,the taking-over of certain foreign banking institutions which were liquidatedafter the outbreak of war between Japan and the Anglo-Saxon countries.
By recent measures the network of fixed exchange rates between thedifferent parts of the yen bloc has been well-nigh completed. The rates thusin force do not correspond, however, to the relative purchasing power of thedifferent currencies; the arrangements which have been introduced for priceequalisation entailed, indeed, an open admission of substantial price discre-pancies existing between the different areas. In this respect, however, condi-tions in the Far East do not differ materially from developments in many otherparts of the world. An example of the increased control exercised by official
End of month
1938 December1939194019411942
Millionsof yuan
162458715ÌTOD
1,593

agencies in the field of foreign exchanges is provided by the transfer to theBank of Japan, in the spring of 1943, of the foreign exchange business pre-viously carried out by the Yokohama Specie Bank. In return the latter bankhas been able to develop its banking business rapidly throughout the southernterritories, the Philippines, Malaya, Java and Burma. In these various areasthe currency units, as mentioned above, are equal to the Japanese yen, butconversions of these foreign currencies into the yen of the home countryare permitted only in exceptional cases and to limited amounts, a rule whichalso applies to the gumpyo circulating in these areas.
In the discussions of fu ture exchange pol icy it is possible to discerntwo distinct — in some ways contradictory — tendencies, both arising out ofthe experience gained during the interval between the two wars. First ofall, there is a profound realisation of the disadvantages connected with over-valued and undervalued currencies and, therefore, great emphasis is laidon the need of br inging exchange rates into l ine wi th the under-ly ing economic cond i t ions in the respect ive countr ies (a restorationof "purchasing power parities" being a somewhat simplified version of theprinciple involved). Countries have found by dire experience how harmfulit is to cling to rates which make a currency overvalued, since this upsetstheir export trade, endangers the current account of the balance of pay-ments, and, what is often more serious, exerts a downward pressure onprices, while costs remain high. To remedy the situation, some countries,of which Germany was the chief example, decided in 1931 and the followingyears to submit their national economies to a comprehensive control, offsettingthe disequilibrium on foreign account by a system of export subsidies andimport charges and stimulating domestic activities by extensive state in-vestments. Elsewhere, the usual result of an uncorrected overvaluation waswidespread unemployment, with much suffering and grave dangers froma social point of view, while the burden of public and private debts wasaggravated by a contraction of the national income.
Undervaluation of a currency, on the other hand, might appear — for atime at least — to bring some advantages, as a means of ensuring remunerativeprices (i. e. prices well above costs) both in export trade and in domesticactivities, including agriculture (the undervaluation acting as a form of protec-tion combined with export premiums). But this is not the end of the story.Countries with undervalued currencies have usually found the terms of tradeaffected to their disadvantage, foreign firms and individuals being able to buygoods and services from them too cheaply. Should reliance upon undervalua-tion become a habit (as the use of artificial stimuli is apt to do) monetarysecurity would soon be impaired, with consequences which would not beimmediately revealed in all their force. Labour circles in a number of countrieswould seem to have realised more and more that, without monetary stability,efforts towards social improvement may soon be nullified, the real value ofcontractual wage rates and social benefits being diminished by rising prices.In relation to foreign markets, the advantages which at first seemed promising
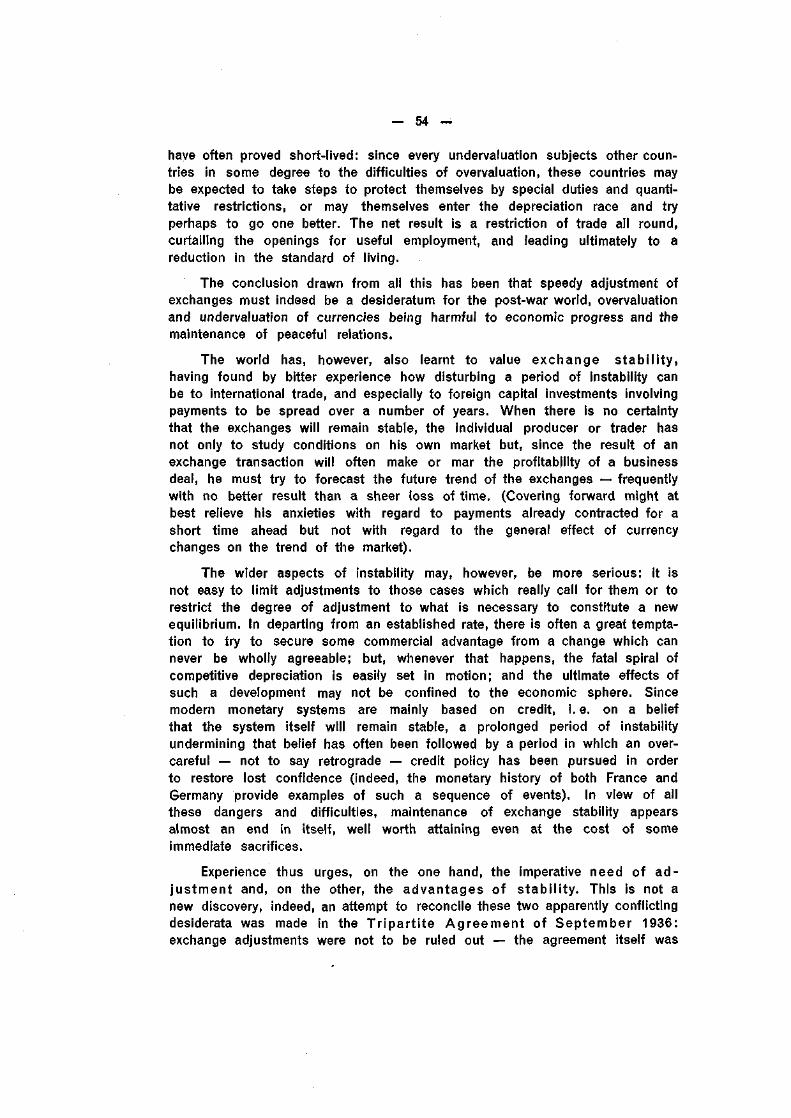
have often proved short-lived: since every undervaluation subjects other coun-tries in some degree to the difficulties of overvaluation, these countries maybe expected to take steps to protect themselves by special duties and quanti-tative restrictions, or may themselves enter the depreciation race and tryperhaps to go one better. The net result is a restriction of trade all round,curtailing the openings for useful employment, and leading ultimately to areduction in the standard of living.
The conclusion drawn from all this has been that speedy adjustment ofexchanges must indeed be a desideratum for the post-war world, overvaluationand undervaluation of currencies being harmful to economic progress and themaintenance of peaceful relations.
The world has, however, also learnt to value exchange s tab i l i ty ,having found by bitter experience how disturbing a period of instability canbe to international trade, and especially to foreign capital investments involvingpayments to be spread over a number of years. When there is no certaintythat the exchanges will remain stable, the individual producer or trader hasnot only to study conditions on his own market but, since the result of anexchange transaction will often make or mar the profitability of a businessdeal, he must try to forecast the future trend of the exchanges — frequentlywith no better result than a sheer loss of time. (Covering forward might atbest relieve his anxieties with regard to payments already contracted for ashort time ahead but not with regard to the general effect of currencychanges on the trend of the market).
The wider aspects of instability may, however, be more serious: it isnot easy to limit adjustments to those cases which really call for them or torestrict the degree of adjustment to what is necessary to constitute a newequilibrium. In departing from an established rate, there is often a great tempta-tion to try to secure some commercial advantage from a change which cannever be wholly agreeable; but, whenever that happens, the fatal spiral ofcompetitive depreciation is easily set in motion; and the ultimate effects ofsuch a development may not be confined to the economic sphere. Sincemodern monetary systems are mainly based on credit, i.e. on a beliefthat the system itself will remain stable, a prolonged period of instabilityundermining that belief has often been followed by a period in which an over-careful — not to say retrograde — credit policy has been pursued in orderto restore lost confidence (indeed, the monetary history of both France andGermany provide examples of such a sequence of events). In view of allthese dangers and difficulties, maintenance of exchange stability appearsalmost an end in itself, well worth attaining even at the cost of someimmediate sacrifices.
Experience thus urges, on the one hand, the imperative need of ad -justment and, on the other, the advantages of stabi l i ty . This is not anew discovery, indeed, an attempt to reconcile these two apparently conflictingdesiderata was made in the Tr ipar t i te Agreement of September 1936:exchange adjustments were not to be ruled out — the agreement itself was

— 55 —
concluded for the immediate purpose of facilitating an alignment of theFrench franc with the dollar and sterling — but the adjustments were to bekept within proper limits, the parties to the agreement trusting that no countrywould "attempt to obtain an unreasonable exchange advantage and therebyhamper the effort to restore more stable economic relations". The hopesthat the agreement would lay the foundation for other necessary adjustments,and thus for a world-wide exchange stability based on appropriate parities,were, however, disappointed; within three years the exchange rates betweenthe three original signatories had all been subjected to major modifications.
When this war is over, similar problems will present themselves and newattempts will be made to find a reasonable way out of the difficulties. Each ofthe two Anglo-Saxon currency plans published in the spring of 1943 set outto provide for reasonable exchange adjustments and safeguards against un-necessary departures from the rule of exchange stability. From the experienceòf the troubled years 1919 to 1939 it seems possible to extract certaingeneral pr inc ip les which may command a fair measure of agreement forthe future.
1. There can be little difference of opinion as to the need, whichwi l l become more evident after the war, for exchange adjustmentsas a resul t of unequal increases in costs and pr ices in d i f ferentcountr ies. For the time being official quotations are maintained by a com-plicated system of trade and exchange control (often tempered, however, bypalliatives such as premiums and subsidies designed to span gaps whichwould otherwise prove unbridgeable). Prestige in currency matters will probablyplay less of a rôle in the future than it did after the last war, since thequestion of returning to old time-honoured parities will rarely arise. But withinthe different countries and in their relations with one another it will probablybe impossible to rule out entirely those clashes of interest which often makeit difficult to arrive at agreed solutions and to work out an objective formulacapable of universal application. In fixing relative exchange rates, attentionmust no doubt first be paid to the factors most resistant to change, namelythe level of wage rates, agricultural prices, and the volume of domestic andforeign indebtedness. The great difficulty will be to find a relationship whichwill not only answer immediate requirements but will also prove tenable inthe years to come.
2. On one point agreement in principle may perhaps be taken for granted;all will concur in condemning currency manipulat ion as an ins t rumentof commercia l pol icy and a fo r t i o r i compet i t ion in deprec ia t ion(or appreciation). While it may be accepted that exchange rates should beadjusted to fit relative cost and price levels and the volume of indebtedness,a country which resorts to manipulation would provoke new disequilibria; and,although such disequilibria might procure the country in question sometemporary commercial advantage, they would for that very reason expose othercountries to corresponding disadvantages and tend to provoke retaliatorymeasures.

- 56 -
The distinction between "adjustment" and "manipulation" is not easy toestablish either in theory or in practice; but the line of argument put forwardto support a change in the rate may possibly reveal the intention of thoseresponsible for the decision. Perhaps the best practical test is willingness orreluctance to accept some immediate sacrifice as a contribution to generalexchange stability. According to the Keynes Plan, the main advantage of amonetary reserve is "to allow time and method for necessary adjustments anda comfortable safeguard behind which the unforeseen and the unexpected canbe faced with equanimity". Thus, this Plan (and perhaps this is even truerof the White Plan) presupposes, as part of the monetary machinery to beused in the future, a willingness to rectify an internal disequilibrium.
In the twelfth Annual Report of this Bank the opinion was expressedthat major maladjustments would probably have to be corrected by alterationsin exchange rates; reductions of wages by anything like 20 or 30 per cent,might expose the social fabric to too great a strain and too heavily increasethe burden of public and private indebtedness. If, on the other hand, thenecessary reduction of costs were limited to something like 10 per cent., itmight well be possible to re-establish equilibrium by a policy of internal costadjustment. The monetary authorities alone, however, have no longer themeans of giving full effect to such a policy, and it was therefore suggestedthat a solution might be found by associating labour organisations in theresponsibility for monetary decisions and in that way arriving at a method ofcost adjustment with a minimum of friction and waste of resources. If it weremade a rule that minor disequilibria should be adjusted by changes in priceand cost levels, an important step would have been taken towards the reali-sation of general exchange stability.
3. Even in cases where a modification of exchange rates is unavoidable,it will usually prove essential to success to combine such a step wi tha direct adjustment of costs and prices. First of all, such a com-bination would ensure a less extensive modification in the rate of exchangethan would otherwise be necessary; the risk of establishing a new disequi-librium by too great a swing in the exchange rate would thus be materiallydiminished. The adjustment of a currency to its proper equilibrium rate doesnot really produce any harmful effects for other countries but, since it eliminatesan obstacle to trade, is in the interests of all, provided, of course, that altera-tions in the rates do not become so frequent as to destroy all sense ofstability. If exchange adjustments were to be regarded as part of a permissiblepolicy to be applied whenever a currency found itself in an unbalanced position,and if such adjustments involved no loss of monetary prestige, it wouldprobably be impossible to prevent their use for improper purposes; the attitudewhich the world in general adopts towards currency changes most cer-tainly influences the amount of effort which each individual country maybe willing to expend in order to rectify its position by other means thanmodifying its exchange rates.
Secondly, by the combination referred to above the problem of a traderevival would be attacked from both the financial and the economic angle; and

— 57 —
this would mean, inter alia, that the business world could not sit back and waitfor the results of some official action but each individual firm would be ex-pected to take the measures necessary to put its own affairs in order. Experiencehas proved that a double attack of this kind, involving an intensification ofindividual efforts, offers the best chance of success (see Introduction, pages 34-35).
Finally, a policy of combining cost adjustments with a modification ofexchange rates probably holds out the greatest hope of restoring confidencein the currency, since it gives reason to believe that the modification of theexchange rate is definitive, being part of a comprehensive plan to secure alasting equilibrium. Not every modification of exchange rates has in the pastproduced the results hoped for; experience has proved that no automaticresults can be expected but that monetary reforms are successful only ifcertain conditions are fulfilled, foremost among them being a strengtheningof public and private credit. If the choice of the new rate appears to bereasonable; if costs are not too high for the level of prices and the budgetis properly drawn up; and if the new arrangements consequently give theimpression of being more than a mere makeshift, the credit position ofboth the government and the business world will be sure to improve. Inthis way a firm basis will be laid for a more confident outlook, soon to bereflected in the rate of investment and the turnover of trade. Wherever,in the past, the authorities allowed important problems concerning the budgetor the cost and price structure to remain unsolved, not even a very con-siderable depreciation was able to produce the desired recovery.
4. A particularly nasty kind of depreciation overtook a number of countriesafter 1918: in advance of actual internal in f la t ionary developments,the exchange rates of a number of countr ies were affected inresponse to heavy sales, especially of bank-notes, on foreign markets. It didnot take long for the precipitous fall in exchange values to intensify therise in domestic prices: for instance, during the wild post-war inflation inGermany, prices for vegetables in small country towns came to be raiseddaily and even several times a day, to conform with the latest Markquotation for the dollar as received from Amsterdam or Zurich. If thereis no complete collapse of the system now in force, a continuation ofwartime controls during the critical period is likely to rule out this typeof price-raising influence at the end of the present war. But a continuedsuppression of the free foreign exchange market will then prevent the ex-changes from finding their own level, and this is not wholly satisfactory either.In the period immediately after the war, market influences, if allowed to makethemselves freely felt, would be so formidable that control would appear tobe the lesser evil. Nevertheless, it would be dangerous to believe that anyfundamental disequilibrium had been cured by attending to what is after allonly a symptom — the weak tendency of the currency. And, if an unbalancedposition were to remain uncorrected, preventing a relaxation of the restrictionsimposed, the whole system of control would act as a brake upon thosedynamic forces whose freedom to operate probably provides the best chanceof restoring business activity and ensuring a healthy demand for labour.

58
5. Another danger may arise from the imperfect synchron isat ionof the s tab i l i sa t ion measures in di f ferent countr ies. In the period1920-29 the leading countries did not stabilise their currencies at even approximatelythe same time, and the late-comers often adopted new rates of exchange whichproved to be out of keeping with the conditions already firmly established inthe other countries. Again, after 1931, when one country after the otherdeparted from the parities which they had adopted in the previous decade,there was not much coordination between the currency changes of theimportant countries: England took the step in 1931, Japan likewise, the UnitedStates in 1933, France and Italy (with the remaining countries of the goldbloc) in 1936, while Germany continued to apply the old gold parity as abasis for the official rate of the Reichsmark in its different clearing andpayments agreements. It is to be hoped that when measures of monetaryreconstruction are undertaken after the present war they will be more nearlysimultaneous, whether this be the result of concerted action or the outcomeof parallel endeavours by individual countries. There can be little doubtthat concerted action may help to restore a fair measure of monetary orderat an earlier date than would otherwise be possible. Many countries willhave insufficient reserves in gold and foreign exchange to pay for theimport of essential raw materials, foodstuffs, machinery and manufacturedgoods; and these countries will, moreover, need to strengthen their monetaryreserves in order to be able to relax their wartime restrictions on exchangeand foreign trade at an early date. If the countries themselves were to
Exchange Rates in Switzerland — in percentages of par.
130
1914- 1920 1921 1922 1923

— 59 —
attempt, by some ingenious technical device, to mobilise the amounts offoreign exchange which they would need, they might easily expose theirmonetary mechanism to an excessive strain. Whatever outside assistancebecomes available, it is almost an essential condition for success that thisshould be given as part of a comprehensive plan aiming at financialand economic equilibrium in the country benefiting from the aid — at least,that is one of the main conclusions which may be drawn from the recon-struction work after the last war.
6. Whatever policy the larger count r ies may adopt to organisefinancial assistance on an international basis, there can be little doubt thatone of the greatest services which they could render the post-war wor ld would be the speedy estab l ishment of stable cond i -t ions w i th in their own economies and in thei r re lat ions wi thone another ; a lack of balance in their exchange positions or a failure ontheir part to bring about a revival in business will not leave other countriesunaffected. It is not the interests of the larger countries which are least servedby a restoration of monetary stability. A smaller country will usually find iteasier than a larger one to derive a stimulus from currency depreciation. Thesmaller country can often assume that prices on world markets will be littleaffected by an alteration in its own exchange rates and that the larger countrieswill not alter their commercial policy because of an added difficulty in whatmay be, for them, only a minor sector of their foreign trade. But suchan added difficulty is nevertheless real and, if several small countries wereto adopt the same course, the combined effect might be acutely felt by thelarger countries. They themselves have not the same possibility of derivingbenefits from exchange alterations, since world prices are often determinedby the quotations on their own markets; and, when great disparities arisebetween the price levels of the larger countries as a result of currencychanges, it will be difficult to avoid a restrictive twist to commercial policy.For a country with a leading position in economic and financial activities it isnatural to stress the advantages inherent in the principle of exchange stability,since a departure from this principle is likely to be at its own expense. Theaction taken by U.S. Congress in April 1943, when it decided not to prolongthe President's powers to alter the gold content of the dollar within the limitsof 60 and 50 per cent, of the old parity, was in many respects typical.
The maintenance of a fixed relationship between gold and the U.S. dollardoes not, of course, in itself constitute a sufficient safeguard against fluctu-ations in commodity prices. From 1914 to 1933 the gold content of the dollarremained unchanged, but American commodity prices (together with world-market prices on a gold basis) varied widely during these years, with reper-cussions on the price level in other countries and particularly in those whichkept their currencies in a fixed relation to the dollar (or to gold, which up to1933 amounted in practice to the same thing).
When one or other of the larger countries insists on the advantages ofexchange stability, it must not be forgotten that under a system of stable

- 60 -
exchanges the fortunes of the smaller countries will be linked most closelyto the developments within the larger units. Experience shows that a countrymay be driven to depreciation through its own fault, for instance by the pursuitof an unsound policy, resulting in an accumulation of budget deficits or anuntoward increase in production costs; it might also happen — though morerarely than is often supposed — that a country has resort to depreciationfor the purpose of gaining distinct commercial advantages. The great changesin currency values after 1929 were for the most part connected with the violentdecline, during the great depression, first in the prices of raw materials andthen in the level of other prices also. It was the countries with a one-sidedeconomic structure, dependent on the export of a few raw materials, that weremost acutely affected — and their currencies were the first to depreciate. Butmany other countries also were driven into a disequilibrium between costsand prices by the continued slump; the monetary changes during the 'thirtiescan, generally speaking, be regarded as a reaction against the unwanted pricedecline. Since fluctuations on the world markets mainly reflect the situationin the larger countries, the attainment of general exchange stability presupposesthat these countries are able to bring about relatively stable business condi-tions. It would, of course, be wrong to demand the impossible: there canbe no complete suppression of business fluctuations so long as economiclife continues to obey the laws of dynamic growth — and that they should doso must after all be the continued hope of mankind; the goal must rather beto smooth out the curve of the business cycle and, in particular, to avoidsuch violent price changes as those experienced during the unbridled inflationafter the last war and the devastating deflation after 1929.
2. FOREIGN TRADE.
Out of more than sixty countries which before the war published foreigntrade returns some two-thirds have successively suspended publication andthese two-thirds, as it happens, accounted for roughly two-thirds of theturnover of world trade in 1938. Among the great powers only the UnitedStates belongs to the remaining one-third, i. e. the countries which continueto publish — though often in a simplified form — regular returns of theirimports and exports. It is true that, in cases where publication of statisticshas been discontinued, speeches by cabinet ministers or high officials oftenshed some light on the trend of affairs. But the information thus obtainedis generally fragmentary in nature and difficult to piece together into asatisfactory picture. Such figures as are given, regularly or from time totime, must, moreover, be read with particular caution, since not only haveprices risen considerably and transport costs most spectacularly (thus tendingto give an inflated impression of the magnitude of trade under war conditions)but shipments of arms and similar products may or may not be includedin the published statistics. In any case, all the available material seemsto point to the fact that a general increase in value as expressed in current
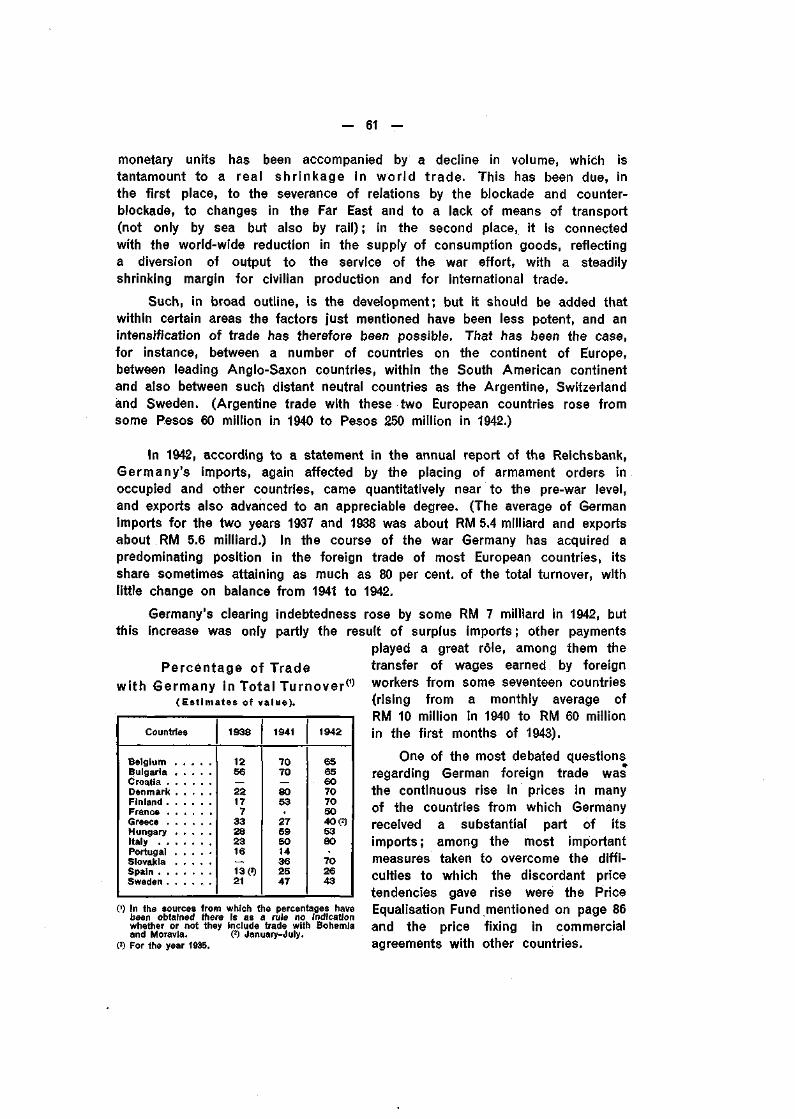
- 61 -
monetary units has been accompanied by a decline in volume, which istantamount to a real shrinkage in wor ld trade. This has been due, inthe first place, to the severance of relations by the blockade and counter-blockade, to changes in the Far East and to a lack of means of transport(not only by sea but also by rail) ; in the second place, it is connectedwith the world-wide reduction in the supply of consumption goods, reflectinga diversion of output to the service of the war effort, with a steadilyshrinking margin for civilian production and for international trade.
Such, in broad outline, is the development; but it should be added thatwithin certain areas the factors just mentioned have been less potent, and anintensification of trade has therefore been possible. That has been the case,for instance, between a number of countries on the continent of Europe,between leading Anglo-Saxon countries, within the South American continentand also between such distant neutral countries as the Argentine, Switzerlandand Sweden. (Argentine trade with these two European countries rose fromsome Pesos 60 million in 1940 to Pesos 250 million in 1942.)
In 1942, according to a statement in the annual report of the Reichsbank,Germany's imports, again affected by the placing of armament orders inoccupied and other countries, came quantitatively near to the pre-war level,and exports also advanced to an appreciable degree. (The average of Germanimports for the two years 1937 and 1938 was about RM 5.4 milliard and exportsabout RM 5.6 milliard.) In the course of the war Germany has acquired apredominating position in the foreign trade of most European countries, itsshare sometimes attaining as much as 80 per cent, of the total turnover, withlittle change on balance from 1941 to 1942.
Germany's clearing indebtedness rose by some RM 7 milliard in 1942, butthis increase was only partly the result of surplus imports; other payments
played a great rôle, among them thePercentage of Trade transfer of wages earned by foreign
wi th Germany in Total Tu rnove r 0 workers from some seventeen countries(Estimates of value). (rising from a monthly average of
RM 10 million in 1940 to RM 60 millionin the first months of 1943).
One of the most debated questionsregarding German foreign trade wasthe continuous rise in prices in manyof the countries from which Germanyreceived a substantial part of itsimports; among the most importantmeasures taken to overcome the diffi-culties to which the discordant pricetendencies gave rise were the Price
0) In the sources from which the percentages have Egalisation Fund mentioned On Dacie 86been obtained there is as a rule no indicationwhether or not they Include trade with Bohemia and the price fixing in Commercialand Moravia. (?) January-July. ^ a
(?) For the year 1935. agreements with other countries.
Countries
BulgariaCroatiaDenmarkFinland
GreeceHungaryItaly
Slovakia
Sweden . . . . . .
1938
1256
22177
33282316
13 m21
1941
7070
8053
27595014362547
1942
65656070705040 (?)5380
702643

- 62 -
Information available regarding Italy's foreign trade in 1942 gave anindication that this trade, although limited to Continental Europe, passed thepre-war level and showed an export surplus. In comparison with the pre-warperiod account must, of course, be taken of the increase in prices. Germany'sshare in Italy's foreign trade would seem to have risen to 80 per cent, in1942*. Since the greater part of the trade with Germany was subject to a pricestop, the general increase in prices probably played less of a rôle in Italy'sforeign sector; and it may thus be concluded that, in volume, foreign tradewas fairly well maintained in 1942. Moreover, the statistics published by anumber of other countries, such as Hungary, Bulgaria, Sweden, etc., revealthat Italy in 1942 ranked second after Germany in their foreign trade. Italianforeign trade took two main directions: f rom the nor th , besides thesupplies of Danish dairy products and of Swedish and Finnish pulp, Italyreceived (principally from Germany) coal, mineral ores and products of the ironand steel industries in exchange for foodstuffs and minerals (such as sulphur,bauxite, quicksilver, etc.), while with the east the exchange was mainly ofpetroleum, timber and oil-seeds against textiles and other finished products.In a trade agreement between Italy, Croatia and Hungary arrangements weremade for a settlement by triangular clearing, under which Italian surplusimports from Croatia would, up to a certain amount, be paid for via Hungary,against which country Italy had a clearing claim, while Hungary had an activebalance in relation to Croatia.
The swelling of the figures for the three countries in the table on the next page— the only ones in the Danubian basin which published trade statistics in 1942 —largely reflects the rise in prices which has occurred in this region in spite ofall the efforts of the price control. In Bulgaria (and the same applies toHungary) there has been further progress in transforming the composition offoreign trade to an increased export of goods of higher value and less bulk.Thus, Bulgaria's importance as a great cereal-exporting country has considerablydeclined. Bad harvests during the last three years, together with increaseddomestic requirements consequent upon enlargement of territory, have necessi-tated not only a drastic cut in exports but also a curtailment of home con-sumption. As sole exception, exports of rice to Roumania would seem tohave been kept at a high level in order to obtain, in exchange, essentialimports of petrol. On the other hand, there has been a continued increasein the exports of tobacco (notably from Greek territory recently attachedto Bulgaria), dried products, jams and fruit juices. The prices of severalBulgarian products — especially tobacco — rose during 1942 above the limitsfixed in various trade agreements. Fresh efforts were made from time totime to adhere more closely to the price relations agreed upon, but it wasfound that strict price fixing in the foreign sector tended to make producersand traders more interested in supplies for the home market, with a consequentneglect of the export trade.
* The n u m b e r of Italian export transactions with Germany in 1942 was only 50 per cent, of the total as shown by thestatistics given in Chapter IV ; but this percentage applies to Italian exports only and it is probable that theaverage value of Italian export transactions with Germany was greater than that with other countries.

- 63 -
In millions ofnational currency
units
Bulgaria :193819411942
Hungary:193819411942
Slovakia:19411942
1 m ports
4,93410,23912,979
411730923
3,4913,900
Exports
5,5799,234
13,418
522791
1,144
3,1823,300
Balance
+ 645—1,005+ 439
+ 111+ 61+ 221
— 309— 600
Foreign Trade In Hungary too, in spite ofof Hungary, Bulgaria and Slovakia, price-stop agreements, export prices
were allowed to rise, but not tothe full extent of domestic priceincreases. Hungary no longer pub-lished details of the distributionof its foreign trade among differentgroups of commodities, but it isknown that the export of manu-factured articles continued to ad-vance at the expense of farm pro-ducts, which up to a few yearsago represented over one-half oftotal exports. Wheat, which was still
the leading export commodity before the war, has lost its old pre-eminence,while tinned fruit and vegetables have gained in importance. In view of thedecline in imports of raw materials and semi-manufactured products, effortshave been made to promote the importation of ready-made articles.
In 1942 Slovakia increased its imports more than its exports, doublingthe import surplus from Ks. 309 to 600 million. But the clearing claim onforeign countries still increased, mainly as a result of remittances from Slovakworkers in Germany, expenditure by Germans evacuated into Slovakia fromparts of the Reich subjected to aerial bombardment, and revenue from transittraffic — all active items in Slovakia's balance of payments. Dealing withSlovakia's balance of payments in 1941, the Governor of the National Bankstated that income from abroad (including Ks. 3,180 million in respect of goodsexported) amounted to Ks. 5,568 million and that payments abroad (includingpayments for imports of Ks. 3,490 million) amounted to Ks. 4,810 million, thusleaving an active balance of over Ks. 750 million. In order to tighten thecontrol of prices in the foreign sector, a special department was establishedin the Ministry of Commerce in the spring of 1943. This department wasentrusted with the task of examining whether the prices agreed upon betweenSlovak nationals and foreign firms corresponded to those fixed by the com-petent authorities in the respective countries.
In the years immediately before the war Continental Europe suppliedabout 80 per cent, of the imports and absorbed about 75 per cent, of theexports of Roumania. 60 to 70 per cent, of the exports consisted of cereals,petroleum and petroleum products; the balance of trade was active to theextent of several milliard lei a year. After the outbreak of hostilities the shareof Continental Europe rose to 100 per cent., exports of cereals falling as aresult of the loss of territory, bad harvests and shortage of manpower, whileIn value, if not in volume, exports of oil increased considerably. The onlyofficial indication concerning the country's foreign trade in 1942 has beenfurnished by the annual report of the National Bank, in which it was statedthat the export surplus was again very large and that oil, wheat, cattle andother foodstuffs constituted the main export items.

- 64 -
During the ten years up to 1940 Roumania's oil production amounted tojust over 3 per cent, of the world output but, according to the publishedstatistics, production declined from a peak of 8.7 million tons in 1936 to5.5 million tons in 1941, being in the latter year only 1.8 per cent, of worldproduction. Roumania exports, however, as much as 70 per cent, of its output,ranking fifth among the oil-exporting countries of the world, after Venezuela,the United States, Iran and the Dutch Indies. (In 1939 the country's oilexports covered 1.6 per cent, of world consumption and 6.5 per cent, ofEuropean consumption.) By the end of 1942 the export price for crude oilhad risen 400 per cent, and for oil products 500 to 600 per cent, above thepre-war level.
No statistics are available for Bohemia and Moravia, A lban ia andSerbia, but for Croat ia figures have been published for the year ended30th September 1942, showing an import surplus of about Kunas 1,500 million,mostly in respect of the two major trading partners, Germany and Italy. Onthe clearing account with these countries, Croatia has, however, an activebalance, due to such items as transit traffic and remittances from workers inGermany.
For the first seven months of 1942 Greek imports are reported to havetotalled Dr. 4,700 million and exports Dr. 2,100 million, but these figures are oflittle significance owing to the peculiar conditions of the country's foreigncommerce. In normal times Greek exports usually covered about two-thirdsof imports, the passive trade balance and other current payments being metby a number of active items, such as emigrants' remittances, shipping revenue,tourist traffic, etc. During 1941, however, these sources of revenue dried up;at the same time the rise in Greek prices made it impossible to export at theofficial rates of exchange. In order to overcome the consequent deadlock,the occupying authorities imposed a strict control over foreign trade by meansof two special monopoly companies (the "Degriges"(1) for German-Greek relationsand the "Sacig"(2)for Italian-Greek relations) whose function it was to fix pricesof goods entering foreign trade and also to determine the use to be made ofimported commodities. A Price Equalisation Fund was authorised to raise theselling prices for imported goods and to collect the difference between theseprices and the amount of the invoice in Reichsmarks or lire converted at theofficial rate of exchange, part of the said difference being available for thelowering of Greek export prices so that the export trade could still be continuedto some extent. Early in the year, moreover, an agreement was signed betweenItaly and Greece whereby the Italian Treasury advanced Lit. 100 million for thetaking-over of all Italian claims in the Italo-Greek clearing account, the advanceto be redeemed gradually by charges on a new account opened on 1st January1943. This arrangement benefited other foreign creditors of Greece also,especially Hungarian and Roumanian exporters, who, for want of a directclearing between their own countries and Greece, in many cases settled theirexport claims via the Italo-Greek account.
0) Deutsch-Griechische Waren-Ausgleichs-Gesellschaft. (2) S. A. Commerciale Italo-Greca.

- 65 -
Regular returns of foreign trade are not published for France but, withthe aid of the customs statistics, the information about the Treasury's advancesagainst clearing accounts and various other data, it has been possible tocompile certain general figures of imports and exports.*
French Imports 1938 and 1942.
Imports
Value :
Weight:FoodstuffsIndustrial materials . . .Finished products....
Total . . .
1938 1942
In milliards of Fr.fcs46.0 25.8
in thousands of tons5,846
39,6631,645
47,154
1,5985,404
5147,516
Percent-age
decline
— 44
— 73— 86— 69— 84
From 1938 to 1942 the shrink-age in the weight of importswas much more pronouncedthan the decrease in value, onereason for this disparity beingthe considerable rise in importprices and another the particu-larly sharp fall in the heavyitems among industrial materials.But, even if allowance is madefor the shift to foodstuffs andfinished products at the ex-
pense of materials, the fact remains that French imports in 1942 sank to thelowest level for well over a century.
It is more difficult to obtain correct figures for the export trade becauseit is often impossible to separate commercial transactions from other deliveries,such as those made under the provisions of the armistice convention. It has,however, been estimated that the value of France's foreign trade turnoverin 1942 was close to the figure for 1938, i.e. Fr.fcs 76.5 milliard. If this esti-mate is accepted, it may be concluded that French exports in 1942 werein the neighbourhood of Fr.fcs 50 milliard. This gives an export surplus
of about Fr.fcs 25 mil-liard. The increase during1942 in the Treasury'sadvances to the Franco-German clearing wasFr.fcs 33 milliard, buta part of this amountcorresponds to pay-ments of a non-com-mercial character (forinstance, remittancesfrom French workers inGermany). The changedgeographical distribu-tion of French foreigntrade is shown by thefirst table on the follow-ing page.
France: Foreign Trade and Custom Receipts.
Foreign Trade15000
Monthly, in millions of Fr.fcs.
12500
10000
7500
5000
2500
llnllllll Miniili Illlll 111••1111111111 111111111111111 r 11 111 111111 1111 ?
Customs1500
1250
1000
750
500
250
1937 1938 1939 M0 19*1 .. 1942 19«
* See an article by Albert Algoud In the "Revue de l'Economie Contemporaine" for April 1943 on "Le Com-merce Extérieur de la France depuis l'Armistice".
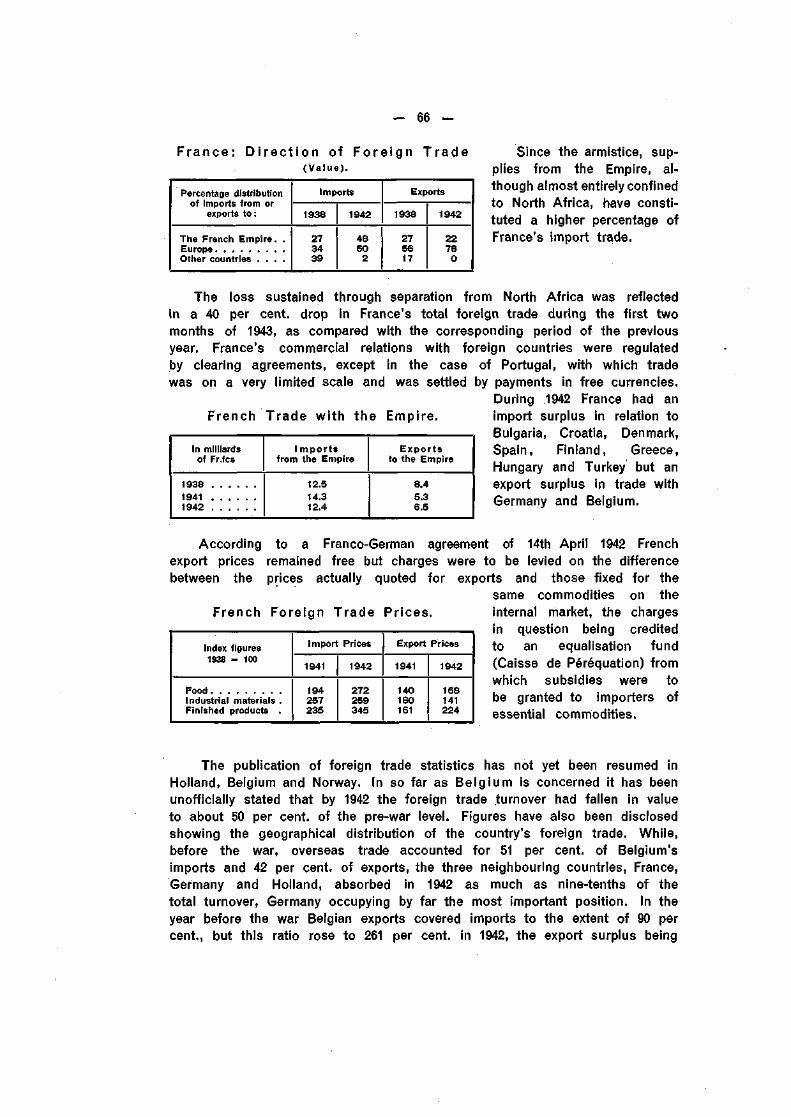
- 66 -
F r a n c e : D i r e c t i o n of F o r e i g n T r a d e(Value).
Percentage distributionof imports from or
exports to :
The French Empire . .
Other countries . . . .
Imports
1938
273439
1942
48502
Exports
1938
275617
1942
22780
Since the armistice, sup-plies from the Empire, al-though almost entirely confinedto North Africa, have consti-tuted a higher percentage ofFrance's import trade.
The loss sustained through separation from North Africa was reflectedin a 40 per cent, drop in France's total foreign trade during the first twomonths of 1943, as compared with the corresponding period of the previousyear. France's commercial relations with foreign countries were regulatedby clearing agreements, except in the case of Portugal, with which tradewas on a very limited scale and was settled by payments in free currencies.
During 1942 France had anFrench Trade wi th the Empire. import surplus in relation to
Bulgaria, Croatia, Denmark,Spain, Finland, Greece,Hungary and Turkey but anexport surplus in trade withGermany and Belgium.
According to a Franco-German agreement of 14th April 1942 Frenchexport prices remained free but charges were to be levied on the differencebetween the prices actually quoted for exports and those fixed for the
same commodities on theFrench Foreign Trade Prices. internal market, the charges
in question being creditedto an equalisation fund(Caisse de Péréquation) fromwhich subsidies were tobe granted to importers ofessential commodities.
In milliardsof Fr.fcs
193819411942
1 mportsfrom the Empire
12.514.312.4
Exportsto the Empire
8.45.36.5
Index figures1938 = 100
Food .Industrial materials .Finished products .
Import Prices
1941
194257235
1942
272259345
Export Prices
1941
140180161
1942
168141224
The publication of foreign trade statistics has not yet been resumed inHolland, Belgium and Norway. In so far as Belgium is concerned it has beenunofficially stated that by 1942 the foreign trade turnover had fallen in valueto about 50 per cent, of the pre-war level. Figures have also been disclosedshowing the geographical distribution of the country's foreign trade. While,before the war, overseas trade accounted for 51 per cent, of Belgium'simports and 42 per cent, of exports, the three neighbouring countries, France,Germany and Holland, absorbed in 1942 as much as nine-tenths of thetotal turnover, Germany occupying by far the most important position. In theyear before the war Belgian exports covered imports to the extent of 90 percent., but this ratio rose to 261 per cent, in 1942, the export surplus being

— 67
for the most part accumulated in Berlin in theBelgian trade with all countries in Continental
Be lg ium: Direct ion of(Value)
Percentage distributionof imports from or
exports to:
GermanyFranceHollandAll other countries* .
Foreign
Imports
1938
11149
66
1941
66111211
1942
56219
14
Trade
Exports
1938
12151261
1941
7210135
1942
781345
form of clearing claims.Europe, except Spain,Portugal and Turkey,was regulated by clearingagreements but, in viewof the large proportionabsorbed by Germany,France and Holland,very little margin wasleft for commercial re-lations with other coun-tries.
* In 1938 overseas countries were shown separately and represented 51 percent, of imports and 42 per cent, of exports.
In spite of the wartime increases in prices, Denmark's foreign tradeturnover fell in value by 30 per cent, between 1938 and 1942; in volume thefall was to one-third of the pre-war figure. Shortage of fodder has necessitatedwholesale slaughterings, reducing the output and export of eggs, butter andmilk. There have, however, been increased deliveries of industrial goods toGermany, the raw materials and semi-manufactured products being furnished
by that country. Never-
Foreign Trade of Denmark, Finland and Sweden, theless, Germany's sharein Danish foreign tradefell from 80 to 70 percent, during the year.It is calculated that in1942 Swedish deliveriesto Denmark as counter-part for Danish exportsof foodstuffs to Finlandamounted to aboutKr. 40 million, and furtherarrangements for suchdeliveries have been con-cluded for 1943.
In volume, Finnish exports were reduced by about two-ihirds and importsby about one-half between 1938 and 1942. In value, exports likewise decreasedduring the same period while imports rose; there was thus a high importsurplus, which, nevertheless, slightly declined in 1942 (the statistics includecivilian goods imported for the army but not imports of war materials). Onlya part of the import surplus, however, constitutes a net charge in the balanceof payments; in Finland, as in most other countries, export values are countedf. o.b. and import values c. i. f. and, since about two-thirds of the foreigntrade is carried by Finnish ships, the import surplus is to a large extent offsetby income from shipping and from Finnish insurance companies. It may bementioned that in 1942 Finnish clearing indebtedness doubled, from FM 1,500 mil-lion to FM 3,000 million.
In millions of nationalcurrency units
Denmark: D.Kr.193819411942
Finland: FM1938 .19411942
Sweden: S. Kr.193819411942
Imports
1,6251,3111,210
8,60710,20111,724
2,0821,6741,770
Exports
1,5351,2781,053
8,3984,3225,989
1,8431,3451,313
Balance
— 90— 33— 157
— 209— 5,879— 5,735
— 239— 329— 457

- 68 -
Before the war Finland supplied about 85 per cent, of its own require-ments of foodstuffs, importing cheap raw materials from overseas and finishedgoods from all over the world, while forestry products accounted for aboutfour-fifths of the country's exports. During the war domestic production offoodstuffs has been hampered by mobilisation, shortage of fertilisers and, in 1940
and 1941, by exceptionallyF in land: Di rect ion of Foreign Trade
(Value).
Percentage distributionof imports fromand exports to :
Great Britain . . . .United States....GermanyItaly . . . . . . . .Sweden . . . . . . .DenmarkOther countries . . .
Imports
1938
229
201
135
30
1941
_*532
187
20
1942
*723889
Exports
1938
449
15253
22
1941
_#5466
1024
1942
*6454
1215
* Included In other countries.
unfavourable weather con-ditions. In 1942 the harvestwas somewhat better anddomestic supplies werefurther improved by in-creased imports fromGermany and credits fromSweden, availableforfoodpurchases in Denmark.The changes in the geo-graphical distribution ofthe country's foreign tradeare shown in the table.
In Sweden import prices in December 1942 were 165 per cent, and exportprices 77 per cent, above the pre-war level, but here too import prices (quotedc. i.f.) have been swollen by high transportation costs, the index of shippingfreights in the Baltic showing a rise of fully 200 per cent, between August1939 and 1942.
A leading official in the Swedish Foreign Office, charged with commercialnegotiations, wrote in the autumn of 1942 that "the most difficult foreign tradequestions are the price questions", special attention being devoted to the taskof checking the advance in import prices. While, for instance, in earlieragreements with Germany the price stop applied only to the more importantcommodities, it was gradually extended to encompass more and more goodsuntil it covered almost 90 per cent, of the commercial exchanges between
Germany and Sweden.Sweden: Di rect ion of Foreign Trade After prolonged negotia-
( V a l u e ) - tions it became possiblein the spring of 1941 toresume trade with certainoverseas countries, parti-cularly in South America,ships provided withGerman "Geleitscheine"and Anglo-Saxon" navi-certs" being able to enterand leave Gothenburg.
Thanks partly to higher imports from overseas countries, the importsurplus increased from S. Kr. 329 million in 1941 to S. Kr. 457 million in 1942.
Percentage distributionof imports fromand exports to:
Northern countries* .Other countries of
Continental EuropeOverseas countries . .
Imports
1938
2410
2442
1941
528
2218
1942
467
2522
Exports
1938
1816
2145
1941
4124
2312
1942
4020
2812
Norway, Denmark and Finland.

- 69 -
Index: 1936-38 = 100
19381939 . . . . . . ; .19401941 . . . . . . . .1942
Imports
103122744948
Exports
93102555041
Volume There was, however, a further fall in theof Sweden's Foreign Trade, aggregate volume of Swedish trade, the total
turnover in 1942 being about 45 per cent, ofthe pre-war figure.
There was a further contraction in theforeign trade of Switzer land in 1942. Mea-sured by 10-ton railway trucks, the weightof the country's imports fell by 10 per cent.
in comparison with the previous year, registering a total reduction of 40 percent, below the pre-war level. For exports, the corresponding reductionswere 20 and 35 per cent. In value, both imports and exports showed higherfigures than before the war, import prices in 1942 being 116 per cent, andexport prices 61 per cent, above the pre-war level. The high import pricesare partly due to heavy transportation costs; before the war, freightpayments to foreign shipowners amounted to Sw.fcs 40-50 million a year; for1942 these payments are estimated to have been well over Sw.fcs 100 million,although Switzerland has acquired a mercantile marine of its own, with atonnage of 58,600 and with Genoa, Barcelona and Lisbon as its principal portsof call in Europe. While in 1914-18 prices of raw materials rose more andfoodstuffs less than the general index figure, foodstuffs have risen most inprice this time — an increase which is the more felt since the domestic output(even with the increased cultivation achieved during the war) covers less than40 per cent, of the country's food requirements. But, even if high prices havebeen paid for foreign goods and for their transportation, essential supplies havebeen procured. While in the years 1915-17 the traditional Swiss import surpluspractically disappeared (in 1916 there was even an export surplus), the surplusof imports in this war has been actually above the pre-war rate. Difficultnegotiations have been undertaken with the belligerents on both sides. Forseveral months in 1943 payments in relation to Germany and some of theoccupied territories were no longer governed by commercial agreements but weresubject to autonomous regulation by the clearing offices in Berlin and Zurich.
With Italy a new quota andForeign Trade clearing agreement was signed
of Swi tzer land, P o r t u g a l a n d Spain. in November 1942, containing,inter alia, a so-called "securityclause", under which Switzer-land was authorised to reduceits exports to Italy if Swissexporters were called upon towait more than four monthsfor their payments through theclearing; on the other hand,Switzerland undertook to in-crease its expprt quotas shouldthe waiting period becomeless than four months.
In millions of nationalcurrency units
Switzerland: Sw.fcs193819411942 . . .
Portugal: Esc.1938 . . .1941 .1942
Spain: gold pesetas1935 . . . . . . . . . .19411942
Imports
1,6072,0242,049
2,3062,6432,457
879550610
Exports
1,3171,4631,572
1,1462,8963,898
588521631
Balance
— 290— 561— 477
— 1,160+ 253+ 1,441
— 291— 29+ 21

- 70 —
A striking feature in Portugal 's foreign trade during 1942 was the un-precedented export surplus, amounting to Esc. 1,441 million, as compared withEsc. 253 million in the previous year and an unfailing import surplus in. thedecade up to 1940. Moreover, the total transit trade reached a peak figureof Esc. 2,511 million in 1942, as compared with Esc. 412 million in 1938.Portugal, indeed, continued to benefit from its geographical position and alsofrom certain features of its national production. Before the war farm andforest products furnished about two-thirds of total exports, minerals and metalscontributing only 7 per cent., while the import surplus was met by such activeitems as Income from foreign investments and emigrants' remittances. By1942 the share of minerals had jumped to 40 per cent, of total exports, owingchiefly to the spectacular rise in the price of tungsten to 30 times the pre-warfigure. On the other hand, difficulties were experienced in maintaining thevolume of imports, which was distinctly smaller in 1942 than in the previousyear. An agreement with Spain, concluded early in 1943, provided for aconsiderable increase in the exchanges between the two countries. About one-third of the total transit trade in 1941 was with Switzerland, and in the sameyear Portugal had with that country an export surplus of about Esc. 400 mil-lion instead of the small import surplus registered in the three years up to 1940.
Foreign Trade of Portugal and Spain(Volume).
In thousandsof. tons
PortugalSpain
1935
2,48811,440
1938
3,924
1941
2,5054,066
1942
1,9453,552
In weight, the total foreigntrade turnover of Portugal fell byone-half from 1938 to 1942. InSpain the shrinkage was evengreater—to one-third of the weightin 1935, before the civil war began.
The value figures in the foreign trade statistics of Spain are givenin gold pesetas, and these show a reduction in the total turnover by about15 per cent, between 1935 and 1942. By 1942 Spanish export prices hadrisen by 184 per cent, above the 1935 level, while import prices stoodat 66 per cent, above that level. Thanks mainly to favourable prices forSpanish products, an export surplus of 21 million gold pesetas was attainedin 1942, as compared with an import surplus of 29 million gold pesetas in theprevious year and 292 million gold pesetas in 1935. Of Spain's foreign trade,
about 500 million gold pesetasS p a i n : out of a total of 1,241 million
D i r e c t i o n of Fo re ign Trade in 1942 g o | d p e s e t a s w a s t h e s h a r e o f
Continental Europe, Germanyoccupying the first place withdeliveries to Spain for 117 mil-lion gold pesetas and purchasesfor 137 million gold pesetas, ascompared with 51 million and162 million respectively in theprevious year.
(Value).
Trade partner
AM countries . . . .of which:
Germany . . . .United KingdomItaly. . . . . . .Switzerland . . .United States . .
Spanish imports Spanish exports
in millions of gold pesetas610
11730242316
631
13772484424

— 71 —
On the other hand, the importance of Latin America has declinedsomewhat: the combined imports from the Argentine, Brazil, Chile, Cuba andMexico amounted to 114 million gold pesetas in 1942, as compared with151 million gold pesetas in the previous year, while exports to these countriestotalled only 15 million gold pesetas — the same figure for the two years.
Of the neutral countries on the continent of Europe, Turkey is the onlyone which (since April 1941) has suspended the publication of its foreigntrade returns. Like Portugal, Turkey has benefited from its geographicalposition and from the production within its borders of a mineral of a highstrategic value (in the world production of chromium Turkey ranked first in1938 with a share of about one-fifth). While maintaining with the continent ofEurope a trade which, apart from armament deliveries, was expected to exceed£T 100 million in 1943, Turkey has been able to develop its commercial relationswith the Anglo-Saxon countries, being also a beneficiary of lend-lease facilities.The total turnover with these countries was valued for 1942 at £T 130 million,the bulk of which passed through the United Kingdom Commercial Corporation.The trend of Turkish foreign trade in the course of the war is reflected in asubstantial increase in the monetary reserves.
According to American statistics the U. S. S. R. received lend-leasedeliveries from the United States in 1942 for an amount of $1,314 million, whileother (cash) exports to the U. S. S. R. were given as $65 million and importsfrom the U. S. S. R. as $25 million. This means that ordinary trade is at a verylow level, as indeed it was already before the war. During the second Five-Year Plan (1933-37) the foreign trade of the U. S. S. R. represented about1 per cent, of total world trade, having been 2 to 2% per cent, in the early'thirties (the high-water mark after 1917), while before 1914 Russia's foreigntrade accounted for about 4 per cent, of world trade. It may also be mentionedthat the percentage of exports in proportion to Russian production is reportedto have fallen from 3.5 per cent, in 1930 to less than 1 per cent, in 1936 —another measure of Soviet Russia's progressive withdrawal at that time fromthe sphere of international trade.
Trade between the Br i t ish Islesand the United States.
In millions of dollars
U. S. exports:Lend-lease deliveries . .Other (cash) exports * . .
Total . . .U.S. imports* . . . . .
1938
—548548119
1941
5721,0701,642
139
1942
1,867495
2,362135
' Including Eire; separate trade statistics have not beenmade available for 1942. In 1938 U.S. exports to the UnitedKingdom alone amounted to $521 million and importsfrom the United Kingdom to $118 million.
In no country has the banon the publication of foreigntrade statistics been more strictlyobserved than in the UnitedKingdom. The only informationfurnished by the British authoritieswould seem to have been astatement in April 1943 by theChancellor of the Exchequer to theeffect that "recently the volumeof exports available to be soldabroad had fairen to about a
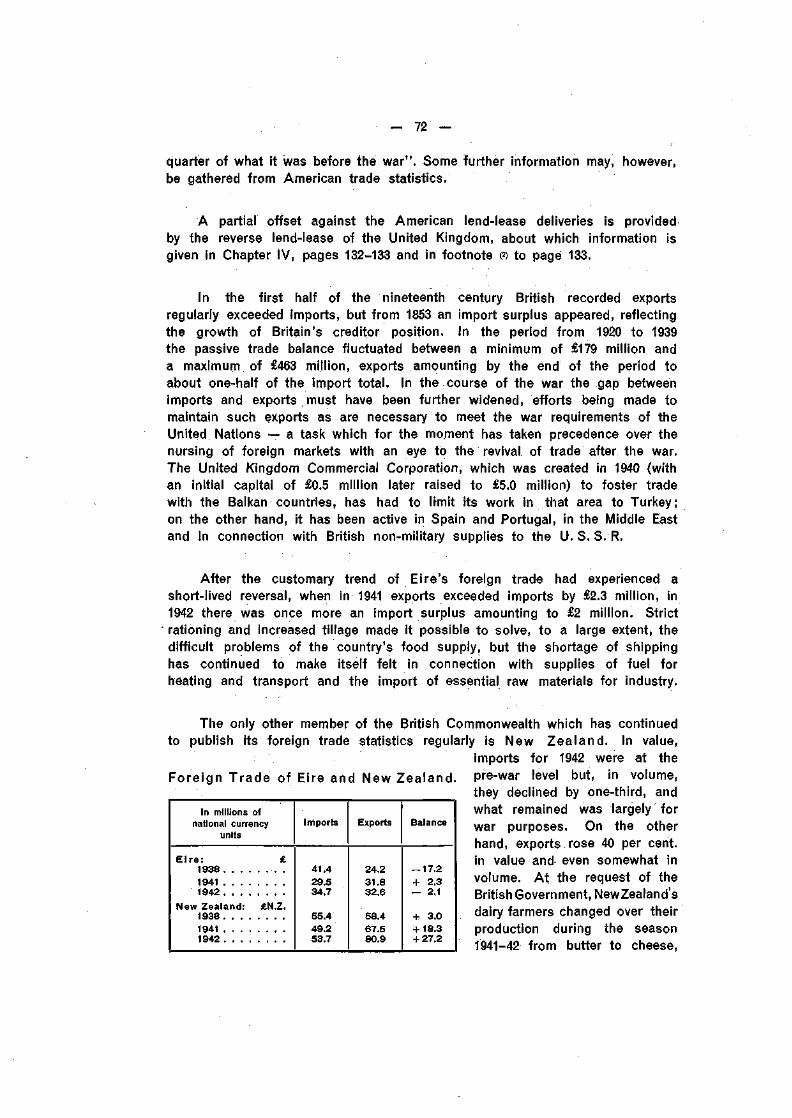
- 72 —
quarter of what it was before the war". Some further information may, however,be gathered from American trade statistics.
A partial offset against the American lend-lease deliveries is providedby the reverse lend-lease of the United Kingdom, about which information isgiven in Chapter IV, pages 132-133 and in footnote (2) to page 133.
In the first half of the nineteenth century British recorded exportsregularly exceeded imports, but from 1853 an import surplus appeared, reflectingthe growth of Britain's creditor position. In the period from 1920 to 1939the passive trade balance fluctuated between a minimum of £179 million anda maximum of £463 million, exports amounting by the end of the period toabout one-half of the import total. In the course of the war the gap betweenimports and exports must have been further widened, efforts being made tomaintain such exports as are necessary to meet the war requirements of theUnited Nations — a task which for the moment has taken precedence over thenursing of foreign markets with an eye to the revival of trade after the war.The United Kingdom Commercial Corporation, which was created in 1940 (withan initial capital of £0.5 million later raised to £5.0 million) to foster tradewith the Balkan countries, has had to limit its work in that area to Turkey;on the other hand, it has been active in Spain and Portugal, in the Middle Eastand in connection with British non-military supplies to the U. S. S. R.
After the customary trend of Eire's foreign trade had experienced ashort-lived reversal, when in 1941 exports exceeded imports by £2.3 million, in1942 there was once more an import surplus amounting to £2 million. Strictrationing and increased tillage made it possible to solve, to a large extent, thedifficult problems of the country's food supply, but the shortage of shippinghas continued to make itself felt in connection with supplies of fuel forheating and transport and the import of essential raw materials for industry.
The only other member of the British Commonwealth which has continuedto publish its foreign trade statistics regularly is New Zealand. In value,
imports for 1942 were at theForeign Trade of Eire and New Zealand, pre-war level but, in volume,
they declined by one-third, andwhat remained was largely forwar purposes. On the otherhand, exports rose 40 per cent,in value and even somewhat involume. At the request of theBritish Government, New Zealand'sdairy farmers changed over theirproduction during the season1941-42 from butter to cheese,
In millions ofnational currency
units
Eire: £193819411942
New Zealand: £N.Z.193819411942 . . . . . . . .
Imports
41.429.534.7
55.449.253.7
Exports
24.231.832.6
58.467.580.9
Balance
— 17.2+ 2.3— 2,1
+ 3.0+ 18.3+ 27.2

- 73 -
switching back to butter when British requirements altered. Up to the end of1942 New Zealand and Aus t ra l ia together received from the United States lend-lease deliveries valued at $289 million and both rendered lend-lease in reverse,including food for the troops, construction of hospital camps, warehouses, etc.for the use of American forces. The New Zealand Government has estimatedthe cost of the reciprocal aid to the U.S. forces at about $50 million up toJune 1943 and the Australian Government put the cost at nearly $200 millionfor the same period. In 1942 Australia provided most of the food for theAmerican forces in the south and south-west Pacific.
The policy of restriction introduced by South A f r i ca in September 1941(by which imports from non-sterling-area countries were made conditionalupon a government permit) together with increased shipping difficulties led toa reduction in imports from £SA 101 million in 1941 to £SA 84 million in 1942.Exports also appear to have declined, a shift being noticeable from agriculturalproducts to increased exports of minerals (other than gold). For India noforeign trade figures are available but it may be mentioned that the United Stateslend-lease deliveries up to the end of 1942 amounted to $295 million, beingon the same scale as those furnished in the same period to Australia andNew Zealand together; reverse lend-lease from India was estimated onAmerican data to be about $57 million up to June 1943.
The necessity of increasing the home production of foodstuffs led theEgyptian Government to reduce the area of cotton, and the crop in 1943was estimated at less than half the peacetime average. Before the warthree-quarters of Egypt's exports consisted of cotton fibre. From the begin-
ning of the war exports de-Egypt 's Foreign Trade. dined steadily, while imports,
including lend-lease, rose sharplyin 1942, the resulting importsurplus being offset, it wouldseem, also by the outlay ofallied forces stationed in thecountry.
The publication of foreign trade returns for Canada was discontinuedin April 1942 but it has been officially stated that exports in 1942 amountedto Can.$ 2,385 million, as compared with Can.$ 1,641 million in the previous year.
The bulk of CanadianCanada's Foreign T rade ; exports consisted of war
September 1939-ApMi 1942. deliveries, Canada rank-ing third among theUnited Nations as anexporter of war equip-ment. The accompanyingtable, covering the firstthirty-two months of
1 Including net non-monetary gold. the war, for which trade
In millions of£E
Imports. . . . . .Exports
1938
3729
— 8
1939
3434
0
1940
3128
— 3
1941
3322
— 11
1942
5519
— 36
. In millions ofCan. dollars
Imports
Balance . . .
U.S.A.
2,3871,361
— 1,026
BritishEmpire
6782,233
+ 1,555
Othercountries
151770
+ 619
Total
3,2164,364
+ 1,148

- 74 -
statistics are available, shows that the import surplus in relation to the UnitedStates was more than outweighed by the export surplus in relation tocountries of the British Empire.
The foreign trade of the United States was influenced in 1942 by threemain factors: a steep increase in lend-lease exports, concentration of avail-
able tonnage on shipmentsForeign Trade of the United States. essential for the war effort;
and loss of trade with theFar East. Nevertheless, asstressed by the U. S. Com-merce Department, exporttrade was "maintained ata surprisingly high levelin spite of mounting ob-stacles to international com-merce".
In value, total exports (including lend-lease but excluding shipmentsto the armed forces overseas) were 50 per cent, greater in 1942 than inthe previous year, reaching a total of $7,826 million, a higher figure than inthe years 1917-18, although below the record of $8,228 million reached in1920 (when, however, prices stood at a higher level). Still, exports in 1942did not constitute more than 5 per cent, of U.S. gross national income.Lend-lease shipments at a rate of $4,668 million were responsible for60 per cent, of total exports and were equal to 92 per cent, of the year'sexport surplus, amounting to $5,083 million. The excess of cash exportsover cash imports was $415 million.
In millions of dollars
Exports
Cash exports
Total importsBalance . . .
Balance between cashexports and cash imports .
1938
3,0943,0941,960
+ 1,134
+ 1,134
1941
7414,4065,1473,345
+ 1,802
+ 1,061
1942
4,6683,1587,8262,743
+ 5,083
+ 415
United States: Lend-Lease and Cash Exports.Monthly, in millions of dollars.
1200 i • 1 1 11200
1000 1000
800
600
400
200
1941 1942 1943
Total imports fell by$602 million from 1941 to1942; the reductions causedby the acute shipping short-age and the loss of majorsources of supply in theFar East were only partiallyoffset by larger importsfrom the British Empire,especially Canada. Emphasishas been laid more and moreon the maintenance of im-ports essential for the war,typical commodities beinggraphite, industrial diamonds,jute, mica splittings, beryl-lium, tungsten and bauxite.

- 75 -
Un i t ed S t a t e s : D i r e c t i o n of Foreign Trade.
In millionsof dollars
United Kingdomand Eire . . . .
Canada 0)U.S.S.RLatin America . .Asia and Oceania?)Rest of the world .
Total
Imports
1938
11926824
485557507
1,960
1941
13957530
1,0861,199
3163,345
1942
13573525
1,022520306
2,743
Exports
1938
54847670
564575861
3,094
1941
1,6421,019
1081,035
719624
5,147
1942
2,3621,3671,379
836880
1,0027,826
Balance
1938
+ 429+ 208+ 46+ 79+ 18+ 354+ 1,134
1941
+ 1,503+ 444+ 78— 51— 480+ 308+ 1,802
1942
+ 2,227+ 632+ 1,354— 186+ 360+ 696+ 5,083
(1) Including Newfoundland, Labrador, St-Pierre and Miquelon, Greenland and Iceland.(?) Including the Far East, India, Australia and New Zealand, but excluding the Near East.
Of total exports in 1942, 68 per cent, were sent to the British Empire(including large consignments to Egypt for the British armed forces stationedthere) and 18 per cent, to the U. S. S. R., which suddenly rose to second placein the list of countries receiving American exports.
Latin America is the only area withthe trade of the United States fell more
Foreign Trade of U. S. A.Monthly, In millions of dollars.
120011001000900800700600500400300200100
MIMIIIIM
. A
ihilrlii
V\ A,,
iilnliilii
A
hlhl
E
1
iilnlnlii
xportsi
l
Dports
ilHhilll Ml
----
:
-•
i. [. i r 17
120011001000900800700600500400300200100
1936 1937 1938 1939 1940 1941 19*2 1943
1936 1937 1938 1939 1940 1941 1943
which trade declined. Exports inthan imports, leaving an import
surplus of .$186 million — al-most four times as large asin 1941. The foreign trade ofthe United States has graduallybeen subjected to more effect-ive control in order to ensureas far as possible that exportsto friendly countries are re-stricted to goods necessaryto maintain their war economyand essential domestic struc-ture and to commodities whichhave to be supplied in ex-change for strategic materials.On these lines an agreementwas concluded between theUnited States and Canada,providing for a coordinationof the two countries' exports toLatin America as from 1st July1943. Earlier in the year, undera new control plan aiming atdecentralisation, special officeshad been set up in the variousLatin American countries toexamine demands for importsfrom the United States.

— 76 —
In 1938 South Amer ica as a whole drew about one-half of its importsfrom Europe and shipped to that continent a proportion of its exports risingfrom one-third for some of the northern and western countries to three-quarters for the basin of the River Plate. Most European countries boughtfrom South America more than they sold there. It was largely with its surplusexports to Europe that South America paid for its surplus imports from theUnited States. The interchange of goods between the South Americancountries was of little importance. In 1938 only 6 per cent, of the exports ofSouth American republics went to and 9% per cent, of their imports came from'Latin American countries.
As a result of the war, trade with Continental Europe has declined to avery low level, Portugal, Spain, Sweden and Switzerland being the only customerswith which a certain amount of trade has still been carried on. The share ofthe United Kingdom has also fallen, it being particularly difficult for the Britishto maintain the volume of their exports to the South American countries. Onthe other hand, the share of the United States has risen and trade betweenSouth American countries has also gained in importance. For the United Statesand Canada, South America has become an important source of supply forsome greatly needed raw materials no longer available from the Far East orother blocked areas. Although the volume of trade was affected by lack ofshipping and the concentration of North American production on the wareffort, with a consequent dearth of finished articles and machinery for export,the decline in volume in 1942 was offset by higher prices and by sale agree-ments with the United States.
Foreign Trade of Latin Amer ican
Countries
Argentina . . . . . .BrazilChileColombiaCosta Rica
Dominican RepublicEcuadorHaitiMexicoPanamaParaguayPeruSalvadorUruguay
In millions of
Pesos pap.CruzeirosPesos orrPesos .ColonesPesos .U.S.$ .Sucres .GourdesPesos .Balboas$ m/n .Soles .ColonesU.S.$ .
Imports
1941
1,2775,514
52517010013412
15038
9153312
3582163
1942
1,2744,644
62210569
14512
20041
7533717
3392164
Countr ies.
Exports
1941
1,6406,729
76817657
21216
20042
7304
154942871
1942
1,9767,495
86319259
18220
29941
9922
164954558
Balance
1941
+ 363+ 1,215+ 243+ 6— 43+ 78+ 4+ 50+ 4— 185— 29+ 3+ 136+ 7+ 8
1942
+ 702+ 2,851+ 241+ 87— 10— 37+ 8+ , 99+ 0+ 239— 35— 1+ 156+ 24— 6
The above table shows that in 1942, with few exceptions, imports intoLatin American countries either fell in value or kept about level with the previousyear, while exports as a rule rose in value. The result was in most cases anincreased export surplus, providing the Latin American countries with a largersupply of liquid foreign resources than they had ever had before. There beinglittle opportunity for the employment abroad of funds, these countries wouldseem to have used only some 20 per cent, of such credit facilities as had beenplaced at their disposal in the United States. Credits granted under lend-lease

- 77 -
arrangements, being mainly for defence purposes, were not published ; but,according to statistics of the Export-Import Bank available early in 1943, asmuch as $743 million, out of total credit authorisations of $1,099 million, wasgranted to Latin American countries, although actual disbursements did notamount to more than $137 million, the chief beneficiary being Brazil. TheNational City Bank in New York has calculated that the combined reserves ofgold and foreign currencies of eleven Latin American countries increased from$775 million in 1940 to $1,325 million at the end of 1942 and to about $1,500 mil-lion at the end of March 1943 — a rapid rate of expansion.
As far as individual commodities are concerned, the picture presented bythe export trade is in no way uniform. Exports of some of the most traditionalLatin American commodities, such as coffee, cocoa, wheat, maize, linseed,etc., though still representing a high percentage of foreign trade, continued todecline, while others, such as meat, cotton, nitrates, mineral ores, etc., eitherheld their own or gained in importance. The interest of the United States was,as a matter of fact, concentrated upon metals and minerals and upon certainagricultural products, such as rubber, sugar, wool, cotton and meat, which areeither important for the war effort or no longer obtainable from the formersources of supply. As regards other products, such as coffee and cocoa,which are of secondary importance for the war effort but of which theUnited States is normally a large consumer, Washington followed the policyof arranging for large-scale purchases over a number of years, even if shippingspace should not be available. In other agricultural products, such as wheat,maize, etc., North America, being itself a producer, has less interest; largestocks of such commodities accumulating in the producing countries werebought by their own governments, which thus assumed a heavy financialburden. With the growing necessity of concentrating industrial effort in theUnited States on war production, preference was given in the course of 1942to semi-finished products (metals, textiles, tinned meat, instead of ore, rawcotton and frozen meat), i.e. to goods of higher value in relation to bulk;this has contributed to the tendency of Latin American exports to fall belowthe 1941 level in physical volume, although the aggregate value was considerablyhigher. In March 1943 the Inter-American Coffee Board decided that, for thequota year ending 30th September 1943, the 1940-41 basic quota of U. S. coffeeimports should be increased by about 100 per cent., making a total of 27.9 mil-lion bags (of 60 kilogrammes) to be imported into the United States duringthe quota year 1942-43 against the 19.7 million bags previously fixed, themajor beneficiaries being Brazil and Colombia.
International trade within South America has in the past been hindered,and is to a great extent still hindered, by the economic structure of theindividual countries (whose production is competitive and, where diversified,not complementary) and by lack of transport facilities. The greater part ofsuch trade is still carried on between Brazil and the Argentine or betweenneighbouring countries. A number of trade agreements have, however, beenconcluded between the various republics, and trade between them is increasing.Thus Brazil is supplying cotton textiles to the whole of South America;

- 78 -
Colombia is exporting coal to the Argentine, which has agreed to buy all theavailable coal for ten years; the Argentine is selling wheat to Bolivia andBrazil and has agreed to buy all the oil produced in certain districts of Boliviafor the next ten years, plans having been made for a pipe-line between thetwo countries. Furthermore, the increased measure in which finished or semi-finished products appear in the foreign trade returns reflects the progressmade in the process of industrialisation ; but the rate of advance is relativelymoderate since, apart from the difficulties — psychological and other — whichsuch a transformation necessarily encounters, there are particular obstaclessuch as scarcity of shipping and the temporary inability of the supplyingcountries to keep pace with the continent's demand for industrial equipment.
The rise in the export surplus of the Argent ine from Pesos 363 millionin 1941 to Pesos 702 million in 1942 was due to higher prices for certainagricultural commodities, such as meat, wool and hides, and to increasedsales of finished products, especially textiles. Owing to reduced shipments ofwheat, maize and linseed and to a shrinkage in supplies of raw materials(especially coal and iron) and of machinery, both exports and imports declinedin volume, the latter falling to the lowest level for the last fifty years. Thatin 1942 exports of industrial goods were nearly as large as those of cerealsconstitutes a great change in the Argentine's foreign trade, and one whichwill probably not be limited to the duration of the war. The Argentine is thecountry on the South American continent whose foreign trade has sufferedmost from the effects of the war. In 1938, the continent of Europe absorbedover 40 per cent, of the Argentine's exports, while 8 per cent, was takenby the United States, which, owing to the competitive character of the twocountries' agriculture, offered only a limited market for the principal agriculturalproducts. The loss suffered through the severance of commercial relationswith the continent of Europe has found only partial compensation in theincreased turnover with the United States and in the intensified trade withother South American countries, whose share rose from 10 per cent, in 1938to about 20 per cent, in 1942.
No official foreign trade returns have been published in Brazil sinceApril 1942, but it has been reported by the Central Bank that there was anexport surplus in 1942 of a little less than Cruzeiros 3,000 million, or some130 per cent, more than in the previous year. Shipments of coffee, cocoa andcotton declined, but some of these reductions were compensated by higherprices. Rubber and manganese were exported in larger volume. In contrastto the Argentine, Brazil's products had better opportunities on the U. S. market,which already before the war absorbed more than one-third of Brazilian exports.The country's mineral wealth has facilitated industrial development and the risein the output of cotton has placed it fourth among the cotton producers of theworld ; Brazil is incidentally the only country which can maintain cotton pro-duction throughout the year, i. e. alternately in the north and in the south,being, in addition, able to produce every quality of cotton. The textile industryhas also made great progress, the output increasing from 823 million metresin 1940 to 1,500 million in 1942.

- 79 -
Uruguay's balance, though active with the United States, is passive in theaggregate, owing to difficulties in the disposal of the country's wool surplus.Chile has benefited from large exports of copper, nitrates, wool and frozenmeat and Peru has shipped sugar as the most important of its export goods,followed by cotton, oil and metallic ores. To compensate for the loss of theJapanese market, which was of great importance for the sale of Peruviancotton, the United States has agreed to buy cotton from Peru, as well asminerals and rubber.
The value of international trade accounted for by the territories in theFar East which have come more or less directly under Japanese dominationamounted in 1938 (including Japan but excluding China) to $4,800 million, ora little over 10 per cent, of total world trade in that year. Since 1940 thepublication of foreign trade statistics has been suspended in one countryafter another in this area and few other indications of their trade are avail-able, but some observations may be made on the commercial principles whichthe authorities have sought to apply in the different territories. In Manchukuothe development in the 'thirties of heavy industries, based on the country'srich deposits of coal and iron, was carried on almost wholly with the aid ofJapanese capital and equipment, exports to Japan consisting of raw materialsfor heavy industries and of agricultural products. Thus, for instance, in thefirst Five-Year Plan, covering the period 1937 to 1942, the direct participation ofJapanese capital amounted to Yen 4 milliard, as part of a total investment ofYen 6.7 milliard. In order to lessen dependence on Japan a new Five-YearPlan was adopted early in 1942, restricting the investment of Japanese capitaland arranging for larger exports of minerals and semi-manufactured productsto Japan. At the same time steps were taken to accelerate the developmentin Manchukuo of light industries capable of producing articles in daily useand also to augment the agricultural output with a view to exporting anincreased proportion of the surplus to Japan.
Until its establishment as a separate country in the year 1938Inner Mongol ia , with a surplus in its external balance, formed part ofthe economy of North China. This relationship was largely changed by thepolicy of the independent government, which founded the Central Bankof Mengchiang to aid in the financing of new investments, principally theexploitation of iron and coal resources and the encouragement of the country'straditional activities: agriculture and cattle breeding. But difficulties arose,owing partly to devastating floods in the summer of 1939 but partly also to the
large imports of indus-Industr ia l Product ion of Inner Mongol ia. trial equipment needed
for the new investments.In 1941, however, con-ditions changed again ;the balance of paymentsin that year producedan estimated surplus of
Indexes1941 = 100
1938193919401941
Milling
901261041CO
Hats andclothing
74356
100
Chemicals
1263
100
Metals
53120100
Processingof
minerals
4093
100

- 80 -
Yuan 34 million and in the first quarter of 1942 a surplus of Yuan 8 million.The central bank sponsored an investigation into the development of lightindustries and helped to find the necessary funds. The indexes given in thetable on the preceding page show the development of a number of industriesup to the outbreak of the Pacific war.
In North China a Five-Year Plan was in preparation in 1941 but itsexecution was affected by the outbreak of the Pacific war. The ptan aimedat increased production of coai, iron and industrial salt and the use of theseproducts in further manufactures. Foodstuffs are imported, payment being facili-tated by remittances from workers who have found employment in Manchukuo.According to the customs statistics, the foreign trade of North China had avalue of Yuan 332 million in 1936, and in the twelve-month period fromNovember 1940 to October 1941 the trade turnover was Yuan 1,383 million.The increase must not be taken to reflect a larger volume of trade since by1941 most commodities in the trade of North China had risen to three or fourtimes their 1936 price.
In the other parts of the Japanese-controlled area of China there arethree principal economic centres : Shanghai, Canton and Hanköw, of whichShanghai is the most important and the most closely connected with theNanking Government. By the outbreak of the Pacific war Shanghai was largelycut off from its ordinary markets and sources of supply. With the supportof the Japanese Government, local industries were encouraged to resume workand barter agreements were concluded with North China, Manchukuo andInner Mongolia. In the region of Canton, which with Hong Kong as thegreat outer seaport is the commercial centre of South China, trade was muchdisturbed by the war; silk exports, vital for this region, were almost reducedto nil, efforts being made, however, to stimulate domestic consumption.Immediately after the occupation of Hong Kong the Japanese authoritiesarranged a series of barter agreements between this town and Canton,Suwatao, Amoi, Hainantao and the Philippines. In June 1943 a barter agree-ment was concluded with Central China, under which Hong Kong was toexport goods to the extent of Yen 17 million and receive imports amountingto Yen 25 million during the year April 1943 to March 1944. By these agree-ments Hong Kong has become a centre for the barter trade system betweenChina and the south-western Pacific area.
In May 1941 two commercial agreements were concluded between Japanand French Indo-China, granting reciprocal facilities for establishment ofbusinesses, navigation, etc. In September 1942 a barter agreement was signedwith Manchukuo and North China and in March 1943 a new barter agreement(the second of its kind) with Japan, providing for increased exports fromFrench Indo-China of resin, timber, yellow flax, rice, cowhides, bones etc.against the import of consumption goods from Japan.
Communiqués published by Japanese military and naval authorities haveannounced the initiation of a large-scale revision of the economic system ofthe south-western Pacific area. In the past this area greatly developed its

- 81 -
primary production, while importing most of the industrial articles needed indaily Hfe from distant countries. The war, causing a severance of commercialrelations-: and a lack of shipping facilities, led to surpluses of some com-modities and scarcities of others and, in order to cope with these difficultiesbut also for more permanent reasons, the policy was adopted of- establishingin this région a certain number of light industries designed to meet essentiallylocal requirements. ;
Under a Five-Year Plan for production of cotton in the southern area(including Burma) cotton plantations have been greatly extended in thePhilippines and Sumatra. As regards other agricultural products, the authoritiesadopted the principle that the production of foodstuffs should be "encouragedin so far as it helped to establish current consumption on a basis of greaterself-sufficiency. Plans have been made, for instance, to replace some of theplantations of sugar-cane by production of other more urgently needed food-stuffs. It is also proposed to explore and develop the countries' mineral andindustrial resources as fully as circumstances permit.
The tendencies discernible in the Far East provide a telling example notonly of the difficulties resulting from a disruption of long-established com-mercial ties but also of the measures which may be planned to attenuate thesedifficulties. Of the new production of consumers' goods, which in the courseof the war has been started in different: parts of the world, something will pre-sumably remain evert after the emergency has passed ; but there can be littledoubt" that ^the broad" currents of trade as determined* by natural advantageswi l l assert themselves as and when commercial in tercourse isresumed on a more normal basis. The present war may have shownlhat a government (able to tax and borrow) can obtain most of the commoditiesit needs (or serviceable substitutes for them) as long as it is willing to pay theprice, however high. But, when it is no longer possible to disregard the manifoldheeds of ordinary consumption and the financial burdens on the state, theproblem will assume a different aspect: the price paid and the quantityobtainable at that price will once more become a consideration, and alongwith them the question of the most favourable conditions for production.
For a period immediately after the cessation of hostilities it may beexpected that government agencies > will continue to handle a large part ofinternational trade. Demobilisation will take time and there will presumablybe deliveries of badJy needed supplies to countries in distress, on terms notstrictly commercial. A-part of this movement of goods will no doubt be ofa temporary character, filling the gap until normal sources of supply have•been reopened; but another part ought to be followed by a continuous flowof trade, which will need to be put on a commercial basis as soon as possible.It is of great importance-that payments should again be made in the ordinary
ìcoùrse of affairs, for if that were not the case the flow of goods could hardlycontinue for long (and à stoppage would be to the disadvantage both of theproducer and of-his customer). Government agencies themselves have, indeed,every reason to assist in creating the conditions for a steady f low of trade.

- 82 -
Trading on official account has often been accused of introducing an arbitraryelement into international trading by making abrupt transfers of orders fromone market to another, not on account of economic calculations but for politicaland other reasons. Private commerce, on the other hand, has striven to buildup direct contacts between business firms in different countries, usuallyestablishing a relationship characterised by a large measure of continuity. Insuch conditions, the business partners, although still exposed to competitionas regards price and quality of goods, could assume that considerations of anextraneous and arbitrary character would not be allowed to break an establishedconnection. If, in certain sections or in relation to certain countries, trade in thefuture remains subject to official direction, it will become more important thanever to recognise that steadiness is a prerequisite of successful foreign trade.
No country can confidently embark upon a line of production for foreignmarkets if it has reason to fear that the demand may suddenly be diverted forcauses unconnected with price and quality of the goods produced. Indeed,it has long been a favourite protectionist argument that foreign trade is subjectto exceptional risks which are not fully taken into account by businessmen in the management of their affairs, and which thus compel thegovernment to provide special safeguards. To lessen the force of thisargument it is necessary to be able to hold out some prospect of areasonable degree of steadiness in the international exchange of goods andservices. Besides calling for assurances from government agencies with regardto their own trade activities, the attainment of greater steadiness presupposesthe pursuit of a commercial and monetary policy with guarantees againstsudden changes in currency rates and sudden additions to tariff barriers.From 1925 to 1929 considerable progress was made in the maintenance ofexchange stability and in freeing international trade from quantitative restric-tions; but the success was short-lived. The tariff increases and currencydepreciations of 1930 and the following years can be understood only if con-sidered as a reaction against the wide — and wild — fall in commodity prices,which deranged world markets and the economies of many countries after1929. Steadiness in foreign trade is thus in a large measure dependent uponstability in the general level of prices.
To achieve such a stability is not easy; many problems will arise, notonly of a monetary character; some of them will best (perhaps only) be solvedby concerted international action. One such problem will be how to ensure anexpansion in effective demand pari passu with the increase in production, andhow to do that without indulging in a dangerous credit inflation liable to befollowed by a setback. In the period immediately after the war, the abundanceof pent-up buying power will be likely, it may be hoped, to ensure a strong de-mand for goods and services, which — after a relatively brief period of shakingdown — may make it less difficult to develop the post-war export trade than isoften feared; after the 1914-18 war, international trade had by 1929, in spite of allobstacles, risen in volume nearly 30 per cent, above the level of 1914. For thefirst few years after the present war the main tasks in the field of foreigntrade will presumably be to find some practical system of financing shipments

- 83 -
of raw materials and to eliminate from the monetary system such measuresas are apt to exert an arbitrary influence on the currents of trade, among themcertain forms of exchange control. Here again, the aim must be to establishan order permitting a steady advance in the international exchange of goodsand services and thus in those sectors of the national economies which aredirected towards intercourse with other countries.
The foreign trade of small countries normally constitutes a greater partof their economic life than is the case in larger countries; the former maytherefore be said to be more dependent upon conditions abroad. This higherdegree of dependence is bound to have an influence on their economic policy;it forces them, for instance, to adapt their cost and price structures morereadily to changes on world markets. In some respects this compulsion mayhave its disadvantages (just as for small countries the narrowness of the homemarket may constitute a handicap) ; but, at the same time, regard for foreigntendencies leads to a higher degree of flexibility than would otherwise benecessary. It makes it less likely that these countries will remain for longin an unbalanced position; they cannot afford to forget that intelligent adapta-tion to changed conditions is one of the requisites for progress. As in otherfields of human activity the principle of conservation has to be supplementedby the principle of change, so in foreign trade attention has to be given tothe need both for steadiness and for flexibility — two requirements which mayappear contradictory but which in actual practice can and must be reconciled.
3. PRICE MOVEMENTS.
While in ordinary times price indexes used to reflect current price move-ments with a high degree of accuracy (as could be seen, for instance, froma comparison of indexes covering different numbers of commodities or indexesweighted differently), the present situation, with a large number of pricesofficially fixed but not always effectively imposed, makes it much more difficultto arrive at an adequate expression of actual changes in the price level.Moreover, it should be borne in mind that a price index, as such, gives noindication of the extent to which the commodities and services entering intothe calculation are available on the market. Even so, the cost-of-living indexin an increasing number of countries has acquired an enhanced importance,in that wage rates and other forms of remuneration are adjusted to changesin that index - if not by law or contract, at least by de facto recognition. Inthese circumstances, the calculation of each index number becomes a matterof general interest, and such questions as whether indirect taxation should bereckoned in the price quotations collected for the index become a subjectof discussion even for the public at large.
While the purpose of a cost-of-living index is to measure changes inoutlay required to maintain an unchanged standard of living for a certainincome group, attempts are often made to calculate subsidiary indexes witha different object in view. Thus, in several countries indexes have been
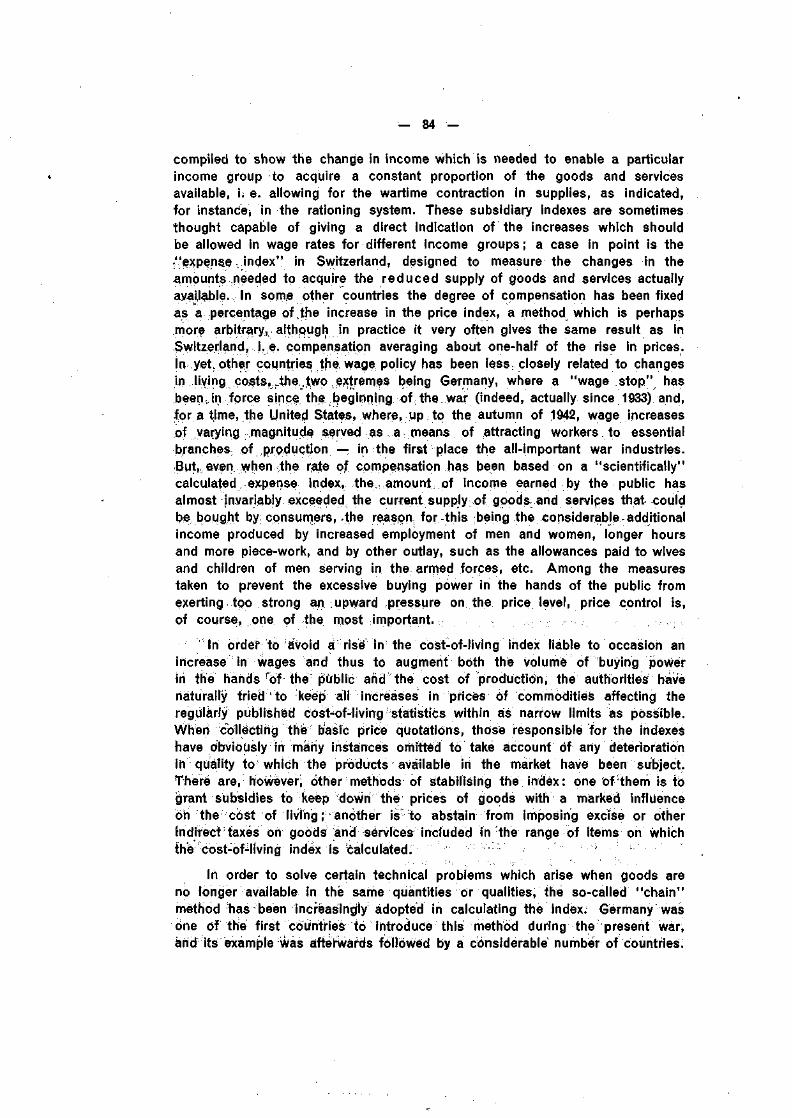
— 84 —
compiled to show the change in income which is needed to enable a particularincome group to acquire a constant proportion of the goods and servicesavailable, i. e. allowing for the wartime contraction in supplies, as indicated,for instance, in the rationing system. These subsidiary indexes are sometimesthought capable of giving a direct indication of the increases which shouldbe allowed in wage rates for different income groups; a case in point is the"expense index" in Switzerland, designed to measure the changes in theamounts needed to acquire the reduced supply of goods and services actuallyavailable. In some other countries the degree of compensation has been fixedas a percentage of,the increase in the price index, a method which is perhapsmore arbitrary! although in practice it very often gives the same result as inSwitzerland, i.e. compensation averaging about one-half of the rise in prices.In yet.other countries the! wage policy has been less: closely related to changesin living costs, .the^two extremes being Germany, where a "wage stop" hasbeen.rin fprce since the beginning of the war (indeed, actually since 1933) and,for a time, the United States, where, up to the autumn of 1942, wage increasesof varying magnitude served as .a means of attracting workers to essentialb/anc h es of production — in the first place the all-important war industries.But,, even when the rate of compensation has been based on a "scientifically"calculated expense index, the s amount, of income earned by the public hasalmost invariably exceeded, the current supply of goods, and services that couldbe bought by consumers! -the reason, for this being the considerable additionalincome produced by increased employment of men and women, longer hoursand more piece-work, and by other outlay, such as the allowances paid to wivesand children of men serving in the armed forces, etc. Among the measurestaken to prevent the excessive buying power in the hands of the public fromexerting too strong an upward pressure on the price level, price control is,of course, one of the most important.
In order to avoid ä rise in the cost-of-fiving index liable to occasion anincrease in wages and thus to augment both the volume of buying powerin the hands rof the public and the cost of production, the authorities havenaturally tried to keep all increases in prices of commodities affecting theregularly' published cöst-oWiving statistics within as narrow limits as possible.Wheri collecting the basrc price quotations, those responsible for the indexeshave obviously in many instances omitted to take account óf any deteriorationinequality to which the products available in the market have been subject.There are, however; other methods of Stabilising the index: one of them is togrant Subsidies to keep tìoWn thé prices of goods with a marked influenceori the cost of living ; another is to abstain from imposing excise or otherindirect taxes on goods and services included in the range of items on whichthe cost-of-living index is calculated. . ;: ;
In order to solve certain technical problems which arise when goods areno longer available in the same quantities or qualities, the so-called "chain"method h as been increasingly adopted in calculating the index. Germany wasone of the first còuntrieè to introduce this rnöthod during the present war,and its example was afterwards followed by a considerable number of countries.
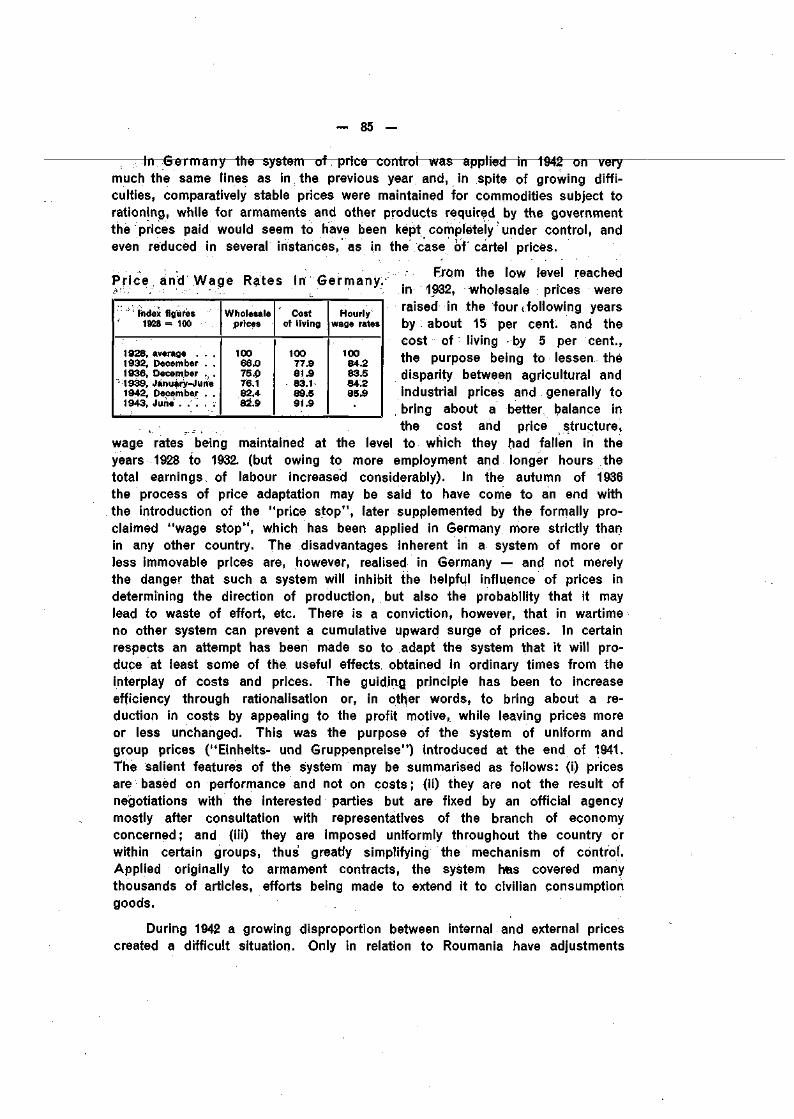
85 —
— In Germany the system of price control was applied in 1942 on verymuch the same lines as in the previous year and, in spite of growing diffi-culties, comparatively stable prices were maintained for commodities subject torationing, while for armaments and other products required by the governmentthe prices paid would seem to have been kept completely under control, andeven reduced in several instances, as in the case of cartel prices.
Price and Wage Rates in Germany.
' Index figures1928 =100
1928, average . . .1932, December . .1936, December . .1939, January-June1942, December . .1943, June . . . . .
Wholesaleprices
10066.075.076.182.482.9
Costof living
10077.981.983.189.591.9
Hourlywage rates
10084.283.584.285.9•
From the low level reachedin 1932, wholesale prices wereraised in the four '(.following, yearsby about 15 per cent, and thecost of living by 5 per cent.,the purpose being to lessen thèdisparity between agricultural andindustrial prices and generally tobring about a better balance in
, _ , , . . . the cost and price structure,wage rates being maintained at the level to which they had fallen in theyears 1928 to 1932. (but owing to more employment and longer hours thetotal earnings of labour increased considerably). In the autumn of 1936the process of price adaptation may be said to have come to an end withthe introduction of the "price stop", later supplemented by the formally pro-claimed "wage stop", which has been applied in Germany more strictly thanin any other country. The disadvantages inherent in a system of more orless immovable prices are, however, realised in Germany — and not merelythe danger that such a system will inhibit the helpful influence of prices indetermining the direction of production, but also the probability that it maylead to waste of effort, etc. There is a conviction, however, that in wartimeno other system can prevent a cumulative upward surge of prices. In certainrespects an attempt has been made so to adapt the system that it will pro^dupe at least some of the useful effects obtained in ordinary times from theinterplay of costs and prices. The guiding principle has been to increaseefficiency through rationalisation or, in otfter words, to bring about a re-duction in costs by appealing to the profit motive, while leaving prices moreor less unchanged. This was the purpose of the system of uniform andgroup prices ("Einheits- und Gruppenpreise") introduced at the end of 1941.The salient features of the system may be summarised as follows: (i) pricesare based on performance and not on costs ; (ii) they are not the result ofnegotiations with the interested parties but are fixed by an official agencymostly after consultation with representatives of the branch of economyconcerned; and (iii) they are imposed uniformly throughout the country orwithin certain groups, thus greatly simplifying the mechanism of control.Applied originally to armament contracts, the system hes covered manythousands of articles, efforts being made to extend it to civilian consumptiongoods.
During 1942 a growing disproportion between internal and external pricescreated a difficult situation. Only in relation to Roumania have adjustments

- 86 -
of clearing rates offset, to an appreciable extent, the steep price increases inthe countries which are Germany's principal trade partners in the Danubianregion.
It has been calculated that in Germany expenditure on food representsabout 50 per cent, of the outlay of an average family (against 15 per cent,for rent and 10 per cent, for clothing); imports of foodstuffs amounted beforethe war to a little more than one-quarter of total German imports ; the greatadvance in prices in the agricultural exporting countries, together with thenecessity of stimulating home production, induced the authorities to grantcertain price increases (affecting milk, butter, pigs, potatoes and vegetables),but the consequences for the consumer were to a large extent avoided byincreased subsidies.
Moreover, as in previous years, steps have been taken to fix, by commer-cial negotiations, the prices of the most important commodities exchangedbetween Germany and other countries. A price stop applicable to theirmutual trade had already been agreed upon in principle between Germanyand Italy in October 1941 and through negotiations between these two countriesa whole series of prices were fixed for different groups' of commodities inMarch 1942. Similar agreements covering à varying range of commodities havebeen concluded by Germany with a number of other countries. Price-fixingof this kind may, however, involve certain dangers, in that producers in thecountries exporting to Germany may find that prices are kept lower for theirexport goods than for other products; this may discourage production andmake exporters more reluctant to sell abroad (not only because the profitsfrom exports tend to be lower but also because the time lag between saleand payment is generally much longer than in the case of the home market).In the winter of 1942-43 a Price Equalisation Fund was instituted in Germany,initially provided with a sum of RM 1 milliard to bring down prices ofimported goods. Thanks to the system of subsidies, the rise in the officialcost-of-living index was limited in 1942 to 2.6 per cent., with only slight changesin all but the prices for textiles, which are shown to have risen by 10.5 per cent,from 1941 to 1942. While rents have been kept unchanged, building costs havecontinued to rise and by 1942 were 20 per cent, above the level in 1936.
In Italy price statistics have not been published regularly since the warbegan but it is known that by June 1942 wholesale prices had risen about50 per cent, above the pre-war level. Between 1939 and 1941 prices of domesticgoods had increased by 25 per cent., while prices of imported goods hadgone up by 40 per cent. Up to the spring of 1943, import prices would seemto have been maintained without any appreciable rise (thanks to the price-fixingthrough commercial agreements, affecting, inter alia, the price of coal, which,together with textiles, showed the steepest rise of all in the 1914-18 war), butprices of domestic goods have continued to mount. Great difficulties in applyingan effective control were encountered owing to the existence of a large numberof medium-sized and small enterprises which produce a variety of productsnot easily brought into a general scheme of standardisation. Some measure

- 87 -
of price supervision was adopted in Italy as early as 1927 and tightened upin 1940, but it was not until January 1942 that an attempt at a uniformand extensive control was made through the creation of an InterministerialCommittee under the chairmanship of the head of the government. It proved,however, impossible to prevent the emergence of an extensive black marketwith high prices, although the authorities again and again denounced thepractice of illegal transactions as disturbing the system of rationing and im-pairing the value of the currency. The necessity of encouraging an increasedoutput, especially of foodstuffs, led to several upward adjustments, the differ-ence between the price paid to the producer and that at which the commoditywas sold being, in the case of primary products, mostly borne by the statethrough a sytem of subsidies, varying according to the quality of the product,the place of production, etc. From Lit. 175 per quintal in 1942 the price ofwheat was, for instance, increased in 1943 to Lit. 235 in northern and centralItaly, Lit. 280 in southern Italy and Lit. 310 for the islands Sardinia and Sicily.This policy of subsidising, however, entailed a heavy financial burden, theannual outlay having, in the financial year 1942-43, reached about Lit. 12 mil-liard, of which Lit. 2.5 milliard represented the cost of premiums allocated forthat year's wheat campaign. A revision of prices for war supplies was initiatedearly in 1943, when a special committee was set up to enquire into war con-tracts for amounts exceeding Lit. 3 million.
A wage and salary stop had been introduced in 1940 but a number ofspecial increases were permitted, often taking the form of family allowances.In the spring of 1943 comprehensive measures of adjustment were applied firstto wages and later on to civil servants' salaries, with increases up to 30 per cent.
In the Danubian and Balkan count r ies the steep rise in priceswhich characterised the year 1941 continued, although not quite at the same rate,
Price Movements in Danubian and
Percentage price Increase during:
Bulgaria:Wholesale pricesCost of living
Hungary:Wholesale pricesCost of living
Roumania:Retail prices
Slovakia:Cost of living (foodstuffs)
Turkey:Wholesale prices OWholesale prices («)Cost of living
Yugoslavia:Cost of living
19392nd half
+ 5+ 2
+ 5+ 1
+ 14
+ ' 8+ 6
+ 13
1940
0//o
+ 26+ 17+ 22
+ 15
+ 25
+ 180)+ 51 (3)+ 25+ 13+ 32
Balkan Countr ies.
1941
+ 27+ 37
+ 26+ 21
+ 67
'+ 25
+ 46+ 42+ 22
+ 46R
1942
+ 19+ 24
+ 16+ 9
+ 48
+ 17
+ 134
+ 94
+ 104(5)
June 1939to
Dec. 1942
+ 101+ 104
+ 88
+ 52
+ 252
+ 74
+ 415(3)
+ 184+ 364ß
(') January 1939 to December 1940. (2) Index of the Ministry of Trade. (3) Compared to average of 1939.(4) Chamber of Trade and Industry of Istanbul. (5) Refers to Croatia, Agram (Zagreb).

— 88 —
during 1942. Generally speaking, this rise was, of course, connected with warcharges, including the surplus exports to allied countries — in the first'placeGermany, though Italy also participated to some extent; but the;, peculiardifficulties which the countries in south-eastern Europe have met with in theirattempts to combat inflation are partly due to the size of their agriculturalpopulation, which, with their present methods of administration, makes a systemof effective rationing almost impossible, and partly to absence, in most cases,of fully-developed financial markets and modern fiscal practices.
Bulgar ia : Price Indexes.
BaseJanuary-June1939 =100
1939 January-June . .1940 December . . . .1941 June . . . . . . .
December . . . .1942 June .
December . . . .1943 June
Generalwhole-sale
prices
100132139168179201224
Importgoods
100163174188203202206
Exportgoods
100113108134150169183
Domesticproductsfor home
con-sumption
100136149181192219249
Costof
living
100124132156177197223
The extent towhich the "' upwardsurge of prices inthe Danubian areahas, of late, reflectedmainly domestic in-fluences may be illu-strated by develop-ments in Bulgar ia.
While up to June1942 the rise in im-port prices above the
January-June 1939 level was higher than the rise in prices of domestic pro-ducts for home consumption, the order had already been reversed by the endof 1942, when a rise of 102 per cent, in import prices compared with a riseof not less than 119 per cent, in prices of domestic products for home con-
sumption. Apart from the effectsof a bad harvest (the third insuccession), the price increasewas accelerated by a considerableadvance in wages, which in mostcases were almost doubled duringthe year, thus adding to the costof production. The consequencewas another sharp rise in the costof living, which in Bulgaria, unlikemost countries, has kept pace withthe rise in wholesale prices. APrice Equalisation Fund was insti-tuted in 1942 to reduce disparitiesbetween import and domesticprices. Early in 1943 the Ministry ofTrade pointed out that the majori-ty of Bulgarian commercial agree-ments contained a price clauseunder which an increase introducedby one of the partners would entaila parallel measure by the other.
Cost of Living in Turkey, Bulgaria and Hungary,Indexes January-June 1939 = 100.«
3001 1 1— : 1 1 1300
100 19« 19«

- 89 -
In Turkey the experiment of allowing a greater degree of freedom to themarkets was tried in the second half of 1942, it .being hoped that a relaxationof the regulations in force would lead to an increased supply of goods andthus bring about a price level which, if not as low as the former official prices,would at least fall short of the highest quotations attained in the black market.But by these changes the basic causes of the price rise were not eliminated ;and in the winter of 1942-43 special measures had to be taken to reduceprices of foodstuffs and clothing for the poorer classes.
In no country has the rise in prices and wages assumed such an in-flationary character as in Greece. The rise practically put a stop to all normalexports, while such importers as were able to buy foreign exchange at officialrates could not help making unduly large profits. One of the measures adoptedto mend the situation was the introduction of a special fund charged withthe task of subsidising exports , whereas in other countries price equalisationfunds have usually owed their origin to the need for stimulating imports.A series of foreign trade measures (see page 64) and the arrival offoodstuffs under the aegis of the Red Cross would seem to have somewhatimproved the position. A sign of this improvement was that workerswere once more beginning to prefer cash to payment in kind. In Croat iaand Serbia, sharp price rises have also occurred, although not on ascale comparable with that in Greece. The official index in Agram (Zagreb)shows a trebling of the cost of living between the summer of 1939 andthe end of 1942. To reduce prices of vital foodstuffs, a Price Equalisation Fundof Kunas 2 milliard was set up and the proceeds from increases in certainconsumption taxes were also allocated to this fund. Official price statisticsceased to be published in Roumania in the middle of 1941 but calculationsby the economic journal "Argus" put the level of retail prices in the spring of1943 at 448, as compared with 100 in the summer of 1939. The developmentof agricultural prices since the beginning of the war may be seen from thefollowing table.
Roumania: Agr i cu l tu ra l Prices.
Products
Wheat . . . .Maize . . . .Barley . . . .Oats . . . . .Rye . . . . .
Lei per quintal in July
1939
427407315445274
1940
560525380653560
1941
1,100720750770900
1942
2,2001,0501,4001,5001,600
1943
2,6001,8001,6601,9001,870
The price ofwheat doubled from1940 to 1941, andagain from 1941 to1942, but in 1943 theincrease was only atthe rate of 18 percent., as a result ofan excellent harvest.
At the end of 1942 a price increase of about 100 per cent, wasallowed to the oil industry, agreement having been secured, as from1st May. 1942, to a price rise of over 40 per cent, in respect of oil exportedto Germany.

— 90 -
BaseJanuary-June
1939 = 100
1939, January-June1940, December . .1941, June
December. .1942, June
December . .1943, June. . . . .
Generalwholesale
prices
100127136161174186205
Agri-culturalproducts
100146153174190204222
Industrialproducts
100118129152166181205
Cost ofliving
100116123140148152156
Hungary: Price Indexes. The accompanying tableshows the development ofprices in Hungary duringthe last few years.
While in 1942 the pricerise had been at a slowerrate than in the previousyear, a marked increasewas sanctioned by newregulations adopted in thespring of 1943 and coming
into force on 1st July. Under these regulations agricultural prices would advance,on an average, 30 per cent., a system of compulsory deliveries of farm productsbeing introduced at the same time. The wages of agricultural labourers werealso increased according to a scale with minimum and maximum rates. Workersemployed in armament industries received an increase of 23 per cent, in theirwages, and other workers 15 per cent, (these being in addition to substantialearlier increases). Employees in public and private enterprises were allowed anincrease of 20 to 23 per cent., together with certain other advantages designedto improve the position of the middle classes. Prices of industrial articles,which in many cases had been low in comparison with the increased cost ofproduction, were raised by 30 to 40 per cent. The purpose of these regulationswas to arrive at a solution which would hold good for at least one year(being thus a kind of price and wage stop) and which would at the sametime bring greater harmony into the price and cost structure and more fairnessinto the remuneration of different sections of the population.
Since the beginning of the war a distinct improvement in conditions hadbeen obtained by agriculture and steps were now being taken, by way of thenew regulations, to make good some of the loss in real income suffered by themiddle class. It was pointed out, however, that no section of the public couldexpect to escape its share of the burden of the war in such of its manifes-tations as higher costs of living, increased taxation and reduced suppliesof most commodities.
A Central Supply Board was set up in Slovakia in the spring of 1942to ensure the supply of foodstuffs and other essential commodities at normalprices. It had been found difficult to prevent goods from escaping to theblack market, by which the real cost of living was increased and the main-tenance of an effectual wage stop accordingly jeopardised. To meet thissituation, a more rigid control was established over foreign trade and specialattention was given to the encouragement of agricultural production, Ks. 100 mil-lion being expended in 1942 on direct subsidies and Ks. 200 million on premiumson cereals, milk and other dairy produce. Further progress has been madein the adaptation of costs and prices in the Protectorate of Bohemiaand Moravia to the German system. Uniform and group prices have beenintroduced for government orders, although in a less rigid form than in

— 91 —
Germany, the degree of rationalisation being less uniform in the industry of theProtectorate than in Germany. As from 1st October 1942 the maximum pricesfor goods exported from or imported into the Protectorate were to be thosecharged on the home market, any deviation from this rule requiring specialpermission. The wage and salary stop at the level prevailing on 15th January1942 has been renewed, higher wages being allowed only in cases of increasedefficiency.
Base:August 1939 = 100
1939 August. . . .December . .
1940 December . .1941 December . .1942 December . .1943 August. . . .
Wholesale pricesA
100126157190227245
B
100121148174204222
Retailprices
100110132151178200
Cost ofliving
100111
• 130154184202
* Indexes calculated by "La Conjoncture Economique et Financière".A = weighted according to consumption 1938.B = weighted according to consumption 1942.
In France the price indexes*, revised to take account of the real consump-tion in 1942 and based exclusively on regulated prices, showed an increase
of 120 per cent, in whole-France: Price Indexes.* s a | e prices and of 100
per cent, in f!he cost ofliving between August 1939and the summer öf 1943,the rate of increase in 1942in both index numbersbeing practically the sameas in the two previousyears (amounting to about20 per cent, per annum).An attempt has alsobeen made to calculate a
general index of all prices, including those for goods bought in the b lackmarke t or acquired in other ways, e. g. by barter transactions or tradingin country districts or by parcels sent from one member of a family toanother. According to these calculations, the index (with the pre-war levelas 100) amounted to 210 by the end of 1941, 280 by the end of 1942and 290 for August 1943. The upward tendency has subsisted in 1943but has been offset to some extent by a sharp fall in some of themore speculative prices. It should be borne in mind that these prices arequoted in what are mostly very narrow markets and that they are as arule extremely sensitive, being influenced "by changes not only of an economicand monetary character but also by political and military events regarded asproviding an indication of the probable duration of the war. It is hardlynecessary to add that these prices are not at all representative of the levelat which commercial exchanges would settle down on a return to normalconditions, the point of equilibrium being probably nearer to the official thanto the black market prices.
In France, as elsewhere, the authorities have been faced with a shortageof goods in conjunction with an abundance of money. It has proved impossibleto withstand price increases even in the official sector, the maintenance ofstability in food prices, for instance, being inconsistent with the need toefrcourage agricultural production. In the autumn of 1942, when prices were
* The Office of General Statistics has resumed the publication of a large number of wholesale and retailprices and, on the basis of these and other data, various institutions have proceeded to calculate generalprice Indexes.

= 92 -
fixed f o r the next year's wheatcrop, a comprehensive system of premiumswas introduced, which had the effect of raising the price of wheat 33 per cent,above the 1940-41 level. Since by 1942 the price of bread had risen by only17 per cent, as compared with 1939, a charge of about Fr.fcs 3 milliard hadto be provided for in the budget to make the official bread price possible.Transport and other difficulties have resulted in a considerable degree ofautarky in the different "départements", the price divergencies already existingbefore the war having been much accentuated. Up to 1942 wages andsalaries would seem to have risen by rather more than 25 per cent.,, laggingconsiderably behind" trie increase in the cost of living. Special family allow-ances have, however, been generally introduced arid other forms of assistancehave been devised, such as the provision of meals in factories; further wagefricreaëes were announced by the government as from June 1943.
No price indexes are available in Hol land, while in B e l g i u m the publi-cation of official price indexes has been resumed for a number of importantcommodities, such as wheat, barley, rye, sugar, coal and steel; by June 1943these quotations showed an increase above the pre-war level varying between30 and 90 per cent., except in the case of sugar, which had risen by 138 percent. Before the war the Dutch price level was 30 to 40 per cent, below that ofGermany, but by the end of 1942 it had been completely adjusted to the heightof German prices. Since 1940 Dutch agriculture has undergone an extensivestructural change, the area under cultivation having been considerably extendedat the expense of pasture land. The resulting increase in cereal production hasnot been sufficient, however, to make good the drastic fall in imports, and theshortage has been progressively aggravated by the exhaustion of stocks. Priceshaving soared to high levels on the black market, the powers of the PriceController were extended late in 1942. Dutch wages do not seem to have beenincreased pari passu with the adjustment of official prices to the German level.
Price movements:Denmark, F in land, Norway, Sweden and Switzer land.
1 Percentage price increase during:
Denmark:Wholesale pricesCost of living
Finland:Wholesale pricesCost of living
Norway:Wholesale pricesCost of living
Sweden :Woleshale pricesCost of living
Switzerland:Wholesale pricesCost of living . . .
19392nd half
%+ 30+ 10
+ 19+ 8
+ 19+ 6
+ 21+. 5
+ 18+ 4
1940
%+ 34+ 28
+ 28+ 21
+ 26+ 22
+ 21+ 15
+ 31+ 13
1941
%+ 10+ 7
+ 19+ 15
+ 16+ 10
+ 12+ 11
+ 21+ 15
1942
%+ 2+ 3
+ 25+ 20
+ 3+ 4
+ 9+ 5
+ 8+ 9
June1939to
Dec. 1942
%+ 95+ 56
+ 127+ 82
+ 79+ 48
+ 79..+ 41
+ 103+ " 46

- 93 -
With the exception of Finland, engaged in active warfare, the differentcountries shown in the above table all managed to slow down the priceincrease during 1942 and to bring it almost to a standstill in thè latterhalf of the year. The firmer hold which the authorities had thus been ableto keep upon price movements was secured not merely by a strengtheningof the price control — important though that was — but by a whole seriesof measures adopted in the different countries, an additional factor beinga distinct weakening in the price-raising influences from abroad. Thus, inDenmark import prices rose by 1.6 per cent, during 1942 as compared with12 per cent, in the preceding year. The greater part of Denmark's foreigntrade has been regulated under agreements stipulating fixed prices for thegoods exchanged and;- in addition, the resistance to price rises in the foreignsector was strengthened by the revaluation of the Danish crown by 8.2 percent, in January 1942. At home, maximum prices have been fixed for nearly90 per cent, of all foodstuffs, most of them more readily available thanks tobetter crops. Owing to the persistent shortage of fodder (due to the cessationof imports from overseas) agricultural output of different kinds of foodstuffshad, by 1942, shrunk to about one-half of the pre-war volume; àt thè endof the year the stock of cattle had fallen by 13 per cent., pigs by 62 per cent,and poultry by 65 per cent, of the pre-war numbers. In order to help smallagricultural producers "whose situation had improved very slightly in comparisonwith that of the larger farmers, a rise of 24 ore per kilogramme in the priceof pig meat was allowed in the spring of 1943, the greater" part of thé resultingburden being assumed by Germany, anxious to encourage this line of produc-tion. Wages and salariée were increased during the year, at the cost of afurther Kr. 100 million on the national wage-bill, the increase being extendedto workers under twenty-three years of age, i.e. to a category which had notbenefited by the previous increase in February 1940. Less in Norway than inthe other Scandinavian countries do the official indexes, based primarily onthe prices fixed for rationed commodities, seem to reflect the actual changesin living costs." If allowance is made for deterioration in quality and for theneed of supplementing the official rations by outside purchases, the actualrise in the cost of living by the end of 1942 was well above the 48 per cent,shown officially. Before the war Norway covered a substantial part of its foodrequirements through imports paid for mostly with the income from shipping,the" Norwegian mercantile marine ranking fourth among the world's commercialfleets. Now that this equilibrium has been disturbed, the heavier cost ofprocuring necessary supplies has contributed much to the difficulties on thedomestic market.
two great obstacles which the authorities in Finland have encounteredin attemptingto master ihej price problem have been the price increases inthe foreign sector (affecting, in particular, imported goods) and the declinein '-hoiire production (up to 18 per cent, of the Finnish population being forlong[-'periods oil active service at the front). In the autumn of 1942 a com-prehensive financial programme was adopted, combined with a tightening ofthe pride control, Under the new provisions, agricultural prices were not to

- 94 -
be increased during the ensuing harvest year, although certain premiums wereto be granted to the producers; and prices for domestic industrial articleswere to be adjusted upwards only in consequence of a rise in the cost ofmaterials (while a rise in costs due to a decline in production or in turnoverwould not justify an increase in the price of the finished article). In con-formity with the principles previously adopted, according to which an increasein the cost of living was to be compensated to the extent of two-thirdsby a rise in wages, it was laid down that each new advance of 10 pointsin the official cost-of-living index beyond the figure of 160 (1938-39 = 100)would entail a 4 per cent, increase in wages. Originally the provisions regardingthe degree of compensation did not apply to farm workers; but by the middleof 1943 agricultural prices had been raised (an increase in retail prices beingavoided by means of government subsidies amounting to FM 1,600 million);and in that connection the same right to compensation was granted to workersemployed in agriculture. It may also be mentioned that, contrary to the prac-tice in most countries, a certain increase in rents has been allowed in orderto offset the rise in maintenance and other charges, the amount of theincrease authorised from 1st September 1942 being 20 per cent.
Since the middle of 1942 a high degree of stability has characterisednearly all branches of Sweden's economic life, including the volume ofindustrial production, wholesale prices, cost of living, etc. The magnitudeof government expenditure, necessitating borrowing at the rate of aboutS.Kr. 150 million a month, has continued to provide an excess of buyingpower, it being estimated that the gross income of the population roseby 32 per cent, between 1939 and 1942, while at the same time theavailable volume of consumption goods fell by 17 per cent. In the autumnof 1942 the government entrusted an outside expert (not a state official)with the negotiations and investigations required to determine the futureeconomic policy best calculated to counteract a harmful rise in prices. While
negotiations were beingconducted with represen-tatives of various econo-mic groups regarding theprices to be paid for the1943 crops, stabilisation ofwages, etc., a temporaryprice stop was imposedon 31st October 1942. Afew weeks later, agreementwas reached with regardto a conditional wagestop: as long as theofficial cost-of-living index(1914 = 100), standing inOctober 1942 at 239, didnot reach the level of 249,
Sweden: Import and Export Prices.Indexes January-June 1939 = 100.
280
2G0
240
220
200
180
I BO
140
120
100
s*" Import goods
„J Export goods
1939 19*0 1941 1942 1943
280
260
240
220
200
180
160
140
120
100

- 95 -
Switzer land: Pr ice Movements.
wage rates would remain unchanged, but they would be increased by5 per cent, if the cost of living rose to a point between 249 and 257; shouldthe latter limit be attained, new negotiations were to take place betweenthe interested parties. In point of fact, however, it proved possible to holddown the cost of living (partly as a result of government subsidies costingS.Kr. 220 million a year) ; in the spring of 1943 the eost-of-living index movedaround 240 and was thus well below the critical margin.
The slackening in the upward movement of prices in Swi tzer land maybe seen from the following table. The Swiss economy, being particularly de-
pendent upon foreigntrade, has been muchaffected by price-rais-ing influences fromabroad, including ahuge increase in thecosts of transport fromoverseas countries (in1938 about two-thirdsof total Swiss importsconsisted of raw ma-terials and foodstuffs).
The upward thrust from abroad, however, made itself felt less strongly in 1942,partly because the rise in the prices of imported goods was not so markedas previously, and partly because of the further shrinkage by 10 per cent,in the volume of imports (to about 60 per cent, of the pre-war figure) withthe result that the proportion of imported goods in total consumption wasmaterially reduced.
Mainly in order to prevent exaggerated price increases and undue profits,about sixty Price Equalisation Funds have been set up in Switzerland,
covering such products aswindow glass, hides andleather, base metals and
Percentage priceincrease during:
Wholesale general indexImported goodsHome-produced goods .Cost of living
19392nd half
%+ 18+ 30+ 10+ 4
1940
%+ 31+ 44+ 21+ 13
1941
%+ 21+ 27+ 16+ 15
1942
%+ 8+ 9+ 7+ 9
June1939 toDec. 1942
%+ 103+ 159+ 65+ 46
Switzerland : Wholesale Prices.Indexes January-June 1939 = 100.
1939 191-0 1941 19*2 1943
a number of foodstuffs.These funds receive pay-ments from exporters andproducers (in a few casesalso contributions from theFederal Government) andthey grant subsidies to pro-ducers and importers whowould otherwise be work-ing at a loss. In the earlymonths of 1943 steps weretaken to bring greater uni-formity into their organisa-tion and methods of working.
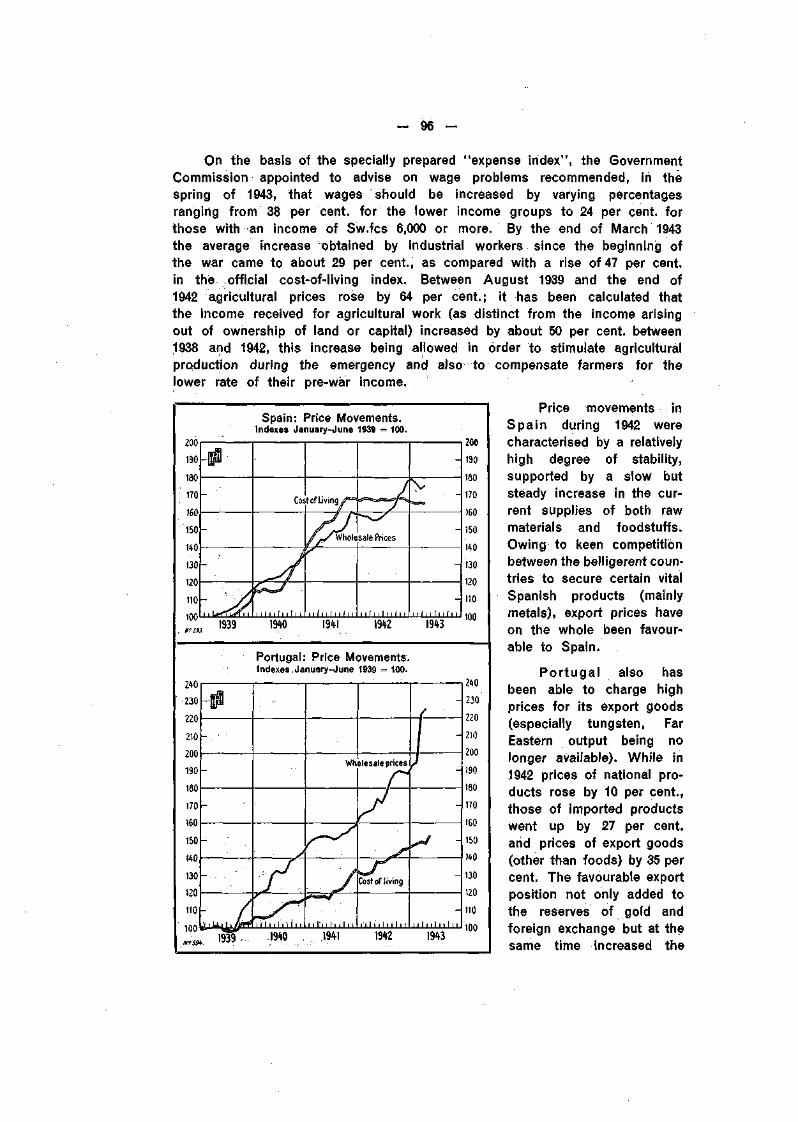
ÒR
On the basis of the specially prepared "expense index", the GovernmentCommission appointed to advise on wage problems recommended, in thespring of 1943, that wages should be increased by varying percentagesranging from 38 per cent, for the lower income groups to 24 per cent, forthose with an income of Sw.fcs 6,000 or more. By the end of March 1943the average mcrease obtained by industrial workers since the beginning ofthe war came to about 29 per cent., as compared with a rise of 47 per cent,in the official cost-of-living index. Between August 1939 and the end of1942 agricultural prices rose by 64 per cent.; it has been calculated thatthe income received for agricultural work (as distinct from the income arisingout of ownership of land or capital) increased by about 50 per cent, between1938 and 1942, this increase being allowed in order to stimulate agriculturalproduction during the emergency and also to compensate farmers for thelower rate of their pre-war income.
240230220210200190180170160150HO130120110100
Spain: Price Movements.Indexes January-June 1939 = 100.
19*2 19«
200190180170160150m130120110100
Portugal: Price Movements.Indexes. January-June 1939 = 100.
- . • ••
-
-
-
-•.. ,
i il M hi Ì M
Wh
• till I r 1 I • L
Diesale prices
/
Cost of living
n Ini ill ii
-
i i 1 nini il1939 1940 . .1941 1912 1943
210230220210200190180170160150WO130120110100
Price movements inSpain during 1942 werecharacterised by a relativelyhigh degree of stability,supported by a slow butsteady increase in the cur-rent supplies of both rawmaterials and foodstuffs.Owing to keen competitionbetween the belligerent coun-tries to secure certain vitalSpanish products (mainlymetals), export prices haveon the whole been favour-able to Spain.
Portugal also hasbeen able to charge highprices for its export goods(especially tungsten, FarEastern output being nolonger available). While in1942 prices of national pro-ducts rose by 10 per cent.,those of imported productswent up by 27 per cent,and prices of export goods(other than foods) by 35 percent. The favourable exportposition not only added tothe reserves of gold andforeign exchange but at thesame time increased the

- 97 -
buying power of the public and was an important factor in bringing aboutthe marked rise in prices and cost of living during 1942. By the end of thatyear the official cost-of-|iving index showed an increase of 46 per cent, abovethe pre-war level, but the real increase was probably somewhat higher, sincethe index only takes account of national products. Wage adjustments, rangingfrom 20 to 50 per cent, above pre-war earnings, had been allowed in 1942and rationing was extended in the spring of 1943.
Price Movements: United K ingdom, Eire, Br i t ish Ind ia, Aus t ra l i a ,New Zealand, Canada and United States.
Percentage price increase(or decrease) during:
United Kingdom:Wholesale pricesCost of living
Eire:Cost of living
British India:Wholesale pricesCost of living
Australia:Wholesale pricesCost of living
New Zealand:Wholesale pricesCost of living
Canada:Wholesale pricesCost of living
United States:Wholesale pricesCost of living
19392nd half
%+ 25+ 12
+ 12
+ 36+ 9
+ 5+ 1
+ 5+ 3
+ 11+ 3
+ 5+ 1
1940
%+ 22+ 13
+ 11
— 12+ 2
+ 9+ 6
+ 14+ 4
+ 3+ 4
+ 1+ 1
1941
%-+. 5+ 2
+ 11
+ 28+ 12
+ 4+ 4
+ 9+ 4
+ 11+ 7
+ 17+ 10
1942
/o+ 3— 1
+ 15
+ 55+ 46
+ 15+ 9.
+ 7+ 2
+ 4+ 3
+ 8+ 9
June 1939to
Dec. 19420/So
+ 64+ 23
+ 59
+ 136+ 81
+ 38+ 22
+ 39+ 14
+ 32+ 18
+ 34+ 22:
In the United Kingdom the same price policy has been pursued asin the previous year and the official indexes of wholesale prices and cost ofliving show only slight changes. Among the principal groups which make upthe wholesale price index the largest advance is registered by "cereals" —an increase of 123 per cent, from August 1939 to March 1943. Accordingto the cost-of-living index, however, the price of flour rose by only 26 percent, and of bread by 9 per cent., the divergence in the price trends revealedby the indexes being largely due to subsidies granted as part of the price-stabilisation policy, which is estimated to cost the government £210 millionin 1943 as compared with £180 million in 1942, £125 million in 1941 and£100 million in 1940. The stability in the cost-of-living index is also dueto an extension of the "utility" class of goods; 80 per cent, of all newclothes are made of standardised materials and practically all new furnitureproduced falls within the utility category. In addition, the purchase tax wasremoved from utility cloth and wearing apparel in August 1942. In the samemonth the output of luxury articles was suspended altogether, with the. resultthat, apart from food, drinks and tobacco, the production of consumption goodsother than utility goods fell to about 20 per cent, of the pre-war volume.

- 98 -
There has been much discussion of the extent to which the officialcost-of-living index gives a true picture of the actual increase in living costs.Even before the war the index took account of only a part of the currentexpenses included in an average household budget; since 1939 a number ofarticles on which it is based have ceased to be available, while certain goodswhich have since become more or less indispensable are not taken into con-sideration. Thanks to the general increase in wages, some of the lower incomegroups are now prepared to pay, for unrationed goods, prices which haveoften doubled and which were formerly beyond their means. The White Paperpublished in connection with the budget in April 1943 came to the conclusionthat, apart from price increases deliberately brought about by higher indirecttaxes, the whole volume of consumption goods and services, including luxurygoods and other non-necessities, had not risen in price by more than 36 percent., against the rise of 28 per cent, registered by the official index.
A corresponding stability does not seem to have been attained withregard to wages. From the summer of 1939 to the end of 1941 the index ofaverage weekly wages (i. e. wage rates) had risen by about 25 per cent, andto the end of 1942 by 30 per cent., but the increase in earnings had been muchgreater, owing principally to overtime and night work and probably to a relativeincrease in piece-work. Statistics of actual earnings, collected by the Ministryof Labour at six-monthly intervals, showed that, for 6,250,000 workers employedin manufacturing industries, average earnings rose by 65 per cent, betweenOctober 1938 and January 1943, while the average level of rates of wages foran ordinary week's work, exclusive of overtime, increased by 26 or 27 percent.And for coal-mining (not included in the above figures) information collected bythe Ministry of Fuel brought out the fact that, from the last quarter of 1939 tothe corresponding quarter of 1943, for all classes of workers (including boys)engaged in or about mines, the average earnings per shift had likewise in-creased by approximately 65 per cent. In general, however, the figures fordifferent industries vary widely, the largest increase in earnings (by more than75 per cent.) being found in the metal, engineering and shipbuilding groups.
In Eire a further advance in prices reflected the great difficulties inobtaining supplies from abroad (the country possessing practically no merchantships of its own) but it was also to some extent connected with an increaseddemand due to the presence of American troops in Northern Ireland. Thecost-of-living index continued to rise, reaching, by the end of 1942, a point60 per cent, above the pre-war level, while the index of agricultural prices bythe same date stood at 75 per cent, above that level. In presenting the budgetfor the fiscal year 1942-43, the Minister of Finance estimated at £3.6 millionthe expenditure to be incurred on subsidising food and peat fuel in order tokeep down the cost of living.
In other countries of the British Empire, as in most parts of the world,local factors have assumed increased importance in the determination of pricedevelopments. In Br i t ish India commodity prices rose again sharply during1942, it being almost impossible in this vast country to introduce a compre-

hensive price control combined with an effective system of rationing, and thusto neutralise the excess of buying power engendered by the swollen warexpenditure. In Aust ra l ia a series of new measures fixed all prices for goodsand services at the level prevailing on 16th April 1943; in order to keep livingcosts down to that level, increased government subsidies were granted andthe purchase tax was reduced as regards clothes and other textiles. In NewZealand an arrangement had been in force for some years under which wagerates were allowed to rise if prices increased by more than 2.5 per cent. Acomprehensive stabilisation scheme was inaugurated in December 1942, withthe object of pegging wages, salaries, rents and the prices of farm products,the Prime Minister having declared that the national income had increasedby about £50 million since 1939, while the supply of consumption goods haddecreased by more than 40 per cent. — a disparity which made stricter controlof the price structure a matter of particular urgency.
The price movements in Australia and New Zealand are of very muchthe same proportions as those in Canada and the United States. Beforethe outbreak of war in 1939 there was an abundant production in all thesecountries and substantial stocks of foodstuffs, which it was difficult to sellat remunerative prices. For a while, the wartime hindrances to export tradeintensified the accumulation of surpluses ; but, as prices began to rise, thestocks constituted valuable reserves to meet the growing demand for domesticconsumption and war purposes. These countries had also large unusedresources of other kinds to draw upon and were thus able, at comparativelyshort notice, to increase their war production on a considerable scale.
In November 1941 a rather elastic system of price ceilings had been intro-duced in Canada, retail prices being brought down to the level prevailingfrom 15th September to 11th October 1941. Wholesale trade was not madesubject to ceilings, but it was expected that the prices fixed for retail saleswould react on the prices paid for goods bought wholesale and would ulti-mately affect producers. In certain cases the government intervened withsubsidies. In the shoe trade, for instance, the retail prices charged when thecontrol became effective were found to be about 15 per cent, above the levelobtaining from 15th September to 11th October; the producer and the retailerthereupon each undertook to reduce prices by 4 per cent., and the governmentagreed to pay the remaining 7 per cent, on condition that within a certaintime it should be relieved of this necessity by further measures of rationali-sation. The system was effective in slowing down the increase in prices, buta shifting of workers to highly-paid branches of the war industries and therecord crops of 1942, which exclusive of subsidies brought Canada's farmersa 20 per cent, increase in their income, added to the abundance of buyingpower in the hands of the public. To prevent a further rise in the cost ofliving and a consequent increase in wages, a number of retail prices werereduced by such means as subsidies, the removal of duties or taxes, anddirect selling at a loss through a government agency. The first reductionswere applied in December 1942 to tea, coffee, milk and oranges, and it was
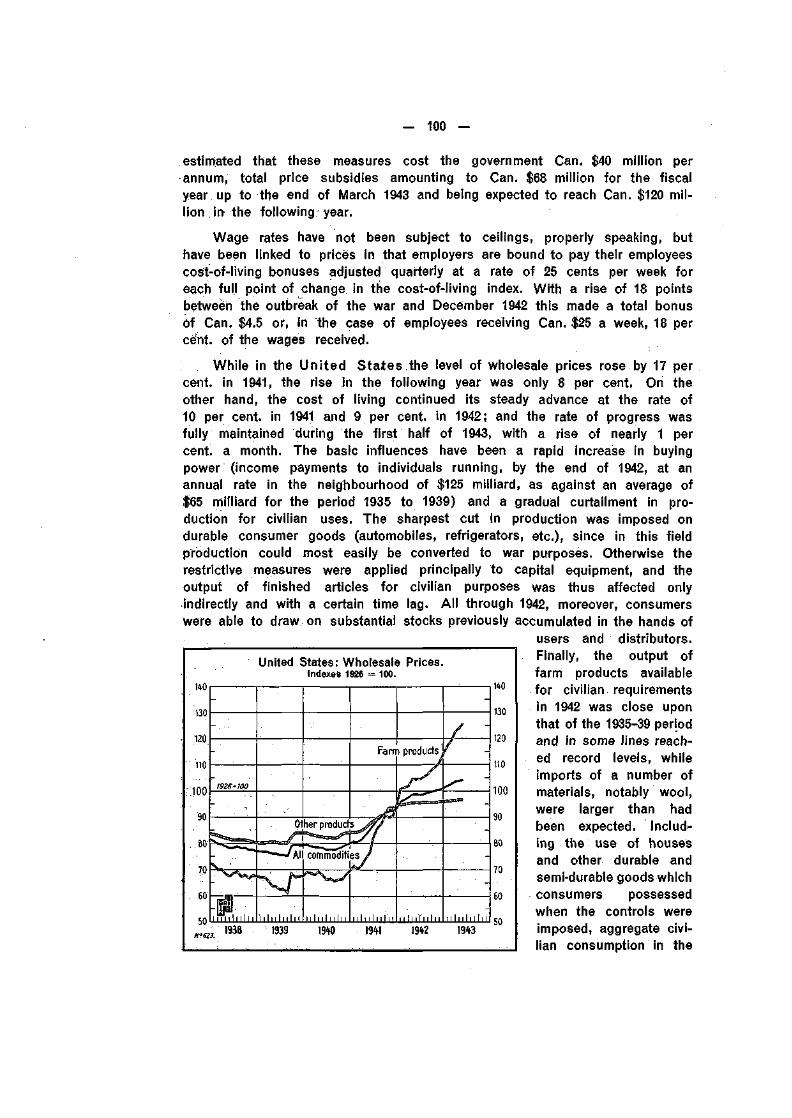
- 100 -
estimated that these measures cost the government Can. $40 million perannum, total price subsidies amounting to Can. $68 million for the fiscalyear up to the end of March 1943 and being expected to reach Can. $120 mil-lion ir> the following year.
Wage rates have not been subject to ceilings, properly speaking, buthave been linked to prices in that employers are bound to pay their employeescost-of-living bonuses adjusted quarterly at a rate of 25 cents per week foreach full point of change in the cost-of-living index. With a rise of 18 pointsbetween the outbreak of the war and December 1942 this made a total bonusof Can. $4.5 or, in the case of employees receiving Can. $25 a week, 18 percent, of the wages received.
While in the United States the level of wholesale prices rose by 17 percent, in 1941, the rise in the following year was only 8 per cent. On theother hand, the cost of living continued its steady advance at the rate of10 per cent, in 1941 and 9 per cent, in 1942; and the rate of progress wasfully maintained during the first half of 1943, with a rise of nearly 1 percent, a month. The basic influences have been a rapid increase in buyingpower (income payments to individuals running, by the end of 1942, at anannual rate in the neighbourhood of $125 milliard, as against an average of$65 milliard for the period 1935 to 1939) and a gradual curtailment in pro-duction for civilian uses. The sharpest cut in production was imposed ondurable consumer goods (automobiles, refrigerators, etc.), since in this fieldproduction could most easily be converted to war purposes. Otherwise therestrictive measures were applied principally to capital equipment, and theoutput of finished articles for civilian purposes was thus affected onlyindirectly and with a certain time lag. All through 1942, moreover, consumerswere able to draw on substantial stocks previously accumulated in the hands of
users and distributors.Finally, the output offarm products availablefor civilian requirementsin 1942 was close uponthat of the 1935-39 periodand in some lines reach-ed record levels, whileimports of a number ofmaterials, notably wool,were larger than hadbeen expected. Includ-ing the use of housesand other durable andsemi-durable goods whichconsumers possessedwhen the controls wereimposed, aggregate civi-lian consumption in the
United States: Wholesale Prices.Indexes 1926 = 100.
M III I I II939 1940 1941 19« 19«
140
130
120
110
100
90
80
70
60
50

— 101 —
spring of 1943 was not far below the pre-war level. There had, however, beena shift to increased food purchases, the amount actually expended on foodbeing fully 60 per cent, larger by the autumn of 1942 than in 1939. Because ofthis shift in demand, conditions became propitious for an increase in the priceof farm products and, that being the case, political pressure for higher pricesmade itself strongly felt. By the end of 1942 farm prices had reached 110 percent, of "parity" (i. e. the range of agricultural prices which gives the farmerthe same buying power in relation to non-farm products as he had in 1909-14).For wheat and maize the so-called "loan rates" were maintained at 85 percent, of parity in order to prevent an increase in the cost offodder for livestockand poultry, but for cotton, tobacco, rice and peanuts the loan rates earlyin October 1942 were raised from 85 to 90 per cent.
In conformity with the Emergency Price Control Act adopted in January1942, the Office of Price Administration proceeded in May of the same yearto stabilise the prices of a great number of goods at the highest level reachedin March. In October the control was extended, on the basis of the levelsexisting on 15th September, to other commodities, including agricultural pro-ducts, and a Director of Economic Stabilization was appointed. Quotas wereestablished for the purpose of restricting future deliveries for civilian con-sumption, which, according to a Presidential statement, would have to bereduced by 25 per cent, below the record year of 1941; plans for rationingmeat, cheese, tinned and dried fruits and vegetables, fats and oils weredrawn up and these were put into effect in the early months of 1943. Aftersome lively controversy, it was decided later in the year that governmentsubsidies might be paid for the purpose of keeping down the cost of living.
It is probable that the considerable increase which is found in the volumeof genuine savings to some extent reflects the influence of rationing and theinability to buy goods which are no longer available; but the current supplyof consumers' goods is still so considerable (and not merely in comparisonwith conditions in other countries) that rationing and similar forms of restrictioncan play only a minor rôle, greater importance attaching to direct limitation ofincomes, e. g. by wage control. Many more workers being employed in industryand a 50 per cent, increase being paid for overtime (i. e. for work in excess óf40 hours), the national wage-bill increased from $61 milliard in 1941 to $80 milliardin 1942. Hourly earnings in manufacturing industries advanced from 78.3 centsin December 1941 to 90.7 cents in December 1942, or by fully 15 per cent. Thejurisdiction of the War Labor Board was extended to all wage-scale changesfor workers not on farms, including changes agreed upon between employersand employees. The Board adopted the policy of rejecting requests entailingincreases in excess of compensation for the 15 per cent, rise in the costof living between January 1941 and May 1942 (in accordance with the "littlesteel formula", so called because it had been worked out as a fair solutionin a conflict involving the smaller steel companies). Further wage increaseswere, however, allowed in a number of cases: for instance, where previousincreases had been less than 15 per cent., or wages had remained at sub-standard levels, or it was considered necessary for certain industries to admit

— 102 —
improvements in wages essential to encourage the war effort. In April 1943further stabilisation measures were adopted, workers being, inter alia, prohi-bited from changing their employment in favour of better-paid work. With thefreezing of certain sections of the price structure, a more deliberate directionof economic life of the country became necessary in the United States, aselsewhere, the War Manpower Commission being charged with the task ofproviding manpower both for the armed forces and for essential industries.From the middle of 1939 to the spring of 1943 earnings per hour in themanufacturing industries increased by about 50 per cent. ; wage rates of farmlabourers, which have remained free of control and which in 1939 were at alow level, would seem to have risen by an even higher percentage.
In millions of bushels*
1934—1938, average19391940194119421943 (estimate)
UnitedStates
717751812946981835
Canada
263521540312593615
Total
9801,2721,3521,2581,5741,450
* 1 bushel of wheat = 60 pounds = 27.2 kilogrammes.
In North Amer ica the wheat harvest in 1942 was the best onrecord, with the single exception of the year 1928. Canada's large harvest
in 1942 was obtainedWheat Product ion from a smaller area than
in the United States and Canada. that sown with wheat ineither 1928 or 1941 andwas thus primarily due toa higher yield per acre.The carry-over of wheat on1st August 1943 was estima-ted at 680 million bushels,only slightly above the es-timate for the carry-over ofwheat in the United States
on the same date. Owing to a record consumption the carry-over in theUnited States rose very little between August 1942 and August 1943, inspite of the abundant harvest. At 1,013 million bushels, or some 80 per cent,above the normal level, the estimated figure of total wheat consumption reflectsan increased use of wheat in industry (manufacture of alcohol for wartimepurposes) and as fodder, particularly for pigs, the U. S. pig stock havingrisen from about 50 million at the beginning of 1939 to approximately 75 mil-lion at the beginning of 1943. For the United States, Canada, Australiaand the Argentine the total carry-over of wheat on 1st August 1943 isestimated at 1,750 million bushels. Compared with normal conditions (the
corresponding figure forCarry-over of Wheat. August 1938 was 280 mil-
lion bushels), this repre-sents a very large accumu-lated supply but, consider-ing the higher level ofconsumption of wheatfor purposes other thanhuman food, there seemslikely to be a continuous
Estimates
1938,1st August1939,1940,1941,1942,1943,
U. S. A. Canada Argen-tina
AustraliaTotal
of fourcountries
in millions of bushels
153253282385632650
25103300480424688
7223075
180198245
3443
10955
122165
284629766
1,1001,3761,748

- 103 -
Wheat Prices, In cents per bushel.
lulu nliiliiln nliilii il uhi nln iihiliiln M hi uhi M nliilii ululimi n n JilI929 I930 I93I I932 I933 193* 1935 1936 1937 1938 1939 1910 19*1 19« 19«
decrease in stocks until the end of the war. The change which hasoccurred is reflected in a stiffening of wheat prices both in Canada and inthe United States.
The maize crop in the United States was also at a high level in 1942,reaching 3,175 million bushels*, as compared with 2,673 million bushels in thepreceding year. In the Argentine, however, the severe drought caused excep-tional damage to the growing maize, entirely destroying the crop in someprovinces. As a result, the total production of maize in the Argentine fell from356 million bushels in 1941-42 to 76 million bushels in 1942-43, and stocks ofmaize, which had been estimated at 280 million bushels at the beginning ofMay 1942 and for want of storage room had then caused the authorities greatconcern, suddenly shrank to less than normal proportions. The price ofmaize in Buenos Aires, which had been down to 83 cents per bushel inNovember 1942 (government support alone preventing it from falling stillfurther), suddenly recovered to 98% cents per bushel at the beginning of 1943and 105 cents in April.
The Conference on Food and Agriculture held at Hot Springs in May-June 1943 dealt with questions of nutrition standards, the expansion of agri-cultural production and its adaptation to consumption needs, as well as themeans of improving distribution. It decided to set up new internationalmachinery in the form of an Interim Commission to function in Washingtonuntil such time as a permanent food organisation could be established. This
* 1 bushel of maize = 56 pounds = 25.4 kilogrammes.

- 104 -
Commission was charged with the promotion and coordination of researchand with the collection and dissemination of information ; it is to submit tothe individual governments recommendations for action along the lines agreedupon by the conference and, further, examine such questions as the develop-ment of agricultural resources, commodity arrangements, consumer cooperatives,land development and other subjects considered at the conference.
Price movements in various Latin Amer ican countr ies.
Percentage price increase(or decrease) during :
19392nd half
%+ 18+ 4
+ 38 0)
+ 2
+ 7+ 5
— 2
1— 2
— 1+ 1
+ 11+ 3
+ 4
- 7 0)
1940
%+ 2— 3
+ 15
+ 7
+ 5+ 10
g
— 6— 2
+ 1+ 1
+ 9+ 9
+ 2
+ 7
1941
%+ 37+ IO
+ 35
+ 12
+ 37+ 23
+ 4
+ 19+ 9
+ 14+ 14
+ 27+ 11
2
— 6
1942
%+ 13
0
+ 29
+ 5B
+ 23+ 26
+ 14
+ 40+ 31
+ 8+ 11
+ 19+ 9
+ 4
+ 16
June 1939to
Dec. 1942
%+ 86+ 12
+ 178
+ 28 P)
+ 90. + 77
+ 10
+ 55+ 38
+ 24+ 30
+ 82+ 36
+ 8
+ 9
Argentina:Wholesale prices . . . .Cost of living
Bolivia:Cost of living
Brazil:Cost of living
Chile:Wholesale prices . . . .Cost of living
Colombia:Cost of living
Costa Rica:Wholesale prices . . . .Cost of living
Mexico:Wholesale prices . . . .Cost of living
Peru :Wholesale prices . . . .Cost of living
Uruguay:Cost of living
Venezuela:Cost of living (foodstuffs)
0) June 1939 to January 1940. «December 1941 to August 1942. (3) June 1939 to August 1942.
More than in other parts of the world* the price movements in the variousLatin Amer ican countr ies have been a result of market forces. Govern-ment intervention through control or subsidies has exerted an influence onlyin particular sections of the national economies, typical cases being the coffeeagreement between fourteen countries, including the United States, and thesupport given to the prices of cereals in the Argentine. In both these casesthe object was to prevent too disastrous a fa l l in the prices paid to the pro-ducers, exports having practically ceased as regards the continent of Europeand being impeded by lack of shipping even as regards countries in theAmerican hemisphere. It is hardly possible to discern any uniformity in thetendencies revealed by the statistics of the Latin American countries. In somethe cost of living, mainly reflecting the price of food, has risen very little,while in others there are distinct signs of inflation produced by uncovereddeficits in the budgets.

- 105 -
A rgen t ine :movements of wholesale pr ices.
on base 1926 = 100
1939 August . . .December . .
1940 December . .1941 December . .1942 December . .
Agri-culturalproducts
7994738078
Non-agri-culturalproducts
109129138194224
Generalwholesale
prices
103122124170193
In the Argent ine the cost-of-living index showed no change on balancein 1942 but wholesale prices rose by 13 per cent, and, as the following tableshows, this was due to higher quotations for non-agricultural products (mostlyindustrial articles either imported or dependent for their production on im-ported raw materials).
The price level of agriculturalproducts at the end of 1942 wasbarely as high as in August 1939.Minimum prices were again fixedfor wheat, linseed and maize, thegovernment continuing to rendersupport to the farmers ; accordingto the report of the Banco Centralefor 1942 the amount borrowed bythe government for the financing ofthe crops totalled Pesos 242 millionin that year, as compared with
505 million in the preceding year, bringing the total of government outlay forthe purchase of crops to about Pesos 1,000 million. As already mentioned,the severe and prolonged drought in the harvest year 1942-43 (the worstfor over twenty years) suddenly altered the price situation for maize; thegovernment, fearing a shortage even for domestic requirements, prohibitedexports for the time being, in striking contrast to the policy previouslyfollowed. Prices for meat products had already risen by 10 to 25 per cent, in1942, no direct government subsidy being necessary since higher internal con-sumption absorbed three-quarters of the production. Several increases in wagerates were allowed, which, together with the lengthening of the working weekin industry, raised average earnings by 13 per cent, as compared with theprevious year. In the spring of 1943 the cost-of-living index showed a suddenadvance and the government then proceeded to fix maximum prices for anumber of consumption goods, including butter, potatoes, rice, flour, breadand cheese.
No statistics of general price movements have been available in Brazilsince the summer of 1942, the cost-of-living index then showing a rise of28 per cent, above the level of June 1939. In the hope of withstanding furtherincreases, a price stop was decreed for the retail trade on the basis of thequotations ruling on 1st December 1942; wages, which had been fixed in May ofthat year, were allowed to rise by 25 to 30 per cent, as compensation for theincrease in the cost of living during the period May to December. Trans-port difficulties had been experienced in obtaining the normal quantum ofwheat from the Argentine, shipping space being the key to the situation forBrazil as for other Latin American countries. In 1941 the United Statesdid not take over coffee up to the full quota previously agreed upon but,under a subsequent arrangement, undertook to purchase [from Brazil 12% millionbags out of the 1941-42 and 1942-43 crops whether or not shipping wasavailable. This arrangement helped to maintain prices in conjunction with

- 106 -
various domestic measures, including official loans up to 80 per cent, of the valueof coffee way-bills, and payments of Cruzeiros 2 per bag of coffee destroyed.
In the Far East there has been a great diversity of price movementsas between different areas. The most pronounced increase appears to haveoccurred in the territories utilising the Chungking yuan as their currency. Butalso in the huge and heterogeneous areas brought together by Japan underthe denomination of Greater East Asia the price variations have been con-siderable. Thus between June 1937 and June 1942, for instance, the level ofwholesale prices in Tokio rose by 49 per cent., in Hsinking by 112 per cent,and in Tientsin by 401 per cent. For Japan this unequal rise in prices createda series of difficult problems: on the one hand, it became necessary to findmeans of overcoming the resulting hindrances to trade and, on the other,to ensure that the Japanese price level should not be raised by expensiveimports from overseas. To achieve the desired results equalisation funds andspecial trading corporations were introduced, furnished with subsidies from theJapanese budget (for further particulars regarding these measures, see pages 51-52).
Another difficult problem was to prevent the wartime industrial expansionand the continuously increasing volume of buying power in the hands ofthe public from producing too precipitous a rise in prices on the domesticmarket. A price stop for certain important classes of commodities wasintroduced in September 1939; but, by the end of 1942, the indexes calculatedby the Bank of Japan showed an increase amounting to 33 per cent, forwholesale prices and 29 per cent, for the cost of living above the level pre-vailing in June 1939.
A new turn wasgiven to price policyin the spring of 1943when a number ofmeasures were takento stimulate the pro-duction of essentialgoods while prevent-ing a rise in the costof living by means of
government subsidies. The maximum prices under the system inaugurated inSeptember 1939 had often barely covered costs and frequently acted as a brakeon production ; under the new system Price Equalisation Funds were created andthese were in a position to take over certain goods from the producer at morethan the official maximum price, the margin covering the higher productioncosts. Thanks to the subsidies, the price charged to the consumer remained thesame. In addition, a system of premiums was introduced, designed to givea stimulus through the profit motive and thus to increase the efficiency ofproduction. Subsidies had already been granted some time before, in orderto encourage certain types of agricultural production ; the Minister of Financestated at the beginning of 1943 that for this purpose about Yen 400 million hadbeen provided in the current budget.
Price movements in Japan.
Percentage price increase(or decrease) during:
Wholesale prices . . . .Cost of living
19392nd half
0/To
+ 17+ 9
1940
%— 1+ 9
1941
0//o
+ 11+ 3
1942
%+ 3+ 2
June1939 toDec.1942
0/To
+ 33+ 29

— 107 —
As a result of the war, there are marked price divergencies, not onlybetween different countries, but also between different sections of the pricestructure within each country, as may be seen from the following table, givingfor a number of countries the percentage rise of different groups in thecost-of-living indexes.
Cost ofof different groups
l i v ing : Percentage increasefrom January-June 1939 to December 1942.
0) Increase compared to the average of 1939.
a rule, however,close to the pre
The headingsdo not cover exactlythe same items fromcountry to country,but differences inthis respect areprobably not toopronounced andcertainly do not al-together rule out acomparison. Cer-tain features arecommon to most ofthe countries con-cerned (includingGermany, where as
the retail prices for rationed commodities have been keptwar level).
Percentage increase(or decrease)
Bulgaria ('). . . .DenmarkFinlandGermanyHungarySwedenSwitzerland . . .United Kingdom .U.S. A
Food
+ 135+ 57+ 89+ 6+ 73+ 42+ 61+ 21+ 41
Heatingand
lighting
+ 50+ 112+ 123— 2+ 31+ 67+ 33+ 33+ 8
Clothing
+ 112+ 84+ 127+ 32+ 78+ 72+ 87+ 82+ 25
Rent
0/To
+ 35+ 7+ 12
00
+ 20
+ 2+ 4
Others
+ 42+ 47+ 81+ 6
(2)+ 41
P)+ 53+ 12
Total
+ 101+ 56+ 81+ 8+ 52+ 42+ 46+ 30+ 22
(?) Not available.
In six out of the nine countries covered by the table the cost ofc lo th ing shows the highest rise of any group, but even in the three remain-ing countries, Bulgaria, Denmark and the United States, the increase is largerin the cost of clothing than in the general index number. The pronouncedrise in the price of clothing reflects a scarcity of textile materials (wool andcotton) and the necessity of resorting to substitutes, of which the cost ofproduction is naturally higher. Several countries have even issued detailedregulations to restrain prices in the market for second-hand clothes.
Rents have, with few exceptions, been kept down almost to the pre-warlevel, an effective price stop being imposed by the authorities, who cancontrol the supply price of houses already built and, as regards the buildingof new houses, have usually made construction subject to a licence, in order toreserve financial resources, material and labour for the prosecution of the war.The ban upon rent increases has been facilitated by the cheap-money policy,under which interest charges on mortgage debts, etc. have remained practicallyunchanged (which was not the case during the 1914-18 war). But other chargeshave undoubtedly increased, and in several countries the question is underdiscussion to what extent rents might be raised in order to meet the increasein daily expenses and the higher maintenance costs which will arise afterthe war. Here and there some attention has been given to the difficult problemof how to re-establish a free rent market after the war, so that private buildingof houses can be set going once more (see Introduction, pages 36-37). The

- 108 -
degree of adjustment which would then have to be made in the existing rentlevel would vary from country to country, according to the extent to whichthe general price level still exceeded the pre-war mark after things had settleddown again, with one proviso, however: there are evidently great possibilitiesof reducing building costs by the introduction of new technical methods(such as pre-fabrication); -and, in so far as these possibilities are fully utilised(which often means the scrapping of certain trade-union and other regulations),a market equilibrium for rents may be found at a lower level than wouldotherwise be necessary.
So long as the war goes on, the authorities endeavour to establish aprice harmony suited to wartime conditions. On the one hand, they mustensure that essential production is not discouraged by prices too low incomparison with other lines of production and, on the other hand, they mustremember that the prices paid determine the basic distribution of income andthat — not least in wartime — considerations of justice and of social orderare of primary importance. Much of the social tension towards the end ofthe 1914-18 war can without doubt be traced to extravagant movements ofwholesale and retail prices, bringing high profits to some and penury toothers. The strict control which a number of governments have this timebeen able to impose, together with the higher taxation of war profits and themore effective aid granted, for instance, to the families of men called up formilitary service, constitute important elements of social, and consequently ofeconomic, stability. Some sacrifices must, even so, be accepted and, whenthe reasons are understood, they are usually borne without strong opposition.Industrial workers have (in some cases with astonishing equanimity) acceptedfar-reaching price rises designed to stimulate agricultural production and togive farmers a fairer remuneration than they had been able to obtain beforethe war. Serious discontent seems only to arise when conditions of fairnessare disregarded ; moreover, if that happens, it is likely that a violent reversalwill set in when peace comes; for a particular branch to obtain a very pro-nounced rise in prices would probably be unwise even from its own pointof view.
Many different influences will affect agr icu l tu ra l pol icy after this war:in some respects this policy may be found to reflect the degree of collaborationestablished within certain groups of countries and in the world as a whole;efforts may also be made to lower the cost of food and thus to improve realwages without diminishing export capacity by a rise in costs. The difficultieswhich will be encountered in finding a solution of these problems will no doubtvary from country to country. A lowering of agricultural prices may for instancebe facilitated by cost reductions when it once more becomes possible to importfodder from abroad. The fact that during the present war farmers have not onlyabstained from increasing their indebtedness but have even repaid debts shouldhelp to ensure a greater flexibility in carrying through cost and price adjust-ments. In North America the demands of mobilisation and the needs of the war

— 109 —
industries have drawn young men from country districts (in the United Statessome 3 million had thus left the farms by the beginning of 1943), and manyof them may never return to their old occupation ; but a permanent reductionin the number of agricultural labourers, whatever difficulties it may cause toindividual farmers, would seem to constitute a certain safeguard against anearly recurrence of agricultural production in excess of current demand. Anothersafeguard in the same connection may be found in a raising of nutritionstandards, which would widen the consumption of basic food products. Theseand other developments may help to alleviate the strain of adjustment; but,even so, any proposed or threatened changes will probably meet with muchresistance, since, apart from the question of daily bread, various aspects ofthe traditional economic and social structure are usually affected by changesin agricultural policy.
The following table shows the great difference which exists between thewheat pr ices on the continent of Europe and in the overseas countries.
Wheat pr ices.Official prices per 100 kg.
Countries
ArgentinaCanada (Winnipeg) (2)Great Britain . . .(5)U.S.A. (Chicago) ODenmark <f)BelgiumSwedenHollandGermanySlovakia (•>)Norway («)Spain («)FranceHungary (*)Bulgaria (•>)Serbia («)Italy . .(«)Switzerland . . . .(<)Roumania . . . .TurkeyCroatia (<)
1942-1943
in nationalcurrency
units
m$n 6.75$ 2.95£ 1.579$ 4.34D.Kr. 28.-Fcs 200.—S.Kr. 27.—FI. 13.625RM 21.—Ks. 250.-N.Kr. 35.—Pts. 84.-Fcs 375.—Pengö 30. —Leva 620.—Din. 600.—Lit. 175.-Fcs 51.50Lei 2,200.—£T 20.- (?)Kunas 600.—
InSwiss francs
(')6.30
11.3927.3218.6625.2227.6827.7231.2836.3337.2534.4033.2137.5031.2633.1151.9039.6951.5050.3866.8051.72
1943-1944
in nationalcurrency
units
m$n 6.75$ 3.71£ 1.480$ 5.29D.Kr. 28.—Fes 200.—S.Kr. 27.50FI. 13.875RM 21. -Ks. 250.—N.Kr. 38.—Pts. 94-104.—Fes 410.—Pengö 40.—Leva 820.—Din. 600.—Lit. 235-310.-Fes 53.50Lei 2,600.—£T 20.-Kunas 1,200.—
InSwiss francs
0)
6.6314.3825.6022.7525.2227.6828.2331.8536.3337.2537.35
37.16-41.1141.—41.6843.7951.90
53.30-70.3053.5059.5466.80
103.44
Percentageincrease
(in nationalcurrency
units)
0%+ 26— 6+ 22
00
+ 2+ 2
00
+ 9+ 12-24
+ 9+ 33+ 32
0+ 34-77
+ 4+ 18
0+ 100
0) Converted at official rates for Argentina, Canada, Great Britain, Sweden, U.S.A. and for the other countriesat clearing rate. (2) June market rate. (3) Average of ten weeks ending October 9th.
(") Price paid to producers. (5) This price occasionally raised to £T 26.
As mentioned in several sections of this Report, a number of govern-ments spend large amounts on subsidies designed to keep down the costof living in spite of the high prices paid to domestic producers or forimports. When, with the return of peace, present rations are increased andrestrictions eventually removed, a maintenance of the system of subsidisingmay entail increased costs for the Treasuries, especially in countries with alarge domestic production, while countries importing a substantial part of

- 110 -
their food supplies may benefit from lower prices abroad and, in particular,from lower freight rates. In framing its wartime policy, Switzerland has grantedsubsidies only in respect of imported commodities, in order to be in a positionto discontinue the payment as and when the foreign goods can be procuredmore cheaply.
Various adjustments of wages may also prove necessary in certaincountries to restore a proper balance both in the domestic price structureand in relation to other countries. After the experience of the twenty yearsbetween the two wars, it is a commonplace to state that there must besome degree of correspondence between cost and wage levels and exchangerates. One difficulty in dealing with these problems internationally arisesfrom the fact that increases in "wages" may mean different things. In theUnited Kingdom, for instance, from the summer of 1939 to the end of 1942there was an increase, amounting to 30 per cent., in average wage ra tesof all workers for a full week's work, exclusive of overtime, and at thesame time an increase in average e a r n i n g s (taking into account the longerhours worked, higher overtime pay, etc.) amounting to fully 60 per cent. Eitherof these percentages may be of importance. The volume of buying powerin the hands of the public, which in a large measure determines the magnitudeof current demand (and thus becomes of importance if it is a question ofpreventing prices from falling), is closely related to the figure for earnings(and perhaps even more to a figure calculated in the Bulletin of the Instituteof Statistics, Oxford, giving the rise in average earnings, less income tax,as 40 per cent.). For the determination of the correct exchange rates betweendifferent countries, average wage rates may, however, be more truly relevant,since they measure by far the most important element in the cost of produc-tion for the economy as a whole, besides representing, in the cost and pricestructure, the factor which is most resistant to changes. In Sweden theavailable statistics furnish figures giving wage rates which seem, on the whole,to be comparable with the British figures, and which show an increase ofapproximately 27 per cerit. between the summer of 1939 and the end of 1942.In the United States, however, there are no general statistics of wage ratescorresponding to the British or Swedish data; but there is an index of "fac-tory average hourly earnings", which naturally takes into account higher payfor overtime and also reflects increased efficiency, and therefore may registerhigher pay even when piece-work rates, for instance, have not changed. Fromthe summer of 1939 to the end of 1942 the index in question shows a riseof 40 per cent.
Attempts have sometimes been made to find a formula in the fieldof foreign exchanges for the calculation of "correct parities" but it isdoubtful whether a universally applicable formula can be found. So muchis certain, however: in any such calculation a comparison between relativewage levels will always be an important element. It would therefore be ofgreat help if those concerned with national and international labour statisticswould arrange for a compilation of wage statistics on a uniform basis for

- 111 -
the various countries, taking account of different aspects of the wageproblems. In doing so they would provide material of great value not onlyin their own field but also for the monetary discussions which will benecessary after the war.
It seems to be generally agreed - at least in theory - that, in order toarrive at a basis for a sustained recovery after the war, a proper balance mustbe established in the domestic price and cost structure of the differentcountries and in their relations with each other. But there can be little doubtthat it will often prove hard in practice to put through the necessary adjust-ments in rents, agricultural prices and wages, since these adjustments willusually affect the real income of some groups of persons ; and those at whosecost the adjustments would be made will not easily be persuaded that asubsequent improvement in the level of production will compensate them forwhatever temporary reduction of their income would be required.

- 112 -
I. PRODUCTION AND MOVEMENTS OF GOLD.
In two respects the year 1942 will remain noteworthy in the history ofgold: after a slight decline in 1941 the output of gold fell sharply in comparisonwith the previous year and for the first time since 1931 there was noincrease in the monetary gold stock of the United States.
From 1930 to 1940 the world output of gold had risen at an average rateof 7 per cent, per annum, or more than twice as fast as in the period 1860-1914.The turn of the trend came in 1941 and in the following year the output fellby about 7 per cent, in those countries for which reliable statistical informa-tion is still available (about three-quarters of the gold production of theworld); the rate of decline, however, varied greatly from one area to another,from 1.8 per cent, in South Africa to 22 per cent, in the United States. Thevolume of production was increasingly affected by higher working costs,shortage of labour and difficulties in obtaining materials and machinery; ina number of countries (and notably the United States, Canada and Australia)an additional factor came into play, viz. government intervention to cur-tail the mining of gold in order to set men, materials and machinery free forthe all-important war production. Gold has, however, continued to be acceptedas a universal means of payment and has held its own in this respect moresuccessfully than in the last war; there is now no example of a gold-refusalpolicy similar to that applied intermittently by Holland and Sweden in the years1916 to 1918.
From 1934 to 1940 the monetary gold stock of the United States increasedby an amount equivalent to the whole current output of gold, which for theseven years may be estimated at $8,500 million, plus $6,500 million representinggold out of hoards and shipments from reserves of central banks. In 1941only one-half of the newly-produced gold was taken by the United States and
in 1942 the U.S. goldstock actually declinedby $11 million. Still, atthe end of the year,the United States pos-sessed $22,700 millionor about 70 per cent,of the total monetarygold stock of theworld. Gold continuedto be sold to theU. S. Treasury fromdomestic production($126 million in 1942)and from neighbouringcountries, especially
United States: Gold held under Earmarkby Federal Reserve Banks for Foreign Account,
in millions of dollars.3500
3000
2500
2000
1500
1000
500
3500
3000
2500
2000
1500
1000
500
. y//?w//y//////7j/////77>*- i | -—**77X////////Y///////!('////.V/Y///'S/W A,5!l 1931 1932 1933 1934 1935 1936 1937 1938 1939 19W 19*1 19« 19«

- 113 -
Canada and Mexico. Since the gold reserves of the United States declinedduring the year, more than all the gold newly acquired went to offset thesales of gold and, in particular, the increase of $458 million in the amountof gold earmarked for account of foreign central banks and governments. TheSwiss National Bank and the Sveriges Riksbank converted a considerable partof their dollar holdings into gold, the former increasing its gold reservesin 1942 by $159 million and the latter by $112 million. Brazil, Cuba and someother Latin American countries are also known to have increased the amountof gold held by them under earmark in the United States.
The total of gold produced in 1942 outside the U.S.S.R. and the areasdominated by Japan would seem to have been between $1,000 and 1,100 million.Of this total some $458 million are accounted for by earmarkings in the UnitedStates. The South African Reserve Bank increased its gold holdings by$268 million — probably all held in the vaults of the bank. Sufficient informa-tion is not available to indicate the destination of the remaining $300 to400 million but it is likely that a substantial part of it was absorbed by themonetary authorities in the gold-producing areas, as was also probably thecase with regard to most of the gold produced in the U.S.S.R. and in theterritories dominated by Japan.
1. THE SUPPLY OF GOLD.
The table on the following page shows the output of gold in the mainproducing areas in so far as relevant statistics are available or reliableestimates can be made. For the world as a whole a figure is also tentativelygiven, but, being partly based on estimates, it is subject to a fairly widemargin of error and merely indicates the general tendency of the currentgold supply.
The output of gold in South A f r i ca during 1942, although below thelevel of the previous year, was still somewhat higher than in 1940, there beingno abrupt change in the conditions of production or the policy of the govern-ment. The South African economy has been closely dependent for over fiftyyears on the fortunes of the gold industry. In spite of efforts made to attaina greater variety, the country's output of minerals is still largely identicalwith the Transvaal gold output; of total commodity exports amounting to£160 million in 1941 not less than £119 million was gold; nearly 70 per cent,of the profits of the gold mining companies are absorbed by taxes and othercontributions (including some payments to the government, which in theaccounts of the companies are counted among working costs), and of budgetrevenue in the financial year 1941-42 the mining industry contributed directlyover 30 percent., and still more indirectly. At the meeting of the Chemical,Metallurgical and Mining Society in Johannesburg in September 1942 theFinance Minister declared that he regarded the maintenance of gold productionas essential not only to South Africa's war effort but also to that of the

— 114 —
WorldGold Production
Union of South Africa . .CanadaUnited States 0)AustraliaMexicoBritish West Africa . . .RhodesiaColombiaBritish IndiaNicaragua (3)ChileRoumania
TotalOther countries (4) . . . .
of which :U.S.S.RPhilippine Islands . .KoreaJapan
TotalWorld Production . .
Value of TotalWorld Production . .
1929 1932 1939 1940 1941 1942
In thousands of fine ounces10,4121,9282,056
42665220856248
364122671
16,7652,427
707152138335
19,192
11,5593,0442,219
7105842935812483301438
11019,7304,524
1,938230276402
24,254
12,8225,0954,6211,636
84484080057031890
325154
28,11510,872
4,500990975850
38,987
14,0475,3114,8631,653
883930830632290140341131
30,05110,649
4,0001,1401,0250
925 O
40,700 (i)
14,3865,3284,7801,458
80092679465528619326696
29,96810,032
*1,196
*
40,000 (4)
14,1214,8003,7411,216
850 (2)83576360526022118282
27,6768,824
*•**
36,500 («)
in millions of dollars (5)672 849 1,365 i ,425 m 1,400 m 1,280 (<)
(1) Without Philippine Islands. (?) Estimated.(3) Estimates for 1939 to 1942 (production being taken to equal 90 per cent, of the country's gold exports).C) Partly estimated. (5) Dollars of present-day value of $35 per ounce of fine gold. * Not available.
United Nations. "There are people", he continued, "who urge that we mustcurtail the production of gold and intensify our war effort, but I believe thewar effort will decrease if this is done. The maintenance of gold productionhas a stabilising effect not only on our economic affairs but also in relationto our politics. Because we have not got a homogeneous public opinion onnational matters we are much more sensitive to economic shock than othernations would be".
The difficulties to which the decrease in the gold output is attributablehave arisen from the following two factors — both connected with the war:scarcity of materials and reduction in the number of workers available. Inorder to overcome these difficulties the mining companies have adopted aconcerted policy. Thus, through the intervention of the Transvaal Chamberof Mines, the Rand mining companies agreed towards the end of 1941 topool their stores of scarce materials (steel, other metals, rubber, etc.), thestores department being charged with the distribution of these materialsaccording to the production programmes and certain advantages being accordedto companies with insufficiently developed reserves of ore. Under the sameagreement, development work was generally curtailed from the beginning of1942 and in this way certain economies were effected, among them a reducedconsumption of mining stores. As the chairman of one of the larger com-panies pointed out, however, there was bound to be a deterioration in theore position, which would have to be rectified at some future date, and workingcosts would then rise accordingly. The savings due to the curtailment ofdevelopment work have not been applied to an increase in dividends or higher

— 115 —
allocation to financial reserves but have been used to enable still poorer oresto be mined. In 1942 the average gold content of ore crushed was reducedto the lowest figure ever recorded: 4.053 pennyweights compared with 4.127pennyweights in the previous year and about 6% pennyweights before theincrease in the South African gold price at the end of 1932, when, after adelay of fifteen months, the South African pound followed the depreciationof the English pound.
The mining industry has also taken measures to assist in the war effort.Up the autumn of 1942 7,000 European employees had been granted permissionto join the forces, with half or quarter pay according to whether they haddependents or not. Other employees have been released for essential warwork, e. g. in base metal mines and collieries, and these mines have alsobeen supplied with native labour; in addition, munitions are manufactured in .the workshops of the companies. At the end of 1942 the Rand mines employed299,000 native workers, compared with 376,000 at the end of February 1942 —the highest figure ever reached. In spite of the fall in the number of workersemployed, the quantity of ore crushed was 66.98 million tons in 1942 — onlyslightly less than the record figure of 67.26 million tons for the previous year.Working costs remained unchanged per ton crushed but rose per ounce offine gold from 102s.6d. in 1941 to 104s.4d. in 1942, the gold price being, asbefore, 168s. (less certain so-called realisation charges). The total grossprofits of the mining companies fell from £45.9 million in 1941 to £43.7 million in1942 and the amount paid as dividends from £19.4 million to £17.5 millionrespectively, dividends being reduced at about the same rate as profits.
The following table shows the fluctuations in the South African goldproduction during and after the 1914-18 war and in the present war.
In the war of1914-48, even morethan in the presentone, the gold indus-try was affected byincreased costs ofmining supplies, acuteshortage of labourand restrictions on theconsumption of explo-sives. After a spurtin the second year ofthe war the gold out-put began to fall —
just as it did this time — during the third year. The introduction of a premiumon gold in 1919, though it saved many mines from closing, did not preventa continued decline in output until 1922, when it was 20 per cent, below thepre-war level. That level, however, thanks to falling commodity prices andthe consequent reduction in working costs, was regained and even surpassedin 1923. From then onwards the output of gold remained fairly stable up to
Gold Product ion in South A f r i ca .
Year
19131914191519161917191819191920192119221923
Inthousandsof ounces
8,7988,3949,0949,2979,0188,4188,3318,1588,1297,0109,149
Index:1913 = 100
70095
1031061039695939280
104
Year
19381939194019411942
.
Inthousandsof ounces
12,16112,82214,04714,38614,121
.
Index:1938 = 100
700705116118116

- 116 -
Gold Production in South Africa and United States.Monthly production In thousands of fine ounces.
WOO
1200
.800
1929, by which year it had risen to only 10,412,000 ounces. For the world as awhole, gold production was likewise comparatively stationary from 1923 to 1929,rising at an average rate, for those six years, of only 1.3 per cent, perannum - and then came the great advance from 1930 to 1940 with an averagerise per annum of 7 per cent., as mentioned at the beginning of this chapter.
In 1941 Canada and the United States, the two largest gold-producingareas after South Africa, had together a gold output of 10.1 million ounces,or 70 per cent, of the 14.4 million ounces extracted in that year from the South
African mines. In thecourse of 1942 theproduction of goldwas largely curtailedin both Canada andthe United States.At first, the curtail-ment was the resultof general trends andmeasures: the volun-tary transfer of work-ers to war industries,the calling-up of mento the armed forcesand the directiongiven to productionby the system ofpriorities in the allo-cation of materials
and machinery; but there was still a shortage of workers in non-ferrousmines and towards the end of the year more direct methods were applied.On 8th October 1942 the War Production Board in Washington publisheda decree, under which, within one week, i.e. by 15th October, the gold mineswere to stop breaking new ore and within sixty days, i.e. by 7th December,all operations at the mines except maintenance work were to cease. The ordercovered all mines in the United States and overseas possessions, includingAlaska. There were only two exceptions: (i) mines which, owing to theiroutput of strategic minerals, had been given a preference rating and (ii) mineswhich in 1941 produced less than 1,200 tons of commercial ore (in the caseof lode mines) and treated less than 1,000 cubic yards of material (in thecase of placer mines). For these small mines a future production limit wasfixed at 100 tons of ore or 100 cubic yards of materials a month. It wasfurther provided that any person who considered that the order would subjecthim to exceptional and unreasonable hardship might appeal to the WarProduction Board. Over one-half of the American gold output has in recentyears been derived from mines producing more than 1,200 tons of ore a year;and mines producing gold as a by-product only — chiefly copper mines —supplied about 10 per cent, of the gold output.
I I I 11 I I 11 I I
1400
1200
1000
800
600
200
1939 1940 1941 19«

- 117 -
In Canada also, gold production was deliberately cut down, the Ministerof Labour declaring in October that it was the intention of the govern-ment gradually to transfer 10,000 gold miners to base-metal mines and warindustries.
These measures, entering into force only towards the end of the year,could not produce their full effect before 1943. In this connection it shouldbe observed that in the past the production figures for the United Statesincluded the new gold received from the Philippine Islands. Since receiptsfrom these Islands ceased near the end of 1941, statistics given in the formhitherto customary (e. g. in the Federal Reserve Bulletin) show a decline inthe gold production of the United States from $209.2 million in 1941 to$130.9 million in 1942, i.e. by as much as 38 per cent.
In a number of other gold-producing areas also, production has beencurtailed by government measures and by the difficulty of obtaining a suffi-cient supply of labour, materials and machinery. From 1940 to 1941 goldproduction in Aust ra l ia was reduced by 12 per cent, and between 1941 and1942 by 17 per cent. In the spring of 1943 the Colonial Office in Londontook steps to curtail production in the Crown Colonies, a scheme being
put into effect in West AfricaEstimates of Wor ld Gold Produc t ion . by which production was
concentrated in the handsof seven large companies.As a result of the relativelysustained production in SouthAfrica, however, the shareof the British Empire in thetotal world output rose in1942, as it had done everyyear since the beginning ofthe war.
It should be remembered that the percentages given in the table canonly be approximately correct since little is known — especially for the year1942 — about the trend of gold production in the U.S.S.R. and in the FarEast. It may, however, be surmised that in both these areas scarcity ofmachinery and tools has made itself felt and that gradually the supply ofworkers has also been reduced, even though, with the exception of the Philippines,the gold-producing centres in Asia are situated far from the actual battlefields.In March 1943 the Manchukuo Government and in the following month theJapanese Government made it known that gold production would be suspendedfor the duration of the war, except in so far as it was linked to the productionof other metals required for the war effort, in particular copper.
Although curtailment of production is the general rule, some countrieshave still continued to encourage the output of gold. Thus, in December 1942the National Bank of Roumania increased the premium on gold, with retro-
In thousandsof fine ounces
Total for the world . . .British Empire
Percentage share of theBritish Empire . . .
Percentage share ofSouth Africa . . . .
1939
38,98722,475
58
33
1940
40,70024,000
59
35
1941
40,00024,150
60
36
1942
36,50022,500
62
39

- 118 -
active effect from 1st January 1942. The basic price of Lei 211,111 per kilo-gramme was not changed but the maximum premium allowed was raised toLei 656,389 per kilogramme instead of Lei 318,889. The difference betweenthe official and the real gold price is borne by the government.
Generally speaking, monetary authorities have sought to strengthen theirreserves of gold, having found that it still offers advantages compared withother means of payment for the acquisition of goods and settlement ofbalances. To that end they have cut down deliveries to arts and indust r iesmaking it obligatory for purchasers of gold and silver objects to furnish anequal amount of the metals in some other form (scrap, coins, etc.). In manycountries there are signs of an increased demand for objects made of gold,silver and platinum, as well as for jewels, indicating a flight into real values.The purchase of bars or coins for hoarding purposes has, with few excep-tions, been prohibited and is, as a matter of fact, being suppressed withconsiderable success.
2. MOVEMENTS OF GOLD.
The table on the following page shows the changes which occurred during1941 and 1942 in the reported gold reserves of central banks and governments.
In 1942 there were two important new features compared with previousyears: first, the appearance of the United States in the group of countrieswhich, on balance, had their gold holdings reduced and, secondly, the move-ment of South Africa to the top of the table as the country with the largestincrease. Switzerland and Sweden continued to add to their gold reserves,followed by Roumania, Brazil, Venezuela, Turkey, etc. Among the countriesin the table there is no great power shown as having increased its goldreserves during 1942, but it may be presumed that both the U.S.S.R. andJapan absorbed domestic output into their reserves.
In the foreign trade of South A f r i ca gold normally plays the rôle ofa commodity the export of which is needed to pay for the country's importsand to meet other charges in the balance of payments. In the course of thewar South Africa has, however, accumulated substantial credit balances abroad,which have only partly been drawn upon to repatriate securities. Considering,inter alia, the increased transport risks, there was no immediate call to speedup exports of gold. For the time being the current gold output has beenacquired by the South African Reserve Bank, of which the second table onthe next page gives the main balance-sheet items at the end of 1938, 1941and 1942 respectively.
In the balance sheet of the South African Reserve Bank acquisitions ofgold are booked at the old standard price of £3.17.10% per fine ounce underthe heading "gold coins and bullion", while the difference between the actual

- 119 —
South A f r i can Reserve Bank.
End-of-year figures
Assets:Gold coins and bullion . .Investments and all other
assetsLiabilities:
Notes in circulation . . . .DepositsOther liabilities
Total of the balance sheet .
1938 1941 1942
in millions of £SA
27
25
19294
52
44
61
30714
105
77
76
40108
5153
price paid to the mines andthe old price is included under"other assets". The increasein the assets of the balancesheet during 1942 seems tobe wholly a result of largergold holdings, which arematched on the liabilitiesside by an increase of£ S.A. 10 million in notes and£ S.A. 37 million in deposits.
ReportedGold Reserves
Group 1: South Africa . . .Switzerland . . .SwedenRoumania . . . .BrazilVenezuela . . . .TurkeyColombia . . . .Chile
CanadaBelgium (2). . . .Bulgaria
Total
Group 2: Argentina . . . .Bohemia and
MoraviaBritish India . . .Denmark
FranceGermanyHungary . . . . .New Zealand . . .PortugalUnited Kingdom (3)
Total
United States» .Uruguay
HollandTotal
TotalReported Reservest5) .
End of1940
End of1941
End of1942
Lossgain
during 1941
-)of+)
during 1942
In millions of dollars (at $35 per fine ounce)
3675021601585129881730207
73424
2,187
35358
2745252
2,00042402423591
2,978
4721,995
90140617
22,889
29,000
3666652231827041921630215
73424
2,469
35461
2744452
2,00042402423591
2,974
4722,737
100235575
23,694
30,000
63482433524111568
1142536256
73525
3,183
35461
2744452
2,00042402423591
2,974
3922,726
89200 (')506
23,560
30,500
— 1+ 163+ 63+ 24+ 19+ 12+ 4
0+ 1— 2
00
+ 282
- C
OO
OO
OO
OO
OO
OO
— 4
0+ 742+ 10+ 95— 42+ 805
+1,000
+ 268+ 159+ 112+ 59+ 45+ 27+ 22+ 9+ 6+ 4+ 1+ 1+ 1+ 714
o o
oo
oo
oo
oo
oo
0
— 8— 11— 11— 35 C)— 69— 134
+ 500
Note: These are "reported gold reserves". Additional gold Is known to be held by several central banks, Interalia those of the Argentine, Portugal and Spain.
(') Partly estimated. (!) Not Including $17 million held by the Treasury.(3) Not including gold held by the Equalisation Fund, i.e. $292 million in December 1940 and $151 million
for 1st September 1941.f>) Not including gold held In the Exchange Stabilization Fund: $48 million in December 1940; $25 million
in December 1941 and $7 million in September 1942.(-•) Partly estimated and including other countries also (but not the U.S.S.R.).

— 120 —
End-of-month figures
Swiss National Bank Sw.fcs1940 December1941 „1942 „ . . . . . .
Sveriges Riksbank S.Kr.*1940 December1941 „ . . . . . .1942 „ . . . . . .
Gold ForeignExchange Total
in millionsof national currency units
2,1732,8793,565
672938
1,407
99767963
839873640
3,1703,5583,628
1,5111,8102,047
* At current quotations for gold and foreign exchange.
Recent increases in the gold holdings of Swi tzer land and Swedenhave been partly due to a net gain of monetary reserves and partly to con-version of foreign exchange — largely dollars — into gold.
During the year 1942 gold and foreign exchange holdings of the SwissNational Bank rose by Sw.fcs 70 million and in the first six months of thefollowing year by a further Sw.fcs 184 million, so that within eighteen monthsthe monetary reserves had risen by Sw.fcs 254 million. This increase — all inthe form of gold — may be taken mainly to reflect a surplus in the balance
of payments with theMonetary Reserves countries in the dollar and
of Switzer land and Sweden 1940-42. s t e r | i n g a r e a s A t p r e s e n t
the balance of paymentsof most countries has tobe split up into differentcompartments for differentmonetary areas, sometimeseven for different countries,there being only limitedpossibilities of employingbalances in one compart-ment for settlement withcountries in another com-
partment. For Switzerland — a country for which information is available toillustrate the general rule — the classification would seem to be as follows:
A. Wi th in the cont inent of Europe.(i) Germany, Italy and most of the occupied countries,(ii) The Balkan countries.(iÜ) France (a special clearing arrangement having been concluded with this country).(iv) Portugal, Spain and Sweden.
B. Outs ide the cont inent of Europe.(i) The dollar area,(ii) The sterling area.(iÜ) The Argentine and Brazil (with which countries certain special problems arise).
In 1942, Switzerland had an active balance in relation to Germany, Italyand the occupied countries and to the dollar and sterling areas but a passivebalance in relation to the Balkan countries and to Portugal, Spain and Sweden.The Swiss National Bank mentioned in its last annual report that "the passivebalances have to be settled for the most part in gold since the dollar canno longer be utilised to the former extent as an international means ofpayment. Gold operations between the National Bank and other banks ofissue have from time to time been fairly substantial; Switzerland has to payin gold not only for imports of commodities but also for transport".
Up to the summer of 1942 dealings in gold coins had been freely per-mitted on the Swiss market, prices fluctuating considerably, as may be seenfrom the following graph.

- 121 —
Gold Prices in Switzerland.Market prices given per kilogramme of fine gold, In Sw.fcs.
7000
6500
6000
5500
5000
Price of U.S. Eagles
Price of 20 francs-J-GpJd_Co]_n i
Price of Gold Bars_I
Gold Price in U.S.A.Converted in to Swiss Francs
-. t . . t . . I . , i19«
700C
6500
6000
5500
5000
4500
In August1942 the SwissNational Bank con-cluded a gentle-men's agreementwith the otherbanks concern-ing transactionsin gold, butthis agreementdid not producethe desired ef-fect, partly be-cause consider-able dealings tookplace outside thebanks. At theinstigation of theNational Bank,
the Federal Government regulated trade in gold by a decree of 7th December1942, under which the right to trade in gold coins or gold bars was limitedto specially licensed firms, and imports and exports of gold required a permitfrom the National Bank, which might be granted only on special conditions andwas subject to recall at any time. The Price Control, acting in conjunctionwith the National Bank, was authorised to impose maximum prices applicableto domestic gold transactions and also to the import and export of gold. Theprices fixed amount to Sw.fcs 4,970 for one kilogramme of fine gold, Sw.fcs 30,50for the 20-franc piece and Sw.fcs 15.25 for the 10-franc piece (with the de-valuation of the Swiss franc by 30 per cent, the price for the 20-franc gold coinwould be Sw.fcs 28.57). For foreign gold coins, corresponding maximum priceshave been fixed. Each transaction is further subject to a commission of % percent, and also to the 4 per cent, turnover tax, since gold coins, whetherSwiss or foreign, have lost their rôle as means of payment and are con-sidered as a commodity.
The Swiss National Bank emphasised in its annual report that these measuresin no way affect the country's foreign payments nor the principles of Swissmonetary policy. They were introduced in order to prevent harmful reper-cussions for Switzerland from such abuses as might arise in connection withcommercial transactions and arbitrage operations in gold. The National Bankplaces monthly quotas of gold at the disposal of domestic firms for industrialand handicraft purposes and in August 1943 it began to sell, from its ownstock, gold coins on the domestic market (the prohibition to export goldwithout a special permit remaining in force).
In 1942 the net acquisitions of gold and foreign exchange by theSveriges Riksbank and the Swedish commercial banks amounted to aboutS.Kr. 253 million, compared with S.Kr. 174 million in the previous year. It is

— 122 —
Swedish Balance of Payments
Current account:Trade deficitIncome from shippingInterest and dividendsPayments for ships sold, proceeds
of sales of commodities pre-viously stored abroad, amountsreceived as insurance, compen-sation for war damage, etc. . .
Surplus on current account . . .Capital account:
Purchase of securities abroad . .Net shift in the clearing and in
the position of trade credits . .Total export of capital . .
Balance
1941 1942
in millions of S.Kr.
— 321+ 350-400+ 75-100
+ 250+ 390
— 40
— 300— 340+ 50
— 457+ 325-375+ 75-100
+ 250-300+ 260
+ 10-20
— 55— 40+ 220
of interest to compare theseamounts with the results ofthe balances of payments forthe same two years.
For 1942 the activebalance of S.Kr. 220 millioncorresponds fairly well to thenet increase of S.Kr. 240 mil-lion in the holdings of goldand foreign exchange. Thedifference of about S.Kr. 20million is due to incomplete-ness of the data and to un-certainties of calculation.
Among the countries in the old world which increased their gold reservesin 1942 mention must also be made of Turkey with a net gain equivalent to$22 million, due at least in part to trade with the U.S.S.R. A free goldmarket has been preserved in Istanbul but the export of gold is forbidden.In 1939 the average rate of the gold pound in terms of paper pounds was£T 14.32; in 1940: £T21.06; and in 1941: £T 25.57. At the beginning of 1942
there was a sharp rise inthe quotations to a peak of£T 40.50. After the PrimeMinister had denounced goldspeculation, the quotation fell
Turkey: Gold Price.Monthly average price of the Turkish Gold Pound
on Istanbul Market,in Turkish Pounds.
M37.50
353250
3027,50
2522,50
20
175015
12,5010
7,50
5
2500
iiliilnhi I1:'illMINI ili 'ill
—y
ilnliiln
J
ilnliiln
' I
iliiliiln
A
\1
Hill
N;
Inllilr
1y A
IIWM INIIIIII, 1931 193? 1933 1934 1935 1936 1937 1938 1939 1940 1941 1942 1943
37,50
35
3250
30
2750
25
22,50
20
1750
15
12,50
10
750
5
250
0
to £T 33 and even to £T 23.50in December 1942 but therewas a rise up to a maximum of£T 37.70 in the spring of 1943.
In Portugal an entirelyfree market for gold hadbeen maintained up to June1942, when it was decreedthat the import, export andre-export of gold bars andgold coins could be effectedonly through the Banco dePortugal. As a result theprice of gold fell, but lateron rose again; and in theautumn all purchases andsales of gold in bars andin coins were made subjectto the authorisation of thecentral bank.

— 123 —
End-of-monthfigures
1939 December194019411942
Goldreserves
Gold hold-ings abroadand netholdingsof foreigncurrencies
Total
In millions of escudos921
1,2391,3431,391
7001,3224,7269,207
1,6212,5616,069
10,598
Banco de Portugal . In the balance sheet of theBanco de Portugal gold is shownunder the heading "Gold reserves"and as an unspecified part of "Goldholdings abroad and net holdingsof foreign currencies". The rapidincrease since 1939 in the assetsshown under these two headingsmay be seen from the accompany-ing table.
Braz i l , Venezuela, Co lombia , Chi le and Peru all increased theirgold holdings in 1942, being able to sell their export products usually at higherprices, but finding it difficult to arrange for a satisfactory volume of imports.The Argen t ine also would seem to have increased its gold holdings sub-stantially in 1942. In the balance sheet of the Banco Central the gold reservewas shown at the figure of about Pesos 1,075 million at the end of both1941 and 1942, but the item "other gold and foreign exchanges", which probablyincludes, inter alia, gold earmarked abroad, increased from Pesos 467 millionat the end of 1941 to Pesos 934 million at the end of 1942 and continuedto increase in the first half of 1943.
In Japan the holdings of gold and foreign exchange are no longer shownseparately in the balance sheet of the central bank. The combined holdingsincreased from Yen 550 million at the end of 1941 to Yen 681 million at theend of 1942, the increase probably being largely accounted for by the inclusionin the monetary reserves of the yield of the domestic gold production.
Among those who lost gold on balance during 1942, the gold reservesof the Nederlandsche Bank decreased from FI. 1,026 million at the endof 1941 to FI. 903 million at the end of 1942, or by about 12 per cent, of theamount held at the beginning of the period. The decrease in the gold reservesof the United States, though small in itself and still more so in relationto the country's total gold stock, may be said to have a symptomatic valuein that it was the first sign of a redistribution of gold, the yield of the world'scurrent gold production having been absorbed in 1942 by other countries.This development would seem to have been welcomed by the authorities ofthe United States. When foreign-owned dollar assets were made subjectto freezing regulations, the necessary licence to convert dollars into goldwould seem to have been granted by the Treasury whenever asked for, andspecial arrangements have been made with certain Latin American countriesunder which dollars acquired by them through ordinary trade or with theproceeds of credits could be converted into gold.
It was, however, in relation to Central and South America that theUnited States developed a deficit in the balance of payments, having thelargest export balance on record with other countries to which deliverieswere largely determined by the various lend-lease arrangements. Thus nopermanent change in the fundamental position is as yet in sight; on

- 124 -
Percentage of World's Gold Stock held in the United States.
10
1860 1870 1880 1890 1900 1910 1920 1930 194-0 1950miss.
the contrary, the demand which may be expected for American productsafter the war may easily bring the problem of one-sided movements ofgold to the fore again.
Although it is not possible to calculate exactly the percentage shareof the wor ld ' s monetary gold which is now in the possession ofthe United States (certain important holdings, e.g. those of the U.S.S.R.,being undisclosed), it is probably safe to say that it cannot be far from 70 percent. Assuming this figure to be correct, the total monetary gold stock would
amount to $32-33 mil-liard, of which $22%milliard would be heldby the United Statesand about $9% milliardoutside that country.For the sake of com-parison it may be in-teresting to recall thatin 1913 the world'smonetary gold stock,including the thensubstantial amountsof coins in circula-tion, was estimatedat $14.8 milliard (the
dollar being counted at the new price of $35 equal to one ounce of finegold), with holdings in the United States of $3.2 milliard and a total goldstock outside the United States of $11% milliard. Of the latter amount$81/3 milliard represented central-bank reserves, the rest being, in the main,gold in circulation. The massive additions to the gold holdings of the UnitedStates since 1914 have, on balance, been more than covered by newly-producedgold and the reduction which has occurred in the amount of gold coins incirculation. The amount of gold held outside the United States as monetaryreserves by central banks and, to a minor extent, by governments is in itsaggregate somewhat larger than before the 1914-18 war, but it is now lessevenly distributed, some European countries having more, others much less,than in 1914.
The Bank of England, though the central bank of the London market,i.e. the world's financial centre in pre-1914 days, never amassed a large goldreserve. At the end of 1914 the bank's gold stock amounted to £35. million,but there was, in addition, a circulation of gold coins and other reserves inthe United Kingdom estimated at £120 million, which served as an additionalline of defence. Most of the gold coins were collected from the public duringthe 1914-18 war, when in part they went to increase the bank's gold reserve,which by the end of 1918 had risen to £108.5 million. The strong positionwhich London held in the foreign exchange markets before 1914 was, indeed,less dependent upon the magnitude of the gold backing than upon the wide-

- 125 -
Monetary Gold Stock.
Countries
1913«
ReservesOtherstocks Total
1929 0) 1938
in millions of dollars (at $35 per fine ounce)
1942
Europe:- Austria . Ï •;-'-.- . . . .
Belgium . . . . . . .Bohemia and MoraviaDenmarkFranceGermanyGreeceHollandHungary
. ItalyNorwayPolandPortugalRoumania
' RussiaSpainSwedenSwitzerlandUnited Kingdom . . .Yugoslavia
America:ArgentinaBrazilCanadaChileUnited StatesUruguayVenezuela
Asia:British IndiaDutch IndiesJapanTurkey . .
Africa:EgyptSouth Africa . . . . .
Australasia:AustraliaNew Zealand
World Total <5). . . .
42581
(2)34
1,150501
8103
048820
(3)1549
1,3321574656
28819
381152272
2,184183
21017
11325
1759
3741
8,373
7434
(2)2
1,7281,183
519
o3025
430
134
1,016
10225
1,0737
32215
1725
2988
6,481
499115
(2)36
2,8781,684
13122
o51822
(3)1554
1,7621574790
1,30419
483152274
53,257
253
21017
145240
3484
33549
14,854
412766378
2,76194813
33049
46266
1341593
249838112256
1,21730
75325425615
7,25311729
21895
91825
32108
31347
18,927
5818353
2,4304027
99837
193948569
133
321701
2,69057
43132
19230
14,5126952
27480
16429
55220
323
27,000
7356144
2,00040
50624
59«241
42 (4)335824
1
354 «115
636
22,7268968
274216*
114
52634
23
32,500
0) From estimates of the League of Nations Gold Committee. O Included In Austria.(3) Included in Austria, Germany and Russia.(4) Published reserve only; an additional amount is known to be included in other items in thè central-bank return.(5) Estimated. * Not available.
spread commercial lending, largely in the form of acceptances, which mademost other markets in the world indebted to London. These markets hadregularly to procure sterling resources for the payment of maturing sterlingliabilities, and a slight shift in the amount of acceptances financed via London(as the result, maybe, of an alteration in discount rates) could as a rule beexpected to influence the supply of and demand for sterling and consequentlyits exchange value. It has been estimated that in August 1914 the amountof acceptances outstanding was between £300 and 350 million, of which at

- 126 -
least two-thirds were met in the regular way in spite of the disturbance on theexchange markets and the declaration of moratoria on the continent of Europe.The pound appreciated in relation to the dollar in the late summer and autumnof 1914, which shows how strong London's position then was.
The Sterling-Dollar Rate - 1914 to 1943.
i i i i i i i i i
3.00WSS7.
I I I I I I
I I I I I I I
I V
I I I I I I ! I I IM1915191B19171818191919201921192219231924- 1925192613271328192913301931193Z19331934-1905193619371938193919401941M219« 19H
6.00
5.75
5-50
5.25
5-00
4.75
4.50
4.25
4.00
3.75
3.50
3.25
3.00
It is sometimes said that in the days of its undisputed financial leader-ship the City of London "managed" the gold standard. If by that word ismeant a conscious attempt to influence the trend of commodity prices, therewas certainly no management; at that time the Bank of England neversought to prevent the variations in the output of gold from producing theirnormal effect on the currency and credit structure and consequently on prices.Neither can it be said that the Bank of England or other central banks regarded itas their task to control the business cycle, except that, in accordance with theircustomary practice, they would react against speculative excesses by increasinginterest rates and, conversely, lower their rates when, in times of depression,the demand for credit became less acute. But the international credit organi-sation which had gradually been built up over the greater part of a century,with its apex in London, was an elastic system, performing cheaply and effi-ciently its primary function of financing a rapidly expanding international trade.The banking houses in London, having connections of long standing withcustomers all over the world, avoided sudden withdrawals of credit; and afree trade policy, adhered to equally in good times and in bad, and combined,as it was, with willingness and ability to lend, facilitated the maintenance ofequilibrium, not only in the British balance of payments but also in the balancesof other countries.
After 1920 there was no longer any paramount financial centre in theold sense, New York having strengthened its position and increased the scopeof its activities but being still engaged in building up the necessary machinery

- 127 -
and extending its knowledge in the sphere of international lending. Moreover,there were in most corners of the world, but particularly in Europe,unbalanced positions left unadjusted and contradictory policies pursued, aswhen heavy financial obligations were piling up at the charge of debtorcountries while at the same time the movement of goods was being increas-ingly obstructed. In the end, the international gold standard, as it had beenestablished in the 'twenties, was_ cjisrujgted_jn_an_era of comprehensiveL ex-change controls and depreciating currencies, with a persistent flow of goldto the United States.
Monetary Gold Stock of the United States.At end of month, in millions of dollars.
1914 1916 1918 1920 1922 192* 1926 1928 1930 1932 193* 1936 1938 19*0 19« 19*4N?62S.
If the development since 1914 is reviewed in broad outline it will befound that the gold acqu is i t ions of the United States can be dividedinto three periods of approximately ten years each:
(i) During the first period from 1914 to 1924 the monetary gold stock ofthe United States (including gold coins in circulation) increased from $3,200to 7,400 million (the dollar in this and the following paragraphs being con-sistently taken at the present price of $35 per ounce of fine gold). Apartfrom a temporary flow of gold from the United States in 1919 and 1920,the general characteristic of this period was that Europe's great requirementsof imports from overseas markets and instability of exchanges in manyEuropean countries diverted the stream of gold to the Federal Reserve System.
(ii) During the second period from 1924 to 1933 the gold holdings of theUnited States changed little on balance, being $7,400 million at the beginning

— 128 —
and $6,900 million at the end of the period. By 1925-26 monetary order hadbeen restored in most European countries, which then set about replenishingtheir reserves, utilising for that purpose any surplus they managed to achievein their balances of payments, or the proceeds of loans and credits grantedlargely by the United States. In conformity with recommendations made bythe Genoa Conference in 1922, many central banks came more and more toinclude foreign exchange in their monetary reserves. This no doubt helpedto relieve the pressure on gold for a time; but, when the depression came,with its monetary anxieties, the conversion of currencies into gold exposeda number of countries to an additional strain which was felt also by theUnited States.
(iii) During the third period from 1933 to 1942 the.. U. S. gold stock hadits most spectacular increase, trebling from $6,900 million in 1933 to $22,750 mil-lion in 1942. Gold was received partly in payment for goods and services, partlyfor the amortisation of debts and partly also as a vehicle for funds movingto the New York market.
Much has been written in analysis of the causes which brought thisstupendous flow of gold across the Atlantic. It is generally agreed thatsuch factors as lack of economic balance, together with political fears inEurope and a high-tariff policy in the United States, played a rôle, but it ismuch more difficult to say whether, as is sometimes assumed, s ter i l i sa t ionof gold in the Amer ican credi t system was also a factor ina t t rac t ing gold to the United States.
In 1914 the Federal Reserve System began to function and introducedinto the credit machinery of the United States a degree of elasticity neverknown before, making it possible, as it happened, to finance the war muchmore easily than would otherwise have been possible. As may be seen fromthe graph, the volume of deposits expanded up to and including 1920. Inthe following year, during the first sharp post-war depression, there was a
decline in the volumeof credit, but it is aremarkable fact that inthe United States, asin practically every othercountry, the reductionin the amount of bankdeposits from the highlevel reached during thewar was comparativelyslight and of shortduration. Already inthe course of 1922the volume of depositswas back at the figureof 1920 and from then
Volume of Deposits in the United States.End-of-June figures, in milliards of dollars.
80
70
60
50
40
30
i i i t
/
• ^ ^ /
i i i i l T n i
/
All banks/
***•/
/
/ê/
'••./Member banks
Note circulation .'" " • " " " " " t " , ,7 i i i i
80
70
60
50
20
10
1905 1910 1915 1920 1925 1930 1935 1940 1945

— 129 —
onwards a marked expansion continued without a break to the middle of 1930.It is true that for some years, especially 1923 and 1924, the Federal ReserveBanks met the demand for additional currency by issuing gold certificatesrequiring a cover of 100 per cent, instead of Federal Reserves notes towhich the ordinary cover regulations applied. But this practice did not preventthe inflow of gold from increasing the funds at the disposal of the memberbanks and thus in no way limited their power to extend credit. It simplyreduced the excess goJd reserves of 4he Federal J5eserveJ3anks^theraseJvesbelow what they otherwise would have been, it being doubtful, however, whetherthis more cautious policy of the monetary authorities had any psychologicaleffect in restraining the market as to the granting of credits*. In the followingyears, from 1924 to 1930, there was, on balance, no addition to the goldreserves of the United States and, considering the great expansion of creditwhich then took place, the question of a sterilisation of gold hardly arises.Indeed, much may be said for the contention that during this phase thecredit system failed to react against the speculative boom or to discriminatesufficiently between different uses of credit. In the sphere of foreignfinancing the American market began to lend abroad both on short and onlong-term account almost as soon as the war was over, and the total offoreign loans and credits reached very large amounts. But here again itmay be contended that a more judicious selection of borrowers and methods,and in several cases also a greater moderation in the amount lent, would havebeen a better policy, especially since far too much credit could be recalledat short notice — a right of which, unfortunately for the general system,extensive use was made when the trend changed.
After 1930, with the great depression and the many currency changes,foreign lending came to a standstill; and internally in the United States thevolume of credit was exposed to a sudden contraction, together with a violentfall in prices — which, it may be saidt came as a painful surprise to the manywho had thought that there could be no real danger of a destructive slump,seeing that there had been no rise in the level of commodity prices or inthe note circulation during the preceding boom. By a continuous reduction ofinterest rates and by open-market operations, attempts were made to counterthe contraction in credit; but the results were not sufficient to offset thepersistent shrinkage intensified by bank failures all over the country. It wassoon obvious that so violent a depression could serve no useful purposeeither as cutting out dead wood from the commercial and industrial structureor as achieving a better balance between costs and prices.
In retrospect, most people would probably agree that it would have beenwise to riposte by a variety of measures and.with much greater energy againstthe depression. In the United States, as in several other countries, a moredecisive expansionist credit policy necessitated an easing of existing cover
* The influence exerted on the credit position by issues of gold certificates in the United States is not tobe compared with the sterilisation effected in the following decade on the London market by the BritishEqualisation Account: through the operations of this Account an inflow of funds was actually preventedfrom enlarging the credit base of the banks and thus restricted their power to lend. It is often said thatexperience from 1919 to 1939 should be utilised In forming the credit policy after this war and it is thereforeimportant to submit the credit measures adopted during these twenty years to careful examination, it beingimpossible in this Report to do more than refer, in passing, to some of the main problems.

— 130 —
and collateral requirements*. In a way this may be said to have involved a"desterilisation" of gold, i.e. a freer utilisation of already accumulated reservesas part of an anti-depression policy. During this period, comprising the years1930 to 1932, the current of gold changed direction several times but there wasno net increase in the gold stock of the United States.
With the inauguration of a new policy in 1933 various financial measureswere adopted at successive stages as a stimulus to recovery: the dollar wasdepreciated, bank deposits were guaranteed, cheap money was made stillcheaper and spending power was placed in the hands of the public throughincreased budget expenditure covered by borrowing. As can be seen from thegraph on page 128, there was an expansion in the volume of deposits up to themiddle of 1937, sustained all the time by gold coming from abroad. In the winterof 1936-37, when the upward movement suddenly took on too nervous andtoo speculative a bent, the authorities began to tighten the reserve require-ments of the banking system, preventing, inter alia, part of the inflowing goldfrom widening the credit base; and more by force of circumstances than bydesign the Federal budget was made to balance for a short while. This policywas meant to give an orderly character to the recovery; so much the greater wasthe disappointment when the longed-for improvement in business was suddenlyinterrupted by the severe setback in the autumn of 1937. There is still livelydiscussion as to what caused this setback; some believe that it was dueto the (in any case rather mild) credit measures, including the short-livedestablishment of budget equilibrium, while others lay stress upon the increasein costs — and especially in wage costs — which went on at a rapid ratefrom 1936 contrary to the careful credit policy. The true explanation is perhapsthat there arose a contradiction between the credit measures on the one handand the cost and price changes on the other. For a moderative credit policy tobe effective it must be allowed to act as a signal, making people abstain fromtoo sudden advances in costs and too rapid increases in inventories — butthat is the opposite of what actually happened in the boom of 1936-37.With the return of depressed conditions an expansionist credit policy wasagain adopted, with a stronger accent, however, on the spreading of purchas-ing power through the budget.
It is indeed easy to place too much reliance on financial measures asan aid to recovery and the maintenance of stability in an international monetarysystem. It was not so much sterilisation of gold by any measure of creditpolicy as failure to establish a proper balance in the economic structure thatcreated difficulties for other countries in their relations with the United States.For that country to accept a volume of imports sufficient to relieve the rest
* The easing was effected partly by taking gold certificates out of circulation. Under the existing regulationssuch certificates could be counted as collateral and as reserves against notes but not as reserves againstdeposits. This particular restriction was, however, of little importance since the gold holdings of the FederalReserve Banks furnished a sufficiency of "cover". But the provisions regarding "collateral" (I.e. the 100 percent, backing of notes and deposits by gold and eligible paper) proved too restrictive in that they limitedthe power of the Federal Reserve Banks to purchase additional government securities until the Glass-SteagallAct, passed in February 1932, permitted the use of such securities as collateral against Federal Reservenotes for the period of one year — a permission which has been extended by subsequent legislation.

- 131 -
of the world from a strain on the balances of payments, it must in particularabstain from tariff increases in times of depression, since at such times thestrain can easily go beyond breaking-point; and it must also achieve a suffi-cient degree of domestic activity and employment to furnish a steady marketfor foreign materials and articles, a question of great importance consideringthat the United States absorbs fully 40 per cent, of the world output of industrialraw materials and thus, by the state of its industry, has more influence than any
-öther-GO-untrT-ofrthe^rtees-^-sueb-pF^power of large areas of the world. As said above, the present cessation of goldacquisitions by the United States, notwithstanding a record export surplus, isexplained by the lend-lease and other credit arrangements that are part of thespecial war measures.
In the years i m m e d i a t e l y a f te r the war , which will be taken upwith all the problems of reconstruction and development, many countries willfind it difficult to meet the resulting foreign charges out of their currentexport proceeds or existing reserves. Special measures will presumablybe required to cope with this situation and inter alia to assist differentcountries in their efforts to replenish their monetary reserves, thus enablingthem to join in an increased exchange of goods and services. When thesetransitional problems have been more or less completely solved, there willstill be the permanent task of building up a system of stable exchanges witha sufficiency of credit for domestic and international trade; and in the executionof this task, as in the earlier reconstruction period, it should be remembered,as one of the lessons from the achievements and failures between the twowars, that no amount of financial facilities will procure a smoothly workingcurrency and credit system, whether based on gold or not, without careful atten-tion to the more d e e p - s e a t e d economic f a c t o r s . Apart from the influencesof purely erratic capital movements, a one-sided flow of gold, like an abnormalaccumulation of debit or credit balances in a country's foreign account, shouldbe regarded as a signal of some lack of equilibrium requiring correction; andone of the more important functions of monetary reserves is to afford timefor the necessary adjustment. There are several ways in which central banks— either directly or through an international institution — can assist one anotherin providing credit facilities to supplement existing resources. In the monetarysystem the currency and credit functions are closely connected and it wouldindeed be short-sighted not to use the system's latent credit powers to eliminatesome of the hindrances blocking the flow of goods and, at the same time,to give an impulse to increased activity. But stimulus is not enough; basicconditions must be such as to allow free scope for a self-sustained commercialand industrial activity, capable of resisting more effectively than in the pastthe hard blows to which economic life is from time to time exposed.

— 132 —
IV. LEND-LEASE, BRITISH DISINVESTMENT AND EUROPEAN CLEARINGS.
The large international movements of goods and services to which theconduct of the war has given rise are reflected, although not fully, in the activeor passive balances, as the case may be, on the financial accounts of thecountries concerned. Three great movements stand out: the lend-lease aidof the United States, with a "reverse" flow growing in importance; the receiptand distribution by Great Britain of provisions from the Empire and othercountries; and Germany's hold on the resources of Continental Europe throughthe mechanism of clearings and the imposition of occupation costs and othercontributions.
During 1942 the lend-lease system was supplemented by the UnitedNations Declaration of 1st January 1942, pledging the employment of their fullresources for the prosecution of the war, and by an agreement of 23rd February1942 applying "reverse lend-lease" terms to aid given by Great Britainto the United States. Since that date identical agreements with the United Stateshave been signed by China and the U.S.S.R., as also by the refugee governmentsof Belgium, Czecho-Slovakia, Greece, Holland, Norway and Yugoslavia. Further,an exchange of letters on 3rd September 1942 between the British Ambassadorin Washington and the U.S. Secretary of State laid down the principle that"as large a portion as possible of the articles and services which eachgovernment may authorise to be provided to the other shall be in the formof reciprocal a id , so that the need of each government for the currencyof the other may be reduced to a minimum". To this the U.S. President, in hissixth quarterly lend-lease report in September 1942, added the rider that "nocountry should grow rich from the war effort of its allies". On 3rd September1942, Australia, New Zealand and La France Combattante* also became partiesto the reciprocal lend-lease arrangements, while Canada decided to make itscontribution to the common war effort outside the lend-lease system.
The lend-lease procedure, which had originally been designed as amethod for a neutral country to give aid to one of the belligerents, was thusmerged in the total war effort of the United Nations and by its extensionas reciprocal aid became, in effect, a pooling of resources amongst belligerentswith a common aim. Lend-lease retains an element of quid pro quo in theprovision for some return in kind, if not in cash, as distinct from the freegift or "mutual aid" formula adopted by Canada.
How far reverse lend-lease has worked it is not possible to say, thekeeping of complete accounts having been dispensed with in the United
By a new agreement concluded in October 1943 between the United States and the French Committee ofNational Liberation the United States provides war material to the French troops on lend-lease termsand French deliveries are made to American troops on reverse lend-lease. American deliveries to theFrench civil population in North Africa are made for cash ; some $56 million had been paid on this accountup to the end of November 1943.

- 133 -
Kingdom, but it has gathered momentum as the U.S. armed forces overseasand their needs have grown in importance and it is known to constitute aconsiderable charge on the current budgets of the United Kingdom, Australiaand New Zealand, as does mutual aid for Canada(1). As regards the UnitedKingdom, the Chancellor of the Exchequer said in his budget speech in April1943 that "the largest amount of our reciprocal aid went to the Americans.Much of this aid took the form of services whose value neither they norwe sought to reckon . . . The amount of lend-lease aid which we receivedfrom the United States was no greater than we ourselves were affording toall our allies without charge"(2).
L e n d - l e a s e A id f r o m U.S.A. — value ofgoods t ransferred and services rendered*.
The original Lend-Lease Ac t was passed on 11th March 1941 and hassince been renewed until June 1944. Up to the end of 1941, $13,000 million(3) ofexpenditure was authorised and contracts for some $10,000 million were made.But these vast sums merely indicated the extent of the aid contemplated and
of preparations made; totallend-lease aid to the end of1941 was little over $1,200 mil-lion, of which three-quarterswas furnished in the form ofgoods, the remainder being inrespect of services rendered(ship repairs etc.). But bythe time the United Statesitself became a belligerent,in December 1941, war pro-duction had got well underway and lend-lease aid in
Quarterly
January-MarchApril-JuneJuly-SeptemberOctober-DecemberTotal for year
1941 1942 1943
in millions of dollars10
136408690
1,244
1,1781,5511,7982,4827,009
2,0672,6033,600**
•* From the reports of the Lend-Lease Administration.
** Preliminary round figure; July 1943 was $1,050 million andAugust $1,262 million. The total up to the end of August 1943 was$15,235 million, of which 45 per cent, went to the United Kingdom,25 per cent, to the U.S.S.R. and 30 per cent, to other allies.
the first quarter of 1942 was nearly equal to that for the whole of theprevious year. And the acceleration has continued : from a monthly averageof $100 million in 1941 the aid given rose to nearly $600 million a month in1942 and since June 1943 it has exceeded $1,000 million monthly.
(') The cost of reciprocal aid in the Australian budget for 1942-43 was £A 59 million and for 1943-44 wasestimated at close on £A 100 million, one-sixth of total war expenditure. In the New Zealand budgetof 1942-43 reciprocal aid amounted to £NZ 7 million and for 1943-44 it was estimated at £NZ 20 million,about one-seventh of total war expenditure. The cost of mutual aid as booked in the Canadian budgetis indicated in Chapter V.
(2) Further information regarding reciprocal lend-lease was furnished in November 1943 in the U.S. President'seleventh lend-lease report to Congress and in a British Treasury White Paper, both of which stressed theimpossibility of assessing in monetary terms the benefits given and received. But as some indication of theorder of magnitude involved, the U.S. President gave the following figures: up to June 1943, $1,171 millionhad been received on lend-lease terms from the British Empire, $871 million from the United Kingdomand about $300 million from the three countries Australia ($196 million), New Zealand ($51 million) and India(about $57 million); estimates based on the first six months of 1943 placed the annual rate of reverse lend-lease rendered to the United States by the British Empire at $1,250 million. The British Treasury WhitePaper estimated that the net contribution of the United Kingdom to the common pool of the United Nationsup to the end of June 1943 totalled £2,250 million, of which £216 million went to the United States asreciprocal aid and £180 million to the U.S.S.R. The figure of £2,250 million represented "payments madeto other members of the United Nations in excess of the sums received from them" or, in other words,an amount measuring the extent to which the United Kingdom has "burdened her future commerce byparting with gold and other capital assets and by incurring liabilities to other members of the United Nations".
(3) The first appropriation of $7,000 million was made on 27th March 1941 and the second of $5,985 millionon 28th October; a third appropriation of $5,425 million became law on 5th March 1942, making a totalof $18,410 million. These were appropriations made directly to the President of the U.S. A. Since theUnited States' entry into the war no further direct appropriations for military items or for merchant shipshave been made, but authorisations have been given for transfers under lend-lease of articles and servicesincluded in regular military or naval budget appropriations. Up to the spring of 1943, $35,970 million ofsuch transfers had been authorised.

- 134 -
U. S. Foreign Trade: Lend-lease and Cash.War period to December 1942.
In millions of dollars
British Empire
UnitedKing-dom
Canada Egypt India
Au-stralia
andNew
Zealand
Others TotalUSSR.
Allothercoun-tries
Totalall
coun-tries
1939(Sept.-Dec.)1940 . .19411942
Total . .
5721,8672,439
12110122
Lend
89446535
-lease «
8287
1 295
ÌX ports
15274289
10128138
7063,1123,818
11,3141,315
34242276
7414,668
5,409
Cash exports.
1939(Sept.-Dec.)194019411942
Total .
1991,0181,070
4952,782
210728
1,0071,2573,202
520
161137323
21789091
280
2894
10788
317
45170338108661
5082,1082,7732,1767,565
3087
10765
289
7431,8261,526
9175,012
1,2814,0214,4063,158
12,866
Total exports.
1939(Sept.-Dec.)194019411942
Total .
1991,0181,6422,3625,221
210728
1,0191,3673,324
520
250583858
217898
378575
2894
122362606
45170348236799
5082,1083,4795,288
11,38311
3087
108,379,604
7431,8261,5601,1595,288
1,2814,0215,1477,826
18,275
Imports.
1939(Sept.-Dec.)194019411942
Total . .
56158139135488
144440575735
1,894
37
122244
29134132105400
934
154219416
89366500216
1,171
3301,1391,5121,4324,413
821302584
5411,4651,8031,2865,095
8792,6253,3452,743
9,592
Surplus Of exports or imports (—) for cash.
194019411942
Total
143860931360
2,294
66288432522
1,308
213
149115
279
(- 8)(- 56)(- 42)(- 14)(-120)
1960
(- 47)(-131)(- 99)
(- 44)(-196)(-162)(-108)(-510)
178969
1,261744
3,152
22667740
205
202361
(-277)(-369)(- 83)
4021,3961,061
415
3,274
Total surplus of exports or imports (—).
1939(Sept.-Dec.)194019411942
Total . .
143860
1,5032,227
4,733
66288444632
1,430
213
238561
814
(- 8)(-56)(-34)273
175
1960
(-32)143
190
(- 44)(-196)(-152)
20
178969
1,9673,856
(-372) 6,970
226678
1,354
1,520
202361
(-243)(-127)
193
4021,3961,8025,083
8,683
"Note: Revised figures up to the end of 1942 place the total exported at $5,959 million; this total does not,however, include airplanes which were flight-delivered and ships sailing under their own power, valuedat approximately $700 million. Only about 90 per cent, of the goods "transferred" were actually exported.
(') Including Eire. (2) Including Newfoundland, Labrador, St-Pierre and Miquelon, Greenland and Iceland.(3) Although not forming an integral part of the Empire, it is convenient to class Egypt here. The figures include
the Sudan as well as Egypt proper. (4) Including Burma and Ceylon.<•) Of the total lend-lease exports of $276 million to "other countries", $38 million went to Latin America and
$85 million to China (in addition to direct financial assistance).

— 135 —
Categories
War materialIndustrial goods . . .Agricultural produce .Services
Totals. . .
U.K. U.S.S.R. Others Total
In millions of dollars1,3011,1001,229
8014,430
1,028379128290
1,826
1,96560992
7103,3760
4,2942,0881,4491,8019,632
(1) From the report of the Lend-Lease Administration published inMarch 1943.
(2) Africa and the Middle East received $1,573 million, China, India,Australia and New Zealand $1,344 million and "others" $460 million.
Ana lys is of lend-lease a l l oca t i ons 0 . Lend-lease aid representsMarch 1941 to February 1943. assistance given to allied and
friendly countries and doesnot include shipments to U.S.armed forces abroad. The ac-companying table reproducesan analysis of the first twoyears of lend-lease, March 1941to February 1943. Of nearly$10,000 million expenditure inthese two years over 80 percent, was for various formsof goods and under 20 per
cent, for services; and of the goods 55 per cent, represented war materials(36 per cent, of the total allocated to the United Kingdom but 67 per cent,of the total sent to the U.S.S.R.) ; 85 per cent, of the agricultural produce(including tobacco) was sent to the United Kingdom. From February 1943tobacco was no longer sent to the United Kingdom on lend-lease terms,except for the armed forces.
Up to the end of 1942 the British Empire and the U. S. S. R. togetherreceived 95 percent, of the U.S. lend-lease exports, as is shown by the tableon the opposite page, which gives an analysis of the direction of U. S.foreign trade since the war and distinguishes lend-lease from other exports.Towards countries other than the British Empire and the U. S. S. R. theUnited States had a passive balance in 1941 and 1942, so that the supply ofgoods on lend-lease terms tended to increase the amount in cash to be paidby the United States; thus no transfer problem arose for these countriesas a whole. Nor was there any transfer problem for the U.S.S.R.: lend-leaseexports accounted for nearly 90 per cent, of total U.S. exports to that countryduring the two years and only a little over $100 million was due to theUnited States on balance to be paid in cash.
Towards the British Empire, however, U.S. exports for cash were maintainedon a very large scale and constituted well over one-half of total exports for1941-42; during these two years some $2,000 million had to be paid on balance-of-trade account in cash. But the various parts of the Empire fared differentlyand, for purposes of analysis, it is convenient to divide it into three parts: theUnited Kingdom, Canada, and the rest of the Empire, including in thisconnection Egypt.
For special reasons, lend-lease material was sent to Egypt on a verylarge scale, especially in 1942, in all over $530 million during the two years; butnet cash imports were also large, the passive balance of about $260 million for1941 and 1942 being cared for by the United Kingdom. Other parts of theEmpire, particularly Australia, New Zealand and India, received lend-lease aidamounting to $720 million; by this aid a passive trade balance of $220 mil-lion in 1941-42 was changed into a surplus of $500 million in the two years.

- 136 -
Lend-lease exports from the U.S.A.Monthly distribution, in millions of U.S. dollars.
19*1 19«
United Kingdom
/ y l l l
19«L
£L J |
1941 19« 1943----- U.S.S.R
In principle, such surplus dollars(in so far as not absorbed byinvisible items of the balance ofpayments) passed over to theUnited Kingdom and the pro-ceeds went to swell the sterlingresources of these countries.
Canada occupies a specialposition between the United Statesand the United Kingdom, partlyfor geographical reasons, butalso because Canada has notaccepted lend-lease aid from theUnited States. The $120 millionshown as lend-lease exports toCanada in the table on page 134probably went to Iceland and othercountries classed with Canadain the statistics. Canada's cashimports from the United Stateswere therefore very high; in1942 they were well over doublethose of the United Kingdomand more than one-half ofthe total for the whole Empire.Canada's balance of paymentsshowed a persistent surplus to-wards the United Kingdom (andthe sterling area as a whole)and a persistent deficit towardsthe United States, as shown inthe table on the opposite page.
This deficit of $720 millionin the period 1939-41 was coveredfrom three sources: (i) overCan. $300 million gold and dollars
were mobilised in 1940 by the Foreign Exchange Control Board (Can. $325 millionbeing borrowed directly from the Bank of Canada for this purpose); (ii) someCan. $250 million was paid in gold by the United Kingdom in 1940 to cover thecost of materials bought in the United States to carry out British Governmentcontracts; and (iii) by an agreement made in April 1941, component partspurchased in the United States for use in carrying out British contracts inCanada were supplied under lend-lease terms on United Kingdom account.In 1942 and 1943 the position appears to have been eased by the considerableamounts of U. S. dollars which became available as a result of increasing U. S.purchases from Canadian war production.
750700650600550500450400350300250200150100500
350300250200150100500
250200150100
500
150100500
150100500
10050
1941 1942 1943
China, India, Australia,New Zealand
194-1 1942 1943
Orner
750
700
650600550-500450
4-00350300250200
150100
500
350
300
250
200150100500250200150100500
150
100
50
015010050010050
19*1 19« 19«
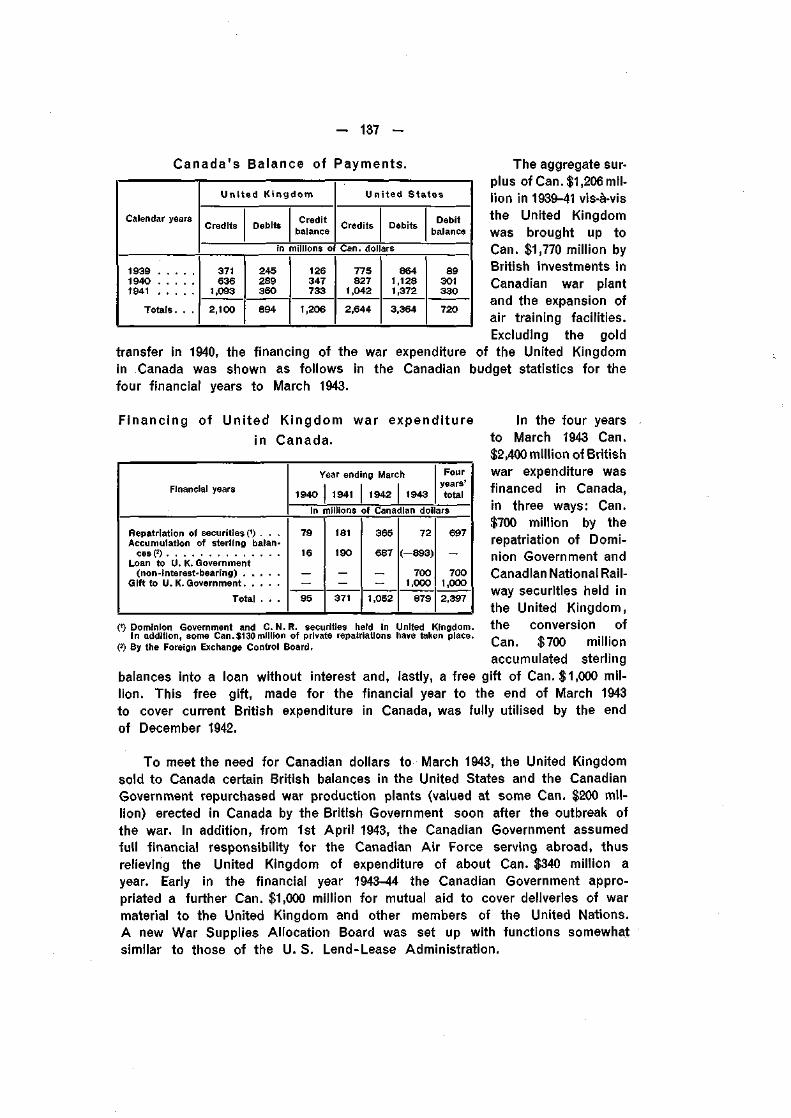
- 137 -
Canada's Balance of Payments. The aggregate sur-plus of Can. $1,206 mil-lion in 1939-41 vis-à-visthe United Kingdomwas brought up toCan. $1,770 million byBritish investments inCanadian war plantand the expansion ofair training facilities.Excluding the gold
transfer in 1940, the financing of the war expenditure of the United Kingdomin Canada was shown as follows in the Canadian budget statistics for thefour financial years to March 1943.
Calendar years
193919401941
Totals. . .
United Kingdom
Credits Debits Creditbalance
United States
Credits Debits Debitbalance
in millions of Can. dollars371636
1,0932,100
245289360894
126347733
1,206
775827
1,0422,644
8641,1281,3723,364
89301330720
Financing of United Kingdom war expendi ture
in Canada.
Financial years
Repatriation of securities (1) . . .Accumulation of sterling balan-
ces«Loan to U. K. Government
(non-interest-bearing) . . . . .Gift to U. K. Government
Total . . .
Y
1940
ear end
1941
in millions79
16
95
181
190
371
ng Marc
1942
h
1943
Fouryears'total
of Canadian dollars365
687
1,052
72
(-893)
7001,000
879
697
7001,0002,397
0) Dominion Government and C. N.R. securities held In United Kingdom.In addition, some Can.$130 million of private repatriations have taken place.
(2) By the Foreign Exchange Control Board.
In the four yearsto March 1943 Can.$2,400 million of Britishwar expenditure wasfinanced in Canada,in three ways: Can.$700 million by therepatriation of Domi-nion Government andCanadian National Rail-way securities held inthe United Kingdom,the conversion ofCan. $700 millionaccumulated sterling
balances into a loan without interest and, lastly, a free gift of Can. $1,000 mil-lion. This free gift, made for the financial year to the end of March 1943to cover current British expenditure in Canada, was fully utilised by the endof December 1942.
To meet the need for Canadian dollars to March 1943, the United Kingdomsold to Canada certain British balances in the United States and the CanadianGovernment repurchased war production plants (valued at some Can. $200 mil-lion) erected in Canada by the British Government soon after the outbreak ofthe war. In addition, from 1st April 1943, the Canadian Government assumedfull financial responsibility for the Canadian Air Force serving abroad, thusrelieving the United Kingdom of expenditure of about Can. $340 million ayear. Early in the financial year 1943-44 the Canadian Government appro-priated a further Can. $1,000 million for mutual aid to cover deliveries of warmaterial to the United Kingdom and other members of the United Nations.A new War Supplies Allocation Board was set up with functions somewhatsimilar to those of the U. S. Lend-Lease Administration.
— 138 —
The United Kingdom has received aid on lend-lease terms from theUnited States, has benefited from Canada's free gift, has realised its reservesof gold and dollars, mobilised securities in dollars and other currencies tomake "cash-and-carry payments", run up sterling and other debts, and otherwise"disinvested" abroad; on the other hand, the United Kingdom has givenmunitions to the U. S. S. R. estimated by the Chancellor of the Exchequer inApril 1943 at £170 million (in addition to non-military goods of over £50 million0),it has supplied the U. S. troops stationed in the United Kingdom(2) and in theColonial Empire, it has passed on lend-lease supplies to other countries, hasitself given aid on lend-lease terms or as free gifts to its allies and otherwisecontributed to the common effort of the United Nations. It is not possibleto draw up a "balance sheet" or "profit and loss account" of all these opera-tions, but certain indications have been given which throw light on the magni-tude of some of the transactions involved.
British cash payments to the United States since the outbreak of warwere stated by the Chancellor of the Exchequer in April 1943 to have totalled£1,500 million for supplies, munitions and the provision of capital equipmentfor the prosecution of the war. Cash-and-carry procedure did not cease whenthe Lend-Lease Act came into operation(3); in fact, payments in cash con-tinued for 65 per cent, of total U. S. exports to the United Kingdom in 1941 andfor 21 per cent, in 1942, as the table on page 134 shows. Indeed, the mostdifficult period for the United Kingdom was precisely when the Lend-LeaseAct had been passed but lend-lease exports had not yet got into theirstride; lend-lease procedure was not made to apply to pre-lend-lease contractsand large sums in dollars had to be provided to meet cash-and-carry com-mitments already made. At this time the liquid gold and dollar reserves of theUnited Kingdom had been exhausted. Several emergency steps were taken:93,000 kilogrammes of gold (value about $105 million) of the reserves of theNational Bank of Belgium were borrowed from the Belgian Government inLondon in March 1941 for two years; a credit of $425 million was obtainedfrom the Reconstruction Finance Corporation in July 1941; and gold to thevalue of about $130 million was bought from the Government of the Unionof South Africa (against the mobilisation and sale of South African securitiesin London).
The first two of these operations constitute the creation of debt andrepresent direct external indebtedness of the British Government. The debtsto the Canadian and Indian Governments as well as part of the debtsto the colonial administrations (included under "all others" in the next table)
(1) In April 1943, it was stated semi-otficially that the value of non-military supplies sent to Russia exceeded£50 million; these supplies were bought by and shipped through the services of the United KingdomCommercial Corporation.
(?) In eighteen months of the war of 1914-18 the United States spent £500 million on supplies for its troopsin the United Kingdom, an average of nearly £28 million a month; in 1941 and 1942 it spent an average ofonly £6,250 a month, the rest being provided by the United Kingdom as reverse lend-lease.
(3) According to the report of the Lend-Lease Administration for the period up to the end of 1942, the totalvalue of all supplies exported under lend-lease for the period March 1941 to December 1942 was$5,959 million;exports to lend-lease countries paid for in cash by the recipients amounted to $6,900 million. Only sinceMarch 1942 have monthly lend-lease exports exceeded non-lend-lease exports.

- 139 -
United Kingdom External Debtar is ing f rom the war.
In millions of £ sterling
Reconstruction Finance Corporation,at 3 per cent. 0)
Belgian Government (2)Canadian Government, interest-free(3)Indian Government, at 2% percent.(')All others
Total outstanding . . '.
End of March
1941 1942 1943
95
15110
9125
1573021
324
represent accumulated sterlingbalances converted into directBritish Government obliga-tions. In April 1943, afterthe gold loan from the BelgianGovernment had been re-paid, the United KingdomExternal Debt contracted dur-ing the war amountedtoaround£300 million.
(1) The total credit made available was $425 million, the equivalent _. . . . . ,. ...of £106 million. These debts, together with
(2) This loan was actually made in March 1941 but was specified .•, _ • .. x _±- M_publicly only In March 1943; it was repaid in gold In April 1943. trie accumulation OT Sterling(3) The equivalent of Can.$700 million. halanroc h\; Fmniro and nthprm The explanation of this loan is given on page 143. Balances DV tmpire ana Otner
countries and their repatriationof sterling securities plus the utilisation of gold and dollar resources, accountfor the "overseas d is inves tment " , or draft on foreign resources, madeby the United Kingdom as indicated in the budget White Papers. In the threeyears 1940-42 this disinvestment (which thus includes both the reduction of
foreign assets and the increase of foreign liabilitiesbut excludes lend-lease and the Canadian gift)amounted to £2,185 million; for the whole war periodup to the end of 1942 the total was probably about£2,350 million. And for the financial year 1943-44 afurther £600 million was foreseen. The distributionof the British overseas disinvestment has changed :whereas in 1940 it was principally in dollars andgold, it is now largely in the form of accumulationof sterling balances and repatriation of sterlingsecurities.
United Kingdom" o v e r s e a s
d i s i n v e s t m e n t " .
Calendaryears
1940 . . . .1941 . . . .1942 . . . .Total . . . .
£millions
756797632
2,185
Canada's sterling balances were converted into a direct loan to the BritishGovernment in March 1942, but other Empire countries continued to repaytheir earlier indebtedness in England and to hold, and generally to increase,their sterling reserves, usually in the form of bank balances, Treasury billsand investments in British Government securities. Quarterly increases of thester l ing hold ings of f ive countr ies of importance in this respect areshown in the table on the next page.
The five countries, Eire, India, Australia, New Zealand and Egypt, heldsterling resources totalling some £660 million at the end of 1942, of whichabout £230 million was accumulated during the year, in addition to considerablerepatriations of sterling securities. India accounted for two-thirds of the accumu-lation of sterling in the war period up to the end of 1942; £150 million wasacquired in 1942 alone and a further £120 million was added in the first halfof 1943.

- 140 -
Ster l ing Resources of B r i t i s h Empire.Quarterly increases or decreases (—) and totals outstanding.
In millions of £ Sterling
1939 January — MarchApril — JuneJuly — SeptemberOctober — December
1940 January — MarchApril — JuneJuly — September . . . .October — December
1941 January — MarchApril — JuneJuly — September . . . .October — December
1942 January — MarchApril — JuneJuly — September . . . .October — December
1943 January — MarchApril — June
Year 1939194019411942 . .
Total increases foryears 1939 — 42
Total increases for periodend August1939 to December 1942
Approximate totals outstandingend 1942 .
Eire(')
1%(-3%)
1%51%
(-2 )25%4%34%64%2%494%4
4%7
1820
49%
52%
120
India(2)
9%(- 4 )
7%26%12161117
(-45 )20%25647
29704522
102%
39%5664%
151
311
310
360
Australia(3)
(- 6%)(- 5%)(- 9 )
12943 •
136
(- 5 )(- 18 )(- 2 )(- 4 )
73
10(- 5 )
6%
(- 9 )29
(- 19 )16
17
36
70
NewZealand
(4)
2O
(- %)5%63%
(-4 )151
(-4%)O4%52%O
(-2%)5
76%I H '
12
27
26%
30
Egypt(5)
(-1 y2>%
3%1%
(- %)52%5
(- %)4%5%8
(- %)16%581
10
41217%29
62%
62%
80
Total
5(- 12%)
350%2826%14%41%
(- 30 )2412%7611 >/26084%7220
128
46110%82%
228
467
486%
660
(1) The sterling reserves of the Currency Commission (from February 1943 the Central Bank of Ireland) plusthe excess of sterling assets over sterling liabilities of the banks in Eire.
(2) The sterling reserve of the Reserve Bank of India plus the sterling assets of the Silver Redemption Fund.(3) Australia's London funds, i. e. the sterling reserve and money at short call in London of the Commonwealth
Bank plus an estimate of the net sterling assets of the trading banks.(4) The net overseas assets of the Reserve Bank of New Zealand and of the trading banks.5) The sterling reserves of the National Bank of Egypt.
Other parts of the Empire have considerable sterling resources in theaggregate, the largest single holding being perhaps that which Malaya accumu-lated before the Japanese occupation and which was as high as £60 million inJuly 1941. Other countries with currency boards operating in sterling havealso increased their reserves, the principal holdings being those of West Africa,Palestine and Irak. Some Empire governments have converted their accumu-lations of sterling into direct loans to the British Treasury, generally interest-free; the chief of these appear to be Newfoundland, Ceylon, East Africa andSouthern Rhodesia (included under "all others" in the table on page 139).
Apart from the Empire, the allied governments in London hold sterlingbalances, particularly those of Holland, Norway (from freights and compensationfor shipping losses) and Belgium (as a result of Belgian Congo exports).As regards other countries, the recent accumulations of sterling by Portugal,Turkey and the Argentine should be mentioned.

— 141 —
Sterling Resources of the British Empire.*Monthlyifigures, In millions of £ sterling.
900
850
800
750
700
G50
600
550
500
900
Up to the end of1942 the Argent inehad repatriated about£7million sterling secu-rities and accumulated£17 million in balancesblocked on specialsterling accounts (withan exchange guaran-tee). In the middleof September 1943,the Argentine FinanceMinistry announcedthat the sterling hold-ing had risen to£42.8 million and wasexpected to be £55 mil-lion by the end of1943. At this timethe Finance Ministrywas authorised toredeem Argentinesterling bonds to atotal of £25 million andraise an internal loanup to Pesos 500 mil-lion for this purpose;the sterling requiredwas to be obtainedin the first placefrom the Central Bankagainst Treasury cer-tificates. Argentinesterling loans issuedin London amountedin all to £39 million
and £14 million would thus remain when the present operation was completed.This amounts, of course, to only a fraction of the foreign investments in theArgentine, which were estimated at the equivalent of £530 million (at Pesos 17)in 1942, 60 per cent, of them being [British.
All in all, the order of magnitude of the liquid sterling resources of theEmpire (Dominions, colonies and other territories), of direct loans made fromaccumulated sterling holdings to the British Government, of sterling funds ofallied governments in London and of other countries, largely on special orregistered accounts, may be indicated at over £1,000 million at the end of 1942,of which perhaps three-quarters had been accumulated since the outbreak of
1935 1940 1941 19« 1943
The "five 'other countries" are Australia, Egypt, Eire, New Zealand andSouth-Africa.

- 142 -
war. But these estimates take no account of the repatriation of sterlingsecurities and other forms of British overseas disinvestment in sterling. Toafford an idea of these developments, some details of the situation as regards thefive countries shown in the above table are given in the following paragraphs.
The sterling holding of the banking system in Eire at the end of 1942consisted of rather over £20 million reserves against the note issue of theCurrency Commission, and rather under £100 million excess of sterling assetsover liabilities held by the Irish banks, both holdings being invested chieflyin British Government securities (as compared with total holdings of under£70 million in the middle of 1939).
India has benefited from profitable exports and very considerable pay-ments by the British Government, and has been enabled to repatriate theIndian Government's sterling debt and to accumulate a large reserve in sterling.
Ind ia 's s ter l ing receipts and out -payments .
Periods
August 1939 to March 1940Financial year
to March 1941to March 1942to March 1943
Total August 1939 to March1943
Incoming steri i ng
ReserveBanknetpur-
chases(1)
U.K.pay-
ments
O
Total
Outgoi ng ster ling
IndianGovt
require-ments
(3)In millions
64
577492
287
12
33150233
428
76
90224325
715
12
232538
98
Sterlingsecuri-ties
repatri-atedC)
Total
ReserveBank
sterlingholding
(5)
Totalrepatri-ations
plus in-crease inReserveBank re-serves insterling
(6)of £ sterling
14
6882
121
285
26
91107159
383
+ 50
— 1+ 117+ 166
+ 332
+ 64
+ 67+ 199+ 287
+ 617
Sources: Reserve Bank of India's Reports on Currency and Finance, the Reserve Bank's returns and Indianbudget statistics.
0) The net purchases of sterling from the market by the Reserve Bank in India, due largely to the activebalance of commodity exports.
(2) Payments made by the Secretary of State for India in London for British Government purchases In Indiaand expenditure for the defence of India, incurred in India and borne by the British Government. Thesepayments do not take account of deliveries of war material, estimated at £45 million for 1942-1943 alone,nor of lend-lease aid from the United States of $295 million up to December 1942.
(3i Indian Government sterling requirements for debt service, pensions etc. plus the requirements of Burma.(4) Purchases of Indian Government sterling securities on the open market and as a result of compulsory
surrender by British nationals. These figures give the actual cost — the nominal amount repatriatedwas higher. Only a relatively small part of the sterling debt was held in India.
(5) The increase (+) or decrease (—) of the Reserve Bank of India's sterling reserves.(E) The total "influx" of sterling as shown by the volume of repatriations and the growth of the Reserve Bank's
sterling holding.
The "influx" of sterling to India for the war period up to March 1943was over £600 million — and of this 70 per cent, was caused by BritishGovernment payments to meet the cost of Indian defence and for purchasesin India; the balance was a result of the surplus of Indian exports (principallyto the United Kingdom) over Indian Government requirements of sterling for

— 143 —
debt service and other payments. Nearly one-half of the £600 million odd wasutilised for the repatriation of the Indian Government's sterling debt and theremainder accumulated as liquid sterling reserves.
Under a financial agreement of November 1939, the Indian Governmentpays and equips land forces raised in India but the United Kingdom meetsall expenses of Indian troops outside India and capital expenditure incurredin India for the defence of India itself. On the other hand, India receiveslend-lease aid from the United States* but is paid in full for all war equipmentexported to other parts of the Empire. The 1939 agreement has resulted,particularly since Japan's entry into the war, in a movement of capital on ascale quite unforeseen when the agreement was signed. Total expenditureon the defence of India in 1941-42 was £225 million, of which the IndianGovernment's share was £75 million, the balance being paid by the UnitedKingdom. The estimates for 1942-43 placed the total at nearly £400 million,of which India was to pay £100 million and the United Kingdom nearly£300 million; actually British payments reached £233 million (in addition to freedeliveries of war materials estimated at £45 million).
In 1939-40 £16 million, in 1940-41 £8 million and in 1941-42 £12 millionof Indian Government sterling bonds were repatriated by purchases on theopen market and, in 1940-41, £2 million were purchased under a licence schemeof February 1940. But since the war the major portion of the repatriationshas been the result of compulsory schemes, the British investor being calledupon to surrender his securities to the British Treasury against payment insterling provided by the Indian Government from the holdings of the ReserveBank. Similarly, sterling securities held in India were mobilised and repaidin rupees. The first compulsory scheme, of February 1941, covered £73 millionand the second scheme, of December 1941, £74 million. In the three financialyears to March 1942, some £187 million Indian Government securities wererepaid (the cost of the repatriations from London being £164 million, as shownin the table).
Complete details of the repatriations and repayments in the year to March1943 are not yet available, but they are known to include the following:
(a) In October 1942 an agreement was announced whereby, for a capitalpayment of £30 million by the Indian Government, the British Treasuryundertook to make available the instalments necessary to cover certainrailway and other annuities, which would run until various dates from1948 to 1959 and had a capital value of about £34 million (the Britishliability of £30 million is shown in the table on page 139);
(b) at the end of 1942 the Indian Government took over certain Indianrailway securities at a total cost of some £15% million;
(c) early in January 1943 £78 million 3% per cent, stock was repaid, the lastremaining direct sterling obligation of the Indian Government;
* Lend-lease aid furnished to India by the United States amounted to $295 million up the end of 1942;reverse lend-lease by India to the United States was officially estimated on American data to be the equi-valent of $57 million up to the end of June 1943.

- 144 —
(d) later in January 1943 certain railway debentures guaranteed by theIndian Government were vested in the British Treasury to the extent of£20 million, prior to repurchase by the Indian Government (in March1943), while a further £11 million were called for repayment in February1944.
The programme of repatriation of the direct and indirect sterling debt of theIndian Government has practically been concluded; there remains a smallresidue of about £12 million (consisting chiefly of bonds in the hands of otherthan British holders, which cannot be requisitioned).
The total debt of the Government of India (in both rupees and sterling)on 31st March 1941 was the equivalent of £936 million, of which £677 million or72 per cent, was represented by profit-producing assets: railways, irrigationworks, public utilities etc. The total interest payable on the debt was £30 million,of which £25 million was covered by fixed interest paid by the railways and othercommercial enterprises to the government, leaving only £5 million as a netinterest charge. The same commercial enterprises paid over profits to theextent of £17 million to the government, thus giving, all told, a net income ofsome £12 million. The interest charge of the debt in its widest sense was,and is, more than covered from the assets created with the aid of borrowing.And, whereas before the war 40 per cent, of the total debt was payable inLondon and required £12 million as interest service, the whole of thegovernment's debt service has now become internal.
This rapid reversal of India's foreign position stands out as one of themost remarkable happenings in financial history. The Indian Governmentborrowed in London for the first time in 1887; between 1914 and 1919 the debtincreased by £30 million to £230 million, while in those years India made giftsof about £150 million to the British Government as a free war contribution;post-1919 borrowing carried the debt (including guaranteed railway debenturesand annuities) to around £350 million at the outbreak of the present war. Notonly has the whole of the direct debt, incurred gradually over more than 50 years,been repaid during the first 3% years of the present war, but India's sterlingreserves have increased by £330 million in the same period. By the summerof 1943, India's sterling reserves had grown to over £500 million, about doublethe value of the remaining British commercial and industrial investments inIndia, which have been estimated at about £250 million.
The financing of these transactions in a country with as narrow a capitalmarket as India has naturally been attended by some difficulties. The table onthe next page shows the evolution of the main items of the return of theReserve Bank of India, converted into sterling for purposes of comparison.Of the total "influx" of over £600 million from August 1939 to March 1943,about £180 million has been placed on the internal market in the form ofrupee securities, while £435 million has been taken up by the Reserve Bankthrough the direct acquisition, on the one hand, of sterling balances andsecurities and, on the other, of rupee securities (equivalent to £100 million).

- 145
Reserve Bank of lndia (1).
Near end of month
Assets
GoldSterling reserve P)
ba-lances
secu-rities total
Indiangovtrupeesecu-rities
Rupeecoin
Liabilities
Notes issued
India Burma
Deposits
Govt banks
in millions of £ sterling1939, March .
August.1940, March .1941, March .1942, March .1943, March .
June . .
33333333333333
116
2132266561
59
45458577
160316426
271
5550
106108186382487
332
24282966
10213189
103
53574226211112
(-46)
134127169180286483550
356
87
101321
15111717152719
16
9201327323540
I n crease s fromAugust 1939 toMarch 1943 . . 15
(1) Rupees converted at 1s.6d. (2) At pre-1931 par value.(3) The yearly increases of this item do not agree exactly with the previous table, partly owing to the date of the
return (the last Friday and not the last day of March), but the total increase for the whole period corresponds.
The chief counterpart of these acquisitions was the increase of the circulationof notes and coins by the equivalent of £400 million from the beginning of thewar to the end of March 1943.
Developments in Australia and New Zealand present a striking contrastto those in India. Each of the two countries maintains its own forces overseas,pays for its war equipment other than that obtained on lend-lease terms, andhas entered into the mutual aid agreements. Neither country has been in aposition to repatriate its sterling debt, although each was able to add a modestincrement to its London funds in 1942 — but as the resultant of a number offactors and not of one-way payments.
As regards Aus t ra l i a , the British Government continues to purchasemeat, butter and cheese, according to contract; it also purchases the wholewool-clip (with an increase of 15 per cent, in the price in 1942), whether it isshipped or not. On the other hand, Australia has had considerable externalpayments to make, including the cost of maintaining Australian forces over-seas and importing war equipment. Some indication of the overseas warexpenditure is given in the budget shown in the table on the next page.
War expenditure "overseas", which totalled £A175 million up to June 1943,is that part borne directly by Australia; such overseas expenditure as cannotbe met currently without undue depletion of London funds has been bookedin inter-Treasury accounts maintained between the Dominion and the UnitedKingdom; £12 million only was borrowed in this way between July andDecember 1940 and this sum was repaid in October 1943. The larger amountborne by Australia in 1942-43 was due not so much to an increase of theexpenditure as to the ability of Australia to bear a greater burden, thesatisfactory position of the balance of payments being in part due to theexpenditure of American forces in Australia.

— 146 —
A u s t r a l i a n
Financial years to30th June
Expenditure :
overseastotal
civil . . .
Total .
Revenue:
totalborrowing •Total . . .
B u d g e t
Closed accounts
1939-40 1940-41 1941-42
Estimates
1942-43 (') 1943-44
in millions of £A
195
2485
109
9022
112(- 3)109
12743
17089
259
12624
150109
259
27347
320101
421
18036
216205
421
48080
560
712
25230
282430712
50070
570145
715
27339
312403715
(') Revised estimates up to May 1943, including supplementary figures.C) £A 30 million of the increase of civil expenditure Is accounted for by the creation of a National Welfare Fund
as a basis for an extension of social benefits.
Australia has not been in a position during the war to make any appreci-able repayments in excess of contractual amortisations on its external debt,which remains at around £600 million, but has undertaken certain conversionoperations. In 1941, some £30 million Commonwealth and State loans wereexchanged for a 3% per cent. 40 to 45-year Commonwealth loan, issued at 99;from December 1941, for nearly a year, Australian loans were practicallyunmarketable at the fixed "minimum prices" in London; but in October 1942these loans began to move up and in November it became possible to issuea 3 per cent. 2 to 4-year loan at 98 to convert the £16% million 2% per cent,bonds of 1939 which matured on 1st January 1943.
Part of the internal budget expenditure has been met by borrowing fromthe Commonwealth Bank and it is the increase of the bank's investments ratherthan fluctuations in sterling holdings which has exerted the chief influenceon the note issue.
Commonwealth Bank of Aust ra l ia .
Weekly returnsnear end of month
Assets
Sterlingreserve
Investments
deben-tures
Common-wealth
Govt bondsO
Discountsand
advances
Totalbalancesheet
Liabilities
Notesin
circulationDeposits
etc.
in millions of £A1938 December19391940194119421943 June . . .
4245876079
80
46505668
101112
52513782
158214
151927232022
159173218243370«440W
50556582
123138
8895128135154
178
0) Including money at short call in London. (2) Including a small amount of British and Colonial bonds(the total of which fell from £A18 million in 1938 to £A12 million in 1940).
(3) Issue and banking departments only, as shown by weekly returns. (4) Provisional.

— 147 —
By the Wartime Banking Control Regulations the trading banks wererequired to deposit with the Commonwealth Bank their "surplus investablefunds", defined as the amount of assets in excess of the average in August1939. Interest is paid at a rate which will make the profits of each bankequal to the average profits of the three pre-war years; this rate may varyfrom bank to bank but appears on the average to be % per cent. Thesedeposits may be withdrawn only with the consent of the Commonwealth Bank;further, long-term government securities (as distinct from Treasury bills) maybe purchased only with the consent'of the Commonwealth Bank, which alsolays down the banks' policy regarding private advances and discounts.
Quarterly averagesfor quarter ending
1938 December1939 „1940 „19411942 „1943 March
Aus t ra l ian Trading Banks.
Assets
Cash Wartimedeposits
Govt SETreasury
bills
curities
bondsAdvances
Totalbalancesheet
Liabilities
Depcurrentaccounts
ositstime
depositsin millions of £A
353743454745
36489
192341466483
212450636063
291294282279244234
380393433452490518
120128153175231262
198200205203191197
New Zealand Budget05.
New Zealand also sells meat, dairy produce and wool under contractto the United Kingdom and has an arrangement with the British Treasury
similar to that of Australia;receipts on this inter-Treasury account are shownin the budget under theheading of "Borrowing fromthe U. K. Government underthe Memorandum of SecurityAgreement". But expen-diture overseas is not givenseparately from other warexpenditure as in Australia;the estimate for 1940-1941included £NZ 19.75 millionfor overseas expenditure ofthe New Zealand army andair force and the amounthas doubtless considerablyexpanded with the growthof total war expenditure.
It has been announcedthat the gross amountborrowed from the United
In millions of £NZ
Expenditurewarsocial securityother . .
Totals (') . . .Current revenue
other currenttotal . . .
Revenuefrom borrowi ng
from United Kingdom .internal war loans . . .
Net borrowing (less re-demptions) .
Lend-leaseTotals (2) . . .
Closed accounts
1939-40
8.010.835.754.5
44.57.2
51.7
3.1
3.1
54.8
1940-41
27.112.635.575.2
61.36.2
67.5
6.012.2
14.5
82.0
1941-42
52.413.536.0
101.9
68.110.078.1
8.223.5
24.4
102.5
Estimates
1942-43
133.0(3)16.033.1
182.1
77.814.292.0
46.0C)35.6
81.610.0«
183.6
0) Financial years ending 31st March. Ordinary, war and social securitybudgets combined. There is also a Development Account coveredby borrowing of £NZ 12 million in 1941-42, for which £NZ 4.5 millionwas estimated in 1942-43.
(2) Differences between total receipts and total expenditures are largelydue to fluctuations of cash balances. (3) Final accounts showedactual war expenditure in 1942-43 as £NZ 144 million.
W Final accounts show only £NZ 15.4 million borrowed from the UnitedKingdom but £NZ 26.8 million was received on lend-lease account.

- 148 -
Kingdom totalled £20.2 million at the end of 1942 and of this £11.4 millionhad been repaid; in March 1943 a further £8.0 million was repaid, leaving only£0.8 million still outstanding; these figures take no account of fresh indebtednesswhich may have been incurred during 1943.
New Zealand's external position has been largely determined by the risein exports from £NZ 67.5 million in 1941 to £NZ 80.9 million in 1942, increasingthe export surplus from £NZ 18.3 million to £NZ 27.2 million. As a result, thesterling assets of the Reserve Bank and tcading banks together have risen from£NZ 25.3 million to £NZ 40.6 million during the year 1942. Advantage was takenof this development to convert a £6 million sterling loan in December 1942 andto make sundry small repayments in London. The total external governmentdebt remains at about £160 million sterling; as in the case of Australia, noappreciable repayments or repatriations have taken place during the war.
Reserve Bank of New Zealand.
Near endof month (1)
1938 December19391940 „194119421943 June. . .
Assets
Gold Sterlingexchange
I nvest-ments
Advancesto
Govt (2)
Totalbalancesheet
Liabilities
Notes incircula-
tion
Depositsgovern-ment banks other
In millions of £NZ2.82.82.82.82.82.8
4.77.0
12.513.326.629.7
3.63.63.83.84.5
10.3
16.423.627.025.528.843.2
28.537.447.347.264.789.5
16.619.222.724.630.832.4
2.82.68.09.0
10.819.1
7.213.312.710.718.530.1
0.10.00.40.30.74.6
0) Last weekly return in month. (2) Marketing Department and other government advances combined.
Internally the situation is influenced by the increase in sterling assets andby government borrowing; the note issue rose by 8 per cent, in 1941 and 25 per cent,in 1942. The trading banks took up government securities on a comparativelylarge scale in 1942, while private advances and discounts fell; time depositsstood still but current accounts rose by 31 per cent., compared with Only9 per cent, in 1941. Total government borrowing of £NZ 35.5 million in 1942
New Zealand Trading Banks.
Near endof month (')
1938 December1939 „1940194119421943 March . .
Assets
Cash«Net
overseasassets
Governmentsecurities
Advancesand
discounts
Liabilities?)
Depositsdemand 1 time
in millions of £NZ11.417.818.615.922.624.4
2.17.1
11.912.014.014.9
8.815.217.523.034.336.2
57.851.148.150.544.044.9
34.241.349.754.070.977.1
29.831.929.429.028.828.6
(1) Last Monday in month. (2) Deposits at Reserve Bank and Reserve Bank notes. (3) In New Zealand only.

— 149 —
was obtained from approximately the following sources: from the public£NZ 15.5 million; from government departments £NZ4.2 million; from the tradingbanks £NZ 8.3 million and from the Reserve Bank £NZ 7.5 million. The amountborrowed from the banking system was thus about equal to that borrowedfrom the public.
The sterling assets of the National Bank of Egypt rose by nearly£30 million in 1942, almost as much as in the previous three years takentogether. In September 1943 the Egyptian Government decided to convert thewhole of its public debt, including external, into new issues of internal loans;the external debt consisted mostly of sterling loans totalling somewhat over£90 million, but a large proportion of these bonds were held in France andin Egypt itself, and some repatriations had recently taken place from London;the Finance Minister estimated the British holding at £E 14 million and otherholdings outside Egypt at £E 18 million.
The dominating influences have been the considerable expenditure of theforces of the United Nations in the country, estimated at £E 63 million in 1941and at over £E 100 million in 1942, and the official British purchases of thecotton crop. The absorption of sterling has made the market very liquid andinterest rates are low; the Egyptian budget for 1942 gave a surplus of some£E 10 million and the government's cotton loans have been greatly oversubscribed.
Nat ional Bank of Egypt C)
Endof
month
Assets
GoldSterling reserves (4)
ritiesbalan-ces etc. total
Egyp-tianGovt
securi-ties (=)
Ad-vancesand dis-counts
Totalbalancesheet
Liabilities
Notecircu-lation
Depositsgovern-ment (6)
banks(net) O other
in millions of £E (2)1938 Dec.1939 „1940 „1941 „1942 „
1943 June
6.26.26.26.26.2
6.2
14.518.931.845.071.578.5
1.50.60.65.98.6
12.8
16.019.532.450.980.191.3
16.012.929.652.069.9
101.0
10.214.09.16.96.03.7
51.256,481.1
119.4166.7209.0
20.426.437.350.775.382.4
4.82.64.8
21.328.651.3
0.10.72.54.1
12.413.2
17.217.026.433.439.1
48.3
(') Combined balance sheets of issue and banking departments.O The £E is practically at par with the £ sterling; the rate of exchange taken in the 1942 balance sheet is
£100 = £E 97.50. (3) At pre-1931 par value.(4) The securities are held as reserves against the note issue and consist of British Government Treasury
bills and War Loan. Other Egyptian banks increased their surplus holdings of sterling but no regularfigures are available. It has been estimated that all the Egyptian banks accumulated the equivalent of about£E 80 million between the beginning of the war and the end of 1941.
(5) Egyptian government securities and securities guaranteed by the Egyptian Government plus a very smallamount of other investments (1942: £E 1.3 million).
(6) According to the annual report of the National Bank for 1942, "capital sums" are included on this accountand the increase does not necessarily signify a large surplus of government revenue.
(7) Banker's accounts are included on both sides of the return; the figure given in the table is the net amount.
T h e note circulation rose by £E 13.4 million in 1941 and £E 24.6 million
in 1942; 45 per cent, of the increase in the latter year was concentrated into
the month of June, with heavy withdrawals of deposits from the banks. T h e
annual report of the National Bank for 1941 had already drawn attention to
the fact that the rise in the note circulation was most marked in those months
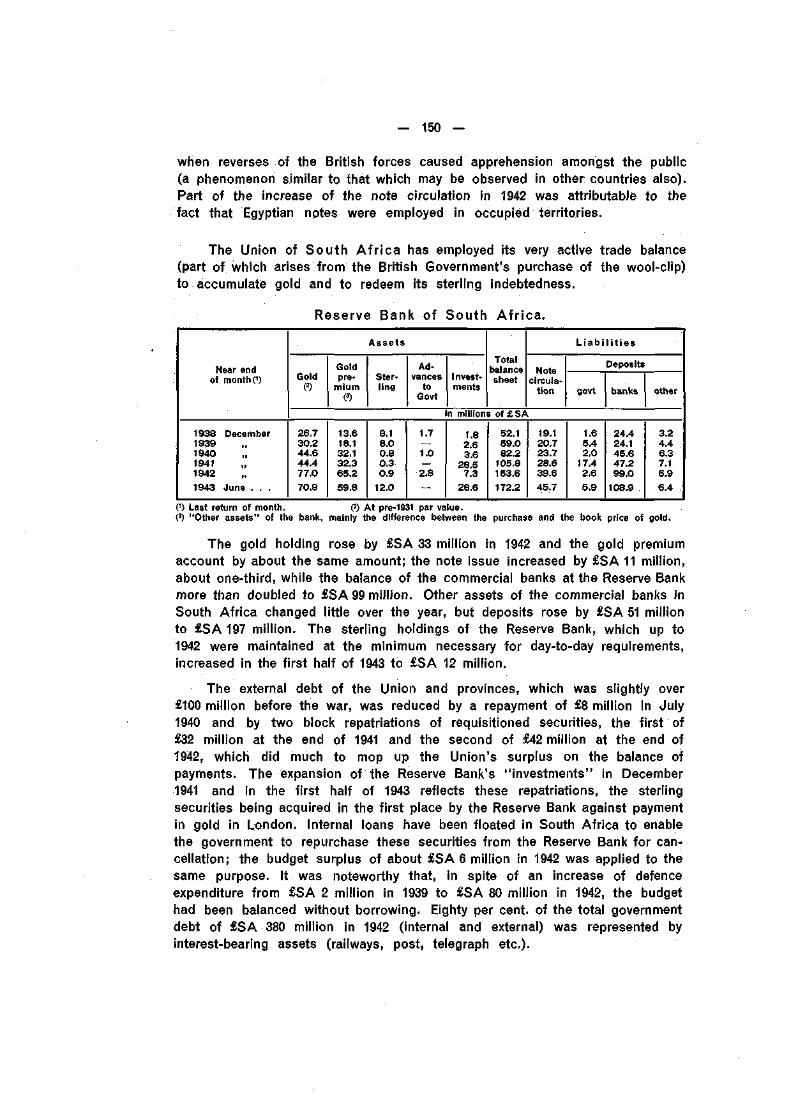
— 150 —
when reverses of the British forces caused apprehension amongst the public(a phenomenon similar to that which may be observed in other countries also).Part of the increase of the note circulation in 1942 was attributable to thefact that Egyptian notes were employed in occupied territories.
The Union of South A f r i ca has employed its very active trade balance(part of which arises from the British Government's purchase of the wool-clip)to accumulate gold and to redeem its sterling indebtedness.
Reserve Bank of South A f r i ca .
Near endof month 0)
1938 December19391940194119421943 June . . .
Assets
Gold(2)
26.730.244.644.477.070.9
Goldpre-
mium(3)
13.618.132.132.365.259.8
Ster-ling
8.18.00.80.30.9
12.0
Ad-vancestoGovt
1.7_1.0—2.8—
Invest-ments
Totalbalancesheet
n millions of £SA1.82.63.6
28.57.3
28.6
52.159.082.2
105.8153.6172.2
Liabilities
Notecircula-
tion
19.120.723.728.639.645.7
Deposits
govt
1.65.42.0
17.42.65.9
banks
24.424.145.647.299.0
108.9
other
3.24.46.37.16.96.4
(') Last return of month. (?) At pre-1931 par value.(3) "Other assets" of the bank, mainly the difference between the purchase and the book price of gold.
The gold holding rose by £SA 33 million in 1942 and the gold premiumaccount by about the same amount; the note issue increased by £SA 11 million,about one-third, while the balance of the commercial banks at the Reserve Bankmore than doubled to £SA 99 million. Other assets of the commercial banks inSouth Africa changed little over the year, but deposits rose by £SA 51 millionto £SA 197 million. The sterling holdings of the Reserve Bank, which up to1942 were maintained at the minimum necessary for day-to-day requirements,increased in the first half of 1943 to £SA 12 million.
The external debt of the Union and provinces, which was slightly over£100 million before the war, was reduced by a repayment of £8 million in July1940 and by two block repatriations of requisitioned securities, the first of£32 million at the end of 1941 and the second of £42 million at the end of1942, which did much to mop up the Union's surplus on the balance ofpayments. The expansion of the Reserve Bank's "investments" in December1941 and in the first half of 1943 reflects these repatriations, the sterlingsecurities being acquired in the first place by the Reserve Bank against paymentin gold in London. Internal loans have been floated in South Africa to enablethe government to repurchase these securities from the Reserve Bank for can-cellation; the budget surplus of about £SA 6 million in 1942 was applied to thesame purpose, it was noteworthy that, in spite of an increase of defenceexpenditure from £SA 2 million in 1939 to £SA 80 million in 1942, the budgethad been balanced without borrowing. Eighty per cent, of the total governmentdebt of £SA 380 million in 1942 (internal and external) was represented byinterest-bearing assets (railways, post, telegraph etc.).

- 151 -
Irr addition to the repatriation of the government's external debt, a sub-stantial amount of private indebtedness has been transferred from British toSouth African ownership, particularly gold shares. The Governor of theReserve Bank at the annual meeting in July 1942 recommended that munici-palities, public bodies and private firms should also seize the favourableopportunity of using local funds to redeem South African liabilities overseas;the possibilities for further repatriations of the Union Government's sterlingdebt have become very limited since almost the entire debt has been repaid,the only remaining sterling loan being the £5 million 3% per cent, bonds 1954-59issued in May 1939.
The Union of South Africa was a borrower in the London market until1939; but, from the outbreak of war up to March 1943, it increased its goldreserves by nearly £80 million (at market price), repaid over £80 million ofthe government's sterling debt and repatriated a substantial volume of goldand other shares.
The following table summarises in round figures the material givenin preceding paragraphs regarding Br i t ish "overseas d i s inves tmen t "in ster l ing in relation to seven countries in the British Empire (but excluding
, . ' ,. Canada's "free gift" of £225 mil-Accumula t ion of s te r l i ng , | | o n a g ^ a s t h e u s e m a d e
repatr ia t ion of secur i t ies etc.» B r i t i s h , h o | d j n g s a n d
September 1939 to March 1943. „ , . , . , . . . ,,the mobilisations of dollarsecurities, etc.). In the threeand a half years to March 1943the overseas disinvestment vis-à-vis these seven countries thusamounted to nearly £1,350 mil-lion, India with £640 millionand Canada with £415 millionrepresenting nearly 80 per cent,of the total disinvestment.This £1,350 million was madeup in almost equal parts ofsterling accumulations (as ba-lances etc. and direct loans)and of sterling securities re-patriated.
Countries
Canada (')EireIndiaEgypt . . . . . . . .
New Zealand . . .South Africa (<). . .
Totals . . .
Accumu-lation ofsterlingbalances
etc.
Directloan toBritishGovt
Sterlingsecuritiesrepatri-
atedTotal
in millions of £ sterling
55330603025
(-10)490
155
30
185
260(3)
280
130(5)670
41555
640603025
1201,345
0) Amounts are rounded off to the nearest £5 million.(2) Excluding the payment of £62% million in gold in 1940 and
Canada's free gift of £225 million In 1942.(3) The repatriation of securities (including private) plus $200 mil-
lion utilised to repurchase British interests.(') In addition, the Reserve Bank of South Africa has added
nearly £80 million to its gold reserves.(5) Round figure, including an allowance for private repatriations.
The repatriation of sterling securities was, therefore, as great as theaccumulation of sterling balances. But the outlet afforded by the repatriationof debt has its limitations and these limits are clearly in sight for certaincountries. The repatriation of Canadian Dominion Government sterling debtwas practically completed in March 1942, when the free gift of £225 mil-lion was granted; British holdings of Canadian securities other than thoseof the Dominion Government amount to the equivalent of fully £250 millionand it was decided that, in the interests of both parties, these investments

— 152 —
should be maintained. And Australia and New Zealand have entered intothe mutual aid arrangements without ever being in a position to repay anyappreciable part of their indebtedness in London. On the other hand, byMarch 1943 the repatriation of the government sterling debts of both Indiaand the Union of South Africa was practically completed.
The overseas disinvestment of the United Kingdom in ster l ing vis-à-visall countries from September 1939 to March 1943 must have exceeded£1,500 million; in the same period £1,500 million was spent in gold anddol lars in the United States. The total net overseas disinvestment wasnot, however, in excess of £3,000 million, but was about £2,500 million upto March 1943. The difference gives a rough measure of the gold and dollarscurrently acquired against sterling from countries within the Empire.
On the continent of Europe the main movements of funds have beendetermined by the use made by Germany of other countries' resources throughthe mechanism of clearings and contributions levied to meet occupation costs,etc. Germany's clear ing indebtedness is represented by the debts ofthe Deutsche Verrechnungskasse but there are certain assimilated liabilities,such as the debts of the Reichskreditkassen to central banks, which are oftenshown in conjunction with the clearing claims and for the sake of uniformitymay be grouped together with them.
No regular statistics of the clearing position are published in Germanybut estimates have been made of the volume of foreign balances held at
the Verrechnungskasse and in-Investment of c lear ing balances etc. vested by it in Reich securities,
in Reich secur i t ies. w h i | e the debt of the Reich tothe central administration of theReichskreditkassen is given inthe monthly public-debt state-ment. The accompanying tableshows the annual increases ofthese two items and the totalincrease for the three years1940-42; as German clearingdebts were practically extin-guished in the early monthsof 1940 and the debt to the
Reichskreditkassen dates only from May 1940, the increase in the years1940-42 may be taken as approximately equal to the totals outstanding.
Germany's clearing debts proper thus amounted to some RM 14% milliardat the end of 1942, nearly one-half of which was accumulated during the year.In addition, the Reichskreditkassen had debts to central banks amounting toabout RM 4% milliard, while some RM 2% milliard Reichskreditkassenscheinewere in circulation (see page 187); these debts to central banks are on. account
In milliards of RM
Verrechnungskasse ('). . .Reichskreditkassen P) . . .
Total foreign sources . . .
1940
1.51.5
3.0
1941
6.03.0
9.0
1942
7.02.7
9.7
Total1940-42
14.57.2
21.7
(') From an article 'by Dr. Günter Keiser in Bankwirtschaft 1943,No. 5. This item also includes Reich securities held directby the banks in Holland and In Bohemia and Moravia.
(2) This is the debt of the Reich to the central administrationof the Reichskreditkassen äs shown In the public debt return.The corresponding liabilities of the Reichskreditkassen consistof Reichskreditkassenscheine in circulation and Relchskredit-kasse debts to central banks.

— 153 —
of Reichskreditkassenscheine withdrawn (as in Belgium) or of direct advancesmade to the Wehrmacht (as in Denmark). Excluding the actual circulation ofReichskreditkassenscheine, which were largely in the eastern occupied territories,the total of German debts on clearing and these other accounts would thusbe about RM 19 milliard at the end of 1942, according to German sources (partof the debts being, however, in the currencies of the creditor countries).
These figures can be largely confirmed from the side of the foreign creditors.As the German debts are generally to central banks directly, or are financed bythem, statistics can be compiled from the information given regularly in Europeancentral-bank returns. The growth of claims on Germany, as shown by eightcountries publishing such data, is illustrated in the graphs on the following pages;
C lea r i ng c l a ims and a s s i m i l a t e d a c c o u n t s .Quarterly (and yearly) increases or decreases (—) and approximate totals outstanding.
Quarterlyand yearly
1941 Jan.-March .April-June .July-Sept. .Oct.-Dec.. .
1942 Jan.-March.April-June .July-Sept. .Oct.-Dec.. .
1943 Jan.-March .April-June .July-Sept. .
Year 1941 . . . .Year 1942 . . . .Approximate totaloutstanding :
end 1942 .Sept. 1943 .
France(1)
Belgium Holland(2)
Denmark(3)
Hungary(4)
Rou-mania
(5)Bulgaria
(e)
Bohemiaand
MoraviaTotal
in millions of Reichsmarks*50
100200250350200500600500750750600
1,650
2,4004,400
14095
255195180310450535485440505685
1,475
2,4153,845
130385375365270(-20)330495510270415
1,2551,075
2,4903,685
9010510512510510585
135165260225425430
1,2451,895
__65208085
(-40)100(-20)11017085
225
310570
1013012510
(-90)808540
(-75)6535
275115
405430
50130SO805570458530**35**35**
340255
695795**
6050
150255(-25)150(-20)335195305375515440
1,5502,425
530995
1,3551,300
925980
1,4352,3251,7902,2352,5104,1805,665
11,51018,045
Note: In general, only clearing claims are shown which have been financed, or refinanced, by the centralbank (in the case of France, by the Treasury). For Belgium, however, certain assimilated claims are included,particularly an account showing Reichskreditkassenscheine withdrawn, amounting to RM 286 million at theend of 1942; and for Denmark, the only country which books occupation costs as a Reichsmark claim, theseare included also and amounted to RM 670 million, rather more than half the total claim on Germany,at the end of 1942. For Bulgaria, the net amount on clearing accounts is shown (assets less liabilities),but the Bulgarian Treasury certificates, denominated in Reichsmarks and purchased by the National Bankfrom its clearing balances, have been added. Since the abolition of the German clearings with Hollandand with Bohemia and Moravia, the central banks of these countries have held Reichsmark claims directly.
The table excludes amounts taken over by Treasuries (e. g. in Holland) and Reichsmark claims of privatebanks (e.g. in Hungary) and of private individuals or firms (for instance, the Belgian National Railways showa claim of B.fcs 2,004 million (RM 160 million) in the balance sheet for 1942 in respect of military transportsand the utilisation of railway stock by the Reichsbahn, while on the other hand the Reichsbahn in its balancesheet for 1942 shows claims of RM 237 million against the railways in the occupied territories).
* Figures are rounded off to RM 5 millions. ** Estimates.0) Advances made by the French Treasury to finance the surplus of exports to Germany. The total for 1941
Is known to have been RM 600 million; in the absence of detailed information for that year a rising tendencyduring the year has been assumed.
(2) The Nederlandsche Bank's figures showed a decline of RM 20 million for the quarter ended June 1942 butsome RM 300 million was transferred to the Dutch Treasury at the beginning of April 1942.
(3) Including occupation costs which, In the case of Denmark, are booked as a claim on Germany.(4) The relevant Item of the National Bank of Hungary's return declined by RM 40 million when RM 161 million
was taken over by the Hungarian Treasury in the middle of September 1942; in all, RM 225 million was takenover in this way during the year. The reduction of RM 20 million to the end of March 1943 was followedby a rise of over RM 100 million in the first week in April, when a new credit appears to have been granted.
(5) In the two months to the end of February 1942 the clearing assets fell by RM 135 million of which RM 50 mil-lion was utilised to purchase gold. Similarly in 1943 clearing assets fell by RM 100million in the two monthsto the end of March, of which again RM 50 million reflected a purchase of gold.
(6) In the three months dune-August 1942 the net clearing claims shown by the National Bank of Bulgariafell altogether by RM 50 million compared with an average increase of over RM 30 million in the other monthsof the year, from which it may be assumed that some RM 150 million was utilised for special purposes.

— 154 —
quarterly and yearly figures of theincreases are given in the tableon the previous page. In boththe graphs and the table localcurrencies have been convertedinto Reichsmarks for purposes ofcomparison.*
This table is compiled fromstatistics covering clearing claimsof the countries concerned vis-à-vis all other countries. Generally,individual debtor countries are notdistinguished in these totals but itis known that the preponderatingdebtor in all cases is Germany.Germany accounted for 90 percent,of the Belgian clearing claims atthe end of 1942, 98 per cent, ofHungarian claims, 99 per cent, ofDutch claims and 100 per cent,of the French total; and similarproportions are applicable toDenmark and other countries. Thusno great error would be made if thefigures given were taken as apply-ing to German clearing debts only.
The total Reichsmark claimsoutstanding of the eight countriesshown in the table reachedRM 11.5 milliard at the end of1942, about 60 per cent, of thetotal for all countries as given fromGerman sources; the increasefor the eight countries during theyear was RM 5.7 milliard againstRM 4.2 milliard in 1941. In additionover RM 800 million was takenover in 1942 by the Treasuries inHolland, Hungary, Roumania andBulgaria and utilised in part forextraordinary payments in Germany.In 1943, the increase of the clearing
• Almost the whole of Germany's export tradeand thus a great part of European trade Is,In fact, conducted in Reichsmarks. The annualreport of the Golddiskontbank for 1942 statesthat Its exchange-guarantee business haslost much of its importance "since Germanexporters are now invoicing almost exclusivelyin Reichsmarks".
Reichsmark Claims Outstanding.Monthly, In millions of Reichsmarks.
4000 4000
WOO19A-1 19« 19«
4000
19«

— 155 —
Reichsmark Claims Outstanding.Monthly, in millions of Reichsmarks.
1000
500
1000
: HUNGARY
Pengöclaiftis on Germany -1940 1941 19« 19«
: ROUMANIA
1000
500
01000
500
1000
500
19«
accounts of the eight countrieswas RM 6.5 milliard in the firstnine months.
Other countries which haveappreciable clearing claims onGermany, but for which no re-gular periodical statistical dataare available, include the follow-ing: Italy, Switzerland, Spain,Slovakia, Croatia(1) and Greece.
Deficits on clearing accountsin Europe other than those ofGermany are mostly of little re-lative importance. Only Finlandappears to be generally indebtedall round (but chiefly to Germanyand largely on account of de-liveries of war materials): thetotal of Finnish clearing debtsrose from RM 75 million at theend of 1941 to RM 150 million(2)
at the end of 1942. Semi-officialestimates made in September 1942placed the French clearing debtto Switzerland at Fr.fcs 1,000 mil-lion (equivalent of Sw.fcs 100 mil-lion). Certain I tal ian clearingdebts are mentioned later. Moredetailed information regarding thedevelopment of the clearings inparticular countries is given inthe following paragraphs.
The surplus on the French clearing with Germany during the year 1941was less than that of Belgium and only one-half that of Holland; but in 1942it expanded to considerably more than double its former volume and exceededthese other two principal suppliers of Germany on credit. Some idea of theextent of French exports to Germany can be obtained from the followingestimates: in the first five months of 1942 French exports to Germany amountedto Fr.fcs 14.7 milliard (over 70 percent, of France's total exports) and importsFr.fcs 3.7 milliard, the Fr.fcs 11.0 milliard surplus of exports being financed bythe French Treasury. The total claim in the clearing with Germany was equi-valent to about RM 2,400 million at the end of 1942.
(?) Clearing claims were first shown in the return of the Croatian State Bank on 15th October 1943 when theytotalled Kunas 2,950 million. (2) i.e. the equivalent of FM 3,000 million. There Is, in addition, aforeign short-term debt of a similar magnitude owed partly to Sweden and partly to the United States.

- 156 -
After France, Balgium was the chief exporter to Germany on credit in1942; the figure in the table for 1941 includes, besides the clearing, the with-drawal during the year of RM 286 million Reichskreditkassenscheine issued in1940; the surplus on the actual clearing account with Germany in 1942 wastwo and a half times as great as in 1941. The total of the Belgian claim onGermany at the end of 1942 was the equivalent of about RM 2,400 million.
Hol land follows closely after France and Belgium. Actually the returnsof the Nederlandsche Bank show an increase of only RM 1,075 million in 1942,compared with RM 1,255 million in 1941, but, in addition, some RIVI 300 millionwere purchased by the Dutch Treasury from the bank early in April 1942.According to unofficial reports, similar purchases took place regularly at theend of each month thereafter, but these transactions were for much smalleramounts and, as these Reichsmarks are not shown amongst the assets in theTreasury returns, it is not possible to make allowance for them. At the endof 1942 the total Reichsmark holding of the Nederlandsche Bank amounted tonearly RM 2,500 million (of which RM 2,300 million was invested in Reichsecurities*); taking account of the Treasury's holding, the total Dutch claimwould be about RM 3,000 million.
Statistical data regarding the I tal ian surplus in the clearing with Germanyare lacking but the increase of the Italian Treasury's assets in the pasttwo years leads to the assumption that the total clearing surplus may bein the neighbourhood of Lit. 15 milliard, say RM 2,000 million, which totalhas been adjusted to the extent of the value of the property of German
nationals repatri-Migrat ion of German Nat iona ls^ . ated from the South
Position at end of 1942. Tyrol and broughtinto the clearing in1940. What amounthas been broughtinto the Italian-German clearing asa result of thisrepatriation has notbeen revealed butnearly 240,000 per-sons had beentransferred fromthe South Tyrol bythe end of 1942,of whom 62,000
(') From the annual report for 1942 of the Deutsche Umsiedlungs-Treuhand- 'Gesellschaft, formed in the autumn of 1939 to ensure the orderly transfer the table shows,of emigrants' property.
(2) Including 16,244 emigrants under the later transfer dating from February 1941.
Date of beginning ofemigration
1939 November . .November . .November . .
1940 September .October . . .December . .
1941 January . . .JuneNovember . .December . .
1942 February . .AprilJulyOctober . . .
Territory from whichemigration took place
Estonia and Latvia (2) . . . .South Tyrol.Volhynia, Galicia etcPolish Governor-GeneralshipBessarabia & North BukovinaDobrudja & South Bukovina .Lithuania
Lai bac h (Ljubljana)BulgariaUSSRGreece (Herakleia)Slovakia
Totals . . .
Totalnumber ofemigrants
80,076237,802134,95030,756
137,11677,23850,90415,35314,8101,9255,314
144551
18,302
806,106
Numberwith
fortunes
35,00062,00060,0007,000
55,00020,00015,0006,0004,500
6901,500
3113
5,000
272,000
* Holland is able to invest Reichsmark balances directly in Reich securities. Other countries hold non-interest-bearing Reichsmark balances at the Verrechnungskasse in Berlin, which Invests these funds in Reichsecurities on its own account.

— 157 —
(The transfer of German nationals, which began in the autumn of 1939,had passed its peak in 1942. Although the last resettlements had not yetbeen completed, the work of the Deutsche Umsiedlungs-Treuhand-Gesellschaftthus entered on a new phase during the year, when it became chiefly aquestion of helping settlers in their new economic surroundings. By the endof 1942 final settlements of property had been made in 195,000 cases, involvingtotal out-payments of RM 219 million plus RM 260 million for maintenance,advances, etc.)
Denmark is the only country where the costs of maintaining the occupy-ing troops, of fortifications etc. are booked as a claim in Reichsmarks, and thisclaim is included with the clearing in the figures given in the table. In 1941the total of RM 425 million was divided equally between the clearing and occu-pation costs. For 1942 the total increase under the two headings was practicallythe same as in the previous year, but the rise in the clearing figure wasrelatively less, particularly in the third quarter, while the occupation costs,which had been running at an average of RM 17-18 million monthly, rose in thelast quarter to over RM 30million a month. Towards the end of 1942 the restric-tions on purchases by German soldiers and the customs control for Germannationals were lifted. Moreover, the Danish Government agreed that the army ofoccupation should be supplied from Danish sources, while hitherto foodstuffshad had to be either imported or bought in the country through the clearingaccount. The total Danish claim in Reichsmarks was about RM 1,250 millionat the end of 1942.
In 1941 the Hungarian National Bank and the commercial banks opened apengö credit in favour of the German clearing office in order to make possiblethe payment of claims of Hungarian exporters. In view of the further increase ofexporters' claims, the Hungarian banks, in the spring of 1942, granted a freshadvance of RM 100 million, raising the amount of claims financed directly bythe National Bank and the Hungarian banks together to the equivalent ofRM 300 million. The Hungarian banks, for a considerable part of this advance,had recourse to the National Bank in the form of credits on current account.These credits and the advances of the National Bank were shown separately inthe return of the latter as "Pengö advances made to foreign countries" and itis this item which is reproduced in the table (in which connection it must beremembered that it does not show the amounts financed by the commercialbanks without recourse to the National Bank).
As the result of an arrangement reached with Germany, the HungarianGovernment in September 1942 took over RM 161 million from the National Bankand by the end of 1942 had bought RM 225 million within the German-Hungariandevisen compensation. The pengö amounts required for this purchase ofReichsmarks were raised by the issue of Treasury certificates which, however,for the most part, were presented by the banks for rediscount at the NationalBank (and booked under the same heading as the refinanced pengö advances,

— 158 —
the title of the item being changed as from 7th December 1942 to "advancesmade for international payments").
The Reichsmarks taken directly by Hungary and the pengö advancestogether amounted to RM 540 million at the end of 1942, an increase ofRM 357 million on the year. In addition, RM 137 million had been utilised bythe Treasury for extraordinary payments. The total claim shown by the NationalBank of Hungary at the end of 1942, and included in the table on page 153,was the equivalent of RM 310 million*.
The rise in the Reichsmark holding of the National Bank of Roumania isshown in the table at RM 115 million for 1942, less than half the increase ofRM 275 million in 1941. Actually the National Bank purchased about the sameamount of Reichsmarks as in the previous year but in the first two months of1942 the equivalent of RM 50 million was used to buy gold from Germany andRM 85 million was sold to the government for the repurchase of Roumaniansecurities from Germany and for other purposes. Again, in the early monthsof 1943, the clearing claims fell by RM 100 million, of which RM 50 million wasutilised to buy gold. The National Bank of Roumania twice suspended itspurchases of Reichsmarks for appreciable periods, the first occasion beingfrom the end of October 1941 until January 1942 (before the first purchase ofgold) and the second being from the end of October 1942 until January 1943(immediately before the second gold purchase). At the end of 1942 the totalclearing claim was nearly RM 400 million.
The Bulgarian National Bank's holding of Reichsmarks, amounting tonearly RM 700 million at the end of 1942, consisted of some RM 450 million clearingclaim and RM 250 million Reichsmark "investments". These investments consistof Bulgarian Government Treasury bills denominated in Reichsmarks, given tothe German armaments and heavy industry in advance payment for ordersplaced. They have been repurchased by the National Bank as a utilisation ofReichsmark balances. By a later arrangement the National Bank providedReichsmarks directly to the government against Treasury bills.
The Reichsmark holding of the National Bank of Bohemia and Moraviaincreased further during 1942 and would be higher still but for two factors,the purchase of Reich securities by the commercial banks and the payment ofa "Matrikular contribution" by the Protectorate to the Reich. The accumulationof Reichsmarks arises not only in trade with Germany but also through exportsto south-eastern European countries in so far as these countries are allowedto settle their debts to the Protectorate out of their Reichsmark claims onGermany. In 1942 certain bonds of south-eastern European countries in privatehands were called for surrender to the National Bank to be offset againstclearing debts due to those countries.
* Further, clearing assets and the corresponding claims against Hungarian exporters are booked under "sundryassets'" and "sundry liabilities" in the National Bank's returns until out-payment or formal advance is made
. (see footnote (') to the table giving figures of the National Bank's return on page 220).
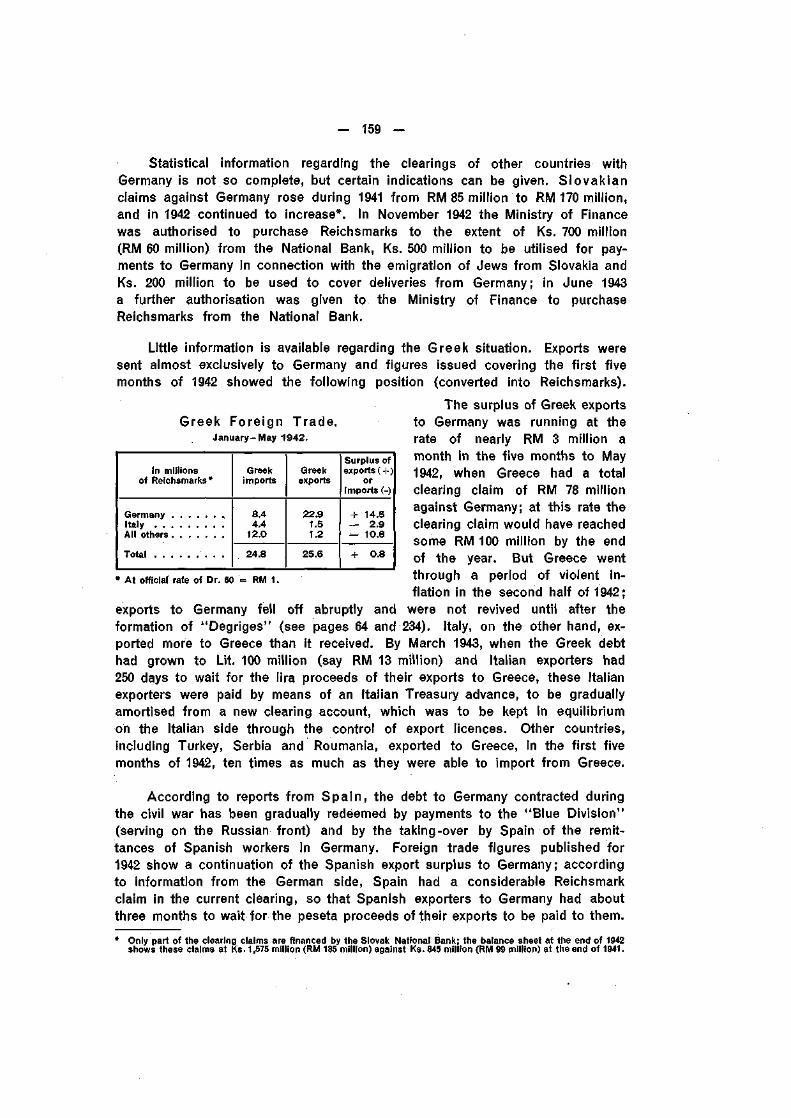
— 159 —
Greek Foreign Trade.January-May 1942.
Statistical information regarding the clearings of other countries withGermany is not so complete, but certain indications can be given. Slovakianclaims against Germany rose during 1941 from RM 85 million to RM 170 million,and in 1942 continued to increase*. In November 1942 the Ministry of Financewas authorised to purchase Reichsmarks to the extent of Ks. 700 million(RM 60 million) from the National Bank, Ks. 500 million to be utilised for pay-ments to Germany in connection with the emigration of Jews from Slovakia andKs. 200 million to be used to cover deliveries from Germany; in June 1943a further authorisation was given to the Ministry of Finance to purchaseReichsmarks from the National Bank.
Little information is available regarding the Greek situation. Exports weresent almost exclusively to Germany and figures issued covering the first fivemonths of 1942 showed the following position (converted into Reichsmarks).
The surplus of Greek exportsto Germany was running at therate of nearly RM 3 million amonth in the five months to May1942, when Greece had a totalclearing claim of RM 78 millionagainst Germany; at this rate theclearing claim would have reachedsome RM 100 million by the endof the year. But Greece wentthrough a period of violent in-flation in the second half of Ì942;
exports to Germany fell off abruptly and were not revived until after theformation of "Degriges" (see pages 64 and 234). Italy, on the other hand, ex-ported more to Greece than it received. By March 1943, when the Greek debthad grown to Lit. 100 million (say RM 13 million) and Italian exporters had250 days to wait for the lira proceeds of their exports to Greece, these Italianexporters were paid by means of an Italian Treasury advance, to be graduallyamortised from a new clearing account, which was to be kept in equilibriumon the Italian side through the control of export licences. Other countries,including Turkey, Serbia and Roumania, exported to Greece, in the first fivemonths of 1942, ten times as much as they were able to import from Greece.
According to reports from Spain , the debt to Germany contracted duringthe civil war has been gradually redeemed by payments to the "Blue Division"(serving on the Russian front) and by the taking-over by Spain of the remit-tances of Spanish workers in Germany. Foreign trade figures published for1942 show a continuation of the Spanish export surplus to Germany; accordingto information from the German side, Spain had a considerable Reichsmarkclaim in the current clearing, so that Spanish exporters to Germany had aboutthree months to wait for the peseta proceeds of their exports to be paid to them.
In millionsof Reichsmarks*
Germany . . . . . . .ItalyAll others
Total
Greekimports
8.44.4
12.0
24.8
Greekexports
22.91.51.2
25.6
Surplus ofexports (+)
orimports (-)
+ 14.5— 2.9— 10.8
+ O.8
• At official rate of Dr. 60 = RM 1.
Only part of the clearing claims are financed by the Slovak National Bank; the balance sheet at the end of 1942shows these claims at Ks. 1,575 million (RM 185 million) against Ks. 845 million (RM 99 million) at the end of 1941.

— 160 —
For most of the countries mentioned above the credits granted to Germanythrough the clearing mechanism were not limited by agreement as to eitheramount or maturity. The Hungarian credits described in preceding paragraphswere limited only as to amount, while the maturity remained indefinite. Somewhatsimilar were the credits granted by Switzer land. In July 1941 it was announcedthat the Swiss Government would guarantee the country's exporters, within thescope of the clearing agreement with Germany, credits up to Sw.fcs 400 million(in addition to the "normal" amount of about Sw.fcs 50 million outstanding),while a further Sw.fcs 400 million would be made available for the period up tothe end of 1942 (forming a total equivalent to about RM 465 million at the officialrate of RM 1 = Sw.fcs 1.76); and the waiting time for Swiss exporters waslimited to three months. Negotiations for the renewal of the clearing agreement,which expired at the end of 1942, led to no definite result; the existing clearingmechanism was, however, maintained and it was decided, inter alia, that theSwiss exporters to Germany might avail themselves of such balances as hadremained unutilised on the previous credit. On 1st October 1943 a new agree-ment was signed, the principle being that the clearing should, in future, bein the main self-supporting without credits; a gradual prolongation of the delay(before Swiss exporters were paid in their domestic currency) was thus to bereckoned with.
Unlike the credits given to Germany by other countries, those granted bySweden have carried interest and have been strictly limited both as to timeand as to amount. In the autumn of 1941 the Swedish Reserve Stocks Officemade a credit of S.Kr. 100 million available to the Clearing Office to financeexports to Germany during the remainder of the year, the credit to be repaidby a first charge on German deliveries of coal, coke and chemical productsduring the first half of 1942. S.Kr. 90 million had been drawn under this creditby the end of the year; three-quarters of this amount was repaid by the duedate in June 1942 and the balance in the second half of the year.
Credits granted directly by Swedish exporters themselves might, moreover,be partially insured through the Government Export Credit Office: in theautumn of 1941 Swedish exporters of cellulose, timber and paper, on contractsof S.Kr. 59 million, gave credits up to March 1942 of S.Kr. 44 million, ofwhich S.Kr. 22 million was guaranteed; these credits also were repaid. For1942, new credits of some S.Kr. 115 million, generally up to about one year,were granted by Swedish exporters, of which one-half were covered by officialguarantees. The total of official and private credits outstanding at the end of1942, the equivalent of some RM 70 million, was thus at about the same levelas a year previously. Apart from the credits, Germany had a surplus balanceon clearing account of about S.Kr. 30 million at the end of 1942, which,following the seasonal movement of trade, grew to over S.Kr. 90 million byMay 1943 but declined in later months. No new credits, official or private,were granted for the first half of 1943, when S.Kr. 8 million of the outstandingadvances was repaid.

- 161 -
In I taly, material was published weekly, showing the date of the last exporttransaction settled through the clearing and its serial number. These numbersindicated the volume of export transactions, if not their value, with each clearingpartner separately. They have been utilised to prepare the following table,showing the number of transactions pertaining to the calendar years 1939-42(not necessarily paid for during the corresponding year).
Number of I tal ian export t ransac t ions .
Clearing partner
All othersTotal . . .
1939 194O
Thousands107692
17161356
11562121267
268
1941 1942
of transactions14652161333
260
10928161252
217
1939 1940 1941 1942
Percentage of total301915
45100
43234%4%
25100
562065
13100
50137/2S'A
24100
* Including Bohemia and Moravia.
The number of Italian export transactions through the clearing fell from356,000 in 1939 (when England was included) to 260,000 in 1941 and 217,000 in1942. The number of exports to Germany increased both absolutely andrelatively until 1941, while those to other countries (with the exception ofHungary) fell off: in 1942 the number of export transactions with Germanyfell by one-quarter.* The German proportion, which had increased from 30 percent, in 1939 to 56 per cent, in 1941, declined to 50 per cent, in 1942. Thefour countries heading the list accounted for 75 per cent, of Italian exporttransactions in 1940, 87 per cent, in 1941 and 76 per cent, in 1942. In thelatter year there was a notable increase of export transactions with Roumania,
Bulgaria and Croatia(included under "allothers" in the table).
German-Italian Clearing.Number of days delay before out-payments due to
Italian exporters were.made in lire.HI i
1937 1938 1943
The surplus ofItalian exports toGermany and the re-patriation of savingsby Italian workers inGermany led to a con-tinuous growth of theGerman clearing debtto Italy. Some indica-tion of this is givenby the graph showingthe number of dayswhich Italian exporters
* It has been stated semiofficially that in value the turnover of Italo-German trade rose from RM 650 millionIn 1939 to over RM 2,000 million in 1941, and in 1942 further increased.

- 162 -
I tal ian Clear ings.
Waiting period for Italian exporters before receivingproceeds in lire, from date when foreign importer paid
domestic currency into his clearing officeC).
had to wait from the date when the German importer made his payment inReichsmarks in Berlin until the proceeds in lire were paid out in Rome. Byagreement this period was limited to 50 days in the first part of 1942; fromSeptember, however, the number of days of waiting rose continuously to over100 at the end of the year but, as a result of new negotiations early in 1943,fell to 50 days again in the middle of April.
As a result of the political events in September 1943, a number ofdifficulties arose; although the Verrechnungskasse in Berlin continued toaccept payments in favour of Italian exporters, these payments could not beconverted into lire since no fully functioning clearing institution remained on theItalian side — nor could wage savings from Italian workers be transferred. Thelira was devalued from 7.6 to 10.0 to the Reichsmark as from 15th September1943 and Reichskreditkassenscheine were temporarily utilised for German mili-tary payments (see page 188).
The accompanying table showsthe number of days which Italianexporters had to wait for the liraproceeds of their exports to variouscountries as at the end of the years1939-42. The number of export trans-actions with Switzerland fell in 1942to little more than one-half of the 1941figure, and the Italian clearing debtincreased; Switzerland still remainedby far the most important partner ofItaly after Germany. With Hungary thenumber of transactions was main-tained; Hungary opened a credit inthe clearing with Italy in 1941 butthis was not utilised until December1942, when Pengö 16 million (theequivalent of, say, RM 10 million) wasdrawn. For neither Switzerland norHungary did the waiting period exceed20 days throughout 1942, and it wasusually 10 or under (i.e. the minimumtime necessary for postal communi-cations and normal administrativeprocedure).
With Sweden, the Italian clearingposition worsened somewhat in thesecond half of 1942; at the end ofthe year, the Italian debt amountedto S. Kr. 12 million and Swedishexporters had about six weeks to
Number of daysat end of year
Croatia (2)GreeceGermanyDenmarkBulgariaFranceTurkeyFinlandSpainSlovakiaPortugalSweden . . . . . .RoumaniaHungarySwitzerland . . . .
1939
2913134959
8535222011459
7
1940
9
116511
7243221711311088
1941
8
561415
379722215111142118
1942
202169105706342362322221717171513
(') Only the clearings which were still active at the endof 1942 are included. Others are omitted: those withEstonia, Latvia and Lithuania, for instance, weredropped from the official statistics in November 1942when Italian exporters had waited 539, 561 and 1,027days respectively for payment (the last paymentsreceived applying to May 1941 for Estonia and Latviaand January 1940 for Lithuania).
(-) Yugoslavia for 1939 and 1940. The relative importanceof Italy and Germany In Croatian trade is reflectedin the turnover of their currencies on the Agram(Zagreb) bourse:
In millions of kunas
1941 July-September . .October-December .
1942 January-March . . .April-JuneJuly-September . .
RM
416788899777947
Lire
159344547358216
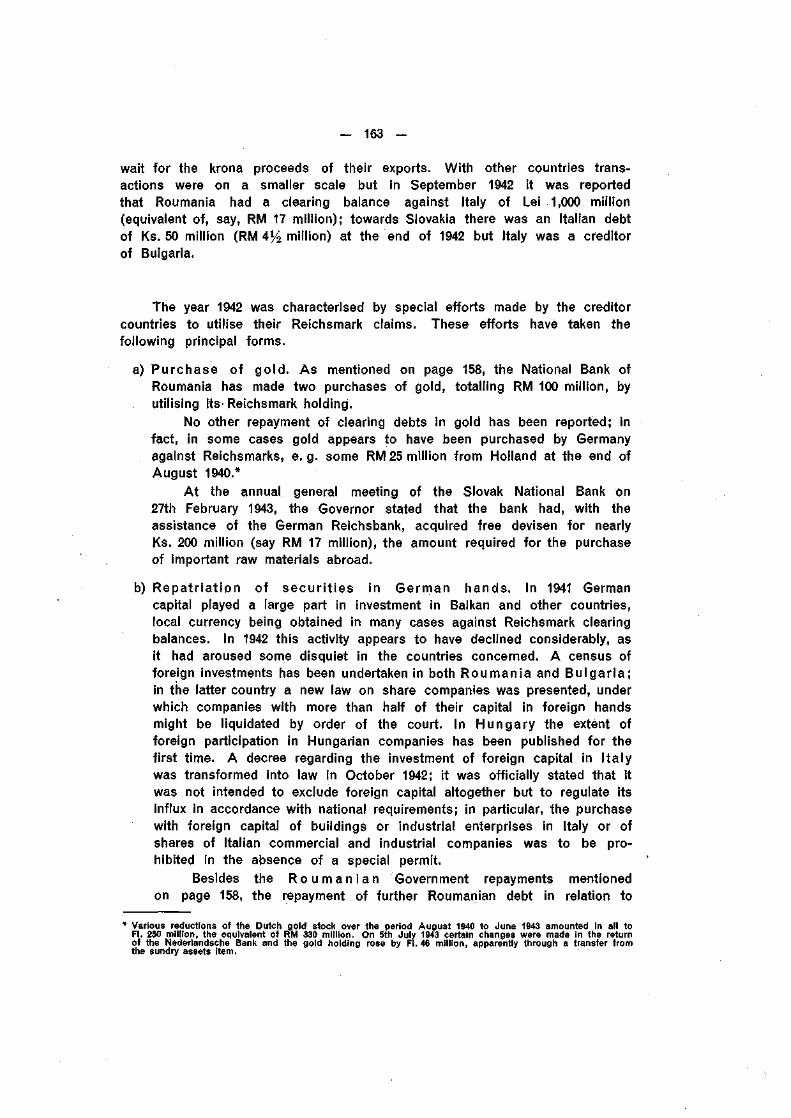
— 163 -
wait for the krona proceeds of their exports. With other countries trans-actions were on a smaller scale but in September 1942 it was reportedthat Roumania had a clearing balance against Italy of Lei 1,000 million(equivalent of, say, RM 17 million); towards Slovakia there was an Italian debtof Ks. 50 million (RM 4% million) at the end of 1942 but Italy was a creditorof Bulgaria.
The year 1942 was characterised by special efforts made by the creditorcountries to utilise their Reichsmark claims. These efforts have taken thefollowing principal forms.
a) Purchase of gold. As mentioned on page 158, the National Bank ofRoumania has made two purchases of gold, totalling RM 100 million, byutilising its Reichsmark holding.
No other repayment of clearing debts in gold has been reported; infact, in some cases gold appears to have been purchased by Germanyagainst Reichsmarks, e.g. some RM 25 million from Holland at the end ofAugust 1940.*
At the annual general meeting of the Slovak National Bank on27th February 1943, the Governor stated that the bank had, with theassistance of the German Reichsbank, acquired free devisen for nearlyKs. 200 million (say RM 17 million), the amount required for the purchaseof important raw materials abroad.
b) Repatr iat ion of secur i t ies in German hands. In 1941 Germancapital played a large part in investment in Balkan and other countries,local currency being obtained in many cases against Reichsmark clearingbalances. In 1942 this activity appears to have declined considerably, asit had aroused some disquiet in the countries concerned. A census offoreign investments has been undertaken in both Roumania and Bu lgar ia ;in the latter country a new law on share companies was presented, underwhich companies with more than half of their capital in foreign handsmight be liquidated by order of the court. In Hungary the extent offoreign participation in Hungarian companies has been published for thefirst time. A decree regarding the investment of foreign capital in Italywas transformed into law in October 1942; it was officially stated that itwas not intended to exclude foreign capital altogether but to regulate itsinflux in accordance with national requirements; in particular, the purchasewith foreign capital of buildings or industrial enterprises in Italy or ofshares of Italian commercial and industrial companies was to be pro-hibited in the absence of a special permit.
Besides the R o u m a n i a n Government repayments mentionedon page 158, the repayment of further Roumanian debt in relation to
* Various reductions of the Dutch gold stock over the period August 1940 to June 1943 amounted in all toFI. 250 million, the equivalent of RM 330 million. On 5th July 1943 certain changes were made in the returnof the Nederlandsche Bank and the gold holding rose by FI. 46 million, apparently through a transfer fromthe sundry assets item.

- 164 -
Germany was agreed upon and the mobilisation of certain Roumanianbonds in German hands was called for by the Reichsbank inMay 1943.
The Hungarian Government in 1942 made extraordinary payments"which under normal conditions would not have taken place"; thesepayments included, in particular, the redemption of the Hungarian quotaof the old government debts of Czecho-Slovakia and Yugoslavia and therepayment of certain Krone and Mark debts of Austria-Hungary datingfrom before 1918 and placed in Germany. In August 1943, a furthermobilisation of Hungarian bonds and coupons in Germany took place.Moreover, it is reported that arrangements have been made betweenHungarian and German banks for the repurchase of Hungarian shares inGerman hands and that these transactions began early in 1943; the scopeof the arrangement is not yet known but capital participations appear tobe excluded.
In the two and a half months to the middle of August 1942, theReichsmark holding of the National Bank of Bulgaria fell by someRM 50 million, a movement due, in part at least, to a return of Bulgariangovernment securities, dating from 1892 to 1909, held in Germany; themobilisation of these securities was called for by an order of theReichsbank in September 1942.
c) The placing of orders in Germany. A method of specifying theutilisation of existing Reichsmark claims has been the placing of largeorders in Germany for delivery after the war, e. g. by the Roumanianrailways (according to the agreement of 4th December 1940). A furtherimportant agreement of this nature was announced in August 1942:special German deliveries of machinery, tools and raw materials etc.were to be made to the Bulgarian authorities for a total present value ofLeva 12 milliard (RM 360 million); the plans provided for delivery periodsof 2 to 2% years, so that the material was expected to arrive in Bulgariaby the end of 1944. By April 1943 it was stated that Bulgarian ordersplaced in Germany had reached Leva 20 milliard (RM 600 million). InSeptember 1943, the Roumanian Ministry of Finance was authorised to takeover RM 200 million from the National Bank to settle claims in connectionwith armament and other orders placed in Germany. The placing ofsimilar orders was also under discussion in Hungary.
Contribution to Germany's war economy was also made by the occupiedcountries in the form of payments to the German (and, to a much smallerextent, Italian) authorities on account of the costs of occupat ion andsimilar charges, such as billeting of troops and requisitions. To give anindication of the importance of this factor also, the table on the follow-ing page has been prepared for four countries for which data have becomeavailable.

— 165 —
Growth of Clearing Claims and Payment of Occupat ion Costs 1940-42.*
Country
France . .Belgium .Holland. .Denmark .
Totals . .
Annual amounts
1940
Clear-ings
Occu-pationcosts
Total
1941
Clear-ings
Occu-pationcosts
Total
1942
Clear-ings
Occu-pationcosts
Total
Totals
Years 1940 to 1942
Clear-ings
Occu-pationcosts
Total
in millions of Reichsmarks150250160190
750
2,000350500200
3,050
2,150600660390
3,800
600680
1,250210
2,740
5,5001,3001,600
210
8,610
6,1001,9802,850420
11,350
1,6501,4801,400
170
4,700
8,6001,5002,000
260
12,360
10,2502,9803,400
430
17,060
2,4002,4102,810
570
8,190
16,1003,1504,100
670
24,020
18,5005,5606,9101,240
32,210
* Figures are rounded off to the nearest RM 10 million.Note: Clearing figures have been brought forward from previously-mentioned data. For Holland an allowance
has been made for the amount taken over by the Treasury in April 1942.As regards occupation costs, the table is compiled from the following material. The amounts actually
paid on account of occupation costs in France (at the rate of Fr.fcs 400 million daily from 25th June 1940to 10th May 1941 and Fr.fcs 300 million daily from 11th May 1941), converted at Fr.fcs 20 = RM 1, wasRM 4,000 million in 1940, RM 6,075 million in 1941 and RM 5,475 million in 1942. The amounts actually utilised(i.e. drawn off the accounts at the Bank of France) were RM 1,730 million In 1940, RM 5,116 million in 1941and RM 7,861 million in 1942. Requisitions and billeting costs, etc., have been given as RM 375 millionIn 1941 and are booked at RM 750 million for 1942. In the table the amounts actually utilised have beentaken plus requisitions (with an allowance for requisitions In 1940).
For Belgium, the 1941 budget accounts give RM 1,212 million for occupation costs and RM 92 millionfor billeting expenses etc. The Dutch figures for occupation costs are derived from the unofficial estimateof FI. 100 million a month given for 1941. For both Belgium and Holland the figures for 1940 and 1942are estimates based inter alia on the data given for 1941. For Denmark, the statistics show the growth ofReichsmark claims on account of advances to the occupying authorities (booked under "sundry assets"in the Nationalbank's return).
The annual amounts contributed by these four countries — France, Belgium,Holland and Denmark — by way of the clearings and by payment of occupationcosts rose from RM 3.8 milliard in 1940 (last half-year only) to RM 11.3 milliardin 1941 and RM 17.1 milliard in 1942. Of the total of over RM 32 milliard inthe two and a half years to the end of 1942, three-quarters was on account ofoccupation costs and one-quarter passed through the clearings; two-thirdsof the occupation costs were paid by France, the remaining third by the otherthree countries together. Estimates for the first nine months of 1943 givean annual rate of over RM 20 milliard, as shown in the table below.
Occupation costs are paid by other countries in Europe but informationis fragmentary. The total credits contracted by the occupying authorities at the
Bank of Norway are estimated inGrow th of C l e a r i n g C l a i m s andPayment of O c c u p a t i o n C o s t s .
Estimates for 1943 (nine months).
Country
FranceBelgiumHollandDenmark . . . .
Totals . . .
1943 January-September
Clearings Occupationcosts Total
in millions of Reichsmarks2,0001,4001,200
3004,900
7,8001,3001,600
35011,050
9,8002,7002,800
65015,950
informed circles to have risen fromN. Kr. 1.5 milliard in December 1940to N. Kr. 3.8 milliard in December1941 and to over N. Kr. 6 milliard inDecember 1942, that is to someRM 3,500 million; against this is tobe set a small debt on clearingaccount to Germany due, however,to imports made by the army ofoccupation. The advances of theBank of Greece on account both ofthe clearings and of the occupation

- 166 -
costs had risen by the end of 1942 (from April 1941) to some Dr. 200 milliard(which would be RM 3,330 million at the official rate of Dr. 60 = RM 1,an amount swollen by the considerable rise of prices in Greece). TheCroatian State Bank in its first published return, for April 1943, showed"claims on foreign countries", due( to advances to occupying troops, atKunas 2,750 million; by the end of September 1943 these claims had risento Kunas 9,020 million. And occupation costs of unknown amount are alsopaid by Serbia.
Including the war contributions of the Governor-Generalship of Polandand the Protectorate of Bohemia and Moravia but excluding all levies on theoccupied parts of Russia, Germany would seem to have received in the twoand a half years up to the end of 1942 some RM 45-50 milliard*, from Europeancountries as a result of recorded transactions on account of occupation costsand through the clearings. Of the total about two-thirds represent occupationcosts, while for the remaining one-third a German liability was incurred onclearing account.
The financing of these vast sums has naturally had important monetaryconsequences in the countries concerned. To arrive at the total amount ofofficial financing in each country, payments in respect of occupation costs andclearing advances must be added to the expenditure in the national budget,and the crucial point of the financial problem will then be what proportions ofthe total are covered by taxation (and other current revenue), by expansion ofbank credit and by direct calls on the central bank. The proportions varyin the different countries but a dominant part of the charges usually falls onthe central bank. It is therefore of some interest to show the degree ofparallelism obtaining between the payment of occupation costs and the growthof clearing claims, on the one hand, and the expansion of the note circulation,on the other, where the items in question are recorded in the balancesheets of the central bank; this is done in the table on the opposite page.
In 1942 there was a very close correspondence between the growth of theclearing claims and the rise of the note circulations in Belgium, Holland,Slovakia and in Bohemia and Moravia; for France the parallelism is with thepayment of occupation costs.
In Hungary and Roumania the note circulations rose in 1942 considerablymore than the clearing claims as shown by the central bank — this impliesthat central-bank credit was extended for other reasons also ; the parallelismwould, however, have been greater but for the purchases of Reichsmarks bythe Treasuries in these countries. In Denmark and Bulgaria, on the otherhand, the note circulations have risen less than the clearing claims — in eachof these two countries "other sight liabilities" of the central bank have risenconsiderably, in Denmark the accounts of the banks and in Bulgaria theaccount of the Treasury.
Dr. Günter Keiser in "Bank Archiv" of 15th February 1942 gave a total of RM 15-17 milliard for all countriesin 1941. The four countries shown in the table appear to account for about three-quarters of the total inthat year.

— 167 —
Clearing c la ims, occupat ion costs and note c i rcu la t ions .
Country
Out-payments onaccount of clear-ing claims or
occupation costs*during year
1941 I 1942
I ncrease ofnote circulation
during year1941 I 1942
In mil I ia rds of national currency units
Out-payments aspercentage ofincrease of note
circulationduring year
1941 I 1942
percentages
Total clearing claims(or occupation costs)
as percentage of notecirculationat end of year
1940 I 1941 I 1942
percentages
Belgium 0) . . . .Bulgaria« . . . .Denmark(3) . . . .FranceWHollandHungaryRoumania . . . .SlovakiaBohemia and
Moravia
8.611.00.88
42.00.950.14
16.50.45
5.1
18.48.20.69
116.20.810.376.80.73
4.4
13.66.90.10
49.10.560.60
32.30.37
2.9
19.45.50.14
112.60.920.97
20.70.72
4.7
6315988086
1702351
122
176
95149493103883833
101
94
951
10937a
124
101
2410720153497
1842
124
441192435562172057
114
• In so far as shown by the central bank. 0) Including Reichskreditkassenscheine withdrawn.(2) Including Reichsmark "investments". Without this item the net clearing claims would amount to 80 per cent,
of the note circulation at the end of 1942.(3) Clearing and occupation costs together. (4) Occupation costs (net movement of special advances
of Bank of France and account of Reichskreditkassen during year — see page 195).
By the end of 1942 the total clearing claims exceeded the note issue inDenmark, Bulgaria and in Bohemia and Moravia; in Holland and Slovakiaclearing claims were around 60 per cent, of the note issue, in Belgium over40 per cent, and in Roumania and Hungary around 20 per cent. Commenting onthis situation*, one of the Vice-Presidents of the Reichsbank stated that for thepresent each country must do what it could to lessen the strain due to the warand take the necessary measures to prevent harmful repercuss ions on itscurrency. As mentioned in the twelfth Annual Report of this Bank, variousefforts have already been made to offset the undesirable monetary effects ofdirect advances of the central banks to finance clearing claims and occupationcosts. In Denmark, where the rise of the note circulation has been leastpronounced, steps have been taken to tie up the banks' cash reserves and tofloat "sterilisation" loans. In Bohemia and Moravia the central bank has forseveral years issued interest-bearing Kassenscheine to mop up the surplusfunds on the market; the Dutch Treasury has taken over part of theReichsmark claims against Treasury certificates, which the Nederlandsche Bankmay sell on the market. In Hungary, part of the clearing claims was financedby the commercial banks and, in Belgium, an effort has been made to check theexpansion by the payment of exporters' claims in blocked Treasury certificates.Further details of the various credit measures taken are given for the individualcountries in Chapter V.
To counteract the undesirable monetary effects, efforts have been made tocheck the increase of central-bank advances; thus from time to time the centralbanks in Hungary, Bulgaria and Roumania, for example, have strictly limited the
* In an article In the Südost-Echo, 16th October 1942.

- 168 -
amounts of Reichsmarks they would buy (especially those arising from incomingcapital). From the point of view of monetary expansion it is of no use merelyto exchange one central-bank asset for another; the swapping of clearingclaims in the central-bank return for something else, whether it be a Treasurycertificate (as in Holland) or even gold (as in Roumania), involves no monetarycontraction (although it may be desirable for other reasons).
Some effect in checking surplus exports and, with them, the monetaryexpansion has been produced by allowing exporters to wait for their moneyuntil it becomes unfrozen by the natural play of the clearing, i. e. until offsetby imports. As mentioned earlier in this chapter, the delay in the payment ofItalian exporters to Germany, which had been limited to 50 days, rose during1942 to over 100 days; and the agreement which limited the waiting time forSwiss exporters to Germany to 90 days lapsed at the end of 1942(1). Spanishand Slovakian exporters to Germany also had about 100 days to wait for theproceeds of the exports to be paid; and in Sweden and Hungary exporterswere not certain to receive immediate payment in their domestic currencies.Early in 1943 negotiations were undertaken by Germany with both Italy andHungary to speed up domestic out-payments to the exporters in thosecountries.
The growth of Germany's clearing debts reflects the surplus of Germanimports including transport and insurance charges etc., payments to contractorsfor armament orders placed by Germany in occupied countries, payments onbehalf of the German army and the repatriation of savings made by foreignworkers0 in Germany. The accelerated rate of growth of German clearingdebts in 1942 and 1943 is the result not only of the intensification of the warbut, to a large extent, of increased prices in the exporting countries.
There is evidently a conflict of interests between the creditors in theclearing, who wish to import, i. e. to turn their Reichsmark claims into goods,and Germany, which seeks the greatest possible contribution from the Europeaneconomy. To questions on this subject, one of the Vice-Presidents of theReichsbank has replied(3) that Germany recognises that its growing clearingindebtedness towards other countries has given rise to anxiety. But it mustbe realised, he added, that Germany, in its conduct of the war, is compelledto have recourse to European resources, so that, for the time being, the estab-lishment of equilibrium in terms of goods between the various countries mustnecessarily be postponed.
There is, however, a further and less evident conflict of German interestsamongst themselves. In order that the clearing mechanism should work smoothly
(1) The new agreement signed on 1st October 1943 provided for the gradual prolongation of the waiting periodup to nine months, say 270 days.
(2) The transfers of funds by foreign workers through the German devisen banks amounted to RM 120 millionIn 1940, to RM 383 million in 1941, to RM 606 million in 1942 and RM 230 million in the first four months of1943: in all, RM 1,339 million. These amounts refer only to transfers through the banks by twelve countries,excluding Holland and Bohemia and Moravia (with no devisen frontier) and Roumania, Croatia and the BalticStates, as also the Ukraine and White Russia (for which other methods of payment were used).
(3) In the article in the Südost-Echo already mentioned.

— 169 —
and that payments to foreign exporters be made immediately in their homecurrency (so that the exporters are not hampered in their activity by havingtheir funds tied up indefinitely in the clearings), the clearings are financed innearly all countries directly by the central bank. This means that central-bankcredit, and generally the note circulation also, rises more or less parallel withthe clearing claim (as has been shown above). Owing to the considerableimportance of these claims measured in the currency of the creditor countriesand to the comparative narrowness of their capital markets, it has becomemore and more difficult to finance any appreciable part of these claims outsidethe central bank. Thus the undesirable monetary effects of the accumulationof clearing claims in the creditor countries have become intensified. Notecirculations expanded to finance clearing claims (and occupation costs), com-bined with falling domestic production and declining imports, have been thecause of soaring prices and quotations, a search for Sachwerte and othersymptoms of inflation. But rising prices throughout a great part of Europelead to higher prices for German imports, and the mobilisation of resourcesfor German account may be seriously impaired by the social influences ofcumulative inflation.
The measures taken to meet this situation are the price stop and exchangestability. If a European price stop for all prices has proved impossible, atleast a price stop for goods entering into foreign trade has been attempted.Most new clearing and commercial agreements (which are often arranged foronly a few months at a time) have clauses fixing the prices of the moreimportant commodities exchanged; and, in addition, measures have been takenfor price equalisation by special funds. Further, as the annual report of theReichsbank points out, in spite of loss of purchasing power due to price andwage increases and other causes in a number of countries, foreign exchangerates have not been adjusted, Germany being desirous of assisting thesecountries in their efforts to maintain the value of their domestic currencies.
There are thus two problems arising from the clearing situation whichaffect both Germany and the clearing creditors alike: the much-discussed pro-blem of future repayment and the more immediate problem of present inflation.
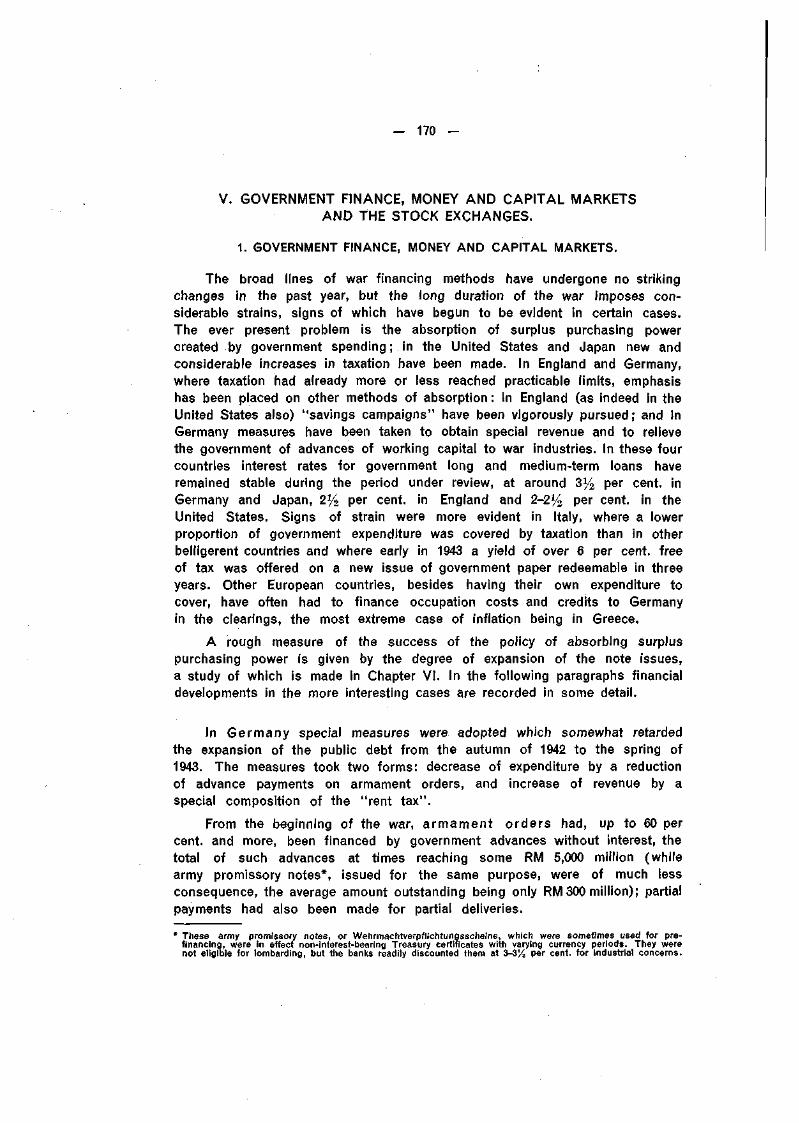
- 170 -
V. GOVERNMENT FINANCE, MONEY AND CAPITAL MARKETSAND THE STOCK EXCHANGES.
1. GOVERNMENT FINANCE, MONEY AND CAPITAL MARKETS.
The broad lines of war financing methods have undergone no strikingchanges in the past year, but the long duration of the war imposes con-siderable strains, signs of which have begun to be evident in certain cases.The ever present problem is the absorption of surplus purchasing powercreated by government spending; in the United States and Japan new andconsiderable increases in taxation have been made. In England and Germany,where taxation had already more or less reached practicable limits, emphasishas been placed on other methods of absorption : in England (as indeed in theUnited States also) "savings campaigns" have been vigorously pursued; and inGermany measures have been taken to obtain special revenue and to relievethe government of advances of working capital to war industries. In these fourcountries interest rates for government long and medium-term loans haveremained stable during the period under review, at around 3% per cent, inGermany and Japan, 2% per cent, in England and 2-2% per cent, in theUnited States. Signs of strain were more evident in Italy, where a lowerproportion of government expenditure was covered by taxation than in otherbelligerent countries and where early in 1943 a yield of over 6 per cent, freeof tax was offered on a new issue of government paper redeemable in threeyears. Other European countries, besides having their own expenditure tocover, have often had to finance occupation costs and credits to Germanyin the clearings, the most extreme case of inflation being in Greece.
A rough measure of the success of the policy of absorbing surpluspurchasing power is given by the degree of expansion of the note issues,a study of which is made in Chapter VI. In the following paragraphs financialdevelopments in the more interesting cases are recorded in some detail.
In Germany special measures were adopted which somewhat retardedthe expansion of the public debt from the autumn of 1942 to the spring of1943. The measures took two forms: decrease of expenditure by a reductionof advance payments on armament orders, and increase of revenue by aspecial composition of the "rent tax".
From the beginning of the war, armament orders had, up to 60 percent, and more, been financed by government advances without interest, thetotal of such advances at times reaching some RM 5,000 million (whilearmy promissory notes*, issued for the same purpose, were of much lessconsequence, the average amount outstanding being only RM 300 million); partialpayments had also been made for partial deliveries.
* These army promissory notes, or Wehrmachtverpflichtungsscheine, which were sometimes used for pre-financing, were in effect non-interest-bearing Treasury certificates with varying currency periods. They werenot eligible for lombarding, but the banks readily discounted them at 3-3% per cent, for industrial concerns.

— 171 —
The system of partial payments was retained, but from 1st October 1942advance payments were greatly reduced, their general abolition being contem-plated after a transitional period of six months. After the expiry of this six-month period, contractors were to utilise their own resources to the fullestextent and to obtain bank credit for the remainder. In future, all claims inrespect of an order might be ceded to a bank in a simplified form asguarantee; if the bank deemed such cession, and other security pledged, in-sufficient collateral for the credit, it might apply for a government guaranteeup to 30 per cent, of the amount of the order (for which the bank wouldpay to the government 1 per cent, on the guaranteed portion outstanding).It was estimated that about one half of the RM 5,000 million could be providedby the contracting firms from their own resources, while the other half wouldhave to be borrowed from the banks.
The gradual abolition of advance payments during six months should havegiven relief to the Treasury of some RM 800 million a month for the transitionalperiod. Although no official data have been published, it is reported that,in practice, many exceptions to the rule were made; these applied particularlyto those branches of industry where advance payments were customary even inpeacetime and to firms which, owing to the smallness of their capital resourcesin relation to their wartime turnover, might find difficulty in obtaining bank credit.The relief to the Treasury was thus less than the figure mentioned above.
The other exceptional measure was the replacement of the rent taxby a composition payment. This tax was originally imposed in 1926 on houseproperty, after the inflation had diminished the burden of mortgage debts; itwas levied by the provinces, or Länder, of the Reich.
By a decree of 31st July 1942 the rent tax was abolished from 1st January1943; the Länder were henceforth without any source of revenue from theirown taxation, and nothing has yet been made known as to compensation*. By31st December 1942 houseowners had to make to the Reich a non-recurrentdischarge payment in cash amounting to ten times the yearly tax, i.e. to a presentvalue of 13% annual payments, subject, however, to certain alleviations.Special taxation privileges were accorded to taxpayers who paid cash fromtheir own resources (by withdrawing bank deposits, selling securities etc.)or borrowed privately from relatives and friends or from banks, or on ordi-nary mortgage. Otherwise householders might cover all or part of the taxpayment by official "composition loans" from mortgage banks and real-estatecredit institutions, from savings banks or from insurance companies ; theseloans would bear interest at 4% per cent, and amortisation charge at 4 percent, of the original loan, so that annual payments would amount to 85 percent, of the previous annual tax and would continue for 17 years. Insurancecompanies and savings banks were expected to make such loans from existingresources and from the normal influx of funds by way of premiums and new
* Total expenditure of the Länder amounted to about RM 3,000 million and net financing requirements afterdeduction of various receipts to RM 2,600 million, so that the rent tax was of considerable relative importance.The last official figures available for the rent tax are those for 1940, when the total was RM 842 million ;Prussia paid RM 511 million, of which Berlin RM 148 million.

- 172 -
deposits. Mortgage banks and real-estate credit institutions, whose receipt ofnew resources was smaller, were permitted to issue new mortgage bonds onthe market.
The total proceeds of the composition would have brought in someRM 8,500 million to the Reich but for the approved exemptions, which tookaccount of war damage and other factors ; estimates of the actual yield wereplaced at RM 7,750 million*, of which some RM 3,600 million was probablypaid through composition loans and somewhat over RM 4,000 million in cash.The first issue of special mortgage bonds was made in October 1942 andin all some RM 1,100 million of 4 per cent, bonds were issued by the springof 1943 at the fixed price of 102y2.
Although the composition payments had to be made by the taxpayer by31st December 1942, technical measures were taken to relieve the moneymarket at the end of the year, so that a large part of the proceeds (estimatedat RM 4 milliard) was paid over to the Reich by the banks only during thefirst half of January 1943.
Budgetary accounts have not been published in Germany for tenyears although certain information regarding receipts has been available, whichhas made it possible to estimate expenditure with some degree of accuracy.Such estimates, however, became more difficult in the current year: statisticsof ordinary taxation have not been published since March 1942, the paymentof the rent-tax composition was spread over the end of the year and littleinformation has been published regarding current receipts other than taxpayments. Such information as is available on taxation, other current receiptsand borrowing has been collected together and an effort made to present apicture as complete as the fragmentary data allow.
By and large, it may be said that the total budgetary receipts of theReich, and, therefore, tota l expenditure, rose from RM 75 milliard in 1940-41to nearly RM 100 milliard in 1941-42 and to over RM 120 milliard in 1942-43,financial years ended March in each case; in September 1941 civil expenditurewas officially stated to be at the rate of RM 20 milliard a year. Total receiptsfrom taxat ion and other current revenue rose from RM 37 milliard in1940-41 to RM 47 milliard in 1941-42 and RM 68 milliard in 1942-43. Ordinarytaxat ion receipts in 1942-43 at RM 34.7 milliard were 7 per cent, above 1941-42,the annual rate of increase having declined from 33 per cent, in the first yearof the war. But the addition of the exceptional receipts from the rent-taxcomposition in 1942-43 gave an absolute increase of RM 10 milliard over 1941-42against RM 5 milliard the previous year. Other current revenue also roseconsiderably, particularly on account of the payment of occupation costs, asthe table shows.
* Some confirmation of this figure is given by the movement of the Reich debt. The total debt rose byRM 5.18 milliard in October and RM 6.59 milliard in November, i.e. RM 11.77 milliard for the two months; theIncrease in December was RM 4.13 milliard, while in January there was a decline by RM 0.08 milliard,so that the net increase for the two months was RM 4.05 milliard. The difference of RM 7.72 milliard forthe two periods corresponds approximately to the rent-tax composition proceeds. In February 1943, theprevious rate of increase of RM 6.4 milliard was resumed, an indication that the rent-tax composition wasterminated.

— 173 —
Reich Budgetary Receipts.
In milliards of RM
Financial years1940-411941-421942 43
Calendar years194019411942
Taxationreceipts
0)
27.232.342.4
26.230.737.8
Other currinternal
(2)
3.33.64.0
2.93.43.9
ant revenueexternal
(3)
6.511.022.0
4.010.019.0
Totalcurrentrevenue
37.046.968.4
33.144.160.7
Borrowing
37.852.155.8
33.748.957.2
Totalbudgetaryreceipts
74.899.0
124.2
66.893.0
117.9
(') Official quarterly statistics cover the period up to March 1942. For the financial year 1942-43 the figureof RM 34.7 milliard given by the Secretary of State at the Finance Ministry in November 1943 has been taken,plus RM 7.7 milliard from the rent-tax composition. Ordinary taxation for the calendar year 1942 would be aboutRM 34.1 milliard ; to this has been added the estimated RM 3.7 milliard of the rent-tax compositionreceived by 31st December 1942, to give the RM 37.8 milliard in the table. As explained on an earlierpage, part of the rent-tax composition was in fact covered by borrowing, but it is not easy to make anadjustment for this factor.
(2) These figures are estimates, based on known figures of internal current revenue for earlier years.(3) These are round figures (based inter alia on the data given in Chapter IV) of occupation costs paid by
the occupied territories, including the war contributions of Bohemia and Moravia and of Poland. Officialfigures of about RM 14 milliard in 1941-42 and RM 26 milliard in 1942-43 for all current receipts (both internaland external) other than taxation have been given by the Secretary of State at the Finance Ministry.
The tota l borrowing of the Reich rose from RM 38 milliard in 1940-41to RM 52 milliard in 1941-42 and RM 56 milliard in 1942-43. The increase ofthe amount borrowed in 1942-43 was thus lower than previously: this was dueto two factors, the smaller increase of expenditure and the greater rise ofcurrent revenue (from the rent-tax composition and from occupation costs).The table on the following page gives an analysis of Reich borrowingover the past three years.
The monthly average of Reich "cash" borrowing, which was RM 4.1 milliardin 1941-42 and RM 4.4 milliard in 1942-43, has recently increased more rapidly:it expanded to RM 6.0 milliard monthly in the April-June quarter of 1943 andto RM 6.3 milliard in the July-September quarter. Reich borrowing is in three mainforms: long-term Treasury certificates and Liquidity loans and short-termTreasury bills; the proportion borrowed at short term rose from somewhatover 50 per cent, in 1940-41 and 1941-42 to 60 per cent, in 1942-43, andhas continued to rise, to 70 per cent, in the July-September quarter of 1943.
No new forms of security have recently been introduced, but "iron savings"and "business-investment deposits", created towards the end of 1941, havebeen continued. Iron sav ings, which are savings deposits tied up until atleast one year after the war, were made even more favourable to the saver(by increased tax advantages), simplified technically (particularly as to the cal-culation of interest, which had caused much extra work for the banks) andfurther extended (as from 1st January 1943); the minimum monthly amountwas lowered and the general maximum of RM 26 was increased to RM 39while the amount of wage bonuses which might be iron-saved was raised toa maximum of RM 1,000 in one year. Iron accounts have, however, tied uponly a small fraction of current savings, some RM 70-80 million a month

- 174 -
out of a total increase of RM 1,750 million a month for all savings deposits in1942; total iron savings at the end of March 1943 slightly exceeded RM 1 milliard.Bus iness- investment and similar deposits at the Treasury, also tied upuntil after the war, produced RM 710 million by the first tranche, paid in up
Reich Pub l i c Debt i nc reases or dec reases (—) 0)
Periods
1940 ApriWune .July-Sept. .Oct.-Dec. . .
1941 Jan.-March .1941 April-June .
July-Sept. .Oct.-Dec. . .
1942 Jan.-March .1942 April-June .
July-Sept. .Oct.-Dec. . .
1943 Jan.-March .1943 April-June .
July-Sept. .
Financial years1940-41 . .1941-42 . .1942-43 . .
Calendar years1940 . . . .1941 . . . .1942 . . . .
Long and middle-term
Trea-sury
certifi-cates(net)
2,0002,3832,7173,7773,4792,7143,6523,8293,7842,6184,3971,1723,4532,895
10,87713,67411,972
7,84113,62214,628
Liqui-dityloans(net)
1,7661,6962,5971,3121,2512,7212,5532,7452,2351,4612,5583,4702,5832,780
7,3719,2709,724
8,2327,8378,999
Total debt outstanding at endof 1942 . . . . 47,392 32,149
NetTotal
3,7154,0795,2864,8794,5855,3986,1837,1026,0244,0466,9314,4685.9945,631
17,95923,26821,469
15,88021,04524,103
80,307
Reichs-bank
workingcredit
in370
— 59— 46— 400
719— 139
134— 445
360123
— 933873
— 83— 26
— 135269423
— 205314
- 895
—
Short
Trea-surybills
millions3,7264,7384,5095,4215,4206,7006,9825,9098,201
10,0039,4145,995
12,02513,365
18,39425,01133,613
17,35824,52333,527
88,742
-term
Taxcertifi-cates
NetTotal
of Reichsmarks— 387— 59— 9— 2— 1
2— 1— 1— 367—1,144— 823— 28— 7— 5
— 457— 5—2,362
—1,124— 6—2,335
1,206
3,7844,6204,5145,0196,2036,5597,1155,6138,1948,9827,6586,840
11,93513,335
17,93725,49031,674
16,27924,89630,447
91,089
Totalcashborrow-
ing
7,4998,6999,8009,898
10,78811,95713,29812,71514,21813,02814,58911,30817,92918,966
35,89648,75853,143
32,15945,94154,550
171,396
Reichs-kredit-kassen-scheine
634875—411664
1,168764751594788566688361497
1,9203,3472,636
1,5083,0072,699
7,219
Total
8,1339,5749,800
10,30911,45213,12514,06213,46614,81213,81615,15511,99618,29019,463
37,81652,10555,779
33,66748,94857,249
178,615(5)
(1) This table Is based on detailed statistics of the public debt published regularly every month. The quarterlyincreases (or decreases) of the main items are given with some modifications of the official data. Firstly,only the "new" domestic debt, i.e. that contracted from 1924 onwards, has been taken into account. Secondly,to obtain the net borrowing for cash, non-cash issues and those made in compensation have been excluded,particularly issues made to compensate German holders of Austrian Government loans (1939) and Czecho-slovak Government loans (1939 and 1941). It was not possible, "however, to make allowance for theTreasury certificates issued to compensate German shareholders of the Austrian National Bank, the Bank ofDanzig, the former Wertpapjersammelbanken, and for the conversion of the German share of the YugoslavGovernment loans, as no distinction was made between these bonds and other market issues; the amountinvolved appears to be small. Thirdly, some reclassifications have been made. Tax certificates issued in 1939and deposits at the Treasury (business-investment deposits etc.) which are shown officially "under the line",i.e. outside the published debt totals, are here included in the short-term and long-term debt respectively.The loan from the Rentenbank (against which notes are issued) is in the nature of central-bank credit and,in keeping with the practice adopted in this Report for other countries also, has been transferred to shortterm (from long term in the published statement). On the other hand, the issue of Reichskreditkassenscheine,shown in the official statistics under "sundry loans" at short term, represents a foreign resource and hasbeen excluded from the ordinary short-term debt and placed in a special column. The effect of these changesis particularly great in 1942-43; as the table shows, the exclusion of Reichskreditkassenscheine and theredemption of tax certificates make a difference together of over RM 5,000 million in the year, short-termborrowing, as shown in the table, being lower than the official statement by that amount.
(2) Conversions and redemptions have been deducted from current issues, including the repayment in 1941 ofthe 5 per cent, loan of 1927.
(3) The figures for quarterly and annual borrowing are net, I. e. with certain deductions for amortisation andredemptions of special non-cash-producing loans not included in preceding columns. The total Includesalso, for 1942, RM 765 million of deposits at the Treasury.
f>) Includes also Rentenbank loan: RM 252 million for 1940, RM 65 million for 1941 and RM 150 million for 1942.(5) The total liabilities of the Reich at the end of 1942 were given officially as RM 185.6 milliard; this total
Included RM 2.6 milliard old debts, RM 1.2 milliard foreign debts and RM 3.2 milliard non-cash and specialissues, which are excluded from this table.
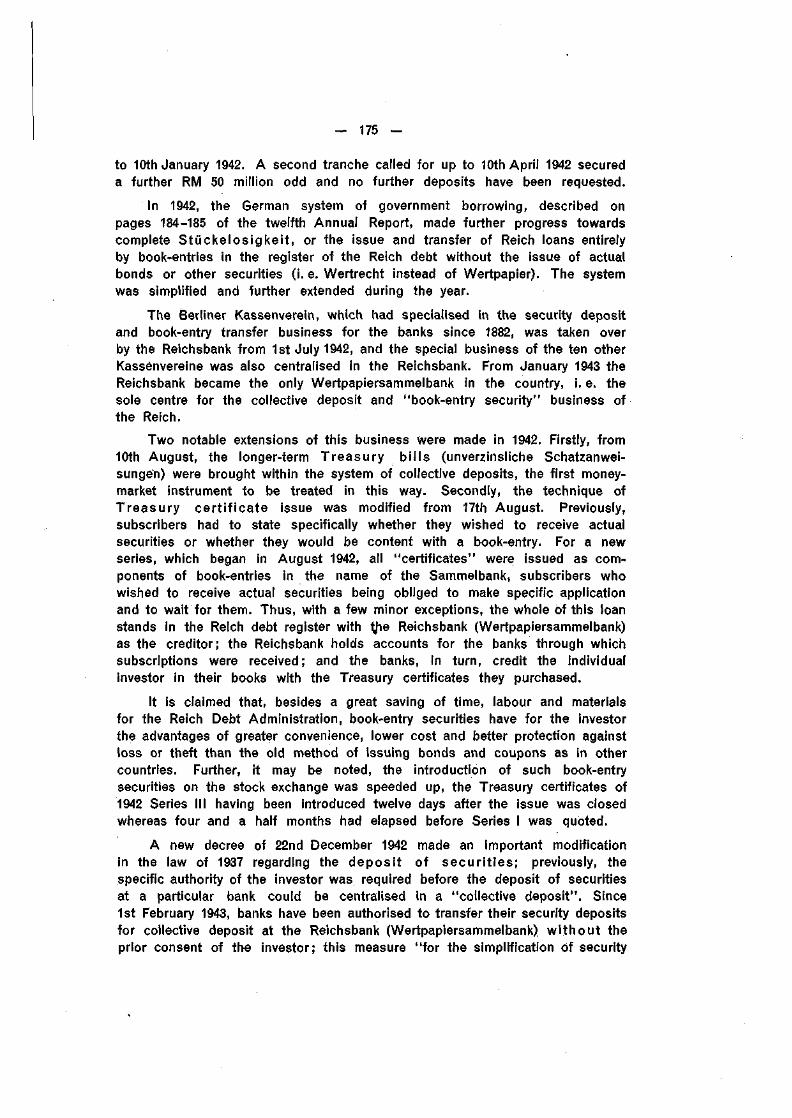
- 175 -
to 10th January 1942. A second tranche called for up to 10th April 1942 secureda further RM 50 million odd and no further deposits have been requested.
In 1942, the German system of government borrowing, described onpages 184-185 of the twelfth Annual Report, made further progress towardscomplete Stückelos igkei t , or the issue and transfer of Reich loans entirelyby book-entries in the register of the Reich debt without the issue of actualbonds or other securities (i. e. Wertrecht instead of Wertpapier). The systemwas simplified and further extended during the year.
The Berliner Kassenverein, which had specialised in the security depositand book-entry transfer business for the banks since 1882, was taken overby the Reichsbank from 1st July 1942, and the special business of the ten otherKassenvereine was also centralised in the Reichsbank. From January 1943 theReichsbank became the only Wertpapiersammelbank in the country, i. e. thesole centre for the collective deposit and "book-entry security" business ofthe Reich.
Two notable extensions of this business were made in 1942. Firstly, from10th August, the longer-term Treasury bi l ls (unverzinsliche Schatzanwei-sungen) were brought within the system of collective deposits, the first money-market instrument to be treated in this way. Secondly, the technique ofTreasury cer t i f icate issue was modified from 17th August. Previously,subscribers had to state specifically whether they wished to receive actualsecurities or whether they would be content with a book-entry. For a newseries, which began in August 1942, all "certificates" were issued as com-ponents of book-entries in the name of the Sammelbank, subscribers whowished to receive actual securities being obliged to make specific applicationand to wait for them. Thus, with a few minor exceptions, the whole of this loanstands in the Reich debt register with tjie Reichsbank (Wertpapiersammelbank)as the creditor; the Reichsbank holds accounts for the banks through whichsubscriptions were received; and the banks, in turn, credit the individualinvestor in their books with the Treasury certificates they purchased.
It is claimed that, besides a great saving of time, labour and materialsfor the Reich Debt Administration, book-entry securities have for the investorthe advantages of greater convenience, lower cost and better protection againstloss or theft than the old method of issuing bonds and coupons as in othercountries. Further, it may be noted, the introduction of such book-entrysecurities on the stock exchange was speeded up, the Treasury certificates of1942 Series III having been introduced twelve days after the issue was closedwhereas four and a half months had elapsed before Series I was quoted.
A new decree of 22nd December 1942 made an important modificationin the law of 1937 regarding the deposi t of secur i t ies ; previously, thespecific authority of the investor was required before the deposit of securitiesat a particular bank could be centralised in a "collective deposit". Since1st February 1943, banks have been authorised to transfer their security depositsfor collective deposit at the Reichsbank (Wertpapiersammelbank) wi thout theprior consent of the investor; this measure "for the simplification of security

- 176 -
business" was particularly recommended to banks in the areas endangered byaerial bombardment, as a safeguard against loss or destruction. As a result ofthe present evolution, the Reichsbank is tending to become the sole depositaryfor actual individual securities as well as the centre for all book-entry securitybusiness.
The German method of issue, transfer, interest payment and redemptionof investments simply by centralised book-entries, which has made enormousstrides since the beginning of the war — the Reichsbank was first given thecharacter of a Wertpapiersammelbank by the new law of 1939 — must not beconsidered merely as a wartime expedient but is the result of a continuousevolution stretching over ten years and more.
The total of the German Reichsbank return rose by nearly RM 7 mil-liard in 1942 against RM 6% milliard in the previous year; over two-thirds ofthe increase in 1942 occurred during the last quarter of the year, as thefollowing table shows.
German Reichsbank.
At end of month
1939 August . .December.
1940 December.1941 December.1942 March . .
June . . .SeptemberDecember.
1943 March . .June . . .September
Assets
Reich paper
Reichworkingcredit
(')
TreasurybillsO
Reichsecuri-
ties(3)
Total
Allotherassets
«
Total ofassetsand
liabili-ties
(5)
Liabilities
Notes Depositsetc.
(6)
Allotherliabili-ties
In millions of RM680785580895450810933
873790765
10,27211,39215,41921,65621,67322,84823,99629,28327,86930,89035,010
1,3081,197
38939129822027229712568
106
12,26013,37416,38826,94222,42123,87825,20129,58028,86731,74835,881
1,4211,8201,6021,5241,4021,4681,4161,7671,5671,4941,771
13,68115,19417,99024,46623,82325,34626,61731,34730,43433,24237,652
10,90711,79814,03319,32519,77420,95422,03724,37524,69726,65030,099
1,4802,0182,5613,6492,7622,9902,9855,2924,3404,8815,601
1,2941,3781,3961,4921,2871,4021,5951,6801,3971,7111,952
(1) This Item is not shown separately in the return but has been taken from the public debt statement.(2) Including also small amounts of other domestic and foreign bills. The total portfolio of the Relchsbank on the
outbreak of war, at RM 10-11 milliard, corresponded approximately to the outstanding total of old "specialbills" then held entirely by the Reichsbank. The special bills with their prolongations originally had acurrency of five years, but It may be assumed that redemption has been adjusted to the practical needsof the budget and central bank (see also footnote to page 162). As ordinary commercial bills have practicallydisappeared, it may be assumed that the increase of the Reichsbank's portfolio of "Bills and cheques,Including Treasury bills" from RM 10 milliard in August 1939 to nearly RM 30 milliard at the end of 1942was entirely due to the taklng-up of Treasury bills.
(3) Probably Including a small amount of other securities.(4) Including the free gold cover, which has remained practically unchanged at RM 71 million since before the war.(5) Only the main assets and liabilities are published weekly without addition. The total Is here added for
convenience. (6) Shown as "other sight liabilities".
The rhythm of the expansion in 1942 was greatly affected by the rent-taxcomposition. Being decreed at the end of July, it led to some sales of Reichsecurities for liquidity purposes and to a tendency for quotations to decline.The Reichsbank purchased a small amount of these securities on the market,less than RM 80 million in all, up to the end of the year; the whole amount,

- 177 -
and more, was resold early in 1943, and by the end of June the bank's holdingof Reich securities was only RM 68 million, an extraordinarily low figure.
The main expansion in 1942 took place through purchases and discountsof Treasury bills, the Reichsbank's holding rising by RM 7,600 million, of whichRM 5,300 million was in the last quarter of the year (including RM 3,700 millionin the last ten days of December alone), the usual end-of-year pressure beingincreased by the payment of about RM 3,700 million of the rent-tax composition.The influx of funds to the Treasury was reflected by the complete repaymentof the Reich working credit in December, whereas it is usually at its highestaround the end of the year; and part, at least, of the considerable increaseof deposits to the record high figure of nearly RM 5,300 million was perhapsdue to the account of the Treasury, which is not shown separately. A re-markable feature of the return is that this item should remain so high in1943. The note issue, which had risen by RM 5,300 million in 1941, increasedby only RM 5,050 million in 1942, of which RM 2,300 million was in the lastquarter of the year. In the first quarter of 1943 the circulation remainedseasonally steady but increases (RM 1,950 million in the second quarter andRM 3,450 million in the third quarter) raised the total for the first time aboveRM 30,000 million in September 1943, some RM 8,000 million higher than ayear previously.
The errd of 1942 caught the German banking system in a period oftransition. Taxpayers' accounts had to be debited with the rent-tax compositionpayment by 31st December 1942, but most of the commercial banks paidthe proceeds over to the Reich largely during the period 2nd to 16th January1943. On 31st December 1942, when the balance sheets were made up, interimaccounts had been opened for the Reich on which a large part of the stilloutstanding tax proceeds were provisionally booked. These interim accountswere not shown separately by the banks, but are included with other depositsin the table on the following page.
Nine important banks showed an increase in the aggregatebalance-sheet total of about one-third in 1942, similar to that in 1941 and 1940.The five Grossbanken, on the other hand, have clearly entered upon a"ritardando" as regards the growth of their deposits and balance sheets, andfigures published for one bank show a slowing-up of the turnover since thewar(1). Their deposits were RM 2,300 million higher on the year 1942, but aroundRM 1,100 million of this was estimated to be on the interim account of the,Reich, so that the real growth of private deposits would be only RM 1,200million (against RM 2,900 million in 1941). Of the RM 1,200 million someRM 900 million was accounted for by an increase in savings deposits (at thethree banks with a large network of branches). Thus, the savings deposits ofthese banks rose in 1942 by over 40 per cent., while their primary commercial-deposit business stagnated(2).
(1) The Deutsche Bank, when publishing its annual report for 1942, gave data showing that from 1933 to 1938the annual turnover was very steady at about 70 times total deposits (excluding banks'), but since the warthe turnover has fallen, relatively, and In 1942 it was only 40 times deposits.
(2) This stagnation of commercial deposits at the Grossbanken is reported to have continued in the first quarterof 1943 but to have given way, since about April, to a further expansion (while business advances wererepaid from the proceeds of industrial bond Issues on the market).

- 178 -
On the other hand, business advances of the Grossbanken have revived ; fromRM 2,750 million at the end of 1940 (the lowest point for many years) they grew toRM 3,100 million at the end of 1941 and, accelerating, to RM 3,900 million at theend of 1942. This increase seems to be connected mainly with credits given tothe official Reichsstelle and other central bodies for the import and distributionof commodities ; these tend to be large credits, as shown by the greateraverage size of new credits granted. With business advances increasing andcommercial deposits practically unchanged, other assets were compressed;
German Banks' balance sheets.
At end of year
Five Grossbanken (3)19381939194019411942
Bank der Deutschen19381939194019411942
Three special banks(5)19381939194019411942
Total n ine banks(6)19381939194019411942
Assets
CashBusi-nessad-
vancesBills
0)
Reich securities
Trea-surybills
Bondsand
certifi-cates
Total
Totalof
balancesheets
O
Liabilities
Deposits etc.
Totalof
whichsavings
de-posits
in millions of Reichsmarks
751741886
1,0051,084
Arbeit62586395
133
417416495579631
1,2291,2151,4441,6791,848
3,3653,4952,7483,0813,889
(4)171179266410493
90146241323605
3,6273,8203,2553,8144,987
2,1462,0392,1672,1662,366
894597
120223
1,387941
1,407916
1,124
3,6223,0253,6713,2023,713
1,2292,6275,1397,0438,823
57590
1,1081,7442,525
7002,4993,6136,627
11,964
1,9865,7169,860
15,41423,312
603347
1,1711,7911,243
10318
234259282
355356528924
1,160
1,061721
1,9332,9742,685
1,8322,9746,3108,834
10,066
160608
1,3422,0032,807
1,0552,8554,1417,551
13,124
3,0476,437
11,79318,38825,997
9,01210,14312,99515,92718,259
513918
1,7952,6543,681
3,9255,3047,136
10,19816,224
13,45016,36521,92628,77838,164
7,6278,804
11,69914,62316,882
473880
1,7512,5973,606
2,8394,2486,1229,226
15,294
10,94013,93319,57226,44635,782
8661,0831,5162,1783,081
9199
130181280
22245
9591,1841,6482,3633,366
Percen-tage
increaseof
balancesheet onprevious
year
11.712.628.122.614.6
16.S78.995.647.838.7
9.935.134.542.959.1
11.321.734.031.332.6
0) These "bills" may be taken to be largely Reich paper once removed, i.e. Solawechsel and Mefobescheinl-gungen, which were popular with the banks since they might be shown in the balance sheet as "bills",for window-dressing purposes.
(2) Including other Items besides those shown separately.(3) Deutsche Bank, Dresdner Bank, Commerz Bank, Reichskreditgesellschaft and Berliner Handelsbank.C) The Bank der Deutschen Arbeit, although it now may rank as one of the Grossbanken (coming third, after
the Deutsche and Dresdner Banks, and before the Commerz Bank) owing to the size of its balance sheet,which has grown by five times since 1938 against the doubling of the aggregate of the other Grossbanken,yet may be classed more as a special bank, on account of its structure and activities: it reflects the finan-cial strength of the German Labour Front, of which It Is the "Hausbank", the increased contributionsof members against diminished outgoings, the savings money for the purchase of the Volkswagen, etc.In consideration of the growing volume of its balance sheet, this bank doubled its capital from RM 25 millionto RM 50 million in 1942.
(5) These are the three "Geldzentralen", i.e. the Deutsche Girozentrale (the central bank of the savings banks),the Deutschlandkasse (the central bank of the cooperatives) and the Prussian State Bank (Seehandlung).
(6) The aggregate resources of the nine banks at the end of 1938 amounted to 44 per cent, of those of all the"reporting banks" which published monthly balance sheets until July 1939.

— 179 —
long-term Reich securities were actually lower by RM 550 million on the year.The increase of the Treasury bill holding by RM 1,800 million in 1942 reflectedpreparations to meet the rent-tax composition payment in January 1943.
The Bank der Deutschen Arbe i t continued to grow relatively tothe Grossbanken, but its development was also slowing down. Unlike the Gross-banken, it transferred the whole rent-tax composition proceeds it had collectedto the Reich before the end of the year, so that the increase of RM 1,010 millionin its deposits is net and compares directly with RM 850 million in 1941. Thisbank also shows a rise of business credits, but by only RM 80 million (20 percent, compared with 26 per cent, for the five Grossbanken) ; in contrast tothe Grossbanken, it slightly increased its holding of long-term Reich securities.
These six banks taken together purchased over RM 2,500 million short-term Reich securities in 1942 and sold over RM 500 million at long term,thus adding some RM 2,000 million net to their holdings, which at the endof the year amounted to RM 12,900 million, nearly 60 per cent, of theirtotal assets.
Of the rise of RM 6,000 million in deposits of the three special banks,RM 4,200 million was in respect of the Deutsche Girozentrale; the annual reportof this bank states, however, that of this sum RM 2,300 million was set asidefor payment of the rent-tax composition in the new year. Even allowing forthis payment, the growth of the Deutsche Girozentrale was far greater thanthat of the Grossbanken, and this reflected the enhanced importance of thesavings banks in the financing of the Reich.
German Savings Banks* .
The increase of savings deposi ts at the savings banks (whichaccount for about three-quarters of all savings deposits) was by 10 per cent,in 1937 and in 1938. For the first time in 1939 the savings deposits of Austriaand the Sudetenland were brought into the Reich statistics; were it not forthis, the increase in 1939 would also have been by 10 per cent. The big riseof savings deposits came after the outbreak of war, increases being by
RM 6% milliard in 1940,RM 9% milliard in 1941 andnearly RM 14 milliard in1942, i.e. by 30, 33 and37 per cent, respectively.Other deposits at the sav-ings banks are largely giroaccounts in connection withtheir credit business, whichshows a relative decline.In August 1943, as a resultof air bombardments andlarge-scale evacuations from
1 Total deposits as at the end of September 1943 Jiave been given Certain towns, Special faci-as RM 73.0 milliard, RM 61.8 milliard being savings deposits and .... i ,,_ ... . • rRM 11.2 milliard other (giro) deposits. llties tor the Withdrawal OT
Deposits at end of year
Other (giro) deposits . . .Total deposits . . .
Increase of savingsdeposits during year
In milliards of RM . . . .
1939 1940 1941 1942
in milliards of RM21.5
•
1939
3.821
28.05.6
33.6
1940
6.530
37.37.7
45.0
1941
9.333
51.29.0
60.2
1942
13.937

— 180 —
savings deposits were accorded to people who had been forced to changetheir place of residence, a factor which was not without its influence onthe expansion of the note circulation at that time; in November, somewhatsimilar facilities were accorded by the urban and rural credit cooperativesby the issue of "guarantee cheques", enabling the holder to draw on hisaccount at one cooperative through the services of another.
As a supplement to statistics on government finance and the bankingsystem, the format ion of money capital in Germany is of particularinterest, and the following table reproduces estimates for recent years.
German money capital format ionand Reich bo r row ing^ .
This table is instructivesince it brings out severalcharacteristics of German warfinancing. Of the total Reichdebt issued in the periodAugust 1939 to December1942, 15 per cent, was sub-scribed with foreign money —plus probably a part of the"unknown" sources (whichall together give another 7 percent.).(11) Some RM 114 milliardis known to have been placedinternally: 36 per cent, withthe banking system (centraland commercial banks), thevery high proportion of 39 percent, with the savings banksand 12 per cent, with insurancecompanies; these institutions
(1) Based on a table given by Günter Keiser in an article in Bankwirtschaft 1943, No. 5.(2) These are all giro deposits, whether at commercial or savings banks, etc. Foreign deposits have been
deducted for 1941 and 1942 and, in the latter year, also RM 4 milliard held in suspense for paymentof the rent-tax composition.
(3) Savings deposits at all institutions, not only at savings banks.C) Liquidity loans purchased by insurance companies and by local authorities.(5) Treasury certificates bought by the market, I. e. outside banks but including some purchases by in-
surance companies and other institutions.(c0 The increase of the Reichskreditkassen loan to the Reich as shown by the official debt statement.0 The investment of clearing balances by the Verrechnungskasse In Berlin and the direct purchases
of Reich securities in Holland and in Bohemia and Moravia.(8) Unknown purchases of Reich short-term paper; in 1939 the greater part of this item consisted of tax
certificates. Keiser in the above-mentioned article says that the fact that a large part of the unknown pur-chases took place in 1942 leads to the presumption that some new source of financing has beenopened up unknown to the public. He also suggests that part of the unknown source may, indeed, be foreign.
(9) The whole of the money capital formation need not necessarily correspond to the increase of theReich debt, but in wartime, when private credit operations are unimportant, the differences are notgreat. The fact that money capital formation was lower than Reich borrowing in the years 1939 to1941 appears to indicate a net repayment of private credit. In 1942 there appears to have been anet increase of over RM 2 milliard, of which part was due to rent-tax composition loans.
(1°) According to estimates in the preceding pages, less RM 4 milliard in 1942 on account of the delayedpayment of the rent-tax composition. The figures differ very slightly from those of Keiser, who gives atotal of RM 145 milliard for the whole period.
(11) Of the RM 21.7 milliard on account of the Verrechnungskasse and Reichskreditkassen, RM 2.6 milliard correspondsto the circulation of Reichskreditkassenscheine, without which the total outstanding would be about RM 19milliard; for further details see Chapter IV.
In milliardsof Reichsmarks
Note circulation. . . .Bank deposits(2) . . .Savings deposits (3) . .Insurance etc.f) . . .Market«Known internal . . . .
Foreign :Reichskreditkassen (6)Verrechnungskasse (7)
Known foreign . . . .
Total knownunknown (e) . . .
Total money capitalformation (9)
Increase of Reichdebt e«)
Aug.-Dec.1939
3.42.20.80.8
7.2
—
—
7.22.1
9.3
10.3
1940
2.38.98.93.63.6
27.3
1.51.53.0
30.31.2
31.5
33.7
1941
5.58.3
14.24.26.0
38.2
3.06.09.0
47.21.6
48.8
48.9
1942
5.05.6
21.04.55.0
41.1
2.77.09.7
50.85.8
56.6
53.2
Total
16.225.044.913.114.6
113.8
7.214.521.7
135.510.7
146.2
146.1

— 181 —
thus account for 87 per cent, of the total, while 13 per cent, only was placedon the market. Indeed, the proportion taken up by institutions was higher,since part of the market purchases were also on their account.
The "market" in this sense is not the same as the "public". The shor t -term borrowing of the Reich has been almost wholly from institutions: theReichsbank and the commercial banks account for a large proportion whilesavings banks and other credit institutions have also taken steps to preservetheir liquid positions; other investors in short-term government paper includethe Verrechnungskasse, the Konversionskasse and banks in Holland and inBohemia and Moravia. Further some interesting estimates have recently beenpublished regarding the distribution of the Reich long and middle-termbor rowing , to which tax certificates have been added.
Dis t r ibut ion of Reich long and middle-term borrowing 0)
Calendar years
1940 Treasury certificatesLiquidity loansTax certificates
Total
1941 Treasury certificatesLiquidity loansTax certificates
Total
1942 Treasury certificatesLiquidity loansTax certificates
Total
Three years 1940-42Treasury certificatesLiquidity loansTax certificates
Total
Credit institutions
Banks Savingsbanks
Co-operatives Total
Otherinvestors Total
(2)In milliards of RM
2.1
0.6
2.7
2.0
2.0
0.5
(-1.2)
(-0.7)
4.6
(-0.6)
4.0
2.43.7
6.1
4.72.8
7.5
6.83.6
10.4
13.910.1
24.0
0.90.50.1
1.5
1.650.25
1.9
1.90.6
(-0.1)
2.4
4.451.35
5.8
5.44.20.7
10.3
8.353.05
11.4
9.24.2
(-1.3)
12.1
22.9511.45
(-0.6)
33.8
2.854.1
(-1.8)
5.15
4.754.85
9.6
5.854.8
(—1.0)9.65
13.4513.75
(—2.8)
24.4
8.25 P)8.3
(-1.1)15.45
13.17.9
21.0
15.059.0
(—2.3)
21.75
36.425.2
(-3.4)
58.2
0) Estimates from Bankwirtschaft No. 15, 1943.P) Slight differences between the total figures and those given in the table on page 174 appear to be due to
the adjustments made in the latter table.(3) Figure adjusted for Reichsbank sales of Treasury certificates in 1940.
Of the RM 58 milliard for the three years 1940-42 various credit institutionstook up nearly RM 34 milliard, of which the savings banks had RM 24 milliard.Insurance companies, the Reichspost and other similar undertakings accountedfor the RM 4-5 milliard of Liquidity loans issued yearly to "other investors";this left some RM 1 milliard in 1940 and RM 4% milliard in each of the years1941 and 1942, a net total of approximately RM 10% milliard (Treasury certifi-cates issued less tax certificates presented), about 7-8 per cent, of total Reich
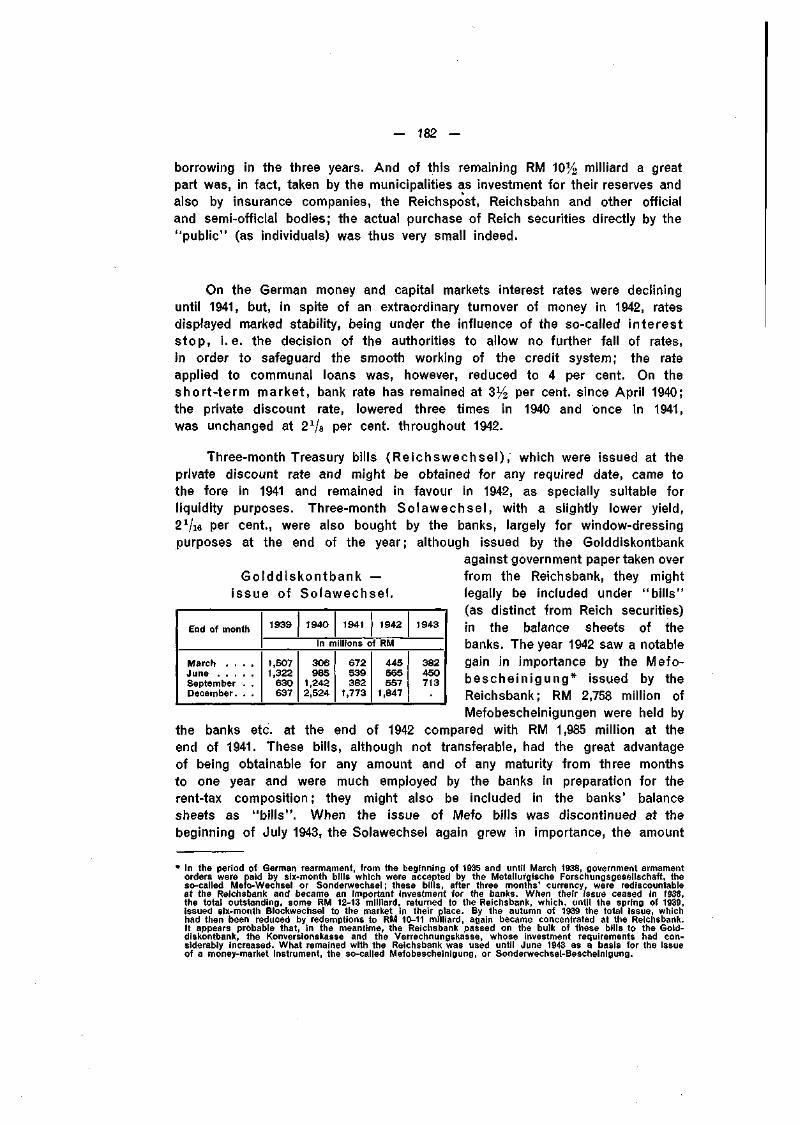
— 182 —
borrowing in the three years. And of this remaining RM 10% milliard a greatpart was, in fact, taken by the municipalities as investment for their reserves andalso by insurance companies, the Reichspost, Reichsbahn and other officialand semi-official bodies; the actual purchase of Reich securities directly by the"public" (as individuals) was thus very small indeed.
On the German money and capital markets interest rates were declininguntil 1941, but, in spite of an extraordinary turnover of money in 1942, ratesdisplayed marked stability, being under the influence of the so-called interests top, i.e. the decision of the authorities to allow no further fall of rates,in order to safeguard the smooth working of the credit system; the rateapplied to communal loans was, however, reduced to 4 per cent. On theshort- term market, bank rate has remained at 3% per cent, since April 1940;the private discount rate, lowered three times in 1940 and once in 1941,was unchanged at 21/a per cent, throughout 1942.
Three-month Treasury bills (Reichswechsel ) , which were issued at theprivate discount rate and might be obtained for any required date, came tothe fore in 1941 and remained in favour in 1942, as specially suitable forliquidity purposes. Three-month Solawechsel , with a slightly lower yield,21/« per cent., were also bought by the banks, largely for window-dressingpurposes at the end of the year; although issued by the Golddiskontbank
against government paper taken overGolddiskontbank — from the Reichsbank, they might
issue of Solawechsel. legally be included under "b i l ls"(as distinct from Reich securities)in the balance sheets of thebanks. The year 1942 saw a notablegain in importance by the Mefo-besche in igung* issued by theReichsbank; RM 2,758 million ofMefobescheinigungen were held by
the banks etc. at the end of 1942 compared with RM 1,985 million at theend of 1941. These bills, although not transferable, had the great advantageof being obtainable for any amount and of any maturity from three monthsto one year and were much employed by the banks in preparation for therent-tax composition; they might also be included in the banks' balancesheets as "bil ls". When the issue of Mefo bills was discontinued at thebeginning of July 1943, the Solawechsel again grew in importance, the amount
End of month
March . . . .
September . .December. . .
1939 1940 1941 1942 1943
In millions of RM1,5071,322
630637
306985
1,2422,524
672539382
1,773
445565557
1,847
382450713
* In the period of German rearmament, from the beginning of 1935 and until March 1938, government armamentorders were paid by six-month bills which were accepted by the Metallurgische Forschungsgesellschaft, theso-called Mefo-Wechsel or Sonderwechsel ; these bills, after three months' currency, were rediscountableat the Reichsbank and became an important investment for the banks. When their issue ceased In 1938,the total outstanding, some RM 12-13 milliard, returned to the Reichsbank, which, until the spring of 1939,issued six-month Blockwechsel to the market in their place. By the autumn of 1939 the total Issue, whichhad then been reduced by redemptions to RM 10-11 milliard, again became concentrated at the Reichsbank.It appears probable that, in the meantime, the Reichsbank passed on the bulk of these bills to the Gold-diskontbank, the Konversionskasse and the Verrechnungskasse, whose investment requirements had con-siderably increased. What remained with the Reichsbank was used until June 1943 as a basis for the issueof a money-market instrument, the so-called Mefobescheinigung, or Sonderwechsel-Bescheinigung.

- 183 -
outstanding rising to RM 2,276 million in November 1943. The longer-term Treasurybills (unverzinsliche Schatzanweisungen) are of six months to two years,with rates which remained unchanged in 1942 at 23/8 per cent, and 27/s per cent,respectively. Daily money showed some narrow fluctuations around theaverage rate of 1.83 per cent.
There was a tendency in 1942 for emphasis to be shifted more toshort-term issues in Reich borrowing as a whole; in this connection it isinteresting to note that over the end of the year the Reichsbank sold aboutRM 500 million Reichswechsel to the banks with the exceptionally short matu-rity of 10-14 days. In spite of the collection by the Treasury of ten years'rent tax within three months, in addition to normal taxation, banking andmarket preparations were adequate and no undue disturbance occurred at themoments of greatest pressure, either at the year's "ult imo" or during thefirst half of January 1943.
On the long-term market the interest rate for Treasury certificates wasmaintained at 3% per cent, but through a change in the calculation of com-mission there was, in fact, an increase of the issue price by % to 99% percent, in April 1943. Similarly the issue price for Liquidity loans was increasedby 1/8 per cent. Besides these small increases of issue prices, the currencyof Treasury certificates and Liquidity loans was slightly extended.
The year 1942 was remarkable for the first big convers ions of pre-warReich loans. The second and third tranches of 4% per cent. Treasury certifi-cates of 1937 for RM 800 million and RM 850 million were converted in Mayand August 1942 respectively; almost the whole amounts were exchanged for3Y2 per cent, certificates, with small conversions into Liquidity loans and cashrepayments. The four tranches of 4% per cent. Treasury certificates issuedin 1938, amounting in all to some RM 6,800 million, were all called for datesin 1943. After the fourth tranche was dealt with in November 1943 thereremained no more immediate possibilities for conversions of any importance.
As regards other than Reich loans, the general interest stop wasmaintained and, in a decree of 10th August 1942, the Reich Minister ofNational Economy made it obligatory for credit institutions and insurancecompanies to apply for special permission in each case before reducinginterest rates, either generally or on individual loans ; exceptions to this rulewere made, particularly for the conversion of mortgage and local authorities'bonds, in accordance with the simplified procedure mentioned in the twelfthAnnual Report. Private capital issues were higher in 1942: new industrialbond issues (with interest at 4 per cent.) rose from RM 540 million in 1941to RM 850 million in 1942 and nearly RM 900 million in the first three quartersof 1943; from the outbreak of war up to September 1943, about one hundredindustrial loans were issued for a total of RM 3,200 million, an amount which,although it appears of little importance compared with Reich loans, exceedsthe entire circulation of domestic industrial loans at the end of 1938(RM 2,740 million).

- 184 -
It is not possible to give a review of the budgetary situation in Bohemiaand Moravia; neither budget accounts nor statistics regarding taxation andborrowing have been published. A "Matrikular" contribution has been paidannually to the Reich, but the amount has not been disclosed. To raise thefunds for this imposition two loans amounting to K. 5,500 million in all (theequivalent of RM 550 million) were floated in 1942, K. 3,000 million of 3% percent. 50-year bonds at par and K. 2,500 million 3% per cent. 20-year certificatesat 99. In 1943 a further K. 4,000 million certificates were issued on the sameterms in March and K. 2,000 million in September; also, in September 1943,a 3% per cent. Liquidity loan for K. 1,000 million was put on tap in theGerman manner.
The monetary position of the country is dominated by the close relation-ship with Germany and the consequent accumulation of claims in Reichsmarks,which since 1940 have covered the note circulation by over 100 per cent.
National Bank of Bohemia and Moravia.
End-of-month figures
Assets
Reichs-mark
claimsInternalcredit
Gold andforeign
exchange
Totalof
balancesheet
Liabilities
Notecirculation
Currentaccounts
etc."Kassen-scheine"
In millions of Kronen
1939 December1940 December1941 December1942 March . .
June . . .SeptemberDecember
1943 March . .June . . .September
3,7917,816
12,95712,73514,20714,02517,36619,30622,36826,122
1,89624
840840917917845896944
1,202
2,4022,2322,3002,2912,2912,2672,2432,2412,2612,287
10,04611,14016,54816,36317,81017,60520,87922,82425,81630,216
6,3456,4539,3989,755
10,40911,40414,08915,40817,45020,086
1,0541,5602,8002,9433,6792,0151,6662,5742,1371,960
5251,0021,8421,8371,8471,8471,7751,8262,1742,432
0) Shown as "sundry assets" in the return. At the end of 1939 K. 2,831 million out of K. 3,791 million wasspecified as claims on Germany and it may be assumed that the items normally accounted for under thisheading have since remained around K. 1,000 million.
(2) Including other items besides those specified.
The growth of claims in Reichsmarks (by K. 4,400 million in 1942 againstmore than K. 5,000 million in 1941) would have been greater but for thepayment of the Matrikular contribution and purchases of Reich securitiesdirectly by the commercial banks. In previous years, only a part of theincrease of Reichsmark claims was matched by a rise of the note circulation,while part was taken on to current accounts and part absorbed by sales ofKassenscheine by the bank on the market. But in 1942 the note circulationexpanded by K. 4,700 million, around 50 per cent., an amount greater thanthe growth of Reichsmark claims. Current accounts reached their peak ofover K. 4,300 million near the end of July 1942, but fell rapidly in thefollowing weeks and were down by over K. 1,100 million on the year, ap-parently owing to the curtailment of advance payments on government orders,as in Germany.

— 185 —
Deposits with the big commercial banks, largely under German control,were reported to have risen by K. 5,060 million to K. 28,440 million atthe end of 1942; an increase of K. 4,450 million in deposits during 1941 wasthe counterpart of purchases of K. 2,970 million Reich Treasury bills andof K. 1,270 million Protectorate securities, while credit to the private economyremained unchanged on balance, and in 1942 the same influences were atwork. Deposits at the savings banks rose by K. 3,840 million to K. 20,863 mil-lion. The concentration of the banking system by liquidations and fusions,which had been proceeding in recent years, was completed in the summerof 1943.
In the last quarter of 1942, Reich securities were introduced, for thefirst time, on the Prague bourse. Bank rate has remained at 3% per cent., towhich it was raised in October 1940 to conform to the Reichsbank level, andother interest rates have been dominated by those ruling in Germany.
Financial year ended March
Expenditure-ordinary . .extraordinaryTotal . . . .
Deficit
1940-41 1941-42 1942-43 1943-44
in millions of zloty1,004
2781,282
974
308
1,768714
2,4821,768
714
2,701477
3,1782,701
477
3,656628
4,2843,656
628
Unlike Bohemia and Moravia, now largely incorporated in the Reich, theGovernor-Generalship of Poland has remained a "Nebenland". The budgetestimates are summarised in the table. Up to 1942-43 expenditure had in-
creased two and aGovernor-Generalship of Poland half times since the
Budget est imates. foundation of theGovernor- General-ship, the amounttaken into the ordin-ary budget, whichin the past twoyears has been co-vered by ordinaryrevenue, increasingeach year. Extra-ordinary expendi-
ture was covered principally by borrowing, the authorisations to borrow amount-ing to ZI. 258 million in 1940-41 and to ZI. 461, 372, and 594 million in the threefollowing years respectively; in addition, an authorisation to draw on the Bankof Issue for an amount up to ZI. 100 million, as working credit, was grantedin 1942-43. In 1942 the territory of the Governor-Generalship was extended bythe incorporation of the district of Galicia. The Governor-Generalship haspaid an annual "war contribution" to the Reich; the amount has not beendisclosed but it is assumed to be included under ordinary expenditure inthe budget.
A review of monetary developments is not possible as the Issue Bankin Cracow, which opened for business in April 1940, has published no returnor balance sheet. Nor are returns available regarding the position of thecommercial banks, whose "old deposits", dating from before the occupation,remained blocked in principle, although some partial out-payments have beenmade; the greater part of the banking business in the country fell to the

— 186 —
subsidiaries of the German Grossbanken. At the end of 1942 there were57 savings banks operating in Poland with total deposits of ZI. 578 million, ofwhich ZI. 167 million were "old deposits"; the bulk of deposits were on currentaccount, only ZI. 30 million being savings deposits.
ReichskreditkassenLoan to the Reich and circulation
of Reichskreditkassenscheine.In millions of RM.
90001 1 1 1 1 1 9000
Reichskredi tkassen, which originally were merely pay-offices for theGerman army and issued what were, in effect, German Government (military)notes, called Reichskreditkassenscheine, extended their activities, particularlyduring the eastern campaign, to become auxiliary central banks in the occupiedterritories and clearing offices between them and the Reich. Stringent "foreignexchange" regulations were imposed to prevent the issue of Kassenscheinefrom adversely affecting the value of Reichsbank notes in Germany. Indeed,the issue of Kassenscheine was restricted ; as soon as arrangements could bemade for the payment of German troops in the currency of the occupied
country, Kassenscheine werewithdrawn and the Kassen gener-ally closed. Thus, Danish crownswere put at the disposal ofthe German army in Denmarkagainst Reichsmark credits atthe Reichskreditkassen centraladministration in Berlin; and inBelgium, Holland, France and,later, Greece, the payment ofoccupation costs in local cur-rencies through the existingcentral banks made the furtherissue of Kassenscheine super-fluous; but in Poland, Croatia,Serbia, the Ukraine and the"Ostland" new central bankswere founded. In the U.S.S.R.rouble currency was obtainedwhen Russian army pay centreswere captured and, later, whensavings were resumed, and theissue of Kassenscheine wascorrespondingly curtailed.
1942 1943
The policy of restricting the circulation of Reichskreditkassenscheine andsubstituting local currency as soon as opportunity occurred was adopted forpractical reasons. Having a fixed relationship to local currencies, Reichs-kreditkassenscheine varied in purchasing power from country to country but,being scarcer than the local currency and having the prestige of beingdenominated in Reichsmarks, they were often preferred to the local currencyand tended to acquire a premium or to be hoarded.

- 187 -
Although there was some further extension of the activity of the Reichs-kreditkassen in 1942, the characteristic of the year and of the early months of1943 was the number of Kassen closed. The extensions in 1942 were chieflyin the U.S.S.R. and in France, where two new Kassen (at Caen and Reims)were opened and one (at Tours) reopened after the crossing of the demarcationline in November. Further, a special Reichskreditkassen authority with fullpowers for the western territories was instituted with headquarters in Brussels(while the central administration of the Kassen in Berlin directed its attentionto the Kassen in the east and south-east). On the other hand, 10 easternKassen (in occupied Polish and Russian territory) were converted into branchesof the Central Bank of the Ukraine in May and one in September 1942, 2 (inTransnistria) were taken over by the National Bank of Roumania and 16(including 14 in the former Baltic States) were absorbed into the newly-formedOstland Central Bank in March 1943.
At the end of 1942 there were 52 Kassen in existence: 16 were in westernEurope, one in Holland (Amsterdam), 4 in Belgium (one being in Brussels) and11 in France (one being in Paris); 5 were in south-eastern Europe, one in each ofthe following countries, Roumania (Bucarest), Bulgaria (Sofia), Greece (Salonika),Croatia (Agram) and Serbia (Belgrade) ; of the 31 in the eastern territories at theend of 1942, about one-half were closed in the early months of 1943. In additionto the 52 Kassen at the end of 1942, the organisation had 74 further exchangeand other offices (including 16 on troop trains). In all territories where Reichs-kreditkassenscheine had been in circulation they remained legal tender at afixed rate to the local currency and they might be reissued at any timeshould the German authorities consider that military developments made thisdesirable.
No balance sheets of the Reichskreditkassen have been published butcertain data are available, as shown in the table.
Reichskredi tkassen.The Reichskreditkassen loan
to the Reich indicates a) the issueof Kassenscheine (in so far asthey are not covered by otherassets, e. g. advances and dis-counts, which are known to bevery small) plus b) the debt ofthe Reichskreditkassen to othercentral banks for liabilities incurred
0) The total of "sundry loans" at short term as given in the Reich debt statements, less a small allowancefor other items which may be included under this heading besides the Reichskreditkassen loan. The legallimit of RM 3,000 million was removed in August 1941.
(2) Reichskreditkassenscheine actually in circulation. The figures for the end of 1941 and 1942 were givenofficially in the annual report of the Reichsbank for 1942. For the end of 1940 a figure has been takenhalf-way between the figures given semi-officially by M. Kretzschmann in an article in "Deutsche Geld-politik" (Schriften der Akademie für Deutsches Recht), i.e. a maximum of around RM 1,000 million in theautumn of 1940 and about RM 400 million at the end of April 1941.
P) This is the difference between the two previous columns and includes Reichskreditkassen debts for Kassen-scheine withdrawn against local currency and for local currency issued direct to the German militaryauthorities against Reichsmark credits in Berlin. Of the total at the end of 1942, some RM 300 million wasowing to the Bank of Issue in Brussels and about RM 650 million to Danmarks Nationalbank. In 1941 and1942 the bulk of the new debt was towards the newly-occupied eastern territories but south-eastern Europewas also included.
At end of year
194019411942
Loan toReich
0)
Circulationof Reichs-
kredit-kassen-scheine
P)
Debts tocentralbanks
(3)in millions of Reichsmarks
1,5004,5007,200
(700)1,8002,600
(800)2,7004,600

- 188 -
by the German troops in local currencies. The Reichskreditkassen figuresdo not include the amounts paid as occupation costs in the various countries(except Denmark), nor do they include the clearing debts of the Verrechnungs-kasse towards foreign countries. The Reichskreditkassen loan to the Reichrose by RM 2,700 million in 1942, against RM 3,000 million in 1941, and totalledsome RM 7,200 million at the end of 1942; by September 1943» it had risen toRM 8,760 million. The expansion of the circulation by RM 800 million in 1942represents, of course, a net figure of total new issues minus withdrawals;a substantial proportion of the RM 2,600 million Reichskreditkassenscheine stilloutstanding at the end of 1942 were in circulation in the Ostland.
In Sofia and Bucarest, the Reichskreditkassen were opened only as liaisonoffices. By an agreement reached in January 1942, the local currency suppliedby the Bulgarian National Bank to the German army was limited to a maximumof RM 100,000 a week. The earlier "canteen money" of Reichskreditkassencoins, which circulated in Bulgaria at ten times their face value, when usedto purchase army stores, was withdrawn from circulation in August 1942 anda new "auxiliary army money" issued in its place; this new currency consistedof 1, 5, 10 and 50 Reichspfennig notes and was also taken at ten timesits face value in the canteens (but only at its nominal amount if used forpurchases from civilians). In March 1943 auxiliary army money was usedalso in Greece, for the first time.
Before the capitulation, payment requirements of the German armedforces in Italy were financed by virtue of special arrangements which did notburden the clearing or constitute commitments for the Reichskreditkassen; onlya part of German soldiers' pay was made available in lire, the balance beingpaid in Germany in Reichsmarks. In September 1943, the German militaryauthorities utilised available balances in lire and began the issue of Reichs-kreditkassenscheine (at the rate of RM 1 = Lit. 10). From 26th October 1943,arrangements for the current supply of lire in the required amounts came intoforce and the issue of Reichskreditkassenscheine ceased; by 10th NovemberScheine in circulation were withdrawn by the commercial banks and by16th November they were handed over to the Banca d'Italia for redemption in lire.Circular cheques, which had been given out for a time by the German militaryauthorities, were also withdrawn.
Owing to the lack of statistics, it was becoming more and more difficult tofollow the development of the monetary situation in Italy until, early in August1943, in a speech after the change of the régime, the Finance Minister madesome of the most important figures public; these figures are incorporated withother available statistics in the following paragraphs. The budgetary positionin recent years is shown at the top of the next page.
Military expenditure, which was less than Lit. 5 milliard a month duringthe financial year ended June 1941, rose to about Lit. 7 milliard a month earlyin 1943 and Lit. 8 milliard a month in the summer. Other expenditure also

— 189 —
Ital ian Budget Accoun ts^ .
Financial yearended June
1938-39. . .1939-40. . .1940-41. . .1941-42. . .1942-43. . .
1943-44. . .
Expenditure
Military Other Total
Taxationand otherrevenue
Budgetdeficit
Credit operations
Borrowing
co
Increase ofTreasury's
netliabilities
(3)
Total
in milliards of lire
15.027.758.971.381.0
100.0
24.932.739.347.354.2
48.0
39.960.498.2
118.6135.2
148.0
27.632.434.241.248.9
50.0
12.328.064.077.486.3
98.0
0.221.114.245648.9
12.06.9
49.831.737.4
12.228.064.077.386.3
0) Closed accounts 1938-39 to 1941-42, provisional results for 1942-43 and estimates for 1943-44. Ordinaryand extraordinary accounts are combined in the table.
(') At long and middle term; during the war essentially by nine-year bonds.(3) Including the floating debt and borrowing from the Banca d'Italia, plus unpaid arrears of expenditure outstanding.
increased appreciably for two principal reasons: price subsidies and the ser-vice of the government debt. For the year 1942-43 subsidies to keep downprices have been given as Lit. 11.8 milliard, while the debt service rose fromLit. 4% milliard in 1934-35 to Lit. 14 milliard in 1942-43 and was estimated atLit. 16% milliard for 1943-44 (when it would absorb one-third of ordinaryrevenue). Severe economies in expenditure were made in 1942-43, includingthe abandonment of certain urgent public works for Lit. 3% milliard. Totalbudgetary expenditure more than doubled from 1939-40 to 1942-43, the per-centage covered by ordinary revenue falling from 53 per cent, to 32 per cent.;according to the Italian Finance Minister, this was the lowest percentage forany belligerent country.
Budget revenue, analysed in the next table, rose by Lit. 14.6 milliard from1940-41 to 1942-43; of this increase Lit. 9.0 milliard was due to taxation andother ordinary revenue and Lit. 5.6 milliard to the recovery of amounts paid in
respect of war expenses.Ital ian Budget Revenue. . , , ,
a As shown above, thebudget deficit was coveredby borrowing at long andmiddle term, and by theincrease of the Treasury'snet liabilities, including thefloating debt and unpaidliabilities outstanding. Thetotal assets and liabilitiesof the Italian state and theTreasury's net liabilities atthe end of June in recentyears are given in the tableon the following page.
Financial years ended June
Direct taxesIndirect taxes and duties. . . .Customs duties and indirect
taxes on consumption . . . .MonopoliesLotteriesMain sources of revenue. . . .Repayments and consortiums .Miscellaneous revenueTotal ordinary revenueRecovery of war expenses . . .
Total revenue . . .
1940-41 1941-42 1942-43
in millions of lire8,9148,954
6,3284,499
51929,215
7004,118
34,033201
34,234
9,54811,127
6,1356,017
58433,4121,2983,508
38,2183,006
41,224
10,81711,330
6,1328,213
67337,1661,2174,644
43,0275,857
48,884

— 190 -
193519361937193819391940194119421943
At end offinancial year(30th June)
Ital ian State
disposable
24.324.529.427.327.534.441.9
Assets and
Assets and Liabilities
Assets
other
72.376.882.789.393.8
103.1103.5
•
total
L iabi l i t ies
of the State
Totalliabilities
In milliards of lire96.6
101.3112.1116.6121.3137.5145.4
•
126.0133.4154.0162.9175.2210.4281.8
•
Excessof
liabilities
29.432.141.946.353.972.9
136.4
•
Treasury'snet
liabilities
16.422.333.042.454.361.3
110.9142.6180.0
0) Including the assets of the Treasury (last given separately as Lit. 7.3 milliard In 1935) and various real andother property (last given separately as Lit. 16.9 milliard in 1935). Further, some Lit. 30 milliard of industrialproperty is classed as "disposable" in the official statement.
(=) This column, in addition to the Lit. 30 milliard of industrial property mentioned above (practically unchangedfrom 1935 to 1941), includes military material (1935: Lit. 24.2 milliard, 1941: Lit. 51.6 milliard), goods destinedfor the service of the state (1935: Lit. 4.8 milliard, 1941: Lit. 7.3 milliard) and scientific and artistic materials(practically unchanged at Lit. 14 milliard from 1935 to 1941).
(3) This column comprises the Treasury's gross liabilities (last given separately as Lit. 23.7 milliard in 1935)plus the government debt (consolidated, perpetual, redeemable and sundry).
(") This is the financial part of the previous column — the gross assets of the Treasury were last given asLit. 7.3 milliard and the gross liabilities as Lit. 23.7 milliard on 30th June 1935, see notes V) and (3) above.The annual increase of the net liabilities of the Treasury represents that part of the budget deficit notcovered by long and middle-term borrowing.
The rapid growth of the Treasury's liabilities is a characteristic ofrecent years. In Italy's three years of war to June 1943, the aggregatebudget deficit of Lit. 228 milliard (as shown by the table on page 189) wascovered as to Lit. 109 milliard by long and middle-term borrowing and asto Lit. 119 milliard by an increase of the Treasury's net liabilities, which thusrose from Lit. 61 milliard in June 1940 to Lit. 180 milliard in June 1943.
A statement of the government debt and Treasury liabilities for the endof March 1943, which appeared in
Ital ian Government Debtand Treasury l iab i l i t ies.
At end of March 1943
Nine-year bondsOther funded and redeemable
debt«Ordinary Treasury bills . . . .Advances of Banca d'Italia(2)Other advances on current
account (3)Government notes issued (4). .AnnuitiesTotal debt and liabilities
In milliardsof lire
123.7
86.743.359.9
53.85.8
38.9412.1
0) Including credit certificates for the financingof public works.
O Lit. 1,000 million ordinary and Lit. 58,882 mil-lion extraordinary advances.
(3) Mostly from Cassa dei Depositi e Prestiti,the central body for the savings banks.
(4) The issue of small government notes isdescribed in Chapter VI.
a foreign technical journal (and was thuspublished for the first time since 1935),may be summarised as shown in the table.
The term "annuities" applies to thearrears of government payments; theseare covered by a system of annuity pay-ments and largely refinanced by the Bancad'Italia through the intermediary of theConsortium for the support of industrialsecurities, as explained in the twelfthAnnual Report of this Bank. The arrearsgrew from Lit. 2.6 milliard in June 1939 toLit. 16.0 milliard in June 1940; at the endof March 1942 the Ministry of Finance wasburdened for the next ten years withannuity payments which had a presentvalue of Lit. 29.7 milliard, arising from thedeferred payment of wartime orders (of

- 191 -
which Lit. 10 milliard had been refinanced through the Consortium by the endof 1941); and by March 1943 the annuities were booked at Lit. 38.9 milliard.
Italian government borrowing at longer term during the war had beenalmost wholly by issues of 5 per cent, tax-free nine-year bonds at 97% (yielding5.93 per cent, including prizes etc.); the Lit. 45 milliard of borrowing in 1941-42was effected through two issues of these bonds in September 1941 andFebruary 1942. Amongst other measures taken in 1942 should be mentionedthe creation of special 3 per cent, five-year Treasury bonds as a compulsoryblocked investment for funds from three separate sources a) war profitsretained by the taxpayer, b) 20 per cent, of new funds deriving from privateissues of shares and other capital increases, and c) funds equal in amountto those employed in the purchase of shares on the bourses; as thesebonds were created more for purposes of control than to obtain revenue,the proceeds were not expected to be high. Indeed, early in 1943, thesemeasures were modified, that under c) being dropped altogether.
In September 1942 an effort was made to introduce cheaper money rates,when a nine-year issue was made at 4 per cent., the issue price being loweredto 92 (with prizes etc. the yield was, however, still 5.68 per cent.); Lit. 25 mil-liard was subscribed. Some other interest rates were also reduced, includingthose for Treasury bills, the twelve-month bills from 5 to 4 per cent, andothers correspondingly, one to two-month bills being abolished. Early in 1943,however, the effort at cheap money was abandoned. Although bank rateremained unchanged at 4% per cent, (as it has done since 1936), the rate ofinterest paid on bank deposits with the Banca d'Italia was raised in March 1943from 1% to 3 per cent., with retroactive effect from 12th December 1942; therate for private deposits on which no interest had been paid so far wasfixed at 1% per cent. The rates on Treasury bills were restored to what theyhad been before September 1942 and the one to two-month bills were reinstated(with interest at 3% per cent.). In June 1943 an issue of 5 per cent, tax-free five-year bonds at 97 produced Lit. 12 milliard (not including amountssubscribed in Sicily and Sardinia); these bonds could be used after threeyears for tax payments and for this period of three years the yield, includingprizes (worth another % per cent, per annum), worked out at well over 6 percent, tax-free. Later, as a result of the developments in July 1943, the governmentbond market weakened and quotations were registered which corresponded toyields of up to 12 per cent, (not counting prizes).
In his speech early in August 1943 the Finance Minister stated that thegovernment debt at long and middle term (funded and redeemable) plus theissue of government notes had reached Lit. 256.9 milliard on 30th June 1943, towhich must be added Lit. 168.9 milliard floating debt (Treasury bills and debtsto the Banca d'Italia and Cassa dei Depositi e Prestiti); this gives a totalof Lit. 425.8 milliard, excluding the annuities on account of arrears.
In July 1943 current receipts fell off, he said, and the total of Treasurybonds outstanding declined, so that the greatest recourse was had by theTreasury to the Banca d'Italia in that month, amounting to Lit. 10.4 milliard

— 192 —
and raising the total direct borrowing of the Treasury from the bank toLit. 58.0 milliard. Allowing, in addition, for the assistance granted by thebank to the Consortium for the support of industrial securities (Lit. 34.2 mil-liard), for cessions in connection with credit certificates issued by theTreasury and credit claims in respect of military supplies, for the paymentof subsistence allowances to soldiers' families and for public works, forthe payment of orders for war supplies and services and for the many otheroccasions on which the bank had provided notes, directly or indirectly, forvarious purposes, the growth of the note circulation of the Banca d'Italiafrom Lit. 25.3 milliard on the eve of Italy's entry into the war to Lit. 96.5 mil-liard on 20th July 1943 was entirely due to government requirements. (Thedevelopment of the note circulation in Italy as shown by the most recentdata is treated on pages 307-308.) In October 1943 restrictions were placedon the withdrawal of bank deposits in the northern section of the country.
As regards the occupied countr ies in western Europe, it isgenerally necessary to rearrange the items of the published budget figures, inthe interest of uniformity and to afford a clearer insight into the situationthan is obtainable from the official statistics. In France, both occupation costsand clearing financing are designated extraordinary "armistice expenditure"outside the budget; in Belgium, the costs of the occupation are treated asbudget expenditure, but the clearing is directly financed by the Bank of Issueoutside the budget; in Denmark, both payments to the occupying authoritiesand the financing of the clearing are made directly by the Nationalbankoutside the budget. Clearly, the payment of occupation costs and the pre-payment of clearing claims in national currency (under government guarantee)are, from a monetary point of view, to be assimilated to budget expenditure.The proportions raised, for example, by taxation or by drawing on central-bankcredit have a certain significance if applied to the total of official financingundertaken, but not if compared only with ordinary budget expenditure (excludingoccupation costs and the clearing). Although information is not complete and,in some cases, only fragmentary, yet this principle of uniformity has been ob-served as far as possible in the presentation of statistics in the following pages.
In France the budgetary posi t ion in 1942 was dominated by expenditureresulting from the armistice. The monthly Treasury returns, resumed in 1942 afterhaving been suspended since August 1939, show total outlay of Fr.fcs 305% mil-liard in the year, of which Fr.fcs 157% milliard, over one-half, was due to expenseson account of the armistice. To these figures must be added the receipts •and expenditure of the Caisse autonome d'amortissement (which covers thedebt service out of special fiscal revenue), balancing at approximatelyFr.fcs 10 milliard (net). Actually, part of the occupation costs paid in 1941were utilised only in 1942 and, if account be taken of this fact, the total paidout comes to Fr.fcs 353% milliard (against Fr.fcs 246 milliard in 1941). Taxationand other current revenue covered 33.6 per cent, of total outlay, includingthat of the Caisse d'amortissement, but only 29.2 per cent, if the delayedutilisation of occupation costs be taken into account.

— 193 —
Revenue from taxation increased in 1942; complete returns for the year showreceipts of Fr.fcs 79 milliard against Fr.fcs 64 milliard in 1941. For 1943 higherrates of taxation have been introduced and estimates were some Fr.fcs 22 mil-liard higher than those made for 1942. Budget expenditure proper in 1942, on theother hand, was some Fr.fcs 5% milliard below the estimates. As a result ofthese developments, the actual budget deficit in 1942 at Fr.fcs 37 milliard wasabout Fr.fcs 20 milliard lower than was foreseen. But this deficit was lessthan one-fifth of the total amount to be financed by credit operations.
French Budge t and T r e a s u r y Expenditure in connect ionA c c o u n t s « . with the armist ice as shown
by the Treasury returns (ex-cluding, e.g., expenses borneby the railways and the P.T.T.)rose from Fr.fcs 142 milliardin 1941 to Fr.fcs 157y2 milliardin 1942 and for 1943 a totalas high as Fr.fcs 260 milliardseems probable. In point offact, the real increase in armis-tice expenditure from 1941 to1942 was still higher, a largerproportion of the provision forcosts of occupation havingbeen utilised (see table onpage 195), and this remainedthe dominating factor in theFrench Treasury position and,indeed, in the country's mone-tary situation also.
(') Realised results for 1941 and 1942; estimates for 1943.(2) In August 1943 supplementary credits of Fr.fcs 4.7 milliard were approved, largely for government subsidies
to stabilising prices; revenue estimates were also raised by Fr.fcs 2.1 milliard. For the firstwith a view ._ . , . . ...nine months of the year budget expenditure amounted to Fr.fcs 96.5 milliard, while taxation and otherrevenue was Fr.fcs 84.7 milliard; the costs of occupation were Fr.fcs 162.6 milliard and the German clearingdeficit Fr.fcs 40.0 milliard.
(3) Ordinary and extraordinary together for 1941 and 1942. For 1943 the distinction was abolished. These figuresdo not include the Caisse autonome d'amortissement.
(4) For 1941, the daily rate of payment to the German authorities at Fr.fcs 400 million a day up to 10th Mayand Fr.fcs 300 million thenceforth would have given Fr.fcs 122% milliard ; other expenses such as the costof billeting raised the total to Fr.fcs 130 milliard. For 1942, the total at the rate of Fr.fcs 300 million dailywould have been Fr.fcs 109% milliard; other charges increased this total to Fr.fcs 123% milliard, as givenin the Treasury return, to which Fr.fcs 1 milliard, the net outlay for requisitions for account of the Germanauthorities, has been added. These figures include also the payments to Italy, which were, however, on acomparatively small stìale; for 1942, they might be estimated at Fr.fcs 2.1 milliard. By law of 9th February 1943a new Treasury account was opened to which were booked advances made by the French Governmentto meet the expenses of the Italian troops In France. For 1943 the rate of payments to Germany has beenincreased to Fr.fcs 500 million a day, less Fr.fcs 200 million a month but plus a total of Fr.fcs 10 milliardin respect of the retroactive application of the rate of Fr.fcs 500 million from 11th November 1942. Thisgives a total of Fr.fcs 190 milliard, to which must be added billeting costs and the new account forpayments to Italy, together making a supplementary amount of at least Fr.fcs 20 milliard.
(5) Advances by the Treasury to the French clearing office to finance the deficit on the Franco-German clearing.(») Owing to the building-up of the Reichskreditkassen account in 1941 and its withdrawal in 1942, a more
realistic picture is given by taking the utilisation of occupation costs rather than their payment. Takingthe utilisation at Fr.fcs 101 % milliard In 1941 and Fr.fcs 157 milliard in 1942 plus actual billeting costsand requisitions, given under 0) above, these net credit financing figures are obtained.
(?) Taking account of the utilisation of occupation costs by the German authorities as under (6) and notmerely the date of formal payment.
(8) Including, for 1942, drawing on the Treasury's accounts for Fr.fcs 3% milliard and some Fr.fcs 6 milliardin suspense (partly due to operations with overseas territories cut off from the "métropole").
Calendar year
Expenditure - budget(3) . . . .armistice:
occupation costs (!)German deficit on clearingO
Treasury advances and sundry
Total Treasury outlayTaxation and other ordinary
Total Treasury credit financing
Net credit financing (6) . . . .
Borrowing from Bank of France
netOOther sources - total
of whichlong-term borrowing . . . .short-term borrowing. . . .
1941 1942 1943(2)
in milliards of Fr.fcs122
13012
2266
79
187
167
7151
116
1%89%25
133
124%33
15305%
96
209%
257%
68116141%
16%11312
144
21050
15419
102
317
317
•

- 194 -
In 1942 the total Treasury expenses not covered by ordinary revenueamounted to nearly Fr.fcs 210 milliard, but actual borrowing brought in slightlyunder Fr.fcs 200 milliard. The movement of the publ ic debt since the waris shown in the following table. In the total debt, which has risen to nearlythree times its pre-war level, the proportion at long term has fallen fromover two-thirds to under one-third and the short-term debt has risencorrespondingly.
Long-term issues of the government and public bodies since thearmistice have been very largely for purposes of conversion; these conversionshave covered about Fr.fcs 100 milliard of old loans and brought the effectiveyields down to a little over 3% per cent. In January 1943 it was possiblefor the Caisse autonome to make a conversion of old issues into 3% per cent,bonds at par.
Middle and shor t - term issues, Treasury bills, 4-year savings bondsand advances from the Bank of France accounted for about 90 per cent,of the increase of the total public debt in 1942. The most important inno-
vation in govern-French Publ ic Debt« outs tanding. ment borrowing was
the introduction of3 per cent. 4-yearsavings bonds inMay 1942 in deno-minations up to onemillion francs; in-terest for the firsttwo years was paidby deduction fromthe issue price andforthelasttwo yearsby premium on re-demption. Prior re-demption might beobtained on certaindefined conditions,which were laterwidened. Savings
bonds were issued at an average rate of about Fr.fcs 1 milliard a month andby March 1943 some Fr.fcs 10 milliard were outstanding. (In February 1943 a lawwas passed making it compulsory to deposit with the Treasury "reserves for therenewal of stocks". The system thus introduced differed slightly from the Germansystem of "business-investment" and "commodity-stocks-replenishment" deposits,the reserves being established at a bank and not directly with the Treasury.They bear interest at 2% per cent., the rate for one-year Treasury bonds).
The ordinary advances by the Bank of France to the government fellby Fr.fcs 1% milliard during 1942, but the special advances to meet thecosts of occupation rose by Fr.fcs 68% milliard. The extent to which the
At end of month
Long term :fundedredeemable . . . .
Middle andshort term :
Treasury bills etc.Bank of France. .
Total . . .
August1939
Dec.1941 O
Dec.1942
Move-ment In1942
Sept.1943
Move-ment innine
monthsof 1943
in milliards of Fr.fcs
55248
10736
446
55278
321227
881
44306
421295
1,066
— 11+ 28
+ 1OO+ 6S(3)
+ 185 m
44344
485382
1,255
+ 38
+ 64+ 87(3)
+ 789(«)
(') Including the Caisse autonome d'amortissement.O Figures published for 1st January 1942.(3) This Item actually covers all banks of issue (Including those of the colonies)
but is, of course, almost entirely concerned with the Bank of France. Accordingto the end-of-year returns, the advances made by the Bank of France rose byFr.fcs B7'/i milliard In 1942.
(4) Not all fluctuations are due to cash disbursements or receipts ; certain factors,such as conversions, fluctuations of exchange rates etc., play a part. In 1942these factors led to a reduction of Fr.fcs 12 milliard, so that total receiptsfrom borrowing were Fr.fcs 197 milliard.

- 195 -
c o s t s of o c c u p a t i o n have been met by direct borrowing from the Bankof France is shown in the following table.
France — Payment of Occupat ion Costs and other expensesin connect ion with the a rm is t i ce^ .
In milliards of Fr.fcs
Total expenditurein connection with the armistice(')
Totalexpenditure
Covered byspecial
advancesof Bank
of FranceTreasury
bills
Of which occupation costsproperly so called
Totalpayments
CO
Of these paymentsamountsutilised
by Germanauthorities
movement ofaccount ofReichs-
kreditkassen
1940 (6)1941 (?)1942 (7)
Totals . . .1943 (Jan .-Sept.) ...(«)
Totals . . .
80.0142.0157.5
80.761.868.5
(— 0.7)80.289.0
80.0121.5109.5
35.2101.7157.2
+ 44.8-+ 19.8
(- 47.7)379.5202.6
211.084.8
168.5117.8
311.0144.4
294.1145.8
+ 16.9(— 1.4)
582.1 295.8 286.3 455.4 439.9 + 15.50) The total of occupation, billeting costs etc., plus the financing of the surplus of exports to Germany (as
shown In the budget accounts).(2) Assuming payments at the daily rates given in footnote 0) to the table on page 193, such payments being
made ten days In advance.(3) Actually utilised for payments or for the accumulation of a stock of notes of the Bank of France.(4) Funds were accumulated on the account of the Reichskreditkassen at the Bank of France in 1940 and 1941
(+), but were drawn down in 1942 (—).(5) Period 25th June 1940 to 2nd January 1941. (6) Period from 3rd January 1941 to 31st December 1941.0 Calendar year to 31st December 1942. (8) 1st January to 30th September 1943.
Up to the end of September 1943 the amounts paid totalled Fr.fcs 582 mil-liard, the equivalent of RM 29 milliard, 50.8 per cent, of which was coveredby advances from the Bank of France and 49.2 per cent, by short-term Treasuryloans.
As regards the costs of occupation properly so called, paid to the accountof the Reichskreditkassen at the Bank of France, whereas in 1940 only aboutone-half and in 1941 four-fifths of the amount credited was actually utilised,in 1942 nearly Fr.fcs 50 milliard of the accumulated balance was withdrawn,in addition to the Fr.fcs 109% milliard received during the year. With theincrease of the French payments to Fr.fcs 500 million a day as from11th November 1942, the amounts utilised by the occupying authorities cor-responded approximately to those currently credited, so that the account ofthe Reichskreditkassen remained fairly stable between Fr.fcs 7 and 16 milliardin the first three quarters of 1943.
It was in May 1942 that the expenses of the occupying authorities beganto exceed considerably the daily payments to the account of the Reichskredit-kassen. This increase appears to have coincided with the commencement ofextensive works by German organisations (the Todt organisation, etc.) andwith big armament orders (in the summer, the figure Fr.fcs 100 milliard wasmentioned semi-officially in this connection), while at the same time theoccupying authorities were, no doubt, accumulating larger reserves of notes.

— 196 —
Account of Reichskreditkassen at Bank of Francein milliards of Fr.fcs.
1941 1942 19«
Amount credited per day to account of Reichskreditkassenand moving average of daily amount drawn
in millions of Fr.fcs.
Thus it is notthe official dates andamounts of paymentsas shown by Treasurystatistics but the ac-tual time and methodof u t i l i s a t i o n ofthe proceeds by theGerman authoritieswhich have set thepace of the monetaryexpansion. The fourphases are illustratedin the table on theopposite page.
Except for thefirst phase, for whichthe increase of thenote circulation cannotbe measured exactly(as the publicationof returns by theBank of France wassuspended from 10thJune) and duringwhich other credititems were important(especially the ordi-nary advances to theTreasury), the notecirculation has risenalmost exactly parallelwith the financing of
the utilisation of occupation costs through the Bank of France. In the secondphase of twelve months to 30th April 1942, the average monthly amount with-drawn by the occupying authorities was Fr.fcs 9.0 milliard: Fr.fcs 4.2 milliardwas covered from the Treasury bill issue and Fr.fcs 4.8 milliard from the Bankof France; the note circulation rose by Fr.fcs 4.9 milliard a month. In the thirdphase of eight months to 31st December 1942, the average monthly amountutilised was Fr.fcs 14.5 milliard: only Fr.fcs 3.2 milliard was covered from theTreasury bill issue and Fr.fcs 11.4 milliard from the Bank of France; the notecirculation rose by Fr.fcs 11.4 milliard monthly. Thus the occupying authoritiesutilised Fr.fcs 5% milliard more a month from May 1942 but Fr.fcs 1 milliardless was raised by Treasury bills, so that Fr.fcs 6% milliard more was drawnfrom the Bank of France and the note issue rose by nearly Fr.fcs 11% mil-liard a month in May-December 1942, instead of by less than Fr.fcs 5 milliard
600
500
300
ZOO
100
-
-
-
1 1 1 1 1 1
Amount dr113 weeks
r
i I I i i I i i I i i
l\ A i(l
awn daily W\A/verages) /
J VAmount credited daily
-
-
-
600
500
400
300
200
100
1940 1941 1942 1943
Note. The account of the Reichskreditkassen has been taken from the weeklyreturn of the Bank of France. The average daily amount drawn has beencalculated by comparing the sums credited with the weekly movement ofthe account.

- 197 -
France — Ut i l isa t ion and f inanc ing of Occupat ion Costs .
Phases in theutilisation
of occupation costs
Daily average credited . .,, ,, withdrawn .,, „ of excess .
Total amounts credited .,, „ withdrawn
Excess of credits (+)
Of amounts withdrawn:Financed by Treasury bill
Financed from Bank of France :increase of special advances
movement of Reichskredit-kassen account (5) . . .
Total . . .
Increase of note circulation .
Monthly averages:
Financed by Treasury billissue
Financed by Bank of France
Increase of note circulation .
First phase
25th June 1940to
30th April 1941
310 days
Second phase
1st May 1941to
30th April 1942
365 days
Third phase
1st May 1942.to
31st Dec. 1942
245 days
Fourth phase
1st Januaryto
30th Sept. 1943
273 days
Total period
25th June 1940to
30th Sept. 1943
1,193 daysIn millions of Fr.fcs
413 0)226
+ 187
300295
+ 5
300475
— 175
529 (?)534
— 5
382369
+ 13
in milliards of Fr.fcs128.0(3)70.1
+ 57.9
24.3
103.7
— 57.945.8
57.9 (?)
109.5107.7
+ 1.8
50.3
59.2
— 1.857.4
59.3
73.5116.3
— 42.8
25.4
48.1
+ 42.890.9
91.1
144.4 0145.8
— 1.4
59.5
84.8
+ 1.486.2
85.2
455.4«439.9
+ 15.5
159.6
295.8
— 15.4280.4
293.5 TO
in milliards of Fr.fcs
6.9
2.44.5
5.7 0
9.0
4.24.8
4.9
14.5
3.211.4
11.4
16.2
6.69.6
9.5
11.1
4.07.1
7.4 (6)
(1) Payments were made at the rate of Fr.fcs 400 million a day during this phase but the average amountcredited slightly exceeds this figure owing to payment ten days In advance.
(2) Payments were made at a daily rate of Fr.fcs 500 million from 1st January 1943 plus a part of the retroactivepayment as from 11th November 1942. See footnote 0) on page 193.
(3) Including Fr.fcs 4 milliard paid in advance up to 10th May 1941.(4) Including Fr.fcs 5 milliard paid In advance up to 10th October 1943.(5) Accumulation of funds on the account (—) or excess of withdrawals (+). (6) From 10th June 1940.
as was previously the case. In the first nine months of the fourthphase, which opened at the beginning of 1943, the average monthly amountutilised increased to Fr.fcs 16.2 milliard: Fr.fcs 6.6 milliard was covered fromthe Treasury bill issue and Fr.fcs 9.6 milliard from the Bank of France; thenote circulation rose by Fr.fcs 9.5 milliard a month.
The increased expenses of the occupying authorities and the consequentwithdrawal of the balance of the Reichskreditkassen, without any correspond-ingly increased issue of Treasury bills in the last eight months of 1942,led directly to an expansion of the note issue at more than double theprevious rate. Commenting on this situation, the annual report of the Bank ofFrance for 1942 says: "The bank fully realises the weight of the financial chargesimposed on France, which risk the frustration of all efforts at recovery".

- 198 -
The stagnation of the business of the Bank of France, except forthe drawings on account of occupation costs and the rise of the note cir-culation, is shown by the bank's return.
Bank of France.
Near end of month
Assets
Gold
Temporaryadvances to govt
ordinary special
Othercredititems
Totalof
balancesheet
Liabilities
NotesCurrent accounts
Treasury private RKKassen
In milliards of Fr.fcs1939 August . .
December1940 December1941 December1942 March . .
June . . .SeptemberDecember
1943 March . .June . . .September
9797858585858585858585
2135646966626868667070
—72
143159178187211236261296
2717161515151718171717
166171292365375392409435460486522
142151218270286309340383410434468
32121111111
1815272529303330353133
416558493217111515
(1) Excluding tne permanent advance of Fr.fcs 10 milliard, unchanged throughout the period.(2) Special advances to the French Government to meet the costs of occupation; the legal limit for these
advances was successively raised to Fr.fcs 321 milliard on 30th September 1943.(3) Bills discounted, 30-day and other advances and bills purchased on the market.« Including the account of the Caisse autonome d'amortissement. (5) Including other sight liabilities.
Gold has remained booked at Fr.fcs 85 milliard; the ordinary ad-vances to the government have fluctuated somewhat below the maximumof Fr.fcs 70 milliard fixed in June 1940. Developments in North Africa led
to a certain livelinessFrench Bank Deposi ts . of credit in the first
half of November 1942:as a result of with-drawals of depositsfrom the banks, theBank of France cameunder some pressure,and the total of the"other credit items"rose from Fr.fcs 17 mil-liard on 29th Octoberto Fr.fcs 22 milliardon 12th November;but the emergencywas soon over andby the middle ofDecember the formerposition was re-estab-lished.
At end of quarter
1941 December (3) . . .1942 March
June .September . . . .December . . . .
1943 March
September . . . .
Paris banksBig
banks(six)
Banquesd'affaires
(two)
Otherbanks(six) 0)
Provin-cial
banks(ten)
Total 24im-
portantdomesticbanks (2)
In milliards of Fr.fcs96.498.7
105.1112.1114.9120.5127.2131.0
8.08.89.49.5
10.910.511.8
11.912.212.613.814.7
14.4C)
16.617.718.620.121.2
23.5
132.9137.3«145.7155.5161.8
• m176.9
0) Five banks only on 30th June 1943, a small bank whose deposits haddeclined to Fr.fcs 320 million at the end of 1942 being excluded.
(2) Further, amongst the large banks were four foreign banks with depositsof Fr.fcs 5 milliard at the end of 1942 and one colonial bank with depositsamounting to about Fr.fcs 1 milliard. Amongst the foreign banks themost important was the Aero Bank, under German control, which IncreasedIts deposits from Fr.fcs 1.1 milliard on 30th June 1942 to Fr.fcs 3.0 milliardon 30th June 1943.
(3) The figures given for December 1941 are those established accordingto the old form and are not exactly comparable with those for 1942.
(«) The aggregate deposits of 181 domestic and foreign banks amounted toFr.fcs 155.7 milliard on 31st March 1942 and to Fr.fcs 200.2 milliard on31st March 1943.

— 199 —
The new banking law of 13th June 1941 obliged all j o in t -s tock banksoperating in France to publish balance sheets of a uniform pattern from31st March 1942, banks with Fr.fcs 500 million deposits or more (of which thereare 31) monthly, and smaller banks (some 150) quarterly. The aggregatedeposits of the twenty-four banks shown in the previous table rose byFr.fcs 29 milliard in 1942, i.e. by 22 per cent, (for all commercial banks in thecountry the increase was Fr.fcs 44% milliard in the twelve months to March1943, i.e. by 28 per cent.). The movement gathered momentum in the thirdquarter, when the increase was nearly Fr.fcs 10 milliard for the twenty-fourbanks, but slowed down to Fr.fcs 6 milliard in the last quarter.
For the sake of continuity with the twelfth Annual Report the accom-panying table summarises the balance sheets of four b i g b a n k s with headoffices in Paris. The increase of deposits at these banks was Fr.fcs 14.5 mil-
liard in 1942 comparedwith Fr.fcs 14.7 milliard in1941 and Fr.fcs 19.9 mil-liard in 1940; proportion-ately, the inerease tn 1942at 19 per cent, was ratherless than that of the totalfor all banks, but it appearsthat the rate of increaseof commercial-bank de-posits in France declinedas the rise of the notecirculation accelerated.In November 1942 someFr.fcs 2% milliard depositswere withdrawn from thefour banks shown in thetable (and a similar amountof Treasury bills discount-ed or allowed to run off).
France —returns of four big commercia l banks«.
At end of month
1938 December1939 December1940 December1941 December1942 March . .
June. . .SeptemberDecember
1943 March . .June . . .September
Assets
Cash Discounts(2)
Advancesand
overdrafts
Liabili-ties
Depositsand currentaccounts
In milliards of Fr.fcs3.94.96.46.97.26.96.98.87.77.57.8
21.329.346.161.662.568.173.172.973.879.484.2
7.7e.i8.68.59.7
10.210.210.69.69.38.9
33.642.162.076.778.884.489.591.296.3
102.0104.8
0) Crédit Lyonnais, Comptoir National d'Escompte, Société Généraleand Crédit Industriel et Commercial. These four banks accountfor 57 per cent, of the total deposits shown in the previous tableand about 51 per cent, of those of the 181 reporting banks.
O In the discount portfolios of the banks, Treasury bills now pre-ponderate.
Three large banks have recently taken steps to bring their capital moreinto line with their increased deposit liabilities: in the third quarter of 1942the Société Générale raised its paid-up capital from Fr.fcs 312% million toFr.fcs 750 million (and its "authorised" capital to Fr.fcs 1,500 million) and theBanque Nationale pour le Commerce et l'Industrie (not included in the table)from Fr.fcs 350 million to Fr.fcs 525 million; in January 1943 the Crédit Lyonnaistook powers to increase its capital from Fr.fcs 400 million to Fr.fcs 1,000 million.Even with these increases the proportion of capital (and reserves) to depositsremained relatively low.
In 1941 the increase of the Treasury bill portfolio ran parallel to therise of deposits but in 1942 the cash reserve was strengthened (in the last

- 200 -
France —movement of savings-bank deposits.*
quarter) while there was some revival of advances and overdrafts (particularlyin the first quarter). If these four banks can be regarded as typical, then itappears that the commercial banks took up only Fr.fcs 23 milliard Treasury billsin 1942 against about Fr.fcs 31 milliard in 1941. Time deposits at these banksaccounted for less than one per cent, of all deposits and their holdings oflong-term government securities were negligible.
In these circumstances the growth of savings deposits became ofeven greater importance. The table shows that the rising tendency in recentyears was sharply accentuated at the beginning of 1943, when the maximumallowable for individual deposits was raised.
In 1942, as a whole,the increase of deposits atFr.fcs 13.8 milliard was morethan twice as high as inthe previous year. But eventhis relatively large figurewas only 43 per cent, ofthe increase in commercial-bank deposits and 12 percent, of the rise in the notecirculation. Nevertheless, thepresent expansion of sav-ings-bank deposits, whichhas been attributed to theagricultural section of thecommunity, is a very signifi-cant change of trend. From
1938 to the middle of 1941 commercial-bank deposits more than doubled, whilesavings deposits roae by only 14 per cent. In 1942 both commercial-bank andsavings deposits increased by around 20 per cent.
For 1942 the maximum for savings deposits on an individual accountwas raised from Fr.fcs 20,000 to Fr.fcs 25,000. The basic interest rate wasreduced from 2% per cent, in 1940 to 2% per cent, in 1941; in 1942 this ratewas further reduced to 2% per cent., but an additional % per cent, was paidon those "stable" deposits showing withdrawals of less than Fr.fcs 8,000 duringthe year (making 2% per cent, in all). From January 1943 the basic rate wasfurther reduced to 1% per cent., but an additional % per cent, was paid on"stable" deposits, which would thus get 2% per cent. At the same time themaximum deposit was raised to Fr.fcs 40,000 (and the withdrawals permitted on"stable" deposits to Fr.fcs 10,000).
A feature of the last three years has been the rapid expansion of the postalgiro system. Deposits on private accounts, which were only Fr.fcs 4.0 milliard inAugust 1939, grew to Fr.fcs 13.7 milliard in December 1941 and Fr.fcs 18.8 milliardin December 1942. A factor in the recent growth has doubtless been the lawmaking certain payments by cheque obligatory.
In milliards of Fr.fcs
1940 January-December . . . .19411942 „1942 January-March
April-June
October-December. . . .
April-JuneTotal deposits outstanding
at end of 1942
CaisseNationale
+ O.6+ 3.3+ 6.6+ 1.9+ 1.4+ 1.4+ 2.0+ 3.8+ 2.9
38.4
Caissesordinaires
— 0.6+ 3.5+ 7.2+ 2.5+ 1.3+ 1.3+ 2.2+ 5.3+ 3.0
52.0
Total
0.0+ 6.7+ 13.8+ 4.4+ 2.6+ 2.6+ 4.1+ 9.1+ 5.9
90.3
• Excess of deposits (+) or withdrawals (—).

- 201
France — Interest Rates.
Annual averages
19381939194019411942
Rente3 pour centperpétuelle
4.023.954.063.193.14
Bonds
onmarket
6.104.974.793.403.08
newissues
0//o
6.935.715.914.503.73
Shareyields
To4.294.263.991.941.22
Bankof Francediscount
2.702.002.001.801.75
Treasurybills of1 year
3.132.753.002.512.25
There was a further tendency for interest rates to fall in 1942. Besidesthe movement of savings-bank rates mentioned above, the rate for two-yearTreasuy bills was reduced by % per cent, to 2% per cent, in May 1942. Thediscount rate of the Bank of France remained at 1% per cent., to which it wasreduced in March 1941. The above table, giving the annual averages of certain ratesand yields, shows how considerable has been the general reduction since 1938.
Belgium — In B e l g i u m thetaxat ion and of f Tci at c r ed it f i h an ci n g. closed budget accounts
for 1942 (and completeestimates for 1943) havenot been published, butregular statistics of taxa-tion and of the govern-ment debt are availableand from these a fairpicture of developmentscan be obtained.
The total of taxa-t ion and borrowing(including the financingof the clearing withGermany) at B.fcs 53 mil-liard in 1942 was fourtimes as high as in 1939(when it was B.fcs 12% mil-liard); in 1943 a total ofB.fcs 64 milliard appearsprobable (on the resultsfor the first nine months).
0) From the return of the Bank of Issue. •(2) The increase of the public debt held by the National Bank and Bank of Issue according to the special quarterly
statement (including open-market purchases). The figures do not agree exactly with those given in a later tableof the weekly returns of the two banks, since these returns do not necessarily fall at the end of the month.
(3) The Increase of the total debt less the amounts under p).(4) The exceptional prolongation, to the end of April 1943, of the period for the accounting of 1942 receiptsraised the total to B.fcs 14.4 milliard.(5) These are closed budget accounts for 1940 and 1941 and estimated figures for 1942 and for the firstnine months of 1943.(6) This total is, of course, somewhat higher than the total of taxation and borrowing, as the latter excludes
current revenue other than taxation and certain other Treasury accounts.
Calendar years
Financed:from central bank
clearing account (1) . . . .direct borrowing («) . . . .
Totalfrom market - long term
Total CTTotal official credit financingTaxation revenueTotal receipts from taxation
and borrowing
Occupation costs (6)Clearing account
Total expenditure^)
Percentage of total taxation andborrowing financed by:
central-bank creditmarket borrowingtaxation
1940 1941 19421943nine
monthsin milliards of B.fcs
3.26.19.30.5
5.66.1
15.48.2
23.6
4.53.2
16.924.6
39.425.834.8
8.55.8
14.33.55.44.7
13.627.912.3
40.2
16.38.5
20.345.1
35.633.a30.6
18.53.2
21.7(-0.1)10.17.3
17.339.013.8(«)
52.8
18.518.521.058.0
41.132.826.1
17.9(- .2)13.82.34.4
16.022.736.511.2
47.7
15.017.917.150.0
28.947.623.5

— 202 —
Belgian Internal Publ ic Debt ou ts tand ing^(and guarantee).
The percentage covered by taxation has fallen throughout the period shown inthe table, while market borrowing has risen. Expenditure in connection with thearmistice (occupation costs and clearing financing) accounted for over one-halfof the total official outlay in 1941 and nearly two-thirds in 1942 and 1943.
The Belgian internal publ ic debt more than doubled from 1939 to1942 and by September 1943 reached B.fcs 111 milliard, excluding B.fcs 3 milliarddue to holders of postal cheque accounts and the government's guarantee onthe National Bank's advance of B.fcs 44% milliard to the Issue Bank (to financethe clearing with Germany).
The bulk of thepublic financing since1939 has been at shortterm, but in 1942 middle-term securities becameof increasing importance.A 3% per cent. 5 to15-year issue was madeat par in June 1942and produced B.fcs 4.4milliard; these certifi-cates were repayable at101 in 5 years, at 107in 10 years and at 115in 15 years, and thushad a yield rising from3.7 to 4.2 and to 4.5 percent., according to ma-turity; a second tranche
End of quarter
1939 December1940 December1941 December1942 March . .
June . . .SeptemberDecember
1943 March . .June . . .September
Government debt
LongtermP)
MiddletermP)
Shortterm(4)
Total(6)
Govern-ment
guaranteeto
NationalBank
(6)in milliards of B.fcs
35.236.139.5 (')39.439.339.238.938.942.542.3
O.70.76.87.4
10.713.016.818.720.521.2
4.415.725.730.532.635.836.740.641.247.5
40.352.571.977.382.688.092.498.2
104.2111.0
1.510.611.915.119.726.933.038.544.5
C) Excluding the sight debt of B.fcs 3.1 milliard on account of depositsof the postal cheque system. 0 Of over five years' maturity.
(3) One to five years' maturity. (") Under one year's maturity.(5) There is, In addition to the Internal debt, foreign debt shown as
B.fcs 17.0 milliard in September 1943.(6) On account of advance to the Bank of Issue, which finances the
clearing with Germany.(7) B.fcs 1.3 milliard of the increase of the Internal long-term debt in 1941
was due to a conversion of foreign debt.
of the same certificatesissued in December 1942brought in B.fcs 5.2 mil-
from an issue of 3% perthe government of over
Hard. In April 1943, B.fcs 3.6 milliard were obtainedcent, tax-free 44-year bonds at 94. Deliveries toB.fcs 75,000 and to the German military authorities are paid by means of3% per cent. 5-year certificates and these are included in the debt state-ment (for an amount estimated at B.fcs 1 to 2 milliard in the middle of 1942).
The short-term debt is almost wholly in the form of Treasury bills witha maximum of 120 days to run. At the end of 1942, B.fcs 18.4 milliard, orone-half, was held by the central bank: but the proportion taken by the centralbank declined; and in the first nine months of 1943 its holding of governmentsecurities actually fell by B.fcs 2.4 milliard. To appreciate the full extensionof centra l -bank credit, however, it is necessary to take the clearing intoaccount, as is done in the next table.
In 1942 B.fcs 3.6 milliard was lent directly to the government, but thefinancing of the clearing and similar accounts demanded B.fcs 18.5 milliard,making the total of credit granted on official account B.fcs 22.1 milliard, com-

— 203 —
Belgium National Bank and Bank of Issue combined returns (1).
Near end of month
1940 December1941 December1942 March . .
June . . .SeptemberDecember
1943 March . .June . . .September
Assets
Claims on Germany
clearingaccount other
P)total
Credit grantedto
govern-to
privateeconomy ment
Totalof
balancesheet
Liabilities
NotesCurrentaccounts
Postalchequeaccounts
In milliards of B.fcs0.97.9
10.213.618.224.731.436.842.9
2.33.83.94.75.75.55.35.35.2
3.211.714.118.323.930.236.742.148.1
1.30.90.80.50.40.70.50.40.6
14.019.622.323.023.323.219.117.720.8
41.755.560.465.170.877.679.983.993.4
34.848.552.556.762.467.970.674.580.7
2.62.32.93.53.44.53.83.74.5
3.43.73.83.83.84.04.24.36.6
0) The principal items omitted from this table are the gold holding of the National Bank, which has remainedbooked at B.fcs 21.7 milliard (all but B.fcs 8 million of which Is held abroad), and claims of slightly overB.fcs 1 milliard on the Bank of France. The Bank of Issue is financed by a current advance from theNational Bank, of which it thus forms, In practice, a specialised department. This advance rose fromB.fcs 10.7 milliard to B.fcs 26.9 milliard during 1942 and, further, to B.fcs 44.5 milliard in September 1943.
(2) Bank of Issue, "créance en devises étrangères" and, from February 1943, Treasury certificates allocatedfor payments through the clearing.
F) Bank of Issue, two accòuhts of Reichskreditkassen plus "monnaies et billets étrangers" at National Bank(until December 1942 and then transferred to Bank of Issue).
(4) Almost wholly by National Bank.(5) All from National Bank (including securities purchased on the market) except B.fcs 3,060 million (unchanged)
held by Bank of Issue against postal cheque accounts. Treasury certificates allocated for payments throughthe clearing are excluded — see (2) above. -
(6) Circulation of National Bank, less small amounts held by Issue Bank.(') National Bank and Bank of Issue combined. At the Bank of Issue is an account of the Reichskreditkassen
(B.fcs 231 million on 31st December 1942 against B.fcs 186 million on 31st December 1941).(8) At Bank of Issue.pared with B.fcs 14.1 milliard in 1941; the rise in the note issue was almostparallel — by B.fcs 19.4 milliard in 1942 against B.fcs 13.7 milliard in 1941. Andin the first nine months of 1943 the clearing account rose by a furtherB.fcs 18 milliard.
Belgian Commercia l Banks«.
At end of month
1939 December
1941 December1942 March
SeptemberDecember
1943 March
September . . . .
Assets
Cash
(2)
Credit granted
to privateeconomy
(3)
to goveTreasury
bills
rnmentlong-termsecurities
Totalbalancesheet
Liabilities
Currentaccounts
m
Timedeposits
(5)In milliards of B.fcs
1.52.22.21.40.80.82.32.20.91.1
9.07.35.85.75.86.06.56.36.25.7
0.74.39.4
11.213.316.015.820.723.528.6
3.23.33.93.93.93.83.74.03.93.4
20.022.126.427.228.932.133.538.540.044.2
11.514.818.619.320.522.523.027.127.731.4
1.21.22.22.32.93.64.55.36.06.6
0) Excluding branches and agencies abroad or in Belgian Congo.(2) Including balance at National Bank, shown under "current accounts"(3) Including advances and overdrafts, commercial bills and acceptances.(4) At sight or one month's notice. (5) At more than one month.
in previous table.

— 204 —
The Treasury bill holding of the commercial banks rose by B.fcs 6.4 mil-liard in 1942 against B.fcs 5.1 milliard in 1941 (and accounted for the bulkof the short-term government securities taken by the market), while long-termgovernment securities declined slightly. In the first nine months of 1943 thebanks took up nearly B.fcs 13 milliard Treasury bills, a fact which sheds lighton the decline of direct government borrowing from the National Bank. The year1942 witnessed a reversal of the long-term tendency of savings-bank de-posi ts to decline — the surplus of deposits in 1942 was the first since 1937;at the end of 1942 the total of savings-bank deposits was B.fcs 12.8 milliard.
Belgium — movement ofsav ings-bank deposi ts*.
Period
1939 January-December . . . .1940 „1941 „ „ . . . .1942
October-December . . . .
April-JuneJuly-September
Total deposits outstandingat end of 1942
In millionsof B.fcs
— 1,052— 747— 233+ 841+ 175+ 171+ 181+ 314+ 716+ 536+ 681
12,803
Excess of deposits (+) or withdrawals (—)at the Caisse Générale d'Epargne (excludinginterest added at end of year).
Postal cheque accounts also grewin 1942 by about B.fcs 0.8 milliard toB.fcs 5.7 milliard, rather less than in theprevious two years; the postal giro hasgreatly extended since the war and thevolume of accounts has doubled fromthe B.fcs 2.9 milliard shown at the endof 1939.
Short-term market rates remainedpractically unchanged; bank rate has beenat 2 per cent, since January 1940. Theyield òf the government 3 per cent, rentefell from an average of 4.4 per cent, in1940 to 3.7 per cent, in 1941 and 3.5 percent, in 1942, and the decline continuedin the early months of 1943.
Belgium —Bank of Issue in Brussels.
From 28th February 1943 the Bank of Issue applied a new procedure tothe payment of creditors in the clearing. Instead of prepayment in full andin cash, payments for merchandise and services of over B.fcs 10,000 tookplace as to 70 per cent, in cash and 30 per cent, in nominative non-transferablecertificates of the Bank of Issue, carrying interest at 1% per cent. FromJune the proportion paid in certificates was reduced to 20 per cent, and thecertificates were accepted by the Treasury in payment of certain direct taxes;
new regulations in August 1943 gave thecertificates a maturity of at most one yearand made them transferable by endorse-ment. The counterpart of these certifi-cates was invested by the Bank of Issuein special Treasury certificates and shownseparately in the bank's] return. The rela-tively small amounts thus "sterilised" areshown in the accompanying table; actuallyin the seven months to the end ofSeptember 1943 total clearing claims of theBank of Issue increased by B.fcs 14,380 mil-lion, of which B.fcs 13,940 million arose
Near end of month
1943 February . . .March . . . .AprilMayJuneJulyAugust . . . .September . .
Clearing claimsoutstanding
paid incash
paid incertificates
in millions of B.fcs28,90331,36133,12335,56336,77538,16441,10642,846
116206281326353380435

- 205 -
from payments in cash and under B.fcs 440 million from payments in certifi-cates (less than 4 per cent, of the total).
Hol land —taxat ion and of f ic ia l credi t f i nanc ing .
For Hol land also, in the absence of budget statistics, the most com-prehensive view of government finances is gained by compiling the total ofrevenue from taxation and official credit financing. Total expenditure, whichwas FI. 1,000 million in 1939, appears to have been about FI. 3,700 million in1941 and over FI. 4,000 million in 1942. In 1942, the clearing required someFI. 1,000 million, slightly more than in 1941, while the amount paid on accountof occupation costs probably rose from the FI. 1,200 million estimated for1941 to some FI. 1,500 million in 1942.
The relative im-portance of taxation re-venue increased from1941 to 1942 andthe same was thecase with borrowingfrom the central bank,while market borrow-ing declined; in thefirst half of 1943 areverse movement ap-pears to have takenplace.
The shor t - termdebt is principally inthe form of Treasurybills, the circulation ofwhich on the marketrose from FI. 1,670 mil-lion at the end of1941 to FI. 2,710 millionin October 1942, i. e.by FI. 1,040 million.Some FI. 330 million ofthese bills were thenabsorbed by a long-term issue, which al-
(2) Estimates based partly on FI.604 million published for the first five months __ « - „ - - i : ja4.Qri „tliorof 1942 (against FI. 450 million for the same period of 1941). s o COnSOIIdaTed Oinerparts of the floating
debt, notably FI. 400 million borrowed on current account from various officialand semi-official bodies. By the end of June 1943 the Treasury bill issue hadrisen above FI. 3,000 million and the total short-term debt above FI. 4,000 million.
The long-term debt increased by over FI. 2,000 million from the outbreakof the war to the end of 1942 (account being taken of amortisations andconsolidations).
Calendar years
Financed:from central bank -
direct borrowingTotal . . .
from market -long and middle term . . .short term: Treasury bills .
otherTotal . . .
Totalofficial credit financing. .
Taxation revenueTotal receipts from taxation
and borrowing
Percentage of total taxation andborrowing financed by:
market borrowing
1940
107168275
448633
(-137)944
1,219925
2,144
12.844.043.2
1941
n millions
945(-248)
697
875608292
1,775
2,4721,219
3,691
78.948.133.0
1942
of florins
1.O1OC)
1,010
869716
(—129)1,456
2,4661,600P)
4,066
24.835.839.4
1943six
months
390 (1)
390
(—119)595486962
1,352800 (')
2,152
18.144.737.2
0) The increase of the clearing items shown in the Nederlandsche Bank'sreturn is only FI. 810 million, but some FI. 220 million were transferred tothe government at the beginning of April 1942 in exchange for Treasurybills, the total financing of Reichsmark claims thus amounting to aboutFi. 1,030 million. FI. 20 million of these Treasury bills had been disposedof by the end of the year, so that the net increase at the centralbank was about FI. 1,010 million. The remaining FI. 200 million weresold on the market during the first half of 1943, so this amount hasbeen deducted from the FI. 590 million increase of clearing claims inthe same period.

- 206 -
Dutch Publ ic Debt outs tanding(and guarantee).
At endof month
0)
1938 Dec.1939 „1940 „1941 „1942 „1943 June
Government debt
Short termcentralbank(2)
Treasurybills(3)
other«
total Long term Total
Governmentguaranteeon accountof clearingadvances
(s).In millions of florins
83251
3199
221426
1,0591,6672,3833,014
553569432724595
1,045
7741,0781,7422,3943,1774,059
3,2123,1403,5884,4635,3325,213
3,9864,2185,3306,8578,5099,272
1101,0501,8602,770
(1) The actual date of the return is the first day of the following month.(2) Direct borrowing, not Including clearing financing. For the end of 1942, the FI. 199 million represented the
balance of Treasury bills placed with the Nederlandsche Bank in exchange for Reichsmarks (and Includedunder "clearings" in the previous table).
(3) On market only (I.e. excluding those placed with Nederlandsche Bank).(4) Including the debt on current account to various official institutions, the issue of government notes etc.(5) Approximate figures from return of Nederlandsche Bank.
The 1942 loan for FI. 1,000 million was the largest single operation effectedon the Dutch market up to that time; amortisation was to take place by 20 equalannuities, so that the average maturity was actually ten years. Some FI. 400 mil-lion was taken firm by various official institutions to consolidate current-account advances previously granted to the Treasury; for the FI. 600 millionplaced on the market, nearly FI. 860 million was subscribed, so that allotmentswere cut down by 30 per cent. A further FI. 1,000 million loan was floated in
July 1943, the issue
Dutch Government long-term issues. P r i ce b e i n 9 r a i s e d
by Y4. FI. 300 mil-lion was taken byofficial institutionsand for the FI. 700million placed onthe market FI. 939million was sub-scribed, allotmentsbeing cut downthis time by 26per cent.
Date of Issue
Before the occupation:1940 January
FebruaryAfter the occupation:
1941 FebruaryNovember
1942 November1943 July
Interestrate%
44
43'A3<A31/2
Issueprice%
100100
10097 '/,99 /,99%
Maximummaturityin years
3040
10202020
Amountof issue
in millionsof florins
300300
500500
1,0001,000
Although no forced loan has actually been made in Holland, an ele-ment of compulsion has not been absent. On each occasion when a loanhas been issued since the war, a forced loan has been threatened shouldthe "voluntary" loan be unsuccessful. And on each successive occasion theterms of the forced loan were made less attractive to the investor; thus, in1942, a 2 per cent. 40-year forced loan was held over the market as a threatif the 3y2 per cent, loan was not satisfactorily subscribed. Moreover, life as-surance companies, savings banks, pension funds and similar institutions have

— 207 —
been instructed to invest the bulk of their funds in government paper and torestrict their purchases of other securities, real estate and mortgages etc. Forthe 1942 loan certain quotas were laid down which investors were expectedto fulfil if they were to escape a forced loan; individuals were to subscribe2 per cent, of net fortunes of FI. 20,000, up to 5 per cent, of FI. 800,000and 10 per cent, above that sum, share companies 3 per cent, of net businesscapital, and investment institutions (insurance companies, savings banks etc.)8 per cent, of total assets. In July 1943, the terms of the threatened forcedloan were made even more severe: a 2 per cent, undated issue at par fordouble the amount of the "voluntary" loan.
The note circulation of the Nederlandsche Bank rose in 1942 at anaccelerated rate as a result of the financing of claims on Germany.
Nederlandsche Bank.
Near end of month
1939 December . .1940 December . .1941 December . .1942 March . . . .
June . . . . .September .December . .
1943 March . . . .JuneSeptember (').
AssetsClaims on Germany (')
"sun-dry ac-counts"
foreignbills total
Loan togovern-ment
Privatedo-
mesticcredit
Gold
Totalof
balancesheet
Liabilities
NotesPrivate
ac—counts
Go-vern-ment
specialaccount
in millions of florins29123153
158161161151
188192159
215
9301,1281,1091,3601,7422,0912,2922,623
31138
1,0831,2851,2701,5211,8932,2792,4842,778
8326118
(-126)187265176122
2
238211165196151143204150140138
1,0141,1021,0261,026943925903886886932
1,4311,7832,3572,5732,6162,9263,2443,5063,5783,927
1,1521,5522,1162,2172,3932,6803,0342,9982,5963,041
229175182168160180141437(6)34O675
568100
(') Except for a small amount indicated by the pre-1940 level of these Items. The total of FI. 2,279 millionIn the table Is for 29th March 1943. According to the annual report of the Nederlandsche Bank for thefinancial year ending 31st March 1943, the total of foreign bills, balances abroad and foreign currency onthe latter date was FI. 2,221 million, of which FI. 2,206 million was in Reichsmarks.
(!) Net, I.e. direct advances, plus Treasury bills placed directly with the bank, less credit on current account;in March 1942 there was a net credit. Slight differences as compared with the previous tables are princi-pally due to the date of the returns.
(3) Excluding Treasury bills placed directly with the bank, but Including the loan to the Dutch East Indies(reduced from FI. 61 million to FI. 53 million over the period shown in the table).
(") Including certain minor items not specified in the table.(6) Account opened in connection with the withdrawal of large bank-notes.(6) The actual private accounts probably remained at about FI. 150-200 million, but withdrawn bank-notes were
also booked provisionally under this heading until a new item was included in the return of 19th April 1943.(7) From 5th July 1943 a number of changes took place in the return; in particular the gold holding rose by
FI. 46 million to FI. 936 million and the "sundry accounts" on the assets side were reduced from FI. 192 mil-lion to FI. 7 million while two new items were shown; "foreign correspondents" for FI. 78 million and"foreign currency" for FI. 28 million. At the end of September 1943, "sundry accounts" were FI. 4 million,foreign correspondents FI. 114 million and foreign currency FI. 41 million; for purposes of comparison the threeitems have been amalgamated as "sundry accounts" in the table.
Claims on Germany (principally the credit balance in the clearing, invested
in Reich Treasury bills) rose by FI. 810 million in 1942, there being, in addi-
t ion, an increase of government borrowing from the central bank to take over
Reichsmark assets; in the first three quarters of 1943 the growth of claims on
Germany was FI. 880 million compared with FI. 440 million during the same
period in 1942. Part of the increase of clearing assets appears to have relation
to a decline in the gold holding by FI. 140 million in the twelve months to

— 208 —
March 1943; on the other hand, the gold holding increased by FI. 46 millionin July 1943 as the result of a transfer from "sundry accounts".
The decrease in the note issue and the increase of private accounts inthe first quarter of 1943 were due to the withdrawal of bank-notes of largedenominations decreed on 13th March (see pages 310-311), and not to anincrease in the banks' cash reserves, which rose to a much smaller extent.
Dutch Commercial Banks 0)
At end of month
1939 December1940 December1941 December1942 March . .
June . . .SeptemberDecember
1943 March . .June . . .
Assets
Cash
(2)
Treasurybills
Securi-ties(3)
Credit toprivate
economy(4)
Allotherassets
Totalof
balancesheet
Liabilities
Depositssight
depositsetc. (5)
timedeposits
Allother
liabilitiesC6)
in millions of florins7651553547625583
110
226547793907965997863916978
363329221614201916
413290223188165165194176165
183168144113111109103103107
9341,0891,2441,2651,3041,3471,2351,2981,376
536699872910942964874917991
405769829399
101109120
358333303273269284260272264
(') Four large banks: Amsterdamsche Bank, Incasso-Bank, Rotterdamsche Bankvereeniging and Twentsche Bank.(2) Including daily money. The increase of this item in March 1943 reflects the withdrawal of large denomina-
tions of bank-notes. (3) Including participations.(4) Advances, overdrafts and commercial bills. (') Shown in the returns as "creditors".(•) Including capital and reserves.
These four banks account for about one-half of the commercial-bankdeposits in Holland. The evolution of their balance sheets is primarily affectedby the repayment of private credit and by government borrowing on Treasurybills (they hold no long-term government securities of any importance).
As the expansion of the note circulation accelerated, the rate of growthof total bank deposits declined from FI. 185 million in 1941 to only FI. 34 mil-lion in 1942 but rose more rapidly in the first half of 1943. Enterprisesother than banks have subscribed to an increasing proportion of the Treasurybill issue and Treasury bills have, indeed, largely taken the place of bankdeposits in the balance sheets of industrial and commercial concerns.
In the course of 1941, the persistent excess of withdrawals over depositsat the savings banks came to an end and in 1942 there was an excessof deposits of FI. 90 million; an increase also of about FI. 90 million indeposits was estimated for the other big group of savings banks, the Boeren-leenbanken. The total of deposits at the post office, the private savings banksand the Boerenleenbanken was about FI. 1,600 million at the end of 1942,still somewhat below the figure of FI. 1,640 million at the end of 1939. Thesubstantial increase of savings deposits in the second quarter of 1943 waspartly due to the withdrawal of large bank-notes from circulation.
The position of the mortgage banks has been difficult since thedevaluation in 1936 owing to the competition of insurance companies and

- 209 -
Hol land — movementof savings-bank deposi ts*
In millions of florins
1939 January-December • . .1940 „ „ . .1941 „ „ . .19421942 January-March
April-JuneJuly-September . . . .October-December . . .
1943 January-MarchApril-June
PostOffice
— 26- 169— 49+ 51+ 14+ 11+ 14+ 12+ 51+ 71
Privatesavingsbanks
— 56— 79— 13+ 40+ 17+ 10+ 10+ 3+ 32+ 35
Total
— 81— 248— 62+ 91+ 31+ 21+ 24+ 15+ 83+ 106
Excess of deposits (+) or withdrawals (—).
other lenders with surplus funds,and the circulation of the mort-gage bonds of 47 Dutch mortgagebanks fell from FI. 1,000 millionin 1934 to FI. 700 million in 1941,parallel with the decline of theirmortgage credits outstanding.Early in 1942 an attempt wasmade to stabilise mortgagerates around 3%-4 per cent.,while the minimum rate formortgage bonds was fixed at3% per cent. To relieve theposition of the mortgage banks,it was decreed later in the year
new mortgages was not to be below 4 per cent,savings banks and pension funds were to
that the interest rate onand that insurance companies,curtail their mortgage lending in favour of investment in government securities.
Interest rates generally remained steady throughout the year. Bankrate has been at 2% per cent, since June 1941, when it was reduced from3 per cent. The bond yield, however, continued downwards from an averageof 4.02 per cent, in 1941 to 3.58 per cent, in 1942.
The Danish budget again closed with a surplus in the financial years1941-42 and 1942-43. But official financing connected with the occupationof the country by Germany, and accounted for outside the budget, rosefrom D.Kr. 890 million in 1941-42 to D.Kr. 935 million in 1942-43; the decline infinancing required for the clearing with Germany was more than offset by theincrease in occupation costs (including expenditure for fortification works).
Denmark —budgets ( 1 ) and o f f i c i a l f i n a n c i n g .
Year ending 31st March
RevenueExpenditu reSurplusClearing accountOccupation costsTotal official credit finan-
Financed -from central bank (net) (2)in other ways
1939-40 1940-41 1941-42 1942-43
in millions of D.Kr.648639
9
(-9)
83(-92)
88482757
498514
955
CM COCO CMO>
93189634
476414
856
737119
1,1251,081
44343592
891
443448
0) Closed budgets 1939-40 to 1941-42; provisional results for 1942-43.(2) The increase of the items "clearing accounts" and "sundry debtors" plus
the "adjustment account" and the movement of the government's accountsat the Nationalbank.
In 1942-43, as inprevious years, allpayments to financethe clearing and onaccount of occupationcosts were madedirectly and in fullby the Nationalbank.By virtue of the law of3rd July 1942, however,the Finance Ministryissued debt certifi-cates, Treasury notesand savings bonds,the proceeds of whichwere transferred to a

- 210 -
special (blocked) account of the Finance Ministry with the Nationalbank.Although there is no legal link between these transfers and the financingof occupation costs and the clearing, there may be justification, from amonetary point of view, for laying stress on the marked change whichtook place from the middle of 1942: 98 per cent, of the total official creditfinancing took the form of borrowing from the Nationalbank in 1940-41 and87 per cent, in 1941-42, but only 50 per cent, in 1942-43; and this changewas effected by means of short-term securities sold on the market to offsetthe influence of the increasing credit granted by the Nationalbank.
Danmarks Nationalbank.
Endof month
AssetsClaims on Germany | Internal credit granted
occu-pationcosts
clear'ing
accountO
total
to privateeconomy
bonds other
togovern-ment
Goldand
foreignassets
Totalof
balancesheet
Liabilities
Notes
Deposits and currentaccounts
banksetc.
governmentordin-ary special
in millions of Danish crowns1939 Dec.1940 Dec.1941 Dec.1942 March
JuneSept.Dec.
1943 MarchJuneSept.
47466907975
1,0971,2121,3901,5671,8392,080
412849
9741,0521,1041,181
1,3171,5471,749
47878
1,756
1,9492,1492,3162,571
2,8843,3863,829
189174148
53368088
716256
3948244
43595156
383646
147
—
—
125126125
124114114115
115118117
9521,3092,118
2,2162,4052,6082,877
3,1563,6474,093
600741842
815844847983
9641,0581,193
134350882
1,0161,1721,0331,002
1,2621,5711,714
148
156145193242
229159214
277358
416537619
0) The figures given relate to the item "sundry debtors" in tha Nationalbank's monthly return. The smallamount normally Included under this heading, generally about the level of December 1939, should be deductedto obtain the actual debt of the Reichskreditkassen to the Nationalbank. For the sake of continuity D.Kr. 61 mil-lion has been added from March 1942 onwards, i.e. the book loss on Reichsmarks debited to the "ad-justment account" of the government when the Danish crown was revalued in January 1942. At the endof 1942 the figure of D.Kr. 1,390 million given in the table was made up as follows: the German debton account of payments to the Wehrmacht was D.Kr. 1,284 million, the "adjustment account" was D.Kr. 61 millionand the normal "sundry debtors" was D.Kr. 45 million (according to the annual report of the Nationalbank).
(2) The remainder of the "adjustment account", D.Kr. 64 million, has been added to this item from March1942 onwards. The increase of this item by D.Kr. 332 million in 1942 indicates the Danish surplus on theclearing during the year. According to the Nationalbank's annual report the turnover on all the clearingsfell from D.Kr. 2,950 million in 1941 to D.Kr. 2,500 million in 1942.
(3) Total of internal credit Items excluding bonds (and shares) and the government overdraft.(4) New account opened by virtue of the laws of 3rd July 1942 and 8th July 1943, as explained in the text.
By September 1943, the Nationalbank's claims on Germany (which are
guaranteed by the Danish Government) amounted to about D.Kr. 3,800 million
and constituted over 90 per cent, of the bank's assets. Corresponding to this
creation of central-bank credit on official account there were the following
movements in other items (from December 1939 to September 1943): credits to the
private economy were repaid to the extent of D.Kr. 480 million, the note issue
expanded by D.Kr. 590 million, the commercial banks' reserve balances (and
other private accounts) rose : by D.Kr. 1,580 million, while the government drew
back D.Kr. 980 million into the Nationalbank by repaying its overdraft and
accumulating a large deposit. The expansion of the commercial banks' reserve
balances was thus nearly three times as much as that of the note issue,
which itself was only 16 per cent, of the creation of credit on official account.

— 211 —
Although the situation in Denmark compared favourably with other countriesin Europe in 1942, yet the basis for a vast expansion of commercial-bank credithad been laid and the Nationalbank observed the monetary development "withthe greatest anxiety", as it remarked in its annual report. The problem wastwofold: to neutralise, or reabsorb, freshly-created central-bank credit and totie up that which had been previously created. The counter-measures recom-mended by the Nationalbank took two lines: (a) to mop up newly-created
•central-bank credit by government borrowing on the market and (b) to tie upthe commercial banks' cash reserves, and thus narrow the basis for an expansionof secondary, or commercial-bank, credit. The result of these recommendationswas the voting of two laws on 3rd July 1942 having the following main lines:
A. The government, through the Minister of Finance, was authorised to issueto investors other than banks up to D.Kr. 200 million 2-year debt certificatesat 1% per cent; and, particularly for bank subscription, up to D.Kr. 300 mil-lion (later increased to 400 million) 6-month Treasury notes at % per cent.;in addition the authorisation included an unlimited amount of 5%-yearsavings bonds with effective interest at 4.1 per cent.; the proceeds ofthese issues were to be placed to a special account which might be drawnupon only with the agreement of the budget commission of the Rigsdag(or, without agreement, for the purpose of amortising the securities issuedin accordance with the same law).
B. Commercial banks were to maintain reserves in cash and balances at theNationalbank equal to the sum of the following:(i) 40 per cent, of the increase of their deposits and current accounts
since August 1939,(ii) 15 per cent, of the total of such deposits and accounts outstanding,(iii) 5 per cent, of savings deposits withdrawable within three months, and(iv) 100 per cent, of the deposit of another bank considered as a reserve
balance.
By the end of 1942 the special blocked account of the government amountedto D.Kr. 358 million, being the cash proceeds from the issue of D.Kr. 98 milliondebt certificates, D.Kr. 250 million Treasury notes and D.Kr. 13 million savingsbonds.
The volume of cash reserves required by the banks under the law of3rd July 1942 is not shown separately, but the Nationalbank's annual reportstates that the total tied up under the law at the end of 1942 was D.Kr. 670 mil-lion, of which D.Kr. 550 million was on special "liquidity" accounts (on whichthe Nationalbank pays interest at 34 per cent.) and D.Kr. 120 million on theirordinary non-interest-bearing account at the Nationalbank or as cash in tills.
At the same time as these measures came into force the Nationalbankdeclared itself prepared to open accounts for banks (and savings banks) at6 months' notice, bearing interest at % per cent., and by December 1942D.Kr. 199 million had been deposited on these accounts. Thus by the endof 1942 the "sterilisation" measures taken by the government and by the

- 212 -
Nationalbank together covered D.Kr. 1,227 million of funds (at an annual costof about D.Kr. 4 million). The President of the Nationalbank stated, however,that the measures taken were insufficient and further steps were foreshadowed.
Danish Commercial Banks.
End of month
1939 December1940 December1941 December1942 March . .
June . . .SeptemberDecember
1943 March . .June • . .September
Assets
Cash Bills
(1)
Advancesandover-drafts
Securi-tiesV)
Totalbalancesheet
Liabilities
Private deposits
currentaccounts
timedeposits total
Depositsmade byotherbanks
P)in millions of Danish crowns
211450952
1,0441,207
839889946
1,1301,198
440381280261273365360359309236
1,671,533,473,406,428,471,482
1,4531,4481,419
615789
1,0061,0631,0701,1671,1681,2091,2861,316
3,5643,7594,4094,4614,7754,7945,0115,1055,6085,728
843958
1,2581,2461,4381,4071,5171,4291,7081,659
1,6121,6571,8571,9511,9622,0522,0782,1882,2242,310
2,4552,6153,1153,1973,4003,4593,5953,6173,9323,969
132243395436462450487580689806
Denmark — movement of
savings-bank deposi ts*.
0) The new Treasury notes appear to have been booked by the banks under both these items. It is probablethat about one-third of the bill portfolio and two-thirds of the securities are government paper, which thusrepresents some 15-20 per cent, of total assets. (2) Including savings banks.
Early in July 1943, a further series of "anti-inflation" measures werepassed by parliament including war-profits taxes and the introduction of com-pulsory savings; in addition, two new "sterilisation loans" were floated:D.Kr. 200 million 2% per cent. 5-year bonds and D.Kr. 200 million 3 per cent.10-year bonds. In the first three quarters of 1943 central-bank credit creationon official account was on a large scale, some D.Kr. 1,260 million againstD.Kr. 560 million in the same period in 1942; but only 18 per cent, was sterilised
by the net increase on the government'stwo accounts and a further 3 per cent, wasabsorbed through sales of bonds by theNationalbank. At the end of September 1943the total funds tied up by the "sterilisation"measures amounted to D.Kr. 2,200 million.
The change which came over theposition of the commercial banks in 1942reflects the "sterilisation" measures of thegovernment; the fall of the cash holding inthe third quarter by D.Kr. 370 million waslargely the result of the purchase ofTreasury notes and other government se-curities by the banks. But in 1943 the banksagain became very liquid. Savings-bankdeposits began to rise sooner than inBelgium and Holland and early in 1943the increase became more rapid.
Period
1939 January-December . . . .1940 „ „ . . . .1941 „ „ . . . .1942 „ „ . . . .1942 January-March
April-June.July-SeptemberOctober-December . . . .
1943 January-MarchApril-JuneJuly-September
Total deposits outstandingat end of 1942
In millionsof D.Kr.
— 33— 63+ 217+ 255+ 91+ 49+ 76+ 40+ 123+ 78+ 92
2,589
°r withdrawals H '

- 213 -
There were few changes in short-term interest rates during the year,but the "sterilisation" measures of July 1942 were not without influence onthe long-term bond market, which suffered one of the sharpest reversalsof recent years. In the first half of the year bond quotations had risen verysharply, reaching their highest level in June, when the yield on the 3% percent, government rentes was 3.91 per cent, (the lowest point for many years).The Nationalbank, which had been steadily reducing its bond portfolio byopen-market sales, held only D.Kr. 32 million at the end of July, the smallestholding for over teii years. Then quotations fell abruptly, especially in September-October 1942 and again in January and February 1943, so that the yield on3% per cent, rentes rose to 4.65 per cent, in February 1943; some relaxationof the pressure occurred in March and, by September 1943, the yield haddeclined to 4.20 per cent.
A number of conversions were carried out by the government andothers during 1942, representing, however, a relatively modest proportion ofthe outstanding volume of bonds, which generally carry interest at 4%-5 percent. The Nationalbank remarked in its annual report for 1942 that the
^act that certain conversion operations had not been satisfactory was (Jinpart due to the reigning uncertainty as to the development of quotationsof long-term bonds and especially the essentially different attitude of themarket as regards investments at short term and at long term. Whereasshort-term paper has always been easily absorbed by the market, buyerswere more reserved on certain occasions as to large offers of long-term bonds."
Published information is scarce regarding financial developments inNorway and regular statistics are practically non-existent. The expenses ofthe Oslo Government in 1942 were about double the budget expenditure beforethe war. The government debt, last given officially as N.Kr. 1,450 million at theend of 1939, was estimated to have risen by some N.Kr. 1,900 million to aboutN.Kr. 3,350 million at the end of.1942 (excluding the debt to the Norges Bankon account of occupation costs). The Oslo Government raised, in all, loansof N.Kr. 725 million and issued some N.Kr. 1,250 million Treasury bills up tothe end of 1942; about N.Kr. 675 million Treasury bills and N.Kr. 425 millionof the loans were floated in 1942, the latter by two issues of 3% per cent.40-year bonds, taken largely by banks and insurance companies for resellingto the public at 99%. In June 1943 two more loans were floated; N.Kr. 150 mil-lion 3% per cent. 40-year bonds and N.Kr. 100 million 2% per cent. 7-yearbonds, both at 99%. And at the same time a N.Kr. 50 million 12-year premiumissue was made.
To ordinary budget expenditure must be added occupat ion costsestimated to be running at nearly N.Kr. 200 million a month in 1942. Thesefunds have been applied not only for the upkeep of the German troops butfor the maintenance of the German civil administration, for the erection of

Norges Bank.
- 214 -
fortifications and for investments mainly in aluminium and water power, theseindustries being financed directly by the Norges Bank. The bank has pub-
lished no returns since March 1940, but avail-able estimates are reproduced in the table. Bythe middle of 1943, the aggregate of occupationcosts paid reached about N.Kr. 7,000 million,of which some N.Kr. 2,000 million had beenfinanced by the Treasury bill issue; togetherwith the direct government debt mentionedin the previous paragraph (including the twoloans floated in June 1943) the total debtmust have exceeded N.Kr. 9,000 million.
End of year
1939194019411942
Aggregateoccupationcosts paid
Notecircula-tion*
in millions of N.Kr.
1,5003,8006,000
5751,0001,5002,000
* The latest figure published in the regularbank returns was N.Kr. 600 million inMarch 1940.
In 1942 the monthly returns previously published by the Norwegian com-mercial banks were suspended. But balance sheets of the three largest banks,which have about one-half of the resources of all the banks, are availableand have been combined in the table below.
Norway — three large banks*.
End of year
Assets
Cash Securities Bills Loans
Totalbalancesheet
Liabilities
Deposits
in millions of N.Kr.
Capitaland
reserves
1939194019411942
24230309238
137191265280
198153351596
399322261228
9101,0811,3401,495
457730978
1,115
102103104105
* Christiania Bank og Kreditkasse, Den Norske Creditbank and Bergens Privatbank.
It is no tewor thy tha t depos i t s rose in 1942 by N.Kr. 138 mi l l ion — only
half as much as in 1941 — wh i le the banks ' cash reserves fe l l . T h e three
banks s h o w n in the tab le were es t imated to ho ld N.Kr. 465 mi l l ion Treasury
bi l ls at the end of 1942; al l commerc ia l banks in the coun t ry probably took
up abou t N.Kr. 500 mi l l ion ou t of s o m e N.Kr. 1,100 mi l l ion government secur i t ies
issued ( long and shor t ) dur ing the year. No in fo rmat ion is avai lable as to the
deve lopment of sav ings-bank depos i t s .
There has been l i t t le change in in teres t rates. T h e d i scoun t rate of the
Norges Bank has remained at 3 per cent , s ince May 1940. T h e th ree big
banks , wh i ch in May 1941, had abo l i shed the % per cent , in terest they paid on
s igh t depos i t s , were ordered by the Min is ter of F inance to pay % per cent , on
s igh t depos i t s of under N.Kr. 1 mi l l ion f r o m December 1941 and % per cent ,
f r o m March 1942. From Oc tobe r 1943 the rate on s igh t depos i t s was again
reduced to % per cen t , but t ime depos i t rates were i n t roduced as f o l l o w s :
y2 per cen t , f o r fou r m o n t h s , % per cent , fo r e ight m o n t h s and 1 per cent ,
fo r twe lve m o n t h s .

- 215 -
Finland was at war with the U. S. S. R. for three and a half months inthe winter of 1939-40 and in June 1941 again became a belligerent. Budgetdeficits of around FM 10 milliard in each of three years 1940, 1941 and 1942,arising entirely from military expenditure, led to a tenfold increase of the publicdebt from FM 3.4 milliard in December 1938 to FM 36.6 milliard in December 1942.
Finland — Publ ic Finance™.
Calendar years
193819391940194119421943
Budget revenue and expenditure
Re-venue
P)
Expenditure
civil mili-tary total
Deficit
Public debt increases (3) (or decreases-)
Internal
long-term
Short-term
centralbank other
totalForeign Total
in milliards of FM5.04.56.0
10.917.418.5
3.74.05.27.17.58.5
1.22.7
12.313.819.220.0
5.06.7
17.520.926.728.5
2.211.610.09.3
10.0
Public debt at the end of 1942 (total)
0.10.80.51.83.8
12.6
0.64.95.23.8
14.6
(-0.1)0.14.22.41.1
4.7
1.59.69.48.7
31.9
(-0.2)0.72.00.60.6
4.7
(-0.2)2.2
11.610.09.3
36.6
(<) Statistics up to 1941 from article by Dr Matti Leppo in "Wirtschaftliche Untersuchungen" issued by theBank of Finland ; for 1942, round figures of budget results from official statements and debt figures fromofficial statistics. For 1943, estimates; in the first three quarters of the year military expenditure amountedto FM 14.2 milliard.
(') Ordinary budget revenue plus certain capital receipts, varying from FM 0.3 to 0.5 milliard in the period1938-41, assimilated to ordinary revenue; in 1942 about FM 13 milliard was received from ordinary taxationand FM 4 milliard from other sources.
(3) The internal debt, which amounted to FM 2.6 milliard at the end of 1938, almost wholly at long term, hadrisen by the end of 1942 to FM 31.9 milliard, of which FM 12.6 milliard was at long and FM 19.3 milliardat short term (including the central-bank credits). The foreign debt rose from FM 0.8 milliard at the endof 1938 to FM 4.7 milliard at the end of 1942, when FM 3.7 milliard was consolidated and FM 1.0 milliardfloating; the most important part of the increase of FM 2.0 milliard in 1940 was due to credits from theUnited States granted during the winter war of 1939-40 and booked at $23 million; other credits have beenreceived from Sweden and, in the clearing, from Germany.
Revenue has risen as a result of increased yields, new taxes (includinga tax on capital) and higher miscellaneous receipts. Civil expenditure hasgrown, largely as a result of increases in interest on the public debt and civilservants' salaries (as partial compensation for the higher living costs). Totalexpenditure as given in the table excludes amortisation of the public debt andthe indemnity payments to Carelians, originally estimated as requiring aboutFM 12% milliard, but later reduced to not more than FM 7 milliard; theseindemnities were partly paid out in 1943, largely by means of special debtcertificates.
The major part of the budget deficits has been covered by internalbor row ing ; in the four years 1939-42 the internal debt rose by FM 29.3 mil-liard, borrowed one-half from the market and one-half from the central bank.Market borrowing in 1942 amounted to nearly FM 5 milliard: FM 3.8 milliardwas raised at long term, principally by the issue, from March 1942 onwards,of the 5% per cent. Fatherland loan, while FM 1.1 milliard was obtained fromtax certificates and other short-term instruments. For 1943, with military ex-penditure running at FM 1.6 milliard a month in the first three quarters of the

- 216 -
year, special measures were considered necessary, owing to the difficulty ofplacing loans with the public; these measures included the issue of a 3% percent. 5-year forced loan based on income and capital and estimated to produceFM 3.5 milliard.
FM 2.6 milliard of the long-term issues in 1942 appears to have beentaken by the commercial banks, as indicated by the increase of their bondholdings. The banks' bill holdings, on the other hand, after rising rapidly to
Finnish Commercial Banks 0)
At end of month
Assets
Cash Internalbills
Loansand
overdraft Bonds
Totalof
balancesheet
LiabilitiesCurrent accounts
and deposits
currentaccounts
timedeposits total
In millions of FM1939 December .1940 December .1941 December .1942 March . . .
June . . . .September.December .
1943 March . . .June.. . .September.
8091,8542,0561,5811,5491,9851,6392,0021,8851,784
1,9043,8262,5283,4204,1313,6633,0703,5124,3025,470
7,7327,1948,1247,9568,1448,2608,7248,9539,3329,469
1,2551,6553,6124,3344,7405,9936,1656,2986,7366,992
13,17816,07618,11318,99520,43721,81521,66822,86924,63626,132
2,4594,6806,0306,3516,9267,0687,2287,7458,2728,605
6,9407,4707,4087,9208,3078,4488,5979,393
10,16210,622
10,76613,48814,82915,88917,04117,62017,93119,49921,16922,270
(1) All commercial banks. (2) Including Treasury bills etc. (3) Including government bonds.M Including other items than those specified. (5) Including also the accounts of credit institutions.
June 1942, fell by over FM 1 milliard in the second half of the year. Depositsand current accounts expanded in 1942 by FM 3.1 milliard, more than doublethe increase of 1941, the rise of time deposits being particularly notable afterthe stagnation of this item in previous years.
Finland —
movement of savings deposi ts.
Calendaryears
194019411942
Newdeposits
With-drawals Movement*
In millions of FM2,2202,4872,993
2,3012,7792,210
— 81— 292+ 783
* Excess of new deposits (+) or withdrawals (—)at ordinary savings banks (excluding interestadded). The total of savings deposits at theend of 1942 was FM 8,856 million; a furtherFM 1,036 million was held at the postal savingsbank.
The acceleration of the increase ofdeposits and current accounts con-tinued in 1943, the rise in the firstthree quarters of the year exceeding thatfor the whole of 1942; amongst theassets, the further expansion of the billportfolio was especially noteworthy,while the banks' cash reserves declined.At the ordinary s a v i n g s banks therewas a surplus of new deposits overwithdrawals in 1942 for the first yearsince 1938.
New borrowing by the government from the Bank of Finland (booked under"discounts" and "sundry accounts" in the returns) declined from FM 5.2 milliardin 1941 to FM 3.8 milliard in 1942 but the note circulation expanded more rapidlyas there was a net withdrawal of funds kept at the bank on current account.

- 217 -
Bank of Finland.
At end of month
Assets
"Sundryaccounts"
Internalbills
discounted
Goldand
foreignexchange
Totalof
balancesheet
Liabilit ies
Notecirculation
Privatecurrent
accounts
Clearingaccountsand otherforeigndebts
in millions of FM1938 December .1939 December .1940 December .1941 December .1942 March . . .
June . . . .September.December .
1943 March . . .June . . . .
78228
1,540
382449108
95914
1,0422,358 P)5,275
12,22513,01014,15314,74615,87317,56815,635
3,4022,9051,7811,104
973926789667580499
5,3256,8099,492
14,17815,16816,35916,41717,57619,51018,230
2,0864,0395,5517,3177,7517,9758,5019,617
10,2069,087 («)
850686834
1,2581,1031,1661,0951,1791,2651,152
7994
6332,5363,2924,0583,4733,3624,6444,502
C) Government borrowing is booked under these two items and not shown separately; the total borrowedby the government from the bank rose from nil at the end of 1938 to FM 10.7 milliard at the end of 1941 andto FM 14.6 milliard at the end of 1942; it was reported at FM 16.3 milliard at the end of March 1943. Creditgranted to the private economy of the country was relatively very small.
(2) Including other items than those specified. (3) Including FM 315 million rediscounted bills.C) By September 1943 the note circulation had again risen, to around FM 9,600 million.
After the record increase of FM 2.3 milliard in the note circulation in1942 and a further rise at the same rate in the early part of the new year,there was a reflux of notes in the second quarter of 1943 due to a proposalthat a forced loan should be imposed by stamping the notes in circulation andreplacing them partially by government securities.
In spite of considerable borrowing by the government from the central bank,the market was not particularly liquid, notes being preferred by the public tobank deposits; the check to the increase of the commercial banks' cash hold-ings in 1942 (and to the current accounts held at the central bank) was evidenceof some tightness during the year, conditions which continued into 1943; bankrate has, however, remained at 4 per cent., unchanged for.ten years. In February1943 the Finance Minister ruled that credit institutions might not raise loanrates beyond the level of October 1940 without prior examination of eachindividual case by the Ministry; and in the same month the Bank of Finlandlaid down new guiding principles for credits granted by the banks, particularlyto exclude speculative purchases of real property and shares.
In south-eastern Europe three count r ies , Hungary, Bulgaria andRoumania, were subject to similar influences; although they did not add totheir territory, as was the case in 1941, they continued to be used in varyingdegrees for transit and as operational or merely supply bases for Germantroops, while themselves remaining active belligerents. Thus, in addition totheir own war expenditure, they had to finance the clearing with Germanyand the outlay in recently attached territories. As their money and capitalmarkets are undeveloped according to western European standards, heavycalls have been made on the central banks.

- 218 -
Although, up to the autumn of 1943, no closed accounts had beenpublished in Hungary since 1939-40, and the budget estimates as presentedto Parliament excluded part of the war and other extraordinary expenditure,yet it was possible to obtain some indication of the execution of the five-yearprogramme inaugurated in March 1938 and intended to provide Pengö 1,000 mil-lion for "investment", namely Pengö 600 million from special resources, includ-ing a tax on capital, and the balance from borrowing (the "Investment" loanof 1938-40). In the programme only Pengö 600 million was originally providedfor armaments but the amount was progressively increased, and actual expendi-ture on armaments amounted in all to Pengö 4,500 million, according to astatement made by the Finance Minister in October 1942; other "invest-ments" (roads etc.) originally estimated at Pengö 400 million actually reachedPengö 1,100 million.
Hungarian Budget Accounts 0)
Financial years
ReceiptsExpenditure
Surplus (+) or deficit (—)
Closed accounts
1938-39 1939-40P)
Estimates
1941 1942 1943(3) 19440
in millions of pengö1,017
930
+ 87
2,0531,822
+ 231
1,5491,769
— 220
2,1992,337
— 138
2,7692,920
— 151
3,9064,180
— 274
0) Excluding the state enterprises and extraordinary expenditure.(0 The budget year was changed from July-June to January-December and the transition budget for 1939-40 was
for 18 months (July 1939-December 1940).(3) The end of the five-year programme, financed through a separate budget, is reflected by the inclusion of a
greater part of war expenditure in the 1943 ordinary budget; the estimated expenditure of the Ministry ofDefence was increased from Pengö 580 million In 1942 to Pengö 845 million in 1943, a fact which explainspart of the rise of total ordinary budget expenditure. Actual receipts in 1943 were well above the estimatesand amounted to Pengö 2,730 million in the first eight months of the year.
(4) Ordinary defence expenditure was included at Pengö 1,513 million in the 1944 estimates.
The net deficit on the ordinary budget from 1938-39 to 1942 amountedto only Pengö 40 million, to which must be added the aggregate deficit ofnearly Pengö 200 million on the state enterprises; but in the same period theinternal public debt rose by nearly ten times to Pengö 3,640 million at theend of 1942. Of the increase of Pengö 3,265 million, Pengö 350 million wasdue to the revalorisation in 1942 of war loans issued in 1914-18 and Pengö500 million represented the debt to the National Bank for the withdrawal ofbank-notes formerly circulating in territories attached to Hungary in the years1938-41; cash receipts thus somewhat exceeded Pengö 2,400 million, an in-dication of the extraordinary expenditure (mostly for armaments and the war)financed by borrowing over the five-year period.
In 1942 net receipts from borrowing for budgetary purposes amounted toPengö 770 million, the main resources being the 4 per cent. Transylvanianpremium loan for Pengö 100 million and two issues of 4% per cent. Treasurybills of Pengö 200 million and Pengö 500 million, placed chiefly with thecommercial banks (Treasury bills placed with business concerns being alsolargely refinanced by the banks). In addition, the Hungarian Governmentcreated Pengö 750 million 4 per cent. Treasury bills (raised in August 1943 to

— 219 —
Hungarian Publ ic Debt 1942'
1942Internal debt - at end ofIncurred prior to 1938: totalIncurred in period 1938-42: total
National BankTreasury bills5 per cent. Investment loan 1938-40 .4'/2 per cent. Transylvanian loan 19414 per cent. Transylvanian loan 1942 .Sundry smaller issuesRevalorisation of war loans 1914-18 .
Total internal debtForeign debt
Millions of pengö
754 P)1,210P)
39523099
227350
3773,265
3,6421,227
Total public debt , 4,869
0) As given by the Finance Minister when presenting the budget esti-mates for 1943.
(2) This figure was given before the amortisation of Pengö 30 million atthe end of the year, which reduced the total to Pengö 724 million, asgiven in the National Bank's balance sheet: of this total only Pengö 221 mil-lion represented the direct drawings of the Treasury, the balance beingthe advances made in connection with the withdrawal of bank-notesformerly circulating in recently attached territories.
(3) Pengö 1,120 million Treasury bills placed with banks and industrialconcerns etc. and Pengö 90 million current overdrafts of the Treasuryfrom the banks.
Pengö 1,000 million) toprovide the funds ne-cessary for taking overReichsmark claims fromthe National Bank; Pengö400 million of these billswere placed in 1942 anda further Pengö 180 mil-lion in the first half of1943. The clearing withGermany has been finan-ced by the Treasury, thecommercial banks andthe National Bank (asexplained on page 157);at the end of 1942 thetotal of the Reichsmarkholding and Pengö ad-
vances to the Germanclearing office was RM 540 million, the equivalent of Pengö 900 million, of whichover Pengö 500 million was financed directly or indirectly by the National Bank,some Pengö 300 million by the commercial banks and less than Pengö 100 mil-lion (net) by the government (after utilisation of the equivalent of some Pengö230 million for extraordinary payments in Germany).
In 1942 the commercial banks opened a new credit for RM 200 million(equivalent of Pengö 330 million) "for the development of commodity trade"with Germany; in addition, Pengö 300 million of discounts and advanceswere granted to the private economy of the country during the year and
Hungarian Commercial Banks0 ' .
At end of month
1940 December1941 December1942 June
December1943 June
Assets
Cash
Credit to privateeconomy
dis-countsand ad-vances
(2)
secu-rities
Creditin
clear-ingto
Ger-many
(3)
Governmentpaper
shortterm
longterm
Totalof
balancesheet
Liabilities
Depositsetc.
currentac-
counts
savingsdepo-sits
Redis-countsanden-
dorse-ments
in millions of pengö
143152123173186
1,2111,8211,6102,1271,962
288354369386384
278282285
492428576
1,1691,915
100199189189178
2,7483,3433,5284,7065,240
8481,0451,0821,3091,479
581581597698729
550WO
1,1082,0092,350
(1) Ten banks having about two-thirds of the resources of all the banks. (2) Including bills rediscounted.(3) At the end of December 1942 the ten banks accounted for Pengö 282 million out of the Pengö 330 million
granted by all the commercial banks together. The figures given in the table are gross and include theamount refinanced, which Is booked as a contra Item, given in the table (with other refinancing) under"rediscounts and endorsements".
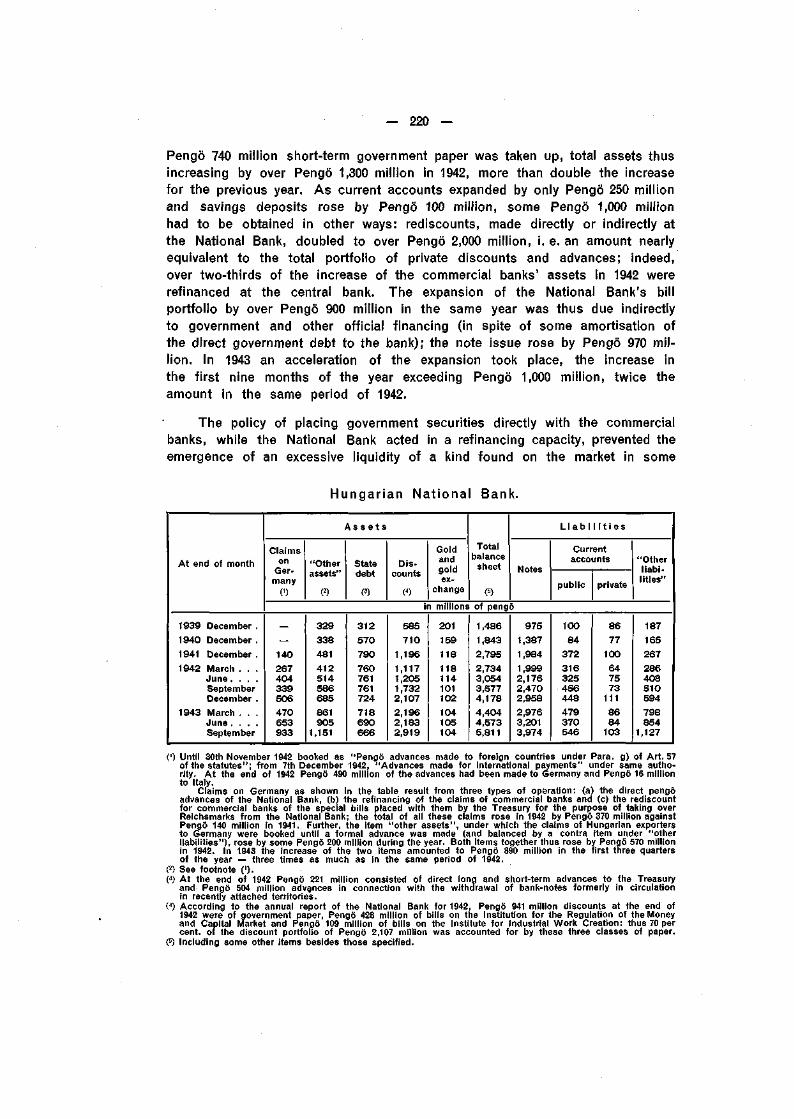
— 220 —
Pengö 740 million short-term government paper was taken up, total assets thusincreasing by over Pengö 1,300 million in 1942, more than double the increasefor the previous year. As current accounts expanded by only Pengö 250 millionand savings deposits rose by Pengö 100 million, some Pengö 1,000 millionhad to be obtained in other ways: rediscounts, made directly or indirectly atthe National Bank, doubled to over Pengö 2,000 million, i. e. an amount nearlyequivalent to the total portfolio of private discounts and advances; indeed,over two-thirds of the increase of the commercial banks' assets in 1942 wererefinanced at the central bank. The expansion of the National Bank's billportfolio by over Pengö 900 million in the same year was thus due indirectlyto government and other official financing (in spite of some amortisation ofthe direct government debt to the bank); the note issue rose by Pengö 970 mil-lion. In 1943 an acceleration of the expansion took place, the increase inthe first nine months of the year exceeding Pengö 1,000 million, twice theamount in the same period of 1942.
The policy of placing government securities directly with the commercialbanks, while the National Bank acted in a refinancing capacity, prevented theemergence of an excessive liquidity of a kind found on the market in some
Hungarian National Bank.
At end of month
Assets
Claimson
Ger-many
"Otherassets"
Statedebt
Dis-counts
CO
Goldandgoldex-
change
Totalbalancesheet
Liabilities
Notes
Currentaccounts
public private
"Otherliabi-lities"
in millions of pengö1939 December .1940 December .1941 December .1942 March . . .
June. . . .SeptemberDecember .
1943 March . . .June . . . .September
140267404339506470653933
329
338
481
412514586685
861905
1,151
312
570
790
760761761724
718690666
585
710
1,196
1,1171,2051,7322,107
2,1962,1832,919
201
159
118
118114101102
104105104
1,486
1,843
2,795
2,7343,0543,5774,178
4,4044,5735,811
975
1,387
1,984
1,9992,1762,4702,958
2,9763,2013,974
100
84
372
316325456448
479370546
86
77
100
647573111
8684103
187165267286408510594798854
1,127
(') Until 30th November 1942 booked as "Pengö advances made to foreign countries under Para, g) of Art. 57of the statutes"; from 7th December 1942, "Advances made for international payments" under same autho-rity. At the end of 1942 Pengö 490 million of the advances had been made to Germany and Pengö 16 millionto Italy.
Claims on Germany as shown in the table result from three types of operation: (a) the direct pengöadvances of the National Bank, (b) the refinancing of the claims of commercial banks and (c) the rediscountfor commercial banks of the special bills placed with them by the Treasury for the purpose of taking overReichsmarks from the National Bank; the total of all these claims rose in 1942 by Pengö 370 million againstPengö 140 million in 1941. Further, the item "other assets", under which the claims of Hungarian exportersto Germany were booked until a formal advance was made (and balanced by a contra item under "otherliabilities"), rose by some Pengö 200 million during the year. Both items together thus rose by Pengö 570 millionin 1942. In 1943 the increase of the two items amounted to Pengö 890 million in the first three quartersof the year — three times as much as in the same period of 1942.
(2) See footnote (').(3) At the end of 1942 Pengö 221 million consisted of direct long and short-term advances to the Treasury
and Pengö 504 million advances in connection with the withdrawal of bank-notes formerly in circulationin recently attached territories.
(") According to the annual report of the National Bank for 1942, Pengö 941 million discounts at the end of1942 were of government paper, Pengö 428 million of bills on the Institution for the Regulation of the Moneyand Capital Market and Pengö 109 million of bills on the Institute for Industrial Work Creation: thus 70 percent, of the discount portfolio of Pengö 2,107 million was accounted for by these three classes of paper.
(5) Including some other items besides those specified.

- 221 —
other countries where the government has borrowed primarily from the centralbank. Beside the financing of government expenditure, the war industriesand the clearing with Germany, the normal credit requirements of the privateeconomy have been relatively small, although some considerable new creditswere obtained from the banks by Christian firms which took over Jewishbusinesses. In April 1942 the National Bank requested the banks to examinecarefully all applications for new credit and to refuse credits for purposesother than those connected with the war effort and public supply, particularlyruling out credit for speculative purposes. Bank rate has remained unchanged
at 3 per cent, since October 1940; themarket rate for prime commercial bills had awide spread of 3%-6 per cent., the maximumrate being reduced from 6% per cent, duringthe year. A representative long-term ratefluctuated as shown in the table, the lowestlevel in 1942 being in June and the highestin December. A noteworthy innovation wasforeshadowed by the Finance Minister inhis budget speech in October 1943: a newlong-term loan was to be raised with itsvalue defined in terms of wheat, 3 per cent.
25-year bonds denominated in 5, 10, 25 and 100 quintals being issued for publicsubscription; the price of issue was Pengö 40 per quintal and this price wasguaranteed as the minimum for the redemption of the bonds: the first tranchewas fixed at Pengö 200 million.
Hungary —l o n g - t e r m i n te res t ra te* .
Years
1939194019411942
Lowest Highest
in percentages6.256.104.905.71
8.337.696.257.09
• The yield of the 5 per cent, forced loan of1924 as published by the Hungarian NationalBank.
In Bulgar ia, the Finance Minister stated in a speech early in August1943 that, although the totals of the ordinary budgets for the six years 1938-43aggregated Leva 69.4 milliard, actual expenditure, including the various special
budgets, would reach Leva 103Bulgarian Treasury Out -payments . milliard; this figure corresponds
closely to the total Treasury outlay,as published in the Treasury re-turns for 1938-42, plus an estimatefor 1943, as shown in the table.On the basis of a peacetimebudget of Leva 7 milliard, said theFinance Minister, the war wouldcost Bulgaria Leva 61 milliard upto the end of 1943.
Internal borrowing, accordingto the Finance Minister, amountedto Leva 21 milliard, including theproceeds of the forced loan of1941, the issue of Treasury certifi-cates and two or three loans
Calendaryears
193819391940194119421943
Totals . . .
Publishedordinarybudgettotals
OtherTreasury
out-payments
TotalTreasury
out-payments
in milliards of leva7.07.68.5
10.114.421.8
69,4
(- 0.3)(—0.4)
0.35.1
10.318.7
33.7
6.77.28.8
15.224.740.5
103.1
The ordinary budget totals given by the Finance Ministercorrespond to the published figures. The total Treasuryout-payments are published monthly in the Treasury statistics;those for 1943 are based on Leva 10.1 milliard for the first threemonths of the year. This estimate may be exceeded, as out-payments in the second quarter of 1943 were running at anannual rate of over Leva 60 milliard. The second column, com-prising "other Treasury out-payments", is the differencebetween the two other columns and gives some idea of thesize of the special budgets.
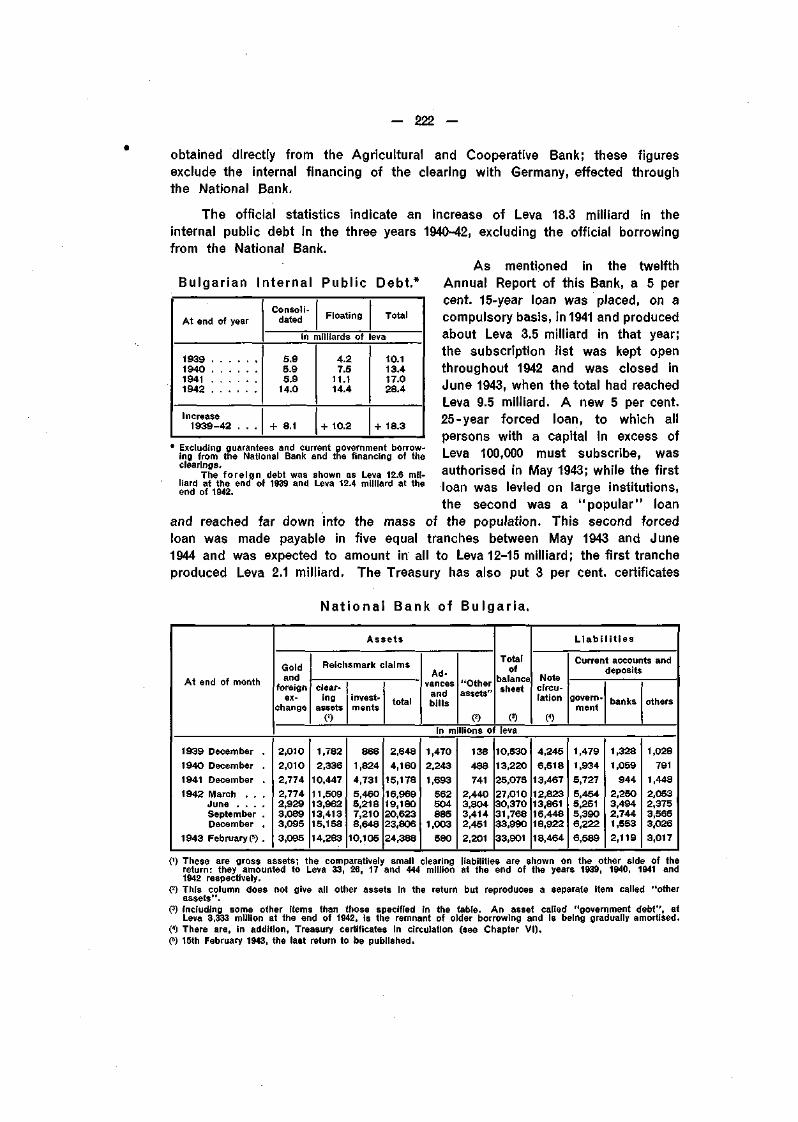
— 222 —
Bulgar ian Internal Publ ic Deb t /
obtained directly from the Agricultural and Cooperative Bank; these figuresexclude the internal financing of the clearing with Germany, effected throughthe National Bank.
The official statistics indicate an increase of Leva 18.3 milliard in theinternal public debt in the three years 1940-42, excluding the official borrowingfrom the National Bank.
As mentioned in the twelfthAnnual Report of this Bank, a 5 percent. 15-year loan was placed, on acompulsory basis, in 1941 and producedabout Leva 3.5 milliard in that year;the subscription list was kept openthroughout 1942 and was closed inJune 1943, when the total had reachedLeva 9.5 milliard. A new 5 per cent.25-year forced loan, to which allpersons with a capital in excess ofLeva 100,000 must subscribe, wasauthorised in May 1943; while the firstloan was levied on large institutions,the second was a "popular" loan
and reached far down into the mass of the population. This second forcedloan was made payable in five equal tranches between May 1943 and June1944 and was expected to amount in all to Leva 12-15 milliard; the first trancheproduced Leva 2.1 milliard. The Treasury has also put 3 per cent, certificates
N a t i o n a l Bank of Bu lga r i a .
At end of year
1939194019411942
Increase1939-42 . . .
Consoli-dated Floating Total
In milliards of leva5.95.95.9
14.0
+ 8.1
4.27.5
11.114.4
+ 10.2
10.113.417.028.4
+ 18.3
* Excluding guarantees and current government borrow-ing from the National Bank and the financing of theclearings.
The foreign debt was shown as Leva 12.6 mil-liard at the end of 1939 and Leva 12.4 milliard at theend of 1942.
At end of month
1939 December .1940 December .1941 December .1942 March . . .
June . . . .September .December .
1943 February p) .
Assets
Goldand
foreignex-
change
Reichsmark claims
clear-ing
assets(')
invest-ments total
Ad-vancesandbills
"Otherassets"
(2)
Totalof
balancesheet
(3)
Liabilities
Notecircu-lation
(4)
Current accounts anddeposits
govern-ment banks others
in millions of leva2,0102,0102,7742,7742,9293,0893,0953,095
1,7822,336
10,44711,50913,96213,41315,15814,283
8661,8244,7315,4605,2187,2108,648
10,105
2,6484,160
15,17816,96919,18020,62323,80624,388
1,4702,2431,693
562504885
1,003580
138488741
2,4403,8043,4142,4512,201
10,53013,22025,07527,01030,37031,76833,99033,901
4,2456,518
13,46712,82313,86116,44818,92218,464
1,4791.9345,7275,4545,2515,3906,2226,589
1,3281,059
9442,2503,4942,7441,5532,119
1,028791
1,4482,0532,3753,5653,0263,017
0) These are gross assets; the comparatively small clearing liabilities are shgwn on the other side of thereturn: they amounted to Leva 33, 26, 17 and 444 million at the end of the years 1939, 1940, 1941 and1942 respectively.
(2) This column does not give all other assets in the return but reproduces a separate Item called "otherassets".
(3) Including some other items than those specified in the table. An asset called "government debt", atLeva 3,333 million at the end of 1942, is the remnant of older borrowing and is being gradually amortised.
(") There are, in addition, Treasury certificates in circulation (see Chapter VI).(5) 15th February 1943, the last return to be published.

— 223 —
in circulation through the intermediary of the National Bank; these certificatesare equivalent to a supplementary interest-bearing note issue, as describedon page 308.
The main items of the balance sheet of the National Bank are givenin the table at the bottom of the opposite page up to 15th February 1943,from which date publication has been suspended. Of the increase inthe total balance sheet by Leva 8.9 milliard in 1942, Leva 8.6 milliardwas due to Reichsmark claims : Leva 4.7 milliard was added to theclearing balance and Leva 3.9 milliard utilised to repurchase Treasury billsdenominated in Reichsmarks (previously given by the Bulgarian Governmentto German firms in prepayment of orders), booked by the National Bankas "investments". The note circulation rose by Leva 5.4 milliard but, asexplained in Chapter VI, this is less than the real expansion of circulatingmedia; the apparent decreases of the note circulation early in 1942 and1943 reflected the issue of Treasury certificates designed to circulate as bank-notes. The increase of the account of the government appears to be partlydue to the placing of such Treasury certificates with the National Bank,which books them under "other assets" until they can be put intocirculation.
An interesting feature in 1942 was the considerable expansion of bankdeposits, the increase at the important banks shown in the table amounting
to Leva 9.2 milliard,Bulgarian Bank Depos i ts . compared with only
Leva 3.8 milliard in 1941and Leva 1.6 milliardin 1940.
Bank rate has re-mained at 5 per cent,and the discount rate ofthe big private banks wasnominally 6-8 per cent.What long-term yieldsmay be is difficult tosay, since governmentsecurities are practicallyunmarketable; it seems
government bonds would be at leaston the forced loans.
At end of month
1939 December . .1940 December . .1941 December . .1942 March . . . .
JuneSeptember . .December . .
1943 March . . . .June . . . . . .
Agricul-turaland
Coopera-tiveBank
Postalsavingsbank
Popularbanks
Bigprivatebanks
Total
in millions of leva6,2557,0217,9928,4039,1069,645
11,42812,26213,034
3,6134,0475,0615,2365,6056,0606,6326,8526,976
3,2093,6224,9905,3255,6586,2457,0867,1817,192
2,3302,2962,7703,4933,7764,2334,8404,8324,959
15,40716,98620,81322,45724,14526,18329,98631,12732,161
certain, however, that the yield ofdouble the 5 per cent, interest paid
Published information regarding the various budget accounts in Roumaniais presented in such a way that it is difficult to form a clear picture ofdevelopments; thus the figures (reproduced in the table on the followingpage) do not include all war expenditure, for which a separate fund hasbeen set up outside the budget; special budgets have also been openedfor Bessarabia and Bukovina. No recent statistics regarding the public debtare available.

- 224 -
Roumanian Budget Totals ( 1 ) .
Calendar years
19381939194019411942
Ordinary(2>
Defence(3)
Total
in milliards of lei30.332.939.556.899.5
3.66.9
15.017.926.6
33.939.854.674.7
126.1
0) As given in the Bulletin of the National Bank.(2) Ordinary taxation revenue plus the surpluses
of the autonomous Institutions and state enter-prises.
(?) Including Aviation and Navy Fund.
In June 1941 the National Bankundertook to make advances available tothe government up to Lei 12 milliard,to meet the "exceptional needs" of theTreasury. These advances were bookedunder "sundry accounts" among the bank'sassets until June 1942, when they wereshown separately; but "sundry accounts"continued to rise after that date and afurther credit appears to have been granted;for the sake of continuity, the two itemsare amalgamated in the table given below.
The expansion of the balance-sheet total by Lei 48 milliard in 1942 com-pared with Lei 44 milliard in the previous year, but the distribution among thevarious items of the return was different: in 1941 three items together, the"sundry accounts" (including advances to the Treasury), advances againstReichsmarks in the clearing and the bill portfolio (consisting largely of Treasurybills rediscounted for armament firms through the Caisse autonome d'amor-tissement et de financement) rose by Lei 39 milliard and provided the bulk of theexpansion in that year; in 1942, these three items rose by only Lei 25 milliard. Butthe gold holding increased by Lei 11 milliard (partly as the result of a purchase
National Bank of Roumania.
Near end of month
Assets
GoldClear-
ingac-
counts
Billsdis-
counted(andsecu-rities)
"Sundry ac-counts"
m
Allotherassets
Totalof
balancesheet
Liabilities
Notecircu-lation
Deposits etc.
public privateothersightliabi-lities
Allotherliabi-lities
in milliards of lei1939 December .1940 December .1941 December .1942 March . .
June . . .SeptemberDecember
1943 March . .June . . .September
20.832.234.337.739.642.545.546.449.454.5
0.80.6
17.111.8(6)16.721.623.919.5023.325.3
20.122.931.833.933.635.640.840.141.352.9
8.55.4
21.627.928.530.532.138.9C)40.243.2
24.130.430.629.430.237.340.842.341.038.9
74.391.5
135.4140.7148.6167.5183.1187.2195.2214.8
48.864.396.796.097.6
102.8117.4119.0122.5140.2
1.53.0 '5.65.58.29.26.65.79.47.5
7.58.6
16.118.321.522.823.724.025.527.5
1.33.46.29.78.9
10.68.4
11.113.112.6
15.212.210.811.212.422.127.027.424.727.0
(') Gold was revalued in May 1940, giving a book profit of about Lei W/2 milliard, which was taken by thegovernment.
(2) "Devises en comptes de clearing, décomptées".(3) The security holding (including participations in banks) amounted to Lei 2.2, 2.4, 4.7 and 6.3 milliard at the
end of the years 1939, 1940, 1941 and 1942 respectively.(4) Including advance to Treasury of Lei 12 milliard shown separately from 20th June 1942.(s) Ministry of Finance, public services and Caisse autonome.(6) A reduction in the clearing accounts from Lei 16.9 milliard on 24th January to Lei 10.4 milliard on 28th February
1942 took place in two steps which corresponded to increases of Lei 3.0 milliard in the gold holding andover Lei 3.0 milliard in the government's advances from the bank. Clearing assets were, therefore, partlyutilised for the purchase of gold and partly transferred to the government for repayment of Reichsmarkdebts or for other purposes.
(') A reduction in the clearing accounts from Lei 23.2 milliard to Lei 19.2 milliard on 20th February 1943 cor-responded to an Increase of a similar amount In "sundry accounts"; clearing assets amounting to Lei 4.0 milliardthus appear to have been transferred to the government against an increase of its advance from the bank.

— 225 —
of gold from Germany) and in other asset items, which had shown little move-ment, on balance, in 1941, and are not specified in the table, there was anexpansion of Lei 10 milliard: Lei 6 milliard in assets "corresponding to sundrytime liabilities" and Lei 4 milliard in "special provisions of foreign exchange"(both of these items probably include clearing assets set aside for specialpurposes). Thus, although direct lending to the government and advanceson clearing account appear to have slowed down, it is probable that the wholeexpansion of the return in 1942, which was somewhat larger than in 1941,was due directly or indirectly to various forms of official financing.
The note circulation increased by Lei 21 milliard in 1942, againstLei 32 milliard in 1941, and private accounts and other sight liabilities roseby less than in the previous year. But, here again, other liabilities, whichhad not increased in 1941, rose by over Lei 14 milliard: "time liabilities"by Lei 7% milliard and "sundry accounts" also by Lei 7% milliard; theannual report of the bank gives no explanation of these increases.
In December 1942, the Treasury was authorised to put out Treasury billswhich were intended to replace part of the bank-note issue, as explained onpage 309; by March 1943 over Lei 9 milliard of these Treasury bills had beenput into circulation. In spite of this issue, the note circulation rose by Lei 23 mil-liard in the first three quarters of 1943, nearly four times as much as in thesame period of 1942; on the assets side, the bill portfolio increased by Lei 12 mil-liard, "sundry accounts" by Lei 11 milliard and the gold holding by Lei 9 milliard.A noteworthy attempt to check the expansion was made in the autumn of 1943when peasants were invited to repay their debts (many having been out-standing since 1934) in wheat, the price of which had more than doubled intwo years.
Roumanian Commercial Banks.
At end of month
1939 December
1942 March
1943 March
Assets
Cash Bills Debtors Secu-rities
Totalof
balancesheet
Liabilities
Deposits Creditors Re-discounts
in milliards of lei5.46.17.35.68.08.9
11.011.1
3.53.34.75.35.95.96.06.0
9.59.0
15.316.418.221.923.924.7
3.03.83.53.43.03.12.92.7
26.425.635.734.839.644.749.649.3
3.22.95.66.17.6
10.212.012.7
12.212.717.317.218.920.621.922.5
3.83.33.93.34.14.25.04.7
The balance-sheet total of the eighteen large commercial banks rose byLei 14 milliard in 1942 against Lei 10 milliard in 1941, There appears to havebeen, in connection with the rise in prices, a further extension of creditsto trade and industry (booked under "debtors"); the banks played a verysmall rôle in the direct financing of government expenditure — indeed, theirsecurity holdings have fallen since 1940. During 1942 the National Bank informedthe banks that only three categories of new credits would be authorised: those

- 226 -
Roumanian Post Off ice Bank.
End of month
1939 December . . .1940 December . . .1941 December . . .1942 June . . . . . .
December . . .
Savingsdeposits
Postalchequeaccounts
Total
in milliards of lei3.23.35.46.89.0
10.8
2.12.14.76.49.1
13.8
5.35.4
10.113.118.124.6
granted to assist the war effort, to stimulate industry or to increase agriculturalproduction. Of the deposits of Lei 12.0 milliard shown at the end of 1942,Lei 10.8 milliard were savings deposits.
Deposits at the Roumanian postoffice have increased considerably, par-ticularly the postal cheque accounts,which by June 1943 had risen tonearly Lei 14 milliard. The investmentof the new deposits at the post office,Lei 8 milliard in 1942 and Lei 6% mil-liard in the first half of 1943, doubt-less provides one of the main sourcesof credit for the government outsidethe National Bank.
Bank rate has remained at 3 per cent., to which it was reduced inSeptember 1940, and credits granted by the commercial banks are pegged at4 per cent, above this level, i. e. at 7 per cent., the yield of governmentbonds on the market being around 9 per cent.
The ordinary budget in Slovakia for 1942 appears to have been wellbalanced; the estimates gave expenditure at Ks. 2,400 million and revenue(including Ks. 1,600 million from taxation) at Ks. 2,200 million; but taxrevenue actually produced Ks. 1,000 million more than the estimates andthe state railways closed with a surplus, instead of an estimated deficitof Ks. 100 million. Any surplus arising on the ordinary budget was doubtlesscarried to the so-called investment budget, in which expenditure was otherwisedependent upon the possibility of market borrowing, The government has notborrowed directly from the central bank, monetary conditions being dominatedby the financing of the clearing with Germany; only a part of the total claims,however, was financed by the central bank.
Slovak National Bank.
At end of month
1939 December . . .1940 December . . .1941 December . . .1942 March
JuneSeptember . . .December . . .
1943 March . . . . .June .September . . .
Assets
"Otherassets" *
Dis-counts
Ad-vances
Statenotedebt
Goldand
foreignexchange
Totalof
balancesheet
Liabilities
Notecircu-lation
Depositsetc.
"Sundryliabi-lities"
in millions of Slovak crowns898
1,0221,4411,5401,7101,9442,1892,2052,3612,234
333257242132285323484448451580
3260209124108106200110204447
469469469469460460460453453453
571089782746678855056
1,7872,1472,6392,5902,8783,1213,5683,4703,6753,912
1,3921,6572,0231,9572,0692,4162,7422,5832,7523,185
20820714715433491
177236192143
87181364370366505541536616469
End-of-year balance sheets show that the clearing accounts included under this item amounted to Ks. 398 millionfor 1940, Ks. 845 million for 1941 and Ks. 1,575 million for 1942.

— 227 —
Clearing claims (booked under "other assets") increased by Ks. 730 mil-lion in 1942 (against Ks. 450 million in 1941) and discounts by Ks. 240 million,while the note circulation rose by Ks. 720 million. The increase in "sundryliabilities" by Ks. 180 million in 1942 reflects the partial payment of clearingclaims in Kassenscheine.
The commercial banks increased their advances ("debtors") by Ks. 500 millionand purchased Ks. 90 million securities during the year 1942; but current accountsand savings deposits together rose by only Ks. 140 million; indeed, currentaccounts actually fell by Ks. 90 million in the second half of the year. In the springof 1942, in order to create favourable conditions for the issue of a governmentloan, the banks had been compelled to reduce the rate on current accounts
from 2% to 1% per cent.,Slovak Commercial Banks. while the rate on savings
deposits remained un-changed. The comparativestagnation of depositswhile the banks wereforced to buy governmentsecurities explains the in-crease of rediscounts atthe National Bank.
The relative tightness which developed on the market in 1942 and persistedin 1943 had four main causes: the payment of clearing claims partly inKassenscheine, the withdrawal by the government of the greater part ofconfiscated Jewish deposits from the banks, the obligation imposed uponshare companies to place a certain proportion of their reserves in govern-ment securities and the evident preference shown by the public for notesrather than bank deposits.
In 1942 two government loans were issued: the 4% per cent. Investmentloan for Ks. 600 million and Ks. 500 million 3 per cent. Kassenscheine. Part ofthe proceeds of these loans was utilised to finance the clearing with Germany.A law was passed in June 1943 authorising the Minister of Finance to takeover a substantial portion of the National Bank's claims in respect of theGerman clearing and to raise the necessary funds by borrowing. Banks andcredit cooperatives have been obliged to invest 22 per cent., and savingsbanks 33 per cent., of the increment of their deposits in government paper,insurance companies the bulk of their premium reserves and all share companiescertain proportions of their reserves.
At end• of year
19411942
Assets
Cash Bills Secu-rities
"Debt-ors"
Liabilities
Currentaccounts
Savingsdeposits
in millions of Ks.
425430
322185
684778
2,5003,000
2,2262,274
1,6711,762
In June 1942 an agreement regulating the partition of outstanding assetsand liabilities of Yugoslavia was signed in Berlin by the successor states.The internal government debt, which amounted to Din. 3Ò.5 milliard, wasdivided up into quotas corresponding approximately to the area of the terri-tory taken over, as shown on the next page. The successor states undertook tocall in the Yugoslav debt in their territory by 22nd November 1942 with a view

— 228 —
Part i t ion of Yugoslavgovernment debt.
Successor States
ItalyC)Hungary .
Serbia«Croatia
Total . . .
Percen-tages
5888
2942
100
(1) Including Albania and Montenegro.(2) Including 4 per cent, in respect of
the Banat.
to converting it into bonds of their own publicdebt; should the Yugoslav debt withdrawn by anystate fall short of the quota, the difference was tobe paid in cash or national bonds to a clearingoffice set up in Belgrade under German admini-stration, which would eventually distribute suchassets amongst those successor states which hadwithdrawn more than their quota. A list of Yugoslavstate debts was appended to the Berlin agree-ment, which also made arrangements regardingthe external debt and entered into considerabledetail as to the settlement of other assets andliabilities in the partitioned territory; the agree-
ment also contained a provision that a settlement was to be reached be-tween the successor states regarding the former Yugoslav National Bank,the State Mortgage Bank, the Chartered Agricultural Bank and the Post Officesavings bank, the liabilities of which had been guaranteed by the formerYugoslav Government.
Croatia and Serbia (formed as separate states in 1941) inherited theYugoslav banking system and in both cases the Yugoslav moratorium provisionswere maintained; the assets and liabilities of the old National Bank of Yugoslavia(which was put into liquidation) were taken over by two new central banks;and in both cases occupation costs had to be paid and claims in the clearingwere run up against Germany.
According to the estimates the ordinary budgets in Croatia balanced atKunas 10.9 milliard in 1942 and Kunas 16.4 milliard in 1943; military expendi-ture (including the Ustacha troops) accounted for 33 per cent, of proposedexpenditure in 1943 and the Ministry of the Interior (including the police)for a further 25 per cent.
Croat ian Budget Estimates.
Calendar years
Expenditure :Defence (1)Interior .TreasuryAll other P)
Total . . .Revenue :
Monopolies etc. . , .Total . . .
1942 1943
in millions of kunas
2,8741,3321,5925,093
10,891
3,4464,3283,117
10,891
5,3934,1132,8284,041
16,375
6,2604,7275,388
16,375
0) Including Kunas 2,113 million for the Ustacha troopsP) Including the Ministries of Education, of Health etc.
But these figures exclude the extra-ordinary budgets covered in other ways;for 1943, Kunas 4.75 milliard extra-ordinary expenditure (with Kunas 3 mil-liard for defence) was approved duringthe first four months of the year,Kunas 1.25 milliard to be covered bythe realisation of property confiscatedfrom Jews (by a law of November 1942)and Kunas 3.50 milliard by borrowing.According to a statement of the FinanceMinister in May 1943, total governmentexpenditure in the two years from10th April 1941 to 31st March 1943was covered as to 55.3 per cent, bycurrent revenue and 44.7 per cent, by

— 229 —
Croat Treasury Cer t i f ica tes.
Maturity
10 years
Interestrate
3 %3/4456/a
Issueprice
100.0099.8599.5098.5097.00
borrowing, so that extraordinary expenditure was probably as great as theordinary budget outlay. And this excludes the financing of occupationcosts effected directly by the State Bank.
Government market borrowing has been in the form of Treasury certifi-cates, three issues of which have been made. The first issue, in December1941, was for about Kunas 2 milliard, a great part of which appears tohave been covered by the compulsory consolidation of large packets of bank-notes of the former National Bank of Yugoslavia brought in for exchange.
Three months later a second issue forKunas 1 milliard was made. There were nofurther issues until May 1943, when thethird tranche brought in Kunas 3.4 milliard;the terms of this issue are shown in theaccompanying table. Although an aggregateof Kunas 6.4 milliard appears to have beenissued, some certificates of relatively shortterm have matured and a total of Kunas 4 mil-
liard outstanding was mentioned in J„uly 1943. In March 1942 bank rate waslowered from 5 to 4 per cent, and the rate for advances from 6 to 5% percent., an attempt to introduce lower market rates being later abandoned.In May 1943 the rate for advances was again increased to 6 per cent,although bank rate was maintained unchanged.
The first business of the Croatian State Bank was the withdrawal andexchange of notes of the former National Bank of Yugoslavia. Difficulties werecaused by a number of factors, including the smuggling of large amountsof dinar notes backwards and forwards over the practically open frontierbetween Croatia and Serbia according to rumours as to their treatment inone or the other country; for this reason packets of more than Din. 3,000 werenot exchanged for new notes but a receipt was given. (Notes of denomina-
tions of Din. 100 and over were regardedas bank-notes but smaller notes of Din. 50and less were treated as a government issueof divisional currency.) The exchange startedin June 1941 and was reflected in the con-siderable increase of giro obligations of theState Bank. In December 1941 these obligationsfell to one-half, when the first tranche ofTreasury certificates was issued; at the endof December 1941 the note issue was Kunas8,352 million. These figures were given in thereport of the bank for 1941, published in thesummer of 1942,
No statistics for the year 1942 are available but, as mentioned on page 295,the new statutes of the bank prescribed the publication of a fortnightly return;the first return, for 30th April 1943, and end-of-month returns for June andthe following months are given in the table on the next page.
Croatian
End of month
1941 April . . .May . . .June . . .July . . .August . .SeptemberOctober. .NovemberDecember
State Bank.
Notecirculation
Giroaccounts
in millions of kunas
8,C52
196364
2,2772,7002,5332,6062,5182,7281,363

- 230 -
Croatian State Bank.
At end of month
1943 April . . . .June . . . .JulyAugust . . .September .October. . ,
Assets
Goldand
foreignex-
change
Ad-vances
tooccupy-
ingtroops
(1)
Clear-ing
claims
Dis-countsandad-
vances(!)
Oldnotesex-
changedetc.00
Over-draftof Fi-nanceMinis-
try(4)
Allotherassets
Totalof
balancesheet
Liabilities
Notecircu-lation
Giro-ac-
counts
Allotherliabili-ties
In millions of kunas1,2761,2982,0092,1943,136
114
2,7504,2895,5897,8599,0219,978 2,714
14,87613,84915,77618,92520,76422,690
7,7947,8137,8107,8117,8597,859
5001
220310348
1,2111,2601,2341,3161,2591,155
27,90729,00932,41938,32542,34944,858
22,24024,19525,69228,26931,81634,316
3,9763,0864,5677,6607,8487,566
1,6911,7282,1602,3962,6852,976
(1) Shown as advances against claims in foreign countries.(2) At the end of 1942 only one Agram (Zagreb) bank had rediscounts, which amounted to Kunas 131 million.(3) The Croatian government debt, created to cover the liabilities of the former National Bank of Yugoslavia,
taken over by the State Bank; liabilities for notes withdrawn constitute the bulk of this item, which alsoincludes liabilities for deposits and old clearing accounts taken over by the new bank.
(') Credits may be granted to the Finance Ministry up to Kunas 500 million on current account.The total circulation of the NationaJ Bank of Yugoslavia had risen, in the
twelve months to March 1941, by Din. 5.0 milliard to its highest point ofDin. 15.4 milliard (on 31st March 1941, the last return before the outbreak ofhostilities); the circulation in the territory which was later called Croatia wasestimated at Din. 6.4 milliard. To cover these notes and other liabilities takenover from the former National Bank, the government created a special debtcertificate, which is shown as a separate asset item in the State Bank'sreturn and in the table above.
The circulation of kuna notes in April 1943 was Kunas 22.2 milliard,the increase over two years thus being Kunas 15.8 milliard, which more thantripled the circulation. The Minister of Finance in a speech on 6th May 1943gave three reasons for this considerable increase: lending to the new govern-ment, advances to the allied troops in occupation and the financing of theclearings with Germany and Italy.
The exact amount of government borrowing from the central bank wasnot, however, given by the Finance Minister in May 1943 and it is not shownas a separate item by the State Bank but, as contact between the bank andthe general economy of the country was reliably reported to have been in-significant, government borrowing is doubtless shown under "discounts andadvances". This borrowing was due, according to the Finance Minister, to theestablishment and organisation of a Croat army, to "public works" includingthe repair of damage done by partisan troops, to caring for refugees fromterritories where partisans were operating and to the expenses connectedwith the foundation of the Croat State.
Advances to the occupying troops were made by the State Bank to covermilitary pay and allowances, the building of barracks and sundry otherexpenses; these advances are shown as a separate item in the return. Thethird and least important reason for the increased note circulation, according

— 231 —
to the F inance Min is ter , w a s t h e f i nanc ing of t he s u r p l u s in the c l ea r i ng ;
the commerc ia l ba lance of t he coun t ry w a s passive w i t h Germany and Italy
but a su rp lus arose t h r o u g h s u c h serv ices as t ra in and o ther t r anspo r t , re-
patr ia t ion of wages f r o m workers in Germany , e tc . A decree of 14th Oc tobe r
1943 mod i f ied the s ta tu tes of t he State Bank, pe rmi t t i ng inter al ia t he f i nanc ing
of t he c lea r ings .
In the six m o n t h s to Oc tobe r 1943 the note c i rcu la t ion rose by Kunas 12.1 m i l -
l iard and g i ro accoun ts by Kunas 3.6 mi l l i a rd , the increases be ing due t o
Kunas 7.8 mi l l iard government b o r r o w i n g , t he payment of Kunas 7.2 mi l l iard
occupa t i on cos t s and Kunas 2.7 mi l l iard advances on c lear ing c la ims ( w h i c h ,
unt i l Sep tember , had been booked under " g o l d and fo re ign e x c h a n g e " ) . T h e
expans ion has taken p lace at an ever - increas ing s p e e d : r ises in the c i rcu la t ion
of Kunas 1 mi l l iard in May and J u n e were f o l l owed by Kunas 1 % mi l l ia rd in
Ju ly , Kunas 2 % mi l l iard in A u g u s t and Kunas 3 % mi l l ia rd in Sep tember ; in
Oc tober the increase was again Kunas 2 % mi l l i a rd , mak ing Kunas 12 mi l l iard
f o r t h e s ix m o n t h s , equ iva lent t o an annua l rate o f expans ion o f over
100 per cent . T h e separate issues of notes by the ci ty of A g r a m (Zagreb)
and by the government are ment ioned on page 317.
T h e balance sheets of t he m o s t impor tan t banks in the coun t ry have
been pub l i shed fo r the end of 1942 and are s u m m a r i s e d in the t ab le ; t he
to ta l of depos i t s and cu r ren t a c c o u n t s , i nc lud ing sav ings depos i t s , a m o u n t e d
to on ly Kunas 13.8 m i l -
l i a rd , a very sma l l f i gu re
compared w i th the note
c i r cu la t i on . A new bank-
ing law of Sep tember
1942 con ta ined p rov i s ions
in tended to ensure the
safety of bank depos i t s .
Bu t t he modes t level of
depos i t s in t he coun t ry
sheds l igh t on the
reasons w h i c h compe l
the gove rnmen t t o t u r n
to the State Bank in
o rder t o cover the bulk
Croat ian Banks.
At end of 1942
Commer-cial
banks0)
Assets:Cash and liquid resourcesSecuritiesAdvances and overdrafts .Mortgage credits
Liabilities:Capital and reserves . . .DepositsCurrent accounts . . . . .
Govern-mentbanks
Savingsbanks
C3)
Total:18
banks
in millions of kunas
1,1881,0603,228
119
7271,5013,963
2,0032,1272,6291,079
634,1682,409
68169
2946
841,083689
3,8723,2566,1511,204
8746,7527,061
0) Six Agram (Zagreb) banks.Ö Three state banks: the Post Office savings bank, the Savings Bank of the
Independent State of Croatia and the State Credit Institution (the formerYugoslav State Mortgage Bank). (3) Nine ordinary savings banks. of its b o r r o w i n g .
Li t t le s ta t is t ica l i n fo rmat ion regard ing deve lopments in S e r b i a has been
a l lowed out of the coun t ry s ince the o c c u p a t i o n . T h e new Serb ian Nat iona l
Bank has issued no return or ba lance sheet and no f i gu res of t he c o m m e r -
cial or sav ings banks are avai lab le . A s ta tement pub l i shed fo r 1942 s h o w e d
the budge t in equ i l i b r i um at D i n . 3,406 mi l l ion and es t imates fo r 1943 were
put at D i n . 5,480 m i l l i o n ; bu t these f i gu res exc luded ext raord inary expend i tu re ,
the payment of occupa t i on c o s t s and the f i nanc ing of t he c lea r ing .

- 232 -
In point of fact, a considerable proportion of government expenditure hasbeen met by advances from the Serbian National Bank, the note issue increasingand the market showing signs of abnormal liquidity. How great the expansionhas been it is not possible to judge, in the absence of reliable data. It wasreported early in June 1942 that the note circulation had reached Din. 10 milliard,of which Din. 6.8 milliard was on account of the exchange of old Yugoslavnotes, the balance being due largely to the payment of occupation costs and thefinancing of clearing claims; further, interest-bearing accounts at the NationalBank amounted to Din. 1.8 milliard and nearly Din. 1 milliard certificates hadbeen issued by the National Bank.
These certificates were the only Serbian paper on the market in 1942.They were issued by the National Bank from March 1942 onwards to mop upsurplus funds and they originally bore interest from 2 per cent, for threemonths up to 3 per cent, for one year. In November 1942 the rates wereraised to 2% and 3% per cent, respectively and in August 1943 the NationalBank decided to issue two-year certificates at 3% per cent. Certificates issuedby the National Bank were rediscountable at all times at par.
In 1943, efforts were made to reduce the calls on the National Bank.From April a number of indirect taxes were raised and railway passenger faresdoubled. Special measures were taken against the hoarding of notes and along-term government issue was made for the first time; in March 1943, a4% per cent. 30-year forced loan for Din. 1,000 million, issued at 98%, wastaken up by the State Mortgage Bank in Belgrade and by the Post Officesavings bank. A further Din. 2,000 million loan in July 1943 was issued in threeforms: bonds with interest at 4% per cent., lottery bonds carrying 2% per cent,and pure lottery bonds without interest but with higher prizes, the bonds beingissued at 98%.
Bank rate has remained at 4 per cent., to which it had been reduced inDecember 1941. From July 1943, interest rates on commercial-bank depositswere fixed, ranging from 1 per cent, on sight accounts to 3 per cent, for one-year deposits; at savings banks, 2 per cent, was paid for sight deposits andother rates up to 3% per cent, for one year. The moratorium on debts incurredprior to 6th April 1941 has been prolonged until 30th June 1944.
Since the second half of 1942 Greece has suffered a catastrophic inflationsuch as has not been seen in Europe for nearly twenty years. Statistical andother information is somewhat fragmentary but all the available indications go toconfirm the violence of the expansion; National Bank shares of Dr. 1,000 werequoted at Dr. 2,000,000 and over when the Athens bourse opened in the middleof December 1942, while the rate for the "gold pound" on the black marketfluctuated between Dr. 170,000 and Dr. 600,000 (the highest rate, in October 1942),against a par rate for sterling of Dr. 600. The circulation of the Bank of Greece,which was only Dr. 7 milliard in December 1938, soared above Dr. 300 milliardin December 1942 and continued its upward course to over Dr. 1,200 milliardin September 1943.

— 233 —
Bank of Greece.
End of month
Assets
Goldand
foreignex-
change
Advanceto
govern-ment
Claimson
Ger-manyandItalyP)
Invest-ments
Allotherassets
Totalof
balancesheet
Liabilities
Notesin
circu-lation
Deposits
govt banks other
In milliards of drachmae1938 December .1939 December .1940 December .1941 March (4) . .
June (5) . . .December(8)
1942 May p) . . .JuneC5) . . .December O
1943 March P) . .September(')
3.84.2
11.920.9
25.9
25.9
9.812.916.515.7
44.7
105.7
—
" "
198.4•
0.50.40.40.5
13.8
m
4.65.97.86.1
•
18.723.436.643.2
7.29.5
15.418.124.048.885.2
100306.0400
1,276
0.50.51.11.7
17Ì2
•
1.00.40.40.6
22.3
8.110.615.217.7
17.8(8)
Note: The war with Italy started in October 1940; hostilities with Germany began In March 1941 and In Aprilthe country was occupied by German and Italian forces.
(1) Gold, sterling and dollars blocked abroad. At the end of 1942. £1 million was held In gold bars and £2.4 millionin gold coin, both blocked in the United States, £43 million was In sterling (from amounts advanced bythe British Government in 1940-41 to cover war expenditure) and $14.5 million in United States banks.
(2) Occupation costs and clearing accounts. By an agreement signed in Rome in the spring of 1942, the Greekstate was burdened with only a part of the occupation costs; any amount spent in excess was carriedon to the Italian-German clearing account, but the Greek state had to advance the extra amount in drachmae.
(3) Including International Financial Commission (1938 Dr. 6.1 milliard, 1939 Dr. 9.0 milliard, 1940 Dr. 11.8 milliardand March 1941 Dr. 12.1 milliard). (») 15th March 1941, the last regular return published.
(5) In June 1942 the Minister of Finance gave these figures of the note circulation for June 1941 and Mayand June 1942. (6) From the end-of-1941 balance sheet of the bank, as published in the Greek press.
(') From information published in the Greek press. The main items of the return were given for 15th December1942 and the note circulation on 25th March 1943 was stated to be "a little over Dr. 400 milliard". Thenote circulation was Dr. 1,276 milliard on 30th September 1943, having risen from Dr. 1,135 milliard on10th September, when other liabilities of the bank were given as Dr. 265 milliard.
(8) Circulation of bank bonds.
The occupation cut off the country from its normal overseas suppliesand shortages soon developed, particularly of foodstuffs; at the same timethe currency was expanded by the issue of some RM 10 million Reichskredit-kassenscheine by the German army, which were later exchanged by the Bankof Greece for its own notes. The Italian authorities also issued notes of theMediterranean Bank. Government revenue, largely derived from customs dutiesand tobacco taxes, fell off sharply as imports ceased and the most importanttobacco areas were attached to Bulgaria. In June 1942 the Minister of Financestated that the budget accounts for the financial year 1941-42 closed withrevenue of Dr. 16.5 milliard and expenditure of Dr. 30.3 milliard, excludingoccupation costs.
An acute economic crisis developed, particularly on the foodstuffs market,and exports to Germany dried up. Emergency steps had to be taken by theGreek Government and experts were appointed by the German and Italianauthorities in October 1942. No full account of the proceedings has beenpublished but the following measures were reported to have been adopted,generally from November 1942 onwards:

— 234 —
(a) Special food imports were made, the contribution of Red Cross institutions beingimportant.
(b) Forced deliveries of agricultural produce from the 1942 domestic crop were paidfor as to 25 per cent, in cash and 75 per cent, in Treasury bills due at the endof March 1943.
(c) Rates of taxation were increased considerably to correspond with the internaldepreciation of the currency, and 60 per cent, of the taxes due in 1943-44 weremade payable in advance in 1942-43.
(d) Other government revenue was augmented by special measures: in particular,all share companies had to increase their capital by 20 per cent, (banks 10 percent, only) by 15th March 1943, and to make a corresponding revaluation of theirassets; the proceeds were to be paid over without compensation to the government(or the new shares issued directly to the government). This measure was con-
. sidered to have the double advantage of putting pressure on share prices andindirectly taxing shareholders (as owners of Sachwerte) while at the same timeproviding funds for the government.
(e) Government salaries and wages were raised to bring them more into line withcurrent prices.
(f) All unutilised bank credit outstanding on 14th November 1942 was cancelled andthe granting of new credit by the commercial banks in excess of Dr. 1 millionto private persons and Dr. 10 million tò companies was put under the controlof a special committee of the Bank of Greece (including German and Italianexperts).
(g) The limit on the withdrawal of bank deposits, which had already been raisedfrom Dr. 30,000 to Dr. 50,000, was further increased to Dr. 100,000 a week from16th November 1942; the moratorium had previously been largely evaded by a systemof discounts for cash payments, amounting at times to nearly 20 per cent. Thedrawing of cheques payable to "bearer" and transfer by endorsement were per-mitted (as was not previously the case). Further, from 19th December 1942, new"free" accounts, with no restriction upon withdrawals, might be opened, in-payments being exclusively in bank-notes.
(h) The deposit of funds at the savings banks was encouraged, the upper limit onindividual savings accounts at the post office being raised in January 1943 toDr. 300,000.
(i) All banks were compelled to maintain a "reserve", in government paper, of25 per cent, against savings deposits and deposits without fixed maturity, and50 per cent, against fixed deposits.
In addition, two monopoly companies were formed, "Degriges" and"Sacig" (as mentioned on page 64), to look after German and Italian interestsrespectively. Previously, a special tax of 100 per cent, of the price had beenplaced on imports to provide the government with funds and to diminishthe excessive profits of importers. This tax was raised to several times itsformer level, made payable to the monopoly companies and utilised partlyto subsidise exports to Germany and Italy and partly to meet the costs ofoccupation. Prices of imports and exports and the use made of imports wereput under the control of the monopoly companies.
Officially the rate of Dr. 60 to the Reichsmark was maintained, althoughGreek share prices had risen ten times and commodity prices a hundredtimes and more above those obtaining when the rate was fixed, since itwas considered that an adjustment to the purchasing power parity wouldadd fuel to the inflationary process. Actually the technique of Degriges wasto arrange deals largely in volumes, quantities of exports being traded forquantities of imports, so that the exchange rate played a minor rôle; and forcapital transfers from Greece to Germany a supplement of varying amount waspayable (to the German military authorities), generally Dr, 540 per Reichsmark,

- 235 -
the effective rate thus working out at Dr. 600 = RM. 1. A Greek exchangeexpert0 stated early in 1943 that the Dr. 26 milliard reserve of gold, sterlingand dollars shown in the balance sheet of the Bank of Greece would.fully cover the note issue when revalued at the new level of the drachmaafter the war; a rate of Dr. 20,000 to the "gold pound", 16 times the rateof April 1941, was suggested.
In the early months of 1943 some provisional stabilisation of the Greekinternal position was reported from German sources as a result of the emer-gency measures. Exports to Germany were again under way; in three monthsDegriges had obtained permits, to the equivalent of about RM 120 million,to import from Greece. Bank credit had been curtailed and the quotationsfor gold, foreign exchange and securities had fallen sharply. But in February1943 the Minister of Finance announced that budget expenditure, excludingoccupation costs, was running at the rate of Dr. 250 milliard per annum,including Dr. 170 milliard for salaries and pensions; and, as further increasesof salaries took place in the following months, these figures have furtherexpanded. Moreover, the rise of the note circulation continued at the samerapid pace; the increase in the last six months of 1942 by Dr. 200 milliardwas followed in the first three months of 1943 by a further increase ofDr. 100 milliard.
In the next six months the expansion again accelerated and the increaseof the note issue was by more than Dr. 800 milliard, the circulation thus triplingin the half-year to September 1943. Further emergency measures were adopted,including the taking-over by the government from the banks of one-half oftheir security holdings and the appointment of government commissioners atall banks and share companies to supervise their business. In October 1943,the Greek exchange expert already mentioned stated(2) that the note issue wasstill fully covered by gold, sterling and dollars at an exchange rate of onlyDr. 100,000 to the "gold pound" (instead of the current market rate, whichwas then Dr. 400,000(3)).
In relation to the belligerents and the occupied countries in Europe,the three neutrals, Swi tzer land, Sweden and Portugal , present a strikingcontrast; although Switzerland and Sweden have had to bear considerabledefence expenditure, this has been financed internally with little or no aidfrom the central banks, the relatively moderate increase of the circulationin the two countries and the more considerable expansion in Portugal beinglargely against gold. None of the three central banks have made directadvances for the financing of clearings.
In Switzer land extraordinary defence expenditure began in 1934 andin the nine years to 1942 amounted to Sw.fcs 4,160 million (of which nearlytwo-thirds represented expenses of mobilisation); Sw.fcs 260 million pertained
0) Monsieur Philaretos, in an article in the Athens press, as quoted by the "Deutsche Volkswirtschaft" 1943,No. 18, and the "Südost-Echo" of 12th February 1943.
(2) As quoted by the "Südost-Echo" of 5th November 1943.<3) In November 1943, the "gold pound" fluctuated between Dr. 800,000 and Dr. 1,900,000.

- 236 -
Central bank returns — Swi tzer land, Sweden and Portugal .
Near end of monti
1939 December1940 December1941 December1942 March . .
June . . .SeptemberDecember
1943 March . .June . . .September
1
IncreaseDecember 1939to December 1942
Switzerland
Goldand
foreignex-
change
Notecircu-lation
Totaldepo-sits0)
in millions of Sw.fcs2,6233,1703,5583,5773,5843,5723,6283,7383,8123,930
1,005
2,0502,2732,3372,2382,2462,3402,6372,5792,6422,805
587
7891,1781,2361,4671,4771,3031,2901,3081,3511,455
501
Sweden
Goldand
foreignex-
change(2)
Notecircu-lation
Deposits
govt(3)
banks
In millions of Swedish Kr.,314,214,496,585,622,675,736,789,865,931
422
1,4221,4821,7001,6491,7051,8322,0161,9311,9692,133
594
267380297406375661744653563361
477
153324417631544266161223173307
8
Portugal
Goldand
foreignex-
changenet
Notecircu-lation
Deposits
govt banks
In millions of escudos1,6212,5616,0697,4398,2679,452
10,59811,35811,92512,598
8,977
2,5502,9034,4884,4754,6144,9445,4815,4405,6796,128
2,931
161247325
1,1261,1411,5721,9332,4722,7312,337
1,772
603851
2,4332,9923,5673,9494,1894,4414,5324,977
3,586
(1) The figure given for all deposits is the total of sight liabilities. Government deposits, which are compara-tively small, are shown only in the annual balance sheets; they amounted to Sw.fcs 11, 7, 195 and 14 millionat the end of 1939, 1940, 1941 and 1942 respectively.
(2) Gold at market price (I.e. as booked, plus the premium account) plus net foreign exchange (at the bookprice). Differences between this column and the figures given on the same subject In Chapter III aredue to the fact that in the latter case the foreign exchange also Is given at market price (according to acalculation published only once a year, for December).
(3) Deposits of state Institutions. These are practically balanced by a contra item of "Funds placed at thedisposal of the National Debt Office" by the bank, e. g. December 1942 S.Kr. 675 million.
to the pre-war period and Sw.fcs 3,900 million to the war years 1939-42. Thedeficit on the ordinary budget was small in comparison, an aggregate ofsome Sw.fcs 200 million in the years 1939^42, but, apart from the budgetaccounts, official credits of Sw.fcs 800 million were granted to Germany inthe clearing, serving to meet passive balances in 1941-43. For 1943, extra-ordinary budget expenditure was estimated at nearly Sw.fcs 1,500 million.
In 1939-42, some Sw.fcs 940 million was raised in extraordinary taxation (overone-half by a tax on capital called the "defence sacrifice"); Sw.fcs250 million wastaken in 1940 from the Exchange Fund, this being equivalent to an extension ofcentral-bank credit; and the balance has been borrowed: nearly Sw.fcs 1,700 million
at long term, generally at 3% perCommercial bank deposi ts — cent..over Sw.fcs800 million through
5 to 7-year Treasury certificatesand about Sw.fcs 800 million through1 to 5-year Treasury bills. Exceptfor the Sw.fcs 250 million from theExchange Fund, direct calls onthe National Bank have been smalland temporary. The extension ofcredit by the commercial banks inSwitzerland has also been verysmall, as the figures for the de-
0) All deposits at commercial banks, including savings deposits.(2) Including Kassenobligationen and Kassenscheine. pOSltS Of the GrOSSbanken SnOW.
Swi tzer land, Sweden and Por tuga l^ .
End of year
1939194019411942
Percentageincrease 1939-42
SwitzerlandP)
Sweden Portugal
in millions of national currency units3,0153,0953,1623,344
11
4,4014,3214,8795,157
11
2,1172,7584,2615,771
173
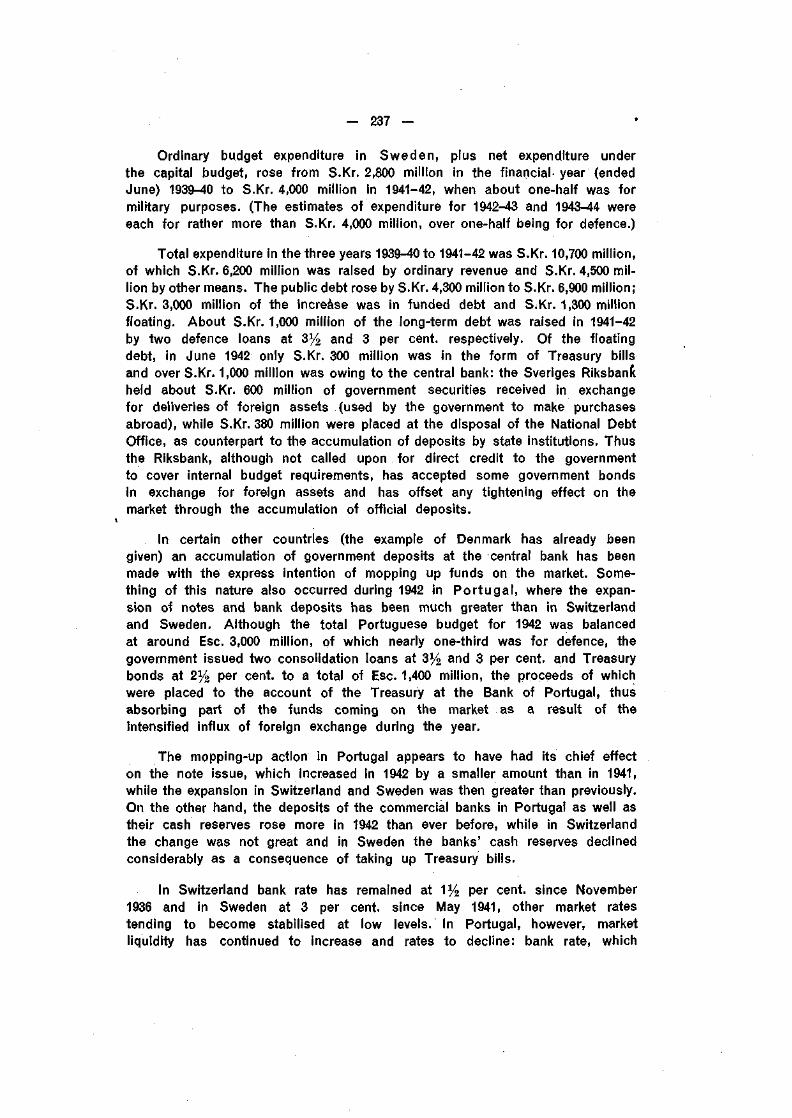
- 237 -
Ordinary budget expenditure in Sweden, plus net expenditure underthe capital budget, rose from S.Kr. 2,800 million in the financial- year (endedJune) 1939-40 to S.Kr. 4,000 million in 1941-42, when about one-half was formilitary purposes. (The estimates of expenditure for 1942-43 and 1943-44 wereeach for rather more than S.Kr. 4,000 million, over one-half being for defence.)
Total expenditure in the three years 1939-40 to 1941-42 was S.Kr. 10,700 million,of which S.Kr. 6,200 million was raised by ordinary revenue and S.Kr. 4,500 mil-lion by other means. The public debt rose by S.Kr. 4,300 million to S.Kr. 6,900 million;S.Kr. 3,000 million of the increase was in funded debt and S.Kr. 1,300 millionfloating. About S.Kr. 1,000 million of the long-term debt was raised in 1941-42by two defence loans at 3% and 3 per cent, respectively. Of the floatingdebt, in June 1942 only S.Kr. 300 million was in the form of Treasury billsand over S.Kr. 1,000 million was owing to the central bank: the Sveriges Riksbanftheld about S.Kr. 600 million of government securities received in exchangefor deliveries of foreign assets (used by the government to make purchasesabroad), while S.Kr. 380 million were placed at the disposal of the National DebtOffice, as counterpart to the accumulation of deposits by state institutions. Thusthe Riksbank, although not called upon for direct credit to the governmentto cover internal budget requirements, has accepted some government bondsin exchange for foreign assets and has offset any tightening effect on themarket through the accumulation of official deposits.
In certain other countries (the example of Denmark has already beengiven) an accumulation of government deposits at the central bank has beenmade with the express intention of mopping up funds on the market. Some-thing of this nature also occurred during 1942 in Portugal , where the expan-sion of notes and bank deposits has been much greater than in Switzerlandand Sweden. Although the total Portuguese budget for 1942 was balancedat around Esc. 3,000 million, of which nearly one-third was for defence, thegovernment issued two consolidation loans at 3% and 3 per cent, and Treasurybonds at 2% per cent, to a total of Esc. 1,400 million, the proceeds of whichwere placed to the account of the Treasury at the Bank of Portugal, thusabsorbing part of the funds coming on the market as a result of theintensified influx of foreign exchange during the year.
The mopping-up action in Portugal appears to have had its chief effecton the note issue, which increased in 1942 by a smaller amount than in 1941,while the expansion in Switzerland and Sweden was then greater than previously.On the other hand, the deposits of the commercial banks in Portugal as well astheir cash reserves rose more in 1942 than ever before, while in Switzerlandthe change was not great and in Sweden the banks' cash reserves declinedconsiderably as a consequence of taking up Treasury bills.
In Switzerland bank rate has remained at \y% per cent, since November1936 and in Sweden at 3 per cent, since May 1941, other market ratestending to become stabilised at low levels. In Portugal, however, marketliquidity has continued to increase and rates to decline: bank rate, which
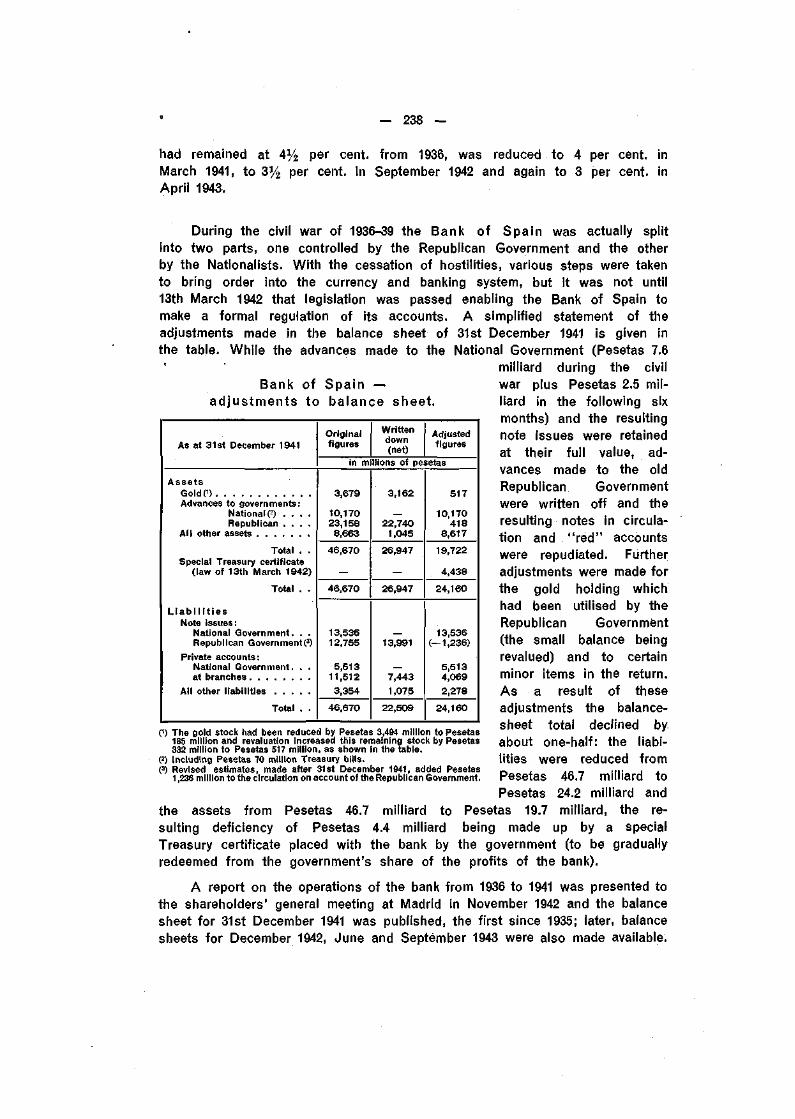
- 238 -
had remained at 4% per cent, from 1936, was reduced to 4 per cent, inMarch 1941, to 3% per cent, in September 1942 and again to 3 per cent, inApril 1943.
During the civil war of 1936-39 the Bank of Spain was actually splitinto two parts, one controlled by the Republican Government and the otherby the Nationalists. With the cessation of hostilities, various steps were takento bring order into the currency and banking system, but it was not until13th March 1942 that legislation was passed enabling the Bank of Spain tomake a formal regulation of its accounts. A simplified statement of theadjustments made in the balance sheet ofthe table. While the advances made to
Bank of Spain —adjustments to balance sheet.
31st December 1941 is given inthe National Government (Pesetas 7.6
milliard during the civilwar plus Pesetas 2.5 mil-liard in the following sixmonths) and the resultingnote issues were retainedat their full value, ad-vances made to the oldRepublican Governmentwere written off and theresulting notes in circula-tion and " red" accountswere repudiated. Furtheradjustments were made forthe gold holding whichhad been utilised by theRepublican Government(the small balance beingrevalued) and to certainminor items in the return,As a result of theseadjustments the balance-sheet total declined byabout one-half: the liabi-lities were reduced fromPesetas 46.7 milliard toPesetas 24.2 milliard and
Pesetas 46.7 milliard to Pesetas 19.7 milliard, the re-of Pesetas 4.4 milliard being made up by a special
As at 31st December 1941
AssetsGoldO)Advances to governments:
National (?) . . . .Republican . . . .
Total . .Special Treasury certificate
(law of 13th March 1942)Total . .
LiabilitiesNote issues:
National Government. . .Republican Government?)
Private accounts:National Government. . .
All other liabilitiesTotal . .
Originalfigures
Writtendown(net)
Adjustedfigures
in millions of pesetas
3,679
10,17023,1588,663
46,670
46,670
13,53612,755
5,51311,5123,354
46,670
3,162
22,7401,045
26,947
26,947
13,991
7,4431,075
22,509
517
10,170418
8,61719,722
4,43824,160
13,536(-1,236)
5,5134,0692,278
24,160
0) The gold stock had been reduced by Pesetas 3,494 million to Pesetas185 million and revaluation increased this remaining stock by Pesetas332 million to Pesetas 517 million, as shown in the table.
(2) Including Pesetas 70 million Treasury bills.(3) Revised estimates, made after 31st December 1941, added Pesetas
1,236 million to the circulation on account of the Republican Government.
the assets fromsuiting deficiencyTreasury certificate placed with the bank by the government (to be graduallyredeemed from the government's share of the profits of the bank).
A report on the operations of the bank from 1936 to 1941 was presented tothe shareholders' general meeting at Madrid in November 1942 and the balancesheet for 31st December 1941 was published, the first since 1935; later, balancesheets for December 1942, June and September 1943 were also made available.

— 239 —
Bank of Spain.
At end of month
1935 December .1941 December .1942 December .1943 June . . . .
September .
Assets
Reserves
gold
0)
silver
Privatecredit
granted
0
Government debt
ad-vance
toTrea-sury(3) .
specialTrea-surycerti-ficats
sundryTrea-suryitems
Totalof
balancesheet
(4)
Liabilities
Notesin
circu-lation
(s)
Accounts
Trea-sury
(5)
private
free"un-block-ed"(6)
in millions of pesetas2,536
487487749C)927(?)
688616624626626
4,8872,8543,0673,3503,074
10,17010,17010,17010,170
4,4384,4174,4174,417
717441547622
1,088
12,78223,08523,03222,74123,026
4,83713,53615,7-3815,19215,610
2831,6501,0723,2503,114
1,3233,6533,4502,7622,737
2,498769738733
(') Including gold and exchange with correspondents. (2) Discounts, advances and overdrafts.(3) Including Treasury bills for Pesetas 70 million. (4) Including other items in addition to those specified.(5) From December 1941 on account of the National Government only.(') These "unblocked" accounts may be utilised for the purchase of government securities.(7) Including also gold from the Institute de Moneda Extranjera: Pesetas 252 million in June and Pesetas 430 mil-
lion in September 1943.
As a result of the repudiation of the notes issued on account of theformer Republican Government, the active note issue in September 1943 wasonly slightly more than three times as high as at the end of 1935, a situationwhich compares not unfavourably with the expansion in other countries overthe same period. The fall in the gold reserve was greater than it appears, sinceit was booked at par value in 1935; the increase in the first three quarters of1943 was principally due to gold taken over from the Foreign Exchange Institute.In September 1943 two-thirds of the assets consisted of government debt inone form or another, but there were signs of a gradual increase of creditgranted to the private economy of the country. As from 1st January 1943the general moratorium, applied since August 1938 to all debts contractedprior to or during the civil war, was lifted.
A step of considerable interest and importance was taken in Turkey,towards the end of 1942, through the introduction of a lump-sum tax onexceptional war profits, which, by its magnitude, nature and method of im-position, acquired the characteristics of a capital levy on a speciaf sectionof the population.
The ostensible intention of the law of 11th November 1942 was to taxsuch persons and firms as, through the special circumstances of the war,or through trading in the black market or by speculation, had made undueprofits which for technical or other reasons remained outside the normal taxschedules; theoretically all persons and firms were liable to the tax who werein possession of capital or who paid income tax. It was expected that besidesbringing in funds to the Treasury the levy would check speculation, bring downprices and force out hoarded and other hidden stocks of commodities on tothe market.

— 240 —
The law did not prescribe a scale of taxation but merely provided upperand lower limits for payments by certain categories of taxpayers. The actuallevying of the tax was left in the hands of a special commission and of localcommittees formed in every vilayet from representatives of the Finance Ministry,of the chamber of commerce, and of the local authorities. The commissionhad very wide powers of assessment, deciding who was to pay the tax and,in each individual case, the amount to be paid. Taxpayers thus had no formsto fill up but merely received a tax demand for a specified amount. Andagainst the assessment of the commission there was no appeal.
Further, a general prohibition was issued against departure from thecountry, bank accounts were blocked and payment in full was called forwithin two weeks. Two further weeks (making one calendar month in all)were eventually allowed, subject to payment of a further 1 per cent, for thefirst week and 2 per cent, for the second week (i. e. an amount equivalentto interest at an average rate of 78 per cent, per annum). During theprocess of collection, it was further announced that those taxpayers who paid20 per cent, of the total at once and in cash might raise bank credits for theremaining 80 per cent, against special security and the payment of interestat 1% per cent, a month (i.e. 18 per cent, per annum). Such credits weregranted, however, only against certain specified assets such as real estate,ships, government bonds and commodities in which the government wasinterested (e. g. cotton, hides, minerals and agricultural products). In spiteof the hard terms, it is probable that without these credits a great part ofthe tax could not have been paid; credits against commodities had beenforbidden a few weeks earlier as a step in the fight against inflation. A furthermonth for payment was allowed to persons who deposited government secu-rities for the full amount or furnished a bank guarantee. Persons assessedwho did not pay within the time limit became liable to forced labour in EastAnatolia, and to the confiscation of their property and that of their family.Chronologically the main events were:
1942 11th November Capital levy law passed.12th „ Law came into force.16th ,, Bank balances blocked.17th December List of taxpayers and assessments published; tax became
due for payment.1943 1st January End of period for payment without interest.
18th „ End of period for payment with interest.20th ,, End of period of grace for all payments.
The levy was originally estimated to produce some £T 500 million butthis estimate was lowered to £T 422 million. Istanbul was assessed at £T 344 millionand the rest of the country at £T 78 million; but, owing to bankruptcies, theclosing of businesses and other reasons, some &T 40—50 million of the Istanbulassessment was cancelled. Final assessments were thus about £T 300 millionfor Istanbul and some £T 380 million for the country as a whole. (Later, somefurther tax demands were sent out but these appear to have been for com-paratively small amounts which probably would not greatly affect the result.)The total assessment for the capital levy was approximately equal to budget

— 241 —
revenue from normal taxation in the current year and equivalent to one-halfof the largely expanded note circulation at the end of 1942.
Actual tax payments received wereBy 1st January 1943 (the end of the period
Turk ish Capital Levy Payments.
published on certain dates,for payment without interest)
less than one-fifth of theamount assessed in Istanbulhad been paid, comparedwith two-thirds for otherparts of the country. Butlarge amounts were col-lected in the followingmonths and by the end ofJune 1943 nearly two-thirdsof the amount assessedin Istanbul had been paid.
The monetary effects of the capital levy cannot be shown completely asno returns are available for the commercial banks, but a reflection of develop-ments in the central bank's return is shown in the following table.
Central Bank of Turkey.
Total paymentreceived
to date given
1943 1st January. .25th February .15th March . .30th June . . .
1943 1st January. .25th February .15th March . .3Oth June . . .
Istanbul Elsewhere Total
In millions of £T58
123135190
52576065
110180195255
In percentages of assessment79414563
67737783
29475167
Near end of month
Assets
GoldClear-ingac-
count
Advancesto Treasury
againstTrea-surybills
againstgold
O
Com-mercialbills
Totalbalancesheet
Liabilities
Noteissue(net)
Depo-sitsin
£T
Goldheld
againstad-
vanceto
Trea-suryP)
Clear-ingac-
count
In millions of £T1939 December19401941 „1942 March
JuneSeptemberDecember
1943 MarchJuneSeptember
36108110124136138142179196201
11275773624858676370
141139137137135134134134132132
115168168250250250250250250
217264299339327367487455410430
499745861926
1,0001,0381,1781,1921,1511,177
281404512559591647734717734741
30787888
11893
144182147143
7878
00 00
00 00
00 00
00
47322229272723252236
0) Including gold held abroad. A liability of £T 1 million on account of a gold deposit has been deducted.(2) A new account of advances to the Treasury against a gold deposit was opened In July 1940 by virtue of
the law No. 3850. (3) Including some Items not specified in the table.(i) Net, I.e. with a deduction of a small amount of notes held In the bank's tills.
The increase of the note circulation, which was at an average rate of£T 9 million a month in 1941 and £T 13 million a month in the first halfof 1942, accelerated to £T 19 million a month in the three months toSeptember 1942 (part of the expansion may, indeed, have been due to rumoursof the impending tax). The first effect of the capital levy was to intensify thismovement — the increase being £T 29 million a month in the three months to

- 242 -
December. In January 1943, however, there was a decline of £T 44 million,while deposits at the bank increased, reflecting the collection of the tax by thegovernment (whose account is not shown separately in the return). By June1943, however, the circulation was back to the level of December 1942; and inthe three months to September 1943 there was a further small increase.
The most important movement of the central bank's assets was theexpansion of bills discounted by £T 120 million in the three months to the endof December 1942, an indication of the tightness of the market as a result ofthe levy; by June 1943 more than one-half of this central-bank credit hadbeen repaid. The increase in the foreign assets of the bank was reportedto be at least partly due to the cancellation of imports by firms which fearedconfiscation of the goods in payment of the levy.
Fiscally, the tax was successful in producing £T 255 million within a fewmonths. From the monetary point of view, no reduction of the note issue wasattained, but the expansion of the circulation was slowed down and the exceptionalextension of central-bank credit was not great. It is difficult to judge the economiceffects: a falling-off of imports was reported to have caused some scarcitiesand, in the first days of the tax, business was at a standstill; a number ofprices fell, at least temporarily, and speculation (e.g. in gold) was checked.
Reports in the foreign press have attributed other than purely fiscal andmonetary motives to the application of the capital levy and have pointed to thefact that four-fifths of the total was assessed on Istanbul with its mixed foreignpopulation. Of some 90,000 persons liable to the tax, 66,000 were in Istanbuland it is reported that 4,000 persons paid one-half of the total tax; however,as four-fifths of Turkish industry and commerce was estimated to be innon-Turkish hands and largely concentrated in Istanbul, it is not surprisingthat a considerable proportion of the tax should be paid by foreigners inwhat has remained the economic centre of modern Turkey.
Budget expenditure in the United Kingdom rose from £4,780 millionin 1941-42 to £5,620 million in 1942-43, i. e. by 18 per cent, compared withan increase of 24 per cent, in the previous financial year; expenditure on the"supply services", which may be counted as war expenditure, amounted to94 per cent, of the total, the same proportion in the two financial years.Lend-lease aid from the United States is not shown in the British budget,which includes, however, among the expenditure, the reverse lend-lease orreciprocal aid, given to the United States and other members of the UnitedNations, although detailed accounts for the different recipients are not kept.Budget expenditure also includes the counterpart of the Canadian contributionof £225 million in 1942-43 and the outlay of £400-500 million to meet the localcosts of the war "from Tunis to Burma", this sum being, as explained by theChancellor of the Exchequer in April 1943, borrowed from the countries concerned.(Further information on lend-lease and related questions is given in Chapter IV.)
Taxat ion receipts rose from £1,962 million in 1941-42 to £2,483 millionin 1942-43, i.e. by 27 per cent, compared with 44 per cent, in the previous

— 243 —
United Kingdom — Public Finances.
Quarterly and yearlyfigures
1940 April-JuneJuly-September . . .October-December .
1941 January-March . . .
July-September . . .October-December .
1942 January-March . . .1942 April-June
July-September . . .October-December .
1943 January-March . . .1943 April-June
July-September . . .Financial years
1940-411941-421942-43
Calendar years194019411942
Budget accounts (cash basis) P)
Current revenue
Tax-ation
(2)
Othercurrent
re-venue
(?)
Cana-dian
contri-bution
Total
Expenditure
War
(4)
Other TotalDeficit
WarDam-ageAct
(5)
Netborrow-
ing
in millions of £ sterling180252290637302392454814435511503
1,034524651
1,3591,9622,483
1,2161,7842,263
812102017263038224131201331
50112113
4193
131
985770
225
225
188264300656319418484853555608604
1,053537682
1,4092,0742,820
1,2571,8772,619
613875
1,0121,137985
1,1101,1681,2381,1981,2291,3641,5051,3041,304
3,6374,5025,296
3,0864,4015,029
824086228951924297709863
10092
230274327
247254306
695915,098,159,074,161,260,280,295,299,461,568,404,396
3,8674,7765,623
3,3334,6545,335
507651798503755743776427741690858514868714
2,4582,7022,803
2,0762,7772,716
302
(-12)
1(- 1)
13
20
32(-12)
507651798503755713774439741689859514868701
2,4582,6822,804
2,0762,7452,729
0) Excluding self-balancing items and lend-lease aid from the United States; expenditure also excludes sinkingfunds, i.e. £17.0 million in 1940-41, £12.2 million in 1941-42, and £14.4 million in 1942-43.
(2) Inland revenue, customs and excise and motor-vehicle duties.(3j Miscellaneous receipts (from the profits of the Bank of England and Exchange Equalisation Account, etc.)
plus net receipts of the Post Office and other sundry revenue.(4) Total supply services (excluding Post Office).(5) Net excess of contributions or of payments (—) under the War Damage Act. These contributions, although
very similar in effect to taxation, are accounted outside the budget; but, when payments are made, theyare entered under expenditure in the budget and an amount sufficient to cover them is taken into "miscel-laneous receipts" from the War Damage Accounts. Only the net amounts are shown in this column; thePresident of the War Damage Committee stated in April 1943 that indemnities so far paid exceeded£100 million.
year. For the first time income tax produced more than £1,000 million, about£200 million coming from seven million wage-earners liable for the tax. Anotable feature in recent years has been the increased proportion produced bydirect taxes — 62.5 per cent, of the total tax revenue in 1942-43 as against55.6 per cent, in 1939-40.
The budget estimates for 1943-44 put total expenditure at £5,760 millionand current revenue at £2,910 million, giving a deficit of £2,850 million; Canadian"mutual aid" in 1943-44, which is to be provided for all the United Nations,is excluded from these figures. As full capacity is reached both revenueand expenditure tend to expand more slowly but-the deficit appears to bestabilised at around £2,800 million. Two items of expenditure deserve specialmention: subsidies with a view to keeping down the cost of living rosefrom £70 million in 1940 to-£142 million in 1941, reached £150 million in 1942and were running at a rate of £180 million in 1943; social services, excluding

- 244 -
Sources of U.K.Government borrowing
September 193 9—March 1943.
Long term:small savingslong-term loans
Short term:Treasury billsTreasury deposit receipts •tax-reserve certificates . .
Extra-budgetary funds etc. • .Total
per cent.2134
10115
19100
Including various other sources, such as overseasborrowing and interest-free loans.
unemployment benefit, which came to£160 million in 1938, were estimated tocost £220 million in 1943.
From September 1939 to the end ofMarch 1943 total war borrowing amountedto £8,667 million, which, as stated bythe Chancellor in his budget speech, wasmade up as follows: 55 per cent, frompublic long-term borrowing, 26 per cent,from public short-term issues and 19 percent, from extra-budgetary funds, directoverseas borrowing and interest-free loans.
Public borrowing, as published in the Treasury returns, is analysedbelow.
United K i n g d o m — Government Borrowing.
Quarterly and yearlyfigures
1940 April-June . . . .July-September .October-December
1941 January-March. .1941 April-June . . . .
July-September .October-December
1942 January-March. .1942 April-June . . . .
July-September .October-December
1943 January-March. .1943 April-June . . . .
July-September .Financial years
1940-41 . . . . . .1941-421942-43 . .
Calendar years194019411942
Total debt outstandingat end of March 1943
Long and middle-termborrowing
Sav-ings
issuesMarketissues
"Otherdebt"
(')
Total
CO
Short-term borrowing
Waysand
meansad-
vances(?)
Trea-surybills
Trea-sury
depositre-
ceipts
Tax-reservecerti-ficates
Total
(2)
Totalborrow-
ing
(4)In millions of £ sterling
888892
182251174207355173170147282311155
449987772
339814845
2,706
24679
213129247143296204184140277179330279
667891780
638816805
8,210
51587
1038638
181293322
35119216
28118222
372
33417730831550635257156353633542347364.1433
1,1341,9921,768
9851,7441,857
11,288
— 2555453615605
— 572
34— 2
6010
— 40
1112394
71116
— 23
289
19829523160
145220
— 30741855
1406
18950
784409218
682395286
2,839
124214929081
212— 315
95169206
3— 44
189
43067
473
338474155
969
17175909693
— 277169
192252
17453
443
173474490187250361203
— 12420535443741
227268
1,324690
1,036
1,0911,002
871
4,540
507651798503755713774439741689859514868701
2,4582,6822,804
2,0762,7452,729
15,828(5)
(') Including direct external borrowing, as given on page 139. (2) Net, I.e. less sinking funds and amortisations.(3) These ways and means advances are partly from the Bank of England and partly from government departments.
Advances from the Bank of England are interest-bearing, the rate varying between Y2 and 1 per cent, sincethe beginning of 1939; they generally reach their highest point at the end of the year, having been £66 millionon 31st December 1941 and £68 million on 31st December 1942. Advances from the government departmentsare partly interest-bearing and partly without Interest; the rate on interest-bearing advances varied In 1939between "/n and 3'/t per cent, but since 1940 it has been "/„ to 1 per cent.
(4) Including small movements of Treasury balances.« Excluding the old "war debt" of £1,032 million to the United States, which would bring the nominal total
up to £16,860 million. This figure does not Include the accrued interest on National Savings certificates,estimated at £172 million In March 1942.

- 245 -
Long-term borrowing in 1942-43 amounted to 63 per cent, of total borrow-ing against 74 per cent, in 1941-42. As regards the so-called savings issuesin 1942-43, £204 million came from National Savings certificates, £111 millionfrom 3 per cent. Defence bonds and £457 million from 3 per cent. Savingsbonds, all of these issues being non-marketable. A distinction sometimes madebetween "small" savings and "large" savings includes National Savings certi-ficates, Defence bonds and the increase of savings-bank accounts in the formerwhile Savings bonds are cfassed with other long-term government loans inthe latter category. As regards the market issues in 1942-43, £535 million wasraised by the tap issues of 2% per cent. National war bonds, while £122 million3 per cent. Funding Loan 1959-69 and £124 million 3 per cent. National DefenceLoan 1954-58 were issued direct to the Commissioners of the National Debtfor the investment of savings-bank deposits.
The British borrowing programme is noteworthy for the great variety ofsecurities offered to the investor; from January 1943 the maximum of savingscertificates which could be bought by one investor was raised from £500nominal to £750, but for the extra £250 only certificates of a new series, bearinginterest at 1.4 per cent, tax free, could be purchased (against 3.2 per cent,on the ordinary issue). In October 1941 a Treasury regulation suspended theissue of government securities as bearer bonds or as inscribed stock, andintroduced the principle that all future issues should be in the form ofregistered stock transferable by deed. The suspension of issues of bearerbonds was understood to be a war measure only, but inscribed stock asa form of security was finally abolished by a new regulation made inDecember 1942.
Short - term borrowing has been in three main forms, the classicmarketable Treasury bill giving way more and more to the two new types ofsecurities introduced during the war: tax-reserve certificates and Treasury
deposit receipts, both of which are non-marketable. The total of Treasury bi l lsoutstanding, £2,840 million at the endof March 1943, still exceeded by over£1,100 million the total of other formsof government short-term borrowing, buttheir importance was declining, only one-fifth of the short-term borrowing in 1942-43being made in this way. About one-thirdof the total Treasury bills outstandingwere issued by tender in 1942 (against two-thirds in 1938), the remainder being issuedthrough the tap to government depart-ments and other official bodies (in-cluding, since July 1941, Empire centraibanks); of the bills issued by tenderonly about one-third were allotted tomoney market firms. In absolute figures,
U.K. Treasury Bi l ls Outs tanding••«
End ofFebruary
1938 . . .1939 . . .1940 . . .1941 . . .1942 . . .1943 . . .
Tender00
TapC3)
Total
In millions of £ sterling532351801845905980
273500622
1,3691,6131,830
805851
1,4232,2142,5182,810
0) This analysis Is made as at the end of Februarysince ' published statistics do not permit theaccurate splitting-up of the total at the end ofDecember or March.
(2) These are bills issued by tenders made eachFriday for the following week, the results of whichare regularly published. All these bills are ofthree months' currency.
(3) Tap bills may be taken up by government depart-ments and other official bodies at any time. Thenormal rate Is Via per cent, below the averageweekly tender rate but in certain special casesonly a nominal rate Is paid. They are issued forthree months or for such shorter periods as maybe convenient.

— 246 —
however, the holding of the discount houses has risen with the total oftender bills. In recent years the structure of the London money market hasbeen strengthened by a series of amalgamations and, in the first half of1943, several firms made relatively considerable increases in their capital inresponse to the wartime growth in the volume of paper handled by them.
Tax-reserve cer t i f icates were first issued in December 1941; theyare not transferable and are intended to absorb ^unds held in readiness fortaxation payments due not less than two months and not more than twoyears from the date of purchase; they carry interest at 1 per cent, free of tax(about the same as the gross yield on Treasury bills) but, after running for twomonths, may be repaid in advance, on request, without interest. They haveproved very popular, and the total outstanding grew steadily to £514 millionat the end of June 1943.
United Kingdom —Tax-reserve cer t i f icates and Treasury deposit receipts.
Issues and redemptionshalf-yearly figures
1940 July-December. . . .1941 January-June
July-December. . . .1942 January-June.
July-December. . . .1943 January-June
Totals . . .
Tax-reserve certificates
Grossissues
Redemp-tions
Netissues
Treasury deposit receipts
Grossissues
Repayments
atmaturity
beforematurity total
Netissues
in millions of £ sterling
17271234253775
646
209
261
1726518844
514
386587880638
1,0291,195
4,715
313466534517866
2,695
4893
122324137370
1,095
48406588858654
1,236
3,790
338181292
(-220)375
(- 41)
925
Of particular interest was the growing importance of Treasury deposi treceipts as a flexible instrument for the investment of the banks' liquid fundsin the year under review. These receipts, first introduced in 1940, are givento banks for deposits at the Treasury for six months at 1VS per cent, interest;the receipts are non-negotiable but carry the right to repayment beforematurity under rebate at bank rate (currently 2 per cent.) and may be usedat any time in lieu of payment in respect of subscriptions to loans for theirown or for customers' account. Of the £3,520 million issued up to the endof December 1942, £2,695 million, i. e. over three-quarters of the total, wereheld until maturity; repayments before maturity were on a particularly largescale in the January to March quarter of 1942 and during the first half of1943, when savings campaigns caused considerable withdrawals from the banksfor investment purposes. Treasury deposit receipts have become second inimportance among the assets of the clearing banks, as the following table shows.
While before the war business advances were the banks' most importantand most remunerative asset, the system of "progress payments" to governmentcontractors has made the war industries largely independent of bank credit

— 247 —
End of month
1939 December .1940 December .1941 December .1942 March . . .
June . . . .September .December .
1943 March . . .June . . . .September .
Londor Clearing Banks«.
Assets
cashre-
serves(2)
274324366347355349390377387389
Liquid
moneyat
callP)
174159141137147127142139165148
assets
billsdis-
counted
334265171163292277198172236209
Trea-sury
depositre-
ceipts
I nvest-ments
In millions of £
314758476543693896884859
1,045
609771999
1,0501,0581,0971,1201,1321,1591,160
Ad-vances
sterling1,002906807838800774773777744733
Che-quesin
courseof
collec-tionetc.
106117146122129106165125144122
Total
balancesheet
2,6973,0503,5823,3163,4973,5913,8643,7763,8683,985
Liabi-lities
Depositand
currentac-
counts
2,4412,8003,3293,0723,2633,3583,6293,5423,6303,737
Liqra
jid ityios
Pri- Secon-mary (*)| dary («)
inpercentagesof total deposits
and current
;/121111111011111110
21263225303334343538
at
0) June and December figures are at end of month; March and September are on varying days of the month.(2) Balances at Bank of England, plus notes and coin in hand.(3) Money lent to the market at call and short notice.(4) Commercial bills have largely disappeared, the holding of the banks probably declining by some £100 million
over the period shown in the table and being replaced to that extent by Treasury bills.(5) Cash reserves as a percentage of deposits and current accounts.(6) Liquid assets other than cash reserves as percentage of deposits and current accounts.
and the banks have followed the government's directives in curtailing lendingunconnected with the war effort*. Advances in the banks' balance sheets weresurpassed by investments in 1941 and by Treasury deposits in 1942, thusfalling to third place in importance among the assets of the banks.
The total government-security holding of the banks at some £2,200 millionthe end of 1942 was almost three times as great as the banks' advances
and amounted to 60 perLondon Clear ing Banks cent, of deposits; and
net increases or d e c r e a s e s (—) of the government secu-of government-secur i ty ho ld ing«. rities taken up in the
three years 1940-42 nearlythree-quarters were Trea-sury deposit receipts. In1942 the government'scall on the banks wasonly one-half of whatit had been in 1941and the expansion ofdeposits consequentlyslowed down, being£300 million against£530 million in the pre-vious year.
Calendar years
194019411942
Three-year period . .
Total holdingend 1942
BillsTreasurydepositreceipts
1 nvest-ments Total
in millions of £ sterling— 69— 94+ 27
— 136
198
+ 314+ 444+ 138
+ 896
896
+ 162+ 228+ 121
+ 511
1,120
+ 407+ 578+ 286
+ 1,271
2,214
0) Assuming bills discounted and investments to be entirely governmentpaper and excluding government securities held indirectly (by way ofcash balances at the Bank of England or money lent at call on themarket). Actually the increase Is somewhat greater, since the commercialbill holding has declined (see footnote (") to the first table on this page).
From 1st March 1943 the Board of Trade prohibited Instalment purchases of all goods subject to pricecontrol, except furniture.

- 248 -
In recent years the expansion of clearing-bank deposits has beenaccounted for by business concerns and not by individuals, a fact which wasbrought out in an analysis given in the budget White Paper; this showedthat in the two and a half years from June 1940 to December 1942 personaldeposits rose by £200 million to £820 million, i. e. 33 per cent., and businessaceounts by £1,150 million to £2,040 million, an increase of 129 percent. (Besidesordinary banking accounts denominated in money and shown in the balancesheets, the introduction and growth of "coupon accounts" and "couponbanking" should be mentioned. These services of the banks have arisen fromthe rationing schemes and in 1942 were extended to cover clothes rationing;all transfers of coupons and documents representing coupons, beyond thepurely retail stage, are made through the banks, which honour "cheques",credit or debit accounts and make transfers, all denominated in numbers ofcoupons.)
Concentration on purchases of Treasury deposit receipts has made thebanks very liquid, the ratio of all liquid assets to deposits having risenfrom 32 per cent, at the end of 1939 to 38, 43 and 45 per cent, at the endof 1940, 1941 and 1942 respectively. The primary cash reserve, as published,remained at 11 per cent, in 1942 and 1943, with a temporary dip to 10 percent, in September; actually there is some "window dressing" in thesefigures and the true proportion may be as much as 2 per cent, lower. Theexpansion has taken place in the secondary reserve, which had risen as highas 38 per cent, in September 1943.
Since the introduction of Treasury deposit receipts the cash positionof the banks has generally been adjusted through fluctuations of their holdingsof this type of paper, but the practice of direct Treasury bill dealings betweenthe Bank of England and the clearing banks has not been discontinued;and Treasury bills may, of course, be allowed to run off. A further elementof elasticity has been available to the bill market through the institution ofopen-market operations more or less "on tap"; although no formal changehas been announced, the bill market knows that in practice the governmentbroker will, at times of pressure, purchase Treasury bills for account of theBank of England at market rates.
Whereas the rate of increase of clearing-bank deposits slowed downfrom 19 per cent, in 1941 to 9 per cent, in 1942, the note circulation of theBank of England, which is covered over 100 per cent, by government securi-ties, continued to expand at the same annual rate of around 22-23 per cent.
No other movement in the return is of particular importance; the Bankof England acquired sufficient government securities to cover the expansionof the note issue and to maintain the bankers' cash reserves at about 11 percent, of their total deposits and current accounts, as shown above. Thewithdrawal of the larger denominations of notes from circulation is treatedon page 310.

- 249 -
Bank of England.
Near end of month Govtsecurities
Assets
Allotherassets
Total, ofbalancesheet •
Liabilities
Notes
Current accounts etc.
Treasuryand
publicdepart-ments
banks other total
In millions of £ sterling1939 December1940 December1941 December1942 March . .
June . . .SeptemberDecember
1943 March . .June . . .September
728851
1,019
9311,0151,0181,190
1,1201,2331,209
33343534373633403433
761885
1,054965
1,0521,0541,2231,1601,2671,242
555616752759801838923935946986
30171121111096
109
117181220116172136223144238173
42535451495249575555
189251285
188232197281
207303238
* The combined returns of the issue and banking departments, omitting duplications due to the holding ofa reserve of bank-notes In the banking department.
A s in recent years, there w a s
1942, except tha t on accoun t of t he
repayments were made. A n in te res t ing
B u i l d i n g S o c i e t i e s ' A d v a n c e s 0 ) .
In millionsof £ sterling
1938 . . . .
1941 . . . .1942 . . . .
Newadvances
44.4
2.24.1
Repay-ments P)
40.7
26.429.0
Netmovement
+ 3.7— 24.2— 24.9
(') Seven important societies. (2) Including interest.
pract ica l ly no capi ta l i ssue act iv i ty in
government , wh i le a cer ta in n u m b e r of
ind ica t ion of cond i t i ons is g iven by the
reversal of t he steady g r o w t h of t h e
bu i l d i ng soc ie t ies , due t o t h e suspens ion
of pr ivate bu i ld ing — the increase of to ta l
advances by £4 mi l l ion in 1938 gave way
to an excess of repayments of abou t
£24 mi l l ion in each of t he t w o years
1941 and 1942, leading t o increased i n -
ves tment in gove rnmen t secur i t ies .
Interest rates have remained pract ical ly w i t h o u t movemen t : bank rate is at
2 per cent . , u n c h a n g e d s i nce O c t o b e r 1939; t h e y ie lds on T reasu ry bi l ls a t
1 per cent . , T reasu ry depos i t rece ip ts at ^ / s per cent , and 7 t o 9-year Nat ional
W a r b o n d s on tap at 2 % per cent , are halved by the deduc t ion of i ncome
tax at t h e s tandard ra te ; in f ac t none of t h e c lear ing banks made su f f i c ien t
pro f i t t o become l iable t o t h e excess prof i ts tax.
T h e Chance l lo r of t h e Exchequer s tated in J u n e 1943 tha t before the war
the average rate of in terest on t h e internal debt had been 3 per cent , and tha t
du r ing the war it had been b rough t d o w n to 2 % per cen t . ; t h e average rate on
all t he new war b o r r o w i n g in England w a s 2 per cent . , w h i c h , after a l l ow ing fo r
i ncome tax, represented a c o s t t o t h e T reasu ry of s l ight ly over 1 per cent . In
his budge t speech in A p r i l 1943 t h e Chance l lo r s a i d : " W e have developed a new
techn ique and we have revo lu t ion ised pub l i c op in ion as t o w h a t are fair rates
of in terest on pub l ic b o r r o w i n g . W e shal l no t on ly pass f r o m war t o peace w i th
in terest at a l ow level bu t in t he recons t ruc t i on wh i ch the coun t ry is expect ing
after t h e war we shal l have the benef i t of cheap money. It is t he gove rnmen t ' s
in ten t ion to main ta in i ts present po l icy of cheap money after the w a r . "

- 250 -
Canadian budgets since the war have been considerably influenced byBritish war expenditure in Canada, which has had to be financed in Canadiandollars, no matter how the settlement with the United Kingdom was made(by Canadian acquisitions of sterling, by repatriations of Canadian securities, bythe free gift from Canada, etc.) and which must be duly taken into accountfor a comprehensive picture of the official financing to be obtained.
Canadian Budget F inance0 .
Financial years ended 31st March
War expenditure
British in Canada(3)Total . . .
Other expenditureLoans and investments
To'tal . . .
Taxation and current receipts . . . .BorrowingDecrease or increase (—) of balances (5)
Total . . .
1939 1940 1941 1942 1943 1944
In millions of Can. dollars
34
3451525
574
49998
(-23)574
14295
23752643
806
535416
(-145)806
819371
1,19046330
1,683
85773789
1,683
1,4151,0522,467
51339
3,019
1,4692,027(-477)3,019
2,994879
3,87359354
4,520
• 2,261 (4)1,510
7494,520
4,890«
4,890611
5,501
2,752(1)
5,501
(1) Closed accounts to 1942; 1943 provisional and 1944 estimates.(2) Including Can.$ 1,000 million expenditure under the Mutual Aid Act.(3) An analysis of this item is given on page 137.(•>) Of income tax and excess profit tax collected in 1943 and 1944 it was estimated that Can.$ 100 million and
Can.$ 250 million respectively will be refunded after the war.(5) Including certain small miscellaneous items.
In the financial year ended March 1943 total financing requirements wereCan.$ 4,500 million, war expenditure being nearly Can.$ 3,900 million; 50 percent, of total expenditure was covered by taxation and other current revenue.War expenditure continues to expand; the estimates for the financial yearending March 1944 place total expenditure at Can.$ 5,500 million, of whichCan.$ 4,900 million is war expenditure, including Can.f 1,000 million for "mutualaid", a figure likely to be surpassed.
Government securities held by the Bank of Canada rose from Can.$ 232 millionin December 1939 to Can.$ 1,130 million in June 1943, in which are includedthe $325 million given to the bank in April 1940, when the gold and foreignexchange holding was transferred to the Foreign Exchange Control Board;the net increase was thus Can.$ 573 million.
As a counterpart to these purchases of government securities stand theincrease of the note issue and of the chartered banks' reserve balances. Thenote circulation as shown in the following table includes the comparativelylarge amounts held in the tills of the banks; the "active circulation" of Bankof Canada notes rose from Can.$ 156 million in December 1939 to Can.$ 256,372 and 553 million in December 1940, 1941 and 1942 respectively.

- 251 -
Bank of Canada.
End of month
Assets
GoldForeign
ex-change
0
Governmentsecurities (3)
short long
Otherassets
Totalof
balancesheet
Liabilities
NotesDeposits
Govern-ment banks other
Otherliabi-lities
In millions of Can. dollars1939 December194019411942 March . .
June . . .SeptemberDecember
1943 March . .June . . .
226 6438
201276
1110
47
182448392387494629807753817
5012721T209322285209276313
51234202622311621
527626843892843936
1,0481,0451,198
233360496509541625694719758
461174
1193119522190
217218232242221246260261301
181066
2725192519
132835162222241929
0) Transferred to Foreign Exchange Control Board In the spring of 1940.(2) From April 1940 this Item consists almost wholly of sterling pledged temporarily from time to time by the
Foreign Exchange Control Board to obtain Canadian dollars. At the end of 1941 Can.$ 201 million was sopledged —a method of short-term government borrowing from the bank; this holding of the Bank of Canadagrew to Can.$ 474 million in March 1942. It was redeemed in two stages: by part of the proceeds of thesecond Victory loan in March and by the sale of Can. $193 million short-term government securities to theBank of Canada in June 1942.
(3) Dominion (and provincial) government securities. Besides securities placed directly with the bank, open-market purchases have been made in order to maintain the cash reserves of the chartered banks.
(') Including those held by the chartered banks in their reserves. In addition, notes of the chartered banksare outstanding, the total falling from Can.$ 85 million in December 1939 to Can.$ 60 million In December1942 (see below).
The chartered banks increased their security holdings between December1939 and June 1943 by slightly over Can.$ 1,000 million while demand depositsrose by nearly Can.$ 1,300 million. The banks' loans increased up to thespring of 1942 but subsequently declined; this was partly the result of thestrict regulation of instalment buying, but also due to the fact that the bankslent freely to subscribers to the first Victory loan of June 1941 but do notappear to have done so on the same scale during 1942.
Canada — Chartered Banks'.0)
End of month
1939 December1940 „19411942 March . .
June . . .SeptemberDecember
1943 March . .June . . .
Assets
Cashreserves
CO
Foreignex-
change
Loansand dis-counts
(4)
Securi-ties(5)
Otherassets
Totalof
balancesheet
Liabilities
NotesDeposits («)
demand time
Otherliabi-lities
in millions of Can. dollars292323356348327366387377421
132159168166181185231223204
,1411,1481,2011,334,165
1,0771,1991,0271,256
1,6461,5311,7591,8811,8832,3402,2932,6892,687
612570653624639594657599665
3,8223,7314,1374,3524,1954,5614,7674,9155,233
858071717269605449
1,0331,1631,4361,7551,5231,7381,9841,9272,319
1,7411,6411,6691,5501,5981,7481,6731,8901,782
963846962976
1,0021,0061,0491,0441,084
0) Ten chartered banks. (2) Balances at the Bank of Canada and Bank of Canada notes.(3) Security loans abroad and net amount due from foreign banks.(4) In Canada only. (6) Principally government securities (Dominion and provincial).

— 252 —
Canada's public borrowing has taken two main forms: special issues,generally of Treasury bills, made directly to the banks, and war loans issuedon the market. In July 1942 a new form of borrowing from the banks wasinitiated with an issue of Can.$ 75 million six-month "deposit certificates" bearinginterest at % per cent., and issues on the same terms were made in sub-sequent weeks, the total outstanding rising to Can.$ 645 million in October.As the proceeds of the third Victory loan came in, the government redeemedCan.$ 205 million, so that Can.$440 million were outstanding at the end of 1942.
Government borrowing from the public has taken the form of Victoryloans issued as 3 per cent. 14-year bonds and 1 % per cent. 3%-year bonds:the second Victory loan issued in February-March 1942 produced Can.$ 840 mil-lion and the third loan, issued in October-November 1942, brought in Can.$ 990 mil-lion, a total of Can.$ 1,830 million during the year 1942. In 1943 two furtherVictory loans were issued: the fifth, in April, brought in Can.$ 1,100 millionand the sixth, in October, 1943 produced Gan.$ 1,200 million.
The year 1942 was for the United States a period of transition tofull war activity and this change is reflected in a remarkable way in the budgetaccounts. War expenditure (which includes the outlay for lend-lease) rose byfour times from $6,300 million in 1940-41 to $26,000 million in 1941-42 with afurther threefold increase to $72,000 million for 1942^43 (financial years endingJune). Thus, in the latter year, average monthly expenditure had risen to thelevel of annual expenditure two years previously (i. e. in the first year of thedefence programme). At the same time civil expenditure, although includingthe increased debt service, was slightly compressed. Revenue rose by nearly70 per cent, from $7,600 million in 1940-41 to $12,800 million in 1941-42 andagain by 70 per cent, to $22,300 million in 1942-43. The resulting budgetdeficit jumped from $5,100 million in 1940-41 to $19,600 million in 1941-42and to $55,900 million in 1942-43. The revised estimates for 1943-44 showtotal expenditure at $106,000 million, including $100,000 million for war activities,and revenue at $38,000 million, giving a deficit of $68,000 million to be coveredby borrowing. A summary of budgetary revenue and expenditure (on a cashbasis) is given in the table on the following page.
The national defence programme was started in June 1940; and warexpenditure rose in the geometric progression of four from about $3,000 to13,000 and 50,000 million in the calendar years 1940, 1941 and 1942. From thesecond half of 1942 war activities have accounted for over 90 per cent, of totalexpenditure. Indeed, there is a striking parallel between 1940-43 and 1916—19 :war expenditure in the first half of 1943 was nearly fifty times as great asit was three years previously and a further increase is planned; from 1915-16to 1918-19 war expenditure also rose by fifty times, from under $290 millionto over $14,400 million, and a further increase was planned.
As a result of the rising national income and increased rates, the pro-ceeds of taxat ion tripled from 1940-41 to 1942-43. The Revenue Act of 1942,passed in October of that year, imposed supplementary taxation estimated

— 253 —
United States — Public Finances.
Quarterlyand
yearly
1940 July-Sept. .Oct.-Dec.. .
1941 Jan.-March .April-June .
1941 July-Sept .Oct.-Dec. . .
1942 Jan.-March.April-June .
1942 July-Sept. .Oct.-Dec.. .
1943 Jan.-March.April-June .
1943 July-Aug.(6).
Financial years1940-41 . .1941-42 . .1942-43 . .
Calendar years1940 . . . .1941 . . . .1942 . . . .
Revenue(')
TaxationOther
internalcurrent )
Total
Expenditure
War (?) Other TotalDeficit
Move-ment ofofficial
balances(')
Totalborrow-
ing(5)
in millions of dollars1,4391,3832,2762,0001,8842,1614,8103,6673,7773,8406,7656,9784,151
7,09912,52221,360
5,5798,321
16,094
5052
171235606173838469
184585*577*
508277922
256527309
1,4891,4352,4472,2351,9442,2224,8833,7503,8613,9096,9497,5634,728
7,60712,79922,282
5,8358,848
16,403
6631,1991,9682,4713,4304,8357,121
10,62714,76617,34818,46121,53513,664
6,30126,01172,109
2,77912,70449,862
1,6201,6591,6171,5131,5711,6471,5571,6091,5401,4521,3841,6931,065
6,4096,3866,070
6,8816,3486,158
2,2832,8583,5853,9845,0016,4828,678
12,23616,30618,80019,84523,22814,729
12,71132,39778,179
9,66019,05256,020
7941,4231,1381,7493,0574,2603,7958,486
12,44514,89112,89615,66510,001
5,10319,59855,897
3,82410,20439,617
+ 599— 331+ 989+ 512— 84+ 1,788+ 43+ 425+ 1,437+ 6,301— 5,850+ 5,170— 2,818
+ 1,770+ 2,172+ 7,058
— 531+ 3,205+ 8,206
1,3931,0922,1272,2612,9736,0483,8388,911
13,88221,1927,046
20,8357,183
6,87321,77062,955
3,29313,40947,823
0) Net receipts, I.e. total receipts less net social-security employment taxes.(2) Panama Canal dues and other miscellaneous receipts.(3) Before December 1941, National defence. Actually war expenditure was somewhat greater than that shown
in the budget statistics, as $2,200 million war expenditure was borne by government corporations in 1941-42and a further $3,300 million was estimated for 1942-43.
(4) Movements of the Treasury's general fund and of the balances held by government agencies with theTreasury. (5) Increase of government securities outstanding, direct and guaranteed.
(e) Two months only; total expenditure in September 1943 was $7,212 million. * Preliminary.
to produce $3,600 million gross in a full year, Of which $1,700 millionwill be returned as post-war credits, so that the net yield would be$6,900 million ; besides providing for an increase of $3,000 million in normalincome tax, the Act instituted a new Victory tax (deducted at source fromsalaries and wages) amounting to 5 per cent, on all incomes above $12a week and affecting about 40 million taxpayers; it is expected to produce$3,100 million, of which over $1,100 million will be returned as post-warcredits. These "post-war" credits, which amount to 25 per cent, of thetax paid by single and 40 per cent, of that paid by married taxpayers (withlimits of $500 and $1,000 a year respectively), may, however, be reclaimedin many cases in the following year as tax credits against regular income taxand against the portion of Victory tax not collected at source. Thus taxpayers,when filing tax returns in March 1944, are permitted to deduct purchases ofU. S. government securities, life assurance premiums and the repayment ofcertain debts, up to an amount equal to the repayable portion of the Victorytax on income of the previous year, instead of waiting for the actual refunds.Somewhat similar provisions apply to excess profits tax; of the $1,900 millionlevied under the new law, $550 million is credited as a post-war refund, but
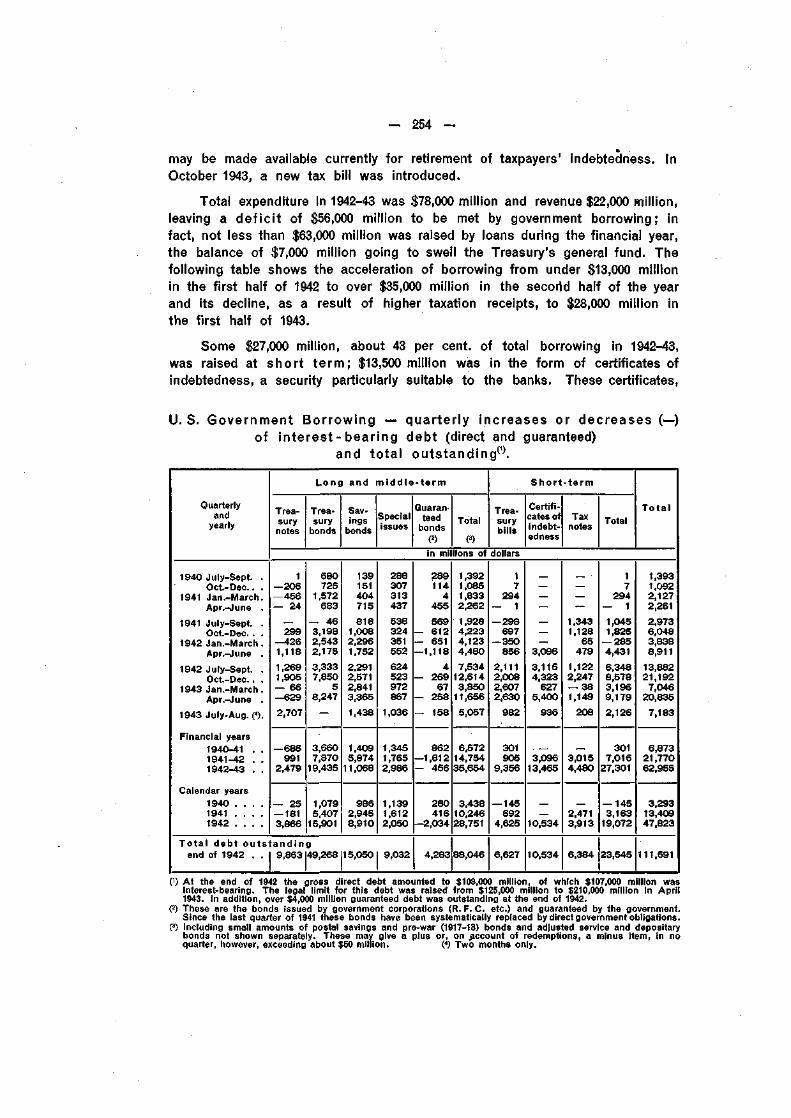
- 254 -
may be made available currently for retirement of taxpayers' indebtedness. InOctober 1943, a new tax bill was introduced.
Total expenditure in 1942-43 was $78,000 million and revenue $22,000 million,leaving a def ic i t of $56,000 million to be met by government borrowing; infact, not less than $63,000 million was raised by loans during the financial year,the balance of $7,000 million going to swell the Treasury's general fund. Thefollowing table shows the acceleration of borrowing from under $13,000 millionin the first half of 1942 to over $35,000 million in the secorid half of the yearand its decline, as a result of higher taxation receipts, to $28,000 million inthe first half of 1943.
Some $27,000 million, about 43 per cent, of total borrowing in 1942-43,was raised at short te rm; $13,500 million was in the form of certificates ofindebtedness, a security particularly suitable to the banks. These certificates,
U.S. Government Borrowing — quarter ly increases or decreases (—)of in te res t -bear ing debt (direct and guaranteed)
and total ou ts tand ing^ .
Quarterlyand
yearly
1940 July-Sept. .Oct.-Dec.. .
1941 Jan.-March.Apr.-June .
1941 July-Sept. .Oct.-Dec. . .
1942 Jan.-March .Apr.-June .
1942 July-Sept. .Oct.-Dec. . .
1943 Jan.-March .Apr.-June .
1943 July-Aug. (4).
Financial years1940-41 . .1941-42 . .1942-43 . .
Calendar years1940 . . . .1941 . . . .1942 . . . .
Trea-surynotes
1—206—456— 24
_299
—4261,1181,2691,905— 66—6292,707
— 685991
2,479
— 25— 1813,866
Long
Trea-sury
bonds
680725
1,572683
— 463,1982,5432,1753,3337,850
58,247—
3,6607,870
19,435
1,0795,407
15,901Total debt outstanding
end of 1942 . . 9,863 49,268
and
Sav-ingsbonds
139151404715818
1,0082,2961,7522,2912,5712,8413,3651,438
1,4095,874
11,068
9862,9458,910
15,050
niddle
Specialissues
288307313437538324351552624523972867
1,036
1,3451,7652,986
1,1391,6122,050
9,032
-term
Guaran-teed
bonds(2)
Total
Oin millions of289114
4455569
— 612— 651—1,118
4— 269
67— 258— 158
862—1,812— 456
280416
—2,034
4,283
1,3921,0851,8332,2621,9284,2234,1234,4807,534
12,6143,850
11,6565,057
6,57214,75435,654
3,43810,24628,751
88,046
Trea-surybills
dollars17
294J
— 298697
— 350856
2,1112,0082,6072,630
982
301905
9,356
— 145692
4,625
6,627
Short
Certifi-cates ofindebt-edness
———
——
3,0963,1154,323
6275,400
936
. _3,096
13,465
—10,534
10,534
-term
Taxnotes
———
1,3431,128
65479
1,1222,247— 381,149
208
3,0154,480
2,4713,913
6,384
Total
17
294— 11,0451,825
— 2854,4316,3488,5783,1969,1792,126
3017,016
27,301
— 1453,163
19,072
23,545
Total
1,3931,0922,1272,2612,9736,0483,8388,911
13,88221,1927,046
20,8357,183
6,87321,77062,955
3,29313,40947,823
111,591
(') At the end of 1942 the gross direct debt amounted to $108,000 million, of which $107,000 million wasinterest-bearing. The legal limit for this debt was raised from $125,000 million to $210,000 million in April1943. In addition, over $4,000 million guaranteed debt was outstanding at the end of 1942.
(?) These are the bonds issued by government corporations (R. F. C. etc.) and guaranteed by the government.Since the last quarter of 1941 these bonds have been systematically replaced by direct government obligations.
(3) Including small amounts of postal savings and pre-war (1917-18) bonds and adjusted service and depositarybonds not shown separately. These may give a plus or, on .account of redemptions, a minus item, in noquarter, however, exceeding about $50 million. (") Two months only.

- 255 -
issued at par (with coupon attached) at a fixed rate of interest and notexceeding one year's maturity, were first put on the market in April 1942.In addition, $9,500 million Treasury bills and $4,500 million of non-marketabletax-anticipation notes were issued during the financial year 1942-43. Some$19,000 million, i. e. over one-half of the long-term borrowing, was madethrough Treasury bonds with maturities generally up to about twenty years.Of the other half, by far the most important item was the issue of $11,000 mil-lion non-marketable savings bonds.
The tremendous acceleration of war expenditure in the United States hasthus involved borrowing on a vast scale — the amount borrowed in 1942-43was nearly four times as great as the total Federal debt of 1930; and stillgreater sums must be borrowed in 1943-44. In these circumstances considerableefforts have been made to create securities suitable to all classes of investors,and, in particular, with the aid of a series of sales campaigns, to borrowdirect ly f rom the public, i. e. from investors other than banks. In 1941 twonew securities were introduced, defence savings bonds and tax-anticipationnotes, both of which were non-marketable; in 1942 new series of tax notes weremade to replace the old ones and the maximum for individual subscribers tosavings bonds was raised from $50,000 to $100,000. A further step was takenwith issues in May, August and December of marketable Treasury bondsnot available to banks on their own account for a period of ten years; saleswere largely made to life assurance companies. Moreover, the technique ofissue was changed; instead of closing subscription lists after only 24 or
Dis t r ibu t ion of U.S. Government Bo r row ing^ .
Calendar years
1940 (twelve months)1941 ,,19421943 (six months) .
Total holdingsat end of 1942 . .
1940 (twelve months)1941 „19421943 (six months) .
Banking System
FederalReserveBanks
Commer-cial
banks(2)
Total
Other investors
MutualSavingsbanks
Insur-ancecom-panies
(3)
Federalagencies
Allothers
(3)
Total
Totalall
investors
in millions of dollars(—300)
703,9401,010
6,190
1,4704,030
19,55010,660
41,340
1,1704,100
23,49011,670
47,530
120480860720
4,560
6001,1003,0001,800
11,000
1,0901,9102,7102,070
12,240
3105,820
17,76011,620
36,260
2,1209,310
24,33016,210
64,060
3,29013,41047,82027,880
111,590
as percentages of total borrowing in each period(—9./)
0.58.23.6
44.730.140.938.2
35.630.649.141.9
3.63.67.S2.6
18.28.26.36.5
33.114.25.77.4
9.443.437.741.6
64.469.450.958.1
100100too100
V) These figures are based on statistics of the distribution of interest-bearing securities only (direct and guaranteed).Figures for banks and Federal agencies and for the totals are rounded to the nearest $10 million.
(2) Member banks of the Federal Reserve System accounted for 90 per cent, of the total for all commercialbanks at thè end of 1942.
(3) In the original statistics (see Federal Reserve Bulletins) these two columns are rounded to the nearest$100 million; In this table the original figures are given for insurance companies and the odd tens of mil-lions necessary to make the four columns total correctly have been added to "all others".

— 256 —
48 hours, as was previously the case, new loans were open for subscriptionfor several weeks at a time in order to ensure a better distribution of thesecurities, a method somewhat similar to the continuous tap issues of market-able loans already obtaining in England and Germany. This technique wascombined with a number of war-loan "drives" by which a variety of long andshort-term government securities were offered for sale within a limited period:the first mixed "war loan" of this type in December 1942, comprising sixdifferent types of security, produced $13,000 million, of which the banks sub-scribed $5,000 million; in April 1943, the second war loan brought in$18,500 million, again including $5,000 million from the banks; and in September-October 1943 the third drive, from which the banks were excluded, produced$19,000 million.
Altogether the Treasury sold to investors other than banks over $24,000 millionin 1942; but, even so, the need for bank purchases was very great. In 1942member banks of the Federal Reserve System nearly doubled their holdingsof U. S. government securities and in 1943 the rise continued, as the followingtable shows.
United States — A l l Member Banks.
End of month
Assets
Reservebalances Loans
SecuritiesU.S. Go-vernment all other
Liabilities
Demanddeposits
0)
U.S. Governmentdemanddeposits
Timedeposits
Totaldeposits
in millions of dollars1940 June . . .
December1941 June . . .
December1942 June . . .
December1943 June . . .
13,75113,99212,95912,39612,29513,07212,093
13,96915,321
16,72918,021
16,92816,088
14,823
14,72215,823
18,07819,539
24,09837,546
46,980
5,7605,982
5,8525,961
5,7745,629
5,352
27,87730,429
32,67833,754
36,96642,570
48,957
711616
6191,709
1,7247,923
7,236
11,45911,687
11,89811,878
11,67312,366
13,382
42,03946,007
48,07651,192
53,43467,276
73,465
(') Adjusted, I.e. other than inter-bank and U.S.Government deposits and less cash items In process of collection.(?) Of individuals, partnerships and corporations. (3) Gross deposits exclusive of Inter-bank.
Other assets on balance have dec l ined . Bank loans , wh i ch had r isen rapidly
by over $4,000 mi l l ion f r o m J u n e 1940 t o December 1941, fe l l by $2,000 mi l l ion
in 1942 and by near ly $1,300 mi l l ion in the f i r s t half o f 1943. T h i s w a s the net
resul t of cont rary movemen ts : t he Federal Reserve res t r ic t ions of Sep tember 1941
on c o n s u m e r credi t were t i gh tened up in May 1942 and bank cred i ts fo r
non -war pu rposes con t i nued to dec l ine (in par t , at least, re f lec t ing the reduced
needs of bus iness fo r such f i n a n c i n g , as sales of au tomob i l es and other
c o n s u m e r s ' durab le g o o d s fel l o f f ) ; but cons iderab le cal ls were made on bank
cred i t as a d i rect consequence of the war . A t all commerc ia l banks in the
coun t ry the net dec l ine of bank loans exceeded $2,000 mi l l ion in 1942; loans
t o f i nance war con t rac ts increased by s o m e $1,700 m i l l i on , wh i l e loans fo r
o ther t han war pu rposes dec l ined by nearly $4,000 m i l l i on .

- 257 -
The provision of working capital(1) to American industry for war produc-tion has taken three main forms. Firstly, under the Act of 22nd June 1940, thearmy and navy were authorised to make direct advances up to 30 per cent,of the amount of the contract (and, later, a further 20 per cent, was allowedfor sub-contractors); these advances were at first free of interest but sub-sequently bore interest at 2% per cent. Secondly, on 9th October 1941, thissystem of "progress payments" was supplemented by the Assignment ofClaims Act, which permitted, for the first time, the assignment of claimson the government; by virtue of this provision, contractors could borrow fromthe banks on the collateral of a claim on the government. But this Act didnot do much, in reality, to expand the banks' lending facilities. Thirdly, anexecutive order of the President, made on 26th March 1942, authorised the Warand Navy Departments and the Maritime Commission to guarantee loans forwar production purposes; the bank making the loan pays for the guaranteea fee ranging from 10 to 50 per cent, of the interest collected, according tothe size of the guarantee. A number of large bank credits have beenobtained in this way(2).
The counterpart to the increase in the banks' lending to the governmentwas a rise of demand deposits, in all by some $16,000 million in 1942, therise being relatively greatest in agricultural districts. The distribution ofdeposits at the end of 1942 was very unusual, those of the public havingrisen by $8,800 million to $42,600 million while the government accounts hadincreased by $6,200 million to the very high figure of $7,900 million. Contrary tothe practice in other countries, the U. S. Government has accounts at the mostimportant commercial banks throughout the country, to facilitate the collectionand transfer of the proceeds of government loans — and, at the end of 1942,these accounts were exceptionally high owing to the current flotation of theVictory loan, the largest single borrowing operation in U. S. financial historyup to that date. Government deposits with the member banks were drawndown in the first quarter of 1943 to only $2,600 million in March, and otherdeposits increased; but government deposits rose again and in April andMay 1943, when other government loans were in course of subscription, theywere around $10,000 million, a record high level.
In the fifteen months to March 1943 demand deposits, both businessand personal, at all commercial banks in the country rose by $15,000 millionto $53,000 million. An exploratory survey made by the Federal Reserve Systemshowed that more than two-thirds of the total demand deposits belonged tobusinesses and less than one-third were personal (including the deposits offarmers); but of the increase of $15,000 million about three-quarters was dueto business deposits and one-quarter to personal deposits; business depositshad grown by one-half and personal deposits by only one-third. A further
0) Fixed capital, on the other hand, has been provided through the Reconstruction Finance Corporation andits subsidiary, the Defense Plant Corporation.
(5) Up to the end of December 1942, $2,700 million guaranteed loans had been authorised; of this amount$800 million were outstanding, $1,450 million were still available and $450 million had been repaid. By August1943, $5,150 million guaranteed loans had been authorised, of which $1,650 million were outstanding and$2,480 million still available while about $1,020 million had been repaid. About 80 per cent, of the loansoutstanding were covered by the guarantees.
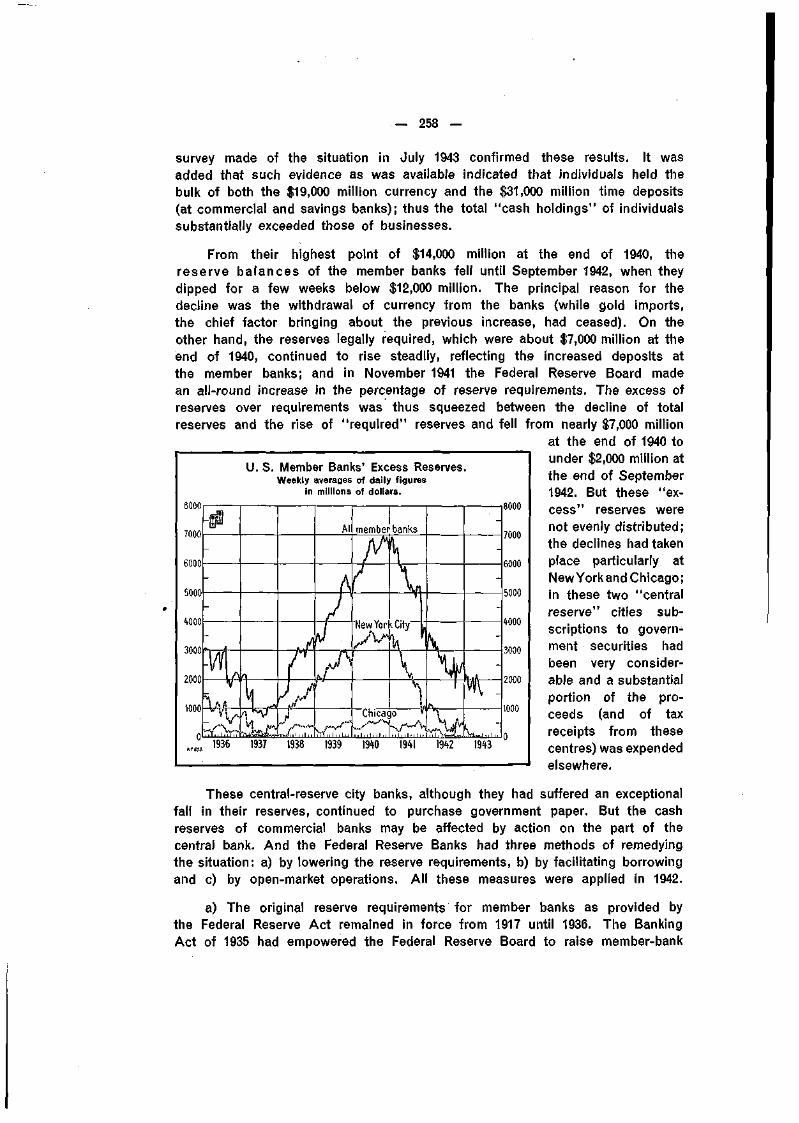
— 258 —
survey made of the situation in July 1943 confirmed these results. It wasadded that such evidence as was available indicated that individuals held thebulk of both the $19,000 million currency and the $31,000 million time deposits(at commercial and savings banks); thus the total "cash holdings" of individualssubstantially exceeded those of businesses.
From their highest point of $14,000 million at the end of 1940, thereserve balances of the member banks fell until September 1942, when theydipped for a few weeks below $12,000 million. The principal reason for thedecline was the withdrawal of currency from the banks (while gold imports,the chief factor bringing about the previous increase, had ceased). On theother hand, the reserves legally required, which were about $7,000 million at theend of 1940, continued to rise steadily, reflecting the increased deposits atthe member banks; and in November 1941 the Federal Reserve Board madean all-round increase in the percentage of reserve requirements. The excess ofreserves over requirements was thus squeezed between the decline of totalreserves and the rise of "required" reserves and fell from nearly $7,000 million
at the end of 1940 tounder $2,000 million atthe end of September1942. But these "ex-cess" reserves werenot evenly distributed;the declines had takenplace particularly atNewYorkand Chicago;in these two "centralreserve" cities sub-scriptions to govern-ment securities hadbeen very consider-able and a substantialportion of the pro-ceeds (and of taxreceipts from thesecentres) was expendedelsewhere.
U. S. Member Banks' Excess Reserves.Weekly averages of daily figures
in millions of dollars.
7000
6000
5000
WOO
3000
2000
1000
member banks
8000
7000
6000
5000
«00
3000
2000
1000
1936 19«
These central-reserve city banks, although they had suffered an exceptionalfall in their reserves, continued to purchase government paper. But the cashreserves of commercial banks may be affected by action on the part of thecentral bank. And the Federal Reserve Banks had three methods of remedyingthe situation: a) by lowering the reserve requirements, b) by facilitating borrowingand c) by open-market operations. All these measures were applied in 1942.
a) The original reserve requirements for member banks as provided bythe Federal Reserve Act remained in force from 1917 until 1936. The BankingAct of 1935 had empowered the Federal Reserve Board to raise member-bank

— 259 —
U. S.—Member Banks' Reserve Requirements.
Date of change (1)
1917 21st June . . .1936 16th August . .1937 1st March . .
1st May . . . .1938 16th April . . .1941 1st November.1942 20th August . .
14th September3rd October . .
Reserve requirements^) against:
Net demand deposits incentralreserve
city banksreserve
city bankscountrybanks
Timedeposits
(all banks)
in percentages
1319/222%26•22'A26242220
10
15
17/,20
17/,20
202020
7
10'/,
12/ 414
12
14
141414
0) Date from which new rates were effective (for 1917, original rates).(2) As percentage of deposits.P) New York and Chicago member banks only.(4) Member banks in ten other cities, where Federal Reserve Banks have seats.(5) All other member banks.
reserve requ i rements up
to a max imum of doub le
the or ig ina l percentages ,
and th ree increases were
made in 1936 and 1937
wh i ch ra ised the percent -
ages to th i s m a x i m u m ;
after a decrease in 1938
reserve requ i rements were
again ra ised t o the
m a x i m u m in November
1941. Changes made t o
that date app l ied to all
t he banks in equa l p ro -
po r t i ons . But on 7th Ju ly
1942 the Federal Reserve
A c t was amended to
a l low reserve requ i re -
ments fo r banks in the
t w o cent ra l - reserve c i t ies
other reserve c i t ies . Th i s permi t ted
of t he specia l pos i t i on of
34/ ,5%656666
to be changed separately f r o m t h o s e in
a mod i f i ca t ion in pol icy wh i ch t ook accoun t
New York and C h i c a g o : fo r these t w o cent ra l - reserve c i t ies the requ i rements
for reserves against demand depos i t s were reduced in A u g u s t , Sep tember
and Oc tober 1942, all toge ther re leas ing abou t $1,200 mi l l ion of reserve f u n d s
and leaving reserve requ i rements at a l i t t le less than one and a half t imes
the or ig ina l percentages (and at t he same percentage as in o ther reserve
c i t ies) . Fur ther , in A p r i l 1943, member banks were granted exempt ion f r o m
reserve requ i rements in respect of U. S . Gove rnmen t depos i t s represent ing
the p roceeds of war l oans .
b) Bo r row ing by member and o ther banks w a s a lso made s imp le r and
cheaper in 1942. W h i l e t h e Federal Reserve m i n i m u m buy ing rate f o r 90-day
bankers ' accep tances , wh i ch rough ly co r responds t o European bank rate,
remained at % per cent , (unchanged s ince Oc tobe r 1933), a rate of 3/s per
cent , was es tab l i shed as the buy ing rate fo r all T reasury bi l ls o f fered to the
Reserve Banks f r o m 30th A p r i l 1942 o n w a r d s . A n d in A u g u s t t he Reserve
Banks agreed tha t t he or ig ina l sel ler, at his request , m igh t repurchase such
bi l ls before matur i ty , at t he same rate. For member banks , th is a r rangemen t
made Treasury bi l ls pract ica l ly the equiva lent of c a s h .
D u r i n g March and A p r i l 1942 rates charged t o member banks fo r advances
secured by government paper were lowered at a number of Federal Reserve
Banks to 1 per cent . , and in Oc tobe r all Federal Reserve Banks es tab l i shed a
new rate of % per cent , fo r advances to member banks on gove rnmen t secur i t ies
wi th less than one year to run . These fac i l i t ies were l i t t le used , however , and
the pr inc ipa l in tervent ion by the Federal Reserve Banks was in the f o r m of
government -secur i t y pu rchases .

— 260 —
c) Open-market operations, which had been of minor interest for a numberof years, the Federal Reserve Banks holding of government securities remainingconstant at somewhat over $2,200 million, became of considerable importancewith the entry of the United States into the war. On 8th December 1941 theBoard of Governors issued a statement which contained the following passage:
"The system is prepared to use its powers to assure that an amplesupply of funds is available at all times for financing the war effort andto exert its influence towards maintaining conditions in the United StatesGovernment security market that are satisfactory from the standpoint ofthe government's requirements."
The Federal Reserve Banks thus had two main objectives of open-marketpolicy, (i) to strengthen the member bank's reserves against the increase oftheir deposits and to cover withdrawals of currency and (ii) to maintain orderlyconditions on the government bond market, especially when large issues werebeing made.
In addition, the Second War Powers Act, approved on 27th March 1942,amended the Federal Reserve Act to permit the Reserve Banks to purchasesecurities direct ly from the government, a form of transaction hitherto prohi-bited ; but the amendment expires at the end of 1944 and the Reserve Banksmay not hold at any one time more than $5,000 million government securitiesacquired directly. Acting under this authority the Federal Reserve Banks have,from time to time, purchased special one-day certificates, which were redeemedthe following day, in accordance with their terms; such certificates werepurchased particularly in June, September and November 1942, the largestpurchase in the year being $422 million on 30th November 1942.
U.S. Federal Reserve
Quarterlymovements
1941 January-March .April-June . . . .July-September .October-December
1942 January-March . .April-June . . . .July-September .October-December
1943 January-March. .
July-SeptemberC)Totals outstanding
end 1942
Banks — movement of pr inc ipal items.
Assets
Increases or decreases (—)of government security
holding
long-term
short-term(2)
total
Liabilities
Increases or decreases (—)
memberbanks'total
reservebalances
memberbanks'
excessreserves
FederalReserveNotes
Moneyin
circulation
(3)in millions of dollars
+ 60
+ 92+ 71+ 1,732—1,155— 688— 74
4,138
+ 10— 10+ 309+ 852+ 890+ 885+ 1,971+2,076
2,051
+ 70— 10+ 401+ 922+ 2,622— 270+1,283+ 2,002
6,189
— 655— 320+ 176— 777+ 125— 270— 713+ 1,525— 358— 674+ 402
13,117
— 839— 566— 41—2,084— 12— 711— 672+ 298— 470— 306+ 681
1,988
+ 223+ 578+ 497+ 957+ 449+ 723+1,270+ 1,502+ 561+ 1,104+ 1,266
12,082
+ 192+ 688+ 551+ 997+ 406+ 817+ 1,320+1,707+ 840+ 1,171+ 1,293
15,410
0) Treasury bonds (direct and guaranteed) and Treasury notes. (?) Treasury certificates and Treasury bills.(3) Total money in circulation besides its chief item, Federal Reserve notes, also includes Treasury currency, i.e.
principally silver currency and subsidiary coin. (4) Up to 22nd September.

- 261 -
The table on the opposite page shows that in 1941, in pursuance of theirmoderative policy, the Federal Reserve Banks hardly intervened in the marketat all, allowing the withdrawals of currency to fall directly on the memberbanks' reserves (and even reinforcing this effect on the excess reserves bythe increase of reserve requirements on 1st November).
With the entry of the United States into the war the picture was modifiedbut no big change took place until the second quarter of 1942, when $300 mil-lion odd of short-term securities were purchased, followed by $850 million inthe third and nearly $900 million in the fourth quarter; purchases of long-termgovernment securities (bonds and notes) were of less relative importance untilthe last quarter of the year, when $1,700 million were bought, making a totalof $2,600 million in this quarter. But Federal Reserve notes (and other moneyin circulation) rose considerably, especially in the second half of 1942, and itwas only in the last quarter of the year that the excess reserves of the memberbanks increased somewhat.
In the first half of 1943 the Reserve Banks were able to unload thelong-term securities they had bought in the last quarter of 1942, but theypurchased some $2,900 million of short-term paper, thus adding a further$1,000 million net to their holdings of U.S. government securities, whichattained $7,200 million in June 1943. Nevertheless, the excess reserves of themember banks declined by a further $800 million in the half-year to only$1,200 million in June 1943, excess reserves at New York and Chicago havingpractically ceased to exist.
The fact that the New York member banks no longer hold any appreciablecash reserves in excess of the legal requirements does not mean, of course,
that these banks have becomeU.S.— New York Member Banks. at all illiquid. On the contrary
they have built up large second-ary reserves of Treasury bills,which, as already mentioned,have, since August 1942, becomepractically the equivalent of cash.In addition, since certificates ofindebtedness were first issued,in April 1942, a large reserveof such securities, having atmost one year to run, has alsoformed part of the liquidity pro-vision of the banks.
In spite of war conditions, the expansion of currency and bank depositsand the vast borrowing programme of the government, interest rates didnot vary much during the period under review. Shor t - term yields havestiffened somewhat since 1941 but remain very low; the reductions of someFederal Reserve rates and the fixing of the new rate for the purchase ofTreasury bills (and the later resale arrangement) were not drives towards
Monthly averages
1941 MarchJune . . . . . .September . . .December . . .
1942 MarchJuneSeptember . . .December . . .
1943 MarchJune
Excessreserves
TreasuryBills
Certificatesof
indebted-ness
in millions of dollars3,2032,2381,834
9899625563024169622
227582495365334391735
1,7371,8142,092
297962
1,4781,9662,539

— 262 —
cheaper money but rather defensive moves against the rising trend of marketrates. The rate for 3-month Treasury bills, which dominates the short-termmarket, rose from an average of 0.014 per cent, in 1940 to 0.103 per cent, in1941 and 0.326 per cent, in 1942; the Federal Reserve purchase rate effectivelyprevented a rise above 0.375 per cent, in the first half of 1943.
As regards the rates for commerc ia l -bank loans, a survey under-taken by the Federal Reserve Board in the spring of 1942 showed that, whilethe average rate was 3% per cent, for both war and non-war purposes, largeborrowers (with assets of over $5 million) paid, on the average, rates onlyone-third of those paid by small borrowers (with assets of $50,000 or less),i.e. 1.8 per cent, against 5.5 per cent. Apparent regional differentials werelargely accounted for by differences in size and business of the borrowerconcerns, although some shifting of the rate structure towards relatively lowerrates in the middle west seemed to be evident. A striking fact brought outby the survey was that, in spite of the persistent cheap-money policy, thecommonest rates were very similar in 1936 and in 1942; for reasons connectedwith the collection of the data, however, it seems probable that there wasactually some slight reduction of rates over the period. Since the spring of1942 there has been evidence of some hardening of conditions: the averagerate for commercial loans by banks in New York City rose from the recordlow level of 1.85 per cent, in March 1942 to 2.70 per cent, in June 1943.
On the long-term market the average rate for tax-exempt Treasurybonds (of more than twelve years' maturity), which had fallen from 2.21 percent, in 1940 to 1.95 per cent, in 1941, rose to 2.02 per cent, in 1942. Butthe best measure of the trend of long-term rates is given by the terms ofrecent issues of taxable Treasury bonds for cash. Before December 1941the interest rate on these bonds was maintained at 2% per cent., while thematurities were lengthened. An attempt to improve loan conditions was made at
the beginning of DecemberU.S. Treasury Bond Issues. 1941 (before the outbreak of
hostilities in the Pacific)with an issue at 2 percent, having 10-14 yearsto run; but this rate wasafterwards maintained onlyin the case of issues for7-9 years. For longer issues2y2 per cent, was paid.Public cash subscriptionsexceeded the totals issuedby amounts which wereconsiderable in 1941 butless so in 1942. There ap-pear to be three principalreasons for this recession:
(i) A further tranche of the October Issue. (2) Issue not available to banks. a) the loans Were much
Date of Issue
1941 March . . . .JuneOctober . . .December . .
0) •1942 February. . .
May('). . . .
JulyAuguste2) • •October . . .December (*).
1943 April P). . . .
Rate ofinterest
per cent.
2'A2'A2'A22V,2%2%222%22'A1%2%2
Maturityin
years
11-1315-1726-3110-1426-3110-1320-257-97-9
20-257-9
21-265
21-267-9
Issuedto
public
Publiccash sub-scriptionstendered
in millions of dollars530660
1,310530
1,0701,510
8801,2902,1001,2401,9602,8303,0603,7604,930
6,1408,270
10,4504,7306,9804,700
8803,2803,8501,2401,9602,8303,3603,760
12,760

— 263 —
larger b) they were so priced as to offer little profit on prompt resales andthus did not attract speculative money and c) the issues, in some cases(as for the 2% per cent, bonds of May 1942), were not specifically limitedand all subscriptions received allotments. A record oversubscription was madeto an issue available to banks in April 1943.
A Financial Control Association was set up in Japan in May 1942 to workin close cooperation with the Bank of Japan and the Ministry of Finance,in the drawing-up of plans for the covering of the government's financialrequirements and the carrying-out of these plans. The Association prescribesthe amounts to be "saved" by various institutions in each quarter of the yearand allocates the amount of government bonds to be taken up. The plansare based on estimates of the national income, the main lines for the distri-bution of which are given in the table. Thus, in 1942-43, it was planned to
raise Yen 7,000 mil-Japanese National Income — d i s t r i b u t i o n ^ . lion by taxation while
Yen 23,000 million(direct governmentborrowing plus theinvestment item) wasto be covered by sav-ings. Actually taxationand other receiptsof the Treasury pro-duced Yen 6,570 mil-lion in 1942-43 andfigures have beenpublished to showthe amount "saved"at Yen 23,460 million.
Financial yearsending March
1941-42 . . .1942-43 . . .1943-44 . . .
Government needs
Taxationand otherreceipts
C2)
Borrow-ing
(3)
Total
Capitalinvest-ment
(4)
Privatecon-
sumptionTotal
in milliards of yen
57
10
131721
182431
566
171513
404550
0) The method of calculating the national Income Is not known and thefigures are probably not directly comparable with those for western countries.
(2) This Item corresponds approximately to the ordinary budget of the13 ministries, which is, however, partly covered by borrowing.
(3) This Is the aggregate of military expenditure, spread over some 49 specialbudgets, mostly covered by borrowing.
(') For the strengthening of the war economy and covered by borrowing.
These figures, which apply to "money-capital formation", are repro-duced in the following table, together with the quotas fixed to cover the
Yen 27 milliard consideredJapanese "savings"^) .
Financial years ending March
Through institutions:
Credit cooperatives
Total . . . . . . . . .Private purchases of securities .
Total "savings" . .
1942-43 1943-44
in milliards of yen
9.213.352.312.87
17.745.72 (2)
23.46
10.34.22.73.5
20.76.3
27.0
0) i.e. money-capital formation (excluding the Bank of Japan).(2) Postal life assurance Yen 0.54 milliard, postal pension fund
Yen 0.29 milliard, trust companies Yen 0.55 milliard, insurance com-panies Yen 1.27 milliard and finance companies Yen 0.22 milliard.
necessary for 1943-44. Forthe first half of the finan-cial year, April to September1943, total "savings" havebeen given as Yen 13,750million.
The budget estimatesfor 1943-44 show total expen-diture at Yen 40,280 million ;but, of this total, Yen 4,200million represents transfersbetween the budgets ; and

- 264 -
Yen 3,300 million of the military expenditure is to be met by "borrowing"in the occupied territories — a term which covers the issue of notes by
the South Seas DevelopmentJapanese Budge t Expend i t u re . Bank*. Revenue to be raised
in Japan is thus aroundYen 33 milliard (rather higherthan that shown in the tableon page 263, probably as aresult of the two supple-mentary budgets ; a thirdsupplementary budget, forYen 620 million, was passedin June and a fourth, forYen 129 million, in November1943).
The accumulation of the budget deficit since the opening of the "Chinaincident" in the middle of 1937 is best shown by the issues of governmentbonds since that time.
Japanese Government internal bond issues and tota ls outstanding.
Estimates for 1943-44
first supplementarysecond supplementary
Sub-total . . .
Sub-total . . .
Total budget expenditure
In millionsof yen
10,0002,350
93013,28021,00034,2806,000
40,280
Quarterly
April-JuneOctober-December. . . .Issued during year . . .
Total outstandingat end of year
1937 1938 1939 1940 1941 1942 1943
in millions of yen185
7212
1,1091,513
10,585
932905
1,1121,4014,350
14,935
1,1301,1031,4171,6695,319
20,254
1,3751,4181,3292,6336,755
27,008
1,6032,0482,1703,2719,092
36,101
3,1493,8373,3043,866
14,156
50,256
3,9664,700»3,800*
•
• Preliminary.
The total internal bonded debt has risen from Yen 9,000 million at theend of 1936 to Yen 50,000 million at the end of 1942 and was increasing in 1943at a rate of over Yen 15,000 million a year. This vast expansion of thepublic debt lends interest to the table on the opposite page, which showsthe principal holders of government bonds and indicates how the new issueshave been placed.
Over the six-year period some 70 per cent, of the issues have beenplaced with the various institutions shown (and further amounts with insur-ance and trust companies); the Bank of Japan has taken 12-13 per cent,of the total issues.
Japanese government borrowing has been almost exclusively by the issueof 3% per cent, bonds at 11-17 years. These bonds are taken up in the first
In the course of the budget debate the Minister of Finance stated that a further Yen 1,600 million wouldbe raised in the occupied territories from the sale of requisitioned goods.

— 265 —
Japan — pr inc ipal holders of government bonds.
Yearly figures
Total outstandi1936193719381939194019411942
1 ncrease during193719381939194019411942
Total increase1937-42
Bankof
Japan
ng at enc829
1,3871,8412,4173,9495,3405,842
year558454576
1,5321,391
502
5,013
Percentage] of bond issue193719381939194019411942
Average.for '"period 1937-42
36.910.410.S22.715.33.5
12.2
Otherspecialbanks
of year323342708
1,0821,0841,6342,143
19366374
2550509
1,820
taken by1.38.47.006.03.6
4.4
Other institutions
Commer-cial
banks
2,5612,5003,6344,6185,9577,944
11,329
(-61)1,134
9841,3391,9873,385
8,768
TreasuryDeposit
Bureau (1)Savingsbanks
in millions of
1,9102,2483,1774,6746,4658,129
11,251
338929
1,4971,7911,6643,122
9,341
various investors_
26.77S.579.627.923.9
21.3
22.321.428.226.518.322.1
22.7
1,0161,1451,4241,8732,5833,3074,712
129279449710724
1,405
3,696
8.56.48.4
10.58.09.9
9.0
Total
yen
5,8106,2358,943
12,24716,08921,01429,435
4252,7083,3043,8424,9258,421
23,625
2S.762.362.156.954.259.5
57.4
Totalinsti-
tutions
6,639!» 7,6221'10,78414,66420,03826,35435,277
9833,1623,8805,3746,3168,923
28,638
65.072.772.979.669.563.0
69.6
Otherinvestors
2,4332,9634,151j,5,590 *6,9709,747
14,979
5301,1881,4391,3802,7775,232
12,546
35.027.327.120.430.537.0
30.4
Total
9,07210,58514,93520,25427,008
i36,10150,256
1,5134,3505,3196,7549,093
14,155
41,184
100100100100100100
100
(') Recipient and investor of the Postal Savings Bank's funds.(2) Including trust companies and insurance companies, which together held about Yen 1,130 million at the
end of 1939 and for which no later figures are available.
place by-the Bank of Japan, which sells them to other investors. Theevolution of the balance sheet of the bank thus depends primarily on theproportion of the bonds issued which are not absorbed by the public butleft remaining in the bank's portfolio.
In 1941, the Bank of Japan took up Yen 1,400 million government bondsand the note circulation rose by Yen 1,200 million; in 1942, the bank took uponly Yen 500 million government bonds; but the note circulation rose againby Yen 1,200 million, while the government built up its deposit account bysome Yen 1,200 million odd. The explanation lies in an expansion of central-bank credit mainly to the banks (against discounts or advances) in order thatthey might purchase their quota of government bonds; a noteworthy counterpartto these purchases was the even greater accumulation of government deposits;these two influences continued in the first quarter of 1943. In the six-yearperiod from the end of 1936 to the end of 1942 the Bank of Japan tookup Yen 5,000 million government bonds, while the note circulation rose byYen 5,300 million (to nearly four times its former level).

- 266 -
Bank of Japan(1).
Near end ofmonth
Assets
Gold andforeign
exchangeDis-
countsand
advances
Govern-mentbonds
Agencies'accounts
Totalbalancesheet
Liabilities
Notecircu-lation
Govern-ment
deposits
Guaran-teed
depositsCurrentaccounts
In millions of yen1936 December1937193819391940
1941 March . .June . . .SeptemberDecember
1942 March . .June . . .SeptemberDecember
1943 March . .June . . .
599853556553566
593585572550
546564675566
579602
745628509
1,065819
652575518904
497373386
1,586
1,605862
8291,3871,8412,4173,949
3,5724,0254,1195,340
5,0185,8875,6725,842
5,6417,387
3457
110198289
286322373466
411492536
1,001
1,6331,777
2,5123,0393,4774,7256,141
5,6236,0216,0867,751
6,8557,9508,002
10,306
10,23411,036
1,8662,3052,7553,6794,777
4,1974,2164,4845,979
5,1435,4195,3707,149
6,5687,155
227303286547738
938839877824
8811,2981,6152,045
2,5422,525
———
170200260
221220245302
264169
129132131162229
121205121186
166237244356
378362
(') The December figures in the top part of the table are from the balance sheets made up at the end of theyear. Quarterly figures for 1941 and 1942 are made up from the weekly returns, the nearest available tothe end of the month,
0') Shown as two items, gold coin and bullion and foreign agencies' accounts, up to the end of 1940 and sincethen as one item, bullion and foreign accounts.
(3) "Government bonds" only In the balance sheets, but the weekly returns give "government bonds andother securities". The holding of other securities must be very small.
(') The reserves of the Banks of Chosen and Taiwan, held up to 1941 in the form of notes of the Bank ofJapan. These two banks had an aggregate note issue of Yen 1,198 million at the end of 1942 againstYen 994 million at the end of 1941.
T h e deve lopment of t he s i tuat ion of t he Japanese c o m m e r c i a l
is s h o w n in the f o l l ow ing tab le .
banks
Japanese bank deposits etc.
End of month
1937 December . . . .1938 „ . . . .1939 „ . . . .19401941 March
JuneSeptember. . . .December . . . .
1942 MarchSeptember. . . .December . . . .
1943 MarchMay
Commercial banks
Advances I nvest-ments Deposits(')
Depositsin otherbanks«
Allbank
depositsMoney
intrust (3)
TreasuryDeposit
Bureau (4)
in millions of yen7,7128,716
11,15213,55413,36313,72713,81715,14315,27516,33516,59417,65818,44619,020
4,6456,1237,7919,624
10,29811,71712,15512,78113,64514,86415,29216,97917,31218,108
12,35215,07319,79424,39023,73926,81826,06929,40628,93932,80031,92635,73836,05837,564
3,3954,0445,2986,8007,1257,7038,0448,3958,7829,622
10,17210,83112,07211,896
15,74719,11725,09231,19030,86434,52134,11337,80137,72142,42242,09846,56948,13049,460
1,8652,0452,3232,6032,7102,8612,9433,0473,1503,2803,4063,5183,6903,814
3,9054,7156,0828,1488,6719,2609,813
10,16911,07912,12413,10313,81615,155
0) Of the Yen 37.6 milliard in May 1943, Yen 19.0 milliard were time deposits bearing interest at 3.3 per cent.(2) Special banks (excluding the Bank of Japan) accounted for Yen 3,350 million and savings banks for
Yen 7,480 million at the end of 1942.(3) At trust companies, which are closely connected with the private banks.(") Deposits from Postal Savings Bank.

— 267 —
In 1942 the security holding of the commercial banks rose by Yen4,200 million and advances, largely to the armament industry, expanded byYen 2,500 million; the increase of deposits was by only Yen 6,300 million.Contrary to developments in many other countries, the government's war finan-cing has not led to a high degree of liquidity of the market and repayment ofbusiness credit; this characteristic feature of Japanese conditions is doubtlessdue in a large measure to the fact that the whole of the government's borrowinghas been at long term while the banks have been called upon to satisfy thegrowing credit needs of the war industries. The tightness of the market wasindicated by the borrowing of the banks at the Bank of Japan in order to takeup their quota of government securities at the end of 1942. The commercialbanks have maintained their position with nearly 80 per cent, of all bankdeposits in the country.
Further steps in the large-scale plan of simplification and rationalisationof banking in Japan were taken in 1942; two notable fusions of old-established "banques d'affaires" with modern deposit banks were those of theMitsui Bank with the Daischi Bank and of the Mitsubishi Bank with theDaihyaku Bank. Of the seven leading Japanese banks it is planned that fourshall survive the process of concentration while many of the small and medium-sized banks will be absorbed. A decree of 20th May 1943 permitted the ordinarybanks to accept savings deposits and transact trustee business, thus furthertightening the links between these classes of business and favouring theconcentration of the banking system. The reorganisation of the YokohamaSpecie Bank is mentioned on page 53.
The Wart ime Financing Bank wasfinancing which was vital to the war effort
Japan - I n t e r n a l Bonds Issuedand Redeemed .
Calendar years
193719381939194019411942
193719381939194019411942
Local go-vernment
bondsBankbonds
Corpora-tion
bondsTotal
in millions of yenNew Issues *
252180261227170299
654845539
1,3911,7672,733
337665
1,2851,3252,1052,338
1,2431,6902,0852,9434,0425,370
Internal Loans Redeemed
222147143167148186
206559275256281539
283172191242280357
711878609665709
1,082
Including refunding.
created early in 1942 to undertakebut of a nature unsuited to existinginstitutions. No returns have beenpublished but it was stated inOctober 1942 that the bank hadgranted credits of Yen 400 million,mainly without security; the usualrate of interest for ten-year creditswas 4.8 to 5 per cent. The bank'srequirements of funds for 1943 havebeen placed at Yen 1,500 million,of which Yen 1,000 million was tobe obtained by the issue of bondsand Yen 500 million from theIndustrial Bank or Treasury DepositBureau; Yen 1,300 million was tobe utilised for advances to theBarter Trading Corporation and tothe principal key industries, andYen 200 million was earmarked forinvestments.

— 268 —
In addition to the huge bond issues of the government the capitalmarket has taken up an increasing amount of private bond issues, particu-larly those of the banks and industrial corporations as the previous tableshows. Interest rates have remained without any notable changes. Govern-ment bonds of 11-17 years bear interest at 3% per cent, and are issued at 98.Bank rate has been unchanged at 3.285 per cent, since April 1936; at thisrate also the bank lends against the collateral of government bonds, i.e.at a rate below the yield of the bonds themselves. The Central Bank ofManchou lowered its discount rate from 4.2 to 4 per cent, in April 1943(while the issue price of government bonds was raised from 96 to 98).
In a discussion of the financial sources covering war expenditure in theIntroduction of this Report (page 15 onwards) the different methods of meetingbudgetary expenditure have been arranged as a sort of "hierarchy" from thepoint of view of their efficacy in resisting inflation. The illustration of thesemethods by specific examples is attended by some difficulty since "genuinesavings" are not easy to define and still less so to measure directly. But someapproximation can be made. Total government expenditure is known for manycountries and also the amounts covered by taxation (and other current revenue)and by borrowing. Further, the amounts borrowed by the government fromthe commercial banks and from the central bank can generally be found inpublished statistics so that the amount borrowed "from others than banks"may be ascertained.
In normal times the residual item thus obtained does not give even anapproximate measurement of the aggregate genuine savings of a community,as private credit operations are then of considerable importance; this wastrue of the United States, for example, even in the years 1940 and 1941. Butin countries which have been at war for some years, such as the UnitedKingdom and Germany, private credit operations unconnected with the wareffort have practically ceased : the increase of the note circulation and ofcommercial-bank deposits can be taken as approximately equivalent to govern-ment borrowing from the central and commercial banks respectively. (It istrue that some repayment of the banks' business advances may continue,but this is to a great extent offset by the larger cash reserves held bythe banks.)
In other words, the total formation of "money capital" is approximatelyequal to government borrowing; this is confirmed by careful estimates of"money-capital formation" made in Germany since the war and reproducedon page 180 of this chapter. Borrowing from other investors than banks thengives some approximation to genuine savings in money form*. The additionof taxation (and other current revenue) to these statistics of money-capitalformation and their reproduction in the form of the hierarchy is shown in thedetailed tables, which also give similar figures for the United Kingdom.
* Genuine savings may, of course, also be held as commercial-bank deposits in both England and Germanybut this would hardly affect the comparability of the figures.

— 269 —
United Kingdom and Germany —Analys is of Government Financing 1940-42.
Sources covering government expenditure
Internally financed :Taxation and other current internal
revenueNon-bank borrowing:
savings issuesother (residual item)
Total taxation and non-bank borrowing .Borrowing from savings banksTotal other than commercial banking
systemBorrowing from commercial banks . . .
Total banking systemTotal expenditure internally financed . .Externally financed :
Current revenueBorrowing
Total externally financed
Total expenditure
As percentages of expenditureinternally financedTaxation and other current internal revenueNon-bank borrowing:
savings issuesother (residual item)
Total taxation and non-bank borrowing .Borrowing from savings banksTotal other than commercial banking
systemBorrowing from commercial banks . . .
Total banking systemTotal expenditure internally financed . .
United Kingdom
1940 1941 1942 Total1940-42
in millions of £ sterling
1,259
316413
1,988128
2,11640562
4672,583
756756
3,339
1940
1,823
"380644
2,852221
3,073611135746
3,819
797797
4,616
1941
2,343
3531,0213,717
238
3,955345171516
4,471
225632857
5,328
1942
5,430
1,0492,0788,557
587
9,1441,361
3681,729
10,873
2252,1852,410
13,283
Average1940-42
Germany
1940 1941 1942 Total1940-42
in milliards of RM
29.1
10.639.78.9
48.68.92.3
11.259.8
5.51.57.0
66.3
1940
34.1
11.946.014.2
60.28.35.5
13.874.0
13.06.0
19.0
93.0
1941
45.7
1.011.958.620.0
78.65.65.0
10.689.2
21.77.0
28.7
117.9
1942
108.9
1.034.4
144.343.1
187.422.812.835.6
223.0
40.214.554.7
277.7
Average1940-42
in percentages48.7
72.216.076.95.0
87.975.72.4
18.1100
47.9
9.976.974.75.8
80.516.03.5
19.5100
52.4
7.922.883.15.3
88.57.73.8
77.5100
49.9
9.619.178.75.4
84.112.53.4
15.9100
48.7
77.766.474.9
87.314.93.8
78.7100
46.7
76.762.279.2
87.411.27.4
18.6100
5 7.3
7.773.365.722.4
88.16.35.6
77.9100
48.9
0.415.464.779.3
84.070.25.8
16.0100
These statistics are a combination of material regarding government financing and money-capital formation ;although the comparison is particularly of sources covering expenditure internally financed, external sourceshave been added to give a complete picture. For the United Kingdom the figures are mostly based ondata given earlier in this chapter, but with the slight adjustments to revenue and expenditure made in thebudget White Paper analysis. To make comparison with Germany possible, government borrowing from the centraland commercial banks is taken as equal to the increases of currency in circulation and of all commercial-bankdeposits respectively. Savings-bank deposits and savings issues are taken from the Bank of England'sStatistical Summary. "Other" internal borrowing is ' the residual item and therefore comprises errors andomissions also. External current revenue in 1942 is the Canadian contribution and external borrowing corres-ponds to overseas disinvestment; although the Canadian contribution is similar in effect to United Stateslend-lease (which is excluded), it appears appropriate to include it for the sake of comparability with previousyears (when payments to Canada were included as overseas disinvestment). The German figures are basedon the statistics given earlier in this chapter, including the analysis of money-capital formation as estimatedby Dr. Keiser. To the known internal sources other than banks (insurance companies, market etc.) have beenadded the residual, or "unknown", sources, which, as Dr. Keiser remarks, may, however, be partly foreign ; butthis addition only raises the total infernal borrowing by 3% per cent, and hardly affects the percentages based onthis total. Internal current revenue is taken from the table on page 173 of this chapter; for 1942 the whole of theRM 7.7 milliard of the rent-tax payment has been included as taxation (although a certain part of this totalwas raised by private borrowing) and the RM 4 milliard paid only in the first half of January 1943 has beendeducted from total borrowing and from borrowing from the commercial banks. External current revenueconsists of occupation costs (given on page 173) plus Reichskreditkasse (page 174); external borrowing appliesto the Verrechnungskasse (page 180). The total expenditure corresponds to the table on page 173.
As regards comparability of the figures it should be noted that "borrowing from the commercial banks"for the United Kingdom represents the increase of all commercial-bank deposits (of which the clearing banksaccount for somewhat over 80 per cent.) ; for Germany the figures are the increase of all "giro" accountsat banks, at savings banks and on postal cheque accounts etc. "Borrowing from savings banks" in theUnited Kingdom is the increase of savings deposits at the postal savings and trustee savings banks but forGermany applies to all savings deposits in the country, whether at the savings banks or not.

— 270 —
In making an analysis of this nature a number of difficulties arise, as re-gards both methods and material, and certain reservations must be made whichare evident from the footnote to the table. Thus for England the Canadiancontribution is included as current external revenue and for Germany thewhole of the RM 7.7 milliard rent-tax composition is classed with internalcurrent revenue in 1942 although, for technical reasons, some RM 4 milliardof the tax was finally paid over to the Treasury in January 1943 and a certainfraction of the funds was actually raised by private borrowing. However, inspite of such difficulties and of the minor errors inherent in the material used,it is believed that, by and large, the analysis gives a reasonably correct viewof developments up to the end of 1942.
In addition to the broad lines of comparison made in the Introduction,the table brings out a number of interesting features of war financing in thetwo countries. In the three years 1940-42, somewhat under one-fifth of totalbudget expenditure was "externally financed" in both Germany and the UnitedKingdom — but this excludes lend-lease aid received by the United Kingdomand German requisitions and other levies in the U.S.S.R.
As regards expenditure "internally financed", the tables point to oneconsiderable difference in financing methods: in Germany, no special issuesof government securities have been made for "small savers", a consequenceof the "noiseless" financing through banks and other institutions — theRM 1 milliard placed under this heading in the table for 1942 represents thevolume of "iron savings", the nearest German equivalent to a savings issue:but in the United Kingdom savings securities accounted for nearly 10 per cent,of internally financed government expenditure. Ordinary savings deposits arethree to four times more important in Germany, as a source of governmentfinancing, than they are in the United Kingdom. And, as these deposits aremade for periods of at most one year, the money is not tied up as it is ina special savings security; savings deposits which may be withdrawn thustend to "deconsolidate" the government long-term debt. All "small savings"together (savings deposits and savings securities) accounted for 15 per cent,of the total internally financed in the United Kingdom and nearly 20 per cent,in Germany; for "other investors", that is insurance companies, other institutionsand private individuals, the percentages are roughly reversed: 15 per cent, inGermany and 21 per cent, in the United Kingdom.
For reasons already mentioned, it is not possible to make an analysis ofgovernment financing in the United States in the same form as for theUnited Kingdom and Germany; but statistics are regularly published regardingthe principal holders of government securities in the United States and thesemay be combined with the budget figures as in the following table.
It will be seen that the expansion of currency and credit in the threeyears, at almost $38 milliard, was appreciably greater than the purchases ofgovernment securities by the banking system as a whole at nearly $29 milliard.But in the three-year period the United States was actually at war for only

- 271 -
United States — analysis of government f inancing 1940-42.
Sources coveringgovernment expenditure
Govt securities taken byFederal Reserve Banks. .All commercial banks . .
Total . . .Other investors
Total government borrowingTaxation and current internal
revenueMovement of official
balancesTotal expenditure
Expansion ofcurrencyand credit - annuallyMoney in circulation . . .Bank deposits*
Total annual increases . . .
1940 1941 1942 Total1940-42
in millions of dollars
C—300)1,4651,1652,1283,293
5,835
5319,660
704,0304,1009,308
13,408
8,848
(—3,205)19,052
3,93519,55023,48524,33847,823
16,403
(—8,206)56,020
3,70525,04528,75035,77464,524
31,086
(-10,880)84,732
in millions of dollars
1,1346,6327,796
2,4285,9048,332
4,25017,50521,755
7,81230,04137,853
1940 1941 1942 Average1940-42
in percentages
(-3./)15.112.022.134.1
60.4
5.5100
0.321.221.548.970.4
46.4
(—16.8)100
7.034.941.943.485.3
29.3
(—14.6)100
4.429.533.942.276.1
36.7
(-12.8)100
in percentages
14.985.1
100
29.170.9
100
19.580.5
100
20.679.4
100
* All banks except Mutual Savings banks.
one full year. And in this year an important change took place: in 1940 and1941 together $5.3 milliard government securities were taken by the bankingsystem but the expansion of currency and bank deposits was $16.0 milliard —in other words, the extension of credit on private account was still verygreat; in 1942 the banks bought $23.5 milliard government securities butcurrency and credit expanded by only $21.9 milliard — thus private credit wasrepaid on balance in this year. In the first six months of 1943 the latter trendcontinued: the banking system took up $1^.8 milliard of government securitiesbut currency and credit expanded by only $9.4 milliard, and there can belittle doubt that net money-capital formation fell well below the figures forgovernment borrowing.
The table given above is somewhat imperfect, since the real utilisation ofcentral-bank credit in the United States was greater than the Federal ReserveBanks' purchases of government securities during the period. Gold acquisitionsand open-market purchases of securities in earlier years had led to anincrease of member-bank reserve balances, greatly in excess of requirements;central-bank credit was thus created which lay dormant for some years. Theactual utilisation of this previously created credit corresponds approximately to thenet decline of member banks' excess reserves. The table on the following pageshows that in the two years 1941 and 1942 newly created Federal Reserve creditamounted to only $4.4 milliard but, in the same period, the utilisation ofpreviously created credit came to $4.6 milliard, giving a total of $9.0 milliard.Together with an increase of nearly a milliard in the gold stock (and themovement of sundry other items) this total utilisation of central-bank creditcovered an increase of the member banks' required reserves by $3.7 milliard andan expansion of money in circulation by $6.7 milliard in the two years 1941 and 1942.

272 —
United States — Total u t i l i sa t ionof Federal Reserve credit.
Calendar years
1940 (twelvemonths)19411942 „1943 (nine months)(c)
Previouslycreated
P)New(2)
Total
in millions of dollars(—1,410)
2,3302,300
90
(- 320)90
4,3203,040
(—1,730)2,4206,6203,130
(1) The decline, or increase (—), of member banks' excessreserves. An adjustment has been made to this columnto take account of the changes made in the percentagesof required reserves In 1941 and 1942, $1,200 million(the estimated effect of the changes) being deductedfrom 1941 and added to 1942.
(2) Including certain miscellaneous items, in addition to the
With the decline of excess reservesto little over $1,000 million in thesummer of 1943 the total of pre-viously created credit was practicallyexhausted and the commercialbanks became more dependentupon Reserve Bank credit freshlycreated, i.e. upon Reserve Bankpurchases of government securities.
Government borrowing fromthe banks was still running veryhigh in the United States in 1942;one reason for this was the
purchases, or sales (—), of government securities shown verv rapid expansion of Federalin the previous table.(?) 1st January to 22nd September 1943. expenditure. Whereas from 1940
to 1942 government expenditure(internally financed) rose by 50 per cent, in Germany and 75 per cent,in the United Kingdom, the increase in the United States was at the rateof 480 per cent. But it must be borne in mind that these figures refer tocentral-government expenditure only and that the United States is a federationof States, each with a separate budget. Whereas in the United Kingdom andin Germany the aggregate of local-government expenditure is barely one-twentieth of the central-government expenditure*, in the United States the situationhas been very different: Federal budget expenditure, although having doubledin the years 1932 to 1939, became equal to the aggregate of State andlocal authorities' expenditure only in the latter year, and it was from theinception of the defence programme in 1940 that Federal expenditure definitelydrew ahead; although by 1942 State and local expenditure had fallen to only14 per cent, of Federal expenditure, it was, proportionately to the centralbudget, still three times as great as in Germany and the United Kingdom.
While the expansion of Federal expenditure from 1940 to 1942 wasby 480 per cent., the expansion of tota l government expenditure (central andlocal) was by 250 per cent. only. In the accounts of the Federal Government,
United States — Federal, State and local budgets.
Calendaryears
Federal . .State
and local
Total . . .
Expend iture
1939 1940 1941 1942
Revenue
1939 1940 1941 1942
Deficit
1939 1940 1941 1942
in milliards of dollars8.9
8.9
17.8
9.7
8.618.3
19.1
8.527.6
56.0
8.064.0
4.9
8.713.6
5.8
9.114.9
8.8
9.518.3
16.4
9.726.1
4.0
0.24.2
3.3
(+0.5)3.4
10.2
(+1.0)9.2
39.6
(+1.7)37.9
This relationship is, of course, largely due to war conditions: since the last complete year of peace, budgetexpenditure in the United Kingdom and Germany has expanded by 4—5% times while local-governmentexpenditure has been compressed; thus local-government expenditure (excluding extra-budgetary funds) hasfallen in relation to expenditure of the central budget in the two countries from around 20 per cent, in 1938to about 4 per cent, in 1942.

— 273 —
In millions of nationalcurrency units
1939 December. . .19401941 „ . . .1942 „ . . .Percentage increase
1939-1942 . . . .
England
Elevenclearingbanks'
deposits
2,4412,8003,3293,629
49
Germany
SixGross-bankendeposits
9,68413,45017,22020,488
112
UnitedStates
Memberbanks'
deposits
39,93046,00751,19267,276
68
current revenue fell from 60 per cent, of expenditure in 1940 to only 29 per cent,in 1942, but total revenue (central and local) declined from 81 per cent, to41 per cent, of total expenditure.
The degree of expansion of currency and credit which government borrow-ing from the banks provokes in a country depends not only on the per-centage of government expenditure financed in this way but also upon therelat ive size of the banking system. As shown in the Introduction, thebanking and currency structure is, in relation to budget expenditure, proportionatelytwice as large in the United Kingdom as in Germany*, so that the same per-
centage of expenditure financed byExpansion of bank deposi ts 1939-42. borrowing from the banks in the two
countries would cause an expansionof currency and credit in Germanytwice as large as in the UnitedKingdom. That something of thisnature has actually happened is con-firmed by the accompanying table,which shows that bank depositsfrom 1939 to 1942 rose by nearly50 per cent, in the United Kingdomand more than doubled in Germany.
In the United States, however, the expansion of bank deposits has beengreater than in the United Kingdom, partly because the proportion of budgetexpenditure financed through the banks has been larger and partly as a resultof the expansion of private credit in 1940 and 1941.
The financing of government expenditure through the banking systemraises the question, so vital for the banks, of the extent to which theassets of the banks cons is t of government secur i t ies , a factordetermining their earning power and their power to grant credit to theprivate economy of the country. Government securities held direct ly bythe commercial banks represent nearly 50 per cent, of total deposits in theUnited States and over 60 per cent, in England and Germany; but theAmerican percentage is rising more rapidly than that of the other twocountries. If government securities held ind i rect ly (through balances at thecentral bank, lending to the money market etc.) were added, the proportionwould reach two-thirds of deposits in the United States and three-quartersin England and Germany. And such proportions are not unrepresentative forthe banking systems of the world as a whole; indeed, in certain Europeancountries government securities represent as much as 80 or even 90 per cent,of bank deposits. It may be mentioned, incidentally, that the large purchasesof government securities by the banks have everywhere had the result ofconsiderably reducing the ratio of capital and reserves to deposits. Thishas led in many countries to a wave of capital increases by banks in order
* An important reason for the relative smallness of the banking structure in Germany compared with theUnited Kingdom and the United States appears to reside in the fact that In the latter two countries the"money capital" created in 1914-18 remained intact when the war was over, whereas in Germany it wasdestroyed in the post-war inflation and the banking system was reconstructed from 1924 onwards.

— 274 —
Position at end of 1942
Government securities held directlyshort termlong and middle term
total
Total assetsTotal deposits
Government securities as percentage of
deposits
England
Elevenclearingbanks
Germany
SixGross-banken
UnitedStates
Allmemberbanks
in millions of national currency units
1,0941,120
2,214
3,8643,629
Ir
576?
11,3481,525
12,873
21,94020,488
10,64826,897
37,546
84,91778,277
i percentages
5963
4448
Commercial banks' ho ld ings to improve the ratioof government secur i t ies. between the banks'
"own resources"and their liabilitiesto the public. Insome cases, wheresuch ratios are fixedby law, a revision ofthe legal provisionshas been made inorder to free thebanks from therestriction whichthese provisionswould otherwiseplace on their pur-chases of govern-ment securities.
A striking difference brought out by the table is that, whereas short- termpaper accounts for nearly 90 per cent, of the government securities held byGerman banks, in England the proportion at short term is under 50 per cent,and in the United States under 30 per cent. This difference is evident alsoas regards the total government borrowing in the three countries.
Of the total internal borrowing in the three years 1940-42, 34 per cent,was at short term in the United States, 39 per cent, in the United Kingdomand 54 per cent, in Germany (excluding the short-term debt to the Reichskredit-kassen); the German percentage increased slowly over the three years, the
American more rapidly;U n i t e d S t a t e s — the British proportion
Ana lys is of government borrowing 1940-42 declined and in 1942in percentages of tota l borrowing. was 32 per cent. A
further interesting move-ment is the increase ofthe proportion of non-marketable debt in totalborrowing in the UnitedKingdom to 60 per cent,in 1942, the average forthe three years being52 per cent.; in theUnited States the aver-age was 37 per cent,and in Germany 17 per
Savings bonds and special Issues etc. (long term) and tax notes (short term).Treasury notes, Treasury bonds and guaranteed securities (long term), Treasury bills andcertificates of Indebtedness (short term).
United States«
Non-marketablelong term . . . .short term . . .total
Marketablelong term . . . .short term . . .total
Total borrowing . .long.term . . . .short term . . .
1940
64
64
40(-4)
36
100104
(-4)
1941
341853
CM 10
47
1007624
1942
238
31
373269
1006040
Average1940-42
271037
382463
1006634
1943Jan.-June
294
33
274067
1005644
* Non-marketable:Marketable :

- 275 -
U n i t e d K i n g d o m and Germany — cent., both showing aA n a l y s i s of g o v e r n m e n t b o r r o w i n g 1940-42 declining trend in the
in percentages of t o t a l b o r r o w i n g . three years, while, con-versely, the issue of mar-ketable securities rose.
The graphs on thefollowing page show thegrowth of cent ra l -government debts inthe United States, theUnited Kingdom andGermany since 1910 ona conventional scale(£1 = $5 = RM 20) andthe proportions of thetotal at short term. Thesegraphs are based on dataapplying to the end ofthe financial years until1927, and thereafter tothe end of the calendaryears. Although theTreasury bill was in-vented in England in the'seventies of the lastcentury it was utilised ina very sparing way until
1914— before the last war government debt at short term hardly existed. During thewar of 1914-18 all governments had recourse to this type of security and by theend of the war short-term indebtedness represented 14 per cent, of the totalin the United States, nearly 20 per cent, in the United Kingdom and 40 percent, in Germany. In the following years some repayments of short-term debttook place in the United States and the United Kingdom; but as the situationdeteriorated in Germany the proportion rose to practically 100 per cent, in 1923.Again, in the present war, Germany has had greater recourse to short-termborrowing than the other two countries and, at the end of 1942, over 50 percent, of the total debt, as shown by the official statement, was at short term.
As regards the t o t a l p u b l i c d e b t s , there was an unprecedented riseduring the war of 1914-18 to $25,000 million in the United States and to nearly
0) United KingdomNon-marketable: Savings certificates, savings bonds, defence bonds and "other debt" (long term), ways
and means advances, Treasury deposit receipts and tax certificates (short term).Marketable: National war bonds and other market securities (long term) and Treasury bills (shortterm).
09 GermanyNon-marketable: Liquidity loans and deposits at the Treasury (long term) credits from the Relchsbank
and Rentenbank, and tax certificates (short term).Marketable: Treasury certificates (long term) and Treasury bills (short term).Note that for Germany the short-term debt to the central administration of the Reichskreditkassen has beenexcluded, a factor which slightly decreases the percentage at short term as compared with the official debtstatement. On the other hand, the credit from the Rentenbank, which is In the nature of central-bank credit,has been included as short-term borrowing, although it is classed as long-term In the official debt statements.
United Kingdom«
Non-marketablelong term . . . .short term . . .total
Marketablelong term . . . .short term . . .total
Total borrowing . .long term . . . .short term . . .
G e r m a n y (2)
Non-marketablelong term . . . .short term . . .total
Marketablelong term . . . .short term . . .total .
Total borrowing . .long term . . . .short term . . .
1940
182037
coco
co o
63
1004753
1940
25(-3)
22
245478
1004951
1941
342256
301444
1006436
1941
171
18
295382
1004654
1942
392160
291140
1006832
1942
18(-6)
12
266288
1004456
Average1940-42
312152
301848
1006139
Average1940-42
20(-3)
17
265783
1004654
1943Jan .-June
435
49
371451
1008119
1943Jan.-June
212
23
156277
1003664

- 276 -
Total central-government debt in the United States,the United Kingdom and Germany 1910-42.
In milliards of national currency units.£%M\ ! i C 6660 ) ; i : i
1910 1915 1920 1925 1930 1935 I9W 19«0 0
Percentage of central-government debtsat short term.
/ Unitedi Kingdom-] 30
20
'U.S.A.
100%
90
80
70
GO
10
1910 1915 1920 1925 1930 1935 1940 19«
How long can this goon? What limit is there tothe growth of public debts?These questions have beenasked with increasing fre-quency in recent years. Theanswer depends upon anumber of factors, some ofwhich are variable. Obviously,confidence in the currency is
one, but, given this factor, then the "burden", in a fiscal sense, will dependupon the size of the debt and the rate of interest, on the one hand, andupon commodity prices and the other components of the national incomeon the other. A sidelight on the magnitude of the burden may be obtainedby comparing the interest paid on the publ ic debt with taxationand other current internal revenue in the budget.
The gcaph opposite shows for the United States, the United Kingdom,Sweden and Italy the proportion which interest payments on the public debt in
£8,000 million (including theforeign "war debt" of about£1,000 million) in the UnitedKingdom; the German debt atMarks 160,000 million in 1919roughly corresponded to thatof the United Kingdom (at£1 = M 20), but by 1923 it hadrisen to over Marks 6,600,000million and was wiped out bythe inflation. By June 1943the British debt amounted to£17,700 million, the UnitedStates debt to $140,000 mil-lion and the German debt toRM 215,000 million; if, insteadof the conventional rates onwhich the graph is based,the rates of £1 = $4 = RM 13be taken, then the Germandebt amounted to almost theequivalent of the British debt,which itself was only one-halfthat of the United States.On a per-capita basis theBritish debt was the greatest,but the others were reducingthe difference.

— 277 —
the national budgets bear to taxation and other current internal revenue in thefinancial years from 1913 to the present time. The increase of the public debtin the United States from 1917 and high interest rates after the war raisedthe proportion which the debt service bore to taxation receipts from 3 percent, in 1916 to 26 per cent, in 1923; there was a further high point at 33 percent, in 1933 (due to the halving of taxation receipts in the three yearsfrom 1930), from which time the proportion declined, to under 10 per cent,in 1941-42, and to only 8 per cent, in 1942-43. For the United Kingdom,payments on the war debt to the United States from 1924 to 1931 made theproportion about 4 per cent, more than it would otherwise have been; onthe internal debt the interest service amounted at its highest point in 1927to 39 per cent, of current revenue. A continuous fall brought the percentagedown to little over 12 in 1942-43 and estimates for 1943-44 give about thesame level. For both the United Kingdom and the United States the effectof the cheap-money policy is very evident from the early 'thirties; and thefurther fall since 1940 is striking; taxation receipts during the war have increasedmore rapidly than public debts, while interest rates have remained unchanged.Sweden is given as an example of a neutral country: the proportion fluctuated
around 8-12 per cent, over theperiod prior to the war; in 1940it was exceptionally low at 5 percent, but rose to 7 and 8 percent,in 1941 and 1942 respectively; in1942-43 revenue from public under-takings (state railways, post andtelegraph, forests, etc.), includedin the current budget receipts,still more than covered intereston the national debt (although thedebt at the end of 1942 exceededthe book value of the state'sassets for the first time).
Interest on public debtas percentage of current revenue.
% 501 1 1 1 1 1 1 150 %
AO
30
20
10
United Kingdom
1910 1915 1920 1925 1930 1935 1940 19«
In Italy the proportion fluctuated between 20 and 30 per cent, before thepresent war: in the year ended June 1940 the percentage fell below 21 for thefirst time since 1926; in 1940-41 and 1941-42 it was 26 per cent, and provisionalfigures for 1942-43 give 32 per cent., based on actual normal revenue includingmiscellaneous receipts; based on taxation alone the percentage in 1942-43was as high as 37 and would be over 40 on the estimates for 1943-44. ForGermany no budget figures are available, but on the total internal debt ofsome RM 160 milliard in the autumn of 1942 an average interest of 3 per cent,would give an interest cost of about RM 4,800 million, say 12 per cent, ofnormal taxation and internal current receipts totalling RM 38.7 milliard in 1942-43.*In Japan, where the public debt is almost wholly at long or middle term,the interest service absorbs about one-third of ordinary budget revenue.
* The turnover of the Reichsschuldenkasse, which as an office of the Reich Debt Administration effects theservice of the Reich debt as to interest and amortisation, increased from RM 15 milliard in the financialyear 1938 to RM 310 milliard in the financial year 1942.

— 278 —
Ownership of U. S. Government securities(direct and guaranteed).
Yearly, In milliards of U. S. dollars.1301 1 1 1 1 1 1130
120
110
100
90
80
70
60
50
40
30
20
10
0GO
"Pjiïl-
-
-
-
-
-
-
-
-
- IAII
- I Zd&Ti i
• ^ ^ .öfter5**estors-1 ! 1 11 1 1 1
J
/
Tora
J
y
j
^H5ari i i i
king sysi i i i
-
-
-
-
-
-
-
-
Ì -
! -
-
emi i i
1920 1925 1930 1935 19«)
120
110
100
90
80
70
60
50
40
30
20
10
060
Insurance companiesEM Savings banksÉM Governmenf agencies
1920 1925 1930 1935 1940
1916 1920 1925 1930 1935 1940 19«
In all cases the absoluteamount of the debt service has,of course, increased. Comparingthe financial year ended in 1943with that ended in 1939, the debtservice in the United Kingdomhas risen by 50 per cent, and inthe United States by 90 per cent.;in Italy and Sweden it hasdoubled, while in Germany, inspite of conversions and re-ductions of interest rates, it musthave risen by four to five times,since the total debt increasedfrom the comparatively low figureof RM 30 milliard on the outbreakof war in 1939 to over RM 200 mil-liard in the middle of 1943.
A further question which oftenarises is: How fa r w i l l g o v e r n -men t i n t e r n a l d e b t s c o n t r a c t -ed d u r i n g t h e war be repa idw h e n the war is over and how farcan such repayments be expectedto reduce the volume of currencyand credit outstanding? Again,reference can be made to pastexperience, though this may not beconclusive as new factors emerge.A graph given on page 214 ofthe twelfth Annual Report ofthis Bank showed that in theUnited Kingdom the purchasingpower created during the war of1914-18 remained outstanding whenthe war was over. It may beobjected that in that country theamount of the public debt repaidwas very small, being only about£300 million, or less than 5 per cent,of the total in the ten yearsafter the war, and that if the debtrepayments had been pursuedmore seriously the reduction ofpurchasing power created duringthe war would have been greater.

- 279 -
But in this respect the position of the United Kingdom was, in fact, a veryfavourable one. In no other country which was belligerent in the war of 1914-18was" any debt repayment made at all, except in the United States, which hada budget surplus in each of the eleven years from 1920 to 1930. During thisperiod the aggregate budget surpluses amounted to $8,360 million (includingsome $2,000 million received as interest and repayment in respect of war debts)and official balances were drawn down by $950 million; as a consequence,$9,310 million of the domestic public debt was repaid. The amount thus repaidover eleven years, however, scarcely amounted to one year's war borrowing($9,270 million in 1917-18 and $13,250 million in 1918-19). Further, the inci-dence of the repayments was very significant: $9,450 million was repaid tothe public (including institutions) while the banking system, after some realisa-tions in 1920 and 1921, increased its holding on balance by a further $140 mil-lion. Thus, in this case also, the purchasing power created during the war
remained when the
Public debt in the United Kingdom and
United States 1919-24.
At endof financial
years *
191919201921192219231924
Movement1919-24
United Kingdom
shortterm
longterm
totaldebt
in millions of £ sterling1,4121,3121,2751,025
810775
— 637
6,0236,5176,2996,6296,9326,866
+ 843
7,4357,8297,5747,6547,7427,641
+ 206
United States
shortterm
longterm
totaldebt
In millions of dollars3,6252,7692,6991,8281,032
808
— 2,817
21,85721,52921,27721,13621,31820,443
— 1,414
25,48224,29823,97622,96422,35021,251
— 4,231
United Kingdom 31st March ; United States 30th June.
war was over.
It is of interestto note, however, thatin both the UnitedKingdom and theUnited States largerepayments of thes h o r t - t e r m debtwere made after thewar. In the five yearsto 1924, 45 per cent, ofthe British and 78 percent, of the U. S.short-term governmentdebts were paid off.
Also in the following respect past experience is worthy of notice.Annual b u d g e t e x p e n d i t u r e in the United Kingdom rose from£200 million before the war (1913-14) by thirteen times to £2,600 millionat the end of the war (1918-19), falling to £800 million six years afterthe war (1924-25) and thereafter remaining at four to five times thepre-1914 figure until the present war. Annual budget expenditure inthe United States expanded more rapidly; from under $750 million beforethe war (1915-16) it rose by twenty-five times to over $18,500 million atthe end of the war (1918-19), falling to $3,000 million after the war (1923-24)and remaining below $4,000 million until 1930-31. In the first year of peace(1919-20) government expenditure in the United Kingdom was reduced bynearly one-third and in the United States by nearly two-thirds from the war-time peak. But in each case, partly as a result of the increased debt service,government budgetary expenditure remained four times and more what it hadbeen before the war.

- 280 -
These experiences of the last war and post-war period may not be con-clusive as regards the conditions which will follow this war, since the methodsof war financing and price control have this time been largely different. But itmust not be assumed that the difficulties of effecting repayments of dead-weight liabilities or of "tying up" purchasing power will be easily overcome;and the history of the past is therefore not without its lesson for today.
2. SHARE MARKETS.
The development of share quotat ions on a number of markets whereadequate indexes are available is shown in the graphs on page 282, and inthe table below which gives a summary of the data on which the graphs arebased; the original indexes used are those calculated and published officially orsemi-officially and they have been recalculated on a pre-war basis (January-June1939 = 100). International comparisons should be made with caution but it isbelieved that the material presented is as reliable as can be obtained.
Indexes of Share Quotat ions 0)
On basis ofJanuary-June1939 = 100
Bucarest^) ....
ParisC)
BudapestPragueBrussels
LisbonMilan
HelsinkiOslo
Amsterdam ....TokioLondon ...Copenhagen . . .ZurichStockholm ....
New YorkMontreal
1927-1929highest(2)
669
239
318154388
122134
957417222511216299122131
296216
1937highest
115
116
214205168
112108
122112112125114151114106106
152146
1939Dec.
173
116
12914684
100134
901021039212693948775
108101
1940Dec.
148
191
134253182
95151
11012013512710587948282
9677
1941Dec.
290
353
327342322
121197
1551581441561199811310297
8273
1942
March
441
453
299
271
143205
19715814913511794116103106
7568
June
380
453
275375290
184184
18916515114612396121102108
7669
Sept.
442
508
303369315
228212
198179150149123107120108113
8169
Dec.
606
594
384364339
261216
179171152148120116115110106
8878
1943
March
553
474381306
256224
188165153164119121116110107
10487
June
521
486381307
234299
198171153167120122122105106
11491
(') The indexes are classed according to the height of quotations in December 1942.(2) The New York market reached its highest point in September 1929 and most other stock exchanges also
were strong in the period 1927-29 (when world production and trade had reached an all-time peak, after thesetback during the war of 1914-18, and American capital was pouring into Europe). As the period is a longway from the base of January-June 1939 and the calculations, in some cases, involved the joining-up ofvarious indexes, the figures are given by way of indication only and meticulous accuracy cannot be claimedfor them.
(3) No index has been published since December 1942 but the boom continued into the early months of 1943(see table on page 284).
(<) For the period 1940-41, when the Paris market was closed, the index has been based on data available forLyons.
Only on the N e w Y o r k and M o n t r e a l stock exchanges were share
quotations still below the pre-war level at the end of 1942 — an astonishing
fact, in its way, considering the unprecedented increases of production in

— 281 —
the two countries; but taxation was high and net profitability had generally notincreased; indeed, it had fallen in many cases. In the spring of 1943, how-ever, the index for New York moved up into the 100-125 range, which Londonhad already reached in the summer of 1942. Both these indexes took a definiteupward turn from the spring of 1942 — from March 1942 to June 1943 theindex for the London market rose by 30 per cent, and that for New York bysome 50 per cent.; turnovers*, which in both markets had been exceptionallylow, about doubled fn volume from the first half of 1942 to the first half of 19.43and brokers' loans in New York showed a distinct tendency to rise, for thefirst time in many years.
The only other overseas stock exchange included in the graphs, Tok io ,also came within the 100-125 gro'up; rigid control measures prevented anyappreciable'increase (or decrease) of the index after the end of 1941. TheJapanese stock exchanges were completely reorganised under a new law ofMarch 1943. ki place of eleven independent private enterprises in the chieftowns, the stock exchanges were reduced in number by amalgamations andfrom 1st July 1943 operated as\! branches of the Nippon Stock ExchangeCompany, a newly^form'ed public corporation under the supervision of theFinance Minister; the leading officials of this company were appointed bythe government, which also subscribed one-quarter of the capital of Yen200 million. Alt dealing was••• strictly controlled with the object of ensuringthat purchases represented genuine investment of disposable capital; quotationswere no longer allowed to reflect the weight of supply and demand but"reasonable prices" were officially fixed.
fn Europe, the bourses of the neutrals, Zurieft and Stockho lm, andoccupied Copenhagen also came within the 100-125 range; little or nothingwas needed by way of supervision to keep the markets relatively moderatein their valuations.
Severe control imposed in the spring of 1942 held the market of Berl inaround the level of 150, which it had then attained. The rise on the year,almost wholly in the first half, was only 5 per cent, and the highest point,in December, remained slightly below the peak reached in September 1941.Amsterdam, under much the same influences, fluctuated more widely aroundthe 150 level; the material for dealing had already been substantially reducedby the prohibition on trading in American shares imposed in 1940 and, whenJapanese troops occupied Dutch possessions in the Far East early in 1942,many market leaders (colonial, petroleum and shipping shares) became spe-culative in nature. Oslo and Helsinki remained throughout the year withinthe range of 150-200, with an irregular tendency to rise. Ih Oslo a committeehas been formed by the Department of Trade to supervise the market.
Lisbon was outstanding in 1942, having an active boom with risingturnovers, which carried the index from a level below the pre-war 100 inthe spring and" summer of 1941 to nearly 270 in January 1943," an advancedue to the extreme liquidity of the money market and to the considerable

— 282 —
200
175
150
125
100
75
50
275
250
225
200
175
150
125
100
75
50
25
700
650
600
550
500
450
400
350
300
250
200
150
100
50
Berlin . Â
w..Amste dam
IL
1937
a s
1938
/&**
1939 1940
Zurich"Vi-., ]•—^ £
1941
Lis
- -A
J
1942 1943
\
JDon 1
r
/
tockhi» tIm
Share Indexes, January-June 1939 = 100.
200 175
175 150
150 125
125 100
100 75
75 50
50 25
V
T
New Y6FI<
* * \v/1
Lordon /
Montreal
1
r
i/
275
250
225
1937 1938 1939 1940 1941 1942 1943
-(half
-
-
-
-
-
-
I
scô/eJ
V
Bi
Pragu
-
carest U"7Ï -
e / / \ A 1
y-
-
-
225
200
175
150200 125
175 100
150 75
125 50
100 150
75 '25
50 100
25 75
700 700
1937 1938 1939 1940 1941 1942 1943
Hilsink
/7 c
r^ ctsio
apenheqen
1937
\ '
1938 1939
/
1940 19411
Tokio
1942 1943
1937 1938 1939 1940 1941 1942 1943
175
150
125
100
75
50
25
225
200
175
150
125
100
75
50
150
12S
100
75
1937 1938 1939 1940 1941 1942 1943 1937 1938 1939 1940 1941 1942 1943
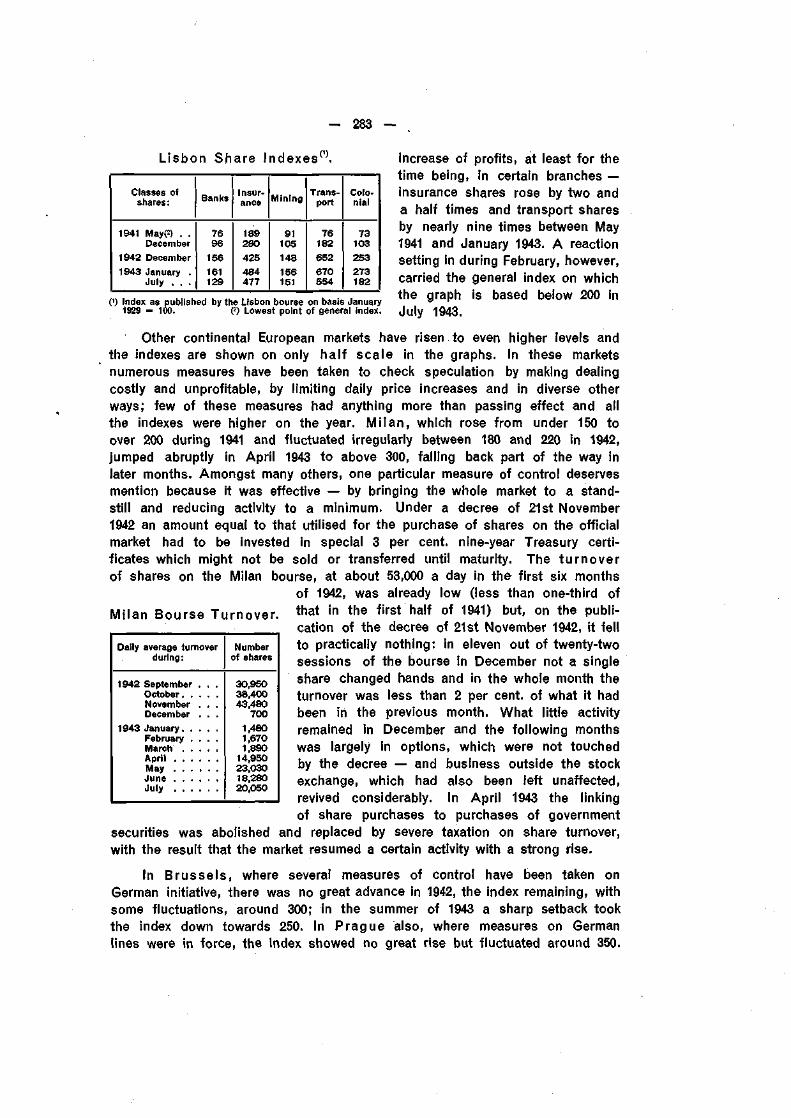
- 283 -
Lisbon Share Indexes .
Classes ofshares:
1941 MayP) . .December
1942 December1943 January .
July . . .
Banks
7696
156161129
Insur-ance
189280425484477
Mining
91105148156151
Trans-port
76182652670554
Colo-nial
73103253273182
0) Index as published by the Lisbon bourse on basis January1929 = 100. (2) Lowest point of general index.
increase of profits, at least for thetime being, in certain branches —insurance shares rose by two anda half times and transport sharesby nearly nine times between May1941 and January 1943. A reactionsetting in during February, however,carried the general index on whichthe graph is based below 200 inJuly 1943.
Other continental European markets have risen to even higher levels andthe indexes are shown on only half scale in the graphs. In these marketsnumerous measures have been taken to check speculation by making dealingcostly and unprofitable, by limiting daily price increases and in diverse otherways; few of these measures had anything more than passing effect and allthe indexes were higher on the year. Mi lan, which rose from under 150 toover 200 during 1941 and fluctuated irregularly between 180 and 220 in 1942,jumped abruptly in April 1943 to above 300, falling back part of the way inlater months. Amongst many others, one particular measure of control deservesmention because it was effective — by bringing the whole market to a stand-still and reducing activity to a minimum. Under a decree of 21st November1942 an amount equal to that utilised for the purchase of shares on the officialmarket had to be invested in special 3 per cent, nine-year Treasury certi-ficates which might not be sold or transferred until maturity. The turnoverof shares on the Milan bourse, at about 53,000 a day in the first six months
of 1942, was already low (less than one-third ofMilan Bourse Turnover. t h a t i n t h e first'half of 1941) but, on the publi-
cation of the decree of 21st November 1942, it fellto practically nothing: in eleven out of twenty-twosessions of the bourse in December not a singleshare changed hands and in the whole month theturnover was less than 2 per cent, of what it hadbeen in the previous month. What little activityremained in December and the following monthswas largely in options, which were not touchedby the decree — and business outside the stockexchange, which had also been left unaffected,revived considerably. In April 1943 the linkingof share purchases to purchases of government
securities was abolished and replaced by severe taxation on share turnover,with the result that the market resumed a certain activity with a strong rise.
In Brussels , where several measures of control have been taken onGerman initiative, there was no great advance in 1942, the index remaining, withsome fluctuations, around 300; in the summer of 1943 a sharp setback tookthe index down towards 250. In Prague also, where measures on Germanlines were in force, the index showed no great rise but fluctuated around 350.
Daily average turnoverduring:
1942 SeptemberOctober. .NovemberDecember
1943 January. .February .March . .April . . .May . . .
July . . .
Numberof shares
30,95038,40043,480
7001,4801,6701,890
14,95023,03018,28020,050

— 284 —
Budapest fell during the first half of 1942, under the influence of variousmeasures of control adopted up to that time, but became stronger in thesummer; and then came a spectacular rise, by 60 per cent, in four months,from under 300 in October 1942 to 480 in February 1943 with a rapidly risingturnover. The movement was, however, abruptly checked, with the indexnot far short of 500 in the latter half of February, when "stop prices" wereintroduced.
But the greatest increases during 1942 occurred in Paris and Bucarest.The index shown in the graph for Paris rose from 350 to 600 and continuedits advance to 650 in January 1943; a reaction in later months took the indexback to 520 in June 1943. The bourses in France were reorganised under alaw of February 1942 and a stock exchange committee was set up, headed bythe Governor of the Bank of France and including a government commissioner.All classes of shares have participated in the rise, even "money shares" likethose of banks (with relatively slight Sachwert value) attaining some four timestheir pre-war price, while certain classes, e. g. construction materials, textilesand navigation shares, increased by ten times and more. The Bucarest indexmore than doubled, from under 300 in December 1941 to over 600 in December1942; no index has since been published by the National Bank of Roumaniabut share quotations continued to rise rapidly in January and February 1943,
Bucarest Stock Exchange.
Monthly average figures
1940 December1941 December1942 December1943 January
FebruaryMarchAprilMayJune
Monthly average quotations in lei
NationalBank
5,3087,913
12,58815,28616,57014,10014,31813,88812,857
AstraRomàna
7801,7493,3184,6424,1534,2934,0954,0133,868
SteauaRomàna
382849
1,8992,2981,9272,0322,1132,2182,077
S. T. B.
1,0901,7623,2844,7194,3754,4272,3542,1842,109
S.A.R. detelefoane
8741,5282,0712,4722,0772,4012,3112,3912,306
Shareindex
(Jan.-June1939 = 100)
142E6C
[B)O)6
Turnoverin
millionsof lei
61129750633394481262283221
relapsing somewhat in later months. The share turnover, which averaged some-what over Lei 200 million a month in the first ten months of the year (aboutthe same as in 1941), rose to Lei 300 million in November and Lei 750 millionin December 1942, falling back in the following months; all classes of sharesparticipated in the boom, especially petroleum, mining and heavy industry. Theindex published by the National Bank, with January 1926 equal to 100, hadrisen above 2,000 at the end of 1942.
In these latter countries, with market prices three to six times pre-warquotations, in a period of generally declining production and profitability andnotwithstanding all efforts at control, the bourses reflect in varying degreesinf lat ionary developments (described in some detail earlier in thischapter). In a few countries inflation has gone even further; but either

— 285 —
the security market has not been reopened, as in Agram (Zagreb), or regularstock exchange indexes are not available, as in Warsaw and Bratislava (Pressburg).For the extreme case of Athens some typical quotations have been collectedin the following table.
Athens Stock Exchange.
Quotations on certain dates
Government loans(a) Internal Drachmae bonds
8% Refugee indemnity 1926-28 . .5% Internal loan 1920
(b) External "gold bonds"4% Monopoly loan 18875% External loan 19144% Water Works loan 1925
Shares
National BankProd, et Engrais ChimiquesHellenic Electric RailwayMatières Colorantes du PiréeHeracles (construction)Atlas (construction)Etma (artificial silk)
Nominalvalue
Dr. 1,000Dr. 200GoldDr. 500Dr. 500$ 1,000
Dr. 5,000Dr. 1,000Dr. 100£ 1Dr. 100Dr. 100Dr. 100Dr. 100
Lastmonth of
peaceOctober1940
(average)
Reopeningof bourse
December1940
Secondreopeningof bourseDecember
1942
Quotationsin
June1943
in drachmae
680100
1,6502,150
92,200
7,29058,6001,120
790860
1,060150
720110
2,0502,600
91,800
7,52058,9001,105
800865
1,075155685
5,950800
27,00035,000
1,700,000
135,0001,900,000
35,00032,00028,00035,0003,500
13,000
8,3501,100
62,00080,500
3,400,000
285,0004,150,000
56,00057,00043,00065,5009,600
37,000
Note: The stock exchange was closed on 28th October 1940, when Greece was invaded by Italian troops, butwas reopened on 19th December 1940. With the commencement of hostilities by Germany in March 1941,the stock exchange was again closed and remained so until 16th December 1942, when it was oncemore reopened as part of the plan for coping with speculation and inflation, described on page 234.
By the middle of 1943 Greek government loans denominated in drachmaewere about 10 times their last peacetime prices (evidently owing to hopes ofrehabilitation); so-called "gold bonds" were at 30-40 times and shares 40-80times their pre-war prices; National Bank shares were as much as 4,000 timestheir nominal value. In September and October a further inflationary waveswept over the market, quotations again rising violently and irregularly; "goldbonds" attained fifty times their pre-war prices. The bourse was again closedfor a few days in October 1943; during this interval a decree was issued underwhich all banks and share companies were obliged to surrender one-half oftheir security portfolios to the government as a non-interest-bearing " loan" toprovide the material for official intervention.
All over the world, share yields have further declined as a result ofcontinuously rising quotations, accompanied by unchanged or even fallingdividends. In the United States (and in Canada) the average yield stillremained above 5 per cent, in 1942 — and the same was true of Japan; bythe end of the year the average yield in England was down to 4% per cent.In all these countries the share yield maintained its usual position above thebond yield; in the United States, the abnormal margin of 5.8 per cent, inApril 1942 had been reduced to 3.6 per cent, by the end of the year.

— 286 —
Yields of Shares and Government Bonds,in percentages.
n I. i r, 11,, i,, I,, 11. i,, i. 11.11111,111111, i,. t, 11.. 1111,. i,. i,. i n, 1938 1939 1940 1941 19« u
1938 1939 1940 1941 1942
JIIII.IIIIIIIIIIMIMIIIIIIIIII. ill, lull. IIIINIIIIIIIIIIIII (,, 1938 1939 1940 1941 1942 u
anQIIIIMIIIIIII,, III Inlnliiliil.. II,IIIIIIIIIII,IIIII.I.II.,IQ
.Bonds.
N?S52.1938 1939 1940 1941 1942
Germ any, , 1 , , 1 , , 1 , , IM 1 , , 1 ,, 1 , ,Illllllllll
BondsZ •!
1 s_y-Shares-
MIMIIIIM Illllllllll
n 11 • I , i I iiiiiIi,i•,Ii•Ii.1i•11 111ii••I 111•11i•t.rI •• 1 i • I • 11 i i I n1938 1939 1940 1941 1942
In Continental Europe theusual relationship is now very rareand a higher yield for shares thanfor bonds is found only in neutralcountries such as Sweden andSwitzerland; elsewhere share yieldshave fallen below, in some caseswell below, bond yields — anindication of abnormal valuations.In Germany the average shareyield was still just over 3 percent, at the end of 1942, but inItaly it was nearer 2 per cent,and in France 1 per cent., thelowest level in that country sincerecords have been kept; and inmany continental European coun-tries, e. g. Belgium, Bohemiaand Moravia, Hungary, Norway,conditions were not very differentfrom those in France, yieldsbeing often so small as to bepractically non-existent. In suchcases shares were bought on aspeculative estimate of the realvalue of a concern in propertyand machinery etc., that is, purelyas Sachwerte.
The wartime boom on theshare markets of ContinentalEurope has caused considerableanxiety in official circles; from1940 onwards direct cont ro lwas gradually imposed on sharedealing and the fixing of quotationson most continental bourses, andthis control has since been pro-gressively tightened: many of themeasures imposed up to themiddle of 1942 were describedin some detail in the twelfthAnnual Report of this Bank. Noneof these measures was really effect-ive so long as it allowed someliberty for dealing and for themarking of current quotations.

— 287 —
The period now under review was characterised in Germany, by theabandonment of a "dynamic" policy of control and the adoption of a "static"line: two classes of measures illustrate this change (i) the compulsory declara-tion and eventual sale of large private share holdings acquired since the warand (ii) the fixing of "stop rates" above which quotations were forbidden.
On 26th February 1942 it was decreed that all shares purchased since1st September 1939 in excess of RM 100,000 and not sold by 15th March 1942were to be declared to the Reichsbank on the basis of market prices on31st December 1941. By a further decree of 9th June 1942 declarations were tobe made, on a monthly basis, if new purchases caused this limit to be attained,and the Reichsbank was empowered to call on owners of declared holdingsto sell them to the bank at the price quoted on 31st December 1941 againstpayment in blocked Treasury certificates. The amount declared was officiallystated to be less than 5 per cent, of all marketable shares; unofficially declara-tions were estimated to have an aggregate value of nearly RM 1 milliard. Outof a total of RM 29 milliard share capital of all German companies only aboutRM 5 milliard were estimated to be in private hands and the amount declaredthus represented a considerable proportion of the actual volume of sharesavailable for market dealings. And these data showed, moreover, that privateowners have been willing to sell, while neither the big concerns* nor publicholders have parted with their participations.
Towards the end of June 1942 a few of the most important market leadersheld by industrial firms were called for sale to the Reichsbank and, later, certainof the larger holdings in the hands of individuals were also called; the marketvalue of the manipulation fund, formed from these called shares and used bythe Reichsbank and Seehandlung to regulate the market, was estimated atRM 100 million. This fund made repeated interventions on a limited and cautiousscale during the second half of the year to amplify the material available onthe market, being in some cases the only source of supply. From 25th February1943 onwards, but without retroactive effect, the limit for the declaration ofholdings was lowered to RM 50,000.
The growth, during the past ten years, of large concerns with an average capital of over RM 100 million isshown by statistics published by "Wirtschaft und Statistik".
German share companies — number and aggregate nominal capital.
Nominal capitalat end of year
Under RM 50 million.RM 50 million and over
Totals . . .
1931
number
10,36671
10,437
millionRM
14,7629,891
24,653
1936
number
7,14955
7.204
millionRM
12,2626,962
19,224
1940
number
5.32671
5.397
millionRM
12,6268,868
21,494
1942
cumber
5.297107
5,404
millionRM
14,92014,141
29,061
Decrease1931-1936
number
3,21716
3,233
millionRM
2,5092,929
5,429
Increase1936-1942
number
(-1.652)52
(-1.800)
millionRM
2,6587,179
9,837
From 1931 to 1942 the large concerns grew in number from 71 to 107; their aggregate capital rose from underRM 10 milliard to over RM 14 milliard while the aggregate capital of all other share companies remained practi-cally unchanged on balance, falling proportionately from 60 per cent, to a little over 50 per cent, of the totalcapital of all companies. Of the increase of RM 7,6 milliard In the nominal capital of all companies in thetwo years 1941 and 1942, RM 3.9 milliard was due to capital increases In connection with the dividend-limitation decree.

— 288 —
These measures represented the dynamic side of the policy adopted,but already in the spring of 1942 a different line was becoming evident. From12th May 1942 onwards, the prices quoted on that day were officially regarded as"guiding quotations" (Richtkurse), thus introducing a sort of price stop ofa general and somewhat elastic nature; for certain leading shares, however(e.g. I. G. Farben and Siemens) actual "stop rates" were enforced. Brokerswere no longer allowed to raise share prices automatically to bring aboutequilibrium between supply and demand, price increases being permitted onlyfor special reasons (e.g. increase of dividend) and after consultation withthe quotation commissioners.
For eight months these measures appeared sufficient but on 25th January1943 a rigid "stop price" for all officially quoted shares was introduced, anyadvance above the quotations of that day being forbidden; monthly adjustmentswere later permitted in order to take account of the dividend included in the price.Downward movements were, of course, allowed but were very rare. In February1943 it was decreed that all current price quotations would be suspendedon the German bourses from the 13th of that month until further notice. From9th April 1943 the Reich Minister for National Economy was authorised totake measures for the fixing of security prices for the duration of the war; thisdecree applied to all securities, including those not officially quoted, andalso to deals between private individuals. And on 29th September 1943 upperprice limits were fixed for practically all securities, including bonds, exceptthose issued by the government.
As a consequence of these announcements of guiding and, later,stop quotations, without regard to the equilibrium of supply and demand(such disregard being, of course, the essence of all "price control"), it soonbecame necessary to resort to partial allocations, or "rationing", in an effortto make an equitable distribution amongst would-be buyers of the inadequatevolume of material on offer.
These drastic German measures were followed in Prague, Budapest andAmsterdam, with some modifications. In Prague, the declaration of sharespurchased during the war was decreed on 11th May, the limit being lowered fromK. 1 million to K. 500,000 from 23rd June 1942. No guiding prices were introducedin 1942 but fluctuations were allowed only on a sliding scale, declining as thesize of the deal increased; stop prices were introduced on 26th February1943. In Budapest the declaration of large share holdings (but not theirsurrender) was decreed in March 1942: holdings of shares officially quotedbecame liable for declaration by 31st March if they exceeded 2 per cent, of thecompany's capital or had a market value of Pengö 200,000 or upwards; allholdings were notifiable, not only those acquired since the war, and declaredholdings might not be further increased without permission of the Ministryof Finance. Stop prices were introduced on 11th February 1943.
In Amsterdam, a decree was issued in September calling for the notifi-cation by 1st November 1942 of all shares bought after 31st December 1941,if their aggregate market value exceeded FI. 100,000 (a limit which was reduced

- 289 -
to FI. 50,000 in February 1943); the Nederlandsche Bank was authorised to requireholders of certain shares to sell them on the stock exchange within a fixedperiod or to surrender them to the bank at the market price of 2nd March 1942(in many cases the lowest for the year) against payment in Dutch Governmentbonds. To prevent evasion of these regulations the provision regarding banksecrecy was suspended in respect of bourse transactions. In November 1942it had been decided to quote only a single price for each share persession, allowing no increases beyond the prices of 9th November; butthis measure, which, in fact, amounted to a general price stop, was fullyenforced for only a few days: it was maintained for colonial, petroleum andshipping shares, but Dutch home industrial and other securities were releasedon 13th November. From 2nd March 1943, however, the price stop was extendedto all shares (and from 11th March to bonds, with the exception of thoseissued by the government and by local authorities). In this instance quotationsweakened for about a month as speculative holdings were disposed of, themarket afterwards returning to the stop level.
The logical end of stock market control was thus reached in the earlymonths of 1943 with rigid stop prices imposed for all shares in Berlinin January, in Prague and Budapest in February and in Amsterdam in March.In each case the "compensation" of purchases and sales by banks or brokersoutside the market was forbidden and all deals had to pass through thebourse.
But on all four markets buying orders largely exceeded sales andrat ioning of purchases became necessary; in these cases, wherestop prices were in force, the upward pressure was indicated by thesmallness of the "ration" or, in other words, the decl ine of theturnover. Although statistics of turnover have been compiled in Berlinin recent months, they have not been published, but information is availablefor the three other markets. In Prague, where the turnover in 1942 was
only a fraction of the pre-war volume,it fell further, between January andJune 1943, by over 70 per cent.; andin Amsterdam and Budapest the fallin the same period was by over 90 percent. For Berl in there were indicationsof similar conditions. Rationing wasintroduced as early as May 1942, whenguiding rates were first fixed; quotationswere suspended if the offer was soS m a N t h a t " ° distribution to purchaserscould be made. It has been officiallyreported that on certain inactive days
the turnover fell to a mere RM 300,000 and distributions to a fraction of oneper cent, of the demand, three-quarters of the shares listed being, at times,unquoted; indeed, the quotations of some leading shares were suspended
V a l u e of Share T u r n o v e r s .
Value of turnovermonthly
1943 January. .February .March . .April . . .May . . .June . . .
Amsterdam0)
million florins5460241895
Budapest(2)
million pengö64392918166
V) Dutch and colonial shares only; the turnover of

— 290 —
for months, in spite of the intervention of the manipulation fund. With theintroduction of stop prices in January 1943 the turnover shrank still further;sales were often so small that no distribution could be made, the manipulationfund intervening to take up the amounts offered. At first some 50 out ofthe 450 listed shares remained below the stop rates — particularly those ad-versely affected by war conditions: shipping, colonial and building shares, forexample — and some dealing in these shares continued. But their numberwas gradually reduced : from February to April about three-quarters of listedshares remained without quotation ; and in the following months the proportionunquoted increased, up to about 85 per cent, in September 1943.
In all these markets the number of brokers has been severely cut down.In Germany, stock exchanges outside Berlin were allowed to open only onthree days of the week from February 1943 onwards, and the session was cutdown from two hours to one. These measures were extended to Berlin inMarch, and later adopted also in Prague.
The history of the stock exchanges of Continental Europe in 1942 showedthat official control was ineffective in those countries where any activityremained, e. g. in France, Hungary, Italy and Roumania. The reorganisation ofthe bourses in France and Hungary, the compulsory registration of shares andtaxation of capital gains in France and Italy, increased taxation on dealing andhigher commissions in many countries did not stop the upward movement.Instead there were violent fluctuations, stagnation being followed by a wildthrust upwards or a temporary cascade of prices downwards — but withquotations always getting higher on balance, generally much higher.
And early in 1943, control tightened into a stranglehold on some conti-nental markets, life becoming practically extinct; as in certain other sectorsof the economy, success in "stabilising the index" was obtained only bydepriving it of any real meaning, since it no longer had reference to anyappreciable volume of actual transactions. The description given of the Parisbourse in 1941 thus acquired a wider application in Continental Europe, morethan one stock exchange degenerating into "an institution where quotationswere registered for deals which did not take place".

- 291 -
VI. CENTRAL BANKING AND CURRENCY DEVELOPMENTS.
In Europe some changes have been made in the laws governing centralbanks, particularly in Holland; new central banks have been founded in Eireand in Croatia and the Caisse Centrale de la France Libre was set up inLondon. Further east, the Ukraine Central Bank opened for business inJune 1942 and the Ostland Central Bank in April 1943. In the Far East thereform of the Central Bank of Manchou followed that of the Bank of Japan,and the South Seas Development Bank, created early in 1942, was authorisedto issue notes in April 1943. Note circulations throughout the world havecontinued to rise, in some cases at an accelerated pace, and considerableshortages of divisional coin have made themselves felt. The development oftransfers, or "cashless payments", in Europe has made further progress, thepostal giro deserving particular mention.
Of recent central-banking changes in Europe by far the most importantwere those in Hol land. Towards the end of June 1943 a decree, publishedin the official bulletin of the German Commissioner for the Occupied DutchTerritory, declared the former central-bank law of 1937 invalid, made theNederlandsche Bank a public corporation and put the bank on a completelynew footing as from 1st June 1943. The bank came under the direct controlof the German Commissioner, while the President and other members of themanagement were reduced to administrative activities, acting on the instruc-tions and under the supervision of the German Commissioner; but, in themanagement, decisions rest with the President. Previously, the managementhad four members; the president and the secretary, originally crown appoint-ments, and two members appointed by the shareholders. At the generalmeeting of shareholders on 29th June 1943 the two Managers appointed bythe shareholders were relieved of their functions at their own request. By thenew law, an advisory committee, formed by the President, who acts as chairman,took the place of the former board of directors, elected by the shareholders.As regards the business of the bank, the most important innovation was theauthorisation to undertake "open-market operations" through the purchase andsale of long-term securities quoted on the stock exchange; previously, onlybills and short-term Treasury certificates could be so purchased. The generalmeeting of shareholders has no functions except to receive the annual balancesheet and report and, on the proposal of the President, to change theauthorised capital. The distribution of profits was considerably modified to theadvantage of the Treasury; the dividend to the shareholders was limited to5 per cent. New statutes for the bank are to be drawn up by the President.This was the first instance of the German authorities' assuming the supremedirection of an existing bank of issue in an occupied country; in other casesthe existing bank was allowed to continue business (as in France), wassupplemented by a new bank attached to the old central bank (as in Belgium)or was replaced by a new bank (as in Poland).

— 292 —
By a law of 22nd August 1942 the National Bank of Roumania was madesubordinate to the new Ministry of National Economy, so that the principle ofautonomy, hitherto in force, has been abolished.
When Poland was invaded by German troops in September 1939 theleading members of the administration of the Bank Polski escaped with thegold reserves. The bank was then closed and its operations were confined tothe administration of its remaining assets; on 1st April 1940 the new Bank ofIssue was opened for business and on 26th April 1940 a German Commissionerwas attached to the office of the Bank Polski. A decree of the GermanGovernor-General dated 15th September 1942 contained new regulations concerningthe administration of the Bank Polski; the competence of the general meeting,the president, the board and the audit committee was abolished; control wasassumed by the German head of the banking control office, who was vestedwith far-reaching powers. The new decree gave detailed regulations regardingthe winding-up of the bank's affairs and, in particular, granted a respite inrespect of all liabilities incurred before 5th October 1939*. The liquidation ofthe Bank of Danzig was completed in 1942 and by a decree of 9th October1942 the shares of the bank were exchanged for 3% per cent. Reich certificatesat the rate of RM 95 nominal for Gulden 100 shares.
The Irish Currency Commission was superseded on 1st February 1943by the Central Bank of Ireland (Bane Ceannais na hEireann). Under theCurrency Act of 1927 the Saorstât pound was covered 100 per cent, by assetsin £ sterling, to which it was held at par; by the Central Bank Act of 1943 thenew bank took over the assets and liabilities of the Currency Commission andthe right of note issue, and was given the duty of "safeguarding the integrityof the currency". Three members of the Currency Commission were electedby the banks, three nominated by the Minister for Finance, the seventh, thechairman, being elected by the other six; the new bank has a governor,
Eire — Note Issue.
Near end of month
IrishCurrency
Commission
Central Bankof Ireland
1938 December1939 „1940194119421943 January .
1943 February.March . .April . . .May . . .June . . .
Assets
Gold Sterling holdingcash balances securities
balancesheet
Liabilities
Notesoutstanding
in millions of £2.02.62.62.62.62.6
2.62.62.62.62.6
0,00.00.00.10.10.1
0.30.10.10.10.1
0.10.31.62.41.60.2
0.91.21.40.91.1
8.89.T
10.913.419.520.0
18.919.119.319.519.5
10.912.015.218.523.922.9
22.823.023.523.223.4
10.912.015.218.523.922.9
22.823.023.523.223.4
* Members of the administration of the Bank Polski who escaped with some of the assets have continued theactivities of the bank, with an office first In Paris and then In London.

— 293 —
appointed by the President of Eire on the advice of the government, threedirectors appointed by the Minister for Finance from a panel prepared for thepurpose by the commercial banks and a maximum of five further directorsotherwise appointed by the Minister for Finance. The bank, unlike the CurrencyCommission, was given the general central-banking functions of receivingdeposits from the commercial banks and public authorities and extending creditby rediscounts and advances; further, the bank was authorised to conduct open-market operations by the purchase and sale of government securities quotedon the stock exchanges. The capital was subscribed by the Minister forFinance, while that of the Currency Commission, held by the commercialbanks, was repaid.
The former Chairman of the Currency Commission was appointedGovernor of the new bank. As the table on the opposite page shows, thereturns of the bank from February 1943 onwards are in the same form asthose of the old Currency Commission; and the Irish pound has continuedto be maintained at par with sterling.
The Caisse Centrale de la France Libre was set up by an "ordon-nance" of 2nd December 1941; it was created as a public institution, governedby the laws in force in territories placed under the authority or the mandateof La France Libre and had a capital of Fr.fcs 100 million, advanced by theFinance Commissioner of the French National Committee. The bank wasempowered to issue its own notes in the above-mentioned territories (as inFrench Equatorial Africa) or to exercise control through existing banks of
End of month
1942 January 0°) .March . . .June . . . .September .December. .
1943 March. . . .JuneO1) . • .
Caisse Centrale de la France
AssetsGold
Art 2
0)
atpur-chaseprice(2)
For-eignex-
change(3)
Noteswith-drawn
(4)
Of-ficesdeschan-ges(6)
OfficeSy-rien
m
Trea-suryad-van-ces
of ba-lancesheet
(')
Libre.
Liabilities
Notesincircu-
lation
Deposits
go-vern-ment banks
Goldpre-mium
(8)
Capi-talandreser-ves(9)
in millions of Fr.fcs
727272
105156
42119103128174193
201538980
1,4311,9182,5542,842
152417464498
100100100170215
.200800904624707
2264
4391
204582
1,4712,6643,5434,1354,753
303061
253519569635
73450
1,0322,0182,6142,7103,165
—225238257670675
48484870
104
100100100100102102102
0) Under Art. 2 of the statutes gold is valued at three times the purchase price; the difference between this valu-ation and the purchase price Is carried In the gold premium account amongst the liabilities.
P) Gold valued at the purchase price of 47,700 francs per kilogramme fine.(3) Government bonds, Treasury bills and bank balances.C) Notes of the Banque de l'Afrique Occidentale withdrawn by the Caisse Centrale.(5) Advances to the Offices des Changes in view of the application of the Franco-British agreement of 19th March 1941.(E) Advances made to the Office Syrien des Céréales.(7) The return, which is divided into two sections, issue department and banking department, is here combined
(omitting the small duplication due to the holding of notes in the banking department).(») See explanation under (1). (9) "Dotation" of Fr.fcs 100 million plus reserves. (10) The first return published.(11) In the May and June 1943 statements, in addition to the items specified, there appeared two new items:
a suspense account of Fr.fcs 42.0 million (on both sides of the return) resulting from the reorganisationof the note issue In French Somaliland, the primary liability remaining with the Banque de l'Indochine,
, which still has the privilege of note issue in this territory; and an engagement tn the form of a banker'sguarantee (also on both sides of the return) for Fr.fcs 8.8 million on behalf of the National Committee.

— 294 —
issue (as in Syria). The note cover consists of gold (valued at three timesits purchase price), of foreign exchange, and of notes previously issued bycolonial banks and withdrawn by the Caisse Centrale.
Apart from currency regulation, the chief function of the new institutionis the coordination of the external exchange of payments of the territoriesconcerned and the maintenance of exchange stability with sterling. Monthlyreturns, which are drawn up in French francs at the fixed rate of 176.625 tothe £ sterling, are given in the previous table.
The Banque de l'Afrique Occidentale, with its head office in Paris (andthus carrying on its administration under the Vichy Government), had a branchin Dakar and agencies in the chief towns of French West and Equatorial Africa.The last complete statement of the note issue was made on 30th June 1940;
in later balance sheets the figures forBanque de l 'A f r i que Occidentale the Cameroons and French Equatorial
note c i rcu la t ion . Africa were repeated unchanged,"communications being interrupted"with the head office. By ordonnance ofLa France Libre dated 24th July 1942,the Banque de l'Afrique Occidentale wastemporarily deprived of its note-issuingprivilege in the Cameroons and FrenchEquatorial Africa from 1st August 1942and its notes were called in for redemp-tion by the Caisse Centrale, at par, by1st October 1942, since when only the
notes of the Caisse Centrale have been legal tender in these territories. Thereturn of the Caisse Centrale shows that Fr.fcs 498 million notes of the Banquede l'Afrique Occidentale had been withdrawn by June 1943.
The increase of the gold holding of the Caisse is explained by thepurchase of the gold output of the mines in the French Congo; the foreignexchange holding of Fr.fcs 2,842 million at the end of June 1943 was theequivalent of £16 million. (Other currency developments in North Africa arementioned in Chapter II, page 44.) From 24th May 1943, notes of the Caissewere issued in French Somaliland by the Djibouti branch of the Banquede l'Indochine.
In millions of Fr.fcs
SenegalGuineaIvory CoastDahomeyTogoCameroonsFrench Equatorial Africa.
Total . .
June1940
52010028488
13983
236
1,451
June1941
675136373137134(83)
(236)
1,774
By decree of the German military commander the National Bank ofYugoslavia was put into liquidation from 29th May 1941. On the same day thedecree establishing the Serbian National Bank was issued and statutes for thenew bank, under German auspices, were published, as indicated in the twelfthAnnual Report of this Bank. In Croat ia , under Italian auspices, a State Bank wasfounded by a decree of the Chief of the "Independent State" dated 10th May 1941;but the new name was merely applied to the branches of the former NationalBank of Yugoslavia in Agram (Zagreb) and other towns in the new State of

- 295 -
Croatia; the bank had to work without legal statutes, according to the lawsgoverning the old National Bank supplemented by instructions from theFinance Ministry. New statutes for the State Bank were not drawn up andpublished until two years later — on 4th May 1943.
The State Bank was then given the sole right of note issue and organised asa share company with a capital of Kunas300 million.The president and vice-presidentof the bank were appointed for three years by the Chief of State; in addition,the board of directors had three members, two of whom were appointed by theshareholders. In practice, according to the Finance Minister, this meant thatthe bank had the rank of a government ministry; the president might sit atcabinet meetings in an advisory capacity. An advisory board of the bank wascomposed of ten members selected by the president among representatives of theeconomic life of the country. The twenty-eight articles of the new statutesgave details regarding the administration and business of the bank; as a matterof fact, its business has been practically confined to the exchange of notes ofthe old National Bank, lending to the government and financing the occupa-tion costs. The bank has published fortnightly returns from the end of April1943, details of which are given on page 230 of this Report; the share capitalwas issued to the public in the first half of August 1943. By a new decreeof 14th October 1943 considerable changes were made in the statutes of theState Bank, which took over the financial business of the various governmentdepartments; in particular, the bank was authorised to purchase and sellclaims in the clearing (and a new item covering clearing claims was openedin the return of 15th October 1943).
In the rear of the area under military authority, the eastern te r r i to r iesoccupied by Germany were divided into two parts for civil administration,both in the form of a Reichskommissariat, the Ukraine in the south and theOstland in the north. By decree of 28th May 1942, all property of the U.S.S.R.in these territories was taken over and administered in the form of atrusteeship.
The creation of the Ukraine Central Bank, with statutes dated5th March 1942, was mentioned in the twelfth Annual Report of this Bank;these statutes were modified on 25th May 1943 to give the bank wider powers.The bank opened for business on 1st June 1942 with 16 branches besides itshead office in Rovno. No returns or balance sheets have been published,but some information has been made available from German sources.
Rouble notes and coins of 3 roubles or less were maintained in circu-lation but all larger rouble notes had their legal-tender status withdrawn andwere exchanged for carbovanez, the new currency introduced by decree of4th July 1942; this operation was completed by the middle of November 1942,when about Roubles 2,000 million had been withdrawn. Notes deriving fromfunds necessary for the business life of the country were exchanged at oncebut other moneys were blocked on a special account at the bank and only

- 296 —
gradually released. In the middle of November 1942, Roubles 425 million werestill blocked but the greater part was released in two steps, in December 1942and May 1943; the funds of persons considered not politically dependableremained blocked.
Besides the exchange of notes, the bank's business has consisted chieflyof three classes of operation: the discount of Treasury certificates 4o meet thewar expenditure of the Reichskommissariat (ordinary expenditure only beingcovered by taxation), the provision of working funds for the railways and thefinancing of the clearing with Germany (and the Governor-Generalship ofPoland). The currency needs of the German army were naturally considerableand, although Reichskreditkassenscheine had been largely withdrawn, somestill remained in circulation alongside the carbovanez (at the rate of RM 1 =Car. 10) and the small rouble currency (at the rate of Rouble 1 = Car. 1).It was stated from German sources that the circulation had expanded inconnection with wartime requirements. Interest rates were practically the sameas those in the Reich.
Contact between the central bank and the private economy of the countrywas comparatively slight and consisted principally in accepting the deposit offunds from the Zentralwirtschaftsbank and their investment in Reich certificates.The Zentralwirtschaftsbank was the central institution of the Wirtschaftsbankenor "business banks", the only type of bank allowed in this territory, underthe decree of 18th March 1942; by the end of 1942 there were 21 of thesebanks (with German managers) having 330 branches (with Ukrainian managers).The banks derived their deposits for the most part from the industrial andagricultural enterprises of the U. S. S. R. (under trustee administration for theGerman Commissioner) and from the German Ostgesellschaften; Ukrainiandeposits were very small. The banks undertook all types of banking businessincluding the granting of long-term credits.
The balance-sheet total of the Zentralwirtschaftsbank, which had its headoffice at Rovno and branches at Kiev and Dnepropetrovsk, had risen fromCar. 1,380 million on 30th June 1942 to Car. 4,683 million on 31st December1942; deposits then amounted to Car. 4,400 million, of which Car. 3,390 millionwere from the Wirtschaftsbanken and Car. 1,010 million from others, whilesavings deposits reached only Car. 32 million; on the assets side, Treasurycertificates accounted for Car. 1,820 million, discounts and advances Car. 1,980 mil-lion and cash reserves Car. 825 million. The capital of Car. 200 million was heldby the German Commissioner. In the first half of 1943 the balance-sheet totalrose further to some Car. 7,000 million.
Developments in the Ostland were slower than in the Ukraine. AnOst land Central Bank was created by decree of 30th July 1942. The newstatutes were practically identical with those of the Ukraine Central Bank(including a general mortgage claim on all real estate in the territory), andwere authorised in the same way by the German Minister for the Occupied

- 297 —
Eastern Territories in agreement with the Commissioner for the Four-Year Plan.The new bank started operations only on 1st April 1943 with a Reichsbankdirektoras President; the head office was at Riga and 26 branches were openedin other towns (generally where Reichskreditkassen had been taken over).Although the Bank was given the exclusive right to issue bank-notesdenominated in Ostland marks (equal to the Reichsmark), no new currencywas in fact issued and Reichskreditkassenscheine remained in circulation assole legal tender; the central bank thus conducted its operations in Reichs-kreditkassenscheine, which it obtained by means of a credit from the administra-tion of the Reichskreditkassen. Of the Roubles 900 million circulating inEstonia and Lithuania 650 million were exchanged and a substantial propor-tion of the RM 2.6 milliard Reichskreditkassenscheine outstanding at the endof 1942 was on account of the Ostland. Currency and other business trans-actions with Germany, previously conducted directly by the Reichskreditkassen,were passed through the clearing between the new central bank and theDeutsche Verrechnungskasse in Berlin. As in the Ukraine, the central bankdiscounted Treasury certificates for the German Commissioner and therailways.
But, contrary to developments in the Ukraine, existing savings banks andcooperatives (with the Gemeinschaftsbank as central institution) and also theprivate banks, largely under the control of the German Grossbanken, weremaintained in the Ostland; and the reintroduction of private property in theBaltic States became the declared policy. The Gemeinschaftsbank Ostland wascreated at the end of February 1942 with its head office in Riga; by July 1943 itsbalance-sheet total had reached RM 270 million. As district branches there werethe Gemeinschaftsbank of White Ruthenia, formed in Minsk in September 1942,and the Gemeinschaftsbank Estland, created in Reval from the former EestiPank in January 1943. These Gemeinschaftsbanken differed from the Wirt-schaftsbanken of the Ukraine in that they did not undertake general bankingbusiness but merely combined the activities of giro centres and cooperativebanks.
In Transnistria, under Roumanian civil administration, the government-owned Bank of Transn is t r ia opened for business with a head office inOdessa and 12 branches on 1st February 1943. This was the only bank in theterritory, its operations being conducted in Reichskreditkassenscheine.
During 1942, the first year of war in the Pacific, further steps were takento organise the "co-prosperity sphere" which, besides Japan, includedManchukuo, the occupied parts of China, Thailand (Siam), French Indo-Chinaand occupied enemy territory in the Philippines (U. S. A.), Burma and Malaya(British) and Java (Dutch). The sweeping reorganisation of the Bank ofJapan early in 1942, to meet the new conditions of war and for the super-vision of the newly-occupied areas, was described in the twelfth Annual Reportof this Bank and recent statistics concerning the bank's activities are givenon page 266.

— 298 —
In October 1942 the reorganisation of the Central Bank of Manchouwas announced. This bank of issue, with head office at Hsinking, was foundedunder Japanese auspices in 1932 (when the Manchukuo yuan was created atpar with the Japanese yen); besides its official business, it has greatly ex-panded its private commercial business in recent years, as the table shows.
Central Bank of Manchou.
End of year
1935193619371938193919401941
Assets
Speciereserve
(1)
Advancesto govern-
ment
Govern-mentbonds
Privatecredit
grantedP)
Totalbalancesheet
Liabilities
Notesissued
«
Govern-ment
depositsPrivate
deposits
in millions of M. Yuan92
17720821615465
167
536237
10939098
185
60189194324417851
1,222
118135176310481774573
412514669914
1,5101,8532,219
179254307426624947
1,262
74114133165455145210
78112132222297380465
(') Gold, silver and yen balances. The presentation of the return was changed in 1939 and from that yearthefigures may not be comparable with earlier years.
(2) Including a small amount (in recent years about 10 per cent.) of other securities.(3) Loans, overdrafts and bills discounted.C) The note circulation increased to M. Yuan 1,670 million on 31st December 1942 and M. Yuan 1,686 million
on 30th June 1943; on the latter date the government bond holding was M. Yuan 1,728 million. By themiddle of September 1943 the note circulation had risen to M. Yuan 2,006 million.
The reorganisation, which was expected to be completed by the end of1942, made the bank a purely government body, in close touch with theMinistry of Finance and with wide powers of control over other financial insti-tutions, on the lines of the reorganised Bank of Japan; the capital was raisedfrom Yuan 30 million (one-half paid up, by private shareholders) to Yuan 100 mil-lion (one-quarter paid up, by the government) on 26th October 1942. The bankwas to give up entirely its private banking business, which was to be takenover largely by the Industrial Bank. New statutes and a special charter forthe bank were to be drawn up.
As regards the monetary reorganisation of the newly -occup ied south-ern ter r i tor ies,* the treatment of individual countries showed similaritiesand distinctions. The similarities concerned the general principles appliedthroughout the area of Japanese supervision in economic and monetary affairs,the closest possible economic relationship with Japan and devaluation of thelocal currencies to parity with the Japanese yen. A distinction was made infavour of the "friendly" countries which "cooperated" with the Japanese andwhich were, therefore, allowed to retain their own note issues (FrenchIndo-China and Thailand) or given the right to organise a new currency(Burma), while in most of the other territories (Hong Kong, Java etc.) theformer issuing authorities were suspended and note issue activities taken overby the South Seas Development Bank.
Information regarding currency developments in the parts of China occupied by the Japanese Is given onpages 50-52.

- 299 -
The balance sheet of the Bank of Indo-China has expanded consider-ably since the occupation of the country by the Japanese. As presentedto the general meeting in Paris in August 1942 it showed the followingsituation for the end of 1941 compared with earlier years.
Banque de l ' lndochine ( 1 ) .
End of year
193819391940(")19411942(5)
Assets
Corre-spon-dents
Bonsde la
défensenationale
Officedes
changes(piastres)
(2)
Ailotherassets
(3)
Totalof
balancesheet
Liabilities
Notecircu-lation
Currentaccounts
Officedes
changes(devises)
(2)
Aliother
liabilities
in millions of Fr.fcs1,6921,614
4,6156,086
2,3913,127
3,341 3,4694,300
767892
956
4,8505,633
12,381
1,8392,2892,9643,6655,148
1,9101,998
3,690 3,8395,600
1,1011,346
1,187
(1) As drawn up by the head office in Paris.O These are Treasury accounts through which the Exchange Office conducts its operations.(3) Including "financial participations" practically unchanged at Fr.fcs 30 million. According to the annual report
for 1941, however, the bank acquired important interests in the capital of the Banque de Paris et des Pays-Bas, of the Caisse Centrale de Réescompte and of the Nederlandsche Handel Maatschappij; these interestswere taken over from Lazard Frères (in liquidation).
(4) It was not possible to draw up a balance sheet for 1940 owing to the fragmentary nature of informationreceived at the head office. The figure for the note circulation in 1940 was given (in piastres) in the annualréport for 1941. (5) Preliminary figures (from annual report published in Paris in November 1943).
The balance-sheet total more than doubled in the two years from1939 to 1941; particularly remarkable was the growth of "correspondents" byFr.fcs 3,000 million (with its counterpart in the note circulation and currentaccounts) and the two new items of around Fr.fcs 3,500 million each onaccount of the Indo-Chinese Exchange Office. This office, which workedthrough Treasury accounts but was managed by the bank, obtained advancesin Indo-Chinese piastres for the purchase of foreign currencies. Preliminaryfigures available for the end of 1942 indicate a further considerable expansionof the balance sheet.
The annual report for 1941 stated that the bank itself, upon instructionsfrom the French Government, had taken over the functions of a clearing officewith foreign countries. In July 1941 an agreement was signed between thebank and the Yokohama Specie Bank whereby settlements between Indo-Chinaand Japan took place in yen only through accounts at the two banks. InNovember 1942 it was announced that, owing to the increasingly close economicrelations of Indo-China with Japan, the bank was opening branches at Tokioand Yokohama; on the other hand, the bank's branches in Hong Kong andShonan (Singapore) have been closed.
The note issue in Tha i land , made by the Ministry of Finance, rose fromBahts 177 million in December 1939 to Bahts 215 million in December 1940,i.e. at the monthly rate of Bahts 3 million; on the outbreak of war in thePacific the issue jumped by Bahts 20 million monthly and emergency measureswere necessary, including a restriction on withdrawals from bank deposits.

300 -
mounting budget deficits.
Thai land Budget Results.*
Financial yearended 31st March
RevenueExpenditure . . .Deficit
1941 1942 1943
In millions of bahts13820466
12521893
148278130
By March 1942, when these measures were relaxed, the note circulation wasBahts 316 million. Although later figures are not available, it is known thatthe circulation increased further in 1942 and 1943, partly as a result of the
On 10th December 1942, a new central bank wasestablished at Bangkok (in the build-ing of the Hong Kong and ShanghaiBanking Corporation), with a capitalof Bahts 20 million subscribed by thegovernment; the currency had alreadybeen devalued by about one-third inApril 1942, to fall into line with theyen parity, and the yen was admitted asnote cover. Before the occupation thebaht had been covered over 100 percent.,
the reserve being largely deposited in London; in June 1942 the Japanesefilled the gap in the note cover with a "book credit" of Yen 200 million.Exchange payments between the two countries take place entirely in yenthrough accounts at the Bank of Japan. By a decree which came into forcein June 1943, the Central Bank of Thailand was to fix the reserves, in cashand balances at the central bank, to be held by all banks, insurance companiesand other financial institutions in Thailand ; and, in September 1943, the"emergency credit-control law" was promulgated, which, in an attempt toobtain a full "absorption" of government borrowing, obliged all banks to hold40 per cent, of their deposits in government bonds.
* Military expenditure accounted for Bahts 102 millionin 1942-43. Estimates for 1943-44 place total expendi-ture at Bahts 400 million.
In the early months of 1942 the South Seas Development Bank wascreated for the exploitation of the newly-occupied enemy countries, as explainedin the twelfth Annual Report of this Bank. At first, this bank acted onlines somewhat similar to those of the German Reichskreditkassen, conductingits business in military notes, or gumpyo, denominated, however, not in yenbut in the currencies of the occupied countries, viz. the Philippine peso,the Dutch East Indies florin, the Straits Settlements dollar and the Burmeserupee, military notes being made legal tender at parity with the local currencies.For Hong Kong the local currency, the Hong Kong dollar (which also had awide circulation in southern China), was replaced by the military yen and, from1st August 1942, its status as legal tender was cancelled. And in thePhilippines the circulation of U. S. dollar notes was prohibited.
Branches of the South Seas Development Bank were opened in the chieftowns of the occupied enemy territories, in Shonan, Manila, Batavia etc. Earlyin 1943 it had in all 17 branches and 5 agencies which, except for the threementioned above, were administered by the Yokohama Specie Bank or theBank of Taiwan (Formosa). Commercial business was generally left in thehands of local banks. British, American, Dutch and other enemy banks wereclosed by the Japanese troops when the occupation took place, their entirebusiness being taken over by the military authorities, and passed gradually tonew branches of Japanese banks, in particular to the Bank of Taiwan (in the

— 301 —
neighbouring islands) and the Yokohama Specie Bank (in the remainingterritories); the latter bank thus largely acquired the business of the Hong Kongand Shanghai Banking Corporation. Some idea of the rapid expansion of theJapanese banks, as a consequence of these proceedings, is given by the factthat early in 1943 the Yokohama Specie Bank had 50 branches in south-easternAsia as against its previous 6, while the Bank of Taiwan had 17 against 5.The South Seas Development Bank supplied these two banks with the militarycurrency necessary for their business by making short-term credit available.
A new phase was opened when the South Seas Development Bankreceived authorisation to issue its own notes in unlimited amounts as from1st April 1943. The military currency would no longer be issued but notesof former issues would remain temporarily in circulation until exchanged orwithdrawn. The change appears to be merely a formal one, since the newbank-notes were to be denominated, as were the military notes, in the currenciesof the occupied territories. No statistics regarding the circulation of militarynotes have been published; the anticipated new issue of South Seas DevelopmentBank notes for the equivalent of Yen 3,300 million has been taken as revenueinto the Japanese budget for 1943-44.
On 20th October 1942 the Japanese military authorities ordered the liquida-tion of the Bank of Java. This bank, which was founded in 1828, hadoffices in Sumatra, Borneo and Celebes as well as in Java; the head officewas at Batavia. The last weekly return published, on 7th February 1942, showeda gold reserve, of FI. 407 million (known to be largely held abroad), con-siderably in excess of the FI. 345 million notes in circulation. The notes wereto remain temporarily in circulation but an eventual exchange for yen currencywas contemplated. Eight other Dutch Indies banks (including the NederlandscheHandel Maatschappij, the Nederlandsch- Indische Handelsbank and theNederlandsch-lndische Escompto Maatschappij), which had been closed sincethe occupation and whose assets had been confiscated, were also put intoliquidation. The moratorium, which had been in force since the occupation,was raised from 20th October 1942.
For the lime being, regulations regarding the cover of the note issueof central banks play no very important rôle. In a few countries (e. g. theUnited States, Switzerland and Sweden) the cover is so high in relation to thenote circulation (and other sight liabilities) as to place no practical restrictionon the issue. In other cases, where such regulations would have becomerestrictive, they have been suspended (e. g. in Belgium), abolished (e. g. inGermany) or adapted to fit the new situation (e. g. in Holland, so as toinclude Reichsmarks*, or in Roumania, so as to include "claims to gold"blocked in enemy countries). The "fiduciary issue" in England was raisedfrom £300 million to £580 million on 5th September 1939, when the gold holding
* The Inclusion of Reichsmarks as well as gold raised the "surplus cover", i. e. that above the legal 40 percent., as shown by the Nederlandsche Bank return, from FI. 61 million to FI. 1,218 million in the week to30th March 1942; in other words, the ratio jumped from 42 per cent, to 88 per cent.

— 302 —
Banque Mell ié Iran 0)
was transferred to the Exchange Equalisation Account; since then practicallythe whole issue has been "fiduciary", i. e. issued without gold cover, and themaximum has been raised from £580 million by nine steps to £1,050 million,from 6th October 1943.
In Bulgar ia, where the regulations prescribe that notes and other sightliabilities outstanding must be covered by a reserve of at least 25 per cent, ingold and free foreign exchange (net), a modification of the statutes in May1941 made it possible to count Reichsmarks as a free currency for this purpose.If the entire Reichsmark holding had been included, a cover of about 100 percent, could have been shown. But, as a matter of fact, the National Bank wasvery sparing in the amount of Reichsmarks included in the cover calculationsand throughout 1942 the ratio only just exceeded the minimum, fluctuatingwithin the narrow limits of 25.10 and 26.86 per cent.
A more picturesque solution was found for some years in Iran where,by the law of 16th November 1936, the crown jewels had been deposited tomake good any deficiency of the metallic (gold and silver) reserve, whichshould amount to 60 per cent, of the notes. Until 1940 the metallic coverexceeded the legal percentage but in 1941 and 1942 it fell below it andthe crown jewels were then valued at an amount sufficient to fill the gap.
The annual report ofthe Banque Mellié Iranfor the financial yearending 29 esfand 1320(20th March 1942) statedthat the legal metalliccover was Rials 670 mil-lion and said "the ratio inrelation to the note circu-lation is 33.59 per cent.,the difference (26.41 percent.) in relation to thelegal minimum (60 per
cent.) being represented by the crown jewels . . . " . Actually the whole calcula-tion in Iran was a pure formality as the gold in the reserve was valued at alegal price less than one-half the market price; the real value of the reservedid, in fact, exceed the legal 60 per cent.
A new law was passed on 19th November 1942 whereby notes issued fromthat date onwards should have a cover of 100 per cent.: 60 per cent, in goldrevalued at the market price of that day and in sterling or dollars convertibleinto gold, plus 40 per cent, in sterling or dollars guaranteed against depre-ciation in terms of gold. The total note issue rose from Rials 3,500 million on19th November 1942 to Rials 4,647 million on 21st March 1943; the increase ofRials 1,147 million was covered by Rials 1,190 million in gold (831 million),sterling (103 million) and dollars (256 million). The total reserve in March 1943 con-sisted of Rials 2,628 million gold and silver (as revalued) and Rials 1,006 million
End of financial year(20th March)
194019411942
Notesissued
(2)Metallic cover
(3)Crown jewels
(4)In millions of rials (and percentages)
1,1141,3501,995
720670670
%64.649.633.6
140527
%
10.426.4
0) Formerly National Bank of Persia.(2) Notes delivered to the bank by the Control Committee, including notes
In circulation and also those in the tills of the bank.(3) Gold and silver placed with the Control Committee.(4) Deposited as cover but not shown In the bank's balance sheet.

— 303 —
in foreign securities. It should be mentioned that the total "issue" includednotes held in the bank's tills; excluding these notes, the net circulationmore than doubled from Rials 1,737 million in March 1942 to Rials 3,723 mil-lion in March 1943. In the latter month the convertibility of the notes intosilver was suspended.
There was already a general upward t rend of note c i rcu la t ionsthroughout the world before the war, as described in earlier Annual Reportsof this Bank; and since 1939 the expansion has gathered momentum*. Theincrease from the average of the first half of 1939 to the end of 1942 rangesfrom a little over 40 per cent, for the Argentine to 4,000 per cent, for Greece(the index for Greece soaring above 17,000 in September 1943).
Index of Note Ci rcu la t ions 0)
Country
Position of index at end of
Dec.1939
Dec.1940
Dec.1941
Dec.1942
June1943
on basis of January — June 1939= 100
Annual percentage increase
Dec.1939to
1940
Dec.1940to
1941
Dec.1941to
1942
June1942to
1943
GreeceIcelandBulgaria . . . .FinlandItalyEgyptTurkeyHungary . . . .FranceAustralia . . . .Roumania. . . .CanadaBelgiumJapanGermany . . . .HollandPortugal . . . .Denmark . . . .United States. .South Africa . .SwedenUnited KingdomSwitzerland . . .Argentina. . . .
127
118
148
184
128129139113127135130122127163
147112121139111111
139112119102
207
216
228
253
164182199161185156172169158205
174150138172127130
145126132109
657
436
471
334
255247253230226205258223219256
237205213195163161
166154136124
4,118
924
662
439
380367362342321321314313307306
295294260228225213
197189153144
5,383(2)
1,059
415
450421361370364383327334«337306
269245254246
193194154148
63
83
54
28414442461632382426
193414241516
. 412117
217
102
107
32
56362743223150323925
363755142824
1522314
112
41
31
50494349425722414020
254322173832
19231316
369 (3)
81
14
44332447404625
3132
26823254135
15181815
0) Only central-bank note circulations are taken Into account, except for the United States for which thetotal "money in circulation" is more appropriate. The countries are arranged according to the heightof the index in December 1942. (=) March 1943. By September 1943 the index had risen to 17,172.
(3) May 1942 to March 1943. (") May 1943. (5) June 1942 to May 1943.
A p a r t f r o m t h e g e n e r a l e f f e c t s of w a r f i n a n c i n g a n d t h e r ise in p r i c e s ,
t h e r e a s o n s f o r t h e i n c r e a s e s o f n o t e c i r c u l a t i o n s m a y b e c o n v e n i e n t l y
d i v i d e d in to f o u r c l a s s e s : a ) i n c r e a s e d n e e d of c u r r e n c y , b) t h e h o a r d i n g ,
* The only exception to this rule would appear to be in the eastern territories occupied by the Japanese, where,owing to special reasons, the circulations in some cases are said to have declined. Thus, it was reportedfrom Shanghai that the circulation of Straits dollars in July 1942 was only 140 million against 220 millionbefore the outbreak of war in the East; the reduction was partly due to destruction caused by the war andpartly to a "g i f t " of 50 million Straits dollars made by Chinese merchants to the Japanese military andnaval authorities. Similarly In Java, where the circulation of notes and coin, including the gumpyo currency,was reported at FI. 400 million In the middle of 1943 against about FI. 500 million before the occupation.

- 304 -
or saving, of notes, c) larger bank reserves and d) other reasons, varyingin importance from country to country.
a) The chief causes of the increased need of currency are the fullemployment of a greater number of workers, the higher wages they generallyearn and the larger proportion of the national income they receive; farmers too,
' who get good prices in wartime, tend to effect a large proportion of theirtransactions in cash. In addition, the rise in the cost of living, as a resultof more expensive imports, higher costs of transport and other causes, leadsto larger currency requirements.
b) Workers and farmers, with more considerable amounts to save, aresometimes without, or unaccustomed to, banking facilities, and their genuinesavings often take the form of holding bank-notes. The difference betweensaving and hoarding is difficult to define, but generally hoarding has cometo mean the withholding of notes beyond the requirements of "pocket money"for current payments, sometimes with some illegitimate purpose in view (e. g.tax evasion).
Saving or hoarding of notes is often taken as a sign of confidence inthe value of the currency. But it also shows a preference for notes to govern-ment securities, a desire to hold money in the most liquid form, and a re-luctance to have savings "tied up" in a more permanent manner; this maybe due, in some measure, to the low rates of interest paid in many partsof the world. But, because people for one reason or another hold morenotes than they need for currency purposes, governments are forced toborrow from central banks; and, the more they borrow in this way, the morethey tend to increase the note issue above the genuine need for currency.In a few cases, such as Swiss francs and U. S. dollars, the hoarding ofnotes outside the country is not without significance.
c) In so far as deposits increase (because industry and trade, as wellas the public, hold larger amounts as bank deposits), the banks need to havehigher cash reserves, part of which are in the form of notes. And, becausethe new deposits may be more unstable than the old ones and more subjectto sudden withdrawal, bank reserves may be increased more than propor-tionately to the rise of deposits.
d) Further, there are a number of reasons which have had influenceof very different weight in various countries. Illegitimate transactions on theblack markets are generally conducted in bank-notes in order to avoid leavingtraces; and notes may be favoured as facilitating evasion of taxation and foreignexchange restrictions. A reason of quite a different character is an extensionof the territory in which the domestic currency circulates, such increaseshaving been of importance for Germany, Hungary and Bulgaria in 1941, butnot in 1942. Further, in England, as elsewhere, the curtailment of banking faci-lities as a consequence of the war has doubtless had some influence: theChairman of the Midland Bank stated in January 1943 that roughly one-fifthof the bank's branches had been destroyed or had suffered appreciable damageas a result of enemy air attacks; most of this damage had been repaired

— 305 —
but, chiefly in order to release manpower, the number of branches had beencut down by one-sixth; this, he added, "may well be one factor among manyin the enlargement of the amount of currency retained in the hands of thepublic." An additional factor in the expansion of currency in England in 1943was the large number of allied troops stationed in the country. Finally,the methods of financing clearings and occupation costs in Europe, andadvances through central banks outside Europe, contributed in particular toan expansion of note issues.
The countries indicated in the table on page 303 and in the graphs onpages 306 and 307 provide representative examples as far as data are available.Some European countries have been omitted owing to lack of statistics, eitherfor the base period in 1939 (e.g. Spain) or for more recent dates (e.g. Albaniaand Norway). The circulation of the Bank of Spain in June 1943, after therepudiation of notes issued on account of the Republican Government duringthe civil war, was slightly more than three times as high as it was at theend of 1935; this expansion compared not unfavourably with the increasesin many European countries. But other countries omitted for lack of datawould appear high in the table. The monthly returns of the National Bankof A lban ia ceased in October 1940 when Italian troops invaded Greece fromAlbanian soil ; at the end of September 1940 the index would have stoodat 336, higher than for any country in the table at that time (the notecirculation being covered over 100 per cent, by Italian lire). And no weeklyreturn or balance sheet for the Norges Bank has been published sincethe occupation of the country by Germany in April 1940; the estimate of thecirculation given on page 214 would place Norway on the same level asFinland at the end of 1942. In Yugoslavia, the index number on the baseJanuary-June 1939 would have been 220 in March 1941, the last month inwhich the National Bank published a return; from this date until September 1943the note issue in Croatia rose by five times, so that the index would haverisen to well over 1,000; on the other hand, no recent information permittinga similar calculation for Serbia is available. And no data are publishedregarding the note circulations in Poland, the Ost land or the Ukra ine;the issue of Re ichskred i tkassensche ine is mentioned on pages 186-188.
As regards the position at the end of 1942 of the groups of countries asgiven in the table: in the United Kingdom and the three neutrals, Sweden,Switzer land and the A rgen t ine , the index was less than 200; but in allfour countries the rate of increase was greater in 1942 than in 1941 (in theUnited Kingdom only slightly so). Statistics published in the budget WhitePaper showed that in the United Kingdom the note circulation has remainedfairly constant at around 10 per cent, of the national income, as it didbefore the war.
At the bottom of the 200-300 group are the Union of South A f r i caand the United States, in both of which the rate of increase is com-paratively high and still rising; in Por tuga l , the total increase is greater thanfor the other European neutrals. ;

— 306 —
Germany is at the top of the200-300 group; the increase in 1941was partly due to the incorporationof new territory into the Reich. InJune 1943 the President of theReichsbank characterised the slowbut steady expansion of the currencyas being something more than a"Schönheitsfehler"*. During 1942 andearly in 1943, the note circulationof the Reichsbank had, in fact,expanded at an even rate of aboutRM 5 milliard above the figures ofthe previous year; from that time,the expansion accelerated in speed:the note circulation at the end ofMarch 1943 was RM 4.9 milliardabove what it had been in March1942 — but at the end of June, July,August and September 1943 thefigures were respectively RM 5.7,6.3, 7.2 and 8.1 milliard higher thanat the end of the correspondingmonths of 1942. This accelerationwas doubtless connected inter aliawith the freedom accorded as towithdrawal of savings deposits (men-tioned on pages 179-180), madenecessary by the air bombardmentsand mass evacuation of the popula-tion from towns. This 200-300 groupalso includes Hoi land and Denmark,which, with Belgium, Roumania,Franceand Hungary in the 300-400 groupand Bulgariaand Greece higher upin the table, are the countries wherethe circulation has been affected bythe payment of occupation costs,the financing of the clearing withGermany, or both together.
The apparent slowing-up of theexpansion in Japan, at the bottomof the 300-400 group, is partly dueto the fact that the Banks of Chosen
* In an article In the "Zeitschrift der Akademiefür Deutsches Recht", Heft 9, 1943.
Index of Note Circulation.January-June 1939 = 100.
(380)

— 307 —
Index of Note Circulation.January-June 1939 = 100.
HOOOlrrpTj TW
I942
and Taiwan no longer hold theirreserves in notes of the Bank ofJapan (which they paid into specialaccounts at that bank). Canadaand Aus t ra l i a , in the same group,are characterised by increasing ratesof expansion. In Turkey also, therate of expansion grew until theend of 1942 but, under the influenceof the capital levy, described onpages 239-242, the circulation ac-tually fell in the first half of 1943.
At the top of the 3Q0-400 groupis Italy; the Banca d'Italia hasissued no weekly returns since1935, but end-of-year balancesheets were published until 1940and material is available on whichcertain estimates, shown in the tableon the next page, are based. Nearthe end of July 1943 the FinanceMinister gave data regarding the cirrculation "on the eve of Italy's entryinto the war" (end of May or earlyJune 1940) and for 20th July 1943(mentioning also the expansion duringthe latter month). The trend of theexpansion, as shown by these figures,indicated an increase of about 50 percent, per annum in 1941 and 1942.This increase appears to have con-tinued, with a slight tendency todecline in speed, during the firsthalf of 1943, but a sharp accelera-tion took place in July. (Notes ofthe Banca d'Italia circulated not onlyin Italy but in the colonies andthe bank had branches in Eritrea,Abyssinia, Libya and Rhodes. Theproportion of the note circulationappertaining to the colonies has notbeen made known. By a decree of25th November 1942 the notes ofLit. 50, 100, 500 and 1,000 which theBanca d'Italia had prepared for issuein Italian East Africa were made

308 —
Note Ci rcu lat ion of Banca d ' I ta l ia .
End of month
1938 Decomberò) .1939 March (3) . .
June (2) . . .December (1)
1940 March («) . .June (!) . . .December 0)
1941 June0 . . .December 09
1942 June (2) . . .December (2)
1943 June (5) . . .July « . . .
Inmillions of
lire
18,95517,96719,35024,43222,64327,19031,30636,00049,00060,00073,00086,15896,541
IndexJan. —June1939 = 100
9994
101128119142164190255310380450505
legal tender for circulation in Italyitself.) In October 1943 it was reportedthat the commercial banks in Milanwere issuing circular cheques to sup-plement the currency.
Egypt and Ice land, wheretroops of the United Nations werestationed, are high up in the tableon page 303 and notable increasestook place in 1942, in Egypt by nearly50 per cent, and in Iceland by over100 per cent. In both cases the excessof commodity exports characteristicof earlier years was turned into animport surplus in 1942; and in bothcases the United States becamethe chief supplier in place of theUnited Kingdom, large deliveriesbeing made on lend-lease terms,in mind that the army stationed in
the local population (of some 120,000)
0) Figures from published balance sheet. Q Estimates.(3) Last week of March. (4) 22nd March.(5) In July 1943 the Finance Minister gave the figure of
Lit. 96,541 million for 20th July 1943, stating that duringJuly the Treasury had had recourse to note issueto the extent of Lit. 10,383 million; and the circulation"on the eve of Italy's entry Into the war" was givenas Lit. 25,344 million.-
As regards Iceland, it must be bornethat country was larger in proportion tothan in any other occupied country.
Finland has been affected by two wars with the U.S.S.R., the winterwar of 1939-40 and the war begun in June 1941 ; the decline of the circulationin the second quarter of 1943 was due to the threat of stamping the notesand thus reducing their value, see page 217. The violent inflation in Greece,which began in the second half of 1942 and continued during 1943, is describedin Chapter V, where more details regarding the factors responsible for theexpansion of circulations in individual countries are given.
It is believed that the indexes shown in the table and illustrated bygraphs give a reasonably correct picture of developments in the countriesconcerned. The only exception is Bulgaria. Although by the end of 1942the index, at 662, stood higher than that of any other continental Europeancountry except Greece, it understates the real expansion. As described in thetwelfth Annual Report of this Bank, the Bulgarian Government by decree of9th February 1942 began the issue through the National Bank of 3 per cent.Treasury certificates in small denominations which, although nominally of oneand two years' maturity, were designed to circulate as interest-bearing bank-notes; they could at any time be cashed at the National Bank at par plusaccrued interest* and they were accepted in government offices in paymentof taxes and other debts to the state. According to a statement of theMinister of Finance in January 1943, some Leva 1,850 million of these Treasury
* To facilitate circulation, the value of the certificates plus accrued interest to the 5th, 15th and 25th of eachmonth was shown in a table printed on the back of each certificate.

- 309 -
certificates were put into circulation in the year 1942*. In December 1942,the National Bank announced that in future Treasury liabilities exceedingLeva 200,000 vis-à-vis firms and private individuals would be paid one-halfin cash and one-half in Treasury certificates.
And in 1943 events moved quickly as the expansion gathered momentum.After new issues of these certificates and the suspension of the publicationof the National Bank's return in the middle of February, the certificatesfell to a discount of 10 per cent, or more on bank-notes. From 20th May 1943it was decreed that Treasury certificates must not be bought at a lowerprice than that paid by the National Bank itself, nor could acceptance ofTreasury certificates as means of payment at the price paid by the Na+ionalBank be refused; this law practically gave Treasury certificates the status offull legal tender, which they had not previously enjoyed. In June 1943 bankswere authorised generally to make payments entirely in Treasury certificates;in some special cases 50 per cent, might be paid out in notes. In the samemonth the National Bank called in its two highest denominations of notes,those of Leva 1,000 and 5,000, of which Leva 15 milliard were in circulation,two-thirds of the total note circulation at that time; holdings up to Leva 4,000were exchanged in full against smaller bank-notes while Leva 500 notes of anew series were given in exchange for 60 per cent, of larger holdings, theremaining 40 per cent, being paid out in Treasury certificates; large notesnot exchanged by 20th September 1943 became invalid and lost their statusas means of payment. Towards the end of September the National Bank beganthe issue of a new series of Leva 1,000 notes.
In Roumania also, the issue of a supplementary currency was prepared.By decree of 16th December 1942 the Ministry of Finance was authorised toput 4 per cent. 6-month Treasury bills (Kassenscheine) into circulation upto a maximum of Lei 10 milliard ; these bills were payable to bearer andtransferable without formalities; they might be used for the payment of taxesand other debts to the state; banks and other institutions which were requiredto hold a certain volume of cash among their assets were entitled to includethese certificates in their cash holdings ; the National Bank was obliged torepurchase them at any time with accrued interest and they were specificallyintended to replace bank-notes in circulation, especially for large transactions.Their acceptance in payment by private persons was not made obligatory atthe time of issue but the possibility of à forced circulation at a later datewas not excluded.
In other countries efforts have been generally directed towards the strictexclusion of anything which might serve as a supplementary currency. InGermany the issue of army promissory notes averaged only about RM 300 mil-lion, recourse to this type of instrument being restricted since it was fearedthat a larger circulation of these notes might become a kind of currency. Andin England postal orders, which were made legal tender on the outbreak of war,
* By March 1943 the total placed was reported to be Leva 2,380 million. In August 1943 the Minister of Financedenied that it was intended to create a supplementary currency and stated that of Leva 28 milliard Treasurycertificates put into circulation Leva 24 milliard had already returned to the National Bank; this appliedto the period before the withdrawal and exchange of large bank-notes.

— 310 —
when a shortage of currency was feared, were deprived of this status aftera few weeks, when the immediate emergency was past. Even in countries likeGreece where, in 1942, part of the crop was paid for in discountable Treasurybills, these bills might not circulate as currency.
In three countries, the United Kingdom, Holland and Brazil, notes inc i rcu la t ion have been wi thdrawn with the general idea of reducing theamounts in circulation and preventing illegitimate transactions. But the modesof withdrawal have been very different.
Until 1928 the Bank of England issued notes only of £5 and upwards;the circulation of currency notes of 10s. and £1, first issued by the Treasuryin 1914, had grown considerably and constituted 72 per cent, of the totalaverage circulation when the note issue was unified in 1928. The notes of £10and upwards rose from 17 per cent, of the total in 1928 to 23 per cent, in 1938(the latest analysis published) the increase being particularly marked from 1936onwards; by the early part of 1943 such notes probably amounted to at leastone-quarter of the total note circulation, say about £250 million.
Towards the end of April 1943 the Chancellor of the Exchequer announcedthat the Bank of England would issue no further notes of denominations of £10and upwards and would withdraw those already issued, as opportunity offered.The notes were not called in and their legal-tender status has in no way beenimpaired ; but as they come back to the banks in the ordinary course of business
they are not reissued. The circulation of theBank of England will thus eventually beconfined to the three smaller denominations,viz. 10s., £1 and £5. The reasons given bythe Chancellor for the decision includedthe simplification of the note issue andthe desire to place difficulties in the wayof those who, by utilising the largerbank-notes, might escape exchange controlor other regulations. No information hasbeen published as to the volume of noteswithdrawn but some indication was givenby the contraction of the note circulationby £7 million in the nine weeks from theend of April to the end of June 1943compared with an expansion of £30 millionin the corresponding period of 1942.
Bank of England
note c i rcu la t ion.
Wednesday figuresIn millions of£ sterling
Aprïl 2S/29May 5/6.
12/1319/2026/27
June 2/3.9/10
16/1723/2430/1 July
July 28/29 . . .Aug. 25/26 . . .Sept. 30/1 Oct. .
1942
771.2776.9780.2782.5788.6792.9793.7793.2796.0801.6824.1828.6838.0
1943
953.4953.9951.6947.3945.0946.4946.9949.4947.7946.3968.1974.9986.5
Before March 1943 about one-quarter of the circulation of theNeder landsche Bank was composed of big notes of FI. 500 and 1,000 andthree-quarters of notes in denominations of FI. 100 down to 10. By a decree ofthe German Commissioner for the Occupied Dutch Territory, published on14th March 1943, all notes of FI. 500 and 1,000 were declared invalid and called inimmediately; holders were obliged to deposit them with the fiscal authorities by
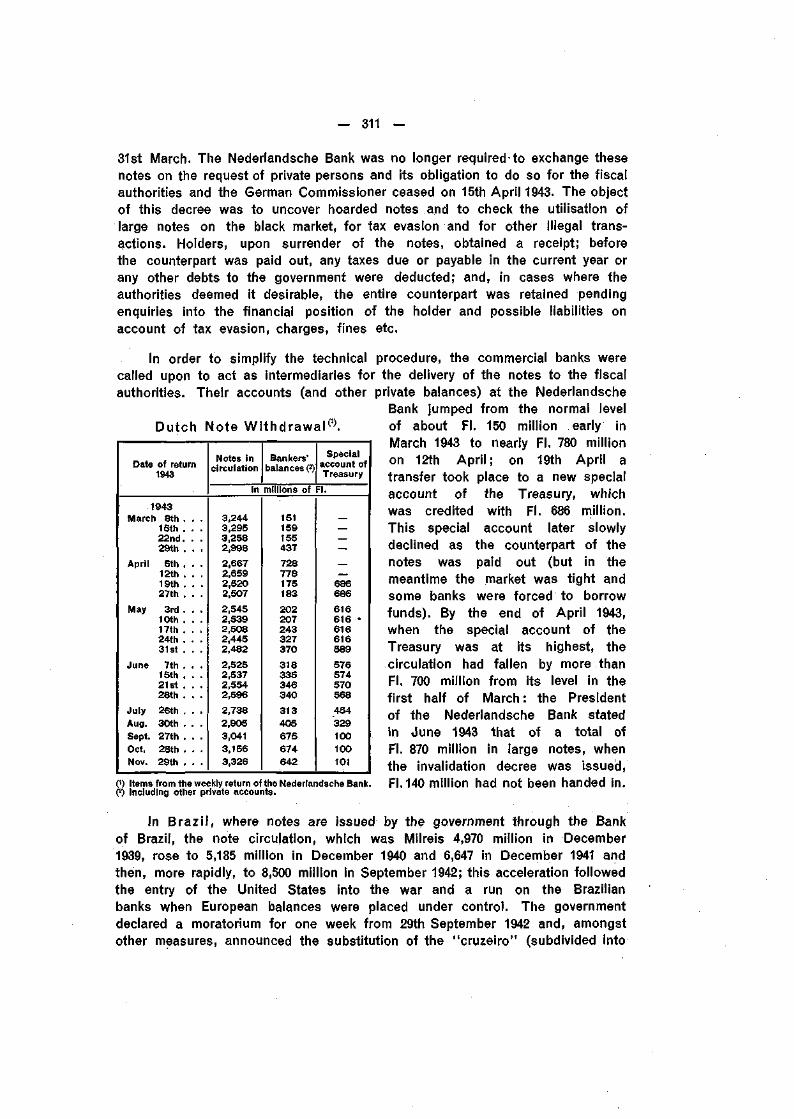
Dutch Note W i t h d r a w a l " .
— 311 —
31st March. The Nederlandsche Bank was no longer required to exchange thesenotes on the request of private persons and its obligation to do so for the fiscalauthorities and the German Commissioner ceased on 15th April 1943. The objectof this decree was to uncover hoarded notes and to check the utilisation oflarge notes on the black market, for tax evasion and for other illegal trans-actions. Holders, upon surrender of the notes, obtained a receipt; beforethe counterpart was paid out, any taxes due or payable in the current year orany other debts to the government were deducted; and, in cases where theauthorities deemed it desirable, the entire counterpart was retained pendingenquiries into the financial position of the holder and possible liabilities onaccount of tax evasion, charges, fines etc.
In order to simplify the technical procedure, the commercial banks werecalled upon to act as intermediaries for the delivery of the notes to the fiscalauthorities. Their accounts (and other private balances) at the Nederlandsche
Bank jumped from the normal levelof about FI. 150 million early inMarch 1943 to nearly FI. 780 millionon 12th April ; on 19th April atransfer took place to a new specialaccount of the Treasury, whichwas credited with FI. 686 million.This special account later slowlydeclined as the counterpart of thenotes was paid out (but in themeantime the market was tight andsome banks were forced to borrowfunds). By the end of April 1943,when the special account of theTreasury was at its highest, thecirculation had fallen by more thanFI. 700 million from its level in thefirst half of March : the Presidentof the Nederlandsche Bank statedin June 1943 that of a total ofFI. 870 million in large notes, whenthe invalidation decree was issued,FI. 140 million had not been handed in.
Date of return1943
1943March 8th
15th22nd29th
April Sth12th19th27th
May 3rd10th17th24th31st
June 7th1Sth21st28th
July 26th .Aug. 30th .Sept. 27th .Oct. 25th .Nov. 29th .
Notes Incirculation
Bankers'balances (2)
Specialaccount ofTreasury
in millions of FI.
3,2443,2953,2582,9982,6672,6592,5202,5072,5452,5392,5082,4452,4822,5252,5372,5542,5962,7382,9053,0413,1563,326
151159155437
728778175183
202207243327370
318335346340
313405675674642
686686
616616616616589
576574570568
454329100100101
0) Items from the weekly return of the Nederlandsche Bank.(2) Including other private accounts.
In B r a z i l , whe re no tes are i ssued by t h e gove rnmen t t h r o u g h t h e Bank
of Braz i l , t he note c i r cu la t i on , w h i c h w a s Mi l re is 4,970 mi l l ion in December
1939, rose to 5,185 mi l l ion in December 1940 and 6,647 in December 1941 and
t h e n , more rapid ly , t o 8,500 mi l l i on in Sep tember 1942; t h i s acce lera t ion f o l l o w e d
t h e entry of t he Uni ted Sta tes in to the war and a run on the Braz i l ian
banks w h e n European ba lances were p laced under c o n t r o l . T h e gove rnmen t
dec lared a mora to r i um fo r one week f r o m 29th Sep tember 1942 a n d , a m o n g s t
o ther measures , a n n o u n c e d the subs t i t u t i on of t h e " c r u z e i r o " (subd iv ided in to

— 312 —
100 centavos) for -the former milreis currency. From 1st November 1942 allpublic accounts, including those of the banks, were to be kept in the new unit(which has the same value as the milreis). The notes outstanding may even-tually be replaced by a new issue, but for the time being the old milreis noteshave remained in circulation with an overprint. By December 1942 the circulationhad fallen to 8,240 million and it remained at about this level in the earlymonths of the new year, rising, however, to 9,330 million in June 1943.
Amongst the measures which, in other countries, directly contributedtowards a reduction of the note circulation may be mentioned the capital levyin Turkey and the threatened stamping of notes in Finland. In south-easternEurope wheat as a measure of value made its appearance in the autumnof 1943: in Hungary a government loan was denominated in quintals of wheat,3V2 per cent. 25-year "wheat bonds" for 5, 10, 25 and 100 quintals beingcreated which it was hoped would be popular with farmers and succeed inattracting hoarded notes; and in Roumania the repayment, in wheat, of oldagricultural debts was invited.
The increased purchasing power in the hands of the public, as shownby the expansion of bank-note circulations, has led to a shortage of d iv i -s ional coin, which is almost universal. And in 1942 this shortage in manycases became acute. Experience has demonstrated that the circulation ofdivisional coin, in its relation to the circulation of bank-notes, may varyfairly widely from time to time and from country to country; but when thecoin circulation falls below a certain minimum proportion, as it is apt to dowhen the bank-note circulation is rising rapidly, shortages of small changeappear which cause tiresome inconvenience in retail purchases and thesettlement of other small transactions.
The evolution of the situation in Sweden, where the expansion of thenote circulation since 1939 has been moderate, compared with other countries(see table on page 303), is illustrated in the graphs on the opposite page.Fluctuations in the circulation of coin are very sluggish compared withthose of the note circulation, partly owing to the time and material neededfor the minting of new coin. As the graphs show, the proportion of coinin Sweden fell during the last war to its lowest point at 6 per cent, of thenote circulation in 1918; in fact, one-krona notes were put into circulationin 1914 and, if they were included with the coin, the proportion for 1918would be raised to 6.7 per cent. One-krona notes, although printed, have notbeen put into circulation during this war, and the proportion of coin fell to6.1 per cent, in 1942.
In other countries similar shortages have appeared and everywhere mintshave been kept busy attempting to cope with the demand. In England theRoyal Mint struck 355 million silver, bronze and nickel-brass coins of a totalvalue of over £12 million during 1942; this was a minting record for divisional

— 313 —
Hates2250
2000
mo
1500
1250
WOO
750
500
250
Sweden:Circulation of Notes and Coins4
In millions of Sw.Kr.
-——»I — -1 t 1 I
* ^f*
1 1 1 1
/
1 1 1 1111 >1111
Note
(
'A
^Com
i i i i
/
y
1 1 1 1
Coins225
200
175
150
125
100
75
50
25
1905N961S.
1910 1915 1920 1925 1930 1935 1940 1945
Coin Circulation as Percentage of Note Circulation.%20 i 1 1 1 1 1 1 1 1 20%
coin, four times as much invalue as the average for the tenyears before the war and one-fifth higher than the previousrecord of £10 million in 1918.Early in May 1943 the UnitedStates agreed to send to England3.1 million ounces of silver onlend-lease terms, while Canadaagreed to supply 1.9 million ; ofthe 5 million ounces, one-thirdwas needed by England forindustrial purposes and two-thirds for coinage.
Very few countries have,however, minted new silvercoins, such minting being con-fined to countries with homeproduction of silver (e. g.Sweden), large stocks (e. g.India) or special sources ofsupply (e. g. England andAustralia on lend-lease). Ascopper and nickel are also inshort supply for coinage pur-poses (even in producingcountries), new coins have forthe most part been of suchmetals as iron (in Bulgaria
and Finland), zinc (in Poland and Roumania) or aluminium (in France andHungary). In the United States the issue of new small coins made of plasticmaterial and of glass has been under consideration.
In some cases a higher demand for small coins has arisen for specialreasons, particularly on account of taxes on retail sales. In Switzerland, for
example, the turnover tax, levied as apercentage of the retail sale price, has pro-voked an enormous demand for "Rappen"and the number of these small piecesminted exceeded that of all other coinstogether in 1941 and 1942.
Whether or not it is necessary toput new small notes into circulationnaturally depends to a large extent on the
17,5
12,5
10
7,5
2,5
V
\
\V
1 1 1 11 1 1 1
\
1 1 1 1
\
17,5
125
7,5
2,5
1905 1910 1915 1920 1925 1930 1935 1940 19«NH20.
Switzer land — mint ing of coinsof very sma l l d e n o m i n a t i o n s .
Number ofpieces inthousands
1939194019411942
One-centimepieces
103,027
12,79418,000
Two-centimepieces
651,3033,4479,000
* From the Skandinaviska Banken Quarterly Review, April 1943. End-of-year figures — in the first graph thecoinage is on ten times the scale for notes. One-krona notes issued during 1914-1918 are excluded from thenote issue. The coin circulation represents total coinage after deducting coin withdrawn from circulation; it may,therefore, be somewhat on the high side as no allowance has been made for coin melted down or lost.

- 314 -
denominations already in existence. Central-batik practice differs very widelyand, to give an idea of the comparative value of the denominations of bank-notes outstanding, the following table has been prepared, which shows, forcertain European countries, the various denominations, converted into Swissfrancs at official rates and given as a percentage of the value of the totalcirculations at the end of 1942.
Denominat ions of Notes of European Central Banks in 1942.The value of the circulation of each denomination as a percentage of the total circulation.
Denominations as convertedinto Sw.fcs
1,000 and over450-500150-25080-12016-6015 and under . . . . . .
Total . . .
Denmark
17
381233
100
France
18
531118
100
Germany
1
214038
100
Holland
24
345
37
100
Hungary
702010
100
Sweden
13
461625
100
Switzer-land
278
43202
100
Average
968
422213
100
This table brings out several interesting points: that among these Europeancountries only in Sweden and Switzerland are very large notes an appre-ciable part of the circulation (in Holland, the large notes, of FI. 500 and 1,000,were withdrawn in March 1943, as already described); that about one-halfof the circulation in many countries comes within the range equivalent toSw.fcs 80-120, etc.
But it shows that there were no central-bank notes the equivalent ofSw.fcs 15 or under in Germany or Holland at the end of 1942 (as therewere practically none in Switzerland before 1939), whereas such small de-nominations amounted to one-quarter of the circulation in Sweden, one-thirdin Denmark etc. The need for small currency in addition to the coinage inthe latter countries is thus already supplied by the central bank, which caneasily expand its issue of such denominations. In other countries new smallnotes have sometimes been issued by the central banks or, more usually,by the governments.
New bank-notes of Sw.fcs 5 were issued by the National Bank ofSwitzer land in 1939 and by the end of 1942 Sw.fcs 56 million were put-standing, about 2 per cent, of the total note issue, the five-franc silver coinbeing the more popular means of payment. The lowest denomination of notesissued by the National Bank of Bulgaria before the war was Leva 500 (equi-valent to about Sw.fcs 27); in 1940 notes of Leva 250 and in 1941 of Leva 200were put into circulation; and in 1943 it was decided to issue notes ofLeva 100, 50 and 20, i. e. equal to the highest denominations of divisionalcoin. In July 1943, the Serbian National Bank began the issue of a newDin. 100 note (the equivalent of Sw.fcs 8 at the official rate).
All these examples of new issues of small denominations are in the formof bank-notes and are included in the circulation of the central banks. But in

- 315 -
many countries small government notes have been issued to supplementthe coinage. Some statistics regarding European issues in recent years aregiven below.
Government Note Issues.
At endof monthIn millionsof national
currency units
1938 Dec.1939 Dec.1940 Dec.1941 March
JuneSept.Dec.
1942 MarchJuneSept.Dec.
1943 MarchJune
Belgium
totalauthor-
ised
totalcircula-tion 0)
B.fcs1,5001,5002,2002,5003,000
1,219
1,919
2,729
3,280
3,377
3,748
3,892
Holland
totalauthor-
ised
totalcircula-
tion
FI.100100100100100100150150150150150150400
11
41608697
117120120127138153218
Roumania
totalcircula-
tion
Lei
9072,7934,0114,3974,4834,249
Italy
totalauthor-
ised
totalcircula-
tion
Lit.2,5003,9503,9503,9504,1504,1504,6504,6504,6505,1506,3006,3007,300
4,534
5,762
Germany (2)
totalissue
netcircula-
tion
RM409
1,0831,3351,3351,4001,4001,400,550
1,550,550,550,550,550
382957
1,1021,0441,0681,1171,2521,2271,2851,2421,2641,2181,309
0) Total circulation of the so-called "Fonds monétaire", which, however, Includes some coin but excludesB.fcs 525 million notes circulating directly on Treasury account (since 1940).
(2) The Issue of the government-controlled Rentenbank. The total issue corresponds to the total of Rentenbankloans to the government. The net circulation excludes those Rentenbank notes held by the Reichsbank.
The Belgian issue dates from October 1926, when the Treasury tookover about B.fcs 700-750 million of National Bank notes of the 5 and 20-francdenominations (to be replaced eventually by coin). The limit to this Treasuryissue was raised from B.fcs 1,200 million to B.fcs. 1,500 million in 1935, whennotes of the B.fcs 50 denomination were also taken over from the NationalBank; in 1940 the limit was raised three times, to B.fcs 2,200 million inNovember, and in 1941 twice, to B.fcs 3,000 million in April. In July 1941 itwas decreed that the limit of the "divisional issue" might exceed the maximaaccording to needs ; and, in March 1943, the limits were suspended retroactivelyfrom December 1941.
In Ho l land, so-called "silver bills" (government notes of FI. 1 and 2%.theoretically convertible into silver) were first put into circulation in 1914, thelegal maximum being raised from the original FI. 25 million to FI. 100 millionat the end of 1918; this maximum was maintained in the years before thepresent war although the circulation was insignificant. A new issue of Silverbills began in 1940 and the maximum was raised to FI. 150 million in September1941. When the large notes of the Nederlandsche Bank were withdrawn inMarch 1943, a shortage of currency made itself felt and the legal maximumissue for silver bills was raised to FI. 250 million in April and again to FI. 400 millionin June 1943.
By a decree of 30th July 1941 the National Bank of Roumania wasauthorised to issue small notes of 1, 2, 5, 20 and 100 lei up to a maximumof Lei 1,000 million, to be utilised for the exchange of roubles; and by a

— 316 —
decree of 12th August 1941 a further Lei 3,500 million of Lei 100 notes wereauthorised, to be given in exchange for coins of Lei 50 and 100, which were tobe withdrawn from circulation: both these issues were for and on behalf ofthe Ministry of Finance and were to be replaced by coin when circumstancespermitted; they do not figure as part of the circulation of the National Bank.
In I taly, the denominations of notes issued by the Banca d'Italia wereof Lit. 50, 100, 500 and 1,000 only; the need for smaller notes was met by theItalian Treasury, which in 1935 was authorised to issue notes of Lit. 10 andin 1939 notes of Lit. 1, 2 and 5 also. The legal maximum, which was fixed atLit. 850 million in 1935, had been raised to Lit. 2,500 million (for all issues) by 1938as shown in the table on the preceding page. In 1941, the maximum was raisedtwice and in 1942 four times, while a further increase to Lit. 7,300 million wasmade in April 1943. Near the middle of 1943 the actual c i rcu la t ion of Treasurynotes was published as having been Lit. 4,534 million at the end of March 1942 andLit. 5,762 million at the end of March 1943, an increase of 27 per cent, on theyear, about half the rate of increase of the circulation of the Banca d'Italia.
In Germany it was decided in 1939 to supplement the coinage not withReichskreditkassenscheine (which had originally been printed for that purpose)but by extending the issue of the government-controlled Rentenbank. Rentenbanknotes had first been issued in 1923 and their total circulation slightly exceededRM 2,000 million when the Reichsbank was reorganised in 1924 and their with-drawal undertaken; in 1930, when RM 430 million were still outstanding, thefinal date for their withdrawal was postponed from 1934 to 1942; and inSeptember 1939 the withdrawal was suspended. The issue of Rentenbank notes,which had fallen to RM 409 million (the amount of the outstanding loan tothe Reich) was extended, by a new loan -of RM 400 million made to the Reichin September 1939 and by various additions, to RM 1,141 million in January1942, thus making a total loan of RM 1,550 million. The net circulation issomewhat lower as some Rentenbank notes are held by the Reichsbank.
Although the total issue of Rentenbank notes has not been raised sinceJanuary 1942, arrangements have been made to increase the volume of smallerissues which supplement the coinage. At the end of 1941 the Rentenbank had
RM 195 million notes outstanding ofReich Currency Ci rcu lat ion
at end of December 1942.
Denomina-tions
of notes
1,000 RM100 ,50 ,20 ,10 ,5 ,2 ,1
1 to 50 Pf.
Totals
Reichs-bank
Renten-bank
Coin Total
in millions of RM194
5,1809,7636,8452,393
•——.——
24,375
_.————
747227290—
1,264
———
1,061217—426
1,704
1945,1809,7636,8452,3931,808
444290426
27,343
the same denominations as thoseof the Reichsbank (RM 10 to 1,000);during 1942 these notes were with-drawn and replaced by notes of theReichsbank, so that at the end ofthe year the Rentenbank issue wasof RM 1, 2 and 5 only, as shownin the table. The net circulationof the Rentenbank rose only fromRM 1,252 million to RM 1,264 millionduring 1942 but the issue of notes ofRM 1 to 5 rose from RM 1,057 millionto RM 1,264 million. In June 1943
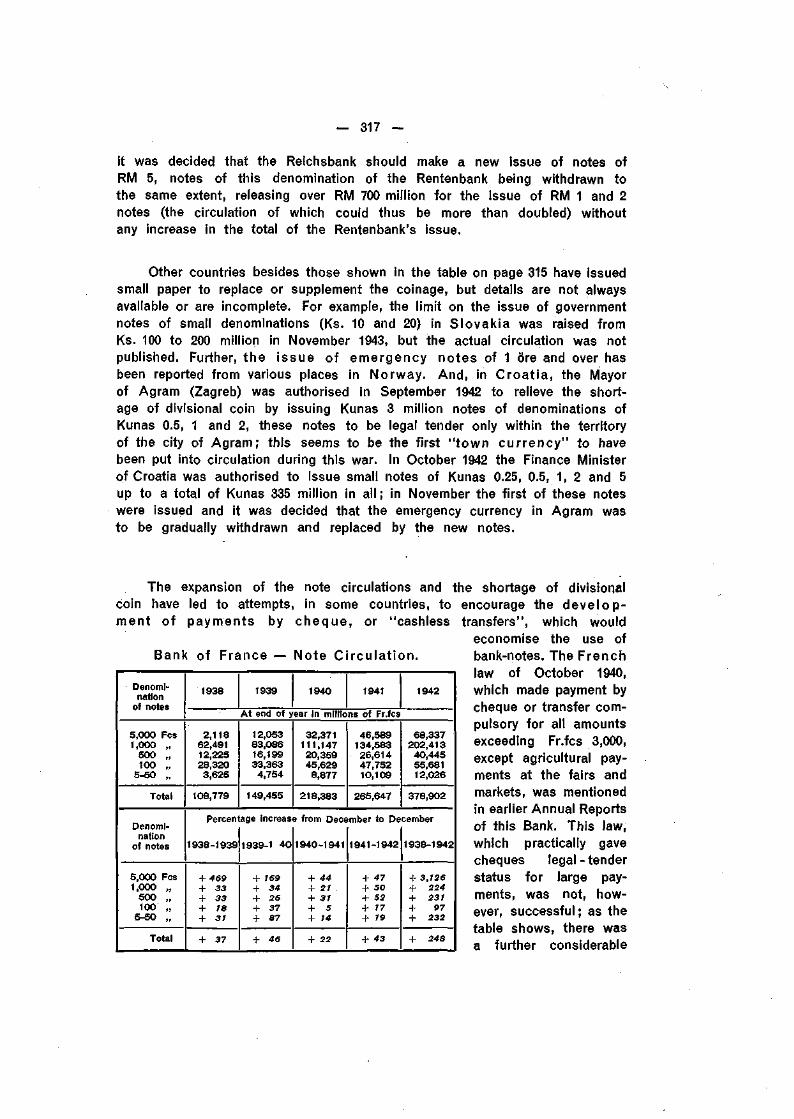
- 317 -
it was decided that the Reichsbank should make a new issue of notes ofRM 5, notes of this denomination of the Rentenbank being withdrawn tothe same extent, releasing over RM 700 million for the issue of RM 1 and 2notes (the circulation of which could thus be more than doubled) withoutany increase in the total of the Rentenbank's issue.
Other countries besides those shown in the table on page 315 have issuedsmall paper to replace or supplement the coinage, but details are not alwaysavailable or are incomplete. For example, the limit on the issue of governmentnotes of small denominations (Ks. 10 and 20) in Slovakia was raised fromKs. 100 to 200 million in November 1943, but the actual circulation was notpublished. Further, the issue of emergency notes of 1 ore and over hasbeen reported from various places in Norway. And, in Croat ia, the Mayorof Agram (Zagreb) was authorised in September 1942 to relieve the short-age of divisional coin by issuing Kunas 3 million notes of denominations ofKunas 0.5, 1 and 2, these notes to be legal tender only within the territoryof the city of Agram; this seems to be the first " town cur rency" to havebeen put into circulation during this war. In October 1942 the Finance Ministerof Croatia was authorised to issue small notes of Kunas 0.25, 0.5, 1, 2 and 5up to a total of Kunas 335 million in all ; in November the first of these noteswere issued and it was decided that the emergency currency in Agram wasto be gradually withdrawn and replaced by the new notes.
The expansion of the note circulations andcoin have led to attempts, in some countries, toment of payments by cheque, or "cashless
Bank of France — Note C i rcu la t ion .
Denomi-nation
of notes
5,000 Fes1,000 „
500 „100 „
5-50 „
Total
Denomi-nation
of notes
5,000 Fes1,000 „
500 „100 „
5-50 „
Total
1938 1939 1940 1941 1942
At end of year In millions of Fr.fcs2,118
62,49112,22528,3203,625
108,779
12,05383,08616,19933,3634,754
149,455
32,371111,14720,35945,6298,877
218,383
46,589134,58326,61447,75210,109
265,647
68,337202,41340,44555,68112,026
378,902
Percentage increase from December to December
1938-1939
+ 469+ 33+ 33+ ia+ 31
+ 37
1939-1 40
+ 169+ 34+ 26+ 37+ 87
+ 46
1940-1941
+ 44+ 21+ 31+ 5+ 14
+ 22
1941-1942
+ 47+ 50+ 52+ 17+ 19
+ 43
1938-1942
+ 3,726+ 224+ 231+ 97+ 232
+ 248
t h e sho r tage of d iv is iona l
encou rage the d e v e l o p -
t r a n s f e r s " , w h i c h w o u l d
e c o n o m i s e t h e use of
bank -no tes . T h e F r e n c h
law of O c t o b e r 1940,
w h i c h made payment by
c h e q u e or t rans fe r c o m -
pu lso ry f o r al l a m o u n t s
exceed ing Fr . fcs 3,000,
except ag r i cu l tu ra l pay-
men ts at t he fa i rs and
markets , w a s men t i oned
in ear l ier A n n u a l Repor ts
o f t h i s Bank. T h i s law,
w h i c h pract ica l ly gave
cheques l e g a l - t e n d e r
s ta tus f o r large pay-
men ts , w a s not , h o w -
ever, success fu l ; as the
tab le s h o w s , there w a s
a fu r the r cons ide rab le

- 318 —.
increase in 1942 in the volume of Fr.fcs 5,000 notes outstanding, althoughpayment by means of such notes was restricted by the law. In February1943 a new decree raised the limit for cash transfers from Fr.fcs 3,000 toFr.fcs 5,000, so that single payments by means of Fr.fcs 5000 notes became freefrom restrictions. Payment by cheque was, however, encouraged by a seriesof new measures : cheque forms were to be issued free of charge, the stampduty of 50 centimes on cheques and transfers was abolished, married womenmight open accounts without the authorisation of their husbands, etc. Further,various classes of payments were listed for which cheques or transfers werecompulsory.
In Hol land the stamp duty of FI. 0.10 was abolished on all bankcheques, transfers and in-payments as from 15th April 1943. An importantstep for the evolution of "cashless transfers" in Germany was taken bythe Deutsche Reichsbahn when it was decided that from 1st January 1943all salaries and wages without exception would be paid, not in cash, but bytransfers to an account at one of the 29 Reichsbahn savings and loan banks;previously about 75 per cent, of the Reichsbahn personnel had voluntarilyagreed to this method of payment. In May 1943, by an agreement betweenthe German banks and insurance companies, extensions were made to thesystem of cashless transfers of insurance premiums. And a decree of 27th July1942 in Roumania made the postal giro obligatory for payments above a certainamount by the government, public bodies and local governments.
The development of the giro mechanism is an essential characteristic ofthe evolution of the payments system in Continental Europe, for which there isno parallel in Anglo-Saxon countries; this is true, in particular, of thepostal g i ro , which provides for cashless transfers of small amounts —of great importance in the retail trade and for salaries, pensions andsimilar payments.
The postal giro had its origin in Austria in 1883 and was introduced inHungary in 1890, Switzerland in 1906 and Germany in 1909; in 1910 the firstinternational postal giro was formed by these four countries to facilitate trans-fers from one to another. Later, many other European countries adopted thepostal giro system, including Belgium (1913), Denmark, France, Holland and Italy(1918-19), Sweden (1925), Bulgaria (1931), Roumania (1933) and Finland (1940).
In all countries the postal giro is now completely separated from thepostal savings bank and forms a special department of the post office, utilisingall the facilities of the postal system. The postal giro may be likened to thecurrent-account business of a commercial bank, but it is not a bank in theordinary sense of the term. It does not grant credit nor has it any mechanismfor the collection of bills and bank cheques ; it does not perform trustee workor investment business nor does it provide any of the facilities required inlarge-scale trading. It is essentially supplementary to the commercial bankingsystem.

— 319 —
From the banking point of view the operations of the postal giro areexceedingly simple and amount to little more than correct book-keeping. Asadvances or loans are not granted and no provision is made for the purchaseand deposit of securities, the large specialised staff of an ordinary bank isnot needed. Generally, a minimum deposit is required from each depositor tocover running expenses, which are low; in most countries deposits arenon-interest-bearing ; funds deposited are automatically invested directly ingovernment securities, while a small cash reserve is held with the centralbank; postal cheques and giro transfers are mostly free of stamp and othertaxes. The growth of the system on the continent is shown in the followingtable.
Postal giro accounts in var ious countr ies.
Year Germany France Switzer-land Belgium Holland Sweden Denmark Hungary
Number of accounts — in thousands — at end of year191019201930
194019411942
60622992
1,3491,5011,629
74497902
1,3140)
103985
137142150
36274462457473
33168392427468
—41
128137148
326575962
213735444850
Balance on accounts — in m i l l i ons of national currency units — at end of year
191019201930
194019411942
1117,571 (2)
616
1,8272,3532,769
5055,245
16,408
28,701
22140238
643701784
3672,094
5,1987,5337,717
95119
463569635
55
317392498
628
105186218
11528119
456690815
Turnover of accounts — in m i l l i a rds of national currency units — during year
191019201930
194019411942
21.8683.90141.4
267.7342.1386.9
56.9440.0760.6
(3)(3)
3.319.928.5
44.450.253.4
34.2334.7305.2482.4533.1
4.911.6
26.130.532.6
6.6
44.251.962.5
1.44.9
11.313.2
• 15.1
8.81.5
14.8
35.248.268.4
0) January 1943. p) Figures swollen by the inflation of the Mark at that time.(3) The tota! turnover for 1941 and 1942 is not available, but the total non-cash transfers rose from Fr.fcs 597 mil-
liard in 1940 to Fr.fcs 886 milliard in 1941 and Fr.fcs 1,159 milliard in 1942.
The re are over a mi l l ion and a half accoun t s in Germany , somewha t
under a mi l l ion and a half in France, half a mi l l ion each in Be lg ium and
Ho l l and , abou t 150,000 in Sw i t ze r land and S w e d e n , and so o n . T h e c o n t i n u o u s
expans ion of t he number of a c c o u n t s and the i r t u rnove r are ind ica t ions of
the ever g r o w i n g popu lar i ty of the sys tem.
T h e deve lopment of the posta l g i ro durin-g the past th i r t y years has had
a revo lu t ionary in f luence on the hab i ts of payment and upon the mechan i sm
of monetary in te rcourse in t h e coun t r i es where it has been i n t r o d u c e d . On the
con t inen t of Europe the pract ica l ly u n a n i m o u s op in i on has c o m e to be tha t ,
c o m p a r e d w i th the bank-cheque sys tem, the pos ta l g i ro saves cons ide rab le
t ime and labour , especia l ly as regards payments of sma l l a m o u n t s . S o far t he

— 320 —
postal giro does not exist outside Continental Europe, except in Japan and incertain territories closely connected with Europe, e. g. Tunis and the BelgianCongo. Incidentally, comparisons of continental European with Anglo-Saxonbanking, especially with regard to the development of cheque payments, aregenerally vitiated by lack of attention to the importance of the postal giro inthe former countries. (It may be recalled that, in October 1942, the KennetCommittee in England made the somewhat surprising recommendation thatthe use of cheques should be reduced and small payments made in cash.)
In conclusion, the veloci ty of note circulations should be mentioned.There is no really satisfactory method of measuring the speed of circulationof bank-notes but available evidence generally goes to show a marked slowing-down of the average velocity in most countries as the total issues have ex-panded ; owing to restrictions and other war conditions, people are unableto use their income as they like and when they like, and so notes are hoarded,that is, temporarily held off the market. Or they may be placed on currentaccount at the banks, where they have a "waiting rôle" for the time being.*The Kaufkraftüberhang as it is called in Germany (or purchasing power"hang-over") poses a question of increasing gravity the longer the warlasts. And, when the war is over, the problem of preventing the surplusof spending power from exerting an active influence in raising prices willbecome more acute; in other words, every effort must be made to absorbthe redundant note issues before the velocity shows signs of rising andbefore the circulations are further augmented by the withdrawal of temporarybank deposits.
The Deutsche Bank, when indicating the decline of turnover during the war (see footnote to page 177),commented that, at the present time, a large part of the outstanding volume of bank deposits appear to havea "waiting rôle", to be "sleeping" until their owners call for them.

— 321 —
VII. CURRENT ACTIVITIES OF THE BANK.*
1. OPERATIONS OF THE_BANKING DEPARTMENT.
The balance sheet of the Bank as on 31st March 1943, examined andfound correct by the auditors, is reproduced in Annex I to the present Report.It shows a total of 483.4 million Swiss gold francs (of 0.2903 grammes offine gold) against 476.6 million on 31st March 1942 and 495.8 million on 31st March1941. As before, the method of conversion of the currencies represented inthe balance sheet is based on the exchange rates quoted for the variouscurrencies against dollars and on the U.S. Treasury's official selling price forgold on the date of the closing of the Bank's accounts. Such variations ashave occurred in the exchange rates between 31st March 1942 and 31st March1943 have affected currencies which have very little influence on the accountsof the Bank.
The scrupulous adherence to the principles of strict neutrality appliedby the Bank since the outbreak of hostilities, the course of events during theyear, and the tightening of the economic control exercised by the authoritiesin most countries have led to a further decline in the volume of the Bank'soperations, the total turnover having, in fact, fallen to about two-thirds of thefigure reached in the previous financial year. The most marked reduction isin the volume of gold operations, while movements on deposit accounts haveremained on the same scale as last year.
The activities of the Bank have, however, been sufficient to keep it incontact with the various markets and to furnish it with practical experienceof the increasingly complex financial machinery characteristic of the presenttime.
In the field of economic studies, the regular work of following monetaryand financial developments in different parts of the world has been kept upin spite of growing difficulties. In addition to the Annual Report, the Bankhas continued to publish collections of exchange restrictions and other currentregulations concerning monetary matters, these publications being in greatdemand.
As in the past, attention has constantly been paid to the maintenanceof the greatest possible liquidity in the assets of the bank. At the end ofthe financial year the Bank's assets in gold for its own account reached ahigher figure than at any time except during a short period before the outbreakof war.
During the financial year under review, the movements in the Bank'sstatement of accounts, showing the position as at the end of each month,
This chapter was submitted to the thirteenth Annual General Meeting of the Bank on 16th June 1943.

- 322 -
remained within narrow limits. From 476.6 million Swiss gold francs on 31st March1942, the total rose to its maximum for the year, 484.8 million, on 30th June,fell to its minimum for the year, 472.6 million, on 31st August, and thereafterremained in the neighbourhood of 480 million, finishing the year at 483.4 millionSwiss gold francs on 31st March 1943.
Earmarked gold, not entered in the balance sheet, totalled 51.6 millionSwiss gold francs on 31st March 1942. Since the end of April the figure hasremained unchanged at 49.3 million.
A comparison of the principal items in the Bank's balance sheet on31st March 1942 and on 31st March 1943 calls for the following observations:
A. L iab i l i t i e s .
The payment of the dividend for the financial year 1941-42 entailed areduction of the reserves from 23.3 million to 21 million Swiss gold francs.Apart from certain fluctuations in the item "Miscellaneous", the chief move-ments among the liabilities during the year are found in the volume of short-term and sight deposits.
Sight deposi ts of central banks for their own account shrankfrom 13.4 million at the beginning of the financial year to a minimum of11.1 million on 28th February 1943, the figure on 31st March being 11.2 million.
Sight deposi ts of central banks for account of th i rd partiesremained more or less stationary round 1.3 million. Deposi ts of otherdepos i to rs , consisting almost exclusively of sight funds, registered a slightrise, from 4.6 million to 5.7 million Swiss gold francs, between 31st March and30th September 1942. After that a steady decline brought the figure down to1.3 million on 31st March 1943.
Deposi ts expressed in a weight of gold show a more irregularmovement. During the two first months of the financial year the figure forthese deposits remained at about 29 million Swiss gold francs, rising to 37.7 mil-lion on 31st July to return to 29.1 million on 31st August. From then onwardsa steady upward movement brought the total to 33.8 million on 30th September,35.4 million on 31st December and 39.7 million on 31st March 1943. A recrudes-cence of activity in the settlement of international postal payments caused anappreciable increase not only in the volume of business but in the numberof transfers effected during the year. The gold sight deposit accounts servingthis purpose offer the Bank's correspondents special technical advantages,since any fractional amount of fine gold can be transferred by a mere bookentry (virement). Thus the machinery ensures a high degree of flexibility inthe payments. During the ten years that the Bank has kept accounts of thiskind there has been a continual increase in their number. Gold sight depositaccounts are at present in operation for twenty-six different depositors (central

- 323 -
B. I. S. — Liabilities.End of month, in millions of Swiss gold francs.
N9SI6.19«
banks or international institutions).These accounts seem to meet areal need in the field of internationaltransactions for which gold servesas a common measure.
In solving the technical ques-tions involved, the Bank has hadto take account of the fact thateach gold commitment has to belocally defined, since gold in onecentre cannot be regarded as exactlyequivalent in value to the sameweight of gold in another centre.A reference to this technical mattermay be of interest now that the ideaof an international unit of accountmore or less connected with goldhas again been put forward.
The accompanying graph showsthe movement of the principal itemson the liabilities side, month bymonth from 31st March 1942 to31st March 1943.
B. Assets .
On the assets side, the total of gold in bars held by the Bank increasedduring the year by the equivalent of 33 million Swiss gold francs.
From 42.1 million Swiss gold francs on 31st March 1942 the figure roseto 65.2 million on 31st July, while the corresponding increase in commit-ments expressed in gold was only from 29 to 37.7 million. Consequently theBank's own stock of gold was more than doubled during that period, passingfrom 13 to 27.5 million gold francs. A reduction of the Bank's gold commitmentsfrom 37.7 to 29.1 million, in August, brought with it a decrease in gold assetsfrom 65.2 to 56.6 million, the Bank's own stock of gold being unaffected. Duringthe rest of the financial year there was a more or less regular monthly increasein this stock, so that at 31st March 1943 it reached its maximum for the yearwith the equivalent of 35.4 million Swiss gold francs, being the differencebetween total gold commitments at 39.7 million and total gold assets at75.1 million Swiss gold francs. For an international institution whose accountsare expressed in a weight of fine gold it is naturally of particular importanceto maintain a proper balance between its assets in currencies and thosein gold.

- 324 -
After an increase from 33 million Swiss gold francs on 31st March 1942to 42.1 million on 31st May, the cash held in d i f ferent currenciesdeclined more or less steadily from then onwards, reaching its minimum forthe year at 28.7 million on 31st March 1943. The reduction was very largelydue to purchases of gold by the Bank. At the end of the financial year theaggregate amount of the Bank's gold and cash holdings was 103.8 millionSwiss gold francs against 75 million on 31st March 1942 — an increase ofnearly 40 per cent.
The total of s ight funds invested at interest never exceeded16.8 million Swiss gold francs, registered on 30th June 1942; the figure for31st March 1943, 15.4 million, is not much higher than the minimum for the year,namely 15.3 million on 28th February.
After having increased from 144 million Swiss gold francs on 31st March1942 to 149.4 million on 31st May, the total of the red iscountable por t fo l iofell to 141.5 million on 30th September, after which it rose steadily, finishingthe financial year at 147.2 million. During most of the year, Treasury billstotalled slightly more than 30 million Swiss gold francs; on 31st January 1943the figure was 31.3 million and on 31st March 28 million. The variations inthe total of bills and acceptances were as follows:
B. I. S. — Assets.End of month, in millions of Swiss gold francs.
N?eis.19«
114.2 million on 31st March 1942119.1 million on 31st May 1942111.1 million on 30th September 1942119.2 million on 31st March 1943.
As regards t ime funds i n -vested at in terest , there is nogreat difference between the initialand the final figures and there hasbeen little divergence from themduring the year.
There was a reduction in theaggregate figure for "sundry bi l lsand inves tments" and also inthe subtotal for securities of thiskind at more than six months. In thefirst case the reduction amounted tosome 24 million Swiss gold francs,in the second case it was about30 million. These changes are theresult of contractual repayments andthey are also in line with the Bank'sliquidity policy.
The graph shows the movementof the principal items on the assetsside, month by month from 31st March1942 to 31st March 1943.

8.940.6
50.5
15.639.6
44.8
— 325 —
The Bank's l iqu id i ty pos i t ion is shown in the following table (inpercentages of the respective balance-sheet totals):
31st March 1942 31st March 1943
Gold in barsCash, sight funds and rediscountable portfolioTime funds, sundry bills and investments, other
assets
100.0 100.0
In spite of the difficulties referred to at the beginning of this chapter,the Bank has regularly found investments for its funds, thanks to the assistanceof all the central banks concerned. As in the preceding year, it has receivedand been able to transfer the interest due on its investments in variousmarkets, with a single notable exception.
The Bank has also received various capital repayments during thefinancial year. The redemptions carried out by the National Bank of Hungaryunder the arrangement concluded in 1940 have had the effect of furtherreducing its debt to the Bank for International Settlements by nearly one-quarter. In a number of other instances repayments have been obtained as aresult of the transfer facilities procured for the Bank by the payment of itsdividend on the various markets.
The volume of gold operat ions in the year under review registereda further substantial reduction, connected with the present circumstances.
Operat ions for the purpose of fac i l i t a t ing the f inanc ingof international trade are naturally still limited to very small amounts. Variousnegotiations have nevertheless been set on foot at the request of the Bank'scorrespondents, and credits placed at the disposal of neutral central bankshave been utilised to more or less the same extent as last year.
The maintenance of such operations even on a reduced scale has beenfound desirable. The credit machinery gradually built up by the Bank beforethe war on the basis of its varied experience in this field may be one of themeans of meeting real needs which will make themselves felt when the wartimerestrictions on international trade begin to be relaxed. The principal end inview is to enable central banks to procure for firms engaged in internationaltrade certain credit facilities which they could not easily obtain in any otherway. "Reciprocal credits" arranged by the Bank between different centralbanks along the lines described in the eighth Annual Report may permit thecovering of exchange risks which could not be normally provided for by forwardexchange transactions or otherwise. It is obvious that special arrangementsmay prove particularly useful in a disturbed period before the ordinary creditmachinery has begun to function regularly once more.
The increase in the aggregate amount of gold and cash holdings, theshortening of the average term of investments, the repayments of capital forwhich it is practically impossible to find another employment offering the same

— 326 —
yield, the fact that on one market interest has not been transferred, and thegeneral decrease in the volume of business — all these factors have necessarilyhad an effect upon the profits for the financial year, as Section 3 of thepresent chapter shows.
The decision taken by the French Minister of Finance to repay, on 1st July1942, holders in Switzerland of the French National Security 4%% Loan 1937led to the closing of the account kept by the Bank for the purpose of supply-ing funds to the paying offices entrusted with the service of this loan inSwitzerland. Furthermore, in consequence of the conversion or repayment ofthe loan in question, the Bank, which had acted merely as an intermediarybetween the French Treasury and the paying offices in Switzerland, wasrelieved of that function on the same date.
The help given by the Bank to the international Red Cross organisationsoperating from Switzerland has taken a number of different forms. Besidesacting as banker for these organisations, the Bank has been happy to renderthem technical assistance. In the present circumstances, these activities, beingby their very nature restricted to a plane of absolute neutrality, are amongthose most in harmony with the general aims of the Bank.
2. TRUSTEE AND AGENCY FUNCTIONS OF THE BANK.
During the year under review, there has been no change or developmentin the Trustee and Agency functions of the Bank, which were described onpp. 155 and 156 of the Bank's tenth Annual Report.
3. NET PROFITS AND DISTRIBUTION.
It is for the present General Meeting to consider the declaration of adividend. The net profit for the year, after making allowance for contingencies,is 4,508,953.89 Swiss gold francs, the Swiss gold franc being as defined byArt. 5 of the Bank's Statutes, i. e. the equivalent of 0.290 322 58 grammesfine gold. This compares with a figure of 5,185,685.90 Swiss gold francs forthe twelfth fiscal year. For the purpose of the Balance Sheet as at 31st March1943, the foreign currency amounts of the assets and liabilities have beenconverted into Swiss gold francs on the basis of the quoted or official ratesof exchange for the respective currencies on that date, and all assets arevalued at or below market quotations, if any, or at or below cost.
After providing for the Legal Reserve that is required by Article 53 (a)of the Statutes, to an amount equal to 5 per cent, of the net profits, i. e.225,447.69 Swiss gold francs (1942:259,284.30 Swiss gold francs), there remain4,283,506.20 Swiss gold francs available towards the payment of a dividend.This sum, together with the remainder of the Dividend Reserve Fund amounting

— 327 -
to 1,626,940.33 Swiss gold francs, is not sufficient to pay the dividend of 6 percent, referred to in Art. 53 (b) of the Statutes. It would appear that in thesecircumstances the Statutes must be regarded as requiring that the total amountavailable, i". e. 5,910,446.53 Swiss gold francs, should be applied to the paymentof a dividend. Consequently, the dividend must be fixed at the number ofSwiss gold francs per share which can be paid out of the total amount avail-able, subject of course to fractions which, as a practical matter, cannot bedistributed. The maximum amount, therefore, which could be distributed asdividend is 29.55 Swiss gold francs per share, and after this distributionthere would remain a surplus of 446.53 Swiss gold francs to be carried for-ward to the fourteenth fiscal year. It is recommended that the GeneralMeeting declare a dividend of 29.55 Swiss gold francs per share in respectof the thirteenth fiscal year and that the remainder of the Dividend ReserveFund, amounting to 1,626,940.33 Swiss gold francs, should be utilised towardsthis purpose. After giving effect to these recommendations, the Legal andGeneral Reserves at the end of the thirteenth fiscal year would amount toa total of 19,607,585.27 Swiss gold francs.
The accounts of the Bank and its thirteenth Annual Balance Sheet havebeen duly audited by Messrs Price, Waterhouse & Co., Zurich. The BalanceSheet will be found in Annex I, as well as the certificate of the auditors tothe effect that they have obtained all the information and explanations theyhave required and that in their opinion the Balance Sheet, together with thenote thereon, is properly drawn up so as to exhibit a true and correct viewof the state of the Bank's affairs according to the best of their informationand the explanations given to them and as shown by its books. The Profitand Loss Account and the Appropriation Account are reproduced in Annex II.
4. CHANGES IN THE BOARD OF DIRECTORS.
The Board, acting by correspondence, unanimously decided to electHerr Ernst Weber, President of the Direktorium of the Swiss National Bank,as Chairman of the Board of Directors, effective 1st December 1942. HerrWeber accepted election as Chairman, under Article 39 of the Statutes, onthe understanding that, if the Board were able to resume its regular meetingsbefore the expiry of his normal term of office, he would place his appointmentat the disposal of his colleagues.
The terms of office of Dr L. J.A.Tr ip and Mr Ivar Rooth having expiredon 31st March 1943, both were re-elected by correspondence for a furtherperiod of three years. With effect from 1st June 1943 the Governor of theBank of Japan reappointed Mr H. Kano for a further term of office as Director.

— 328 -
CONCLUSION.
The expansion of industrial output achieved by the principal belligerentcountries has provided further proof, if such were needed, that the greatadvance in manufacturing technique has continued at a rate fully as high in thepresent century as at any time during the previous hundred years. The warhas stimulated invention which has added considerably to the fund of con-structive ideas — many of the lessons now learnt may bring a lasting contri-bution to the solution of problems of production and distribution in the future.
The lack of basic materials and foodstuffs at present experienced indifferent degrees in practically all countries is a consequence of that deliberateobstruction of international trade which forms part of warfare. Before theoutbreak of war in 1939 there was an abundance of supplies on the worldmarkets; thanks to improved methods of extraction and production, materialsand foodstuffs could be obtained with less expenditure of labour than everbefore; but, even so, prices tended, on the whole, to be too low to providethe producer with a fair remuneration, rather than too burdensome for thepurchaser. The cost of materials had, indeed, become progressively a less im-portant factor in production, such articles as motor cars and radios beingtypical examples. The tendency for the relative value of materials to declineis, of course, only the latest phase of a process which has stretched overcenturies. Francis Bacon wrote about the year 1600 that: "it cometh manytimes to pass that materiam superabit opus, that the work and carriage is moreworth than the material and enricheth a state more". The growing importanceof the "value added in manufacture" makes it now more than ever beforeimperative to advance the industrial efficiency of the working population andto secure orderly production and distribution — tasks which have becomemore difficult through the increasingly complicated character of modern society.
A hundred years ago it was the confident belief of an age busy with thereshaping of the economic system that a natural harmony would result ifonly the mass of hampering trade regulations were swept aside so that theable and active could make their full contribution to the increase in wealth andwelfare. This was, no doubt, the appropriate philosophy for a period of greattransformation, when strong dynamic forces were bringing about a rapidincrease in industrial production and a consequent improvement in the standardof living, with a trebling of real wages between 1850 and 1914. But full freedomfrom regulations was never achieved and as time went on "laissez faire"proved an insufficient precept for economic policy; since 1914-18 it has givenway to a growing measure of governmental intervention, whose proper limits,however, remain a matter of controversy. The state can obviously not escaperesponsibility in matters such as foreign-trade policy and monetary legislation.

- 329 -
And the government (either central or local) has further assumed an increasingnumber of functions in the economic field: it runs public enterprises, it pro-vides social services and, as part of its concern with the problem of unem-ployment, it intervenes to mitigate the cyclical fluctuations of business. Finally,the heavy burden of modern taxation has given the decisions of governmentsa greater consequence than ever before from an economic point of view.
In all these matters it is, of course, of the highest importance that themeasures taken should be not improvised but well considered — in otherwords, that there should be proper planning. This may appear self-evident,but the very word "planning" has come to be surrounded by a number ofcomplexes. There are some who extol it as the watchword for a new eco-nomic era, while others see in it a cloak for much they consider harmful andsuspect. However one may regard the question, it is of practical importanceto understand some of the reasons for the distrust of planning. There are,in the first place, certain arguments specifically political in character, as,for instance, that increased regulation will lead to strong concentrations ofeconomic and political power and that these will prove detrimental to themaintenance of individual freedom. There are, further, the fears that plannedeconomy will in practice amount to little more than planned spending; andthere are two other objections : that planning will be abused for the promotionof particular group interests at the expense of the community as a wholeand that government intervention will be pushed so far that too little scopewill be left for private initiative and enterprise.
These objections cannot all be lightly dismissed. If planning \s to succeed,care must be taken to avoid the pitfalls and shortcomings only too often associatedwith it; in particular, government action cannot with impunity run counter tothe principles of the price system, according to which the real value of goodsand services depends ultimately upon scarcity in relation to utility. That costsand prices should balance; that, whatever measures be taken to prevent violentshort-run fluctuations, supply and demand must in the long run be allowedto determine prices — these are precepts which governments themselves mustobserve if their plans are not to be defeated by hard and obstinate facts.In a sense, planning has no doubt come to stay; but planning itself mustconform to the fundamental requisites of economic progress, if it is to achievethat harmony of interests between nations and classes without which therecan be no solid basis for expansion and for the welfare that goes with it.Such harmony is never easily attained ; yet there is, even in the midst ofthis war, an unmistakable endeavour to find solutions for the many newproblems confronting our present age. It is, then, well to remember that man'smaterial welfare need be held back neither by lack of technical knowledgenor by insufficiency in nature's gift of basic materials. On the contrary, afterthe war the main difficulty, and therefore the main problem, in this field willbe how to secure a sufficient degree of harmony internationally and sociallywithout stifling initiative and enterprise or impairing the flexibility essentialfor sustained economic progress.
A N N E X E S

B A L A N C E S H E E T
IN SWISS GOLD FRANCS (UNITS OF 0.29032258...
ASSETS
I-GOLD IN BARS
II-CASHOn hand and on current account
with Banks
HI—SIGHT FUNDS at interest . .
IV-REDISCOUNTABLE BILLSAND ACCEPTANCES1. Commercial Bills and Bankers'
Acceptances2. Treasury Bills
V-TIME FUNDS at interest1. Not exceeding 3 months . .2. Between 3 and 6 months . .
VI-SUNDRY BILLS AND INVEST-MENTS1. Treasury Bills2. Railway, Postal Administration
and Other Bills and SundryInvestments
119,261,524.1727,975,994.11
20,923,430.245,680.95
75,073,006.12
120,818,343.50
VII-OTHER ASSETS
NOTE — The Bank holds assets in gold at each of the places where gold depositsare repayable and in short-term and sight funds in the same currencies asthe corresponding deposits, in all cases substantially greater than thedeposits in question (Items IV and V — Liabilities).
The use of dollar assets and bar gold held in the U.S.A. Is subject,under wartime regulations, to U.S. Treasury license. As regards assetsheld in countries whose currencies are subject to exchange restrictions, theGovernments concerned have, either as signatories of the Hague Agree-ment of 1930 (Article X) or by special measures, declared the Bank to beimmune "from any disabilities and from any restrictive measures such ascensorship, requisition, seizure or confiscation, in time of peace or war,reprisals, prohibition or restriction of export of gold or currency and othersimilar interferences, restrictions or prohibitions". Moreover, after providingfor the German Government Deposit out of investments in Germany, nearly60% of the assets then remaining are covered by special contracts guaranteeingtheir gold value.
The Bank's commitment in respect of the Annuity Trust AccountDeposits is not clearly established, but it is stated at its maximum amountin Swiss Gold Francs.
For Balance Sheet purposes the currency amounts of the assets andliabilities have been converted into Swiss Gold Francs on the basis ofquoted or official rates of exchange for the respective currencies.
75,136,419.77
28,675,281.18
15,389,882.95
147,237,518.28
20,929,111.19
195,891,349.62123,099.66
483,382,662.65
%15.6
5.9
3.2
24.75.8
4.30.0
15.5
25.0
0.0
100.0
TO THE BOARD OF DIRECTORS AND SHAREHOLDERSOF THE BANK FOR INTERNATIONAL SETTLEMENTS, BASLE.In conformity with Article 52 of the Bank's Statutes, we have examined the books and accounts
ation and explanations we have required and that in our opinion the above Balance Sheet, togetherBank's affairs according to the best of our information and the explanations given to us and as showncurrencies concerned.
ZURICH, April 29, 1943.

ANNEX
A S A T M A R C H 3 1 , 1 9 4 3
GRAMMES FINE GOLD - ART. 5 OF THE STATUTES)
LIABILITIES
I-CAPITALAuthorised and issued 200,000shares, each of 2,500 Swissgold francsof which 25% paid up . . . .
II-RESERVES1. Legal Reserve Fund . . . .2. Dividend Reserve Fund . . .3. General Reserve Fund . . .
Ill-LONG TERM DEPOSITS1. Annuity Trust Account
Deposits2. German Government Deposit
IV-SHORT TERM AND SIGHTDEPOSITS (various currencies)1. Central Banks for their own
account:(a) Not exceeding 3 months(b) Sight
2. Central Banks for the accountof others:
Sight3. Other depositors:
(a) Not exceeding 3 months(b) Sight
V-SHORT TERM AND SIGHTDEPOSITS (Gold)1. Not exceeding 3 months . .2. Sight
VI-MISCELLANEOUS
500,000,000.-
6,039,487.451,626,940.33
13,342,650.13
152,606,250.-76,303,125.—
3,968,900.—11,247,655.36
24,381.011,244,245.17
947,479.3738,764,050.83
VII-SURPLUSProfit for the financial year ended March 31, 1943 . . .
125,000,000.—
21,009,077.91
228,909,375.-
15,216,555.36
1,270,259.99
1,268,626.18
39,711,530.20
46,488,284.12
4,508,953.89
483,382,662.65
25.9
4.3
31.615.8
0.82.3
0.3
0.00.3
0.28.0
9.6
0.9
100.0
of the Bank for the financial year ending March 31,1943, and we report that we have obtained all the inform-with the Note thereon, is properly drawn up so as to exhibit a true and correct view of the state of theby the books of the Bank, as expressed in the above-described Swiss gold franc equivalents of the
PRICE, WATERHOUSE & Co.

ANNEX II
PROFIT AND LOSS ACCOUNTfor the financial year ended March 31, 1943
Swiss goldfrancs
Net Income from the use of the Bank's capital and the deposits entrusted to it,after necessary allowance for contingencies 6,389,808.56
Commission earned as Trustee (or Fiscal Agent to Trustees) for International Loans 66,000.42Transfer fees 13.67
6,455,822.65Costs of Administration :—
Board of Directors — fees and travelling expenses 76,576.02Executives and staff — salaries and travelling expenses . . . . 1,507,144.28Rent, insurance, heating, light and water 102,754.19Consumable office supplies, books, publications 113,873.54Telephone, telegraph and postage 36,688.71Experts' fees (Auditors, interpreters, etc.) 12,353.98Cantonal taxation 35,421.51Tax on French issue of Bank's shares 26,106.89Miscellaneous 35,949.64 1,946,868.76
NET PROFIT:— 4,508,953.89
APPROPRIATION ACCOUNT
NET PROFIT FOR THE FINANCIAL YEAR ENDED MARCH 31, 1943 4,508,953.89To the Legal Reserve Fund in accordance with Article 53 (a) of the Statutes,
— 5 % of 4,508,953.89 225,447.69Available towards a dividend for the year 4,283,506.20From the Dividend Reserve Fund 1,626,940.33
5,910,446.53Dividend of 29.55 Swiss gold francs per share 5,910,000.—Carried forward 446.53

. B O A R D O F D I R E C T O R S *
Weber, Zurich " V . - " . - <• Chairman
v Dott. V. Azzolini, Rome* ' *-
. Y. Bréart de Boisanger, Paris
,Baron Brincard, Paris
J/Valther Funk, Berlin..
Alexandre Galopin, Brussels .
.-Prof." Francesco „Giordani, Rome
Hisaakira-Kano, Tokio; -,>
Sir Otto Niemeyer, London !
* Montagu Collet Norman, London; Ivar Rooth, Stockholm , / v «
Dr. Hermann Schmitz, Berlin >-
General Manager ll4t" • 'Assistant General Manager
Raffaele Pjlotti J ^ ^ V / Ä ' s Secretary General'^ - „ ^
• — Z e e l a n d r " / " ! ^ * . ^ '".> Manager
Economic Adviser
Adviser
.hls'Alternate Is In abeyance^ 1