31st March 2021 - L&T Finance
54
1 Data as on March 31, 2021 FUND FACTS Product labelling overleaf. 31 st March 2021
-
Upload
khangminh22 -
Category
Documents
-
view
2 -
download
0
Transcript of 31st March 2021 - L&T Finance

1
Data as on March 31, 2021
FUNDFACTS
Product labelling overleaf.
31st March 2021
2
Data as on March 31, 2021
All Product Labelling Disclosures 3
CEO’S View 4
Glossary 5
How to read a Factsheet 6
Equity Market Review 7
Debt Market Review 8
L&T Flexicap Fund 9
L&T Tax Advantage Fund 10
L&T Large and Midcap Fund 11
L&T Infrastructure Fund 12
L&T India Large Cap Fund 13
L&T India Value Fund 14
L&T Midcap Fund 15
L&T Emerging Businesses Fund 16
L&T Business Cycles Fund 17
L&T Focused Equity Fund 18
L&T Nifty 50 Index Fund 19
L&T Nifty Next 50 Index Fund 20
L&T Balanced Advantage Fund (Formerly known as L&T Dynamic Equity Fund)
21
L&T Hybrid Equity Fund 22
L&T Arbitrage Opportunities Fund 23
L&T Equity Savings Fund 24
L&T Overnight Fund (Formerly known as L&T Cash Fund)
25
L&T Liquid Fund 26
L&T Ultra Short Term Fund 27
L&T Money Market Fund 28
L&T Banking and PSU Debt Fund 29
L&T Short Term Bond Fund 30
L&T Low Duration Fund 31
L&T Credit Risk Fund 32
L&T Flexi Bond Fund 33
L&T Triple Ace Bond Fund 34
L&T Gilt Fund 35
L&T Conservative Hybrid Fund 36
L&T Resurgent India Bond Fund 37
Fund Manager wise Scheme Details 38
SIP Performance Of Growth Option 39
NAV 41
Performance of Schemes 43
Minimum Investment Amount Details 47
Total Expense Ratio 47
IDCW History 48
L&T Investment Management Limited Branch Details
51
CONTENTS PG. NO CONTENTS PG. NO

3
Data as on March 31, 2021
L&T Overnight Fund (Formerly known as L&T Cash Fund) - An open ended debt scheme investing in overnight securities:• Reasonable returns with lower volatility and higher liquidity over short term • Investment in debt and money market instruments with overnight maturity
L&T Arbitrage Opportunities Fund - An open ended scheme investing in arbitrage opportunities: • Generation of reasonable returns over short to medium term • Investment predominantly in arbitrage opportunities in the cash and derivatives segments of the equity markets; and debt and money market instruments
All Product Labelling Disclosures
*Investors should consult their financial advisers if in doubt about whether the product is suitable for them.#The Macaulay duration is the weighted average term to maturity of the cash flows from a bond. The weight of each cash flow is determined by dividing the present value of the cash flow by the price.
L&T Flexicap Fund - An open ended dynamic equity scheme investing across large cap, mid cap, small cap stocks:ᵟ • Long term capital growth • Investment predominantly in equity and equity-related securitiesL&T Tax Advantage Fund - An open ended equity linked saving scheme with a statutory lock in of 3 years and tax benefit: • Long term capital growth • Investment predominantly in equity and equity-related securitiesL&T Large and Midcap Fund - An open ended equity scheme investing in both large cap and mid cap stocks: • Long term capital growth • Investment predominantly in equity and equity-related securities, with minimum allocation of at least 35% each to large cap and mid cap companies
L&T India Value Fund - An open ended equity scheme following a value investment strategy: • Long term capital appreciation • Investment predominantly in equity and equity-related securities in Indian markets and foreign securities, with higher focus on undervalued securities
L&T Focused Equity Fund - An open ended equity scheme investing in maximum 30 stocks in large, mid and smallcap companies: • Long term capital appreciation • Investment in a concentrated portfolio of equity and equity related instruments of maximum 30 stocks.
L&T Nifty 50 Index Fund - An open-ended Equity Scheme tracking NIFTY 50 Index: • Long term capital appreciation • Investment in equity securities covered by the NIFTY 50.
L&T Nifty Next 50 Index Fund - An open-ended Equity Scheme tracking Nifty Next 50 Index: •Long term capital appreciation • Investment in equity securities covered by the NIFTY NEXT 50L&T Midcap Fund - An open ended equity scheme predominantly investing in mid cap stocks: • Long term capital appreciation • Investment primarily in midcap equity and equity-related securitiesL&T India Large Cap Fund - An open ended equity scheme predominantly investing in large cap stocks: • Long term capital appreciation • Investment in equity and equity related securities, including equity derivatives in the Indian markets and foreign securities; with predominant investments in large cap stocksL&T Infrastructure Fund - An open-ended equity scheme investing in infrastructure sector: • Long term capital appreciation • Investment predominantly in equity and equity-related instruments of companies in the infrastructure sectorL&T Emerging Businesses Fund - An open-ended equity scheme predominantly investing in small cap stocks: • Long term capital appreciation • Investment predominantly in equity and equity-related securities, including equity derivatives in Indian markets with key theme focus being emerging companies (small cap stocks); and foreign securitiesL&T Business Cycles Fund - An open–ended equity scheme following business cycles based investing theme: • Long term capital appreciation • Investment predominantly in equity and equity-related securities, including equity derivatives in Indian markets with focus on riding business cycles through dynamic allocation between various sectors and stocks at different stages of business cycles in the economyL&T Hybrid Equity Fund - An open ended hybrid scheme investing predominantly in equity and equity related instruments: • Long term capital appreciation and generation of reasonable returns • Investment in equity and equity-related securities and debt and money market instruments.
Scheme name and Type of scheme This product is suitable for investors who are seeking* Riskometer
L&T Equity Savings Fund - An open ended scheme investing in equity, arbitrage and debt:ᵟ • Generation of regular income by predominantly investing in arbitrage opportunities in the cash and derivatives segment and long–term capital appreciation through unhedged exposure to equity and equity related instruments. • Investment in equity and equity related instruments, derivatives and debt and money market instruments
L&T Banking and PSU Debt Fund - An open ended debt scheme primarily investing in debt instruments of banks, public sector undertakings, public financial institutions and municipal bonds: • Generation of reasonable returns and liquidity over short term • Investment predominantly in securities issued by Banks, Public Sector Undertakings and Public Financial Institutions and municipal corporations in IndiaL&T Credit Risk Fund - An open ended debt scheme predominantly investing in AA and below rated corporate bonds: • Generation of regular returns and capital appreciation over medium to long term • Investment in debt instruments(including securitized debt), government and money market securitiesL&T Flexi Bond Fund - An open ended dynamic debt scheme investing across duration: • Generation of reasonable returns over medium to long term • Investment in fixed income securitiesL&T Triple Ace Bond Fund - An open ended debt scheme predominantly investing in AA+ and above rated corporate bonds: • Generation of regular and stable income over medium to long term • Investment predominantly in AA+ and above rated corporate bonds and money market instruments
L&T Gilt Fund - An open ended debt scheme investing in government securities across maturity: • Generation of returns over medium to long term • Investment in Government SecuritiesL&T Resurgent India Bond Fund - An open ended medium term debt scheme investing in instruments such that the Macaulay duration of the portfolio is between 3 years to 4 years (please refer to page no. 18 under the section “Asset Allocation Pattern” in the SID for details on Macaulay’s Duration)#: • Generation of income over medium term • Investment primarily in debt and money market securitiesL&T Balanced Advantage Fund (Formerly known as L&T Dynamic Equity Fund) - An open ended dynamic asset allocation fund: • Long term capital appreciation and generation of reasonable returns • Investment in equity and equity related instruments, derivatives and debt and money market instruments.L&T Conservative Hybrid Fund - An open ended hybrid scheme investing predominantly in debt instruments: • Generation of regular income over medium to long term • Investment in debt, equity and money market securities
L&T Liquid Fund - An open ended liquid scheme: • Generation of reasonable returns while maintaining safety and superior liquidity over short term • Investment predominantly in highly liquid money market instruments, government securities and corporate debt.L&T Ultra Short Term Fund - An open ended ultra-short term debt scheme investing in instruments such that the Macaulay duration of the portfolio is between 3 months to 6 months (please refer to page no.18 under the section “Asset Allocation Pattern” in the SID for details on Macaulay’s Duration)#: • Generation of reasonable and stable income and liquidity over short term • Investments predominantly in highly liquid money market instruments, government securities and corporate debtL&T Money Market Fund - An open ended debt scheme investing in money market instruments: • Generation of regular income over short to medium term • Investment in money market instrumentsL&T Short Term Bond Fund -An open ended short term debt scheme investing in instruments such that the Macaulay duration of the portfolio is between 1 year to 3 years (please refer to page no.16 under the section “Asset Allocation Pattern” in the SID for details on Macaulay’s Duration)#: • Generation of regular returns over short term • Investment in fixed income securities of shorter term maturity.L&T Low Duration Fund - An open ended low duration debt scheme investing in instruments such that the Macaulay duration of the portfolio is between 6 months to 12 months (please refer to page no.17 under the section “Asset Allocation Pattern” in the SID for details on Macaulay’s Duration)#: • Generation of reasonable returns over short to medium term • Investment in fixed income securities and money market instruments
Low
Low to
Moderate Moderate Moderately
Low
Low to
Moderate Moderate
High
Very High
High
VERYHIGHLOW
Investors understand that their principal will be at low risk
Low
Low
to
ModerateModerate Moderately
Low
Low
to
ModerateModerate
High
VeryHigh
High
VERYHIGHLOW
Investors understand that their principal will be from low to moderate risk
Low
Low
to
ModerateModerate Moderately
Low
Low
to
ModerateModerate
High
VeryHigh
High
VERYHIGHLOW
Investors understand that their principal will be at moderate risk
Low
Low
to
ModerateModerate Moderately
Low
Low
to
ModerateModerate
High
VeryHigh
High
VERYHIGHLOW
Investors understand that their principal will be at very high risk
Low
Low
to
ModerateModerate Moderately
Low
Low
to
ModerateModerate
High
VeryHigh
High
VERYHIGHLOW
Investors understand that their principal will be at moderately high risk
4
Data as on March 31, 2021
CEO’s VIEW
KAILASH KULKARNI
CEO, L&T Mutual Fund
Thank you, FY 20-21
If anyone was looking for an illustrative year in recent memory, which was challenging, disruptive and unpredictable at the same time, and also affected one and all, FY21 certainly fits the bill because it caught pretty much everyone by surprise and breached all boundaries of imagination and forecasts. Looking back at the fiscal we just left behind, most of us can say with conviction that we have endured one of the toughest years of our lives as far as investing is concerned. The S&P BSE Sensex was at 29,468 on March 31, 2020, and is at 49,509 as on March 31, 2021. From the lows of the market on April 1, 2020, to the market recovery and volatility we saw especially in February-March 2021, the year not only taught us a great deal about investing behaviour, but also imparted some crucial life lessons. Our culture teaches us to venerate and revere anyone who has taught us anything, and this year has been nothing short of a Guru for us.
Hence, with all humility and gratitude at my command, I want to say “Thank You” to FY21.
Key learnings from FY 20-21
∙ Use technology to your advantage: This year taught us that with the progress made over the years, we could use technology to our advantage and ensures business continuity when it came to personal investments or running businesses. Seamless online transactions, mobile apps, UPI, digital payment platforms and video-conferencing got even the un-initiated fall in love with technology.
∙ Liquidity is important: The year taught us that having liquidity (ability to get the cashback) is an important factor in the decision-making while we plan our investments. In all this panic, mutual funds stood out as a great investment product as one could redeem and get the money back in T+1 or T+3 days.
∙ Prioritise ‘needs’ over ‘wants’: The year taught us that just to maintain a lifestyle, over-leveraging oneself is an imprudent choice. Too much EMI as a percentage of what one earns is detrimental to one’s financial health and one should prioritise expenses while taking loans. Any borrowing should enable one to attain good needs like home or education and you should think carefully before indulging in credit cards and personal loans for lifestyle “wants”.
∙ Power of Asset Allocation: The year also taught us why asset allocation is important. It gave us the experience of the equity market meltdown in March 2020 and a credit crisis in April end. It taught us why investing across asset classes based on the risk profile of every individual is important in the long run.
∙ Don’t get overwhelmed by panic: The year taught us that stopping SIPs just because of irrational fear of looking at past returns is not good. A few very good months (For example Apr’20 to Feb’21) can dramatically change the past returns and also taught us that cost averaging and the power of compounding work to the investors’ benefit in the long run.
∙ Stick to basics even during a bull run: The year also taught us not to get swayed by optimism. Informed decision-making and sticking to the basics of investing as per the financial goals apply when markets are surging or hitting the bottom. One must not try to time the market and should spend ‘time’ in the market to build wealth.
∙ Health & Life Insurance is a necessity: Invest in the health and life covers because no other year has taught us more about the uncertainty of health as this one. Arm yourself with adequate cover for the unfortunate eventualities for yourself and your loved ones.
∙ Financial Literacy is a necessity: In the age of Google, translations and voice-based options for answering your queries – understanding your finances is a necessity for everyone irrespective of their age, gender, or socio-economic background. You have all the information you need to know at your disposal – so please read and stay informed. And when you need help in-person, there are professionals like your banker, financial advisor and broker who are equipped to provide you with suitable solutions. Feel free to reach out to them.
I conclude by saying that above everything, we must be grateful for the year for its teachings and treasure our learnings, because a year like this does not come often. Stay invested, stay disciplined, don’t go by hearsays, and seek qualified advice before embarking on the investment journey.
Thank you and stay safe!
Source: BSE
Disclaimer: The article (including market views expressed herein) is for general information only and does not have regard to specific investment objectives, financial situation and the particular needs of any specific person who may receive this information. The data/information used/disclosed in the article is only for information purposes and not guaranteeing / indicating any returns. The article provides general information and comparisons made (if any) are only for illustration purposes. Investments in mutual funds and secondary markets inherently involve risks and recipient should consult their legal, tax and financial advisors before investing. Recipient of this document should understand that statements made herein regarding future prospects may not be realized. Recipient should also understand that any reference to the indices/ sectors/ securities/ schemes etc. in the article is only for illustration purpose and are NOT stock recommendation(s) from the author or L&T Investment Management Limited, the asset management company of L&T Mutual Fund (“the Fund”) or any of its associates. Any performance information shown refers to the past and should not be seen as an indication of future returns. The value of investments and any income from them can go down as well as up. The distribution of the article in certain jurisdictions may be restricted or totally prohibited and accordingly, persons who come into possession of the article are required to inform themselves about, and to observe, any such restrictions.
Mutual Fund investments are subject to market risks, read all scheme related documents carefully.

5
Data as on March 31, 2021
GLOSSARYData as on June 30, 2020
GLOSSARY
SHARPE RATIOSharpe Ratio is a risk to reward ratio, it measures portfolio returns generated in excess to the investment in risk-free asset, for per unit of total risk taken. While, positive Sharpe ratio indicates, portfolio compensating investors with excess returns (over risk-free rate) for the commensurate risk taken; negative Sharpe ratio indicates, investors are better off investing in risk-free assets.
IDCWIDCW stands for ‘Income Distribution cum Capital Withdrawal option’. The amounts can be distributed out of investors’ capital (Equalization Reserve), which is part of the sale price that represents realized gains, as may be declared by the Trustees at its discretion from time to time (subject to the availability of distributable surplus as calculated in accordance with the Regulations).Refer our notice no. 55 and addendum no. 56 dated March 26, 2021 for details on IDCW.
PORTFOLIO YIELD (YIELD TO MATURITY)Weighted average yield of the securities in scheme portfolio.
RISK FREE RETURNThe theoretical rate of return of an investment with safest (zero risk) investment in a country.
BETABeta (B) of a portfolio is a number indicating the relation between portfolio returns with that of the market index i.e. it measure the volatility, or systematic risk, of a portfolio in comparison to the market as a whole.
STANDARD DEVIATIONA statistical measure that defines expected volatility/risk associated with a portfolio. This explains the variation/deviation from the average returns delivered by the portfolio. A higher standard deviation means higher volatility (risk) and a lower standard deviation means lower volatility.
MODIFIED DURATIONA formula that expresses the measurable change in the value of a security in response to a change in interest rates. Modified duration of portfolio can be used to anticipate the change in market value of portfolio for every change in portfolio yield.
TRACKING ERRORTracking error indicates how closely the portfolio return is tracking the benchmark Index return. It measures the deviation between portfolio return and benchmark index return. A lower tracking error indicates portfolio closely tracking benchmark index and higher tracking error indicates portfolio returns with higher deviation from benchmark index returns.
TOTAL EXPENSE RATIOTotal expenses charged to scheme for the month expressed as a percentage to averagemonthly net assets.
AVERAGE MATURITYWeighted average maturity of the securities in scheme.

6
Data as on March 31, 2021
HOW TO READ A FACTSHEET
FUND MANAGERAn employee of the asset management company such as a mutual fund or life insurer, who manages investments of the scheme. He is usually part of a larger team of fund managers and research analysts.
APPLICATION AMOUNT FOR FRESH SUBSCRIPTIONThis is the minimum investment amount for a new investor in a mutual fund scheme.
MINIMUM ADDITIONAL AMOUNTThis is the minimum investment amount for an existing investor in a mutual fund scheme.
YIELD TO MATURITYThe Yield to Maturity or the YTM is the rate of return anticipated on a bond if held until maturity. YTM is expressed as an annual rate. The YTM factors in the bond’s current market price, par value, coupon interest rate and time to maturity.
SIPSIP or systematic investment plan works on the principle of making periodic investments of a fixed sum. It works similar to a recurring bank deposit. For instance, an investor may opt for an SIP that invests Rs 500 every 15th of the month in an equity fund for a period of three years.
NAVThe NAV or the net asset value is the total asset value per unit of the mutual fund after deducting all related and permissible expenses. The NAV is calculated at the end of every business day. It is the value at which the investor enters or exits the mutual fund.
BENCHMARKA group of securities, usually a market index, whose performance is used as a standard or benchmark to measure investment performance of mutual funds, among other investments. Some typical benchmarks include the Nifty, Sensex, BSE200, BSE500, 10-Year Gsec.
EXIT LOADExit load is charged at the time an investor redeems the units of a mutual fund. The exit load is deducted from the prevailing NAV at the time of redemption. For instance, if the NAV is Rs. 100 and the exit load is 1 %, the redemption price would be Rs.99 per unit.
MODIFIED DURATIONModified duration is the price sensitivity and the percentage change in price for a unit change in yield.
STANDARD DEVIATIONStandard deviation is a statistical measure of the range of an investment’s performance. When a mutual fund has a high standard deviation, its means its range of performance is wide, implying greater volatility.
SHARPE RATIOThe Sharpe Ratio, named after its founder, the Nobel Laureate William Sharpe, is a measure of risk-adjusted returns. It is calculated using standard deviation and excess return to determine reward per unit of risk.
BETA RATIO (PORTFOLIO BETA)Beta is a measure of an investment’s volatility vis-a-vis the market. Beta of less than 1 means that the security will be less volatile than the market. A beta of greater than 1 implies that the security’s price will be more volatile than the market.
AVERAGE PORTFOLIO PE (AVERAGE P/E)It is price to earnings ratio of the stocks calculated for the entire portfolio on a weighted average basis.
AVERAGE PORTFOLIO PRICE TO BOOK RATIO (AVERAGE P/BV)It is price to book value of the stocks calculated for the entire portfolio on a weighted average basis.
AVERAGE PORTFOLIO IDCW YIELD (AVERAGE IDCW YIELD)It is IDCW yield of the stocks calculated for the entire portfolio on a weighted average basis.
NET EQUITYNet equity level is the net equity exposure percentage adjusted for any derivative positions in stocks or index for hedging or rebalancing purpose.
R SQUAREDIt is a statistical measure of how closely the portfolio returns are correlated with its benchmark.
AUMAUM or assets under management refers to the recent / updated cumulative market value of investments managed by a mutual fund or any investment firm.
HOLDINGSThe holdings or the portfolio is a mutual fund’s latest or updated reported statement of investments/securities. These are usually displayed in terms of percentage to net assets or the rupee value or both. The objective is to give investors an idea of where their money is being invested by the fund manager.
NATURE OF SCHEMEThe investment objective and underlying investments determine the nature of the mutual fund scheme. For instance, a mutual fund that aims at generating capital appreciation by investing in stock markets is an equity fund or growth fund. Likewise, a mutual fund that aims at capital preservation by investing in debt markets is a debt fund or income fund. Each of these categories may have sub-categories.
RATING PROFILEMutual funds invest in securities after evaluating their
IDCWIDCW stands for ‘Income Distribution cum Capital Withdrawal option’. The amounts can be distributed out of investors’ capital (Equalization Reserve), which is part ofthe sale price that represents realized gains, as may be declared by the Trustees at its discretion from time to time(subject to the availability of distributable surplus as calculated in accordance with the Regulations).Refer our notice no. 55 and addendum no. 56 dated March 26, 2021 for details on IDCW.
creditworthiness as disclosed by the ratings. A depiction of the mutual fund in various investments based on their ratings becomes the rating profile of the fund. Typically, this is a feature of debt funds.

7
Data as on March 31, 2021
Source: Bloomberg, MSCI
Indian equities continued to outperform the Emerging Markets (EMs) beating concerns over increasing COVID-19 cases and building inflationary pressure. Markets started on an upward trend led by supportive global cues. However, performance was choppy later as markets traded in line with global markets on worries over increasing bond yields.
MSCI India (USD) rose 2.2% in March and significantly outperformed peers MSCI APxJ (-2.3%) and MSCI EM (-1.7%). Nifty50 and S&P BSE Sensex ended the month of March with 1.1% and 0.8% returns, respectively. Midcaps and Smallcaps outperformed the Largecaps by 0.2% and 1.6%, respectively in March.
Among broader markets, the Midcap index outperformed the Largecap index by 20 bps while the Smallcap index outperformed the Largecap index by 160 bps. BSE Midcap and BSE Smallcap indices ended the month of March with 1.0% and 2.5% returns, respectively.
GLOBAL MARKETSGlobal equities traded higher but exhibited divergent regional trends. EM equities underperformed (MXEF - 1.7%) as the resurgence of a virus outbreak and rising US yields wore down risk appetite.
In the developed space, European equities (SXXP +6.1%) outperformed relative to their US peers (SPX +4.2%). Bond yields continued to advance higher on accelerating growth/inflation expectations and positive economic data, despite downside surprise on US core inflation.
Worldwide, major indices saw positive trends except for Hang Seng. Euro Stoxx was the outperformer with 7.8% returns, followed by Dow Jones (+6.6%) and FTSE (+3.6%). Nikkei and Hang Seng were the worst performers with +0.7% and -2.1% respective returns.
SECTOR PERFORMANCEIndian equity markets outperformed MSCI Emerging Market Index. IT, FMCG and Metals outperformed while Realty and Oil & Gas were notable laggards in March.
IT was the best performing sector with 8.7% returns outperforming Sensex by 7.8%. FMCG (7.6%), Metal (4.6%), Consumer Durables (3.4%), Power (2.3%) and Healthcare (2.3%) outperformed the Sensex.
Capital Goods (-2.0%), Auto (-3%), and Bank (-3.7%) underperformed Sensex. Realty and Oil & Gas were the worst performing sectors with (-4.2%) and (-4.7%) returns, respectively.
INSTITUTIONAL ACTIVITYFIIs recorded monthly inflows of US$2.6 bn into Indian equities in the month of March vs. inflows of $3.0 bn in February taking FY21 net inflows to $37.8 bn. This is the 6th consecutive month of inflows.
DIIs turned net equity buyers in March post a five-month consecutive outflows streak with inflows of US$756 mn in March vs. outflow of US$986 mn in February taking the FY21 tally of outflows to $18.2 bn.
Within DIIs, both Mutual funds and insurance funds were net sellers. Mutual funds were net equity sellers at $17 mn while insurance funds sold $331 mn of equities in March.
Mutual fund and insurance fund flow data is as of March 16, 2021.
MACRO-ECONOMIC DEVELOPMENTSHeadline CPI for February at 5% was in-line but the composition is becoming uncomfortable from a policy perspective, with easing in food inflation being offset by firmer core inflation. Food prices rose 0.1% MoM in Feb on the back of contraction last month. Core-Core momentum (core inflation-ex-gasoline and diesel) remained sticky and elevated at 0.5% MoM both in January and February.
Composite PMI increased for a second straight month, rising by 1.5 pt MoM to 57.3 in Feb. The increase was led primarily by a sharp rise in services (+2.5 pts), which printed at 55.3, the highest in a year. The manufacturing index retreated gradually (-0.2 pts), but off a high base and still printed at 57.5. With the link between mobility (activity) and virus proliferation breaking down as consumers continue to normalize, services activity is mean-reverting. Forward-looking new orders also remained strong across both manufacturing and services.
IIP printed below expectations coming at -1.6% YoY for Jan. While it was a downside surprise, sequentially IP still rose 0.7% MoM on the back of the upwardly revised 2.1% increase last month. In level terms, industrial production continued to inch up and was 97% of its pre-pandemic level in January compared to 96% in December. Production for consumer durables (99%) is close to pre-pandemic level and non-durables (93%) has fallen behind pre-pandemic levels.
The trade deficit narrowed to US$12.6 bn in February, from US$14.5 bn last month. While domestic demand continues to firm, external demand appears to be consolidating after a sharp run-up. India’s FX reserves are close to their all-time peak at $582 bn as of March 19, 2021. FX reserves have decreased by US$1.6 bn in the last 4 weeks. INR gained 0.5% and ended the month at 73.11/$ in March.
Benchmark 10-year treasury yields averaged at 6.19% in Mar (11 bps higher vs. Feb avg.). US 10Y yields are at 1.74% (34 bps MoM, +107 bps YoY). Brent oil price fell 3.1 % MoM in Mar after a remarkable 17.5% MoM gain in February.
Fiscal deficit for Apr-Feb came at INR 14.1 tn or 76% of the budgeted FY21 deficit (INR 18.5 tn). This compares to 111% reached during the same time frame in FY20.
OUTLOOKMSCI India outperformed MSCI EM by 3.9 ppts and ranked 10 performance-wise in the EM cohort. This was on the back of a strong performance seen in the previous month. India’s performance rank in EM stood at 10th (among 27 EMs) vs. 6th in February. The BSE Sensex continued to underperform the broader market in March, while the MSCI India Growth index underperformed the Standard and Value indices for the 4th month in a row.
The daily number of new cases (7DMA) has increased from 11k in mid-February to 62k now. The first wave peaked at 93k in mid-September. The positivity rate (new cases per 100 tests) has more than tripled over the last 6 weeks from 1.6% in mid-February to 5.9% now. Up to now, there does not appear to be a material impact on national mobility and activity. Ramping up the vaccination drive could effectively break the link between mobility/activity and the proliferation of COVID-19 cases.
Improvement in economic activity is reflected in GST collections as March witnessed all-time high GST revenue at Rs 1.24 tn mark. This was the 6th consecutive month with collections of more than Rs 1 tn. The sustained GST collection and several other data points show the economy moving close to normal across most segments. Other high-frequency data points for March also reflect sustained growth in YoY terms, indicating a favorable growth outlook in the near terms. E-way bill for March has achieved a new milestone of 7.12 cr. This is the highest number of e-way bills generated in any month during last three years journey of E-way bill system.
Overall, the recent surge in COVID-19 cases are less likely to impact the growth momentum, which should strengthen further, supported by normalization of economic activity, helped by the pickup in the vaccination drive. Apart from a boost from normalization in activity levels, the policy mix (monetary/fiscal) is supportive of growth, which, coupled with a positive outlook for global growth, bodes well for growth recovery to broaden and continue. Overall, we are at the cusp of the economic recovery cycle given the government efforts towards capex targeted through both Budget 2021 and PLI schemes rolled out for 13 sectors.
EQUITYMARKETREVIEW
8
Data as on March 31, 2021
Volatility across asset classes, both globally and in domestic markets continued. Fed kept policy rates and the pace of asset purchase program unchanged. However, they acknowledged pick-up in both growth and inflation. With markets wary of higher inflation, US Treasury yields saw a sharp movement upwards. The 10-year benchmark moved up by around 30-35 bps over the month. Crude prices after a sharp rise in February remained broadly range-bound in March.On the domestic front, headline inflation inched higher to 5.03% vs 4.06% the previous month. Core inflation continued to remain sticky at 5.9% vs 5.7% the previous month. The inflation targeting regime, which was due for a review at the end-March, has been retained at 4% (+/-2%) for the next five years. The CRR dispensation of 1% which was provided last year, has been partially pulled back with Banks required to keep CRR at 3.5% currently. However, this might open up more room for OMO purchase by RBI. The 10-year G-Sec moved from 6.23% to 6.18% over the month. The Government cancelled the last scheduled auction in March (due to high cash balance position), which resulted in 10-year yields falling to 6.12% in the interim.The government announced the borrowing calendar for H1 FY2022, where gross borrowing for H1 FY2022 was estimated at INR 7.24 lakh Crs (~60% of the budgeted target for FY2022). The supply in the 10-year segment was on expected lines, however, supply in the longer end was higher than expected, keeping that segment under pressure. With a sharp rise in COVID cases recently, expectations have built of the accommodative stance to remain longer than earlier expected. This led to short end rates falling in the recent past. With supply-side pressures on long tenor Corporate bonds abating and heavy investments by long only investors in year-end, spreads of long tenor Corporate bonds vis-à-vis G-Sec also compressed.
Note: L&T Investment Management and the content providers of this article shall not be liable for any errors in the content or for any actions taken in reliance thereon. The recipient should note that the views expressed above are solely the views of L&T Investment Management Limited and/or its Fund Managers and it should not be construed as a recommendation to buy or sell any securities/stocks in any sectors. The article (including market views expressed herein) is for general information only and does not have regard to specific investment objectives, financial situation and the particular needs of any specific person who may receive this information. Investments in mutual funds and secondary markets inherently involve risks and recipient should consult their legal, tax and financial advisors before investing.
Source: MOSPI, Internal, Bloomberg
MARKET PERFORMANCE The 10-year benchmark G-Sec yield closed at 6.18%, down by 5 bps from its previous close of 6.23% while that on the short-term 1-year bond ended 5 bps lower at 3.85%.In the corporate bond segment, yields fell across the yield curve over the month. The 10-year AAA bond yield ended 27 bps lower at 6.85%, while the short-term 1-year AAA bond yield ended 15 bps down at 4.20%. The spread between 1-year and 10-year, AAA bond narrowed. Within the short-term segment, the yield on 3-month commercial paper (CP) was down 10 bps to 3.5% while 1-year CP yield was down 5 bps at 4.25%.
Monetary PolicyThe Monetary Policy Committee (MPC) came out with their bi-monthly policy statement today. Some of the key announcements are as follows:• The MPC members unanimously voted for keeping the policy rates unchanged• The MPC also unanimously decided to continue with an accommodative stance as long as necessary to sustain growth on a durable basis and continue to mitigate the impact of COVID-19 on the economy, while ensuring that inflation remained within the target going forward• As a fall out of the growth-driven Budget by the Government, demand has picked up. However, the recent surge in COVID infections has added uncertainty to the growth outlook. To counter spillovers to the economy at large, fiscal and monetary authorities will stand ready to act. Considering these factors, the MPC has retained its expectation of real GDP growth at 10.5% for FY2022• The projection for CPI inflation has been revised to 5% for Q4 FY2021, 5.2% in H1 FY2022, 4.4% in Q3 FY2022 and 5.1% in Q4 FY2022Unlike previous policies where the MPC gave a time-frame based guidance on accommodative stance, this time around they have dropped the time frame based guidance, and given more outcome-based guidance, possibly because of the uncertainty around the evolving impact of the pandemic on growth.The Governor also made two very important announcements in his address today:• Given the success of the Variable Rate Reverse Repo (VRRR) auctions and the rising surplus liquidity in the system, RBI announced to further conduct VRRR auctions of longer maturity. However, the RBI reiterated that this should not be considered as liquidity tightening• The Governor announced a secondary market G-Sec acquisition program (G-SAP 1.0), where the RBI will upfront commit to a specific amount of open market purchases of G-Sec in order to ensure orderly evolution of yield curve. For Q1 FY2022, G-SAP of INR 1 lakh Crs will be conducted, the first of which will be conducted for an amount of INR 25,000 Crs on April 15, 2021. Separately, the RBI will continue to use other tools under LAF, long term repo/reverse repo auctions, FX operations, OMOs and special OMOs as and when required
The G-SAP program is essentially a commitment from the RBI to provide durable liquidity to the system irrespective of market conditions.Some of the other non-policy related announcements are as follows:• The on-tap TLTRO scheme provided to Banks to lend to specific sectors which were allowed till March 31, 2021, has been extend by a period of 6 months• Special liquidity facility worth INR 50,000 Crs will be provided to All India Financial Institutions (NABARD, NHB and SIDBI) for FY2022• Bank lending to NBFCs (for on-lending to Agri/MSME/Housing) which were allowed under PSL will be extended till Sep 30, 2021The Governor reiterated that RBI stands committed to ensuring ample system liquidity in consonance with the accommodative stance of the MPC, and RBI will continue to preserve financial stability and insulate domestic financial markets from volatility arising from global spillovers.Post policy, G-Sec upto 5-year segment remained neutral to negative, however beyond 5 yr segment, yields were down by 3-7 bps. Money market papers were up ~10 bps, 2-3 yr Corporate bonds were up 5-10 bps, however, the 5-10 yr segment was down by up to 5bps. With longer tenor VRRR pushing short end rates higher and G-SAP program providing predictability on G-Sec supply absorption by RBI and in turn supporting longer end rates, markets are now expecting the yield curve to flatten. However, it will have to be seen how the G-SAP is conducted and which segments on the curve does the RBI target. Overall, the RBI governor has been very articulate in his communication that the RBI and MPC stand ready to support growth in the face of the second wave of the pandemic, and will ensure that the bond market functions in an orderly manner, with adequate provision of liquidity. While this does provide much-needed comfort to market participants, especially for yields at the longer end of the curve via the newly announced GSAP 1.0 the program, the announcement regarding the longer tenor ariable rate reverse repos (VRRR) does suggest that RBI is moving in a calibrated manner towards nudging up levels at the shorter end of the curve. Yields at the extreme short end have been trading close to the reverse repo rate with hardly any reward in the 0-6 month part of the curve. Effective implementation of the VRRR can gradually push up the term premia in the money market part of the curve, leading to a gradual flattening of the yield curve, which so far has been extremely steep. Yields in the short to medium (2-3 years) part of the curve have moved higher over the past few months, thereby offering better value for investors looking for some yield pickup over other money market segments. For investors with a long term horizon of 3 years and more, the steepness of the curve – especially between the 3-year and 7-year segment of the curve – is very attractive, and yields in the 7-year segment (where L&T Triple Ace Bond Fund is positioned) offer a substantial cushion to be able to offset the impact from the upward move in rates which is likely over the coming few years. Spreads on less liquid AAA securities and some of the good quality AA securities still remain attractive, and in an environment of interest rates trending higher, a strategy that delivers better yield pickup through judicious exposure to such securities, while still keeping duration moderate – are well suited for investors with a 3 year + horizon. L&T Resurgent India Bond Fund is well-positioned in this segment.
DEBTMARKETREVIEW
9
Data as on March 31, 2021
Flexicap Fund
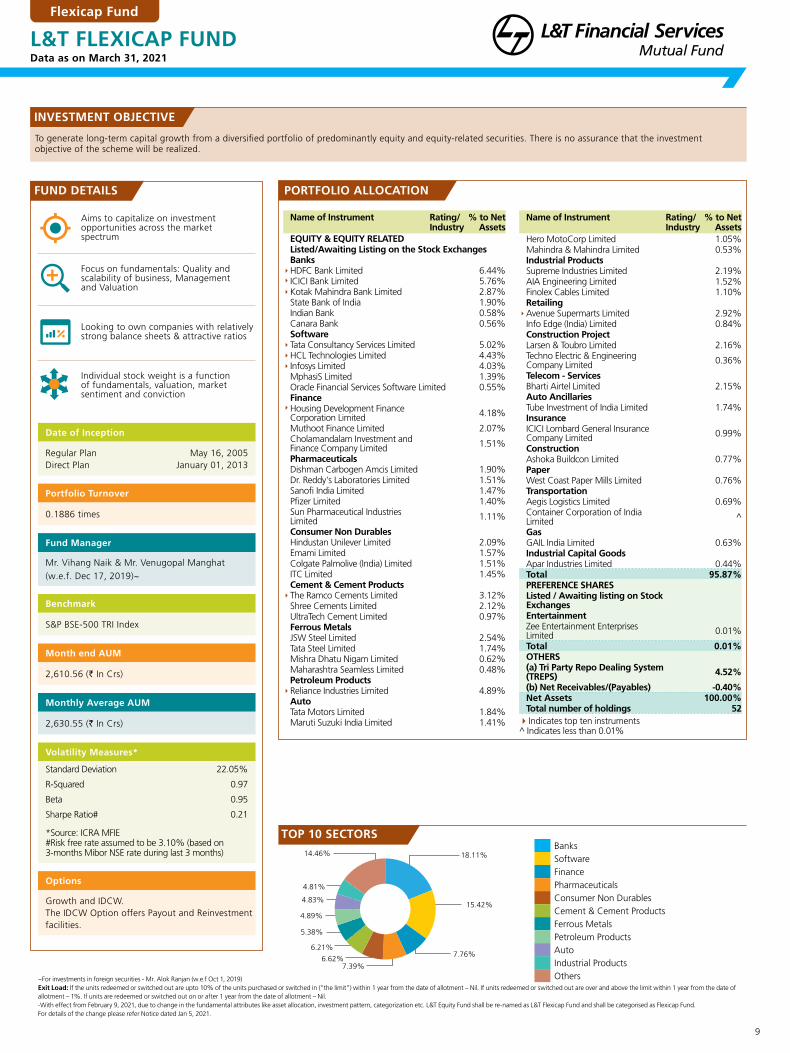
L&T FLEXICAP FUND
To generate long-term capital growth from a diversified portfolio of predominantly equity and equity-related securities. There is no assurance that the investment objective of the scheme will be realized.
Aims to capitalize on investment opportunities across the market spectrum
Focus on fundamentals: Quality and scalability of business, Management and Valuation
Looking to own companies with relatively strong balance sheets & attractive ratios
Individual stock weight is a function of fundamentals, valuation, market sentiment and conviction
INVESTMENT OBJECTIVE
FUND DETAILS
Date of Inception
Regular Plan Direct Plan
May 16, 2005 January 01, 2013
Portfolio Turnover
0.1886 times
Fund Manager
Mr. Vihang Naik & Mr. Venugopal Manghat (w.e.f. Dec 17, 2019)~
Benchmark
S&P BSE-500 TRI Index
Month end AUM
2,610.56 (` In Crs)
Monthly Average AUM
2,630.55 (` In Crs)
Volatility Measures*
Standard Deviation 22.05%
R-Squared 0.97
Beta 0.95
Sharpe Ratio# 0.21
*Source: ICRA MFIE #Risk free rate assumed to be 3.10% (based on 3-months Mibor NSE rate during last 3 months)
Options
Growth and IDCW. The IDCW Option offers Payout and Reinvestment facilities.
PORTFOLIO ALLOCATION
Name of Instrument Rating/Industry
% to Net Assets
EQUITY & EQUITY RELATEDListed/Awaiting Listing on the Stock ExchangesBanks
HDFC Bank Limited 6.44%ICICI Bank Limited 5.76%Kotak Mahindra Bank Limited 2.87%
State Bank of India 1.90%Indian Bank 0.58%Canara Bank 0.56%Software
Tata Consultancy Services Limited 5.02%HCL Technologies Limited 4.43%Infosys Limited 4.03%
MphasiS Limited 1.39%Oracle Financial Services Software Limited 0.55%Finance
Housing Development Finance Corporation Limited 4.18%
Muthoot Finance Limited 2.07%Cholamandalam Investment and Finance Company Limited 1.51%
PharmaceuticalsDishman Carbogen Amcis Limited 1.90%Dr. Reddy's Laboratories Limited 1.51%Sanofi India Limited 1.47%Pfizer Limited 1.40%Sun Pharmaceutical Industries Limited 1.11%
Consumer Non DurablesHindustan Unilever Limited 2.09%Emami Limited 1.57%Colgate Palmolive (India) Limited 1.51%ITC Limited 1.45%Cement & Cement Products
The Ramco Cements Limited 3.12%Shree Cements Limited 2.12%UltraTech Cement Limited 0.97%Ferrous MetalsJSW Steel Limited 2.54%Tata Steel Limited 1.74%Mishra Dhatu Nigam Limited 0.62%Maharashtra Seamless Limited 0.48%Petroleum Products
Reliance Industries Limited 4.89%AutoTata Motors Limited 1.84%Maruti Suzuki India Limited 1.41%
Name of Instrument Rating/Industry
% to Net Assets
Hero MotoCorp Limited 1.05%Mahindra & Mahindra Limited 0.53%Industrial ProductsSupreme Industries Limited 2.19%AIA Engineering Limited 1.52%Finolex Cables Limited 1.10%Retailing
Avenue Supermarts Limited 2.92%Info Edge (India) Limited 0.84%Construction ProjectLarsen & Toubro Limited 2.16%Techno Electric & Engineering Company Limited 0.36%
Telecom - ServicesBharti Airtel Limited 2.15%Auto AncillariesTube Investment of India Limited 1.74%InsuranceICICI Lombard General Insurance Company Limited 0.99%
ConstructionAshoka Buildcon Limited 0.77%PaperWest Coast Paper Mills Limited 0.76%TransportationAegis Logistics Limited 0.69%Container Corporation of India Limited ^
GasGAIL India Limited 0.63%Industrial Capital GoodsApar Industries Limited 0.44%Total 95.87%PREFERENCE SHARESListed / Awaiting listing on Stock ExchangesEntertainmentZee Entertainment Enterprises Limited 0.01%
Total 0.01%OTHERS(a) Tri Party Repo Dealing System (TREPS) 4.52%
(b) Net Receivables/(Payables) -0.40%Net Assets 100.00%Total number of holdings 52Indicates top ten instruments^ Indicates less than 0.01%
~For investments in foreign securities - Mr. Alok Ranjan (w.e.f Oct 1, 2019) Exit Load: If the units redeemed or switched out are upto 10% of the units purchased or switched in (“the limit”) within 1 year from the date of allotment – Nil. If units redeemed or switched out are over and above the limit within 1 year from the date of allotment – 1%. If units are redeemed or switched out on or after 1 year from the date of allotment – Nil.-With effect from February 9, 2021, due to change in the fundamental attributes like asset allocation, investment pattern, categorization etc. L&T Equity Fund shall be re-named as L&T Flexicap Fund and shall be categorised as Flexicap Fund.For details of the change please refer Notice dated Jan 5, 2021.
TOP 10 SECTORSBanksSoftwareFinancePharmaceuticalsConsumer Non DurablesCement & Cement ProductsFerrous MetalsPetroleum ProductsAutoIndustrial ProductsOthers
18.11%
15.42%
7.76%
7.39%
6.62%
6.21%
5.38%
4.89%
4.83%
4.81%
14.46%

10
Data as on March 31, 2021
PORTFOLIO ALLOCATION
Name of Instrument Rating/Industry
% to Net Assets
Auto Ancillaries Tube Investment of India Limited 2.93%
TVS Srichakra Limited 0.70%Ferrous MetalsTata Steel Limited 1.79%Ratnamani Metals & Tubes Limited 1.13%Petroleum Products
Reliance Industries Limited 2.87%Consumer DurablesTitan Company Limited 2.40%Somany Ceramics Limited 0.44%Leisure ServicesJubilant Foodworks Limited 2.50%Industrial ProductsGreaves Cotton Limited 1.45%Finolex Cables Limited 0.69%WIM Plast Limited 0.26%Textile ProductsK.P.R. Mill Limited 2.15%RetailingTrent Limited 2.12%Telecom - ServicesBharti Airtel Limited 2.07%AutoMaruti Suzuki India Limited 1.93%TransportationAegis Logistics Limited 1.07%Aerospace & DefenseBharat Electronics Limited 0.65%ConstructionAshoka Buildcon Limited 0.64%PaperEmami Paper Limited 0.49%PesticidesSharda Cropchem Limited 0.42%ChemicalsAtul Limited 0.32%Arti Surfactants Limited 0.01%Total 94.45%PREFERENCE SHARESListed / Awaiting listing on Stock ExchangesEntertainmentZee Entertainment Enterprises Limited 0.01%
Total 0.01%OTHERS(a) Tri Party Repo Dealing System (TREPS) 6.23%
(b) Net Receivables/(Payables) -0.69%Net Assets 100.00%Total number of holdings 60
Name of Instrument Rating/Industry
% to Net Assets
EQUITY & EQUITY RELATEDListed/Awaiting Listing on the Stock ExchangesBanks
ICICI Bank Limited 3.55% State Bank of India 3.07%
HDFC Bank Limited 2.82%Kotak Mahindra Bank Limited 2.08%City Union Bank Limited 0.16%IndusInd Bank Limited 0.01%Software
Infosys Limited 3.90%HCL Technologies Limited 3.47% Tata Consultancy Services Limited 2.94%
Oracle Financial Services Software Limited 1.13%
Affle India Limited ^Consumer Non Durables
Emami Limited 3.33%ITC Limited 2.51%Berger Paints India Limited 2.10%Asian Paints Limited 1.46%Hindustan Unilever Limited 1.03%Nestle India Limited 0.48%PharmaceuticalsAbbott India Limited 2.20%Sanofi India Limited 1.78%Alkem Laboratories Limited 1.62%IPCA Laboratories Limited 1.43%Dr. Reddy's Laboratories Limited 1.29%Sun Pharmaceutical Industries Limited 0.78%
Lupin Limited ^Pfizer Limited ^Cement & Cement Products
The Ramco Cements Limited 3.14%Shree Cements Limited 2.80%ACC Limited 1.69%UltraTech Cement Limited 0.93%InsuranceICICI Lombard General Insurance Company Limited 2.56%
HDFC Life Insurance Company Limited 1.33%
General Insurance Corporation of India 0.93%
FinanceHousing Development Finance Corporation Limited 2.33%
Cholamandalam Investment and Finance Company Limited 2.21%
Construction Project Larsen & Toubro Limited 3.24%
Engineers India Limited 0.61%Techno Electric & Engineering Company Limited 0.51%
Indicates top ten instruments^ Indicates less than 0.01%
ELSS Fund
L&T TAX ADVANTAGE FUND
To generate long-term capital growth from a diversified portfolio of predominantly equity and equity-related securities. There is no assurance that the investment objective of the scheme will be realized.
An open-ended ELSS fund with a flexible, go-anywhere approach
Well-diversified portfolio; Bottom-up investment approach
Focus on fundamentals: quality and scalability of business, management and valuation
3-year lock-in helps the fund manager take positions in stocks with longer term return potential
INVESTMENT OBJECTIVE
FUND DETAILS PORTFOLIO ALLOCATION
Date of Inception
Regular Plan Direct Plan
February 27, 2006 January 01, 2013
Portfolio Turnover
0.1331 times
Fund Manager
Mr. Vihang Naik & Mr. Venugopal Manghat (w.e.f. Dec 17, 2019)
Benchmark
S&P BSE 200 TRI Index
Month end AUM
3,407.09 (` In Crs)
Monthly Average AUM
3,455.56 (` In Crs)
Volatility Measures*
Standard Deviation 22.90%
R-Squared 0.96
Beta 1.00
Sharpe Ratio# 0.19
*Source: ICRA MFIE #Risk free rate assumed to be 3.10% (based on 3-months Mibor NSE rate during last 3 months)
Options
Growth and IDCW. The IDCW Option offers Payout.
Exit Load: Nil. For details of the performance of the schemes, please refer page nos 43 to 46. For product label please refer Page 3 of the factsheet.
TOP 10 SECTORSBanksSoftwareConsumer Non DurablesPharmaceuticalsCement & Cement ProductsInsuranceFinanceConstruction ProjectAuto AncillariesFerrous MetalsOthers
11.69%
11.44%
10.91%
9.10%8.56%
4.82%
4.54%
4.36%
3.63%
2.92%
22.49%
11
Data as on March 31, 2021
Large and Midcap Fund
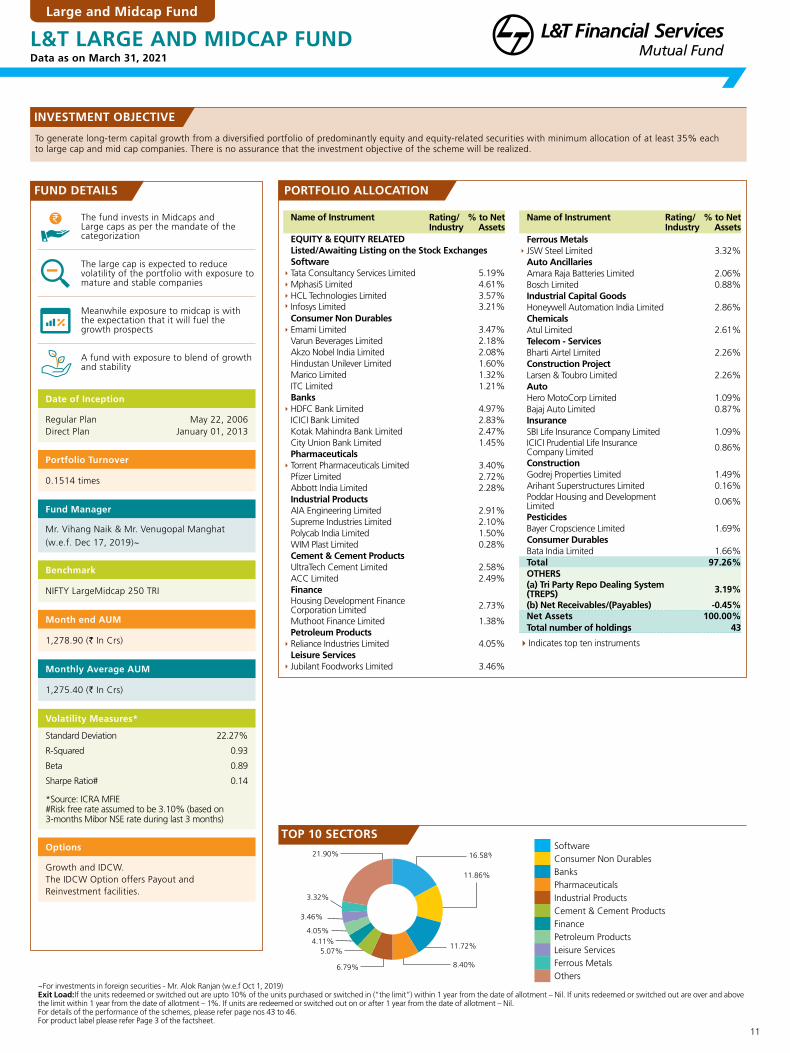
L&T LARGE AND MIDCAP FUND
To generate long-term capital growth from a diversified portfolio of predominantly equity and equity-related securities with minimum allocation of at least 35% each to large cap and mid cap companies. There is no assurance that the investment objective of the scheme will be realized.
The fund invests in Midcaps and Large caps as per the mandate of the categorization
The large cap is expected to reduce volatility of the portfolio with exposure to mature and stable companies
Meanwhile exposure to midcap is with the expectation that it will fuel the growth prospects
A fund with exposure to blend of growth and stability
INVESTMENT OBJECTIVE
FUND DETAILS PORTFOLIO ALLOCATION
Date of Inception
Regular Plan Direct Plan
May 22, 2006 January 01, 2013
Portfolio Turnover
0.1514 times
Fund Manager
Mr. Vihang Naik & Mr. Venugopal Manghat (w.e.f. Dec 17, 2019)~
Benchmark
NIFTY LargeMidcap 250 TRI
Month end AUM
1,278.90 (` In Crs)
Monthly Average AUM
1,275.40 (` In Crs)
Volatility Measures*
Standard Deviation 22.27%
R-Squared 0.93
Beta 0.89
Sharpe Ratio# 0.14
*Source: ICRA MFIE #Risk free rate assumed to be 3.10% (based on 3-months Mibor NSE rate during last 3 months)
Options
Growth and IDCW. The IDCW Option offers Payout and Reinvestment facilities.
~For investments in foreign securities - Mr. Alok Ranjan (w.e.f Oct 1, 2019) Exit Load:If the units redeemed or switched out are upto 10% of the units purchased or switched in (“the limit”) within 1 year from the date of allotment – Nil. If units redeemed or switched out are over and above the limit within 1 year from the date of allotment – 1%. If units are redeemed or switched out on or after 1 year from the date of allotment – Nil. For details of the performance of the schemes, please refer page nos 43 to 46. For product label please refer Page 3 of the factsheet.
Name of Instrument Rating/Industry
% to Net Assets
EQUITY & EQUITY RELATEDListed/Awaiting Listing on the Stock ExchangesSoftware
Tata Consultancy Services Limited 5.19%MphasiS Limited 4.61%HCL Technologies Limited 3.57% Infosys Limited 3.21%
Consumer Non DurablesEmami Limited 3.47%
Varun Beverages Limited 2.18%Akzo Nobel India Limited 2.08%Hindustan Unilever Limited 1.60%Marico Limited 1.32%ITC Limited 1.21%Banks
HDFC Bank Limited 4.97%ICICI Bank Limited 2.83%Kotak Mahindra Bank Limited 2.47%City Union Bank Limited 1.45%Pharmaceuticals
Torrent Pharmaceuticals Limited 3.40%Pfizer Limited 2.72%Abbott India Limited 2.28%Industrial ProductsAIA Engineering Limited 2.91%Supreme Industries Limited 2.10%Polycab India Limited 1.50%WIM Plast Limited 0.28%Cement & Cement ProductsUltraTech Cement Limited 2.58%ACC Limited 2.49%FinanceHousing Development Finance Corporation Limited 2.73%
Muthoot Finance Limited 1.38%Petroleum Products
Reliance Industries Limited 4.05%Leisure Services
Jubilant Foodworks Limited 3.46%
Name of Instrument Rating/Industry
% to Net Assets
Ferrous MetalsJSW Steel Limited 3.32%
Auto AncillariesAmara Raja Batteries Limited 2.06%Bosch Limited 0.88%Industrial Capital GoodsHoneywell Automation India Limited 2.86%ChemicalsAtul Limited 2.61%Telecom - ServicesBharti Airtel Limited 2.26%Construction ProjectLarsen & Toubro Limited 2.26%AutoHero MotoCorp Limited 1.09%Bajaj Auto Limited 0.87%InsuranceSBI Life Insurance Company Limited 1.09%ICICI Prudential Life Insurance Company Limited 0.86%
ConstructionGodrej Properties Limited 1.49%Arihant Superstructures Limited 0.16%Poddar Housing and Development Limited 0.06%
PesticidesBayer Cropscience Limited 1.69%Consumer DurablesBata India Limited 1.66%Total 97.26%OTHERS(a) Tri Party Repo Dealing System (TREPS) 3.19%
(b) Net Receivables/(Payables) -0.45%Net Assets 100.00%Total number of holdings 43
Indicates top ten instruments
TOP 10 SECTORSSoftwareConsumer Non DurablesBanksPharmaceuticalsIndustrial ProductsCement & Cement ProductsFinancePetroleum ProductsLeisure ServicesFerrous MetalsOthers
16.58%
11.86%
11.72%
8.40%6.79%
5.07%
4.11%
4.05%
3.46%
3.32%
21.90%

12
Data as on March 31, 2021
Sectoral Fund
L&T INFRASTRUCTURE FUND
To generate capital appreciation by investing predominantly in equity and equity related instruments of companies in the infrastructure sector. There is no assurance that the investment objective of the scheme will be realized.
Provides opportunity to benefit from participation in India’s structural infrastructure growth
Potential to deliver higher returns, although with relatively higher risk
A product with potential to generate significant alpha, especially during economic recovery
A product with a minimum investment horizon of 5 years
INVESTMENT OBJECTIVE
FUND DETAILS PORTFOLIO ALLOCATION
Date of Inception
Regular Plan Direct Plan
September 27, 2007 January 01, 2013
Portfolio Turnover
0.1286 times
Fund Manager
Mr. Venugopal Manghat & Mr. Vihang Naik (w.e.f. Dec 17, 2019)
Benchmark
Nifty Infrastructure TRI Index
Month end AUM
1,230.03 (` In Crs)
Monthly Average AUM
1,244.68 (` In Crs)
Volatility Measures*
Standard Deviation 26.22%
R-Squared 0.86
Beta 1.01
Sharpe Ratio# -0.04
*Source: ICRA MFIE #Risk free rate assumed to be 3.10% (based on 3-months Mibor NSE rate during last 3 months)
Options
Growth and IDCW. The IDCW option offers IDCW Payout and IDCW Reinvestment facilities.
Exit Load: If the units redeemed or switched out are upto 10% of the units purchased or switched in (“the limit”) within 1 year from the date of allotment – Nil. If units redeemed or switched out are over and above the limit within 1 year from the date of allotment – 1%. If units are redeemed or switched out on or after 1 year from the date of allotment – Nil.For details of the performance of the schemes, please refer page nos 43 to 46.For product label please refer Page 3 of the factsheet.
Name of Instrument Rating/Industry
% to Net Assets
Telecom - ServicesBharti Airtel Limited 6.16%
Petroleum ProductsReliance Industries Limited 5.39%
ConstructionGodrej Properties Limited 2.70%Brigade Enterprises Limited 1.79%PNC Infratech Limited 0.66%Poddar Housing and Development Limited 0.05%
PowerTata Power Company Limited 2.95%KEC International Limited 0.25%Aerospace & Defense
Bharat Electronics Limited 3.00%TransportationGujarat Pipavav Port Limited 1.53%Aegis Logistics Limited 1.03%Ferrous MetalsTata Steel Limited 1.78%Maharashtra Seamless Limited 0.63%Consumer DurablesVoltas Limited 1.88%Dixon Technologies (India) Limited 0.17%PaperCentury Textiles & Industries Limited 1.02%Non - Ferrous MetalsHindalco Industries Limited 0.98%Total 99.70%OTHERS(a) Tri Party Repo Dealing System (TREPS) 0.88%
(b) Net Receivables/(Payables) -0.58%Net Assets 100.00%Total number of holdings 43Indicates top ten instruments
TOP 10 SECTORSCement & Cement ProductsIndustrial ProductsIndustrial Capital GoodsConstruction ProjectTelecom - ServicesPetroleum ProductsConstructionPowerAerospace & DefenseTransportationOthers
21.49%
16.33%
16.18%13.73%
6.16%
5.39%
5.20%
3.20%
3.00%
2.56%
6.46%
Name of Instrument Rating/Industry
% to Net Assets
EQUITY & EQUITY RELATEDListed/Awaiting Listing on the Stock ExchangesCement & Cement Products
The Ramco Cements Limited 7.36%UltraTech Cement Limited 4.52%Grasim Industries Limited 3.87%
Shree Cements Limited 2.21%Birla Corporation Limited 2.09%ACC Limited 1.44%Industrial Products
Polycab India Limited 3.80%Grindwell Norton Limited 3.18%
Cummins India Limited 2.39%Carborundum Universal Limited 1.99%Finolex Cables Limited 1.85%AIA Engineering Limited 1.67%Orient Refractories Limited 1.45%Industrial Capital Goods
Honeywell Automation India Limited 4.12%ABB India Limited 2.81%Isgec Heavy Engineering Limited 2.01%Kennametal India Limited 1.71%Thermax Limited 1.56%BEML Limited 1.45%Indian Hume Pipe Company Limited 0.88%Apar Industries Limited 0.83%Siemens Limited 0.80%Mazagon Dock Shipbuilders Limited 0.01%Construction Project
Larsen & Toubro Limited 10.27%Techno Electric & Engineering Company Limited 1.74%
H.G Infra Engineering Limited 1.72%

13
Data as on March 31, 2021
Large Cap Fund
L&T INDIA LARGE CAP FUND
To generate long-term capital appreciation from a diversified portfolio of predominantly equity and equity related securities, including equity derivatives, in the Indian markets. The Scheme will predominantly invest in large cap stocks. The Scheme could also additionally invest in Foreign Securities. There is no assurance that the investment objective of the scheme will be realized.
Invests predominantly in large cap companies
Focus on fundamentals: Quality and scalability of business, Management and Valuation
Looking to own companies with strong balance sheets and strong cash flows
Individual stock weight is a function of fundamentals, valuation, market sentiment and conviction
INVESTMENT OBJECTIVE
FUND DETAILS PORTFOLIO ALLOCATION
Date of Inception
Regular Plan Direct Plan
October 23, 2007 January 01, 2013
Portfolio Turnover
0.4128 times
Fund Manager
Mr. Venugopal Manghat (w.e.f. Nov 24, 2012) & Mr. Vihang Naik (w.e.f. Dec 17, 2019)~
Benchmark
S&P BSE 100 TRI Index
Month end AUM
626.19 (` In Crs)
Monthly Average AUM
628.09 (` In Crs)
Volatility Measures*
Standard Deviation 21.33%
R-Squared 0.98
Beta 0.96
Sharpe Ratio# 0.38
*Source: ICRA MFIE #Risk free rate assumed to be 3.10% (based on 3-months Mibor NSE rate during last 3 months)
Options
Growth and IDCW. The IDCW option offers IDCW Payout and IDCW Reinvestment facilities.
~For investments in foreign securities - Mr. Alok Ranjan (w.e.f Oct 1, 2019) Exit Load: If the units redeemed or switched out are upto 10% of the units purchased or switched in (“the limit”) within 1 year from the date of allotment – Nil. If units redeemed or switched out are over and above the limit within 1 year from the date of allotment – 1%. If units are redeemed or switched out on or after 1 year from the date of allotment – Nil. For details of the performance of the schemes, please refer page nos 43 to 46.For product label please refer Page 3 of the factsheet.
Name of Instrument Rating/Industry
% to Net Assets
EQUITY & EQUITY RELATEDListed/Awaiting Listing on the Stock ExchangesBanks
HDFC Bank Limited 9.21% ICICI Bank Limited 8.93%State Bank of India 4.10%
Kotak Mahindra Bank Limited 2.09%Software
Infosys Limited 8.16%HCL Technologies Limited 3.38%
Tata Consultancy Services Limited 2.95%Petroleum Products
Reliance Industries Limited 6.53%Bharat Petroleum Corporation Limited 1.00%
Consumer Non DurablesITC Limited 2.66%Hindustan Unilever Limited 1.67%Nestle India Limited 1.03%Tata Consumer Products Limited 0.87%Asian Paints Limited 0.66%Dabur India Limited 0.39%Finance
Housing Development Finance Corporation Limited 3.48%
SBI Cards and Payment Services Limited 1.67%
LIC Housing Finance Limited 1.25%Mahindra & Mahindra Financial Services Limited 0.88%
Cement & Cement ProductsUltraTech Cement Limited 3.09%
Shree Cements Limited 1.77%The Ramco Cements Limited 1.61%PharmaceuticalsDivi's Laboratories Limited 1.78%Sun Pharmaceutical Industries Limited 1.68%
Dr. Reddy's Laboratories Limited 1.64%IPCA Laboratories Limited 0.86%AutoMahindra & Mahindra Limited 3.02%Maruti Suzuki India Limited 1.65%Hero MotoCorp Limited 0.39%Bajaj Auto Limited 0.37%Ferrous Metals
Tata Steel Limited 3.87%InsuranceSBI Life Insurance Company Limited 1.65%
Name of Instrument Rating/Industry
% to Net Assets
ICICI Lombard General Insurance Company Limited 1.19%
HDFC Life Insurance Company Limited 0.73%
Construction ProjectLarsen & Toubro Limited 3.11%
Telecom - ServicesBharti Airtel Limited 2.35%ConstructionGodrej Properties Limited 2.00%ChemicalsAtul Limited 1.38%RetailingTrent Limited 0.66%Avenue Supermarts Limited 0.66%Consumer DurablesTitan Company Limited 0.61%Whirlpool of India Limited 0.34%Healthcare ServicesApollo Hospitals Enterprise Limited 0.68%Industrial Capital GoodsABB India Limited 0.57%Aerospace & DefenseBharat Electronics Limited 0.47%Auto AncillariesJamna Auto Industries Limited 0.45%Leisure ServicesJubilant Foodworks Limited 0.33%Total 99.82%PREFERENCE SHARESListed / Awaiting listing on Stock ExchangesEntertainmentZee Entertainment Enterprises Limited 0.02%Total 0.02%BONDS & NCDsListed / awaiting listing on the stock exchanges
Britannia Industries Limited CRISIL AAA ^
Total - OTHERS(a) Tri Party Repo Dealing System (TREPS) 0.61%
(b) Net Receivables/(Payables) -0.45%Net Assets 100.00%Total number of holdings 48Indicates top ten instruments^ Indicates less than 0.01%
TOP 10 SECTORSBanksSoftwarePetroleum ProductsFinanceConsumer Non DurablesCement & Cement ProductsPharmaceuticalsAutoFerrous MetalsInsuranceOthers
24.33%
14.49%
7.53%
7.28%
7.28%
6.47%
5.96%
5.43%
3.87%
3.57%
13.63%

14
Data as on March 31, 2021
Value Fund
L&T INDIA VALUE FUND
To generate long-term capital appreciation from diversified portfolio of predominantly equity and equity related securities, in the Indian markets with higher focus on undervalued securities. The Scheme could also additionally invest in Foreign Securities in international markets. There is no assurance that the investment objective of the scheme will be realized.
Diversified equity fund with strong value bias that aims to deliver long term superior risk adjusted returns
Focus on identifying valuation anomalies versus the economic potential of a business over the medium term
Aims to minimize portfolio risk by investing in quality companies, monitoring corporate fundamentals closely
No sector/market cap bias
INVESTMENT OBJECTIVE
FUND DETAILS PORTFOLIO ALLOCATION
Date of Inception
Regular Plan Direct Plan
January 08, 2010 January 01, 2013
Portfolio Turnover
0.3907 times
Fund Manager
Mr. Venugopal Manghat (w.e.f. Nov 24, 2012) & Mr. Vihang Naik (w.e.f. Dec 17, 2019)~
Benchmark
S&P BSE 200 TRI Index
Month end AUM
6,741.24 (` In Crs)
Monthly Average AUM
6,784.67 (` In Crs)
Volatility Measures*
Standard Deviation 25.21%
R-Squared 0.96
Beta 1.11
Sharpe Ratio# 0.21
*Source: ICRA MFIE #Risk free rate assumed to be 3.10% (based on 3-months Mibor NSE rate during last 3 months)
Options
Growth and IDCW. The IDCW option offers IDCW Payout and IDCW Reinvestment facilities.
~For investments in foreign securities - Mr. Alok Ranjan (w.e.f Oct 1, 2019) Exit Load: If the units redeemed or switched out are upto 10% of the units purchased or switched in (“the limit”) within 1 year from the date of allotment – Nil. If units redeemed or switched out are over and above the limit within 1 year from the date of allotment – 1%. If units are redeemed or switched out on or after 1 year from the date of allotment – Nil. For details of the performance of the schemes, please refer page nos 43 to 46.For product label please refer Page 3 of the factsheet.
Name of Instrument Rating/Industry
% to Net Assets
Ferrous Metals Jindal Steel & Power Limited 3.29%
Ratnamani Metals & Tubes Limited 1.35%ConstructionPNC Infratech Limited 1.05%KNR Constructions Limited 1.00%Oberoi Realty Limited 0.93%Brigade Enterprises Limited 0.81%Prestige Estates Projects Limited 0.26%Construction ProjectLarsen & Toubro Limited 2.57%FertilisersCoromandel International Limited 1.48%Chambal Fertilizers & Chemicals Limited 0.68%Zuari Agro Chemicals Limited 0.05%Telecom - ServicesBharti Airtel Limited 2.02%PowerKEC International Limited 1.69%Tata Power Company Limited 0.15%Auto AncillariesBalkrishna Industries Limited 0.71%Endurance Technologies Limited 0.63%Textile ProductsK.P.R. Mill Limited 1.13%Industrial ProductsCummins India Limited 0.68%InsuranceICICI Lombard General Insurance Company Limited 0.63%Leisure ServicesThe Indian Hotels Company Limited 0.60%Total 99.41%PREFERENCE SHARESListed / Awaiting listing on Stock ExchangesEntertainmentZee Entertainment Enterprises Limited ^Total - OTHERS(a) Tri Party Repo Dealing System (TREPS) 0.40%
(b) Net Receivables/(Payables) 0.19%Net Assets 100.00%Total number of holdings 55
Name of Instrument Rating/Industry
% to Net Assets
EQUITY & EQUITY RELATEDListed/Awaiting Listing on the Stock ExchangesBanks
ICICI Bank Limited 8.98%HDFC Bank Limited 6.15% State Bank of India 2.88%
The Federal Bank Limited 2.00%Software
Infosys Limited 7.44%HCL Technologies Limited 4.09% Persistent Systems Limited 2.85%
Firstsource Solutions Limited 1.28%Oracle Financial Services Software Limited 0.64%Cement & Cement ProductsThe Ramco Cements Limited 2.51%Ambuja Cements Limited 1.77%Birla Corporation Limited 1.17%Shree Cements Limited 0.89%JK Lakshmi Cement Limited 0.87%Petroleum Products
Reliance Industries Limited 4.93%Hindustan Petroleum Corporation Limited 1.40%Chemicals
Deepak Nitrite Limited 4.23%Navin Fluorine International Limited 0.98%Aarti Industries Limited 0.54%Phillips Carbon Black Limited 0.46%Finance
Housing Development Finance Corporation Limited 3.75%
LIC Housing Finance Limited 1.32%Muthoot Finance Limited 0.73%AutoMahindra & Mahindra Limited 2.06%Tata Motors Limited 1.17%Maruti Suzuki India Limited 1.01%Hero MotoCorp Limited 0.72%Escorts Limited 0.67%PharmaceuticalsSun Pharmaceutical Industries Limited 2.47%IPCA Laboratories Limited 1.37%Divi's Laboratories Limited 0.90%Suven Pharmaceuticals Limited 0.66%Consumer Non DurablesEmami Limited 2.53%ITC Limited 2.28%
Indicates top ten instruments^ Indicates less than 0.01%
TOP 10 SECTORSBanksSoftwareCement & Cement ProductsPetroleum ProductsChemicalsFinanceAutoPharmaceuticalsConsumer Non DurablesFerrous MetalsOthers
20.01%
16.30%
7.21%
6.33%6.21%
5.80%
5.63%
5.40%
4.81%
4.64%
17.07%

15
Data as on March 31, 2021
Midcap Fund
L&T MIDCAP FUND
To generate capital appreciation by investing primarily in midcap stocks. There is no assurance that the investment objective of the scheme will be realized.
The fund invests predominantly in midcap stocks
Looks to invest in fundamentally strong companies with good growth prospects
Focus on valuations – aims to own stocks with high margin of safety to reduce overall portfolio risk
Aims at broad diversification of portfolio, with a view to manage liquidity at the aggregate portfolio level
INVESTMENT OBJECTIVE
FUND DETAILS PORTFOLIO ALLOCATION
Date of Inception
Regular Plan Direct Plan
August 09, 2004 January 01, 2013
Portfolio Turnover
0.2031 times
Fund Manager
Mr. Vihang Naik (w.e.f. June 28, 2016) & Mr. Venugopal Manghat (w.e.f. Dec 17, 2019)
Benchmark
Nifty Midcap 100 TRI Index
Month end AUM
6,428.48 (` In Crs)
Monthly Average AUM
6,367.59 (` In Crs)
Volatility Measures*
Standard Deviation 24.26%
R-Squared 0.96
Beta 0.82
Sharpe Ratio# 0.20
*Source: ICRA MFIE #Risk free rate assumed to be 3.10% (based on 3-months Mibor NSE rate during last 3 months)
Options
Growth and IDCW. The IDCW option offers IDCW Payout and IDCW Reinvestment facilities.
Exit Load:If the units redeemed or switched out are upto 10% of the units purchased or switched in (“the limit”) within 1 year from the date of allotment – Nil. If units redeemed or switched out are over and above the limit within 1 year from the date of allotment – 1%. If units are redeemed or switched out on or after 1 year from the date of allotment – Nil.For details of the performance of the schemes, please refer page nos 43 to 46.For product label please refer Page 3 of the factsheet.
TOP 10 SECTORS
Name of Instrument Rating/Industry
% to Net Assets
EQUITY & EQUITY RELATEDListed/Awaiting Listing on the Stock ExchangesPharmaceuticals
IPCA Laboratories Limited 3.07%Abbott India Limited 1.87%Suven Pharmaceuticals Limited 1.70%Pfizer Limited 1.16%Eris Lifesciences Limited 1.16%Alkem Laboratories Limited 1.01%Consumer Non Durables
Emami Limited 4.66% 3M India Limited 2.68%
Berger Paints India Limited 1.43%Godfrey Phillips India Limited 1.05%Software
MphasiS Limited 4.85%Affle India Limited 2.59%BIRLASOFT Limited 2.27%Finance
Sundaram Finance Limited 3.02%Cholamandalam Investment and Finance Company Limited 2.50%
CRISIL Limited 1.45%Manappuram Finance Limited 1.00%Muthoot Finance Limited 0.91%Industrial Products
Cummins India Limited 2.79%Supreme Industries Limited 2.62%AIA Engineering Limited 1.14%Timken India Limited 1.03%Chemicals
Atul Limited 2.80%Aarti Industries Limited 1.98%Deepak Nitrite Limited 1.47%Vinati Organics Limited 0.70%Ferrous Metals
Ratnamani Metals & Tubes Limited 2.90%Jindal Steel & Power Limited 1.70%Healthcare ServicesSyngene International Limited 2.42%Apollo Hospitals Enterprise Limited 1.68%ConstructionGodrej Properties Limited 2.55%Oberoi Realty Limited 1.29%Poddar Housing and Development Limited 0.02%Pesticides
Bayer Cropscience Limited 3.44%
Name of Instrument Rating/Industry
% to Net Assets
Auto AncillariesBosch Limited 1.24%Sundram Fasteners Limited 1.03%Amara Raja Batteries Limited 0.60%MRF Limited 0.36%Consumer DurablesJohnson Controls - Hitachi Air Conditioning India Limited 1.62%
Voltas Limited 1.56%InsuranceMax Financial Services Limited 2.31%General Insurance Corporation of India 0.47%Capital MarketsMulti Commodity Exchange of India Limited 1.85%
ICICI Securities Limited 0.91%Cement & Cement Products
The Ramco Cements Limited 2.76%TransportationBlue Dart Express Limited 2.35%FertilisersCoromandel International Limited 2.22%Textile ProductsPage Industries Limited 1.93%Dollar Industries Limited 0.06%Industrial Capital GoodsThermax Limited 1.27%ABB India Limited 0.14%GasMahanagar Gas Limited 1.14%RetailingTrent Limited 0.98%BanksCity Union Bank Limited 0.77%Petroleum ProductsCastrol India Limited 0.67%Leisure ServicesThe Indian Hotels Company Limited 0.47%Construction ProjectH.G Infra Engineering Limited 0.29%Total 95.91%OTHERS(a) Tri Party Repo Dealing System (TREPS) 3.78%
(b) Net Receivables/(Payables) 0.31%Net Assets 100.00%Total number of holdings 57
Indicates top ten instruments
TOP 10 SECTORSPharmaceuticalsConsumer Non DurablesSoftwareFinanceIndustrial ProductsChemicalsFerrous MetalsHealthcare ServicesConstructionPesticidesOthers
9.97%
9.82%
9.71%
8.88%
7.58%6.95%
4.60%
4.10%
3.86%
3.44%
27.00%
16
Data as on March 31, 2021
Small Cap Fund
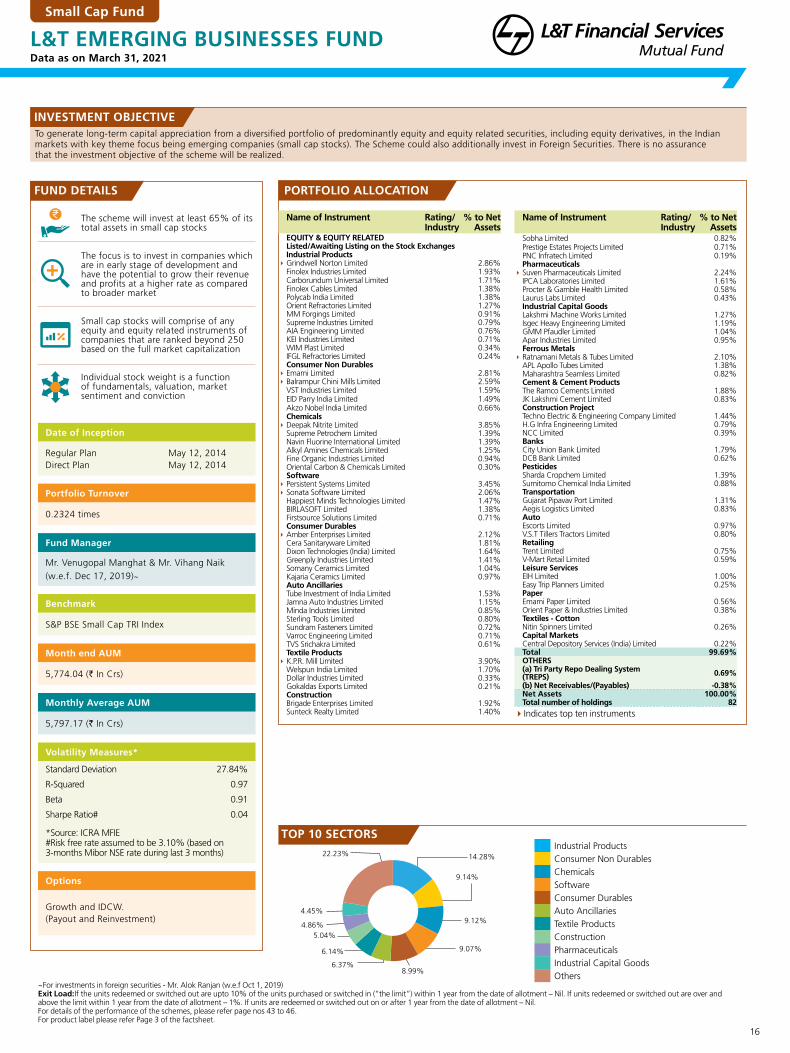
L&T EMERGING BUSINESSES FUND
To generate long-term capital appreciation from a diversified portfolio of predominantly equity and equity related securities, including equity derivatives, in the Indian markets with key theme focus being emerging companies (small cap stocks). The Scheme could also additionally invest in Foreign Securities. There is no assurance that the investment objective of the scheme will be realized.
The scheme will invest at least 65% of its total assets in small cap stocks
The focus is to invest in companies which are in early stage of development and have the potential to grow their revenue and profits at a higher rate as compared to broader market
Small cap stocks will comprise of any equity and equity related instruments of companies that are ranked beyond 250 based on the full market capitalization
Individual stock weight is a function of fundamentals, valuation, market sentiment and conviction
INVESTMENT OBJECTIVE
FUND DETAILS PORTFOLIO ALLOCATION
Date of Inception
Regular Plan Direct Plan
May 12, 2014 May 12, 2014
Portfolio Turnover
0.2324 times
Fund Manager
Mr. Venugopal Manghat & Mr. Vihang Naik (w.e.f. Dec 17, 2019)~
Benchmark
S&P BSE Small Cap TRI Index
Month end AUM
5,774.04 (` In Crs)
Monthly Average AUM
5,797.17 (` In Crs)
Volatility Measures*
Standard Deviation 27.84%
R-Squared 0.97
Beta 0.91
Sharpe Ratio# 0.04
*Source: ICRA MFIE #Risk free rate assumed to be 3.10% (based on 3-months Mibor NSE rate during last 3 months)
Options
Growth and IDCW. (Payout and Reinvestment)
~For investments in foreign securities - Mr. Alok Ranjan (w.e.f Oct 1, 2019) Exit Load:If the units redeemed or switched out are upto 10% of the units purchased or switched in (“the limit”) within 1 year from the date of allotment – Nil. If units redeemed or switched out are over andabove the limit within 1 year from the date of allotment – 1%. If units are redeemed or switched out on or after 1 year from the date of allotment – Nil.For details of the performance of the schemes, please refer page nos 43 to 46.For product label please refer Page 3 of the factsheet.
Name of Instrument Rating/Industry
% to Net Assets
Sobha Limited 0.82%Prestige Estates Projects Limited 0.71%PNC Infratech Limited 0.19%Pharmaceuticals
Suven Pharmaceuticals Limited 2.24%IPCA Laboratories Limited 1.61%Procter & Gamble Health Limited 0.58%Laurus Labs Limited 0.43%Industrial Capital GoodsLakshmi Machine Works Limited 1.27%Isgec Heavy Engineering Limited 1.19%GMM Pfaudler Limited 1.04%Apar Industries Limited 0.95%Ferrous Metals
Ratnamani Metals & Tubes Limited 2.10%APL Apollo Tubes Limited 1.38%Maharashtra Seamless Limited 0.82%Cement & Cement ProductsThe Ramco Cements Limited 1.88%JK Lakshmi Cement Limited 0.83%Construction ProjectTechno Electric & Engineering Company Limited 1.44%H.G Infra Engineering Limited 0.79%NCC Limited 0.39%BanksCity Union Bank Limited 1.79%DCB Bank Limited 0.62%PesticidesSharda Cropchem Limited 1.39%Sumitomo Chemical India Limited 0.88%TransportationGujarat Pipavav Port Limited 1.31%Aegis Logistics Limited 0.83%AutoEscorts Limited 0.97%V.S.T Tillers Tractors Limited 0.80%RetailingTrent Limited 0.75%V-Mart Retail Limited 0.59%Leisure ServicesEIH Limited 1.00%Easy Trip Planners Limited 0.25%PaperEmami Paper Limited 0.56%Orient Paper & Industries Limited 0.38%Textiles - CottonNitin Spinners Limited 0.26%Capital MarketsCentral Depository Services (India) Limited 0.22%Total 99.69%OTHERS(a) Tri Party Repo Dealing System (TREPS) 0.69%
(b) Net Receivables/(Payables) -0.38%Net Assets 100.00%Total number of holdings 82
Name of Instrument Rating/Industry
% to Net Assets
EQUITY & EQUITY RELATEDListed/Awaiting Listing on the Stock ExchangesIndustrial Products
Grindwell Norton Limited 2.86%Finolex Industries Limited 1.93%Carborundum Universal Limited 1.71%Finolex Cables Limited 1.38%Polycab India Limited 1.38%Orient Refractories Limited 1.27%MM Forgings Limited 0.91%Supreme Industries Limited 0.79%AIA Engineering Limited 0.76%KEI Industries Limited 0.71%WIM Plast Limited 0.34%IFGL Refractories Limited 0.24%Consumer Non Durables
Emami Limited 2.81%Balrampur Chini Mills Limited 2.59%
VST Industries Limited 1.59%EID Parry India Limited 1.49%Akzo Nobel India Limited 0.66%Chemicals
Deepak Nitrite Limited 3.85%Supreme Petrochem Limited 1.39%Navin Fluorine International Limited 1.39%Alkyl Amines Chemicals Limited 1.25%Fine Organic Industries Limited 0.94%Oriental Carbon & Chemicals Limited 0.30%Software
Persistent Systems Limited 3.45% Sonata Software Limited 2.06%
Happiest Minds Technologies Limited 1.47%BIRLASOFT Limited 1.38%Firstsource Solutions Limited 0.71%Consumer Durables
Amber Enterprises Limited 2.12%Cera Sanitaryware Limited 1.81%Dixon Technologies (India) Limited 1.64%Greenply Industries Limited 1.41%Somany Ceramics Limited 1.04%Kajaria Ceramics Limited 0.97%Auto AncillariesTube Investment of India Limited 1.53%Jamna Auto Industries Limited 1.15%Minda Industries Limited 0.85%Sterling Tools Limited 0.80%Sundram Fasteners Limited 0.72%Varroc Engineering Limited 0.71%TVS Srichakra Limited 0.61%Textile Products
K.P.R. Mill Limited 3.90%Welspun India Limited 1.70%Dollar Industries Limited 0.33%Gokaldas Exports Limited 0.21%ConstructionBrigade Enterprises Limited 1.92%Sunteck Realty Limited 1.40% Indicates top ten instruments
TOP 10 SECTORSIndustrial ProductsConsumer Non DurablesChemicalsSoftwareConsumer DurablesAuto AncillariesTextile ProductsConstructionPharmaceuticalsIndustrial Capital GoodsOthers
14.28%
9.14%
9.12%
9.07%
8.99%6.37%
6.14%
5.04%
4.86%
4.45%
22.23%

17
Data as on March 31, 2021
Thematic Fund
L&T BUSINESS CYCLES FUND
To seek to generate long-term capital appreciation from a diversified portfolio of predominantly equity and equity related securities, including equity derivatives, in the Indian market with focus on riding business cycles through dynamic allocation between various sectors and stocks at different stages of business cycles in the economy. There is no assurance that the investment objective of the scheme will be realized.
A product that is suitable for investors looking to benefit from positioning of portfolio on business up-cycle
Potential to deliver higher alpha over long term
Suitable for investors looking to benefit from economic expansion cycle
Adds style diversification to investor’s portfolio
INVESTMENT OBJECTIVE
FUND DETAILS PORTFOLIO ALLOCATION
Date of Inception
Regular Plan Direct Plan
August 20, 2014 August 20, 2014
Portfolio Turnover
0.1814 times
Fund Manager
Mr. Venugopal Manghat (w.e.f. Aug 20, 2014) & Mr. Vihang Naik (w.e.f. Dec 17, 2019)~
Benchmark
S&P BSE 200 TRI Index
Month end AUM
525.48 (` In Crs)
Monthly Average AUM
530.70 (` In Crs)
Volatility Measures*
Standard Deviation 27.58%
R-Squared 0.88
Beta 1.16
Sharpe Ratio# 0.08
*Source: ICRA MFIE #Risk free rate assumed to be 3.10% (based on 3-months Mibor NSE rate during last 3 months)
Options
Growth and IDCW. The IDCW option offers Payout or Reinvestment facilities.
~For investments in foreign securities - Mr. Alok Ranjan (w.e.f Oct 1, 2019) Exit Load:If the units redeemed or switched out are upto 10% of the units purchased or switched in (“the limit”) within 1 year from the date of allotment – Nil. If units redeemed or switched out are over and above the limit within 1 year from the date of allotment – 1%. If units are redeemed or switched out on or after 1 year from the date of allotment – Nil.For details of the performance of the schemes, please refer page nos 43 to 46.For product label please refer Page 3 of the factsheet.
Name of Instrument Rating/Industry
% to Net Assets
EQUITY & EQUITY RELATEDListed/Awaiting Listing on the Stock ExchangesBanks
HDFC Bank Limited 8.08% ICICI Bank Limited 7.47%
State Bank of India 2.07%Kotak Mahindra Bank Limited 1.91%Cement & Cement Products
UltraTech Cement Limited 5.32% The Ramco Cements Limited 3.06% Shree Cements Limited 2.75%
Birla Corporation Limited 1.78%Industrial Products
Timken India Limited 3.10%AIA Engineering Limited 1.69%Carborundum Universal Limited 1.41%Finolex Cables Limited 1.18%Schaeffler India Limited 1.11%Chemicals
Deepak Nitrite Limited 4.93%Atul Limited 1.60%Aarti Industries Limited 1.11%ConstructionKNR Constructions Limited 2.69%Godrej Properties Limited 2.59%Ahluwalia Contracts India Limited 1.50%PNC Infratech Limited 0.62%Ferrous Metals
Ratnamani Metals & Tubes Limited 4.84%Jindal Steel & Power Limited 2.55%Petroleum Products
Reliance Industries Limited 5.20%Hindustan Petroleum Corporation Limited 0.67%AutoMahindra & Mahindra Limited 2.56%Maruti Suzuki India Limited 1.86%Tata Motors Limited 0.71%Hero MotoCorp Limited 0.63%Consumer DurablesKajaria Ceramics Limited 1.74%
Name of Instrument Rating/Industry
% to Net Assets
Blue Star Limited 1.15%Whirlpool of India Limited 1.13%Titan Company Limited 0.96%Johnson Controls - Hitachi Air Conditioning India Limited 0.71%
Industrial Capital GoodsABB India Limited 1.74%Indian Hume Pipe Company Limited 1.16%Honeywell Automation India Limited 0.75%Thermax Limited 0.72%Abb Power Products And Systems India Limited 0.05%
Construction Project Larsen & Toubro Limited 3.35%
RetailingTrent Limited 1.87%Avenue Supermarts Limited 0.69%FinanceHousing Development Finance Corporation Limited 2.10%
PesticidesPI Industries Limited 1.06%Bayer Cropscience Limited 0.67%Auto AncillariesSundram Fasteners Limited 1.46%TransportationAegis Logistics Limited 1.26%FertilisersCoromandel International Limited 1.10%Leisure ServicesEIH Limited 0.92%Non - Ferrous MetalsHindalco Industries Limited 0.19%Total 99.77%OTHERS(a) Tri Party Repo Dealing System (TREPS) 0.58%
(b) Net Receivables/(Payables) -0.35%Net Assets 100.00%Total number of holdings 49Indicates top ten instruments
TOP 10 SECTORSBanksCement & Cement ProductsIndustrial ProductsChemicalsConstructionFerrous MetalsPetroleum ProductsAutoConsumer DurablesIndustrial Capital GoodsOthers
19.53%
12.91%
8.49%
7.64%7.40%
7.39%
5.87%
5.76%
5.69%
4.42%
14.67%

18
Data as on March 31, 2021
Focused Fund
L&T FOCUSED EQUITY FUND
The investment objective of the scheme is to provide capital appreciation by investing in equity and equity related instruments of maximum 30 stocks. There is no assurance that the investment objective of the scheme will be realized.
An open-ended equity scheme following a concentrated strategy
The fund aims to invest using a concentrated strategy by limiting to 30 stocks in the portfolio
Concentrated risk is mitigated by investing in companies with scalable opportunities, strong corporate governance and robust balance sheet
Ability to harness opportunities across the market spectrum - No market cap, sector or style bias
INVESTMENT OBJECTIVE
FUND DETAILS PORTFOLIO ALLOCATION
Date of Inception
Regular Plan Direct Plan
November 5, 2018 November 5, 2018
Portfolio Turnover
0.5605 times
Fund Manager
Mr. Vihang Naik (w.e.f. Nov 05, 2018) & Mr. Venugopal Manghat (w.e.f. Dec 17, 2019)
Benchmark
Nifty 500 TRI Index
Month end AUM
858.05 (` In Crs)
Monthly Average AUM
849.43 (` In Crs)
Options
Growth and IDCW. The IDCW option offers IDCW Payout and IDCW Reinvestment facilities.
Exit Load:If the units redeemed or switched out are upto 10% of the units purchased or switched in (“the limit”) within 1 year from the date of allotment – Nil. If units redeemed or switched out are over and above the limit within 1 year from the date of allotment – 1%. If units are redeemed or switched out on or after 1 year from the date of allotment – Nil.For details of the performance of the schemes, please refer page nos 43 to 46. For product label please refer Page 3 of the factsheet.
Name of Instrument Rating/Industry
% to Net Assets
Maruti Suzuki India Limited 2.33%
Pesticides
Bayer Cropscience Limited 2.84%
PI Industries Limited 1.28%
Construction Project
Larsen & Toubro Limited 4.10%
Finance
Sundaram Finance Limited 3.78%
Industrial Products
Greaves Cotton Limited 3.75%
Ferrous Metals
Tata Steel Limited 3.18%
Chemicals
Aarti Industries Limited 2.36%
Retailing
Avenue Supermarts Limited 2.22%
Telecom - Services
Bharti Airtel Limited 2.19%
Construction
Godrej Properties Limited 1.71%
Total 88.33%
OTHERS(a) Tri Party Repo Dealing System (TREPS) 10.00%
(b) Net Receivables/(Payables) 1.67%Net Assets 100.00%
Total number of holdings 29
Name of Instrument Rating/Industry
% to Net Assets
EQUITY & EQUITY RELATED
Listed/Awaiting Listing on the Stock Exchanges
Software
Tata Consultancy Services Limited 8.52%
Infosys Limited 6.51%
Affle India Limited 4.15%
HCL Technologies Limited 3.43%
Pharmaceuticals
IPCA Laboratories Limited 2.77%
Dr. Reddy's Laboratories Limited 2.76%
Torrent Pharmaceuticals Limited 1.92%
Procter & Gamble Health Limited 1.68%
Consumer Non Durables
Colgate Palmolive (India) Limited 3.42%
Hindustan Unilever Limited 2.96%
ITC Limited 0.97%
Heritage Foods Limited 0.03%
Transportation
Blue Dart Express Limited 3.97%Container Corporation of India Limited 2.39%
Cement & Cement Products
The Ramco Cements Limited 4.79%
JK Lakshmi Cement Limited 1.01%
Petroleum Products
Reliance Industries Limited 4.84%
Auto
Hero MotoCorp Limited 2.47% Indicates top ten instruments
TOP 10 SECTORSSoftwarePharmaceuticalsConsumer Non DurablesTransportationCement & Cement ProductsPetroleum ProductsAutoPesticidesConstruction ProjectFinanceOthers
22.61%
9.13%
7.38%
6.36%
5.80%
4.84%
4.80%
4.12%
4.10%
3.78%
15.41%

19
Data as on March 31, 2021
Index Fund
L&T NIFTY 50 INDEX FUND
The scheme will adopt a passive investment strategy. The scheme will invest in stocks comprising the Nifty 50 index in the same proportion as in the index with the objective of achieving returns equivalent to the Total Returns Index of Nifty 50 index by minimizing the performance difference between the benchmark index and the scheme. The Total Returns Index is an index that reflects the returns on the index from index gain/ loss plus dividend payments by the constituent stocks. There is no assurance that the investment objective of the scheme will be realized.
INVESTMENT OBJECTIVE
PORTFOLIO ALLOCATION
Date of Inception
Regular Plan Direct Plan
April 15, 2020 April 15, 2020
Portfolio Turnover
0.1493 times
Fund Manager
Mr. Praveen Ayathan (w.e.f. Apr 15, 2020)
Benchmark
Nifty 50 Index TRI
Month end AUM
62.13 (` In Crs)
Monthly Average AUM
61.66 (` In Crs)
Options
Growth and IDCW. The IDCW option offers Payout or Reinvestment facilities.
Exit Load:If the Units redeemed or switched out are upto 10% of the units purchased or switched in (“the limit”) within 1 month from the date of allotment. – Nil. If units redeemed or switched out are over and above the limit within 1 month from the date of allotment – 1%. If units are redeemed or switched out on or after 1 month from the date of allotment – Nil For details of the performance of the schemes, please refer page nos 43 to 46.For product label please refer Page 3 of the factsheet.
Name of Instrument Rating/Industry
% to Net Assets
EQUITY & EQUITY RELATEDListed/Awaiting Listing on the Stock ExchangesBanks
HDFC Bank Limited 10.22% ICICI Bank Limited 6.33%Kotak Mahindra Bank Limited 4.04%Axis Bank Limited 2.75%
State Bank of India 2.20%IndusInd Bank Limited 0.85%Software
Infosys Limited 7.97% Tata Consultancy Services Limited 5.17%
HCL Technologies Limited 1.68%Tech Mahindra Limited 0.97%Wipro Limited 0.96%Petroleum Products
Reliance Industries Limited 10.18%Bharat Petroleum Corporation Limited 0.63%Indian Oil Corporation Limited 0.37%Consumer Non Durables
Hindustan Unilever Limited 3.41% ITC Limited 3.00%
Asian Paints Limited 1.80%Nestle India Limited 0.96%Britannia Industries Limited 0.67%Tata Consumer Products Limited 0.60%Finance
Housing Development Finance Corporation Limited 7.07%
Bajaj Finance Limited 2.15%AutoMaruti Suzuki India Limited 1.43%Mahindra & Mahindra Limited 1.20%Tata Motors Limited 0.85%Bajaj Auto Limited 0.75%Hero MotoCorp Limited 0.59%Eicher Motors Limited 0.57%PharmaceuticalsSun Pharmaceutical Industries Limited 1.01%
Dr. Reddy's Laboratories Limited 0.86%Divi's Laboratories Limited 0.73%
Name of Instrument Rating/Industry
% to Net Assets
Cipla Limited 0.65%Cement & Cement ProductsUltraTech Cement Limited 1.22%Grasim Industries Limited 0.87%Shree Cements Limited 0.62%Construction ProjectLarsen & Toubro Limited 2.69%InsuranceBajaj Finserv Limited 0.92%HDFC Life Insurance Company Limited 0.91%
SBI Life Insurance Company Limited 0.54%Telecom - ServicesBharti Airtel Limited 1.96%Ferrous MetalsTata Steel Limited 0.96%JSW Steel Limited 0.71%PowerPower Grid Corporation of India Limited 0.87%
NTPC Limited 0.80%Consumer DurablesTitan Company Limited 1.02%TransportationAdani Ports and Special Economic Zone Limited 0.81%
Non - Ferrous MetalsHindalco Industries Limited 0.75%OilOil & Natural Gas Corporation Limited 0.59%PesticidesUPL Limited 0.55%Minerals/MiningCoal India Limited 0.43%Total 99.84%OTHERS(a) Tri Party Repo Dealing System (TREPS) 1.21%
(b) Net Receivables/(Payables) -1.05%Net Assets 100.00%Total number of holdings 50Indicates top ten instruments
TOP 10 SECTORSBanksSoftwarePetroleum ProductsConsumer Non DurablesFinanceAutoPharmaceuticalsCement & Cement ProductsConstruction ProjectInsuranceOthers
26.39%
16.75%
11.18%
10.44%
9.22%
5.39%
3.25%
2.71%
2.69%
2.37%
9.45%
Low cost: The fund doesn’t require a high level of active management and the stock selection is automatic hence it is cost-effective
No Active Risk: As the fund manager is not taking active calls to generate alpha, the fund doesn’t carry any active risk
Broad Diversification - Exposure to the broader market and get to know where the fund is investing
Low Portfolio Turnover - Portfolio turnover is quite low since portfolio rebalancing happens with Index rebalancing only
FUND DETAILS
`

20
Data as on March 31, 2021
Index Fund
L&T NIFTY NEXT 50 INDEX FUND
The scheme will adopt a passive investment strategy. The scheme will invest in stocks comprising the Nifty Next 50 index in the same proportion as in the index with the objective of achieving returns equivalent to the Total Returns Index of Nifty Next 50 index by minimizing the performance difference between the benchmark index and the scheme. The Total Returns Index is an index that reflects the returns on the index from index gain/ loss plus dividend payments by the constituent stocks. There is no assurance that the investment objective of the scheme will be realized.
INVESTMENT OBJECTIVE
PORTFOLIO ALLOCATION
Date of Inception
Regular Plan Direct Plan
April 15, 2020 April 15, 2020
Portfolio Turnover
0.9439 times
Fund Manager
Mr. Praveen Ayathan (w.e.f. Apr 15, 2020)
Benchmark
Nifty Next 50 Index TRI
Month end AUM
25.20 (` In Crs)
Monthly Average AUM
24.66 (` In Crs)
Options
Growth and IDCW. The IDCW option offers IDCW Payout and IDCW Reinvestment facilities.
Exit Load:If the units redeemed or switched out are up to 10% of the units purchased or switched in (“the limit”) within 1 month from the date of allotment – Nil. If units redeemed or switched out are over and above the limit within 1 month from the date of allotment – 1%. If units redeemed or switched out on or after 1 month from the date of allotment – Nil For details of the performance of the schemes, please refer page nos 43 to 46.For product label please refer Page 3 of the factsheet.
Name of Instrument Rating/Industry
% to Net Assets
ICICI Prudential Life Insurance Company Limited 1.71%
BanksBandhan Bank Limited 2.28%Yes Bank Limited 1.61%Punjab National Bank 0.88%Minerals/Mining
Adani Enterprises Limited 2.81%NMDC Limited 1.26%Cement & Cement ProductsAmbuja Cements Limited 2.25%ACC Limited 1.60%Non - Ferrous Metals
Vedanta Limited 3.80%Healthcare Services
Apollo Hospitals Enterprise Limited 2.90%Chemicals
Pidilite Industries Limited 2.74%Consumer DurablesHavells India Limited 2.61%Leisure ServicesJubilant Foodworks Limited 2.21%Telecom - Equipment & AccessoriesIndus Towers Limited 1.97%SoftwareLarsen & Toubro Infotech Limited 1.83%ConstructionDLF Limited 1.76%Petroleum ProductsHindustan Petroleum Corporation Limited 1.64%Industrial Capital GoodsSiemens Limited 1.63%TransportationInterGlobe Aviation Limited 1.56%Capital MarketsHDFC Asset Management Company Limited 1.54%Total 99.47%OTHERS(a) Tri Party Repo Dealing System (TREPS) 1.49%
(b) Net Receivables/(Payables) -0.96%Net Assets 100.00%Total number of holdings 50
Name of Instrument Rating/Industry
% to Net Assets
EQUITY & EQUITY RELATEDListed/Awaiting Listing on the Stock ExchangesConsumer Non Durables
Dabur India Limited 3.03%Godrej Consumer Products Limited 2.74%
Marico Limited 2.11%Colgate Palmolive (India) Limited 2.06%Berger Paints India Limited 1.84%United Spirits Limited 1.65%United Breweries Limited 1.37%Procter & Gamble Hygiene and Health Care Limited 0.97%
PharmaceuticalsAurobindo Pharma Limited 2.46%Lupin Limited 2.44%Biocon Limited 1.80%Torrent Pharmaceuticals Limited 1.24%Alkem Laboratories Limited 1.15%Cadila Healthcare Limited 1.12%Abbott India Limited 0.64%Retailing
Avenue Supermarts Limited 3.45% Info Edge (India) Limited 3.28%
GasGAIL India Limited 2.43%Indraprastha Gas Limited 1.78%Petronet LNG Limited 1.67%FinancePiramal Enterprises Limited 2.08%Bajaj Holdings & Investment Limited 1.34%Muthoot Finance Limited 1.30%SBI Cards and Payment Services Limited 1.06%
PowerAdani Green Energy Limited 3.50%
Adani Transmission Limited 2.02%Auto AncillariesMotherson Sumi Systems Limited 2.40%MRF Limited 1.66%Bosch Limited 1.19%Insurance
ICICI Lombard General Insurance Company Limited 3.10%
Indicates top ten instruments
TOP 10 SECTORSConsumer Non DurablesPharmaceuticalsRetailingGasFinancePowerAuto AncillariesInsuranceBanksMinerals/MiningOthers
15.77%
10.85%
6.73%
5.88%
5.78%
5.52%
5.25%
4.81%
4.77%
4.07%
30.04%
Low cost: The fund doesn’t require a high level of active management and the stock selection is automatic hence it is cost-effective
No Active Risk: As the fund manager is not taking active calls to generate alpha, the fund doesn’t carry any active risk
Broad Diversification - Exposure to the broader market and get to know where the fund is investing
Low Portfolio Turnover - Portfolio turnover is quite low since portfolio rebalancing happens with Index rebalancing only
FUND DETAILS
`

21
Data as on March 31, 2021
Dynamic Asset Allocation Fund
To seek to generate long-term capital appreciation from a diversified portfolio of equity and equity related securities and to generate reasonable returns by investing in a portfolio of debt and money market instruments and arbitrage opportunities in the cash and derivatives segments of the equity markets. There is no assurance that the investment objective of the scheme will be realized.
A product that follows basic principle of investing - buy low, sell high
A tax efficient product suitable for long-term goal-based investing
Portfolio actively managed to deliver alpha through stock selection
Aims to limit downside by dynamically changing equity allocation based on market valuations
INVESTMENT OBJECTIVE
FUND DETAILS PORTFOLIO ALLOCATION
Date of Inception
Regular Plan Direct Plan
February 07, 2011 January 01, 2013
Portfolio Turnover
4.9211 times
Fund Manager
Mr. Vihang Naik & Mr. Venugopal Manghat (w.e.f. Dec 17, 2019), Mr. Praveen Ayathan (w.e.f. Jan 30, 2016) (for investments in equity and equity related instruments) & Mr. Jalpan Shah (w.e.f. May 30, 2016) (investments in debt and debt related instruments)
Benchmark
50% - S&P BSE-200 TRI Index and 50% CRISIL Short Term Bond Fund Index
Month end AUM
1,581.84 (` In Crs)
Monthly Average AUM
1,483.01 (` In Crs)
Options
Growth and IDCW. The IDCW option offers Payout and Reinvestment facilities.
Exit Load:If the units redeemed or switched out are upto 10% of the units purchased or switched in (“the limit”) within 1 year from the date of allotment – Nil. If units redeemed or switched out are over and above the limit within 1 year from the date of allotment – 1%. If units are redeemed or switched out on or after 1 year from the date of allotment – Nil.For details of the performance of the schemes, please refer page nos 43 to 46.^The name of the Scheme is changed to L&T Balanced Advantage Fund from L&T Dynamic Equity Fund with effect from August 01, 2019 (‘effective date’). Also, note that there has been changes in the fundamentalattributes of the Scheme applicable from the effective date. For further information please refer the Notice cum Addendum dated June 24, 2019.For product label please refer Page 3 of the factsheet.
Data as on March 31, 2021
L&T BALANCED ADVANTAGE FUND (Formerly known as L&T Dynamic Equity Fund)^
Name of Instrument % to Net Assets
% to Net Assets
(hedged)
% to Net Assets
(unhedged)
EQUITY & EQUITY RELATED
Listed/Awaiting Listing on the Stock ExchangesBanksHDFC Bank Limited 1.56% 0.10% 1.46%
ICICI Bank Limited 4.68% 3.63% 1.05%Kotak Mahindra Bank Limited 0.75% - 0.75%
State Bank of India 2.47% 2.47% - Axis Bank Limited 1.35% 1.35% - Consumer Non DurablesZydus Wellness Limited 1.22% - 1.22%Dabur India Limited 0.83% - 0.83%Hindustan Unilever Limited 0.59% - 0.59%Asian Paints Limited 0.50% - 0.50%ITC Limited 1.71% 1.29% 0.42%Colgate Palmolive (India) Limited 1.70% 1.70% - United Spirits Limited 0.42% 0.42% - Software
Infosys Limited 2.37% 0.91% 1.46%HCL Technologies Limited 1.37% 0.09% 1.28%Tata Consultancy Services Limited 1.75% 0.85% 0.90%MphasiS Limited 0.89% - 0.89%Tech Mahindra Limited 0.32% 0.32% - Transportation
Adani Ports and Special Economic Zone Limited 3.79% 3.79% -
Container Corporation of India Limited 2.02% 2.02% -
Petroleum ProductsReliance Industries Limited 2.89% 1.65% 1.24%Bharat Petroleum Corporation
Limited 2.53% 2.53% -
Telecom - ServicesBharti Airtel Limited 5.33% 4.24% 1.09%
PharmaceuticalsDivi's Laboratories Limited 1.37% 0.66% 0.71%Cipla Limited 0.71% - 0.71%Alkem Laboratories Limited 0.65% - 0.65%Dr. Reddy's Laboratories Limited 0.61% - 0.61%Biocon Limited 0.28% - 0.28%Lupin Limited 0.38% 0.38% - Glenmark Pharmaceuticals Limited 0.10% 0.10% - AutoHero MotoCorp Limited 0.61% - 0.61%Maruti Suzuki India Limited 1.18% 0.65% 0.53%Tata Motors Limited 0.95% 0.55% 0.40%Mahindra & Mahindra Limited 0.32% - 0.32%Escorts Limited 0.38% 0.38% - Bajaj Auto Limited 0.28% 0.28% - Ferrous Metals
Tata Steel Limited 3.33% 2.31% 1.02%Jindal Steel & Power Limited 0.23% 0.23% - EntertainmentSun TV Network Limited 1.48% 1.48% - Zee Entertainment Enterprises Limited 1.14% 1.14% -
Cement & Cement ProductsShree Cements Limited 1.83% - 1.83%Grasim Industries Limited 0.30% 0.30% - Ambuja Cements Limited 0.12% 0.12% - FinanceCRISIL Limited 0.87% - 0.87%
Name of Instrument % to Net Assets
% to Net Assets
(hedged)
% to Net Assets
(unhedged)Housing Development Finance Corporation Limited 1.29% 1.29% -
Non - Ferrous MetalsVedanta Limited 1.94% 1.94% -
ConstructionSunteck Realty Limited 0.57% - 0.57%DLF Limited 1.29% 1.29% - InsuranceICICI Lombard General Insurance Company Limited 0.73% - 0.73%
HDFC Life Insurance Company Limited 0.63% - 0.63%
RetailingAvenue Supermarts Limited 0.79% - 0.79%Construction ProjectLarsen & Toubro Limited 0.45% - 0.45%H.G Infra Engineering Limited 0.28% - 0.28%Auto AncillariesBalkrishna Industries Limited 0.50% 0.50% - GasIndraprastha Gas Limited 0.50% 0.50% - PowerTata Power Company Limited 0.41% 0.41% - Capital MarketsHDFC Asset Management Company Limited 0.30% - 0.30%
PaperEmami Paper Limited 0.08% - 0.08%Total 67.92% 41.87% 26.05%Name of Instrument Rating
Industry% to Net
AssetsDEBT INSTRUMENTSFixed Rates Bonds - CorporateListed / Awaiting listing on Stock ExchangesExport Import Bank of India CRISIL AAA 1.80%National Highways Authority of India CRISIL AAA 1.73%Indian Railway Finance Corporation Limited CRISIL AAA 1.72%National Bank for Agriculture & Rural Development CRISIL AAA 1.02%
Total 6.27%Investment Funds/Mutual FundsL&T Liquid Fund - Direct Plan - Growth Unrated 5.13%Total 5.13%Central Government Securities06.18% GOI 04-NOV-2024 SOVEREIGN 10.00%05.22% GOI 15-JUN-2025 SOVEREIGN 3.17%Total 13.17%OTHERSDeposits (placed as margins)(a) Fixed DepositsHDFC Bank Limited 1.69%Total 1.69%(b) Margin as Cash Margin 0.04%(c) Tri Party Repo Dealing System (TREPS) 8.89%(d) Net Receivables/(Payables) -3.11%Net Assets 100.00%Total number of holdings 57
Indicates top ten instrumentsAll corporate ratings are assigned by rating agencies like CRISIL; CARE; ICRA; IND.Total outstanding position (as at Mar, 2021) in Derivative Instruments (Gross Notional) 66,634.75 lakhsTotal percentage of existing assets hedged through futures is 41.87%
TOP 10 SECTORS BanksConsumer Non DurablesSoftwareTransportationPetroleum ProductsTelecom - ServicesPharmaceuticalsAutoFerrous MetalsEntertainmentOthers
10.81%
6.97%
6.70%
5.81%
5.42%
5.33%
4.10%
3.72%
3.56%
2.62%
12.88%

22
Data as on March 31, 2021
Aggressive Hybrid Fund
L&T HYBRID EQUITY FUND
To seek to generate long-term capital appreciation from a diversified portfolio of predominantly equity and equity related securities and to generate reasonable returns through a portfolio of debt and money market instruments. There is no assurance that the investment objective of the scheme will be realized.
INVESTMENT OBJECTIVE
PORTFOLIO ALLOCATION
~For investments in foreign securities - Mr. Alok Ranjan (w.e.f Oct 1, 2019)Exit Load:If the units redeemed or switched out are upto 10% of the units purchased or switched in (“the limit”) within 1 year from the date of allotment – Nil. If units redeemed or switched out are over and above the limit within 1 year from the date of allotment – 1%. If units are redeemed or switched out on or after 1 year from the date of allotment – Nil.For details of the performance of the schemes, please refer page nos 43 to 46.For product label please refer Page 3 of the factsheet.
A Fund that allocates assets across equities and Debt• Invests 65-75% in equity (shares)
and equity related instruments• 25-35% allocation to debt (bonds)
and money market instruments
Equity investments well diversified across sectors and market capitalization segments
Relatively conservative approach in managing debt component to provide stability to the portfolio
FUND DETAILS
Date of Inception
Regular Plan Direct Plan
February 07, 2011 January 01, 2013
Portfolio Turnover
0.6340 times
Fund Manager
Mr. Venugopal Manghat & Mr. Vihang Naik (w.e.f. Dec 17, 2019) (for investments in equity and equity related instruments), Mr. Shriram Ramanathan (w.e.f. May 30, 2016) (investments in debt and debt related instruments)~
Benchmark
CRISIL Hybrid 35+65 - Aggressive Index
Month end AUM
5,385.96 (` In Crs)
Monthly Average AUM
5,458.17 (` In Crs)
Volatility Measures*
Standard Deviation 16.84%
R-Squared 0.98
Beta 1.14
Sharpe Ratio# 0.29
*Source: ICRA MFIE #Risk free rate assumed to be 3.10% (based on 3-months Mibor NSE rate during last 3 months)
Options
• Growth• IDCW Option (Reinvestment and Payout)• Annual IDCW Option (Reinvestment and
Payout)
Name of Instrument Rating/Industry
% to Net Assets
Consumer DurablesSomany Ceramics Limited 0.18%Non - Ferrous MetalsHindalco Industries Limited 0.10%Total 75.21%MONEY MARKET INSTRUMENTCertificate of Deposit/Commercial PaperExport Import Bank of India CRISIL AAA 0.17%Total 0.17%DEBT INSTRUMENTSFixed Rates Bonds - CorporateListed / Awaiting listing on Stock ExchangesState Bank Of India (Basel III Compliant AT 1 Bond) CRISIL AA+ 1.05%
Reliance Industries Limited CRISIL AAA 1.00%Housing Development Finance Corporation Limited CRISIL AAA 0.52%
Power Finance Corporation Limited CRISIL AAA 0.51%National Bank for Agriculture & Rural Development CRISIL AAA 0.50%
Small Industries Development Bank of India CARE AAA 0.40%
Sikka Ports & Terminals Limited (erstwhile Reliance Ports & Terminals Ltd) CRISIL AAA 0.23%
State Bank Of India (Basel III Compliant AT 1 Bond) CRISIL AA+ 0.23%
HDFC Bank Limited CRISIL AAA 0.21%Export Import Bank of India CRISIL AAA 0.12%National Bank for Agriculture & Rural Development CRISIL AAA 0.10%
IndusInd Bank Limited (Basel III Compliant AT 1 Bond) CRISIL AA 0.09%
Power Finance Corporation Limited CRISIL AAA 0.07%National Bank for Agriculture & Rural Development CRISIL AAA 0.05%
Power Finance Corporation Limited CRISIL AAA 0.05%Sikka Ports & Terminals Limited (erstwhile Reliance Ports & Terminals Ltd) CRISIL AAA 0.04%
Small Industries Development Bank of India CARE AAA 0.04%
Nuclear Power Corporation Of India Limited CRISIL AAA 0.03%
Power Grid Corporation of India Limited CRISIL AAA 0.01%Total 5.25%GOVERNMENT SECURITIESFixed Rates Bonds - Government06.45% GOI 7-OCT-2029 SOVEREIGN 2.32%07.32% GOI 28-JAN-2024 SOVEREIGN 2.20%06.18% GOI 04-NOV-2024 SOVEREIGN 2.06%07.27% GOI 08-APR-2026 SOVEREIGN 2.02%07.26% GOI 14-JAN-2029 SOVEREIGN 1.98%07.17% GOI 08-JAN-2028 SOVEREIGN 0.99%05.15% GOI 09-NOV-2025 SOVEREIGN 0.93%08.89% TELANGANA SDL 16-OCT-2024 SOVEREIGN 0.64%08.88% ANDHRA SDL 16-OCT-2024 SOVEREIGN 0.53%5.60% MAHARSHTRA SDL 09-SEP-2024 SOVEREIGN 0.47%05.79% GOI 11-MAY-2030 SOVEREIGN 0.45%6.70% TAMILNADU SDL - 16-OCT-2024 SOVEREIGN 0.30%8.87% HIMACHAL SDL - 16-OCT-2024 SOVEREIGN 0.21%06.79% GOI 15-MAY-2027 SOVEREIGN 0.20%8.72% KERALA SDL 29-OCT-2024 SOVEREIGN 0.12%07.68% GOI 15-DEC-2023 SOVEREIGN 0.01%Total 15.43%Others(c) Tri Party Repo Dealing System (TREPS) 4.16%(d) Net Receivables/(Payables) -0.22%Net Assets 100.00%Total number of holdings 50
Name of Instrument Rating/Industry
% to Net Assets
EQUITY & EQUITY RELATEDListed/Awaiting Listing on the Stock ExchangesBanks
ICICI Bank Limited 8.37%HDFC Bank Limited 6.39% State Bank of India 2.09%
Kotak Mahindra Bank Limited 0.39%Software
Infosys Limited 4.22%HCL Technologies Limited 2.63%
Tata Consultancy Services Limited 2.02%Oracle Financial Services Software Limited 1.60%PharmaceuticalsSun Pharmaceutical Industries Limited 2.07%IPCA Laboratories Limited 1.77%Divi's Laboratories Limited 0.94%Gland Pharma Limited 0.64%Alkem Laboratories Limited 0.38%Cement & Cement Products
The Ramco Cements Limited 2.62%UltraTech Cement Limited 2.05%Shree Cements Limited 1.13%Consumer Non DurablesEmami Limited 2.08%Dabur India Limited 1.08%Nestle India Limited 0.92%Varun Beverages Limited 0.71%Tata Consumer Products Limited 0.63%Finance
Housing Development Finance Corporation Limited 3.60%Mahindra & Mahindra Financial Services Limited 0.76%SBI Cards and Payment Services Limited 0.72%Petroleum Products
Reliance Industries Limited 4.18%Construction Project
Larsen & Toubro Limited 2.94%Techno Electric & Engineering Company Limited 0.46%
Ferrous Metals Jindal Steel & Power Limited 2.42%
Tata Steel Limited 0.42%AutoMahindra & Mahindra Limited 1.94%Maruti Suzuki India Limited 0.70%Textile ProductsK.P.R. Mill Limited 1.31%Page Industries Limited 0.40%Dollar Industries Limited 0.17%ConstructionGodrej Properties Limited 1.67%Telecom - ServicesBharti Airtel Limited 1.67%PesticidesPI Industries Limited 0.93%Sharda Cropchem Limited 0.42%RetailingTrent Limited 0.85%Avenue Supermarts Limited 0.40%InsuranceICICI Lombard General Insurance Company Limited 0.77%
SBI Life Insurance Company Limited 0.34%Industrial ProductsSupreme Industries Limited 1.02%ChemicalsAtul Limited 0.77%GasMahanagar Gas Limited 0.57%Industrial Capital GoodsApar Industries Limited 0.36%FertilisersChambal Fertilizers & Chemicals Limited 0.21%Healthcare ServicesApollo Hospitals Enterprise Limited 0.20% Indicates top ten instruments
All corporate ratings are assigned by rating agencies like CRISIL; CARE; ICRA; IND ,BWR.
TOP 10 SECTORSBanksSoftwareCement & Cement ProductsPharmaceuticalsConsumer Non DurablesFinancePetroleum ProductsConstruction ProjectFerrous MetalsAutoOthers
17.24%
10.47%
5.80%
5.80%
5.42%
5.08%
4.18%
3.40%
2.84%
2.64%
12.34%

23
Data as on March 31, 2021
Hybrid Arbitrage Fund
L&T ARBITRAGE OPPORTUNITIES FUND
To seek to generate reasonable returns by predominantly investing in arbitrage opportunities in the cash and derivatives segments of the equity markets and by investing balance in debt and money market instruments. There is no assurance that the investment objective of the scheme will be realized.
Aims to generate returns through fully hedged exposure to equities
Tax efficient, as tax treatment is similar to equity funds
Focus on generating ‘Market-Neutral’ returns
INVESTMENT OBJECTIVE
FUND DETAILS PORTFOLIO ALLOCATION
Date of Inception
Regular Plan Direct Plan
June 30, 2014 June 30, 2014
Portfolio Turnover
17.3569 times
Fund Manager
Mr. Venugopal Manghat (w.e.f June 30, 2014) & Mr. Praveen Ayathan (w.e.f June 30, 2014) for equity portion, Mr. Jalpan Shah (w.e.f January 24, 2019) for Debt Portion~
Benchmark
Nifty 50 Arbitrage Index
Month end AUM
3,494.07 (` In Crs)
Monthly Average AUM
3,472.12 (` In Crs)
Options
•Growth •IDCW Option 1. Monthly IDCW (Payout and Re-investment) 2. Quarterly IDCW (Payout and Re-investment)
~For investments in foreign securities - Mr. Alok Ranjan (w.e.f Oct 1, 2019)Exit Load:For redemption on or before 1 month from the date of allotment or Purchase applying First in First out basis - 0.50% of Applicable NAV. After 1 month from the date of allotment or Purchase applying First in First out basis NIL.For details of the performance of the schemes, please refer page nos 43 to 46.For product label please refer Page 3 of the factsheet.
Name of Instrument % to NetAssets
% to NetAssets
(hedged)EQUITY & EQUITY RELATEDListed/Awaiting Listing on the Stock ExchangesBanks
ICICI Bank Limited 4.65% 4.65% State Bank of India 2.39% 2.39%
Canara Bank 0.68% 0.68%Bank of Baroda 0.41% 0.41%City Union Bank Limited 0.22% 0.22%Axis Bank Limited 0.16% 0.16%IndusInd Bank Limited 0.12% 0.12%Bandhan Bank Limited 0.07% 0.07%Kotak Mahindra Bank Limited 0.03% 0.03%The Federal Bank Limited 0.01% 0.01%Consumer Non Durables
ITC Limited 4.43% 4.43%United Spirits Limited 0.73% 0.73%Asian Paints Limited 0.52% 0.52%Britannia Industries Limited 0.43% 0.43%Godrej Consumer Products Limited 0.34% 0.34%Colgate Palmolive (India) Limited 0.32% 0.32%Nestle India Limited 0.28% 0.28%Marico Limited 0.21% 0.21%Dabur India Limited 0.06% 0.06%Berger Paints India Limited 0.04% 0.04%Hindustan Unilever Limited 0.01% 0.01%Transportation
Adani Ports and Special Economic Zone Limited 5.51% 5.51%Indian Railway Catering & Tourism Corp Limited 0.80% 0.80%Container Corporation of India Limited 0.08% 0.08%Finance
Housing Development Finance Corporation Limited 4.01% 4.01%
Piramal Enterprises Limited 0.87% 0.87%Manappuram Finance Limited 0.30% 0.30%Shriram Transport Finance Company Limited 0.26% 0.26%Power Finance Corporation Limited 0.24% 0.24%Rec Limited 0.22% 0.22%Bajaj Finance Limited 0.04% 0.04%Petroleum Products
Bharat Petroleum Corporation Limited 2.74% 2.74%Indian Oil Corporation Limited 1.39% 1.39%Reliance Industries Limited 0.90% 0.90%Hindustan Petroleum Corporation Limited 0.49% 0.49%Telecom - Services
Bharti Airtel Limited 5.45% 5.45%Pharmaceuticals
Sun Pharmaceutical Industries Limited 1.68% 1.68%Dr. Reddy's Laboratories Limited 0.74% 0.74%Divi's Laboratories Limited 0.52% 0.52%Granules India Limited 0.34% 0.34%Torrent Pharmaceuticals Limited 0.22% 0.22%Cadila Healthcare Limited 0.21% 0.21%Lupin Limited 0.18% 0.18%Aurobindo Pharma Limited 0.04% 0.04%Glenmark Pharmaceuticals Limited 0.04% 0.04%Pfizer Limited 0.04% 0.04%Alembic Pharmaceuticals Limited 0.03% 0.03%Alkem Laboratories Limited 0.03% 0.03%Ferrous Metals
Tata Steel Limited 1.79% 1.79%Jindal Steel & Power Limited 1.02% 1.02%Steel Authority of India Limited 0.80% 0.80%JSW Steel Limited 0.08% 0.08%Power
Tata Power Company Limited 1.74% 1.74%NTPC Limited 1.11% 1.11%Power Grid Corporation of India Limited 0.40% 0.40%Non - Ferrous MetalsVedanta Limited 1.26% 1.26%National Aluminium Company Limited 0.73% 0.73%Hindalco Industries Limited 0.20% 0.20%SoftwareInfosys Limited 0.97% 0.97%Tata Consultancy Services Limited 0.53% 0.53%Larsen & Toubro Infotech Limited 0.27% 0.27%Tech Mahindra Limited 0.13% 0.13%HCL Technologies Limited 0.06% 0.06%Coforge Limited 0.02% 0.02%Wipro Limited 0.02% 0.02%MindTree Limited 0.01% 0.01%MphasiS Limited ^ ^ChemicalsTata Chemicals Limited 1.01% 1.01%SRF Limited 0.34% 0.34%Deepak Nitrite Limited 0.10% 0.10%Pidilite Industries Limited 0.04% 0.04%Navin Fluorine International Limited 0.02% 0.02%Aarti Industries Limited ^ ^EntertainmentZee Entertainment Enterprises Limited 0.83% 0.83%Sun TV Network Limited 0.57% 0.57%Cement & Cement ProductsACC Limited 0.61% 0.61%Grasim Industries Limited 0.43% 0.43%The Ramco Cements Limited 0.20% 0.20%Ambuja Cements Limited 0.08% 0.08%UltraTech Cement Limited 0.07% 0.07%InsuranceBajaj Finserv Limited 0.78% 0.78%ICICI Prudential Life Insurance Company Limited 0.18% 0.18%Max Financial Services Limited 0.07% 0.07%
Name of Instrument % to NetAssets
% to NetAssets
(hedged)SBI Life Insurance Company Limited 0.03% 0.03%ICICI Lombard General Insurance Company Limited 0.02% 0.02%
Minerals/MiningNMDC Limited 0.85% 0.85%Coal India Limited 0.22% 0.22%PesticidesUPL Limited 0.92% 0.92%PI Industries Limited 0.07% 0.07%GasPetronet LNG Limited 0.38% 0.38%GAIL India Limited 0.18% 0.18%Indraprastha Gas Limited 0.11% 0.11%Gujarat Gas Limited 0.03% 0.03%AutoMaruti Suzuki India Limited 0.20% 0.20%Bajaj Auto Limited 0.17% 0.17%Tata Motors Limited 0.10% 0.10%Ashok Leyland Limited 0.05% 0.05%Eicher Motors Limited 0.03% 0.03%Escorts Limited 0.02% 0.02%Mahindra & Mahindra Limited ^ ^Consumer DurablesBata India Limited 0.27% 0.27%Havells India Limited 0.17% 0.17%Voltas Limited 0.10% 0.10%Titan Company Limited 0.01% 0.01%Aerospace & DefenseBharat Electronics Limited 0.46% 0.46%Auto AncillariesMotherson Sumi Systems Limited 0.19% 0.19%MRF Limited 0.10% 0.10%Balkrishna Industries Limited 0.08% 0.08%Amara Raja Batteries Limited 0.03% 0.03%Apollo Tyres Limited 0.03% 0.03%RetailingInfo Edge (India) Limited 0.32% 0.32%Trent Limited 0.08% 0.08%Industrial Capital GoodsBharat Heavy Electricals Limited 0.30% 0.30%Siemens Limited 0.03% 0.03%Engineering ServicesL&T Technology Services Limited 0.26% 0.26%Healthcare ServicesApollo Hospitals Enterprise Limited 0.20% 0.20%Construction ProjectLarsen & Toubro Limited 0.14% 0.14%ConstructionDLF Limited 0.10% 0.10%Capital MarketsHDFC Asset Management Company Limited 0.04% 0.04%Textile ProductsPage Industries Limited 0.03% 0.03%Industrial ProductsBharat Forge Limited 0.03% 0.03%Telecom - Equipment & AccessoriesIndus Towers Limited 0.02% 0.02%OilOil & Natural Gas Corporation Limited ^ ^Total 66.32% 66.32%MONEY MARKET INSTRUMENTCertificate of Deposit/Commercial PaperNational Bank for Agriculture & Rural Development ICRA A1+ 1.39%
National Bank for Agriculture & Rural Development IND A1+ 0.71%
Axis Bank Limited CRISIL A1+ 0.70%Housing Development Finance Corporation Limited ICRA A1+ 0.70%
Total 3.50%Central Government Securities08.20% GOI 15-FEB-2022 SOVEREIGN 0.75%06.84% GOI 19-DEC-2022 SOVEREIGN 0.15%Total 0.90%Treasury Bill364 DAYS T-BILL 12-AUG-2021 SOVEREIGN 1.41%364 DAYS T-BILL 03-FEB-2022 SOVEREIGN 1.39%364 DAYS T-BILL 09-SEP-2021 SOVEREIGN 1.27%364 DAYS T-BILL 20-JAN-22 SOVEREIGN 0.69%364 DAYS T-BILL 13-JAN-2022 SOVEREIGN 0.56%Total 5.32%Investment Funds/Mutual FundsL&T Liquid Fund - Direct Plan - Growth Unrated 15.41%Total 15.41%OTHERSDeposits (placed as margins)(a) Fixed DepositsHDFC Bank Limited 3.24%Federal Bank Limited 0.15%Total 3.39%(b) Margin as Cash Margin 0.10%(c) Tri Party Repo Dealing System (TREPS) 3.17%(d) Net Receivables/(Payables) 1.89%Net Assets 100.00%Total number of holdings 123
Indicates top ten instruments^ Indicates less than 0.01%All corporate ratings are assigned by rating agencies like CRISIL; CARE; ICRA; IND,BWR.Total outstanding position (as at Mar 2021) in Derivative Instruments (Gross Notional) 232,855.94 lakhsTotal percentage of existing assets hedged through futures is 66.32%
TOP 10 SECTORS
Banks PharmaceuticalsConsumer Non Durables Ferrous MetalsTransportation PowerFinance Non - Ferrous MetalsPetroleum Products OthersTelecom - Services
8.74%
7.37%
6.39%
5.94%
5.52%
5.45%
4.07%
3.69%
3.25%
2.19%
13.71%

24
Data as on March 31, 2021
Equity Savings Fund
L&T EQUITY SAVINGS FUND
To generate regular income by predominantly investing in arbitrage opportunities in the cash and derivatives segments of the equity markets and debt and money market instruments and to generate long-term capital appreciation through unhedged exposure to equity and equity related instruments. There is no assurance that the invest-ment objective of the scheme will be realized.
INVESTMENT OBJECTIVE
PORTFOLIO ALLOCATION
Exit Load:If the units redeemed or switched out are upto 10% of the units purchased or switched in (“the limit”) within 1 year from the date of allotment – Nil. If units redeemed or switched out are over and above the limit within 1 year from the date of allotment – 1%. If units are redeemed or switched out on or after 1 year from the date of allotment – Nil.For details of the performance of the schemes, please refer page nos 43 to 46.For product label please refer Page 3 of the factsheet.
A Fund that allocates assets across equities and debt• Gross investment in equity (shares)
is 65%. Of this net equity levels are maintained between 15-45%
• 10-35% allocation to debt (bonds) and money market instruments
Aims to limit downside while generating returns through arbitrage investments
Aims to minimize portfolio risk by investing in quality companies, monitoring corporate fundamentals closely
A tax efficient product suitable for long-term investing
FUND DETAILS
Date of Inception
Regular Plan Direct Plan
October 18, 2011 January 01, 2013
Portfolio Turnover
4.5069 times
Fund Manager
Mr. Venugopal Manghat (w.e.f. Nov 24, 2012) & Mr. Vihang Naik (w.e.f. Dec 17, 2019), Mr. Praveen Ayathan (w.e.f. Jan 09, 2015) (for investments in equity and equity related instruments) & Mr. Jalpan Shah (w.e.f. May 30, 2016) (for investments in debt and debt related instruments)
Benchmark
NIFTY Equity Savings Index
Month end AUM
67.19 (` In Crs)
Monthly Average AUM
68.66 (` In Crs)
Options
•Growth •IDCW: 1. Monthly IDCW (Reinvestment and Payout) 2. Quarterly IDCW (Reinvestment and Payout)
Name of Instrument % to Net Assets
% to Net Assets
(hedged)
% to Net Assets
(unhedged)EQUITY & EQUITY RELATEDListed/Awaiting Listing on the Stock ExchangesBanks
HDFC Bank Limited 3.96% - 3.96%State Bank of India 3.51% - 3.51%ICICI Bank Limited 7.08% 5.24% 1.84%
FinanceCholamandalam Financial Holdings Limited 1.27% - 1.27%
Housing Development Finance Corporation Limited 5.96% 4.91% 1.05%
Cholamandalam Investment and Finance Company Limited 0.64% - 0.64%
SBI Cards and Payment Services Limited 0.03% - 0.03%
Indiabulls Housing Finance Limited 1.99% 1.99% -
SoftwareInfosys Limited 3.19% - 3.19%
HCL Technologies Limited 1.71% - 1.71%Persistent Systems Limited 1.10% - 1.10%Tata Consultancy Services Limited 0.64% - 0.64%
Oracle Financial Services Software Limited 0.30% - 0.30%
AutoMaruti Suzuki India Limited 1.00% - 1.00%V.S.T Tillers Tractors Limited 0.91% - 0.91%Hero MotoCorp Limited 0.25% - 0.25%
Bajaj Auto Limited 2.19% 2.19% - ChemicalsNavin Fluorine International Limited 0.62% - 0.62%
SRF Limited 1.91% 1.91% - Pidilite Industries Limited 1.75% 1.75% - Cement & Cement Products
Ambuja Cements Limited 1.93% - 1.93%Shree Cements Limited 1.01% - 1.01%The Ramco Cements Limited 0.49% - 0.49%Consumer Non DurablesEmami Limited 0.98% - 0.98%ITC Limited 0.95% - 0.95%Tata Consumer Products Limited 0.48% - 0.48%
Hindustan Unilever Limited 0.46% - 0.46%Avanti Feeds Limited 0.19% - 0.19%PowerPower Grid Corporation of India Limited 1.54% 1.54% -
Tata Power Company Limited 1.45% 1.45% - Petroleum Products
Reliance Industries Limited 2.09% - 2.09%Bharat Petroleum Corporation Limited 0.69% 0.69% -
ConstructionOberoi Realty Limited 1.13% - 1.13%Prestige Estates Projects Limited 0.86% - 0.86%Ahluwalia Contracts India Limited 0.71% - 0.71%
PharmaceuticalsSun Pharmaceutical Industries Limited 1.11% - 1.11%
IPCA Laboratories Limited 0.57% - 0.57%
Name of Instrument % to Net Assets
% to Net Assets
(hedged)
% to Net Assets
(unhedged)Cipla Limited 0.55% - 0.55%Divi's Laboratories Limited 0.33% - 0.33%Ferrous MetalsTata Steel Limited 1.16% - 1.16%Jindal Steel & Power Limited 1.02% - 1.02%Construction ProjectLarsen & Toubro Limited 1.37% - 1.37%Engineers India Limited 0.62% - 0.62%Industrial Capital GoodsBEML Limited 0.56% - 0.56%Indian Hume Pipe Company Limited 0.38% - 0.38%
Telecom - ServicesBharti Airtel Limited 0.81% - 0.81%Leisure ServicesThe Indian Hotels Company Limited 0.71% - 0.71%
Aerospace & DefenseBharat Electronics Limited 0.67% - 0.67%Industrial ProductsFinolex Cables Limited 0.61% - 0.61%Textile ProductsPage Industries Limited 0.52% - 0.52%PaperTamil Nadu Newsprint & Papers Limited 0.50% - 0.50%
TransportationAdani Ports and Special Economic Zone Limited 0.26% 0.26% -
GasGAIL India Limited 0.23% - 0.23%Total 66.95% 21.93% 45.02%Name of Instrument Rating
Industry% to Net
AssetsPREFERENCE SHARESListed / Awaiting listing on Stock ExchangesEntertainmentZee Entertainment Enterprises Limited 0.01%Total 0.01%BONDS & NCDsListed / awaiting listing on the stock exchangesAmba River Coke Limited (Subsidiary of JSW Steel Ltd) CARE AA- 2.88%
Total 2.88%Zero Coupon Bonds - CorporateListed / awaiting listing on the stock exchangesAditya Birla Housing Finance Limited ICRA AAA 1.33%Total 1.33%Central Government Securities07.32% GOI 28-JAN-2024 SOVEREIGN 8.00%Total 8.00%OTHERSInvestment Funds/Mutual FundsL&T Liquid Fund - Direct Plan - Growth Unrated 2.98%Total 2.98%(b) Margin as Cash Margin 0.30%(c) Tri Party Repo Dealing System (TREPS) 18.09%(d) Net Receivables/(Payables) -0.54%Net Assets 100.00%Total number of holdings 54
Indicates top ten instrumentsAll corporate ratings are assigned by rating agencies like CRISIL; CARE; ICRA; IND, BWR.Total outstanding position (as at Mar, 2021) in Derivative Instruments (Gross Notional) 1,482.45 lakhsTotal percentage of existing assets hedged through futures is 21.93%
TOP 10 SECTORSBanksFinanceSoftwareAutoChemicalsCement & Cement ProductsConsumer Non DurablesPowerPetroleum ProductsConstructionOthers
14.55%
9.89%
6.94%
4.35%
4.28%
3.43%
3.06%
2.99%
2.78%
2.70%
11.99%

5.75%
Mutual Fund investments are subject to market risks, read all scheme related documents carefully.
EQUITY FUND SNAPSHOTData as on March 31, 2021
7.70%4.12% 10.70%
0.45%0.16% 6.46%4.09% 0.31% 0.50% 2.74% 11.54% 0.59% 0.30% 0.23% 5.54%
12.91% 11.67% 0.93%
3.11%
Portfolio at a Glance Portfolio at a Glance
Large Cap
Mid Cap
Small Cap
Hedged
Cash
Name of
the Fund
Benchmark
Fund Category
Month end AUM
(Rs in Crs)
Inception Date
(Regular Plan)
Growth of `1 Lac
invested at inception
Top 10 equity holding%
Standard Deviation
R-Squared
Beta
Sharpe Ratio
Total Expense Ratio^
Top 10 sector
L&T Flexicap L&T India Large L&T Midcap L&T Emerging L&T Large and L&T India
Fund Cap Fund Fund Businesses Fund Midcap Fund Value Fund
S&P BSE-500 S&P BSE 100 Nifty Midcap S&P BSE Small Cap NIFTY LargeMidcap S&P BSE 200
TRI Index TRI Index 100 TRI Index TRI Index 250 TRI Index
Flexi Cap Large Cap Mid Cap Small Cap Large and Midcap Value
2,610.56 626.19 6,428.48 5,774.04 1,278.90 6,741.24
May 16, 2005 Oct 23, 2007 Aug 09, 2004 May 12, 2014 May 22, 2006 Jan 08, 2010
`10,00,570 `3,42,910 `17,52,600 `3,02,350 `5,76,590 `4,56,630
43.66% 53.86% 32.97% 27.98% 39.25% 48.59%
L&T Infrastructure L&T Business L&T Tax L&T Focused L&T Balanced L&T Hybrid L&T Equity
Fund Cycles Fund Advantage Fund Equity Fund Advantage Fund Equity Fund Savings Fund
Nifty Infrastructure S&P BSE 200 S&P BSE 200 Nifty 500 50% - S&P BSE-200 CRISIL Hybrid 35+65 NIFTY Equity Savings
TRI Index TRI Index TRI Index TRI Index TRI Index and 50% - Aggressive Index Index
CRISIL Short Term
Bond Fund Index
Sectoral Thematic ELSS Focused Dynamic Asset Aggressive Hybrid Equity Savings
Allocation Fund
1,230.03 525.48 3,407.09 858.05 1,581.84 5,385.96 67.19
Sept 27, 2007 Aug 20, 2014 Feb 27, 2006 Nov 5, 2018 Feb 07, 2011 Feb 07, 2011 Oct 18, 2011
`1,81,700 `1,90,240 `6,72,500 `1,39,290 `2,87,980 `3,21,740 `2,05,990
51.67% 48.10% 32.44% 47.84% 12.55%$ 39.46% 22.03%#
22.05% 21.33% 24.26% 27.84% 22.27% 25.21%
0.97 0.98 0.96 0.97 0.93 0.96
0.95 0.96 0.82 0.91 0.89 1.11
0.21 0.38 0.20 0.04 0.14 0.21
2.10% 2.54% 1.89% 1.95% 2.28% 1.89%
26.22% 27.58% 22.90% - - 16.84% -
0.86 0.88 0.96 - - 0.98 -
1.01 1.16 1.00 - - 1.14 -
-0.04 0.08 0.19 - - 0.29 -
2.27% 2.55% 2.00% 2.42% 2.11% 1.89% 1.57%
$Net Equity for Balanced Advantage Fund is 26.05%.#Net Equity for Equity Savings Fund is 45.02%.^Note: Expense ratio is for regular plan as on 31st March 2021.
DisclaimersThe document indicates the strategy/ investment approach currently followed by the schemes and the same may change in future depending on market conditions and other factors.Past performance may or may not be sustained in future and should not be used as a basis for comparison with other investments. For performance refer page 39-40 and 43-46 of the factsheet while reading this document.
Exit Load
If the units redeemed or switched out are upto 10% of the units purchased or switched in (“the limit”) within 1 year from the date of allotment – Nil. If units redeemed or switched out are over and above the limit
within 1 year from the date of allotment – 1%. If units are redeemed or switched out on or after 1 year from the date of allotment – Nil. (L&T Flexicap Fund, L&T Emerging Businesses Fund, L&T Large and Midcap
Fund, L&T Focused Equity Fund, L&T India Large Cap Fund, L&T Midcap Fund, L&T India Value Fund, L&T Infrastructure Fund, L&T Business Cycles Fund, L&T Balanced Advantage Fund, L&T Hybrid Equity Fund & L&T
Equity Savings Fund).
CL08060
9.61%10.57%
41.87%
54.66%24.79%
17.44%
29.66%21.93%
33.05%58.88%37.88%
35.98%
35.85%
27.87%
58.84%
29.03%
47.58%24.11%
28.08%
31.67%
68.02%
4.81%
4.83%
4.89%
5.38%
6.21%
6.62%
7.39%
7.76%
15.42%
18.11%
Industrial
Products
Auto
Petroleum
Products
Ferrous
Metals
Cement &
Cement Products
Consumer
Non Durables
Pharmaceuticals
Finance
Software
Banks
3.57%
3.87%
5.43%
5.96%
6.47%
7.28%
7.28%
7.53%
14.49%
24.33%
Insurance
Ferrous
Metals
Auto
Pharmaceuticals
Cement &
Cement Products
Finance
Consumer
Non Durables
Petroleum
Products
Software
Banks
3.44%
3.86%
4.10%
4.60%
6.95%
7.58%
8.88%
9.71%
9.82%
9.97%
Pesticides
Construction
Healthcare
Services
Ferrous
Metals
Chemicals
Industrial
Products
Finance
Software
Consumer
Non Durables
Pharmaceuticals
4.45%
4.86%
5.04%
6.14%
6.37%
8.99%
9.07%
9.12%
9.14%
14.28%
Industrial
Capital Goods
Pharmaceuticals
Construction
TextileTT
Products
Auto
Ancillaries
Consumer
Durables
Software
Chemicals
Consumer
Non Durables
Industrial
Products
3.32%
3.46%
4.05%
4.11%
5.07%
6.79%
8.40%
11.72%
11.86%
16.58%
Ferrous
Metals
Leisure
Services
Petroleum
Products
Finance
Cement &
Cement Products
Industrial
Products
Pharmaceuticals
Banks
Consumer
Non Durables
Software
4.64%
4.81%
5.40%
5.63%
5.80%
6.21%
6.33%
7.21%
16.30%
20.01%
Ferrous
Metals
Consumer
Non Durables
Pharmaceuticals
Auto
Finance
Chemicals
Petroleum
Products
Cement &
Cement Products
Software
Banks
2.56%
3.00%
3.20%
5.20%
5.39%
6.16%
13.73%
16.18%
16.33%
21.49%
TransportationTT
Aerospace &
Defense
Power
Construction
Petroleum
Products
Telecom -
Services
Construction
Project
Industrial
Capital Goods
Industrial
Products
Cement &
Cement Products
4.42%
5.69%
5.76%
5.87%
7.39%
7.40%
7.64%
8.49%
12.91%
19.53%
Industrial
Capital Goods
Consumer
Durables
Auto
Petroleum
Products
Ferrous
Metals
Construction
Chemicals
Industrial
Products
Cement &
Cement Products
Banks
2.92%
3.63%
4.36%
4.54%
4.82%
8.56%
9.10%
10.91%
11.44%
11.69%
Ferrous
Metals
Auto
Ancillaries
Construction
Project
Finance
Insurance
Cement &
Cement Products
Pharmaceuticals
Consumer
Non Durables
Software
Banks
3.78%
4.10%
4.12%
4.80%
4.84%
5.80%
6.36%
7.38%
9.13%
22.61%
Finance
Construction
Project
Pesticides
Auto
Petroleum
Products
Cement &
Cement Products
TransportationTT
Consumer
Non Durables
Pharmaceuticals
Software
2.62%
3.56%
3.72%
4.10%
5.33%
5.42%
5.81%
6.70%
6.97%
10.81%
Entertainment
Ferrous
Metals
Auto
Pharmaceuticals
Telecom -
Services
Petroleum
Products
TransportationTT
Software
Consumer
Non Durables
Banks
2.64%
2.84%
3.40%
4.18%
5.08%
5.42%
5.80%
5.80%
10.47%
17.24%
Auto
Ferrous
Metals
Construction
Project
Petroleum
Products
Finance
Consumer
Non Durables
Pharmaceuticals
Cement &
Cement Products
Software
Banks
2.70%
2.78%
2.99%
3.06%
3.43%
4.28%
4.35%
6.94%
9.89%
14.55%
Construction
Petroleum
Products
Power
Consumer
Non Durables
Cement &
Cement Products
Chemicals
Auto
Software
Finance
Banks
71.16%
17.02%
88.69% 72.26%
17.19%
62.07%
21.82%
22.32%
53.10% 2.98%
32.08%
22.14%

Mutual Fund investments are subject to market risks, read all scheme related documents carefully.
DEBT FUND SNAPSHOT
Data as on March 31, 2021
Rating Profile Rating Profile
Asset Allocation Profile Asset Allocation Profile
A
A+
A-
AA+
AA
AA-
A1+
AAA
SOV
Cash & Equivalent
NAME OFTHE FUND
Benchmark
Fund Category
Month end AUM(Rs in Crs)
Inception Date(Regular Plan)
Minimum Investment Horizon
Total Expense Ratio+^
L&T Liquid L&T Ultra L&T Money L&T Low L&T Short Term L&T Resurgent Fund Short Term Fund Market Fund Duration Fund Bond Fund India Bond Fund
NIFTY Liquid Index NIFTY Ultra Short NIFTY Money Market NIFTY Low Duration NIFTY Short Duration CRISIL Medium Term Duration Debt Index Index Debt Index Debt Index Debt Index
Liquid Ultra Short Term Duration Money Market Low duration Short duration Medium duration
6,766.02 2,207.56 1,065.84 999.81 5,450.24 739.85
October 03, 2006 April 10, 2003 August 10, 2005 December 04, 2010 December 27, 2011 February 02, 2015
1 day + 1 Month + 1 Month + 3 Months + 6 Months + 2 Years +
0.20% 0.39% 0.73% 0.95% 0.75% 1.51%
L&T Flexi Bond L&T Credit Risk L&T Triple Ace L&T Banking and L&T Gilt Fund L&T ConservativeFund Fund Bond Fund PSU Debt Fund Hybrid Fund
CRISIL Dynamic Debt CRISIL Composite CRISIL Corporate NIFTY Banking & PSU CRISIL Dynamic CRISIL Hybrid 85+15 -Index Credit Risk Index Bond Composite Index Debt Index Gilt Index Conservative Index
Dynamic Bond Credit Risk Corporate Bond Banking & PSU Gilt Conservative Hybrid
65.63 227.32 6,974.22 4,840.13 262.45 36.32
September 27, 2010 October 08, 2009 March 31, 1997 September 12, 2012 March 29, 2000 July 31, 2003
1 Year + / Tactical 1 Year + 1 Year + 3 Months + 1 Year + / Tactical -
1.62% 1.66% 0.63% 0.61% 1.70% 2.24%
+Effective April 01, 2019 Total Expense Ratio (TER) stands revised. For the actual current expenses charged to the scheme, please refer the website of the Mutual Fund - www.ltfs.com^Note: Expense ratio is for regular plan as on 31st March 2021.
Disclaimers
The document indicates the strategy / investment approach currently followed by the schemes and the same may change in future depending on market conditions and other factors. Refer factsheet while reading this document.
Exit Load• For redemption within 1 year from the date of allotment or Purchase applying First in First out basis – 0.50% of Applicable NAV. For redemption After 1 year from the date of
allotment or Purchase applying First in First out basis - Nil (L&T Flexi Bond Fund)• If the amount sought to be redeemed or switched out on or before 30 days from the date of allotment: 0.50%. If the amount sought to be redeemed or switched out is invested
for a period of more than 30 days from the date of allotment: Nil (w.e.f. March 22, 2021) (L&T Triple Ace Bond Fund)• If the units redeemed or switched out are upto 10% of the units purchased or switched in (“the limit”) within 1 year from the date of allotment – Nil. If units redeemed or
switched out are over and above the limit within 1 year from the date of allotment – 1%. If units are redeemed or switched out on or after 1 year from the date of allotment – Nil. (L&T Credit Risk Fund & L&T Conservative Hybrid Fund)
• Nil (L&T Ultra Short Term Fund, L&T Money Market Fund, L&T Banking and PSU Debt Fund, L&T Short Term Bond Fund, L&T Gilt Fund & L&T Low Duration Fund)• For redemption on or before 90 days from the date of allotment or Purchase applying First in First out basis – 1% of the applicable NAV. For redemption after 90 days from the
date of allotment or Purchase applying First in First out basis - Nil (w.e.f July 9, 2020) (L&T Resurgent India Bond Fund)• Effective October 20, 2019, exit load will be applicable on all fresh investments in L&T Liquid Fund
CL08060
Treasury Bill
Securitised Debt
Government Bond
NCD
Money Market Instrument
NR/NP
TREPS Reverse Repo
Equity & Equity Related
Units redeemed / switched-out within “X” days from the date of allotment
Day 1 Day 2 Day 3 Day 4 Day 5 Day 6 Day 7 onwards
Exit Load (as a % of redemption proceeds) 0.0070% 0.0065% 0.0060% 0.0055% 0.0050% 0.0045% Nil
2.17%
1.77%
39.17%
56.89%
17.37%
34.10%
45.60%
2.93%
27.95%
63.76%
8.29%
4.93%
7.00%
52.44%
10.88%
4.40%
20.35%
4.47%
42.68%
40.47%
12.38%
50.22%
19.03%
12.97%
3.27%
7.66%
6.85%
40.00%
60.00%4.77%
17.39%
12.52%
36.63%
23.31%
5.38%
66.42%
6.30%
27.28%
6.79%
19.70%
70.37%
3.14%
75.17%
24.83%
17.39%
12.16%
19.88%
50.57%
EQUITY & EQUITY
RELATED
2.17%
56.90%
39.17%
1.64%
0.13%
23.98%
45.59%
10.13%
17.36%
14.08%
-11.15% -9.30%
17.59%
63.76%
27.95% 12.37%
5.36%
7.98%
58.48%
4.93%
-15.71%
26.59%
4.47%
16.30%
-3.92%
42.68%
38.33%
2.09%
-3.52%
12.97%
11.18%
6.75%
72.62%
0.13%
39.87%
60.00% 60.13%
17.28%
9.96%
0.11%
12.52%
-9.69%
27.28%
15.99%
66.40%
0.01%
19.70%
4.02%
6.78%
69.48%
-0.12%
24.95%
75.17%
12.16%
50.57%
19.89%
17.38%

25
Data as on March 31, 2021
Overnight Fund
L&T OVERNIGHT FUND (Formerly known as L&T Cash Fund)^
The investment objective of the Scheme is to generate regular returns in line with the overnight rates. There is no assurance that the investment objective of the scheme will be realized.
INVESTMENT OBJECTIVE
FUND DETAILS PORTFOLIO ALLOCATION
Date of Inception
Regular Plan November 27, 2006
Direct Plan January 01, 2013
Fund Manager
Mr. Jalpan Shah (w.e.f. May 30, 2016) and Mr. Shriram Ramanathan (w.e.f. April 03, 2017)
Benchmark
CRISIL Overnight Index
Month end AUM
941.68 (` In Crs)
Monthly Average AUM
1,395.23 (` In Crs)
Options
•Growth •IDCW option (Reinvestment and Payout)
Name of Instrument Rating/Industry
% to Net Assets
DEBT INSTRUMENTS
OthersTri Party Repo Dealing System (TREPS)/Reverse Repo
99.66%
Net Receivable/Payable 0.34%Net Assets 100.00%
Name of Instrument Rating/Industry
% to Net Assets
Average Maturity: Since the fund invests in overnight securities average maturity is taken as 1 day.Modified Duration 0.01 yearsMacaulay Duration 0.01 yearsYTM 3.40%
Exit Load: NilFor details of the performance of the schemes, please refer page nos 43 to 46.^The name of the Scheme is changed to L&T Overnight Fund from L&T Cash Fund with effect from February 1, 2020 (‘effective date’).For product label please refer Page 3 of the factsheet.
TREPS/Rev Repo/NR/NP
% RATING PROFILE % ASSET ALLOCATION PROFILE
100.00%0.34%
99.66%
TREPS / Rev Repo/NR/NP
100.00%
0%
20%
40%
60%
80%
100%
120%
% MATURITY PROFILE
TREPS / Reverse Repo
Net Receivables / (Payables)

26
Data as on March 31, 2021
A1+/ A1+(SO)
AAA/ AAA(CE)/ AAA(SO)
Sovereign
TREPS/Rev Repo/NR/NP
% RATING PROFILE % ASSET ALLOCATION PROFILE
2.17%
39.17%
1.77%
56.89%56.90%
39.17%
0.13%
1.64%
2.17%
98.23%
1.77%
0%
20%
40%
60%
80%
100%
0 - 3 months TREPS / Rev Repo/NR/NP
% MATURITY PROFILE
L&T LIQUID FUND
The investment objective of the Scheme is to generate regular returns in line with the overnight rates.
INVESTMENT OBJECTIVE
FUND DETAILS PORTFOLIO ALLOCATION
Date of Inception
Regular Plan October 03, 2006
Direct Plan December 31, 2012
Fund Manager
Mr Shriram Ramanathan and Mr. Jalpan Shah (w.e.f. June 30, 2014)
Benchmark
NIFTY Liquid Index
Month end AUM
6,766.02 (` In Crs)
Monthly Average AUM
7,437.16 (` In Crs)
Options
•Growth •IDCW (Reinvestment and Payout) - Weekly IDCW •Daily IDCW Reinvestment Plan
To generate reasonable returns while maintaining safety and providing the investor superior liquidity. To achieve this objective, investments will be predominantly made in a well-diversified and highly liquid portfolio of money market instruments, government securities and corporate debt. There is no assurance that the investment objective of the scheme will be realized.
INVESTMENT OBJECTIVE
FUND DETAILS PORTFOLIO ALLOCATION
Exit Load: Effective October 20, 2019, exit load will be applicable on all fresh investments in L&T Liquid Fund
For details of the performance of the schemes, please refer page nos 43 to 46.For product label please refer Page 3 of the factsheet.
Units redeemed / switched-out within “X” days from the date of allotment
Day 1 Day 2 Day 3 Day 4 Day 5 Day 6 Day 7 onwards
Exit Load (as a % of redemption proceeds) 0.0070% 0.0065% 0.0060% 0.0055% 0.0050% 0.0045% Nil
Liquid Fund
Name of Instrument Rating/Industry
% to Net Assets
DEBT INSTRUMENTSMONEY MARKET INSTRUMENTS Commercial Paper (Listed / Awaiting listing on Stock Exchanges) /Certificate of Deposit
National Bank for Agriculture & Rural Development
ICRA A1+/IND A1+ 8.69%
Reliance Industries Limited CRISIL A1+ 6.64%Export Import Bank of India CRISIL A1+ 5.15% Indian Oil Corporation Limited ICRA A1+ 4.80%Tata Power Company Limited CRISIL A1+ 4.43%Power Grid Corporation of
India Limited CRISIL A1+ 4.41%
ICICI Securities Limited CRISIL A1+ 3.68%Bank Of Baroda IND A1+ 3.67%Axis Bank Limited CRISIL A1+ 3.31%HDFC Securities Limited CRISIL A1+ 2.94%Jamnagar Utilities and Power Pvt Limited CRISIL A1+ 2.94%
Small Industries Development Bank of India IND A1+ 2.94%
NTPC Limited ICRA A1+ 2.20%Kotak Securities Limited CRISIL A1+ 1.10%Total 56.90%Non Convertible DebenturesListed/Awaiting Listing on the ExchangeTata Capital Financial Services Limited
CRISIL AAA 0.87%
Mahindra & Mahindra Financial Services Limited
IND AAA 0.80%
Name of Instrument Rating/Industry
% to Net Assets
Kotak Mahindra Investments Limited
CRISIL AAA 0.50%
Total 2.17%Treasury Bill
364 DAYS T-BILL 27-MAY-21 SOVEREIGN 7.35%364 DAYS T-BILL 22-APR-21 SOVEREIGN 4.43%91 DAYS T-BILL 03-JUN-21 SOVEREIGN 4.41%182 DAYS T-BILL 29-APR-21 SOVEREIGN 4.28%
364 DAYS T-BILL 29-APR-21 SOVEREIGN 3.69%
364 DAYS T-BILL 13-MAY-21 SOVEREIGN 3.68%
91 DAYS T-BILL 06-MAY-2021 SOVEREIGN 3.68%
91 DAYS T-BILL 29-APR-21 SOVEREIGN 2.95%
364 DAYS T-BILL 10-Jun-2021 SOVEREIGN 2.50%
364 DAYS T-BILL 03-Jun-2021 SOVEREIGN 2.20%
Total 39.17%OthersTri Party Repo Dealing System (TREPS)/Reverse Repo 1.64%
Net Receivable/Payable 0.13%
Net Assets 100.00%
Average Maturity 0.12 years
Modified Duration 0.12 years
Macaulay Duration 0.12 years
YTM 3.32%
Indicates top ten instruments
As on March 31, 2021, the aggregate investments by the schemes of L&T Mutual Fund into L&T Liquid Fund is Rs. 62,148.21 Lakhs
Money Market Instrument
Non Convertible Debentures
Treasury Bill
TREPS / Reverse Repo
Net Receivables / (Payables)

27
Data as on March 31, 2021
Ultra Short Term Duration Fund
L&T ULTRA SHORT TERM FUND
To generate reasonable and stable income and provide liquidity to the unit holder. To achieve this objective the scheme will invest predominantly in a well diversified and highly liquid portfolio of money market instruments, government securities and corporate debt. The scheme will not invest in equities or equity related instruments. There is no assurance that the investment objective of the scheme will be realized.
INVESTMENT OBJECTIVE
FUND DETAILS PORTFOLIO ALLOCATION
A1+/ A1+(SO)
AAA/ AAA(SO)/ AAA(CE)
Sovereign
TREPS/Rev Repo/NR/NP
Date of Inception
Regular Plan April 10, 2003
Direct Plan January 01, 2013
Fund Manager
Mr. Jalpan Shah (w.e.f June 30, 2014) & Mr. Shriram Ramanathan (w.e.f March 21, 2020)
Benchmark
NIFTY Ultra Short Duration Debt Index
Month end AUM
2,207.56 (` In Crs)
Monthly Average AUM
2,111.71 (` In Crs)
Options
•Growth •IDCW (Reinvestment and Payout) 1. Weekly IDCW 2. Monthly IDCW 3. Semi- annual IDCW •Daily IDCW Reinvestment Plan
Exit Load: NilFor details of the performance of the schemes, please refer page nos 43 to 46.For product label please refer Page 3 of the factsheet.
% RATING PROFILE % ASSET ALLOCATION PROFILE
2.93%
45.60%
17.37%
34.10%
23.98%
45.59%
17.36%
14.08%
-11.15%
10.13%
29.73%
19.93%
47.41%
2.93%
0%
10%
20%
30%
40%
50%
0- 3 Months 3- 6 Months 6 Months -
1 Year
TREPS / Rev
Repo/NR/NP
% MATURITY PROFILE
Name of Instrument Rating/Industry
% to Net Assets
DEBT INSTRUMENTSMONEY MARKET INSTRUMENTS Commercial Paper (Listed / Awaiting listing on Stock Exchanges) /Certificate of Deposit
Housing Development Finance Corporation Limited ICRA A1+ 8.90%
National Bank for Agriculture & Rural Development IND A1+ 8.77%
Axis Bank Limited CRISIL A1+ 7.75%
Bank of Baroda IND A1+ 4.51%
LIC Housing Finance Limited CRISIL A1+ 4.50%
NTPC Limited ICRA A1+ 4.47%
Reliance Industries Limited CRISIL A1+ 3.38%
Kotak Mahindra Bank Limited CRISIL A1+ 2.19%
Bajaj Finance Limited CRISIL A1+ 1.12%
Total 45.59%
GOVERNMENT BONDS
08.79% GOI 8-NOV-2021 SOVEREIGN 14.48%
08.20% GOI 15-FEB-2022 SOVEREIGN 9.50%
Total 23.98%
Name of Instrument Rating/Industry
% to Net Assets
Listed/Awaiting Listing on the ExchangeNon Convertible Debentures
Small Industries Development Bank of India CARE AAA 6.56%
National Highways Authority of India CRISIL AAA 4.72%
Kotak Mahindra Prime Limited CRISIL AAA 3.65%
Reliance Industries Limited CRISIL AAA 2.43%
Total 17.36%
Treasury Bill
91 DAYS T-BILL 11-JUN-21 SOVEREIGN 10.13%
Total 10.13%
OthersTri Party Repo Dealing System (TREPS)/Reverse Repo 14.08%
Net Receivable/Payable -11.15%
Net Assets 100.00%
Average Maturity 0.48 years
Modified Duration 0.47 years
Macaulay Duration 0.48 years
YTM 3.63%
Indicates top ten instruments
Money Market Instrument
Non Convertible Debentures
Government Bonds
Treasury Bill
TREPS / Reverse Repo
Net Receivables / (Payables)

28
Data as on March 31, 2021L&T MONEY MARKET FUND
The investment objective of the Scheme is to generate regular returns in line with the overnight rates.
INVESTMENT OBJECTIVE
FUND DETAILS PORTFOLIO ALLOCATION
A1+/ A1+(SO)
Sovereign
TREPS/Rev Repo/NR/NP
Exit Load: NilFor details of the performance of the schemes, please refer page nos 43 to 46.For product label please refer Page 3 of the factsheet.
% RATING PROFILE % ASSET ALLOCATION PROFILE
8.29%
63.76%
27.95%
-9.30%
63.76%
17.59%
27.95%
68.52%
18.61%
4.58% 8.29%
0%
20%
40%
60%
80%
0- 3
Months
3- 6
Months
6 Months -
1Year
TREPS / Rev
Repo/NR/NP
To generate regular income through investment in a portfolio comprising substantially of money market instruments. There is no assurance that the investment objective of the scheme will be realized.
INVESTMENT OBJECTIVE
% ASSET ALLOCATION PROFILE
% MATURITY PROFILE
Money Market Fund
Date of Inception
Regular Plan August 10, 2005
Direct Plan January 01, 2013
Fund Manager
Mr. Jalpan Shah (w.e.f April 03, 2017) & Mr. Shriram Ramanathan (w.e.f March 21, 2020)
Benchmark
NIFTY Money Market Index
Month end AUM
1,065.84 (` In Crs)
Monthly Average AUM
821.16 (` In Crs)
Options
•Growth •IDCW 1. Daily IDCW (Payout) 2. Weekly IDCW (Payout) 3. Monthly IDCW (Re-investment and Payout)
Name of Instrument Rating/Industry
% to Net Assets
DEBT INSTRUMENTSMONEY MARKET INSTRUMENTS Commercial Paper (Listed / Awaiting listing on Stock Exchanges) /Certificate of Deposit
Reliance Industries Limited CRISIL A1+ 6.99%National Bank for Agriculture &
Rural Development IND A1+ 6.99%
Export Import Bank of India CRISIL A1+ 6.98%Sun Pharmaceuticals Industries
Limited CRISIL A1+ 4.66%
LIC Housing Finance Limited CRISIL A1+ 4.66%
Axis Bank Limited CRISIL A1+/ICRA A1+ 4.66%
HDFC Securities Limited CRISIL A1+ 4.65%
Bajaj Housing Finance Limited CRISIL A1+ 4.58%
IndusInd Bank Limited CRISIL A1+ 3.26%
Indus Towers Limited ICRA A1+ 2.34%Bahadur Chand Investments Private Limited ICRA A1+ 2.34%
Network18 Media & Investments Limited IND A1+ 2.33%
Kotak Securities Limited CRISIL A1+ 2.33%Housing Development Finance Corporation Limited ICRA A1+ 2.33%
Bank Of Baroda IND A1+ 2.33%
Name of Instrument Rating/Industry
% to Net Assets
Bajaj Finance Limited CRISIL A1+ 2.33%
Total 63.76%
Treasury Bill364 DAYS T-BILL 01-JUL-21 SOVEREIGN 9.31%364 DAYS T-BILL 7-MAY-21 SOVEREIGN 7.02%182 DAYS T-BILL 01-JUL-21 SOVEREIGN 4.65%
364 DAYS T-BILL 05-AUG-2021 SOVEREIGN 4.64%
364 DAYS T-BILL 17-JUN-21 SOVEREIGN 2.33%
Total 27.95%
OthersTri Party Repo Dealing System (TREPS)/Reverse Repo 17.59%
Net Receivable/Payable -9.30%
Net Assets 100.00%
Average Maturity 0.21 years
Modified Duration 0.21 years
Macaulay Duration 0.22 years
YTM 3.43%
Indicates top ten instruments
Money Market Instrument
Treasury Bill
TREPS / Reverse Repo
Net Receivables / (Payables)

29
Data as on March 31, 2021
Banking & PSU Fund
L&T BANKING AND PSU DEBT FUND
To generate reasonable returns by primarily investing in debt and money market securities that are issued by Banks, Public Sector Undertakings (PSUs) and Public Financial Institutions (PFIs) in India. There is no assurance that the investment objective of the scheme will be realized.
INVESTMENT OBJECTIVE
FUND DETAILS PORTFOLIO ALLOCATION
Date of Inception
Regular Plan September 12, 2012
Direct Plan January 01, 2013
Fund Manager
Mr. Jalpan Shah (w.e.f. May 30, 2016) & Mr. Shriram Ramanathan (w.e.f. March 29, 2017)
Benchmark
NIFTY Banking & PSU Debt Index
Month end AUM
4,840.13 (` In Crs)
Monthly Average AUM
4,994.85 (` In Crs)
Options
•Growth •IDCW option (Reinvestment and Payout)
Exit Load: NilFor details of the performance of the schemes, please refer page nos 43 to 46.For product label please refer Page 3 of the factsheet.
% RATING PROFILE % ASSET ALLOCATION PROFILE
3.14%
19.70%
70.37%
6.79%
19.70%
4.02%6.78%
69.48%
0.01%
12.87%
69.22%
10.55%0.57% 6.79%
0%10%20%30%40%50%60%70%80%
1 - 2 Years 2 - 3 Years 3 - 5 Years Greater than5 years
TREPS / RevRepo/NR/NP
% MATURITY PROFILE
Name of Instrument Rating/Industry
% to Net Assets
DEBT INSTRUMENTS
Money Market InstrumentCommercial Paper (Listed / Awaiting listing on Stock Exchanges)/Certificate of DepositExport Import Bank of India CRISIL AAA 4.02%
Total 4.02%
GOVERNMENT BONDS
07.32% GOI 28-JAN-2024 SOVEREIGN 10.88%06.18% GOI 04-NOV-2024 SOVEREIGN 8.71%
07.35% GOI 22-JUN-2024 SOVEREIGN 0.11%
Total 19.70%Non Convertible DebenturesListed/Awaiting Listing on the Exchange
National Bank for Agriculture & Rural Development
CRISIL AAA/ICRA AAA 9.68%
Hindustan Petroleum Corporation Limited CRISIL AAA 7.73%
Housing Development Finance Corporation Limited CRISIL AAA 7.62%
National Housing Bank CRISIL AAA 7.10%NTPC Limited CRISIL AAA 7.04%
Indian Oil Corporation Limited CRISIL AAA 5.84%Power Grid Corporation of India
Limited CRISIL AAA 4.87% Indian Railway Finance
Corporation Limited CRISIL AAA 4.70%
Power Finance Corporation Limited CRISIL AAA 4.33%
State Bank Of India (Basel III Compliant AT 1 Bond) CRISIL AA+ 2.90%
Name of Instrument Rating/Industry
% to Net Assets
Rec Limited CRISIL AAA 2.15%
Export Import Bank of India CRISIL AAA 1.69%Housing and Urban Development Corporation Limited
CARE AAA 1.21%
Small Industries Development Bank of India ICRA AAA 1.07%
State Bank Of India (Basel III Compliant Tier 2 Bond) CRISIL AAA 0.57%
National Highways Authority of India CRISIL AAA 0.55%
HDFC Bank Limited (Basel III Compliant AT 1 Bond) CRISIL AA+ 0.23%
NHPC Limited IND AAA 0.12%Nuclear Power Corporation Of India Limited CRISIL AAA 0.08%
Total 69.48%
OthersTri Party Repo Dealing System (TREPS)/Reverse Repo 6.78%
Net Receivable/Payable 0.01%
Net Assets 100.00%
Average Maturity 2.26 years
Modified Duration 2.00 years
Macaulay Duration 2.09 years
YTM 5.05%
Indicates top ten instruments
AA+/ AA+(SO)/ AA+(CE)
AAA/ AAA(SO)/ AAA(CE)
Sovereign
TREPS/Rev Repo/NR/NP
Money Market Instruments
Government Bonds
Non Convertible Debentures
TREPS / Reverse Repo
Net Receivables / (Payables)
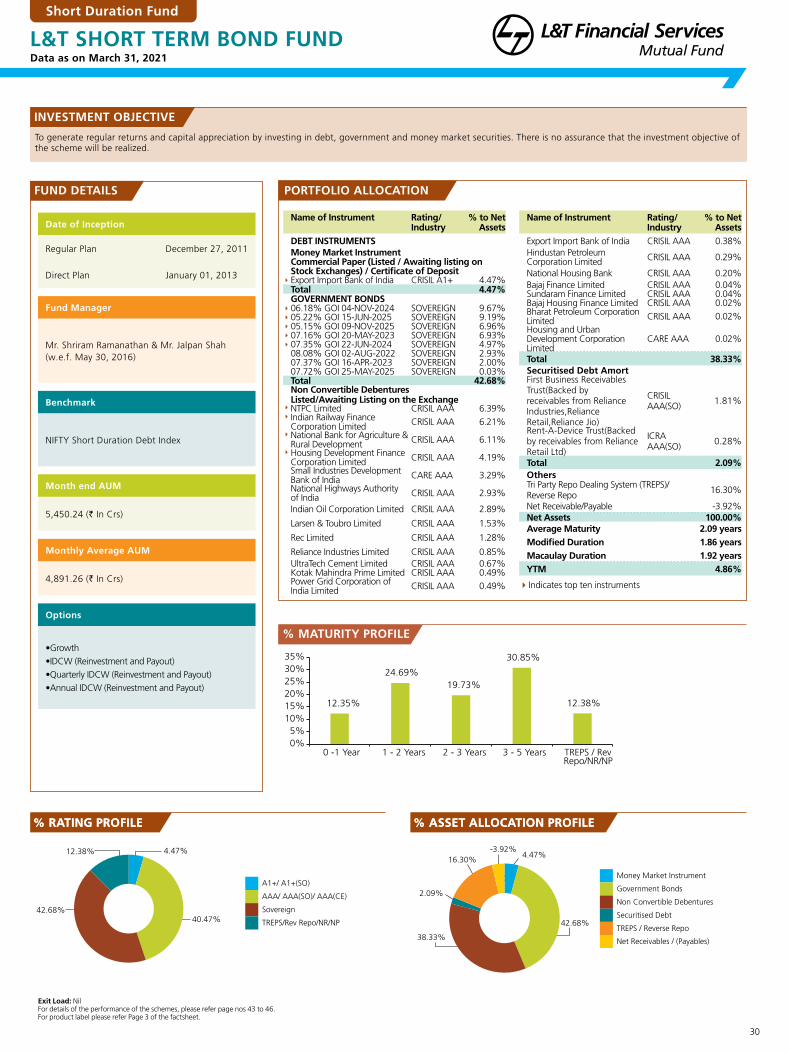
30
Data as on March 31, 2021L&T SHORT TERM BOND FUND
The investment objective of the Scheme is to generate regular returns in line with the overnight rates.
INVESTMENT OBJECTIVE
FUND DETAILS PORTFOLIO ALLOCATION
Exit Load: NilFor details of the performance of the schemes, please refer page nos 43 to 46.For product label please refer Page 3 of the factsheet.
% RATING PROFILE % ASSET ALLOCATION PROFILE
40.47%
42.68%
12.38% 4.47% -3.92%4.47%
42.68%
38.33%
2.09%
16.30%
12.35%
24.69%
19.73%
30.85%
12.38%
0%
5%
10%
15%
20%
25%
30%
35%
0 -1 Year 1 - 2 Years 2 - 3 Years 3 - 5 Years TREPS / RevRepo/NR/NP
To generate regular returns and capital appreciation by investing in debt, government and money market securities. There is no assurance that the investment objective of the scheme will be realized.
INVESTMENT OBJECTIVE
% RATING PROFILE % ASSET ALLOCATION PROFILE
% MATURITY PROFILE
Short Duration Fund
Date of Inception
Regular Plan December 27, 2011
Direct Plan January 01, 2013
Fund Manager
Mr. Shriram Ramanathan & Mr. Jalpan Shah (w.e.f. May 30, 2016)
Benchmark
NIFTY Short Duration Debt Index
Month end AUM
5,450.24 (` In Crs)
Monthly Average AUM
4,891.26 (` In Crs)
Options
•Growth •IDCW (Reinvestment and Payout) •Quarterly IDCW (Reinvestment and Payout) •Annual IDCW (Reinvestment and Payout)
Name of Instrument Rating/Industry
% to Net Assets
DEBT INSTRUMENTSMoney Market Instrument Commercial Paper (Listed / Awaiting listing on Stock Exchanges) / Certificate of Deposit
Export Import Bank of India CRISIL A1+ 4.47%Total 4.47%GOVERNMENT BONDS
06.18% GOI 04-NOV-2024 SOVEREIGN 9.67%05.22% GOI 15-JUN-2025 SOVEREIGN 9.19%05.15% GOI 09-NOV-2025 SOVEREIGN 6.96%07.16% GOI 20-MAY-2023 SOVEREIGN 6.93%07.35% GOI 22-JUN-2024 SOVEREIGN 4.97%
08.08% GOI 02-AUG-2022 SOVEREIGN 2.93%07.37% GOI 16-APR-2023 SOVEREIGN 2.00%07.72% GOI 25-MAY-2025 SOVEREIGN 0.03%Total 42.68%Non Convertible DebenturesListed/Awaiting Listing on the Exchange
NTPC Limited CRISIL AAA 6.39% Indian Railway Finance
Corporation Limited CRISIL AAA 6.21%National Bank for Agriculture &
Rural Development CRISIL AAA 6.11%Housing Development Finance
Corporation Limited CRISIL AAA 4.19%Small Industries Development Bank of India CARE AAA 3.29%National Highways Authority of India CRISIL AAA 2.93%
Indian Oil Corporation Limited CRISIL AAA 2.89%
Larsen & Toubro Limited CRISIL AAA 1.53%
Rec Limited CRISIL AAA 1.28%
Reliance Industries Limited CRISIL AAA 0.85%UltraTech Cement Limited CRISIL AAA 0.67%Kotak Mahindra Prime Limited CRISIL AAA 0.49%Power Grid Corporation of India Limited CRISIL AAA 0.49%
Name of Instrument Rating/Industry
% to Net Assets
Export Import Bank of India CRISIL AAA 0.38%Hindustan Petroleum Corporation Limited CRISIL AAA 0.29%
National Housing Bank CRISIL AAA 0.20%Bajaj Finance Limited CRISIL AAA 0.04%Sundaram Finance Limited CRISIL AAA 0.04%Bajaj Housing Finance Limited CRISIL AAA 0.02%Bharat Petroleum Corporation Limited CRISIL AAA 0.02%Housing and Urban Development Corporation Limited
CARE AAA 0.02%
Total 38.33%Securitised Debt AmortFirst Business Receivables Trust(Backed by receivables from Reliance Industries,Reliance Retail,Reliance Jio)
CRISIL AAA(SO) 1.81%
Rent-A-Device Trust(Backed by receivables from Reliance Retail Ltd)
ICRA AAA(SO) 0.28%
Total 2.09%OthersTri Party Repo Dealing System (TREPS)/Reverse Repo 16.30%
Net Receivable/Payable -3.92%Net Assets 100.00%Average Maturity 2.09 yearsModified Duration 1.86 yearsMacaulay Duration 1.92 yearsYTM 4.86%
Indicates top ten instruments
A1+/ A1+(SO)
AAA/ AAA(SO)/ AAA(CE)
Sovereign
TREPS/Rev Repo/NR/NP
Money Market Instrument
Government Bonds
Non Convertible Debentures
Securitised Debt
TREPS / Reverse Repo
Net Receivables / (Payables)
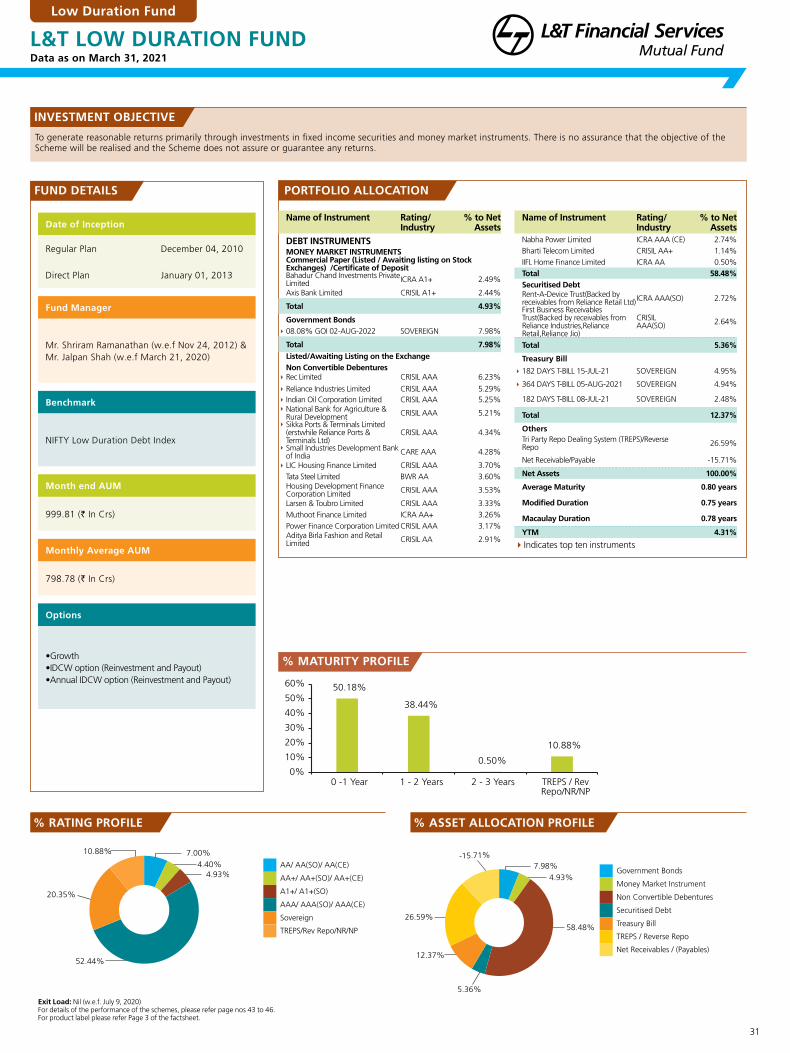
31
Data as on March 31, 2021
Low Duration Fund
L&T LOW DURATION FUND
To generate reasonable returns primarily through investments in fixed income securities and money market instruments. There is no assurance that the objective of the Scheme will be realised and the Scheme does not assure or guarantee any returns.
INVESTMENT OBJECTIVE
FUND DETAILS PORTFOLIO ALLOCATION
Date of Inception
Regular Plan December 04, 2010
Direct Plan January 01, 2013
Fund Manager
Mr. Shriram Ramanathan (w.e.f Nov 24, 2012) & Mr. Jalpan Shah (w.e.f March 21, 2020)
Benchmark
NIFTY Low Duration Debt Index
Month end AUM
999.81 (` In Crs)
Monthly Average AUM
798.78 (` In Crs)
Options
•Growth •IDCW option (Reinvestment and Payout) •Annual IDCW option (Reinvestment and Payout)
Exit Load: Nil (w.e.f. July 9, 2020)For details of the performance of the schemes, please refer page nos 43 to 46.For product label please refer Page 3 of the factsheet.
% RATING PROFILE % ASSET ALLOCATION PROFILE
7.00%10.88%
52.44%
4.40%
4.93%
20.35%
4.93%
26.59%
-15.71%
12.37%
7.98%
58.48%
5.36%
50.18%
38.44%
0.50%
10.88%
0%
10%
20%
30%
40%
50%
60%
0 -1 Year 1 - 2 Years 2 - 3 Years TREPS / Rev
Repo/NR/NP
% MATURITY PROFILE
Name of Instrument Rating/Industry
% to Net Assets
DEBT INSTRUMENTSMONEY MARKET INSTRUMENTS Commercial Paper (Listed / Awaiting listing on Stock Exchanges) /Certificate of DepositBahadur Chand Investments Private Limited ICRA A1+ 2.49%
Axis Bank Limited CRISIL A1+ 2.44%
Total 4.93%
Government Bonds08.08% GOI 02-AUG-2022 SOVEREIGN 7.98%
Total 7.98%Listed/Awaiting Listing on the ExchangeNon Convertible Debentures
Rec Limited CRISIL AAA 6.23%Reliance Industries Limited CRISIL AAA 5.29% Indian Oil Corporation Limited CRISIL AAA 5.25%National Bank for Agriculture &
Rural Development CRISIL AAA 5.21%Sikka Ports & Terminals Limited
(erstwhile Reliance Ports & Terminals Ltd)
CRISIL AAA 4.34%
Small Industries Development Bank of India CARE AAA 4.28%
LIC Housing Finance Limited CRISIL AAA 3.70%Tata Steel Limited BWR AA 3.60%Housing Development Finance Corporation Limited CRISIL AAA 3.53%
Larsen & Toubro Limited CRISIL AAA 3.33%Muthoot Finance Limited ICRA AA+ 3.26%Power Finance Corporation Limited CRISIL AAA 3.17%Aditya Birla Fashion and Retail Limited CRISIL AA 2.91%
Name of Instrument Rating/Industry
% to Net Assets
Nabha Power Limited ICRA AAA (CE) 2.74%Bharti Telecom Limited CRISIL AA+ 1.14%IIFL Home Finance Limited ICRA AA 0.50%Total 58.48%Securitised DebtRent-A-Device Trust(Backed by receivables from Reliance Retail Ltd)ICRA AAA(SO) 2.72%First Business Receivables Trust(Backed by receivables from Reliance Industries,Reliance Retail,Reliance Jio)
CRISIL AAA(SO) 2.64%
Total 5.36%
Treasury Bill
182 DAYS T-BILL 15-JUL-21 SOVEREIGN 4.95%
364 DAYS T-BILL 05-AUG-2021 SOVEREIGN 4.94%
182 DAYS T-BILL 08-JUL-21 SOVEREIGN 2.48%
Total 12.37%
OthersTri Party Repo Dealing System (TREPS)/Reverse Repo 26.59%
Net Receivable/Payable -15.71%
Net Assets 100.00%
Average Maturity 0.80 years
Modified Duration 0.75 years
Macaulay Duration 0.78 years
YTM 4.31%
Indicates top ten instruments
AA/ AA(SO)/ AA(CE)
AA+/ AA+(SO)/ AA+(CE)
A1+/ A1+(SO)
AAA/ AAA(SO)/ AAA(CE)
Sovereign
TREPS/Rev Repo/NR/NP
Government Bonds
Money Market Instrument
Non Convertible Debentures
Securitised Debt
Treasury Bill
TREPS / Reverse Repo
Net Receivables / (Payables)
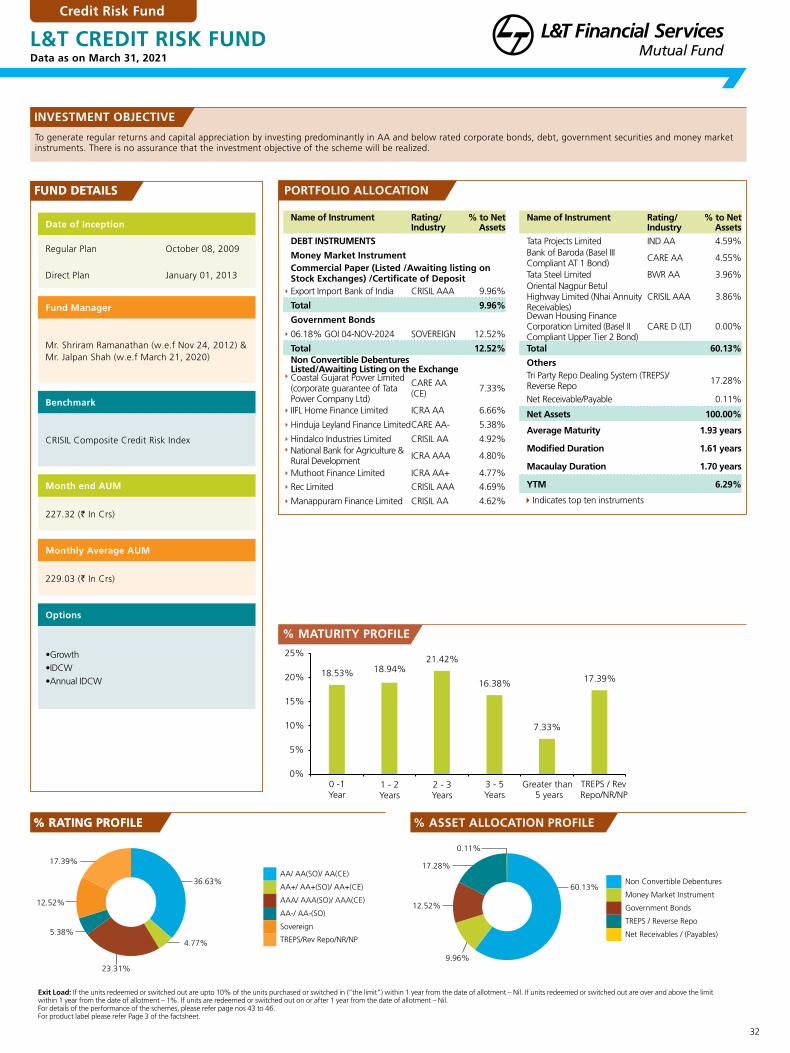
32
Data as on March 31, 2021
To generate regular returns and capital appreciation by investing predominantly in AA and below rated corporate bonds, debt, government securities and money market instruments. There is no assurance that the investment objective of the scheme will be realized.
L&T CREDIT RISK FUND
INVESTMENT OBJECTIVE
FUND DETAILS PORTFOLIO ALLOCATION
Exit Load: If the units redeemed or switched out are upto 10% of the units purchased or switched in (“the limit”) within 1 year from the date of allotment – Nil. If units redeemed or switched out are over and above the limitwithin 1 year from the date of allotment – 1%. If units are redeemed or switched out on or after 1 year from the date of allotment – Nil.For details of the performance of the schemes, please refer page nos 43 to 46.For product label please refer Page 3 of the factsheet.
% RATING PROFILE % ASSET ALLOCATION PROFILE
17.39%
36.63%
12.52%
4.77%
5.38%
23.31%
0.11%
60.13%
9.96%
17.28%
12.52%
18.53% 18.94%21.42%
16.38%
7.33%
17.39%
0%
5%
10%
15%
20%
25%
0 -1Year
1 - 2Years
2 - 3Years
3 - 5Years
Greater than5 years
TREPS / RevRepo/NR/NP
FUND DETAILS
% RATING PROFILE
% MATURITY PROFILE
Credit Risk Fund
Date of Inception
Regular Plan October 08, 2009
Direct Plan January 01, 2013
Fund Manager
Mr. Shriram Ramanathan (w.e.f Nov 24, 2012) & Mr. Jalpan Shah (w.e.f March 21, 2020)
Benchmark
CRISIL Composite Credit Risk Index
Month end AUM
227.32 (` In Crs)
Monthly Average AUM
229.03 (` In Crs)
Options
•Growth •IDCW •Annual IDCW
Name of Instrument Rating/Industry
% to Net Assets
DEBT INSTRUMENTS
Money Market InstrumentCommercial Paper (Listed /Awaiting listing on Stock Exchanges) /Certificate of Deposit
Export Import Bank of India CRISIL AAA 9.96%
Total 9.96%
Government Bonds06.18% GOI 04-NOV-2024 SOVEREIGN 12.52%
Total 12.52%Non Convertible Debentures Listed/Awaiting Listing on the Exchange
Coastal Gujarat Power Limited (corporate guarantee of Tata Power Company Ltd)
CARE AA (CE) 7.33%
IIFL Home Finance Limited ICRA AA 6.66%Hinduja Leyland Finance Limited CARE AA- 5.38%Hindalco Industries Limited CRISIL AA 4.92%National Bank for Agriculture &
Rural Development ICRA AAA 4.80%
Muthoot Finance Limited ICRA AA+ 4.77%Rec Limited CRISIL AAA 4.69%Manappuram Finance Limited CRISIL AA 4.62%
Name of Instrument Rating/Industry
% to Net Assets
Tata Projects Limited IND AA 4.59%Bank of Baroda (Basel III Compliant AT 1 Bond) CARE AA 4.55%
Tata Steel Limited BWR AA 3.96%Oriental Nagpur Betul Highway Limited (Nhai Annuity Receivables)
CRISIL AAA 3.86%
Dewan Housing Finance Corporation Limited (Basel II Compliant Upper Tier 2 Bond)
CARE D (LT) 0.00%
Total 60.13%
OthersTri Party Repo Dealing System (TREPS)/Reverse Repo 17.28%
Net Receivable/Payable 0.11%
Net Assets 100.00%
Average Maturity 1.93 years
Modified Duration 1.61 years
Macaulay Duration 1.70 years
YTM 6.29%
AA/ AA(SO)/ AA(CE)
AA+/ AA+(SO)/ AA+(CE)
AAA/ AAA(SO)/ AAA(CE)
AA-/ AA-(SO)
Sovereign
TREPS/Rev Repo/NR/NP
Non Convertible Debentures
Money Market Instrument
Government Bonds
TREPS / Reverse Repo
Net Receivables / (Payables)
Indicates top ten instruments

33
Data as on March 31, 2021
Dynamic Bond Fund
L&T FLEXI BOND FUND
To generate reasonable returns through a diversified portfolio of fixed income securities. There is no assurance that the investment objective of the scheme will be real-ized.
INVESTMENT OBJECTIVE
FUND DETAILS PORTFOLIO ALLOCATION
Date of Inception
Regular Plan September 27, 2010
Direct Plan January 01, 2013
Fund Manager
Mr. Shriram Ramanathan (w.e.f. Feb 02, 2015) & Mr. Jalpan Shah (w.e.f. May 30, 2016)
Benchmark
CRISIL Dynamic Debt Index
Month end AUM
65.63 (` In Crs)
Monthly Average AUM
65.68 (` In Crs)
Options
•Growth •IDCW option (Reinvestment and Payout) •Annual option (Reinvestment and Payout)
Exit Load: For redemption within 1 year from the date of allotment or Purchase applying First in First out basis – 0.50% of Applicable NAV. For redemption After 1 year from the date of allotment or Purchase applying First inFirst out basis - NilFor details of the performance of the schemes, please refer page nos 43 to 46. For product label please refer Page 3 of the factsheet.
% RATING PROFILE % ASSET ALLOCATION PROFILE
60.00%
40.00%
60.00%
39.87%
0.13%
0.83%
59.17%
40.00%
0%
20%
40%
60%
80%
2 - 3 Years Greater than 5
years
TREPS / Rev
Repo/NR/NP
% MATURITY PROFILE
Name of Instrument Rating/Industry
% to Net Assets
DEBT INSTRUMENTS
GOVERNMENT BONDS
07.17% GOI 08-JAN-2028 SOVEREIGN 31.07%
06.79% GOI 15-MAY-2027 SOVEREIGN 24.16%
06.45% GOI 7-OCT-2029 SOVEREIGN 3.94%
07.68% GOI 15-DEC-2023 SOVEREIGN 0.83%
Total 60.00%
Name of Instrument Rating/Industry
% to Net Assets
OthersTri Party Repo Dealing System (TREPS)/Reverse Repo 39.87%
Net Receivable/Payable 0.13%
Net Assets 100.00%
Average Maturity 3.95 years
Modified Duration 3.08 years
Macaulay Duration 3.18 years
YTM 6.34%
Sovereign
TREPS/Rev Repo/NR/NP
Government Bonds
TREPS / Reverse Repo
Net Receivables / (Payables)

34
Data as on March 31, 2021
To generate regular return by investing predominantly in AA+ and above rated debt and money market instruments. There is no assurance that the investment objective of the scheme will be realized.
L&T TRIPLE ACE BOND FUND
INVESTMENT OBJECTIVE
FUND DETAILS PORTFOLIO ALLOCATION
Exit Load: If the amount sought to be redeemed or switched out on or before 30 days from the date of allotment: 0.50%. If the amount sought to be redeemed or switched out is invested for a period of more than 30 days from the date of allotment: Nil (w.e.f. March 22, 2021)For details of the performance of the schemes, please refer page nos 43 to 46. For product label please refer Page 3 of the factsheet.
% RATING PROFILE % ASSET ALLOCATION PROFILE
66.42%6.30%
27.28%
27.28%
66.40%
-9.69%
15.99%
93.70%
6.30%
0%
20%
40%
60%
80%
100%
Greater than 5 years TREPS / Rev Repo/NR/NP
% ASSET ALLOCATION PROFILE
% MATURITY PROFILE
Corporate Bond Fund
Date of Inception
Regular Plan March 31, 1997
Direct Plan January 01, 2013
Fund Manager
Mr. Shriram Ramanathan (w.e.f. June 30, 2014) & Mr. Jalpan Shah (w.e.f. April 03, 2017)
Benchmark
CRISIL Corporate Bond Composite Index
Month end AUM
6,974.22 (` In Crs)
Monthly Average AUM
6,333.91 (` In Crs)
Options
•Growth •IDCW (Reinvestment and Payout) 1. Quarterly IDCW 2. Semi-Annual IDCW 3. Annual IDCW
Name of Instrument Rating/Industry
% to Net Assets
DEBT INSTRUMENTS
GOVERNMENT BONDS07.26% GOI 14-JAN-2029 SOVEREIGN 10.31%07.17% GOI 08-JAN-2028 SOVEREIGN 10.29%06.45% GOI 7-OCT-2029 SOVEREIGN 5.19%
06.79% GOI 15-MAY-2027 SOVEREIGN 0.76%6.47% MAHARSHTRA SDL 21-OCT-2028 SOVEREIGN 0.73%
Total 27.28%Non Convertible Debentures Listed/Awaiting Listing on the Exchange
National Bank for Agriculture & Rural Development
ICRA AAA/CRISIL AAA/IND AAA
10.16%
National Highways Authority of India CRISIL AAA 9.49%
Indian Railway Finance Corporation Limited
CARE AAA/CRISIL AAA 9.03%
NTPC Limited CRISIL AAA 6.76%Export Import Bank of India CRISIL AAA 6.26%Power Grid Corporation of
India Limited CRISIL AAA 5.52%Housing and Urban
Development Corporation Limited
CARE AAA/ICRA AAA 4.86%
HDFC Bank Limited CRISIL AAA 3.91%
Name of Instrument Rating/Industry
% to Net Assets
Rec Limited CRISIL AAA 3.84%
Housing Development Finance Corporation Limited CRISIL AAA 3.20%
Indian Oil Corporation Limited CRISIL AAA 1.93%
Food Corporation of India Limited
CRISIL AAA (CE) 0.96%
Nuclear Power Corporation Of India Limited CRISIL AAA 0.31%
NHPC Limited CARE AAA 0.17%
Total 66.40%
OthersTri Party Repo Dealing System (TREPS)/Reverse Repo 15.99%
Net Receivable/Payable -9.69%
Net Assets 100.00%
Average Maturity 7.37 years
Modified Duration 5.39 years
Macaulay Duration 5.66 years
YTM 6.68%
Indicates top ten instruments
AAA/ AAA(SO)/ AAA(CE)
Sovereign
TREPS/Rev Repo/NR/NP
Government Bonds
Non Convertible Debentures
TREPS / Reverse Repo
Net Receivables / (Payables)

35
Data as on March 31, 2021
To generate returns from a portfolio from investments in Government Securities. There is no assurance that the investment objective of the scheme will be realized.
L&T GILT FUND
INVESTMENT OBJECTIVE
FUND DETAILS
Exit Load: Nil.For details of the performance of the schemes, please refer page nos 43 to 46. For product label please refer Page 3 of the factsheet.
Gilt Fund
Date of Inception
Regular Plan March 29, 2000
Direct Plan January 01, 2013
Fund Manager
Mr. Jalpan Shah (w.e.f. May 30, 2016) & Mr. Shriram Ramanathan (w.e.f. April 03, 2017)
Benchmark
CRISIL Dynamic Gilt Index
Month end AUM
262.45 (` In Crs)
Monthly Average AUM
260.50 (` In Crs)
Options
•Growth •IDCW option (Reinvestment and Payout) Quarterly IDCW
% RATING PROFILE
75.17%
24.83%
% RATING PROFILE
PORTFOLIO ALLOCATION
% ASSET ALLOCATION PROFILE
-0.12%
24.95%
75.17%
75.17%
24.83%
0%
10%
20%
30%
40%
50%
60%
70%
80%
Greater than 5 years TREPS / Rev Repo/NR/NP
% ASSET ALLOCATION PROFILE
% MATURITY PROFILE
Name of Instrument Rating/Industry
% to Net Assets
DEBT INSTRUMENTS
GOVERNMENT BONDS
06.79% GOI 15-MAY-2027 SOVEREIGN 24.17%
07.17% GOI 08-JAN-2028 SOVEREIGN 20.58%
07.26% GOI 14-JAN-2029 SOVEREIGN 20.29%
06.45% GOI 7-OCT-2029 SOVEREIGN 9.86%
06.19% GOI 16-SEP-2034 SOVEREIGN 0.27%
Total 75.17%
Name of Instrument Rating/Industry
% to Net Assets
OthersTri Party Repo Dealing System (TREPS)/Reverse Repo 24.95%
Net Receivable/Payable -0.12%
Net Assets 100.00%
Average Maturity 5.34 years
Modified Duration 4.09 years
Macaulay Duration 4.22 years
YTM 6.41%
Sovereign
TREPS/Rev Repo/NR/NP
Government Bonds
TREPS / Reverse Repo
Net Receivables / (Payables)

36
Data as on March 31, 2021
To generate regular income through investments in a range of Debt, Equity and Money Market Instruments. Income will be distributed only if the same is earned by the scheme and there can be no assurance that the objective of the scheme will be realized.
L&T CONSERVATIVE HYBRID FUND
INVESTMENT OBJECTIVE
FUND DETAILSFUND DETAILS
Conservative Hybrid Fund
Date of Inception
Regular Plan July 31, 2003
Direct Plan January 01, 2013
Fund Manager
Mr. Venugopal Manghat (w.e.f. Nov 24, 2012) & Mr. Vihang Naik (w.e.f. Dec 17, 2019) (for investments in equity and equity related instruments) Mr. Jalpan Shah (w.e.f. May 30, 2016) (for investments in debt and debt related instruments)
Benchmark
CRISIL Hybrid 85+15 - Conservative Index
Month end AUM
36.32 (` In Crs)
Monthly Average AUM
36.27 (` In Crs)
Options
•Growth •IDCW (Reinvestment and Payout) 1. Monthly IDCW 2. Quarterly IDCW
Exit Load: If the units redeemed or switched out are upto 10% of the units (the limit) purchased or switched within 1 year from the date of allotment – Nil. If units redeemed or switched out are over and above the limit within1 year from the date of allotment – 1%. If units are redeemed or switched out on or after 1 year from the date of allotment – Nil.For details of the performance of the schemes, please refer page nos 43 to 46. For product label please refer Page 3 of the factsheet.
% RATING PROFILE
17.39%
19.88%50.57%
12.16%
PORTFOLIO ALLOCATION
% ASSET ALLOCATION PROFILE % MATURITY PROFILE
50.57%
17.38%
12.16%
19.89%
11.45%
5.93%
14.99%
29.89%
5.70%
19.88%
12.16%
0%
5%
10%
15%
20%
25%
30%
35%
0 -1Year
1 - 2Years
2 - 3Years
3 - 5Years
Greater
5 years
Equity &EquityRelated
TREPS / RevRepo/NR/NPthan
Name of Instrument Rating/Industry
% to Net Assets
DEBT INSTRUMENTSGovernment Bonds
07.59% GOI 11-JAN-2026 SOVEREIGN 29.88%07.37% GOI 16-APR-2023 SOVEREIGN 14.99%06.45% GOI 7-OCT-2029 SOVEREIGN 5.70%
Total 50.57%EQUITY & EQUITY RELATED Listed / awaiting listing on the stock exchanges
Infosys Limited Software 1.40%HDFC Bank Limited Banks 1.34% ICICI Bank Limited Banks 1.27%Reliance Industries Limited Petroleum
Products 0.92%
HCL Technologies Limited Software 0.76%
The Ramco Cements Limited
Cement & Cement Products
0.67%
Happiest Minds Technologies Limited Software 0.66%
Larsen & Toubro Limited Construction Project 0.66%
Sun Pharmaceutical Industries Limited Pharmaceuticals 0.64%
Endurance Technologies Limited Auto Ancillaries 0.62%
K.P.R. Mill Limited Textile Products 0.60%
UltraTech Cement LimitedCement & Cement Products
0.59%
Brigade Enterprises Limited Construction 0.55%Dr. Reddy's Laboratories Limited Pharmaceuticals 0.51%
Tata Consultancy Services Limited Software 0.49%
APL Apollo Tubes Limited Ferrous Metals 0.47%Godrej Properties Limited Construction 0.46%Mahindra & Mahindra Limited Auto 0.38%
State Bank of India Banks 0.38%Sobha Limited Construction 0.37%Ahluwalia Contracts India Limited Construction 0.35%
Jindal Steel & Power Limited Ferrous Metals 0.35%
Bharti Airtel Limited Telecom - Services 0.34%
Hindustan Petroleum Corporation Limited
Petroleum Products 0.34%
Axis Bank Limited Banks 0.33%Maruti Suzuki India Limited Auto 0.32%Trent Limited Retailing 0.32%IPCA Laboratories Limited Pharmaceuticals 0.31%
Hindustan Unilever Limited Consumer Non Durables 0.29%
Cholamandalam Investment and Finance Company Limited
Finance 0.28%
Lumax Industries Limited Auto Ancillaries 0.28%
Name of Instrument Rating/Industry
% to Net Assets
Atul Limited Chemicals 0.27%Hero MotoCorp Limited Auto 0.26%Bajaj Auto Limited Auto 0.24%
ITC Limited Consumer Non Durables 0.24%
Sundaram Finance Limited Finance 0.23%
Shree Cements LimitedCement & Cement Products
0.20%
Alkem Laboratories Limited Pharmaceuticals 0.19%The Indian Hotels Company Limited Leisure Services 0.19%
Blue Star Limited Consumer Durables 0.17%
Engineers India Limited Construction Project 0.15%
Kotak Mahindra Bank Limited Banks 0.15%
Housing Development Finance Corporation LimitedFinance 0.14%
Jamna Auto Industries Limited Auto Ancillaries 0.11%
Lupin Limited Pharmaceuticals 0.05%Mazagon Dock Shipbuilders Limited
Industrial Capital Goods 0.04%
Total 19.88%PREFERENCE SHARESListed/awaiting listing on the stock exchangesZee Entertainment Enterprises Limited
Media & Entertainment 0.01%
Total 0.01%Non Convertible Debentures Listed/Awaiting Listing on the Exchange
Rec Limited CRISIL AAA 7.15%National Bank for
Agriculture & Rural Development
CRISIL AAA 5.93%
Power Finance Corporation Limited CRISIL AAA 4.30%
Total 17.38%OthersTri Party Repo Dealing System (TREPS)/Reverse Repo 12.16%
Net Receivable/Payable 0.00%Net Assets 100.00%
Average Maturity 3.03 years
Modified Duration 2.50 years
Macaulay Duration 2.58 years
YTM 5.24%
Indicates top ten instruments
AAA/ AAA(SO)/ AAA(CE)
Equity & Equity Related
Sovereign
TREPS/Rev Repo/NR/NP
Government Bonds
Equity & Equity Related
Non Convertible Debentures
TREPS / Reverse Repo

37
Data as on March 31, 2021
Medium Duration Fund
L&T RESURGENT INDIA BOND FUND
To seek to generate income by investing primarily in debt and money market securities. There is no assurance that the investment objective of the scheme will be realized.
INVESTMENT OBJECTIVE
FUND DETAILS
Exit Load: For redemption on or before 90 days from the date of allotment or Purchase applying First in First Out basis – 1% of the applicable NAV. For redemption after 90 days from the date of allotment or Purchase applying Firstin First out basis - Nil (w.e.f July 9, 2020)For details of the performance of the schemes, please refer page nos 43 to 46. For product label please refer Page 3 of the factsheet.
% RATING PROFILE
7.66% 19.03%
12.97%
50.22%
3.27%
6.85%
PORTFOLIO ALLOCATION
% ASSET ALLOCATION PROFILE % MATURITY PROFILE
-3.52%
12.97%
72.62%
6.75%
11.18%
9.83%
20.97% 20.44% 19.99%
7.66%
0%
5%
10%
15%
20%
0 -1
Year
1 - 2
Years
2 - 3
Years
3 - 5
Years
Greater
than
5 years
TREPS / Rev
Repo/NR/NP
21.10%
25%
Date of Inception
Regular Plan February 02, 2015
Direct Plan February 02, 2015
Fund Manager
Mr. Shriram Ramanathan (w.e.f Feb 02, 2015) & Mr. Jalpan Shah (w.e.f March 21, 2020)
Benchmark
CRISIL Medium Term Debt Index
Month end AUM
739.85 (` In Crs)
Monthly Average AUM
749.50 (` In Crs)
Options
•Growth •IDCW option (Payout and Reinvestment) •Annual IDCW (Payout and Reinvestment)
Name of Instrument Rating/Industry
% to Net Assets
DEBT INSTRUMENTS
GOVERNMENT BONDS06.45% GOI 7-OCT-2029 SOVEREIGN 5.60%06.18% GOI 04-NOV-2024 SOVEREIGN 3.99%
05.22% GOI 15-JUN-2025 SOVEREIGN 3.38%
Total 12.97%Non Convertible Debentures Listed/Awaiting Listing on the Exchange
Coastal Gujarat Power Limited (corporate guarantee of Tata Power Company Ltd)
CARE AA (CE) 7.89%
Sikka Ports & Terminals Limited (erstwhile Reliance Ports & Terminals Ltd)
CRISIL AAA 7.50%
Power Finance Corporation Limited CRISIL AAA 7.37%
National Bank for Agriculture & Rural Development
CRISIL AAA/ICRA AAA 7.26%
Housing Development Finance Corporation Limited CRISIL AAA 5.50%
Oriental Nagpur Betul Highway Limited (Nhai Annuity Receivables)
CRISIL AAA 4.18%
Patel Knr Heavy Infrastructures Limited (Nhai Annuity Receivables)
CARE AA+ 3.96%
Muthoot Finance Limited ICRA AA+ 3.56%
Indian Oil Corporation Limited CRISIL AAA 3.55%
Manappuram Finance Limited CARE AA 3.50%Andhra Pradesh Expressway Limited (Nhai Annuity Receivables)
IND AAA 3.47%
IIFL Home Finance Limited ICRA AA 3.41%
Hinduja Leyland Finance Limited CARE AA- 3.27%
Name of Instrument Rating/Industry
% to Net Assets
State Bank Of India (Basel III Compliant AT 1 Bond) CRISIL AA+ 2.89%
L&T Metro Rail (Hyderabad) Limited (Put Option On L&T Limited )
IND AAA (CE) 2.46%
IOT Utkal Energy Services Limited (Long term take or pay agreement with IOCL)
CRISIL AAA 1.87%
IndusInd Bank Limited (Basel III Compliant AT 1 Bond) CRISIL AA 0.67%
Indian Railway Finance Corporation Limited CRISIL AAA 0.31%
Dewan Housing Finance Corporation Limited (Basel II Compliant Upper Tier 2 Bond)
CARE D (LT) 0.00%
Total 72.62%
Securitised DebtFirst Business Receivables
Trust(Backed by receivables from Reliance Industries,Reliance Retail,Reliance Jio)
CRISIL AAA(SO) 6.75%
Total 6.75%
OthersTri Party Repo Dealing System (TREPS)/Reverse Repo 11.18%
Net Receivable/Payable -3.52%
Net Assets 100.00%
Average Maturity 3.11 years
Modified Duration 2.49 years
Macaulay Duration 2.62 years
YTM 6.52%
Indicates top ten instruments
AA/ AA(SO)/ AA(CE)
AA+/ AA+(SO)/ AA+(CE)
AAA/ AAA(SO)/ AAA(CE)
AA-/ AA-(SO)
Sovereign
TREPS/Rev Repo/NR/NP
Government Bonds
Non Convertible Debentures
Securitised Debt
TREPS / Reverse Repo
Net Receivables / (Payables)

38
Data as on March 31, 2021FUND MANAGER WISE SCHEME DETAILS
*For investments in Foreign Securities
Sr. No. Mr. Praveen Ayathan Total No. of years of experience: 28
1 L&T Arbitrage Opportunities Fund (Co-FM)
2 L&T Equity Savings Fund (Co-FM)
3L&T Balanced Advantage Fund (Formerly known as L&T DynamicEquity Fund) (Co-FM)
4 L&T Nifty 50 Index Fund
5 L&T Nifty Next 50 Index Fund
Sr. No. Mr. Shriram Ramanathan Total No. of years of experience: 20
1 L&T Liquid Fund
2 L&T Low Duration Fund
3 L&T Credit Risk Fund
4 Fixed Maturity Plans (Co-FM)
5 L&T Triple Ace Bond Fund
6 L&T Resurgent India Bond Fund
7 L&T Hybrid Equity Fund (Debt Component)
8 L&T Short Term Bond Fund
9 L&T Flexi Bond Fund
10 L&T Overnight Fund (Formerly known as L&T Cash Fund) (Co-FM)
11 L&T Banking and PSU Debt Fund (Co-FM)
12 L&T Gilt Fund (Co-FM)
13 L&T Ultra Short Term Fund (Co-FM)
14 L&T Money Market Fund (Co-FM)
Sr. No. Mr. Jalpan Shah Total No. of years of experience: 16
1 L&T Liquid Fund (Co-FM)
2 L&T Ultra Short Term Fund
3 L&T Short Term Bond Fund (Co-FM)
4 L&T Flexi Bond Fund (Co-FM)
5 L&T Gilt Fund
6 L&T Banking and PSU Debt Fund
7 L&T Overnight Fund (Formerly known as L&T Cash Fund)
8 Fixed Maturity Plans
9 L&T Conservative Hybrid Fund (Debt Component)
10L&T Balanced Advantage Fund (Formerly known as L&T DynamicEquity Fund) (Debt Portion)
11 L&T Equity Savings Fund (Debt Portion)
12 L&T Triple Ace Bond Fund (Co-FM)
13 L&T Money Market Fund
14 L&T Arbitrage Opportunities Fund (Debt Portion)
15 L&T Low Duration Fund (Co-FM)
16 L&T Credit Risk Fund (Co-FM)
17 L&T Resurgent India Bond Fund (Co-FM)
Sr. No. Mr. Vihang Naik Total No. of years of experience: 14
1 L&T Flexicap Fund
2 L&T Large and Midcap Fund
3 L&T Tax Advantage Fund
4L&T Balanced Advantage Fund (Formerly known as L&T DynamicEquity Fund) (Equity Component)
5 L&T Infrastructure Fund (Co-FM)
6 L&T Hybrid Equity Fund (Equity Component) (Co-FM)
7 L&T Midcap Fund
8 L&T Emerging Businesses Fund (Co-FM)
9 L&T Focused Equity Fund
10 L&T India Large Cap Fund (Co-FM)
11 L&T Emerging Opportunities Fund Series - I
12 L&T Emerging Opportunities Fund Series - II
13 L&T India Value Fund (Co-FM)
14 L&T Business Cycles Fund (Co-FM)
15 L&T Equity Savings Fund (Equity Component) (Co-FM)
16 L&T Conservative Hybrid Fund (Equity Component) (Co-FM)
Sr. No. Mr. Venugopal Manghat Total No. of years of experience: 25
1 L&T India Large Cap Fund
2 L&T India Value Fund
3 L&T Conservative Hybrid Fund (Equity Component)
4 L&T Equity Savings Fund (Equity Component)
5 L&T Arbitrage Opportunities Fund
6 L&T Business Cycles Fund
7 L&T Flexicap Fund (Co-FM)
8 L&T Large and Midcap Fund (Co-FM)
9 L&T Tax Advantage Fund (Co-FM)
10 L&T Balanced Advantage Fund (Formerly known as L&T Dynamic Equity Fund) (Equity Component) (Co-FM)
11 L&T Infrastructure Fund
12 L&T Hybrid Equity Fund (Equity Component)
13 L&T Midcap Fund (Co-FM)
14 L&T Emerging Businesses Fund
15 L&T Focused Equity Fund (Co-FM)
16 L&T Emerging Opportunities Fund Series - I (Co-FM)
17 L&T Emerging Opportunities Fund Series - II (Co-FM)
Sr. No. Mr. Alok Ranjan
Total No. of years of experience: 81 L&T Flexicap Fund*
2 L&T India Large Cap Fund*
3 L&T Large and Midcap Fund*
4 L&T India Value Fund*
5 L&T Hybrid Equity Fund
6 L&T Emerging Businesses Fund*
7 L&T Arbitrage Opportunities Fund*
8 L&T Business Cycles Fund*

39
Data as on March 31, 2021
SIP Performance Of Equity Oriented Schemes - Growth Option
L&T Flexicap Fund - Regular Plan 1 Year 3 Year 5 Year 7 Year 10 Year Since Inception
Total Amount Invested (`) 120000 360000 600000 840000 1200000 1910000
Market value of the invested amount (`) 152585 448694 790255 1212048 2231447 5694868
Scheme Returns (%) 54.26 14.86 10.97 10.30 11.93 12.58
Total Value of S&P BSE-500 TRI Index (B*) (`) 160719 485959 882751 1375291 2502715 5817884
S&P BSE-500 TRI Index Returns (B*) (%) 68.82 20.52 15.45 13.85 14.08 12.81
Total Value of S&P BSE SENSEX TRI (AB*) (`) 155772 480791 902816 1388826 2471874 6082805
S&P BSE SENSEX TRI Returns (AB*) (%) 59.92 19.75 16.37 14.12 13.84 13.30
L&T India Large Cap Fund - Regular Plan 1 Year 3 Year 5 Year 7 Year 10 Year Since Inception
Total Amount Invested (`) 120000 360000 600000 840000 1200000 1620000
Market value of the invested amount (`) 152444 460372 822313 1253016 2259726 3919961
Scheme Returns (%) 54.01 16.66 12.57 11.24 12.16 12.24
Total Value of S&P BSE 100 TRI (B*) (`) 157647 478429 878339 1358535 2438806 4048825
S&P BSE 100 TRI Returns (B*) (%) 63.28 19.40 15.25 13.50 13.59 12.67
Total Value of S&P BSE SENSEX TRI (AB*) (`) 155772 480791 902816 1389259 2472307 4097000
S&P BSE SENSEX TRI Returns (AB*) (%) 59.92 19.75 16.37 14.13 13.85 12.83
L&T Tax Advantage Fund - Regular Plan 1 Year 3 Year 5 Year 7 Year 10 Year Since Inception
Total Amount Invested (`) 120000 360000 600000 840000 1200000 1820000
Market value of the invested amount (`) 156331 456617 807691 1271047 2373778 5378842
Scheme Returns (%) 60.92 16.09 11.85 11.64 13.09 13.14
Total Value of S&P BSE 200 TRI (B*) (`) 159434 485108 887912 1382762 2512952 5199802
S&P BSE 200 TRI Returns (B*) (%) 66.50 20.39 15.69 14.00 14.15 12.75
Total Value of S&P BSE SENSEX TRI (AB*) (`) 155772 480791 902816 1388826 2471874 5233613
S&P BSE SENSEX TRI Returns (AB*) (%) 59.92 19.75 16.37 14.12 13.84 12.83
L&T India Value Fund - Regular Plan 1 Year 3 Year 5 Year 7 Year 10 Year Since Inception
Total Amount Invested (`) 120000 360000 600000 840000 1200000 1350000
Market value of the invested amount (`) 162347 472772 824182 1331989 2819737 3450409
Scheme Returns (%) 71.78 18.55 12.66 12.95 16.30 15.74
Total Value of S&P BSE 200 TRI (B*) (`) 159434 485108 887912 1382762 2512952 2991944
S&P BSE 200 TRI Returns (B*) (%) 66.50 20.39 15.69 14.00 14.15 13.42
Total Value of S&P BSE SENSEX TRI (AB*) (`) 155772 480791 902816 1388826 2471874 2947309
S&P BSE SENSEX TRI Returns (AB*) (%) 59.92 19.75 16.37 14.12 13.84 13.17
L&T Large and Midcap Fund - Regular Plan 1 Year 3 Year 5 Year 7 Year 10 Year Since Inception
Total Amount Invested (`) 120000 360000 600000 840000 1200000 1790000
Market value of the invested amount (`) 149505 444294 779065 1204654 2286886 4904912
Scheme Returns (%) 48.84 14.17 10.39 10.13 12.39 12.49
Total Value of NIFTY LargeMidcap 250 TRI (B*) (`) 165021 498793 902775 1434141 2738819 5645194
NIFTY LargeMidcap 250 (B*) (%) 76.67 22.40 16.36 15.02 15.76 14.13
Total Value of S&P BSE SENSEX TRI (AB*) (`) 155772 480791 902816 1389259 2472307 5039606
S&P BSE SENSEX TRI Returns (AB*) (%) 59.92 19.75 16.37 14.13 13.85 12.81
L&T Midcap Fund - Regular Plan 1 Year 3 Year 5 Year 7 Year 10 Year Since Inception
Total Amount Invested (`) 120000 360000 600000 840000 1200000 2000000
Market value of the invested amount (`) 161013 478223 848022 1397734 3045508 9202526
Scheme Returns (%) 69.35 19.37 13.82 14.30 17.73 16.40
Total Value of Nifty Midcap 100 TRI (B*) (`) 174372 504920 864722 1369101 2621601 7486875
Nifty Midcap 100 TRI Returns (B*) (%) 94.06 23.28 14.61 13.72 14.94 14.32
Total Value of S&P BSE SENSEX TRI (AB*) (`) 155772 480791 902816 1388826 2471874 7187143
S&P BSE SENSEX TRI Returns (AB*) (%) 59.92 19.75 16.37 14.12 13.84 13.90
Past performance may or may not be sustained in the future. SIP Return are calculated on XIRR basis. IDCW are assumed to be reinvested and bonus is adjusted. Load is not taken into consideration. For SIP returns, monthly investment of ` 10000 invested on the 1st day of every month has been considered.*B: Scheme Benchmark, AB: Additional Benchmark
L&T Infrastructure Fund - Regular Plan 1 Year 3 Year 5 Year 7 Year 10 Year Since Inception
Total Amount Invested (`) 120000 360000 600000 840000 1200000 1630000
Market value of the invested amount (`) 165897 442375 759356 1200479 2293021 3408353
Scheme Returns (%) 78.28 13.87 9.36 10.04 12.44 10.24
Total Value of Nifty Infrastructure TRI (B*) (`) 158200 480482 824776 1185801 1866683 2471699
Nifty Infrastructure TRI Returns (B*) (%) 64.27 19.70 12.69 9.69 8.56 5.89
Total Value of S&P BSE SENSEX TRI (AB*) (`) 155772 480791 902816 1388826 2471874 4133907
S&P BSE SENSEX TRI Returns (AB*) (%) 59.92 19.75 16.37 14.12 13.84 12.78

40
Data as on March 31, 2021
SIP Performance Of Equity Oriented Schemes - Growth Option
L&T Focused Equity Fund - Regular Plan 1 Year 3 Year 5 Year 7 Year 10 Year Since Inception
Total Amount Invested (`) 120000 NA NA NA NA 290000
Market value of the invested amount (`) 150081 NA NA NA NA 370979
Scheme Returns (%) 49.85 NA NA NA NA 21.00
Total Value of Nifty 500 TRI (B*) (`) 160114 NA NA NA NA 387823
Nifty 500 TRI Returns (B*) (%) 67.73 NA NA NA NA 25.06
Total Value of S&P BSE SENSEX TRI (AB*) (`) 155772 NA NA NA NA 380757
S&P BSE SENSEX TRI Returns (AB*) (%) 59.92 NA NA NA NA 23.37
L&T Arbitrage Opportunities Fund - Regular Plan 1 Year 3 Year 5 Year 7 Year 10 Year Since Inception
Total Amount Invested (`) 120000 360000 600000 NA NA 820000
Market value of the invested amount (`) 122424 388008 686853 NA NA 996803
Scheme Returns (%) 3.79 4.93 5.35 NA NA 5.64
Total Value of Nifty 50 Arbitrage Index (B*) (`) 122195 383014 670892 NA NA 968164
Nifty 50 Arbitrage Index Returns (B*) (%) 3.43 4.07 4.42 NA NA 4.80
Total Value of CRISIL 1 Year T-Bill Index (AB*) (`) 122457 394143 702922 NA NA 1027435
CRISIL 1 Year T-Bill Index Returns (AB*) (%) 3.84 5.98 6.27 NA NA 6.51
L&T Emerging Businesses Fund - Regular Plan 1 Year 3 Year 5 Year 7 Year 10 Year Since Inception
Total Amount Invested (`) 120000 360000 600000 NA NA 830000
Market value of the invested amount (`) 175098 475540 832190 NA NA 1345859
Scheme Returns (%) 95.43 18.96 13.06 NA NA 13.75
Total Value of S&P BSE SmallCap TRI (B*) (`) 179323 525860 890820 NA NA 1359257
S&P BSE SmallCap TRI Returns (B*) (%) 103.45 26.26 15.82 NA NA 14.03
Total Value of S&P BSE SENSEX TRI (AB*) (`) 155772 480791 902816 NA NA 1364196
S&P BSE SENSEX TRI Returns (AB*) (%) 59.92 19.75 16.37 NA NA 14.13
L&T Balanced Advantage Fund - Regular Plan 1 Year 3 Year 5 Year 7 Year 10 Year Since Inception
Total Amount Invested (`) 120000 360000 600000 840000 1200000 1220000
Market value of the invested amount (`) 132027 420015 746973 1121318 2069712 2127271
Scheme Returns (%) 19.21 10.29 8.71 8.12 10.51 10.53Total Value of 50% - S&P BSE-200 TRI and 50% - CRISIL Short Term Bond Fund Index (B*) (`) 140408 451615 823247 1260098 2163770 221948650% - S&P BSE-200 TRI and 50% - CRISIL Short Term Bond Fund Index Returns (B*) (%) 33.18 15.31 12.62 11.39 11.35 11.32
Total Value of S&P BSE SENSEX TRI (AB*) (`) 155772 480738 902639 1388622 2471174 2533658
S&P BSE SENSEX TRI Returns (AB*) (%) 59.92 19.74 16.36 14.12 13.84 13.75
L&T Equity Savings Fund - Regular Plan 1 Year 3 Year 5 Year 7 Year 10 Year Since Inception
Total Amount Invested (`) 120000 360000 600000 840000 NA 1150000
Market value of the invested amount (`) 139069 422393 733683 1095392 NA 1691626
Scheme Returns (%) 30.92 10.67 7.99 7.47 NA 7.83
Total Value of NIFTY Equity Savings Index (B^) (`) 133987 428002 773708 1177483 NA 1860320
NIFTY Equity Savings Index Returns (B^) (%) 22.44 11.58 10.12 9.49 NA 9.72
Total Value of CRISIL 10 Yr Gilt Index (AB^) (`) 121386 404821 715672 1092225 NA 1658818
CRISIL 10 Yr Gilt Index Returns (AB^) (%) 2.16 7.78 6.99 7.39 NA 7.44
L&T Business Cycles Fund - Regular Plan 1 Year 3 Year 5 Year 7 Year 10 Year Since Inception
Total Amount Invested (`) 120000 360000 600000 NA NA 800000
Market value of the invested amount (`) 163511 463776 786323 NA NA 1116417
Scheme Returns (%) 73.90 17.19 10.77 NA NA 9.86
Total Value of S&P BSE 200 TRI (B*) (`) 159434 485108 887912 NA NA 1286697
S&P BSE 200 TRI Returns (B*) (%) 66.50 20.39 15.69 NA NA 14.05
Total Value of S&P BSE SENSEX TRI (AB*) (`) 155772 480791 902816 NA NA 1297347
S&P BSE SENSEX TRI Returns (AB*) (%) 59.92 19.75 16.37 NA NA 14.30
L&T Hybrid Equity Fund - Regular Plan 1 Year 3 Year 5 Year 7 Year 10 Year Since Inception
Total Amount Invested (`) 120000 360000 600000 840000 1200000 1220000
Market value of the invested amount (`) 145965 442510 779297 1214730 2311384 2375962
Scheme Returns (%) 42.69 13.89 10.41 10.37 12.59 12.57
Total Value of CRISIL Hybrid 35+65 - Aggressive Index (B*) (`) 145615 464869 849068 1322064 2332529 2392462
CRISIL Hybrid 35+65 - Aggressive Index Returns (B*) (%) 42.08 17.35 13.87 12.74 12.76 12.70
Total Value of S&P BSE SENSEX TRI (AB*) (`) 155772 480791 902816 1389259 2471617 2534101
S&P BSE SENSEX TRI Returns (AB*) (%) 59.92 19.75 16.37 14.13 13.84 13.76
Past performance may or may not be sustained in the future. SIP Return are calculated on XIRR basis. IDCW are assumed to be reinvested and bonus is adjusted. Load is not taken into consideration. For SIP returns, monthly investment of ` 10000 invested on the 1st day of every month has been considered.*B: Scheme Benchmark, AB: Additional Benchmark

41
Data as on March 31, 2021
L&T Flexicap FundOption NAV (`)IDCW Option - Regular Plan 31.268Growth Option - Regular Plan 100.057IDCW Option - Direct Plan 36.095Growth Option - Direct Plan 105.897
L&T Business Cycles FundOption NAV (`)IDCW Option - Regular Plan 15.761Growth Option - Regular Plan 19.024IDCW Option - Direct Plan 16.381Growth Option - Direct Plan 19.986
L&T Nifty 50 Index FundOption NAV (`)IDCW Option - Regular Plan 16.431Growth Option - Regular Plan 16.431IDCW Option - Direct Plan 16.499Growth Option - Direct Plan 16.499
L&T Tax Advantage FundOption NAV (`)IDCW Option - Regular Plan 22.448Growth Option - Regular Plan 67.250IDCW Option - Direct Plan 29.544Growth Option - Direct Plan 70.876
L&T Large and Midcap FundOption NAV (`)IDCW Option - Regular Plan 26.748Growth Option - Regular Plan 57.659IDCW Option - Direct Plan 30.477Growth Option - Direct Plan 61.392
L&T India Large Cap FundOption NAV (`)IDCW Option - Regular Plan 18.491Growth Option - Regular Plan 34.291IDCW Option - Direct Plan 20.260Growth Option - Direct Plan 36.486
L&T India Value FundOption NAV (`)IDCW Option - Regular Plan 32.077Growth Option - Regular Plan 45.663IDCW Option - Direct Plan 36.931Growth Option - Direct Plan 48.907
L&T Midcap FundOption NAV (`)IDCW Option - Regular Plan 49.020Growth Option - Regular Plan 175.260IDCW Option - Direct Plan 52.970Growth Option - Direct Plan 188.970
L&T Infrastructure FundOption NAV (`)IDCW Option - Regular Plan 18.170Growth Option - Regular Plan 18.170IDCW Option - Direct Plan 19.520Growth Option - Direct Plan 19.520
L&T Emerging Businesses FundOption NAV (`)IDCW Option - Regular Plan 21.955Growth Option - Regular Plan 30.235IDCW Option - Direct Plan 23.714Growth Option - Direct Plan 32.122
L&T Focused Equity FundOption NAV (`)IDCW Option - Regular Plan 13.929Growth Option - Regular Plan 13.929IDCW Option - Direct Plan 14.308Growth Option - Direct Plan 14.308
L&T Nifty Next 50 Index FundOption NAV (`)IDCW Option - Regular Plan 14.755Growth Option - Regular Plan 14.755IDCW Option - Direct Plan 14.819Growth Option - Direct Plan 14.819
L&T Overnight FundOption NAV (`)Daily IDCW Option - Regular Plan 1023.3000Weekly IDCW Option - Regular Plan 1000.2047Monthly IDCW Option - Regular Plan 1005.3751Growth Option - Regular Plan 1529.1611Daily IDCW Option - Direct Plan 1023.3000Weekly IDCW Option - Direct Plan 1001.6018Monthly IDCW Option - Direct Plan 1060.0791Growth Option - Direct Plan 1605.6674
L&T Liquid FundOption NAV (`)Daily IDCW 1011.7794Weekly IDCW 1002.9437Growth 2806.2247Daily IDCW - Direct Plan 1014.3496Weekly IDCW - Direct Plan 1001.1764Growth - Direct Plan 2818.9266
L&T Ultra Short Term FundOption NAV (`)Daily IDCW 10.3221Weekly IDCW 11.1026Monthly IDCW 12.7473Semi Annual IDCW 25.8814Growth 34.2302Bonus 18.6714Regular Growth 32.9394Daily IDCW - Direct Plan 10.5092Weekly IDCW - Direct Plan 11.2835Monthly IDCW - Direct Plan 13.0456Growth - Direct Plan 35.0941Bonus - Direct Plan 19.1697
L&T Money Market FundOption NAV (`)Daily IDCW Plan - Regular Plan 10.8591Weekly IDCW - Regular Plan 13.0319Monthly IDCW - Regular Plan 11.5434Growth Plan - Regular Plan 20.7718Daily IDCW Plan - Direct Plan 10.8591Weekly IDCW Plan - Direct Plan 13.1018Monthly IDCW - Direct Plan 12.0668Growth Plan - Direct Plan 21.4587
NAV
(Data as on March 31, 2021)Equity Funds
(Data as on March 31, 2021)Debt Funds

42
Data as on March 31, 2021
L&T Banking and PSU Debt FundOption NAV (`)Daily IDCW Option - Regular Plan 11.0766Weekly IDCW Option - Regular Plan 10.8114Monthly IDCW Option - Regular Plan 11.2877Growth Option - Regular Plan 19.4044Daily IDCW Option - Direct Plan 11.1611Weekly IDCW Option - Direct Plan 10.8150Monthly IDCW Option - Direct Plan 11.6990Growth Option - Direct Plan 20.1120
L&T Short Term Bond FundOption NAV (`)Monthly IDCW - Regular Plan 11.3394Quarterly IDCW - Regular Plan 10.9441Annual IDCW - Regular Plan 12.3697Growth - Regular Plan 20.8400Bonus - Regular Plan 20.8399Monthly IDCW - Direct Plan 11.8850Quarterly IDCW - Direct Plan 11.5903Annual IDCW - Direct Plan 12.7523Growth - Direct Plan 21.6502
L&T Low Duration FundOption NAV (`)IDCW Option - Regular Plan 10.5354Annual IDCW Option - Regular Plan 10.5272Growth Option - Regular Plan 22.1773IDCW Option - Direct Plan 11.0923Annual IDCW Option - Direct Plan 10.7725Growth Option - Direct Plan 22.8861
L&T Flexi Bond FundOption NAV (`)IDCW Option - Regular Plan 11.1213Annual IDCW Option - Regular Plan 10.9059Growth Option - Regular Plan 23.2346IDCW Option - Direct Plan 13.1084Annual IDCW Option - Direct Plan 11.2808Growth Option - Direct Plan 24.5237
L&T Gilt FundOption NAV (`)Quarterly IDCW - Regular Plan 11.8394Growth - Regular Plan 53.4274Quarterly IDCW - Direct Plan 13.0212Growth - Direct Plan 58.1962
L&T Credit Risk FundOption NAV (`)IDCW - Regular Plan 10.2000Annual IDCW - Regular Plan 11.1325Growth - Regular Plan 22.3123Bonus - Regular Plan 21.9531IDCW - Direct Plan 10.7259Annual IDCW - Direct Plan 11.5913Growth - Direct Plan 23.3771
L&T Triple Ace Bond FundOption NAV (`)Quarterly IDCW - Regular Plan 11.5621Semi Annual IDCW - Regular Plan 17.0710Annual IDCW - Regular Plan 11.8295Growth Plan - Regular Plan 56.8021Bonus - Regular Plan 21.5765Quarterly IDCW - Direct Plan 11.8760Semi Annual IDCW - Direct Plan 19.9578Annual IDCW - Direct Plan 11.9052Growth Plan - Direct Plan 59.6391
NAV
L&T Balanced Advantage FundOption NAV (`)IDCW Option - Regular Plan 17.705Growth Option - Regular Plan 28.798IDCW Option - Direct Plan 19.681Growth Option - Direct Plan 31.485
L&T Hybrid Equity FundOption NAV (`)IDCW Option - Regular Plan 22.864Annual IDCW - Regular Plan 14.169Growth Option - Regular Plan 32.174IDCW Option - Direct Plan 25.865Annual IDCW - Direct Plan 15.138Growth Option - Direct Plan 34.975
L&T Arbitrage Opportunities FundOption NAV (`)Monthly IDCW - Regular Plan 10.164Quarterly IDCW - Regular Plan 10.752Growth - Regular Plan 14.978Monthly IDCW - Direct Plan 10.451Quarterly IDCW - Direct Plan 11.008Growth - Direct Plan 15.584
L&T Equity Savings FundOption NAV (`)Monthly IDCW - Regular Plan 12.420Quarterly IDCW - Regular Plan 13.127Growth Plan - Regular Plan 20.599Monthly IDCW - Direct Plan 13.621Quarterly IDCW - Direct Plan 13.936Growth Plan - Direct Plan 21.992
L&T Resurgent India Bond FundOption NAV (`)IDCW Option - Regular Plan 11.0446Annual IDCW - Regular Plan 11.3792Growth Option - Regular Plan 15.7943IDCW Option - Direct Plan 11.6228Annual IDCW - Direct Plan 12.0180Growth Option - Direct Plan 16.6750
L&T Conservative Hybrid FundOption NAV (`)Monthly IDCW - Regular Plan 11.1151Quarterly IDCW - Regular Plan 10.9977Growth Plan - Regular Plan 40.2205Monthly IDCW - Direct Plan 11.9171Quarterly IDCW - Direct Plan 11.5834Growth Plan - Direct Plan 42.4940
(Data as on March 31, 2021)Hybrid Funds
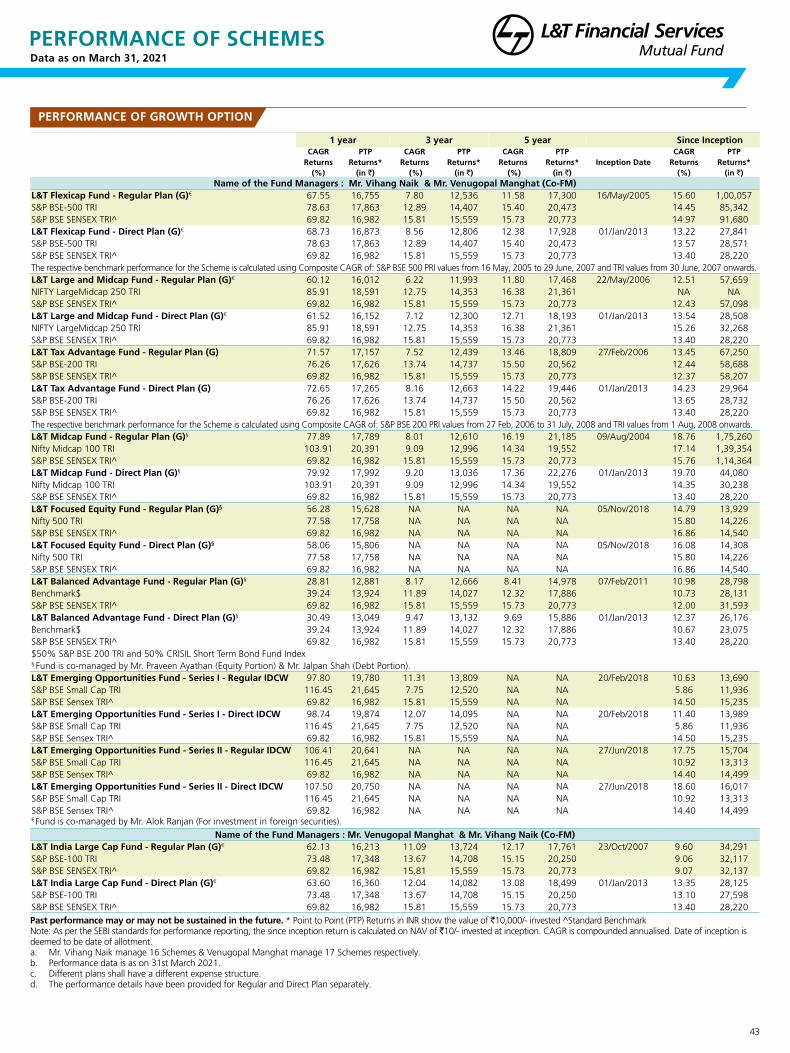
43
Data as on March 31, 2021
PERFORMANCE OF SCHEMES
PERFORMANCE OF GROWTH OPTION
1 year 3 year 5 year Since InceptionCAGR
Returns (%)
PTP Returns*
(in `)
CAGR Returns
(%)
PTP Returns*
(in `)
CAGR Returns
(%)
PTP Returns*
(in `)Inception Date
CAGR Returns
(%)
PTP Returns*
(in `)Name of the Fund Managers : Mr. Vihang Naik & Mr. Venugopal Manghat (Co-FM)
L&T Flexicap Fund - Regular Plan (G)€ 67.55 16,755 7.80 12,536 11.58 17,300 16/May/2005 15.60 1,00,057S&P BSE-500 TRI 78.63 17,863 12.89 14,407 15.40 20,473 14.45 85,342S&P BSE SENSEX TRI^ 69.82 16,982 15.81 15,559 15.73 20,773 14.97 91,680L&T Flexicap Fund - Direct Plan (G)€ 68.73 16,873 8.56 12,806 12.38 17,928 01/Jan/2013 13.22 27,841S&P BSE-500 TRI 78.63 17,863 12.89 14,407 15.40 20,473 13.57 28,571S&P BSE SENSEX TRI^ 69.82 16,982 15.81 15,559 15.73 20,773 13.40 28,220The respective benchmark performance for the Scheme is calculated using Composite CAGR of: S&P BSE 500 PRI values from 16 May, 2005 to 29 June, 2007 and TRI values from 30 June, 2007 onwards.L&T Large and Midcap Fund - Regular Plan (G)€ 60.12 16,012 6.22 11,993 11.80 17,468 22/May/2006 12.51 57,659NIFTY LargeMidcap 250 TRI 85.91 18,591 12.75 14,353 16.38 21,361 NA NAS&P BSE SENSEX TRI^ 69.82 16,982 15.81 15,559 15.73 20,773 12.43 57,098L&T Large and Midcap Fund - Direct Plan (G)€ 61.52 16,152 7.12 12,300 12.71 18,193 01/Jan/2013 13.54 28,508NIFTY LargeMidcap 250 TRI 85.91 18,591 12.75 14,353 16.38 21,361 15.26 32,268S&P BSE SENSEX TRI^ 69.82 16,982 15.81 15,559 15.73 20,773 13.40 28,220L&T Tax Advantage Fund - Regular Plan (G) 71.57 17,157 7.52 12,439 13.46 18,809 27/Feb/2006 13.45 67,250S&P BSE-200 TRI 76.26 17,626 13.74 14,737 15.50 20,562 12.44 58,688S&P BSE SENSEX TRI^ 69.82 16,982 15.81 15,559 15.73 20,773 12.37 58,207L&T Tax Advantage Fund - Direct Plan (G) 72.65 17,265 8.16 12,663 14.22 19,446 01/Jan/2013 14.23 29,964S&P BSE-200 TRI 76.26 17,626 13.74 14,737 15.50 20,562 13.65 28,732S&P BSE SENSEX TRI^ 69.82 16,982 15.81 15,559 15.73 20,773 13.40 28,220The respective benchmark performance for the Scheme is calculated using Composite CAGR of: S&P BSE 200 PRI values from 27 Feb, 2006 to 31 July, 2008 and TRI values from 1 Aug, 2008 onwards.L&T Midcap Fund - Regular Plan (G)§ 77.89 17,789 8.01 12,610 16.19 21,185 09/Aug/2004 18.76 1,75,260Nifty Midcap 100 TRI 103.91 20,391 9.09 12,996 14.34 19,552 17.14 1,39,354S&P BSE SENSEX TRI^ 69.82 16,982 15.81 15,559 15.73 20,773 15.76 1,14,364L&T Midcap Fund - Direct Plan (G)§ 79.92 17,992 9.20 13,036 17.36 22,276 01/Jan/2013 19.70 44,080Nifty Midcap 100 TRI 103.91 20,391 9.09 12,996 14.34 19,552 14.35 30,238S&P BSE SENSEX TRI^ 69.82 16,982 15.81 15,559 15.73 20,773 13.40 28,220L&T Focused Equity Fund - Regular Plan (G)§ 56.28 15,628 NA NA NA NA 05/Nov/2018 14.79 13,929Nifty 500 TRI 77.58 17,758 NA NA NA NA 15.80 14,226S&P BSE SENSEX TRI^ 69.82 16,982 NA NA NA NA 16.86 14,540L&T Focused Equity Fund - Direct Plan (G)§ 58.06 15,806 NA NA NA NA 05/Nov/2018 16.08 14,308Nifty 500 TRI 77.58 17,758 NA NA NA NA 15.80 14,226S&P BSE SENSEX TRI^ 69.82 16,982 NA NA NA NA 16.86 14,540L&T Balanced Advantage Fund - Regular Plan (G)§ 28.81 12,881 8.17 12,666 8.41 14,978 07/Feb/2011 10.98 28,798Benchmark$ 39.24 13,924 11.89 14,027 12.32 17,886 10.73 28,131S&P BSE SENSEX TRI^ 69.82 16,982 15.81 15,559 15.73 20,773 12.00 31,593L&T Balanced Advantage Fund - Direct Plan (G)§ 30.49 13,049 9.47 13,132 9.69 15,886 01/Jan/2013 12.37 26,176Benchmark$ 39.24 13,924 11.89 14,027 12.32 17,886 10.67 23,075S&P BSE SENSEX TRI^ 69.82 16,982 15.81 15,559 15.73 20,773 13.40 28,220$50% S&P BSE 200 TRI and 50% CRISIL Short Term Bond Fund Index§ Fund is co-managed by Mr. Praveen Ayathan (Equity Portion) & Mr. Jalpan Shah (Debt Portion).L&T Emerging Opportunities Fund - Series I - Regular IDCW 97.80 19,780 11.31 13,809 NA NA 20/Feb/2018 10.63 13,690S&P BSE Small Cap TRI 116.45 21,645 7.75 12,520 NA NA 5.86 11,936S&P BSE Sensex TRI^ 69.82 16,982 15.81 15,559 NA NA 14.50 15,235L&T Emerging Opportunities Fund - Series I - Direct IDCW 98.74 19,874 12.07 14,095 NA NA 20/Feb/2018 11.40 13,989S&P BSE Small Cap TRI 116.45 21,645 7.75 12,520 NA NA 5.86 11,936S&P BSE Sensex TRI^ 69.82 16,982 15.81 15,559 NA NA 14.50 15,235L&T Emerging Opportunities Fund - Series II - Regular IDCW 106.41 20,641 NA NA NA NA 27/Jun/2018 17.75 15,704S&P BSE Small Cap TRI 116.45 21,645 NA NA NA NA 10.92 13,313S&P BSE Sensex TRI^ 69.82 16,982 NA NA NA NA 14.40 14,499L&T Emerging Opportunities Fund - Series II - Direct IDCW 107.50 20,750 NA NA NA NA 27/Jun/2018 18.60 16,017S&P BSE Small Cap TRI 116.45 21,645 NA NA NA NA 10.92 13,313S&P BSE Sensex TRI^ 69.82 16,982 NA NA NA NA 14.40 14,499€ Fund is co-managed by Mr. Alok Ranjan (For investment in foreign securities).
Name of the Fund Managers : Mr. Venugopal Manghat & Mr. Vihang Naik (Co-FM) L&T India Large Cap Fund - Regular Plan (G)€ 62.13 16,213 11.09 13,724 12.17 17,761 23/Oct/2007 9.60 34,291S&P BSE-100 TRI 73.48 17,348 13.67 14,708 15.15 20,250 9.06 32,117S&P BSE SENSEX TRI^ 69.82 16,982 15.81 15,559 15.73 20,773 9.07 32,137L&T India Large Cap Fund - Direct Plan (G)€ 63.60 16,360 12.04 14,082 13.08 18,499 01/Jan/2013 13.35 28,125S&P BSE-100 TRI 73.48 17,348 13.67 14,708 15.15 20,250 13.10 27,598S&P BSE SENSEX TRI^ 69.82 16,982 15.81 15,559 15.73 20,773 13.40 28,220Past performance may or may not be sustained in the future. * Point to Point (PTP) Returns in INR show the value of `10,000/- invested ^Standard Benchmark Note: As per the SEBI standards for performance reporting, the since inception return is calculated on NAV of `10/- invested at inception. CAGR is compounded annualised. Date of inception is deemed to be date of allotment.a. Mr. Vihang Naik manage 16 Schemes & Venugopal Manghat manage 17 Schemes respectively.b. Performance data is as on 31st March 2021. c. Different plans shall have a different expense structure. d. The performance details have been provided for Regular and Direct Plan separately.
Data as on March 31, 2021

44
Data as on March 31, 2021
PERFORMANCE OF SCHEMES
PERFORMANCE OF GROWTH OPTION
1 year 3 year 5 year Since InceptionCAGR
Returns (%)
PTP Returns*
(in `)
CAGR Returns
(%)
PTP Returns*
(in `)
CAGR Returns
(%)
PTP Returns*
(in `)Inception Date
CAGR Returns
(%)
PTP Returns*
(in `)L&T India Value Fund - Regular Plan (G)€ 84.44 18,444 8.26 12,701 13.79 19,087 08/Jan/2010 14.48 45,663
S&P BSE-200 TRI 76.26 17,626 13.74 14,737 15.50 20,562 11.27 33,172
S&P BSE SENSEX TRI^ 69.82 16,982 15.81 15,559 15.73 20,773 11.21 32,978
L&T India Value Fund - Direct Plan (G)€ 86.21 18,621 9.30 13,069 14.83 19,972 01/Jan/2013 18.24 39,830
S&P BSE-200 TRI 76.26 17,626 13.74 14,737 15.50 20,562 13.65 28,732
S&P BSE SENSEX TRI^ 69.82 16,982 15.81 15,559 15.73 20,773 13.40 28,220
L&T Business Cycles Fund - Regular Plan (G)€ 76.84 17,684 5.34 11,694 11.42 17,177 20/Aug/2014 10.21 19,024
S&P BSE 200 TRI 76.26 17,626 13.74 14,737 15.50 20,562 12.09 21,278
S&P BSE Sensex TRI^ 69.82 16,982 15.81 15,559 15.73 20,773 11.38 20,404
L&T Business Cycles Fund - Direct Plan (G)€ 78.56 17,856 6.24 12,001 12.28 17,853 20/Aug/2014 11.03 19,986
S&P BSE 200 TRI 76.26 17,626 13.74 14,737 15.50 20,562 12.09 21,278
S&P BSE Sensex TRI^ 69.82 16,982 15.81 15,559 15.73 20,773 11.38 20,404€Fund is co-managed by Mr. Alok Ranjan (for investments in foreign securities).
L&T Conservative Hybrid Fund - Regular Plan (G)¥ 15.13 11,513 7.06 12,279 7.43 14,309 31/Jul/2003 8.19 40,220
CRISIL Hybrid 85+15 - Conservative Index 16.57 11,657 10.12 13,366 9.92 16,051 8.83 44,620
CRISIL 10 Yr Gilt Index^ 3.60 10,360 8.24 12,693 7.17 14,141 6.01 28,079
L&T Conservative Hybrid Fund - Direct Plan (G)¥ 15.76 11,576 7.71 12,507 8.13 14,786 01/Jan/2013 8.06 18,953
CRISIL Hybrid 85+15 - Conservative Index 16.57 11,657 10.12 13,366 9.92 16,051 9.69 21,442
CRISIL 10 Yr Gilt Index^ 3.60 10,360 8.24 12,693 7.17 14,141 7.17 17,704¥Fund is co-managed by Mr. Jalpan Shah (Debt Portion).
L&T Equity Savings Fund - Regular Plan (G)£ 33.62 13,362 6.34 12,033 7.44 14,318 18/Oct/2011 7.94 20,599
NIFTY Equity Savings Index 26.39 12,639 9.88 13,279 9.91 16,043 9.90 24,420
CRISIL 10 Yr Gilt Index^ 3.60 10,360 8.24 12,693 7.17 14,141 7.62 20,020
L&T Equity Savings Fund - Direct Plan (G)£ 34.79 13,479 7.26 12,349 8.32 14,919 01/Jan/2013 8.67 19,851
NIFTY Equity Savings Index 26.39 12,639 9.88 13,279 9.91 16,043 9.60 21,300
CRISIL 10 Yr Gilt Index^ 3.60 10,360 8.24 12,693 7.17 14,141 7.17 17,704£Fund is co-managed by Mr. Praveen Ayathan (Equity Portion) & Jalpan Shah (Debt Portion).
L&T Emerging Businesses Fund - Regular Plan (G)€ 100.10 20,010 4.09 11,283 16.53 21,500 12/May/2014 17.42 30,235
S&P BSE Small Cap TRI 116.45 21,645 7.75 12,520 15.38 20,458 16.64 28,880
S&P BSE SENSEX TRI^ 69.82 16,982 15.81 15,559 15.73 20,773 12.89 23,059
L&T Emerging Businesses Fund - Direct Plan (G)€ 102.27 20,227 5.22 11,654 17.66 22,562 12/May/2014 18.45 32,122
S&P BSE Small Cap TRI 116.45 21,645 7.75 12,520 15.38 20,458 16.64 28,880
S&P BSE SENSEX TRI^ 69.82 16,982 15.81 15,559 15.73 20,773 12.89 23,059
L&T Infrastructure Fund - Regular Plan (G) 73.54 17,354 1.96 10,601 12.70 18,188 27/Sep/2007 4.52 18,170
Nifty Infrastructure TRI 76.07 17,607 9.16 13,018 11.82 17,491 0.58 10,806
S&P BSE SENSEX TRI^ 69.82 16,982 15.81 15,559 15.73 20,773 11.34 42,717
L&T Infrastructure Fund - Direct Plan (G) 75.54 17,554 3.05 10,948 13.83 19,119 01/Jan/2013 13.90 29,265
Nifty Infrastructure TRI 76.07 17,607 9.16 13,018 11.82 17,491 7.24 17,795
S&P BSE SENSEX TRI^ 69.82 16,982 15.81 15,559 15.73 20,773 13.40 28,220
L&T Hybrid Equity Fund - Regular Plan (G)¥ 50.37 15,037 7.92 12,581 10.76 16,676 07/Feb/2011 12.20 32,174
CRISIL Hybrid 35+65 - Aggressive Index 49.75 14,975 12.88 14,403 13.61 18,938 11.49 30,160
S&P BSE SENSEX TRI^ 69.82 16,982 15.81 15,559 15.73 20,773 12.00 31,593
L&T Hybrid Equity Fund - Direct Plan (G)¥ 51.93 15,193 9.05 12,979 11.94 17,578 01/Jan/2013 14.39 30,316
CRISIL Hybrid 35+65 - Aggressive Index 49.75 14,975 12.88 14,403 13.61 18,938 12.36 26,144
S&P BSE SENSEX TRI^ 69.82 16,982 15.81 15,559 15.73 20,773 13.40 28,220€Fund is co-managed by Mr. Alok Ranjan (for investments in Foreign Securities). ¥Fund is co-managed by Mr. Shriram Ramanathan (Debt Portion) .
Name of the Fund Manager : Mr. Venugopal Manghat
L&T Arbitrage Opportunities Fund - Regular Plan (G)§ 3.86 10,386 5.37 11,706 5.67 13,178 30/Jun/2014 6.16 14,978
Nifty 50 Arbitrage Index 2.34 10,234 4.57 11,440 4.83 12,663 5.51 14,368
CRISIL 1 Yr T-Bill Index^ 4.66 10,466 6.48 12,082 6.50 13,706 6.94 15,733
L&T Arbitrage Opportunities Fund - Direct Plan (G)§ 4.45 10,445 5.97 11,907 6.28 13,564 30/Jun/2014 6.79 15,584
Nifty 50 Arbitrage Index 2.34 10,234 4.57 11,440 4.83 12,663 5.51 14,368
CRISIL 1 Yr T-Bill Index^ 4.66 10,466 6.48 12,082 6.50 13,706 6.94 15,733§Fund is co-managed by Mr. Praveen Ayathan, Mr. Alok Ranjan (For investments in foreign securities.) & Jalpan Shah (Debt Portion).
Past performance may or may not be sustained in the future. * Point to Point (PTP) Returns in INR show the value of `10,000/- invested ^Standard Benchmark Note: As per the SEBI standards for performance reporting, the since inception return is calculated on NAV of `10/- invested at inception. CAGR is compounded annualised. Date of inception is deemed to be date of allotment.a. Mr. Venugopal Manghat manages 17 Schemes, Mr. Vihang Naik manages 16 Schemes & Mr. Praveen Ayathan manages 5 Schemes.b. Performance data is as on 31st March 2021. c. Different plans shall have a different expense structure. d. The performance details have been provided for Regular and Direct Plan separately.
Data as on March 31, 2021
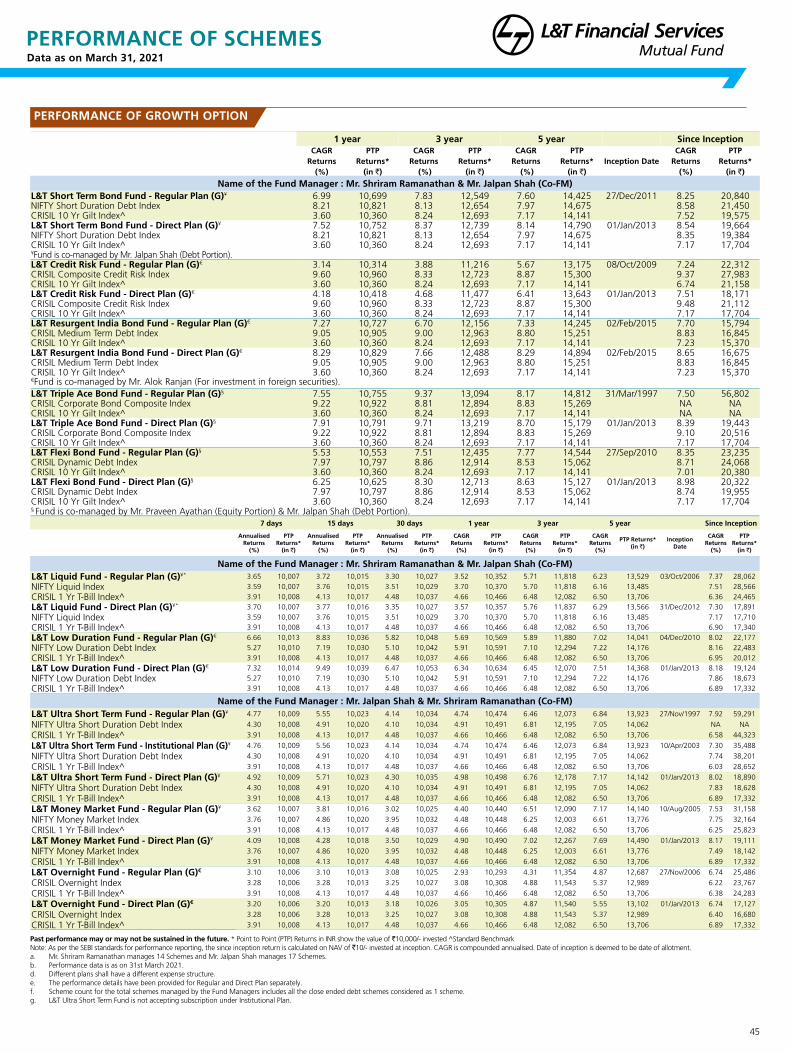
45
Data as on March 31, 2021
PERFORMANCE OF SCHEMES
PERFORMANCE OF GROWTH OPTION
1 year 3 year 5 year Since InceptionCAGR
Returns (%)
PTP Returns*
(in `)
CAGR Returns
(%)
PTP Returns*
(in `)
CAGR Returns
(%)
PTP Returns*
(in `)Inception Date
CAGR Returns
(%)
PTP Returns*
(in `)
Name of the Fund Manager : Mr. Shriram Ramanathan & Mr. Jalpan Shah (Co-FM)L&T Short Term Bond Fund - Regular Plan (G)¥ 6.99 10,699 7.83 12,549 7.60 14,425 27/Dec/2011 8.25 20,840NIFTY Short Duration Debt Index 8.21 10,821 8.13 12,654 7.97 14,675 8.58 21,450CRISIL 10 Yr Gilt Index^ 3.60 10,360 8.24 12,693 7.17 14,141 7.52 19,575L&T Short Term Bond Fund - Direct Plan (G)¥ 7.52 10,752 8.37 12,739 8.14 14,790 01/Jan/2013 8.54 19,664NIFTY Short Duration Debt Index 8.21 10,821 8.13 12,654 7.97 14,675 8.35 19,384CRISIL 10 Yr Gilt Index^ 3.60 10,360 8.24 12,693 7.17 14,141 7.17 17,704¥Fund is co-managed by Mr. Jalpan Shah (Debt Portion).L&T Credit Risk Fund - Regular Plan (G)€ 3.14 10,314 3.88 11,216 5.67 13,175 08/Oct/2009 7.24 22,312CRISIL Composite Credit Risk Index 9.60 10,960 8.33 12,723 8.87 15,300 9.37 27,983CRISIL 10 Yr Gilt Index^ 3.60 10,360 8.24 12,693 7.17 14,141 6.74 21,158L&T Credit Risk Fund - Direct Plan (G)€ 4.18 10,418 4.68 11,477 6.41 13,643 01/Jan/2013 7.51 18,171CRISIL Composite Credit Risk Index 9.60 10,960 8.33 12,723 8.87 15,300 9.48 21,112CRISIL 10 Yr Gilt Index^ 3.60 10,360 8.24 12,693 7.17 14,141 7.17 17,704L&T Resurgent India Bond Fund - Regular Plan (G)€ 7.27 10,727 6.70 12,156 7.33 14,245 02/Feb/2015 7.70 15,794CRISIL Medium Term Debt Index 9.05 10,905 9.00 12,963 8.80 15,251 8.83 16,845CRISIL 10 Yr Gilt Index^ 3.60 10,360 8.24 12,693 7.17 14,141 7.23 15,370L&T Resurgent India Bond Fund - Direct Plan (G)€ 8.29 10,829 7.66 12,488 8.29 14,894 02/Feb/2015 8.65 16,675CRISIL Medium Term Debt Index 9.05 10,905 9.00 12,963 8.80 15,251 8.83 16,845CRISIL 10 Yr Gilt Index^ 3.60 10,360 8.24 12,693 7.17 14,141 7.23 15,370€Fund is co-managed by Mr. Alok Ranjan (For investment in foreign securities).L&T Triple Ace Bond Fund - Regular Plan (G)§ 7.55 10,755 9.37 13,094 8.17 14,812 31/Mar/1997 7.50 56,802CRISIL Corporate Bond Composite Index 9.22 10,922 8.81 12,894 8.83 15,269 NA NACRISIL 10 Yr Gilt Index^ 3.60 10,360 8.24 12,693 7.17 14,141 NA NAL&T Triple Ace Bond Fund - Direct Plan (G)§ 7.91 10,791 9.71 13,219 8.70 15,179 01/Jan/2013 8.39 19,443CRISIL Corporate Bond Composite Index 9.22 10,922 8.81 12,894 8.83 15,269 9.10 20,516CRISIL 10 Yr Gilt Index^ 3.60 10,360 8.24 12,693 7.17 14,141 7.17 17,704L&T Flexi Bond Fund - Regular Plan (G)§ 5.53 10,553 7.51 12,435 7.77 14,544 27/Sep/2010 8.35 23,235CRISIL Dynamic Debt Index 7.97 10,797 8.86 12,914 8.53 15,062 8.71 24,068CRISIL 10 Yr Gilt Index^ 3.60 10,360 8.24 12,693 7.17 14,141 7.01 20,380L&T Flexi Bond Fund - Direct Plan (G)§ 6.25 10,625 8.30 12,713 8.63 15,127 01/Jan/2013 8.98 20,322CRISIL Dynamic Debt Index 7.97 10,797 8.86 12,914 8.53 15,062 8.74 19,955CRISIL 10 Yr Gilt Index^ 3.60 10,360 8.24 12,693 7.17 14,141 7.17 17,704§ Fund is co-managed by Mr. Praveen Ayathan (Equity Portion) & Mr. Jalpan Shah (Debt Portion).
7 days 15 days 30 days 1 year 3 year 5 year Since Inception
Annualised Returns
(%)
PTP Returns*
(in `)
Annualised Returns
(%)
PTP Returns*
(in `)
Annualised Returns
(%)
PTP Returns*
(in `)
CAGR Returns
(%)
PTP Returns*
(in `)
CAGR Returns
(%)
PTP Returns*
(in `)
CAGR Returns
(%)
PTP Returns* (in `)
Inception Date
CAGR Returns
(%)
PTP Returns*
(in `)
Name of the Fund Manager : Mr. Shriram Ramanathan & Mr. Jalpan Shah (Co-FM)L&T Liquid Fund - Regular Plan (G)¥* 3.65 10,007 3.72 10,015 3.30 10,027 3.52 10,352 5.71 11,818 6.23 13,529 03/Oct/2006 7.37 28,062
NIFTY Liquid Index 3.59 10,007 3.76 10,015 3.51 10,029 3.70 10,370 5.70 11,818 6.16 13,485 7.51 28,566
CRISIL 1 Yr T-Bill Index^ 3.91 10,008 4.13 10,017 4.48 10,037 4.66 10,466 6.48 12,082 6.50 13,706 6.36 24,465
L&T Liquid Fund - Direct Plan (G)¥* 3.70 10,007 3.77 10,016 3.35 10,027 3.57 10,357 5.76 11,837 6.29 13,566 31/Dec/2012 7.30 17,891
NIFTY Liquid Index 3.59 10,007 3.76 10,015 3.51 10,029 3.70 10,370 5.70 11,818 6.16 13,485 7.17 17,710
CRISIL 1 Yr T-Bill Index^ 3.91 10,008 4.13 10,017 4.48 10,037 4.66 10,466 6.48 12,082 6.50 13,706 6.90 17,340
L&T Low Duration Fund - Regular Plan (G)€ 6.66 10,013 8.83 10,036 5.82 10,048 5.69 10,569 5.89 11,880 7.02 14,041 04/Dec/2010 8.02 22,177
NIFTY Low Duration Debt Index 5.27 10,010 7.19 10,030 5.10 10,042 5.91 10,591 7.10 12,294 7.22 14,176 8.16 22,483
CRISIL 1 Yr T-Bill Index^ 3.91 10,008 4.13 10,017 4.48 10,037 4.66 10,466 6.48 12,082 6.50 13,706 6.95 20,012
L&T Low Duration Fund - Direct Plan (G)€ 7.32 10,014 9.49 10,039 6.47 10,053 6.34 10,634 6.45 12,070 7.51 14,368 01/Jan/2013 8.18 19,124
NIFTY Low Duration Debt Index 5.27 10,010 7.19 10,030 5.10 10,042 5.91 10,591 7.10 12,294 7.22 14,176 7.86 18,673
CRISIL 1 Yr T-Bill Index^ 3.91 10,008 4.13 10,017 4.48 10,037 4.66 10,466 6.48 12,082 6.50 13,706 6.89 17,332
Name of the Fund Manager : Mr. Jalpan Shah & Mr. Shriram Ramanathan (Co-FM) L&T Ultra Short Term Fund - Regular Plan (G)¥ 4.77 10,009 5.55 10,023 4.14 10,034 4.74 10,474 6.46 12,073 6.84 13,923 27/Nov/1997 7.92 59,291
NIFTY Ultra Short Duration Debt Index 4.30 10,008 4.91 10,020 4.10 10,034 4.91 10,491 6.81 12,195 7.05 14,062 NA NA
CRISIL 1 Yr T-Bill Index^ 3.91 10,008 4.13 10,017 4.48 10,037 4.66 10,466 6.48 12,082 6.50 13,706 6.58 44,323
L&T Ultra Short Term Fund - Institutional Plan (G)¥ 4.76 10,009 5.56 10,023 4.14 10,034 4.74 10,474 6.46 12,073 6.84 13,923 10/Apr/2003 7.30 35,488
NIFTY Ultra Short Duration Debt Index 4.30 10,008 4.91 10,020 4.10 10,034 4.91 10,491 6.81 12,195 7.05 14,062 7.74 38,201
CRISIL 1 Yr T-Bill Index^ 3.91 10,008 4.13 10,017 4.48 10,037 4.66 10,466 6.48 12,082 6.50 13,706 6.03 28,652
L&T Ultra Short Term Fund - Direct Plan (G)¥ 4.92 10,009 5.71 10,023 4.30 10,035 4.98 10,498 6.76 12,178 7.17 14,142 01/Jan/2013 8.02 18,890
NIFTY Ultra Short Duration Debt Index 4.30 10,008 4.91 10,020 4.10 10,034 4.91 10,491 6.81 12,195 7.05 14,062 7.83 18,628
CRISIL 1 Yr T-Bill Index^ 3.91 10,008 4.13 10,017 4.48 10,037 4.66 10,466 6.48 12,082 6.50 13,706 6.89 17,332
L&T Money Market Fund - Regular Plan (G)¥ 3.62 10,007 3.81 10,016 3.02 10,025 4.40 10,440 6.51 12,090 7.17 14,140 10/Aug/2005 7.53 31,158
NIFTY Money Market Index 3.76 10,007 4.86 10,020 3.95 10,032 4.48 10,448 6.25 12,003 6.61 13,776 7.75 32,164
CRISIL 1 Yr T-Bill Index^ 3.91 10,008 4.13 10,017 4.48 10,037 4.66 10,466 6.48 12,082 6.50 13,706 6.25 25,823
L&T Money Market Fund - Direct Plan (G)¥ 4.09 10,008 4.28 10,018 3.50 10,029 4.90 10,490 7.02 12,267 7.69 14,490 01/Jan/2013 8.17 19,111
NIFTY Money Market Index 3.76 10,007 4.86 10,020 3.95 10,032 4.48 10,448 6.25 12,003 6.61 13,776 7.49 18,142
CRISIL 1 Yr T-Bill Index^ 3.91 10,008 4.13 10,017 4.48 10,037 4.66 10,466 6.48 12,082 6.50 13,706 6.89 17,332
L&T Overnight Fund - Regular Plan (G)€ 3.10 10,006 3.10 10,013 3.08 10,025 2.93 10,293 4.31 11,354 4.87 12,687 27/Nov/2006 6.74 25,486
CRISIL Overnight Index 3.28 10,006 3.28 10,013 3.25 10,027 3.08 10,308 4.88 11,543 5.37 12,989 6.22 23,767
CRISIL 1 Yr T-Bill Index^ 3.91 10,008 4.13 10,017 4.48 10,037 4.66 10,466 6.48 12,082 6.50 13,706 6.38 24,283
L&T Overnight Fund - Direct Plan (G)€ 3.20 10,006 3.20 10,013 3.18 10,026 3.05 10,305 4.87 11,540 5.55 13,102 01/Jan/2013 6.74 17,127
CRISIL Overnight Index 3.28 10,006 3.28 10,013 3.25 10,027 3.08 10,308 4.88 11,543 5.37 12,989 6.40 16,680
CRISIL 1 Yr T-Bill Index^ 3.91 10,008 4.13 10,017 4.48 10,037 4.66 10,466 6.48 12,082 6.50 13,706 6.89 17,332
Past performance may or may not be sustained in the future. * Point to Point (PTP) Returns in INR show the value of `10,000/- invested ^Standard Benchmark Note: As per the SEBI standards for performance reporting, the since inception return is calculated on NAV of `10/- invested at inception. CAGR is compounded annualised. Date of inception is deemed to be date of allotment.a. Mr. Shriram Ramanathan manages 14 Schemes and Mr. Jalpan Shah manages 17 Schemes.b. Performance data is as on 31st March 2021. d. Different plans shall have a different expense structure. e. The performance details have been provided for Regular and Direct Plan separately.f. Scheme count for the total schemes managed by the Fund Managers includes all the close ended debt schemes considered as 1 scheme. g. L&T Ultra Short Term Fund is not accepting subscription under Institutional Plan.
Data as on March 31, 2021

46
Data as on March 31, 2021
PERFORMANCE OF GROWTH OPTION
1 year 3 year 5 year Since InceptionCAGR
Returns (%)
PTP Returns*
(in `)
CAGR Returns
(%)
PTP Returns*
(in `)
CAGR Returns
(%)
PTP Returns*
(in `)Inception Date
CAGR Returns
(%)
PTP Returns*
(in `)Name of the Fund Manager : Mr. Jalpan Shah & Mr. Shriram Ramanathan (Co-FM)
L&T Gilt Fund - Regular Plan (G) 5.60 10,560 7.34 12,378 7.41 14,297 29/Mar/2000 8.30 53,427CRISIL Dynamic Gilt Index 6.49 10,649 8.98 12,957 8.21 14,839 8.83 59,248CRISIL 10 Yr Gilt Index^ 3.60 10,360 8.24 12,693 7.17 14,141 NA NAL&T Gilt Fund - Direct Plan (G) 6.85 10,685 8.69 12,851 8.84 15,277 01/Jan/2013 9.95 21,867CRISIL Dynamic Gilt Index 6.49 10,649 8.98 12,957 8.21 14,839 8.28 19,271CRISIL 10 Yr Gilt Index^ 3.60 10,360 8.24 12,693 7.17 14,141 7.17 17,704L&T Banking and PSU Debt Fund - Regular Plan (G) 7.89 10,789 8.02 12,616 7.93 14,650 12/Sep/2012 8.06 19,404NIFTY Banking & PSU Debt Index 7.75 10,775 7.90 12,572 7.85 14,593 8.32 19,826CRISIL 10 Yr Gilt Index^ 3.60 10,360 8.24 12,693 7.17 14,141 7.37 18,383L&T Banking and PSU Debt Fund - Direct Plan (G) 8.33 10,833 8.47 12,773 8.41 14,975 01/Jan/2013 8.51 19,617NIFTY Banking & PSU Debt Index 7.75 10,775 7.90 12,572 7.85 14,593 8.26 19,242CRISIL 10 Yr Gilt Index^ 3.60 10,360 8.24 12,693 7.17 14,141 7.17 17,704L&T FMP - XVI - Plan A - (1100D) - Regular Plan (G) 5.67 10,567 7.21 12,331 NA NA 22/Dec/2017 7.16 12,540CRISIL Composite Bond Fund Index 7.69 10,769 8.97 12,953 NA NA 8.56 13,085CRISIL 10 Yr Gilt Index^ 3.60 10,360 8.24 12,693 NA NA 7.50 12,673L&T FMP - XVI - Plan A - (1100D) - Direct Plan (G) 5.83 10,583 7.38 12,390 NA NA 22/Dec/2017 7.33 12,606CRISIL Composite Bond Fund Index 7.69 10,769 8.97 12,953 NA NA 8.56 13,085CRISIL 10 Yr Gilt Index^ 3.60 10,360 8.24 12,693 NA NA 7.50 12,673L&T FMP - XVII - Plan B - (1452D) - Regular Plan (G) 8.46 10,846 NA NA NA NA 28/Jun/2018 9.30 12,780CRISIL Composite Bond Fund Index 7.69 10,769 NA NA NA NA 10.23 13,082CRISIL 10 Yr Gilt Index^ 3.60 10,360 NA NA NA NA 9.70 12,910L&T FMP - XVII - Plan B - (1452D) - Direct Plan (G) 8.74 10,874 NA NA NA NA 28/Jun/2018 9.61 12,879CRISIL Composite Bond Fund Index 7.69 10,769 NA NA NA NA 10.23 13,082CRISIL 10 Yr Gilt Index^ 3.60 10,360 NA NA NA NA 9.70 12,910L&T FMP - XVII - Scheme C - (1114D) - Regular Plan (G) 7.16 10,716 NA NA NA NA 11/Sep/2018 8.78 12,396CRISIL Composite Bond Fund Index 7.69 10,769 NA NA NA NA 10.91 13,027CRISIL 10 Yr Gilt Index^ 3.60 10,360 NA NA NA NA 10.54 12,916L&T FMP - XVII - Scheme C - (1114D) - Direct Plan (G) 7.47 10,747 NA NA NA NA 11/Sep/2018 9.11 12,494CRISIL Composite Bond Fund Index 7.69 10,769 NA NA NA NA 10.91 13,027CRISIL 10 Yr Gilt Index^ 3.60 10,360 NA NA NA NA 10.54 12,916L&T FMP - XVIII - Scheme A - (1104D) - Regular Plan (G) 6.80 10,680 NA NA NA NA 28/Sep/2018 8.57 12,290CRISIL Composite Bond Fund Index 7.69 10,769 NA NA NA NA 10.91 12,963CRISIL 10 Yr Gilt Index^ 3.60 10,360 NA NA NA NA 10.13 12,737L&T FMP - XVIII - Scheme A - (1104D) - Direct Plan (G) 7.11 10,711 NA NA NA NA 28/Sep/2018 8.91 12,385CRISIL Composite Bond Fund Index 7.69 10,769 NA NA NA NA 10.91 12,963CRISIL 10 Yr Gilt Index^ 3.60 10,360 NA NA NA NA 10.13 12,737L&T FMP - XVIII - Scheme B - (1229D) - Regular Plan (G) 8.28 10,828 NA NA NA NA 30/Nov/2018 9.62 12,391CRISIL Composite Bond Fund Index 7.69 10,769 NA NA NA NA 10.28 12,565CRISIL 10 Yr Gilt Index^ 3.60 10,360 NA NA NA NA 9.03 12,237L&T FMP - XVIII - Scheme B - (1229D) - Direct Plan (G) 8.55 10,855 NA NA NA NA 30/Nov/2018 9.89 12,463CRISIL Composite Bond Fund Index 7.69 10,769 NA NA NA NA 10.28 12,565CRISIL 10 Yr Gilt Index^ 3.60 10,360 NA NA NA NA 9.03 12,237L&T FMP - XVIII - Scheme C - (1178D) - Regular Plan (G) 9.06 10,906 NA NA NA NA 18/Feb/2019 9.64 12,149CRISIL Composite Bond Fund Index 7.69 10,769 NA NA NA NA 10.48 12,346CRISIL 10 Yr Gilt Index^ 3.60 10,360 NA NA NA NA 9.11 12,025L&T FMP - XVIII - Scheme C - (1178D) - Direct Plan (G) 9.31 10,931 NA NA NA NA 18/Feb/2019 9.89 12,208CRISIL Composite Bond Fund Index 7.69 10,769 NA NA NA NA 10.48 12,346CRISIL 10 Yr Gilt Index^ 3.60 10,360 NA NA NA NA 9.11 12,025L&T FMP - XVIII - Scheme D - (1155D) - Regular Plan (G) 8.42 10,842 NA NA NA NA 12/Feb/2019 9.53 12,141CRISIL Composite Bond Fund Index 7.69 10,769 NA NA NA NA 10.40 12,347CRISIL 10 Yr Gilt Index^ 3.60 10,360 NA NA NA NA 8.95 12,004L&T FMP - XVIII - Scheme D - (1155D) - Direct Plan (G) 8.59 10,859 NA NA NA NA 12/Feb/2019 9.69 12,180CRISIL Composite Bond Fund Index 7.69 10,769 NA NA NA NA 10.40 12,347CRISIL 10 Yr Gilt Index^ 3.60 10,360 NA NA NA NA 8.95 12,004
6 months 1 year 3 year Since InceptionAnnualised
Returns (%)
PTP Returns*
(in `)
CAGR Returns
(%)
PTP Returns*
(in `)
CAGR Returns
(%)
PTP Returns*
(in `)Inception Date
Absolute Returns
(%)
PTP Returns*
(in `)Name of the Fund Manager : Mr. Praveen Ayathan
L&T Nifty 50 Index Fund - Regular Plan (G) 61.16 13,050 NA NA NA NA 15/Apr/2020 64.31 16,431Nifty 50 TRI 62.62 13,122 NA NA NA NA 66.20 16,620L&T Nifty 50 Index Fund - Direct Plan (G) 61.71 13,077 NA NA NA NA 15/Apr/2020 64.99 16,499Nifty 50 TRI 62.62 13,122 NA NA NA NA 66.20 16,620L&T Nifty Next 50 Index Fund - Regular Plan (G) 52.47 12,617 NA NA NA NA 15/Apr/2020 47.55 14,755Nifty Next 50 TRI 53.74 12,680 NA NA NA NA 49.23 14,923Nifty 50 TRI^ 62.62 13,122 NA NA NA NA 66.20 16,620L&T Nifty Next 50 Index Fund - Direct Plan (G) 53.05 12,645 NA NA NA NA 15/Apr/2020 48.19 14,819Nifty Next 50 TRI 53.74 12,680 NA NA NA NA 49.23 14,923Nifty 50 TRI^ 62.62 13,122 NA NA NA NA 66.20 16,620Past performance may or may not be sustained in the future. * Point to Point (PTP) Returns in INR show the value of `10,000/- invested ^Standard Benchmark Note: As per the SEBI standards for performance reporting, the since inception return is calculated on NAV of ̀ 10/- invested at inception. CAGR is compounded annualised. Date of inception is deemed to be date of allotment.a. Mr. Shriram Ramanathan manages 14 Schemes, Mr. Jalpan Shah manages 17 Schemes & Mr. Praveen Ayathan manages 5 Schemes.b. Performance data is as on 31st March 2021. c. Different plans shall have a different expense structure. d. The performance details have been provided for Regular and Direct Plan separately.e. Scheme count for the total schemes managed by the Fund Managers includes all the close ended debt schemes considered as 1 scheme. Common to all Schemes: Performance of the schemes (wherever provided) are calculated basis CAGR for the past 1 year, 3 years, 5 years and for period less than 1 year, returns are calculated on simple annualized basis. In case, the start/end date of the concerned period is a non - business day (NBD), the NAV of the previous date is considered for computation of returns.
PERFORMANCE OF SCHEMESData as on March 31, 2021

47
Data as on March 31, 2021
- Including Additional Expenses in terms of Reg 52(6A)(c), B30 charges in terms of Reg 52(6A)(b) and GST on Management Fees. - Total Expense Ratio is as on the last business day of the month+Effective April 01, 2019 Total Expense Ratio (TER) stands revised. For the actual current expenses charged to the scheme, please refer the website of the Mutual Fund - www.ltfs.com
Fund Name Regular Direct
L&T Flexicap Fund 2.10% 1.44%
L&T Tax Advantage Fund 2.00% 1.38%
L&T Large and Midcap Fund 2.28% 1.44%
L&T India Large Cap Fund 2.54% 1.64%
L&T India Value Fund 1.89% 0.95%
L&T Midcap Fund 1.89% 0.76%
L&T Infrastructure Fund 2.27% 1.26%
L&T Emerging Businesses Fund 1.95% 0.87%
L&T Business Cycles Fund 2.55% 1.53%
L&T Focused Equity Fund 2.42% 1.24%
L&T Nifty 50 Index Fund 0.70% 0.30%
L&T Nifty Next 50 Index Fund 0.70% 0.25%
L&T Balanced Advantage Fund 2.11% 0.81%
L&T Hybrid Equity Fund 1.89% 0.92%
L&T Arbitrage Opportunities Fund 0.99% 0.29%
L&T Equity Savings Fund 1.57% 0.80%
L&T Overnight Fund 0.20% 0.10%
L&T Liquid Fund 0.20% 0.15%
L&T Ultra Short Term Fund 0.39% 0.23%
L&T Money Market Fund 0.73% 0.25%
L&T Banking and PSU Debt Fund 0.61% 0.21%
L&T Short Term Bond Fund 0.75% 0.25%
L&T Low Duration Fund 0.95% 0.30%
L&T Credit Risk Fund 1.66% 0.87%
L&T Flexi Bond Fund 1.62% 0.90%
L&T Triple Ace Bond Fund 0.63% 0.27%
L&T Gilt Fund 1.70% 0.45%
L&T Conservative Hybrid Fund 2.24% 1.65%
L&T Resurgent India Bond Fund 1.51% 0.60%
Fund NameMinimum Application size
(Initial)Additional Investment Minimum Redemption Size
L&T Flexicap Fund `5,000 per application `1,000 per application `500 or 50 units
L&T Tax Advantage Fund `500 per application and in multiples of `500 thereafter `500 per applicationb and in multiples of `500 thereafter `500 or 50 units
L&T Large and Midcap Fund `5,000 per application `1,000 per application `500 or 50 units
L&T India Large Cap Fund `5,000 per application `1,000 per application `500 or 50 units
L&T India Value Fund `5,000 per application `1,000 per application `500 or 50 units
L&T Midcap Fund `5,000 per application and in multiples of `1 thereafter `1,000 per application and in multiples of `1 thereafter `500 or 50 units
L&T Infrastructure Fund `5,000 per application and in multiples of `1 thereafter `1,000 per application and in multiples of `1 thereafter `500 or 50 units
L&T Emerging Businesses Fund `5,000 per application `1,000 per application `500 or 50 units
L&T Business Cycles Fund `5,000 per application and inmultiples of `1 thereafter `1,000 per application and in multiples of `1 thereafter `500 or 50 units
L&T Focused Equity Fund `5,000 per application and in multiples of `1 thereafter `1,000 per application and in multiples of `1 thereafter `500 or 50 units
L&T Nifty 50 Index Fund `5,000 per application and in multiples of `1 thereafter `1,000 per application and in multiples of `1 thereafter `500 or 50 units
L&T Nifty Next 50 Index Fund `5,000 per application and in multiples of `1 thereafter `1,000 per application and in multiples of `1 thereafter `500 or 50 units
L&T Balanced Advantage Fund `5,000 per application `1,000 per application `500 or 50 units
L&T Hybrid Equity Fund `5,000 per application `1,000 per application `500 or 50 units
L&T Arbitrage Opportunities Fund `5,000 per application and in multiples of `1 thereafter `1,000 per application and in multiples of `1 thereafter `500 or 50 units or account balance, whichever is lower.
L&T Equity Savings Fund `5,000 per application and in multiples of `1 thereafter `1,000 per application and in multiples of `1 thereafter `500 or 50 units
L&T Overnight FundGrowth and IDCW: `10,000 per application and in multiples of `1 thereafter. In case of
Daily IDCW Option, `1,00,000 and in multiples of `1 thereafter.`1,000 per application and thereafter in multiples of `1 `1000 or 1 unit
L&T Liquid FundWeekly IDCW and Growth: `10,000 per application and in
multiples of `1 thereafter Daily IDCW Reinvestment Plan (“DDRIP”): `1,00,000 per application and in multiples of `1 thereafter
`1,000 per application and in multiples of `1 thereafterRegular Plan : `1000/- per application or 1 unit
Weekly IDCW/ Growth/ DDRIP: `1000 per application or 1 unit
L&T Ultra Short Term Fund
Growth/Weekly IDCW/Monthly IDCW/Semi-Annual IDCW:`10,000 per application and in multiples of `1 thereafter; Daily
IDCW Reinvestment Plan: `1,00,000 per application and inmultiples of `1 thereafter.
`1,000 per application and in multiples of `1 thereafter
Regular Plan: `500/- per application or 50 unitsWeekly IDCW/Monthly IDCW/Semi Annual IDCW/ Growth/
Bonus DDRIP: `500 per application or 50 Units
L&T Money Market Fund `10,000 per application and in multiples of `1 thereafter `1,000 per application and in multiples of `1 thereafter `500 or 50 units
L&T Banking and PSU Debt Fund `10,000 per application `1,000 per application and thereafter in multiples of `1 `500 or 50 units
L&T Short Term Bond Fund `10,000 per application and in multiples of `1 thereafter `1,000 per application and in multiples of `1 thereafter `500 or 50 units
L&T Low Duration Fund `10,000 per application `1,000 per application `500 or 50 units
L&T Credit Risk Fund `10,000 per application and in multiples of `1 thereafter. `1,000 per application and in multiples of `1 thereafter.Retail Option : `500/- per application or 50 units
IDCW/ Growth/Bonus: `500 per application or 50 units
L&T Flexi Bond Fund `10,000 per application `1,000 per application and thereafter in multiples of `1 `500 or 50 units
L&T Triple Ace Bond Fund `10,000 per application and in multiples of `1 thereafter `1,000 per application and in multiples of `1 thereafter `500 or 50 units
L&T Gilt Fund `10,000 per application and in multiples of `1 thereafter `1,000 per application and in multiples of `1 thereafter `500 or 50 units
L&T Conservative Hybrid Fund `10,000 per application and in multiples of `1 thereafter `1,000 per application and in multiples of `1 thereafter `500 or 50 units
L&T Resurgent India Bond Fund `5,000 per application and in multiples of `1 thereafter `1,000 per application and in multiples of `1 thereafter `500 or 50 units
MINIMUM INVESTMENT AMOUNT DETAILS
TOTAL EXPENSE RATIO+
Data as on March 31, 2021

48
Data as on March 31, 2021
IDCW HISTORY FOR EQUITY SCHEMES
L&T Flexicap Fund (formerly known as L&T Equity Fund)
Record Date NAV as on date of declaration (`) Quantum of IDCW (`) Per Unit
Regular Plan IDCW12-Jan-2017 29.302 2.2500 19-Jan-2018 36.698 2.5000 24-Jan-2019 31.507 2.5000 24-Jan-2020 31.507 2.5000 24-Feb-2021 34.611 2.5000 Direct Plan IDCW24-Jan-2019 35.423 2.500024-Jan-2020 36.035 2.850024-Feb-2021 39.889 2.8500
L&T Midcap FundRecord Date NAV as on date of
declaration (`)Quantum of IDCW
(`) Per UnitRegular Plan IDCW18-Aug-2016 39.950 3.500010-Aug-2017 50.380 4.000017-Aug-2018 48.880 4.000023-Aug-2019 38.240 3.250026-Aug-2020 38.480 1.5000Direct Plan IDCW17-Aug-2018 51.500 4.000023-Aug-2019 40.930 3.500026-Aug-2020 41.680 2.0000
L&T Tax Advantage FundRecord Date NAV as on date of
declaration (`)Quantum of IDCW
(`) Per UnitRegular Plan IDCW22-Mar-2019 21.903 1.0000 26-Nov-2019 21.578 0.750020-Mar-2020 17.780 0.800024-Dec-2020 22.438 0.900026-Mar-2021 23.129 0.9000Direct Plan IDCW20-Mar-2020 21.649 0.900024-Dec-2020 28.929 0.900026-Mar-2021 30.147 0.9000
L&T Large and Midcap Fund
Record Date NAV as on date of declaration (`)
Quantum of IDCW (`) Per Unit
Regular Plan IDCW 22-Jan-2021 27.092 0.160023-Feb-2021 27.346 0.160023-Mar-2021 26.979 0.1600Direct Plan IDCW22-Jan-2021 30.809 0.180023-Feb-2021 31.122 0.180023-Mar-2021 30.727 0.1800
L&T India Large Cap FundRecord Date NAV as on date of
declaration (`)Quantum of IDCW
(`) Per UnitRegular Plan IDCW21-Dec-2018 17.075 1.3000 23-Dec-2019 17.752 1.3000 24-Dec-2020 18.367 1.1000Direct Plan IDCW21-Dec-2018 18.333 1.4000 23-Dec-2019 19.214 1.4000 24-Dec-2020 20.071 1.2000
L&T India Value FundRecord Date NAV as on date of
declaration (`)Quantum of IDCW
(`) Per UnitRegular Plan IDCW21-Jun-2016 21.768 1.500015-Jun-2017 27.613 1.750021-Jun-2018 27.372 1.7500Direct Plan IDCW21-Jun-2016 22.379 1.400015-Jun-2017 29.698 1.500021-Jun-2018 30.105 1.4000
L&T Balanced Advantage Fund (Formerly known as L&T Dynamic Equity Fund)
Record Date NAV as on date of declaration (`)
Quantum of IDCW (`) Per Unit
Regular Plan IDCW22-Jan-2021 18.048 0.110023-Feb-2021 18.050 0.110023-Mar-2021 17.795 0.1000Direct Plan IDCW22-Jan-2021 20.004 0.120023-Feb-2021 20.031 0.120023-Mar-2021 19.770 0.1100
L&T Hybrid Equity FundRecord Date NAV as on date of
declaration (`)Quantum of IDCW
(`) Per UnitRegular Plan IDCW23-Dec-2020 22.102 0.100022-Jan-2021 22.786 0.120023-Feb-2021 23.815 0.120023-Mar-2021 23.182 0.1200Direct Plan IDCW23-Dec-2020 24.932 0.110022-Jan-2021 25.729 0.130023-Feb-2021 26.919 0.140023-Mar-2021 26.219 0.1400Record Date NAV as on date of
declaration (`)Quantum of IDCW
(`) Per UnitRegular Plan - Annual IDCW22-Mar-2019 12.642 0.619820-Mar-2020 11.080 0.000026-Mar-2021 14.794 0.7000Direct Plan - Annual IDCW22-Mar-2019 13.242 0.664120-Mar-2020 11.710 0.000026-Mar-2021 15.803 0.7500
L&T Arbitrage Opportunities FundRecord Date NAV as on Record
Date (`)Quantum of IDCW
(`) Per UnitRegular Plan - Monthly IDCW25-Sep-2020 10.192 0.030030-Oct-2020 10.196 0.030027-Nov-2020 10.174 0.030001-Jan-2021 10.176 0.030029-Jan-2021 10.165 0.020026-Feb-2021 10.180 0.030026-Mar-2021 10.186 0.0300Direct Plan - Monthly IDCW25-Sep-2020 10.439 0.030030-Oct-2020 10.449 0.030027-Nov-2020 10.433 0.030001-Jan-2021 10.443 0.030029-Jan-2021 10.437 0.020026-Feb-2021 10.459 0.030026-Mar-2021 10.472 0.0300Record Date NAV as on date of
declaration (`)Quantum of IDCW
(`) Per Unit
Regular Plan - Quarterly IDCW24-Sep-2020 10.683 0.090023-Dec-2020 10.681 0.050019-Mar-2021 10.722 0.0000Direct Plan - Quarterly IDCW24-Sep-2020 10.935 0.090023-Dec-2020 10.952 0.090019-Mar-2021 10.973 0.0000
L&T Business Cycles FundRecord Date NAV as on date of
declaration (`)Quantum of IDCW
(`) Per UnitRegular Plan IDCW14-Jul-2017 15.408 1.0000 20-Jul-2018 14.520 0.900003-Oct-2019 13.452 0.7000Direct Plan IDCW14-Jul-2017 15.697 1.0000 20-Jul-2018 14.911 0.900003-Oct-2019 13.974 0.9000
L&T Emerging Businesses FundRecord Date NAV as on date of
declaration (`)Quantum of IDCW
(`) Per UnitRegular Plan IDCW12-Oct-2017 23.181 2.000026-Oct-2018 20.289 1.5000 23-Oct-2019 17.110 1.2000Direct Plan IDCW12-Oct-2017 23.781 2.0000 26-Oct-2018 21.044 1.600023-Oct-2019 17.912 1.0000
Pursuant to payment of dividend, NAV per unit of the IDCW options of the aforesaid schemes will fall to the extent of the payment and statutory levy (if applicable). Face value `10/-.Past performance of the aforesaid schemes may or may not be sustained in future. *Please note that the IDCW rates mentioned are post applicable dividend distribution tax deduction.
L&T Equity Savings FundRecord Date NAV as on date of
declaration (`)Quantum of IDCW
(`) Per Unit
Regular Plan - Monthly IDCW25-Jan-2021 12.217 0.060025-Feb-2021 12.557 0.060025-Mar-2021 12.290 0.0600Direct Plan - Monthly IDCW25-Jan-2021 13.364 0.060025-Feb-2021 13.751 0.060025-Mar-2021 13.471 0.0600
Record Date NAV as on date of declaration (`)
Quantum of IDCW (`) Per Unit
Regular Plan - Quarterly IDCW24-Sep-2020 11.876 0.000023-Dec-2020 12.818 0.150019-Mar-2021 13.360 0.1800Direct Plan - Quarterly IDCW24-Sep-2020 12.706 0.150023-Dec-2020 13.578 0.160019-Mar-2021 14.176 0.1900

49
Data as on March 31, 2021
IDCW HISTORY FOR DEBT SCHEMES
L&T Overnight Fund*
Record Date NAV as on Record Date (`)
Quantum of IDCW (Corporate) (`) Per Unit
Quantum of IDCW (Non-Corporate)
(`) Per UnitRegular Plan - Monthly IDCW
25-Mar-21 1,006.86 2.0000 2.000025-Feb-21 1,006.50 2.0000 2.000025-Jan-21 1,006.03 2.0000 2.0000Direct Plan - Monthly IDCW25-Mar-21 1,061.62 2.1000 2.100025-Feb-21 1,061.14 2.1000 2.100025-Jan-21 1,060.56 2.1000 2.1000
L&T Money Market FundRecord Date NAV as on Record
Date (`)Quantum of IDCW
(Corporate) (`) Per Unit
Quantum of IDCW (Non-Corporate)
(`) Per UnitRegular - Monthly IDCW
25-Mar-21 11.5768 0.0400 0.040025-Feb-21 11.5920 0.0400 0.040025-Jan-21 11.6035 0.0400 0.0400Direct Plan - Monthly IDCW25-Mar-21 12.0989 0.0400 0.040025-Feb-21 12.1086 0.0400 0.040025-Jan-21 12.1138 0.0400 0.0400
L&T Banking and PSU Debt FundRecord Date NAV as on Record
Date (`)Quantum of IDCW
(Corporate) (`) Per Unit
Quantum of IDCW (Non-Corporate)
(`) Per UnitRegular Plan - Monthly IDCW
25-Mar-21 11.3213 0.0500 0.050025-Feb-21 11.3077 0.0500 0.050025-Jan-21 11.4004 0.0500 0.0500Direct Plan - Monthly IDCW25-Mar-21 11.7312 0.0500 0.050025-Feb-21 11.7118 0.0500 0.050025-Jan-21 11.8020 0.0500 0.0500
L&T Short Term Bond Fund
Record Date NAV as on Record Date (`)
Quantum of IDCW (Corporate) (`) Per Unit
Quantum of IDCW (Non-Corporate)
(`) Per UnitRegular Plan - Monthly IDCW25-Mar-21 11.3792 0.0500 0.050025-Feb-21 11.3793 0.0500 0.050025-Jan-21 11.4602 0.0500 0.0500Direct Plan - Monthly IDCW25-Mar-21 11.9232 0.0500 0.050025-Feb-21 11.9165 0.0500 0.050025-Jan-21 11.9937 0.0500 0.0500Record Date NAV as on date of
declaration (`)Quantum of IDCW
(Corporate) (`) Per Unit
Quantum of IDCW (Non-Corporate) (`)
Per UnitRegular Plan - Quarterly IDCW19-Mar-21 11.0181 0.1400 0.140023-Dec-20 11.2324 0.1600 0.160024-Sep-20 11.1484 0.1600 0.1600Direct Plan - Quarterly IDCW19-Mar-21 11.6574 0.1400 0.140023-Dec-20 11.8611 0.1600 0.160024-Sep-20 11.7491 0.1600 0.1600Regular Plan - Annual IDCW19-Mar-21 13.0935 0.8000 0.800020-Mar-20 12.9759 0.5336 0.576322-Mar-19 12.7702 0.5336 0.5763Direct Plan - Annual IDCW19-Mar-21 13.5202 0.8500 0.850020-Mar-20 13.3607 0.5670 0.612322-Mar-19 13.1148 0.5670 0.6123
L&T Low Duration FundRecord Date NAV as on Record
Date (`)Quantum of IDCW
(Corporate) (`) Per Unit
Quantum of IDCW (Non-Corporate)
(`) Per UnitRegular Plan - Monthly IDCW25-Mar-21 10.5639 0.0400 0.040025-Feb-21 10.5723 0.0500 0.050025-Jan-21 10.5959 0.0500 0.0500Direct Plan - Monthly IDCW25-Mar-21 11.1190 0.0400 0.040025-Feb-21 11.1196 0.0500 0.050025-Jan-21 11.1358 0.0500 0.0500
Record Date NAV as on date of declaration (`)
Quantum of IDCW (Corporate) (`) Per Unit
Quantum of IDCW (Non-Corporate)
(`) Per UnitRegular Plan - Annual IDCW19-Mar-21 11.1871 0.7000 0.700020-Mar-20 11.2609 0.4669 0.504222-Mar-19 11.4578 0.4669 0.5042Regular Plan - Annual IDCW19-Mar-21 11.4276 0.7000 0.700020-Mar-20 11.4234 0.4669 0.504222-Mar-19 11.5584 0.4669 0.5042
L&T Credit Risk FundRecord Date NAV as on Record
Date (`)Quantum of IDCW
(Corporate) (`) Per Unit
Quantum of IDCW (Non-Corporate)
(`) Per UnitRegular Plan - Monthly IDCW25-Mar-21 10.2382 0.0500 0.050025-Feb-21 10.2152 0.0500 0.050025-Jan-21 10.2792 0.0500 0.0500Direct Plan - Monthly IDCW25-Mar-21 10.7621 0.0500 0.050025-Feb-21 10.7289 0.0500 0.050025-Jan-21 10.7865 0.0500 0.0500
Record Date NAV as on date of declaration (`)
Quantum of IDCW (Corporate) (`) Per Unit
Quantum of IDCW (Non-Corporate)
(`) Per UnitRegular Plan - Annual IDCW19-Mar-21 11.0601 0.0000 0.000020-Mar-20 11.4070 0.4669 0.504222-Mar-19 11.8266 0.4669 0.5042Direct Plan - Annual IDCW19-Mar-21 11.5112 0.0000 0.000020-Mar-20 11.7550 0.4669 0.504222-Mar-19 12.0881 0.4669 0.5042
L&T Gilt FundRecord Date NAV as on date of
declaration (`)Quantum of IDCW
(Corporate) (`) Per Unit
Quantum of IDCW (Non-Corporate)
(`) Per UnitRegular Plan - Quarterly IDCW19-Mar-21 11.9549 0.2500 0.250023-Dec-20 12.5248 0.2500 0.250024-Sep-20 12.4319 0.2500 0.2500Direct Plan - Quarterly IDCW19-Mar-21 13.1348 0.2700 0.270023-Dec-20 13.7180 0.2700 0.2700
24-Sep-20 13.5753 0.2700 0.2700
L&T Ultra Short Term FundRecord Date NAV as on Record
Date (`)Quantum of IDCW
(Corporate) (`) Per Unit
Quantum of IDCW (Non-Corporate)
(`) Per UnitMonthly IDCW25-Mar-21 12.7869 0.0500 0.050025-Feb-21 12.7999 0.0500 0.050025-Jan-21 12.8125 0.0500 0.0500Direct Plan - Monthly IDCW25-Mar-21 13.0846 0.0500 0.050025-Feb-21 13.0952 0.0500 0.050025-Jan-21 13.1052 0.0500 0.0500Semi Annual IDCW19-Mar-21 25.8148 0.0000 0.000024-Sep-20 25.4101 0.0000 0.000020-Mar-20 24.5802 0.0000 0.0000Direct Plan - Semi Annual IDCW16-Mar-16 10.4889 0.1338 0.1445

50
Data as on March 31, 2021
IDCW HISTORY FOR DEBT SCHEMES
L&T Flexi Bond FundRecord Date NAV as on Record
Date (`)
Quantum of IDCW (Corporate) (`) Per Unit
Quantum of IDCW (Non-Corporate)
(`) Per UnitRegular Plan - Monthly IDCW25-Mar-21 11.1796 0.0600 0.060025-Feb-21 11.1884 0.0600 0.060025-Jan-21 11.4485 0.0600 0.0600Direct Plan - Monthly IDCW25-Mar-21 13.1749 0.0700 0.070025-Feb-21 13.1773 0.0700 0.070025-Jan-21 13.4748 0.0700 0.0700
Record Date NAV as on date of declaration (`)
Quantum of IDCW (Corporate) (`) Per Unit
Quantum of IDCW (Non-Corporate)
(`) Per UnitRegular Plan - Annual IDCW19-Mar-21 11.4848 0.7000 0.700020-Mar-20 11.5612 0.4669 0.504222-Mar-19 11.2338 0.4669 0.5042Direct Plan - Annual IDCW19-Mar-21 11.8712 0.7200 0.720020-Mar-20 11.8483 0.4669 0.504222-Mar-19 11.4212 0.4669 0.5042
L&T Triple Ace Bond FundRecord Date NAV as on date of
declaration (`)Quantum of IDCW
(Corporate) (`) Per Unit
Quantum of IDCW (Non-Corporate)
(`) Per UnitRegular Plan - Quarterly IDCW19-Mar-21 11.5655 0.2000 0.200023-Dec-20 12.0079 0.2000 0.200024-Sep-20 11.9204 0.2000 0.2000Direct Plan - Quarterly IDCW19-Mar-21 11.8818 0.2100 0.210023-Dec-20 12.3301 0.2100 0.210024-Sep-20 12.2350 0.2100 0.2100Regular Plan - Annual IDCW19-Mar-21 12.3257 0.7000 0.700020-Mar-20 11.9928 0.3669 0.396222-Mar-19 11.1585 0.3669 0.3962Direct Plan - Annual IDCW19-Mar-21 12.3978 0.7000 0.700020-Mar-20 12.0195 0.3669 0.3962Regular Plan - Semi Annual IDCW19-Mar-21 17.1803 0.4000 0.400024-Sep-20 17.5205 0.4000 0.400020-Mar-20 16.7172 0.2668 0.2881Direct Plan -Semi Annual IDCW19-Mar-21 20.0642 0.4500 0.450024-Sep-20 20.4104 0.4500 0.450020-Mar-20 19.4270 0.3002 0.3241
L&T Conservative Hybrid Fund
Record Date NAV as on Record Date (`)
Quantum of IDCW (Corporate)
Quantum of IDCW (Non-Corporate)
(`) Per Unit (`) Per Unit
Regular Plan - Monthly IDCW25-Mar-21 11.0875 0.0500 0.050025-Feb-21 11.1974 0.0500 0.050025-Jan-21 11.1555 0.0500 0.0500Direct Plan - Monthly IDCW25-Mar-21 11.8928 0.0600 0.060025-Feb-21 12.0117 0.0600 0.060025-Jan-21 11.9673 0.0600 0.0600Record Date NAV as on date of
declaration (`)Quantum of IDCW
(Corporate)Quantum of IDCW (Non-Corporate)
Regular Plan - Quarterly IDCW19-Mar-21 11.2084 0.2200 0.220023-Dec-20 11.2665 0.2200 0.220024-Sep-20 11.0109 0.2200 0.2200Direct Plan - Quarterly IDCW19-Mar-21 11.8001 0.2300 0.230023-Dec-20 11.8436 0.2300 0.230024-Sep-20 11.5592 0.2300 0.2300
L&T Resurgent India Bond FundRecord Date NAV as on date of
declaration (`)Quantum of IDCW
(Corporate) (`) Per Unit
Quantum of IDCW (Non-Corporate)
(`) Per UnitRegular Plan - Monthly IDCW25-Mar-21 11.0890 0.0600 0.060025-Feb-21 11.0656 0.0600 0.060025-Jan-21 11.1727 0.0700 0.0700Direct Plan - Monthly IDCW25-Mar-21 11.6646 0.0600 0.060025-Feb-21 11.6289 0.0600 0.060025-Jan-21 11.7288 0.0700 0.0700Regular Plan - Annual IDCW19-Mar-21 12.0606 0.7700 0.770020-Mar-20 11.8937 0.4669 0.504222-Mar-19 11.7524 0.4669 0.5042Direct Plan - Annual IDCW19-Mar-21 12.7162 0.8000 0.800020-Mar-20 12.3921 0.4669 0.504222-Mar-19 12.1130 0.4669 0.5042
Pursuant to payment of dividend, NAV per unit of the IDCW options of the aforesaid schemes will fall to the extent of the payout and statutory levy (if applicable). *Face value `1000/-. For the remaining scheme Face value is ̀ 10/-. Past performance of the aforesaid schemes may or may not be sustained in future. Please note that the IDCW rates mentioned are post applicable dividend distribution tax deduction.
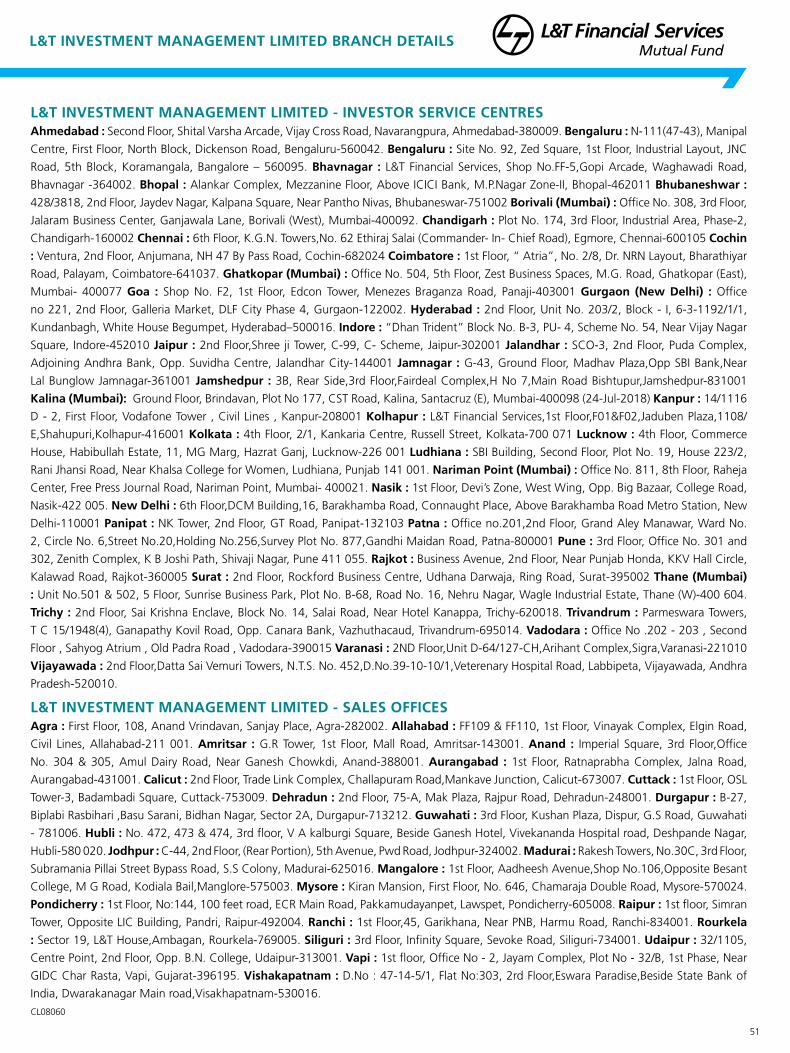
51
Data as on March 31, 2021L&T INVESTMENT MANAGEMENT LIMITED BRANCH DETAILS
L&T INVESTMENT MANAGEMENT LIMITED - INVESTOR SERVICE CENTRESAhmedabad : Second Floor, Shital Varsha Arcade, Vijay Cross Road, Navarangpura, Ahmedabad-380009. Bengaluru : N-111(47-43), Manipal
Centre, First Floor, North Block, Dickenson Road, Bengaluru-560042. Bengaluru : Site No. 92, Zed Square, 1st Floor, Industrial Layout, JNC
Road, 5th Block, Koramangala, Bangalore – 560095. Bhavnagar : L&T Financial Services, Shop No.FF-5,Gopi Arcade, Waghawadi Road,
Bhavnagar -364002. Bhopal : Alankar Complex, Mezzanine Floor, Above ICICI Bank, M.P.Nagar Zone-II, Bhopal-462011 Bhubaneshwar :
428/3818, 2nd Floor, Jaydev Nagar, Kalpana Square, Near Pantho Nivas, Bhubaneswar-751002 Borivali (Mumbai) : Office No. 308, 3rd Floor,
Jalaram Business Center, Ganjawala Lane, Borivali (West), Mumbai-400092. Chandigarh : Plot No. 174, 3rd Floor, Industrial Area, Phase-2,
Chandigarh-160002 Chennai : 6th Floor, K.G.N. Towers,No. 62 Ethiraj Salai (Commander- In- Chief Road), Egmore, Chennai-600105 Cochin
: Ventura, 2nd Floor, Anjumana, NH 47 By Pass Road, Cochin-682024 Coimbatore : 1st Floor, “ Atria”, No. 2/8, Dr. NRN Layout, Bharathiyar
Road, Palayam, Coimbatore-641037. Ghatkopar (Mumbai) : Office No. 504, 5th Floor, Zest Business Spaces, M.G. Road, Ghatkopar (East),
Mumbai- 400077 Goa : Shop No. F2, 1st Floor, Edcon Tower, Menezes Braganza Road, Panaji-403001 Gurgaon (New Delhi) : Office
no 221, 2nd Floor, Galleria Market, DLF City Phase 4, Gurgaon-122002. Hyderabad : 2nd Floor, Unit No. 203/2, Block - I, 6-3-1192/1/1,
Kundanbagh, White House Begumpet, Hyderabad–500016. Indore : “Dhan Trident” Block No. B-3, PU- 4, Scheme No. 54, Near Vijay Nagar
Square, Indore-452010 Jaipur : 2nd Floor,Shree ji Tower, C-99, C- Scheme, Jaipur-302001 Jalandhar : SCO-3, 2nd Floor, Puda Complex,
Adjoining Andhra Bank, Opp. Suvidha Centre, Jalandhar City-144001 Jamnagar : G-43, Ground Floor, Madhav Plaza,Opp SBI Bank,Near
Lal Bunglow Jamnagar-361001 Jamshedpur : 3B, Rear Side,3rd Floor,Fairdeal Complex,H No 7,Main Road Bishtupur,Jamshedpur-831001
Kalina (Mumbai): Ground Floor, Brindavan, Plot No 177, CST Road, Kalina, Santacruz (E), Mumbai-400098 (24-Jul-2018) Kanpur : 14/1116
D - 2, First Floor, Vodafone Tower , Civil Lines , Kanpur-208001 Kolhapur : L&T Financial Services,1st Floor,F01&F02,Jaduben Plaza,1108/
E,Shahupuri,Kolhapur-416001 Kolkata : 4th Floor, 2/1, Kankaria Centre, Russell Street, Kolkata-700 071 Lucknow : 4th Floor, Commerce
House, Habibullah Estate, 11, MG Marg, Hazrat Ganj, Lucknow-226 001 Ludhiana : SBI Building, Second Floor, Plot No. 19, House 223/2,
Rani Jhansi Road, Near Khalsa College for Women, Ludhiana, Punjab 141 001. Nariman Point (Mumbai) : Office No. 811, 8th Floor, Raheja
Center, Free Press Journal Road, Nariman Point, Mumbai- 400021. Nasik : 1st Floor, Devi’s Zone, West Wing, Opp. Big Bazaar, College Road,
Nasik-422 005. New Delhi : 6th Floor,DCM Building,16, Barakhamba Road, Connaught Place, Above Barakhamba Road Metro Station, New
Delhi-110001 Panipat : NK Tower, 2nd Floor, GT Road, Panipat-132103 Patna : Office no.201,2nd Floor, Grand Aley Manawar, Ward No.
2, Circle No. 6,Street No.20,Holding No.256,Survey Plot No. 877,Gandhi Maidan Road, Patna-800001 Pune : 3rd Floor, Office No. 301 and
302, Zenith Complex, K B Joshi Path, Shivaji Nagar, Pune 411 055. Rajkot : Business Avenue, 2nd Floor, Near Punjab Honda, KKV Hall Circle,
Kalawad Road, Rajkot-360005 Surat : 2nd Floor, Rockford Business Centre, Udhana Darwaja, Ring Road, Surat-395002 Thane (Mumbai)
: Unit No.501 & 502, 5 Floor, Sunrise Business Park, Plot No. B-68, Road No. 16, Nehru Nagar, Wagle Industrial Estate, Thane (W)-400 604.
Trichy : 2nd Floor, Sai Krishna Enclave, Block No. 14, Salai Road, Near Hotel Kanappa, Trichy-620018. Trivandrum : Parmeswara Towers,
T C 15/1948(4), Ganapathy Kovil Road, Opp. Canara Bank, Vazhuthacaud, Trivandrum-695014. Vadodara : Office No .202 - 203 , Second
Floor , Sahyog Atrium , Old Padra Road , Vadodara-390015 Varanasi : 2ND Floor,Unit D-64/127-CH,Arihant Complex,Sigra,Varanasi-221010
Vijayawada : 2nd Floor,Datta Sai Vemuri Towers, N.T.S. No. 452,D.No.39-10-10/1,Veterenary Hospital Road, Labbipeta, Vijayawada, Andhra
Pradesh-520010.
L&T INVESTMENT MANAGEMENT LIMITED - SALES OFFICESAgra : First Floor, 108, Anand Vrindavan, Sanjay Place, Agra-282002. Allahabad : FF109 & FF110, 1st Floor, Vinayak Complex, Elgin Road,
Civil Lines, Allahabad-211 001. Amritsar : G.R Tower, 1st Floor, Mall Road, Amritsar-143001. Anand : Imperial Square, 3rd Floor,Office
No. 304 & 305, Amul Dairy Road, Near Ganesh Chowkdi, Anand-388001. Aurangabad : 1st Floor, Ratnaprabha Complex, Jalna Road,
Aurangabad-431001. Calicut : 2nd Floor, Trade Link Complex, Challapuram Road,Mankave Junction, Calicut-673007. Cuttack : 1st Floor, OSL
Tower-3, Badambadi Square, Cuttack-753009. Dehradun : 2nd Floor, 75-A, Mak Plaza, Rajpur Road, Dehradun-248001. Durgapur : B-27,
Biplabi Rasbihari ,Basu Sarani, Bidhan Nagar, Sector 2A, Durgapur-713212. Guwahati : 3rd Floor, Kushan Plaza, Dispur, G.S Road, Guwahati
- 781006. Hubli : No. 472, 473 & 474, 3rd floor, V A kalburgi Square, Beside Ganesh Hotel, Vivekananda Hospital road, Deshpande Nagar,
Hubli-580 020. Jodhpur : C-44, 2nd Floor, (Rear Portion), 5th Avenue, Pwd Road, Jodhpur-324002. Madurai : Rakesh Towers, No.30C, 3rd Floor,
Subramania Pillai Street Bypass Road, S.S Colony, Madurai-625016. Mangalore : 1st Floor, Aadheesh Avenue,Shop No.106,Opposite Besant
College, M G Road, Kodiala Bail,Manglore-575003. Mysore : Kiran Mansion, First Floor, No. 646, Chamaraja Double Road, Mysore-570024.
Pondicherry : 1st Floor, No:144, 100 feet road, ECR Main Road, Pakkamudayanpet, Lawspet, Pondicherry-605008. Raipur : 1st floor, Simran
Tower, Opposite LIC Building, Pandri, Raipur-492004. Ranchi : 1st Floor,45, Garikhana, Near PNB, Harmu Road, Ranchi-834001. Rourkela
: Sector 19, L&T House,Ambagan, Rourkela-769005. Siliguri : 3rd Floor, Infinity Square, Sevoke Road, Siliguri-734001. Udaipur : 32/1105,
Centre Point, 2nd Floor, Opp. B.N. College, Udaipur-313001. Vapi : 1st floor, Office No - 2, Jayam Complex, Plot No - 32/B, 1st Phase, Near
GIDC Char Rasta, Vapi, Gujarat-396195. Vishakapatnam : D.No : 47-14-5/1, Flat No:303, 2rd Floor,Eswara Paradise,Beside State Bank of
India, Dwarakanagar Main road,Visakhapatnam-530016.CL08060

52
Data as on March 31, 2021
THIS FAR?
THIS FAR?
HOW FAR WOULD YOU GOTO FULFIL YOUR PASSION?
THIS FAR?
Follow us on
#SIPTakesYouFurther
Plan ahead with SIP and go further on your favourite activity.We all have our own passion, whether it is to scale the tallest peak or drive across many countries. But the one thing that could take you there is a good plan. Start a Systematic Investment Plan (SIP) and invest monthly to help you reach your goal. Each small installment adds up over time and with the power of compounding could grow to a substantial amount. So rather than attempting basecamp, you could set your sights on the tallest peaks!
CL06709
An investor education & awareness initiative.Investors should deal only with Registered Mutual Funds, to be verified on SEBI website under "Intermediaries/Market Infrastructure Institutions".Refer www.ltfs.com for details on completing one-time KYC (Know Your Customer) process, change of details like address, phone number etc. and change of bank details etc. For complaints redressal, either visit www.ltfs.com or SEBI's website www.scores.gov.in
Mutual Fund investments are subject to market risks, read all scheme related documents carefully.
visit www.ltfs.com/sipcall 1800 2000 400
THIS FAR?
TOUCHGET IN
Give a missed call on92129 00020 from your registered mobile to receive total valuation on SMS and statements for all your folios and corresponding schemes on your registered email ID.
Get latest NAV ofyour scheme.SMS LNTMF NAV <Scheme Code*> to 56767#
#Visit the Customer Service section on our website for scheme codes.
For furtherqueries, email [email protected]