
entrepreneurial - finance
400
-
Upload
khangminh22 -
Category
Documents
-
view
0 -
download
0
Transcript of entrepreneurial - finance

ENTREPRENEURIAL
FINANCE

This page intentionally left blank
ENTREPRENEURIAL
FINANCEFinance and Business Strategies for the Serious Entrepreneur
Second Edition
STEVEN ROGERSGordon and Llura Gund Family Professor of Entrepreneurship
Director, Larry and Carol Levy Institute for Entrepreneurial PracticeJ.L. Kellogg School of Management, Northwestern University
WITH ROZA MAKONNEN
New York Chicago San Francisco LisbonLondon Madrid Mexico City Milan New Delhi
San Juan Seoul Singapore Sydney Toronto
Copyright © 2009, 2003 by The McGraw-Hill Companies, Inc. All rights reserved. Except as permit-ted under the United States Copyright Act of 1976, no part of this publication may be reproduced ordistributed in any form or by any means, or stored in a database or retrieval system, without the priorwritten permission of the publisher.
ISBN: 978-0-07-159127-0
MHID: 0-07-159127-3
The material in this eBook also appears in the print version of this title: ISBN: 978-0-07-159126-3,MHID: 0-07-159126-5.
All trademarks are trademarks of their respective owners. Rather than put a trademark symbol afterevery occurrence of a trademarked name, we use names in an editorial fashion only, and to the benefit of the trademark owner, with no intention of infringement of the trademark. Where such designations appear in this book, they have been printed with initial caps.
McGraw-Hill eBooks are available at special quantity discounts to use as premiums and sales promotions, or for use in corporate training programs. To contact a representative please visit theContact Us page at www.mhprofessional.com.
This publication is designed to provide accurate and authoritative information in regard to the subjectmatter covered. It is sold with the understanding that neither the author nor the publisher is engagedin rendering legal, accounting, or other professional service. If legal advice or other expert assistanceis required, the services of a competent professional person should be sought.
——From a Declaration of Principles jointly adopted by a Committee of the American BarAssociation and a Committee of Publishers.
TERMS OF USE
This is a copyrighted work and The McGraw-Hill Companies, Inc. (“McGraw-Hill”) and its licensorsreserve all rights in and to the work. Use of this work is subject to these terms. Except as permittedunder the Copyright Act of 1976 and the right to store and retrieve one copy of the work, you may notdecompile, disassemble, reverse engineer, reproduce, modify, create derivative works based upon,transmit, distribute, disseminate, sell, publish or sublicense the work or any part of it withoutMcGraw-Hill’s prior consent. You may use the work for your own noncommercial and personal use;any other use of the work is strictly prohibited. Your right to use the work may be terminated if youfail to comply with these terms.
THE WORK IS PROVIDED “AS IS.” McGRAW-HILL AND ITS LICENSORS MAKE NO GUAR-ANTEES OR WARRANTIES AS TO THE ACCURACY, ADEQUACY OR COMPLETENESS OFOR RESULTS TO BE OBTAINED FROM USING THE WORK, INCLUDING ANY INFORMA-TION THAT CAN BE ACCESSED THROUGH THE WORK VIA HYPERLINK OR OTHERWISE,AND EXPRESSLY DISCLAIM ANY WARRANTY, EXPRESS OR IMPLIED, INCLUDING BUTNOT LIMITED TO IMPLIED WARRANTIES OF MERCHANTABILITY OR FITNESS FOR APARTICULAR PURPOSE. McGraw-Hill and its licensors do not warrant or guarantee that the functions contained in the work will meet your requirements or that its operation will be uninterrupted or error free. Neither McGraw-Hill nor its licensors shall be liable to you or anyone elsefor any inaccuracy, error or omission, regardless of cause, in the work or for any damages resultingtherefrom. McGraw-Hill has no responsibility for the content of any information accessed through thework. Under no circumstances shall McGraw-Hill and/or its licensors be liable for any indirect, incidental, special, punitive, consequential or similar damages that result from the use of or inabilityto use the work, even if any of them has been advised of the possibility of such damages. This limitation of liability shall apply to any claim or cause whatsoever whether such claim or causearises in contract, tort or otherwise.
C O N T E N T S
Preface xi
Chapter 1
The Entrepreneurial Spectrum 1
Introduction 1Entrepreneurial Finance 2Types of Entrepreneurs 3The Entrepreneurial Spectrum 5
Chapter 2
The Entrepreneur 17
Introduction 17Success Rates of Entrepreneurs 17Why Become an Entrepreneur? 24Traits of an Entrepreneur 35Impact on the Economy 45Impact on Gender and Race 48
Chapter 3
The Business Plan 55
Introduction 55The Dual-Purpose Document 56Business Plan Development and Advice 57The Business Plan 58Development of Pro Formas 71Checklist of Financial Information 74
v
Most Important Business Plan Sections 75Business Plan Development Sources 76After the Business Plan Is Written 78
Chapter 4
Financial Statements 81
Introduction 81The Income Statement 82The Balance Sheet 92The Statement of Cash Flows 97
Chapter 5
Financial Statement Analysis 103
Introduction 103The Proactive Analysis 103Income Statement Analysis 107Ratio Analysis 108Breakeven Analysis 116Measuring Growth 117Case Study—Clark Company 121Gross Margins 131Net Margins 139Other Issues to Consider 143
Chapter 6
Cash Flow Management 149
Introduction 149Types of Cash Flow 149Cash Flow Forecasts 153Cash Flow Management 155Accounts Receivable 158Accounts Payable 168The Cash Gap 170Working Capital 174Finding Cash 175
vi Contents
Chapter 7
Valuation 179
Introduction 179Valuing the Clark Company 182Premoney and Postmoney Valuations 183Why Value Your Company? 185Key Factors Influencing Valuation 187Valuation Methods 203Multiples 203Multiples of Gross Margin 210Different Industries Use Different Multiple Benchmarks 210Asset Valuation 214Capitalization of Cash Flows 214Valuing Technology and Internet Companies 220
Chapter 8
Raising Capital 229
Introduction 229Value-Added Investors 231Sources of Capital 232The Investment Is in the Entrepreneur 233
Chapter 9
Debt Financing 237
Introduction 237Types of Debt 238Sources of Debt Financing 239Creative Ways to Structure Long-Term Debt 262Long-Term Debt Rules to Live By 263Debt Financing for Working Capital 264
Chapter 10
Equity Financing 275
Introduction 275
Contents vii
Sources of Equity Capital 276Private Placements 281Corporate Venture Capital 284Private Equity Firms 285International Private Equity 291Advice for Raising Private Equity 292Increasing Specialization of Private Equity Firms 293Identifying Private Equity Firms 294Small-Business Investment Companies 295Initial Public Offerings 297Public Equity Markets 300The IPO Process 304The Financing Spectrum 309Direct Public Offerings 310
Chapter 11
Financing for Minorities and Women 315
Introduction 315Minorities—Debt Financing 318Minorities—Equity Financing 319Women—Debt Financing 321Women—Equity Financing 322
Chapter 12
Taking a Job with an Entrepreneurial Firm 327
Introduction 327Case Study: Considering a Job Offer from an Early-Stage Company 328Case Study Analysis 338
Chapter 13
Intrapraneurship: Corporate Entrepreneurship 345
The Intrapreneurship Spectrum 346
viii Contents
Intrapreneurship Models 348Traits of the High-Growth Intrapreneur 349Acts of Intrapreneurship 350Signs of Intrapreneurial Success 352Standard Operating Procedures 353Intrapreneurship Blunder 354
Conclusion 357
Appendices 359
Appendix A: Industry Profitability 359Appendix B: U.S. Funds Focused on Minority Markets 367
Index 373
Contents ix

This page intentionally left blank
xi
P r e f a c e
It is morning at Opryland in Nashville, Tennessee, a place whereyoung crooners from Charlie Pride and Johnny Cash to GarthBrooks and the Dixie Chicks have realized their dreams. Not faraway is the Grand Ole Opry—country music’s equivalent of theBroadway stage—and a full day of work is about to begin. But thismorning, the visitors have business, not music, on their minds.This is a conference for future entrepreneurs from around the country. Their schedules are packed with seminars on financing, marketing, and operations. Here is a sample: “Business Start-UpEssentials,” “How to Find Money-Making Ideas,” and “DesigningProducts.”
Of course, none of this would be particularly noteworthyexcept when you consider that these conventioneers are agedseven to ten—and they are not the youngest group here. There isanother set of entrepreneur seminars for kids aged four to six. It’scalled the “Kidpreneurs Konference,” sponsored by Black Enterprisemagazine and Wendy’s, and this sixth annual event is a sellout.Nearby, the kids’ parents, all entrepreneurs or future entrepreneursthemselves, are packed into their own seminars. If there ever was adoubt that this is the glory age of the entrepreneur, a few days withthese “titans of tomorrow” should put that notion to bed.
I write this book, this story of opportunities, because I havebeen blessed with so many of my own. It’s said that a good entre-preneur always sees sun in the clouds and a glass half full. My wife,

Michele, and my daughters, Akilah and Ariel, laugh at me when I tell them that I have gone through life always believing that whenI walk through a door, the light will shine on me, no matter who elseis in the room. Like every good entrepreneur, I believe in myself, butI also have enough humility to know that one does not go from thewelfare rolls on Chicago’s South Side to owning three successfulcompanies, sitting on the boards of several Fortune 500 companies[S. C. Johnson & Son (formerly S. C. Johnson Wax), SuperValu,AMCORE Financial, and Harris Associates, a $60 billion mutualfund], and teaching at the finest business school in America withouta healthy supply of luck—and a handful of caring people.
The first entrepreneur I ever met was a woman named OllieMae Rogers—the oldest daughter in a family of 10 kids, and theonly one among them who never graduated from high school, letalone college. Fiercely independent, she left home at the age of 17and got married. The marriage, I believe, was simply an excuse toleave home. Leaving home meant that she got her independence,and if she was nothing else, Ollie Mae, my mother, was a fireball ofindependence. When my older brother, my two sisters, and Iburied her a few years ago, the eulogy fell to me. I described mymother as a Renaissance woman filled with paradoxes. She was a tough and gutsy woman whose extensive vocabulary flowed eloquently although she barely finished the tenth grade.
I like to think of my mother as an eccentric “mom-and-pop”entrepreneur. Growing up, we were like the old Sanford and Son tel-evision series—selling used furniture at the weekend flea marketson Maxwell Street on Chicago’s South Side. Nearly every Saturdayand Sunday morning, my older brother, John, and I were up at 4 a.m. loading my mother’s beat-up jalopy of a station wagon untilwe could fit no more “merchandise” on the seats, in the trunk, andon the roof. When I talk to prospective entrepreneurs, I tell them togo sell something at a flea market. You need to really live, breathe,and feel the rejection of hustling for “sells.”
When I think back on it now, I realize that my mother justloved the art of the deal, and this, among other things, became partof my being. It was common for my mother to leave our space atthe market and go shopping, leaving the operations to my brotherand me—the savvy and sophisticated five-year-old business maverick. That is how I learned to sell, negotiate, and schmooze a
xii Preface
customer. I started my first little business venture in that very samemarket: a shoeshine stand. People would stroll by, and I’d lurethem in with the oh-so-memorable pitch line: “Shine your shoes,comb your hair, and make you feel like a millionaire.”
As far back as I can remember, I always held a job. When weweren’t working the flea markets, my brother and I found otherjobs; from helping the local milkman make his deliveries to work-ing as a stock boy at the neighborhood grocery store, we did whatwe needed to do. By the time I reached high school, I was pluckedout of the Chicago public schools by a nonprofit organizationcalled A Better Chance, a private national program that identifiesacademically gifted minority kids from low-income communitiesand sends them to schools where their potential can be realized. (I now serve on the organization’s board of directors). I was sent toRadnor High School in Wayne, Pennsylvania. I played on the foot-ball team, and when the season was over, I worked as a janitor’sassistant to help send some money home to my mother.
My mother started running a small used-furniture storefront,and when I came home for the summer breaks, she stopped work-ing and turned the operation over to me. So by the age of 15, I hadto manage a few employees, open and close the business, negotiatewith our customers, and run the daily operations. My mother,unbeknownst to her, was nurturing a budding entrepreneur. She truly is the reason that my brother, my sisters, and I have allgravitated to leadership positions in our professional lives. Mybrother is a supervisor of probation officers, my older sister,Deniece, owns her own delivery business, and my youngest sister,Laura, is manager of a McDonald’s restaurant.
I went on to attend Williams College (I am a former trustee),where, for the first time, the money I made was all mine. It’s whereI met my future wife, Michele, and between the two of us, we musthave had every job on the darn campus. Williams is a liberal arts school, and at the time there were no finance courses or anyother business classes to be found on campus. I majored in history.During my senior year at Williams, I took an accounting class atnearby North Adams State College. After graduating fromWilliams, I worked for Cummins Engine Company. At Cummins, I worked as a purchasing agent with a start-up venture in RockyMount, North Carolina, called Consolidated Diesel Company
Preface xiii
(CDC). At CDC, I was responsible for developing a new supplierorganization, and it was there that I got my first taste of finance. It was a position that put me smack-dab in the middle of theexpense line item “cost of goods sold” because I was ultimatelyresponsible for buying several engine components. The greatestbenefit of this experience was the negotiating skills that I continuedto develop.
After four years, I left and was accepted at Harvard BusinessSchool (I am a former trustee), where I received my first formaleducation in finance. That was the main reason that I attendedbusiness school: I knew that I wanted to be an entrepreneur, and Iknew that if I was going to be successful, I needed to understandfinance. My introductory finance class was taught by Professor BillSahlman. When I told him about my meager background in thesubject, he told me to relax, that any novice can understand thesubject with a little common sense. Though he never told me this,I quickly realized that the subject was made easier by having anoutstanding professor, like Sahlman, who could teach a user-friendly finance course that combined academic theory and realpractices into a powerful lesson.
While I was at Harvard, I recognized what many entrepre-neurs find out the hard way: being a successful entrepreneur is noteasy. I knew about the failure rate, and I was never really interestedin starting a company from scratch. I wanted to buy an existingbusiness. It’s funny when I think back about all the jobs that I hadas a kid. My older brother always had the same job first, so evenback then, I was taking over an existing enterprise. I decided thatgoing the franchise route was the smartest thing for me to do, andI applied for the franchisee program at McDonald’s. My plan wasto eventually buy a large number of the stores and become a fast-food mogul. Out of 30,000 applicants for the franchisee programthat year, McDonald’s accepted 50, and I was one of them.
The program required future franchisees to work 15 to 20hours a week (for free, of course) over a two-year period. I actuallydid my fast-food tour of duty with the McDonald’s right around thecorner from Harvard. So during my second year at HarvardBusiness School, my classmates would come in and see this hulkingsecond-year MBA student, decked out in the official McDonald’spants and shirt, dropping their fries into the grease and cleaning the
xiv Preface
stalls of the bathroom. Of course they were thinking, “What the hellare you doing?” But I learned a valuable lesson over the years:you’re making an investment in yourself, and why should you carewhat someone else thinks? I believe this is an important lesson foreveryone. There’s a certain level of humility that all entrepreneursmust have. You want to talk about risks? Taking risks is not justabout taking risks with your money; it is about risking your repu-tation by being willing to be the janitor. If you don’t have thatmindset and you can’t handle that, then entrepreneurship is not for you.
After graduating from HBS, I still had a year to go with the McDonald’s ownership program. In order to earn money, I accepted a consulting job with Bain & Company. During theweek, I would fly all over the United States on my consultingassignments, and on the weekends, I would return to the SoldiersField Avenue McDonald’s in Boston and put in the hours required.Once I had completed the program and it was time for me to buymy own McDonald’s, I could not come to terms with the corpora-tion on a price for the store it wanted to sell. We went around and around, and finally I decided that maybe franchising was not for me after all. Like my mother, I am not very good at taking orders, living my life in a template designed by someoneelse, and doing what someone else believes I should do. My expe-rience with McDonald’s was phenomenal, and I have nothing butrespect for the company, but it was time for me to purchase myown business.
Eventually, after working with a business broker, I settled onpurchasing a manufacturing business. Before I sold the companyand left for my dream job of teaching at Kellogg, I had purchasedan additional manufacturing firm and a retail business. Being yourown boss and running your own business is both an exhilaratingand a frightening prospect for most people. This is a club for hardworkers. If you want an 8-to–5 job, do not join. This is a club whosemembers flourish on chaos, uncertainty, and ambiguity. These arepeople who thrive on solving problems.
By picking up this book, you have singled yourself out assomeone who wants to learn. This book is designed for existingand future entrepreneurs who are not financial managers but wanta simple and practical approach to understanding entrepreneurial
Preface xv
finance. This is not a traditional, boring, “comprehensive” how-to book, because that is not what most prospective or existingentrepreneurs need, nor is it the way I teach. Most academicianshave never worked in business, and the “real-world practices”component is conspicuously missing from their teaching arsenal.My approach is to combine legitimate and important academic the-ory with real-world lessons. In my class, I call this “putting meat onthe carcass.”
But this is not just a book of war stories. Just as I do in myclasses, I have made every effort to ensure that the reader gets tan-gible tools that can be used to improve the potential for entrepre-neurial success. The entrepreneur needs to know financial formulasand how to use them to spot problems or seize opportunities.
Like Professor Sahlman, I subscribe to the “this is not brainsurgery” approach to finance, and I stress the fact that everyonecan, and, more importantly, must, learn finance. I believe that thebaseball always finds a weak outfielder, and the same principleholds true for entrepreneurs: if finance is a weakness, the entre-preneur will be haunted by it. This book is intended for individu-als who have little background in financial management, peoplewho have taken entrepreneurship courses, and those who alreadyhave practical experience in business. These groups include MBAstudents, prospective entrepreneurs, and existing entrepreneurs.My success in communicating to this audience through this bookwas greatly enhanced by the help that I received from numerouspeople, including my secretary, Brenda McDaniel, who tran-scribed. I also owe a major debt of gratitude to the followingKellogg alums: Thane Gauthier, ’05; Roza Makonnen, ’97; PaulSmith, ’07; Scott Whitaker, ’97; and David Wildermuth, ’01.
A year after purchasing my first business, I vividly rememberreturning from an early appointment and driving beside LakeMichigan on Lake Shore Drive. It was a gorgeous warm and sunnyday, and I pulled off the road and got out of my car. There was noboss I had to call and no need to conjure up a reason for not return-ing to work. There was no manager to ask for an extended lunchbreak. I removed my socks and shoes, put my toes in the sand, andstayed there at the beach for the rest of the afternoon. Being anentrepreneur never felt so good.
xvi Preface

Entrepreneurship is about getting your hands dirty and put-ting your toes in the sand. This book aims to help you get there. AsIrving Berlin once advised a young songwriter by the name ofGeorge Gershwin, “Why the hell do you want to work for some-body else? Work for yourself!”
Preface xvii

This page intentionally left blank

ENTREPRENEURIAL
FINANCE

This page intentionally left blank
INTRODUCTION
The 1990s could be called the original “entrepreneurship genera-tion.”1 Never before had the entrepreneurial spirit been as strong, inAmerica and abroad, as it was during that decade. More than600,000 new businesses were created at the beginning of the 1990s,with each subsequent year breaking the record of the previous onefor start-ups.2 By 1997, entrepreneurs were starting a record 885,000new businesses a year—that’s more than 2,400 a day. This astonish-ing increase in new companies was more than 4 times the numberof firms created in the 1960s, and more than 16 times as many asduring the 1950s, when 200,000 and 50,000, respectively, were beingcreated each year.3 This unprecedented growth in entrepreneurialactivity was evidenced across all industries, including manufac-turing, retail, real estate, and various technology industries. Thisdecade was also an “equal opportunity” time, as the entrepreneur-ial euphoria of the 1990s was shared by both genders and across allethnicities and races. I’ve always believed that the beauty of entre-preneurship is that it is color-blind and gender-neutral.
New evidence indicates that this 1990s generation of entre-preneurs may actually be surpassed in upcoming years by themembers of “Generation Y,” or those born between the years 1977and 1994. This should come as no surprise when one considers thatthis group grew up during entrepreneurship’s golden age and latersaw its parents laid off or downsized out of “lifetime” corporate
1
C H A P T E R 1
The EntrepreneurialSpectrum
jobs. Generation Y has also spent most of its life and virtually all ofits postsecondary years in a digital age, where technology has sig-nificantly reduced the barriers of entry for start-ups. The membersof Generation Y, who may have seen VHS tapes and record albumsonly at neighborhood garage sales or museums, are now enrollingin college entrepreneurship classes at a rate that is roughly seventimes what it was just six years ago. Jeff Cornwall, the entrepre-neurial chair at Belmont University in Nashville, characterizesGeneration Y’s increase in entrepreneurial interest well: “Forty percent or more of students who come into our undergraduateentrepreneurship program as freshmen already have a business.It’s a whole new world.”4
ENTREPRENEURIAL FINANCE
In a recent survey of business owners, the functional area theycited as being the one in which they had the weakest skill was the area of financial management—accounting, bookkeeping, the raising of capital, and the daily management of cash flow.Interestingly, these business owners also indicated that they spentmost of their time on finance-related activities. Unfortunately, thefindings of this survey are an accurate portrayal of most entrepre-neurs—they are comfortable with the day-to-day operation of theirbusinesses and with the marketing and sales of their products or services, but they are very uncomfortable with the financialmanagement of their companies. Entrepreneurs cannot afford thisdiscomfort. They must realize that financial management is not asdifficult as it is made out to be. It must be used and embracedbecause it is one of the key factors for entrepreneurial success.
This book targets prospective and existing “high-growth”entrepreneurs who are not financial managers. Its objective is to bea user-friendly book that will provide these entrepreneurs with an understanding of the fundamentals of financial managementand analysis that will enable them to better manage the financialresources of their business and create economic value. However,the book is not a course in corporate finance. Rather, entrepreneur-ial finance is more integrative, including the analysis of qualitativeissues such as marketing, sales, personnel management, and strate-gic planning. The questions that will be answered will include:
2 CHAPTER 1
What financial tools can be used to manage the cash flow of thebusiness efficiently? Why is valuation important? What is the valueof the company? Finally, how, where, and when can financialresources be acquired to finance the business?
Before we immerse ourselves in the financial aspects of entre-preneurship, let us look at the general subject of entrepreneurship.
TYPES OF ENTREPRENEURS
There are essentially two kinds of entrepreneurs: the “mom-and-pop” entrepreneur, a.k.a. the “lifestyle” entrepreneur, and the “high-growth” entrepreneur.5
The Lifestyle Entrepreneur
Lifestyle entrepreneurs are those entrepreneurs who are primarilylooking for their business to provide them with a decent standardof living. They are not focused on growth; rather, they run theirbusiness almost haphazardly, with minimal or no systems in place.They do not necessarily have any strategic plans regarding thegrowth and future of their business and gladly accept whatever thebusiness produces. Their objective is to manage the business sothat it remains small and provides them with enough income tomaintain a certain, typically middle-class, lifestyle. For example,Sue Yellin, a small-business consultant, says she is determined toremain a one-person show, earning just enough money to live com-fortably and “feed my cat Fancy Feasts.”6
While they may have started out as lifestyle entrepreneurs,some owners ultimately become, voluntarily or involuntarily, high-growth entrepreneurs because their business grows despite theiroriginal intention. For example, the Inc. magazine 500 is composedof 500 successful high-growth entrepreneurs. When a survey wastaken of these entrepreneurs, their answers for the completion ofthe statement, “My original goals when I started the company . . .”suggest that almost 20 percent were originally lifestyle entrepre-neurs, given the following responses:
■ Company to grow as fast as possible: 50.9 percent.■ Company to grow slowly: 29.4 percent.
The Entrepreneurial Spectrum 3
■ Start small and stay small: 5.8 percent.■ No plan at all: 13.8 percent.7
Finally, one of the most prominent stories of a lifestyle entre-preneur turned high-growth entrepreneur is that of Ewing MarionKauffman, who started his pharmaceutical company, MarionLaboratories, in 1957 with the objective of “just making a living”for his family. He ultimately grew the firm to over $5 billion inannual revenues by 1986, creating wealth for himself (he sold thecompany in 1989 for over $5 billion) and for 300 employees, whobecame millionaires.8
The High-Growth Entrepreneur
The high-growth entrepreneur, on the other hand, is proactivelylooking to grow annual revenues and profits exponentially. Thistype of entrepreneur has a plan that is reviewed and revised regu-larly, and the business is run according to this plan. Unlike thelifestyle entrepreneur, the high-growth entrepreneur runs the busi-ness with the expectation that it will grow exponentially, with theby-product being the creation of wealth for himself, his investors,and possibly his employees. One of the best stories of high-growthentrepreneurship is Google, which will be discussed in greaterdetail later. The high-growth entrepreneur understands that a suc-cessful business is one that has basic business systems—financialmanagement, cash flow planning, strategic planning, marketing,and so on—in place. Inc. magazine surveyed a group of entrepre-neurs who were identified as “changing the face of AmericanBusiness” and found that these entrepreneurs were high-growthentrepreneurs, demonstrated by the fact that not only were theymillionaires, but they grew their firms from median sales of$146,000 with 4.5 employees to median sales of $11 million with219 employees. These data also show that these entrepreneursgrew their companies efficiently, since their sales per employeeincreased from $32,444 to $50,228, a 55 percent improvement.
Wilson Harrell, a former entrepreneur and current Inc. maga-zine columnist, did a fantastic job of describing the differencebetween these two types of entrepreneurs. The first description isthat of a lifestyle entrepreneur:
4 CHAPTER 1
Let’s say a man buys a dry cleaning shop. He goes to work at 7 a.m.At 7 p.m. he comes home, kisses the wife, grabs the kids, and goesoff to a school play. At his office you’ll see plaques all over the walls:Chamber of Commerce, Rotary Club, the local Republican orDemocratic club. He’s a pillar of the community, and everybodyloves him, even the bankers.
Change the scenario. After the man buys the dry cleaning shop, hegoes home and tells his wife, “Dear, we’re going to mortgage thishouse, borrow money from everyone we can, including your motherand maybe even your brother, and hock everything else, because I’mabout to buy another dry cleaner. Then I’ll hock the first to buyanother, and then another, because I’m going to be the biggest drycleaner in this city, this state, this nation!”9
The second scenario obviously describes the life of a high-growth entrepreneur who has the long-term plan of dominatingthe national dry cleaning industry by acquiring competitors, firstlocally and then nationally. His financing plan is to leverage theassets of the cleaners to obtain commercial debt from traditionalsources such as banks, combined with “angel” financing from relatives.
Unfortunately, not all entrepreneurs who seek high growthcan attain it. Sometimes circumstances outside of their control canhamper their growth plans. For example, one entrepreneur inMaine complained that he could not grow his business because oflabor shortages in the region. He said, “I’m disgusted by the laborsituation around here. People don’t want to get ahead. It adds upto businesses staying small.”10
THE ENTREPRENEURIAL SPECTRUM
When most people think of the term entrepreneur, they envisionsomeone who starts a company from scratch. This is a major mis-conception. As the entrepreneurial spectrum in Figure 1-1 shows,the tent of entrepreneurship is broader and more inclusive. It includes not only those who start companies from scratch (i.e., start-up entrepreneurs), but also those people who acquiredan established company through inheritance or a buyout (i.e.,acquirers). The entrepreneurship tent also includes franchisors aswell as franchisee. Finally, it also includes intrapreneurs, or corporate
The Entrepreneurial Spectrum 5
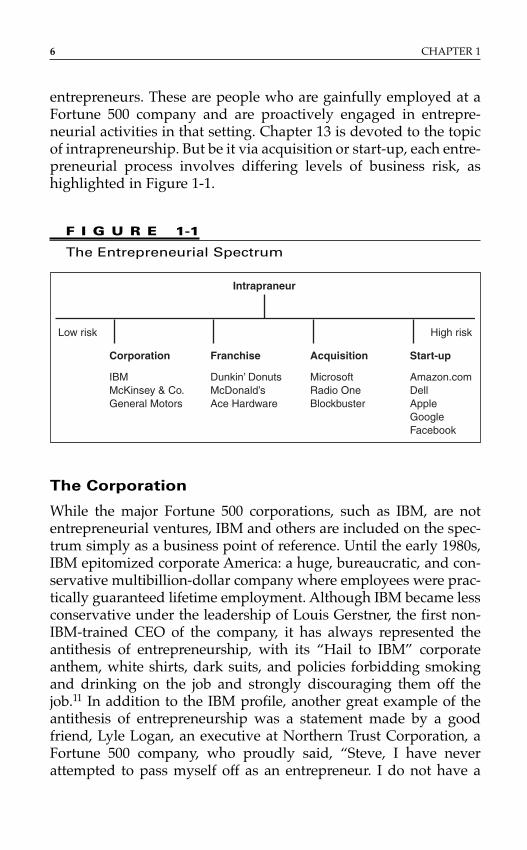
entrepreneurs. These are people who are gainfully employed at aFortune 500 company and are proactively engaged in entrepre-neurial activities in that setting. Chapter 13 is devoted to the topicof intrapreneurship. But be it via acquisition or start-up, each entre-preneurial process involves differing levels of business risk, ashighlighted in Figure 1-1.
6 CHAPTER 1
F I G U R E 1-1
The Entrepreneurial Spectrum
Corporation Franchise Acquisition Start-up
IBM Dunkin’ Donuts Microsoft Amazon.comMcKinsey & Co. McDonald’s Radio One DellGeneral Motors Ace Hardware Blockbuster Apple Google Facebook
Low risk
Intrapraneur
High risk
The Corporation
While the major Fortune 500 corporations, such as IBM, are notentrepreneurial ventures, IBM and others are included on the spec-trum simply as a business point of reference. Until the early 1980s,IBM epitomized corporate America: a huge, bureaucratic, and con-servative multibillion-dollar company where employees were prac-tically guaranteed lifetime employment. Although IBM became lessconservative under the leadership of Louis Gerstner, the first non-IBM-trained CEO of the company, it has always represented theantithesis of entrepreneurship, with its “Hail to IBM” corporateanthem, white shirts, dark suits, and policies forbidding smokingand drinking on the job and strongly discouraging them off thejob.11 In addition to the IBM profile, another great example of theantithesis of entrepreneurship was a statement made by a goodfriend, Lyle Logan, an executive at Northern Trust Corporation, aFortune 500 company, who proudly said, “Steve, I have neverattempted to pass myself off as an entrepreneur. I do not have a
single entrepreneurial bone in my body. I am very happy as a cor-porate executive.” As can be seen, the business risk associated withan established company like IBM is low. Such companies have along history of profitable success and, more importantly, haveextremely large cash reserves on hand.
The Franchise
Franchising accounts for 40 percent of all retail sales in the UnitedStates, employs over 18 million people and accounts for roughly$1.5 trillion in economic output.12 Like a big, sturdy tree that con-tinues to grow branches, a well-run franchise can spawn hundredsof entrepreneurs. The founder of a franchise—the franchisor—is astart-up entrepreneur, such as Bill Rosenberg, who foundedDunkin’ Donuts in the 1950s and now has approximately 7,400stores in 30 countries.13 These guys sell enough donuts in a year tocircle the globe . . . twice! Rosenberg’s franchisees (more than 5,500in the United States alone14), who own and operate individual fran-chises, are also entrepreneurs. They take risks, operate their busi-nesses expecting to gain a profit, and, like other entrepreneurs, canhave cash flow problems. The country’s first franchisees were anetwork of salesmen who in the 1850s paid the Singer SewingMachine Company for the right to sell the newly patented machinein different regions of the country. The franchise system ultimatelybecame popular as franchisees began operating in the auto, oil, andfood industries. Today, it’s estimated that a new franchise outletopens somewhere in the United States every 8 minutes.15
Franchisees are business owners who put their capital at riskand can go out of business if they do not generate enough profits toremain solvent.16 By one estimate, there are over 750,000 individualfranchise business units in America,17 of which 10,000 are home-based. The average initial investment in a franchise, not includingreal estate, is approximately $250,000.18 Examples include Mel Farr,the owner of five auto dealerships. Farr’s auto group is just 1 of 15subsidiaries in his business empire—valued at more than $573 mil-lion. Another such entrepreneur is Valerie Daniels-Carter, thefounder of a holding company that manages 70 Pizza Hut and 36 Burger King restaurants that total over $85 million in combinedannual revenue.19 Additional data from the International FranchiseAssociation and the U.S. Department of Commerce, given in
The Entrepreneurial Spectrum 7
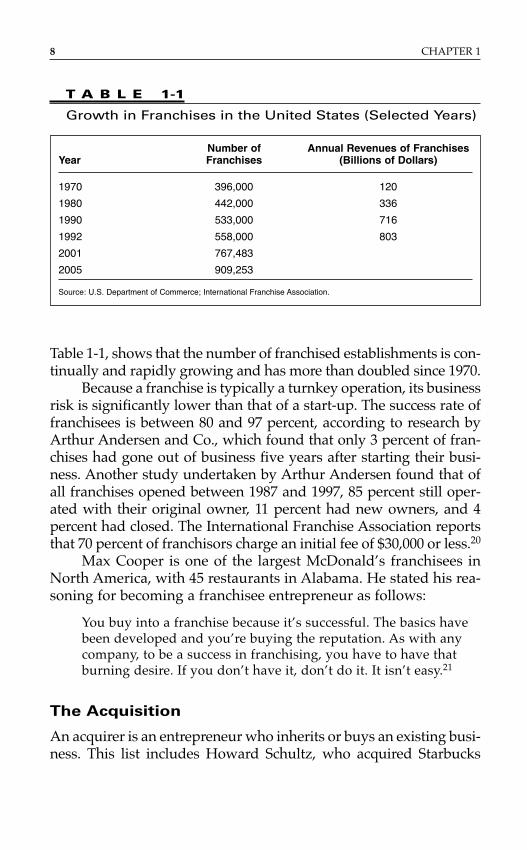
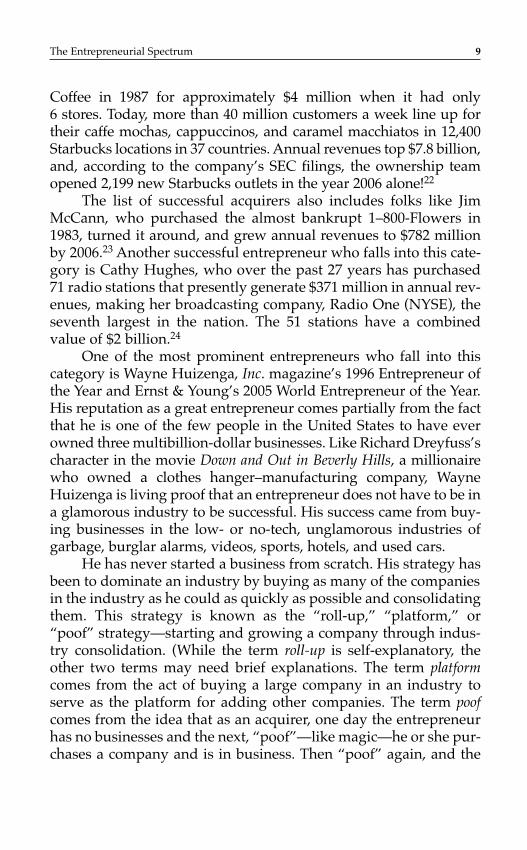
Table 1-1, shows that the number of franchised establishments is con-tinually and rapidly growing and has more than doubled since 1970.
Because a franchise is typically a turnkey operation, its businessrisk is significantly lower than that of a start-up. The success rate offranchisees is between 80 and 97 percent, according to research byArthur Andersen and Co., which found that only 3 percent of fran-chises had gone out of business five years after starting their busi-ness. Another study undertaken by Arthur Andersen found that ofall franchises opened between 1987 and 1997, 85 percent still oper-ated with their original owner, 11 percent had new owners, and 4percent had closed. The International Franchise Association reportsthat 70 percent of franchisors charge an initial fee of $30,000 or less.20
Max Cooper is one of the largest McDonald’s franchisees inNorth America, with 45 restaurants in Alabama. He stated his rea-soning for becoming a franchisee entrepreneur as follows:
You buy into a franchise because it’s successful. The basics havebeen developed and you’re buying the reputation. As with anycompany, to be a success in franchising, you have to have thatburning desire. If you don’t have it, don’t do it. It isn’t easy.21
The Acquisition
An acquirer is an entrepreneur who inherits or buys an existing busi-ness. This list includes Howard Schultz, who acquired Starbucks
8 CHAPTER 1
T A B L E 1-1
Growth in Franchises in the United States (Selected Years)
Number of Annual Revenues of FranchisesYear Franchises (Billions of Dollars)
1970 396,000 120
1980 442,000 336
1990 533,000 716
1992 558,000 803
2001 767,483
2005 909,253
Source: U.S. Department of Commerce; International Franchise Association.
Coffee in 1987 for approximately $4 million when it had only 6 stores. Today, more than 40 million customers a week line up fortheir caffe mochas, cappuccinos, and caramel macchiatos in 12,400Starbucks locations in 37 countries. Annual revenues top $7.8 billion,and, according to the company’s SEC filings, the ownership teamopened 2,199 new Starbucks outlets in the year 2006 alone!22
The list of successful acquirers also includes folks like JimMcCann, who purchased the almost bankrupt 1–800-Flowers in1983, turned it around, and grew annual revenues to $782 millionby 2006.23 Another successful entrepreneur who falls into this cate-gory is Cathy Hughes, who over the past 27 years has purchased71 radio stations that presently generate $371 million in annual rev-enues, making her broadcasting company, Radio One (NYSE), theseventh largest in the nation. The 51 stations have a combinedvalue of $2 billion.24
One of the most prominent entrepreneurs who fall into thiscategory is Wayne Huizenga, Inc. magazine’s 1996 Entrepreneur ofthe Year and Ernst & Young’s 2005 World Entrepreneur of the Year.His reputation as a great entrepreneur comes partially from the factthat he is one of the few people in the United States to have everowned three multibillion-dollar businesses. Like Richard Dreyfuss’scharacter in the movie Down and Out in Beverly Hills, a millionairewho owned a clothes hanger–manufacturing company, WayneHuizenga is living proof that an entrepreneur does not have to be ina glamorous industry to be successful. His success came from buy-ing businesses in the low- or no-tech, unglamorous industries ofgarbage, burglar alarms, videos, sports, hotels, and used cars.
He has never started a business from scratch. His strategy hasbeen to dominate an industry by buying as many of the companiesin the industry as he could as quickly as possible and consolidatingthem. This strategy is known as the “roll-up,” “platform,” or“poof” strategy—starting and growing a company through indus-try consolidation. (While the term roll-up is self-explanatory, theother two terms may need brief explanations. The term platformcomes from the act of buying a large company in an industry toserve as the platform for adding other companies. The term poofcomes from the idea that as an acquirer, one day the entrepreneurhas no businesses and the next, “poof”—like magic—he or she pur-chases a company and is in business. Then “poof” again, and the
The Entrepreneurial Spectrum 9
company grows exponentially via additional acquisitions.) As JimBlosser, one of Huizenga’s executives, noted, “Wayne doesn’t likestart-ups. Let someone else do the R&D. He’d prefer to pay a littlemore for a concept that has demonstrated some success and mayjust need help in capital and management.”25
Huizenga’s entrepreneurial career began in 1961 when he pur-chased his first company, Southern Sanitation Company, in Florida.The company’s assets were a garbage truck and a $500-a-monthtruck route, which he worked personally, rising at 2:30 a.m. everyday. This company ultimately became the multibillion-dollar WasteManagement Inc., which Huizenga had grown nationally throughaggressive acquisitions. In one nine-month period, Waste Manage-ment bought 100 smaller companies across the country. In ten yearsthe company grew from $5 million a year to annual profits of$106.5 million on nearly $1 billion in revenues. In four more years,revenue doubled again.26
Huizenga then exited this business and went into the videorental business by purchasing the entire Blockbuster Video fran-chise for $32 million in 1984, after having been unable to purchasethe Blockbuster franchise for the state of Florida because the state’sterritorial rights had already been sold to other entrepreneursbefore Huizenga made his offer. When he acquired BlockbusterVideo, it had 8 corporate and 11 franchise stores nationally. The franchisor was generating $7 million annually through directrentals from the 8 stores, plus franchise fees and royalties from the11 franchised stores.27 Under Huizenga, who didn’t even own aVCR at the time, Blockbuster flourished. For the next seven years,through internal growth and acquisitions, Blockbuster averaged anew store opening every 17 hours, resulting in its becoming largerthan its next 550 competitors combined. Over this period of time,the price of its stock increased 4,100 percent: someone who hadinvested $25,000 in Blockbuster stock in 1984 would have foundthat seven years later that investment would be worth $1.1 million,and an investment of $1 million in 1984 would have turned into $41million during this time period. In January 1994, Huizenga soldBlockbuster Video, which had grown to 4,300 stores in 23 countries,to Viacom for $8.5 billion.
Huizenga has pursued the same roll-up strategy in the autobusiness by rapidly buying as many dealerships as he possibly can
10 CHAPTER 1
and bundling them together under the AutoNation brand. By 2001,AutoNation was the largest automobile retailer in the UnitedStates, a title it still holds in 2008. By the way, if you ever find your-self behind the wheel of a National or Alamo rental car, you’re alsodriving one of Wayne’s vehicles—both companies are among his holdings. What Huizenga eventually hopes to do is to have an entire life cycle for a car. In other words, he buys cars from the manufacturer, sells some of them as new, leases or rents the balance, and later sells the rented cars as used.
Huizenga also owns or previously owned practically everyprofessional sports franchise in Florida, including the NationalFootball League’s Miami Dolphins, the National Hockey League’sFlorida Panthers, and Major League Baseball’s Florida Marlins. Henever owned the National Basketball League’s Miami Heat; hiscousin did.
Now, here’s your bonus points question—the one I always askmy Kellogg students. What’s the common theme among all ofHuizenga’s various businesses—videos, waste, sports, and auto-mobiles? Each one of them involves the rental of products, gener-ating significant, predictable, and, perhaps most importantly,recurring revenues. The video business rents the same video overand over again, and the car rental business rents the same car amultitude of times. In waste management, he rented the trash con-tainers. But what’s being rented in the sports business? He rentsthe seats in the stadiums and arenas that he owns. Other businessesthat are in the seat rental business are airlines, movie theaters, pub-lic transportation, and universities!
Another example of an acquirer is Bill Gates, the founder ofMicrosoft. The company’s initial success came from an operatingsystem called MS-DOS, which was originally owned by a companycalled Seattle Computer Products. In 1980, IBM was looking for anoperating system. After hearing about Bill Gates, who had droppedout of Harvard to start Microsoft in 1975 with his friend Paul Allen,the IBM representatives went to Albuquerque, New Mexico, whereGates and Allen were, to see if Gates could provide them with theoperating system they needed. At the time, Microsoft’s productwas a version of the programming language BASIC for the Altair8800, arguably the world’s first personal computer. BASIC hadbeen invented in 1964 by John Kenney and Thomas Kurtz.28 As he
The Entrepreneurial Spectrum 11
did not have an operating system, Gates recommended that IBMcontact another company called Digital Research. Gary Kildall, theowner of Digital Research, was absent when the IBM representa-tives visited, and his staff refused to sign a nondisclosure statementwith IBM without his consent, so the representatives went back toGates to see if he could recommend someone else. True oppor-tunistic entrepreneur that he is, Gates told them that he had anoperating system to provide to them and finalized a deal with IBM.Once he had done so, he went out and bought the operating system, Q-DOS, from Seattle Computer Products for $50,000 andcustomized it for IBM’s first PC, which was introduced in August1981. The rest is entrepreneurial history. So Bill Gates, one of theworld’s wealthiest people, with a personal net worth in excess of$50 billion, achieved his initial entrepreneurial success as anacquirer and has continued on this path ever since. Despite itscourt battles, Microsoft continues to grow, investing hundreds ofmillions of dollars each year to acquire technologies and compa-nies. Over the last three years, Microsoft has spent more than $3 billion on acquisitions.29 Don’t worry, however—there’s stillsome spare change in the Microsoft couch. In June 2007, Microsofthad $23.4 billion in cash on its books.30 In October 2007, Microsoftpaid $240 million for 1.6 percent of the online social networkFacebook, which was founded three years earlier.
The Start-Up
Creating a company from nothing other than an idea for a productor service is the most difficult and risky way to be a successful entre-preneur. Two great examples of start-up entrepreneurs are SteveWozniak, a college dropout, and Steve Jobs of Apple Computer. Asan engineer at Hewlett-Packard, Wozniak approached the companywith an idea for a small personal computer. The company did nottake him seriously and rejected his idea; this decision turned out to be one of the greatest intrapraneurial blunders in history. With $1,300 of his own money, Wozniak and his friend Steve Jobslaunched Apple Computer from his parents’ garage.
The Apple Computer start-up is a great example of a start-upthat was successful because of the revolutionary technological
12 CHAPTER 1
innovation created by the technology genius Wozniak. Other entre-preneurial firms that were successful as a result of technologicalinnovations include Amazon.com, founded by Jeff Bezos; Google,with Harry Page and Sergey Brin; and Facebook, with MarkZuckerberg.
But entrepreneurial start-up opportunities in the technologyindustry do not have to be limited to those who create new techno-logy. For example, Dell Computer, one of the largest computer sys-tems companies in the world, with $61 billion in annual revenues in2008,31 is not now, and never has been, a research and develop-ment–driven company, unlike the companies previously mentioned.Michael Dell, the founder, got his entrepreneurial opportunity fromthe implementation of the simple idea that he could “out-execute”his competitors. He has always built computers to customer ordersand sold them directly to consumers at prices lower than those of hiscompetitors. As he explained, “I saw that you’d buy a PC for about$3000 and inside that PC was about $600 worth of parts. IBM wouldbuy most of these parts from other companies, assemble them, andsell the computer to a dealer for $2000. Then the dealer, who knewvery little about selling or supporting computers, would sell it for$3000, which was even more outrageous.”32
Michael Dell, who dropped out of the University of Texas andfounded his company in 1984 with a $1,000 loan from his parents,went on to become in 1992, at age 27, the youngest CEO of aFortune 500 company. Less than 10 years later, Dell had revenuesof more than $15 billion in just the first six months of 2001, and itsfounder topped the Forbes “40 richest under 40” list. Today, Dell isranked number 43 on the Forbes list of the world’s billionaires,with a net worth in excess of $16 billion.33
Entrepreneurial start-ups have not been limited to techno-logy companies. In 1993, Kate Spade quit her job as the accessorieseditor for Mademoiselle and, with her husband, Andy, started herown women’s handbag company called Kate Spade, Inc. Her bags,a combination of whimsy and function, have scored big returns on the initial $35,000 investment from Andy’s 401(k). In 1999, sales had doubled to $50 million. Neiman Marcus purchased a 56 percent stake in February 1999 for $33.6 million.34 And in 2006,revenues reached $84 million.
The Entrepreneurial Spectrum 13
Finally, there are also numerous successful start-ups thatbegan from an idea other than the entrepreneur’s. For example,Mario and Cheryl Tricoci are the owners of a $40 million interna-tional day spa company headquartered in Chicago called MarioTricoci’s. In 1986, after returning from a vacation at a premier spaoutside the United States, they noticed that there were virtually noday spas in the country, only those with weeklong stay require-ments. Therefore, they started their day spa company, based on theideas and styles they had seen during their international travels.35
N O T E S
1. Michie P. Slaughter, “Entrepreneurship: Economic Impact and PublicPolicy Implications,” Center for Entrepreneurial Leadership Inc.,Ewing Marion Kauffman Foundation, March 1996; Mike Hermann,Kauffman Foundation, 1997.
2. Wendy M. Beech, “Business Profiles: And the Winners Are . . . , “Black Enterprise; Carolyn M. Brown and Tonia L. Shakespeare, “ACall to Arms for Black Business,” Black Enterprise, November 1996,pp. 79–80.
3. Office of Economic Research, Small Business Administration.4. Donna Fena, “The Making of an Entrepreneurial Generation,” Inc.,
July 2007.5. Raymond W. Smilor, “Vital Speeches and Articles of Interest,
Entrepreneurship and Philanthropy,” prepared for the Fifth AnnualKellogg-Kauffman Aspen Seminar on Philanthropy, September 1996.
6. New York Times, September 23, 1998.7. “1995 Inc. 500 Almanac,” Inc., 1995.8. Anne Morgan, Prescription for Success: The Life and Values of Ewing
Marion Kauffman, 1995.9. Wilson Harrell, Inc.
10. David H. Freedman, “The Money Trail,” Inc., December 1998.11. John Greenwald, “Master of the Mainframe: Thomas Watson Jr.,”
Time, December 7, 1998.12. Kerry Pipes, “History of Franchising: This Business Model Is an
Original—and a Winner,” Franchising.com Web site, posted onMarch 25, 2007.
13. Dunkin’ Donuts Franchising Web site, http://www.dunkinfranchising.com/aboutus/franchise/franchise-overview.html.
14 CHAPTER 1
14. Ibid.15. Pipes, “History of Franchising.”16. “Answers to the 21 Most Commonly Asked Questions about
Franchising,” International Franchise Association home page,October 22, 2001, http://www.franchise.org/resourcectr/faq/faq.asp.
17. Pipes, “History of Franchising.”18. Gerda D. Gallop, “15 Franchises You Can Run from Home,” Black
Enterprise, September 9, 1998.19. QSR Magazine, June 2006.20. “The Profile of Franchising,” International Franchise Association
Educational Foundation Inc., 2001.21. Kristen Dunlop Godsey, “Market like Mad: How One Man Built a
McDonald’s Franchise Empire,” Success, February 1997.22. Starbucks, 2006 Annual Report, Starbucks home page,
www.starbucks.com.23. 1–800-Flowers.com Inc., 2006 Annual Report, 1–800-Flowers.com
Inc. home page, www.1800flowers.com.24. Radio One, Inc., 2005 Annual Report, Radio One home page,
www.radio-one.com.25. Duncan Maxwell Andersen and Michael Warshaw, with Mari-Alyssa
Mulvihill, “The 1 Entrepreneur in America: Blockbuster Video’sWayne Huizenga,” Success, March 1995, p. 36.
26. Ibid.27. “Wayne Huizenga,” video, University of Southern California.28. David Gelernter, “Software Strongman: Bill Gates,” Time, December
7, 1998, p. 131.29. BusinessWeek, January 1997.30. Microsoft, Inc., 2007 Annual Report, Microsoft home page,
www.microsoft.com.31. Dell Inc., 2008 Annual Report, Dell home page, www.dell.com.32. Richard Murphy, “Michael Dell,” Success, January 1999.33. “World’s Billionaires List,” Forbes, March 2008.34. “Top Entrepreneurs of 1999,” BusinessWeek, January 2000,
http://www.businessweek.co/smallbiz/content/jan2000/ep3663075.htm.
35. Terri Roberson, “The Partners behind the Day Spa Explosion,”Today’s Chicago Woman, December 1998.
The Entrepreneurial Spectrum 15

This page intentionally left blank
INTRODUCTION
Faced with a white-knuckle crisis on the Apollo 13 mission, leg-endary NASA flight director Gene Kranz rallied his troops with thenow famous and stirring battle cry, “Failure is not an option.”Unfortunately, a few million entrepreneurs beg to differ.
SUCCESS RATES OF ENTREPRENEURS
It takes a certain amount of guts, nerve, chutzpah—whatever youwant to call it—to cut the safety net and go out on your own andstart a business. No one who does it, including me, has the end goalof burning through his life savings, failing miserably, and dyingalone and penniless! In reality, the deck is stacked against the entre-preneur. In Appendix C you will find a ranking of the riskiest andsafest small businesses as determined by the percentage of thosebusinesses that make or lose money. The failure rate of companies,particularly start-ups, is staggering. A study by the Small BusinessAdministration (SBA) showed the following failure rates for smallbusinesses:
■ 34 percent within two years after starting up■ 56 percent after four years1
17
C H A P T E R 2
The Entrepreneur
Another study done by Dun & Bradstreet shows that 63 percentof businesses with less than 20 employees fail within four years anda whopping 91 percent fail within ten.2 Failure rates for start-upcompanies are also high in foreign markets. For example, in NewZealand, research shows that 53 percent of small and medium-sizedbusinesses fail within three years.3 Statistics Canada indicated that145,000 new businesses start up each year in Canada, and 137,000 gobankrupt there. Every year, 470,000 new businesses open in Brazil,but 43 percent of these businesses will close their doors before theirthird anniversary.4
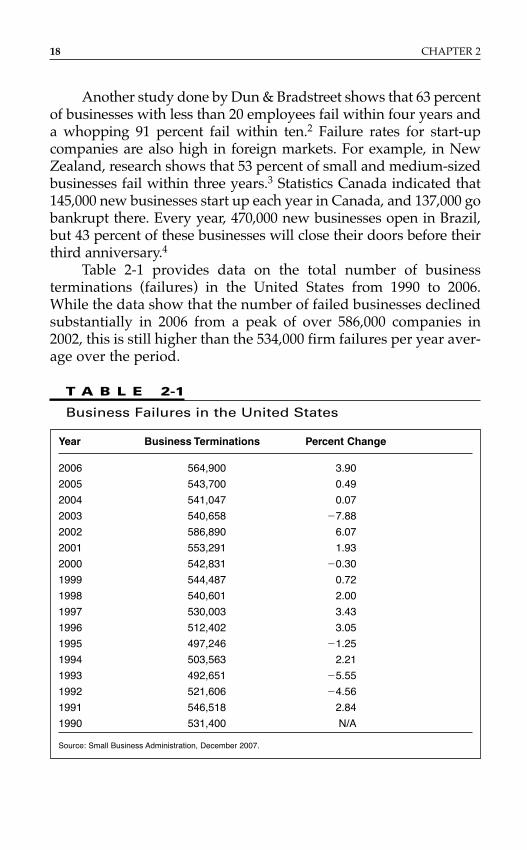
Table 2-1 provides data on the total number of business terminations (failures) in the United States from 1990 to 2006.While the data show that the number of failed businesses declinedsubstantially in 2006 from a peak of over 586,000 companies in2002, this is still higher than the 534,000 firm failures per year aver-age over the period.
18 CHAPTER 2
Year Business Terminations Percent Change
2006 564,900 3.90
2005 543,700 0.49
2004 541,047 0.07
2003 540,658 �7.88
2002 586,890 6.07
2001 553,291 1.93
2000 542,831 �0.30
1999 544,487 0.72
1998 540,601 2.00
1997 530,003 3.43
1996 512,402 3.05
1995 497,246 �1.25
1994 503,563 2.21
1993 492,651 �5.55
1992 521,606 �4.56
1991 546,518 2.84
1990 531,400 N/A
Source: Small Business Administration, December 2007.
T A B L E 2-1
Business Failures in the United States
Failure rates climbed significantly in 2001 and 2002, when the“dot-bomb” era claimed thousands of casualties, turned Nasdaqdarlings into duds, and foreshadowed a broader economic slow-down. True entrepreneurs have remarkable resilience, however, andthe statistics suggest that they need it. The average entrepreneurfails 3.8 times before succeeding.4a One such entrepreneur is StevePerlman, the cofounder of Web TV Networks, which he sold toMicrosoft in 1997 for $425 million. Before his success with Web TV,he had been involved in three start-up failures in a 10-year period.
Despite these odds, people are still pursuing the entrepreneur-ial dream. And this is taking place not only in the United States, butoverseas as well. For example, in Taiwan, 1,373 electronics compa-nies were started in 1997. By the end of the year, 1,147 of these com-panies, or 84 percent, had gone out of business.5 Despite this highfailure rate, the entrepreneurial spirit was alive and well in Taiwanat that time, as evidenced by the fact that the venture capital indus-try in Taiwan, which had a compound annual growth rate (CAGR)of less than 16 percent from 1990 to 1995 and never exceededUS$600 million in total investments during that period, grew over67 percent from 1996 to 1997 and over 36 percent from 1997 to 1998,ending at $2.2 billion in total investments in 1998.6 In 2005, theTaiwanese venture capital industry invested over $5.7 billion. 6a
One of the obvious reasons for the high rate of entrepreneur-ial failure is that it is tough to have a successful product, let alonean entire company. A recent Nielsen BASES and Ernst & Youngstudy found that about 95 percent of new consumer products in theUnited States fail.7 Kevin Clancy and Peter Krieg of CopernicusMarketing Consulting estimated that no more than 10 percent of allnew products or services are successful.8 Google’s vice presidentfor search products and user experience estimates that up to 60 to80 percent of Google’s products may eventually crash and burn.9
Another reason for failure is that people are starting compa-nies and then learning about cash flow management, marketing,human resource development, and other such areas on the job.Too many people are learning about what to do when you havecash flow problems when they actually have those problems,rather than in a classroom setting or as an intern with an entre-preneurial firm. This type of training is costly, because the mistakes that are made have an impact on the sustainability of a
The Entrepreneur 19
company. A study of unsuccessful entrepreneurs found that mostof them attributed their lack of success to inadequate training.10
The area in which they lacked the most training was cash flowmanagement.11
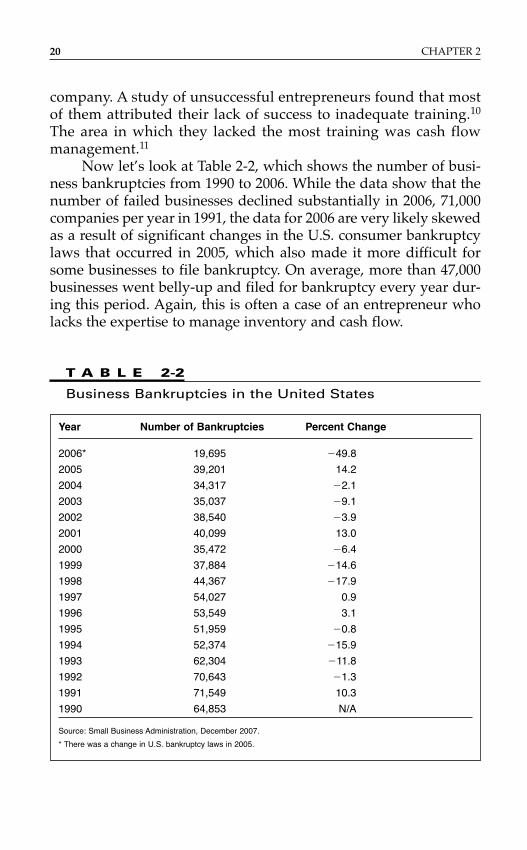
Now let’s look at Table 2-2, which shows the number of busi-ness bankruptcies from 1990 to 2006. While the data show that thenumber of failed businesses declined substantially in 2006, 71,000companies per year in 1991, the data for 2006 are very likely skewedas a result of significant changes in the U.S. consumer bankruptcylaws that occurred in 2005, which also made it more difficult forsome businesses to file bankruptcy. On average, more than 47,000businesses went belly-up and filed for bankruptcy every year dur-ing this period. Again, this is often a case of an entrepreneur wholacks the expertise to manage inventory and cash flow.
20 CHAPTER 2
Year Number of Bankruptcies Percent Change
2006* 19,695 �49.8
2005 39,201 14.2
2004 34,317 �2.1
2003 35,037 �9.1
2002 38,540 �3.9
2001 40,099 13.0
2000 35,472 �6.4
1999 37,884 �14.6
1998 44,367 �17.9
1997 54,027 0.9
1996 53,549 3.1
1995 51,959 �0.8
1994 52,374 �15.9
1993 62,304 �11.8
1992 70,643 �1.3
1991 71,549 10.3
1990 64,853 N/A
Source: Small Business Administration, December 2007.
* There was a change in U.S. bankruptcy laws in 2005.
T A B L E 2-2
Business Bankruptcies in the United States
What we see in the tables is that the business bankruptcytrends in Table 2-2 and the trends for business starts and failurescited in Table 2-1 can be mapped to specific macroeconomic situa-tions occurring in the country. Specifically, we see that the numberof bankruptcies peaked in 1991, when the United States was miredin a recession, and the number of business failures peaked in 2002following the dot-bomb period described previously. Thus, duringtough economic times, the number of business failures willincrease because owners cannot pay the bills. At the same time, thenumber of entrepreneurial start-ups will also generally increaseduring these periods because people get downsized.
There’s an important lesson here. All entrepreneurs, prospec-tive and existing, should easily and readily be able to answer the question, what happens to my business during a recession?Businesses respond to recessions differently. For example, one typeof business that does well during recessions is auto parts and serv-ice because people tend to repair old cars rather than buy newones. The alcoholic beverages industry also does well during reces-sions because people tend to drink more when they are depressedor unhappy. Businesses that do not fare as well include restaurants(people eat at home more), the vacation industry, and any busi-nesses that sell luxury items, such as boats.
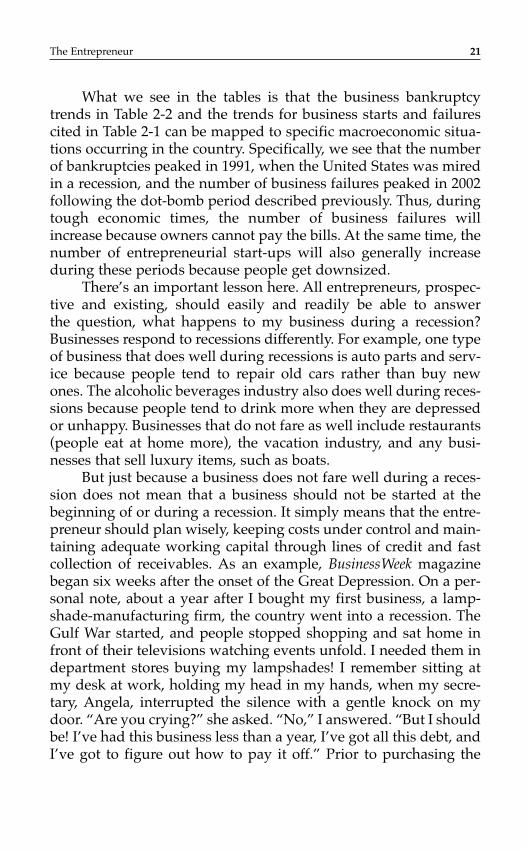
But just because a business does not fare well during a reces-sion does not mean that a business should not be started at thebeginning of or during a recession. It simply means that the entre-preneur should plan wisely, keeping costs under control and main-taining adequate working capital through lines of credit and fastcollection of receivables. As an example, BusinessWeek magazinebegan six weeks after the onset of the Great Depression. On a per-sonal note, about a year after I bought my first business, a lamp-shade-manufacturing firm, the country went into a recession. TheGulf War started, and people stopped shopping and sat home infront of their televisions watching events unfold. I needed them indepartment stores buying my lampshades! I remember sitting atmy desk at work, holding my head in my hands, when my secre-tary, Angela, interrupted the silence with a gentle knock on mydoor. “Are you crying?” she asked. “No,” I answered. “But I shouldbe! I’ve had this business less than a year, I’ve got all this debt, andI’ve got to figure out how to pay it off.” Prior to purchasing the
The Entrepreneur 21
business, I had laid out a specific plan for dealing with a downturn,and we did manage to make it through. But in the spirit of candor,I have to admit that I underestimated how tight business would be.It was ugly.
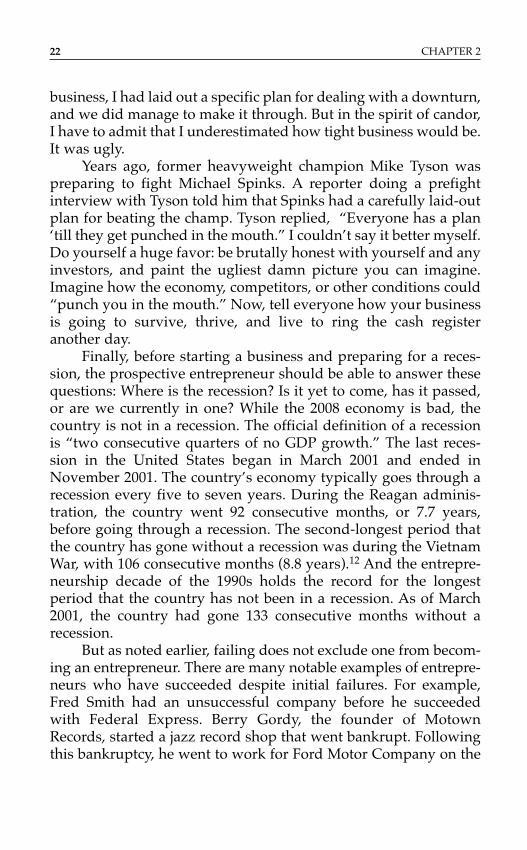
Years ago, former heavyweight champion Mike Tyson waspreparing to fight Michael Spinks. A reporter doing a prefightinterview with Tyson told him that Spinks had a carefully laid-outplan for beating the champ. Tyson replied, “Everyone has a plan‘till they get punched in the mouth.” I couldn’t say it better myself.Do yourself a huge favor: be brutally honest with yourself and anyinvestors, and paint the ugliest damn picture you can imagine.Imagine how the economy, competitors, or other conditions could“punch you in the mouth.” Now, tell everyone how your businessis going to survive, thrive, and live to ring the cash registeranother day.
Finally, before starting a business and preparing for a reces-sion, the prospective entrepreneur should be able to answer thesequestions: Where is the recession? Is it yet to come, has it passed,or are we currently in one? While the 2008 economy is bad, thecountry is not in a recession. The official definition of a recessionis “two consecutive quarters of no GDP growth.” The last reces-sion in the United States began in March 2001 and ended inNovember 2001. The country’s economy typically goes through arecession every five to seven years. During the Reagan adminis-tration, the country went 92 consecutive months, or 7.7 years,before going through a recession. The second-longest period thatthe country has gone without a recession was during the VietnamWar, with 106 consecutive months (8.8 years).12 And the entrepre-neurship decade of the 1990s holds the record for the longestperiod that the country has not been in a recession. As of March2001, the country had gone 133 consecutive months without arecession.
But as noted earlier, failing does not exclude one from becom-ing an entrepreneur. There are many notable examples of entrepre-neurs who have succeeded despite initial failures. For example,Fred Smith had an unsuccessful company before he succeededwith Federal Express. Berry Gordy, the founder of MotownRecords, started a jazz record shop that went bankrupt. Followingthis bankruptcy, he went to work for Ford Motor Company on the
22 CHAPTER 2
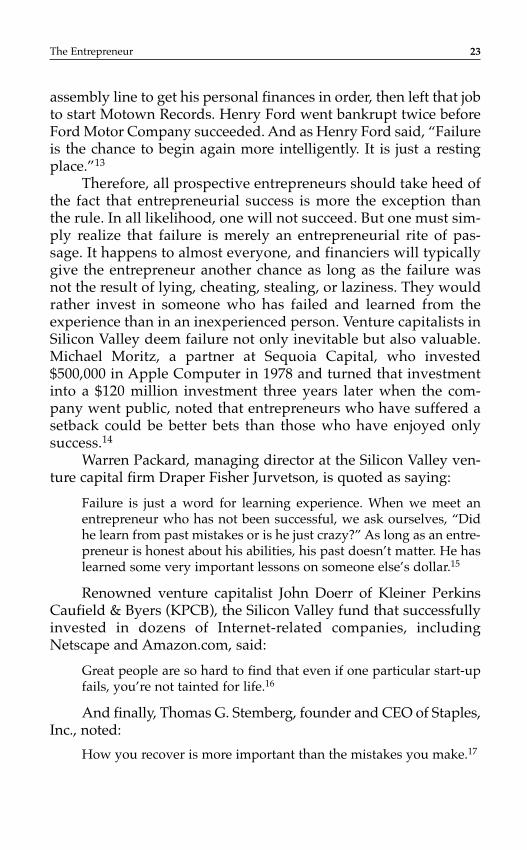
assembly line to get his personal finances in order, then left that jobto start Motown Records. Henry Ford went bankrupt twice beforeFord Motor Company succeeded. And as Henry Ford said, “Failureis the chance to begin again more intelligently. It is just a restingplace.”13
Therefore, all prospective entrepreneurs should take heed ofthe fact that entrepreneurial success is more the exception thanthe rule. In all likelihood, one will not succeed. But one must sim-ply realize that failure is merely an entrepreneurial rite of pas-sage. It happens to almost everyone, and financiers will typicallygive the entrepreneur another chance as long as the failure wasnot the result of lying, cheating, stealing, or laziness. They wouldrather invest in someone who has failed and learned from theexperience than in an inexperienced person. Venture capitalists inSilicon Valley deem failure not only inevitable but also valuable.Michael Moritz, a partner at Sequoia Capital, who invested$500,000 in Apple Computer in 1978 and turned that investmentinto a $120 million investment three years later when the com-pany went public, noted that entrepreneurs who have suffered asetback could be better bets than those who have enjoyed onlysuccess.14
Warren Packard, managing director at the Silicon Valley ven-ture capital firm Draper Fisher Jurvetson, is quoted as saying:
Failure is just a word for learning experience. When we meet anentrepreneur who has not been successful, we ask ourselves, “Didhe learn from past mistakes or is he just crazy?” As long as an entre-preneur is honest about his abilities, his past doesn’t matter. He haslearned some very important lessons on someone else’s dollar.15
Renowned venture capitalist John Doerr of Kleiner PerkinsCaufield & Byers (KPCB), the Silicon Valley fund that successfullyinvested in dozens of Internet-related companies, includingNetscape and Amazon.com, said:
Great people are so hard to find that even if one particular start-upfails, you’re not tainted for life.16
And finally, Thomas G. Stemberg, founder and CEO of Staples,Inc., noted:
How you recover is more important than the mistakes you make.17
The Entrepreneur 23
WHY BECOME AN ENTREPRENEUR?
A Harris Interactive study found that 47 percent of Americans whodo not currently own their own business have dreamed of startingtheir own business.18 Now, why do people want to become entre-preneurs? Why has entrepreneurship become so popular? Everyonehas a different reason for wanting to start a business.
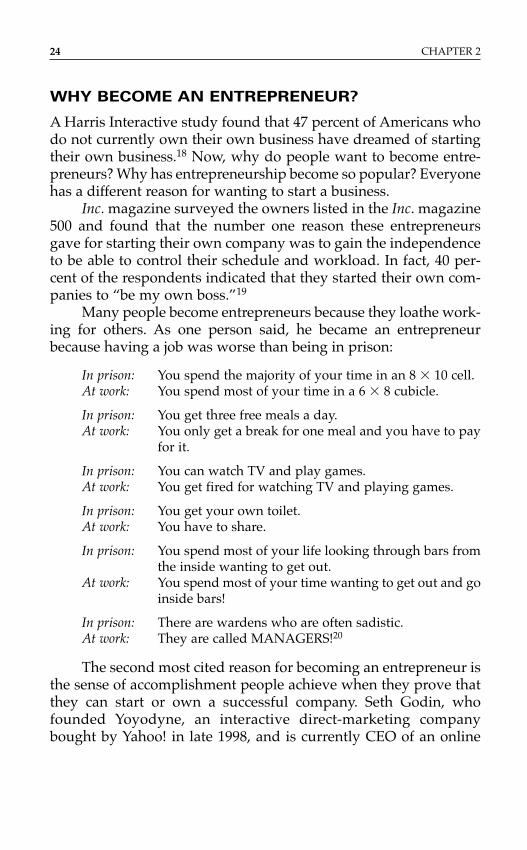
Inc. magazine surveyed the owners listed in the Inc. magazine500 and found that the number one reason these entrepreneursgave for starting their own company was to gain the independenceto be able to control their schedule and workload. In fact, 40 per-cent of the respondents indicated that they started their own com-panies to “be my own boss.”19
Many people become entrepreneurs because they loathe work-ing for others. As one person said, he became an entrepreneurbecause having a job was worse than being in prison:
In prison: You spend the majority of your time in an 8 � 10 cell.At work: You spend most of your time in a 6 � 8 cubicle.
In prison: You get three free meals a day.At work: You only get a break for one meal and you have to pay
for it.
In prison: You can watch TV and play games.At work: You get fired for watching TV and playing games.
In prison: You get your own toilet.At work: You have to share.
In prison: You spend most of your life looking through bars fromthe inside wanting to get out.
At work: You spend most of your time wanting to get out and goinside bars!
In prison: There are wardens who are often sadistic.At work: They are called MANAGERS!20
The second most cited reason for becoming an entrepreneur isthe sense of accomplishment people achieve when they prove thatthey can start or own a successful company. Seth Godin, whofounded Yoyodyne, an interactive direct-marketing companybought by Yahoo! in late 1998, and is currently CEO of an online
24 CHAPTER 2
venture called Squidoo, a tool that lets users build Web pages,explains the desire: “Most people can’t understand why someonewho made $10 million would do it again. That’s because most people don’t like working, and they think it’s irrational to keepworking.”21 Joseph Schumpeter, the originator of the famous “creative destruction” moniker for capitalism, described it well.“Entrepreneurs, he insisted . . . feel the will to conquer: the impulseto fight, to prove oneself superior to others, to succeed for the sake,not fruits of success, but of success itself. . . . There is the joy of cre-ating, of getting things done, or simply of exercising one’s energyand ingenuity.”22
Interestingly, most people, young or old, do not becomeentrepreneurs to become rich. This was the case with the 2005 Inc.Entrepreneur of the Year, Ping Fu. Ms. Fu was deported in 1981 bythe Chinese government after releasing a research report on infan-ticide. She came to America and, after she learned English, becameadept at computer programming. The owner of her companyoffered her 5 percent equity in the business where she worked andan opportunity to become a millionaire. Fu turned him down.Why? Because for her it was about creating something of value,not getting rich. She is now CEO of Geomagic, a digital shape sam-pling and processing company with $30 million per year in rev-enue.23 In another example, in a survey of high school teensundertaken by the Gallup Organization, 71 percent of the respon-dents said that they were interested in starting their own busi-nesses. However, only 26 percent cited earning a lot of money astheir primary motivation for starting a business.24 In the Inc. mag-azine survey mentioned earlier, “making a lot of money” was onlythe third most popular reason why entrepreneurs started theirown companies. Finally, a 2006 survey conducted by theUniversity of Nebraska indicated that only 6 percent of businessowners believe that the major reason to start a business is to “earnlots of money.”25
What is evident is that for most people, making a lot of moneyis not necessarily the driving force for becoming an entrepreneur.However, despite this fact, the majority of wealthy people in theUnited States became rich as a result of being an entrepreneur. Theby-product of entrepreneurship is wealth creation. In the United
The Entrepreneur 25
States, there are approximately 371 billionaires, 1 million decamil-lionaires, and over 9 million millionaires.26 In The Millionaire NextDoor, the authors found that 80 percent of these people gained their wealth by becoming entrepreneurs or as a result of being partof an entrepreneurial venture. For example, one of the country’swealthiest people, Bill Gates, achieved his wealth by foundingMicrosoft. Besides Gates, Microsoft has produced an additional10,000 millionaires.27 Many of these wealthy people are young menand women who were very ambitious, smart, and talented.
To further support the wealth creation–entrepreneurship relationship, Forbes reported that three out of five of the Forbes 400richest Americans were first-generation entrepreneurs.28 But thiswealth creation–entrepreneurship relationship is not new. John D.Rockefeller cofounded Standard Oil, the first major U.S. multina-tional corporation, in 1870. In 1913, his personal net worth was$900 million, which was equivalent to more than 2 percent of thecountry’s gross national product. Today, 2 percent of the country’sgross national product would be approximately $273 billion, morethan five times Bill Gates’s net worth.
As mentioned earlier, for some people, becoming an entrepre-neur was not a choice; rather, they took this route when they werelaid off from their jobs. Others started companies with the objectiveof creating jobs for others. One entrepreneur who has been selectedby Inc. magazine as one of the company builders who is “changingthe face of American businesses” is quoted as saying, “I have abusiness that has the highest integrity in town. . . . People respectme and I support 72 families.”29 For some entrepreneurs, theirbusiness is an outlet for their creative talent. Others feel the need toleave behind a legacy that embodies their values. Still others havecommunity or societal concerns that they feel can best beaddressed through their company.30
For some people, becoming an entrepreneur is the naturalthing to do. They either are the offspring of an entrepreneur or have developed an interest in being an entrepreneur becausethey were exposed to the business world at an early age. Success-ful high-growth entrepreneurs who were offspring of entrepre-neurs include Berry Gordy of Motown Records; Wayne Huizengaof Waste Management, Blockbuster Video, and AutoNation;
26 CHAPTER 2
Josephine Esther Mentzer of Estée Lauder; Ted Turner of TBS andCNN television stations; and Akio Morita, who left the sake busi-ness that his family owned for 14 generations to start Sony. DonaldTrump is also included in this group; ironically, in contrast toDonald and his high-income real estate clients, his father ownedreal estate that he rented to low-income and working-class familiesin New York.
Another high-growth entrepreneur who belongs in this cate-gory is John Rogers, Jr., the founder of Ariel Capital—a financialmanagement firm that manages billions of dollars. Financial man-agement is in Rogers’s blood. To encourage his son’s interest inbusiness, every birthday and Christmas, John’s father gave hisyoung son stocks as gifts. John’s parents, grandparents, and great-grandparents have always owned their own businesses. In fact, hisgreat-grandfather, C. J. Stafford, was an attorney by training butalso owned a hotel in Florida. It burned down in the early 1900swhen he was falsely accused of starting a race riot. Instead of giv-ing up, Stafford fled Florida and came to Chicago, where he startedhis own law firm.
Other entrepreneurs start companies to develop a new idea orinvention. For example, as discussed earlier, Steve Wozniak, thecofounder of Apple Computer, became an entrepreneur by default.If Hewlett-Packard had not rejected his idea for a user-friendlysmall personal computer, he probably would not have resignedfrom the company to start his own business and launch a dramaticchange in the computer hardware industry.
Another reason why people want to become entrepreneurs isbecause of the emergence of role models. Fifteen years ago, themain business role models were corporate executives such asRobert Goizueta, the legendary CEO of the Coca-Cola Corporationwho died of cancer in 1997, and Jack Welch of General Electric. Inthe entrepreneurship decade of the 1990s, entrepreneurs becameprimary business role models, the people that everyone wanted toemulate. For example, Christian and Timbers, a consulting firm,identified the top CEOs who were mentioned the most often inmajor business publications in 1997. As Figure 2-1 shows, three ofthe CEOs who received the most mentions were founders of theircompanies [those names with an asterisk (*)].31
The Entrepreneur 27
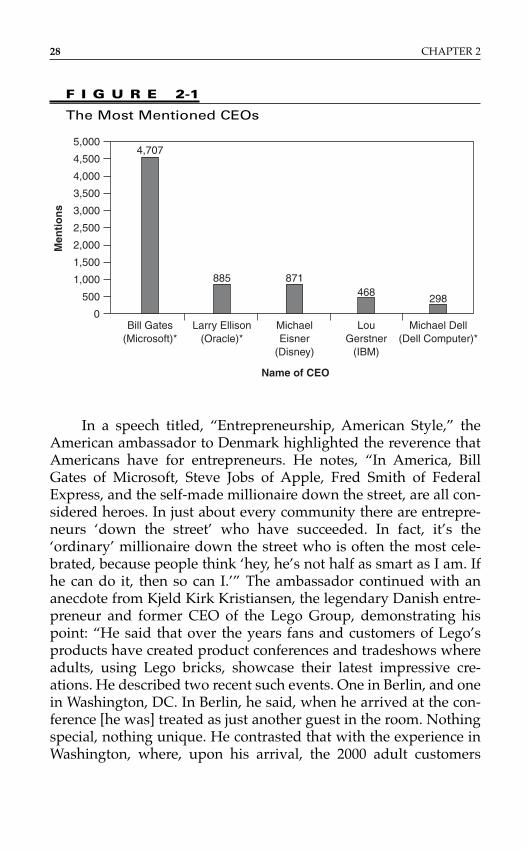
In a speech titled, “Entrepreneurship, American Style,” theAmerican ambassador to Denmark highlighted the reverence thatAmericans have for entrepreneurs. He notes, “In America, BillGates of Microsoft, Steve Jobs of Apple, Fred Smith of FederalExpress, and the self-made millionaire down the street, are all con-sidered heroes. In just about every community there are entrepre-neurs ‘down the street’ who have succeeded. In fact, it’s the‘ordinary’ millionaire down the street who is often the most cele-brated, because people think ‘hey, he’s not half as smart as I am. Ifhe can do it, then so can I.’” The ambassador continued with ananecdote from Kjeld Kirk Kristiansen, the legendary Danish entre-preneur and former CEO of the Lego Group, demonstrating hispoint: “He said that over the years fans and customers of Lego’sproducts have created product conferences and tradeshows whereadults, using Lego bricks, showcase their latest impressive cre-ations. He described two recent such events. One in Berlin, and onein Washington, DC. In Berlin, he said, when he arrived at the con-ference [he was] treated as just another guest in the room. Nothingspecial, nothing unique. He contrasted that with the experience inWashington, where, upon his arrival, the 2000 adult customers
28 CHAPTER 2
F I G U R E 2-1
The Most Mentioned CEOs
5,000
4,500
4,000
3,500
3,000
2,500
2,000
1,500
1,000
500
0
4,707
885 871468
298
Michael Dell(Dell Computer)*
LouGerstner
(IBM)
MichaelEisner
(Disney)
Name of CEO
Men
tio
ns
Larry Ellison(Oracle)*
Bill Gates(Microsoft)*
who were gathered there treated him as a rock star, as a celebrity,as a hero; gathering around, taking photographs, seeking auto-graphs. He says when he gets to go to America for a show like this,he knows how Elvis Presley must have felt.”32
In 1997, Inc. magazine conducted a study aimed at assessingthe impact of entrepreneurs and their companies on Americanbusinesses. A total of 500 entrepreneurs who had founded theircompanies between 1982 and 1996 and 200 upper- and middle-level Fortune 500 executives (vice presidents, directors, and man-agers) were surveyed and asked the same questions. When askedwhether they agreed with the statement, “Entrepreneurs are theheroes of American business,” 95 percent of the entrepreneurs and68 percent of the corporate executives agreed. These results werestarkly different from the responses given by these two groups 10years earlier, when 74 percent of entrepreneurs and 49 percent ofexecutives had agreed with this statement. Interestingly, 37 percentof the corporate executives noted that if they could live their livesover, they would choose to run their own companies.33
While annual corporate venture capital investments of $1.3 bil-lion in 2005 are down from the stratospheric $17 billion invested in2000, many of America’s most profitable companies continue todevote resources to spurring entrepreneurial activity.34 Several com-panies have, in fact, demonstrated this support by creating pro-grams that encourage and assist employees who want to becomeentrepreneurs. Boeing’s Chairman’s Innovation Initiative, a $200million in-house venture capital fund, provides employees theopportunities to develop new business ideas from company-devel-oped ideas. Procter & Gamble pushes “open innovation,” encour-aging managers to seek new business ideas outside as well as insidethe company.35 Other firms, such as Intel, have internal venture cap-ital arms that search for the next breakthrough technologies. Intelhas invested more than $4 billion in about 1,000 companies since theearly 1990s, maintaining a consistent investment pace through twomajor recessions. Adobe functions as a sole limited partner in a ven-ture capital fund that it outsources to Granite Ventures in an effortto maintain relationships with the start-up community.36
Finally, as shown in Figure 2-2, a Coca-Cola Companyannouncement to all the company’s employees provides an exam-ple of corporations supporting entrepreneurship.
The Entrepreneur 29
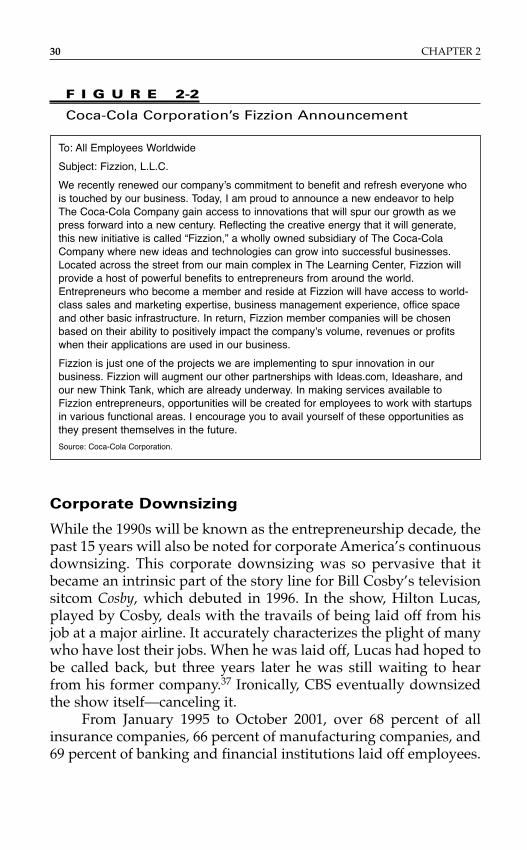
Corporate Downsizing
While the 1990s will be known as the entrepreneurship decade, thepast 15 years will also be noted for corporate America’s continuousdownsizing. This corporate downsizing was so pervasive that itbecame an intrinsic part of the story line for Bill Cosby’s televisionsitcom Cosby, which debuted in 1996. In the show, Hilton Lucas,played by Cosby, deals with the travails of being laid off from hisjob at a major airline. It accurately characterizes the plight of manywho have lost their jobs. When he was laid off, Lucas had hoped tobe called back, but three years later he was still waiting to hearfrom his former company.37 Ironically, CBS eventually downsizedthe show itself—canceling it.
From January 1995 to October 2001, over 68 percent of allinsurance companies, 66 percent of manufacturing companies, and69 percent of banking and financial institutions laid off employees.
30 CHAPTER 2
F I G U R E 2-2
Coca-Cola Corporation’s Fizzion Announcement
To: All Employees Worldwide
Subject: Fizzion, L.L.C.
We recently renewed our company’s commitment to benefit and refresh everyone whois touched by our business. Today, I am proud to announce a new endeavor to helpThe Coca-Cola Company gain access to innovations that will spur our growth as wepress forward into a new century. Reflecting the creative energy that it will generate,this new initiative is called “Fizzion,” a wholly owned subsidiary of The Coca-ColaCompany where new ideas and technologies can grow into successful businesses.Located across the street from our main complex in The Learning Center, Fizzion willprovide a host of powerful benefits to entrepreneurs from around the world.Entrepreneurs who become a member and reside at Fizzion will have access to world-class sales and marketing expertise, business management experience, office spaceand other basic infrastructure. In return, Fizzion member companies will be chosenbased on their ability to positively impact the company’s volume, revenues or profitswhen their applications are used in our business.
Fizzion is just one of the projects we are implementing to spur innovation in ourbusiness. Fizzion will augment our other partnerships with Ideas.com, Ideashare, andour new Think Tank, which are already underway. In making services available toFizzion entrepreneurs, opportunities will be created for employees to work with startupsin various functional areas. I encourage you to avail yourself of these opportunities asthey present themselves in the future.
Source: Coca-Cola Corporation.
Layoffs have become a fact of life for American workers, and in2001, the corporate carnage set new records. The numbers were sosignificant that Forbes magazine began to post a daily body counton its Web site. Major corporations trimming their ranks includedLucent (40,000 workers), Ford (5,000 white-collar workers), Agilent(4,000 workers), and Gateway (5,000 workers). By September 2001,more than 1.1 million employees had gotten the ax—an 83 percentjump from the previous year’s tally and far above any annual totalin the last 12 years.38 The terrorist attack on the World Trade Centerin September 2001 added even more casualties, with virtually all ofthe nation’s airlines announcing major layoffs, more than 100,000workers, in the weeks that followed. Others in the travel industryfollowed suit, with Starwood Hotels and Resorts laying off 10,000workers. American workers have plenty of company overseas:more than 2 million workers in Japan and Southeast Asia lost theirjobs in 2001.39
In 2008, the pace of corporate layoffs has started to increaseagain. The U.S. Department of Labor reports that from January 2008to May 2008, there were 7,615 different layoff events of at least 50people in the United States, resulting in almost 784,000 new claimsfor unemployment benefits. This is up substantially from the 6,325events and 650,000 new claimants of just one year earlier.40 Some ofthe business layoffs announced during that period included AOL(2,000), Morgan Stanley (5,000), Merrill Lynch (4,000), and Yahoo!(2,000).41
While many furloughed workers will eventually return toother corporate jobs, it’s likely that others will follow in the foot-steps of previous pink-slip recipients. Many workers who lost theirjobs during the corporate cutbacks of the 1980s and 1990s eitherchose or were forced to pursue the entrepreneurial route ratherthan employment in the corporate arena. A survey of the foundersof the 1996 Inc. 500—a list of the 500 fastest-growing small compa-nies—found that 40 percent of these founders started their busi-nesses after a company reshuffling.42
The Council on Competiveness, an organization devoted todriving U.S. competiveness in world markets, explains, “Economicgrowth is not an orderly process of incremental improvements—ithappens because new firms are created and older firms aredestroyed. . . . And entrepreneurs are the moving force behind this
The Entrepreneur 31
churn that underpins the dynamism of the U.S. economy.”Economist Joseph Schumpeter refers to this process as “creativedestruction.” A result of this creative destruction is that employeesare laid off as firms downsize or go out of business. This unem-ployment generates new entrepreneurial ventures.43
An example of an entrepreneur who chose to start his ownbusiness after being downsized is Patrick Kelly, who started a com-pany called Physicians Sales and Services, which now has over $1.6billion in revenue and is the nation’s largest supplier of medical sup-plies to physicians’ offices. When asked why he became an entre-preneur, he said, “I didn’t choose to become an entrepreneur. I gotfired and started a company in order to earn a living. I had to learnto be a CEO. I’ll tell you right now, I stole every idea I have. There isnot an original thought in my head. I stole everything and youshould too.” Another happy story regarding a downsized employeeis the story of Bill Rasmussen, who was laid off from his public rela-tions job in 1979. He went on to start the Entertainment SportsProgramming Network (ESPN) in Connecticut, which is now jointlyowned by Disney and the Hearst family and has over $4 billion inannual revenues through four domestic cable networks, the nation’slargest sports radio network, and the most visited sports Web site onthe Internet.44
Academic Training
In 1970, only 16 American universities provided training in entre-preneurship. Today, more than 2,000 universities throughout thecountry (roughly two-thirds of all institutions) have at least oneclass, and many more classes are being taught in universities allover the world. In 1980, there were 18 entrepreneurship endowedchairs at business schools; today, there are more than 270.45,46 Infact, entrepreneurship has become an academic discipline in virtu-ally all of the top business schools across the country. Another indi-cator of academia’s commitment to this field is the fact thatbusiness schools offer not only classes, but also minors and majorsin the field of entrepreneurship. The number of entrepreneurshipmajors in undergraduate and MBA programs has risen from as fewas 175 in 1990 to more than 500 today.47 A major contributor to thegrowth of entrepreneurship on campus is the Kauffman Campus
32 CHAPTER 2
Initiative, which is directing $100 million to the creation of entre-preneurial education programs.
Does entrepreneurial training work? While concrete researchis difficult to gather and entrepreneurs such as Steve Jobs of Appleand Bill Gates of Microsoft have certainly succeeded without sucheducation, a 2002 study by the University of Arizona showed thatfive years after graduation, the average annual income for entre-preneurship majors and MBAs who concentrated in entrepreneur-ship at school was 27 percent higher than that for students withother business majors and students with standard MBA’s.48
In addition, according to a study by the Kauffman Foundation, 32 percent of successful entrepreneurs had taken at least five busi-ness classes, while only 18 percent of unsuccessful entrepreneurshad taken these kinds of courses.
Anecdotal evidence is plentiful. Mark Cuban, who sold hisstart-up, Broadcast.com, to Yahoo! for $6 billion in 1999 and is thecurrent owner of the Dallas Mavericks and HDNet, swears by hisentrepreneurship training. He notes, “One of the best classes I evertook was entrepreneurship in my freshman year at IndianaUniversity. It really motivated me. There is so much more to start-ing a business than just understanding finance, accounting, andmarketing. Teaching kids what has worked with startup compa-nies and learning about experiences that others have had couldreally make a difference. I know it did for me.”49
Tatiana Saribekian, a Russian immigrant, believes that SanDiego State University’s MBA program helped her master the artof the deal. After failing with her first U.S.-based lumber venture,she decided to get an MBA, and concentrated in entrepreneurship.She has recently started over as a builder and reflects on her MBAin entrepreneurship: “My classes opened my eyes to how businessworks here in America. It is completely different from Russia. I think this time I will have a better chance at success.”50
Finally, the growth in entrepreneurship will be forever linkedwith America’s technological revolution, which began in the early1980s. Companies such as Microsoft, Apple, Lotus, and Dell, toname a few, gave birth to the present $600 billion technology indus-try. Advances in technology have led to the proliferation of newproducts and services fostering the creation of companies in newareas, such as Internet-based businesses. For example, in 1999,
The Entrepreneur 33
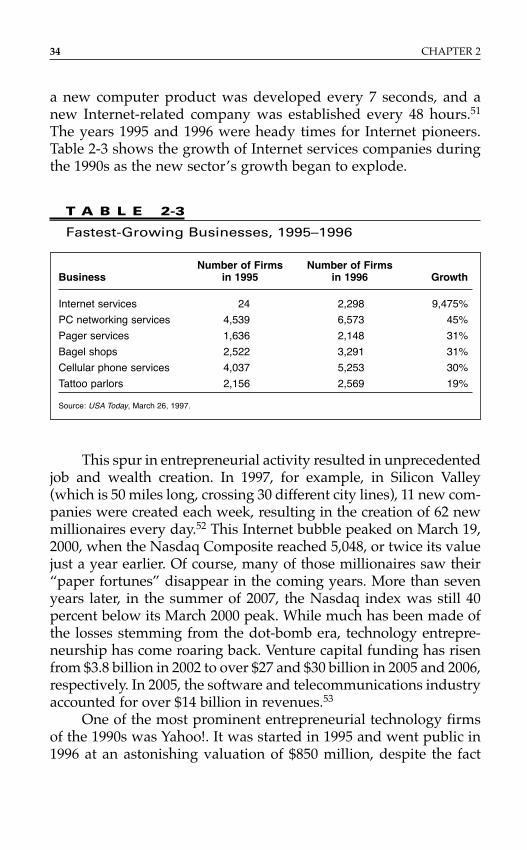
a new computer product was developed every 7 seconds, and a new Internet-related company was established every 48 hours.51
The years 1995 and 1996 were heady times for Internet pioneers.Table 2-3 shows the growth of Internet services companies duringthe 1990s as the new sector’s growth began to explode.
34 CHAPTER 2
Number of Firms Number of FirmsBusiness in 1995 in 1996 Growth
Internet services 24 2,298 9,475%
PC networking services 4,539 6,573 45%
Pager services 1,636 2,148 31%
Bagel shops 2,522 3,291 31%
Cellular phone services 4,037 5,253 30%
Tattoo parlors 2,156 2,569 19%
Source: USA Today, March 26, 1997.
T A B L E 2-3
Fastest-Growing Businesses, 1995–1996
This spur in entrepreneurial activity resulted in unprecedentedjob and wealth creation. In 1997, for example, in Silicon Valley(which is 50 miles long, crossing 30 different city lines), 11 new com-panies were created each week, resulting in the creation of 62 newmillionaires every day.52 This Internet bubble peaked on March 19,2000, when the Nasdaq Composite reached 5,048, or twice its valuejust a year earlier. Of course, many of those millionaires saw their“paper fortunes” disappear in the coming years. More than sevenyears later, in the summer of 2007, the Nasdaq index was still 40percent below its March 2000 peak. While much has been made ofthe losses stemming from the dot-bomb era, technology entrepre-neurship has come roaring back. Venture capital funding has risenfrom $3.8 billion in 2002 to over $27 and $30 billion in 2005 and 2006,respectively. In 2005, the software and telecommunications industryaccounted for over $14 billion in revenues.53
One of the most prominent entrepreneurial technology firmsof the 1990s was Yahoo!. It was started in 1995 and went public in1996 at an astonishing valuation of $850 million, despite the fact
that its profits in 1996 were only $81,000 on revenues of $400,000.In 2001, the company lost 90 percent of its market capitalization,forced out its CEO, announced not one but two series of layoffs,and was struggling to regain its footing. Like the technology indus-try itself, however, Yahoo! has rebounded. Between April 2, 2001,and April 2, 2007, Yahoo!’s share price has risen from $7 per shareto over $31 per share. This is a return of more than 440 percent.
Technology still remains a huge driver of entrepreneurshiptoday. In fact, around 2005, Internet start-ups began to see a resur-gence, due in part to the development of the next wave of Internetapplications, commonly dubbed “Web 2.0” and most popularlycharacterized by Facebook.com. While this Web 2.0 period has seenan increase in the number of firms getting funded, an increase invaluations, and an increase in prominent acquisitions, fortunately, itappears that some of the craziness seen in the 1990s has been tem-pered. Bill Burnham, a former partner at Mobius Venture Capital,describes this new mentality well: “The bubble generation is muchmore attuned to the fact that things can get really out of hand.There’s a level of caution that has been ingrained.”54
TRAITS OF AN ENTREPRENEUR
Building a successful, sustainable business requires courage,patience, and resilience. It demands a level of commitment that fewpeople are capable of making. Membership in the “entrepreneursclub,” while not exclusive, does seem to attract a certain type ofindividual. What, if any, are the common attributes of successfulhigh-growth entrepreneurs?
While it is impossible to identify all the traits that are commonto all entrepreneurs, it is possible to describe certain characteristicsthat are exhibited by most successful entrepreneurs. A survey of400 entrepreneurs undertaken by an executive development con-sultant, Richard Hagberg, identified the top 10 characteristics thatdefine entrepreneurs. These characteristics are
■ Focused, steadfast, and undeviating■ Positive outlook■ Opinionated and judges quickly■ Impatient
The Entrepreneur 35
■ Prefers simple solutions■ Autonomous and independent■ Aggressive■ Risk taker■ Acts without deliberation and reactive■ Emotionally aloof 55
While this list is thorough, the addition of a few more traitswould make it more complete:
■ Opportunist■ Sacrificer■ Visionary■ Problem solver■ Comfortable with ambiguity or uncertainty
Some of these traits are worth discussing in more detail.
Focused, Steadfast, and Undeviating
Successful entrepreneurs are focused on their mission and commit-ted to getting it accomplished despite the enormous odds againstthem. They are tenacious in nature—they persevere. They are notquitters. If you want to join the club of entrepreneurship and youhave never done anything to its completion in your life, this may notbe the club for you, because it is one where you will be required tohang tough even when times get rough. And in all likelihood, espe-cially in the first three to five years of a new business, there will bemore bad times than good, no matter how successful the venture is.
An example of an entrepreneur who was focused on her goalsis Josephine Esther Mentzer, the founder of the Estée LauderCosmetic Company, who is described as a person who “simply out-worked everyone else in the cosmetics industry. She stalked thebosses of New York City department stores until she got somecounter space at Saks Fifth Avenue in 1948.”56 Her company, whichpresently controls 8 percent of the cosmetics market in U.S. depart-ment stores and had $6.4 billion in revenues in 2006 from 130 coun-tries throughout the world, pioneered the practice, which is commontoday, of giving a free gift to customers with a purchase.
36 CHAPTER 2
Positive Outlook and Optimistic
Entrepreneurs are confident optimists, especially when it comes totheir ideas and their ability to successfully achieve their goals.They are people who view the future in a positive light, seeingobstacles as challenges to be overcome, not as stumbling blocks.They visualize themselves as owners of businesses, employers, andchange agents. The rough-and-tumble world of entrepreneurshipis not a good fit for someone who is not an optimist.
Bryant Gumbel, the former Today show host and CBS morningshow anchor, once told a story that illustrates this point well:
It is Christmas morning and two kids—one a pessimist, the other anoptimist—open their presents. The pessimist gets a brand new bikedecked out with details and accessories in the latest style. “It looksgreat,” he says. “But it will probably break soon.” The second kid, anoptimist and future entrepreneur, opens a huge package, finds itfilled with horse manure and jumps with glee, exclaiming, “Theremust be a pony in there somewhere!”57
Prefers Simple Solutions
Ross Perot, the founder of EDS, and Ted Turner, the founder ofCNN, are two successful entrepreneurs who have a prototypicalknack for always describing the simplicity of their entrepreneurialendeavors. One of their favorite quotes, stated with their respectivecomforting southern accents, is, “It’s real simple.” One can easilyenvision one of them being the entrepreneur described in the fol-lowing story of a chemist, a physicist, an engineer, and an entre-preneur. Each of them was asked how he or she would measure theheight of a light tower with the use of a barometer. The chemistexplained that she would measure the barometric pressure at thebase of the tower and at the top of the tower. Because barometricpressure is related to altitude, she would determine the height ofthe tower from the difference in pressures. The physicist said thathe would drop the barometer from the top of the tower and timehow long it took to fall to the ground. From this time and the lawof gravity, he could determine the tower’s height. The engineersaid that she would lower the barometer from the top of the toweron a string and then measure the length of the string. Finally, the
The Entrepreneur 37
entrepreneur said that he would go to the keeper of the tower, whoprobably knows every detail about the tower, and say, “Look, ifyou tell me the height of the tower, I’ll give you this new shinybarometer.”58
Autonomous and Independent
Entrepreneurs are known to be primarily driven by the desire to beindependent of bosses and bureaucratic rules. Essentially, theymarch to their own beat. As one observer who was experienced intraining entrepreneurs noted, “Entrepreneurs don’t march left,right, left. They march left, left, right, right, left, hop, and skip.”59
Risk Taker
A study by Wayne Stewart, a management professor at ClemsonUniversity, investigated common traits among serial entrepre-neurs, whom he defined as people owning and operating three ormore businesses over their lifetime. He found that the 12 percent ofall entrepreneurs who fit the “serial entrepreneur” bill had a higherpropensity for risk, innovation, and achievement than their coun-terparts. In essence, they were less scared of failure.60
The most common misconception people have of entrepre-neurs is that they are blind risk takers. Most people think thatentrepreneurs are no more than wild gamblers who start busi-nesses with the same attitude and preparation that they wouldundertake if they were going to Las Vegas to roll the dice, hopingfor something positive to happen. This perception could not be fur-ther from the truth. Successful entrepreneurs are, without doubt,risk takers—they have to be if they are going to seize upon newopportunities and act decisively in ambiguous situations—but forthe most part they are “educated” risk takers. They weigh theopportunity and its associated risks before they take action. Theyresearch the market or business opportunity, prepare solid busi-ness plans prior to taking action, and afterward diligently “work”the plan. They also recognize that risk taking does not—despite thefact that this is a calculated risk—always guarantee success. Thereare always exceptions to the rule, however. Fred Smith, the founderand CEO of Federal Express, did roll the dice, so to speak, 20 years
38 CHAPTER 2
ago when his start-up was low on capital. Despondent after beingunsuccessful at raising capital during a trip to Chicago, he boardeda plane to Las Vegas at O’Hare Airport instead of to his home inMemphis and played blackjack, winning $30,000, which he used tosave his company.
Entrepreneurs are risk takers because failure does not scarethem. As John Henry Peterman, the founder of the Kentucky-basedJ. Peterman catalog, commonly known as the company thatemployed Elaine Benis on the hit television series Seinfeld, said,“There is a great fear of failure in most people. I never had that. Iffailing at something destroys you, then you really have failed. Butif failing leads you to a new understanding, new knowledge, youhave not. If you don’t make any mistakes, you’re not doing itright.”61
Opportunist
Entrepreneurs are proactive by nature. The difference between anentrepreneur and a nonentrepreneur is that the former does nothesitate to seize upon opportunities. When entrepreneurs see anopportunity, they execute a plan to take advantage of it. That dis-position is in stark contrast to nonentrepreneurs, who may seesomething glittering at the bottom of a stream and say, “Isn’t thatgold?” But instead of stopping and mining the gold, they simplykeep paddling their boat.62 An example of this type of opportunismis the story of Henry Kwahar, who owned a hot dog stand on thesouth side of Chicago in the early 1970s. During one of the hottestdays of August 1973, a refrigerated truck filled with frozen fishbroke down in front of Henry’s stand. Rather than let the fish spoil,Henry, who had never sold fish before, offered to buy the entirestock at a very sharp discount. The truck driver agreed, and that ishow Dock’s Great Fish Fast Food Restaurant began. Henry namedthe restaurants after his father, Dock. There are presently 27 Dock’srestaurants in Chicago and Cleveland.
Sacrificer
Every successful entrepreneur will acknowledge that success doesnot come without sacrifice. The most common sacrifice that an
The Entrepreneur 39
entrepreneur makes is in terms of personal income, particularlyduring the initial stages of a company. Almost all entrepreneursmust be willing to give up some amount of personal income to geta business started, either by committing their own resources or by taking a cut in pay. One of Jeff Bezos’s early investors said thatthe most convincing factor was that Bezos had given up a job at D. E. Shaw with a seven-figure annual salary to start Amazon.com.The investor quoted, “The fact that Bezos had left that kind of sit-uation overwhelmed me. It gave me a very, very powerful urge toget involved with this guy.”63 In fact, capital providers, such asbankers and venture capitalists, want to see an entrepreneur earn-ing a salary that is enough to live comfortably, but not too com-fortably, during the buildup stage of the business. Specifically, theentrepreneur’s expected salary should be enough to cover her per-sonal bills (e.g., home mortgage, car payment, and so on), but notenough to permit personal savings of any significant magnitude.This indicates to potential financial backers both the entrepre-neur’s level of commitment to the venture and her realism aboutthe challenges that lie ahead.
A case in point: In 1996, a venture capitalist received a businessplan from a team of three prospective entrepreneurs who wantedto start a national daily newspaper targeting middle-class minori-ties. The idea seemed sound—such a newspaper did not exist tomeet the demands of a rapidly growing segment of the U.S. popu-lation. The request for start-up capital was rejected, however, as itwas evident to the venture capitalist, upon reading the businessplan, that the team did not understand this key notion of sacrific-ing personal income. The three of them included in their projec-tions starting salaries of nearly $400,000 each, comparable to thecorporate salaries they were earning at the time! Such salaries putthem in the top 1 percent of the highest-salaried people in the coun-try. The venture capitalist viewed this as a sure sign that these threebusinesspeople were not sincere entrepreneurs. Business owners in general earn much less than what these three prospective entre-preneurs expected. Even 10 years after those entrepreneurs pro-posed combined compensation of over $1.2 million, according toSalary.com’s survey of small businesses in 2006, the average basesalary for CEOs of small businesses was $258,000 (see Table 2-4 ).64
For entrepreneurs in information technology and health sciences,
40 CHAPTER 2
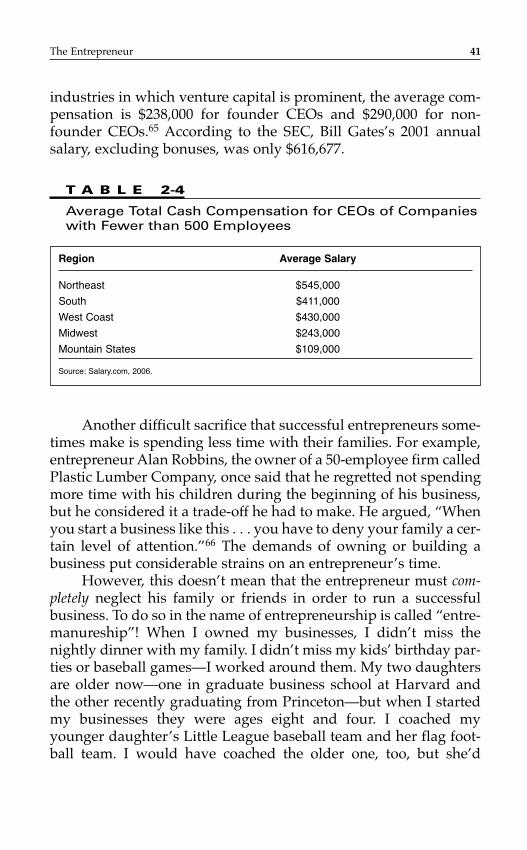
industries in which venture capital is prominent, the average com-pensation is $238,000 for founder CEOs and $290,000 for non-founder CEOs.65 According to the SEC, Bill Gates’s 2001 annualsalary, excluding bonuses, was only $616,677.
The Entrepreneur 41
Region Average Salary
Northeast $545,000
South $411,000
West Coast $430,000
Midwest $243,000
Mountain States $109,000
Source: Salary.com, 2006.
T A B L E 2-4
Average Total Cash Compensation for CEOs of Companieswith Fewer than 500 Employees
Another difficult sacrifice that successful entrepreneurs some-times make is spending less time with their families. For example,entrepreneur Alan Robbins, the owner of a 50-employee firm calledPlastic Lumber Company, once said that he regretted not spendingmore time with his children during the beginning of his business,but he considered it a trade-off he had to make. He argued, “Whenyou start a business like this . . . you have to deny your family a cer-tain level of attention.”66 The demands of owning or building abusiness put considerable strains on an entrepreneur’s time.
However, this doesn’t mean that the entrepreneur must com-pletely neglect his family or friends in order to run a successfulbusiness. To do so in the name of entrepreneurship is called “entre-manureship”! When I owned my businesses, I didn’t miss thenightly dinner with my family. I didn’t miss my kids’ birthday par-ties or baseball games—I worked around them. My two daughtersare older now—one in graduate business school at Harvard andthe other recently graduating from Princeton—but when I startedmy businesses they were ages eight and four. I coached myyounger daughter’s Little League baseball team and her flag foot-ball team. I would have coached the older one, too, but she’d
decided that perhaps it would be best for me to simply cheer fromthe stands. I’ve seen more of my kids’ games and events than anyother parent I know.
Of course you’re going to work long hours in the first coupleof years to get your business going. But one of the beautiful thingsabout being your own boss is that, by and large, you’re the onewho determines which hours to work. In addition to sitting on several boards of billion-dollar companies, I’m also a director forseveral start-ups. I tell these entrepreneurs, “Go home, have dinnerwith the family, and read the kids a bedtime story. Then get yourbutt back to work.” When Staples surveyed small-business owners(those with under 20 employees), 33 percent reported workingwhile they eat dinner, 73 percent said that they worked duringtheir last vacation, and over 75 percent reported working morethan a 40-hour workweek.67 The MasterCard Global BusinessSurvey of 4,000 small-business owners found that the average U.S.business manager works 52 hours per week. This figure actuallyrises to 54 hours per week if you include all eight countries sur-veyed.68 When Inc. magazine surveyed the CEOs of its 500 fastest-growing companies, 66 percent of them remember working at least70 hours per week when they started their company, and 40 per-cent reported working more than 80 hours per week.69 Ken Ryan,CEO of Airmax, told Inc., “There were times when I slept on thefloor by the phone so as not to miss a call.” The good news is thatonly 13 percent say that they now log more than 70 hours. Trust me,it gets better. You can make time to take your kids to the park, butnobody said starting a business was a walk in one.
Visionary
Webster’s Collegiate Dictionary defines a visionary as someone whois “marked by foresight.” This is an appropriate characterization ofmost successful entrepreneurs. They are able to anticipate futuretrends, identify opportunities, and visualize the actions needed toaccomplish a desired goal. They must then sell this vision to poten-tial customers, financiers, and employees. A couple of entrepre-neurs who were great visionaries and made an impact on almosteveryone’s daily lives include
42 CHAPTER 2
Ray Kroc, Founder—McDonald’s CorporationRay Kroc was an acquirer; he purchased McDonald’s restaurants in1961 for $2.7 million from the two brothers who founded the chain,Dick and Mac McDonald. After concluding that Americans werebecoming people who increasingly liked to “eat and run” ratherthan dining traditionally at a restaurant or eating at home, his visionwas to build the quick-service, limited-menu restaurants throughoutthe country. McDonald’s, with operations in 118 countries, is nowthe largest restaurant company in the world. By the way, for thegraying dreamers reading this book, Kroc was a 52-year-old sales-man when he bought McDonald’s.
Akio Morita, Cofounder—Sony CorporationAkio Morita cofounded Sony—the company that a Harris surveyranked as the number one consumer brand in America for the sev-enth consecutive year in 2006. The company, which was started in1942 under the name Tokyo Telecommunications Engineering Inc.and went on to become the first Japanese firm on the NYSE in 1970,succeeded by using Akio’s vision to market the company throughoutthe world so that the name would immediately communicate highproduct quality. While this is a marketing concept that is commonlyused today, it was not so 40 years ago, especially in Japan. In fact,most Japanese manufacturers produced products under somebodyelse’s name, including Pentax for Honeywell, Ricoh for Savin, andSanyo for Sears. Sony successfully introduced the small pocket-sizedtransistor radio in 1957. Six years later, in 1963, with the vision ofmaking Sony an international company, Morita moved his entire fam-ily to New York so that he could personally get to know the interests,needs, and culture of Americans and the American market.70
All successful entrepreneurs are visionaries at one time oranother. They have to constantly reinvent their strategy, look fornew opportunities, and go after new products and new ideas ifthey are to survive. However, this does not mean that they havethis ability all the time. Visionaries can become nonvisionaries. Infact, as Cognetics Consulting points out, sometimes “the mostastute masters of the present are often the least able to see thefuture.”71 Examples of some famous nonvisionaries include:
Heavier than air flying machines are impossible.—Lord Kelvin
President of the Royal Society, in 189572
The Entrepreneur 43
Everything that can be invented has been invented.—Charles H. Duell
Commissioner, U.S. Office of Patents, in 189973
I think there is a world market for maybe five computers.—Thomas Watson
Chairman, IBM, in 194374
We don’t like their music, we don’t like their sound, and guitarmusic is on the way out.
—Decca Recording Company,rejecting the Beatles in 196275
There is no reason anyone would want a computer in their home.—Ken Olsen
Founder and Chairman, Digital Equipment Corp., in 197776
Problem Solver
Anyone working in today’s competitive and ever-changing busi-ness environment knows that the survival of a company, be it largeor small, depends on its ability to quickly identify problems andfind solutions. Successful entrepreneurs are comfortable with andadept at identifying and solving problems facing their businesses.Risk takers by nature, they are willing to try new ways to solve theproblems facing their companies and are capable of learning fromtheir own and others’ mistakes or failures. The successful entrepre-neur is one who says, “I failed here, but this is what I learned.”Successful entrepreneurs are always capable of extracting somepositive lesson from any experience.
An example of someone who exhibits this characteristic isNorm Brodsky, a former owner of six companies and presently awriter for Inc. magazine. In an article, he says, “I prefer chaos. Deepdown I like having problems. It’s hard to admit it, but I enjoy theexcitement of working in a crisis atmosphere. That’s one of the rea-sons I get so much pleasure out of starting businesses. You havenothing but problems when you are starting out.”77
Comfortable with Ambiguity or Uncertainty
The ability to function in an environment of continual uncertaintyis a common trait found among successful entrepreneurs. Often,they will be required to make decisions, such as determining
44 CHAPTER 2
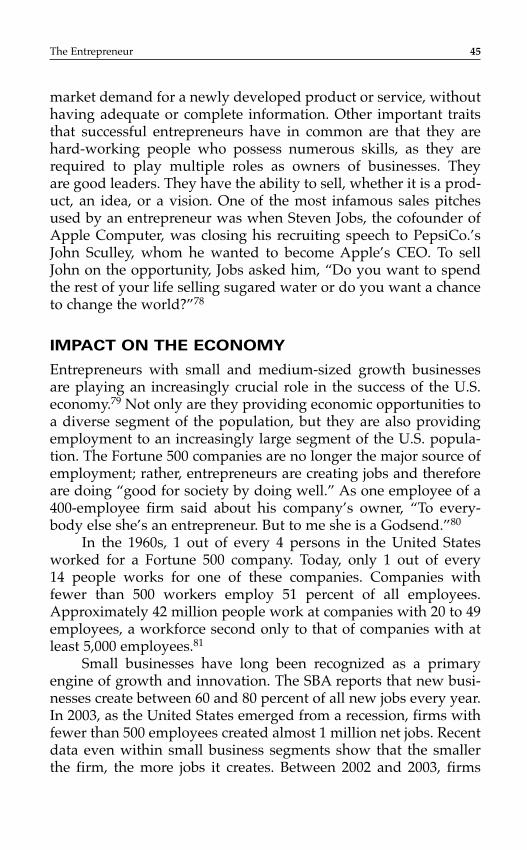
market demand for a newly developed product or service, withouthaving adequate or complete information. Other important traitsthat successful entrepreneurs have in common are that they arehard-working people who possess numerous skills, as they arerequired to play multiple roles as owners of businesses. They are good leaders. They have the ability to sell, whether it is a prod-uct, an idea, or a vision. One of the most infamous sales pitchesused by an entrepreneur was when Steven Jobs, the cofounder ofApple Computer, was closing his recruiting speech to PepsiCo.’sJohn Sculley, whom he wanted to become Apple’s CEO. To sellJohn on the opportunity, Jobs asked him, “Do you want to spendthe rest of your life selling sugared water or do you want a chanceto change the world?”78
IMPACT ON THE ECONOMY
Entrepreneurs with small and medium-sized growth businessesare playing an increasingly crucial role in the success of the U.S.economy.79 Not only are they providing economic opportunities toa diverse segment of the population, but they are also providingemployment to an increasingly large segment of the U.S. popula-tion. The Fortune 500 companies are no longer the major source ofemployment; rather, entrepreneurs are creating jobs and thereforeare doing “good for society by doing well.” As one employee of a400-employee firm said about his company’s owner, “To every-body else she’s an entrepreneur. But to me she is a Godsend.”80
In the 1960s, 1 out of every 4 persons in the United Statesworked for a Fortune 500 company. Today, only 1 out of every 14 people works for one of these companies. Companies withfewer than 500 workers employ 51 percent of all employees.Approximately 42 million people work at companies with 20 to 49employees, a workforce second only to that of companies with atleast 5,000 employees.81
Small businesses have long been recognized as a primaryengine of growth and innovation. The SBA reports that new busi-nesses create between 60 and 80 percent of all new jobs every year.In 2003, as the United States emerged from a recession, firms withfewer than 500 employees created almost 1 million net jobs. Recentdata even within small business segments show that the smallerthe firm, the more jobs it creates. Between 2002 and 2003, firms
The Entrepreneur 45
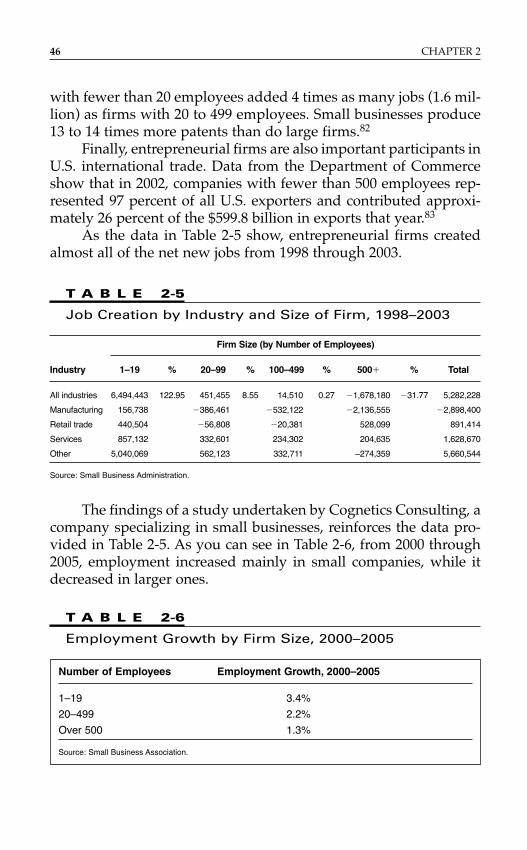
with fewer than 20 employees added 4 times as many jobs (1.6 mil-lion) as firms with 20 to 499 employees. Small businesses produce13 to 14 times more patents than do large firms.82
Finally, entrepreneurial firms are also important participants inU.S. international trade. Data from the Department of Commerceshow that in 2002, companies with fewer than 500 employees rep-resented 97 percent of all U.S. exporters and contributed approxi-mately 26 percent of the $599.8 billion in exports that year.83
As the data in Table 2-5 show, entrepreneurial firms createdalmost all of the net new jobs from 1998 through 2003.
46 CHAPTER 2
Firm Size (by Number of Employees)
Industry 1–19 % 20–99 % 100–499 % 500� % Total
All industries 6,494,443 122.95 451,455 8.55 14,510 0.27 �1,678,180 �31.77 5,282,228
Manufacturing 156,738 �386,461 �532,122 �2,136,555 �2,898,400
Retail trade 440,504 �56,808 �20,381 528,099 891,414
Services 857,132 332,601 234,302 204,635 1,628,670
Other 5,040,069 562,123 332,711 –274,359 5,660,544
Source: Small Business Administration.
T A B L E 2-5
Job Creation by Industry and Size of Firm, 1998–2003
The findings of a study undertaken by Cognetics Consulting, acompany specializing in small businesses, reinforces the data pro-vided in Table 2-5. As you can see in Table 2-6, from 2000 through2005, employment increased mainly in small companies, while itdecreased in larger ones.
Number of Employees Employment Growth, 2000–2005
1–19 3.4%
20–499 2.2%
Over 500 1.3%
Source: Small Business Association.
T A B L E 2-6
Employment Growth by Firm Size, 2000–2005
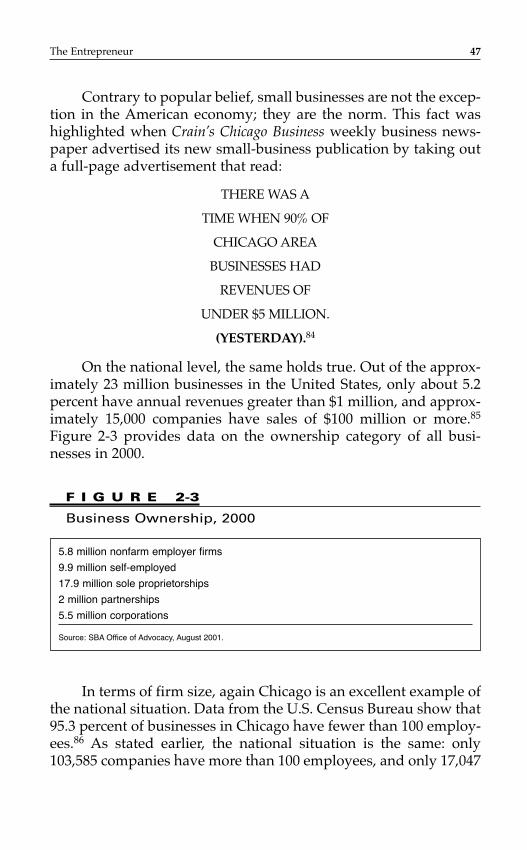
Contrary to popular belief, small businesses are not the excep-tion in the American economy; they are the norm. This fact washighlighted when Crain’s Chicago Business weekly business news-paper advertised its new small-business publication by taking outa full-page advertisement that read:
THERE WAS A
TIME WHEN 90% OF
CHICAGO AREA
BUSINESSES HAD
REVENUES OF
UNDER $5 MILLION.
(YESTERDAY).84
On the national level, the same holds true. Out of the approx-imately 23 million businesses in the United States, only about 5.2percent have annual revenues greater than $1 million, and approx-imately 15,000 companies have sales of $100 million or more.85
Figure 2-3 provides data on the ownership category of all busi-nesses in 2000.
The Entrepreneur 47
F I G U R E 2-3
Business Ownership, 2000
5.8 million nonfarm employer firms
9.9 million self-employed
17.9 million sole proprietorships
2 million partnerships
5.5 million corporations
Source: SBA Office of Advocacy, August 2001.
In terms of firm size, again Chicago is an excellent example ofthe national situation. Data from the U.S. Census Bureau show that95.3 percent of businesses in Chicago have fewer than 100 employ-ees.86 As stated earlier, the national situation is the same: only103,585 companies have more than 100 employees, and only 17,047
employ more than 500 employees. In fact, of the 5.88 million com-panies with at least 1 employee, more than 60 percent employfewer than 5 people, while 89 percent employ fewer than 20.87
Clearly, large companies are the exception.The dominance of small businesses as major employers holds
true on the international level as well, particularly in Asia. InJapan, for example, 70 percent of the workforce is employed atcompanies with 300 or fewer workers88; in South Korea, 87 percentof the workforce is employed in companies with less than 200employees.89 In Taiwan, 78 percent of the labor force is employedby companies with fewer than 200 employees.90 Small companiesare also very dominant in the United Kingdom, where 99.3 percentof all businesses had fewer than 49 employees and 58.5 percent ofall employment came from firms with fewer than 250 employees.91
Thus, small-business owners should not be ashamed orembarrassed by their size, but should rather be proud that they aremajor contributors to the success of the U.S. and the global econ-omy. They are, in fact, economic “heroes and sheroes.”
IMPACT ON GENDER AND RACE
The entrepreneurial phenomenon has been widespread and inclu-sive, affecting both genders and all races and nationalities in theUnited States. One group that has benefited is female entrepre-neurs. In the 1960s, there were fewer than 1 million women-ownedbusinesses employing less than 1 million people. By the 1970s,women owned less than 5 percent of all businesses in the UnitedStates. In the 1980s, they owned about 3 million businesses,approximately 20 percent of all businesses, generating $40 billionin annual revenues.
Things have changed tremendously. Recent statistics from theCenter for Women’s Business Research showed that in 2006, pri-vately held women-owned businesses in the United States totaled7.7 million, employed 7.1 million people, and generated $1.1 tril-lion in revenues. This report defines women-owned businesses asprivately held firms in which women own 51 percent or more ofthe firm. When firms that are 50 percent owned by women are con-sidered, an additional 2.7 million firms come into play, raising thetotal number of firms to 41 percent of all privately held firms in the
48 CHAPTER 2
country. Between 1997 and 2006, the number of majority women-owned firms increased 42.3 percent—nearly twice the rate of allother firms (excluding publicly held companies). Also, at 4.4 per-cent growth, revenues for these firms increased faster than thenational average, which was actually a decline of 1.2 percent for thesame period.92 Finally, not surprisingly, contrary to much of whatis said in the popular press, women are not starting businesses outof need. Forte Foundation research reports that women start busi-nesses for the same reasons as men: because they are driven toachieve and want control over their achievement.93
The entrepreneurship revolution has also included virtuallyall of the country’s minority groups. Minority-owned firms grewthree times faster than the national average between 1997 and 2002,increasing from 3.1 million to about 4.1 million firms. The numberof African –American–owned businesses jumped 45 percent to 1.2million over the same five-year period, and the number of Asian-owned businesses jumped 24 percent to 1.1 million. Hispanic enter-prises also saw a significant increase, moving up 31 percent to 1.6million.94 Finally, for minority women, the data are also strong. Thenumber of businesses owned by women of color grew at six timesthe rate of all privately held firms in the United States and gener-ated $147 billion in annual sales.
N O T E S
1. Small Business Administration, Office of Advocacy, “FrequentlyAsked Questions,” June 2006.
2. “Some of the Reasons Why Businesses Fail and How to AvoidThem,” Entrepreneur Weekly, Issue 36, March 10, 1996.
3. Statistics New Zealand, 2003.4. The Brazilian Micro and Small Business Support Service(SEBRAE),
August 2004.4a. Black Enterprise, December 1997.5. Jonathan Moore, Pete Engardio, and Moon Ihlwan, “The Taiwan
Touch,” BusinessWeek, May 25, 1998.6. AnnaLee Saxenian, “Taiwan’s Hsinchu Region: Imitator and
Partner for Silicon Valley,” Stanford Institute for Policy Research,June 16, 2001.
The Entrepreneur 49
6a. Taiwan Private Equity and Venture Capital Association, 2008.7. “Failure Rate of New Products Is 65%,”International Manufacturing
Review, July 1, 1999.8. Kevin J. Clancey and Peter C. Krieg, “Surviving Innovation,”
Marketing Management, March/April 2003.9. “So Much Fanfare, So Few Hits,” BusinessWeek, July 10, 2006.
10. Hisrish and Brush survey, 1988.11. Dun & Bradstreet, Crain’s Small Business, February 1997.12. Del Jones, “Optimism about Economy Astounds Experts,” USA
Today, March 24, 1998.13. Steve Mariotti, The Young Entrepreneur’s Guide to Starting and
Running a Business (New York: Times Books, 2000).14. Otis Port, “Starting Up Again—and Again and Again,”
BusinessWeek, August 25, 1997.15. New York Times, September 23, 1998.16. Fast Company, February–March 1998.17. Success, May 27, 1998.18. Harris Survey, 2002.19. Robert A. Mamis, Inc., March 1997, p. 73.20. Jack Bishop, Jr., Ph.D.21. “The Secrets of Serial Success,” Wall Street Journal,
August 20, 2007, p. R1.22. “Mapping the Entrepreneurial Psyche,” Inc., August 2007, p. 73.23. “Entrepreneur of the Year: The Dimensions of Ping Yu,” Inc.,
July 19, 2007.24. Junior Achievement Poll on Teens and Entrepreneurship,
August 2006.25. William Walsted, “Entrepreneurship in Nebraska: Findings from a
Gallup Survey,” University of Nebraska–Lincoln, 2006.26. Spectrem Group, 2006.27. “The Microsoft Millionaires Come of Age,” New York Times,
May 29, 2005.28. Paul Maidment, Forbes, September 27, 2005.29. Roper Starch Worldwide, “Risk and Reward: A Study of the
Company Builders Who Are Changing the Face of AmericanBusiness,” Inc., 1997, p. 5.
30. Harvard Business Review, November–December 1996, p. 122.31. Anne R. Carey and Dave Merrill, “CEOs Who Are Household
Names,” USA Today, July 22, 1998.
50 CHAPTER 2
32. James P. Cain, U.S. ambassador to Denmark, Speech to BørsenExecutive Club, September 28, 2006.
33. Roper Starch Worldwide, “Risk and Reward.”34. National Venture Capital Association, “Venture Capital, Without
the Risk,” March 28, 2005.35. Council on Competitiveness, “Where America Stands:
Entrepreneurship,” February 2007.36. National Venture Capital Association, “Venture Capital, Without
the Risk.”37. USA Today, December 7, 1998.38. Gene Koretz, “Downsized in a Down Economy,” BusinessWeek,
September 17, 2001.39. “Layoff Tracker,” Forbes.com, September 25, 2001.40. Bureau of Labor Statistics, May 2008.41. “The Language of Loss for the Jobless,” New York Times, May 18, 2008.42. Inc., March 1997.43. Council on Competitiveness, “Where America Stands.”44. Walt Disney Company, 2006 Annual Report.45. Ethan Bronner, “Students at B-Schools Flock to the E-Courses,”
New York Times, September 23, 1998, p. 6.46. Donald Kuratko, “The Emergence of Entrepreneurship Education,”
September 2005.47. USA Today, July 18, 2007.48. “Can Entrepreneurship Be Taught?” Fortune Small Business,
March 10, 2006.49. Ibid.50. Ibid.51. Cynthia Hanson, “Working Smart,” Chicago Tribune, October 8,
1995.52. Forbes, November 15, 1998.53. National Venture Capital Association, “2005–2006 Year in Review.”54. “It Feels Like 1998 All Over Again,” BusinessWeek, May 22, 2006.55. I. Jeanne Dugan, ed., “Portrait of an Entrepreneur,”
BusinessWeek/Enterprise.56. Grace Mirabella, “Beauty Queen: Estee Lauder,” Time, December 7,
1998.57. Tom Stemberg, Staples for Success.58. Morton I. Kamien, “Entrepreneurship: What Is It?” BusinessWeek
Executive Briefing Service, 1994.
The Entrepreneur 51
59. Paul Verrochi, “The Quotable Entrepreneur,” Inc., December 1998.60. “The Secrets of Serial Success,” Wall Street Journal, August 20, 2007.61. USA Today, April 23, 1997.62. Inc., December 1998.63. Business 2.0, April 2000, p. 261.64. Salary.com, “2006 Small Business Executive Compensation Survey.”65. WilmerHale, “2006 Compensation and Entrepreneurship Report in
Life Sciences.”66. Timothy Aeppel, “Losing Faith: Personnel Disorders Sap a Factory
Owner of His Early Idealism,” Wall Street Journal, September 27,1996, p. A13.
67. Staples Survey.68. KRC Research, MasterCard Global Small Business Survey,
December 2006.69. Anne Murphy, “Analysis of the 2000 Inc. 500,” Inc.com.70. Kenichi Ottmae, “Guru of Gadgets: Akio Morita,” Time, December
7, 1998.71. Cognetics Consulting, October 17, 1997.72. Ibid.73. Ibid.74. Ibid.75. Ibid.76. Ibid.77. Norm Brodsky with Bo Burningham, “Necessary Losses,” Inc.,
December 1997, p. 120.78. Philip Elmer DeWitt, “Steve Jobs: Apple’s Anti-Gates,” Time,
December 7, 1998, p. 133.79. Unless otherwise stated, small businesses are defined as firms with
fewer than 500 employees.80. “Owning the Airwaves,” Essence, October 1998.81. U.S. Census Bureau, 2002.82. Small Business Administration, June 2006.83. Ibid.84. Crain’s Chicago Business, January 24, 1994.85. Small Business Administration, June 2006.86. U.S. Census Bureau, 2002.87. Small Business Administration, June 2006.88. Japan Small and Medium Enterprise Agency.
52 CHAPTER 2

89. Korea Small and Medium Business Administration, 2004.90. Taiwan Small and Medium Enterprise Administration, 2004.91. U.K. Small Business Service, 2004.92. Center for Women’s Business Research, “Women-Owned
Businesses in the United States, 2006.”93. Nan Langowitz, “The Myths and Realities about Women
Entrepreneurs,” Babson Alumni Magazine, Winter 2004; LA Times,June 2, 2001.
94. U.S. Census Bureau, 2002.
The Entrepreneur 53

This page intentionally left blank
INTRODUCTION
Starting a new business or growing an already established onerequires careful planning. An entrepreneur is faced with the chal-lenge of making decisions in an ever-changing business environ-ment that is affected by external factors, many of them beyond theentrepreneur’s direct control. The emergence of new competitors,technological advances, and changes in the macroeconomic andregulatory environments are just a few of the factors with which anentrepreneur needs to deal.
In order to build a successful and sustainable business, entre-preneurs must be forward-looking and determine what lies aheadfor their company, what their future objectives and strategies are,and how they plan to achieve their goals and manage their risks.This is done through a business plan, which, unfortunately, manyentrepreneurs never write. As Thomas Doherty, the senior vicepresident of a commercial bank, said, “Most small business ownershave the plan in their head, but we would like to see a larger num-ber who actually put it down on paper and think through some of the details—financing, competition, strengths and weaknesses,the whole strategic plan.”1 Essentially, the business plan is the evi-dence that the entrepreneur respects the “seven Ps of business”:proper prior preparation prevents piss-poor performance.2
55
C H A P T E R 3
The Business Plan
THE DUAL-PURPOSE DOCUMENT
For the entrepreneur, the business plan serves a dual purpose.First, it should be used as an internal document to help define acompany’s strategies and objectives and provide a plan for thefuture growth of the company. It is basically the company’s “roadmap,” laying out the planned entrepreneurial journey. The planshould not be written and filed away. It must become a living,breathing document. To be successful and experience high growth,the entrepreneur must “work the plan” by using it as a proactivetool. The business plan is an evolving, rather than an immutable,document. The entrepreneur should update and revise it at leastonce a year, preferably at the end of each year in preparation for thenext year’s operations.
In addition, an entrepreneur must always present the businessplan to a potential investor(s) when raising capital. It should benoted that business plans are not always capital-raising docu-ments. Some entrepreneurs mistakenly believe that having a busi-ness plan is synonymous with raising capital. There is an endlessnumber of stories about business plans sent to potential investorsthat never provide key information, such as how much capital the entrepreneur wants, what the capital is going to be used for,and what the investor will get in terms of targeted returns. A well-articulated business plan—one in which a company’s vision,strategies, financing needs, and goals are clearly outlined—will notonly help an entrepreneur keep his business on track, but alsomake it easier for him to raise capital.
Investors are inundated with business plans but are willingto finance only a few. The old axiom “you get only one chance tomake a good first impression” is especially true when you areprocuring capital for your business. Typically, that one chance isthrough the business plan. For example, John Doerr, of the ven-ture capital firm of Kleiner Perkins Caufield & Byers (KPCB),said, “We receive 2,500 plans per year, meet with at least 100 ofthose who submitted the plans and invest in about 25.”3 To theinvestor, the business plan in most cases is the first, and often theonly, representation of an entrepreneur. Therefore, it is importantto have a well-written, original, and thorough business plan. Awell-written business plan is one that is free of grammatical
56 CHAPTER 3
errors, concise, and simple to understand; it clearly describes thecompany’s product or service and tells the reader the amount ofcapital being sought and the way it will be repaid. A businessplan with all these elements will be well received by potentialinvestors.
BUSINESS PLAN DEVELOPMENT AND ADVICE
One venture capitalist suggests that the business plan be written oredited by the entrepreneurial team member who is the best writerand the most articulate.4 The result should be a document that canbe understood by the average 14-year-old. In fact, after writing theplan, the entrepreneur should give it to a teenager and ask her toread it and verbally explain what the proposed product or serviceis, how it is going to be made available to the marketplace, howmuch capital is being requested, and if the management team isexperienced or inexperienced, old or young. There is nothing morefrustrating for a potential investor than expending valuable timereading a plan that is difficult to understand because of compli-cated and/or vague descriptions, poor writing, misspellings, andgrammatical errors. In response to criticism that the business plancould not be understood, many entrepreneurs will say, “I know. Letme meet with you to explain it.” No! The business plan should bea viable and adequate communication tool on its own, in theabsence of the entrepreneur.
Another option for getting the business plan written that isavailable to the entrepreneur is to approach a graduate businessschool. Many of these schools allow their students to get academiccredit for working on business projects, including writing businessplans for local entrepreneurs, under the supervision of an entrepre-neurship professor. Such graduate schools include New YorkUniversity’s Stern School of Business and Northwestern University’sKellogg School of Management. There are also numerous Web sites(e.g., Garage.com) and books (e.g., Business Plans for Dummies) thatcan help with basic templates. More sources are noted at the end ofthis chapter, in Figure 3-1.
Investors are primarily interested in knowing what they willget in return for risking their capital and whether the entrepreneurhas the ability to successfully execute the plan that will deliver this
The Business Plan 57
return. A well-written plan provides all the necessary informationabout the company and the business opportunity to enable investorsto assess whether the venture is worth financing. What is the properlength of a business plan? While there is no “right” length, shorterplans tend to be better received. At the maximum, a business planshould be no longer than 30 pages.
The information contained in a business plan will varydepending on the investor(s) being solicited for financing and thetype of company seeking funding. Is the financing for an acquisi-tion or a start-up? For instance, a start-up company with a newproduct or service should provide data that substantiate the exis-tence of market demand for the product or service. Also, priorityshould be placed on ensuring that investors are convinced that the management team has the experience and the skills necessaryto launch and manage a new business venture. Bill Sutter, formergeneral partner at Mesirow Capital, says that the three most impor-tant things he looks for in a business plan are (1) management, (2) management, and (3) cash flow.5
Concerning the targeted audience, if the business plan is to bepresented to someone who is familiar with the industry, the com-pany, or the management team, it may not be necessary to provideas much detailed information as it would if the plan were beingpresented to potential investors who had no such knowledge.
The greatest examples of this fact are the plans submitted byIntel and Sun Microsystems to Kleiner Perkins Caufield & Byers.The Intel business plan was one page, and the Sun Microsystemsbusiness plan was three pages. KPCB financed both companies.
THE BUSINESS PLAN
The development of a business plan can be a difficult, time-con-suming process, but it must be done. While the general format of abusiness plan is standard, it should be written in a way that high-lights the uniqueness of the company. The business plan should:
■ Tell a complete story about the company: its managementteam, product or service, financing needs, and strategies,and the financial and nonfinancial goals the companyexpects to achieve.
58 CHAPTER 3
■ Be a balanced document, highlighting both the positiveand negative aspects of the business opportunity.
■ Be a forward-looking document with a time frame of atleast three years.
■ Be clear, concise, and organized.■ Be simple to understand.■ Provide realistic data to substantiate its claims.■ Propose the deal to the investors—what the expected
returns on their investment are, and what the exit orliquidation options available to investors are.
■ Provide historical and projected financial statements.
The contents of the business plan will vary depending on thetype of business. For example, a research and development sectionshould be included if the company’s product is in the research anddevelopment stage or if the company has undertaken substantialresearch and development to get the product to market, e.g., a newdrug or new technology. On the other hand, this section would notbe required in a plan for a restaurant, for example. The researchand development section should include a summary of the majorfindings, while the details should be included in the appendixes. Ingeneral, a business plan contains the following sections.
Executive Summary
In most instances, given the large number of business plans thatthey receive, the only section that potential investors will read thor-oughly is the executive summary. This section may be the onlyopportunity for an entrepreneur to make a good first impression ona potential financier. Therefore, it is the most important section ofthe business plan. It has to capture all the main issues contained inthe detailed business plan. It should be concise (i.e., no longer thantwo pages), be clear and simple to understand, and present a goodsummary of the most relevant information needed by potentialinvestors.
In support of the point just stated, Barbara Kamm, while anexecutive at Silicon Valley Bank, said, “When bankers review a busi-ness plan, they want to see a well-written executive summary. The
The Business Plan 59
executive summary is the key—it’s where you distill the essence ofyour business.”6 In addition to a summary of the main issues of thebusiness plan, a good executive summary must include the follow-ing items, which are often missing from executive summaries (andsometimes even the full business plans) written by novices:
■ Return on investment (ROI). This is the amount earned on an investor’s capital, expressed as a percentage. Forexample, for an investment of $1 million that returns $5 million, the ROI is 400 percent.
■ Internal rate of return (IRR). This is the return oninvestment taking into consideration the length of theinvestment. Using the previous example, if five years is thelength of time of the investment, then the IRR is 38 percent.
■ Current and potential risks.
The Company
The objective of this section is to provide information on the back-ground of the company. The following questions should beanswered:
■ When was the company established, and by whom?■ Is it a start-up or a going concern?■ What type of industry is it in? Service, retail, or
manufacturing?■ What market area(s) does it serve or intend to serve?■ What is the business’s legal structure—sole proprietorship,
corporation, or limited partnership?■ Who are the company’s principals, and what are their
ownership stakes? What experience and skills do theybring, and what is their involvement in the day-to-dayoperations of the company?
■ What is the total number of employees?■ What is the revenue size of the company?■ What is the historical growth rate of the company?
Information related to the legal structure of the companyshould also be provided. There are advantages and disadvantagesof different legal structures, as detailed here.
60 CHAPTER 3
Sole ProprietorshipAdvantages
■ There is no legal expense for setting up a formalstructure.
■ It is easy to set up, and therefore is the most typical waysmall businesses start.
■ All income is reported on Schedule C of the owner’spersonal income tax return.
■ All legitimate expenses can be deducted from businessincome or income earned at another job.
Disadvantages
■ There is unlimited personal liability for business debts.■ The business can’t have employees unless you get an
employer ID number to file payroll tax returns.■ You are unable to take certain kinds of business
deductions.
General and Limited PartnershipsAdvantages
■ You save money on accounting and legal fees.■ Business income or losses go to the partners, who report it
on their personal income returns.■ Business expenses and other deductions flow to the
partners.■ Limited partners are not personally liable for business
debts, and only in some instances are they liable for thefull amount of their original investment.
■ Regardless of ownership percentages, all operationaldecisions are made only by the general partners.
Disadvantages
■ General partners are personally liable for businessobligations and can be personally sued.
■ Limited partners cannot participate in any decisions orthey will jeopardize their liability status.
The Business Plan 61
C CorporationAdvantages
■ You get protection from personal liability for businessdebts.
■ There is no limit on the number of shareholders or onstock classes or voting arrangements.
■ It can provide qualified stock option and employee stockpurchase plans to employees as incentives.
■ There is no need to restructure prior to an IPO.
Disadvantages
■ Costs of incorporation can be significant.■ The corporation is taxed as a separate entity.■ Dividend income is taxed at both the corporate and the
shareholder level (double taxation).■ The corporate tax rate may be higher than the personal
tax rate.
S CorporationAdvantages
■ It has the same limited liability as a C corporation has.■ Profits are passed through to shareholders and taxed on
an individual’s return, similar to a partnership.■ Deduction of losses on a personal tax return is allowed up
to the amount of the individual’s cost of the company’sstock, plus any loans made to the company.
Disadvantages
■ The corporation can’t have more than 35 shareholders.■ It can have only one class of stock, limiting the
flexibility to add future investors and restrict their share of profits.
■ It can’t have foreigners, trusts, or other corporations asshareholders.
62 CHAPTER 3
■ It can’t offer certain benefits that a C corporation can, suchas medical reimbursement plans.
LLC (Limited Liability Corporation)Advantages
■ It has the ownership flexibility of a C corporation.■ There is no limit to the number of shareholders.■ You can create several classes of shareholders (founders
can be entitled to a greater share of profits or of the stock’sfuture value if it is sold to the public).
■ There is no double taxation because profits are taxed onlyat the shareholder level.
■ There is no limit to the deductibility of losses forshareholders.
Disadvantages
■ If you convert a current corporation to an LLC, you mighthave to liquidate first and owe a big tax.
■ You cannot transfer the business of your old corporationto a new LLC.
Each state has its own laws regarding how businesses must bestructured and operated. Be sure to check the laws of your state orspeak with a lawyer, if necessary, since many states have significantpenalties for failing to register businesses properly, and manyrequire out-of-state entities that do business within their borders topay income or other taxes, especially if those entities have employ-ees in the state or own property there. It is generally a good idea toincorporate in the state in which your place of business will be, butmany companies also choose to incorporate in a state like Delaware,which has a well-developed body of corporate law and is generallyconsidered more business-friendly than some other states.7 Thereare many online resources, such as www.legalzoom.com andwww.incorporate.com, that will assist you in choosing a legal entityfor your company, provide sample incorporation documents, andactually manage the incorporation process for you in whatever stateyou choose—for a fee, of course.
The Business Plan 63
The Industry
It is necessary to provide the context in which the business willoperate. Macroeconomic as well as industry-specific data shouldbe presented to provide a better understanding of the overall envi-ronment in which the company will operate. This informationshould include:
■ Macroeconomic data, such as the unemployment rate,inflation rates, interest rates, and so on, that have or willhave an impact on the industry and, more specifically, onthe company’s operations.
■ Information on regulatory changes that might have animpact on the industry or the company.
■ A description of the industry—e.g., major participants,competition, and so on.
■ The size of the industry—e.g., historical, current, andfuture trends.
■ Characteristics of the industry—e.g., is it seasonal, cyclical,or countercyclical?
■ Trends taking place in the industry that have an impact on the business—e.g., consolidation or deregulation.
■ The key drivers in the industry—e.g., R&D, marketing,price, quick delivery, or relationships.
■ Industry growth rates—past and future.■ Customer payment practices—for example, are there
slow payers, such as the government or insurancecompanies?
The Market
This section should provide a description of the target market(s)—both primary and secondary. It’s important to be specific whenidentifying the markets to be targeted. If the product or service isnew, market research data should be included to provide informa-tion on initial and future markets. Research can be done by payinga consulting firm or by getting the information free, or at a sub-stantially lower cost, by going to a local business school and asking
64 CHAPTER 3
the marketing department to assign students to do it as a project foracademic credit. Questions to be answered include the following:
■ What are the key customer market segments? What istheir size?
■ Where are these market segments located? Are theyregional, national, or international?
■ What are the past growth rates in the market andanticipated trends?
■ What are the market characteristics—seasonal, cyclical,and so on?
■ Are there any anticipated changes within the primarymarket?
■ How will each customer market segment be reached?■ How are purchasing decisions made? By whom? What are
the factors that influence purchasing decisions?■ How do customers buy products—through competitive
bidding, contracts, unit purchases, or some other way?■ Is there a possibility to create new customer bases?
If so, how?
Product or Service Description
Investors need to know the type of product or service the companywill offer to customers. They will need the following information:
■ A detailed description of the product or service to bedeveloped and marketed, including:– The benefits of the product or service– The stage of the product or service—is it an idea, a
prototype, or at some other stage?■ Key product characteristics—performance, quality,
durability, price, service, and so on.■ What is your differentiation strategy?■ What is your positioning strategy?■ What is your pricing strategy? Why?■ What are the chances of product obsolescence?
The Business Plan 65
■ Are there legal issues relating to the product or servicethat provide legal protection, e.g., obtained or pendingpatents, copyrights, trademarks, royalties, and so on?
■ Other legal and regulatory issues that relate to the productor service.
Competition
Competition is a reality for every business. You should not under-estimate a competitor’s capabilities or overestimate your capacity todeal with them. Investors prefer to go with entrepreneurs who havea realistic assessment of their competitors and, accordingly, make arealistic plan for dealing with this competition. In this section, keycompetitors—direct and indirect—should be identified, and anexplanation of how the company will successfully compete shouldbe provided. Questions to be answered include the following:
■ Who are the key competitors, both direct and indirect? Arethey mom-and-pop or high-growth entrepreneurs? Whatare their strengths and weaknesses?
■ Where do they operate? Are they local or national players?■ What is the market share of each?■ What are the key competitive factors—pricing, quality,
performance, or something else? How does your companyfare in this regard?
■ What are the competitors’ present market shares? Whatare their expected market shares? How will your companygain market share?
■ Are there any barriers to entry into the market—e.g., isthis a capital-intensive industry?
■ What do you plan to do to mitigate this competition?
Marketing and Sales
The main question to answer here is how the product or service isgoing to be made available in the marketplace.
■ What is your marketing strategy?■ How is your product or service going to be advertised and
promoted?
66 CHAPTER 3
■ How important is marketing to the industry?■ What is the expected return on resources spent on
marketing?■ What is the sales growth—historical, current, and expected
in three years?■ What is the sales strategy to achieve these sales levels? At
a regional or national level?■ What is the product distribution strategy? Will there be an
in-house sales force or outside manufacturers’representatives? What is the sales compensation plan?
■ What are the sales per employee—historical, present,future, and for the industry as a whole?
Facilities
Information provided in this section should include:
■ A description of plants and their operations—size, location(e.g., rural or urban), age, and condition of plants
■ Ownership or lease■ Cost estimates to run facilities■ Capital equipment required■ Condition of equipment and property■ Sales per square foot■ Insurance—coverage and name of provider(s)■ Access to public transportation■ Utilities■ Available parking for customers and employees
Operating Plan
Information should be provided to explain the day-to-day opera-tions of the company, including the following:
Business Operations■ Days of operation and hours■ Shutdown periods■ Number of shifts
The Business Plan 67
Production■ Production plans■ Key quality-control issues■ Capacity■ Utilization■ Bottlenecks■ Automation: technology versus manual■ Build to order versus build to inventory
Purchasing■ Purchasing plans■ Material resource systems■ Inventory plan■ Suppliers—local or national, proximity, single or multiple■ Product delivery■ Office: invoicing, payables, collecting■ Receiving and shipping
Labor Force■ Number of employees■ Skill levels■ Gender■ Age range■ Union versus nonunion status■ Years of service■ Compensation and salary plan■ Hourly versus exempt■ Payroll—weekly versus monthly■ Benefits■ Safety concerns■ Insurance■ Source of labor■ Productivity per employee■ Projections for labor force changes in the future
68 CHAPTER 3
Management Team
One of the most important elements that investors look for whenassessing the viability of a business venture is the strength of the management team. In this section, it is important to providebackground information on the people who will be involved inthe day-to-day operations of the company. From this information,the investor will try to determine whether the management teamcan implement the plan successfully. The ideal management teamhas complementary skills and expertise. Information shouldinclude:
■ Names and titles of the key management personnel■ Experience, skill levels, and functional responsibilities of
the key management personnel■ Anticipated changes in the management team■ Names of the principal owners■ Names of the members of the board of directors■ Names and affiliation(s) of advisors—both external and
internal■ Compensation plan for key members of the management
team■ Life insurance policy for the CEO or president of the
company■ Succession plan■ Investments
Appendixes and Tables
Information in this section may include:
■ Résumés and biographies■ Union contracts■ Leases■ Customer contracts■ Research findings
The Business Plan 69
References
References should include both financial (i.e., personal and business)and character references. The idea is to make the investor as comfort-able and knowledgeable as possible about the company and theentrepreneurial team. For example, when seeking bank financing,Tom and Cherry Householder, the founders of Staffing Resources, aprominent regional temporary staffing company in Illinois, submit-ted more than 15 letters of reference from their local police chief, frompoliticians, and even from competitors of their bank. It worked. Theygot the $135,000 line of credit they needed to start their business.8
Potential Risks
An assessment of the risks currently facing the company, as well asfuture risks and how the company intends to mitigate these risks,needs to be presented. Some risks, such as “acts of God” (e.g.,weather, major disasters, unexpected death, and so on), may not beexclusive to the company and therefore cannot be dealt with by thecompany. The objective is to assure the investor that the entrepreneur(1) has a realistic view of the business opportunities and the risksassociated with pursuing those opportunities, and (2) has proactivelythought through how to manage and mitigate those risks that can bedealt with by the company. Potential risks to consider include:
■ The advent of a recession.■ The unanticipated demise or removal of the CEO.■ Unanticipated changes in key management personnel.■ Appropriateness of insurance coverage and amount
required.■ The loss of a major customer(s). This issue is particularly
relevant if the company’s revenues are dependent on oneor a few major customers.
■ Problems with suppliers.■ A potential strike or labor stoppage.■ A capital or financing shortfall.
Financial Statements and Pro Formas
Projecting the future is challenging, but it must be done. Debt andequity investors know that financial projections that go out three to
70 CHAPTER 3
five years into the future are at best guesstimates—they have to be,as no one can predict the future (unless, of course, guaranteed futurecontracts have been signed). Potential investors are looking for pro-jections grounded in defensible logic. When asked how financiers know when pro formas are correct, a venture capitalistresponded, “We don’t know. In all likelihood, they will be ultimatelywrong. In a start-up, it is rare for pro formas to ever match reality.We are looking for logical, defensible reasoning behind the numbersversus B.S.—‘Blue Sky’—projections simply pulled out of the air.”
DEVELOPMENT OF PRO FORMAS
Entrepreneurs should develop pro forma financial statements forall new entrepreneurial opportunities, including either a start-upor an existing company that is being purchased. Any pro formashould have figures for at least three years and three scenarios—abest-case, worst-case, and most-likely-case scenario. If only onescenario is provided, then the automatic assumption is that it is thebest case because most people always put their best, not theirworst, foot forward. The historical performance of a companydrives the financial projections for the future of that company,unless there is other information that indicates that past perform-ance is not a good indicator of future performance.
For example, if a new contract has been signed with a newcustomer, then this could be used to adjust the financial projec-tions. Otherwise, historical numbers must be used.
For instance, Livent Inc. created major musicals such as Joseph andthe Amazing Technicolor Dreamcoat and Ragtime. In 1998, the companyadded Chicago’s Oriental Theatre to the three other company-owned theaters in New York, Toronto, and Vancouver. Livent’s proformas for the newly renovated Oriental Theatre were allegedlybased on its success with Joseph, which it had staged two years ear-lier at the Chicago theater and in similar venues throughout thecountry. Livent’s projections were as follows:
Oriental Theatre■ 80 percent capacity■ 52 weeks per year■ $40 million annual gross revenues
The Business Plan 71
Before the end of 1998, Livent Inc. experienced major financial diffi-culties and filed for Chapter 11 bankruptcy. In bankruptcy court, anattorney for the city of Chicago, which filed a condemnation case,challenged the legitimacy of the pro formas. He argued that the $40million annual projected gross revenues was out of line with realityand intentionally fraudulent, given the fact that “in a recent year, asimilar theater located in downtown Chicago and similar in size,reported an annual gross of just $20,455,000!”9
When there are no historical data, financial projections for astart-up company can be determined in one of the following ways:
■ Conduct an industry analysis and select a company withinthe same industry that can be used as a comparable.Where possible, review the sales figures of this companyto determine its sales history from Year 1 as well as itssales growth in the past few years. Extrapolate from thesefigures and use the data to determine sales growth foryour company. Cost figures may be determined from costdata obtained through research on, for example, a publiclyowned company in the same industry.
■ If sales commitments have already been secured, use thesecommitments to calculate the worst-case scenario. Uselarger amounts to calculate the best-case and most-likely-case scenarios.
■ If the product or service is completely new, marketresearch can be undertaken to determine the overallmarket demand for this new product or service. Identifythe size of the market and assume that the company willget a specific percentage of the total market, depending onthe total number of competitors. Also, identify thepotential customers and estimate the number of units thatcan be sold to each. It is critical that whenever possiblethis market research be based on both secondary research(third party market reports and/or articles from crediblesources) and also primary research (direct conversationsand/or surveys with potential customers in the targetedsegment). This ensures that the projections are based onreliable, defensible information sources and are not just“back of the envelope” guesses.
72 CHAPTER 3
■ Alternatively, you can use specific figures for yourprojections, based on your own assumptions orexpectations. It is important to state what these assumptionsare and to justify why you believe them to be realistic.
An important issue for a start-up company to consider is tomake sure that all the necessary equipment financing needs areincluded.
Before closing this section on pro forma development, a majorwarning must be given. It is important that the worst-case-scenariopro formas show that the cash flow can service the company’s debt.Otherwise, procuring financing, particularly debt, may prove to bevirtually impossible. This does not mean that the pro formasshould be developed by working backward and “plugging” num-bers. For example, if the principal payments on debt obligations are$7,000 per month, it would be wrong to forecast the monthly rev-enue size, gross margins, and so on such that at least $7,000 wouldbe generated in after-tax cash flow to service this obligation.
No, pro formas should be developed from the top down; fore-casting defensible revenues and legitimate variable costs, includ-ing labor and materials, and market-rate fixed costs such as rent. If,after developing the pro formas in this manner, it is shown thatdebt cannot be serviced, the action that needs to be taken is not toplug numbers, but rather to
■ Reduce the amount of the debt.■ Lower the interest rates on the debt.■ Extend the terms of your loan.
All of these actions are designed to free up cash flow to serv-ice short-term debt.
Even if the entrepreneur is successful in raising capital using proformas filled with plugged numbers, she will ultimately experiencedifficulties when the company’s performance proves to be lower thanthe projections and the cash flow is not sufficient to meet debt obli-gations. Finally, experienced business investors such as bankers andventure capitalists can easily detect pro formas filled with pluggednumbers because typically the projections are such that all the com-pany’s debt can be serviced, with maybe a little cash left over.Therefore, do not plug numbers. A pro forma development casestudy for Clark Company is included at the end of Chapter 5.
The Business Plan 73
CHECKLIST OF FINANCIAL INFORMATION
To enable investors to better understand the information presentedin this section, it is best to provide a summary of financial data andthen present the detailed financial tables. Data should include:
■ Historical financial statements (i.e., three to five years):– Cash flow statement– Income statement– Balance sheet
■ Pro formas (i.e., three to five years). Financial projections(as described previously) should be provided under threescenarios—best, worst, and most-likely cases—where eachscenario is based upon a different set of assumptions. Forexample, the worst-case scenario may assume no growthfrom Year 1 to Year 2, the best-case scenario may assume 5 percent growth, and the most-likely-case scenario mayassume a 2 percent growth rate. A summary of theassumptions should also be provided.
■ Detailed description of banking relationships for businessaccounts and payroll.
■ The terms and rates of loans and their amortization period.■ The proposed financing plan, including:
– The amount being requested.– Sources and uses of funds. [Note: This information is
important for several reasons. First, financiers need toknow how their funds are going to be used. Second,identifying other investors who are willing to provideyou with resources (sources) will encourage potentialinvestors to make a similar commitment—people find iteasier to invest once they know that others have alreadydone so. Third, value-added investors may be able tohelp you find alternative ways of getting resources.]
– Payback and collateral.– Proposed strategy for the liquidation of investors’
positions.■ Financing plan for the immediate term, short term, and
long term.
74 CHAPTER 3
■ Working capital needs.■ Line of credit.■ Cash flow from operations—outside investors, sell debt,
or IPO.
MOST IMPORTANT BUSINESS PLAN SECTIONS
By now, you realize that your business plan had better be com-pelling if your venture hopes to receive funding. Here’s one morereview of the “must haves” of any good business plan.
The Executive Summary
As stated earlier, the executive summary is probably the mostimportant section of the business plan. Most potential investorsdon’t have the time to read through a detailed plan, and thereforethey read through the summary quickly to assess whether or not aventure is worth pursuing. It is extremely important to make surethat this summary is clear and explicitly highlights the factors dif-ferentiating the company that is seeking capital from its competi-tors. For example, the 20-page Amazon.com business plan wasvery successful at highlighting the fact that the book retailingindustry averaged 2.7 inventory turns a year, while Amazon.complanned annual inventory turns of 70.
The Management Team
Jeff Bezos’s first investors said, “We didn’t invest in Amazon.com,we invested in Jeff.”10 This is a perfect confirmation of the old axiom,“The investment is in the jockey, not the horse.” In other words, theinvestment is in the team, not necessarily in the idea, product, orservice. Experience has shown that having the right managementteam can usually be the deciding factor in the success or failure of abusiness venture. Remember, the venture capitalist Bill Sutter gavemanagement as two of the three most important things that he looksfor. The scarcest resource for venture capitalists today is good man-agement. A good management team can take a mediocre idea andmake it successful. Conversely, a bad management team can take an
The Business Plan 75
outstanding idea and ruin it. One venture capitalist said, “In theworld today, there’s plenty of technology, plenty of money, plenty ofventure capital. What is in short supply are great teams.”
Investors look carefully to see who the members of the man-agement team are, particularly if the venture is a start-up company.Do they have complementary skills, or are they a homogeneousgroup? Do they have relevant industry, market, or product experi-ence? How was the leader selected? Do the team members haveexperience working with one another? Do they have contacts in theindustry that can be leveraged? What are their track records inmanagement, leadership, and execution?
Great teams are made up of smart people with complementaryskills and styles—not everyone can deal with “in-your-face” man-agers—and the commonality of passion for the business, commit-ment to growing it rapidly and exponentially, and the experienceand drive to execute quickly without quitting.
Financial Projections
Investors understand the difficulty of preparing projections offuture revenues and profits. They do not expect the financial pro-jections to be “correct”; rather, they want to see whether the entre-preneur used realistic assumptions in preparing these projections.They look at whether the analysis is logical and defensible, giventhe realities of the marketplace. They not only look at whether theprojected cash flow can service the debt, but also ask whether thecash flow projections justify the value placed on the firm today andin the future, and also whether the company is the size they areinterested in. For example, some financiers want to do business onlywith companies that will have at least $200 million in revenue byYear 3. It is important to make sure that all relevant information isprovided in this section and to make all the assumptions used clear.
BUSINESS PLAN DEVELOPMENT SOURCES
There are numerous books available that provide detailed infor-mation on the preparation of a business plan; you can find them inthe small-business section of most major bookstores. In addition,
76 CHAPTER 3
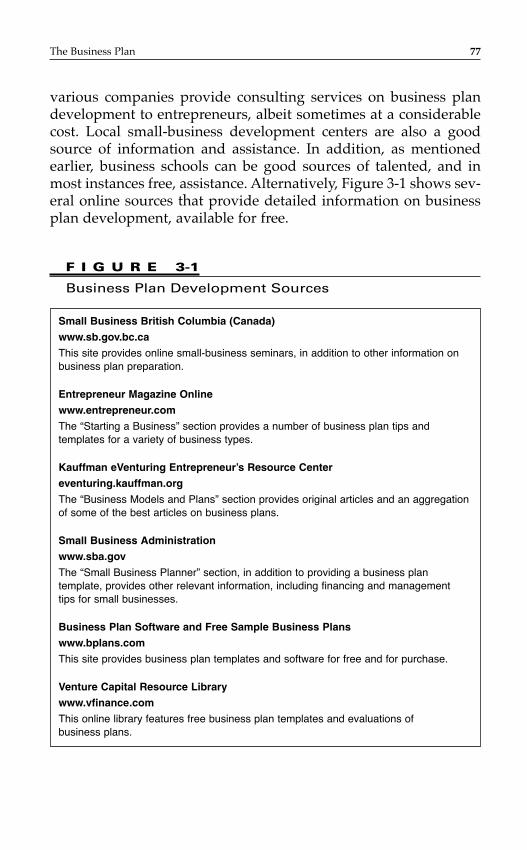
various companies provide consulting services on business plandevelopment to entrepreneurs, albeit sometimes at a considerablecost. Local small-business development centers are also a goodsource of information and assistance. In addition, as mentionedearlier, business schools can be good sources of talented, and inmost instances free, assistance. Alternatively, Figure 3-1 shows sev-eral online sources that provide detailed information on businessplan development, available for free.
The Business Plan 77
F I G U R E 3-1
Business Plan Development Sources
Small Business British Columbia (Canada)
www.sb.gov.bc.ca
This site provides online small-business seminars, in addition to other information onbusiness plan preparation.
Entrepreneur Magazine Online
www.entrepreneur.com
The “Starting a Business” section provides a number of business plan tips andtemplates for a variety of business types.
Kauffman eVenturing Entrepreneur’s Resource Center
eventuring.kauffman.org
The “Business Models and Plans” section provides original articles and an aggregationof some of the best articles on business plans.
Small Business Administration
www.sba.gov
The “Small Business Planner” section, in addition to providing a business plantemplate, provides other relevant information, including financing and management tips for small businesses.
Business Plan Software and Free Sample Business Plans
www.bplans.com
This site provides business plan templates and software for free and for purchase.
Venture Capital Resource Library
www.vfinance.com
This online library features free business plan templates and evaluations of business plans.
AFTER THE BUSINESS PLAN IS WRITTEN
It is very important to choose potential investors carefully—youwill be establishing an important long-term relationship withthem. Do your research on a potential investor(s) before sendingyour business plan to ensure a better rate of acceptance. Find outwhat types of deals the investor pursues. What is the firm’s invest-ment strategy, and what are its selection criteria? What is its suc-cess rate? How have the investors reacted during critical situations,such as a financial crisis? Do the investors just bail out, or are theyin for the long haul? One good source of information in this regardis other companies that have received backing from that particularinvestor. Will the investors be “value-added” investors (discussedin more detail in Chapter 8), providing useful advice and contacts,or will they provide only financial resources?
It is extremely important that you know your audience so thatyou can limit your search to those who have an affinity for doingbusiness with you. If your company is a start-up, then you shouldsend the plan to those who provide “seed” or start-up capitalrather than later-stage financing. For example, it would be a wasteof time to send a business plan for the acquisition of a grocery storeto a technology-focused lender, such as the Silicon Valley Bank.This issue will be discussed in more detail in Chapter 8, “RaisingCapital.”
It is always advisable to get what Bill Sutter calls “an endorsedrecommendation,” preferably from someone who has had previousbusiness dealings with the investor, before submitting your businessplan. John Doerr at KPCB stated, “I can’t recall ever having investedin a business on the basis of an unsolicited business plan.”11 Thisendorsement will guarantee that your business plan will be consid-ered more carefully and seriously. If a recommendation is not possi-ble, then an introduction by someone who knows the investor willbe helpful. In most instances, unsolicited business plans submittedto venture capital firms without a referral have a lower chance of get-ting funding than those submitted with one. If you are submitting anunsolicited business plan, it is important that you write it to be con-sistent with the investment strategy of the investor.
A good example of someone who did it correctly is MitchKapor, the founder of Lotus Development Corporation, who, in1981, sent his business plan to only one venture capital firm.
78 CHAPTER 3
Recognizing that his business plan was somewhat different—itincluded a statement that said he wasn’t motivated by profit—heknew himself and his company well enough to know that not allventure capitalists would take him seriously. He carefully selectedone firm—Sevin and Rosen. Why? Because this firm was used todoing business with his “type”—namely, computer programmers.They knew him personally, and they also knew the industry. It wasa good decision. He got the financing he sought, even though hehad a poorly organized, nontraditional plan. The way to find debtand equity providers who have a proclivity for certain types ofdeals will be discussed in Chapter 8.
N O T E S
1. Martha Russis, “Loans Will Flow, but Less Freely than during 1998,”Crain’s Chicago Business/Small Business Report, December 14, 1998, p. SB4.
2. Black Enterprise.3. Fast Company, February–March 1998.4. Ibid.5. Bill Sutter, classroom presentation at Kellogg School of
Management, March 10, 1999.6. Chicago Sun-Times, April 4, 1996.7. Constance Bagley and Craig Dauchy, The Entrepreneur’s Guide to
Business Law, 2nd ed. (1993), pp. 76–77.8. Inc., December 1998.9. Laurie Cohen and Andrew Martin, “Theater Plan Not Living Up to
Billing,” Chicago Tribune, January 15, 1999.10. Business 2.0, April 2000, p. 259.11. The New Yorker, August 11, 1997.
The Business Plan 79

This page intentionally left blank
INTRODUCTION
As stated earlier, one of the most important sections of the businessplan is the one that details the firm’s financial statements.Therefore, the discussion in this chapter is intended as an overviewof the main issues of relevance regarding key financial statements.The objective is to teach the purpose of the different statements,their components, and their significance to entrepreneurs who arenot financial managers. This is the final step toward making finan-cial statement analysis, which will be the focus of the next chapter,simple and user-friendly.
Financial statements are important because they provide valu-able information that is typically used by business managers andinvestors. However, it is not necessary for the entrepreneur to beable to personally develop financial statements.
In this chapter, we will focus on three financial statements: theincome statement, the balance sheet, and the statement of cashflows. Each of these statements, in one way or another, describes acompany’s financial health. For example, the income statementdescribes a company’s profitability. It is a measurement of the com-pany’s financial performance over time. Is the company making orlosing money? On the other hand, the balance sheet describes thefinancial condition of a company at a particular time. Does it ownmore than it owes? Can it remain in business?
81
C H A P T E R 4
Financial Statements
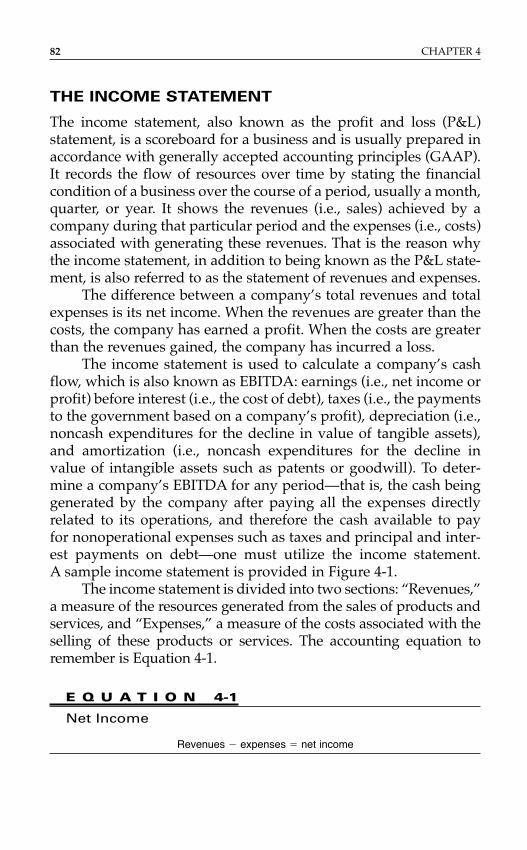
THE INCOME STATEMENT
The income statement, also known as the profit and loss (P&L)statement, is a scoreboard for a business and is usually prepared inaccordance with generally accepted accounting principles (GAAP).It records the flow of resources over time by stating the financialcondition of a business over the course of a period, usually a month,quarter, or year. It shows the revenues (i.e., sales) achieved by acompany during that particular period and the expenses (i.e., costs)associated with generating these revenues. That is the reason whythe income statement, in addition to being known as the P&L state-ment, is also referred to as the statement of revenues and expenses.
The difference between a company’s total revenues and totalexpenses is its net income. When the revenues are greater than thecosts, the company has earned a profit. When the costs are greaterthan the revenues gained, the company has incurred a loss.
The income statement is used to calculate a company’s cashflow, which is also known as EBITDA: earnings (i.e., net income orprofit) before interest (i.e., the cost of debt), taxes (i.e., the paymentsto the government based on a company’s profit), depreciation (i.e.,noncash expenditures for the decline in value of tangible assets),and amortization (i.e., noncash expenditures for the decline invalue of intangible assets such as patents or goodwill). To deter-mine a company’s EBITDA for any period—that is, the cash beinggenerated by the company after paying all the expenses directlyrelated to its operations, and therefore the cash available to pay for nonoperational expenses such as taxes and principal and inter-est payments on debt—one must utilize the income statement. A sample income statement is provided in Figure 4-1.
The income statement is divided into two sections: “Revenues,”a measure of the resources generated from the sales of products andservices, and “Expenses,” a measure of the costs associated with theselling of these products or services. The accounting equation toremember is Equation 4-1.
E Q U A T I O N 4-1
Net Income
Revenues � expenses � net income
82 CHAPTER 4
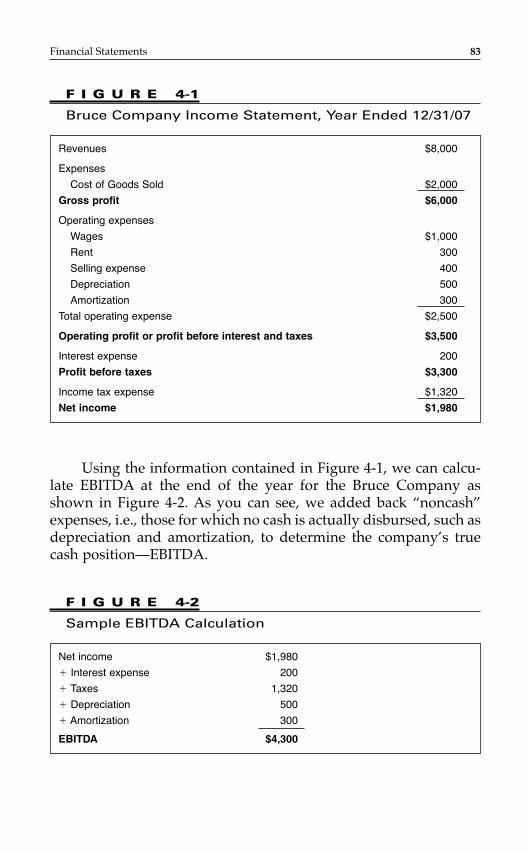
Using the information contained in Figure 4-1, we can calcu-late EBITDA at the end of the year for the Bruce Company asshown in Figure 4-2. As you can see, we added back “noncash”expenses, i.e., those for which no cash is actually disbursed, such asdepreciation and amortization, to determine the company’s truecash position—EBITDA.
Financial Statements 83
F I G U R E 4-1
Bruce Company Income Statement, Year Ended 12/31/07
Revenues $8,000
Expenses
Cost of Goods Sold $2,000
Gross profit $6,000
Operating expenses
Wages $1,000
Rent 300
Selling expense 400
Depreciation 500
Amortization 300
Total operating expense $2,500
Operating profit or profit before interest and taxes $3,500
Interest expense 200
Profit before taxes $3,300
Income tax expense $1,320
Net income $1,980
F I G U R E 4-2
Sample EBITDA Calculation
Net income $1,980
� Interest expense 200
� Taxes 1,320
� Depreciation 500
� Amortization 300
EBITDA $4,300
Let us define and analyze each revenue and expense item onthe typical income statement:
Revenues■ Receipts from the sale of products and services■ Returns on investments, such as interest earned on a
company’s marketable securities, including stocks andbonds
■ Franchising fees paid by franchisees■ Rental property income
Expenses■ Cost of goods sold■ Operating expenses■ Financing expenses■ Tax expenses
Cost of Goods SoldThe cost of goods sold (known as the COGS) or the cost of servicesrendered is the cost of the raw materials and direct labor requiredto produce the product or service that generated the revenue. TheCOGS does not include any overhead, such as utilities or manage-ment costs. The difference between revenues and the COGS isgross profit, a.k.a. gross margin. The proper way to calculate thegross profit is simply to subtract the COGS, as defined earlier, fromthe revenues produced by the sale of the company’s goods or serv-ices. Other income, such as interest earned on investments, shouldnot be included.
The reason for this is that in the world of finance, internal com-parisons of a company’s year-to-year performance, and also exter-nal comparisons of a company’s performance to that of anothercompany or an entire industry, are quite common. These kinds ofcomparisons are called internal and external benchmarking. Therefore,in order to make “apples-to-apples” comparisons that are notskewed by, for example, Company A’s revenues being stronger thanCompany B’s because the former is getting higher interest pay-ments on investments, only the revenues from operations are used.
84 CHAPTER 4
To determine gross profit from total revenues, regardless of thesource, would be to ignore the obvious definition of the COGS,which is the cost of only the goods sold to generate revenues.
Operating ExpensesOperating expenses, also known as selling, general, and administra-tive expenses (SG&A), are all of the other tangible and intangible(e.g., depreciation and amortization) expenses required to carry onthe day-to-day activities of a company. Included in this category arefixed costs (i.e., those costs that do not vary with the volume of busi-ness), such as insurance, rent, and management salaries, and variablecosts (i.e., the costs that vary depending upon the volume produced),such as utilities (e.g., electricity and water) and invoice documents.For example, in the Bruce income statement in Figure 4-1, the rent is$300 per year—an amount that remains the same whether 200 or2,000 widgets per year were produced.
Another simple way to think about fixed versus variable costsis to determine the expenses that would be affected by, for exam-ple, closing the company for a month. The rent would still be dueto the landlord, and interest payments on bank loans would still bedue to the bank. These are the fixed costs. On the other hand, sincethe company is closed and is not producing or shipping for amonth, there would be no need to buy invoice documents, and util-ity bills would decrease dramatically, since electricity and waterwere not being used.
Excluded from this category are interest expenses, which arenot operating expenses, but rather financing expenses. Therefore,revenues minus the sum of the COGS and operating expenses equalsoperating income, or EBIT (earnings before interest and taxes). Theoperating income is then used to make any interest payments ondebt. The balance is called earnings before taxes (EBT), and thesefunds are then used to pay taxes on the company’s EBT figure.
As stated earlier, “intangible, noncash” expenses—expensesthat do not require actual cash disbursements, such as depreciationand amortization—are also included in the operating expense category. Every company, under GAAP, is allowed to “write off”(i.e., expense) a portion of its tangible assets each year over the life of the asset. The theory behind this practice is that the value of all assets typically depreciates over time as a result of natural
Financial Statements 85
deterioration and regular use. Therefore, the depreciation of anasset is a cost to the company because the value of the asset isdeclining. As we will see in the discussion of the balance sheet laterin this chapter, the depreciated value of the asset is recognized onthe balance sheet, and the amount it depreciates each year is pre-sented on the income statement.
The amount to be depreciated each year is determined by theaccounting method that the company selects to recognize depreci-ation. The most common methods are straight-line (i.e., an equalpercentage of the asset’s cost minus salvage value is recognizedeach year for the predetermined number of useful years) and accelerated (i.e., double-declining-balance or sum-of-the-years’digits, which recognize a larger portion of the depreciation in theearly years).
The method used to calculate depreciation can have a signifi-cant impact on the timing of reported income. Using the straight-line depreciation method rather than one of the two acceleratedmethods, double-declining-balance or sum-of-the-years’-digits,will result in a higher net income in the early periods and lower netincome in the later years of an asset’s estimated useful life. Also,the change in net income from one period to the next is greaterunder the double-declining balance method than it is under thesum-of-the-years’-digits method. This makes the former methodthe most extreme form of depreciation. Finally, the two acceleratedmethods produce low levels of net income in the early periods thatincrease rapidly over the asset’s life.1
While depreciation is the expensing of tangible assets, amorti-zation is the expensing of intangible assets. Intangible assets includesuch items as goodwill (i.e., the surplus paid over an asset’s bookvalue), franchise rights, patents, trademarks, exploration rights,copyrights, and noncompete agreements. These items must beamortized, generally in equal annual amounts, over 15 years.
Other ExpensesFound on the income statement, financing expenses are basicallythe interest payments paid on loans to the business. And finally, taxexpenses are the taxes due on the company’s profits. There are alsoother taxes that a company incurs, including unemployment andreal estate taxes, but these fall into the operating expenses category.
86 CHAPTER 4
If a company has a negative profit before taxes—in otherwords, a loss—then corporate taxes are not due to the government.In fact, not only will taxes not be due, but also the company’s lossescan be used to reduce tax obligations on future positive profits.This is called a tax-loss carryforward, where a company’s previouslosses can be carried forward against future profits. Interestingly, acompany with a history of annual losses can be more valuable to aprospective buyer than a company that regularly has a breakevenor profitable financial history. Since tax-loss carryforwards aretransferable from seller to buyer, they are attractive to a prospec-tive buyer because they are assets for companies that are trying toshield future profits.
At the end of the year, if a company’s net income after taxes ispositive, it is retained in the form of retained earnings, reflected onthe next year’s beginning balance sheet, or distributed to investorsas dividends, as shown in Equation 4-2.
E Q U A T I O N 4-2
Retained Earnings and Shareholders’ Dividends
Revenues � expenses � net income
→ Retained earnings and shareholders’ dividends
Before closing the discussion of the income statement, it isimperative that we clear up a few terms that are commonly usedinterchangeably. These include:
■ Revenues and sales■ Margins, profits, earnings, and income
The three different kinds of margins, profits, earnings, andincome—in the order of their appearance on the income state-ment—are as follows:
■ Gross. The difference between revenues and COGS■ Operating. Revenues – (COGS � operating expenses)■ Net. The difference between revenues and all of the
company’s costs
Financial Statements 87
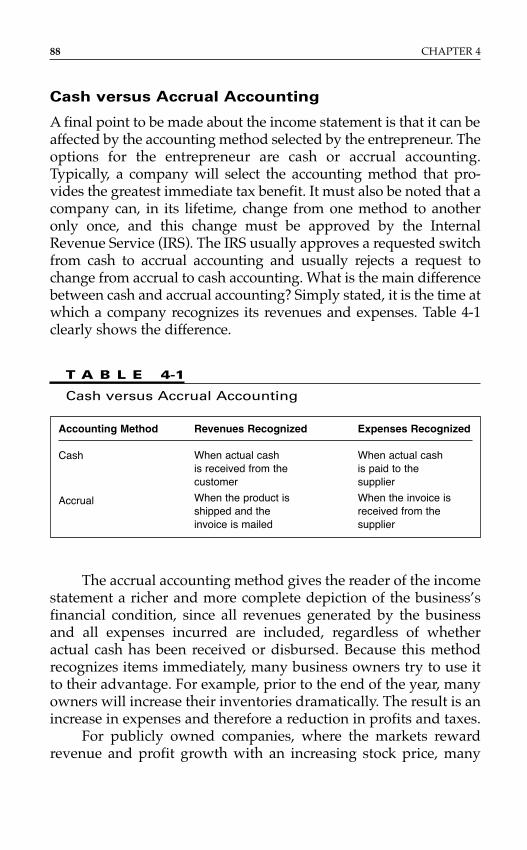
Cash versus Accrual Accounting
A final point to be made about the income statement is that it can beaffected by the accounting method selected by the entrepreneur. Theoptions for the entrepreneur are cash or accrual accounting.Typically, a company will select the accounting method that pro-vides the greatest immediate tax benefit. It must also be noted that acompany can, in its lifetime, change from one method to anotheronly once, and this change must be approved by the InternalRevenue Service (IRS). The IRS usually approves a requested switchfrom cash to accrual accounting and usually rejects a request tochange from accrual to cash accounting. What is the main differencebetween cash and accrual accounting? Simply stated, it is the time atwhich a company recognizes its revenues and expenses. Table 4-1clearly shows the difference.
88 CHAPTER 4
T A B L E 4-1
Cash versus Accrual Accounting
Accounting Method Revenues Recognized Expenses Recognized
Cash
Accrual
When actual cashis received from thecustomer
When the product isshipped and theinvoice is mailed
When actual cashis paid to thesupplier
When the invoice isreceived from thesupplier
The accrual accounting method gives the reader of the incomestatement a richer and more complete depiction of the business’sfinancial condition, since all revenues generated by the businessand all expenses incurred are included, regardless of whetheractual cash has been received or disbursed. Because this methodrecognizes items immediately, many business owners try to use itto their advantage. For example, prior to the end of the year, manyowners will increase their inventories dramatically. The result is anincrease in expenses and therefore a reduction in profits and taxes.
For publicly owned companies, where the markets rewardrevenue and profit growth with an increasing stock price, many
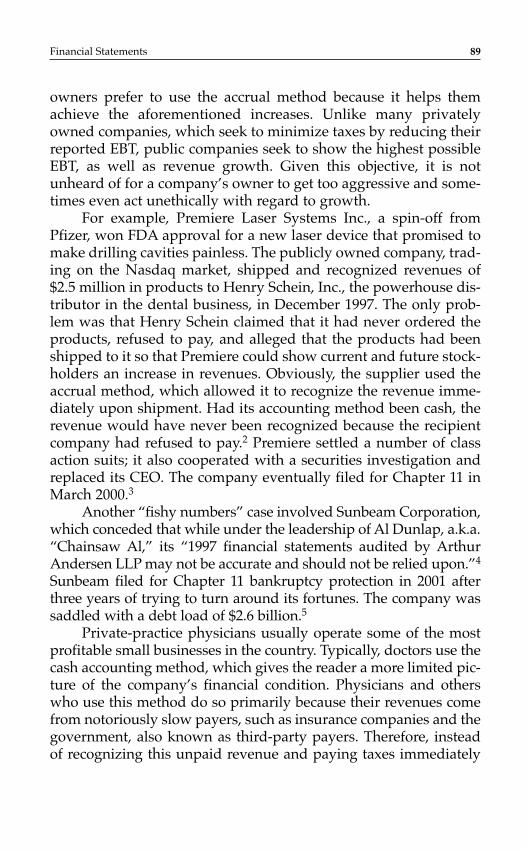
owners prefer to use the accrual method because it helps themachieve the aforementioned increases. Unlike many privatelyowned companies, which seek to minimize taxes by reducing theirreported EBT, public companies seek to show the highest possibleEBT, as well as revenue growth. Given this objective, it is notunheard of for a company’s owner to get too aggressive and some-times even act unethically with regard to growth.
For example, Premiere Laser Systems Inc., a spin-off fromPfizer, won FDA approval for a new laser device that promised tomake drilling cavities painless. The publicly owned company, trad-ing on the Nasdaq market, shipped and recognized revenues of$2.5 million in products to Henry Schein, Inc., the powerhouse dis-tributor in the dental business, in December 1997. The only prob-lem was that Henry Schein claimed that it had never ordered theproducts, refused to pay, and alleged that the products had beenshipped to it so that Premiere could show current and future stock-holders an increase in revenues. Obviously, the supplier used theaccrual method, which allowed it to recognize the revenue imme-diately upon shipment. Had its accounting method been cash, therevenue would have never been recognized because the recipientcompany had refused to pay.2 Premiere settled a number of classaction suits; it also cooperated with a securities investigation andreplaced its CEO. The company eventually filed for Chapter 11 inMarch 2000.3
Another “fishy numbers” case involved Sunbeam Corporation,which conceded that while under the leadership of Al Dunlap, a.k.a.“Chainsaw Al,” its “1997 financial statements audited by ArthurAndersen LLP may not be accurate and should not be relied upon.”4
Sunbeam filed for Chapter 11 bankruptcy protection in 2001 afterthree years of trying to turn around its fortunes. The company wassaddled with a debt load of $2.6 billion.5
Private-practice physicians usually operate some of the mostprofitable small businesses in the country. Typically, doctors use thecash accounting method, which gives the reader a more limited pic-ture of the company’s financial condition. Physicians and otherswho use this method do so primarily because their revenues comefrom notoriously slow payers, such as insurance companies and thegovernment, also known as third-party payers. Therefore, insteadof recognizing this unpaid revenue and paying taxes immediately
Financial Statements 89
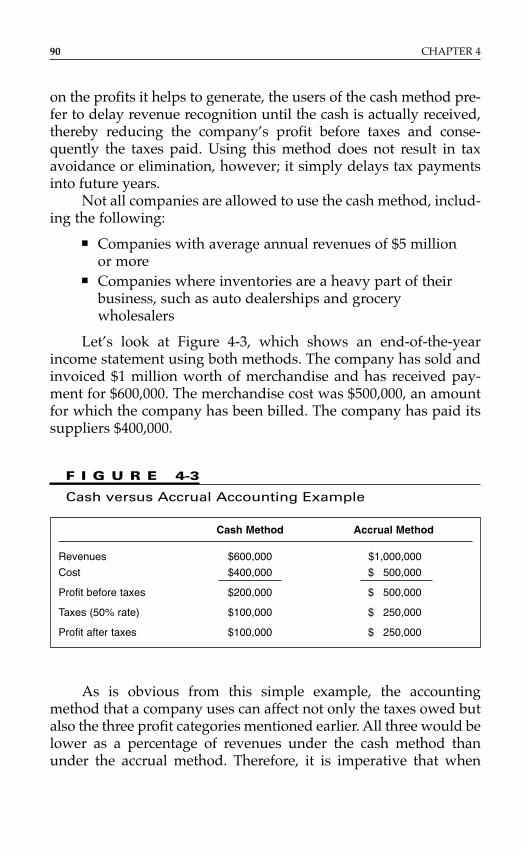
on the profits it helps to generate, the users of the cash method pre-fer to delay revenue recognition until the cash is actually received,thereby reducing the company’s profit before taxes and conse-quently the taxes paid. Using this method does not result in taxavoidance or elimination, however; it simply delays tax paymentsinto future years.
Not all companies are allowed to use the cash method, includ-ing the following:
■ Companies with average annual revenues of $5 million or more
■ Companies where inventories are a heavy part of theirbusiness, such as auto dealerships and grocerywholesalers
Let’s look at Figure 4-3, which shows an end-of-the-yearincome statement using both methods. The company has sold andinvoiced $1 million worth of merchandise and has received pay-ment for $600,000. The merchandise cost was $500,000, an amountfor which the company has been billed. The company has paid itssuppliers $400,000.
90 CHAPTER 4
F I G U R E 4-3
Cash versus Accrual Accounting Example
Cash Method Accrual Method
Revenues $600,000 $1,000,000
Cost $400,000 $ 500,000
Profit before taxes $200,000 $ 500,000
Taxes (50% rate) $100,000 $ 250,000
Profit after taxes $100,000 $ 250,000
As is obvious from this simple example, the accountingmethod that a company uses can affect not only the taxes owed butalso the three profit categories mentioned earlier. All three would belower as a percentage of revenues under the cash method thanunder the accrual method. Therefore, it is imperative that when
comparing income statement items against those of other compa-nies, the comparison be made with those using the same accountingmethod.
As mentioned earlier, a company can change its accountingmethod with the approval of the IRS. To see the impact of thesechanges, examine Figure 4-4.
Financial Statements 91
F I G U R E 4-4
Income Statement for the Bruce Company
Cash Business with Business withNo Receivables Receivables
Cash to accrual ■ Revenues remain the same. ■ Revenues increase.■ Expenses increase ■ Expenses increase■ Profit before taxes decreases. ■ Profit before taxes increases.■ Taxes decrease. ■ Taxes increase.■ Net income decreases. ■ Net income increases.
Accrual to cash ■ Revenues remain the same. ■ Revenues decrease.■ Expenses decrease. ■ Expenses decrease.■ Profit before taxes increases. ■ Profit before taxes decreases.■ Taxes increase. ■ Taxes decrease.■ Net income increases. ■ Net income decreases.
Why would someone in a business with receivables want toswitch from the cash method to the accrual accounting methodwhen the result can be an increase in taxes? There could be severallegitimate business reasons, including the following:
■ For better comparison purposes, the company may wantto use the same accounting method used by itscompetitors.
■ The entrepreneur may be preparing the company to gopublic or to be sold. The accrual method would show thecompany to be bigger and more profitable than it wouldappear using the cash method.
Before ending the discussion on accounting methods, itshould be pointed out that in December 1999, the IRS issued new
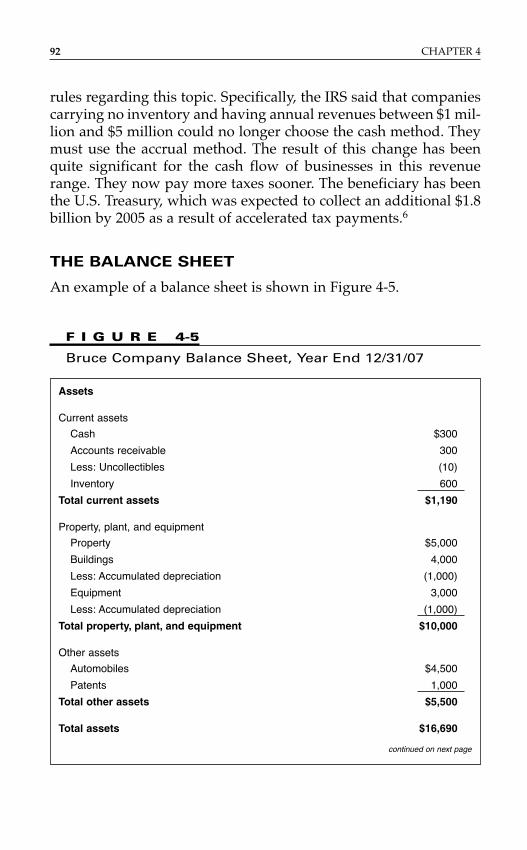
rules regarding this topic. Specifically, the IRS said that companiescarrying no inventory and having annual revenues between $1 mil-lion and $5 million could no longer choose the cash method. Theymust use the accrual method. The result of this change has beenquite significant for the cash flow of businesses in this revenuerange. They now pay more taxes sooner. The beneficiary has beenthe U.S. Treasury, which was expected to collect an additional $1.8billion by 2005 as a result of accelerated tax payments.6
THE BALANCE SHEET
An example of a balance sheet is shown in Figure 4-5.
92 CHAPTER 4
F I G U R E 4-5
Bruce Company Balance Sheet, Year End 12/31/07
Assets
Current assets
Cash $300
Accounts receivable 300
Less: Uncollectibles (10)
Inventory 600
Total current assets $1,190
Property, plant, and equipment
Property $5,000
Buildings 4,000
Less: Accumulated depreciation (1,000)
Equipment 3,000
Less: Accumulated depreciation (1,000)
Total property, plant, and equipment $10,000
Other assets
Automobiles $4,500
Patents 1,000
Total other assets $5,500
Total assets $16,690
continued on next page
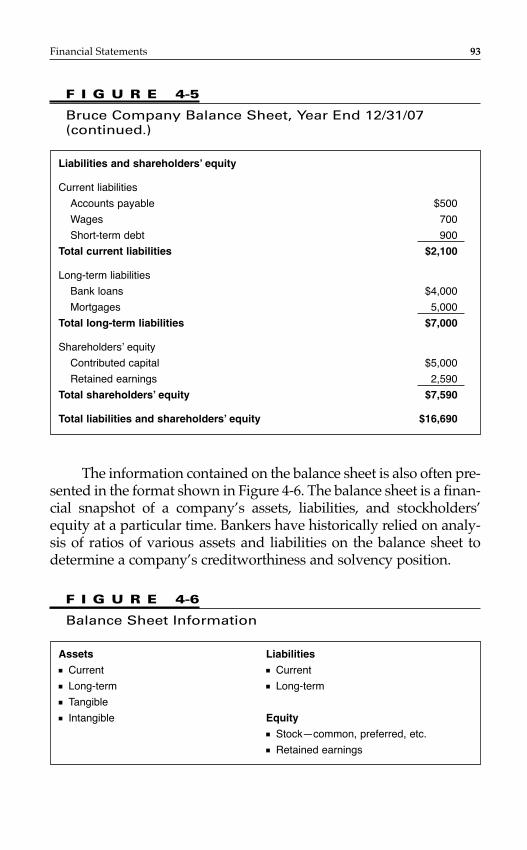
The information contained on the balance sheet is also often pre-sented in the format shown in Figure 4-6. The balance sheet is a finan-cial snapshot of a company’s assets, liabilities, and stockholders’equity at a particular time. Bankers have historically relied on analy-sis of ratios of various assets and liabilities on the balance sheet todetermine a company’s creditworthiness and solvency position.
Financial Statements 93
F I G U R E 4-5
Bruce Company Balance Sheet, Year End 12/31/07 (continued.)
Liabilities and shareholders’ equity
Current liabilities
Accounts payable $500
Wages 700
Short-term debt 900
Total current liabilities $2,100
Long-term liabilities
Bank loans $4,000
Mortgages 5,000
Total long-term liabilities $7,000
Shareholders’ equity
Contributed capital $5,000
Retained earnings 2,590
Total shareholders’ equity $7,590
Total liabilities and shareholders’ equity $16,690
F I G U R E 4-6
Balance Sheet Information
Assets Liabilities■ Current ■ Current■ Long-term ■ Long-term■ Tangible■ Intangible Equity
■ Stock—common, preferred, etc.■ Retained earnings
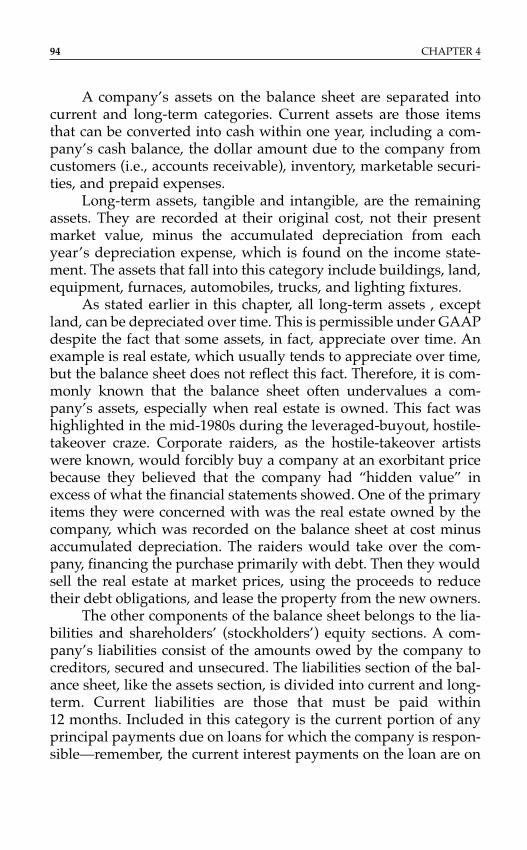
A company’s assets on the balance sheet are separated intocurrent and long-term categories. Current assets are those itemsthat can be converted into cash within one year, including a com-pany’s cash balance, the dollar amount due to the company fromcustomers (i.e., accounts receivable), inventory, marketable securi-ties, and prepaid expenses.
Long-term assets, tangible and intangible, are the remainingassets. They are recorded at their original cost, not their presentmarket value, minus the accumulated depreciation from eachyear’s depreciation expense, which is found on the income state-ment. The assets that fall into this category include buildings, land,equipment, furnaces, automobiles, trucks, and lighting fixtures.
As stated earlier in this chapter, all long-term assets , exceptland, can be depreciated over time. This is permissible under GAAPdespite the fact that some assets, in fact, appreciate over time. Anexample is real estate, which usually tends to appreciate over time,but the balance sheet does not reflect this fact. Therefore, it is com-monly known that the balance sheet often undervalues a com-pany’s assets, especially when real estate is owned. This fact washighlighted in the mid-1980s during the leveraged-buyout, hostile-takeover craze. Corporate raiders, as the hostile-takeover artistswere known, would forcibly buy a company at an exorbitant pricebecause they believed that the company had “hidden value” inexcess of what the financial statements showed. One of the primaryitems they were concerned with was the real estate owned by thecompany, which was recorded on the balance sheet at cost minusaccumulated depreciation. The raiders would take over the com-pany, financing the purchase primarily with debt. Then they wouldsell the real estate at market prices, using the proceeds to reducetheir debt obligations, and lease the property from the new owners.
The other components of the balance sheet belongs to the lia-bilities and shareholders’ (stockholders’) equity sections. A com-pany’s liabilities consist of the amounts owed by the company tocreditors, secured and unsecured. The liabilities section of the bal-ance sheet, like the assets section, is divided into current and long-term. Current liabilities are those that must be paid within 12 months. Included in this category is the current portion of anyprincipal payments due on loans for which the company is respon-sible—remember, the current interest payments on the loan are on
94 CHAPTER 4
the income statement—and accounts payable, which is very simplymoney owed to suppliers. Long-term liabilities are all of the com-pany’s other obligations. For example, if the company owns realestate and has a mortgage, the total balance due on that mortgageminus the current portion would be reflected in the long-term liabilities category.
Stockholders’ equity is the difference between total assets andtotal liabilities. It is the net worth of the company, including thestock issued by the company and the accumulated earnings thatthe company has retained each year. Remember, the retained earn-ings are an accumulation of the profits from the income statement.Note that the company’s net worth is not necessarily the com-pany’s value or what it would sell for. A company with a negativenet worth, where total liabilities exceed total assets, may sell forquite a bit of money without any problems. As we will see inChapter 7, the net worth of a company typically has no bearing onits valuation. A few important equations to remember are shown inEquation 4-3.
E Q U A T I O N 4-3
Shareholders’ Equity
Total assets � total liabilities � shareholders’ equity
Net worth � total assets � total liabilities
Therefore Net worth � shareholders’ equity
Finally, the items on the balance sheet are also used to com-pute a company’s working capital and working capital needs. Networking capital is simply a measure of the company’s ability topay its bills—in other words, the company’s short-term financialstrength. A company’s net working capital is measured as shownin Equation 4-4.
E Q U A T I O N 4-4
Net Working Capital
Net working capital � current assets � current liabilities
Financial Statements 95
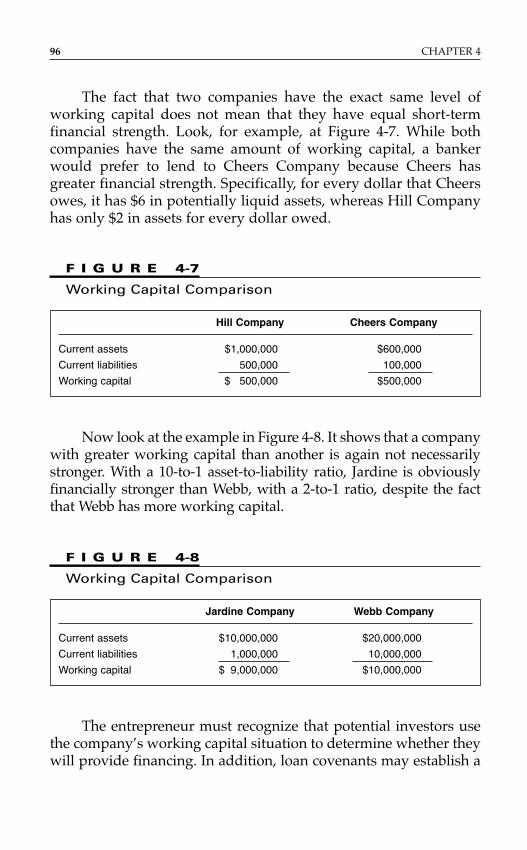
The fact that two companies have the exact same level ofworking capital does not mean that they have equal short-termfinancial strength. Look, for example, at Figure 4-7. While bothcompanies have the same amount of working capital, a bankerwould prefer to lend to Cheers Company because Cheers hasgreater financial strength. Specifically, for every dollar that Cheersowes, it has $6 in potentially liquid assets, whereas Hill Companyhas only $2 in assets for every dollar owed.
96 CHAPTER 4
F I G U R E 4-7
Working Capital Comparison
Hill Company Cheers Company
Current assets $1,000,000 $600,000
Current liabilities 500,000 100,000
Working capital $ 500,000 $500,000
F I G U R E 4-8
Working Capital Comparison
Jardine Company Webb Company
Current assets $10,000,000 $20,000,000
Current liabilities 1,000,000 10,000,000
Working capital $ 9,000,000 $10,000,000
Now look at the example in Figure 4-8. It shows that a companywith greater working capital than another is again not necessarilystronger. With a 10-to-1 asset-to-liability ratio, Jardine is obviouslyfinancially stronger than Webb, with a 2-to-1 ratio, despite the factthat Webb has more working capital.
The entrepreneur must recognize that potential investors usethe company’s working capital situation to determine whether theywill provide financing. In addition, loan covenants may establish a
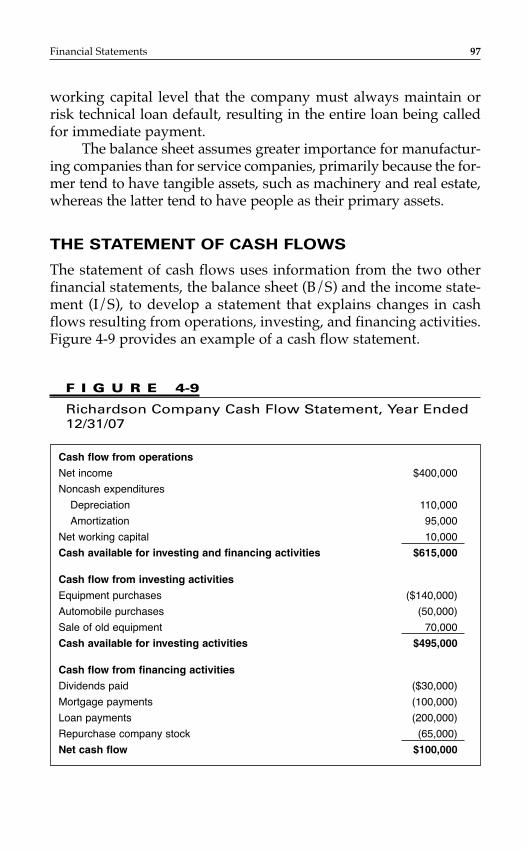
working capital level that the company must always maintain orrisk technical loan default, resulting in the entire loan being calledfor immediate payment.
The balance sheet assumes greater importance for manufactur-ing companies than for service companies, primarily because the for-mer tend to have tangible assets, such as machinery and real estate,whereas the latter tend to have people as their primary assets.
THE STATEMENT OF CASH FLOWS
The statement of cash flows uses information from the two otherfinancial statements, the balance sheet (B/S) and the income state-ment (I/S), to develop a statement that explains changes in cashflows resulting from operations, investing, and financing activities.Figure 4-9 provides an example of a cash flow statement.
Financial Statements 97
F I G U R E 4-9
Richardson Company Cash Flow Statement, Year Ended12/31/07
Cash flow from operations
Net income $400,000
Noncash expenditures
Depreciation 110,000
Amortization 95,000
Net working capital 10,000
Cash available for investing and financing activities $615,000
Cash flow from investing activities
Equipment purchases ($140,000)
Automobile purchases (50,000)
Sale of old equipment 70,000
Cash available for investing activities $495,000
Cash flow from financing activities
Dividends paid ($30,000)
Mortgage payments (100,000)
Loan payments (200,000)
Repurchase company stock (65,000)
Net cash flow $100,000
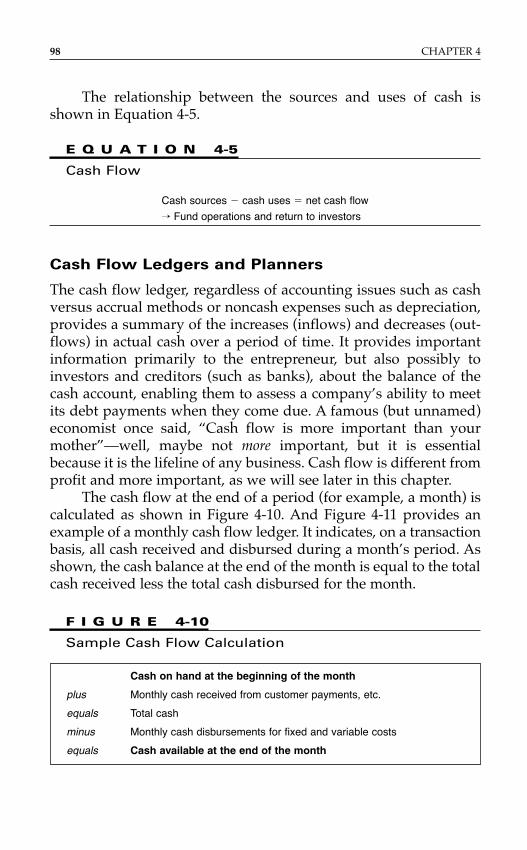
The relationship between the sources and uses of cash isshown in Equation 4-5.
E Q U A T I O N 4-5
Cash Flow
Cash sources � cash uses � net cash flow
→ Fund operations and return to investors
Cash Flow Ledgers and Planners
The cash flow ledger, regardless of accounting issues such as cashversus accrual methods or noncash expenses such as depreciation,provides a summary of the increases (inflows) and decreases (out-flows) in actual cash over a period of time. It provides importantinformation primarily to the entrepreneur, but also possibly toinvestors and creditors (such as banks), about the balance of thecash account, enabling them to assess a company’s ability to meetits debt payments when they come due. A famous (but unnamed)economist once said, “Cash flow is more important than yourmother”—well, maybe not more important, but it is essentialbecause it is the lifeline of any business. Cash flow is different fromprofit and more important, as we will see later in this chapter.
The cash flow at the end of a period (for example, a month) iscalculated as shown in Figure 4-10. And Figure 4-11 provides anexample of a monthly cash flow ledger. It indicates, on a transactionbasis, all cash received and disbursed during a month’s period. Asshown, the cash balance at the end of the month is equal to the totalcash received less the total cash disbursed for the month.
98 CHAPTER 4
F I G U R E 4-10
Sample Cash Flow Calculation
Cash on hand at the beginning of the month
plus Monthly cash received from customer payments, etc.
equals Total cash
minus Monthly cash disbursements for fixed and variable costs
equals Cash available at the end of the month
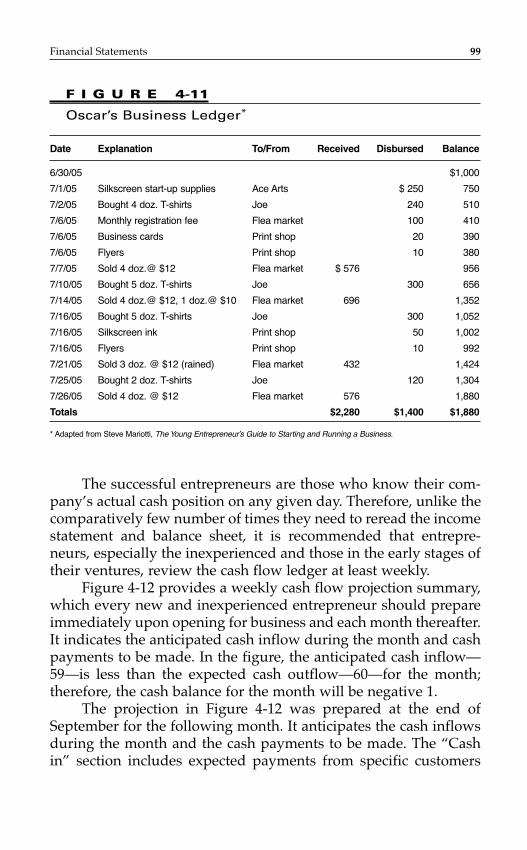
The successful entrepreneurs are those who know their com-pany’s actual cash position on any given day. Therefore, unlike thecomparatively few number of times they need to reread the incomestatement and balance sheet, it is recommended that entrepre-neurs, especially the inexperienced and those in the early stages oftheir ventures, review the cash flow ledger at least weekly.
Figure 4-12 provides a weekly cash flow projection summary,which every new and inexperienced entrepreneur should prepareimmediately upon opening for business and each month thereafter.It indicates the anticipated cash inflow during the month and cashpayments to be made. In the figure, the anticipated cash inflow—59—is less than the expected cash outflow—60—for the month;therefore, the cash balance for the month will be negative 1.
The projection in Figure 4-12 was prepared at the end ofSeptember for the following month. It anticipates the cash inflowsduring the month and the cash payments to be made. The “Cashin” section includes expected payments from specific customers
Financial Statements 99
F I G U R E 4-11
Oscar’s Business Ledger*
Date Explanation To/From Received Disbursed Balance
6/30/05 $1,000
7/1/05 Silkscreen start-up supplies Ace Arts $ 250 750
7/2/05 Bought 4 doz. T-shirts Joe 240 510
7/6/05 Monthly registration fee Flea market 100 410
7/6/05 Business cards Print shop 20 390
7/6/05 Flyers Print shop 10 380
7/7/05 Sold 4 doz.@ $12 Flea market $ 576 956
7/10/05 Bought 5 doz. T-shirts Joe 300 656
7/14/05 Sold 4 doz.@ $12, 1 doz.@ $10 Flea market 696 1,352
7/16/05 Bought 5 doz. T-shirts Joe 300 1,052
7/16/05 Silkscreen ink Print shop 50 1,002
7/16/05 Flyers Print shop 10 992
7/21/05 Sold 3 doz. @ $12 (rained) Flea market 432 1,424
7/25/05 Bought 2 doz. T-shirts Joe 120 1,304
7/26/05 Sold 4 doz. @ $12 Flea market 576 1,880
Totals $2,280 $1,400 $1,880
* Adapted from Steve Mariotti, The Young Entrepreneur’s Guide to Starting and Running a Business.
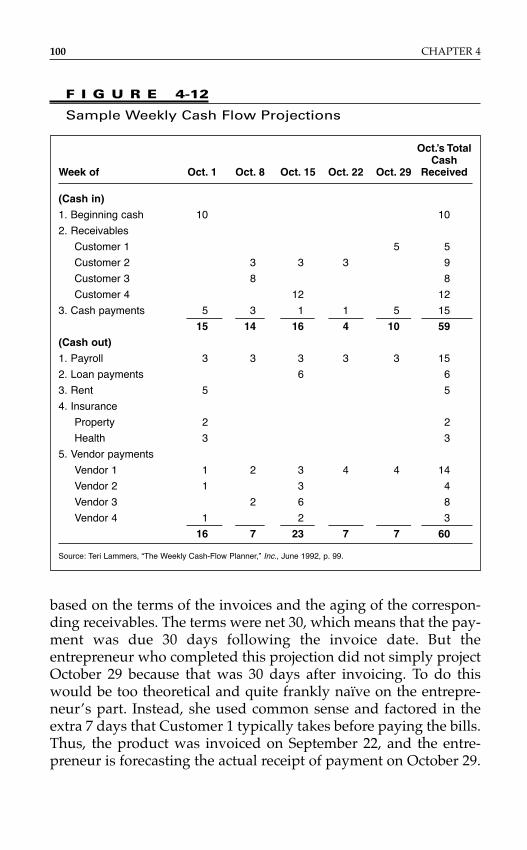
based on the terms of the invoices and the aging of the correspon-ding receivables. The terms were net 30, which means that the pay-ment was due 30 days following the invoice date. But theentrepreneur who completed this projection did not simply projectOctober 29 because that was 30 days after invoicing. To do thiswould be too theoretical and quite frankly naïve on the entrepre-neur’s part. Instead, she used common sense and factored in theextra 7 days that Customer 1 typically takes before paying the bills.Thus, the product was invoiced on September 22, and the entre-preneur is forecasting the actual receipt of payment on October 29.
100 CHAPTER 4
F I G U R E 4-12
Sample Weekly Cash Flow Projections
Oct.’s Total Cash
Week of Oct. 1 Oct. 8 Oct. 15 Oct. 22 Oct. 29 Received
(Cash in)
1. Beginning cash 10 10
2. Receivables
Customer 1 5 5
Customer 2 3 3 3 9
Customer 3 8 8
Customer 4 12 12
3. Cash payments 5 3 1 1 5 15
15 14 16 4 10 59
(Cash out)
1. Payroll 3 3 3 3 3 15
2. Loan payments 6 6
3. Rent 5 5
4. Insurance
Property 2 2
Health 3 3
5. Vendor payments
Vendor 1 1 2 3 4 4 14
Vendor 2 1 3 4
Vendor 3 2 6 8
Vendor 4 1 2 3
16 7 23 7 7 60
Source: Teri Lammers, “The Weekly Cash-Flow Planner,” Inc., June 1992, p. 99.
This section also includes the cash payments expected each weekthroughout the month. These are expected to be actual cash pay-ments that customers make when they pick up their merchandise.In these cases, the entrepreneur is not supplying any credit to thecustomer.
By doing this kind of projection each month, the entrepreneurcan schedule her payments to suppliers to match her expected cashreceipts. This planner allows her to be proactive, as all entrepre-neurs should be, with regard to the money owed to her suppliers.It enables her to let specific vendors know in advance that her pay-ment will probably be late. The cash flow ledger and planner aresimple and very useful tools that the entrepreneur should use tomanage cash flow successfully.
N O T E S
1. Jamie Pratt, Financial Accounting, 2nd ed. (Cincinnati, Ohio: South-Western Publishing Co., 1994), pp. 396–397.
2. Kathleen Morris, “No Laughing Gas Matter—A Dental-Tech StartupMay Have Hyped Its Numbers,” BusinessWeek, June 9, 1998, p. 44.
3. Stanford Law School, Securities Class Action Clearinghouse,http://securities.stanford.edu/1012/PLSIA98/.
4. Martha Brannigan, “Sunbeam Concedes 1997 Statements May BeOff,” Wall Street Journal, July 1, 1998, p. A4.
5. U.S. Business Journal, February 2001.6. Crain’s Chicago Business, July 10, 2000.
Financial Statements 101

This page intentionally left blank
INTRODUCTION
Sadly, it is common to hear entrepreneurs say, “I do not know anything about finance, because I was never good with numbers.Therefore, I focus on my product and let someone else worry aboutthe numbers.” Someone with such an attitude can never achievesuccessful high-growth entrepreneurship. Financial statementanalysis is not brain surgery! Everyone can understand it. In fact,no matter how distasteful or uncomfortable it might be to the high-growth entrepreneur, he must learn and use financial statementanalysis. Finance is like medicine. No one likes it because it usuallytastes awful, but everyone knows that it is good for you.
PROACTIVE ANALYSIS
Entrepreneurs must engage in proactive analysis of their financialstatements to better manage their company and influence the busi-ness decisions of the company’s managers, as well as attract capitalfrom investors and creditors.1
Financial statements must be used as tangible managementtools, not simply as reporting documents. While it is not required thatthe entrepreneur be able to develop these statements herself—a jobthat is done by the CFO—she must be able to completely understandevery line item. The entrepreneur who cannot do this will have amuch more difficult time growing the company and raising capital.
103
C H A P T E R 5
Financial StatementAnalysis
For example, one of the fundamentals of finance says thataccounts receivable (A/R) and inventory should not grow at anannual rate faster than revenue growth. If they do, it is a sign that thecompany’s working capital is being depleted because the accountsreceivable and inventory represent a drag on a company’s cash.
A case in point: The management team at Lucent Technologiesfailed to do a proactive analysis of this relationship. The result? Thestock price declined 30 percent shortly after the company reportedits 1999 financial results. The results showed that compared withthe previous year, revenues grew an impressive 20 percent.Unfortunately, A/R and inventory grew 41 percent and 54 percent,respectively!
Another problem for entrepreneurs who do not analyze theirfinancial statements proactively is that these entrepreneurs alsorisk being taken advantage of or exploited. There are numerousaccounts of companies losing money to employees who were steal-ing products and cash. In many instances, the theft was not identi-fied immediately because the owners excluded themselves from allfinancial statement analysis. Not surprisingly, many of the thievesare bookkeepers, accountants, accounts receivable and payableclerks, and CFOs. All of the aforementioned are positions inti-mately involved in the company’s financings. There’s a lesson here:thieves do not always look like scumbags! Heck, if they did, youwould not have hired that person in the first place.
Automated Equipment Inc. is a family-run manufacturingbusiness in Niles, Illinois. The company’s bookkeeper was afriendly 35-year-old woman who was inflating payouts to vendorsand then altering the names on the checks and depositing them inaccounts under her control. It took the company four years to dis-cover the embezzlement, and by then the woman had stolen nearly$610,000, leaving the company in near financial ruin. Among otherthings, the bookkeeper purchased a Cadillac sport-utility vehicle,expensive clothing, and fine meats. Oh, she also put a $30,000 addi-tion on her home. The theft forced the company to lay off 4 of its 11 employees, including the owner’s wife and a 27-year worker. By the way, the bookkeeper had a separate federal student loanconviction from her previous job.
Bette Wildermuth, a longtime business broker in Richmond,Virginia, has 25 years’ worth of stories of business owners getting
104 CHAPTER 5
surprised by the people they trust. Often, she’s the one who catchesthe shenanigans when poring over financials at the time of a sale.“I was asked by the owner of a fabrication company to come talkabout the possibility of selling his company. He specifically askedme to come on a Wednesday afternoon because his bookkeeperwould not be there. You see he didn’t want to cause her any worryover a possible job loss. After all, she’d been with his company for15 years.” Wildermuth was left alone with the books and records totry and determine a valuation. After about two hours, she said, theowner returned and proudly asked, “Did you notice that our salesare up and we’re continuing to make a profit?” Wildermuth hadnoticed and congratulated him. “I also told him that an astutebuyer would notice that and more, and that both of us would havethe same question. ‘Bob,’ I asked, ‘Why are you paying your homemortgage from the business account?’ He told me that that wasimpossible because his mortgage had been paid off years ago.” Itturned out that the sweet, Norman Rockwellesque woman whohad handled his finances for 15 years was robbing him blind. Shewas also paying her personal Visa card from the company books.“When I told him what was going on,” Wildermuth remembers,“he looked like he had been punched in the stomach.”
Another great example to highlight this point is the story ofRae Puccini, who, by the time she was 55 years old, had been convicted eight times over two decades for stealing money fromher employers. In July 2000, while facing another conviction for the same crime, she committed suicide. Her final crime wasusing her position as the office manager to steal $800,000 from her employer, Edelman, Combs & Latturner (ECL), a prominentChicago-based law firm that hired her in 1996. The lawsuit againsther stated,
She forged signatures, cut herself “bonus” checks and transferredmoney from her bosses’ bank account. She used the firm’s AmericanExpress credit card to pay for a Caribbean cruise and a vacation atthe Grand Hotel on Mackinac Island, Michigan. She also used thecredit card to pay for a Mexico vacation with her boyfriend as wellas groceries, flowers, furniture and liquor. Her 2000 Buick LeSabrewas paid for by a $35,000 bonus that she paid herself. Her mostexpensive gift to herself was the $200,000 house that she purchasedin the suburbs, using a $42,000 check that she cut from the firm.2
Financial Statement Analysis 105
How did she pull off this incredible crime? First, she created afake résumé to hide her prison record. Second, she earned heremployers’ trust easily. Third, she worked long hours to create animpression that she was very dedicated to the firm. As an attorneyat another law firm, where she also stole money, stated, “She osten-sibly was very loyal and trusted. She came in early and stayedlate.”3 The final reason was that no one in the law firm wasinvolved in the supervision and analysis of its financials. She waspractically given carte blanche, without any checks and balances.She was finally caught when ECL partners asked her to show doc-umentation explaining how the company’s cash had been spent.When she hedged, the partners looked through her work area andfound incriminating evidence.4
Approximately one month before her death, Puccini went toa funeral home, selected flowers, and paid for her body to be cremated. She donated many of her clothes to Goodwill and setup a postfuneral dinner at a Greek restaurant. Her final act was totype a confessional letter that included the statement, “No oneknew what I was doing with the finances of ECL.”5 She wasabsolutely correct.
When the entrepreneur is involved in his company’s finances,such sordid stories regarding losses of cash to theft can be practi-cally eliminated because the entrepreneur’s knowledge and partic-ipation serve as a deterrent.
To utilize the financial statements as management tools, theentrepreneur must have them prepared more than once a year.Monthly financial statements developed by an outside accountingfirm can be expensive. In addition, monthly statements, by defini-tion, are short-term-focused, and their analysis may encourageentrepreneurs to micromanage and overreact. The ideal is to pro-duce quarterly statements, which should be completed, and be inthe entrepreneur’s hand for analysis, no later than 30 days follow-ing the close of a quarter.
In this chapter, we will learn that the data contained in finan-cial statements can be analyzed to tell an interesting and com-pelling story about the financial condition of a business. Includedin the financial statement analysis discussion will be a case study.We will examine the income statement of the Clark Company to
106 CHAPTER 5
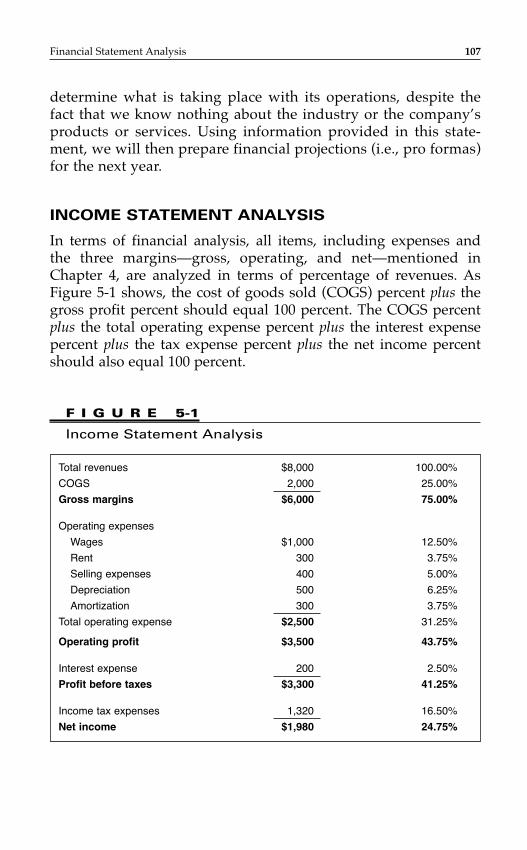
determine what is taking place with its operations, despite thefact that we know nothing about the industry or the company’sproducts or services. Using information provided in this state-ment, we will then prepare financial projections (i.e., pro formas)for the next year.
INCOME STATEMENT ANALYSIS
In terms of financial analysis, all items, including expenses and the three margins—gross, operating, and net—mentioned inChapter 4, are analyzed in terms of percentage of revenues. AsFigure 5-1 shows, the cost of goods sold (COGS) percent plus thegross profit percent should equal 100 percent. The COGS percentplus the total operating expense percent plus the interest expensepercent plus the tax expense percent plus the net income percentshould also equal 100 percent.
Financial Statement Analysis 107
F I G U R E 5-1
Income Statement Analysis
Total revenues $8,000 100.00%
COGS 2,000 25.00%
Gross margins $6,000 75.00%
Operating expenses
Wages $1,000 12.50%
Rent 300 3.75%
Selling expenses 400 5.00%
Depreciation 500 6.25%
Amortization 300 3.75%
Total operating expense $2,500 31.25%
Operating profit $3,500 43.75%
Interest expense 200 2.50%
Profit before taxes $3,300 41.25%
Income tax expenses 1,320 16.50%
Net income $1,980 24.75%
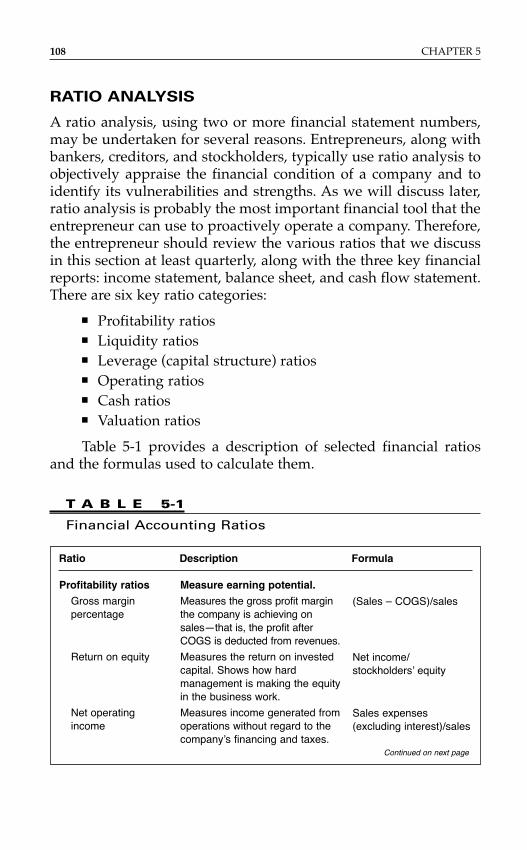
RATIO ANALYSIS
A ratio analysis, using two or more financial statement numbers,may be undertaken for several reasons. Entrepreneurs, along withbankers, creditors, and stockholders, typically use ratio analysis toobjectively appraise the financial condition of a company and toidentify its vulnerabilities and strengths. As we will discuss later,ratio analysis is probably the most important financial tool that theentrepreneur can use to proactively operate a company. Therefore,the entrepreneur should review the various ratios that we discussin this section at least quarterly, along with the three key financialreports: income statement, balance sheet, and cash flow statement.There are six key ratio categories:
■ Profitability ratios■ Liquidity ratios■ Leverage (capital structure) ratios■ Operating ratios■ Cash ratios■ Valuation ratios
Table 5-1 provides a description of selected financial ratiosand the formulas used to calculate them.
108 CHAPTER 5
Ratio Description Formula
Profitability ratios
Gross marginpercentage
Return on equity
Net operatingincome
Measure earning potential.
Measures the gross profit marginthe company is achieving onsales—that is, the profit afterCOGS is deducted from revenues.
Measures the return on investedcapital. Shows how hardmanagement is making the equityin the business work.
Measures income generated fromoperations without regard to thecompany’s financing and taxes.
(Sales – COGS)/sales
Net income/stockholders’ equity
Sales expenses(excluding interest)/sales
T A B L E 5-1
Financial Accounting Ratios
Continued on next page
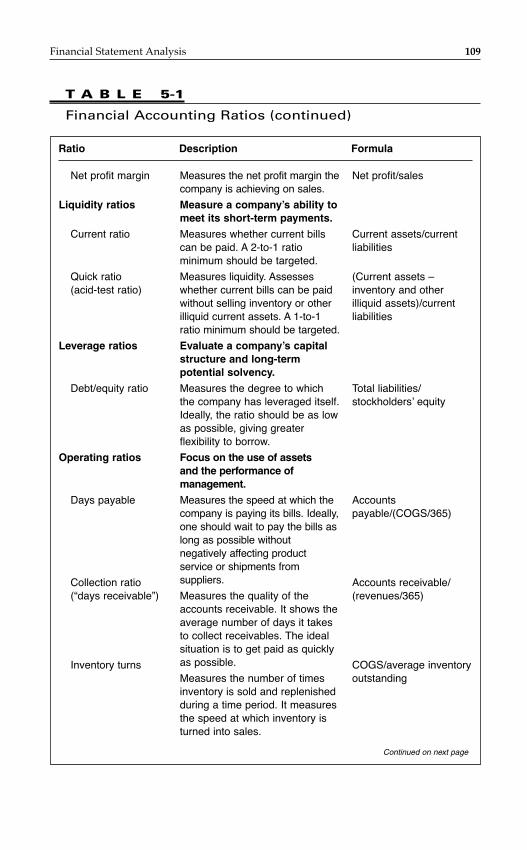
Financial Statement Analysis 109
Ratio Description Formula
Net profit margin
Liquidity ratios
Current ratio
Quick ratio (acid-test ratio)
Leverage ratios
Debt/equity ratio
Operating ratios
Days payable
Collection ratio(“days receivable”)
Inventory turns
Measures the net profit margin thecompany is achieving on sales.
Measure a company’s ability tomeet its short-term payments.
Measures whether current billscan be paid. A 2-to-1 ratiominimum should be targeted.
Measures liquidity. Assesseswhether current bills can be paidwithout selling inventory or otherilliquid current assets. A 1-to-1ratio minimum should be targeted.
Evaluate a company’s capitalstructure and long-termpotential solvency.
Measures the degree to whichthe company has leveraged itself.Ideally, the ratio should be as lowas possible, giving greaterflexibility to borrow.
Focus on the use of assets and the performance ofmanagement.
Measures the speed at which thecompany is paying its bills. Ideally,one should wait to pay the bills aslong as possible withoutnegatively affecting productservice or shipments fromsuppliers.
Measures the quality of theaccounts receivable. It shows theaverage number of days it takesto collect receivables. The idealsituation is to get paid as quicklyas possible.
Measures the number of timesinventory is sold and replenishedduring a time period. It measuresthe speed at which inventory isturned into sales.
Net profit/sales
Current assets/currentliabilities
(Current assets –inventory and otherilliquid assets)/currentliabilities
Total liabilities/stockholders’ equity
Accountspayable/(COGS/365)
Accounts receivable/ (revenues/365)
COGS/average inventoryoutstanding
T A B L E 5-1
Financial Accounting Ratios (continued)
Continued on next page
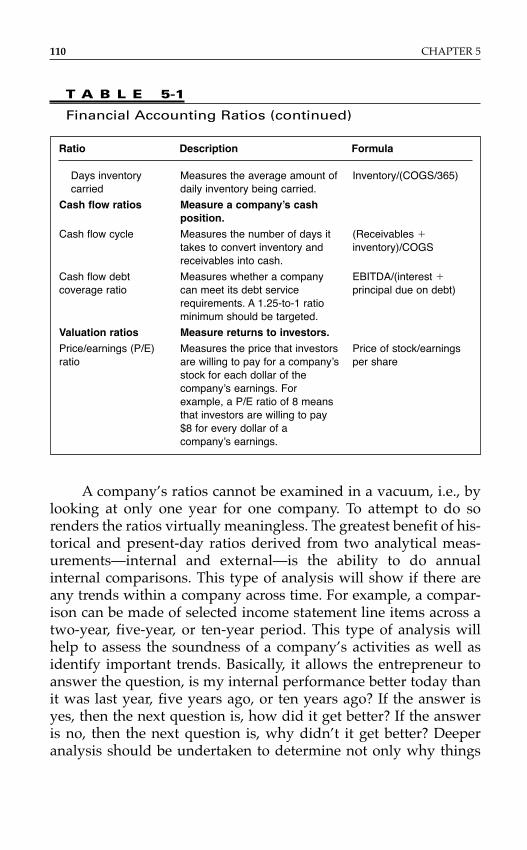
A company’s ratios cannot be examined in a vacuum, i.e., bylooking at only one year for one company. To attempt to do so renders the ratios virtually meaningless. The greatest benefit of his-torical and present-day ratios derived from two analytical meas-urements—internal and external—is the ability to do annualinternal comparisons. This type of analysis will show if there areany trends within a company across time. For example, a compar-ison can be made of selected income statement line items across atwo-year, five-year, or ten-year period. This type of analysis willhelp to assess the soundness of a company’s activities as well asidentify important trends. Basically, it allows the entrepreneur toanswer the question, is my internal performance better today thanit was last year, five years ago, or ten years ago? If the answer isyes, then the next question is, how did it get better? If the answeris no, then the next question is, why didn’t it get better? Deeperanalysis should be undertaken to determine not only why things
110 CHAPTER 5
Ratio Description Formula
Days inventorycarried
Cash flow ratios
Cash flow cycle
Cash flow debtcoverage ratio
Valuation ratios
Price/earnings (P/E)ratio
Measures the average amount ofdaily inventory being carried.
Measure a company’s cashposition.
Measures the number of days ittakes to convert inventory andreceivables into cash.
Measures whether a companycan meet its debt servicerequirements. A 1.25-to-1 ratiominimum should be targeted.
Measure returns to investors.
Measures the price that investorsare willing to pay for a company’sstock for each dollar of thecompany’s earnings. Forexample, a P/E ratio of 8 meansthat investors are willing to pay$8 for every dollar of acompany’s earnings.
Inventory/(COGS/365)
(Receivables �inventory)/COGS
EBITDA/(interest �principal due on debt)
Price of stock/earningsper share
T A B L E 5-1
Financial Accounting Ratios (continued)
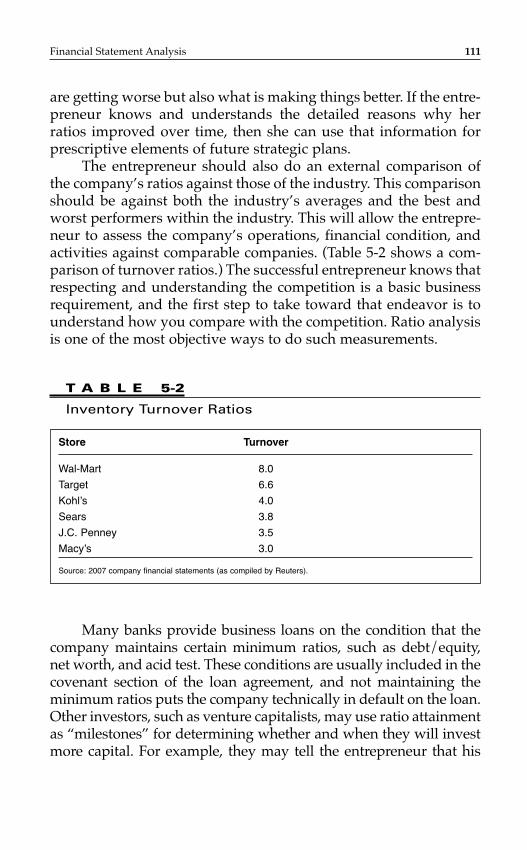
Financial Statement Analysis 111
are getting worse but also what is making things better. If the entre-preneur knows and understands the detailed reasons why herratios improved over time, then she can use that information forprescriptive elements of future strategic plans.
The entrepreneur should also do an external comparison ofthe company’s ratios against those of the industry. This comparisonshould be against both the industry’s averages and the best andworst performers within the industry. This will allow the entrepre-neur to assess the company’s operations, financial condition, andactivities against comparable companies. (Table 5-2 shows a com-parison of turnover ratios.) The successful entrepreneur knows thatrespecting and understanding the competition is a basic businessrequirement, and the first step to take toward that endeavor is tounderstand how you compare with the competition. Ratio analysisis one of the most objective ways to do such measurements.
Store Turnover
Wal-Mart 8.0
Target 6.6
Kohl’s 4.0
Sears 3.8
J.C. Penney 3.5
Macy’s 3.0
Source: 2007 company financial statements (as compiled by Reuters).
T A B L E 5-2
Inventory Turnover Ratios
Many banks provide business loans on the condition that thecompany maintains certain minimum ratios, such as debt/equity,net worth, and acid test. These conditions are usually included in thecovenant section of the loan agreement, and not maintaining theminimum ratios puts the company technically in default on the loan.Other investors, such as venture capitalists, may use ratio attainmentas “milestones” for determining whether and when they will investmore capital. For example, they may tell the entrepreneur that his
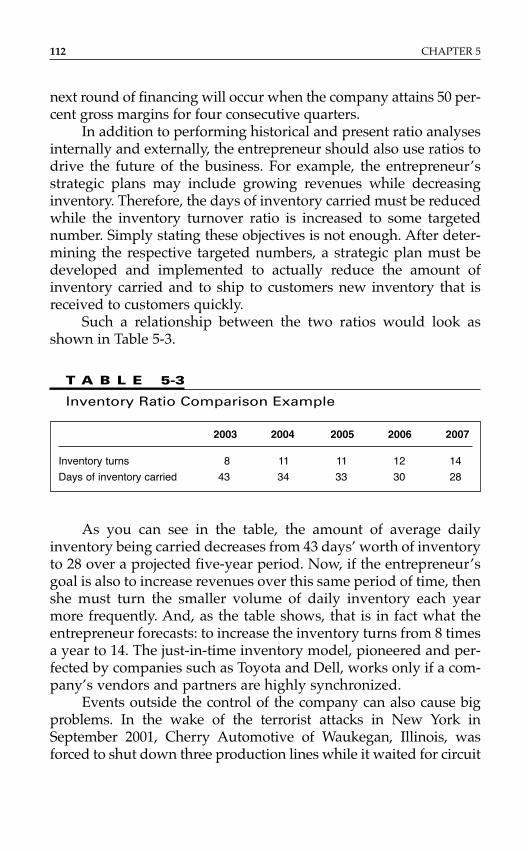
112 CHAPTER 5
next round of financing will occur when the company attains 50 per-cent gross margins for four consecutive quarters.
In addition to performing historical and present ratio analysesinternally and externally, the entrepreneur should also use ratios todrive the future of the business. For example, the entrepreneur’sstrategic plans may include growing revenues while decreasinginventory. Therefore, the days of inventory carried must be reducedwhile the inventory turnover ratio is increased to some targetednumber. Simply stating these objectives is not enough. After deter-mining the respective targeted numbers, a strategic plan must bedeveloped and implemented to actually reduce the amount ofinventory carried and to ship to customers new inventory that isreceived to customers quickly.
Such a relationship between the two ratios would look asshown in Table 5-3.
2003 2004 2005 2006 2007
Inventory turns 8 11 11 12 14
Days of inventory carried 43 34 33 30 28
T A B L E 5-3
Inventory Ratio Comparison Example
As you can see in the table, the amount of average dailyinventory being carried decreases from 43 days’ worth of inventoryto 28 over a projected five-year period. Now, if the entrepreneur’sgoal is also to increase revenues over this same period of time, thenshe must turn the smaller volume of daily inventory each yearmore frequently. And, as the table shows, that is in fact what theentrepreneur forecasts: to increase the inventory turns from 8 timesa year to 14. The just-in-time inventory model, pioneered and per-fected by companies such as Toyota and Dell, works only if a com-pany’s vendors and partners are highly synchronized.
Events outside the control of the company can also cause bigproblems. In the wake of the terrorist attacks in New York inSeptember 2001, Cherry Automotive of Waukegan, Illinois, wasforced to shut down three production lines while it waited for circuit
boards to be flown in from Asia. The delay cost the company $40,000.To ensure that this didn’t happen again, Cherry started carryingthree weeks’ worth of components inventory, compared with thetwo to three days’ worth it carried prior to the attacks. Managersdescribed the move as “going from just-in-time to just-in-case.” Notthat the owners took the decision lightly; by their estimates, that one change will cost the company $250,000 annually.6 Appendix Aoffers a listing of national average inventory turnover ratios andamount of sales in ending inventory for selected retail and wholesaleindustries.
Another proactive way to use ratios is for the entrepreneur toset short-term, medium-term, and long-term objectives with regardto internal and external ratios. For example, the short-term plancovers the next 12 months to get the days receivables ratio backdown to the best level in the company’s 10-year history. Themedium-term (i.e., 24 months) plan may be to get the company’sdays receivable down to at least the industry average. Finally, thelong-term (i.e., 36 months) plan may be to make the company’sdays receivable the lowest in the industry, making it the marketleader. Thus, ratios have immense value to the entrepreneur as ana-lytical and proactive management tools. And successful entrepre-neurs regularly compare their performance against historicalhighs, lows, and trends, as well as against the industry.
What are good and bad ratios? Well, it depends on whichratios are being examined and, more importantly, the specificindustry. Regarding the first point, good days receivable are deter-mined by a company’s invoice terms. The standard invoice has thefollowing terms: “2/10, net 30 days.” This means that the payer cantake a 2 percent discount if the invoice is paid within 10 days. After10 days, the invoice’s gross amount must be paid within the next20 days. Thus, the customer is being given a total of 30 days fol-lowing the date of the invoice to pay the bill. If the company doesbusiness under these terms, then days receivable of 45 days orgreater are considered bad. The ideal target is to have days receiv-able no more than 10 days greater than the invoice.
The second factor that determines what are good and bad ratiosis the industry (see Table 5-4 for good and bad key ratios for severalindustries). For example, if we analyze two different technologyindustries, we will see two distinctly different ideas of what is
Financial Statement Analysis 113
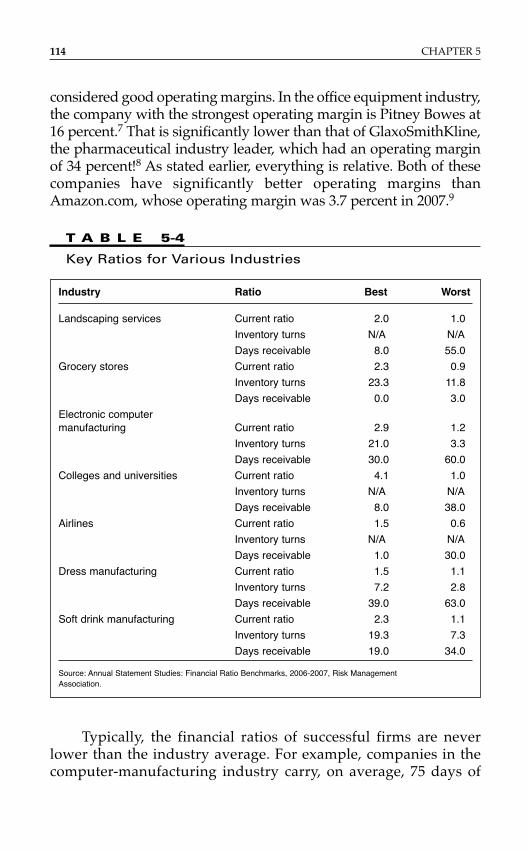
114 CHAPTER 5
considered good operating margins. In the office equipment industry,the company with the strongest operating margin is Pitney Bowes at16 percent.7 That is significantly lower than that of GlaxoSmithKline,the pharmaceutical industry leader, which had an operating marginof 34 percent!8 As stated earlier, everything is relative. Both of thesecompanies have significantly better operating margins thanAmazon.com, whose operating margin was 3.7 percent in 2007.9
Typically, the financial ratios of successful firms are neverlower than the industry average. For example, companies in thecomputer-manufacturing industry carry, on average, 75 days of
Industry Ratio Best Worst
Landscaping services Current ratio 2.0 1.0
Inventory turns N/A N/A
Days receivable 8.0 55.0
Grocery stores Current ratio 2.3 0.9
Inventory turns 23.3 11.8
Days receivable 0.0 3.0
Electronic computermanufacturing Current ratio 2.9 1.2
Inventory turns 21.0 3.3
Days receivable 30.0 60.0
Colleges and universities Current ratio 4.1 1.0
Inventory turns N/A N/A
Days receivable 8.0 38.0
Airlines Current ratio 1.5 0.6
Inventory turns N/A N/A
Days receivable 1.0 30.0
Dress manufacturing Current ratio 1.5 1.1
Inventory turns 7.2 2.8
Days receivable 39.0 63.0
Soft drink manufacturing Current ratio 2.3 1.1
Inventory turns 19.3 7.3
Days receivable 19.0 34.0
Source: Annual Statement Studies: Financial Ratio Benchmarks, 2006-2007, Risk Management Association.
T A B L E 5-4
Key Ratios for Various Industries
inventory. That dramatically contrasts with Dell, which carries anaverage of 4 days of inventory.10 This is one of the reasons whyDell has been so financially successful. As Kevin Rollins, CEO ofDell at the time, explained, “Our product is unique, in that it’slike fresh fish. The longer you keep it, the more it loses value. Inour industry, the product depreciates anywhere from a half to afull point a week. You can literally see the stuff rot. Cutting inven-tory is not just a nice thing to do, it’s a financial imperative.”11
There are some instances where it is perfectly acceptable for acompany’s ratios to be worse than the industry average. Thisoccurs when the below-average ratios are part of the company’sstrategic plan. For example, inventory turns and days inventorycarried that are slower and greater, respectively, than the industryaverage may not be signs of negative performance. It could be thatthe company’s strategic plan requires it to carry levels of inventorygreater than the industry average; as a result, inventory turnswould be slower. For example, if a company promises overnightdelivery, while competitors ship in 14 days, that company’s inven-tory carried will be higher and turns will be slower. Ideally, thegross margins should be higher than the industry’s because thecompany should be able to charge a premium for the faster deliv-eries. Given this fact, it is essential that the entrepreneur perform acomparison of industry averages when writing the business plan,when developing the projections, and, most importantly, beforesubmitting the plan to prospective investors.
An example of a company that runs with higher expensesthan its competitors is Commonwealth Worldwide ChauffeuredTransportation. Dawson Rutter, the company’s founder and CEO,dropped out of three universities before starting the company.Over a four-year period, Commonwealth grew its business from 40customers to 4,000 and increased its revenues over 248 percent.Rutter has the philosophy of “building the church for EasterSunday.” He says, “We create infrastructure in anticipation of rev-enue. That ensures delivery will be impeccable 100 percent of thetime. We can always handle 105 percent of our absolute busiestday. Is that a more expensive way of doing it? You bet. But the factis we don’t lose customers, which means we can afford to pay thatpremium.”12
How can entrepreneurs find out industry averages for pri-vate companies? Figure 5-2 lists periodicals and other resources
Financial Statement Analysis 115
116 CHAPTER 5
commonly used to compare an existing company’s performanceagainst the industry, as well as to determine if the pro formas in abusiness plan are in line with the industry being entered. As notedpreviously, you’ll also find national averages for turnover ratios inAppendix A.
F I G U R E 5-2
Industry Ratio Sources
Annual Statement Studies, Risk Management Association (formerly Robert Morris Associates)
Almanac of Business and Industrial Financial Ratios, Prentice Hall
Bizstats.com
Industry Norms and Key Business Ratios, Dun & Bradstreet
Risk Management Association eCompare2, online financial statement analysis tool
Value Line Investment Survey
BREAKEVEN ANALYSIS
The analysis of financial statements should also be used to deter-mine a company’s breakeven (BE) point. Successful entrepreneursknow how many widgets, meals, or hours of service they have tosell, serve, or provide, respectively, before they can take any realcash out of the company. Equation 5-1 shows the equation for cal-culating a company’s BE point.
E Q U A T I O N 5-1
Breakeven Point
Fixed expenses � gross margin � total breakeven sales
Total breakeven sales � unit price � number of units to sell
Using the information contained in Figures 4-1 and 4-4 for theBruce Company, one can prepare a selected set of financial ratiosand BE for the company. Table 5-5 shows the financial ratios, BE,and an explanation of the numbers.
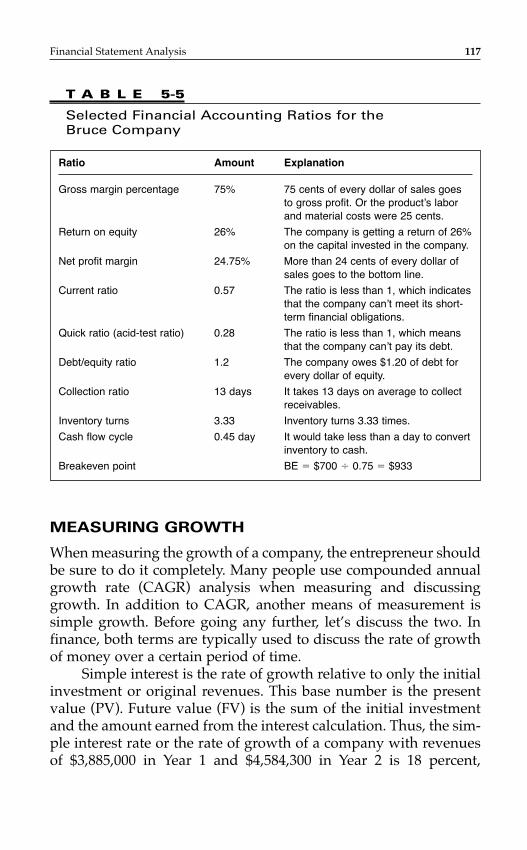
Financial Statement Analysis 117
MEASURING GROWTH
When measuring the growth of a company, the entrepreneur shouldbe sure to do it completely. Many people use compounded annualgrowth rate (CAGR) analysis when measuring and discussinggrowth. In addition to CAGR, another means of measurement issimple growth. Before going any further, let’s discuss the two. Infinance, both terms are typically used to discuss the rate of growthof money over a certain period of time.
Simple interest is the rate of growth relative to only the initialinvestment or original revenues. This base number is the presentvalue (PV). Future value (FV) is the sum of the initial investmentand the amount earned from the interest calculation. Thus, the sim-ple interest rate or the rate of growth of a company with revenuesof $3,885,000 in Year 1 and $4,584,300 in Year 2 is 18 percent,
Ratio Amount Explanation
Gross margin percentage 75% 75 cents of every dollar of sales goesto gross profit. Or the product’s laborand material costs were 25 cents.
Return on equity 26% The company is getting a return of 26%on the capital invested in the company.
Net profit margin 24.75% More than 24 cents of every dollar ofsales goes to the bottom line.
Current ratio 0.57 The ratio is less than 1, which indicatesthat the company can’t meet its short-term financial obligations.
Quick ratio (acid-test ratio) 0.28 The ratio is less than 1, which meansthat the company can’t pay its debt.
Debt/equity ratio 1.2 The company owes $1.20 of debt forevery dollar of equity.
Collection ratio 13 days It takes 13 days on average to collectreceivables.
Inventory turns 3.33 Inventory turns 3.33 times.
Cash flow cycle 0.45 day It would take less than a day to convertinventory to cash.
Breakeven point BE � $700 � 0.75 � $933
T A B L E 5-5
Selected Financial Accounting Ratios for the Bruce Company
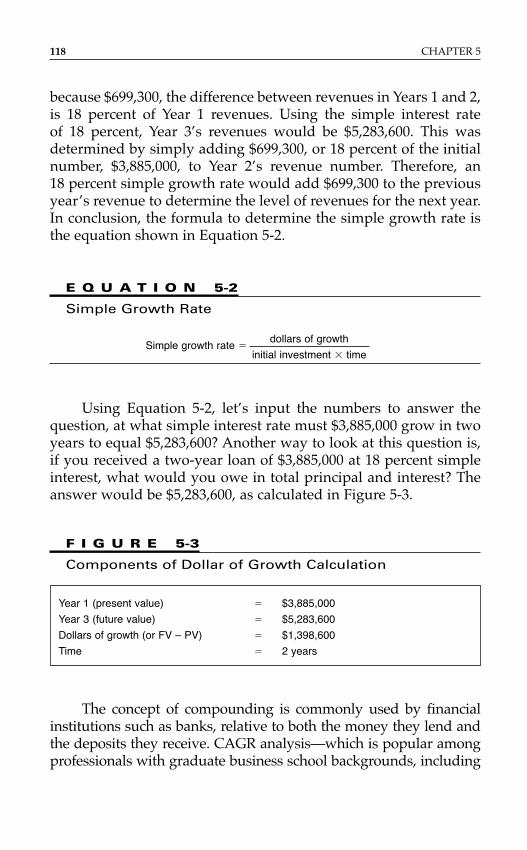
118 CHAPTER 5
because $699,300, the difference between revenues in Years 1 and 2,is 18 percent of Year 1 revenues. Using the simple interest rate of 18 percent, Year 3’s revenues would be $5,283,600. This wasdetermined by simply adding $699,300, or 18 percent of the initialnumber, $3,885,000, to Year 2’s revenue number. Therefore, an 18 percent simple growth rate would add $699,300 to the previousyear’s revenue to determine the level of revenues for the next year.In conclusion, the formula to determine the simple growth rate isthe equation shown in Equation 5-2.
E Q U A T I O N 5-2
Simple Growth Rate
Simple growth rate �dollars of growth
initial investment � time
Using Equation 5-2, let’s input the numbers to answer thequestion, at what simple interest rate must $3,885,000 grow in twoyears to equal $5,283,600? Another way to look at this question is,if you received a two-year loan of $3,885,000 at 18 percent simpleinterest, what would you owe in total principal and interest? Theanswer would be $5,283,600, as calculated in Figure 5-3.
F I G U R E 5-3
Components of Dollar of Growth Calculation
Year 1 (present value) � $3,885,000
Year 3 (future value) � $5,283,600
Dollars of growth (or FV – PV) � $1,398,600
Time � 2 years
The concept of compounding is commonly used by financialinstitutions such as banks, relative to both the money they lend andthe deposits they receive. CAGR analysis—which is popular amongprofessionals with graduate business school backgrounds, including
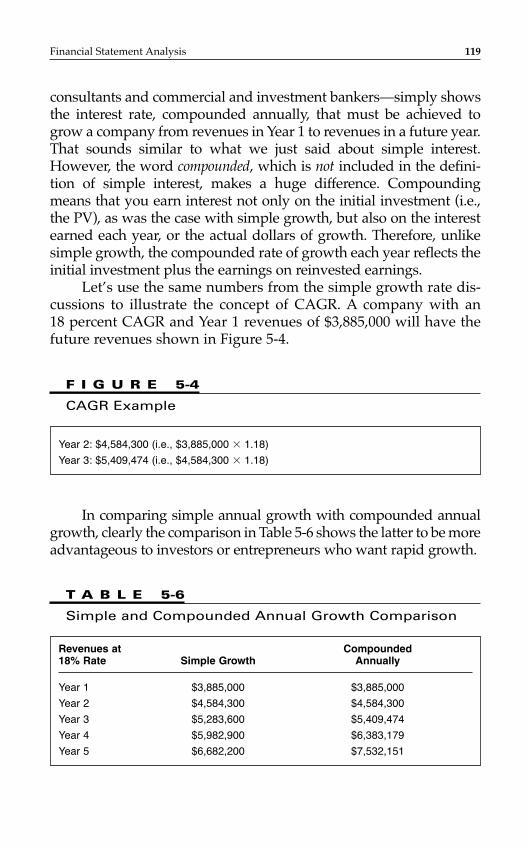
Financial Statement Analysis 119
consultants and commercial and investment bankers—simply showsthe interest rate, compounded annually, that must be achieved togrow a company from revenues in Year 1 to revenues in a future year.That sounds similar to what we just said about simple interest.However, the word compounded, which is not included in the defini-tion of simple interest, makes a huge difference. Compoundingmeans that you earn interest not only on the initial investment (i.e.,the PV), as was the case with simple growth, but also on the interestearned each year, or the actual dollars of growth. Therefore, unlikesimple growth, the compounded rate of growth each year reflects theinitial investment plus the earnings on reinvested earnings.
Let’s use the same numbers from the simple growth rate dis-cussions to illustrate the concept of CAGR. A company with an 18 percent CAGR and Year 1 revenues of $3,885,000 will have thefuture revenues shown in Figure 5-4.
F I G U R E 5-4
CAGR Example
Year 2: $4,584,300 (i.e., $3,885,000 � 1.18)
Year 3: $5,409,474 (i.e., $4,584,300 � 1.18)
In comparing simple annual growth with compounded annualgrowth, clearly the comparison in Table 5-6 shows the latter to be moreadvantageous to investors or entrepreneurs who want rapid growth.
Revenues at Compounded18% Rate Simple Growth Annually
Year 1 $3,885,000 $3,885,000
Year 2 $4,584,300 $4,584,300
Year 3 $5,283,600 $5,409,474
Year 4 $5,982,900 $6,383,179
Year 5 $6,682,200 $7,532,151
T A B L E 5-6
Simple and Compounded Annual Growth Comparison
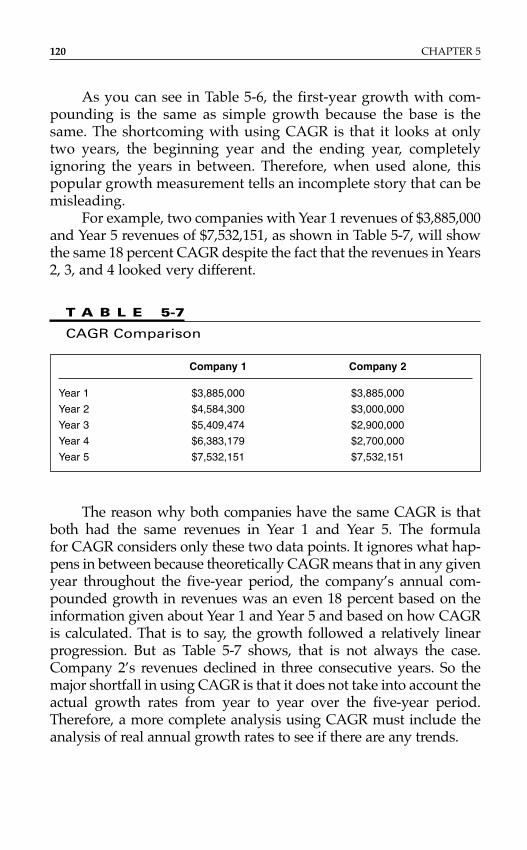
120 CHAPTER 5
As you can see in Table 5-6, the first-year growth with com-pounding is the same as simple growth because the base is thesame. The shortcoming with using CAGR is that it looks at onlytwo years, the beginning year and the ending year, completelyignoring the years in between. Therefore, when used alone, thispopular growth measurement tells an incomplete story that can bemisleading.
For example, two companies with Year 1 revenues of $3,885,000and Year 5 revenues of $7,532,151, as shown in Table 5-7, will showthe same 18 percent CAGR despite the fact that the revenues in Years2, 3, and 4 looked very different.
Company 1 Company 2
Year 1 $3,885,000 $3,885,000
Year 2 $4,584,300 $3,000,000
Year 3 $5,409,474 $2,900,000
Year 4 $6,383,179 $2,700,000
Year 5 $7,532,151 $7,532,151
T A B L E 5-7
CAGR Comparison
The reason why both companies have the same CAGR is thatboth had the same revenues in Year 1 and Year 5. The formula for CAGR considers only these two data points. It ignores what hap-pens in between because theoretically CAGR means that in any givenyear throughout the five-year period, the company’s annual com-pounded growth in revenues was an even 18 percent based on theinformation given about Year 1 and Year 5 and based on how CAGRis calculated. That is to say, the growth followed a relatively linearprogression. But as Table 5-7 shows, that is not always the case.Company 2’s revenues declined in three consecutive years. So themajor shortfall in using CAGR is that it does not take into account theactual growth rates from year to year over the five-year period.Therefore, a more complete analysis using CAGR must include theanalysis of real annual growth rates to see if there are any trends.
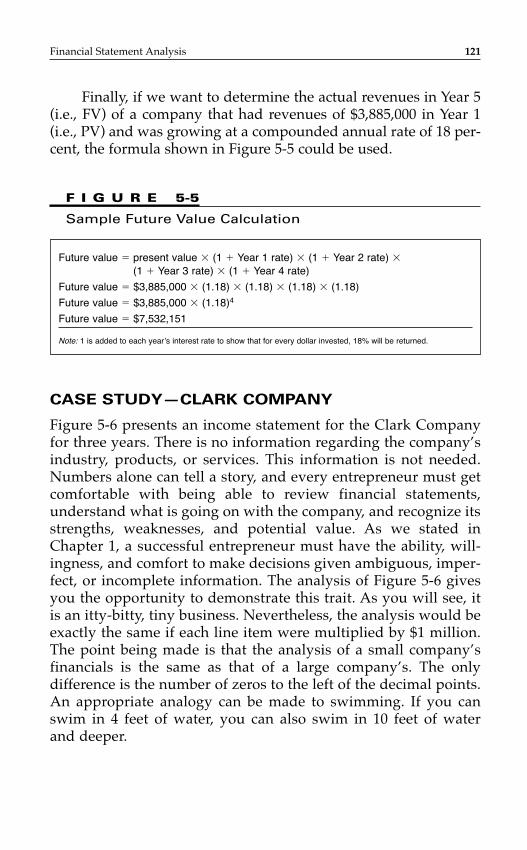
Financial Statement Analysis 121
Finally, if we want to determine the actual revenues in Year 5(i.e., FV) of a company that had revenues of $3,885,000 in Year 1(i.e., PV) and was growing at a compounded annual rate of 18 per-cent, the formula shown in Figure 5-5 could be used.
F I G U R E 5-5
Sample Future Value Calculation
Future value � present value � (1 � Year 1 rate) � (1 � Year 2 rate) �(1 � Year 3 rate) � (1 � Year 4 rate)
Future value � $3,885,000 � (1.18) � (1.18) � (1.18) � (1.18)
Future value � $3,885,000 � (1.18)4
Future value � $7,532,151
Note: 1 is added to each year’s interest rate to show that for every dollar invested, 18% will be returned.
CASE STUDY—CLARK COMPANY
Figure 5-6 presents an income statement for the Clark Companyfor three years. There is no information regarding the company’sindustry, products, or services. This information is not needed.Numbers alone can tell a story, and every entrepreneur must getcomfortable with being able to review financial statements,understand what is going on with the company, and recognize itsstrengths, weaknesses, and potential value. As we stated inChapter 1, a successful entrepreneur must have the ability, will-ingness, and comfort to make decisions given ambiguous, imper-fect, or incomplete information. The analysis of Figure 5-6 givesyou the opportunity to demonstrate this trait. As you will see, itis an itty-bitty, tiny business. Nevertheless, the analysis would beexactly the same if each line item were multiplied by $1 million.The point being made is that the analysis of a small company’sfinancials is the same as that of a large company’s. The only difference is the number of zeros to the left of the decimal points.An appropriate analogy can be made to swimming. If you canswim in 4 feet of water, you can also swim in 10 feet of water and deeper.
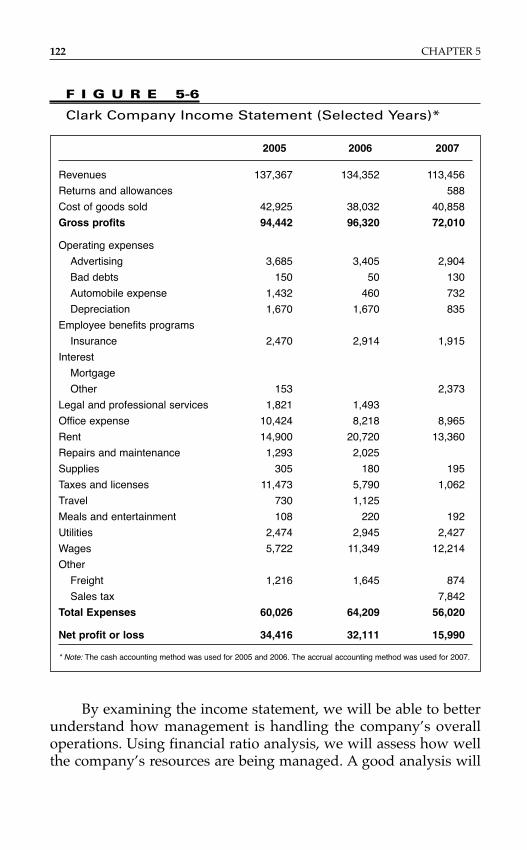
122 CHAPTER 5
By examining the income statement, we will be able to betterunderstand how management is handling the company’s overalloperations. Using financial ratio analysis, we will assess how wellthe company’s resources are being managed. A good analysis will
F I G U R E 5-6
Clark Company Income Statement (Selected Years)*
2005 2006 2007
Revenues 137,367 134,352 113,456
Returns and allowances 588
Cost of goods sold 42,925 38,032 40,858
Gross profits 94,442 96,320 72,010
Operating expenses
Advertising 3,685 3,405 2,904
Bad debts 150 50 130
Automobile expense 1,432 460 732
Depreciation 1,670 1,670 835
Employee benefits programs
Insurance 2,470 2,914 1,915
Interest
Mortgage
Other 153 2,373
Legal and professional services 1,821 1,493
Office expense 10,424 8,218 8,965
Rent 14,900 20,720 13,360
Repairs and maintenance 1,293 2,025
Supplies 305 180 195
Taxes and licenses 11,473 5,790 1,062
Travel 730 1,125
Meals and entertainment 108 220 192
Utilities 2,474 2,945 2,427
Wages 5,722 11,349 12,214
Other
Freight 1,216 1,645 874
Sales tax 7,842
Total Expenses 60,026 64,209 56,020
Net profit or loss 34,416 32,111 15,990
* Note: The cash accounting method was used for 2005 and 2006. The accrual accounting method was used for 2007.
Financial Statement Analysis 123
enable a potential buyer to assess, for example, whether the com-pany is worth acquiring, based on its strengths and weaknesses,and to determine how much to pay for it.
When analyzing the numbers, it is important to (1) look at thenumbers and compare them with historical performance or with abenchmark such as an industry average, to assess how the com-pany is performing in that specific area, and (2) highlight anytrends. The importance of trends as one looks at financial state-ments is that they are used to predict the future. One shouldalways ask: Is there a trend in this line item? Is it an upward ordownward trend? What is the main reason(s) for this trend? Whatdoes the trend mean for the future?
The following assumptions should be made in the analysis ofthe Clark Company case:
■ This company is a cash business; there are no receivables.■ It is owner-operated.■ The numbers provided are correct.
An analysis of every line item could be made, but our analy-sis will focus on three of the most important items: revenue, grossprofit, and net profit.
Revenue Analysis
The analysis of a company’s historical annual revenue includesanswers to the following questions: What are the sales growth ratesfor the past few years? What is the trend in sales growth? Is itdeclining or increasing? Why are revenues increasing or decreas-ing? Not only should you be concerned about whether or not rev-enues are increasing, but you should also ask whether the increaseis consistent with what is taking place in the industry. Sales increas-ing for a short period may not be good enough. You need to com-pare a company’s sales growth with the rate at which you want it togrow. The absolute minimum amount you want sales to grow, at anannual rate, is at the rate of inflation, which since 1774 has averagedapproximately 4.1 percent per year.13 Some industries have clearlyoutperformed this benchmark. For example, in the professionalsports industry, since 2002, the average annual percentage increasein ticket prices for the four major sports leagues (i.e., the NBA, NFL,
NHL, and MLB) has been 14.5 percent.14,15 The revenue at thelargest 17 securities companies in 2006 rose a staggering 44 per-cent.16 In 2006, Fortune 500 companies increased their revenues by9 percent,17 while inflation that year was 3 percent.
Revenue for the Clark Company has been declining. Revenuesdeclined by 2 percent between 2005 and 2006 and by 16 percentbetween 2006 and 2007. This downward trend is a cause for con-cern. Some of the reasons for the decline in revenues may be:
■ Price increases resulting from higher costs.■ The owner is despondent, and he is not managing his
business properly, or he simply is not present at thecompany.
■ Increased competition, as a result of the high grossmargins, could be putting pressure on prices. One way tokeep prices high is to have a patent on a product, whichallows the owner to set the price fairly high. This assumes,of course, that there is a demand for the product or service.When the patent expires, the business will inevitably facecompetition.
■ The product could be becoming obsolete.■ An unanticipated event or an act of God, known in the
legal profession as a “force majeure,” could be one reasonfor the decline in revenue. For example, there could havebeen a tornado or a severe rainstorm and the storage areawhere the entire inventory was kept could have beenflooded, thereby damaging inventory and reducing thevolume that was available for sale.
■ There could have construction outside of the company’splace of business that prevents easy access by customers.
So there are, in some instances, legitimate reasons why rev-enue could be decreasing that have nothing to do with the sound-ness of the business or its management. When undertakingfinancial analysis, it is important to consider all likely scenarios.
While strong revenue growth is typically viewed positively, itcan also be a sign of bad tidings. The fundamentals of finance asso-ciate excellent revenue increases with at least correspondingincreases in the company’s net income. The best example of this
124 CHAPTER 5
point is Microsoft. From 1990, when Microsoft introduced itsWindows 3.0 operating system, to 1999, its revenues grew 17 times,from $1.18 billion to $19.8 billion. During the same time period, itsnet income grew an astounding 28 times, from $279 million to $7.79billion! On a larger scale, the Fortune 500 demonstrated this con-cept in historic fashion between 2000 and 2006. Aided by strongproductivity gains and a growing economy, the largest Americancompanies grew earnings an astonishing 80 percent while revenuegrowth grew 38 percent. During this period, posttax profit marginshit 7.9 percent, a 27 percent increase over the already impressive 6.2 percent margins in 2000.18
But if revenues are growing because prices have been lowered,then that means that the company is probably growing at the expenseof margins. Therefore, the growth may not in fact be profitable. Forexample, during the period from 1991 to 1997, Hewlett-Packard’srevenue from personal computers increased dramatically to approxi-mately $9 billion in annual revenues. Also during this period, its mar-ket share increased from 1 to 4 percent. In 1998, with the support of price cuts, sales increased 13 percent. Despite all this good news,HP’s personal computer business experienced a loss of in excess of$100 million.19
Another issue with regard to revenue growth that you shouldbe aware of is that the growth may be occurring because competi-tors are conceding the market. Competitors may be leaving themarket because the product will soon be obsolete; or perhaps theyare leaving because the ever-increasing cost of doing business—things such as liability insurance—is driving them out of the market. Thus, it is just as important for the entrepreneur to knowwhy he is experiencing excellent growth as it is to know the rea-sons for low or no growth. The successful entrepreneur knows thatrevenues should be grown strategically. It is well-managed growththat ultimately improves the profitability of the company.
Sometimes growing too fast can be just as damaging as nogrowth at all. A few problems common to rapid growth are poorquality, late deliveries, an overworked labor force, cash shortages,and brand dilution. Unmanaged growth is usually not profitable.For example, Michael Dell, the founder of Dell Computers, whichgrew 87 percent per year for the first eight years and 34 percentannually since 1992, said, “I’ve learned from experience that
Financial Statement Analysis 125
a company can grow too fast. You have to be careful aboutexpanding too quickly because you won’t have the experience orthe infrastructure to succeed.”20 This comment was made after heexperienced a $94 million charge against earnings in 1993 for,among other things, the failure of a line of poor-quality laptops.
The story of 180s, a sports apparel company, further demon-strates the dangers of growing too fast. At one point, the companywas ranked number 32 on the prestigious Inc. 500 list of fastest-growing companies. The firm grew revenues from $1 million in1999 to $50 million in 2004. However, by 2005, 180s was suffocatingunder too much debt and was taken over by a private equity firm.Lamenting its impending sale, Bernie Tenenbaum, a venture capi-talist who had considered investing in 180s at one point, said, “I’dsay they’d be lucky to get 10 cents on the dollar.” Actually, he wasoptimistic—it turned out to be 8 cents on the dollar. Bill Besselman,a one-time partner with the co-owners of the firm, explains theirfailure: “In the end, they grew the top line, but they didn’t managethe bottom line. They got sucked into the vortex.”21
Even Starbucks, one of the greatest entrepreneurial stories ofall time, has suffered unmanageable growth that has diluted itsbrand and caused it to fall behind Dunkin’ Donuts in customer loyalty. Starbucks founder and chairman Howard Schultz explainshow growing too fast caused this problem: “Over the past tenyears, in order to achieve the growth, development, and scale nec-essary to go from less than 1,000 stores to 13,000 stores and beyond,we have had to make a series of decisions that, in retrospect, haveled to the watering down of the Starbucks experience, and, whatsome might call the commoditization of our brand.”22 In 2008Starbucks took steps to correct this problem by announcing theclosing of 600 underperforming stores across the United States.
The Largest Customer
Inherent in the growth issue is a key question: how large is thecompany’s largest customer? Ideally, an entrepreneur’s largest customer should account for no more than 10 to 15 percent of the company’s total revenues. The reasoning is that a companyshould be able to lose its largest customer and still remain in busi-ness. Of course, the ideal is often not the reality. One survey of 300
126 CHAPTER 5
manufacturers in the apparel and home goods industries showedthat over half of these firms receive more than 20 percent of theirsales from their largest customer.23 The goal should be to diversifyyour client base while maintaining the benefits of economies ofscale. An example of a company that suffered as a result of notproperly diversifying is Boston Communications Group, Inc.(BCGI). In 2004, Verizon Wireless, representing approximately 20 percent of BCGI sales, decided to end the relationship between the two companies.24 BCGI’s shares, which had traded as high as$22 in 2003, dropped 50 percent in one year. The company wasunable to recover. In 2006, it laid off 21 percent of its workforce andfired two of its top officials. The company was finally purchased in2007 by India-based Megasoft Ltd. for $3.60 per share, less than 20 percent of its 2003 value.25
Interestingly, many companies find that losing the customerthat generates the largest amount of revenue actually results inmore company profitability, because the largest customers arerarely the most profitable. The reason is that customers who pur-chase large volumes are often invoiced at lower prices. For exam-ple, Morse Industries, a private lamp manufacturer, was ecstatic toget Wal-Mart, the country’s largest retailer, as a customer. Theaddition of Wal-Mart increased its revenue over 50 percent in oneyear. But after one year, the company decided to drop Wal-Mart asa customer. Why? The revenues of Morse Industries had grownenormously, but the gross, operating, and net margins had actuallydeclined because the company charged Wal-Mart 25 percent lessthan it charged its other customers. Another reason for the declinewas that Wal-Mart’s orders were so large that Morse Industries’labor force could barely produce enough. The result was thatorders placed by other consumers, who were not receiving a dis-count and therefore were generating higher margins, were beingdelayed or even canceled. Several of these long-term, excellent,paying customers quietly moved their business from MorseIndustries to another supplier.
The founder of Morse solved the company’s problem after heperformed an analysis of his company’s growth and found that itwas not profitable. His analysis included using the matrix shownin Figure 5-7 to define each customer and the importance of thatcustomer.
Financial Statement Analysis 127
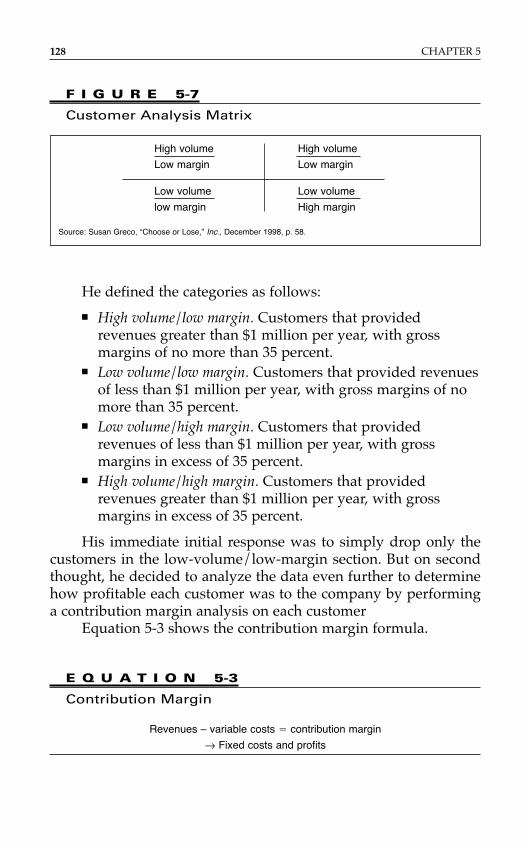
128 CHAPTER 5
He defined the categories as follows:
■ High volume/low margin. Customers that providedrevenues greater than $1 million per year, with grossmargins of no more than 35 percent.
■ Low volume/low margin. Customers that provided revenuesof less than $1 million per year, with gross margins of nomore than 35 percent.
■ Low volume/high margin. Customers that providedrevenues of less than $1 million per year, with grossmargins in excess of 35 percent.
■ High volume/high margin. Customers that providedrevenues greater than $1 million per year, with grossmargins in excess of 35 percent.
His immediate initial response was to simply drop only thecustomers in the low-volume/low-margin section. But on secondthought, he decided to analyze the data even further to determinehow profitable each customer was to the company by performinga contribution margin analysis on each customer
Equation 5-3 shows the contribution margin formula.
E Q U A T I O N 5-3
Contribution Margin
Revenues – variable costs � contribution margin
→ Fixed costs and profits
F I G U R E 5-7
Customer Analysis Matrix
High volume High volume
Low margin Low margin
Low volume Low volume
low margin High margin
Source: Susan Greco, “Choose or Lose,” Inc., December 1998, p. 58.
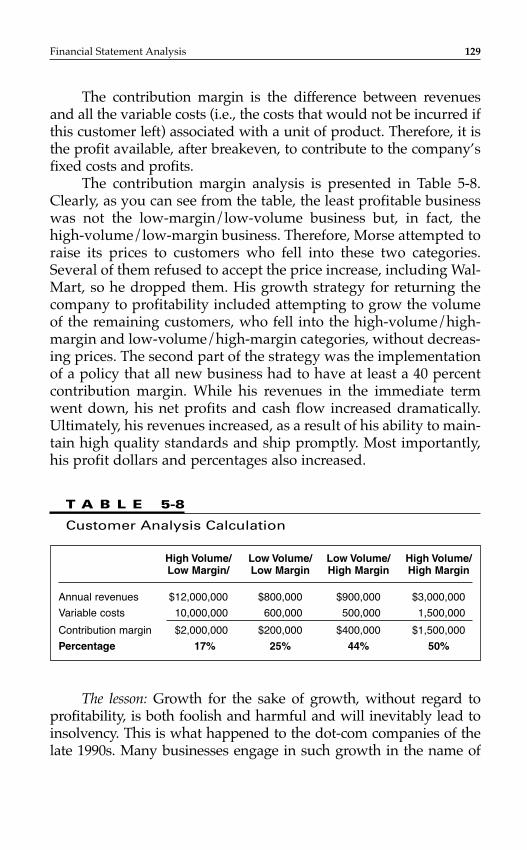
Financial Statement Analysis 129
The contribution margin is the difference between revenuesand all the variable costs (i.e., the costs that would not be incurred ifthis customer left) associated with a unit of product. Therefore, it isthe profit available, after breakeven, to contribute to the company’sfixed costs and profits.
The contribution margin analysis is presented in Table 5-8.Clearly, as you can see from the table, the least profitable businesswas not the low-margin/low-volume business but, in fact, thehigh-volume/low-margin business. Therefore, Morse attempted toraise its prices to customers who fell into these two categories.Several of them refused to accept the price increase, including Wal-Mart, so he dropped them. His growth strategy for returning thecompany to profitability included attempting to grow the volumeof the remaining customers, who fell into the high-volume/high-margin and low-volume/high-margin categories, without decreas-ing prices. The second part of the strategy was the implementationof a policy that all new business had to have at least a 40 percentcontribution margin. While his revenues in the immediate termwent down, his net profits and cash flow increased dramatically.Ultimately, his revenues increased, as a result of his ability to main-tain high quality standards and ship promptly. Most importantly,his profit dollars and percentages also increased.
High Volume/ Low Volume/ Low Volume/ High Volume/Low Margin/ Low Margin High Margin High Margin
Annual revenues $12,000,000 $800,000 $900,000 $3,000,000
Variable costs 10,000,000 600,000 500,000 1,500,000
Contribution margin $2,000,000 $200,000 $400,000 $1,500,000
Percentage 17% 25% 44% 50%
T A B L E 5-8
Customer Analysis Calculation
The lesson: Growth for the sake of growth, without regard toprofitability, is both foolish and harmful and will inevitably lead toinsolvency. This is what happened to the dot-com companies of thelate 1990s. Many businesses engage in such growth in the name of
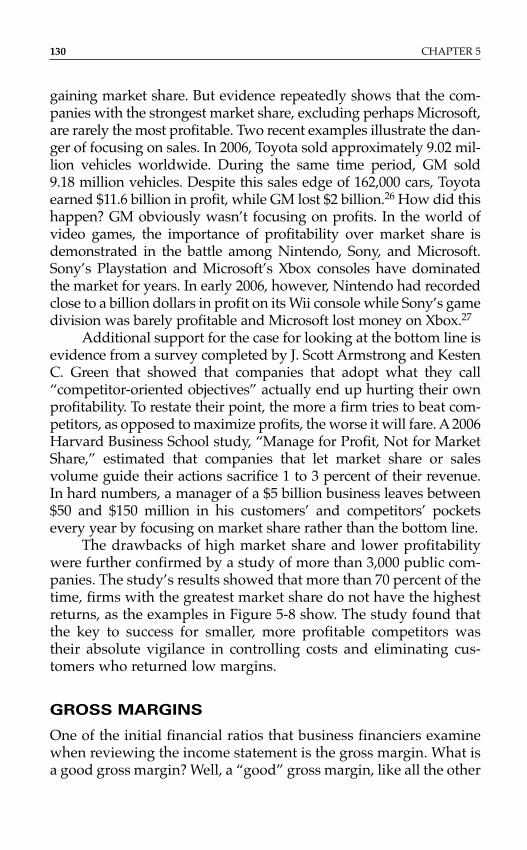
gaining market share. But evidence repeatedly shows that the com-panies with the strongest market share, excluding perhaps Microsoft,are rarely the most profitable. Two recent examples illustrate the dan-ger of focusing on sales. In 2006, Toyota sold approximately 9.02 mil-lion vehicles worldwide. During the same time period, GM sold 9.18 million vehicles. Despite this sales edge of 162,000 cars, Toyotaearned $11.6 billion in profit, while GM lost $2 billion.26 How did thishappen? GM obviously wasn’t focusing on profits. In the world ofvideo games, the importance of profitability over market share isdemonstrated in the battle among Nintendo, Sony, and Microsoft.Sony’s Playstation and Microsoft’s Xbox consoles have dominatedthe market for years. In early 2006, however, Nintendo had recordedclose to a billion dollars in profit on its Wii console while Sony’s gamedivision was barely profitable and Microsoft lost money on Xbox.27
Additional support for the case for looking at the bottom line isevidence from a survey completed by J. Scott Armstrong and KestenC. Green that showed that companies that adopt what they call“competitor-oriented objectives” actually end up hurting their ownprofitability. To restate their point, the more a firm tries to beat com-petitors, as opposed to maximize profits, the worse it will fare. A 2006Harvard Business School study, “Manage for Profit, Not for MarketShare,” estimated that companies that let market share or sales volume guide their actions sacrifice 1 to 3 percent of their revenue. In hard numbers, a manager of a $5 billion business leaves between$50 and $150 million in his customers’ and competitors’ pocketsevery year by focusing on market share rather than the bottom line.
The drawbacks of high market share and lower profitabilitywere further confirmed by a study of more than 3,000 public com-panies. The study’s results showed that more than 70 percent of thetime, firms with the greatest market share do not have the highestreturns, as the examples in Figure 5-8 show. The study found thatthe key to success for smaller, more profitable competitors wastheir absolute vigilance in controlling costs and eliminating cus-tomers who returned low margins.
GROSS MARGINS
One of the initial financial ratios that business financiers examinewhen reviewing the income statement is the gross margin. What isa good gross margin? Well, a “good” gross margin, like all the other
130 CHAPTER 5
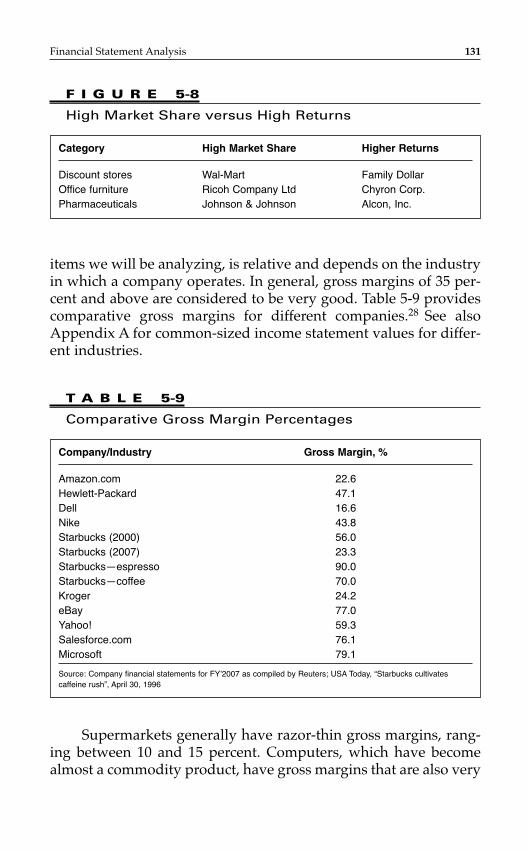
Financial Statement Analysis 131
items we will be analyzing, is relative and depends on the industryin which a company operates. In general, gross margins of 35 per-cent and above are considered to be very good. Table 5-9 providescomparative gross margins for different companies.28 See alsoAppendix A for common-sized income statement values for differ-ent industries.
F I G U R E 5-8
High Market Share versus High Returns
Category High Market Share Higher Returns
Discount stores Wal-Mart Family DollarOffice furniture Ricoh Company Ltd Chyron Corp.Pharmaceuticals Johnson & Johnson Alcon, Inc.
Company/Industry Gross Margin, %
Amazon.com 22.6Hewlett-Packard 47.1Dell 16.6Nike 43.8Starbucks (2000) 56.0Starbucks (2007) 23.3Starbucks—espresso 90.0Starbucks—coffee 70.0Kroger 24.2eBay 77.0Yahoo! 59.3Salesforce.com 76.1Microsoft 79.1
Source: Company financial statements for FY’2007 as compiled by Reuters; USA Today, “Starbucks cultivates caffeine rush”, April 30, 1996
T A B L E 5-9
Comparative Gross Margin Percentages
Supermarkets generally have razor-thin gross margins, rang-ing between 10 and 15 percent. Computers, which have becomealmost a commodity product, have gross margins that are also very
slim. That is why it is so difficult to compete in the computer hard-ware industry: because the average price at which a retailer sells acomputer is only about 10 to 15 percent higher than what it costs toproduce it. On the other hand, some computer manufacturers havebeen able to achieve gross margins that are higher than the indus-try average. One example was Compaq Computer, which was thenumber two computer manufacturer in the country before itsmerger with Hewlett-Packard in 2002. Compaq consistently hadgross margins above 20 percent. The combined Hewlett-Packardhad a corporate gross margin of 47.1 percent in 2007 largely due toits higher gross margin services and printer businesses. 28a
There are several industries in which companies make verydecent gross margins. For example, Nike’s average gross margin isabout 44 percent, whereas Starbucks, as indicated in Table 5-9,applies toward its gross profit 70 cents of every dollar it makesselling coffee. Or more profoundly, as Table 5-9 also shows, a cupof Starbucks espresso, with a 90 percent gross margin, costs only10 percent of its selling price!29 Starbucks' overall corporate grossmargin has fallen to roughly 23 percent in 2007, which is morethan half of what its margins were just 7 years earlier. Much ofthis drop can be attributed to the increasing percentage of foodand other lower margin products sold in its retail establishmentsMicrosoft on the other hand still enjoys a gross margin of nearly 80 percent.
Gross margins are also very high in other businesses, some ofthem illegal. University of Chicago economist Steven Leavitt andHarvard sociologist Sudir Venkadisch undertook an analysis of thefinancial books of a drug gang—a very rare set of financial state-ments to analyze. Not surprisingly, they found that the gang wasable to reap very high gross margins—approximately 80 percent—by selling crack cocaine.30
A venture capitalist once stated, “Gross margin is the entre-preneur’s best friend. It can absorb all manner of adversity with twoexceptions, philanthropy or pricing stupidity. Actually, in this casethe two are synonymous.”31 Good gross margins provide a noviceentrepreneur with breathing space, allowing him a chance to makecostly mistakes and still be potentially profitable. On the otherhand, in a low-gross-margin business—such as grocery stores, forexample—management mistakes and waste, as well as theft andpilferage, must be minimized, because the margins are too thin to
132 CHAPTER 5
be able to absorb these costs. A low-gross-margin business mustalso have volume, whereas a high-gross-margin business may sac-rifice unit volume sales because its ultimate profit comes from thehigh margins. The ideal business, like Microsoft, dominates itsindustry relative to units of volume, while at the same time main-taining high gross margins. This is a rarity. High-gross-marginindustries inevitably attract competitors who compete on price,thereby reducing gross margins throughout the industry.
For example, independent retailers of books used to enjoygross margins in excess of 35 percent. Those attractive gross mar-gins were the primary reason that major chains such as Barnes &Noble and Amazon.com entered the market and now dominate it.Twenty years ago, independent retailers sold 60 percent of all booktitles. Since 1991, the independents’ share of the book market hasdeclined from 32 percent to 10 percent. The big competitorsincreased because of the attractiveness of the gross margins.32
I always tell my Kellogg students, “If you leave here, startyour own business, and are lucky enough to have good gross mar-gins, for God’s sake, don’t brag about it.” If someone asks you,“How’s business?” your standard reply should be a simple shrugof the shoulders and a polite response of, “Not bad; could alwaysbe better.” It is always tough to maintain high gross margins. Oneway companies are able to do so is to have a patent or copyright onthe product, essentially giving them a legal monopoly for a periodof time. That was the case with the product Nutrasweet, an artifi-cial sugar sweetener whose patent expired in 1999.
Ironically, not every entrepreneur is interested in high-gross-margin businesses. One of the primary reasons, as stated earlier, isbecause heavy competition is inevitable. Therefore, those who areinterested in low-margin businesses are those who view excellentoperational execution as their competitive advantage or as a barrierto entry of competitors. For example, as noted earlier, the computermanufacturing industry is notorious for low gross margins.Despite this fact, Dell Computers is able to prosper as the numbertwo manufacturer in the world because of its outstanding opera-tions—it carries four days of inventory compared with ten days atHewlett-Packard. This means that Dell can turn its inventory morethan 83 times a year compared with the industry’s average of 4.9.The attitude of an entrepreneur who knows his competitive advan-tage is best illustrated by Michael Dell, who stated that he was not
Financial Statement Analysis 133
happy with his company’s inventory of four days—his ultimategoal is to measure Dell’s inventory not in days, but in hours.33
Gross margins are a factor that the entrepreneur should focuson very heavily in the business plan as well as in operations. Good,healthy gross margins do not usually happen by chance. They mayhappen by chance for the “mom-and-pop” entrepreneur who runsa business haphazardly. Because the strategy is to sell whatever canbe sold at whatever cost, the mom-and-pop enterprise expects toabsorb the costs and take whatever falls to the bottom line.
A high-growth entrepreneur, in contrast, is one who manageswith a plan in mind. This entrepreneur expects to grow the companyat a certain rate and plans to have a certain level of gross margins. A high-growth entrepreneur is one who wants to have a companyfor the purpose of wealth creation and therefore is an absolute bull-dog when it comes to managing gross margins. The question thatlogically follows is, how can gross margins be increased?
Cut Labor and/or Material Costs
The following are ways to reduce labor costs:
■ Train the workforce so that productivity increases.■ Reduce the labor force and have fewer employees work
more efficiently. GE, one of the most profitable companiesin the world, did just this. Over an eight-year period, GEcut 208,000 jobs worldwide. In one division, it cut 1,800jobs, and profits rose 21 percent.34
■ Reduce employee absenteeism, which results in increasedlabor costs because of the need for overtime pay. Industrystudies have shown that employee absenteeism is at itshighest point since 1999 and can cost companies as muchas 15 percent of their payroll.
■ Make the workforce more productive by using technology.For example, technology has been used in McDonald’sfranchises to reduce labor costs. The production processhas been automated to the point where one person cannow do what it used to take four people to do in terms ofcooking and food preparation.
■ Increase volume. The cost per item produced or cost perservice rendered should go down as the volume goes up.
134 CHAPTER 5
Labor costs should go down as employees gain moreexperience. People learn more and therefore shouldbecome more efficient, even if this is not done through theintroduction of new technology.
■ Find a cheaper labor force. Companies can move theiroperations, for instance, to a different region of thecountry or abroad, where labor is cheaper. For example,Nike manufactures all its products outside the UnitedStates in low-labor-cost countries such as China andThailand, where unskilled labor can cost as little as $0.67per hour, or 3 percent of the average hourly compensationcost for production workers in the United States for thesame year. Even skilled labor can be significantly cheaperoutside the United States. Draft Dynamix, the leadingfantasy sports draft software company, used softwareprogrammers in India to build its first product. Theprogrammers cost approximately $20 per hour for workthat costs as much as $60 per hour in the United States.Over the course of a year, outsourcing the work to Indiasaved Draft Dynamix in excess of $90,000. The CEO ofDraft Dynamix, Ted Kasten, provides perspective onoverseas labor: “I would caution that it isn’t a one-for-onesavings. Working with overseas software consultants andprogrammers requires more time per task than a U.S.based programmer due to time differences and distance.”“Still,” he explains, “we wouldn’t have made it withoutthese programmers. The cash we saved from these laborcosts enabled us to survive long enough to startgenerating revenue.” Draft Dynamix recently licensed itsproduct to CBS Sportline and ESPN.com, two of theleading fantasy sports Web sites on the Internet, andsecured another round of angel financing. One cautionarynote here: using labor outside the country sometimes hasits own risks. After the September 11, 2001, terrorist attackin New York, Illinois-based Product DevelopmentTechnologies Inc. (PDT) scratched plans to source aclient’s manufacturing job in Brazil. The company wasworried about the reliability of air shipments fromabroad. Making the parts at home squeezed profits on the$60,000 order because labor costs were 30 percent higher.
Financial Statement Analysis 135
But as PDT’s owner said, “We can’t afford to be even aweek late.”35
■ Provide employees with stock options, restricted stockunits, or other incentive programs in lieu of higher salaries.
■ Reduce employee benefit costs. Employer healthinsurance premiums have risen 81 percent since 2000. Infact, a survey of small businesses conducted by theNational Federation of Independent Business and WellsFargo showed that the cost of health insurance was thenumber one concern of small-business owners. Theworld of health insurance is ever changing, but optionssuch as health savings accounts and healthreimbursement arrangements offer mechanisms enablingemployers to control costs.36
■ Continually turn over the workforce, reducing the numberof higher-paid unskilled workers. For example, fast-foodrestaurants expect and want a certain amount of annualturnover in their unskilled employees because newerworkers cost less.
■ Implement good management skills. One of the easiestways to reduce labor costs is simply for entrepreneurs tomanage their employees. They need to manage, referringto the good old way of managing people, which meansstating expectations, giving employees the necessary tools,and holding them accountable for their performance.
The following are ways to reduce material costs:
■ Obtain competitive bids from suppliers, which may allowfor the purchase of materials at lower cost.
■ Buy in higher volumes to get volume discounts. Theproblem here is the inventory carrying cost. Ideally, onedoes not want to increase inventory. Therefore, theentrepreneur should make commitments to its suppliers tobuy a certain volume within a period of time. Such acommitment should result in price-volume discounts. Thecommitment versus buy strategy allows entrepreneurs tokeep inventories low, costs down, and cash available forother investments or uses.
136 CHAPTER 5
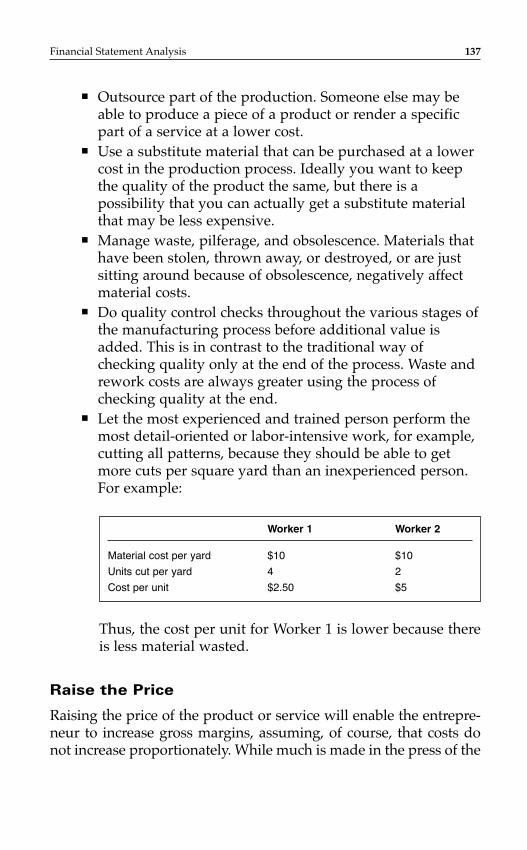
■ Outsource part of the production. Someone else may beable to produce a piece of a product or render a specificpart of a service at a lower cost.
■ Use a substitute material that can be purchased at a lowercost in the production process. Ideally you want to keepthe quality of the product the same, but there is apossibility that you can actually get a substitute materialthat may be less expensive.
■ Manage waste, pilferage, and obsolescence. Materials thathave been stolen, thrown away, or destroyed, or are justsitting around because of obsolescence, negatively affectmaterial costs.
■ Do quality control checks throughout the various stages ofthe manufacturing process before additional value isadded. This is in contrast to the traditional way ofchecking quality only at the end of the process. Waste andrework costs are always greater using the process ofchecking quality at the end.
■ Let the most experienced and trained person perform themost detail-oriented or labor-intensive work, for example,cutting all patterns, because they should be able to getmore cuts per square yard than an inexperienced person.For example:
Thus, the cost per unit for Worker 1 is lower because thereis less material wasted.
Raise the Price
Raising the price of the product or service will enable the entrepre-neur to increase gross margins, assuming, of course, that costs donot increase proportionately. While much is made in the press of the
Financial Statement Analysis 137
Worker 1 Worker 2
Material cost per yard $10 $10
Units cut per yard 4 2
Cost per unit $2.50 $5
138 CHAPTER 5
various factors that can produce pricing power for a company, thebest way to increase profitability through price increases is by dif-ferentiating and creating value for which the consumer will pay.Linear Technology, a $1.1 billion semiconductor company, is a primeexample of creating pricing power through differentiation. In con-trast to industry heavyweights like Intel, which focus on biggerclients with huge demand for commodity-like chips, Linear has cho-sen to operate on the periphery and sell to smaller clients with needsthat Linear can service better than the competition. The result?Linear’s chips are priced a third more than its rivals’, and the com-pany made a 39 percent net profit margin in 2006, besting the techindustry’s best-known profit powerhouses, Microsoft Corp. andGoogle Inc., which earned 26 percent and 24 percent, respectively.37
Amazingly, there are companies that, for a short time, were successful in challenging the importance of business fundamentalswith regard to gross margins. For the most part, this was true in thee-commerce industry, where most companies were primarilyfocused on growing revenues even when it was at the expense ofgross margins. For example, buy.com formerly sold merchandise,including CDs, books, videos, software, and computer equipment, atcost and, shockingly, sometimes even below cost. The companyguaranteed the lowest prices available on the Internet. The resultwas zero and sometimes negative gross margins! Despite these facts,buy.com, which was founded in 1996, had 1998 revenues of $111 mil-lion and a public market valuation in excess of $400 million.38
But reality set in, and by September 2001 the vultures were cir-cling with stockholder class-action lawsuits. In just over a year,buy.com’s stock price had dropped from its opening-day price ofjust over $30 a share to about $0.08 per share. Its stock was delistedfrom the Nasdaq on August 14, 2001. I hope your kid’s college fundwas not tied up in that one. All kidding aside, these kinds of infa-mous cases—where managers “fumble the fundamentals”—playout every day in far more subtle ways in every business sector.When entrepreneurs ignore the fundamentals of finance or simplytrust someone else to stand guard, they invite trouble to the table.
Before we close this section on gross margin, let us analyzethe Clark Company. What are the gross margins for the ClarkCompany? They are as follows:
Financial Statement Analysis 139
■ 2005: 70 percent■ 2006: 72 percent■ 2007: 64 percent
The company has excellent gross margins—in excess of 60 percent for all three years. However, one sees an 8 percentagepoint decline in gross margins in 2007, indicating that somethinghas changed.
What are some of the possible reasons for a decline in grossmargins?
■ There may have been a change in the product mix beingsold. A higher percentage of lower-margin items may havebeen sold.
■ The cost of supplies may have gone up.■ The company may have changed its accounting system
from a cash system to accrual. This change in accountingsystem results in no change in the timing of cash receipts;since this is a cash business and therefore the companydoes not have receivables, the change in the system willnot affect the timing of when revenues are recognized.However, the accounting system change forces thecompany to recognize costs earlier. The result of thischange is potentially lower gross margins because costs are being recognized earlier, and therefore lower net profit as well.
■ The company may be buying from different suppliers athigher costs and/or selling to different customers.
An examination of the income statement shows that 2006 wasthe first year in which products were returned. Also, and moreimportantly, as the note at the bottom of the statement shows, therewas a change in the accounting method, from cash to accrual. Andas we just stated, the change does not affect revenues because thisis a cash business, but it does have a negative effect on all threemargins because more expenses are being recognized. Therefore, asa result of the change, we are not comparing “apples to apples”with the prior year.
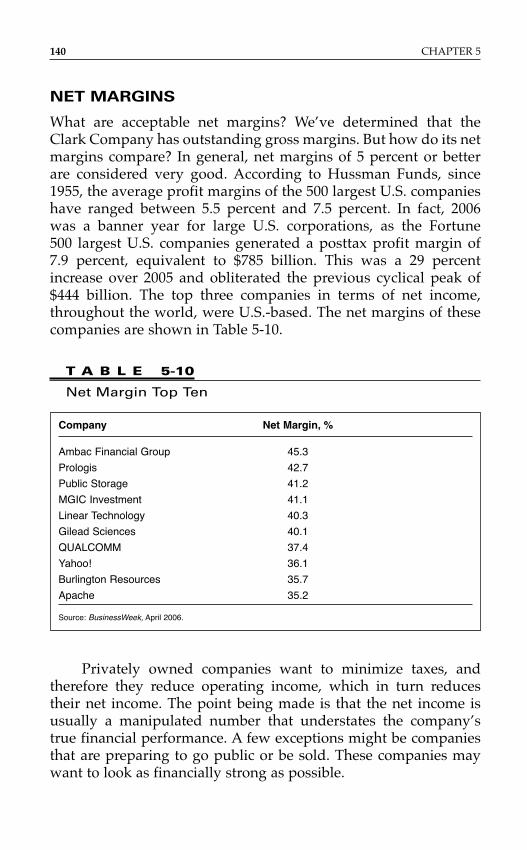
140 CHAPTER 5
NET MARGINS
What are acceptable net margins? We’ve determined that theClark Company has outstanding gross margins. But how do its netmargins compare? In general, net margins of 5 percent or betterare considered very good. According to Hussman Funds, since1955, the average profit margins of the 500 largest U.S. companieshave ranged between 5.5 percent and 7.5 percent. In fact, 2006 was a banner year for large U.S. corporations, as the Fortune 500 largest U.S. companies generated a posttax profit margin of 7.9 percent, equivalent to $785 billion. This was a 29 percentincrease over 2005 and obliterated the previous cyclical peak of$444 billion. The top three companies in terms of net income,throughout the world, were U.S.-based. The net margins of thesecompanies are shown in Table 5-10.
Company Net Margin, %
Ambac Financial Group 45.3
Prologis 42.7
Public Storage 41.2
MGIC Investment 41.1
Linear Technology 40.3
Gilead Sciences 40.1
QUALCOMM 37.4
Yahoo! 36.1
Burlington Resources 35.7
Apache 35.2
Source: BusinessWeek, April 2006.
T A B L E 5-10
Net Margin Top Ten
Privately owned companies want to minimize taxes, andtherefore they reduce operating income, which in turn reducestheir net income. The point being made is that the net income isusually a manipulated number that understates the company’strue financial performance. A few exceptions might be companiesthat are preparing to go public or be sold. These companies maywant to look as financially strong as possible.
In contrast, a publicly owned company aggressively seeks pos-itive net margins, as high as possible, because the net margin affectsthe stock price. As one money manager remarked, “There is agreater tendency among companies to pull out the stops to generatethe kind of positive earnings that Wall Street demands.”39 For exam-ple, a few years ago, America Online decided not to recognize somehuge marketing expenses in its quest for positive annual earnings.The Securities and Exchange Commission unearthed this fact andforced AOL to take a charge of more than $385 million in 1996, wip-ing out all the profit the company had made up to that point.
The greatest example of this kind of chicanery was the case ofEnron, the one-time darling of Wall Street. Through off-balance-sheet transactions, Enron masked hundreds of millions of dollarsof losses in its effort to continually beat analysts’ estimates. Thehouse of cards eventually crumbled, and one year after rankingnumber seven on the Fortune 500, Enron filed for bankruptcy. Thecarnage was severe, with more than 5,600 employees losing theirjobs and in many cases their life savings. Over 20,000 creditorswere left holding $63 billion in debt, and tens of billions in share-holder value was lost.40,41
Government regulation has targeted this kind of fraudulentbehavior, and it has had an impact. A 2002 survey indicated that 59 percent of CFOs disclosed more information in financial state-ments than they had previously done, and 57 percent said that theyplanned to disclose more information in the next 12 months.42
Moreover, the Sarbanes-Oxley reform act has targeted this kind ofabuse and changed the way in which corporate boardrooms andaudit firms operate. However, this problem will never completelygo away. Therefore, when analyzing the financial statements of aprivately or publicly owned company, beware. Things—especiallynet income—may be significantly different from what the state-ments show.
The problem with looking at just net income for a public orprivate company is that income does not pay the bills. Cash flowpays the bills. Net income is typically an understatement of thecompany’s cash flow because it includes noncash expenses such asdepreciation and amortization. In addition, expenditures that havenothing to do with the operation of the company may also beincluded, thereby lowering the company’s net income. It is com-mon for owners of private companies to run certain personal
Financial Statement Analysis 141
142 CHAPTER 5
expenditures through their income statement because they view itas one of the perks of ownership. Therefore, one must realize thatnet income can be, and usually is, a manipulated number. Forexample, the late Leona Helmsley, owner of several upscale hotelsin New York while she was alive, made improvements to her per-sonal home and charged them against her company, thereby reduc-ing the taxes owed. She was convicted of tax evasion as a result andserved time in prison. One of the smoking guns used to convict herwas an employee who quoted her as saying, “Only poor peoplepay taxes.”
The reality that net income can be a manipulated number isbest illustrated by a controversy regarding the 1995 movie ForrestGump. The movie has grossed over $600 million worldwide, mak-ing it one of the highest-grossing movies in history. A fellow whoagreed to take a percentage of the movie’s net income as his com-pensation wrote the story. Believe it or not, this movie neverreported a positive net income, and thus the writer was due noth-ing. The issue was in dispute for a number of years and wasrecently resolved, finally opening the door for the long-awaitedsequel to the original blockbuster. What’s the entrepreneurialmoral of the story? As an investor, never agree to take a percentageof the net income because you cannot control the expenses, be theyreal or make-believe.
Conversely, if you are the entrepreneur, always try to com-pensate investors based on net income, never on revenues. Basingcompensation on revenues has gotten many entrepreneurs infinancial trouble, because giving someone a percentage of revenues(“off the top”) ignores whether a company has a positive cash flow.
The final problem that must be highlighted, with regard toputting too much importance on net earnings, is that the net earn-ings figure does not tell you where the earnings came from. Didthey come from strong company operations or from financialinstruments? A fundamentally sound company derives most ofits earnings from operations, specifically from product sales orservices rendered, not from interest earned on invested capital.The primary reliance upon interest earned would force the com-pany to be in the money management business. Yahoo!, whichhad always been touted as one of the few profitable Internet
Financial Statement Analysis 143
companies, found itself being justifiably criticized in 1997 and1998. The criticism came from the observation that “in 1997 and1998, Yahoo’s interest income accounted for nearly 40% of its netincome. By comparison, Cisco’s 1998 interest income was only12.5% of its earnings and Microsoft’s 15.5%.”43 As noted inChapter 2, Yahoo! began an ugly downward spiral in 2001 and isstruggling to recover.
Before we close this section, let us analyze the net income ofthe Clark Company. The net margins for the Clark Company are 25,24, and 14 percent for 2005, 2006, and 2007, respectively. This wouldindicate that the company’s net margins are outstanding. The trend,however, is downward, with the caveat that the final year was negatively affected by the change in accounting method previouslydiscussed.
OTHER ISSUES TO CONSIDER
Is the Owner Managing the Business Full Time?
When evaluating the income statement of the Clark Company, onecan find evidence that the owner may not be at the place of busi-ness on a full-time basis. First, there is an increase in wages, whichmay represent the hiring of a new employee to run the business, asthe owner is taking more time off. An examination of a company’sfinancial statements requires a thorough analysis of the wages sec-tion. It is important to ask: Who are the employees? Do theseemployees actually exist? In some cities like Chicago, dead menhave been known to vote in elections, and they also appear on citypayrolls. During the due diligence, if the name of an employee isprovided, you should look to see if the last name of the employeematches the last name of the owner. It would also be wise to followup with the question, “How many employees are relatives, andwhat are their specific tasks and responsibilities?” Wages may haveincreased because a relative of the owner has been added to thepayroll and is being paid an exorbitant wage for doing nothing orfor doing something as simple as opening and locking up the com-pany every day.
Figure 5-9 presents financial projections for 2008 for the ClarkCompany, based on historical information.
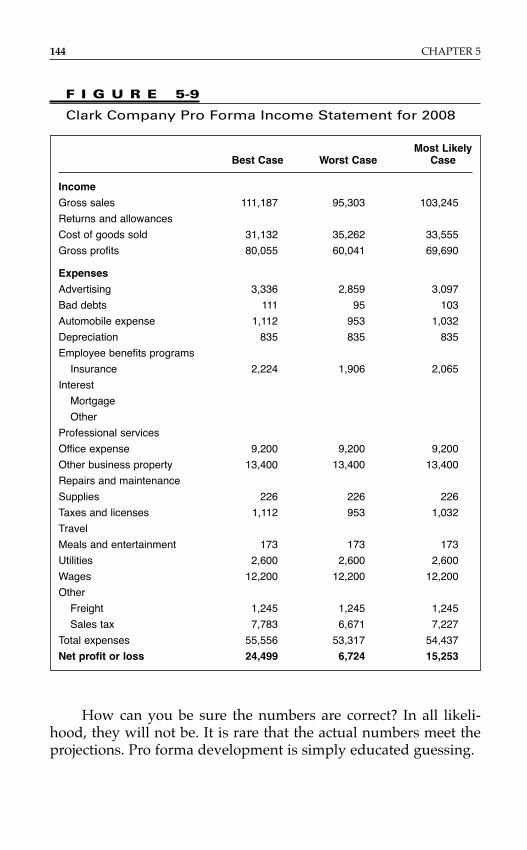
144 CHAPTER 5
How can you be sure the numbers are correct? In all likeli-hood, they will not be. It is rare that the actual numbers meet theprojections. Pro forma development is simply educated guessing.
F I G U R E 5-9
Clark Company Pro Forma Income Statement for 2008
Most Likely Best Case Worst Case Case
Income
Gross sales 111,187 95,303 103,245
Returns and allowances
Cost of goods sold 31,132 35,262 33,555
Gross profits 80,055 60,041 69,690
Expenses
Advertising 3,336 2,859 3,097
Bad debts 111 95 103
Automobile expense 1,112 953 1,032
Depreciation 835 835 835
Employee benefits programs
Insurance 2,224 1,906 2,065
Interest
Mortgage
Other
Professional services
Office expense 9,200 9,200 9,200
Other business property 13,400 13,400 13,400
Repairs and maintenance
Supplies 226 226 226
Taxes and licenses 1,112 953 1,032
Travel
Meals and entertainment 173 173 173
Utilities 2,600 2,600 2,600
Wages 12,200 12,200 12,200
Other
Freight 1,245 1,245 1,245
Sales tax 7,783 6,671 7,227
Total expenses 55,556 53,317 54,437
Net profit or loss 24,499 6,724 15,253
Revenues
Historically, if we look at the Clark Company pro forma incomestatement shown in Figure 5-9, the best case is a decrease in rev-enue of 2 percent; the worst case is a decrease of 16 percent. Andthe most-likely-case scenario is taken as an average of these twoextremes—a decrease of 9 percent. This is a reasonable, logicalargument for preparing the projections for sales revenue.
Gross Margins
With regard to gross margins, there were no clear trends during thethree years of data that were provided. Gross margins increasedbetween 2005 and 2006 and then declined between 2006 and 2007.The best-case gross margin would be 72 percent, the worst-casegross margin would be 64 percent, and the most-likely-case sce-nario would be an average of the two—68 percent. Again, there isvery logical reasoning behind the development of these projec-tions, which is what financiers hope to find.
N O T E S
1. Jamie Pratt, Financial Accounting, 2nd ed. (Cincinnati, Ohio: South-Western Publishing Co., 1994), p. 709.
2. Chicago Tribune, July 25, 2000, p. 12.3. Ibid.4. Ibid.5. Ibid.6. Crain’s Chicago Business, October 1, 2001.7. Reuters.com office equipment industry company rankings, accessed
in July 2007.8. Reuters.com pharmaceutical industry company rankings, accessed
in July 2007.9. Amazon.com financials, as compiled by Reuters.com, July 2007.
10. Dell, 2006 Annual Report.11. “The Wal-Mart of High Tech?” Fast Company, November 2004.12. “What’s Wrong with This Picture? Nothing!” Inc., June 2007.
Financial Statement Analysis 145
13. Lawrence H. Officer and Samuel H. Williamson, “Annual InflationRates in the United States, 1774–2006, and United Kingdom,1265–2006,” MeasuringWorth.com, 2007.
14. Team Marketing Report, www.teammarketing.com, 2007.15. “NFL Ticket Prices Rise for Third Straight Year,” USA Today,
September 6, 2006.16. 2007 Fortune ranking of fastest-growing industries in the Fortune
500.17. Ibid.18. “A Profit Gusher of Epic Proportions,” Fortune, April 15, 2007.19. Eric Nee, “Defending the Desktop,” Forbes, December 28, 1998, pp.
53–54.20. Richard Murphy, “Michael Dell,” Success.21. John Anderson, “The Company That Grew Too Fast,” Inc.com from
Inc. magazine, November 2005.22. Howard Schultz, e-mail to senior Starbucks management, February
14, 2007.23. CIT Commercial Services and Home Furnishing News, 2002
Customer Concentration Survey.24. Boston Business Journal, June 18, 2004.25. Boston Herald, June 12, 2007.26. “Toyota Tops GM in World Auto Sales,” MSNBC.com, April 24, 2007.27. “In Praise of Third Place,” The New Yorker, December 4, 2006.28. BusinessWeek, September 7, 1998.28a. 2007 corporate financial statements as compiled by Reuters29. Bruce Horovitz, “Big Markups Drive Starbucks’ Growth,” USA
Today, April 30, 1998, p. 1B.30. Scott Woolley, “Greedy Bosses,” Forbes, August 24, 1998, p. 53.31. Mid-Atlantic Venture Partners, 1997.32. Shawn Rea, “Buy the Book,” Black Enterprise, February 1999, p. 176.33. Dell financial data as compiled by Hoovers, July 2007.34. Robert Sherrill, “Corporate Cannibalism at GE,” Chicago Sun-Times,
November 22, 1998, p. 20E.35. James B. Arndorfer, “Attacks Show Risks of Exporting Jobs,” Crain’s
Chicago Business, October 1, 2001.36. Bruce Phillips, “Small Business Problems and Priorities,” National
Federation of Independent Business, June 2004.37. “Pricing Power: In a Tech Backwater, a Profit Fortress Rises,” Wall
Street Journal, July 10, 2007.
146 CHAPTER 5

38. Alex Gove, “Margin of Error,” Red Herring, February 1999, p. 140.39. Thor Valdmanis, “Cooking the Books, a Common Trick of the
Trade,” USA Today, August 11, 1998.40. “The Fall of Enron,” NPR.com.41. “From Collapse to Convictions: A Timeline,” CBS News Online,
October 23, 2006.42. “The Fear of All Sums,” CFO Magazine, August 1, 2002.43. Forbes ASAP, February 22, 1999, p. 24.
Financial Statement Analysis 147

This page intentionally left blank
INTRODUCTION
Nothing is as important to a business as positive cash flow. As Ioften tell my students, “For any business, depending on the entre-preneur’s gender, positive cash flow is King or Queen!” Withoutcash, an entrepreneur will not be able to buy inventory or equip-ment, make payroll, pay bills and utilities, or repay debt. Cash isnecessary not only to keep a business going, but also to grow thebusiness. Seth Godin is the founder of Yoyodyne, an online direct-marketing company that he later sold to Yahoo! for $30 million. As an entrepreneur who bootstrapped his business for the first few years, he notes that happiness for a business owner boils downto one simple thing: positive cash flow.1 Companies that cannotachieve positive cash flow are essentially nonvoluntary not-for-profit organizations that eventually become insolvent. That is thereason why so many dot-com companies became dot-bombs.
TYPES OF CASH FLOW
A business’s cash flow is commonly referred to as EBITDA, whichis an acronym for earnings before interest, taxes, depreciation, andamortization. EBITDA is the cash available to service debt (i.e.,make principal and interest payments), pay taxes, buy capitalequipment, and return profits to shareholders after paying all of a
149
C H A P T E R 6
Cash FlowManagement
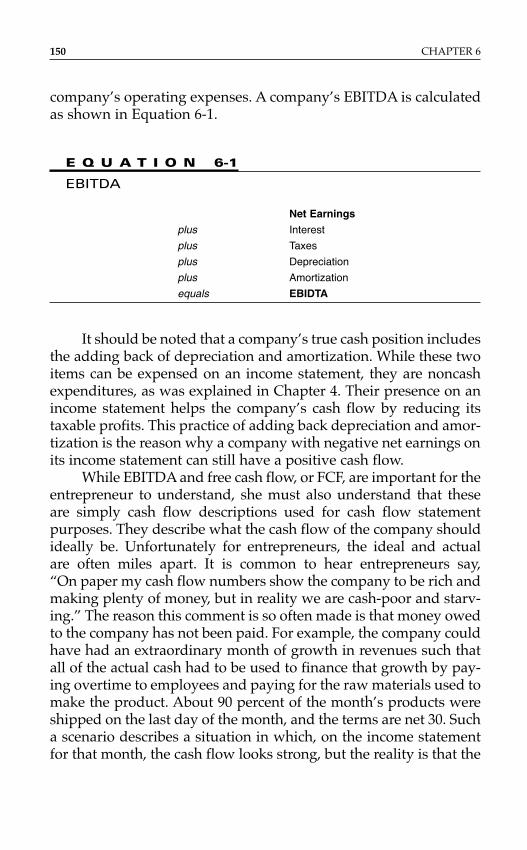
company’s operating expenses. A company’s EBITDA is calculatedas shown in Equation 6-1.
E Q U A T I O N 6-1
EBITDA
Net Earnings
plus Interest
plus Taxes
plus Depreciation
plus Amortization
equals EBIDTA
It should be noted that a company’s true cash position includesthe adding back of depreciation and amortization. While these twoitems can be expensed on an income statement, they are noncashexpenditures, as was explained in Chapter 4. Their presence on anincome statement helps the company’s cash flow by reducing itstaxable profits. This practice of adding back depreciation and amor-tization is the reason why a company with negative net earnings onits income statement can still have a positive cash flow.
While EBITDA and free cash flow, or FCF, are important for theentrepreneur to understand, she must also understand that theseare simply cash flow descriptions used for cash flow statement purposes. They describe what the cash flow of the company shouldideally be. Unfortunately for entrepreneurs, the ideal and actual are often miles apart. It is common to hear entrepreneurs say, “On paper my cash flow numbers show the company to be rich andmaking plenty of money, but in reality we are cash-poor and starv-ing.” The reason this comment is so often made is that money owedto the company has not been paid. For example, the company couldhave had an extraordinary month of growth in revenues such thatall of the actual cash had to be used to finance that growth by pay-ing overtime to employees and paying for the raw materials used tomake the product. About 90 percent of the month’s products wereshipped on the last day of the month, and the terms are net 30. Sucha scenario describes a situation in which, on the income statementfor that month, the cash flow looks strong, but the reality is that the
150 CHAPTER 6
cash will not actually arrive until at least 30 days later. This “paper-rich, cash-poor” situation resulted from taking advantage of theopportunity to increase profitable revenues.
Paper-rich, cash-poor as it relates to poor cash flow manage-ment occurs when the money from the customer is past due. Tosucceed, the entrepreneur must be an absolutely vigilant bulldogabout maximizing the actual day-to-day cash flow of the business.
Ensuring that a company has adequate cash on hand to fundits operations and pay off its obligations is essential. It is importantto put a system in place that enables the entrepreneur to properlymonitor and manage both expected cash receipts (i.e., cash inflows)and payables (i.e., cash outflows). The lack of an efficient cash flowmanagement system can have severe negative consequences for acompany’s bottom line. For example, for service companies, whoseexpenses are heavily front-loaded into labor costs, profits diminishwith every additional unnecessary week that it takes to get costsreimbursed. For manufacturers, this problem is even more severe,since they often have to spend large amounts of money up front onmaterials, production, and inventory, and they have long lag timesbetween cash outflows and the receipt of money from customers.How does the delay in cash receipts diminish profits?
The importance of managing a company’s cash needs accu-rately is highlighted by the following example. The Gartner Groupis a high-tech consulting firm that generated $1.06 billion in revenuesin 2006. When founder Michael Fernandez and his cofounders wereraising capital for the company, they decided to limit the capital theyraised to $30 million, even though they could have raised twice asmuch. They placed this limit because they wanted to restrict theamount of equity they would have to give up. However, they did notanticipate the problems they would face as they tried to develop anew product for their company, nor did they adequately assess theircash needs during this crucial period.
One problem that arose was that the manufacturer of the disk drives for the company’s laptops went out of business. Giventhat there was only one company equipped to manufacture thesedrives, Gartner experienced production delays until a second man-ufacturer could be found. Once this manufacturer was identified,Gartner had to spend several months redesigning the disk drive sothat the new manufacturer could produce it. In the meantime, the
Cash Flow Management 151
company ran out of money and was forced to file for Chapter 11.The lesson that Fernandez learned, the hard way, is that it is essen-tial to focus on cash flow. As he notes, “We were obsessed with rev-enues and profits and trying to hold on to the equity,” rather thanon cash flow.2 Today he insists that his executives and employeeslook at cash flow every single day. However, this is an area that fewentrepreneurs focus on, particularly when they are starting theircompanies.
There are endless examples of entrepreneurs who neglect topursue prudent cash flow management, particularly when theircompany is doing well. As Godin noted in 1998, “We think aboutthis [cash flow] every day. But there are a lot of people who forget,when times are as good as they have been over the past few years,that the business world is cyclical and that you need money tomake money.”3 The stronger the economy is and the faster a com-pany is growing, the easier it can be to overlook cash flow controls,sometimes without suffering immediate negative consequences.But eventually, when there is a downturn in the economy, theentrepreneur may face a cash crunch. As a CPA once told me, “Thebest thing about volatile economic conditions is that they remindmanagers to refocus their attention on the basics.” In fact, during acash flow crisis, fast growth usually exacerbates the problemsbecause companies spend cash on supplies and payroll—often atan accelerated rate because of fast growth—while waiting longperiods to collect receivables.
A case in point is Douglas Roberson, president of AtlanticNetwork Systems, a data and voice systems integrator, whose company’s revenues quadrupled from $100,000 in its first year to$460,000 in the next. During this growth period, the members of hisstaff did not concern themselves with cash flow because sales weregrowing at such a phenomenal rate. “I actually believed that themore money companies owed us, the better shape we were in,”Roberson confessed.4 It was not until his company went throughan extended period in which it was unable to collect its receivablesthat he realized the importance of managing cash. His companyhad to use all its existing lines of credit to keep its operations goingwhile waiting for bills to be paid. It was a real-life lesson. He, likemost entrepreneurs, learned that managing cash flow was differentfrom just accumulating sales. As he noted, “If you don’t do serious
152 CHAPTER 6
projections about how much cash you’ll need to handle sales—andhow long it will take to collect on invoices—you can wind up outof business, no matter how fast you’re growing.”5
CASH FLOW FORECASTS
Preparing a cash flow forecast allows an entrepreneur to determinea business’s financing needs. If an entrepreneur finds that the busi-ness has a forecasted cash shortage as a result of rapid growth, thenit might be necessary to raise external money to meet the com-pany’s financial needs. A good cash flow forecast will allow theentrepreneur to determine the exact amount of cash needed andalso when it is needed. In general, there are several reasons whybusinesses raise outside capital. First, seasonal needs, such as holi-day sales, may require the purchase of additional materials and thepayment of additional production expenses to meet this temporaryincrease in demand. Second, more capital may be needed to financelong-term sales growth. As a company’s sales grow, more inven-tory must be purchased and additional workers will be needed. Allthese activities will require additional cash, which may not be onhand. A good cash flow forecast will allow an entrepreneur to fore-cast financing needs for these activities. Third, an entrepreneurmay have to purchase expensive capital equipment or make expen-sive repairs to existing equipment.
Entrepreneurs must know that projected cash flow determinesthe amount of capital a company needs in the future. The followingsteps should be taken to make that determination:
■ Prepare a 3- to 5-year (i.e., monthly annual projection)cash flow projection.
■ To make the projection, use FCF plus debt obligations (i.e., interest and principal payments), which is called net cash flow.
■ Choose the largest cumulative negative cash flownumber—this is the capital needed.
To better illustrate these steps let’s look at the 5-year net cashflow numbers for the Johnson Company, shown in Table 6-1.
With the information in Table 6-1, the Johnson Company can eas-ily determine its capital needs by completing the chart in Table 6-2.
Cash Flow Management 153
By plugging in the numbers from the cash flow projection, theJohnson Company would determine that $260 is needed becausethat is the largest cumulative number over the projected time frame.
The obvious question now is, when should you get the cash?There are two schools of thought in response to this question. Thefirst is that you should get only what you need from year to year,or a “series of funding.” The second is that you should get the maximum that you will need at once. Both have advantages anddisadvantages, as shown here.
Obtain Series of Funding
Pros
■ It keeps the entrepreneur disciplined and minimizeswasting money.
■ The entrepreneur is paying only for current expenses.■ The new series of capital comes in at a higher valuation,
thereby allowing less equity to be surrendered.
154 CHAPTER 6
T A B L E 6-1
Projected Net Cash Flow Calculation
Year Projected Net Cash Flow
1 �100
2 �90
3 �70
4 85
5 100
Year 1 Year 2 Year 3 Year 4 Year 5
Projected NCF �100 �90 �70 85 100
Cumulative projected NCF �100 �190 �260 �175 �75
T A B L E 6-2
Cumulative Net Cash Flow Calculation
Cons
■ There is no certainly that more capital will be available inthe future.
■ Resources must be allocated to securing additionalfunding.
Obtain All Funding at One Time
Pros
■ There is no need to allocate resources to raise futurefunding.
■ It avoids the risk of capital not being available in thefuture.
Cons
■ Forecasts may be wrong as a result of incoming cash flowsoccurring earlier than Year 4, requiring less up-frontcapital. Additionally, in the case of an equity capitalinvestment, too much equity is surrendered, or in the caseof a debt capital investment, interest on unnecessarycapital will be paid.
■ Receiving too much capital at one time spoils theinexperienced entrepreneur and could lead to unnecessary waste of the capital.
■ Invested capital comes in at a lower valuation.
CASH FLOW MANAGEMENT
Cash flow management can be as simple as preserving future cashby not spending as much today. For example, in order to deal withseasonal sales, a company may choose not to spend as much inOctober if December—when October’s bills come due—is tradi-tionally a poor sales month and won’t generate enough receipts tocover those bills.6 Cash flow management can also involve makingsomewhat complicated decisions about delaying payments to asupplier in order to use cash resources to temporarily increase pro-duction. Or it can involve making decisions about borrowing or
Cash Flow Management 155
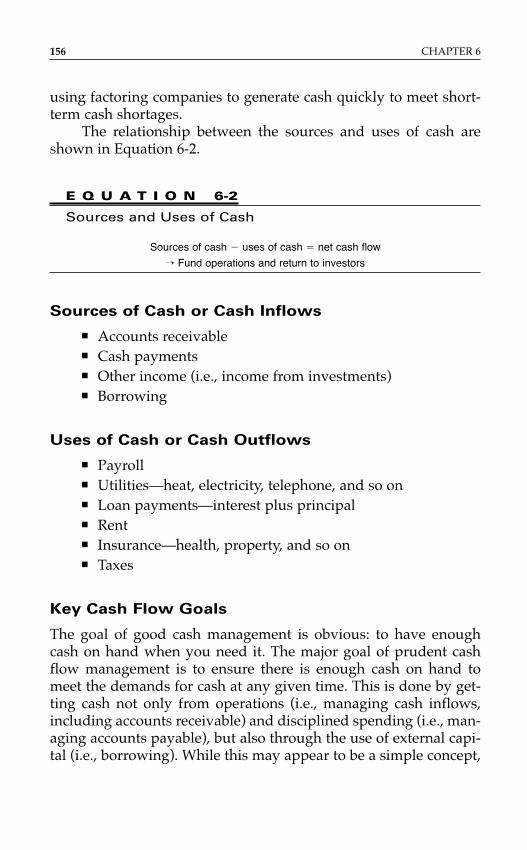
using factoring companies to generate cash quickly to meet short-term cash shortages.
The relationship between the sources and uses of cash areshown in Equation 6-2.
E Q U A T I O N 6-2
Sources and Uses of Cash
Sources of cash � uses of cash � net cash flow
→ Fund operations and return to investors
Sources of Cash or Cash Inflows
■ Accounts receivable■ Cash payments■ Other income (i.e., income from investments)■ Borrowing
Uses of Cash or Cash Outflows
■ Payroll■ Utilities—heat, electricity, telephone, and so on■ Loan payments—interest plus principal■ Rent■ Insurance—health, property, and so on■ Taxes
Key Cash Flow Goals
The goal of good cash management is obvious: to have enoughcash on hand when you need it. The major goal of prudent cashflow management is to ensure there is enough cash on hand tomeet the demands for cash at any given time. This is done by get-ting cash not only from operations (i.e., managing cash inflows,including accounts receivable) and disciplined spending (i.e., man-aging accounts payable), but also through the use of external capi-tal (i.e., borrowing). While this may appear to be a simple concept,
156 CHAPTER 6
in reality it is a process that even the most experienced financialofficers and executives find difficult to carry out successfully.
The trick to handling cash flow is in the timing—as an entre-preneur, you want your customers to pay as soon as possible (if pos-sible in advance), while you pay your suppliers and vendors as lateas possible without jeopardizing your relationship with them oryour credit standing. The idea is that money that is collected inreceivables today, and that does not have to go out as payables, is,in fact, an important source of internally generated working capital.
While it may not be the most fun thing to do, it is importantfor an entrepreneur to spend time (at least an hour a day) workingon cash flow. It is without a doubt one of the most crucial things anentrepreneur can do for a business. This exercise forces an entre-preneur to think about what he is doing in terms of cold, hard cash.
Cash Flow Ledgers and Projections
The cash flow ledger provides important information about thebalance of the cash account, enabling the entrepreneur to assess thecompany’s ability to fund its operations and also meet debt pay-ments as they come due. It indicates, on a transaction basis, all cashreceived and disbursed during a month’s period. Successful entre-preneurs are those who know their company’s actual cash positionon any given day. Therefore, it is recommended that the entrepre-neur, especially the inexperienced and those in the early stages oftheir ventures, review their cash flow ledger at least weekly.
In addition to the ledger, a weekly cash flow projection sum-mary, as discussed in Chapter 4, should be prepared when openinga business and every month thereafter. This projection indicates theanticipated cash inflow during the month along with the cash pay-ments to be made. By doing this kind of projection each month, theentrepreneur can schedule payments to suppliers to match expectedcash receipts. This planner allows the entrepreneur to be proactivewith regard to the money owed to suppliers and enables the entre-preneur to let specific vendors know in advance that a payment willprobably be late. The cash flow ledger and planner are simple andvery useful tools that should be used to manage cash flow success-fully. It is important to be consistent and work through each lineitem so that forecasts can be as accurate as possible.
Cash Flow Management 157
To prepare cash flow forecasts, the entrepreneur should firstlook at historical cash flow, if this information is available. Constructmonthly historical cash flows for at least the past year or, if possible,the past few years. It will be easier to forecast many items, such asutility bills, if what has been spent in the past is known.
Using these historical figures, prepare forecasts for the weeklycash flows for a month at a time. First, determine the cash inflowsfor each month—usually cash sales and accounts receivable. Then determine the cash outflows—utilities, payroll and otheremployee-related expenses, inventory, equipment purchases, andso on. Compare inflows with outflows to determine the company’snet cash position.
The cash flow forecast allows an entrepreneur to track actualperformance against forecasts and plans. Each month, an entrepre-neur should compare the forecast with the actual results and calculate the variance between the actual amount incurred and theforecast line by line. Then calculate the percentage variance (i.e.,the actual minus the forecast divided by the forecast). Focus on theareas where overspending occurred, looking at the dollar amountand percentage over the budget. Where the difference is significant,determine whether the expenditure was justified, and, if not, howto reduce it. By doing this every month, an entrepreneur will findthat he can control expenses much more effectively.
ACCOUNTS RECEIVABLE
The major area of vulnerability for many entrepreneurs is accountsreceivable. On any given day, it is estimated that 5 million busi-nesses are behind on their bills.7 As stated earlier, many entrepre-neurs, particularly in the early or fast-growth stages of theirbusiness, focus more on generating sales than they do on collectingreceivables. While this is never a good idea, it can turn into a dis-astrous situation if the economy slows down and more customerstake longer to pay their bills—usually the result is a cash crunch fora company.
This problem is not unique to American entrepreneurs. InAustralia, a survey conducted by Dun & Bradstreet and RoyMorgan Research showed that the majority of small and medium-sized enterprises no longer expect to be paid on time. As for the old
158 CHAPTER 6
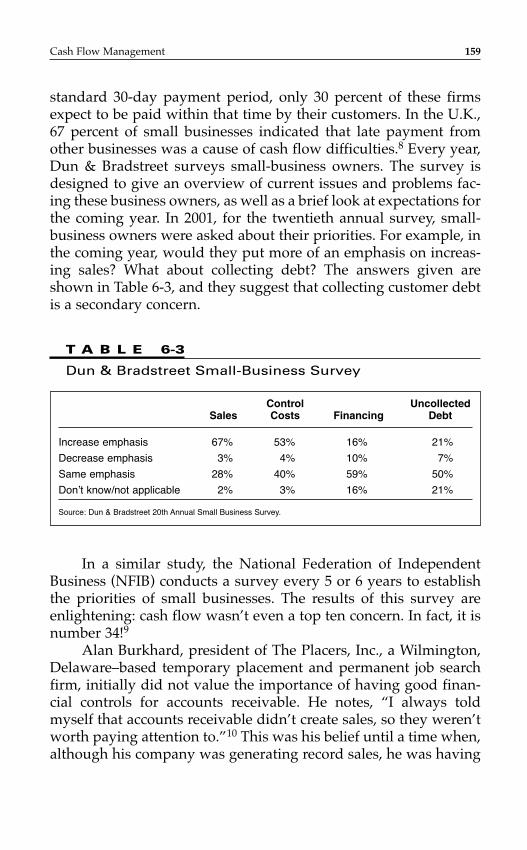
standard 30-day payment period, only 30 percent of these firmsexpect to be paid within that time by their customers. In the U.K.,67 percent of small businesses indicated that late payment fromother businesses was a cause of cash flow difficulties.8 Every year,Dun & Bradstreet surveys small-business owners. The survey isdesigned to give an overview of current issues and problems fac-ing these business owners, as well as a brief look at expectations forthe coming year. In 2001, for the twentieth annual survey, small-business owners were asked about their priorities. For example, inthe coming year, would they put more of an emphasis on increas-ing sales? What about collecting debt? The answers given areshown in Table 6-3, and they suggest that collecting customer debtis a secondary concern.
Cash Flow Management 159
Control UncollectedSales Costs Financing Debt
Increase emphasis 67% 53% 16% 21%
Decrease emphasis 3% 4% 10% 7%
Same emphasis 28% 40% 59% 50%
Don’t know/not applicable 2% 3% 16% 21%
Source: Dun & Bradstreet 20th Annual Small Business Survey.
T A B L E 6-3
Dun & Bradstreet Small-Business Survey
In a similar study, the National Federation of IndependentBusiness (NFIB) conducts a survey every 5 or 6 years to establishthe priorities of small businesses. The results of this survey areenlightening: cash flow wasn’t even a top ten concern. In fact, it isnumber 34!9
Alan Burkhard, president of The Placers, Inc., a Wilmington,Delaware–based temporary placement and permanent job searchfirm, initially did not value the importance of having good finan-cial controls for accounts receivable. He notes, “I always toldmyself that accounts receivable didn’t create sales, so they weren’tworth paying attention to.”10 This was his belief until a time when,although his company was generating record sales, he was having
difficulty running his company because of cash problems. The rootof the problem: an inefficient accounts receivable system.
“None of our customers paid us in any kind of timely fashion.And 60–70% of our delinquent accounts were actually owed by ourregular customers. Every single week we had to pay salaries andpayroll taxes for every temp we placed on a job. But it was takingus 60 or 90 days or longer to collect our bills from the companiesthat were hiring those temps.”11 By allowing its customers to takeso long to pay, The Placers was actually giving them an interest-free loan to cover their own payroll costs.
Unfortunately, it is quite common for entrepreneurs to com-plain about their need for more working capital when in fact thecompany already has the money in accounts receivable. When youare an entrepreneur, you had better be an absolutely vigilant bull-dog (as noted at the beginning of this chapter) when it comes tocollecting your receivables. This is the lifeblood of the business—collecting your receivables as quickly as possible. Candidly, whenI first owned my business, I was a bit of a wimp. I was scared thatif I called the customers and said something, well, they would no longer do business with me. I learned very quickly that if youdo not say something, you are not going to be sitting around forvery long saying, “Where’s my money?” Instead, you’re going tobe saying, “Where’s my business?” The money simply needs to becollected by whatever means necessary. As one entrepreneurstated, “I get on the phone and beg.”12
Accounts Receivable Systems
A good accounts receivable collection system is proactive. It alsoallows the entrepreneur to do business with customers that may nothave a credit history, or even those who have a bad credit history.The major components of an effective system include these steps:
■ Before you go into business, perform an analysis of theindustry’s payment practice. Is this an industrycharacterized by historically slow-paying customers, such as the government or health insurance companies?Figure 5-2 lists periodicals that can be used as part of anindustry analysis. If an industry is characterized by slow-paying customers, this does not necessarily mean that you
160 CHAPTER 6
should not enter it; it simply means that you should beeven more diligent about developing and maintaining adisciplined system.
■ Have all new customers complete a credit report beforeyou provide any services or products. The report shouldbe simple but thorough and should contain the followinginformation:– The age of the company– The owner(s) of the company– Whether the company has ever declared Chapter 7 or 11
bankruptcy and whether the owner has ever declaredChapter 13
– The current name of the company and any previousnames
– The maximum credit level desired– The telephone numbers and fax numbers and/or
addresses of three supplier references, along with thelength and terms of the relationship with these suppliers
– The name of the company’s primary bank, its accountnumber(s), and a contact number for the bank officerresponsible for managing the company’s accounts
– Whether or not the company agrees to pay invoicesaccording to your terms
■ Consider the following options if a potential customerdoes not have a credit history or has a bad one:– At the time of order receipt, require an up-front pay-
ment equal to the cost of goods sold for the order, withthe balance due at the time of shipment. This ensuresthat your costs are covered if the customer cancels theorder after production has begun.
– Obtain a 100 percent payment before work on the ordercan begin.
– Require a 100 percent payment before or at the time ofdelivery (COD).
– Request a 33 percent payment at order receipt and 33 percent at the time of shipment, with the balance due 30 days later.
Cash Flow Management 161
■ Contact all references immediately and inquire about theircredit experience with the prospective customer.Questions should include:– How many years have they had this customer?– What is the maximum amount of credit they have pro-
vided this customer? Have there been any increases ordecreases in the credit limit? If so, why?
– What are their invoice terms?– Does the customer typically pay within 10, 30, 60, or
90 days?– Have they ever received any checks from this customer,
and have any of them bounced?– Do they recommend this company as a good customer?– Have they had any problems doing business with this
company?
If all references are satisfactory, inform your customers thattheir orders will be processed immediately. Also remind customersof the company’s invoice terms and ask if they have any problemsadhering to them. Specifically, ask customers how they normallypay their bills. The reason behind this question is that some com-panies have their own system for paying bills, regardless of thesupplier’s invoice terms.
Successful entrepreneurs know how their key customers paytheir bills. For example:
■ Some customers pay their bills once a month, typically onthe thirtieth or thirty-first. To be paid on the thirtieth, themerchandise must be received by the tenth; otherwise, thepayment will be made on the thirtieth of the next month.
■ Some pay 30 days after receipt of the goods or services.Therefore, the supplier is penalized if the shipment isdelayed by the carrier.
■ Some pay 30 days after products that were damagedduring delivery have been replaced.
It is also important to ask customers for the name of theaccounts payable clerk who will be responsible for paying invoices.When I operated my business, you’d better believe that I knew
162 CHAPTER 6
every accounts payable clerk at every one of my customers. I knewtheir names, their kids’ names, the flowers they liked. Heck, theiremployers must have wondered why we were so cozy. You knowwhy? Any edge I could gain in getting my bills paid earlier waswell worth a few timely cards, a few nice words, and flowers on abirthday.
Other important key steps toward the effective managementof accounts receivable include the following:
■ All invoices should be mailed on the same day that theproduct is shipped or services rendered. Do not holdinvoices until the next day or the end of the week, and donot wait and send invoices once a month. Such a practicewill certainly delay payment.
■ Make sure that the invoice highlights the payment termsin bold capital letters or in a different color from the rest ofthe invoice. The terms should be printed at the top of thepage of the invoice. The most common invoice terms are“2/10, net 30.” This means that if the customer payswithin 10 days of the invoice date, she is allowed a 2 percent discount. Otherwise, the entire invoice amount isdue within 30 days of the invoice date.
■ Manage the collection of accounts receivable. It is naïve toexpect all customers to pay in a timely fashion. In thebusiness of collecting receivables, the squeaky wheel doesin fact get the oil.
■ The entrepreneur should have a weekly receivables agingreport showing the customer accounts that are outstandingfor 30 days or more.
■ For invoices that have not been paid seven days after thedue date, automatic action of some kind should be taken.
■ Excellent payment history is no longer than 10 days morethan the invoice terms. If the terms are net 30 and paymentoccurs in 50 days, then no future orders should be sent before receipt of some kind of payment, as mentioned earlier.
Collecting accounts receivable can be an intimidating experience, especially for the inexperienced entrepreneur. In many
Cash Flow Management 163
instances, the new entrepreneur is afraid to implement a systemsimilar to the one discussed here because of the fear of losing rev-enue if the customer gets offended. Such a concern is foolish andnaïve. It is also a good idea to have someone other than you sendthe strong letters and make the tough phone calls. At my company,a woman named Angela—our CFO—was our resident pit bull. Wehad a system in place where our terms were net 30, and if weweren’t paid by the thirty-fifth day, an automatic reminder wentout to the customer—a neon green sheet of paper in a neon greenenvelope. It said, “Just a reminder if you’ve forgotten us.” If wehadn’t been paid five days after that, another notice—this one hotpink—went out. I had one customer call me to say, “Steve, everytime I open one of these doggone notices, I get blinded by thesheets of paper. Why don’t you stop sending them to me?” I replied, “Listen, I just own the company. Angela runs everythingout there. Now the way that I can get Angela to stop is for you tosimply pay on time. It’s a simple solution.”
But everyone has his own system, and occasionally the entre-preneur needs to show a little “tough love.” I love the story that abusiness broker in Richmond, Virginia, Bette Wildermuth, tellsabout one of her clients. “This gentleman owns an excavation com-pany. He always does excellent work, meets the developers’ timeschedule, and makes sure his crews clean up after themselves.Usually he gets paid within 10 days of completing the job. Butevery once in a while, a developer really drags things out. Theexcavator’s solution: he puts on his muddiest contractor boots andgoes to the developer’s fancy office with the nice oriental rugs.When he arrives, he announces in a very loud voice that he hascome to pick up the overdue check and plans to sit in the lobbyuntil it’s ready. Needless to say, this does tend to speed up theprocess.”
For the entrepreneur who just doesn’t have the stomach forcollections, one option is to get “credit insurance,” where theinsurer pays the claim within 60 days and then assumes theresponsibility for collection. Baltimore, Maryland–based AmericanCredit Indemnity Company, the country’s largest issuer of creditinsurance, charges 1 percent of the sales insured and will insureonly receivables from customers who historically have paid within30 days.13
164 CHAPTER 6
Remember, good customers typically expect to pay their billswithin five to ten days after the due date unless they have a specialpayables system, as was mentioned earlier. Even those customersplan to pay, but according to their system. A bad customer is onewho is very cavalier about paying bills. These types of customerswill pay only when they are forced to do so, even when they havethe money. Ultimately, the experienced entrepreneur sees that thelatter are not profitable customers and does not mind losing them.
When such a decision has been made, extreme action shouldbe taken, such as hiring a lawyer, at a cost of approximately $2,000,to get a “writ of attachment” within 60 days against the delinquentcustomer’s corporate bank account. This action generally gets thecustomer’s immediate attention for settling the delinquency.14
Before leaving the subject of an accounts receivable system,here are a few don’ts:
■ Don’t be rude to customers. Don’t threaten them.■ Don’t assume that a slow-paying customer is a thief or a
bum. It may be that the customer has fallen on temporarytough economic times.
■ Don’t take legal action against a customer until the bill isat least 45 days past due and you have personally spokento the customer and tried to get payment.
■ Don’t pay independent sales representatives until youreceive payment from the customer. Some salesrepresentatives do not care if a customer is a knowndelinquent payer. Taking an order from such a customermay not bother the salesperson, since she is not the oneinvesting in raw materials. Therefore, discourage suchaction with a policy that specifies that salesrepresentatives will not receive their full commission ifpayment is received more than a certain number of dayslate. For example, if the payment is 15 days late, thecommission is reduced by 15 percent.
To check on the quality of accounts receivable, several ratioscan be used. The first step in checking the quality is to determinewhat the company’s collection ratio, or “days receivable” or“accounts receivable turnover,” is. This ratio measures the quality
Cash Flow Management 165
of a company’s accounts receivable. It shows the average numberof days it takes to collect accounts receivable. To look at it anotherway, this ratio indicates the number of days, on average, that ittakes a business to convert receivables to cash. Equation 6-3 showsthe equation to calculate days receivable.
E Q U A T I O N 6-3
Days Receivable
Outstanding receivables/annual sales/365 days
The same formula can be restated as Equation 6-4.
E Q U A T I O N 6-4
Days Receivable
Outstanding receivables/average daily sales
In this case, average daily sales can be calculated usingEquation 6-5.
E Q U A T I O N 6-5
Average Daily Sales
Average daily sales � annual sales/365 days
The goal is to get the customers to pay as soon as possible.Therefore, a low number is desirable. At a minimum, a company’sdays receivable should be equal to the industry’s average. Also, itshould not exceed the company’s days payable ratio, because if itdoes, this indicates that bills are being paid faster than paymentsare being received.
For example, a company with $5 million in annual revenuesand $800,000 in accounts receivable has an accounts receivableturnover ratio of 58.4 days, calculated as shown in Figure 6-1.
166 CHAPTER 6
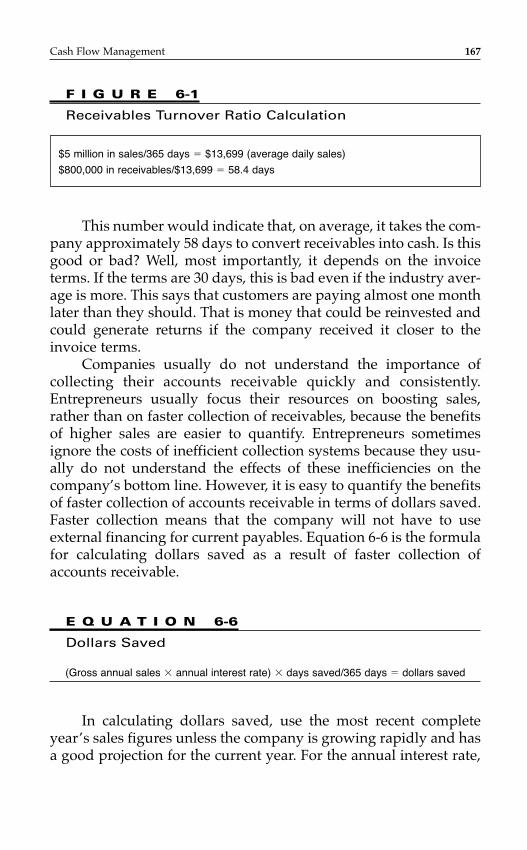
This number would indicate that, on average, it takes the com-pany approximately 58 days to convert receivables into cash. Is thisgood or bad? Well, most importantly, it depends on the invoiceterms. If the terms are 30 days, this is bad even if the industry aver-age is more. This says that customers are paying almost one monthlater than they should. That is money that could be reinvested andcould generate returns if the company received it closer to theinvoice terms.
Companies usually do not understand the importance of collecting their accounts receivable quickly and consistently.Entrepreneurs usually focus their resources on boosting sales,rather than on faster collection of receivables, because the benefitsof higher sales are easier to quantify. Entrepreneurs sometimesignore the costs of inefficient collection systems because they usu-ally do not understand the effects of these inefficiencies on thecompany’s bottom line. However, it is easy to quantify the benefitsof faster collection of accounts receivable in terms of dollars saved.Faster collection means that the company will not have to useexternal financing for current payables. Equation 6-6 is the formulafor calculating dollars saved as a result of faster collection ofaccounts receivable.
E Q U A T I O N 6-6
Dollars Saved
(Gross annual sales � annual interest rate) � days saved/365 days � dollars saved
In calculating dollars saved, use the most recent completeyear’s sales figures unless the company is growing rapidly and hasa good projection for the current year. For the annual interest rate,
Cash Flow Management 167
F I G U R E 6-1
Receivables Turnover Ratio Calculation
$5 million in sales/365 days � $13,699 (average daily sales)
$800,000 in receivables/$13,699 � 58.4 days
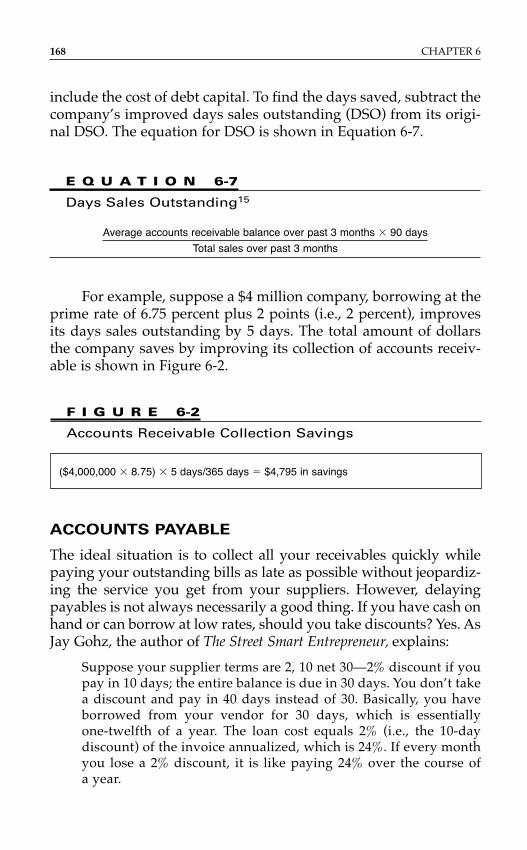
include the cost of debt capital. To find the days saved, subtract thecompany’s improved days sales outstanding (DSO) from its origi-nal DSO. The equation for DSO is shown in Equation 6-7.
E Q U A T I O N 6-7
Days Sales Outstanding15
Average accounts receivable balance over past 3 months � 90 days
Total sales over past 3 months
For example, suppose a $4 million company, borrowing at theprime rate of 6.75 percent plus 2 points (i.e., 2 percent), improvesits days sales outstanding by 5 days. The total amount of dollarsthe company saves by improving its collection of accounts receiv-able is shown in Figure 6-2.
168 CHAPTER 6
F I G U R E 6-2
Accounts Receivable Collection Savings
($4,000,000 � 8.75) � 5 days/365 days � $4,795 in savings
ACCOUNTS PAYABLE
The ideal situation is to collect all your receivables quickly whilepaying your outstanding bills as late as possible without jeopardiz-ing the service you get from your suppliers. However, delayingpayables is not always necessarily a good thing. If you have cash onhand or can borrow at low rates, should you take discounts? Yes. AsJay Gohz, the author of The Street Smart Entrepreneur, explains:
Suppose your supplier terms are 2, 10 net 30—2% discount if youpay in 10 days; the entire balance is due in 30 days. You don’t takea discount and pay in 40 days instead of 30. Basically, you haveborrowed from your vendor for 30 days, which is essentially one-twelfth of a year. The loan cost equals 2% (i.e., the 10-day discount) of the invoice annualized, which is 24%. If every monthyou lose a 2% discount, it is like paying 24% over the course of a year.
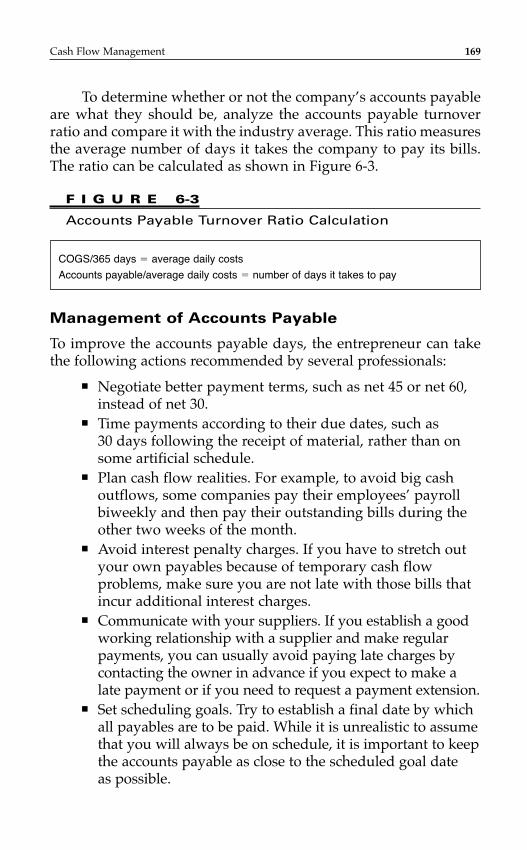
To determine whether or not the company’s accounts payableare what they should be, analyze the accounts payable turnoverratio and compare it with the industry average. This ratio measuresthe average number of days it takes the company to pay its bills.The ratio can be calculated as shown in Figure 6-3.
Cash Flow Management 169
F I G U R E 6-3
Accounts Payable Turnover Ratio Calculation
COGS/365 days � average daily costs
Accounts payable/average daily costs � number of days it takes to pay
Management of Accounts Payable
To improve the accounts payable days, the entrepreneur can takethe following actions recommended by several professionals:
■ Negotiate better payment terms, such as net 45 or net 60,instead of net 30.
■ Time payments according to their due dates, such as 30 days following the receipt of material, rather than onsome artificial schedule.
■ Plan cash flow realities. For example, to avoid big cashoutflows, some companies pay their employees’ payrollbiweekly and then pay their outstanding bills during theother two weeks of the month.
■ Avoid interest penalty charges. If you have to stretch outyour own payables because of temporary cash flowproblems, make sure you are not late with those bills thatincur additional interest charges.
■ Communicate with your suppliers. If you establish a goodworking relationship with a supplier and make regularpayments, you can usually avoid paying late charges bycontacting the owner in advance if you expect to make alate payment or if you need to request a payment extension.
■ Set scheduling goals. Try to establish a final date by whichall payables are to be paid. While it is unrealistic to assumethat you will always be on schedule, it is important to keepthe accounts payable as close to the scheduled goal date as possible.
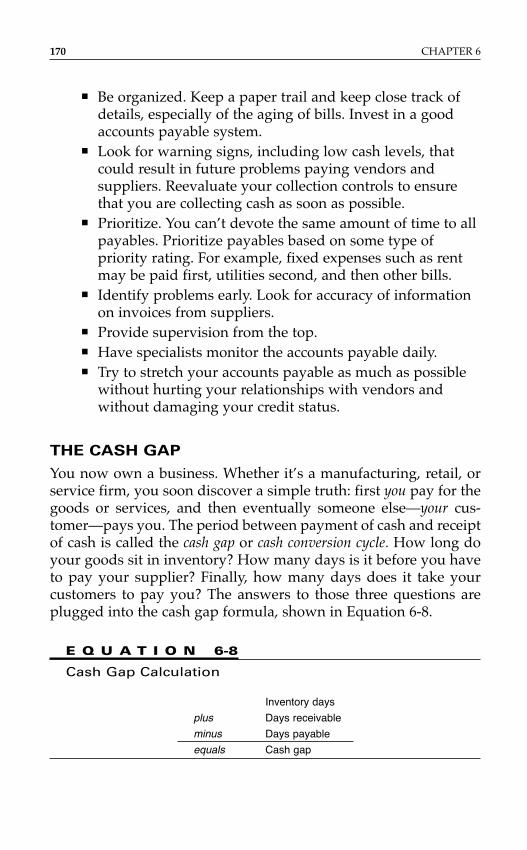
■ Be organized. Keep a paper trail and keep close track ofdetails, especially of the aging of bills. Invest in a goodaccounts payable system.
■ Look for warning signs, including low cash levels, thatcould result in future problems paying vendors andsuppliers. Reevaluate your collection controls to ensurethat you are collecting cash as soon as possible.
■ Prioritize. You can’t devote the same amount of time to allpayables. Prioritize payables based on some type ofpriority rating. For example, fixed expenses such as rentmay be paid first, utilities second, and then other bills.
■ Identify problems early. Look for accuracy of informationon invoices from suppliers.
■ Provide supervision from the top.■ Have specialists monitor the accounts payable daily.■ Try to stretch your accounts payable as much as possible
without hurting your relationships with vendors andwithout damaging your credit status.
THE CASH GAP
You now own a business. Whether it’s a manufacturing, retail, orservice firm, you soon discover a simple truth: first you pay for thegoods or services, and then eventually someone else—your cus-tomer—pays you. The period between payment of cash and receiptof cash is called the cash gap or cash conversion cycle. How long doyour goods sit in inventory? How many days is it before you haveto pay your supplier? Finally, how many days does it take yourcustomers to pay you? The answers to those three questions areplugged into the cash gap formula, shown in Equation 6-8.
E Q U A T I O N 6-8
Cash Gap Calculation
Inventory days
plus Days receivable
minus Days payable
equals Cash gap
170 CHAPTER 6
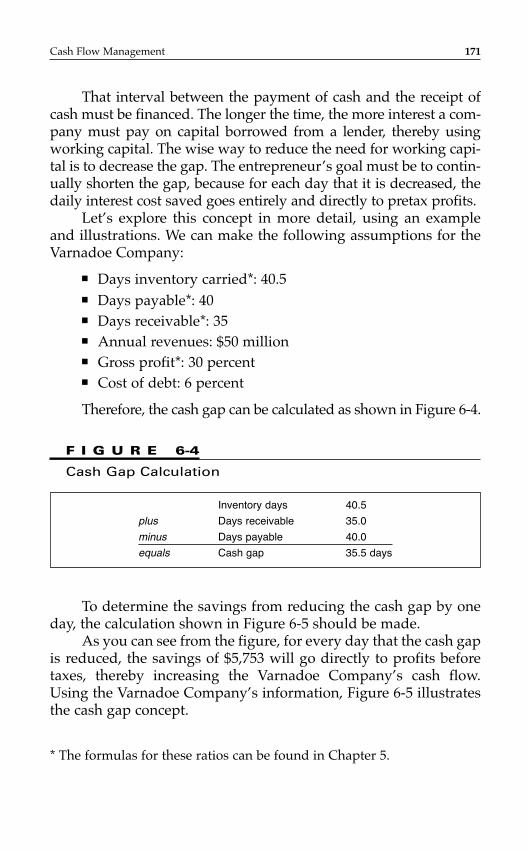
That interval between the payment of cash and the receipt ofcash must be financed. The longer the time, the more interest a com-pany must pay on capital borrowed from a lender, thereby usingworking capital. The wise way to reduce the need for working capi-tal is to decrease the gap. The entrepreneur’s goal must be to contin-ually shorten the gap, because for each day that it is decreased, thedaily interest cost saved goes entirely and directly to pretax profits.
Let’s explore this concept in more detail, using an exampleand illustrations. We can make the following assumptions for theVarnadoe Company:
■ Days inventory carried*: 40.5■ Days payable*: 40■ Days receivable*: 35■ Annual revenues: $50 million■ Gross profit*: 30 percent■ Cost of debt: 6 percent
Therefore, the cash gap can be calculated as shown in Figure 6-4.
Cash Flow Management 171
F I G U R E 6-4
Cash Gap Calculation
Inventory days 40.5
plus Days receivable 35.0
minus Days payable 40.0
equals Cash gap 35.5 days
To determine the savings from reducing the cash gap by oneday, the calculation shown in Figure 6-5 should be made.
As you can see from the figure, for every day that the cash gapis reduced, the savings of $5,753 will go directly to profits beforetaxes, thereby increasing the Varnadoe Company’s cash flow.Using the Varnadoe Company’s information, Figure 6-5 illustratesthe cash gap concept.
* The formulas for these ratios can be found in Chapter 5.
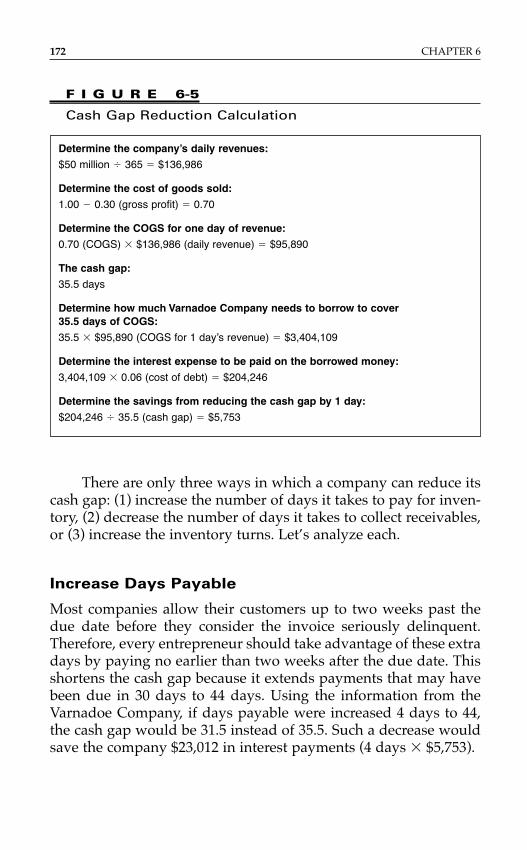
There are only three ways in which a company can reduce itscash gap: (1) increase the number of days it takes to pay for inven-tory, (2) decrease the number of days it takes to collect receivables,or (3) increase the inventory turns. Let’s analyze each.
Increase Days Payable
Most companies allow their customers up to two weeks past thedue date before they consider the invoice seriously delinquent.Therefore, every entrepreneur should take advantage of these extradays by paying no earlier than two weeks after the due date. Thisshortens the cash gap because it extends payments that may havebeen due in 30 days to 44 days. Using the information from theVarnadoe Company, if days payable were increased 4 days to 44,the cash gap would be 31.5 instead of 35.5. Such a decrease wouldsave the company $23,012 in interest payments (4 days � $5,753).
172 CHAPTER 6
F I G U R E 6-5
Cash Gap Reduction Calculation
Determine the company’s daily revenues:
$50 million � 365 � $136,986
Determine the cost of goods sold:
1.00 � 0.30 (gross profit) � 0.70
Determine the COGS for one day of revenue:
0.70 (COGS) � $136,986 (daily revenue) � $95,890
The cash gap:
35.5 days
Determine how much Varnadoe Company needs to borrow to cover 35.5 days of COGS:
35.5 � $95,890 (COGS for 1 day’s revenue) � $3,404,109
Determine the interest expense to be paid on the borrowed money:
3,404,109 � 0.06 (cost of debt) � $204,246
Determine the savings from reducing the cash gap by 1 day:
$204,246 � 35.5 (cash gap) � $5,753
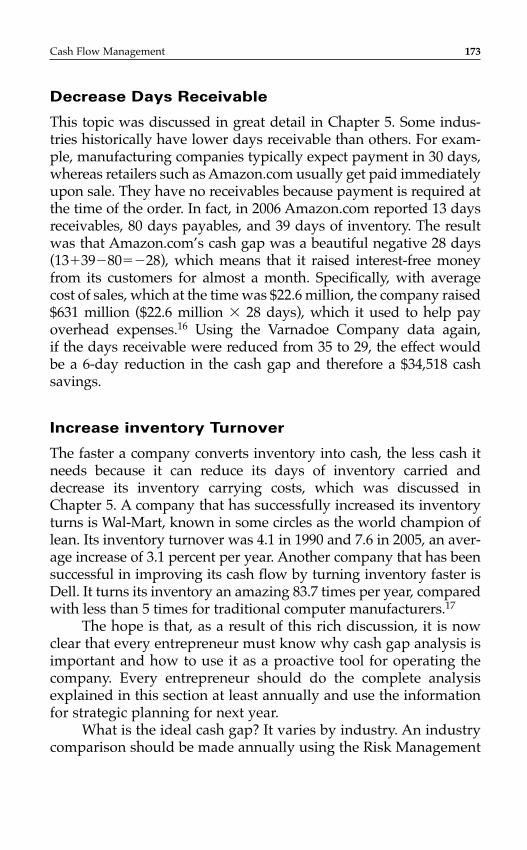
Decrease Days Receivable
This topic was discussed in great detail in Chapter 5. Some indus-tries historically have lower days receivable than others. For exam-ple, manufacturing companies typically expect payment in 30 days,whereas retailers such as Amazon.com usually get paid immediatelyupon sale. They have no receivables because payment is required atthe time of the order. In fact, in 2006 Amazon.com reported 13 daysreceivables, 80 days payables, and 39 days of inventory. The resultwas that Amazon.com’s cash gap was a beautiful negative 28 days(13�39�80��28), which means that it raised interest-free moneyfrom its customers for almost a month. Specifically, with averagecost of sales, which at the time was $22.6 million, the company raised$631 million ($22.6 million � 28 days), which it used to help payoverhead expenses.16 Using the Varnadoe Company data again, if the days receivable were reduced from 35 to 29, the effect would be a 6-day reduction in the cash gap and therefore a $34,518 cash savings.
Increase inventory Turnover
The faster a company converts inventory into cash, the less cash itneeds because it can reduce its days of inventory carried anddecrease its inventory carrying costs, which was discussed inChapter 5. A company that has successfully increased its inventoryturns is Wal-Mart, known in some circles as the world champion oflean. Its inventory turnover was 4.1 in 1990 and 7.6 in 2005, an aver-age increase of 3.1 percent per year. Another company that has beensuccessful in improving its cash flow by turning inventory faster isDell. It turns its inventory an amazing 83.7 times per year, comparedwith less than 5 times for traditional computer manufacturers.17
The hope is that, as a result of this rich discussion, it is nowclear that every entrepreneur must know why cash gap analysis isimportant and how to use it as a proactive tool for operating thecompany. Every entrepreneur should do the complete analysisexplained in this section at least annually and use the informationfor strategic planning for next year.
What is the ideal cash gap? It varies by industry. An industrycomparison should be made annually using the Risk Management
Cash Flow Management 173
Association (formerly Robert Morris Associates) guide. A few ofthe industries are highlighted in Table 6-4.
WORKING CAPITAL
The procurement, maintenance, and management of working cap-ital seem to be some of the most common and challenging tasksfacing entrepreneurs. Therefore, let’s devote a little more time tothe subject.
As was stated earlier in this chapter, the interval between acompany’s payment and receipt of cash must be financed. Themoney for this is called working capital, which consists of fundsinvested in all current assets, including inventory, accounts receiv-able, and cash. Gross working capital is used to finance only thecompany’s current assets. Net working capital, which is a meas-urement of a company’s solvency, is current assets minus current
174 CHAPTER 6
Receivables � Inventory � Payables � Cash Gap
Manufacturing
Bread and bakery 25 19 23 21
Bottled soft drinks 29 30 31 28
Women’s dresses 41 54 26 10
Wholesale
Office supplies 40 28 31 37
Auto 17 66 13 70
Toys, hobby goods 50 94 39 104
Retail
Gasoline stations 5 9 13 0
Drugstores 20 50 32 38
Shoes 2 130 30 103
Service
Equipment rental 7 N/A N/A 7
Motels and hotels 8 N/A N/A 8
Accounting firms 64 N/A N/A 64
Source: Risk Management Association (formerly Robert Morris Associates), 2006.
T A B L E 6-4
Cash Gaps by Industry, 2006
liabilities. The goal is to have positive net working capital. Thegreater the net working capital, the stronger the company’s cashposition relative to its ability to service its other expenses, includ-ing long-term debt.
Very few companies are able to finance their working capitalneeds internally. Therefore, external financing in the form of debtor equity is inevitable. How much working capital is ideal? Oneexpert, Skip Grandt, a commercial lender with 20 years of experi-ence, says that he likes to see a company have net working capitallevels at 3 to 6 times its annual fixed costs.18 A great resource forfinding working capital levels for different industries is CFOMagazine’s annual working capital survey, which can be found onCFO’s Web site (www.cfo.com).
FINDING CASH
Entrepreneurs have frequently asked me to help them raise exter-nal financing from debt and/or equity investors. Most of the time,after reviewing the financial statements, I have told them that theydo not need outside capital. They simply need to reduce theirinventory and/or accounts receivable levels. That’s right. Cash isoften readily available to entrepreneurs who carry excessiveamounts of these two assets.
What is the ideal level of inventory that an entrepreneurshould carry? The formula to make this determination is shown inEquation 6-9.
E Q U A T I O N 6-9
Ideal Inventory Calculation
Ideal inventory � COGS/targeted inventory turns
Let’s use the information from the Hoy Company to show howan entrepreneur can raise internal cash by applying this formula.The Hoy Company had the following numbers for 2008:
■ Revenues: $30,848,000■ Cost of goods sold (COGS): $13,989,000
Cash Flow Management 175
■ Inventory: $9,762,000■ Inventory turns: 1.43 times■ Average industry inventory turns: 2 times■ Accounts receivable: $5,996,000■ Days receivable: 71■ Average days receivable for industry: 40
If in 2009, the revenues and COGS remained the same as in 2008, but the entrepreneur was able to turn inventory 2 timesrather than 1.43 times, the cash savings would be dramatic. Theideal level of inventory is $6,994,500, determined by $13,989,000/2.The actual savings based on the 2008 inventory level would be$2,767,500 in cold, hard cash!
What is the ideal level of accounts receivable that an entrepre-neur should carry? The formula to make this determination can beseen in Equation 6-10.
E Q U A T I O N 6 - 1 0
Ideal Level of Accounts Receivable
Ideal level of accounts receivable � average daily sales � targeted days receivable
Using the same information for the Hoy Company, if daysreceivable can be reduced from 71 to 40 days, the cash savingswould be significant. To compute average daily sales, the annualrevenue must be divided by 365. Therefore, $30,848,000/365 gener-ates average daily sales of $84,515. This figure multiplied by 40 daysreceivable shows that the Hoy Company’s ideal level of receivablesshould be $3,380,600. The actual savings based on the 2001 accountsreceivable, or $5,996,000, would be $2,615,400 in cold, hard cash!
N O T E S
1. Jill Andresky Fraser, “Riding the Economic Rollercoaster,” Inc.,December 1998, p. 126.
2. Michael Fernandez, “My Big Mistake,” Inc., December 1998, p. 123.3. Fraser, “Riding the Economic Rollercoaster.”
176 CHAPTER 6
4. “Running on Empty,” Inc.5. Ibid.6. Fraser, “Riding the Economic Rollercoaster.”7. Gini Graham Scott and John J. Harrison, Collection Techniques for a
Small Business (Grants Pass, Oregon: Oasis Press, 1994).8. U.K. Survey of Small Businesses, 2005.9. Bruce D. Phillips, “Small Business Problems and Priorities,”
National Federation of Independent Business, June 2004.10. Jill Andresky Fraser, “Getting Paid,” Inc., June 1990.11. Ibid.12. Wall Street Journal, October 25, 1999, p. 9.13. Chicago Sun-Times, May 25, 1999, p. 48.14. Ibid.15. Source: Jill Andresky Fraser, “Collection: Days Saved, Thousands
Earned,” Inc., November 1995.16. Journal of Accountancy, October 1999, p. 29.17. Dell company financials as compiled by Hoovers, July 2007.18. Skip Grandt, interview with author.
Cash Flow Management 177

This page intentionally left blank
INTRODUCTION
When I teach my MBA students about entrepreneurial finance, onDay 1 of the classes, I run through an exercise in which studentsattempt to value a company. You should know that many of thesestudents have previously sat through high-level finance classes,know about discounted cash flows, and have their heads full of formulas. We look at the numbers. “Tell me what you would payfor the company,” I demand. The valuations range from zero to$300,000. Actually, I tell them, when the company was sold, it wentfor $38,000. It sold for the price of its inventory. There is a storybehind the valuation that is not quantitative. The owner had to sellthe company, because his wife told him that if he didn’t, she wasgoing to leave him and retire down in Florida by herself. It hadnothing to do with a multiple of cash flows, multiple of revenue, oranything other than that he simply had to get out of the business.
Here’s the lesson: valuation is very tricky and can never bedone in a vacuum. Entrepreneurs must learn the methods used tovalue companies and become comfortable with the “ambiguity ofvaluation” and the fact that the valuation process is not a hard-and-fast science. The story of Bain Consulting highlights this fact. In 1973, Bill Bain, a former vice president at Boston ConsultingGroup, and seven partners founded the consulting firm BainConsulting. From the mid-1980s through 1993, it was estimated thatBain’s revenues had increased from $100 million to $220 million.
179
C H A P T E R 7
Valuation
During this time, the eight partners decided to sell 30 percent of thecompany to a Bain Employee Stock Option Plan (ESOP) for $200million. This transaction gave the company an implied valuation of$666 million. A few years later, the vice presidents of the companytook legal action against these partners, which ended in the partnersreturning $100 million to the company as well as the 70 percent ofthe company’s equity that they held. This transaction, in which theeight partners essentially sold 100 percent of their equity back to thecompany, changed the valuation from $666 million to $200 million,a reduction of more than 70 percent! The point of this story is toshow that even a world-class organization such as Bain, filled withbrilliant MBA graduates from some of the finest business schools inthe country, including Kellogg, Harvard, Stanford, and Wharton,could not initially come up with the “correct” valuation.
Let me repeat it again. The valuation of a company, particu-larly that of a start-up, is not an exact science. As Nick Smith, a ven-ture capitalist in Minnesota, stated, “Valuation in a start-up is anillusion.” Therefore, the true value of a company, be it a start-up ora mature business, is established in the marketplace. Very simply, acompany’s ultimate value is the price agreed to by the seller andthe buyer. This fact can be traced back to the first century BC, whenPublilius Syrus stated, “Everything is worth what its purchaserwill pay for it.”
One of the best examples of this fact is highlighted by the storyof Apple Computer and Be, Inc. In October 1996, Apple Computer’sCEO, Gil Amelio, began negotiations to buy Be, Inc., from its CEO,Jean-Louis Gassée. Be had developed a new operating system calledBeOs that some people in the industry said “put Apple’s Macintoshand Microsoft’s Windows to shame.”1 Like most opportunisticentrepreneurs, Gassée was more than willing to sell his 6-year-oldentrepreneurial venture, which he had financed with $20 millionfrom venture capitalists and other private investors. In 1996, Be,Inc., had 40 employees and approximately $3 million in annual rev-enues. Amelio offered $100 million for the small company. Gasséethought the value of Be, Inc., was much greater and countered witha $285 million asking price, which amounted to approximately 10 percent of Apple’s valuation.
Amelio refused to offer anything over the $100 million price.Instead, he bought the more established NeXt Software, Inc., which
180 CHAPTER 7
ironically had been founded by Steve Jobs, Apple Computer’sfounder and current CEO. Therefore, what was the value of Be,Inc., in 1996? It was an amount between $100 million and $285 mil-lion. And what happened to Be, Inc.? In September 2001, Nasdaqregulators told the company that they were delisting it for failingto maintain a minimum bid price of at least a dollar for 30 consec-utive days. Be, Inc.’s shares were trading for about 14 cents. Thatsame month, Be, Inc., announced that it would sell its remainingassets and technology to Palm Inc. for $11 million.
This overvaluation experience taught Gassée the valuable les-son that all entrepreneurs must learn: “pigs get fat and hogs getslaughtered.” He could have been a nice fat happy pig by accept-ing the $100 million. Instead, he got greedy, a common trait of hogs,and got nothing.
Despite the fact that business valuation is not an exact science,entrepreneurs should determine a value for their company at leastonce a year. This process must not intimidate them. As has beenrepeatedly stated throughout this book, it is not brain surgery. Infact, it can be rather simple, and almost everyone can do it. What isthe reason for performing an annual valuation of a company? Thereare many. If the entrepreneur does not determine the value of hiscompany, then someone else will, and the entrepreneur will not behappy with the result. For example, if the entrepreneur is selling hisbusiness and relies entirely on a prospective buyer to determine itsworth, the buyer will certainly look out for her own interests andprice it low. The entrepreneur must, therefore, look out for his ownbest interests by establishing a price that he is comfortable with,using logical and acceptable valuation methods. Which methodsare correct? As you will see later in this chapter, all of them.
Valuation involves estimating the worth or price of a company.Different industries use different methods to determine this value.Some industries use complicated quantitative models, while othersuse relatively simple approaches. Regardless of the methodologyused, however, the valuation of a business incorporates not only afinancial analysis of the company, but also a subjective assessmentof other factors that may be difficult to quantify, including:
■ Stage of the company■ Management team assessment
Valuation 181
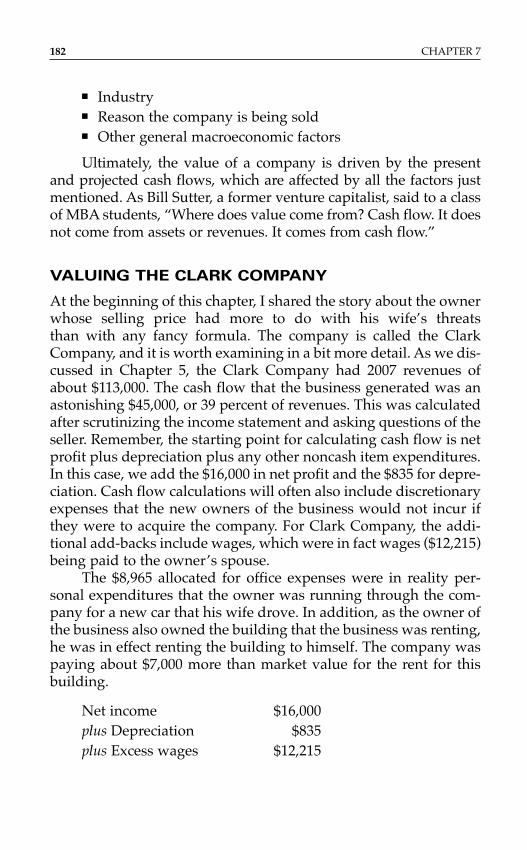
■ Industry■ Reason the company is being sold■ Other general macroeconomic factors
Ultimately, the value of a company is driven by the presentand projected cash flows, which are affected by all the factors justmentioned. As Bill Sutter, a former venture capitalist, said to a classof MBA students, “Where does value come from? Cash flow. It doesnot come from assets or revenues. It comes from cash flow.”
VALUING THE CLARK COMPANY
At the beginning of this chapter, I shared the story about the ownerwhose selling price had more to do with his wife’s threats than with any fancy formula. The company is called the ClarkCompany, and it is worth examining in a bit more detail. As we dis-cussed in Chapter 5, the Clark Company had 2007 revenues ofabout $113,000. The cash flow that the business generated was anastonishing $45,000, or 39 percent of revenues. This was calculatedafter scrutinizing the income statement and asking questions of theseller. Remember, the starting point for calculating cash flow is netprofit plus depreciation plus any other noncash item expenditures.In this case, we add the $16,000 in net profit and the $835 for depre-ciation. Cash flow calculations will often also include discretionaryexpenses that the new owners of the business would not incur ifthey were to acquire the company. For Clark Company, the addi-tional add-backs include wages, which were in fact wages ($12,215)being paid to the owner’s spouse.
The $8,965 allocated for office expenses were in reality per-sonal expenditures that the owner was running through the com-pany for a new car that his wife drove. In addition, as the owner ofthe business also owned the building that the business was renting,he was in effect renting the building to himself. The company waspaying about $7,000 more than market value for the rent for thisbuilding.
Net income $16,000plus Depreciation $835plus Excess wages $12,215
182 CHAPTER 7
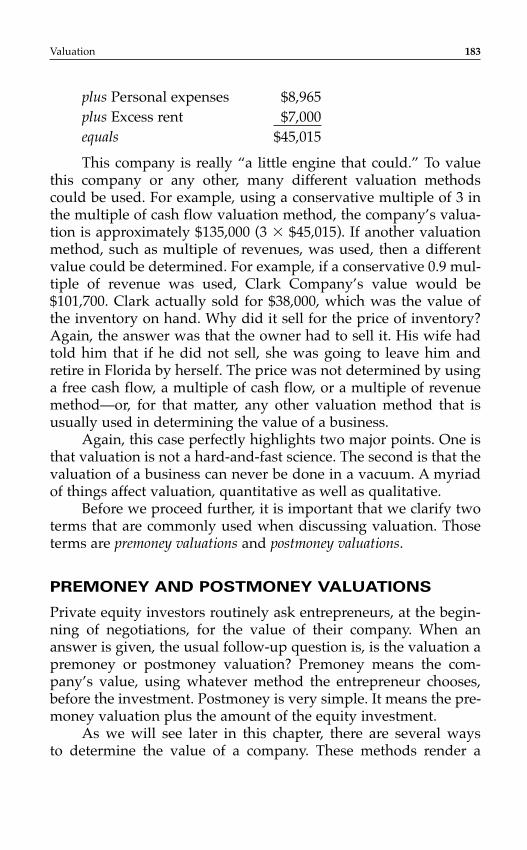
plus Personal expenses $8,965plus Excess rent $7,000equals $45,015
This company is really “a little engine that could.” To valuethis company or any other, many different valuation methodscould be used. For example, using a conservative multiple of 3 inthe multiple of cash flow valuation method, the company’s valua-tion is approximately $135,000 (3 � $45,015). If another valuationmethod, such as multiple of revenues, was used, then a differentvalue could be determined. For example, if a conservative 0.9 mul-tiple of revenue was used, Clark Company’s value would be$101,700. Clark actually sold for $38,000, which was the value ofthe inventory on hand. Why did it sell for the price of inventory?Again, the answer was that the owner had to sell it. His wife hadtold him that if he did not sell, she was going to leave him andretire in Florida by herself. The price was not determined by usinga free cash flow, a multiple of cash flow, or a multiple of revenuemethod—or, for that matter, any other valuation method that isusually used in determining the value of a business.
Again, this case perfectly highlights two major points. One isthat valuation is not a hard-and-fast science. The second is that thevaluation of a business can never be done in a vacuum. A myriadof things affect valuation, quantitative as well as qualitative.
Before we proceed further, it is important that we clarify twoterms that are commonly used when discussing valuation. Thoseterms are premoney valuations and postmoney valuations.
PREMONEY AND POSTMONEY VALUATIONS
Private equity investors routinely ask entrepreneurs, at the begin-ning of negotiations, for the value of their company. When ananswer is given, the usual follow-up question is, is the valuation apremoney or postmoney valuation? Premoney means the com-pany’s value, using whatever method the entrepreneur chooses,before the investment. Postmoney is very simple. It means the pre-money valuation plus the amount of the equity investment.
As we will see later in this chapter, there are several ways to determine the value of a company. These methods render a
Valuation 183
premoney valuation. Therefore, if the multiple of revenue methodcreates a $12 million valuation and the company is pursuing $3 million of private equity capital, the postmoney valuation willbe $15 million if the equity capital is successfully raised.
The significance of the two valuation terms is to ensure thatboth parties, the entrepreneur and the investor, are viewing the valuation the same way. The other significance is that postmoneyvaluations determine how much equity the investor gets. This own-ership amount is calculated by dividing the investment by the post-money valuation. Using the previous example, if the premoneyvalue is $12 million, then the person who invests $3 million will get20 percent (i.e., $3 million invested divided by the sum of the $12million premoney valuation plus the $3 million investment).
The problem arises when the investor thinks the value is postmoney and the entrepreneur considers it premoney. In thatinstance, if the $12 million valuation is thought to be postmoney,the premoney valuation would be $9 million. The investor thinkshis that $3 million investment will get him 25 percent of the equity(i.e., $3 million divided by the sum of $9 million � $3 million),while the entrepreneur wants to give up only 20 percent.
This is the reason why it is imperative for both parties toquickly agree on what they mean. Therefore, when she is asked byinvestors whether the valuation is premoney or postmoney, theentrepreneur’s answer should be a resounding, “Premoney withthe equity amount for the investor determined by the postmoneyvaluation.”
Another major point to be made is that the postmoney valua-tion of the last financing round is usually where the premoney val-uation of the next round begins—unless there is an increase in thevaluation using another agreed-upon method. In the earlier exam-ple, the first round, the “Series A,” was financed at a $15 millionpostmoney valuation. Therefore, the premoney valuation for thenext round of financing, the “Series B,” will be $15 million, and if anew investor puts in $3 million, the new postmoney valuation willbe $18 million. The Series B investor will receive 17 percent of theequity for his second round of financing. The Series A investor,who invested $3 million for 20 percent will now own 20 percent of83 percent (the balance of the equity after Series B), or 16.6 percentof the company
184 CHAPTER 7
Finally, the private equity industry has a rule of thumb thatSeries B financing should never be done at a valuation more thantwice the Series A valuation.2
WHY VALUE YOUR COMPANY?
There are numerous reasons why an entrepreneur should know thevalue of her business. These include:
■ To determine a sale price for the company■ To determine how much equity to give up for partnership
agreements■ To determine how much equity to give up for investor
capital
Let us discuss this final point in a little more detail.
How Much Equity to Give Up
It is quite common for entrepreneurs to establish the value of theircompanies unknowingly when they are raising capital. Many ofthem will determine the amount of capital they need and at thesame time arbitrarily state the level of ownership they wish toretain. Such an act automatically places an implied value on thecompany. For example, if an entrepreneur is looking to raise$100,000 and says he wants to retain 90 percent of the company, thepostmoney valuation is $1 million.
The most common minimum level of ownership that manystart-up entrepreneurs seek is 51 percent. They believe this to bethe minimal number they need to maintain their control of thecompany. Therefore, they are willing to give up 49 percent. Theproblem with arbitrarily giving up 49 percent for an investment isthat it typically gives the company too low a valuation and littleequity to sell to future investors.
Another very simple way to determine the level of equity togive up is by calculating the company’s value using the methodsthat will be cited later in this chapter. This calculation should bedone prior to taking any fund-raising action. After the valuationhas been logically, rather than arbitrarily, calculated, the amount of equity capital needed, as explained in Chapter 10, should be
Valuation 185
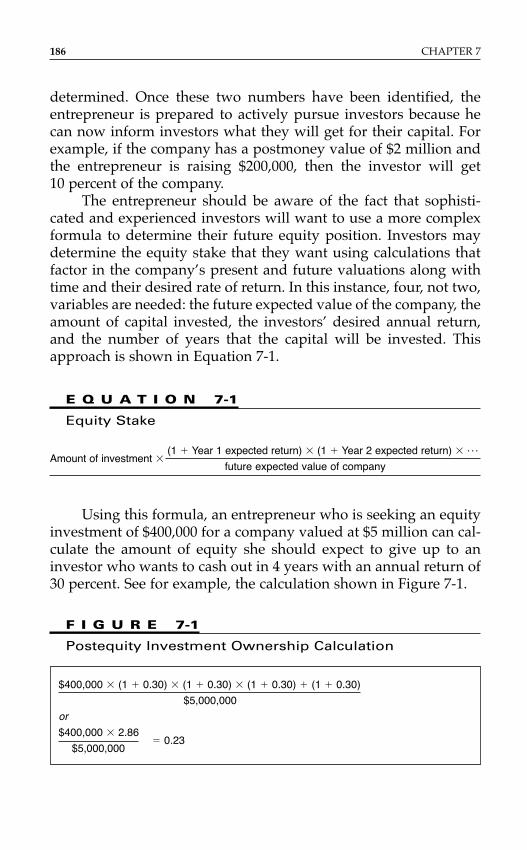
determined. Once these two numbers have been identified, theentrepreneur is prepared to actively pursue investors because hecan now inform investors what they will get for their capital. Forexample, if the company has a postmoney value of $2 million andthe entrepreneur is raising $200,000, then the investor will get 10 percent of the company.
The entrepreneur should be aware of the fact that sophisti-cated and experienced investors will want to use a more complexformula to determine their future equity position. Investors maydetermine the equity stake that they want using calculations thatfactor in the company’s present and future valuations along withtime and their desired rate of return. In this instance, four, not two,variables are needed: the future expected value of the company, theamount of capital invested, the investors’ desired annual return,and the number of years that the capital will be invested. Thisapproach is shown in Equation 7-1.
E Q U A T I O N 7-1
Equity Stake
Amount of investment �(1 � Year 1 expected return) � (1 � Year 2 expected return) � . . .
future expected value of company
Using this formula, an entrepreneur who is seeking an equityinvestment of $400,000 for a company valued at $5 million can cal-culate the amount of equity she should expect to give up to aninvestor who wants to cash out in 4 years with an annual return of30 percent. See for example, the calculation shown in Figure 7-1.
186 CHAPTER 7
F I G U R E 7-1
Postequity Investment Ownership Calculation
$400,000 � (1 � 0.30) � (1 � 0.30) � (1 � 0.30) � (1 � 0.30)
$5,000,000
or
$400,000 � 2.86
$5,000,000 � 0.23
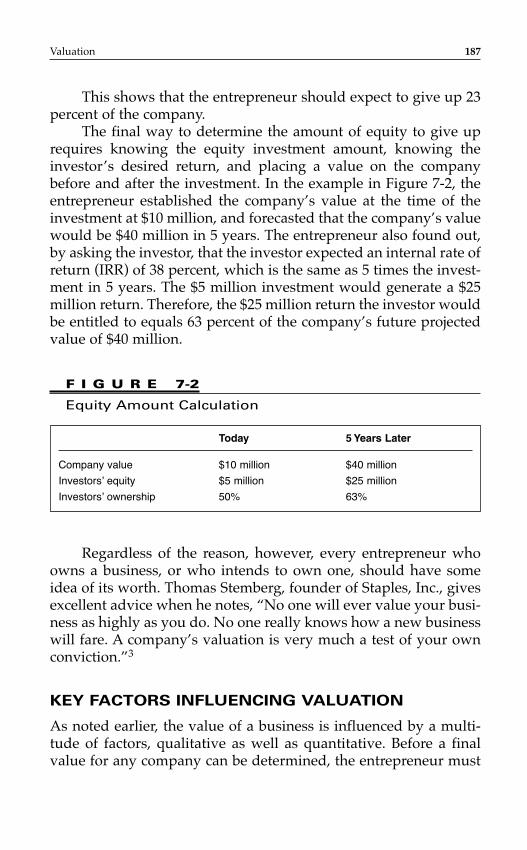
This shows that the entrepreneur should expect to give up 23percent of the company.
The final way to determine the amount of equity to give uprequires knowing the equity investment amount, knowing theinvestor’s desired return, and placing a value on the companybefore and after the investment. In the example in Figure 7-2, theentrepreneur established the company’s value at the time of theinvestment at $10 million, and forecasted that the company’s valuewould be $40 million in 5 years. The entrepreneur also found out,by asking the investor, that the investor expected an internal rate ofreturn (IRR) of 38 percent, which is the same as 5 times the invest-ment in 5 years. The $5 million investment would generate a $25million return. Therefore, the $25 million return the investor wouldbe entitled to equals 63 percent of the company’s future projectedvalue of $40 million.
Valuation 187
Today 5 Years Later
Company value $10 million $40 million
Investors’ equity $5 million $25 million
Investors’ ownership 50% 63%
F I G U R E 7-2
Equity Amount Calculation
Regardless of the reason, however, every entrepreneur whoowns a business, or who intends to own one, should have someidea of its worth. Thomas Stemberg, founder of Staples, Inc., givesexcellent advice when he notes, “No one will ever value your busi-ness as highly as you do. No one really knows how a new businesswill fare. A company’s valuation is very much a test of your ownconviction.”3
KEY FACTORS INFLUENCING VALUATION
As noted earlier, the value of a business is influenced by a multi-tude of factors, qualitative as well as quantitative. Before a finalvalue for any company can be determined, the entrepreneur must
identify and review these factors. This procedure is commonlyreferred to as completing a “contextual factor analysis.” In otherwords, what is the general context in which the valuation is takingplace? A proper valuation of a company does not occur in a vac-uum. A solid valuation contextual factor analysis should includethe following factors:
■ The historical, present, and projected cash flow of the company.
■ Who is valuing the company?■ Is it a private or a public company?■ The availability of capital.■ Is it a strategic or a financial buyer?■ The company’s stage of entrepreneurship.■ Is the company being sold at an auction?■ The state of the economy.■ The reason the company is being valued.■ Tangible and intangible assets.■ The industry.■ The quality of the management team.■ Projected performance.
Let’s discuss each factor in more detail.
Cash Flow Status
Historically, the value of a company has been largely driven by itspresent and projected cash flow. Contrary to this historical practice,however, over the last few years, technology companies, particu-larly Internet and e-commerce businesses, have created immensevalue without the existence or the projection of positive cash flowin the foreseeable future. Despite this fact, which we will analyzeand discuss in more detail later in this chapter, the argument of thisbook is that all entrepreneurs should focus on creating and maxi-mizing value by aggressively pursuing positive cash flow.
The idea that value comes from positive cash flow is rathersimple and direct. The entrepreneurial pursuit of business oppor-tunities usually comes with one basic goal in mind: to make more
188 CHAPTER 7
money than you spend—also known as positive cash flow. Theother issues mentioned in Chapter 2 regarding why people chooseto become entrepreneurs, including to create jobs, nurture an idea,and get rich, are simply by-products of the successful attainment ofthe goal of making more money than you spend.
Thus, the cash flow of the company is where its true value lies.This cash flow can be used to reward employees with specialbonuses, reward owners and investors, or reinvest in the companyto make it even stronger in the future. It should be noted that thetiming of a company’s cash flows can also affect its value, depend-ing on who is valuing the company. For example, the entrepreneurwho is buying a company should give the greatest importance tothe targeted company’s present, not future, cash flows. The reasonis that future cash flows are uncertain. They are merely projections,with no assurance of achievement. Experienced entrepreneurs likeWayne Huizenga correctly refuse to pay for the unknown. Whenasked about valuation, Huizenga said, “We pay for what we know,today’s cash flow, not tomorrow’s.”4
The other reason that buyers should base their valuation ontoday’s cash flow is that future cash flow comes from the work putin by the new buyer. Paying the seller for the company’s future performance would be rewarding the seller for the work the buyerwill do. By doing so, the buyer would essentially be giving awaythe value that he will create. The craziness of the practice of valu-ing a company and paying the seller based on a company’s futurecash flow is something akin to the following. A prospective homebuyer sees a house for sale in Beverly Hills that has been appraisedat $10 million in its present condition and needs a lot of repairs.The buyer does due diligence and finds that once the repairs havebeen completed, the value of the house will be $30 million. Withthis information, the buyer makes an offer of $30 million, payingthe seller for the work he is about to do!
Obviously, such a scenario is utterly ridiculous, and the sameshould hold true with a business. The value of a business to a buyershould be based on the company’s most recent cash flow, not thefuture. The difference between the present and future cash flowsbelongs to the buyer. On the other hand, if the person valuing thecompany is the seller, she will want the valuation to be based onfuture cash flow because the future is always projected to be rosier
Valuation 189
than the present, which would lead to a higher valuation. In thecase of a start-up, a valuation based on cash flow projected for thefuture is acceptable to investors and the entrepreneur because thereis no historical or present cash flow.
Finally, the cash flow of a company directly affects its valuebased on the amount of debt it can service. This can be determinedby working backward. The idea is that, for the buyer, the value ofa company is primarily based on the amount of debt that can beserviced by the company’s cash flow in 5 to 7 years (the typicalamortization period for a commercial loan) under the worst-casescenario (the worst-case scenario should be the actual for the mostrecent year). Most highly leveraged acquisitions have capital struc-tures consisting of 80 percent debt and 20 percent equity. Therefore,if an entrepreneur were able to get a 7-year commercial loan for 80 percent of the value of a company that had a worst-case pro-jected cash flow of $100,000 for the first year, the company’s valuewould be $875,000.
This valuation is based on the fact that 80 percent of the com-pany’s value equals $700,000 cumulative cash flow projected over 7 years. Thus, each percentage of ownership of the company is valued at $8,750, or 100 percent equals $875,000. This relationshipbetween value, debt serviceability, and present cash flow is sup-ported by a comment made by Sam Zell after he purchased theChicago Tribune newspaper in 2007 with $8.2 billion in debt.Regarding the 2006 cash flow of $1.3 billion Sam said, “I don’t thinkyou need it to go up, you need for it not to go down.”5
Who Is Valuing the Company?
Are you the entrepreneur who is selling the business or raising cap-ital? Are you the buyer of the entire company or an equity investor?As Stemberg aptly points out:
The central tension in a venture capital deal is how much the newcompany is worth. The company’s valuation governs how much ofit the entrepreneur will own. Venture capitalists yearn to keep thevaluation low and take control. Entrepreneurs want to push thenumber up to raise the maximum amount of cash and keep controlthemselves.6
190 CHAPTER 7
Stemberg’s experience with venture capitalists highlights thetension that often exists between financiers (both venture capital-ists and others) and the entrepreneur. He notes:
I thought Staples was worth $8 million post-money when I wentout to raise capital. I wanted to raise $4 million for 50% of thecompany. Relative to the company’s value, are you the insurancecompany who has to pay a claim, or are you the claimant? The former wants a lower company valuation than the latter. Are youthe party in a marriage divorce trying to minimize payments toyour spouse as assets are being divided or are you the spouse?The venture capitalists wanted to value the company at $6 million.On January 23, 1986, I struck a deal: The venture capitalists wouldpay $4.5 million for 56% of the company. Staples was worth $8 million.7
The value placed on a business will depend on which side ofthe table you sit on: If you are the entrepreneur, you will want ashigh a valuation as possible so that you give up as little equity aspossible. If you are the investor (e.g., the venture capitalist), youwill want a low valuation because you will want to get as muchequity as possible for your investment. As Scott Meadow, a 20-yearveteran of the venture capital industry, said, “I’m going to pay youas little as possible for as much of your company as I can get.”8 Thispoint is best illustrated by the experience by Stemberg that was justcited. The venture capitalists initially wanted 66.6 percent ofStaples for their investment, compared with the 56 percent theyreceived. Not all investors are as aggressive as Scott Meadow, men-tioned earlier. Another venture capitalist is quoted as saying, “Thekey to valuing a company is to do it in a way that enables theinvestor to get his desired return, while keeping the entrepreneurhappy and motivated.” Obviously, this venture capitalist seeks avaluation that creates a “win-win” situation for the investor andthe entrepreneur.
Public versus Private Company
Two companies of similar age, operating in the same industry, producing exactly the same products or services, and achieving the same level of revenues, profits, and growth rates, will have
Valuation 191
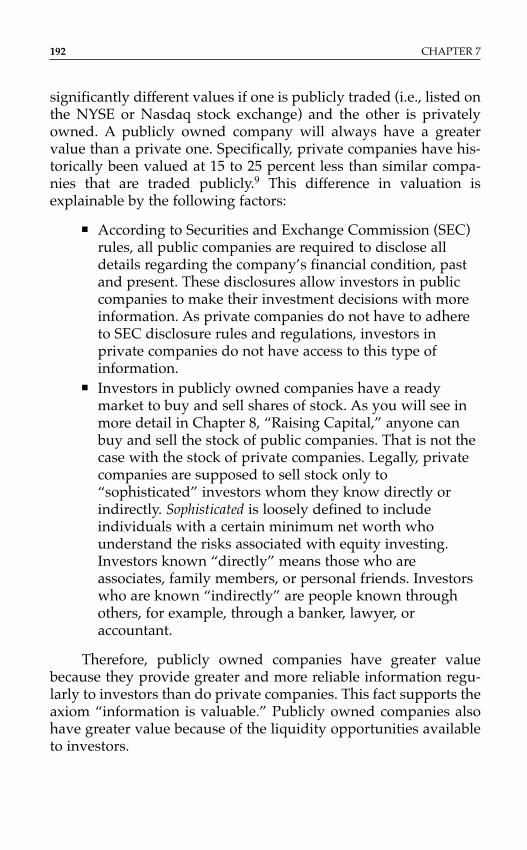
significantly different values if one is publicly traded (i.e., listed onthe NYSE or Nasdaq stock exchange) and the other is privatelyowned. A publicly owned company will always have a greatervalue than a private one. Specifically, private companies have his-torically been valued at 15 to 25 percent less than similar compa-nies that are traded publicly.9 This difference in valuation isexplainable by the following factors:
■ According to Securities and Exchange Commission (SEC)rules, all public companies are required to disclose alldetails regarding the company’s financial condition, pastand present. These disclosures allow investors in publiccompanies to make their investment decisions with moreinformation. As private companies do not have to adhereto SEC disclosure rules and regulations, investors inprivate companies do not have access to this type ofinformation.
■ Investors in publicly owned companies have a readymarket to buy and sell shares of stock. As you will see inmore detail in Chapter 8, “Raising Capital,” anyone canbuy and sell the stock of public companies. That is not thecase with the stock of private companies. Legally, privatecompanies are supposed to sell stock only to“sophisticated” investors whom they know directly orindirectly. Sophisticated is loosely defined to includeindividuals with a certain minimum net worth whounderstand the risks associated with equity investing.Investors known “directly” means those who areassociates, family members, or personal friends. Investorswho are known “indirectly” are people known throughothers, for example, through a banker, lawyer, oraccountant.
Therefore, publicly owned companies have greater valuebecause they provide greater and more reliable information regu-larly to investors than do private companies. This fact supports theaxiom “information is valuable.” Publicly owned companies alsohave greater value because of the liquidity opportunities availableto investors.
192 CHAPTER 7
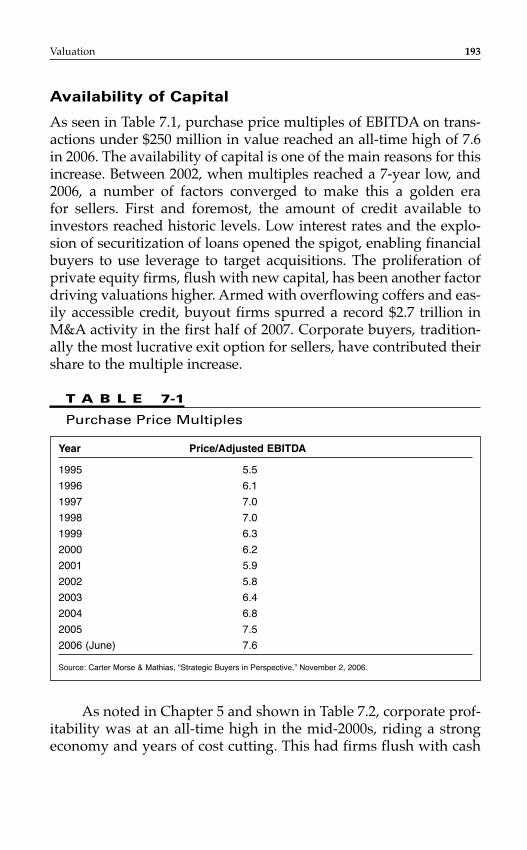
Availability of Capital
As seen in Table 7.1, purchase price multiples of EBITDA on trans-actions under $250 million in value reached an all-time high of 7.6in 2006. The availability of capital is one of the main reasons for thisincrease. Between 2002, when multiples reached a 7-year low, and2006, a number of factors converged to make this a golden era for sellers. First and foremost, the amount of credit available toinvestors reached historic levels. Low interest rates and the explo-sion of securitization of loans opened the spigot, enabling financialbuyers to use leverage to target acquisitions. The proliferation ofprivate equity firms, flush with new capital, has been another factordriving valuations higher. Armed with overflowing coffers and eas-ily accessible credit, buyout firms spurred a record $2.7 trillion inM&A activity in the first half of 2007. Corporate buyers, tradition-ally the most lucrative exit option for sellers, have contributed theirshare to the multiple increase.
Valuation 193
Year Price/Adjusted EBITDA
1995 5.5
1996 6.1
1997 7.0
1998 7.0
1999 6.3
2000 6.2
2001 5.9
2002 5.8
2003 6.4
2004 6.8
2005 7.5
2006 (June) 7.6
Source: Carter Morse & Mathias, “Strategic Buyers in Perspective,” November 2, 2006.
T A B L E 7-1
Purchase Price Multiples
As noted in Chapter 5 and shown in Table 7.2, corporate prof-itability was at an all-time high in the mid-2000s, riding a strongeconomy and years of cost cutting. This had firms flush with cash
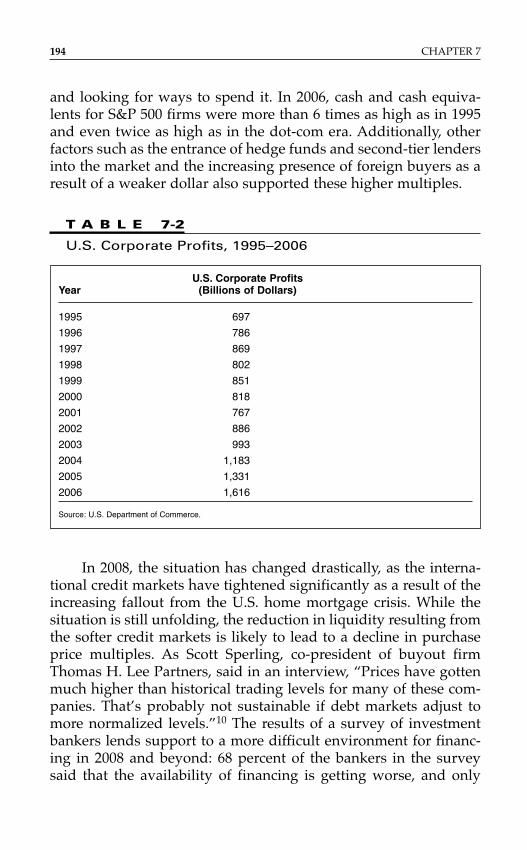
and looking for ways to spend it. In 2006, cash and cash equiva-lents for S&P 500 firms were more than 6 times as high as in 1995and even twice as high as in the dot-com era. Additionally, otherfactors such as the entrance of hedge funds and second-tier lendersinto the market and the increasing presence of foreign buyers as aresult of a weaker dollar also supported these higher multiples.
194 CHAPTER 7
U.S. Corporate Profits Year (Billions of Dollars)
1995 697
1996 786
1997 869
1998 802
1999 851
2000 818
2001 767
2002 886
2003 993
2004 1,183
2005 1,331
2006 1,616
Source: U.S. Department of Commerce.
T A B L E 7-2
U.S. Corporate Profits, 1995–2006
In 2008, the situation has changed drastically, as the interna-tional credit markets have tightened significantly as a result of theincreasing fallout from the U.S. home mortgage crisis. While thesituation is still unfolding, the reduction in liquidity resulting fromthe softer credit markets is likely to lead to a decline in purchaseprice multiples. As Scott Sperling, co-president of buyout firmThomas H. Lee Partners, said in an interview, “Prices have gottenmuch higher than historical trading levels for many of these com-panies. That’s probably not sustainable if debt markets adjust tomore normalized levels.”10 The results of a survey of investmentbankers lends support to a more difficult environment for financ-ing in 2008 and beyond: 68 percent of the bankers in the surveysaid that the availability of financing is getting worse, and only
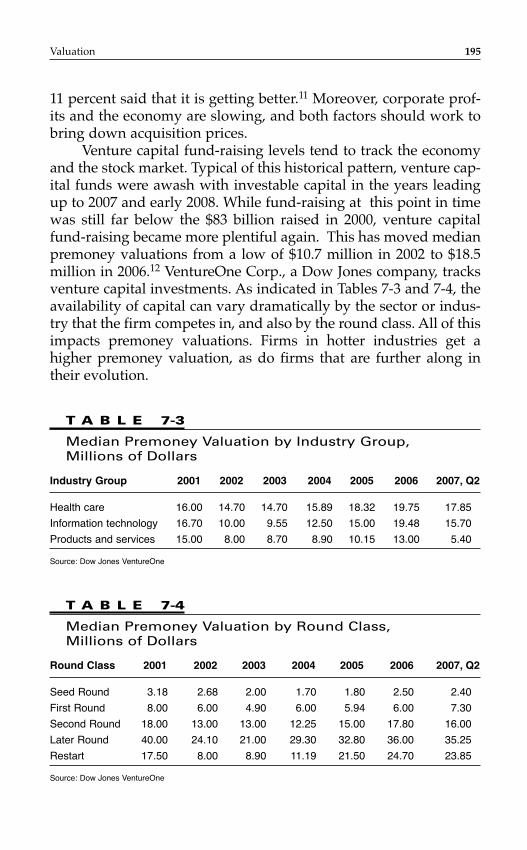
11 percent said that it is getting better.11 Moreover, corporate prof-its and the economy are slowing, and both factors should work tobring down acquisition prices.
Venture capital fund-raising levels tend to track the economyand the stock market. Typical of this historical pattern, venture cap-ital funds were awash with investable capital in the years leadingup to 2007 and early 2008. While fund-raising at this point in timewas still far below the $83 billion raised in 2000, venture capitalfund-raising became more plentiful again. This has moved medianpremoney valuations from a low of $10.7 million in 2002 to $18.5million in 2006.12 VentureOne Corp., a Dow Jones company, tracksventure capital investments. As indicated in Tables 7-3 and 7-4, theavailability of capital can vary dramatically by the sector or indus-try that the firm competes in, and also by the round class. All of thisimpacts premoney valuations. Firms in hotter industries get ahigher premoney valuation, as do firms that are further along intheir evolution.
Valuation 195
Industry Group 2001 2002 2003 2004 2005 2006 2007, Q2
Health care 16.00 14.70 14.70 15.89 18.32 19.75 17.85
Information technology 16.70 10.00 9.55 12.50 15.00 19.48 15.70
Products and services 15.00 8.00 8.70 8.90 10.15 13.00 5.40
Source: Dow Jones VentureOne
T A B L E 7-3
Median Premoney Valuation by Industry Group,Millions of Dollars
Round Class 2001 2002 2003 2004 2005 2006 2007, Q2
Seed Round 3.18 2.68 2.00 1.70 1.80 2.50 2.40
First Round 8.00 6.00 4.90 6.00 5.94 6.00 7.30
Second Round 18.00 13.00 13.00 12.25 15.00 17.80 16.00
Later Round 40.00 24.10 21.00 29.30 32.80 36.00 35.25
Restart 17.50 8.00 8.90 11.19 21.50 24.70 23.85
Source: Dow Jones VentureOne
T A B L E 7-4
Median Premoney Valuation by Round Class, Millions of Dollars
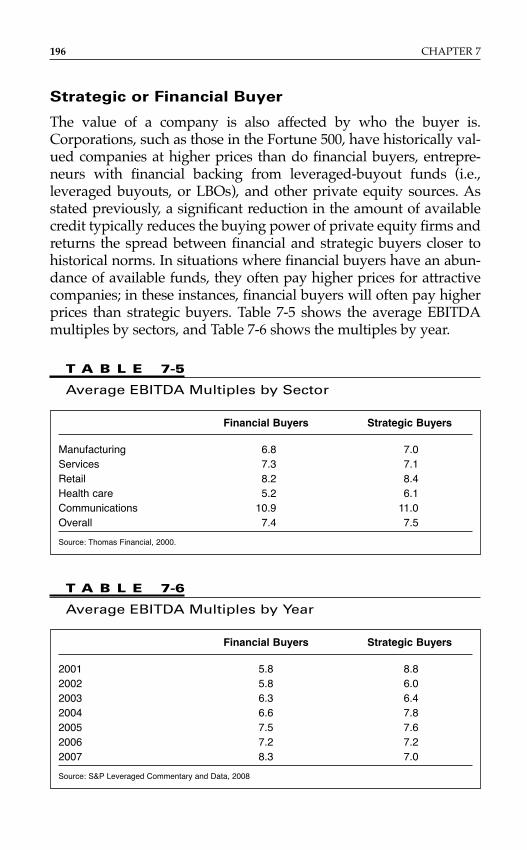
Strategic or Financial Buyer
The value of a company is also affected by who the buyer is.Corporations, such as those in the Fortune 500, have historically val-ued companies at higher prices than do financial buyers, entrepre-neurs with financial backing from leveraged-buyout funds (i.e.,leveraged buyouts, or LBOs), and other private equity sources. Asstated previously, a significant reduction in the amount of availablecredit typically reduces the buying power of private equity firms andreturns the spread between financial and strategic buyers closer tohistorical norms. In situations where financial buyers have an abun-dance of available funds, they often pay higher prices for attractivecompanies; in these instances, financial buyers will often pay higherprices than strategic buyers. Table 7-5 shows the average EBITDAmultiples by sectors, and Table 7-6 shows the multiples by year.
196 CHAPTER 7
Financial Buyers Strategic Buyers
Manufacturing 6.8 7.0Services 7.3 7.1Retail 8.2 8.4Health care 5.2 6.1Communications 10.9 11.0Overall 7.4 7.5
Source: Thomas Financial, 2000.
T A B L E 7-5
Average EBITDA Multiples by Sector
Financial Buyers Strategic Buyers
2001 5.8 8.82002 5.8 6.02003 6.3 6.42004 6.6 7.82005 7.5 7.62006 7.2 7.22007 8.3 7.0
Source: S&P Leveraged Commentary and Data, 2008
T A B L E 7-6
Average EBITDA Multiples by Year
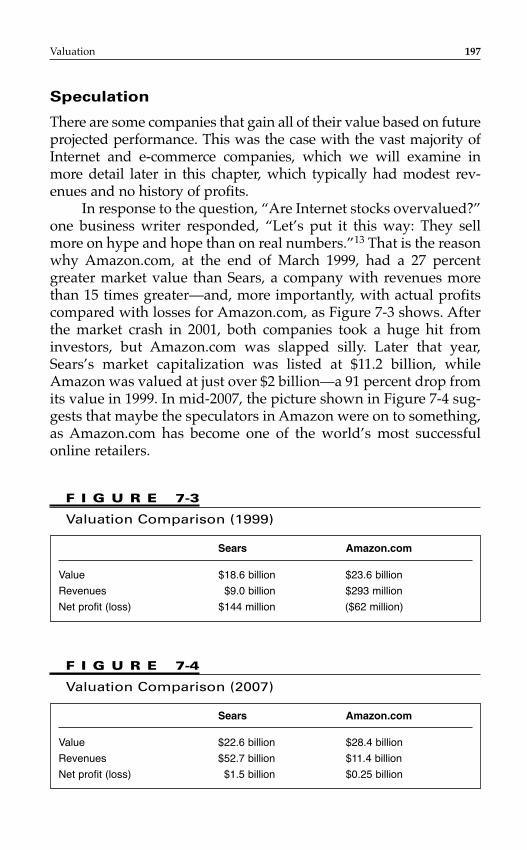
Speculation
There are some companies that gain all of their value based on futureprojected performance. This was the case with the vast majority ofInternet and e-commerce companies, which we will examine inmore detail later in this chapter, which typically had modest rev-enues and no history of profits.
In response to the question, “Are Internet stocks overvalued?”one business writer responded, “Let’s put it this way: They sellmore on hype and hope than on real numbers.”13 That is the reasonwhy Amazon.com, at the end of March 1999, had a 27 percentgreater market value than Sears, a company with revenues morethan 15 times greater—and, more importantly, with actual profitscompared with losses for Amazon.com, as Figure 7-3 shows. Afterthe market crash in 2001, both companies took a huge hit frominvestors, but Amazon.com was slapped silly. Later that year,Sears’s market capitalization was listed at $11.2 billion, whileAmazon was valued at just over $2 billion—a 91 percent drop fromits value in 1999. In mid-2007, the picture shown in Figure 7-4 sug-gests that maybe the speculators in Amazon were on to something,as Amazon.com has become one of the world’s most successfulonline retailers.
Valuation 197
Sears Amazon.com
Value $18.6 billion $23.6 billion
Revenues $9.0 billion $293 million
Net profit (loss) $144 million ($62 million)
F I G U R E 7-3
Valuation Comparison (1999)
Sears Amazon.com
Value $22.6 billion $28.4 billion
Revenues $52.7 billion $11.4 billion
Net profit (loss) $1.5 billion $0.25 billion
F I G U R E 7-4
Valuation Comparison (2007)
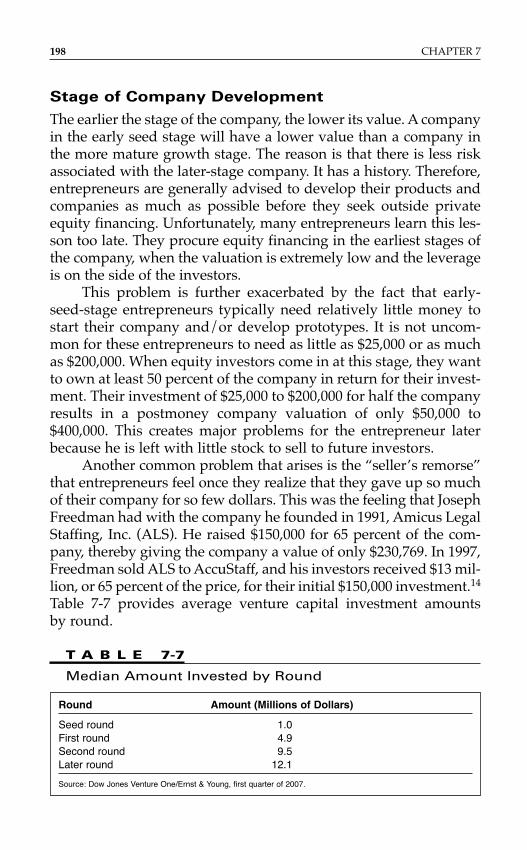
Stage of Company Development
The earlier the stage of the company, the lower its value. A companyin the early seed stage will have a lower value than a company inthe more mature growth stage. The reason is that there is less riskassociated with the later-stage company. It has a history. Therefore,entrepreneurs are generally advised to develop their products andcompanies as much as possible before they seek outside privateequity financing. Unfortunately, many entrepreneurs learn this les-son too late. They procure equity financing in the earliest stages ofthe company, when the valuation is extremely low and the leverageis on the side of the investors.
This problem is further exacerbated by the fact that early-seed-stage entrepreneurs typically need relatively little money tostart their company and/or develop prototypes. It is not uncom-mon for these entrepreneurs to need as little as $25,000 or as muchas $200,000. When equity investors come in at this stage, they wantto own at least 50 percent of the company in return for their invest-ment. Their investment of $25,000 to $200,000 for half the companyresults in a postmoney company valuation of only $50,000 to$400,000. This creates major problems for the entrepreneur laterbecause he is left with little stock to sell to future investors.
Another common problem that arises is the “seller’s remorse”that entrepreneurs feel once they realize that they gave up so muchof their company for so few dollars. This was the feeling that JosephFreedman had with the company he founded in 1991, Amicus LegalStaffing, Inc. (ALS). He raised $150,000 for 65 percent of the com-pany, thereby giving the company a value of only $230,769. In 1997,Freedman sold ALS to AccuStaff, and his investors received $13 mil-lion, or 65 percent of the price, for their initial $150,000 investment.14
Table 7-7 provides average venture capital investment amounts by round.
198 CHAPTER 7
Round Amount (Millions of Dollars)
Seed round 1.0First round 4.9Second round 9.5Later round 12.1
Source: Dow Jones Venture One/Ernst & Young, first quarter of 2007.
T A B L E 7-7
Median Amount Invested by Round
Auction
When a company is being sold via an auction process, it theoreti-cally will ultimately be valued based on what the market will bear.This process typically has multiple potential buyers bidding againsteach other. The result is usually a nice high price for the seller. Forexample, in 2007, Microsoft outbid Google and Yahoo! for the rightto buy a portion of Facebook. Microsoft’s $240 million investmentfor 1.6 percent of Facebook gave the company a value of $15 billion!At the time, Facebook’s revenues were less than $50 million.
State of the Economy
The condition of the country’s and possibly even the world’s eco-nomy can dramatically affect the valuation of a company. As statedearlier in this chapter, the value of companies being started up or purchased increased annually for 5 years until 2000. It is notmerely a coincidence that this occurred at the same time that theU.S. economy experienced the longest period of continuous eco-nomic growth without a recession, as stated in Chapter 2.
A strong economy translates into an increased availability ofinvestor capital, which in turn, as we mentioned earlier in thischapter, translates into leverage for the entrepreneur. Obviously,the converse is true. The value of companies typically declines asthe economy worsens because investors have less money to invest.Therefore, the economy affects the availability of capital, which inturn affects the value of companies.
This is not just economic theory, but a fact, evidenced by, forexample, what occurred during the last recession. In 2001, theUnited States went into a recession. Capital raised (i.e., availablefor investing) by all private equity firms (i.e., venture capital, LBO,and mezzanine funds) was $89.2 billion. The next year, 2002, wasthe first full year of the recession. Capital raised for the year plum-meted to $33.6 billion, a 62 percent decrease from a year earlier.Every year since 2002, the economy has improved, and the privateequity available to entrepreneurs has correspondingly increased,as the data in Table 7-8 show.
Reason for Selling
The value of a company that is being sold is directly related to thereason behind the sale. A company has its greatest value if the
Valuation 199
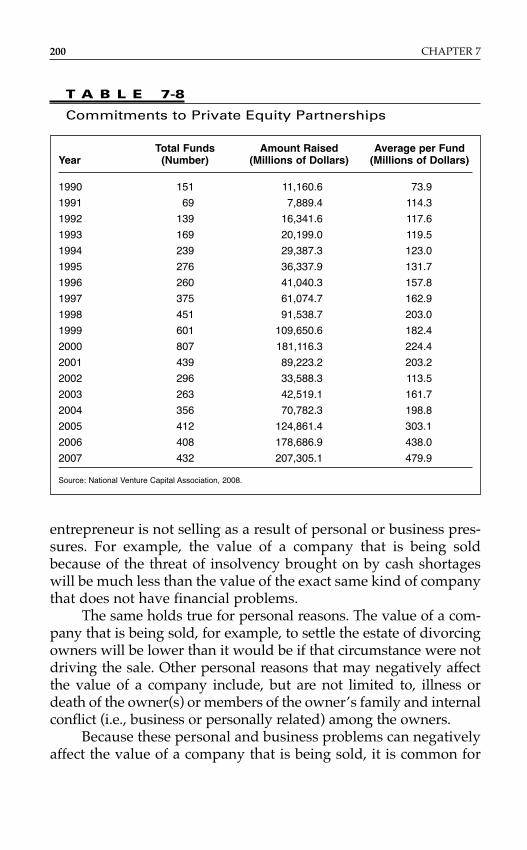
entrepreneur is not selling as a result of personal or business pres-sures. For example, the value of a company that is being soldbecause of the threat of insolvency brought on by cash shortageswill be much less than the value of the exact same kind of companythat does not have financial problems.
The same holds true for personal reasons. The value of a com-pany that is being sold, for example, to settle the estate of divorcingowners will be lower than it would be if that circumstance were notdriving the sale. Other personal reasons that may negatively affectthe value of a company include, but are not limited to, illness ordeath of the owner(s) or members of the owner’s family and internalconflict (i.e., business or personally related) among the owners.
Because these personal and business problems can negativelyaffect the value of a company that is being sold, it is common for
200 CHAPTER 7
Total Funds Amount Raised Average per FundYear (Number) (Millions of Dollars) (Millions of Dollars)
1990 151 11,160.6 73.9
1991 69 7,889.4 114.3
1992 139 16,341.6 117.6
1993 169 20,199.0 119.5
1994 239 29,387.3 123.0
1995 276 36,337.9 131.7
1996 260 41,040.3 157.8
1997 375 61,074.7 162.9
1998 451 91,538.7 203.0
1999 601 109,650.6 182.4
2000 807 181,116.3 224.4
2001 439 89,223.2 203.2
2002 296 33,588.3 113.5
2003 263 42,519.1 161.7
2004 356 70,782.3 198.8
2005 412 124,861.4 303.1
2006 408 178,686.9 438.0
2007 432 207,305.1 479.9
Source: National Venture Capital Association, 2008.
T A B L E 7-8
Commitments to Private Equity Partnerships
owners to disclose as little as possible about the real reasons for thesale. That is why it is essential for any entrepreneur who is buyinga company to do thorough due diligence to determine the reasonthe company is being sold before valuing the company and makingan offer. The major lesson to be learned from this section is thatinformation is valuable. The same lesson was the highlight of anearlier section in this chapter, which discussed the reason why pub-lic companies have greater value than private companies.
Tangible and Intangible Assets
The tangible and intangible assets of a company will also affect thecompany’s value. Most of the value of manufacturing companiestypically lies in tangible assets. The age and condition of theseassets—such as machinery, equipment, and inventory—will have adirect impact on the company’s value. For example, if the equip-ment is old and in poor condition as a result of overuse or lack ofmaintenance, the company will have a lower value than a similarcompany with newer and better-maintained equipment.
The same holds true for intangible assets, including a com-pany’s customer list, patents, and name. For example, if a com-pany’s name is damaged, the company will have less value thananother company in the same industry with a strong, reputablename. That is the reason why AirTran Airways changed its namefrom Value Jet Airlines. The latter’s name had been severely dam-aged as a result of a disastrous plane crash in 1996.
Type of Industry
The industry that a company competes in is also very important toits valuation. It is not uncommon for two separate companies indifferent industries, but with similar revenues, profits, and growth,to have significantly different valuations. As we will see later inthis chapter, that was most certainly the case a few years ago whencomparing Internet and e-commerce companies with companies inalmost any other industry. Based on the price/earnings ratio (P/Eratio) valuation method, which we will also discuss in more detaillater in this chapter, the industries with the highest and lowest val-uations were the ones shown in Figure 7-5.
Valuation 201
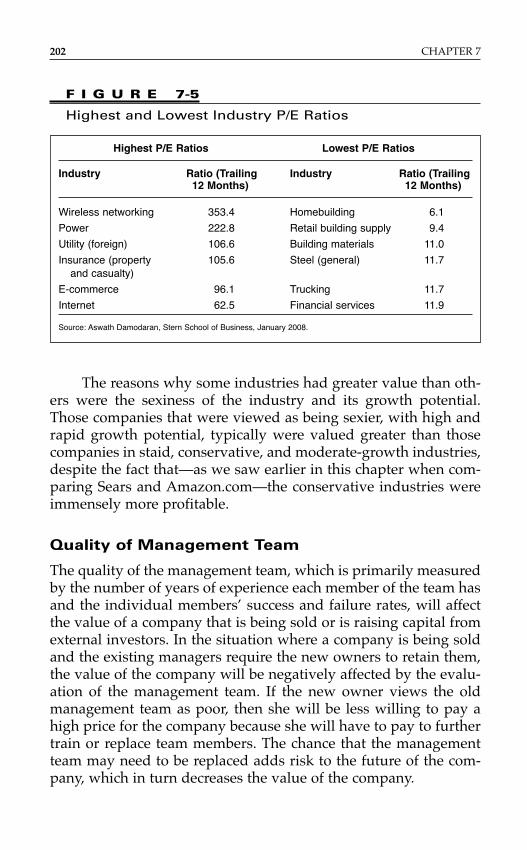
The reasons why some industries had greater value than oth-ers were the sexiness of the industry and its growth potential.Those companies that were viewed as being sexier, with high andrapid growth potential, typically were valued greater than thosecompanies in staid, conservative, and moderate-growth industries,despite the fact that—as we saw earlier in this chapter when com-paring Sears and Amazon.com—the conservative industries wereimmensely more profitable.
Quality of Management Team
The quality of the management team, which is primarily measuredby the number of years of experience each member of the team hasand the individual members’ success and failure rates, will affectthe value of a company that is being sold or is raising capital fromexternal investors. In the situation where a company is being soldand the existing managers require the new owners to retain them,the value of the company will be negatively affected by the evalu-ation of the management team. If the new owner views the oldmanagement team as poor, then she will be less willing to pay ahigh price for the company because she will have to pay to furthertrain or replace team members. The chance that the managementteam may need to be replaced adds risk to the future of the com-pany, which in turn decreases the value of the company.
202 CHAPTER 7
Highest P/E Ratios Lowest P/E Ratios
Industry Ratio (Trailing Industry Ratio (Trailing12 Months) 12 Months)
Wireless networking 353.4 Homebuilding 6.1
Power 222.8 Retail building supply 9.4
Utility (foreign) 106.6 Building materials 11.0
Insurance (property 105.6 Steel (general) 11.7and casualty)
E-commerce 96.1 Trucking 11.7
Internet 62.5 Financial services 11.9
Source: Aswath Damodaran, Stern School of Business, January 2008.
F I G U R E 7-5
Highest and Lowest Industry P/E Ratios
Private equity investors will give greater value to a companythat has experienced management. The reason is exactly the sameas that just mentioned: risk. The greater the risk, the lower the val-uation. For example, two start-up companies looking for the sameamount of investor capital will have significantly different valua-tions if one company’s management is composed of people withstart-up experience and the other’s has none.
VALUATION METHODS
There are numerous ways to value a company, and seemingly,almost no two people do it the same way. Methods may differ fromindustry to industry, as we will see later in this chapter, as well asfrom appraiser to appraiser. It is important to know that there is nosingle valuation methodology that is superior to all the others; eachhas its own benefits and limitations. But ultimately, most businessappraisers prefer and use one method over another. Typically, the commitment to one method comes after experimenting with several methods and determining which consistently provides thevaluation that the person is most comfortable with.
Candidly, valuation is part gut and part science, and simplysaying that you believe in one valuation method is all well andgood. The rubber hits the road when you actually risk your owncapital using one or more of these methods to value a business. Thepoint is that an entrepreneur’s valuation method is determined byexperience; without that valuable experience, it is strongly recom-mended that the entrepreneur use at least two different valuationmethods to determine a company’s range of valuations.
Valuation methods basically fall into three categories: (1) asset-based, (2) cash flow capitalization, and (3) multiples. In the world ofentrepreneurship, if there is a most popular and commonly usedvaluation category, it is multiples, and within this category, the mostpopular method is the multiple of cash flow.
MULTIPLES
Multiple of Cash Flow
The cash flow of a company represents the funds available to meetboth its debt obligations and its equity payments. These funds canbe used to make interest and/or principal payments on debt, and
Valuation 203
also to provide dividend payments, share repurchases, and rein-vestments in the company. One way of valuing a company is bydetermining the level of cash available to undertake these activi-ties. This level of cash is determined by calculating earnings beforeinterest, taxes, depreciation, and amortization—EBITDA.
In this valuation methodology, EBITDA is multiplied by a spec-ified figure (i.e., the multiplier) to determine the value of the com-pany. In general, as shown here, a multiplier of between 3 and 10 isused. However, buyers’ market or sellers’ market, sales growth,industry growth potential, variability in a company’s earnings, andexit options available to investors are all factors that affect the levelof the multiplier used in valuation. The multiple is not static, butevergreen. It can change for a myriad of reasons.
As venture capitalist Bill Sutter, a graduate of PrincetonUniversity and Stanford Business School, stated:
Virtually every conversation about a company’s valuation in the pri-vate equity industry starts with a 5 times cash flow multiple discussion.The multiple will go up for qualitative reasons like super managementand higher growth and will go down for other types of industries thatare recessionary, where risk and volatility is perceived to be higher.15
Another means of reducing or improving valuations based oncash flow multiples is to adjust EBITDA. The adjusted EBITDAshould be calculated after the entrepreneur’s salary has beendeducted. The reason is that the entrepreneur is entitled to receive amarket-rate salary. This salary should be treated as a legitimateexpense on the income statement. If the owner’s salary is not rec-ognized, then the company’s EBITDA will be artificially inflated,resulting in an overvaluation of the company. This result would notbe in the best interest of a buyer, who would pay more for a com-pany, nor would it be in the best interest of an investor, who wouldget less equity for her investment. In the case of a buyer, the properway to determine EBITDA is to replace the seller’s salary with thenew salary anticipated by the buyer, as long as it is at a justifiablemarket-rate level. The calculation is shown in Equation 7-2.
E Q U A T I O N 7-2
EBITDA Salary Adjustment
Adjusted EBITDA � EBITDA � seller’s salary � buyer’s salary
204 CHAPTER 7
For example, if a company in an industry that commonly usesa multiple of 7 had an EBITDA of $500,000, one would assume a val-uation of $3.5 million. But suppose further analysis of the seller’sfinancial statements shows that he took a salary of only $50,000when similar-size companies in the same industry paid their owners$125,000. If the buyer intends to pay himself the market rate of$125,000, then the company’s value, using the EBITDA multiple of 7,should be $2,975,000 [i.e., ($500,000 � $50,000 � $125,000) � 7]. This$525,000 difference is an 18 percent overvaluation!
Please note that the change in the owner’s salary would alsoaffect the amount of taxes paid by the company. Since the new salarywould decrease the operating profit, the taxes would also decrease.
As stated earlier, multiples of EBITDA up to 10 are notuncommon. For example, in 2008, Mars, the candy manufacturer,agreed to buy Wrigley, the gum company, for $23 billion, or 19times EBITDA, whereas the packaged food industry generallyaverages a 12 multiple.16 But this author discourages acceptance ofsuch multiples unless you are the seller of the entire company or aportion of it. For a buyer, it is suggested that multiples no greaterthan 5 should be accepted. The reason is that valuation should besuch that cash flow, under the worst-case scenario, will be able tocompletely service the debt obligation in the typical 5- to 7-yearamortization period.
At a 5 multiple, if the capital structure is 60 to 80 percent debt,as is common, then it can be serviced within 7 years. For example, ifthe Grant Company’s EBITDA is $1 million, a buyer should pay no more than $5 million. With an 80 percent, or $4 million, loan at 7 percent, if the cash flow over the next 7 years remained the sameand no major capital improvements were needed, the total $7 millioncould comfortably service the debt obligation.
Multiple of Free Cash Flow
Finally, for companies requiring major investments in new equip-ment in order to sustain growth, it is common to use a multiple of the company’s free cash flow (FCF) instead of just EBITDA.This is a more conservative cash description that yields a lowervaluation. For multiple purposes, FCF is calculated as shown inEquation 7-3.
Valuation 205
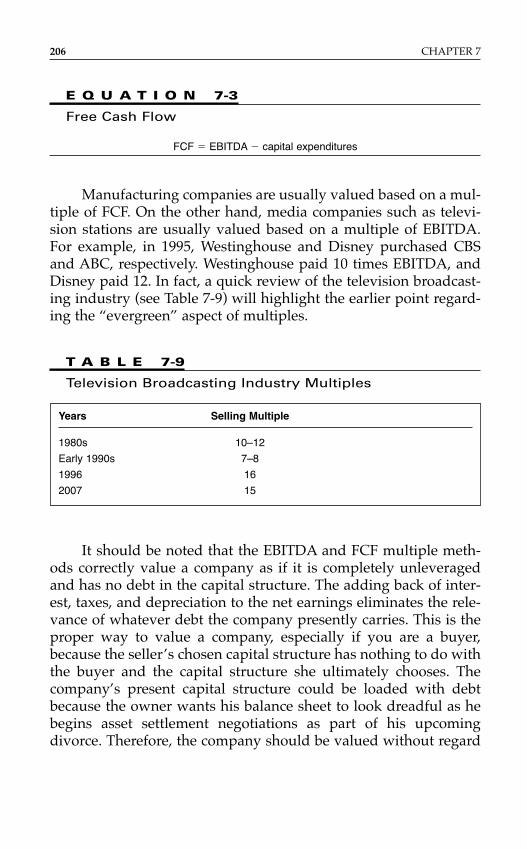
E Q U A T I O N 7-3
Free Cash Flow
FCF � EBITDA � capital expenditures
Manufacturing companies are usually valued based on a mul-tiple of FCF. On the other hand, media companies such as televi-sion stations are usually valued based on a multiple of EBITDA.For example, in 1995, Westinghouse and Disney purchased CBSand ABC, respectively. Westinghouse paid 10 times EBITDA, andDisney paid 12. In fact, a quick review of the television broadcast-ing industry (see Table 7-9) will highlight the earlier point regard-ing the “evergreen” aspect of multiples.
206 CHAPTER 7
Years Selling Multiple
1980s 10–12
Early 1990s 7–8
1996 16
2007 15
T A B L E 7-9
Television Broadcasting Industry Multiples
It should be noted that the EBITDA and FCF multiple meth-ods correctly value a company as if it is completely unleveragedand has no debt in the capital structure. The adding back of inter-est, taxes, and depreciation to the net earnings eliminates the rele-vance of whatever debt the company presently carries. This is theproper way to value a company, especially if you are a buyer,because the seller’s chosen capital structure has nothing to do withthe buyer and the capital structure she ultimately chooses. Thecompany’s present capital structure could be loaded with debtbecause the owner wants his balance sheet to look dreadful as hebegins asset settlement negotiations as part of his upcomingdivorce. Therefore, the company should be valued without regard
to its existing debt. Once the buyer determines the value she wantsto pay, she can agree to inherit the debt as part of her payment. Forexample, if the company’s value is $5 million, the buyer can agreeto pay it by assuming the $1 million of long-term debt that theseller owes and paying the $4 million balance in cash.
Multiple of Sales
This multiple is one of the more widely used valuation methods.Sales growth prospects and investor optimism play a major role indetermining the level of the multiple to be used, and differentindustries use different multiples. In the food industry, businessesgenerally sell for 1 to 2 times revenue, but sales growth prospectscan have an impact on raising or lowering the multiplier. For exam-ple, Quaker Oats, a strategic buyer, paid $1.7 billion, or 3.5 timesrevenue, for Snapple in 1995 at a time when similar companieswere being sold for a sales multiple of 2 or less. Quaker’s rationale:it expected rapid growth from Snapple.
However, that rapid growth did not happen. Two years later,Quaker sold Snapple to Triarc Cos. for $300 million, equivalent toa little more than 50 percent of its annual revenues of $550 million.Quaker’s obvious overvaluation of Snapple was instrumental inthe CEO’s departure from the company. On the other hand, Triarc’sowners were given the greatest compliment after buying Snapplewhen someone said, “They stole the company!”17 In 2001, PepsiCoacquired Quaker for $13.4 billion.
Other industries that are commonly valued on a multiple of rev-enues include the radio station industry. Typical valuations are 2.0 to2.5 times revenues for small-market stations, 3 to 3.5 times for mid-dle-market stations, and 4 times for large-market stations. Anothersuch industry is professional services firms, which are typically val-ued at 1 to 3 times revenues. But the most prominent industry thatused the multiple of sales model is technology, especially the Internetindustry, which will be discussed in more detail later in this chapter.
The shortcoming of this method is that it ignores whether thecompany is making cash. The focus is entirely on the top line.Therefore, this valuation method is best suited for those entrepre-neurs who are focusing on growing market share by acquiring
Valuation 207
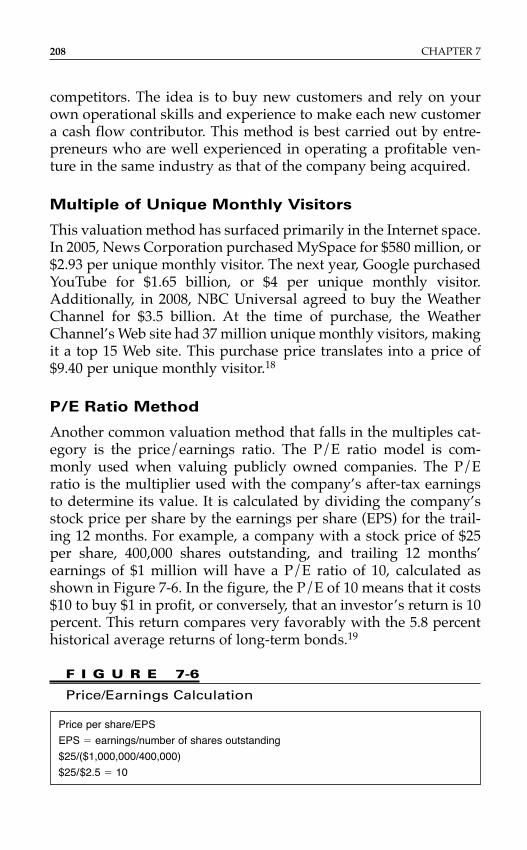
competitors. The idea is to buy new customers and rely on yourown operational skills and experience to make each new customera cash flow contributor. This method is best carried out by entre-preneurs who are well experienced in operating a profitable ven-ture in the same industry as that of the company being acquired.
Multiple of Unique Monthly Visitors
This valuation method has surfaced primarily in the Internet space.In 2005, News Corporation purchased MySpace for $580 million, or$2.93 per unique monthly visitor. The next year, Google purchasedYouTube for $1.65 billion, or $4 per unique monthly visitor.Additionally, in 2008, NBC Universal agreed to buy the WeatherChannel for $3.5 billion. At the time of purchase, the WeatherChannel’s Web site had 37 million unique monthly visitors, makingit a top 15 Web site. This purchase price translates into a price of$9.40 per unique monthly visitor.18
P/E Ratio Method
Another common valuation method that falls in the multiples cat-egory is the price/earnings ratio. The P/E ratio model is com-monly used when valuing publicly owned companies. The P/Eratio is the multiplier used with the company’s after-tax earningsto determine its value. It is calculated by dividing the company’sstock price per share by the earnings per share (EPS) for the trail-ing 12 months. For example, a company with a stock price of $25per share, 400,000 shares outstanding, and trailing 12 months’earnings of $1 million will have a P/E ratio of 10, calculated asshown in Figure 7-6. In the figure, the P/E of 10 means that it costs$10 to buy $1 in profit, or conversely, that an investor’s return is 10percent. This return compares very favorably with the 5.8 percenthistorical average returns of long-term bonds.19
208 CHAPTER 7
Price per share/EPS
EPS � earnings/number of shares outstanding
$25/($1,000,000/400,000)
$25/$2.5 � 10
F I G U R E 7-6
Price/Earnings Calculation
The average historical P/E multiple for the Dow JonesIndustrial Average and Standard & Poor’s 500 is 16. In 1998, dur-ing the heart of the stock market rise, the S&P multiple was 28 andthe Dow 22.20 In late 2001, in the heart of the market crash, the S&Pmultiple was 23.5 and the Dow multiple was 57.3. If you excludeHoneywell (P/E of 731, due in large part to GE’s attempted acqui-sition), the Dow multiple was 32.9. That multiple is higher than thehistorical averages for some good reasons. The Dow consists oflarger blue-chip companies that tend to have less volatility, andduring the economic downturn, investors were migrating to thesesafer companies. Consequently, the P/E multiples of these compa-nies tended to be higher than normal.
P/E multiples are published daily in the business sections ofnewspapers, showing the ratios for publicly traded companies incomparable businesses. Companies in the same industry may havedifferent P/E multiples despite the fact that they have similarannual earnings and a similar number of outstanding shares. Thedifference may be related to the price of the stock. Investors may bewilling to pay a higher stock price for one company because of itshigher forecasted growth rate, the presence of more experiencedmanagement, the settlement of a recent lawsuit, or the approval ofa new patent. In this example, the company with the higher stockprice would have a higher P/E multiple and therefore a higher val-uation. Thus, it can be concluded that when a company has a P/Emultiple that is higher than the industry average, it’s primarilybecause investors have a positive view of the company’s growthopportunities and expect relatively reliable earnings. Conversely,lower P/E multiples are associated with low growth, erratic earn-ings, and perceived future financial risk.
Be mindful of the fact that the use of P/E multiples is ideallyfor publicly owned companies. But P/E multiples are sometimesused to value private companies.
The ideal way to value a private company using a P/E multi-ple is to find the public company that is the most comparable. Themost important criterion to look for is a company with exactly thesame, or as close as possible, products or services. The objective is to select a company in the same business. The other importantcriteria are as follows:
■ Revenue size■ Profitability
Valuation 209
■ Growth history and potential■ Company age
After the best comparable is determined, the P/E multipleshould be discounted. The reason? As stated earlier in this chapter,the value of a publicly owned company will always be higher thanthat of a private company with exactly the same revenues, profits,cash flow, growth potential, and age, as a result of liquidity andaccess to information. The result is that private companies are typically valued 15 to 25 percent lower than public companies.Therefore, the P/E multiple of a public company that is selected asthe best comparable should be discounted by 15 to 25 percent.
MULTIPLE OF GROSS MARGIN
As a rule of thumb, the multiple of gross margins should be nohigher than 2. Therefore, a company with revenues of $50 millionand gross margin of 30 percent has a value of $30 million (i.e.,$50 million � 0.30 � $15 million; $15 million � 2 � $30 million).
DIFFERENT INDUSTRIES USE DIFFERENT
MULTIPLE BENCHMARKS
Before we close out the discussion of multiples, it is important tohighlight the fact that different industries use not only differentmultiple numbers but also different benchmarks. They include thefollowing:
■ Distribution companies in the soft drink and alcoholicbeverages industry are valued at a multiple of the numberof cases sold.
■ The pawnshop industry, which provides loans averaging$70 to $100 at annual interest rates ranging from 12 to 240percent, typically uses one of two valuation methods: themultiple of earnings model or the multiple of loan balancemodel. There are over 15,000 pawnshops in the UnitedStates, and approximately 6 percent are publicly owned.These public pawnshops are valued at a multiple of 18.5times earnings, which is significantly higher than thefigures for private shops, which are valued at between 4 and 7 times earnings.
210 CHAPTER 7
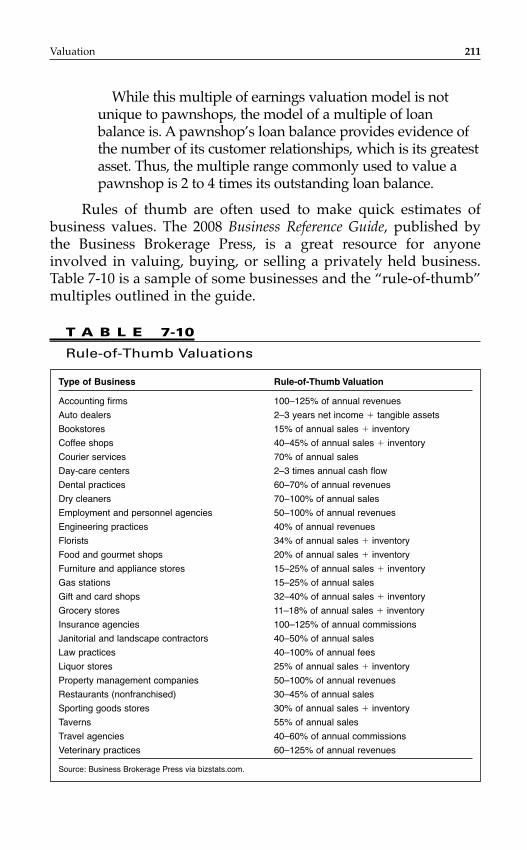
While this multiple of earnings valuation model is notunique to pawnshops, the model of a multiple of loanbalance is. A pawnshop’s loan balance provides evidence ofthe number of its customer relationships, which is its greatestasset. Thus, the multiple range commonly used to value apawnshop is 2 to 4 times its outstanding loan balance.
Rules of thumb are often used to make quick estimates ofbusiness values. The 2008 Business Reference Guide, published bythe Business Brokerage Press, is a great resource for anyoneinvolved in valuing, buying, or selling a privately held business.Table 7-10 is a sample of some businesses and the “rule-of-thumb”multiples outlined in the guide.
Valuation 211
Type of Business Rule-of-Thumb Valuation
Accounting firms 100–125% of annual revenues
Auto dealers 2–3 years net income � tangible assets
Bookstores 15% of annual sales � inventory
Coffee shops 40–45% of annual sales � inventory
Courier services 70% of annual sales
Day-care centers 2–3 times annual cash flow
Dental practices 60–70% of annual revenues
Dry cleaners 70–100% of annual sales
Employment and personnel agencies 50–100% of annual revenues
Engineering practices 40% of annual revenues
Florists 34% of annual sales � inventory
Food and gourmet shops 20% of annual sales � inventory
Furniture and appliance stores 15–25% of annual sales � inventory
Gas stations 15–25% of annual sales
Gift and card shops 32–40% of annual sales � inventory
Grocery stores 11–18% of annual sales � inventory
Insurance agencies 100–125% of annual commissions
Janitorial and landscape contractors 40–50% of annual sales
Law practices 40–100% of annual fees
Liquor stores 25% of annual sales � inventory
Property management companies 50–100% of annual revenues
Restaurants (nonfranchised) 30–45% of annual sales
Sporting goods stores 30% of annual sales � inventory
Taverns 55% of annual sales
Travel agencies 40–60% of annual commissions
Veterinary practices 60–125% of annual revenues
Source: Business Brokerage Press via bizstats.com.
T A B L E 7-10
Rule-of-Thumb Valuations
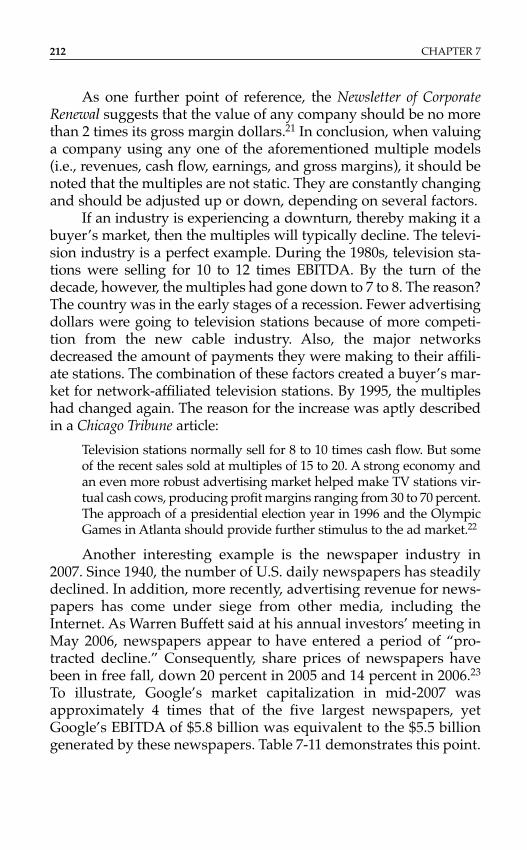
As one further point of reference, the Newsletter of CorporateRenewal suggests that the value of any company should be no morethan 2 times its gross margin dollars.21 In conclusion, when valuinga company using any one of the aforementioned multiple models(i.e., revenues, cash flow, earnings, and gross margins), it should benoted that the multiples are not static. They are constantly changingand should be adjusted up or down, depending on several factors.
If an industry is experiencing a downturn, thereby making it abuyer’s market, then the multiples will typically decline. The televi-sion industry is a perfect example. During the 1980s, television sta-tions were selling for 10 to 12 times EBITDA. By the turn of thedecade, however, the multiples had gone down to 7 to 8. The reason?The country was in the early stages of a recession. Fewer advertisingdollars were going to television stations because of more competi-tion from the new cable industry. Also, the major networksdecreased the amount of payments they were making to their affili-ate stations. The combination of these factors created a buyer’s mar-ket for network-affiliated television stations. By 1995, the multipleshad changed again. The reason for the increase was aptly describedin a Chicago Tribune article:
Television stations normally sell for 8 to 10 times cash flow. But someof the recent sales sold at multiples of 15 to 20. A strong economy andan even more robust advertising market helped make TV stations vir-tual cash cows, producing profit margins ranging from 30 to 70 percent.The approach of a presidential election year in 1996 and the OlympicGames in Atlanta should provide further stimulus to the ad market.22
Another interesting example is the newspaper industry in2007. Since 1940, the number of U.S. daily newspapers has steadilydeclined. In addition, more recently, advertising revenue for news-papers has come under siege from other media, including theInternet. As Warren Buffett said at his annual investors’ meeting inMay 2006, newspapers appear to have entered a period of “pro-tracted decline.” Consequently, share prices of newspapers havebeen in free fall, down 20 percent in 2005 and 14 percent in 2006.23
To illustrate, Google’s market capitalization in mid-2007 wasapproximately 4 times that of the five largest newspapers, yetGoogle’s EBITDA of $5.8 billion was equivalent to the $5.5 billiongenerated by these newspapers. Table 7-11 demonstrates this point.
212 CHAPTER 7
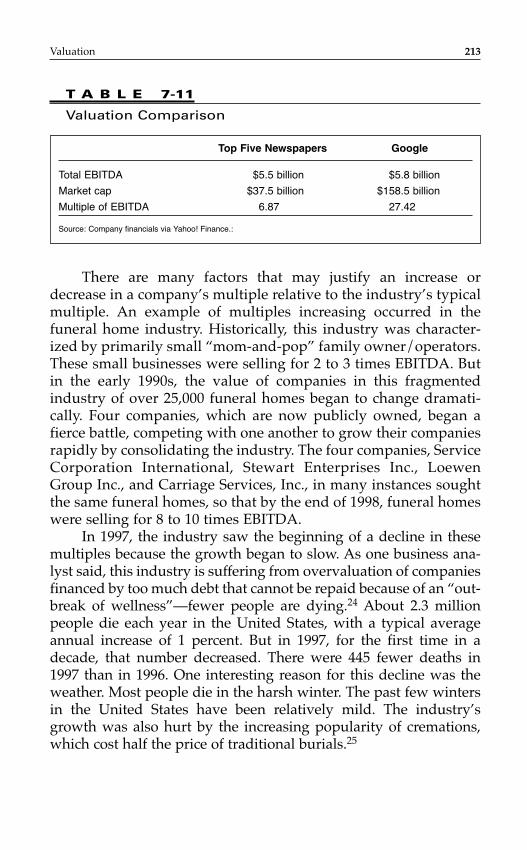
There are many factors that may justify an increase ordecrease in a company’s multiple relative to the industry’s typicalmultiple. An example of multiples increasing occurred in thefuneral home industry. Historically, this industry was character-ized by primarily small “mom-and-pop” family owner/operators.These small businesses were selling for 2 to 3 times EBITDA. Butin the early 1990s, the value of companies in this fragmentedindustry of over 25,000 funeral homes began to change dramati-cally. Four companies, which are now publicly owned, began afierce battle, competing with one another to grow their companiesrapidly by consolidating the industry. The four companies, ServiceCorporation International, Stewart Enterprises Inc., LoewenGroup Inc., and Carriage Services, Inc., in many instances soughtthe same funeral homes, so that by the end of 1998, funeral homeswere selling for 8 to 10 times EBITDA.
In 1997, the industry saw the beginning of a decline in thesemultiples because the growth began to slow. As one business ana-lyst said, this industry is suffering from overvaluation of companiesfinanced by too much debt that cannot be repaid because of an “out-break of wellness”—fewer people are dying.24 About 2.3 millionpeople die each year in the United States, with a typical averageannual increase of 1 percent. But in 1997, for the first time in adecade, that number decreased. There were 445 fewer deaths in1997 than in 1996. One interesting reason for this decline was theweather. Most people die in the harsh winter. The past few wintersin the United States have been relatively mild. The industry’sgrowth was also hurt by the increasing popularity of cremations,which cost half the price of traditional burials.25
Valuation 213
Top Five Newspapers Google
Total EBITDA $5.5 billion $5.8 billion
Market cap $37.5 billion $158.5 billion
Multiple of EBITDA 6.87 27.42
Source: Company financials via Yahoo! Finance.:
T A B L E 7-11
Valuation Comparison
The final example of an ever-changing multiple was thatapplied to high-growth Microsoft. From 1994 to 1996, Microsoft’smultiple of revenues more than doubled, from 6 to 14.26
ASSET VALUATION
In the past, the value of a company’s assets had a great significancein determining the company’s overall valuation. Today, mostAmerican companies do not have many tangible assets becauseeach year fewer things are produced in the United States. Most areproduced overseas in low-wage-paying countries like China, India,and Taiwan.
The result is that over time, the value of a company is depend-ent less on its assets than on its cash flow. Asset value tends to bemost meaningful in cases in which financially troubled companiesare being sold. In that case, the negotiation for the value of the com-pany typically begins at the depreciated value of its assets.
CAPITALIZATION OF CASH FLOWS
Free Cash Flow Method
The most complicated and involved valuation model is the freecash flow model, also known as the discounted cash flow or capi-talization of cash flow model. It is a model that relies on projectionsfilled with assumptions, because there are so many unknown vari-ables. Therefore, it is the model most commonly used to valuehigh-risk start-ups.
Simply stated, free cash flow is the portion of a company’soperating cash flow that is available for distribution to theproviders of debt (i.e., interest and principal payments) and equity(i.e., dividend payments and repurchase of stock) capital. This isthe cash that is available after the operating taxes, working capitalneeds, and capital expenditures have been deducted.
Using this valuation method, one approach is to forecast theFCF as the Japanese do: for 25 years without regard to what hap-pens later, because its discounted value will be insignificant.Another similar, and more commonly used, approach is to separatethe value of the business into two time periods: during and after anexplicitly forecasted period. The “during” period is referred to asthe planning period. The “after” period is referred to as the residual.
214 CHAPTER 7
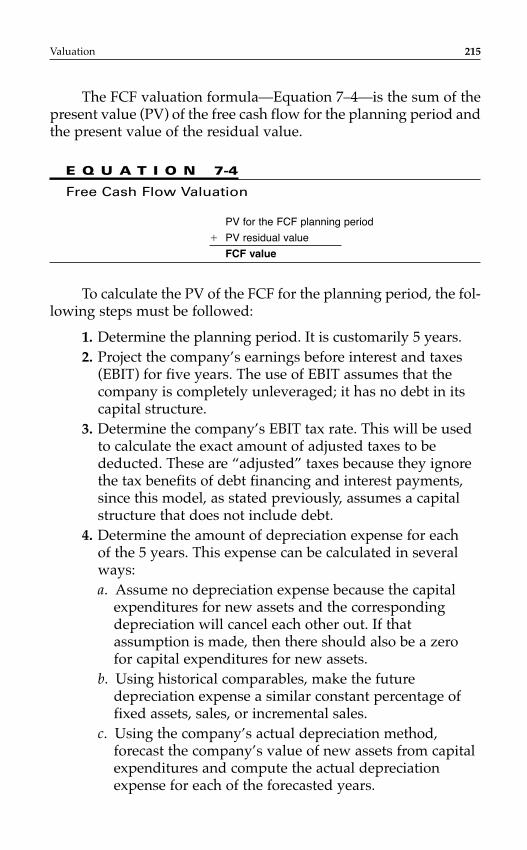
The FCF valuation formula—Equation 7–4—is the sum of thepresent value (PV) of the free cash flow for the planning period andthe present value of the residual value.
E Q U A T I O N 7-4
Free Cash Flow Valuation
PV for the FCF planning period
� PV residual value
FCF value
To calculate the PV of the FCF for the planning period, the fol-lowing steps must be followed:
1. Determine the planning period. It is customarily 5 years.2. Project the company’s earnings before interest and taxes
(EBIT) for five years. The use of EBIT assumes that thecompany is completely unleveraged; it has no debt in itscapital structure.
3. Determine the company’s EBIT tax rate. This will be usedto calculate the exact amount of adjusted taxes to bededucted. These are “adjusted” taxes because they ignorethe tax benefits of debt financing and interest payments,since this model, as stated previously, assumes a capitalstructure that does not include debt.
4. Determine the amount of depreciation expense for each of the 5 years. This expense can be calculated in severalways:a. Assume no depreciation expense because the capital
expenditures for new assets and the correspondingdepreciation will cancel each other out. If thatassumption is made, then there should also be a zerofor capital expenditures for new assets.
b. Using historical comparables, make the futuredepreciation expense a similar constant percentage offixed assets, sales, or incremental sales.
c. Using the company’s actual depreciation method,forecast the company’s value of new assets from capitalexpenditures and compute the actual depreciationexpense for each of the forecasted years.
Valuation 215
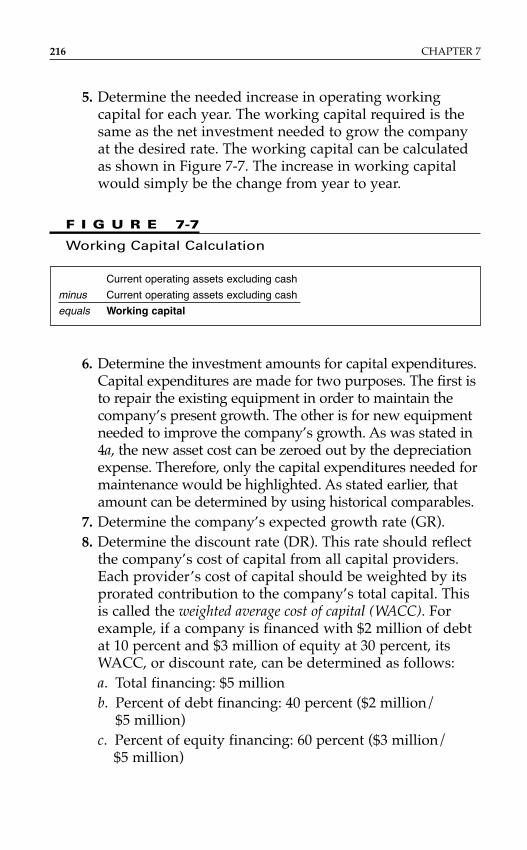
5. Determine the needed increase in operating workingcapital for each year. The working capital required is thesame as the net investment needed to grow the companyat the desired rate. The working capital can be calculatedas shown in Figure 7-7. The increase in working capitalwould simply be the change from year to year.
216 CHAPTER 7
Current operating assets excluding cash
minus Current operating assets excluding cash
equals Working capital
F I G U R E 7-7
Working Capital Calculation
6. Determine the investment amounts for capital expenditures.Capital expenditures are made for two purposes. The first isto repair the existing equipment in order to maintain thecompany’s present growth. The other is for new equipmentneeded to improve the company’s growth. As was stated in4a, the new asset cost can be zeroed out by the depreciationexpense. Therefore, only the capital expenditures needed formaintenance would be highlighted. As stated earlier, thatamount can be determined by using historical comparables.
7. Determine the company’s expected growth rate (GR).8. Determine the discount rate (DR). This rate should reflect
the company’s cost of capital from all capital providers.Each provider’s cost of capital should be weighted by itsprorated contribution to the company’s total capital. Thisis called the weighted average cost of capital (WACC). Forexample, if a company is financed with $2 million of debtat 10 percent and $3 million of equity at 30 percent, itsWACC, or discount rate, can be determined as follows:a. Total financing: $5 millionb. Percent of debt financing: 40 percent ($2 million/
$5 million)c. Percent of equity financing: 60 percent ($3 million/
$5 million)
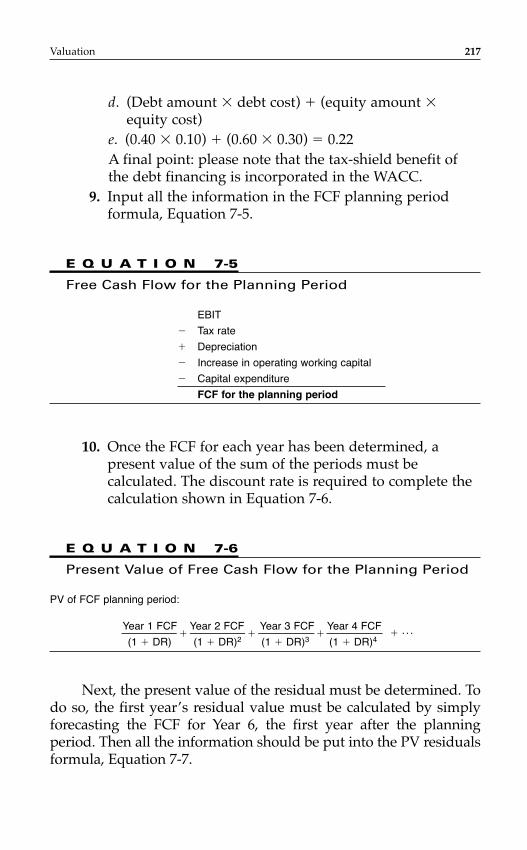
d. (Debt amount � debt cost) � (equity amount �equity cost)
e. (0.40 � 0.10) � (0.60 � 0.30) � 0.22A final point: please note that the tax-shield benefit of the debt financing is incorporated in the WACC.
9. Input all the information in the FCF planning periodformula, Equation 7-5.
E Q U A T I O N 7-5
Free Cash Flow for the Planning Period
EBIT
� Tax rate
� Depreciation
� Increase in operating working capital
� Capital expenditure
FCF for the planning period
10. Once the FCF for each year has been determined, apresent value of the sum of the periods must becalculated. The discount rate is required to complete thecalculation shown in Equation 7-6.
E Q U A T I O N 7-6
Present Value of Free Cash Flow for the Planning Period
PV of FCF planning period:
Year 1 FCF Year 2 FCF Year 3 FCF Year 4 FCF � . . .
(1 � DR) (1 � DR)2 (1 � DR)3 (1 � DR)4
Next, the present value of the residual must be determined. Todo so, the first year’s residual value must be calculated by simplyforecasting the FCF for Year 6, the first year after the planningperiod. Then all the information should be put into the PV residualsformula, Equation 7-7.
Valuation 217
� � � � . . .
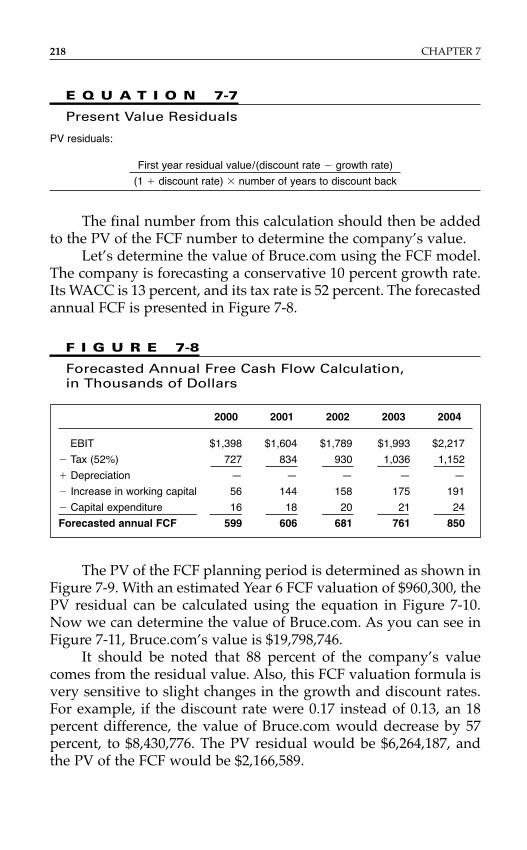
E Q U A T I O N 7-7
Present Value Residuals
PV residuals:
First year residual value/(discount rate � growth rate)
(1 � discount rate) � number of years to discount back
The final number from this calculation should then be addedto the PV of the FCF number to determine the company’s value.
Let’s determine the value of Bruce.com using the FCF model.The company is forecasting a conservative 10 percent growth rate.Its WACC is 13 percent, and its tax rate is 52 percent. The forecastedannual FCF is presented in Figure 7-8.
218 CHAPTER 7
2000 2001 2002 2003 2004
EBIT $1,398 $1,604 $1,789 $1,993 $2,217
� Tax (52%) 727 834 930 1,036 1,152
� Depreciation — — — — —
� Increase in working capital 56 144 158 175 191
� Capital expenditure 16 18 20 21 24
Forecasted annual FCF 599 606 681 761 850
F I G U R E 7-8
Forecasted Annual Free Cash Flow Calculation, in Thousands of Dollars
The PV of the FCF planning period is determined as shown inFigure 7-9. With an estimated Year 6 FCF valuation of $960,300, thePV residual can be calculated using the equation in Figure 7-10.Now we can determine the value of Bruce.com. As you can see inFigure 7-11, Bruce.com’s value is $19,798,746.
It should be noted that 88 percent of the company’s valuecomes from the residual value. Also, this FCF valuation formula isvery sensitive to slight changes in the growth and discount rates.For example, if the discount rate were 0.17 instead of 0.13, an 18percent difference, the value of Bruce.com would decrease by 57percent, to $8,430,776. The PV residual would be $6,264,187, andthe PV of the FCF would be $2,166,589.
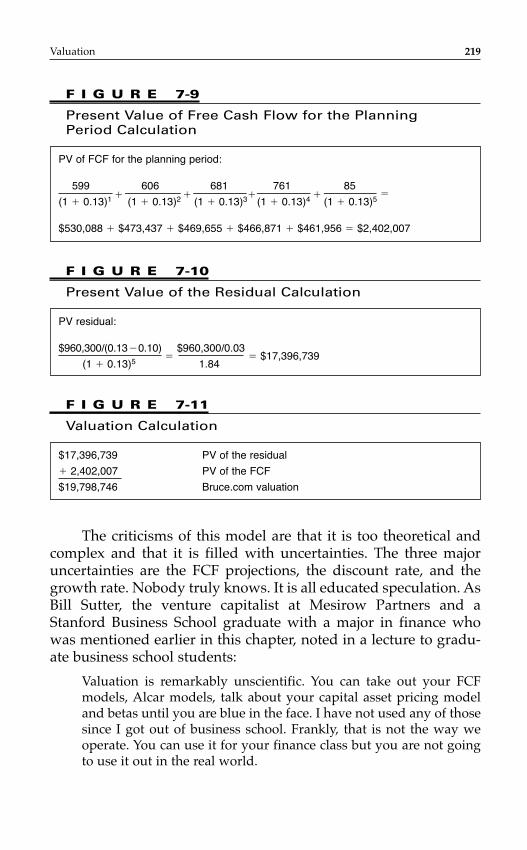
The criticisms of this model are that it is too theoretical andcomplex and that it is filled with uncertainties. The three majoruncertainties are the FCF projections, the discount rate, and thegrowth rate. Nobody truly knows. It is all educated speculation. AsBill Sutter, the venture capitalist at Mesirow Partners and aStanford Business School graduate with a major in finance whowas mentioned earlier in this chapter, noted in a lecture to gradu-ate business school students:
Valuation is remarkably unscientific. You can take out your FCFmodels, Alcar models, talk about your capital asset pricing modeland betas until you are blue in the face. I have not used any of thosesince I got out of business school. Frankly, that is not the way weoperate. You can use it for your finance class but you are not goingto use it out in the real world.
Valuation 219
PV of FCF for the planning period:
599 606 681 761 85
(1 � 0.13)1 (1 � 0.13)2 (1 � 0.13)3 (1 � 0.13)4 (1 � 0.13)5�
$530,088 � $473,437 � $469,655 � $466,871 � $461,956 � $2,402,007
F I G U R E 7-9
Present Value of Free Cash Flow for the Planning Period Calculation
PV residual:
$960,300/(0.13�0.10)�
$960,300/0.03 � $17,396,739
(1 � 0.13)5 1.84
F I G U R E 7-10
Present Value of the Residual Calculation
$17,396,739 PV of the residual
� 2,402,007 PV of the FCF
$19,798,746 Bruce.com valuation
F I G U R E 7-11
Valuation Calculation
� � � �
VALUING TECHNOLOGY AND INTERNET
COMPANIES
In most instances, the valuation methods discussed in this chapterwere not applicable when valuing start-up Internet and relatedtechnology companies during the 1990s. The P/E ratio methodcould not be used because the companies had no “E.” Until 2000,Internet companies that had negligible or no present cash flowstreams, and in most instances did not expect to get positive cashflow streams for years to come, had been valued at extremely highprices at the time they went public. Examples of this includeNetscape, Yahoo!, and Amazon.com, to name just a few of the better-known brand names.
When Netscape, the Internet browser company, went publicin 1996, the value of its stock went from $28 to $171 per share overa three-month period, despite the fact that the company had nevermade a profit. AOL eventually acquired Netscape.
In 1995, two Stanford Ph.D. students founded Yahoo!, theInternet search engine company. In 1996, with annual revenues of$1.4 million and profits of only $81,000, the company went publicat a valuation of $850 million. In 1999, Yahoo!’s $19 billion marketvalue was equivalent to that of CBS, which had 37 times Yahoo!’srevenues.
Finally, the most famous e-commerce company, Amazon.com,which went public in May 1997 at a value of $500 million despitethe absence of any historical, present, or near-term projected prof-its, once had a value greater than profitable Fortune 500 companiessuch as Sears, as noted earlier in this chapter. Another example: theInternet firm Epigraph had expected revenues of $250,000 in 1999and $1.4 million in 2000. When asked when his company mightbecome profitable, the founder responded, “Oh, come on. We’re anInternet company!”27
In the late 1990s, the prices of Internet and technology com-panies soared enormously: Dell Computer rose 249 percent in 1998,Amazon.com went up 966 percent during the same year, andYahoo! went up 584 percent, while eBay rose 1240 percent from itsinitial offering price. These valuations called into question whetherconventional valuation methods were applicable in estimating theworth of Internet stocks. As one stockbroker noted, “I don’t knowhow you value these things. It’s a new set of rules. The Internet
220 CHAPTER 7
stocks are bizarre and outrageous.”28 And as we all discovered,many of those high-flying Internet stocks could be hazardous toone’s health.
A prominent investor, Warren Buffett, the CEO of BerkshireHathaway, who has forgone any significant investment in techno-logy-related stocks, was also baffled by these stocks’ valuations. Ata 1999 news conference, he cheerfully closed a discussion of howhe thought business schools should teach the principles of valuingcompanies by saying, “I would say for a final exam, here’s thestock of any Internet company, what is it worth? And anybody whogave an answer, flunks.”
Warren Buffett and others who believed that Internet stockswere valued more on hope and on hype than on real numbers werejustifiably concerned that most Internet companies had high debtlevels, few assets, and, most importantly, a limited, if any, historyof profits. Despite this, investors were more than willing to paypremium prices for their stocks, with the expectation that thesecompanies would eventually produce significant earnings.
Therefore, given all this controversy, what was (were) the bestmethod(s) to use for valuing technology and Internet companies?Quite frankly, all of them had major drawbacks. The least practicalmethod seemed to be a multiple of earnings or cash flow. As statedearlier, most of these companies had not only negative earnings butalso negative cash flow. For example, in 1998, Forbes magazineidentified what it called “the Internet landscape,” which included46 companies that covered the breadth of the Internet market, fromsemiconductor chips to sports commentary. Only 14 (or 35 percent)of the companies had had at least a breakeven net income for theprevious 12 months. Despite this fact, the value of the lowest com-pany was $182 million.29
Using the comparable valuation method also created problems.The process of borrowing a valuation from a similar company thathad been priced by an acquisition or some other event did not workvery convincingly either, says columnist Jim Jubak, especially giventhe fact that all Internet companies might be overpriced.30 For exam-ple, two Internet service providers, Mindspring Enterprises Inc. andEarthLink Network Inc., were sold in 1998. Their selling prices trans-lated into a value of $1,500 per subscriber. In mid-1998, AmericaOnline (AOL), the largest and most prominent Internet service
Valuation 221
provider—now operated by Time Warner—had 14 million sub-scribers. If AOL were valued based on comparable subscriber rates,the company’s value at the time would have been $21 billion, not theactual $14 billion. Thus, using the comparable method would havefoolishly suggested that AOL was 33 percent undervalued.
Even the most popular and seemingly acceptable valuationmethod for the Internet industry, the multiple of revenues, had manyjustifiable critics. The rule of thumb was to use a multiple of between5 and 7 times a company’s projected, not current, revenues to deter-mine valuation. The multiple would go up or down depending onthe company’s revenue growth rates and gross margins.
Criticisms of this model included the fact that a 5 to 7 multi-ple for companies that had low or no profits seemed excessivelyhigh when a company like Sears was valued at a revenue multipleof 1 and a profitable media company such as Gannett was valuedat a multiple of 5. The other problem was that the value was basedon projected revenues, not present. If Amazon.com as of the thirdquarter of 1999 had been valued based on present revenues, themultiplier would have been an astonishing 20 times. Even moreastounding is that, because of the use of projected revenues, a com-pany like Yahoo! had a $19 billion market value, similar to that of CBS television, despite the fact CBS had revenues 37 times thoseof Yahoo!.
Another example of the craziness of the revenue valuationmodel previously used to value Internet companies was a com-pany called Rhythms NetConnections, a high-speed Internet accessfirm. Rhythms NetConnections, with revenues of $5.8 million, wasvalued at $3.1 billion, or 539 times revenues. In defense of this multiple, the founder said it was justified because RhythmsNetConnections was growing exponentially, doubling its sizeevery quarter.31 On August 1, 2001, Rhythms NetConnections andall of its wholly owned U.S. subsidiaries voluntarily filed for reor-ganization under Chapter 11.
To get a sense of perspective, let us look at the Standard &Poor’s Industrial 400. If the companies on this list were valuedbased on multiples of revenues, their historical median from 1956 to1997 is 0.9 times. The highest the multiple ever got during the 1990sin a frothy public market was a whopping 2.2 multiple of sales. Theprevious record multiple was 1.25 times, in the mid-1960s.
222 CHAPTER 7
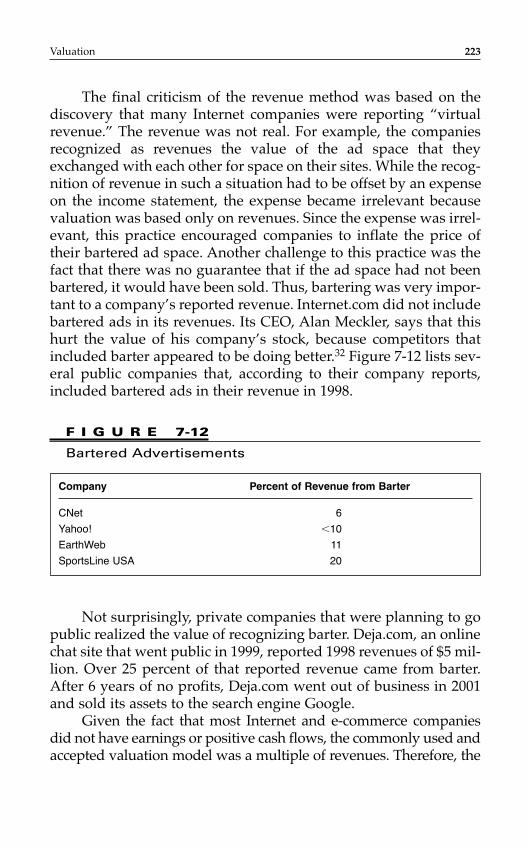
The final criticism of the revenue method was based on thediscovery that many Internet companies were reporting “virtualrevenue.” The revenue was not real. For example, the companiesrecognized as revenues the value of the ad space that theyexchanged with each other for space on their sites. While the recog-nition of revenue in such a situation had to be offset by an expenseon the income statement, the expense became irrelevant becausevaluation was based only on revenues. Since the expense was irrel-evant, this practice encouraged companies to inflate the price oftheir bartered ad space. Another challenge to this practice was thefact that there was no guarantee that if the ad space had not beenbartered, it would have been sold. Thus, bartering was very impor-tant to a company’s reported revenue. Internet.com did not includebartered ads in its revenues. Its CEO, Alan Meckler, says that thishurt the value of his company’s stock, because competitors thatincluded barter appeared to be doing better.32 Figure 7-12 lists sev-eral public companies that, according to their company reports,included bartered ads in their revenue in 1998.
Valuation 223
Company Percent of Revenue from Barter
CNet 6
Yahoo! �10
EarthWeb 11
SportsLine USA 20
F I G U R E 7-12
Bartered Advertisements
Not surprisingly, private companies that were planning to gopublic realized the value of recognizing barter. Deja.com, an onlinechat site that went public in 1999, reported 1998 revenues of $5 mil-lion. Over 25 percent of that reported revenue came from barter.After 6 years of no profits, Deja.com went out of business in 2001and sold its assets to the search engine Google.
Given the fact that most Internet and e-commerce companiesdid not have earnings or positive cash flows, the commonly used andaccepted valuation model was a multiple of revenues. Therefore, the
companies were in constant aggressive pursuit of increased revenuesto bolster their valuations. As stated earlier, this practice of rewardingrevenues without regard to profit seemingly encouraged more com-panies to recognize “virtual revenue.” The standard accounting rules,which have now been revised, vaguely stated that retailers that donot assume the risk of holding inventory are “business agents” andshould book as revenue only the difference between what the retailcustomer pays and the wholesale price. Therefore, if a retailer chargesa customer $200 for a bike that will be shipped to the customerdirectly from the manufacturer (i.e., drop-shipped) and the manufac-turer charges the retailer $100, the amount of revenue recognized bythe retailer should be the $100 difference, not $200.
The vagueness of the accounting rules resulted in Internetcompanies recognizing revenues differently. This inconsistencymade some companies seem significantly larger than others. Forexample, Preview Travel’s CFO, Bruce Carmedelle, said that rivalPriceline.com appeared to be 10 times larger even though it “sellsonly a few more tickets than we do.” At one time, Priceline.comcounted as revenue what customers paid for airline tickets, whilePreview counted only the commissions it got from carriers.
This virtual revenue phenomenon also occurred when a com-pany generated sales both by shipping inventory from its warehouseand by having the products shipped directly from its supplier’swarehouse to the end customer. Ideally, the revenue amounts shouldhave been recognized differently. In the former case, the amount ofrevenue that should have been recognized was the total price thatthe customer paid. In the latter case, where the product was beingdrop-shipped, the revenue recognized should have been only thedifference between the retail and wholesale prices. Xoom.com, nowpart of NBCi, was one of the companies that adhered to this practice.But many other companies, such as Theglobe.com, booked revenuethe same way in all cases, although some items came from companywarehouses and others from suppliers.33
Theglobe.com would soon see its world come crashing down.From its opening-day high of $97 in 1998, the stock was delistedand trading for just 7 cents a share in late 2001. The technologyindustry, which came under justifiable criticism for overvaluationof companies without profits, began using the multiple of grossmargin method. This method became more popular after it was
224 CHAPTER 7
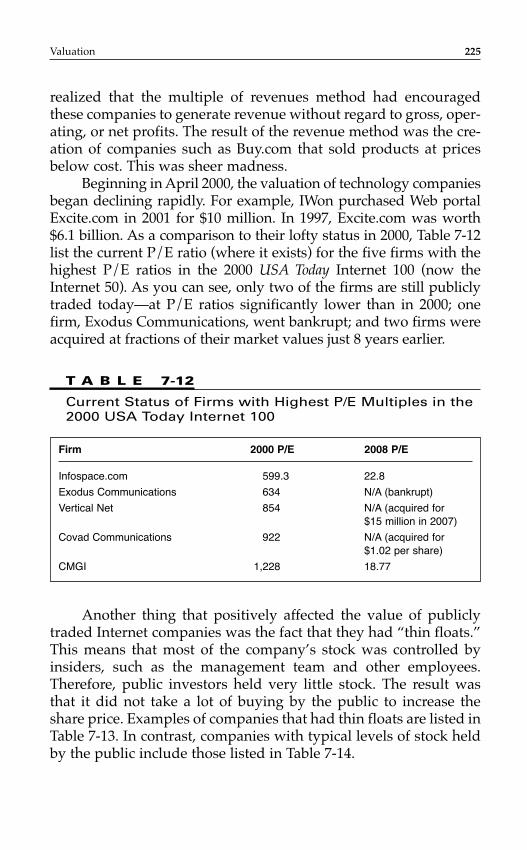
realized that the multiple of revenues method had encouragedthese companies to generate revenue without regard to gross, oper-ating, or net profits. The result of the revenue method was the cre-ation of companies such as Buy.com that sold products at pricesbelow cost. This was sheer madness.
Beginning in April 2000, the valuation of technology companiesbegan declining rapidly. For example, IWon purchased Web portalExcite.com in 2001 for $10 million. In 1997, Excite.com was worth$6.1 billion. As a comparison to their lofty status in 2000, Table 7-12list the current P/E ratio (where it exists) for the five firms with thehighest P/E ratios in the 2000 USA Today Internet 100 (now theInternet 50). As you can see, only two of the firms are still publiclytraded today—at P/E ratios significantly lower than in 2000; onefirm, Exodus Communications, went bankrupt; and two firms wereacquired at fractions of their market values just 8 years earlier.
Valuation 225
Firm 2000 P/E 2008 P/E
Infospace.com 599.3 22.8
Exodus Communications 634 N/A (bankrupt)
Vertical Net 854 N/A (acquired for $15 million in 2007)
Covad Communications 922 N/A (acquired for $1.02 per share)
CMGI 1,228 18.77
T A B L E 7-12
Current Status of Firms with Highest P/E Multiples in the2000 USA Today Internet 100
Another thing that positively affected the value of publiclytraded Internet companies was the fact that they had “thin floats.”This means that most of the company’s stock was controlled byinsiders, such as the management team and other employees.Therefore, public investors held very little stock. The result wasthat it did not take a lot of buying by the public to increase theshare price. Examples of companies that had thin floats are listed inTable 7-13. In contrast, companies with typical levels of stock heldby the public include those listed in Table 7-14.
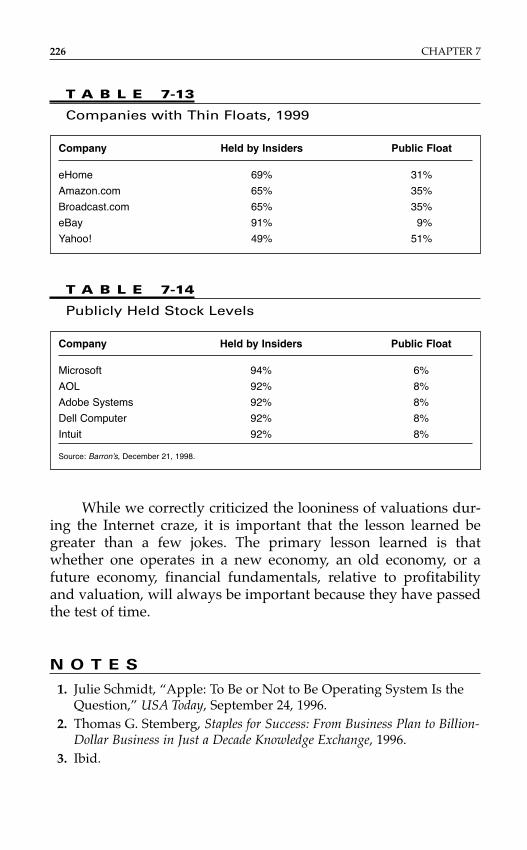
While we correctly criticized the looniness of valuations dur-ing the Internet craze, it is important that the lesson learned begreater than a few jokes. The primary lesson learned is thatwhether one operates in a new economy, an old economy, or afuture economy, financial fundamentals, relative to profitabilityand valuation, will always be important because they have passedthe test of time.
N O T E S
1. Julie Schmidt, “Apple: To Be or Not to Be Operating System Is theQuestion,” USA Today, September 24, 1996.
2. Thomas G. Stemberg, Staples for Success: From Business Plan to Billion-Dollar Business in Just a Decade Knowledge Exchange, 1996.
3. Ibid.
226 CHAPTER 7
Company Held by Insiders Public Float
eHome 69% 31%
Amazon.com 65% 35%
Broadcast.com 65% 35%
eBay 91% 9%
Yahoo! 49% 51%
T A B L E 7-13
Companies with Thin Floats, 1999
Company Held by Insiders Public Float
Microsoft 94% 6%
AOL 92% 8%
Adobe Systems 92% 8%
Dell Computer 92% 8%
Intuit 92% 8%
Source: Barron’s, December 21, 1998.
T A B L E 7-14
Publicly Held Stock Levels
4. Ibid.5. Chicago Tribune, April 7, 2007.6. Stemberg, “Staples for Success.”7. Ibid.8. Ibid.9. Udayan Gupta, “Companies Enjoy Privacy as Need for Public Deals
Ebbs,” Wall Street Journal, December 17, 1995.10. “Sperling Says Debt Crunch Could Tighten PE Purse Strings,” Deal
Journal, Wall Street Journal, July 25, 2007.11. Bill Haynes, “Industry Risk—Merger Professionals Bullish about
Continued Availability of Debt,” Global Association of RiskProfessionals, July 19, 2007.
12. “Venture Capital Industry Overview,” Dow Jones VentureSource.13. Forbes, July 27, 1998, p. 112.14. Stephanie Gruner, “The Trouble with Angels,” Inc., p. 47.15. Bill Sutter, classroom presentation at Kellogg School of
Management, March 10, 1999.16. Crain’s Chicago Business, May 5, 2008, p. 2.17. Jeanne Dugan, “Will Triarc Make Snapple Crackle?” BusinessWeek,
April 28, 1997.18. Chicago Sun-Times, July 7, 2008.19. Wall Street Journal, March 30, 1998.20. Forbes, June 15, 1998.21. Newsletter of Corporate Renewal, February 14, 2000.22. Tim Jones, “Rich Harvests in Television’s Killing Fields,” Chicago
Tribune, October 22, 1995.23. Project for Excellence in Journalism, “The State of the News
Media 2007.”24. Brian Edwards and Mary Ann Sabo, “A Grim Tale,” Chicago Tribune,
October 29, 1999, Section 6N.25. Ibid.26. Barron’s, September 15, 1997.27. Crain’s Chicago Business, September 27, 1999, p. 57.28. Forbes, July 27, 1998, p. 112.29. “Jubak’s Journal: Putting a Price on the Future,” Forbes.30. Ibid.31. Robert McGough, “No Earnings? No Problem! Price-Sales Ratio Use
Rises,” Wall Street Journal, November 26, 1999, pp. C1–2.
Valuation 227

32. Matt Krantz, “Web Site Revenue May Not Be Cash,” USA Today,September 9, 1999, p. 1B.
33. Matt Krantz, “Vague Rules Let Net Firms Inflate Revenue,” USAToday, November 22, 1999, p. 1B.
228 CHAPTER 7
Money is always dull, except when you haven’t got any, and thenit’s terrifying.
Sheila Bishop, The House with Two Faces (1960)
INTRODUCTION
As Gene Wang, a successful business owner, noted, for the entre-preneur who is in the capital-raising stage, there are four importantthings to do:
1. Never run out of money.2. Really understand your business or product.3. Have a good product.4. Never run out of money.1
These are great words of advice, but for many entrepreneurs,accomplishing points 1 and 4 is easier said than done.
One of the most common complaints about entrepreneurshipconcerns money. Entrepreneurs repeatedly lament the fact thatraising capital is their greatest challenge because there seemingly isnever enough and the fund-raising process takes too long. Theseare not groundless complaints. Thomas Balderston, a venture cap-italist, said, “Too few entrepreneurs recognize that raising capital isa continuing process.”2 Also, it is extremely tough, as it should be,
229
C H A P T E R 8
Raising Capital
to raise capital, be it debt or equity, for start-ups, expansions, oracquisitions. The process typically takes several years and multiplerounds.
The founding and funding of Google is a classic example ofthis process. Initially, college friends Sergey Brin and Larry Pagemaxed out their credit cards to buy the terabytes of storage thatthey needed to start Google. Next, they raised $100,000 from AndyBechtolsheim, one of the founders of Sun Microsystems, andanother $900,000 from their network of family, friends, andacquaintances. Subsequently, Google raised $24 million from twoventure capital firms and $1.67 billion from its IPO. The companywas 31/2 years old when it raised venture capital, and 81/2 when ithad its initial public offering (IPO).3
Why is it so difficult to raise capital? The most logical reasonis that capital providers are taking major risks in financing entre-preneurial ventures. Remember the statistic cited in Chapter 2?Roughly 60 percent of businesses fail within the first 4 years, andalmost nine out of ten fail within 10 years. Over a long time win-dow, the success rate is only 10 percent. Given this fact, capitalproviders are justified in performing lengthy due diligence todetermine the creditworthiness of entrepreneurs. It may seem sac-rilegious for this author to say, but it must be said: those whobecome entrepreneurs are not entitled to financing simply becausethey joined the club.
As stated in Chapter 1, one of my objectives for this book is tosupply you with information, insights, and advice that will, Ihope, increase your chances of procuring capital. Here are somewords on the advice front: since it is so tough to raise capital, theentrepreneur must be steadfast and undeviating in this pursuit.Recall from Chapter 2 that this is one of the traits of successfulhigh-growth entrepreneurs. They are not quitters. They are thick-skinned enough that hearing the word no does not completelydeter or terminate their efforts. A great example of an entrepreneurwith such perseverance is Howard Schultz, the CEO of Starbucks.When he was in search of financing for the acquisition ofStarbucks, he approached 242 people and was rejected 217 times.He finally procured the financing, acquired the company, andtoday boasts a public company that has 12,400 locations and morethan 145,000 employees.4
230 CHAPTER 8
VALUE-ADDED INVESTORS
Howard Schultz and all other successful high-growth entrepre-neurs know not only that it is important to raise the proper amountof capital at the best terms, but that it is even more important toraise it from the right investors. There is an old saying in entrepre-neurial finance: whom you raise money from is more importantthan the amount or the cost. The ideal is to raise capital from“value-added” investors. These are people who provide you withvalue in addition to their financial investment. For example, value-added investors may give the company legitimacy and credibilitybecause of their upstanding reputation.
Value-added investors also include those who help entrepre-neurs acquire new customers, employees, or additional capital. Agreat example of an entrepreneur who understands the impor-tance of value-added investors is the founder of eBay, whoaccepted capital from the famous venture capital firm Benchmark.Ironically, eBay did not really need the money. It has always beenprofitable. It took $5 million from Benchmark for two reasons. Thefirst was that it felt that Benchmark’s great reputation would giveeBay credibility. The second was that it wanted Benchmark, whichhad extensive experience in the public markets, to help eBay makean IPO.
Another great example of an entrepreneur who understoodthe importance of a value-added investor is Jeff Bezos ofAmazon.com. When pursuing venture capital financing, Bezosrejected money from two funds that offered a higher valuation andbetter terms than Kleiner Perkins Caufield & Byers (KPCB), whichhe accepted. When asked why he took KPCB’s lower bid, heresponded, “If we’d thought all this was purely about money, we’dhave gone with another firm. But KPCB is the gravitational centerof a huge piece of the Internet world. Being with them is like beingon prime real estate.”5
In addition to investing $8 million, KPCB also helped per-suade Scott Cook, the chairman of Intuit, to join Amazon.com’sboard. KPCB also immediately helped Bezos recruit two vice pres-idents and, in May 1997, helped him take Amazon.com public.
While these two examples highlight only venture capitalists, itmust be made perfectly clear that there are several other sources ofvalue-added capital.
Raising Capital 231
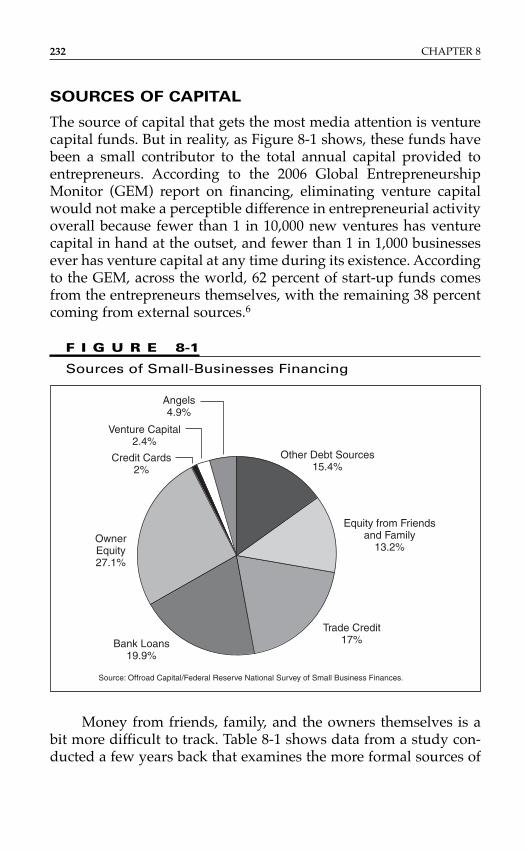
SOURCES OF CAPITAL
The source of capital that gets the most media attention is venturecapital funds. But in reality, as Figure 8-1 shows, these funds havebeen a small contributor to the total annual capital provided toentrepreneurs. According to the 2006 Global EntrepreneurshipMonitor (GEM) report on financing, eliminating venture capitalwould not make a perceptible difference in entrepreneurial activityoverall because fewer than 1 in 10,000 new ventures has venturecapital in hand at the outset, and fewer than 1 in 1,000 businessesever has venture capital at any time during its existence. Accordingto the GEM, across the world, 62 percent of start-up funds comesfrom the entrepreneurs themselves, with the remaining 38 percentcoming from external sources.6
232 CHAPTER 8
F I G U R E 8-1
Sources of Small-Businesses Financing
Source: Offroad Capital/Federal Reserve National Survey of Small Business Finances.
Other Debt Sources15.4%
Angels4.9%
Venture Capital2.4%
OwnerEquity27.1%
Bank Loans19.9%
Trade Credit17%
Equity from Friendsand Family
13.2%
Credit Cards2%
Money from friends, family, and the owners themselves is abit more difficult to track. Table 8-1 shows data from a study con-ducted a few years back that examines the more formal sources of
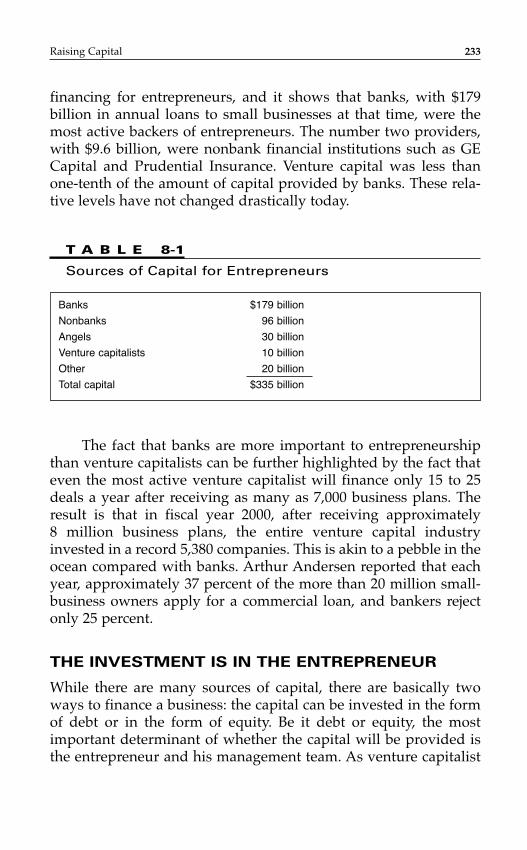
financing for entrepreneurs, and it shows that banks, with $179 billion in annual loans to small businesses at that time, were themost active backers of entrepreneurs. The number two providers,with $9.6 billion, were nonbank financial institutions such as GECapital and Prudential Insurance. Venture capital was less thanone-tenth of the amount of capital provided by banks. These rela-tive levels have not changed drastically today.
Raising Capital 233
Banks $179 billion
Nonbanks 96 billion
Angels 30 billion
Venture capitalists 10 billion
Other 20 billion
Total capital $335 billion
T A B L E 8-1
Sources of Capital for Entrepreneurs
The fact that banks are more important to entrepreneurshipthan venture capitalists can be further highlighted by the fact thateven the most active venture capitalist will finance only 15 to 25deals a year after receiving as many as 7,000 business plans. Theresult is that in fiscal year 2000, after receiving approximately 8 million business plans, the entire venture capital industryinvested in a record 5,380 companies. This is akin to a pebble in theocean compared with banks. Arthur Andersen reported that eachyear, approximately 37 percent of the more than 20 million small-business owners apply for a commercial loan, and bankers rejectonly 25 percent.
THE INVESTMENT IS IN THE ENTREPRENEUR
While there are many sources of capital, there are basically twoways to finance a business: the capital can be invested in the formof debt or in the form of equity. Be it debt or equity, the mostimportant determinant of whether the capital will be provided isthe entrepreneur and his management team. As venture capitalist
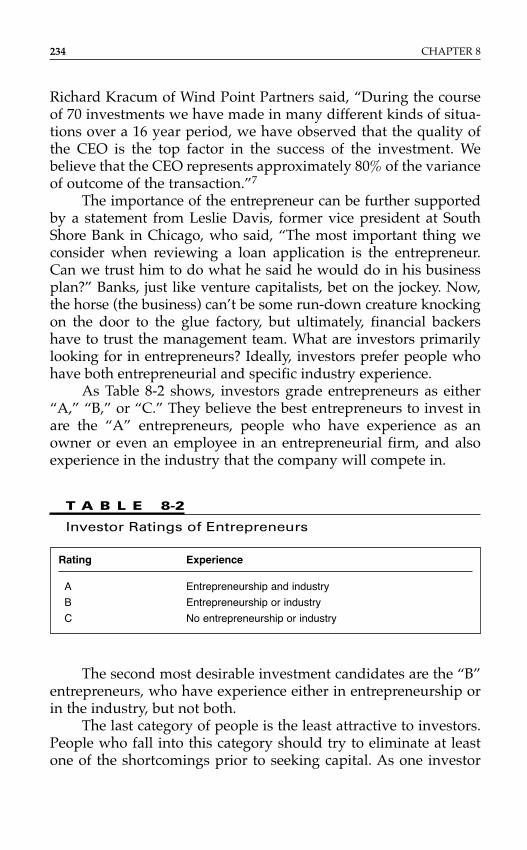
Richard Kracum of Wind Point Partners said, “During the courseof 70 investments we have made in many different kinds of situa-tions over a 16 year period, we have observed that the quality ofthe CEO is the top factor in the success of the investment. Webelieve that the CEO represents approximately 80% of the varianceof outcome of the transaction.”7
The importance of the entrepreneur can be further supportedby a statement from Leslie Davis, former vice president at SouthShore Bank in Chicago, who said, “The most important thing weconsider when reviewing a loan application is the entrepreneur.Can we trust him to do what he said he would do in his businessplan?” Banks, just like venture capitalists, bet on the jockey. Now,the horse (the business) can’t be some run-down creature knockingon the door to the glue factory, but ultimately, financial backershave to trust the management team. What are investors primarilylooking for in entrepreneurs? Ideally, investors prefer people whohave both entrepreneurial and specific industry experience.
As Table 8-2 shows, investors grade entrepreneurs as either“A,” “B,” or “C.” They believe the best entrepreneurs to invest inare the “A” entrepreneurs, people who have experience as anowner or even an employee in an entrepreneurial firm, and alsoexperience in the industry that the company will compete in.
234 CHAPTER 8
T A B L E 8-2
Investor Ratings of Entrepreneurs
Rating Experience
A Entrepreneurship and industry
B Entrepreneurship or industry
C No entrepreneurship or industry
The second most desirable investment candidates are the “B”entrepreneurs, who have experience either in entrepreneurship orin the industry, but not both.
The last category of people is the least attractive to investors.People who fall into this category should try to eliminate at leastone of the shortcomings prior to seeking capital. As one investor
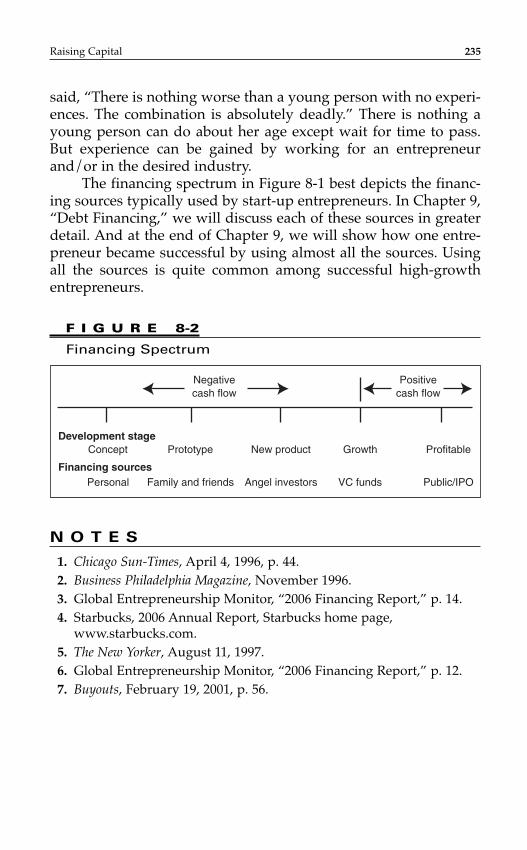
said, “There is nothing worse than a young person with no experi-ences. The combination is absolutely deadly.” There is nothing ayoung person can do about her age except wait for time to pass.But experience can be gained by working for an entrepreneurand/or in the desired industry.
The financing spectrum in Figure 8-1 best depicts the financ-ing sources typically used by start-up entrepreneurs. In Chapter 9,“Debt Financing,” we will discuss each of these sources in greaterdetail. And at the end of Chapter 9, we will show how one entre-preneur became successful by using almost all the sources. Usingall the sources is quite common among successful high-growthentrepreneurs.
Raising Capital 235
F I G U R E 8-2
Financing Spectrum
Negativecash flow
Positivecash flow
Development stage
Financing sources
Concept Prototype New product Growth Profitable
Personal Family and friends Angel investors VC funds Public/IPO
N O T E S
1. Chicago Sun-Times, April 4, 1996, p. 44.2. Business Philadelphia Magazine, November 1996.3. Global Entrepreneurship Monitor, “2006 Financing Report,” p. 14.4. Starbucks, 2006 Annual Report, Starbucks home page,
www.starbucks.com.5. The New Yorker, August 11, 1997.6. Global Entrepreneurship Monitor, “2006 Financing Report,” p. 12.7. Buyouts, February 19, 2001, p. 56.

This page intentionally left blank
INTRODUCTION
Bill Gates has a rule that Microsoft, rather than incurring debt,must always have enough money in the bank to run for a year evenwith no revenues.1 In 2007, Microsoft had $23.4 billion in cash onits balance sheet.2 Unfortunately, 99.9 percent of entrepreneurs willnever be able to emulate this financing plan. Therefore, they mustbe willing to pursue and accept debt financing.
Debt is money provided in exchange for the owner’s word(sometimes backed up by tangible assets as collateral as well as thepersonal guarantees of the owner) that the original investment plusa predetermined fixed or variable interest rate will be repaid in itsentirety over a set period of time.
As we saw in Chapter 8, banks have been by far the biggestsource of capital for entrepreneurs on an annual basis. In June 2004,commercial banks had a total of $1.4 trillion in business loans out-standing (in other words, total loans, not just the notes written thatyear). Of that, 38 percent, or $522 billion, was in small-businessloans (loans of less than $1 million).3
In today’s environment, lenders want to see a company’s capital structure with debt equivalent to no more than 4.3 timesEBITDA.4
237
C H A P T E R 9
Debt Financing
TYPES OF DEBT
There are basically four types of debt: senior, subordinated (some-times called sub debt), short-term, and long-term. The first tworefer to the order of entitlement or preference that the lender hasagainst the debt recipient. Senior debt holders have top priorityover all other debt and equity providers. The senior holders are the“secured creditors,” who have an agreement that they are to bepaid before any other creditors. If the company is dissolved, thesenior holders are entitled to be paid first and “made whole” asmuch as possible by selling the company’s assets. After the seniordebt holders have been completely repaid, the remaining assets, ifthere are any, can go to the providers of subordinated debt.
A lender does not automatically get the senior position simplybecause he made the first loan. The lender must request this posi-tion, and all other present and future lenders must approve it. Thiscan sometimes be a problem because some lenders may refuse tosubordinate their loan to any others. If the other lenders will notacquiesce, then the loan is generally not made.
Sub debt, also referred to as mezzanine debt, is subordinatedto senior debt but ranks higher than equity financing. The term mezzanine comes from the theater, where there are often three levels,with the middle level being called the mezzanine. Both types ofdebt are used for financing working capital, capital expenditures,and acquisitions. Mezzanine financing usually occurs after seniorlenders exhaust their lending capabilities. Finally, because it is in asubordinate position, mezzanine debt is typically more expensivethan senior debt.
Mezzanine and senior debt, in addition to equity, constitute acompany’s capital structure, which describes how the companyfinances itself. Therefore, when a company’s capital structure issaid to be highly leveraged, this means that it has a large amountof long-term debt.
Debt that is amortized over a period longer than 12 months isconsidered long-term debt (LTD). It can be senior or mezzanine. Itis found in the balance sheet in the long-term liabilities section.Loans for real estate and equipment are usually multiyear, long-term debt obligations.
In contrast, short-term debt (STD) is that which is due withinthe next 12 months. STD comes in two forms: revolver debt, which
238 CHAPTER 9
is used for working capital, and current maturity of long-term debt.It is found in the balance sheet in the current liabilities section. Thisdebt typically has a higher cost than does long-term debt. Short-term debt is usually used to buy inventory and to fund day-to-dayoperating needs.
Let’s look at the strengths and weaknesses of debt financing.
Pros■ The entrepreneur retains complete ownership.■ The cost of capital is low.■ Loan payments are predictable.■ There is a 5- to 7-year payback period.■ It can involve value-added lenders.■ It provides tax benefits.
Cons■ Personal guarantees are required.■ The lender can force the business into bankruptcy.■ Amounts may be limited to value of the company’s assets.■ Payments are due regardless of the company’s profits.
SOURCES OF DEBT FINANCING
The major sources of debt financing are personal savings, familyand friends, angels, foundations, government, banks, factors, cus-tomer financing, supplier financing, purchase order financing, andcredit cards. Let’s review these sources in more detail.
Personal Savings
An entrepreneur often uses her own money to finance the company.This is especially true in the early stages of a start-up. The GlobalEntrepreneurship Monitor’s “2006 Financing Report” showed that62 percent of the funds available to start-ups across the globe camefrom the entrepreneurs themselves.5 The primary reason for this isthat banks and other institutional debt providers do not supply
Debt Financing 239
start-up capital because it is too risky. Start-ups have no history ofcash flow that can be used to repay the debt obligation.
Using the entrepreneur’s own capital is commonly referred toas “bootstrapping.” This is how, for example, Ernest and Julio Gallostarted their wine business in a rented warehouse in Modesto,California, in 1933, at the heart of the Depression. After researchingthe industry at the local library, they decided to start their businessusing what little capital they had, and they convinced local farmersto provide them with grapes and defer payment until the wine wassold. They also bought crushing and fermenting equipment on 90-day terms. Today, the company started by these two bootstrap-pers enjoys annual worldwide sales of more than $900 million.Other examples of bootstrapping include Domino’s Pizza,Hallmark Cards, Black & Decker, and Ross Perot’s EDS.6
Often the start-up investments are made in the form of equityinstead of debt. But there are no rules that require such an equityinvestment. An entrepreneur’s ownership stake does not have tocome from his capital investment. In fact, it should come from hishard work, called “sweat equity.” My advice is that all investmentsthat the entrepreneur makes in his company should be in the formof debt at a reasonable interest rate. The repayment of this debtallows the entrepreneur to receive capital from the company with-out the money being taxed because it was simply the return of theoriginal investment. The interest payment would be deductible bythe company, reducing its tax liability. The entrepreneur would berequired to pay personal taxes on the interest earned.
All of this is more favorable to the entrepreneur than if thecapital were invested as equity. In that case, if it were repaid by thecompany, it would be taxed at the investor’s personal tax level, and any dividends would also be taxed. Unlike interest payments,dividends paid are not tax-deductible. Therefore, the companywould receive no tax reduction benefits.
Family and Friends
As stated earlier, it is virtually impossible to procure debt financingfor start-ups. Therefore, an obvious viable alternative is family andfriends. The benefit of raising debt capital from this source is mul-tifold. Raising money may be easier and faster because the lenders
240 CHAPTER 9
are providing the capital for emotional rather than business reasons. They want to support the family member or friend. Thatwas the case with Jeff Bezos’s first outside lenders, who were hisparents. Another benefit, especially with debt, is that if repaymentscannot be made, these lenders may be more conciliatory than insti-tutional lenders. Unlike the latter, they are not likely to force theentrepreneur into bankruptcy if he defaults on the loan.
The negative aspects of procuring money from family andfriends exceed the positives, however. First, these are typically notvalue-added investors. Second, they may not be “sophisticatedinvestors,” which we will discuss in more detail later in this chap-ter. They may not understand either the risk of the investment orits form. Regarding the first point, they may not really comprehendthe fact that such an investment might be completely lost, yieldingno capital return at all. They expect to be repaid no matter whathappens. They also may not realize that as debt investors, they arenot entitled to any ownership stake, only a predetermined interestpayment and the return of their original investment. This usuallybecomes an issue when the entrepreneur is extremely successful in increasing the company’s value. In such a case, many familymembers and friends may not be content with simply having theirprincipal returned and earning interest on that money. They expectto share in the firm’s value appreciation. In essence, they expecttheir debt to be treated as equity. If it is not, they feel that they havebeen cheated by their own child, grandchild, niece or nephew, orchildhood friend.
This final point leads to the greatest problem with raising debtcapital from family and friends: there is a risk of irreparably dam-aging or losing important personal relationships. As one professorsaid, “Remember these are people whom you eat Thanksgivingwith, and it may not be safe to sit next to your uncle if you have lostall his money and he has sharp utensils in his hands.”
In closing, my advice is to refrain from raising debt capitalfrom family and friends. If this cannot be avoided, adhere to thefollowing recommendations:
■ Raise money only from those who can afford to lose theentire amount. Do not get money from a grandparent whohas no savings and lives on a fixed government income.
Debt Financing 241
Make it clear to the family members that they are puttingtheir entire investment at risk; therefore, there is a chancethat it may not be repaid.
■ Write a detailed loan agreement clearly highlighting theinterest, the payment amounts, and the expected paymentdates.
■ The agreement should give the investor the right toconvert any or all of the investment into company stock,thereby giving the investor an ownership stake ifdesirable.
Alternatively, the agreement should be that theinvestment is mezzanine financing, which is debt withequity. The investor receives all of the investment back,interest, and an equity stake in the company.
■ Personally guarantee at least the amount of the investmentand at most the investment plus the amount of interestthat the investment could have gained had it been put in asafe certificate of deposit. Today that would yieldapproximately 4 percent.
Angel Investors
Angel investors are typically wealthy individuals who invest incompanies. (The term was originally coined to describe individu-als who were patrons of the arts.) They are different from familyand friends in that they usually do not know or have a relationshipwith the entrepreneur prior to the investment. In addition, they aresophisticated investors who thoroughly understand the risk of theinvestment and are comfortably able to absorb a complete loss oftheir investment. Angel investors are typically former entrepre-neurs who focus on industries in which they have experience.Prominent examples of companies that received angel investingare the Ford Motor Company, The Body Shop, and Amazon.
With venture capital increasingly looking toward later-stageinvestments, money from angels has provided the bulk of seed andstart-up capital in the United States, with some estimates placingthat percentage at as much 90 percent of all early-stage capital provided in the country.7 A University of New Hampshire study
242 CHAPTER 9
estimated that in 2006, there were 234,000 active angel investors inthe United States who annually provided $50,000 to $500,000 perdeal in debt and equity to entrepreneurs. In 2006, angels funded51,000 businesses at a cost of $25.6 billion. These numbers grew10.8 percent and 3.0 percent, respectively, from 2005.8 Whileincreases in available capital from angels obviously delight entre-preneurs, they generate the opposite response from many in theinstitutional venture capital community, since they create morecompetition for deals and increase valuations. Some venture capi-talists call money from angels “dumb money,” alleging that it is farless than value-added money. In my opinion, such insulting com-ments are simply sour grapes.
For many years, angel investing has been an important part ofthe financial support and mentoring available to entrepreneurs thatassists them in bridging the financing gap between the individualinvestments of friends and family members and the institutionalventure capital provided by traditional VC firms. Increasingly,though, angel investors are formalizing into angel investor groupsin order to attract better deals; provide infrastructure and supportfor the tax, legal, and other issues that arise from angel investing;and provide more formal support systems that allow them toincrease their real and perceived “value added.”9 In 2006, therewere nearly 250 formal angel investor groups in the United States,up from just below 100 groups in 1999.10
While most angels demand equity for their investments, thereare some who have invested debt in companies that had “shakycredit” and had been dumped by their banks. In those instances, theangels restructured the loans at significantly higher interest rates.
The positive aspect of getting debt financing from angels isthat they can be more flexible in their terms than an institution likea bank. For example, the angel can make a 10-year loan, whereasthe maximum term of a bank’s commercial loan is typically 5 to 7 years. Also, angel investors, unlike banks, make their own rulesfor lending. A bank may have a rule that a loan will not be pro-vided to any applicant who has declared personal bankruptcy. Theangel, on the other hand, uses her own discretion in determiningwhether she wants to make a loan to such a person.
On the negative side, the cost of debt capital from angels isusually higher than that of institutional financing. It is not unusual
Debt Financing 243
for these investors to charge entrepreneurs 2 percent per month,which equals an astounding annual rate of 24 percent. Not only issuch a rate higher than the 2 to 3 percent over prime that banksusually charge their best customers, but it is also greater than the18 percent that some credit cards charge their customers. The othernegative is that, unlike banks, which cannot legally interfere withtheir customers’ day-to-day business operations or strategy, theangel typically expects to be involved. For some entrepreneurs, thismay ultimately cause problems.
When most people think about formal organizations that pro-vide debt capital, banks are the first ones that come to mind. But asstated earlier, there are other types of debt providers. Let’s reviewand discuss a few of these nonbank sources of capital.
Foundations
Another interesting source of capital for entrepreneurs is philan-thropic organizations, including the Ford Foundation, theMacArthur Foundation, the Wieboldt Foundation, and theRetirement Research Foundation. Historically, these organizationshave provided grants and loans only to not-for-profit entities. Butsince the beginning of the 1990s, they have broadened their loanactivity to include for-profit companies that provide a social good.Eligible companies are those that explicitly state their intention toimprove society by doing such things as employing former con-victs, building homes in economically deprived areas, providingchild-care services to single mothers, or offering computer trainingto low-income families. Specific examples include the MacArthurFoundation’s loan to a Washington, D.C., publisher that tracks theeconomic policies of states. The loan was used by the company topurchase additional computers. Another example is the inventoryloan that the Wieboldt Foundation made to a Chicago companycalled Commons Manufacturing that makes window blinds that gointo public housing.11
Foundations also provide grants to community developmentcorporations (CDCs), which, in turn, use the money to providebusiness loans. The objectives of the CDCs are the same as founda-tions’, which is to lend capital to businesses that provide a benefitto society. An example of such a CDC is Coastal Enterprises, an
244 CHAPTER 9
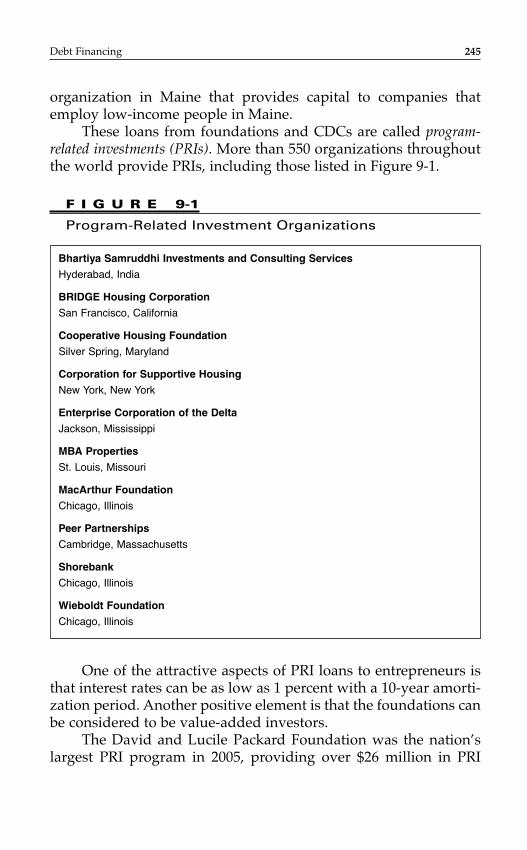
organization in Maine that provides capital to companies thatemploy low-income people in Maine.
These loans from foundations and CDCs are called program-related investments (PRIs). More than 550 organizations throughoutthe world provide PRIs, including those listed in Figure 9-1.
Debt Financing 245
F I G U R E 9-1
Program-Related Investment Organizations
Bhartiya Samruddhi Investments and Consulting Services
Hyderabad, India
BRIDGE Housing Corporation
San Francisco, California
Cooperative Housing Foundation
Silver Spring, Maryland
Corporation for Supportive Housing
New York, New York
Enterprise Corporation of the Delta
Jackson, Mississippi
MBA Properties
St. Louis, Missouri
MacArthur Foundation
Chicago, Illinois
Peer Partnerships
Cambridge, Massachusetts
Shorebank
Chicago, Illinois
Wieboldt Foundation
Chicago, Illinois
One of the attractive aspects of PRI loans to entrepreneurs isthat interest rates can be as low as 1 percent with a 10-year amorti-zation period. Another positive element is that the foundations canbe considered to be value-added investors.
The David and Lucile Packard Foundation was the nation’slargest PRI program in 2005, providing over $26 million in PRI
investments.12 If more information about PRIs is desired, twosources are a book entitled Program Related Investments: A Guide toFunders and Trends and The PRI Directory: Charitable Loans and OtherProgram-Related Investments by Foundations.
Government
Local, state, and federal government agencies have programs forproviding loans to entrepreneurs. These programs are typicallypart of a municipality’s economic development or commercedepartment. Some government loans are attractive because theyoffer below-market rates. SBA and CAP (capital access program)loans are usually market-priced, which we will discuss later. Theyare provided to companies that are geographically located in themunicipal area, that can prove their ability to repay, and, just asimportantly, that will use the money to retain existing jobs or cre-ate new jobs. Regarding the retention of jobs, entrepreneurs inChicago have accessed capital from the city for the acquisition ofa company based on the fact that if they did not buy the company,someone else might do so and move it, along with the jobs, toanother city. Other entrepreneurs have procured expansion debt capital with the agreement that for every $20,000 that the city provides, one new job will be created in 18 to 24 months.Practically every town, city, and state provides such job-relateddebt financing.
The negative aspect of these loans on the local and state levelsis that they often take a long time to procure. The applicant has to complete a lot of paperwork, and the process can take as long as12 months.
A great periodical for identifying federal, state, and local gov-ernment economic programs is The Small Business Financial ResourceGuide, which can be received free by writing to the U.S. Chamber ofCommerce Small Business Center at 1615 H Street, NW, Washington,D.C. 10062. It can also be ordered online through MasterCard’s Website at www.mastercard.com.13
Another drawback for some entrepreneurs is that the applicant must personally guarantee the loans. Personal guaran-tees will be discussed in more detail at the end of the discussion of debt.
246 CHAPTER 9
Capital Access ProgramsOne local government program that does not take as long is yourstate or municipality’s capital access program (CAP). There arepresently 25 states and several cities that operate CAPs, whichwere first introduced in Michigan in 1986.14 By 1998, CAPs hadprovided more than 25,000 loans totaling nearly $1.5 billion. Whilethis is a pittance compared with the $19.1 billion guaranteed by theSBA, CAPs are rapidly becoming popular, as they compete withSBA loans.
The CAP loan product is a “credit enhancement” that inducesbanks to consider loan requests that they might otherwise haverejected because of deficiencies in collateral or cash flow. The mech-anism for a CAP loan typically involves the bank and the borrowerpaying a fee ranging from 3 to 7 percent of the loan amount to aloan-loss reserve account held at the bank. This loan reserve con-tribution is then matched by state or local money, with the totalreserve ranging from 6 to 14 percent of the loan. This amount isused to cover any loan losses.15
Banks seemingly like this state or local government–sponsoredloan program because the banks, not the government agency, set theterms, rates, fees, and collateral. They do not have to get approvalfrom any other organization or agency. Entrepreneurs like it for thesame reason. The bank has the flexibility to approve a loan that maynot qualify for SBA financing for one reason or another. Anotherattraction is that entrepreneurs have stated that CAP financing isfaster than SBA loans. CAPs differ in the size of the eligible loans,the nature of eligible borrowers, and the size of the loan-lossreserve. Check with your state or municipality’s economic develop-ment agency to determine if a CAP exists.
Small Business Administration Loan ProgramFederal business loan programs fall under the authority of the U.S.Small Business Administration, which is the largest source of long-term small-business lending in the nation. Each year, the SBA guar-antees loans totaling more than $19 billion. And since its inceptionin 1953, the agency has helped fund approximately 20 million busi-nesses. There are two primary reasons for the popularity of SBAloans. First, the length of an SBA loan can be longer than that of aregular commercial loan. For example, an SBA-guaranteed loan
Debt Financing 247
can be for as long as 10 years for a working capital loan, comparedwith 1 to 5 years normally. Second, the SBA guarantees loans toborrowers who cannot get financing elsewhere.
It should be made perfectly clear that the SBA does not pro-vide loans directly to entrepreneurs. It uses other financial institu-tions, banks and nonbanks, to do the actual lending. The SBA givesthese approved institutions the authority to represent it as a lenderand will guarantee up to 85 percent of the loan. For example, alender, with the SBA’s approval, may provide a $100,000 loan to theentrepreneur. If the recipient defaults on the loan, the lender hasonly 15 percent at risk because the SBA guarantees the balance ofthe loan.
Most of these loans go to established businesses. About one-third, or just over $6 billion, of SBA loans are lent to new businesseseach year. A few start-ups that received SBA loans are Ben &Jerry’s, Nike, Federal Express, Apple Computer, and Intel.
Some people foolishly believe that they can default on theloan because there will be minimal consequences. Nothing couldbe further from the truth. Remember, all SBA loans are personallyguaranteed. Also, the lender, despite the SBA guarantee, willdoggedly pursue the payment of as much of the loan as possiblebefore requesting SBA reimbursement. The lender’s reputation ison the line, and if the lender’s loan default rate becomes too high,the SBA will discontinue that bank’s participation in the program.
SBA lenders fall into three categories: general, certified, andpreferred lenders. General lenders are those that have a small vol-ume of deals or very little experience in providing SBA loans.Therefore, they must submit all of an applicant’s loan informationto the national SBA office to obtain its approval before they canapprove a loan. The process can take several weeks and evenmonths. In contrast, the other types of SBA lenders can act faster.
The most active and expert lenders qualify for the SBA’sstreamlined lending programs. Under these programs, lenders aregiven partial or full authority to approve loans, which results infaster service from the SBA. Certified lenders are those that havebeen heavily involved in regular SBA loan-guarantee processingand have met certain other criteria. They receive a partial delega-tion of authority and are given a 3-day turnaround on their appli-cations by the SBA (they may also use regular SBA loan
248 CHAPTER 9
processing). Certified lenders account for 4 percent of all SBA busi-ness loan guarantees. Preferred lenders are chosen from among theSBA’s best lenders and enjoy full delegation of lending authority inexchange for a lower rate of guarantee. This lending authoritymust be renewed at least every 2 years, and the SBA examines thelender’s portfolio periodically. Preferred loans account for morethan 21 percent of SBA loans.16
To find a list of the SBA lenders in any state, go to www.sba.govor contact the SBA hotline at 800–827–5722. There is a publicationavailable for each state that is updated at least every 2 years. It listsall the lenders and shows whether they are general, preferred, orcertified. The SBA also posts a state-by-state listing of SBA preferredor certified lenders online
The SBA’s most popular lending programs are the 7(a) LoanGuaranty, Micro Loan, and 504 (CDC) Loan programs. Before welook at each of these programs, let’s discuss a few of the generalhighlights of SBA financing terms.
Depending on the program, loans can be amortized for asmany as 25 years. Interest rates vary. The SBA charges the lender afee between 3 and 3.5 percent of the loan, which is usually passedon to the loan recipient. And all investors with a stake of 20 percentor more in the company must personally guarantee the loan.Finally, if the loan is to be used to purchase another company, theseller must subordinate his financing of the company to the SBA.In fact, the SBA might require the seller to agree to “absolute sub-ordination.” In this case, no payments can be made to the seller aslong as SBA money is outstanding.
To be eligible for an SBA loan, the business must qualify as a small business, be for-profit, not already have the internalresources to provide the financing, and be able to demonstraterepayment ability. The SBA uses varying requirements to deter-mine whether a business is small; these requirements depend onvarious factors, including the industry in which the company oper-ates. For example, because the SBA targets smaller companies, theapplicant can’t have a workforce the size of GE. If the company isin manufacturing, it cannot employ more than 1,500 people, andthe maximum number of employees for a wholesale business is100. The SBA’s requirements and guidelines can be found atwww.sba.gov.
Debt Financing 249
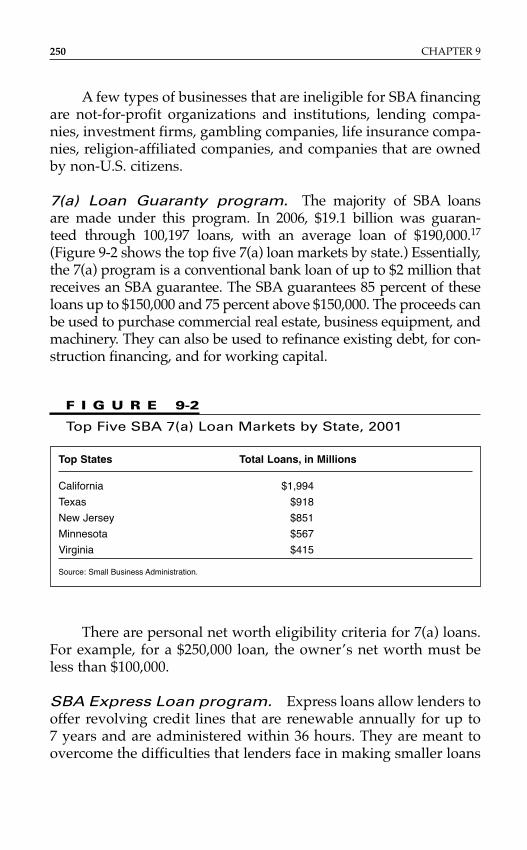
A few types of businesses that are ineligible for SBA financingare not-for-profit organizations and institutions, lending compa-nies, investment firms, gambling companies, life insurance compa-nies, religion-affiliated companies, and companies that are ownedby non-U.S. citizens.
7(a) Loan Guaranty program. The majority of SBA loans are made under this program. In 2006, $19.1 billion was guaran-teed through 100,197 loans, with an average loan of $190,000.17
(Figure 9-2 shows the top five 7(a) loan markets by state.) Essentially,the 7(a) program is a conventional bank loan of up to $2 million thatreceives an SBA guarantee. The SBA guarantees 85 percent of theseloans up to $150,000 and 75 percent above $150,000. The proceeds canbe used to purchase commercial real estate, business equipment, andmachinery. They can also be used to refinance existing debt, for con-struction financing, and for working capital.
250 CHAPTER 9
Top States Total Loans, in Millions
California $1,994
Texas $918
New Jersey $851
Minnesota $567
Virginia $415
Source: Small Business Administration.
F I G U R E 9-2
Top Five SBA 7(a) Loan Markets by State, 2001
There are personal net worth eligibility criteria for 7(a) loans.For example, for a $250,000 loan, the owner’s net worth must beless than $100,000.
SBA Express Loan program. Express loans allow lenders tooffer revolving credit lines that are renewable annually for up to 7 years and are administered within 36 hours. They are meant toovercome the difficulties that lenders face in making smaller loans
that are too expensive to underwrite as part of the traditional 7(a)program. Under this program, loans under $25,000 do not requirecollateral. Lenders use their own application forms. The maximumloan amount is $350,000, with a 50 percent SBA guaranty. In someareas, there are special versions of this program for veterans(Patriot Express) and those doing business in low- and moderate-income areas (Community Express).
Loan prequalification. Business applicants with needs of lessthan $250,000 can be reviewed and potentially authorized by theSBA before the loans are taken to lenders for consideration. Theprogram employs intermediary organizations to assist borrowers indeveloping a viable loan application. Small Business DevelopmentCenters (discussed later in this chapter) provide this service forfree. For-profit organizations will charge a fee. The application isexpedited by the SBA after submission. Interest rates, maturities,and guarantee percentages follow the 7(a) guidelines.18
Micro Loan program. Nonprofit groups such as communitydevelopment corporations are the primary issuers of micro loans.These are the smallest loans guaranteed by the SBA, at levels assmall as $450. The maximum is $35,000, with the average loanbeing $13,000. Since 1992, the SBA has provided loans totalingmore than $321 million to over 28,000 borrowers. Interest rates onthese loans are generally between 8 and 13 percent. In 2006, theMicro Loan program provided more than $33 million in loans tomore than 2,500 borrowers. There are 170 intermediaries that dis-burse these loans.19
504 (CDC) Loan program. This loan program is a long-termfinancing tool for economic development within a community thatis offered through certified development companies (CDCs) in anarea. The program provides growing businesses with long-term,fixed-rate financing for major fixed assets, such as land and build-ings. The funds cannot be used for working capital or inventory,consolidating or repaying debt, or refinancing. CDCs are nonprofitcorporations set up to contribute to the economic development of their community and retain jobs. CDCs work with the SBA andprivate-sector lenders to provide financing to small businesses.
Debt Financing 251
There are 270 CDCs nationwide, each covering a specific area. Loanamounts vary, but can be as large as $4 million. In 2006, the SBAapproved 9,720 loans totaling $5.61 billion under this program.20
Nonbank SBA LendersAs stated earlier, the SBA guarantees loans made by both banksand other financial institutions. These other lenders compete withbanks by offering lower rates and faster loan approval. The SBArefers to these firms as small business lending companies (SBLCs).
One of the largest non-bank lenders is CIT Small BusinessLending, a division of CIT Group Inc., which is a publicly tradedglobal commercial finance company. CIT has been named the topSBA 7(a) lender for nine consecutive years and is one of the toplenders to minorities, women, and veterans in the country. The fol-lowing are examples of some of CIT’s primary lending criteria:
■ Adequate historic cash flow to cover the debt■ Business debt to net worth ratio must meet industry
average■ Borrowers must be actively involved in the day-to-day
operation of the business■ Satisfactory personal credit histories are required for all
principals and guarantors■ No past bankruptcies or felony arrests
Other prominent large non-bank SBA lenders include the SmallBusiness Loan Source and Loan Source Financial. Unfortunately, as ofthis writing, the number of nonbank lenders is decreasing. Bankshave lowered their rates to a point at which the nonbanks can nolonger compete. One reason that banks have been able to do this isthat their cost of capital is lower than that of nonbanks. Banks use thedeposits they have, whereas nonbanks must get their money from thepublic capital markets. Another reason is that banks are using theircommercial loans as “loss leaders.” They will sacrifice returns onbusiness loans to increase the number of customers who use many oftheir other services, such as online banking, personal savings, loanaccounts, and cash management programs. Nonbanks that havedeparted from or significantly decreased their loan business includeHeller Financial, Transamerica Finance, and The Money Store.21
252 CHAPTER 9
Debt Financing 253
Banks with SBA Loan ProgramsApproximately 6,000 of the 8,799 banks in the country (down from14,000 in 1997) use the SBA’s guaranteed loan program. Certifiedlender status is held by 850 banks and preferred lender status by 450banks. The Small Business Administration produces an annual reporton the small-business lending activities of the nation’s leading com-mercial banks. The SBA analyzes lending patterns and ranks “small-business-friendly” banks in every state and on a national level. TheSBA says that its goal is to give small businesses an easy-to-use toolfor locating likely loan sources in their communities. It also aims tonudge banks to compete more aggressively for small-firm customers.The report is a great resource for entrepreneurs trying to determinewhich banks will be more likely to lend a sympathetic ear and, moreimportantly, some cash for their business. The most recent report istitled “Small Business and Micro Business Lending, 2006–2007” andcan be found at http://www.sba.gov/advo/research. This reportcovers micro lending (under $100,000) and small-business lending(between $100,000 and $1 million).
Advice for Getting an SBA LoanIt has been estimated that the SBA will approve less than 50 percentof requested loans. Some advice for improving your chance ofobtaining an SBA-guaranteed loan is provided here:
■ Clean up your personal financial problems. Most of the rejectedloans are rejected because of the applicants’ poor personalcredit history. Before applying, the entrepreneur shouldreduce his credit card debt, and also the number of creditcards he has. Financiers are aware of these numbers andview holding too many credit cards negatively. It isespecially important for loan applicants to know theirthree-digit credit or FICO score, which ranks theircreditworthiness on a scale from 501 to 990. Finally, beforeapplying, the entrepreneur should check with the majorcredit bureaus and make sure there are no errors on hiscredit reports. The bureaus are Equifax (www.equifax.com),TransUnion (www.transunion.com), and Experian(www.experian.com). Americans are entitled to one freecredit report per year.
■ Define your goals realistically. Apply for a specific dollaramount, and identify in detail how the funds will be used.Develop realistic, logical financial pro formas that showthat even under the worst-case scenario, the debt can berepaid. At a minimum, most lenders want to see that acompany’s annual cash flow is 1.25 times its total annualloan obligations (principal and interest). Do not plug innumbers. Do not ask for money that you cannot forecastbeing paid back.
■ Begin early. Apply for financing at least 6 months beforethe money is needed.
■ Work with experienced lenders. Apply to institutions thathave certified or preferred lender status.
■ Submit an excellent business plan. Follow the guidelines andadvice presented in Chapter 3 regarding the developmentof a business plan. Make sure the entire plan, especiallythe executive summary, is well written, clear, andthorough. Just as important, check and recheck allnumbers, making sure that they are correct and that themath is perfect. All numbers must add up.
■ Collect preapplication information. Loans for existing andstart-up businesses require much of the same information,including:– The personal tax returns of all investors with at least
20 percent ownership for the past 3 years– The personal financial statements for all investors with
at least 20 percent ownership– The ownership documents, including franchise agree-
ments and incorporation papersA few pieces of information are needed for an existingbusiness that are not needed for a start-up and viceversa:
For an existing company:– Tax returns for the past 3 years– Interim financial statements– Business debt schedule
254 CHAPTER 9
For a start-up company:– Business plan– Potential sources of capital– Available collateral
■ Do not lie. Never lie. An entrepreneur’s greatest asset is hisreputation.
Other SBA Programs
Small Business Development Centers (SBDCs). Thereare more than 1,000 SBDCs, most of which are located in universi-ties throughout the country. This program is a collaborative effortbetween the SBA, the academic community, the private sector, andstate and local governments. The centers provide management and technical assistance as well as assistance in the preparation ofloan applications. The services are tailored to the local economiesthey serve.
SCORE. This advisory group has 389 chapters and 10,500 retiredand active senior executives and small-business owner volunteers.They provide marketing advice, business plan preparation, andbusiness planning, and they handle approximately 10,000 cases permonth. Information can be found at www.score.org.
Small Business Training Network. This network is an onlinetraining resource for small-business owners. The resource offersonline courses, workshops, publications, information resources,learning tools, direct access to electronic counseling, and other formsof technical assistance. It can be found at www.sba.gov/training.
Banks without SBA Loan Programs
Historically, banks without SBA programs (those that use personalguarantees as their primary collateral), including some communitydevelopment banks, have not been viewed as great friends to entre-preneurs. The reason is that most were asset-backed lenders thatdetermined the loan amount using a strict formula, such as 80 percentof the value of accounts receivable plus 20 percent of inventory and
Debt Financing 255
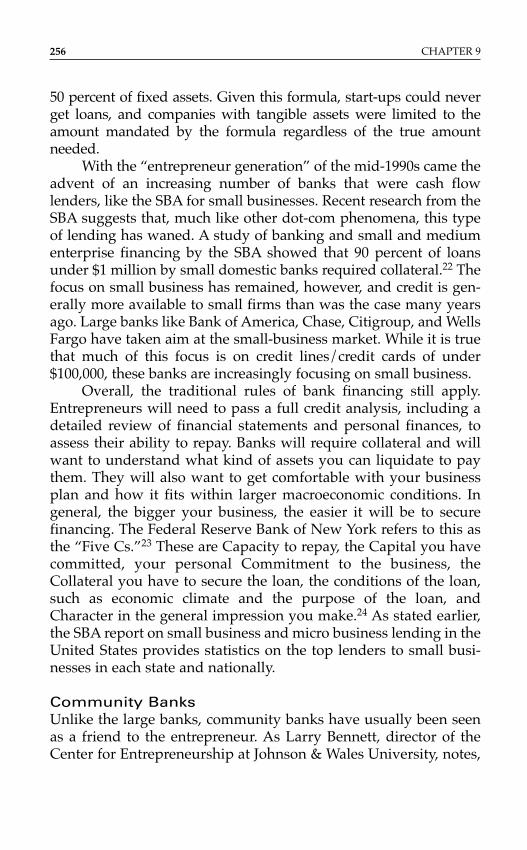
50 percent of fixed assets. Given this formula, start-ups could neverget loans, and companies with tangible assets were limited to theamount mandated by the formula regardless of the true amountneeded.
With the “entrepreneur generation” of the mid-1990s came theadvent of an increasing number of banks that were cash flowlenders, like the SBA for small businesses. Recent research from theSBA suggests that, much like other dot-com phenomena, this typeof lending has waned. A study of banking and small and mediumenterprise financing by the SBA showed that 90 percent of loansunder $1 million by small domestic banks required collateral.22 Thefocus on small business has remained, however, and credit is gen-erally more available to small firms than was the case many yearsago. Large banks like Bank of America, Chase, Citigroup, and WellsFargo have taken aim at the small-business market. While it is truethat much of this focus is on credit lines/credit cards of under$100,000, these banks are increasingly focusing on small business.
Overall, the traditional rules of bank financing still apply.Entrepreneurs will need to pass a full credit analysis, including adetailed review of financial statements and personal finances, toassess their ability to repay. Banks will require collateral and willwant to understand what kind of assets you can liquidate to paythem. They will also want to get comfortable with your businessplan and how it fits within larger macroeconomic conditions. Ingeneral, the bigger your business, the easier it will be to securefinancing. The Federal Reserve Bank of New York refers to this asthe “Five Cs.”23 These are Capacity to repay, the Capital you havecommitted, your personal Commitment to the business, theCollateral you have to secure the loan, the conditions of the loan,such as economic climate and the purpose of the loan, andCharacter in the general impression you make.24 As stated earlier,the SBA report on small business and micro business lending in theUnited States provides statistics on the top lenders to small busi-nesses in each state and nationally.
Community BanksUnlike the large banks, community banks have usually been seenas a friend to the entrepreneur. As Larry Bennett, director of theCenter for Entrepreneurship at Johnson & Wales University, notes,
256 CHAPTER 9
Debt Financing 257
“There is a huge difference in banks’ receptivity to lending to entre-preneurs.” The biggest difference is that local and regional bankswill more readily agree to customize loans to fit entrepreneurs’needs.25 These are typically small independent banks that special-ize in certain types of targeted lending. After years of consolida-tion, community banks are making a comeback. There are morethan 9,000 such banks in the country, some of which are listed inFigure 9-3. To find out who and where they are, contact theIndependent Community Bankers of America at 1–800–422–8439or visit www.icba.org.
Community Bank Investment Focus
Mechanics and Farmers Bank African Americans
Durham, North Carolina
Michigan Heritage Bank Equipment leasing
Novi, Michigan
United Commercial Bank Asian small-business community
San Francisco, California
Legacy Bank Urban families and entrepreneurs
Milwaukee, Wisconsin
First Truck Bank Small and women-owned businesses
Charlotte, North Carolina
F I G U R E 9-3
Various Community Banks
Entrepreneurs should choose the bank that best fits theirneeds. Bill Dunkelberg, chief economist at the National Federationof Independent Business and chairman of a small bank in CherryHill, New Jersey, explains how entrepreneurs should think aboutchoosing a bank. He says that small businesses should “figure out ifthey fit better with the point scoring model [or] if playing golf withthe loan officer would help.” In short, Dunkelberg is saying thatlarger banks will look more at the numbers behind your business,whereas small community banks will get to know the entrepreneurand may be more willing to work a bit more with her.26
Community Development Financial
Institutions (CDFIs)
CDFIs primarily provide loan financing to businesses that are generally unbankable by traditional industry standards. They aretypically community development loan funds, banks, creditunions, and community development venture funds. The pricingon these loans is a bit higher to reflect the additional risk, from 0.5 to 3.0 percent above normal loan rates. There are about 1,000CDFIs nationwide. In 2005, CDFIs funded more than 2,000 smalland medium-size businesses and held $739 million in outstandingloans and investments. Another 5,800 companies received loans of$35,000 or less. CDFIs can make riskier loans because they are notrestricted by regulation. CDFIs can also be value-added investors.There is no listing of every CDFI, but the Treasury Department hasa partial list at www.cdfifund.gov, and more resources can befound at www.cdfi.org.
CDFIs can be useful for starting up or growing a businesswhen bank financing is not an option and your returns are not highenough to attract the interest of angel investors or venture capitalfirms. CDFIs also can be useful for owners with less than perfectcredit. CDFIs typically fund businesses in economically depressedor rural areas.
Personal Guarantees
One of the greatest drawbacks to debt financing from banks formany entrepreneurs is the personal guarantee, which is collater-alized by all one’s assets, including one’s home. While such aguarantee is not required for loans from all capital sources, it isfor any SBA financing. Leslie Davis, a former commercial lender,said that it is not unusual for entrepreneurs to say, “I cannot agreeto personally guarantee the loan because my spouse will not letme.” In those cases, she immediately rejects the loan, because, asshe explains, “If the spouse does not completely believe in theentrepreneur, why should we?”
One of the greatest fears that entrepreneurs have is losing theirhomes. Bankers estimate that at least 90 percent of first-time businessowners use their homes as collateral. These are the entrepreneurs and
258 CHAPTER 9
spouses who are completely committed. Should they worry? Yes andno. If the borrower defaults and a personal guarantee is backed par-tially or completely by his home, the lender has the legal right to sellthe home in order to recoup its investment. But private banks andthe SBA typically attempt to work with the entrepreneur to developa long-term repayment plan that does not include selling the house.This point was supported by an SBA director who said, “Our posi-tion as far as personal residences is to try to work with the individ-ual borrower as much as possible. We look at the home as collateralof the last resort. We certainly don’t want to retain assets, especiallynot residential real estate.”27
Therefore, it is good advice to communicate regularly with thelender after providing a personal guarantee, so that if the loanbecomes a problem, it can be restructured prior to default. Loanofficers have been trained to receive bad news. They do not neces-sarily like it, but they like surprises even less. Keep the loan officerinformed. The loan officer wants you to repay the loan and suc-ceed, and will help if you pursue the problem early. Even whendefault is inevitable or occurs, the loan officer will still help you aslong as you communicate, are open with information, are willingto negotiate, and agree to a payment plan that could take 10 to 15years. Most importantly, demonstrate a “good-faith effort” to workthings out.
The worst thing you can do when you are facing default is tobecome difficult, noncommunicative, or threatening. Do not attemptto negotiate by threatening that you will declare bankruptcy if thelender does not give you what you want. Such threats usually upsetthe lender, and if you carry out the threat, it will be more harmful toyour future than to the lender’s. In such combative cases, the lenderwill not only pursue the home that was used as collateral, but alsoseek to garnish any future earnings that the entrepreneur may haveto fulfill the entire debt obligation.
Try to work things out. As stated in Chapter 1, most success-ful high-growth entrepreneurs fail at least 2 times. Give yourselfanother chance by making the bad experience a win-win situationfor both you and the financier. The financier wins by receiving pay-ment, and you win by keeping a strong reputation and puttingyourself in a position to receive financing from the same lender forfuture deals. As one bank executive explained, “If you’ve had some
Debt Financing 259
financial trouble in the past, it doesn’t mean that I’ll turn youdown. I’ll be curious about how you responded to the trouble.”28
Nonbank Financial Institutions without
SBA Loan Programs
Many nonbank financial institutions without SBA programs alsoprovide long-term debt financing to entrepreneurs. Included in thisgroup are national insurance companies, such as NorthwesternMutual and Prudential. Their loans can be used for working capi-tal, business acquisitions, and equipment and machinery. Theseinstitutions tend to have higher minimum loan levels than banksthat service entrepreneurs. For example, Prudential’s loan levelranges between $10 and $15 million. Another difference from tra-ditional bank lending is that if the insurance company were a subordinated lender, the loan would be for only 1 to 1.5 timesEBITDA. As the senior lender, nonbank financial institutions willbe similar to banks, lending as much as 3 times EBITDA. Anotherattraction is that these institutions are not asset lenders; they arecash flow lenders. As one supplier said, “We don’t look at collateralupfront. We look at management’s work history, and then the cashflow of the business. Banks don’t usually do that.”29 The final sig-nificant difference is one of their main attractions: be it senior orsubordinated debt, they can amortize the loan over 15 years. Thiscompares very favorably with the maximum 7 years that banks traditionally offer.
Person-to-Person (P2P) Lending
For prospective entrepreneurs who have had difficulty qualifyingfor traditional commercial or SBA loan products because of poorcredit ratings and/or an unproven track record, an increasinglypopular alternative for start-up capital is person-to-person (P2P)lending. At Web sites like Prosper.com, Zopa (www.zopa.com),Lending Club (www.lendingclub.com), and GlobeFunder(www.globefunder.com), entrepreneurs are able to connect withpeople across the globe who desire to lend small sums of money tostrangers for the promise of higher returns than they might seewith their traditional personal banking products. P2P lending
260 CHAPTER 9
allows individuals to lend to each other at a set rate for a fixedperiod of time, offer built-in solutions for loan repayment andtracking, and employ social networking capabilities that allow bor-rowers to tell the stories associated with their need for capital.30
The maximum loan amount at a P2P site is typically $25,000(although maximum loan amounts are expected to increase to asmuch as $100,000 in the future), with loans often syndicated amongseveral lenders.31 Each of the major sites employs a slightly differentmodel, but all typically require that borrowers register on their site,submit to a basic credit check (with required minimum credit scoresof approximately 640), and have a debt/equity ratio of around 30 percent. Currently, roughly 20 percent of the loans on the fourmajor P2P sites (Prosper, Zopa, LendingClub, and GlobeFunder) arefor business purposes.32
While rates on P2P sites can be more attractive than usingcredit card debt to finance a business, there are downsides to con-sider. These loans typically require both principal and interest to bepaid down every month (whereas several types of bank loansallow only interest payments at first). Additionally, the fixed pay-ment periods associated with these loans can often be difficult tomanage for seasonal businesses. Finally, it is almost impossible torenegotiate these loans once their terms are set.33
P2P lending will not replace traditional commercial lendinganytime soon, but it is a growing niche. Entrepreneurs are espe-cially cautioned to carefully consider their overall debt levels andability to repay before obtaining a P2P loan, since these productsdo not come with the built-in sanity checks that a commercialbanker brings to the traditional bank loan process.
CREATIVE WAYS TO STRUCTURE
LONG-TERM DEBT
Debt is usually structured so that it is amortized over 5 to 7 years,with interest and principal payments due each month. For the first-time or inexperienced entrepreneur, it is recommended that you askfor more lenient terms. The purpose is to give you a little breathingroom immediately after you procure the loan, so that your entirefocus can be on operating the company and not becoming a slave toservicing debt. The options for repaying the debt could include:
Debt Financing 261
■ Making payments quarterly or semiannually.■ Making only interest payments each quarter, with a
principal balloon payment at the end of Year 5 or Year 7.■ Making no payments at all until three to 6 months
following the loan closing; then paying interest only forthe balance of the fiscal year, followed by quarterlypayments of interest and principal for four to 6 years.
■ With SBA loans, structuring fixed principal and interestmonthly payments even with a variable rate. If interestrates go down, you pay down the principal faster. Ifinterest rates rise, you’ll have a balloon payment atmaturity.
These are only a few suggestions that every entrepreneurshould consider pursuing. As is obvious, these structures free upa lot of cash in the early stages—cash that the entrepreneur canuse to solidify the financial foundation of the company. Theseoptions, or any variation of them, are not typically offered auto-matically by the lender. The entrepreneur must ask for them during negotiations.
LONG-TERM DEBT RULES TO LIVE BY
In summary, here are a few final pieces of advice relative to debtfinancing:
■ Always take the maximum number of years allowable forrepayments. Try to include a no-prepayment-penaltyclause in the agreement.
■ Get a fixed rather than a floating rate of interest. Knowwhat your future payments will always be.
■ Expect loan application rejection. Do not be thin-skinned.■ After getting the loan, keep your investors informed. Send
them monthly or quarterly financial statements and, ifpossible, send out a quarterly status report. Invite lendersto visit your business at least once a year. A few of thesesuggestions may actually be required as stipulated in yourloan documents.
■ When things go wrong, renegotiate.
262 CHAPTER 9
■ Keep excellent and timely financial statements. Historicalstatements should be readily available at any time. Theyshould be neatly stored in an organized filing system.
■ Once the loan application has been submitted, expect tohear from a loan officer by telephone before or after normalworking hours. This is one of the ways bankers evaluate theworking habits of the entrepreneur. Does she come in earlyand stay late? Or is she an 8:00 a.m. to 5:00 p.m. person? (Toprove you are not the latter, call the loan officer at 6:00 a.m.or 9:00 p.m. and leave a message on his voice mail that youare in your office and working and thought he might bedoing the same, because you had a question for him.)
DEBT FINANCING FOR WORKING CAPITAL
Up to this point, the sources of capital discussed could have beenused for business acquisitions, start-ups, or working capital. Asstated before, most entrepreneurs find access to working capitaltheir greatest problem. Therefore, in addition to the aforemen-tioned sources, here are other sources of debt financing specificallyfor working capital.
Factors
Factoring firms, or factors, are asset-based lenders. The asset thatthey use for collateral is a company’s accounts receivable (AR). Byway of example, a company sells its AR, at a discount, to a factor. Thisallows the company to get immediate cash for the products shippedor services rendered. Factoring is one of the oldest financial toolsavailable, as it dates back to the Mesopotamians. It was also a tool ofthe American colonists, who would ship furs, lumber, and tobacco toEngland. Eventually, the U.S. garment industry became a user. Today,factoring has over $120 billion in annual volume in the United States.Worldwide, factoring volume is over $1.5 trillion annually.
The usual agreement is that when the product is shipped,copies of the shipping document, called the bill of lading, and theinvoice are faxed to the factor. Typically, within 48 hours, the factordeposits 70 to 90 percent of the invoice amount into the client’saccount. When the customer pays the bill, which is usually remitted
Debt Financing 263
to the factor in accordance with instructions on the invoice, the fac-tor takes the 70 to 90 percent that it had advanced to the client plus 2 to 4 percent for the use of its capital. The balance is sent to the client.
There are two types of factors, recourse and nonrecourse. Theformer buys accounts receivable with an agreement that it will bereimbursed by the client for receivables that cannot be collected.The latter type takes all of the risk of collecting the receivables. If areceivable is not paid, the client has no obligations to the factor.Obviously, the fees charged by nonrecourse factors are greater thanthose charged by recourse factors.
Regardless of the type of factor, before reaching an agreementwith a client, the factor investigates the creditworthiness of theclient’s customers. In most instances, the factor will “cherry-pick,”or select, certain customers and reject the accounts of others. Therejected customers are those that have a history of slow payment.
The factoring industry has continued to grow for a number ofreasons. First, factors provide immediate access to cash. This can beparticularly helpful for fast-growing companies or companies thatare in immediate need of liquidity. Alton Johnson of Bossa NovaBeverage Group used factoring to avoid giving up equity duringthe early stages of the firm’s growth. This got the firm to prof-itability without giving up precious equity. In some industries, fac-toring is actually the most profitable way to go. For example, RogerShorey, president of Accurate Metal Fabricators, a Florida-basedkitchen-cabinet company, receives discounts for immediate pay-ment that exceed the costs of factoring. Another force driving thegrowth in the factoring industry has been globalization. Factoringis an excellent way for small companies to manage the uncertaintyof a new export market.34
On the flip side, there are some clear negatives associated withfactoring, and it should almost always be viewed as a stopgap ortemporary measure. The primary negative associated with factor-ing is that factoring is very expensive. At 2 to 4 percent per 30-dayperiod, the annual cost of factoring is between 24 and 48 percentinterest. There are very few businesses that can generate returns atthese levels for sustained periods of time. Factors also typicallyprefer to engage in longer-term contracts. Finally, a company’sexisting debt covenants may forbid it from using this source of cap-ital because it involves the selling of assets.
264 CHAPTER 9
Debt Financing 265
How can an entrepreneur find a factor? Usually the factor willfind you. Once you go into business, factors will begin mailing youunsolicited requests to use their services. The postcard or letter willnot call it factoring; instead, it will call it working capital or inven-tory financing.
There are hundreds of factoring firms in the country. Someonline resources on factoring include Factors Chain International(www.factor-chain.com) and the International Factoring Association(www.factoring.org). Also, Alana Davidson, the principal of IBCFunding, a factoring broker, has written a paper entitled “TenFrequently Asked Questions about Factoring.” It can be obtainedfree of charge by writing to IBC Funding, 3705 Ingomar Street, NW,Washington, D.C. 20015.35
Advice for Using Factors
■ Factors are ideal for businesses in industries with inherentlong cash gaps, such as the health-care industry, whereinsurance companies are notoriously slow in payingclaims, or the apparel industry, where producers must buyfabric 6 to 9 months before they use it.
■ Factors are also ideal for companies that are experiencingor forecasting rapid growth.
■ Factors are also ideal for companies that are firstexperimenting with exporting goods to foreign countrieswith unfamiliar regulations.
■ They are ideal for companies that cannot get capital fromanywhere else.
■ However, factors should be used only by companies thathave included the cost of factoring in their prices.Otherwise, the cost of factoring could eliminate all of thecompany’s profits. In fact, one factor suggested that theonly firms that should use this financing method are thosewith at least 20 percent gross margins.36
■ Companies with many small customers should not usefactoring, as it is cumbersome to deal with checking thecredit of so many customers.
■ Ultimately, cheaper forms of capital should replace factorfinancing. It is too expensive to use on a long-term basis.
266 CHAPTER 9
Customer Financing
The idea that a customer could be a provider of debt may seemodd, but it is indeed possible and has happened many times.Customers are willing to provide capital to suppliers who providethem with a high-quality or unique product that they may not beable to buy somewhere else. This financing can be a direct loan ora down payment on a future order. That is the financing thatRobert Stockard, the owner of Sales Consultants of Boston (SCB),an executive recruiting firm, received from his largest customer,MCI. When the telecommunications giant needed a temporarysales force of 1,200 people to launch its new calling plan, Friendsand Family, nationally, it hired SCB. Rather than approach a bankfor additional working capital to finance this larger-than-usual job,Stockard persuaded MCI to make a 10 percent down payment onthe $2.5 million contract.37
Entrepreneurs like Stockard who successfully procure work-ing capital from customers show that anything is possible if yousimply ask. An investor who is also a customer is a value-addedinvestor.
But raising capital from a customer has a few drawbacks thatshould be considered first. One is that you may risk losing cus-tomers who are competitors of your investor. Another is that, as aninvestor, your customer could get access to key information aboutyour company and use it to become your competitor.
Still another negative is that once a customer is an investor,the customer knows more about the true state of the company’soperations. This exposure to the company’s internal operationsmay cause the customer to seek another supplier if the customerthinks the company is poorly managed.
Finally, the additional insight that a customer has may makeit tough for a supplier to increase prices, since the customer nowknows the cost of the product. Therefore, be careful when accept-ing capital from customers.
Supplier Financing
Suppliers are automatically financiers if they give their customerscredit. The simplest way for entrepreneurs to improve their sup-plier financing is by delaying the payment of their bills. This is
called “involuntary extended supplier financing.” But sometimes asupplier will graciously agree to extend its invoice terms to help acustomer finance a large order that, in turn, helps the supplier sellmore goods.
And there are other instances where a supplier will give adirect loan to a customer. That was the case when Rich FoodHoldings, a grocery wholesaler in Richmond, Virginia, loaned $3 million to Johnny Johnson, a grocery chain owner, “to buy mybuildings, equipment and groceries. In exchange, I agreed to pur-chase 60% of my inventory from them.”38
Like customer financing, supplier financing has a few nega-tive aspects. The first is that the supplier may require you to pur-chase most or all of your products from it. This causes a problemwhen the supplier has poor delivery, poor quality, and higherprices.
Another problem may be that because your supplier is aninvestor, other suppliers that are the supplier’s competitors mayrefuse to continue to do business with you.
Purchase Order Financing
Although they may seem alike, factoring and purchase orderfinancing are two different things. The first provides financingafter the order has been produced and shipped. The latter providescapital at a much earlier stage—when the order has been received.There are many businesses that have orders that they cannot fillbecause they cannot buy inventory. This working capital is used topay for the inventory needed to fill an order. It is a great resourcefor companies that are growing fast but do not have the capital tobuy additional inventory to maintain their growth.
That was the case with Jeffrey Martinez, the president ofOcean World Fisheries USA in Florida. His company is an importerof shrimp and crab from Latin America. His customers were givinghim purchase orders at a rapid pace. He, in turn, was generatingorders to his supplier faster than he was collecting receivables,which created a cash shortage and diminished the speed withwhich he could buy more inventory. In addition, his suppliersexpected to be paid immediately upon delivery. He had to pay for inventory before he got paid. Martinez explained his working
Debt Financing 267
capital problem this way: “We’re able to sell all the shrimp and crabwe could import and more. But when suppliers put the product ina container, they expect to be paid immediately.”39 His solution?He procured inventory using purchase order financing fromGerber Trade Finance in New York, which allowed him to pay forhis inventory upon delivery.
This type of financing is designed for companies that cannotget a traditional loan from a bank or finance company, perhapsbecause they are carrying too much long-term debt. It is idealshort-term financing for companies that do not hold inventory forlong, such as importers, wholesalers, and distributors.
Like factoring, purchase order financing is not cheap. Thelender charges fees that range from 5 to 10 percent of the purchaseorder’s value, and payment is due in 30 to 90 days.40
Purchase order financing is riskier than factoring because the collateral is inventory, which may get damaged, be poorly produced, or get spoiled. Therefore, banks and other traditionalfinanciers have not wholeheartedly embraced this type of debtfinancing.
In addition to Gerber, two additional purchase order finan-ciers are Bankers Capital and Transcap Trade Finance. Both arelocated in Northbrook, Illinois.
Credit Cards
The final source of debt working capital is from credit cards. Butbefore proceeding, let me offer a stern warning about using creditcards. Be careful! The abuse of credit cards can be one of the entre-preneur’s easiest and quickest ways to go out of business.
Americans owe more than $2 trillion on their credit cards.41
The top four cards are Visa, MasterCard, American Express andDiscover, which collectively hold approximately 70 percent of mar-ket share. It is estimated that 88 million U.S. households have at leastone credit card. In 2004, the Federal Reserve Survey of ConsumerFinances found that the median balance for household credit carddebt was $5,100. Americans for Fairness in Lending reports that thecredit card industry is cashing in on this debt, with $36.8 billion inprofits in 2006, up nearly 80 percent from $20.5 billion in 2000. Notsurprisingly, with all this money to be made, the number of credit
268 CHAPTER 9
card offers has skyrocketed. The number of credit card solicitationsin the mail has increased from 1.1 billion in 1990 to over 6 billion in2005. There areapproximately 280 million men, women, and chil-dren in the entire country. This is equivalent to 21 solicitations forevery person in the country!
One group that has been receptive to these solicitations is entrepreneurs. A 2007 survey done by the National Small BusinessAssociation showed that credit cards were the most common financ-ing option that entrepreneurs used to meet their capital needs.Entrepreneurs have embraced credit card use for several reasons.First and foremost, credit cards are very easy to get, as proved by thestatistics just cited. Second, the card allows easy access to as muchas $100,000 in cash advances without having to explain how themoney will be spent. Small businesses that don’t qualify for bankloans also look to credit cards to finance their growth. The final rea-son is that if they are used methodically and strategically, creditcards can provide inexpensive capital. Regarding this final point,there are two ways in which the capital can be cheap. The first is byusing cards that offer introductory rates as low as 3.9 percent. Thesecond is a situation where the capital can be provided as an inter-est-free short-term loan. That occurs when the bill is paid off eachmonth during the grace period.
This second method highlights one of several negative aspectsof using credit cards for working capital: one large bill comes dueevery month, as opposed to small bills from many suppliers whenyou pay by check. When cash is short, it is easier to juggle the pay-ments of a number of small bills than one large bill.
This problem leads to the next issue, and that is the assess-ment of expensive late-payment penalties. In 1997, the governmentlifted restrictions on maximum penalty charges, resulting in creditcard issuers charging whatever late fee they wanted, even if the billwas paid only one day after the grace period. Until that ruling,most banks charged an annual fee of about $25, fixed rates to allborrowers, and late fees of $10 or less. Furthermore, most cardscame with a grace period. Since that ruling, late fees have jumpedto $39, and in some cases the grace period has been eliminated.Moreover, credit card companies have begun increasing rates onborrowers for reasons ranging from being late on a house paymentto using too much of their available credit.
Debt Financing 269
One thing that has not changed is the high interest rates.While many credit card companies use low introductory rates tolure new customers, once these rates expire in 3 to 6 months, thetraditionally high credit card rates of 12 to 20 percent or even moretake effect. This is very expensive money because of the high ratesand the fact that the interest charges are compounded. Gettingbehind on credit card payments can put an entrepreneur in a deepfinancial hole. The worst is when the debt is so far past due that theinterest costs are being compounded and late penalties are beingadded, so that payments never decrease the principal. A situationlike this can harm the entrepreneur’s personal credit because she isliable, not the business.
Another challenge in using credit cards other than for cashadvances is finding suppliers that will accept them. Suppliers thatmight have credit card payment capabilities have an aversion toaccepting credit cards because the suppliers have to pay the issu-ing institution 1.5 to 3.0 percent. This in effect reduces the pricethey charge you.
The final negative is that the use of personal credit cards forbusiness purposes is a violation of the customer-cardholder agree-ment that you sign.
If you are not dissuaded from using a credit card, here are afew suggestions:
■ Pay the entire bill before the end of the grace period toeliminate interest charges or late fees. Payment means thatthe money must actually be received, not simply be “inthe mail.”
■ Not all cards have grace periods. Use only those that do.■ Know how long your grace period is. That is the amount
of time a lender allows before charging interest on thebalance due. Some grace periods are as few as 20 days. Ifthe bill is paid in full before the end of the grace period,no interest is charged. You should know that federal lawsays that credit card bills must be received no later than 14days before the grace period ends.
■ Refrain from getting cash advances if interest is chargedimmediately after the money is given, regardless ofwhether the account is paid in full during the grace
270 CHAPTER 9
period. In addition to interest charges, most credit cardcompanies charge a fee of 2 to 5 percent of the total cashadvance. Use only cards that treat cash advances like othercharges that you make.
■ Find out the closing date of your credit card statement.This is the date in every month when billing for thatmonth ends. For example, if your statement closing date isthe tenth of every month and you have a 20-day graceperiod, complete payment must be made and received bythe thirtieth of the month in order to avoid interestcharges.
■ When using the card to pay suppliers, get an agreementwith them that no matter when you make the actualpurchase, they will bill the credit card on the dayfollowing your statement closing date. Using the examplein the previous item, that date would be the eleventh ofthe month. Therefore, that charge will not show up untilyou receive the bill that closed on the tenth of the nextmonth. With a 20-day grace period added to that, youcould get a 50-day interest-free loan.
Let’s use a more detailed example to illustrate this point.The Perkins Company purchases 60 widgets from theSteinharter Company for $1,000 on October 14. The PerkinsCompany’s closing statement date is the twenty-ninth ofeach month. Therefore, the Steinharter Company submitsthe charge on October 30. On November 29, the charge issent to the Perkins Company by the issuer. The 20-daygrace period ends December 18. The Perkins Companypays the entire bill at the bank on December 17. The resultis that the Perkins Company received an interest-free$1,000 loan for 62 days, from October 14 to December 17.
In closing—be careful! Credit card companies are constantlychanging things. One such change could be your closing statementdate or the number of days in your grace period. Unnoticedchanges in either could result in your owing a complete month’sworth of interest because your payment was one day late. Finally,just as with any other contract, make sure to read the fine print andknow what obligations you and your business must fulfill.
Debt Financing 271
N O T E S
1. Time, January 13, 1997, p. 49.2. Microsoft, Inc., 2007 Annual Report, Microsoft home page,
http://www.microsoft.com/msft/reports/ar07/staticversion/10k_fh_fin.html.
3. SBA Office of Advocacy, “Small Business and Micro Business Lendingin the United States for Data Years 2003–2004,” November 2005.
4. Barnes and Thornburg, “M&A Trends 2006.”5. Global Entrepreneurship Monitor, “2006 Financing Report.”6. Andrew J. Sherman, “Raising Money in Tough Times: An
Entrepreneur’s Guide to Bootstrapping,” www.eventuring.org,January 1, 2003.
7. James Geshwiler, Marianne Hudson, John May, “State of AngelGroups: A Report on ACA and ACEF,” April 27, 2006.
8. Jeffrey Sohl, “The Angel Investor Market in 2006: The Angel MarketContinues Steady Growth,” University of New Hampshire Centerfor Venture Research.
9. Ewing Marion Kauffman Foundation, “Business Angel InvestingGroups Growing in North America,” October 2002.
10. Geshwiler, Hudson, and May, “State of Angel Groups.”11. Crain’s Chicago Business, November 6, 1996.12. Chronicle of Philanthropy, “Slow Growth at the Biggest
Foundations,” March 23, 2006.13. Inc., February 1998, p. 80.14. Milken Institute’s Los Angeles Economy Project, Section 6, October
2005.15. Ibid.16. Entrepreneur.com, “SBA-Guaranteed Loans”; accessed August 24,
2007.17. Small Business Administration, 2006.18. Small Business Administration, “Information on Basic 7(a) Loan
Program.”19. Small Business Administration, Office of Entrepreneurial
Development, “An Introduction to the U.S. Small BusinessAdministration,” 2007.
20. Ibid.21. Crain’s Chicago Business, August 13, 2001.
272 CHAPTER 9
22. Small Business Administration, “Banking and SME Financing in theUnited States,” June 2006.
23. Federal Reserve Bank of New York, “The Credit Process: A Guidefor Small Business Owners.”
24. Entrepreneur.com, “Bank-Term Loans.”25. “The State of Small-Business Funding,” Entrepreneur July 2006.26. “How Small Firms Can Weather a Credit Crunch,” Wall Street
Journal, August 7, 2007, p. B9.27. Nation’s Business, July 1996, p. 45R.28. Inc., June 1987, p. 150.29. Crain’s Chicago Business, December 1996, p. 22.30. Maureen Farrell, “Banking 2.0: New Capital Connections for
Entrepreneurs,” Forbes.com, February 2008.31. Alex Salkever, Inc., “Brother, Can You Spare a Dime?” August 2006.32. Farrell, “Banking 2.0.”33. Ibid.34. “Fast Money,” Wall Street Journal August 20, 2007, p. R7.35. Nation’s Business, September 1996, p. 21.36. Black Enterprise, July 1999, p. 40.37. Forbes, December 28, 1998, p. 91.38. Black Enterprise, March 1998, p. 84.39. Chicago Sun-Times, July 17, 2001, p. 47.40. Crain’s Chicago Business, March 13, 2000.41. Federal Reserve Statistical Release, “Consumer Credit.”
Debt Financing 273

This page intentionally left blank
INTRODUCTION
Equity capital is money provided in exchange for ownership in thecompany. The equity investor receives a percentage of ownershipthat ideally appreciates as the company grows. The investor mayalso receive a portion of the company’s annual profits, called divi-dends, based on his ownership percentage. For example, a 10 per-cent dividend yield or payout on a company’s stock worth $200 pershare means an annual dividend of $20.
Before deciding to pursue equity financing, the entrepreneurmust know the positive and negative aspects of this capital.
Pros■ No personal guarantees are required.■ No collateral is required.■ No regular cash payments are required.■ There can be value-added investors.■ Equity investors cannot force a business into bankruptcy.■ On average, companies with equity financing grow faster.
275
C H A P T E R 1 0
Equity Financing
Cons■ Dividends are not deductible.■ The entrepreneur has new partners.■ It is typically very expensive.■ The entrepreneur can be replaced.
SOURCES OF EQUITY CAPITAL
Many of the sources of debt capital can also provide equity capital.Therefore, for those common sources, what was said about themearlier in the book also applies here. When appropriate, a few addi-tional issues might be added in this discussion of equity. Other-wise, please refer to Chapter 9.
Personal Savings
When an entrepreneur personally invests money in the company, itshould be in the form of debt, not equity. This will allow the entre-preneur to recover her investment with only the interest receivedbeing taxed. The principal will not be taxed, as it is viewed by theIRS as a return of the original investment. This is in contrast to thetax treatment of capital invested as equity. Like interest, the divi-dend received would be taxed, along with the entire amount of theoriginal investment, even if no capital gain is realized.
The entrepreneur’s equity stake should come from her hardwork in starting and growing the company, not her monetary con-tribution. This is called sweat equity.
Friends and Family
Equity investments are not usually accompanied by personal guarantees from the entrepreneur. However, such assurances maybe required of the entrepreneur when he receives capital fromfriends and family in order to maintain the relationship if the busi-ness fails.
But this may be a small price to pay in order to realize anentrepreneurial dream. Start-up capital is virtually impossible toobtain except through friends and family. Dan Lauer experienced
276 CHAPTER 10
this firsthand when he was starting his company, Haystack Toys, in1988. He raised $250,000 from family and friends after quitting hisjob as a banker. He went to family and friends after 700 submissionletters to investors went unanswered.1
Angel Investors
Wealthy individuals usually like to invest in the form of equitybecause they want to share in the potential growth of the company’svaluation. There is presently and has always been a dearth of capitalfor the earliest stages of entrepreneurship—the seed or start-upstage. Angel investors have done an excellent job of providing capi-tal for this stage. Their investments are typically between $25,000and $150,000. In exchange, they expect high returns (a minimum 38percent IRR), similar to what venture capitalists get. Since they areinvesting at the earliest stage, they usually also get a large ownershipposition in the company because the valuation is so low.
As was stated in Chapter 9, many angel investors are formersuccessful entrepreneurs. One of the prominent former entrepre-neurs who has gone on to become an angel investor is Mitch Kapor,who in 1982 founded Lotus Development, the producer of Lotus1–2–3 software, which is now a division of IBM. Since he becamean angel in 1994, one of his most successful investments was inUUNet, the first Internet access provider.
But angel investing has never been limited to former entre-preneurs. In fact, Apple Computer got its first outside financingfrom an angel who had never owned a company. He was A. C.“Mike” Markkula, who gained his initial wealth from being ashareholder and corporate executive at Intel. In 1977 he invested$91,000 in Apple Computer and personally guaranteed another$250,000 in credit lines. When Apple went public in 1980, his stockin the company was worth more than $150 million.2
This is one of several reasons why the number of angelinvestors increased so dramatically during the 1990s: returns. Thepublicity surrounding successful entrepreneurial ventures oftenincluded stories about the returns that investors received. These stories, coupled with research, led many wealthy individuals to theprivate equity industry. And while the anecdotal stories themselvesare quite impressive, the more seductive story is empirical research
Equity Financing 277
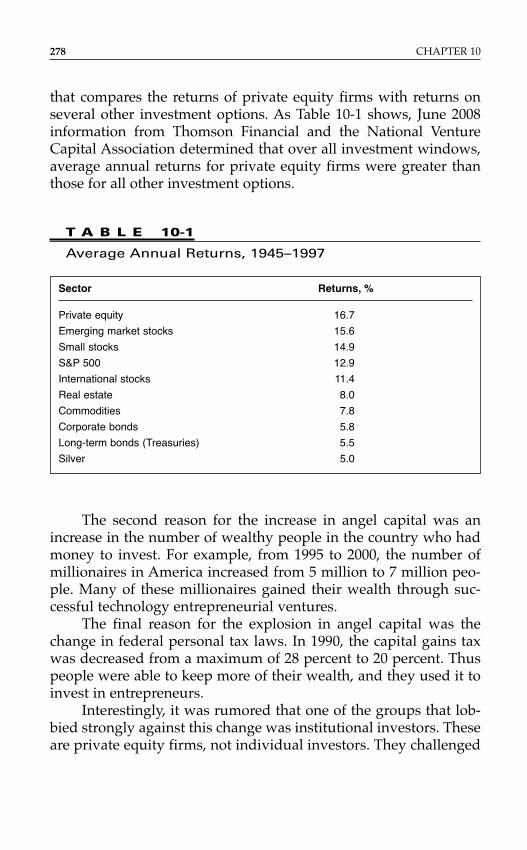
that compares the returns of private equity firms with returns onseveral other investment options. As Table 10-1 shows, June 2008information from Thomson Financial and the National VentureCapital Association determined that over all investment windows,average annual returns for private equity firms were greater thanthose for all other investment options.
278 CHAPTER 10
T A B L E 10-1
Average Annual Returns, 1945–1997
Sector Returns, %
Private equity 16.7
Emerging market stocks 15.6
Small stocks 14.9
S&P 500 12.9
International stocks 11.4
Real estate 8.0
Commodities 7.8
Corporate bonds 5.8
Long-term bonds (Treasuries) 5.5
Silver 5.0
The second reason for the increase in angel capital was anincrease in the number of wealthy people in the country who hadmoney to invest. For example, from 1995 to 2000, the number ofmillionaires in America increased from 5 million to 7 million peo-ple. Many of these millionaires gained their wealth through suc-cessful technology entrepreneurial ventures.
The final reason for the explosion in angel capital was thechange in federal personal tax laws. In 1990, the capital gains taxwas decreased from a maximum of 28 percent to 20 percent. Thuspeople were able to keep more of their wealth, and they used it toinvest in entrepreneurs.
Interestingly, it was rumored that one of the groups that lob-bied strongly against this change was institutional investors. Theseare private equity firms, not individual investors. They challenged
the change because they correctly predicted that it would hurt theirbusiness. They believed that as more money became available toentrepreneurs, a company’s valuation would inevitably increaseand there would be more competition. Rich Karlgaard, the pub-lisher of Forbes magazine, made this same point:
In my cherubic youth I used to wonder why so many venture capi-talists opposed a reduced capital gains tax. Then I woke up to thefacts. Crazy as it sounds, even though venture capitalists stand tobenefit individually by reduced capital gains taxes, the reducedrates would also lower entry barriers for new competition in the form of corporations and angels. That might lead to—too muchventure capital.3
Even though the amount of capital invested by venture capi-talists and angel investors is traditionally on a similar scale, accord-ing to the Center for Venture Research at the University of NewHampshire, there were significantly fewer companies funded byventure capital firms (4,000) than by angel investors (51,000). In2005, there were an estimated 234,000 active angel investors. Thecurrent yield on angel investments, or the percentage of investmentsshown that ultimately receive investments by angels, is 20.1 percent.This is down from 23 percent in 2000 but up from the 10 percentyield after the Internet bubble burst in 2000. In 2006, 21 percent ofangel investments were directed to health services and medicaldevices and equipment, 18 percent to software, and 18 percent tobiotechnology firms.
Despite private equity firms’ complaints, the increase in avail-able capital was clearly a huge positive for entrepreneurs. A fewother positive aspects of angel equity capital for entrepreneurs areas follows:
■ Seed capital is being provided. Most institutional investorsdo not finance this early stage of entrepreneurship.
■ Many of the angels have great business experience andtherefore are value-added investors.
■ Angel investors can be more patient than institutionalinvestors, who have to answer to their limited partnerinvestors.
Equity Financing 279
But there are also a few negative aspects to raising moneyfrom angels:
■ Potential interference. Most angels want not only a seat onthe board of directors, but also a very active advisory role,which can be troublesome to the entrepreneur.
■ Limited capital. The investor may be able to invest only inthe initial round of financing because of limited capitalresources.
■ The capital can be expensive. Angels typically expectannual returns in excess of 25 percent.
Regarding this final point, here is what an angel investor saidabout his expectations:
I expect to make a good deal of money—more than I would make byputting my capital into a bank, bonds, or publicly traded stocks. Mygoal, after getting my principal back, is to earn 33% of my initialinvestment every year for as long as the business is in operation.
My usual understanding is that for my investment I own 51% ofthe stock until I am paid back, whereupon my stake drops to 25%.After that we split every dollar that comes out of the business untilI earn my 33% return for the year.4
Despite the drawbacks, most entrepreneurs who raise angelcapital successfully do not regret it. As one entrepreneur said,“Without angel money, I wouldn’t have been able to accomplishwhat I have. Giving up stock was the right thing to do.”5
Gaining access to angel investors is not an easy task. CalSimmons, an Alexandria, Virginia–based angel investor and coau-thor of Every Business Needs an Angel, says, “You need to have net-works. If someone I know and respect refers me, then I’m going toalways take the time to take a meeting.” Angel groups are anothermechanism for getting access to angel investors. There are currently94 angel groups in operation, and they accept applications to presentto their angels. Some of these groups charge entrepreneurs a nominalfee of $100 to $200 to present.
There are forums in almost every region of the country similarto the Midwest Entrepreneurs Forum in Chicago. At this event, heldthe second Monday of each month, entrepreneurs make presenta-tions to angel investors. There are also several angel-related Websites, including the Angels Forum (www.angelsforum.com) in Silicon
280 CHAPTER 10
Valley, SourceCapitalnet.com (www.sourcecapitalnet.com) in NewYork, and Angel Investor News (www.angel-investor-news.com).The SBA started ACE-NET (www.ace-net.org) in 1998 to help bringentrepreneurs and angels together online. Its official name is nowActive Capital, which reflect its desire to provide a proactiveapproach to helping small businesses obtain private capital. TheEwing Marion Kauffman Foundation also manages the Angel CapitalAssociation (www.angelcapitalassociation.org), which is an angelcapital industry trade group with nearly 150 members.
PRIVATE PLACEMENTS
When entrepreneurs seek financing, be it debt or equity, from anyof the sources mentioned up until now, that financing is called aprivate placement offering. That is, capital is not being raised on theopen market via an initial public offering, which will be discussedlater in this chapter. The capital is being raised from select individ-uals or organizations that meet all of the standards set by Section4(2) of the U.S. Securities Act of 1933 and Regulation D, an amend-ment to this act that clarified the rules for those seeking a privateplacement exemption. The rule says, “Neither the issuer nor anyperson acting on its behalf shall offer or sell the securities by anyform of general solicitation or general advertising. This includesadvertisements, articles or notices in any form of media. Also, therelationship between the party offering the security and the poten-tial investor will have been established prior to the launch of theoffering.”6 All of this simply means that an entrepreneur cannotsolicit capital by standing on the corner trying to sell stock in hiscompany to any passersby. He also cannot put an ad in a newspa-per or magazine recruiting investors. He must know his investors,directly or indirectly. Potential investors in the latter category areknown through the entrepreneur’s associates, such as his attorney,accountant, or investment banker.
The final part of the regulation says that fund-raising effortsmust be restricted to “accredited investors only.” These investorsare also known as sophisticated investors. Such an investor has tomeet one of the following three criteria:
■ An individual net worth (or joint net worth with spouse)that is greater than $1 million
Equity Financing 281
■ An individual income (without any income of a spouse) inexcess of $200,000 in each of the two most recent years andreasonably expects an income in excess of $200,000 in thecurrent year
■ Joint income with spouse in excess of $300,000 in each ofthe two most recent years and reasonably expects to havejoint income in excess of $300,000 in the current year
Prior to accepting investments, the entrepreneur must getconfirmation of this sophisticated investor status by requiring allthe investors to complete a form called the Investor Questionnaire.This form must be accompanied by a letter from the entrepreneur’sattorney or accountant stating that the investors meet all of theaccreditation requirements.
Violation of any part of Regulation D could result in a 6-monthsuspension of fund-raising or something as severe as the company’sbeing required to immediately return all the money to the investors.Therefore, the entrepreneur should hire an attorney experiencedwith private placements before raising capital. Figure 10-1 summa-rizes the Regulation D rules and restrictions.
As stated earlier, sources of capital for a private placement areangel investors, insurance companies, banks, family, and friends,along with pension funds and private investment pools. There areno hard-and-fast rules regarding the structure or terms of a privateplacement. Therefore, private placements are ideal for high-riskand small companies. The offering can be for all equity, all debt, ora combination of debt and equity. The entrepreneur can issue theoffering or use an investment banker.
The largest and most prominent national investment banksthat handle private placements are Merrill Lynch, JPMorgan, andCredit Suisse First Boston. These three bankers raise a total of over$30 billion annually for entrepreneurs. Regional investmentbankers are better suited for raising small amounts of capital.
When hiring an investment banker, the entrepreneur shouldexpect to pay either a fixed fee or a percentage of the money raised(which can be up to 10 percent) and/or give the fund-raiser a per-centage of the company’s stock (up to 5 percent). One important pieceof advice is that the entrepreneur should be extremely cautious aboutusing the same investment banker to determine the amount of capital
282 CHAPTER 10
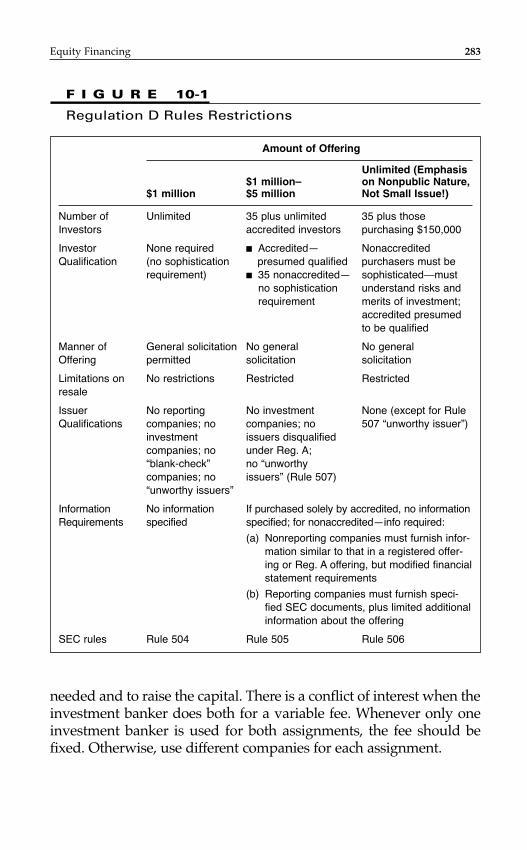
Equity Financing 283
F I G U R E 10-1
Regulation D Rules Restrictions
Amount of Offering
Unlimited (Emphasis $1 million– on Nonpublic Nature,
$1 million $5 million Not Small Issue!)
Number of Unlimited 35 plus unlimited 35 plus those Investors accredited investors purchasing $150,000
Investor None required ■ Accredited— Nonaccredited Qualification (no sophistication presumed qualified purchasers must be
requirement) ■ 35 nonaccredited— sophisticated—must no sophistication understand risks and requirement merits of investment;
accredited presumedto be qualified
Manner of General solicitation No general No general Offering permitted solicitation solicitation
Limitations on No restrictions Restricted Restrictedresale
Issuer No reporting No investment None (except for Rule Qualifications companies; no companies; no 507 “unworthy issuer”)
investment issuers disqualified companies; no under Reg. A; “blank-check” no “unworthy companies; no issuers” (Rule 507)“unworthy issuers”
Information No information If purchased solely by accredited, no information Requirements specified specified; for nonaccredited—info required:
(a) Nonreporting companies must furnish infor-mation similar to that in a registered offer-ing or Reg. A offering, but modified financialstatement requirements
(b) Reporting companies must furnish speci-fied SEC documents, plus limited additionalinformation about the offering
SEC rules Rule 504 Rule 505 Rule 506
needed and to raise the capital. There is a conflict of interest when theinvestment banker does both for a variable fee. Whenever only oneinvestment banker is used for both assignments, the fee should befixed. Otherwise, use different companies for each assignment.
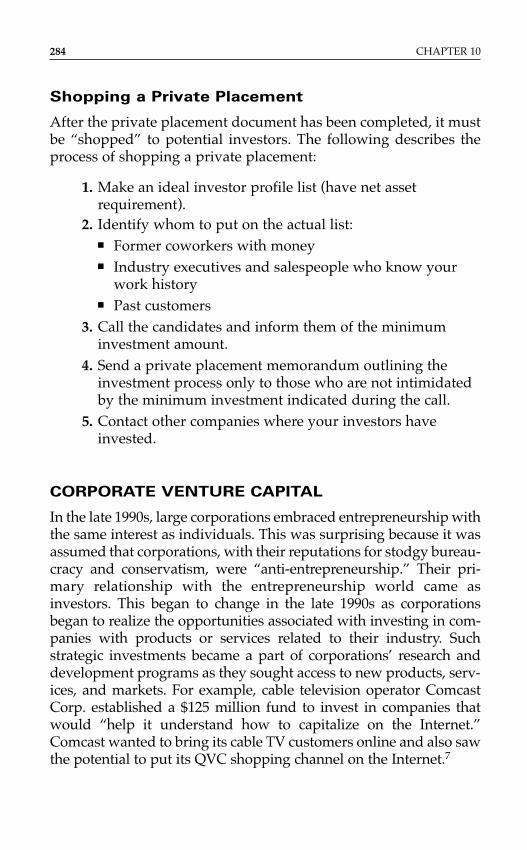
Shopping a Private Placement
After the private placement document has been completed, it mustbe “shopped” to potential investors. The following describes theprocess of shopping a private placement:
1. Make an ideal investor profile list (have net assetrequirement).
2. Identify whom to put on the actual list:■ Former coworkers with money■ Industry executives and salespeople who know your
work history■ Past customers
3. Call the candidates and inform them of the minimuminvestment amount.
4. Send a private placement memorandum outlining theinvestment process only to those who are not intimidatedby the minimum investment indicated during the call.
5. Contact other companies where your investors haveinvested.
CORPORATE VENTURE CAPITAL
In the late 1990s, large corporations embraced entrepreneurship withthe same interest as individuals. This was surprising because it wasassumed that corporations, with their reputations for stodgy bureau-cracy and conservatism, were “anti-entrepreneurship.” Their pri-mary relationship with the entrepreneurship world came asinvestors. This began to change in the late 1990s as corporationsbegan to realize the opportunities associated with investing in com-panies with products or services related to their industry. Suchstrategic investments became a part of corporations’ research anddevelopment programs as they sought access to new products, serv-ices, and markets. For example, cable television operator ComcastCorp. established a $125 million fund to invest in companies thatwould “help it understand how to capitalize on the Internet.”Comcast wanted to bring its cable TV customers online and also sawthe potential to put its QVC shopping channel on the Internet.7
284 CHAPTER 10
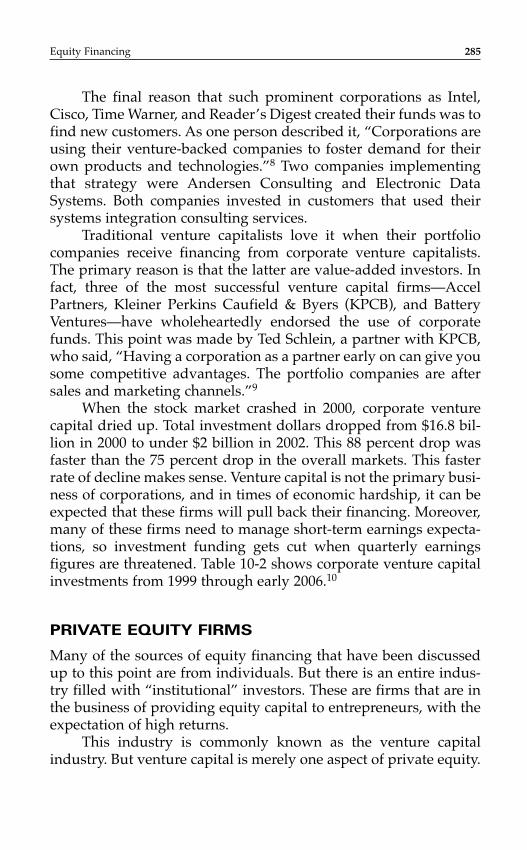
The final reason that such prominent corporations as Intel,Cisco, Time Warner, and Reader’s Digest created their funds was tofind new customers. As one person described it, “Corporations areusing their venture-backed companies to foster demand for theirown products and technologies.”8 Two companies implementingthat strategy were Andersen Consulting and Electronic DataSystems. Both companies invested in customers that used their systems integration consulting services.
Traditional venture capitalists love it when their portfoliocompanies receive financing from corporate venture capitalists.The primary reason is that the latter are value-added investors. Infact, three of the most successful venture capital firms—AccelPartners, Kleiner Perkins Caufield & Byers (KPCB), and BatteryVentures—have wholeheartedly endorsed the use of corporatefunds. This point was made by Ted Schlein, a partner with KPCB,who said, “Having a corporation as a partner early on can give yousome competitive advantages. The portfolio companies are aftersales and marketing channels.”9
When the stock market crashed in 2000, corporate venturecapital dried up. Total investment dollars dropped from $16.8 bil-lion in 2000 to under $2 billion in 2002. This 88 percent drop wasfaster than the 75 percent drop in the overall markets. This fasterrate of decline makes sense. Venture capital is not the primary busi-ness of corporations, and in times of economic hardship, it can beexpected that these firms will pull back their financing. Moreover,many of these firms need to manage short-term earnings expecta-tions, so investment funding gets cut when quarterly earnings figures are threatened. Table 10-2 shows corporate venture capitalinvestments from 1999 through early 2006.10
PRIVATE EQUITY FIRMS
Many of the sources of equity financing that have been discussedup to this point are from individuals. But there is an entire indus-try filled with “institutional” investors. These are firms that are inthe business of providing equity capital to entrepreneurs, with theexpectation of high returns.
This industry is commonly known as the venture capitalindustry. But venture capital is merely one aspect of private equity.
Equity Financing 285
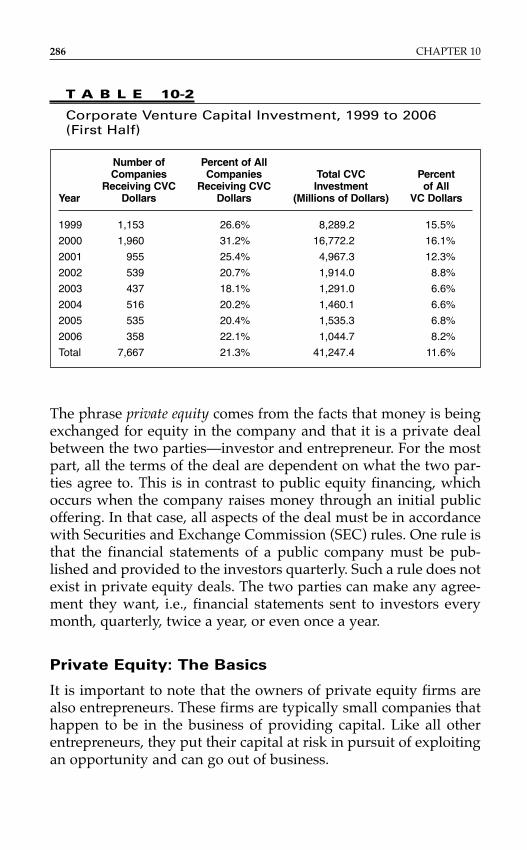
The phrase private equity comes from the facts that money is beingexchanged for equity in the company and that it is a private dealbetween the two parties—investor and entrepreneur. For the mostpart, all the terms of the deal are dependent on what the two par-ties agree to. This is in contrast to public equity financing, whichoccurs when the company raises money through an initial publicoffering. In that case, all aspects of the deal must be in accordancewith Securities and Exchange Commission (SEC) rules. One rule isthat the financial statements of a public company must be pub-lished and provided to the investors quarterly. Such a rule does notexist in private equity deals. The two parties can make any agree-ment they want, i.e., financial statements sent to investors everymonth, quarterly, twice a year, or even once a year.
Private Equity: The Basics
It is important to note that the owners of private equity firms arealso entrepreneurs. These firms are typically small companies thathappen to be in the business of providing capital. Like all otherentrepreneurs, they put their capital at risk in pursuit of exploitingan opportunity and can go out of business.
286 CHAPTER 10
Number of Percent of All Companies Companies Total CVC Percent
Receiving CVC Receiving CVC Investment of AllYear Dollars Dollars (Millions of Dollars) VC Dollars
1999 1,153 26.6% 8,289.2 15.5%
2000 1,960 31.2% 16,772.2 16.1%
2001 955 25.4% 4,967.3 12.3%
2002 539 20.7% 1,914.0 8.8%
2003 437 18.1% 1,291.0 6.6%
2004 516 20.2% 1,460.1 6.6%
2005 535 20.4% 1,535.3 6.8%
2006 358 22.1% 1,044.7 8.2%
Total 7,667 21.3% 41,247.4 11.6%
T A B L E 10-2
Corporate Venture Capital Investment, 1999 to 2006 (First Half)
Legal Structure
Most private equity firms are organized as limited partnerships or limited liability companies. These structures offer advantagesover general partnerships by indemnifying the external investorsand the principals. They also have advantages over C corpora-tions because they limit the life of the firm to a specific amountof time (usually 10 years), which is attractive to investors.Furthermore, the structures eliminate the double taxation on dis-tributed profits.
The professional investors who manage the firm are the general partners (GPs). The GPs invest only 1 to 5 percent of their personal capital in the fund and make all the decisions.External investors in a typical private equity partnership arecalled limited partners (LPs). During the fund-raising process,LPs pledge or commit a specified amount of capital for the newventure fund. For most funds formed today, the minimum capitalcommitment from any single LP is $1 million; however, the actualminimum contribution is completely at the discretion of the firm.The commitment of capital is formalized through the signing of the partnership agreement between the LP and the venturefirm. The partnership agreement details the terms of the fund and legally binds the LPs to provide the capital that they havepledged.
Getting Their Attention
GPs rely on their proprietary network of entrepreneurs, friendlyattorneys, limited partners, and industry contacts to introducethem to new companies. They are much more likely to spend timelooking at a new opportunity that was referred to them by asource they find trustworthy than one referred by other sources. A business plan that is referred through their network is also less likely to be “shopped around” to all the other venture capital-ists focused on a particular industry segment. GPs want to avoid getting involved in an auction for the good deals becausebidding drives up the valuation. In the course of a year, a typicalprivate equity firm receives thousands of business plans. Lessthan 10 percent of these deals move to the due diligence phase ofthe investment.
Equity Financing 287
Business Plan Review
Most firms use a screening process to prioritize the deals they areconsidering. Generally, associates within a firm are given theresponsibility of screening new business plans based on a set ofinvestment criteria, developed over time by the firm. These criteriaare grounded in the characteristics of completed deals that havebeen successful for the firm in the past. Several of the parametersused to screen business plans are:
■ Industry■ Growth expectations■ Phase in the life cycle■ Differentiating factors■ Management■ Terms of the deal
An entrepreneur can expedite the process by creating a con-cise, accurate, and compelling document that addresses aninvestor’s key concerns. The ability of the entrepreneur to effec-tively communicate her ideas through a written business plan iscritical to receiving funding for the project.
Once a deal passes the first screen by meeting a majority of theinitial criteria, a private equity firm begins an exhaustive investi-gation of the industry, the managers, and the financial projectionsof the potential investment. Due diligence may include hiring con-sultants to investigate the feasibility of a new product; doing exten-sive reference checking on management, including backgroundchecks; and undertaking detailed financial modeling to check thelegitimacy of projections. The entire due diligence process takesfrom 30 to 90 days in a deal that receives funding.
Management
Most GPs list management as their most important criterion for thesuccess of an investment. The management team is evaluatedbased on attributes that define its leadership ability, experience,and reputation, including:
■ Recognized achievement■ Teamwork
288 CHAPTER 10
■ Work ethic■ Operating experience■ Commitment■ Integrity■ Reputation■ Entrepreneurial experience
GPs use a variety of methods to confirm the information pro-vided by an entrepreneur, including extensive interviews, privatedetectives, background checks, and reference checks. During theinterview process, the entrepreneur must provide compelling evi-dence of the merits of the plan and of the management team’s abil-ity to execute it. Therefore, the management team must clearly andconcisely articulate the product or service concept and be preparedto answer a series of in-depth questions. Additionally, the inter-view process provides an indication to both sides of the fit betweenthe venture capitalist and the entrepreneur. A good fit is critical tothe potential success of the investment because of the difficult deci-sions that inevitably need to be made during the life of the rela-tionship.
Some firms believe in the strength of management so muchthat they invest in a management team or a manager before a com-pany exists. Often, these entrepreneurs have successfully brought acompany to a lucrative exit and are looking for the next opportu-nity. Some venture firms give these seasoned veterans the title“entrepreneur in residence” and fund the search for their nextopportunity.
Ideal Candidate
Again, private equity from institutional investors is ideal for entre-preneurial firms with excellent management teams. These compa-nies should be predicted to experience or be experiencing rapidannual growth of at least 20 percent. The industry should be largeenough to sustain two large successful competitors. And the prod-uct should have:
■ Limited technical and operational risks■ Proprietary and differentiating features
Equity Financing 289
■ Above-average gross margins■ Short sales cycles■ Repeat sales opportunities
Finally, the company must have the potential to increase in value sufficiently in 5 to 7 years for the investor to realize her minimum targeted return. Coupled with this growth poten-tial must be at least two explicit discernible exit opportunities(sell the company or take it public) for the investor. The entrepre-neur and the investor must agree on the timing of this potentialexit and the strategy in advance. For example, an ideal entrepre-neurial financing candidate is one who knows that he wants to raise $10 million in equity capital for 10 percent of his com-pany and expects to sell the company to a Fortune 500 corpora-tion in 5 years for 7 times the company’s present value. This tells the investor that she can exit the deal in Year 5 and receive$70 million for her investment.
When an entrepreneur goes after private equity funding, heshould know what kind of returns are expected. The institutionalprivate equity industry and the targeted minimum internal rates ofreturn are noted in Table 10-3.
290 CHAPTER 10
T A B L E 10-3
Targeted IRR for Private Equity Investors
Private Equity Investor Type Targeted IRR
Corporate finance 20–40%
Mezzanine funds 15–25%
Venture capital funds 38–50%
Again, private equity investors make their “real” money whena portfolio company has a liquidation event: the company goes pub-lic, merges, recapitalizes, or gets acquired. Depending on the equityfirm and its investment life cycle, the fund’s investors typically planto exit anywhere between three and 10 years after the initial invest-ment. Among other things, investors consider the time value ofmoney—the concept that a million dollars today is worth more than
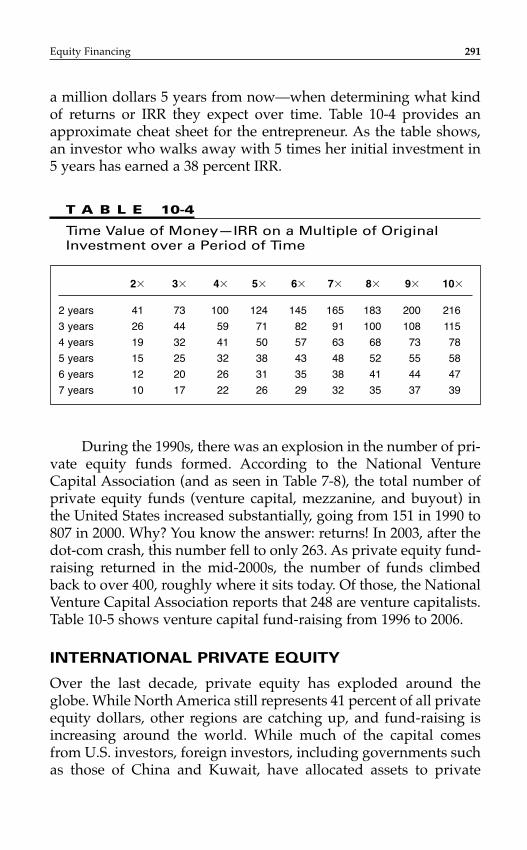
a million dollars 5 years from now—when determining what kindof returns or IRR they expect over time. Table 10-4 provides anapproximate cheat sheet for the entrepreneur. As the table shows,an investor who walks away with 5 times her initial investment in5 years has earned a 38 percent IRR.
Equity Financing 291
T A B L E 10-4
Time Value of Money—IRR on a Multiple of OriginalInvestment over a Period of Time
2� 3� 4� 5� 6� 7� 8� 9� 10�
2 years 41 73 100 124 145 165 183 200 216
3 years 26 44 59 71 82 91 100 108 115
4 years 19 32 41 50 57 63 68 73 78
5 years 15 25 32 38 43 48 52 55 58
6 years 12 20 26 31 35 38 41 44 47
7 years 10 17 22 26 29 32 35 37 39
During the 1990s, there was an explosion in the number of pri-vate equity funds formed. According to the National VentureCapital Association (and as seen in Table 7-8), the total number ofprivate equity funds (venture capital, mezzanine, and buyout) inthe United States increased substantially, going from 151 in 1990 to807 in 2000. Why? You know the answer: returns! In 2003, after thedot-com crash, this number fell to only 263. As private equity fund-raising returned in the mid-2000s, the number of funds climbedback to over 400, roughly where it sits today. Of those, the NationalVenture Capital Association reports that 248 are venture capitalists.Table 10-5 shows venture capital fund-raising from 1996 to 2006.
INTERNATIONAL PRIVATE EQUITY
Over the last decade, private equity has exploded around theglobe. While North America still represents 41 percent of all privateequity dollars, other regions are catching up, and fund-raising isincreasing around the world. While much of the capital comesfrom U.S. investors, foreign investors, including governments suchas those of China and Kuwait, have allocated assets to private
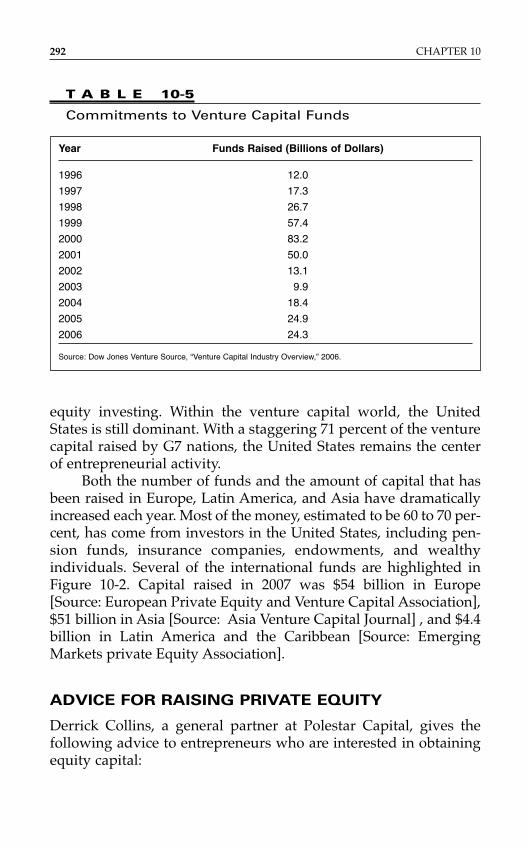
equity investing. Within the venture capital world, the UnitedStates is still dominant. With a staggering 71 percent of the venturecapital raised by G7 nations, the United States remains the centerof entrepreneurial activity.
Both the number of funds and the amount of capital that hasbeen raised in Europe, Latin America, and Asia have dramaticallyincreased each year. Most of the money, estimated to be 60 to 70 per-cent, has come from investors in the United States, including pen-sion funds, insurance companies, endowments, and wealthyindividuals. Several of the international funds are highlighted inFigure 10-2. Capital raised in 2007 was $54 billion in Europe[Source: European Private Equity and Venture Capital Association],$51 billion in Asia [Source: Asia Venture Capital Journal] , and $4.4billion in Latin America and the Caribbean [Source: EmergingMarkets private Equity Association].
ADVICE FOR RAISING PRIVATE EQUITY
Derrick Collins, a general partner at Polestar Capital, gives the following advice to entrepreneurs who are interested in obtainingequity capital:
292 CHAPTER 10
Year Funds Raised (Billions of Dollars)
1996 12.0
1997 17.3
1998 26.7
1999 57.4
2000 83.2
2001 50.0
2002 13.1
2003 9.9
2004 18.4
2005 24.9
2006 24.3
Source: Dow Jones Venture Source, “Venture Capital Industry Overview,” 2006.
T A B L E 10-5
Commitments to Venture Capital Funds
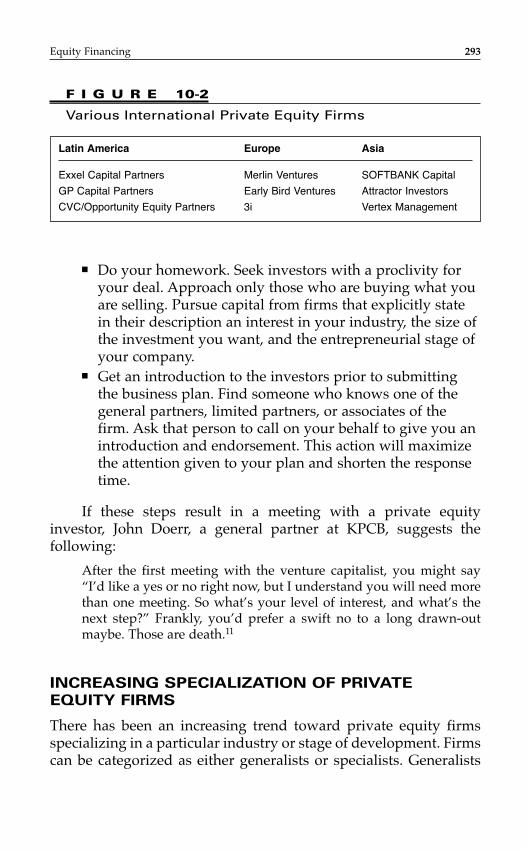
■ Do your homework. Seek investors with a proclivity foryour deal. Approach only those who are buying what youare selling. Pursue capital from firms that explicitly statein their description an interest in your industry, the size ofthe investment you want, and the entrepreneurial stage ofyour company.
■ Get an introduction to the investors prior to submittingthe business plan. Find someone who knows one of thegeneral partners, limited partners, or associates of thefirm. Ask that person to call on your behalf to give you anintroduction and endorsement. This action will maximizethe attention given to your plan and shorten the responsetime.
If these steps result in a meeting with a private equityinvestor, John Doerr, a general partner at KPCB, suggests the following:
After the first meeting with the venture capitalist, you might say“I’d like a yes or no right now, but I understand you will need morethan one meeting. So what’s your level of interest, and what’s thenext step?” Frankly, you’d prefer a swift no to a long drawn-outmaybe. Those are death.11
INCREASING SPECIALIZATION OF PRIVATE
EQUITY FIRMS
There has been an increasing trend toward private equity firmsspecializing in a particular industry or stage of development. Firmscan be categorized as either generalists or specialists. Generalists
Equity Financing 293
Latin America Europe Asia
Exxel Capital Partners Merlin Ventures SOFTBANK Capital
GP Capital Partners Early Bird Ventures Attractor Investors
CVC/Opportunity Equity Partners 3i Vertex Management
F I G U R E 10-2
Various International Private Equity Firms
are more opportunistic and look at a variety of opportunities, fromhigh-tech to high-growth retail. Specialized firms tend to focus onan industry segment or two, for instance, software and communi-cations. Notice that these are still very broad industries.
Specialization has increased for several reasons. First, in anincreasingly competitive industry, venture capitalists are compet-ing for deal flow. If a firm is the recognized expert in a certainindustry area, then it is more likely that this firm will be exposed todeals in this area. Additionally, the firm is better able to assess andvalue the deal because of its expertise in the industry. Finally, somespecialized firms are able to negotiate lower valuations and betterterms because the entrepreneur values the industry knowledgeand contacts that a specialized firm can provide. Entrepreneursshould keep this in mind when raising funds. As important as it isfor entrepreneurs to target the correct investment stage of aprospective venture capital firm, it is equally important that theyconsider the industry specialization of the firm.
IDENTIFYING PRIVATE EQUITY FIRMS
One of the best resources for finding the appropriate privateequity firm is Pratt’s Guide to Private Equity and Venture CapitalSources, which lists companies by state, preferred size of invest-ment, and industry interests. Several additional resources areavailable online:
1. The National Venture Capital Association atwww.nvca.org or 703–351–5269
2. VentureOne at ventureone.com3. New Hampshire Center for Venture Research at
http://wsbe2.unh.edu/center-venture-research4. Ewing Marion Kauffman Foundation at
http://www.kauffman.org/resources.cfm
Another online source is the W. Maurice Young Entrepre-neurship and Venture Capital Research Centre. It produces theVenture Capital Web Links site. More than 150 Web sites, including71 sites filled with lists of investors, are highlighted.
The final suggestion is to pursue the opportunity to make apresentation at a venture capital forum such as the Springboard
294 CHAPTER 10
Conference for female entrepreneurs or the Mid-Atlantic VentureFair, which is open to entrepreneurs in all industries and at allstages of the business cycle. These are usually 2-day events whereentrepreneurs get a chance to present to and meet local andnational private equity providers. Typically the entrepreneur mustsubmit an application with a fee of approximately $200. If theinvestor is selected to make a 10- to 15-minute presentation, anadditional fee of $500 or so may be required. The National VentureCapital Association should be contacted to find out about forumsand their locations, times, and dates.
SMALL-BUSINESS INVESTMENT COMPANIES
The federal government, through the SBA, also provides equitycapital to entrepreneurs. Small-business investment companies(SBICs) are privately owned, for-profit equity firms that arelicensed and regulated by the SBA. SBICs invest in businessesemploying fewer than 500 people and showing a net worth notgreater than $18 million and after-tax income not exceeding $6 mil-lion over the two most recent years. There are more than 418 SBICsin the country with over $23 billion nationwide. In 2006, the SBICprogram firms invested $2.9 billion in equity and debt capital. Thefirms made approximately 4,000 investments in 2,121 differentsmall businesses. Investments range from $150,000 to $5 million.
SBICs were created in 1957 for the purpose of expanding theavailability of risk capital to entrepreneurs. Many of the first pri-vate equity firms were SBICs. And many of the country’s success-ful companies received financing from an SBIC. These includeIntel, Compaq Computer, and Outback Steakhouse. They alsoinclude some notable debacles like the venture begun by SusanMacDougal, who used her $300,000 to invest in a little real estateproject called the Whitewater Development Corporation.
In most ways, SBICs are similar to traditional private equityfirms. The primary difference between the two is their originationand their financing. Anyone can start a traditional private equityfirm as long as he can raise the capital. But someone who is inter-ested in starting an SBIC firm must first get a license from the SBA.Interest in creating an SBIC comes from the attractive financingarrangement: for every dollar raised by the general partners for the
Equity Financing 295
fund, the SBA will invest $2 at a very low interest rate, with no pay-ments due for either 5 or 10 years. Therefore, if the general partnersobtain $25 million in commitments from private sources, the SBAwill invest $50 million, making it a $75 million fund.
SBICs invest $150,000 to $5 million in each deal. They tend tofocus on growth-stage companies rather than pure start-ups.
Included under the SBIC program are specialized small-busi-ness investment companies (SSBICs). They are similar to SBICs inevery way except that they tend to make smaller investments and,most importantly, they are created specifically to provide invest-ments in companies owned by socially and economically disad-vantaged entrepreneurs.
Although they are not technically part of the SBIC program,the New Markets Venture Capital Program and Rural BusinessInvestment Program are modeled on the SBIC program. The twoprograms combined provide equity capital to entrepreneurs with companies in rural, urban, and specially designated low- andmoderate-income (LMI) areas.12
Clearly, the comprehensive SBIC program has been a strongcontributor to the emergence and success of entrepreneurship inAmerica. It has increased the pool of equity capital for entrepre-neurs, as well as made equity capital available to underservedentrepreneurs. The general private equity industry has a reputa-tion for being interested only in investments in technology entre-preneurs. In contrast, SBICs have a reputation for doing “low-tech”and “no-tech” deals. Both reputations are unfounded. Traditionalprivate firms such as Thoma Cressey Equity Partners invest inlater-stage, “no-tech” companies, and SBICs such as ChicagoVenture Partners invest in technology companies. In fact, 11 of thetop 100 companies on the 2005 Inc. 500 list of America’s fastest-growing companies received SBIC financing, as did 8 of the top 100“Hot Growth Companies for 2005” featured in BusinessWeek.13
Figure 10-3 lists a sample of successful SBIC-backed companies.A free directory of operating SBICs can be obtained by calling
the SBA Office of Investments at 202–205–6510 or going online athttp://www.sba.gov/aboutsba/sbaprograms/inv/inv_directory_sbic.html. There is also a national SBIC trade association. Its direc-tory can be accessed free and SBICs can be sorted by criteria atwww.nasbic.org.
296 CHAPTER 10
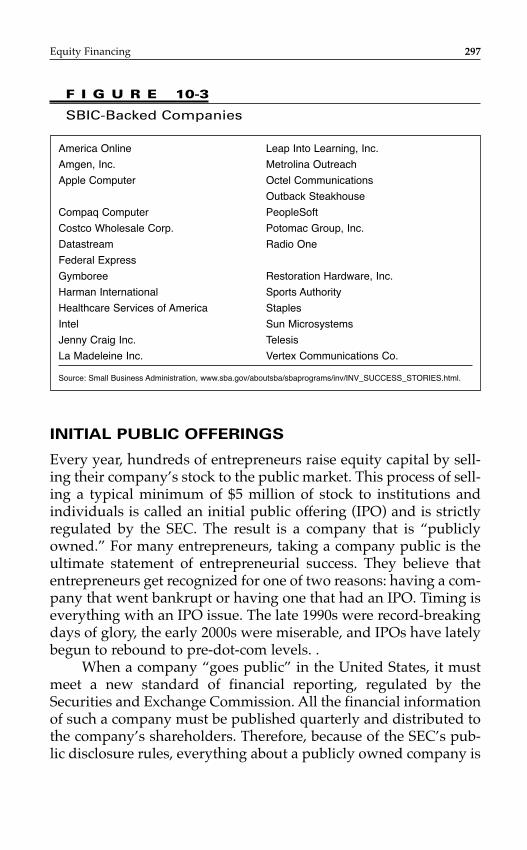
INITIAL PUBLIC OFFERINGS
Every year, hundreds of entrepreneurs raise equity capital by sell-ing their company’s stock to the public market. This process of sell-ing a typical minimum of $5 million of stock to institutions andindividuals is called an initial public offering (IPO) and is strictlyregulated by the SEC. The result is a company that is “publiclyowned.” For many entrepreneurs, taking a company public is theultimate statement of entrepreneurial success. They believe thatentrepreneurs get recognized for one of two reasons: having a com-pany that went bankrupt or having one that had an IPO. Timing iseverything with an IPO issue. The late 1990s were record-breakingdays of glory, the early 2000s were miserable, and IPOs have latelybegun to rebound to pre-dot-com levels. .
When a company “goes public” in the United States, it mustmeet a new standard of financial reporting, regulated by theSecurities and Exchange Commission. All the financial informationof such a company must be published quarterly and distributed tothe company’s shareholders. Therefore, because of the SEC’s pub-lic disclosure rules, everything about a publicly owned company is
Equity Financing 297
America Online Leap Into Learning, Inc.
Amgen, Inc. Metrolina Outreach
Apple Computer Octel Communications
Outback Steakhouse
Compaq Computer PeopleSoft
Costco Wholesale Corp. Potomac Group, Inc.
Datastream Radio One
Federal Express
Gymboree Restoration Hardware, Inc.
Harman International Sports Authority
Healthcare Services of America Staples
Intel Sun Microsystems
Jenny Craig Inc. Telesis
La Madeleine Inc. Vertex Communications Co.
Source: Small Business Administration, www.sba.gov/aboutsba/sbaprograms/inv/INV_SUCCESS_STORIES.html.
F I G U R E 10-3
SBIC-Backed Companies
open to potential and present shareholders. Information such asthe president’s salary and bonus, the company’s number ofemployees, and the company’s profits are open to the public,including competitors.
This source of capital was extraordinarily popular during the1990s. From 1970 to 1997, entrepreneurs raised $297 billion throughIPOs. More than 58 percent of this capital was raised between 1993and 1997.14 In 1999 and 2000, entrepreneurs were the highlysought-after guests of honor at a record private equity feast. Themoney flowed, and entrepreneurs could, in essence, auction offtheir business plans to the highest bidders. Average valuations ofhigh-tech start-ups rose from about $11 million in 1996 to almost$30 million in 2000.15 But by the summer of 2000, as the Nasdaqbegan to crash, venture capital investments began to slow dramat-ically. As Table 10-6 shows, the boom began to end in 2000 whenthe public markets became less interested in hyped technologycompanies that had no foreseeable chances of making profits.According to research by PricewaterhouseCoopers, in the firstthree months of 2001, venture capitalists reduced their investmentsin high-tech start-ups by $6.7 billion—a 40 percent drop from theprevious quarter. In the first quarter of 2001, only 21 companieswent public compared with 123 in the same quarter a year earlier.And by late 2001, the IPO market was down dramatically.
For firms that are still committed to going public with an IPOissue during sluggish times, patience had better be a core compe-tency. Venture Economics, a research firm that follows the venturecapital industry, studied the time it takes a company to go from itsfirst round of financing to its initial public offering. In 1999, a com-pany took an average of 140 days; 2 years later, that average hadsurged to 487 days—a jump of 247 percent.
1990s IPO Boom
The stock market boom of the 1990s was historic. In 1995, Netscapewent public despite the fact that it had never made a profit. Thiswas the beginning of the craze of companies going public eventhough they had no profits. In the history of the United States,there has never been another decade that had as many IPOs orraised as much capital. Barron’s called it one of the greatest gold
298 CHAPTER 10
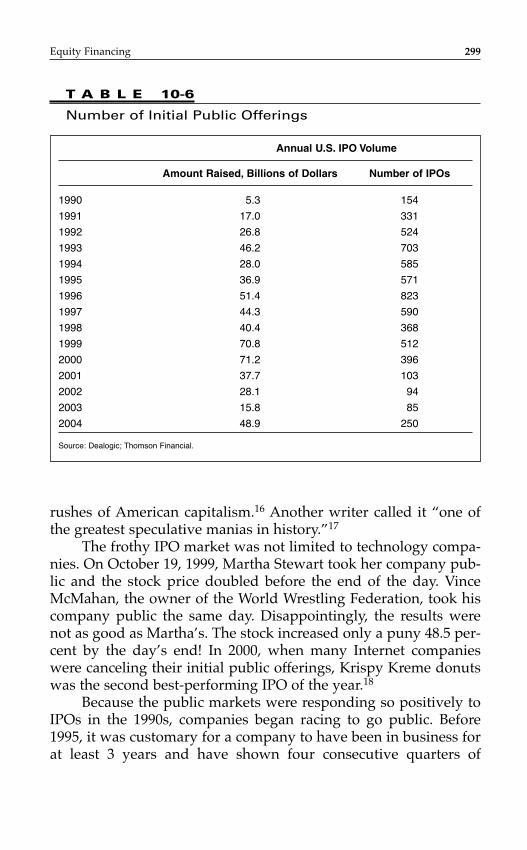
rushes of American capitalism.16 Another writer called it “one ofthe greatest speculative manias in history.”17
The frothy IPO market was not limited to technology compa-nies. On October 19, 1999, Martha Stewart took her company pub-lic and the stock price doubled before the end of the day. VinceMcMahan, the owner of the World Wrestling Federation, took hiscompany public the same day. Disappointingly, the results werenot as good as Martha’s. The stock increased only a puny 48.5 per-cent by the day’s end! In 2000, when many Internet companieswere canceling their initial public offerings, Krispy Kreme donutswas the second best-performing IPO of the year.18
Because the public markets were responding so positively toIPOs in the 1990s, companies began racing to go public. Before1995, it was customary for a company to have been in business forat least 3 years and have shown four consecutive quarters of
Equity Financing 299
T A B L E 10-6
Number of Initial Public Offerings
Annual U.S. IPO Volume
Amount Raised, Billions of Dollars Number of IPOs
1990 5.3 154
1991 17.0 331
1992 26.8 524
1993 46.2 703
1994 28.0 585
1995 36.9 571
1996 51.4 823
1997 44.3 590
1998 40.4 368
1999 70.8 512
2000 71.2 396
2001 37.7 103
2002 28.1 94
2003 15.8 85
2004 48.9 250
Source: Dealogic; Thomson Financial.
increasing profits before it could do an IPO. The perfect examplewas Microsoft. Bill Gates took it public in 1986, more than a decadeafter he founded it. By the time Microsoft went public, it hadrecorded several consecutive years of profitability.
But as stated earlier, the Netscape IPO in August 1995changed things for the next 5 years. In addition to having noprofit, Netscape was very young, having been in business foronly 16 months. By the end of 1999, the Netscape story was verycommon.19 The absurdity was best described by a Wall Street ana-lyst, who said, “Major Wall Street firms used to require four quar-ters of profits before an IPO. Then it went to four quarters ofrevenue, and now it’s four quarters of breathing.”20
This IPO euphoria created unparalleled wealth for entrepre-neurs, especially those in Silicon Valley’s technology industry. At the height of the boom in 1999, it was reported that SiliconValley executives held $112 billion in stock and options. This was slightly more than Portugal’s entire gross domestic product of$109 million.21
As all this information shows, entrepreneurs were using IPOsto raise capital for the company’s operations as well as to gain personal wealth.
PUBLIC EQUITY MARKETS
After a company goes public, it is listed and traded on one of sev-eral markets in the United States. More than 13,000 companies arelisted on these markets. The three major and most popular marketsare the New York Stock Exchange (NYSE), the American StockExchange (AMEX), and the National Association of SecuritiesDealers Automated Quotations (Nasdaq). Let’s look at each ingreater detail.
NYSE
With its start in 1792, the New York Stock Exchange is the oldesttrading market in the world. It also has the largest valuation. Thesetwo facts are the reason the NYSE that is called the “Cadillac ofsecurities markets.” Companies listed on this market are consideredthe strongest financially of companies on the three markets. In order
300 CHAPTER 10

to be listed on the NYSE, the value of the company’s outstandingshares must be at least $18 million, and its annual earnings beforetaxes (EBT) must be at least $2.5 million. Companies listed on thismarket are the older, more venerable companies, such as GeneralElectric, Sears, and McDonald’s. In 2000 Microsoft moved to theNYSE from the Nasdaq.
AMEX
The American Stock Exchange is the world’s largest market for for-eign stocks and the second-largest trading market. The marketvalue of a listed company must be at least $3 million, with anannual EBT of $750,000. In this market, traders buy and sell stocks,options, and derivatives in person at auctions. In 1998 the AMEXand Nasdaq markets merged and took the name Nasdaq-AmexMarket Group. At the time, the total market value of all companieslisted on both markets was $2.2 trillion, compared with $11.6 tril-lion for the NYSE.22
Nasdaq
The Nasdaq market opened in 1971 and was the first electronicstock market. More shares (an average of 1.8 billion per day) aretraded over this market than over any other in the world.23
The minimum market value for companies listed on this mar-ket is $1 million. There is no minimum EBT requirement. That iswhy this market, with over 5,000 listings, is the fastest-growingmarket in the world. The Nasdaq is heavily filled with tech,biotech, and small-company stocks. Trading on this market occursvia telephone and computer. All the technology companies thatwent public since 1995 did so on the Nasdaq market.
Reasons for Going Public
Entrepreneurs take their companies public for several reasons. Thefirst is to raise capital for the operations of the company. Becausethe money is to be used to grow the company rapidly, the equitycapital provided through an IPO may be preferred over debt. In theinstances of the tech companies in the 1990s that had negative cash
Equity Financing 301
flow, they could not raise debt capital. Only equity financing wasavailable to them.
Even if a company can afford debt capital, some entrepre-neurs prefer capital from an IPO because it can be relatively cheap.In fact, the cost of the capital can be lower than that of debt. Theexplanation is very simple math.
Over the history of the Dow Jones Industrial Average, theaverage P/E ratio is 14. This means that investors are willing topay $14 for every $1 of earnings. Therefore, the cost of this capi-tal is only 7 percent ($1/$14)—about 2 percentage points less thanthe cost of debt today, which at prime plus 2 is approximately 9 percent.
Another reason for going public is that it can be easier torecruit and retain excellent employees by combining publiclytraded stock with their salaries. This allows employees to benefitpersonally when the value of the company increases as a result oftheir hard work.
Still another good reason is that an IPO provides the entre-preneur with another form of currency that can be used to grow thecompany. In the 1990s, companies’ stock was being widely used ascurrency. Instead of buying other companies with cash, many buy-ers paid the sellers with their stock. The seller would then hold thestock and benefit from any future increases in its value. In fact,many deals did not close or were delayed in closing because theseller wanted the buyer’s stock instead of cash. This was the casewhen Disney purchased the ABC network. Disney wanted to paycash, but the members of the ABC team held out until they receivedDisney stock. Their reasoning was that $1 worth of Disney’s stockwas more valuable than $1 cash. They were willing to make theassumption that, unlike cash, which depreciates as a result of infla-tion, the stock would appreciate.
The final reason for going public is to provide a liquidity exit forthe stockholders, including employees, management, and investors.
Reasons for Not Going Public
Taking a company public is extremely difficult. In fact, less than 20 percent of the entrepreneurs who attempt to take a companypublic are successful.24 And the process can take a long time—aslong as 2 years.
302 CHAPTER 10
Also, completing an IPO is very expensive. The typical cost isapproximately $500,000. Then there are additional annual coststhat must be incurred to meet SEC regulations regarding publicdisclosure, including the publication of the quarterly financialstatements.
By the time most companies go public, they have receivedfinancing from family and friends, angels, and at least two roundsfrom institutional investors. As a result, most founders will belucky if they retain 10 percent ownership. The exception to this ruleis Bill Gates, who owns approximately 20 percent of Microsoft.25
Another is Jeff Bezos, who owns 41 percent of Amazon.com. In late2001, with his company’s stock tanking, that stake was worth justunder $1 billion.
One of the greatest problems with going public is that most ofthe stock is owned by large institutional investors, which have ashort-term focus. They exert continual pressure on the CEO todeliver increasing earnings every quarter.
The final reason for not going public is that while fundsreceived when stock is sold by the company can be immediatelyused for operations, stock owned by the key management teamcannot be sold immediately. SEC Rule 144 says that all key mem-bers of the company cannot sell any of their stock. These key mem-bers are officers, directors, and inside shareholders, includingventure capitalists, who own “restricted stock.” This is stock thatwas not registered with the SEC. This is in contrast to the shares ofstock issued to the public at the IPO. These stocks are unrestricted.
The holding period for restricted stock is 2 years from the dateof purchase. At that time, the restricted stockholders may sell theirstock as long as they do not sell more than 1 percent of the totalnumber of shares outstanding in any 3-month period.26 For exam-ple, if the entrepreneur owns 1 million of the 90 million shares ofoutstanding common stock, she may not sell more than 900,000shares of the stock in a 3-month period.
Control
One negative myth about going public is that if the entrepreneurowns less than 51 percent of the company, he loses control. This isnot true. Founders including Bill Gates, Jeff Bezos, and Michael Dellown less than 51 percent of their companies, but they still have
Equity Financing 303
control. The same is true of the Ford family, which owns only 6.5 percent of Ford Motor Company. The key to having control ishaving influence on the majority of the voting stock. Some stock maybe nonvoting stock, a.k.a. capital stock. The entrepreneur, his family,and board members may own virtually none of the nonvoting stockbut a majority of the voting stock. This fact, along with the entrepre-neur’s being in a management position and being the one whodetermines who sits on the board of directors, keeps him in control.
THE IPO PROCESS
As has been stated earlier, taking a company public can be expen-sive and time-consuming for the entrepreneur. But when it is doneright and for the correct reasons, it can be very rewarding.
While it can take up to 24 months to complete an IPO, invest-ment banking firm William Blair & Company said that 52 to 59weeks is the norm.
Bessemer Venture Partners, a leading venture capital firm,accurately described a simplified step-by-step IPO process:
1. The entrepreneur decides to take the company public toraise money for future acquisitions.
2. He interviews and selects investment banks (IBs).3. He meets with the IBs that will underwrite the offering.4. He files the IPO registration with the SEC.5. The SEC reviews and approves the registration.6. The IBs and the entrepreneur go on a “road show.”7. The IBs take tentative commitments.8. IPO.
Let’s discuss these steps in more detail.
The IPO Decision
The entrepreneur’s decision to do an IPO can be made almost theday the person decides to go into business. Some entrepreneursarticulate their plans for going public in their original businessplan. In starting the business, one of their future objectives is toown a public company.
304 CHAPTER 10
Others may decide to go public when they get institutionalfinancing. The venture capitalist may provide them with financingonly if they agree to go public in 3 to 5 years. In such a case, theentrepreneur and the investor may make the decision.
Other entrepreneurs may decide to go public when theyreview their 3- to 5-year business plan and realize that their abilityto grow as fast as they would like will be determined by the avail-ability of outside equity capital—more than they can get from insti-tutional investors.
Interviews and Selection of Investment Banks
Once the decision to go public has been made, the entrepreneurmust hire one or more investment banks to underwrite the offering.This process of selecting an IB is called the “bake-off.” Ideally, sev-eral IBs that are contacted by the entrepreneur will quickly study thecompany’s business and afterwards solicit, via presentations andmeetings, the entrepreneur’s selection of their firms. The IB’s com-pensation is typically no more than 7 percent of the capital raised.
Underwriter(s) Meetings
After the IBs are selected, the entrepreneur will meet with theunderwriters to plan the IPO. This process includes determiningthe company’s value, the number of shares that will be issued, the selling price of the shares, and the timing of the road show andthe IPO.
In typical public offerings, the underwriters buy all of thecompany’s shares at the initial offer price and then sell them at theIPO. When underwriters make this agreement with the entrepre-neurs, this is called a firm commitment.
There are also underwriters that make “best-efforts” agree-ments. In this case, they will not purchase the stock but will makeevery effort to sell it to a third party.
IPO Registration
The entrepreneur’s attorney must file the registration statementwith the SEC. This is a two-part document. The first part is called
Equity Financing 305
a prospectus and discloses all the information about the company,including the planned use of the money, the valuation, a descrip-tion of management, and financial statements. The prospectus isthe document given to potential investors.
The first printing of this prospectus is called a red herringbecause it contains warnings to the reader that certain things in thedocument might change. These warnings are printed in red ink.
The second part of the document is the actual registrationstatement. The four items disclosed are:
■ Expenses of distribution■ Indemnification of directors and officers■ Recent sales of unregistered securities■ Exhibits and financial statement schedules27
SEC Approval
The SEC reviews the registration statement in detail to determinethat all disclosures have been made and that the information is cor-rect and easy to comprehend. The reviewer can approve the state-ment, allowing the next step in the IPO process to commence; delaythe review until changes are made to the statement that satisfy thereviewer; or put a “stop order,” which terminates the statementregistration process with a disapproval decision.
The Road Show
Once approval of the registration statement has been obtained, theentrepreneur and the IB are free to begin the process of marketingthe IPO to potential investors. This is called the road show, wherethe entrepreneur makes presentations about the company to thepotential investors that the IB has identified.
Investment Commitments
During the road show, the entrepreneur makes a “pitch” for whythe investors should buy the company’s stock. After each presenta-tion, the IBs will meet with the potential investors to determinetheir interest. The investors’ tentative commitments for an actual
306 CHAPTER 10
number of shares are recorded in the “book” that the IB takes toeach road show presentation.
The IB wants to accumulate a minimum number of tentativecommitments before proceeding to the IPO. IBs like to have threetentative commitments for every share of stock that will beoffered.28
The IPO
On the day when the IPO will occur, the investment bank and the entrepreneur determine the official stock selling price and thenumber of shares to be sold. The price may change between thetime they began the road show and the day of the IPO, as a resultof interest in the stock. If the tentative commitments were greaterthan a 3-to-1 ratio, then the offering price may be increased. Itmay be lowered if the opposite occurred. That is exactly whathappened to the stock of Wired Ventures, which attempted to gopublic in 1996. Originally the company wanted to sell 4.75 millionshares at $14 each. By the date of the IPO, it made the decisionwith its IB, Goldman Sachs, to reduce the offering to 3 millionshares at a price of $10 per share. One of the reasons for thischange was the fact that hours before the stock had to be officiallypriced for sale, the offer was still undersubscribed by 50 percent.Even at this lower price, though, the IPO never took place. WiredVentures was not able to raise the $60 million it sought, and itincurred expenses of approximately $1.3 million in its attempt togo public.
Choosing the Right Investment Banker
As the preceding information shows, the ability to have a success-ful IPO is significantly dependent on the IB. The most criticalaspects of an IB are its ability to value the company properly, assistthe attorney and entrepreneur in developing the registration state-ment, help the entrepreneur develop an excellent presentation forthe road show, access its database to reach the proper potentialinvestors and invite them to the presentation, and sell the stock.Therefore, the entrepreneur must do as much as possible to selectthe best IB for her IPO. A few suggestions are as follows:
Equity Financing 307
■ Identify the firms that have successfully taken companiespublic that are similar to yours in size, industry, andamount to be raised. A great resource for finding thesecompanies is Going Public: The IPO Reporter, published bySecurities Data Publishing (212–765–5311).
■ Select experienced firms. At a minimum, the ideal firm has underwritten two deals annually for the past 3 years.The firms that are underwriting eight deals per year, ortwo each quarter, may be too busy to give proper attentionto your deal. Also eliminate those whose dealsconsistently take more than 90 days to get registrationapproval.
■ Select underwriters that price their deals close to at leastthe stock’s first-day closing. If an underwriter prices thestock too low, so that the stock increases dramatically inprice by the end of the first day, then the entrepreneursold more equity than needed. For example, if the initialoffering was 1 million shares at $5 per share and the stockclosed the first day at $10 per share, then the stock wasunderpriced. Instead of raising $5 million for 1 millionshares, the entrepreneur could have raised the sameamount for 500,000 shares had the underwriter priced thestock better.
■ Select underwriters that file planned selling prices close tothe actual price at the initial offering. Some underwritersfile at a price and then try to force the entrepreneur toopen at a lower price so that they can sell the stock andtheir investors can reap the benefits of the increase. Thispractice, when it is done, usually occurs a day or so priorto the IPO, when the underwriter threatens to terminatethe offering if the price is not reduced. To minimize thechances of this happening, the entrepreneur should selectonly underwriters that have a consistent pattern of filingand bringing the stock to the market at similar prices.
■ Select underwriters that have virtually no experience withfailing to complete the offering. Companies that file for anIPO but do not make it are considered “damaged goods”by investors.
308 CHAPTER 10
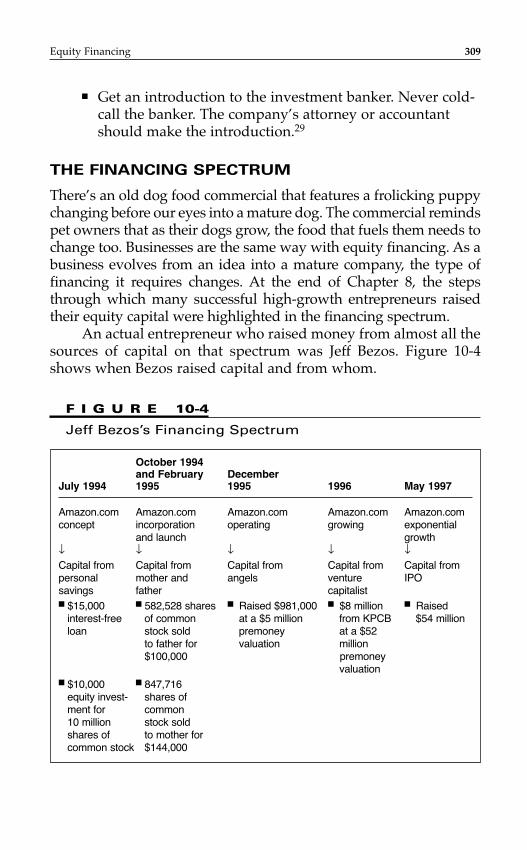
■ Get an introduction to the investment banker. Never cold-call the banker. The company’s attorney or accountantshould make the introduction.29
THE FINANCING SPECTRUM
There’s an old dog food commercial that features a frolicking puppychanging before our eyes into a mature dog. The commercial remindspet owners that as their dogs grow, the food that fuels them needs tochange too. Businesses are the same way with equity financing. As abusiness evolves from an idea into a mature company, the type offinancing it requires changes. At the end of Chapter 8, the stepsthrough which many successful high-growth entrepreneurs raisedtheir equity capital were highlighted in the financing spectrum.
An actual entrepreneur who raised money from almost all thesources of capital on that spectrum was Jeff Bezos. Figure 10-4shows when Bezos raised capital and from whom.
Equity Financing 309
October 1994 and February December
July 1994 1995 1995 1996 May 1997
Amazon.com Amazon.com Amazon.com Amazon.com Amazon.comconcept incorporation operating growing exponential
and launch growth↓ ↓ ↓ ↓ ↓Capital from Capital from Capital from Capital from Capital frompersonal mother and angels venture IPOsavings father capitalist■ $15,000 ■ 582,528 shares ■ Raised $981,000 ■ $8 million ■ Raised
interest-free of common at a $5 million from KPCB $54 millionloan stock sold premoney at a $52
to father for valuation million $100,000 premoney
valuation■ $10,000 ■ 847,716
equity invest- shares of ment for common 10 million stock soldshares of to mother forcommon stock $144,000
F I G U R E 10-4
Jeff Bezos’s Financing Spectrum
DIRECT PUBLIC OFFERINGS
In 1989, the SEC made it possible for companies seeking less than$5 million to raise it directly from the public without going throughthe expensive and time-consuming IPO process described earlier.This direct process is aptly called a direct public offering, or DPO.In a DPO, shares are usually sold for $1 to $10 each without anunderwriter, and the investors do not face the sophisticatedinvestor requirements. Forty-five states allow DPOs, and the usuallegal, accounting, and marketing fees are less than $50,000.
There are three DPO programs that have been used by thou-sands of entrepreneurs. The programs are:
1. Regulation D, Rule 504, which is also called the SmallCorporate Offering Registration, a.k.a. SCOR
2. Regulation A3. Intrastate
The SEC has a free pamphlet entitled “Q & A: Small Businessand the SEC—Help Your Company Go Public” available on its website at www.sec.gov. Let's discuss each DPO program in more detail.
■ Small Corporate Offering Registration. In the SmallCorporate Offering Registration, or SCOR, program, theentrepreneur has 12 months to raise a maximum of $1million. Shares can be sold to an unlimited number ofinvestors throughout the country via general solicitationand even advertising. One entrepreneur who accessedcapital via a DPO was Rick Moon, the founder ofThanksgiving Coffee Co. Rick raised $1.25 million in 1996for 20 percent of his coffee and tea wholesaling company,which had annual revenues of $4.6 million. Heaggressively advertised the offering to his suppliers andcustomers on his Web site, in his catalog, on his coffee-bean bags, and on the bean dispensers in stores.30
■ Regulation A offering. Under the Regulation A program, anentrepreneur can raise a maximum of $5 million in 12months. Unlike offerings under SCOR, where no SECfilings are required, this offering must be filed with theSEC. Otherwise, all the attributes assigned to SCOR areapplicable to Regulation A. Dorothy Pittman Hughes, the
310 CHAPTER 10
founder of Harlem Copy Center, with $300,000 in annualrevenues in 1998, began raising $2 million under thisprogram by offering stock for $1 per share. The minimumnumber of shares that adults could buy was 50; forchildren, the minimum was 25.31
■ Intrastate program. The intrastate program requirescompanies to limit the sale of their stock to investors inone state. This program has other significant differencesfrom SCOR and Regulation A. First, there are no federallaws limiting the maximum that can be raised or the timeallowed. These two items vary by state. The otherdifference is that the stock cannot be resold outside thestate for 9 months.
The DPO is best suited for historically profitable companieswith audited financial statements and a well-written business plan.Shareholders are typically affinity groups that are somehow tied tothe company, such as customers, employees, suppliers, distribu-tors, and friends. After completing a DPO, the company can still doa traditional IPO at a later date. Real Goods Trading Company didjust that. In 1991, it raised $1 million under SCOR. Two years later,it raised an additional $3.6 million under Regulation A. Today itsstock is traded on the Nasdaq market.
DPOs have a few negative aspects. First, it is estimated thatover 70 percent of those who register for a DPO fail, for variousreasons. But the greatest drawback is the fact that there is no pub-lic market exchange like the NYSE for DPO stock. This type ofexchange brings sellers and buyers together, and that does notexist for DPOs. Therefore, the ability to raise capital is negativelyaffected by legitimate concerns on the potential investors’ partthat their investment cannot be made liquid easily. Another prob-lem is that the absence of a market leaves the market appreciationof the stock in question. One critic of DPOs said, “There is no liquidity in these offerings. Investors are stepping into a leg-hold trap.”32 As a result, DPO investors tend to be long-term-focused. Trading in the stock is usually arranged by the companyor made through an order-matching service that the companymanages. The shareholders can also get liquid if the company issold, the owners buy back the stock, or the company does a tra-ditional IPO.
Equity Financing 311
Because this is a book about finance, not about law, we haveintentionally avoided a long discussion of the legal aspects ofentrepreneurship. That doesn’t mean that you should ignore thelegal ins and outs of running a business or getting one started. Onegreat resource that comes highly recommended from my studentsis the book The Entrepreneur’s Guide to Business Law by ConstanceBagley and Craig Dauchy.
NOTES
1. BusinessWeek, January 8, 2001, p. 55.2. Forbes ASAP, June 1, 1998, p. 24.3. Forbes, January 10, 2000, p. F.4. Inc., July 1997, p. 48.5. Crain’s Chicago Business, March 9, 1999, p. SB4.6. BUYOUTS, February 8, 1999, p. 23.7. Private Equity Analyst, August 1999, p. 36.8. Ibid., p. 34.9. Ibid.
10. PricewaterhouseCoopers/National Venture Capital Association,“Corporate Venture Capital Activity on the Rise in 2006.”
11. Fast Company, February 1998, p. 86.12. Small Business Administration.13. National Association of Small Business Investment Companies,
February 2006.14. Directorship Inc., Fall 1998, p. 1.15. The Economist, May 3, 2001.16. Fast Company, January 2000, p. 50.17. Edward Chancellor, Devil Take the Hindmost: A History of Financial
Speculation (New York: Farrar, Straus, Giroux, 1999).18. Boston Globe, February 21, 2001.19. USA Today, June 22, 2000.20. USA Today, December 23, 1999.21. Time, September 27, 1999.22. Chicago Sun-Times, November 3, 1998, p. 45.23. Chicago Sun-Times, September 3, 2000, p. 47A.24. Wall Street Journal, April 6, 2001, p. C1.
312 CHAPTER 10

25. USA Today, January 21, 1999.26. The Entrepreneur’s Guide to Going Public, p. 297.27. Ibid., p. 202.28. Inc., February 1998, p. 57.29. Success, January 1999, p. 20.30. Inc., December 1996, p. 70.31. Essence, May 1998, p. 64.32. USA Today, April 29, 1997, p. 4B.
Equity Financing 313

This page intentionally left blank
INTRODUCTION
As noted in the beginning of the book, minority- and women-owned firms are fast becoming powerful economic forces in thesmall-business world. Minority-owned businesses grew more than3 times as fast as U.S. firms overall between 1997 and 2002, increas-ing from 3.1 million to 4.1 million firms.1 The following statisticscome from a report by the Small Business Administration in 2007and are worth considering:
■ Minority-owned firms generated $694 billion in annualrevenue.
■ While Hispanics controlled the largest share of firmsowned by minorities and constituted the largest minoritybusiness community, Asian- and Pacific Islander–ownedfirms had the largest share of minority-owned businessrevenues—49 percent.
■ Black-owned firms experienced explosive growth. Thetotal number of black-owned firms grew 45 percent, whiletheir total receipts grew 25 percent.
■ The number of employees declined by 6 percent for white-owned firms, while Hispanic firms saw the highestemployment growth—11 percent.
315
C H A P T E R 1 1
Financing forMinorities andWomen
■ Women owned 17 percent of all private firms withemployees in the United States; Native Americans womenowned 30 percent of all businesses with employees ownedby Native Americans, the highest percentage among allethnic groups.
As I also mentioned at the beginning of the book, my mother,Ollie Mae Rogers, was the first entrepreneur I ever met, andaccordingly, I have a tremendous amount of respect for womenentrepreneurs. As noted earlier, women-owned businesses totalover $1.9 trillion in annual sales and have more than 12.8 millionemployees nationwide.2 Between 1997 and 2006, the number ofmajority women-owned firms increased from 5.4 million to 7.7 mil-lion, an increase of 42 percent, almost double that of all firms.3Between 1997 and 2004, the number of privately held firms that aremore than 50 percent owned by women of color grew 6 times asfast as the total number of privately held firms.4
Needless to say, minority and women entrepreneurs haveplayed the game of catch-up brilliantly, and they have forced thetraditional small-business infrastructure to change. Thank God weare past the era when women could not get a loan without theirhusband’s signature and it was legal to reject a loan applicationfrom a person simply because of his ethnicity or race! The laws thatmade such gender and racial discrimination legal had a profoundeffect on minority and women entrepreneurship. The inability toaccess capital from other than personal savings, family, friends,and angels retarded the growth of most entrepreneurs from thesetwo sectors. Given the absence of growth capital from financialinstitutions, these entrepreneurs, in essence, were involuntarily rel-egated to a life as mom-and-pop, or lifestyle, entrepreneurs. Thelegacy is that we have virtually no major corporations that werefounded by minorities or women.
Recent research from the SBA also indicates that race is a sig-nificant predictor of the likelihood of opening a business and that theodds of a minority person opening a business are 55 percent lowerthan those for a nonminority. The data in Table 11-1 show the com-position of the total U.S. population side by side with a breakdownof U.S. business receipts by race. While the situation continues toimprove, these data clearly indicate that the process is still ongoing.
316 CHAPTER 11
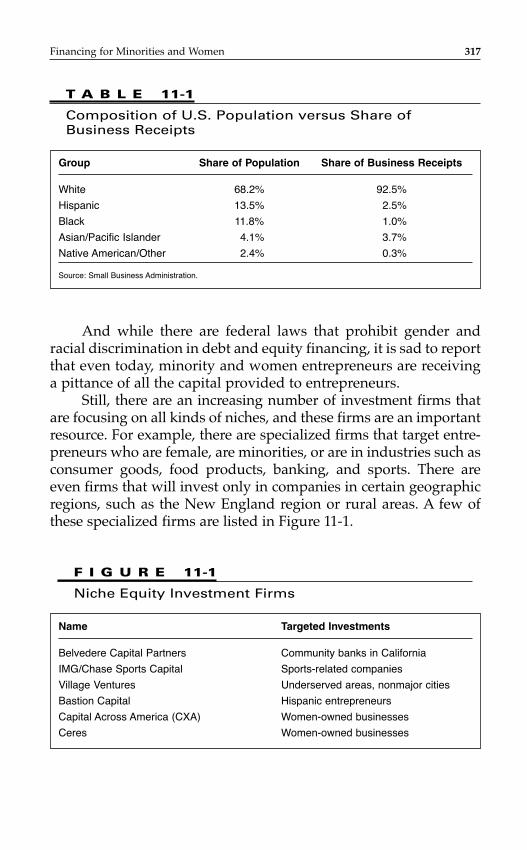
And while there are federal laws that prohibit gender andracial discrimination in debt and equity financing, it is sad to reportthat even today, minority and women entrepreneurs are receivinga pittance of all the capital provided to entrepreneurs.
Still, there are an increasing number of investment firms thatare focusing on all kinds of niches, and these firms are an importantresource. For example, there are specialized firms that target entre-preneurs who are female, are minorities, or are in industries such asconsumer goods, food products, banking, and sports. There areeven firms that will invest only in companies in certain geographicregions, such as the New England region or rural areas. A few ofthese specialized firms are listed in Figure 11-1.
Financing for Minorities and Women 317
T A B L E 11-1
Composition of U.S. Population versus Share of Business Receipts
Group Share of Population Share of Business Receipts
White 68.2% 92.5%
Hispanic 13.5% 2.5%
Black 11.8% 1.0%
Asian/Pacific Islander 4.1% 3.7%
Native American/Other 2.4% 0.3%
Source: Small Business Administration.
F I G U R E 11-1
Niche Equity Investment Firms
Name Targeted Investments
Belvedere Capital Partners Community banks in California
IMG/Chase Sports Capital Sports-related companies
Village Ventures Underserved areas, nonmajor cities
Bastion Capital Hispanic entrepreneurs
Capital Across America (CXA) Women-owned businesses
Ceres Women-owned businesses
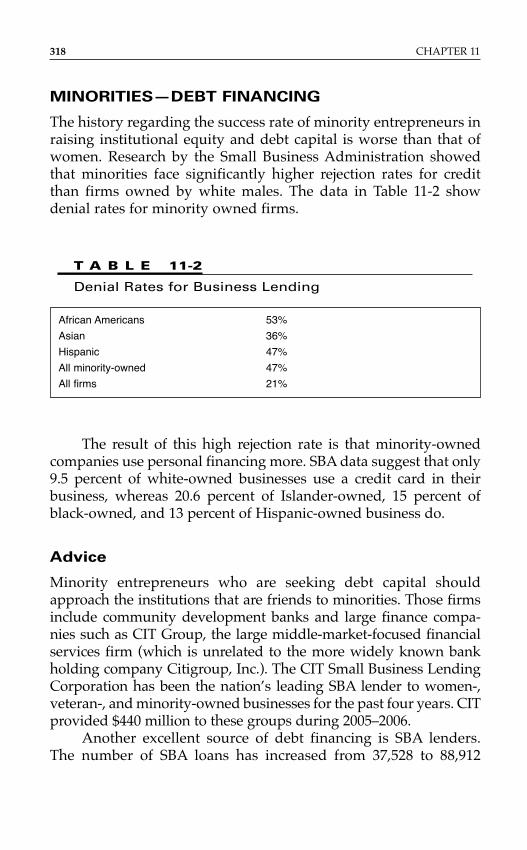
MINORITIES—DEBT FINANCING
The history regarding the success rate of minority entrepreneurs inraising institutional equity and debt capital is worse than that ofwomen. Research by the Small Business Administration showedthat minorities face significantly higher rejection rates for creditthan firms owned by white males. The data in Table 11-2 showdenial rates for minority owned firms.
318 CHAPTER 11
T A B L E 11-2
Denial Rates for Business Lending
African Americans 53%
Asian 36%
Hispanic 47%
All minority-owned 47%
All firms 21%
The result of this high rejection rate is that minority-ownedcompanies use personal financing more. SBA data suggest that only9.5 percent of white-owned businesses use a credit card in theirbusiness, whereas 20.6 percent of Islander-owned, 15 percent ofblack-owned, and 13 percent of Hispanic-owned business do.
Advice
Minority entrepreneurs who are seeking debt capital shouldapproach the institutions that are friends to minorities. Those firmsinclude community development banks and large finance compa-nies such as CIT Group, the large middle-market-focused financialservices firm (which is unrelated to the more widely known bankholding company Citigroup, Inc.). The CIT Small Business LendingCorporation has been the nation’s leading SBA lender to women-,veteran-, and minority-owned businesses for the past four years. CITprovided $440 million to these groups during 2005–2006.
Another excellent source of debt financing is SBA lenders.The number of SBA loans has increased from 37,528 to 88,912
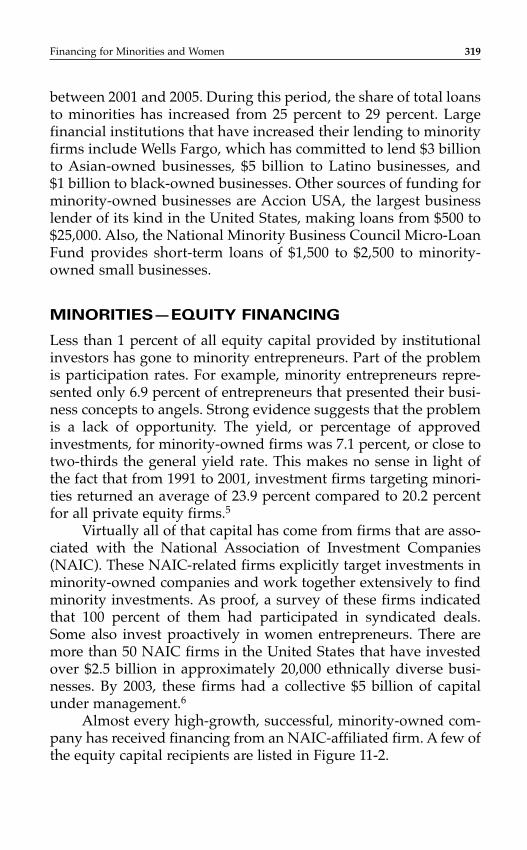
between 2001 and 2005. During this period, the share of total loansto minorities has increased from 25 percent to 29 percent. Largefinancial institutions that have increased their lending to minorityfirms include Wells Fargo, which has committed to lend $3 billionto Asian-owned businesses, $5 billion to Latino businesses, and $1 billion to black-owned businesses. Other sources of funding forminority-owned businesses are Accion USA, the largest businesslender of its kind in the United States, making loans from $500 to$25,000. Also, the National Minority Business Council Micro-LoanFund provides short-term loans of $1,500 to $2,500 to minority-owned small businesses.
MINORITIES—EQUITY FINANCING
Less than 1 percent of all equity capital provided by institutionalinvestors has gone to minority entrepreneurs. Part of the problemis participation rates. For example, minority entrepreneurs repre-sented only 6.9 percent of entrepreneurs that presented their busi-ness concepts to angels. Strong evidence suggests that the problemis a lack of opportunity. The yield, or percentage of approvedinvestments, for minority-owned firms was 7.1 percent, or close totwo-thirds the general yield rate. This makes no sense in light ofthe fact that from 1991 to 2001, investment firms targeting minori-ties returned an average of 23.9 percent compared to 20.2 percentfor all private equity firms.5
Virtually all of that capital has come from firms that are asso-ciated with the National Association of Investment Companies(NAIC). These NAIC-related firms explicitly target investments inminority-owned companies and work together extensively to findminority investments. As proof, a survey of these firms indicatedthat 100 percent of them had participated in syndicated deals.Some also invest proactively in women entrepreneurs. There aremore than 50 NAIC firms in the United States that have investedover $2.5 billion in approximately 20,000 ethnically diverse busi-nesses. By 2003, these firms had a collective $5 billion of capitalunder management.6
Almost every high-growth, successful, minority-owned com-pany has received financing from an NAIC-affiliated firm. A few ofthe equity capital recipients are listed in Figure 11-2.
Financing for Minorities and Women 319
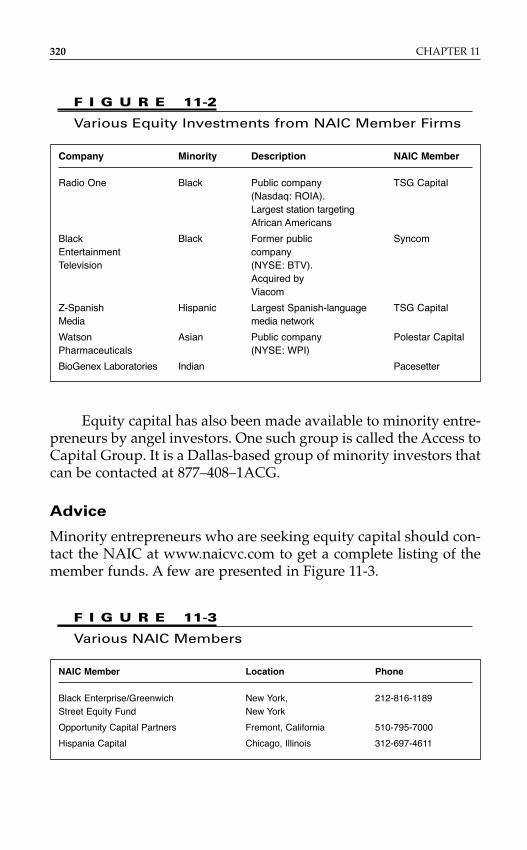
Equity capital has also been made available to minority entre-preneurs by angel investors. One such group is called the Access toCapital Group. It is a Dallas-based group of minority investors thatcan be contacted at 877–408–1ACG.
Advice
Minority entrepreneurs who are seeking equity capital should con-tact the NAIC at www.naicvc.com to get a complete listing of themember funds. A few are presented in Figure 11-3.
320 CHAPTER 11
Company Minority Description NAIC Member
Radio One Black Public company TSG Capital(Nasdaq: ROIA). Largest station targetingAfrican Americans
Black Black Former public SyncomEntertainment company Television (NYSE: BTV).
Acquired by Viacom
Z-Spanish Hispanic Largest Spanish-language TSG CapitalMedia media network
Watson Asian Public company Polestar CapitalPharmaceuticals (NYSE: WPI)
BioGenex Laboratories Indian Pacesetter
F I G U R E 11-2
Various Equity Investments from NAIC Member Firms
NAIC Member Location Phone
Black Enterprise/Greenwich New York, 212-816-1189Street Equity Fund New York
Opportunity Capital Partners Fremont, California 510-795-7000
Hispania Capital Chicago, Illinois 312-697-4611
F I G U R E 11-3
Various NAIC Members
WOMEN—DEBT FINANCING
Throughout history, women have always had a tough time gettingdebt capital from institutions such as banks. Fortunately, that situ-ation has begun to improve in recent years. A new study by WellsFargo showed that 70 percent of women express satisfaction withtheir access to credit. That figure is up from 50 percent 10 yearsago.7 Moreover, women business owners’ access to commercialcredit increased by more than two-thirds between 1996 and 2003,from 20 percent of women using commercial credit in 1996 to 34 percent in 2003.
However, there is still considerable work to be done. An SBAstudy showed that 32 percent of male-owned businesses had a lineof credit, compared to only 23 percent of women-owned busi-nesses. Rejection rates for a bank line of credit for a woman-ownedbusiness were higher, at 45 percent versus 32 percent for a male-owned firm. Rejection rates for all credit sources for women-owned firms were 26 percent as compared to 20 percent for allfirms. Finally, 22 percent of women view credit as their greatestchallenge during their first 2 years in operation, versus 13 percentfor men.8 To compound the problem, the Wells Fargo studyshowed that many women business owners are not taking advan-tage of the full range of credit products. For example, 74 percentnever considered pledging accounts receivable, 55 percent neverconsidered unsecured personal loans, and 42 percent never con-sidered vendor credit.9
Advice
Women who are seeking debt financing should approach institu-tions that want to do business with women. Those firms include SBAlenders and banks such as Wells Fargo, which in 1994 committed toloan $1 billion to women entrepreneurs. A year later, Wells Fargobecame so convinced that financing women entrepreneurs was agreat strategy that it increased its commitment to $10 billion to beinvested over a 10-year period. In the following 10 years, Wells Fargolent more than $25 billion through 600,000 loans to women businessowners.10 This additional commitment came after the NationalFoundation for Women Business Owners published research show-ing that investing in women entrepreneurs was sound business
Financing for Minorities and Women 321
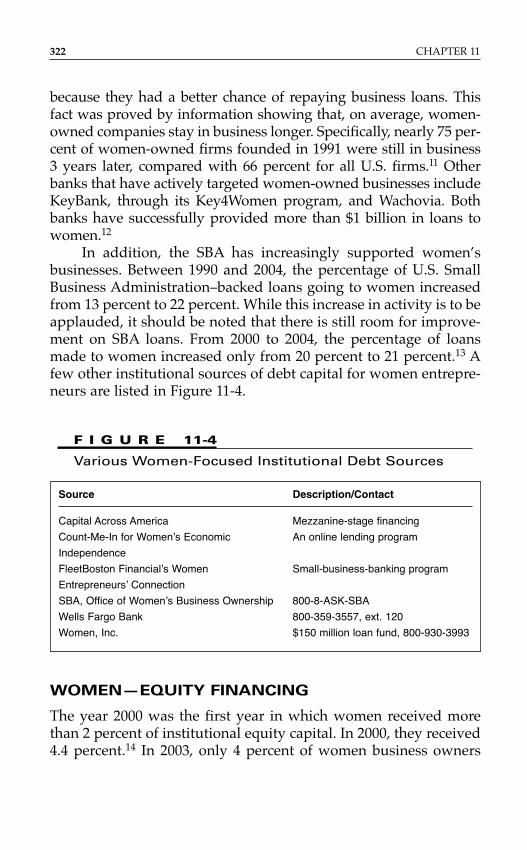
because they had a better chance of repaying business loans. Thisfact was proved by information showing that, on average, women-owned companies stay in business longer. Specifically, nearly 75 per-cent of women-owned firms founded in 1991 were still in business 3 years later, compared with 66 percent for all U.S. firms.11 Otherbanks that have actively targeted women-owned businesses includeKeyBank, through its Key4Women program, and Wachovia. Bothbanks have successfully provided more than $1 billion in loans towomen.12
In addition, the SBA has increasingly supported women’sbusinesses. Between 1990 and 2004, the percentage of U.S. SmallBusiness Administration–backed loans going to women increasedfrom 13 percent to 22 percent. While this increase in activity is to beapplauded, it should be noted that there is still room for improve-ment on SBA loans. From 2000 to 2004, the percentage of loansmade to women increased only from 20 percent to 21 percent.13 Afew other institutional sources of debt capital for women entrepre-neurs are listed in Figure 11-4.
322 CHAPTER 11
F I G U R E 11-4
Various Women-Focused Institutional Debt Sources
Source Description/Contact
Capital Across America Mezzanine-stage financing
Count-Me-In for Women’s Economic An online lending program
Independence
FleetBoston Financial’s Women Small-business-banking program
Entrepreneurs’ Connection
SBA, Office of Women’s Business Ownership 800-8-ASK-SBA
Wells Fargo Bank 800-359-3557, ext. 120
Women, Inc. $150 million loan fund, 800-930-3993
WOMEN—EQUITY FINANCING
The year 2000 was the first year in which women received morethan 2 percent of institutional equity capital. In 2000, they received4.4 percent.14 In 2003, only 4 percent of women business owners
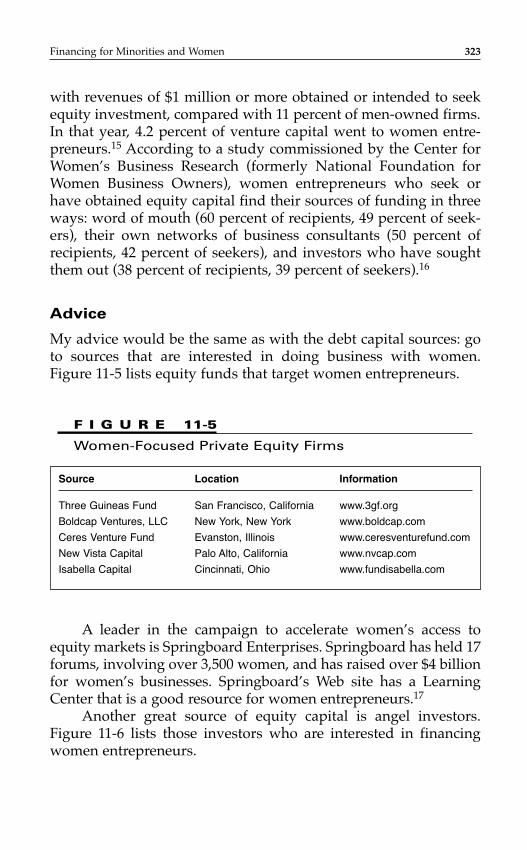
with revenues of $1 million or more obtained or intended to seekequity investment, compared with 11 percent of men-owned firms.In that year, 4.2 percent of venture capital went to women entre-preneurs.15 According to a study commissioned by the Center forWomen’s Business Research (formerly National Foundation forWomen Business Owners), women entrepreneurs who seek orhave obtained equity capital find their sources of funding in threeways: word of mouth (60 percent of recipients, 49 percent of seek-ers), their own networks of business consultants (50 percent ofrecipients, 42 percent of seekers), and investors who have soughtthem out (38 percent of recipients, 39 percent of seekers).16
Advice
My advice would be the same as with the debt capital sources: goto sources that are interested in doing business with women.Figure 11-5 lists equity funds that target women entrepreneurs.
Financing for Minorities and Women 323
F I G U R E 11-5
Women-Focused Private Equity Firms
Source Location Information
Three Guineas Fund San Francisco, California www.3gf.org
Boldcap Ventures, LLC New York, New York www.boldcap.com
Ceres Venture Fund Evanston, Illinois www.ceresventurefund.com
New Vista Capital Palo Alto, California www.nvcap.com
Isabella Capital Cincinnati, Ohio www.fundisabella.com
A leader in the campaign to accelerate women’s access toequity markets is Springboard Enterprises. Springboard has held 17forums, involving over 3,500 women, and has raised over $4 billionfor women’s businesses. Springboard’s Web site has a LearningCenter that is a good resource for women entrepreneurs.17
Another great source of equity capital is angel investors.Figure 11-6 lists those investors who are interested in financingwomen entrepreneurs.
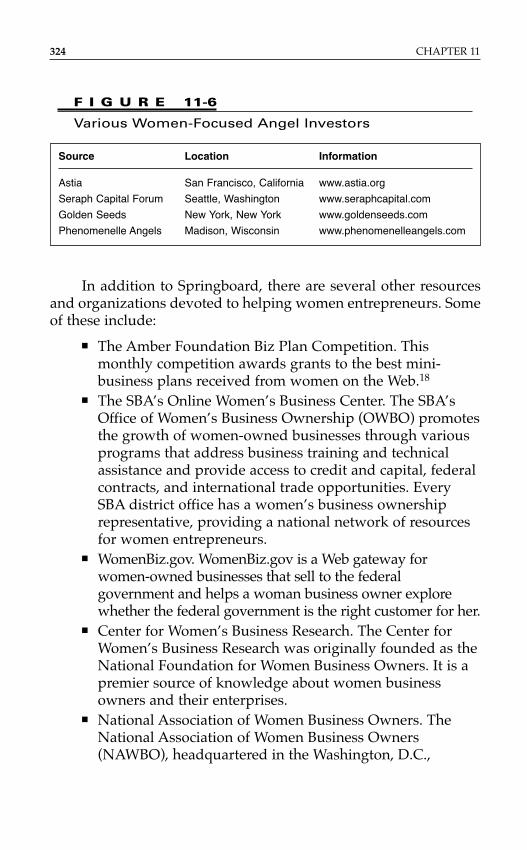
In addition to Springboard, there are several other resourcesand organizations devoted to helping women entrepreneurs. Someof these include:
■ The Amber Foundation Biz Plan Competition. Thismonthly competition awards grants to the best mini-business plans received from women on the Web.18
■ The SBA’s Online Women’s Business Center. The SBA’sOffice of Women’s Business Ownership (OWBO) promotesthe growth of women-owned businesses through variousprograms that address business training and technicalassistance and provide access to credit and capital, federalcontracts, and international trade opportunities. EverySBA district office has a women’s business ownershiprepresentative, providing a national network of resourcesfor women entrepreneurs.
■ WomenBiz.gov. WomenBiz.gov is a Web gateway forwomen-owned businesses that sell to the federalgovernment and helps a woman business owner explorewhether the federal government is the right customer for her.
■ Center for Women’s Business Research. The Center forWomen’s Business Research was originally founded as theNational Foundation for Women Business Owners. It is apremier source of knowledge about women businessowners and their enterprises.
■ National Association of Women Business Owners. TheNational Association of Women Business Owners(NAWBO), headquartered in the Washington, D.C.,
324 CHAPTER 11
F I G U R E 11-6
Various Women-Focused Angel Investors
Source Location Information
Astia San Francisco, California www.astia.org
Seraph Capital Forum Seattle, Washington www.seraphcapital.com
Golden Seeds New York, New York www.goldenseeds.com
Phenomenelle Angels Madison, Wisconsin www.phenomenelleangels.com
metropolitan area, is the only dues-based nationalorganization representing the interests of all womenentrepreneurs in all types of businesses. The organizationcurrently has more than 75 chapters and is represented in35 countries.
■ Center for Women & Enterprise. CWE is the largestregional entrepreneurial training organization in Bostonand Worcester, Massachusetts, and Providence, RhodeIsland. Its mission is to empower women to becomeeconomically self-sufficient and prosperous throughentrepreneurship.
■ Women’s Business Development Center. The WBDC offersa full-service approach to launching emerging businessesand strengthening existing businesses owned by womenin the Chicago area. Services of the WBDC includeworkshops and one-on-one counseling on all aspects ofbusiness development, including marketing, finance,business management, technology integration, and more.The WBDC has consulted with more than 35,000 womenentrepreneurs, helping them to start and grow theirbusinesses, and facilitated the receipt of over $24 millionin loans to women business owners.
While things are improving for both women and minorities,it is not happening fast enough. Poor access to capital for thesetwo groups is hurting America. Former SBA chief Aida Alvarezstated it beautifully when she said: “Businesses owned by womenand minorities are multiplying at a faster rate than all other U.S.businesses. If we don’t start investing now in the potential of the businesses, we will not have a successful economy in the newmillennium.”19
N O T E S
1. U.S. Census Bureau, 2002.2. Center for Women’s Business Research, “Women-Owned Businesses
in the United States, 2006: A Fact Sheet,” 2006.3. Ibid.
Financing for Minorities and Women 325
4. “Women Lead the Startup Stats,” BusinessWeek, November 29, 2004.5. Minority Business Development Agency, “Expanding Financing
Opportunities for Minorities,” 2004.6. National Association of Investment Companies, www.naivc.com.7. Center for Women’s Business Research, “Capital Choices: Volume
Two, The Value of Knowledge,” 2006.8. Center for Women’s Business Research, press release, January 25,
2005.9. Center for Women’s Business Research, “Women Business Owners
in Nontraditional Industries,” 2005.10. Wells Fargo, press release, May 2, 2006.11. National Foundation for Women Business Owners, October 17, 1996.12. Atlanta Journal-Constitution, July 4, 2007.13. Center for Women’s Business Research, press release, January 25, 2005.14. USA Today.com, August 14, 2001, http://www.usatoday.com.15. Ottawa Business Journal, November 29, 2004.16. “Women Entrepreneurs in the Equity Capital Markets: The New
Frontier, National Foundation for Women Business Owners, 2000.17. Springboard Enterprises Web site.18. Georgia SBDC Network, “New Non Traditional Financial Sources,”
August 2006.19. Chicago Sun-Times, March 24, 1999, p. 69.
326 CHAPTER 11
C H A P T E R 1 2
Taking a Job with anEntrepreneurial Firm
INTRODUCTION
Five years ago, the Levy Entrepreneur Institute at Kellogg publishedthe findings of our research regarding Kellogg alums and entrepre-neurship. Specifically, we wanted to answer the question, how manyof our 45,000 alums have become entrepreneurs? The first stage ofthis research focused on alums who majored in entrepreneurshipfrom 1997 to 2005, while they were students. We contacted 1,500alums and got a 36 percent response. We were enormously happywith the findings, which are given in Figure 12-1.
One of the unexpected takeaways from the research was thata large percentage of our alumni who were involved in entrepre-neurship were employees in an entrepreneurial firm. They hadresigned from their safe job with successful investment banking,consulting, or manufacturing companies and had taken a job witha start-up firm. How does a person make such a decision to leavethe security of a well-established, in many instances Fortune 500company to work for a high-risk venture in its embryonic stages ofdevelopment?
The following case study, followed by an analysis of the situ-ation, should be used as a template for answering these questions:Should I leave my job to take a job with a start-up? How should I do a financial analysis of the decision?
327
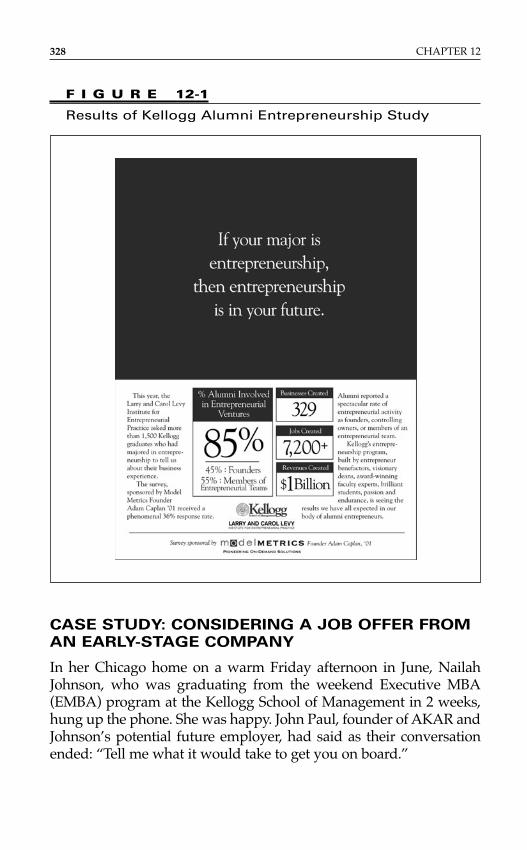
CASE STUDY: CONSIDERING A JOB OFFER FROM
AN EARLY-STAGE COMPANY
In her Chicago home on a warm Friday afternoon in June, NailahJohnson, who was graduating from the weekend Executive MBA(EMBA) program at the Kellogg School of Management in 2 weeks,hung up the phone. She was happy. John Paul, founder of AKAR andJohnson’s potential future employer, had said as their conversationended: “Tell me what it would take to get you on board.”
328 CHAPTER 12
F I G U R E 12-1
Results of Kellogg Alumni Entrepreneurship Study
For many reasons, Johnson was excited about joining anentrepreneurial firm and possibly much later even buying herown business. She recalled including this goal in the essays thathad helped her gain admission to the Kellogg School 2 years ear-lier. The role Paul wanted Johnson to have at AKAR was appeal-ing: a director of sales and marketing position with significantlymore responsibility than Johnson currently had, and with possiblepromotion to vice president in less than 12 months. Johnson hadheard about the many downsides and upsides of positions with anearly-stage company. If the company failed, it could result in adirect financial loss because employees at start-ups were paid lowsalaries. On the other hand, the financial rewards could be lucra-tive if the employees owned part of the company and its valueincreased.
Johnson had joined Motorola in 2004 as a director of opera-tions. Recently, based largely on her Kellogg School training and herdesire to broaden her on-the-job skills, Johnson had successfullymoved to a product marketing manager role. She and her husbandenjoyed comfortable professional and social lives in Chicago. Just 2 days earlier, Johnson had informed her husband that she waspregnant with their first child. They expected this new addition totheir family to increase their annual budget by $19,000. Early intheir marriage, they had envisioned her becoming a full-timemother when the time came.
Still giddy from Paul’s call, Johnson sat at her kitchen table,thinking about what he had said: “The sooner we can start you, thebetter.” Until that moment, Johnson would have predicted that shewould accept the position with AKAR on the spot, on almost anyterms that sounded reasonable; after all, she had invested manymonths and a great deal of energy in making it happen. But now,as the costs and benefits of the position swirled through her mind,she felt unsure about what terms to request. Johnson owed Paul ananswer in 5 days, but she was not sure if she could determine whatshe wanted even if she had 3 months. She also considered rejectingthis opportunity because the risk was too high and the timing waspoor. Finally, she wondered, if she took this or any other job, wouldshe ever become an actual entrepreneur, or would she always besimply someone’s employee? Should she pursue acquiring herown company instead?
Taking a Job with an Entrepreneurial Firm 329
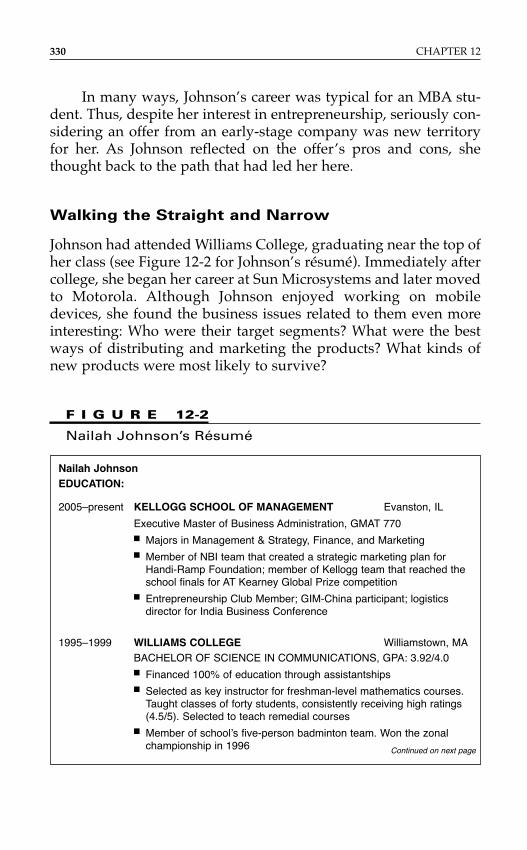
In many ways, Johnson’s career was typical for an MBA stu-dent. Thus, despite her interest in entrepreneurship, seriously con-sidering an offer from an early-stage company was new territoryfor her. As Johnson reflected on the offer’s pros and cons, shethought back to the path that had led her here.
Walking the Straight and Narrow
Johnson had attended Williams College, graduating near the top ofher class (see Figure 12-2 for Johnson’s résumé). Immediately aftercollege, she began her career at Sun Microsystems and later movedto Motorola. Although Johnson enjoyed working on mobiledevices, she found the business issues related to them even moreinteresting: Who were their target segments? What were the bestways of distributing and marketing the products? What kinds ofnew products were most likely to survive?
330 CHAPTER 12
F I G U R E 12-2
Nailah Johnson’s Résumé
Nailah JohnsonEDUCATION:
2005–present KELLOGG SCHOOL OF MANAGEMENT Evanston, IL
Executive Master of Business Administration, GMAT 770■ Majors in Management & Strategy, Finance, and Marketing■ Member of NBI team that created a strategic marketing plan for
Handi-Ramp Foundation; member of Kellogg team that reached theschool finals for AT Kearney Global Prize competition
■ Entrepreneurship Club Member; GIM-China participant; logisticsdirector for India Business Conference
1995–1999 WILLIAMS COLLEGE Williamstown, MABACHELOR OF SCIENCE IN COMMUNICATIONS, GPA: 3.92/4.0■ Financed 100% of education through assistantships■ Selected as key instructor for freshman-level mathematics courses.
Taught classes of forty students, consistently receiving high ratings(4.5/5). Selected to teach remedial courses
■ Member of school’s five-person badminton team. Won the zonalchampionship in 1996 Continued on next page
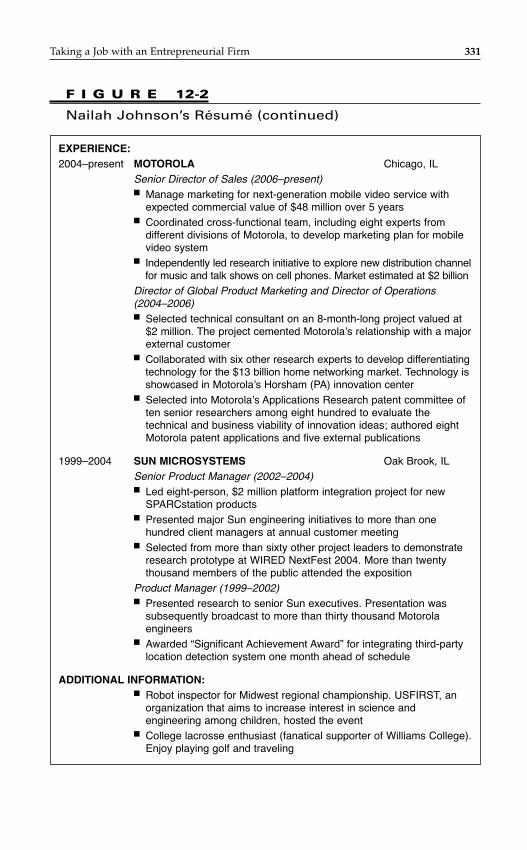
Taking a Job with an Entrepreneurial Firm 331
F I G U R E 12-2
Nailah Johnson’s Résumé (continued)
EXPERIENCE:2004–present MOTOROLA Chicago, IL
Senior Director of Sales (2006–present)■ Manage marketing for next-generation mobile video service with
expected commercial value of $48 million over 5 years■ Coordinated cross-functional team, including eight experts from
different divisions of Motorola, to develop marketing plan for mobilevideo system
■ Independently led research initiative to explore new distribution channelfor music and talk shows on cell phones. Market estimated at $2 billion
Director of Global Product Marketing and Director of Operations(2004–2006)■ Selected technical consultant on an 8-month-long project valued at
$2 million. The project cemented Motorola’s relationship with a majorexternal customer
■ Collaborated with six other research experts to develop differentiatingtechnology for the $13 billion home networking market. Technology isshowcased in Motorola’s Horsham (PA) innovation center
■ Selected into Motorola’s Applications Research patent committee often senior researchers among eight hundred to evaluate thetechnical and business viability of innovation ideas; authored eightMotorola patent applications and five external publications
1999–2004 SUN MICROSYSTEMS Oak Brook, ILSenior Product Manager (2002–2004)■ Led eight-person, $2 million platform integration project for new
SPARCstation products■ Presented major Sun engineering initiatives to more than one
hundred client managers at annual customer meeting■ Selected from more than sixty other project leaders to demonstrate
research prototype at WIRED NextFest 2004. More than twentythousand members of the public attended the exposition
Product Manager (1999–2002)■ Presented research to senior Sun executives. Presentation was
subsequently broadcast to more than thirty thousand Motorolaengineers
■ Awarded “Significant Achievement Award” for integrating third-partylocation detection system one month ahead of schedule
ADDITIONAL INFORMATION:■ Robot inspector for Midwest regional championship. USFIRST, an
organization that aims to increase interest in science andengineering among children, hosted the event
■ College lacrosse enthusiast (fanatical supporter of Williams College).Enjoy playing golf and traveling
These interests led to Johnson’s application to the KelloggSchool. Because she had always had an interest in start-ups, shetook several courses in entrepreneurship and joined the entrepre-neurship club. As part of these student activities, Johnson enjoyeddiscussing entrepreneurship, especially the potential for new high-tech products, but her career goals remained focused on larger-com-pany opportunities. In line with this, she pursued a marketingmanager position at Motorola and was pleasantly surprised toreceive an offer. The new position came with a salary of $115,000 (a 30 percent raise that put her in the 28 percent tax bracket), bonuspotential of approximately 25 percent of her salary, and responsibil-ities for marketing a next-generation mobile video device. Johnsonloved the work, and was already in line for a promotion to businessdevelopment manager.
Taking on the new position a year ago had not been the onlychange in her life: she married Naeem, her classmate at Kellogg,soon afterward. They purchased a $400,000 two-bedroom condo inChicago. The Johnsons made a 20 percent down payment (theirentire savings) and secured a 30-year fixed-rate mortgage at 6 per-cent interest. The mortgage and the school loans were their onlydebts. Monthly assessment, taxes, and insurance were approxi-mately 40 percent of the mortgage. All other household expenses,including telephone, electricity, cable, gas, and groceries, wereapproximately 35 percent of the monthly mortgage. They ownedtwo cars, which were paid in full.
By the time Johnson was considering a position with AKAR,Naeem had also been promoted at Kraft; his salary was $105,000,with a bonus of approximately 20 percent. His company’s health,medical, dental, and vision care insurance were all free. Together, thecouple led a busy but enjoyable life, building their career experience,earning their MBAs, and taking vacations. They spent approxi-mately 25 percent of Naeem’s monthly salary on recreational activi-ties. Despite some tuition reimbursement from their companies, theyamassed significant student debt (see Figure 12-3).
Below is a summary of all loans processed by the financial aidoffice as of 6/14/2007. The principal amounts listed are the origi-nal principal balances. These amounts do not reflect any paymentsmade to these loans. Loans from other institutions are not includedon this form.
332 CHAPTER 12
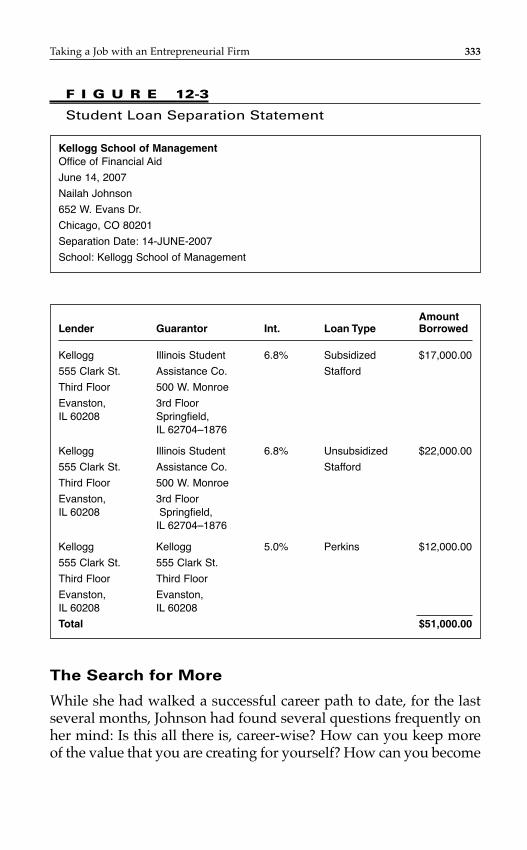
Taking a Job with an Entrepreneurial Firm 333
F I G U R E 12-3
Student Loan Separation Statement
Kellogg School of ManagementOffice of Financial Aid
June 14, 2007
Nailah Johnson
652 W. Evans Dr.
Chicago, CO 80201
Separation Date: 14-JUNE-2007
School: Kellogg School of Management
AmountLender Guarantor Int. Loan Type Borrowed
Kellogg Illinois Student 6.8% Subsidized $17,000.00
555 Clark St. Assistance Co. Stafford
Third Floor 500 W. Monroe
Evanston, 3rd FloorIL 60208 Springfield,
IL 62704–1876
Kellogg Illinois Student 6.8% Unsubsidized $22,000.00
555 Clark St. Assistance Co. Stafford
Third Floor 500 W. Monroe
Evanston, 3rd FloorIL 60208 Springfield,
IL 62704–1876
Kellogg Kellogg 5.0% Perkins $12,000.00
555 Clark St. 555 Clark St.
Third Floor Third Floor
Evanston, Evanston, IL 60208 IL 60208
Total $51,000.00
The Search for More
While she had walked a successful career path to date, for the lastseveral months, Johnson had found several questions frequently onher mind: Is this all there is, career-wise? How can you keep moreof the value that you are creating for yourself? How can you become
a millionaire without risking everything? These questions also arosewhen she recalled how much she had enjoyed her entrepreneurshipclasses or heard news of others’ entrepreneurial accomplishments.
According to the Kellogg World alumni magazine, DenieceGrant, a recent alumna from the part-time evening program, hadraised $4 million in angel and early-stage venture capital for the com-pany she founded, which provided software that allowed computersto search automatically for information related to documents onwhich the user was working. Grant gave “put rights” to some of hermanagers who owned stock in the company. She had originally giventhese employees restricted stock units (RSUs) when they were hired.
Raymond Robinson, a friend of Johnson in Chicago who hadgraduated from the full-time day program 2 years earlier, wasalready a vice president with a 2 percent ownership stake afterexercising the stock options given to him when he was hired at awireless technology company that had just completed a successfulinitial public offering (IPO). Robinson was now a multimillionaire.His stock options were originally scheduled to vest 20 percentannually after his second year of employment. But the IPO trig-gered the “change in control” clause, resulting in the immediatefull vesting of 100 percent of his options. “That could be me,”Johnson thought when she heard such stories.
Four months ago, after the completion of a very challengingproject at work, Johnson had decided to stop sitting on the side-lines of entrepreneurship. She began reading entrepreneurshipmagazines and books, reaching out to friends who she thoughtwould know of opportunities with early-stage companies, scour-ing the Kellogg School alumni database for people in small firms,and setting up as many informational interviews as she could.Johnson also connected with a recruiter who specialized in place-ments at early-stage firms and a business broker who could showher businesses for sale. The time she spent on the search, on top ofher responsibilities at work and at school, left Johnson with almostno space in her weekly schedule for fitness, social activities, orspending time with Naeem. But it felt like the right thing to do.
Despite Johnson’s enthusiasm for the search, months passedwithout major progress. If anything, like a corporate Goldilocks, shediscovered many of the things she was not seeking in a new oppor-tunity: what had appeared initially to be several promising positions
334 CHAPTER 12
were rejected as being too risky (a five-person software company inthe initial fund-raising stage), not exciting enough (a firm that pro-vided marketing solutions to the paper industry), or too strange (a venture that developed software so proprietary that the foundersasked all employees to sign nondisclosure agreements—daily).
But 2 months earlier, Johnson’s luck had changed when she met John Paul. Johnson had signed up to meet him through theentrepreneurship center’s Entrepreneur-in-Residence program(EIR), through which entrepreneurs and principal investors spent afull day at Kellogg meeting in 30-minute sessions with individualstudents to answer questions and provide experience-based insights.
AKAR: The Opportunity
John Paul was only 46 years old, but he had already sold two com-panies. According to an article Johnson had read, AKAR, Paul’smost recent venture, was very promising and had received signifi-cant industry attention. The article also characterized Paul as a“gambler with great judgment—or maybe great luck.”
After dropping out of Grambling University in 1981, Paulhad worked as a computer programmer for a series of video gamemanufacturers before moving into roles in operations and data-base design. He prided himself on being self-taught in mostaspects of business, from finance to marketing: “Best teachers I ever had? Trial and error,” he often said. Paul sold his first com-pany, GamerParadize (launched out of his apartment 6 years earlier), one of the first online gaming portals, to Midway Gamesfor $40 million (20 times its revenues) in its third year of opera-tions. Paul owned 60 percent of the company, and the top two lev-els of management (vice presidents and managers), consisting ofnine people, owned 20 percent. At closing, the four vice presidentsshared $4 million. The remaining 20 percent went to the investors,who had invested $2 million 5 years earlier.
Paul was much more ambitious for his second company: tofund X-Cell, an Internet design and security firm, he obtained ven-ture backing of $15 million. He had “call rights” agreements with allmanagers who owned stock in the company, giving him the optionto buy the stock back at any time at a multiple of 3 times the origi-nal price. Unfortunately, because of a patent-related lawsuit,
Taking a Job with an Entrepreneurial Firm 335
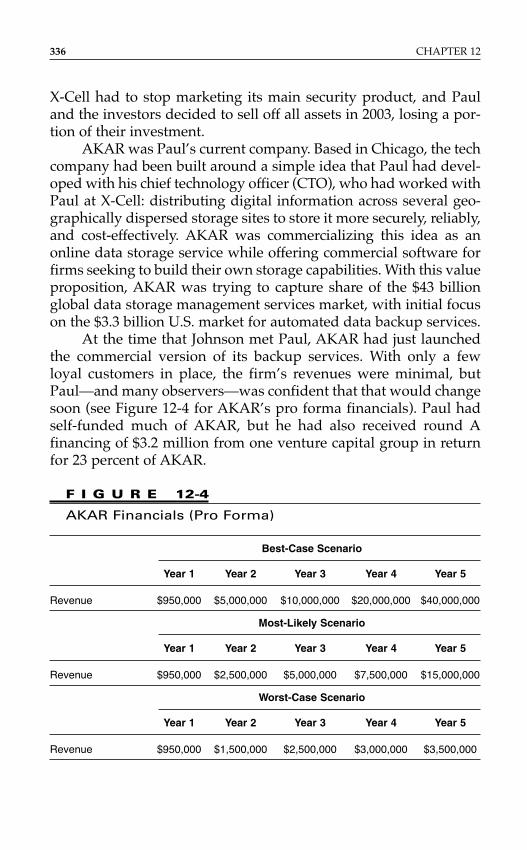
X-Cell had to stop marketing its main security product, and Pauland the investors decided to sell off all assets in 2003, losing a por-tion of their investment.
AKAR was Paul’s current company. Based in Chicago, the techcompany had been built around a simple idea that Paul had devel-oped with his chief technology officer (CTO), who had worked withPaul at X-Cell: distributing digital information across several geo-graphically dispersed storage sites to store it more securely, reliably,and cost-effectively. AKAR was commercializing this idea as anonline data storage service while offering commercial software forfirms seeking to build their own storage capabilities. With this valueproposition, AKAR was trying to capture share of the $43 billionglobal data storage management services market, with initial focuson the $3.3 billion U.S. market for automated data backup services.
At the time that Johnson met Paul, AKAR had just launchedthe commercial version of its backup services. With only a fewloyal customers in place, the firm’s revenues were minimal, butPaul—and many observers—was confident that that would changesoon (see Figure 12-4 for AKAR’s pro forma financials). Paul hadself-funded much of AKAR, but he had also received round Afinancing of $3.2 million from one venture capital group in returnfor 23 percent of AKAR.
336 CHAPTER 12
F I G U R E 12-4
AKAR Financials (Pro Forma)
Best-Case Scenario
Year 1 Year 2 Year 3 Year 4 Year 5
Revenue $950,000 $5,000,000 $10,000,000 $20,000,000 $40,000,000
Most-Likely Scenario
Year 1 Year 2 Year 3 Year 4 Year 5
Revenue $950,000 $2,500,000 $5,000,000 $7,500,000 $15,000,000
Worst-Case Scenario
Year 1 Year 2 Year 3 Year 4 Year 5
Revenue $950,000 $1,500,000 $2,500,000 $3,000,000 $3,500,000
Aside from CEO Paul, AKAR had 14 employees; most of thesewere engineers with hardware and/or software experience, severalof whom had come to AKAR directly from college. None of them,including Paul, was paid a six-figure salary. Paul believed thateveryone should sacrifice salary for annual performance bonusesand company stock. The only other senior manager at AKAR wasMark Chin, the CTO. Chin had helped Paul build X-Cell. “Myright- and left-hand man,” Paul often called him.
From the moment Johnson met Paul, she described the recruit-ing process as “casual, but intense.” For example, the day after theevent where they first met, Paul called Johnson and told her howimpressed he had been by Johnson’s qualifications. “You’d make aheck of a marketing director,” Paul said numerous times. In theweeks that followed, the two kept in close contact: three phone callsthat lasted late into the night, several strings of e-mail correspon-dence, and two dinners. During these interactions, they discussedtechnology trends, the fit between Johnson and AKAR, sports, andPaul’s personal life. Johnson learned that Paul had divorced andremarried (“Second time’s the charm, so far”) and had two elemen-tary school–age stepchildren, a 132-foot yacht (“Want to sail heraround the world—hopefully after selling this company”), and TypeII diabetes (“For me, they’re not doughnuts, they’re dough-nots”).
One month ago, Paul had invited Johnson to meet the CTOand tour AKAR’s office, a hip loft space in the Bronzeville neigh-borhood of Chicago. The meeting with CTO Chin was similar toJohnson’s encounters with Paul: casual but intense. For almost twoand a half hours, Chin discussed AKAR’s products, mission, andculture, rarely pausing to ask Johnson questions. When he did, itwas typically to probe Johnson’s level of commitment to AKAR’svision and mission. During the marathon interview, Chin used thephrase “John’s way” often, endowing it with an almost mythicalquality. After the interview, Paul and Chin introduced Johnson toseveral of the other employees and took her out to dinner with acustomer. On her way home, an exhausted Johnson called Naeem.“It’s like I already work there,” she told him.
Four days after the meeting, Paul called Johnson with goodnews: the team wanted to make her an offer. “But first,” Paul said,“it would mean a lot to us if you and Naeem came to ‘Shut Up andSing’ in 2 weeks.” Johnson thought she had misheard Paul, until he
Taking a Job with an Entrepreneurial Firm 337
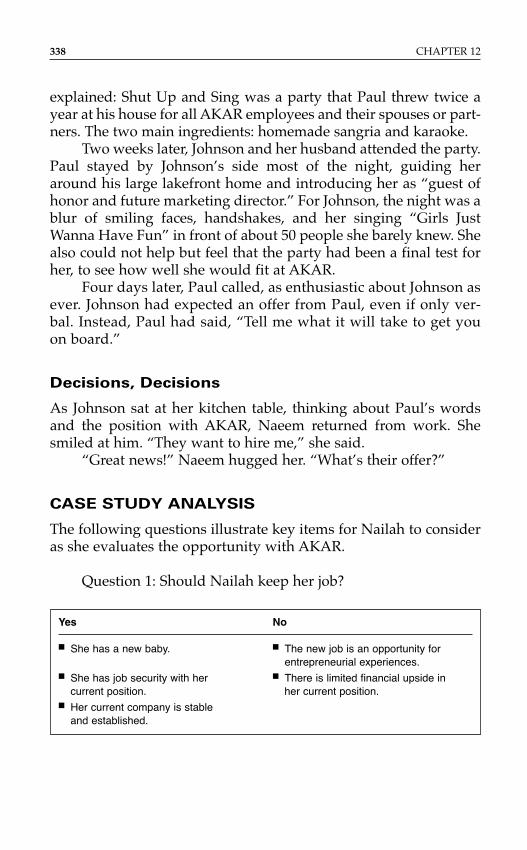
explained: Shut Up and Sing was a party that Paul threw twice ayear at his house for all AKAR employees and their spouses or part-ners. The two main ingredients: homemade sangria and karaoke.
Two weeks later, Johnson and her husband attended the party.Paul stayed by Johnson’s side most of the night, guiding heraround his large lakefront home and introducing her as “guest ofhonor and future marketing director.” For Johnson, the night was ablur of smiling faces, handshakes, and her singing “Girls JustWanna Have Fun” in front of about 50 people she barely knew. Shealso could not help but feel that the party had been a final test forher, to see how well she would fit at AKAR.
Four days later, Paul called, as enthusiastic about Johnson asever. Johnson had expected an offer from Paul, even if only ver-bal. Instead, Paul had said, “Tell me what it will take to get youon board.”
Decisions, Decisions
As Johnson sat at her kitchen table, thinking about Paul’s wordsand the position with AKAR, Naeem returned from work. Shesmiled at him. “They want to hire me,” she said.
“Great news!” Naeem hugged her. “What’s their offer?”
CASE STUDY ANALYSIS
The following questions illustrate key items for Nailah to consideras she evaluates the opportunity with AKAR.
Question 1: Should Nailah keep her job?
338 CHAPTER 12
Yes No
■ She has a new baby. ■ The new job is an opportunity forentrepreneurial experiences.
■ She has job security with her ■ There is limited financial upside incurrent position. her current position.
■ Her current company is stable and established.
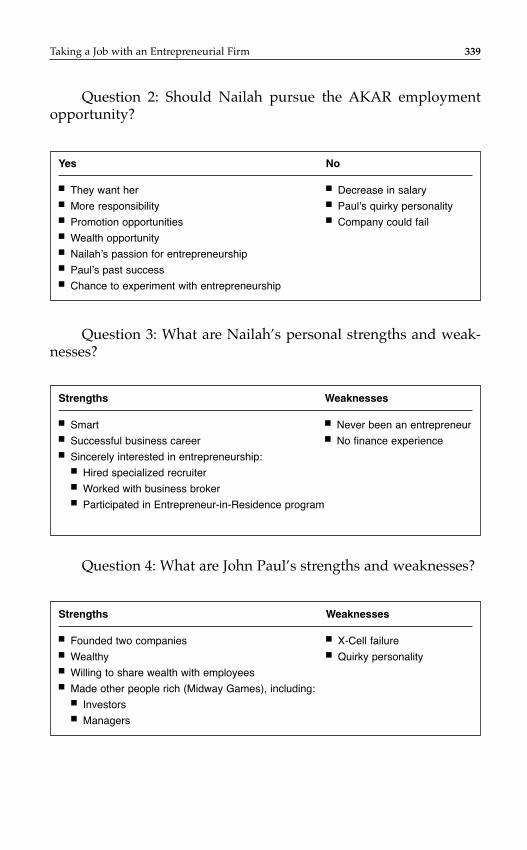
Question 2: Should Nailah pursue the AKAR employmentopportunity?
Taking a Job with an Entrepreneurial Firm 339
Yes No
■ They want her ■ Decrease in salary■ More responsibility ■ Paul’s quirky personality■ Promotion opportunities ■ Company could fail■ Wealth opportunity ■ Nailah’s passion for entrepreneurship■ Paul’s past success■ Chance to experiment with entrepreneurship
Question 3: What are Nailah’s personal strengths and weak-nesses?
Strengths Weaknesses
■ Smart ■ Never been an entrepreneur■ Successful business career ■ No finance experience■ Sincerely interested in entrepreneurship:
■ Hired specialized recruiter■ Worked with business broker■ Participated in Entrepreneur-in-Residence program
Question 4: What are John Paul’s strengths and weaknesses?
Strengths Weaknesses
■ Founded two companies ■ X-Cell failure■ Wealthy ■ Quirky personality■ Willing to share wealth with employees■ Made other people rich (Midway Games), including:
■ Investors■ Managers
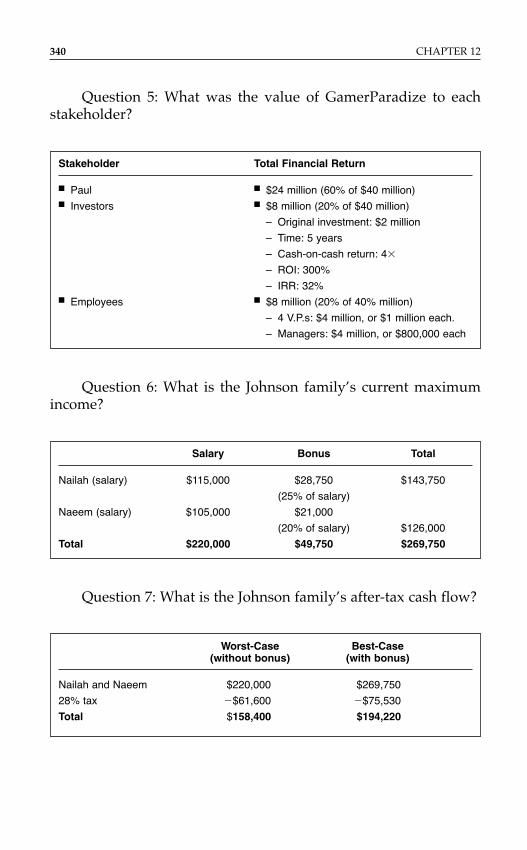
Question 5: What was the value of GamerParadize to eachstakeholder?
340 CHAPTER 12
Stakeholder Total Financial Return
■ Paul ■ $24 million (60% of $40 million)■ Investors ■ $8 million (20% of $40 million)
– Original investment: $2 million
– Time: 5 years
– Cash-on-cash return: 4�
– ROI: 300%
– IRR: 32%■ Employees ■ $8 million (20% of 40% million)
– 4 V.P.s: $4 million, or $1 million each.
– Managers: $4 million, or $800,000 each
Question 6: What is the Johnson family’s current maximumincome?
Salary Bonus Total
Nailah (salary) $115,000 $28,750 $143,750
(25% of salary)
Naeem (salary) $105,000 $21,000
(20% of salary) $126,000
Total $220,000 $49,750 $269,750
Question 7: What is the Johnson family’s after-tax cash flow?
Worst-Case Best-Case(without bonus) (with bonus)
Nailah and Naeem $220,000 $269,750
28% tax �$61,600 �$75,530
Total $158,400 $194,220
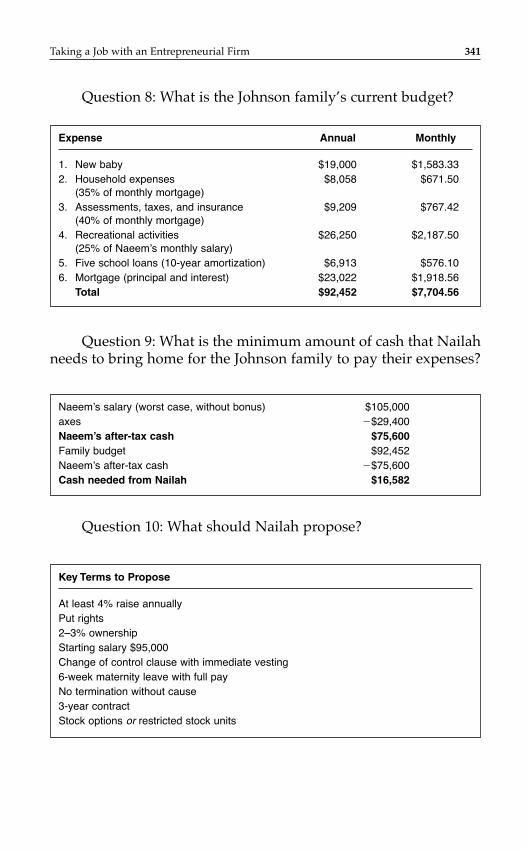
Question 8: What is the Johnson family’s current budget?
Taking a Job with an Entrepreneurial Firm 341
Expense Annual Monthly
1. New baby $19,000 $1,583.332. Household expenses $8,058 $671.50
(35% of monthly mortgage)3. Assessments, taxes, and insurance $9,209 $767.42
(40% of monthly mortgage)4. Recreational activities $26,250 $2,187.50
(25% of Naeem’s monthly salary)5. Five school loans (10-year amortization) $6,913 $576.106. Mortgage (principal and interest) $23,022 $1,918.56
Total $92,452 $7,704.56
Question 9: What is the minimum amount of cash that Nailahneeds to bring home for the Johnson family to pay their expenses?
Naeem’s salary (worst case, without bonus) $105,000axes �$29,400Naeem’s after-tax cash $75,600Family budget $92,452Naeem’s after-tax cash �$75,600Cash needed from Nailah $16,582
Question 10: What should Nailah propose?
Key Terms to Propose
At least 4% raise annuallyPut rights2–3% ownershipStarting salary $95,000Change of control clause with immediate vesting6-week maternity leave with full payNo termination without cause3-year contractStock options or restricted stock units
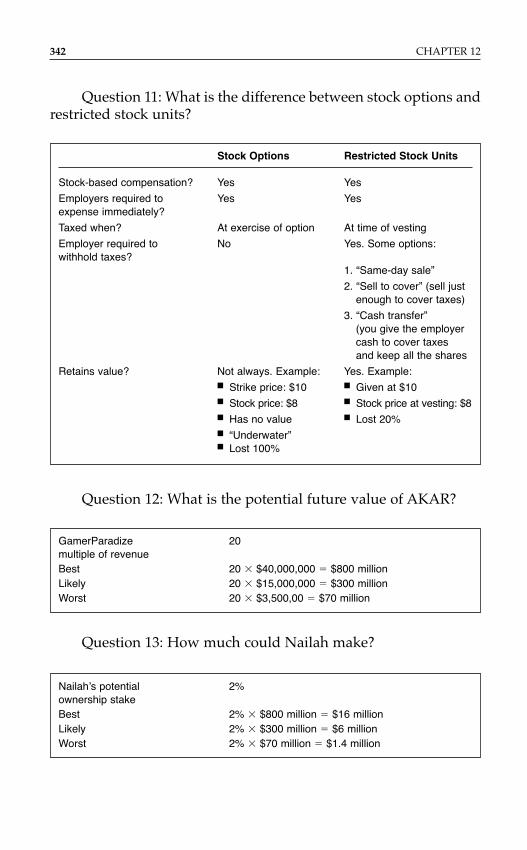
Question 11: What is the difference between stock options andrestricted stock units?
342 CHAPTER 12
Stock Options Restricted Stock Units
Stock-based compensation? Yes Yes
Employers required to Yes Yesexpense immediately?
Taxed when? At exercise of option At time of vesting
Employer required to No Yes. Some options:withhold taxes?
1. “Same-day sale”
2. “Sell to cover” (sell just enough to cover taxes)
3. “Cash transfer” (you give the employercash to cover taxes and keep all the shares
Retains value? Not always. Example: Yes. Example:■ Strike price: $10 ■ Given at $10■ Stock price: $8 ■ Stock price at vesting: $8■ Has no value ■ Lost 20%■ “Underwater”■ Lost 100%
Question 12: What is the potential future value of AKAR?
GamerParadize 20multiple of revenueBest 20 � $40,000,000 � $800 millionLikely 20 � $15,000,000 � $300 millionWorst 20 � $3,500,00 � $70 million
Question 13: How much could Nailah make?
Nailah’s potential 2%ownership stakeBest 2% � $800 million � $16 millionLikely 2% � $300 million � $6 millionWorst 2% � $70 million � $1.4 million
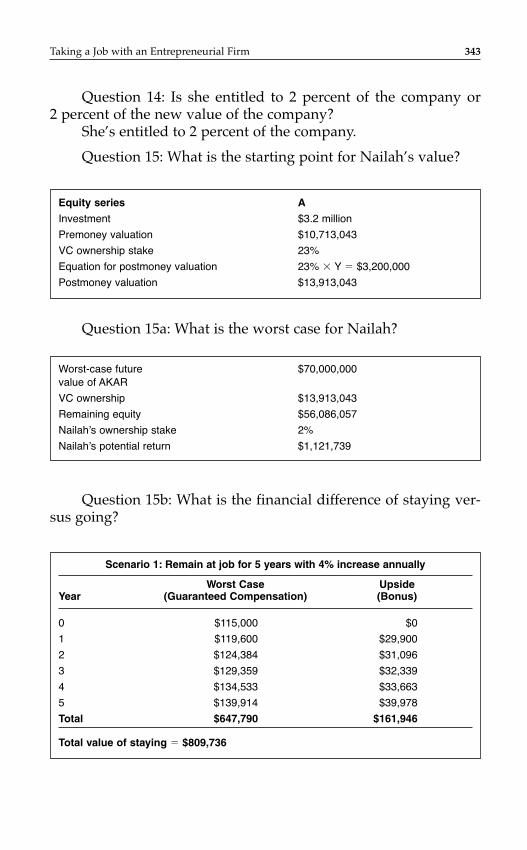
Question 14: Is she entitled to 2 percent of the company or 2 percent of the new value of the company?
She’s entitled to 2 percent of the company.
Question 15: What is the starting point for Nailah’s value?
Taking a Job with an Entrepreneurial Firm 343
Equity series A
Investment $3.2 million
Premoney valuation $10,713,043
VC ownership stake 23%
Equation for postmoney valuation 23% � Y � $3,200,000
Postmoney valuation $13,913,043
Question 15a: What is the worst case for Nailah?
Worst-case future $70,000,000value of AKAR
VC ownership $13,913,043
Remaining equity $56,086,057
Nailah’s ownership stake 2%
Nailah’s potential return $1,121,739
Question 15b: What is the financial difference of staying ver-sus going?
Scenario 1: Remain at job for 5 years with 4% increase annually
Worst Case UpsideYear (Guaranteed Compensation) (Bonus)
0 $115,000 $0
1 $119,600 $29,900
2 $124,384 $31,096
3 $129,359 $32,339
4 $134,533 $33,663
5 $139,914 $39,978
Total $647,790 $161,946
Total value of staying � $809,736
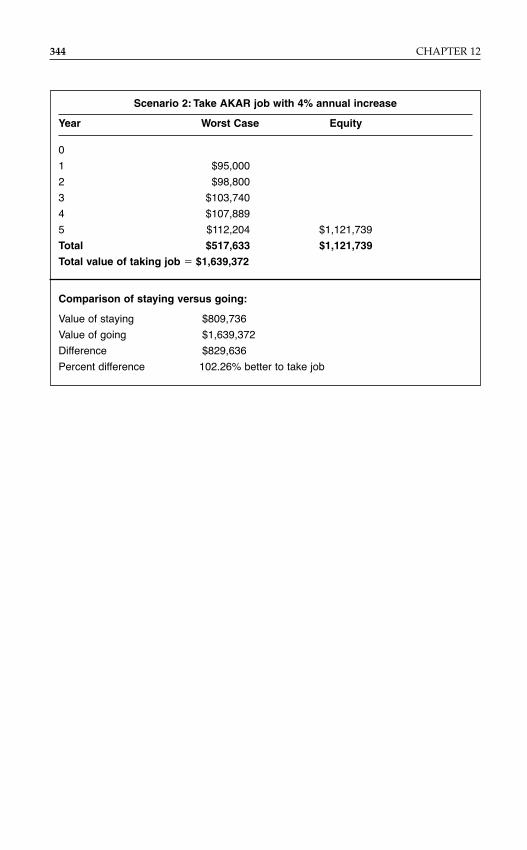
344 CHAPTER 12
Scenario 2: Take AKAR job with 4% annual increase
Year Worst Case Equity
0
1 $95,000
2 $98,800
3 $103,740
4 $107,889
5 $112,204 $1,121,739
Total $517,633 $1,121,739
Total value of taking job � $1,639,372
Comparison of staying versus going:
Value of staying $809,736
Value of going $1,639,372
Difference $829,636
Percent difference 102.26% better to take job
Joseph Alois Schumpeter, an Austrian-trained economist whotaught at Harvard, is considered the chief proponent and popular-izer of the word entrepreneur in 1911. During the next decade, hemade the following statement in support of the idea that entrepre-neurship was not limited to small start-up firms, but could alsooccur within big established firms: “Innovation within the shell ofexisting corporations offers a much more convenient access to theentrepreneurial functions than existed in the world of owner-managed firms. Many a would-be entrepreneur of today does notfound a firm, not because he could not do so, but simply becausehe prefers the other method.”1
Thus, the idea of corporate entrepreneurship was born almost100 years ago. This activity is now commonly referred to asintrapreneurship. While I introduced intrapreneurship in Chapter 1when discussing the entrepreneurial spectrum, I chose not to dis-cuss it in greater detail because I believe that an entire chaptershould be devoted to the subject. I also believe that to really under-stand intrapreneurship, one must thoroughly understand entrepre-neurship, and therefore I wanted the reader to fully digest all thelessons about entrepreneurship in the previous chapters beforetackling this subject.
Intrapreneurship is the spirit and act of entrepreneurship in a corporate setting. I have done training sessions on the topic of intrapreneurship at Nike, Hearst Management Institute,
345
C H A P T E R 1 3
Intrapreneurship
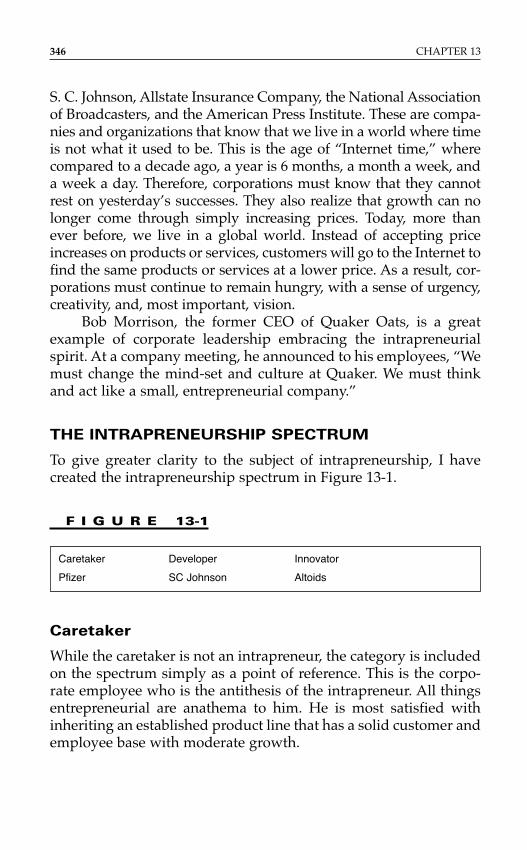
S. C. Johnson, Allstate Insurance Company, the National Associationof Broadcasters, and the American Press Institute. These are compa-nies and organizations that know that we live in a world where timeis not what it used to be. This is the age of “Internet time,” wherecompared to a decade ago, a year is 6 months, a month a week, anda week a day. Therefore, corporations must know that they cannotrest on yesterday’s successes. They also realize that growth can nolonger come through simply increasing prices. Today, more thanever before, we live in a global world. Instead of accepting priceincreases on products or services, customers will go to the Internet tofind the same products or services at a lower price. As a result, cor-porations must continue to remain hungry, with a sense of urgency,creativity, and, most important, vision.
Bob Morrison, the former CEO of Quaker Oats, is a greatexample of corporate leadership embracing the intrapreneurialspirit. At a company meeting, he announced to his employees, “Wemust change the mind-set and culture at Quaker. We must thinkand act like a small, entrepreneurial company.”
THE INTRAPRENEURSHIP SPECTRUM
To give greater clarity to the subject of intrapreneurship, I have created the intrapreneurship spectrum in Figure 13-1.
346 CHAPTER 13
F I G U R E 13-1
Caretaker Developer Innovator
Pfizer SC Johnson Altoids
Caretaker
While the caretaker is not an intrapreneur, the category is includedon the spectrum simply as a point of reference. This is the corpo-rate employee who is the antithesis of the intrapreneur. All thingsentrepreneurial are anathema to him. He is most satisfied withinheriting an established product line that has a solid customer andemployee base with moderate growth.
Developer
This is the intrapreneur who takes a company’s existing productsor services and pursues high growth by targeting new customersand markets. While the products or services are not new, they haveno brand equity with the new targeted markets. For example,Altoids was a 200-year-old British product that was originally usedto calm upset stomachs. It has been owned by Kraft Foods, whosold it to Wm. Wrigley Jr. Company, and it is now the most popu-lar breath mint (even more popular than Certs), with over 20 per-cent of the $300 million U.S. breath mint category.
Another great example is the Pfizer company’s introductionof sildenafil, a drug that was initially studied for hypertension. Itwas patented in 1996. The story goes that when male patients usedthe drug, their wives complained to the doctors that their husbandswere now chasing them around the house like they did duringtheir honeymoon decades earlier. With these data, in 1998, Pfizerdecided to target a new market with the same drug, which we allknow as Viagra.
Innovator
This is the intrapreneur who pursues high growth for his companythrough new products, services, and/or business models. Theinnovator is not a member of the company’s R&D department, andtherefore creating new products, services, or business models is nother official responsibility.
A great example of an intrapreneur in this category is SamJohnson, the former CEO of S. C. Johnson. Several decades ago,Sam, the grandson of the company’s founder, decided to pursuethe development of a new product without the approval of hisfather, who was the CEO. The company, which now manufacturesan entire spectrum of consumer products, including Glade airfresheners, Windex, Scrubbing Bubbles toilet cleaners, and Oust airsanitizer, was primarily a manufacturer of wax cleaners. Sam cameto his father and informed him that he had developed a new prod-uct, outside of the research and development department. Hisfather’s reply was, “That’s fine as long as it has wax in it.” Samresponded, “No it does not have wax in its ingredients, but if you
Intrapreneurship 347
include it, the product would be less effective.” Sam’s new productwas a pesticide that we all know today as Raid.
INTRAPRENEURSHIP MODELS
Intrapreneurs, whether they are developers or innovators, use dif-ferent formal or informal models to bring their innovative ideas tofruition. The best descriptions of these models were published in arecent research paper by corporate entrepreneurship expert RobertWolcott, an outstanding scholar and adjunct professor in the LevyEntrepreneur Institute at Kellogg, and Michael Lippitz, a researchfellow at Northwestern. These models are the Opportunist, theEnabler, and the Producer.2
The Opportunist
This model basically says to employees, “Do whatever you want todo, because the company does not have any formal systems rela-tive to corporate entrepreneurship.” This is a model in which newservices or products, like Raid, come from individual champions,not through systems. Ironically, success under this model typicallyleads an organization to implement a more formal model, such asthe Producer or the Enabler.
The Enabler
This model says to employees, “Anybody in the company can comeup with a new service or product, but here is the process for devel-oping it.” With this model, the company explicitly communicates toits employees the procedures for requesting development capitaland the criteria that will be used to determine which projects receivefunding. Google is a company that has had major success with thismodel. For example, its service Google Talk, which is a free systemfor instant and voice messaging, came from an employee as part ofthe company’s 10 percent program. This innovative program allowsall employees to devote 10 percent of their daily working hours tothe development of their own ideas. As one Google employeestated, “We’re an internal ecosystem for entrepreneurs . . . sort oflike the Silicon Valley ecosystem but inside one company.”
348 CHAPTER 13
The Producer
This model openly recognizes and proactively supports the impor-tance of entrepreneurship in a corporate setting. The company cre-ates a separate entity that has the specific task of creating newproducts or services outside of the present business. Several compa-nies have embraced this model, including Xerox, with its NewEnterprises Division; Coca-Cola’s Innovation centers in five differentlocations throughout the world; and Cargill’s Emerging BusinessAccelerator division.
TRAITS OF THE HIGH-GROWTH INTRAPRENEUR
In Chapter 2 we identified 15 common attributes of successfulhigh-growth entrepreneurs. Interestingly, while many of thosetraits also apply to the intrapreneur, there are a few uniqueattributes.
Those attributes include:
■ Risk taker■ Hard worker■ Has a plan■ Good manager■ Visionary■ Profit focused■ Innovator■ Accepts being managed
Some of these traits are worth discussing in more detail.
Risk Taker
The successful intrapreneur is not a blind risk taker. He has a plan,especially if he works for a company that uses the developer orinnovator model, and he executes the plan according to a definedtimeline. This is called “planning the work and working the plan.”Unlike the entrepreneur, who typically risks his personal assets, theintrapreneur’s risk is much less. At the most, he could lose his jobif his new ideas or innovations are not commercially successful.
Intrapreneurship 349
However, while the intrapreneur’s risk may be less than the entrepreneur’s, he certainly assumes greater risk than the averagecorporate employee.
Accepts Being Managed
One of the reasons why some people become entrepreneurs is thatthey want to be as independent as possible. Specifically, they loathethe idea of having a boss. In contrast, the intrapreneur, given hisstatus as an employee, accepts the fact that he answers to a man-ager above him. He does not have carte blanche to do anything thathe wants to do. He must usually seek and receive approval from ahigher authority in the company’s organization chart. The intrapre-neur usually accepts being managed by others as a standard wayof doing business.
ACTS OF INTRAPRENEURSHIP
Intrapreneurial activities include acquisitions of other companiesand product lines, the introduction of new products outside of thetraditional research and development process, the creation of newstrategic partners, and changes in a company’s business model.Let’s review, through anecdotes, each of these activities in greaterdetail.
Acquisitions of Other Companies and
Product Lines
In 1998, McDonald’s purchased 90 percent of Chipotle MexicanGrill, a chain of 14 restaurants that was founded in 1993 by SteveElis, a professional chef trained at the Culinary Institute ofAmerica. This acquisition was truly an intrapreneurial act of inno-vation on McDonald’s part. Prior to this acquisition, the companyseemingly viewed innovation as simply putting the letters “Mc” onthe beginning of any idea. For example, it unsuccessfully experi-mented with the McDiner, a restaurant serving traditional food,such as meat loaf and mashed potatoes, in a diner.
350 CHAPTER 13
Introduction of New Products Outside of the
Traditional R&D Process
A great example of the intrapreneurship model in which “prod-ucts emerged from champions rather than systems,” a phrase cre-ated by Bill Perez, occurred at SC Johnson Wax company with thedevelopment of its storage bag product line, which generates inexcess of $150 million of annual revenues. The original idea andthe development of the prototypes came not from the company’sR&D department, but from two marketing department employ-ees. The company had no plans to enter the storage bag categoryuntil these two intrapreneurs persuaded management that it wasa business that could be grown fast. As Bill Perez, the former CEOof SC Johnson, said about the two employees, “Nobody askedthem to do it.”
Creation of New Strategic Partners
In 1994, Viacom, a $10 billion entertainment conglomerate thatowned Madison Square Garden, MTV Networks, ShowtimeNetworks, numerous theme parks, and dozens of television stations,purchased the 6,000-store Blockbuster video chain for $8 billion. Twoyears later, Blockbuster’s cash flow had dropped 42 percent. SumnerRedstone, the 75-year-old chairman and founder of Viacom, knewthat he had to make changes. Rather than simply cutting overhead,he got intrapreneurial.
Redstone knew that videos shown at home provided moviestudios with nearly 3 times the revenue of showings in movie the-aters. The studios charged Blockbuster a flat fee of $80 per video.In contrast, movie theaters usually did not pay a fixed price;instead, they split the revenues with the studios. Redstone decidedthat this partnership model between movie studios and theatersshould also be applied to Blockbuster. The first studio that heapproached with this partnership was Warner Brothers, whichrejected the proposal. His next target was Disney, which he suc-cessfully convinced that it could make money if it treatedBlockbuster as a partner, instead of as a customer. The agreementwas that Blockbuster’s fixed cost of $80 per video would be
Intrapreneurship 351
reduced to $8 and that Disney would receive 40 percent of thevideo’s rental revenues for up to 26 weeks, at which timeBlockbuster could sell the video, thereby recouping its original $8investment.
The financial results were enormously positive for both par-ties because they reduced the outlay of capital by Blockbusterwhile allowing it to increase its stock of the most popular videos.Six other studios followed Disney with a similar strategic partner-ship with Blockbuster, including Warner Brothers.
Changes in Business Model
Three of America’s blue-chip companies, IBM, Best Buy, and Nike,have been wonderfully intrapreneurial by changing their businessmodels. IBM, a company that was seemingly an antiquated, lum-bering old has-been by the 1990s, was turned around by a greatintrapreneur, Lou Gerstner, the CEO, who did not have a technol-ogy background when he came from RJR Nabisco. Gerstner suc-cessfully changed IBM from an equipment supplier, as it had beenfor its entire life, to a solution provider/consultant.
After Wal-Mart, the world’s largest retailer, began sellingbrand-name consumer electronics earlier this decade, it wasassumed that Best Buy’s revenues would decline dramatically.Instead of acting like a victim, however, Best Buy became intrapre-neurial. Five years ago, it changed its model from being exclusivelya retailer to being a solution provider, like IBM, by adding installa-tion services and trained salespeople, which Wal-Mart did notoffer. Best Buy’s revenues increased 16 percent.
Phil Knight, the great entrepreneur who founded Nike in 1974as an importer of running shoes, later changed its model to an ath-letic shoe and apparel manufacturer. Today it is also a successfulretailer.
SIGNS OF INTRAPRENEURIAL SUCCESS
A company has successfully created an intrapreneurial spirit andprogram when it is unequivocally clear that it agrees to manageintrapreneurs differently from other employees by encouragingthem and giving them the space and freedom to innovate.
352 CHAPTER 13
Further evidence of intrapreneurship includes the company’sacceptance of failure. Google is a great example. In response to anunsuccessful innovation that cost the company several milliondollars, Larry Page, one of Google’s founders, told the employeewho had been in charge of the idea, “I’m so glad you made thismistake, because I want to run a company where we are movingtoo quickly and doing too much, not being too cautious and doingtoo little. If we don’t have any of these mistakes, we’re just not tak-ing enough risk.”3
The final sign of successful intrapreneurship is when the com-pany proactively encourages employees with creative ideas to stepforward. An extreme example is Sealed Air Corporation, which has14,000 employees. Its employees are encouraged to bring entrepre-neurial ideas directly to its CEO.
STANDARD OPERATING PROCEDURES
The ideal intrapreneurship system should be made up of the fol-lowing processes:
1. The system should be simple and user-friendly. The U.S. ForestService Eastern Region changed its innovation suggestionprocess from a four-page form to telling its employees, “If you have an idea, tell your supervisor or send an e-mail. If you do not get a response in 2 weeks, as long as the idea is not illegal, go ahead and implement theidea.” Before the change, the 2,500 employees submitted,on average, 60 ideas annually. A year after the newprocedures were implemented, 6,000 new ideas weresubmitted!
2. Reward employees for successful ideas. Share the wealth.Northwestern University has a results-oriented rewardsystem for anyone who develops an idea that getscommercialized. In 2007, chemistry professor RichardSilverman received his portion of the royalties that theuniversity received from a pharmaceutical firm, Pfizer,which purchased Lyrica, a chronic pain relief drug that hadbeen created by Silverman. The university received morethan $700 million. Silverman’s portion has not been
Intrapreneurship 353
publicly disclosed, but it can be assumed that it’s manymillions of dollars, given the fact that he and his wife are the primary benefactors for the new $100 millionNorthwestern University building that will “bring together engineering, biology and chemistry forinterdisciplinary research.” Its name will be the Richard and Barbara Silverman Hall for Molecular Therapeutics and Diagnostics.
3. All ideas should be reviewed, and the submitters should beinformed of a decision as soon as possible.
4. Every step in the review process should be transparent and wellpublicized, as should the criteria used to approve ideas.
5. The review and approval process should be managed by morethan one person.
6. All intrapreneurial success stories should be publicizedthroughout the company to all employees.
7. Employee expectations should be proactively managed.Employees should be told that in the entrepreneurshipworld, most new companies do not succeed. And the sameapplies in the corporate intrapreneurship world, wheremost ideas will be rejected.
INTRAPRENEURSHIP BLUNDER
The implementation of the procedures just listed will almost guar-antee that a company does not duplicate one of the greatestintrapreneurial blunders in corporate history. In the mid-1970s,Steve Wozniak, a college dropout and self-taught electronics engi-neer, worked at Hewlett-Packard (HP). He offered his employerthe chance to develop the idea that he had for a user-friendly per-sonal computer. Hewlett-Packard said no thank you. So with$1,300 derived from selling his van and other assets, he left HP atthe age of 26 and, with the help of his friend, Steven Jobs, devel-oped the Apple I computer for their new entrepreneurial start-up,Apple Computer, Inc.
354 CHAPTER 13

N O T E S
1. Gary Emmon, “Up from the Ashes: the Life and Thought of JosephSchumpeter,” Harvard Business School Alumni Bulletin, June 2007, p. 25.
2. Robert C. Wolcott and Michael J. Lippitz, “The Four Models ofCorporate Entrepreneurship,” MIT Sloan Management Review,Fall 2007, p. 77.
3. Adam Lashinsky, “Chaos by Design,” Fortune, October 2, 2006, p. 88.
Intrapreneurship 355

This page intentionally left blank
C o n c l u s i o n
My alma mater, the Harvard Business School, recently asked me tosit on a panel to discuss entrepreneurship. All the other panelistswere current entrepreneurs, and the questions eventually focusedon the future of entrepreneurship: given the tough economic times,was this really the right time to consider starting a business?Everyone else on the panel shook his head no. By now, I think youcan guess my answer: of course this is the right time to start a busi-ness! In every recession, depression, and downturn that this coun-try has ever seen, entrepreneurship has been the engine of growth.
After the terrorist attack on September 11, 2001, the airlineindustry alone laid off more than 100,000 workers. Which Fortune500 company do you think will hire all those pink-slip recipients? Ifanyone is waiting for the big companies with thousands of employ-ees to fill a cloudy day with sun and turn around these tough times,she is in for a long and disappointing wait. Entrepreneurs hold thekeys to the next generation of Fortune 500 companies. Of coursecapital is constrained, and investors are more skeptical than theyhave been. In many ways, that’s good news. It means that only thebest companies—those with the best ideas and the best managers—will get financial backing. I’m a firm believer that good managersmake better decisions when times are tough. And tough times makebetter managers. Expenditures are scrutinized more carefully, cashflow gets a closer look, innovative partnerships are born, and man-agers learn once again that execution is everything.
357

Is this the right time for you? Only you can answer that ques-tion. Volkswagen has a catchy marketing campaign that tells con-sumers, “On the road of life, there are drivers and passengers.Drivers wanted.” For future entrepreneurs, the worst thing youcould do to yourself is to spend your life kicking the tires and won-dering whether you should have taken a risk, cut the safety net, andtaken the plunge. Entrepreneurship is about passion, vision, focus,and sweat, and no swing of the stock market will ever change that.Around every corner is the next idea, the next dream, and the nextbusiness opportunity. I wish you well on your adventure.
358 Conclusion
The following table looks at the national averages for corporate grossprofit, net income, and return on equity. The data were compiled byBizStats.com using information from a large variety of sources,including the Internal Revenue Service, U.S. Census Bureau, the U.S.Department of Commerce and the U.S. Department of Labor.
359
A P P E N D I X A
Industry Profitability
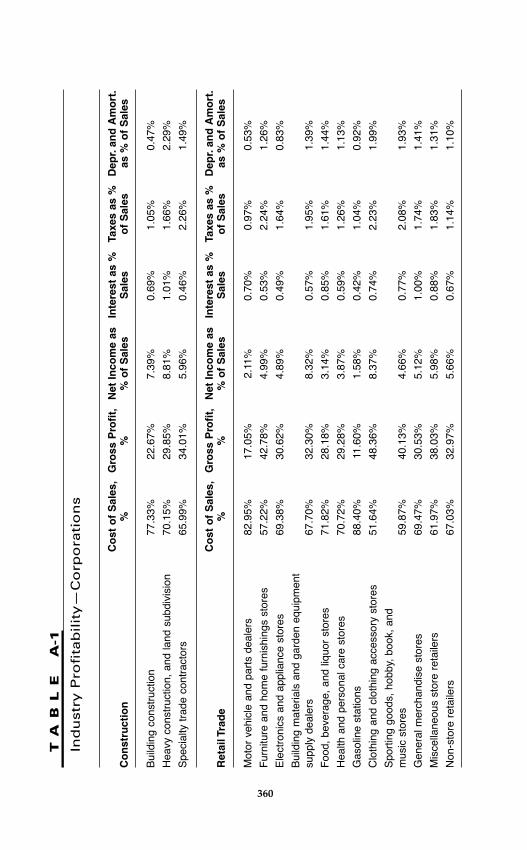
360
TA
BL
E
A-1
Ind
ustr
y P
rofi
tab
ilit
y—
Co
rpo
rati
on
s
Co
st o
f S
ales
,G
ross
Pro
fit,
Net
Inco
me
asIn
tere
st a
s %
Taxe
s as
%D
epr.
and
Am
ort
.C
on
stru
ctio
n%
%%
of
Sal
esS
ales
of
Sal
esas
% o
f S
ales
Bui
ldin
g co
nstr
uctio
n77
.33%
22.6
7%7.
39%
0.69
%1.
05%
0.47
%
Hea
vy c
onst
ruct
ion,
and
land
sub
divi
sion
70.1
5%29
.85%
8.81
%1.
01%
1.66
%2.
29%
Spe
cial
ty t
rade
con
trac
tors
65.9
9%34
.01%
5.96
%0.
46%
2.26
%1.
49%
Co
st o
f S
ales
,G
ross
Pro
fit,
Net
Inco
me
asIn
tere
st a
s %
Taxe
s as
%D
epr.
and
Am
ort
.R
etai
l Tra
de
%%
% o
f S
ales
Sal
eso
f S
ales
as %
of
Sal
es
Mot
or v
ehic
le a
nd p
arts
dea
lers
82.9
5%17
.05%
2.11
%0.
70%
0.97
%0.
53%
Fur
nitu
re a
nd h
ome
furn
ishi
ngs
stor
es57
.22%
42.7
8%4.
99%
0.53
%2.
24%
1.26
%
Ele
ctro
nics
and
app
lianc
e st
ores
69.3
8%30
.62%
4.89
%0.
49%
1.64
%0.
83%
Bui
ldin
g m
ater
ials
and
gar
den
equi
pmen
tsu
pply
dea
lers
67.7
0%32
.30%
8.32
%0.
57%
1.95
%1.
39%
Foo
d, b
ever
age,
and
liqu
or s
tore
s71
.82%
28.1
8%3.
14%
0.85
%1.
61%
1.44
%
Hea
lth a
nd p
erso
nal c
are
stor
es70
.72%
29.2
8%3.
87%
0.59
%1.
26%
1.13
%
Gas
olin
e st
atio
ns88
.40%
11.6
0%1.
58%
0.42
%1.
04%
0.92
%
Clo
thin
g an
d cl
othi
ng a
cces
sory
sto
res
51.6
4%48
.36%
8.37
%0.
74%
2.23
%1.
99%
Spo
rtin
g go
ods,
hob
by,
book
, an
dm
usic
sto
res
59.8
7%40
.13%
4.66
%0.
77%
2.08
%1.
93%
Gen
eral
mer
chan
dise
sto
res
69.4
7%30
.53%
5.12
%1.
00%
1.74
%1.
41%
Mis
cella
neou
s st
ore
reta
ilers
61.9
7%38
.03%
5.98
%0.
88%
1.83
%1.
31%
Non
-sto
re r
etai
lers
67.0
3%32
.97%
5.66
%0.
67%
1.14
%1.
10%
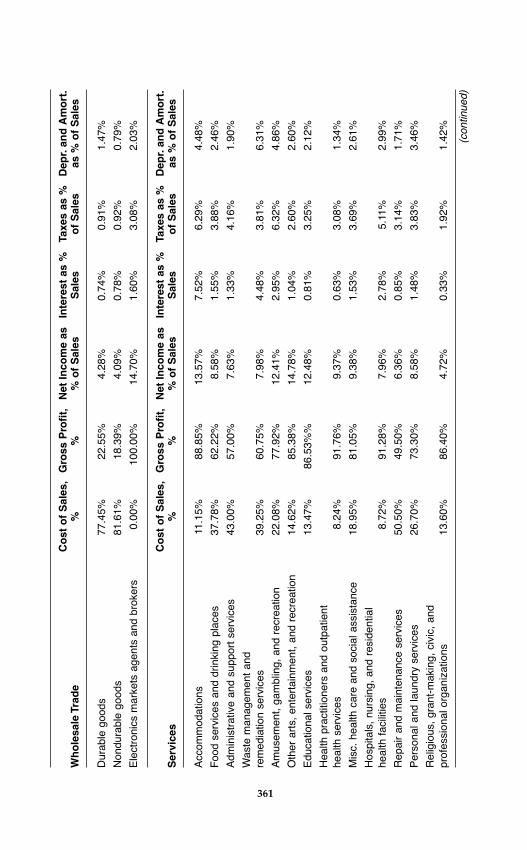
361
Co
st o
f S
ales
,G
ross
Pro
fit,
Net
Inco
me
asIn
tere
st a
s %
Taxe
s as
%D
epr.
and
Am
ort
.W
ho
lesa
le T
rad
e%
%%
of
Sal
esS
ales
of
Sal
esas
% o
f S
ales
Dur
able
goo
ds77
.45%
22.5
5%4.
28%
0.74
%0.
91%
1.47
%
Non
dura
ble
good
s81
.61%
18.3
9%4.
09%
0.78
%0.
92%
0.79
%
Ele
ctro
nics
mar
kets
age
nts
and
brok
ers
0.00
%10
0.00
%14
.70%
1.60
%3.
08%
2.03
%
Co
st o
f S
ales
,G
ross
Pro
fit,
Net
Inco
me
asIn
tere
st a
s %
Taxe
s as
%D
epr.
and
Am
ort
.S
ervi
ces
%%
% o
f S
ales
Sal
eso
f S
ales
as %
of
Sal
es
Acc
omm
odat
ions
11.1
5%88
.85%
13.5
7%7.
52%
6.29
%4.
48%
Foo
d se
rvic
es a
nd d
rinki
ng p
lace
s37
.78%
62.2
2%8.
58%
1.55
%3.
88%
2.46
%
Adm
inis
trat
ive
and
supp
ort
serv
ices
43.0
0%57
.00%
7.63
%1.
33%
4.16
%1.
90%
Was
te m
anag
emen
t an
d re
med
iatio
n se
rvic
es39
.25%
60.7
5%7.
98%
4.48
%3.
81%
6.31
%
Am
usem
ent,
gam
blin
g, a
nd r
ecre
atio
n22
.08%
77.9
2%12
.41%
2.95
%6.
32%
4.86
%
Oth
er a
rts,
ent
erta
inm
ent,
and
recr
eatio
n14
.62%
85.3
8%14
.78%
1.04
%2.
60%
2.60
%
Edu
catio
nal s
ervi
ces
13.4
7%86
.53%
%12
.48%
0.81
%3.
25%
2.12
%
Hea
lth p
ract
ition
ers
and
outp
atie
nt
heal
th s
ervi
ces
8.24
%91
.76%
9.37
%0.
63%
3.08
%1.
34%
Mis
c. h
ealth
car
e an
d so
cial
ass
ista
nce
18.9
5%81
.05%
9.38
%1.
53%
3.69
%2.
61%
Hos
pita
ls,
nurs
ing,
and
res
iden
tial
heal
th f
acili
ties
8.72
%91
.28%
7.96
%2.
78%
5.11
%2.
99%
Rep
air
and
mai
nten
ance
ser
vice
s50
.50%
49.5
0%6.
36%
0.85
%3.
14%
1.71
%
Per
sona
l and
laun
dry
serv
ices
26.7
0%73
.30%
8.58
%1.
48%
3.83
%3.
46%
Rel
igio
us,
gran
t-m
akin
g, c
ivic
, an
d pr
ofes
sion
al o
rgan
izat
ions
13.6
0%86
.40%
4.72
%0.
33%
1.92
%1.
42%
(con
tinue
d)
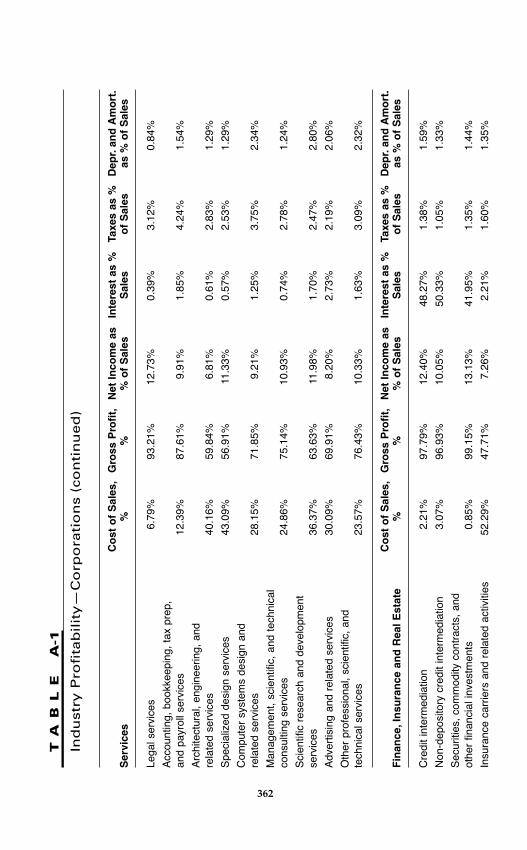
362
TA
BL
E
A-1
Ind
ustr
y P
rofi
tab
ilit
y—
Co
rpo
rati
on
s (
co
nti
nu
ed
)
Co
st o
f S
ales
,G
ross
Pro
fit,
Net
Inco
me
asIn
tere
st a
s %
Taxe
s as
%D
epr.
and
Am
ort
.S
ervi
ces
%%
% o
f S
ales
Sal
eso
f S
ales
as %
of
Sal
es
Lega
l ser
vice
s6.
79%
93.2
1%12
.73%
0.39
%3.
12%
0.84
%
Acc
ount
ing,
boo
kkee
ping
, ta
x pr
ep,
and
payr
oll s
ervi
ces
12.3
9%87
.61%
9.91
%1.
85%
4.24
%1.
54%
Arc
hite
ctur
al,
engi
neer
ing,
and
re
late
d se
rvic
es40
.16%
59.8
4%6.
81%
0.61
%2.
83%
1.29
%
Spe
cial
ized
des
ign
serv
ices
43.0
9%56
.91%
11.3
3%0.
57%
2.53
%1.
29%
Com
pute
r sy
stem
s de
sign
and
re
late
d se
rvic
es28
.15%
71.8
5%9.
21%
1.25
%3.
75%
2.34
%
Man
agem
ent,
scie
ntifi
c, a
nd t
echn
ical
co
nsul
ting
serv
ices
24.8
6%75
.14%
10.9
3%0.
74%
2.78
%1.
24%
Sci
entif
ic r
esea
rch
and
deve
lopm
ent
serv
ices
36.3
7%63
.63%
11.9
8%1.
70%
2.47
%2.
80%
Adv
ertis
ing
and
rela
ted
serv
ices
30.0
9%69
.91%
8.20
%2.
73%
2.19
%2.
06%
Oth
er p
rofe
ssio
nal,
scie
ntifi
c, a
nd
tech
nica
l ser
vice
s23
.57%
76.4
3%10
.33%
1.63
%3.
09%
2.32
%
Co
st o
f S
ales
,G
ross
Pro
fit,
Net
Inco
me
asIn
tere
st a
s %
Taxe
s as
%D
epr.
and
Am
ort
.F
inan
ce,I
nsu
ran
ce a
nd
Rea
l Est
ate
%%
% o
f S
ales
Sal
eso
f S
ales
as %
of
Sal
es
Cre
dit
inte
rmed
iatio
n2.
21%
97.7
9%12
.40%
48.2
7%1.
38%
1.59
%
Non
-dep
osito
ry c
redi
t in
term
edia
tion
3.07
%96
.93%
10.0
5%50
.33%
1.05
%1.
33%
Sec
uriti
es,
com
mod
ity c
ontr
acts
, an
d ot
her
finan
cial
inve
stm
ents
0.85
%99
.15%
13.1
3%41
.95%
1.35
%1.
44%
Insu
ranc
e ca
rrie
rs a
nd r
elat
ed a
ctiv
ities
52.2
9%47
.71%
7.26
%2.
21%
1.60
%1.
35%

363
Fun
ds,
trus
ts,
and
othe
r fin
anci
al v
ehic
les
0.00
%10
0.00
%70
.62%
5.19
%0.
74%
1.61
%
Dep
osito
ry c
redi
t in
term
edia
tion
0.05
%99
.95%
18.3
3%43
.10%
2.23
%2.
24%
Ban
k ho
ldin
g co
mpa
nies
0.62
%99
.38%
17.5
1%33
.32%
1.77
%3.
61%
Rea
l est
ate
serv
ices
15.1
7%84
.83%
19.7
7%2.
87%
2.99
%2.
09%
Ren
tal a
nd le
asin
g se
rvic
es19
.72%
80.2
8%11
.51%
8.81
%2.
48%
19.3
3%
Less
ors
of n
onfin
anci
al in
tang
ible
ass
ets
7.70
%92
.30%
37.9
7%0.
75%
2.12
%4.
58%
Co
st o
f S
ales
,G
ross
Pro
fit,
Net
Inco
me
asIn
tere
st a
s %
Taxe
s as
%D
epr.
and
Am
ort
.In
form
atio
n%
%%
of
Sal
esS
ales
of
Sal
esas
% o
f S
ales
Pub
lishi
ng in
dust
ries
23.0
1%76
.99%
17.7
8%3.
34%
2.56
%3.
90%
Mot
ion
pict
ure
and
soun
d re
cord
ing
24.8
0%75
.20%
11.1
2%11
.57%
1.55
%12
.16%
Bro
adca
stin
g (e
xcep
t in
tern
et)
19.2
5%80
.75%
8.58
%5.
10%
1.84
%13
.48%
Inte
rnet
pub
lishi
ng a
nd b
road
cast
ing
18.3
2%81
.68%
10.9
8%6.
00%
3.12
%7.
15%
Tele
com
mun
icat
ions
13.5
2%86
.48%
11.2
9%7.
31%
2.70
%9.
27%
Inte
rnet
ser
vice
pro
vide
rs,
sear
ch p
orta
ls,
data
pro
cess
ing
10.1
4%89
.86%
9.36
%3.
02%
2.22
%7.
72%
Oth
er in
form
atio
n se
rvic
es18
.17%
81.8
3%10
.87%
3.71
%2.
28%
4.30
%
Co
st o
f S
ales
,G
ross
Pro
fit,
Net
Inco
me
asIn
tere
st a
s %
Taxe
s as
%D
epr.
and
Am
ort
.M
anu
fact
uri
ng
%%
% o
f S
ales
Sal
eso
f S
ales
as %
of
Sal
es
Foo
d m
anuf
actu
ring
62.7
3%37
.27%
11.5
1%2.
43%
2.01
%2.
03%
Bev
erag
es a
nd t
obac
co p
rodu
cts
man
ufac
turin
g43
.00%
57.0
0%17
.94%
3.50
%7.
26%
3.08
%
Text
ile m
ills
and
text
ile p
rodu
ct m
ills
67.4
0%32
.60%
5.97
%1.
31%
1.69
%1.
93%
App
arel
man
ufac
turin
g61
.70%
38.3
0%7.
28%
1.26
%1.
96%
1.25
%
Leat
her
and
allie
d pr
oduc
t m
anuf
actu
ring
59.9
1%40
.09%
8.85
%1.
27%
1.63
%1.
42%
Woo
d pr
oduc
t m
anuf
actu
ring
71.0
6%28
.94%
6.97
%2.
32%
1.57
%2.
08%
Pap
er m
anuf
actu
ring
64.3
6%35
.64%
11.3
1%3.
45%
1.34
%2.
89%
(con
tinue
d)
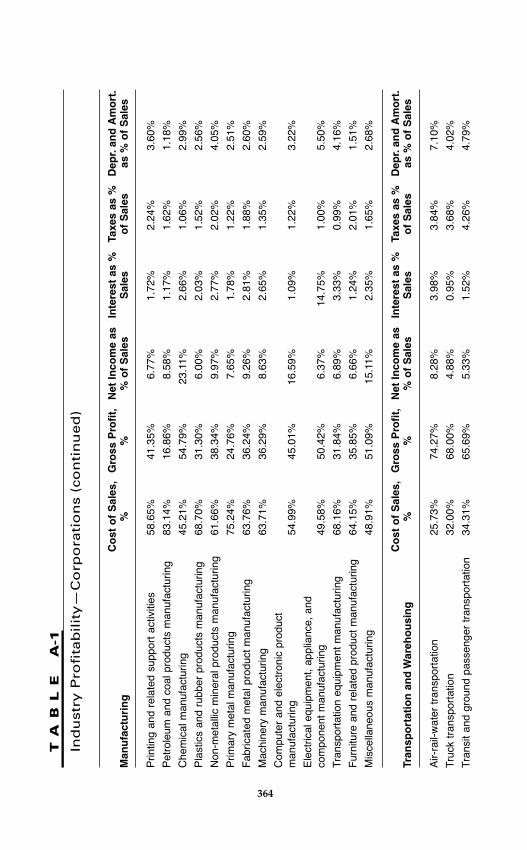
364
TA
BL
E
A-1
Ind
ustr
y P
rofi
tab
ilit
y—
Co
rpo
rati
on
s (
co
nti
nu
ed
)
Co
st o
f S
ales
,G
ross
Pro
fit,
Net
Inco
me
asIn
tere
st a
s %
Taxe
s as
%D
epr.
and
Am
ort
.M
anu
fact
uri
ng
%%
% o
f S
ales
Sal
eso
f S
ales
as %
of
Sal
es
Prin
ting
and
rela
ted
supp
ort
activ
ities
58.6
5%41
.35%
6.77
%1.
72%
2.24
%3.
60%
Pet
role
um a
nd c
oal p
rodu
cts
man
ufac
turin
g83
.14%
16.8
6%8.
58%
1.17
%1.
62%
1.18
%
Che
mic
al m
anuf
actu
ring
45.2
1%54
.79%
23.1
1%2.
66%
1.06
%2.
99%
Pla
stic
s an
d ru
bber
pro
duct
s m
anuf
actu
ring
68.7
0%31
.30%
6.00
%2.
03%
1.52
%2.
56%
Non
-met
allic
min
eral
pro
duct
s m
anuf
actu
ring
61.6
6%38
.34%
9.97
%2.
77%
2.02
%4.
05%
Prim
ary
met
al m
anuf
actu
ring
75.2
4%24
.76%
7.65
%1.
78%
1.22
%2.
51%
Fab
ricat
ed m
etal
pro
duct
man
ufac
turin
g63
.76%
36.2
4%9.
26%
2.81
%1.
88%
2.60
%
Mac
hine
ry m
anuf
actu
ring
63.7
1%36
.29%
8.63
%2.
65%
1.35
%2.
59%
Com
pute
r an
d el
ectr
onic
pro
duct
m
anuf
actu
ring
54.9
9%45
.01%
16.5
9%1.
09%
1.22
%3.
22%
Ele
ctric
al e
quip
men
t, ap
plia
nce,
and
co
mpo
nent
man
ufac
turin
g49
.58%
50.4
2%6.
37%
14.7
5%1.
00%
5.50
%
Tran
spor
tatio
n eq
uipm
ent
man
ufac
turin
g68
.16%
31.8
4%6.
89%
3.33
%0.
99%
4.16
%
Fur
nitu
re a
nd r
elat
ed p
rodu
ct m
anuf
actu
ring
64.1
5%35
.85%
6.66
%1.
24%
2.01
%1.
51%
Mis
cella
neou
s m
anuf
actu
ring
48.9
1%51
.09%
15.1
1%2.
35%
1.65
%2.
68%
Co
st o
f S
ales
,G
ross
Pro
fit,
Net
Inco
me
asIn
tere
st a
s %
Taxe
s as
%D
epr.
and
Am
ort
.Tr
ansp
ort
atio
n a
nd
War
eho
usi
ng
%%
% o
f S
ales
Sal
eso
f S
ales
as %
of
Sal
es
Air-
rail-
wat
er t
rans
port
atio
n25
.73%
74.2
7%8.
28%
3.98
%3.
84%
7.10
%
Truc
k tr
ansp
orta
tion
32.0
0%68
.00%
4.88
%0.
95%
3.68
%4.
02%
Tran
sit
and
grou
nd p
asse
nger
tra
nspo
rtat
ion
34.3
1%65
.69%
5.33
%1.
52%
4.26
%4.
79%

365
Pip
elin
e tr
ansp
orta
tion
32.3
9%67
.61%
21.3
5%4.
86%
3.91
%7.
34%
Oth
er t
rans
port
atio
n an
d su
ppor
t ac
tiviti
es36
.45%
63.5
5%7.
18%
0.68
%2.
83%
2.69
%
War
ehou
sing
and
sto
rage
29.5
5%70
.45%
8.44
%4.
01%
3.53
%4.
46%
Co
st o
f S
ales
,G
ross
Pro
fit,
Net
Inco
me
asIn
tere
st a
s %
Taxe
s as
%D
epr.
and
Am
ort
.A
gri
cult
ure
,fo
rest
ry a
nd
fis
hin
g%
%%
of
Sal
esS
ales
of
Sal
esas
% o
f S
ales
Agr
icul
tura
l pro
duct
ion
43.8
6%56
.14%
10.0
1%1.
97%
1.94
%4.
42%
For
estr
y an
d lo
ggin
g62
.01%
37.9
9%7.
98%
2.26
%1.
82%
3.91
%
Fis
hing
, hu
ntin
g, a
nd t
rapp
ing
56.8
3%43
.17%
7.97
%1.
01%
1.86
%2.
72%
Co
st o
f S
ales
,G
ross
Pro
fit,
Net
Inco
me
asIn
tere
st a
s %
Taxe
s as
%D
epr.
and
Am
ort
.M
inin
g%
%%
of
Sal
esS
ales
of
Sal
esas
% o
f S
ales
Oil
and
gas
extr
actio
n44
.33%
55.6
7%25
.04%
3.00
%2.
69%
5.41
%
Coa
l min
ing
56.4
5%43
.55%
5.42
%2.
37%
5.31
%7.
14%
Met
al o
re m
inin
g43
.32%
56.6
8%26
.22%
2.03
%1.
68%
13.3
5%
Non
-met
allic
min
eral
min
ing
and
quar
ryin
g60
.19%
39.8
1%7.
91%
3.25
%2.
68%
7.31
%
Sup
port
act
iviti
es f
or m
inin
g35
.46%
64.5
4%16
.31%
3.43
%2.
20%
7.87
%
Sou
rce:
Biz
Sta
ts.c
om

This page intentionally left blank

A P P E N D I X B
U.S. Funds Focusedon Minority Markets
367
The following table notes a number of U.S. funds that targetminority markets.

368
TA
BL
E
B–
1
Pri
vate
Eq
uit
y F
irm
s F
ocu
sed
on
Min
ori
ty M
ark
ets
Fir
m
21st
Cen
tury
Cap
ital
Alto
s V
entu
res
Asc
end
Ven
ture
Gro
up
Bla
ck E
nter
pris
e/G
reen
wic
h S
tree
t F
und
CS
W C
apita
l
Ful
crum
Cap
ital G
roup
Lo
cati
on
Dal
las,
TX
Men
lo P
ark,
CA
New
Yor
k, N
Y
New
Yor
k, N
Y
New
Yor
k, N
Y
Cul
ver
City
, C
A
Geo
gra
ph
ic P
refe
ren
ce
Nat
iona
l
Wes
tern
U.S
.
Nat
iona
l; M
id A
tlant
ic;
Cal
iforn
ia
Nat
iona
l
Nor
th A
mer
ica
Bus
ines
ses
loca
ted
in a
ndem
ploy
ing
from
Sou
ther
nC
alifo
rnia
’s u
nder
-ser
ved
urba
n co
mm
uniti
es
Ind
ust
ry P
refe
ren
ce
Man
ufac
turin
g, v
alue
-add
eddi
strib
utio
n, s
ervi
ce a
ndm
edia
Info
rmat
ion
tech
nolo
gy
App
lied
tech
nolo
gy w
ith a
focu
s on
ent
erpr
ise
softw
are,
outs
ourc
ed b
usin
ess
serv
ices
,an
d ap
plia
nce
devi
ces;
educ
atio
n se
ctor
Tele
com
, co
nsum
er g
oods
,m
edia
, fin
anci
al s
ervi
ces,
reta
il, in
form
atio
n te
ch.
Gen
eral
indu
stria
l and
cons
umer
Com
mer
cial
and
con
sum
erse
rvic
es c
ompa
nies
; lig
htm
anuf
actu
ring;
com
mun
icat
ions
; no
turn
arou
nds;
rea
l est
ate
proj
ect
finan
ce;
tale
nt-d
riven
ente
rtai
nmen
t; re
-lend
ing
orte
chno
logy
; se
lect
sta
rt-u
pfin
anci
ng
Inve
stm
ent T
ype
Buy
outs
, re
capi
taliz
atio
ns,
grow
th e
quity
Firs
t in
stitu
tiona
l rou
nd
Com
pani
es p
oise
d to
expe
rienc
e dr
amat
ic r
even
uegr
owth
Exp
ansi
on a
nd a
cqui
sitio
nfin
anci
ng;
buyo
uts
and
succ
essi
ons
Doe
s no
t ge
nera
lly p
artic
ipat
ein
sta
rtup
s, t
echn
olog
yco
mpa
nies
, or
rea
l est
ate
inve
stm
ents
.
Com
pani
es t
hat
are
impo
rtan
tin
min
ority
and
urb
anco
mm
uniti
es

369
Gen
Nx3
60 C
apita
l Par
tner
s
His
pani
a C
apita
l Par
tner
s
ICV
Cap
ital P
artn
ers
Mile
ston
e G
row
th F
und
MM
G V
entu
res
Nog
ales
Inv
esto
rs
Opp
ortu
nity
Cap
ital
Pro
spec
t, K
Y
Chi
cago
, IL
New
Yor
k, N
Y
Min
neap
olis
, M
N
Bal
timor
e, M
D
Los
Ang
eles
, C
A
Fre
mon
t, C
A
Gen
eral
ly f
ocus
es o
n U
Sbu
t co
nsid
er g
loba
lin
vest
men
t op
port
uniti
es
US
His
pani
c M
arke
t
US
Min
neso
ta
Mid
-Atla
ntic
Reg
ion
Sel
ecte
d In
vest
men
tsou
tsid
e of
thi
s co
re a
rea
Nat
iona
l, W
est
Coa
st
N/A
Indu
stria
l wat
er t
reat
men
t,sp
ecia
lty c
hem
ical
s, a
nden
gine
ered
mat
eria
ls.
Indu
stria
l mac
hine
ry &
equi
pmen
t co
mpo
nent
s,in
dust
rial s
ecur
ity s
ervi
ces
Div
ersi
fied
Hea
lthca
re,
food
pro
cess
ing
cons
umer
pro
duct
s an
dse
rvic
es,
com
mer
cial
ser
vice
,m
edia
and
tele
com
mun
icat
ions
, in
dust
rial
man
ufac
turin
g
Min
ority
-ow
ned
com
pani
es
Tele
com
mun
icat
ions
,in
form
atio
n te
chno
logy
,he
alth
care
, an
d th
e co
mpu
ter
softw
are
and
serv
ices
indu
strie
s
Any
indu
stry
Com
mun
icat
ions
, ap
plie
dte
chno
logy
, he
alth
care
,A
fric
an-A
mer
ican
fun
eral
hom
es a
nd c
emet
erie
s
Indu
stria
l bus
ines
s-to
-bu
sine
ss c
ompa
nies
Wel
l-est
ablis
hed
busi
ness
that
prov
ide
good
s an
d se
rvic
es to
the
His
pani
c co
mm
unity
or
are
His
pani
c-ow
ned
Com
pani
es t
hat
are
base
d in
,hi
re f
rom
, or
ser
ve A
mer
ica’
sin
ner
citie
s; o
wne
d an
d/or
man
aged
by
ethn
ic m
inor
ities
Pro
vide
equ
ity-t
ype
finan
cing
and
man
agem
ent
assi
stan
ceto
min
ority
ent
repr
eneu
rs
Min
ority
-ow
ned
and
oper
ated
busi
ness
es t
hat
are
pois
ed f
orgr
owth
Late
r st
age
expa
nsio
nac
quis
ition
Late
r st
age
com
pani
es s
eeki
ngac
quis
ition
and
exp
ansi
onca
pita
l, pr
efer
red
equi
ty, o
req
uity
-link
ed in
stru
men
ts
(Con
tinue
d)
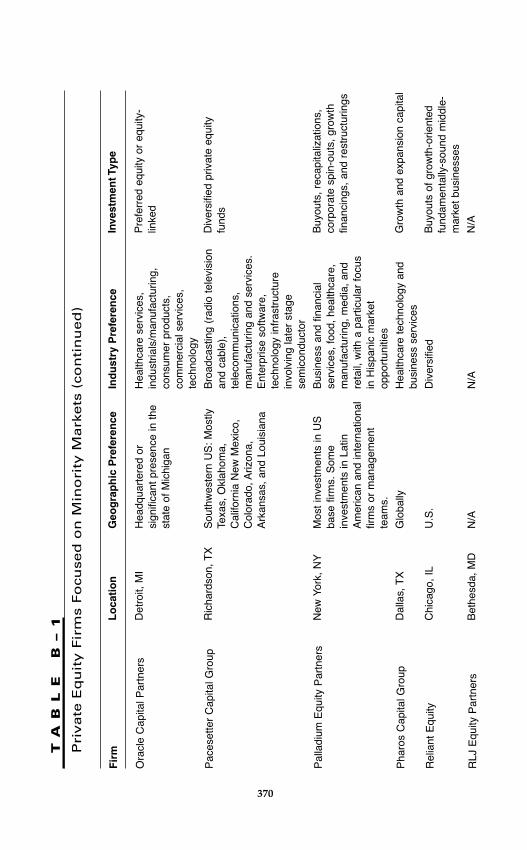
370
TA
BL
E
B–
1
Pri
vate
Eq
uit
y F
irm
s F
ocu
sed
on
Min
ori
ty M
ark
ets
(co
nti
nu
ed
)
Fir
m
Ora
cle
Cap
ital P
artn
ers
Pac
eset
ter
Cap
ital G
roup
Pal
ladi
um E
quity
Par
tner
s
Pha
ros
Cap
ital G
roup
Rel
iant
Equ
ity
RLJ
Equ
ity P
artn
ers
Lo
cati
on
Det
roit,
MI
Ric
hard
son,
TX
New
Yor
k, N
Y
Dal
las,
TX
Chi
cago
, IL
Bet
hesd
a, M
D
Geo
gra
ph
ic P
refe
ren
ce
Hea
dqua
rter
ed o
rsi
gnifi
cant
pre
senc
e in
the
stat
e of
Mic
higa
n
Sou
thw
este
rn U
S:
Mos
tlyTe
xas,
Okl
ahom
a,C
alifo
rnia
New
Mex
ico,
Col
orad
o, A
rizon
a,A
rkan
sas,
and
Lou
isia
na
Mos
t in
vest
men
ts in
US
base
firm
s. S
ome
inve
stm
ents
in L
atin
Am
eric
an a
nd in
tern
atio
nal
firm
s or
man
agem
ent
team
s.
Glo
bally
U.S
.
N/A
Ind
ust
ry P
refe
ren
ce
Hea
lthca
re s
ervi
ces,
indu
stria
ls/m
anuf
actu
ring,
cons
umer
pro
duct
s,co
mm
erci
al s
ervi
ces,
tech
nolo
gy
Bro
adca
stin
g (r
adio
tel
evis
ion
and
cabl
e),
tele
com
mun
icat
ions
,m
anuf
actu
ring
and
serv
ices
.E
nter
pris
e so
ftwar
e,te
chno
logy
infr
astr
uctu
rein
volv
ing
late
r st
age
sem
icon
duct
or
Bus
ines
s an
d fin
anci
alse
rvic
es,
food
, he
alth
care
,m
anuf
actu
ring,
med
ia,
and
reta
il, w
ith a
par
ticul
ar f
ocus
in H
ispa
nic
mar
ket
oppo
rtun
ities
Hea
lthca
re t
echn
olog
y an
dbu
sine
ss s
ervi
ces
Div
ersi
fied
N/A
Inve
stm
ent T
ype
Pre
ferr
ed e
quity
or
equi
ty-
linke
d
Div
ersi
fied
priv
ate
equi
tyfu
nds
Buy
outs
, re
capi
taliz
atio
ns,
corp
orat
e sp
in-o
uts,
gro
wth
finan
cing
s, a
nd r
estr
uctu
rings
Gro
wth
and
exp
ansi
on c
apita
l
Buy
outs
of
grow
th-o
rient
edfu
ndam
enta
lly-s
ound
mid
dle-
mar
ket
busi
ness
es
N/A
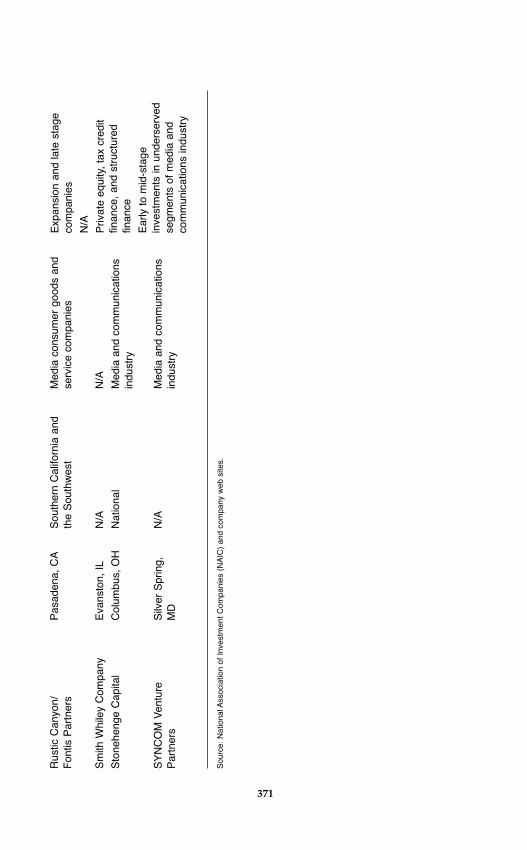
371
Rus
tic C
anyo
n/F
ontis
Par
tner
s
Sm
ith W
hile
y C
ompa
ny
Sto
nehe
nge
Cap
ital
SY
NC
OM
Ven
ture
P
artn
ers
Sou
rce:
Nat
iona
l Ass
ocia
tion
of I
nves
tmen
t C
ompa
nies
(N
AIC
) an
d co
mpa
ny w
eb s
ites.
Pas
aden
a, C
A
Eva
nsto
n, I
L
Col
umbu
s, O
H
Silv
er S
prin
g,M
D
Sou
ther
n C
alifo
rnia
and
the
Sou
thw
est
N/A
Nat
iona
l
N/A
Med
ia c
onsu
mer
goo
ds a
ndse
rvic
e co
mpa
nies
N/A
Med
ia a
nd c
omm
unic
atio
nsin
dust
ry
Med
ia a
nd c
omm
unic
atio
nsin
dust
ry
Exp
ansi
on a
nd la
te s
tage
com
pani
es
N/A
Priv
ate
equi
ty,
tax
cred
itfin
ance
, an
d st
ruct
ured
finan
ce
Ear
ly t
o m
id-s
tage
inve
stm
ents
in u
nder
serv
edse
gmen
ts o
f m
edia
and
com
mun
icat
ions
indu
stry

This page intentionally left blank

I N D E X
Accounting methods, 86, 88–91, 139, 143
Accounts payable, 93, 95, 109, 156,162–163, 168–170
Accounts receivable, 92, 94, 104, 109,156, 158–160, 163, 165–168,174–176, 256, 264–265, 321
Accredited investors, 281, 283Accrual accounting, 88, 90–91, 122Acquisition(s), 6, 8, 10, 12, 35, 58, 78,
190, 193, 195, 209, 221, 230, 238,246, 261, 264, 304, 352, 368–369
Active Capital, 281AKAR, 330–331, 334, 337–341, 344–346Allied Capital, 252–253Allstate Insurance Company, 348Altoids, 348, 349Amazon.com:
cash flow, 171, 173entrepreneurship, 1–6, 14, 22, 24–30,
32–37, 41, 49–52financial statements, 116, 121, 123,
132, 141, 143financing, 230–233, 235valuation, 179–181, 183–193, 195,
197–199, 201–205, 207–211,213–215, 218–225
America Online (AOL), 141, 221, 297
American Express, 105, 269American Press Institute, 348American Stock Exchange, 300–301Amortization, 74, 82–83, 85–86, 97,
107, 141, 149–150, 190, 204–205,245, 343
Anathema, 348Angel investors, 235, 242–243, 259,
277, 279–280, 282, 320, 323AOL (America Online), 31, 141,
220–222, 226Apparel, 114, 126–127, 266, 354, 363Apple Computer, 12, 23, 27, 45,
180–181, 248, 277, 297, 356Arthur Andersen, LLP, 8, 89, 233Asset-to-liability ratio, 96Assets:
debt financing, 263–264, 270financial statements, 81, 83, 85, 87,
89, 91, 93–95, 97, 99, 101,103–104, 106, 111
valuation, 201–205, 214AutoNation, 11, 26
Backup services, 338Bain, Bill, 179Balance sheet(s), 74, 81, 86–87, 92–95,
97, 99, 108, 206, 237–239
373
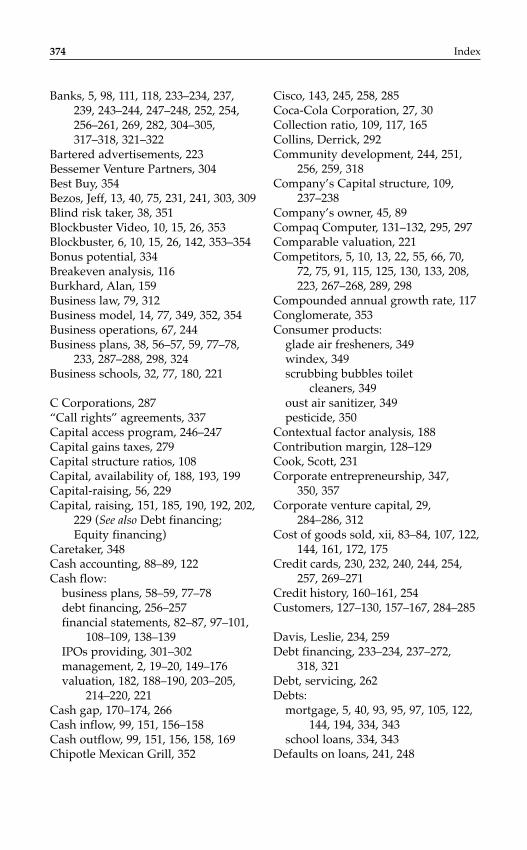
Banks, 5, 98, 111, 118, 233–234, 237,239, 243–244, 247–248, 252, 254,256–261, 269, 282, 304–305,317–318, 321–322
Bartered advertisements, 223Bessemer Venture Partners, 304Best Buy, 354Bezos, Jeff, 13, 40, 75, 231, 241, 303, 309Blind risk taker, 38, 351Blockbuster Video, 10, 15, 26, 353Blockbuster, 6, 10, 15, 26, 142, 353–354Bonus potential, 334Breakeven analysis, 116Burkhard, Alan, 159Business law, 79, 312Business model, 14, 77, 349, 352, 354Business operations, 67, 244Business plans, 38, 56–57, 59, 77–78,
233, 287–288, 298, 324Business schools, 32, 77, 180, 221
C Corporations, 287“Call rights” agreements, 337Capital access program, 246–247Capital gains taxes, 279Capital structure ratios, 108Capital, availability of, 188, 193, 199Capital-raising, 56, 229Capital, raising, 151, 185, 190, 192, 202,
229 (See also Debt financing;Equity financing)
Caretaker, 348Cash accounting, 88–89, 122Cash flow:
business plans, 58–59, 77–78debt financing, 256–257financial statements, 82–87, 97–101,
108–109, 138–139IPOs providing, 301–302management, 2, 19–20, 149–176valuation, 182, 188–190, 203–205,
214–220, 221Cash gap, 170–174, 266Cash inflow, 99, 151, 156–158Cash outflow, 99, 151, 156, 158, 169Chipotle Mexican Grill, 352
Cisco, 143, 245, 258, 285Coca-Cola Corporation, 27, 30Collection ratio, 109, 117, 165Collins, Derrick, 292Community development, 244, 251,
256, 259, 318Company’s Capital structure, 109,
237–238Company’s owner, 45, 89Compaq Computer, 131–132, 295, 297Comparable valuation, 221Competitors, 5, 10, 13, 22, 55, 66, 70,
72, 75, 91, 115, 125, 130, 133, 208,223, 267–268, 289, 298
Compounded annual growth rate, 117Conglomerate, 353Consumer products:
glade air fresheners, 349windex, 349scrubbing bubbles toilet
cleaners, 349oust air sanitizer, 349pesticide, 350
Contextual factor analysis, 188Contribution margin, 128–129Cook, Scott, 231Corporate entrepreneurship, 347,
350, 357Corporate venture capital, 29,
284–286, 312Cost of goods sold, xii, 83–84, 107, 122,
144, 161, 172, 175Credit cards, 230, 232, 240, 244, 254,
257, 269–271Credit history, 160–161, 254Customers, 127–130, 157–167, 284–285
Davis, Leslie, 234, 259Debt financing, 233–234, 237–272,
318, 321Debt, servicing, 262Debts:
mortgage, 5, 40, 93, 95, 97, 105, 122,144, 194, 334, 343
school loans, 334, 343Defaults on loans, 241, 248
374 Index
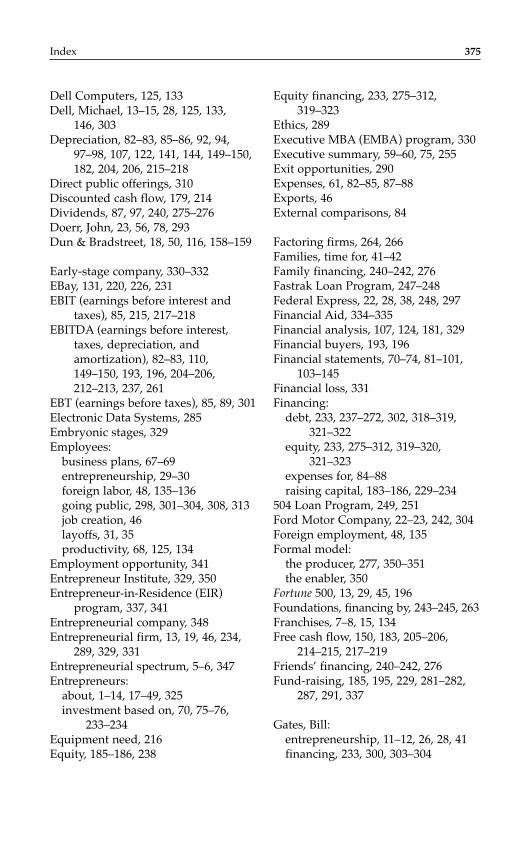
Dell Computers, 125, 133Dell, Michael, 13–15, 28, 125, 133,
146, 303Depreciation, 82–83, 85–86, 92, 94,
97–98, 107, 122, 141, 144, 149–150,182, 204, 206, 215–218
Direct public offerings, 310Discounted cash flow, 179, 214Dividends, 87, 97, 240, 275–276Doerr, John, 23, 56, 78, 293Dun & Bradstreet, 18, 50, 116, 158–159
Early-stage company, 330–332EBay, 131, 220, 226, 231EBIT (earnings before interest and
taxes), 85, 215, 217–218EBITDA (earnings before interest,
taxes, depreciation, andamortization), 82–83, 110, 149–150, 193, 196, 204–206,212–213, 237, 261
EBT (earnings before taxes), 85, 89, 301Electronic Data Systems, 285Embryonic stages, 329Employees:
business plans, 67–69entrepreneurship, 29–30foreign labor, 48, 135–136going public, 298, 301–304, 308, 313job creation, 46layoffs, 31, 35productivity, 68, 125, 134
Employment opportunity, 341Entrepreneur Institute, 329, 350Entrepreneur-in-Residence (EIR)
program, 337, 341Entrepreneurial company, 348Entrepreneurial firm, 13, 19, 46, 234,
289, 329, 331Entrepreneurial spectrum, 5–6, 347Entrepreneurs:
about, 1–14, 17–49, 325investment based on, 70, 75–76,
233–234Equipment need, 216Equity, 185–186, 238
Equity financing, 233, 275–312,319–323
Ethics, 289Executive MBA (EMBA) program, 330Executive summary, 59–60, 75, 255Exit opportunities, 290Expenses, 61, 82–85, 87–88Exports, 46External comparisons, 84
Factoring firms, 264, 266Families, time for, 41–42Family financing, 240–242, 276Fastrak Loan Program, 247–248Federal Express, 22, 28, 38, 248, 297Financial Aid, 334–335Financial analysis, 107, 124, 181, 329Financial buyers, 193, 196Financial statements, 70–74, 81–101,
103–145Financial loss, 331Financing:
debt, 233, 237–272, 302, 318–319,321–322
equity, 233, 275–312, 319–320,321–323
expenses for, 84–88raising capital, 183–186, 229–234
504 Loan Program, 249, 251Ford Motor Company, 22–23, 242, 304Foreign employment, 48, 135Formal model:
the producer, 277, 350–351the enabler, 350
Fortune 500, 13, 29, 45, 196Foundations, financing by, 243–245, 263Franchises, 7–8, 15, 134Free cash flow, 150, 183, 205–206,
214–215, 217–219Friends’ financing, 240–242, 276Fund-raising, 185, 195, 229, 281–282,
287, 291, 337
Gates, Bill:entrepreneurship, 11–12, 26, 28, 41financing, 233, 300, 303–304
Index 375
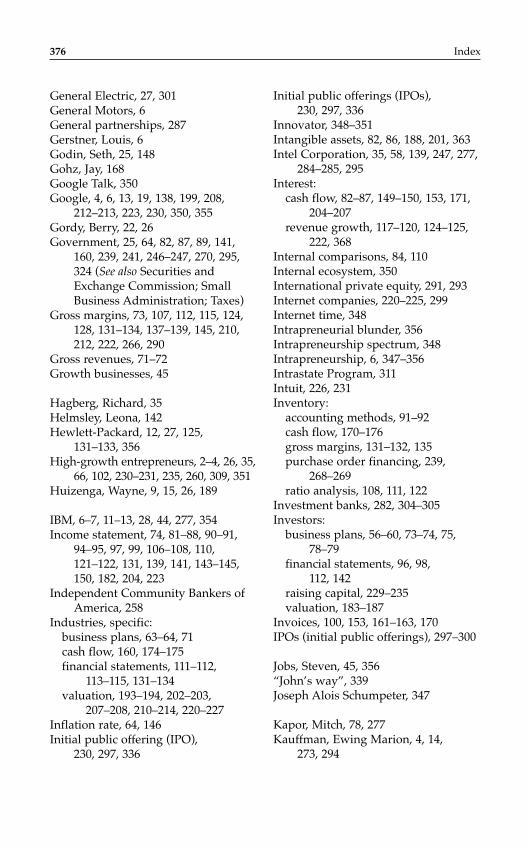
General Electric, 27, 301General Motors, 6General partnerships, 287Gerstner, Louis, 6Godin, Seth, 25, 148Gohz, Jay, 168Google Talk, 350Google, 4, 6, 13, 19, 138, 199, 208,
212–213, 223, 230, 350, 355Gordy, Berry, 22, 26Government, 25, 64, 82, 87, 89, 141,
160, 239, 241, 246–247, 270, 295,324 (See also Securities andExchange Commission; SmallBusiness Administration; Taxes)
Gross margins, 73, 107, 112, 115, 124,128, 131–134, 137–139, 145, 210,212, 222, 266, 290
Gross revenues, 71–72Growth businesses, 45
Hagberg, Richard, 35Helmsley, Leona, 142Hewlett-Packard, 12, 27, 125,
131–133, 356High-growth entrepreneurs, 2–4, 26, 35,
66, 102, 230–231, 235, 260, 309, 351Huizenga, Wayne, 9, 15, 26, 189
IBM, 6–7, 11–13, 28, 44, 277, 354Income statement, 74, 81–88, 90–91,
94–95, 97, 99, 106–108, 110,121–122, 131, 139, 141, 143–145,150, 182, 204, 223
Independent Community Bankers ofAmerica, 258
Industries, specific:business plans, 63–64, 71cash flow, 160, 174–175financial statements, 111–112,
113–115, 131–134valuation, 193–194, 202–203,
207–208, 210–214, 220–227Inflation rate, 64, 146Initial public offering (IPO),
230, 297, 336
Initial public offerings (IPOs), 230, 297, 336
Innovator, 348–351Intangible assets, 82, 86, 188, 201, 363Intel Corporation, 35, 58, 139, 247, 277,
284–285, 295Interest:
cash flow, 82–87, 149–150, 153, 171,204–207
revenue growth, 117–120, 124–125,222, 368
Internal comparisons, 84, 110Internal ecosystem, 350International private equity, 291, 293Internet companies, 220–225, 299Internet time, 348Intrapreneurial blunder, 356Intrapreneurship spectrum, 348Intrapreneurship, 6, 347–356Intrastate Program, 311Intuit, 226, 231Inventory:
accounting methods, 91–92cash flow, 170–176gross margins, 131–132, 135purchase order financing, 239,
268–269ratio analysis, 108, 111, 122
Investment banks, 282, 304–305Investors:
business plans, 56–60, 73–74, 75,78–79
financial statements, 96, 98, 112, 142
raising capital, 229–235valuation, 183–187
Invoices, 100, 153, 161–163, 170IPOs (initial public offerings), 297–300
Jobs, Steven, 45, 356“John’s way”, 339Joseph Alois Schumpeter, 347
Kapor, Mitch, 78, 277Kauffman, Ewing Marion, 4, 14,
273, 294
376 Index
Kellogg School of Management, 57, 79,227, 330, 332, 335
Kleiner, Perkins, Caufield & Byers, 23,56, 58, 231, 285
Kraft Foods, 349Kraft, 334, 349Kroc, Ray, 43
Layoffs, 31, 35Ledgers, 98, 157Legal structure of company, 60Leverage ratios, 109Liabilities, 93–96, 109, 175, 238–239Lifestyle entrepreneurs, 3, 316Limited liability corporation, 63Limited partnerships, 61, 287Liquidity ratios, 108–109Loan Separation, 335Long-term debt, 175, 207, 238–239, 252Lotus Development Corp., 78Lucent Technologies, 104
Madison Square Garden, 353Management teams, 289, 370Management tools, 103, 106, 113Marathon interview, 339Mario Tricoci’s, 14Marketing, 50, 64–67, 141, 146Martinez, Jeffrey, 268Material costs, 117, 134, 136–137McDonald’s Corp., 6, 8, 43, 134, 301, 352Mentzer, Josephine Esther, 27, 36Mezzanine debt, 238Michael Lippitz, 350Micro loan Program, 251Microsoft:
corporate venture capital, 29,284–286, 312
debt financing, 237entrepreneurship, 6, 14, 22, 24–30,
32–37equity financing, 285–286, 302, 309,
317, 319, 322financial statements, 111, 116, 121,
123, 132, 141, 143valuation, 213–215, 218–226
Milken Institute, 273Minority-owned businesses, 315,
318–319Morita, Akio, 27, 43, 52Morse Industries, 127Motorola, 331–334Multimillionaire, 336Multiples as valuation methods,
203–214
NASDAQ (National Association ofSecurities Dealers AutomatedQuotations), 19, 34, 89, 138, 181,192, 298, 300–301, 311, 320
National Association of Broadcasters, 348
National Association of SecuritiesDealers Automated Quotations(NASDAQ), 300
National Venture Capital Association,51, 200, 291, 294–295, 312
Net income, 82–83, 86–87, 91, 97,107–108, 124–125, 140–143, 182,211, 221, 359–365
Net margins, 127, 139–140, 143Net working capital, 95, 97, 174–175Netscape, 23, 220, 298, 300New markets venture capital
program, 296New York Stock Exchange, 300Niche equity investment firms, 317Nike Corp., 131–132, 135, 248, 347,
354Nike, 354Nonbank financial institutions, 233, 261
Operating expenses, 83–87, 107, 122, 150
Operating income, 85, 108, 140Operating margins, 114Operating plan, 67Operating ratios, 108–109
Patents, 44, 46, 66, 82, 86, 92, 201Personal savings, 40, 239, 252, 276, 316Pfizer, 89, 349, 355
Index 377
Postmoney valuations, 183–184Premoney valuations, 183, 195Primary benefactors, 356Private equity firms, 193, 196, 199,
278–279, 285–287, 293–295, 319,323, 368
Private placements, 281–282Privately owned companies, 89, 140Pro formas, 70–74, 107, 116, 255Production plans, 68Profit and loss (P&L) statement, 82Profit margin, 108–109, 117, 125, 138,
140, 212Profitability ratios, 108Program-related investments, 246Prototypes, 198, 353Publicly owned companies, 88, 192,
208–209Puccini, Rae, 105Purchase order financing, 239, 268–269Purchasing plans, 68
Quaker Oats, 207, 348Quality control, 68, 137
Raising capital, 39, 56, 73, 78, 103, 151,185, 190, 192, 202, 229–235, 282
Ratio analysis, 108, 111, 122Recurring revenues, 11Registration statement for IPOs, 305Regulation A Offering, 310Regulation D, 281–283, 310Reimbursement, 63, 136, 248, 334Reputation, 8–9, 231, 248, 256, 260, 284,
288–289, 296Resources, 2–3, 29, 40, 63, 67, 70, 74,
78, 82, 115, 122, 140, 155, 167, 249,256, 259, 266, 280, 294, 324
Résumé, 69, 106, 332–333Restricted stock units (RSUs) 336Restricted stock, 135, 303, 336, 343–344Retailer, 11, 127, 132–133, 173, 197, 224,
354, 360Retained earnings, 87, 93, 95Revenue analysis, 123Revenues, 4, 8–11, 82–92, 220, 222–225
Richard Silverman, 355Risks, 7, 38, 55, 60, 70, 135, 146, 192,
230, 283, 289, 351Robbins, Alan, 41Robert Wolcott, 350Rogers, Ollie Mae, x, 316Rule 504 program, 283, 310
S Corporations, 196Salary, 40–41, 52, 68, 204–205, 298, 334,
339, 341–343Sales, 13, 66–67, 122–123, 125,
127, 130, 132Sales, general, and administrative
expenses, 85Sales multiple, 207SBA Express Loan Program, 250Schultz, Howard, 8, 126, 146, 230–231Sears, 43, 197, 202, 220, 222, 301Secured creditors, 238Securities and Exchange Commission,
141, 192, 286, 297Senior debt, 2387(a) Loan Guaranty program, 250Short-term debt, 73, 93, 238Shut Up and Sing, 339–340Small Business, Administration:
business failures, 18, 21, 231business plan development, 57, 76, 77debt financing, 246–254, 259–262,
319, 322economy, impact on, 45equity financing, 295–297raising capital, 231
Small Corporate Offering Registration, 310
Small-business investment companies,295–296
Smith, Fred, 22, 28, 38Sole proprietorships, 47Sony Corporation, 43Sophisticated investors, 192,
241–242, 281Speculation, 197, 219, 312Springboard Conference, 294Staples, Inc., 23, 187
378 Index
Starbucks Coffee, 8Start-up firms, 347Stemberg, Thomas G., 23, 226Stock-based compensation, 344Stockholders’ equity, 93, 95, 108–109Strategic buyers, 193, 196Strategic partnership, 354Subordinated debt, 238, 261Sun Microsystems, 58, 230, 297,
332–333Supplier financing, 239, 267–268Sutter, Bill, 58, 75, 78–79, 182, 204,
219, 227Sweat equity, 240, 276
Tangible assets, 82, 85–86, 97, 201, 211,214, 237, 257
Target segments, 332Targeted lending, 258Taxes, 82–83, 85–92, 107–108, 122, 140,
142, 144, 149–150, 156, 160, 171,204–206, 214–215, 240, 279, 301,334, 343–344, 360–365
Technology, 13, 34–35, 134, 137,220–221, 225, 278–279, 296,298–301, 325, 333, 336, 338–339,354, 368, 369–370
Technology companies, 13, 188, 220,225, 296, 298–299, 301, 369
Theft, 104, 106, 132Thin floats, 225–226Time Warner (AOL Time Warner),
222, 285Traits of an entrepreneur, 35Turner, Ted, 27, 37Underwriters for IPOs, 305, 308, 310
Valuation of companies, 183, 187, 190,204, 277, 279
Valuation ratios, 108, 110Value-added investors, 74, 231, 241,
245, 259, 275, 279, 285Venture capital:
availability, 188, 193–194, 199, 227,295, 305
business plans, 38, 56–57, 59, 77–78
choosing, 63, 258, 307entrepreneurs, 21, 39–41, 233equity financing, 285–295, 309, 317ratio analysis, 108, 111, 122
Virtual revenue, 223–224
Wal-Mart, 111, 127, 129, 131, 145, 173, 354
Walt Disney Company, 51Wang, Gene, 229Wells Fargo Bank, 322Wildermuth, Bette, 104, 164Wm. Wrigley Jr. Company, 349Women-owned businesses, 48,
53, 258, 316–317, 321–322, 324, 357
Working capital, 75, 95–97, 104, 114,157, 160, 171, 174–175,214,216–218, 238, 239, 248,250–251, 261, 264, 266–270
Wozniak, Steve, 12, 27, 356
Xoom.com, 224
Yahoo!, 24, 31, 33, 35, 131, 140,142–143, 149, 199, 220, 222, 226
Index 379