THE EFFECT OF ENTREPRENEURIAL ACTIVITY ON NATIONAL ECONOMIC GROWTHThe NetherlandsTHE EFFECT OF...
24
THE EFFECT OF ENTREPRENEURIAL ACTIVITY ON NATIONAL ECONOMIC GROWTH André van Stel, Martin Carree and A. Roy Thurik ISSN 05-1 André van Stel Max Planck Institute of Economics Research Department on Entrepreneurship, Growth & Public Policy Kahlaische Straße 10 D-07745 Germany Martin Carree University of Maastricht 6200 MD Maastricht The Netherlands A. Roy Thurik Erasmus University Rotterdam NL-3000 DR Rotterdam The Netherlands And Max Planck Institute of Economics December 2005
-
Upload
independent -
Category
Documents
-
view
0 -
download
0
Transcript of THE EFFECT OF ENTREPRENEURIAL ACTIVITY ON NATIONAL ECONOMIC GROWTHThe NetherlandsTHE EFFECT OF...
THE EFFECT OF ENTREPRENEURIAL ACTIVITY ON NATIONAL ECONOMIC GROWTH
André van Stel, Martin Carree and A. Roy Thurik
ISSN 05-1
André van Stel Max Planck Institute of Economics
Research Department on Entrepreneurship, Growth & Public Policy Kahlaische Straße 10
D-07745 Germany
Martin Carree
University of Maastricht 6200 MD Maastricht
The Netherlands
A. Roy Thurik Erasmus University Rotterdam
NL-3000 DR Rotterdam The Netherlands
And Max Planck Institute of Economics
December 2005
THE EFFECT OF ENTREPRENEURIAL ACTIVITY ON NATIONAL
ECONOMIC GROWTH
by André van Stel, Martin A. Carree and A. Roy Thurik
This research was undertaken by the Institute for Development Strategies. The statements, findings, conclusions, and recommendations are those of the authors and do not necessarily reflect the views of the Institute for Development Strategies, or the Ameritech Foundation.
1
The effect of entrepreneurial activity on national economic growth
André van Stel (Max Planck Institute for Research into Economic Systems, Jena, Germany, and
EIM Business and Policy Research, Zoetermeer, The Netherlands)
Martin Carree (University of Maastricht)
Roy Thurik
(Erasmus University Rotterdam, EIM, and Max Planck Institute Jena) ABSTRACT: Entrepreneurial activity is generally assumed to be an important aspect of the organization of industries most conducive to innovative activity and unrestrained competition. This paper investigates whether total entrepreneurial activity influences GDP growth for a sample of 36 countries. We test whether this influence depends on the level of economic development measured as GDP per capita. Adjustment is made for a range of alternative explanations for achieving economic growth by incorporating the Growth Competitiveness Index. We find that entrepreneurial activity by nascent entrepreneurs and owner/managers of young businesses affects economic growth, but that this effect depends upon the level of per capita income. This suggests that entrepreneurship plays a different role in countries in different stages of economic development. JEL-CODES: L16, M13, O11, O40 KEYWORDS: Entrepreneurial activity, economic growth, economic development, nascent entrepreneurs ACKNOWLEDGEMENT: We are grateful to Rolf Sternberg, Sander Wennekers and two anonymous referees for comments and encouragement.
CONTACT: André van Stel, Max Planck Institute for Research into Economic Systems, Kahlaische Straße 10, D-07745 Jena, Germany; Email: [email protected]; Telephone: +49-3641-686727 VERSION: January 2005.

2
1. INTRODUCTION
There are many factors that influence the speed of economic progress. Such factors may
include climate, education, property rights, saving propensity, presence of seaports, etc. The
empirical growth literature has suggested a large number of economic and non-economic variables
that may influence economic growth (Sala-i-Martin, 1997 and Bleaney and Nishiyama, 2002).
Entrepreneurship has failed to be included in this list of variables (see e.g. Table 1 in Bleaney and
Nishiyama, 2002). On the one hand, this is surprising since many economists would claim that
entrepreneurial activity is vital to economic progress.1 They will, for example, refer to the demise of
communist economies where entrepreneurial activity was almost absent and to contributions by
Schumpeter (1934) and (neo-)Austrian economists (like Kirzner, 1973).2 On the other hand, it is
less surprising since the measurement of the factor ‘entrepreneurship’ is far from easy. Most factors
contributing to economic progress can be measured using existing secondary sources for a wide
variety of countries. However, aside from self-employment measures, which are questionable
measures of entrepreneurial activity, there were no sources up till recently to compare this activity
across countries. The Global Entrepreneurship Monitor (GEM) has changed this.
There are various ways in which entrepreneurship may affect economic growth.
Entrepreneurs may introduce important innovations by entering markets with new products or
production processes (Acs and Audretsch, 1990 and 2003). Entrepreneurs often play vital roles in
the early evolution of industries, examples of such (successful American) entrepreneurs include
Andrew Carnegie, Michael Dell, Thomas Edison, Henry Ford, Bill Gates, Ray Kroc and Sam
1 The recognition of the importance of entrepreneurial activity has been absent for a while in mainstream (theoretical) economics. Baumol (1968) complained that entrepreneurship, being hard to capture into mathematical equations, disappeared from mainstream (neo-classical) economics. Kirzner (1973) observed that the neo-classical model constrained the decision making of the entrepreneur, in terms of product quality and price, technology, within limits wholly alien to the context in which real world entrepreneurs characteristically operate. Also see Barreto (1989) and Kirchhoff (1994, p. 30). 2 Schumpeter (1950, p. 13): “The function of entrepreneurs is to reform or revolutionize the pattern of production by exploring an invention, or more generally, an untried technological possibility for producing a new commodity or producing an old one in a new way… To undertake such new things is difficult and constitutes a distinct economic

3
Walton. Entrepreneurs may increase productivity by increasing competition (Geroski, 1989; Nickel,
1996; Nickel et al., 1997). They may enhance our knowledge of what is technically viable and what
consumers prefer by introducing variations of existing products and services in the market. The
resulting learning process speeds up the discovery of the dominant design for product-market
combinations. Knowledge spillovers play an important role in this process (Audretsch and Feldman,
1996; Audretsch and Stephan, 1996; Audretsch and Keilbach, 2004). Lastly, they may be inclined to
work longer hours and more efficiently as their income is strongly linked to their working effort.
In this paper, we empirically investigate the effect of entrepreneurial activity on economic
growth at the country level. We use recent and new material provided by the Global
Entrepreneurship Monitor (GEM). It contains the Total Entrepreneurial Activity (TEA) rate
measuring the relative amount of nascent entrepreneurs and business owners of young firms for a
range of countries. This variable is (consistently) measured across a variety of countries and appears
to be a useful index for measuring the extent of ‘entrepreneurship’. An important element in our
analysis is to consider whether entrepreneurial activity plays a similar growth-stimulating role in
highly developed economies (relatively rich countries) and in less developed economies (relatively
poor countries, including both transformation economies and developing countries). Carree and
Thurik (1999), for example, indicate that the presence of small firms in manufacturing industries
benefits growth for the richest among EU-countries, but not for EU-countries with somewhat lower
GDP per capita, like Portugal and Spain. This is in line with the regime shift introduced by
Audretsch and Thurik (2001). They argue that there has been a shift from a model of the ‘managed
economy’ towards that of the ‘entrepreneurial economy’ in highly developed economies.
Our test of the influence of ‘entrepreneurship’ is based on a statistical analysis of whether
Total Entrepreneurial Activity (TEA) influenced GDP growth in the 1999-2003 period for a sample
of 36 countries. We test whether this influence depends upon the level of economic development
function, first because they lie outside of the routine tasks which everybody understands, and secondly, because the environment resists in many ways.”
4
measured as GDP per capita. We also distinguish between the extent of influence of
‘entrepreneurship’ for three groups of countries, viz. highly developed economies, transition
economies and developing countries. Although the limited number of observations does not allow
for many competing explanatory variables, we include the Growth Competitiveness Index (GCI) in
our model. This variable captures a range of alternative explanations for achieving sustained
economic growth. In addition, we incorporate the initial level of economic development to correct
for convergence.
The rest of this paper is organized as follows. In section 2 the relation between
entrepreneurial activity and economic growth and its dependence on the stage of economic
development are discussed and the TEA and GCI rates are introduced. In section 3 we present our
model and a description of the variables. Section 4 is used for results and section 5 concludes.
2. ENTREPRENEURSHIP, COMPETITIVENESS AND GROWTH
There have been efforts to empirically investigate the importance of the impact of
entrepreneurship on economic performance, especially at the firm, region or industry level (e.g.
Audretsch, 1995, Audretsch and Fritsch, 2002 and Caves, 1998).3 However, contributions at the
level of the nation state are limited. Two recent exceptions are studies into the effect of self-
employment rates on economic growth figures: Blanchflower (2000) and Carree et al. (2002). Even
in these cases it is questionable whether self-employment rates are an adequate measure of
entrepreneurial activity. This paper is a first attempt to investigate whether differences in the start-
up activity and presence of young firms across countries has an impact on their economic
performance.
3 See Carree and Thurik (2003) for a survey of studies of the impact of entrepreneurship on growth at various levels of observation.
5
The last two decades have witnessed both large (conglomerate) companies increasingly
concentrating on core competences and experiencing mass lay-offs (especially in traditional
manufacturing industries) and high-technology innovative small firms having come to the forefront
of technological development in many (new) industries. These developments would suggest the key
importance for modern economies of a sound entrepreneurial climate for achieving economic
progress. In particular, Audretsch and Thurik (2001) argued that highly developed economies have
experienced a shift from the model of the ‘managed economy’ towards that of the ‘entrepreneurial
economy’. The model of the ‘managed economy’ is the political, social and economic response to
an economy dictated by the forces of large-scale production, reflecting the predominance of the
production factors of capital and (unskilled) labor as the sources of competitive advantage. By
contrast, the model of the ‘entrepreneurial economy’ is the political, social and economic response
to an economy dictated not just by the dominance of the production factor of knowledge – which
Romer (1990, 1994) and Lucas (1988) identified as replacing the more traditional factors as the
source of competitive advantage – but also by a very different, but complementary factor they had
overlooked: the presence of entrepreneurial activity to accommodate knowledge spillovers (see Acs
and Audretsch, 2003; Audretsch and Keilbach, 2004).
The transition as described by Audretsch and Thurik (2001) can also be described in more
‘Schumpeterian’ terms.4 In Schumpeter (1934) the role of the entrepreneur as prime cause of
economic development was emphasized. Schumpeter described how the innovating entrepreneur
challenges incumbent firms by introducing new inventions that make current technologies and
products obsolete. This process of creative destruction is the main characteristic of what has been
called the Schumpeter Mark I regime. In Schumpeter (1950) the focus was on innovative activities
by large and established firms. Schumpeter described how large firms outperformed their smaller
counterparts in the innovation and appropriation process through a strong positive feedback loop
4 Other terms are also possible, like the transition from the fourth to the fifth Kondratiev wave (Freeman and Perez, 1988).
6
from innovation to increased R&D activities. This process of creative accumulation is the main
characteristic of what has been called the Schumpeter Mark II regime. The extent to which either of
the two Schumpeterian technological regimes prevails in a certain period and industry varies. It may
depend upon the nature of knowledge required to innovate, the opportunities of appropriability, the
degree of scale (dis)economies, the institutional environment, the importance of absorptive
capacity, demand variety, etc. Industries in a Schumpeter Mark II regime are likely to develop a
more concentrated market structure in contrast to industries in a Schumpeter Mark I regime where
small firms will proliferate. The distinction between the Schumpeter Mark I and the Mark II
regimes is closely related to that of the ‘entrepreneurial’ versus ‘managed’ economy.
These discussions suggest that the role and importance of entrepreneurial ventures may
differ from one stage of economic development to another. Theoretical support for this idea was
given by Lloyd-Ellis and Bernhardt (2000) who described how an economy goes through various
stages of economic development.5 Therefore, we should be careful when comparing countries in
different stages of economic development. For example, high start-up rates in developing countries
could be less a sign of economic strength when compared to such rates in highly developed
economies. That is, a far smaller percentage of these start-ups in developing countries when
compared to rich countries may develop into high-growth companies generating substantial value
added. In particular, average human capital levels of entrepreneurs may differ between countries
(shopkeepers versus Schumpeterian entrepreneurs). High start-up rates, reported in individual
surveys, may be a sign of a substantial ‘informal sector’ in developing countries, not being a
characteristic of an economy in progress. The main argument of this paper is that the impact of
‘entrepreneurship’ on growth differs for countries at different stages of development. For highly
developed countries we expect a positive impact of entrepreneurial activity on subsequent economic
5 The intertemporal relation between occupational choice and economic development has been dealt with in a series of recent papers (Banerjee and Newman, 1993; Iyigun and Owen, 1999; Lloyd-Ellis and Bernhardt, 2000).

7
performance. For relatively poor countries it is more uncertain what high start-up rates stand for, in
terms of an industrial organization conducive to innovation and economic growth.
Countries, even in similar stages of economic development, differ strongly in the rates of
entrepreneurial activity. The GEM Global Executive Reports show considerable differences
between countries like Japan, France, Belgium and Sweden with low entrepreneurial activity and
countries like the U.S., Canada, Australia and South Korea with high entrepreneurial activity. Some
developing countries like Thailand and India top the list of countries with high entrepreneurial
activity. Entrepreneurial activity is correlated with the self-employment rate (see e.g. Table I in
Carree et al., 2002 and Table 2.1 in Audretsch et al., 2002). However, there are exceptions to this
rule. Japan, for example, has self-employment rates that are relatively close to those of the U.S.
However, the new entry rate is far smaller in Japan, where there are many (inefficient) small
establishments in the retail and wholesale sectors. Carree et al. (2002) showed that countries may
not only have too few self-employed, but may also have too many. Italy is given as an example for
the latter situation.6
If entrepreneurial activity is important for economic progress we should find that countries
that are highly ranked on the list in terms of this activity also grow relatively fast. The usual ceteris
paribus condition applies here since there are many other factors that may explain economic
progress. These include factors like schooling, inflation, investment in fixed assets, climate,
institutional quality and property rights. It is important to gain insight in alternative explanations for
economic growth next to entrepreneurial activity.
In the present section we will discuss our two key variables, the TEA rate capturing
elements of ‘entrepreneurial energy’ and the GCI rate encompassing a range of alternative
explanatory variables.
6 See also Van Stel and Carree (2004) who distinguish between the manufacturing and service sector.
8
Total Entrepreneurial Activity (TEA)
Data on total entrepreneurial activity are taken from the Global Entrepreneurship Monitor
(GEM) Adult Population Survey. This database contains various entrepreneurial measures that are
constructed on the basis of surveys of -on average- some 3,000 respondents per country (37
countries in 2002). The total entrepreneurial activity rate (TEA) is defined as that percentage of
adult population (18-64 years old) that is either actively involved in starting a new venture or is the
owner/manager of a business that is less than 42 months old (Reynolds et al., 2002). In 2002 the
TEA rate (per 100 adults) ranged from values above 15 in Chile, Thailand and India, to 10.5 in the
United States, to values below four in Russia, Belgium, France, Japan, Croatia and Hong Kong. See
Appendix 1. For most countries, TEA rates in 2002 were lower than in 2001 due to a universal
decline in economic growth rates in 2002 compared to 2001. The relative rankings between
countries though remained quite stable (Reynolds et al., 2002). For the 28 countries that participated
in GEM both in 2001 and in 2002, the rank correlation (Spearman’s ρ statistic) was 0.8. This
indicates that total entrepreneurial activity may be seen as a structural characteristic of an economy.
This makes the variable suitable for inclusion in models aiming to explain structural growth such as
the model that we estimate in this paper.
Growth Competitiveness Index (GCI)
The Growth Competitiveness framework is employed by the World Economic Forum’s
Global Competitiveness Report (GCR). A central objective of the GCR is to assess the capacity of
the world’s economies to achieve sustained economic growth. In the GCR this is done by analyzing
the extent to which individual national economies have the structures, institutions, and policies in
place for economic growth over the medium term (McArthur and Sachs, 2002). These features of
national economies are summarized in the Growth Competitiveness Index (GCI). The GCR
identifies three inter-related mechanisms involved in economic growth: efficient division of labor,
capital accumulation (including human capital), and technological advance. Concerning the last-
9
mentioned mechanism, a distinction is made between the creation of new technologies
(technological innovation) and the adoption of technologies that have been developed abroad
(technology transfer). In the GCR framework technological innovation is seen as the most important
factor for achieving long-term economic growth. In this connection the GCR distinguishes between
core economies (countries that are technological innovators) and non-core economies.7 The core
economies are typically the richest countries. It is argued that economic growth is achieved in
different ways in these two types of economies. In core economy countries growth is powered by
their capacity to innovate and to win new global markets for their technologically advanced
products (technological innovation). High growth rates in non-core economies are often achieved by
rapidly absorbing the advanced technologies and capital of the core economies, for example through
high levels of foreign direct investment from high-tech multinationals of the core economies
(technology transfer). This type of growth process is sometimes also called “catch-up growth”.
Besides technology, two other major pillars of growth are identified in the Growth
Competitiveness framework: the quality of public institutions and the macro-economic
environment. Institutions are crucial for their role in ensuring the protection of property rights, the
objective resolution of contract and other legal disputes, and the transparency of government. All
these factors are important for achieving an efficient division of labor. Public institutions are also
important for establishing the societal stability required to achieve economic growth. The macro-
economic environment relates to government monetary and fiscal policies and the stability of
financial institutions. It involves such things as budget balance, modest taxation, high rates of
national savings and a realistic level of the exchange rate that preserves the competitiveness of the
export sector. Again, these factors are important conditions for achieving capital accumulation and
an efficient division of labor which in turn influence economic growth.
7 A country is defined to be a core economy if it achieves at least 15 US utility patents per million population. Twenty-four countries met this criterion in 2000.

10
In the GCR the growth potential of economies is measured by the Growth Competitiveness
Index (GCI). This index aims to “measure the capacity of the national economy to achieve sustained
economic growth over the medium term, controlling for the current level of economic development”
(McArthur and Sachs, 2002). The GCI reflects the three major pillars of economic growth identified
in the GCR framework: technology, public institutions, and the macroeconomic environment. It is
argued that these factors play different roles at different stages of economic development, and
therefore these factors (or sub-indexes) are given different relative weights in constructing the
overall GCI index for economies at different stages of development. In particular, for the so-called
core economies identified in GCR the technology sub-index is given a higher weight compared to
the non-core economies. This is because technology is the main source of competitiveness in
modern economies. Likewise, within the technology sub-index, innovation gets a higher relative
weight compared to technology transfer in the core economies. Information from ‘hard’ data
sources (international statistics) and information from the GCR Executive Opinion Survey are
combined for the construction of the GCI.8
The GCI tries to capture factors determining economic growth. In a test regression for 75
countries, McArthur and Sachs (2002) showed that the 2001 GCI indeed has a significantly positive
influence on economic growth over the period 1992-2000, while controlling for the catch-up effect
as measured by initial income level of countries. This supports the view that the GCI indeed
captures important factors that determine the capacity of national economies to grow. However, a
disadvantage of this approach is that the GCI is used to explain past growth instead of future
growth, resulting in a clear direction of causality problem. In this paper, we try to solve this
causality problem.
8 The Executive Opinion Survey is a survey among firms within countries. The goal of the survey is to capture a broad array of intangible factors that cannot be found in official statistics but that nonetheless may influence the growth potential of countries. For details, see Cornelius and McArthur (2002).
11
3. MODEL AND DATA
In this section we discuss our data and present our model. We make use of the Global
Entrepreneurship Monitor (GEM), the Global Competitiveness Report (GCR), and other sources.
Data on four basic variables are used in our model: total entrepreneurial activity, growth of GDP,
per capita income, and the growth competitiveness index. The sources and definitions of these
variables are listed below.
Total Entrepreneurial Activity (TEA)
Data on total entrepreneurial activity are taken from the GEM Adult Population Survey for 2002.
Growth of GDP ( ) GDPΔ
GDP growth rates are taken from the IMF World Economic Outlook database of the International
Monetary Fund, version September 2003.
Per capita income (GNIC)
Gross national income per capita 2001 is expressed in (thousands of) purchasing power parities per
US$, and these data are taken from the 2002 World Development Indicators database of the World
Bank.
Growth Competitiveness Index (GCI)
Data on the GCI 2001 are taken from page 32 of The Global Competitiveness Report 2001-2002.
The variable was described in section 2.
In this paper we investigate whether entrepreneurship may be considered a determinant of
economic growth, next to technology, public institutions and the macroeconomic environment
(which are captured in a combined way by the GCI). As both entrepreneurship and the factors
underlying the GCI are assumed to be structural characteristics of an economy, we do not want to
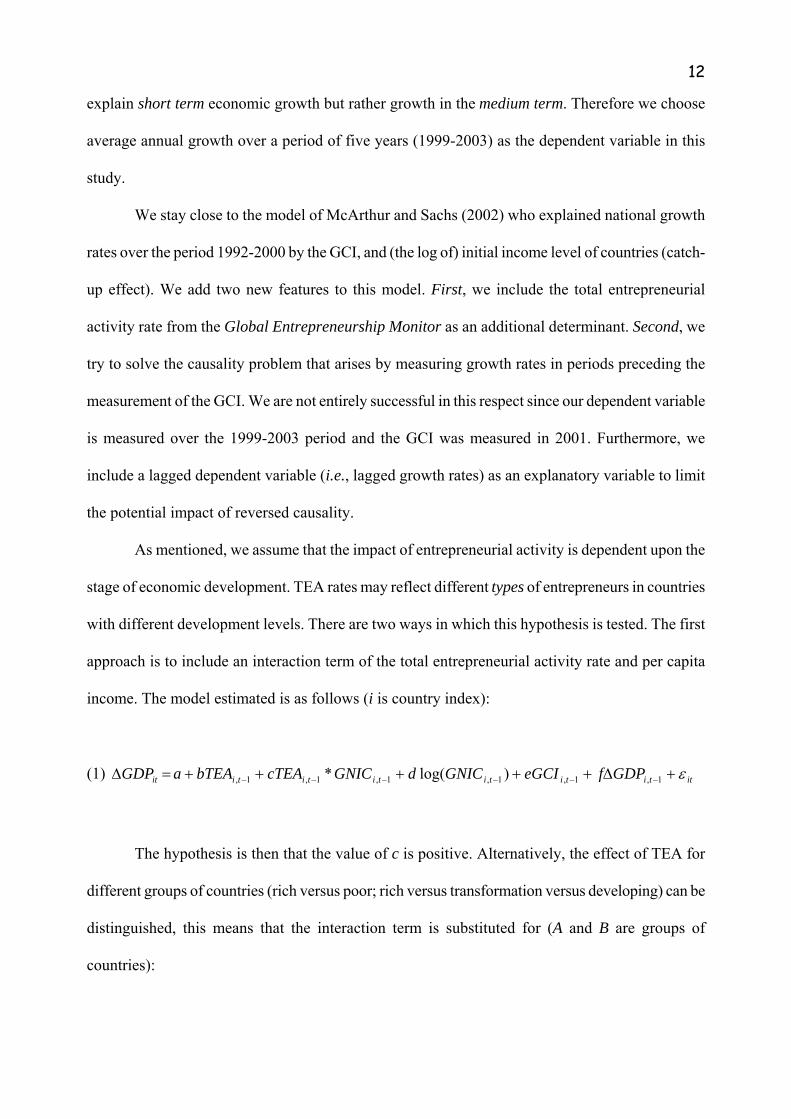
12
explain short term economic growth but rather growth in the medium term. Therefore we choose
average annual growth over a period of five years (1999-2003) as the dependent variable in this
study.
We stay close to the model of McArthur and Sachs (2002) who explained national growth
rates over the period 1992-2000 by the GCI, and (the log of) initial income level of countries (catch-
up effect). We add two new features to this model. First, we include the total entrepreneurial
activity rate from the Global Entrepreneurship Monitor as an additional determinant. Second, we
try to solve the causality problem that arises by measuring growth rates in periods preceding the
measurement of the GCI. We are not entirely successful in this respect since our dependent variable
is measured over the 1999-2003 period and the GCI was measured in 2001. Furthermore, we
include a lagged dependent variable (i.e., lagged growth rates) as an explanatory variable to limit
the potential impact of reversed causality.
As mentioned, we assume that the impact of entrepreneurial activity is dependent upon the
stage of economic development. TEA rates may reflect different types of entrepreneurs in countries
with different development levels. There are two ways in which this hypothesis is tested. The first
approach is to include an interaction term of the total entrepreneurial activity rate and per capita
income. The model estimated is as follows (i is country index):
(1) ittitititititiit GDPfeGCIGNICdGNICcTEAbTEAaGDP ε+Δ+++++=Δ −−−−−− 1,1,1,1,1,1, )log(*
The hypothesis is then that the value of c is positive. Alternatively, the effect of TEA for
different groups of countries (rich versus poor; rich versus transformation versus developing) can be
distinguished, this means that the interaction term is substituted for (A and B are groups of
countries):
13
(2) ittititiBti
Atiit GDPfeGCIGNICdcTEAbTEAaGDP ε+Δ+++++=Δ −−−−− 1,1,1,1,1, )log(
When A is the group of relatively rich countries (and B the group of relatively poor
countries), our hypothesis is that the value of b is larger than that of c.
4. RESULTS
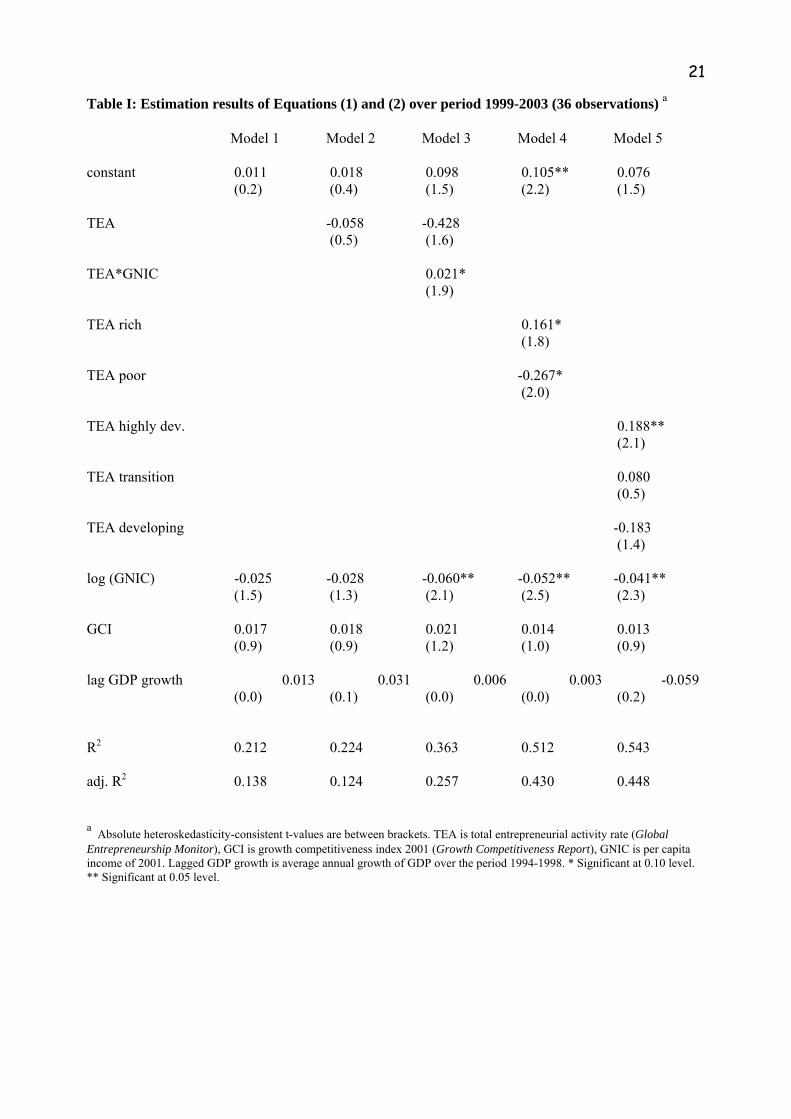
Regression results are presented in Table I. The regressions use data for the 37 countries that
participated in GEM 2002, minus Croatia.9 These regressions use TEA 2002 as entrepreneurship
measure. The countries participating in GEM 2002 are listed in Appendix 1. There are five
countries that we classify as transition economies, viz. China, Hungary, Poland, Russia and
Slovenia. There are seven countries that we classify as developing countries, viz. Argentina, Brazil,
Chile, India, Mexico, South Africa and Thailand. Eleven of these twelve countries are classified as
(relatively) poor, the exception being Slovenia.10
[Table I about here]
All model specifications in Table I use initial income and lagged growth as control
variables. We present results for a model including the growth competitiveness index only (Model
1), a model including the GCI and a linear TEA term (Model 2), a model including GCI, TEA and
the interaction term of TEA and per capita income (Equation (1), Model 3), a model including GCI,
TEA for the twenty-five (relatively) rich countries and TEA for the eleven (relatively) poor
countries (Equation (2), Model 4) and a model including GCI, TEA for the twenty-four highly
9 Croatia is excluded because the Growth Competitiveness Index is not available. 10 The richest of the eleven relatively poor countries is Hungary with a 2001 per capita income of 12,570 US $. The poorest of the twenty-five relatively rich countries is Taiwan with a 2001 per capita income of 16,761 US $. Hence, there is a clear gap between the two groups of countries in terms of GNIC. Slovenia has a 2001 per capita income of
14
developed countries (the rich countries except Slovenia), TEA for the five transition economies and
TEA for the seven developing countries (Model 5).
In each of the models we find a negative effect of initial income (logarithm of GNIC),
confirming a catch-up effect, and a positive effect of the GCI. The positive effect of the GCI is not
significant, though. When we compare Model 2 to Model 1 we find that the addition of only a linear
TEA term decreases the adjusted R2. The effect is also not significant. The addition of a linear term
in combination with the interaction term increases the adjusted R2 considerably, compared to
specifications using GCI only. The interaction term has the expected positive effect and this is
significant at the 10% significance level.11 Hence, the impact of entrepreneurial activity increases
with per capita income. The impact can be written as GNIC021.428. +− . This expression has value
zero for a per capita income level of about 20,000 US$. Hence, only beyond this level, increasing
levels of entrepreneurial activity benefit economic growth. For comparison, 20 out of the 36
countries in our data set have a 2001 per capita income level that is higher than 20,000 US$.12
The two models in which the effect of TEA is allowed to be different for two or three groups
of countries perform much better than Model 3 in terms of adjusted R2. The effect of TEA is found
to be significantly positive for the relatively rich countries, while it is found to be significantly
negative for the relatively poor countries. Model 5 shows that the latter effect is mainly due to the
developing countries and not so much the transition economies.13 For the highly developed
18,160 US $. 11 The correlation between TEA and the interaction term TEA*GNIC is only 0.35 suggesting no problems of multicollinearity. 12 Spain is closest to the critical value with a 2001 per capita income of 20,150 US$. 13 Note that our specification in Models 4 and 5 is equivalent to including the variable TEA and slope dummies for rich countries (Model 4) or for transition and highly developed countries (Model 5). We choose to present coefficients and t-values in deviation from zero instead of presenting estimation results in deviation from a reference group. Furthermore, we assume a constant in Equation (2) equal for each of the groups of countries. Should the constant be assumed to differ for rich and poor countries, the difference of the effect of entrepreneurial activity between the rich and poor country groups remains significant. However, where the constant is assumed different for the three groups of countries (highly developed, transition, developing), the difference of the effect of entrepreneurial activity between the groups fails to be significant. Likelihood ratio tests reveal that Model 2 (which has a log likelihood value of 96.5) is rejected in favor of a specification assuming the constant to be identical across the three groups of countries (but having different effects of entrepreneurial activity), but also in favor of a specification assuming identical effects of entrepreneurial activity (but having different constants). However, the log likelihood value of the former specification is higher (106.0 versus 105.3).
15
economies the effect of TEA is significant at the 5%-confidence interval. The fact that Models 4
and 5 provide a much better fit than Model 3 suggests that the impact of entrepreneurial activity
does not change in a continuous way over the course of economic development, but is different in
different stages of development (comprising broad ranges of GDP per capita). However, the results
should be interpreted with care given the small number of countries (especially the transition and
developing economies). In addition, the analysis has a cross-sectional nature and does not follow
countries over the entire range of economic development.
The effect of entrepreneurial activity is significant even after correcting for the GCI. This
suggests that the two effects are complementary. The additional positive impact of entrepreneurship
in highly developed economies may be caused by various factors. It may indicate that
entrepreneurial activity is important in the process of the commercialization of new (technological)
knowledge. It may also indicate that entrepreneurial activity is important for a healthy development
of the business population. Eliasson (1995) showed that the absence of new entrants is expected to
have a negative impact on the economic performance of the Swedish economy after about two
decades. New firms are important in the introduction of various (non-technological) innovations and
they may also serve as a vehicle of increased work effort since the reward for entrepreneurs is likely
to be more effort-dependent than for employees. Entrepreneurs may also be more likely than
incumbent firms to enter (or even create) new industries. The history of the software- and biotech-
industries shows the importance of new firms in the early phases of the industry evolution.
Because our entrepreneurship data are from 2002, and we want to measure the impact on
medium term growth, we cannot avoid that the periods for which we measure economic growth and
entrepreneurship partly overlap. This makes it difficult to assess the correct direction of causality.
Therefore we have estimated various model specifications in which the lengths of the growth
periods vary from two to five years. We also varied the most recent year for which we measure
Hence, we have decided to present these results. The evidence for the three groups of countries should however be interpreted with care.
16
growth (2002 or 2003). This is because 2003 is a growth projection instead of a realization. Results
of these exercises are presented in an early version of this paper (Van Stel et al., 2004). The results
imply that the longer the growth period, the less strong is the business cycle effect (effect of lagged
growth). For five-year periods the business cycle effect is almost absent and this may indicate that
the length of the average business cycle is about five years. Obviously, for shorter periods the effect
of the lagged dependent variable is stronger, leaving less room for the other variables to contribute
to explained variation in growth rates. However, the general pattern is the same throughout all
estimations. There is a positive effect on growth of GCI and an effect of TEA that increases with
per capita income. Therefore we feel that our results are quite robust.14
5. DISCUSSION
Entrepreneurship fails to be a well documented factor in the empirical growth literature
because of difficulties defining and measuring entrepreneurship. The investigation of the impact of
entrepreneurial activity on economic growth has been one of the main justifications of the Global
Entrepreneurship Monitor project. In the present paper we have critically analyzed whether the
acclaimed impact of the Total Entrepreneurial Activity (TEA) rate on economic growth stands the
test of adding competing variables. There is an impact but not a simple linear one of the TEA rate
on GDP-growth. We find that the TEA rate has a negative effect for the relatively poor countries,
while it has a positive effect for the relatively rich countries. The results show that entrepreneurship
matters. However, the effect of entrepreneurial activity on growth is not straightforward and can
possibly be interpreted using the distinction between the Schumpeter Mark I versus Mark II regimes
or the ‘entrepreneurial’ versus ‘managed’ economy.
14 Another test of robustness is to consider the impact on the estimation results of leaving out one country (leaving 35 observations). For Model 3 we find that the t-values of the interaction term then range between 0.89 (leaving out Russia) and 2.43 (leaving out Ireland). For Model 5 we then find that the t-values of TEA for the highly developed economies range between 1.35 (leaving out Korea) and 3.91 (leaving out New Zealand). The t-values of TEA for the developing countries range between -0.74 (leaving out Russia) and -1.87 (leaving out Ireland).
17
Most of the 20th century can be described as a period of accumulation. From the Second
Industrial Revolution till at least the conglomerate merger wave of the late 1960s the large firm
share was on the rise in most industries and the economy as a whole. It was the period of “scale and
scope” (Chandler 1990). It was the era of the hierarchical industrial firm growing progressively
larger through exploiting economies of scale and scope in areas like production, distribution,
marketing and R&D. The period has the characteristics of the Schumpeter Mark II regime.
However, by the end of the 20th century things seemed to have changed (Carree et al., 2002). The
results of the present study provide some support for such a regime switch. Even so, the small
number of observations and the specificity of the time period under investigation do not allow for
too strong conclusions.
One striking result of our study is the negative impact of entrepreneurship on GDP growth
for developing countries. The result that poorer countries fail to benefit from entrepreneurial
activity does not imply that entrepreneurship should be discouraged in these countries. Instead, it
may be an indication that there are not enough larger companies present in these countries. Large
firms play an important role in the transformation process from a developing economy to a
developed economy. Through exploitation of economies of scale and scope they are able to produce
medium-tech products. Many local workers may be employed by the large firms and, by training on
the job, these local workers may become more productive compared to if they are running a small
store and struggling to survive as an “entrepreneur”. Furthermore, in the proximity of large firms,
smaller firms may also flourish, as they may act as suppliers for large firms (outsourcing) and may
learn a lot from the large companies.
A second possible explanation for the negative effect in poorer countries is that the
entrepreneurs have lower human capital levels compared to entrepreneurs in developed countries, as
we hypothesized earlier. It is likely that the negative effect reflects the presence of many “marginal”
entrepreneurs (shopkeepers) in small crafts who may be more productive as wage-earner in a bigger
18
firm. On the contrary, in developed countries TEA may reflect more innovative entrepreneurs in
new sectors (for instance software companies). Of course, the human capital levels of the
entrepreneurs cannot be identified from the TEA variable, which hampers interpretation. For poorer
countries, even if there are not many large firms and also not many people with high human capital
levels, it may still be wise to encourage entrepreneurship if the alternative is unemployment. But
perhaps entrepreneurship is not as productive then as in the presence of large firms. Small and large
firms often complement each other (Rothwell, 1983; Nooteboom, 1994; Freeman and Perez, 1988).
It is suggested that developing countries can benefit considerably from foreign direct investment by
MNCs since this also increases the potential economic contribution of local entrepreneurial activity.
REFERENCES
Acs, Z.J., and D.B. Audretsch, 1990, Innovation and Small Firms, Cambridge, MA: MIT Press.
Acs, Z.J., and D.B. Audretsch, 2003, Innovation and technological change, in: Z.J. Acs and D.B. Audretsch
(eds.), Handbook of Entrepreneurship Research, Boston: Kluwer Academic Publishers, 55-79.
Audretsch, D.B., 1995, Innovation and Industry Evolution, Cambridge, MA: MIT Press.
Audretsch, D.B. and M. Feldman, 1996, R&D spillovers and the geography of innovation and production,
American Economic Review 86, 630-640.
Audretsch, D.B. and M. Fritsch, 2002, Growth regimes over time and space, Regional Studies 36, 113-124.
Audretsch, D.B. and M. Keilbach, 2004, Entrepreneurship capital and economic performance, Regional
Studies 38, 949-959.
Audretsch, D.B. and P. Stephan, 1996, Company-scientist locational links: the case of biotechnology,
American Economic Review 86, 641-652.
Audretsch, D.B. and A.R. Thurik, 2001, What is new about the new economy: sources of growth in the
managed and entrepreneurial economies, Industrial and Corporate Change 10, 267-315.
Audretsch, D.B., A.R. Thurik, I. Verheul and A.R.M. Wennekers (eds.), 2002, Entrepreneurship:
Determinants and Policy in a European - US Comparison, Boston/Dordrecht: Kluwer Academic
Publishers.
Banerjee, A.V. and A.F. Newman, 1993, Occupational choice and the process of development, Journal of
Political Economy 101, 274-298.
Barreto, H., 1989, The Entrepreneur in Microeconomic Theory: Disappearance and Explanation, London:
Routledge.
19
Baumol, W.J., 1968, Entrepreneurship in economic theory, American Economic Review Papers and
Proceedings 58, 64-71.
Blanchflower, D.G., 2000, Self-employment in OECD countries, Labour Economics 7, 471-505.
Bleaney, M. and A. Nishiyama, 2002, Explaining growth: a contest between models, Journal of Economic
Growth 7, 43-56.
Carree, M., A. van Stel, R. Thurik and S. Wennekers, 2002, Economic development and business
ownership: an analysis using data of 23 OECD countries in the period 1976-1996, Small Business
Economics 19, 271-290.
Carree, M.A., and A.R. Thurik, 1999, Industrial structure and economic growth, in D.B. Audretsch and
A.R. Thurik (eds.), Innovation, Industry Evolution and Employment, Cambridge: Cambridge
University Press, 86-110.
Carree, M.A. and A.R. Thurik, 2003, The impact of entrepreneurship on economic growth, in: Z.J. Acs and
D.B. Audretsch (eds.), Handbook of Entrepreneurship Research, Boston: Kluwer Academic
Publishers, 437-471.
Caves, R.E., 1998, Industrial organization and new findings on the turnover and mobility of firms, Journal
of Economic Literature 36, 1947-1982.
Chandler, A.D. Jr., 1990, Scale and Scope: The Dynamics of Industrial Capitalism, Cambridge: Harvard
University.
Cornelius, P.K., and J.W. McArthur, 2002, The executive opinion survey, in: M.E. Porter, J.D. Sachs, P.K.
Cornelius, J.W. McArthur, K. Schwab (eds.), The Global Competitiveness Report 2001-2002, New
York: Oxford University Press, 166-177.
Eliasson, G., 1995, Economic growth through competitive selection, paper presented at the 22nd EARIE-
conference, Juan les Pins, September 1995.
Freeman, C. and C. Perez, 1988, Structural crises of adjustment: business cycles and investment behavior,
in: Dosi, G., Freeman, C., Nelson, R., Silverberg, G., and L. Soete, (eds.), Technical Change and
Economic Theory, London: Pinter Publishers.
Geroski, P.A., 1989, Entry, innovation, and productivity growth, Review of Economics and Statistics 71,
572-578.
Iyigun, M.F. and A.L. Owen, 1999, Entrepreneurs, professionals, and growth, Journal of Economic Growth
4, 213-232.
Kirchhoff, B.A., 1994, Entrepreneurship and Dynamic Capitalism, Westport CT: Praeger.
Kirzner, I., 1973, Competition & Entrepreneurship, Chicago: University of Chicago Press.
Lloyd-Ellis, H. and D. Bernhardt, 2000, Enterprise, inequality and economic development, Review of
Economic Studies 67, 147-168.
Lucas, R.E., 1988, On the mechanics of economic development, Journal of Monetary Economics 22, 3-39.
McArthur, J.W., and J.D. Sachs, 2002, The Growth Competitiveness Index: Measuring Technological
Advancement and the Stages of Development, in: M.E. Porter, J.D. Sachs, P.K. Cornelius, J.W.

20
McArthur, K. Schwab (eds.), The Global Competitiveness Report 2001-2002, New York: Oxford
University Press, 28-51.
Nickell, S., P. Nicolitsas and N. Dryden, 1997, What makes firms perform well? European Economic
Review 41, 783-796.
Nickell, S.J., 1996, Competition and corporate performance, Journal of Political Economy 104, 724-746.
Nooteboom, B., 1994, Innovation and diffusion in small business: theory and empirical evidence, Small
Business Economics 6, 327-347.
Reynolds, P.D., W.D. Bygrave, E. Autio, L.W. Cox, and M. Hay, 2002, Global Entrepreneurship Monitor,
2002 Executive Report, Wellesley, MA: Babson College.
Romer, P.M., 1990, Endogenous technological change, Journal of Political Economy 98, 71-101.
Romer, P.M., 1994, The origins of endogenous growth, Journal of Economic Perspectives 8, 3-22.
Rothwell, R., 1983, Innovation and firm size: a case for dynamic complementarity; Or, is small really so
beautiful?, Journal of General Management 8, 5-25.
Sala-i-Martin, X., 1997, I just ran two million regressions, American Economic Review 87, 178-183.
Schumpeter, J.A., 1934, The Theory of Economic Development, Cambridge, MA: Harvard University Press.
Schumpeter, J.A., 1950, Capitalism, Socialism and Democracy, New York: Harper and Row.
Van Stel, A. and M. Carree, 2004, Business ownership and sectoral growth: an empirical analysis of 21
OECD countries, International Small Business Journal 22 (4), 389-419.
Van Stel, A., M. Carree and R. Thurik, 2004, The effect of entrepreneurship on national economic growth:
an analysis using the GEM database, EIM Scales Paper N200320, Zoetermeer, NL: EIM.
This paper can be downloaded from www.eim.net.
21
Table I: Estimation results of Equations (1) and (2) over period 1999-2003 (36 observations) a
Model 1 Model 2 Model 3 Model 4 Model 5 constant 0.011 0.018 0.098 0.105** 0.076 (0.2) (0.4) (1.5) (2.2) (1.5) TEA -0.058 -0.428 (0.5) (1.6) TEA*GNIC 0.021* (1.9) TEA rich 0.161* (1.8) TEA poor -0.267* (2.0) TEA highly dev. 0.188** (2.1) TEA transition 0.080 (0.5) TEA developing -0.183 (1.4) log (GNIC) -0.025 -0.028 -0.060** -0.052** -0.041** (1.5) (1.3) (2.1) (2.5) (2.3) GCI 0.017 0.018 0.021 0.014 0.013 (0.9) (0.9) (1.2) (1.0) (0.9) lag GDP growth 0.013 0.031 0.006 0.003 -0.059 (0.0) (0.1) (0.0) (0.0) (0.2) R2 0.212 0.224 0.363 0.512 0.543 adj. R2 0.138 0.124 0.257 0.430 0.448 a Absolute heteroskedasticity-consistent t-values are between brackets. TEA is total entrepreneurial activity rate (Global Entrepreneurship Monitor), GCI is growth competitiveness index 2001 (Growth Competitiveness Report), GNIC is per capita income of 2001. Lagged GDP growth is average annual growth of GDP over the period 1994-1998. * Significant at 0.10 level. ** Significant at 0.05 level.
22
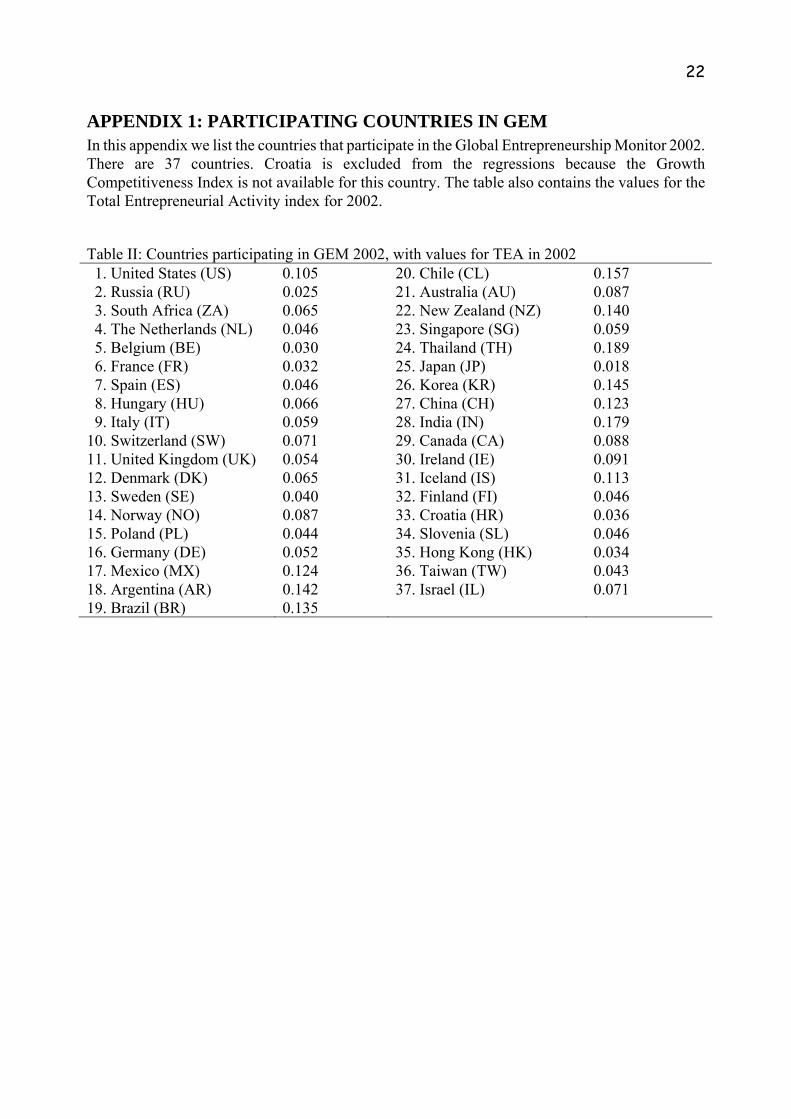
APPENDIX 1: PARTICIPATING COUNTRIES IN GEM In this appendix we list the countries that participate in the Global Entrepreneurship Monitor 2002. There are 37 countries. Croatia is excluded from the regressions because the Growth Competitiveness Index is not available for this country. The table also contains the values for the Total Entrepreneurial Activity index for 2002.
Table II: Countries participating in GEM 2002, with values for TEA in 2002 1. United States (US) 0.105 20. Chile (CL) 0.157 2. Russia (RU) 0.025 21. Australia (AU) 0.087 3. South Africa (ZA) 0.065 22. New Zealand (NZ) 0.140 4. The Netherlands (NL) 0.046 23. Singapore (SG) 0.059 5. Belgium (BE) 0.030 24. Thailand (TH) 0.189 6. France (FR) 0.032 25. Japan (JP) 0.018 7. Spain (ES) 0.046 26. Korea (KR) 0.145 8. Hungary (HU) 0.066 27. China (CH) 0.123 9. Italy (IT) 0.059 28. India (IN) 0.179 10. Switzerland (SW) 0.071 29. Canada (CA) 0.088 11. United Kingdom (UK) 0.054 30. Ireland (IE) 0.091 12. Denmark (DK) 0.065 31. Iceland (IS) 0.113 13. Sweden (SE) 0.040 32. Finland (FI) 0.046 14. Norway (NO) 0.087 33. Croatia (HR) 0.036 15. Poland (PL) 0.044 34. Slovenia (SL) 0.046 16. Germany (DE) 0.052 35. Hong Kong (HK) 0.034 17. Mexico (MX) 0.124 36. Taiwan (TW) 0.043 18. Argentina (AR) 0.142 37. Israel (IL) 0.071 19. Brazil (BR) 0.135