Regional competitiveness, university spillovers, and entrepreneurial activity
40
econstor www.econstor.eu Der Open-Access-Publikationsserver der ZBW – Leibniz-Informationszentrum Wirtschaft The Open Access Publication Server of the ZBW – Leibniz Information Centre for Economics Nutzungsbedingungen: Die ZBW räumt Ihnen als Nutzerin/Nutzer das unentgeltliche, räumlich unbeschränkte und zeitlich auf die Dauer des Schutzrechts beschränkte einfache Recht ein, das ausgewählte Werk im Rahmen der unter → http://www.econstor.eu/dspace/Nutzungsbedingungen nachzulesenden vollständigen Nutzungsbedingungen zu vervielfältigen, mit denen die Nutzerin/der Nutzer sich durch die erste Nutzung einverstanden erklärt. Terms of use: The ZBW grants you, the user, the non-exclusive right to use the selected work free of charge, territorially unrestricted and within the time limit of the term of the property rights according to the terms specified at → http://www.econstor.eu/dspace/Nutzungsbedingungen By the first use of the selected work the user agrees and declares to comply with these terms of use. zbw Leibniz-Informationszentrum Wirtschaft Leibniz Information Centre for Economics Audretsch, David B.; Hülsbeck, Marcel; Lehmann, Erik E. Working Paper Regional competitiveness, university spillovers and entrepreneurial activity UO Working Paper Series, No. 02-10 Provided in Cooperation with: University of Augsburg, Chair of Management and Organization Suggested Citation: Audretsch, David B.; Hülsbeck, Marcel; Lehmann, Erik E. (2010) : Regional competitiveness, university spillovers and entrepreneurial activity, UO Working Paper Series, No. 02-10 This Version is available at: http://hdl.handle.net/10419/57893
Transcript of Regional competitiveness, university spillovers, and entrepreneurial activity
econstor www.econstor.eu
Der Open-Access-Publikationsserver der ZBW – Leibniz-Informationszentrum WirtschaftThe Open Access Publication Server of the ZBW – Leibniz Information Centre for Economics
Nutzungsbedingungen:Die ZBW räumt Ihnen als Nutzerin/Nutzer das unentgeltliche,räumlich unbeschränkte und zeitlich auf die Dauer des Schutzrechtsbeschränkte einfache Recht ein, das ausgewählte Werk im Rahmender unter→ http://www.econstor.eu/dspace/Nutzungsbedingungennachzulesenden vollständigen Nutzungsbedingungen zuvervielfältigen, mit denen die Nutzerin/der Nutzer sich durch dieerste Nutzung einverstanden erklärt.
Terms of use:The ZBW grants you, the user, the non-exclusive right to usethe selected work free of charge, territorially unrestricted andwithin the time limit of the term of the property rights accordingto the terms specified at→ http://www.econstor.eu/dspace/NutzungsbedingungenBy the first use of the selected work the user agrees anddeclares to comply with these terms of use.
zbw Leibniz-Informationszentrum WirtschaftLeibniz Information Centre for Economics
Audretsch, David B.; Hülsbeck, Marcel; Lehmann, Erik E.
Working Paper
Regional competitiveness, university spillovers andentrepreneurial activity
UO Working Paper Series, No. 02-10
Provided in Cooperation with:University of Augsburg, Chair of Management and Organization
Suggested Citation: Audretsch, David B.; Hülsbeck, Marcel; Lehmann, Erik E. (2010) : Regionalcompetitiveness, university spillovers and entrepreneurial activity, UO Working Paper Series,No. 02-10
This Version is available at:http://hdl.handle.net/10419/57893
Electronic copy available at: http://ssrn.com/abstract=1588935Electronic copy available at: http://ssrn.com/abstract=1588935Electronic copy available at: http://ssrn.com/abstract=1588935
Monika Lindner‐Lehmann [Geben Sie den Firmennamen ein]
23.02.2010
David B. Audretsch, Marcel Hülsbeck and Erik E. Lehmann
Regional Competitiveness, UniversitySpillovers, And Entrepreneurial Activity This study examines the impact of regional competitiveness on the innovative activity of entrepreneurial firms. Based on a unique and hand collected data set of publicly listed high technology start‐ups and university regions, this paper tests how regional competitiveness and university spillovers affect the innovation behaviour of entrepreneurial firms. The results provide strong evidence that regional competitiveness and university spillovers are strong complements in fostering innovation activity of entrepreneurial firms. However, the results also raise the question whether incentives for universities and their actors might lead to crowding out effects. Keywords: regional competitiveness; university spillovers;entrepreneurship
JEL: M13, L 20, R30
‐ forthcoming ‐
UO‐Working‐Paper Series 02‐10 Version 1.1, April 21
th 2010
Corresponding Author: Dr. Marcel Hülsbeck Chair of Management and Organization University of Augsburg Universitätsstr. 16 D‐86159 Augsburg, Germany Fon: +49 (0) 821 598 4162 Fax: +49 (0) 821 598 144162 [email protected]‐augsburg.de
2010
Electronic copy available at: http://ssrn.com/abstract=1588935
Research Paper No. 2010-04-01
Regional Competitiveness, University Spillovers and
Entrepreneurial Activity
David B. Audretsch
Marcel Hülbeck
Erik E. Lehmann
Electronic copy available at: http://ssrn.com/abstract=1588935Electronic copy available at: http://ssrn.com/abstract=1588935Electronic copy available at: http://ssrn.com/abstract=1588935
2
Regional Competitiveness, University Spillovers,
And Entrepreneurial Activity
David B. Audretsch*, Indiana University, King Saud University and WHU Vallendar
Marcel Hülsbeck**, University of Augsburg
Erik E. Lehmann***, University of Augsburg
21/04/2010 16:54:00
This study examines the impact of regional competitiveness on the innovative activity of entrepreneurial firms. Based on a unique and hand collected data set of publicly listed high technology start-ups and university regions, this paper tests how regional competitiveness and university spillovers affect the innovation behaviour of entrepreneurial firms. The results provide strong evidence that regional competitiveness and university spillovers are strong complements in fostering innovation activity of entrepreneurial firms. However, the results also raise the question whether incentives for universities and their actors might lead to crowding out effects.
Keywords: regional competitiveness; university spillovers; entrepreneurship
JEL: M13, L 20, R30
* Ameritech Chair of Economic Development & Director Indiana University - Institute for Development Strategies, 1315 East Tenth Street, Bloomington, IN 47405, United States; King Saud University, Riyadh 11451, Saudi Arabia; WHU - Otto Beisheim Graduate School of Management; Burgplatz 2; D-56179 Vallendar, 56179 Germany **Department of Business and Economics, University of Augsburg, Universitätsstrasse 16, 86159 Augsburg, Germany. [email protected]; Fax.: (+49) (0)821 598 144162 *** Department of Business and Economics, University of Augsburg, Universitätsstrasse 16, 86159 Augsburg, Germany. [email protected]; Fax.: (+49) (0)821 598 4228 . We are grateful to Katharine Wirsching, Alexander Starnecker and Stephanie C. Göttche for research assistance. We gratefully acknowledge the advice and recommendations of two anonymous reviewers and of the participants of the workshop on “Entrepreneurial activity and Regional Competitiveness” at the Basque Institute of Competitiveness, San Sebastian, June, 2009, in particular Roy Thurik, Enrico Santarelli and our discussant Evila Piva.
Electronic copy available at: http://ssrn.com/abstract=1588935
3
Introduction
The production, acquisition, absorption, reproduction, and dissemination of knowledge
is seen as the fundamental characteristic of contemporary competitive dynamics
likewise in fostering innovative activity (SORENSEN and AUDIA, 2000; BAUM and
SORENSON, 2003; VARGA, 2000; STUART and SHANE, 2002; ANSELIN et al.,
2000; SANTORO and CHAKRABARTI, 2002). One result of this area of research is
that some locations experience stronger economic performance than others, especially
in fostering entrepreneurial activity (AUDRETSCH et al., 2006; PORTER, 2003).
The theoretical background for empirical findings is provided by the endogenous
growth theory (ROMER, 1986, 1990; LUCAS, 1988). This theory explains innovation
as an industrial combination of labour and knowledge (i.e. firm R&D) on the one hand
and as combination of human capital and knowledge through university research on the
other hand: knowledge production is a function of university and industry innovation.
At the same time the major part of knowledge production cannot be effectively
expressed using symbolic forms or representation, but remains embedded in relatively
immobile human capital (KOGUT and ZANDER, 1992; GERTLER, 2003). Since tacit
knowledge cannot be easily transferred over large distances or bought via the market.
This gives rise to the regional knowledge production as the prevalent economic
explanation of the competitiveness of regions (GRILICHES, 1979; PAKES and
GRILICHES, 1984; LEVIN et al., 1987)
Past research points out that the main source of tacit knowledge are research intense
universities (JAFFE, 1989; JAFFE et al., 1993; ACS et al., 1992, 1994) as producers of
human capital and research which “spill over” (ARROW, 1962b) to the regional
industry, especially innovative firms. These firms in turn use this knowledge to create
4
new products and foster regional competitiveness (ANSELIN et al., 1997; ACS et al.,
2002; RIP, 2002; FRITSCH and SLAVTCHEV, 2005; DRUCKER and GOLDSTEIN
2007). Doubtless, the existence of universities augments regional competitiveness to
foster entrepreneurial activities and regional growth. However, there is only scarce
evidence about the separate impact of either regional endowment and the existence of
universities on entrepreneurial activity. In this paper we fill this gap by analyzing the
separate impact of universities and regional endowments on the innovation behaviour of
young and high-technology intensive firms.
We argue that there are some key questions regarding the locational decisions of firms
which remain rather unexplored. While research has identified the important role that
universities play in generating knowledge spillovers on the one hand and regional
competitiveness on the other hand, the combined importance of both factors in
transmitting knowledge spillovers remains relatively unexplored. Furthermore,
anecdotal evidence suggests that the presence of a large university is a necessary
element in the social and cultural climate that creative individuals demand. Thus, three
hypotheses are tested. The first hypothesis is focused only on the impact of regional
competitiveness on innovation behaviour of entrepreneurial firms. The second only
points on university research expenditures and university spillover shaping innovation
behaviour of firms. Finally, the third hypothesis states that only both, regional
competitiveness together with research university expenditures, significantly shape the
innovation behaviour of firms.
The purpose of this paper is to address these questions focusing on how regional
competitiveness and university spillovers shape the innovation behaviour of
entrepreneurial firms. This is realized by explaining the innovation behaviour of
5
entrepreneurial firms – as measured by firm patents (endogenous variable) – as a
function of the regional competitiveness, proximity to the next university and the
research outputs of this university. Thereby not only the combined knowledge
production of industry and research, but also the characteristics proposed by
endogenous growth theory can be identified separately.
This paper is based on a hand collected dataset of all 475 IPOs in Germany over a ten
year period (1997-2007). In particular, compelling evidence is found that neither
regional competitiveness alone nor the research output of close universities alone can
explain the patenting activities of entrepreneurial firms alone. However, combining both
sources of spillovers, the results clearly show that firm behaviour is significantly shaped
by research intensive universities but also by regions with above average endowments.
Thus, the results confirm studies pointing out that distance matters for university
spillovers. Especially research output measured by citations positively shapes the
number of firm patents. In contrast, there could not be found any significant impact of
the number of university patents on firm patents. These results are in line with the
sectoral differentiation of industry innovation and university research as suggested by
endogenous growth theory and at the same time confirm the synergies of both sectors in
producing new knowledge. These beneficial effects on fostering entrepreneurship as the
predominant agent of innovation (see ACS and PLUMMER, 2005; Müller, 2006) are
moderated by public policy. We find that a liberal (i.e. market oriented) government on
federal state level promotes entrepreneurship while social-democratic (i.e.
interventionist) government impedes entrepreneurship. Finally, the results also shed
some light on the question, whether universities might not only foster entrepreneurial
activities but also compete with young firms.
6
The findings also indicate that regional competitiveness significantly shapes
entrepreneurial behaviour. Measures like the GDP/employee or population density
explain significantly the number of patents of a firm located in the respective region.
One of the most striking finding however is the number of firms founded in that region
or, what AUDRETSCH and KEILBACH (2004) call, entrepreneurial capital. The
results also reflect the structural change towards an entrepreneurial economy as
proposed by AUDRETSCH and THURIK (2001).
The remainder of the paper is organized as follows: Section 2 summarizes the literature
and introduces the testable hypotheses raised in this paper. Section 3 contains the
description of the database, and the estimation techniques. The empirical results are
presented in section 4. The last section presents a summary and conclusions.
Regional Competitiveness, Firm Location and Innovative Activity
The point of departure is that the location decision of firms in an imperfectly
competitive industry is not random, but based on two considerations: The cost of market
access and growth opportunities as well as quality and the cost of inputs at each
location. The better part of competitiveness of knowledge-based and high-technology
firms is determined by the latter factor. In this paper it is argued that high-tech-firms
chose their location based on their assessment of regional competitiveness (productivity,
innovations). Therefore one should be able to predict the innovative activity of young
high-tech firms by using indicators of regional competitiveness, i.e. highly innovative
firms settle in highly competitive regions.
7
In microeconomic theory the work of SOLOW (1956) proves the existence of a latent
variable other than technology (K) and labour (L) in (regional) economic growth. The
endogenous growth model (ROMER, 1986, 1990) identifies this variable as new
knowledge embedded in human capital (H). New knowledge itself consists of
innovation (ARROW, 1962a) and education (UZAWA, 1965) and is a result of the
interactive learning processes. New knowledge is created by combining existing
knowledge (A) with human capital (H*A). Innovation is formed by employing labour
(L) to existing knowledge (L*A). Output (Y) is produced by applying existing
technology (K) to the aforementioned factors:
( ) ( )Y H A L A K
ROMER (1990) distinguishes three societal domains with unique roles in this
production process. Universities produce new knowledge through research and
education (H*A), Industrial R&D creates innovation (L*A) and industrial production
uses technology (K) to create goods. These distinct domains are interconnected by
knowledge spillovers. Economically relevant knowledge is produced as a combination
of university research and industry R&D. The better the regional endowment with
innovative industry and universities, the higher is the innovative activity. As innovation
is a main driver of productivity, regional competitiveness can be interpreted as a direct
effect of the regional knowledge production and spillovers.
The view that knowledge spills over from universities to firms who commercialize that
knowledge is supported by theoretical models (ROMER, 1986, 1990; KRUGMAN,
1991; GROSSMAN and HELPMAN, 1991) and tested by a number of empirical studies
(JAFFE, 1989; JAFFE et al., 1993; ACS et al., 1992, 1994; AUDRETSCH and
FELDMAN, 1996; AUDRETSCH and STEPHAN, 1996; AUDRETSCH and
8
LEHMANN, 2005; AUDRETSCH et al., 2005). In the empirical literature, the sources
of knowledge spillovers are identified by the number of patents (JAFFE, 1989), the
number and quality of citations (AUDRETSCH and FELDMAN, 1996), local proximity
to universities (AUDRETSCH and LEHMANN, 2005), the endowment of universities
(AUDRETSCH et al., 2005) or the kind of knowledge (Audretsch et al., 2004) among
others. According to this literature is hypothesized that all inputs provided by research
universities as well as local proximity should enhance the number of patents of firms
located in this region.
The geographical approach to knowledge production is not only explained by the local
proximity of research universities but also by the regional industry. In the last years, the
expression of regional competitiveness entered the literature (BUDD and HIRMIS,
2004; BOSCHMA, 2004) which shows that territorial competition shaped from
countries to smaller geographic locations, regions. MARTIN and TYLER (2000)
describe three instances on which regions compete: the ability to attract capital, the
ability to attract high skilled employees and entrepreneurs, and the ability to attract
knowledge and innovation activity. As BUDD and HIRMIS (2004, p. 1021) point out,
regional competitiveness appears to be neither the simple aggregation of firms nor a
weighted disaggregation of the national economy. BOSCHMA (2004, p. 1005) clearly
points out that “like market shares shifting between firms, successful regions will
increase their relative share in the (national or world) economy at the expense of lagging
region”. While firms directly compete in market shares, regions are more or less directly
in a state of competition trying to attract creative talent and investments from elsewhere
(FLORIDA, 2002). However, successful regions as a relevant entity should affect the
behaviour and performance of local firms (BOSCHMA, 2004).
9
The approach of regional competitiveness has demonstrated the importance of the
spatial dimension in analysis of the innovative process. There now exists a large body of
literature showing the relevance of industrial districts (BECATTINI, 1990), regional
labour markets (FRITSCH, 1997), geographic location of R&D (PIERGIOVANNI and
SANTARELLI, 2001) or the concept of social capital (PUTNAM, 1993). Especially the
latter influenced a new body of literature, pointing out the importance of investments in
social capital (SIMMIE, 2003). AUDRETSCH and KEILBACH (2004) followed this
approach by pointing out the importance of a regions entrepreneurship capital as a
driving force in explaining the innovation behaviour of entrepreneurial firms.
The prediction that innovative activity favours those with direct access to knowledge
producing inputs does not necessarily apply to all cases. In this context, innovative
studies benefit if they take consideration of a unit of observation which also comprises
the spatial dimension of the system of innovation or the local endowments in which
each firm belongs. This resulting geographical approach to knowledge production was
thus originally developed by JAFFE (1989). Based on this approach it is differentiated
among the two sources of knowledge spillovers: research expenditures undertaken by
research universities and the innovation capacities of industries in the same region.
These knowledge spillovers are assumed from universities, regions or both. Such
spillovers serve as a source of knowledge creating the entrepreneurial opportunities to
generate innovate outputs.
To sum up, three testable hypotheses are formulated based on the above cited literature.
The first hypothesis (H1) is built on the literature of local proximity to research intense
universities and the impact on individual entrepreneurial companies. This literature
argues that the innovation behaviour of entrepreneurial firms is connected to the
10
university knowledge production (Audretsch and Lehmann 2005; Colombo et al. 2010).
Local innovation activity by entrepreneurial firms is positively affected by knowledge
spillovers from universities:
H1:“University Spillover Thesis”: Research expenditures by local universities
significantly increase the innovation behaviour of entrepreneurial firms
The second hypothesis (H2) summarizes findings from the broad literature highlighting
the impact of regional and industrial endowment on entrepreneurial firms (see e.g.
Boschma, 2004; Fritsch, 1997; Audretsch and Feldman, 1996). This hypothesis states
that innovation behaviour of entrepreneurial firms is shaped by regional specific
variables, like the existence of entrepreneurship capital (Putnam, 2003; Audretsch et al.
2006, p. 60ff).
H2: “Regional Innovation Capacity Thesis”: Superior regional endowment
significantly increases the innovation behaviour of entrepreneurial firms.
Finally, the third hypothesis (H3) is built on the above mentioned literature on regional
competitiveness, highlighting the complementary of both, the existence of excellent
universities and superior regional endowment, fosters entrepreneurial growth. These
works showed that knowledge produced by universities is captured within the regional
environment and results in enhanced entrepreneurial activity (see e.g. Goldstein and
Renault, 2004).
11
H3:” Regional Competitiveness Thesis”: Only the combination of research
expenditures by local universities and superior regional endowment significantly
increases the innovation behaviour of entrepreneurial firms.
Data and Measurement
Sample Selection
To test the influence of regional competitiveness and university spillovers on
entrepreneurial activity, we use a unique and hand collected dataset of high technology
German IPO-firms. Our initial dataset compiled all IPOs of German issuers, as
identified by their ISINs, in segments of Deutsche Boerse AG (German Stock
Exchange) in the period from 1997 to 2007. Containing 433 IPOs in segments of
Deutsche Boerse AG’s regulated market our initial sample covered about 90 percent of
total regulated market IPOs in Germany in the respective time period. Additionally, all
42 firms listed in Deutsche Boerse AG’s primary statistics for this time period that had
their IPOs in the open market segment were included. From these 475 observations all
banks (3 firms), holding companies (7 firms) and established firms which are founded
more than 8 years (the median age in the whole dataset) before an IPO and employed
more than 1.000 employees (236 firms) were dropped. This leads to a sample of 229
firms which is defined as young and high-tech entrepreneurial firms and includes highly
innovative industries, like biotechnology, medical devices, life sciences, e-commerce,
and other high-technology industries which represent the knowledge-based economy.
The reason to use the time period 1996 - 2007 was because in the years before IPO were
a rather seldom phenomenon in Germany and only large and established firms put their
12
shares public. Moreover, no IPO was observed from 2007 until March 2010. A selection
bias since IPO firms may represent rather successful operating companies is known (see
e.g. AUDRETSCH et al. 2006).However, in contrast to private entrepreneurial firms,
IPO has to publish information to the public. This allows gathering detailed information
about the firms.
Variables and Measurement
This company dataset was pooled with indicators of regional competitiveness and
university characteristics within the respective region to account for the impact of
industry and research on regional entrepreneurship. Like other studies before (see e.g.
JAFFE, 1989; ACS et al. 1992) the relationship across geographical areas and
university research expenditures is examined on the one and private innovation output
by entrepreneurial firms on the other hand in terms of patent counts. Although patents
may be a rather questionable measure, “a patent after all represents a minimal quantum
of invention that has passed both the scrutiny of the patent officer as to its novelty and
the test of the investment of effort and resources by the inventor and his organization”
(GRILICHES, 1990, p. 1669). The crucial innovative input is new technological
knowledge generated by R&D, and the relevant innovative output is technological
knowledge resulting in patent innovations (GRILICHES, 1979, 1984). In this way, it
should be expected that firms differ in their number of patents by their location and
therefore their access to sources of inputs. The number of patents is taken from the
German patent office (Deutsches Patentamt).
Firm location is often measured by geographic districts, which are comparable to the
Standard Metropolitan Statistical Areas (SMSA), often used in regional studies for the
United States (VARGA, 2000). The regional level of analysis is based on labour market
13
regions (LMRs), sometimes also called travel-to-work-areas. LMRs are constructed to
represent regions of common economic activity by merging administrative districts
based on human capital commuting in and out of these counties (hence travel-to-work-
areas). In this way LMRs are mapping the mobility of human capital in space and
integrate intraregional geographic effects, while confining interregional spillover
effects. LMRs are used according to the construction by ECKEY et al. (2006) through
factor analysis with oblique rotation and a constraint of a one way commuting time of
60 minutes, resulting in 150 LMRs based on 440 administrative districts in Germany.
These LMRs are not biased by administrative or political considerations. Hence,
choosing LMRs as the level of analysis, not only represents the geographic dispersion
of economic activity, but also controls for the economic geography of regions.
Regions and regional competitiveness indicators
Next, variables indicating regional competitiveness are introduced. As noted above,
region is captured by labour market regions (LMR). The impact of regional
competitiveness on entrepreneurial innovation is measured by employing proxies for
industrial spillovers, regional productivity, industry structure, innovative capacity of the
industry, entrepreneurial capital, and political and historical influences. Unspecific
(intra- and interindustrial) spillovers are accounted for population density (inhabitants
per square kilometer) as suggested by the urbanization economics literature
(HENDERSON, 1983, 1986; GLAESER et al., 1992; GLAESER, 1999). Regional
productivity is not measured by GDP per capita (the usual control for productivity in
entrepreneurship literature, e.g. FELDMAN et al., 2002; POWERS and
MCDOUGALL, 2005) but as GDP per employee to correct for variations in population
and labour market structure. At the same time for industrial structure is controlled for by
14
decomposing the regional GDP into the gross value added per capita (GVA/Capita) by
industry (GVA/Capita Industry) and industrial services (GVA/Capita Services). To
measure the innovative activity of the regional industry the number of industry patents
per year is used. As shown by GREIF et al. (2006), those are highly correlated (r0.9561)
with industrial R&D-spending at the level of administrative regions. Regional R&D-
spending has been found to be a relevant measure of regional innovative
competitiveness (FELDMAN et al., 2002; LINDELÖF and LÖFSTEN, 2004; LINK and
SIEGEL, 2005). Empirical evidence suggests that technology entrepreneurs interact
creatively and thus prefer to be located in a region in which entrepreneurs are
concentrated. Hence, the number of new businesses per 1000 inhabitants is used to
factor in the regional entrepreneurial capital.
Finally, regional impacts of federal state level economic policy is controlled by using a
dummy variable for this area governed by the social democrats (SPD, known for their
non-liberal economic policy) but also for political changes (Change). In contrast,
Christian Democrats (CDU) are highly interested in fostering economic and
entrepreneurial activities and invest more money in start-up Projects or regional R&D.
Like in Bavaria, they directly support university-industry links as well as they foster
cooperation across large incumbent firms and entrepreneurial firms (see Hülsbeck and
Lehmann, 2007). As a consequence, it can be expected that entrepreneurial innovation
behaviour is also shaped by the kind of politics in the respective. Possible historical
impacts of the former German Democratic Republic are captured by a dummy for
regions in ‚East Germany‘. All data, excluding the number of industry patents, have
been collected by using the regional statistics database of the German Federal Statistical
Office. Data of industry patents were calculated using the German Patent Atlas by
GREIF et al. (2006).
15
University spillovers
Now, variables to measure quantity, quality and spillover effects from all the German
universities with science and or technology departments (n=66) are introduced.
University spillovers could be defined as an externality accessed by firms, for which the
university is the source of the spillover but not fully compensated (HARRIS, 2001).
Due to the fact that firms access external knowledge at a cost that is lower than the cost
of producing this value internally or of acquiring it externally from a larger geographic
distance (HARHOFF, 2000), they will exhibit higher expected profits. The cost of
transferring such knowledge is a function of geographic distance and gives rise to
localized externalities (SIEGEL et al., 2003). As previous research shows, the
production of knowledge and thus spillovers by universities is significantly shaped by
quantity and quality parameters (see VARGA, 2000; HENDERSON et al., 1998; HALL
et al., 2003; MCWILLIAMS and SIEGEL, 2000; AUDRETSCH and STEPHAN, 1996,
1999; ZUCKER et al., 1998). To capture the spillover mechanism, this literature will be
followed measuring quantity and quality effects by the number of articles by scientists
of a university, the citations, third party funding, the number of university patents and
the number of students. To control for size effects, based on the empirical literature the
ratios per researchers are used. All university data come from the research ranking of
German universities (BERGHOFF et al., 2006). To control for the introduction of the
German copy of the Bayle-Dole Act (Arbeitnehmererfindungsgesetz) in 2002, the
number of university patents before 2001 (#patents 97-01) and after 2001 (#patents 02-
06) are included. As previous research shows, the number of university patents
increased significantly in the USA after the Bayle-Dole Act in 1980 (see HENDERSON
et al., 1998, for quantity effects, but also MOWERY and ZIEDONIS, 2002, for
qualitative effects).
16
As ARROW points out, “learning […] takes place during activity” (1962a, p. 155) and
thus leads to path dependencies, it will be controlled for learning effects in patenting.
As previous studies show, this experience could be expressed by time effects (COUPÉ,
2003; FRIEDMAN and SILBERMAN, 2003). Ergo, the age of the first patent
application is included to control for learning effects and in this manner path
dependencies in patenting. However, universities in Germany differ largely in two
aspects: Whether they have a medical or an engineering department. Consequently,
dummy variables indicating universities with a large department in medicine (Medicine
Faculty) or engineering (Engineer Faculty) are used.
As noted earlier, spillover effects diminish over time and distance. Thereupon, as
JAFFE (1989) points out, geographical location is important in capturing the benefits of
spillovers when the mechanism of knowledge is informal conversation, as is the case of
tacit knowledge. Then, "...geographic proximity to the spillover source may be helpful
or even necessary in capturing the spillover benefits" (JAFFE, 1989, p.957). SHANE
(2001a, 2001b) explores the determinants of proximity to the MIT (Massachusetts
Institute of Technology) on new firm formation. His main finding is that universities
create technological spillovers, which could be exploited by the formation of new firms.
Thus, the limited geographic reach of such channels for the exchange of information
and know-how is assumed to be one of the leading causes of the impact of geographic
proximity. That is why geographical proximity enters in the analysis. To test the impact
of universities on a firm's location decision, the distance to the closest university as the
dependent variable is taken. Since universities in Germany are more geographically
concentrated compared to the U.S., there is the need for a measure, which is sensitive to
small variations. The distance is measured in kilometres using the online database of the
German Automobile Club (www.adac.de). All firms located within a radius of 2.5
17
kilometres are classified as belonging in the distance category of 1 kilometre – the
smallest value. While some universities, like the University of Konstanz, are very small
in their geographic expansion, others, like the universities of Munich are quite large. To
control for this variation, the closest distance towards a university is measured with 1
km but including all firms located within the inner circle of 2.5 km (the median of the
geographic expansion of universities) as located also closest towards a university.
Research Methods
The number of firm patents as a function of regional competitiveness, the existence of a
university, university output, industry and firm specific variables is empirically
modelled. As the endogenous variable is discrete rather than continuous and cannot
become negative linear regression models result in biased estimations (see Kennedy,
2003, pp.48). In early empirical research this problem was bypassed by using
logarithms of the native indicators to transform discrete variables into continuous ones
while buffering nonlinear effects. However this procedure does not account for
unobserved heterogeneity among units or correlated error terms. To obtain unbiased
estimations one can use a Poisson regression model. This model bases on the Poisson
distribution, which predicts independent rare events (e.g. a patent grant). However, note
that a Poisson model assumes equality between the mean and variance of the dependent
variable. Specification tests for overdispersion (CAMERON and TRIVEDI, 1997) reject
the Poisson as the appropriate distribution for the data used in this study. To relax this
assumption we use negative binomial distribution, a discrete probability distribution of
the number of successes in a row of Bernoulli trials. For example, if one tosses a coin
until he gets five ‘heads’ the number of ‘tails’ occurring in this process follows a
negative binomial distribution. As can be inferred from this simple example the
18
negative binomial distribution does not assume the independence of trials - the more
‘heads’ in a row one gets, the more likely it becomes to get ‘tails’ - and can therefore
account for contagion effects in the sample (JOHNSON et al., 2005). In the present case
one can assume learning effects in a way that firms with high patent counts are more
likely to get additional patents. This illustrates the violation of the linearity assumption
of ordinary least squares regression as well. In summary the negative binomial
regression model is the only model allowing for non-linearity, contagion, unobserved
heterogeneity (GOURIEROUX et al., 1984) and correlated standard errors (LONG,
1997) at the same time. Nevertheless the empirical models presented in the following
subsections were tested against alternative models using the ‘countfit‘ procedure
suggested by LONG and FREESE (2006, pp.409) and found the negative binomial
regression model superior to the Poisson regression, zero inflated Poisson regression
and zero inflated negative binomial regression for all tests (Bayes Information Criterion,
Akaike Information Criterion, Vuong-Test, likelihood-ratio-test).
Four different models were estimated. Model (I) includes only industry variables and
firm size to explain the number of patents. Model (II) expands the first specification by
including variables measuring regional competitiveness. In Model (III) the impact of
university spillovers on the number of firm patents is estimated. Then, in the forth
specification (Model IV) the variables jointly together are estimated.
Model (I): Firm patents = f(Industry, Size) + Error
Model (II) Firm patents = f(regional competitiveness, Industry, Size) + Error
Model (III): Firm patents = f(university spillovers, Industry, Size) + Error
19
Model (IV): Firm patents =f(regional competitiveness, university spillovers, industry,
size) + Error
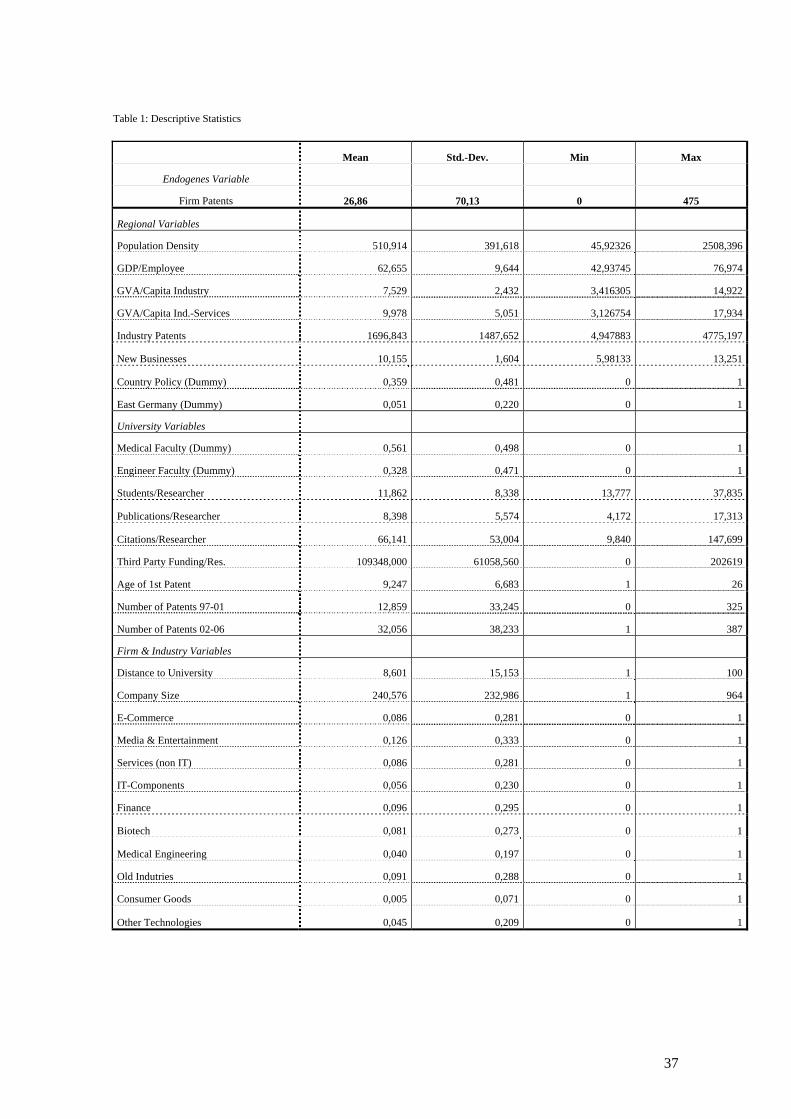
Descriptive Statistics
Table 1 presents and summarizes the descriptive statistics. On average, a firm owns 26
patents. However, as shown by the standard deviation, this variable is highly skewed,
with a maximum value of 475 patents. A closer look at the “Firm & Industry Variables”
shows an average entrepreneurial firm in our data set is located within a radius of about
8 km away from the next university and employs about 240 employees.
The first rows contain the variables indicating regional competitiveness (regional
variables) in labour market regions. The variables differ considerably across the regions.
On average, there live about 500 people/square kilometre with a maximum value of
more than 2,500 and a minimum value under 50 people per square-kilometre. There also
large differences in GVA/Capita-Values or in new business creation – or entrepreneurial
capital.
Also, public universities in Germany differ significantly in their research outputs and
expenditures. While there are universities without third party funding, only about 4
publications per researcher and no registered patent until 1997, there also exists some
excellent research universities with more than 200.000€ funding per researcher or about
150 citations per researcher. [Table 1 about here]
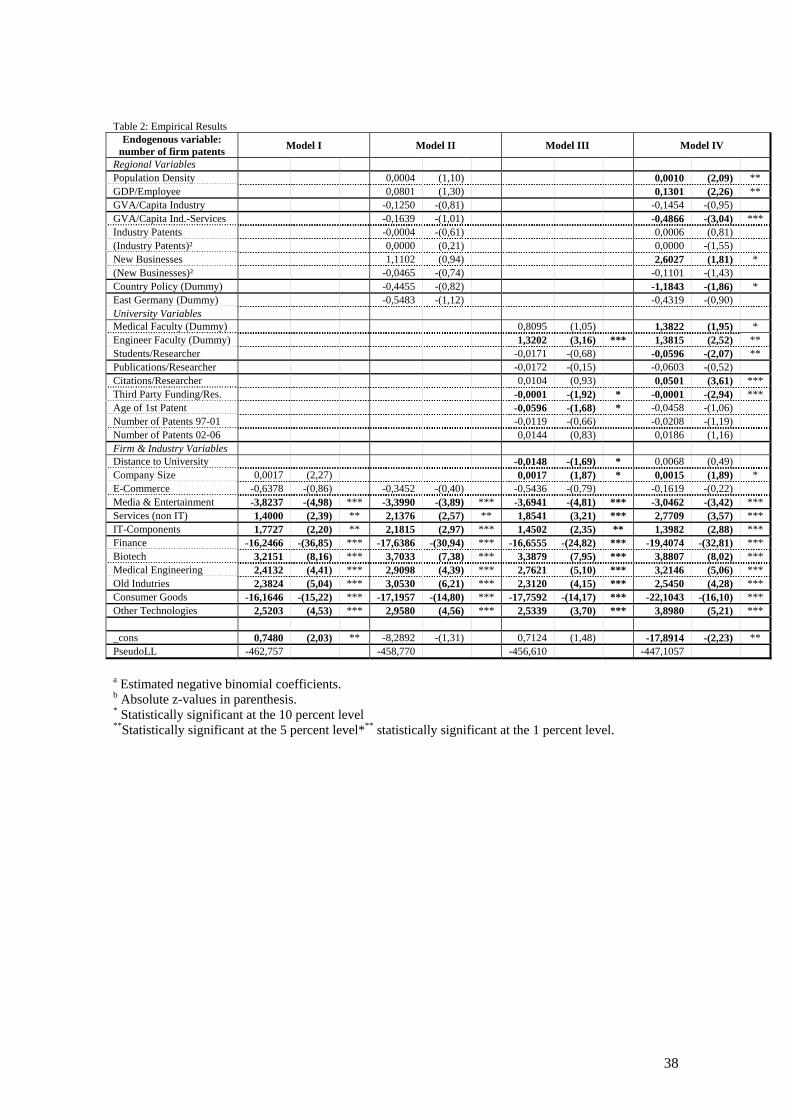
Empirical Evidence
The empirical results from the negative binomial regressions are presented in table 2. In
20
the first specification (Model I), only industry dummies and firm size are included to
explain the number of patents owned by firms. The results, as depicted in column 2,
clearly show that industries differ significantly in their patent activity. While observing
a significant and positive coefficient in high-tech industries like biotech or medicine and
life sciences, a significant lower patenting intensity is observed in the
Media&Entertainment industries or consumer goods industries. Interestingly, firm size,
as measured by the number of employees, remains insignificant.
Next, the first hypothesis (H1) is tested by Model (II). This regression model only
includes the variable of regional competitiveness. While the industry dummies remain
significant as in Model (I), none of the regional variables shows a significant impact in
explaining the number of firm patents. This leads to rejection the first hypothesis
concluding that regional competitiveness as expressed by the set of variables does not
show any significant impact on a firms’ innovation behaviour. This result confirms
previous findings that firm behaviour is not necessarily shaped by the local endowments
alone (AUDRETSCH and FRITSCH, 2003 among others).
Then, it is up to control for the second hypothesis (H2) that university research
expenditures significantly shape the number of firm patents and include university
specific variables to measure the spillover effects of the closest university. The results
from Model (III) are depicted in column 4. As before, the regression results cannot find
empirical support for the hypothesis that university research expenditures significantly
shape the innovation behaviour of entrepreneurial firms. There is only one variable
which fits to the hypothesis. The dummy variable indicating a technically oriented
university enters the regression positively while the existence of a medicine faculty has
no statistically significant impact. However, the results show some puzzling findings.
21
First, third party funding seems to lower significantly the innovation behaviour of
entrepreneurial firms. In the last decade, third party funding is one of the major goals
for university professors. Their individual and personnel income significantly increases
with the amount of third party funding acquired, both by higher salaries paid by the
universities and directly linked transfers from the industries. Since entrepreneurial firms
often lack substantial financial resources, large incumbent firms are more attractive as
research partners. Thus, it may be more attractive to professors to compete with
entrepreneurial firms. There laboratories are mostly paid by the tax payer or funds from
larger firms. They also have superior access to the critical resource of excellent
researchers. The negative impact of the year of the first university patent shows that
universities with long experience in patenting their inventions may compete directly
with entrepreneurial firms. Then, third party funding by the industry may lead to
crowding out effects of entrepreneurial innovation behaviour. While the dummy
variable indicating a medical university enters the regression insignificantly, the dummy
variable indicating the existence of an engineering faculty shows a positive and
significant impact. This result reflects the long tradition of German universities in
Engineering.
As well the number of firms’ patents is negatively shaped by distance, which confirms
earlier studies (AUDRETSCH et al., 2005) that knowledge spills over to firms closer
located to the source of knowledge. In this specification, firm size shows a positive and
significant impact indicating that the number of patents goes in line with firm size and
experience effects of universities.
Finally, the third hypothesis (H3) is tested in that both, research intense university and
regional variables together, shape the innovation behaviour of firms. Thus, in the fourth
22
specification (Model IV), all variables in the regression are included. In contrast to the
previous regressions, now, some variables indicating regional competitiveness and
university research expenditures enter the regression significantly. This could be
interpreted as regional competitiveness and university output being strong complements
in fostering entrepreneurial activity. A positive and significant influence of the
population density and the GDP per employee is observed. High population density is
associated with lower costs of communication by closer relationships and network
effects. The negative and significant sign of the GVA (gross value added) in the service
sector reflects that patenting activities in this lower compared to the industrial sector.
The number of start-ups enters the regression positively and highly significant. This
variable reflects the entrepreneurial capacity of regions or the “entrepreneurial culture”
(AUDRETSCH and KEILBACH, 2004). Entrepreneurial culture reflects such features
as the availability and access to capital, regional policy and incentive programs to
support and stimulate entrepreneurial start-up, the support of network programs among
others. Finally, a negative and significant impact of the policy variable is observed. This
policy variable replaces the variable indicating East-Germany as a significant control
variable found in earlier studies. Entrepreneurship policy like supporting and providing
networks, local attitudes towards “entrepreneurs” or incentive programs to foster and
stimulate transfer programs differ significantly among the two major parties in
Germany, the Socialist Democratic Party and the Christian Democratic Party (see e.g.
HÜLSBECK and LEHMANN, 2007). [Table 2 about here]
While the variables indicating regional competitiveness only show a significant impact
in the joint estimation with the university variables, the latter remain significant in the
regression. As has been confirmed by HÜLSBECK and LEHMANN (2010) these
results point to a coevolution of region and university. The coefficients of the dummy
23
variables indicating a medicine faculty and an engineer faculty show a highly significant
impact on firm patents. Also, the number of citations enter the regression significant
positively now. The negative impact of the number of students/researchers points out
that researchers are more engaged in teaching and less in doing research. In contrast to
the US or the UK, where a kind of labour division across lecturers and research
researchers can be observed, in Germany professors as well as PhD-candidates or post-
docs, which are paid by the public hand, have to teach up to 10 hours a week. Thus, an
increase in the number of students per researchers lowers the capacity for doing
research. As before, the coefficient of the variable third party funding per researcher
remains negative and significant. As explained above, it must be assumed that this
finding may be a hint to crowding out effects through a change in the incentive system.
Finally, a positive and significant impact of citations per researchers on the patenting
behaviour of firms is to observe. This result confirms other findings (ZUCKER et al.,
1998; AUDRETSCH et al., 2005) that research intensive universities provide positive
spillover effects to high-technology firms.
Limitations of the Study
As for most papers, some limitations of the present analysis need to be noted. The main
limitations of the study come from the characteristics of the dataset. First, the analysis
relies on a sample of IPO firms, which, as such, can be viewed as a positive selection of
successful entrepreneurial firms. This may limit the results to IPO firms. However,
those firms are the most dynamic firms in regional area showing the highest growth
rates and impact on regional growth (see e.g. COLOMBO, et al. 2010). Furthermore,
the sample is restricted to firms younger than 8 years – the median value of the total
sample. This selection bias towards younger firms is intended. The most serious
24
problem of this work is the use of patent counts as a proxy for intellectual capital and
technological capabilities. Although other studies also rely on patent counts, this is by
far not satisfying. In a famous survey, GRILICHES (1990) criticizes the use and abuse
of patent numbers as indicators for innovation behaviour or technological indicators:
Not all inventions are patentable, not all inventions are patented and finally, the
inventions that are patented differ greatly in their quality. The first two points may
result in a selection bias, which may lead to an underestimation of our results. However,
as GRILICHES suggests (p. 1669), both problems can be taken care of by industry
dummies, which are included in the regressions. Our results clearly show that there are
significant differences in the number of patents across the included industries. Citing
Frederic Scherer, GRILICHES (p. 1669) suggests that for the third problem, that patents
differ in their quality, one tries to invoke the help of the “law of large numbers”, where
the significance of any sampled patent can be interpreted as random variable with some
probability distribution. However, we think that our dataset, in particular the number of
firm patents, not necessarily follows the law of large numbers. Finally, only the number
of firm patents at the time of IPO is used.
Further research may also investigate this issue, analysing how the innovation
behaviour of individual entrepreneurial firms is shaped by universities and regional
endowment. This research should take the limitations of this study into account and use
a more accurate dataset and measures for the quality of innovation behaviour. Instead of
simply measuring the number of patents, other measures like patent citations should be
used. Finally, future research should also go a step further, analyzing the links – perhaps
the role of the key inventor - across the entrepreneurial firms – and the university and/or
the regions. In particular, future research should provide further evidence of crowding
out effects of third party funding on entrepreneurial innovation behaviour. In this
25
context, the role of large incumbents should also be considered to analyze their impact
in the triangle of university, regional competitiveness and entrepreneurial firms. By that,
the role of regional government policy should also be mentioned and analyzed.
Summary and Conclusions
It is widely observed that entrepreneurial activity varies across geographic space.
Efforts to systematically link spatial variations in entrepreneurship with location
specific characteristics showed that such spatial activity is not all random but rather
shaped by factors associated with particular regions. While empirical evidence has
already been provided supporting the impact of regions on the one hand and universities
on the other on innovation activities, little is known about the separate and joint effect
of those sources of spillovers. This paper has found that the innovation activity of young
and high-tech firms is shaped by above average local endowments and research
intensive universities. While the results show that regional competitiveness and research
output by universities are close substitutes in shaping firm behaviour, it was possible to
show that the existence of research intensive universities may have a stronger impact on
firm behaviour than regional competitiveness alone. While regional competitiveness is
undoubtedly important in influencing the innovation behaviour of young and small
firms, the impact of the local endowment only significantly shapes the innovation
behaviour if research intensive universities are located in this region. As comparative
advantage has become more important for regions, the results also show the significant
impact that public policy has on the innovative process in young and high-tech firms.
Public policy can shape the competitiveness of regions by providing both, the
26
infrastructure that enables young firms to absorb necessary resources but as well to
provide the right incentives for entrepreneurs and researchers.
However, the results also find some puzzling results. A significant impact of third party
funding on entrepreneurial innovation behaviour was found. This can be explained by
crowding out effects due to changes in the salary and bonus system of professors and
researchers in Germany. While it might be interesting for researchers to invest in
university-spinoffs and start an own firm, it is of less interest to cooperate with young
and entrepreneurial firms. First, those entrepreneurial firms may directly compete with
their own firm or research. The superior access to excellent researchers for professors
leads to a comparative disadvantage for entrepreneurial firms. Secondly, research
funding from the industry increases the personnel income of professors. Directly in that
they receive bonus-like payments, indirectly by increasing their bargaining power for
their salaries. Although there is no empirical study about this effect, the phenomenon is
actually a topic in the management press (see: Manager Magazine). Policy makers thus
should put more attention on whether public founded research leads to spillover or
crowding out effects for entrepreneurial firms. The results also shed some light that
regional governmental policy as expressed by different attitudes of parties toward an
entrepreneurial society shapes the innovation behaviour of entrepreneurial firms.
27
References
ACS Z., AUDRETSCH D. B. and FELDMAN M. P. (1992) Real Effects of Academic
Research: Comment, American Economic Review 82, 363-367.
ACS Z., AUDRETSCH D. B. and FELDMAN M. P. (1994) R&D Spillovers and
Innovative Activity, Managerial and Decision Economics 15, 131-138.
ACS Z. J., ANSELIN L. and VARGA A. (2002) Patents and innovation counts as
measures of regional production of new knowledge, Research Policy 31,
1069-85.
ACS Z. J. and PLUMMER L. A. (2005) Penetrating the knowledge filter 'in regional
economies, The Annals of Regional Science 39, 439-56.
ANSELIN L., VARGA A. and ACS Z. (1997) Local geographic spillovers between
university research and high technology innovations, Journal of Urban
Economics 42, 422-48.
ANSELIN L., VARGA A. and ACS Z. (2000) Geographical Spillovers and University
Research: A Spatial Econometric Perspective, Growth and Change 31 (4),
501-515.
ARROW K. J. (1962a) The Economic Implications of Learning by Doing, Review of
Economic Studies, 155-173.
ARROW K. J. (1962b) Economic welfare and the allocation of resources for inventions,
in NELSON R. R. (Ed) The Rate and Direction of Inventive Activity, pp.
609-26. Princeton University Press, Princeton, NJ.
AUDRETSCH D. B. and FELDMAN M. P. (1996) R&D Spillovers and the Geography
of Innovation and Production, American Economic Review 86, 630-640.
28
AUDRETSCH D. B. and FRITSCH M. (2003) Linking Entrepreneurship to Growth:
The Case of West Germany, Industry and Innovation 10, 65-73.
AUDRETSCH D. B. and KEILBACH M. (2004) Entrepreneurship Capital and
Economic Performance, Regional Studies 38, 949-959.
AUDRETSCH D. B. and LEHMANN E. E. (2005) Does the Knowledge Spillover
Theory of Entrepreneurship hold for Regions?, Research Policy 34 (8),
1191-1202.
AUDRETSCH D. B. and STEPHAN P. E. (1996) Company-Scientist Locational Links:
The Case of Biotechnology, American Economic Review 86 (3), 641-652.
AUDRETSCH D. B. and STEPHAN P. E. (1999) Knowledge Spillovers in
Biotechnology: Sources and Incentives, Journal of Evolutionary Economics
19, 97-107.
AUDRETSCH D. B. and THURIK R. (2001) What's New about the New Economy?
Sources of Growth in the Managed and Entrepreneurial Economies,
Industrial and Corporate Change 19, 795-821.
AUDRETSCH D. B., KEILBACH M. C. and LEHMANN E. E. (2006)
Entrepreneurship and Economic Growth, Oxford University Press USA,
Oxford.
AUDRETSCH D. B., LEHMANN E. E. and WARNING S. (2004) University
Spillovers: Does the Kind of Science Matter?, Industry and Innovation, 11
(3), 193-205.
AUDRETSCH D. B., LEHMANN E. E. and WARNING S. (2005) University
Spillovers and New Firm Location, Research Policy 34(7), 1113-1122.
29
BAUM J. A. C. and SORENSON O. (2003) Advances in Strategic Management:
Geography and Strategy, Vol. 20, JAI Press: Greenwich CT.
BECATTINI G. (1990) The Marshallian Industrial District as a Socio-economic Notion,
in BECATTINI G., PYKE F. and SENGENBERGER W. (Eds.) Industrial
Districts and Inter-firm Co-operation in Italy, 37-51. International Labor
Studies, Geneva.
BERGHOFF S., FEDERKEIL G., GIEBISCH P., HACHMEISTER C.-D., HENNINGS
M. and MÜLLER-BÖLING D. (2006) Das CHE ForschungsRanking
deutscher Universitäten 2006. Centrum für Hochschulentwicklung,
Gütersloh.
BOSCHMA R. A. (2004) Competitiveness of Regions from an Evolutionary
Perspective, Regional Studies 38, 1001-1014.
BUDD L. and HIRMIS A. K. (2004) Conceptual Framework for Regional
Competitiveness, Regional Studies 38, 1015-1028.
CAMERON, A. and TRIVEDI, P., (1997) Regression Analysis of Count Data,
Cambridge: Cambridge University Press.
COLOMBO, M. G. , D’ADDA, D. and PIVA, E. (2010) The Contribution of University
Research to the growth of academic start-ups: An empirical analysis,
Journal of Technology Transfer 35(1), 113-140.
COUPÉ T. (2003) Science is Golden: Academic R&D and University Patents, Journal
of Technology Transfer 28, 31-46.
DRUCKER J. and GOLDSTEIN H. (2007) Assessing the Regional Economic
Development Impacts of Universities: A Review of Current Approaches,
International Regional Science Review 30, 20-46.
30
ECKEY H. F., KOSFELD R. and TÜRCK M. (2006) Abgrenzung deutscher
Arbeitsmarktregionen, Raumforschung und Raumordnung 64, 299-309.
FELDMAN M. P., FELLER I., BERCOVITZ J. and BURTON R. (2002) Equity and
the Technology Transfer Strategies of American Research Universities,
Management Science 48 (1), 105-121.
FLORIDA R. (2002) Bohemia and Economic Geography, Journal of Economic
Geography 2, 55-71.
FRITSCH M. (1997) New Firms and Regional Employment Change, Small Business
Economics 9 (5), 437-448.
FRITSCH M. and SLAVTCHEV V. (2005) The Role of Regional Knowledge Sources
for Innovation: An Empirical Assessment. Technical University
Bergakademie Freiberg-Faculty of Economics and Business Administration.
FRIEDMAN, J. and SILBERMAN J. (2003) University Technology Transfer: Do
Incentives, Management and Location Matter?, Journal of Technology
Transfer 28, 17-30.
GERTLER M. S. (2003) Tacit Knowledge and the Economic Geography of Context, or
The Undefinable Tacitness of Being (There), Journal of Economic
Geography 3, 75-99.
GLAESER E. L. (1999) Learning in Cities, Journal of Urban Economics 46 (2), 254-
277.
GLAESER E. L., KALLAL H. D., SCHEINKMAN J. D. and SHLEIFER A. (1992)
Growth in Cities, Journal of Political Economy 100 (6), 1126-1152.
31
GOLDSTEIN, H. A. and RENAULT, C. S. (2004) Contributions of Universities to
Regional Economic Development: A Quasi-Experimental Approach,
Regional Studies 38(7), 733-746.
GOURIEROUX C. S., MONFORT A. and TROGNON A. (1984) Pseudo maximum
likelihood methods: applications to Poisson models, Econometrica: Journal
of the Econometric Society, 701-20.
GREIF S., SCHMIEDL D. and NIEDERMEYER G. (2006) Patentatlas 2006,
Regionaldaten der Erfindungstätigkeit, Deutsches Patent- und Markenamt,
München.
GRILICHES Z. (1979) Issues in Assessing the Contribution of Research and
Development to Productivity Growth, The Bell Journal of Economics 10
(1), 92-116.
GRILICHES Z. (1984) R&D, Patents and Productivity, University of Chicago Press,
Chicago.
GRILICHES Z. (1990) Patent Statistics as Economic Indicators: A Survey, Journal of
Economic Literature 28, 1661-707.
GROSSMAN G. M. and HELPMAN E. (1991) Innovation and Growth in the Global
Economy, MIT Press, Cambridge.
HALL B. H., LINK A. N. and SCOTT J. T. (2003) Universities as Research Partners,
Review of Economics and Statistics.
HARHOFF D. (2000) R&D Spillovers, Technological Proximity, and Productivity
Growth - Evidence from German Panel Data, Schmalenbach Business
Review 52, 238-260.
32
HARRIS R. G. (2001) The Knowledge-Based Economy: Intellectual Origins and New
Economic Perspectives, International Journal of Management Review 3, 21-
41.
HENDERSON J. V. (1983) Industrial Base and City Size, American Economic Review
73 (2), 164-168.
HENDERSON J. V. (1986) Efficiency of Resource Usage and City Size, Journal of
Urban Economics 19 (1), 47-70.
HENDERSON R., JAFFE A. B. and TRAJTENBERG M. (1998) Universities as a
Source of Commercial Technology: A Detailed Analysis of University
Patenting 1965-1988, Review of Economics and Statistics 65, 119-127.
HÜLSBECK M. and LEHMANN E. E. (2007) Entrepreneurship Policy in Bavaria:
Between Laptop and Lederhosen, in AUDRETSCH D. (Ed.) Handbook of
Entrepreneurship Policy, 200-212. Edward Elgar, Northampton.
HÜLSBECK M. and LEHMANN E. E. (2010) The Role of Regional Knowledge
Production in University Technology Transfer: Isolating Coevolutionary
Effects (forthcoming).
JAFFE A. B. (1989) Real Effects of Academic Research, American Economic Review
79, 957-970.
JAFFE A. B., TRAJTENBERG M. and HENDERSON R. (1993) Geographic
Localization of Knowledge Spillovers as evidenced by Patent Citations,
Quarterly Journal of Economics 63, 577-598.
JOHNSON N. L., KOTZ S. and KEMP A. W. (2005) Univariate discrete distributions.
Wiley-Interscience.
KENNEDY P. (2003) A guide to econometrics. MIT press, Cambridge (MA).
33
KOGUT B. and ZANDER U. (1992) Knowledge of the Firm, Combinative Capabilities,
and the Replication of Technology, Organization Science 3, 383-397.
KRUGMAN P. (1991) Geography and Trade, Leuven University, MIT Press,
Cambridge.
LEVIN R., KLEVORICK A., NELSON R., WINTER S., GILBERT R. and
GRILICHES Z. (1987) Appropriating the returns from industrial research
and development, Brookings papers on economic activity, 783-831.
LINDELÖF P. and LÖFSTEN H. (2004) Proximity as a Resource Base for Competitive
Advantage: University–industry Links for Technology Transfer, The
Journal of Technology Transfer 29 (3), 311-326.
LINK A. and SIEGEL D. S. (2005) Generating Science-based Growth: an Econometric
Analysis of the Impact of Organizational Incentives on University Industry
Technology Transfer, European Journal of Finance 11 (3), 169-181.
LONG J. S. (1997) Regression Models for Categorical and Limited Dependent
Variables. SAGE Publications, Thousand Oaks, London and New Delhi.
LONG J. S. and FREESE J. (2006) Regression models for categorical dependent
variables using Stata. Stata press, College Station (TX).
LUCAS R. (1988) On the Mechanics of Economic Development, Journal of Monetary
Economics 22, 3-42.
MARTIN R. and TYLER P. (2000) Regional Employment Evolutions in the European
Union: A Preliminary Analysis, Regional Studies 34 7), 601-616.
MCWILLIAMS A. and SIEGEL D. S. (2000) Corporate Social Responsibility and
Financial Performance: Correlation or Misspecification?, Strategic
Management Journal 21, 603-609.
34
MOWERY D. C. and ZIEDONIS A. A. (2002) Academic Patent Quality and Quantity
before and after the Bayle-Dole Act in the United States, Research Policy
31, 399-418.
MÜLLER P. (2006) Exploring the knowledge filter: How entrepreneurship and
university-industry relationships drive economic growth. Research Policy
35, 1499-1508.
PAKES A. and GRILICHES Z. (1984) Patents and R&D at the firm level: a first look,
in GRILICHES Z. (Ed) R&D, Patents, and Productivity, pp. 55-71.
University of Chicago Press, Chicago.
PIERGIOVANNI R. and SANTARELLI E. (2001) Patents and the Geographic
Localization of R&D Spillovers in French Manufactoring, Regional Studies
35, 697-702.
PORTER M. E. (2003) The Economic Performance of Regions, Regional Studies, Vol.
37, 549–578.
POWERS J. B. and MCDOUGALL P. P. (2005) University Start-up Formation and
Technology Licensing with Firms that go Public: a Resource-based View of
Academic Entrepreneurship, Journal of Business Venturing 20 (3), 291-311.
PUTNAM R. D. (1993) Making Demogracy Work. Civic Traditions in Modern Italy,
Princeton University Press, Princeton.
RIP A. (2002) Regional Innovation Systems and the Advent of Strategic Science,
Journal of Technology Transfer 27, 123-31.
ROMER P. M. (1986) Increasing Returns and Long-Run Growth, Journal of Political
Economy 94 (5), 1002-1037.
35
ROMER P. M. (1990) Endogenous Technological Change, The Journal of Political
Economy 98 (5), 71-102.
SANTORO M. D. and CHAKRABARTI A. K. (2002) Firm Size and Technology
Centrality in Industry-University Interactions, Research Policy 31, 1163-
1180.
SHANE S. (2001a) Technological Opportunities and New Firm Creation, Management
Science 47, 205-220.
SHANE S. (2001b) Technology Regimes and New Firm Formation, Management
Science 47, 1173-1190.
SIEGEL D. S., WESTHEAD P. and WRIGHT M. (2003) Assessing the Impact of
Science Parks on the Research Productivity of Firms: Exploratory Evidence
from the United Kingdom, International Journal of Industrial Organization.
SIMMIE J. (2003) Innovation and Urban Regions as National and International Nodes
for the Transfer and Sharing of Knowledge, Regional Studies 37, 607-620.
SOLOW R. M. (1956) A contribution to the theory of economic growth, The Quarterly
Journal of Economics, 65-94.
SORENSEN O. and AUDIA G. (2000) The Social Structure of Entrepreneurial
Activity: Geographic Concentration of Footwear Production in the U.S,
1940-1989, American Journal of Sociology 106, 324-362.
STUART T. E. and SHANE S. (2002) Organizational Endowments and the
Performance of University Start-ups, Management Science 48, 151-170.
UZAWA H. (1965) Optimum technical change in an aggregative model of economic
growth, International Economic Review, 18-31.

36
VARGA A. (2000) Local Academic Knowledge Transfers and the Concentration of
Economic Activity, Journal of Regional Science 40, 289-309.
ZUCKER L. G., DARBY M. R. and ARMSTRONG J. (1998) Intellectual Human
Capital and the Birth of U.S. Biotechnology Enterprises, American
Economic Review 88 (1), 290-306.
37
Table 1: Descriptive Statistics
Mean Std.-Dev. Min Max
Endogenes Variable
Firm Patents 26,86 70,13 0 475
Regional Variables
Population Density 510,914 391,618 45,92326 2508,396
GDP/Employee 62,655 9,644 42,93745 76,974
GVA/Capita Industry 7,529 2,432 3,416305 14,922
GVA/Capita Ind.-Services 9,978 5,051 3,126754 17,934
Industry Patents 1696,843 1487,652 4,947883 4775,197
New Businesses 10,155 1,604 5,98133 13,251
Country Policy (Dummy) 0,359 0,481 0 1
East Germany (Dummy) 0,051 0,220 0 1
University Variables
Medical Faculty (Dummy) 0,561 0,498 0 1
Engineer Faculty (Dummy) 0,328 0,471 0 1
Students/Researcher 11,862 8,338 13,777 37,835
Publications/Researcher 8,398 5,574 4,172 17,313
Citations/Researcher 66,141 53,004 9,840 147,699
Third Party Funding/Res. 109348,000 61058,560 0 202619
Age of 1st Patent 9,247 6,683 1 26
Number of Patents 97-01 12,859 33,245 0 325
Number of Patents 02-06 32,056 38,233 1 387
Firm & Industry Variables
Distance to University 8,601 15,153 1 100
Company Size 240,576 232,986 1 964
E-Commerce 0,086 0,281 0 1
Media & Entertainment 0,126 0,333 0 1
Services (non IT) 0,086 0,281 0 1
IT-Components 0,056 0,230 0 1
Finance 0,096 0,295 0 1
Biotech 0,081 0,273 0 1
Medical Engineering 0,040 0,197 0 1
Old Indutries 0,091 0,288 0 1
Consumer Goods 0,005 0,071 0 1
Other Technologies 0,045 0,209 0 1
38
Table 2: Empirical Results Endogenous variable:
number of firm patents Model I Model II Model III Model IV
Regional Variables Population Density 0,0004 (1,10) 0,0010 (2,09) ** GDP/Employee 0,0801 (1,30) 0,1301 (2,26) ** GVA/Capita Industry -0,1250 -(0,81) -0,1454 -(0,95) GVA/Capita Ind.-Services -0,1639 -(1,01) -0,4866 -(3,04) *** Industry Patents -0,0004 -(0,61) 0,0006 (0,81) (Industry Patents)² 0,0000 (0,21) 0,0000 -(1,55) New Businesses 1,1102 (0,94) 2,6027 (1,81) * (New Businesses)² -0,0465 -(0,74) -0,1101 -(1,43) Country Policy (Dummy) -0,4455 -(0,82) -1,1843 -(1,86) * East Germany (Dummy) -0,5483 -(1,12) -0,4319 -(0,90) University Variables Medical Faculty (Dummy) 0,8095 (1,05) 1,3822 (1,95) * Engineer Faculty (Dummy) 1,3202 (3,16) *** 1,3815 (2,52) ** Students/Researcher -0,0171 -(0,68) -0,0596 -(2,07) ** Publications/Researcher -0,0172 -(0,15) -0,0603 -(0,52) Citations/Researcher 0,0104 (0,93) 0,0501 (3,61) *** Third Party Funding/Res. -0,0001 -(1,92) * -0,0001 -(2,94) *** Age of 1st Patent -0,0596 -(1,68) * -0,0458 -(1,06) Number of Patents 97-01 -0,0119 -(0,66) -0,0208 -(1,19) Number of Patents 02-06 0,0144 (0,83) 0,0186 (1,16) Firm & Industry Variables Distance to University -0,0148 -(1,69) * 0,0068 (0,49) Company Size 0,0017 (2,27) 0,0017 (1,87) * 0,0015 (1,89) * E-Commerce -0,6378 -(0,86) -0,3452 -(0,40) -0,5436 -(0,79) -0,1619 -(0,22) Media & Entertainment -3,8237 -(4,98) *** -3,3990 -(3,89) *** -3,6941 -(4,81) *** -3,0462 -(3,42) *** Services (non IT) 1,4000 (2,39) ** 2,1376 (2,57) ** 1,8541 (3,21) *** 2,7709 (3,57) *** IT-Components 1,7727 (2,20) ** 2,1815 (2,97) *** 1,4502 (2,35) ** 1,3982 (2,88) *** Finance -16,2466 -(36,85) *** -17,6386 -(30,94) *** -16,6555 -(24,82) *** -19,4074 -(32,81) *** Biotech 3,2151 (8,16) *** 3,7033 (7,38) *** 3,3879 (7,95) *** 3,8807 (8,02) *** Medical Engineering 2,4132 (4,41) *** 2,9098 (4,39) *** 2,7621 (5,10) *** 3,2146 (5,06) *** Old Indutries 2,3824 (5,04) *** 3,0530 (6,21) *** 2,3120 (4,15) *** 2,5450 (4,28) *** Consumer Goods -16,1646 -(15,22) *** -17,1957 -(14,80) *** -17,7592 -(14,17) *** -22,1043 -(16,10) *** Other Technologies 2,5203 (4,53) *** 2,9580 (4,56) *** 2,5339 (3,70) *** 3,8980 (5,21) ***
_cons 0,7480 (2,03) ** -8,2892 -(1,31) 0,7124 (1,48) -17,8914 -(2,23) ** PseudoLL -462,757 -458,770 -456,610 -447,1057
a Estimated negative binomial coefficients. b Absolute z-values in parenthesis. * Statistically significant at the 10 percent level **Statistically significant at the 5 percent level*** statistically significant at the 1 percent level.