IIFL FINANCE
48
IIFL FINANCE April 28, 2022 The Manager, Listing Department, BSE Limited, Phiroze Jeejeebhoy Tower, Dalai Street, Mumbai 400 001. BSE Scrip Code: 532636 The Manager, Listing Department, The National Stock Exchange of India Ltd., Exchange Plaza, 5th Floor, Plot C/1, G Block, Bandra - Kuria Complex, Bandra (E), Mumbai 400 051. NSE Symbol: IIFL Sub: Press Release and presentation on Audited Financial Results for the quarter and year ended March 31, 2022 Dear Sir/Madam, Pursuant to Regulation 30 of the SEBI (Listing Obligations and Disclosure Requirements) Regulations, 2015, we are enclosing herewith the press release and presentation to be made to the Investors/Analysts on the Audited Financial Results of the Company for the quarter and year ended March 31, 2022 as follows: 1. Press Release — Annexure 1. 2. Presentation - Annexure 2. The same has also been made available on the website of the Company, i.e. www.iifl.com. Kindly take the same on record and oblige. Thanking You, Yours faithfully, For IIFL Finance Limited neha Patwardhan r 0 Company Secretary Email Id: csteamglifl.com Encl: as above CC: Singapore Exchange Securities Trading Limited 2, Shenton Way, #02-02, SGX Centre 1, Singapore - 068 804 IIFL Finance Limited CIN No.: L67100MH1995PLC093797 Corporate Office — 802, 8th Floor, Hub Town Solaris, N.S. Phadke Marg, Vijay WAr, Andheri East, Mumbai 400069 Tel: (91-22) 6758 1000 .Fax: (91-22) 6788 1010 Regd. Office — IIFL House, Sun Infotech Park, Road No. 16V, Plot No. B-23, MIDC, Thane Industrial Ai ea, Wagle Estate, Thane — 400604 Tel: (91-22) 41035000. Fax: (91-22) 258066.54 E-mail: csteam.liifl corn Website: www.iifl.corn
-
Upload
khangminh22 -
Category
Documents
-
view
0 -
download
0
Transcript of IIFL FINANCE

IIFL FINANCE April 28, 2022
The Manager, Listing Department, BSE Limited, Phiroze Jeejeebhoy Tower, Dalai Street, Mumbai 400 001. BSE Scrip Code: 532636
The Manager, Listing Department, The National Stock Exchange of India Ltd., Exchange Plaza, 5th Floor, Plot C/1, G Block, Bandra - Kuria Complex, Bandra (E), Mumbai 400 051. NSE Symbol: IIFL
Sub: Press Release and presentation on Audited Financial Results for the quarter and year ended March 31, 2022
Dear Sir/Madam,
Pursuant to Regulation 30 of the SEBI (Listing Obligations and Disclosure Requirements) Regulations, 2015, we are enclosing herewith the press release and presentation to be made to the Investors/Analysts on the Audited Financial Results of the Company for the quarter and year ended March 31, 2022 as follows:
1. Press Release — Annexure 1.
2. Presentation - Annexure 2.
The same has also been made available on the website of the Company, i.e. www.iifl.com.
Kindly take the same on record and oblige.
Thanking You, Yours faithfully,
For IIFL Finance Limited
neha Patwardhan r0 Company Secretary
Email Id: csteamglifl.com Encl: as above
CC: Singapore Exchange Securities Trading Limited 2, Shenton Way, #02-02, SGX Centre 1, Singapore - 068 804
IIFL Finance Limited CIN No.: L67100MH1995PLC093797
Corporate Office — 802, 8th Floor, Hub Town Solaris, N.S. Phadke Marg, Vijay WAr, Andheri East, Mumbai 400069
Tel: (91-22) 6758 1000 .Fax: (91-22) 6788 1010
Regd. Office — IIFL House, Sun Infotech Park, Road No. 16V, Plot No. B-23, MIDC, Thane Industrial Ai ea, Wagle Estate, Thane — 400604
Tel: (91-22) 41035000. Fax: (91-22) 258066.54 E-mail: csteam.liifl corn Website: www.iifl.corn
1
IIFL Finance Limited
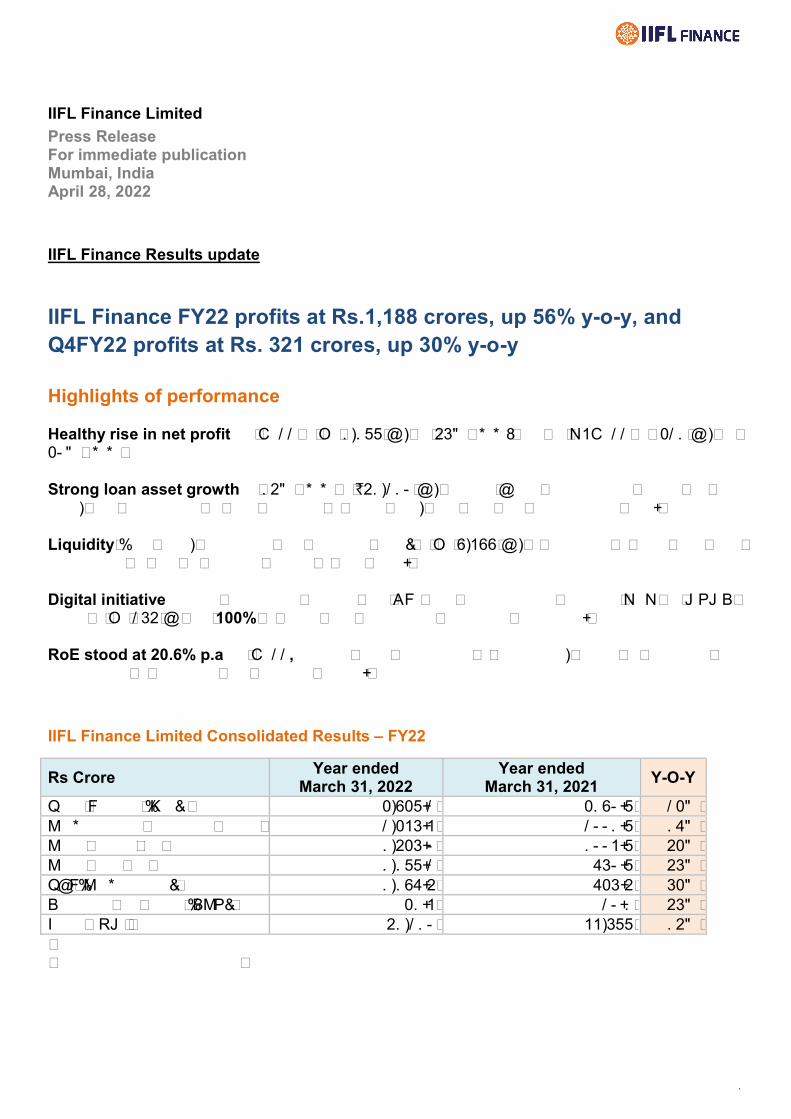
Press Release For immediate publication Mumbai, India April 28, 2022
IIFL Finance Results update
IIFL Finance FY22 profits at Rs.1,188 crores, up 56% y-o-y, and Q4FY22 profits at Rs. 321 crores, up 30% y-o-y Highlights of performance Healthy rise in net profit for FY22 at Rs 1,188 Cr, up 56% y-o-y; and for Q4FY22 at ₹321 Cr, up 30% y-o-y Strong loan asset growth of 15% y-o-y to 51,210 Cr, despite Covid interruptions during the year, was contributed by core products of home loan, gold loan and microfinance loan. Liquidity (free cash, equivalent and undrawn lines) at Rs 9,499 Cr, is adequate to meet near term obligations as well as planned growth in loan book. Digital initiative gained impressive traction with DIY loan disbursement doubling QoQ for MSME loans to Rs 265 Cr and 100% of home loan processing becoming paperless. RoE stood at 20.6% p.a for FY22, despite huge investment in expansion, driven by improved productivity of operating and financial assets.
IIFL Finance Limited Consolidated Results – FY22
Rs Crore Year ended
March 31, 2022 Year ended
March 31, 2021 Y-O-Y
Total Income (Net)* 3,938.2 3190.8 23% Pre-provision operating profit* 2,346.4 2001.8 17% Profit before tax 1,536.0 1004.8 53% Profit after tax 1,188.2 760.8 56% TCI (Pre-minority) 1,197.5 736.5 63% Earnings per share (EPS) 31.4 20.1 56% Loan AUM 51,210 44,688 15%
2
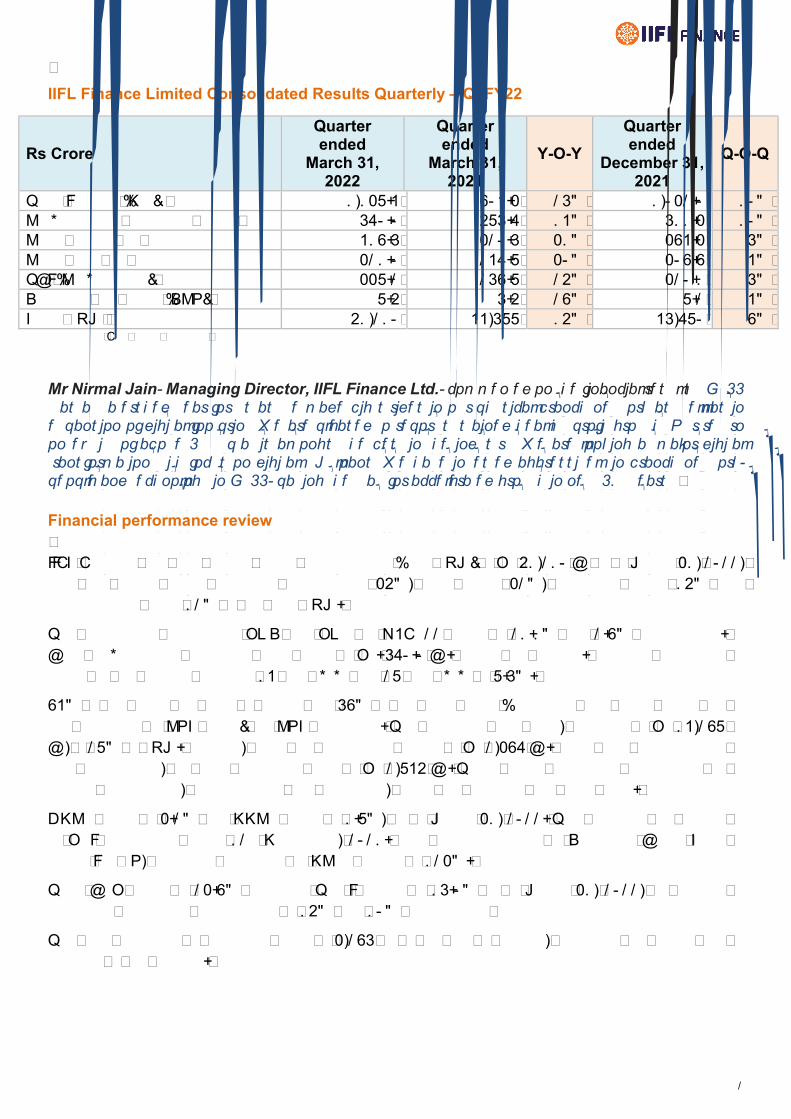
IIFL Finance Limited Consolidated Results Quarterly – Q4FY22
Rs Crore
Quarter ended
March 31, 2022
Quarter ended
March 31, 2021
Y-O-Y
Quarter ended
December 31, 2021
Q-O-Q
Total Income (Net)* 1,138.4 904.3 26% 1,032.0 10% Pre-provision operating profit* 670.0 586.7 14% 611.3 10% Profit before tax 419.6 320.6 31% 394.3 6% Profit after tax 321.0 247.8 30% 309.9 4% TCI (Pre-minority) 338.2 269.8 25% 320.1 6% Earnings per share (EPS) 8.5 6.5 29% 8.2 4% Loan AUM 51,210 44,688 15% 46,780 9%
*excluding Fair value changes
Mr Nirmal Jain, Managing Director, IIFL Finance Ltd., commented on the financial results: “FY22 was a watershed year for us as we made big strides in our physical branch network as well as in expansion of digital footprint. We are pleased to report sustained healthy profit growth. Our return on equity of above 20% p.a. is amongst the best in the industry. We are looking at major digital transformation with focus on digital DIY loans. We have invested aggressively in branch network, people and technology in FY22, paving the way for accelerated growth in next 2-3 years.” Financial performance review IIFL Finance had loan assets under management (loan AUM) of Rs 51,210 Cr as at March 31, 2022, with the home loans segment constituting 35%, gold loans 32%, business loans 15% and microfinance loans 12% of the total AUM.
The company’s annualized ROE and ROA for Q4FY22 stood at 21.1% and 2.9% respectively. Core pre-provision operating profit stood at Rs. 670.0 Cr. during the quarter. Average borrowing costs for the quarter declined 14 bps q-o-q and 28 bps y-o-y to 8.6%.
94% of our loans are retail in nature and 69% of our retail loans (excluding gold loans which are not classified as PSL loans) are PSL compliant. The assigned loan book, currently at Rs 14,298 Cr, is 28% of AUM. Besides, there are securitized assets of Rs 2,397 Cr. Apart from securitization and assignment, we have colending book of Rs 2,845 Cr. There exists significant opportunity for further assignment, securitization and colending, given our granular and retail book.
GNPA stood at 3.2% and NNPA stood at 1.8%, as at March 31, 2022. This includes the impact of RBI notification dated 12th November, 2021. With implementation of Expected Credit Loss under Ind AS, provision coverage on NPAs stands at 123%.
Total CAR stood at 23.9% including Tier I capital of 16.0% as at March 31, 2022, as against minimum regulatory requirement of 15% and 10% respectively
The total presence of branches stood at 3,296 as at the end of quarter, spanning the length and breadth of the country.
3
Business segment review
Home Loans: At the end of the quarter, retail home loan assets grew by 23% y-o-y and 7% q-o-q to Rs 17,727 Cr. The primary focus in this segment is on affordable and non-metro housing loans. Over 55,700 customers were benefitted with a subsidy of more than Rs 1,300 Cr under the Pradhan Mantri Awas Yojana – Credit Linked Subsidy Scheme.
Gold Loans: As of March 31, 2022 the gold loans AUM grew to Rs. 16,228 Cr, showing a strong growth of 23% y-o-y and 11% q-o-q. Gold loans are provided through our widespread presence in 1,260+ cities across 22 states to salaried, self-employed and MSME customer segments.
Microfinance: The microfinance loan AUM stood at Rs. 6,155 Cr, up 30% y-o-y and 22% q-o-q, as at March 31, 2022. The microfinance customer base stood at 17.5 lakh customers.
Business loans: Secured business loans grew by 4% y-o-y to Rs. 5,675 Cr. whereas unsecured business loans de-grew by 7% y-o-y to Rs. 1,884 Cr.
Liquidity position
Cash and cash equivalents and committed credit lines from banks and institutions of Rs 9,499 Cr were available as on March 31, 2022. During the quarter, we raised Rs 5,954 Cr through term loans, bonds and refinance. Loans of Rs 4,284 Cr were securitized and assigned during the quarter. Additionally, during the quarter, IIFL Finance successfully raised Rs. 1,464 Cr via refinancing, out of which Rs. 1,200 Cr was from NABARD.
IIFL Finance bought back US$50 million overseas bonds
During the quarter, the company bought back US$50 million worth of bonds. The Company had raised US$400 million through its maiden overseas bonds issue in February 2020 at an effective issue price of $998.75 per $1000 of face value, to fund its business growth. Bonds of $376 million were outstanding as on March 31, 2021. During FY22 the Company had bought back bonds of US$52.3 million including $50 million at par through an open tender offer in March 21, 2022. The buyback was funded by corresponding ECB loan of maturity not less than the maturity of the bonds bought back, in line with RBI regulations. This will reduce cost of funds by approximately 225 basis points on this transaction. After these buybacks, bonds of US$323.7 million remain outstanding as on March 31, 2022.
Raised US$ 68 Million from Asian Development Bank
IIFL Home Finance Limited has raised US$68 million by issue of NCDs to Asian Development Bank (ADB) to improve funding to affordable green housing for lower-income groups in India. 80% will be earmarked for women borrowers and 20% for green-certified homes.
Awards and Accolades:
IIFL Finance received ‘The Most Preferred Brand Award for Sustained Brilliance in Brand Building’ at Marksmen Daily Awards.
IIFL Finance’s ‘Gold Loan at Home’ product received ‘Customer Services Excellence Award’ at the World BFSI Congress
IIFL Finance’s ‘WhatsApp Loan’ product received ‘Best Use of Mobile Technology in Financial Services’ award at the World BFSI Congress
IIFL Finance was certified as ‘Great Place to Work’ for the fourth year in a row
4
About IIFL
IIFL Group is one of the leading players in the Indian financial services space. Prior to the Composite Scheme of Arrangement (effective May 2019), IIFL Finance Limited (Erstwhile “IIFL Holdings Limited”) (Bloomberg Code: IIFL IN, NSE: IIFL, BSE: IIFL) was engaged in the business of financing, asset and wealth management, retail and institutional broking, financial products distribution and investment banking through its various subsidiaries.
IIFL Finance Ltd is one of the leading retail focused diversified NBFC in India, engaged in the business of loans and mortgages along with its subsidiaries - IIFL Home Finance Limited and IIFL Samasta Finance Limited. IIFL Finance, through its subsidiaries, offers a wide spectrum of products such as Home loan, Gold loan, Business loan, Microfinance, Capital Market finance and Developer & Construction finance to a vast customer base of over 8 million customers. IIFL Finance has widened its pan-India reach through extensive network of branches spread across the country and various digital channels.
IIFL Securities Limited is one of the largest independent full-service retail and institutional broking house along with being a leading investment advisory firm in India providing diversified financial services and products to corporate, institutional investors, foreign portfolio investors, mutual funds, insurance companies, alternative investment funds, trusts, high net worth individuals and retail clients.
IIFL Wealth is one of the fastest growing private wealth management firms in India with an AUM greater than USD 30 billion (as on December 2021). They serve the highly specialized and sophisticated needs of high net worth and ultra-high net worth individuals, affluent families, family offices and institutional clients through a comprehensive range of tailored wealth management solutions.
This document may contain certain forward looking statements based on management expectations. Actual results may vary significantly from these forward looking statements. This document does not constitute an offer to buy or sell IIFL products, services or securities. The press release, results and presentation for analysts/press for the quarter and year ended March 31, 2022, are available under the ‘Financials’ section on our website www.iifl.com.
IIFL Group refers to IIFL Finance Ltd and its group companies.
Media Relations IIFL Finance Ltd Sourav Mishra Email:[email protected]
Investor Relations IIFL Finance Ltd Anup Varghese Email:[email protected]
April 28, 2022IIFL Finance Limited
Performance reviewQuarter and year ended March 31, 2022 (Q4FY22 & FY22) Bloomberg: IIFL IN

2
Highlights of financial performance Q4FY22 & FY22
Business model, environment & strategy
Quarterly trends
Business segments review
Bank partnerships and digital updates
Corporate and miscellany
3-10
12-15
17-24
26-30
32-34
36-42
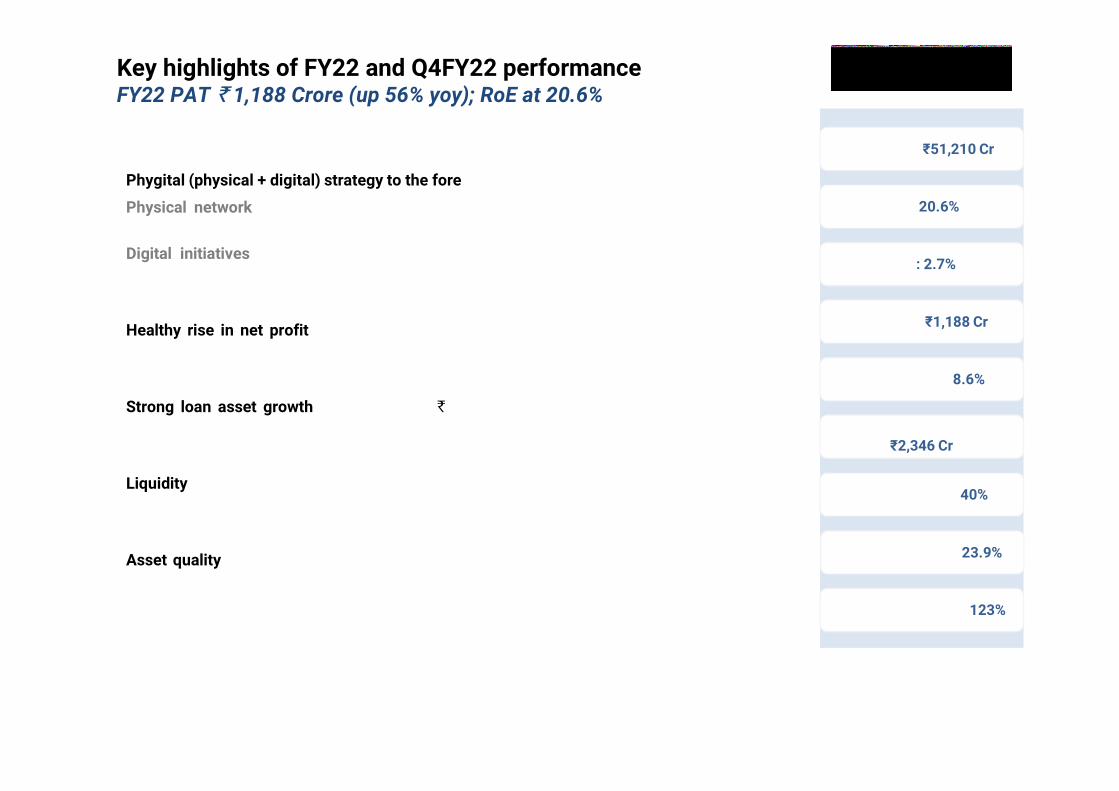
Key highlights of FY22 and Q4FY22 performanceFY22 PAT 1,188 Crore (up 56% yoy); RoE at 20.6%
3
Loan AUM: ₹51,210 Cr
ROE: 20.6%
ROA: 2.7%
Net Profit: ₹1,188 Cr
Cost of funds: 8.6%
Pre-provision profit:₹2,346 Cr
Cost to Income: 40%
Capital Adequacy: 23.9%
Provision Coverage: 123%
Phygital (physical + digital) strategy to the fore
Physical network in FY22 grew by over 40%, with 731 new branches & 8500 more people,causing QoQ operating cost rise of ~₹50 Cr, but paving the way for accelerated growth in future.
Digital initiatives gained impressive traction with DIY loan disbursement doubling QoQ forMSME loans to ₹265 Cr and 100% of home loan processing becoming paperless.
Healthy rise in net profit for FY22 by 56% y-o-y to ₹1,188 Cr; despite investment in capacityexpansion. RoE for the year was above 20%.
Strong loan asset growth of 15% y-o-y to 51,210 Cr., despite Covid interruptions during theyear, was contributed by core products of home loan, gold loan and microfinance loan.
Liquidity (free cash, equivalent and undrawn lines) at ₹9,499 Cr, is adequate to meet near termobligations as well as planned growth in loan book.
Asset quality has improved QoQ but with impact of RBI circular November 12, 2021; reportedGNPA and NNPA stood at 3.2% & 1.8%.
4
Q4FY22 and full year FY22 Results (Consolidated) FY22 net profit up 56% yoy, income up 23% yoy
5
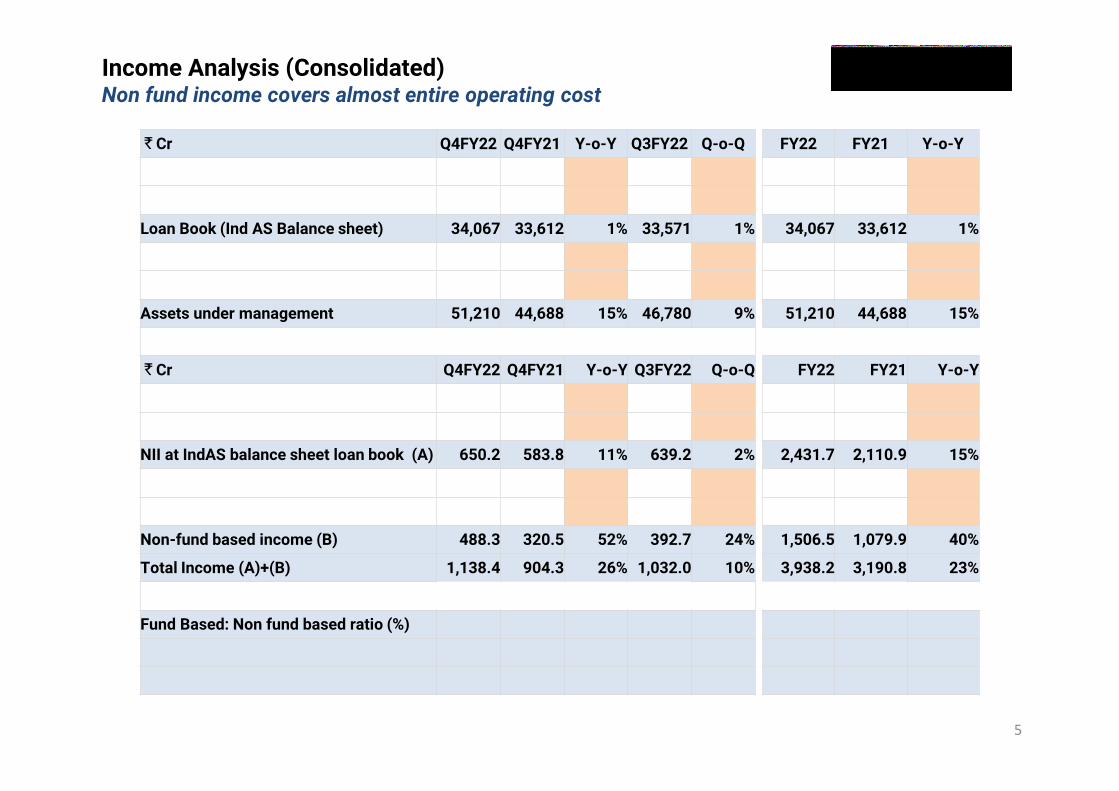
Income Analysis (Consolidated) Non fund income covers almost entire operating cost
Cr Q4FY22 Q4FY21 Y-o-Y Q3FY22 Q-o-Q FY22 FY21 Y-o-Y
Loan book using risk capital 31,670 29,784 6% 30,379 4% 31,670 29,784 6%
Securitized book 2,397 3,829 (37%) 3,191 (25%) 2,397 3,829 (37%)
Loan Book (Ind AS Balance sheet) 34,067 33,612 1% 33,571 1% 34,067 33,612 1%
Assigned assets 14,298 11,042 29% 12,365 16% 14,298 11,042 29%
Co-lending book 2,845 34 8170% 845 237% 2,845 34 8170%
Assets under management 51,210 44,688 15% 46,780 9% 51,210 44,688 15%
Cr Q4FY22 Q4FY21 Y-o-Y Q3FY22 Q-o-Q FY22 FY21 Y-o-Y
Interest income 1,423.4 1,264.4 13% 1,412.0 1% 5,422.7 4,719.2 15%
Interest expense (773.2) (680.6) 14% (772.8) 0% (2,991.0) (2,608.3) 15%
NII at IndAS balance sheet loan book (A) 650.2 583.8 11% 639.2 2% 2,431.7 2,110.9 15%
Income from assigned assets 377.7 240.8 57% 310.2 22% 1,194.3 852.8 40%
Fee and commission income 110.6 79.7 39% 82.5 34% 312.2 227.1 37%
Non-fund based income (B) 488.3 320.5 52% 392.7 24% 1,506.5 1,079.9 40%
Total Income (A)+(B) 1,138.4 904.3 26% 1,032.0 10% 3,938.2 3,190.8 23%
Fund Based: Non fund based ratio (%)
Fund based income 57% 65% 62% 62% 66%
Non-fund based income 43% 35% 38% 38% 34%
6
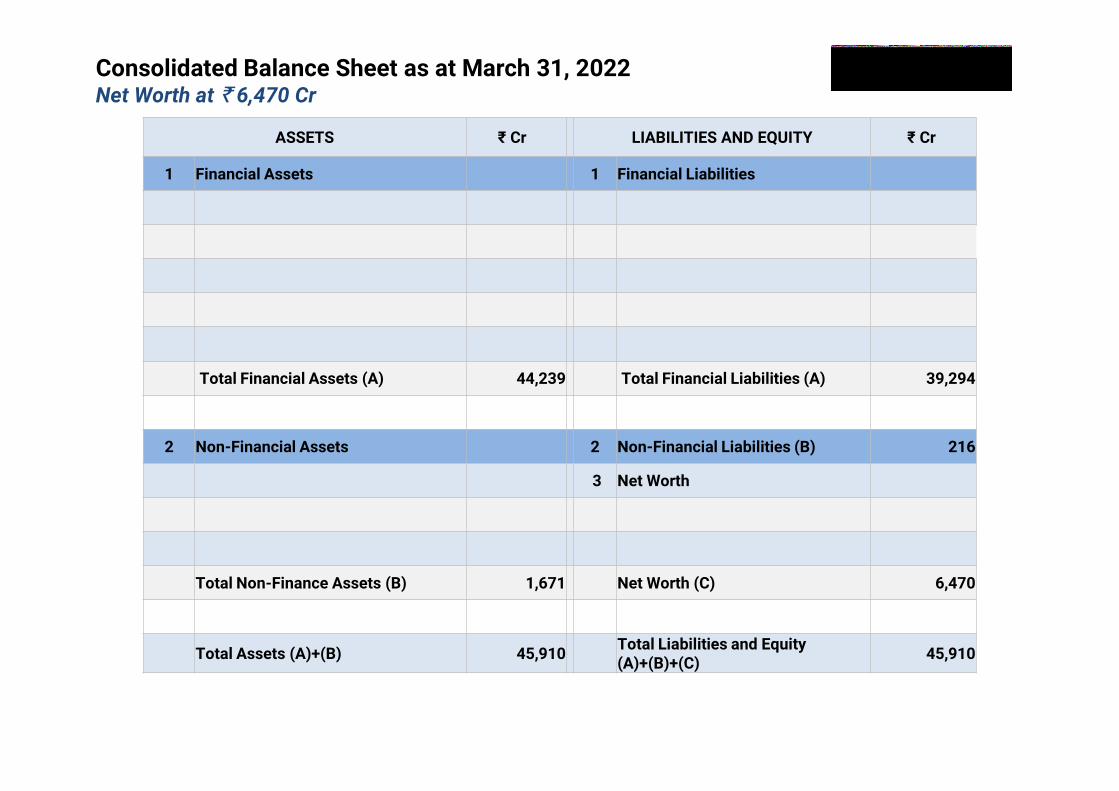
Consolidated Balance Sheet as at March 31, 2022Net Worth at 6,470 Cr
ASSETS ₹ Cr LIABILITIES AND EQUITY ₹ Cr
1 Financial Assets 1 Financial Liabilities
(a) Cash and Bank Balances 8,157 (a) Payables 152
(b) Receivables 199 (b) Borrowings
(c) Loan Assets 33,693 - NCDs 10,407
(d) Investments 1,192 - Others 25,319
(e) Other financial assets 998 (c) Other financial liabilities 3,346
Total Financial Assets (A) 44,239 Total Financial Liabilities (A) 39,294
2 Non-Financial Assets 2 Non-Financial Liabilities (B) 216
(a) Current & Deferred tax assets (Net) 520 3 Net Worth
(b) Property, Plant and Equipment etc. 781 (a) Equity 76
(c) Other non-financial assets 370 (b) Reserves 6,394
Total Non-Finance Assets (B) 1,671 Net Worth (C) 6,470
Total Assets (A)+(B) 45,910 Total Liabilities and Equity (A)+(B)+(C)
45,910
7
The figures are annualised wherever applicable
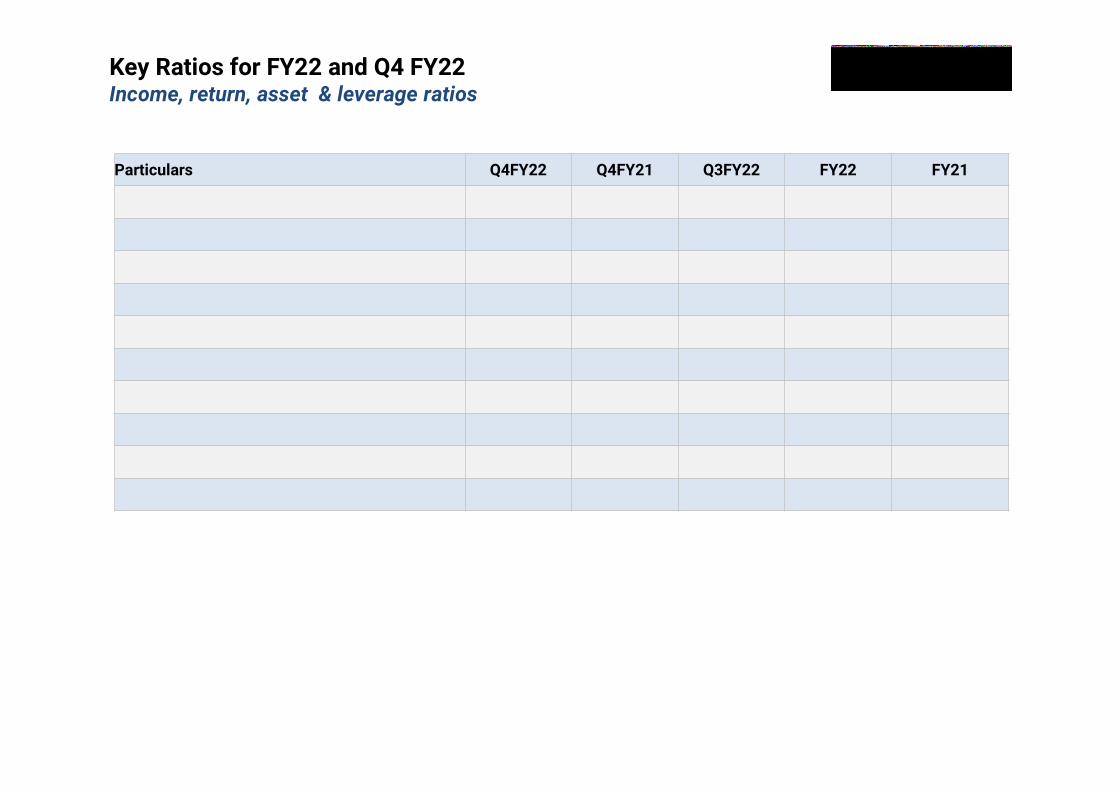
Key Ratios for FY22 and Q4 FY22Income, return, asset & leverage ratios
Particulars Q4FY22 Q4FY21 Q3FY22 FY22 FY21
NIM on On-book Assets 7.7% 7.2% 7.3% 7.0% 6.9%
Non Fund based income/ Total Income 42.9% 35.4% 38.1% 38.3% 33.8%
Cost-to-income 40.9% 32.8% 39.3% 39.6% 35.4%
Operating Expenses/ Average AUM 3.8% 2.9% 3.7% 3.5% 2.9%
PPOP/ Average AUM 5.5% 5.4% 5.4% 5.2% 4.9%
Provisions/ PPOP 38.3% 56.2% 41.9% 37.8% 58.4%
Provisions/ Average Loan Book 3.0% 4.1% 3.1% 2.6% 3.9%
Return on assets 2.9% 2.5% 2.9% 2.7% 2.0%
Return on equity 21.1% 19.1% 20.7% 20.6% 15.3%
Debt Equity Ratio 5.5 6.0 5.4 5.5 6.0
8
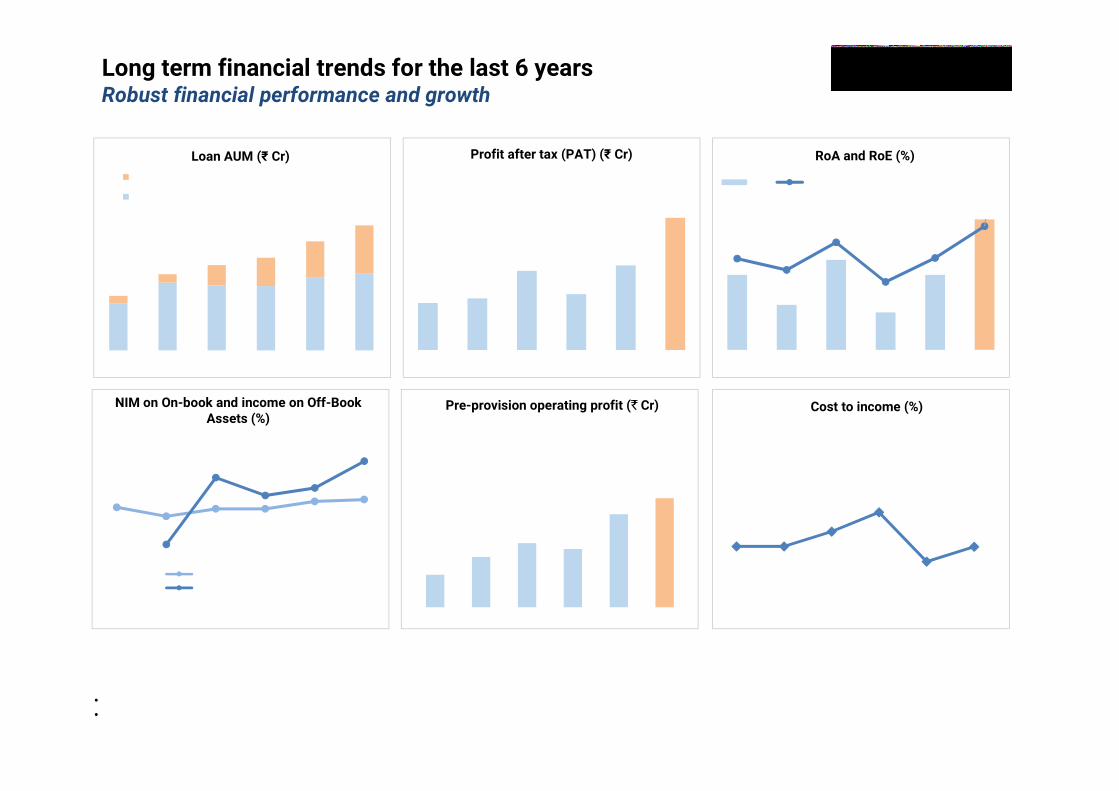
19,280 27,709 26,576 26,271 29,784 31,671
FY17 FY18 FY19 FY20 FY21 FY22
Off Book (assignment, securitisation & colending)
On Book
423 465
712
503
761
1,188
FY17 FY18 FY19 FY20 FY21 FY22
Loan AUM (₹ Cr) Profit after tax (PAT) (₹ Cr)
• Note: FY18 onwards numbers are as per IND AS. Prior years’ numbers are as per IGAAP• Colending includes Business Correspondence and Co-origination
51,210
44,68837,95134,904
31,228
22,281
Long term financial trends for the last 6 yearsRobust financial performance and growth
701
1,082 1,383 1,253
2,002 2,346
FY17 FY18 FY19 FY20 FY21 FY22
Pre-provision operating profit ( Cr)
6.5% 5.9% 6.4% 6.4%6.9% 7.0%
4.0%
8.5%
7.3%7.8%
9.6%
FY17 FY18 FY19 FY20 FY21 FY22
Net interest margin on On-book assets (%)
Assignment and fee income as a % of Off book
40% 40%45%
52%
35%40%
FY17 FY18 FY19 FY20 FY21 FY22
2.0%1.6%
2.2%
1.5%
2.0%
2.7%
15.2%13.3%
17.9%
11.3%
15.3%
20.6%
FY17 FY18 FY19 FY20 FY21 FY22
RoA RoE
RoA and RoE (%)
Cost to income (%)NIM on On-book and income on Off-Book Assets (%)
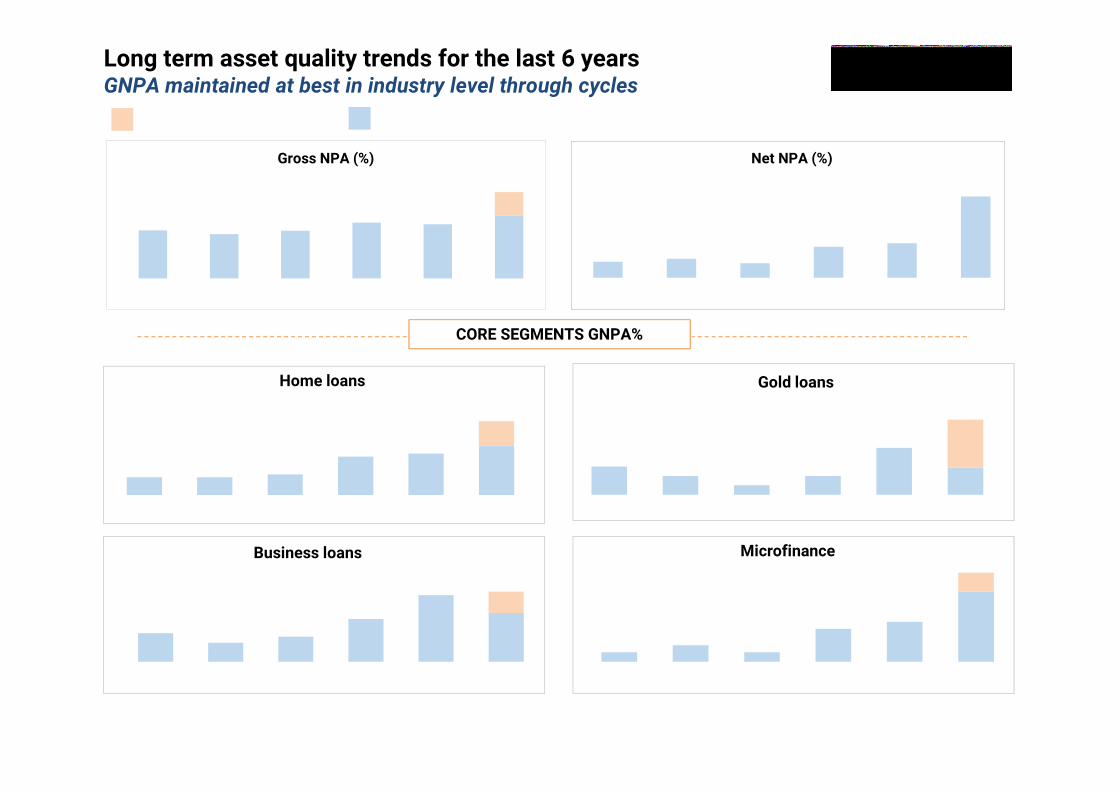
Note: Gross NPAs for FY18 onwards are as per IndAS (include securitized assets); other numbers are as per IGAAP
0.7% 0.7% 0.8%1.4% 1.5% 1.8%
0.8%
FY17 FY18 FY19 FY20 FY21 FY22
0.4% 0.3% 0.2% 0.3%0.6%
0.4%
0.5%
FY17 FY18 FY19 FY20 FY21 FY22
2.5% 1.7% 2.2%3.7%
5.7%4.2%
1.8%
FY17 FY18 FY19 FY20 FY21 FY22
0.5% 0.8% 0.5%1.5% 1.8%
3.1%
0.8%
FY17 FY18 FY19 FY20 FY21 FY22
Home loans
Business loans
Gold loans
Microfinance
9
Long term asset quality trends for the last 6 yearsGNPA maintained at best in industry level through cycles
2.6% 0.9%
6.0%3.9%
0.52% 0.58% 0.49% 0.82% 0.89%
1.83%
FY17 FY18 FY19 FY20 FY21 FY22
Gross NPA (%) Net NPA (%)
1.76% 1.62% 1.74% 2.04% 1.98% 2.30%
0.85%
FY17 FY18 FY19 FY20 FY21 FY22
3.15%
CORE SEGMENTS GNPA%
Additional impact on GNPA of RBI circular dated 12th Nov’21
GNPA as computed prior to RBI circular dated 12th Nov’21
10
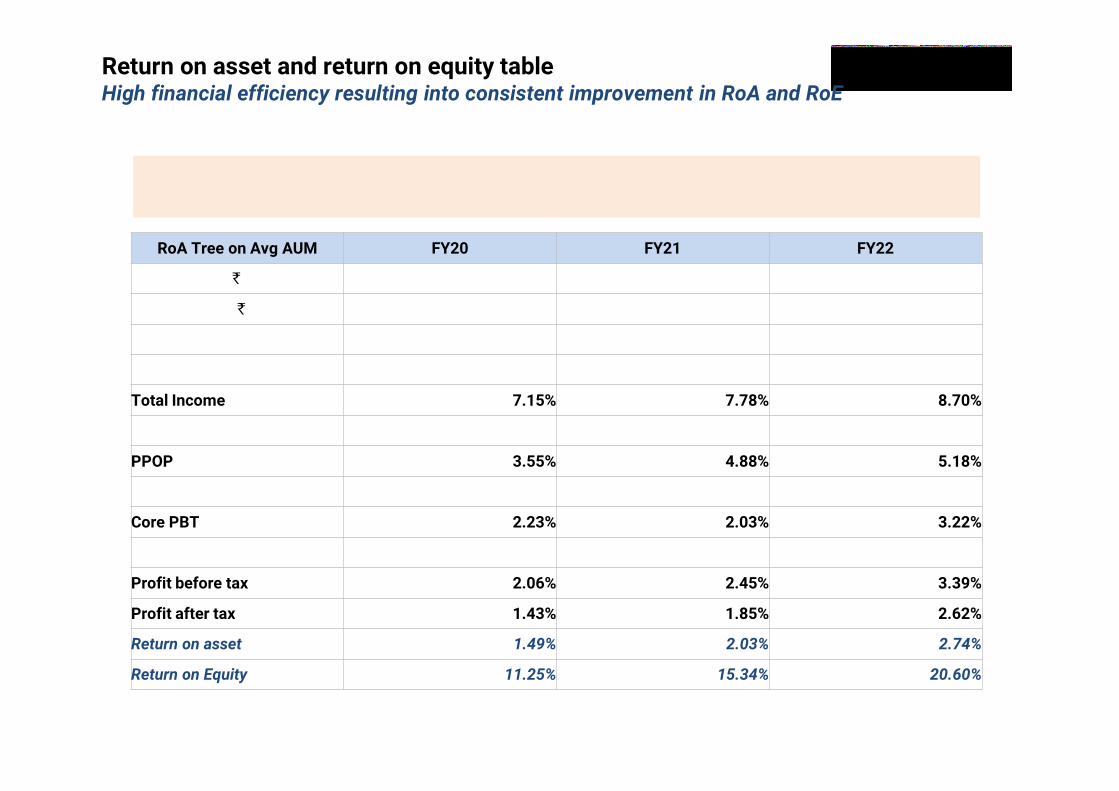
Return on asset and return on equity tableHigh financial efficiency resulting into consistent improvement in RoA and RoE
Focus on improving RoA and RoE by improving NIM, optimising cost via operational efficiency + digitisation & maintaining best in class asset quality
RoA Tree on Avg AUM FY20 FY21 FY22
Closing AUM ( Cr) 37,951 44,688 51,210
Average AUM ( Cr) 35,261 41,031 45,271
NIM 6.65% 7.22% 8.01%
Other Income 0.50% 0.55% 0.69%
Total Income 7.15% 7.78% 8.70%
Operating cost (3.60%) (2.90%) (3.52%)
PPOP 3.55% 4.88% 5.18%
Provision (1.32%) (2.85%) (1.96%)
Core PBT 2.23% 2.03% 3.22%
Fair value changes (0.18%) 0.42% 0.17%
Profit before tax 2.06% 2.45% 3.39%
Profit after tax 1.43% 1.85% 2.62%
Return on asset 1.49% 2.03% 2.74%
Return on Equity 11.25% 15.34% 20.60%
11
Highlights of financial performance Q4FY22 & FY22
Business model, environment & strategy
Quarterly trends
Business segments review
Bank partnerships and digital updates
Corporate and miscellany
3-10
12-15
17-24
26-30
32-34
36-42
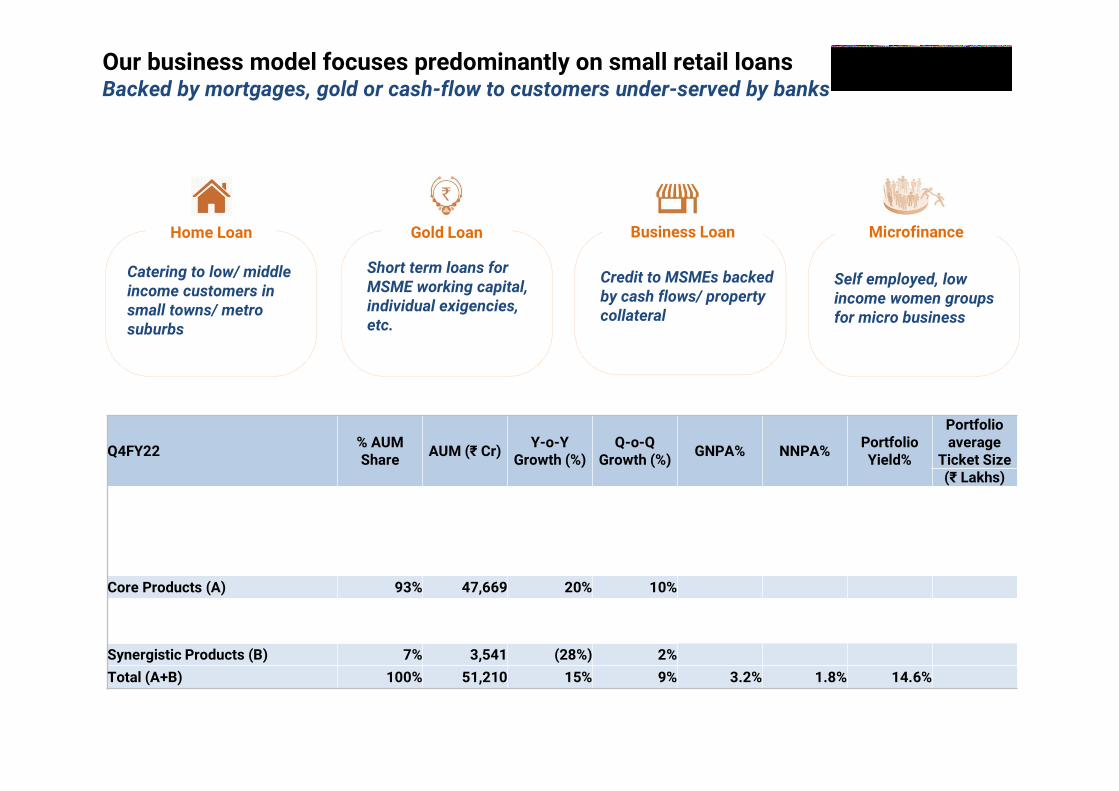
Our business model focuses predominantly on small retail loans Backed by mortgages, gold or cash-flow to customers under-served by banks
12
Home Loan Business LoanGold Loan Microfinance
Catering to low/ middle income customers in small towns/ metro suburbs
Credit to MSMEs backed by cash flows/ property collateral
Short term loans for MSME working capital, individual exigencies, etc.
Self employed, low income women groups for micro business
Q4FY22 % AUM Share AUM (₹ Cr) Y-o-Y
Growth (%)Q-o-Q
Growth (%) GNPA% NNPA% Portfolio Yield%
Portfolio average
Ticket Size (₹ Lakhs)
Home Loans 35% 17,727 23% 7% 2.6% 1.8% 10.0% 16.6
Gold Loans 32% 16,228 23% 11% 0.9% 0.7% 16.3% 0.7
Business Loans 15% 7,559 1% 6% 6.0% 3.4% 15.9% 10.3
Microfinance 12% 6,155 30% 22% 3.9% 1.5% 21.9% 0.3
Core Products (A) 93% 47,669 20% 10%
Construction & Real Estate 6% 2,899 (32%) 4% 4.2% 2.5% 14.7% 2,812.6
Capital Market Finance 1% 642 (3%) (9%) 0.0% 0.0% 11.8% 121.5
Synergistic Products (B) 7% 3,541 (28%) 2%
Total (A+B) 100% 51,210 15% 9% 3.2% 1.8% 14.6%
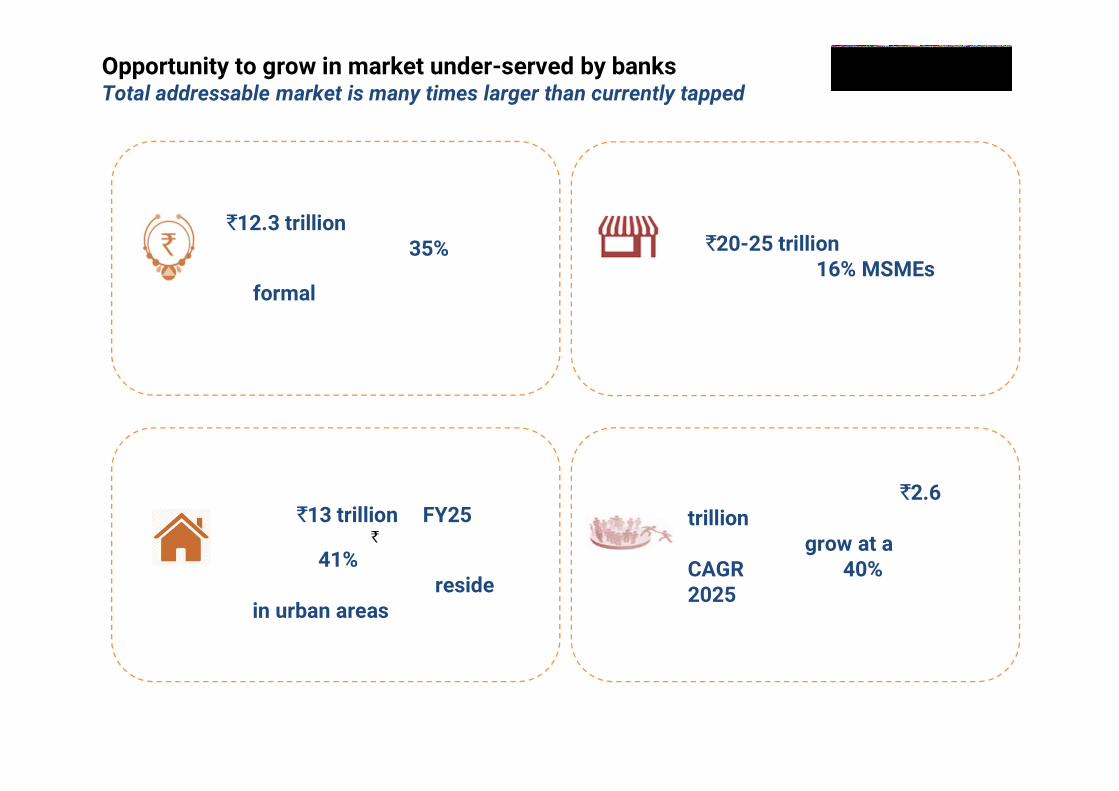
Opportunity to grow in market under-served by banksTotal addressable market is many times larger than currently tapped
13
MICRO-FINANCEHOME LOAN
BUSINESS LOANGOLD
12.3 trillion is the overall gold
loan market in India. Only 35% of the gold loan lending in India is done by
the formal segment, rest 65% is still served by the informal segment
Overall credit gap in the MSME sector is
~ 20-25 trillion according to a RBI
2019 report. Only 16% MSMEs received financing from formal institutions
Affordable housing market to
touch 13 trillion by FY25 from the current 9 trillion. Also,
by 2030, 41% of India's
population is expected to reside in urban areas
Current MFI market in India is 2.6 trillion (FY21). Indian MFI Market
is anticipated to grow at a CAGR of more than 40% through
2025, driven by women oriented MSMEs
Source : 1. CLSA 2. Reserve Bank of India 3. UN Report 4. McKinsey Research 5. ACCA report 6. Monarch NetworthCapital 7. CRISIL Research 8. Status of Microfinance in India Report 2021 by NABARD
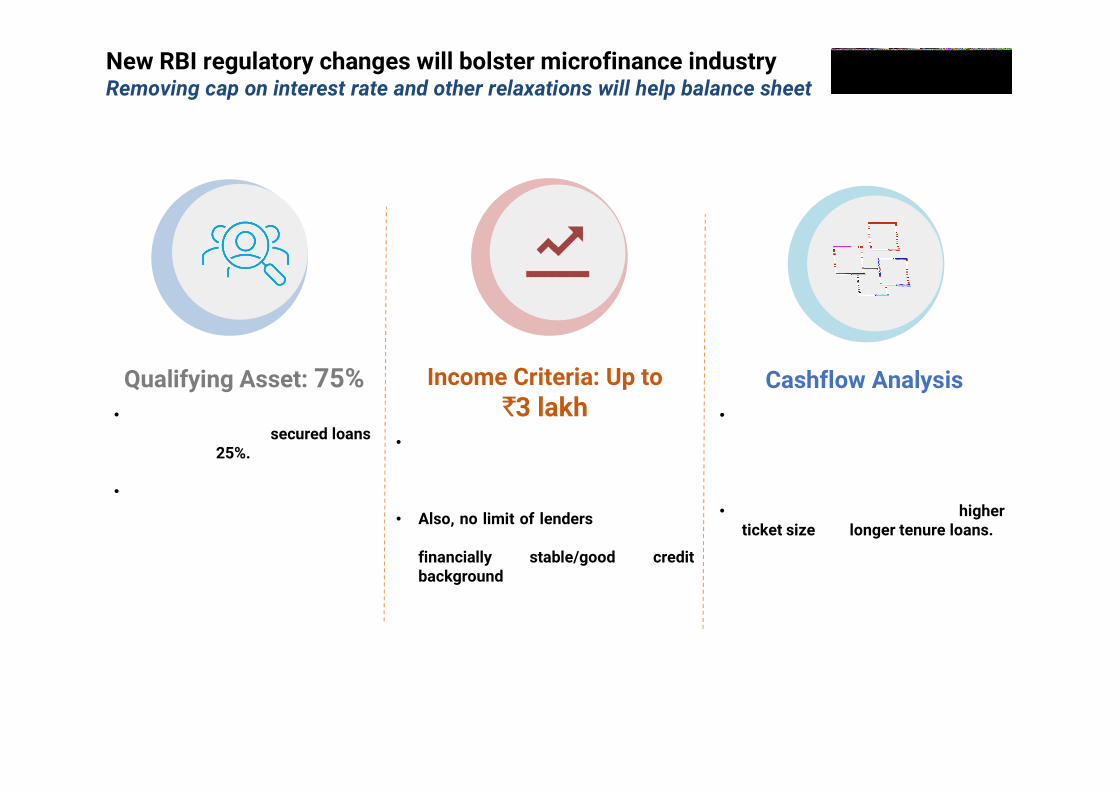
Cashflow Analysis• Since cashflow analysis of customer
is mandatory, it will help in gettingbetter customers and create strongportfolio.
• Also, it will create scope for higherticket size and longer tenure loans.
Qualifying Asset: 75%• Microfinance companies can
now increase their secured loansshare upto 25%.
• IIFL Samasta Finance currentlyhas only ~7% retail portfoliowhich can be expanded further infuture
Income Criteria: Up to 3 lakh
• Increase in household income criteriahas created an opportunity to broadencustomer segment for MFI.
• Also, no limit of lenders will create anopportunity to attract customers fromfinancially stable/good creditbackground category.
New RBI regulatory changes will bolster microfinance industryRemoving cap on interest rate and other relaxations will help balance sheet
15
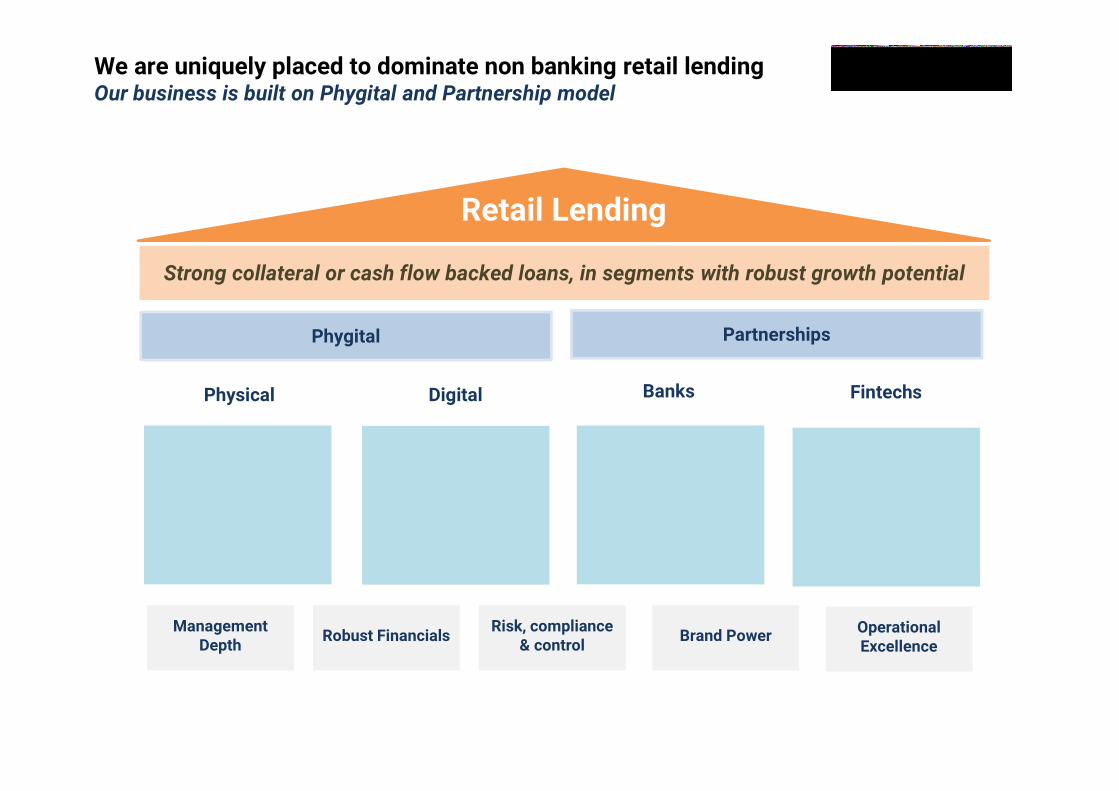
Retail Lending
Strong collateral or cash flow backed loans, in segments with robust growth potential
Unique capability to source quality retail & PSL loans for banks
make a win-win partnership
Innovative digital solutions drive cost
optimization, cross sell and superior underwriting
Network of 3,200+ branches help
origination, collection and physical storage of
gold
Robust FinancialsManagement Depth
Digital BanksPhysical
Harnessing fintech innovations for
customer sourcing and best-in-class experience
to customers
Fintechs
Phygital Partnerships
Risk, compliance & control Brand Power Operational
Excellence
We are uniquely placed to dominate non banking retail lendingOur business is built on Phygital and Partnership model

16
Highlights of financial performance Q4FY22 & FY22
Business model, environment & strategy
Quarterly trends
Business segments review
Bank partnerships and digital updates
Corporate and miscellany
3-10
12-15
17-24
26-30
32-34
36-42
17
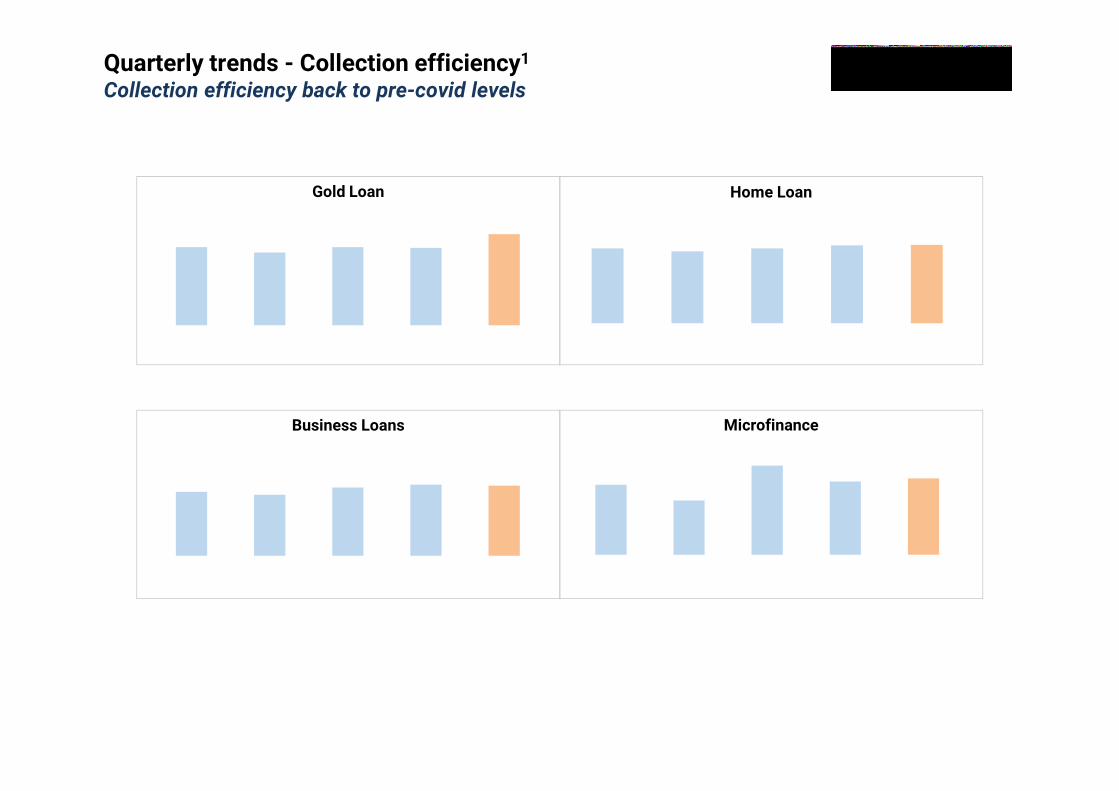
101% 94% 101% 100%
118%
Q4FY21 Q1FY22 Q2FY22 Q3FY22 Q4FY22
99% 97% 99% 101% 101%
Q4FY21 Q1FY22 Q2FY22 Q3FY22 Q4FY22
88% 84%94% 98% 97%
Q4FY21 Q1FY22 Q2FY22 Q3FY22 Q4FY22
Gold Loan Home Loan
Business Loans Microfinance
1Including arrears but excluding prepayments
94%84%
106%96% 98%
Q4FY21 Q1FY22 Q2FY22 Q3FY22 Q4FY22
Quarterly trends - Collection efficiency1
Collection efficiency back to pre-covid levels
18
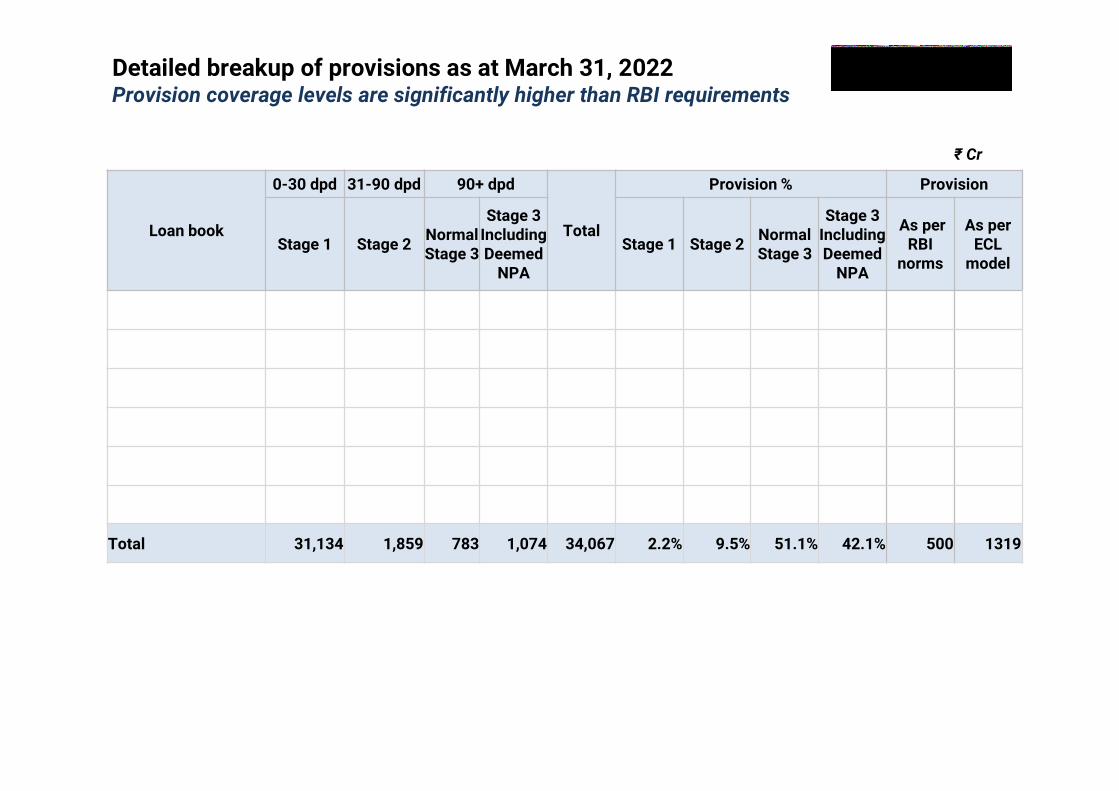
₹ Cr
Dpd: Days past dueECL: Expected credit loss
Detailed breakup of provisions as at March 31, 2022Provision coverage levels are significantly higher than RBI requirements
Loan book
0-30 dpd 31-90 dpd 90+ dpd
Total
Provision % Provision
Stage 1 Stage 2Normal Stage 3
Stage 3 Including Deemed
NPA
Stage 1 Stage 2Normal Stage 3
Stage 3 Including Deemed
NPA
As per RBI
norms
As per ECL
model
Home Loans 10,358 359 194 286 11,003 1.5% 6.5% 38.0% 31.5% 126 270
Business Loans 5,204 691 261 376 6,271 2.5% 16.0% 52.9% 43.5% 134 402
Gold Loans 7,109 368 30 68 7,545 0.8% 1.6% 33.2% 20.8% 43 78
Microfinance 5,170 316 175 221 5,707 2.0% 4.5% 73.3% 60.9% 126 252
Construction & Real Estate
2,652 124 123 123 2,899 9.1% 18.5% 40.4% 40.4% 69 314
Capital Market Finance
641 1 0 0 642 0.4% 0.4% 0.0% 0.0% 2 3
Total 31,134 1,859 783 1,074 34,067 2.2% 9.5% 51.1% 42.1% 500 1319
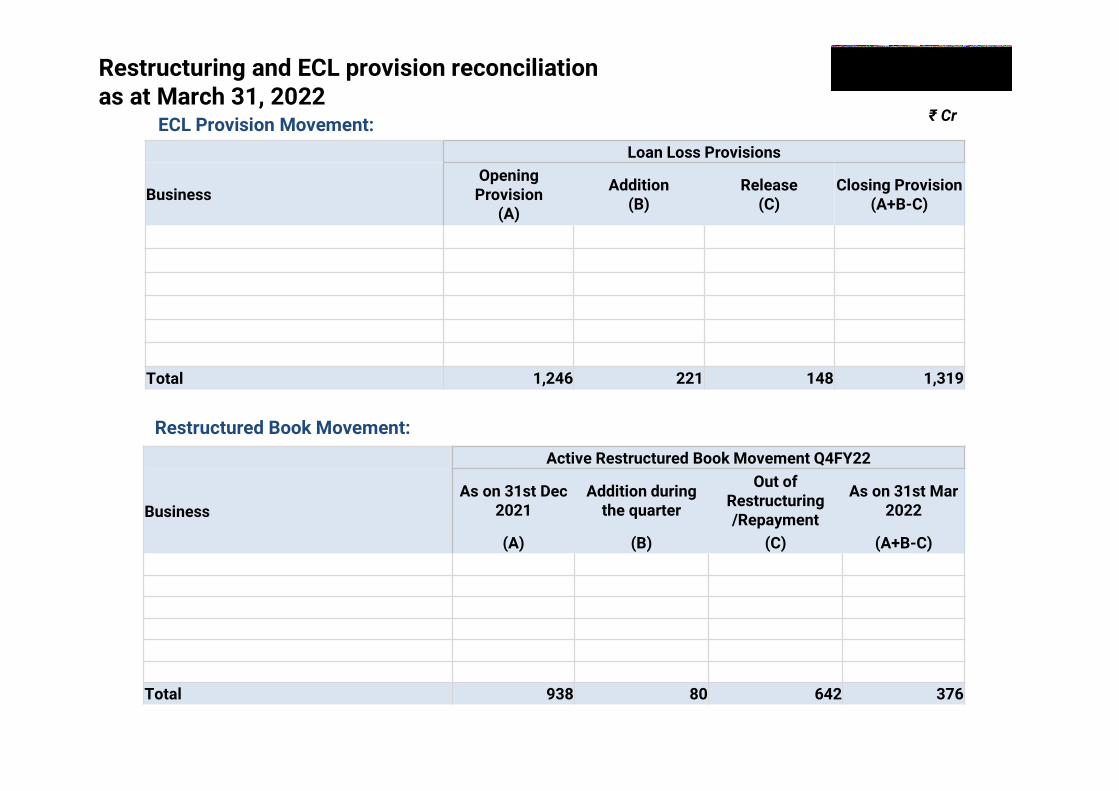
Restructuring and ECL provision reconciliation as at March 31, 2022
19
₹ Cr
Loan Loss Provisions
BusinessOpening
Provision (A)
Addition(B)
Release(C)
Closing Provision(A+B-C)
Home Loans 254 23 7 270Business Loans 384 52 34 402Gold Loans 87 8 16 78Microfinance 285 11 43 252Capital Market Finance 23 1 21 3Construction & Real Estate / Others 213 126 27 314Total 1,246 221 148 1,319
Active Restructured Book Movement Q4FY22
BusinessAs on 31st Dec
2021Addition during
the quarter
Out of Restructuring /Repayment
As on 31st Mar 2022
(A) (B) (C) (A+B-C)Home Loans 200 - 61 139Business Loans 266 - 131 135Gold Loans - - - -Microfinance 300 - 300 -Capital Market Finance - - - -Construction & Real Estate / Others 172 80 150 102Total 938 80 642 376
ECL Provision Movement:
Restructured Book Movement:
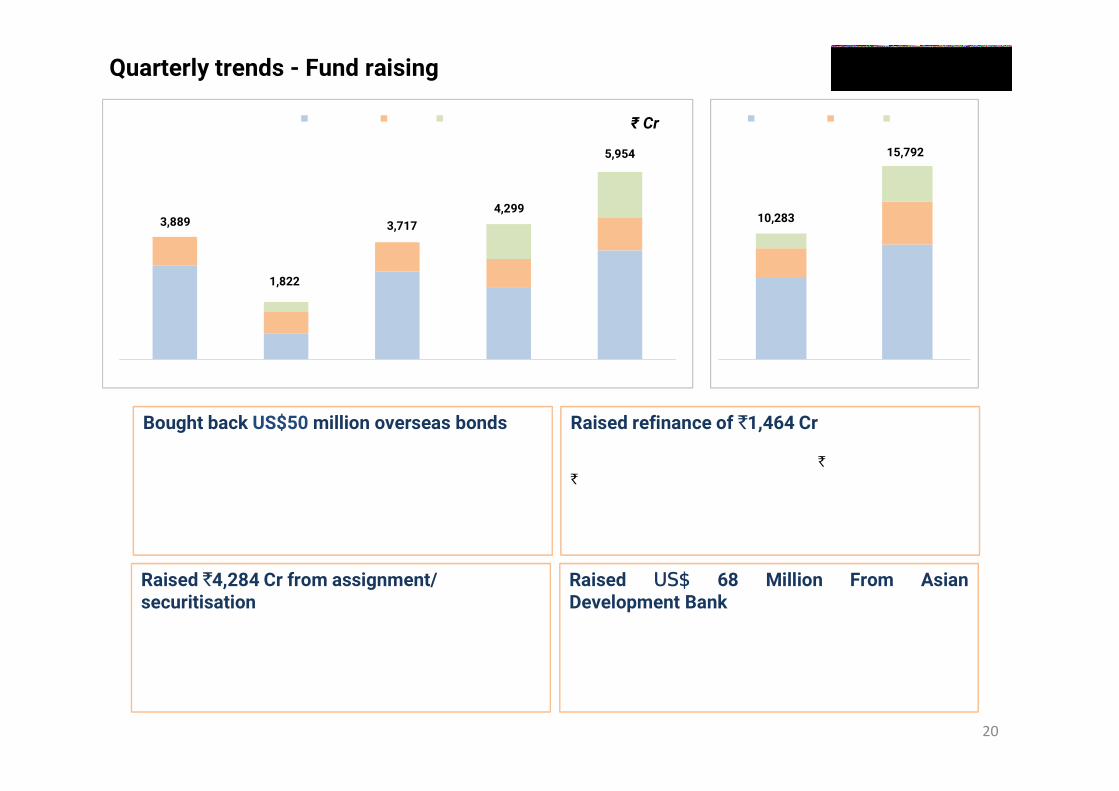
2,981
831
2,799 2,296
3,458
908
671
918 893
1,032
320
1,110
1,464
Q4FY21 Q1FY22 Q2FY22 Q3FY22 Q4FY22
Term Loan Bonds Refinance
3,889
1,822
5,954
Quarterly trends - Fund raising
₹ Cr
3,717
Bought back US$50 million overseas bonds
Bought back US$50 million worth of overseas bonds at par,funded by a corresponding ECB loan of maturity not less thanthe maturity of the bonds bought back, in line with RBIregulations. This will reduce its cost of funds byapproximately 225 basis points on this transaction.
Raised 4,284 Cr from assignment/ securitisation
During the quarter we raised ₹4,284 Cr through securitized/assigned loans.
Raised refinance of 1,464 Cr
During the quarter raised refinance of 1,464 Cr., out of which1,200 Cr was from NABARD.
Raised 68 Million From AsianDevelopment Bank
Successfully raised long term funds of US$ 68 Million fromADB to improve financial access to affordable green housing& lower-income women borrowers.
20
4,299
6,648 9,384
2,433
3,514 1,202
2,894
FY21 FY22
Term Loan Bonds Refinance
10,283
15,792
1,113 1,722 2,105
7,379 9,717 11,076
14,298
623 1,279 1,414
949
1,963
3,828
2,397
Mar 16 Mar 17 Mar 18 Mar 19 Mar 20 Mar 21 Mar 22
Assignment Securitisation 11,680
3,519
3,0011,745
14,904
8,328
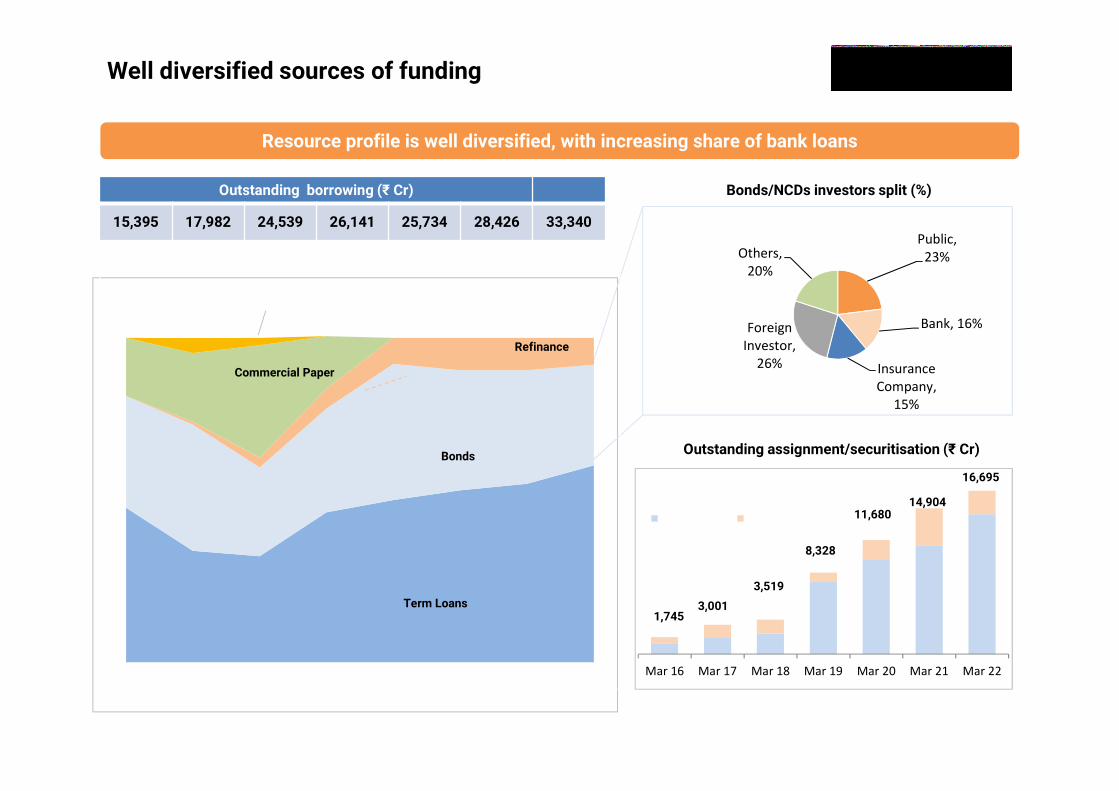
Resource profile is well diversified, with increasing share of bank loans
Well diversified sources of funding
21
Outstanding borrowing (₹ Cr)
15,395 17,982 24,539 26,141 25,734 28,426 33,340
48%34% 33%
46% 50% 53% 55% 61%
34%
39%
27%
32%
42% 37% 35%31%
0%
1%
3%
6%
8% 10%10%
8%
18%21%
35%
16%
Mar'16 Mar'17 Mar'18 Mar'19 Mar'20 Mar'21 Dec'21 Mar'22
Refinance
CBLO
Term Loans
Bonds
Commercial Paper
16,695
Bonds/NCDs investors split (%)
Outstanding assignment/securitisation (₹ Cr)
Public, 23%
Bank, 16%
Insurance Company,
15%
Foreign Investor,
26%
Others, 20%
241 3,024 4,441 5,723
7,936
16,506
29,400
34,247
47,913
7,519 10,024
12,539 15,500
19,875
24,646
36,718
41,541
47,913
14 days 1 month 2 months 3 months 6 months 1 year 3 years 5 years All
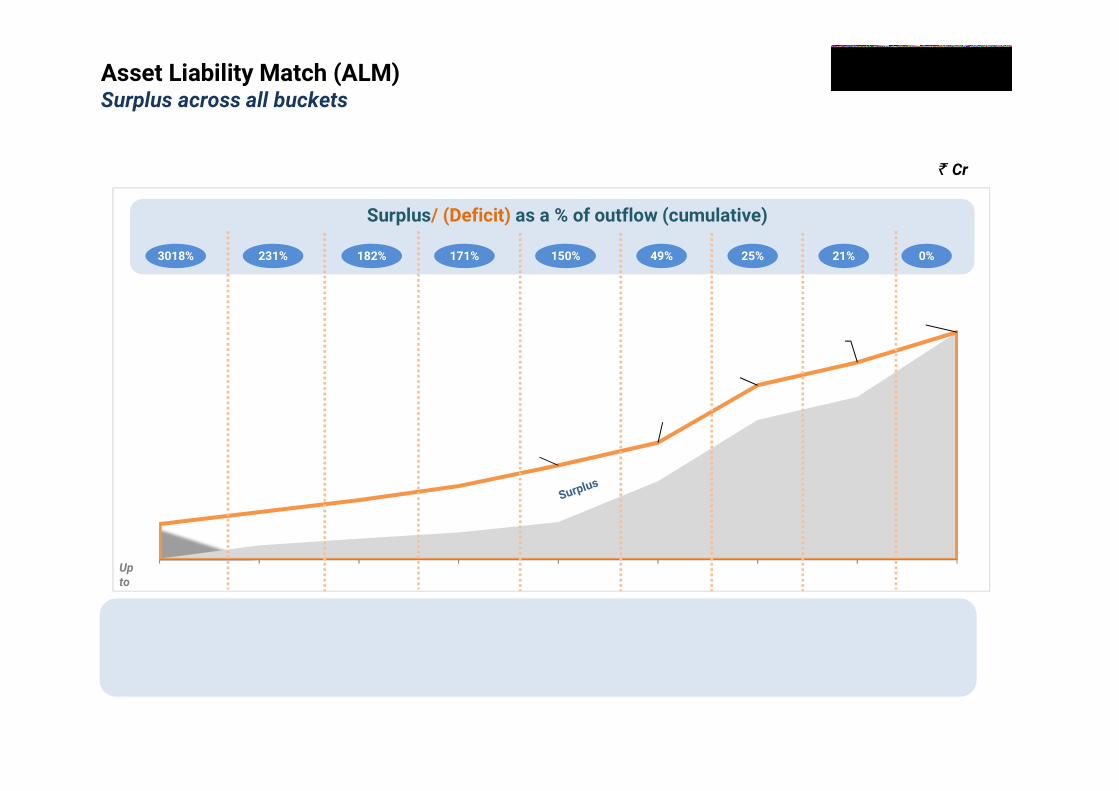
3018% 182%231% 171% 49%150% 25% 0%21%
Up to
This ALM chart shows structural liquidity at consolidated level for IIFL Finance & its subsidiaries. This is prepared broadly basedon RBI format, assuming static balance sheet position, not taking into account fresh disbursements. The inflows does notconsider collection of assigned assets, basis behavioral pattern applied conservatively.
This ALM chart shows structural liquidity at consolidated level for IIFL Finance & its subsidiaries. This is prepared broadly basedon RBI format, assuming static balance sheet position, not taking into account fresh disbursements. The inflows does notconsider collection of assigned assets, basis behavioral pattern applied conservatively.
Surplus/ (Deficit) as a % of outflow (cumulative)
Cr
Asset Liability Match (ALM)Surplus across all buckets
22
23As of March 2022
₹ Cr
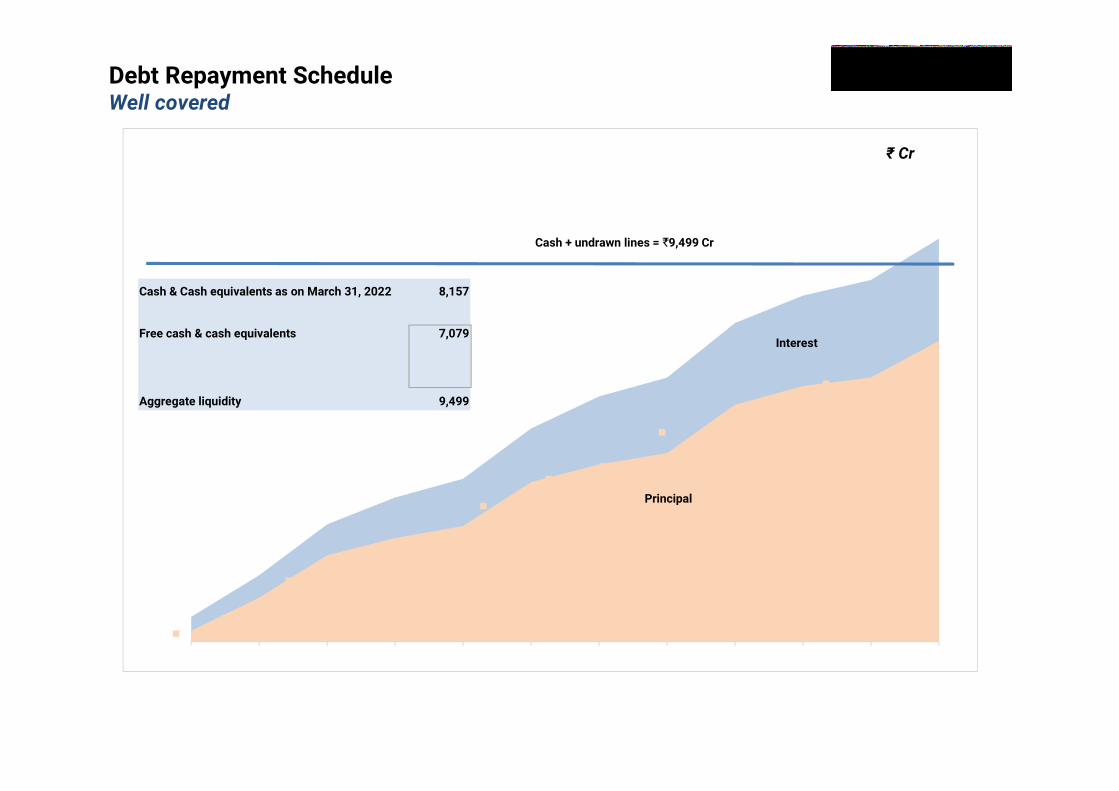
Debt Repayment ScheduleWell covered
623
1,679
2,970
3,653
4,123
5,400
6,211
6,688
8,073 8,768
9,164
10,217
268 1,116
2,185
2,624 2,925
4,039
4,487 4,776
6,003
6,475
6,695
7,622
Apr'22 May'22 Jun'22 Jul'22 Aug'22 Sep'22 Oct'22 Nov'22 Dec'22 Jan'23 Feb'23 Mar'23
Principal
Cash + undrawn lines = 9,499 Cr
Interest
Cash & Cash equivalents as on March 31, 2022 8,157
Earmarked cash & cash equivalents (1,078)
Free cash & cash equivalents 7,079
Liquid investments / Unutilised CC (+) 586
Undrawn credit lines (+) 1,834
Aggregate liquidity 9,499
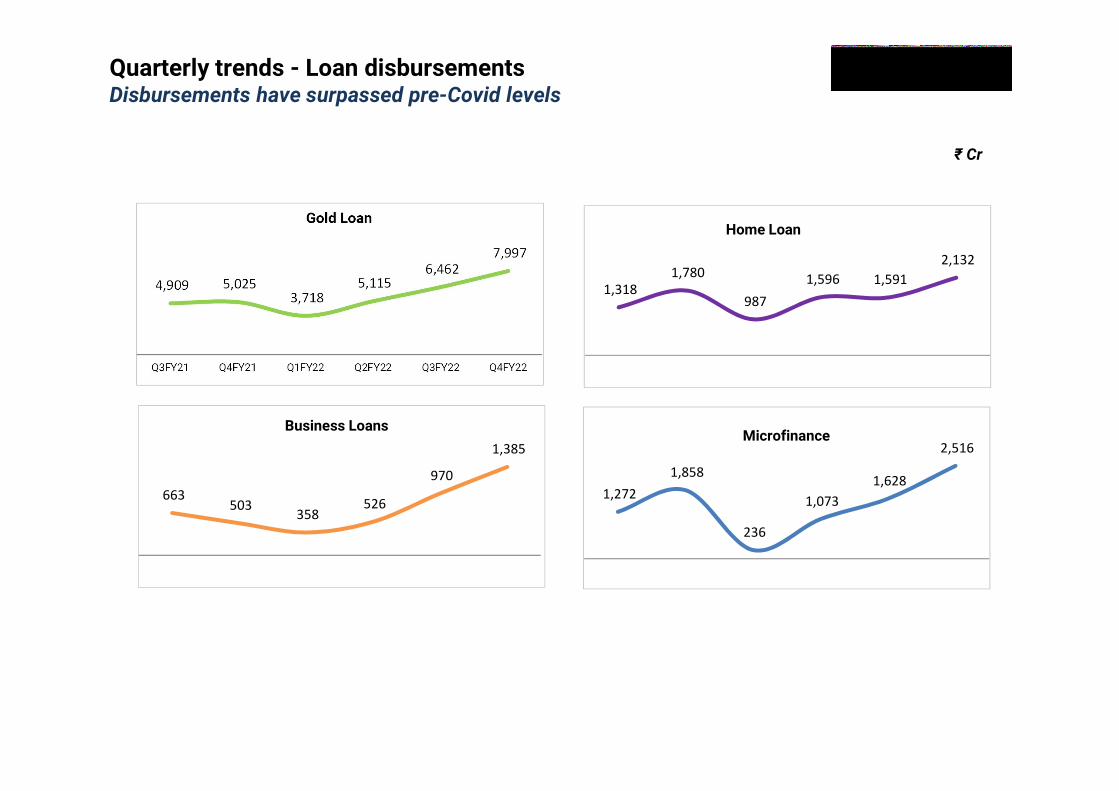
1,272 1,858
236
1,073 1,628
2,516
Q3FY21 Q4FY21 Q1FY22 Q2FY22 Q3FY22 Q4FY22
Microfinance
663 503
358 526
970
1,385
Q3FY21 Q4FY21 Q1FY22 Q2FY22 Q3FY22 Q4FY22
Business Loans
1,318 1,780
987 1,596 1,591
2,132
Q3FY21 Q4FY21 Q1FY22 Q2FY22 Q3FY22 Q4FY22
Home Loan
4,909 5,025 3,718
5,115 6,462
7,997
Q3FY21 Q4FY21 Q1FY22 Q2FY22 Q3FY22 Q4FY22
Gold Loan
24
Quarterly trends - Loan disbursementsDisbursements have surpassed pre-Covid levels
₹ Cr

25
Highlights of financial performance Q4FY22 & FY22
Business model, environment & strategy
Quarterly trends
Business segments review
Bank partnerships and digital updates
Corporate and miscellany
3-10
12-15
17-24
26-30
32-34
36-42
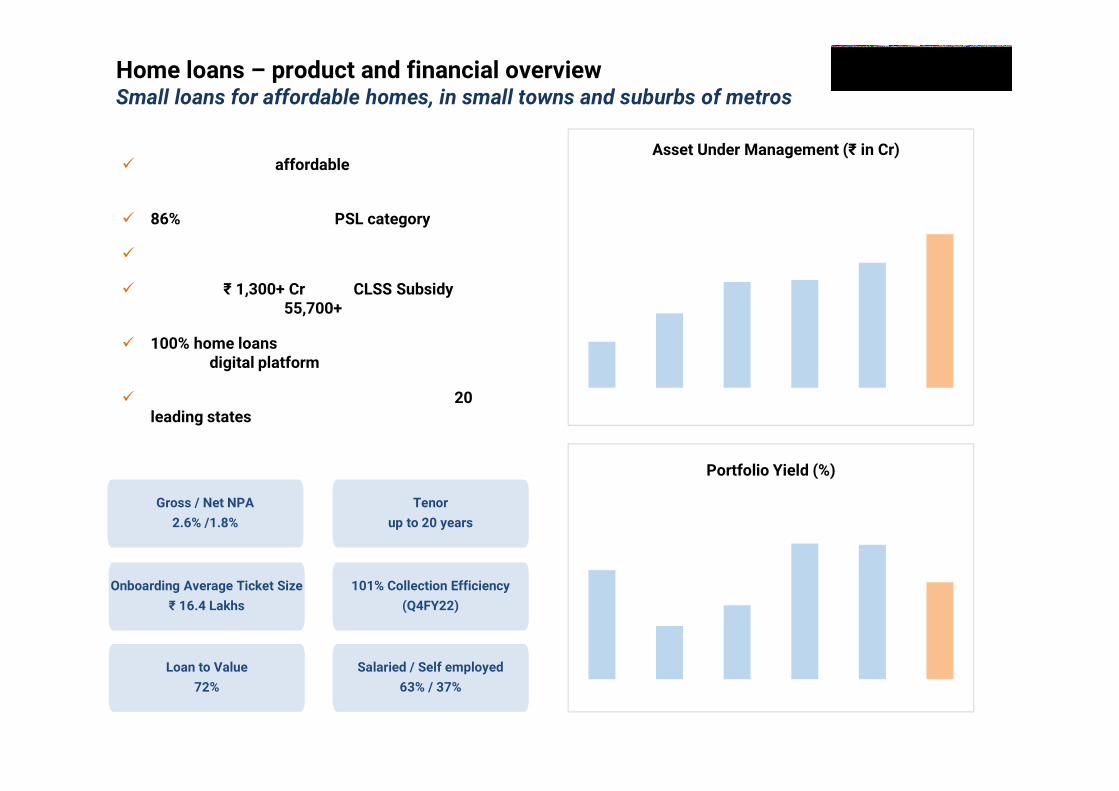
Home loans – product and financial overviewSmall loans for affordable homes, in small towns and suburbs of metros
Primary focus on affordable and non-metro customers.
86% of home loans under PSL category.
Focus is on first time home buyers.
Benefit of ₹ 1,300+ Cr under CLSS Subsidy has been given to over 55,700+ customers.
100% home loans are on-boarded and decisioned through digital platform
Well diversified portfolio across more than 20 leading states
Loan to Value
72%
Onboarding Average Ticket Size
₹ 16.4 Lakhs
Tenor
up to 20 years
26
101% Collection Efficiency
(Q4FY22)
Gross / Net NPA
2.6% /1.8%
5,300
8,579
12,197 12,443 14,439
17,727
FY17 FY18 FY19 FY20 FY21 FY22
Asset Under Management (₹ in Cr)
Salaried / Self employed
63% / 37%
10.1%
9.6%
9.8%
10.3% 10.3%
10.0%
FY17 FY18 FY19 FY20 FY21 FY22
Portfolio Yield (%)
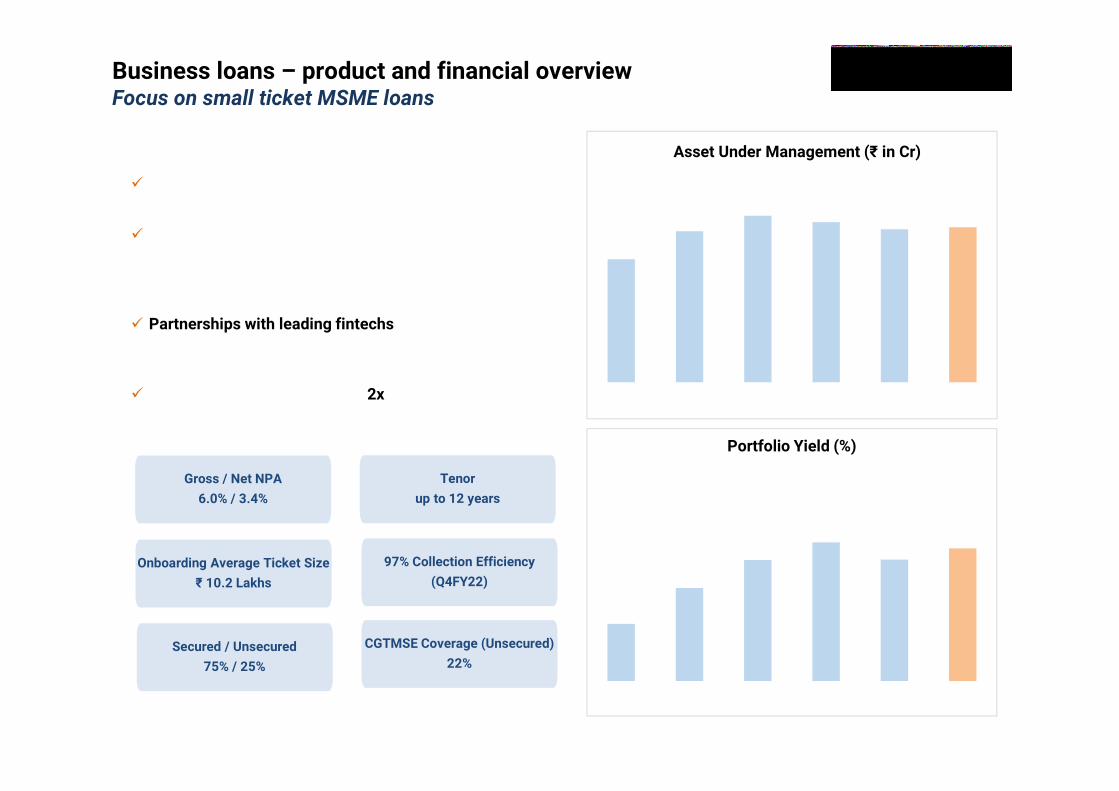
For business loans backed by cash flows
Focus on balancing prudent credit underwriting with instant in-principle decision and automated disbursements based on analytical scorecards
Partnerships with leading fintechs with appropriate risk sharing arrangements
Average security cover of over 2x for secured loans
Business loans – product and financial overviewFocus on small ticket MSME loans
27
CGTMSE Coverage (Unsecured)
22%
Onboarding Average Ticket Size
₹ 10.2 Lakhs
97% Collection Efficiency
(Q4FY22)
Tenor
up to 12 years Gross / Net NPA
6.0% / 3.4%
6,000
7,3618,117 7,805
7,464 7,559
FY17 FY18 FY19 FY20 FY21 FY22
Asset Under Management (₹ in Cr)
Secured / Unsecured
75% / 25%
14.0%
14.9%
15.6%
16.1%
15.6%15.9%
FY17 FY18 FY19 FY20 FY21 FY22
Portfolio Yield (%)
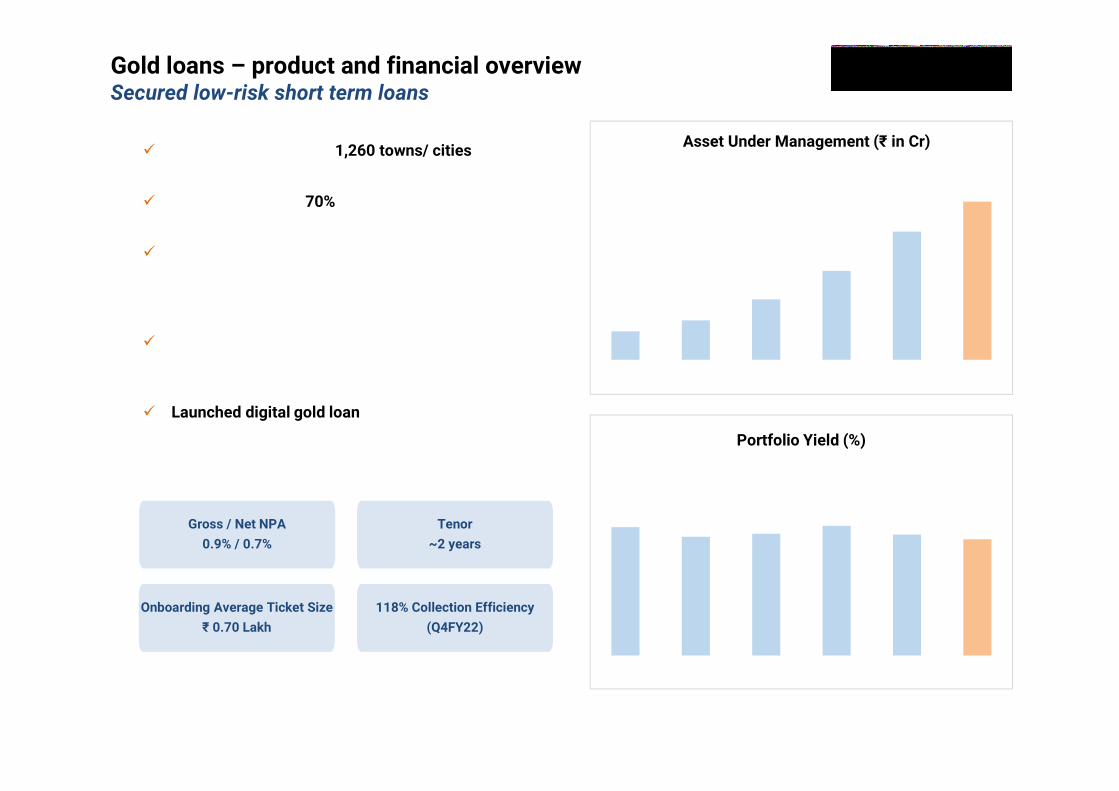
Branches in more than 1,260 towns/ cities
On-boarding LTV ~70%
In-house loan origination tablet application equipped to screen customers for earlier defaults, frauds and negative customer lists
Strong emphasis on collections and resolution resulting in negligible losses
Launched digital gold loan – for top-up and online renewal of gold loans
Gold loans – product and financial overviewSecured low-risk short term loans
28
Onboarding Average Ticket Size
₹ 0.70 Lakh
118% Collection Efficiency
(Q4FY22)
Tenor
~2 years
Gross / Net NPA
0.9% / 0.7%
2,9104,037
6,195
9,125
13,149
16,228
FY17 FY18 FY19 FY20 FY21 FY22
Asset Under Management (₹ in Cr)
18.8%17.8% 18.1%
19.0%18.0% 17.5%
FY17 FY18 FY19 FY20 FY21 FY22
Portfolio Yield (%)
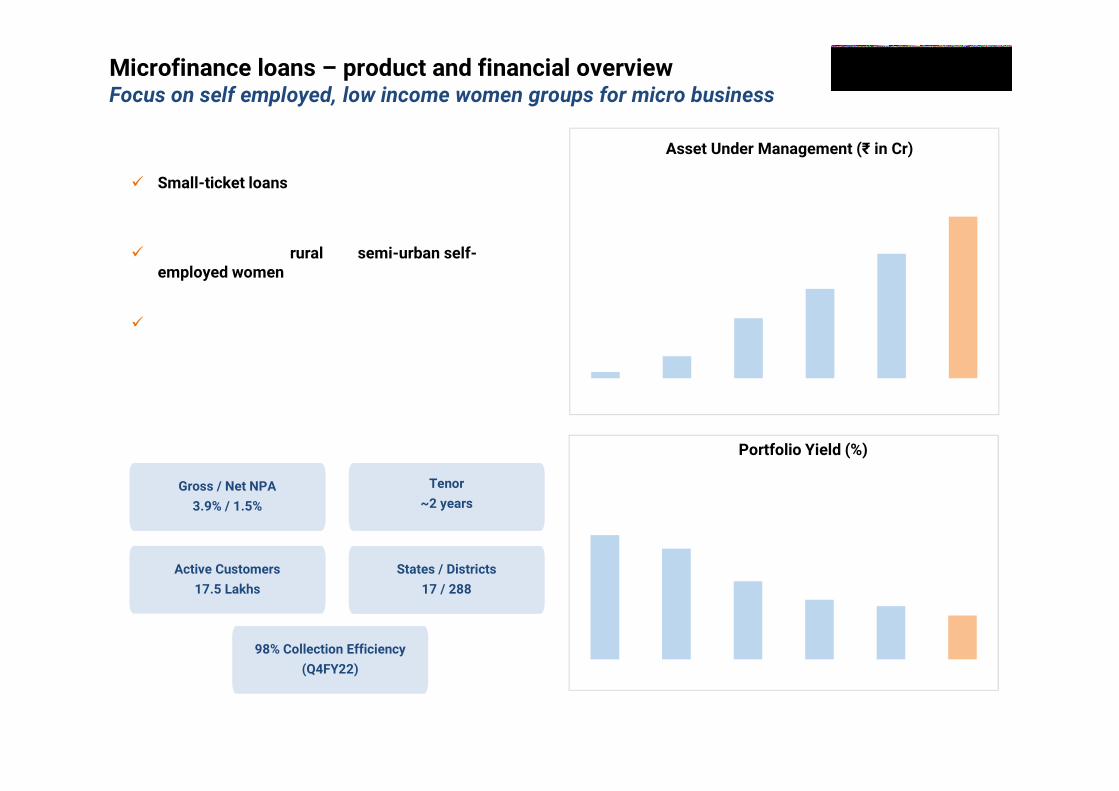
Microfinance loans – product and financial overviewFocus on self employed, low income women groups for micro business
Small-ticket loans for purpose of income generation activities
Target segment is rural and semi-urban self-employed women in joint liability groups
Strong emphasis on training and awareness of all customers detailing end use of funds, timely repayment and emphasis on joint liability
29
98% Collection Efficiency
(Q4FY22)
Active Customers
17.5 Lakhs
Tenor
~2 years
States / Districts
17 / 288
Gross / Net NPA
3.9% / 1.5%
238840
2,286
3,400
4,738
6,155
FY17 FY18 FY19 FY20 FY21 FY22
Asset Under Management (₹ in Cr)
25.4%24.8%
23.4%
22.6%22.3%
21.9%
FY17 FY18 FY19 FY20 FY21 FY22
Portfolio Yield (%)
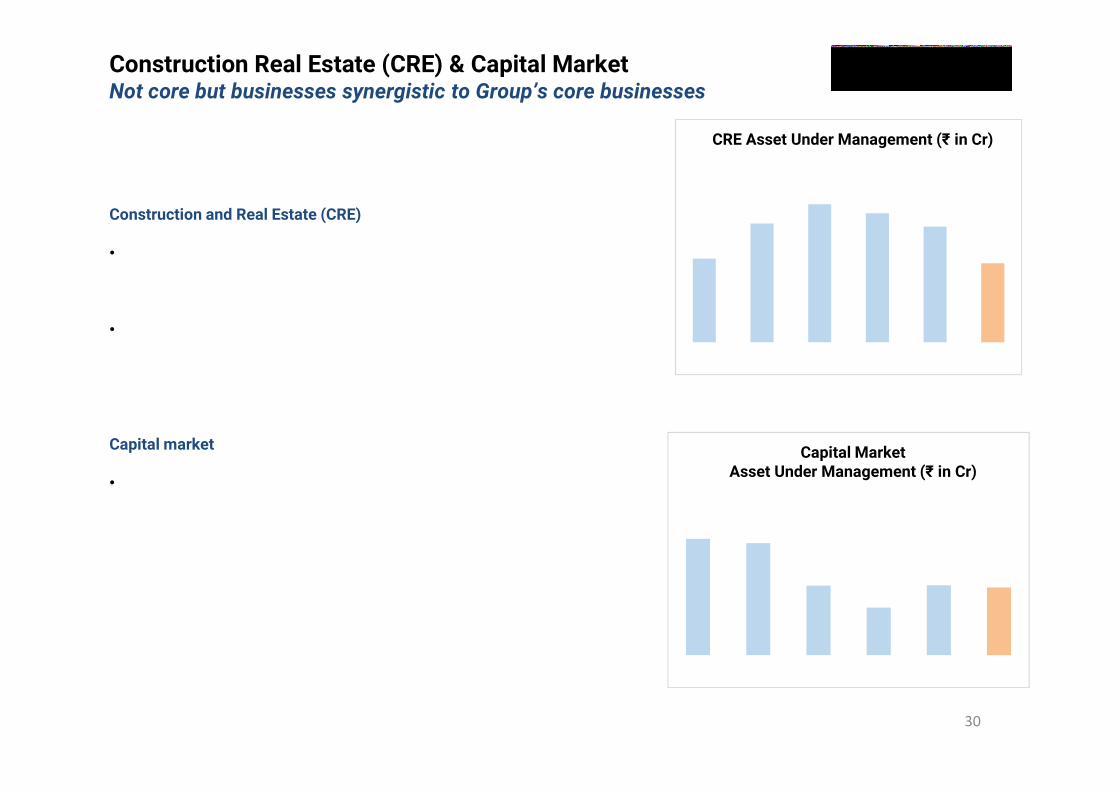
Construction Real Estate (CRE) & Capital MarketNot core but businesses synergistic to Group’s core businesses
30
Construction and Real Estate (CRE)
• IIFL Finance will continue to provide funding for completion of its already funded projects, with appropriate internal approvals and in compliance with RBI guidelines
• IIFL Finance subsidiary HFC provides funding for LAP (Loan against Property) and CF (Construction Finance) the way large established HFCs also do.
Capital market
• The Loan against shares and capital market portfolio is not core focus for growth but synergistic with group businesses. The strategy is to restrict to clients of group companies, thereby minimising operating cost and with strict risk control of the lending portfolio.
3,067
4,355
5,0554,727
4,235
2,899
FY17 FY18 FY19 FY20 FY21 FY22
CRE Asset Under Management (₹ in Cr)
1,104 1,063
660
451
663 642
FY17 FY18 FY19 FY20 FY21 FY22
Capital MarketAsset Under Management (₹ in Cr)

31
Highlights of financial performance Q4FY22 & FY22
Business model, environment & strategy
Quarterly trends
Business segments review
Bank partnerships and digital updates
Corporate and miscellany
3-10
12-15
17-24
26-30
32-34
36-42
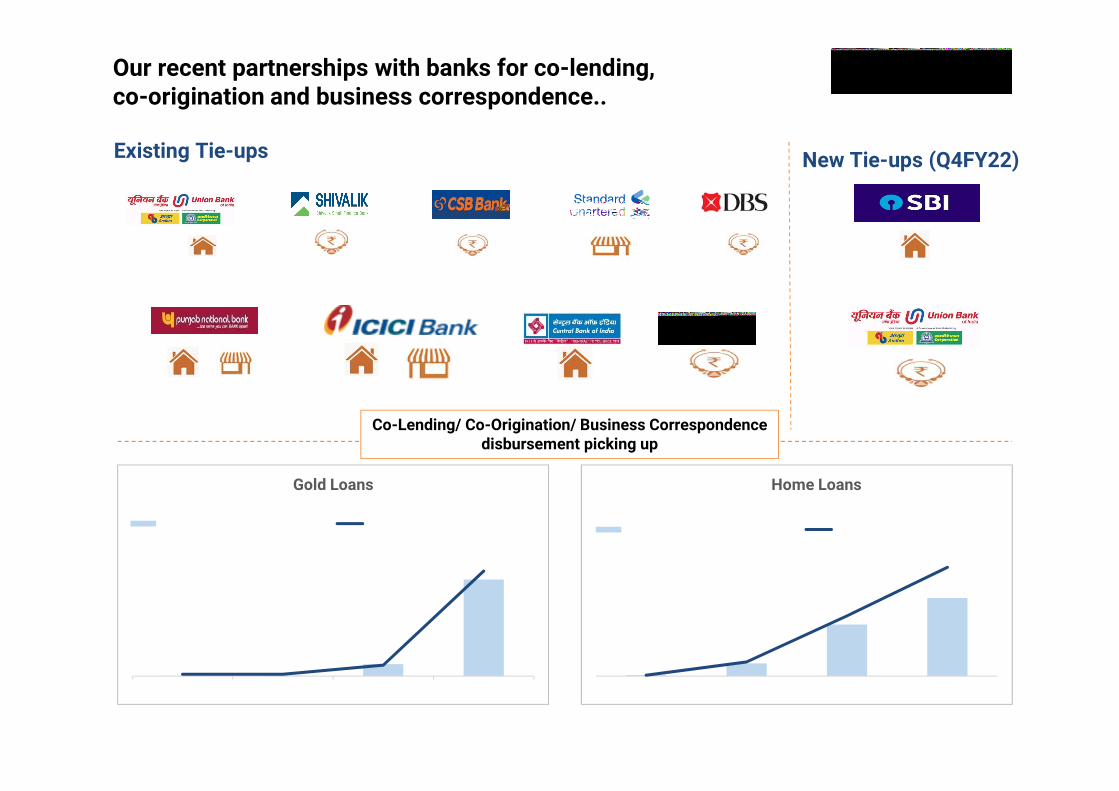
Our recent partnerships with banks for co-lending, co-origination and business correspondence..
32
Gold Loan
Gold Loan
Gold Loan
Home Loan
Home Loan and MSME LAP
Gold Loan Business Loan
Home Loan and MSME LAP Home Loan
12163
655
991
0.1%1.2%
5.1%
9.2%
Q1FY22 Q2FY22 Q3FY22 Q4FY22
Home Loans
Colending Disbursement (Rs. in Cr.) Colending AUM as a % of total AUM
1 13 260
2,097
0.2%0.2%
1.2%
11.4%
Q1FY22 Q2FY22 Q3FY22 Q4FY22
Gold Loans
Colending disbursement (Rs. in Cr.) Colending AUM as a % of total AUM
Co-Lending/ Co-Origination/ Business Correspondence disbursement picking up
Existing Tie-ups New Tie-ups (Q4FY22)
Gold Loan Home Loan
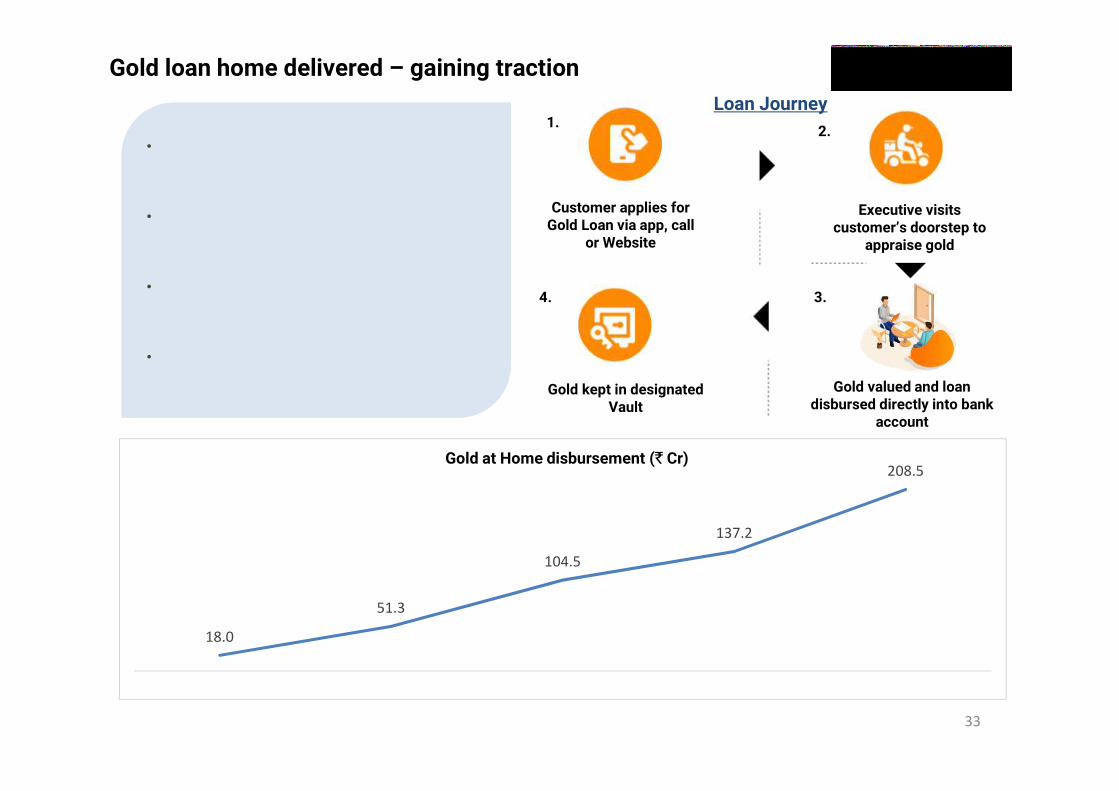
Customer applies for Gold Loan via app, call
or Website
Executive visits customer’s doorstep to
appraise gold
Gold valued and loan disbursed directly into bank
account
Gold kept in designated Vault
Gold loan home delivered – gaining tractionLoan Journey
33
• Gold loan at customer’s doorstep initiativetargets branchless expansion of Gold Loanbusiness.
• The initiative started a year ago, saw significanttraction with disbursements rising 52% qoq to₹209 Cr in Q4FY22.
• We have proprietary technology to provide highlevel of security, paperless and frictionlessexperience to the customer.
• We are currently operating in 19 cities which weplan to expand to ~50 cities.
1.2.
3.4.
18.0
51.3
104.5
137.2
208.5
Q4FY21 Q1FY22 Q2FY22 Q3FY22 Q4FY22
Gold at Home disbursement ( Cr)
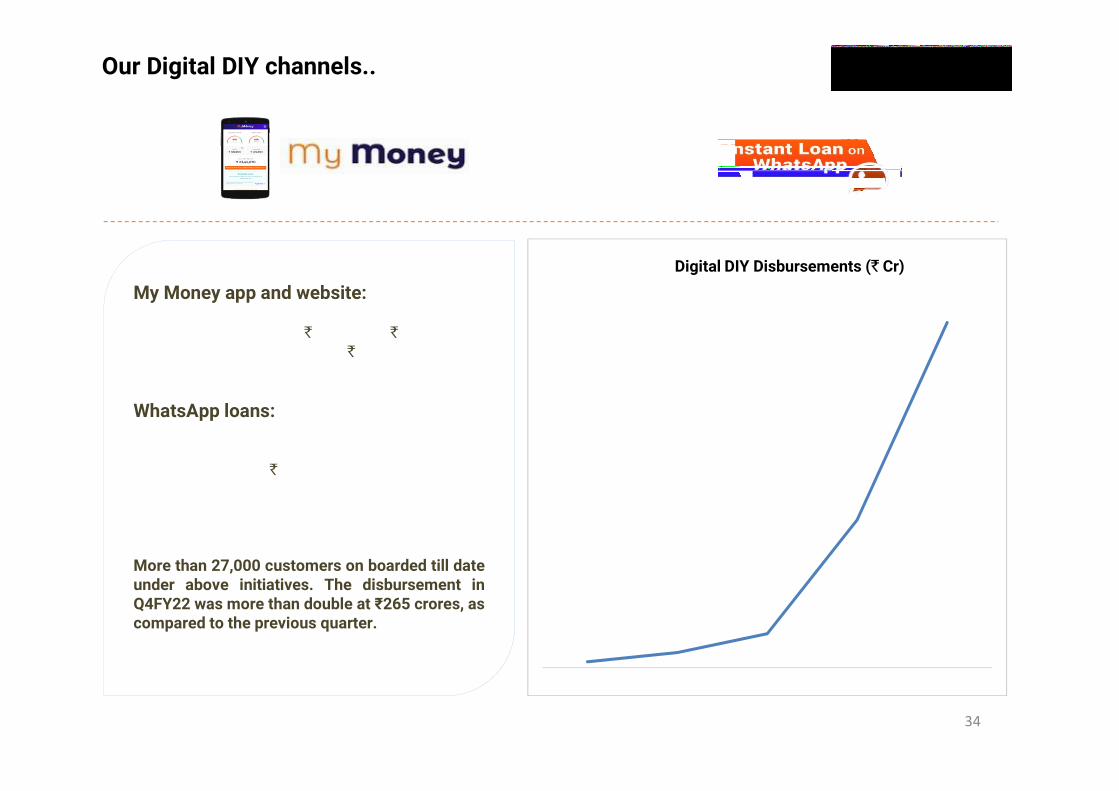
4.5 11.6
26.1
113.6
265.4
Q4FY21 Q1FY22 Q2FY22 Q3FY22 Q4FY22
Our Digital DIY channels..
My Money app and website:a. 100% online loan application process.b. Loans ranging from 50,000 to 10 lakhs for
Business Loans and from 5,000 to ₹2 lakhsfor Personal Loans
WhatsApp loans:a. Ease of chat has been brought to the
complex loan journeyb. Loan up to 10 lakhs with minimum
documentation and approval in 5 mins.c. API Integration with fintech vendors
More than 27,000 customers on boarded till dateunder above initiatives. The disbursement inQ4FY22 was more than double at ₹265 crores, ascompared to the previous quarter.
34
Digital DIY Disbursements ( Cr)

35
Highlights of financial performance Q4FY22 & FY22
Business model, environment & strategy
Quarterly trends
Business segments review
Bank partnerships and digital updates
Corporate and miscellany
3-10
12-15
17-24
26-30
32-34
36-42
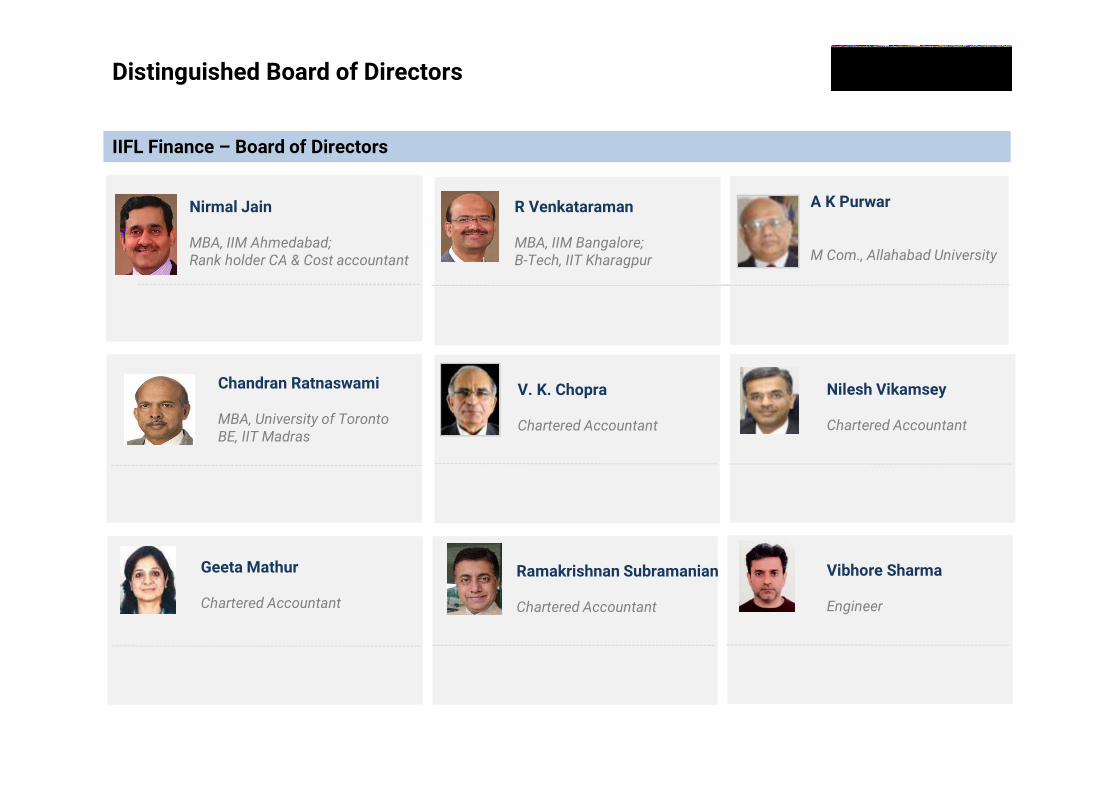
IIFL Finance – Board of Directors
Distinguished Board of Directors
36
Founded and led IIFL since 1995Worked with Unilever for 5 years
Nirmal JainManaging DirectorMBA, IIM Ahmedabad; Rank holder CA & Cost accountant
Co-founder of IIFLWorked with ICICI Bank, Barclays,GE Capital
R VenkataramanJoint Managing DirectorMBA, IIM Bangalore;B-Tech, IIT Kharagpur
Managing Director, Hamblin Watsa Investment Counsel Ltd.Director & CEO, Fairfax India Holdings
Chandran RatnaswamiNon-Executive DirectorMBA, University of TorontoBE, IIT Madras
Chairman of Tadas Wind Energy Private Limited & Eroute Technologies Private Limited; Former Chairman, SBI
A K PurwarChairman and Independent DirectorM Com., Allahabad University
Senior Partner at Khimji Kunverji & Co; Past President of The Institute of Chartered Accountants of India
Nilesh VikamseyIndependent DirectorChartered Accountant
Former Whole-Time Member, SEBIFormer Chairman & MD - Corporation Bank and SIDBI
V. K. ChopraIndependent DirectorChartered Accountant
Co-chair for the India Chapter of Women Corporate Directors Foundation
Geeta MathurIndependent DirectorChartered Accountant
Sr. Advisor, Operating Partner, Consultant with PE, VC, FIs and Fintech in India
Ramakrishnan SubramanianIndependent DirectorChartered Accountant
Engineering & product leader with over 20 years of experienceEarliest members of InfoEdge India
Vibhore SharmaIndependent DirectorEngineer
IIFL Finance
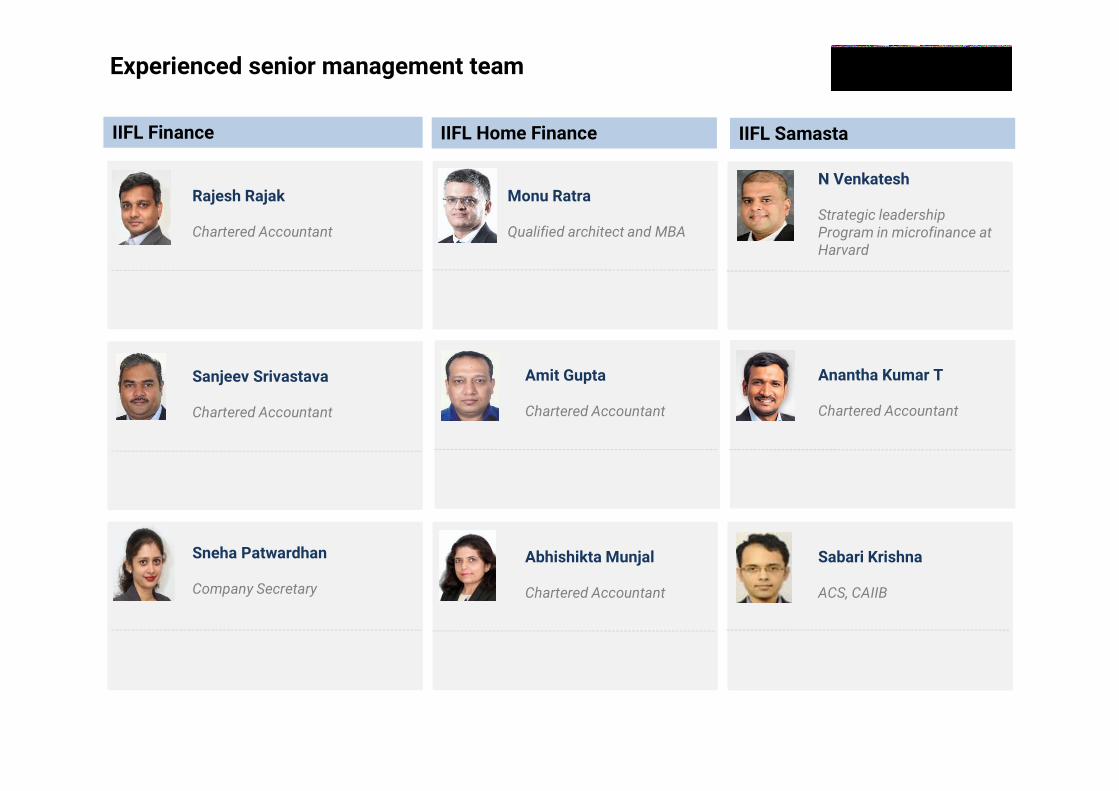
Experienced senior management team
37
SVP- heading Business Finance function with HDFC Bank Ltd for 14 years.
Rajesh Rajak Chief Financial OfficerChartered Accountant
20+ years of experience with HDFC, ICICI Bank and Indiabulls Housing in mortgages.
Monu Ratra Chief Executive OfficerQualified architect and MBA
20 years of experience in the financial services sector
N VenkateshChief Executive OfficerStrategic leadership Program in microfinance at Harvard
Over 20 years of experience in financial services
Sanjeev SrivastavaChief Risk OfficerChartered Accountant
10+ years of varied experience across industries such as financial services, steel, garments and IT
Anantha Kumar TChief Financial OfficerChartered Accountant
20+ years of experience in financial services in accounting, finance, audit & compliance
Amit GuptaChief Financial OfficerChartered Accountant
13 years of experience in the field of Secretarial, Compliance, Legal.
Sneha PatwardhanCompliance OfficerCompany Secretary
19 years of work experience with 17+ years experience in mortgages and housing finance
Abhishikta MunjalChief Risk OfficerChartered Accountant
13+ years of experience in Risk Management, Operational Risk, Risk Assessment, Compliance
Sabari KrishnaChief Risk OfficerACS, CAIIB
IIFL Home Finance IIFL Samasta
38
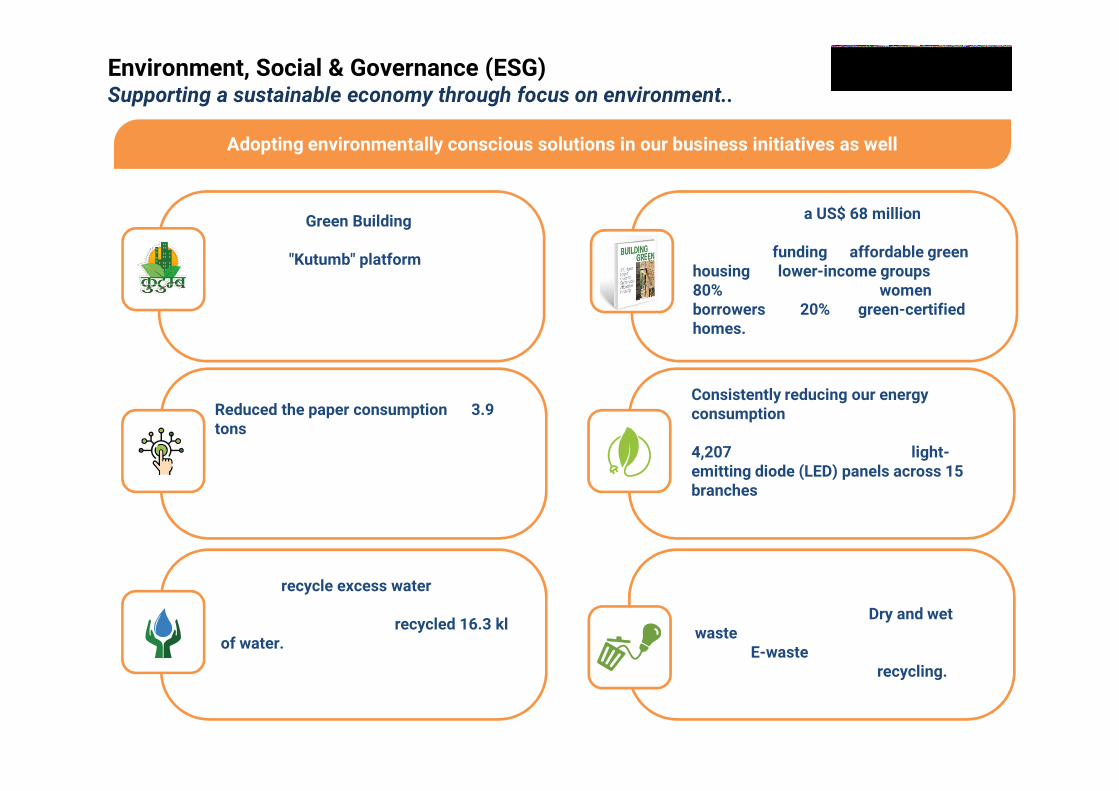
Reduced the paper consumption by 3.9 tons in FY21 by digitalizing and automating processes for loan application (approximately 7.8 lakh sheets of paper).
We also recycle excess water from RO water purifier for use in toilets and urinals. During FY21, we recycled 16.3 kl of water. We have also installed sensors in washrooms that control water consumption
Pioneered Green Building concept in partnership with housing developers through "Kutumb" platform. It provides industry experts and housing developers, a platform to promote sustainable infrastructure.
Consistently reducing our energy consumption by using energy efficient lighting at our branches. We replaced 4,207 incandescent lights with light-emitting diode (LED) panels across 15 branches, which is an ongoing process
We measure our waste generation and aim to strengthen our waste management initiatives. Dry and wet waste is picked up by local municipal bodies. E-waste and paper waste is given to authorized vendors for recycling.
Adopting environmentally conscious solutions in our business initiatives as well
IIFL has signed a US$ 68 million loan with Asian Development Bank (ADB) to improve funding to affordable green housing for lower-income groups in India. 80% will be earmarked for women borrowers and 20% for green-certified homes.
Environment, Social & Governance (ESG)Supporting a sustainable economy through focus on environment..
39
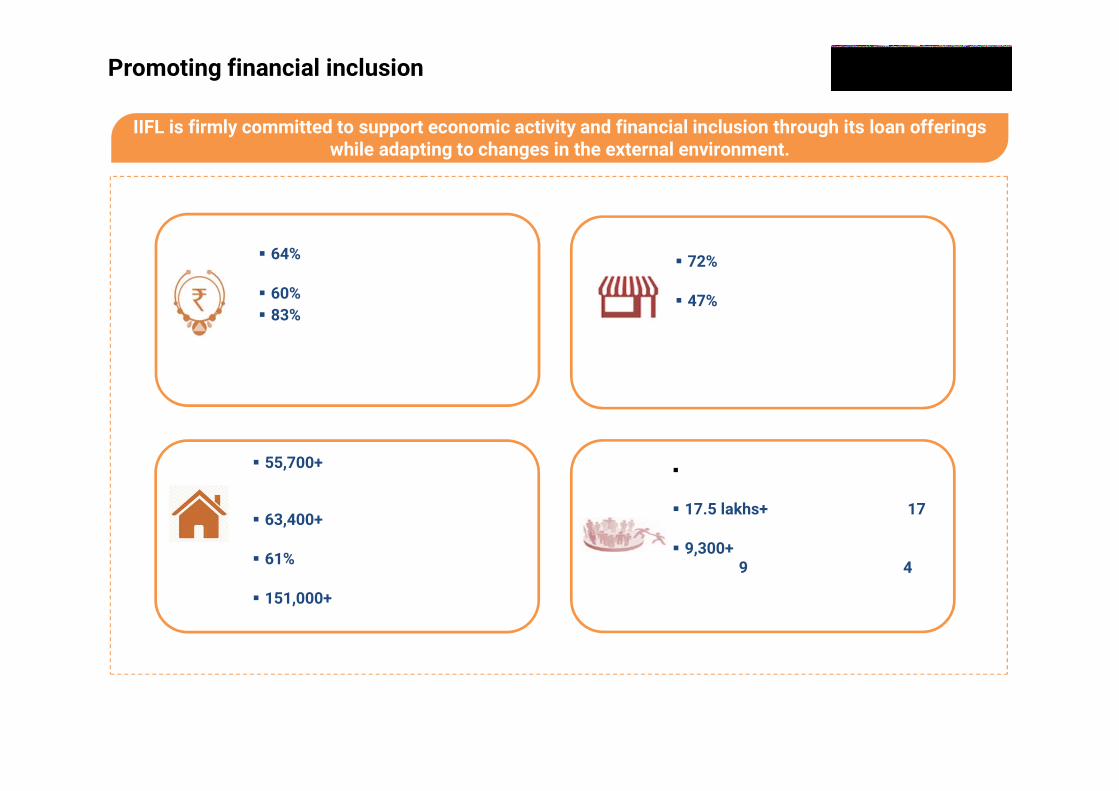
IIFL is firmly committed to support economic activity and financial inclusion through its loan offerings while adapting to changes in the external environment.
64% of gold loan are of less than ₹ 50,000 value
60% of loans given to small businesses 83% of the branches are located in tier
II, III cities and rural areas
Small-ticket loans for purpose of income generation activities
17.5 lakhs+ families benefited in 17 states with financial intervention
9,300+ dairy farmers supported through 9 cattle health centers in 4States.
MICRO-FINANCE
HOME LOAN
72% of the Unsecured MSME loans given are of less than ₹ 1 Million
47% of unsecured loans are to borrowers who are new to credit
BUSINESS LOAN
GOLD
55,700+ families benefitted under CLSS and 1300+ Cr. subsidy provided till date
63,400+ loans given to the informal segment
61% loans given to female owners/co-owners
151,000+ loans to first time home buyers
Promoting financial inclusion
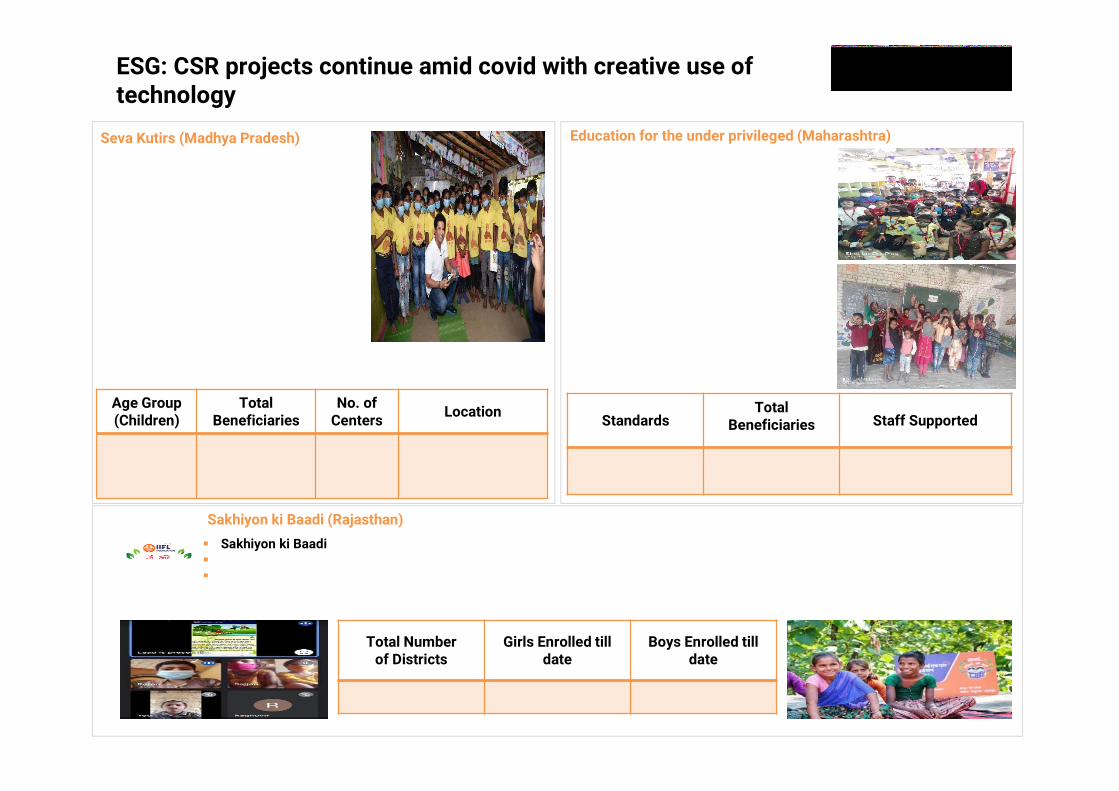
Sakhiyon ki Baadi is an initiative aimed at eradication of female illiteracy from Rajasthan Learning centres has been set up for children in the age group of 4 yrs. to 14 yrs. old The centres are located in the areas dominated by native Scheduled Tribe communities, where girls often dropout of school or are
never enrolled at one.
ESG: CSR projects continue amid covid with creative use of technology
Sakhiyon ki Baadi (Rajasthan)
Total Numberof Districts
Girls Enrolled till date
Boys Enrolled till date
13 32,264 3,495
Because of COVID-19 pandemic government schools remained shut which led to interruption in Mid-Day Meal programme. IIFL Foundation supported provision for nutritional and healthy meals, both Lunch and Dinner to students of government schools in 5 such villages in Madhya Pradesh by establishing Seva Kutirs. The learning centres were paid a visit by International Cricket Legend Sachin Tendulkar.
Seva Kutirs (Madhya Pradesh)
Age Group (Children)
Total Beneficiaries
No. ofCenters Location
4 to 15 years 2,207 21 District- Khandwa,
MP
StandardsTotal
Beneficiaries Staff Supported
1 to 10th 353 6
Since 2018, IIFL Foundation has been supporting education of the children from the Financially weaker section of the community residing at Janupada Vaibhav Nagar locality (slum settlement) located at Kandivali (E), Mumbai. Almost 90% of the parents earn their livelihood through menial occupations and find it difficult to meet financial demands to offer their children quality education .
Through IIFL foundation these children are offered education without charging any fees
Education for the under privileged (Maharashtra)
40
41
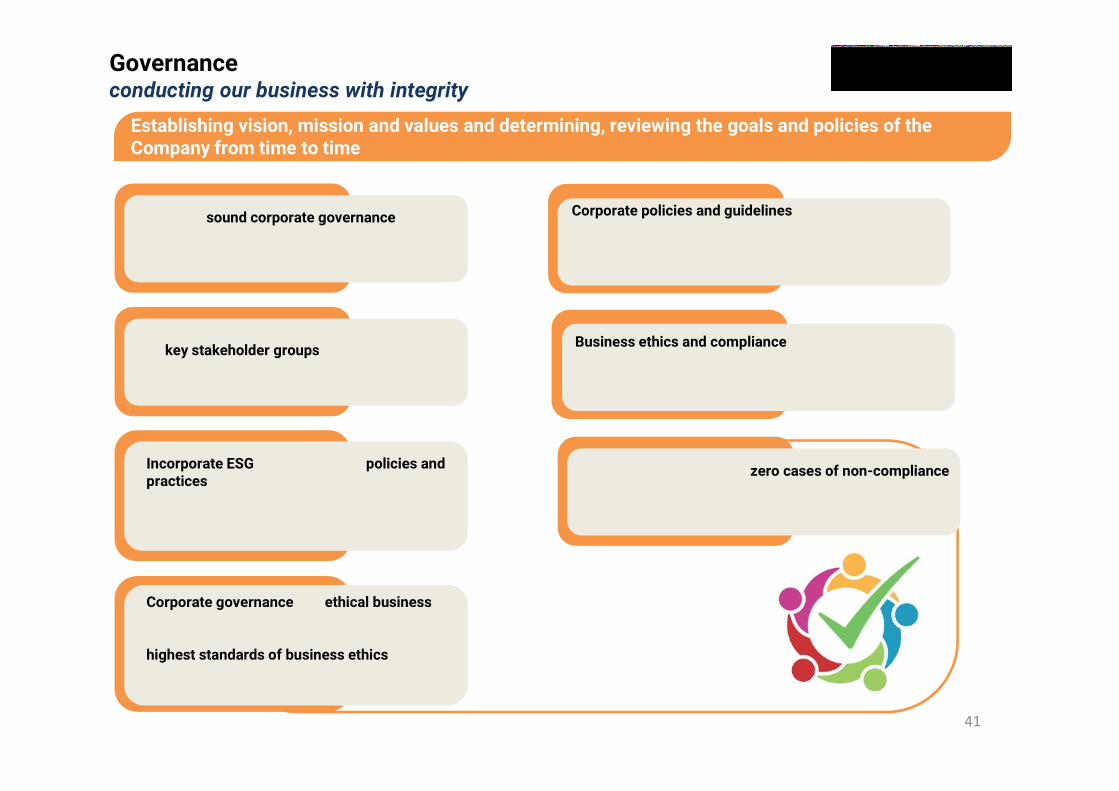
Promote sound corporate governance practices, ethical standards, and compliance with the laws of the land.
Disclose our strategy, key targets and goals to all key stakeholder groups (internal and external), and report our progress annually.
Incorporate ESG aspects into our policies and practices, assess our performance through a robust internal ESG governance structure
Corporate governance and ethical businessconduct are one of the fundamental pillars of a successful business. We strive to maintain the highest standards of business ethics.
In FY 20-21, we reported zero cases of non-compliancewith financial, environmental, and socio-economic regulations.
Corporate policies and guidelines: Board Diversity Policy, Whistle Blower Policy, CSR Policy, Interest Rate Policy, Grievance Redressal Policy, etc.
Business ethics and compliance: Anti-Corruption Policy, Vigilance Policy & Code of Conduct.
Establishing vision, mission and values and determining, reviewing the goals and policies of the Company from time to time
Governance conducting our business with integrity
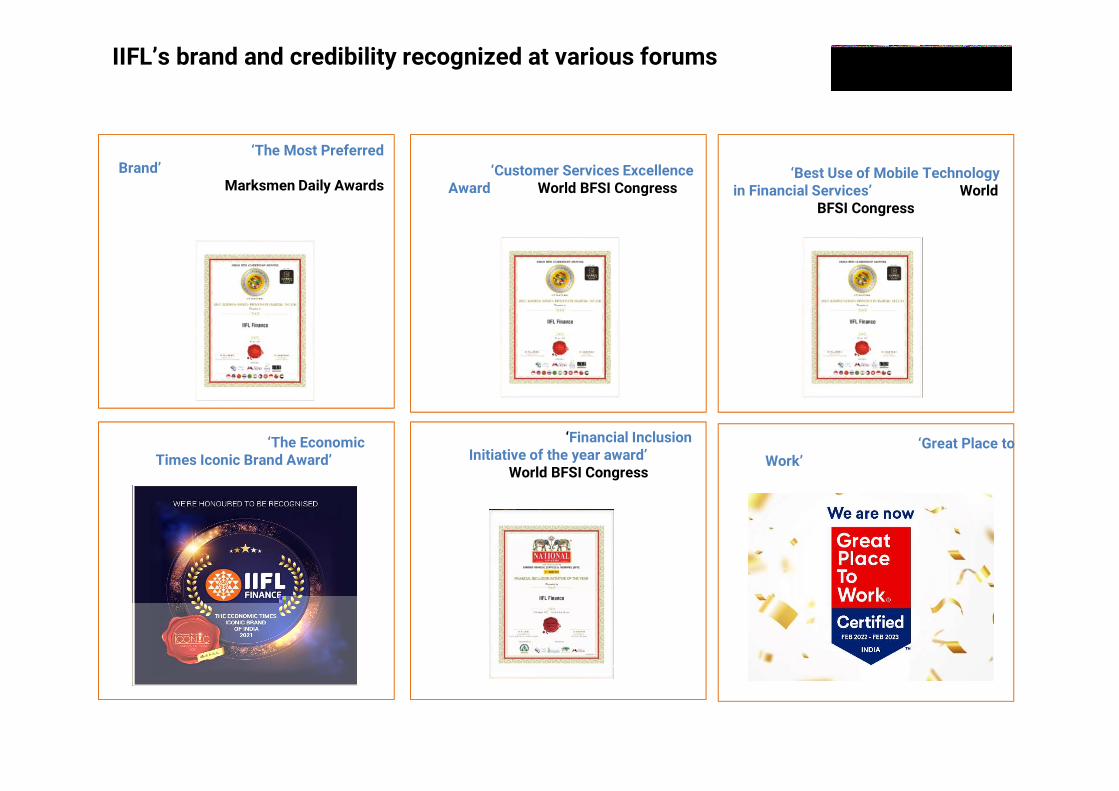
IIFL’s brand and credibility recognized at various forums
42
IIFL Finance received ‘The Most Preferred Brand’ Award for Sustained Brilliance in
Brand Building at Marksmen Daily Awards
IIFL Finance’s ‘WhatsApp Loan’ product received ‘Best Use of Mobile Technology in Financial Services’ award at the World
BFSI Congress
IIFL Finance’s ‘Gold Loan at Home’ product received ‘Customer Services Excellence
Award’ at the World BFSI Congress
IIFL Finance was certified as ‘Great Place to Work’ for the fourth year in a row
IIFL Finance received ‘Financial Inclusion Initiative of the year award’at the World BFSI Congress
IIFL Finance received ‘The Economic Times Iconic Brand Award’
Thank you
Published in April 2022
IIFL Finance Ltd. All rights reserved. Regd. Off: IIFL House, Sun Infotech Park, Road No. 16V, Plot No.B-23, Thane Industrial Area, Wagle Estate, Thane – 400604.
This report is for information purposes only and does not construe to be any investment, legal or taxation advice. It is not intended as an offer or solicitation forthe purchase and sale of any financial instrument. Any action taken by you on the basis of the information contained herein is your responsibility alone and IIFLFinance Ltd (hereinafter referred as IIFL) and its subsidiaries or its employees or directors, associates will not be liable in any manner for the consequences of suchaction taken by you. We have exercised due diligence in checking the correctness and authenticity of the information contained herein, but do not represent thatit is accurate or complete. IIFL or any of its subsidiaries or associates or employees shall not be in any way responsible for any loss or damage that may arise to anyperson from any inadvertent error in the information contained in this publication. The recipients of this report should rely on their own investigations. IIFL and/orits subsidiaries and/or directors, employees or associates may have interests or positions, financial or otherwise in the securities mentioned in this report.
43