STRATEGIC FINANCE PLAN
50
STRATEGIC FINANCE PLAN Submitted by the Lake County Schools Leadership Team 2016 – 2018 Final Plan January 12, 2015
-
Upload
khangminh22 -
Category
Documents
-
view
0 -
download
0
Transcript of STRATEGIC FINANCE PLAN
STRATEGIC FINANCE PLAN
Submitted by the
Lake County Schools Leadership Team
2016 –2018
Final Plan January 12, 2015

January 12, 2015
Dear Chair, Members of the School Board, and Citizens of Lake County:
I am pleased to submit to you Lake County Schools’ second Three-Year Strategic Finance Plan.
The School Board’s support continues to give us the necessary guidance and encouragement to assemble this plan. The Three-Year Strategic Finance Plan embraces a bold set of initiatives that hold the promise of meeting the need of redefining how we grow student achievement. It continues to align resources to our instructional priorities and outlines a long-term plan to make these priorities a reality. I wholeheartedly believe that, when enacted, this plan will positively transform teaching and learning in Lake County Schools.
In school year 2013-2014, we determined that we would put in place a Three-Year Strategic Finance Plan. The Leadership Team worked with the LCS School Board over six months with the support of the Boston Consulting Group to establish the first LCS Strategic Finance Plan. On December 16, 2013, the School Board of Lake County adopted this plan. It has served as the framework for establishing instructional priorities supported by identified realignment opportunities for the 2014-15 school year.
This second rolling Three-Year Strategic Finance Plan (SFP) demonstrates this ongoing process of identifying instructional priorities that will support student achievement for all LCS students with the goal of being C2Ready. In order to fund these priorities, we continue the process of identifying realignment opportunities. As was the case last year, the SFP will anchor the line-item budget for the 2015-2016 school year and beyond.
Change doesn’t occur overnight, which is why it is significant to note that both our instructional priorities and realignment opportunities take multiple years to play out. As you examine the SFP, you will notice that most of the categories continue from the first year of the plan and are projected into the future as well. Both our Instructional Priorities and Realignment Opportunities take multiple years to play out. We intend to make deliberate decisions and stabilize this really good effort.
We recognize that it is critical to keep the process going. In upcoming SFPs we will go on to new things, but now we need to put our identified initiatives in place and establish them as the “way we do work.” We are realigning work responsibilities. We are focusing on efficiencies within the realignments and effectiveness of the instructional priorities we have proposed. We are using multiple measures to evaluate the instructional priorities and learn what is effective and should remain part of the SFP over time. We are also studying what should be added to our work over time.
For this second year of the SFP process we will continue the following instructional priorities that we believe will support long-term success for students. They will continue to be implemented with the following cumulative three-year costs (incremental to our existing investments in these areas):
ELL and Struggling Students and Schools: $ 5.5 million
Talent Development Pipeline: $ 4.8 million
Teacher Induction & Coaching: $ 1.2 million
Program Evaluation & Innovation: $0.6 million
Personalized Learning for Teachers/Leaders: $2.3 million
Personalized Learning for Students: $7.8 million
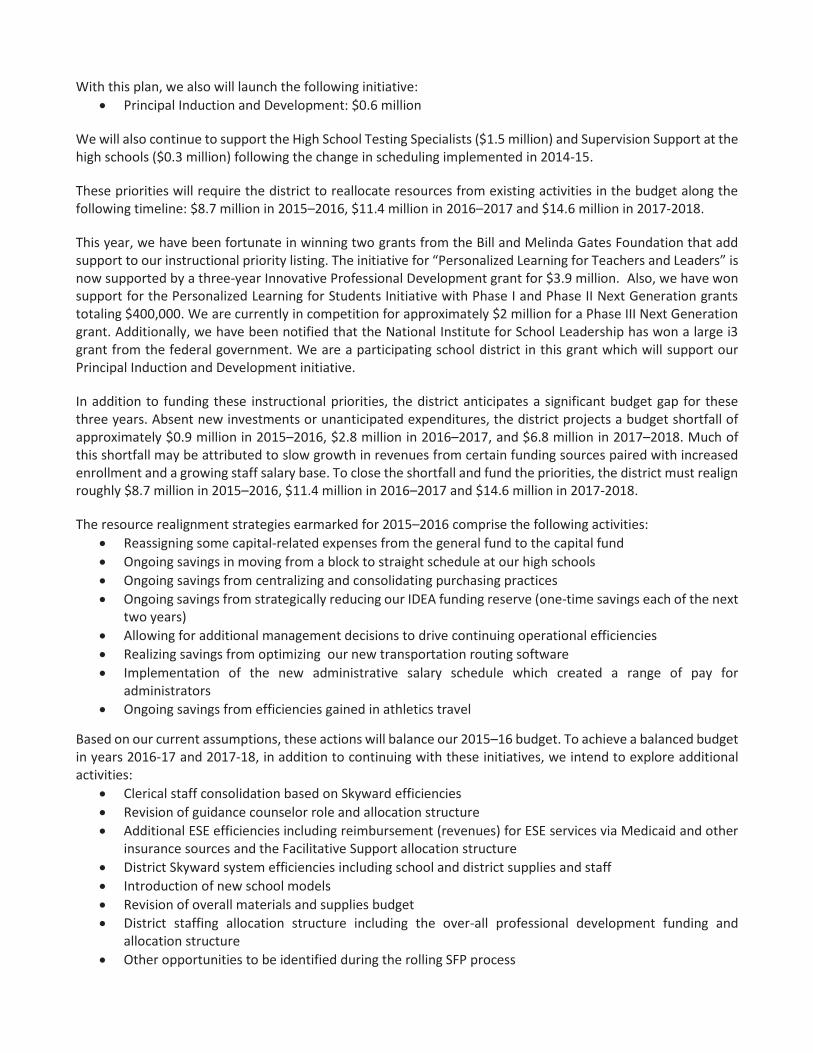
With this plan, we also will launch the following initiative:
Principal Induction and Development: $0.6 million
We will also continue to support the High School Testing Specialists ($1.5 million) and Supervision Support at the high schools ($0.3 million) following the change in scheduling implemented in 2014-15.
These priorities will require the district to reallocate resources from existing activities in the budget along the following timeline: $8.7 million in 2015–2016, $11.4 million in 2016–2017 and $14.6 million in 2017-2018.
This year, we have been fortunate in winning two grants from the Bill and Melinda Gates Foundation that add support to our instructional priority listing. The initiative for “Personalized Learning for Teachers and Leaders” is now supported by a three-year Innovative Professional Development grant for $3.9 million. Also, we have won support for the Personalized Learning for Students Initiative with Phase I and Phase II Next Generation grants totaling $400,000. We are currently in competition for approximately $2 million for a Phase III Next Generation grant. Additionally, we have been notified that the National Institute for School Leadership has won a large i3 grant from the federal government. We are a participating school district in this grant which will support our Principal Induction and Development initiative.
In addition to funding these instructional priorities, the district anticipates a significant budget gap for these three years. Absent new investments or unanticipated expenditures, the district projects a budget shortfall of approximately $0.9 million in 2015–2016, $2.8 million in 2016–2017, and $6.8 million in 2017–2018. Much of this shortfall may be attributed to slow growth in revenues from certain funding sources paired with increased enrollment and a growing staff salary base. To close the shortfall and fund the priorities, the district must realign roughly $8.7 million in 2015–2016, $11.4 million in 2016–2017 and $14.6 million in 2017-2018.
The resource realignment strategies earmarked for 2015–2016 comprise the following activities:
Reassigning some capital-related expenses from the general fund to the capital fund
Ongoing savings in moving from a block to straight schedule at our high schools
Ongoing savings from centralizing and consolidating purchasing practices
Ongoing savings from strategically reducing our IDEA funding reserve (one-time savings each of the next two years)
Allowing for additional management decisions to drive continuing operational efficiencies
Realizing savings from optimizing our new transportation routing software
Implementation of the new administrative salary schedule which created a range of pay for administrators
Ongoing savings from efficiencies gained in athletics travel
Based on our current assumptions, these actions will balance our 2015–16 budget. To achieve a balanced budget in years 2016-17 and 2017-18, in addition to continuing with these initiatives, we intend to explore additional activities:
Clerical staff consolidation based on Skyward efficiencies
Revision of guidance counselor role and allocation structure
Additional ESE efficiencies including reimbursement (revenues) for ESE services via Medicaid and other insurance sources and the Facilitative Support allocation structure
District Skyward system efficiencies including school and district supplies and staff
Introduction of new school models
Revision of overall materials and supplies budget
District staffing allocation structure including the over-all professional development funding and allocation structure
Other opportunities to be identified during the rolling SFP process
Upon approval, the Three-Year SFP will serve to guide our annual budgeting process to ensure our instructional priorities are being funded and budget gaps are closed. We will continue to update the plan each year on a rolling basis, evaluating activities of the prior year and adding one year to the plan. The plan's extended time horizon and rolling nature increase our ability to spend money smarter—so that every dollar is used to support the community's educational vision and priorities.
LCS has been privileged to be part of the development of this emphasis on spending money smartly - where every dollar is used to support priorities that produce stellar teaching and learning. Along with three other districts, the initial project has become the basis for other school districts in the United States to create their own plans. The project developed the tools, strategies and structures to support this work and are featured on an easily accessible website at smarterschoolspending.org.
This plan was not created in a vacuum and will not continue without input from multiple stakeholders. Numerous individuals from schools, the district office, and the community have developed the instructional priorities and resource realignment opportunities. I wish to thank all stakeholders for their time and input. Through our work groups and input from our community on Mindmixer we have had a significant contribution to the district’s efforts. Everyone’s participation is critical to the success of the SFP.
In closing, I think it’s important to note that this is a continuous process. We do not see a finish line as this truly becomes a working document that is unceasingly assessed. Together, using this process, we are certainly making the vision of a stronger Lake County School District a reality.
Sincerely,
Susan Moxley
Susan Moxley, Ed.D. Superintendent of Lake County Schools Lake County's second Three-Year Strategic Finance Plan was developed by the members of the Lake County Schools Leadership Team in collaboration with numerous individuals from schools, the district office, and the community as part of the EngageLCS initiative:
Project Oversight & Management Working Groups
Leadership Team Susan Moxley, Superintendent (Lead) Marilyn Doyle, Chief of Administration Will Davis, Chief of Operations Liz Hobert, Coordinator, Special Projects Carol MacLeod, Chief Financial Officer Laurie Marshall, Chief of Staff Sherry Owens, LCS Communications Officer Creed Wheeler, Executive Director of IT Community Advisory Group (This advisory group will be developed to parallel the School Models Working Group with representatives from each region included)
Communications & Stakeholder Engagement Group Sherry Owens, LCS Communications Officer Brian Payne, LCS Community Resource Liaison Liz Hobert, Coordinator, Special Projects (Team to be reconfigured by new Communications Officer)

Instructional Priorities Working Groups
ELL & Struggling Students Kati Pearson, Director of Teaching and Learning (Lead)) David Christiansen, Chief Academic Officer (Lead) Robin Neeld, Title III Program Specialist Jeanette Tietjen, MTSS Program Manager Rehana Insanally, Program Specialist, Differentiated Accountability Liz Bourdon, Director, Federal Compensatory Education Judy Miller, Director of ESE Carmen Arnold, Director of Curriculum & Instruction, Elementary Bonita Blair, AP Literature and Composition Teacher, ERHS Rob McCue, Principal, SLHS Barbara Longo, Principal, OPMS Leah Fischer, Principal, SSES Teacher Induction/Training for Instructional Coaches Group Stacey Roberts, Director, PD and Leadership (Lead) Rusty Dosh, Administrative Coordinator, Federal Programs Kathy Halbig, Manager of Innovative Learning Randy Campbell, Principal, UHS Andrea Guogas, Project Manager, Evaluation and Compensation Elizabeth Feld, Instructional Coach Theresa Frisby, Instructional Coach Linda Conner, Instructional Coach Judy Davis, Instructional Coach Val Pumariega, Instructional Coach Nicole Moses, Instructional Coach Stacia Tatum, Instructional Coach Kenya Williams, Instructional Coach Bill Miller, Principal, LHS Abigail Crosby, Assistant Principal, WHMS Midge Abston, Assistant Principal, SSES Robin Myers, Principal, Lake Hills
Coaching Framework: Principal Induction Group Marilyn Doyle, Chief of Administration (Lead) Laurie Marshall, Chief of Staff Carolyn Samuel, Director of HR Stacey Roberts, Director, PD and Leadership Melissa DeJarlais, Principal, FPES Pam Chauteneuf, Principal, GMS Jacob Stein, Assistant Principal, ERHS Steve Benson, Principal CMS Linda Shepherd-Miller, Principal, LMHS Brenna Burkhead, Principal, SES Personalized Learning for Teachers & Leaders David Christiansen, Chief Academic Officer Stacey Roberts, Director, PD and Leadership Andrea Pyatt, iPD Facilitator Kelly Cousineau, iPD Design Expert Kathy Halbig, Manager of Innovative Learning Liz Hobert, Coordinator, Special Projects Michael Geoffrion, Teacher, EHS Dennis Doherty, WHMS Teacher Latonyia McDuffie, Teacher, BSE Stuart Klatte, President, LCEA Julie Robinson-Lueallen, Principal, ERHS Randy Campbell, Principal, UHS Charlie McDaniel, Principal, ERMS Kathy Falcon, Assistant Principal, SBES
Personalized Learning for Students Kathy Halbig, Manager of Innovative Learning (Lead) Creed Wheeler, Executive Director, IT David Christiansen, Chief Academic Officer Carol MacLeod, Chief Financial Officer Laurie Marshall, Chief of Staff Marilyn Doyle, Chief of Administration Will Davis, Chief of Operations Sherry Owens, LCS Communications Officer Liz Hobert, Coordinator Special Projects
Kathleen Jarvis, Director of Curriculum and Instruction, Secondary
Carmen Arnold, Director of Curriculum and Instruction, Elementary
Missy Broker, Innovative Learning Specialist Brent Balkaran, Teacher, Tavares High School Clinton Pownall, Community Member/Business Owner Bill Giffing, Community Member Dr. Michael Hynes, Director of Teaching and Learning, UCF
Jacob Stein, Assistant Principal, East Ridge High School William Roberts, Assistant Principal, Windy Hill Middle School Heather Gelb, Principal, Sawgrass Bay Elementary School) Talent Development Pipeline Group Andrea Guogas, Project Manager Evaluation and Compensation (Lead) Laurie Marshall, Chief of Staff Marilyn Doyle, Chief of Administration Dominick Pedata, Supervisor, Employee Relations and Compensation Stuart Klatte, President, LCEA TBD, Program Specialist from ASU Julie Summerlin, Coordinator, Career, Adult & Community Education Michelle Hoppenstedt, HR Tech & Support Manager Maureen Slovak, Ad Hoc Member Linda Shepherd-Miller, Principal, LMHS Principal
TBD, Middle School Administrator TBD, Elementary Administrator
Program Evaluation and Innovation Kathleen Gingras, Director, Planning, Evaluation and Accountability (Lead) Carol MacLeod or designee, Chief Financial Officer
David Christiansen, Chief Academic Officer Liz Hobert, Coordinator, Special Projects
Creed Wheeler or designee, Executive Director, IT Laurie Marshall or designee, Chief of Staff Jan Tobias, Director, Student Services
Rusty Dosh, Administrative Coordinator, Federal Programs Naomi VanAmberg, Federal Programs Judy Miller, Director, ESE Jeffrey Cooper, Program Innovation and Evaluation Specialist Parul Acharya, Program Innovation and Evaluation Analyst
(Ad Hoc members: Principal Representatives and District Staff as needed for innovation submissions and program evaluations)
Realignment Opportunities Working Groups
Self-funding across PD initiatives: IDEA and Title I and II Realignment David Christiansen, Chief Academic Officer (Co-lead) Carol MacLeod, Chief Financial Officer (Co-lead) Stacey Roberts, Director, Professional Development & Leadership Pat Lawson, Administrative Coordinator, ESE Rusty Dosh, Administrative Coordinator Federal Programs Melissa Lyford, Program Specialist, ESE Laura Wright, ESE School Specialist, MDMS Trella Mott, Principal, TMS Kay Sawchuk, Principal, EES School Models David Christiansen, Chief Academic Officer (Co-lead) Maggie Teachout, Director, Career, Adult & Community Education (Co-lead) Academic Cabinet Carmen Arnold, Director Curriculum Pre K-5 Liz Bourdon, Director, Federal Compensatory Education Sebrina N. Dillon-Banks, Administrative Coordinator, Safe Schools Marilyn A. Doyle, Chief of Administration Kathleen R. Gingras, Director of Planning, Program Evaluation and Accountability Andrea Guogas, Evaluation and Compensation Manager Kathleen Halbig, Manager of Innovative Learning Liz Hobert, Coordinator Special Projects & Grant Services Kathlene A. Jarvis, Director of Curriculum and Instruction Laurie Marshall, Chief of Staff Judy Miller, Director ESE Kati R. Pearson, Director of Teaching and Learning Stacey R. Roberts, Director PD and Leadership Janice Tobias, Director of Student Services Creed R. Wheeler, Executive Director of IT Heather Hamilton, Assistant Manager of Information and Operations Services Pat Lawson, ESE Administrative Coordinator Laura Woodham, Program Specialist, Professional Development Harry Fix, Director, Growth Planning Barbara Cadwell, Student Information Analyst Maureen Slovak, Budget & FTE Manager Clarence Truitt, Assistant Principal, LHS Kevin Caldwell, Assistant Principal, TMS Patrick Galatowitsch, Principal, LES
IDEA Efficiencies Judy Miller, Director, ESE Maureen Slovak, Budget and FTE Manager Kristine Hawkins, Administrative Coordinator, Student Services Brenna Burkhead, Principal, SES Deborah Stedelin, Assistant Principal, Lake Hills Holly Ryan, Assistant Principal, UHS Gary Dodds, Supervisor, Food Services Consolidated Purchasing Pam Hayes, Purchasing Manager (Co-lead) Karen Briggs, Director of Finance (Co-lead) Creed Wheeler, Executive Director, IT Kathlene Jarvis, Director of Curriculum and Instruction, 6-12 Carmen Arnold, Director Curriculum Pre K-5 Doug McCarl, Financial Reporting Manager Mike Corr, Director, Maintenance Judy Miller, Director, ESE Liz Bourdon, Director, Federal Compensatory Education Sebrina Dillon-Banks, Administrative Coordinator, Safe Schools Gary Dodds, Supervisor, Food Services
Lauren DeRidder, Risk Manager Jan Tobias, Director, Student Services Edward Pfender, Supervisor, Transportation Pati Painter, Senior Executive Assistant Debbie Stivender, School Board Member TBD classified personnel Linda Shepherd-Miller, Principal, LMHS Kelly Sanders, Principal, UMS William Roberts, Assistant Principal, WHMS Clerical Staffing Carolyn Samuel, Director, HR Services (Lead) Tom Mock, Director, Internal Audit Kim Cronin, SIEU Jessica Hopperton, Data Entry, Virtual School Kimberly Jarvis, Principal, GES Angela Jones, Administrative Assistant to Chief of Operations Diane Lingerfelt, Fiscal Assistant, Risk Management Charlene Moye, HR Specialist Jennifer Pease, School Secretary, Carver Middle Julie Summerlin, Coordinator, Career, Adult & Community Education Yvette Kinsler, Clerical Assistant
Guidance Counselors Jan Tobias, Director, Student Services Kristine Hawkins, Administrative Coordinator, Student Services Kenneth Lyford, Program Specialist, Student Services Cheri Burgess, School Counselor, SLHS Denise Burry, Parent Michelle Carpenter, Parent Pam Chauteauneuf, Principal, GMS Mollie Cunningham, Principal, CMS Priya Duryee, Program Specialist, Student Services Pat Lawson, Administrative Coordinator, ESE Tonya Mass, Program Specialist, Testing and Evaluation Caroline O’Conner, School Counselor, WHMS Stacy Pallitto, School Counselor, TES Angela Ratter, Program Specialist, Student Services Debra Rogers, Principal, UES Nanci Schwartz, Parent Jeanette Tietjen, Program Manager, Teaching and Learning Paula Wicker, Program Manager, Testing and Evaluation
Transportation Scott Pfender, Supervisor, Transportation (Lead) Dawn McDonald, Senior Planner Harris Jacobs, Manager, Information Services Lauren DeRidder, Risk Manager Kim Varnadore, SAC Representative, MDHS Beth Shaver, SAC Representative, GLES Mike Woods, Planner, Metropolitan Planning Organization Ken Wells, Bus driver, Leesburg lot Linda Monroe, Bus driver, Lake Ridge lot Kim Cronin, SEIU Lori Mattox, Transportation Operations Manager Dominick Pedata, Supervisor, Employee Relations and Compensation Karen Oates, Assistant Principal, MDMS Anthony Russell, Assistant Principal, LHS Charles Feld, Assistant Principal, ERHS Keith Hunt, Assistant Principal, WHMS

Maintenance Lawn Care Will Davis, Chief of Operations (Lead) Mike Corr, Director, Maintenance Gary Rogers, Maintenance Manager Dominick Pedata, Supervisor, Employee Relations and Compensation Tom Mock, Director, Internal Audit Pat Todd, District Athletic Director Wayne Kicklighter, Maintenance Manager Mark Kelly, Grounds Representative Terry White, Custodian, PRES Gregg Moore, Head Custodian, UMS Alphonso Williams, Custodian, TES Kim Cronin, SEIU Kelly Sanders, Principal, UMS Carl Hall, Assistant Principal, THS Johnathan Owens, Principal, EMS Cleamstine Caple, Principal, CES Central Office for District Staff/Consolidating Title I Offices Will Davis, Chief of Operations (Lead) Carol MacLeod, Chief Financial Officer Tom Mock, Director, Internal Audit Kelly Randall, Senior Planner Rusty Dosh, Administrative Coordinator, Federal Programs

Table of Contents Introduction ................................................................................................................................................................ 1
LCS baseline financial picture .................................................................................................................................... 14
Funding the district's instructional priorities: Budget realignment .......................................................................... 16
Tracking progress ...................................................................................................................................................... 21
Conclusion ................................................................................................................................................................. 23
Appendix ................................................................................................................................................................... 24
Appendix A: Resources for ELL and Struggling Students & Schools .......................................................................... 25
Appendix B: Talent Development Pipeline ............................................................................................................... 28
Appendix C: Teacher Induction and Coaching Framework ....................................................................................... 31
Appendix D: Principal Induction and Development .................................................................................................. 33
Appendix E: Program Evaluation & Innovation Process............................................................................................ 35
Appendix F: Personalized Learning for Teachers and Leaders .................................................................................. 37
Appendix G: Personalized Learning for Students ..................................................................................................... 40
1
Introduction
Purpose of the Strategic Finance Plan
The Lake County School District (LCS) Leadership Team commits to presenting a budget that aligns to the strategic resource alignment decisions outlined in the Strategic Finance Plan (SFP), so that the budget supports execution on the district's strategic goals.
This Three-Year Strategic Finance Plan outlines Lake County School District's financial strategy over a three-year period. Its objectives are to:
1) Identify the district's strategic priorities 2) Estimate the costs of those priorities 3) Describe the actions to be taken that will save or realign money to fund those priorities
How this plan differs from the typical approach
Typically, school districts use a single-year planning horizon and rely heavily on the previous year's expenditures to project the following year's expenses. This approach does not allow for a strong link between spending and a district's priorities. Additionally, the full, multi-year, detailed cost of initiatives often is not known or considered as part of the budgeting process. At the end of the typical process, a district has a detailed and precise picture for the single year and an imprecise, potentially even inaccurate picture for future years.
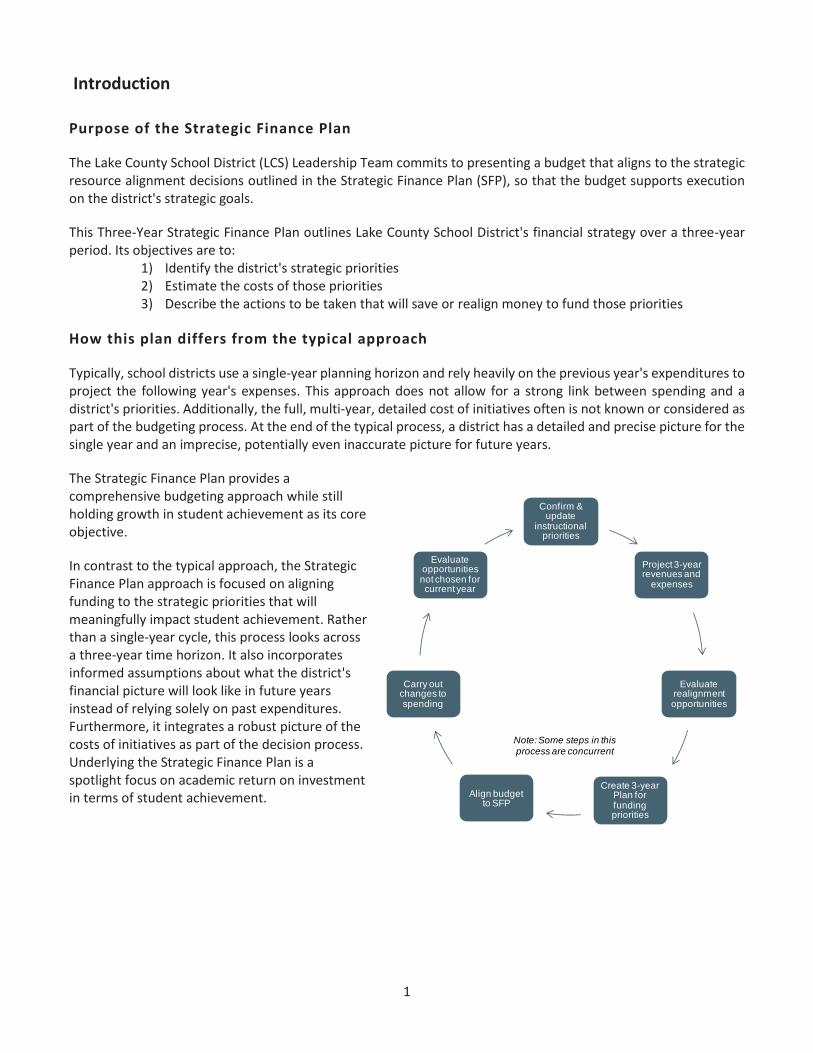
The Strategic Finance Plan provides a comprehensive budgeting approach while still holding growth in student achievement as its core objective.
In contrast to the typical approach, the Strategic Finance Plan approach is focused on aligning funding to the strategic priorities that will meaningfully impact student achievement. Rather than a single-year cycle, this process looks across a three-year time horizon. It also incorporates informed assumptions about what the district's financial picture will look like in future years instead of relying solely on past expenditures. Furthermore, it integrates a robust picture of the costs of initiatives as part of the decision process. Underlying the Strategic Finance Plan is a spotlight focus on academic return on investment in terms of student achievement.
Confirm & update
instructional priorities
Project 3-year revenues and
expenses
Evaluate realignment opportunities
Create 3-year Plan for funding priorities
Align budgetto SFP
Carry out changes to spending
Evaluate opportunities not chosen for current year
Note: Some steps in this process are concurrent

2
The SFP is a rolling view of district finances
The SFP was submitted for the School Board's approval in January 2014. The Leadership Team will update the SFP each fall prior to the start of the budgeting cycle, on a rolling basis, evaluating activities of the prior year and adding one year onto the plan. Similar to the district's five-year Capital Plan, a benefit of the SFP is its multi-year span. Painting a long-term view of the district's financial baseline and investment strategy provides visibility into the future financial picture sufficiently far in advance of when action is required. This district shift away from "just-in-time" alignment of the budget supports being strategic in planning and decision-making.
Widening the time span, however, brings uncertainty to the planning process. The plan for investing and realigning is sensitive to the projected budget for these years, which is dependent upon several revenue- and enrollment-related assumptions that are not known until after each school year begins. Funding levels for Florida School Districts are determined annually by action of the Florida Legislature through the General Appropriations Act. The Legislative Session begins early in March and is scheduled to convene for 60 days, barring the need for extended sessions. Statutorily, the final budget is not approved by the School Board until early September, although the fiscal year begins on July 1.
Timing Steps in state Budget Process
March Legislative session begins
May Legislative session ends
June Governor approves state budget
July 1 Fiscal year begins
September Board approves final budget
This Legislative timeframe is part of the uncertainty to consider in the presentation of the SFP. This plan lays out particular 2015-16 actions based on stated assumptions. Unexpected changes in revenue or enrollment projections will require changing the planned execution of the SFP. Specific changes will be addressed as part of the creation of the district budget. Understanding that budgeting is intended to be a fluid and dynamic process, subject to revision and reflection, commitment to funding the district's instructional priorities stands firm.
For 2016-18, the district also commits to presenting a balanced budget that continues to fund instructional priorities. Because extended projections are less certain and less precise than 2015-16, exactly how this will be accomplished is less defined. However, the district commits to continuing actions to fund the identified instructional priorities in 2016-18.

3
Overview of Instructional Priorities
The instructional priorities included in the SFP address the immediate needs of students and support achievement of all students long-term. The following priorities have been implemented for the 2014-15 school year:

4
Instructional priorities: incremental investment by year
Implementing these instructional priorities will require a significant investment of time and talent. The district will monitor the performance of these instructional priorities throughout the process, maintaining a focus on academic return on investment.
Note: Some figures have been rounded; for more precise cost breakdown, see Appendices A-G
5
Detail on programming for each Instructional Priority
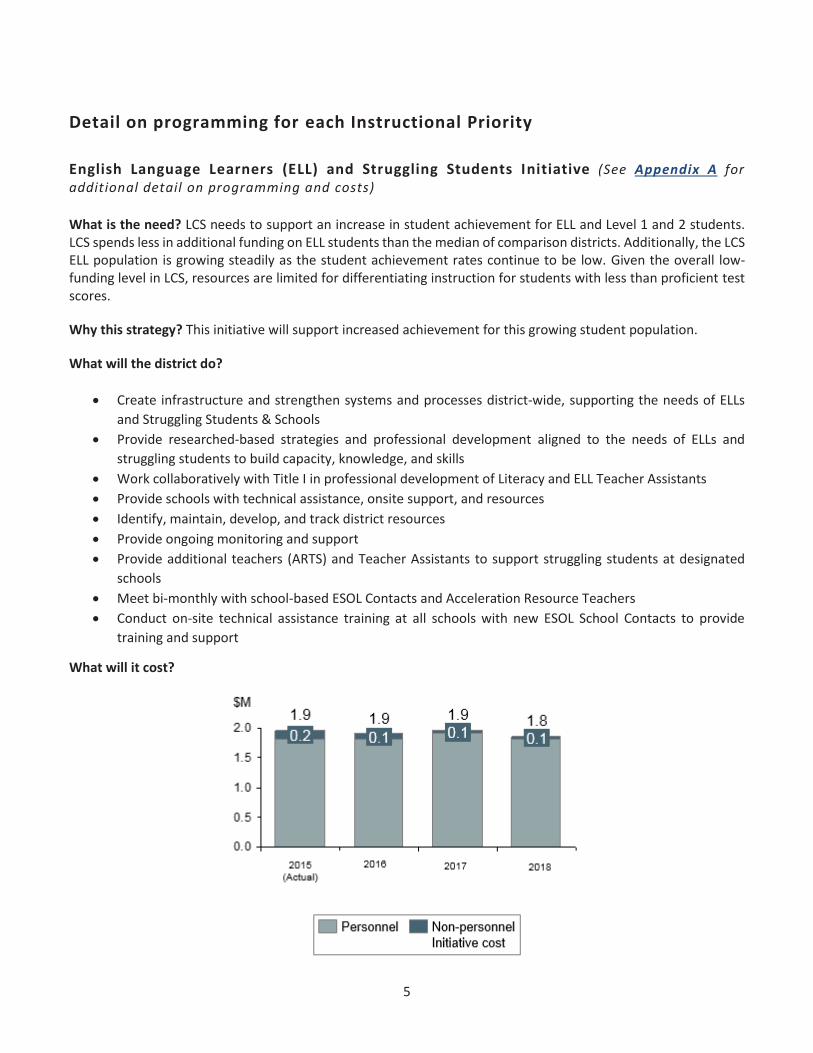
English Language Learners (ELL) and Struggling Students Initiative (See Appendix A for additional detail on programming and costs)
What is the need? LCS needs to support an increase in student achievement for ELL and Level 1 and 2 students. LCS spends less in additional funding on ELL students than the median of comparison districts. Additionally, the LCS ELL population is growing steadily as the student achievement rates continue to be low. Given the overall low-funding level in LCS, resources are limited for differentiating instruction for students with less than proficient test scores.
Why this strategy? This initiative will support increased achievement for this growing student population.
What will the district do?
Create infrastructure and strengthen systems and processes district-wide, supporting the needs of ELLs
and Struggling Students & Schools
Provide researched-based strategies and professional development aligned to the needs of ELLs and
struggling students to build capacity, knowledge, and skills
Work collaboratively with Title I in professional development of Literacy and ELL Teacher Assistants
Provide schools with technical assistance, onsite support, and resources
Identify, maintain, develop, and track district resources
Provide ongoing monitoring and support
Provide additional teachers (ARTS) and Teacher Assistants to support struggling students at designated
schools
Meet bi-monthly with school-based ESOL Contacts and Acceleration Resource Teachers
Conduct on-site technical assistance training at all schools with new ESOL School Contacts to provide
training and support
What will it cost?

6
What gains does the district expect?
Return Metrics
Goal:
Outperform State Targets
State Target AMO
Reading 2015
District Target AMO
Reading 2015
State Target AMO
Reading 2016
District Target AMO
Reading 2016
State Target AMO
Reading 2017
District Target AMO
Reading 2017
State Target AMO
Reading 2018
District Target AMO
Reading 2018
English Language Learners
49 49 56 60 62 70 TBD 72
Goal:
Decrease Amount
District Reading
2012
District Reading
2013
District Reading
2014
District Reading Target 2015
District Reading Target 2016
District Reading Target 2017
District Reading
Target 2018
Level 1&2 Students
44 44 43 30 26 22 18
Goal: Increase Achievement
District Reading
2012
District Reading
2013
District Reading
2014
District Reading Target 2015
District Reading Target 2016
District Reading Target 2017
District Reading
Target 2018
Lowest 25%
66 61 66 70 70 75 75
Goal: Increase Achievement
District Grad Rate
2012
District Grad Rate
2013
District Grad Rate
2014
District Grad Rate
Target 2015
District Grad Rate
Target 2016
District Grad Rate
Target 2017
District Reading
Target 2018
Graduation Rate (All
Students) 75 78 80 85 90 95 95
Graduation Rate (ELL)
61 57 62 70 80 90 95

7
Talent Development Pipeline (See Appendix B for additional detail on programming and costs)
What is the need? The district needs to provide transparent pathways and clear processes for promotion and increased responsibility for teachers, administrators and district leadership through the creation of a talent development pipeline. The pipeline needs to be aligned with the staff compensation system to provide incentives for staff members to improve and gain more responsibility
Why this strategy? Lake County School District’s compensation system has not rewarded teachers for excellence in the classroom, nor has it recognized that some instructional positions require different skill sets. This approach does not optimally support increased student achievement, nor does it fully recognize teacher quality. This strategy will reward the most effective teachers in the district and increase effectiveness and impact of instructional leaders in order to drive student achievement.
What will the district do?
Implement Career Pathways for teachers and other instructional Staff
Reward teachers based on performance as indicated through summative evaluations
Provide leadership opportunities to teachers and other instructional staff based on performance as
indicated through summative evaluations
What will it cost?
What gains does the district expect?
Performance Return Metrics 2015 2016 2017 2018
% of teachers with positive value -added measures (VAM) 81% 82% 83% 84%
Increased retention rate of Highly Effective teachers (% retained annually)
70% 78% 86% 90%
Higher turnover of teachers rated Ineffective (% who leave the district voluntari ly annually) 2% 3% 5% 7%
Increased teacher transfer rates from low -need schools to high-need schools
2% 3% 5% 7%
% of administrators reporting that pipeline helps retain effective teachers
65% 75% 90% 95%
% of teachers reporting that pipeline contributes positively to motivation to improve instructional practice
65% 75% 90% 95%

8
Teacher Induction and Coaching Framework (See Appendix C for additional detail on programming and costs)
What is the need? This priority provides a district framework for instructional coaching and high-quality teacher induction support for all new teachers. Research is clear that the most important factor in improving student achievement is the quality of the classroom teacher. Through this priority, Lake County will be able to increase teacher effectiveness and new teacher retention. Why this strategy? This priority is based on the work of the New Teacher Center and Marzano/Learning Sciences International. Through these nationally recognized, research-based organizations our instructional coaches will develop a deep repertoire of coaching skills that impact teacher practice to improve student learning outcomes.
What will the district do?
Site-based support for all first year teachers
Collaborative support with school leadership teams for teachers in their second and third year of teaching
Training for all district instructional coaches and school-based content coaches
District framework for training instructional coaches
What will it cost?
What gains does the district expect?
* Additional metrics in development
9
Principal Induction & Development (See Appendix D for additional detail on programming and costs)
What is the need? LCS principals, as the instructional leaders of schools, are central to student achievement. However, Lake County has no funding and no formal support system for new principals. Additionally, deeper training for established principals is needed to support them as instructional leaders.
Why this strategy? This strategy will increase teacher effectiveness and ultimately support growth in student achievement through the focused development of strong instructional leaders.
What will the district do? • Improve the level of support given to principals through professional development, one-on-one mentoring,
and professional learning communities. • Create the role of Principal Coach, tasked with program oversight and implementation, organizing
professional development for principals, and meeting with principals regularly to provide feedback. • Provide tailored, targeted support based on four groupings of staff: targeted assistant principals, first-year
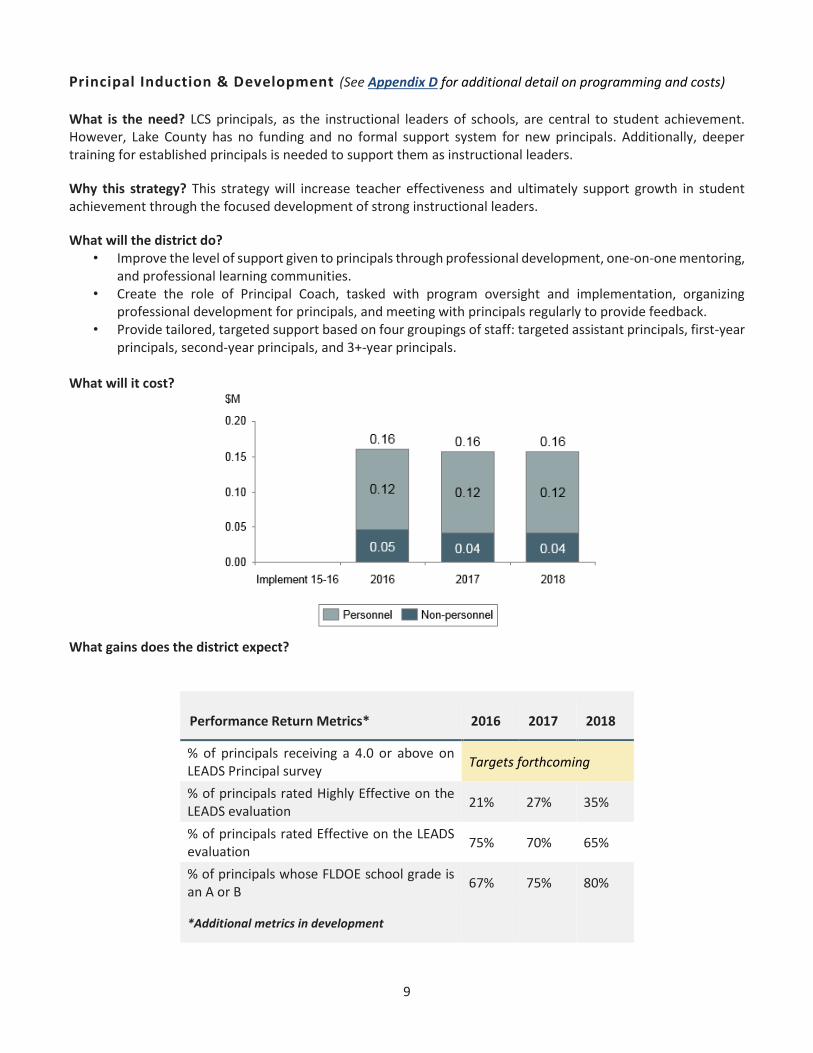
principals, second-year principals, and 3+-year principals. What will it cost?
What gains does the district expect?
Performance Return Metrics* 2016 2017 2018
% of principals receiving a 4.0 or above on LEADS Principal survey Targets forthcoming
% of principals rated Highly Effective on the LEADS evaluation 21% 27% 35%
% of principals rated Effective on the LEADS evaluation 75% 70% 65%
% of principals whose FLDOE school grade is an A or B 67% 75% 80%
*Additional metrics in development

10
Program Evaluation & Innovation Process (See Appendix E for additional detail on programming and costs)
What is the need? To provide a framework for rigorously evaluating existing and new programs in order to enable the implementation of programs that will ultimately drive student achievement in the most cost-effective way possible. Implement and culturally embed a standardized set of steps in the program evaluation process, with clearly assigned ownership of actions at each step, and a clear timeline for decision-making. Develop a culture of data-driven decision making through implementation of this process.
Why this strategy? To ensure the best return on investment for district funds.
What will the district do?
Evaluating targeted innovations to determine best investments for intended outcomes.
Evaluating all instructional priorities included in the District Finance Plan to report return on investment
Evaluating current programs to determine return on investment to inform decisions on continuing,
modifying or discontinuing programs (Achieve 3000, PD 360, AVID, PreK Reading Programs)
What will it cost?
What gains does the district expect? Return Metrics*
2015 2016 2017 2018
# of Program Evaluations of Instructional Priorities
7 7 7 7
# Program Evaluations on additional high profile/high investment programs
4 5 6 7
Cost savings as a result of program evaluations
$25,000 $50,000 $100,000 $150,000
Percentage of ROI calculations determined to be positive returns.
60% 75% 90% 90%
Percentage of identified performance metrics for monitored programs showing improvement
50%
65%
75%
80%
Stakeholder satisfaction regarding integrity of evaluation process
100% 100% 100% 100%
Stakeholder satisfaction related to effectiveness of program monitoring
100% 100% 100% 100%
*Additional metrics in development

11
Personalized Learning for Teachers and Leaders (See Appendix F for additional detail on programming and costs)
What is the need? With this initiative, LCS will focus on methods to personalize learning for teachers and leaders through various systems, structures and support systems. This fills the need for professional learning that is innovative and driven by the needs of leaders, teachers and students. The initiative will allow LCS to integrate a system of supports and professional learning for teachers that will empower them as they develop more effective teaching practices. Why this strategy? LCS will seek to address the lack of an integrated, aligned system for personalized learning to support teachers’ effectiveness. This problem is amplified by the move to more rigorous standards that require significant shifts in instruction, curriculum and assessment.
What will the district do?
Ensure all teachers have ample time within the school day for collaboration (without sacrificing quality student learning) focused on core instructional work
Provide multi-modal access to high-quality PD content based on teachers’ needs and student results
Provide all teachers with frequent opportunities and multiple sources of feedback on their instructional practice
Assess the impact of professional development content and experiences What will it cost?
What gains does the district expect?
Performance Return Metrics YR 1 YR 2 YR 3
Teacher effectiveness ratings
Metrics being revised to coordinate with Innovative Professional Development (iPD) grant evaluation
Value-added measures (VAM)
Feedback from teacher survey
Usage rate for professional development software (currently PD360)

12
Personalized Learning for Students (See Appendix G for additional detail on programming and costs)
What is the need? This instructional priority helps fulfill the district need of teaching all of our Lake County students in a way that will prepare them for success in college and/or career. Why this strategy? By providing a learning environment that is personalized (and individualized) based on a student’s likes, interests, and needs, we believe we can move into a system in which all students find success.
What will the district do?
Eight schools are currently in the planning stages for implementation of personalized learning during the
2015 – 16 school year including Lost Lake Elementary, Sawgrass Bay Elementary, Carver Middle, Windy Hill
Middle, Eustis High School, Lake Minneola High School, South Lake High School, and Umatilla High School
are all part of our first cohort of schools
On December 11, 2014, each of the above schools presented their plans for personalized learning, and, if
selected to move forward, will begin a phase of deeper, more specific planning (from January 2015 – August
2016), and then will begin implementation in August 2015. Those schools selected to move forward will
receive implementation funds from the Bill and Melinda Gates Foundation of up to $500,000 per school
Cross-functional teams are finishing up with initial guidance that can help other LCS schools as they begin
to come online with personalized learning in future cohorts. Teams have been focusing on the five strategic
goals for personalized learning: student-directed learning; learner profiles and individual paths to mastery;
competency-based progression; flexible learning environments; and accountability and continuous
improvement
Cross district teams, consisting of representatives from Lake County along with representatives from each
of the other five districts participating in the NextGen grant (Henry County, GA; Pinellas Co, FL; Dallas, TX;
Denver, CO; and Riverside, CA) are creating guidance in the areas of Budget and Finance, Competency-
Based Progression, Communication, Talent and Professional Development, and Technology
What will it cost?
13
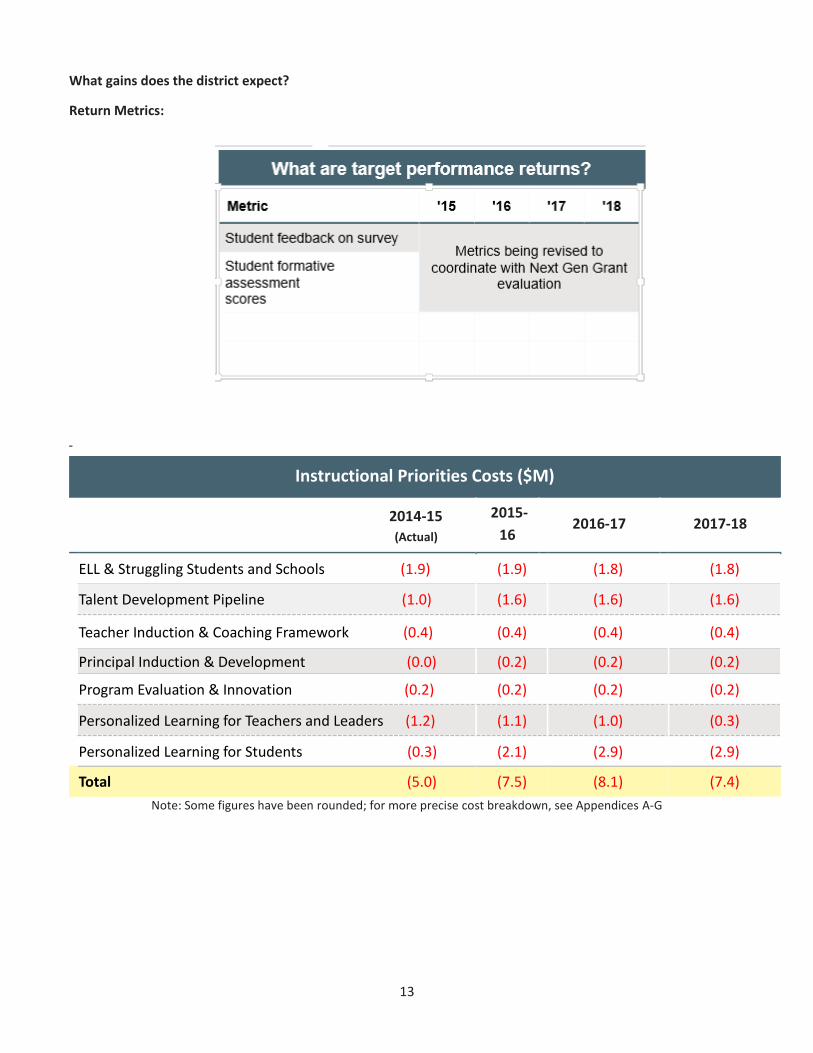
What gains does the district expect?
Return Metrics:
Instructional Priorities Costs ($M)
2014-15 (Actual)
2015-
16 2016-17 2017-18
ELL & Struggling Students and Schools (1.9) (1.9) (1.8) (1.8)
Talent Development Pipeline (1.0) (1.6) (1.6) (1.6)
Teacher Induction & Coaching Framework (0.4) (0.4) (0.4) (0.4)
Principal Induction & Development (0.0) (0.2) (0.2) (0.2)
Program Evaluation & Innovation (0.2) (0.2) (0.2) (0.2)
Personalized Learning for Teachers and Leaders (1.2) (1.1) (1.0) (0.3)
Personalized Learning for Students (0.3) (2.1) (2.9) (2.9)
Total (5.0) (7.5) (8.1) (7.4)
Note: Some figures have been rounded; for more precise cost breakdown, see Appendices A-G

14
Instructional Priorities Costs ($M) – Incremental expenditure view
(View shows additional funding added in a given year on top of the continuing investment from previous years)
2014-15 (Actual)
2015-
16 2016-17 2017-18
ELL & Struggling Students and Schools (1.9) 0 0.1 0.1
Talent Development Pipeline (1.0) (0.6) 0 0
Teacher Induction & Coaching Framework (0.4) 0 0 0
Principal Induction & Development (0.0) (0.2) 0 0
Program Evaluation & Innovation (0.2) 0 0 0
Personalized Learning for Teachers and Leaders (1.2) 0.1 0.1 0.7
Personalized Learning for Students (0.3) (1.8) (0.8) 0
Total (5.0) (2.3) (0.7) (7.4)
LCS baseline financial picture
Creating the second Strategic Finance Plan embeds this process in the district’s regular “way of doing work.”
Our goal is a continuing effort to improve efficiencies and move funding to target key instructional priorities.
LCS has an exceptionally lean budget and has historically done a good job of identifying, prioritizing, and protecting mandatory costs so that requirements have been met. Turning to a school-by-school view, school allocation formulas and systems largely distribute resources evenly across the district. Expenditures on direct instruction as a percent of the total budget were lower than anticipated as a result of both the substantial amount of fixed costs required to run a school district and strategic decisions in previous years.
These key learnings point to a number of ways to improve and grow as a district. LCS needs to continue to increase focus on instructional priorities rather than simply thinking of a budget in terms of bottom-line financials. The academic return-on-investment must be the central focus of the budget process. Though equity between school allocations is not a fault, it is imperative that the district creates more room to offer tailored, differentiated resources to schools and students based on their individual needs when possible. In order to support these paradigm shifts, LCS is aligning the myriad of budgeting processes for various revenue sources, including the General Fund, federal Title funds, federal Exceptional Student Education funds, and the Capital Fund. This will support the district in creating a complete picture of realignment opportunities and their strategic alignment to the instructional priorities.

15
In the first SFP, we projected significant budget gaps would need to be closed over the next three years
The baseline represents a projected financial picture if LCS were to make no specific new investments and spend money largely in line with prior years. The baseline is conservative and based on historical understanding of funding levels and necessary expenditures. Absent significant funding shifts, we projected that expenses would exceed revenues by a significant amount; $3.8 million in 2014-15, $7.1 million in 2015-16 and $10.4 million in 2016-17.
Through realignments we made last year, we changed our budget baseline and narrowed these gaps

16
This gap is based on a number of assumptions. Overall, projections are based on historical year-to-year changes in revenues and expenses.
Specific additional revenue assumptions include the following:
Entitlement (e.g., Title) funding is flat due to sequestration
2.0% increase in per-FTE state funding
Annual increase of 500 students
Key expense assumptions include the following
Available pool of funds for staff compensation increases by 2.5% annually
Maintenance of reserves calculated at required 4% of total revenue
Funding the district's instructional priorities: Budget realignment
Though the listed realignment figures are estimates, LCS is committed to funding the instructional priorities
The estimated dollar savings amounts that follow are approximations based on the work of interdisciplinary district teams to project how the ideas submitted to the EngageLCS effort might be actualized. These teams considered the qualitative impacts (impact on the student experience, feasibility, degree of strategic alignment with the district's instructional priorities), as well as the quantitative figures. LCS is committing to funding these priorities over the next three years, though specific actions or figures may change over time. LCS will determine the specific actions needed to achieve these realignments over the coming months, as the district enters the 2015-2016 budget cycle.
17
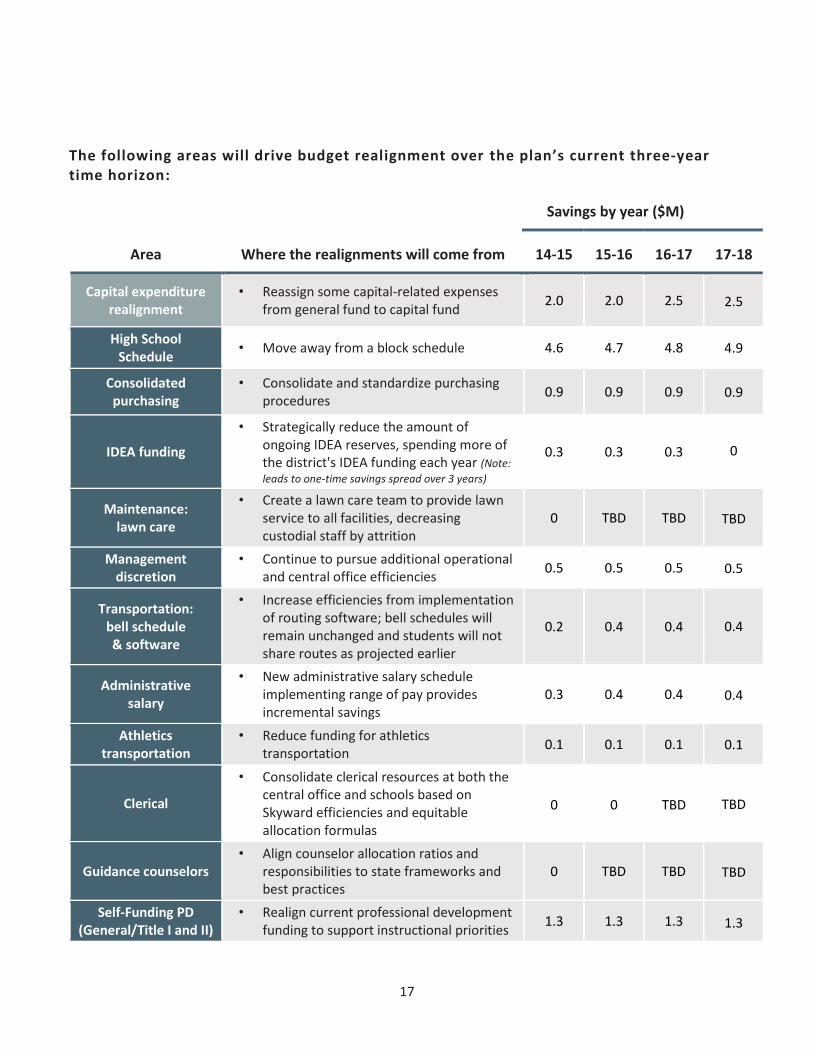
The following areas will drive budget realignment over the plan’s current three-year time horizon:
Area Where the realignments will come from
Savings by year ($M)
14-15 15-16 16-17 17-18
Capital expenditure realignment
• Reassign some capital-related expenses from general fund to capital fund
2.0 2.0 2.5 2.5
High School Schedule
• Move away from a block schedule 4.6 4.7 4.8 4.9
Consolidated purchasing
• Consolidate and standardize purchasing procedures
0.9 0.9 0.9 0.9
IDEA funding
• Strategically reduce the amount of ongoing IDEA reserves, spending more of the district's IDEA funding each year (Note:
leads to one-time savings spread over 3 years)
0.3 0.3 0.3 0
Maintenance: lawn care
• Create a lawn care team to provide lawn service to all facilities, decreasing custodial staff by attrition
0 TBD TBD TBD
Management discretion
• Continue to pursue additional operational and central office efficiencies
0.5 0.5 0.5 0.5
Transportation: bell schedule & software
• Increase efficiencies from implementation of routing software; bell schedules will remain unchanged and students will not share routes as projected earlier
0.2 0.4 0.4 0.4
Administrative salary
• New administrative salary schedule implementing range of pay provides incremental savings
0.3 0.4 0.4 0.4
Athletics transportation
• Reduce funding for athletics transportation
0.1 0.1 0.1 0.1
Clerical
• Consolidate clerical resources at both the central office and schools based on Skyward efficiencies and equitable allocation formulas
0 0 TBD TBD
Guidance counselors • Align counselor allocation ratios and
responsibilities to state frameworks and best practices
0 TBD TBD TBD
Self-Funding PD (General/Title I and II)
• Realign current professional development funding to support instructional priorities
1.3 1.3 1.3 1.3

18
Details on the realignment opportunities are as follows:
Savings Opportunity Area 2014-15 15-16 16-17 17-18
Capital Expenditure Realignment1
Use the capital fund to
pay for some capital-related expenses currently paid for through the general fund
Maintain this realignment for 2015-16 to
maintain the savings. Increase amount by $0.5 million
High School Schedule
Move all high schools in
LCS from a block schedule to a 6x7 schedule
Ongoing savings from the actions in 2014-
15
Consolidated Purchasing
Centralize purchasing
process to realize greater savings
Continue with this practice and incrementally increase savings realized
IDEA funding2
(Non-recurring savings)
Strategically decrease
IDEA funding annually held in reserve to yield one-time savings for three years
No savings designated in 2017-18
Maintenance: lawn care
Continue exploration of
lawn care services savings
Adjust budget to reflect any identified savings; report due February 6
Management discretion
Determine additional operational and central office efficiencies on an
ongoing, rolling basis
Transportation: bell schedule
& software
Utilize routing software
to create more efficient routes; explore two-tiered bussing
Ongoing savings from routing software efficiencies established in 2014-15
Administrative salary
Established new salary
schedule with ranges of pay
Ongoing savings from action in 2014-15 with new salary schedule that includes ranges of pay
Athletics transportation
Reduce athletics
transportation funding to schools by 25%
Ongoing savings from 2014-15 change
Clerical No action; further study
of clerical roles Potential for savings based on Skyward
efficiencies
Guidance Counselors
No action; assessment
phase for actions in future years including review of counselors' duties
Incremental alignment of guidance counselor ratios to match state average; ongoing review of counselors’ role; report due June 30
1. G iv e n p ro p e rt y v a lu e in c r e a s e s , L C S e x p e c t s in c re a s e s t o t h e c a p i t a l f u n d 2 . Th is a c t io n le a d s t o o n e - t im e s a v i n g s f o r y e a rs 20 15 - 16 a n d 2 01 6 - 1 7; t h i s s a v in g s w i l l n ot b e p os s i b le in 2 0 18

19
In order to balance the 2015-2016 budget and fund the instructional priorities, the district will take action to realign approximately $8.7 million.
Realignment Opportunities Investment Opportunities
2015–16 Area 2015-16
Shift of expenses out of general fund ($M) Baseline ($M)
Capital expenditures 2.0
Surplus (gap) (1.8)
Realignments within general fund ($M) IP Costs ($M)
High school schedule 4.7 Roll forward from previous year 0.94
Consolidated purchasing 0.9 ELL and Struggling Students & Schools (1.9)
IDEA funding (non-recurring) 0.3 Talent Development Pipeline (1.6)
Maintenance: lawn care TBD Teacher Induction & Coaching (0.4)
Management discretion 0.5 Principal Induction & Development (0.2)
Transportation 0.4 Program Evaluation & Innovation (0.2)
Administrative salaries 0.3 Pers. Learning (Teachers/Leaders) (1.1)
Athletics transportation 0.1 Pers. Learning (Students) (2.1)
Clerical TBD
Guidance Counselors TBD Total: Priorities only (7.5)
Additional Savings Additions: HS Testing/Super (0.5)
Self-funding Prof. Development 1.3
Total Savings 10.0 Total including baseline gap (8.7)
Note: Some figures have been rounded; for more precise instructional priorities costs, see Appendices A-G

20
With the 2015-16 balanced budget as described, $4.6M in 2016-2017 and $6.6M in 2017-18 remain as budget gaps to be filled
Options being evaluated to fill the future budget deficits:
School models: Examine magnet school models, Collegiate H.S., School Choice, CTE Academies, etc.; report from work group due June 30
IDEA efficiencies: Pursue additional reimbursements and evaluate efficiencies of staffing placement; ongoing study needed for any changes, data available supports current status
Skyward Systems efficiencies: Potential to reduce both supplies and staff; report due June 30 based on fuller implementation of Skyward
District staffing: Examine roles and responsibilities of district-level positions; Report due March 30
Central Office for district staff: Explore costs and efficiencies gained from a centralized location for district departments; report due June 30
Consolidating Title I offices: Research completed; determined no cost saving to consolidating the two Title I offices into one location
Over-all picture over the next three years
21
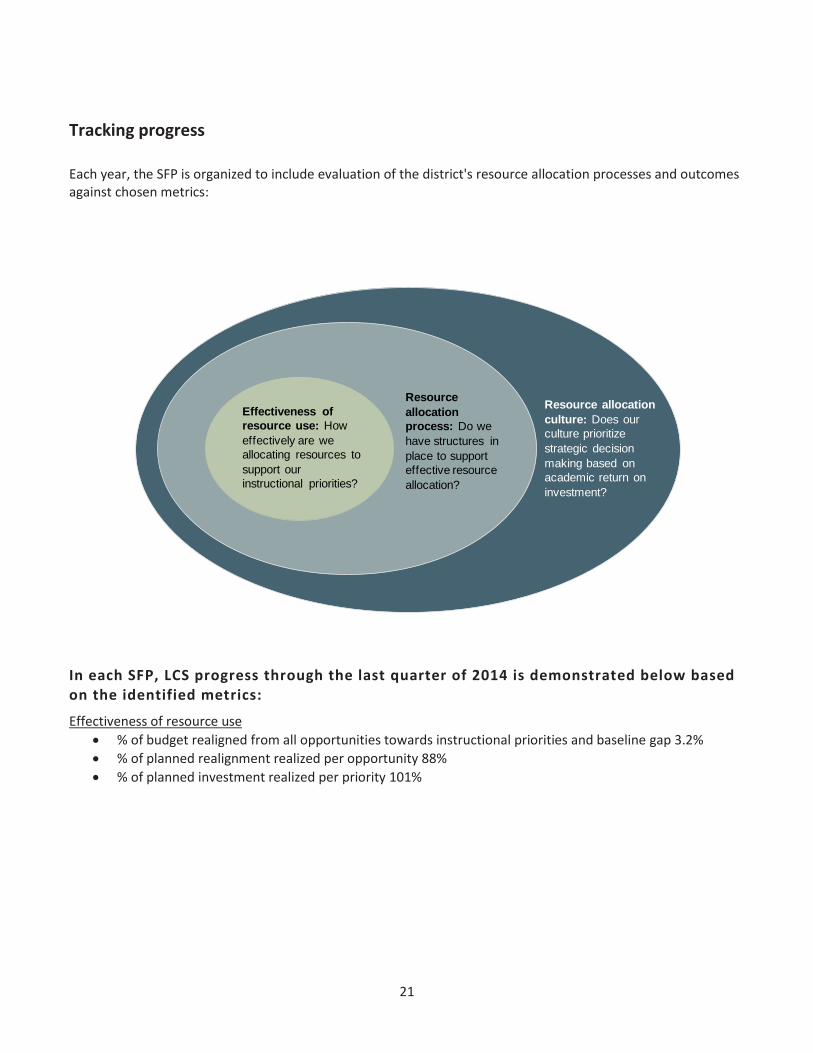
Tracking progress
Each year, the SFP is organized to include evaluation of the district's resource allocation processes and outcomes against chosen metrics:
In each SFP, LCS progress through the last quarter of 2014 is demonstrated below based on the identified metrics:
Effectiveness of resource use
% of budget realigned from all opportunities towards instructional priorities and baseline gap 3.2%
% of planned realignment realized per opportunity 88%
% of planned investment realized per priority 101%
Effectiveness of
resource use: How
effectively are we
allocating resources to
support our
instructional priorities?
Resource
allocation
process: Do we
have structures in
place to support
effective resource
allocation?
Resource allocation
culture: Does our
culture prioritize
strategic decision
making based on
academic return on
investment?

22
Successes and barriers in realizing Realignment Opportunities:
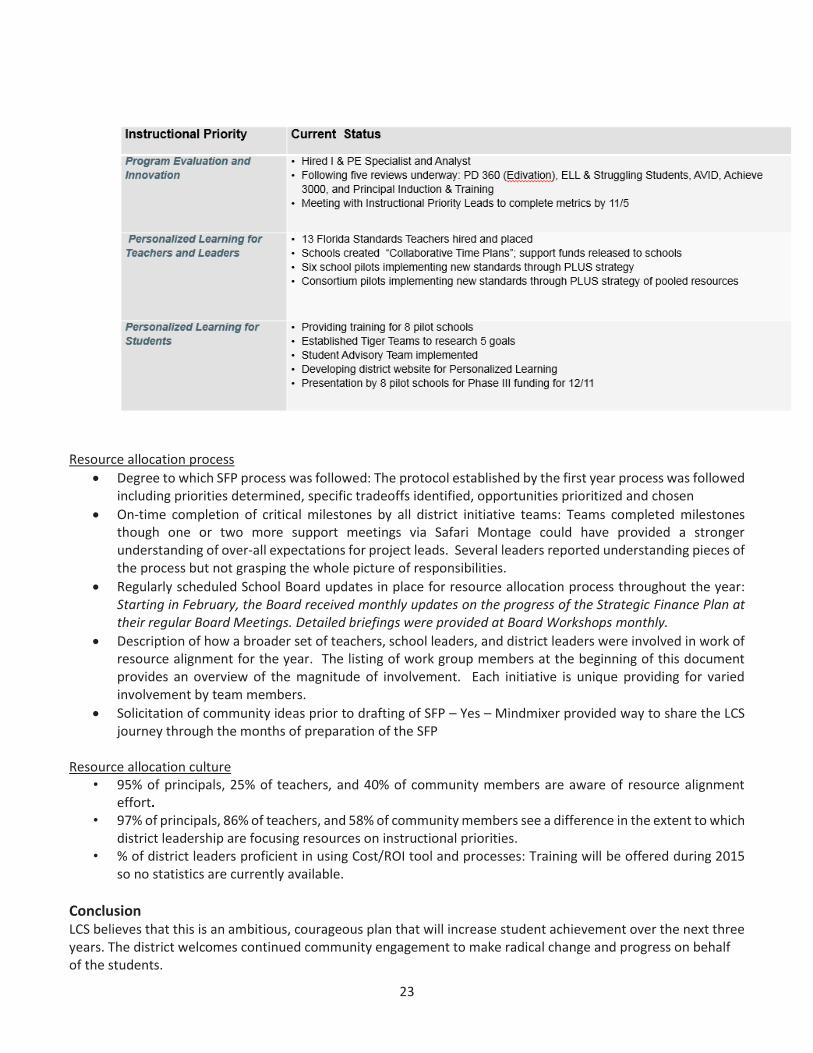
Performance on established return metrics by priority: Priorities will be measured at the end of the 2014-15 school year and reported to the School Board and in the next Strategic Finance Plan. Implementation of the instructional priorities did not begin until July 2014. A full year of performance is required before measurements can be completed.
Successes and barriers around Instructional Priorities: implementing, achieving returns, meeting program goals:
23
Resource allocation process
Degree to which SFP process was followed: The protocol established by the first year process was followed including priorities determined, specific tradeoffs identified, opportunities prioritized and chosen
On-time completion of critical milestones by all district initiative teams: Teams completed milestones though one or two more support meetings via Safari Montage could have provided a stronger understanding of over-all expectations for project leads. Several leaders reported understanding pieces of the process but not grasping the whole picture of responsibilities.
Regularly scheduled School Board updates in place for resource allocation process throughout the year: Starting in February, the Board received monthly updates on the progress of the Strategic Finance Plan at their regular Board Meetings. Detailed briefings were provided at Board Workshops monthly.
Description of how a broader set of teachers, school leaders, and district leaders were involved in work of resource alignment for the year. The listing of work group members at the beginning of this document provides an overview of the magnitude of involvement. Each initiative is unique providing for varied involvement by team members.
Solicitation of community ideas prior to drafting of SFP – Yes – Mindmixer provided way to share the LCS journey through the months of preparation of the SFP
Resource allocation culture • 95% of principals, 25% of teachers, and 40% of community members are aware of resource alignment
effort. • 97% of principals, 86% of teachers, and 58% of community members see a difference in the extent to which
district leadership are focusing resources on instructional priorities. • % of district leaders proficient in using Cost/ROI tool and processes: Training will be offered during 2015
so no statistics are currently available.
Conclusion LCS believes that this is an ambitious, courageous plan that will increase student achievement over the next three years. The district welcomes continued community engagement to make radical change and progress on behalf of the students.

24
APPENDIX
Appendix
25
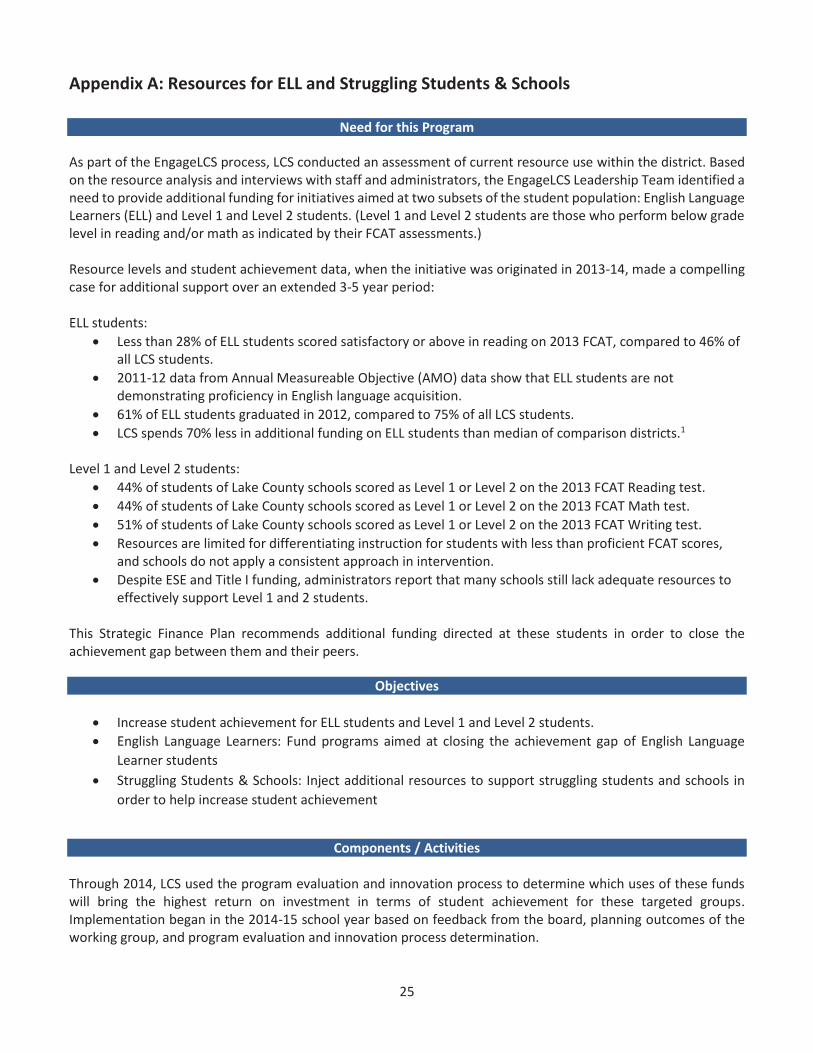
Appendix A: Resources for ELL and Struggling Students & Schools
Need for this Program As part of the EngageLCS process, LCS conducted an assessment of current resource use within the district. Based on the resource analysis and interviews with staff and administrators, the EngageLCS Leadership Team identified a need to provide additional funding for initiatives aimed at two subsets of the student population: English Language Learners (ELL) and Level 1 and Level 2 students. (Level 1 and Level 2 students are those who perform below grade level in reading and/or math as indicated by their FCAT assessments.) Resource levels and student achievement data, when the initiative was originated in 2013-14, made a compelling case for additional support over an extended 3-5 year period: ELL students:
Less than 28% of ELL students scored satisfactory or above in reading on 2013 FCAT, compared to 46% of all LCS students.
2011-12 data from Annual Measureable Objective (AMO) data show that ELL students are not demonstrating proficiency in English language acquisition.
61% of ELL students graduated in 2012, compared to 75% of all LCS students.
LCS spends 70% less in additional funding on ELL students than median of comparison districts.1 Level 1 and Level 2 students:
44% of students of Lake County schools scored as Level 1 or Level 2 on the 2013 FCAT Reading test.
44% of students of Lake County schools scored as Level 1 or Level 2 on the 2013 FCAT Math test.
51% of students of Lake County schools scored as Level 1 or Level 2 on the 2013 FCAT Writing test.
Resources are limited for differentiating instruction for students with less than proficient FCAT scores, and schools do not apply a consistent approach in intervention.
Despite ESE and Title I funding, administrators report that many schools still lack adequate resources to effectively support Level 1 and 2 students.
This Strategic Finance Plan recommends additional funding directed at these students in order to close the achievement gap between them and their peers.
Objectives
Increase student achievement for ELL students and Level 1 and Level 2 students.
English Language Learners: Fund programs aimed at closing the achievement gap of English Language
Learner students
Struggling Students & Schools: Inject additional resources to support struggling students and schools in
order to help increase student achievement
Components / Activities
Through 2014, LCS used the program evaluation and innovation process to determine which uses of these funds will bring the highest return on investment in terms of student achievement for these targeted groups. Implementation began in the 2014-15 school year based on feedback from the board, planning outcomes of the working group, and program evaluation and innovation process determination.
26
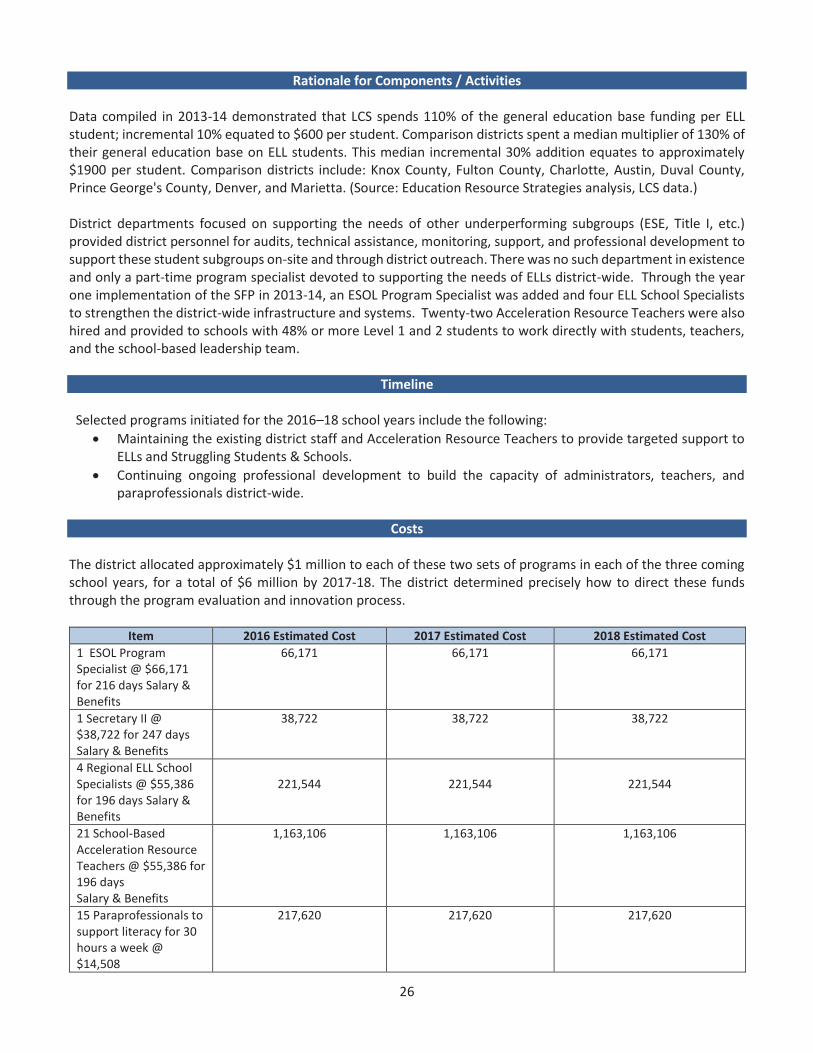
Rationale for Components / Activities Data compiled in 2013-14 demonstrated that LCS spends 110% of the general education base funding per ELL student; incremental 10% equated to $600 per student. Comparison districts spent a median multiplier of 130% of their general education base on ELL students. This median incremental 30% addition equates to approximately $1900 per student. Comparison districts include: Knox County, Fulton County, Charlotte, Austin, Duval County, Prince George's County, Denver, and Marietta. (Source: Education Resource Strategies analysis, LCS data.) District departments focused on supporting the needs of other underperforming subgroups (ESE, Title I, etc.) provided district personnel for audits, technical assistance, monitoring, support, and professional development to support these student subgroups on-site and through district outreach. There was no such department in existence and only a part-time program specialist devoted to supporting the needs of ELLs district-wide. Through the year one implementation of the SFP in 2013-14, an ESOL Program Specialist was added and four ELL School Specialists to strengthen the district-wide infrastructure and systems. Twenty-two Acceleration Resource Teachers were also hired and provided to schools with 48% or more Level 1 and 2 students to work directly with students, teachers, and the school-based leadership team.
Timeline
Selected programs initiated for the 2016–18 school years include the following:
Maintaining the existing district staff and Acceleration Resource Teachers to provide targeted support to ELLs and Struggling Students & Schools.
Continuing ongoing professional development to build the capacity of administrators, teachers, and paraprofessionals district-wide.
Costs
The district allocated approximately $1 million to each of these two sets of programs in each of the three coming school years, for a total of $6 million by 2017-18. The district determined precisely how to direct these funds through the program evaluation and innovation process.
Item 2016 Estimated Cost 2017 Estimated Cost 2018 Estimated Cost
1 ESOL Program Specialist @ $66,171 for 216 days Salary & Benefits
66,171 66,171 66,171
1 Secretary II @ $38,722 for 247 days Salary & Benefits
38,722 38,722 38,722
4 Regional ELL School Specialists @ $55,386 for 196 days Salary & Benefits
221,544
221,544
221,544
21 School-Based Acceleration Resource Teachers @ $55,386 for 196 days Salary & Benefits
1,163,106 1,163,106 1,163,106
15 Paraprofessionals to support literacy for 30 hours a week @ $14,508
217,620 217,620 217,620
27
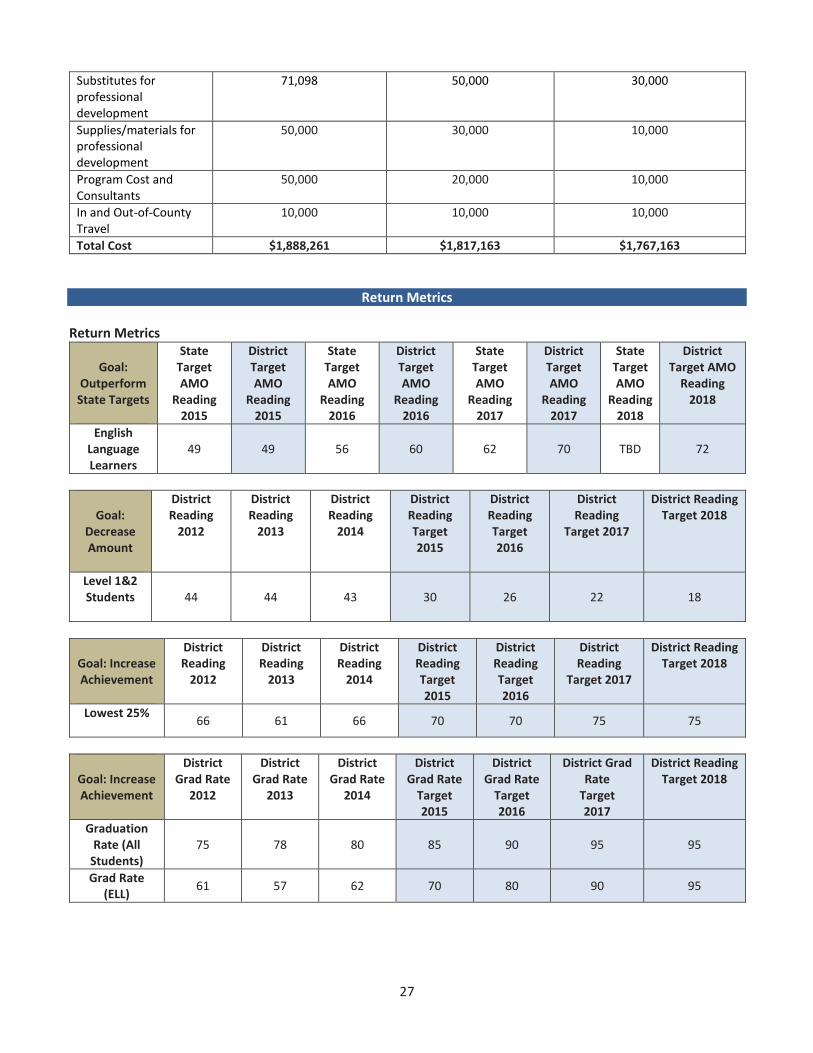
Substitutes for professional development
71,098 50,000 30,000
Supplies/materials for professional development
50,000 30,000 10,000
Program Cost and Consultants
50,000 20,000 10,000
In and Out-of-County Travel
10,000 10,000 10,000
Total Cost $1,888,261 $1,817,163 $1,767,163
Return Metrics
Return Metrics
Goal:
Outperform State Targets
State Target AMO
Reading 2015
District Target AMO
Reading 2015
State Target AMO
Reading 2016
District Target AMO
Reading 2016
State Target AMO
Reading 2017
District Target AMO
Reading 2017
State Target AMO
Reading 2018
District Target AMO
Reading 2018
English Language Learners
49 49 56 60 62 70 TBD 72
Goal:
Decrease Amount
District Reading
2012
District Reading
2013
District Reading
2014
District Reading Target 2015
District Reading Target 2016
District Reading
Target 2017
District Reading Target 2018
Level 1&2 Students
44 44 43 30 26 22 18
Goal: Increase Achievement
District Reading
2012
District Reading
2013
District Reading
2014
District Reading Target 2015
District Reading Target 2016
District Reading
Target 2017
District Reading Target 2018
Lowest 25%
66 61 66 70 70 75 75
Goal: Increase Achievement
District Grad Rate
2012
District Grad Rate
2013
District Grad Rate
2014
District Grad Rate
Target 2015
District Grad Rate
Target 2016
District Grad Rate
Target 2017
District Reading Target 2018
Graduation Rate (All
Students) 75 78 80 85 90 95 95
Grad Rate (ELL)
61 57 62 70 80 90 95
28
Appendix B: Talent Development Pipeline
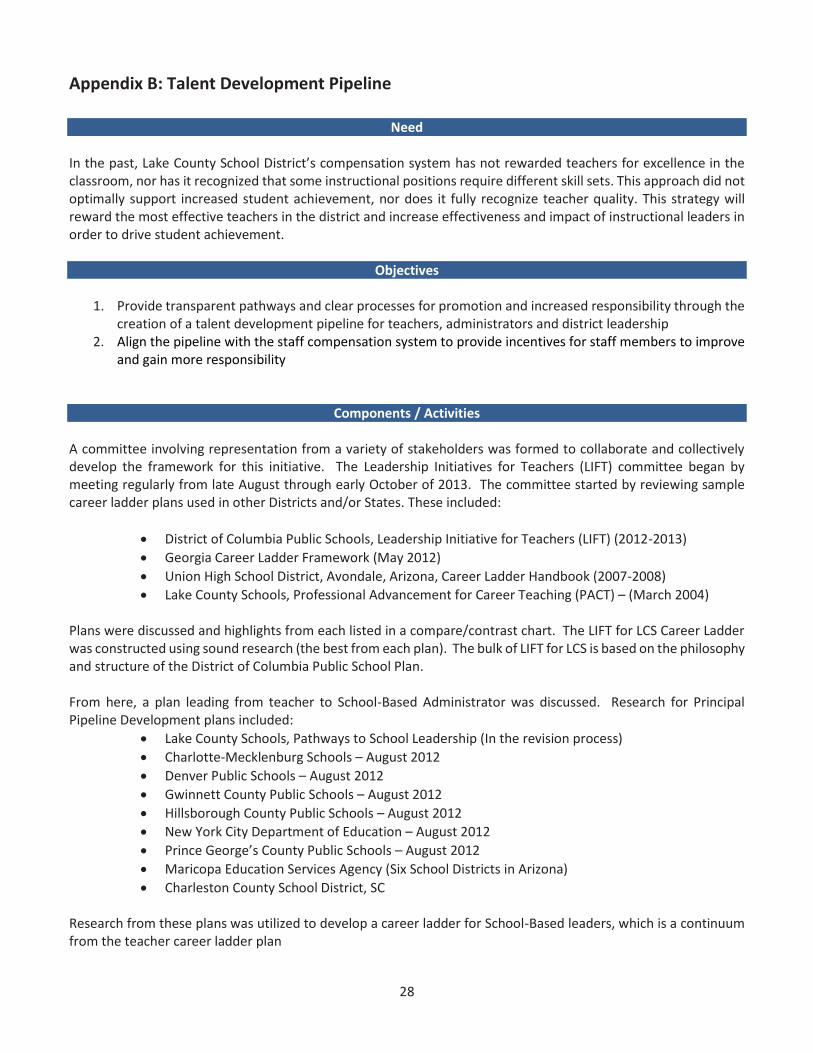
Need
In the past, Lake County School District’s compensation system has not rewarded teachers for excellence in the classroom, nor has it recognized that some instructional positions require different skill sets. This approach did not optimally support increased student achievement, nor does it fully recognize teacher quality. This strategy will reward the most effective teachers in the district and increase effectiveness and impact of instructional leaders in order to drive student achievement.
Objectives
1. Provide transparent pathways and clear processes for promotion and increased responsibility through the creation of a talent development pipeline for teachers, administrators and district leadership
2. Align the pipeline with the staff compensation system to provide incentives for staff members to improve and gain more responsibility
Components / Activities A committee involving representation from a variety of stakeholders was formed to collaborate and collectively develop the framework for this initiative. The Leadership Initiatives for Teachers (LIFT) committee began by meeting regularly from late August through early October of 2013. The committee started by reviewing sample career ladder plans used in other Districts and/or States. These included:
District of Columbia Public Schools, Leadership Initiative for Teachers (LIFT) (2012-2013)
Georgia Career Ladder Framework (May 2012)
Union High School District, Avondale, Arizona, Career Ladder Handbook (2007-2008)
Lake County Schools, Professional Advancement for Career Teaching (PACT) – (March 2004)
Plans were discussed and highlights from each listed in a compare/contrast chart. The LIFT for LCS Career Ladder was constructed using sound research (the best from each plan). The bulk of LIFT for LCS is based on the philosophy and structure of the District of Columbia Public School Plan. From here, a plan leading from teacher to School-Based Administrator was discussed. Research for Principal Pipeline Development plans included:
Lake County Schools, Pathways to School Leadership (In the revision process)
Charlotte-Mecklenburg Schools – August 2012
Denver Public Schools – August 2012
Gwinnett County Public Schools – August 2012
Hillsborough County Public Schools – August 2012
New York City Department of Education – August 2012
Prince George’s County Public Schools – August 2012
Maricopa Education Services Agency (Six School Districts in Arizona)
Charleston County School District, SC
Research from these plans was utilized to develop a career ladder for School-Based leaders, which is a continuum from the teacher career ladder plan
29
Finally, a District Staff pathway was discussed. Much discussion was held on this pathway. The committee agreed that a new step for Lead Program Specialist and/or Program Manager needed to be added. After a review of our current system, a career path along with eligibility requirements at each level was developed for careers at the District level. From here, the framework was taken to the LCS School Board and the LCEA Negotiations Committee for approval. Once approved, a variety of communication modes were developed to inform staff about the initiative. These include:
A LIFT for LCS Newsletter that will be sent to all staff
A voice-over PowerPoint explaining the LIFT for LCS framework and how it will be implemented available
for all staff
Numerous presentations at Principal’s and Assistant Principal’s meetings
Once Summative Evaluations for the 2013-2014 school year are finalized, LIFT for LCS will be implemented.
Rationale for Components / Activities Traditionally, many teachers have found that the only way to advance in their careers is to leave the classroom. The LIFT for LCS changes that. LIFT is a five-stage career ladder that provides high-performing teachers with opportunities for advancement inside the classroom, as well as additional responsibility and increased recognition and compensation. At its core, LIFT is about honoring teachers as professionals, and making DCPS a place where teachers at any point in their careers can continue to learn and grow in an environment where they are respected and appreciated.
Timeline LIFT for LCS will be implemented during the 2014-2015 school year.
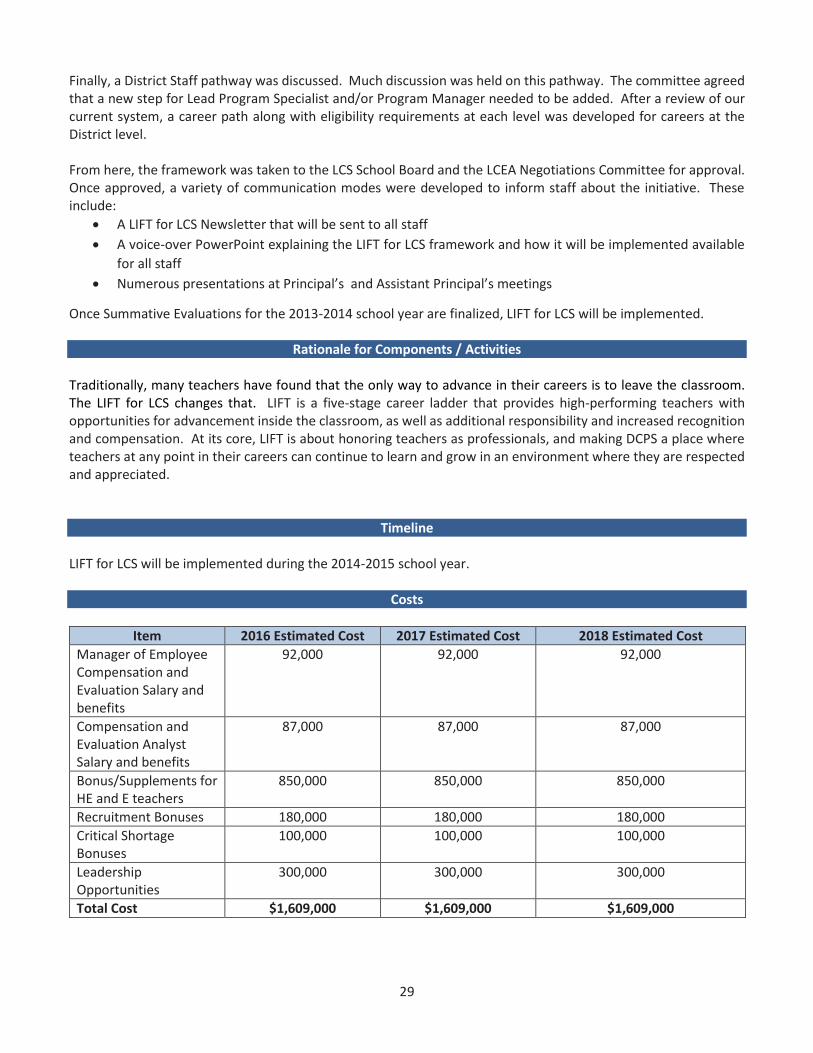
Costs
Item 2016 Estimated Cost 2017 Estimated Cost 2018 Estimated Cost
Manager of Employee Compensation and Evaluation Salary and benefits
92,000 92,000 92,000
Compensation and Evaluation Analyst Salary and benefits
87,000 87,000 87,000
Bonus/Supplements for HE and E teachers
850,000 850,000 850,000
Recruitment Bonuses 180,000 180,000 180,000
Critical Shortage Bonuses
100,000 100,000 100,000
Leadership Opportunities
300,000 300,000 300,000
Total Cost $1,609,000 $1,609,000 $1,609,000
30
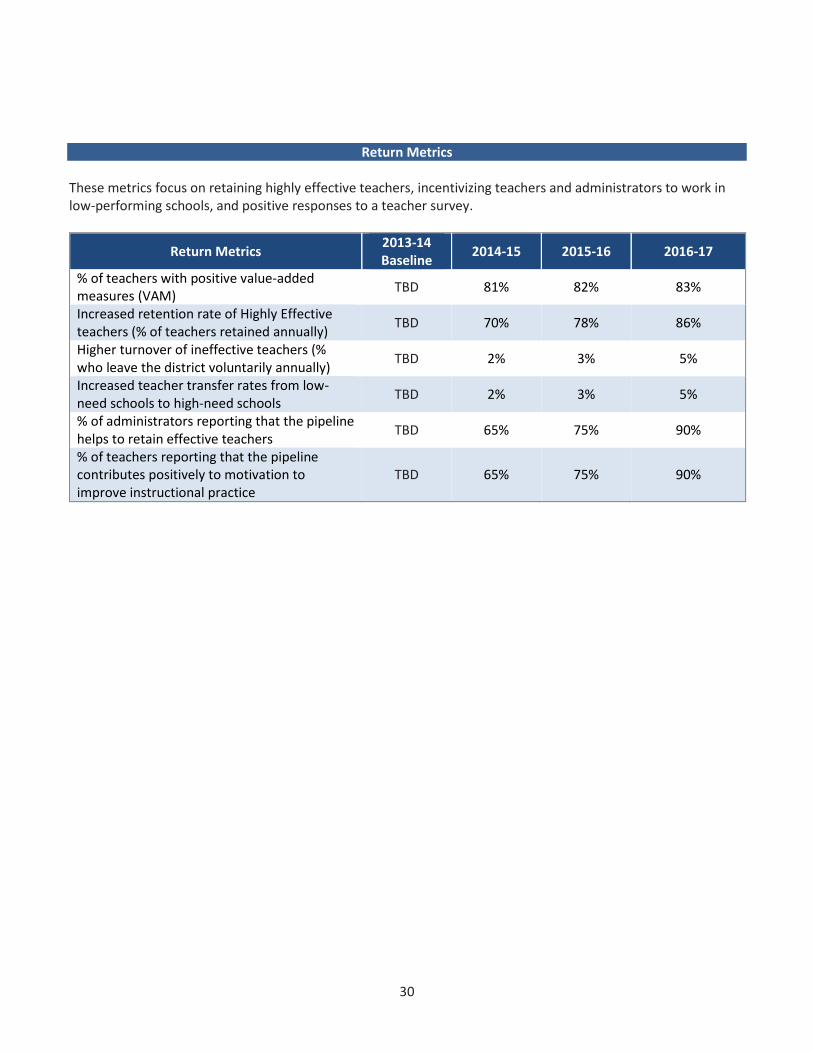
Return Metrics These metrics focus on retaining highly effective teachers, incentivizing teachers and administrators to work in low-performing schools, and positive responses to a teacher survey.
Return Metrics 2013-14 Baseline
2014-15 2015-16 2016-17
% of teachers with positive value-added measures (VAM)
TBD 81% 82% 83%
Increased retention rate of Highly Effective teachers (% of teachers retained annually)
TBD 70% 78% 86%
Higher turnover of ineffective teachers (% who leave the district voluntarily annually)
TBD 2% 3% 5%
Increased teacher transfer rates from low- need schools to high-need schools
TBD 2% 3% 5%
% of administrators reporting that the pipeline helps to retain effective teachers
TBD 65% 75% 90%
% of teachers reporting that the pipeline contributes positively to motivation to improve instructional practice
TBD 65% 75% 90%
31
Appendix C: Teacher Induction and Coaching Framework
Need for this Program Each year, more than 10% of the district's teaching staff is new to the profession. In 2012–2013, new teachers were supported on a 1:73 coach-to-teacher ratio. Due to the high ratio, new teachers had only brief contact with their district instructional coaches, and intensive support was provided only in critical situations. Through this priority, coach-to-teacher ratios are now 1:30. The district has also lacked a consistent protocol for training district and school-based coaches across departments. Teachers do not always receive the support and feedback needed for the growth and development of effective instructional practices. In addition, the district has not implemented a consistent process for new teacher mentorship at schools. Through this instructional priority, the district will be able to provide focused support for new teachers, allowing them to grow in the profession and support them in helping their students gain higher achievement. A strong district-wide framework for training all coaches is needed. Objectives
Improve the quality of coaching in the district through establishing a district-wide framework for training
coaches.
Provide new teachers with robust mentoring from instructional coaches, which will increase student
achievement and teacher retention.
Components / Activities The instructional priority is focused on providing focused professional development for district and school based coaches supporting new teachers, maintaining effective teacher-to-coach ratios, and building capacity and sustainability for effective instructional practices of new teachers that impact student learning outcomes. Professional development will focus on research-based practices for effective mentoring and coaching practices. Collaborative partners for the professional learning include the New Teacher Center and Marzano/Learning Sciences International. During the 2014-2015 school year, there are eleven (11) scheduled days of professional learning. Effective coaching practices will be shared through various district professional learning opportunities. Due to new district instructional coaches hired through this priority, coach-to-teacher ratios are currently 1:30 for first-year teachers, and 1:50 for second-year teachers. Coaches are assigned based on the feeder patterns, allowing for a consistent level of support across schools. New teachers receive an average of 30-45 minutes of coaching support each week, based on their individual needs. The district coaches are working collaboratively with school leadership teams to build a culture of coaching at all schools. The focus for coaching and mentoring support is based on the Marzano Instructional Framework as it is our language of instruction. Coaches work with new teachers to learn the framework through the implementation of the Florida Standards utilizing the tools and resources developed by Lake County Schools. The coaches also monitor new teacher participation at required and recommended training events, as well as guide them through the certification process. The desired result of this instructional priority is to improve teacher effectiveness that impacts student learning outcomes and results in higher teacher retention rates and over-all more effective instruction. Additionally, a strong district-wide framework for training all coaches and developing a common language will be a priority.

32
Rationale for Components / Activities Research is clear that the most important factor in improving student achievement is the quality of the teacher in the classroom. Having 350-400 new teachers each year is counterproductive to building capacity for a highly effective instructional staff. Implementing a teacher induction and coaching framework that is grounded in research-based practices will help Lake County develop the capacity for sustainable change for effective instructional practices that impact student learning. Effective teachers need effective coaches. Through focused and ongoing professional development, instructional coaches and school-based content coaches will develop the common language and skilled practices that guide effective teacher induction and coaching. According to the New Teacher Center, effective teacher induction programs provide coaching and support to new teachers during their first three years in the classroom. Expanding the district instructional coach team allows for this intensive level of induction support that focuses on developing coaching practices around common protocol for all district coaches and supports over-all teacher effectiveness. Timeline The Teacher Induction and Instructional Coaching initiative launched in the fall of 2013 as a pilot project supporting teacher induction for 75 first-year teachers. In the fall of 2014, additional district instructional coaches were added to provide teacher induction support for all first and second year teachers. Through ongoing training and school-based collaborative efforts, support for third year teachers will be provided beginning in fall 2015.
Costs
Return Metrics
Item 2016 Estimated Cost 2017 Estimated Cost 2018 Estimated Cost
Program Specialist Salary and benefits
67,000 67,000 67,000
District Coaches Salary and benefits
166,000 166,000 166,000
Consultant Fees 100,000 100,000 100,000
Prof. Dev. Costs 18,000 18,000 18,000
Prof. Dev. Materials 5,000 5,000 5,000
Online Coaching Tools 11,000 11,000 11,000
In-County / Coaches 5,500 5,500 5.,500
Supplies for Coaches 500 500 500
Total Cost $373,000 $373,000 $373,000
Return Metrics 2014-15 2015-16 2016-17
2017-
18
% of Effective teachers retained 73% 75% 77% 79% First-year teacher value-added measures (VAM) Waiting for compilation of 2013-14 scores
to create 2015 baseline First-year teacher instructional practice scores 3.01
(Effective) 3.10 3.20 3.30
% of first-year teachers rated Effective or Highly Effective 93% 95% 97% 99%

33
Appendix D: Principal Induction and Development
Need for this Program The Principal Induction and Development Program is a structured approach to increase support, build capacity and retain high quality principals. This collaborative process will engage new principals in a one-on-one relationship with the principal coach designed to support the principal’s professional and personal development.
Objectives o Ensure that principals receive in-depth coaching support during their first two years. o Improve the level of coaching given to all principals and potential principal candidates through professional
development, one-on-one mentoring, and professional learning communities.
Components / Activities The program will feature structured modules for each cohort: Targeted APs, first-year principals, second-year principals, and 3+-year principals. This program will be a blended partnership between the district and the National Institute for School Leadership (NISL), a training organization that specializes in executive development. A new position, Mentor Principal Coach, will ensure high standards of implementation fidelity and sustainability of this program (see job responsibilities below). The program includes professional development for all principals and targeted assistant principals who will serve as principal interns.
Role of Principal Coach
Program Oversight / Implementation
•Coordinate site-based mentor relationship
•Coordinate Principal Mentor cohort groups
•Organize professional development
•Coordinate New Principal Academy (3 days)
•Establish documentation and support materials
•Ensure program infrastructure, fidelity & sustainability
Professional Development
•Train principal mentors using train-the-trainer model in partnership with the National Institute for School Leadership
•Coordinate New Principal Induction Academies quarterly during phases 1 and 2
•Establish modules/ work sessions
•Align principal induction program with other district professional development offerings
Field Work
•Meet with new principals weekly or bi-weekly; perform joint school walk-throughs
•Provide coaching feedback
•Meet with experienced site-based principals to sustain relationships and align support
•Conduct professional development follow-up
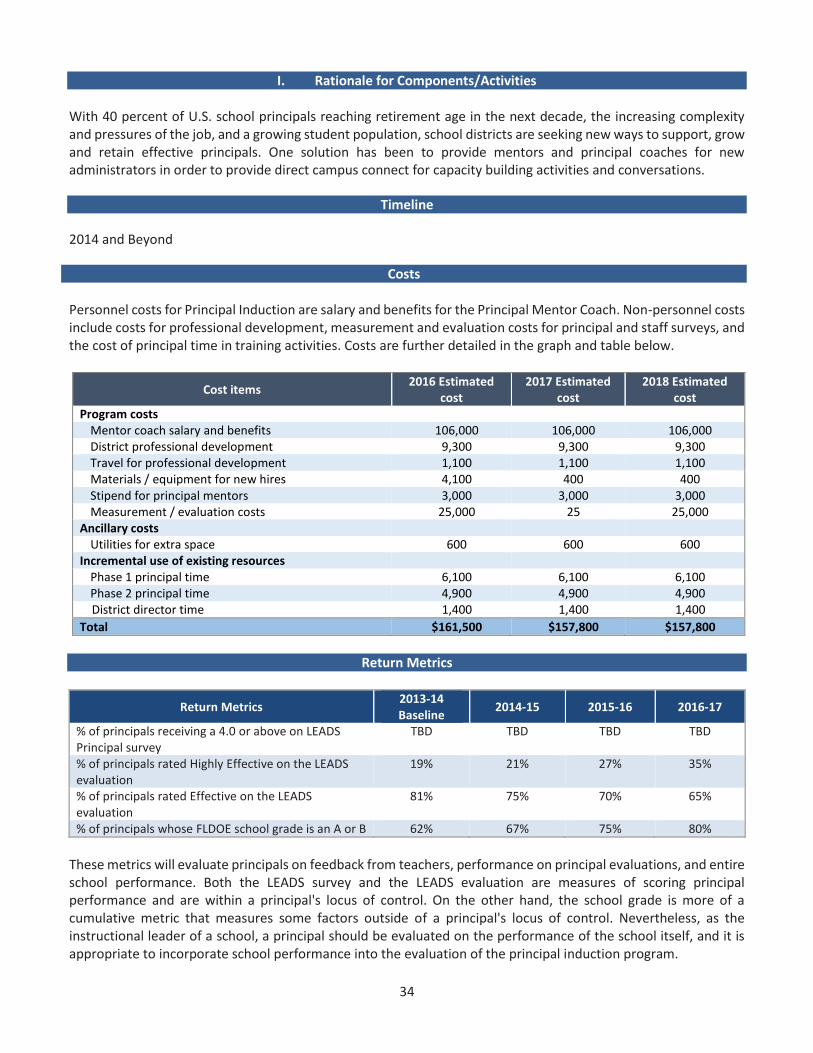
34
I. Rationale for Components/Activities With 40 percent of U.S. school principals reaching retirement age in the next decade, the increasing complexity and pressures of the job, and a growing student population, school districts are seeking new ways to support, grow and retain effective principals. One solution has been to provide mentors and principal coaches for new administrators in order to provide direct campus connect for capacity building activities and conversations.
Timeline 2014 and Beyond
Costs Personnel costs for Principal Induction are salary and benefits for the Principal Mentor Coach. Non-personnel costs include costs for professional development, measurement and evaluation costs for principal and staff surveys, and the cost of principal time in training activities. Costs are further detailed in the graph and table below.
Return Metrics
These metrics will evaluate principals on feedback from teachers, performance on principal evaluations, and entire school performance. Both the LEADS survey and the LEADS evaluation are measures of scoring principal performance and are within a principal's locus of control. On the other hand, the school grade is more of a cumulative metric that measures some factors outside of a principal's locus of control. Nevertheless, as the instructional leader of a school, a principal should be evaluated on the performance of the school itself, and it is appropriate to incorporate school performance into the evaluation of the principal induction program.
Cost items 2016 Estimated
cost 2017 Estimated
cost 2018 Estimated
cost Program costs
Mentor coach salary and benefits 106,000 106,000 106,000 District professional development 9,300 9,300 9,300 Travel for professional development 1,100 1,100 1,100 Materials / equipment for new hires 4,100 400 400 Stipend for principal mentors 3,000 3,000 3,000 Measurement / evaluation costs 25,000 25 25,000
Ancillary costs Utilities for extra space 600 600 600
Incremental use of existing resources Phase 1 principal time 6,100 6,100 6,100 Phase 2 principal time 4,900 4,900 4,900 District director time 1,400 1,400 1,400
Total $161,500 $157,800 $157,800
Return Metrics 2013-14 Baseline
2014-15 2015-16 2016-17
% of principals receiving a 4.0 or above on LEADS Principal survey
TBD TBD TBD TBD
% of principals rated Highly Effective on the LEADS evaluation
19% 21% 27% 35%
% of principals rated Effective on the LEADS evaluation
81% 75% 70% 65%
% of principals whose FLDOE school grade is an A or B 62% 67% 75% 80%

35
Appendix E: Program Evaluation & Innovation Process
Need for this Program Student achievement depends upon the effectiveness of instructional programs. Lake County Schools previously had no clear, standardized process for evaluating operational and academic return on investment (ROI) for promising programs and current student initiatives. The district defines the academic ROI of instructional programs as the growth in academic achievement of LCS students. For operational programs, the ROI may be expressed in terms of efficiency or effectiveness in conducting the day-to-day operations of the district. The Program Innovation and Evaluation initiative provides a clear process to eliminate or retool ineffective programs and continue fund and provide resources for promising and effective programs. The process identifies, evaluates, implements, tracks, and reassesses programs.
Objectives
Provide a framework for rigorously evaluating existing and new programs in order to enable the implementation of programs that will ultimately drive student achievement in the most cost-effective way possible.
Implement and culturally embed a standardized set of steps in the program evaluation process, with clearly assigned ownership of actions at each step, and a clear timeline for decision-making.
Develop a culture of data-driven decision making through implementation of this process.
Components / Activities The process will proceed as follows: At the center of the process is a tool the district has designed to measure and compare the cost and operational and academic ROI of selected programs. The Cost/ROI tool was created to be versatile enough to evaluate both new and existing programs that are either instructional or operational. It facilitates the projection of comprehensive costs of a program, including direct program costs, ancillary costs, incremental costs due to the use
of existing resources, and cost relief the program affords. The tool supports the tracking of impact evaluation against both a baseline performance level and a projected target. The new Program Innovation and Evaluation staff now meets with the leaders of instructional priorities and targeted programs for evaluation to develop and verify performance metrics, all associated costs, implementation details and reporting. The staff continues to develop the system of operation for this initiative. What is the rationale for these components/activities? (This is written in paragraphs and gives a detailed understanding of the rationale for the particular components and activities that are being implemented) This process will allow the district to:
Proactively examine promising programs and assess projected impacts on student achievement and operations
Gather full program implementation costs
Support fidelity of implementation of programs through rigorous monitoring
Align spending to the district's instructional priorities and Strategic Finance Plan
Compare different programs with similar objectives based on ROI
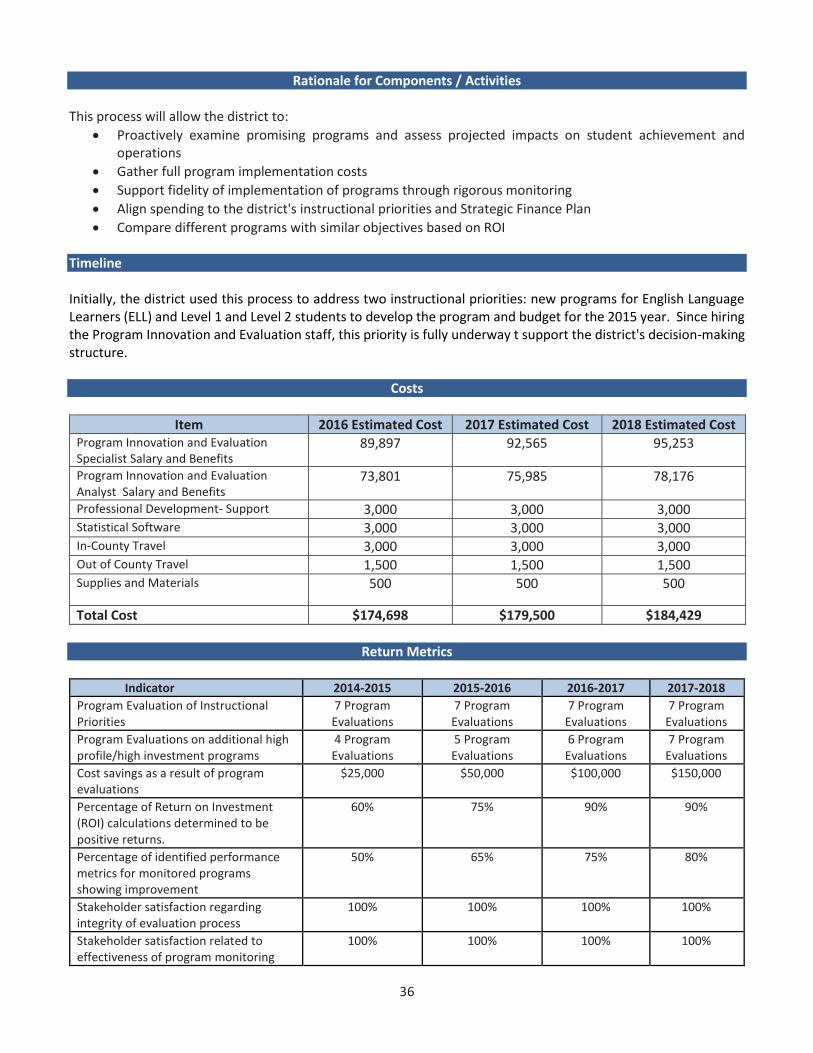
36
Rationale for Components / Activities This process will allow the district to:
Proactively examine promising programs and assess projected impacts on student achievement and operations
Gather full program implementation costs
Support fidelity of implementation of programs through rigorous monitoring
Align spending to the district's instructional priorities and Strategic Finance Plan
Compare different programs with similar objectives based on ROI Timeline Initially, the district used this process to address two instructional priorities: new programs for English Language Learners (ELL) and Level 1 and Level 2 students to develop the program and budget for the 2015 year. Since hiring the Program Innovation and Evaluation staff, this priority is fully underway t support the district's decision-making structure.
Costs
Item 2016 Estimated Cost 2017 Estimated Cost 2018 Estimated Cost Program Innovation and Evaluation Specialist Salary and Benefits
89,897 92,565 95,253
Program Innovation and Evaluation Analyst Salary and Benefits
73,801 75,985 78,176
Professional Development- Support 3,000 3,000 3,000 Statistical Software 3,000 3,000 3,000 In-County Travel 3,000 3,000 3,000 Out of County Travel 1,500 1,500 1,500 Supplies and Materials 500 500 500
Total Cost $174,698 $179,500 $184,429
Return Metrics
Indicator 2014-2015 2015-2016 2016-2017 2017-2018
Program Evaluation of Instructional Priorities
7 Program Evaluations
7 Program Evaluations
7 Program Evaluations
7 Program Evaluations
Program Evaluations on additional high profile/high investment programs
4 Program Evaluations
5 Program Evaluations
6 Program Evaluations
7 Program Evaluations
Cost savings as a result of program evaluations
$25,000 $50,000 $100,000 $150,000
Percentage of Return on Investment (ROI) calculations determined to be positive returns.
60% 75% 90% 90%
Percentage of identified performance metrics for monitored programs showing improvement
50% 65% 75% 80%
Stakeholder satisfaction regarding integrity of evaluation process
100% 100% 100% 100%
Stakeholder satisfaction related to effectiveness of program monitoring
100% 100% 100% 100%
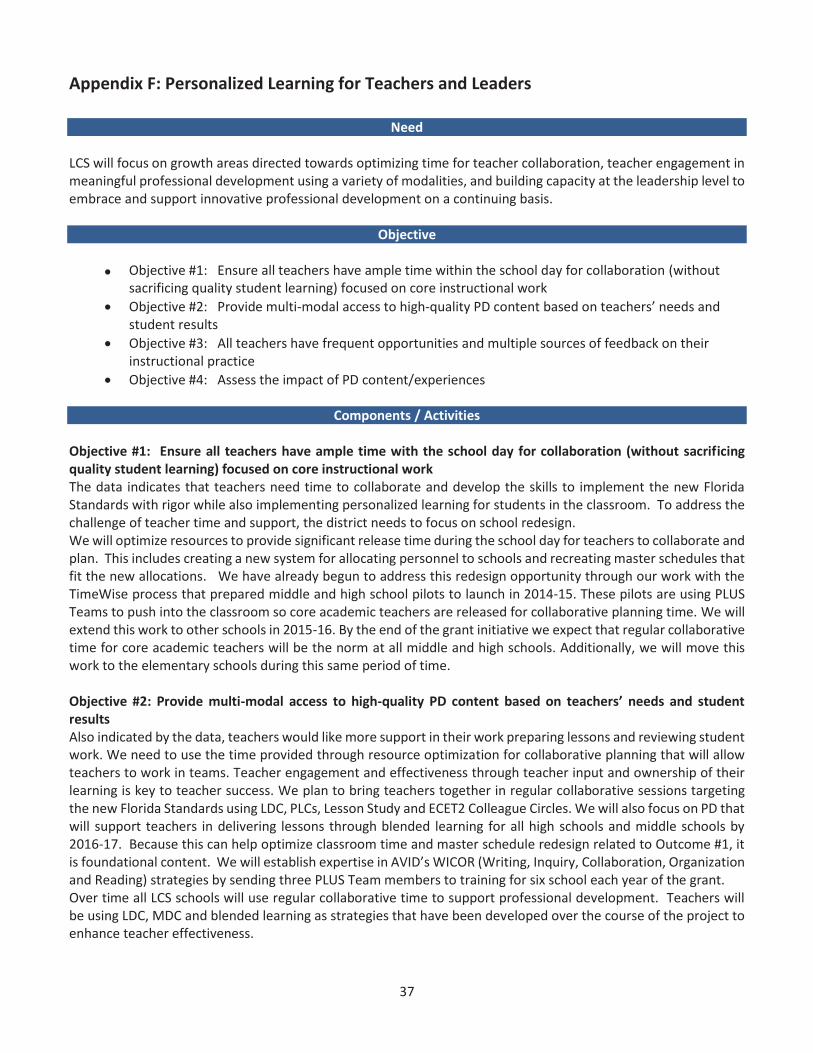
37
Appendix F: Personalized Learning for Teachers and Leaders
Need LCS will focus on growth areas directed towards optimizing time for teacher collaboration, teacher engagement in meaningful professional development using a variety of modalities, and building capacity at the leadership level to embrace and support innovative professional development on a continuing basis.
Objective
Objective #1: Ensure all teachers have ample time within the school day for collaboration (without sacrificing quality student learning) focused on core instructional work
Objective #2: Provide multi-modal access to high-quality PD content based on teachers’ needs and student results
Objective #3: All teachers have frequent opportunities and multiple sources of feedback on their instructional practice
Objective #4: Assess the impact of PD content/experiences
Components / Activities Objective #1: Ensure all teachers have ample time with the school day for collaboration (without sacrificing quality student learning) focused on core instructional work The data indicates that teachers need time to collaborate and develop the skills to implement the new Florida Standards with rigor while also implementing personalized learning for students in the classroom. To address the challenge of teacher time and support, the district needs to focus on school redesign. We will optimize resources to provide significant release time during the school day for teachers to collaborate and plan. This includes creating a new system for allocating personnel to schools and recreating master schedules that fit the new allocations. We have already begun to address this redesign opportunity through our work with the TimeWise process that prepared middle and high school pilots to launch in 2014-15. These pilots are using PLUS Teams to push into the classroom so core academic teachers are released for collaborative planning time. We will extend this work to other schools in 2015-16. By the end of the grant initiative we expect that regular collaborative time for core academic teachers will be the norm at all middle and high schools. Additionally, we will move this work to the elementary schools during this same period of time. Objective #2: Provide multi-modal access to high-quality PD content based on teachers’ needs and student results Also indicated by the data, teachers would like more support in their work preparing lessons and reviewing student work. We need to use the time provided through resource optimization for collaborative planning that will allow teachers to work in teams. Teacher engagement and effectiveness through teacher input and ownership of their learning is key to teacher success. We plan to bring teachers together in regular collaborative sessions targeting the new Florida Standards using LDC, PLCs, Lesson Study and ECET2 Colleague Circles. We will also focus on PD that will support teachers in delivering lessons through blended learning for all high schools and middle schools by 2016-17. Because this can help optimize classroom time and master schedule redesign related to Outcome #1, it is foundational content. We will establish expertise in AVID’s WICOR (Writing, Inquiry, Collaboration, Organization and Reading) strategies by sending three PLUS Team members to training for six school each year of the grant. Over time all LCS schools will use regular collaborative time to support professional development. Teachers will be using LDC, MDC and blended learning as strategies that have been developed over the course of the project to enhance teacher effectiveness.
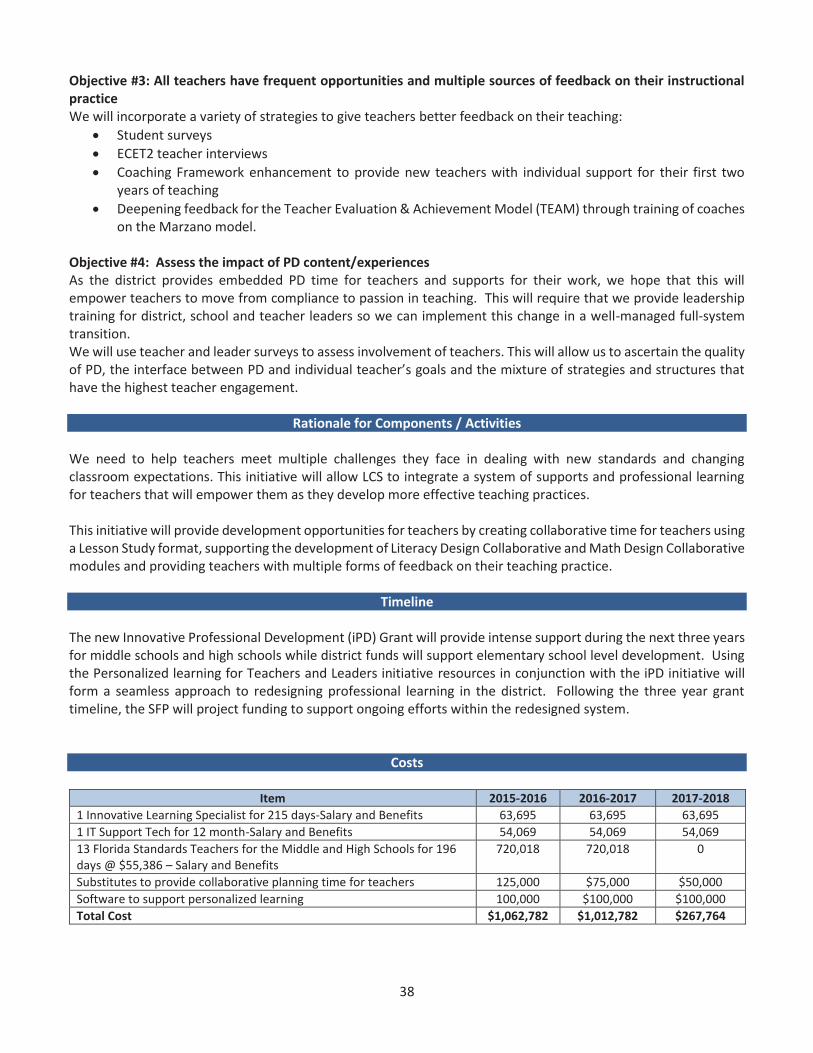
38
Objective #3: All teachers have frequent opportunities and multiple sources of feedback on their instructional practice We will incorporate a variety of strategies to give teachers better feedback on their teaching:
Student surveys
ECET2 teacher interviews
Coaching Framework enhancement to provide new teachers with individual support for their first two years of teaching
Deepening feedback for the Teacher Evaluation & Achievement Model (TEAM) through training of coaches on the Marzano model.
Objective #4: Assess the impact of PD content/experiences As the district provides embedded PD time for teachers and supports for their work, we hope that this will empower teachers to move from compliance to passion in teaching. This will require that we provide leadership training for district, school and teacher leaders so we can implement this change in a well-managed full-system transition. We will use teacher and leader surveys to assess involvement of teachers. This will allow us to ascertain the quality of PD, the interface between PD and individual teacher’s goals and the mixture of strategies and structures that have the highest teacher engagement.
Rationale for Components / Activities We need to help teachers meet multiple challenges they face in dealing with new standards and changing classroom expectations. This initiative will allow LCS to integrate a system of supports and professional learning for teachers that will empower them as they develop more effective teaching practices. This initiative will provide development opportunities for teachers by creating collaborative time for teachers using a Lesson Study format, supporting the development of Literacy Design Collaborative and Math Design Collaborative modules and providing teachers with multiple forms of feedback on their teaching practice.
Timeline The new Innovative Professional Development (iPD) Grant will provide intense support during the next three years for middle schools and high schools while district funds will support elementary school level development. Using the Personalized learning for Teachers and Leaders initiative resources in conjunction with the iPD initiative will form a seamless approach to redesigning professional learning in the district. Following the three year grant timeline, the SFP will project funding to support ongoing efforts within the redesigned system.
Costs
Item 2015-2016 2016-2017 2017-2018
1 Innovative Learning Specialist for 215 days-Salary and Benefits 63,695 63,695 63,695
1 IT Support Tech for 12 month-Salary and Benefits 54,069 54,069 54,069
13 Florida Standards Teachers for the Middle and High Schools for 196 days @ $55,386 – Salary and Benefits
720,018
720,018 0
Substitutes to provide collaborative planning time for teachers 125,000 $75,000 $50,000
Software to support personalized learning 100,000 $100,000 $100,000
Total Cost $1,062,782 $1,012,782 $267,764
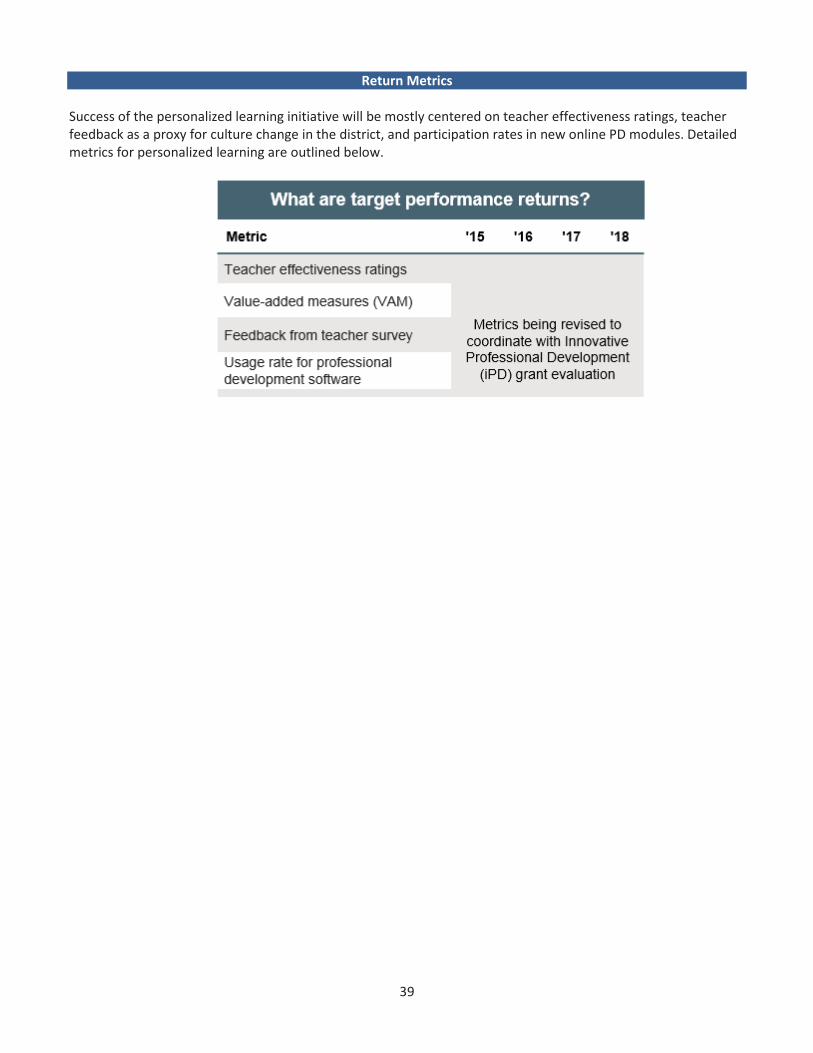
39
Return Metrics Success of the personalized learning initiative will be mostly centered on teacher effectiveness ratings, teacher feedback as a proxy for culture change in the district, and participation rates in new online PD modules. Detailed metrics for personalized learning are outlined below.
40
Appendix G: Personalized Learning for Students
Need Throughout the district, LCS students have a wide variety of starting positions in terms of academic achievement. A one-size-fits-all approach does not meet the diverse needs of students. By personalizing instruction in a student-centered classroom, the district can tailor its approach to the academic needs of students to increase student achievement.
Vision / Objective Five strategic goals have been established for personalized learning for students. They are:
1. Encourage student-directed learning
2. Develop and implement learner profiles and individual paths to mastery for each student
3. Establish a system of competency-based progression
4. Establish flexible learning environments
5. Develop a system of accountability and continuous improvement
Components / Activities We have developed a detailed strategic plan for the district for the successful implementation of personalized learning. Our plan calls for a gradual scale-up implementation of 4-6 schools per year, with a goal of being fully personalized by 2022. In order to begin the work, eight schools were selected as our first cohort, and for the past five months, they have been in the process of exploring personalized learning. As a result of research, travel to districts and/or schools that have recently implemented personalized learning, and training/coaching with personalized learning coaches, each of the eight schools has envisioned an implementation strategy for their school. The next phase of the work begins with the eight schools presenting their plans to district staff to determine school readiness to move forward. Those schools selected to move forward will being the work of deeper planning (from Jan – August 2015) and then implementation of their plan during the 2015 – 16 school year.
Rationale for Components / Activities As the move to personalized learning is transformational, we felt it was important to scale up gradually. In addition, we felt it was important that each school have a level of autonomy in determining the best implementation strategies and timelines for their individual schools. To facilitate schools’ learning process and professional development around personalized learning (PL), funds were made available (through a grant from the Bill and Melinda Gates Foundation) to visit PL schools and districts around the nation, and also to engage personalized learning experts to provide coaching and training for school staffs.
Timeline The timeline for implementing personalized learning district-wide is estimated to be eight years. The scale up calls for 4–6 schools to come onboard each year in two phases of work: one cohort will be spending a year planning for their implementation while the other cohort begins the implementation after having completed a planning year. In this way we’ll be building capacity.
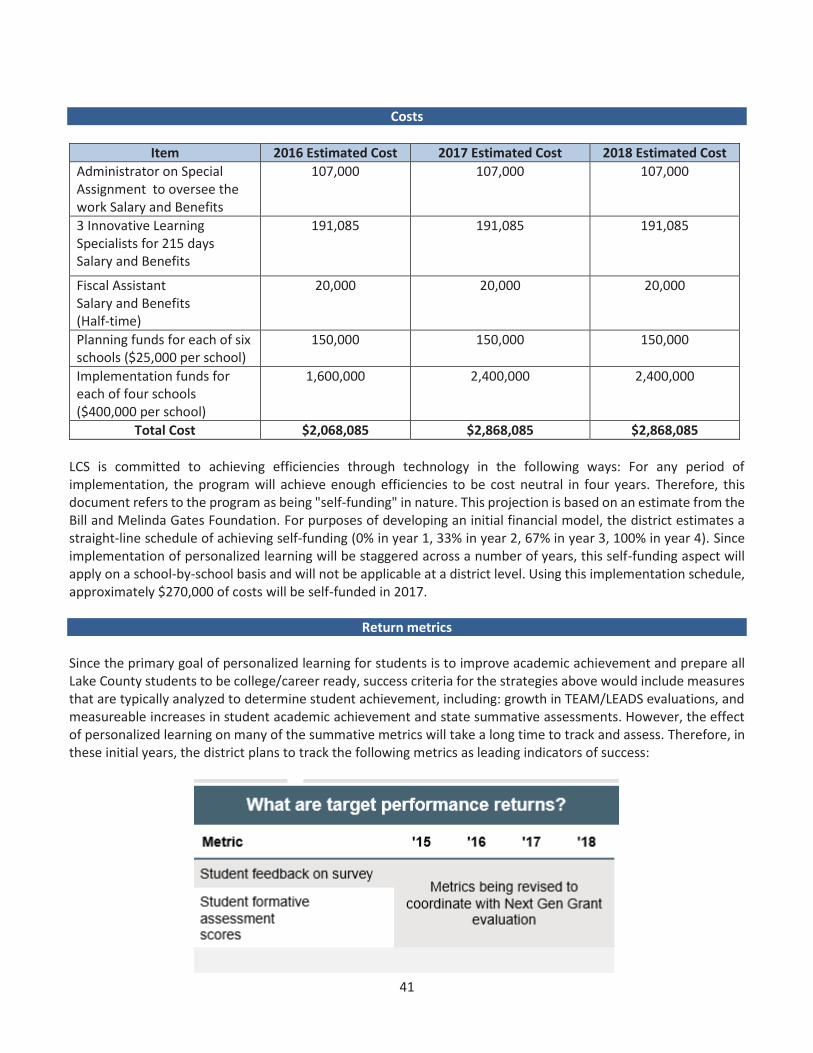
41
Costs
Item 2016 Estimated Cost 2017 Estimated Cost 2018 Estimated Cost
Administrator on Special Assignment to oversee the work Salary and Benefits
107,000
107,000 107,000
3 Innovative Learning Specialists for 215 days Salary and Benefits
191,085 191,085 191,085
Fiscal Assistant Salary and Benefits (Half-time)
20,000 20,000 20,000
Planning funds for each of six schools ($25,000 per school)
150,000 150,000 150,000
Implementation funds for each of four schools ($400,000 per school)
1,600,000 2,400,000 2,400,000
Total Cost $2,068,085 $2,868,085 $2,868,085
LCS is committed to achieving efficiencies through technology in the following ways: For any period of implementation, the program will achieve enough efficiencies to be cost neutral in four years. Therefore, this document refers to the program as being "self-funding" in nature. This projection is based on an estimate from the Bill and Melinda Gates Foundation. For purposes of developing an initial financial model, the district estimates a straight-line schedule of achieving self-funding (0% in year 1, 33% in year 2, 67% in year 3, 100% in year 4). Since implementation of personalized learning will be staggered across a number of years, this self-funding aspect will apply on a school-by-school basis and will not be applicable at a district level. Using this implementation schedule, approximately $270,000 of costs will be self-funded in 2017.
Return metrics Since the primary goal of personalized learning for students is to improve academic achievement and prepare all Lake County students to be college/career ready, success criteria for the strategies above would include measures that are typically analyzed to determine student achievement, including: growth in TEAM/LEADS evaluations, and measureable increases in student academic achievement and state summative assessments. However, the effect of personalized learning on many of the summative metrics will take a long time to track and assess. Therefore, in these initial years, the district plans to track the following metrics as leading indicators of success:

42