north dakota vision zero plan strategic highway safety plan ...
150
North Dakota Vision Zero Plan 2018
-
Upload
khangminh22 -
Category
Documents
-
view
0 -
download
0
Transcript of north dakota vision zero plan strategic highway safety plan ...

North Dakota Vision Zero Plan 20
18

NORTH DAKOTAVISION ZERO PLAN
STRATEGIC HIGHWAY SAFETY PLAN UPDATE
2018-2023

iiiStrategic Highway Safety Plan Update 2018-2023
ContentsLetter from the NDDOT Director ............................................ iv
Executive Summary .......................................................... ES-1
Section 1: Introduction ....................................................... 1-1
Leadership Structure .......................................................... 1-1
Executive Leadership Team ................................................. 1-1
Steering Committee ............................................................ 1-2
Safety Emphasis Area Teams ............................................... 1-3
Safety Partners ................................................................... 1-3
Section 2: Vision, Mission, and Goals ............................... 2-1
National Towards Zero Deaths and North Dakota Vision Zero .................................................... 2-1
Section 3: Update Process ................................................. 3-1
Vision Zero Update Process ............................................... 3-1
Background and Process Overview ................................... 3-1
Federal Requirements ...................................................... 3-2
Stakeholder Collaboration – A Consultative Approach ......... 3-4
Stakeholder Collaboration Process .................................... 3-5
Engagement Events ......................................................... 3-5
Stakeholder Participation Summary .................................. 3-7
Section 4: Data-Driven Prioritization ................................ 4-1
Safety Emphasis Areas ..................................................... 4-1
Safety Strategies ............................................................. 4-6
Crash Data Trends ........................................................... 4-6
Crash and Injury Rates ..................................................... 4-9
Section 5: Priority Safety Strategies for Safety Emphasis Areas .................................... 5-1
Introduction ........................................................................ 5-1
Lane Departure .................................................................. 5-3
Intersections ...................................................................... 5-4
Impaired Driving ................................................................. 5-5
Unbelted Vehicle Occupants ................................................ 5-6
Speeding/Aggressive Drivers ............................................... 5-7
Young Drivers ..................................................................... 5-8
Other Areas of Emphasis ................................................ 5-9
Heavy Vehicles ................................................................. 5-11
Older Drivers .................................................................... 5-12
Pedestrians/Bicyclists ....................................................... 5-13
Local System Roadways .................................................... 5-14
Oil Impact Counties ........................................................... 5-15
Section 6: Statewide Policy Directions ............................. 6-1
Section 7: Implementation and Evaluation ...................... 7-1
Section 8: Conclusion ........................................................... 8-1
Section 9: References and Acronyms .................................. 9-1
Appendix A: Regional Vision Zero Workshop Invitation ...... A-1
Appendix B: Regional Vision Zero Workshop Materials ...... B-1
Appendix C: Emphasis Area Crash Facts Sheets ................. C-1
Appendix D: 2012-2016 County Fatalities ............................D-1

ivStrategic Highway Safety Plan Update 2018-2023
Letter from the NDDOT Director

Strategic Highway Safety Plan Update 2018-2023
EXECUTIVE SUMMARY
EXECUTIVE SUMM
ARY

ES-1Strategic Highway Safety Plan Update 2018-2023
Executive SummaryThis Vision Zero Plan (i.e., Strategic Highway Safety Plan [SHSP] Update, 2018-2023) is the result of a comprehensive and coordinated effort by North Dakota state agencies and more than 200 safety partners representing local and tribal governments and private organizations who are focused on reducing the number of motor vehicle crash fatalities on state and local roadways. This plan is data driven and analysis of North Dakota crash data was used to identify and prioritize crash types, safety strategies, and the types of roadway facilities considered the best candidates for safety investment.
The underlying foundations of this plan include a vision, mission statement, and a short-term goal (NDDOT, 2018a).
> Vision: Establish a culture of personal responsibility where motor vehicle fatalities andserious injuries are recognized as preventable and not tolerated.
> Mission: Eliminate fatalities and serious injuries caused by motor vehicle crashes.
> Short-Term Goal: To reduce annual motor vehicle crash fatalities to fewer than75 by 2025.
Since 2009, fatalities in North Dakota have declined at a rate of approximately 1% per year. This decline includes the spike in fatalities from 2010 through 2013 that coincides with a period of unprecedented economic development and growth associated with the extraction of crude oil in the northwestern part of the state (Oil-Impact Counties). In response to the increase in traffic volumes and the number of crashes, North Dakota invested in roadway expansion and a variety of low-cost safety strategies in this area. As a result of North Dakota’s investment, the number of fatalities has fallen dramatically.
North Dakota’s crash data support the adoption of the following Priority Safety Emphasis Areas:
� Lane Departure.
� Intersections.
� Alcohol and/or DrugRelated.
� Unbelted VehicleOccupants.
� Speeding/AggressiveDriving.
� Young Drivers.
ES
North Dakota’s current fatality trend (refer to Figure 2-1) is on a downward 1% per year slope that would reach 118 fatalities in 2025. To reach North Dakota’s Vision Zero interim goal of 75 or fewer by 2025 requires increasing the rate of crash reduction from 1% to approximately 4.6% annually. The Executive Leadership Team believes this can be achieved through implementing new bold and proven safety strategies.

ES-2 Strategic Highway Safety Plan Update 2018-2023
ESIn addition to these Priority Safety Emphasis Areas, North Dakota supports five Other Areas of Emphasis based on the number of serious injuries and increasing crash trends including:
� Heavy Vehicles. � Local System Roadways.
� Older Drivers. � Oil-Impact Counties.
� Pedestrians/Bicyclists.
North Dakota’s original SHSP was prepared in 2006 and updated in 2013 (CH2M HILL, 2013). Since 2013, North Dakota has focused safety investment on a list of priority safety strategies and has expanded safety investment to implement low-cost strategies along the local road system. The state has seen motor vehicle crash fatalities decline. Example accomplishments of this investment are highlighted below:
� Local Road Safety Program – North Dakota Department of Transportation (NDDOT) partnered with local agencies across the state to conduct a systemic risk-based evaluation of their systems and identify safety projects for low-cost, proven effective safety strategies at high-risk locations. The state’s Highway Safety Improvement Program (HSIP) has gone from very low levels of investment along local roadways to around 50%.
� Enhanced road edges – widespread implementation of rumble strips and wider edge lines along state and county roadways.
� Enhanced horizontal curve delineation – chevron warning signs along rural state, county, and tribal roadways.
� Enhanced intersection recognition – destination lighting at more than 300 rural intersections and upgraded traffic signs and pavement markings at almost 800 rural intersections along state, county, and tribal roadways.
� Enhanced pedestrian safety – countdown pedestrian timers and leading pedestrian intervals at urban signalized intersections.
� Enhanced technical assistance and training for behavioral safety partners – driving under the influence (DUI) training for law enforcement and court personnel and Child Passenger Safety workshops.
� Enhanced high visibility enforcement programs – results of crash analysis were used to better inform selection of times and locations for high visibility enforcement campaigns.
� Continued strengthening of traffic safety policy – strengthened state laws dealing with DUI (sanctions for high blood alcohol content (BAC) offenders and increased jail time for repeat offenders), Child Passenger Safety (requiring children through age 7 be restrained), and Distracted Driving.
This Vision Zero Plan builds on these accomplishments by continuing to focus on implementation of evidenced-based infrastructure strategies, such as:
� Rural safety corridors.
� Longitudinal delineators along rural two-lane highways.
� Street lights at rural intersections.
� Reduced conflict intersections along rural expressways.
� Barrier in freeway medians.
This plan also supports enhancing statewide policies addressing driver behavior, such as; enacting a primary seat belt enforcement law, adding ignition interlock to the menu of tools available to address alcohol and/or drug related driving, evidence-based behavioral strategies, and charging higher fines for right-of-way and speeding violations.

Strategic Highway Safety Plan Update 2018-2023
SECTION 1Introduction
SECTION 1Introduction

Executive Leadership Team
Steering Committee
Emphasis Area Teams
LaneDeparture
YoungDrivers Intersections
Speeding/Aggressive
Driving
Unbelted Vehicle
Occupants
Alcoholand/or Drug
Related
Introduction 1Sect
ion
1-1Strategic Highway Safety Plan Update 2018-2023
LEADERSHIP STRUCTURESuccess of the North Dakota Vision Zero Plan depends, in part, upon an effective leadership structure to facilitate and oversee the development, implementation, monitoring, and updating of the plan.
The Vision Zero leadership structure is detailed in Figure 1-1.
EXECUTIVE LEADERSHIP TEAMThe North Dakota Vision Zero Executive Leadership Team members provide high-level direction and are responsible for defining priority agency and organization-specific safety initiatives, dedicating and leveraging resources, and providing information and guidance on safety-related efforts to the Vision Zero Steering Committee.
The members of the Executive Leadership Team reflect North Dakota’s transportation leaders. Their commitment to paving the way for the effective adoption of bold safety strategies and intra- and inter-organizational cooperation is critical to reaching North Dakota’s goal of zero motor vehicle crash fatalities and serious injuries. The Executive Leadership Team members are detailed in Table 1-1.
Name Organization TitleCrosby, R. Blake North Dakota League of Cities Executive Director
Davis, Scott North Dakota Indian Affairs Commission
Executive Director
Nelson, Mark North Dakota Department of Transportation
Deputy Director Driver and Vehicle Services and Business Operations
Pfennig, Phil Chief North Dakota Bureau of Criminal Investigation, Office of Attorney General
Chief Agent
Solberg, Brandon North Dakota Highway Patrol Colonel
Sorel, Tom North Dakota Department of Transportation, Governor’s Representative for Highway Safety
Director
Traynor, Terry North Dakota Association of Counties
Executive Director
Tufte, MyLynn North Dakota Department of Health State Health Officer
VandeWalle, Gerald North Dakota Supreme Court Chief Justice
Figure 1-1. Vision Zero Leadership Structure
Table 1-1. Executive Leadership Team
1-2 Strategic Highway Safety Plan Update 2018-2023
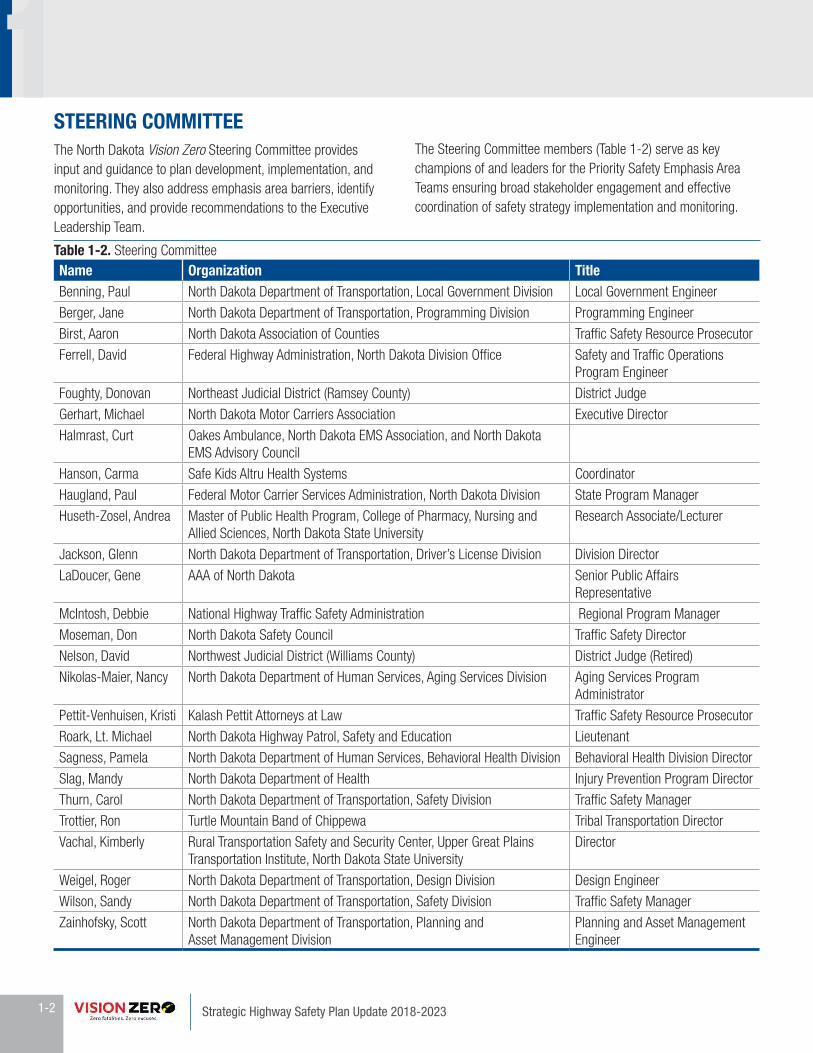
1STEERING COMMITTEE The North Dakota Vision Zero Steering Committee provides input and guidance to plan development, implementation, and monitoring. They also address emphasis area barriers, identify opportunities, and provide recommendations to the Executive Leadership Team.
Name Organization TitleBenning, Paul North Dakota Department of Transportation, Local Government Division Local Government Engineer
Berger, Jane North Dakota Department of Transportation, Programming Division Programming Engineer
Birst, Aaron North Dakota Association of Counties Traffic Safety Resource Prosecutor
Ferrell, David Federal Highway Administration, North Dakota Division Office Safety and Traffic Operations Program Engineer
Foughty, Donovan Northeast Judicial District (Ramsey County) District Judge
Gerhart, Michael North Dakota Motor Carriers Association Executive Director
Halmrast, Curt Oakes Ambulance, North Dakota EMS Association, and North Dakota EMS Advisory Council
Hanson, Carma Safe Kids Altru Health Systems Coordinator
Haugland, Paul Federal Motor Carrier Services Administration, North Dakota Division State Program Manager
Huseth-Zosel, Andrea Master of Public Health Program, College of Pharmacy, Nursing and Allied Sciences, North Dakota State University
Research Associate/Lecturer
Jackson, Glenn North Dakota Department of Transportation, Driver’s License Division Division Director
LaDoucer, Gene AAA of North Dakota Senior Public Affairs Representative
McIntosh, Debbie National Highway Traffic Safety Administration Regional Program Manager
Moseman, Don North Dakota Safety Council Traffic Safety Director
Nelson, David Northwest Judicial District (Williams County) District Judge (Retired)
Nikolas-Maier, Nancy North Dakota Department of Human Services, Aging Services Division Aging Services Program Administrator
Pettit-Venhuisen, Kristi Kalash Pettit Attorneys at Law Traffic Safety Resource Prosecutor
Roark, Lt. Michael North Dakota Highway Patrol, Safety and Education Lieutenant
Sagness, Pamela North Dakota Department of Human Services, Behavioral Health Division Behavioral Health Division Director
Slag, Mandy North Dakota Department of Health Injury Prevention Program Director
Thurn, Carol North Dakota Department of Transportation, Safety Division Traffic Safety Manager
Trottier, Ron Turtle Mountain Band of Chippewa Tribal Transportation Director
Vachal, Kimberly Rural Transportation Safety and Security Center, Upper Great Plains Transportation Institute, North Dakota State University
Director
Weigel, Roger North Dakota Department of Transportation, Design Division Design Engineer
Wilson, Sandy North Dakota Department of Transportation, Safety Division Traffic Safety Manager
Zainhofsky, Scott North Dakota Department of Transportation, Planning and Asset Management Division
Planning and Asset Management Engineer
The Steering Committee members (Table 1-2) serve as key champions of and leaders for the Priority Safety Emphasis Area Teams ensuring broad stakeholder engagement and effective coordination of safety strategy implementation and monitoring.
Table 1-2. Steering Committee

1
1-3Strategic Highway Safety Plan Update 2018-2023
SAFETY EMPHASIS AREA TEAMSThe Priority Safety Emphasis Area Teams originate from an analysis of North Dakota’s serious crash data that point to the most common types of crashes and contributing factors. The six Emphasis Area Teams reflect the six priority safety emphasis areas of the North Dakota Vision Zero Plan. Emphasis Area Teams develop implementation action plans for priority strategies identified in the plan, engage safety partners and stakeholders in implementation, monitor progress, and recommend mid-course strategy changes if interim safety goals are not met.
Safety Emphasis Area Team members (Table 1-3) serve as the front-line, multi-disciplinary team which puts the plan into action. With more clearly defined roles and responsibilities, all safety stakeholders can identify how they can best support implementation efforts.
Priority Emphasis Area Team Lead Organization Lane Departure Berger, Jane North Dakota Department of Transportation
Intersections Berger, Jane North Dakota Department of Transportation
Alcohol and/or Drug Related Birst, Aaron North Dakota Association of Counties
Pettit-Venhuisen, Kristi Kalash Pettit Attorneys at Law
Unbelted Vehicle Occupants Terry Weaver North Dakota Safety Council
Speeding/Aggressive Driving Lt. Roark, Michael North Dakota Highway Patrol, Safety and Education
Young Drivers LaDoucer, Gene AAA of North Dakota
SAFETY PARTNERSVision Zero brings together a wide range of organizations and individuals under a unified commitment to reduce crash fatalities and serious injuries. In preparation for Vision Zero Plan development, two informational webinars and six regional Vision Zero workshops were conducted across the state to engage more than 200 safety partners. Stakeholders were from diverse disciplines including education, enforcement, engineering, and emergency medical services (the 4 Es of Safety), the courts, health care, and community safety advocates and provided the critical safety perspectives needed to move Toward Zero Deaths (TZD) and serious injuries on North Dakota roads.
NDDOT is grateful for the active participation of the following partner organizations to develop the Vision Zero Plan as well as the diverse safety stakeholders who actively support the plan’s implementation.
At a Vision Zero safety workshop in Bismarck, North Dakota, Howard Preston presents on an infrastructure strategy to safety stakeholders.
SHSP Priority Emphasis Areas * Lane Departure.
* Intersections.
* Alcohol and/or Drug Related.
* Unbelted Vehicle Occupants.
* Speeding/Aggressive Driving.
* Young Drivers.
Table 1-3. Priority Safety Emphasis Area Teams

1-4 Strategic Highway Safety Plan Update 2018-2023
1Participating OrganizationsAAA The Auto Club Group
Adams County
AirMed (Sanford Health)
Alexander First Response
Altru Ambulance
City-County Health District
Billings County
Bismarck Burleigh Public Health
Bismarck Police Department
Bismarck-Mandan Metropolitan Planning Organization (MPO)
Bottineau County Emergency Management
Brosz Engineering, Inc.
Burleigh County Sheriff’s Department
Burleigh County
Cass County Highway Department
Cass County Sheriff’s Office
Cass County State’s Attorney’s Office
Cavalier County Health District
Central North America Trade Corridor Association – Highway 52
Central Valley Health District
City of Bismarck
City of Dickinson
City of Fargo
City of Grand Forks
City of Mandan
City of Minot
City of Williston
Dickinson Police Department
Dunn County
Fargo Police Department
Fargo-Moorhead Ambulance Service
Fargo-Moorhead Metropolitan Council of Governments
Federal Highway Administration
Federal Motor Carrier Administration
First Care Health Center
Foster County Public Health
Grand Forks County
Grand Forks MPO
Grand Forks Police Department
Houston Engineering Inc.
Jamestown Planning and Zoning
Kalash Pettit Attorneys at Law
Kidder County Ambulance
KLJ
LaMoure County
Mandan Police Department
McKenzie County
McKenzie County Sheriff’s Office
McKenzie County State’s Attorney
Metro Ambulance
Minnesota Department of Transportation
Minnesota State Patrol
Minnesota Toward Zero Deaths
Minot Air Force Base
Minot Area Chamber of Commerce
Nelson-Griggs District Health Unit
National Highway Traffic Safety Administration-Region 8
North Dakota Active Transportation Alliance
North Dakota Association of Counties

1
1-5Strategic Highway Safety Plan Update 2018-2023
North Dakota Department of Health
North Dakota Department of Human Services
North Dakota Department of Transportation
North Dakota Driver and Traffic Safety Education Association
North Dakota Emergency Medical Service Advisory Committee
North Dakota Highway Patrol
North Dakota Insurance Reserve Fund
North Dakota Indian Affairs Commission
North Dakota League of Cities
North Dakota Legislature
North Dakota Motor Carriers Association
North Dakota Office of Attorney General-Crime Laboratory Division
North Dakota Safety Council
North Dakota State University
North Dakota State University Police
North Dakota Supreme Court
North Dakota Township Officers Association
North Dakota Workforce Safety & Insurance
Northeast Judicial District
Northwest Judicial District
Oakes Ambulance
Ramsey County
Rolette County Public Health District
Safe Kids Grand Forks
State’s Attorney’s Office
Three Affiliated Tribes Community Health Representative (CHR) Program
Turtle Mountain Band of Chippewa
Ulteig Engineers
University of North Dakota Police Department
North Dakota State University, Upper Great Plains Transportation Institute
Walsh County Health District
Ward County
Watford City Police
Williston Police Department

Strategic Highway Safety Plan Update 2018-2023
SECTION 2Vision, Mission,
and Goals
SECTION 2Vision, M
ission, and Goals

2-1Strategic Highway Safety Plan Update 2018-2023
NATIONAL TOWARDS ZERO DEATHS AND NORTH DAKOTA’S VISION ZERO The national TZD strategy and the North Dakota Vision Zero program are based on the premise that even one crash-related death is unacceptable. TZD and North Dakota Vision Zero share core principles that acknowledge motor vehicle crash deaths are preventable. Human error on the roadway necessitates safeguards to reduce crash fatalities and an interdisciplinary, data-driven approach provides the foundation and diverse perspectives needed to address the complex road safety problem.
The national TZD initiative began in 2009 at a stakeholder workshop to develop a strategic safety plan that evolved into Toward Zero Deaths: A National Strategy on Highway Safety. The TZD National Strategy seeks to create a safety culture where drivers reject risky behaviors and all those who are involved in national, state, and local transportation systems incorporate safety into all their decisions (TZD, 2015).
In January 2018, NDDOT, North Dakota Highway Patrol (NDHP), and the North Dakota Department of Health (NDDoH), launched Vision Zero to serve as the framework to guide all statewide traffic safety activity, including (but not limited to):
1. Widespread public education/outreach.
2. Working with the legislature to ensure state laws represent best practices in traffic safety.
3. High visibility enforcement of existing laws.
4. Technology advancements.
5. Infrastructure/road safety improvements
Along with the support and action of these lead agencies, private sector stakeholders that share interest in traffic safety are critical partners in Vision Zero efforts.
Vision, Mission, and Goals 2Se
ctio
n State Agencies Partner to Launch Vision Zero Traffic Safety Initiative
®
®
We can’t view traffic safety as solely a government issue. Vision Zero emphasizes
motorists’ responsibility to drive safely…buckle up, drive sober, pay attention, and obey the law. Prevention of traffic deaths is every North Dakotan’s responsibility.”
— Governor Doug Burgum
Even one life lost on North Dakota roads is unacceptable. Zero deaths is not an
impossible goal, but it will take all of us to get there.”
— Tom Sorel, NDDOT Director

0
20
40
60
80
100
120
140
160
180
Fata
lities
Year
North Dakota Fatalities Goal Setting
Historic Continuation of 2009-2016 Trend 3.75% Annual Reduction Trend
Long Term Vision of Zero
Goal of 75 or FewerFatalities by 2025
2-2 Strategic Highway Safety Plan Update 2018-2023
Figure 2-1. North Dakota Fatality Trend (with extrapolated line to 75 fatalities in 2025 and then 0)
2Vision, Mission, and Goals A key first step in the safety planning process involves identifying the vision, mission, and goals for the reduction in the number of fatalities and serious injuries. North Dakota’s adopted vision provides clear strategic direction for the updated plan: Establish a culture of personal responsibility where motor vehicle fatalities and serious injuries are recognized as preventable and not tolerated.
North Dakota’s Vision Zero mission statement provides insight about how the vision will be achieved: Eliminate fatalities and serious injuries caused by motor vehicle crashes.
North Dakota’s short-term goal is to reduce annual motor vehicle crash fatalities to fewer than 75 by 2025.
The current fatality trend (Figure 2-1) is on a downward 1% per year slope that would reach 118 fatalities in 2025. To reach North Dakota’s goal of fewer than 75 fatalities by 2025 would require increasing the rate of crash reduction from 1% to approximately 4.6% annually. To accomplish this, new bold and proven strategies must be implemented.
Source: NDDOT, 2017
An increase in the rate of reduction of crash-related fatalities requires NDDOT to improve the efficiency of safety investments – implementation of more effective safety strategies, selection of more at-risk locations for safety investments, and adoption of new safety-related policies that are proven to support increased crash reduction.

Strategic Highway Safety Plan Update 2018-2023
SECTION 3Update Process
SECTION 3Update Process

3-1Strategic Highway Safety Plan Update 2018-2023
VISION ZERO UPDATE PROCESSThe North Dakota Vision Zero Plan process builds upon experience gained and lessons learned from previous North Dakota SHSP development efforts. This Section 3 summarizes the background and process overview, federal requirements, safety stakeholder collaboration, and key program accomplishments since the previous 2013 North Dakota SHSP.
BACKGROUND AND PROCESS OVERVIEWThe SHSP is a statewide, data-driven, multiyear safety plan that provides a comprehensive framework for reducing serious crashes. The SHSP is a key requirement of the HSIP, which is a core Federal-aid program to reduce fatalities and serious injuries on all public roads. The NDDOT Safety Division also receives federal funding through the National Highway Traffic Safety Administration (NHTSA) to support driver behavior-related safety strategies to complement the infrastructure-related strategies supported by HSIP funds. Development of North Dakota’s SHSP is led by NDDOT in cooperation with local, regional, state, federal, tribal, academic, non-profit, and private-sector safety partners and stakeholders. The SHSP focuses on critical safety needs and guides investment decisions to support strategies or countermeasures proven to save lives.
The first North Dakota SHSP was adopted in 2006. Shortly thereafter, North Dakota’s 2008 oil boom sparked increases in population, commercial vehicle traffic, and vehicle miles traveled, which culminated in increased motor vehicle crash fatalities. Consequently, the North Dakota SHSP was updated in 2013 (CH2M, 2013) with an intensified commitment to both strengthen safety stakeholder engagement and to
Update Process 3The Vision Zero Plan focuses on critical safety needs and guides investment decisions to support strategies or countermeasures that are proven to save lives.
further invest in proven, evidence-based safety strategies to reduce North Dakota’s serious crashes.
In 2018, the North Dakota Vision Zero initiative was launched and the SHSP became the North Dakota Vision Zero Plan. The process began with a program assessment of North Dakota’s previously implemented infrastructure and driver behavior-related safety countermeasures to gain understanding of their comprehensiveness, how they reflected evidence-based or proven safety approaches, and to identify what changes should be considered during the update process. Figure 3-1 illustrates the core components or overview of North Dakota’s SHSP update process.
Image source: https://www.ndstudies.gov/energy; Photo courtesy of Whiting Oil
Sect
ion

3-2 Strategic Highway Safety Plan Update 2018-2023
Figure 3-1. Core Components of North Dakota’s 2018 Vision Zero Update
Program Assessment
CrashAnalysis
Select Safety Emphasis Areas
Regional Safety Workshops
DevelopComprehensive List of Proposed Safety Strategies
IdentifyPriority Safety
Strategies
UpdateNorth Dakota’s
SHSP
– Project Programming– Project Development– Implementation– Progress Monitoring and Evaluation
North Dakota’s Vision Zero/SHSP Update Process
A data-driven, collaborative approach supported the above core components and integrated the perspectives of diverse safety stakeholders across the state throughout the plan’s update process. This was accomplished through:
� A comprehensive analysis of North Dakota’s crashdata including 5 years (2012-2016) of crash data from stateand local road systems, with a focus on the most seriouscrashes; those that resulted in fatalities and serious injuries.The resulting crash analysis examined the characteristics ofthe road system to support the prioritization of crash types(emphasis areas where large numbers of crashes representthe greatest opportunity for crash reduction) and facility types(description of the types of roads where the priority crash typesare over-represented). Crash data analysis results, together withevidence-based strategy information, supported the selection ofpriority safety strategies.
� Early and extensive safety stakeholder outreach andcollaboration including an initial kickoff webinar, crash datawebinar, Emphasis Area Team input to initial safety strategies, sixregional stakeholder workshops, and a post-regional workshops’Vision Zero leadership debriefing on selected priority strategiesand interim goals. More specifics on the stakeholder outreach isdescribed later in this section.
FEDERAL REQUIREMENTSThe Federal Fixing America’s Surface Transportation or FAST Act continues state SHSP requirements initiated under the Moving Ahead for Progress in the 21st Century (MAP-21) Act. In March 2016, the Federal Highway Administration (FHWA) issued the Strategic Highway Safety Plan (SHSP) Guidance (FHWA, 2016) to further clarify state SHSP requirements. The following summarizes each Federal SHSP requirement and references the corresponding update text.
� A Consultative Approach: States must develop their safetyplans in consultation with a variety of stakeholders, includingstate and local; law enforcement, engineering, educators, andemergency responders. Consultation involves active participationby multidisciplinary safety stakeholders and sharing of safetydata.
See pages 3-4 to 3-7 in Section 3 for a detailed description ofNorth Dakota’s consultative approach.
� Coordination with Other Plans: The SHSP provides strategicdirection for state safety plans including HSIP, the HighwaySafety Plan, and the Commercial Vehicle Safety Plan and alignswith other long-range transportation and metropolitan plans aswell as tribal safety plans, all supporting a performance-basedhighway safety program.
3

3-3Strategic Highway Safety Plan Update 2018-2023
3See page 7-7 in Section 7 for a detailed description of North Dakota’s coordination with other plans.
� Data-Driven Prioritization: Safety planning reflects a multi-level prioritization exercise that uses the results of analyzingcrash data to support:
– Screening of crash types to identify areas of emphasis.
– Screening of safety countermeasures or strategies based ondocumented, proven effectiveness to generate an evidence-based short list of high-priority strategies.
– Identification of roadway types where implementation of thehigh-priority safety strategies would be expected to result inthe greatest reduction in serious crashes.
See pages 4-1 and 4-2 in Section 4 for a detailed description of North Dakota’s data-driven problem identification.
� Consideration of Additional Safety Factors: Additionalfactors to be considered when defining safety emphasis areasand safety strategies include findings of Road Safety Audits,locations of fatalities and serious injuries, rural road safety,bicycle and pedestrian serious crashes, and the results ofsystemic risk assessments.
See pages 4-3 through 4-5 in Section 4 for information onadditional safety factors considered for North Dakota.
� Performance-Based Approach: SHSP’s are required todocument the state’s adopted performance-based goalsincluding a short-term target and long-term vision (Section 2). Inaddition, as part of the performance-based program, states arerequired to set annual safety targets that align with the SHSP’slong-term goals.
These annual targets are established and outlined in NorthDakota’s annual infrastructure-based HSIP and the behavioral-based Highway Safety Plan, which are aligned with NorthDakota’s short-term target and long-term vision.
See pages 2-1 and 2-2 in Section 2 of Vision, Mission, and Goalfor a detailed description on North Dakota’s performance-basedapproach.
� Effective Strategies/Countermeasures: Priority will be givento safety strategies/countermeasures that have been provento be effective at reducing crash-related fatalities and seriousinjuries for the priority safety emphasis areas. Considerationshould also be given to low-cost strategies/countermeasuresthat can be widely deployed at high-risk locations.
See pages 4-6 and 5-1 through 5-2 in Sections 4 and 5, respectively, for a detailed description of the consideration and selection of effective strategies and countermeasures for North Dakota.
�Multidisciplinary: SHSP’s must incorporate perspectives froma variety of factors including the 4 Es of safety with applicationsto infrastructure and driver-behavior emphasis areas andstrategies.
See pages 3-4 and 3-5 in Section 3 for further informationregarding North Dakota’s approach to obtain multidisciplinaryperspectives and input to emphasis area strategies.
� Special Requirements: Legislation requires states to addresstwo special rules in SHSP updates: a) define High Risk RuralRoads (HRRR), and b) develop strategies to address older driverand pedestrian safety, if there has been an increase in fatalitiesand serious injuries to older drivers and pedestrians.
See page 4-9 in Section 4 for a detailed description of NorthDakota’s HRRR, Older Driver, and pedestrian safety specialrequirements.
� SHSP Evaluation: States must regularly evaluate theirsafety programs, using current safety data to confirm thevalidity of emphasis areas, strategies/countermeasures, andprogress toward adopted interim goals. The SHSP must definemechanisms for tracking SHSP implementation and monitoringprogress, including an evaluation and update schedule.
See pages 7-6 and 7-7 in Section 7 for further information ofNorth Dakota’s evaluation approach.
� SHSP Update: The SHSP must be updated no later than5-years from the previous approved version and meet updaterequirements and approvals.
See pages 3-1 and 3-2 in Section 3 of The Update Process forreference to North Dakota’s 2013 and 2018 updates.
� Approval of SHSP Update: FHWA Division Office approvesthe process used to update SHSPs and not specific content.To support FHWA’s review, the SHSP must include a chapter/section(s) describing the development process.
See page 3-2 in Section 3 for a detailed description of the NorthDakota’s SHSP development process.
The North Dakota SHSP Update process addresses Federal SHSP requirements as described in the referenced sections.

3-4 Strategic Highway Safety Plan Update 2018-2023
STAKEHOLDER COLLABORATION – A CONSULTATIVE APPROACHDuring planning and development of the Vision Zero Plan, a diverse group of safety stakeholders were engaged across the state to provide critical input. Stakeholders included safety stakeholders representing the 4 Es of safety as well as non-traditional partners, such as commercial vehicle representatives, tribal governments, judicial staff, and non-motorist groups. Further, special outreach to local and state elected officials helped to encourage their participation in the Vision Zero update process.
Figure 3-2 depicts the structure of the coordination process between stakeholders and Vision Zero or SHSP project team. Through a consultative approach and facilitated engagement, participants shared valuable feedback on local application of current safety strategies and their local/regional experiences regarding priority North Dakota safety needs, proven strategies, and best practices to carry forward in the Vision Zero update.
StrategicHighway
Safety Plan
SHSPProjectTeam
StakeholdersSHSP Executive Leadership Team
SHSP Steering CommitteeSHSP Emphasis Areas Teams
Traf�c Safety Partners NetworkRegional Safety Stakeholders
(via SHSP regional workshops)
Statewide Safety Stakeholders(via Traf�c Safety Partners Summit)
Other Safety Plan Representatives
Figure 3-2. Structure of the Coordination Process Between Stakeholders and Vision Zero or SHSP Project Team
Comprehensive Safety StakeholdersThe following stakeholder safety groups represents the agencies and organizations involved in the Vision Zero update process:
� Education Institutions and community outreach – state, local.
� Enforcement – state, county, city.
� Engineering – state, county, city, consultants.
� Emergency Medical Services – public, private.
� Federal partners – NHTSA and FHWA.
� Governor’s Highway Safety Representative.
� Insurance agencies.
� Supreme Court Chief Justice, District Judges, state and private attorneys/county prosecutors.
� Local community representatives/private citizens.
�Military representative – Air Force.
�Motor Vehicle Administration.
� Non-motorist representation – pedestrian, bicycle and transit.
� Public health and human services staff – state, county, city.
� Elected officials – state, county, city.
�Motor carrier representatives – federal, state.
� Rail representation – Operation Lifesaver.
� Road maintenance – state, county, city.
� Tribal representatives: leadership, transportation, education.
� Traffic safety advocacy groups.
� Transportation Planning – state, regional, MPO, county, city, consultants.
3

Key Regional Stakeholder Engagment
Invitation to feature regional safety successes.
Emphasis Area Team Engagement
Leveraging experience from the EA teams to inform regional strategy discussions.
Regional Workshops Stakeholder Engagement
Customize regional workshops to re�ect regional needs/successes.
Vision Zero Plan Update Communication
Communication outreach to Vision Zero participating and non-participating stakeholders.
3-5Strategic Highway Safety Plan Update 2018-2023
Figure 3-3. Stakeholder Engagement Approach
STAKEHOLDER COLLABORATION PROCESS A cross-section of multidisciplinary stakeholders participated in several outreach events throughout the Vision Zero Plan process as illustrated in Figure 3-3. The stakeholders provided valuable guidance to updating the Vision Zero Plan through open dialogue at direct in-person meetings, workshops, and webinars. Stakeholder engagement events are described in the following section.
ENGAGEMENT EVENTSSeveral safety stakeholder engagement opportunities were available throughout the Vision Zero update process and are detailed below.
Vision Zero/SHSP Kickoff Webinar – March 13, 2018Members of the Vision Zero Executive Leadership Team and the Vision Zero Steering Committee were invited to participate in the March 2018 kickoff webinar. The two groups were solicited early in the update process to offer valuable perspectives on the approach and provide recommendations. During the kickoff webinar, participants were debriefed on the update process and federal requirements, the newly launched Vision Zero program, and the Vision Zero Safety Workshop implementation beginning March through April 2018. Members were invited to provide their perspectives on the Vision Zero update process.
Solicitation of Vision Zero/SHSP Safety Emphasis Area Team InputThe North Dakota Vision Zero Emphasis Area Teams representing the four behavioral and two infrastructure priority safety emphasis areas served a key role throughout the Vision Zero update. The Emphasis Area Teams identified priority needs, framed challenges, identified safety strategies, recommended priorities, and will play a central role in strategy implementation.
Prior to the Vision Zero safety workshops, leaders of the emphasis area teams (together with NDDOT safety staff) offered their expertise to create initial emphasis area safety strategies based on North Dakota crash data, knowledge of proven safety counter measures, and experience with North Dakota safety culture. Their input on the initial strategies strengthened the statewide context for the regional Vision Zero safety workshop discussions, presentations, and materials.
3

3-6 Strategic Highway Safety Plan Update 2018-2023
Date Location
March 21, 2018 Fargo – Fargo Dome
March 22, 2018 Grand Forks – Ramada Grand Forks
April 3, 2018 Minot – Ward County Courthouse
April 4, 2018 Bismarck – Ramkota
April 17, 2018 Dickinson City Hall
April 18, 2018 Williston – Ernie French Center
Table 3-1. Date and Locations of Each Regional Vision Zero One-Day Safety Workshop
Regional Vision Zero One-Day Safety Workshops North Dakota selected six regional locations across the state to host the one-day safety workshops, as presented in Figure 3-4, which were held in March and April 2018. The primary goals of the Vision Zero Safety Workshops were to solicit safety stakeholder input and perspectives and educate stakeholders on proven safety strategies. The regional workshop approach versus a single statewide workshop provided a greater opportunity to gain unique perspectives among regional stakeholders and to help align local needs with statewide safety priorities.
Table 3-1 outlines the dates and locations for each workshop. A copy of the invitation sent to stakeholders is presented in Appendix A.
Workshop AgendaThe six Vision Zero Safety Workshops (Figures 3-5 and 3-6) occurred over 7 hours and included the following agenda components (included in Appendix B):
� Foundational presentations on the North Dakota Vision Zero initiative and an overview of the North Dakota SHSP/Vision Zero background and update process.
� A review of the importance of a data-driven safety approach and an overview of North Dakota’s serious crash data and priority emphasis areas.
� Stakeholder discussion of priority regional safety needs and successes.
� Infrastructure and behavioral emphasis area strategy presentation and stakeholder discussions, focusing on proven, evidence-based strategies. Participants had the opportunity to recommend new strategies and modify existing strategies.
� Stakeholder voting on priority safety strategies based on crash data, evidence-based strategies and best practices, multidisciplinary input, and local/regional perspectives.
North Dakota chose a full-group discussion format for infrastructure and behavior-related safety strategies versus a structure using separate breakout discussions for each. The full-group discussion approach promoted cross-education of effective strategies and interdisciplinary discussion offering the sharing of diverse perspectives resulting in a more comprehensive understanding of safety approaches among all stakeholders.
In addition, each workshop provided an opportunity to include local/regional speakers to highlight local safety accomplishments.
Figure 3-5. Vision Zero Safety Workshop – Grand Forks
Figure 3-6. Vision Zero Safety Workshop – Fargo – EA Strategy Voting
Figure 3-4. Vision Zero Safety Workshop Locations
Williston
Dickinson
Minot
BismarckFargo
Grand Forks
3

3-7Strategic Highway Safety Plan Update 2018-2023
Each participant received the following printed supporting material, which are presented in Appendix B:
� Vision Zero Safety Workshop agenda.
� Presenter biographies.
�Workshop-specific participant list (not included).
�Workshop presentation.
� Emphasis area table of statewide injuries.
� Emphasis area crash fact sheets (see Appendix C).
� Emphasis area strategy tables.
Priority SHSP Safety Strategy Review and CommentFollowing the Vision Zero Safety Workshops, the Vision Zero Executive Leadership Team and Steering Committee members met on May 24, 2018 to review workshop stakeholder discussion and safety strategy input and provide initial comment and feedback on recommended priority safety strategies for each of the six priority emphasis areas. Members were provided one-page summaries of the emphasis areas with highlights of North Dakota crash data analyses, fatalities, and serious injury trends from 2008-2016. The one-page summaries also included the recommended priority safety strategies, reflecting, in part, input
from the Vision Zero Safety Workshops. The meeting discussion recapped the Vision Zero Update process, stakeholder input received, emphasis area priority safety strategies, potential policy-related efforts, and the Vision Zero Update interim goal. In addition, Vision Zero leadership members were invited to further consider the recommended priority safety strategies and offer additional feedback by June 7, 2018.
STAKEHOLDER PARTICIPATION SUMMARY Statewide outreach efforts included inviting more than 2,000 stakeholders, of which, more than 200 participated in emphasis area strategy formation, two webinars, six Vision Zero Safety Workshops, and priority strategy selection. Stakeholder comments were carefully reviewed and considered for the Vision Zero Update. In addition, during the workshops, participants were invited to sign up for North Dakota Vision Zero Behavioral Emphasis Area Teams to expand the statewide participation in Vision Zero strategy development and implementation. More than 60 additional members were added to the behavioral emphasis area teams, including Young Driver, Unbelted Occupants, Alcohol and/or Drug Use, and Speeding/Aggressive Driving.
3

Strategic Highway Safety Plan Update 2018-2023
SECTION 4Data-Driven Prioritization
SECTION 4Data-Driven
Prioritization

4-1Strategic Highway Safety Plan Update 2018-2023
Data-driven Prioritization 4Se
ctio
n
As part of the Vision Zero Plan’s analytical process, it is essential to use a data-driven approach to determine appropriate candidates for safety investment because, in the absence of data, crash types and roadway facilities could be misconceived as equal candidates for safety investment. Therefore, FHWA requires the Vision Zero Plan development process be data driven to avoid misconceptions. Crash type data and roadway system characterization are necessary to support the prioritization that is an integral part of strategic safety planning.
For North Dakota, the crash data analyses involved four steps. The first step includes disaggregating crash types into categories defined by FHWA and then ranking the categories based on the number of fatalities and serious injuries. Since there is not enough safety funding to widely deploy projects that address all crash types, states are encouraged to adopt a short list of safety emphasis areas from among the categories with the greatest number of crashes. Focusing safety investments in the top ranked emphasis areas (those with the greatest number of fatalities and serious injuries) is most likely to result in the greatest opportunity for crash reduction.
The second step is identifying high-priority safety countermeasures/strategies that are linked to specific crash types. The third step is analyzing crash data to identify the types of roadway facilities where the priority crash types occur in the greatest numbers. The fourth and final step is to develop a historic trend of fatalities and serious injuries to indicate the progress North Dakota has made in addressing the number of priority crash types. The trend should also document total fatalities across the country to provide a comparison to nationwide priority crash types.
SAFETY EMPHASIS AREASConsistent with FHWA guidance (FHWA, 2016), North Dakota has adopted the number of motor vehicle crash fatalities plus incapacitating injuries (serious injuries) as the safety performance measure underlying the development of this Vision Zero Plan. Crash data from the most recent 5-year period (2012-2016) were assembled, analyzed, and disaggregated into four basic categories (Drivers and Passengers, Vulnerable Users, Vehicles, and Infrastructure) and 15 safety emphasis areas (as suggested by FHWA). In addition to disaggregating by emphasis area, serious injuries were disaggregated by state versus local system roadways. The number of injuries documented are greater than the actual number of fatalities and injuries across the state’s road system because assigning crashes to these categories involves, in many cases, double or triple counting. For example, a single crash that resulted in an injury to a Young Driver could also have involved Speeding, Unbelted Occupants, and a Lane Departure/Single-Vehicle crash.
Fact sheets summarizing key information for each adopted Priority Safety Emphasis Area are included in Appendix C.
The results of the analysis support the adoption of the following as Priority Safety Emphasis Areas: 1. Lane Departure.2. Intersections.
3. Alcohol and/or Drug Related.4. Unbelted Vehicle Occupants.
5. Speeding/Aggressive Driving.6. Young Drivers.
4-2 Strategic Highway Safety Plan Update 2018-2023
4Based on the number of serious injuries and increasing crash trends, North Dakota supports five Other Areas of Emphasis in addition to the Priority Safety Emphasis Areas including:
1. Heavy Vehicle.
2. Older Drivers.
3. Pedestrians/Bicyclists.
4. Local System Roadways.
5. Oil-Impact Counties.
To gain a better understanding of the relationships among the emphasis areas, further analysis was conducted and the results are in Table 4-1. Key takeaways from this effort include (NDDOT, 2017):
� 42% of serious injuries to Young Drivers are associated with Speeding/Aggressive Driving.
� 48% of serious injuries to Older Drivers are associated with Intersection related crashes.
� 63% of Alcohol and/or Drug related serious injuries involve Unbelted Vehicle Occupants.
� 32% of serious injuries to pedestrians are Alcohol and/or Drug related.
� 54% of serious injuries to bicyclists are Intersection related.
� 30% of serious injuries to motorcyclists are Intersection related.
� 67% of serious injuries associated with Heavy Vehicle crashes occurred in Oil-Impact Counties.
� 49% of serious injuries involving Lane Departure are associated with Speeding/Aggressive Driving.
� 57% of serious injuries associated with Multi-Vehicle Opposing (Head-On) crashes occurred in the Oil-Impact Counties.
� 56% of serious injuries associated with Winter Weather conditions occurred in the Oil-Impact Counties.
As part of the data-driven prioritization process, crash trees were developed to document a disaggregation by state (Figure 4-1) versus local (Figure 4-2) system roadways and urban versus rural areas. Key takeaways from this effort include (NDDOT, 2017):
� A total of 48% of serious injuries occurred on state system roadways and 52% on local system roadways.
�Majority of serious injuries occurred in rural areas (92% on the state system and 67% on the local system).
� The most common type of crash resulting in serious injuries in rural areas on both state and local system roadways is a non-intersection, single-vehicle lane departure, on a tangent (straight) section of road with Unbelted Vehicle Occupants.
� In rural areas, approximately 25% of crashes involving serious injuries occurred in curves and this is considered over-represented based on an estimate that curves make up fewer than 5% of state and local system roadways based on mileage.
� In rural areas, approximately 1% of crashes involving serious injuries are associated with animal hits (primarily deer).
� In urban areas, crashes involving serious injuries are almost evenly divided on state and local systems between intersections and non-intersections.
� In urban areas, approximately 30% of crashes involving serious injuries occurred at intersections with traffic signal control (57% on the state system and 24% on the local system) and this is considered over-represented based on an estimate that signal-controlled intersections make up fewer than 10% of all intersections.

- 10.2% 19.6% 13.2% 19.0% 18.1% 25.2% 9.6% 9.1% 10.1% 2.9% 16.8% 20.6% 21.6% 19.5% 13.9% 10.7% 16.5% 18.2%
6.5% - 7.4% 2.7% 13.4% 8.9% 8.4% 25.0% 11.9% 12.8% 11.8% 5.1% 16.5% 10.8% 19.3% 10.4% 14.7% 8.4% 11.6%
42.3% 25.2% - 51.2% 27.2% 43.3% 23.8% 9.6% 36.3% 36.8% 5.9% 49.1% 25.8% 44.6% 28.3% 62.6% 42.7% 42.6% 39.4%
24.0% 7.9% 43.1% - 16.8% 43.2% 32.2% 7.7% 30.6% 20.0% 5.9% 42.3% 40.0% 23.0% 23.9% 18.0% 30.7% 34.2% 33.1%
7.3% 8.1% 4.9% 3.6% - 6.4% 4.2% 7.7% 2.2% 9.5% 2.9% 7.4% 5.5% 2.7% 5.7% 2.3% 8.0% 6.2% 7.0%
48.3% 37.3% 53.3% 63.3% 44.4% - 13.3% 28.8% 52.2% 42.1% 67.6% 57.4% 45.5% 33.8% 41.3% 37.6% 54.7% 49.1% 48.5%
6.0% 3.1% 2.6% 4.2% 2.6% 1.2% - 0.0% 2.8% 2.3% 0.0% 0.9% 1.0% 0.0% 3.5% 2.7% 10.7% 3.5% 4.3%
0.8% 3.4% 0.4% 0.4% 1.7% 0.9% 0.0% - 0.3% 0.5% 0.0% 0.1% 0.2% 1.4% 2.9% 0.2% 2.7% 0.4% 1.6%
4.8% 10.0% 8.9% 9.0% 3.0% 10.4% 6.3% 1.9% - 2.5% 0.0% 9.6% 5.0% 17.6% 10.1% 0.0% 12.0% 8.5% 9.7%
10.1% 20.2% 17.0% 11.0% 24.6% 15.8% 9.8% 5.8% 4.7% - 29.4% 10.5% 33.3% 36.5% 20.6% 23.1% 18.7% 24.5% 18.2%
0.2% 1.0% 0.2% 0.2% 0.4% 1.4% 0.0% 0.0% 0.0% 1.7% - 0.0% 0.0% 0.0% 0.0% 0.2% 0.0% 0.7% 1.0%
40.6% 19.4% 55.0% 56.4% 46.6% 52.2% 9.1% 1.9% 43.4% 25.3% 0.0% - 5.5% 21.6% 18.3% 41.4% 30.7% 43.4% 44.1%
14.3% 18.1% 8.3% 15.3% 9.9% 11.9% 2.8% 1.9% 6.6% 23.1% 0.0% 1.6% - 0.0% 10.4% 14.8% 12.0% 14.5% 12.7%
2.7% 2.1% 2.5% 1.6% 0.9% 1.6% 0.0% 1.9% 4.1% 4.5% 0.0% 1.1% 0.0% - 2.5% 1.9% 1.3% 1.9% 2.2%
30.9% 48.3% 20.8% 20.9% 23.3% 24.6% 23.1% 53.8% 30.0% 32.6% 0.0% 12.0% 23.7% 32.4% - 19.9% 21.3% 27.8% 28.9%
12.1% 14.4% 25.4% 8.7% 5.2% 12.4% 9.8% 1.9% 0.0% 20.3% 2.9% 15.0% 18.7% 13.5% 11.0% - 1.3% 17.8% 16.0%
1.3% 2.9% 2.5% 2.1% 2.6% 2.6% 5.6% 3.8% 2.8% 2.3% 0.0% 1.6% 2.2% 1.4% 1.7% 0.2% - 2.2% 2.3%
45.4% 36.2% 54.2% 51.8% 44.4% 50.7% 39.9% 13.5% 43.8% 67.4% 35.3% 49.3% 57.2% 43.2% 48.2% 55.8% 49.3% - 50.1%
Emphasis Area Matrix (K+A injuries) - Statewide
Intersection
Winter Weather
Work Zone
Oil-Impact Counties
Older Driver
Young Driver
Youn
g Dr
iver
Speeding/AggressiveDriving
Alcohol and/orDrug Related
Distracted/Asleep/Fatigued
Unbelted VehicleOccupants
Pedestrian
Bicyclist
Motorcycle
Heavy Vehicles
Train
Lane Departure:Single-Vehicle
Lane
Dep
artu
re:
Sing
le-V
ehic
le
Lane Departure:Multi-Vehicle (Opposing
Traffic)Lane Departure:
Multi-Vehicle (SameDirection)
Lane
Dep
artu
re:
Mul
ti-Ve
hicl
e(O
ppos
ing
Traffi
c)
Lane
Dep
artu
re:
Mul
ti-Ve
hicl
e (S
ame
Dire
ction
)
Oil-
Impa
ct C
ounti
es
Tota
l
Win
terW
eath
er
Wor
kZo
ne
Inte
rsec
tion
Pede
stria
n
Bicy
clis
t
Mot
orcy
cle
He
avy
Vehi
cles
Trai
n
Unb
elte
d Ve
hicl
eO
ccup
ants
Alco
hol a
nd/o
rDr
ug R
elat
ed
Old
er D
river
Spee
ding
/Agg
ress
ive
Driv
ing
Dist
ract
ed/A
slee
p/Fa
tigue
d
4-3Strategic Highway Safety Plan Update 2018-2023
4Table 4-1. Safety Emphasis Area Correlation Matrix
The emphasis area matrix is a powerful tool for identifying relationships and correlations between emphasis areas, which can be critical information in selecting appropriate highway safety strategies. It presents a cross table of emphasis area representation, with the column headers on the top of the table representing the target emphasis area, and the index headers on the left of the table representing the related emphasis area. The cells in the table represent the total percentage of crashes within the target emphasis area which are also identified as being within the related emphasis area. To read the matrix, consider the following
� Identify a target emphasis area from the column headers at the top of the matrix. This emphasis area will be the focus of the analysis.
� Identify a related emphasis area from the index headers at the left of the matrix. This emphasis area will identify a subset of the target emphasis area.
� Identify the cell which is within the selected column and the selected row. The value in this cell indicates the percent share, which is the size of the subset of the target emphasis area which the related emphasis area represents.
� Use the identified values to fill in the following sentence “Of all target emphasis area crashes, percent share of them also fall within the related emphasis area.”

4-4 Strategic Highway Safety Plan Update 2018-2023
4Figure 4-1. North Dakota Statewide Crash Tree/State System
2012 2016
Local
Urban Rural
X "" X ""
47% 53% 25% 75%49% 51% 23% 77%
Signalized Unsignalized Other/Unknown Signalized Unsignalized Other/Unknown
56% 14% 30% 10% 28% 62%57% 11% 32% 5% 31% 65%
1 AG 308 45% 15 42% 1 AG 80 46% 4 57% 1 AG 37 22% 3 19% 1 AG 117 26% 23 22%10 RA 113 17% 7 19% 10 RA 47 27% 3 43% 10 RA 49 29% 6 38% 10 RA 187 41% 50 48%3 HO 17 2% 0 0% 3 HO 8 5% 0 0% 3 HO 9 5% 1 6% 3 HO 10 2% 2 2%2 RE 152 22% 3 8% 2 RE 22 13% 0 0% 2 RE 50 30% 4 25% 2 RE 47 10% 8 8%X YD 201 29% 11 31% X YD 39 22% 2 29% X YD 45 27% 2 13% X YD 97 21% 19 18%X OD 157 23% 4 11% X OD 39 22% 3 43% X OD 40 24% 6 38% X OD 107 24% 27 26%X UB 78 11% 15 42% X UB 23 13% 0 0% X UB 37 22% 8 50% X UB 148 33% 54 52%X AL 40 6% 7 19% X AL 15 9% 0 0% X AL 24 14% 4 25% X AL 78 17% 29 28%X SP 173 25% 12 33% X SP 37 21% 0 0% X SP 54 32% 4 25% X SP 84 19% 21 20%X LD-SV 11 2% 5 14% X LD-SV 4 2% 0 0% X LD-SV 9 5% 2 13% X LD-SV 82 18% 15 14%X LD-MV 51 7% 1 3% X LD-MV 17 10% 0 0% X LD-MV 22 13% 1 6% X LD-MV 55 12% 14 13%X HV 11 2% 1 3% X HV 1 1% 0 0% X HV 40 24% 4 25% X HV 148 33% 46 44%
Yes NM 51 7% 6 17% Yes NM 4 2% 0 0% Yes NM 6 4% 0 0% Yes NM 12 3% 2 2%
X ""
2% 98%1% 99%
On Curve Off Curve On Curve Off Curve
7% 93% 18% 82%14% 86% 22% 78%
1 AG 2 2% 0 0% 1 AG 117 9% 8 14% 1 AG 14 2% 2 1% 1 AG 176 4% 42 5%10 RA 2 2% 0 0% 10 RA 56 4% 1 2% 10 RA 19 2% 10 4% 10 RA 135 3% 44 5%
AG 3 HO 7 8% 3 33% 3 HO 39 3% 5 9% 3 HO 66 8% 40 16% 3 HO 262 7% 126 15%RA 2 RE 25 27% 0 0% 2 RE 793 61% 9 16% 2 RE 53 6% 12 5% 2 RE 926 24% 145 17%HO X YD 18 20% 1 11% X YD 337 26% 11 19% X YD 112 13% 26 10% X YD 639 16% 130 15%RE X OD 13 14% 0 0% X OD 232 18% 9 16% X OD 76 9% 19 8% X OD 469 12% 92 11%YD X UB 22 24% 7 78% X UB 177 14% 19 33% X UB 275 33% 138 55% X UB 1,091 28% 426 49%OD X AL 16 18% 3 33% X AL 104 8% 12 21% X AL 227 27% 122 49% X AL 663 17% 244 28%UB X SP 48 53% 2 22% X SP 687 53% 23 40% X SP 388 46% 124 50% X SP 1,782 46% 356 41%AL X LD-SV 40 44% 4 44% X LD-SV 161 12% 15 26% X LD-SV 550 65% 153 61% X LD-SV 1,893 48% 399 46%SP X LD-MV 14 15% 3 33% X LD-MV 141 11% 16 28% X LD-MV 149 18% 58 23% X LD-MV 599 15% 194 22%
LD-SV X HV 4 4% 0 0% X HV 44 3% 7 12% X HV 162 19% 52 21% X HV 851 22% 248 29%LD-MV Yes NM 0 0% 0 0% Yes NM 22 2% 2 4% Yes NM 3 0% 3 1% Yes NM 58 1% 35 4%
HV
NM
Urban Rural
State System Local System
Serious - % Serious Injuries 3,294
North Dakota Statewide Crash Tree - State System
1,596 48% 1,698 52%
ExampleAll - %
5-Year Crashes 1
Total Injuries 26,345
1,467 92%2,606 29% 6,519 71%
Young Driver
Rear End
Head-On
Right Angle
Angle (not specific)
Other/Unknown682 174 36436 7 20
Crash Type 2Crash Type 2
22010416
State
63 66 340 1,1271,220 1,386 1,648 4,871
Intersection Related Non-Intersection Related Intersection Related Non-Intersection Related
9,125 35% 17,220 65%
129 8%
864
Crash Type 2Crash Type 2
Version 0.1, Printed 7/11/2018
Crash Type Codes
Off Curve91 1,295
57
Crash Type 2
Signalized
Non-Motorized
Heavy Vehicle
Lane Departure: Multi-Vehicle
Lane Departure: Single-Vehicle
Speeding/Aggressive
Alcohol and/or Drug Related
Unbelted Vehicle Occupants
Older Driver
Crash Type 2
Refer to associated documentation for detailed definitions of categories used herein1 Source: NDDOT Crash Database, Retrieved 12/22/2017; 2012-20162 Emphasis areas and crash types are not mutually exclusive, so percentages may not add up to 100%
Animal Non-Animal111 4,760
2509
13 1,114
On Curve Off Curve846 3,914
On Curve
Crash Type 2 Crash Type 2
Signalized Unsignalized1,026454168Other/UnknownUnsignalized

4-5Strategic Highway Safety Plan Update 2018-2023
4Figure 4-2. North Dakota Statewide Crash Tree/Local System
2012 2016
Local
Urban Rural
X "" X ""
54% 46% 27% 73%51% 49% 21% 79%
Signalized Unsignalized Other/Unknown Signalized Unsignalized Other/Unknown
31% 23% 45% 3% 29% 68%24% 28% 48% 3% 32% 66%
1 AG 644 31% 26 33% 1 AG 484 32% 23 26% 1 AG 11 27% 3 50% 1 AG 101 25% 12 17%10 RA 489 24% 16 20% 10 RA 506 34% 26 29% 10 RA 7 17% 2 33% 10 RA 131 32% 23 32%3 HO 117 6% 4 5% 3 HO 45 3% 6 7% 3 HO 3 7% 0 0% 3 HO 9 2% 3 4%2 RE 455 22% 7 9% 2 RE 194 13% 7 8% 2 RE 8 20% 0 0% 2 RE 42 10% 2 3%X YD 610 30% 30 38% X YD 486 32% 22 24% X YD 7 17% 0 0% X YD 111 27% 21 30%X OD 414 20% 18 23% X OD 280 19% 19 21% X OD 5 12% 2 33% X OD 75 18% 13 18%X UB 203 10% 14 18% X UB 209 14% 28 31% X UB 9 22% 2 33% X UB 143 35% 40 56%X AL 106 5% 3 4% X AL 105 7% 19 21% X AL 7 17% 2 33% X AL 74 18% 22 31%X SP 426 21% 11 14% X SP 280 19% 25 28% X SP 17 41% 2 33% X SP 131 32% 24 34%X LD-SV 33 2% 5 6% X LD-SV 61 4% 12 13% X LD-SV 7 17% 0 0% X LD-SV 88 22% 24 34%X LD-MV 288 14% 11 14% X LD-MV 166 11% 17 19% X LD-MV 5 12% 0 0% X LD-MV 34 8% 7 10%X HV 31 2% 3 4% X HV 30 2% 4 4% X HV 5 12% 0 0% X HV 57 14% 8 11%
Yes NM 137 7% 16 20% Yes NM 93 6% 5 6% Yes NM 2 5% 0 0% Yes NM 6 1% 2 3%
X ""
1% 99%1% 99%
On Curve Off Curve On Curve Off Curve
7% 93% 22% 78%17% 83% 27% 73%
1 AG 22 5% 0 0% 1 AG 433 8% 19 7% 1 AG 13 2% 5 2% 1 AG 64 2% 9 1%10 RA 5 1% 1 2% 10 RA 217 4% 9 4% 10 RA 3 0% 1 0% 10 RA 48 2% 10 2%
AG 3 HO 30 7% 5 10% 3 HO 163 3% 17 7% 3 HO 16 2% 6 3% 3 HO 104 4% 27 4%RA 2 RE 88 22% 2 4% 2 RE 2,776 54% 40 16% 2 RE 12 1% 1 0% 2 RE 228 8% 22 4%HO X YD 107 27% 10 19% X YD 1,532 30% 61 24% X YD 156 19% 28 13% X YD 829 29% 146 24%RE X OD 19 5% 3 6% X OD 665 13% 23 9% X OD 35 4% 12 5% X OD 173 6% 38 6%YD X UB 100 25% 27 52% X UB 654 13% 95 37% X UB 342 42% 135 61% X UB 1,076 37% 344 56%OD X AL 122 30% 31 60% X AL 647 13% 91 36% X AL 283 35% 115 52% X AL 739 25% 240 39%UB X SP 236 59% 24 46% X SP 2,475 48% 119 46% X SP 480 59% 146 66% X SP 1,199 41% 231 38%AL X LD-SV 160 40% 27 52% X LD-SV 728 14% 90 35% X LD-SV 656 80% 188 85% X LD-SV 1,842 64% 403 66%SP X LD-MV 65 16% 7 13% X LD-MV 483 9% 33 13% X LD-MV 32 4% 11 5% X LD-MV 218 8% 47 8%
LD-SV X HV 12 3% 2 4% X HV 86 2% 12 5% X HV 74 9% 19 9% X HV 362 12% 65 11%LD-MV Yes NM 9 2% 2 4% Yes NM 354 7% 53 21% Yes NM 10 1% 8 4% Yes NM 67 2% 31 5%
HV
NM Version 0.1, Printed 7/11/2018
Alcohol and/or Drug Related
Speeding/Aggressive
Lane Departure: Single-Vehicle
Lane Departure: Multi-Vehicle
Heavy Vehicle
Non-Motorized
Right Angle
Head-On
Rear End
Young Driver
Older Driver
Unbelted Vehicle Occupants
Crash Type 2 Crash Type 2
Crash Type Codes
Angle (not specific)
Crash Type 2 Crash Type 2
On Curve Off Curve818 2,900402 5,109
46 3,718
52 256
7 833
Crash Type 2 Crash Type 2 Crash Type 2 Crash Type 2
On Curve Off Curve
Animal Non-Animal
222 611
79 90 157 6 71 1472,050 1,506 2,963 41 409 976
326 308 224 840
Signalized Unsignalized Other/Unknown Signalized Unsignalized Other/Unknown
Intersection Related Non-Intersection Related Intersection Related Non-Intersection Related6,519 5,511 1,426 3,764
12,030 70% 5,190 30%634 37% 1,064 63%
Urban Rural
3,294
LocalState System Local System
9,125 35% 17,220
North Dakota Statewide Crash Tree - Local System
Example 5-Year Crashes 1
All - % Total Injuries 26,345
Refer to associated documentation for detailed definitions of categories used herein1 Source: NDDOT Crash Database, Retrieved 12/22/2017; 2012-20162 Emphasis areas and crash types are not mutually exclusive, so percentages may not add up to 100%
65%1,596 48% 1,698 52%
Serious - % Serious Injuries

4-6 Strategic Highway Safety Plan Update 2018-2023
4SAFETY STRATEGIESAdoption of the six Priority Safety Emphasis Areas and five Other Areas of Emphasis began the prioritization/screening process of safety strategies. The process started with a review of safety research reports including:
� National Cooperative Highway Research Program’s (NCHRP’s) Report 500 Series (NCHRP, 2017).
� FHWA’s Crash Modification Factor (2014).
� Highway Safety Manual (MnDOT, 2014).
� NHTSA’s Countermeasures that Work (NHTSA, 2015).
Focusing on adopted emphasis areas reduced the number of infrastructure and driver-behavior safety strategies from more than 700 to around 140.
The initial list of infrastructure and driver-behavior-based safety strategies is included in Appendix B. The selected high-priority, evidence-based safety strategies associated with each of the adopted emphasis areas are documented in Chapter 5 of this Vision Zero Plan and include:
� Lane Departure.
– Enhanced road edges.
– Designating and deploying safety corridors.
� Intersections.
– Improve intersection recognition by enhancing traffic control devices and adding street lights.
– Reduce intersection conflicts by implementing design improvements, including roundabouts and Restricted Crossing U-Turns along divided roadways.
– Address red-light running at urban signalized intersections through confirmation lights and partnerships with local law enforcement.
� Alcohol and/or Drug Use.
– Implement an ignition interlock program.
– Enhance alcohol and/or drug related driving detection through expanded enforcement and sobriety checkpoints.
� Unbelted Vehicle Occupants.
– Enact primary seat belt legislation.
– Strengthen penalties for lack of seat belt use.
� Speeding/Aggressive Driving.
– Enact legislation to increase fines for speed violations.
– Explore pilot automated enforcement projects.
� Young Drivers.
– Enhanced graduated drivers licensing.
– Enhanced monitoring of teen driving.
CRASH DATA TRENDSWhile 5-years of crash data were sufficient to identify priorities, they were not sufficient to develop trend indicating changes in the number of motor vehicle crash fatalities and serious injuries over time. As a result, the data set was expanded to 8 years (2009-2016) and the results of this effort are documented in Table 4-2 and Figure 4-3. The data indicate the following about crashes in North Dakota during this 9-year period. County fatalities for 2012-2016 are documented in Appendix D.
� An average of 119 fatal crashes per year and 507 serious injury crashes per year.
� An average of 136 fatalities per year and 607 serious injuries per year.
Metric SeverityYear
2009 2010 2011 2012 2013 2014 2015 2016
Crashes Fatal (K) 116 92 130 147 133 121 111 102
Serious (K+A) 361 393 536 634 578 544 554 454
All Severities 17,749 17,132 18,840 18,381 18,989 16,142 15,296 15,187
Injuries Fatal (K) 140 105 148 170 148 135 131 113
Serious (K+A) 470 481 610 745 665 653 686 545
All Severities 4,621 4,784 5,170 5,490 5,524 5,429 5,133 4,769
Table 4-2. North Dakota Summary of Injuries versus Crashes by Severity and Year (NDDOT, 2017)

4-7Strategic Highway Safety Plan Update 2018-2023
4Figure 4-3. North Dakota Fatality and Serious Injury Trend
20162015201420132012
Year
201120102009
800
700
600
500
400
300
200
100
0
Coun
t of I
njur
ies
Statewide Fatality & Serious Injury HistoryFatalitiesSerious InjuriesFatalities & Serious Injuries
� There are approximately 1.1 fatalities per fatal crash and 1.2 serious injuries per injury crash.
� Fatalities and serious injuries increased from 2009 through 2012 and then decreased to 2016. However, the overall trend shows a decrease of about 1% per year for fatalities and an increase of 4% per year for serious injuries.
North Dakota’s fatalities trend is relatively flat, like the national trend (Figure 4-4). However, the exception between the two trends is that the most recent 5 years of fatalities are trending down in North Dakota and are trending up at the national level.
The data-driven analysis determined that serious crashes and the resulting fatalities and injuries were over-represented in the Oil-Impact Counties (the seventeen counties that make up the northwestern portion of North Dakota). These counties have experienced significant growth from a traffic volume and economic development perspective because of activity associated with crude oil extraction from the Bakken Formation. These Oil-Impact Counties saw traffic volumes more than double between 2009 and 2014 and the statewide fraction of serious crashes increased from around 30% to more than 50%.
The Oil-Impact Counties trend since 2009 (Figure 4-5) shows an overall increase of serious injuries of around 8% per year. However, there are two distinctly different patterns. Between 2009 and 2012 serious injuries increased at a rate of 20% per year and between 2012 and 2016 serious injuries decreased at a rate of 14% per year. Since the oil boom began, considerable investment has been made in the area, including expansion of the state’s roadway system and implementation of a variety of safety improvements. Since 2012, oil extraction activities have diminished due to the reduction in the worldwide price of crude oil, but it is too soon to tell exactly what is behind the substantial reduction in serious injuries in the Oil-Impact Counties.
Figure 4-4. North Dakota and National Motor Vehicle Crash Fatalities (NHTSA, 2016; NHTSA, 2017a)
Figure 4-5. North Dakota Serious Injuries by Oil-Producing Counties (NHTSA, 2016; NHTSA, 2017a)
250
200
150
100
50
0
Nor
th D
akot
a Fa
talit
ies
Nat
iona
l Fat
aliti
es
40,00035,000
30,00025,00020,00015,000
5,000
10,000
020162015201420132012
Year
201120102009
North Dakota – Historic North Dakota – TrendlineNational – Historic National – Trendline
450400350300250200150100500
Nor
th D
akot
a Fa
talit
ies
20162015201420132012
Year
201120102009
Oil County – Historic Oil County – Trendline
Non-Oil County – Historic Non-Oil County – Trendline

4-8 Strategic Highway Safety Plan Update 2018-2023
4Review of North Dakota’s annual number of fatalities and serious injuries shows relatively large fluctuations on a year-to-year basis. FHWA encourages states to plot 5-year rolling averages to provide a general trend with additional insight to support the selection of short-term goals for the reduction of serious injuries.
The 5-year rolling average trend of fatalities in North Dakota and nationally (Figure 4-6) shows results similar to those identified on a year-by-year analysis; flat trend with the North Dakota numbers trending slightly down and the national numbers trending slightly up.
Figure 4-6. North Dakota and National Motor Vehicle Crash Fatalities 5-Year Rolling Average (NHTSA, 2016; NHTSA, 2017a)
250
200
150
100
50
0
Nor
th D
akot
a Fa
talit
ies
Nat
iona
l Fat
aliti
es
40,000
30,000
20,000
10,000
020162015201420132012
Year201120102009
North Dakota – Historic North Dakota – 5-Year Rolling Average
National – Historic National – 5-Year Rolling Average
Figure 4-7. Young Driver Trend (NDDOT, 2017)
Figure 4-8. Lane Departure – Single-Vehicle Trend (NDDOT, 2017) Figure 4-9. Older Driver Trend (NDDOT, 2017)
100
120140160180
406080
200
Nor
th D
akot
a Fa
talit
ies
201620152014Year
20132012
Historic Predicted
200
250
300
350
100
150
50
0
Serio
us In
jurie
s
201620152014Year
20132012
Historic Predicted
708090
100
5040
60
30
1020
0
Serio
us In
jurie
s
201620152014
Year
20132012
Historic Predicted
Analysis of North Dakota’s crash data indicate the following (NDDOT, 2017):
� Among the Priority Safety Emphasis Areas, the trends for Unbelted Occupants, Speeding/Aggressive Driving, Alcohol and/or Drug Related, Intersections, and Young Drivers (Figure 4-7) have decreased between 6% and 11% per year. The trend for Lane Departure is flat (Figure 4-8).
� Among the Other Areas of Emphasis, the trends for Heavy Vehicles, Older Drivers (Figure 4-9), Pedestrians/Bicyclists, Local System Roadways, and Oil-Impact Counties have increased between 1% and 9% per year.

4-9Strategic Highway Safety Plan Update 2018-2023
4CRASH AND INJURY RATESThe analytical process includes normalizing the number of fatalities and serious injuries based on the amount of travel across the state and the result is expressed as a rate of fatalities or serious injuries per 100 million vehicle miles traveled (HMVMT). The data reveal a similar pattern for fatalities, serious injuries, the amount of travel across the state and rates. From 2009 to 2012, all statistics increased but by 2016 had dropped back to values that were still somewhat higher than in 2009 for the total number of serious injuries and vehicle miles traveled and somewhat lower than in 2009 for fatalities and serious injury rates (Table 4-3). As was the case for the trends for fatalities and serious injuries, the trend for rates show two
Year2009 2010 2011 2012 2013 2014 2015 2016
Stat
ewid
e
Injury Frequency
Fatal (K) 140 105 148 170 148 135 131 113
Serious (K+A) 470 481 610 745 665 653 686 545
Injury Rate per HMVMT
Fatal (K) 1.763 1.265 1.615 1.684 1.465 1.294 1.300 1.160
Serious (K+A) 5.917 5.793 6.655 7.381 6.584 6.257 6.806 5.595
HMVMT 79.430 83.026 91.663 100.929 100.997 104.366 100.791 97.400
Table 4-3. Statewide Annual Comparison of Serious Injury Frequency versus Serious Injury Rate (NDDOT, 2017)
different patterns. A distinct increase in rates between 2009 and 2012 followed by a distinct decrease in rates between 2012 and 2016.
Crash and injury rates were also documented for the classes of roadways that define North Dakota’s HRRR (Table 4-4). In North Dakota, HRRRs are any roadway functionally classified as a rural collector or rural local road with a crash rate for fatalities and serious injuries that exceeds the statewide average for those facilities or that will likely have increases in traffic volumes that would result in crash rates that exceed the statewide average rates. The average fatality and injury rates (per HMVMT) for rural collectors and rural local roads are 0.83, 2.46, 0.99, and 3.78, respectively.
Year2009 2010 2011 2012 2013 2014 2015 2016
Rura
l Col
lect
or
Injury Frequency
Fatal (K) 22 6 4 12 8 1 10 5
Serious (K+A) 34 25 24 31 22 15 36 23
Injury Rate per HMVMT
Fatal (K) 2.555 0.686 0.378 1.025 0.660 0.078 0.816 0.451
Serious (K+A) 3.948 2.856 2.269 2.648 1.816 1.166 2.938 2.072
HMVMT 8.612 8.752 10.578 11.708 12.114 12.867 12.252 11.098
Rura
l Loc
al R
oads
Injury Frequency
Fatal (K) 31 11 12 4 9 9 3 2
Serious (K+A) 67 50 43 39 44 41 28 12
Injury Rate per HMVMT
Fatal (K) 3.359 1.188 1.094 0.334 0.748 0.743 0.252 0.172
Serious (K+A) 7.259 5.399 3.919 3.256 3.658 3.385 2.350 1.030
HMVMT 9.229 9.261 10.973 11.977 12.029 12.113 11.916 11.655
Table 4-4. Injury Rates for High Risk Rural Roads

Strategic Highway Safety Plan Update 2018-2023
SECTION 5Priority Safety
Strategies
SECTION 5Priority Safety Strategies
for Safety Emphasis Areas

5-1Strategic Highway Safety Plan Update 2018-2023
INTRODUCTIONA key part of the data-driven prioritization process for a strategic safety plan is identifying high-priority, evidence-based safety countermeasures/strategies for each adopted safety emphasis area. This approach is based on three important points.
1. Safety countermeasures/strategies are aligned with specific emphasis areas.
2. Safety countermeasures/strategies are not equally effective at reducing crashes. As state’s screen for potential countermeasures/strategies, an awareness of historic crash reduction is an important consideration.
3. Experience suggests that developing safety projects from a short list of highly effective strategies is more efficient and effective because there is not enough safety funding for an extensive list of strategies. Therefore, investing in proven, effective strategies will likely result in greater crash reductions.
North Dakota’s crash data identified six crash types based on the total number of serious injures (fatalities plus serious injuries) during the 2012-2016 study period. Investment in these priority safety emphasis areas would represent the greatest opportunity for crash reduction. The adopted Priority Safety Emphasis Areas are detailed below and are represented in annual averages (NDDOT, 2017):
� Lane Departure (381 serious injuries/year and 58% of serious injury crashes).
� Intersections (191 serious injuries/year and 29% of all serious injury crashes).
� Alcohol and/or Drug Related (218 serious injuries/year and 33% of all serious injury crashes).
Prioritizing Safety Strategies for safety Emphasis Areas 5Se
ctio
n
� Unbelted Vehicle Occupants (320 serious injuries/year and 48% of all serious injury crashes).
� Speeding/Aggressive Driving (260 serious injuries/year and 39% of all serious injury crashes).
� Young Drivers (120 serious injuries/year and 18% of all serious injury crashes).
The high-priority safety countermeasures/strategies in the following priority safety emphasis areas are the result of a screening process that began with more than 140 strategies from a variety of safety research reports (NCHRP Report 500 Series [2017], FHWA’s Crash Modification Factor website [2014], the Highway Safety Manual [MnDOT, 2014], and NHTSA’s Countermeasures That Work [2015]). These strategies were evaluated based on documented crash reduction, estimated implementation costs, consistency with North Dakota’s safety culture, and feedback from approximately 200 North Dakota safety partners that participated in a series of safety workshops conducted around the state.
In addition to the adopted priority safety emphasis areas, North Dakota will focus safety investments on five Other Areas of Emphasis, including (NDDOT, 2017):
� Heavy Vehicles (120 serious injuries/year and 18% of all serious injury crashes).
� Older Drivers (76 serious injuries/year and 12% of all serious injury crashes).
� Pedestrians/Bicyclists (39 serious injuries/year and 6% of all serious injury crashes).
� Local System Roadways (340 serious injuries/year and 52% of all serious injury crashes).
� Oil-impact Counties (277 serious injuries/year and 42% of all serious injury crashes).
5-2 Strategic Highway Safety Plan Update 2018-2023
5Heavy Vehicles, Older Drivers, and Pedestrians/Bicyclists were selected for inclusion in this SHSP because even though the number of serious injury crashes did not rise to the level of those associated with the Priority Safety Emphasis Areas, the crash trend are increasing (9% per year, 5% per year, and 4% per year, respectively). Local Road Systems and Oil-impact Counties were selected because the large number of crashes represented an opportunity for reduction and crash characteristics and associated safety countermeasures/strategies could be identified.

20162015201420132012
Year
201120102009
400
450
350
300
250
200
150
100
50
0
Coun
t of I
njur
ies
FatalitiesSerious InjuriesFatalities & Serious Injuries
Figure 5-1. Lane Departure Fatality and Serious Injury History
Source: NDDOT, 2017
5-3Strategic Highway Safety Plan Update 2018-2023
LANE DEPARTURELane-departure crashes include single-vehicle run-off-the-road (to the right and left) crashes and multiple vehicle collisions when vehicles wander outside their lane and result in either head-on or side-swipe collisions.
On North Dakota roadways, there were 1,581 serious injury lane-departure crashes resulting in 1,906 serious injuries between 2012 and 2016. This is an average of 381 serious injuries per year and accounted for nearly 58% of serious injury crashes during the 5-year study period (NDDOT, 2017).
Highlights from the most recent data (2012-2016) for lane-departure crashes on North Dakota roadways include (NDDOT, 2017):
�Majority of these serious injuries occurred on rural (85%), state (46%), and local (39%) road systems.
�Majority of lane-departure serious injuries are from single-vehicle crashes (75%).
� Highway curve serious injuries (26%) are considered over-represented.
� The most harmful events for single-vehicle serious injuries involved overturning/rolling over (72%) and collisions with fixed objects (13%) such as trees, utility/light poles, traffic signs, and mail boxes.
�Male drivers between the age of 20 and 29 were involved in the largest number of serious injury crashes (22%).
� A plurality of Lane Departure serious injuries (31%) occurred during summer months and a majority occurred on dry roads (75%) during daylight conditions (51%).
� Unbelted Drivers and occupants accounted for more than 50% of fatalities and serious injuries.
� Alcohol and/or drug Related driving (41%) and Speeding/Aggressive driving (40%) were common contributing factors.
Priority Safety StrategiesTo increase safety measures to reduce Lane Departure crashes, the following strategies should be implemented:
� Install safety corridors.
� Include longitudinal delineators.
� Embed wet reflective pavement markings.
� Install 6-inch-wide edge lines.
� Install edge and center line rumble strips.
� Add chevrons (curve warning signs).
� Implement shoulder paving (including edge-line rumble strips).
�Median barriers.

5-4 Strategic Highway Safety Plan Update 2018-2023
INTERSECTIONSBetween 2012 and 2016, there were 805 serious crashes on North Dakota roadways. These resulted in 953 serious injuries in which the crash occurred at or in relation to an intersection. This is an average of 191 serious injuries per year that accounted for nearly 29% of all serious injuries during the 5-year period. Serious injuries near intersections include multi-vehicle (77%) and single-vehicle (23%) collisions. The most common types of intersection-related multi-vehicle serious injuries result from right-angle crashes (58%) and rear-end crashes (11%) that occur at STOP (23%) and signal-controlled (18%) locations (NDDOT, 2017).
Highlights from the most recent data (2012-2016) include (NDDOT, 2017):
�Majority of these serious injuries occurred on rural (59%), state (36%), and local (23%) road systems.
�Male drivers between the age of 20 and 29 were involved in the largest number of serious injury crashes (17%).
� A plurality of intersection serious injuries occurred during summer months (33%) and a majority occurred on dry roads (80%) during daylight conditions (62%).
� Unbelted drivers and occupants accounted for 41% of fatalities and serious injuries.
� Speeding (28%), alcohol (24%), and failure to yield (22%) were cited as the most common contributing factors.
� The most common type of serious injury at rural STOP controlled intersections results from a right-angle crash where the driver on the minor approach stopped and then pulled into traffic on the major approach (a gap selection issue). The most common type of serious injury at urban signal-controlled intersections results from a right-angle collision where a vehicle ran the red light.
Priority Safety StrategiesTo increase safety measures to reduce intersection crashes, the following strategies should be implemented:
� Install roundabouts (instead of traffic signals).
� Install reduced conflict intersections.
� Install street lighting.
� Install rural intersection collision warning systems (RICWS).
� Require confirmation lights on traffic signals to support red-light running enforcement efforts.
� Require access management (near intersections).
20162015201420132012
Year
201120102009
250
200
150
100
50
0
Coun
t of I
njur
ies
FatalitiesSerious InjuriesFatalities & Serious Injuries
Figure 5-2. Intersection Fatality and Serious Injury History
Source: NDDOT, 2017

Source: NDDOT, 2017
20162015201420132012
Year
201120102009
300
250
200
150
100
50
0
Coun
t of I
njur
ies
FatalitiesSerious InjuriesFatalities & Serious Injuries
Figure 5-3. Alcohol/Drug Related Fatality and Serious Injury History
5-5Strategic Highway Safety Plan Update 2018-2023
Priority Safety StrategiesTo increase safety measures to reduce Alcohol and/or Drug Use related serious injuries, the following strategies should be implemented:
� Implement an ignition interlock program (item requiring legislation to enact law [Policy] ). � Strengthen enhanced penalties for high BAC offenders (Policy). �Maintain high visibility sobriety checkpoints.
� Conduct a comprehensive assessment of administrative licensing sanctions for both alcohol and drug-impaired driving.
� Limit the scope of administrative hearings to relevant facts and issues.
� Identify/implement approaches to effectively educate judges on DUI and drug enforcement protocol and importance of prosecuting alcohol and/or drug-impaired cases.
� Expand officer Advanced Roadside Impaired Driving Enforcement (ARIDE) training and officer use of Drug Recognition Experts (DRE).
� Strengthen prosecutor and law enforcement training on investigating and prosecuting alcohol and/or drug-impaired cases.
�Mandate alcohol server training as a condition of alcohol licensure (Policy). � Strengthen highly publicized compliance checks and server training for alcohol retailers and merchants.
ALCOHOL AND/OR DRUG USE Driving while impaired by alcohol and drug use poses a serious threat to drivers who operate vehicles while impaired and other motorists and road users sharing the roadway. In North Dakota, driving under the influence of alcohol and illegal or prescription drugs is a leading contributor to fatal and serious injury crashes. Yet, these types of serious crashes are 100% preventable. Although North Dakota has a general .08 BAC limit for those operating vehicles, drivers can be convicted of drunk driving even when their BAC is under that limit. The average BAC among North Dakota DUI offenders is .17 – one of the highest in the country and is more than twice the legal limit of .08. Despite aggressive DUI safety measures, the alcohol and/or drug-impaired driving problem has proved resistant to change.
On North Dakota roadways, there were 886 serious crashes resulting in 1,091 serious injuries between 2012 and 2016 in which the crash involved alcohol or drugs. This is an average of 218 serious injuries per year and accounted for 33% of all serious injuries during the 5-year study period.
Highlights from the most recent crash data (2012-2016) (NDDOT, 2017) include:
�Most alcohol and/or drug related serious injuries result from single-vehicle type crashes (66%) and most often involved a vehicle rollover (61%).
� Intersection-related angle crashes and head-on crashes account for a large portion of North Dakota’s serious injuries (25%) and pose a serious threat to other motorists.
� Younger drivers ages 20 through 29 were at highest risk for an alcohol and/or drug related serious injury at 36%.
� Of the alcohol and/or drug related serious injuries, contributing factors included Unbelted Vehicle Occupants (63%) and Speeding/ Aggressive driving (51%).
� Across all times of day, there is greater risk at night for serious injuries involving alcohol or drugs (66%).

20162015201420132012
Year
201120102009
450400350300250
15010050
0
Coun
t of I
njur
ies
200
FatalitiesSerious InjuriesFatalities & Serious Injuries
Source: Kahane, 2015, NDDOT, 2017, NHTSA, 1984, NHTSA, 2016
Figure 5-4. Unbelted Occupants Fatality and Serious Injury History
5-6 Strategic Highway Safety Plan Update 2018-2023
UNBELTED VEHICLE OCCUPANTS Buckling up is the single most effective protective measure in the event of a crash. Seat belts securely restrain occupants within the vehicle’s protective cab compartment. When lap and shoulder seat belts are used, the risk of fatal injury to front-seat passenger car occupants is reduced by 45% and the risk of moderate-to-critical injury is reduced by 50%.
Safety benefits are even greater for light-truck occupants, with seat belts reducing fatalities by 60% (Kahane, 2015).
Other seat belt safety facts include (NHTSA, 2016):
� Air bags are designed to work with seat belts, not replace them.Even without an airbag, motorists are safer buckled up than withan airbag and not buckled up; being ejected from a vehicle isnearly always deadly.
�Most fatal crashes happen within 25 miles from home and atspeeds of less than 40 mph.
� Incidents involving fire or water account for one-half of 1% ofall crashes. Occupants wearing a seat belt have a much greaterchance of being conscious and able-bodied to safely escape.
North Dakota’s statewide driver and right-front-seat passenger seat belt use is nearly 80% (NDDOT, 2017) and is considerably less than the national average of 90% (NHTSA, 2016). On North Dakota roadways, there were 1,264 serious crashes resulting in 1,599 serious injuries between 2012 and 2016 in which the crash involved an unbelted or improperly restrained occupant. This is an average of 320 serious injuries per year and accounted for nearly half or 49% of all serious injuries during the 5-year study period.
Highlights from the most recent crash data (2012-2016) (NDDOT, 2017) include:
�Most serious injuries involving an unbelted motoristoccurred on rural roads (84%) on both the state (46%)and local road (38%) systems.
� Most unbelted serious injuries result from single-vehicle type crashes (60%) and most often involve a vehicle rollover (66%) or an angle crash (20%).� Younger drivers ages 20 through 29 were at highest risk for an
unbelted serious injury at 34%.
� Alcohol and/or drug-impaired drivers are also often unbuckled (43%).
Priority Safety StrategiesTo increase safety measures to reduce Unbelted Vehicle Occupant crashes, the following strategies should be implemented:
� Enact primary seat belt legislation that includes primaryenforcement of seat belt use for all passengers, of all ages, in allseating positions (Policy). � Enact stronger penalties for lack of seat belt use (Policy). � Conduct outreach to tribal governments to enforce tribal primaryseatbelt law and outreach to rural law enforcement to enforceNorth Dakota’s seatbelt law.
� Promote employer and insurance safety programs for non-compliance of belt use.
� Promote statewide education of child restraint best practices.

20162015201420132012
Year
201120102009
350
300
250
150
100
50
0
Coun
t of I
njur
ies
200
FatalitiesSerious InjuriesFatalities & Serious Injuries
Figure 5-5. Speeding/Aggressive Driver Fatality and Serious Injury History
Source: NDDOT, 2017
5-7Strategic Highway Safety Plan Update 2018-2023
SPEEDING/AGGRESSIVE DRIVING Speeding substantially increases the occurrence and seriousness of crashes. Higher speeds result in reducing a driver’s response time to avoid a crash, increases the need for greater stopping distance, increases crash impact, and increases the potential for loss of vehicle control. Aggressive drivers most often commit a combination of unsafe traffic offenses such as, exceeding safe speeds for road conditions, following too closely, failing to yield, swerving in and out of traffic, and disregarding traffic controls that endanger themselves, their occupants, and other roadway users. Other risk factors such as alcohol and/or drug use and lack of seat belt restraints are associated with higher percentages of speeding or aggressive driving serious crashes.
On North Dakota roadways, there were 1,071 serious crashes resulting in 1,298 serious injuries between 2012 and 2016 in which the crash involved a speeding or aggressive driver (NDDOT, 2017). This is an average of 260 serious injuries per year and accounted for 39% of all serious injuries during the 5-year study period.
Highlights from the most recent crash data (2012-2016) include (NDDOT, 2017):
�Most serious injuries involving Speeding/Aggressive Drivingoccurred on rural roads (80%) on state (44%) and localroad (36%) systems.
�Most speed-related serious injuries are single-vehicle type (60%) and most often involved a vehiclerollover (61%).
� Intersection-related angle and rear-end crashes result in a high number of serious injuries (32%) and pose a serious threat to other motorists.� Younger male drivers ages 20 through 29 were at highest risk
for a speed-related crash (29%).� Of the speed-related serious injuries, contributing factors
included Unbelted Vehicle Occupants (53%) and alcohol or drug use (43%).� Summer months, particularly afternoons and evenings, account
for 31% of speed-related serious injuries.
Priority Safety StrategiesTo increase safety measures to reduce Speeding/Aggressive Driving crashes, the following strategies should be implemented:
� Increase fines for right-of-way and speed violations and enhancepenalties for habitual offenders (item requiring legislation toenact law [Policy] ). � Strengthen sustained, well-publicized speed enforcementresulting in greater speed detection and public perceived risk ofbeing stopped and ticketed.
� Implement pilot automated enforcement projects (i.e., work orschool zones), coupled with public outreach, and assess impacton aggressive driving and public acceptance (Policy).

20162015201420132012
Year
201120102009
350
300
250
150
100
50
0
Coun
t of I
njur
ies
200
FatalitiesSerious InjuriesFatalities & Serious Injuries
Figure 5-6. Young Driver Fatality and Serious Injury History
Source: NDDOT, 2017
5-8 Strategic Highway Safety Plan Update 2018-2023
Priority Safety StrategiesTo increase safety measures to reduce Young Driver crashes, the following strategies should be implemented:
� Enforce seat belt use for all passengers in all seating positions.
� Enact primary seat belt legislation that includes primary enforcement of seat belt use for all passengers, of all ages, in all seating positions (Policy). � Strengthen fines/penalties for speed violations (Policy). � Strengthen enforcement of underage drinking and driving.
� Implement hands-free cell phone law to aid in the detection and enforcement of distracted driving (Policy). � Restrict passengers for 6 months for all novice drivers under the age of 18 (Policy). � Extend nighttime driving restriction to 6 months for all novice drivers under the age of 18 (Policy). � Implement a policy requiring a minimum age of 15 (or 16) for learner’s permit (Policy). � Implement a policy requiring a minimum age of 17 to qualify for a full, unrestricted license (Policy). � Require parent education as a driver education classroom component (Policy). � Require classroom education for licensure and incorporate educating novice drivers about driving risks (Policy).
YOUNG DRIVERS In the United States, the fatal crash rate per mile driven for young drivers 16 to 19 years of age is nearly 3 times the rate for drivers 20 years old and older (Insurance Institute for Highway Safety Highway Loss Data Institute, 2018). Motor vehicle crashes are a leading cause of teen death with the highest risk during the first 6 months of licensure. Young drivers are over-represented in serious crashes because of their lack of maturity leading to risky driving habits and their inexperience in recognizing and skillfully responding to hazards. Young drivers tend to overestimate their driving ability and underestimate the dangers on the road.
On North Dakota roadways, there were 480 serious crashes resulting in 601 serious injuries between 2012 and 2016 in which the crash involved a driver between the ages of 14 and 20. This is an average of 120 serious injuries per year and accounted for nearly 18% of all serious injuries during the 5-year study period.
Highlights from the most recent crash data (2012-2016) (NDDOT, 2017) include:
�Majority of serious injuries involving a young driver occurred on rural roads (68%) on state (32%) and local road (36%) systems.
� Half of young driver-related serious injuries are single-vehicle type (51%) and more often involved a vehicle rollover (55%) and an angle crash (27%).
� Young drivers ages 14, 15, 16, and 17 accounted for 38% of young driver serious injuries. Drivers 18, 19, and 20 were involved in the largest number of crashes at 62%.
� Young driver serious injuries more often occurred during the summer months (34%) on dry roads (78%) and during daylight conditions (60%).
� Unbelted occupants (48%), speeding (42%), and driver impairment (24%) were key contributors to the seriousness of young driver injuries.

5-9Strategic Highway Safety Plan Update 2018-2023
Other Areas of Emphasis

5-10 Strategic Highway Safety Plan Update 2018-2023
HEAVY VEHICLESHeavy vehicle crashes involve at least one single unit truck, semi-tractor trailer, or a triple combination. Most fatalities resulting from heavy vehicle crashes are the occupants of passenger vehicles due to the difference in the weight of large trucks as well as greater ground clearance, which can result in a smaller vehicle under-riding the truck in a crash. National studies have shown that car drivers are principally at fault in about three-quarters of fatal car-truck crashes (ATA, 2013). Sharing the road can be done safely if motorists drive a safe distance from heavy trucks and account for the breaking, visibility, and maneuverability limitations of large trucks.
Heavy vehicles make up approximately 8% of North Dakota’s vehicle registrations. Crashes involving these heavy vehicles result in 120 serious injuries per year, approximately 18% of all serious injuries, and are increasing at a rate of around 9% per year.
Highlights from the most recent data (2012-2016) (NDDOT, 2017) include:
� 75% of serious injuries involving heavy vehicles occur on state system highways versus 48% of all serious injuries.
� From a behavior perspective, drivers involved in a heavy vehicle crash are less likely to be impaired (20% versus 33% overall) or speeding (37% versus 39%), more likely to have been distracted (10% versus 7%), and more likely to be belted (58% versus 51%).
� From an infrastructure perspective, heavy vehicle serious injuries are less likely to be categorized as a single-vehicle Lane Departure (25% versus 44% overall), and more likely to involve multiple vehicles at an intersection (33% versus 29%) or head-on with an opposing vehicle (23% versus 13%).
� 20% of heavy vehicle serious injuries occur during winter weather conditions compared to 16% overall.
Priority Safety StrategiesTo increase safety measures to reduce Heavy Vehicle crashes, the following strategies should be implemented:
� Reduce fatigue related crashes by improving the efficiency of existing truck parking spaces and by installing center and edge-line rumble strips.
� Conduct traffic enforcement, coupled with public outreach, with a special focus on higher-risk traffic areas/times, such the oil region, winter driving, and grain harvest season.
� Increase safety awareness of the motoring public, motor carriers, and heavy vehicle drivers through Share the Road Safely/No-Zone education and outreach activities.
� Improve safety through expanded truck maintenance programs, increased driver and vehicle inspections, and post-crash analysis.
� Improve roadway infrastructure for heavy vehicle operation by adding turn lanes at key intersections, developing/deploying rural safety corridors, and installing dynamic intersection warning systems at intersections determined to be at-risk.
� Improve heavy vehicle safety data by increasing the accuracy and completeness of crash reports.
� Improve commercial motor vehicle safety and size and weight compliance by using enhanced screening technologies.
20162015201420132012
Year
201120102009
160
140
120
80
60
40
20
0
Coun
t of I
njur
ies
100
FatalitiesSerious InjuriesFatalities & Serious Injuries
Figure 5-7. Heavy Vehicle Fatality and Serious Injury History
Source: NDDOT, 2017

20162015201420132012
Year
201120102009
120
100
80
40
20
0
Coun
t of I
njur
ies
60
FatalitiesSerious InjuriesFatalities & Serious Injuries
Figure 5-8. Older Driver Fatality and Serious Injury History
Source: NDDOT, 2017
5-11Strategic Highway Safety Plan Update 2018-2023
OLDER DRIVERSOlder drivers include drivers, pedestrians, bicyclists, and motorcyclists that are 65 years and older. Census data indicate that people 65 and older make up approximately 14.5% of North Dakota’s population compared to 14.1% nationally.
On North Dakota’s roadways, there were 381 serious injuries related to older road user crashes between 2012 and 2016. This is an average of 76 serious injuries per year and accounted for approximately 12% of all serious injuries during the 5-year study period.
Safety research suggests that the aging process affects driver performance in key ways including: reduced visual acuity, increased reaction times, and limitations in judging time and distance.
Literature (NDDOT, 2017) also suggests that Older Drivers tend to be physically frailer and, as a result, crashes more often result in serious injuries for Older Drivers.
Highlights from the most recent data (2012 - 2016) (NDDOT, 2017) for crashes involving older road users on North Dakota’s roadways include:
�Majority of the serious injuries from these crashes occurred on the state’s system (53%).
� The most common types of serious injuries involving older road users occur at intersections – 48% versus 29% of all serious injuries.
� Older road users are also over-represented in head-on and sideswipe opposite direction crashes (18% versus 13% of all serious injuries) and serious injuries involving bicycles (3% versus 2% of all serious injuries).
� Older road users are under-represented in serious injuries involving Unbelted Vehicle Occupants (37% versus 48% of all serious injuries), Speeding/
Aggressive Driving (25% versus 39% of all serious injuries) and Alcohol and/or Drug Related (8% versus 33% of all serious injuries).
Priority Safety StrategiesTo increase safety measures to reduce Older Driver crashes, the following strategies should be implemented:
� Establish a broad-based coalition to address older adults’ transportation needs.
� Implement localized license-driver testing to enable older drivers to maintain independent mobility through obtaining a restricted driver’s license within their local geographical area.
� Develop informational resource(s) and conduct public outreach for older driver safety; addressing driving skill assessment and screening, educational opportunities, licensing options, and safe mobility alternatives including shared-ride technology applications.
� Establish statewide one-stop, online resource to inform and guide the public on safety screening for law enforcement, family, and physicians to report at-risk drivers; driving skill assessments, educational courses, licensing options, and safe mobility alternatives.

20162015201420132012
Year
201120102009
60
50
40
20
10
0
Coun
t of I
njur
ies
30
FatalitiesSerious InjuriesFatalities & Serious Injuries
Figure 5-9. Pedestrian/Bicyclists Fatality and Serious Injury History
Source: NDDOT, 2017
5-12 Strategic Highway Safety Plan Update 2018-2023
PEDESTRIANS/BICYCLISTSPedestrians and bicyclists are considered at-risk road users because of their significant weight disadvantage in encounters with motor vehicles. Pedestrians and bicyclists incurred 195 serious injuries (143 pedestrians and 52 bicyclists) between 2012 and 2016. This is an average of 39 serious injuries per year and accounted for approximately 6% of serious injuries during the 5-year study period.
Highlights from the most recent data (2012-2016) for pedestrian/bicycle crashes include:
� 56% of serious pedestrian/bike injuries occurred in urban areas.
� 74% of serious pedestrian/bike injuries occurred on local system roadways.
� Approximately 30% of serious pedestrian/bike injuries occurred at intersections (23% for pedestrians and 54% for bicycles).
� 21% of serious pedestrian/bike injuries involved a young driver between 14 to 20 years old compared to 18% of all serious injuries.
� 25% of serious pedestrian/bike injuries were considered alcohol/drug related.
� Teenagers (10-19) and younger adult drivers (20-29) were involved in more than 40% of serious pedestrian/bike injuries.
� Around two-thirds of those involved in serious pedestrian/bike injuries were males.
Priority Safety Strategies To increase safety measures to reduce Pedestrian/Bicyclist crashes, the following strategies should be implemented:
� Curb Extensions (at urban intersections).
�Median Refuge Islands (at urban intersection and mid-block crossings).
� Road Diets (convert urban 4-lane arterials and collectors to 3-lane facilities).
� Rapid Rectangular Flashing Beacons.
� High-Intensity Activated crossWalK (HAWK) Pedestrian Activated Signals.
� Count Down Timers and Leading Pedestrian Intervals (at traffic signals).
� Adoption and Implementation of Bike Friendly Edge Rumble Strips (periodic gaps in the line of rumbles to allow bikes the opportunity to move from travel lanes to shoulders without traversing any grooves).

5-13Strategic Highway Safety Plan Update 2018-2023
20162015201420132012
Year
201120102009
450400
350
20015010050
0
Coun
t of I
njur
ies
300250
FatalitiesSerious InjuriesFatalities & Serious Injuries
LOCAL SYSTEM ROADWAYSLocal governments own and operate approximately 100,000 (93%) of the almost 107,000 miles of roads in North Dakota. Crashes along this local system resulted in 1,698 serious injuries between 2012 and 2016. This is an average of 340 per year and accounted for 52% of all serious injury crashes during the 5-year study period (NDDOT, 2017).
Highlights from the most recent data include (NDDOT, 2017):
� 63% of serious injuries on local roads occurred in rural areas.
– 79% of rural serious injuries were segment related, of which 85% involved single-vehicle run-off-the-road crashes, of which 27% occurred in horizontal curves. Only 1% of serious rural injuries involved hitting wildlife (deer).
– 21% of rural serious injuries were intersection related. Most occurred at locations with STOP sign control, of which 49% involved a right-angle collision.
– 37% of serious injuries on local roads occurred in urban areas.
– 51% of urban serious injuries were intersection related. 24% occurred at locations with traffic signal control, of which 53% involved a right-angle collision.
Priority Safety StrategiesTo increase safety measures to reduce Local System Roadway crashes, the following strategies should be implemented:
� Continue to inform local governments of the North Dakota Local Road Safety Plans (LRSP) and educate them on the process to access HSIP funds to advance the LRSP.
Rural Roads � Install enhanced edge lines (6 inches and embedded wet-reflective).
� Install intersection street lighting.
� Install chevrons (enhanced curve warning).
Urban Roads � Install pedestrian enhancements – curb extensions, median refuge islands, countdown timers, and leading pedestrian interval at traffic signals.
� Install confirmation lights at traffic signals (to supplement enhanced enforcement of red-light running).
Figure 5-10. Local System Fatality and Serious Injury History
Source: NDDOT, 2017

5-14 Strategic Highway Safety Plan Update 2018-2023
20162015201420132012
Year
201120102009
450400
350
20015010050
0
Coun
t of I
njur
ies
300250
FatalitiesSerious InjuriesFatalities & Serious Injuries
OIL-IMPACT COUNTIES Seventeen counties comprise the northwest quarter of North Dakota and have experienced significant traffic volume and economic development growth because of the crude oil extraction from the Bakken Formation. In fact, traffic volumes more than doubled between 2008 and 2014 and the statewide fraction of serious injuries increased from around 30% to more than 50% (an annual increase approaching 15% per year). Since 2014, the volume of traffic and the number of serious crashes have decreased but remain well above 2008 values.
Highlights from the most recent data (2012-2016) (NDDOT, 2017) regarding crashes in the Oil-Impact Counties include:
� There were 1,651 serious injuries, an average of 329 per year.
– These serious injuries represent around 50% of all serious injuries statewide.
� Approximately 67% of all heavy truck-related crashes in North Dakota occurred in the Oil-Impact Counties.
� Crashes categorized as speed related, heavy truck related, Lane Departure, multi-vehicle opposing, and winter weather are above statewide averages.
Priority Safety StrategiesTo increase safety measures to reduce crashes in Oil-Impact Counties, the following strategies should be implemented:
� Install left- and right-turn lanes.
� Install street lights at key intersections.
� Install safety corridors.
� Install RICWS.
Figure 5-11. Oil-Impact Counties Fatality and Serious Injury History
Source: NDDOT, 2017
Image source: https://www.ndstudies.gov/energy; Photo courtesy of Whiting Oil.
Strategic Highway Safety Plan Update 2018-2023
SECTION 6Statew
ide Policy Directions
SECTION 6Statewide Policy
Directions

6-1Strategic Highway Safety Plan Update 2018-2023
Statewide Policy Directions 6Effective traffic safety policy plays a critical role in successfully implementing North Dakota’s comprehensive strategy to reach Vision Zero. Evidence-based or proven traffic safety laws, backed by consistent, highly visible enforcement and public outreach, is proven to be a strong catalyst for changing high-risk driver behavior, cultural norms, and public perceptions about road safety (World Health Organization, 2013).
Equally important is the public’s awareness of and support for traffic laws and regulations intended to keep them and loved ones safe. During the Vision Zero safety workshops, North Dakota safety stakeholders and partners from across the state representing multi-disciplinary and multi-jurisdictional perspectives, discussed and identified the following priority legislative/policy-related safety strategies as essential to advancing the Vision Zero Plan:
Belt Use � Enact primary seat belt law.
� Stronger penalties for lack of seat belt use.
Alcohol and/or Drug Related � Implement an ignition interlock program.
� Strengthen enhanced penalties for high BAC offenders.
�Mandate alcohol server training as a condition of alcohol licensure.
Speed � Increase fines for speed violations.
� Enhance penalties for habitual speed offenders.
� Implement pilot automated enforcement projects.
Young Drivers � Hands-free cell phone law to aid in the detection and enforcement of distracted driving.
North Dakota then-Governor Jack Dalrymple signs Impaired Driving Bill (2013)
� Strengthen Graduated Driver Licensing, including:
– Passenger restriction lasting 6 months for all novice drivers under the age of 18.
– Extend nighttime driving restriction lasting 6 months for all novice drivers under the age of 18.
– Minimum age of 15 (or 16) for learner’s permit.
– Minimum age of 17 to qualify for a full, unrestricted license.
– Require parent education as a driver education classroom component.
– Require classroom education for licensure.
The NHTSA’s study, A Comparative Analysis of State Traffic Safety Countermeasures and Implications for Progress “Toward Zero Deaths” in the United States (NHTSA, 2017b), concluded that states that implemented a greater number of the selected, proven behavioral countermeasures or safety strategies had lower fatality rates. More simply, states implementing a greater number of proven strategies, save more lives. North Dakota’s Vision Zero Plan incorporates 9 of the 11 NHTSA-selected priority countermeasures; of the 9 strategies included in the Vision Zero Plan, 6 are policy-related.
Sect
ion

Strategic Highway Safety Plan Update 2018-2023
SECTION 7Implementation and
Evaluation
SECTION 7Im
plementation and
Evaluation

Strategic Highway Safety Plan Update 2018-2023 7-1
Implementation and evaluation 7Se
ctio
n
IMPLEMENTATIONImplementation is the foundation for this Vision Zero Plan and is the basis of support for the short-term goal of fewer than 75 fatalities by year 2025. Implementation is also integral to the long-term vison of zero crash-related deaths by deployment of evidenced-based strategies for at-risk, serious crash locations and to strengthen statewide policies. To gain a better perspective about implementation, the previous SHSP and annual HSIP (infrastructure projects) and Highway Safety Program (driver-behavior initiatives) reports were reviewed.
The 2013 SHSP (CH2M HILL, 2013) documented infrastructure and driver-behavior priorities, including:
� Infrastructure: Lane departure crashes along rural roadways, rural and urban intersection crashes with a focus on right-angle collisions and an expanded level of safety investment along the state’s local system of roadways where one-half of serious crashes occur.
� Driver Behavior: Improved safety partnerships, enhanced technical assistance and training, additional data-driven components to increase the effectiveness of high visibility enforcement campaigns and continued strengthening of the state’s traffic safety policy.
Highlights of what North Dakota has accomplished relative to implementation over the past 5 years and the adopted priorities for implementation looking ahead to the next 5 years are included in this section.
Accomplishments – Looking BackSince the 2013 North Dakota SHSP (CH2M HILL, 2013), North Dakota has successfully reduced fatalities and serious injuries through enhanced existing transportation-safety programs and policy and the implementation of new safety programs.
Examples of North Dakota’s infrastructure and behavioral-related efforts to improve safety on all public roads follow.
Infrastructure Highlights of infrastructure-related safety accomplishments include completing the Local Road Safety Program and implementing low-cost safety strategies along road segments, curves, and intersections as well as a select few higher-cost strategies.
Local Road Safety Program. The 2013 SHSP documented that more than one-half of serious crashes in North Dakota occur on the local road system and, historically, there has been little safety project development engagement with local agencies and even less safety investment along the local system. To address these issues, the SHSP committed NDDOT to increasing the level of engagement with local agencies in statewide safety planning and committed to dedicating one-half of the Highway Safety Improvement Funds to local system projects. To that end, NDDOT partnered with the 53 counties (including the 12 largest cities, four Native American reservations, and one national park) to prepare safety studies of their road systems. Safety plans (that included a systemic risk evaluation, system prioritization, and project development) were completed for these local agencies in 2016. Following completion of the individual plans, agencies began submitting projects for HSIP funding using application forms that were prepared and included in each plan. These projects are now being implemented and there is a 50-50 distribution of HSIP funds between the state and local system.
Low cost segment-based safety strategies. Majority of serious injury crashes in North Dakota are in rural areas and the most common type of serious crash is single-vehicle

7-2 Strategic Highway Safety Plan Update 2018-2023
7lane departure. To address these crashes, NDDOT has placed a high-priority on widely deploying low-cost, proven effective safety strategies, including:
� Center, shoulder, and edge rumble strips – center and edge rumble strips have been deployed along the entire rural state system (approximately 6,000 miles) and as part of 11 county and 2 tribal safety projects (that were identified as part of the Local Road Safety Program).
� Enhanced edge lines – 8 counties have implemented projects to install enhanced edge line (6-inch wide edge lines as opposed to the traditional 4-inch lines) along their rural roadways.
� Enhanced horizontal curve delineation – analysis of North Dakota crash data indicates that serious injuries associated with single-vehicle lane departure crashes are over-represented in horizontal curves, as a result, enhanced curve delineation (chevron warning signs, delineators, pavement markings, and shoulder paving/widening) is being implemented at high-priority locations on the state’s system as part of 8 districtwide safety projects and on the local system as part of 6 county and 2 tribal safety projects.
� Shoulder drop-offs and clear zones – projects that involve eliminating the drop-off from pavement surface to gravel shoulders and establishing clear zones (obstacle free recovery areas adjacent to the traveled portion of the roadway) are being implemented as part of several county- and tribal-safety projects.
Low cost intersection-based safety strategies. Intersection crashes at both rural and urban intersections have also been a priority for safety investment, including:
� Street lights at rural intersections – NDDOT is in the process of installing destination lighting at 308 rural intersections along state and county systems as part of eight districtwide safety projects. Further installation of street lights at intersections along the local system is being done as part of two county and one tribal safety project.
� Enhanced intersection traffic control devices – providing larger regulatory and warning signs and adding pavement messages and STOP bars is underway at 778 rural intersections along the state’s system and this type of work is also being done along the local system as part of 16 county and 3 tribal safety projects.
� Dynamic warning systems – systems that use technology to provide an advanced warning of approaching vehicles at rural intersections have demonstrated an ability to reduce right-angle collisions that cause majority of serious injuries at rural
intersections. Rural intersection collision warning systems have been installed at three locations along the state’s system.
� Confirmation lights – in urban areas the most common type of crash resulting in serious injuries is a right-angle collision at intersections with traffic signal control, an indication of a problem associated with red-light running. To address this urban problem, three cities have undertaken projects to install confirmation lights, which are small lights added to traffic signal mast arms that help law enforcement be more effective in their efforts to both monitor and tag red-light violators.
� Pedestrian enhancements – the number of serious injuries involving pedestrians in North Dakota is increasing and many of these crashes occur at signal-controlled intersections in urban areas. To address this growing problem, four cities have implemented projects to add count-down pedestrian timers and one city is in the process of adding leading pedestrian intervals to their traffic signal systems. Some cities are implementing advance walk technology.
In addition to these low-cost strategies, NDDOT has also placed a priority on replacing STOP and signal control at 10 identified high volume/crash prone intersections along the state’s system with roundabouts. Roundabouts are a high-cost strategy (around $1 to $2 million per intersection), but have been proven effective at virtually eliminating right-angle collisions, which are the cause of majority of serious injuries at these types of intersections.
Behavioral Highlights of behavioral-related accomplishments include expanded partnerships, safety partner technical assistance and training, expanded high-visibility enforcement, strengthening of traffic safety policies, and behavioral program evaluation.
Expanded, diverse safety partnerships. Since the 2013 SHSP (CH2M HILL, 2013), North Dakota has intentionally and strategically extended the interdisciplinary reach of its safety partners and stakeholders. SHSP implementation efforts require the leadership and engagement of the 4Es of safety. However, successful SHSP implementation extends beyond the traditional 4Es to also include engagement and support of state, local, and tribal partners representing the judicial system, public and private sectors, government agencies, elected officials, employers, community groups, nonprofits and advocacy groups, and the media. In addition, collaborative public-private partnerships can extend beyond the base government resources to improve safety. Since the 2013 SHSP (CH2M HILL, 2013), safety partners

Strategic Highway Safety Plan Update 2018-2023 7-3
have leveraged financial, staffing, knowledge/expertise, and informational resources to work toward common goals. North Dakota has greatly strengthened and diversified its statewide safety network to include non-traditional safety stakeholders through the following example programming initiatives:
� Traffic Safety (now Vision Zero) Partner Network.
� County outreach program.
� SHSP strategy implementation teams.
� LRSP.
Technical assistance and training for behavioral safety partners. North Dakota has bolstered its technical assistance and training so safety partners are equipped to effectively carryout their respective safety roles and serve as champions of the state SHSP initiatives. The NDDOT Safety Division and partners have offered technical assistance and training through statewide conferences/workshops and have provided easy access to a wide range of supporting information and materials through web-based resources and targeted email communication. Training includes, but is not limited to:
� Annual Traffic Safety (now Vision Zero) Partner Summit.
� Traffic Safety Resource Prosecutors.
� DUI training for enforcement and court personnel.
� Child Passenger Safety workshops, presentations, and car seat clinics.
Data-driven, high visibility enforcement programs. Cooperative high visibility enforcement (HVE) campaigns bring together state, county, city, university, and tribal law enforcement agencies to offer multiagency, highly visible, saturated enforcement. North Dakota’s HVE offer a consistent media messaging that empowers the driving public to make the right choice to drive safely; buckled up, focused, sober, and to drive at safe speeds. Data-driven enforcement and the supporting public outreach campaigns are planned during months, time of day, and at locations and community events that, based on analysis of crash data, are of higher risk for serious crashes. North Dakota has experienced successful declines in motor vehicle crash fatalities since 2012, and the evidence-based, proven approach of HVE campaigns are a cornerstone to continuing this positive safety trend. North Dakota’s statewide HVE saturations include:
� U Drive. U Text. U Pay. Distracted driving campaigns.
� Click It or Ticket It seat belt campaigns.
� Drive Sober or Get Pulled Over campaigns.
Continued strengthening of North Dakota traffic safety policy. Public education coupled with strong driving laws supported by enforcement action is the most effective approach to improve driver behavior. Since the 2013 SHSP (CH2M HILL, 2013), North Dakota has made strong advancements in improving traffic safety policy, including:
� Strengthened DUI law through: (1) enhanced sanctions for high BAC DUI offenders; (2) increased jail time for repeat offenders; (3) criminalizing BAC test refusal; (4) mandatory and extended enrollment of repeat offenders in the 24/7 Sobriety Program.
� Strengthened Child Passenger Safety law requiring children to be restrained through age 7.
� Enhanced distracted driving law that strengthens the fine if a driver violating a traffic law is found to impair the safe operation of his/her vehicle.
Supporting strong safety program evaluation. The NDDOT Safety Division and partners have strongly invested in program evaluation to assess behavioral program effectiveness, to monitor progress, and to inform programming decisions. The North Dakota State University Upper Great Plains Transportation Institute is a key provider of evaluation services as well as special NHTSA assessment teams to support North Dakota’s behavioral program improvement efforts. NHTSA’s guide on behavioral program evaluation, The Art of Appropriate Evaluation for Highway Safety Program Managers (1999), outlines five basic methods to measure safety program effects including observational surveys; knowledge, attitude, and awareness surveys; activity records; data records; and media coverage. The NDDOT Safety Division Annual Report, Fiscal Year 2017 (NDDOT, 2018b) reports on all five measures. The following sampling of evaluation studies provides the needed feedback and data to help inform the NDDOT Safety Division’s programming decisions:
� Annual Knowledge, Attitudes, Behaviors, and Beliefs (KABB) survey.
� Annual crash and driver data analysis and performance monitoring.
� 24/7 Sobriety Program evaluation.
� Analysis of DUI arrest and conviction data.
� Annual observational seat belt use survey.
� NHTSA Impaired Driving Assessment.
� NHTSA Occupant Protection Assessment.
7

7-4 Strategic Highway Safety Plan Update 2018-2023
7IMPLEMENTATION – LOOKING AHEAD Results of the data-driven prioritization process indicate that from an infrastructure perspective, the primary emphasis be placed on implementing evidence-based strategies intended to mitigate Lane Departure crashes in rural areas and Intersection crashes in rural and urban areas on the state and local system of roadways. The data suggest a secondary emphasis on crashes involving Heavy Vehicles (especially in the Oil-Impact Counties) and Pedestrians/Bicyclists. From a driver-behavior perspective, the primary emphasis is on addressing Unbelted Vehicle Occupants, Speeding/Aggressive Driving, Alcohol and/or Drug Related driving, and Young Drivers with a secondary emphasis on Older Drivers.
North Dakota’s Emphasis Area Teams will be instructed to focus their efforts on implementing the following types of evidence-based strategies at high-priority locations identified through crash analysis and systemic risk-based evaluations and determining annual quantities to be deployed (miles of segments to be treated, numbers of intersections, number of training activities, and numbers of high enforcement campaigns) based on budget constraints, partnerships, and overall feasibility. The strategies for the teams to focus on include:
� Lane Departure.
– Safety corridors along two-lane rural highways; features thatwould be added in the safety corridors include: longitudinaldelineators, enhanced edge lines, enhanced curve warningsigns, shoulder paving, destination street lights, and turn lanesat key intersections.
– Longitudinal delineators.
– Embedded wet-reflective pavement markings.
– 6-inch edge lines.
– Edge and center rumble strips.
– Shoulder paving.
– Center buffers (to address head-on crashes).
– Median barrier (along freeways).
� Intersections.
– Roundabouts (instead of traffic signals).
– Reduced conflict intersections.
– Street lighting.
– Install dynamic intersection warning systems at ruralintersections (RICWS).
– Confirmation lights (on urban traffic signals to support red-light enforcement).
– Access management (near intersections).
� Alcohol and/or Drug Related Driving.
– Implement an ignition inter-lock program.
– Strengthen enhanced penalties for high BAC offenders.
– Maintain high visibility sobriety check points.
– Conduct a comprehensive assessment of administrativelicensing sanctions for driving while impaired by alcohol and/or drug related use.
– Limit the scope of administrative hearings.
– Identify/implement approaches to more effectively educatejudges.
– Expand ARIDE training.
– Strengthen prosecutor and law enforcement training.
– Support mandating alcohol server training as a condition ofalcohol licensure.
– Strengthen highly publicized compliance checks and alcoholserver training retailers and merchants.
� Unbelted Vehicle Occupants.
– Support enacting primary seat belt legislation for all ages.
– Support enacting higher penalties for lack of seat belt use.
– Conduct outreach to both tribal and local governments relatedto improving seat belt usage and enforcement.
– Promote employer and insurance safety programs for non-compliance of belt use.
– Promote statewide education of child restraint best practices.
� Speeding/Aggressive Driving.
– Support increased fines for right-of-way and speed violationsand enhance penalties for habitual offenders.
– Strengthen speed enforcement campaigns.
– Implement pilot automated enforcement projects (school orwork zones) coupled with public outreach.
� Young Drivers.
– Enforce seat belt use for all passengers.
– Enact primary seat belt legislation that includes primaryenforcement of seat belt use for all passengers, of all ages, inall seating positions

Strategic Highway Safety Plan Update 2018-2023 7-5
7 – Strengthen penalties for speed violations.
– Strengthen enforcement of underage drinking and driving.
– Implement hands-free cell phone law.
– Restrict passengers for 6 months for all novice drivers under 18 years of age.
– Extend nighttime driving restriction to 6 months for all novice drivers under 18 years of age.
– Implement a policy requiring a minimum age of 15 for a learner’s permit.
– Implement a policy requiring a minimum age of 17 to qualify for a full, unrestricted license.
– Require classroom education for licensure.
– Require parent participation as part of the driver education classroom component.
� Heavy Vehicles.
– Reduce fatigue-related crashes by improving the efficiency of existing truck parking spaces and by installing center and edge-line rumble strips.
– Conduct traffic enforcement, coupled with public outreach, with a special focus on higher-risk traffic areas/times, such the oil region, winter driving, and grain harvest season.
– Increase the safety awareness of the motoring public, motor carriers, and heavy vehicle drivers through Share the Road Safely/No-Zone education and outreach activities.
– Improve safety through expanded truck maintenance programs, increased driver and vehicle inspections, and post-crash analysis.
– Improve roadway infrastructure for heavy vehicle operation by adding turn lanes at key intersections, developing/deploying rural safety corridors, and installing dynamic intersection warning systems at intersections determined to be at-risk.
– Improve heavy vehicle safety data by increasing the accuracy and completeness of crash reports.
– Improve commercial motor vehicle safety and size and weight compliance through enhanced screening technologies.
� Older Drivers.
– Establish a coalition to address older driver’s transportation needs.
– Implement localized license-driver testing to enable older drivers to maintain independent mobility through obtaining a restricted license within their geographic area.
– Develop informational resources and conduct public outreach for older driver safety; addressing driving skill assessment and screening, educational opportunities, licensing options, and safe mobility alternatives including shared-ride technology applications.
– Establish statewide one-stop online resource to inform and guide the public on safety screening, driving skill assessments, licensing options, and safe mobility alternatives.
� Pedestrians/Bicyclists.
– Curb extensions and median refuge islands at urban intersections and mid-block crossing locations.
– Road diets (convert urban four-lane arterials and collectors to three-lane facilities).
– Dynamic warning devices – Rapid Rectangular Flashing Beacons and HAWK activated signals.
– Count-down times and leading pedestrian intervals at urban traffic signals.
– Adopt and implement bike friendly edge rumble strips (periodic gaps in the line of rumbles to allow bicycles the opportunity to move from travel lanes to shoulders without traversing any grooves).
� Local System Roadways
– Continue to inform local governments of the North Dakota LRSP and educate them on the process to access HSIP funds to advance the LRSP.
– Rural Roads
» Install enhanced edge lines (6 inches and embedded wet-reflective).
» Install intersection street lighting.
» Install chevrons (enhanced curve warning).
– Urban Roads
» Install pedestrian enhancements – curb extensions, median refuge islands, countdown timers, and leading pedestrian interval at traffic signals.
» Install confirmation lights at traffic signals (to supplement enhanced enforcement of red-light running).
� Oil-Impact Counties
– Install left- and right-turn lanes.
– Install street lights at key intersections.
– Install safety corridors.
– Install rural intersection collision warning systems (RICWS).

7-6 Strategic Highway Safety Plan Update 2018-2023
7Moving Vision Zero Forward – Key ExamplesAs illustrated by the following examples, NDDOT will partner with U.S. Department of Transportation, Federal Aviation Administration, and local communities to achieve Vision Zero.
Unmanned Aircraft System Integration Pilot Program. The implementation of new, cutting-edge technology is a critical component of North Dakota’s Vision Zero strategy. The U.S. Department of Transportation and Federal Aviation Administration awarded the Unmanned Aircraft System Integration Pilot Program to NDDOT in May 2018. As the lead applicant for this program in North Dakota, NDDOT will work with partners and stakeholders to achieve several strategic objectives. A primary objective is integrating UAS or drone use for the safety of the traveling public to achieve Vision Zero.
Vision Zero Communities. Over half or 52 percent of North Dakota’s fatal and severe injuries occur on its local roads. To accelerate North Dakota’s traffic safety efforts, it is imperative that local communities become more engaged in the state’s life-saving traffic safety efforts. On August 1, 2018, the NDDOT launched the Vision Zero Community Program.
A Vision Zero Community agrees to work toward zero motor vehicle crash fatalities and serious injuries in the community through implementing evidence-based strategies proven to reduce motor vehicle crashes including: widespread public education/outreach; implementing policies that support driver and passenger safety; high visibility enforcement of existing laws; technology advancements; and infrastructure/road safety improvements. The
designation allows communities to receive technical assistance and support through the lead Vision Zero agencies and other Vision Zero partners to achieve the zero goal.
In turn, the Vision Zero Update process reviewed and considered the results and outcomes of other state, local, and tribal highway safety plans to inform Vision Zero planning and priority strategy selection. For example, the outcomes of the North Dakota LRSPs were considered in establishing Vision Zero strategies for high-risk rural segments and intersections to further reduce North Dakota’s fatalities and serious injuries.
The intentional alignment of transportation safety plans leverages limited resources and advances the implementation of the overarching Vision Zero Plan through safety project prioritization and delivery to move North Dakota toward its vision of zero deaths.
EvaluationThe key to effectively manage safety programs is knowing whether adopted initiatives have been effective and should therefore be continued or whether the initiatives did not achieve desired outcomes and should be modified or discontinued. Evaluation is used to help inform safety program managers about effectiveness.
North Dakota will continue evaluating outcomes on an annual basis. NDDOT will complete a review of crash data, including disaggregation of crashes into emphasis areas and development of trend lines to determine if implementation is driving North Dakota toward the 2025 goal of fewer than 75 motor vehicle crash-related fatalities. In addition, North Dakota will add an output-based component to the annual review process. Outcomes measured in crash reduction only become apparent several years after implementation. It takes time to develop and deploy safety projects and then wait for several years of crash data to accumulate. Still, it may be difficult to determine with a high degree of certainty the effect of investment due to small sample sizes and short time frames. To help safety program managers deal with this challenge and to provide interim checks on progress, Emphasis Area Teams will add an annual review of outputs. The review will assess (1) if the investment funds the deployment of priority strategies and the amount of funding established by the Emphasis Area teams at the beginning of each year and (2) if the distribution of safety funding between emphasis areas and state and local systems is consistent with the adopted objectives.

Strategic Highway Safety Plan Update 2018-2023
The intentional alignment of transportation safety plans leverages limited resources and advances the implementation of the overarching Vision Zero Plan through safety project prioritization and delivery to move North Dakota toward its vision of zero deaths.
7-7
The results of these outcome and output-based evaluations will guide Emphasis Area Teams and safety program managers relative to establishing investment targets for the following year.
North Dakota is also committed to the ongoing evaluation of behavioral program effectiveness though the continued use of the Annual KABB survey, annual observations of seat belt usage, and participation in NHTSA’s program assessments.
Vision Zero Plan Coordination with Other Plans The Vision Zero Plan serves as North Dakota’s overarching transportation safety plan providing strategic direction for the state’s HSIP, HSP, and the Commercial Vehicle Safety Plan (CVSP). The plan’s strategic goal, safety priorities, and strategies will be coordinated for alignment during the revisions and updates of these state safety plans as well as the development of the state’s long-range statewide strategic transportation plan, TransAction III;
7active and public transportation plan ND Moves; North Dakota’s Statewide Transportation Improvement Program; and the MPO Transportation Improvement Program. The Vision Zero safety priorities and strategies are aligned and the Planning & Asset Management Division, Local Government Division, Programming Division (responsible for the HSIP), Safety Division (responsible for the HSP), and the North Dakota Highway Patrol (responsible for the CVSP) helped to inform the Vision Zero planning discussions and resulting safety strategies.

Strategic Highway Safety Plan Update 2018-2023
SECTION 8Conclusion
SECTION 8Conclusion

8-1Strategic Highway Safety Plan Update 2018-2023
Conclusion 8This Vision Zero Plan is the product of a 9-month effort by the Executive Leadership Team, the Steering Committee, Emphasis Area Teams, and the state’s safety partners. This plan is data driven and includes input from more than 200 representatives of local governments and private organizations representing the 4 Es of safety.
The Executive Leadership Team recognizes that this updated plan is a necessary part of achieving the short-range goal (fewer than 75 fatalities by the year 2025) and the vision of zero fatalities. However, the current fatality trend of a decrease of 1% per year will not achieve either the short-range goal or the long-term vision of zero fatalities in the near future. Reaching these objectives requires implementation that targets the adopted Priority Safety Emphasis Areas and invests in evidence-based strategies that are deployed at high-priority locations. The Executive Leadership Team also recognizes that current state polices will have to be enhanced to address seat belt usage, Alcohol and/or Drug Related Driving, and Speeding/Aggressive Driving.
Since the preparation of North Dakota’s last safety Plan in 2013, much has been accomplished:
� Safety projects along local road systems have been added to the state’s HSIP.
� Proven effective, low-cost strategies have been deployed along rural segment including curves and intersections on state, county, and tribal roadways.
� DUI related training has been provided for law enforcement and county personnel. Child Passenger Safety workshops have been conducted.
� DUI, Child Passenger Safety, and Distracted Driving laws were strengthened.
Over this timeframe, statewide fatalities dropped by more than 20%. However, the Executive Leadership Team also recognizes
that relying on what was done in the past will not result in reaching the adopted goals. Achieving the goal will require the implementation of more effective and proven strategies, renewed efforts using new analytical methods to identify high-priority candidate locations for safety investment, and new statewide policies to address our Priority Safety Emphasis Areas. Examples of proven safety strategies and policies for implementation include:
� Deploy rural safety corridors.
� Add delineators along rural, two-lane highways to improve driver navigation.
� Continue to address rural intersections by adding street lights, dynamic warning systems, and roundabouts.
� Address safety at rural intersections by incorporating the design concept of reduced conflict intersections.
� Add barriers in freeway medians to prevent rare but often deadly head-on crashes.
� Improve seat belt usage by supporting enactment of primary seat belt legislation.
� Reduce alcohol and/or drug related driving by supporting the addition of ignition interlocks to the available menu of strategies.
� Increase the deterrence effect of law enforcement by supporting the increase in fines for right-of-way and speeding violations.
It is understood that the update of this plan is an on-going process and the next step is working closely with traffic safety partners to implement and enhance the state’s policies and practices that are the key to achieving the desired outcomes of fewer than 75 motor vehicle crash fatalities by 2025 and ultimately getting to zero.
Sect
ion

Strategic Highway Safety Plan Update 2018-2023
SECTION 9References and
Acronyms
SECTION 9References and
Acronyms

9-1Strategic Highway Safety Plan Update 2018-2023
Sect
ion
References and AcronymsAmerican Trucking Association (ATA). 2013. Relative Contribution/Fault in Car-Truck Crashes. February. http://www.trucking.org/ATA%20Docs/News%20and%20Information/Reports%20Trends%20and%20Statistics/02%2012%2013%20--%20FINAL%202013%20Car-Truck%20Fault%20Paper.pdf. Accessed July 13, 2018.
CH2M HILL. 2013. North Dakota Strategic Highway Safety Plan. September.
Federal Highway Administration (FHWA). 2016. Strategic Highway Safety Plan Guidance. March.
Federal Highway Administration (FHWA). 2014. Crash Modification Factor (CMF) Clearinghouse. http://safety.fhwa.dot.gov/tools/crf/resources/. Modified October 2014.
Insurance Institute for Highway Safety Highway Loss Data Institute. 2018. Teenagers. http://www.iihs.org/iihs/topics/t/teenagers/fatalityfacts/teenagers. Accessed April 30, 2018.
Kahane, C. J. 2015. Lives Saved by Vehicle Safety Technologies and Associated Federal Motor Vehicle Safety Standards, 1960 to 2012. Passenger Cars and LTVs. January. https://crashstats.nhtsa.dot.gov/Api/Public/ViewPublication/812069. Accessed July 18, 2018.
Minnesota Department of Transportation (MnDOT). 2014. Minnesota Strategic Highway Safety Plan 2014–2019. December.
North Dakota Department of Transportation (NDDOT). 2017. Database 2012‐2016. Personal Communication [email] from Casteel, M. to CH2M HILL. December.
North Dakota Department of Transportation (NDDOT). 2018a. Vision Zero. Zero Fatalities. Zero Excuses. https://visionzero.nd.gov/. Accessed July 12, 2018.
NDDOT, 2018b. NDDOT Safety Division Annual Report, Fiscal Year 2017. February. http://www.dot.nd.gov/divisions/safety/docs/HSP%20Annual%20Report.pdf. Accessed July 12, 2018.
National Cooperative Highway Research Program (NCHRP). NCHRP Report 500: Guidance for Implementation of the AASHTO Strategic Highway Safety Plan. The National Academies of Sciences, Engineering, Medicine. http://www.trb.org/Main/Blurbs/175381.aspx. Modified March 2017.
National Highway Traffic Safety Administration (NHTSA). 1999. The Art of Appropriate Evaluation for Highway Safety Program Managers. June. https://one.nhtsa.gov/portal/site/NHTSA/. Accessed July 12, 2018.
9Sect
ion

9-2 Strategic Highway Safety Plan Update 2018-2023
National Highway Traffic Safety Administration (NHTSA). 2015. Countermeasures that Work: A Highway Safety Countermeasure Guide For State Highway Safety Offices. National Highway Traffic Safety Administration (NHTSA). 2016. Data Resource Website, Fatality Analysis Reporting System (FARS) Encyclopedia. https://www-fars.nhtsa.dot.gov/Main/index.aspx. Accessed March 1, 2018.
National Highway Traffic Safety Administration (NHTSA). 2016. Quick Facts 2016. https://crashstats.nhtsa.dot.gov/Api/Public/ViewPublication/812451. Accessed July 18, 2018.
National Highway Traffic Safety Administration (NHTSA). 2017a. USDOT Releases 2016 Fatal Traffic Crash Data. October. https://www.nhtsa.gov/press-releases/usdot-releases-2016-fatal-traffic-crash-data. Accessed March 1, 2018.
National Highway Traffic Safety Administration (NHTSA). 2017b. A Comparative Analysis of State Traffic Safety Countermeasures and Implications for Progress “Toward Zero Deaths” in the United States. Traffic Safety Facts, Research Note, DOT HS 812 392. October.
Toward Zero Death (TZD). 2015. A National Strategy on Highway Safety. http://www.google.com/url?sa=t&rct=j&q=&esrc=s&source=web&cd=1&ved=0ahUKEwis-fLh56TcAhVm7IMKHQYdDW8QFggoMAA&url=http%3A%2F%2Fwww.towardzerodeaths.org%2Fwp-content%2Fuploads%2FTZD_Strategy_12_1_2014.pdf&usg=AOvVaw0io0T7Ul5aJjAuAlK1Kl_k. Accessed July 16, 2018.
Drivers and Passengers Toward Zero-Focused Safety Programs. http://www.towardzerodeaths.org/wp-content/uploads/8415_2_AASHTO_TZD_Zero_Focused_Programs_Sheet.pdf. Accessed June 14, 2018.
World Health Organization. 2013. Strengthening road safety legislation: a practice and resource manual for countries. http://apps.who.int/iris/bitstream/handle/10665/85396/9789241505109_eng.pdf;jsessionid=51A24882BCFC0345978367D60D5871E2?sequence=1. Accessed June 28, 2018.
9-3Strategic Highway Safety Plan Update 2018-2023
Acronyms

9-4Strategic Highway Safety Plan Update 2018-2023
9Acronyms
4 Es of Safety education, enforcement, engineering, and emergency medical services
ARIDE Advanced Roadside Impaired Driving Enforcement
BAC blood alcohol content
CVSP Commercial Vehicle Safety Plan
DRE Drug Recognition Expert
DUI driving under the influence
FHWA Federal Highway Administration
HAWK High-Intensity Activated crossWalK
HRRR High Risk Rural Roads
HMVMT 100 million vehicle miles traveled
HSIP Highway Safety Improvement Program
HVE high visibility enforcement
KABB Knowledge, Attitudes, Behaviors, and Beliefs
LRSP Local Road Safety Plan
MPO Metropolitan Planning Organization
NCHRP National Cooperative Highway Research Program
NDDOT North Dakota Department of Transportation
NDDoH North Dakota Department of Health
NDHP North Dakota Highway Patrol
NHTSA National Highway Traffic Safety Administration
Policy item requiring legislation to enact law
RICWS rural intersection collision warning system
SHSP Strategic Highway Safety Plan
TZD Towards Zero Deaths

Strategic Highway Safety Plan Update 2018-2023
APPENDIX AW
orkshop Invitation
APPENDIX ARegional Vision Zero Workshop Invitation

A-1Strategic Highway Safety Plan Update 2018-2023
Dates & Locations
Please Join Us!
Vision Zero Workshops
Wednesday, March 21, 2018 RSVP by March 7 Fargo Dome 1800 North University Dr Fargo, ND 58102
Thursday, March 22, 2018 RSVP by March 7 Ramada Grand Forks 1205 N 43rd St Grand Forks, ND 58203
Tuesday, April 3, 2018 RSVP by March 20 Ward County Courthouse 315 3rd St SE Minot, ND 58701
Wednesday, April 4, 2018 RSVP by March 20 Ramkota 800 S 3rd St Bismarck, ND 58504
Tuesday, April 17, 2018 RSVP by April 3 Dickinson City Hall 99 2nd St E Dickinson, ND 58601
Wednesday, April 18, 2018 RSVP by April 3 Ernie French Center 14120 Hwy 2 Williston, ND 55801
Please RSVP using this link: https://www.surveymonkey.com/r/SHSPWorkshops
The North Dakota Department of Transportation (NDDOT) and partners seek your input to update the North Dakota Vision Zero plan (also known as the North Dakota Strategic Highway Safety Plan [SHSP]), through your participation in one of six upcoming regional Vision Zero workshops.
Vision Zero is a multi-agency initiative led by the NDDOT, the North Dakota Department of Health and the North Dakota Highway Patrol. Vision Zero is a statewide, interdisciplinary and coordinated approach to road safety involving 4E partners in education, enforcement, engineering and emergency medical services and other public and private sector partners. All partners work together to reduce motor vehicle crash fatalities and serious injuries to zero.
Vision Zero applies proven strategies including: (1) widespread public education/outreach, (2) working with the legislature to ensure state laws represent best practices in traffic safety, (3) high visibility enforcement of existing laws, (4) technology advancements, and (5) infrastructure/road safety improvements. Updating North Dakota’s Vision Zero plan is a critical step to move toward North Dakota’s zero goal.
Each day will begin with registration from 8:00-8:30 am, followed by the Vision Zero workshop from 8:30 am-3:30 pm. There will be a break for lunch on your own from 12:00 pm-1:00 pm.
The workshops will provide an overview of the planning process, examine crash data trends in North Dakota, highlight featured safety accomplishments, and most importantly, offer facilitated safety stakeholder dialogue and prioritization of safety strategies for the Vision Zero plan.
Included in the online registration is a survey for safety stakeholders to offer key regional traffic safety accomplishments and a suggested spokesperson for potential inclusion in a regional workshop. Please consider what accomplishment(s) may be helpful to feature during one of the safety workshops.
We value your partnership and we hope you will join us to offer your input into this critically important plan to save lives on North Dakota roads.
If you have questions, you may contact me at 701-328-4434 or [email protected].
Respectfully,
Karin Mongeon
Safety Division Director North Dakota Department of Transportation
Appendix A A

Strategic Highway Safety Plan Update 2018-2023
APPENDIX BW
orkshop Materials
APPENDIX BRegional Vision Zero Workshop Materials

Strategic Highway Safety Plan Update 2018-2023 B-1
Appendix B B
Vision Zero Workshop –Dickinson, ND North Dakota Strategic Highway Safety Plan Update April 17, 2018 WORKSHOP AGENDA 8:00 AM Registration, Coffee and Networking 8:30 AM Welcome and Introductions North Dakota’s Statewide Traffic Safety Initiative – Vision
Zero – Zero Fatalities. Zero Excuses. An Overview of North Dakota’s Strategic Highway Safety
Plan and Processes
Stakeholder Discussion: What is important to incorporate in the updated Vision Zero Plan? 9:45 – 10:00 AM Break (15 min.)
Overview of Severe Crash Data and Identification of Priority Emphasis Areas
Stakeholder Discussion: North Dakota Safety Strategies:
Infrastructure 11:45 – 1:00 PM Lunch (On Your Own) Stakeholder Discussion: North Dakota Safety Strategies
Behavioral 2:40 – 3:05 PM Stakeholder Strategy Prioritization and Break Prioritization Debrief Workshop Wrap Up: Next Steps and Staying Connected 3:30 PM Adjourn

B-2 Strategic Highway Safety Plan Update 2018-2023
B
Vision Zero Workshops Team Bios
Karin Mongeon, Safety Division Director (NDDOT) [email protected] Karin Mongeon has been the Safety Division Director for the NDDOT since 2014. Prior to this Karin was the manager of the NDDOT’s Traffic Safety Office for eight years. Karin graduated from the University of Mary in Bismarck with a bachelor’s degree in nursing. She worked as an oncology nurse before transitioning to state government where she’s been responsible for the administration of various public health and human services programs for nearly 20 year
Paul Benning, Local Government Division Director (NDDOT) [email protected]
Paul earned his Bachelor of Science degree in Civil Engineering from the North Dakota State University in 1987. He began working fulltime with the NDDOT right after college. During his career, Paul has served the NDDOT in a number of capacities, including his current position as the Director of Local Government. He has been active in helping Local Public Agencies, such as Counties and Cities for nearly 20 years. Paul is a Professional Engineer with a background in statewide county, city, and transit administrative activities.
Jane Berger, Programming Division Director (NDDOT) [email protected] Jane Berger is the Programming Division Director for the North Dakota Department of Transportation. She is a registered Professional Engineer and has 19 years of experience at the North Dakota DOT with a background in Traffic Operations, Pavement Management and Project Programming. Jane is a steering committee member for the state Strategic Highway Safety Plan and was a member of the DOT team partnering with local agencies throughout the state to develop Local Road Safety Plans
Bryon Fuchs, Assistant Local Government Engineer
Bryon is the Assistant Local Government Engineer for the North Dakota Department of Transportation. He graduated from NDSU and is a Registered Professional Engineer in the State of North Dakota. He is responsible for various funding programs that assist Local Public Agencies (LPA’S) with improving their Transportation Infrastructure (Roads and Bridges), pedestrian and bicycle facilities, access to recreational areas, and Safety Improvement Projects. He is married and has one son.
Shawn Kuntz, Traffic Operations Engineering Team Lead [email protected] Shawn is the Traffic Operations Engineering Team Leader for the NDDOT and a licensed Professional Engineer in North Dakota. Shawn represents North Dakota as a member of the AASHTO Subcommittee on Traffic Engineering. He manages the development and implementation of the Highway Safety Improvement Program in coordination with the Local Road Safety Program and the Strategic Highway Safety Plan.

B-3Strategic Highway Safety Plan Update 2018-2023
B
Vision Zero Workshops Team Bios
Scott Zainhofsky, Planning/Asset Management Director [email protected] Scott Zainhofsky is the Planning/Asset Management Division Engineer for the NDDOT. He has been in this position since 2007 and has held several positions both in the central office and a district office of the Department. Currently, Scott has the pleasure of leading a great team whose responsibilities include: long-range and modal planning, service- and asset-related investment analysis, pavement management, infrastructure-data management, rail programs, mapping, and traffic data. He has been a registered Professional Engineer in the state of North Dakota since June 2002 and holds Bachelors and Masters degrees in Civil Engineering from the University of North Dakota.
Howard Preston, Principal Transportation Engineer (CH2M now Jacobs)
[email protected] Howard Preston is a Principal Transportation Engineer at Jacobs, with more than 30 years of experience in safety improvement projects and safety studies and research. He worked in both public and private sector. He started his career with MnDOT developing MnDOT’s highway safety improvement program. After his experience at MnDOT, he worked for private engineering companies where has managed teams of transportation engineers, designers, and planners working on a wide variety of projects. During Howard’s career, he has led multiple statewide safety projects and assisted in the development of over 150 safety plans. Howard graduated from Iowa State University with a degree in Civil Engineering and is a registered Professional Engineer.
Cheri Marti, Driver Behavior Team Lead and Outreach Facilitator (CH2M now Jacobs) [email protected] Cheri Marti joined CH2M, now Jacobs, as the driver behavior specialist in 2011. Her work with Jacobs supports the driver behavior components and stakeholder engagement for traffic safety planning. Prior to joining Jacobs, Cheri served 4 years as the Minnesota Governor’s Representative for Highway Safety and the Director of the Office of Traffic Safety for the Minnesota Department of Public Safety. Highlights of her public service involve strengthening Minnesota traffic safety policy including the passage of Primary Enforcement of Seat Belt Law, DWI Ignition Interlock law, enhanced booster seat and Graduated Drivers License laws, and no text and accessing web while driving law. In addition, she worked to strengthen and provide structure to the nationally recognized Minnesota Toward Zero Deaths Program. Cheri holds a Masters degree in Adult Education and Organization Development from the University of Minnesota.
Renae Kuehl, Senior Associate (SRF Consulting Group, Inc)
Renae is a Senior Associate with SRF Consulting Group, and has more than 18 years of traffic, transportation safety, and transportation research related experience. Renae is a registered Professional Engineer and Professional Traffic Operations Engineer. She has a Bachelor of Science degree in Civil Engineering from the University of Minnesota. She has experience with a traffic safety audits, plans and analysis, including statewide safety analysis for state and county roadways.

B-4 Strategic Highway Safety Plan Update 2018-2023
B 4/17/2018
1
Vision Zero Workshop Dickinson: April 17, 2018
Karin Mongeon, NDDOTJane Berger, NDDOTCheri Marti, JacobsHoward Preston, Jacobs
Welcome and Introductions

B-5Strategic Highway Safety Plan Update 2018-2023
B4/17/2018
2
1. To deepen safety stakeholder understanding of:– North Dakota’s Vision Zero initiative and the relationship with the ND SHSP
Update.– North Dakota’s severe crashes, causal factors, and priority safety emphasis areas.– Proven traffic safety strategies to reduce severe crashes
2. To solicit stakeholder perspectives of and input to:– Safety emphasis area challenges– Safety strategies and recommended priorities
3. To expand safety stakeholder engagement in ND SHSP Implementation.
SHSP Regional Workshop Goals
8:30 AM Welcome and IntroductionsNorth Dakota’s Vision Zero InitiativeOverview of North Dakota’s Strategic Highway Safety Plan Stakeholder Discussion: What is important to incorporate in the updated Vision Zero Plan?
10:00 BreakOverview of Severe Crash Data and Identification of Priority Emphasis AreasStakeholder Discussion: Safety Strategies - Infrastructure
11:45 PM Lunch (on your own)1:00 PM Stakeholder Discussion: Safety Strategies - Behavioral
Stakeholder Strategy Prioritization and BreakPrioritization DebriefWorkshop Wrap Up: Next Steps and Staying Connected
3:30 PM Adjourn
Workshop Agenda

B-6 Strategic Highway Safety Plan Update 2018-2023
B 4/17/2018
3
1) Agenda2) Team Bios3) Participant List4) PPT Slides5) EA Table 6) EA Fact Sheets 7) Lane Departure Strategy Table8) Unsignalized Intersection Strategy Table9) Signalized Intersection Strategy Table10) Impaired Driving Strategy Table11) Unbelted Strategy Table12) Young Driver Strategy Table13) Speed/Aggressive Driving Strategy Table14) Evaluation Form
Handout Review
Forms available for Law Enforcement POST credits
ND Vision Zero Workshop – April 2018
Vision Zero Initiative

B-7Strategic Highway Safety Plan Update 2018-2023
B4/17/2018
4
What is Vision Zero?
• The State of North Dakota is calling for an end to motor vehicle crash fatalities and serious injuries through Vision Zero.
• Every life matters.• Crashes are not accidents!• Crashes are preventable.– Ninety-four percent (94%) of motor vehicle crashes are due in part to human
error.
Vision Zero Overview
Vision Zero Video

B-8 Strategic Highway Safety Plan Update 2018-2023
B 4/17/2018
5
Why Vision Zero?
• Interdisciplinary effort involving state agencies and public and private sector partners.
• Leadership commitment to a comprehensive, multidisciplinary, aggressive and proactive approach to improving safety.
• Establishes a culture of personal responsibility behind the wheel, where motor vehicle fatalities and serious injuries are recognized as preventable and no longer tolerated as acceptable.
Vision Zero applies proven strategies including:
(1) Widespread public education/outreach(2) Working with the legislature to ensure state laws represent best
practices in traffic safety(3) High visibility enforcement of existing laws(4) Technology advancements(5) Infrastructure/road safety improvements
Vision Zero Overview

B-9Strategic Highway Safety Plan Update 2018-2023
B4/17/2018
6
Technology Advancements Video
How Will We Achieve Vision Zero?
• Through the North Dakota Strategic Highway Safety Plan (SHSP) and process. An SHSP is:– A statewide, coordinated safety plan that provides a comprehensive
framework and specific goals and objectives to reduce fatalities and serious injuries on all public roads.
– A federal requirement (23 U.S.C. § 148) and a major part of the core Highway Safety Improvement Program (HSIP).
• State DOTs are responsible to meet SHSP requirements.
SHSP Relationship

B-10 Strategic Highway Safety Plan Update 2018-2023
B 4/17/2018
7
SHSP Structure
Executive Leadership Team
Steering Committee
Emphasis Area Teams
Lane Departure
Unbelted Vehicle
OccupantImpaired Driving
Speed/Aggressive
DrivingYoung Drivers Intersections
SHSP Emphasis Area Teams
• Establish EA-related goals • Frame challenges• Identify safety strategies and recommended priorities• Identify lead agency/partner for strategy implementation
*Signup sheets to get involved with behavioral EA teams will be passed around

B-11Strategic Highway Safety Plan Update 2018-2023
B4/17/2018
8
Common themes of comprehensive traffic safety programs
• Zero vision and goal setting• Leadership and safety culture• Focused safety priorities and strategies• Supporting program structure• Key partner/stakeholder engagement and communication• Technical assistance and training• Implementation and progress monitoring
SHSP Task: Vision Zero Program Framework
SHSP Update Requirements

B-12 Strategic Highway Safety Plan Update 2018-2023
B 4/17/2018
9
• North Dakota 2013 SHSP• States must complete an SHSP
update no later than 5 years from the previous approved version.
• SHSP updates must meet the same SHSP requirements and approvals.
SHSP Update
Consultative Approach• Coordination/engagement with a multi-disciplinary group of stakeholders
SHSP Update Requirements

B-13Strategic Highway Safety Plan Update 2018-2023
B4/17/2018
10
SHSP Update Requirements
Data Driven Analytical Process• Use crash data to support a three-level
prioritization exercise across both state and local road systems that identifies/prioritizes Crash Types
• Safety Strategies/Countermeasures & Facility Types (rural vs. urban, state vs. local roads, 2-lane vs. multi-lane roads, conventional roads vs. freeways, etc.)
Performance Based Short Term Goals• Adoption of performance based goals – Number & rate of fatalities, number & rate
of serious injuries & number of non-motorized (pedestrians and bicycles) fatalities and serious injuries
SHSP Update Requirements

B-14 Strategic Highway Safety Plan Update 2018-2023
B 4/17/2018
11
Multi-disciplinary• Address Education, Enforcement,
Engineering and Emergency Services
SHSP Update Requirements
New Photo – Cheri?
Special Requirements• Define High Risk Rural Roads &
develop strategies/countermeasures to address older driver & pedestrian safety
SHSP Update & Approval
SHSP Update Requirements

B-15Strategic Highway Safety Plan Update 2018-2023
B4/17/2018
12
North Dakota’s SHSP Process
Crash Analysis Select Safety Emphasis Areas
Develop Comprehensive
List of Safety Strategies
Regional Safety Workshops
Identify Short List of Critical Strategies
Identify Safety Project Categories
Update North Dakota’s SHSP
• Project Programming• Project Development• Implementation• Progress Monitoring and
Evaluation
Program Assessment
2013 SHSP Implementation: Example Highlights

B-16 Strategic Highway Safety Plan Update 2018-2023
B 4/17/2018
13
Strategy Effectiveness
• All safety strategies are NOT equal from the perspective of effectiveness or cost
• Known effectiveness about various safety strategies helps support the identification, prioritization and adoption of the most important strategies as part of the data driven process.
AASHTO Provides National Direction
• Goal of a strategic plan for highway safety is to positively impact the nation’s (and state’s) present and predicted statistics on vehicular related death and injury
• Use a data driven process• Published in 2004; implementation
is now the focus

B-17Strategic Highway Safety Plan Update 2018-2023
B4/17/2018
14
AASHTO’s Strategic Highway Safety Plan
• 22 Emphasis Areas (“Goals”)
• A “comprehensive approach” to reducing highway fatalities
• To be implemented across all jurisdictions (state, county, municipal, and tribal lands)
Safety Strategies Overview: NCHRP Report 500
• A series of comprehensive guides intended to facilitate agency implementation of SHSP objectives
• Focus is on low-cost, readily implementable strategies
• Proven Effective
• Tried
• Experimental

B-18 Strategic Highway Safety Plan Update 2018-2023
B 4/17/2018
15
Safety Strategies Overview: NHTSA’s Countermeasures That Work
• Assists State Highway Safety Offices (SHSOs) in selecting effective, science-based traffic safety countermeasures.
• Summarizes use, effectiveness, costs, and implementation time
• References research summaries & individual studies, highlighting experience and knowledge gained by others
Screening AASHTO’s 22 Key Emphasis Areas
Bicyclists
Vehicle-TrainCrashes
EMS
Improving Information Systems
North Dakota’s CEA’s
Safety Management Systems
Run-Off Road
The Critical Emphasis Areaswill represent the areas with the greatest potential to reduce the number of traffic fatalities in North Dakota.

B-19Strategic Highway Safety Plan Update 2018-2023
B4/17/2018
16
• AASHTO’s SHSP, NCHRP Report 500 Implementation Guidelines, NHTSA’s Countermeasures That Work, and input from Safety Partners.• The strategies will be screened using:
- Crash data- Effectiveness- Cost- Input from Safety Workshop
• The Selected Strategies should have the greatest potential to reduce the number of traffic fatalities.
Screening - Initial Strategies
Speeding/Aggressive Driving
Selected Strategies
Input from Safety Workshop, Crash Data, Effectiveness, and Cost
Implementation Highlight
• Recognizing over 50 percent of severe crashes occur on local roads, NDDOT partnered with counties, cities, and tribes to prepare Local Road Safety Plans for each entity– Data driven analysis to identify at-risk locations and low-cost
systemic safety projects (signing, marking, lighting) for locals to easily submit projects through NDDOT federal Highway Safety Improvement Program.
– To date 25 counties, 4 major cities, and 3 tribes have participated
– Approximately $16M in projects programmed
Infrastructure: Local Road Safety Plans

B-20 Strategic Highway Safety Plan Update 2018-2023
B 4/17/2018
17
Source: FHWA
Where can Data-Driven Safety Analysis (DDSA) be applied in the Project Development Process?
What is a Systemic Risk Assessment?
• Analytical approach identifies and prioritizes safety deficiencies on roads based on risk of crash (vs. density of crashes).
• Identifies risk factors based on roadway and traffic characteristics common to locations with fatal and injury crash histories.
• Prioritizes the road system for safety investment by documenting the number of risk factors present at each location. The greater the number of risk factors present at any location, the greater the risk and the higher the priority as a candidate for safety investment.
• Proactive deployment of safety projects on at-risk locations (vs. reacting to where crashes occur)

B-21Strategic Highway Safety Plan Update 2018-2023
B4/17/2018
18
What is the benefit of a systemic process?
• It works – it is approved by FHWA as a data-driven process to identify safety improvement projects, including those considered eligible for Highway Safety Improvement Program (HSIP) funding.
• It leads to implementation – the process has identified more than $300M of low-cost, local safety improvement projects in Minnesota.
• It allows agencies to proactively deploy safety projects on at-risk locations.
With the systemic process, the answer to “How many people have to die before you do something?” – is Zero!
• Strategies:
– Education/Outreach• Reaching people where they live, work and play
– Enforcement
– Engineering
– Emergency Medical Services
– Environmental Strategies
Driver/Passenger Behavior

B-22 Strategic Highway Safety Plan Update 2018-2023
B 4/17/2018
19
• Law enforcement conduct 11 high visibility enforcement (HVE) campaigns per year.– Click It or Ticket – 3 HVE campaigns
per year– Drive Sober or Get Pulled Over – 3 HVE
campaigns per year– Underage drinking enforcement – 3
HVE campaigns per year– U Drive. U Text. U Pay. –2 HVE
campaigns per year
• Campaigns are coupled with extensive paid, earned and social media.
Driver/Passenger Behavior – Implementation Example/Highlight
Click to add textClick to add text
Goal: To deter high-risk behavior through increased perception of being caught.
• Impaired driving HVE media – Taylor Berhow campaign• Taylor drove after drinking alcohol on October 29, 2011 and killed his three
friends. He shares his story to deter others from driving impaired.• Features TV, radio, digital and social media ads.• Has had the most extensive reach of any campaign funded to date.
Driver/Passenger Behavior - Implementation Example/Highlight

B-23Strategic Highway Safety Plan Update 2018-2023
B4/17/2018
20
Driver/Passenger Behavior
SHSP Stakeholder Engagement

B-24 Strategic Highway Safety Plan Update 2018-2023
B 4/17/2018
21
Stakeholder Engagement/Communication
• Wednesday March 21, 2018 – Fargo Dome (Fargo)
• Thursday, March 22, 2018– Ramada Grand Forks (Grand Forks)
• Tuesday, April 3, 2018– Ward County Courthouse (Minot)
• Wednesday, April 4, 2018– Ramkota (Bismarck)
• Tuesday, April 17, 2018– Dickinson City Hall (Dickinson)
• Wednesday, April 18, 2018– Ernie French Center (Williston)
Regional Workshop Dates/Locations
RSVP at https://www.surveymonkey.com/r/SHSPWorkshops

B-25Strategic Highway Safety Plan Update 2018-2023
B4/17/2018
22
– Vision Zero Executive Leadership Team and Steering Committee members– Law Enforcement – State, county, city and tribal– Health Care
• NDDoH personnel, emergency medical services providers, public health, etc.– Elected Officials
• State legislators, county board members, city council members, auditors, mayors– Transportation Agency Practitioners
• NDDOT personnel, county/city engineering, planning and road supervisors– Motor Carriers– Tribal Representatives– Judges and State Attorneys, Prosecutors– National Parks– Federal Partners – National Highway Traffic Safety Administration (NHTSA) and Federal
Highway Administration (FHWA)– Education Representatives
• Vision Zero Partner Network, drivers education instructors, insurance agencies, behavioral health, ND Safety Council, non-motorist groups, etc.
Profile of Stakeholder Involvement
Stakeholder Discussion: What is important to incorporate in the updated Vision Zero strategic safety plan?
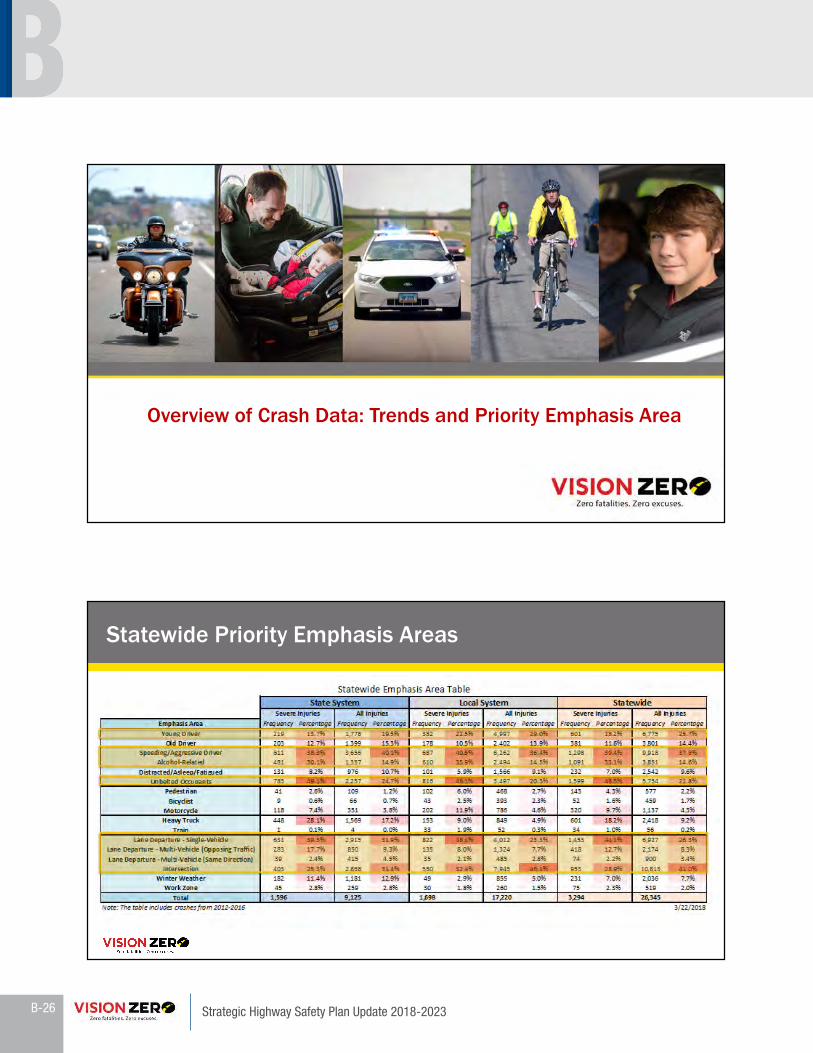
B-26 Strategic Highway Safety Plan Update 2018-2023
B 4/17/2018
23
Overview of Crash Data: Trends and Priority Emphasis Area
Statewide Priority Emphasis Areas

B-27Strategic Highway Safety Plan Update 2018-2023
B4/17/2018
24
Fatal + Severe Injury Crashes & RatesState vs. Local
2008 2009 2010 2011 2012 2013 2014 2015 2016K 45 72 52 72 83 71 63 77 57A 91 97 122 192 201 182 187 195 153K+A 136 169 174 264 284 253 250 272 210K 0.009 0.014 0.010 0.012 0.012 0.011 0.009 0.012 0.009A 0.019 0.019 0.023 0.032 0.030 0.028 0.028 0.031 0.025K+A 0.029 0.033 0.032 0.045 0.043 0.039 0.037 0.043 0.034
4,771 5,083 5,409 5,929 6,669 6,566 6,742 6,383 6,138K 51 44 40 58 64 62 58 34 45A 149 148 179 214 286 263 236 248 199K+A 200 192 219 272 350 325 294 282 244K 0.011 0.009 0.007 0.010 0.010 0.009 0.009 0.005 0.007A 0.031 0.029 0.033 0.036 0.043 0.040 0.035 0.039 0.032K+A 0.042 0.038 0.040 0.046 0.052 0.049 0.044 0.044 0.040
2,837 2,860 2,893 3,237 3,424 3,534 3,695 3,696 3,602
Analysis Year
Stat
eLo
cal
Crash Frequency
Crash Rate (per MVMT)
MVMT
Crash Frequency
Crash Rate (per MVMT)
MVMT
Fatal + Severe Injury Crashes & RatesRural vs. Urban
2008 2009 2010 2011 2012 2013 2014 2015 2016K 85 112 83 115 130 122 107 97 92A 165 158 198 279 358 330 313 311 232K+A 250 270 281 394 488 452 420 408 324K 0.016 0.020 0.014 0.017 0.017 0.016 0.014 0.013 0.013A 0.030 0.028 0.033 0.041 0.047 0.043 0.040 0.042 0.033K+A 0.046 0.047 0.047 0.058 0.064 0.060 0.053 0.055 0.046
5,426 5,701 5,998 6,799 7,648 7,596 7,869 7,386 7,000K 11 4 9 15 17 11 14 14 10A 75 87 103 127 129 115 110 132 120K+A 86 91 112 142 146 126 124 146 130K 0.002 0.001 0.002 0.002 0.002 0.001 0.002 0.002 0.001A 0.014 0.015 0.017 0.019 0.017 0.015 0.014 0.018 0.017K+A 0.016 0.016 0.019 0.021 0.019 0.017 0.016 0.020 0.019
2,182 2,242 2,304 2,367 2,445 2,504 2,567 2,693 2,740
Analysis Year
Rura
lU
rban
Crash Frequency
Crash Rate (per MVMT)
MVMT
Crash Frequency
Crash Rate (per MVMT)
MVMT

B-28 Strategic Highway Safety Plan Update 2018-2023
B 4/17/2018
25
Fatal + Severe Injury Crashes & RatesOil County vs. Non-Oil County
2008 2009 2010 2011 2012 2013 2014 2015 2016K 39 47 33 63 83 88 63 53 44A 59 83 138 224 261 232 218 206 137K+A 98 130 171 287 344 320 281 259 181K 0.019 0.021 0.013 0.019 0.020 0.022 0.015 0.013 0.013A 0.028 0.037 0.055 0.067 0.063 0.057 0.050 0.052 0.039K+A 0.047 0.057 0.069 0.086 0.083 0.079 0.065 0.065 0.052
2,091 2,270 2,495 3,330 4,126 4,046 4,338 3,984 3,482K 57 69 59 67 64 45 58 58 58A 181 162 163 182 226 213 205 237 215K+A 238 231 222 249 290 258 263 295 273K 0.027 0.030 0.024 0.020 0.016 0.011 0.013 0.015 0.017A 0.087 0.071 0.065 0.055 0.055 0.053 0.047 0.059 0.062K+A 0.114 0.102 0.089 0.075 0.070 0.064 0.061 0.074 0.078
5,516 5,673 5,808 5,836 5,967 6,054 6,099 6,095 6,258
Analysis Year
Oil
Coun
tyN
on-O
il Co
unty Crash
Frequency
Crash Rate (per MVMT)
MVMT
Crash Frequency
Crash Rate (per MVMT)
MVMT
Fatalities (Number of People) –Statewide vs. National, 5-year Rolling Average
0
5,000
10,000
15,000
20,000
25,000
30,000
35,000
40,000
0
50
100
150
200
250
2008 2009 2010 2011 2012 2013 2014 2015 2016
Nat
iona
l Fat
aliti
es
Nor
th D
akot
a Fa
talit
ies
Year
North Dakota - Historic North Dakota - 5-Year Rolling AverageNational - Historic National - 5-Year Rolling Average

B-29Strategic Highway Safety Plan Update 2018-2023
B4/17/2018
26
Fatalities and Severe Injuries (Number of People) –Non-Oil County vs. Oil County, 5-year Rolling Average
0
50
100
150
200
250
300
350
400
450
2008 2009 2010 2011 2012 2013 2014 2015 2016
Seve
re In
jurie
s
Year
Non-Oil County - Historic Non-Oil County - 5-Year Rolling AverageOil County - Historic Oil County - 5-Year Rolling Average
Fatalities and Severe Injuries (Number of People) –Local vs. State System, 5-year Rolling Average

B-30 Strategic Highway Safety Plan Update 2018-2023
B 4/17/2018
27
Fatalities and Severe Injuries (Number of People) –Urban vs. Rural, 5-year Rolling Average
Emphasis Area: Fatalities and Severe Injuries Intersection Trendline
0
50
100
150
200
250
2012 2013 2014 2015 2016
K+A
Inju
ries
Year
Historic Predicted
*Example Trendline – all Emphasis Areas are experiencing the same trend

B-31Strategic Highway Safety Plan Update 2018-2023
B4/17/2018
28
Interact with the Presentation
Via web browser, go to:
PollEv.com/srfconsulting01
Text to: 22333Message: SRFCONSULTING01
Interact with the Presentation
When a question is provided in the web browser,
check your response
Web Browser view:
When textinga response,
type the letter as seen on the slide
Text view:

B-32 Strategic Highway Safety Plan Update 2018-2023
B 4/17/2018
29
Infrastructure Safety Strategies: Lane Departure
• US 52 and a couple of other highway corridors with high severe crashes will be identified through review of crash and citation data.
• Concept of designating safety corridors– collaborative approach to bring
heightened awareness and focus to safety on specific corridors.
– 4 E’s • Enforcement, Education, Engineering, EMS
Infrastructure Strategies: Lane Departure – (E1) Safety Corridor

B-33Strategic Highway Safety Plan Update 2018-2023
B4/17/2018
30
• The designated safety corridors may receive:– signage identifying them as safety corridors – heightened enforcement of all traffic violations
occurring within the corridor– application of low cost corridor wide infrastructure
safety solutions (may include enhanced signing, pavement marking, lighting, turn lanes, etc)
– public education about the corridors
• Corridors will be monitored for effectiveness in severe crash reduction and may be undesignated after a period of time.
Infrastructure Strategies:Lane Departure – (E1) Safety Corridor
Example Sign
Crash Reduction Factor• Experimental
Typical Installation Costs• Varies ($5000 per mile to ?)
Centerline Rumble Strips
Infrastructure Strategies: Lane Departure – (D1) Rural Corridor Delineation
Crash Reduction Factor• 40% head-on/sideswipe crashes
Typical Installation Costs• $3,600 per mile

B-34 Strategic Highway Safety Plan Update 2018-2023
B 4/17/2018
31
Shoulder/Edgeline Rumble Strips
Infrastructure Strategies: Lane Departure – (A2) Rural Corridor Delineation
Crash Reduction Factor• 20% run off road crashes
Typical Installation Costs• $5,850 per mile
Delineators
Infrastructure Strategies: Lane Departure – (A3) Rural Corridor Delineation
Crash Reduction Factor• 18% to 34% non-
intersection, head-on, run-off-road, sideswipe, nighttime crash types
Typical Installation Costs• $500 per curve

B-35Strategic Highway Safety Plan Update 2018-2023
B4/17/2018
32
Infrastructure Strategies: Lane Departure – (A6) Rural Corridor Shoulder Improvements
Crash Reduction Factor• 20% to 30% run-off-the-road
crashes (with shoulder rumble) (2’ only)
Typical Installation Costs• $54,000 per mile + $5,850
per mile (for Edge Rumble)
Shoulder Paving
Infrastructure Strategies: Lane Departure – (A6) Rural Corridor Shoulder Improvements
Crash Reduction Factor• 5% to 10%
Typical Installation Costs• $10,000 to $20,000 per
mile
Eliminating Drop Offs

B-36 Strategic Highway Safety Plan Update 2018-2023
B 4/17/2018
33
Infrastructure Strategies: Lane Departure – (D2) Center Buffer between Opposing Lanes
Crash Reduction Factor• 50% for all crashes &
100% for head-on crashes
Typical Installation Costs• $150,000 to $500,000
per mile
Infrastructure Strategies:Lane Departure – (D2) Road Diet (3- and 5-Lane Conversions)
Typical Installation Costs• $48,000 per mile [three-lane]
+$54,000 per mile [five-lane] +$36,000 per signalized intersection for updates (for example, loop and signal head placement)
Crash Reduction Factor• 30% to 50%
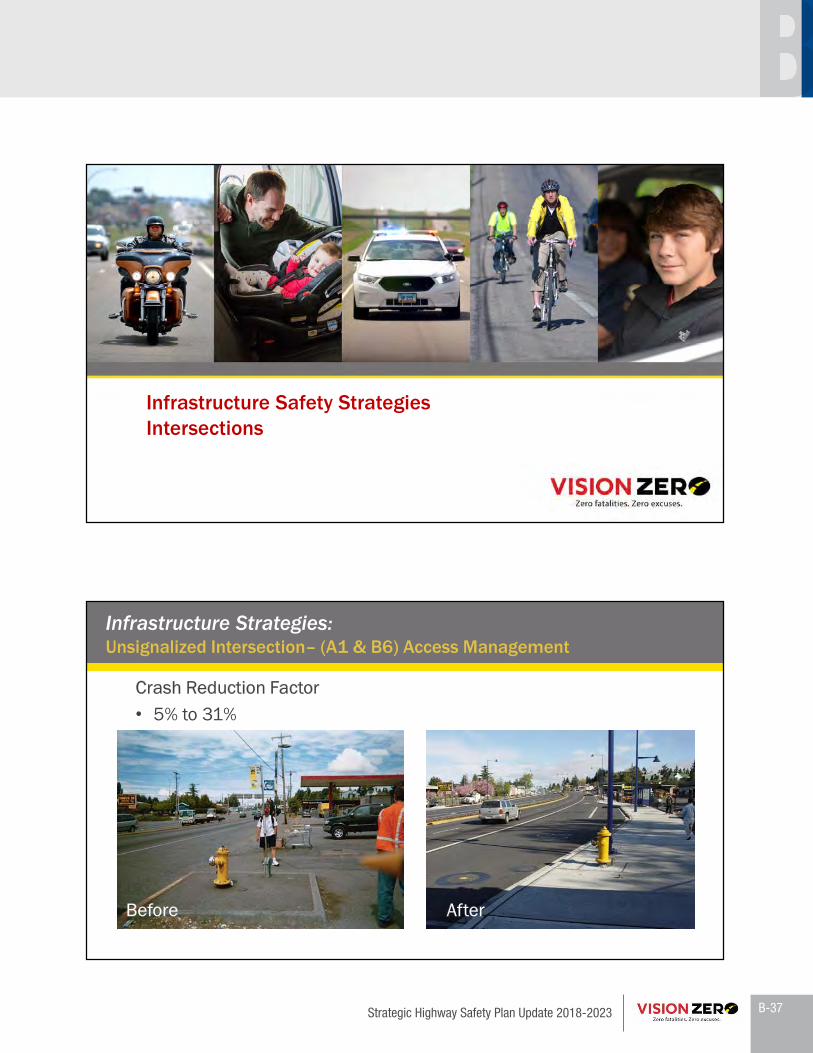
B-37Strategic Highway Safety Plan Update 2018-2023
B4/17/2018
34
Infrastructure Safety StrategiesIntersections
Infrastructure Strategies: Unsignalized Intersection– (A1 & B6) Access Management
Crash Reduction Factor• 5% to 31%
Before After

B-38 Strategic Highway Safety Plan Update 2018-2023
B 4/17/2018
35
Infrastructure Strategies: Unsignalized Intersection– (D4) Urbanization (Make it Feel Urban)
Before After
Crash Reduction Factor• Not Available (Tried)
Typical Installation Costs• $500,000 to
$1,000,000 per mile
Infrastructure Strategies: Unsignalized Intersection– (B11) Restricted Crossing U-Turn (RCUT) Intersections
Crash Reduction Factor• 17% all crashes• 100% angle crashes
Typical Installation Costs• $750,000 per intersection
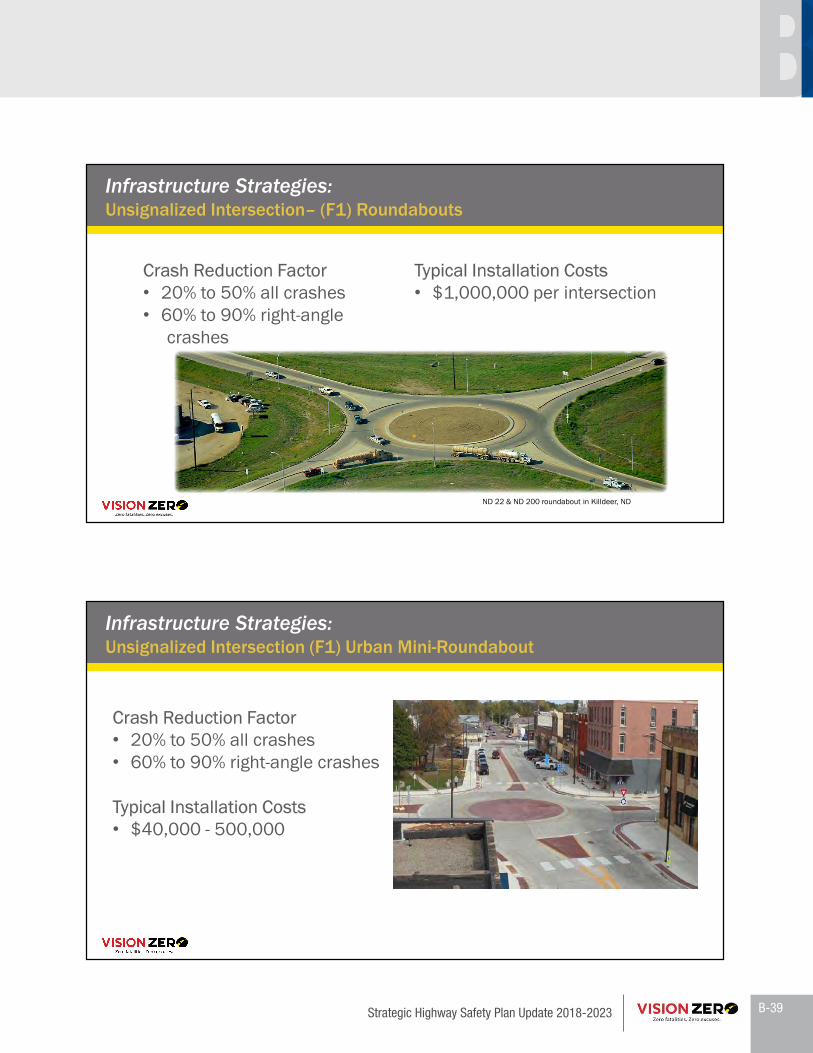
B-39Strategic Highway Safety Plan Update 2018-2023
B4/17/2018
36
Infrastructure Strategies: Unsignalized Intersection– (F1) Roundabouts
Crash Reduction Factor• 20% to 50% all crashes• 60% to 90% right-angle
crashes
Typical Installation Costs• $1,000,000 per intersection
ND 22 & ND 200 roundabout in Killdeer, ND
Infrastructure Strategies: Unsignalized Intersection (F1) Urban Mini-Roundabout
Crash Reduction Factor• 20% to 50% all crashes• 60% to 90% right-angle crashes
Typical Installation Costs• $40,000 - 500,000

B-40 Strategic Highway Safety Plan Update 2018-2023
B 4/17/2018
37
Infrastructure Strategies:Unsignalized Intersection – (D3) Rural Intersection Conflict Warning System (RICWS)
Crash Reduction Factor• 50% all crashes• 75% severe right angle
crashes
Typical Installation Costs• $75,000 to $125,000
per intersection
Infrastructure Strategies: Unsignalized Intersection– (D1) Traffic Calming - Zig Zag Pavement Markings
Crash Reduction Factor• Not Available
Typical Installation Costs• $2,850

B-41Strategic Highway Safety Plan Update 2018-2023
B4/17/2018
38
Infrastructure Safety StrategiesLRSP Projects – Rural and Urban Areas
Program Focus: Deployment of proven, effective & low cost strategies
Infrastructure Strategies:Local Road Safety Program – Priority Safety Strategies
Urban
• Traffic Signal Confirmation Lights• Curb Extensions
Rural
• Enhanced Edgelines• Intersection Street Lighting• Chevrons

B-42 Strategic Highway Safety Plan Update 2018-2023
B 4/17/2018
39
Enhanced Edgelines (6” & 8”)
Infrastructure Strategies: Lane Departure – (A2) LRSP Projects (Rural)
Crash Reduction Factor• 10% to 45% all rural
serious crashes (6”)
Typical Installation Costs• $2,000 per mile
Roadway with 8-in edgeline
Roadway with 4-in edgeline
Intersection Destination Lighting
Infrastructure Strategies: Unsignalized Intersection – (D2) LRSP Projects (Rural)
Crash Reduction Factor• 25% to 40% of
nighttime crashes
Typical Installation Costs• $10,000 per light

B-43Strategic Highway Safety Plan Update 2018-2023
B4/17/2018
40
Chevrons
Infrastructure Strategies: Lane Departure – (A3) LRSP Projects (Rural)
Crash Reduction Factor• 20% to 30%
Typical Installation Costs• $3,960 per curve
Traffic Signal Confirmation Lights
Infrastructure Strategies: Signalized Intersection – (E1) LRSP Projects (Urban)
Crash Reduction Factor• 25% to 84% in violations• 9% angle crashes
Typical Installation Costs• $1,200 per two approaches

B-44 Strategic Highway Safety Plan Update 2018-2023
B 4/17/2018
41
Curb Extension
Infrastructure Strategies: Unsignalized Intersection – (B10) LRSP Projects (Urban)
Crash Reduction Factor• Increase in vehicles
yielding to pedestrians
Typical Installation Costs• $ 36,000 per corner
Behavioral Safety Strategies: Impaired Driving

B-45Strategic Highway Safety Plan Update 2018-2023
B4/17/2018
42
• 33% of severe injuries • 55% severe injuries, younger drivers age 20-39; 69%
male drivers• 63% of severe crashes unbelted • 45% of fatalities involve an impaired driver vs. 28% US • 36% of impaired-driving fatalities involved driver BAC of
.15 > vs. 19% US
Behavioral Strategies:North Dakota Impaired Facts
Good News – ND Impaired-related fatalities declining since 2012What more will ND do to continue the downward trend line?
Capitalize on the “teachable moment” following a crash • Patients are screened for alcohol use
problems• Brief interventions counsel patients on
alcohol’s affect on injury risk & overall health
Proven: Reduces drinking and self-reported drinking and driving
Behavioral Strategies: Impaired – (A3) Employ alcohol screening and brief interventions in health care settings

B-46 Strategic Highway Safety Plan Update 2018-2023
B 4/17/2018
43
• Prevent serving/selling to intoxicated or underage customers • Server/seller training - Sell, prepare, dispense, serve or otherwise
deliver alcoholic beverages statewide.
Behavioral Strategies: Impaired - (A4) Mandate alcohol server/seller training as a condition of alcohol licensure.
HVE + Checkpoints Goal: Deterrence through raising the perceived risk of arrest
• Highly visible enforcement + strong public outreach
• Multiple jurisdictions, multiple squads• Paid, earned/free, and social media
outreach (pre and post-enforcement)
Proven: Sustained highly visible enforcement or numerous checkpoints reduce alcohol-related fatalities 11% - 20%.
Behavioral Strategies: Impaired – (B1) Strengthen public perceived risk of arrest through highly visible enforcement (HVE); (B2) Maintain high visibility sobriety checkpoints

B-47Strategic Highway Safety Plan Update 2018-2023
B4/17/2018
44
ND 24/7 Sobriety Program: • No alcohol use, no bars, 24/7 • Sobriety testing with law enforcement 2X
day, 7 days/week • Monitoring: Breath testing, SCRAM
bracelet, drug patch • Avoid jail while successfully in the
program
Proven: In ND, those successfully completing program, 96.1% did not reoffend.
Behavioral Strategies: Impaired – (C1) Strengthen repeat DUI offender monitoring
ND’s Strengthened DUI law: • Increased fines for DUI
convictions• Increased jail time for
second and subsequent DUI offenses
• Requires repeat DUI offenders to participate in ND’s 24/7 Sobriety Program for one year
Behavioral Strategies: Impaired – (C1) Strengthen repeat DUI offender monitoring

B-48 Strategic Highway Safety Plan Update 2018-2023
B 4/17/2018
45
Highly intensive supervision for high-risk DUI offenders• Regular case reviews - judge, prosecutor,
probation and treatment • Regular offender court appearances • Frequent urine testing • Random visits from law enforcement • Treatment required• Community serviceProven: Reduces re-offense offense by approx. 50%; Georgia study – DUI Court 9% re-offended vs. 24% traditional programs
Behavioral Strategies:Impaired – (C2) Expand DUI Courts
Separates the drinking driver from the vehicle• Analyzes a driver’s breath; disables the engine if alcohol detected• A condition to regain driving privileges• Provides a pathway for legal drivingProven: Just released - IIHS Study: II reduced drunk crash fatalities by 16%. Since 2006 and "All-Offender" law, New Mexico reduced drunk driving fatalities by 22%.
Behavioral Strategies:Impaired – (C3) Implement an Ignition Interlock Program

B-49Strategic Highway Safety Plan Update 2018-2023
B4/17/2018
46
Swift and certain penalty for DUI vs. lengthy and uncertain outcomes of criminal process • Administrative license suspension (ALS)
or revocation (ALR) • Automatic sanction for BAC or drug test
refusal and BAC test failure• Arresting officer takes license • Immediate penalty - no proof of guilt
required• Serves as a strong deterrentProven: ALS/ALR has reduced alcohol-related fatal crash involvement by 5%
Behavioral Strategies: Impaired – (C7) Conduct a comprehensive assessment of administrative licensing sanctions for both alcohol and drug-impaired driving.
Behavioral Safety Strategies: Occupant Protection/Belt Use
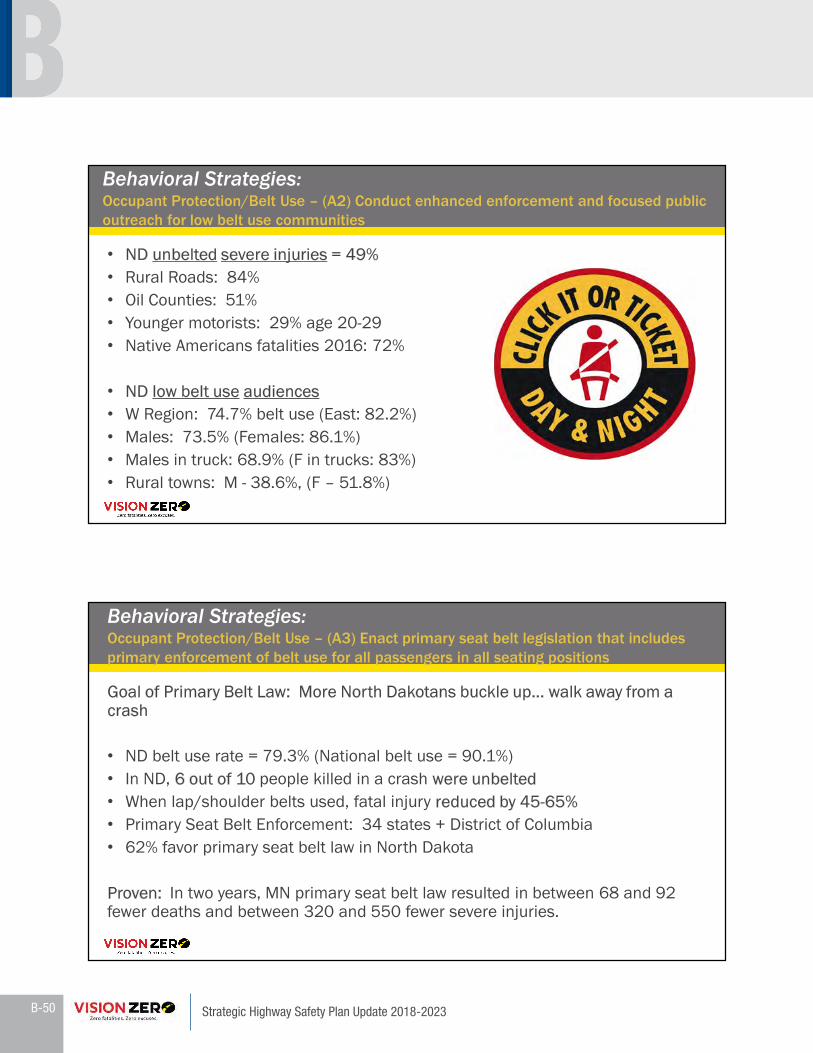
B-50 Strategic Highway Safety Plan Update 2018-2023
B 4/17/2018
47
• ND unbelted severe injuries = 49%• Rural Roads: 84%• Oil Counties: 51%• Younger motorists: 29% age 20-29• Native Americans fatalities 2016: 72%
• ND low belt use audiences• W Region: 74.7% belt use (East: 82.2%)• Males: 73.5% (Females: 86.1%)• Males in truck: 68.9% (F in trucks: 83%)• Rural towns: M - 38.6%, (F – 51.8%)
Behavioral Strategies: Occupant Protection/Belt Use – (A2) Conduct enhanced enforcement and focused public outreach for low belt use communities
Goal of Primary Belt Law: More North Dakotans buckle up… walk away from a crash
• ND belt use rate = 79.3% (National belt use = 90.1%) • In ND, 6 out of 10 people killed in a crash were unbelted• When lap/shoulder belts used, fatal injury reduced by 45-65%• Primary Seat Belt Enforcement: 34 states + District of Columbia• 62% favor primary seat belt law in North Dakota
Proven: In two years, MN primary seat belt law resulted in between 68 and 92 fewer deaths and between 320 and 550 fewer severe injuries.
Behavioral Strategies: Occupant Protection/Belt Use – (A3) Enact primary seat belt legislation that includes primary enforcement of belt use for all passengers in all seating positions
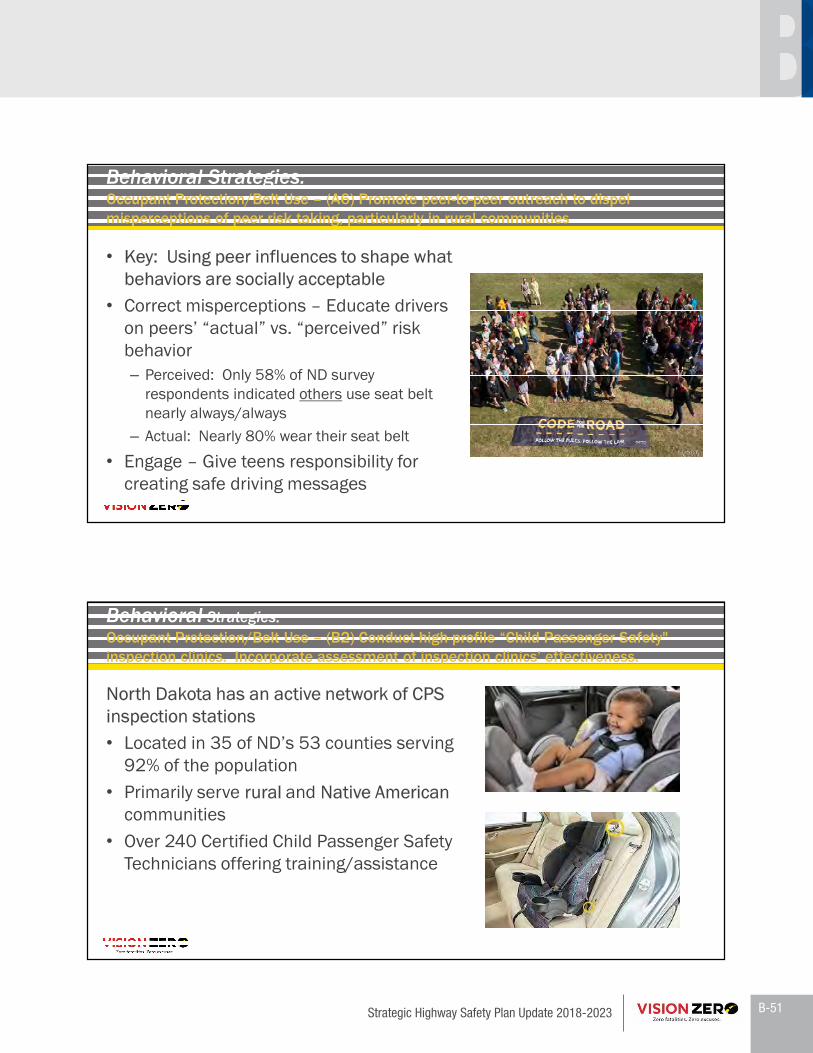
B-51Strategic Highway Safety Plan Update 2018-2023
B4/17/2018
48
• Key: Using peer influences to shape what behaviors are socially acceptable
• Correct misperceptions – Educate drivers on peers’ “actual” vs. “perceived” risk behavior– Perceived: Only 58% of ND survey
respondents indicated others use seat belt nearly always/always
– Actual: Nearly 80% wear their seat belt
• Engage – Give teens responsibility for creating safe driving messages
Behavioral Strategies: Occupant Protection/Belt Use – (A6) Promote peer-to-peer outreach to dispel misperceptions of peer risk taking, particularly in rural communities
North Dakota has an active network of CPS inspection stations• Located in 35 of ND’s 53 counties serving
92% of the population• Primarily serve rural and Native American
communities• Over 240 Certified Child Passenger Safety
Technicians offering training/assistance
Behavioral Strategies: Occupant Protection/Belt Use – (B2) Conduct high-profile “Child Passenger Safety" inspection clinics. Incorporate assessment of inspection clinics’ effectiveness.

B-52 Strategic Highway Safety Plan Update 2018-2023
B 4/17/2018
49
Behavioral Safety Strategies: Young Driver
Insurance Institute for Highway Safety - GDL calculatorEstimates the impact of strengthening key graduated driver licensing provisions on fatal crash rates among young drivers for each state.• A4 – Min. age of 15 for permit = 13% reduction in ND fatal crash rate• A6 – Implement passenger restrictions: 1 = 7% reduction in ND fatal rate
0 = 21% reduction• A8 – Min age of 16 for restricted license = 13% reduction in ND fatal rate
Min age of 17 for restricted license = 25% reduction
http://www.iihs.org/iihs/topics/laws/gdl_calculator?topicName=teenagers
Behavioral Strategies: Young Driver – (A) Enhance Graduated Driver Licensing

B-53Strategic Highway Safety Plan Update 2018-2023
B4/17/2018
50
Parent component helps to actively engage parents and to understand:• Their role in monitoring/supervising
their teen’s skill development • Teen driving risks and • GDL safety provisions and their role• How to promote effective
communication with their teen
Behavioral Strategies: Young Driver - (C1) Require parent education as a driver education classroom component
• Hands-Free Law: 5 states + D.C.; all are primary enforcement laws• Teen drivers age 15-19, 43% text while
driving, 61% read texts while driving (Teen Driver Survey, 2012)• 91% of college students reported to have
sent text messages while driving (He et al., 2015).• Young drivers, aged 18-20, are involved in
more crashes involving phone usage while driving, than any other age group (NHTSA).
Behavioral Strategies:Young Driver – (B4) Enact "hands-free" law to aid enforcement.
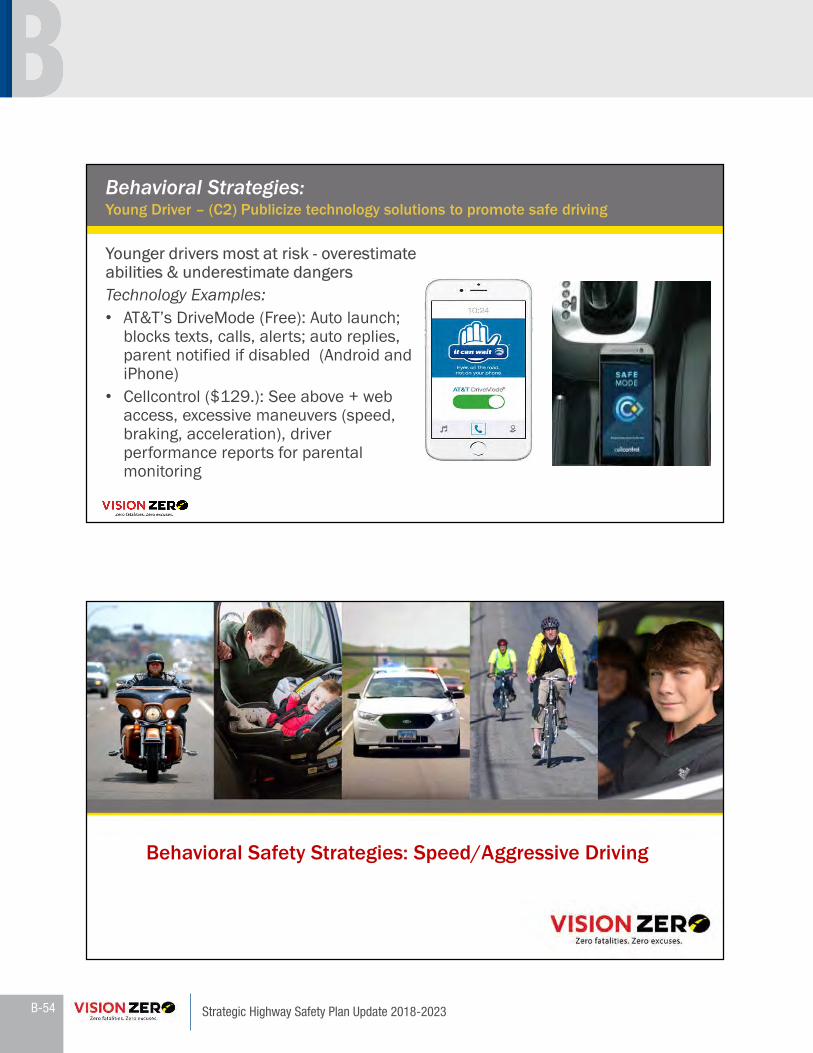
B-54 Strategic Highway Safety Plan Update 2018-2023
4/17/2018
51
Younger drivers most at risk - overestimate abilities & underestimate dangers Technology Examples: • AT&T’s DriveMode (Free): Auto launch;
blocks texts, calls, alerts; auto replies, parent notified if disabled (Android and iPhone)
• Cellcontrol ($129.): See above + web access, excessive maneuvers (speed, braking, acceleration), driver performance reports for parental monitoring
Behavioral Strategies: Young Driver – (C2) Publicize technology solutions to promote safe driving
Behavioral Safety Strategies: Speed/Aggressive Driving
B
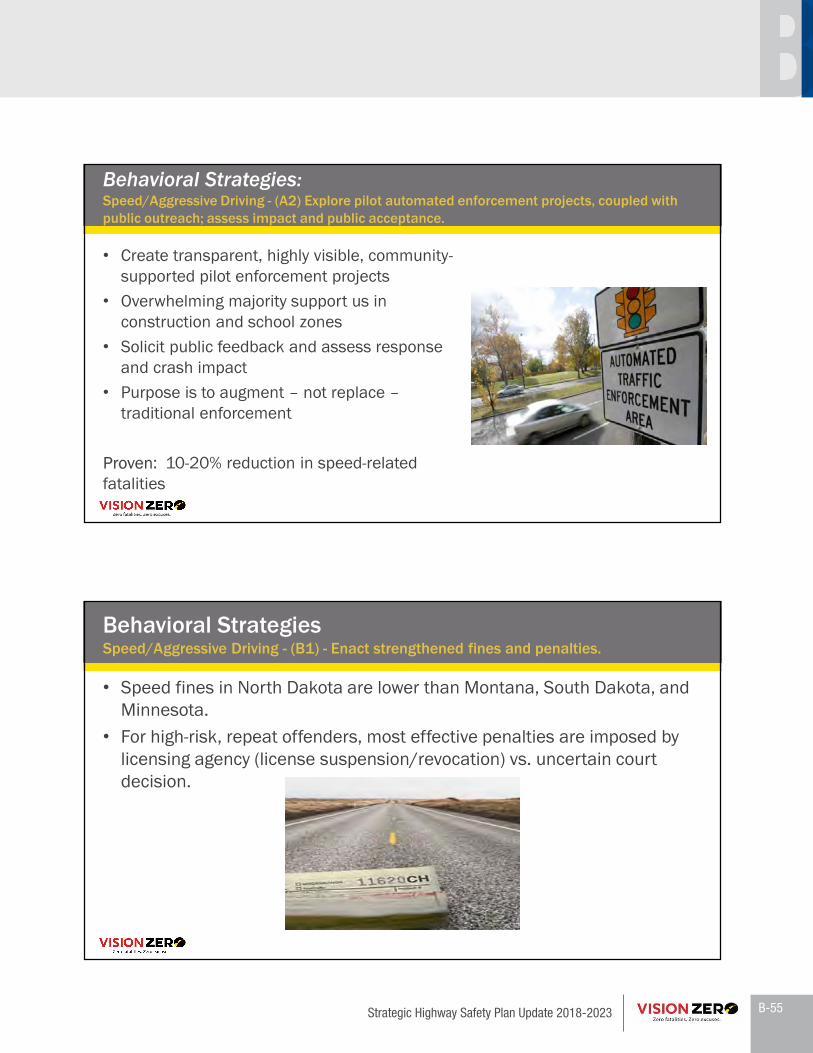
B-55Strategic Highway Safety Plan Update 2018-2023
4/17/2018
52
• Create transparent, highly visible, community-supported pilot enforcement projects
• Overwhelming majority support us in construction and school zones
• Solicit public feedback and assess response and crash impact
• Purpose is to augment – not replace –traditional enforcement
Proven: 10-20% reduction in speed-related fatalities
Behavioral Strategies: Speed/Aggressive Driving - (A2) Explore pilot automated enforcement projects, coupled with public outreach; assess impact and public acceptance.
• Speed fines in North Dakota are lower than Montana, South Dakota, and Minnesota.
• For high-risk, repeat offenders, most effective penalties are imposed by licensing agency (license suspension/revocation) vs. uncertain court decision.
Behavioral StrategiesSpeed/Aggressive Driving - (B1) - Enact strengthened fines and penalties.
B

B-56 Strategic Highway Safety Plan Update 2018-2023
4/17/2018
53
Stakeholder Strategy Prioritization
Prioritization Debrief
B

B-57Strategic Highway Safety Plan Update 2018-2023
4/17/2018
54
• Vision Zero Workshops March 21 and 22 April 3 and 4– April 17 and 18
• May 2018 - Workshop input shared with Vision Zero/SHSP Executive and Steering Committees
• July 1, 2018 - Draft Vision Zero plan/SHSP for stakeholder review and comment
• August 1, 2018 – Final Vision Zero plan/SHSP submitted to the Federal Highway Administration (FHWA) North Dakota Division for approval
• October 31, 2018 – Vision Zero Framework• Stakeholder involvement for plan implementation• Sign up to be part of an EA team
Next Steps
Karin MongeonSafety Division DirectorNorth Dakota Department of [email protected]
Thank you for your participation!
We value your feedback.Please complete the workshop evaluation – last page in your folder.
Questions?
B

B-58 Strategic Highway Safety Plan Update 2018-2023
ND Statewide Priority Emphasis Areas
Emphasis Area Frequency Percentage Frequency Percentage Frequency Percentage Frequency Percentage Frequency Percentage Frequency PercentageYoung Driver 219 13.7% 1,778 19.5% 382 22.5% 4,997 29.0% 601 18.2% 6,775 25.7%
Old Driver 203 12.7% 1,399 15.3% 178 10.5% 2,402 13.9% 381 11.6% 3,801 14.4%Speeding/Aggressive Driver 611 38.3% 3,656 40.1% 687 40.5% 6,262 36.4% 1,298 39.4% 9,918 37.6%
Alcohol-Related 481 30.1% 1,357 14.9% 610 35.9% 2,494 14.5% 1,091 33.1% 3,851 14.6%Distracted/Asleep/Fatigued 131 8.2% 976 10.7% 101 5.9% 1,566 9.1% 232 7.0% 2,542 9.6%
Unbelted Occupants 783 49.1% 2,257 24.7% 816 48.1% 3,497 20.3% 1,599 48.5% 5,754 21.8%Pedestrian 41 2.6% 109 1.2% 102 6.0% 468 2.7% 143 4.3% 577 2.2%
Bicyclist 9 0.6% 66 0.7% 43 2.5% 393 2.3% 52 1.6% 459 1.7%Motorcycle 118 7.4% 351 3.8% 202 11.9% 786 4.6% 320 9.7% 1,137 4.3%Heavy Truck 448 28.1% 1,569 17.2% 153 9.0% 849 4.9% 601 18.2% 2,418 9.2%
Train 1 0.1% 4 0.0% 33 1.9% 52 0.3% 34 1.0% 56 0.2%Lane Departure - Single-Vehicle 631 39.5% 2,915 31.9% 822 48.4% 4,012 23.3% 1,453 44.1% 6,927 26.3%
Lane Departure - Multi-Vehicle (Opposing Traffic) 283 17.7% 850 9.3% 135 8.0% 1,324 7.7% 418 12.7% 2,174 8.3%Lane Departure - Multi-Vehicle (Same Direction) 39 2.4% 415 4.5% 35 2.1% 485 2.8% 74 2.2% 900 3.4%
Intersection 403 25.3% 2,868 31.4% 550 32.4% 7,945 46.1% 953 28.9% 10,813 41.0%Winter Weather 182 11.4% 1,181 12.9% 49 2.9% 855 5.0% 231 7.0% 2,036 7.7%
Work Zone 45 2.8% 259 2.8% 30 1.8% 260 1.5% 75 2.3% 519 2.0%Total 1,596 9,125 1,698 17,220 3,294 26,345
Note: The table includes crashes from 2012-2016 3/22/2018
Statewide Emphasis Area TableState System Local System Statewide
Severe Injuries All Injuries Severe Injuries All Injuries Severe Injuries All Injuries
B

B-59Strategic Highway Safety Plan Update 2018-2023
Lane Departure Strategies - 58% of all severe injuries during 5-year period
Objectives Strategies
Relative Cost to Implement and
Operate Effectiveness Included in 2013 SHSP
A - Keep vehicles from encroaching on the roadside
A1 - Install shoulder rumble strips Low Tried X
A2 - Install edge lines "profile marking", edge line rumble strips, modified shoulder rumble strips, 6-inch edge line, or embedded wet-reflective pavement markings on section with narrow or no paved shoulders
Low Experimental
X
A3 - Provide enhanced shoulders, lighting, delineation (for example, Chevrons), or pavement markings for sharp horizontal curves Low Tried / Proven X
A4 - Provide improved highway geometry for horizontal curves Moderate Proven X
A5 - Provide skid-resistance pavement surfaces Moderate Proven X
A6 - Apply shoulder treatments *Eliminate shoulder drop-offs from paved road to unpaved shoulder *Shoulder edge *Widen and/or pave shoulders
Low Experimental Proven
X
B - Minimize the likelihood of crashing into an object or overturning if the vehicle travels off the shoulder
B1 - Design safer slopes and ditches to prevent rollovers Moderate Proven X
B2 - Remove/relocate objects in hazardous locations Moderate to High Proven X
C - Reduce the severity of the crash C1 - Improve design and application of barrier and attenuation systems Moderate to High Tried X
D - Reduce the likelihood of a head-on vehicles collision
D1 - Install centerline rumble strips for two-lane roads Low Proven X
D2 – Install center buffers between opposing lanes Moderate to High Tried
D3 - Install cable median barrier for narrow-width medians & multilane roads Moderate to High Proven X
E – Reduce number and severity of crashes
E1 – Designate as Safety Corridor - heightened enforcement PLUS implementation of corridor wide, low-cost infrastructure safety solutions Moderate to High Tried
B

B-60 Strategic Highway Safety Plan Update 2018-2023
Unsignalized Intersection Strategies - 29% of all severe injuries during 5-year period
Objectives Strategies Relative Cost to Implement
and Operate Effectiveness Included in 2013 SHSP
A - Improve management of access near unsignalized intersections
A1 - Implement driveway closure/relocations (Access Management) Moderate Tried X
B - Reduce the frequency and severity of intersection conflicts through geometric design improvements
B1 - Provide left-turn lanes at intersections Moderate Proven X
B2 - Provide offset left-turn lanes at intersections Moderate to High Tried X
B3 - Provide acceleration lanes at divided highway intersections Moderate Tried X
B4 - Provide right-turn lanes at intersections Moderate Proven X
B5 - Provide offset right-turn lanes at intersections Moderate to High Tried X
B6 - Channelize or close median openings to restrict or eliminate turning maneuvers (Access Management) Low Tried X
B7 - Close or relocate "high-risk" intersections High Tried X
B8 - Convert Radial T Intersections High Tried
B9 - Realign intersection approaches to reduce or eliminate intersection skew High Proven X
B10 - Improve pedestrian and bicycle facilities to reduce conflicts between motorists and non-motorists
(Curb Extensions & Medians) Moderate Proven X
B11– Convert Divided Intersections to Restricted Crossing U-Turn (RCUT) Moderate to High Proven
B

B-61Strategic Highway Safety Plan Update 2018-2023
B Unsignalized Intersection Strategies - 29% of all severe injuries during 5-year period
Objectives Strategies Relative Cost to Implement
and Operate Effectiveness Included in 2013 SHSP
C - Improve sight distance at unsignalized intersections
C1 - Clear sight triangle on stop- or yield-controlled approaches to intersections, including snow removal Low Tried X
D - Improve driver awareness of intersections as viewed from the intersection approach
D1 - Improve visibility of intersections by providing enhanced signing, delineation, or pavement markings/messages Low Tried X
D2 - Improve visibility of intersections by providing appropriate street lighting Moderate to High Proven X
D3 - Install larger regulatory and warning signs at intersections, including the use of dynamic warning signs at appropriate intersections
(LED Stop Signs & Dynamic Intersection Conflict Warning Systems) (Dynamic Speed Feedback Signs)
Low to Moderate Tried X
D4 – Urbanization - Make it feel urban (curb & gutter, street lights, sidewalks, etc.) Moderate to High Tried
F - Choose appropriate intersection traffic control to minimize crash frequency and severity
F1 - Construct roundabouts at appropriate locations High Proven X
F2 – Convert to All-Way Stop Low Tried

B-62 Strategic Highway Safety Plan Update 2018-2023
BSignalized Intersection Strategies - 29% of all severe injuries during 5-year period
Objectives Strategies Relative Cost to Implement
and Operate Effectiveness Included in 2013 SHSP
A - Reduce frequency and severity of intersection conflicts through traffic control and operational improvements
A1 - Employ multiphase signal operation
(including Flashing Yellow Arrows) Low Tried / Proven X
A2 - Optimize clearance intervals Low Proven X
A3 - Restrict or eliminate turning maneuvers (including right turns on red) Low Tried X
A4 - Employ signal coordination along a corridor or route Moderate Proven X
A5 - Provide countdown timers, advanced walk phase, and other low-cost pedestrian/bicycle facility improvements Low Tried / Proven X
B - Reduce frequency and severity of intersection conflicts through geometric improvements
B1 - Provide/improve left-turn channelization Moderate Proven X
B2 - Provide/improve right-turn channelization Moderate Proven X
B3 - Improve geometry of pedestrian and bicycle facilities Low Tried / Proven X
B4 – Convert to Signalized Restricted Crossing U-Turn High Tried
B5 – Convert T Intersections to Continuous Green T Moderate to High Tried
D - Improve driver awareness of intersections and signal control
D1 - Improve visibility of signals (overhead indications, 12" lenses, background shields, LED's) and signs (mast arm mounted street names) at intersections Low Tried X
E - Improve driver compliance with traffic control devices
E1 - Supplement conventional enforcement of red-light running with confirmation lights; include a public information campaign to increase awareness and compliance
Low Tried X
F - Improve access management near signalized intersections
F1 - Restrict access to properties using driveway closures or turn restrictions Low Tried X
F2 - Restrict cross-median access near intersections Low Tried X
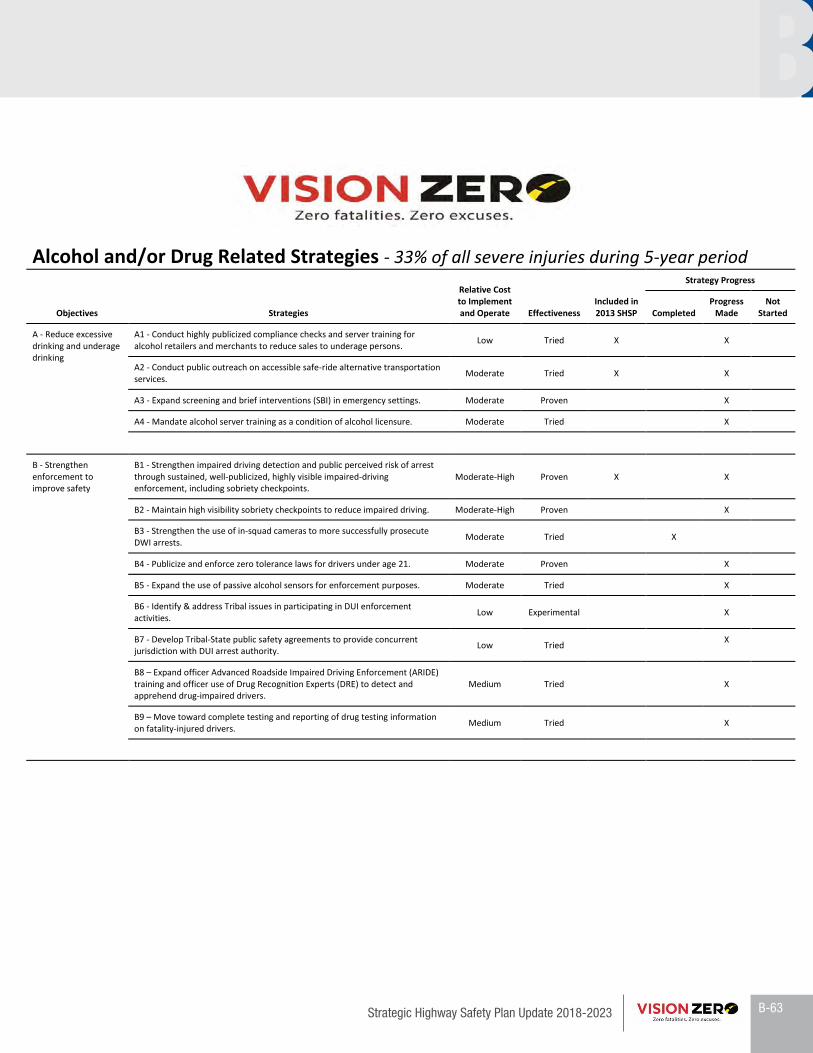
B-63Strategic Highway Safety Plan Update 2018-2023
BAlcohol and/or Drug Related Strategies - 33% of all severe injuries during 5-year period
Objectives Strategies
Relative Cost to Implement and Operate Effectiveness
Included in 2013 SHSP
Strategy Progress
Completed Progress
Made Not
Started
A - Reduce excessive drinking and underage drinking
A1 - Conduct highly publicized compliance checks and server training for alcohol retailers and merchants to reduce sales to underage persons. Low Tried X X
A2 - Conduct public outreach on accessible safe-ride alternative transportation services. Moderate Tried X X
A3 - Expand screening and brief interventions (SBI) in emergency settings. Moderate Proven X
A4 - Mandate alcohol server training as a condition of alcohol licensure. Moderate Tried X
B - Strengthen enforcement to improve safety
B1 - Strengthen impaired driving detection and public perceived risk of arrest through sustained, well-publicized, highly visible impaired-driving enforcement, including sobriety checkpoints.
Moderate-High Proven X X
B2 - Maintain high visibility sobriety checkpoints to reduce impaired driving. Moderate-High Proven X
B3 - Strengthen the use of in-squad cameras to more successfully prosecute DWI arrests. Moderate Tried X
B4 - Publicize and enforce zero tolerance laws for drivers under age 21. Moderate Proven X
B5 - Expand the use of passive alcohol sensors for enforcement purposes. Moderate Tried X
B6 - Identify & address Tribal issues in participating in DUI enforcement activities. Low Experimental X
B7 - Develop Tribal-State public safety agreements to provide concurrent jurisdiction with DUI arrest authority. Low Tried X
B8 – Expand officer Advanced Roadside Impaired Driving Enforcement (ARIDE) training and officer use of Drug Recognition Experts (DRE) to detect and apprehend drug-impaired drivers.
Medium Tried X
B9 – Move toward complete testing and reporting of drug testing information on fatality-injured drivers. Medium Tried X

B-64 Strategic Highway Safety Plan Update 2018-2023
BAlcohol and/or Drug Related Strategies - 33% of all severe injuries during 5-year period
Objectives Strategies
Relative Cost to Implement and Operate Effectiveness
Included in 2013 SHSP
Strategy Progress
Completed Progress
Made Not
Started
C – Prosecute, impose sanctions on, and treat impaired offenders
C1 - Strengthen repeat DWI offender monitoring programs. High Proven X
C2 - Expand high-supervision DUI Courts for repeat offenders. High Proven X
C3 - Implement an Ignition Interlock program. Moderate Proven X X
C4 - Remove the option for BAC Test refusal by making refusal a criminal offense. Low Proven X X
C5 - Pursue increased penalties for high BAC offenders. Low Proven X X
C6 - Explore limiting the scope of administrative hearings to relevant facts and issues. Low Tried X
C7 - Conduct a comprehensive assessment of administrative licensing sanctions for both alcohol and drug-impaired driving. Low Proven/Tried X X
C8 - Educate prosecutors and law enforcement on the importance of investigating and prosecuting impaired and drugged-driving cases. Low Tried X
C9 - Identify approaches to effectively educate judges on DUI and drug enforcement protocol and the importance of investigating and prosecuting impaired driving cases.
Low Tried X
C10 – Enhance training for prosecutors in the successful prosecution of drug-impaired drivers. Low Tried X

B-65Strategic Highway Safety Plan Update 2018-2023
BUnbelted Vehicle Occupants Strategies – 49% of all server injuries during 5-year period
Objectives Strategies
Relative Cost to Implement and Operate Effectiveness
Included in 2013 SHSP
Strategy Progress
Completed Progress
Made Not
Started
A - Maximize use of occupant restraints by all vehicle occupants
A1 - Conduct statewide high visibility and highly publicized targeted enforcement campaigns to maximize belt and child restraint use, including nighttime enforcement.
Moderate-High Proven X X
A2 - Conduct enhanced enforcement and focused public outreach for low belt use communities including rural areas and North Dakota’s western region as well as low belt use audiences.
Moderate-High Proven X
A3 - Enact primary seat belt legislation that includes primary enforcement of belt use for all passengers in all seating positions. Low Proven X X
A4 - Strengthen penalties for lack of seat belt use. Low Tried X X
A5 - Conduct targeted and highly publicized enforcement for drivers under 18 at school locations. Moderate Proven X
A6 - Promote peer-to-peer outreach to dispel misperceptions of peer risk taking, particularly in rural communities. Low Proven X
A7 - Conduct enforcement outreach to tribal governments to enforce tribal primary seatbelt law and outreach to rural law enforcement to enforce secondary seatbelt law.
Low Tried X
A8 - Conduct outreach on unbelted risks and OP benefits to educational institutions including elementary schools in geographical areas with low belt use and tribal colleges.
Moderate Experimental X
B - Insure that restraints, especially child and infant restraints, are properly used
B1 - Strengthen child booster safety law for children up to age 8. Low Proven X
B2 - Conduct high-profile “Child Passenger Safety" inspection clinics events at multiple community locations to educate on the proper use of restraint devices. Incorporate assessment of inspection clinics’ effectiveness to affect proper child restraint.
Low Proven X
B3 - Promote statewide education for rear-facing child restraint through age 2 and other child restraint best practices (e.g., booster seat until age 9, transport children 12 and younger in the back seat, etc.).
Moderate Tried X

B-66 Strategic Highway Safety Plan Update 2018-2023
BUnbelted Vehicle Occupants Strategies – 49% of all server injuries during 5-year period
Objectives Strategies
Relative Cost to Implement and Operate Effectiveness
Included in 2013 SHSP
Strategy Progress
Completed Progress
Made Not
Started
C - Provide use requirements through alternative sources
C1 - Use employer, insurance or workforce safety programs for non-compliance of belt use polices Moderate Tried X

B-67Strategic Highway Safety Plan Update 2018-2023
BSpeeding/Aggressive Driving Strategies – 39% of all severe injuries during 5-year period
Objectives Strategies
Relative Cost to Implement and Operate Effectiveness
Included in 2013 SHSP
Strategy Progress
Completed Progress
Made Not
Started
A - Heighten driver awareness of aggressive driving/speed-related consequences
A1 - Strengthen speed detection and public perceived risk of being stopped and ticketed through sustained, well-publicized speed enforcement.
High Proven X X
A2 - Explore pilot automated enforcement projects (i.e., speed cameras in work or school zones, red light running cameras), coupled with public outreach about the projects, to assess impact on aggressive driving and public acceptance.
High Proven X
B - Improve efficiency and effectiveness of aggressive driving/speed enforcement efforts
B1 - Enact/support legislation to strengthen penalties such as increased fines for right-of-way and speed violations and enhanced penalties for habitual offenders.
Low Tried X X
B2 – Review commercial motor vehicle (CMV) Weigh-in-Motion speed data to determine the need for more focused CMV speed enforcement.
Low Experimental X
C - Review crash data C1 - Analyze data to clearly define aggressive driving and identify factors contributing to aggressive driving. Low Tried X
D - Set appropriate speed limits
D1 - Install speed signing using variable message signs in school zones. Low Tried X X
D2 – Assess and implement speed limits consistent with the analysis of actual sped profiles and supported by the enforcement of limits. Low Proven X

B-68 Strategic Highway Safety Plan Update 2018-2023
BSpeeding/Aggressive Driving Strategies – 39% of all severe injuries during 5-year period
Objectives Strategies
Relative Cost to Implement and Operate Effectiveness
Included in 2013 SHSP
Strategy Progress
Completed Progress
Made Not Started
E - Communicate appropriate speeds through use of traffic control devices
E1 - Implement active speed warning signs, including dynamic message boards at rural to urban transitions. Low Tried X
E2 - Use on-pavement measures to communicate the need to reduce speeds. Moderate Tried X
F - Ensure that roadway design and traffic control elements support appropriate and safe speeds
F1 - Effect safe speed transitions through design elements and on approaches to lower speed areas. High Tried X
F2- Increase signage for no-passing zones. Low Tried X

B-69Strategic Highway Safety Plan Update 2018-2023
BYoung Drivers Strategies - 18% of all severe injuries during 5-year period
Objectives Strategies
Relative Cost to Implement and Operate Effectiveness
Included in 2013 SHSP
Strategy Progress
Completed Progress
Made Not
Started
A - Enhance Graduated Driver Licensing
A1 - Enact enhanced graduated drivers licensing system. Low Proven X X
A2 – Enact requirement for learner's permit or supervised driving to be held a minimum of 6 months (or a year). Low Proven X
A3 – Extend night driving restriction to include all novice drivers under the age of 18 lasting a minimum of 6 months from date of licensure. Low Proven X
A4 - Enact minimum age of 15 (or 16) for learner's permit. Low Tried X
A5 - Require 30 to 50 hours of supervised driving for drivers 16 to 17 years of age. Low Proven X X
A6 - Implement passenger restrictions for all novice drivers under the age of 18 lasting a minimum of 6 months from date of licensure. Low Proven X X
A7 - Prohibit cell phone use for drivers under the age of 18. Low Tried X
A8 - Implement minimum age of 17 to qualify for a full, unrestricted license. Low Tried X X
B - Publicize, enforce, and adjudicate laws pertaining to young drivers
B1 - Publicize and enforce teen driving license provisions. Moderate Proven X X
B2 – Publicize and enforce laws pertaining to underage drinking and driving.
Moderate to High Proven X X
B3 - Publicize and enforce helmet law for young motorcycle riders under 18. Low Proven
B4 – Enact hands-free cell phone use law to help detect and enforce no-texting/no-web-while driving law. Low Tried X
C - Assist parents in monitoring their teens' driving
C1 - Require parent education as a driver education classroom component. Low Experimental X X
C2 - Publicize technology solutions to promote safe driving behaviors, reduce driver distraction and promote parental engagement. Moderate Experimental X

B-70 Strategic Highway Safety Plan Update 2018-2023
BYoung Drivers Strategies - 18% of all severe injuries during 5-year period
Objectives Strategies
Relative Cost to Implement and Operate Effectiveness
Included in 2013 SHSP
Strategy Progress
Completed Progress
Made Not
Started
D - Improve young driver training
D1 - Improve content and delivery of driver education/training including vehicle recovery skills training.
Moderate to High Experimental X
D2 – Require classroom education for licensure and incorporate educating novice drivers about driving risks. Low Tried X X

Strategic Highway Safety Plan Update 2018-2023
APPENDIX CEm
phasis Area Crash Facts Sheets
APPENDIX CEmphasis Area
Crash Facts Sheets

C-1Strategic Highway Safety Plan Update 2018-2023
Appendix C CLane DepartureNorth Dakota Strategic Highway Safety Plan Update
◦Age Female Male Total≤19 94 (5%) 131 (6%) 225 (11%)
20-29 128 (6%) 450 (22%) 578 (28%)30-39 70 (3%) 323 (16%) 393 (19%)40-49 64 (3%) 283 (14%) 348 (17%)50-59 59 (3%) 255 (12%) 314 (15%) Straight 1400, 73%≥60 54 (3%) 163 (8%) 217 (10%) On Curve 496, 26%
Unknown 10, 1%
◦
◦
◦
◦
Rural Urban TotalState 881 (46%) 51 (3%) 932 (49%)Local 744 (39%) 230 (12%) 974 (51%) ◦Total 1625 (85%) 281 (15%) 1906 (100%)
◦◦
◦
Prepared by CH2M HILL, Inc.
Note: Totals may not sum to 100% due to some crashes showing characteristics of multiple lane departure types.
Roadway Characteristics
The top 5 counties represent 40% of these severe injuries: Williams (12%), McKenzie (10%), Ward (7%), Cass (6%), and Burleigh (5%).
Fixed Object
Location
Seasonal Factors
Driver Demographics
Other / Unknown
Contributing Factors
Crash Details
Note: Totals may not sum to 100% due to drivers of unknown age and/or sex.
Most Harmful Event for Single Vehicle Collision TypeOverturn / Rollover 857 (72%)
158 (13%)72 (6%)46 (4%)
◦ 75% of these lane departure severe injuries are Single Vehicle type and 26% occurred on a curve.
Severe (Fatal + Incapacitating) Injuries Involving Lane DepartureMarch 16, 2018
Across all seasons, nighttime (6:00 PM - 2:59 AM) account for 45% (724) of these severe injuries.
The setting of these severe injuries is primarily Rural (85%) and a majority occurred on the Local (51%) system.
The majority of these severe injuries occur in Oil Counties (51%).
A total of 2077 drivers were involved in these 1581 crashes.
Most of these severe injuries occurred under Dry (75%), Daylight (51%) conditions.
Officers reported a total of 2106 contributing factors in these crashes, among which Speed appears most often.
28 (2%)28 (2%)
Ditch / EmbankmentParked Motor Vehicle
Ran off Roadway
15% (290) of these severe injuries, occuring among 15% (242) of these crashes, are intersection related.
Alcohol or drugs were involved in 41% (784) of these severe injuries and 40% (637) of these severe crashes.
On North Dakota roadways, there were 1581 severe crashes resulting in 1906 severe injuries between 2012 and 2016 in which the crash involved a vehicle that departed the travel lane or the roadway. This is an average of 381 severe injuries
per year and accounted for nearly 58% of all severe injuries during the five year period.
0 50 100 150 200 250 300 350 400 450
Speed (394, 18%)
Failed to Keep in Proper Lane (240, 11%)
Too Fast for Conditions (230, 11%)
Weather (185, 9%)
Over-Correcting/Over-Steering (183, 9%)
Erratic/Reckless/Aggressive Driving (180, 8%)
Improper Evasive Action (180, 8%)
Drove Left of Center (132, 6%)
Failed to Yield (76, 4%)
Attention Distracted (64, 3%)
Improper Overtaking (42, 2%)
Vision Obstructed (41, 2%)
Improper Turn (40, 2%)
Mechanical Failure (38, 2%)
Disregard Traffic Signs/Markings (28, 1%)
Animal in Roadway (26, 1%)
Ran Red Light (15, 1%)
Following Too Close (12, 1%)
Count of Contributing Factors
49%37%
14%
51%
Non-Oil (36 Counties, 934)Top Oil (10 Counties, 701)Other Oil (7 Counties, 271)
Spring Summer Fall Winter Total12:00-2:59 AM 60 (3%) 86 (5%) 80 (4%) 33 (2%) 259 (14%)3:00-5:59 AM 40 (2%) 43 (2%) 33 (2%) 17 (1%) 133 (7%)6:00-8:59 AM 46 (2%) 47 (2%) 72 (4%) 55 (3%) 220 (12%)
9:00-11:59 AM 29 (2%) 60 (3%) 36 (2%) 58 (3%) 183 (10%)12:00-2:59 PM 53 (3%) 66 (3%) 64 (3%) 49 (3%) 232 (12%)3:00-5:59 PM 74 (4%) 102 (5%) 84 (4%) 41 (2%) 301 (16%)6:00-8:59 PM 75 (4%) 97 (5%) 109 (6%) 50 (3%) 331 (17%)
9:00-11:59 PM 48 (3%) 96 (5%) 74 (4%) 29 (2%) 247 (13%)Total 425 (22%) 597 (31%) 552 (29%) 332 (17%) 1906 (100%)
Dry 1434 (75%)Snow/Ice 296 (16%)
Wet 114 (6%)Dirt/Gravel 54 (3%)
Other 8 (0%)
Surface ConditionDaylight 978 (51%)
Dark (Not Lighted) 623 (33%)Dawn/Dusk 164 (9%)
Dark (Lighted) 134 (7%)Unknown 7 (0%)
Lighting Condition
Single Vehicle (1453, 75%)
Multi-Vehicle: Opposite Direction
(418, 21%)
Multi-Vehicle: Same Direction (74, 4%)

Strategic Highway Safety Plan Update 2018-2023 C-2
CIntersectionsNorth Dakota Strategic Highway Safety Plan Update
◦Age Female Male Total≤19 69 (4%) 88 (6%) 157 (10%)
20-29 115 (7%) 265 (17%) 380 (25%)30-39 70 (5%) 178 (12%) 248 (16%)40-49 69 (4%) 201 (13%) 270 (18%)50-59 70 (5%) 176 (11%) 246 (16%)≥60 76 (5%) 162 (11%) 238 (15%)
◦◦
◦
◦
Rural Urban TotalState 340 (36%) 63 (7%) 403 (42%)Local 224 (24%) 326 (34%) 550 (58%) ◦Total 564 (59%) 389 (41%) 953 (100%)
◦◦
◦
Prepared by CH2M HILL, Inc.
The top 5 counties represent 56% of these severe injuries: Williams (14%), Cass (12%), Ward (12%), Burleigh (9%), and McKenzie (9%).
Pedalcycle
Location
Seasonal Factors
Driver Demographics
Other / Unknown
Contributing Factors
Crash Details
Note: Totals may not sum to 100% due to drivers of unknown age and/or sex.
Most Harmful Event for Single Vehicle Collision TypeOverturn / Rollover 81 (40%)
30 (15%)23 (11%)18 (9%)
Severe (Fatal + Incapacitating) Injuries Involving IntersectionsMarch 16, 2018
Across all seasons, nighttime (6:00 PM - 2:59 AM) account for 45% (724) of these severe injuries.
The setting of these severe injuries is primarily Rural (59%) and a majority occurred on the Local (58%) system.
The majority of these severe injuries occur in Non-Oil Counties (52%).
A total of 1540 drivers were involved in these 805 crashes.
Most of these severe injuries occurred under Dry (80%), Daylight (62%) conditions.
Officers reported a total of 1055 contributing factors in these crashes, among which Failed to Yield appears most often.
13 (6%)39 (19%)
PedestrianFixed Object
Ditch / Embankment
Alcohol or drugs were involved in 24% (228) of these severe injuries and 23% (182) of these severe crashes.
The traffic control devices at these intersections were Stop/Yield (215, 23%) and Signalized (171, 18%). No traffic control was reported for 518 (54%) of these severe injuries.
On North Dakota roadways, there were 805 severe crashes resulting in 953 severe injuries between 2012 and 2016 in which the crash occurred at or in relation to an intersection. This is an average of 191 severe injuries per year and
accounted for nearly 29% of all severe injuries during the five year period.
0 50 100 150 200 250 300 350 400
Failed to Yield (340, 22%)
Speed (145, 9%)
Weather (69, 4%)
Ran Red Light (69, 4%)
Erratic/Reckless/Aggressive Driving (61, 4%)
Disregard Traffic Signs/Markings (59, 4%)
Vision Obstructed (51, 3%)
Improper Turn (43, 3%)
Too Fast for Conditions (42, 3%)
Improper Evasive Action (38, 2%)
Following Too Close (33, 2%)
Attention Distracted (32, 2%)
Failed to Keep in Proper Lane (25, 2%)
Improper Overtaking (15, 1%)
Mechanical Failure (14, 1%)
Drove Left of Center (11, 1%)
Over-Correcting/Over-Steering (6, 0%)
Animal in Roadway (2, 0%)
Count of Contributing Factors
52%32%
16%
48%
Non-Oil (36 Counties, 494)Top Oil (10 Counties, 302)Other Oil (7 Counties, 157)
Spring Summer Fall Winter Total12:00-2:59 AM 8 (1%) 24 (3%) 31 (3%) 7 (1%) 70 (7%)3:00-5:59 AM 8 (1%) 19 (2%) 13 (1%) 3 (0%) 43 (5%)6:00-8:59 AM 23 (2%) 28 (3%) 51 (5%) 25 (3%) 127 (13%)
9:00-11:59 AM 18 (2%) 35 (4%) 17 (2%) 20 (2%) 90 (9%)12:00-2:59 PM 28 (3%) 73 (8%) 40 (4%) 44 (5%) 185 (19%)3:00-5:59 PM 48 (5%) 66 (7%) 50 (5%) 35 (4%) 199 (21%)6:00-8:59 PM 31 (3%) 34 (4%) 51 (5%) 24 (3%) 140 (15%)9:00-11:59 PM 18 (2%) 37 (4%) 35 (4%) 9 (1%) 99 (10%)
Total 182 (19%) 316 (33%) 288 (30%) 167 (18%) 953 (100%)
Dry 764 (80%)Snow/Ice 100 (10%)
Wet 81 (8%)Dirt/Gravel 8 (1%)
Other 0 (0%)
Surface ConditionDaylight 592 (62%)
Dark (Not Lighted) 170 (18%)Dark (Lighted) 114 (12%)Dawn/Dusk 75 (8%)Unknown 2 (0%)
Lighting Condition
Angle (553, 58%)
Single Vehicle (219, 23%)
Rear-End (109, 11%)
Head-On (45, 5%)
Sideswipe (Same Direction) (18, 2%)
Sideswipe (Opposite Direction) (9, 1%)
Other (0, 0%)

Strategic Highway Safety Plan Update 2018-2023 C-3
CAlcohol or Drug RelatedNorth Dakota Strategic Highway Safety Plan Update
◦
Age Female Male Total≤19 25 (3%) 45 (5%) 70 (8%)
20-29 55 (6%) 271 (30%) 326 (36%)30-39 34 (4%) 167 (18%) 201 (22%)40-49 25 (3%) 124 (14%) 150 (17%)50-59 18 (2%) 100 (11%) 119 (13%)≥60 5 (1%) 32 (4%) 37 (4%)
◦
◦
◦
◦
Rural Urban TotalState 455 (42%) 26 (2%) 481 (44%)Local 438 (40%) 172 (16%) 610 (56%) ◦Total 893 (82%) 198 (18%) 1091 (100%)
◦◦
◦
Contributing Factors
Crash Details
Location
Note: Totals may not sum to 100% due to drivers of unknown age and/or sex.
Fixed Object 64 (10%)41 (7%)
Seasonal Factors
27 (4%)21 (3%)
Most Harmful Event for Single Vehicle Collision Type376 (61%)Overturn / Rollover
21% (228) of these severe injuries, occuring among 21% (182) of these crashes, are intersection related.
Of these severe injuries, 51% involved speeding or aggressive driving, 63% involved an unbelted occupant, and 56% involved single-vehicle lane departure.
Pedestrian
Prepared by CH2M HILL, Inc.
Severe (Fatal + Incapacitating) Injuries Involving Alcohol or DrugsMarch 27, 2018
Across all seasons, nighttime (6:00 PM - 2:59 AM) accounts for 66% (719) of these severe injuries.
The setting of these severe injuries is primarily Rural (82%) and a majority occurred on the Local (56%) system.
The majority of these severe injuries occur in Oil Counties (52%).
Most occurred under Dry (82%), Dark (Not Lighted) (46%) conditions.
Officers reported a total of 1167 contributing factors in these crashes, among which Speed appears most often.
88 (14%)
Ditch / EmbankmentParked Motor Vehicle
The top 5 counties represent 45% of these severe injuries: Williams (13%), McKenzie (11%), Ward (8%), Cass (7%), and Burleigh (6%).
A total of 1209 drivers were involved in these 886 crashes, of which 903 drivers had been using drugs or alcohol.
On North Dakota roadways, there were 886 severe crashes resulting in 1091 severe injuries between 2012 and 2016 in which the crash involved alcohol or drugs. This is an average of 218 severe injuries per year and accounted for nearly
33% of all severe injuries during the five year period.
Driver Demographics
Other / Unknown
0 50 100 150 200 250 300
Speed (283, 23%)
Erratic/Reckless/Aggressive Driving (187, 15%)
Failed to Keep in Proper Lane (131, 11%)
Over-Correcting/Over-Steering (104, 8%)
Improper Evasive Action (85, 7%)
Too Fast for Conditions (78, 6%)
Drove Left of Center (72, 6%)
Failed to Yield (48, 4%)
Disregard Traffic Signs/Markings (31, 3%)
Attention Distracted (30, 2%)
Weather (29, 2%)
Improper Turn (21, 2%)
Ran Red Light (19, 2%)
Following Too Close (16, 1%)
Improper Overtaking (11, 1%)
Mechanical Failure (9, 1%)
Vision Obstructed (7, 1%)
Animal in Roadway (6, 0%)
Count of Contributing Factors
Collision Type
Single Vehicle (724, 66%)
Angle (148, 14%)
Head-On (124, 11%)
Rear-End (64, 6%)
Sideswipe (Opposite Direction) (19, 2%)
Sideswipe (Same Direction) (11, 1%)
Other (1, 0%)
48%37%
15%
52%
Non-Oil (36 Counties, 526)Top Oil (10 Counties, 404)Other Oil (7 Counties, 161)
Spring Summer Fall Winter Total12:00-2:59 AM 59 (5%) 92 (8%) 90 (8%) 32 (3%) 273 (25%)3:00-5:59 AM 22 (2%) 39 (4%) 19 (2%) 15 (1%) 95 (9%)6:00-8:59 AM 18 (2%) 15 (1%) 16 (1%) 10 (1%) 59 (5%)
9:00-11:59 AM 5 (0%) 13 (1%) 5 (0%) 9 (1%) 32 (3%)12:00-2:59 PM 15 (1%) 10 (1%) 22 (2%) 9 (1%) 56 (5%)3:00-5:59 PM 33 (3%) 43 (4%) 34 (3%) 20 (2%) 130 (12%)6:00-8:59 PM 45 (4%) 64 (6%) 58 (5%) 35 (3%) 202 (19%)
9:00-11:59 PM 43 (4%) 98 (9%) 79 (7%) 24 (2%) 244 (22%)Total 240 (22%) 374 (34%) 323 (30%) 154 (14%) 1091 (100%)
Dry 893 (82%)Snow/Ice 90 (8%)
Wet 85 (8%)Dirt/Gravel 17 (2%)
Other 6 (1%)
Surface ConditionDark (Not Lighted) 502 (46%)
Daylight 351 (32%)Dark (Lighted) 149 (14%)
Dawn/Dusk 83 (8%)Unknown 6 (1%)
Lighting Condition

Strategic Highway Safety Plan Update 2018-2023 C-4
CUnbelted OccupantsNorth Dakota Strategic Highway Safety Plan Update
◦
Age Female Male Total≤19 113 (6%) 184 (10%) 297 (17%)
20-29 125 (7%) 481 (27%) 606 (34%)30-39 77 (4%) 265 (15%) 342 (19%)40-49 43 (2%) 176 (10%) 220 (12%)50-59 34 (2%) 153 (9%) 187 (10%)≥60 27 (2%) 114 (6%) 141 (8%)
◦
◦
◦
◦
Rural Urban TotalState 736 (46%) 47 (3%) 783 (49%)Local 608 (38%) 208 (13%) 816 (51%) ◦Total 1344 (84%) 255 (16%) 1599 (100%)
◦◦
◦
Prepared by CH2M HILL, Inc.
The top 5 counties represent 41% of these severe injuries: Williams (12%), McKenzie (10%), Ward (7%), Burleigh (6%), and Cass (6%).
Ditch / Embankment
On North Dakota roadways, there were 1264 severe crashes resulting in 1599 severe injuries between 2012 and 2016 in which the crash involved an unbelted or improperly belted occupant. This is an average of 320 severe injuries per year
and accounted for nearly 49% of all severe injuries during the five year period.
Driver Demographics
Other / Unknown
Contributing Factors
Crash Details
Location
Note: Totals may not sum to 100% due to drivers of unknown age and/or sex.
Fixed Object 66 (8%)
The majority of these severe injuries occur in Oil Counties (51%).
Most occurred under Dry (79%), Daylight (52%) conditions.
Officers reported a total of 1706 contributing factors in these crashes, among which Speed appears most often.
128 (16%)
A total of 1820 drivers were involved in these 1264 crashes, in which 1793 occupants were unbelted.
Severe (Fatal + Incapacitating) Injuries Involving Unbelted OccupantsMarch 27, 2018
Across all seasons, nighttime (6:00 PM - 2:59 AM) account for 45% (724) of these severe injuries.
The setting of these severe injuries is primarily Rural (84%) and a majority occurred on the Local (51%) system.
Parked Motor VehiclePedestrian
25% (394) of these severe injuries, occuring among 25% (310) of these crashes, are intersection related.
Most Harmful Event for Single Vehicle Collision TypeOverturn / Rollover 514 (66%)
Of these severe injuries, 43% involved speeding or aggressive driving, 43% involved alcohol or drugs, and 52% involved single-vehicle lane departure.
12 (2%)
36 (5%)
Seasonal Factors
26 (3%)
0 50 100 150 200 250 300 350
Speed (324, 18%)
Failed to Yield (159, 9%)
Erratic/Reckless/Aggressive Driving (157, 9%)
Failed to Keep in Proper Lane (152, 8%)
Too Fast for Conditions (152, 8%)
Improper Evasive Action (144, 8%)
Over-Correcting/Over-Steering (135, 7%)
Weather (100, 5%)
Drove Left of Center (81, 4%)
Attention Distracted (66, 4%)
Disregard Traffic Signs/Markings (40, 2%)
Vision Obstructed (40, 2%)
Following Too Close (39, 2%)
Improper Turn (35, 2%)
Mechanical Failure (26, 1%)
Ran Red Light (21, 1%)
Improper Overtaking (18, 1%)
Animal in Roadway (17, 1%)
Count of Contributing Factors
Collision Type
Single Vehicle (963, 60%)
Angle (322, 20%)
Rear-End (141, 9%)
Head-On (135, 8%)
Sideswipe (Opposite Direction) (18, 1%)
Sideswipe (Same Direction) (15, 1%)
Other (5, 0%)
49%36%
15%
51%
Non-Oil (36 Counties, 789)Top Oil (10 Counties, 572)Other Oil (7 Counties, 238)
Spring Summer Fall Winter Total12:00-2:59 AM 42 (3%) 63 (4%) 78 (5%) 20 (1%) 203 (13%)3:00-5:59 AM 22 (1%) 31 (2%) 25 (2%) 11 (1%) 89 (6%)6:00-8:59 AM 34 (2%) 42 (3%) 58 (4%) 46 (3%) 180 (11%)
9:00-11:59 AM 21 (1%) 41 (3%) 34 (2%) 42 (3%) 138 (9%)12:00-2:59 PM 37 (2%) 72 (5%) 47 (3%) 30 (2%) 186 (12%)3:00-5:59 PM 61 (4%) 98 (6%) 66 (4%) 57 (4%) 282 (18%)6:00-8:59 PM 70 (4%) 84 (5%) 87 (5%) 51 (3%) 292 (18%)9:00-11:59 PM 45 (3%) 89 (6%) 74 (5%) 21 (1%) 229 (14%)
Total 332 (21%) 520 (33%) 469 (29%) 278 (17%) 1599 (100%)
Dry 1260 (79%)Snow/Ice 196 (12%)
Wet 107 (7%)Dirt/Gravel 29 (2%)
Other 7 (0%)
Surface ConditionDaylight 828 (52%)
Dark (Not Lighted) 522 (33%)Dark (Lighted) 126 (8%)
Dawn/Dusk 117 (7%)Unknown 6 (0%)
Lighting Condition

Strategic Highway Safety Plan Update 2018-2023 C-5
CSpeeding or Aggressive DrivingNorth Dakota Strategic Highway Safety Plan Update
◦
Age Female Male Total≤19 57 (5%) 100 (9%) 157 (14%)
20-29 69 (6%) 321 (29%) 390 (36%)30-39 35 (3%) 163 (15%) 199 (18%)40-49 47 (4%) 130 (12%) 178 (16%)50-59 16 (1%) 92 (8%) 109 (10%)≥60 13 (1%) 47 (4%) 60 (5%)
◦
◦
◦
◦
Rural Urban TotalState 570 (44%) 41 (3%) 611 (47%)Local 472 (36%) 215 (17%) 687 (53%) ◦Total 1042 (80%) 256 (20%) 1298 (100%)
◦◦
◦
Of these severe injuries, 43% involved alcohol or drugs, 53% involved an unbelted occupant, and 55% involved single-vehicle lane departure.
The top 5 counties represent 45% of these severe injuries: Williams (12%), McKenzie (12%), Ward (9%), Cass (7%), and Burleigh (6%).
Ditch / Embankment
Location
Seasonal Factors
32 (5%)26 (4%)21 (3%)
Most Harmful Event for Single Vehicle Collision Type403 (61%)Overturn / Rollover
Contributing Factors
Crash Details
Note: Totals may not sum to 100% due to drivers of unknown age and/or sex.
Fixed Object 75 (11%)
Prepared by CH2M HILL, Inc.
Severe (Fatal + Incapacitating) Injuries Involving Speeding or Aggressive DrivingMarch 27, 2018
Summer afternoons and nights (12:00 PM - 2:59 AM) account for 25% (325) of these severe injuries.
The setting of these severe injuries is primarily Rural (80%) and a majority occurred on the Local (53%) system.
The majority of these severe injuries occur in Oil Counties (54%).
Most occurred under Dry (66%), Daylight (51%) conditions.
Officers reported a total of 1923 contributing factors in these crashes, among which Speed appears most often.
102 (15%)
Parked Motor VehiclePedestrian
21% (270) of these severe injuries, occuring among 22% (231) of these crashes, are intersection related.
A total of 1598 drivers were involved in these 1071 crashes, of which 1093 drivers had been driving aggressively.
On North Dakota roadways, there were 1071 severe crashes resulting in 1298 severe injuries between 2012 and 2016 in which the crash involved speeding or aggressive driving. This is an average of 260 severe injuries per year and
accounted for nearly 39% of all severe injuries during the five year period.
Driver Demographics
Other / Unknown
0 100 200 300 400 500 600 700
Speed (589, 36%)
Too Fast for Conditions (309, 19%)
Erratic/Reckless/Aggressive Driving (293, 18%)
Weather (155, 9%)
Following Too Close (104, 6%)
Improper Evasive Action (96, 6%)
Failed to Keep in Proper Lane (80, 5%)
Over-Correcting/Over-Steering (64, 4%)
Failed to Yield (53, 3%)
Attention Distracted (34, 2%)
Drove Left of Center (32, 2%)
Vision Obstructed (24, 1%)
Disregard Traffic Signs/Markings (23, 1%)
Improper Turn (18, 1%)
Ran Red Light (17, 1%)
Improper Overtaking (14, 1%)
Mechanical Failure (11, 1%)
Animal in Roadway (7, 0%)
Count of Contributing Factors
Collision Type
Single Vehicle (774, 60%)
Rear-End (222, 17%)
Angle (198, 15%)
Head-On (61, 5%)
Sideswipe (Same Direction) (19, 1%)
Sideswipe (Opposite Direction) (18, 1%)
Other (6, 0%)
46%39%
15%
54%
Non-Oil (36 Counties, 595)Top Oil (10 Counties, 505)Other Oil (7 Counties, 198)
Spring Summer Fall Winter Total12:00-2:59 AM 36 (3%) 64 (5%) 61 (5%) 27 (2%) 188 (14%)3:00-5:59 AM 20 (2%) 24 (2%) 29 (2%) 9 (1%) 82 (6%)6:00-8:59 AM 30 (2%) 28 (2%) 38 (3%) 58 (4%) 154 (12%)
9:00-11:59 AM 20 (2%) 28 (2%) 22 (2%) 47 (4%) 117 (9%)12:00-2:59 PM 36 (3%) 53 (4%) 41 (3%) 45 (3%) 175 (13%)3:00-5:59 PM 45 (3%) 79 (6%) 37 (3%) 47 (4%) 208 (16%)6:00-8:59 PM 49 (4%) 66 (5%) 56 (4%) 41 (3%) 212 (16%)
9:00-11:59 PM 33 (3%) 63 (5%) 46 (4%) 20 (2%) 162 (12%)Total 269 (21%) 405 (31%) 330 (25%) 294 (23%) 1298 (100%)
Dry 852 (66%)Snow/Ice 324 (25%)
Wet 76 (6%)Dirt/Gravel 37 (3%)
Other 9 (1%)
Surface ConditionDaylight 665 (51%)
Dark (Not Lighted) 401 (31%)Dark (Lighted) 126 (10%)
Dawn/Dusk 101 (8%)Unknown 5 (0%)
Lighting Condition

Strategic Highway Safety Plan Update 2018-2023 C-6
C
◦
Age Female Male Total14 or 15 38 (7%) 28 (5%) 66 (13%)16 or 17 56 (11%) 73 (14%) 129 (25%)
18, 19 or 20 106 (21%) 215 (42%) 321 (62%)
◦
◦
◦
◦
Rural Urban TotalState 193 (32%) 26 (4%) 219 (36%)Local 217 (36%) 165 (27%) 382 (64%)Total 410 (68%) 191 (32%) 601 (100%)
◦◦
◦
◦
Prepared by CH2M HILL, Inc.
Most Harmful Event for Single Vehicle Collision TypeOverturn / Rollover 130 (55%)
33 (14%)
Seasonal Factors
26 (11%)12 (5%)9 (4%)
28 (12%)
Alcohol or drugs were involved in 24% (144) of these severe injuries and 23% (109) of these severe crashes.
Fixed ObjectParked Motor VehicleDitch / Embankment
31% (186) of these severe injuries, occuring among 33% (158) of these crashes, are intersection related.
The top 5 counties represent 47% of these severe injuries: Cass (11%), Williams (11%), Ward (9%), Burleigh (8%), and McKenzie (7%).
Pedestrian
On North Dakota roadways, there were 480 severe crashes resulting in 601 severe injuries between 2012 and 2016 in which the crash involved a driver between the ages of 14 and 20. This is an average of 120 severe injuries per year and
accounted for nearly 18% of all severe injuries during the five year period.
A total of 803 drivers were involved in these 480 crashes, of which 516 were between the ages of 14 and 20.
Driver Demographics
Other / Unknown
Contributing FactorsOfficers reported a total of 639 contributing factors in these crashes, among which Speed appears most often.
Crash Details
Location
Note: Totals may not sum to 100% due to drivers of unknown age and/or sex.
Young DriversNorth Dakota Strategic Highway Safety Plan Update
Severe (Fatal + Incapacitating) Injuries Involving Young DriversMarch 16, 2018
Most occurred under Dry (78%), Daylight (60%) conditions.
Summer afternoon and evenings (12:00-11:59 PM) account for 24% (145) of these severe injuries.
The setting of these severe injuries is primarily Rural (68%) and a majority occurred on the Local (64%) system.
The majority of these severe injuries occur in Non-Oil Counties (55%).
0 20 40 60 80 100 120 140
Speed (125, 15%)
Failed to Yield (92, 11%)
Erratic/Reckless/Aggressive Driving (57, 7%)
Too Fast for Conditions (54, 7%)
Improper Evasive Action (48, 6%)
Weather (36, 4%)
Over-Correcting/Over-Steering (33, 4%)
Vision Obstructed (32, 4%)
Attention Distracted (31, 4%)
Following Too Close (27, 3%)
Failed to Keep in Proper Lane (24, 3%)
Drove Left of Center (17, 2%)
Disregard Traffic Signs/Markings (15, 2%)
Ran Red Light (14, 2%)
Improper Turn (11, 1%)
Mechanical Failure (10, 1%)
Improper Overtaking (9, 1%)
Animal in Roadway (4, 0%)
Count of Contributing Factors
Collision Type
Single Vehicle (305, 51%)
Angle (163, 27%)
Rear-End (63, 10%)
Head-On (59, 10%)
Sideswipe (Same Direction) (6, 1%)
Sideswipe (Opposite Direction) (4, 1%)
Other (1, 0%)
54%29%
17%
46%
Non-Oil (36 Counties, 328)Top Oil (10 Counties, 173)Other Oil (7 Counties, 100)
Spring Summer Fall Winter Total12:00-2:59 AM 8 (1%) 12 (2%) 19 (3%) 4 (1%) 43 (7%)3:00-5:59 AM 9 (1%) 13 (2%) 11 (2%) 3 (0%) 36 (6%)6:00-8:59 AM 8 (1%) 24 (4%) 26 (4%) 14 (2%) 72 (12%)
9:00-11:59 AM 9 (1%) 10 (2%) 14 (2%) 6 (1%) 39 (6%)12:00-2:59 PM 18 (3%) 38 (6%) 16 (3%) 22 (4%) 94 (16%)3:00-5:59 PM 31 (5%) 41 (7%) 23 (4%) 25 (4%) 120 (20%)6:00-8:59 PM 33 (5%) 39 (6%) 40 (7%) 17 (3%) 129 (21%)
9:00-11:59 PM 17 (3%) 27 (4%) 9 (1%) 15 (2%) 68 (11%)Total 133 (22%) 204 (34%) 158 (26%) 106 (18%) 601 (100%)
Dry 470 (78%)Snow/Ice 71 (12%)
Wet 38 (6%)Dirt/Gravel 16 (3%)
Other 6 (1%)
Surface ConditionDaylight 359 (60%)
Dark (Not Lighted) 144 (24%)Dawn/Dusk 53 (9%)
Dark (Lighted) 44 (7%)Unknown 1 (0%)
Lighting Condition

Strategic Highway Safety Plan Update 2018-2023 C-7
C
◦
Age Female Male Total65-74 48 (14%) 154 (45%) 202 (59%)75-84 40 (12%) 60 (18%) 100 (29%)≥85 12 (4%) 26 (8%) 38 (11%)
◦
◦
◦
◦
Rural Urban TotalState 182 (48%) 21 (6%) 203 (53%)Local 80 (21%) 98 (26%) 178 (47%)Total 262 (69%) 119 (31%) 381 (100%)
◦◦
◦
◦
Prepared by CH2M HILL, Inc.
Most Harmful Event for Single Vehicle Collision TypeOverturn / Rollover 32 (36%)
14 (16%)
Seasonal Factors
14 (16%)5 (6%)4 (4%)
21 (23%)
Alcohol or drugs were involved in 8% (30) of these severe injuries and 9% (29) of these severe crashes.
Fixed ObjectPedestrian
Parked Motor Vehicle
48% (184) of these severe injuries, occuring among 49% (155) of these crashes, are intersection related.
Officers reported a total of 407 contributing factors in these crashes, among which Failed to Yield appears most often.
The top 5 counties represent 43% of these severe injuries: Ward (10%), Burleigh (10%), Cass (10%), Williams (7%), and Grand Forks (6%).
Pedalcycle
On North Dakota roadways, there were 317 severe crashes resulting in 381 severe injuries between 2012 and 2016 in which the crash involved a driver over the age of 64. This is an average of 76 severe injuries per year and accounted for
nearly 12% of all severe injuries during the five year period.
A total of 616 drivers were involved in these 317 crashes, of which 340 were over the age of 64.
Driver Demographics
Other / Unknown
Contributing Factors
Crash Details
Location
Note: Totals may not sum to 100% due to drivers of unknown age and/or sex.
Severe (Fatal + Incapacitating) Injuries Involving Older DriversMarch 15, 2018
Most occurred under Dry (77%), Daylight (81%) conditions.
Across all seasons, midday (9:00 AM - 5:59 PM) accounts for 71% (270) of these severe injuries.
The setting of these severe injuries is primarily Rural (69%) and a majority occurred on the State (53%) system.
The majority of these severe injuries occur in Non-Oil Counties (64%).
0 20 40 60 80 100 120
Failed to Yield (108, 18%)
Weather (39, 6%)
Speed (37, 6%)
Following Too Close (24, 4%)
Failed to Keep in Proper Lane (24, 4%)
Vision Obstructed (22, 4%)
Improper Evasive Action (22, 4%)
Ran Red Light (20, 3%)
Erratic/Reckless/Aggressive Driving (18, 3%)
Improper Turn (18, 3%)
Attention Distracted (17, 3%)
Too Fast for Conditions (16, 3%)
Drove Left of Center (12, 2%)
Mechanical Failure (10, 2%)
Over-Correcting/Over-Steering (8, 1%)
Disregard Traffic Signs/Markings (7, 1%)
Improper Overtaking (5, 1%)
Animal in Roadway (0, 0%)
Count of Contributing Factors
Collision Type
Angle (170, 45%)
Single Vehicle (99, 26%)
Rear-End (60, 16%)
Head-On (38, 10%)
Sideswipe (Opposite Direction) (7, 2%)
Sideswipe (Same Direction) (6, 2%)
Other (1, 0%)
64%
19%
17%
36%
Non-Oil (36 Counties, 243)Top Oil (10 Counties, 73)Other Oil (7 Counties, 65)
Spring Summer Fall Winter Total12:00-2:59 AM 4 (1%) 2 (1%) 1 (0%) 0 (0%) 7 (2%)3:00-5:59 AM 4 (1%) 1 (0%) 1 (0%) 0 (0%) 6 (2%)6:00-8:59 AM 5 (1%) 8 (2%) 16 (4%) 6 (2%) 35 (9%)
9:00-11:59 AM 12 (3%) 25 (7%) 7 (2%) 13 (3%) 57 (15%)12:00-2:59 PM 29 (8%) 48 (13%) 22 (6%) 20 (5%) 119 (31%)3:00-5:59 PM 24 (6%) 31 (8%) 25 (7%) 14 (4%) 94 (25%)6:00-8:59 PM 11 (3%) 12 (3%) 12 (3%) 10 (3%) 45 (12%)
9:00-11:59 PM 2 (1%) 8 (2%) 7 (2%) 1 (0%) 18 (5%)Total 91 (24%) 135 (35%) 91 (24%) 64 (17%) 381 (100%)
Dry 292 (77%)Snow/Ice 53 (14%)
Wet 33 (9%)Dirt/Gravel 3 (1%)
Other 0 (0%)
Surface ConditionDaylight 308 (81%)
Dark (Not Lighted) 38 (10%)Dark (Lighted) 19 (5%)
Dawn/Dusk 16 (4%)Unknown 0 (0%)
Lighting Condition
Older DriversNorth Dakota Strategic Highway Safety Plan Update

Strategic Highway Safety Plan Update 2018-2023
APPENDIX D2012-2016 County
Fatalities
APPENDIX D2012-2016 County
Fatalities

D-1Strategic Highway Safety Plan Update 2018-2023
2012-2016 COUNTY FATALITIESCounty Fatalities County FatalitiesAdams 2 McLean 19
Barnes 17 Mercer 8
Benson 15 Morton 24
Billings 4 Mountrail 29
Bottineau 9 Nelson 10
Bowman 3 Oliver 2
Burke 8 Pembina 7
Burleigh 29 Pierce 12
Cass 26 Ramsey 11
Cavalier 7 Ransom 6
Dickey 4 Renville 3
Divide 6 Richland 11
Dunn 16 Rolette 18
Eddy 3 Sargent 3
Emmons 6 Sheridan 1
Foster 0 Sioux 9
Golden Valley 3 Slope 4
Grand Forks 20 Stark 28
Grant 4 Steele 1
Griggs 3 Stutsman 28
Hettinger 1 Towner 3
Kidder 5 Traill 11
LaMoure 5 Walsh 12
Logan 0 Ward 52
McHenry 11 Wells 2
McIntosh 1 Williams 83
McKenzie 92
TOTAL 697
Appendix D D