
America's Marine Highway stakeholders - DigitalCommons ...
17
University of Rhode Island University of Rhode Island DigitalCommons@URI DigitalCommons@URI Marine Affairs Faculty Publications Marine Affairs 2020 America’s Marine Highway stakeholders: a system-scale analysis America’s Marine Highway stakeholders: a system-scale analysis of influence in decision making of influence in decision making Amit J. Mokashi Austin Becker James J. Corbett Follow this and additional works at: https://digitalcommons.uri.edu/maf_facpubs
-
Upload
khangminh22 -
Category
Documents
-
view
2 -
download
0
Transcript of America's Marine Highway stakeholders - DigitalCommons ...
University of Rhode Island University of Rhode Island
DigitalCommons@URI DigitalCommons@URI
Marine Affairs Faculty Publications Marine Affairs
2020
America’s Marine Highway stakeholders: a system-scale analysis America’s Marine Highway stakeholders: a system-scale analysis
of influence in decision making of influence in decision making
Amit J. Mokashi
Austin Becker
James J. Corbett
Follow this and additional works at: https://digitalcommons.uri.edu/maf_facpubs
ART ICLE
America’s Marine Highway stakeholders:a system-scale analysis of influence in decisionmaking
Amit J. Mokashi1 & Austin Becker2 & James J. Corbett3
Received: 23 April 2020 /Accepted: 9 July 2020/# World Maritime University 2020
AbstractThis work surveys stakeholders of America’s Marine Highway to identify theirperceived influence on each other’s resource allocation decision making. Thevalue/criticality of the resource held by the stakeholder group can be indirectlymeasured by the influence exerted by the group on its peers and its externalstakeholders. The stakeholder map visualizes how the various stakeholder groupsinfluence each other. Survey of the US Marine Highway stakeholders revealspeers as the most dominant influence among shippers, environmental advocates,and regulators. Results suggest that only suppliers and transportation providersexhibit distinct dominance of customer-supplier influence over that of their peers.This snapshot of stakeholder relationships is a powerful tool for both businesses aswell as regulators in their pursuit of shared objectives in a network-centricenvironment. Stakeholder relationship influence results, and their graphical illus-tration, contribute to understanding the underlying dynamics of a changing valueadvantage in the current and coming decades of shipping.
Keywords Stakeholder . Influence . Peers . America’sMarineHighway
WMU Journal of Maritime Affairshttps://doi.org/10.1007/s13437-020-00212-0
Electronic supplementary material The online version of this article (https://doi.org/10.1007/s13437-020-00212-0) contains supplementary material, which is available to authorized users.
* Amit J. [email protected]
1 School of Business, New Jersey City University, Jersey City, NJ, USA2 Department of Marine Affairs, University of Rhode Island, Kingston, NY, USA3 College of Earth, Ocean, and Environment, University of Delaware, Newark, NY, USA

1 Introduction
“Even more than other parts of the nation’s transportation system, marine transpor-tation is a joint private- and public-sector enterprise. The private sector owns andoperates the vessels and most of the terminals—it is responsible for the commerce thatflows through the system. The public sector provides much of the infrastructure at portsand on the waterways—it is responsible for keeping the system functioning in supportof commerce, and for doing so in a safe, secure, and environmentally sound manner”(National Research Council (U.S.). Committee for a Study of the Federal Role in theMarine Transportation System 2004).
Stakeholders of America’s Marine Highway (AMH) have individual priorities thatneed to be considered and balanced whenever any actor makes a decision that impactsthe system as a whole. Since the maritime transportation system provides a public goodto local and national society, the priorities of the public’s stake in the AMH should beconsidered. When it comes to such societal benefits, public policy decision-makersneed to understand the best places to intervene in the system to maximize efficiency. Astakeholder-based approach to planning, managing, and regulating systems depends onunderstanding how the various stakeholders influence the system as a whole. Thisresearch presents a methodology for identifying the perceived influence of five stake-holder groups with respect to trading these resources within the marketplace.
1.1 America’s Marine Highway
Waterways were historically the mode of choice due to their efficiency in labor as wellas effort. As Adam Smith famously noted: “A broad-wheeled waggon, attended by twomen, and drawn by eight horses, in about six weeks’ time carries and brings backbetween London and Edinburgh near four-ton weight of goods. In about the same timea ship navigated by six or eight men, and sailing between the ports of London andLeith, frequently carries and brings back two-hundred-ton weight of goods. Six or eightmen, therefore, by the help of water-carriage, can carry and bring back in the sametime the same quantity of goods between London and Edinburgh, as fifty broad-wheeled waggons, attended by a hundred men, and drawn by four hundred horses.”(Smith 2007, p. 19)
The example illustrated by Adam Smith precisely conveys the advantages thatmarine transportation has over the traditional land modes, even in the domesticmovement of freight. This form of coastal marine transportation is also called shortsea shipping or marine highways in the USA. It is a subset of the shipping industry,defined by various characteristics, such as political (national/regional boundary), geo-graphical (region, coastline, water depth, inland/river, contiguous/connected land, i.e.,connected by bridges or tunnels), vessel types (size, design, cargo), or cargo operations(feeder, regional intermodal traffic) (Musso et al. 2010). This study focuses on stake-holders of AMH. AMH, in its current form, emerged from the “Energy Independenceand Security Act of 2007” SEC. 1121. § 55605, which defines US Short Sea Trans-portation as “… the carriage by vessel of cargo that is contained in intermodal cargocontainers and loaded by crane on the vessel; or loaded on the vessel by means ofwheeled technology and that is loaded at a port in the United States and unloaded eitherat another port in the United States or at a port in Canada located in the Great Lakes
Mokashi A.J. et al.
Saint Lawrence Seaway System or vice-versa.” US “short sea shipping” operatorscontinue to enjoy a captive market under the Jones Act cabotage law, which putssignificant restrictions on international vessels trading between US states (MerchantMarine Act of 1920 1920). However, the market for movement of goods within thecontiguous USA is contestable, and the potential for competition exists from othermodes.
1.2 Stakeholder theory
Stakeholder theory has had its share of proponents as well as critics. One prominentsuch critic was the Nobel Laureate Milton Friedman, who insisted that the stakeholderapproach was “pure and unadulterated socialism” (Friedman 2007). It is a criticismbourne from the wide range of entities that end up being considered as qualifying underthe numerous wide definitions of the term “stakeholder.” It is, therefore, necessary to beable to differentiate between stakeholder groups. This work uses a relatively restrictivedefinition of stakeholder proposed by Max Clarkson (Clarkson 1994, p. 5; Friedmanand Miles 2006, p. 6): “[stakeholders] Bear some form of risk as a result of havinginvested some sort of capital, human or financial, something of value in a firm … [or]… are placed at risk as a result of a firm’s activities.” Thus, the stakeholder, here, is anentity involved with the AMH system or placed at risk as a result of its activities.
1.3 Stakeholder network
Individual stakeholders in the AMH network relate to each other due, in part, to theirresource interdependence (Roome 2001). Single actors (individuals or organizations)rarely exist or act without external support. As Rowley (1997) proposes in his seminalpaper, stakeholder relations are not dyadic (connection between exactly two entities)but rather a network of relations. Rowley points out that since all stakeholders do notdirectly influence each other, the primary (intermediary) has the power to control theindirect influence of the secondary stakeholder and that this explains (or predicts) theway the stakeholders in it would behave. This shift towards a multistakeholdernetwork, with fragmented influence, makes policymaking a complex exercise both inconception and execution (Klijn 2008).
A stakeholder network permits the stakeholders to influence outcomes usingindirect influence where a direct influence on a stakeholder is relatively weaker thanan indirect path of influence. In a policy context, this network of stakeholders canbe characterized as “a set of political actors who engage in resource exchange overpublic policy (policy decisions) as a consequence of their resource interdepen-dence” (Compston 2009, p. 11). This exchange can be explained by the principleof reciprocity, i.e., “the giving of benefits to another in return of benefits received”(Molm 2010). Others see this as a “resource dependence network,” in which thebases of power dependence are resource inequalities (Knoke and Chen 2008). Theterm “resource” in these definitions means anything that is controlled by one actor/stakeholder, which is desired by another and can be traded in some relevant sense(Compston 2009). As Freeman (2010, p. 27) points out, “No stakeholder standsalone in the process of value creation. The stakes of each stakeholder group aremultifaceted and inherently connected to each other.”
America’s Marine Highway stakeholders: a system-scale analysis of...

This approach towards policy development, therefore, matches seamlessly with thestakeholder theory (stakeholders being actors in policy arenas). When we measure theinfluence, we can gauge the criticality of the resource, which the influencer possesses,to the influenced. The primary tradable resources in the policy context include policyamendments, access, veto power, information, cooperation with implementation, re-course to courts, political support, patronage, private investment, and fluid funds(Compston 2009). Table 1 shows the resources held by the various AMH stakeholders.
1.4 Stakeholder influence
“Influence” is the use of the capacity to effect change in an organization’s decisions,policies, or behavior (Berger and Reber 2006). In this work, it serves as a proxy for theperceived criticality of the resource/s held by a group of stakeholders. Resourcesinclude monetary, commercial, political, and technological support. Since criticalresources are held by external stakeholders, those stakeholders with the ability towithhold resources can create leverage to influence others in the system.
2 Stakeholders in a maritime network
The maritime industry has evolved from an independent to a networked existence(Notteboom and Winkelmans 2003). Regulatory bodies are prominent for financialconfidence, reliability of goods tracking, and cargo safety. One of the latest actorsinvolved with maritime ventures is the environmental non-governmental group (NGO)that acts on behalf of the environment or an impacted population. Stakeholdersinvolved in the venture increase the value of their resources by forming relations witheach other to create a network. This network acts as a marketplace where resources areexchanged to create value.
Table 1 America’s Marine Highway stakeholders and their resources
AMH stakeholder Examples of types of support/resources
(1) Port operators Cooperation with implementation, information,and time by avoiding delay causingmaneuvers such as recourse to courts(American Waterways Operators (AWO)2019; IAPH, AAPA, ESPO, AIVP, & PIANC, 2018).
(2) Vessel operators
(3) Shippers Demand for ecofriendly services (Fries et al. 2010).
(4) Suppliers Cooperation with implementation in the form ofchange in material supply e.g., low sulfur fuel,low emission engines, and ecofriendly shipdesign (Semolinos et al. 2013).
(5) Regulators Policy amendments and access to policymakers(Kongsvik et al. 2014).
(6) Environmental NGOs Information and political support (Peet 1994).
(7) Other modes Cooperation with implementation(Van Der Horst and De Langen 2008).
Mokashi A.J. et al.
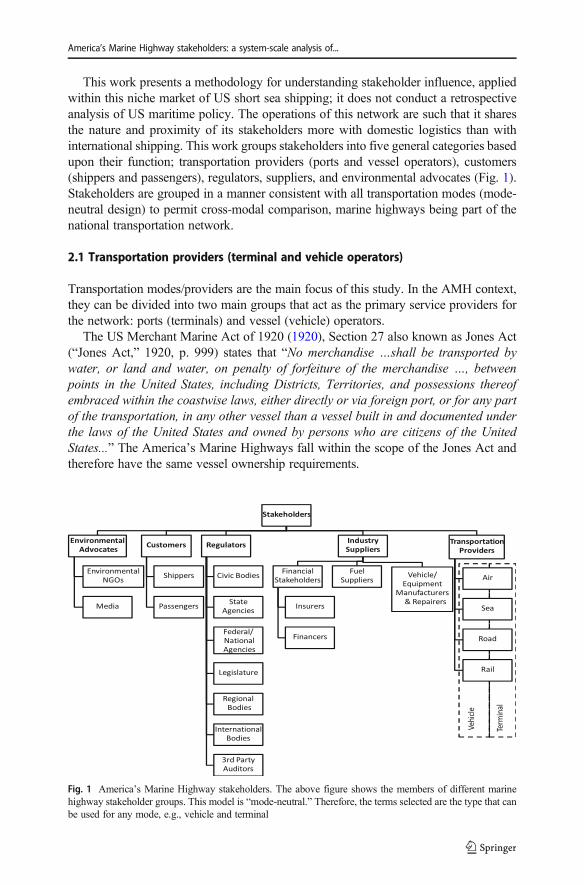
This work presents a methodology for understanding stakeholder influence, appliedwithin this niche market of US short sea shipping; it does not conduct a retrospectiveanalysis of US maritime policy. The operations of this network are such that it sharesthe nature and proximity of its stakeholders more with domestic logistics than withinternational shipping. This work groups stakeholders into five general categories basedupon their function; transportation providers (ports and vessel operators), customers(shippers and passengers), regulators, suppliers, and environmental advocates (Fig. 1).Stakeholders are grouped in a manner consistent with all transportation modes (mode-neutral design) to permit cross-modal comparison, marine highways being part of thenational transportation network.
2.1 Transportation providers (terminal and vehicle operators)
Transportation modes/providers are the main focus of this study. In the AMH context,they can be divided into two main groups that act as the primary service providers forthe network: ports (terminals) and vessel (vehicle) operators.
The US Merchant Marine Act of 1920 (1920), Section 27 also known as Jones Act(“Jones Act,” 1920, p. 999) states that “No merchandise …shall be transported bywater, or land and water, on penalty of forfeiture of the merchandise …, betweenpoints in the United States, including Districts, Territories, and possessions thereofembraced within the coastwise laws, either directly or via foreign port, or for any partof the transportation, in any other vessel than a vessel built in and documented underthe laws of the United States and owned by persons who are citizens of the UnitedStates...” The America’s Marine Highways fall within the scope of the Jones Act andtherefore have the same vessel ownership requirements.
Fig. 1 America’s Marine Highway stakeholders. The above figure shows the members of different marinehighway stakeholder groups. This model is “mode-neutral.” Therefore, the terms selected are the type that canbe used for any mode, e.g., vehicle and terminal
America’s Marine Highway stakeholders: a system-scale analysis of...
The demands placed of vessels suitable for AMH operations make them expensiveto construct and operate (CSI 2005). The US Maritime Administration funded a designproject that proposed 11 different designs deemed suitable for AMH operations (HEC2011). The designs prepared included Roll-On/Roll-Off (RoRo), RoRo/ContainerCarrier (Rocon), container feeder ship, and a RoRo passenger ship (Ropax). The factorsconsidered in the design process included type of cargo, market, routes, militarycapability, Jones Act, efficiency, subsidy, manning, environmental as well as otherregulatory requirements.
AMH operators need other modes to provide the end-to-end, door-to-door, trans-portation service (Paixão and Marlow 2002). Ports are the interfaces between thetransportation modes, i.e., they enable the use and interchange of modes (Bonsall1998). Thus, seaports enable interchange between seaways and land-based modes suchas road and rail. For a marine highway network (as opposed to ocean shipping), the roleof ports and terminals is far more critical than the vessel speed as the efficient shift inmode (reduction in dwell time) contributes considerably to the time taken and thus theviability of the multimodal haul (Alderton 2008; Bagnell et al. 2009; Becker et al.2004; Johnson and Styhre 2015; Paixão and Marlow 2002; Rodrigue et al. 2013). Sincethe AMH cannot function without the interphases, particularly in the multimodalenvironment, they are treated together as a singular entity, i.e., transportation providers.
2.2 Customers (shippers/passengers)
Transportation is a service industry, which functions in response to the demands of itscustomers. In the marine highways context as a modal alternative to road haul, these arethe (breakbulk) shippers and (ferry) passengers. One of the critical developments in thecustomers’ (shippers) attitudes has been the shift from the traditional operational approachof the economic order quantity (EOQ) focused on minimizing the costs of ordering andholding inventory (Min and Sui Pheng 2005), towards broader just-in-time philosophy,requiring smaller, more frequent shipments (UNCTAD 2018) dependent on reliable, andresponsive transportation (Lai and Cheng 2009). This shift in attitude is both an oppor-tunity as well as a threat to the ports and vessel operators. Traditionally, maritimetransportation has not been the ideal candidate for a shipper seeking those attributes.However, changes in technology, as well as attitudes, may help. The new vessel designsproposed for the AmericanMarineHighwayswhile varied do tend to be generally smaller,faster, multipurpose (can carry smaller parcels of different types of cargoes) vessels withRoRo ramps (either dedicated RoRo or RoCon ships) (HEC 2011). Other related devel-opments like automatic identification system (AIS), automated cargo/container handling,and information sharing are likely to improve the efficiency as well as reliability of theservice provided by the AMH operators to each other (carriers and port operators), as wellas their customers/shippers. Marine highways have varying degrees of direct benefit interms of door-to-door freight costs for the shipper. However, they also provide manyindirect benefits for both the shipper as well as the society in general.
2.3 Regulators
Marine highways, being part of the national transportation network, share similarregulatory oversight as the other modes with additional international requirements as
Mokashi A.J. et al.
lead down by the International Maritime Organization. Of significant relevance is therole of independent auditors such as the classification societies. While these entities donot possess direct authority, their expertise contributes to the legitimacy of theircertificates/endorsements. These certificates are relied upon by other bodies to establishthe seaworthiness of ships.
2.4 Suppliers
This category encompasses all the service providers that enable the maritime venture.Broadly, these include financiers, insurers, fuel suppliers, ship store/provisions sup-pliers, shipbuilders and repairers, and other equipment manufacturers and suppliers.Often suppliers undertake more than one role, e.g., shipbuilders and ship suppliers alsoprovide financial support in the form of credit, which in turn can be the deciding factorfor selection. There are also examples of shipbuilders and financers turning shipowners.Shipbuilders often during lean times build ships even when no order has been placed tokeep the workforce occupied, thereby becoming de facto shipowners that even operatethe vessels till a suitable buyer is identified. Financers also end up as de facto ownerswhen they foreclose on a lien; this was one of the reasons for the development of theship management industry. This group is necessarily diverse, by definition, althoughfurther investigations could disaggregate and evaluate the co-influence of suppliers inmore detail.
2.5 Environmental advocates
Environmental advocates are special interest groups, environmentally active media, andNGOs that advocate protection of the environment and conservation of resources. Thiscategory of stakeholders that have gained salience by their role as environmentalrepresentatives of the grass-root public. Benefits of AMH from environmental perspec-tive include improved energy efficiency, reduced air pollution, and reduced highwaynoise (Perakis and Denisis 2008).
Subsequent sections discuss the method used to collect quantitative data on influ-ence as well as the results of the endeavor.
3 Methods
3.1 Stakeholder network analysis
Stakeholder networks can be analyzed by focusing on stakeholders (their attributes),their relations (resource dependence), or the outcome of their attributes and theirrelations in terms of the stakeholders’ positions on issues. The form that the analysismight take depends on the reasons motivating the analysis. This work primarilyexplores stakeholder analysis as a tool for better environmental policy making (forbusiness strategies and public policy). Legislators often need to be supported by“predigested, explicitly evaluative information which takes into account the politicalas well as the policy implication” (Kingdon 1973; Schneier and Gross 1993). Morganand Peha (2003) have emphasized the importance of “making the stakeholder reactions
America’s Marine Highway stakeholders: a system-scale analysis of...
part of the process…” so that policy makers “…not only learn what stakeholdersprefer, they also learn the strength of those preferences.”
In this work, influence diagrams are used to analyze and illustrate stakeholderrelationships. To understand the dynamics of this network, stakeholder analysis uses“influence” as a proxy for the criticality of the resources held by a group of stake-holders. We use the links between the stakeholder groups to represent the strength (e.g.,criticality) of dependence on resources. This resource dependence manifests itself in theform of influence that the possessor of the resource has on the demander. A compar-ative scale is used, as influence is an abstract attribute. Another option would be todevelop an absolute scale using examples, but this approach was considered lessreliable than a relative scale on both theoretical and practical bases. The magnitudeand the direction of the influence are represented by the arrows. There is another veryimportant source of influence: the members of the group itself, i.e., peers. These are,therefore, included as a category for consideration.
3.2 Analytic hierarchy process
Analytic hierarchy process (AHP), a multicriteria decision making method (MCDM)used for group decision making (GDM), aggregates the judgments of respondentsassuming their homogeneity (Mardle et al. 2004; Solms 2009). This is difficult toachieve in a multistakeholder environment, particularly when respondents reflectdiverse preferences. Thus, this study grouped similar stakeholder clusters (Fig. 1) andaggregated responses using the geometric mean of the judgments. This approachmerges the individual respondent’s identity, and uses the algebraic mean of individualpriorities, thus maintaining the individual group’s identity (Forman and Peniwati 1998).Harmonization of stakeholder judgments was not possible due to a remote and indi-vidual collection of responses and the small size of the population surveyed. Anyattempts at harmonizing could also be counterproductive due to the possibility of“groupthink,” i.e., irrational choice to conform to a consensus (Janis 1982; Solms2009).
Comparion®, a web-based tool, along with emails and phone for communication,facilitated the survey process. Because Comparion® has a seamless interface withExpert Choice® AHP software and can calculate AHP results independently to verifysurvey results, it was selected for collecting survey responses. A combination ofComparion® and Expert Choice® is used to identify stakeholder’s influencers andtheir environmental preferences. Thomas L. Saaty developed AHP in the 1970s(Schmoldt 2001). It uses pairwise comparisons and calculates overall ratios usingeigenvectors. Survey respondents access Comparion® using a link embedded in theinvitation email. Its intuitive graphic interface provides a convenient mode of compar-ing two criteria.
3.3 Survey
This research surveyed AMH stakeholders from a variety of geographic locations in theUSA in order to capture a wide range of representatives of the AMH. The surveytargeted a nationwide audience, with an additional focus on the Great Lakes (part ofAmerica’s Marine Highway) stakeholders (Fig. 1). Potential respondents in leadership
Mokashi A.J. et al.

positions were identified and selected through a search of entities involved in the AMHinitiative (e.g., through Journal of Commerce, North American Marine Highways &Logistics Conference Delegates, Greenwood’s Guide to Great Lakes Shipping). Thesurvey was thus non-probabilistic, purposive sampling of the total identified popula-tion. These respondents were asked to complete a pairwise comparison of influenceexerted by the five main types of stakeholders (environmental advocates, shippers/passengers, regulators, suppliers, and transportation) on their operations. They wereasked about their perception of influence exerted on them and not exerted by them. Thisproduces a ratio of influences acting on a group.
Respondents were further asked to evaluate the influence of their own group, as wellto give an idea of peer influence/pressure. One hundred thirty-one valid responses werereceived from 617 survey invitations sent (21.2%). The number of comparisonsrequired in AHP is N × (N − 1) / 2, N being the number of nodes in a cluster(Forman and Selly 2001). This means a rapid rise in the number of comparisonsrequired with the increase in the number of criteria (stakeholder groups in this case).Therefore, while the respondents have only been asked to evaluate the five groups, theability to sort the respondents into many more subgroups has been maintained as shownin Fig. 1.
Since the values derived are ratios, we cannot add them to calculate secondaryinfluence. Furthermore, these are relative (not absolute) values. So, the 0.4 or 40%influence on group A by group B may be less than 0.3 or 30% on group C bygroup D. The pooling of results within a stakeholder group is made using thegeometric mean of their individual judgments, as the group is treated as a singularentity. The pooling of global priorities for the entire network is done using thearithmetic mean of stakeholder group priorities, which retains their individuality(Forman and Peniwati 1998).
In sum, this study and the survey that supported it had some unique features:
1. The same model is used for all respondents.2. The respondents’ group is not identified in the survey instrument.3. The peers are not identified as a separate category in the survey instrument.4. Since there is no explicit categorization done by the investigators before the
invitation to participate in the survey or by respondents in the survey, the processmimics a double-blind study.
4 Results and discussion
The results of the survey are given in Table 2.Figure 2 graphically represents 25 stakeholder relationships within the marine
highway network. The five main groups are denoted as circles, while the influenceexerted on them is shown by the arrows heading in. The thickness of the circlesshows the influence that the group exerts on its members, i.e., peer influence/pressure. The size of the circle shows the aggregate influence the group exerts onthe network. The thickness of the lines shows the comparative influence exertedwhile their shade or pattern the consensus or lack thereof (variation) in terms ofstandard deviation in the responses.
America’s Marine Highway stakeholders: a system-scale analysis of...
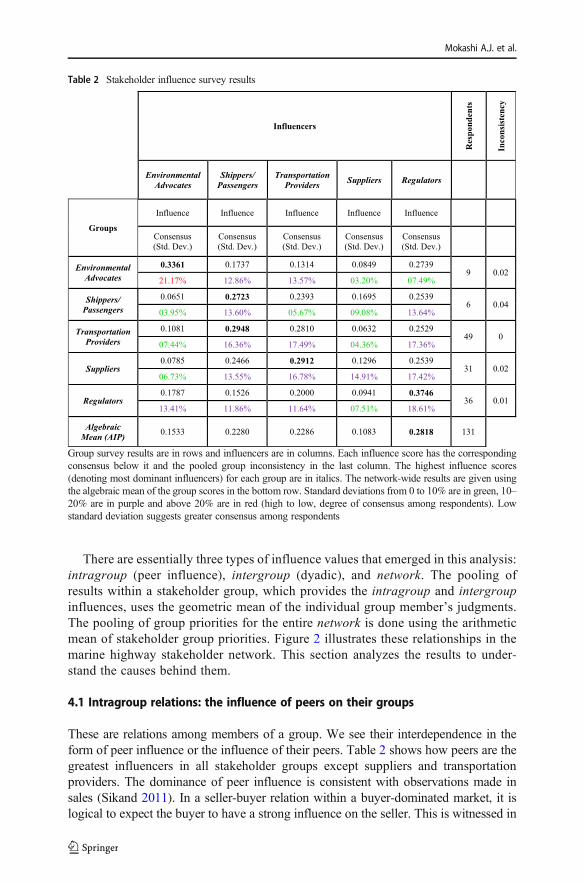
There are essentially three types of influence values that emerged in this analysis:intragroup (peer influence), intergroup (dyadic), and network. The pooling ofresults within a stakeholder group, which provides the intragroup and intergroupinfluences, uses the geometric mean of the individual group member’s judgments.The pooling of group priorities for the entire network is done using the arithmeticmean of stakeholder group priorities. Figure 2 illustrates these relationships in themarine highway stakeholder network. This section analyzes the results to under-stand the causes behind them.
4.1 Intragroup relations: the influence of peers on their groups
These are relations among members of a group. We see their interdependence in theform of peer influence or the influence of their peers. Table 2 shows how peers are thegreatest influencers in all stakeholder groups except suppliers and transportationproviders. The dominance of peer influence is consistent with observations made insales (Sikand 2011). In a seller-buyer relation within a buyer-dominated market, it islogical to expect the buyer to have a strong influence on the seller. This is witnessed in
Table 2 Stakeholder influence survey results
Influencers
Respo
nden
ts
Inconsist
ency
Environmental Advocates
Shippers/ Passengers
Transportation Providers Suppliers Regulators
GroupsInfluence Influence Influence Influence Influence
Consensus
(Std. Dev.)
Consensus
(Std. Dev.)
Consensus
(Std. Dev.)
Consensus
(Std. Dev.)
Consensus
(Std. Dev.)
EnvironmentalAdvocates
0.3361 0.1737 0.1314 0.0849 0.27399 0.02
21.17% 12.86% 13.57% 03.20% 07.49%
Shippers/Passengers
0.0651 0.2723 0.2393 0.1695 0.25396 0.04
03.95% 13.60% 05.67% 09.08% 13.64%
TransportationProviders
0.1081 0.2948 0.2810 0.0632 0.252949 0
07.44% 16.36% 17.49% 04.36% 17.36%
Suppliers0.0785 0.2466 0.2912 0.1296 0.2539
31 0.0206.73% 13.55% 16.78% 14.91% 17.42%
Regulators0.1787 0.1526 0.2000 0.0941 0.3746
36 0.0113.41% 11.86% 11.64% 07.51% 18.61%
AlgebraicMean (AIP) 0.1533 0.2280 0.2286 0.1083 0.2818 131
Group survey results are in rows and influencers are in columns. Each influence score has the correspondingconsensus below it and the pooled group inconsistency in the last column. The highest influence scores(denoting most dominant influencers) for each group are in italics. The network-wide results are given usingthe algebraic mean of the group scores in the bottom row. Standard deviations from 0 to 10% are in green, 10–20% are in purple and above 20% are in red (high to low, degree of consensus among respondents). Lowstandard deviation suggests greater consensus among respondents
Mokashi A.J. et al.

the supplier and transportation provider groups, where the corresponding buyer groupshave the strongest influence. Transportation providers are customers (buyers) of thesuppliers, while in turn being the sellers of transportation services to the shippers.Interestingly, transportation providers do seem to also have considerable group identity(peers 0.2871), which is close to the maximum influence exerted on the group, that isby their customers (shippers/passengers 0.2948). Strong peer influence helps themcooperate (not just compete) with each other to lobby for favorable policy changes.This relation contrasts with that of the suppliers who have very little peer influence(0.1296), which can be problematic when it comes to adopting innovative productssuch as alternative fuels.
4.2 Intergroup (dyadic) relations: the influence of groups on each other
Intergroup (dyadic) relations are relations between pairs of stakeholder groups. Influ-ence values derived from the pairwise comparisons made by stakeholder respondentsshow the relative value of the stakeholder resources as perceived by the respondentgroup. These values were calculated using a geometric mean (aggregate) of individualjudgments by respondents within a group, i.e., aggregating individual judgments (AIJs)(Forman and Peniwati 1998). Intergroup influence is probably most interesting from anetwork perspective. It is this influence that the stakeholders within the network will tryto leverage. Mapping intergroup influences show the path of maximum power between
Fig. 2 America’s Marine Highway stakeholder influence network (to scale). This figure graphically representsthe results of the stakeholder survey given in Table 2. Circles denote the stakeholder groups. Their diametersshow the relative aggregate influence of the group within the network. Circle thickness shows their relativepeer influence (influence of group members on each other). The thickness and direction of the arrows show therelative magnitude and direction of influence between groups. The shading/pattern of the lines shows theconsensus of the respondents around the value. The position of the circles in the figure has no impliedsignificance
America’s Marine Highway stakeholders: a system-scale analysis of...

and over stakeholder groups. An excellent example of these relations is that of betweenenvironmental advocates and transportation providers. Transportation operations, par-ticularly those of ships, have a considerable ecological impact. Environmental advo-cates have often tried to induce ship operators to improve their environmental perfor-mance. They (environmental advocates), however, have limited direct influence on theship operators (0.1081). Environmental advocates, however, do have considerableinfluence on the regulators (0.1787), who, in turn, have maximum influence on theship operators (0.2529). Environmental advocates are, therefore, able to effectivelyinfluence the ship operators by working with the regulators. Here, the resources tradedby the environmental advocates are the goodwill/endorsement of the environment-conscious public with the regulators (Mitchell et al. 1991), in exchange for favorablepolicy for the ship operators, to induce improved environmental performance(MARAD and EPA 2011).
4.3 Network relations—aggregate group (network) influence on each group
The group influence number represents the aggregate value of the stakeholder group’sresource within the network, i.e., quantifies the overall influence of a group within thenetwork. Since the number is derived from the responses of five distinctly differentgroups, algebraic mean (aggregate) of the group priorities has been used to maintain theindividual group identity that is “aggregating individual priorities (AIPs)” (Forman andPeniwati 1998). As these values refer to aggregate group influences, each group isconsidered as an equal singular entity with all constituent members having equalintragroup influence. The overall dominance of the regulators is obvious in theseresults (0.2818), along with the lack of same by the environmental advocates(0.1533). These results could be a reflection of the culture prevailing in the marineindustry in the USA. It is reasonable to assume that a similar inland and short seashipping network in Europe would have significantly different influence values forthese groups.
4.4 Comparisons of intragroup and intergroup influences
This study demonstrates the strength of peer influence within the various AMHstakeholder groups. In three out of five groups of stakeholders (shippers/passen-gers, environmental advocates, and regulators), respondents reported that theirpeers influenced their operational decisions the most. Both transportation pro-viders and suppliers have a competitive business environment that justifies lowerpeer and higher customer influence. Overall, regulators have the highest influencein the network (0.2818). This suggests that a regulators’ lead initiative has the besthope of success. As depicted in Fig. 2, the low influence exerted by the environ-mental advocates on the shippers suggests that these groups have little power toinduce better environmental performance from transportation providers (maritimeoperators). On the other hand, environmental advocates have a relatively strongrelationship with the regulators, who in turn are among the strongest externalinfluencers of the transportation providers. Thus, while environmental groups maynot be in a position to directly influence a given firm, they do play a strong role inshaping policy.
Mokashi A.J. et al.
4.5 Heterogeneity of groups
Operators of AMH vessels are a dynamic and heterogeneous group, i.e., their choices/costs vary between each other as well as possibly over time. In the context of theimplementation of a policy for marine highways, the high peer influence exhibited in 3out of 5 groups could overcome the divergence in opinion (groupthink). Respondentsthat provide distinctly varied services to the marine highway operators (MHOs) weregrouped under the category “suppliers.” Functionally, this is true, i.e., their role is thatof suppliers. However, their relations with the marine highway stakeholders as well aswith others grouped in the supplier category varies. Combining these varied serviceproviders under the generalized designation as suppliers were necessitated by the needto contain the model and the required responses to a reasonable size. AHP analysisrequires pairwise comparisons between criteria. The number of comparisons required inAHP is N× (N− 1) / 2, N being the number of nodes in a cluster (Forman and Selly2001). Therefore, adding a separate group or splitting a group considerably increasesthe responses required, which, in turn, reduces the response rate of complete responses.The results obtained from the survey could have several possible interpretations. Onethat makes sense in the maritime context is that the suppliers, in general, listen to theircustomers more than their peers. Future work could explore these service providers asseparate entities for a better understanding of the relations between them and betweenthem and other stakeholder groups.
5 Limitations
This research has been an exercise in group decision making. Some unique challengeswere faced in this process. One limitation of the survey was the low/asymmetricresponse rate among groups. The need to solicit and incorporate stakeholder prioritiesfrom representatives in leadership positions, who are often too busy to respond tosurveys, reduced the response rate. Of some concern is the limited number of shippersthat have responded (6). The reason for this was the commercial sensitivity of theinformation, i.e., the identity of the shippers. These small numbers do not have amethodological impact, as AHP is often used for small groups or even individuals. Itshould also be noted that since we are working with geometric means (AIJ) forintergroup and intragroup influences and algebraic means (AIP) for network influences,we are comparing means to means. Therefore, the varying number of respondentswithin each group does not skew the results. However, the reliability/(statistical)significance of the results does suffer from fewer responses. Therefore, a larger sampleis recommended before fully interpreting these results.
6 Conclusion
This study explored the influence held by five AMH system stakeholder groups in thebroad contexts of policy and management. Results describe how five groups (environ-mental advocates, shippers/passengers, transportation providers, suppliers, regulators)perceive the influence of their peers, the other groups, and the network as a whole in
America’s Marine Highway stakeholders: a system-scale analysis of...
their decision making. Making a positive change in a system as complex and diverse asthe America’s Marine Highway system is particularly challenging due to variedincentive structures, mandates, and priorities of the individual actors. Thus, if an entity,such as an environmental advocate, wishes to initiate changes, it must seek appropriateentry points in the decision system and understand the influence pathways. Forexample, actions such as switching to more environmentally friendly vessel fuelsources or changing shipping routes to avoid whale migration areas could find willingvessel operators if regulators advocated such actions. This work benefits the stake-holders of the AMH, as it illustrates how the decision system operates with respect togroups’ influence on each other and their peer networks. Each group within the systemcan understand how to elicit cooperation from other groups by targeting those in thesystem which hold the greatest influence. Notably, regulators hold the highest level ofinfluence over all groups. Environmental advocates can influence regulators but haveless of an influence on the marine highway operators that make up the AMH system.Thus, they may benefit from reaching out to regulators, who would in turn act asproxies to help advocates achieve the desired environmental performance from themarine highway operators. Finally, this work endeavored to not just find the influencesbetween the stakeholder groups but also communicate them for policymakers. Thelatter was efficiently done visually using a novel method developed by the authors. Itsutility can be confirmed by comparing the ability to assimilate the results from Table 2using the numerical values given, with the graphical depiction of the same in Fig. 2.
Acknowledgments Authors would like to thank the AMH stakeholder survey respondents for their time andpatience in responding to the survey questionnaire.
Funding information This study was partly funded by the Maritime Administration an agency within theU.S. Department of Transportation.
References
Alderton PM (2008) Port management and operations, 3rd edn. Informa, LondonAmerican Waterways Operators (AWO) (2019) Press Kit [Press release]. Retrieved from https://www.
americanwaterways.com/sites/default/files/2019PressKit.pdf. Accessed 2 Apr 2020Bagnell D, Saunders C, Silva R, Tedesco MP (2009) Operational development of marine highways to serve
the U.S. Pacific coast. Transp Res Rec 2100(1):76–85. https://doi.org/10.3141/2100-09Becker JFF, Burgess A, Henstra DAJME, Logistics (2004) No need for speed in short sea shipping. 6(3):236–
251. https://doi.org/10.1057/palgrave.mel.9100111Berger BK, Reber BH (2006) Gaining influence in public relations: the role of resistance in practice. Lawrence
Erlbaum Publishers, MahwahBonsall S (1998, 10/1998). [ENGMRM012 maritime transport systems]Clarkson MBE (1994) A risk based model of stakeholder theory Paper presented at the Proceedings of the
Second Toronto Conference on Stakeholder Theory TorontoCompston H (2009) Policy networks and policy change: putting policy network theory to the test. Palgrave
Macmillan, BasingstokeCSI (2005) Short-sea and coastal shipping options study Retrieved from http://temis.documentation.
developpement-durable.gouv.fr/docs/Temis/0060/Temis-0060304/16566.pdf. Accessed 2 Dec 2018Forman E, Peniwati K (1998) Aggregating individual judgments and priorities with the analytic hierarchy
process. Eur J Oper Res 108(1):165–169 Retrieved from http://www.sciencedirect.com/science/article/B6VCT-3TC6THR-19/2/379c4b553d9827927aa26aa55f987e80. Accessed 7 Oct 2012
Mokashi A.J. et al.
Forman EH, Selly MA (2001) Decision by objectives: how to convince others that you are right. WorldScientific, River Edge
Freeman RE (ed) (2010) Stakeholder theory : the state of the art. Cambridge University Press, CambridgeFriedman AL, Miles S (2006) Stakeholders: Theory & Practice. Oxford University Press, OxfordFriedman M (2007) The social responsibility of business is to increase its profits. in: Zimmerli WC, Holzinger
M, Richter K (eds) Corporate ethics and corporate governance. Springer Berlin Heidelberg, Berlin,Heidelberg, pp 173–178. https://doi.org/10.1007/978-3-540-70818-6_14
Fries N, de Jong GC, Patterson Z, Weidmann U (2010) Shipper willingness to pay to increase environmentalperformance in freight transportation. Transp Res Rec 2168(1):33–42. https://doi.org/10.3141/2168-05
HEC (2011) American Marine Highway Design Project (MARAD DTMA1C10061). 1200 New JerseyAvenue, SE, Washington, DC 20590. Retrieved from https://www.marad.dot.gov/wp-content/uploads/pdf/AMH_Report_Final_Report_10282011_updated.pdf. Accessed 12 Nov 2018
IAPH, AAPA, ESPO, AIVP, PIANC (2018) World Ports Sustainability Program (WPSP) Charter.International Association of Ports and Harbors (IAPH), European Sea Ports Organisation (ESPO),International Association of Cities and Ports (AIVP), World Association for Waterborne TransportInfrastructure (PIANC). https://sustainableworldports.org. Accessed 14 March 2018
Janis IL (1982) Groupthink : psychological studies of policy decisions and fiascoes, 2nd edn. HoughtonMifflin, Boston
Johnson H, Styhre L (2015) Increased energy efficiency in short sea shipping through decreased time in port.Transp Res A Policy Pract 71:167–178. https://doi.org/10.1016/j.tra.2014.11.008
Kingdon JW (1973) Congressmen’s voting decisions. Harper & Row, New YorkKlijn E-H (2008) The Oxford handbook of inter-organizational relations. In: Cropper S, Ebers M, Huxham C,
Smith Ring P (eds) Oxford handbooks. Oxford University Press, Oxford, pp 118–146Knoke D, Chen X (2008) Political Perspectives on Inter-Organizational Networks. In: Cropper S (ed) The
Oxford handbook of inter-organizational relations. Oxford University Press, Oxford, p xxiv, 782 pKongsvik TØ, Størkersen K, Antonsen S (2014) The relationship between regulation, safety management
systems and safety culture in the maritime industry. Safety, Reliability and Risk Analysis: Beyond theHorizon, 467–473
Lai K-h, Cheng TCE (2009) Just-in-time logistics. In: Farnham, England. Gower, BurlingtonMARAD, EPA (2011) America’s Marine Highway Report to CongressMardle S, Pascoe S, Herrero I (2004) Management objective importance in fisheries: an evaluation using the
analytic hierarchy process (AHP). Environ Manag 33(1):1–11. https://doi.org/10.1007/s00267-003-3070-y
Merchant Marine Act of 1920 (1920) § Twenty-Seven 988–1008 (1920 06/05/1920)Min W, Sui Pheng L (2005) Economic order quantity (EOQ) versus just-in-time (JIT) purchasing: an
alternative analysis in the ready-mixed concrete industry. Constr Manag Econ 23(4):409–422.https://doi.org/10.1080/01446190500041339
Mitchell RC, Mertig AG, Dunlap RE (1991) Twenty years of environmental mobilization: Trends amongnational environmental organizations. Soc Natural Resour 4:219–234. https://doi.org/10.1080/08941929109380756
Molm LD (2010) The structure of reciprocity. Soc Psychol Q 73(2):119–131 Retrieved from http://www.jstor.org/stable/25677393. Accessed 29 Jul 2018
Morgan MG, Peha J (Eds.) (2003) Science and Technology Advice for Congress Washington: Resources forthe Future
Musso E, Casaca ACP, Lynce AR (2010) Economics of Short Sea shipping. In: Grammenos CT (ed) Thehandbook of maritime economics and business. Lloyd’s List, London, pp 391–430
National Research Council (U.S.). Committee for a Study of the Federal Role in the Marine TransportationSystem (2004) The marine transportation system and the Federal Role: measuring performance, targetingimprovement. Transportation Research Board, Washington
Notteboom T, Winkelmans W (2003) Dealing with stakeholders in the port planning process. In Across theborder: building upon a quarter century of transport research in the Benelux.-Antwerpen, 2003 (pp. 249-265)
Paixão AC, Marlow PB (2002) Strengths and weaknesses of short sea shipping. Mar Policy 26(3):167–178.https://doi.org/10.1016/S0308-597X(01)00047-1
Peet G (1994) The role of (environmental) non-governmental organizations at the Marine EnvironmentProtection Committee (MEPC) of the International Maritime Organization (IMO), and at the LondonDumping Convention (LDC). Ocean Coast Manag 22(1):3–18. https://doi.org/10.1016/0964-5691(94)90080-9
America’s Marine Highway stakeholders: a system-scale analysis of...
Perakis AN, Denisis A (2008) A survey of short sea shipping and its prospects in the USA. Marit PolicyManag 35(6):591–614. https://doi.org/10.1080/03088830802469501
Rodrigue J-P, Comtois C, Slack B (2013) The geography of transport systems, 3rd edn. Routledge, LondonRoome N (2001) Conceptualizing and studying the contribution of networks in environmental management
and sustainable development. Bus Strateg Environ 10(2):69–76. https://doi.org/10.1002/bse.276Rowley TJ (1997) Moving beyond dyadic ties: a network theory of stakeholder influences. Acad Manag Rev
22(4):887–910 Retrieved from http://www.jstor.org/stable/259248. Accessed 7 Oct 2012Schmoldt DL (2001) The analytic hierarchy process in natural resource and environmental decision making.
In: Dordrecht. Kluwer Academic PublishersSchneier EV, Gross B (1993) Legislative strategy: shaping public policy. St. Martin’s Press, New YorkSemolinos P, Olsen G, Giacosa A (2013) LNG as marine fuel: challenges to be overcome. Paper presented at
the 17th International Conference & Exhibition on liquefied natural gas, TOTAL Gas & Power, HoustonSikand A (2011). Peer influence vs. manager authority—which wins? Sales Practice. The Sales Challenger™.
News and Insight from the Team. Retrieved from http://saleschallenger.exbdblogs.com/2011/08/23/peer-influence-vs-manager-authority%e2%80%94which-wins/. Accessed 16 Nov 2011
Smith A (2007) An inquiry into the nature and causes of the wealth of nations. In: Soares SM (ed) Books I, II,III, IV and V. MetaLibri digital library, p 754
Solms SV (2009) Homogeneity and choice aggregation in the analytic hierarchy process. Paper presented atthe ISHAP 2009 IProceedings of the international symposium on the analytic hierarchy process for multi-criteria decision making, Pittsburgh. http://www.isahp.org/2009Proceedings/Final_Papers/93_von_Solms_Homogeneity_and_Choice_Aggregation_REV_FIN.pdf. Accessed 7 Oct 2012
UNCTAD (2018) 50 years of review of maritime transport, 1968–2018: reflecting on the past, exploring thefuture. Retrieved from https://unctad.org/en/PublicationsLibrary/dtl2018d1_en.pdf. Accessed 2 Apr 2019
Van Der Horst MR, De Langen PW (2008) Coordination in hinterland transport chains: a major challenge forthe seaport community. Marit Econ Logist 10(1):108–129. https://doi.org/10.1057/palgrave.mel.9100194
World Ports Sustainability Program (WPSP) Charter (2018)
Publisher’s note Springer Nature remains neutral with regard to jurisdictional claims in published maps andinstitutional affiliations.
Mokashi A.J. et al.