South Dakota Technical Institute Licensure and Certification ...
Upload
khangminh22Category
view
2download
0
National (Prior Year) 221,176 36.2 16.8 8.1 0.8 1.6 2.6 33.9
Comparison of Racial and Ethnic Distribution (2)
Local AgencyNumber
Included in Analysis
White, Not Hispanic
%
Black, Not Hispanic
%
Hispanic
%
American Indian/Alaska
Native%
Asian/Pacific Islander
%
Multiple Races
%
All Other/Unknown
%
Region 1 231 73.6 0.4 7.4 9.5 1.7 6.9 0.4
Region 2 335 31.3 0.6 3.9 54.9 0.0 8.1 1.2
Region 3 331 42.6 1.8 27.2 5.7 17.8 3.3 1.5
Region 5 1,072 42.2 19.3 17.8 11.7 3.6 4.9 0.5
South Dakota 3,634 44.1 6.4 12.8 27.2 3.4 5.3 0.8
(1) Reporting period is January 1 through December 31(2) Excludes data with errors* National includes previous year’s data for all participating States and ITOs.* Percentages are not calculated if <100 records are available for analysis after exclusions.
2020 Pregnancy Nutrition Surveillance
Comparison of Racial and Ethnic Distribution by Local Agency
Table 3F (1)
South Dakota
Run Date: 1/13/2022WIC PNSS & PedNSS
Page : 1

Comparison of Age Distribution (2)
Local Agency Number Included in
Analysis
< 15 Years
%
15 - 17 Years
%
18 - 19 Years
%
20 - 29 Years
%
30 - 39 Years
%
>= 40 Years
%
Unknown
%
Region 1 231 0.0 2.2 8.2 62.8 24.2 2.6 0.0
Region 2 335 0.3 3.0 6.0 64.8 24.5 1.2 0.3
Region 3 331 0.0 4.2 9.7 59.8 25.1 1.2 0.0
Region 5 1,072 0.1 2.8 6.5 55.9 32.4 2.1 0.3
South Dakota 3,634 0.1 3.4 8.0 57.8 28.5 2.0 0.1
National (Prior Year) 221,182 0.1 2.5 7.4 58.4 29.1 2.5 0.1
(1) Reporting period is January 1 through December 31(2) Excludes data with errors* National includes previous year’s data for all participating States and ITOs.* Percentages are not calculated if <100 records are available for analysis after exclusions.
2020 Pregnancy Nutrition Surveillance
Comparison of Age Distribution by Local Agency
Table 4F (1)
South Dakota
Run Date: 1/13/2022WIC PNSS & PedNSS
Page : 2

Comparison of Maternal Health Indicators (2,3)
Local Agency Prepregnancy BMI
(4)
Weight Gain
(5)
Anemia(Low Hb/Hct)
(6)
GestationalDiabetesDuring
Pregnancy
HypertensionDuring
Pregnancy
Under-weight
Over-weight
< Ideal > Ideal 3rd Trimester Postpartum
Number % (Rank) % (Rank) Number % (Rank) % (Rank) Number % (Rank) Number % (Rank) Number % (Rank) Number % (Rank)
Region 1 195 3.1 (2) 63.1 (2) 167 16.8 (1) 55.1 (4) 61 11.5 (1) 24 16.7 (1) 102 10.8 (1) 102 10.8 (2)
Region 2 236 1.7 (1) 64.4 (3) 181 22.1 (3) 48.1 (2) 63 22.2 (3) 38 42.1 (3) 119 11.8 (2) 119 10.1 (1)
Region 3 226 3.5 (3) 65.0 (4) 164 19.5 (2) 48.2 (3) 74 24.3 (4) 30 56.7 (4) 128 15.6 (3) 128 10.9 (3)
Region 5 682 4.8 (4) 61.9 (1) 554 24.2 (4) 44.9 (1) 137 21.2 (2) 70 25.7 (2) 390 17.2 (4) 390 12.1 (4)
South Dakota 2,690 3.3 63.5 2,139 20.9 47.1 684 24.0 342 35.4 1,373 12.7 1,377 12.3
National (Prior Year) 199,022 3.3 61.4 128,933 28.2 45.4 41,219 22.0 59,728 19.4 139,782 38.2 140,227 38.3
(1) Reporting period is January 1 through December 31.(2) Excludes records with unknown data or errors.(3) Rank compares one Local Agency's rate to other Local Agencies. Rank 1 = best rate.(4) Based on 2009 IOM report, "Weight Gain During Pregnancy": underweight (BMI <18.5), normal weight (BMI 18.5 to 24.9), overweight (BMI 25.0 to 29.9), obese (BMI >30.0).(5) Based on 2009 IOM report, "Weight Gain During Pregnancy": underweight during pregnancy (ideal weight gain = 28 to 40 pounds), normal weight prepregnancy (ideal weight gain = 25 to 35 pounds), overweight prepregnancy (ideal weight gain = 15 to 25 pounds), obese prepregnancy (ideal weight gain = 11 to 20 pounds).(6) Based on 1990 MMWR, "Recommendations to Prevent and Control Iron Deficiency in the United States"; adjusted for altitude and smoking.* National includes previous year’s data for all participating States and ITOs.* Percentages are not calculated if <100 records are available for analysis after exclusions.
2020 Pregnancy Nutrition Surveillance
Comparison of Maternal Health Indicators by Local Agency
Table 5F (1)
South Dakota
Run Date: 1/13/2022WIC PNSS & PedNSS
Page : 3
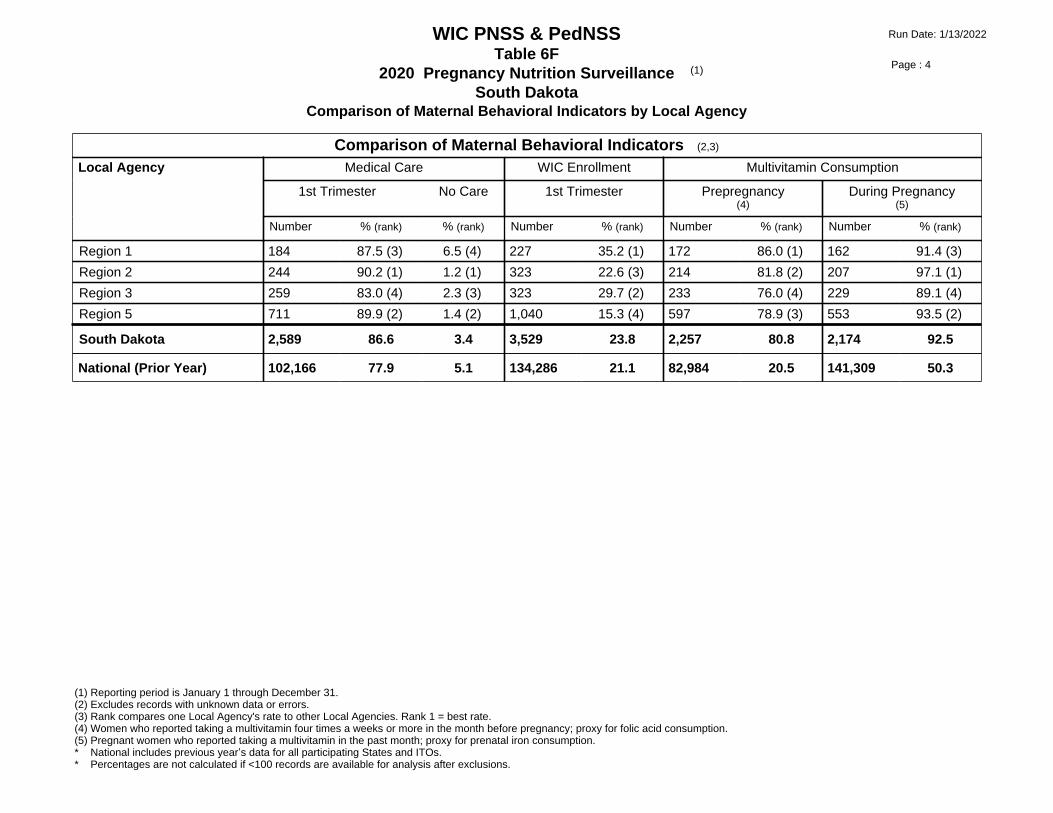
National (Prior Year) 102,166 77.9 5.1 134,286 21.1 82,984 20.5 141,309 50.3
Comparison of Maternal Behavioral Indicators (2,3)
Local Agency Medical Care WIC Enrollment Multivitamin Consumption
1st Trimester No Care 1st Trimester Prepregnancy(4)
During Pregnancy(5)
Number % (rank) % (rank) Number % (rank) Number % (rank) Number % (rank)
Region 1 184 87.5 (3) 6.5 (4) 227 35.2 (1) 172 86.0 (1) 162 91.4 (3)
Region 2 244 90.2 (1) 1.2 (1) 323 22.6 (3) 214 81.8 (2) 207 97.1 (1)
Region 3 259 83.0 (4) 2.3 (3) 323 29.7 (2) 233 76.0 (4) 229 89.1 (4)
Region 5 711 89.9 (2) 1.4 (2) 1,040 15.3 (4) 597 78.9 (3) 553 93.5 (2)
South Dakota 2,589 86.6 3.4 3,529 23.8 2,257 80.8 2,174 92.5
(1) Reporting period is January 1 through December 31.(2) Excludes records with unknown data or errors.(3) Rank compares one Local Agency's rate to other Local Agencies. Rank 1 = best rate.(4) Women who reported taking a multivitamin four times a weeks or more in the month before pregnancy; proxy for folic acid consumption.(5) Pregnant women who reported taking a multivitamin in the past month; proxy for prenatal iron consumption.* National includes previous year’s data for all participating States and ITOs.* Percentages are not calculated if <100 records are available for analysis after exclusions.
2020 Pregnancy Nutrition Surveillance
Comparison of Maternal Behavioral Indicators by Local Agency
Table 6F (1)
South Dakota
Run Date: 1/13/2022WIC PNSS & PedNSS
Page : 4

National (Prior Year) 126,132 26.9 133,382 14.1 82,119 9.2 126,697 9.6 164,079 5.3
Comparison of Smoking Indicators (2,3)
Local Agency
Smoking
Quit SmokingBy First Prenatal
Visit and Stayed OffCigarettes (4)
Smoking in Household
3 MonthsPrior to Pregnancy
Last 3 Monthsof Pregnancy
Prenatal Postpartum
Number % (rank) Number % (rank) Number % (rank) Number % (rank) Number % (rank)
Region 1 209 82.8 (2) 119 41.2 (4) 133 17.3 (1) 171 9.9 (4) 219 3.7 (4)
Region 2 283 84.1 (3) 150 32.0 (3) 171 15.8 (3) 220 8.2 (3) 309 1.3 (2)
Region 3 300 75.7 (1) 150 22.0 (1) 163 12.9 (4) 243 5.3 (2) 308 0.3 (1)
Region 5 892 86.4 (4) 456 26.1 (2) 458 16.6 (2) 582 4.0 (1) 1,003 1.6 (3)
South Dakota 3,142 83.6 1,623 29.9 1,772 17.2 2,338 6.2 3,385 1.6
(1) Reporting period is January 1 through December 31.(2) Excludes records with unknown data or errors.(3) Rank compares one Local Agency's rate to other Local Agencies. Rank 1 = best rate.(4) Among women who smoked 3 months prior to pregnancy.* National includes previous year’s data for all participating States and ITOs.* Percentages are not calculated if <100 records are available for analysis after exclusions.
2020 Pregnancy Nutrition Surveillance
Comparison of Smoking Indicators by Local Agency
Table 7F (1)
South Dakota
Run Date: 1/13/2022WIC PNSS & PedNSS
Page : 5

National (Prior Year) 142,320 9.3 6.6 143,640 11.5 123,562 3.8 143,021 57.0
Comparison of Infant Health Indicators (2,3)
Local Agency Birthweight Preterm Full Term LBW Ever Breastfed
Low(4)
High(5)
(6) (7)
Number % (rank) % (rank) Number % (rank) Number % (rank) Number % (rank)
Region 1 197 7.1 (2) 9.1 (3) 212 11.8 (1) 173 2.3 (1) 198 82.3 (1)
Region 2 260 5.8 (1) 10.0 (4) 306 14.4 (3) 219 2.3 (1) 264 66.3 (3)
Region 3 283 8.5 (3) 5.3 (1) 310 13.9 (2) 245 3.7 (4) 282 66.0 (4)
Region 5 908 9.8 (4) 6.9 (2) 1,015 14.9 (4) 770 3.1 (3) 927 77.3 (2)
South Dakota 3,045 7.8 7.8 3,363 14.1 2,610 2.5 3,074 76.9
(1) Reporting period is January 1 through December 31.(2) Excludes records with unknown data or errors.(3) Rank compares one Local Agency's rate to other Local Agencies. Rank 1 = best rate.(4) <2500 g.(5) >4000 g.(6) <37 weeks gestation.(7) 37 or more weeks gestation and <2500 g.* National includes previous year’s data for all participating States and ITOs.* Percentages are not calculated if <100 records are available for analysis after exclusions.
2020 Pregnancy Nutrition Surveillance
Comparison of Infant Health Indicators by Local Agency
Table 8F (1)
South Dakota
Run Date: 1/13/2022WIC PNSS & PedNSS
Page : 6

Comparison of Racial and Ethnic Distribution (2)
Local AgencyNumber
Included in Analysis
White, Not Hispanic
%
Black, Not Hispanic
%
Hispanic
%
American Indian/Alaska
Native%
Asian/Pacific Islander
%
Multiple Races
%
All Other/Unknown
%
Region 1 777 74.8 0.6 6.8 7.9 1.4 7.7 0.8
Region 2 949 32.5 0.2 3.4 51.9 0.2 10.5 1.3
Region 3 1,109 44.5 3.1 24.4 8.3 14.7 3.2 1.7
Region 4 990 51.9 1.3 11.9 27.6 2.0 4.3 0.9
Region 5 3,084 44.6 20.2 15.5 11.4 3.8 4.0 0.5
Region 6 613 58.6 0.5 11.4 25.3 0.3 3.3 0.7
Region 7 1,528 29.3 0.8 5.6 58.7 0.5 3.5 1.6
South Dakota 10,715 44.9 6.6 11.8 27.6 3.2 4.8 1.0
(1) Reporting period is January 1 through December 31.(2) Excludes data with errors.* Percentages are not calculated if <100 records are available for analysis after exclusions.
Comparison of Racial and Ethnic Distribution by Local Agency
Table 3F
South Dakota
Run Date: 1/13/2022WIC PNSS & PedNSS
2018 - 2020 Pregnancy Nutrition Surveillance (1)
Combined 3 Years
Page : 7

Comparison of Age Distribution (2)
Local Agency Number Included in
Analysis
< 15 Years
%
15 - 17 Years
%
18 - 19 Years
%
20 - 29 Years
%
30 - 39 Years
%
>= 40 Years
%
Unknown
%
Region 1 777 0.0 2.3 7.7 63.7 24.5 1.5 0.3
Region 2 949 0.2 4.0 8.4 60.5 25.2 1.6 0.1
Region 3 1,109 0.0 2.9 9.4 59.0 27.5 1.3 0.0
Region 4 990 0.1 2.1 7.3 62.0 26.9 1.5 0.1
Region 5 3,084 0.0 3.0 7.6 56.6 30.5 2.0 0.3
Region 6 613 0.0 2.9 9.8 60.7 25.4 1.0 0.2
Region 7 1,528 0.1 4.6 10.7 57.1 25.9 1.5 0.0
South Dakota 10,715 0.1 3.3 8.6 58.5 27.6 1.7 0.1
(1) Reporting period is January 1 through December 31.(2) Excludes data with errors.* Percentages are not calculated if <100 records are available for analysis after exclusions.
Comparison of Age Distribution by Local Agency
Table 4F
South Dakota
Run Date: 1/13/2022WIC PNSS & PedNSS
2018 - 2020 Pregnancy Nutrition Surveillance (1)
Combined 3 Years
Page : 8

Comparison of Maternal Health Indicators (2,3)
Local Agency Prepregnancy BMI
(4)
Weight Gain
(5)
Anemia(Low Hb/Hct)
(6)
GestationalDiabetesDuring
Pregnancy
HypertensionDuring
Pregnancy
Under-weight
Over-weight
< Ideal > Ideal 3rd Trimester Postpartum
Number % (Rank) % (Rank) Number % (Rank) % (Rank) Number % (Rank) Number % (Rank) Number % (Rank) Number % (Rank)
Region 1 724 2.9 (2) 61.2 (4) 634 18.1 (1) 51.9 (7) 407 9.6 (1) 215 11.6 (1) 613 9.8 (2) 613 11.4 (5)
Region 2 819 1.7 (1) 61.4 (5) 669 22.6 (5) 46.5 (3) 469 17.7 (7) 239 43.5 (7) 681 10.9 (3) 679 9.6 (2)
Region 3 925 4.0 (5) 61.1 (3) 766 23.5 (6) 40.9 (1) 604 14.7 (4) 221 29.4 (5) 839 11.4 (4) 840 9.5 (1)
Region 4 944 3.3 (3) 60.1 (2) 807 24.8 (7) 47.7 (4) 670 12.8 (2) 332 24.1 (2) 922 11.4 (4) 923 14.3 (7)
Region 5 2,403 4.2 (6) 58.7 (1) 1,994 21.7 (4) 48.0 (5) 1,245 13.7 (3) 727 26.1 (3) 2,247 13.0 (7) 2,255 11.1 (4)
Region 6 593 3.9 (4) 68.1 (7) 509 21.2 (3) 44.0 (2) 391 17.6 (6) 228 36.8 (6) 570 11.8 (6) 571 10.7 (3)
Region 7 1,473 4.3 (7) 63.7 (6) 1,195 20.2 (2) 50.5 (6) 897 16.6 (5) 539 27.5 (4) 1,386 6.2 (1) 1,390 11.7 (6)
South Dakota 9,232 3.5 61.7 7,647 21.5 47.4 5,032 15.5 2,681 28.4 7,892 10.7 7,909 11.5
(1) Reporting period is January 1 through December 31.(2) Excludes records with unknown data or errors.(3) Rank compares one Local Agency's rate to other Local Agencies. Rank 1 = best rate.(4) Based on 2009 IOM report, "Weight Gain During Pregnancy": underweight (BMI <18.5), normal weight (BMI 18.5 to 24.9), overweight (BMI 25.0 to 29.9), obese (BMI >30.0).(5) Based on 2009 IOM report, "Weight Gain During Pregnancy": underweight during pregnancy (ideal weight gain = 28 to 40 pounds), normal weight prepregnancy(ideal weight gain = 25 to 35 pounds), overweight prepregnancy (ideal weight gain = 15 to 25 pounds), obese prepregnancy (ideal weight gain = 11 to 20 pounds).(6) Based on 1990 MMWR, "Recommendations to Prevent and Control Iron Deficiency in the United States"; adjusted for altitude and smoking.* Percentages are not calculated if <100 records are available for analysis after exclusions.
Comparison of Maternal Health Indicators by Local Agency
Table 5F
South Dakota
Run Date: 1/13/2022WIC PNSS & PedNSS
2018 - 2020 Pregnancy Nutrition Surveillance (1)
Combined 3 Years
Page : 9

South Dakota 9,141 87.2 2.0 10,443 25.3 8,738 77.6 6,974 91.3
Comparison of Maternal Behavioral Indicators (2,3)
Local Agency Medical Care WIC Enrollment Multivitamin Consumption
1st Trimester No Care 1st Trimester Prepregnancy(4)
During Pregnancy(5)
Number % (rank) % (rank) Number % (rank) Number % (rank) Number % (rank)
Region 1 699 87.4 (3) 4.4 (7) 756 31.2 (3) 678 79.6 (3) 541 92.6 (3)
Region 2 810 86.7 (4) 1.6 (3) 923 26.5 (5) 776 78.6 (4) 653 93.9 (1)
Region 3 978 85.9 (5) 1.0 (2) 1,091 29.5 (4) 965 72.7 (7) 808 87.7 (7)
Region 4 929 85.6 (6) 1.9 (5) 968 34.0 (1) 922 76.0 (5) 728 87.8 (6)
Region 5 2,569 90.7 (1) 0.8 (1) 3,016 17.8 (7) 2,422 75.5 (6) 1,773 91.4 (5)
Region 6 572 88.1 (2) 1.6 (3) 595 33.1 (2) 564 79.8 (2) 439 92.0 (4)
Region 7 1,393 85.1 (7) 1.9 (5) 1,478 23.6 (6) 1,370 80.1 (1) 1,009 93.5 (2)
(1) Reporting period is January 1 through December 31.(2) Excludes records with unknown data or errors.(3) Rank compares one Local Agency's rate to other Local Agencies. Rank 1 = best rate.(4) Women who reported taking a multivitamin four times a weeks or more in the month before pregnancy; proxy for folic acid consumption.(5) Pregnant women who reported taking a multivitamin in the past month; proxy for prenatal iron consumption.* Percentages are not calculated if <100 records are available for analysis after exclusions.
Comparison of Maternal Behavioral Indicators by Local Agency
Table 6F
South Dakota
Run Date: 1/13/2022WIC PNSS & PedNSS
2018 - 2020 Pregnancy Nutrition Surveillance (1)
Combined 3 Years
Page : 10

Comparison of Smoking Indicators (2,3)
Local Agency
Smoking
Quit SmokingBy First Prenatal
Visit and Stayed OffCigarettes (4)
Smoking in Household
3 MonthsPrior to Pregnancy
Last 3 Monthsof Pregnancy
Prenatal Postpartum
Number % (rank) Number % (rank) Number % (rank) Number % (rank) Number % (rank)
Region 1 598 57.9 (7) 595 25.7 (7) 299 27.1 (6) 553 8.7 (3) 733 2.5 (4)
Region 2 713 56.0 (6) 683 19.3 (5) 344 32.3 (4) 674 12.0 (7) 874 3.1 (7)
Region 3 896 45.0 (3) 845 15.7 (2) 331 26.0 (7) 834 4.9 (2) 1,023 1.6 (2)
Region 4 752 44.5 (2) 919 24.5 (6) 307 40.7 (3) 737 8.7 (3) 931 2.6 (5)
Region 5 2,165 51.9 (5) 2,272 14.3 (1) 776 29.6 (5) 1,812 3.6 (1) 2,873 1.5 (1)
Region 6 460 42.6 (1) 548 19.2 (4) 181 42.0 (2) 448 10.3 (6) 573 2.8 (6)
Region 7 1,049 50.0 (4) 1,222 16.9 (3) 463 44.3 (1) 1,018 9.0 (5) 1,397 2.1 (3)
South Dakota 8,091 56.2 7,832 19.4 3,548 30.2 7,198 7.1 9,950 2.0
(1) Reporting period is January 1 through December 31.(2) Excludes records with unknown data or errors.(3) Rank compares one Local Agency's rate to other Local Agencies. Rank 1 = best rate.(4) Among women who smoked 3 months prior to pregnancy.* Percentages are not calculated if <100 records are available for analysis after exclusions.
Comparison of Smoking Indicators by Local Agency
Table 7F
South Dakota
Run Date: 1/13/2022WIC PNSS & PedNSS
2018 - 2020 Pregnancy Nutrition Surveillance (1)
Combined 3 Years
Page : 11
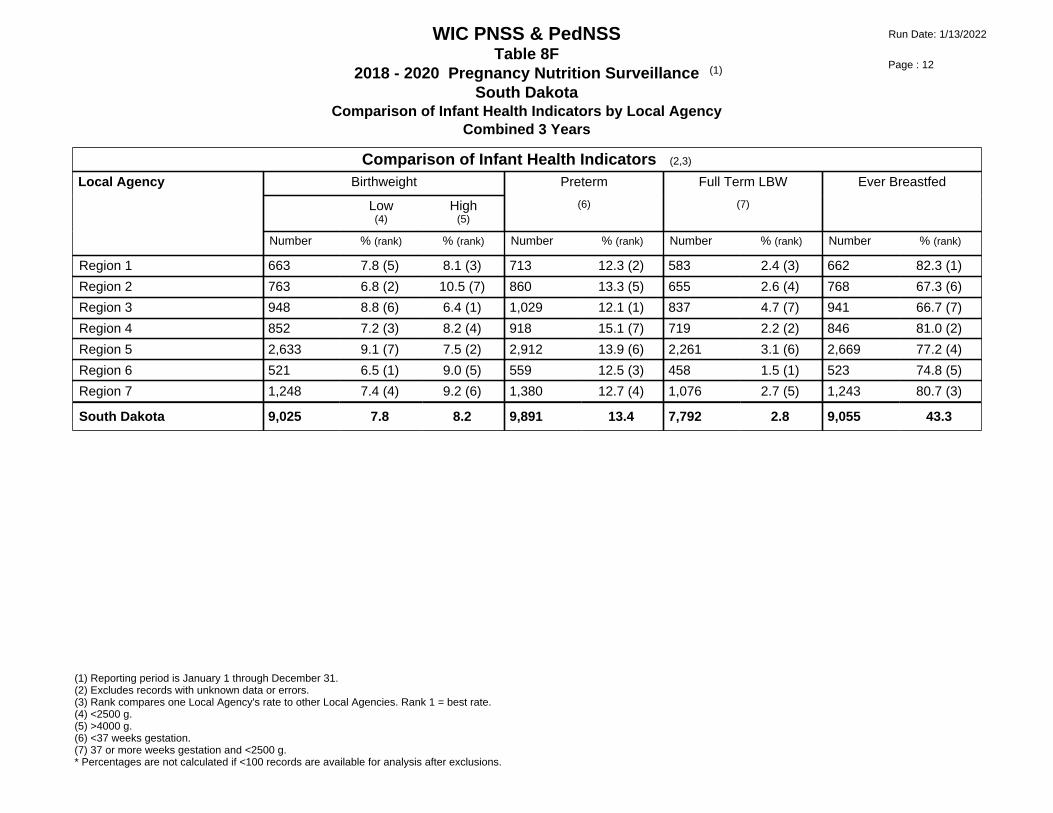
Comparison of Infant Health Indicators (2,3)
Local Agency Birthweight Preterm Full Term LBW Ever Breastfed
Low(4)
High(5)
(6) (7)
Number % (rank) % (rank) Number % (rank) Number % (rank) Number % (rank)
Region 1 663 7.8 (5) 8.1 (3) 713 12.3 (2) 583 2.4 (3) 662 82.3 (1)
Region 2 763 6.8 (2) 10.5 (7) 860 13.3 (5) 655 2.6 (4) 768 67.3 (6)
Region 3 948 8.8 (6) 6.4 (1) 1,029 12.1 (1) 837 4.7 (7) 941 66.7 (7)
Region 4 852 7.2 (3) 8.2 (4) 918 15.1 (7) 719 2.2 (2) 846 81.0 (2)
Region 5 2,633 9.1 (7) 7.5 (2) 2,912 13.9 (6) 2,261 3.1 (6) 2,669 77.2 (4)
Region 6 521 6.5 (1) 9.0 (5) 559 12.5 (3) 458 1.5 (1) 523 74.8 (5)
Region 7 1,248 7.4 (4) 9.2 (6) 1,380 12.7 (4) 1,076 2.7 (5) 1,243 80.7 (3)
South Dakota 9,025 7.8 8.2 9,891 13.4 7,792 2.8 9,055 43.3
(1) Reporting period is January 1 through December 31.(2) Excludes records with unknown data or errors.(3) Rank compares one Local Agency's rate to other Local Agencies. Rank 1 = best rate.(4) <2500 g.(5) >4000 g.(6) <37 weeks gestation.(7) 37 or more weeks gestation and <2500 g.* Percentages are not calculated if <100 records are available for analysis after exclusions.
Comparison of Infant Health Indicators by Local Agency
Table 8F
South Dakota
Run Date: 1/13/2022WIC PNSS & PedNSS
2018 - 2020 Pregnancy Nutrition Surveillance (1)
Combined 3 Years
Page : 12
Copyright © 2022 FDOKUMEN